UNITED STATES
SECURITIES AND EXCHANGE COMMISSION
Washington, D.C. 20549
FORM N-CSR
CERTIFIED SHAREHOLDER REPORT OF REGISTERED MANAGEMENT
INVESTMENT COMPANIES
Investment Company Act file number: 811-5141
Pacific Select Fund
(Exact name of registrant as specified in charter)
700 Newport Center Drive, P.O. Box 7500, Newport Beach, CA 92660
(Address of principal executive offices)
Robin S. Yonis
Vice President and General Counsel of Pacific Select Fund
700 Newport Center Drive
Post Office Box 9000
Newport Beach, CA 92660
(Name and address of agent for service)
Copies to:
Anthony Zacharski, Esq
Dechert LLP
90 State House Square
Hartford, CT 06103-3702
Registrant’s telephone number, including area code: (949) 219-6767
Date of fiscal year end: December 31
Date of reporting period: January 1, 2012–December 31, 2012
Form N-CSR is to be used by management investment companies to file reports with the Commission not later than 10 days after the transmission to stockholders of any report that is required to be transmitted to stockholders under Rule 30e-1 under the Investment Company Act of 1940 (17 CFR 270.30e-1). The Commission may use the information provided on Form N-CSR in its regulatory, disclosure review, inspection, and policymaking roles.
A registrant is required to disclose the information specified by Form N-CSR, and the Commission will make this information public. A registrant is not required to respond to the collection of information contained in Form N-CSR unless the Form displays a currently valid Office of Management and Budget (“OMB”) control number. Please direct comments concerning the accuracy of the information collection burden estimate and any suggestions for reducing the burden to Secretary, Securities and Exchange Commission, 450 Fifth Street, NW, Washington, DC 20549-0609. The OMB has reviewed this collection of information under the clearance requirements of 44 U.S.C. § 3507.
Item 1. Reports to Stockholders.
The following is a copy of the report transmitted to stockholders pursuant to Rule 30e-1 under the Act (17 CFR 270.30e-1).
TABLE OF CONTENTS
PACIFIC SELECT FUND
The 2012 Annual Report for the American Funds® Insurance Series (“AFIS”) will be mailed separately to all Pacific Life Insurance Company and Pacific Life & Annuity Company variable life insurance policyholders and variable annuity contract owners with allocations to the American Funds Growth, American Funds Growth-Income and American Funds Asset Allocation Portfolios of the Pacific Select Fund (“PSF”). For those policyholders and contract owners, the AFIS Annual Report should be read in conjunction with the PSF Annual Report included herein.
PACIFIC SELECT FUND
Dear Shareholders:
We are pleased to share with you the Pacific Select Fund (Fund) Annual Report dated December 31, 2012. The Fund is the underlying investment vehicle for variable life insurance policies and variable annuity contracts offered by Pacific Life Insurance Company (Pacific Life) or its subsidiaries. Pacific Life Fund Advisors LLC (PLFA) is the adviser to the Fund and supervises the management of all of the Fund’s portfolios. As Adviser to the Fund, PLFA manages the Portfolio Optimization Conservative, Portfolio Optimization Moderate-Conservative, Portfolio Optimization Moderate, Portfolio Optimization Growth, and Portfolio Optimization Aggressive-Growth Portfolios (Portfolio Optimization Portfolios), each of which is an asset allocation “fund of funds” and which invests in certain other Fund portfolios.
PLFA also manages the Pacific Dynamix-Conservative Growth, Pacific Dynamix-Moderate Growth and Pacific Dynamix-Growth Portfolios (Pacific Dynamix Portfolios) each of which is an asset allocation “fund of funds” and which invests in certain other Fund portfolios (Pacific Dynamix Underlying Portfolios) that are only available for investment by the three Pacific Dynamix Portfolios and are included in a separate Annual Report. Please see “Where to Go for More Information” for instructions on how to obtain the Pacific Dynamix Underlying Portfolios’ Annual Report.
Additionally, PLFA does business under the name “Pacific Asset Management” and manages the Cash Management and the High Yield Bond Portfolios under that name. For the other portfolios, with the exception of the American Funds® Growth, the American Funds® Growth-Income and the American Funds® Asset Allocation Portfolios, the Adviser has retained other firms to serve as portfolio managers under its supervision. Each of the American Funds Growth, the American Funds Growth-Income and the American Funds Asset Allocation Portfolios (the master-feeder portfolios) invests all of its assets in a master fund; and consequently, the Adviser has not retained other portfolio managers to manage assets of these portfolios. The portfolio managers and their portfolios as of December 31, 2012 are listed below:
| | |
| Portfolio | | Portfolio Manager |
| Cash Management | | Pacific Asset Management |
| Diversified Bond | | Western Asset Management Company (Western Asset) |
| Floating Rate Loan | | Eaton Vance Management (Eaton Vance) |
| High Yield Bond | | Pacific Asset Management |
| Inflation Managed | | Pacific Investment Management Company LLC (PIMCO) |
| Inflation Protected | | Western Asset Management Company (Western Asset) |
| Managed Bond | | Pacific Investment Management Company LLC (PIMCO) |
| Short Duration Bond | | T. Rowe Price Associates, Inc. (T. Rowe Price) |
| Emerging Markets Debt | | Ashmore Investment Management Limited (Ashmore) |
American Funds® Growth American Funds® Growth-Income | | Capital Research and Management Company (Capital Research)–adviser to the Master Growth and Growth-Income Funds |
| Comstock | | Invesco Advisers, Inc. (Invesco) |
| Dividend Growth | | T. Rowe Price Associates, Inc. (T. Rowe Price) |
| Equity Index | | BlackRock Investment Management, LLC (BlackRock) |
Focused 30
Growth LT | | Janus Capital Management LLC (Janus) |
| Large-Cap Growth | | UBS Global Asset Management (Americas) Inc. (UBS) |
| Large-Cap Value | | ClearBridge Advisors, LLC (ClearBridge) |
| Long/Short Large-Cap | | J.P. Morgan Investment Management Inc. (JP Morgan) |
| Main Street® Core | | OppenheimerFunds, Inc. (Oppenheimer) |
| Mid-Cap Equity | | Lazard Asset Management LLC (Lazard) |
| Mid-Cap Growth | | Morgan Stanley Investment Management Inc. (Morgan Stanley) |
| Mid-Cap Value | | BlackRock Capital Management, Inc. (BlackRock Capital) |
| Small-Cap Equity | | BlackRock Investment Management, LLC (BlackRock)/ Franklin Advisory Services, LLC (Franklin) |
| Small-Cap Growth | | Fred Alger Management, Inc. (Alger) |
| Small-Cap Index | | BlackRock Investment Management, LLC (BlackRock) |
| Small-Cap Value | | NFJ Investment Group LLC (NFJ) |
| Health Sciences | | Jennison Associates LLC (Jennison) |
| Real Estate | | Morgan Stanley Investment Management Inc. (Morgan Stanley) |
| Technology | | Columbia Management Investment Advisers, LLC (Columbia) |
| Emerging Markets | | OppenheimerFunds, Inc. (Oppenheimer) |
| International Large-Cap | | MFS Investment Management (MFS) |
| International Small-Cap | | Batterymarch Financial Management, Inc. (Batterymarch) |
| International Value | | J.P. Morgan Investment Management Inc. (JP Morgan) |
A-1
PACIFIC SELECT FUND
| | |
| Portfolio | | Portfolio Manager |
| Currency Strategies | | UBS Global Asset Management (Americas) Inc. (UBS) |
| Global Absolute Return | | Eaton Vance Management (Eaton Vance) |
| Precious Metals | | Wells Capital Management Incorporated (Wells Capital) |
| American Funds® Asset Allocation | | Capital Research and Management Company (Capital Research)– adviser to the Master Asset Allocation Fund |
Pacific Dynamix-Conservative Growth Pacific Dynamix-Moderate Growth Pacific Dynamix-Growth Portfolio Optimization Conservative Portfolio Optimization Moderate-Conservative Portfolio Optimization Moderate Portfolio Optimization Growth Portfolio Optimization Aggressive-Growth | | Pacific Life Fund Advisors LLC (PLFA) |
Each of the portfolio managers, or in the case of the master-feeder portfolios, the adviser to the master funds, has prepared a discussion regarding the performance of the portfolios that they manage, including commentary discussing positive and negative factors affecting performance for the past twelve months.
We appreciate your confidence in the Fund and look forward to serving your financial needs in the years to come.
Sincerely,
| | |
 | |  |
James T. Morris Chairman of the Board Pacific Select Fund | | Mary Ann Brown Chief Executive Officer Pacific Select Fund |
A-2
PACIFIC SELECT FUND PERFORMANCE DISCUSSION
This Annual Report is provided for the general information of investors with beneficial interests in the Fund. This report is not authorized for distribution to prospective investors unless preceded or accompanied by a current Fund prospectus, as supplemented, which contains information about the Fund and each of its portfolios, including their investment objectives, risks, charges and expenses. You should read the prospectus carefully before investing. There is no assurance that a portfolio will achieve its investment objective. Each portfolio is subject to market risk. The value of a portfolio changes as its asset values go up or down. The value of a portfolio’s shares will fluctuate, and when redeemed, may be worth more or less than their original cost. The total return for each portfolio of the Fund includes reinvestment of all dividends and capital gain distributions, if any. The total returns and seven-day yield (Cash Management Portfolio only) do not include deductions at the separate account or contract level for cost of insurance charges, premium loads, administrative charges, maintenance fees, premium tax charges, mortality and expense risk charges, or other charges that may be incurred under a contract which, if incurred, would have resulted in lower returns. Past performance is not predictive of future performance. This report shows you the performance of the Fund’s portfolios compared to benchmark indices. Index performance is provided for illustrative and comparative purposes only and does not predict or depict the performance of the portfolios. Indices are unmanaged, do not incur transaction costs and cannot be purchased directly by investors. Index returns include reinvested dividends.
PLFA supervises the management of all of the portfolios of the Fund (subject to the review of the Fund’s Board) and directly manages, under the name Pacific Asset Management, the Cash Management and High Yield Bond Portfolios. PLFA also manages the Pacific Dynamix Portfolios and the Portfolio Optimization Portfolios. PLFA has written the general market conditions commentary which expresses PLFA’s opinions and views on how the market generally performed for the year ended December 31, 2012.
For the other portfolios, with the exception of the American Funds® Growth, American Funds® Growth-Income, and American Funds® Asset Allocation Portfolios (managed by Capital Research), PLFA has retained other firms to serve as portfolio managers under its supervision. Each of the portfolio managers (including Capital Research) has written a separate commentary specific to the portfolio(s) that they manage and as such, is based on their opinions of how their portfolio(s) performed during the year. The views expressed in the commentaries reflect those of the portfolio managers for the year ended December 31, 2012.
All views are subject to change at any time based upon market or other conditions, and the Fund, its adviser and the portfolio managers disclaim any responsibility to update such views. Any references to “we,” “I,” or “ours” are references to the portfolio manager or adviser, as applicable. The adviser and portfolio managers may include statements that constitute “forward-looking statements” under the United States (U.S.) securities laws. Forward-looking statements include information concerning possible or assumed future results of the Fund’s investment operations, asset levels, earnings, expenses, industry or market conditions, regulatory developments and other aspects of the Fund’s operations or general economic conditions. In addition, when used in this report, words such as “believes,” “expects,” “anticipates,” “intends,” “plans,” “estimates,” “projects” and future or conditional verbs such as “will,” “may,” “could,” “should” and “would,” or any other statement that necessarily depends on future events, are intended to identify forward-looking statements. Forward-looking statements are not guarantees of performance or economic results. They involve risks, uncertainties and assumptions. Although such statements are based on expectations that the adviser or a portfolio manager believes to be reasonable, actual results may differ materially from expectations. Investors must not rely on any forward-looking statements.
In connection with any forward-looking statements and any investment in the Fund, investors should carefully consider the investment objectives, policies and risks described in the Fund’s current prospectus, as supplemented, and the Statement of Additional Information, as supplemented.
Market Conditions (for the year ended December 31, 2012)
Executive Summary
In 2012, financial markets experienced pockets of volatility but finished the calendar year with solid gains. While the geopolitical and economic uncertainty that overwhelmed investors in 2011 lingered in 2012, no major disruptions caused the markets to veer off-course for a prolonged period. Nonetheless, the short-term “risk-on” and “risk-off” trend persisted with macro headlines primarily driving market sentiments.
Several key events caused volatility to rise in the first-half of the year. Without a solid economic foundation, markets continue to rely on support from policy actions. In order for the Federal Reserve (Fed) to continue with its low interest rate policies (toward which markets have reacted positively), inflation had to remain tamed. Earlier in the year, tensions over Iran’s nuclear program pushed oil prices higher, which created some concerns over inflation and the ability of the central bank to maintain its support. Additionally, the euro crisis appeared to have reached peak levels around the start of the reporting period. Amid this challenging environment, European countries saw changes in their political landscape. This included France electing a new president, as its citizens voted in favor of François Hollande’s anti-austerity push. The backlash from anti-austerity supporters (a united front against rampant unemployment and government spending cuts accompanied by strikes and demonstrations) caused additional concerns of unwinding the progress in Europe. Additionally, the economic drag from Europe had global implications that caused global economic growth projections to be revised downward. Concerns over China and its exports to Europe also weighed on its ability to sustain its dominant growth.
Despite the headwinds around the globe, financial markets marched higher over the second-half of the year. Although oil prices fluctuated since the sanctions against Iranian oil began, a dramatic impact on world oil supply and prices did not materialize. Without the threat of uncontrolled inflation, the Fed continued to provide further support by extending “Operation Twist” (its program to keep long-term rates low by selling its short-term assets and buying long-term Treasuries). The Fed also launched a third round of quantitative easing in September to purchase an additional
| | |
| | See explanation of symbol and benchmark definitions on A-56 through A-57 |
A-3
PACIFIC SELECT FUND PERFORMANCE DISCUSSION (Continued)
$40 billion in mortgage-backed securities (MBS) per month. From abroad, the political and economic disturbances in Europe finally led to the European Central Bank (ECB) to pledge full support to preserve the euro, which helped unfreeze capital flow throughout the European banking system.
Throughout the reporting period, central banks continued to play a vital role in sustaining the financial market recovery by providing unprecedented liquidity in the global banking system. While such efforts may have helped rejuvenate financial markets, political upheaval introduced uncertainty in the marketplace. Both U.S. and European politicians continued to muddle through their respective fiscal and economic issues. In the U.S., fears of the “fiscal cliff” scenario developed from the inability of Congress to promptly settle budgetary disagreements. In the eurozone, European politicians have struggled to agree and settle on the appropriate policy actions to recover their economies.
The global economy maintained a steady but slow recovery throughout the reporting period. Various risks continued to linger and influenced markets to varying degrees. The following sections highlight how specific market segments responded to the events that unfolded over the year.
Fixed Income
As the overall market sentiment improved relative to the prior reporting period, the broad, fixed income segment fell behind the broad, equity market. For the 2012 calendar year, the overall fixed income market (as measured by the Barclays U.S. Aggregate Bond Index) gained 4.21%. Short-term Treasuries and credits barely budged in 2012 as the Fed continued to maintain a near zero interest rate policy for the Federal Funds (Fed Funds). Long-term Treasuries benefited moderately from the Fed’s efforts to keep long-term yields low. Treasury yields (which have an inverse relationship to prices) continued to hit historic low levels, as the 10-Year Treasury yield dipped below 1.50% during the reporting period. The Barclays Long Term U.S. Treasury Index increased 3.56% for the calendar year.
In this environment, the riskier sectors within the fixed income segment performed relatively well. Emerging markets debt delivered strong results over the reporting period, as the J.P. Morgan Emerging Markets Bond Index Global Diversified Index returned 17.44% for the calendar year. The high yield market also experienced a strong rally with lower-rated credits outpacing those in the investment grade tiers. Additionally, the collateralized loan obligation market showed some revival throughout the calendar year, which boded well for bank loans. Throughout this low, Treasury yield environment, investors looked across the riskier spectrum to obtain yields.
Domestic Equity
The broad, domestic equity market experienced modest swings throughout the year but managed to finish the reporting period with a gain of 16.00% for the S&P 500 Index. Results were relatively mixed for the various categories within the domestic equities segment. One common theme among domestic equities was the double-digit returns across the market capitalization and style groups. With respect to market capitalization, mid-capitalization stocks outpaced those of large- and small-capitalizations. Value styles outperformed those of growth, which were primarily driven by the strong performances of the financials sector over the calendar year. The sector’s strong performance followed a dismal year in 2011, which then recovered as the central banks moved aggressively to support the global banking system. For the year, cyclical sectors (e.g. consumer discretionary) generally outpaced those of the defensive sectors (e.g. utilities). High dividend-paying sectors that typically include utilities stocks lost momentum during the reporting period after a strong rally in the prior year.
For the majority of the year, equity investors appeared to have focused more on the potential for capital appreciation. During uncertain environments (as in the second quarter of 2012), investors may lean toward capital protection where more conservative stocks such as those paying dividends and/or in defensive sectors tend to hold well. Over the past couple of years, real estate investment trusts (REITs) have displayed some hybrid characteristics for capital appreciation and capital protection. REITs have generally kept up with the overall equity market and maintained their gains during turbulent moments, delivering positive returns for all four quarters of the reporting period, which helped the Financial Times Stock Exchange National Association of Real Estate Investment Trust (FTSE NAREIT) Equity REITs Index gain 18.06% for the calendar year.
International Equity
After a difficult year for foreign stocks in 2011, international stocks (both developed and emerging markets) experienced a strong recovery over the reporting period. The Morgan Stanley Capital International Europe, Australasia, and Far East (MSCI EAFE) Index and the MSCI Emerging Markets Index returned 17.32% and 18.22%, respectively. In the foreign equity market, smaller-capitalization stocks outperformed their larger counterparts. Similar to the U.S. equity market, financials led the pace among the sector groups. Performances were largely boosted by the ECB’s vow to aggressively intervene to support the euro.
Europe’s troubles have impacted many of its trading partners, which led to concerns over countries such as China that exports to those regions. Many economists and market participants had considered the probability of a hard-landing scenario where China’s economic growth would experience a significant drop. However, China has displayed some resiliency despite the impact on their exports, which have eased some concerns.
Concluding Remarks
Economic reports indicated that, the world economy grew at approximately 3.20% in 2012 (International Monetary Fund–World Economic Outlook Update–January 2013). Emerging markets, particularly China, contributed to that growth. Developed nations, on the other hand, crawled at a sluggish pace or contracted. Despite the dismal economic indicators, equity markets thrived over the calendar year. Perhaps, this was driven more out of relief of avoiding meltdown scenarios that markets had feared rather than reactions to signs of a strong and prosperous fundamental outlook.
| | |
| | See explanation of symbol and benchmark definitions on A-56 through A-57 |
A-4
PACIFIC SELECT FUND PERFORMANCE DISCUSSION (Continued)
The question remains on the sustainability of the market rise. Heading into 2013, equity valuations indicate that stock markets are trading near their three-year fair value range. However, these valuation levels remain below their long-term historical levels (e.g. 10-year averages). These trading ranges may be a reflection of the general market environment. Over the past few years, the world has been dealing with various crises, which may be causing a hesitation to push valuations back to longer-term historic levels.
More clarity has developed in 2013, but challenges still linger. The crisis level in the eurozone appears to have dwindled, but economic activity is expected to remain weak in the region. Although the situation in the U.S. is relatively better than its developed counterparts in Europe, economic growth is expected to remain modest. The benign economic activity in developed nations is anticipated to dampen demand for exports from emerging markets. This may have some varying implications to these emerging markets nations. Nonetheless, growth in countries such as China is expected to remain solid.
Performances in 2012 showed investors that markets can diverge from economic fundamentals. The level of uncertainty and risks throughout the globe may have caused some investors to reduce or avoid equity exposure in 2012. Those investors would have missed out on the impressive performance delivered from equities. This validates the importance of proper asset allocation to navigate through various market conditions.
Cash Management Portfolio (managed by Pacific Asset Management)
Q. How did the portfolio perform for the year ended December 31, 2012?
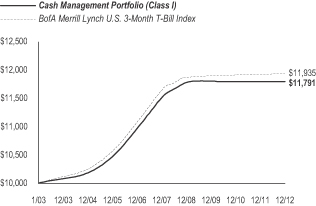
A. For the year ended December 31, 2012, the Cash Management Portfolio’s Class I returned 0.00%, compared to a 0.11% return for its benchmark, the BofA Merrill Lynch U.S. 3-Month T-Bill Index. The current yield measured during the seven-day period ended December 31, 2012 was 0.00%.
The following graph compares the performance of a hypothetical $10,000 investment in Class I shares of the portfolio to its benchmark for the ten-year period ended December 31, 2012. For comparison purposes, the performance of Class P shares and its benchmark for the period from inception of Class P on May 2, 2011 through December 31, 2012 are also shown in the table below. The portfolio’s performance reflects reinvestments of all dividends and capital gains distributions, if any.
Performance Comparison
| | | | | | | | | | | | |
| Average Annual Total Returns for the periods ended December 31, 2012 | |
| | | 1 Year | | | 5 Years | | | 10 Years | |
| | | |
Portfolio’s Class I | | | 0.00% | | | | 0.49% | | | | 1.66% | |
BofA Merrill Lynch U.S.
3-Month T-Bill Index | | | 0.11% | | | | 0.52% | | | | 1.78% | |
| | | 1 Year | | | Since
Inception
(5/2/11)~ | | | | |
| | | |
Portfolio’s Class P | | | 0.00% | | | | 0.00% | | | | | |
BofA Merrill Lynch U.S.
3-Month T-Bill Index | | | 0.11% | | | | 0.09% | | | | | |
Performance data quoted represents past performance. Investment return and principal value will fluctuate so that shares of the portfolio when redeemed may be worth more or less than their original cost. Past performance is not predictive of future performance. | |
Q. Discuss both positive and negative factors that materially affected the portfolio’s performance during the year, including relevant market conditions, investment strategies and techniques, and particular sectors or securities.
A. For the reporting period, the portfolio’s Class I underperformed the benchmark. We at Pacific Asset Management continue to manage the portfolio with a focus on stability, liquidity, and current income through a consistent, disciplined investment approach emphasizing industry and asset type diversification. A low Fed Funds target rate and a shrinking supply of commercial paper constrained the absolute return environment for the portfolio. This environment generated relative outperformance by the longer duration assets in the portfolio. Citing the slack in the economy and the weakness in the labor force, the Fed remained accommodative throughout the year. The Fed Funds target rate was unchanged, remaining at the range between 0.00% and 0.25 percent. The three-month London Interbank Offered Rate (LIBOR) was very stable finishing at 0.31% on December 31, 2012. Fewer companies utilized the commercial paper market during the year which reduced supply and further lowered available yields.
Although the employment picture has started to improve and the economy is strengthening, we believe the Fed is going to remain cautious through the next few years and will want to ensure the recovery is on very solid footing before any tightening of monetary policy. We expect any tightening to be well forecasted to the market and would expect to shorten the fund’s weighted average maturity heading into a rate increase.
Diversified Bond Portfolio (managed by Western Asset Management Company)
Q. How did the portfolio perform for the year ended December 31, 2012?
A. For the year ended December 31, 2012, the Diversified Bond Portfolio’s Class I returned 8.37%, compared to a 4.21% return for its benchmark, the Barclays U.S. Aggregate Bond Index.
| | |
| | See explanation of symbol and benchmark definitions on A-56 through A-57 |
A-5
PACIFIC SELECT FUND PERFORMANCE DISCUSSION (Continued)
The following graph compares the performance of a hypothetical $10,000 investment in Class I shares of the portfolio to its benchmark for the period from inception on May 1, 2006 through December 31, 2012. For comparison purposes, the performance of Class P shares and its benchmark for the period from inception of Class P on May 2, 2011 through December 31, 2012 are also shown in the table below. The portfolio’s performance reflects reinvestments of all dividends and capital gains distributions, if any.
Performance Comparison

| | (1) | Western Asset Management Company began managing the portfolio on February 2, 2009, and some investment policies changed at that time. Another firm managed the portfolio before that date. |
| | | | | | | | | | | | |
Average Annual Total Returns for the periods ended December 31, 2012(1) | |
| | | 1 Year | | | 5 Years | | | Since
Inception
(5/1/06) | |
| | | |
Portfolio’s Class I | | | 8.37% | | | | 5.47% | | | | 5.07% | |
Barclays U.S. Aggregate
Bond Index | | | 4.21% | | | | 5.95% | | | | 6.29% | |
| | | 1 Year | | | Since
Inception
(5/2/11)~ | | | | |
| | | |
Portfolio’s Class P | | | 8.58% | | | | 7.46% | | | | | |
Barclays U.S. Aggregate
Bond Index | | | 4.21% | | | | 6.18% | | | | | |
Performance data quoted represents past performance. Investment return and principal value will fluctuate so that shares of the portfolio when redeemed may be worth more or less than their original cost. Past performance is not predictive of future performance. | |
Q. Discuss both positive and negative factors that materially affected the portfolio’s performance during the year, including relevant market conditions, investment strategies and techniques, and particular sectors or securities.
A. For the reporting period, the portfolio’s Class I outperformed the benchmark. When selecting securities, Western Asset employs a team-oriented investment process which considers sector allocation, issue selection, duration exposure, term structure weighting and country/currency allocations. Generally, the manager expects the portfolio’s average duration to be within a range of 2.5 to 7 years. Duration is often used to measure a bond’s sensitivity to interest rates. The longer a portfolio’s duration, the more sensitive it is to interest rate risk. The shorter a portfolio’s duration, the less sensitive it is to interest rate risk.
Despite the backdrop of a sluggish U.S. recovery and global uncertainties, spread sectors ended the reporting period meaningfully tighter which drove the portfolio’s strong performance. The portfolio’s non-Agency MBS allocation was the single largest contributor to portfolio performance as the sector benefited from positive carry, advantageous market technicals as well as from continued coupon and principal payments. Home default rates fell, and the nationwide home prices, as measured by the Case-Shiller Home Price Index, improved. We continue to believe that potential returns for non-Agency mortgages remain more heavily skewed to the upside, especially as delinquency rates have improved. An overweight exposure to high yield bonds was also a contributor to portfolio performance as default rates remained low and spreads tightened. Investment grade credit spreads also tightened by almost 90 basis points (bps), and the portfolio’s allocation to financials and industrials aided performance. We continue to favor financials, which remain discounted by the market, albeit currently to a lesser degree than in recent months. In-line with other spread sectors, commercial mortgage-backed securities (CMBS) outperformed during the year. The portfolio’s underweight positions to this sector resulted in this allocation detracting from portfolio performance. The portfolio’s Agency mortgage allocation, however, was a contributor to its performance. Throughout the year, we focused on selecting certain mortgage pools and coupons which avoided exaggerated risk of government-sponsored mortgage refinancing, thus decreasing prepayment risk. This strategic issue selection aided performance, and we brought the portfolio’s allocation down later during the reporting period due to elevated valuation and in favor of opportunities in the high yield space. The portfolio’s overall tactical duration positioning had a relatively small, positive impact on its performance as rates ended the year lower on the whole. Yield curve positioning, on the other hand, with a bias toward longer-dated yields detracted as the curve steepened over the year (as measured by the steepness between the 5-year and 30-year Treasury yields).
Continued mild gross domestic product (GDP) growth supports our view that the economic recovery is proceeding along a subdued, yet positive, trajectory. Barring a sudden contagion, we expect a continuation of positive, domestic economic growth. We continue to favor spread sectors. We are maintaining our exposure to the high yield sector given increased support from the Fed, stable-to-improving fundamentals and advantageous technicals. In Agency mortgages, we will continue to emphasize coupon selection to reduce prepayment risk as opposed to focusing on the overall sector weight. We believe that potential returns for the non-Agency mortgage sector remain more heavily skewed to the upside, especially as delinquency rates and home prices improve. We will maintain a short duration position, which we may tactically adjust. We will continue to favor an overweight to the back end of the yield curve as a hedge against periodic flights-to-safety.
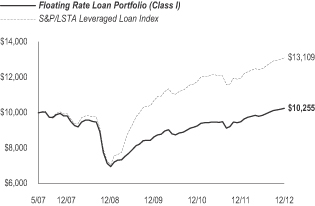
Floating Rate Loan Portfolio (managed by Eaton Vance Management)
Q. How did the portfolio perform for the year ended December 31, 2012?
A. For the year ended December 31, 2012, the Floating Rate Loan Portfolio’s Class I returned 8.10%, compared to a 9.66% return for its benchmark, the S&P/LSTA Leveraged Loan Index.
| | |
| | See explanation of symbol and benchmark definitions on A-56 through A-57 |
A-6
PACIFIC SELECT FUND PERFORMANCE DISCUSSION (Continued)
The following graph compares the performance of a hypothetical $10,000 investment in Class I shares of the portfolio to its benchmark for the period from inception on May 1, 2007 through December 31, 2012. For comparison purposes, the performance of Class P shares and its benchmark for the period from inception of Class P on May 2, 2011 through December 31, 2012 are also shown in the table below. The portfolio’s performance reflects reinvestments of all dividends and capital gains distributions, if any.
Performance Comparison
| | (1) | Eaton Vance Management began managing the portfolio on May 1, 2010, and some investment policies changed at that time. Another firm managed the portfolio before that date. |
| | | | | | | | | | | | |
Average Annual Total Returns for the periods ended December 31, 2012(1) | |
| | | 1 Year | | | 5 Years | | | Since
Inception
(5/1/07) | |
| | | |
Portfolio’s Class I | | | 8.10% | | | | 0.88% | | | | 0.44% | |
S&P/LSTA Leveraged Loan Index | | | 9.66% | | | | 5.68% | | | | 4.89% | |
| | | 1 Year | | | Since
Inception
(5/2/11)~ | | | | |
| | | |
Portfolio’s Class P | | | 8.31% | | | | 5.10% | | | | | |
S&P/LSTA Leveraged Loan Index | | | 9.66% | | | | 4.73% | | | | | |
Performance data quoted represents past performance. Investment return and principal value will fluctuate so that shares of the portfolio when redeemed may be worth more or less than their original cost. Past performance is not predictive of future performance. | |
Q. Discuss both positive and negative factors that materially affected the portfolio’s performance during the year, including relevant market conditions, investment strategies and techniques, and particular sectors or securities.
A. For the reporting period, the portfolio’s Class I underperformed the benchmark. Relative to the benchmark, the portfolio maintains a greater focus on higher-quality loans. As loan prices for the higher-quality segments of the loan market began the year near par ($98.98 for BBB loans and $97.88 for BB loans), they possessed less price appreciation potential than their lower-quality counterparts, so investment income made up a significant portion of their returns during the reporting period. In comparison, the average price of the more speculative CCC loan segment ended the year at $79.25, up from $69.44 a year earlier. As a result, lower-quality loans outperformed higher-quality loans by a meaningful margin. CCC loans notched a18.35% gain, outpacing the 7.17% and 5.13% returns for BB and BBB loans respectively. Loans in default within the benchmark were the biggest gainers over the reporting period, rising 25.77%.
The portfolio’s underweight to CCC loans, overweight to BB loans, and avoidance of any defaulted loans all detracted from the portfolio’s relative performance during the reporting period. While higher risk can be rewarded over short periods, such as the market environment in 2012, it is Eaton Vance’s experience that a higher-quality stance has generally resulted in better risk-adjusted results over time. We believe the optimal risk/return profile can be achieved predominately through interest income realized through investments of higher-quality loans, rather than focusing largely on capital gains associated with distressed loans.
The portfolio management team employs a rigorous, bottom-up credit research process where loan selection drives portfolio performance. With that said, deconstructing results from the perspective of industry exposures can be instructive. Publishing and utilities, two of the worst-performing industry groups in 2011, rebounded in 2012, posting strong returns of 20.3% and 12.0% respectively. The portfolio’s material underweight exposure to these industries weighed on the portfolio’s relative performance results.
Contributing to portfolio relative performance were underweight exposures to the aerospace & defense and telecommunications industries, which both lagged the broader market, delivering returns of 2.1% and 7.4% respectively.
As of December 31, 2012, the portfolio was well diversified with 357 loan issuer positions across 35 industries. The portfolio’s higher-quality positioning is exhibited in its average loan price of $99.49 compared to a $97.51 average loan price for the benchmark as of December 31, 2012. Additionally, given the floating rate nature of the asset class, the loans in the portfolio reset their coupons every 49 days on average as of December 31, 2012, resulting in a limited interest rate risk exposure for the portfolio as compared to longer duration fixed income funds.
High Yield Bond Portfolio (managed by Pacific Asset Management)
Q. How did the portfolio perform for the year ended December 31, 2012?
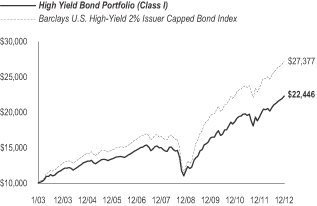
A. For the year ended December 31, 2012, the High Yield Bond Portfolio’s Class I returned 15.30%, compared to a 15.78% return for its benchmark, the Barclays U.S. High-Yield 2% Issuer Capped Bond Index.
| | |
| | See explanation of symbol and benchmark definitions on A-56 through A-57 |
A-7
PACIFIC SELECT FUND PERFORMANCE DISCUSSION (Continued)
The following graph compares the performance of a hypothetical $10,000 investment in Class I shares of the portfolio to its benchmark for the ten-year period ended December 31, 2012. For comparison purposes, the performance of Class P shares and its benchmark for the period from inception of Class P on May 2, 2011 through December 31, 2012 are also shown in the table below. The portfolio’s performance reflects reinvestments of all dividends and capital gains distributions, if any.
Performance Comparison
| | | | | | | | | | | | |
Average Annual Total Returns for the periods ended December 31, 2012 | |
| | | 1 Year | | | 5 Years | | | 10 Years | |
| | | |
Portfolio’s Class I | | | 15.30% | | | | 8.24% | | | | 8.42% | |
Barclays U.S. High-Yield 2% Issuer Capped Bond Index | | | 15.78% | | | | 10.45% | | | | 10.60% | |
| | | 1 Year | | | Since
Inception
(5/2/11)~ | | | | |
| | | |
Portfolio’s Class P | | | 15.53% | | | | 7.86% | | | | | |
Barclays U.S. High-Yield 2% Issuer Capped Bond Index | | | 15.78% | | | | 8.85% | | | | | |
Performance data quoted represents past performance. Investment return and principal value will fluctuate so that shares of the portfolio when redeemed may be worth more or less than their original cost. Past performance is not predictive of future performance. | |
Q. Discuss both positive and negative factors that materially affected the portfolio’s performance during the year, including relevant market conditions, investment strategies and techniques, and particular sectors or securities.
A. For the reporting period, the portfolio’s Class I underperformed the benchmark. The portfolio seeks a high level of current income by investing in non-investment grade debt instruments. Using a fundamental credit approach with a top-down overlay, Pacific Asset Management’s team of portfolio managers and research analysts look at the relative value of each security and assess the macro environment and marketplace for tailwinds and catalysts.
The portfolio’s overweight to B rated securities and underweight to BB rated securities was a benefit to portfolio performance, while the equal weighting to CCC rated securities was neutral to its performance. The portfolio’s underweight to refining and overweight to consumer cyclicals helped its performance while the portfolio’s underweight to homebuilders and banking detracted from portfolio performance. The portfolio duration was higher than the benchmark during the year, which was a positive contributor to its performance as longer duration securities benefited from spread compression.
Inflation Managed Portfolio (managed by Pacific Investment Management Company LLC)
Q. How did the portfolio perform for the year ended December 31, 2012?
A. For the year ended December 31, 2012, the Inflation Managed Portfolio’s Class I returned 9.87%, compared to a 6.98% return for its benchmark, the Barclays U.S. TIPS Index.
The following graph compares the performance of a hypothetical $10,000 investment in Class I shares of the portfolio to its benchmark for the ten-year period ended December 31, 2012. For comparison purposes, the performance of Class P shares and its benchmark for the period from inception of Class P on May 2, 2011 through December 31, 2012 are also shown in the table below. The portfolio’s performance reflects reinvestments of all dividends and capital gains distributions, if any.
Performance Comparison
| | | | | | | | | | | | |
Average Annual Total Returns for the periods ended December 31, 2012 | |
| | | 1 Year | | | 5 Years | | | 10 Years | |
| | | |
Portfolio’s Class I | | | 9.87% | | | | 7.92% | | | | 6.96% | |
Barclays U.S. TIPS Index | | | 6.98% | | | | 7.04% | | | | 6.65% | |
| | | 1 Year | | | Since
Inception
(5/2/11)~ | | | | |
| | | |
Portfolio’s Class P | | | 10.09% | | | | 10.27% | | | | | |
Barclays U.S. TIPS Index | | | 6.98% | | | | 9.37% | | | | | |
Performance data quoted represents past performance. Investment return and principal value will fluctuate so that shares of the portfolio when redeemed may be worth more or less than their original cost. Past performance is not predictive of future performance. | |
| | |
| | See explanation of symbol and benchmark definitions on A-56 through A-57 |
A-8
PACIFIC SELECT FUND PERFORMANCE DISCUSSION (Continued)
Q. Discuss both positive and negative factors that materially affected the portfolio’s performance during the year, including relevant market conditions, investment strategies and techniques, and particular sectors or securities.
A. For the reporting period, the portfolio’s Class I outperformed the benchmark. We at PIMCO implemented the portfolio’s investment strategies by investing in bonds and derivative instruments. During the reporting period, an underweight position to treasury inflation protected securities (TIPS) through cash bonds and interest rate swaps was a negative influence on the portfolio’s performance as real yields rallied during the reporting period. However, favoring the intermediate portion of the TIPS curve to capture higher real yields helped the portfolio’s performance. The portfolio was short Australian dollar holdings for part of the reporting period which detracted from its performance as this currency appreciated versus the U.S. dollar.
A position in bonds of financial companies outperformed the broader, corporate market and added to portfolio performance, amid an accommodative monetary policy and improving housing data. Exposure to non-Agency MBS was a positive influence on the portfolio’s performance supported by positive supply technicals. Exposure to non-U.S. developed interest rates through inflation-linked bonds and interest rate swaps added to portfolio performance as these countries have stronger sovereign balance sheets and higher real yields that leave room to respond to continued global economic growth pressures. The portfolio’s exposure to emerging markets local debt denominated in Brazilian real, achieved through zero coupon swaps, added to the portfolio’s performance as the Monetary Policy Committee cut the policy rate.
We expect the global economy to grow at a real rate of 1.50 to 2.00 % in 2013. Real growth will be moderated by efforts to resolve debt overhangs through fiscal restraint as evidenced by the slowing in corporate profits, capital expenditures and global trade. Simultaneously, inflation will decrease in the near-term. Households will continue to de-lever their balance sheets while the corporate sector remains reluctant to engage its own. Nominal growth could, however, be bolstered by the continued resolve of central banks. The balance of these forces will determine if GDP growth has slowed to stall speed or if a coordinated global slowdown can be averted.
With regard to portfolio strategy, we look to reduce risk while preferring high quality income, over price appreciation, as risk premiums still appear richly priced relative to our outlook. We plan to maintain an overall neutral duration position with a focus on intermediate maturity TIPS that offer higher real yields and potential for price appreciation as the maturity rolls down. We will remain underweight both long-dated TIPS and nominals due to unfavorable risk/return characteristics. With low real yields in the U.S., we plan to continue holding inflation-linked bonds (ILBs) from Australia and Mexico that are linked to stronger sovereign balance sheets. To take advantage of the country’s persistent inflation and the exaggerated reaction to potential methodology changes to its inflation calculation, we plan to tactically hold United Kingdom (U.K.) ILBs. We look to allocate Italian ILBs to benefit from attractive valuations from recent market dislocations along with the potential for ECB purchases. We plan to maintain exposure to interest rates in countries such as Brazil, which have relatively high nominal and real local interest rates and steep yield curves with the potential to capture roll-down.
Inflation Protected Portfolio (managed by Western Asset Management Company)
Q. How did the portfolio perform for the year ended December 31, 2012?
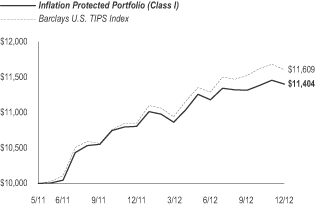
A. For the year ended December 31, 2012, the Inflation Protected Portfolio’s Class I returned 5.51%, compared to a 6.98% return for its benchmark, the Barclays U.S. TIPS Index.
The following graph compares the performance of a hypothetical $10,000 investment in Class I shares of the portfolio to its benchmark for the period from inception on May 2, 2011 through December 31, 2012. For comparison purposes, the performance of Class P shares and its benchmark for the period from inception of Class P on May 2, 2011 through December 31, 2012 are also shown in the table below. The portfolio’s performance reflects reinvestments of all dividends and capital gains distributions, if any.
Performance Comparison
| | | | | | | | |
Average Annual Total Returns for the periods ended December 31, 2012 | |
| | | 1 Year | | | Since
Inception
(5/2/11)~ | |
| | |
Portfolio’s Class I | | | 5.51% | | | | 8.19% | |
Barclays U.S. TIPS Index | | | 6.98% | | | | 9.37% | |
| | | 1 Year | | | Since
Inception
(5/2/11)~ | |
| | |
Portfolio’s Class P | | | 5.72% | | | | 8.33% | |
Barclays U.S. TIPS Index | | | 6.98% | | | | 9.37% | |
Performance data quoted represents past performance. Investment return and principal value will fluctuate so that shares of the portfolio when redeemed may be worth more or less than their original cost. Past performance is not predictive of future performance. | |
Q. Discuss both positive and negative factors that materially affected the portfolio’s performance during the year, including relevant market conditions, investment strategies and techniques, and particular sectors or securities.
A. For the reporting period, the portfolio’s Class I underperformed the benchmark. Western Asset maintains the portfolio’s strategy of holding a mixture of TIPS, total return swaps on TIPS, and inflation-linked bonds issued by foreign governments. Non-U.S. dollar-denominated inflation linked securities were chosen based on value relative to TIPS of a corresponding maturity.
| | |
| | See explanation of symbol and benchmark definitions on A-56 through A-57 |
A-9
PACIFIC SELECT FUND PERFORMANCE DISCUSSION (Continued)
Market expectations of inflation ended 2012 significantly higher, despite the considerable volatility over the reporting period. Beginning the reporting period at a level of 1.95%, the 10-year breakeven inflation rate rose to 2.45% in March 2012 as the Fed extended its commitment to keep rates low. But once again Europe’s problems spilled over into global markets in April and May, this time focused on Spain, lowering inflation expectations and risky asset prices. June saw the ECB combine with politicians to stem the Spanish problems, and together with further action from the Fed, drove break evens and risk asset prices up throughout the remainder of 2012, closing the year near their recent highs. All of the above culminated in a strong performance from TIPS with the benchmark returning 6.98%.
For the year as a whole, the portfolio lagged the benchmark as TIPS rallied strongly and outperformed the selected foreign issues that detracted from performance. Most notable was the turbulence in the U.K. inflation-linked market caused by the U.K government’s decision to review the Retail Price Index (RPI) inflation measure, which had they gone ahead, would have damaged both value and reputation of the market.
Our expectations for a continued economic recovery, albeit at a subdued pace, are supported by ongoing, modest GDP growth. We expect a continuation of mildly positive domestic economic growth and for inflation linked assets to perform modestly well into 2013. However, caution is the watchword as we head into 2013. We remain cognizant of potential negative spillover effects should a contagion erupt overseas and of the impact of domestically driven events such as the impending debt ceiling debates. Still, the Fed remains highly accommodative and continues to implement non-traditional easing programs. Corporate balance sheets remain strong. Overseas, the European sovereign debt crisis has moderated and the Chinese economy appears to be picking up. Therefore, we expect real yields to rise moderately, especially in maturities under five-to-seven years, and we continue to look to hold inflation-linked securities from commodity-driven economies, such as Australia and Canada, or in the U.K. where inflation protection is cheaper than in the U.S. instead of equivalent TIPS.
Managed Bond Portfolio (managed by Pacific Investment Management Company LLC)
Q. How did the portfolio perform for the year ended December 31, 2012?
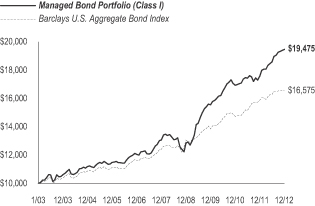
A. For the year ended December 31, 2012, the Managed Bond Portfolio’s Class I returned 10.72%, compared to a 4.21% return for its benchmark, the Barclays U.S. Aggregate Bond Index.
The following graph compares the performance of a hypothetical $10,000 investment in Class I shares of the portfolio to its benchmark for the ten-year period ended December 31, 2012. For comparison purposes, the performance of Class P shares and its benchmark for the period from inception of Class P on May 2, 2011 through December 31, 2012 are also shown in the table below. The portfolio’s performance reflects reinvestments of all dividends and capital gains distributions, if any.
Performance Comparison
| | | | | | | | | | | | |
| Average Annual Total Returns for the periods ended December 31, 2012 | |
| | | 1 Year | | | 5 Years | | | 10 Years | |
| | | |
Portfolio’s Class I | | | 10.72% | | | | 8.30% | | | | 6.89% | |
Barclays U.S. Aggregate
Bond Index | | | 4.21% | | | | 5.95% | | | | 5.18% | |
| | | 1 Year | | | Since
Inception
(5/2/11)~ | | | | |
| | | |
Portfolio’s Class P | | | 10.94% | | | | 7.31% | | | | | |
Barclays U.S. Aggregate
Bond Index | | | 4.21% | | | | 6.18% | | | | | |
Performance data quoted represents past performance. Investment return and principal value will fluctuate so that shares of the portfolio when redeemed may be worth more or less than their original cost. Past performance is not predictive of future performance. | |
Q. Discuss both positive and negative factors that materially affected the portfolio’s performance during the year, including relevant market conditions, investment strategies and techniques, and particular sectors or securities.
A. For the reporting period, the portfolio’s Class I outperformed the benchmark. We at PIMCO implemented the portfolio’s investment strategies by investing in bonds and derivative instruments. Tactical duration positioning in the U.S. through the use of cash bonds and interest rate swaps was positive for the portfolio’s performance. Within investment grade credit, a focus on financials added to portfolio performance returns as this sector outperformed the broader corporate market amid an accommodative monetary policy and improving housing data. Additionally, holdings of Agency MBS during the reporting period impacted the portfolio’s performance positively as this sector outperformed like-duration Treasuries. An allocation to non-Agency MBS, which was supported by positive supply technicals, also contributed to performance.
Beyond core sectors, exposure to non-U.S. developed interest rates, particularly core Europe, through cash bonds and interest rate swaps, added to portfolio performance as rates declined in this region on renewed confidence in the ECB. Exposure to high yield, through the use of cash bonds and interest rate swaps, also added to portfolio performance as spreads tightened. Exposure to emerging markets local interest rates in Brazil through cash bonds and interest rate swaps added to portfolio performance as the Monetary Policy Committee cut the policy rate. Holdings of Build America Bonds (BABs) were positive for portfolio performance, as this sector continued to offer attractive valuations relative to similarly rated corporates.
| | |
| | See explanation of symbol and benchmark definitions on A-56 through A-57 |
A-10
PACIFIC SELECT FUND PERFORMANCE DISCUSSION (Continued)
We expect the global economy to grow at a real rate of 1.50 to 2.0 % in 2013. Real growth will be moderated by efforts to resolve debt overhangs through fiscal restraint as evidenced by the slowing in corporate profits, capital expenditures and global trade. Simultaneously, inflation will decrease in the near-term. Households will continue to de-lever their balance sheets while the corporate sector remains reluctant to engage its own. Nominal growth could, however, be bolstered by the continued resolve of central banks. The balance of these forces will determine if GDP growth has slowed to stall speed or if a coordinated global slowdown can be averted.
With regard to portfolio strategy, we plan to continue to reduce risk while preferring high quality income, over price appreciation, as risk premiums still appear richly priced relative to our outlook. We will remain focused on sectors that will benefit from central bank actions that have increased liquidity and suppressed volatility. We look to selectively add high quality duration in countries with healthier balance sheets and independent monetary policy, including, Australia, Canada, Brazil, and Mexico. We plan to reduce holdings in Agency MBS to benchmark weightings as Agency MBS appear fully priced with limited upside following recent central bank actions. We will continue to hold non-Agency MBS and commercial MBS that have senior positions in the capital structure as another source of yield. Within credit, we aim to shift credit exposure toward securities higher in the capital structure and remain cautious on the bonds of companies with economic exposure to Europe. We also look to retain exposure to select corporate and quasi-sovereign bonds in countries with strong initial conditions and strong balance sheets such as Brazil and Mexico. We will continue to hold high quality municipal bonds which have reverted to fair value and will also retain longer-dated TIPS positions to protect against potentially higher long-term inflation. Finally, we will maintain an overall neutral currency stance with slight overweight positions in high quality, emerging markets currencies such as the Brazilian real, Chinese yuan, and Mexican peso.
Short Duration Bond Portfolio (managed by T. Rowe Price Associates, Inc.)
Q. How did the portfolio perform for the year ended December 31, 2012?
A. For the year ended December 31, 2012, the Short Duration Bond Portfolio’s Class I returned 3.19%, compared to a 1.26% return for its benchmark, the Barclays 1-3 Year U.S. Government Credit/Bond Index.
The following graph compares the performance of a hypothetical $10,000 investment in Class I shares of the portfolio to its benchmark for the period from inception on May 1, 2003 through December 31, 2012. For comparison purposes, the performance of Class P shares and its benchmark for the period from inception of Class P on May 2, 2011 through December 31, 2012 are also shown in the table below. The portfolio’s performance reflects reinvestments of all dividends and capital gains distributions, if any.
Performance Comparison

| | (1) | T. Rowe Price Associates, Inc. began managing the portfolio on May 1, 2011, and some investment policies changed at that time. Another firm managed the portfolio before that date. |
| | | | | | | | | | | | |
| Average Annual Total Returns for the periods ended December 31, 2012(1) | |
| | | 1 Year | | | 5 Years | | | Since
Inception
(5/1/03) | |
| | | |
Portfolio’s Class I | | | 3.19% | | | | 2.11% | | | | 2.38% | |
Barclays 1-3 Year U.S. Government Credit/Bond Index | | | 1.26% | | | | 2.88% | | | | 3.10% | |
| | | 1 Year | | | Since
Inception
(5/2/11)~ | | | | |
| | | |
Portfolio’s Class P | | | 3.40% | | | | 2.23% | | | | | |
Barclays 1-3 Year U.S. Government Credit/Bond Index | | | 1.26% | | | | 1.31% | | | | | |
Performance data quoted represents past performance. Investment return and principal value will fluctuate so that shares of the portfolio when redeemed may be worth more or less than their original cost. Past performance is not predictive of future performance. | |
Q. Discuss both positive and negative factors that materially affected the portfolio’s performance during the year, including relevant market conditions, investment strategies and techniques, and particular sectors or securities.
A. For the reporting period, the portfolio’s Class I outperformed the benchmark. We at T. Rowe Price invest the portfolio’s assets in fixed income securities (including derivatives on such securities). Normally the portfolio will focus on high quality, investment grade securities. Generally, we expect to track the duration of the benchmark (plus or minus a half-year), although the securities held may have short-, intermediate-, and long-terms to maturity. In addition to making active sector allocations and security selection decisions, the management team monitors portfolio duration as part of the management for the portfolio.
Sector allocations were the primary driver of relative returns. The portfolio’s overweight allocation to short-term, investment-grade corporate bonds with a corresponding underweight to Treasuries benefited the portfolio’s performance returns the most. Despite intermittent pressure stemming from macro-economic concerns, corporate bonds proved resilient. The sector generated strong returns as demand increased significantly as investors sought an incremental yield advantage in a low-rate environment. In addition to the portfolio’s corporate allocation, its out-of-benchmark exposure to high yield bonds and CMBS also drove performance to a lesser extent. For similar reasons as the corporate sector, investors continued to reach for yield in these higher beta (risk) sectors, as rates remain at absolute lows.
| | |
| | See explanation of symbol and benchmark definitions on A-56 through A-57 |
A-11
PACIFIC SELECT FUND PERFORMANCE DISCUSSION (Continued)
Our strategic underweight to Treasuries also contributed to portfolio performance returns relative to the benchmark. Although Treasury issues posted positive absolute returns for the reporting period, spread sectors such as corporate and securitized holdings outperformed due to insatiable demand for incremental yield, several periods of optimism regarding global economic conditions, and monetary policy support by the ECB and the Fed. Therefore, the portfolio’s underweight exposure to Treasuries benefited the portfolio.
Positioning on the yield curve was also a driver of relative performance as rates along the intermediate portion of the curve experienced declines during the reporting period—driven lower in part by significant investor concerns over global economic conditions, the sovereign debt crisis in the eurozone, and continued support for the Treasury market via Fed policy. The portfolio’s modest exposure to intermediate maturities mostly through MBS and investment-grade corporates, contributed to portfolio performance.
There were only a few very minor detractors for the reporting period. The portfolio’s allocations in several Money Center Banks detracted as the portfolio’s holdings were floating rate securities and those with shorter-duration. The fixed-rate, longer-duration banking names in the benchmark outperformed. The portfolio’s exposure to Telecom Italia S.P.A. detracted from its performance for similar reasons as the short-duration bonds from the issuer did not perform as well as the longer-duration bonds in the benchmark.
Emerging Markets Debt Portfolio (managed by Ashmore Investment Management Limited)
Q. How did the portfolio perform for the period ended December 31, 2012?
A. The portfolio commenced operations on April 30, 2012. For the period from inception through December 31, 2012, the Emerging Markets Debt Portfolio’s Class I returned 10.60%, compared to a 10.85% return for its benchmark, the J.P. Morgan Emerging Markets Bond Index (EMBI) Global Diversified Index.
The following graph compares the performance of a hypothetical $10,000 investment in Class I shares of the portfolio to its benchmark for the period from inception on April 30, 2012 through December 31, 2012. For comparison purposes, the performance of Class P shares and its benchmark for the period from inception of Class P on April 30, 2012 through December 31, 2012 are also shown in the table below. The portfolio’s performance reflects reinvestments of all dividends and capital gains distributions, if any.
Performance Comparison
| | | | | | |
Total Returns for the period from Inception through December 31, 2012 | |
| | | | | Since
Inception
(4/30/12)~ | |
| | |
Portfolio’s Class I | | | | | 10.60% | |
J.P. Morgan EMBI Global Diversified Index | | | | | 10.85% | |
| | | | | Since
Inception
(4/30/12)~ | |
| | |
Portfolio’s Class P | | | | | 10.74% | |
J.P. Morgan EMBI Global Diversified Index | | | | | 10.85% | |
Performance data quoted represents past performance. Investment return and principal value will fluctuate so that shares of the portfolio when redeemed may be worth more or less than their original cost. Past performance is not predictive of future performance. | |
Q. Discuss both positive and negative factors that materially affected the portfolio’s performance during the period, including relevant market conditions, investment strategies and techniques, and particular sectors or securities.
A. For the period since inception through December 31, 2012, the portfolio’s Class I underperformed the benchmark. We at Ashmore tactically manage exposure to external debt, local currency and corporate debt. The portfolio invests its assets in debt instruments that are economically tied to emerging market countries, which are issued by governments (sovereigns), government-guaranteed or majority government-owned entities (quasi-sovereigns), government agencies and corporate issuers, and may be denominated in any currency, including the local currency of the issuer.
The portfolio’s allocation to external debt during the reporting period was just over 60% of the portfolio, peaking in August before dropping back to original levels. The portfolio’s underweight allocation to external debt detracted from performance over the reporting period, as sovereign external debt performed better than local currency and corporate bonds in 2012. However, within this theme, our country/security selection contributed positively to portfolio performance. During the reporting period, Venezuela, Russia and Brazil performed the best within external debt markets.
The portfolio’s exposure to local currency instruments was managed dynamically during the reporting period. The exposure was increased significantly during the third quarter, when we expected local currency-denominated bonds and currencies to respond well to ongoing policy action by global central banks. First, local currency bonds rallied as emerging market central banks’ cut their domestic interest rates and attracted inflows. Additionally, in September, emerging markets currencies benefited from a new round of quantitative easing by the Fed. Over the reporting period, the portfolio’s exposure to local currency bonds was a positive contributor to performance, principally because the portfolio was invested in local markets where interest rates markets performed very well (Brazil, Russia).
| | |
| | See explanation of symbol and benchmark definitions on A-56 through A-57 |
A-12
PACIFIC SELECT FUND PERFORMANCE DISCUSSION (Continued)
During the reporting period, we increased and then maintained the portfolio’s exposure to corporate bonds, as their value relative to sovereigns has represented one of the best opportunities in emerging markets fixed income. Value was added to the portfolio as a result of the portfolio’s overweight positions in Chinese corporate bonds, notably in the real estate sector.
Considering the portfolio’s country-level attribution across all three themes (external debt, local debt and corporate debt), China, Brazil and Mexico were the three, largest contributors to performance relative to the benchmark. The portfolio was overweight relative to the benchmark in all three countries. In Brazil, the portfolio benefited particularly from positions in local currency government bonds, which rallied as the central bank cut interest rates aggressively. In China, the portfolio’s corporate bond positions performed very well as fears of economic slowdown gave way to solid growth and a market recovery. In Mexico, the portfolio benefited from overweight positions in all three themes, helped by a solid macroeconomic performance in 2012. Conversely, the top detractors relative to the benchmark were Turkey, Peru and Hungary; three countries where the portfolio has been underweight, and which performed quite well for different reasons. Turkey delivered a better-than-expected economic performance in 2012. In Peru, we have felt for some time that the assets were expensive, and we have maintained an underweight position as we saw better opportunities in other markets. Hungary managed to recover the support of investors despite accumulating significant economic challenges since the previous year.
American Funds Growth Portfolio (Capital Research and Management Company manages the Master Growth Fund)
Q. How did the portfolio perform for the year ended December 31, 2012?
A. For the year ended December 31, 2012, the American Funds Growth Portfolio’s Class I returned 17.45%, compared to a 16.00% return for its benchmark, the S&P 500 Index. The American Funds Growth Portfolio (Feeder Growth Portfolio) invests all of its assets in Class 1 shares of the Growth Fund, a series of the American Funds Insurance Series®, a registered open-end investment company (Master Growth Fund). The Master Growth Fund returned 18.19% for the same period. The performance for the Feeder Growth Portfolio was lower than the Master Growth Fund due to expenses incurred by the Feeder Growth Portfolio.
The following graph compares the performance of a hypothetical $10,000 investment in Class I shares of the portfolio to its benchmark for the period from inception on May 2, 2005 through December 31, 2012. For comparison purposes, the performance of Class P shares and its benchmark for the period from inception of Class P on May 2, 2011 through December 31, 2012 are also shown in the table below. The portfolio’s performance reflects reinvestments of all dividends and capital gains distributions, if any.
Performance Comparison
| | | | | | | | | | | | |
Average Annual Total Returns for the periods ended December 31, 2012 | |
| | | 1 Year | | | 5 Years | | | Since
Inception
(5/2/05)~ | |
| | | |
Portfolio’s Class I | | | 17.45% | | | | 0.52% | | | | 5.52% | |
S&P 500 Index | | | 16.00% | | | | 1.66% | | | | 4.96% | |
| | | 1 Year | | | Since
Inception
(5/2/11)~ | | | | |
| | | |
Portfolio’s Class P | | | 17.68% | | | | 1.71% | | | | | |
S&P 500 Index | | | 16.00% | | | | 5.08% | | | | | |
Performance data quoted represents past performance. Investment return and principal value will fluctuate so that shares of the portfolio when redeemed may be worth more or less than their original cost. Past performance is not predictive of future performance. | |
Q. Discuss both positive and negative factors that materially affected the portfolio’s performance during the year, including relevant market conditions, investment strategies and techniques, and particular sectors or securities.
A. The discussion that follows relates to the master fund. For the reporting period, the portfolio’s Class I outperformed the benchmark. The Master Growth Fund (the “fund”) invests primarily in common stocks and seeks to invest in companies that appear to offer superior opportunities for growth of capital. The health care sector continued to be one of the main contributors to the fund’s results, with several biotechnology companies recording strong gains. Increasing consumer confidence helped lift companies in the consumer discretionary sector, including several of the fund’s largest holdings. Information technology and financial holdings also contributed to results.
The fund’s weakest sectors were materials and energy, which have experienced lower demand in recent months as economic growth has stalled in China and other key economies.
Outside the U.S., the fund’s best performance results again came from holdings in Spain, India and the Netherlands — holdings in Brazil and South Africa detracted from is performance.
As global uncertainty persists, Capital Research’s portfolio counselors continue to search for companies with good valuations and accelerating growth prospects.
| | |
| | See explanation of symbol and benchmark definitions on A-56 through A-57 |
A-13
PACIFIC SELECT FUND PERFORMANCE DISCUSSION (Continued)
American Funds Growth-Income Portfolio (Capital Research and Management Company manages the Master Growth-Income Fund)
Q. How did the portfolio perform for the year ended December 31, 2012?
A. For the year ended December 31, 2012, the American Funds Growth-Income Portfolio’s Class I returned 17.06%, compared to a 16.00% return for its benchmark, the S&P 500 Index. The American Funds Growth-Income Portfolio (Feeder Growth-Income Portfolio) invests all of its assets in Class 1 shares of the Growth-Income Fund, a series of the American Funds Insurance Series®, a registered open-end investment company (Master Growth-Income Fund). The Master Growth-Income Fund returned 17.79% for the same period. The performance for the Feeder Growth-Income Portfolio was lower than the Master Growth-Income Fund due to expenses incurred by the Feeder Growth-Income Portfolio.
The following graph compares the performance of a hypothetical $10,000 investment in Class I shares of the portfolio to its benchmark for the period from inception on May 2, 2005 through December 31, 2012. For comparison purposes, the performance of Class P shares and its benchmark for the period from inception of Class P on May 2, 2011 through December 31, 2012 are also shown in the table below. The portfolio’s performance reflects reinvestments of all dividends and capital gains distributions, if any.
Performance Comparison
| | | | | | | | | | | | |
Average Annual Total Returns for the periods ended December 31, 2012 | |
| | | 1 Year | | | 5 Years | | | Since
Inception
(5/2/05)~ | |
| | | |
Portfolio’s Class I | | | 17.06% | | | | 0.57% | | | | 4.06% | |
S&P 500 Index | | | 16.00% | | | | 1.66% | | | | 4.96% | |
| | | |
| | | 1 Year | | | Since
Inception
(5/2/11)~ | | | | |
| | | |
Portfolio’s Class P | | | 17.30% | | | | 4.24% | | | | | |
S&P 500 Index | | | 16.00% | | | | 5.08% | | | | | |
Performance data quoted represents past performance. Investment return and principal value will fluctuate so that shares of the portfolio when redeemed may be worth more or less than their original cost. Past performance is not predictive of future performance. | |
Q. Discuss both positive and negative factors that materially affected the portfolio’s performance during the year, including relevant market conditions, investment strategies and techniques, and particular sectors or securities.
A. The discussion that follows relates to the master fund. For the reporting period, the portfolio’s Class I outperformed the benchmark. The Master Growth-Income Fund (the “fund”) invests primarily in common stocks or other securities that demonstrate the potential for appreciation and/or dividends. Growing consumer confidence and an improved housing market in the U.S. helped companies in the consumer discretionary sector perform well, benefiting the fund’s performance. Stock selection was a key factor, with holdings in the media industry, particularly two cable television companies, having the most positive impact on the performance of the fund.
Good stock selection also helped in other sectors, including health care, where several of the fund’s investments in U.S. biotechnology companies were performing well, as well as telecommunication services and information technology.
The fund’s weakest sector was energy, where companies were hurt by falling oil prices and lower demand. A relatively underweight to financial companies also held back portfolio performance results. Because of ongoing macro concerns, Capital Research’s portfolio counselors held a sizable portion of assets in cash. This cautionary measure helped the fund when stocks declined in the second quarter, but proved a drag on the full-year return.
While problems in Europe, China and the U.S. persist, there have recently been encouraging developments, and we remain confident that the fund’s holdings can prosper over the long-term.
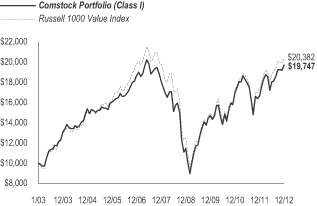
Comstock Portfolio (managed by Invesco Advisers, Inc.)
Q. How did the portfolio perform for the year ended December 31, 2012?
A. For the year ended December 31, 2012, the Comstock Portfolio’s Class I returned 18.54%, compared to a 17.51% return for its benchmark, the Russell 1000 Value Index.
| | |
| | See explanation of symbol and benchmark definitions on A-56 through A-57 |
A-14
PACIFIC SELECT FUND PERFORMANCE DISCUSSION (Continued)
The following graph compares the performance of a hypothetical $10,000 investment in Class I shares of the portfolio to its benchmark for the ten-year period ended December 31, 2012. For comparison purposes, the performance of Class P shares and its benchmark for the period from inception of Class P on May 2, 2011 through December 31, 2012 are also shown in the table below. The portfolio’s performance reflects reinvestments of all dividends and capital gains distributions, if any.
Performance Comparison
| | (1) | Invesco Advisers, Inc. began managing the portfolio on June 1, 2010. Another firm managed the portfolio before that date. |
| | | | | | | | | | | | |
Average Annual Total Returns for the periods ended December 31, 2012(1) | |
| | | 1 Year | | | 5 Years | | | 10 Years | |
| | | |
Portfolio’s Class I | | | 18.54% | | | | 1.73% | | | | 7.04% | |
Russell 1000 Value Index | | | 17.51% | | | | 0.59% | | | | 7.38% | |
| | | |
| | | 1 Year | | | Since
Inception
(5/2/11)~ | | | | |
| | | |
Portfolio’s Class P | | | 18.78% | | | | 3.69% | | | | | |
Russell 1000 Value Index | | | 17.51% | | | | 4.69% | | | | | |
Performance data quoted represents past performance. Investment return and principal value will fluctuate so that shares of the portfolio when redeemed may be worth more or less than their original cost. Past performance is not predictive of future performance. | |
Q. Discuss both positive and negative factors that materially affected the portfolio’s performance during the year, including relevant market conditions, investment strategies and techniques, and particular sectors or securities.
A. For the reporting period, the portfolio’s Class I outperformed the benchmark. We at Invesco aim to exploit market inefficiencies by investing in companies that appear undervalued relative to the market in general. Ultimately, we believe the market will recognize the value in these companies, and we will sell as the stock prices begin to reflect their intrinsic value. Although we are benchmark agnostic, we feel that stock selection, as opposed to making sector bets, may provide a more consistent opportunity for success. In addition, we believe investors can take advantage of pricing anomalies by purchasing undervalued stocks before there is a recognizable catalyst.
The portfolio’s investable universe includes all large-capitalization, U.S.-denominated equities. To distill these investments, we first filter for companies with sufficient liquidity. We filter the remaining securities on valuation metrics depending upon the growth or cyclical nature of their business. The result of this filtering process is a pool of highly liquid securities that we believe are statistically inexpensive relative to the broader market. Companies identified in the filtering process are thoroughly analyzed to assess intrinsic value and their ability to achieve fair value.
On the positive side, a significant overweight position and strong stock selection in the consumer discretionary sector was one of the largest contributors to portfolio performance. The portfolio’s main consumer discretionary sector exposure was in the media companies industry, with holdings such as Comcast Corp., Time Warner Cable, Inc. and News Corp. contributing the most within this industry and benefiting portfolio performance. Comcast, a top cable provider that is well positioned to take advantage of secular changes in broadband and content delivery, exhibited significant free cash flow generation, enabling the company to return capital to investors in terms of buying back company stock at attractive valuations. Strong stock selection within the financials sector also contributed to portfolio performance. The Allstate Corp., Citigroup, Inc. and The Bank of New York Mellon Corp. were the top performers within this sector, posting strong returns for the reporting period and boosting portfolio performance. Citigroup is currently trading at attractive valuations, despite the strong performance over the reporting period and has a strong capital and reserve position. Stock selection within industrials enhanced portfolio performance, as well. Textron, Inc. was a clear contributor to portfolio performance, posting over 30% returns for the reporting period. Having a material underweight to the utilities sector also boosted relative performance, as this was the worst performing sector within the benchmark for the reporting period. The portfolio has long been underweight the utilities sector, as valuations have not been attractive overall, due to investors’ desire for yield, driving up stock prices in this sector. Stock selection within the consumer staples sector also helped portfolio performance, followed by strong stock selection within the materials sector. Notably, International Paper Co., boosted portfolio performance on both an absolute and relative basis, as the company experienced continued revenue growth through the reporting period and successfully implemented price increases.
On the negative side, unfavorable stock selection within the energy sector detracted from portfolio performance. Select holdings such as Weatherford International Ltd., Royal Dutch Shell P.L.C. and Halliburton Co. were large detractors within the sector, negatively impacting portfolio performance. During the reporting period, Weatherford International continued to deal with an unfavorable drilling and service environment, as well as issues with internal accounting controls. Weak stock selection within the health care sector, specifically, within pharmaceuticals, also acted as a large detractor to the portfolio’s relative performance for the year. Specifically, Bristol-Myers Squibb Co. and GlaxoSmithKline P.L.C. performed poorly as these stocks contributed negatively to the portfolio’s performance returns during the reporting period. A material overweight to and stock selection within information technology sector hampered portfolio performance, as well. Hewlett-Packard Co. and Microsoft Corp. were large detractors within this sector and dragged down portfolio performance. During the reporting period, investors continued to be concerned with
| | |
| | See explanation of symbol and benchmark definitions on A-56 through A-57 |
A-15
PACIFIC SELECT FUND PERFORMANCE DISCUSSION (Continued)
Hewlett-Packard over the short-term due to changes in management and the resulting inconsistent, strategic plans. Stock selection and an underweight to the telecommunication services sector detracted from the portfolio’s relative performance. Vodafone Group P.L.C. disappointed investors with a negative return for the year, based on poor financials. Not owning Sprint Nextel Corp. was a large detractor from portfolio performance, as the stock experienced outsized returns, performing over 140% for the year.
During the reporting period, the portfolio’s select holdings in information technology services, insurance, media and consumer staples were trimmed based on valuations. Toward the end of the reporting period, select-holdings in information technology equipment and energy were added to the portfolio based on displaying weakness. Portfolio positions in a food & beverage company, an oil and gas exploration and production company and a holding in consumer durables were also added to the portfolio.
Dividend Growth Portfolio (managed by T. Rowe Price Associates, Inc.)
Q. How did the portfolio perform for the year ended December 31, 2012?
A. For the year ended December 31, 2012, the Dividend Growth Portfolio’s Class I returned 14.55%, compared to a 16.00% return for its benchmark, the S&P 500 Index.
The following graph compares the performance of a hypothetical $10,000 investment in Class I shares of the portfolio to its benchmark for the ten-year period ended December 31, 2012. For comparison purposes, the performance of Class P shares and its benchmark for the period from inception of Class P on May 2, 2011 through December 31, 2012 are also shown in the table below. The portfolio’s performance reflects reinvestments of all dividends and capital gains distributions, if any.
Performance Comparison

| | (1) | T. Rowe Price Associates, Inc. began managing the portfolio on May 1, 2010. The portfolio changed its name from Diversified Research Portfolio, and some investment policies changed at that time. Another firm managed the portfolio before that date. |
| | | | | | | | | | | | |
Average Annual Total Returns for the periods ended December 31, 2012(1) | |
| | | 1 Year | | | 5 Years | | | 10 Years | |
| | | |
Portfolio’s Class I | | | 14.55% | | | | 1.12% | | | | 6.40% | |
S&P 500 Index | | | 16.00% | | | | 1.66% | | | | 7.10% | |
| | | |
| | | 1 Year | | | Since
Inception
(5/2/11)~ | | | | |
| | | |
Portfolio’s Class P | | | 14.78% | | | | 5.24% | | | | | |
S&P 500 Index | | | 16.00% | | | | 5.08% | | | | | |
Performance data quoted represents past performance. Investment return and principal value will fluctuate so that shares of the portfolio when redeemed may be worth more or less than their original cost. Past performance is not predictive of future performance. | |
Q. Discuss both positive and negative factors that materially affected the portfolio’s performance during the year, including relevant market conditions, investment strategies and techniques, and particular sectors or securities.
A. For the reporting period, the portfolio’s Class I underperformed the benchmark. The portfolio seeks to concentrate on high quality names with balance sheet strength that we at T. Rowe believe can grow steadily and emerge as consistent outperformers. The portfolio’s position in the financials sector was a significant detractor from its relative performance, mainly due to stock selection. Specifically detracting from portfolio performance was insurance broker Willis Group Holdings P.L.C. The company announced disappointing earnings on lower-than-expected organic growth and margin contraction. Elsewhere, shares of The PNC Financial Services Group, Inc. pulled back during the fourth quarter, also detracting from the portfolio’s performance return. The company missed earnings expectations, driven by lower security yields and slowing loan growth. We continue to believe PNC Financial Services Group will benefit from its management transition, as well as cost savings from its recent acquisition of RBC Centura.
The energy sector was another notable detractor from portfolio relative performance, due to stock selection. After a strong 2011, gas transmission and distribution company Spectra Energy Corp. pulled back during the reporting period, negatively impacting portfolio performance. The company faced commodity weakness, particularly due to weak natural gas liquid fundamentals. During the reporting period, Peabody Energy Corp., the largest U.S. coal producer, negatively impacted portfolio performance and was sold on the back of deteriorating coal fundamentals, largely driven by a slowing Chinese real estate market.
In contrast, the telecommunication services sector was a key contributor to portfolio relative performance returns, driven by deft stock picking. Specifically contributing to portfolio performance was Crown Castle International Corp., along with other wireless communication tower companies. Crown was noteworthy as it benefited from continued demand for higher data capacity to support smart phone technology. The company also purchased approximately 7,100 cell phone towers from T-Mobile USA to further expand its U.S. holdings.
Elsewhere, the consumer staples sector positively contributed to the portfolio’s relative performance returns, driven by positive stock selection. Globally improving fundamentals in the spirits industry benefited Pernod-Ricard S.A. During the reporting period, the company experienced strong pricing trends due to high exposure to brown spirits and high exposure to emerging Asia. Also, McCormick & Co., Inc. continues to separate itself
| | |
| | See explanation of symbol and benchmark definitions on A-56 through A-57 |
A-16
PACIFIC SELECT FUND PERFORMANCE DISCUSSION (Continued)
from other food companies due to a combination of both pricing and volume growth. The company also has one of the better geographic footprints among food players, and its organic sales continue to surprise to the upside.
Equity Index Portfolio (managed by BlackRock Investment Management, LLC)
Q. How did the portfolio perform for the year ended December 31, 2012?
A. For the year ended December 31, 2012, the Equity Index Portfolio’s Class I returned 15.77%, compared to a 16.00% return for its benchmark, the S&P 500 Index.
The following graph compares the performance of a hypothetical $10,000 investment in Class I shares of the portfolio to its benchmark for the ten-year period ended December 31, 2012. For comparison purposes, the performance of Class P shares and its benchmark for the period from inception of Class P on May 2, 2011 through December 31, 2012 are also shown in the table below. The portfolio’s performance reflects reinvestments of all dividends and capital gains distributions, if any.
Performance Comparison

| | (1) | BlackRock Investment Management, LLC acquired the assets of Mercury Advisors, an affiliate of Merrill Lynch Investment Managers, L.P., effective September 29, 2006 and began managing the portfolio on that date. Mercury Advisors began managing the portfolio on January 1, 2000. Another firm managed the portfolio before that date. |
| | | | | | | | | | | | |
Average Annual Total Returns for the periods ended December 31, 2012(1) | |
| | | 1 Year | | | 5 Years | | | 10 Years | |
| | | |
Portfolio’s Class I | | | 15.77% | | | | 1.39% | | | | 6.82% | |
S&P 500 Index | | | 16.00% | | | | 1.66% | | | | 7.10% | |
| | | 1 Year | | | Since
Inception
(5/2/11)~ | | | | |
| | | |
Portfolio’s Class P | | | 16.00% | | | | 5.03% | | | | | |
S&P 500 Index | | | 16.00% | | | | 5.08% | | | | | |
Performance data quoted represents past performance. Investment return and principal value will fluctuate so that shares of the portfolio when redeemed may be worth more or less than their original cost. Past performance is not predictive of future performance. | |
Q. Discuss both positive and negative factors that materially affected the portfolio’s performance during the year, including relevant market conditions, investment strategies and techniques, and particular sectors or securities.
A. For the reporting period, the portfolio’s Class I underperformed the benchmark. The portfolio seeks to replicate as closely as possible, the total return of the benchmark as represented by the S&P 500 Index. In accordance with BlackRock’s passive investment strategy, the portfolio was positioned to match the risk characteristics of the benchmark throughout the reporting period. Following a tumultuous 2011, equity markets began 2012 with a strong rally amid lower volatility.
From a sector perspective, global central bank stimulus drove financials and consumer discretionary stocks higher in 2012. Telecommunication services performed well, and health care stocks rebounded after valuations had been pushed down amid regulatory uncertainty. While all of the S&P 500 Index sectors moved higher during the reporting period, energy stocks were hindered by declining oil prices in the latter part of the reporting period, and utilities became less favorable as investors sought riskier investments.
Focused 30 Portfolio (managed by Janus Capital Management LLC)
Q. How did the portfolio perform for the year ended December 31, 2012?
A. For the year ended December 31, 2012, the Focused 30 Portfolio’s Class I returned 23.21%, compared to a 15.26% return for its benchmark, the Russell 1000 Growth Index.
| | |
| | See explanation of symbol and benchmark definitions on A-56 through A-57 |
A-17
PACIFIC SELECT FUND PERFORMANCE DISCUSSION (Continued)
The following graph compares the performance of a hypothetical $10,000 investment in Class I shares of the portfolio to its benchmark for the ten-year period ended December 31, 2012. For comparison purposes, the performance of Class P shares and its benchmark for the period from inception of Class P on May 2, 2011 through December 31, 2012 are also shown in the table below. The portfolio’s performance reflects reinvestments of all dividends and capital gains distributions, if any.
Performance Comparison
| | | | | | | | | | | | |
Average Annual Total Returns for the periods ended December 31, 2012 | |
| | | 1 Year | | | 5 Years | | | 10 Years | |
| | | |
Portfolio’s Class I | | | 23.21% | | | | -1.64% | | | | 11.60% | |
Russell 1000 Growth Index | | | 15.26% | | | | 3.12% | | | | 7.52% | |
| | | 1 Year | | | Since
Inception
(5/2/11)~ | | | | |
| | | |
Portfolio’s Class P | | | 23.45% | | | | 3.30% | | | | | |
Russell 1000 Growth Index | | | 15.26% | | | | 4.70% | | | | | |
| | | | | | |
Performance data quoted represents past performance. Investment return and principal value will fluctuate so that shares of the portfolio when redeemed may be worth more or less than their original cost. Past performance is not predictive of future performance. |
Q. Discuss both positive and negative factors that materially affected the portfolio’s performance during the year, including relevant market conditions, investment strategies and techniques, and particular sectors or securities.
A. For the reporting period, the portfolio’s Class I outperformed the benchmark. We at Janus believe the portfolio’s performance during the reporting period illustrates our emphasis on identifying long-duration growth companies with characteristics such as durable competitive advantages, a proven ability to gain market share or the potential to expand into new markets with enduring and innovative products.
Stock selections in information technology, telecommunication services and consumer discretionary sectors were the largest contributors to portfolio relative performance. The portfolio’s holdings in the materials and industrials sectors hurt its relative performance. Stock selection in the technology sector was one of the biggest drivers of outperformance. In technology, there was a proliferation of data usage through mobile devices at work and at home during the reporting period, with broad implications for content owners, Internet companies and device manufacturers. We believe this backdrop provides a multi-year growth opportunity for companies with durable competitive advantages such as Apple, Inc., eBay, Inc. and Crown Castle International Corp., the portfolio’s three top performing stocks during the reporting period. We also see the value of data increasing—creating opportunities for technologies that help customers store, access and analyze data. An example of this is EMC Corp., a data storage and organization business, that we believe is well positioned to benefit from growth in availability and value of data.
Stock selection in the consumer discretionary sector was also a strong driver of the portfolio’s relative outperformance. We think meeting the needs of the newly wealthy in emerging markets appears to be a multi-year growth opportunity for companies with durable competitive advantages. We believe companies with strong brands and growth prospects in their core markets should be able to capture growth from emerging markets as consumers in these markets are willing to pay a premium for premium brands that they view as guarantees of quality or outward evidence of their success. We have identified and invested in luxury goods, lifestyle and fashion brands including Cie Financiere Richemont S.A. and Prada S.P.A., that we believe are capable of delivering rapid earnings growth in emerging economies while continuing to deliver strong earnings in their more mature markets.
A string of acquisitions and new services by eBay serve as a stronger partner to the merchants that use its platform. These services enhance eBay’s competitive positioning relative to other e-commerce platforms. Meanwhile, eBay’s PayPal is making inroads with its new off-line business, announcing a deal with Discover Financial Services that will allow PayPal customers to use the payment service in any store that accepts Discover card. The partnership should make it easier for retailers to accept PayPal as a payment service, and help expand the franchise as customers start using PayPal in stores.
Crown Castle owns and operates cellular towers that are used by mobile carriers. We like Crown Castle’s recurring revenue stream it receives from mobile carriers who rent tower space. We believe the company is positioned for future growth as mobile carriers are likely to increase capital expenditures to keep up with the increase in mobile data use. Apple remains the largest position in our portfolio. We believe the company has developed a strong ecosystem with multiple devices bringing consumers and businesses into the Apple family. Once introduced to the Apple brand, customers tend to increase spending on its products, and they become more loyal and profitable to the company. Richemont was up roughly 50% since the summer. The luxury goods company is building out distribution and product and has benefited from new wealth creation in emerging markets where many consumers are anxious to buy premium luxury brands for the first time. The company has also benefited from an increased number of Chinese travelers. Luxury goods and other products cost more in China than they do in other regions of the world. As more Chinese consumers travel abroad, they are using the opportunity to load up on less expensive luxury products.
The holdings in the industrials and materials sectors were the largest detractors from the portfolio’s relative performance during the reporting period. The portfolio includes only one holding in the materials sector, Turquoise Hill Resources Ltd. (formerly Ivanhoe Mines). The stock was
| | |
| | See explanation of symbol and benchmark definitions on A-56 through A-57 |
A-18
PACIFIC SELECT FUND PERFORMANCE DISCUSSION (Continued)
down during the reporting period, reflecting what we believed to be investor concern about how a rights offering would affect future earnings-per-share and the weaker economy as a whole. Over the long-term, we still feel positive about the potential of the company’s Mongolian mine, which represents one of the largest, high-grade copper deposits in the world. We believe the mine’s value will eventually accrue to shareholders.
The portfolio’s returns in the industrials sector were positive, but lagged sector returns for the benchmark. The holdings were mostly concentrated in transport services, logistics and asset-light companies that tend to underperform the more cyclical names in the sector. We think this is a short-term phenomenon and believe our holdings have attractive, long-term growth drivers. One of the portfolio’s weakest holdings in the sector, for example, was the logistics company C.H. Robinson Worldwide, Inc. The company was impacted by a shortage of trucking capacity, which reduced profitability as truckers were able to demand better pricing. We continue to like C.H. Robinson’s business model, however, which has posted consistent year-over-year growth. We think the long-term opportunity and value of the business remains intact.
Specific detractors from portfolio performance, in addition to Turquoise Hill, were Zynga, Inc., FaceBook, Inc. and Ford Motor Co. We liked Zynga’s social gaming platform, but the company’s reliance on FaceBook to create network effects for its games has proved challenging. The portfolio exited the position to pursue other opportunities. While the company is the leading social media network, FaceBook has been challenged monetizing this asset. The position was eliminated to pursue other companies which we believe have better risk/reward profiles. Ford Motor Co. fell as investors grew concerned over the time it would take the company to fix its business in Europe. The portfolio’s position was sold during the reporting period.
We have been encouraged to see the market respond more to the underlying fundamentals of companies this year. We think this will be the case going into 2013. Much attention has been paid to today’s macroeconomic risks and uncertainties. We believe these are “known unknowns” that are already priced into the market, so we expect business fundamentals to be the biggest driver of stock performance in the coming months. In that environment, we believe the type of competitively advantaged, long-duration growth companies we seek to identify should be recognized by the market for the strength of their businesses and the elements that set them apart from their competitors.
Growth LT Portfolio (managed by Janus Capital Management LLC)
Q. How did the portfolio perform for the year ended December 31, 2012?
A. For the year ended December 31, 2012, the Growth LT Portfolio’s Class I returned 18.24%, compared to a 15.26% return for its benchmark, the Russell 1000 Growth Index.
The following graph compares the performance of a hypothetical $10,000 investment in Class I shares of the portfolio to its benchmark for the ten-year period ended December 31, 2012. For comparison purposes, the performance of Class P shares and its benchmark for the period from inception of Class P on May 2, 2011 through December 31, 2012 are also shown in the table below. The portfolio’s performance reflects reinvestments of all dividends and capital gains distributions, if any.
Performance Comparison
| | | | | | | | | | | | |
| Average Annual Total Returns for the periods ended December 31, 2012 | |
| | | 1 Year | | | 5 Years | | | 10 Years | |
| | | |
Portfolio’s Class I | | | 18.24% | | | | 0.03% | | | | 7.30% | |
Russell 1000 Growth Index | | | 15.26% | | | | 3.12% | | | | 7.52% | |
| | | 1 Year | | | Since
Inception
(5/2/11)~ | | | | |
| | | |
Portfolio’s Class P | | | 18.45% | | | | 2.38% | | | | | |
Russell 1000 Growth Index | | | 15.26% | | | | 4.70% | | | | | |
Performance data quoted represents past performance. Investment return and principal value will fluctuate so that shares of the portfolio when redeemed may be worth more or less than their original cost. Past performance is not predictive of future performance. | |
Q. Discuss both positive and negative factors that materially affected the portfolio’s performance during the year, including relevant market conditions, investment strategies and techniques, and particular sectors or securities.
A. For the reporting period, the portfolio’s Class I outperformed the benchmark. We at Janus believe the portfolio’s relative outperformance demonstrates our emphasis on long-duration, high quality growth companies. Rather than tilt the portfolio around unpredictable macroeconomic events, we focus instead on finding companies with clearly definable and sustainable growth drivers. In our view, these companies have a high barrier to entry, a winning management team with a clear vision for the future of their company, or a definable edge in an attractive industry with high growth potential. We believe these competitively-advantaged companies do not need a strong macroeconomic environment for growth. If we are correct in identifying the perceived advantages of most of the companies in the portfolio, we believe we should outperform the benchmark in uncertain and slow economic environments, as these companies execute on the unique strategies or innovations that make them more successful than their competitors. This investment strategy played out this year as the portfolio’s outperformance was driven almost entirely by stock selection. Stock selection made the strongest contributions to the portfolio’s relative performance in the technology and consumer staples sectors.
| | |
| | See explanation of symbol and benchmark definitions on A-56 through A-57 |
A-19
PACIFIC SELECT FUND PERFORMANCE DISCUSSION (Continued)
However, stock selection in the energy and health care sectors detracted from the portfolio’s relative performance. We maintained a higher-than-normal cash position during much of the reporting period. The higher cash allocation was a drag on portfolio performance, but we like having the flexibility to take advantage of attractive opportunities when there is a market pullback, and believe it gave us the opportunity to add some companies to the portfolio at attractive valuations.
Apple, Inc. remains a top position in the portfolio and was the largest contributor to its performance during the reporting period. We believe Apple has developed a strong ecosystem with multiple devices bringing consumers and businesses into the Apple family. Once introduced to the Apple brand, customers tend to increase spending on its products becoming more loyal and profitable to the company. Also a top contributor to portfolio performance was eBay, Inc. as the company is seeing a reacceleration in its core marketplace business and continued growth in PayPal on-line and off-line globally. We like the value proposition eBay’s e-commerce platform offers retailers and consumers and also believe there is a growing opportunity set for the PayPal franchise. Another top contributor to portfolio performance was Oracle Corp. We like the company for its recurring maintenance contracts, historically dominant market share and pricing power. Its generally stable cash flows are appealing to us as well.
J.C. Penney Co., Inc. was the largest detractor from portfolio performance as the company’s turnaround under new management has taken longer-than-expected which has weighed on performance. The portfolio’s position was sold after questions about management’s ability to execute on its intended strategy. Zynga, Inc. also detracted from portfolio performance. The position was sold as the quick shift to mobile and a more challenging competitive landscape undermined the attractiveness of the investment for the long-term. Another detractor from portfolio performance was Ogx Petroleo Gas Participaoes S.A. The company reported slower-than-expected well flow rates than it had projected earlier during the reporting period. The position in the stock was eliminated during the reporting period to pursue companies with better risk/reward profiles.
While equity markets would generally benefit from a stronger economic backdrop, we think a slow-growth economy actually benefits our investment approach. In a growth-challenged world, companies with competitive advantages that demonstrate better-than-average growth should be rewarded. We believe this environment favors individual security selection and fundamental research that seeks to identify companies that are truly differentiated from their competitors.
Large-Cap Growth Portfolio (managed by UBS Global Asset Management (Americas) Inc.)
Q. How did the portfolio perform for the year ended December 31, 2012?
A. For the year ended December 31, 2012, the Large-Cap Growth Portfolio’s Class I returned 18.23%, compared to a 15.26% return for its benchmark, the Russell 1000 Growth Index.
The following graph compares the performance of a hypothetical $10,000 investment in Class I shares of the portfolio to its benchmark for the ten-year period ended December 31, 2012. For comparison purposes, the performance of Class P shares and its benchmark for the period from inception of Class P on May 2, 2011 through December 31, 2012 are also shown in the table below. The portfolio’s performance reflects reinvestments of all dividends and capital gains distributions, if any.
Performance Comparison

| | (1) | UBS Global Asset Management (Americas) Inc. began managing the portfolio on May 1, 2009, and some investment policies changed at that time. Other firms managed the portfolio before that date. |
| | | | | | | | | | | | |
| Average Annual Total Returns for the periods ended December 31, 2012(1) | |
| | | 1 Year | | | 5 Years | | | 10 Years | |
| | | |
Portfolio’s Class I | | | 18.23% | | | | -0.97% | | | | 4.17% | |
Russell 1000 Growth Index | | | 15.26% | | | | 3.12% | | | | 7.52% | |
| | | 1 Year | | | Since
Inception
(5/2/11)~ | | | | |
| | | |
Portfolio’s Class P | | | 18.47% | | | | 5.28% | | | | | |
Russell 1000 Growth Index | | | 15.26% | | | | 4.70% | | | | | |
Performance data quoted represents past performance. Investment return and principal value will fluctuate so that shares of the portfolio when redeemed may be worth more or less than their original cost. Past performance is not predictive of future performance. | |
Q. Discuss both positive and negative factors that materially affected the portfolio’s performance during the year, including relevant market conditions, investment strategies and techniques, and particular sectors or securities.
A. For the reporting period, the portfolio’s Class I outperformed the benchmark. During the reporting period, we at UBS continued to execute on our strategy of buying companies trading at attractive price levels relative to our scenario-based discounted cash flow (DCF) valuation analysis and selling when portfolio holdings have reached our price objectives or where we have experienced a thesis violation. We continue to execute across the three buckets of growth for opportunities: elite, classical, and cyclical growth. In recent years, our team has grown accustomed to investing in volatile macroeconomic environments, which are highly complex to analyze, and where the range of outcomes remains wide. Within this type of environment, we remain firmly committed to our discipline of bottom-up security selection. We conduct in-depth research on company business models, seeking to find dominant companies that can take market share, exercise pricing power, and convert a high level of net income
| | |
| | See explanation of symbol and benchmark definitions on A-56 through A-57 |
A-20
PACIFIC SELECT FUND PERFORMANCE DISCUSSION (Continued)
to free cash flow in any macroeconomic environment. Our scenario-based DCF work allows us to understand the magnitude and duration of sales growth and free cash flow generation for a given company and to identify mis-pricings by the market. During the reporting period, the complex and rapidly-changing macroeconomic environment has created the market volatility which affords us the opportunity to execute on our strategy and purchase dominant companies at attractive prices. During the reporting period, the portfolio outperformed its benchmark through purchase and sale decisions across a number of portfolio holdings and sectors.
Within the materials sector, the portfolio’s position in The Sherwin-Williams Co., a paint manufacturer and distributor, was a material contributor to portfolio performance. Sherwin has a differentiated business model, integrating its operations from paint manufacture to company-owned retail stores serving the professional painter. While the company operates in a mature industry with end markets and input costs that are cyclical, it is best defined as a classical growth company as it consistently delivers stable sales growth and free cash flow generation. Sherwin was initially purchased a couple years ago. We believed the market misunderstood the company’s growth trajectory, owing in part to headwinds from the housing crisis. During the reporting period, Sherwin’s earnings growth accelerated as housing starts in the U.S. rebounded, resulting in it being one of the portfolio’s top contributors to its performance. Consistent with our discipline, the position was trimmed five times between May and June, as the upside to the target price declined.
Several of the portfolio’s holdings within information technology were also strong contributors to outperformance. Visa, Inc. was the top active overweight position and was a strong contributor to the portfolio’s performance. The company exceeded its own earnings guidance as it easily adjusted to new debit card regulation in the U.S., while delivering upside to operating margins. When Visa was initially purchased in 2011, the uncertain impact of newly-finalized regulation was an overhang that afforded a very attractive buying opportunity. The company has since been re-rated higher to more fully reflect the company’s intrinsic value; salesforce.com, Inc. also outperformed. We purchased it in January, and the portfolio benefited from a re-valuation upwards during the first quarter, which helped its performance. The portfolio’s exposure was trimmed in June as the company approached our price objective, and then increased the position again in August after the shares sold off, reflecting assumptions that were too pessimistic based on our fundamental work. Apple, Inc. was a strong performer during the reporting period, owing to the continued success of the iPhone and iPad. The portfolio has since transitioned from a small overweight position to an underweight position, which has also helped its performance.
During the reporting period, a number of the portfolio’s key holdings in the consumer discretionary sector were solid contributors to its performance and were examples of the ability of elite growth companies to generate shareholder value through periods where headwinds would derail more average businesses. Also adding to portfolio performance was Amazon.com, Inc., as it was re-valued higher, despite near-term concerns over operating margin expansion, as the company continued to deepen its customer loyalty and product category over a highly fixed asset base. Also outperforming was priceline.com, Inc., benefiting portfolio performance, despite a temporary sell-off due to concerns that its exposure to weakening Continental European economies would dampen its results. This holding continued to gain share during the reporting period, amidst economic weakness, which has propelled the valuation higher from the intermittent sell-off.
Positive contribution to portfolio performance was in security selection within the health care sector, in particular Gilead Sciences, Inc. While controversial at first, we believe the decision to purchase Pharmasset has proven to be the correct bet as the company’s production of Hepatitis C Vaccines (HCV) has exceeded high expectation for potency and efficacy, while at the same time name brand potential competitors (Bristol, Idenix, etc.) have seen their pipeline products run into safety and/or efficacy headwinds. Additionally, within telecommunication services sector, the portfolio’s holding in Crown Castle International Corp. was a positive contributor to its performance.
Several specific security holdings and sector weightings did contribute to underperformance during the year. Within consumer staples sector, the positions in Monster Beverage Corp. and The Estee Lauder Cos., Inc. were detractors from portfolio performance. Monster, a maker of energy drinks fell under pressure during the summer on concerns of heightened regulatory scrutiny of their products. We added to the strategy’s position as we deemed the sell-off to be overdone and have been rewarded as the stock moved higher in the fourth quarter. Additionally, the strategy remained underweight to the financials sector throughout the year, which detracted from portfolio performance on a relative basis.
The financials sector was the best performing sector in the benchmark 2012 after health care as the tail risk from Europe was largely removed due to ECB action. We continue to avoid the financials sector as we favor better and more transparent business models elsewhere with more attractive risk/return.
Large-Cap Value Portfolio (managed by ClearBridge Advisors, LLC)
Q. How did the portfolio perform for the year ended December 31, 2012?
A. For the year ended December 31, 2012, the Large-Cap Value Portfolio’s Class I returned 16.40%, compared to a 17.51% return for its benchmark, the Russell 1000 Value Index.
| | |
| | See explanation of symbol and benchmark definitions on A-56 through A-57 |
A-21
PACIFIC SELECT FUND PERFORMANCE DISCUSSION (Continued)
The following graph compares the performance of a hypothetical $10,000 investment in Class I shares of the portfolio to its benchmark for the ten-year period ended December 31, 2012. For comparison purposes, the performance of Class P shares and its benchmark for the period from inception of Class P on May 2, 2011 through December 31, 2012 are also shown in the table below. The portfolio’s performance reflects reinvestments of all dividends and capital gains distributions, if any.
Performance Comparison

| | (1) | ClearBridge Advisors, LLC assumed management of the portfolio on October 1, 2006. Salomon Brothers Asset Management Inc, an affiliate of ClearBridge, managed the portfolio from January 4, 1999 to September 30, 2006. Another firm managed the portfolio before that date. |
| | | | | | | | | | | | |
| Average Annual Total Returns for the periods ended December 31, 2012(1) | |
| | | 1 Year | | | 5 Years | | | 10 Years | |
| | | |
Portfolio’s Class I | | | 16.40% | | | | 1.32% | | | | 7.13% | |
Russell 1000 Value Index | | | 17.51% | | | | 0.59% | | | | 7.38% | |
| | | 1 Year | | | Since
Inception
(5/2/11)~ | | | | |
| | | |
Portfolio’s Class P | | | 16.64% | | | | 6.22% | | | | | |
Russell 1000 Value Index | | | 17.51% | | | | 4.69% | | | | | |
Performance data quoted represents past performance. Investment return and principal value will fluctuate so that shares of the portfolio when redeemed may be worth more or less than their original cost. Past performance is not predictive of future performance. | |
Q. Discuss both positive and negative factors that materially affected the portfolio’s performance during the year, including relevant market conditions, investment strategies and techniques, and particular sectors or securities.
A. For the reporting period, the portfolio’s Class I underperformed the benchmark. The ClearBridge large-capitalization value team utilizes an interactive, research-driven approach to identify companies with strong business franchises and attractive valuations. We look for companies with proven business models and sustainable competitive advantages capable of generating superior returns over time across a range of potential scenarios. We place a heavy emphasis on higher certainty of near- and medium-term cash flows, while discounting earnings from emerging business models or products. We consider valuations relative to normalized earnings power.
On an absolute basis, the portfolio had positive returns in all ten economic sectors in which it was invested during the reporting period. The greatest contributions to the portfolio’s performance return came from the consumer discretionary, financials and consumer staples sectors. Relative to the benchmark, the portfolio’s overall sector allocation contributed to performance for the reporting period. The portfolio’s overweight position in the consumer discretionary sector and its underweight in the utilities sector positively impacted its relative performance for the reporting period. Furthermore, security selection within the consumer staples and utilities sectors added to the portfolio’s relative performance. In terms of individual holdings, the leading contributors to portfolio performance included positions in News Corp., Time Warner Cable, Inc., JPMorgan Chase & Co., Wells Fargo & Co. and Time Warner, Inc.
Relative to the benchmark, overall security selection detracted from the portfolio’s performance. Specifically, stock selection within the financials, health care and information technology sectors negatively impacted the portfolio’s relative performance. Additionally, an underweight position in the financials sector and an overweight holding in the consumer staples sector detracted from relative portfolio performance for the reporting period. On an individual holding basis, the leading detractors from portfolio performance for the reporting period included positions in Hewlett-Packard Co., Johnson Controls, Inc., Teva Pharmaceuticals, Inc., Xerox Corp. and Apache Corp.
During the reporting period, we identified multiple opportunities to add to existing holdings or establish new portfolio positions in companies that we considered to be strong franchises trading at very attractive valuations. New portfolio positions were established in Capital One Financial Corp. and Teva Pharmaceuticals Industries Ltd. At the same time, the existing positions were sold in El Paso Corp., The Charles Schwab Corp., Unilever P.L.C., Johnson Controls, Inc. and Hewlett-Packard Co., and proceeds reinvested in areas where we believe there to be better risk-adjusted return opportunities.
We continue to believe that large-capitalization companies with sustainable competitive advantages and solid balance sheets will be able to navigate the challenging economic environment and generate strong returns over time.
Long/Short Large-Cap Portfolio (managed by J.P. Morgan Investment Management Inc.)
Q. How did the portfolio perform for the year ended December 31, 2012?
A. For the year ended December 31, 2012, the Long/Short Large-Cap Portfolio’s Class I returned 18.09%, compared to a 16.00% return for its benchmark, the S&P 500 Index.
| | |
| | See explanation of symbol and benchmark definitions on A-56 through A-57 |
A-22
PACIFIC SELECT FUND PERFORMANCE DISCUSSION (Continued)
The following graph compares the performance of a hypothetical $10,000 investment in Class I shares of the portfolio to its benchmark for the period from inception on May 1, 2008 through December 31, 2012. For comparison purposes, the performance of Class P shares and its benchmark for the period from inception of Class P on May 2, 2011 through December 31, 2012 are also shown in the table below. The portfolio’s performance reflects reinvestments of all dividends and capital gains distributions, if any.
Performance Comparison

| | (1) | J.P. Morgan Investment Management Inc. became sole manager of the portfolio on May 1, 2011. The portfolio was co-managed with another firm before that date. |
| | | | | | | | |
Average Annual Total Returns for the periods ended December 31, 2012(1) | |
| | | 1 Year | | | Since
Inception
(5/1/08) | |
| | |
Portfolio’s Class I | | | 18.09% | | | | 1.80% | |
S&P 500 Index | | | 16.00% | | | | 2.92% | |
| | | 1 Year | | | Since
Inception
(5/2/11)~ | |
| | |
Portfolio’s Class P | | | 18.32% | | | | 3.60% | |
S&P 500 Index | | | 16.00% | | | | 5.08% | |
Performance data quoted represents past performance. Investment return and principal value will fluctuate so that shares of the portfolio when redeemed may be worth more or less than their original cost. Past performance is not predictive of future performance. | |
Q. Discuss both positive and negative factors that materially affected the portfolio’s performance during the year, including relevant market conditions, investment strategies and techniques, and particular sectors or securities.
A. For the reporting period, the portfolio’s Class I outperformed the benchmark. We at J.P. Morgan believe that strong investment results can be consistently achieved through bottom-up, strong stock selection with minimal exposure to risks associated with market timing or factor bets. Our stock selection philosophy is the heart of our process. We believe that a company’s stock price should reflect the present value of its long-term future cash flows. By looking beyond any near-term issues and understanding the long-term “normalized” earnings power of a company, we can take advantage of the temporary mis-pricing of stocks. The 30/30 (extension) piece of the portfolio was flat for the fourth quarter but outperformed for the year. The industrial cyclical, autos and transportation and energy sectors benefited the portfolio’s performance, while the pharmaceutical/medical technology, financial services and basic materials sectors hurt its performance. For the reporting period, stock selection in retail, utilities, and consumer cyclical contributed to the portfolio’s returns. Meanwhile, health services and systems, consumer staples, and financial services detracted from its performance.
Within the industrial cyclical sector, an underweight in General Electric Co. contributed to the portfolio’s performance returns as investors reacted negatively to disappointing third quarter earnings results, partially attributable to weak organic growth. General Electric continues to be expensive on a valuation basis, as both an industrial company and as a bank, and we do not believe it has a sustainable business model. We choose to not own the name at this time. Within the consumer staples sector, an overweight in General Motors Co. aided portfolio performance as the company announced its plan to buy back stock from the Treasury, removing the government overhang. In addition, the company has amassed a strong balance sheet with plenty of cash following bankruptcy. U.S. auto sales were healthy in the fourth quarter of the reporting period, which provided an additional lift. Both cyclical and secular trends are working in General Motor’s favor, given the product refresh cycle in 2013. The company also has a large footprint in emerging markets, particularly China, giving it an advantage versus competitors. Within the semiconductor sector, an overweight position in Lam Research Corp., a supplier of equipment and services to the semi-conductor industry, added value to the portfolio’s performance during the reporting period. After tremendous weakness in memory, pricing has seemed to bottom-out. Also, Lam Research benefits from the increase in capital intensity that occurs as semi-conductor manufacturers move down to smaller process nodes, driven by the shift towards mobile. Our longer-term outlook remains constructive as we believe an improving macro environment could provide a nice tailwind for equipment spending, with heavy exposure to the very weak memory segment, which is poised to rebound strongly.
On the downside, CME Group, Inc. lagged its peers within financials, negatively impacting portfolio performance, as our exchange volume forecasts proved overly bullish. Part of this can be attributed to regulatory uncertainty about new swap clearing rules, which further depressed volumes. In addition, the latest round of quantitative easing hurt CME’s interest rate complex, a large portion of the business. We are still confident in CME’s prospects due to its strong capital return policy and new clearing rules which should serve as an additional revenue opportunity. Also detracting from portfolio performance was an overweight to CSX Corp. Railroad companies most likely underperformed due to weakness in coal demand due to low natural gas prices, the warm winter and elevated stockpiles. The excess coal inventory overhang is expected to persist for the next few quarters in 2013, which acted as an additional overhang during the reporting period. Despite near-term headwinds, we believe fundamentals are solid, which should drive longer-term performance. We continue to maintain an overweight position in the company. Within the pharmaceutical/medical technology sector, an overweight in Merck Co., Inc. detracted from portfolio performance driven by setbacks in its cholesterol and biosimilar programs. Despite recent negative developments, we still like Merck due to its growing core franchise, a strong drug pipeline and a proven ability to increase its dividend going forward.
| | |
| | See explanation of symbol and benchmark definitions on A-56 through A-57 |
A-23
PACIFIC SELECT FUND PERFORMANCE DISCUSSION (Continued)
Main Street Core Portfolio (managed by OppenheimerFunds, Inc.)
Q. How did the portfolio perform for the year ended December 31, 2012?
A. For the year ended December 31, 2012, the Main Street Core Portfolio’s Class I returned 17.02%, compared to a 16.00% return for its benchmark, the S&P 500 Index.
The following graph compares the performance of a hypothetical $10,000 investment in Class I shares of the portfolio to its benchmark for the ten-year period ended December 31, 2012. For comparison purposes, the performance of Class P shares and its benchmark for the period from inception of Class P on May 2, 2011 through December 31, 2012 are also shown in the table below. The portfolio’s performance reflects reinvestments of all dividends and capital gains distributions, if any.
Performance Comparison
| | | | | | | | | | | | |
Average Annual Total Returns for the periods ended December 31, 2012 | |
| | | 1 Year | | | 5 Years | | | 10 Years | |
| | | |
Portfolio’s Class I | | | 17.02% | | | | 1.55% | | | | 6.71% | |
S&P 500 Index | | | 16.00% | �� | | | 1.66% | | | | 7.10% | |
| | | 1 Year | | | Since
Inception
(5/2/11)~ | | | | |
| | | |
Portfolio’s Class P | | | 17.25% | | | | 6.82% | | | | | |
S&P 500 Index | | | 16.00% | | | | 5.08% | | | | | |
Performance data quoted represents past performance. Investment return and principal value will fluctuate so that shares of the portfolio when redeemed may be worth more or less than their original cost. Past performance is not predictive of future performance. | |
Q. Discuss both positive and negative factors that materially affected the portfolio’s performance during the year, including relevant market conditions, investment strategies and techniques, and particular sectors or securities.
A. For the reporting period, the portfolio’s Class I outperformed the benchmark. Domestic equities generally produced positive portfolio returns during the reporting period. The portfolio outperformed the benchmark primarily in the information technology sector due to better relative stock selection. The portfolio underperformed the benchmark primarily in the consumer discretionary and industrials sectors. Oppenheimer’s long-term investment process remains the same. We seek companies with sustainable competitive advantages, with the management skill and financial resources to generate stronger profit margins, take market share from weaker players, and/or return significant capital to shareholders. We focus on leading firms in structurally attractive industries with committed management teams that have proven records of performance. We seek to invest in such companies when their valuations are attractive and believe that this disciplined approach is the key to generating positive, long-term returns. We believe our investment strategy has the potential to provide both upside participation and a degree of downside protection.
During the reporting period, the top performing stocks that benefited the portfolio’s performance were information technology stocks, Apple, Inc. and eBay, Inc.; financials stocks, Citigroup, Inc., JPMorgan Chase & Co. and Discover Financial Services. Apple, which was the top holding of the portfolio at reporting period end, continued to benefit from its success at innovation and its highly recognizable brand. eBay had a turnaround in its marketplace segment with improvements to the user-experience leading to increased loyalty and a large number of transactions. PayPal, eBay’s on-line payment service, also continued to be a significant contributor to eBay’s growth with results that exceeded expectations. Rounding out the top performing stocks for the portfolio were Citigroup, JPMorgan Chase & Co. and Discover Financial Services. Following several moves by the Fed to help spur growth, bank stocks generally rallied during the reporting period, and financials was the top performing benchmark sector. The reporting period also saw a more constructive view for large banks with greater global exposure.
The top detractors from portfolio performance were information technology stock, FaceBook, Inc.; energy stock, Occidental Petroleum Corp.; industrial stock, Towers Watson & Co.; utilities stock, The AES Corp.; and consumer staples stock, Mondelez International, Inc. Social media firm FaceBook faced concerns around how best to deliver effective advertising to mobile devices and monetize its significant network of users. General Motors Co.’s announcement to pull its advertising from FaceBook, Inc. highlighted these concerns. Occidental Petroleum Corp.’s stock performance was hurt by volatile oil and gas prices, which at times dropped sharply during the reporting period amid global macroeconomic market fears. We exited our position in Occidental. We established a position in global employee-benefits consulting company Towers Watson & Co. during the reporting period. Towards the end of the reporting period, Towers announced an earnings slip as costs rose and revenue and profits fell. The AES Corp., an operator of utilities and wholesale power generators, announced a third quarter loss as the company took a goodwill impairment charge and saw lower revenue in its Latin American utilities business. Snack company Mondelez International, Inc., formerly known as Kraft Foods, reported disappointing first quarter results, missing on its top and bottom lines primarily due to currency headwinds.
At the end of the reporting period, the largest overweight position in the portfolio was in the financials sector. Additionally, overweight positions were also in consumer staples, health care, industrials and information technology sectors. The portfolio was underweight mostly in utilities, energy, consumer discretionary, materials and telecommunication services.
| | |
| | See explanation of symbol and benchmark definitions on A-56 through A-57 |
A-24
PACIFIC SELECT FUND PERFORMANCE DISCUSSION (Continued)
Despite macroeconomic headwinds, we believe that many U.S. corporations have continued to build balance sheet strength and have generally made effective capital allocation decisions. While profit growth is likely to slow, we believe balance sheets may remain healthy and returns on capital may remain stable.
Mid-Cap Equity Portfolio (managed by Lazard Asset Management LLC)
Q. How did the portfolio perform for the year ended December 31, 2012?
A. For the year ended December 31, 2012, the Mid-Cap Equity Portfolio’s Class I returned 7.35%, compared to a 17.28% return for its benchmark, the Russell Midcap Index.
The following graph compares the performance of a hypothetical $10,000 investment in Class I shares of the portfolio to its benchmark for the ten-year period ended December 31, 2012. For comparison purposes, the performance of Class P shares and its benchmark for the period from inception of Class P on May 2, 2011 through December 31, 2012 are also shown in the table below. The portfolio’s performance reflects reinvestments of all dividends and capital gains distributions, if any.
Performance Comparison
| | | | | | | | | | | | |
Average Annual Total Returns for the periods ended December 31, 2012 | |
| | | 1 Year | | | 5 Years | | | 10 Years | |
| | | |
Portfolio’s Class I | | | 7.35% | | | | 1.33% | | | | 7.77% | |
Russell Midcap Index | | | 17.28% | | | | 3.57% | | | | 10.65% | |
| | | 1 Year | | | Since
Inception
(5/2/11)~ | | | | |
| | | |
Portfolio’s Class P | | | 7.55% | | | | -3.47% | | | | | |
Russell Midcap Index | | | 17.28% | | | | 2.48% | | | | | |
Performance data quoted represents past performance. Investment return and principal value will fluctuate so that shares of the portfolio when redeemed may be worth more or less than their original cost. Past performance is not predictive of future performance. | |
Q. Discuss both positive and negative factors that materially affected the portfolio’s performance during the year, including relevant market conditions, investment strategies and techniques, and particular sectors or securities.
A. For the reporting period, the portfolio’s Class I underperformed the benchmark. Lazard analyzes a company’s value by comparing its share price with its return on total capital or equity. Companies are considered undervalued when their share price is lower than their estimated worth or growth prospects. The manager focuses on individual stock selection rather than on forecasting stock market trends. Stock selection in the energy sector contributed to portfolio performance.
Benefiting portfolio performance were shares of Marathon Petroleum Corp., which rose after the company reported robust earnings, primarily due to retail fuel and merchandise margins as well as corporate expense. The company also completed a significant portion of a $2 billion share repurchase program. Stock selection and an underweight position in the industrials sector also helped portfolio performance return. Private correctional facilities operator, Corrections Corp. of America, also benefited portfolio performance as shares rose as the company announced the initiation of a quarterly cash dividend of $0.20 per share beginning in June of 2012. The stock also appreciated on speculation that it would be converted into a REIT. Also positively impacting portfolio performance was Thomas & Betts Corp. as shares rose after the company was offered a buyout from a competitor.
In contrast, stock selection in the information technology sector detracted from portfolio performance. Chipmaker Marvell Technology Group Ltd. declined, detracting from the portfolio’s performance, after the company posted weak results due to a softening personal computer (PC) and hard-disk drive market. Also negatively impacting the portfolio’s performance, were shares of NetApp, Inc., a storage and data management solution provider, which declined after the company reported guidance which was lower-than-expected due to the macroeconomic environment. Given the likelihood of revenue growth and margin expansion, we see upside in the security from current levels. Stock selection in the consumer discretionary sector also hurt portfolio performance. Detracting from portfolio performance were shares of casino game manufacturer International Game Technology which declined after reporting results that disappointed the market. The expectation shortfall was driven by a significant decline in new units due to a lack of casino openings, and lower margins in the company’s game operations business due to lower interest rates.
To the extent the U.S. successfully addresses its fiscal challenges, we believe there is substantial upside for U.S. equities. We remain confident that, over time, political leaders in Washington will make decisions that will place the U.S. on a more sustainable fiscal trajectory than at present. However, it is critical that decisions be made to remove the fiscal uncertainty from the economic horizon. By agreeing on a substantial package for deficit reduction, we believe the government will also provide increased room for flexibility to address risk factors that might arise in the future even if the package does not represent a complete fiscal solution. We will continue to monitor the progress on deficits with hopes of a resolution. In the interim, we continue to focus on identifying companies with solid balance sheets that can generate strong organic cash flow growth for shareholders, and that have the operational flexibility that we believe could deal with most fiscal scenarios.
| | |
| | See explanation of symbol and benchmark definitions on A-56 through A-57 |
A-25
PACIFIC SELECT FUND PERFORMANCE DISCUSSION (Continued)
Mid-Cap Growth Portfolio (managed by Morgan Stanley Investment Management Inc.)
Q. How did the portfolio perform for the year ended December 31, 2012?
A. For the year ended December 31, 2012, the Mid-Cap Growth Portfolio’s Class I returned 7.49%, compared to a 15.81% return for its benchmark, the Russell Midcap Growth Index.
The following graph compares the performance of a hypothetical $10,000 investment in Class I shares of the portfolio to its benchmark for the ten-year period ended December 31, 2012. For comparison purposes, the performance of Class P shares and its benchmark for the period from inception of Class P on May 2, 2011 through December 31, 2012 are also shown in the table below. The portfolio’s performance reflects reinvestments of all dividends and capital gains distributions, if any.
Performance Comparison
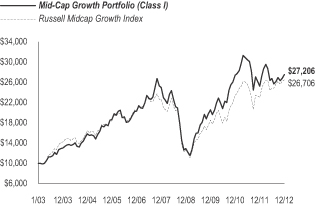
| | (1) | Morgan Stanley Investment Management Inc. manages the portfolio and used to do business in certain instances under the name Van Kampen, and managed the portfolio under the Van Kampen name from May 1, 2003 to May 1, 2010. Another firm managed the portfolio prior to May 1, 2003. |
| | | | | | | | | | | | |
Average Annual Total Returns for the periods ended December 31, 2012(1) | |
| | | 1 Year | | | 5 Years | | | 10 Years | |
| | | |
Portfolio’s Class I | | | 7.49% | | | | 1.68% | | | | 10.53% | |
Russell Midcap Growth Index | | | 15.81% | | | | 3.23% | | | | 10.32% | |
| | | |
| | | 1 Year | | | Since
Inception
(5/2/11)~ | | | | |
| | | |
Portfolio’s Class P | | | 7.71% | | | | -7.97% | | | | | |
Russell Midcap Growth Index | | | 15.81% | | | | 1.14% | | | | | |
Performance data quoted represents past performance. Investment return and principal value will fluctuate so that shares of the portfolio when redeemed may be worth more or less than their original cost. Past performance is not predictive of future performance. | |
Q. Discuss both positive and negative factors that materially affected the portfolio’s performance during the year, including relevant market conditions, investment strategies and techniques, and particular sectors or securities.
A. For the reporting period, the portfolio’s Class I underperformed the benchmark. The Morgan Stanley portfolio management team looks for high quality growth companies that we believe have the following attributes: sustainable competitive advantages, above-average business visibility, rising return on invested capital, strong free cash flow generation and a favorable risk/reward profile. We find these companies through intense fundamental research. Our emphasis is on secular growth, and as a result, short-term market events are not as meaningful in the stock selection process.
The technology sector detracted from portfolio performance, hurt by both stock selection and an overweight in the sector. A position in the on-line deals provider Groupon, Inc. performed unfavorably, dragging down portfolio performance. Stock selection and an underweight relative to the benchmark in the materials and processing sector hampered relative portfolio performance, primarily due to the rare earths miner Molycorp, Inc. Another area of relative weakness in the portfolio was stock selection in the consumer discretionary sector, where a position in New Oriental Education & Technology Group, Inc., a private educational services provider in China, hurt the portfolio performance returns the most.
Stock selection in the producer durables sector was a positive contributor to portfolio performance. A holding in Intertek Group P.L.C., a product testing and inspection firm, was the largest contributor to portfolio performance in the sector. The utilities sector was additive to portfolio performance as well, although the relative gains were somewhat off-set by the negative effect of an overweight in the sector. Exposure to infrastructure asset management company Brookfield Infrastructure Partners L.P. was beneficial to portfolio performance.
Mid-Cap Value Portfolio (managed by BlackRock Capital Management, Inc)
Q. How did the portfolio perform for the year ended December 31, 2012?
A. For the year ended December 31, 2012, the Mid-Cap Value Portfolio’s Class I returned 14.49%, compared to a 18.53% return for its benchmark, the S&P MidCap 400 Value Index and 18.51% for the Russell Midcap Value Index. The portfolio’s benchmark was changed to the S&P MidCap 400 Value Index to more closely reflect the types of securities in which the portfolio invests. The former benchmark, the Russell Midcap Value Index is being provided for comparison purposes.
| | |
| | See explanation of symbol and benchmark definitions on A-56 through A-57 |
A-26
PACIFIC SELECT FUND PERFORMANCE DISCUSSION (Continued)
The following graph compares the performance of a hypothetical $10,000 investment in Class I shares of the portfolio to its benchmark for the period from inception on January 2, 2009 through December 31, 2012. For comparison purposes, the performance of Class P shares and its benchmark for the period from inception of Class P on May 2, 2011 through December 31, 2012 are also shown in the table below. The portfolio’s performance reflects reinvestments of all dividends and capital gains distributions, if any.
Performance Comparison
| | | | | | | | |
| Average Annual Total Returns for the periods ended December 31, 2012 | |
| | | 1 Year | | | Since
Inception
(1/2/09)~ | |
| | |
Portfolio’s Class I | | | 14.49% | | | | 14.06% | |
S&P MidCap 400 Value Index | | | 18.53% | | | | 17.40% | |
Russell Midcap Value Index | | | 18.51% | | | | 18.28% | |
| | |
| | | 1 Year | | | Since
Inception
(5/2/11)~ | |
| | |
Portfolio’s Class P | | | 14.72% | | | | -0.78% | |
S&P MidCap 400 Value Index | | | 18.53% | | | | 2.47% | |
Russell Midcap Value Index | | | 18.51% | | | | 3.68% | |
Performance data quoted represents past performance. Investment return and principal value will fluctuate so that shares of the portfolio when redeemed may be worth more or less than their original cost. Past performance is not predictive of future performance. | |
Q. Discuss both positive and negative factors that materially affected the portfolio’s performance during the year, including relevant market conditions, investment strategies and techniques, and particular sectors or securities.
A. For the reporting period, the portfolio’s Class I underperformed its benchmarks, despite the absolute gains in the rising market environment. We at BlackRock adhere to an investment approach for the portfolio that is driven by bottom-up stock selection. Investment decisions are based on fundamental research designed to identify stocks of mid-capitalization companies facing temporary challenges or under-earning their potential but with opportunities for improvement. The portfolio is diversified by sector and security and maintains a mid-capitalization value style consistent with that of the benchmark.
Allocation and selection decisions were both, in aggregate, detractors from the portfolio’s relative performance. From an allocation perspective, the portfolio’s modest overweight to the underperforming consumer staples sector although off-set by strong selection, was a detractor as were underweights to industrials and financials. Selection, like allocation, detracted from the industrials sector as well as financials and energy but was additive to portfolio performance in health care, consumer discretionary and consumer staples.
We are cautious in our industrials positioning, noting that the period of slow, global economic growth and post-crisis recovery has altered industry cycles and reduced predictability across the sector. For example, we expect ongoing weakness in housing to weigh on building-related areas; and, although the stocks of some such companies performed well recently on encouraging housing data points (without evidence of volume improvements), we view these businesses as risky. Nonetheless, in the most recent period, underweighting some such outperforming areas of industrials as building products, commercial services & supplies, and industrial conglomerates detracted from performance. Selection in industrials detracted from portfolio performance specifically in the machinery, construction & engineering and aerospace & defense industries. Company-specific issues in a few holdings and absence from a few high-performing names contributed to portfolio underperformance. We continue to underweight the industrials sector and maintain a barbell approach, balancing relatively stable names, such as Dover Corp. and Parker Hannifin Corp., with somewhat higher risk stocks such as Navistar International Corp. and Kennametal, Inc.
Selection and an overweight to energy detracted from portfolio performance with the sector underperforming on commodity weakness and the portfolio’s tilt toward exploration and production businesses, adding to the effect. We remain of the view that one of the most promising opportunities in the mid-capitalization space presently is in companies well positioned to take advantage of technological advancements in oil and gas extraction. Recent advances have enabled access to previously inaccessible commodity deposits leading to a now largely complete land-grab in the richest prospective areas for drilling. Mid-capitalization energy service companies were early and aggressive in this area and thus have a disproportionately large share of expertise and acreage compared to their large-capitalization competitors. Commodity price weakness in the near-term has created opportunity, and we have added to our favorite names in this space in spite of their near-term underperformance.
Selection within the financials sector was also a net detractor from portfolio performance, notably in insurers, thrifts and real estate management. We continue to maintain an underweight to the financials broadly, the largest portion of which is concentrated in REITs. We are cautious around the valuations of REITs and favor real estate management companies as an alternative. During the reporting period, REITs performed strongly as investors were attracted to their lofty dividends; however, the portfolio’s real estate management holdings underperformed. An underweight to capital markets companies also detracted from performance, notably absence from several asset managers.
Within the materials sector, the portfolio’s selection in metals & mining detracted, as did selection and an underweight to chemicals. Additionally, the portfolio’s holdings in paper & forest products underperformed.
| | |
| | See explanation of symbol and benchmark definitions on A-56 through A-57 |
A-27
PACIFIC SELECT FUND PERFORMANCE DISCUSSION (Continued)
Offsetting the previously mentioned detractors, were positive effects from good stock selection in health care and consumer discretionary. Amongst health care names, health care providers and the services industry proved strongly additive to the portfolio’s performance as did the portfolio’s weighting in the biotechnology industry. The portfolio was overweight to names in the health care sector whose valuations we believed reflected overly bearish sentiment, much of which was owed to interpretations of the implications of the U.S. health care reform legislation. As the year progressed, we shifted from health maintenance organizations (HMOs) toward hospitals, which we believe will benefit as volume growth becomes a reality and bad debt expenses diminish. In the consumer discretionary sector, the portfolio’s holdings in household durables, specialty retailers and the hotel, restaurant & leisure industry all proved additive to the portfolio’s performance, largely on good selection. The portfolio’s overweight to the textile, apparel & luxury goods industry was beneficial to its performance as well.
At the close of the reporting period, the most notable sector weightings relative to the benchmark included overweight consumer discretionary, health care, energy, information technology while underweight financials, utilities, industrials, consumer staples and materials.
Small-Cap Equity Portfolio (co-managed by BlackRock Investment Management, LLC and Franklin Advisory Services, LLC)
Q. How did the portfolio perform for the year ended December 31, 2012?
A. For the year ended December 31, 2012, the Small-Cap Equity Portfolio’s Class I returned 15.93%, compared to a 18.05% return for its benchmark, the Russell 2000 Value Index.
The following graph compares the performance of a hypothetical $10,000 investment in Class I shares of the portfolio to its benchmark for the period from inception on May 2, 2005 through December 31, 2012. For comparison purposes, the performance of Class P shares and its benchmark for the period from inception of Class P on May 2, 2011 through December 31, 2012 are also shown in the table below. The portfolio’s performance reflects reinvestments of all dividends and capital gains distributions, if any.
Performance Comparison
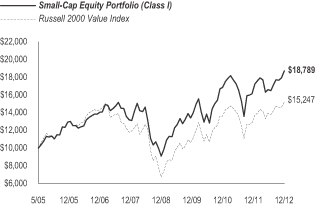
| | (1) | BlackRock Investment Management, LLC and Franklin Advisory Services, LLC began co-managing the portfolio on May 1, 2010, and some investment policies changed at that time. Another firm managed the portfolio before that date. |
| | | | | | | | | | | | |
| Average Annual Total Returns for the periods ended December 31, 2012(1) | |
| | | 1 Year | | | 5 Years | | | Since
Inception
(5/2/05)~ | |
| | | |
Portfolio’s Class I | | | 15.93% | | | | 5.30% | | | | 8.57% | |
Russell 2000 Value Index | | | 18.05% | | | | 3.55% | | | | 5.65% | |
| | | |
| | | 1 Year | | | Since
Inception
(5/2/11)~ | | | | |
| | | |
Portfolio’s Class P | | | 16.16% | | | | 2.02% | | | | | |
Russell 2000 Value Index | | | 18.05% | | | | 1.78% | | | | | |
Performance data quoted represents past performance. Investment return and principal value will fluctuate so that shares of the portfolio when redeemed may be worth more or less than their original cost. Past performance is not predictive of future performance. | |
Q. Discuss both positive and negative factors that materially affected the portfolio’s performance during the year, including relevant market conditions, investment strategies and techniques, and particular sectors or securities.
A. For the reporting period, the portfolio’s Class I underperformed the benchmark. The following discussions are from each of the co-portfolio managers, BlackRock and Franklin, respectively.
BlackRock
The portfolio invests in small-capitalization securities that are included in the benchmark, the Russell 2000 Value Index, or have economic characteristics similar to the securities included in the benchmark. Following a tumultuous 2011, equity markets began 2012 with a strong rally amid lower volatility.
From a sector perspective, global central bank stimulus drove financials and consumer discretionary stocks higher in 2012 which contributed to portfolio performance. Telecommunication services performed well and health care stocks rebounded after valuations had been pushed down amid regulatory uncertainty. While all of the Russell 2000 Value Index sectors moved higher for the year, energy stocks were hindered by declining oil prices in the latter part of the year, and utilities became less favorable as investors sought riskier investments and detracted from portfolio performance.
Franklin
We at Franklin seek to invest in small-capitalization companies that we believe are selling below their underlying worth. Our strategy is to buy and hold a portfolio of fundamentally sound companies for five years or more on average. We purchase securities at what we consider attractive prices, often when they are out-of-favor with other investors. The portfolio employs a bottom-up stock selection process. Securities are selected without regard to benchmark comparisons, and we aim for long-term results. As a result, the portfolio frequently contains sector and security allocations that are significantly different than those of the benchmark.
| | |
| | See explanation of symbol and benchmark definitions on A-56 through A-57 |
A-28
PACIFIC SELECT FUND PERFORMANCE DISCUSSION (Continued)
All sectors aided the portfolio’s absolute performance, especially industrials, consumer discretionary, financials and materials. Contributors to the portfolio’s (absolute) performance in the consumer discretionary sector included recreational vehicle manufacturer Thor Industries, Inc., and fashion footwear and marketer Brown Shoe Co., Inc. In the industrials sector, among key contributors to portfolio returns were contractor and construction materials producer Granite Construction, Inc. and architectural glass producer Apogee Enterprises, Inc. Insurer Protective Life Corp. also boosted returns.
Detractors from the portfolio’s performance during the reporting period included auto components supplier, Gentex Corp.; marine oil services provider, Tidewater, Inc.; diversified oilfield services company, Oil States International, Inc.; oil tanker operator, Overseas Shipholding Group, Inc.; and gas utility, Energen Corp.
Small-Cap Growth Portfolio (managed by Fred Alger Management, Inc.)
Q. How did the portfolio perform for the year ended December 31, 2012?
A. For the year ended December 31, 2012, the Small-Cap Growth Portfolio’s Class I returned 12.87%, compared to a 14.59% return for its benchmark, the Russell 2000 Growth Index.
The following graph compares the performance of a hypothetical $10,000 investment in Class I shares of the portfolio to its benchmark for the ten-year period ended December 31, 2012. For comparison purposes, the performance of Class P shares and its benchmark for the period from inception of Class P on May 2, 2011 through December 31, 2012 are also shown in the table below. The portfolio’s performance reflects reinvestments of all dividends and capital gains distributions, if any.
Performance Comparison
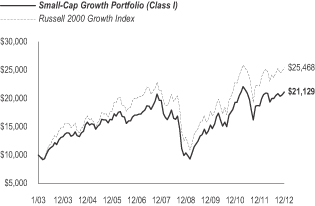
| | (1) | Fred Alger Management, Inc. began managing the portfolio on May 1, 2007, and some investment policies changed at that time. Other firms managed the portfolio before that date. |
| | | | | | | | | | | | |
| Average Annual Total Returns for the periods ended December 31, 2012(1) | |
| | | 1 Year | | | 5 Years | | | 10 Years | |
| | | |
Portfolio’s Class I | | | 12.87% | | | | 1.45% | | | | 7.77% | |
Russell 2000 Growth Index | | | 14.59% | | | | 3.49% | | | | 9.80% | |
| | | |
| | | 1 Year | | | Since
Inception
(5/2/11)~ | | | | |
| | | |
Portfolio’s Class P | | | 13.09% | | | | -2.49% | | | | | |
Russell 2000 Growth Index | | | 14.59% | | | | -1.02% | | | | | |
Performance data quoted represents past performance. Investment return and principal value will fluctuate so that shares of the portfolio when redeemed may be worth more or less than their original cost. Past performance is not predictive of future performance. | |
Q. Discuss both positive and negative factors that materially affected the portfolio’s performance during the year, including relevant market conditions, investment strategies and techniques, and particular sectors or securities.
A. For the reporting period, the portfolio’s Class I underperformed the benchmark. The largest sector weightings in the portfolio were in the information technology and consumer discretionary sectors. The largest sector overweight for the reporting period was in consumer discretionary while the largest sector underweight was in health care. Favorable stock selection in the technology and consumer staples sectors were the most important contributors to the portfolio’s performance. The health care and industrials sectors detracted from its performance. Alger’s investment philosophy and process remains unchanged: a research intensive, bottom-up, fundamental approach focused on discovering the fastest growing companies undergoing “Positive Dynamic Change”. Our experienced research team continues to identify many small-capitalization companies undergoing “Positive Dynamic Change” where it is our opinion that our forward-looking assessment of their fundamentals exceeded Wall Street’s consensus.
Mellanox Technologies Ltd. and SolarWinds, Inc. were among the top contributors to the portfolio’s absolute performance. Mellanox Technologies is a provider of interconnect solutions that facilitate low latency, high speed data transmission between servers and storage systems. The company contributed to portfolio performance as a high-unit volume growth story because of very strong earnings growth driven by a substantially greater adoption of their Infiniband product than anticipated. SolarWinds, Inc. provides a broad array of network management software solutions for information technology professionals at a highly competitive price. This is also a high-unit volume growth company that contributed positively to portfolio performance after beating forecasts for an eighth straight quarter. Their model and approach to doing business has produced increasing sales growth, healthy operating margins and delivered consistent results to the benefit of their shareholders.
LogMeIn, Inc. and Key Energy Services, Inc. were among the top detractors to the portfolio’s absolute performance. LogMeIn develops and markets a suite of remote access, remote support, and collaboration solutions that provide instant, secure connections between internet enabled devices. We originally purchased the shares as a high-unit volume growth company as its solutions are used to connect more internet-enabled devices than any other connectivity service. However, the shares detracted from performance due to weaker-than-expected European demand and the subsequent downward pressure on revenue; and therefore, we sold LogMeIn. Key Energy Services provides a full range of well services
| | |
| | See explanation of symbol and benchmark definitions on A-56 through A-57 |
A-29
PACIFIC SELECT FUND PERFORMANCE DISCUSSION (Continued)
to onshore oil and natural gas companies and is the largest onshore well servicing contractor based on the number of rigs owned in the U.S. The majority of the company’s revenues are related to oil-based activity, and lower energy prices impacted operating results causing the shares to detract from portfolio performance. Management for Key Energy Services indicated that the shift from gas to oil basins and labor-related issues will continue to impact operations. We sold the shares as we reduced exposure to the energy sector.
We believe that Alger’s philosophy of investing in “Positive Dynamic Change” has never been more appropriate than today. While change is almost always unsettling for some investors, we believe that it generates opportunities to buy strong companies with superior potential for growth that are trading at attractive valuations. We continue to believe that research is the cornerstone of superior portfolio management, regardless of economic conditions, and that our proven and disciplined process for identifying companies experiencing “Positive Dynamic Change” will continue to produce superior long-term results for our clients.
Small-Cap Index Portfolio (managed by BlackRock Investment Management, LLC)
Q. How did the portfolio perform for the year ended December 31, 2012?
A. For the year ended December 31, 2012, the Small-Cap Index Portfolio’s Class I returned 16.13%, compared to a 16.35% return for its benchmark, the Russell 2000 Index.
The following graph compares the performance of a hypothetical $10,000 investment in Class I shares of the portfolio to its benchmark for the ten-year period ended December 31, 2012. For comparison purposes, the performance of Class P shares and its benchmark for the period from inception of Class P on May 2, 2011 through December 31, 2012 are also shown in the table below. The portfolio’s performance reflects reinvestments of all dividends and capital gains distributions, if any.
Performance Comparison

| | (1) | BlackRock Investment Management, LLC acquired the assets of Mercury Advisors, an affiliate of Merrill Lynch Investment Managers, L.P., effective September 29, 2006 and began managing the portfolio on that date. Mercury Advisors began managing the portfolio on January 1, 2000. Another firm managed the portfolio before that date. |
| | | | | | | | | | | | |
| Average Annual Total Returns for the periods ended December 31, 2012(1) | |
| | | 1 Year | | | 5 Years | | | 10 Years | |
| | | |
Portfolio’s Class I | | | 16.13% | | | | 3.15% | | | | 9.27% | |
Russell 2000 Index | | | 16.35% | | | | 3.56% | | | | 9.72% | |
| | | |
| | | 1 Year | | | Since
Inception
(5/2/11)~ | | | | |
| | | |
Portfolio’s Class P | | | 16.37% | | | | 0.27% | | | | | |
Russell 2000 Index | | | 16.35% | | | | 0.38% | | | | | |
Performance data quoted represents past performance. Investment return and principal value will fluctuate so that shares of the portfolio when redeemed may be worth more or less than their original cost. Past performance is not predictive of future performance. | |
Q. Discuss both positive and negative factors that materially affected the portfolio’s performance during the year, including relevant market conditions, investment strategies and techniques, and particular sectors or securities.
A. For the reporting period, the portfolio’s Class I underperformed the benchmark. The portfolio seeks to replicate as closely as possible, the total return of the benchmark as represented by the Russell 2000 Index. In accordance with BlackRock’s passive investment strategy, the portfolio was positioned to match the risk characteristics of the benchmark throughout the reporting period. Following a tumultuous 2011, equity markets began 2012 with a strong rally amid lower volatility.
From a sector perspective, global central bank stimulus drove financials and consumer discretionary stocks higher in 2012. Telecommunication services performed well, and health care stocks rebounded after valuations had been pushed down amid regulatory uncertainty. While all of the S&P 500 Index sectors moved higher for the reporting period, energy stocks were hindered by declining oil prices in the latter part of the reporting period, and utilities became less favorable as investors sought riskier investments.
Small-Cap Value Portfolio (managed by NFJ Investment Group LLC)
Q. How did the portfolio perform for the year ended December 31, 2012?
A. For the year ended December 31, 2012, the Small-Cap Value Portfolio’s Class I returned 11.09%, compared to a 18.05% return for its benchmark, the Russell 2000 Value Index.
| | |
| | See explanation of symbol and benchmark definitions on A-56 through A-57 |
A-30
PACIFIC SELECT FUND PERFORMANCE DISCUSSION (Continued)
The following graph compares the performance of a hypothetical $10,000 investment in Class I shares of the portfolio to its benchmark for the period from inception on May 1, 2003 through December 31, 2012. For comparison purposes, the performance of Class P shares and its benchmark for the period from inception of Class P on May 2, 2011 through December 31, 2012 are also shown in the table below. The portfolio’s performance reflects reinvestments of all dividends and capital gains distributions, if any.
Performance Comparison
| | | | | | | | | | | | |
| Average Annual Total Returns for the periods ended December 31, 2012 | |
| | | 1 Year | | | 5 Years | | | Since
Inception
(5/1/03) | |
| | | |
Portfolio’s Class I | | | 11.09% | | | | 5.39% | | | | 11.57% | |
Russell 2000 Value Index | | | 18.05% | | | | 3.55% | | | | 9.41% | |
| | | 1 Year | | | Since
Inception
(5/2/11)~ | | | | |
| | | |
Portfolio’s Class P | | | 11.31% | | | | 1.55% | | | | | |
Russell 2000 Value Index | | | 18.05% | | | | 1.78% | | | | | |
Performance data quoted represents past performance. Investment return and principal value will fluctuate so that shares of the portfolio when redeemed may be worth more or less than their original cost. Past performance is not predictive of future performance. | |
Q. Discuss both positive and negative factors that materially affected the portfolio’s performance during the year, including relevant market conditions, investment strategies and techniques and particular sectors or securities.
A. For the reporting period, the portfolio’s Class I underperformed the benchmark. We at NFJ focus on investing in undervalued companies relative to the market across a broad range of industry groups. We normally invest significantly in securities of companies that the portfolio managers expect will generate income (for example, by paying dividends).
Absolute results were strong and favorable during the reporting period in light of equity returns over the past decade. However, the benchmark’s return exceeded the portfolio’s returns. This year we have seen market participants pay up for higher dividend-paying stocks with less regard to valuation. With just under 40% of the benchmark consisting of non-dividend paying stocks according to FactSet Research Systems, Inc., and valuation pressures impacting many of the remaining dividend payers, our commitment to investing at the intersection of yield and value has been limited.
In spite of the challenging environment, overall absolute returns were favorable, with health care and energy names in the portfolio leading portfolio performance. Returns from PerkinElmer, Inc. benefited the portfolio’s performance results. The company has enhanced its productivity and product mix, resulting in higher operating margins. Additionally, the market responded well to the company’s recent takeover of Chinese infectious disease diagnostic firm Shanghai Haoyuan Biotech Co. Ltd. Many domestic petroleum refiners did well during the reporting period as a result of access to relatively cheap, crude oil feedstock (West Texas Intermediate (WTI)). Long-time holding and refining operation Holly Frontier Corp. delivered strong results during the reporting period; the stock was sold during the fourth quarter based on the size requirements of a small-capitalization stock.
Issue selection in materials and financials was poor, as several positions in each sector posted declines detracting from portfolio performance. For many precious metals miners, costs have increased at a faster pace than the prices of the commodities they sell, such as gold. The market has become impatient with some of these miners, including Canada-based IAMGOLD Corp. The stock trades at compelling valuation levels and pays out an attractive yield but negatively impacted the portfolio’s performance. Shares of pawn shop operator Cash America International, Inc. fell for the year, in part due to unprofitable locations in Mexico, negatively impacting portfolio performance. The company’s third quarter earnings were down largely as a result of one-time expenses related to trimming operations and an unsuccessful bid to spin-out its online lending business.
An overweight in energy and underweight in financials muted the portfolio’s relative returns. Energy was the weakest sector in the benchmark for the reporting period. Conversely, the benchmark’s financials sector delivered some of the strongest total returns in 2012. An underweight in information technology and overweight in materials contributed positively to the portfolio’s performance. The uncertain environment hurt many information technology names. In contrast, the materials sector was the second strongest performer in the benchmark for the reporting period.
Health Sciences Portfolio (managed by Jennison Associates LLC)
Q. How did the portfolio perform for the year ended December 31, 2012?
A. For the year ended December 31, 2012, the Health Sciences Portfolio’s Class I returned 25.68%, compared to a 16.17% return for its benchmark, the S&P Composite 1500 Index and a 18.35% return for the S&P Composite 1500 Health Care Index.
| | |
| | See explanation of symbol and benchmark definitions on A-56 through A-57 |
A-31
PACIFIC SELECT FUND PERFORMANCE DISCUSSION (Continued)
The following graph compares the performance of a hypothetical $10,000 investment in Class I shares of the portfolio to its benchmark for the ten-year period ended December 31, 2012. For comparison purposes, the performance of Class P shares and its benchmark for the period from inception of Class P on May 2, 2011 through December 31, 2012 are also shown in the table below. The portfolio’s performance reflects reinvestments of all dividends and capital gains distributions, if any.
Performance Comparison
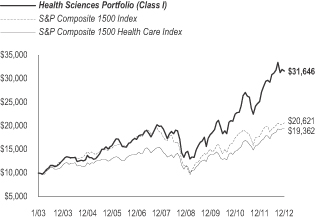
| | (1) | Jennison Associates LLC began managing the portfolio on May 1, 2005, and some investment policies changed at that time. Another firm managed the portfolio before that date. |
| | | | | | | | | | | | |
| Average Annual Total Returns for the periods ended December 31, 2012(1) | |
| | | 1 Year | | | 5 Years | | | 10 Years | |
| | | |
Portfolio’s Class I | | | 25.68% | | | | 9.66% | | | | 12.21% | |
S&P Composite 1500 Index | | | 16.17% | | | | 2.07% | | | | 7.51% | |
S&P Composite 1500 Health Care Index | | | 18.35% | | | | 5.10% | | | | 6.83% | |
| | | 1 Year | | | Since
Inception
(5/2/11)~ | | | | |
| | | |
Portfolio’s Class P | | | 25.93% | | | | 11.55% | | | | | |
S&P Composite 1500 Index | | | 16.17% | | | | 4.76% | | | | | |
S&P Composite 1500 Health Care Index | | | 18.35% | | | | 9.71% | | | | | |
Performance data quoted represents past performance. Investment return and principal value will fluctuate so that shares of the portfolio when redeemed may be worth more or less than their original cost. Past performance is not predictive of future performance. | |
Q. Discuss both positive and negative factors that materially affected the portfolio’s performance during the year, including relevant market conditions, investment strategies and techniques, and particular sectors or securities.
A. For the reporting period, the portfolio’s Class I outperformed the broad-based S&P Composite 1500 Index and also outperformed the health care-specific S&P Composite 1500 Health Care Index. Every sector in the health care–specific benchmark rose with advances largest in biotechnology and life sciences tools and services. The health care technology sector’s gain was comparatively subdued. Jennison’s management team strives to construct a well-diversified portfolio that draws on rigorous research and bottom-up stock selection. In all areas, the manager looks for companies benefiting from new product approvals, significant mergers and partnerships, or the global economic environment.
In the portfolio, holdings in the life sciences tools and services, health care equipment and supplies, and biotechnology sectors made the biggest gains, while biotechnology positions contributed most to its performance return. The portfolio’s health care technology holdings lost ground and detracted from its return.
Biotechnology holdings, Medivation, Inc., Alexion Pharmaceuticals, Inc., BioMarin Pharmaceutical, Inc., ARIAD Pharmaceuticals, Inc. and Regeneron Pharmaceuticals, Inc. were key contributors to the portfolio’s strong performance returns. Medivation climbed on news that the Food and Drug Administration (FDA) approved its experimental prostate cancer drug, Xtandi, for the treatment of patients with metastatic castration-resistant prostate cancer who have previously received docetaxel, another oncology treatment. Clinical trial data showed that Xtandi helped post-chemotherapy patients live longer, suggesting that the treatment could become a significant player in the global prostate cancer market. The portfolio’s position in Medivation was eliminated in December to realize gains.
Alexion Pharmaceuticals rose on strong financial results and favorable market sentiment about its lead product, Soliris. Soliris treats two rare, genetic, and potentially life-threatening blood disorders: paroxysmal nocturnal hemoglobinuria (PNH), and atypical hemolytic uremic syndrome (aHUS). The company is aggressively pursuing label expansion opportunities in other autoimmune and inflammatory disease settings.
BioMarin Pharmaceutical also gained on trial data that showed its enzyme replacement therapy, GALNS, improved the walking distance for patients with the rare lysosomal storage disorder mucopolysaccharidosis type IVA (Morquio A Syndrome). Designated an “orphan disease” by the FDA, Morquio A Syndrome causes growth retardation, flat feet, and other abnormalities. We believe sales of GALNS could eventually total hundreds of millions of dollars, as drugs for treating orphan diseases often command high prices. BioMarin’s product pipeline also includes treatments for phenylketonuria, an inherited metabolic disease, and achondroplasia, a bone-growth disorder.
Additionally, Ariad Pharmaceuticals advanced on trial data that confirmed the efficacy of its leukemia inhibitor, ponatinib, in certain patients with drug-resistant myeloid leukemia. Another drug candidate, tyrosine-kinase inhibitor AP2611, has shown anti-tumor activity in certain categories of patients with advanced non-small cell lung cancer.
Regeneron Pharmaceuticals surged, reflecting FDA approval of Eylea, the company’s treatment for wet, age-related macular degeneration (AMD), a leading cause of blindness in the elderly. Eylea is being studied for other eye disorders, including central retinal vein occlusion, diabetic macular edema, and myopic choroidal neovascularization.
In health care providers and services, Amerigroup Corp. climbed on news of its acquisition by health insurer WellPoint, Inc. Amerigroup focuses on serving people who receive health care through publicly sponsored programs, such as Medicaid, Supplemental Security Income, and the State Children’s Health Insurance Program.
| | |
| | See explanation of symbol and benchmark definitions on A-56 through A-57 |
A-32
PACIFIC SELECT FUND PERFORMANCE DISCUSSION (Continued)
Key detractors from portfolio performance included biotechnology positions Elan Corp. P.L.C., Chelsea Therapeutics International, Inc. and Rigel Pharmaceuticals, Inc. Elan fell on disappointing results from late-stage clinical trials of bapineuzumab, an Alzheimer’s therapy the company is developing with Pfizer and Johnson & Johnson.
Chelsea Therapeutics International dropped on news that the FDA denied approval of Northera, a proposed treatment for neurogenic orthostatic hypotension, a chronic and potentially debilitating drop in blood pressure commonly associated with Parkinson’s disease. We eliminated the portfolio’s position in Chelsea before the FDA’s rejection of Northera on underlying weakness in the findings of an FDA panel that had recommended approval.
Rigel declined after data from a Phase II study of its lead drug, fostamatinib, called into question the drug’s efficacy as a monotherapy for rheumatoid arthritis. We eliminated the portfolio’s position in Rigel on the disappointing data.
Pharmaceutical holdings Corcept Therapeutics, Inc. and Shire P.L.C. also detracted from portfolio performance. Corcept fell on disappointing sales of Korlym, its drug for the treatment of Cushing’s syndrome. Korlym seeks to regulate release patterns of cortisol in patients with psychotic depression and Cushing’s syndrome, a hormone disorder caused by high levels of cortisol in the blood.
Specialty biopharmaceutical company, Shire, was hurt by uncertainties about its attention deficit/hyperactivity disorder (ADHD) franchise. In December, the company announced that its ADHD drug Elvanse (known as Vyvanse in the U.S.) received a positive opinion from the U.K.’s, Medicines and Healthcare Products Regulatory Agency (MHRA), which was acting on behalf of seven other European countries (Denmark, Finland, Germany, Ireland, Norway, Spain, and Sweden). We expect Elvanse to be launched mid-2013 in the European Union (E.U). The ADHD market has meaningful growth potential. Many of Shire’s other products, including Vpriv (for Gaucher disease), Intuniv (for ADHD), and Elaprase (for Hunter syndrome), are performing well.
Real Estate Portfolio (managed by Morgan Stanley Investment Management Inc.)
Q. How did the portfolio perform for the year ended December 31, 2012?
A. For the year ended December 31, 2012, the Real Estate Portfolio’s Class I returned 16.21%, compared to a 16.00% return for the broad-based S&P 500 Index and 18.06% for the FTSE NAREIT Equity REITs Index. The S&P 500 Index was added to compare performance of the portfolio against a large portion of the U.S. equities market.
The following graph compares the performance of a hypothetical $10,000 investment in Class I shares of the portfolio to its benchmark for the ten-year period ended December 31, 2012. For comparison purposes, the performance of Class P shares and its benchmark for the period from inception of Class P on May 2, 2011 through December 31, 2012 are also shown in the table below. The portfolio’s performance reflects reinvestments of all dividends and capital gains distributions, if any.
Performance Comparison

| | (1) | Morgan Stanley Investment Management Inc. manages the portfolio and used to do business in certain instances under the name Van Kampen, and managed the portfolio under the Van Kampen name from the portfolio’s inception until May 1, 2010. |
| | | | | | | | | | | | |
| Average Annual Total Returns for the periods ended December 31, 2012(1) | |
| | | 1 Year | | | 5 Years | | | 10 Years | |
| | | |
Portfolio’s Class I | | | 16.21% | | | | 5.03% | | | | 12.58% | |
S&P 500 Index | | | 16.00% | | | | 1.66% | | | | 7.10% | |
FTSE NAREIT Equity REITs Index | | | 18.06% | | | | 5.45% | | | | 11.63% | |
| | | 1 Year | | | Since
Inception
(5/2/11)~ | | | | |
| | | |
Portfolio’s Class P | | | 16.44% | | | | 6.24% | | | | | |
S&P 500 Index | | | 16.00% | | | | 5.08% | | | | | |
FTSE NAREIT Equity REITs Index | | | 18.06% | | | | 8.03% | | | | | |
Performance data quoted represents past performance. Investment return and principal value will fluctuate so that shares of the portfolio when redeemed may be worth more or less than their original cost. Past performance is not predictive of future performance. | |
Q. Discuss both positive and negative factors that materially affected the portfolio’s performance during the year, including relevant market conditions, investment strategies and techniques, and particular sectors or securities.
A. For the reporting period, the portfolio’s Class I outperformed the broad-based S&P 500 Index but underperformed the sector-specific FTSE NAREIT Equity REITs Index. During the reporting period, movements in REIT share prices appeared to have been largely influenced by transactional evidence in the private markets of strong investor demand for core assets at valuations that demonstrate the acceptance of low expected returns. REITs have also been impacted by the “risk-on/risk-off” gyrations of the broader equity markets which may have also been reflected in the S&P 500 Index. The Morgan Stanley portfolio management team has maintained its core investment philosophy as a real estate value investor. This results in the ownership of stocks whose share prices provide real estate exposure at what we believe to be the best valuation relative to their underlying asset values.
| | |
| | See explanation of symbol and benchmark definitions on A-56 through A-57 |
A-33
PACIFIC SELECT FUND PERFORMANCE DISCUSSION (Continued)
During the reporting period, bottom-up stock selection and top-down sector allocation detracted from the portfolio’s performance relative to the FTSE NAREIT Equity REITs Index. Cash held in the portfolio also detracted from its performance.
From a bottom-up perspective, the portfolio achieved favorable relative stock selection in the diversified and hotel sectors; however, this was off-set by relative losses from stock selection in the health care and central business district (CBD) office sectors. From a top-down perspective, the underweight to the specialty office sector contributed to the portfolio’s relative performance; however, this was offset by the overweight to the CBD office and apartment sectors, detracting from its relative performance.
We continue to focus on relative implied valuations as a key metric. Our company-specific research leads us to an overweighting in the portfolio to a group of companies that are focused in the ownership of upscale urban hotels, high quality malls, apartments, CBD office assets and a number of out-of-favor companies and an underweighting to companies concentrated in the ownership of health care, specialty office, storage and industrial assets.
Technology Portfolio (managed by Columbia Management Investment Advisers, LLC)
Q. How did the portfolio perform for the year ended December 31, 2012?
A. For the year ended December 31, 2012, the Technology Portfolio’s Class I returned 7.14%, compared to a 16.00% return for the S&P 500 Index and a 15.23% return for the S&P North American Technology Index.
The following graph compares the performance of a hypothetical $10,000 investment in Class I shares of the portfolio to its benchmark for the ten-year period ended December 31, 2012. For comparison purposes, the performance of Class P shares and its benchmark for the period from inception of Class P on May 2, 2011 through December 31, 2012 are also shown in the table below. The portfolio’s performance reflects reinvestments of all dividends and capital gains distributions, if any.
Performance Comparison

| | (1) | Columbia Management Investment Advisers, LLC began managing the portfolio on May 1, 2010, and some investment policies changed at that time. Other firms managed the portfolio before that date. |
| | | | | | | | | | | | |
| Average Annual Total Returns for the periods ended December 31, 2012(1) | |
| | | 1 Year | | | 5 Years | | | 10 Years | |
| | | |
Portfolio’s Class I | | | 7.14% | | | | -1.79% | | | | 8.26% | |
S&P 500 Index | | | 16.00% | | | | 1.66% | | | | 7.10% | |
S&P North American Technology Index | | | 15.23% | | | | 3.54% | | | | 9.40% | |
| | | 1 Year | | | Since
Inception
(5/2/11)~ | | | | |
| | | |
Portfolio’s Class P | | | 7.36% | | | | -2.14% | | | | | |
S&P 500 Index | | | 16.00% | | | | 5.08% | | | | | |
S&P North American Technology Index | | | 15.23% | | | | 3.72% | | | | | |
Performance data quoted represents past performance. Investment return and principal value will fluctuate so that shares of the portfolio when redeemed may be worth more or less than their original cost. Past performance is not predictive of future performance. | |
Q. Discuss both positive and negative factors that materially affected the portfolio’s performance during the year, including relevant market conditions, investment strategies and techniques, and particular sectors or securities.
A. For the reporting period, the portfolio’s Class I underperformed the broad-based S&P 500 Index, and also underperformed the sector-specific S&P North American Technology Index. We at Columbia seek long-term capital appreciation by constructing a conviction-weighted portfolio of technology and technology-related companies, as driven by rigorous bottom-up fundamental and valuation analysis.
Relative to the S&P 500 Index, an underweight to the financials, consumer discretionary and health care sectors detracted from the portfolio’s relative performance. The portfolio’s investments were concentrated in the technology sector, where poor stock selection and overweight postures to the semiconductor and software industries magnified the relative underperformance to the S&P 500 Index during the reporting period.
Relative to the S&P North American Technology Index, stock selection within the semiconductor, software, internet software & services and computer & peripheral industries detracted from portfolio performance as did an overweight relative to the semiconductor industry and a relative underweight in the internet software & services industry. A combination of industry allocation and stock selection accounted for the portfolio’s underperformance. Within semiconductors & semiconductor equipment, the portfolio was overweight relative to the S&P North American Technology Index, which hampered the portfolio’s performance returns as a significant slow-down in the PC market had an immediate impact on this industry. Positions in Advanced Micro Devices, Inc. and Marvell Technology Group, Ltd. detracted the most from the portfolio’s performance. Advanced Micro Devices shares declined as the company failed to execute on its product delivery plan. Marvell Technology, which had significant exposure to the hard-disc drive market, performed poorly as PC demand among consumers and businesses disappointed. On the positive side, the portfolio did well to avoid holding a position in Intel, as the industry bellwether performed poorly.
In the software industry, a position in entertainment data software company Rovi Corp. significantly detracted from the portfolio’s performance results. However, positions in software companies Synopsis and Symantec each added value to the portfolio, rebounding solidly from earlier
| | |
| | See explanation of symbol and benchmark definitions on A-56 through A-57 |
A-34
PACIFIC SELECT FUND PERFORMANCE DISCUSSION (Continued)
weakness. An underweight in internet software & services also hampered the portfolio’s relative performance results. The industry rose strongly in 2012, and valuation concerns relative to growth prospects led us to underweight the industry relative to the benchmark, which hurt the portfolio’s performance returns during the reporting period.
In computers & peripherals, the portfolio lost some ground by underweighting industry giant Apple, Inc., which generated strong gains for the reporting period. As part of our management team’s risk management strategy, we generally trim high conviction names as they grow beyond 8.00% of portfolio assets. NetApp, Inc., which manufactures storage arrays, detracted from portfolio performance results, as its product transition took longer than anticipated. A position in Dell, Inc. was hurt by the slowdown in the PC market even though the company has taken steps to diversify away from being solely a PC manufacturer. A decision to underweight Hewlett-Packard Co., which performed poorly in 2012, helped offset some of these losses.
Stock selection relative to the S&P North American Technology Index in the communications equipment industry helped the portfolio’s relative performance results most. The portfolio was overweight in QUALCOMM, Inc., which was a strong performer for the reporting period. In addition, the portfolio did not own certain benchmark stocks that lost competitive ground to Apple’s iPhone, benefiting the portfolio’s performance during the reporting period. Also, underweighting exposure to networking stocks, which were pressured by a slowdown in carrier spending, and to infrastructure stocks, helped the portfolio’s annual performance.
Looking ahead, the U.S. economy has shown modest improvement, and we believe that fiscal and monetary policy are likely to play a meaningful role in determining whether the current, fragile, economic recovery blossoms or continues to deliver uninspiring growth in 2013. We intend to adjust the portfolio’s exposure accordingly. We are optimistic that the PC supply chain has worked through its excess inventory and are hopeful that the worst is over for PC-related companies. We are still of the opinion that demand for computing is growing globally, and traditional PCs will remain a part of that landscape along with the fast-growing tablet and smart-phone categories. The portfolio remains overweight relative to the benchmark in the semiconductor industry. Given attractive valuations, investor apathy and positive semiconductor capital equipment trends, we are optimistic that the chip-related holdings in the portfolio may also be poised for better performance. Finally, we are constructive in our view toward an uptick in enterprise spending, as corporations invest in information technology in an effort to improve productivity. The key question that remains is the timing of such an upward turn.
Emerging Markets Portfolio (managed by OppenheimerFunds, Inc.)
Q. How did the portfolio perform for the year ended December 31, 2012?
A. For the year ended December 31, 2012, the Emerging Markets Portfolio’s Class I returned 21.52%, compared to a 18.22% return for its benchmark, the MSCI Emerging Markets Index.
The following graph compares the performance of a hypothetical $10,000 investment in Class I shares of the portfolio to its benchmark for the ten-year period ended December 31, 2012. For comparison purposes, the performance of Class P shares and its benchmark for the period from inception of Class P on May 2, 2011 through December 31, 2012 are also shown in the table below. The portfolio’s performance reflects reinvestments of all dividends and capital gains distributions, if any.
Performance Comparison
| | | | | | | | | | | | |
| Average Annual Total Returns for the periods ended December 31, 2012 | |
| | | 1 Year | | | 5 Years | | | 10 Years | |
| | | |
Portfolio’s Class I | | | 21.52% | | | | 4.13% | | | | 20.59% | |
MSCI Emerging Markets Index | | | 18.22% | | | | -0.92% | | | | 16.52% | |
| | | 1 Year | | | Since
Inception
(5/2/11)~ | | | | |
| | | |
Portfolio’s Class P | | | 21.77% | | | | -1.51% | | | | | |
MSCI Emerging Markets Index | | | 18.22% | | | | -5.09% | | | | | |
Performance data quoted represents past performance. Investment return and principal value will fluctuate so that shares of the portfolio when redeemed may be worth more or less than their original cost. Past performance is not predictive of future performance. | |
Q. Discuss both positive and negative factors that materially affected the portfolio’s performance during the year, including relevant market conditions, investment strategies and techniques, and particular sectors or securities.
A. For the reporting period, the portfolio’s Class I outperformed the benchmark. The portfolio’s outperformance of the benchmark was primarily due to strong, relative stock selection in the consumer staples, financials and consumer discretionary sectors. The portfolio underperformed primarily in the information technology sector as a result of weaker relative stock selection. Brazil, Turkey and Russia were top contributors to the portfolio’s performance while the U.K. and China were underperformers for the portfolio.
We at Oppenheimer use an investment approach designed to produce long-term growth with a degree of downside protection. The portfolio seeks to invest in high quality companies in emerging markets that it believes have meaningful and persistent competitive advantages. Our investments tend to be in companies that have low capital requirements and the potential to produce high returns on invested capital throughout the business cycle.
| | |
| | See explanation of symbol and benchmark definitions on A-56 through A-57 |
A-35
PACIFIC SELECT FUND PERFORMANCE DISCUSSION (Continued)
Top performing stocks contributing to portfolio performance for the reporting period included consumer staples stocks Magnit O.J.S.C. (Russia) and Fomento Economico Mexicano S.A.B. de CV (FEMSA (Mexico)); financials stocks Haci Omer Sabanci Holdings A.S. (Turkey) and SM Prime Holdings, Inc. (Philippines); and consumer discretionary stock, Prada S.P.A. (Italy).
Magnit O.J.S.C. is one of Russia’s largest food retailers, with nearly 5,000 retail outlets. During the reporting period, the company experienced increased sales, and its stock price exceeded its peak level from early 2011. FEMSA owns and operates OXXO, the largest convenience store chain in Latin America. FEMSA is also one of the largest, independent Coca-Cola bottlers in the world and holds a 20% stake in Heineken. The stock continued to perform well as sales increased across its businesses, most notably OXXO. Haci Omer Sabanci Holdings is the second largest conglomerate in Turkey, and it continued to post strong revenues from its different divisions and enjoyed healthy growth.
Prada is an Italian-based manufacturer of luxury leather goods and clothing for men and women. Particularly strong demand in Asia helped drive shares of Prada higher over the reporting period. SM Prime Holdings is the largest shopping mall and retail operator in the Philippines. The company continued to expand by opening new malls in the Philippines and China and benefited from organic growth in existing stores on robust consumer spending and strong economic fundamentals.
The top detractors from portfolio performance included information technology stocks Infosys Ltd. (India), Baidu, Inc. (China), and HTC Corp. (Taiwan); consumer discretionary stock New Oriental Education & Technology Group, Inc. (China); and energy stock BG Group P.L.C. (U.K.).
Infosys announced its revenue outlook faced challenges due to Hurricane Sandy in the U.S., delaying client orders. Additionally, it was negatively impacted by a recession in India and ongoing problems around the need for economic and political reform in that country. Baidu is a Chinese language internet search provider based in Beijing. Increasing regulations from the Chinese government made the market somewhat jittery about Chinese internet stocks, in addition to overall concerns about a moderating Chinese economy and Baidu’s trailing entrance into new application technologies.
New Oriental Education is a provider of private educational services in China. The company met with some challenges during the reporting period, and its stock price took a significant hit after it disclosed that the SEC was looking into the company’s accounting practices, attributing the probe to a recent consolidation of one of its entities into a wholly-owned subsidiary.
HTC is the designer and manufacturer of Android phones. HTC’s stock performance declined during the reporting period amid fiercer competition from Apple and Samsung, driving down HTC’s earnings. Shares of BG Group declined in part due to lower oil prices and some internal management restructurings which gave the market pause. Another detractor from portfolio performance was Anglo American Platinum Ltd. (U.K.) as its stock declined after downgrades were issued that cited production issues across a few of its business, strikes at its South African mines and issues in its copper unit.
At the reporting period end, the portfolio had its most significant overweight positions relative to the benchmark in the consumer staples, consumer discretionary and information technology sectors and its largest underweights in materials, financials, utilities, telecommunication services, energy and industrials.
We remain optimistic regarding the emerging markets and the portfolio despite short-term volatility. The developed world continues to have many unresolved structural problems. It is our opinion that the emerging markets will remain the engines of global growth with the sizable majority of global growth coming out of them. The hyper-normal growth that came out of the economic crisis, we believe, will be replaced by more sustainable, albeit slower growth. We currently see valuations in emerging markets, presenting us with some potentially attractive opportunities.
International Large-Cap Portfolio (managed by MFS Investment Management)
Q. How did the portfolio perform for the year ended December 31, 2012?
A. For the year ended December 31, 2012, the International Large-Cap Portfolio’s Class I returned 22.53%, compared to a 17.32% return for its benchmark, the MSCI EAFE Index.
| | |
| | See explanation of symbol and benchmark definitions on A-56 through A-57 |
A-36
PACIFIC SELECT FUND PERFORMANCE DISCUSSION (Continued)
The following graph compares the performance of a hypothetical $10,000 investment in Class I shares of the portfolio to its benchmark for the ten-year period ended December 31, 2012. For comparison purposes, the performance of Class P shares and its benchmark for the period from inception of Class P on May 2, 2011 through December 31, 2012 are also shown in the table below. The portfolio’s performance reflects reinvestments of all dividends and capital gains distributions, if any.
Performance Comparison

| | (1) | MFS Investment Management began managing the portfolio on January 1, 2004. Another firm managed the portfolio before that date. |
| | | | | | | | | | | | |
Average Annual Total Returns for the periods ended December 31, 2012(1) | |
| | | 1 Year | | | 5 Years | | | 10 Years | |
| | | |
Portfolio’s Class I | | | 22.53% | | | | 0.98% | | | | 9.78% | |
MSCI EAFE Index | | | 17.32% | | | | -3.69% | | | | 8.21% | |
| | | 1 Year | | | Since
Inception
(5/2/11)~ | | | | |
| | | |
Portfolio’s Class P | | | 22.78% | | | | -0.15% | | | | | |
MSCI EAFE Index | | | 17.32% | | | | -3.59% | | | | | |
Performance data quoted represents past performance. Investment return and principal value will fluctuate so that shares of the portfolio when redeemed may be worth more or less than their original cost. Past performance is not predictive of future performance. | |
Q. Discuss both positive and negative factors that materially affected the portfolio’s performance during the year, including relevant market conditions, investment strategies and techniques, and particular sectors or securities.
A. For the reporting period, the portfolio’s Class I outperformed the benchmark. We at MFS use a bottom-up investment style, involving the research of the fundamentals of each individual opportunity and analyzing certain aspects of a company such as earnings, cash flows, growth potential and management abilities. Stock selection in the consumer staples sector was a primary driver of the portfolio’s performance relative to the benchmark. A key factor for positive relative results within this sector was the portfolio’s holdings of Dutch brewer Heineken N.V. (Netherlands) and skin and beauty care products maker Beiersdorf A.G. (Germany), both of which outperformed the benchmark during the reporting period.
Stock selection in the health care sector was another positive factor for the portfolio’s relative performance. The portfolio’s ownership in shares of strong-performing health care products maker Bayer A.G. (Germany) benefited relative performance results. Stock selection in the basic materials sector also boosted the portfolio’s relative returns. However, there were no individual stocks within this sector that were among the portfolio’s top relative contributors to its performance. Stock selection in the special products & services sector also bolstered relative performance. Holdings of provider Amadeus IT Holding S.A. (Spain), a leading provider of internet technology to the global tourism and travel industry, benefited the portfolio’s relative returns as the stock posted strong performance for the reporting period.
The portfolio’s holdings of banking firm ICICI Bank Ltd. (India), French electrical distribution equipment manufacturer Schneider Electric S.A., business software developer SAP A.G. (Germany), financial services firm HSBC Holdings P.L.C. (U.K.), advertising and marketing firm WPP P.L.C. (U.K.) and South Korean microchip and electronics manufacturer Samsung Electronics Co. Ltd. boosted the portfolio’s relative results as all six stocks outperformed the benchmark.
During the reporting period, the portfolio’s currency exposure contributed to its relative performance. All of MFS’ investment decisions are driven by the fundamentals of each individual opportunity and as such, it is common for our portfolios to have different currency exposure than the benchmark.
Stock selection in the financial services sector detracted from relative performance. The portfolio’s holdings of wealth management firm Julius Baer Group Ltd. (Switzerland) and Australian insurance company QBE Insurance Group Ltd. were among the portfolio’s top relative detractors. Holdings of weak-performing oil and gas exploration company INPEX Corp. (Japan), telecommunication services provider China Unicom Ltd. (Hong Kong), printers and computer peripherals maker Canon, Inc. (Japan), telecommunication services firm TIM Participacoes S.A. (Brazil), imaging, health care, and medical products manufacturer Hoya Corp. (Japan), and Israeli-headquartered security software provider Check Point Software Technologies Ltd. all held back the portfolio’s relative performance. The portfolio’s timing in the ownership of supermarkets and convenient stores operator Tesco Corp. (U.K.), also negatively impacted its relative results.
International Small-Cap Portfolio (managed by Batterymarch Financial Management, Inc.)
Q. How did the portfolio perform for the year ended December 31, 2012?
A. For the year ended December 31, 2012, the International Small-Cap Portfolio’s Class I returned 19.44%, compared to a 18.55% return for its benchmark, the S&P Developed Ex-U.S. SmallCap Index.
| | |
| | See explanation of symbol and benchmark definitions on A-56 through A-57 |
A-37
PACIFIC SELECT FUND PERFORMANCE DISCUSSION (Continued)
The following graph compares the performance of a hypothetical $10,000 investment in Class I shares of the portfolio to its benchmark for the period from inception on May 1, 2006 through December 31, 2012. For comparison purposes, the performance of Class P shares and its benchmark for the period from inception of Class P on May 2, 2011 through December 31, 2012 are also shown in the table below. The portfolio’s performance reflects reinvestments of all dividends and capital gains distributions, if any.
Performance Comparison
| | | | | | | | | | | | |
Average Annual Total Returns for the periods ended December 31, 2012 | |
| | | 1 Year | | | 5 Years | | | Since Inception (5/1/06) | |
| | | |
Portfolio’s Class I | | | 19.44% | | | | -2.32% | | | | -0.61% | |
S&P Developed Ex-U.S. SmallCap Index | | | 18.55% | | | | -1.26% | | | | 1.52% | |
| | | 1 Year | | | Since
Inception
(5/2/11)~ | | | | |
| | | |
Portfolio’s Class P | | | 19.68% | | | | -2.82% | | | | | |
S&P Developed Ex-U.S. SmallCap Index | | | 18.55% | | | | -4.82% | | | | | |
Performance data quoted represents past performance. Investment return and principal value will fluctuate so that shares of the portfolio when redeemed may be worth more or less than their original cost. Past performance is not predictive of future performance. | |
Q. Discuss both positive and negative factors that materially affected the portfolio’s performance during the year, including relevant market conditions, investment strategies and techniques, and particular sectors or securities.
A. For the reporting period, the portfolio’s Class I outperformed the benchmark. We at Batterymarch maintain a well-diversified, style-neutral portfolio with modest region and sector allocations versus the benchmark through the combination of portfolio construction rules and sector ranks. The portfolio continues to invest in excess of 100 companies and generally expects to invest a significant amount of its assets in about the same number of non-U.S. countries as the benchmark.
Stock selection benefited the portfolio during the reporting period. Positive stock selection results were largely driven by selection in continental Europe. Stock selection in the industrials, financials and information technology sectors was especially strong benefiting the portfolio’s performance. Stock selection also added significantly to the portfolio’s relative performance return in South Korea.
At the security level, an overweight to German-based Duerr A.G. was the leading contributor to the portfolio’s performance. Duerr A.G. is a holding company that provides equipment, services and systems primarily for the automobile and aircraft industries and reported strong sales revenues in 2012. Overweight to Aberdeen Asset Management P.L.C. in the U.K. and OC Oerlikon Corp. A.G. in Switzerland also contributed positively to portfolio performance.
The impact of region and sector allocation was essentially neutral before the impact of cash, which detracted from portfolio performance in a positive return environment. The advantage of an underweight in the commodity-sensitive countries of Australia, New Zealand and Canada was offset by an overweight to Japan, which underperformed the benchmark for the reporting period.
Stock selection in Japan was the biggest detractor from portfolio relative performance, especially in the consumer discretionary, financials ex-banks and industrials sectors. Stock selection was also difficult in U.K industrials. At the stock level, the three primary detractors were in the Australia, New Zealand and Canada region, specifically overweights to Poseidon Concepts Corp. (hurt by slowing growth and high levels of accounts receivables that may need to be written-off), Iluka Resources Ltd. (a non-benchmark position that had previously been a major contributor) and Emeco Holdings Ltd. All had negative, double-digit returns for the portion of the year held in the portfolio.
The portfolio has a conservative currency hedging strategy designed to protect the underlying value of equity investments. We may hedge major currencies (yen, euro and British pound) to the U.S. dollar, up to 15% of the underlying portfolio. At times during the reporting period, the portfolio held small, model-driven currency hedges on exposures to all three currencies. A hedge on the yen initiated in December was still in place as of the end of the reporting period. The total impact of these derivative positions on the portfolio’s performance for the reporting period was a modest gain (both realized and unrealized).
International Value Portfolio (managed by J.P. Morgan Investment Management Inc.)
Q. How did the portfolio perform for the year ended December 31, 2012?
A. For the year ended December 31, 2012, the International Value Portfolio’s Class I returned 17.82%, compared to a 17.32% return for its benchmark, the MSCI EAFE Index.
| | |
| | See explanation of symbol and benchmark definitions on A-56 through A-57 |
A-38
PACIFIC SELECT FUND PERFORMANCE DISCUSSION (Continued)
The following graph compares the performance of a hypothetical $10,000 investment in Class I shares of the portfolio to its benchmark for the ten-year period ended December 31, 2012. For comparison purposes, the performance of Class P shares and its benchmark for the period from inception of Class P on May 2, 2011 through December 31, 2012 are also shown in the table below. The portfolio’s performance reflects reinvestments of all dividends and capital gains distributions, if any.
Performance Comparison
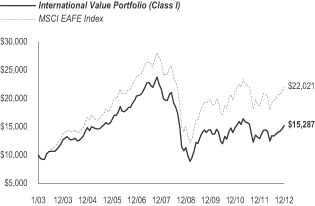
| | (1) | J.P. Morgan Investment Management Inc. began managing the portfolio on January 1, 2011, and some investment policies changed at that time. Other firms managed the portfolio before that date. |
| | | | | | | | | | | | |
Average Annual Total Returns for the periods ended December 31, 2012(1) | |
| | | 1 Year | | | 5 Years | | | 10 Years | |
| | | |
Portfolio’s Class I | | | 17.82% | | | | -6.79% | | | | 4.34% | |
MSCI EAFE Index | | | 17.32% | | | | -3.69% | | | | 8.21% | |
| | | 1 Year | | | Since
Inception
(5/2/11)~ | | | | |
| | | |
Portfolio’s Class P | | | 18.05% | | | | -4.09% | | | | | |
MSCI EAFE Index | | | 17.32% | | | | -3.59% | | | | | |
Performance data quoted represents past performance. Investment return and principal value will fluctuate so that shares of the portfolio when redeemed may be worth more or less than their original cost. Past performance is not predictive of future performance. | |
Q. Discuss both positive and negative factors that materially affected the portfolio’s performance during the year, including relevant market conditions, investment strategies and techniques, and particular sectors or securities.
A. For the reporting period, the portfolio’s Class I outperformed the benchmark. We at J.P. Morgan maintain a transparent and uniform investment philosophy which drives all in-house research efforts and all investment decisions. We seek to add value to clients’ portfolios by capitalizing on mis-valuations that arise within and across the world’s equity markets. We do this by investing in undervalued securities, as identified by in-house valuation tools and research analysts. Our process is dominated by bottom-up stock selection.
Stock selection in aggregate, added value, underpinned by strong showings in basic industries, health care, insurance and technology semi-conductors. Sector allocation, however, was a major detractor from portfolio performance. The portfolio was underweight in property (the best-performing sector for the year) and overweight in weaker sectors like telecommunication services, utilities and technology hardware. Stock selection in banks/capital markets also detracted from the portfolio’s relative returns. Regionally, stock selection in Japan and an underweight to the Pacific Rim weighed on its returns, while stock selection in the U.K. and exposure to the emerging markets contributed.
At the stock level, Vodafone Group P.LC., the U.K. telecommunication services provider, detracted from portfolio performance during the reporting period. Service sales (excluding the impact of acquisitions and currency movements) fell during the second quarter of the reporting period, the first decline in over two years. At the same time, the company took a write-down on its Spanish and Italian operations, which resulted in a loss for the fiscal first-half, versus a profit the year before. Despite the setback, the company expects operating profits for the full year to be at the upper-half of the projected range, primarily due to cost cutting. Management also announced it would initiate a share buyback program utilizing the dividends it receives from its ownership in Verizon Wireless Communications, Inc., which announced it would distribute dividends to its owners.
On the upside, Volkswagen A.G., the German automaker, was a strong performer, contributing to portfolio performance. Despite an uncertain economic environment, the company stuck by its sales and growth targets for the year, underscoring its strength relative to other regional competitors. By relying on growth in the U.S. and China and expanding its Audi brand, Volkswagen has avoided much of the five-year contraction that has plagued other European automakers. Operating profits at the company declined year-over-year in the third quarter but were somewhat in-line with Wall Street estimates. Sales were up for the reporting period. Volkswagen still plans to “match” last year’s operating income.
Currency Strategies Portfolio (managed by UBS Global Asset Management (Americas) Inc.)
Q. How did the portfolio perform for the period ended December 31, 2012?
A. The portfolio commenced operations on September 28, 2012. For the period from inception through December 31, 2012, the Currency Strategies Portfolio’s Class I returned -1.14%, compared to a 0.02% return for its benchmark, the Citigroup 1-Month U.S. T-Bill Index.
| | |
| | See explanation of symbol and benchmark definitions on A-56 through A-57 |
A-39
PACIFIC SELECT FUND PERFORMANCE DISCUSSION (Continued)
The following graph compares the performance of a hypothetical $10,000 investment in Class I shares of the portfolio to its benchmark for the period from inception on September 28, 2012 through December 31, 2012. For comparison purposes, the performance of Class P shares and its benchmark for the period from inception of Class P on September 28, 2012 through December 31, 2012 are also shown in the table below. The portfolio’s performance reflects reinvestments of all dividends and capital gains distributions, if any.
Performance Comparison
| | | | |
Total Returns for the period from Inception through December 31, 2012 | |
| | | Since
Inception
(9/28/12)~ | |
| |
Portfolio’s Class I | | | -1.14% | |
Citigroup 1-Month U.S. T-Bill Index | | | 0.02% | |
| |
| | | | |
| |
Portfolio’s Class P | | | -1.09% | |
Citigroup 1-Month U.S. T-Bill Index | | | 0.02% | |
Performance data quoted represents past performance. Investment return and principal value will fluctuate so that shares of the portfolio when redeemed may be worth more or less than their original cost. Past performance is not predictive of future performance. | |
Q. Discuss both positive and negative factors that materially affected the portfolio’s performance during the period, including relevant market conditions, investment strategies and techniques, and particular sectors or securities.
A. For the period since inception through December 31, 2012, the portfolio’s Class I underperformed the benchmark. Under normal market conditions, this portfolio invests in derivatives and high-quality debt securities to establish exposures to global currencies. We at UBS seek to gain positive exposures to currencies that we believe are undervalued and negative exposure to currencies that are believed to be overvalued.
For the reporting period, derivatives, including non-deliverable forwards, had a negative impact on the portfolio’s performance. Over the fourth quarter, commodities prices broadly decreased. Historically, the Australian dollar and New Zealand dollar have shown a positive correlation with commodity prices, so the fundamental mis-pricing of these currencies appears to have increased. We believe this enhances the attractiveness of short exposure to these currencies; however, due to the “risk-on” nature of the markets in the fourth quarter, higher-risk currencies rallied, causing the Australian dollar and New Zealand dollar short positions to negatively impact the portfolio’s performance.
In emerging markets, the portfolio was long the Korean won and the Malaysian ringgit, which were underpinned by relatively strong economic growth, healthy trades and net, international lending positions. The portfolio is also long the Mexican peso, which is attractive on a valuation basis and had an attractive level of inflation-adjusted interest rates relative to other currencies. Our positioning in “risk-on” emerging markets currencies is further supported by stronger data releases from both the U.S. and China. During the reporting period, these positions positively impacted the portfolio’s performance. As noted earlier in this discussion, the “risk-on” environment was beneficial for higher-risk currencies such as the emerging markets currencies held in the portfolio.
In the longer-term, we expect to remain long the U.S. dollar which appears undervalued on a trade-weighted basis. We also expect that the U.S. economy will outperform, aided by a rebound in the housing market and moves towards greater energy self-sufficiency. In addition, the U.S. economy appears to be further along in the deleveraging cycle than many other major economies. U.S. dollar positioning was positive for the reporting period. Additionally, as the tail risk of a eurozone break-up appears to have almost wholly diminished, we maintain an overall long position in the euro. This position benefited the portfolio during the reporting period.
Global Absolute Return Portfolio (managed by Eaton Vance Management)
Q. How did the portfolio perform for the period ended December 31, 2012?
A. The portfolio commenced operations on September 28, 2012. For the period from inception through December 31, 2012, the Global Absolute Return Portfolio’s Class I returned -0.20%, compared to a 0.04% return for its benchmark, the BofA Merrill Lynch U.S. 3-Month T-Bill Index.
| | |
| | See explanation of symbol and benchmark definitions on A-56 through A-57 |
A-40
PACIFIC SELECT FUND PERFORMANCE DISCUSSION (Continued)
The following graph compares the performance of a hypothetical $10,000 investment in Class I shares of the portfolio to its benchmark for the period from inception on September 28, 2012 through December 31, 2012. For comparison purposes, the performance of Class P shares and its benchmark for the period from inception of Class P on September 28, 2012 through December 31, 2012 are also shown in the table below. The portfolio’s performance reflects reinvestments of all dividends and capital gains distributions, if any.
Performance Comparison
| | | | |
Total Returns for the period from Inception through December 31, 2012 | |
| | | Since
Inception
(9/28/12)~ | |
| |
Portfolio’s Class I | | | -0.20% | |
BofA Merrill Lynch U.S. 3-Month T-Bill Index | | | 0.04% | |
| |
| | | | |
| |
Portfolio’s Class P | | | -0.15% | |
BofA Merrill Lynch U.S. 3-Month T-Bill Index | | | 0.04% | |
Performance data quoted represents past performance. Investment return and principal value will fluctuate so that shares of the portfolio when redeemed may be worth more or less than their original cost. Past performance is not predictive of future performance. | |
Q. Discuss both positive and negative factors that materially affected the portfolio’s performance during the period, including relevant market conditions, investment strategies and techniques, and particular sectors or securities.
A. For the period since inception through December 31, 2012, the portfolio’s Class I underperformed the benchmark. Eaton Vance invests the portfolio in securities, derivatives and other instruments to establish long and short investment exposures around the world, typically seeking to establish such investment exposures to individual countries based on management’s view of the investment merits of a country. The portfolio normally invests in multiple countries and may have significant exposure to foreign currencies.
In Latin America, the portfolio’s long position in currencies detracted from its performance, and credit positions, both long and short, reduced portfolio performance returns as well. Drilling down into specific countries in the region, long dollar credit positions in Argentina detracted from portfolio returns. The risk of a technical default greatly increased during the fourth quarter following a surprise U.S. court ruling that will attempt to force payment to creditors still holding debt on which the country defaulted in 2001.
In Asia, many of the portfolio’s long and short positions contributed positively to the portfolio’s performance, although gains were tempered by hedging positions in credit. In the Middle East and Africa, currency long and short positions were additive to portfolio performance returns. The portfolio’s short position in the Japanese yen had a positive impact on its performance as the new administration is expected to push for a much more accommodative monetary policy from the Bank of Japan. A long position in the Indian rupee generated negative performance returns for the portfolio during the reporting period as reform announcement momentum stalled, and poor economic data resulted in losses after a large rally in the third quarter.
Short credit positions in Western Europe were detrimental to the portfolio’s performance returns, while long currency and credit positions in Eastern Europe generated positive performance returns for the portfolio. The portfolio’s short positions in French and Spanish credit produced negative performance returns amid heightened volatility across the eurozone. Technical factors are pushing French yields lower, while markets expect Spain to receive a bailout.
Facing slowing economic growth, the National Bank of Poland cut rates twice during the period, which aided a long position in Polish rates, benefiting the portfolio.
Precious Metals Portfolio (managed by Wells Capital Management Incorporated)
Q. How did the portfolio perform for the period ended December 31, 2012?
A. The portfolio commenced operations on September 28, 2012. For the period from inception through December 31, 2012, the Precious Metals Portfolio’s Class I returned -14.01%, compared to a -14.51% return for its benchmark, the FTSE Gold Mines Index.
| | |
| | See explanation of symbol and benchmark definitions on A-56 through A-57 |
A-41
PACIFIC SELECT FUND PERFORMANCE DISCUSSION (Continued)
The following graph compares the performance of a hypothetical $10,000 investment in Class I shares of the portfolio to its benchmark for the period from inception on September 28, 2012 through December 31, 2012. For comparison purposes, the performance of Class P shares and its benchmark for the period from inception of Class P on September 28, 2012 through December 31, 2012 are also shown in the table below. The portfolio’s performance reflects reinvestments of all dividends and capital gains distributions, if any.
Performance Comparison
| | | | |
Total Returns for the period from Inception through December 31, 2012 | |
| | | Since
Inception
(9/28/12)~ | |
| |
Portfolio’s Class I | | | -14.01% | |
FTSE Gold Mines Index | | | -14.51% | |
| |
| | | | |
| |
Portfolio’s Class P | | | -13.96% | |
FTSE Gold Mines Index | | | -14.51% | |
Performance data quoted represents past performance. Investment return and principal value will fluctuate so that shares of the portfolio when redeemed may be worth more or less than their original cost. Past performance is not predictive of future performance. | |
Q. Discuss both positive and negative factors that materially affected the portfolio’s performance during the period, including relevant market conditions, investment strategies and techniques, and particular sectors or securities.
A. For the period from inception through December 31, 2012, the portfolio’s Class I outperformed the benchmark. The Wells Capital portfolio management team invests in companies involved in the exploration, development, mining, processing, or dealing of gold, precious metals, and minerals, which tend to have a relatively high correlation to underlying commodity prices and relatively low correlation to the prices of other stocks and bonds. Wells Capital takes a disciplined approach to risk management through top-down analysis and bottom-up stock selection, while diversifying across market capitalizations, production profiles, and geographies and focusing on a long-term investment horizon, looking for companies that have lower-than-average cost structures, are well managed, and are likely to improve their relative values over time.
The portfolio benefited from holding relatively more cash than normal by buying shares into a declining gold market. The portfolio held approximately 7.4% of assets in cash on average throughout the reporting period, which outperformed the benchmark’s precious metals equity holdings and added to its relative performance. A greater exposure to smaller-capitalization stocks relative to the benchmark added to the portfolio’s returns. However, several large-capitalization mining companies, including Barrick Gold Corp. and Newmont Mining Corp., reported disappointing third quarter results because of rising production costs and company-specific issues, dragging down portfolio performance.
Franco Nevada and Fresnillo P.L.C., which together comprise nearly 5% of the portfolio, were important contributors to the portfolio’s performance. Franco Nevada reported better-than-expected third quarter earnings along with a dividend hike which supported the stock price. We like the company’s collection of royalties in politically stable geographies, strong management team and cash-rich balance sheet. Silver miner Fresnillo also reported strong third quarter earnings. We believe Fresnillo is well positioned as the low-cost silver producer and could appreciate on better relative silver performance. In addition, exploration and development company Queenston Mining, Inc., contributed to the portfolio’s performance results as it was the subject of a takeover offer. Torex Gold Resources, Inc. outperformed on the news that a $380 million financing project to build its Morelos Mine in Mexico was successful. We believe this helped to reduce investor fears that they wouldn’t be able to secure financing.
IAMGOLD Corp. was the most significant detractor from the portfolio’s performance during the reporting period as the stock underperformed when the company announced that 2013 gold production would be lower-than-expected. The shortfall was the result of an unexpected delay in the commissioning of its new Westwood Mine. Also detracting from portfolio performance during the reporting period was gold mining holding Randgold Resources Ltd. The stock’s decline reflected, in part, a pullback from a 37% gain in the third quarter of 2012 as well as production results and company guidance that were below analysts’ expectations. We still believe in Randgold due to its solid production track record, expertise in mine design, and financial discipline.
We maintained a geographic underweight to South Africa due to the country’s long-standing trend of high and increasing labor costs. That positioning detracted from the portfolio’s relative results during the reporting period as South African miners rebounded from previous weakness. Earlier in 2012, South African mining companies suffered from a series of violent strikes that disrupted operations and pressured their stock prices. The companies were able to settle the strikes, largely by raising wages, and we believe that South African mining stocks outperformed during the reporting period as a result. Our long-term view on these stocks remains unchanged.
American Funds Asset Allocation Portfolio (Capital Research and Management Company manages the Master Asset Allocation Fund)
Q. How did the portfolio perform for the year ended December 31, 2012?
A. For the year ended December 31, 2012, the American Funds Asset Allocation Portfolio’s Class I returned 15.72%, compared to a 16.00% return for its benchmark, the S&P 500 Index and a 4.21% for the Barclays U.S. Aggregate Bond Index. The American Funds Asset Allocation Portfolio (Feeder Asset Allocation Portfolio) invests all of its assets in Class 1 shares of the Asset Allocation Fund, a series of the American Funds
| | |
| | See explanation of symbol and benchmark definitions on A-56 through A-57 |
A-42
PACIFIC SELECT FUND PERFORMANCE DISCUSSION (Continued)
Insurance Series®, a registered open-end investment company (Master Asset Allocation Fund). The Master Asset Allocation Fund returned 16.44% for the same period. The performance for the Feeder Asset Allocation Portfolio was lower than the Master Asset Allocation Fund due to expenses incurred by the Feeder Asset Allocation Portfolio.
The following graph compares the performance of a hypothetical $10,000 investment in Class I shares of the portfolio to its benchmark for the period from inception on February 2, 2009 through December 31, 2012. The portfolio’s performance reflects reinvestments of all dividends and capital gains distributions, if any.
Performance Comparison
| | | | | | | | |
Average Annual Total Returns for the periods ended December 31, 2012 | |
| | | 1 Year | | | Since
Inception
(2/2/09)~ | |
| | |
Portfolio’s Class I | | | 15.72% | | | | 14.49% | |
S&P 500 Index | | | 16.00% | | | | 17.53% | |
Barclays U.S. Aggregate Bond Index | | | 4.21% | | | | 6.50% | |
Performance data quoted represents past performance. Investment return and principal value will fluctuate so that shares of the portfolio when redeemed may be worth more or less than their original cost. Past performance is not predictive of future performance. | |
Q. Discuss both positive and negative factors that materially affected the portfolio’s performance during the year, including relevant market conditions, investment strategies and techniques, and particular sectors or securities.
A. The discussion that follows relates to the master fund. For the reporting period, the portfolio’s Class I underperformed the S&P 500 Index but outperformed the Barclays U.S. Aggregate Bond Index. The Master Asset Allocation Fund (the “fund”) invests in a diversified portfolio of common stocks and other equity securities, bonds and other intermediate and long-term debt securities, and money market instruments (debt securities maturing in one year or less). After a strong start to the year, U.S. stocks faltered in April and May before a mid-year rally that continued until October when investors lost patience with the fiscal cliff negotiations.
Holdings in eight of the fund’s ten industry sectors recorded double-digit gains for the year. Better U.S. housing data, stronger auto sales and rising consumer confidence lifted stocks in the consumer discretionary sector, which had the fund’s best returns. Media, specialty retail and auto companies were the sector’s major contributors. The financials sector also provided strong results, while the fund’s second-smallest sector, utilities, detracted from performance.
The fund’s holdings outside the U.S. were generally positive—the Netherlands, South Korea, France and South Africa had the most positive impact to performance.
During the reporting period, Capital Research’s portfolio counselors continued to emphasize investments in stocks, which accounted for approximately 70% of the fund’s net assets at the end of the reporting period.
Pacific Dynamix Portfolios
The Pacific Dynamix-Conservative Growth, Pacific Dynamix-Moderate Growth and Pacific Dynamix-Growth Portfolios each invest its assets in the Pacific Dynamix Underlying Portfolios to achieve a specified risk target.
Performance
Since the performance of each Pacific Dynamix Portfolio is a composite of the performance of each of the Pacific Dynamix Underlying Portfolios in which it invests (which may include bonds and domestic and/or international equities), there is no one, broad-based industry index to use as a comparison to a Pacific Dynamix Portfolio’s performance. Therefore, we at PLFA have provided information regarding three broad-based indices to use as a comparison to each Pacific Dynamix Portfolio’s performance. In addition, to assist in performance comparisons, composite benchmarks were constructed for each Pacific Dynamix Portfolio; each is comprised of the three broad-based indices shown below. The composite benchmarks were constructed with allocations to each asset class that correspond to the allocations for the Pacific Dynamix Portfolios that were in effect at that time. However, the actual allocation of any Pacific Dynamix Portfolio will naturally vary as a result of market performance over time. The performance for these broad-based indices for the year ended December 31, 2012 is shown in the following table:
| | | | |
Broad-Based Indices | | | |
S&P 500 Index (U.S. Stocks) | | | 16.00% | |
MSCI World ex USA Index (International Stocks) | | | 16.41% | |
Barclays U.S. Aggregate Bond Index (Fixed Income) | | | 4.21% | |
| | |
| | See explanation of symbol and benchmark definitions on A-56 through A-57 |
A-43
PACIFIC SELECT FUND PERFORMANCE DISCUSSION (Continued)
It should be noted that the benchmark indices for the Pacific Dynamix Underlying Portfolios may differ from the Pacific Dynamix Portfolios’ broad-based indices. The following investments comprise the Pacific Dynamix Underlying Portfolios for the Pacific Dynamix Portfolios. Not all of the Pacific Dynamix Underlying Portfolios were represented in each of the Pacific Dynamix Portfolio models during the reporting period, and the allocation of each of the Pacific Dynamix Underlying Portfolios within the Pacific Dynamix Portfolio models did vary. The Pacific Dynamix Underlying Portfolios’ one-year performance for the year ended December 31, 2012 listed below is net of portfolio expenses.
| | | | |
Pacific Dynamix Underlying Portfolios | | | |
PD Aggregate Bond Index ‘P’ | | | 3.94% | |
PD High Yield Bond Market ‘P’ | | | 14.91% | |
PD Large-Cap Growth Index ‘P’ | | | 15.02% | |
PD Large-Cap Value Index ‘P’ | | | 17.17% | |
PD Small-Cap Growth Index ‘P’ | | | 14.30% | |
PD Small-Cap Value Index ‘P’ | | | 17.62% | |
PD Emerging Markets ‘P’ | | | 17.42% | |
PD International Large-Cap ‘P’ | | | 17.12% | |
Pacific Dynamix-Conservative Growth Portfolio (managed by Pacific Life Fund Advisors LLC)
Q. How did the portfolio perform for the year ended December 31, 2012?
A. For the year ended December 31, 2012, the Pacific Dynamix-Conservative Growth Portfolio’s Class I returned 9.42%, compared to a 4.21% return for the Barclays U.S. Aggregate Bond Index, a 16.00% return for the S&P 500 Index, a 16.41% return for the MSCI World ex USA Index, and a 9.02% return for the Pacific Dynamix-Conservative Growth Composite Benchmark.
| | |
| | See explanation of symbol and benchmark definitions on A-56 through A-57 |
A-44
PACIFIC SELECT FUND PERFORMANCE DISCUSSION (Continued)
The following graph compares the performance of a hypothetical $10,000 investment in Class I shares of the portfolio to its benchmark for the period from inception on May 1, 2009 through December 31, 2012. The portfolio’s performance reflects reinvestments of all dividends and capital gains distributions, if any.
Performance Comparison

| | | | | | | | |
Average Annual Total Returns for the periods ended December 31, 2012 | |
| | | 1 Year | | | Since
Inception
(5/1/09) | |
| | |
Portfolio’s Class I | | | 9.42% | | | | 10.00% | |
Barclays U.S. Aggregate Bond Index | | | 4.21% | | | | 6.53% | |
S&P 500 Index | | | 16.00% | | | | 16.81% | |
MSCI World ex USA Index | | | 16.41% | | | | 12.05% | |
Pacific Dynamix-Conservative Growth Composite Benchmark | | | 9.02% | | | | 10.40% | |
| | | | |
Performance data quoted represents past performance. Investment return and principal value will fluctuate so that shares of the portfolio when redeemed may be worth more or less than their original cost. Past performance is not predictive of future performance. |
Q. Discuss both positive and negative factors that materially affected the portfolio’s performance during the year, including relevant market conditions, investment strategies and techniques, and particular sectors or securities.
A. The portfolio has just over half of its allocation in passively-managed, fixed income strategies. The remainder of the portfolio is allocated to four, passively-managed, domestic equity strategies and one, quantitatively-driven, international equity strategy. For the reporting period, the portfolio’s Class I returned 9.42% compared to 9.02% for the Pacific Dynamix-Conservative Growth Composite Benchmark. The riskier categories within each fixed income and domestic equity segment of the portfolio collectively detracted from its relative performance.
The fixed income segment of the portfolio outperformed the broad, fixed income benchmark. The allocation to the PD High Yield Bond Market Portfolio primarily contributed to the segment’s relative performance, whereas the PD Aggregate Bond Index Portfolio lagged the benchmark. The PD Aggregate Bond Index and PD High Yield Bond Market Portfolios seek to match the total returns of the Barclays U.S. Aggregate Bond and Barclays U.S. High-Yield 2% Issuer Capped Bond Indices, respectively.
As a group, the portfolio’s domestic equity segment outpaced the S&P 500 Index. Both the PD Large-Cap Value Index and PD Small-Cap Value Index Portfolios contributed to returns, as value styles benefited from the strong performance in the financials sector. The PD Large-Cap Growth Index and PD Small-Cap Growth Index Portfolios lagged behind the broad, equity market and detracted from performance. The domestic equity strategies generally seek to replicate the returns of their respective benchmarks. Specifically, the PD Large-Cap Growth Index and PD Large-Cap Value Index Portfolios attempt to mirror the Russell 1000 Growth and Russell 1000 Value Indices, respectively. The PD Small-Cap Growth Index and PD Small-Cap Value Index Portfolios generally seek to replicate the returns of the Russell 2000 Growth and Russell 2000 Value Indices, respectively.
| | |
| | See explanation of symbol and benchmark definitions on A-56 through A-57 |
A-45
PACIFIC SELECT FUND PERFORMANCE DISCUSSION (Continued)
The international segment of the portfolio outpaced the MSCI World ex U.S. Index. The PD International Large-Cap Portfolio has a value bias relative to the benchmark, which may have helped its performance. Similar to domestic equities, foreign value stocks outpaced their growth counterparts.
Pacific Dynamix-Moderate Growth Portfolio (managed by Pacific Life Fund Advisors LLC)
Q. How did the portfolio perform for the year ended December 31, 2012?
A. For the year ended December 31, 2012, the Pacific Dynamix-Moderate Growth Portfolio’s Class I returned 11.74%, compared to a 16.00% return for the S&P 500 Index, a 4.21% return for the Barclays U.S. Aggregate Bond Index, a 16.41% return for the MSCI World ex USA Index, and a 11.33% return for the Pacific Dynamix-Moderate Growth Composite Benchmark.
The following graph compares the performance of a hypothetical $10,000 investment in Class I shares of the portfolio to its benchmark for the period from inception on May 1, 2009 through December 31, 2012. The portfolio’s performance reflects reinvestments of all dividends and capital gains distributions, if any.
Performance Comparison
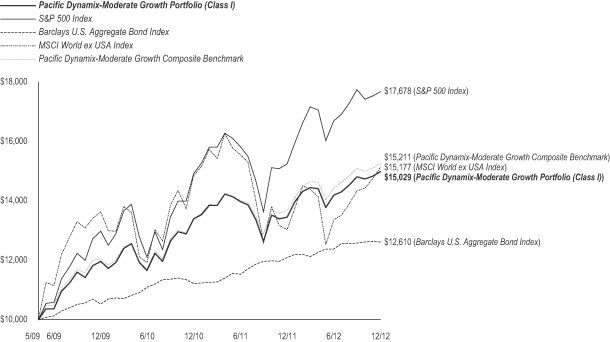
| | | | | | | | |
Average Annual Total Returns for the periods ended December 31, 2012 | |
| | | 1 Year | | | Since
Inception
(5/1/09) | |
| | |
Portfolio’s Class I | | | 11.74% | | | | 11.74% | |
S&P 500 Index | | | 16.00% | | | | 16.81% | |
Barclays U.S. Aggregate Bond Index | | | 4.21% | | | | 6.53% | |
MSCI World ex USA Index | | | 16.41% | | | | 12.05% | |
Pacific Dynamix-Moderate Growth
Composite Benchmark | | | 11.33% | | | | 12.12% | |
| | | | |
Performance data quoted represents past performance. Investment return and principal value will fluctuate so that shares of the portfolio when redeemed may be worth more or less than their original cost. Past performance is not predictive of future performance. |
Q. Discuss both positive and negative factors that materially affected the portfolio’s performance during the year, including relevant market conditions, investment strategies and techniques, and particular sectors or securities.
A. The portfolio has just under half of its allocation in passively-managed, fixed income strategies. The majority of the portfolio is allocated to four, passively-managed, domestic equity strategies and two, quantitatively-driven, international equity strategies. For the reporting period, the portfolio’s Class I returned 11.74% compared to 11.33% for the Pacific Dynamix-Moderate Growth Composite Benchmark. The riskier categories within each fixed-income and equity segment of the portfolio collectively detracted from its performance.
As a group, the portfolio’s domestic equity segment outpaced the S&P 500 Index. Both the PD Large-Cap Value Index and PD Small-Cap Value Index Portfolios contributed to returns, as value styles benefited from the strong performance in the financials sector. The PD Large-Cap Growth Index and PD Small-Cap Growth Index Portfolios lagged behind the broad, equity market and detracted from performance. The domestic
| | |
| | See explanation of symbol and benchmark definitions on A-56 through A-57 |
A-46
PACIFIC SELECT FUND PERFORMANCE DISCUSSION (Continued)
equity strategies generally seek to replicate the returns of their respective benchmarks. Specifically, the PD Large-Cap Growth Index and PD Large-Cap Value Index Portfolios attempt to mirror the Russell 1000 Growth and Russell 1000 Value Indices, respectively. The PD Small-Cap Growth Index and PD Small-Cap Value Index Portfolios generally seek to replicate the returns of the Russell 2000 Growth and Russell 2000 Value Indices, respectively.
The international segment of the portfolio outpaced the MSCI World ex USA Index. The PD International Large-Cap Portfolio has a value bias relative to the benchmark, which may have helped its performance. Similar to domestic equities, foreign value stocks outpaced their growth counterparts.
The fixed income segment of the portfolio outperformed the broad, fixed income benchmark. The allocation to the PD High Yield Bond Market Portfolio primarily contributed to the segment’s relative performance, whereas the PD Aggregate Bond Index Portfolio lagged the benchmark. The PD Aggregate Bond Index and PD High Yield Bond Market Portfolios seek to match the total returns of the Barclays U.S. Aggregate Bond and Barclays U.S. High-Yield 2% Issuer Capped Bond Indices, respectively.
Pacific Dynamix-Growth Portfolio (managed by Pacific Life Fund Advisors LLC)
Q. How did the portfolio perform for the year ended December 31, 2012?
A. For the year ended December 31, 2012, the Pacific Dynamix-Growth Portfolio’s Class I returned 13.76%, compared to a 16.00% return for the S&P 500 Index, a 16.41% return for the MSCI World ex USA Index, a 4.21% return for the Barclays U.S. Aggregate Bond Index, and a 13.91% return for the Pacific Dynamix-Growth Composite Benchmark.
The following graph compares the performance of a hypothetical $10,000 investment in Class I shares of the portfolio to its benchmark for the period from inception on May 1, 2009 through December 31, 2012. The portfolio’s performance reflects reinvestments of all dividends and capital gains distributions, if any.
Performance Comparison
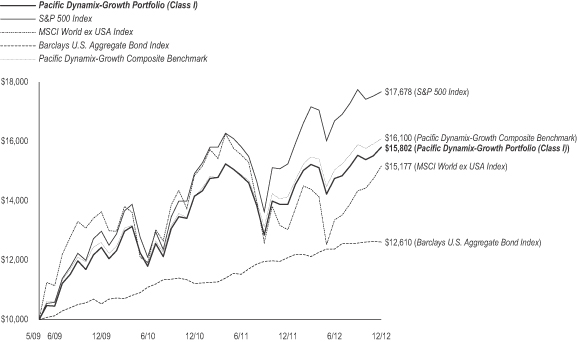
| | | | | | | | |
Average Annual Total Returns for the periods ended December 31, 2012 | |
| | | 1 Year | | | Since
Inception
(5/1/09) | |
| | |
Portfolio’s Class I | | | 13.76% | | | | 13.28% | |
S&P 500 Index | | | 16.00% | | | | 16.81% | |
MSCI World ex USA Index | | | 16.41% | | | | 12.05% | |
Barclays U.S. Aggregate Bond Index | | | 4.21% | | | | 6.53% | |
Pacific Dynamix-Growth Composite Benchmark | | | 13.91% | | | | 13.87% | |
| | | | |
Performance data quoted represents past performance. Investment return and principal value will fluctuate so that shares of the portfolio when redeemed may be worth more or less than their original cost. Past performance is not predictive of future performance. |
| | |
| | See explanation of symbol and benchmark definitions on A-56 through A-57 |
A-47
PACIFIC SELECT FUND PERFORMANCE DISCUSSION (Continued)
Q. Discuss both positive and negative factors that materially affected the portfolio’s performance during the year, including relevant market conditions, investment strategies and techniques, and particular sectors or securities.
A. The portfolio has a majority of its allocation in equity, including four, passively-managed, domestic equity portfolios and two, quantitatively-driven, international equity portfolios. The rest of the portfolio is invested in a passively-managed, fixed income portfolio. For the reporting period, the portfolio’s Class I returned 13.76% compared to 13.91% for the Pacific Dynamix-Growth Composite Benchmark. The riskier categories within the domestic and foreign equity segments of the portfolio detracted from its performance.
As a group, the portfolio’s domestic equity segment outpaced the S&P 500 Index. Both the PD Large-Cap Value Index and PD Small-Cap Value Index Portfolios contributed to returns, as value styles benefited from the strong performance in the financials sector. The PD Large-Cap Growth Index and PD Small-Cap Growth Index Portfolios lagged behind the broad, equity market and detracted from performance. The domestic equity strategies generally seek to replicate the returns of their respective benchmarks. Specifically, the PD Large-Cap Growth Index and PD Large-Cap Value Index Portfolios attempt to mirror the Russell 1000 Growth and Russell 1000 Value Indices, respectively. The PD Small-Cap Growth Index and PD Small-Cap Value Index Portfolios generally seek to replicate the returns of the Russell 2000 Growth and Russell 2000 Value Indices, respectively.
The international segment of the portfolio outpaced the MSCI World ex USA Index. The PD International Large-Cap Portfolio has a value bias relative to the benchmark, which may have helped its performance. Similar to domestic equities, foreign value stocks outpaced their growth counterparts.
The fixed income segment of the portfolio (i.e. PD Aggregate Bond Index Portfolio) underperformed the broad, fixed income benchmark. The PD Aggregate Bond Index Portfolio seeks to match the total returns of the Barclays U.S. Aggregate Bond Index.
Portfolio Optimization Portfolios
The Portfolio Optimization Conservative, Portfolio Optimization Moderate-Conservative, Portfolio Optimization Moderate, Portfolio Optimization Growth, and Portfolio Optimization Aggressive-Growth Portfolios are allocated amongst the Underlying Portfolios to achieve a specified risk target:
Performance
Since the performance of each Portfolio Optimization Portfolio is a composite of the performance of each of the Underlying Portfolios in which it invests (which may include bonds and domestic and/or international equities), there is no one, broad-based industry index to use as a comparison to a Portfolio Optimization Portfolio’s performance. Therefore, we at PLFA have provided information regarding three broad-based indices to use as a comparison to each Portfolio Optimization Portfolio’s performance. In addition, to assist in performance comparisons, composite benchmarks were constructed for each Portfolio Optimization Portfolio; each is comprised of the three, broad-based indices shown below. The composite benchmarks were constructed with allocations to each asset class that correspond to the allocations for the Portfolio Optimization Portfolios that were in effect at that time. However, the actual allocation of any Portfolio Optimization Portfolio will naturally vary as a result of market performance over time. The one-year performance for these broad-based indices for the year ended December 31, 2012 is shown in the following table:
| | | | |
Broad-Based Indices | | | |
S&P 500 Index (U.S. Stocks) | | | 16.00% | |
MSCI EAFE Index (International Stocks) | | | 17.32% | |
Barclays U.S. Aggregate Bond Index (Fixed Income) | | | 4.21% | |
| | |
| | See explanation of symbol and benchmark definitions on A-56 through A-57 |
A-48
PACIFIC SELECT FUND PERFORMANCE DISCUSSION (Continued)
It should be noted that the benchmark indices for the portfolios may differ from the portfolios’ broad-based indices. The following investments comprise the Underlying Portfolios for the Portfolio Optimization Portfolios. Not all of the Underlying Portfolios were represented in each of the Portfolio Optimization Portfolio models during the reporting period, and the allocation of each of the Underlying Portfolios within the Portfolio Optimization Portfolio models did vary. The Underlying Portfolios’ performance for the year ended December 31, 2012 listed below is net of portfolio expenses.
| | | | |
Cash Management ‘P’ | | | 0.00 | % |
Diversified Bond ‘P’ | | | 8.58 | % |
Floating Rate Loan ‘P’ | | | 8.31 | % |
High Yield Bond ‘P’ | | | 15.53 | % |
Inflation Managed ‘P’ | | | 10.09 | % |
Inflation Protected ‘P’ | | | 5.72 | % |
Managed Bond ‘P’ | | | 10.94 | % |
Short Duration Bond ‘P’ | | | 3.40 | % |
Emerging Markets Debt ‘P’ | | | 10.74 | %(1) |
American Funds Growth ‘P’ | | | 17.68 | % |
American Funds Growth-Income ‘P’ | | | 17.30 | % |
Comstock ‘P’ | | | 18.78 | % |
Dividend Growth ‘P’ | | | 14.78 | % |
Equity Index ‘P’ | | | 16.00 | % |
Focused 30 ‘P’ | | | 23.45 | % |
Growth LT ‘P’ | | | 18.45 | % |
Large-Cap Growth ‘P’ | | | 18.47 | % |
Large-Cap Value ‘P’ | | | 16.64 | % |
Long/Short Large-Cap ‘P’ | | | 18.32 | % |
| | | | |
Main Street Core ‘P’ | | | 17.25 | % |
Mid-Cap Equity ‘P’ | | | 7.55 | % |
Mid-Cap Growth ‘P’ | | | 7.71 | % |
Mid-Cap Value ‘P’ | | | 14.72 | % |
Small-Cap Equity ‘P’ | | | 16.16 | % |
Small-Cap Growth ‘P’ | | | 13.09 | % |
Small-Cap Index ‘P’ | | | 16.37 | % |
Small-Cap Value ‘P’ | | | 11.31 | % |
Health Sciences ‘P’ | | | 25.93 | % |
Real Estate ‘P’ | | | 16.44 | % |
Technology ‘P’ | | | 7.36 | % |
Emerging Markets ‘P’ | | | 21.77 | % |
International Large-Cap ‘P’ | | | 22.78 | % |
International Small-Cap ‘P’ | | | 19.68 | % |
International Value ‘P’ | | | 18.05 | % |
Currency Strategies ‘P’ | | | -1.09 | %(2) |
Global Absolute Return ‘P’ | | | -0.15 | %(2) |
Precious Metals ‘P’ | | | -13.96 | %(2) |
| (1) | Commenced operations on April 30, 2012. Returns are from April 30, 2012 through December 31, 2012. |
| (2) | Commenced operations on September 28, 2012. Returns are from September 28, 2012 through December 31, 2012. |
Portfolio Optimization Conservative Portfolio (managed by Pacific Life Fund Advisors LLC)
Q. How did the portfolio perform for the year ended December 31, 2012?
A. For the year ended December 31, 2012, the Portfolio Optimization Conservative Portfolio’s Class I returned 10.11%, compared to a 4.21% return for the Barclays U.S. Aggregate Bond Index, a 16.00% return for the S&P 500 Index, a 17.32% return for the MSCI EAFE Index, and a 6.39% return for the Portfolio Optimization Conservative Composite Benchmark.
| | |
| | See explanation of symbol and benchmark definitions on A-56 through A-57 |
A-49
PACIFIC SELECT FUND PERFORMANCE DISCUSSION (Continued)
The following graph compares the performance of a hypothetical $10,000 investment in Class I shares of the portfolio to its benchmark for the period from inception on May 2, 2011 through December 31, 2012. The portfolio’s performance reflects reinvestments of all dividends and capital gains distributions, if any.
Performance Comparison
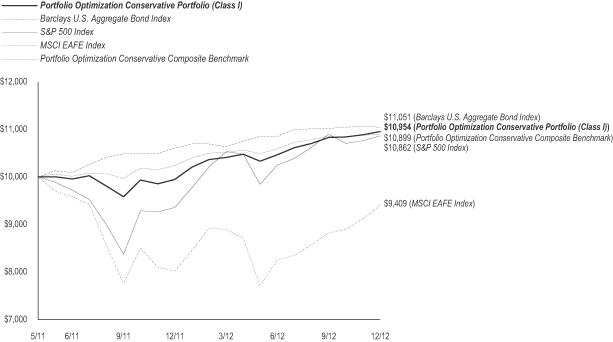
| | | | | | | | |
| Average Annual Total Returns for the periods ended December 31, 2012 | |
| | | 1 Year | | | Since
Inception
(5/2/11)~ | |
| | |
Portfolio’s Class I | | | 10.11% | | | | 5.61% | |
Barclays U.S. Aggregate Bond Index | | | 4.21% | | | | 6.18% | |
S&P 500 Index | | | 16.00% | | | | 5.08% | |
MSCI EAFE Index | | | 17.32% | | | | -3.59% | |
Portfolio Optimization Conservative Composite Benchmark | | | 6.39% | | | | 5.30% | |
| | | | |
Performance data quoted represents past performance. Investment return and principal value will fluctuate so that shares of the portfolio when redeemed may be worth more or less than their original cost. Past performance is not predictive of future performance. |
Q. Discuss both positive and negative factors that materially affected the portfolio’s performance during the year, including relevant market conditions, investment strategies and techniques, and particular sectors or securities.
A. The Portfolio Optimization Conservative Portfolio is primarily comprised of various fixed income strategies and has a small allocation to equity portfolios. Fixed income investments include intermediate-term bonds, short duration securities, inflation-protected bonds, high yield debt and floating rate loans. The equity segment mainly encompasses domestic and foreign large-capitalization portfolios. Three alternative strategies, the Precious Metals, Currencies Strategies and Global Absolute Return Portfolios, which commenced operations on September 28, 2012, were added to the portfolio.
For reporting period, the portfolio’s Class I returned 10.11% compared to 6.39% for the Portfolio Optimization Conservative Composite Benchmark. At the broad asset class level, the portfolio’s fixed income allocation materially outperformed the Barclays U.S. Aggregate Bond Index. The portfolio’s domestic and international equity segments also outpaced the S&P 500 Index and the MSCI EAFE Index, respectively.
With credits outperforming long-term Treasuries, sector positioning played an important role on relative performance. The Managed Bond Portfolio delivered strong results through its tactical duration positioning as well as allocations to mortgages and emerging markets bonds. Additionally, the portfolio’s allocation to riskier, fixed income strategies (e.g. High Yield Bond Portfolio) also contributed to overall performance. On the other hand, the Short Duration Bond Portfolio was the only fixed income strategy to lag behind the broad fixed income index.
The portfolio’s equity segment consists of primarily large-capitalization strategies, which contributed to performance within the domestic equity group. Contributions from the large-capitalization investments were offset by weak performances from the Mid-Cap Equity and Mid-Cap Growth Portfolios. Both the International Large-Cap and International Value Portfolios outperformed the broad foreign equity index.
| | |
| | See explanation of symbol and benchmark definitions on A-56 through A-57 |
A-50
PACIFIC SELECT FUND PERFORMANCE DISCUSSION (Continued)
Portfolio Optimization Moderate-Conservative Portfolio (managed by Pacific Life Fund Advisors LLC)
Q. How did the portfolio perform for the year ended December 31, 2012?
A. For the year ended December 31, 2012, the Portfolio Optimization Moderate-Conservative Portfolio’s Class I returned 11.65%, compared to a 4.21% return for the Barclays U.S. Aggregate Bond Index, a 16.00% return for the S&P 500 Index, a 17.32% return for the MSCI EAFE Index, and a 8.70% return for the Portfolio Optimization Moderate-Conservative Composite Benchmark.
The following graph compares the performance of a hypothetical $10,000 investment in Class I shares of the portfolio to its benchmark for the period from inception on May 2, 2011 through December 31, 2012. The portfolio’s performance reflects reinvestments of all dividends and capital gains distributions, if any.
Performance Comparison

| | | | | | | | |
| Average Annual Total Returns for the periods ended December 31, 2012 | |
| | | 1 Year | | | Since
Inception
(5/2/11)~ | |
| | |
Portfolio’s Class I | | | 11.65% | | | | 4.73% | |
Barclays U.S. Aggregate Bond Index | | | 4.21% | | | | 6.18% | |
S&P 500 Index | | | 16.00% | | | | 5.08% | |
MSCI EAFE Index | | | 17.32% | | | | -3.59% | |
Portfolio Optimization Moderate-Conservative
Composite Benchmark | | | 8.70% | | | | 4.90% | |
| | | | |
Performance data quoted represents past performance. Investment return and principal value will fluctuate so that shares of the portfolio when redeemed may be worth more or less than their original cost. Past performance is not predictive of future performance. |
Q. Discuss both positive and negative factors that materially affected the portfolio’s performance during the year, including relevant market conditions, investment strategies and techniques, and particular sectors or securities.
A. The Portfolio Optimization Moderate-Conservative Portfolio has a diversified allocation mix that is modestly overweight in fixed income. Fixed income investments include intermediate-term bonds as well as short duration securities, inflation-protected bonds, high yield debt and floating rate loans. The equity exposure is diversified across style (growth/value), market capitalization and region (including an allocation to foreign small-capitalization and emerging market strategies). Three alternative strategies, the Precious Metals, Currencies Strategies and Global Absolute Return Portfolios, which commenced operations on September 28, 2012, were added to the portfolio.
For the reporting period, the portfolio’s Class I returned 11.65% compared to 8.70% for the Portfolio Optimization Moderate-Conservative Composite Benchmark. At the broad asset class level, the portfolio’s fixed income allocation materially outperformed the Barclays U.S. Aggregate Bond Index. The portfolio’s domestic and international equity segments also outpaced the S&P 500 Index and the MSCI EAFE Index, respectively.
| | |
| | See explanation of symbol and benchmark definitions on A-56 through A-57 |
A-51
PACIFIC SELECT FUND PERFORMANCE DISCUSSION (Continued)
With credits outperforming long-term Treasuries, sector positioning played an important role on relative performance. The Managed Bond Portfolio delivered strong results through its tactical duration positioning as well as allocations to mortgages and emerging markets bonds. Additionally, the portfolio’s allocation to riskier, fixed income strategies (e.g. High Yield Bond Portfolio) also contributed to overall performance. On the other hand, the Short Duration Bond Portfolio was the only fixed income strategy to lag behind the broad fixed income index.
Within the domestic equity segment, the Comstock, Large-Cap Growth and Main Street Core Portfolios contributed to performance. Contributions from these large-capitalization strategies were offset by weak performances from the Mid-Cap Equity and Mid-Cap Growth Portfolios. All foreign equity strategies in the portfolio outperformed the broad foreign equity index. The International Large-Cap and Emerging Markets Portfolios were among the top performers among the group.
Portfolio Optimization Moderate Portfolio (managed by Pacific Life Fund Advisors LLC)
Q. How did the portfolio perform for the year ended December 31, 2012?
A. For the year ended December 31, 2012, the Portfolio Optimization Moderate Portfolio’s Class I returned 12.94%, compared to a 4.21% return for the Barclays U.S. Aggregate Bond Index, a 16.00% return for the S&P 500 Index, a 17.32% return for the MSCI EAFE Index, and a 10.99% return for the Portfolio Optimization Moderate Composite Benchmark.
The following graph compares the performance of a hypothetical $10,000 investment in Class I shares of the portfolio to its benchmark for the period from inception on May 2, 2011 through December 31, 2012. The portfolio’s performance reflects reinvestments of all dividends and capital gains distributions, if any.
Performance Comparison

| | | | | | | | |
| Average Annual Total Returns for the periods ended December 31, 2012 | |
| | | 1 Year | | | Since
Inception
(5/2/11)~ | |
| | |
Portfolio’s Class I | | | 12.94% | | | | 3.65% | |
Barclays U.S. Aggregate Bond Index | | | 4.21% | | | | 6.18% | |
| | |
S&P 500 Index | | | 16.00% | | | | 5.08% | |
MSCI EAFE Index | | | 17.32% | | | | -3.59% | |
Portfolio Optimization Moderate Composite Benchmark | | | 10.99% | | | | 4.35% | |
| | | | |
Performance data quoted represents past performance. Investment return and principal value will fluctuate so that shares of the portfolio when redeemed may be worth more or less than their original cost. Past performance is not predictive of future performance. |
Q. Discuss both positive and negative factors that materially affected the portfolio’s performance during the year, including relevant market conditions, investment strategies and techniques, and particular sectors or securities.
A. The Portfolio Optimization Moderate Portfolio maintains a mix of equity and fixed income portfolios. The equity exposure is diversified across style (growth/value), market capitalization and region (including allocations to foreign small capitalization and emerging markets stocks). Fixed
| | |
| | See explanation of symbol and benchmark definitions on A-56 through A-57 |
A-52
PACIFIC SELECT FUND PERFORMANCE DISCUSSION (Continued)
income investments include intermediate-term bonds, short duration securities, inflation-protected bonds, high yield debt and floating rate loans. Three alternative strategies, the Precious Metals, Currencies Strategies and Global Absolute Return Portfolios, which commenced operations on September 28, 2012, were added to the portfolio.
For the reporting period, the portfolio’s Class I returned 12.94% compared to 10.99% for the Portfolio Optimization Moderate Composite Benchmark. At the broad asset class level, the portfolio’s fixed income allocation materially outperformed the Barclays U.S. Aggregate Bond Index. The portfolio’s domestic and international equity segments also outpaced the S&P 500 Index and the MSCI EAFE Index, respectively.
With credits outperforming long-term Treasuries, sector positioning played an important role on relative performance. The Managed Bond Portfolio delivered strong results through its tactical duration positioning as well as allocations to mortgages and emerging markets bonds. Additionally, the portfolio’s allocation to riskier, fixed income strategies (e.g. High Yield Bond Portfolio) also contributed to overall performance. On the other hand, the Short Duration Bond Portfolio was the only fixed income strategy to lag behind the broad fixed income index.
Within the domestic equity segment, the Comstock, Large-Cap Growth and Long/Short Large-Cap Portfolios contributed to performance. Contributions from these large-capitalization strategies were offset by weak performances from the Mid-Cap Equity and Mid-Cap Growth Portfolios. All foreign equity strategies in the portfolio outperformed the broad foreign equity index. The International Large-Cap and Emerging Markets Portfolios were among the top performers among the group.
| | |
| | See explanation of symbol and benchmark definitions on A-56 through A-57 |
A-53
PACIFIC SELECT FUND PERFORMANCE DISCUSSION (Continued)
Portfolio Optimization Growth Portfolio (managed by Pacific Life Fund Advisors LLC)
Q. How did the portfolio perform for the year ended December 31, 2012?
A. For the year ended December 31, 2012, the Portfolio Optimization Growth Portfolio’s Class I returned 14.02%, compared to a 16.00% return for the S&P 500 Index, a 4.21% return for the Barclays U.S. Aggregate Bond Index, a 17.32% return for the MSCI EAFE Index, and a 13.35% return for the Portfolio Optimization Growth Composite Benchmark.
The following graph compares the performance of a hypothetical $10,000 investment in Class I shares of the portfolio to its benchmark for the period from inception on May 2, 2011 through December 31, 2012. The portfolio’s performance reflects reinvestments of all dividends and capital gains distributions, if any.
Performance Comparison
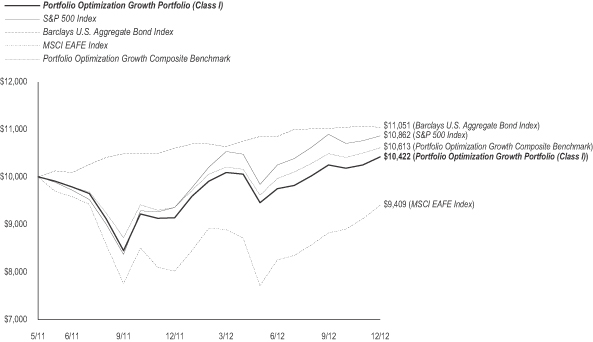
| | | | | | | | |
| Average Annual Total Returns for the periods ended December 31, 2012 | |
| | | 1 Year | | | Since
Inception
(5/2/11)~ | |
| | |
Portfolio’s Class I | | | 14.02% | | | | 2.51% | |
S&P 500 Index | | | 16.00% | | | | 5.08% | |
Barclays U.S. Aggregate Bond Index | | | 4.21% | | | | 6.18% | |
MSCI EAFE Index | | | 17.32% | | | | -3.59% | |
Portfolio Optimization Growth
Composite Benchmark | | | 13.35% | | | | 3.64% | |
| | | | |
Performance data quoted represents past performance. Investment return and principal value will fluctuate so that shares of the portfolio when redeemed may be worth more or less than their original cost. Past performance is not predictive of future performance. |
Q. Discuss both positive and negative factors that materially affected the portfolio’s performance during the year, including relevant market conditions, investment strategies and techniques, and particular sectors or securities.
A. The Portfolio Optimization Growth Portfolio has a diversified allocation mix that is overweight in equity. The equity exposure is diversified across style (growth/value), market capitalization and region (which include allocations to foreign small capitalization and emerging markets stocks). The portfolio also maintains exposure to select sectors such as publicly traded real estate investment trusts (REITs). Fixed income investments include intermediate-term bonds as well as specific strategies such as short duration and inflation-protected bonds. Three alternative strategies, the Precious Metals, Currencies Strategies and Global Absolute Return Portfolios, which commenced operations on September 28, 2012, were added to the portfolio.
For the reporting period, the portfolio’s Class I returned 14.02% compared to 13.35% for the Portfolio Optimization Growth Composite Benchmark. At the broad asset class level, the portfolio’s fixed income allocation materially outperformed the Barclays U.S. Aggregate Bond Index. The portfolio’s domestic equity segment modestly lagged behind the S&P 500 Index. However, the international equity group outpaced the MSCI EAFE Index.
| | |
| | See explanation of symbol and benchmark definitions on A-56 through A-57 |
A-54
PACIFIC SELECT FUND PERFORMANCE DISCUSSION (Continued)
Within the domestic equity segment, the Comstock, Large-Cap Growth and Long/Short Large-Cap Portfolios contributed to performance. Contributions from these large-capitalization strategies were offset by weak performances from the Mid-Cap Equity and Mid-Cap Growth Portfolios.
All foreign equity strategies in the portfolio outperformed the broad foreign equity index. The International Large-Cap and Emerging Markets Portfolios were among the top performers among the group.
With credits outperforming long-term Treasuries, sector positioning played an important role on relative performance. The Managed Bond Portfolio delivered strong results through its tactical duration positioning as well as allocations to mortgages and emerging markets bonds. Additionally, the portfolio’s allocation to its other core bonds strategy (i.e. Diversified Bonds Portfolio) also contributed to overall performance. On the other hand, the Short Duration Bond Portfolio was the only fixed income strategy to lag behind the broad fixed income index.
Portfolio Optimization Aggressive-Growth Portfolio (managed by Pacific Life Fund Advisors LLC)
Q. How did the portfolio perform for the year ended December 31, 2012?
A. For the year ended December 31, 2012, the Portfolio Optimization Aggressive-Growth Portfolio’s Class I returned 15.17%, compared to a 16.00% return for the S&P 500 Index, a 17.32% return for the MSCI EAFE Index, a 4.21% return for the Barclays U.S. Aggregate Bond Index, and a 15.41% return for the Portfolio Optimization Aggressive-Growth Composite Benchmark.
The following graph compares the performance of a hypothetical $10,000 investment in Class I shares of the portfolio to its benchmark for the period from inception on May 2, 2011 through December 31, 2012. The portfolio’s performance reflects reinvestments of all dividends and capital gains distributions, if any.
Performance Comparison

| | | | | | | | |
Average Annual Total Returns for the periods ended December 31, 2012 | |
| | | 1 Year | | | Since
Inception
(5/2/11)~ | |
| | |
Portfolio’s Class I | | | 15.17% | | | | 1.23% | |
S&P 500 Index | | | 16.00% | | | | 5.08% | |
MSCI EAFE Index | | | 17.32% | | | | -3.59% | |
Barclays U.S. Aggregate Bond Index | | | 4.21% | | | | 6.18% | |
Portfolio Optimization Aggressive-Growth
Composite Benchmark | | | 15.41% | | | | 2.87% | |
| | | | |
Performance data quoted represents past performance. Investment return and principal value will fluctuate so that shares of the portfolio when redeemed may be worth more or less than their original cost. Past performance is not predictive of future performance. |
Q. Discuss both positive and negative factors that materially affected the portfolio’s performance during the year, including relevant market conditions, investment strategies and techniques, and particular sectors or securities.
| | |
| | See explanation of symbol and benchmark definitions on A-56 through A-57 |
A-55
PACIFIC SELECT FUND PERFORMANCE DISCUSSION (Continued)
A. The Portfolio Optimization Aggressive-Growth Portfolio allocates primarily to domestic and international equity portfolios which are diversified across style (growth/value), market capitalization and region (which include allocations to foreign small-capitalization and emerging markets stocks). The portfolio also maintains exposure to select sectors such as publicly traded REITs as well as a small allocation to intermediate-term fixed income securities. Three alternative strategies, the Precious Metals, Currencies Strategies and Global Absolute Return Portfolios, which commenced operations on September 28, 2012, were added to the portfolio.
For the reporting period, the portfolio’s Class I returned 15.17% compared to 15.41% for the Portfolio Optimization Aggressive-Growth Composite Benchmark. At the broad asset class level, the portfolio’s domestic equities segment modestly lagged behind the S&P 500 Index. The portfolio’s fixed income and international equity segments outperformed the Barclays U.S. Aggregate Bond Index and the MSCI EAFE Index, respectively.
Within the domestic equity segment, the Comstock, Large-Cap Growth and Long/Short Large-Cap Portfolios contributed to performance. Contributions from these large-capitalization strategies were offset by weak performances from the Mid-Cap Equity and Mid-Cap Growth Portfolios.
All foreign equity strategies in the portfolio outperformed the broad foreign equity index. The International Large-Cap and Emerging Markets Portfolios were among the top performers among the group.
With credits outperforming long-term Treasuries, sector positioning played an important role on relative performance. The Managed Bond Portfolio delivered strong results through its tactical duration positioning as well as allocations to mortgages and emerging markets bonds. Additionally, the portfolio’s allocation to its other core bonds strategy (i.e. Diversified Bond Portfolio) also contributed to overall performance.
Explanation of Symbol for Pacific Select Fund Performance Discussion
~ Due to data limitation the benchmark since inception return reflects the commencement period from the first calendar day of the month the portfolio commenced its operations.
Benchmark Definitions
Barclays 1-3 Year U.S. Government/Credit Bond Index is the 1-3 year component of the U.S. Government/Credit Index. The U.S. Government/Credit Bond Index is the non-securitized component of the U.S. Aggregate Bond Index. The U.S. Government/Credit Bond Index includes Treasuries, government-related issues and corporates. The total return is equal to the change in price plus the coupon return.
Barclays U.S. Aggregate Bond Index covers the U.S. dollar-denominated, investment-grade, fixed-rate, taxable bond market of SEC-registered securities. The index includes bonds from the Treasury, government-related, corporate, mortgage-backed securities, asset-backed securities, and corporate mortgage-backed securities sectors. The total return is equal to the change in price plus the coupon return.
Barclays U.S. High-Yield 2% Issuer Capped Bond Index is an index that is an issuer-constrained version of the U.S. Corporate High-Yield Index that covers the U.S. dollar-denominated, non-investment grade fixed-rate taxable corporate bond market and limits issuer exposures to a maximum of 2% and redistributes the excess market value index-wide on a prorata basis. The total return is equal to the change in price plus the coupon return.
Barclays U.S. Treasury Inflation Protected Securities (TIPS) Index is an index of all outstanding treasury inflation protected securities issued by the U.S. government. The total return is equal to the change in price plus the coupon return.
BofA Merrill Lynch U.S. 3-Month Treasury Bill (T-Bill) Index is an index comprised of a single Treasury bill issue purchased at the beginning of the month and held for a full month, then sold and rolled into a newly selected Treasury bill issue. Results include the reinvestment of all distributions.
Citigroup 1-Month U.S. Treasury Bill (T-Bill) Index is a market value-weighted index of public obligations of the U.S. Treasury with maturities of one month.
FTSE Gold Mines Index represents an accurate reflection and comprehensive coverage of the global gold markets. The index includes all gold mining companies that have a sustainable and attributable gold production of at least 300,000 ounces a year and that derive 51% or more of their revenue from mined gold.
FTSE National Association of Real Estate Investment Trusts (NAREIT) Equity Real Estate Investment Trusts (REITs) Index is one index of a series of indexes represented in the FTSE NAREIT U.S. Real Estate Index Series and represents tax-qualified REITs listed on the New York Stock Exchange (NYSE), American Stock Exchange and National Association of Securities Dealers Automated Quotations (NASDAQ). Results include reinvested dividends.
J.P. Morgan Emerging Markets Bond Index (EMBI) Global Diversified Index series comprises of USD denominated Brady bonds, eurobonds and traded loans issued by sovereign and quasi sovereign entities in emerging markets countries. The Diversified version limits the weights of the index countries by only including a specified portion of those countries’ eligible current face amounts of debt outstanding. This provides a more even distribution of weights within the countries in the index.
Morgan Stanley Capital International (MSCI) Europe, Australasia and Far East (EAFE) Index is an index of stocks from 21 countries/regions in Europe, Australia, New Zealand and Asia. Results include reinvested dividends after deducting withholding taxes.
MSCI Emerging Markets Index is an index typically made up of stocks from approximately 26 emerging markets countries. Results include reinvested dividends after deducting withholding taxes.
MSCI World ex USA Index is a free float-adjusted market capitalization weighted index that is designed to measure the equity market performance of developed markets. As of May 30, 2011, the MSCI World ex USA Index will consists of 23 developed market county indices. Results include reinvested dividends after deducting withholding taxes.
A-56
PACIFIC SELECT FUND PERFORMANCE DISCUSSION (Continued)
Pacific Dynamix-Conservative Growth Composite Benchmark is 60% Barclays U.S. Aggregate Bond; 30% S&P 500; 10% MSCI World ex USA (Net) Indices.
Pacific Dynamix-Moderate Growth Composite Benchmark is 45% S&P 500; 40% Barclays U.S. Aggregate Bond; 15% MSCI World ex USA (Net) Indices.
Pacific Dynamix-Growth Composite Benchmark is 55% S&P 500; 25% MSCI World ex USA (Net); 20% Barclays U.S. Aggregate Bond Indices.
Portfolio Optimization Conservative Composite Benchmark is 73% Barclays U.S. Aggregate Bond; 15% S&P 500; 7% BofA Merrill Lynch U.S. 3-Month T-Bill and 5% MSCI EAFE (Net) Indices.
Portfolio Optimization Moderate-Conservative Composite Benchmark is 55% Barclays U.S. Aggregate Bond; 30% S&P 500; 10% MSCI EAFE (Net), and 5% BofA Merrill Lynch U.S. 3-Month T-Bill Indices.
Portfolio Optimization Moderate Composite Benchmark is 43% Barclays U.S. Aggregate Bond; 40% S&P 500; 15% MSCI EAFE (Net), and 2% BofA Merrill Lynch U.S. 3-Month T-Bill Indices.
Portfolio Optimization Growth Composite Benchmark is 55% S&P 500; 25% Barclays U.S. Aggregate Bond; and 20% MSCI EAFE (Net) Indices.
Portfolio Optimization Aggressive-Growth Composite Benchmark is 65% S&P 500; 25% MSCI EAFE (Net); and 10% Barclays U.S. Aggregate Bond Indices.
Russell 1000 Growth Index is an index of large companies that have higher price-to-book ratios and forecasted growth values than the Russell 1000 Value Index. Results include reinvested dividends.
Russell 1000 Value Index measures the performance of the large-capitalization value segment of the U.S. equity universe. It is an index of companies with a less-than average growth orientation. Companies in this index have lower price-to book and price-earnings ratios, higher dividend yields and lower forecasted growth rates than companies in the Russell 1000 Growth Index. Results include reinvested dividends.
Russell 2000 Growth Index measures the performance of the small-capitalization growth segment of the U.S. equity universe. It is an index of approximately 1,200 small companies with higher price-to-book ratios and forecasted growth values than companies in the Russell 2000 Value Index. Results include reinvested dividends.
Russell 2000 Index is an index of the 2,000 smallest companies listed in the Russell 3000 Index. Results include reinvested dividends.
Russell 2000 Value Index measures the performance of the small-capitalization value segment of the U.S. equity universe. It is an index of companies that have lower price-to-book ratios and lower forecasted growth values than companies in the Russell 2000 Growth Index. Results include reinvested dividends.
Russell Midcap Growth Index is an index that measures the performance of the mid-capitalization growth segment of the U.S. equity universe. It includes those companies within the Russell Midcap Index with higher price-to-book ratios and higher forecasted growth values. Results include reinvested dividends.
Russell Midcap Index is an index of approximately 800 of the smallest companies in the Russell 1000 Index. Results include reinvested dividends.
Russell Midcap Value Index measures the performance of the mid-cap value segment of the U.S. equity universe. It includes those Russell Midcap Index companies with lower price-to-book ratios and lower forecasted growth values. The Russell Midcap Value Index is constructed to provide a comprehensive and unbiased barometer of the mid-cap value market. The Index is completely reconstituted annually to ensure larger stocks do not distort the performance and characteristics of the true mid-cap value market. Results include reinvested dividends.
S&P 500 Index is an index of the stocks of approximately 500 large-capitalization companies traded in U.S. stock markets. Results include reinvested dividends.
S&P Composite 1500 Health Care Index is an unmanaged capitalization-weighted index that measures the performance of the health care sector of the S&P Composite 1500 Index. Results include reinvested dividends.
S&P Composite 1500 Index is an index made up of the S&P 500 Index, the S&P MidCap 400 Index and the S&P SmallCap 600 Index. Results include reinvested dividends.
S&P Developed Ex-U.S. SmallCap Index is an index of the bottom 15% of approximately 12,400 companies measured by market capitalization in 83 developed countries, excluding the U.S.
S&P/LSTA Leveraged Loan Index is a daily total return index that uses Loan Syndications & Trading Association/Loan Pricing Corp. (LSTA/LPC) mark-to-market pricing to calculate market value change. On a real-time basis, the leveraged loan index (LLI) tracks the current outstanding balance and spread over London Interbank Offered Rate (LIBOR) for fully funded term loans. The facilities included in the LLI represent a broad cross section of leveraged loans syndicated in the U.S., including dollar-denominated loans to overseas issuers.
S&P MidCap 400 Value Index is an unmanaged index that measures the performance of the mid-capitalization value sector of the U.S. equity market. It is a subset of the S&P Mid Cap 400 Index and consists of those stocks in the S&P Mid Cap 400 Index exhibiting the strongest value characteristics as determined by the index provider, representing approximately 50% of the market capitalization of the S&P MidCap 400 Index.
S&P North American Technology Index is a modified-capitalization-weighted index of technology-related stocks. Results include reinvested dividends.
A-57
PACIFIC SELECT FUND
CASH MANAGEMENT PORTFOLIO
Schedule of Investments
December 31, 2012
| | | | | | | | |
| | | Principal
Amount | | | Value | |
SHORT-TERM INVESTMENTS - 99.2% | | | | | |
| | |
Commercial Paper - 81.7% | | | | | | | | |
| | |
AstraZeneca PLC (United Kingdom)
0.140% due 01/04/13 | | | $14,700,000 | | | | $14,699,829 | |
Bank of Nova Scotia NY
0.010% due 01/02/13 | | | 1,800,000 | | | | 1,800,000 | |
0.120% due 01/02/13 | | | 25,000,000 | | | | 24,999,917 | |
Chevron Corp
0.140% due 01/04/13 | | | 14,750,000 | | | | 14,749,828 | |
Colgate-Palmolive Co
0.050% due 01/10/13 | | | 2,750,000 | | | | 2,749,966 | |
Dover Corp
0.100% due 01/04/13 | | | 12,250,000 | | | | 12,249,898 | |
Emerson Electric Co
0.150% due 03/21/13 | | | 24,500,000 | | | | 24,491,935 | |
General Electric Capital Corp | | | | | | | | |
0.020% due 01/03/13 | | | 12,000,000 | | | | 11,999,987 | |
0.090% due 03/18/13 | | | 15,000,000 | | | | 14,997,150 | |
Glaxosmithkline Finance PLC (United Kingdom)
0.150% due 01/31/13 | | | 10,000,000 | | | | 9,998,750 | |
Google Inc
0.090% due 01/16/13 | | | 23,000,000 | | | | 22,999,138 | |
John Deere Financial Inc (Canada)
0.150% due 01/28/13 | | | 6,250,000 | | | | 6,249,297 | |
Kimberly-Clark Worldwide Inc
0.090% due 01/14/13 | | | 23,000,000 | | | | 22,999,253 | |
Nestle Capital Corp | | | | | | | | |
0.020% due 01/23/13 | | | 18,000,000 | | | | 17,999,780 | |
0.040% due 01/17/13 | | | 10,000,000 | | | | 9,999,822 | |
NetJets Inc
0.100% due 01/07/13 | | | 17,000,000 | | | | 16,999,717 | |
Northwestern University | | | | | | | | |
0.140% due 01/28/13 | | | 9,000,000 | | | | 8,999,055 | |
0.152% due 01/15/13 | | | 19,100,000 | | | | 19,098,886 | |
Parker Hannifin Corp
0.110% due 01/10/13 | | | 9,700,000 | | | | 9,699,733 | |
PepsiCo Inc
0.050% due 01/28/13 | | | 28,000,000 | | | | 27,998,950 | |
Philip Morris International Inc
0.110% due 01/28/13 | | | 23,700,000 | | | | 23,698,045 | |
Praxair Inc
0.090% due 01/10/13 | | | 19,000,000 | | | | 18,999,573 | |
Roche Holdings Inc
0.100% due 01/08/13 | | | 19,500,000 | | | | 19,499,621 | |
Rockwell Collins Inc
0.120% due 01/08/13 | | | 9,900,000 | | | | 9,899,769 | |
Royal Bank of Canada (Canada)
0.050% due 01/07/13 | | | 24,250,000 | | | | 24,249,798 | |
The Coca-Cola Co | | | | | | | | |
0.110% due 01/18/13 | | | 10,000,000 | | | | 9,999,481 | |
0.130% due 02/12/13 | | | 18,100,000 | | | | 18,097,255 | |
The Procter & Gamble Co
0.041% due 03/04/13 | | | 26,250,000 | | | | 26,242,767 | |
| | | | | | | | |
| | | Principal
Amount | | | Value | |
The Walt Disney Co
0.120% due 03/22/13 | | | $18,000,000 | | | | $17,995,200 | |
Toronto-Dominion Holdings USA Inc
0.190% due 01/03/13 | | | 16,250,000 | | | | 16,249,828 | |
Toyota Motor Credit Corp
0.190% due 01/02/13 | | | 27,700,000 | | | | 27,699,854 | |
Wal-Mart Stores Inc
0.110% due 01/29/13 | | | 13,800,000 | | | | 13,798,819 | |
| | | | | | | | |
| | | | | | | 522,210,901 | |
| | | | | | | | |
U.S. Treasury Bills - 16.2% | | | | | | | | |
| | |
0.092% due 03/07/13 | | | 30,000,000 | | | | 29,995,015 | |
0.105% due 02/14/13 | | | 30,000,000 | | | | 29,996,149 | |
0.108% due 01/24/13 | | | 28,000,000 | | | | 27,998,067 | |
0.133% due 05/23/13 | | | 15,000,000 | | | | 14,992,130 | |
| | | | | | | | |
| | | | | | | 102,981,361 | |
| | | | | | | | |
Repurchase Agreement - 1.3% | | | | | | | | |
| | |
State Street Bank & Trust Co
0.010% due 01/02/13
(Dated 12/31/12, repurchase price of $8,522,332; collateralized by
Fannie Mae: 2.140% due 11/07/22
and value $8,695,480) | | | 8,522,327 | | | | 8,522,327 | |
| | | | | | | | |
| | |
Total Short-Term Investments
(Amortized Cost $633,714,589) | | | | | | | 633,714,589 | |
| | | | | | | | |
| | |
TOTAL INVESTMENTS - 99.2%
(Amortized Cost $633,714,589) | | | | | | | 633,714,589 | |
| |
OTHER ASSETS & LIABILITIES, NET - 0.8% | | | | 5,322,884 | |
| | | | | | | | |
| | |
NET ASSETS - 100.0% | | | | | | | $639,037,473 | |
| | | | | | | | |
Notes to Schedule of Investments
| (a) | As of December 31, 2012, the portfolio was diversified as a percentage of net assets as follows: |
| | | | |
Commercial Paper | | | 81.7% | |
U.S. Treasury Bills | | | 16.2% | |
Repurchase Agreement | | | 1.3% | |
| | | | |
| | | 99.2% | |
Other Assets & Liabilities, Net | | | 0.8% | |
| | | | |
| | | 100.0% | |
| | | | |
| (b) | As of December 31, 2012, the portfolio’s Standard & Poor’s quality ratings as a percentage of total fixed income investments were as follows (Unaudited): |
| | | | |
A-1 (Short-Term Debt only) | | | 100.0% | |
| | | | |
| (c) | Short-term investments reflect either the stated coupon rate or the annualized effective yield on the date of purchase for discounted investments. |
| (d) | Fair Value Measurements |
The following is a summary of the portfolio’s investments as categorized under the three-tier hierarchy of inputs used in valuing the portfolio’s assets and liabilities (See Note 3D in Notes to Financial Statements) as of December 31, 2012:
| | | | | | | | | | | | | | | | | | |
| | | Total Value at
December 31, 2012 | | | Level 1
Quoted Price | | | Level 2
Significant
Observable Inputs | | | Level 3
Significant
Unobservable Inputs | |
Assets | | Short-Term Investments | | | $633,714,589 | | | | $- | | | | $633,714,589 | | | | $- | |
| | | | | | | | | | | | | | | | | | |
| | |
| See Notes to Financial Statements | | See explanation of symbols and terms, if any, on page B-143 |
B-1
PACIFIC SELECT FUND
DIVERSIFIED BOND PORTFOLIO
Schedule of Investments
December 31, 2012
| | | | | | | | |
| | | Shares | | | Value | |
PREFERRED STOCKS - 0.2% | | | | | |
| |
Financials - 0.2% | | | | | |
| | |
Citigroup Capital XIII | | | 61,350 | | | | $1,711,665 | |
GMAC Capital Trust I | | | 229,331 | | | | 6,111,671 | |
| | | | | | | | |
| | | | | | | 7,823,336 | |
| | | | | | | | |
Total Preferred Stocks
(Cost $7,267,172) | | | | | | | 7,823,336 | |
| | | | | | | | |
| | |
| | | Principal
Amount | | | | |
| |
CORPORATE BONDS & NOTES - 34.1% | | | | | |
| | |
Consumer Discretionary - 1.6% | | | | | | | | |
| | |
CCO Holdings LLC | | | | | | | | |
7.000% due 01/15/19 | | | $1,310,000 | | | | 1,419,712 | |
8.125% due 04/30/20 | | | 2,250,000 | | | | 2,531,250 | |
CityCenter Holdings LLC
7.625% due 01/15/16 | | | 1,200,000 | | | | 1,290,000 | |
Comcast Cable Communications Holdings Inc
9.455% due 11/15/22 | | | 1,840,000 | | | | 2,784,014 | |
Comcast Corp | | | | | | | | |
5.150% due 03/01/20 | | | 1,658,000 | | | | 1,966,489 | |
5.650% due 06/15/35 | | | 470,000 | | | | 551,913 | |
5.700% due 05/15/18 | | | 5,000,000 | | | | 6,016,160 | |
6.950% due 08/15/37 | | | 2,075,000 | | | | 2,816,122 | |
DISH DBS Corp | | | | | | | | |
6.750% due 06/01/21 | | | 2,290,000 | | | | 2,622,050 | |
7.750% due 05/31/15 | | | 766,000 | | | | 860,792 | |
McDonald’s Corp
6.300% due 10/15/37 | | | 495,000 | | | | 685,764 | |
MGM Resorts International
5.875% due 02/27/14 | | | 665,000 | | | | 694,925 | |
News America Inc | | | | | | | | |
4.500% due 02/15/21 | | | 90,000 | | | | 102,898 | |
6.200% due 12/15/34 | | | 1,000,000 | | | | 1,212,085 | |
Time Warner Cable Inc | | | | | | | | |
4.125% due 02/15/21 | | | 730,000 | | | | 800,052 | |
5.500% due 09/01/41 | | | 40,000 | | | | 44,547 | |
5.875% due 11/15/40 | | | 2,750,000 | | | | 3,207,113 | |
6.550% due 05/01/37 | | | 1,565,000 | | | | 1,937,789 | |
6.750% due 06/15/39 | | | 1,630,000 | | | | 2,069,163 | |
7.300% due 07/01/38 | | | 2,305,000 | | | | 3,065,058 | |
8.250% due 04/01/19 | | | 5,985,000 | | | | 7,968,956 | |
Time Warner Entertainment Co LP
8.375% due 07/15/33 | | | 890,000 | | | | 1,299,832 | |
Time Warner Inc | | | | | | | | |
4.700% due 01/15/21 | | | 410,000 | | | | 467,113 | |
6.250% due 03/29/41 | | | 350,000 | | | | 432,527 | |
UBM PLC (United Kingdom)
5.750% due 11/03/20 ~ | | | 2,220,000 | | | | 2,343,581 | |
Univision Communications Inc
6.750% due 09/15/22 ~ | | | 1,140,000 | | | | 1,182,750 | |
Virgin Media Secured Finance PLC (United Kingdom)
6.500% due 01/15/18 | | | 280,000 | | | | 302,750 | |
WPP Finance (United Kingdom)
8.000% due 09/15/14 | | | 1,353,000 | | | | 1,496,806 | |
| | | | | | | | |
| | | | | | | 52,172,211 | |
| | | | | | | | |
Consumer Staples - 3.3% | | | | | | | | |
| | |
Altria Group Inc | | | | | | | | |
2.850% due 08/09/22 | | | 4,200,000 | | | | 4,159,831 | |
4.750% due 05/05/21 | | | 4,000,000 | | | | 4,536,576 | |
8.500% due 11/10/13 | | | 1,490,000 | | | | 1,587,872 | |
9.250% due 08/06/19 | | | 3,330,000 | | | | 4,635,190 | |
| | | | | | | | |
| | | Principal
Amount | | | Value | |
Anheuser-Busch InBev Worldwide Inc | | | | | | | | |
2.500% due 07/15/22 | | | $6,570,000 | | | | $6,617,271 | |
5.000% due 04/15/20 | | | 1,070,000 | | | | 1,281,317 | |
5.375% due 01/15/20 | | | 4,500,000 | | | | 5,480,276 | |
CVS Caremark Corp | | | | | | | | |
2.750% due 12/01/22 | | | 240,000 | | | | 241,117 | |
6.125% due 09/15/39 | | | 4,300,000 | | | | 5,507,810 | |
CVS Pass-Through Trust | | | | | | | | |
5.298% due 01/11/27 ~ | | | 792,948 | | | | 882,069 | |
6.036% due 12/10/28 | | | 3,499,540 | | | | 4,102,874 | |
Diageo Capital PLC (United Kingdom)
5.750% due 10/23/17 | | | 4,630,000 | | | | 5,582,146 | |
Diageo Investment Corp
2.875% due 05/11/22 | | | 4,420,000 | | | | 4,566,766 | |
Heineken NV (Netherlands)
1.400% due 10/01/17 ~ | | | 1,530,000 | | | | 1,526,567 | |
Kraft Foods Group Inc | | | | | | | | |
3.500% due 06/06/22 ~ | | | 4,090,000 | | | | 4,369,400 | |
5.375% due 02/10/20 ~ | | | 1,549,000 | | | | 1,861,136 | |
Molson Coors Brewing Co
3.500% due 05/01/22 | | | 500,000 | | | | 528,333 | |
Mondelez International Inc | | | | | | | | |
5.375% due 02/10/20 | | | 1,411,000 | | | | 1,704,578 | |
6.000% due 02/11/13 | | | 5,360,000 | | | | 5,389,485 | |
PepsiCo Inc | | | | | | | | |
0.700% due 08/13/15 | | | 5,470,000 | | | | 5,480,092 | |
7.900% due 11/01/18 | | | 1,498,000 | | | | 2,023,166 | |
Pernod-Ricard SA (France) | | | | | | | | |
2.950% due 01/15/17 ~ | | | 1,230,000 | | | | 1,294,461 | |
4.450% due 01/15/22 ~ | | | 5,850,000 | | | | 6,475,312 | |
Philip Morris International Inc | | | | | | | | |
2.500% due 08/22/22 | | | 2,300,000 | | | | 2,312,737 | |
2.900% due 11/15/21 | | | 2,450,000 | | | | 2,550,261 | |
4.500% due 03/20/42 | | | 1,900,000 | | | | 2,066,868 | |
6.375% due 05/16/38 | | | 1,970,000 | | | | 2,684,899 | |
Reynolds American Inc | | | | | | | | |
3.250% due 11/01/22 | | | 1,600,000 | | | | 1,608,670 | |
6.750% due 06/15/17 | | | 1,207,000 | | | | 1,458,570 | |
Reynolds Group Issuer Inc | | | | | | | | |
5.750% due 10/15/20 ~ | | | 1,990,000 | | | | 2,059,650 | |
6.875% due 02/15/21 | | | 1,380,000 | | | | 1,493,850 | |
7.125% due 04/15/19 | | | 1,340,000 | | | | 1,447,200 | |
Safeway Inc | | | | | | | | |
3.950% due 08/15/20 | | | 90,000 | | | | 90,085 | |
4.750% due 12/01/21 | | | 2,300,000 | | | | 2,371,567 | |
6.350% due 08/15/17 | | | 575,000 | | | | 653,487 | |
The Kroger Co
6.400% due 08/15/17 | | | 2,610,000 | | | | 3,152,525 | |
Wal-Mart Stores Inc | | | | | | | | |
5.250% due 09/01/35 | | | 730,000 | | | | 887,555 | |
5.375% due 04/05/17 | | | 915,000 | | | | 1,083,922 | |
| | | | | | | | |
| | | | | | | 105,755,491 | |
| | | | | | | | |
Energy - 5.6% | | | | | | | | |
| | |
Access Midstream Partners LP | | | | | | | | |
4.875% due 05/15/23 | | | 700,000 | | | | 711,375 | |
6.125% due 07/15/22 | | | 2,495,000 | | | | 2,700,838 | |
Anadarko Finance Co (Canada)
7.500% due 05/01/31 | | | 1,195,000 | | | | 1,582,113 | |
Anadarko Petroleum Corp | | | | | | | | |
6.375% due 09/15/17 | | | 5,085,000 | | | | 6,078,294 | |
8.700% due 03/15/19 | | | 4,285,000 | | | | 5,785,688 | |
Apache Corp | | | | | | | | |
3.250% due 04/15/22 | | | 2,130,000 | | | | 2,259,336 | |
4.750% due 04/15/43 | | | 1,140,000 | | | | 1,242,239 | |
6.900% due 09/15/18 | | | 5,000,000 | | | | 6,381,910 | |
Arch Coal Inc
7.000% due 06/15/19 | | | 4,050,000 | | | | 3,786,750 | |
Baker Hughes Inc | | | | | | | | |
3.200% due 08/15/21 | | | 200,000 | | | | 213,393 | |
7.500% due 11/15/18 | | | 4,060,000 | | | | 5,383,032 | |
| | |
| See Notes to Financial Statements | | See explanation of symbols and terms, if any, on page B-143 |
B-2
PACIFIC SELECT FUND
DIVERSIFIED BOND PORTFOLIO
Schedule of Investments (Continued)
December 31, 2012
| | | | | | | | |
| | | Principal
Amount | | | Value | |
BP Capital Markets PLC (United Kingdom) | | | | | | | | |
3.125% due 10/01/15 | | | $7,940,000 | | | | $8,433,598 | |
3.245% due 05/06/22 | | | 2,400,000 | | | | 2,530,661 | |
3.561% due 11/01/21 | | | 450,000 | | | | 486,673 | |
Chesapeake Energy Corp | | | | | | | | |
6.500% due 08/15/17 | | | 650,000 | | | | 708,500 | |
6.625% due 08/15/20 | | | 360,000 | | | | 387,900 | |
6.775% due 03/15/19 | | | 1,780,000 | | | | 1,784,450 | |
7.250% due 12/15/18 | | | 410,000 | | | | 448,950 | |
Cie Generale de Geophysique-Veritas (France)
9.500% due 05/15/16 | | | 4,450,000 | | | | 4,794,875 | |
Concho Resources Inc | | | | | | | | |
5.500% due 10/01/22 | | | 700,000 | | | | 742,000 | |
6.500% due 01/15/22 | | | 1,606,000 | | | | 1,774,630 | |
ConocoPhillips
6.500% due 02/01/39 | | | 1,040,000 | | | | 1,476,164 | |
CONSOL Energy Inc
6.375% due 03/01/21 | | | 2,650,000 | | | | 2,729,500 | |
Devon Energy Corp | | | | | | | | |
3.250% due 05/15/22 | | | 1,200,000 | | | | 1,253,516 | |
7.950% due 04/15/32 | | | 3,470,000 | | | | 5,137,283 | |
Enterprise Products Operating LLC | | | | | | | | |
5.250% due 01/31/20 | | | 60,000 | | | | 71,344 | |
5.950% due 02/01/41 | | | 520,000 | | | | 628,340 | |
6.125% due 10/15/39 | | | 260,000 | | | | 314,374 | |
6.300% due 09/15/17 | | | 5,000,000 | | | | 6,052,445 | |
6.500% due 01/31/19 | | | 2,100,000 | | | | 2,633,230 | |
8.375% due 08/01/66 § | | | 3,000,000 | | | | 3,426,432 | |
Hess Corp
8.125% due 02/15/19 | | | 7,530,000 | | | | 9,915,790 | |
Kerr-McGee Corp | | | | | | | | |
6.950% due 07/01/24 | | | 220,000 | | | | 278,985 | |
7.875% due 09/15/31 | | | 3,617,000 | | | | 4,807,702 | |
Key Energy Services Inc
6.750% due 03/01/21 | | | 2,640,000 | | | | 2,653,200 | |
Kinder Morgan Energy Partners LP
6.850% due 02/15/20 | | | 3,000,000 | | | | 3,782,241 | |
MarkWest Energy Partners LP | | | | | | | | |
5.500% due 02/15/23 | | | 1,680,000 | | | | 1,831,200 | |
6.250% due 06/15/22 | | | 920,000 | | | | 1,016,600 | |
Noble Energy Inc | | | | | | | | |
6.000% due 03/01/41 | | | 2,000,000 | | | | 2,411,352 | |
8.250% due 03/01/19 | | | 3,290,000 | | | | 4,314,361 | |
Occidental Petroleum Corp | | | | | | | | |
2.700% due 02/15/23 | | | 3,520,000 | | | | 3,595,127 | |
3.125% due 02/15/22 | | | 3,600,000 | | | | 3,832,542 | |
Peabody Energy Corp
6.000% due 11/15/18 | | | 3,000,000 | | | | 3,202,500 | |
Petrobras International Finance Co (Cayman) | | | | | | | | |
3.875% due 01/27/16 | | | 2,750,000 | | | | 2,914,337 | |
5.375% due 01/27/21 | | | 12,560,000 | | | | 14,189,987 | |
7.875% due 03/15/19 | | | 3,600,000 | | | | 4,511,477 | |
Petroleos Mexicanos (Mexico) | | | | | | | | |
5.500% due 01/21/21 | | | 1,570,000 | | | | 1,842,395 | |
6.000% due 03/05/20 | | | 2,000,000 | | | | 2,400,000 | |
8.000% due 05/03/19 | | | 5,700,000 | | | | 7,481,250 | |
Plains Exploration & Production Co
6.125% due 06/15/19 | | | 5,750,000 | | | | 6,296,250 | |
QEP Resources Inc | | | | | | | | |
5.250% due 05/01/23 | | | 1,100,000 | | | | 1,182,500 | |
6.875% due 03/01/21 | | | 690,000 | | | | 798,675 | |
Regency Energy Partners LP
6.500% due 07/15/21 | | | 2,450,000 | | | | 2,695,000 | |
Schlumberger Norge AS (Norway)
4.200% due 01/15/21 ~ | | | 50,000 | | | | 56,598 | |
SESI LLC
7.125% due 12/15/21 | | | 850,000 | | | | 949,875 | |
Shell International Finance BV (Netherlands)
4.375% due 03/25/20 | | | 4,020,000 | | | | 4,666,227 | |
| | | | | | | | |
| | | Principal
Amount | | | Value | |
Sinopec Group Overseas Development Ltd (United Kingdom)
2.750% due 05/17/17 ~ | | | $2,400,000 | | | | $2,493,833 | |
The Williams Cos Inc | | | | | | | | |
7.500% due 01/15/31 | | | 4,635,000 | | | | 5,798,538 | |
7.875% due 09/01/21 | | | 440,000 | | | | 567,286 | |
WPX Energy Inc
6.000% due 01/15/22 | | | 270,000 | | | | 292,275 | |
| | | | | | | | |
| | | | | | | 182,717,936 | |
| | | | | | | | |
Financials - 12.2% | | | | | | | | |
| | |
American Express Credit Corp
5.125% due 08/25/14 | | | 11,279,000 | | | | 12,088,494 | |
American Honda Finance Corp
1.000% due 08/11/15 ~ | | | 5,100,000 | | | | 5,131,645 | |
American International Group Inc | | | | | | | | |
3.750% due 11/30/13 ~ | | | 1,900,000 | | | | 1,949,512 | |
5.850% due 01/16/18 | | | 2,000,000 | | | | 2,368,814 | |
8.250% due 08/15/18 | | | 3,465,000 | | | | 4,561,617 | |
ANZ New Zealand International Ltd (New Zealand)
1.850% due 10/15/15 ~ | | | 2,630,000 | | | | 2,681,359 | |
Bank of America Corp | | | | | | | | |
3.875% due 03/22/17 | | | 1,230,000 | | | | 1,334,848 | |
4.500% due 04/01/15 | | | 6,700,000 | | | | 7,145,081 | |
5.000% due 05/13/21 | | | 5,590,000 | | | | 6,386,709 | |
5.650% due 05/01/18 | | | 6,720,000 | | | | 7,824,553 | |
5.750% due 12/01/17 | | | 560,000 | | | | 653,216 | |
7.625% due 06/01/19 | | | 6,485,000 | | | | 8,302,836 | |
Bank of Tokyo-Mitsubishi UFJ Ltd (Japan) 3.850% due 01/22/15 ~ | | | 2,110,000 | | | | 2,230,584 | |
Barclays Bank PLC (United Kingdom)
6.050% due 12/04/17 ~ | | | 170,000 | | | | 188,829 | |
BBVA U.S. Senior SAU (Spain) | | | | | | | | |
3.250% due 05/16/14 | | | 5,380,000 | | | | 5,386,596 | |
4.664% due 10/09/15 | | | 6,880,000 | | | | 7,058,192 | |
Berkshire Hathaway Inc
3.200% due 02/11/15 | | | 800,000 | | | | 842,606 | |
BNP Paribas SA (France)
2.375% due 09/14/17 | | | 3,740,000 | | | | 3,796,515 | |
Canadian Imperial Bank of Commerce (Canada)
2.000% due 02/04/13 ~ | | | 11,740,000 | | | | 11,756,706 | |
Caterpillar Financial Services Corp
5.450% due 04/15/18 | | | 2,315,000 | | | | 2,767,476 | |
CIT Group Inc
4.250% due 08/15/17 | | | 1,840,000 | | | | 1,902,713 | |
Citigroup Inc | | | | | | | | |
3.953% due 06/15/16 | | | 2,320,000 | | | | 2,498,533 | |
5.500% due 04/11/13 | | | 8,420,000 | | | | 8,507,332 | |
5.500% due 10/15/14 | | | 710,000 | | | | 762,044 | |
5.900% § ± | | | 1,310,000 | | | | 1,328,457 | |
5.950% § ± | | | 2,250,000 | | | | 2,280,938 | |
6.000% due 12/13/13 | | | 8,090,000 | | | | 8,479,024 | |
6.000% due 08/15/17 | | | 5,155,000 | | | | 6,077,585 | |
6.010% due 01/15/15 | | | 5,600,000 | | | | 6,121,814 | |
6.125% due 11/21/17 | | | 100,000 | | | | 119,103 | |
6.375% due 08/12/14 | | | 650,000 | | | | 702,694 | |
6.875% due 03/05/38 | | | 7,000,000 | | | | 9,222,710 | |
8.500% due 05/22/19 | | | 610,000 | | | | 820,698 | |
Commonwealth Bank of Australia (Australia) | | | | | | | | |
1.250% due 09/18/15 | | | 6,100,000 | | | | 6,170,260 | |
3.750% due 10/15/14 ~ | | | 2,490,000 | | | | 2,618,875 | |
5.000% due 10/15/19 ~ | | | 1,060,000 | | | | 1,232,620 | |
Cooperatieve Centrale Raiffeisen-Boerenleenbank BA (Netherlands) 11.000% § ± ~ | | | 3,830,000 | | | | 5,211,699 | |
Credit Agricole SA (France)
8.375% § ± ~ | | | 8,630,000 | | | | 9,190,950 | |
| | |
| See Notes to Financial Statements | | See explanation of symbols and terms, if any, on page B-143 |
B-3
PACIFIC SELECT FUND
DIVERSIFIED BOND PORTFOLIO
Schedule of Investments (Continued)
December 31, 2012
| | | | | | | | |
| | | Principal
Amount | | | Value | |
Daimler Finance North America LLC | | | | | | | | |
1.300% due 07/31/15 ~ | | | $2,310,000 | | | | $2,324,703 | |
2.625% due 09/15/16 ~ | | | 5,390,000 | | | | 5,603,633 | |
Ford Motor Credit Co LLC | | | | | | | | |
4.250% due 09/20/22 | | | 750,000 | | | | 793,735 | |
5.000% due 05/15/18 | | | 3,070,000 | | | | 3,393,940 | |
5.750% due 02/01/21 | | | 1,270,000 | | | | 1,464,013 | |
8.125% due 01/15/20 | | | 2,850,000 | | | | 3,659,751 | |
General Electric Capital Corp | | | | | | | | |
1.625% due 07/02/15 | | | 1,970,000 | | | | 2,003,768 | |
3.750% due 11/14/14 | | | 9,000,000 | | | | 9,494,415 | |
4.375% due 09/16/20 | | | 640,000 | | | | 714,788 | |
5.300% due 02/11/21 | | | 2,640,000 | | | | 3,066,727 | |
5.875% due 01/14/38 | | | 1,570,000 | | | | 1,895,423 | |
6.000% due 08/07/19 | | | 8,010,000 | | | | 9,750,661 | |
6.150% due 08/07/37 | | | 1,105,000 | | | | 1,374,875 | |
6.875% due 01/10/39 | | | 2,440,000 | | | | 3,319,474 | |
Goldman Sachs Capital II
4.000% due 06/01/43 § | | | 8,875,000 | | | | 6,943,179 | |
HSBC Bank USA NA
7.000% due 01/15/39 | | | 3,040,000 | | | | 4,113,135 | |
HSBC Finance Corp
6.676% due 01/15/21 | | | 2,420,000 | | | | 2,873,034 | |
Hyundai Capital America
2.125% due 10/02/17 ~ | | | 1,370,000 | | | | 1,380,864 | |
Intesa Sanpaolo SPA (Italy)
3.625% due 08/12/15 ~ | | | 2,330,000 | | | | 2,332,640 | |
JPMorgan Chase & Co | | | | | | | | |
1.100% due 10/15/15 | | | 7,930,000 | | | | 7,934,528 | |
4.250% due 10/15/20 | | | 1,230,000 | | | | 1,368,922 | |
4.350% due 08/15/21 | | | 690,000 | | | | 772,200 | |
4.500% due 01/24/22 | | | 2,310,000 | | | | 2,615,327 | |
JPMorgan Chase Bank NA
6.000% due 10/01/17 | | | 8,000,000 | | | | 9,477,504 | |
Lloyds Banking Group PLC
(United Kingdom)
5.920% § ± ~ | | | 5,900,000 | | | | 4,543,000 | |
M&T Bank Corp
6.875% ± ~ | | | 4,590,000 | | | | 4,797,936 | |
MetLife Inc
4.750% due 02/08/21 | | | 2,370,000 | | | | 2,753,931 | |
Metropolitan Life Global Funding I
5.125% due 04/10/13 ~ | | | 3,750,000 | | | | 3,797,231 | |
Morgan Stanley | | | | | | | | |
4.750% due 03/22/17 | | | 600,000 | | | | 655,004 | |
5.450% due 01/09/17 | | | 5,155,000 | | | | 5,707,951 | |
National Australia Bank Ltd (Australia) 1.600% due 08/07/15 | | | 2,000,000 | | | | 2,031,174 | |
Nordea Bank AB (Sweden) | | | | | | | | |
3.700% due 11/13/14 ~ | | | 620,000 | | | | 651,140 | |
4.875% due 05/13/21 ~ | | | 6,220,000 | | | | 6,677,692 | |
QBE Insurance Group Ltd (Australia) 9.750% due 03/14/14 ~ | | | 2,026,000 | | | | 2,179,190 | |
Santander U.S. Debt SAU (Spain) | | | | | | | | |
3.724% due 01/20/15 ~ | | | 2,900,000 | | | | 2,914,590 | |
3.781% due 10/07/15 ~ | | | 2,750,000 | | | | 2,767,231 | |
SLM Corp | | | | | | | | |
3.875% due 09/10/15 | | | 2,710,000 | | | | 2,787,338 | |
8.000% due 03/25/20 | | | 3,380,000 | | | | 3,878,550 | |
Standard Chartered PLC (United Kingdom) 6.409% § ± ~ | | | 3,900,000 | | | | 3,982,192 | |
State Street Corp
4.956% due 03/15/18 | | | 9,430,000 | | | | 10,689,697 | |
Sumitomo Mitsui Banking Corp (Japan) | | | | | | | | |
3.100% due 01/14/16 ~ | | | 1,300,000 | | | | 1,386,964 | |
3.150% due 07/22/15 ~ | | | 4,330,000 | | | | 4,563,036 | |
Teachers Insurance & Annuity Association of America
6.850% due 12/16/39 ~ | | | 2,090,000 | | | | 2,837,039 | |
Temasek Financial I Ltd (Singapore) 2.375% due 01/23/23 ~ | | | 3,460,000 | | | | 3,420,843 | |
| | | | | | | | |
| | | Principal
Amount | | | Value | |
The Goldman Sachs Group Inc | | | | | | | | |
4.750% due 07/15/13 | | | $190,000 | | | | $194,010 | |
5.250% due 10/15/13 | | | 930,000 | | | | 962,748 | |
5.250% due 07/27/21 | | | 1,030,000 | | | | 1,175,081 | |
5.750% due 01/24/22 | | | 400,000 | | | | 473,262 | |
5.950% due 01/15/27 | | | 3,270,000 | | | | 3,544,389 | |
6.000% due 05/01/14 | | | 960,000 | | | | 1,022,007 | |
6.000% due 06/15/20 | | | 5,460,000 | | | | 6,492,027 | |
6.250% due 02/01/41 | | | 7,880,000 | | | | 9,676,593 | |
6.750% due 10/01/37 | | | 2,645,000 | | | | 2,999,938 | |
The Royal Bank of Scotland Group PLC (United Kingdom) | | | | | | | | |
2.550% due 09/18/15 | | | 980,000 | | | | 1,003,519 | |
5.000% due 10/01/14 | | | 1,510,000 | | | | 1,552,185 | |
6.400% due 10/21/19 | | | 370,000 | | | | 437,478 | |
7.640% § ± | | | 1,600,000 | | | | 1,456,000 | |
7.648% § ± | | | 420,000 | | | | 428,400 | |
Toyota Motor Credit Corp
1.250% due 10/05/17 | | | 5,450,000 | | | | 5,493,066 | |
UBS AG (Switzerland)
2.250% due 01/28/14 | | | 1,790,000 | | | | 1,816,329 | |
Vesey Street Investment Trust I
4.404% due 09/01/16 § | | | 1,840,000 | | | | 1,986,637 | |
Wachovia Bank NA
6.600% due 01/15/38 | | | 2,080,000 | | | | 2,857,462 | |
Wachovia Capital Trust III
5.570% § ± | | | 6,950,000 | | | | 6,941,312 | |
Wells Fargo & Co | | | | | | | | |
1.500% due 01/16/18 | | | 1,730,000 | | | | 1,734,263 | |
2.100% due 05/08/17 | | | 1,430,000 | | | | 1,479,481 | |
3.676% due 06/15/16 § | | | 2,830,000 | | | | 3,061,222 | |
4.600% due 04/01/21 | | | 6,240,000 | | | | 7,183,008 | |
ZFS Finance USA Trust II
6.450% due 12/15/65 § ~ | | | 4,445,000 | | | | 4,778,375 | |
| | | | | | | | |
| | | | | | | 398,145,997 | |
| | | | | | | | |
Health Care - 2.2% | | | | | | | | |
| | |
AbbVie Inc | | | | | | | | |
1.750% due 11/06/17 ~ | | | 5,730,000 | | | | 5,796,886 | |
2.900% due 11/06/22 ~ | | | 3,500,000 | | | | 3,567,676 | |
Express Scripts Holding Co
3.500% due 11/15/16 ~ | | | 10,520,000 | | | | 11,254,559 | |
GlaxoSmithKline Capital Inc
6.375% due 05/15/38 | | | 2,455,000 | | | | 3,394,396 | |
GlaxoSmithKline Capital PLC (United Kingdom)
2.850% due 05/08/22 | | | 4,100,000 | | | | 4,262,315 | |
HCA Inc | | | | | | | | |
6.500% due 02/15/20 | | | 1,200,000 | | | | 1,353,000 | |
7.500% due 02/15/22 | | | 3,060,000 | | | | 3,519,000 | |
Humana Inc
3.150% due 12/01/22 | | | 1,300,000 | | | | 1,293,959 | |
Medtronic Inc | | | | | | | | |
3.125% due 03/15/22 | | | 430,000 | | | | 456,934 | |
4.450% due 03/15/20 | | | 2,110,000 | | | | 2,452,685 | |
Pfizer Inc | | | | | | | | |
6.200% due 03/15/19 | | | 1,020,000 | | | | 1,290,010 | |
7.200% due 03/15/39 | | | 4,000,000 | | | | 6,137,984 | |
Roche Holdings Inc
6.000% due 03/01/19 ~ | | | 2,400,000 | | | | 2,989,248 | |
Tenet Healthcare Corp | | | | | | | | |
8.875% due 07/01/19 | | | 2,920,000 | | | | 3,285,000 | |
10.000% due 05/01/18 | | | 1,090,000 | | | | 1,245,325 | |
Teva Pharmaceutical Finance Co BV (Netherlands)
3.650% due 11/10/21 | | | 820,000 | | | | 878,323 | |
Teva Pharmaceutical Finance IV BV (Netherlands)
3.650% due 11/10/21 | | | 2,020,000 | | | | 2,163,675 | |
Thermo Fisher Scientific Inc
3.600% due 08/15/21 | | | 1,590,000 | | | | 1,692,394 | |
| | |
| See Notes to Financial Statements | | See explanation of symbols and terms, if any, on page B-143 |
B-4
PACIFIC SELECT FUND
DIVERSIFIED BOND PORTFOLIO
Schedule of Investments (Continued)
December 31, 2012
| | | | | | | | |
| | | Principal
Amount | | | Value | |
UnitedHealth Group Inc | | | | | | | | |
3.875% due 10/15/20 | | | $2,110,000 | | | | $2,339,980 | |
5.700% due 10/15/40 | | | 10,000 | | | | 12,131 | |
5.800% due 03/15/36 | | | 660,000 | | | | 796,921 | |
6.875% due 02/15/38 | | | 1,000,000 | | | | 1,374,286 | |
Watson Pharmaceuticals Inc
1.875% due 10/01/17 | | | 1,590,000 | | | | 1,612,147 | |
WellPoint Inc | | | | | | | | |
1.250% due 09/10/15 | | | 1,210,000 | | | | 1,220,277 | |
3.125% due 05/15/22 | | | 2,050,000 | | | | 2,073,255 | |
3.700% due 08/15/21 | | | 1,610,000 | | | | 1,694,676 | |
7.000% due 02/15/19 | | | 3,870,000 | | | | 4,818,386 | |
| | | | | | | | |
| | | | | | | 72,975,428 | |
| | | | | | | | |
Industrials - 1.9% | | | | | | | | |
| | |
Air 2 U.S.
8.027% due 10/01/20 ~ | | | 1,920,033 | | | | 1,977,634 | |
Boeing Capital Corp
4.700% due 10/27/19 | | | 1,360,000 | | | | 1,605,696 | |
Continental Airlines Inc
6.750% due 09/15/15 ~ | | | 2,225,000 | | | | 2,347,375 | |
CSC Holdings LLC
8.625% due 02/15/19 | | | 3,035,000 | | | | 3,642,000 | |
Delta Air Lines Pass-Through Trust ‘A’ 6.821% due 02/10/24 | | | 4,258,170 | | | | 4,752,969 | |
Eaton Corp | | | | | | | | |
1.500% due 11/02/17 ~ | | | 2,000,000 | | | | 2,005,668 | |
2.750% due 11/02/22 ~ | | | 4,810,000 | | | | 4,799,673 | |
4.150% due 11/02/42 ~ | | | 2,040,000 | | | | 2,065,176 | |
General Electric Co | | | | | | | | |
0.850% due 10/09/15 | | | 2,180,000 | | | | 2,189,001 | |
5.250% due 12/06/17 | | | 3,535,000 | | | | 4,171,424 | |
International Lease Finance Corp | | | | | | | | |
6.500% due 09/01/14 ~ | | | 2,080,000 | | | | 2,230,800 | |
6.750% due 09/01/16 ~ | | | 5,660,000 | | | | 6,381,650 | |
John Deere Capital Corp
5.350% due 04/03/18 | | | 3,480,000 | | | | 4,156,035 | |
Kansas City Southern de Mexico SA de CV (Mexico)
12.500% due 04/01/16 | | | 2,389,000 | | | | 2,627,900 | |
Raytheon Co
3.125% due 10/15/20 | | | 1,680,000 | | | | 1,788,713 | |
The Boeing Co
4.875% due 02/15/20 | | | 5,300,000 | | | | 6,389,850 | |
UAL Pass-Through Trust
9.750% due 07/15/18 | | | 621,919 | | | | 719,872 | |
United Technologies Corp | | | | | | | | |
4.500% due 04/15/20 | | | 2,130,000 | | | | 2,504,181 | |
4.500% due 06/01/42 | | | 2,320,000 | | | | 2,580,515 | |
Waste Management Inc
7.375% due 05/15/29 | | | 1,510,000 | | | | 1,994,708 | |
| | | | | | | | |
| | | | | | | 60,930,840 | |
| | | | | | | | |
Information Technology - 0.2% | | | | | | | | |
| | |
Freescale Semiconductor Inc
10.125% due 12/15/16 | | | 816,000 | | | | 842,520 | |
Hewlett-Packard Co
4.500% due 03/01/13 | | | 325,000 | | | | 326,744 | |
National Semiconductor Corp
6.600% due 06/15/17 | | | 380,000 | | | | 469,605 | |
Oracle Corp
1.200% due 10/15/17 | | | 5,180,000 | | | | 5,199,472 | |
| | | | | | | | |
| | | | | | | 6,838,341 | |
| | | | | | | | |
Materials - 3.3% | | | | | | | | |
| | |
ArcelorMittal (Luxembourg)
5.000% due 02/25/17 | | | 1,330,000 | | | | 1,343,343 | |
Ball Corp
6.750% due 09/15/20 | | | 2,880,000 | | | | 3,189,600 | |
Barrick Gold Corp (Canada) | | | | | | | | |
3.850% due 04/01/22 | | | 810,000 | | | | 858,142 | |
6.950% due 04/01/19 | | | 2,470,000 | | | | 3,075,004 | |
| | | | | | | | |
| | | Principal
Amount | | | Value | |
Barrick North America Finance LLC
4.400% due 05/30/21 | | | $3,500,000 | | | | $3,841,222 | |
BHP Billiton Finance USA Ltd (Australia) | | | | | | | | |
3.250% due 11/21/21 | | | 1,070,000 | | | | 1,152,572 | |
6.500% due 04/01/19 | | | 6,830,000 | | | | 8,715,394 | |
Celulosa Arauco y Constitucion SA (Chile) 4.750% due 01/11/22 | | | 2,625,000 | | | | 2,763,681 | |
Cliffs Natural Resources Inc | | | | | | | | |
3.950% due 01/15/18 | | | 1,800,000 | | | | 1,813,066 | |
4.800% due 10/01/20 | | | 1,210,000 | | | | 1,203,346 | |
6.250% due 10/01/40 | | | 4,960,000 | | | | 4,839,517 | |
Ecolab Inc
4.350% due 12/08/21 | | | 1,270,000 | | | | 1,418,717 | |
FMG Resources Property Ltd (Australia) | | | | | | | | |
6.375% due 02/01/16 ~ | | | 540,000 | | | | 561,600 | |
7.000% due 11/01/15 ~ | | | 3,060,000 | | | | 3,228,300 | |
Freeport-McMoRan Copper & Gold Inc 3.550% due 03/01/22 | | | 6,325,000 | | | | 6,278,334 | |
Georgia-Pacific LLC
7.700% due 06/15/15 | | | 780,000 | | | | 900,416 | |
LyondellBasell Industries NV (Netherlands) | | | | | | | | |
5.000% due 04/15/19 | | | 885,000 | | | | 982,350 | |
5.750% due 04/15/24 | | | 885,000 | | | | 1,044,300 | |
6.000% due 11/15/21 | | | 1,890,000 | | | | 2,225,475 | |
Potash Corp of Saskatchewan Inc (Canada) 4.875% due 03/30/20 | | | 640,000 | | | | 736,202 | |
Rio Tinto Finance USA Ltd (Australia) | | | | | | | | |
1.875% due 11/02/15 | | | 3,700,000 | | | | 3,799,637 | |
2.500% due 05/20/16 | | | 1,410,000 | | | | 1,472,755 | |
3.750% due 09/20/21 | | | 2,320,000 | | | | 2,482,811 | |
4.125% due 05/20/21 | | | 1,120,000 | | | | 1,238,516 | |
6.500% due 07/15/18 | | | 870,000 | | | | 1,086,751 | |
9.000% due 05/01/19 | | | 2,880,000 | | | | 3,957,990 | |
RockTenn Co | | | | | | | | |
3.500% due 03/01/20 ~ | | | 1,020,000 | | | | 1,047,648 | |
4.000% due 03/01/23 ~ | | | 1,330,000 | | | | 1,352,345 | |
Southern Copper Corp
5.250% due 11/08/42 | | | 7,320,000 | | | | 7,341,828 | |
Steel Dynamics Inc
7.625% due 03/15/20 | | | 1,700,000 | | | | 1,887,000 | |
Vale Overseas Ltd (Cayman) | | | | | | | | |
4.375% due 01/11/22 | | | 10,949,000 | | | | 11,730,649 | |
6.875% due 11/21/36 | | | 4,520,000 | | | | 5,611,793 | |
8.250% due 01/17/34 | | | 1,205,000 | | | | 1,656,412 | |
Vedanta Resources PLC (United Kingdom) | | | | | | | | |
8.750% due 01/15/14 ~ | | | 2,288,000 | | | | 2,413,840 | |
9.500% due 07/18/18 ~ | | | 1,100,000 | | | | 1,280,180 | |
Xstrata Finance Canada Ltd (Canada) | | | | | | | | |
1.800% due 10/23/15 ~ | | | 3,820,000 | | | | 3,843,050 | |
2.450% due 10/25/17 ~ | | | 3,430,000 | | | | 3,465,912 | |
| | | | | | | | |
| | | | | | | 105,839,698 | |
| | | | | | | | |
Telecommunication Services - 2.2% | | | | | | | | |
| | |
America Movil SAB de CV (Mexico) | | | | | | | | |
5.000% due 03/30/20 | | | 2,740,000 | | | | 3,198,857 | |
5.625% due 11/15/17 | | | 1,500,000 | | | | 1,810,245 | |
AT&T Inc | | | | | | | | |
2.625% due 12/01/22 | | | 2,500,000 | | | | 2,506,505 | |
3.875% due 08/15/21 | | | 2,750,000 | | | | 3,067,394 | |
4.350% due 06/15/45 ~ | | | 52,000 | | | | 52,288 | |
4.450% due 05/15/21 | | | 60,000 | | | | 69,346 | |
5.100% due 09/15/14 | | | 780,000 | | | | 838,221 | |
5.500% due 02/01/18 | | | 5,915,000 | | | | 7,051,904 | |
5.550% due 08/15/41 | | | 1,560,000 | | | | 1,873,938 | |
5.600% due 05/15/18 | | | 260,000 | | | | 313,884 | |
6.300% due 01/15/38 | | | 5,375,000 | | | | 6,897,748 | |
Cellco Partnership
8.500% due 11/15/18 | | | 7,120,000 | | | | 9,803,129 | |
Cricket Communications Inc
7.750% due 05/15/16 | | | 500,000 | | | | 531,875 | |
| | |
| See Notes to Financial Statements | | See explanation of symbols and terms, if any, on page B-143 |
B-5
PACIFIC SELECT FUND
DIVERSIFIED BOND PORTFOLIO
Schedule of Investments (Continued)
December 31, 2012
| | | | | | | | |
| | | Principal
Amount | | | Value | |
Deutsche Telekom International Finance BV (Netherlands) | | | | | | | | |
5.750% due 03/23/16 | | | $3,300,000 | | | | $3,761,977 | |
6.750% due 08/20/18 | | | 1,545,000 | | | | 1,920,036 | |
Intelsat Jackson Holdings SA (Luxembourg) | | | | | | | | |
7.250% due 04/01/19 | | | 2,088,000 | | | | 2,255,040 | |
7.500% due 04/01/21 | | | 2,520,000 | | | | 2,790,900 | |
Rogers Communications Inc (Canada) 6.800% due 08/15/18 | | | 760,000 | | | | 962,162 | |
Sprint Capital Corp
8.750% due 03/15/32 | | | 3,899,000 | | | | 4,786,022 | |
Sprint Nextel Corp
9.000% due 11/15/18 ~ | | | 1,870,000 | | | | 2,314,125 | |
Telefonica Emisiones SAU (Spain) | | | | | | | | |
5.134% due 04/27/20 | | | 2,380,000 | | | | 2,507,925 | |
5.462% due 02/16/21 | | | 370,000 | | | | 395,438 | |
5.877% due 07/15/19 | | | 350,000 | | | | 383,250 | |
6.221% due 07/03/17 | | | 150,000 | | | | 167,250 | |
6.421% due 06/20/16 | | | 250,000 | | | | 277,250 | |
UPCB Finance III Ltd (Cayman)
6.625% due 07/01/20 ~ | | | 2,340,000 | | | | 2,518,425 | |
Verizon Communications Inc | | | | | | | | |
1.250% due 11/03/14 | | | 3,000,000 | | | | 3,036,816 | |
2.450% due 11/01/22 | | | 6,030,000 | | | | 6,037,785 | |
Vimpel Communications (Ireland)
8.375% due 04/30/13 ~ | | | 515,000 | | | | 527,772 | |
| | | | | | | | |
| | | | | | | 72,657,507 | |
| | | | | | | | |
Utilities - 1.6% | | | | | | | | |
| | |
AEP Texas Central Transition Funding LLC 5.306% due 07/01/21 | | | 2,500,000 | | | | 3,077,016 | |
Calpine Construction Finance Co LP 8.000% due 06/01/16 ~ | | | 1,285,000 | | | | 1,371,738 | |
Calpine Corp
7.500% due 02/15/21 ~ | | | 3,402,000 | | | | 3,776,220 | |
Dominion Resources Inc | | | | | | | | |
5.150% due 07/15/15 | | | 4,500,000 | | | | 4,970,885 | |
5.200% due 08/15/19 | | | 2,300,000 | | | | 2,735,914 | |
DPL Inc
7.250% due 10/15/21 | | | 550,000 | | | | 591,250 | |
Duke Energy Corp
3.550% due 09/15/21 | | | 1,050,000 | | | | 1,107,494 | |
Energy Future Intermediate Holding Co LLC 10.000% due 12/01/20 | | | 4,500,000 | | | | 5,096,250 | |
FirstEnergy Corp
7.375% due 11/15/31 | | | 8,750,000 | | | | 11,308,981 | |
MidAmerican Energy Holdings Co | | | | | | | | |
6.125% due 04/01/36 | | | 601,000 | | | | 759,285 | |
6.500% due 09/15/37 | | | 2,400,000 | | | | 3,190,385 | |
Pacific Gas & Electric Co | | | | | | | | |
6.050% due 03/01/34 | | | 3,052,000 | | | | 3,935,285 | |
8.250% due 10/15/18 | | | 930,000 | | | | 1,267,269 | |
PacifiCorp
5.650% due 07/15/18 | | | 1,860,000 | | | | 2,274,038 | |
The AES Corp | | | | | | | | |
8.000% due 06/01/20 | | | 2,530,000 | | | | 2,922,150 | |
9.750% due 04/15/16 | | | 990,000 | | | | 1,188,000 | |
Virginia Electric & Power Co 6.350% due 11/30/37 | | | 1,680,000 | | | | 2,322,696 | |
| | | | | | | | |
| | | | | | | 51,894,856 | |
| | | | | | | | |
Total Corporate Bonds & Notes (Cost $1,007,317,142) | | | | | | | 1,109,928,305 | |
| | | | | | | | |
| | |
SENIOR LOAN NOTES - 1.5% | | | | | | | | |
| | |
Consumer Discretionary - 0.8% | | | | | | | | |
| | |
Allison Transmission Inc Term B1
2.710% due 08/07/14 § | | | 427,613 | | | | 430,419 | |
AMC Entertainment Inc Term B2 (Extended)
4.250% due 12/15/16 § | | | 1,957,895 | | | | 1,971,661 | |
| | | | | | | | |
| | | Principal
Amount | | | Value | |
Caesars Entertainment Operating Co Term B6 (Extended)
5.467% due 01/26/18 § | | | $1,800,000 | | | | $1,612,350 | |
Cengage Learning Acquisitions Inc (Extended)
5.720% due 07/05/17 § | | | 1,371,062 | | | | 1,083,139 | |
Charter Communications Operating LLC | | | | | | | | |
Term C (Extended) | | | | | | | | |
3.470% due 09/06/16 § | | | 2,029,547 | | | | 2,042,859 | |
Term D | | | | | | | | |
4.000% due 05/15/19 § | | | 1,488,750 | | | | 1,502,475 | |
Dunkin Brands Inc Term B2
4.000% due 11/23/17 § | | | 1,487,881 | | | | 1,500,586 | |
Landry’s Inc Term B
6.500% due 04/24/18 § | | | 1,985,000 | | | | 2,009,812 | |
Las Vegas Sands LLC | | | | | | | | |
(Extended) (Delayed Draw) | | | | | | | | |
2.760% due 11/23/16 § | | | 421,699 | | | | 423,162 | |
Term B (Extended) | | | | | | | | |
2.760% due 11/23/16 § | | | 2,098,164 | | | | 2,105,442 | |
Michaels Stores Inc Term B2
4.912% due 07/29/16 § | | | 2,048,108 | | | | 2,069,320 | |
The Gymboree Corp (Initial)
5.000% due 02/23/18 § | | | 1,875,859 | | | | 1,734,231 | |
The Neiman Marcus Group Inc (Extended) 4.750% due 05/16/18 § | | | 2,000,000 | | | | 2,006,388 | |
Univision Communications Inc (Extended) 4.466% due 03/31/17 § | | | 2,375,524 | | | | 2,341,190 | |
Visant Holding Corp Term B
5.250% due 12/22/16 § | | | 1,471,901 | | | | 1,337,222 | |
Wendy’s International Inc Term B
4.750% due 05/15/19 § | | | 1,995,000 | | | | 2,017,801 | |
| | | | | | | | |
| | | | | | | 26,188,057 | |
| | | | | | | | |
Consumer Staples - 0.0% | | | | | | | | |
| | |
Del Monte Foods Co
4.500% due 03/08/18 § | | | 958,759 | | | | 962,155 | |
| | | | | | | | |
| | |
Financials - 0.1% | | | | | | | | |
| | |
First Data Corp | | | | | | | | |
(Add on) | | | | | | | | |
5.216% due 09/24/18 § | | | 1,000,000 | | | | 983,125 | |
Term B (Extended) | | | | | | | | |
4.217% due 03/23/18 § | | | 3,257,313 | | | | 3,109,603 | |
Term B2 (Non-Extended) | | | | | | | | |
2.967% due 09/24/14 § | | | 175,297 | | | | 175,557 | |
| | | | | | | | |
| | | | | | | 4,268,285 | |
| | | | | | | | |
Health Care - 0.1% | | | | | | | | |
| | |
Capsugel Holdings U.S. Inc Term B
4.750% due 08/01/18 § | | | 1,351,949 | | | | 1,368,848 | |
CHS/Community Health Systems Inc (Extended)
3.921% due 01/25/17 § | | | 170,930 | | | | 172,198 | |
Hanger Orthopedic Group Inc Term C 4.012% due 12/01/16 § | | | 1,473,869 | | | | 1,481,239 | |
| | | | | | | | |
| | | | | | | 3,022,285 | |
| | | | | | | | |
Industrials - 0.3% | | | | | | | | |
| | |
BakerCorp International Inc Term B
5.000% due 06/01/18 § | | | 994,962 | | | | 1,002,840 | |
FGI Operating Company LLC
5.500% due 04/19/19 § | | | 1,990,926 | | | | 1,946,130 | |
Nielsen Finance LLC Term C
3.463% due 05/02/16 § | | | 3,374,046 | | | | 3,396,024 | |
Schaeffler AG Term C2 (Germany)
6.000% due 01/27/17 § | | | 2,000,000 | | | | 2,025,000 | |
The Hertz Corp Term B
3.750% due 03/09/18 § | | | 992,424 | | | | 993,122 | |
| | | | | | | | |
| | | | | | | 9,363,116 | |
| | | | | | | | |
| | |
| See Notes to Financial Statements | | See explanation of symbols and terms, if any, on page B-143 |
B-6
PACIFIC SELECT FUND
DIVERSIFIED BOND PORTFOLIO
Schedule of Investments (Continued)
December 31, 2012
| | | | | | | | |
| | | Principal
Amount | | | Value | |
Materials - 0.1% | | | | | | | | |
| | |
Fairmount Minerals Ltd Term B
5.250% due 03/15/17 § | | | $1,752,688 | | | | $1,749,872 | |
| | | | | | | | |
| | |
Telecommunication Services - 0.1% | | | | | | | | |
| | |
Telesat LLC Term B
4.250% due 03/28/19 § | | | 1,492,500 | | | | 1,505,559 | |
| | | | | | | | |
| | |
Utilities - 0.0% | | | | | | | | |
| | |
Equipower Resources Holdings LLC (1st Lien)
6.500% due 12/21/18 § | | | 1,243,750 | | | | 1,256,965 | |
| | | | | | | | |
| | |
Total Senior Loan Notes
(Cost $48,201,308) | | | | | | | 48,316,294 | |
| | | | | | | | |
|
MORTGAGE-BACKED SECURITIES - 37.0% | |
|
Collateralized Mortgage Obligations - Commercial - 1.4% | |
| | |
Banc of America Commercial Mortgage Trust | | | | | | | | |
5.421% due 09/10/45 " § | | | 1,119,000 | | | | 1,225,118 | |
5.732% due 05/10/45 " § | | | 3,980,000 | | | | 4,569,595 | |
Bear Stearns Commercial Mortgage Securities
5.712% due 09/11/38 " § | | | 6,625,000 | | | | 7,600,051 | |
Citigroup Commercial Mortgage Trust 5.702% due 12/10/49 " § | | | 480,000 | | | | 546,335 | |
Commercial Mortgage Pass-Through Trust 5.748% due 06/10/46 " § | | | 5,000,000 | | | | 5,690,330 | |
DBUBS Mortgage Trust (IO)
1.461% due 08/10/44 " § ~ | | | 13,166,604 | | | | 612,425 | |
GE Capital Commercial Mortgage Corp Trust
5.543% due 12/10/49 " | | | 920,000 | | | | 1,055,542 | |
Greenwich Capital Commercial Funding Corp
5.867% due 07/10/38 " § | | | 2,041,000 | | | | 2,303,441 | |
GS Mortgage Securities Corp II (IO)
1.756% due 08/10/44 " § ~ | | | 5,765,494 | | | | 497,983 | |
JP Morgan Chase Commercial Mortgage Securities Corp | | | | | | | | |
5.336% due 05/15/47 " | | | 4,455,000 | | | | 5,114,369 | |
5.440% due 05/15/45 " | | | 1,516,000 | | | | 1,710,007 | |
5.930% due 02/12/51 " § | | | 400,000 | | | | 464,871 | |
LB-UBS Commercial Mortgage Trust | | | | | | | | |
5.424% due 02/15/40 " | | | 235,000 | | | | 273,523 | |
5.865% due 06/15/38 " § | | | 1,575,000 | | | | 1,822,677 | |
Lehman Brothers Floating Rate Commercial Mortgage Trust
0.329% due 09/15/21 " § ~ | | | 442,264 | | | | 441,301 | |
Merrill Lynch Mortgage Trust
5.849% due 06/12/50 " § | | | 140,000 | | | | 161,781 | |
Merrill Lynch/Countrywide Commercial Mortgage Trust | | | | | | | | |
5.204% due 12/12/49 " § | | | 680,000 | | | | 754,480 | |
5.378% due 08/12/48 " | | | 5,570,000 | | | | 6,404,996 | |
Morgan Stanley Bank of America Merrill
Lynch Trust (IO)
1.937% due 08/15/45 " § ~ | | | 10,797,000 | | | | 1,211,855 | |
UBS-Barclays Commercial Mortgage Trust 3.317% due 12/10/45 " ~ | | | 1,740,000 | | | | 1,769,208 | |
Wachovia Bank Commercial Mortgage Trust
5.308% due 11/15/48 " | | | 1,037,000 | | | | 1,195,510 | |
WFRBS Commercial Mortgage Trust (IO) | | | | | | | | |
1.152% due 02/15/44 " § ~ | | | 16,295,706 | | | | 794,880 | |
1.608% due 06/15/45 " § ~ | | | 3,257,383 | | | | 355,351 | |
| | | | | | | | |
| | | | | | | 46,575,629 | |
| | | | | | | | |
| | | | | | | | |
| | | Principal
Amount | | | Value | |
Collateralized Mortgage Obligations - Residential - 14.3% | |
| | |
Adjustable Rate Mortgage Trust | | | | | | | | |
0.460% due 03/25/36 " § | | | $903,974 | | | | $540,103 | |
2.860% due 07/25/35 " § | | | 1,139,420 | | | | 980,606 | |
2.871% due 10/25/35 " § | | | 10,260,000 | | | | 8,103,958 | |
Bear Stearns Adjustable Rate Mortgage Trust
2.649% due 10/25/36 " § | | | 601,482 | | | | 467,445 | |
CC Funding Corp | | | | | | | | |
0.390% due 08/25/47 " § ~ | | | 1,378,143 | | | | 831,692 | |
0.410% due 01/25/36 " § ~ | | | 17,607 | | | | 13,735 | |
0.440% due 07/25/36 " § ~ | | | 202,276 | | | | 161,024 | |
0.500% due 10/25/35 " § ~ | | | 50,467 | | | | 40,736 | |
0.510% due 08/25/35 " § ~ | | | 22,180 | | | | 17,767 | |
Citigroup Mortgage Loan Trust | | | | | | | | |
2.430% due 02/25/36 " § ~ | | | 3,062,305 | | | | 3,053,838 | |
2.838% due 04/25/37 " § | | | 2,864,278 | | | | 2,258,462 | |
6.500% due 10/25/36 " ~ | | | 4,458,189 | | | | 3,041,729 | |
Citimortgage Alternative Loan Trust
6.000% due 01/25/37 " | | | 8,018,624 | | | | 6,403,196 | |
Countrywide Alternative Loan Trust | | | | | | | | |
6.000% due 03/25/27 " | | | 718,058 | | | | 651,297 | |
6.500% due 09/25/34 " | | | 1,710,453 | | | | 1,743,309 | |
6.500% due 09/25/36 " | | | 3,888,185 | | | | 3,034,586 | |
Countrywide Home Loan Mortgage
Pass-Through Trust
5.500% due 07/25/35 " | | | 4,659,824 | | | | 4,794,255 | |
Fannie Mae | | | | | | | | |
0.560% due 05/25/34 " § | | | 2,254,851 | | | | 2,263,322 | |
4.000% due 04/25/40 - 07/25/40 " | | | 37,500,000 | | | | 40,938,375 | |
5.500% due 04/25/42 " | | | 17,000,000 | | | | 19,001,027 | |
6.000% due 05/25/42 " | | | 7,900,000 | | | | 8,861,987 | |
6.500% due 06/25/39 - 07/25/42 " | | | 20,000,000 | | | | 22,822,368 | |
7.000% due 05/25/42 " | | | 3,466,562 | | | | 4,095,984 | |
Fannie Mae (IO) | | | | | | | | |
3.000% due 11/25/26 - 09/25/27 " | | | 26,353,397 | | | | 2,897,631 | |
3.500% due 11/25/41 " | | | 6,461,379 | | | | 719,644 | |
4.000% due 11/25/39 " | | | 3,068,130 | | | | 329,305 | |
4.500% due 11/25/39 " | | | 2,228,115 | | | | 240,890 | |
4.790% due 04/25/40 " § | | | 15,617,620 | | | | 1,505,292 | |
5.000% due 01/25/38 - 01/25/39 " | | | 4,932,820 | | | | 572,495 | |
5.000% due 01/25/39 " § | | | 1,598,936 | | | | 172,536 | |
5.190% due 08/25/42 " § | | | 3,309,223 | | | | 677,951 | |
5.500% due 01/25/39 " § | | | 1,569,189 | | | | 197,522 | |
5.710% due 06/25/41 " § | | | 6,900,485 | | | | 996,532 | |
5.740% due 09/25/41 " § | | | 12,165,040 | | | | 2,272,371 | |
5.790% due 12/25/40 - 08/25/42 " § | | | 24,647,018 | | | | 3,939,815 | |
5.890% due 07/25/40 - 09/25/42 " § | | | 5,348,740 | | | | 1,388,144 | |
5.940% due 11/25/42 - 12/25/42 " § | | | 4,080,311 | | | | 1,159,689 | |
5.950% due 12/25/39 " § | | | 2,493,955 | | | | 315,399 | |
6.000% due 01/25/38 - 07/25/38 " | | | 7,059,134 | | | | 897,184 | |
6.220% due 05/25/41 " § | | | 1,753,528 | | | | 304,348 | |
6.270% due 04/25/40 " § | | | 3,437,463 | | | | 563,144 | |
6.290% due 09/25/36 - 06/25/42 " § | | | 11,575,640 | | | | 2,006,779 | |
6.320% due 12/25/40 - 01/25/41 " § | | | 7,203,072 | | | | 1,194,895 | |
6.340% due 03/25/39 - 07/25/39 " § | | | 9,018,286 | | | | 2,239,773 | |
6.390% due 11/25/36 - 07/25/42 " § | | | 5,391,458 | | | | 1,237,229 | |
6.430% due 07/25/41 " § | | | 3,097,666 | | | | 426,343 | |
6.440% due 09/25/40 - 03/25/42 " § | | | 13,618,454 | | | | 2,623,408 | |
6.470% due 07/25/41 " § | | | 6,715,302 | | | | 1,041,521 | |
6.490% due 07/25/26 - 02/25/27 " § | | | 10,331,531 | | | | 1,907,093 | |
Fannie Mae (PO)
0.272% due 03/25/42 " | | | 800,000 | | | | 750,810 | |
Freddie Mac | | | | | | | | |
1.209% due 02/15/32 " § | | | 317,798 | | | | 325,294 | |
4.000% due 12/15/39 " | | | 10,346,417 | | | | 11,339,383 | |
5.000% due 02/15/30 - 03/15/35 " | | | 25,676,691 | | | | 29,081,306 | |
5.500% due 07/15/34 " | | | 9,696,754 | | | | 11,416,138 | |
6.000% due 05/15/36 " | | | 9,490,713 | | | | 10,973,865 | |
| | |
| See Notes to Financial Statements | | See explanation of symbols and terms, if any, on page B-143 |
B-7
PACIFIC SELECT FUND
DIVERSIFIED BOND PORTFOLIO
Schedule of Investments (Continued)
December 31, 2012
| | | | | | | | |
| | | Principal
Amount | | | Value | |
Freddie Mac (IO) | | | | | | | | |
3.000% due 09/15/31 " | | | $5,822,977 | | | | $686,347 | |
5.741% due 06/15/42 " § | | | 1,154,381 | | | | 276,910 | |
5.791% due 06/15/42 " § | | | 9,025,314 | | | | 2,291,622 | |
5.821% due 09/15/37 " § | | | 3,850,714 | | | | 640,556 | |
5.841% due 04/15/39 - 09/15/39 " § | | | 22,993,992 | | | | 4,585,994 | |
5.891% due 10/15/42 " § | | | 3,284,596 | | | | 868,524 | |
5.941% due 10/15/42 - 11/15/42 " § | | | 5,185,706 | | | | 1,517,082 | |
6.000% due 01/15/41 " | | | 4,308,594 | | | | 673,580 | |
6.021% due 01/15/40 " § | | | 1,282,864 | | | | 187,213 | |
6.031% due 02/15/40 " § | | | 3,299,674 | | | | 535,955 | |
6.081% due 11/15/36 " § | | | 2,122,095 | | | | 362,653 | |
6.391% due 11/15/41 - 09/15/42 " § | | | 10,191,958 | | | | 2,714,107 | |
6.481% due 12/15/36 " § | | | 2,317,328 | | | | 418,412 | |
6.991% due 08/15/35 " § | | | 1,330,369 | | | | 183,885 | |
Freddie Mac Multifamily Structured
Pass-Through Certificates (IO) | | | | | | | | |
0.559% due 04/15/33 " § | | | 1,199,172 | | | | 1,200,815 | |
1.051% due 01/25/20 " § | | | 11,396,877 | | | | 680,086 | |
1.229% due 04/25/20 " § | | | 34,048,399 | | | | 2,289,976 | |
1.271% due 04/25/21 " § | | | 10,012,917 | | | | 842,342 | |
1.395% due 06/25/21 " § | | | 11,024,102 | | | | 940,064 | |
1.456% due 12/25/21 " § | | | 7,212,302 | | | | 719,582 | |
1.506% due 08/25/20 " § | | | 12,938,054 | | | | 1,071,044 | |
1.515% due 06/25/22 " § | | | 4,358,129 | | | | 485,960 | |
1.557% due 02/25/18 " § | | | 32,532,959 | | | | 2,222,375 | |
1.582% due 10/25/21 " § | | | 6,110,050 | | | | 668,299 | |
1.675% due 06/25/20 " § | | | 33,813,997 | | | | 3,188,187 | |
1.675% due 07/25/21 " § | | | 15,102,772 | | | | 1,705,986 | |
2.090% due 05/25/18 " § | | | 24,031,352 | | | | 2,320,227 | |
Government National Mortgage Association | | | | | | | | |
0.560% due 08/20/58 " § | | | 23,863,255 | | | | 23,937,028 | |
0.710% due 03/20/61 " § | | | 3,497,577 | | | | 3,537,367 | |
1.209% due 05/20/60 " § | | | 928,353 | | | | 957,476 | |
4.500% due 07/20/39 - 10/20/39 " | | | 18,800,000 | | | | 21,536,837 | |
5.000% due 07/20/39 - 04/16/40 " | | | 10,600,000 | | | | 12,345,600 | |
Government National Mortgage
Association (IO) | | | | | | | | |
3.500% due 04/20/27 - 02/20/38 " | | | 11,874,151 | | | | 1,712,689 | |
4.039% due 12/20/40 " § | | | 1,665,238 | | | | 229,282 | |
5.000% due 11/20/36 " | | | 5,164,523 | | | | 392,233 | |
5.469% due 03/20/40 " § | | | 12,044,430 | | | | 1,851,061 | |
5.539% due 03/20/40 " § | | | 14,180,061 | | | | 2,115,475 | |
5.789% due 09/20/40 - 03/20/41 " § | | | 13,437,400 | | | | 2,164,963 | |
5.791% due 02/16/40 - 03/16/41 " § | | | 2,690,143 | | | | 486,482 | |
5.889% due 06/20/42 " § | | | 4,367,625 | | | | 1,049,263 | |
5.891% due 08/16/42 " § | | | 3,771,360 | | | | 889,344 | |
5.921% due 02/16/36 " § | | | 6,228,251 | | | | 816,217 | |
5.939% due 02/20/40 " § | | | 8,819,473 | | | | 1,456,337 | |
5.969% due 09/20/40 " § | | | 2,625,714 | | | | 410,069 | |
5.989% due 05/20/37 " § | | | 6,310,770 | | | | 954,302 | |
6.039% due 02/20/40 " § | | | 10,540,690 | | | | 1,880,405 | |
6.139% due 11/20/39 " § | | | 2,781,558 | | | | 388,045 | |
6.269% due 04/20/40 " § | | | 838,743 | | | | 152,556 | |
6.289% due 03/20/39 - 05/20/40 " § | | | 8,779,552 | | | | 1,657,230 | |
6.339% due 11/20/38 - 12/20/38 " § | | | 2,666,518 | | | | 375,901 | |
6.341% due 04/16/34 " § | | | 1,509,239 | | | | 82,202 | |
6.419% due 11/20/38 " § | | | 1,640,134 | | | | 207,955 | |
6.439% due 01/20/40 " § | | | 1,359,076 | | | | 236,631 | |
6.441% due 11/16/41 " § | | | 2,001,183 | | | | 484,460 | |
6.489% due 06/20/35 " § | | | 2,420,863 | | | | 240,942 | |
6.491% due 12/16/36 " § | | | 3,211,524 | | | | 460,082 | |
6.539% due 02/20/35 " § | | | 3,937,598 | | | | 685,455 | |
GSMPS Mortgage Loan Trust | | | | | | | | |
0.560% due 03/25/35 " § ~ | | | 1,939,351 | | | | 1,632,624 | |
0.560% due 09/25/35 " § ~ | | | 5,743,402 | | | | 4,833,865 | |
GSR Mortgage Loan Trust
2.756% due 07/25/35 " § | | | 1,000,000 | | | | 912,812 | |
GSR Mortgage Loan Trust (IO)
6.340% due 10/25/36 " § | | | 3,914,023 | | | | 925,749 | |
| | | | | | | | |
| | | Principal
Amount | | | Value | |
Homestar Mortgage Acceptance Corp 0.760% due 01/25/35 " § | | | $2,066,596 | | | | $1,983,514 | |
Indymac Index Mortgage Loan Trust | | | | | | | | |
0.450% due 06/25/37 " § | | | 4,987,369 | | | | 4,071,274 | |
0.470% due 06/25/35 " § | | | 3,770,259 | | | | 3,017,395 | |
JPMorgan Mortgage Trust
3.105% due 08/25/35 " § | | | 2,400,000 | | | | 2,191,972 | |
Lehman Mortgage Trust
6.000% due 05/25/37 " | | | 1,396,555 | | | | 1,313,833 | |
MASTR Adjustable Rate Mortgages Trust 2.670% due 04/21/34 " § | | | 5,225,780 | | | | 5,358,272 | |
MASTR Reperforming Loan Trust | | | | | | | | |
0.570% due 07/25/35 " § ~ | | | 7,763,250 | | | | 6,035,776 | |
7.000% due 08/25/34 " ~ | | | 2,655,388 | | | | 2,705,245 | |
Merrill Lynch Mortgage Investors Inc 2.582% due 06/25/35 " § | | | 4,000,000 | | | | 3,699,994 | |
Morgan Stanley Mortgage Loan Trust | | | | | | | | |
2.909% due 07/25/35 " § | | | 3,178,617 | | | | 2,501,198 | |
2.982% due 07/25/34 " § | | | 1,446,654 | | | | 1,433,205 | |
Nomura Asset Acceptance Corp
6.500% due 02/25/35 " ~ | | | 3,626,969 | | | | 3,785,897 | |
RAAC Series
6.000% due 09/25/34 " | | | 1,737,190 | | | | 1,761,370 | |
RBSSP Resecuritization Trust
3.460% due 12/26/35 " § ~ | | | 1,833,339 | | | | 1,859,290 | |
Residential Asset Securitization Trust | | | | | | | | |
0.710% due 07/25/36 " § | | | 1,133,255 | | | | 727,689 | |
6.000% due 08/25/36 " | | | 3,010,395 | | | | 2,614,098 | |
Structured Adjustable Rate Mortgage
Loan Trust | | | | | | | | |
0.510% due 08/25/37 " § | | | 1,642,084 | | | | 1,169,973 | |
2.804% due 05/25/34 " § | | | 2,288,981 | | | | 2,329,996 | |
5.313% due 05/25/36 " § | | | 5,473,284 | | | | 4,421,439 | |
5.324% due 05/25/36 " § | | | 7,743,639 | | | | 6,427,568 | |
Wachovia Mortgage Loan Trust LLC 0.390% due 01/25/37 " § | | | 1,666,059 | | | | 998,430 | |
WaMu Mortgage Pass-Through Certificates | | | | | | | | |
0.500% due 10/25/45 " § | | | 5,642,478 | | | | 5,390,140 | |
0.530% due 08/25/45 " § | | | 7,111,330 | | | | 6,701,874 | |
0.800% due 07/25/44 " § | | | 781,602 | | | | 714,473 | |
2.435% due 09/25/33 " § | | | 604,214 | | | | 618,306 | |
2.461% due 02/25/33 " § | | | 1,616,382 | | | | 1,624,736 | |
2.473% due 10/25/33 " § | | | 5,948,284 | | | | 6,111,606 | |
5.093% due 07/25/37 " § | | | 9,927,389 | | | | 9,070,134 | |
5.787% due 10/25/36 " § | | | 2,629,286 | | | | 2,181,456 | |
Washington Mutual Alternative Mortgage Pass-Through Certificates
6.000% due 07/25/36 " | | | 1,508,733 | | | | 1,071,230 | |
Wells Fargo Mortgage Loan Trust
3.105% due 08/27/35 " § ~ | | | 5,287,421 | | | | 5,352,808 | |
Wells Fargo Mortgage-Backed Securities Trust | | | | | | | | |
6.000% due 06/25/37 " | | | 5,475,483 | | | | 5,320,363 | |
6.000% due 08/25/37 " | | | 4,040,008 | | | | 4,090,750 | |
| | | | | | | | |
| | | | | | | 464,766,556 | |
| | | | | | | | |
Fannie Mae - 9.8% | | | | | | | | |
| | |
2.500% due 01/01/28 - 01/01/43 " | | | 38,700,000 | | | | 40,211,867 | |
3.000% due 09/01/42 - 01/01/43 " | | | 78,001,443 | | | | 81,941,439 | |
3.500% due 10/01/42 - 01/01/43 " | | | 26,445,745 | | | | 28,524,387 | |
4.000% due 10/01/41 - 06/01/42 " | | | 52,068,346 | | | | 56,003,982 | |
4.500% due 04/01/23 - 11/01/41 " | | | 30,788,242 | | | | 33,523,367 | |
5.000% due 07/01/33 - 06/01/41 " | | | 31,246,245 | | | | 34,284,765 | |
5.500% due 04/01/37 - 11/01/38 " | | | 15,768,486 | | | | 17,201,833 | |
6.000% due 04/01/33 - 10/01/40 " | | | 18,423,548 | | | | 20,224,054 | |
7.000% due 02/01/39 " | | | 7,459,680 | | | | 8,878,905 | |
| | | | | | | | |
| | | | | | | 320,794,599 | |
| | | | | | | | |
Freddie Mac - 4.0% | | | | | | | | |
| | |
2.656% due 11/01/36 " § | | | 802,490 | | | | 858,547 | |
3.500% due 01/01/28 - 11/01/42 " | | | 6,391,721 | | | | 6,918,093 | |
| | |
| See Notes to Financial Statements | | See explanation of symbols and terms, if any, on page B-143 |
B-8
PACIFIC SELECT FUND
DIVERSIFIED BOND PORTFOLIO
Schedule of Investments (Continued)
December 31, 2012
| | | | | | | | |
| | | Principal
Amount | | | Value | |
4.000% due 10/01/25 - 10/01/42 " | | | $33,259,998 | | | | $35,236,216 | |
4.500% due 09/01/40 " | | | 10,236,705 | | | | 11,234,445 | |
5.000% due 12/01/35 - 03/01/38 " | | | 21,042,642 | | | | 22,666,419 | |
5.292% due 06/01/37 " § | | | 294,766 | | | | 317,391 | |
5.415% due 07/01/37 " § | | | 688,431 | | | | 742,311 | |
5.500% due 08/01/37 - 12/01/38 " | | | 12,098,650 | | | | 13,082,933 | |
5.511% due 06/01/37 " § | | | 2,590,408 | | | | 2,794,186 | |
5.571% due 06/01/37 " § | | | 273,557 | | | | 295,361 | |
6.000% due 10/01/36 - 11/01/39 " | | | 30,330,245 | | | | 33,190,683 | |
6.003% due 01/01/37 " § | | | 172,290 | | | | 185,617 | |
6.500% due 09/01/39 " | | | 1,823,590 | | | | 2,072,727 | |
| | | | | | | | |
| | | | | | | 129,594,929 | |
| | | | | | | | |
Government National Mortgage Association - 7.5% | |
| | |
0.846% due 08/20/60 " § | | | 1,113,437 | | | | 1,103,729 | |
3.000% due 01/01/43 " | | | 10,400,000 | | | | 11,058,126 | |
3.500% due 01/01/43 " | | | 51,500,000 | | | | 55,970,040 | |
4.000% due 01/01/43 " | | | 11,200,000 | | | | 12,286,751 | |
4.500% due 01/20/40 - 03/20/41 " | | | 53,895,298 | | | | 59,398,171 | |
5.000% due 10/20/39 - 11/20/40 " | | | 56,401,309 | | | | 62,238,899 | |
5.500% due 06/15/36 " | | | 1,600,000 | | | | 1,780,000 | |
6.000% due 06/20/35 - 03/20/42 " | | | 32,032,891 | | | | 35,790,689 | |
6.500% due 10/20/37 " | | | 2,932,666 | | | | 3,330,450 | |
| | | | | | | | |
| | | | | | | 242,956,855 | |
| | | | | | | | |
Total Mortgage-Backed Securities
(Cost $1,178,044,747) | | | | | | | 1,204,688,568 | |
| | | | | | | | |
| | |
ASSET-BACKED SECURITIES - 3.5% | | | | | | | | |
| | |
ACE Securities Corp
0.990% due 04/25/34 " § | | | 2,562,452 | | | | 2,270,207 | |
Aegis Asset-Backed Securities Trust 1.230% due 04/25/34 " § | | | 2,212,558 | | | | 1,833,703 | |
Ameriquest Mortgage Securities Inc
0.555% due 04/25/34 " § | | | 2,278,258 | | | | 2,189,112 | |
Argent Securities Inc
1.110% due 10/25/34 " § | | | 6,950,000 | | | | 6,135,707 | |
Asset-Backed Securities Corp Home Equity 0.740% due 06/25/34 " § | | | 2,357,223 | | | | 2,330,935 | |
Avis Budget Rental Car Funding
AESOP LLC | | | | | | | | |
2.100% due 03/20/19 " ~ | | | 2,300,000 | | | | 2,348,368 | |
2.802% due 05/20/18 " ~ | | | 2,125,000 | | | | 2,242,732 | |
3.150% due 03/20/17 " ~ | | | 2,210,000 | | | | 2,338,837 | |
Bear Stearns Asset-Backed Securities Trust 0.780% due 09/25/34 " § | | | 1,438,367 | | | | 1,399,422 | |
Citigroup Mortgage Loan Trust | | | | | | | | |
0.280% due 05/25/37 " § | | | 1,255,203 | | | | 921,362 | |
0.360% due 08/25/36 " § | | | 864,033 | | | | 778,142 | |
0.640% due 07/25/35 " § | | | 1,455,000 | | | | 1,429,931 | |
Countrywide Asset-Backed Certificates 0.270% due 11/25/37 " § | | | 793,384 | | | | 790,595 | |
Countrywide Home Equity Loan Trust 0.359% due 11/15/36 " § | | | 274,429 | | | | 235,085 | |
Credit-Based Asset Servicing &
Securitization LLC
0.990% due 07/25/33 " § | | | 1,611,608 | | | | 1,353,197 | |
EFS Volunteer No 2 LLC
1.557% due 03/25/36 " § ~ | | | 3,800,000 | | | | 3,943,600 | |
EFS Volunteer No 3 LLC
1.207% due 04/25/33 " § ~ | | | 3,200,000 | | | | 3,268,258 | |
Greenpoint Manufactured Housing | | | | | | | | |
2.977% due 03/18/29 " § | | | 2,550,000 | | | | 2,117,723 | |
3.604% due 06/19/29 " § | | | 1,025,000 | | | | 899,007 | |
3.708% due 02/20/30 " § | | | 1,075,000 | | | | 912,349 | |
3.709% due 03/13/32 " § | | | 2,675,000 | | | | 2,246,854 | |
3.712% due 02/20/32 " § | | | 1,825,000 | | | | 1,557,541 | |
7.270% due 06/15/29 " | | | 4,720,000 | | | | 4,619,051 | |
GSAA Trust
0.370% due 07/25/36 " § | | | 2,818,183 | | | | 1,347,365 | |
GSAMP Trust
0.760% due 03/25/34 " § | | | 3,376,870 | | | | 3,335,745 | |
| | | | | | | | |
| | | Principal
Amount | | | Value | |
Hertz Vehicle Financing LLC
5.290% due 03/25/16 " ~ | | | $3,380,000 | | | | $3,678,250 | |
Home Equity Asset Trust
0.640% due 02/25/36 " § | | | 2,000,000 | | | | 1,493,115 | |
Keycorp Student Loan Trust
0.575% due 10/25/32 " § | | | 2,368,387 | | | | 2,189,939 | |
Nelnet Education Loan Funding Inc
1.090% due 02/25/39 " § | | | 3,650,000 | | | | 3,308,240 | |
Nelnet Student Loan Trust
0.475% due 01/25/37 " § | | | 1,239,928 | | | | 1,180,406 | |
Northstar Education Finance Inc
1.713% due 01/29/46 " § | | | 2,500,000 | | | | 2,090,082 | |
Novastar Home Equity Loan
1.270% due 12/25/33 " § | | | 2,110,151 | | | | 1,853,008 | |
Origen Manufactured Housing Contract Trust | | | | | | | | |
2.307% due 04/15/37 " § | | | 12,978,554 | | | | 8,418,143 | |
2.583% due 10/15/37 " § | | | 12,100,000 | | | | 7,964,427 | |
PAMCO CLO
7.910% due 02/06/13 " | | | 2,426,930 | | | | 752,348 | |
Residential Asset Mortgage Products Trust | | | | | | | | |
0.620% due 11/25/35 " § | | | 2,000,000 | | | | 1,774,703 | |
5.350% due 02/25/33 " § | | | 2,541,593 | | | | 2,310,996 | |
Residential Asset Securities Corp Trust
0.360% due 06/25/36 " § | | | 3,017,271 | | | | 2,910,308 | |
Saxon Asset Securities Trust
0.900% due 05/25/35 " § | | | 2,904,228 | | | | 2,674,397 | |
SLM Student Loan Trust | | | | | | | | |
0.425% due 01/25/27 " § | | | 4,100,000 | | | | 3,984,983 | |
0.435% due 01/25/27 " § | | | 3,950,000 | | | | 3,868,318 | |
0.598% due 12/15/25 " § ~ | | | 3,150,000 | | | | 3,088,861 | |
0.960% due 05/26/26 " § | | | 2,200,000 | | | | 2,226,695 | |
Structured Asset Investment Loan Trust 1.210% due 10/25/33 " § | | | 1,200,000 | | | | 1,062,890 | |
Structured Asset Securities Corp
3.450% due 02/25/32 " | | | 3,307,378 | | | | 3,282,338 | |
| | | | | | | | |
| | |
Total Asset-Backed Securities
(Cost $111,519,540) | | | | | | | 112,957,275 | |
| | | | | | | | |
|
U.S. GOVERNMENT AGENCY ISSUES - 3.0% | |
| | |
Fannie Mae | | | | | | | | |
4.482% due 10/09/19 | | | 30,610,000 | | | | 26,835,879 | |
6.625% due 11/15/30 | | | 15,850,000 | | | | 24,165,687 | |
Financing Corp Strips | | | | | | | | |
1.346% due 08/03/18 | | | 960,000 | | | | 896,476 | |
2.042% due 03/07/19 | | | 2,060,000 | | | | 1,899,176 | |
3.337% due 12/27/18 | | | 10,969,000 | | | | 10,162,625 | |
3.932% due 11/02/18 | | | 12,210,000 | | | | 11,369,927 | |
4.006% due 12/06/18 | | | 5,350,000 | | | | 4,911,803 | |
4.352% due 09/26/19 | | | 5,315,000 | | | | 4,806,976 | |
Tennessee Valley Authority
5.250% due 09/15/39 | | | 8,810,000 | | | | 11,602,567 | |
| | | | | | | | |
| | |
Total U.S. Government Agency Issues
(Cost $88,234,454) | | | | | | | 96,651,116 | |
| | | | | | | | |
| | |
U.S. TREASURY OBLIGATIONS - 14.9% | | | | | | | | |
| | |
U.S. Treasury Bonds - 5.8% | | | | | | | | |
| | |
2.750% due 08/15/42 | | | 129,185,000 | | | | 124,300,256 | |
3.125% due 02/15/42 | | | 62,900,000 | | | | 65,543,750 | |
| | | | | | | | |
| | | | | | | 189,844,006 | |
| | | | | | | | |
U.S. Treasury Inflation Protected Securities - 0.4% | |
| | |
2.500% due 01/15/29 ^ ‡ | | | 2,747,396 | | | | 3,917,616 | |
3.875% due 04/15/29 ^ ‡ | | | 5,783,222 | | | | 9,588,854 | |
| | | | | | | | |
| | | | | | | 13,506,470 | |
| | | | | | | | |
| | |
| See Notes to Financial Statements | | See explanation of symbols and terms, if any, on page B-143 |
B-9
PACIFIC SELECT FUND
DIVERSIFIED BOND PORTFOLIO
Schedule of Investments (Continued)
December 31, 2012
| | | | | | | | |
| | | Principal
Amount | | | Value | |
U.S. Treasury Notes - 8.7% | | | | | | | | |
| | |
0.250% due 08/31/14 | | | $2,110,000 | | | | $2,110,825 | |
0.250% due 09/15/15 | | | 650,000 | | | | 648,680 | |
0.250% due 10/15/15 | | | 1,910,000 | | | | 1,905,674 | |
0.375% due 11/15/15 | | | 1,280,000 | | | | 1,281,300 | |
0.500% due 05/31/13 | | | 130,000 | | | | 130,229 | |
0.625% due 08/31/17 | | | 24,020,000 | | | | 23,993,722 | |
0.750% due 10/31/17 | | | 38,200,000 | | | | 38,316,395 | |
1.000% due 09/30/16 | | | 190,000 | | | | 193,592 | |
1.125% due 12/31/19 | | | 45,590,000 | | | | 45,426,150 | |
1.250% due 10/31/19 | | | 86,690,000 | | | | 87,346,937 | |
1.625% due 08/15/22 | | | 61,770,000 | | | | 61,306,725 | |
1.625% due 11/15/22 | | | 20,260,000 | | | | 20,016,252 | |
| | | | | | | | |
| | | | | | | 282,676,481 | |
| | | | | | | | |
| | |
Total U.S. Treasury Obligations
(Cost $482,622,270) | | | | | | | 486,026,957 | |
| | | | | | | | |
|
FOREIGN GOVERNMENT BONDS & NOTES - 3.1% | |
| | |
Brazil Notas do Tesouro Nacional ‘F’ (Brazil) | | | | | | | | |
10.000% due 01/01/14 | | | BRL 4,518,000 | | | | 2,266,229 | |
10.000% due 01/01/17 | | | 62,889,000 | | | | 32,415,555 | |
10.000% due 01/01/21 | | | 3,202,000 | | | | 1,651,186 | |
Malaysia Government (Malaysia) | | | | | | | | |
3.835% due 08/12/15 | | | MYR 19,011,000 | | | | 6,341,524 | |
4.262% due 09/15/16 | | | 5,325,000 | | | | 1,810,415 | |
Mexican Bonos (Mexico) | | | | | | | | |
6.500% due 06/09/22 | | | MXN 258,216,300 | | | | 21,712,838 | |
8.000% due 06/11/20 | | | 341,768,000 | | | | 31,159,338 | |
10.000% due 12/05/24 | | | 14,760,000 | | | | 1,600,655 | |
| | | | | | | | |
| | |
Total Foreign Government Bonds & Notes
(Cost $100,558,545) | | | | | | | 98,957,740 | |
| | | | | | | | |
| | |
MUNICIPAL BONDS - 0.6% | | | | | | | | |
| | |
Pennsylvania Higher Education Assistance Agency | | | | | | | | |
1.284% due 05/01/46 § | | | $16,925,000 | | | | 16,092,984 | |
1.831% due 05/01/46 § | | | 2,025,000 | | | | 1,924,855 | |
1.986% due 05/01/46 § | | | 750,000 | | | | 712,870 | |
Student Loan Funding Corp OH ‘A’
0.228% due 09/01/47 § | | | 1,300,000 | | | | 1,289,352 | |
| | | | | | | | |
| | |
Total Municipal Bonds
(Cost $18,869,430) | | | | | | | 20,020,061 | |
| | | | | | | | |
| | |
PURCHASED OPTIONS - 0.0% | | | | | | | | |
(See Note (g) in Notes to Schedule of Investments)
(Cost $433,476) | | | | 210,719 | |
| | | | | | | | |
| | |
SHORT-TERM INVESTMENTS - 6.8% | | | | | | | | |
| | |
U.S. Government Agency Issue - 0.9% | | | | | | | | |
| | |
Fannie Mae
0.112% due 02/01/13 | | | 29,000,000 | | | | 28,997,253 | |
| | | | | | | | |
| | |
Repurchase Agreements - 5.9% | | | | | | | | |
| | |
Fixed Income Clearing Corp
0.010% due 01/02/13
(Dated 12/31/12, repurchase price of $43,226,181; collateralized by Fannie Mae: 5.000% due 04/15/15 and value $5,588 and U.S.Treasury Notes: 0.250% due 03/31/14 and value $44,090,044) | | | 43,226,157 | | | | 43,226,157 | |
| | | | | | | | |
| | | Principal
Amount | | | Value | |
The Royal Bank of Scotland Group PLC 0.170% due 01/02/13
(Dated 12/31/12, repurchase price of $150,001,417; collateralized by U.S. Treasury Notes: 2.125% due 08/15/2021 and value $153,000,022) | | | $150,000,000 | | | | $150,000,000 | |
| | | | | | | | |
| | | | | | | 193,226,157 | |
| | | | | | | | |
| | |
Total Short-Term Investments
(Cost $222,223,410) | | | | | | | 222,223,410 | |
| | | | | | | | |
| | |
TOTAL INVESTMENTS - 104.7%
(Cost $3,265,291,494) | | | | | | | 3,407,803,781 | |
| |
OTHER ASSETS & LIABILITIES, NET - (4.7%) | | | | (154,012,090 | ) |
| | | | | | | | |
| | |
NET ASSETS - 100.0% | | | | | | | $3,253,791,691 | |
| | | | | | | | |
Notes to Schedule of Investments
| (a) | As of December 31, 2012, the portfolio was diversified as a percentage of net assets as follows: |
| | | | |
Mortgage-Backed Securities | | | 37.0% | |
Corporate Bonds & Notes | | | 34.1% | |
U.S. Treasury Obligations | | | 14.9% | |
Short-Term Investments | | | 6.8% | |
Asset-Backed Securities | | | 3.5% | |
Foreign Government Bonds & Notes | | | 3.1% | |
U.S. Government Agency Issues | | | 3.0% | |
Senior Loan Notes | | | 1.5% | |
Municipal Bonds | | | 0.6% | |
Equity Securities | | | 0.2% | |
| | | | |
| | | 104.7% | |
Other Assets & Liabilities, Net | | | (4.7% | ) |
| | | | |
| | | 100.0% | |
| | | | |
| (b) | As of December 31, 2012, the portfolio’s Standard & Poor’s quality ratings as a percentage of total fixed income investments were as follows (Unaudited): |
| | | | |
AAA | | | 2.0% | |
A-1 (Short-Term Debt only) | | | 5.7% | |
AA/U.S. Government & Agency Issues | | | 51.6% | |
A | | | 16.7% | |
BBB | | | 11.0% | |
BB | | | 4.5% | |
B | | | 2.4% | |
CCC | | | 0.2% | |
CC | | | 1.3% | |
C | | | 0.4% | |
D | | | 1.1% | |
Not Rated | | | 3.1% | |
| | | | |
| | | 100.0% | |
| | | | |
| (c) | Short-term investments reflect either the stated coupon rate or the annualized effective yield on the date of purchase for discounted investments. |
| (d) | As of December 31, 2012, investments with total aggregate values of $4,550,177 were fully or partially segregated with broker(s)/custodian as collateral for open futures contracts. In addition, $72,025 and $270,000 in cash was segregated as collateral for open futures contracts and swaps contracts, respectively. |
| | |
| See Notes to Financial Statements | | See explanation of symbols and terms, if any, on page B-143 |
B-10
PACIFIC SELECT FUND
DIVERSIFIED BOND PORTFOLIO
Schedule of Investments (Continued)
December 31, 2012
| (e) | Open futures contracts outstanding as of December 31, 2012 were as follows: |
| | | | | | | | | | | | |
| Long Futures Outstanding | | Number of
Contracts | | | Notional
Amount | | | Unrealized
Appreciation
(Depreciation) | |
Eurodollar (06/13) | | | 674 | | | | $674,000,000 | | | | $36,472 | |
U.S. Treasury 30-Year
Bonds (03/13) | | | 50 | | | | 5,000,000 | | | | (176,491 | ) |
| | | | | | | | | | | | |
| | | | | | | | | | | (140,019 | ) |
| | | | | | | | | | | | |
| | | |
Short Futures Outstanding | | | | | | | | | |
Eurodollar (06/14) | | | 674 | | | | 674,000,000 | | | | (38,753 | ) |
U.S. Treasury 2-Year
Notes (03/13) | | | 53 | | | | 10,600,000 | | | | (5,969 | ) |
U.S. Treasury 5-Year
Notes (03/13) | | | 586 | | | | 58,600,000 | | | | (53,920 | ) |
U.S. Treasury 10-Year
Notes (03/13) | | | 2,078 | | | | 207,800,000 | | | | 1,526,809 | |
U.S. Treasury 30-Year
Bonds (03/13) | | | 894 | | | | 89,400,000 | | | | 1,218,689 | |
| | | | | | | | | | | | |
| | | | | | | | | | | 2,646,856 | |
| | | | | | | | | | | | |
| | | |
Total Futures Contracts | | | | | | | | | | | $2,506,837 | |
| | | | | | | | | | | | |
| (f) | Forward foreign currency contracts outstanding as of December 31, 2012 were as follows: |
| | | | | | | | | | | | | | | | | | | | |
Currency
Purchased | | | Currency
Sold | | | Expiration | | | Counterparty | | Unrealized
Appreciation
(Depreciation) | |
| JPY | | | 1,083,500,000 | | | USD | | | 13,557,138 | | | | 02/13 | | | CIT | | | ($1,046,658 | ) |
| USD | | | 20,643,713 | | | EUR | | | 15,825,000 | | | | 01/13 | | | CIT | | | (248,425 | ) |
| USD | | | 53,340,089 | | | EUR | | | 41,843,240 | | | | 02/13 | | | CIT | | | (1,911,417 | ) |
| USD | | | 26,356,564 | | | EUR | | | 20,612,000 | | | | 02/13 | | | MSC | | | (860,353 | ) |
| USD | | | 35,708,097 | | | GBP | | | 22,397,000 | | | | 02/13 | | | CIT | | | (670,252 | ) |
| USD | | | 13,581,268 | | | JPY | | | 1,083,500,000 | | | | 01/13 | | | JPM | | | 1,072,918 | |
| USD | | | 48,884,861 | | | JPY | | | 4,007,312,000 | | | | 02/13 | | | CIT | | | 2,615,000 | |
| | | | | | | | | | | | | | | | | | | | |
| | | | |
Total Forward Foreign Currency Contracts | | | | | | | | | | | | | ($1,049,187 | ) |
| | | | | | | | | | | | | | | | | | | | |
| (g) | Purchased options outstanding as of December 31, 2012 were as follows: |
Options on Exchange-Traded Futures Contracts
| | | | | | | | | | | | | | | | | | | | | | |
| Description | | Exercise
Price | | | Expiration
Date | | | Counter-
party | | Number of
Contracts | | | Cost | | | Value | |
Call - CME 10-Year U.S. Treasury Note Futures (01/13) | | | $133.50 | | | | 01/25/13 | | | MER | | | 572 | | | | $153,796 | | | | $169,813 | |
Call - CME 30-Year U.S. Treasury Bond Futures (01/13) | | | 152.00 | | | | 01/25/13 | | | MER | | | 238 | | | | 279,680 | | | | 40,906 | |
| | | | | | | | | | | | | | | | | | | | | | |
Total Purchased Options | | | | | | | | | | | | | | | | | $433,476 | | | | $210,719 | |
| | | | | | | | | | | | | | | | | | | | | | |
| (h) | Transactions in written options for the year ended December 31, 2012 were as follows: |
| | | | | | | | | | | | |
| | | Number of
Contracts | | | Notional Amount
in $ | | | Premium | |
Outstanding, December 31, 2011 | | | 238 | | | | - | | | | $82,527 | |
Call Options Written | | | 2,385 | | | | 58,334,000 | | | | 1,062,109 | |
Put Options Written | | | 3,701 | | | | 538,092,200 | | | | 5,097,996 | |
Call Options Expired | | | (376 | ) | | | - | | | | (75,825 | ) |
Put Options Expired | | | (1,935 | ) | | | (369,861,000 | ) | | | (1,844,988 | ) |
Call Options Closed | | | (2,009 | ) | | | (58,334,000 | ) | | | (986,284 | ) |
Put Options Closed | | | (2,004 | ) | | | (168,231,200 | ) | | | (3,335,535 | ) |
| | | | | | | | | | | | |
Outstanding, December 31, 2012 | | | - | | | | - | | | | $- | |
| | | | | | | | | | | | |
| | |
| See Notes to Financial Statements | | See explanation of symbols and terms, if any, on page B-143 |
B-11
PACIFIC SELECT FUND
DIVERSIFIED BOND PORTFOLIO
Schedule of Investments (Continued)
December 31, 2012
| (i) | Swap agreements outstanding as of December 31, 2012 were as follows: |
Credit Default Swaps on Credit Indices – Buy Protection (1)
| | | | | | | | | | | | | | | | | | | | | | | | | | |
| Referenced Obligation | | Fixed Deal
Pay Rate | | | Expiration
Date | | | Counter-
party | | Notional
Amount (3) | | | Value (4) | | | Upfront
Premiums
Paid
(Received) | | | Unrealized
Depreciation | |
CDX.NA.HY.19 | | | 0.500% | | | | 12/20/17 | | | BNP | | | $14,900,000 | | | | ($70,323 | ) | | | ($29,800 | ) | | | ($40,523 | ) |
CMBX 1 2006-1 | | | 0.100% | | | | 10/12/52 | | | CSF | | | 7,011,161 | | | | 140,204 | | | | 277,727 | | | | (137,523 | ) |
CMBX 1 2006-1 | | | 0.100% | | | | 10/12/52 | | | GSC | | | 2,085,605 | | | | 41,706 | | | | 86,031 | | | | (44,325 | ) |
CMBX 1 2006-1 | | | 0.100% | | | | 10/12/52 | | | JPM | | | 3,965,028 | | | | 79,290 | | | | 133,820 | | | | (54,530 | ) |
CMBX 1 2006-1 | | | 0.100% | | | | 10/12/52 | | | MSC | | | 6,925,913 | | | | 138,499 | | | | 268,379 | | | | (129,880 | ) |
| | | | | | | | | | | | | | | | | | | | | | | | | | |
| | | | | | | | | | | | | | | | | $329,376 | | | | $736,157 | | | | ($406,781 | ) |
| | | | | | | | | | | | | | | | | | | | | | | | | | |
Credit Default Swaps on Credit Indices – Sell Protection (2)
| | | | | | | | | | | | | | | | | | | | | | | | | | |
| Referenced Obligation | | Fixed Deal
Receive
Rate | | | Expiration
Date | | | Counter-
party | | Notional
Amount (3) | | | Value (4) | | | Upfront
Premiums
Paid
(Received) | | | Unrealized
Appreciation
(Depreciation) | |
CMBX 2 2006-2 | | | 0.070% | | | | 03/15/49 | | | BOA | | | $4,991,000 | | | | ($151,867 | ) | | | ($293,221 | ) | | | $141,354 | |
CMBX 2 2006-2 | | | 0.070% | | | | 03/15/49 | | | CSF | | | 2,729,000 | | | | (83,038 | ) | | | (160,329 | ) | | | 77,291 | |
CMBX 4 2007-2 | | | 0.350% | | | | 02/17/51 | | | CSF | | | 1,600,000 | | | | (69,371 | ) | | | (130,000 | ) | | | 60,629 | |
CMBX NA AM 1 | | | 0.500% | | | | 10/12/52 | | | CSF | | | 607,000 | | | | (23,027 | ) | | | (56,337 | ) | | | 33,310 | |
CMBX NA AM 1 | | | 0.500% | | | | 10/12/52 | | | GSC | | | 1,572,000 | | | | (59,636 | ) | | | (145,410 | ) | | | 85,774 | |
| | | | | | | | | | | | | | | | | | | | | | | | | | |
| | | | | | | | | | | | | | | | | ($386,939 | ) | | | ($785,297 | ) | | | $398,358 | |
| | | | | | | | | | | | | | | | | | | | | | | | | | |
| | | | | | | |
Total Credit Default Swaps | | | | | | | | | | | | | | | | | ($57,563 | ) | | | ($49,140 | ) | | | ($8,423 | ) |
| | | | | | | | | | | | | | | | | | | | | | | | | | |
| | (1) | If the portfolio is a buyer of protection and a credit event occurs, as defined under the terms of that particular swap agreement, the portfolio will either (i) receive from the seller of protection an amount equal to the notional amount of the swap and deliver the referenced obligation or underlying investments comprising the referenced index or (ii) receive a net settlement amount in the form of cash or investments equal to the notional amount of the swap less the recovery value of the referenced obligation or underlying investments comprising the referenced index. |
| | (2) | If the portfolio is a seller of protection and a credit event occurs, as defined under the terms of that particular swap agreement, the portfolio will either (i) pay to the buyer of protection an amount equal to the notional amount of the swap and take delivery of the referenced obligation or underlying investments comprising the referenced index or (ii) pay a net settlement amount in the form of cash or investments equal to the notional amount of the swap less the recovery value of the referenced obligation or underlying investments comprising the referenced index. |
| | (3) | The maximum potential amount the portfolio could be required to pay as a seller of credit protection or receive as a buyer of credit protection if a credit event occurs as defined under the terms of that particular swap agreement. |
| | (4) | The quoted market prices and resulting values for credit default swap agreements on credit indices serve as an indicator of the current status of the payment/performance risk and is a representation of the likelihood of an expected liability (or profit) for the credit derivative had the notional amount of the swap agreement been closed/sold as of the year end. Increasing values, in absolute terms when compared to the notional amount of the swap, represent a deterioration of the referenced entity’s credit soundness and a greater likelihood of risk of default or other credit event occurring as defined under the terms of the agreement. |
Total Return Swaps
| | | | | | | | | | | | | | | | | | | | | | | | | | |
| Receive Total Return | | Pay | | Counter-
party | | | Expiration
Date | | | Notional
Amount | | | Value | | | Upfront
Premiums
Paid
(Received) | | | Unrealized
Appreciation (Depreciation) | |
Interest from Fannie Mae | | 1-Month USD-LIBOR -0.249 bp | | | BRC | | | | 01/12/41 | | | | $779,970 | | | | $173 | | | | ($144 | ) | | | $317 | |
| | | | | | | | | | | | | | | | | | | | | | | | | | |
| | | | | | | |
Total Swap Agreements | | | | | | | | | | | | | | | | | ($57,390 | ) | | | ($49,284 | ) | | | ($8,106 | ) |
| | | | | | | | | | | | | | | | | | | | | | | | | | |
| | |
| See Notes to Financial Statements | | See explanation of symbols and terms, if any, on page B-143 |
B-12
PACIFIC SELECT FUND
DIVERSIFIED BOND PORTFOLIO
Schedule of Investments (Continued)
December 31, 2012
| (j) | Fair Value Measurements |
The following is a summary of the portfolio’s investments as categorized under the three-tier hierarchy of inputs used in valuing the portfolio’s assets and liabilities (See Note 3D in Notes to Financial Statements) as of December 31, 2012:
| | | | | | | | | | | | | | | | | | |
| | | | | Total Value at
December 31, 2012 | | | Level 1
Quoted Price | | | Level 2
Significant
Observable Inputs | | | Level 3
Significant
Unobservable Inputs | |
Assets | | Preferred Stocks (1) | | | $7,823,336 | | | | $7,823,336 | | | | $- | | | | $- | |
| | Corporate Bonds & Notes | | | 1,109,928,305 | | | | - | | | | 1,102,477,830 | | | | 7,450,475 | |
| | Senior Loan Notes | | | 48,316,294 | | | | - | | | | 47,233,155 | | | | 1,083,139 | |
| | Mortgage-Backed Securities | | | 1,204,688,568 | | | | - | | | | 1,203,584,839 | | | | 1,103,729 | |
| | Asset-Backed Securities | | | 112,957,275 | | | | - | | | | 112,204,927 | | | | 752,348 | |
| | U.S. Government Agency Issues | | | 96,651,116 | | | | - | | | | 96,651,116 | | | | - | |
| | U.S. Treasury Obligations | | | 486,026,957 | | | | - | | | | 486,026,957 | | | | - | |
| | Foreign Government Bonds & Notes | | | 98,957,740 | | | | - | | | | 98,957,740 | | | | - | |
| | Municipal Bonds | | | 20,020,061 | | | | - | | | | 20,020,061 | | | | - | |
| | Short-Term Investments | | | 222,223,410 | | | | - | | | | 222,223,410 | | | | - | |
| | Derivatives: | | | | | | | | | | | | | | | | |
| | Credit Contracts | | | | | | | | | | | | | | | | |
| | Swaps | | | 399,699 | | | | - | | | | 399,699 | | | | - | |
| | Foreign Currency Contracts | | | | | | | | | | | | | | | | |
| | Forward Foreign Currency Contracts | | | 3,687,918 | | | | - | | | | 3,687,918 | | | | - | |
| | Interest Rate Contracts | | | | | | | | | | | | | | | | |
| | Futures | | | 2,781,970 | | | | 2,781,970 | | | | - | | | | - | |
| | Purchased Options | | | 210,719 | | | | 210,719 | | | | - | | | | - | |
| | Swaps | | | 173 | | | | - | | | | 173 | | | | - | |
| | | | | | | | | | | | | | | | | | |
| | Total Interest Rate Contracts | | | 2,992,862 | | | | 2,992,689 | | | | 173 | | | | - | |
| | | | | | | | | | | | | | | | | | |
| | Total Assets - Derivatives | | | 7,080,479 | | | | 2,992,689 | | | | 4,087,790 | | | | - | |
| | | | | | | | | | | | | | | | | | |
| | Total Assets | | | 3,414,673,541 | | | | 10,816,025 | | | | 3,393,467,825 | | | | 10,389,691 | |
| | | | | | | | | | | | | | | | | | |
Liabilities | | Derivatives: | | | | | | | | | | | | | | | | |
| | Credit Contracts | | | | | | | | | | | | | | | | |
| | Swaps | | | (457,262 | ) | | | - | | | | (457,262 | ) | | | - | |
| | Foreign Currency Contracts | | | | | | | | | | | | | | | | |
| | Forward Foreign Currency Contracts | | | (4,737,105 | ) | | | - | | | | (4,737,105 | ) | | | - | |
| | Interest Rate Contracts | | | | | | | | | | | | | | | | |
| | Futures | | | (275,133 | ) | | | (275,133 | ) | | | - | | | | - | |
| | | | | | | | | | | | | | | | | | |
| | Total Liabilities - Derivatives | | | (5,469,500 | ) | | | (275,133 | ) | | | (5,194,367 | ) | | | - | |
| | | | | | | | | | | | | | | | | | |
| | Total Liabilities | | | (5,469,500 | ) | | | (275,133 | ) | | | (5,194,367 | ) | | | - | |
| | | | | | | | | | | | | | | | | | |
| | Total | | | $3,409,204,041 | | | | $10,540,892 | | | | $3,388,273,458 | | | | $10,389,691 | |
| | | | | | | | | | | | | | | | | | |
During the year ended December 31, 2012, an investment with a value of $882,069 was transferred from level 3 to level 2 due to valuation being updated from a single broker quoted vendor price to an evaluated vendor price based on observable inputs. Also during the period, investments with a total aggregate value of $50,802,696 were transferred from level 3 to level 2 due to valuation being updated from a price determined by a valuation committee established under the Valuation Policy to an evaluated vendor price based on observable inputs.
The following is a reconciliation of investments for significant unobservable inputs (Level 3) used in valuing the portfolio’s assets and liabilities (See Note 3D in Notes to Financial Statements) for the year ended December 31, 2012:
| | | | | | | | | | | | | | | | | | | | | | | | |
| | | Corporate
Bonds & Notes | | | Senior
Loan Notes | | | Mortgage-Backed
Securities | | | Asset-Backed
Securities | | | Municipal
Bonds | | | Total | |
Value, Beginning of Year | | | $3,571,807 | | | | $- | | | | $29,655,986 | | | | $11,656,411 | | | | $23,751,528 | | | | $68,635,732 | |
Purchases | | | 4,815,376 | | | | 1,275,452 | | | | 4,435 | | | | 2,426,930 | | | | - | | | | 8,522,193 | |
Sales (includes paydowns) | | | (503,067 | ) | | | (3,617 | ) | | | (1,619,160 | ) | | | (10,615,495 | ) | | | (4,850,000 | ) | | | (17,591,339 | ) |
Accrued Discounts (Premiums) | | | (18,550 | ) | | | 1,708 | | | | (36 | ) | | | 18,672 | | | | 59,614 | | | | 61,408 | |
Net Realized Gains (Losses) | | | (15,726 | ) | | | 257 | | | | (622 | ) | | | 322,461 | | | | 362,354 | | | | 668,724 | |
Change in Net Unrealized Appreciation (Depreciation) | | | 482,704 | | | | (190,661 | ) | | | 537,521 | | | | 251,609 | | | | 696,565 | | | | 1,777,738 | |
Transfers In | | | - | | | | - | | | | - | | | | - | | | | - | | | | - | |
Transfers Out | | | (882,069 | ) | | | - | | | | (27,474,395 | ) | | | (3,308,240 | ) | | | (20,020,061 | ) | | | (51,684,765 | ) |
| | | | | | | | | | | | | | | | | | | | | | | | |
Value, End of Year | | | $7,450,475 | | | | $1,083,139 | | | | $1,103,729 | | | | $752,348 | | | | $- | | | | $10,389,691 | |
| | | | | | | | | | | | | | | | | | | | | | | | |
| | | | | | | | | | | | | | | | | | | | | | | | |
Change in Net Unrealized Appreciation (Depreciation) on
Level 3 Investments Held at the End of Year, if Applicable | | | $383,375 | | | | ($190,661 | ) | | | $15,116 | | | | ($1,674,582 | ) | | | $- | | | | ($1,466,752 | ) |
| | | | | | | | | | | | | | | | | | | | | | | | |
| | (1) | For equity investments categorized in a single level, refer to the schedule of investments for further industry breakout. |
| | |
| See Notes to Financial Statements | | See explanation of symbols and terms, if any, on page B-143 |
B-13
PACIFIC SELECT FUND
FLOATING RATE LOAN PORTFOLIO
Schedule of Investments
December 31, 2012
| | | | | | | | |
| | |
Shares | | | Value | |
COMMON STOCKS - 0.7% | | | | | |
| |
Consumer Discretionary - 0.7% | | | | | |
| | |
Euramax Holdings Inc ‘A’ * ¯ | | | 947 | | | | $198,954 | |
Metro-Goldwyn-Mayer Studios Inc * ¯ | | | 178,408 | | | | 6,809,245 | |
| | | | | | | | |
| | | | | | | 7,008,199 | |
| | | | | | | | |
Total Common Stocks
(Cost $4,342,094) | | | | | | | 7,008,199 | |
| | | | | | | | |
| | |
| | | Principal
Amount | | | | |
| |
CORPORATE BONDS & NOTES - 5.1% | | | | | |
| | |
Consumer Discretionary - 1.3% | | | | | | | | |
| | |
AMC Entertainment Inc
8.750% due 06/01/19 | | | $500,000 | | | | 556,250 | |
AMC Networks Inc
4.750% due 12/15/22 | | | 60,000 | | | | 60,600 | |
Brookfield Residential Properties Inc (Canada)
6.500% due 12/15/20 ~ | | | 100,000 | | | | 103,000 | |
Cablevision Systems Corp
7.750% due 04/15/18 | | | 500,000 | | | | 558,750 | |
Caesars Entertainment Operating Co Inc
5.375% due 12/15/13 | | | 55,000 | | | | 53,900 | |
Caesars Operating Escrow LLC
9.000% due 02/15/20 ~ | | | 95,000 | | | | 95,475 | |
CCO Holdings LLC | | | | | | | | |
5.250% due 09/30/22 | | | 250,000 | | | | 254,375 | |
7.875% due 04/30/18 | | | 1,000,000 | | | | 1,081,250 | |
Cequel Communications Holdings I LLC
6.375% due 09/15/20 ~ | | | 220,000 | | | | 230,175 | |
Chrysler Group LLC
8.250% due 06/15/21 | | | 1,000,000 | | | | 1,105,000 | |
Cinemark USA Inc
5.125% due 12/15/22 ~ | | | 45,000 | | | | 45,788 | |
Claire’s Stores Inc
9.000% due 03/15/19 ~ | | | 145,000 | | | | 156,237 | |
Clear Channel Worldwide Holdings Inc
6.500% due 11/15/22 ~ | | | 235,000 | | | | 244,338 | |
Continental Rubber Of America Corp
4.500% due 09/15/19 ~ | | | 170,000 | | | | 174,827 | |
Education Management LLC
8.750% due 06/01/14 | | | 280,000 | | | | 226,100 | |
Ford Motor Co
7.450% due 07/16/31 | | | 1,000,000 | | | | 1,275,000 | |
Laureate Education Inc
9.250% due 09/01/19 ~ | | | 590,000 | | | | 619,500 | |
Limited Brands Inc
5.625% due 02/15/22 | | | 195,000 | | | | 213,037 | |
MGM Resorts International | | | | | | | | |
5.875% due 02/27/14 | | | 500,000 | | | | 522,500 | |
6.625% due 12/15/21 | | | 210,000 | | | | 210,262 | |
7.750% due 03/15/22 | | | 365,000 | | | | 392,375 | |
Michaels Stores Inc
7.750% due 11/01/18 ~ | | | 65,000 | | | | 71,663 | |
National CineMedia LLC
6.000% due 04/15/22 | | | 60,000 | | | | 63,900 | |
New Academy Finance Corp
8.000% due 06/15/18 ~ | | | 250,000 | | | | 254,375 | |
Party City Holdings Inc
8.875% due 08/01/20 ~ | | | 160,000 | | | | 172,400 | |
Petco Animal Supplies Inc
9.250% due 12/01/18 ~ | | | 1,000,000 | | | | 1,115,000 | |
PVH Corp
4.500% due 12/15/22 | | | 70,000 | | | | 71,050 | |
Radio Systems Corp
8.375% due 11/01/19 ~ | | | 80,000 | | | | 83,600 | |
| | | | | | | | |
| | | Principal
Amount | | | Value | |
Regal Entertainment Group
9.125% due 08/15/18 | | | $1,000,000 | | | | $1,120,000 | |
Ruby Tuesday Inc
7.625% due 05/15/20 ~ | | | 35,000 | | | | 33,600 | |
Sally Holdings LLC
5.750% due 06/01/22 | | | 230,000 | | | | 250,700 | |
ServiceMaster Co
7.000% due 08/15/20 ~ | | | 140,000 | | | | 141,050 | |
Starz LLC
5.000% due 09/15/19 ~ | | | 85,000 | | | | 87,550 | |
Studio City Finance Ltd (United Kingdom)
8.500% due 12/01/20 ~ | | | 305,000 | | | | 320,441 | |
Tempur-Pedic International Inc
6.875% due 12/15/20 ~ | | | 70,000 | | | | 72,362 | |
The McClatchy Co
9.000% due 12/15/22 ~ | | | 120,000 | | | | 123,150 | |
Unitymedia Hessen GmbH & Co KG (Germany)
5.500% due 01/15/23 ~ | | | 200,000 | | | | 207,500 | |
Viking Cruises Ltd (Bermuda)
8.500% due 10/15/22 ~ | | | 80,000 | | | | 86,800 | |
Virgin Media Finance PLC (United Kingdom)
4.875% due 02/15/22 | | | 200,000 | | | | 205,500 | |
VWR Funding Inc
7.250% due 09/15/17 ~ | | | 235,000 | | | | 247,925 | |
WMG Acquisition Corp
6.000% due 01/15/21 ~ | | | 65,000 | | | | 68,900 | |
Wolverine WorldWide Inc
6.125% due 10/15/20 ~ | | | 50,000 | | | | 52,750 | |
| | | | | | | | |
| | | | | | | 13,028,955 | |
| | | | | | | | |
Consumer Staples - 0.2% | | | | | | | | |
| | |
Constellation Brands Inc | | | | | | | | |
4.625% due 03/01/23 | | | 90,000 | | | | 94,500 | |
6.000% due 05/01/22 | | | 70,000 | | | | 80,500 | |
Harbinger Group Inc
7.875% due 07/15/19 ~ | | | 60,000 | | | | 59,775 | |
Innovation Ventures LLC
9.500% due 08/15/19 ~ | | | 70,000 | | | | 66,150 | |
Land O’ Lakes Inc
6.000% due 11/15/22 ~ | | | 60,000 | | | | 65,100 | |
Michael Foods Group Inc
9.750% due 07/15/18 | | | 500,000 | | | | 555,000 | |
Michael Foods Holding Inc
8.500% due 07/15/18 ~ | | | 90,000 | | | | 92,025 | |
Reynolds Group Issuer Inc | | | | | | | | |
7.875% due 08/15/19 | | | 150,000 | | | | 167,625 | |
9.875% due 08/15/19 | | | 245,000 | | | | 263,375 | |
Smithfield Foods Inc
6.625% due 08/15/22 | | | 125,000 | | | | 138,437 | |
Spectrum Brands Escrow Corp | | | | | | | | |
6.375% due 11/15/20 ~ | | | 65,000 | | | | 68,413 | |
6.625% due 11/15/22 ~ | | | 95,000 | | | | 102,125 | |
Spectrum Brands Inc
6.750% due 03/15/20 ~ | | | 75,000 | | | | 80,625 | |
The Pantry Inc
8.375% due 08/01/20 ~ | | | 95,000 | | | | 99,750 | |
| | | | | | | | |
| | | | | | | 1,933,400 | |
| | | | | | | | |
Energy - 0.6% | | | | | | | | |
| | |
Access Midstream Partners LP
4.875% due 05/15/23 | | | 150,000 | | | | 152,437 | |
Berry Petroleum Co
6.750% due 11/01/20 | | | 1,000,000 | | | | 1,080,000 | |
Bristow Group Inc
6.250% due 10/15/22 | | | 100,000 | | | | 107,375 | |
Chesapeake Energy Corp
6.125% due 02/15/21 | | | 145,000 | | | | 151,163 | |
Concho Resources Inc
5.500% due 04/01/23 | | | 100,000 | | | | 105,250 | |
| | |
| See Notes to Financial Statements | | See explanation of symbols and terms, if any, on page B-143 |
B-14
PACIFIC SELECT FUND
FLOATING RATE LOAN PORTFOLIO
Schedule of Investments (Continued)
December 31, 2012
| | | | | | | | |
| | | Principal
Amount | | | Value | |
Continental Resources Inc
5.000% due 09/15/22 | | | $340,000 | | | | $368,050 | |
CVR Refining LLC
6.500% due 11/01/22 ~ | | | 160,000 | | | | 160,000 | |
EP Energy LLC | | | | | | | | |
6.875% due 05/01/19 | | | 185,000 | | | | 201,650 | |
9.375% due 05/01/20 | | | 140,000 | | | | 158,550 | |
EPL Oil & Gas Inc
8.250% due 02/15/18 ~ | | | 95,000 | | | | 98,088 | |
Inergy Midstream LP
6.000% due 12/15/20 ~ | | | 50,000 | | | | 51,750 | |
Laredo Petroleum Inc | | | | | | | | |
7.375% due 05/01/22 | | | 80,000 | | | | 87,200 | |
9.500% due 02/15/19 | | | 500,000 | | | | 561,250 | |
MEG Energy Corp (Canada)
6.375% due 01/30/23 ~ | | | 130,000 | | | | 136,175 | |
Newfield Exploration Co
5.625% due 07/01/24 | | | 160,000 | | | | 173,200 | |
Offshore Group Investment Ltd (Cayman)
7.500% due 11/01/19 ~ | | | 80,000 | | | | 81,200 | |
OGX Austria GmbH (Austria)
8.500% due 06/01/18 ~ | | | 375,000 | | | | 339,375 | |
Oil States International Inc
6.500% due 06/01/19 | | | 785,000 | | | | 839,950 | |
Penn Virginia Resource Partners LP
8.375% due 06/01/20 ~ | | | 65,000 | | | | 70,363 | |
Plains Exploration & Production Co
6.875% due 02/15/23 | | | 260,000 | | | | 298,350 | |
QEP Resources Inc
5.250% due 05/01/23 | | | 100,000 | | | | 107,500 | |
Sabine Pass LNG LP
6.500% due 11/01/20 ~ | | | 130,000 | | | | 132,925 | |
Seadrill Ltd (Bermuda)
5.625% due 09/15/17 ~ | | | 345,000 | | | | 344,137 | |
SM Energy Co
6.500% due 01/01/23 | | | 85,000 | | | | 91,375 | |
Tesoro Corp
5.375% due 10/01/22 | | | 130,000 | | | | 139,100 | |
| | | | | | | | |
| | | | | | | 6,036,413 | |
| | | | | | | | |
Financials - 0.4% | | | | | | | | |
| | |
A-S Co-Issuer Subsidiary Inc
7.875% due 12/15/20 ~ | | | 85,000 | | | | 85,425 | |
Ally Financial Inc | | | | | | | | |
4.625% due 06/26/15 | | | 110,000 | | | | 114,739 | |
8.000% due 12/31/18 | | | 1,000,000 | | | | 1,175,000 | |
CIT Group Inc | | | | | | | | |
4.750% due 02/15/15 ~ | | | 475,000 | | | | 496,375 | |
5.000% due 08/15/22 | | | 25,000 | | | | 26,756 | |
5.250% due 03/15/18 | | | 30,000 | | | | 32,250 | |
E*TRADE Financial Corp | | | | | | | | |
6.000% due 11/15/17 | | | 20,000 | | | | 20,550 | |
6.375% due 11/15/19 | | | 60,000 | | | | 61,800 | |
First Data Corp | | | | | | | | |
6.750% due 11/01/20 ~ | | | 230,000 | | | | 233,450 | |
7.375% due 06/15/19 ~ | | | 140,000 | | | | 145,600 | |
General Motors Financial Co Inc
4.750% due 08/15/17 ~ | | | 845,000 | | | | 889,135 | |
Hub International Ltd
8.125% due 10/15/18 ~ | | | 90,000 | | | | 92,700 | |
Neuberger Berman Group LLC
5.625% due 03/15/20 ~ | | | 200,000 | | | | 210,500 | |
Nuveen Investments Inc
9.500% due 10/15/20 ~ | | | 165,000 | | | | 165,000 | |
TransUnion Holding Co Inc
9.625% due 06/15/18 | | | 170,000 | | | | 180,625 | |
| | | | | | | | |
| | | | | | | 3,929,905 | |
| | | | | | | | |
| | | | | | | | |
| | | Principal
Amount | | | Value | |
Health Care - 0.8% | | | | | | | | |
| | |
Alere Inc
9.000% due 05/15/16 | | | $1,000,000 | | | | $1,060,000 | |
Biomet Inc
6.500% due 08/01/20 ~ | | | 145,000 | | | | 154,606 | |
CDRT Holding Corp
9.250% due 10/01/17 ~ | | | 100,000 | | | | 102,500 | |
CHS/Community Health Systems Inc | | | | | | | | |
5.125% due 08/15/18 | | | 155,000 | | | | 161,975 | |
7.125% due 07/15/20 | | | 160,000 | | | | 171,000 | |
DaVita HealthCare Partners Inc
5.750% due 08/15/22 | | | 265,000 | | | | 280,569 | |
DJO Finance LLC
8.750% due 03/15/18 ~ | | | 25,000 | | | | 27,438 | |
Endo Health Solutions Inc
7.000% due 07/15/19 | | | 485,000 | | | | 519,556 | |
HCA Holdings Inc
6.250% due 02/15/21 | | | 60,000 | | | | 61,650 | |
HCA Inc
7.500% due 02/15/22 | | | 835,000 | | | | 960,250 | |
Hologic Inc
6.250% due 08/01/20 ~ | | | 305,000 | | | | 330,162 | |
IMS Health Inc
6.000% due 11/01/20 ~ | | | 100,000 | | | | 105,000 | |
INC Research LLC
11.500% due 07/15/19 ~ | | | 65,000 | | | | 67,600 | |
Jaguar Holding Co II
9.500% due 12/01/19 ~ | | | 1,000,000 | | | | 1,140,000 | |
Kinetic Concepts Inc
10.500% due 11/01/18 ~ | | | 250,000 | | | | 263,437 | |
MultiPlan Inc
9.875% due 09/01/18 ~ | | | 1,000,000 | | | | 1,120,000 | |
Physio-Control International Inc
9.875% due 01/15/19 ~ | | | 100,000 | | | | 110,250 | |
United Surgical Partners International Inc
9.000% due 04/01/20 | | | 65,000 | | | | 72,475 | |
Valeant Pharmaceuticals International
6.375% due 10/15/20 ~ | | | 135,000 | | | | 145,125 | |
VPI Escrow Corp
6.375% due 10/15/20 ~ | | | 165,000 | | | | 177,788 | |
Warner Chilcott Co LLC
7.750% due 09/15/18 | | | 680,000 | | | | 727,600 | |
| | | | | | | | |
| | | | | | | 7,758,981 | |
| | | | | | | | |
Industrials - 0.5% | | | | | | | | |
| | |
ADS Waste Holdings Inc
8.250% due 10/01/20 ~ | | | 65,000 | | | | 68,575 | |
Air Lease Corp
4.500% due 01/15/16 ~ | | | 500,000 | | | | 507,500 | |
Clean Harbors Inc
5.125% due 06/01/21 ~ | | | 45,000 | | | | 46,800 | |
Covanta Holding Corp
6.375% due 10/01/22 | | | 95,000 | | | | 103,588 | |
FTI Consulting Inc
6.000% due 11/15/22 ~ | | | 70,000 | | | | 72,800 | |
General Cable Corp
5.750% due 10/01/22 ~ | | | 100,000 | | | | 104,000 | |
HDTFS Inc
6.250% due 10/15/22 ~ | | | 65,000 | | | | 69,550 | |
Huntington Ingalls Industries Inc
7.125% due 03/15/21 | | | 680,000 | | | | 742,900 | |
Interline Brands Inc
10.000% due 11/15/18 ~ | | | 150,000 | | | | 163,500 | |
International Lease Finance Corp
8.750% due 03/15/17 | | | 1,000,000 | | | | 1,160,000 | |
Mead Products LLC
6.750% due 04/30/20 ~ | | | 130,000 | | | | 137,150 | |
| | |
| See Notes to Financial Statements | | See explanation of symbols and terms, if any, on page B-143 |
B-15
PACIFIC SELECT FUND
FLOATING RATE LOAN PORTFOLIO
Schedule of Investments (Continued)
December 31, 2012
| | | | | | | | |
| | | Principal
Amount | | | Value | |
Nortek Inc | | | | | | | | |
8.500% due 04/15/21 | | | $35,000 | | | | $39,025 | |
8.500% due 04/15/21 ~ | | | 130,000 | | | | 144,625 | |
10.000% due 12/01/18 | | | 105,000 | | | | 117,338 | |
The Manitowoc Co Inc
5.875% due 10/15/22 | | | 85,000 | | | | 85,213 | |
TransDigm Inc
7.750% due 12/15/18 | | | 770,000 | | | | 855,662 | |
United Rentals North America Inc | | | | | | | | |
7.375% due 05/15/20 ~ | | | 60,000 | | | | 66,150 | |
7.625% due 04/15/22 ~ | | | 135,000 | | | | 151,538 | |
| | | | | | | | |
| | | | | | | 4,635,914 | |
| | | | | | | | |
Information Technology - 0.2% | | | | | | | | |
| | |
Alliance Data Systems Corp
6.375% due 04/01/20 ~ | | | 55,000 | | | | 58,850 | |
Equinix Inc
7.000% due 07/15/21 | | | 1,000,000 | | | | 1,113,750 | |
Infor US Inc
9.375% due 04/01/19 | | | 165,000 | | | | 186,037 | |
Lender Processing Services Inc
5.750% due 04/15/23 | | | 95,000 | | | | 99,038 | |
NCR Corp
5.000% due 07/15/22 ~ | | | 80,000 | | | | 81,700 | |
Nuance Communications Inc
5.375% due 08/15/20 ~ | | | 100,000 | | | | 105,000 | |
SSI Investments II Ltd
11.125% due 06/01/18 | | | 100,000 | | | | 111,125 | |
| | | | | | | | |
| | | | | | | 1,755,500 | |
| | | | | | | | |
Materials - 0.3% | | | | | | | | |
| | |
AK Steel Corp
8.750% due 12/01/18 ~ | | | 60,000 | | | | 63,525 | |
Alphabet Holding Co Inc
7.750% due 11/01/17 ~ | | | 160,000 | | | | 165,200 | |
Celanese U.S. Holdings LLC
4.625% due 11/15/22 | | | 55,000 | | | | 57,887 | |
Eldorado Gold Corp (Canada)
6.125% due 12/15/20 ~ | | | 240,000 | | | | 245,400 | |
FMG Resources Property Ltd (Australia) | | | | | | | | |
7.000% due 11/01/15 ~ | | | 30,000 | | | | 31,650 | |
8.250% due 11/01/19 ~ | | | 60,000 | | | | 64,200 | |
IAMGOLD Corp (Canada)
6.750% due 10/01/20 ~ | | | 165,000 | | | | 161,287 | |
Inmet Mining Corp (Canada)
7.500% due 06/01/21 ~ | | | 60,000 | | | | 62,550 | |
LyondellBasell Industries NV (Netherlands)
5.750% due 04/15/24 | | | 200,000 | | | | 236,000 | |
Molycorp Inc
10.000% due 06/01/20 ~ | | | 115,000 | | | | 107,525 | |
New Gold Inc (Canada) | | | | | | | | |
6.250% due 11/15/22 ~ | | | 90,000 | | | | 93,600 | |
7.000% due 04/15/20 ~ | | | 45,000 | | | | 48,263 | |
Rockwood Specialties Group Inc
4.625% due 10/15/20 | | | 165,000 | | | | 171,394 | |
Sawgrass Merger Sub Inc
8.750% due 12/15/20 ~ | | | 60,000 | | | | 60,750 | |
Sealed Air Corp | | | | | | | | |
6.500% due 12/01/20 ~ | | | 60,000 | | | | 65,100 | |
8.375% due 09/15/21 ~ | | | 1,000,000 | | | | 1,147,500 | |
Taminco Global Chemical Corp
9.750% due 03/31/20 ~ | | | 30,000 | | | | 33,000 | |
Tronox Finance LLC
6.375% due 08/15/20 ~ | | | 140,000 | | | | 141,925 | |
| | | | | | | | |
| | | | | | | 2,956,756 | |
| | | | | | | | |
Telecommunication Services - 0.5% | | | | | | | | |
| | |
Avaya Inc | | | | | | | | |
9.000% due 04/01/19 ~ | | | 90,000 | | | | 92,025 | |
10.125% due 11/01/15 | | | 250,000 | | | | 225,000 | |
Crown Castle International Corp
5.250% due 01/15/23 ~ | | | 130,000 | | | | 139,587 | |
| | | | | | | | |
| | | Principal
Amount | | | Value | |
Hughes Satellite Systems Corp
6.500% due 06/15/19 | | | $1,000,000 | | | | $1,107,500 | |
Intelsat Jackson Holdings SA (Luxembourg)
7.250% due 10/15/20 ~ | | | 105,000 | | | | 114,450 | |
Intelsat Luxembourg SA (Luxembourg)
11.500% due 02/04/17 | | | 250,000 | | | | 266,562 | |
SBA Communications Corp
5.625% due 10/01/19 ~ | | | 130,000 | | | | 136,988 | |
SBA Telecommunications Inc
5.750% due 07/15/20 ~ | | | 125,000 | | | | 133,281 | |
Sprint Capital Corp
8.750% due 03/15/32 | | | 15,000 | | | | 18,413 | |
Sprint Nextel Corp | | | | | | | | |
6.000% due 12/01/16 | | | 455,000 | | | | 497,087 | |
6.000% due 11/15/22 | | | 230,000 | | | | 237,475 | |
7.000% due 08/15/20 | | | 180,000 | | | | 197,550 | |
9.000% due 11/15/18 ~ | | | 85,000 | | | | 105,188 | |
9.125% due 03/01/17 | | | 100,000 | | | | 118,250 | |
UPCB Finance VI Ltd (Cayman)
6.875% due 01/15/22 ~ | | | 250,000 | | | | 271,875 | |
Windstream Corp
7.750% due 10/01/21 | | | 1,000,000 | | | | 1,085,000 | |
| | | | | | | | |
| | | | | | | 4,746,231 | |
| | | | | | | | |
Utilities - 0.3% | | | | | | | | |
| | |
AmeriGas Finance LLC | | | | | | | | |
6.750% due 05/20/20 | | | 120,000 | | | | 132,300 | |
7.000% due 05/20/22 | | | 150,000 | | | | 167,625 | |
DPL Inc
7.250% due 10/15/21 | | | 1,000,000 | | | | 1,075,000 | |
Edison Mission Energy
7.500% due 06/15/13 Y | | | 250,000 | | | | 133,125 | |
NRG Energy Inc
8.250% due 09/01/20 | | | 1,000,000 | | | | 1,125,000 | |
| | | | | | | | |
| | | | | | | 2,633,050 | |
| | | | | | | | |
Total Corporate Bonds & Notes
(Cost $45,843,382) | | | | | | | 49,415,105 | |
| | | | | | | | |
| |
SENIOR LOAN NOTES - 92.3% | | | | | |
| |
Consumer Discretionary - 30.2% | | | | | |
| | |
99 Cents Only Stores
5.250% due 01/11/19 § | | | 643,512 | | | | 651,669 | |
Acosta Inc Term D
5.000% due 03/02/18 § | | | 2,363,151 | | | | 2,386,782 | |
Advantage Sales & Marketing Inc Term B
5.250% due 12/18/17 § | | | 2,376,500 | | | | 2,399,524 | |
Affinion Group Inc Term B
6.500% due 07/16/15 § | | | 4,093,460 | | | | 3,755,017 | |
Affinity Gaming LLC Term B
5.500% due 11/09/17 § | | | 496,250 | | | | 501,212 | |
Alliance Laundry Systems LLC (1st Lien)
5.500% due 12/10/18 § | | | 400,000 | | | | 404,500 | |
Allied Security Holdings LLC (1st Lien)
5.250% due 02/03/17 § | | | 712,318 | | | | 714,099 | |
Allison Transmission Inc | | | | | | | | |
Term B1 (Non-Extended) | | | | | | | | |
2.710% due 08/07/14 § | | | 1,267,341 | | | | 1,275,659 | |
Term B3 | | | | | | | | |
4.250% due 08/23/19 § | | | 2,810,893 | | | | 2,842,515 | |
Altegrity Inc | | | | | | | | |
2.961% due 02/21/15 § | | | 2,143,922 | | | | 1,996,527 | |
Tranche D | | | | | | | | |
7.750% due 02/20/15 § | | | 860,027 | | | | 855,726 | |
AMC Entertainment Inc | | | | | | | | |
Term B2 (Extended) | | | | | | | | |
4.250% due 12/15/16 § | | | 1,942,559 | | | | 1,956,217 | |
Term B3 | | | | | | | | |
4.750% due 02/22/18 § | | | 1,237,500 | | | | 1,249,208 | |
Ameristar Casinos Inc Term B
4.000% due 04/16/18 § | | | 1,299,078 | | | | 1,310,242 | |
| | |
| See Notes to Financial Statements | | See explanation of symbols and terms, if any, on page B-143 |
B-16
PACIFIC SELECT FUND
FLOATING RATE LOAN PORTFOLIO
Schedule of Investments (Continued)
December 31, 2012
| | | | | | | | |
| | | Principal
Amount | | | Value | |
ARAMARK Corp | | | | | | | | |
(Extended) (LC - 3 Facility) | | | | | | | | |
3.459% due 07/26/16 § | | | $169,638 | | | | $170,644 | |
(Extended) (Letter of Credit) | | | | | | | | |
3.459% due 07/26/16 § | | | 307,355 | | | | 309,177 | |
Term B (Extended) | | | | | | | | |
3.462% due 07/26/16 § | | | 4,673,529 | | | | 4,701,248 | |
Term C (Extended) | | | | | | | | |
3.527% due 07/26/16 § | | | 2,105,790 | | | | 2,118,279 | |
Ascena Retail Group Inc Term B
4.750% due 06/14/18 § | | | 954,104 | | | | 963,049 | |
Ascend Learning Inc Term B
6.500% due 05/23/17 § | | | 2,257,849 | | | | 2,265,752 | |
Asurion LLC | | | | | | | | |
(1st Lien) | | | | | | | | |
5.500% due 05/24/18 § | | | 10,026,511 | | | | 10,141,395 | |
(2nd Lien) | | | | | | | | |
9.000% due 05/24/19 § | | | 222,930 | | | | 230,175 | |
Audio Visual Services Group Inc
6.750% due 11/09/18 § | | | 1,246,875 | | | | 1,228,172 | |
Autoparts Holdings Ltd (1st Lien)
6.500% due 07/28/17 § | | | 518,438 | | | | 520,058 | |
BAR/BRI Review Courses Inc Term B
6.000% due 06/16/17 § | | | 827,688 | | | | 828,722 | |
Bass Pro Group LLC
4.000% due 11/30/19 § | | | 1,650,000 | | | | 1,653,437 | |
BBHI Acquisition LLC Term B
4.500% due 12/14/17 § | | | 1,592,500 | | | | 1,604,942 | |
Brickman Group Holdings Inc Term B
5.500% due 10/14/16 § | | | 2,417,867 | | | | 2,460,179 | |
Burger King Corp Term B
3.750% due 09/27/19 § | | | 3,142,125 | | | | 3,167,655 | |
Caesars Entertainment Operating Co | | | | | | | | |
Term B2 | | | | | | | | |
3.210% due 01/28/15 § | | | 1,500,000 | | | | 1,479,271 | |
Term B6 (Extended) | | | | | | | | |
5.460% due 01/26/18 § | | | 3,872,847 | | | | 3,469,103 | |
Cedar Fair LP Term B
4.000% due 12/15/17 § | | | 1,887,852 | | | | 1,908,303 | |
Cengage Learning Acquisitions Inc
(Non-Extended)
2.720% due 07/03/14 § | | | 3,283,141 | | | | 2,596,416 | |
Centerplate Inc Term B
5.753% due 10/15/18 § | | | 400,000 | | | | 403,250 | |
Cequel Communications LLC Term B 4.000% due 02/14/19 § | | | 6,624,938 | | | | 6,665,422 | |
Charter Communications Operating LLC | | | | | | | | |
Term C (Extended) | | | | | | | | |
3.470% due 09/06/16 § | | | 5,054,721 | | | | 5,087,875 | |
Term D | | | | | | | | |
4.000% due 05/15/19 § | | | 2,927,875 | | | | 2,954,867 | |
Chrysler Group LLC Term B
6.000% due 05/24/17 § | | | 7,490,937 | | | | 7,665,686 | |
Clear Channel Communications Inc Term B
3.862% due 01/29/16 § | | | 1,476,399 | | | | 1,227,257 | |
ClubCorp Club Operations Inc Term B
5.000% due 11/30/16 § | | | 2,282,184 | | | | 2,316,417 | |
Crown Media Holdings Inc Term B
5.750% due 07/14/18 § | | | 608,625 | | | | 611,668 | |
Cumulus Media Holdings Inc (1st Lien)
4.500% due 09/17/18 § | | | 5,357,377 | | | | 5,382,251 | |
Dave & Buster’s Inc
5.500% due 06/01/16 § | | | 1,950,000 | | | | 1,956,094 | |
David’s Bridal Inc Term B
5.000% due 10/11/19 § | | | 750,000 | | | | 752,968 | |
DineEquity Inc Term B
4.250% due 10/19/17 § | | | 1,304,043 | | | | 1,317,084 | |
Dunkin Brands Inc Term B2
4.000% due 11/23/17 § | | | 5,728,778 | | | | 5,777,696 | |
Education Management LLC Term C3
8.250% due 03/29/18 § | | | 2,628,477 | | | | 2,199,160 | |
| | | | | | | | |
| | | Principal
Amount | | | Value | |
Entercom Radio LLC Term B
5.000% due 11/23/18 § | | | $695,000 | | | | $703,253 | |
Equinox Fitness Clubs (1st Lien)
due 11/16/19 µ | | | 1,400,000 | | | | 1,414,000 | |
Evergreen Acquisition Co 1 LP
5.000% due 07/09/19 § | | | 771,130 | | | | 775,227 | |
Federal-Mogul Corp | | | | | | | | |
Term B | | | | | | | | |
2.148% due 12/29/14 § | | | 5,557,453 | | | | 5,116,330 | |
Term C | | | | | | | | |
2.148% due 12/28/15 § | | | 2,930,154 | | | | 2,697,573 | |
FoxCo Acquisition Sub LLC Term B
5.500% due 07/14/17 § | | | 1,596,000 | | | | 1,620,606 | |
FTD Inc
4.750% due 06/11/18 § | | | 1,554,985 | | | | 1,570,534 | |
General Nutrition Centers Inc
3.750% due 03/02/18 § | | | 8,254,989 | | | | 8,291,104 | |
Genpact International Inc Term B
4.250% due 08/30/19 § | | | 1,870,313 | | | | 1,891,353 | |
Getty Images Inc Term B
4.750% due 10/18/19 § | | | 5,475,000 | | | | 5,489,542 | |
Go Daddy Operating Co LLC
5.500% due 12/17/18 § | | | 1,925,625 | | | | 1,931,242 | |
Gray Television Inc Term B
4.750% due 10/15/19 § | | | 530,180 | | | | 533,825 | |
Harbor Freight Tools USA Inc Term B 5.500% due 11/14/17 § | | | 1,172,063 | | | | 1,185,737 | |
HHI Holdings LLC (1st Lien)
6.000% due 10/03/18 § | | | 2,375,000 | | | | 2,410,625 | |
Instant Web Inc | | | | | | | | |
(Delayed Draw) | | | | | | | | |
3.587% due 08/07/14 § | | | 206,373 | | | | 160,971 | |
Term B | | | | | | | | |
3.587% due 08/07/14 § | | | 1,979,723 | | | | 1,544,184 | |
Interactive Data Corp Term B
4.500% due 02/12/18 § | | | 3,726,951 | | | | 3,751,385 | |
Isle of Capri Casinos Inc Term B
4.750% due 03/24/17 § | | | 1,179,000 | | | | 1,195,456 | |
J Crew Group Inc Term B
4.500% due 03/07/18 § | | | 4,161,625 | | | | 4,184,456 | |
Jo-Ann Stores Inc
4.750% due 03/16/18 § | | | 3,664,726 | | | | 3,684,578 | |
Kabel Deutschland GmbH Term F (Germany)
4.250% due 02/01/19 § | | | 1,400,000 | | | | 1,410,209 | |
Landry’s Inc Term B
6.500% due 04/24/18 § | | | 1,588,000 | | | | 1,607,850 | |
Language Line LLC Term B
6.250% due 06/20/16 § | | | 2,597,052 | | | | 2,590,559 | |
Las Vegas Sands LLC | | | | | | | | |
(Extended) (Delayed Draw) | | | | | | | | |
2.760% due 11/23/16 § | | | 340,478 | | | | 341,659 | |
Term B (Extended) | | | | | | | | |
2.760% due 11/23/16 § | | | 1,678,365 | | | | 1,684,187 | |
Laureate Education Inc (Extended)
5.250% due 06/18/18 § | | | 3,937,424 | | | | 3,920,198 | |
LIN Television Corp Term B | | | | | | | | |
due 12/21/18 µ | | | 767,250 | | | | 773,004 | |
4.000% due 12/21/18 § | | | 767,250 | | | | 773,004 | |
Live Nation Entertainment Inc Term B 4.500% due 11/07/16 § | | | 2,056,032 | | | | 2,068,866 | |
LodgeNet Entertainment Corp
8.500% due 04/04/14 § Y | | | 603,555 | | | | 430,536 | |
Mediacom Broadband LLC Term F
4.500% due 10/23/17 § | | | 3,900,000 | | | | 3,912,187 | |
Mediacom LLC Term E
4.500% due 10/23/17 § | | | 5,852,444 | | | | 5,848,786 | |
Meritas LLC (1st Lien)
7.500% due 07/28/17 § | | | 876,156 | | | | 878,346 | |
| | |
| See Notes to Financial Statements | | See explanation of symbols and terms, if any, on page B-143 |
B-17
PACIFIC SELECT FUND
FLOATING RATE LOAN PORTFOLIO
Schedule of Investments (Continued)
December 31, 2012
| | | | | | | | |
| | | Principal
Amount | | | Value | |
MGM Resorts International Term B
4.250% due 12/20/19 § | | | $2,900,000 | | | | $2,935,345 | |
Michaels Stores Inc Term B3 (Extended)
4.813% due 07/29/16 § | | | 6,480,355 | | | | 6,547,472 | |
Midcontinent Communications Term B
4.000% due 12/30/16 § | | | 1,928,804 | | | | 1,937,643 | |
Mission Broadcasting Inc Term B
4.500% due 12/03/19 § | | | 204,286 | | | | 206,839 | |
National CineMedia LLC Term B (1st Lien)
3.470% due 11/23/19 § | | | 600,000 | | | | 602,000 | |
National Vision Inc Term B
7.000% due 08/02/18 § | | | 918,063 | | | | 931,833 | |
Nelson Education Ltd (Canada)
2.811% due 07/03/14 § | | | 2,294,056 | | | | 1,823,774 | |
Nexstar Broadcasting Inc
4.500% due 12/03/19 § | | | 1,142,143 | | | | 1,156,420 | |
NPC International Inc Term B
4.500% due 12/01/18 § | | | 834,417 | | | | 842,761 | |
Ollie’s Bargain Outlet Inc
6.250% due 09/27/19 § | | | 548,625 | | | | 553,083 | |
Orbitz Worldwide Inc
3.212% due 07/25/14 § | | | 2,682,995 | | | | 2,586,855 | |
OSI Restaurant Partners LLC Term B
4.800% due 10/24/19 § | | | 3,050,000 | | | | 3,083,995 | |
P.F. Chang’s China Bistro Inc Term B
5.250% due 07/02/19 § | | | 473,813 | | | | 479,143 | |
Penn National Gaming Inc Term B
3.750% due 07/16/18 § | | | 398,993 | | | | 401,112 | |
Petco Animal Supplies Inc
4.500% due 11/24/17 § | | | 3,077,348 | | | | 3,104,001 | |
Pilot Travel Centers LLC | | | | | | | | |
Term B | | | | | | | | |
3.750% due 03/30/18 § | | | 2,277,010 | | | | 2,291,953 | |
Term B2 | | | | | | | | |
4.250% due 08/07/19 § | | | 773,063 | | | | 779,988 | |
Pinnacle Entertainment Inc Series A (Incremental)
4.000% due 03/19/19 § | | | 719,563 | | | | 725,859 | |
Raycom TV Broadcasting Inc Term B
4.250% due 05/31/17 § | | | 1,108,125 | | | | 1,106,740 | |
RE/MAX International Inc
5.500% due 04/15/16 § | | | 1,754,702 | | | | 1,759,089 | |
RGIS Services LLC | | | | | | | | |
(Extended) | | | | | | | | |
4.561% due 10/18/16 § | | | 2,057,597 | | | | 2,073,029 | |
Term C | | | | | | | | |
5.500% due 10/18/17 § | | | 1,612,813 | | | | 1,628,941 | |
Sagittarius Restaurants LLC Term B
7.515% due 05/18/15 § | | | 808,438 | | | | 812,985 | |
SeaWorld Parks & Entertainment Inc Term B
4.000% due 08/17/17 § | | | 1,669,928 | | | | 1,685,056 | |
Serta Simmons Holdings LLC
5.000% due 10/01/19 § | | | 1,850,000 | | | | 1,855,267 | |
ServiceMaster Co (Extended)
4.460% due 01/31/17 § | | | 4,852,812 | | | | 4,871,515 | |
Sinclair Television Group Inc Term B
4.000% due 10/28/16 § | | | 961,029 | | | | 967,828 | |
Six Flags Theme Parks Inc Term B
4.000% due 12/20/18 § | | | 1,540,089 | | | | 1,549,852 | |
SRAM LLC Term B
4.781% due 06/07/18 § | | | 1,457,111 | | | | 1,464,396 | |
SymphonyIRI Group Inc Term B
5.000% due 12/01/17 § | | | 1,058,875 | | | | 1,062,184 | |
Tempur-Pedic International Inc Term B
due 12/12/19 µ | | | 2,100,000 | | | | 2,129,312 | |
The Goodyear Tire & Rubber Co (2nd Lien)
4.750% due 04/30/19 § | | | 8,250,000 | | | | 8,320,125 | |
The Neiman Marcus Group Inc (Extended)
4.750% due 05/16/18 § | | | 6,450,000 | | | | 6,470,601 | |
| | | | | | | | |
| | | Principal
Amount | | | Value | |
The Pep Boys-Manny Moe & Jack Term B
5.000% due 10/11/18 § | | | $525,000 | | | | $529,375 | |
Town Sports International Inc Term B
5.750% due 05/11/18 § | | | 1,108,220 | | | | 1,121,149 | |
Travelport LLC | | | | | | | | |
(Extended) | | | | | | | | |
5.105% due 08/21/15 § | | | 2,975,123 | | | | 2,863,556 | |
Tranche S | | | | | | | | |
5.061% due 08/21/15 § | | | 768,384 | | | | 739,569 | |
Tribune Co
due 12/17/19 µ | | | 1,925,000 | | | | 1,925,241 | |
Univision Communications Inc (Extended)
4.462% due 03/31/17 § | | | 6,333,260 | | | | 6,241,725 | |
Veyance Technologies Inc | | | | | | | | |
2.470% due 07/31/14 § | | | 1,713,271 | | | | 1,699,993 | |
(Delayed Draw) | | | | | | | | |
2.470% due 07/31/14 § | | | 245,399 | | | | 243,497 | |
Term B (Incremental) | | | | | | | | |
5.500% due 07/31/14 § | | | 421,813 | | | | 422,340 | |
Visant Holding Corp Term B
5.250% due 12/22/16 § | | | 2,590,176 | | | | 2,353,175 | |
VWR Funding Inc | | | | | | | | |
(Non-Extended) | | | | | | | | |
2.712% due 06/30/14 § | | | 1,455,844 | | | | 1,458,271 | |
Term B (Extended) | | | | | | | | |
4.462% due 04/03/17 § | | | 2,461,096 | | | | 2,474,940 | |
Warnaco Inc
3.750% due 06/15/18 § | | | 640,250 | | | | 637,049 | |
Weather Channel Term B
4.250% due 02/13/17 § | | | 7,923,506 | | | | 8,019,246 | |
Weight Watchers International Inc Term F
4.000% due 03/15/19 § | | | 1,687,250 | | | | 1,701,482 | |
Wendy’s International Inc Term B
4.750% due 05/15/19 § | | | 2,369,063 | | | | 2,396,138 | |
WMG Acquisition Corp
5.250% due 11/01/18 § | | | 625,000 | | | | 633,073 | |
Wolverine Worldwide Inc Term B
4.000% due 07/31/19 § | | | 578,906 | | | | 583,248 | |
Zuffa LLC Term B
2.250% due 06/19/15 § | | | 2,893,454 | | | | 2,869,342 | |
| | | | | | | | |
| | | | | | | 292,483,346 | |
| | | | | | | | |
Consumer Staples - 6.2% | |
| | |
AdvancePierre Foods Inc
5.750% due 07/10/17 § | | | 1,450,000 | | | | 1,469,031 | |
Blue Buffalo Co Ltd Term B
6.500% due 08/08/19 § | | | 1,521,188 | | | | 1,536,399 | |
Brasa Holdings Inc (1st Lien)
7.500% due 07/19/19 § | | | 523,688 | | | | 528,924 | |
Clearwater Seafoods Ltd Partnership Term B (Canada)
6.750% due 06/06/18 § | | | 497,500 | | | | 499,677 | |
Del Monte Foods Co
4.500% due 03/08/18 § | | | 9,275,996 | | | | 9,308,851 | |
Dole Food Co Inc Term B2
5.033% due 07/06/18 § | | | 1,258,337 | | | | 1,263,282 | |
High Liner Foods Inc Term B (Canada)
7.000% due 12/19/17 § | | | 841,500 | | | | 847,285 | |
JBS USA Holdings Inc
4.250% due 05/25/18 § | | | 5,764,719 | | | | 5,764,719 | |
KIK Custom Products Inc | | | | | | | | |
(1st Lien) | | | | | | | | |
2.570% due 06/02/14 § | | | 3,569,173 | | | | 3,363,946 | |
(2nd Lien) | | | | | | | | |
5.313% due 11/28/14 § | | | 2,500,000 | | | | 2,000,000 | |
(Canadian) | | | | | | | | |
2.570% due 06/02/14 § | | | 613,740 | | | | 578,450 | |
Michael Foods Group Inc
4.250% due 02/23/18 § | | | 781,583 | | | | 787,933 | |
NBTY Inc Term B1
4.250% due 10/02/17 § | | | 3,254,052 | | | | 3,290,042 | |
| | |
| See Notes to Financial Statements | | See explanation of symbols and terms, if any, on page B-143 |
B-18
PACIFIC SELECT FUND
FLOATING RATE LOAN PORTFOLIO
Schedule of Investments (Continued)
December 31, 2012
| | | | | | | | |
| | | Principal
Amount | | | Value | |
Pinnacle Foods Finance LLC | | | | | | | | |
Term E | | | | | | | | |
4.750% due 10/17/18 § | | | $372,188 | | | | $375,511 | |
Term F | | | | | | | | |
4.750% due 10/17/18 § | | | 1,243,750 | | | | 1,257,742 | |
Prestige Brands Inc
5.250% due 01/31/19 § | | | 455,492 | | | | 461,593 | |
Reynolds Group Holdings Inc
4.750% due 09/28/18 § | | | 6,059,813 | | | | 6,142,790 | |
Rite Aid Corp | | | | | | | | |
Term 2 | | | | | | | | |
1.970% due 06/04/14 § | | | 5,744,457 | | | | 5,718,607 | |
Term 5 | | | | | | | | |
4.500% due 03/02/18 § | | | 2,700,749 | | | | 2,699,061 | |
Solvest Ltd Term C2 (Bermuda)
5.018% due 07/06/18 § | | | 2,251,765 | | | | 2,260,613 | |
Spectrum Brands Inc
4.500% due 12/17/19 § | | | 3,825,000 | | | | 3,862,952 | |
Sprouts Farmers Markets Holdings LLC (Incremental)
6.000% due 04/18/18 § | | | 746,250 | | | | 754,645 | |
The Pantry Inc Term B
5.750% due 08/02/19 § | | | 498,750 | | | | 503,894 | |
US Foods Inc Term B (Extended)
5.750% due 03/31/17 § | | | 3,548,473 | | | | 3,568,433 | |
Wilton Brands LLC
7.500% due 08/30/18 § | | | 740,625 | | | | 748,031 | |
| | | | | | | | |
| | | | | | | 59,592,411 | |
| | | | | | | | |
Energy - 3.6% | |
| | |
Arch Coal Inc Term B
5.750% due 05/16/18 § | | | 3,377,349 | | | | 3,420,171 | |
Citgo Petroleum Corp | | | | | | | | |
Term B | | | | | | | | |
8.000% due 06/24/15 § | | | 235,268 | | | | 237,474 | |
Term C | | | | | | | | |
9.000% due 06/23/17 § | | | 4,651,964 | | | | 4,736,281 | |
Crestwood Holdings LLC Term B
9.750% due 03/26/18 § | | | 1,389,825 | | | | 1,412,989 | |
Energy Transfer Equity LP Term B
3.750% due 03/24/17 § | | | 3,375,000 | | | | 3,406,377 | |
Frac Tech International LLC Term B
8.500% due 05/06/16 § | | | 2,249,312 | | | | 1,876,770 | |
Gibson Energy ULC Term B (Canada)
4.750% due 06/15/18 § | | | 2,679,750 | | | | 2,713,665 | |
Invenergy LLC Term B
9.000% due 11/21/17 § | | | 940,126 | | | | 961,278 | |
MEG Energy Corp Term B (Canada)
4.000% due 03/16/18 § | | | 1,555,313 | | | | 1,571,108 | |
Obsidian Natural Gas Trust
7.000% due 11/02/15 § | | | 3,777,158 | | | | 3,796,044 | |
Patriot Coal Corp
9.250% due 10/04/13 § | | | 950,000 | | | | 957,125 | |
Plains Exploration & Production Co
4.000% due 11/30/19 § | | | 2,225,000 | | | | 2,235,197 | |
Samson Investment Co (2nd Lien)
6.000% due 09/25/18 § | | | 950,000 | | | | 960,094 | |
Sheridan Production Partners I LLC | | | | | | | | |
Term B2 | | | | | | | | |
5.000% due 09/14/19 § | | | 2,301,711 | | | | 2,332,642 | |
Term B2 I-A | | | | | | | | |
5.000% due 09/25/19 § | | | 304,996 | | | | 309,094 | |
Term B2 I-M | | | | | | | | |
5.000% due 09/25/19 § | | | 186,293 | | | | 188,796 | |
Tallgrass Operations LLC
5.250% due 11/13/18 § | | | 2,475,000 | | | | 2,505,938 | |
Tervita Corp (Canada)
6.500% due 11/14/14 § | | | 1,687,250 | | | | 1,688,655 | |
| | | | | | | | |
| | | | | | | 35,309,698 | |
| | | | | | | | |
| | | | | | | | |
| | | Principal
Amount | | | Value | |
Financials - 5.1% | |
| | |
Altisource Solutions SARL (1st Lien) (Luxembourg)
5.750% due 11/27/19 § | | | $925,000 | | | | $929,625 | |
American Capital Holdings Inc
5.500% due 08/22/16 § | | | 950,000 | | | | 966,625 | |
AmWINS Group Inc (1st Lien)
5.750% due 06/06/19 § | | | 1,169,125 | | | | 1,176,432 | |
Asset Acceptance Capital Corp Term B
8.750% due 11/14/17 § | | | 1,638,750 | | | | 1,657,145 | |
Citco Funding LLC
5.500% due 06/29/18 § | | | 2,117,750 | | | | 2,141,575 | |
CNO Financial Group Inc Term B2
5.000% due 09/20/18 § | | | 1,149,563 | | | | 1,159,852 | |
Compass Investors Inc
5.250% due 12/27/19 § | | | 2,400,000 | | | | 2,398,001 | |
Cunningham Lindsey U.S. Inc (1st Lien) (Canada)
5.000% due 10/29/19 § | | | 750,000 | | | | 757,500 | |
First Data Corp | | | | | | | | |
(Add on) | | | | | | | | |
5.211% due 09/24/18 § | | | 1,425,000 | | | | 1,400,953 | |
Term B (Extended) | | | | | | | | |
4.211% due 03/23/18 § | | | 1,634,332 | | | | 1,560,220 | |
Term B1 | | | | | | | | |
2.961% due 09/24/14 § | | | 221,071 | | | | 221,301 | |
Term B3 | | | | | | | | |
2.961% due 09/24/14 § | | | 44,372 | | | | 44,438 | |
Hamilton Lane Advisors LLC
6.500% due 02/23/18 § | | | 914,375 | | | | 914,375 | |
Harbourvest Partners LLC Term B
4.750% due 11/21/17 § | | | 1,075,000 | | | | 1,083,062 | |
HUB International Ltd | | | | | | | | |
(Extended) | | | | | | | | |
4.712% due 06/13/17 § | | | 5,671,412 | | | | 5,735,216 | |
(Extended) (Incremental) | | | | | | | | |
6.750% due 12/13/17 § | | | 3,870,750 | | | | 3,910,263 | |
iPayment Inc Term B
5.750% due 05/08/17 § | | | 675,000 | | | | 672,469 | |
LPL Holdings Inc | | | | | | | | |
Term A | | | | | | | | |
2.712% due 03/29/17 § | | | 986,563 | | | | 986,974 | |
Term B | | | | | | | | |
4.000% due 03/29/19 § | | | 3,200,813 | | | | 3,224,818 | |
MIP Delaware LLC
5.500% due 07/12/18 § | | | 822,131 | | | | 830,352 | |
Nuveen Investments Inc | | | | | | | | |
(Extended) | | | | | | | | |
5.811% due 05/12/17 § | | | 5,444,200 | | | | 5,481,629 | |
(Extended) (1st Lien) | | | | | | | | |
5.811% due 05/13/17 § | | | 3,030,800 | | | | 3,045,954 | |
(Incremental) | | | | | | | | |
7.250% due 05/13/17 § | | | 700,000 | | | | 704,200 | |
Shield Finance Co SARL Term B (Luxembourg)
6.500% due 05/10/19 § | | | 1,144,250 | | | | 1,147,111 | |
The TCW Group Inc Term B
due 12/20/19 µ | | | 625,000 | | | | 626,562 | |
Trans Union LLC Term B
5.500% due 02/12/18 § | | | 5,831,842 | | | | 5,921,751 | |
Walter Investment Management Corp
5.750% due 11/28/17 § | | | 518,438 | | | | 521,354 | |
| | | | | | | | |
| | | | | | | 49,219,757 | |
| | | | | | | | |
Health Care - 15.3% | |
| | |
Alere Inc | | | | | | | | |
Term B | | | | | | | | |
4.750% due 06/30/17 § | | | 3,085,938 | | | | 3,104,950 | |
Term B1 | | | | | | | | |
4.750% due 06/30/17 § | | | 742,500 | | | | 747,075 | |
| | |
| See Notes to Financial Statements | | See explanation of symbols and terms, if any, on page B-143 |
B-19
PACIFIC SELECT FUND
FLOATING RATE LOAN PORTFOLIO
Schedule of Investments (Continued)
December 31, 2012
| | | | | | | | |
| | | Principal
Amount | | | Value | |
Term B2 (Incremental) | | | | | | | | |
4.750% due 06/30/17 § | | | $595,500 | | | | $598,850 | |
Alliance HealthCare Services Inc Term B
7.250% due 06/01/16 § | | | 1,457,747 | | | | 1,441,347 | |
Aptalis Pharma Inc Term B
5.500% due 02/10/17 § | | | 1,739,500 | | | | 1,751,097 | |
Ardent Medical Services Inc Term B
7.250% due 09/15/15 § | | | 856,581 | | | | 858,723 | |
AssuraMed Holding Inc (1st Lien)
5.500% due 10/24/19 § | | | 925,000 | | | | 935,118 | |
Bausch & Lomb Inc Term B
5.250% due 05/17/19 § | | | 3,482,500 | | | | 3,518,568 | |
Biomet Inc Term B (Extended)
4.008% due 07/25/17 § | | | 7,717,493 | | | | 7,775,343 | |
BSN Medical Acquisition Holding GmbH
Term B-1A (Germany)
5.000% due 10/18/19 § | | | 675,000 | | | | 680,062 | |
Catalent Pharma Solutions Inc (Incremental)
5.250% due 09/15/17 § | | | 792,015 | | | | 801,915 | |
CHG Buyer Corp (1st Lien)
5.000% due 11/22/19 § | | | 773,063 | | | | 774,995 | |
Community Health Systems Inc (Extended)
3.811% due 01/25/17 § | | | 10,523,777 | | | | 10,601,853 | |
Convatec Inc
5.000% due 12/22/16 § | | | 1,397,003 | | | | 1,417,958 | |
DaVita Inc | | | | | | | | |
Term B | | | | | | | | |
4.500% due 10/20/16 § | | | 3,797,500 | | | | 3,828,829 | |
Term B2 | | | | | | | | |
4.000% due 11/01/19 § | | | 3,625,000 | | | | 3,658,216 | |
DJO Finance LLC | | | | | | | | |
Term B2 (Extended) | | | | | | | | |
5.212% due 11/01/16 § | | | 2,486,959 | | | | 2,500,431 | |
Term B3 | | | | | | | | |
6.250% due 09/15/17 § | | | 2,084,251 | | | | 2,102,489 | |
Drumm Investors LLC
5.000% due 05/04/18 § | | | 987,151 | | | | 930,389 | |
Emdeon Inc Term B1
5.000% due 11/02/18 § | | | 1,017,313 | | | | 1,028,884 | |
Emergency Medical Services Corp
5.250% due 05/25/18 § | | | 2,852,128 | | | | 2,877,084 | |
Grifols Inc Term B
4.250% due 06/01/17 § | | | 3,811,034 | | | | 3,853,116 | |
Hanger Orthopedic Group Inc Term C
4.000% due 12/01/16 § | | | 1,835,575 | | | | 1,844,753 | |
HCA Inc | | | | | | | | |
Term B2 (Extended) | | | | | | | | |
3.561% due 03/31/17 § | | | 3,000,000 | | | | 3,012,189 | |
Term B3 (Extended) | | | | | | | | |
3.462% due 05/01/18 § | | | 10,397,103 | | | | 10,437,017 | |
Health Management Associates Inc Term B
4.500% due 11/16/18 § | | | 2,425,500 | | | | 2,448,013 | |
Hologic Inc Term B
4.500% due 08/01/19 § | | | 2,194,500 | | | | 2,223,531 | |
IASIS Healthcare LLC
5.000% due 05/03/18 § | | | 2,087,813 | | | | 2,098,252 | |
IMS Health Inc Term B
4.500% due 08/25/17 § | | | 6,389,939 | | | | 6,440,343 | |
inVentiv Health Inc | | | | | | | | |
(Combined) | | | | | | | | |
6.500% due 08/04/16 § | | | 2,314,486 | | | | 2,227,693 | |
Term B3 (Incremental) | | | | | | | | |
6.750% due 05/15/18 § | | | 893,186 | | | | 870,857 | |
Kindred Healthcare Inc
5.250% due 06/01/18 § | | | 1,645,218 | | | | 1,610,943 | |
Kinetic Concepts Inc Term C1
5.500% due 05/04/18 § | | | 5,865,750 | | | | 5,939,072 | |
LHP Hospital Group Inc
9.000% due 07/03/18 § | | | 646,750 | | | | 654,026 | |
MedAssets Inc Term B
4.000% due 11/30/19 § | | | 700,000 | | | | 700,875 | |
| | | | | | | | |
| | | Principal
Amount | | | Value | |
Medpace Inc
6.500% due 06/16/17 § | | | $1,037,615 | | | | $996,111 | |
MMM Holdings Inc
9.750% due 10/09/17 § | | | 810,526 | | | | 806,474 | |
MSO of Puerto Rico Inc
9.750% due 10/26/17 § | | | 589,474 | | | | 586,526 | |
Multiplan Inc Term B
4.750% due 08/26/17 § | | | 5,191,738 | | | | 5,230,676 | |
MX USA Inc Term B
6.500% due 04/28/17 § | | | 719,563 | | | | 721,361 | |
One Call Medical Inc
7.000% due 08/16/19 § | | | 1,050,000 | | | | 1,055,250 | |
Onex CareStream Finance LP Term B
5.000% due 02/25/17 § | | | 1,890,279 | | | | 1,889,098 | |
Par Pharmaceutical Cos Inc Term B
5.000% due 09/30/19 § | | | 1,346,625 | | | | 1,348,448 | |
Pharmaceutical Product Development Inc
Term B
6.250% due 12/05/18 § | | | 2,524,500 | | | | 2,567,891 | |
Physiotherapy Associates Holdings Inc
(1st Lien)
6.008% due 04/30/18 § | | | 373,125 | | | | 374,291 | |
Quintiles Transnational Corp | | | | | | | | |
Term B | | | | | | | | |
4.500% due 06/08/18 § | | | 5,417,500 | | | | 5,417,500 | |
Term B1 (Incremental) | | | | | | | | |
4.500% due 06/08/18 § | | | 473,813 | | | | 473,813 | |
RadNet Management Inc Term B
5.505% due 09/30/18 § | | | 1,695,750 | | | | 1,704,229 | |
RPI Finance Trust | | | | | | | | |
Tranche 2 | | | | | | | | |
3.500% due 05/09/18 § | | | 2,509,618 | | | | 2,533,668 | |
Tranche 2 (Incremental) | | | | | | | | |
4.000% due 11/09/18 § | | | 1,040,607 | | | | 1,052,639 | |
Sage Products Inc
5.250% due 12/17/19 § | | | 675,000 | | | | 680,906 | |
Select Medical Corp Term B
5.500% due 06/01/18 § | | | 3,743,000 | | | | 3,764,833 | |
Sheridan Holdings Inc (1st Lien)
6.000% due 06/29/18 § | | | 671,625 | | | | 681,280 | |
The TriZetto Group Inc Term B
4.750% due 05/02/18 § | | | 827,301 | | | | 825,025 | |
Truven Health Analytics Inc Term B
5.750% due 06/01/19 § | | | 1,920,175 | | | | 1,926,176 | |
Universal Health Services Inc Term B
3.750% due 11/15/16 § | | | 1,316,980 | | | | 1,324,552 | |
Valeant Pharmaceuticals International Inc
(Canada) | | | | | | | | |
Series C Tranche B | | | | | | | | |
4.250% due 12/11/19 § | | | 2,300,000 | | | | 2,318,400 | |
Series D Tranche B | | | | | | | | |
4.250% due 02/13/19 § | | | 2,216,250 | | | | 2,231,948 | |
Vanguard Health Holding Co II LLC Term B
5.000% due 01/29/16 § | | | 5,408,212 | | | | 5,462,294 | |
Warner Chilcott Co LLC | | | | | | | | |
Term A | | | | | | | | |
3.750% due 03/17/16 § | | | 326,000 | | | | 329,260 | |
Term B2 | | | | | | | | |
4.250% due 03/15/18 § | | | 1,105,789 | | | | 1,114,181 | |
Warner Chilcott Corp | | | | | | | | |
Term B1 | | | | | | | | |
4.250% due 03/15/18 § | | | 2,211,579 | | | | 2,228,362 | |
Term B1 (Incremental) | | | | | | | | |
4.250% due 03/15/18 § | | | 839,893 | | | | 846,267 | |
WC Luxco SARL Term B3 (Luxembourg)
4.250% due 03/15/18 § | | | 1,520,460 | | | | 1,531,999 | |
| | | | | | | | |
| | | | | | | 148,318,314 | |
| | | | | | | | |
| | |
| See Notes to Financial Statements | | See explanation of symbols and terms, if any, on page B-143 |
B-20
PACIFIC SELECT FUND
FLOATING RATE LOAN PORTFOLIO
Schedule of Investments (Continued)
December 31, 2012
| | | | | | | | |
| | | Principal
Amount | | | Value | |
Industrials - 10.2% | |
| | |
ADS Waste Holdings Inc Term B
5.250% due 10/09/19 § | | | $2,250,000 | | | | $2,280,937 | |
Alliant Holdings I Inc Term B
5.000% due 12/20/19 § | | | 2,275,000 | | | | 2,281,370 | |
Alpha D2 Ltd Term B2 (Extended) (United Kingdom)
6.000% due 04/30/19 § | | | 2,382,030 | | | | 2,420,738 | |
Armstrong World Industries Inc Term B
4.000% due 03/09/18 § | | | 1,157,768 | | | | 1,168,261 | |
BakerCorp International Inc Term B
5.000% due 06/01/18 § | | | 2,049,063 | | | | 2,065,285 | |
Bombardier Recreational Products Inc (Canada) | | | | | | | | |
Term B2 (Extended) | | | | | | | | |
4.510% due 06/28/16 § | | | 4,040,742 | | | | 4,081,150 | |
Term B3 (Extended) | | | | | | | | |
due 06/28/16 µ | | | 550,000 | | | | 555,500 | |
Brand Energy & Infrastructure Services Inc | | | | | | | | |
Term 1 (Canadian) | | | | | | | | |
6.250% due 10/23/18 § | | | 178,585 | | | | 176,743 | |
Term B1 | | | | | | | | |
6.250% due 10/16/18 § | | | 744,103 | | | | 736,430 | |
Brock Holdings III Inc Term B
6.000% due 03/16/17 § | | | 1,382,668 | | | | 1,391,310 | |
ClientLogic Corp (Extended)
7.097% due 01/30/17 § | | | 2,102,207 | | | | 2,054,908 | |
Colfax Corp Term B
4.500% due 01/11/19 § | | | 3,667,962 | | | | 3,706,362 | |
Covanta Energy Corp
4.000% due 03/28/19 § | | | 521,063 | | | | 528,227 | |
CPM Acquisition Corp (1st Lien)
6.250% due 08/29/17 § | | | 573,563 | | | | 578,581 | |
DAE Aviation Holdings Inc | | | | | | | | |
Term B | | | | | | | | |
6.250% due 10/29/18 § | | | 754,989 | | | | 766,313 | |
Term B2 | | | | | | | | |
6.250% due 11/02/18 § | | | 342,261 | | | | 347,395 | |
Delos Aircraft Inc Term 2
4.750% due 04/12/16 § | | | 1,625,000 | | | | 1,645,313 | |
Ducommun Inc
5.500% due 06/28/17 § | | | 599,145 | | | | 605,136 | |
DynCorp International LLC Term B
6.250% due 07/07/16 § | | | 688,994 | | | | 693,874 | |
Edwards Ltd Term B (Cayman)
5.500% due 05/31/16 § | | | 1,310,066 | | | | 1,313,341 | |
Evergreen International Aviation Inc
11.500% due 06/30/15 § Y | | | 1,080,869 | | | | 1,059,252 | |
Firth Rixson PLC Term B (United Kingdom)
5.500% due 06/30/17 § | | | 375,000 | | | | 378,281 | |
Flying Fortress Inc (1st Lien)
5.000% due 06/30/17 § | | | 4,300,000 | | | | 4,332,250 | |
Generac Power Systems Inc Term B
6.250% due 05/30/18 § | | | 1,795,500 | | | | 1,841,883 | |
Grede LLC Term B
7.000% due 04/03/17 § | | | 1,258,000 | | | | 1,264,290 | |
Hamilton Sundstrand Industrial (1st Lien)
5.000% due 12/13/19 § | | | 2,275,000 | | | | 2,297,952 | |
Husky Injection Molding Systems Ltd Term B (Canada)
5.750% due 06/29/18 § | | | 928,735 | | | | 942,666 | |
IG Investment Holdings LLC (1st Lien)
6.000% due 10/31/19 § | | | 900,000 | | | | 902,250 | |
JMC Steel Group Inc
4.750% due 04/03/17 § | | | 859,701 | | | | 870,447 | |
KAR Auction Services Inc Term B
5.000% due 05/19/17 § | | | 3,619,875 | | | | 3,658,336 | |
Metaldyne Co LLC Term B
6.000% due 12/18/18 § | | | 1,500,000 | | | | 1,515,000 | |
Monitronics International Inc Term B
5.500% due 03/23/18 § | | | 1,091,753 | | | | 1,104,035 | |
| | | | | | | | |
| | | Principal
Amount | | | Value | |
Nielsen Finance LLC Class B
3.963% due 05/02/16 § | | | $9,127,004 | | | | $9,188,940 | |
Pelican Products Inc (1st Lien) (Delayed Draw)
7.000% due 07/11/18 § | | | 621,875 | | | | 612,547 | |
Progressive Waste Solutions Ltd Term B (Canada)
3.500% due 10/24/19 § | | | 598,500 | | | | 604,485 | |
Rexnord Corp Term B
4.500% due 04/02/18 § | | | 4,182,829 | | | | 4,225,967 | |
Sedgwick CMS Holdings Inc
5.000% due 12/30/16 § | | | 1,486,111 | | | | 1,489,826 | |
Sensata Technologies Finance Co LLC
3.750% due 05/11/18 § | | | 4,457,125 | | | | 4,480,030 | |
Sequa Corp Term B
5.250% due 05/29/17 § | | | 1,775,000 | | | | 1,789,791 | |
Ship U.S. Bidco Inc Term B2
5.250% due 10/15/17 § | | | 989,394 | | | | 997,433 | |
SumTotal Systems Inc (1st Lien)
6.250% due 10/25/19 § | | | 1,500,000 | | | | 1,485,000 | |
Swift Transportation Co Inc Term B2
5.000% due 12/21/17 § | | | 2,204,414 | | | | 2,229,443 | |
Tank Holding Corp Term B
5.500% due 07/09/19 § | | | 1,122,789 | | | | 1,131,210 | |
TASC Inc Term B
4.500% due 12/18/15 § | | | 1,819,022 | | | | 1,820,443 | |
Terex Corp Term B
4.500% due 04/28/17 § | | | 913,461 | | | | 924,422 | |
The Corporate Executive Board Co Term B
5.000% due 07/02/19 § | | | 600,000 | | | | 604,125 | |
The Hertz Corp | | | | | | | | |
Term B | | | | | | | | |
3.750% due 03/09/18 § | | | 4,445,813 | | | | 4,448,938 | |
Term B (Add on) | | | | | | | | |
3.750% due 03/11/18 § | | | 2,075,000 | | | | 2,080,837 | |
The Manitowoc Co Inc Term B
4.250% due 11/13/17 § | | | 177,188 | | | | 178,738 | |
Tomkins LLC Term B
4.250% due 09/29/16 § | | | 1,916,986 | | | | 1,932,562 | |
Transdigm Inc | | | | | | | | |
Term B | | | | | | | | |
4.000% due 02/14/17 § | | | 2,793,000 | | | | 2,815,257 | |
Term B2 (Add on) | | | | | | | | |
4.000% due 02/14/17 § | | | 2,406,047 | | | | 2,425,382 | |
TriMas Corp Term B
3.750% due 10/10/19 § | | | 947,625 | | | | 952,363 | |
U.S. Security Holdings Inc | | | | | | | | |
6.000% due 07/28/17 § | | | 785,213 | | | | 792,084 | |
(Delayed Draw) | | | | | | | | |
6.000% due 07/28/17 § | | | 153,689 | | | | 155,033 | |
Waupaca Foundry Inc
5.764% due 06/29/17 § | | | 731,367 | | | | 742,338 | |
WireCo WorldGroup Inc
6.000% due 02/15/17 § | | | 748,125 | | | | 759,347 | |
| | | | | | | | |
| | | | | | | 98,430,357 | |
| | | | | | | | |
Information Technology - 8.6% | |
| | |
Aeroflex Inc Term B
5.750% due 05/09/18 § | | | 731,832 | | | | 740,065 | |
Applied Systems Inc (1st Lien)
5.500% due 12/08/16 § | | | 1,748,355 | | | | 1,763,653 | |
Aspect Software Inc Term B
7.000% due 05/06/16 § | | | 3,769,096 | | | | 3,806,787 | |
Attachmate Corp (1st Lien)
7.250% due 11/22/17 § | | | 3,489,063 | | | | 3,527,690 | |
Booz Allen Hamilton Inc Term B
4.500% due 07/31/19 § | | | 947,625 | | | | 960,063 | |
CCC Information Services Inc
due 12/25/19 µ | | | 350,000 | | | | 351,896 | |
Cinedigm Digital Funding I LLC
5.250% due 04/29/16 § | | | 623,788 | | | | 626,517 | |
| | |
| See Notes to Financial Statements | | See explanation of symbols and terms, if any, on page B-143 |
B-21
PACIFIC SELECT FUND
FLOATING RATE LOAN PORTFOLIO
Schedule of Investments (Continued)
December 31, 2012
| | | | | | | | |
| | | Principal
Amount | | | Value | |
CommScope Inc
4.250% due 01/12/18 § | | | $3,905,438 | | | | $3,937,169 | |
CompuCom Systems Inc
6.500% due 10/02/18 § | | | 900,000 | | | | 905,625 | |
Dealer Computer Services Inc Term B
3.750% due 04/20/18 § | | | 3,109,357 | | | | 3,130,734 | |
DG FastChannel Inc Term B | | | | | | | | |
due 07/26/18 µ | | | 1,000,000 | | | | 950,000 | |
5.750% due 07/26/18 § | | | 1,961,357 | | | | 1,863,289 | |
Eagle Parent Inc
5.000% due 05/16/18 § | | | 3,299,750 | | | | 3,328,623 | |
EIG Investors Corp (1st Lien)
6.250% due 11/08/19 § | | | 2,325,000 | | | | 2,330,812 | |
Expert Global Solutions Inc Term B
8.000% due 04/03/18 § | | | 2,500,630 | | | | 2,514,696 | |
Freescale Semiconductor Inc Term B (Extended)
4.464% due 12/01/16 § | | | 2,057,497 | | | | 2,023,205 | |
Hyland Software Inc (1st Lien)
5.500% due 10/25/19 § | | | 400,000 | | | | 401,688 | |
IAP Worldwide Services Inc
10.000% due 12/31/15 § | | | 3,723,915 | | | | 2,830,176 | |
Infor U.S. Inc Term B2
5.250% due 04/05/18 § | | | 6,492,416 | | | | 6,564,443 | |
Kronos Inc (1st Lien)
5.500% due 10/25/19 § | | | 1,825,000 | | | | 1,846,672 | |
Magic Newco LLC (1st Lien)
7.250% due 12/12/18 § | | | 1,670,813 | | | | 1,686,685 | |
Mercury Payment Systems LLC Term B (Canada)
5.500% due 07/03/17 § | | | 1,260,876 | | | | 1,275,061 | |
Microsemi Corp
4.000% due 02/02/18 § | | | 1,942,105 | | | | 1,960,069 | |
NeuStar Inc Term B
5.000% due 11/08/18 § | | | 1,259,063 | | | | 1,268,113 | |
NXP BV (Netherlands) | | | | | | | | |
Term A2 | | | | | | | | |
5.500% due 03/03/17 § | | | 1,333,125 | | | | 1,362,079 | |
Term B (Incremental) | | | | | | | | |
5.250% due 03/19/19 § | | | 2,059,438 | | | | 2,080,460 | |
Term C | | | | | | | | |
4.750% due 01/11/20 § | | | 1,050,000 | | | | 1,056,235 | |
Open Solutions Inc Term B
2.435% due 01/23/14 § | | | 1,488,160 | | | | 1,415,612 | |
Renaissance Learning Inc Term B
5.750% due 11/13/18 § | | | 648,375 | | | | 651,617 | |
Rocket Software Inc
5.750% due 02/08/18 § | | | 569,250 | | | | 571,385 | |
RP Crown Parent LLC (1st Lien)
6.750% due 12/14/18 § | | | 3,000,000 | | | | 3,000,537 | |
SafeNet Inc Term B
2.712% due 04/12/14 § | | | 113,950 | | | | 113,808 | |
Semtech Corp Term B
4.250% due 03/20/17 § | | | 522,375 | | | | 527,925 | |
Serena Software Inc | | | | | | | | |
(Extended) | | | | | | | | |
4.211% due 03/10/16 § | | | 2,269,173 | | | | 2,276,736 | |
Term B | | | | | | | | |
5.000% due 03/10/16 § | | | 425,000 | | | | 428,719 | |
Sirius Computer Solutions Inc Term B 8.000% due 11/30/18 § | | | 686,538 | | | | 692,975 | |
SkillSoft Corp Term B
5.000% due 05/26/17 § | | | 1,318,110 | | | | 1,331,292 | |
Softlayer Technologies Inc Term B
7.250% due 11/05/16 § | | | 833,000 | | | | 838,206 | |
Sophia LP Term B
6.250% due 07/19/18 § | | | 1,744,640 | | | | 1,769,174 | |
Spansion LLC Term B
5.250% due 12/11/18 § | | | 872,756 | | | | 880,938 | |
| | | | | | | | |
| | | Principal
Amount | | | Value | |
SS&C Technologies Inc | | | | | | | | |
Term B1 | | | | | | | | |
5.000% due 06/07/19 § | | | $1,199,550 | | | | $1,213,421 | |
Term B2 | | | | | | | | |
5.000% due 06/07/19 § | | | 124,091 | | | | 125,022 | |
SunGard Data Systems Inc | | | | | | | | |
Term B | | | | | | | | |
3.866% due 02/26/16 § | | | 3,318,803 | | | | 3,341,580 | |
Term C | | | | | | | | |
3.963% due 02/28/17 § | | | 2,570,093 | | | | 2,588,549 | |
VeriFone Inc Term B
4.250% due 12/28/18 § | | | 278,489 | | | | 279,011 | |
Vertafore Inc
5.250% due 07/29/16 § | | | 1,195,611 | | | | 1,210,556 | |
Wall Street Systems Inc (1st Lien)
5.750% due 10/24/19 § | | | 1,375,000 | | | | 1,381,875 | |
Web.com Group Inc Term B
5.500% due 10/27/17 § | | | 3,175,737 | | | | 3,205,510 | |
Wyle Services Corp Term B
5.000% due 03/27/17 § | | | 532,773 | | | | 535,284 | |
| | | | | | | | |
| | | | | | | 83,472,237 | |
| | | | | | | | |
Materials - 5.4% | |
| | |
AZ Chem U.S. Inc
7.250% due 12/22/17 § | | | 1,354,625 | | | | 1,379,008 | |
BWAY Corp Term B
4.500% due 08/07/17 § | | | 2,375,000 | | | | 2,390,338 | |
Emerald Performance Materials LLC Term B 6.750% due 05/18/18 § | | | 820,875 | | | | 827,032 | |
Essar Steel Algoma Inc (Canada)
8.750% due 09/19/14 § | | | 1,172,063 | | | | 1,169,132 | |
Fairmount Minerals Ltd Term B
5.250% due 03/15/17 § | | | 3,643,181 | | | | 3,637,327 | |
FMG America Finance Inc (Australia)
5.250% due 10/18/17 § | | | 6,384,000 | | | | 6,448,338 | |
General Chemical Corp
5.002% due 10/06/15 § | | | 692,471 | | | | 696,799 | |
Harko CV Term B (Netherlands)
4.458% due 08/02/17 § | | | 666,563 | | | | 674,061 | |
Huntsman International LLC Term B (Extended)
2.757% due 04/19/17 § | | | 2,022,454 | | | | 2,025,402 | |
Ineos U.S. Finance LLC
6.500% due 05/04/18 § | | | 4,416,625 | | | | 4,471,144 | |
John Henry Holdings Inc Term B
6.000% due 12/04/18 § | | | 700,000 | | | | 706,125 | |
Momentive Specialty Chemicals Inc | | | | | | | | |
Term C-1B (Extended) | | | | | | | | |
4.000% due 05/05/15 § | | | 669,440 | | | | 671,114 | |
Term C-2B (Extended) | | | | | | | | |
4.063% due 05/05/15 § | | | 286,687 | | | | 287,404 | |
Term C-7B (Extended) | | | | | | | | |
4.063% due 05/05/15 § | | | 3,275,219 | | | | 3,176,962 | |
Noranda Aluminum Acquisition Corp Term B 5.750% due 02/24/19 § | | | 1,290,250 | | | | 1,300,733 | |
Novelis Inc (Canada) | | | | | | | | |
4.000% due 03/10/17 § | | | 3,479,008 | | | | 3,512,928 | |
Term B2 (Incremental) | | | | | | | | |
4.000% due 03/10/17 § | | | 864,063 | | | | 872,487 | |
OMNOVA Solutions Inc (Extended)
5.500% due 05/31/17 § | | | 661,500 | | | | 669,769 | |
PQ Corp (1st Lien)
5.250% due 05/08/17 § | | | 1,350,000 | | | | 1,358,775 | |
Preferred Proppants LLC Term B
7.500% due 12/15/16 § | | | 915,750 | | | | 851,648 | |
Sealed Air Corp
4.000% due 10/03/18 § | | | 1,530,625 | | | | 1,554,700 | |
Summit Materials Cos I LLC Term B
6.000% due 01/30/19 § | | | 620,313 | | | | 626,322 | |
SunCoke Energy Inc Term B
4.000% due 07/26/18 § | | | 640,252 | | | | 641,853 | |
| | |
| See Notes to Financial Statements | | See explanation of symbols and terms, if any, on page B-143 |
B-22
PACIFIC SELECT FUND
FLOATING RATE LOAN PORTFOLIO
Schedule of Investments (Continued)
December 31, 2012
| | | | | | | | |
| | | Principal
Amount | | | Value | |
Taminco Global Chemical Corp Term B1
5.250% due 02/15/19 § | | | $496,250 | | | | $501,419 | |
TricorBraun Inc Term B
5.503% due 05/03/18 § | | | 798,000 | | | | 804,318 | |
Trinseo Materials Operating SCA Term B (Luxembourg)
8.000% due 08/02/17 § | | | 2,168,250 | | | | 2,125,564 | |
Tronox Pigments BV (Netherlands) | | | | | | | | |
(Delayed Draw) | | | | | | | | |
4.250% due 02/08/18 § | | | 223,875 | | | | 226,184 | |
Term B | | | | | | | | |
4.250% due 02/08/18 § | | | 820,875 | | | | 830,110 | |
Unifrax Corp
6.500% due 11/28/18 § | | | 743,120 | | | | 751,790 | |
United Distribution Group Inc
7.500% due 10/09/18 § | | | 1,300,000 | | | | 1,254,500 | |
Univar Inc Term B
5.000% due 06/30/17 § | | | 3,924,911 | | | | 3,923,820 | |
Walter Energy Inc Term B
5.750% due 04/02/18 § | | | 2,376,374 | | | | 2,398,652 | |
| | | | | | | | |
| | | | | | | 52,765,758 | |
| | | | | | | | |
Telecommunication Services - 5.1% | |
| | |
Alaska Communications Systems Holdings Inc Term B
5.500% due 10/21/16 § | | | 978,391 | | | | 929,471 | |
Atlantic Broadband Finance LLC Term B
4.500% due 11/29/19 § | | | 975,000 | | | | 985,562 | |
Bragg Communications Inc Term B (Canada)
4.000% due 02/28/18 § | | | 521,063 | | | | 525,622 | |
Cellular South Inc Term B
4.500% due 07/27/17 § | | | 1,083,500 | | | | 1,091,626 | |
Cricket Communications Inc
4.750% due 10/10/19 § | | | 550,000 | | | | 554,469 | |
Genesys Telecom Holdings U.S. Inc Term B
6.750% due 01/31/19 § | | | 794,000 | | | | 804,917 | |
Intelsat Jackson Holdings Ltd Term B1 (Luxembourg)
4.500% due 04/02/18 § | | | 13,232,500 | | | | 13,355,377 | |
MetroPCS Wireless Inc Term B3 (Incremental)
4.000% due 03/16/18 § | | | 7,558,813 | | | | 7,590,310 | |
SBA Finance | | | | | | | | |
3.750% due 06/29/18 § | | | 1,206,625 | | | | 1,211,150 | |
(Add on) | | | | | | | | |
3.750% due 09/27/19 § | | | 500,000 | | | | 503,125 | |
Syniverse Holdings Inc
5.000% due 04/23/19 § | | | 2,238,750 | | | | 2,258,339 | |
Telesat LLC Term B
4.250% due 03/28/19 § | | | 4,900,375 | | | | 4,943,253 | |
UPC Financing Partnership (Netherlands) | | | | | | | | |
Term AF | | | | | | | | |
4.000% due 01/29/21 § | | | 975,000 | | | | 974,696 | |
Term T | | | | | | | | |
3.714% due 12/30/16 § | | | 1,456,978 | | | | 1,451,515 | |
Term X | | | | | | | | |
3.714% due 12/29/17 § | | | 7,000,000 | | | | 6,994,750 | |
WaveDivision Holdings LLC Term B
5.500% due 08/09/19 § | | | 375,000 | | | | 379,449 | |
West Corp | | | | | | | | |
Term B4 | | | | | | | | |
5.500% due 07/15/16 § | | | 3,873,080 | | | | 3,932,388 | |
Term B6 | | | | | | | | |
5.750% due 06/29/18 § | | | 1,318,375 | | | | 1,337,327 | |
| | | | | | | | |
| | | | | | | 49,823,346 | |
| | | | | | | | |
Utilities - 2.6% | |
| | |
Calpine Corp | | | | | | | | |
4.500% due 04/02/18 § | | | 4,494,938 | | | | 4,546,782 | |
Term B2 | | | | | | | | |
4.500% due 04/02/18 § | | | 1,231,250 | | | | 1,245,102 | |
Term B3 | | | | | | | | |
4.500% due 10/09/19 § | | | 972,563 | | | | 983,393 | |
| | | | | | | | |
| | | Principal
Amount | | | Value | |
Dynegy MidWest Generation LLC
9.250% due 08/04/16 § | | | $582,386 | | | | $607,137 | |
Dynegy Power LLC
9.250% due 08/04/16 § | | | 931,957 | | | | 976,891 | |
LSP Madison Funding LLC
5.500% due 06/28/19 § | | | 1,260,075 | | | | 1,280,551 | |
NRG Energy Inc Term B
4.000% due 07/02/18 § | | | 5,713,000 | | | | 5,782,179 | |
Raven Power Finance LLC Term B
7.250% due 11/15/18 § | | | 600,000 | | | | 600,000 | |
Texas Competitive Electric
Holdings Co LLC (Extended)
4.746% due 10/10/17 § | | | 9,414,018 | | | | 6,339,334 | |
The AES Corp
4.250% due 06/01/18 § | | | 2,554,313 | | | | 2,585,329 | |
| | | | | | | | |
| | | | | | | 24,946,698 | |
| | | | | | | | |
Total Senior Loan Notes
(Cost $889,126,221) | | | | | | | 894,361,922 | |
| | | | | | | | |
|
SHORT-TERM INVESTMENT - 1.1% | |
|
Repurchase Agreement - 1.1% | |
| | |
Fixed Income Clearing Corp
0.010% due 01/02/13
(Dated 12/31/12, repurchase price of $10,528,046; collateralized by U.S.
Treasury Notes: 0.250% due 07/15/15
and value $10,740,000) | | | 10,528,040 | | | | 10,528,040 | |
| | | | | | | | |
| | |
Total Short-Term Investment
(Cost $10,528,040) | | | | | | | 10,528,040 | |
| | | | | | | | |
| | |
TOTAL INVESTMENTS - 99.2%
(Cost $949,839,737) | | | | | | | 961,313,266 | |
| |
OTHER ASSETS & LIABILITIES, NET - 0.8% | | | | 7,876,711 | |
| | | | | | | | |
| |
NET ASSETS - 100.0% | | | | $969,189,977 | |
| | | | | | | | |
Notes to Schedule of Investments
| (a) | As of December 31, 2012, the portfolio was diversified as a percentage of net assets as follows: |
| | | | |
Consumer Discretionary | | | 32.2% | |
Health Care | | | 16.1% | |
Industrials | | | 10.7% | |
Information Technology | | | 8.8% | |
Consumer Staples | | | 6.4% | |
Materials | | | 5.7% | |
Telecommunication Services | | | 5.6% | |
Financials | | | 5.5% | |
Energy | | | 4.2% | |
Utilities | | | 2.9% | |
Short-Term Investment | | | 1.1% | |
| | | | |
| | | 99.2% | |
Other Assets & Liabilities, Net | | | 0.8% | |
| | | | |
| | | 100.0% | |
| | | | |
| (b) | As of December 31, 2012, the portfolio’s Standard & Poor’s quality ratings as a percentage of total fixed income investments were as follows (Unaudited): |
| | | | |
A-1 (Short-Term Debt only) | | | 1.1% | |
BBB | | | 3.0% | |
BB | | | 48.3% | |
B | | | 40.6% | |
CCC | | | 2.2% | |
CC | | | 0.1% | |
Not Rated | | | 4.7% | |
| | | | |
| | | 100.0% | |
| | | | |
| | |
| See Notes to Financial Statements | | See explanation of symbols and terms, if any, on page B-143 |
B-23
PACIFIC SELECT FUND
FLOATING RATE LOAN PORTFOLIO
Schedule of Investments (Continued)
December 31, 2012
| (c) | Short-term investments reflect either the stated coupon rate or the annualized effective yield on the date of purchase for discounted investments. |
| (d) | Investments with a total aggregate value of $1,622,913 or 0.2% of the portfolio’s net assets were in default as of December 31, 2012. |
| (e) | Restricted securities as of December 31, 2012 were as follows: |
| | | | | | | | | | | | |
Issuer and
Acquisition Date | | Cost | | | Value | | | Value as a % of
Net Assets | |
Euramax Holdings Inc ‘A’
Acq. 06/29/09 | | | $60,302 | | | | $198,954 | | | | 0.0% | |
Metro-Goldwyn-Mayer Studios Inc
Acq. 12/30/10 | | | 4,281,792 | | | | 6,809,245 | | | | 0.7% | |
| | | | | | | | | | | | |
| | | $4,342,094 | | | | $7,008,199 | | | | 0.7% | |
| | | | | | | | | | | | |
| (f) | Pursuant to the terms of the following senior loan agreement, the portfolio had an unfunded loan commitment of $278,571 or less than 0.1% of the net assets as of December 31, 2012, which could be extended at the option of the borrower: |
| | | | | | | | | | | | |
| Borrower | | Unfunded Loan
Commitment | | | Value | | | Unrealized
Appreciation | |
Mission Broadcasting Inc Term B | | | $278,571 | | | | $282,054 | | | | $3,483 | |
| | | | | | | | | | | | |
| (g) | Fair Value Measurements |
The following is a summary of the portfolio’s investments as categorized under the three-tier hierarchy of inputs used in valuing the portfolio’s assets and liabilities (See Note 3D in Notes to Financial Statements) as of December 31, 2012:
| | | | | | | | | | | | | | | | | | |
| | | | | Total Value at
December 31, 2012 | | | Level 1
Quoted Price | | | Level 2
Significant
Observable Inputs | | | Level 3
Significant
Unobservable Inputs | |
Assets | | Common Stocks (1) | | | $7,008,199 | | | | $- | | | | $7,008,199 | | | | $- | |
| | Corporate Bonds & Notes | | | 49,415,105 | | | | - | | | | 49,415,105 | | | | - | |
| | Senior Loan Notes | | | 894,361,922 | | | | - | | | | 891,531,746 | | | | 2,830,176 | |
| | Short-Term Investment | | | 10,528,040 | | | | - | | | | 10,528,040 | | | | - | |
| | Unfunded Loan Commitment | | | 3,483 | | | | - | | | | 3,483 | | | | - | |
| | | | | | | | | | | | | | | | | | |
| | Total | | | $961,316,749 | | | | $- | | | | $958,486,573 | | | | $2,830,176 | |
| | | | | | | | | | | | | | | | | | |
| | (1) | For equity investments categorized in a single level, refer to the schedule of investments for further industry breakout. |
| | |
| See Notes to Financial Statements | | See explanation of symbols and terms, if any, on page B-143 |
B-24
PACIFIC SELECT FUND
HIGH YIELD BOND PORTFOLIO
Schedule of Investments
December 31, 2012
| | | | | | | | |
| | | Principal
Amount | | | Value | |
CORPORATE BONDS & NOTES - 89.3% | | | | | |
| | |
Consumer Discretionary - 18.1% | | | | | | | | |
| | |
99 Cents Only Stores
11.000% due 12/15/19 | | | $4,041,000 | | | | $4,626,945 | |
Allison Transmission Inc
7.125% due 05/15/19 ~ | | | 3,000,000 | | | | 3,217,500 | |
Beazer Homes USA Inc
8.125% due 06/15/16 | | | 4,000,000 | | | | 4,280,000 | |
9.125% due 06/15/18 | | | 2,375,000 | | | | 2,487,813 | |
Boyd Gaming Corp
9.000% due 07/01/20 ~ | | | 3,350,000 | | | | 3,316,500 | |
Bresnan Broadband Holdings LLC
8.000% due 12/15/18 ~ | | | 2,500,000 | | | | 2,712,500 | |
Brookfield Residential Properties Inc (Canada)
6.500% due 12/15/20 ~ | | | 1,200,000 | | | | 1,236,000 | |
Cablevision Systems Corp
8.625% due 09/15/17 | | | 5,000,000 | | | �� | 5,856,250 | |
Caesars Entertainment Operating Co Inc
10.000% due 12/15/18 | | | 2,000,000 | | | | 1,335,000 | |
11.250% due 06/01/17 | | | 5,500,000 | | | | 5,919,375 | |
Caesars Operating Escrow LLC
9.000% due 02/15/20 ~ | | | 850,000 | | | | 854,250 | |
CCO Holdings LLC
6.500% due 04/30/21 | | | 2,600,000 | | | | 2,817,750 | |
7.000% due 01/15/19 | | | 3,500,000 | | | | 3,793,125 | |
7.250% due 10/30/17 | | | 4,775,000 | | | | 5,228,625 | |
Cedar Fair LP
9.125% due 08/01/18 | | | 5,550,000 | | | | 6,271,500 | |
Cequel Communications Holdings I LLC
6.375% due 09/15/20 ~ | | | 2,200,000 | | | | 2,301,750 | |
Chrysler Group LLC
8.250% due 06/15/21 | | | 4,000,000 | | | | 4,420,000 | |
CityCenter Holdings LLC
7.625% due 01/15/16 | | | 3,100,000 | | | | 3,332,500 | |
10.750% due 01/15/17 | | | 4,492,559 | | | | 4,674,196 | |
CKE Restaurants Inc
11.375% due 07/15/18 | | | 4,930,000 | | | | 5,694,150 | |
Clear Channel Communications Inc
5.500% due 12/15/16 | | | 6,275,000 | | | | 3,765,000 | |
9.000% due 12/15/19 ~ | | | 680,000 | | | | 625,600 | |
Clear Channel Worldwide Holdings Inc
6.500% due 11/15/22 ~ | | | 3,395,000 | | | | 3,539,287 | |
7.625% due 03/15/20 | | | 3,000,000 | | | | 3,033,750 | |
Dana Holding Corp
6.750% due 02/15/21 | | | 6,250,000 | | | | 6,750,000 | |
DISH DBS Corp
4.625% due 07/15/17 | | | 6,000,000 | | | | 6,285,000 | |
5.875% due 07/15/22 | | | 1,000,000 | | | | 1,080,000 | |
6.750% due 06/01/21 | | | 4,000,000 | | | | 4,580,000 | |
7.875% due 09/01/19 | | | 2,000,000 | | | | 2,380,000 | |
Fiesta Restaurant Group Inc
8.875% due 08/15/16 | | | 3,810,000 | | | | 4,090,987 | |
Great Canadian Gaming Corp (Canada)
6.625% due 07/25/22 ~ | | | CAD 3,925,000 | | | | 4,108,682 | |
Griffey Intermediate Inc
7.000% due 10/15/20 ~ | | | $3,850,000 | | | | 3,955,875 | |
Jo-Ann Stores Holdings Inc
9.750% due 10/15/19 ~ | | | 2,250,000 | | | | 2,280,938 | |
Jo-Ann Stores Inc
8.125% due 03/15/19 ~ | | | 6,000,000 | | | | 6,135,000 | |
Landry’s Holdings II Inc
10.250% due 01/01/18 ~ | | | 2,700,000 | | | | 2,700,000 | |
Lennar Corp
4.750% due 11/15/22 ~ | | | 3,900,000 | | | | 3,831,750 | |
Limited Brands Inc
5.625% due 02/15/22 | | | 4,250,000 | | | | 4,643,125 | |
6.625% due 04/01/21 | | | 5,000,000 | | | | 5,750,000 | |
| | | | | | | | |
| | | Principal
Amount | | | Value | |
Live Nation Entertainment Inc
8.125% due 05/15/18 ~ | | | $3,000,000 | | | | $3,247,500 | |
MGM Resorts International
6.625% due 07/15/15 | | | 3,000,000 | | | | 3,232,500 | |
6.625% due 12/15/21 | | | 2,100,000 | | | | 2,102,625 | |
6.750% due 10/01/20 ~ | | | 3,850,000 | | | | 3,941,437 | |
7.625% due 01/15/17 | | | 6,000,000 | | | | 6,450,000 | |
8.625% due 02/01/19 ~ | | | 2,000,000 | | | | 2,240,000 | |
NPC International Inc
10.500% due 01/15/20 | | | 3,650,000 | | | | 4,252,250 | |
Petco Holdings Inc
8.500% due 10/15/17 ~ | | | 3,200,000 | | | | 3,304,000 | |
PVH Corp
4.500% due 12/15/22 | | | 3,850,000 | | | | 3,907,750 | |
Scientific Games Corp
8.125% due 09/15/18 | | | 3,000,000 | | | | 3,315,000 | |
Scientific Games International Inc
6.250% due 09/01/20 ~ | | | 1,850,000 | | | | 1,912,438 | |
ServiceMaster Co
8.000% due 02/15/20 | | | 3,000,000 | | | | 3,142,500 | |
Sinclair Television Group Inc
6.125% due 10/01/22 ~ | | | 1,850,000 | | | | 1,972,563 | |
8.375% due 10/15/18 | | | 2,000,000 | | | | 2,245,000 | |
9.250% due 11/01/17 ~ | | | 3,000,000 | | | | 3,315,000 | |
Sirius XM Radio Inc
5.250% due 08/15/22 ~ | | | 875,000 | | | | 888,125 | |
Six Flags Entertainment Corp
5.250% due 01/15/21 ~ | | | 3,150,000 | | | | 3,157,875 | |
Standard Pacific Corp
8.375% due 05/15/18 | | | 6,000,000 | | | | 6,990,000 | |
8.375% due 01/15/21 | | | 3,000,000 | | | | 3,495,000 | |
The Goodyear Tire & Rubber Co
8.250% due 08/15/20 | | | 2,550,000 | | | | 2,811,375 | |
The Ryland Group Inc
5.375% due 10/01/22 | | | 4,300,000 | | | | 4,412,875 | |
Toys R Us Inc
10.375% due 08/15/17 | | | 3,425,000 | | | | 3,587,687 | |
Toys R Us Property Co II LLC
8.500% due 12/01/17 | | | 4,000,000 | | | | 4,260,000 | |
Unitymedia Hessen GmbH & Co KG (Germany)
5.500% due 01/15/23 ~ | | | 1,800,000 | | | | 1,867,500 | |
7.500% due 03/15/19 ~ | | | 2,250,000 | | | | 2,486,250 | |
Wolverine World Wide Inc
6.125% due 10/15/20 ~ | | | 3,850,000 | | | | 4,061,750 | |
XM Satellite Radio Inc
7.625% due 11/01/18 ~ | | | 3,975,000 | | | | 4,452,000 | |
| | | | | | | | |
| | | | | | | 234,961,723 | |
| | | | | | | | |
Consumer Staples - 3.5% | | | | | | | | |
| | |
Del Monte Corp
7.625% due 02/15/19 | | | 4,500,000 | | | | 4,713,750 | |
JBS USA LLC
8.250% due 02/01/20 ~ | | | 3,000,000 | | | | 3,195,000 | |
New Albertsons Inc
7.450% due 08/01/29 | | | 2,000,000 | | | | 1,130,000 | |
Reynolds Group Issuer Inc
5.750% due 10/15/20 ~ | | | 5,700,000 | | | | 5,899,500 | |
7.875% due 08/15/19 | | | 1,500,000 | | | | 1,676,250 | |
8.500% due 05/15/18 | | | 7,500,000 | | | | 7,725,000 | |
9.000% due 04/15/19 | | | 4,750,000 | | | | 4,963,750 | |
Rite Aid Corp
9.250% due 03/15/20 | | | 3,500,000 | | | | 3,745,000 | |
Smithfield Foods Inc
7.750% due 07/01/17 | | | 3,000,000 | | | | 3,510,000 | |
Spectrum Brands Escrow Corp
6.375% due 11/15/20 ~ | | | 350,000 | | | | 368,375 | |
| | |
| See Notes to Financial Statements | | See explanation of symbols and terms, if any, on page B-143 |
B-25
PACIFIC SELECT FUND
HIGH YIELD BOND PORTFOLIO
Schedule of Investments (Continued)
December 31, 2012
| | | | | | | | |
| | | Principal
Amount | | | Value | |
Spectrum Brands Inc
6.750% due 03/15/20 ~ | | | $3,850,000 | | | | $4,138,750 | |
U.S. Foods Inc
8.500% due 06/30/19 ~ | | | 3,850,000 | | | | 3,946,250 | |
| | | | | | | | |
| | | | | | | 45,011,625 | |
| | | | | | | | |
Energy - 15.8% | | | | | | | | |
| | |
Access Midstream Partners LP
4.875% due 05/15/23 | | | 1,100,000 | | | | 1,117,875 | |
Alpha Natural Resources Inc
6.000% due 06/01/19 | | | 3,000,000 | | | | 2,775,000 | |
6.250% due 06/01/21 | | | 2,000,000 | | | | 1,840,000 | |
9.750% due 04/15/18 | | | 2,650,000 | | | | 2,875,250 | |
Antero Resources Finance Corp
6.000% due 12/01/20 ~ | | | 3,000,000 | | | | 3,052,500 | |
9.375% due 12/01/17 | | | 4,000,000 | | | | 4,410,000 | |
Arch Coal Inc
7.000% due 06/15/19 | | | 2,000,000 | | | | 1,870,000 | |
7.250% due 06/15/21 | | | 6,550,000 | | | | 6,075,125 | |
9.875% due 06/15/19 ~ | | | 2,500,000 | | | | 2,612,500 | |
Atlas Pipeline Escrow LLC
6.625% due 10/01/20 ~ | | | 2,750,000 | | | | 2,860,000 | |
Basic Energy Services Inc
7.750% due 02/15/19 | | | 2,500,000 | | | | 2,500,000 | |
Bristow Group Inc
6.250% due 10/15/22 | | | 2,550,000 | | | | 2,738,062 | |
Chaparral Energy Inc
7.625% due 11/15/22 ~ | | | 5,000,000 | | | | 5,255,000 | |
8.250% due 09/01/21 | | | 1,550,000 | | | | 1,689,500 | |
Chesapeake Energy Corp
6.625% due 08/15/20 | | | 5,000,000 | | | | 5,387,500 | |
9.500% due 02/15/15 | | | 3,128,000 | | | | 3,550,280 | |
Cimarex Energy Co
5.875% due 05/01/22 | | | 4,000,000 | | | | 4,400,000 | |
Cloud Peak Energy Resources LLC
8.250% due 12/15/17 | | | 3,000,000 | | | | 3,225,000 | |
Concho Resources Inc
5.500% due 10/01/22 | | | 1,850,000 | | | | 1,961,000 | |
7.000% due 01/15/21 | | | 3,990,000 | | | | 4,468,800 | |
CONSOL Energy Inc
8.250% due 04/01/20 | | | 4,000,000 | | | | 4,350,000 | |
Crosstex Energy LP
8.875% due 02/15/18 | | | 3,025,000 | | | | 3,282,125 | |
Drill Rigs Holdings Inc
6.500% due 10/01/17 ~ | | | 1,600,000 | | | | 1,600,000 | |
EP Energy LLC
6.875% due 05/01/19 | | | 4,300,000 | | | | 4,687,000 | |
7.750% due 09/01/22 | | | 950,000 | | | | 1,011,750 | |
9.375% due 05/01/20 | | | 1,900,000 | | | | 2,151,750 | |
EPE Holdings LLC
8.125% due 12/15/17 ~ | | | 950,000 | | | | 944,063 | |
EV Energy Partners LP
8.000% due 04/15/19 | | | 4,000,000 | | | | 4,265,000 | |
Forest Oil Corp
7.500% due 09/15/20 ~ | | | 3,000,000 | | | | 3,165,000 | |
Halcon Resources Corp
8.875% due 05/15/21 ~ | | | 2,850,000 | | | | 3,035,250 | |
Hilcorp Energy I LP
7.625% due 04/15/21 ~ | | | 2,000,000 | | | | 2,190,000 | |
8.000% due 02/15/20 ~ | | | 4,000,000 | | | | 4,400,000 | |
Holly Energy Partners LP
6.500% due 03/01/20 ~ | | | 1,300,000 | | | | 1,397,500 | |
Key Energy Services Inc
6.750% due 03/01/21 | | | 4,744,000 | | | | 4,767,720 | |
6.750% due 03/01/21 ~ | | | 1,150,000 | | | | 1,150,000 | |
Linn Energy LLC
6.250% due 11/01/19 ~ | | | 1,900,000 | | | | 1,919,000 | |
7.750% due 02/01/21 | | | 5,500,000 | | | | 5,885,000 | |
MarkWest Energy Partners LP
6.250% due 06/15/22 | | | 3,000,000 | | | | 3,315,000 | |
| | | | | | | | |
| | | Principal
Amount | | | Value | |
MEG Energy Corp (Canada)
6.375% due 01/30/23 ~ | | | $1,650,000 | | | | $1,728,375 | |
6.500% due 03/15/21 ~ | | | 2,500,000 | | | | 2,643,750 | |
Newfield Exploration Co
5.625% due 07/01/24 | | | 850,000 | | | | 920,125 | |
5.750% due 01/30/22 | | | 3,000,000 | | | | 3,315,000 | |
Northern Tier Energy LLC
7.125% due 11/15/20 ~ | | | 2,850,000 | | | | 2,964,000 | |
Oasis Petroleum Inc
6.500% due 11/01/21 | | | 2,000,000 | | | | 2,135,000 | |
6.875% due 01/15/23 | | | 3,000,000 | | | | 3,232,500 | |
OGX Austria GmbH (Austria)
8.500% due 06/01/18 ~ | | | 4,500,000 | | | | 4,072,500 | |
Oil States International Inc
5.125% due 01/15/23 ~ | | | 350,000 | | | | 355,688 | |
Peabody Energy Corp
6.000% due 11/15/18 | | | 2,120,000 | | | | 2,263,100 | |
6.250% due 11/15/21 | | | 1,500,000 | | | | 1,601,250 | |
Plains Exploration & Production Co
6.500% due 11/15/20 | | | 2,950,000 | | | | 3,281,875 | |
6.750% due 02/01/22 | | | 4,500,000 | | | | 5,073,750 | |
8.625% due 10/15/19 | | | 5,000,000 | | | | 5,712,500 | |
QEP Resources Inc
5.250% due 05/01/23 | | | 1,350,000 | | | | 1,451,250 | |
5.375% due 10/01/22 | | | 2,600,000 | | | | 2,801,500 | |
Regency Energy Partners LP
5.500% due 04/15/23 | | | 950,000 | | | | 1,018,875 | |
6.875% due 12/01/18 | | | 3,875,000 | | | | 4,243,125 | |
Sabine Pass LNG LP
6.500% due 11/01/20 ~ | | | 1,500,000 | | | | 1,533,750 | |
7.500% due 11/30/16 | | | 6,500,000 | | | | 7,198,750 | |
Samson Investment Co
9.750% due 02/15/20 ~ | | | 1,850,000 | | | | 1,965,625 | |
SandRidge Energy Inc
7.500% due 03/15/21 | | | 3,350,000 | | | | 3,601,250 | |
8.000% due 06/01/18 ~ | | | 2,000,000 | | | | 2,130,000 | |
Seadrill Ltd (Bermuda)
5.625% due 09/15/17 ~ | | | 3,050,000 | | | | 3,042,375 | |
SESI LLC
6.375% due 05/01/19 | | | 6,500,000 | | | | 6,987,500 | |
7.125% due 12/15/21 | | | 2,000,000 | | | | 2,235,000 | |
Targa Resources Partners LP
5.250% due 05/01/23 ~ | | | 2,850,000 | | | | 2,964,000 | |
Venoco Inc
11.500% due 10/01/17 | | | 3,000,000 | | | | 3,157,500 | |
WPX Energy Inc
6.000% due 01/15/22 | | | 3,000,000 | | | | 3,247,500 | |
| | | | | | | | |
| | | | | | | 205,056,963 | |
| | | | | | | | |
Financials - 8.7% | | | | | | | | |
| | |
A-S Co-Issuer Subsidiary Inc
7.875% due 12/15/20 ~ | | | 1,850,000 | | | | 1,859,250 | |
Ally Financial Inc
4.625% due 06/26/15 | | | 2,650,000 | | | | 2,764,178 | |
5.500% due 02/15/17 | | | 2,900,000 | | | | 3,115,696 | |
6.250% due 12/01/17 | | | 2,500,000 | | | | 2,776,475 | |
7.500% due 09/15/20 | | | 3,000,000 | | | | 3,633,750 | |
American International Group Inc
8.175% due 05/15/68 § | | | 4,800,000 | | | | 6,276,000 | |
Bank of America Corp
8.000% § ± | | | 3,000,000 | | | | 3,321,723 | |
CBRE Services Inc
6.625% due 10/15/20 | | | 4,500,000 | | | | 4,944,375 | |
CIT Group Inc
5.250% due 03/15/18 | | | 2,950,000 | | | | 3,171,250 | |
5.375% due 05/15/20 | | | 925,000 | | | | 1,015,188 | |
5.500% due 02/15/19 ~ | | | 2,000,000 | | | | 2,190,000 | |
CNH Capital LLC
6.250% due 11/01/16 | | | 4,422,000 | | | | 4,897,365 | |
| | |
| See Notes to Financial Statements | | See explanation of symbols and terms, if any, on page B-143 |
B-26
PACIFIC SELECT FUND
HIGH YIELD BOND PORTFOLIO
Schedule of Investments (Continued)
December 31, 2012
| | | | | | | | |
| | | Principal
Amount | | | Value | |
E*TRADE Financial Corp
6.000% due 11/15/17 | | | $950,000 | | | | $976,125 | |
6.375% due 11/15/19 | | | 1,000,000 | | | | 1,030,000 | |
First Data Corp
6.750% due 11/01/20 ~ | | | 1,850,000 | | | | 1,877,750 | |
7.375% due 06/15/19 ~ | | | 3,600,000 | | | | 3,744,000 | |
12.625% due 01/15/21 | | | 6,284,000 | | | | 6,645,330 | |
Host Hotels & Resorts LP REIT
6.000% due 11/01/20 | | | 9,475,000 | | | | 10,469,875 | |
Igloo Holdings Corp
8.250% due 12/15/17 ~ | | | 850,000 | | | | 843,625 | |
Liberty Mutual Group Inc
7.800% due 03/07/87 ~ | | | 7,057,000 | | | | 7,886,197 | |
Lloyds Banking Group PLC (United Kingdom)
6.413% § ± ~ | | | 3,000,000 | | | | 2,655,000 | |
Mattamy Group Corp (Canada)
6.500% due 11/15/20 ~ | | | 2,250,000 | | | | 2,266,875 | |
6.875% due 11/15/20 ~ | | | CAD 1,500,000 | | | | 1,519,302 | |
Neuberger Berman Group LLC
5.875% due 03/15/22 ~ | | | $5,750,000 | | | | 6,123,750 | |
Nuveen Investments Inc
9.125% due 10/15/17 ~ | | | 4,400,000 | | | | 4,345,000 | |
9.500% due 10/15/20 ~ | | | 1,950,000 | | | | 1,950,000 | |
Onex USI Aquisition Corp
7.750% due 01/15/21 ~ | | | 1,800,000 | | | | 1,782,000 | |
RBS Capital Trust I
4.709% § ± | | | 3,716,000 | | | | 2,917,060 | |
RBS Capital Trust II
6.425% § ± | | | 3,000,000 | | | | 2,640,000 | |
Regions Bank
6.450% due 06/26/37 | | | 2,000,000 | | | | 2,118,080 | |
SL Green Realty Corp REIT
7.750% due 03/15/20 | | | 5,500,000 | | | | 6,843,078 | |
Springleaf Finance Corp
5.400% due 12/01/15 | | | 5,000,000 | | | | 4,750,000 | |
| | | | | | | | |
| | | | | | | 113,348,297 | |
| | | | | | | | |
Health Care - 8.9% | | | | | | | | |
| | |
American Renal Associates Holdings Inc
9.750% due 03/01/16 | | | 2,329,887 | | | | 2,469,680 | |
American Renal Holdings Co Inc
8.375% due 05/15/18 | | | 2,545,000 | | | | 2,691,338 | |
Biomet Inc
6.500% due 08/01/20 ~ | | | 2,850,000 | | | | 3,038,813 | |
CDRT Holding Corp
9.250% due 10/01/17 ~ | | | 2,850,000 | | | | 2,921,250 | |
CHS/Community Health Systems Inc
5.125% due 08/15/18 | | | 875,000 | | | | 914,375 | |
7.125% due 07/15/20 | | | 1,100,000 | | | | 1,175,625 | |
8.000% due 11/15/19 | | | 5,300,000 | | | | 5,763,750 | |
ConvaTec Healthcare E SA (Luxembourg)
10.500% due 12/15/18 ~ | | | 4,000,000 | | | | 4,430,000 | |
DaVita HealthCare Partners Inc
5.750% due 08/15/22 | | | 2,800,000 | | | | 2,964,500 | |
6.375% due 11/01/18 | | | 4,000,000 | | | | 4,300,000 | |
DJO Finance LLC
7.750% due 04/15/18 | | | 3,250,000 | | | | 3,144,375 | |
8.750% due 03/15/18 ~ | | | 250,000 | | | | 274,375 | |
9.750% due 10/15/17 | | | 2,000,000 | | | | 1,790,000 | |
9.875% due 04/15/18 ~ | | | 1,000,000 | | | | 1,037,500 | |
Elan Finance PLC (Ireland)
6.250% due 10/15/19 ~ | | | 3,800,000 | | | | 3,990,000 | |
Emergency Medical Services Corp
8.125% due 06/01/19 | | | 3,000,000 | | | | 3,309,375 | |
Fresenius Medical Care U.S. Finance II Inc
5.875% due 01/31/22 ~ | | | 4,450,000 | | | | 4,850,500 | |
Grifols Inc
8.250% due 02/01/18 | | | 3,750,000 | | | | 4,148,437 | |
| | | | | | | | |
| | | Principal
Amount | | | Value | |
HCA Holdings Inc | | | | | | | | |
6.250% due 02/15/21 | | | $6,650,000 | | | | $6,832,875 | |
7.750% due 05/15/21 | | | 4,000,000 | | | | 4,360,000 | |
HCA Inc
5.875% due 03/15/22 | | | 3,250,000 | | | | 3,550,625 | |
7.250% due 09/15/20 | | | 8,415,000 | | | | 9,361,687 | |
HealthSouth Corp
5.750% due 11/01/24 | | | 3,350,000 | | | | 3,425,375 | |
inVentiv Health Inc
9.000% due 01/15/18 ~ | | | 2,350,000 | | | | 2,379,375 | |
MultiPlan Inc
9.875% due 09/01/18 ~ | | | 3,500,000 | | | | 3,920,000 | |
Phibro Animal Health Corp
9.250% due 07/01/18 ~ | | | 3,000,000 | | | | 3,015,000 | |
Prospect Medical Holdings Inc
8.375% due 05/01/19 ~ | | | 4,700,000 | | | | 4,970,250 | |
Tenet Healthcare Corp
4.750% due 06/01/20 ~ | | | 3,350,000 | | | | 3,408,625 | |
6.750% due 02/01/20 ~ | | | 1,250,000 | | | | 1,292,188 | |
8.000% due 08/01/20 | | | 1,750,000 | | | | 1,893,281 | |
9.250% due 02/01/15 | | | 3,000,000 | | | | 3,382,500 | |
Valeant Pharmaceuticals International
6.750% due 10/01/17 ~ | | | 4,000,000 | | | | 4,340,000 | |
Vanguard Health Holding Co II LLC
8.000% due 02/01/18 | | | 4,000,000 | | | | 4,160,000 | |
VPI Escrow Corp
6.375% due 10/15/20 ~ | | | 1,950,000 | | | | 2,101,125 | |
| | | | | | | | |
| | | | | | | 115,606,799 | |
| | | | | | | | |
Industrials - 10.3% | | | | | | | | |
| | |
ADS Waste Holdings Inc
8.250% due 10/01/20 ~ | | | 4,350,000 | | | | 4,589,250 | |
Air Lease Corp
4.500% due 01/15/16 ~ | | | 3,000,000 | | | | 3,045,000 | |
5.625% due 04/01/17 | | | 7,000,000 | | | | 7,455,000 | |
Ashtead Capital Inc
6.500% due 07/15/22 ~ | | | 2,850,000 | | | | 3,106,500 | |
Avis Budget Car Rental LLC
8.250% due 01/15/19 | | | 7,200,000 | | | | 7,992,000 | |
9.750% due 03/15/20 | | | 2,500,000 | | | | 2,900,000 | |
AWAS Aviation Capital Ltd (Ireland)
7.000% due 10/17/16 ~ | | | 3,070,400 | | | | 3,254,624 | |
BE Aerospace Inc
5.250% due 04/01/22 | | | 1,850,000 | | | | 1,970,250 | |
6.875% due 10/01/20 | | | 4,000,000 | | | | 4,470,000 | |
Bombardier Inc (Canada)
5.750% due 03/15/22 ~ | | | 4,800,000 | | | | 4,956,000 | |
Clean Harbors Inc
5.125% due 06/01/21 ~ | | | 2,850,000 | | | | 2,964,000 | |
Cleaver-Brooks Inc
8.750% due 12/15/19 ~ | | | 350,000 | | | | 362,250 | |
Continental Airlines Pass-Through Trust ‘B’
5.500% due 04/29/22 | | | 2,450,000 | | | | 2,560,250 | |
Delta Air Lines Pass-Through Trust ‘A’
4.750% due 05/07/21 | | | 3,050,000 | | | | 3,263,500 | |
FTI Consulting Inc
6.000% due 11/15/22 ~ | | | 850,000 | | | | 884,000 | |
6.750% due 10/01/20 | | | 2,000,000 | | | | 2,145,000 | |
HD Supply Inc
8.125% due 04/15/19 ~ | | | 2,750,000 | | | | 3,141,875 | |
11.500% due 07/15/20 ~ | | | 850,000 | | | | 959,438 | |
HDTFS Inc
5.875% due 10/15/20 ~ | | | 350,000 | | | | 367,500 | |
6.250% due 10/15/22 ~ | | | 250,000 | | | | 267,500 | |
International Lease Finance Corp
5.875% due 04/01/19 | | | 5,000,000 | | | | 5,291,145 | |
5.875% due 08/15/22 | | | 3,000,000 | | | | 3,180,213 | |
6.250% due 05/15/19 | | | 6,500,000 | | | | 6,955,000 | |
6.750% due 09/01/16 ~ | | | 3,400,000 | | | | 3,833,500 | |
| | |
| See Notes to Financial Statements | | See explanation of symbols and terms, if any, on page B-143 |
B-27
PACIFIC SELECT FUND
HIGH YIELD BOND PORTFOLIO
Schedule of Investments (Continued)
December 31, 2012
| | | | | | | | |
| | | Principal
Amount | | | Value | |
Jaguar Holding Co I
9.375% due 10/15/17 ~ | | | $850,000 | | | | $896,750 | |
JMC Steel Group Inc
8.250% due 03/15/18 ~ | | | 2,500,000 | | | | 2,625,000 | |
Masco Corp
7.750% due 08/01/29 | | | 3,000,000 | | | | 3,338,523 | |
Nortek Inc
8.500% due 04/15/21 | | | 4,000,000 | | | | 4,460,000 | |
8.500% due 04/15/21 ~ | | | 850,000 | | | | 945,625 | |
Roofing Supply Group LLC
10.000% due 06/01/20 ~ | | | 2,950,000 | | | | 3,318,750 | |
Silver II Borrower (Luxembourg)
7.750% due 12/15/20 ~ | | | 600,000 | | | | 624,000 | |
The Hertz Corp
7.500% due 10/15/18 | | | 4,500,000 | | | | 4,995,000 | |
TransDigm Inc
7.750% due 12/15/18 | | | 4,470,000 | | | | 4,967,287 | |
U.S. Airways Pass-Through Trust ‘A’
7.125% due 04/22/25 | | | 5,660,929 | | | | 6,368,545 | |
U.S. Airways Pass-Through Trust ‘B’
6.750% due 12/03/22 | | | 850,000 | | | | 871,250 | |
United Rentals North America Inc
5.750% due 07/15/18 ~ | | | 750,000 | | | | 811,875 | |
7.625% due 04/15/22 ~ | | | 750,000 | | | | 841,875 | |
8.250% due 02/01/21 | | | 7,700,000 | | | | 8,720,250 | |
8.375% due 09/15/20 | | | 4,250,000 | | | | 4,728,125 | |
9.250% due 12/15/19 | | | 2,000,000 | | | | 2,290,000 | |
USG Corp
7.875% due 03/30/20 ~ | | | 3,000,000 | | | | 3,352,500 | |
| | | | | | | | |
| | | | | | | 134,069,150 | |
| | | | | | | | |
Information Technology - 1.5% | | | | | | | | |
| | |
Advanced Micro Devices Inc
7.500% due 08/15/22 ~ | | | 1,850,000 | | | | 1,530,875 | |
7.750% due 08/01/20 | | | 3,000,000 | | | | 2,527,500 | |
Alion Science & Technology Corp
10.250% due 02/01/15 | | | 4,500,000 | | | | 2,351,250 | |
CDW LLC
8.500% due 04/01/19 | | | 2,500,000 | | | | 2,718,750 | |
CommScope Inc
8.250% due 01/15/19 ~ | | | 2,750,000 | | | | 3,025,000 | |
Fidelity National Information Services Inc
5.000% due 03/15/22 | | | 3,000,000 | | | | 3,232,500 | |
Freescale Semiconductor Inc
8.050% due 02/01/20 | | | 2,500,000 | | | | 2,500,000 | |
9.250% due 04/15/18 ~ | | | 2,000,000 | | | | 2,195,000 | |
| | | | | | | | |
| | | | | | | 20,080,875 | |
| | | | | | | | |
Materials - 11.1% | | | | | | | | |
| | |
AK Steel Corp
8.375% due 04/01/22 | | | 3,000,000 | | | | 2,595,000 | |
Alphabet Holding Co Inc
7.750% due 11/01/17 ~ | | | 2,350,000 | | | | 2,426,375 | |
APERAM (Luxembourg)
7.375% due 04/01/16 ~ | | | 4,000,000 | | | | 3,750,000 | |
ArcelorMittal (Luxembourg)
6.125% due 06/01/18 | | | 3,000,000 | | | | 3,042,858 | |
6.750% due 02/25/22 | | | 8,675,000 | | | | 9,111,379 | |
7.250% due 03/01/41 | | | 2,675,000 | | | | 2,482,761 | |
ARD Finance SA (Luxembourg)
11.125% due 06/01/18 ~ | | | 2,361,611 | | | | 2,493,222 | |
Ardagh Packaging Finance PLC (Ireland)
9.125% due 10/15/20 ~ | | | 5,250,000 | | | | 5,748,750 | |
Berry Plastics Corp
9.500% due 05/15/18 | | | 4,150,000 | | | | 4,585,750 | |
BOE Merger Corp
9.500% due 11/01/17 ~ | | | 2,250,000 | | | | 2,261,250 | |
Boise Cascade LLC
6.375% due 11/01/20 ~ | | | 2,150,000 | | | | 2,219,875 | |
| | | | | | | | |
| | | Principal
Amount | | | Value | |
Boise Paper Holdings LLC
8.000% due 04/01/20 | | | $4,500,000 | | | | $4,995,000 | |
Building Materials Corp of America
6.750% due 05/01/21 ~ | | | 2,500,000 | | | | 2,768,750 | |
6.875% due 08/15/18 ~ | | | 6,450,000 | | | | 6,998,250 | |
Celanese U.S. Holdings LLC
4.625% due 11/15/22 | | | 3,850,000 | | | | 4,052,125 | |
Eldorado Gold Corp (Canada)
6.125% due 12/15/20 ~ | | | 4,200,000 | | | | 4,294,500 | |
FMG Resources August 2006 Property Ltd (Australia)
6.875% due 02/01/18 ~ | | | 5,750,000 | | | | 5,958,437 | |
7.000% due 11/01/15 ~ | | | 10,055,000 | | | | 10,608,025 | |
8.250% due 11/01/19 ~ | | | 4,000,000 | | | | 4,280,000 | |
Hexion U.S. Finance Corp
8.875% due 02/01/18 | | | 3,500,000 | | | | 3,613,750 | |
9.000% due 11/15/20 | | | 3,000,000 | | | | 2,752,500 | |
Ineos Finance PLC (United Kingdom)
7.500% due 05/01/20 ~ | | | 850,000 | | | | 894,625 | |
INEOS Group Holdings SA (Luxembourg)
8.500% due 02/15/16 ~ | | | 1,500,000 | | | | 1,500,000 | |
Longview Fibre Paper & Packaging Inc
8.000% due 06/01/16 ~ | | | 3,750,000 | | | | 3,956,250 | |
Louisiana-Pacific Corp
7.500% due 06/01/20 | | | 4,800,000 | | | | 5,448,000 | |
LyondellBasell Industries NV (Netherlands)
5.000% due 04/15/19 | | | 6,500,000 | | | | 7,215,000 | |
Momentive Performance Materials Inc
8.875% due 10/15/20 ~ | | | 2,000,000 | | | | 2,027,500 | |
New Gold Inc (Canada)
6.250% due 11/15/22 ~ | | | 4,440,000 | | | | 4,617,600 | |
Novelis Inc (Canada)
8.375% due 12/15/17 | | | 2,550,000 | | | | 2,824,125 | |
8.750% due 12/15/20 | | | 2,000,000 | | | | 2,240,000 | |
Rock-Tenn Co
4.450% due 03/01/19 ~ | | | 3,720,000 | | | | 4,015,803 | |
Sappi Papier Holding GmbH (Austria)
7.750% due 07/15/17 ~ | | | 1,000,000 | | | | 1,093,750 | |
8.375% due 06/15/19 ~ | | | 3,350,000 | | | | 3,672,438 | |
Sealed Air Corp
8.375% due 09/15/21 ~ | | | 5,000,000 | | | | 5,737,500 | |
Taminco Acquisition Corp
9.125% due 12/15/17 ~ | | | 1,300,000 | | | | 1,290,250 | |
Tronox Finance LLC
6.375% due 08/15/20 ~ | | | 3,850,000 | | | | 3,902,937 | |
Walter Energy Inc
9.875% due 12/15/20 ~ | | | 1,850,000 | | | | 2,072,000 | |
| | | | | | | | |
| | | | | | | 143,546,335 | |
| | | | | | | | |
Telecommunication Services - 7.2% | | | | | | | | |
| | |
Avaya Inc
7.000% due 04/01/19 ~ | | | 3,000,000 | | | | 2,820,000 | |
Clearwire Communications LLC
12.000% due 12/01/15 ~ | | | 2,500,000 | | | | 2,687,500 | |
Cricket Communications Inc
7.750% due 05/15/16 | | | 3,000,000 | | | | 3,191,250 | |
7.750% due 10/15/20 | | | 3,200,000 | | | | 3,280,000 | |
Crown Castle International Corp
5.250% due 01/15/23 ~ | | | 4,500,000 | | | | 4,831,875 | |
Digicel Group Ltd (Bermuda)
8.250% due 09/30/20 ~ | | | 1,000,000 | | | | 1,105,000 | |
Digicel Ltd (Bermuda)
7.000% due 02/15/20 ~ | | | 3,161,000 | | | | 3,413,880 | |
12.000% due 04/01/14 ~ | | | 2,500,000 | | | | 2,731,250 | |
Frontier Communications Corp
7.125% due 01/15/23 | | | 2,350,000 | | | | 2,499,813 | |
8.250% due 04/15/17 | | | 3,500,000 | | | | 4,060,000 | |
Hughes Satellite Systems Corp
7.625% due 06/15/21 | | | 7,000,000 | | | | 7,997,500 | |
| | |
| See Notes to Financial Statements | | See explanation of symbols and terms, if any, on page B-143 |
B-28
PACIFIC SELECT FUND
HIGH YIELD BOND PORTFOLIO
Schedule of Investments (Continued)
December 31, 2012
| | | | | | | | |
| | | Principal
Amount | | | Value | |
Intelsat Jackson Holdings SA (Luxembourg)
7.250% due 10/15/20 ~ | | | $1,600,000 | | | | $1,744,000 | |
Intelsat Luxembourg SA (Luxembourg)
11.250% due 02/04/17 | | | 6,500,000 | | | | 6,898,125 | |
11.500% due 02/04/17 | | | 7,204,101 | | | | 7,681,373 | |
Level 3 Communications Inc
11.875% due 02/01/19 | | | 2,000,000 | | | | 2,315,000 | |
Level 3 Financing Inc
7.000% due 06/01/20 ~ | | | 3,700,000 | | | | 3,880,375 | |
MetroPCS Wireless Inc
7.875% due 09/01/18 | | | 3,000,000 | | | | 3,262,500 | |
Sprint Capital Corp
6.875% due 11/15/28 | | | 6,000,000 | | | | 6,270,000 | |
Sprint Nextel Corp
6.000% due 11/15/22 | | | 7,900,000 | | | | 8,156,750 | |
7.000% due 03/01/20 ~ | | | 2,000,000 | | | | 2,330,000 | |
9.000% due 11/15/18 ~ | | | 2,800,000 | | | | 3,465,000 | |
Telesat (Canada)
6.000% due 05/15/17 ~ | | | 3,750,000 | | | | 3,956,250 | |
UPCB Finance III Ltd (Cayman)
6.625% due 07/01/20 ~ | | | 2,750,000 | | | | 2,959,687 | |
Windstream Corp
7.500% due 06/01/22 | | | 2,000,000 | | | | 2,130,000 | |
| | | | | | | | |
| | | | | | | 93,667,128 | |
| | | | | | | | |
Utilities - 4.2% | | | | | | | | |
| | |
AES Corp
9.750% due 04/15/16 | | | 2,500,000 | | | | 3,000,000 | |
Calpine Corp
7.500% due 02/15/21 ~ | | | 4,725,000 | | | | 5,244,750 | |
7.875% due 01/15/23 ~ | | | 2,925,000 | | | | 3,319,875 | |
CMS Energy Corp
6.250% due 02/01/20 | | | 3,000,000 | | | | 3,515,880 | |
Edison Mission Energy
7.200% due 05/15/19 Y | | | 4,000,000 | | | | 2,140,000 | |
7.750% due 06/15/16 Y | | | 2,000,000 | | | | 1,070,000 | |
Energy Future Intermediate Holding Co LLC
11.750% due 03/01/22 ~ | | | 4,000,000 | | | | 4,460,000 | |
GenOn Americas Generation LLC
9.125% due 05/01/31 | | | 2,000,000 | | | | 2,210,000 | |
GenOn Energy Inc
7.875% due 06/15/17 | | | 2,000,000 | | | | 2,220,000 | |
9.875% due 10/15/20 | | | 2,050,000 | | | | 2,378,000 | |
Ipalco Enterprises Inc
7.250% due 04/01/16 ~ | | | 2,450,000 | | | | 2,750,125 | |
NRG Energy Inc
6.625% due 03/15/23 ~ | | | 1,000,000 | | | | 1,075,000 | |
7.625% due 01/15/18 | | | 7,250,000 | | | | 8,083,750 | |
7.875% due 05/15/21 | | | 2,000,000 | | | | 2,230,000 | |
Puget Energy Inc
5.625% due 07/15/22 | | | 2,350,000 | | | | 2,537,772 | |
Texas Competitive Electric Holdings Co LLC
10.250% due 11/01/15 | | | 6,059,000 | | | | 1,802,552 | |
15.000% due 04/01/21 | | | 2,000,000 | | | | 690,000 | |
Wind Acquisition Holdings Finance SA (Luxembourg)
12.250% due 07/15/17 ~ | | | 6,161,194 | | | | 6,315,224 | |
| | | | | | | | |
| | | | 55,042,928 | |
| | | | | | | | |
| | |
Total Corporate Bonds & Notes (Cost $1,096,582,838) | | | | | | | 1,160,391,823 | |
| | | | | | | | |
| |
CONVERTIBLE CORPORATE BONDS & NOTES - 0.5% | | | | | |
| | |
Energy - 0.2% | | | | | | | | |
| | |
Peabody Energy Corp
4.750% due 12/15/66 | | | 3,000,000 | | | | 2,904,375 | |
| | | | | | | | |
| | | | | | | | |
| | | Principal
Amount | | | Value | |
Telecommunication Services - 0.3% | | | | | | | | |
| | |
Clearwire Communications LLC
8.250% due 12/01/40 ~ | | | $3,500,000 | | | | $3,871,875 | |
| | | | | | | | |
| | |
Total Convertible Corporate Bonds & Notes (Cost $6,386,136) | | | | | | | 6,776,250 | |
| | | | | | | | |
| | |
SENIOR LOAN NOTES - 6.2% | | | | | | | | |
| | |
Consumer Discretionary - 2.7% | | | | | | | | |
| | |
99 Cents Only Stores
5.250% due 01/11/19 § | | | 2,487,469 | | | | 2,518,997 | |
Acosta Inc Term D
5.000% due 03/02/18 § | | | 1,246,875 | | | | 1,259,344 | |
Caesars Entertainment Operating Co Term B6 (Extended)
5.460% due 01/26/18 § | | | 1,500,000 | | | | 1,343,625 | |
Cequel Communications LLC Term B
4.000% due 02/14/19 § | | | 1,985,000 | | | | 1,997,130 | |
Clear Channel Communications Inc Term B
3.862% due 01/29/16 § | | | 2,272,798 | | | | 1,889,263 | |
ClubCorp Club Operations Inc Term B
5.000% due 11/30/16 § | | | 1,984,810 | | | | 2,014,582 | |
Evergreen Acqisition Co 1 LP
5.000% due 07/09/19 § | | | 1,990,013 | | | | 2,000,586 | |
Lord & Taylor Holdings LLC Term B
5.750% due 01/11/19 § | | | 1,200,803 | | | | 1,213,749 | |
Petco Animal Supplies Inc
4.500% due 11/24/17 § | | | 3,583,838 | | | | 3,614,878 | |
Regent Seven Seas Cruises Inc Term B
6.250% due 12/21/18 § | | | 987,500 | | | | 1,002,313 | |
SeaWorld Parks & Entertainment Inc Term B
4.000% due 08/17/17 § | | | 3,860,326 | | | | 3,895,296 | |
Serta Simmons Holdings LLC
5.000% due 10/01/19 § | | | 2,000,000 | | | | 2,005,694 | |
Six Flags Theme Parks Inc Term B
4.000% due 12/20/18 § | | | 2,030,887 | | | | 2,043,760 | |
The Neiman Marcus Group Inc (Extended)
4.750% due 05/16/18 § | | | 4,000,000 | | | | 4,012,776 | |
Wendy’s International Inc Term B
4.750% due 05/15/19 § | | | 3,990,000 | | | | 4,035,602 | |
| | | | | | | | |
| | | | | | | 34,847,595 | |
| | | | | | | | |
Consumer Staples - 0.6% | | | | | | | | |
| | |
BJ’s Wholesale Club Inc (1st Lien)
5.750% due 09/26/19 § | | | 1,000,000 | | | | 1,015,179 | |
Sprouts Farmers Markets Holdings LLC
6.000% due 04/18/18 § | | | 3,451,093 | | | | 3,489,918 | |
(Incremental) | | | | | | | | |
6.000% due 04/18/18 § | | | 995,000 | | | | 1,006,193 | |
SUPERVALU Inc Term B
8.000% due 08/30/18 § | | | 2,487,500 | | | | 2,530,514 | |
| | | | | | | | |
| | | | | | | 8,041,804 | |
| | | | | | | | |
Energy - 0.2% | | | | | | | | |
| | |
Chesapeake Energy Corp
5.750% due 12/01/17 § | | | 2,000,000 | | | | 2,006,388 | |
Samson Investment Co (2nd Lien)
6.000% due 09/25/18 § | | | 1,000,000 | | | | 1,010,625 | |
| | | | | | | | |
| | | | | | | 3,017,013 | |
| | | | | | | | |
Financials - 0.7% | | | | | | | | |
| | |
First Data Corp
(Add on) | | | | | | | | |
5.211% due 09/24/18 § | | | 1,000,000 | | | | 983,125 | |
Term B (Extended) | | | | | | | | |
4.211% due 03/23/18 § | | | 2,000,000 | | | | 1,909,306 | |
| | |
| See Notes to Financial Statements | | See explanation of symbols and terms, if any, on page B-143 |
B-29
PACIFIC SELECT FUND
HIGH YIELD BOND PORTFOLIO
Schedule of Investments (Continued)
December 31, 2012
| | | | | | | | |
| | | Principal
Amount | | | Value | |
Nuveen Investments Inc | | | | | | | | |
due 05/13/17 µ | | | $2,000,000 | | | | $2,010,000 | |
(Extended) (1st Lien) | | | | | | | | |
5.811% due 05/13/17 § | | | 2,000,000 | | | | 2,010,000 | |
Realogy Corp
(Extended) | | | | | | | | |
4.461% due 10/10/16 § | | | 2,317,729 | | | | 2,327,869 | |
(Extended) (Letter of Credit) | | | | | | | | |
4.464% due 10/10/16 § | | | 167,651 | | | | 168,384 | |
| | | | | | | | |
| | | | | | | 9,408,684 | |
| | | | | | | | |
Health Care - 1.2% | | | | | | | | |
| | |
Bausch & Lomb Inc Term B
5.250% due 05/17/19 § | | | 3,980,000 | | | | 4,021,221 | |
Hologic Inc Term B
4.500% due 08/01/19 § | | | 2,992,500 | | | | 3,032,087 | |
Par Pharmaceutical Cos Inc Term B
5.000% due 09/30/19 § | | | 2,992,500 | | | | 2,996,552 | |
Pharmaceutical Product Development Inc
Term B
6.250% due 12/05/18 § | | | 1,984,962 | | | | 2,019,080 | |
U.S. Renal Care Inc (1st Lien)
6.250% due 07/02/19 § | | | 2,985,000 | | | | 3,029,775 | |
| | | | | | | | |
| | | | | | | 15,098,715 | |
| | | | | | | | |
Telecommunication Services - 0.6% | | | | | | | | |
| | |
Intelsat Jackson Holdings SA (Luxembourg)
Tranche B
4.500% due 04/02/18 § | | | 3,959,900 | | | | 3,996,671 | |
Level 3 Financing Inc Term B
5.250% due 08/01/19 § | | | 1,000,000 | | | | 1,011,094 | |
Telesat LLC Term B
4.250% due 03/28/19 § | | | 1,990,000 | | | | 2,007,413 | |
| | | | | | | | |
| | | | | | | 7,015,178 | |
| | | | | | | | |
Utilities - 0.2% | | | | | | | | |
| | |
Texas Competitive Electric Holdings Co LLC (Extended)
4.746% due 10/10/17 § | | | 3,797,685 | | | | 2,557,335 | |
| | | | | | | | |
| | |
Total Senior Loan Notes
(Cost $79,576,327) | | | | | | | 79,986,324 | |
| | | | | | | | |
| |
SHORT-TERM INVESTMENT - 2.5% | | | | | |
| |
Repurchase Agreement - 2.5% | | | | | |
| | |
Fixed Income Clearing Corp
0.010% due 01/02/13
(Dated 12/31/12, repurchase price of $32,937,503; collateralized by U.S. Treasury Notes: 0.250% due 07/15/15 and value $33,600,000) | | | 32,937,485 | | | | 32,937,485 | |
| | | | | | | | |
| | |
Total Short-Term Investment (Cost $32,937,485) | | | | | | | 32,937,485 | |
| | | | | | | | |
| | |
TOTAL INVESTMENTS - 98.5%
(Cost $1,215,482,786) | | | | | | | 1,280,091,882 | |
| |
OTHER ASSETS & LIABILITIES, NET - 1.5% | | | | 19,028,713 | |
| | | | | | | | |
| |
NET ASSETS - 100.0% | | | | $1,299,120,595 | |
| | | | | | | | |
Notes to Schedule of Investments
| (a) | As of December 31, 2012, the portfolio was diversified as a percentage of net assets as follows: |
| | | | |
Consumer Discretionary | | | 20.8% | |
Energy | | | 16.2% | |
Materials | | | 11.1% | |
Industrials | | | 10.3% | |
Health Care | | | 10.1% | |
Financials | | | 9.4% | |
Telecommunication Services | | | 8.1% | |
Utilities | | | 4.4% | |
Consumer Staples | | | 4.1% | |
Short-Term Investment | | | 2.5% | |
Information Technology | | | 1.5% | |
| | | | |
| | | 98.5% | |
Other Assets & Liabilities, Net | | | 1.5% | |
| | | | |
| | | 100.0% | |
| | | | |
| (b) | As of December 31, 2012, the portfolio’s Standard & Poor’s quality ratings as a percentage of total fixed income investments were as follows (Unaudited): |
| | | | |
A-1 (Short-Term Debt only) | | | 2.6% | |
A | | | 0.3% | |
BBB | | | 5.5% | |
BB | | | 33.0% | |
B | | | 40.3% | |
CCC | | | 11.2% | |
CC | | | 3.1% | |
C | | | 0.1% | |
D | | | 0.4% | |
Not Rated | | | 3.5% | |
| | | | |
| | | 100.0% | |
| | | | |
| (c) | Short-term investments reflect either the stated coupon rate or the annualized effective yield on the date of purchase for discounted investments. |
| (d) | Investments with a total aggregate value of $3,210,000 or 0.2% of the net assets were in default as of December 31, 2012. |
| | |
| See Notes to Financial Statements | | See explanation of symbols and terms, if any, on page B-143 |
B-30
PACIFIC SELECT FUND
HIGH YIELD BOND PORTFOLIO
Schedule of Investments (Continued)
December 31, 2012
| (e) | Swap agreements outstanding as of December 31, 2012 were as follows: |
Credit Default Swaps on Credit Indices - Sell Protection (1)
| | | | | | | | | | | | | | | | | | | | | | | | | | |
| Referenced Obligation | | Fixed Deal
Receive
Rate | | Expiration
Date | | | Counter-
party | | | Notional
Amount (2) | | | Value (3) | | | Upfront
Premiums
Paid
(Received) | | | Unrealized
Appreciation | |
OTC - Dow Jones CDX HY19 5Y | | 5.000% | | | 12/20/17 | | | | JPM | | | | $10,000,000 | | | | $72,986 | | | | $53,125 | | | | $19,861 | |
| | | | | | | | | | | | | | | | | | | | | | | | | | |
| | | | | | | |
Total Swap Agreements | | | | | | | | | | | | | | | | | $72,986 | | | | $53,125 | | | | $19,861 | |
| | | | | | | | | | | | | | | | | | | | | | | | | | |
| | (1) | If the portfolio is a seller of protection and a credit event occurs, as defined under the terms of that particular swap agreement, the portfolio will either (i) pay to the buyer of protection an amount equal to the notional amount of the swap and take delivery of the referenced obligation or underlying investments comprising the referenced index or (ii) pay a net settlement amount in the form of cash or investments equal to the notional amount of the swap less the recovery value of the referenced obligation or underlying investments comprising the referenced index. |
| | (2) | The maximum potential amount the portfolio could be required to pay as a seller of credit protection or receive as a buyer of credit protection if a credit event occurs as defined under the terms of that particular swap agreement. |
| | (3) | The quoted market prices and resulting values for credit default swap agreements on credit indices serve as an indicator of the current status of the payment/performance risk and is a representation of the likelihood of an expected liability (or profit) for the credit derivative had the notional amount of the swap agreement been closed/sold as of the year end. Increasing values, in absolute terms when compared to the notional amount of the swap, represent a deterioration of the referenced entity’s credit soundness and a greater likelihood of risk of default or other credit event occurring as defined under the terms of the agreement. |
| (f) | Fair Value Measurements |
The following is a summary of the portfolio’s investments as categorized under the three-tier hierarchy of inputs used in valuing the portfolio’s assets and liabilities (See Note 3D in Notes to Financial Statements) as of December 31, 2012:
| | | | | | | | | | | | | | | | | | |
| | | | | Total Value at
December 31, 2012 | | | Level 1
Quoted Price | | | Level 2
Significant
Observable Inputs | | | Level 3
Significant
Unobservable Inputs | |
Assets | | Corporate Bonds & Notes | | | $1,160,391,823 | | | | $- | | | | $1,147,328,278 | | | | $13,063,545 | |
| | Convertible Corporate Bonds & Notes | | | 6,776,250 | | | | - | | | | 6,776,250 | | | | - | |
| | Senior Loan Notes | | | 79,986,324 | | | | - | | | | 79,986,324 | | | | - | |
| | Short-Term Investment | | | 32,937,485 | | | | - | | | | 32,937,485 | | | | - | |
| | Derivatives: | | | | | | | | | | | | | | | | |
| | Credit Contracts | | | | | | | | | | | | | | | | |
| | Swaps | | | 72,986 | | | | - | | | | 72,986 | | | | - | |
| | | | | | | | | | | | | | | | | | |
| | Total | | | $1,280,164,868 | | | | $- | | | | $1,267,101,323 | | | | $13,063,545 | |
| | | | | | | | | | | | | | | | | | |
The following is a reconciliation of investments for significant unobservable inputs (Level 3) used in valuing the portfolio’s assets and liabilities (See Note 3D in Notes to Financial Statements) for the year ended December 31, 2012:
| | | | |
| | | Corporate
Bonds & Notes | |
Value, Beginning of Year | | | $- | |
Purchases | | | 6,447,063 | |
Sales | | | - | |
Accrued Discounts (Premiums) | | | (2,009 | ) |
Net Realized Gains (Losses) | | | - | |
Change in Net Unrealized Appreciation | | | 249,946 | |
Transfers In | | | 6,368,545 | |
Transfers Out | | | - | |
| | | | |
Value, End of Year | | | $13,063,545 | |
| | | | |
Change in Net Unrealized Appreciation on Level 3 Investments Held at the End of Year, if Applicable | | | $249,946 | |
| | | | |
The significant unobservable inputs were provided by a vendor-priced single broker quote.
| | |
| See Notes to Financial Statements | | See explanation of symbols and terms, if any, on page B-143 |
B-31
PACIFIC SELECT FUND
INFLATION MANAGED PORTFOLIO
Schedule of Investments
December 31, 2012
| | | | | | | | |
| | | Shares | | | Value | |
CONVERTIBLE PREFERRED STOCKS - 0.2% | | | | | |
| |
Financials - 0.2% | | | | | |
| | |
Wells Fargo & Co 7.500% | | | 3,200 | | | | $3,920,000 | |
| | | | | | | | |
| | |
Total Convertible Preferred Stocks
(Cost $3,200,000) | | | | | | | 3,920,000 | |
| | | | | | | | |
| | |
| | | Principal
Amount | | | | |
| |
CORPORATE BONDS & NOTES - 14.9% | | | | | |
| | |
Consumer Discretionary - 0.8% | | | | | | | | |
| | |
Centex Corp
5.700% due 05/15/14 | | | $3,500,000 | | | | 3,692,500 | |
DISH DBS Corp
7.000% due 10/01/13 | | | 9,000,000 | | | | 9,382,500 | |
| | | | | | | | |
| | | | | | | 13,075,000 | |
| | | | | | | | |
Energy - 0.6% | | | | | | | | |
| | |
AK Transneft OJSC (Ireland)
7.700% due 08/07/13 ~ | | | 7,500,000 | | | | 7,821,037 | |
Gazprom OAO (Luxembourg)
7.343% due 04/11/13 ~ | | | 1,200,000 | | | | 1,220,520 | |
| | | | | | | | |
| | | | | | | 9,041,557 | |
| | | | | | | | |
Financials - 12.4% | | | | | | | | |
| | |
Ally Financial Inc
3.510% due 02/11/14 § | | | 13,000,000 | | | | 13,281,060 | |
3.709% due 06/20/14 § | | | 11,700,000 | | | | 12,027,249 | |
American International Group Inc
8.625% due 05/22/68 § ~ | | | GBP 650,000 | | | | 1,291,777 | |
ANZ New Zealand International Ltd (New Zealand)
0.751% due 08/19/14 § ~ | | | $10,000,000 | | | | 10,044,020 | |
Bank of Nova Scotia (Canada)
0.510% due 03/27/14 | | | 1,100,000 | | | | 1,100,067 | |
BPCE SA (France)
2.375% due 10/04/13 ~ | | | 9,862,000 | | | | 9,967,425 | |
Citigroup Inc
2.310% due 08/13/13 § | | | 3,512,000 | | | | 3,546,263 | |
Commonwealth Bank of Australia (Australia)
0.588% due 09/17/14 § ~ | | | 8,100,000 | | | | 8,130,837 | |
0.763% due 07/12/13 § ~ | | | 54,400,000 | | | | 54,526,861 | |
0.810% due 06/25/14 § ~ | | | 18,500,000 | | | | 18,642,117 | |
Dexia Credit Local SA (France)
0.793% due 04/29/14 § ~ | | | 28,400,000 | | | | 28,026,665 | |
Eksportfinans ASA (Norway)
2.375% due 05/25/16 | | | 1,800,000 | | | | 1,718,147 | |
HCP Inc REIT
6.700% due 01/30/18 | | | 3,000,000 | | | | 3,620,976 | |
ICICI Bank Ltd (India)
2.062% due 02/24/14 § ~ | | | 1,300,000 | | | | 1,278,942 | |
ING Bank Australia Ltd (Australia)
3.790% due 06/24/14 § | | | AUD 2,000,000 | | | | 2,088,983 | |
Lehman Brothers Holdings Inc
1.000% due 09/27/27 Y | | | $1,700,000 | | | | 401,625 | |
Marsh & McLennan Cos Inc
5.750% due 09/15/15 | | | 1,092,000 | | | | 1,224,865 | |
Merrill Lynch & Co Inc
5.450% due 02/05/13 | | | 9,000,000 | | | | 9,039,285 | |
Morgan Stanley
0.520% due 03/01/13 § | | | EUR 600,000 | | | | 792,090 | |
| | | | | | | | |
| | | Principal
Amount | | | Value | |
SLM Corp
3.991% due 03/17/14 ^ § | | | $1,535,000 | | | | $1,539,728 | |
4.041% due 02/01/14 ^ § | | | 1,055,000 | | | | 1,063,851 | |
4.111% due 01/31/14 ^ § | | | 2,472,000 | | | | 2,489,551 | |
4.116% due 11/21/13 ^ § | | | 300,000 | | | | 302,841 | |
4.441% due 12/15/13 ^ § | | | 200,000 | | | | 200,598 | |
Westpac Banking Corp (Australia)
3.585% due 08/14/14 ~ | | | 12,300,000 | | | | 12,900,154 | |
| | | | | | | | |
| | | | | | | 199,245,977 | |
| | | | | | | | |
Health Care - 0.0% | | | | | | | | |
| | |
Cardinal Health Inc
6.000% due 06/15/17 | | | 250,000 | | | | 289,725 | |
| | | | | | | | |
| | |
Industrials - 0.5% | | | | | | | | |
| | |
Con-way Inc
7.250% due 01/15/18 | | | 4,000,000 | | | | 4,636,864 | |
International Lease Finance Corp
5.625% due 09/20/13 | | | 2,630,000 | | | | 2,705,612 | |
| | | | | | | | |
| | | | | | | 7,342,476 | |
| | | | | | | | |
Materials - 0.6% | | | | | | | | |
| | |
Rexam PLC (United Kingdom)
6.750% due 06/01/13 ~ | | | 4,200,000 | | | | 4,292,434 | |
Temple-Inland Inc
6.625% due 01/15/18 | | | 4,000,000 | | | | 4,809,556 | |
| | | | | | | | |
| | | | | | | 9,101,990 | |
| | | | | | | | |
Utilities - 0.0% | | | | | | | | |
| | |
Indianapolis Power & Light Co
6.300% due 07/01/13 ~ | | | 500,000 | | | | 513,814 | |
| | | | | | | | |
| | |
Total Corporate Bonds & Notes
(Cost $232,703,292) | | | | | | | 238,610,539 | |
| | | | | | | | |
| |
SENIOR LOAN NOTES - 0.2% | | | | | |
| |
Telecommunication Services - 0.2% | | | | | |
| | |
Vodafone Americas Finance 2
6.875% due 08/11/15 § | | | 2,768,819 | | | | 2,838,039 | |
| | | | | | | | |
| | |
Total Senior Loan Notes
(Cost $2,759,944) | | | | | | | 2,838,039 | |
| | | | | | | | |
| |
MORTGAGE-BACKED SECURITIES - 9.9% | | | | | |
|
Collateralized Mortgage Obligations - Commercial - 1.0% | |
| | |
Banc of America Commercial
Mortgage Trust
0.383% due 06/10/49 " § ~ | | | 182,836 | | | | 182,869 | |
5.685% due 06/10/49 " § | | | 182,836 | | | | 182,809 | |
Banc of America Re-REMIC Trust
5.623% due 06/24/50 " § ~ | | | 1,600,000 | | | | 1,817,320 | |
5.634% due 02/17/51 " § ~ | | | 1,700,000 | | | | 1,963,789 | |
Credit Suisse Mortgage Capital Certificates
5.467% due 09/18/39 " § ~ | | | 6,900,000 | | | | 7,878,808 | |
GS Mortgage Securities Corp II
1.103% due 03/06/20 " § ~ | | | 466,693 | | | | 467,157 | |
1.260% due 03/06/20 " § ~ | | | 2,500,000 | | | | 2,503,508 | |
JP Morgan Chase Commercial Mortgage Securities Corp
4.654% due 01/12/37 " | | | 241,948 | | | | 245,419 | |
Merrill Lynch/Countrywide Commercial Mortgage Trust
5.700% due 09/12/49 " | | | 700,000 | | | | 824,391 | |
| | | | | | | | |
| | | | | | | 16,066,070 | |
| | | | | | | | |
| | |
| See Notes to Financial Statements | | See explanation of symbols and terms, if any, on page B-143 |
B-32
PACIFIC SELECT FUND
INFLATION MANAGED PORTFOLIO
Schedule of Investments (Continued)
December 31, 2012
| | | | | | | | |
| | | Principal
Amount | | | Value | |
Collateralized Mortgage Obligations - Residential - 8.5% | | | | | |
| | |
Arran Residential Mortgages Funding PLC (United Kingdom)
1.391% due 05/16/47 " § ~ | | | EUR 91,522 | | | | $120,970 | |
Banc of America Funding Corp
5.621% due 01/20/47 " § | | | $2,546,853 | | | | 1,861,744 | |
Banc of America Mortgage Trust
3.111% due 06/25/35 " § | | | 870,989 | | | | 804,136 | |
3.123% due 08/25/35 " § | | | 723,331 | | | | 681,627 | |
4.920% due 11/25/34 " § | | | 148,484 | | | | 147,416 | |
Bear Stearns Adjustable Rate
Mortgage Trust
2.240% due 08/25/35 " § | | | 1,235,237 | | | | 1,247,094 | |
2.909% due 03/25/35 " § | | | 1,711,501 | | | | 1,532,820 | |
2.972% due 01/25/35 " § | | | 790,827 | | | | 784,381 | |
Bear Stearns Structured Products Inc Trust
2.797% due 01/26/36 " § | | | 15,216,639 | | | | 10,060,417 | |
2.829% due 12/26/46 " § | | | 6,565,493 | | | | 3,647,551 | |
CC Funding Corp
0.340% due 05/25/48 " § ~ | | | 212,439 | | | | 142,983 | |
Chase Mortgage Finance Corp
3.006% due 02/25/37 " § | | | 300,130 | | | | 299,090 | |
Chaseflex Trust
6.000% due 02/25/37 " | | | 802,506 | | | | 660,688 | |
Citigroup Mortgage Loan Trust Inc
0.280% due 01/25/37 " § ~ | | | 589,093 | | | | 329,315 | |
2.270% due 09/25/35 " § | | | 1,374,873 | | | | 1,366,115 | |
2.340% due 09/25/35 " § | | | 1,230,862 | | | | 1,214,292 | |
2.600% due 05/25/35 " § | | | 189,988 | | | | 187,032 | |
2.689% due 08/25/35 " § | | | 1,798,394 | | | | 974,831 | |
3.091% due 09/25/37 " § Y | | | 144,513 | | | | 109,845 | |
Countrywide Alternative Loan Trust
0.420% due 07/25/46 " § | | | 2,054,355 | | | | 1,536,506 | |
0.490% due 12/25/35 " § | | | 119,367 | | | | 93,765 | |
5.500% due 06/25/35 " | | | 2,200,000 | | | | 1,957,319 | |
6.000% due 01/25/37 " Y | | | 1,684,632 | | | | 1,370,802 | |
Countrywide Home Loan
Mortgage Pass-Through Trust
0.530% due 03/25/35 " § | | | 151,916 | | | | 100,479 | |
0.550% due 06/25/35 " § ~ | | | 1,174,408 | | | | 1,008,947 | |
2.924% due 11/19/33 " § | | | 167,469 | | | | 168,271 | |
3.026% due 08/25/34 " § | | | 89,819 | | | | 78,434 | |
Deutsche ALT-A Securities Inc Alternate Loan Trust
0.310% due 10/25/36 " § | | | 90,753 | | | | 39,989 | |
Fannie Mae
0.268% due 12/25/36 " § | | | 379,104 | | | | 362,435 | |
0.270% due 07/25/37 " § | | | 3,228,183 | | | | 3,103,415 | |
0.360% due 08/25/34 " § | | | 612,092 | | | | 604,882 | |
0.560% due 07/25/37 - 05/25/42 " § | | | 471,734 | | | | 473,968 | |
2.713% due 05/25/35 " § | | | 2,546,044 | | | | 2,702,601 | |
Freddie Mac
0.439% due 02/15/19 " § | | | 10,154,876 | | | | 10,184,178 | |
0.559% due 12/15/30 " § | | | 12,525 | | | | 12,526 | |
0.659% due 09/15/42 " § | | | 5,465,381 | | | | 5,484,069 | |
Freddie Mac Structured
Pass-Through Securities
1.360% due 02/25/45 " § | | | 4,064,064 | | | | 3,936,487 | |
Granite Mortgages PLC (United Kingdom)
0.898% due 09/20/44 " § ~ | | | GBP 1,795,999 | | | | 2,881,334 | |
Greenpoint Mortgage Funding Trust
0.430% due 06/25/45 " § | | | $1,503,843 | | | | 1,206,251 | |
0.480% due 11/25/45 " § | | | 744,533 | | | | 543,949 | |
GSMPS Mortgage Loan Trust
7.000% due 06/25/43 " ~ | | | 532,212 | | | | 540,447 | |
GSR Mortgage Loan Trust
3.004% due 01/25/35 " § | | | 1,274,176 | | | | 1,257,141 | |
Harborview Mortgage Loan Trust
0.490% due 02/19/36 " § | | | 281,500 | | | | 188,860 | |
| | | | | | | | |
| | | Principal
Amount | | | Value | |
Holmes Master Issuer PLC
(United Kingdom)
1.560% due 10/15/54 " § ~ | | | EUR 25,300,000 | | | | $33,773,919 | |
Impac CMB Trust
1.210% due 07/25/33 " § | | | $334,250 | | | | 300,117 | |
Imperial Savings Association
7.034% due 02/25/18 " § | | | 882 | | | | 908 | |
Indymac Index Mortgage Loan Trust
0.420% due 05/25/46 " § | | | 1,334,463 | | | | 994,068 | |
0.450% due 07/25/35 " § | | | 557,324 | | | | 457,255 | |
2.651% due 12/25/34 " § | | | 1,999,800 | | | | 1,774,121 | |
JPMorgan Mortgage Trust
2.536% due 07/27/37 " § ~ | | | 1,566,090 | | | | 1,270,456 | |
3.026% due 08/25/35 " § | | | 989,284 | | | | 886,250 | |
3.048% due 07/25/35 " § | | | 939,458 | | | | 959,197 | |
3.105% due 08/25/35 " § | | | 1,302,844 | | | | 1,297,335 | |
5.319% due 09/25/35 " § | | | 316,602 | | | | 309,278 | |
MASTR Adjustable Rate Mortgages Trust
2.630% due 11/21/34 " § | | | 168,963 | | | | 169,363 | |
Mellon Residential Funding Corp
0.649% due 12/15/30 " § | | | 609,852 | | | | 609,332 | |
0.909% due 11/15/31 " § | | | 900,743 | | | | 889,142 | |
Merrill Lynch Mortgage Investors Inc
5.079% due 12/25/35 " § | | | 601,410 | | | | 555,962 | |
Merrill Lynch Mortgage Investors Trust
0.460% due 11/25/35 " § | | | 1,033,342 | | | | 969,323 | |
3.115% due 06/25/37 " § | | | 1,275,618 | | | | 1,225,721 | |
NCUA Guaranteed Notes Trust
0.658% due 10/07/20 " § | | | 8,032,752 | | | | 8,062,875 | |
RALI Trust
0.510% due 08/25/35 " § | | | 606,876 | | | | 447,862 | |
Ryland Mortgage Securities Corp
5.782% due 10/01/27 " § | | | 20,641 | | | | 17,112 | |
Securitized Asset Sales Inc
0.742% due 11/26/23 " § | | | 12,618 | | | | 12,949 | |
Sequoia Mortgage Trust
0.910% due 10/19/26 " § | | | 526,816 | | | | 526,670 | |
Structured Adjustable Rate Mortgage
Loan Trust
1.572% due 01/25/35 " § | | | 548,805 | | | | 390,474 | |
2.775% due 02/25/34 " § | | | 196,960 | | | | 199,930 | |
2.797% due 08/25/35 " § | | | 1,258,962 | | | | 1,147,861 | |
Structured Asset Mortgage Investments Inc
0.340% due 03/25/37 " § | | | 173,444 | | | | 117,385 | |
0.430% due 05/25/36 " § | | | 1,136,155 | | | | 752,578 | |
0.460% due 07/19/35 " § | | | 1,202,234 | | | | 1,046,658 | |
0.490% due 02/25/36 " § | | | 1,310,812 | | | | 883,586 | |
0.870% due 10/19/34 " § | | | 604,693 | | | | 594,648 | |
Structured Asset Securities Corp
2.555% due 01/25/32 " § | | | 15,406 | | | | 13,264 | |
2.859% due 10/28/35 " § ~ | | | 372,090 | | | | 344,306 | |
Swan Trust (Australia)
4.402% due 04/25/41 " § | | | AUD 886,208 | | | | 925,701 | |
WaMu Mortgage
Pass-Through Certificates
0.470% due 11/25/45 " § | | | $830,970 | | | | 775,152 | |
0.936% due 05/25/47 " § | | | 1,954,015 | | | | 1,610,851 | |
1.160% due 02/25/46 " § | | | 768,937 | | | | 706,834 | |
1.365% due 11/25/42 " § | | | 102,646 | | | | 98,624 | |
2.454% due 06/25/33 " § | | | 1,339,573 | | | | 1,373,547 | |
2.511% due 11/25/46 " § | | | 510,030 | | | | 461,542 | |
5.324% due 08/25/35 " § | | | 707,699 | | | | 695,111 | |
Wells Fargo Mortgage-Backed
Securities Trust
2.624% due 12/25/34 " § | | | 1,049,776 | | | | 1,049,530 | |
2.626% due 09/25/34 " § | | | 508,059 | | | | 527,628 | |
2.696% due 11/25/34 " § | | | 395,548 | | | | 398,696 | |
5.575% due 04/25/36 " § | | | 715,887 | | | | 709,515 | |
| | | | | | | | |
| | | | | | | 136,342,038 | |
| | | | | | | | |
| | |
| See Notes to Financial Statements | | See explanation of symbols and terms, if any, on page B-143 |
B-33
PACIFIC SELECT FUND
INFLATION MANAGED PORTFOLIO
Schedule of Investments (Continued)
December 31, 2012
| | | | | | | | |
| | | Principal
Amount | | | Value | |
Fannie Mae - 0.3% | | | | | | | | |
| | |
1.360% due 11/01/42 - 10/01/44 " § | | | $595,820 | | | | $608,272 | |
2.148% due 02/01/36 " § | | | 98,229 | | | | 99,701 | |
2.195% due 01/01/25 " § | | | 61,297 | | | | 61,799 | |
2.280% due 12/01/22 " § | | | 19,056 | | | | 20,334 | |
2.379% due 12/01/34 " § | | | 185,877 | | | | 195,167 | |
2.454% due 11/01/35 " § | | | 168,935 | | | | 177,612 | |
2.479% due 10/01/35 " § | | | 287,555 | | | | 306,849 | |
2.494% due 08/01/17 " § | | | 250,014 | | | | 256,757 | |
2.638% due 05/01/35 " § | | | 66,536 | | | | 70,991 | |
2.735% due 03/01/35 " § | | | 69,189 | | | | 69,903 | |
2.769% due 03/01/35 " § | | | 633,448 | | | | 675,622 | |
2.830% due 03/01/35 " § | | | 45,653 | | | | 47,107 | |
3.063% due 09/01/35 " § | | | 283,937 | | | | 303,052 | |
3.120% due 04/01/35 " § | | | 776,121 | | | | 818,917 | |
3.340% due 03/01/18 " § | | | 118,546 | | | | 124,685 | |
3.500% due 07/01/26 " § | | | 10,297 | | | | 10,315 | |
4.998% due 08/01/24 " § | | | 14,667 | | | | 14,878 | |
5.328% due 11/01/35 " § | | | 524,840 | | | | 566,119 | |
5.337% due 01/01/36 " § | | | 511,105 | | | | 550,670 | |
5.496% due 03/01/36 " § | | | 336,755 | | | | 364,094 | |
| | | | | | | | |
| | | | | | | 5,342,844 | |
| | | | | | | | |
Freddie Mac - 0.1% | | | | | | | | |
| | |
2.367% due 01/01/34 " § | | | 444,581 | | | | 473,535 | |
2.856% due 08/01/35 " § | | | 30,582 | | | | 32,605 | |
5.083% due 10/01/35 " § | | | 289,331 | | | | 310,174 | |
5.683% due 03/01/36 " § | | | 278,077 | | | | 302,224 | |
| | | | | | | | |
| | | | | | | 1,118,538 | |
| | | | | | | | |
Government National Mortgage Association - 0.0% | | | | | |
| | |
1.625% due 11/20/26 " § | | | 19,144 | | | | 19,755 | |
1.750% due 09/20/22 - 07/20/25 " § | | | 116,903 | | | | 121,634 | |
2.000% due 10/20/24 - 01/20/27 " § | | | 101,101 | | | | 105,114 | |
2.500% due 02/20/25 " § | | | 25,899 | | | | 26,994 | |
| | | | | | | | |
| | | | | | | 273,497 | |
| | | | | | | | |
Total Mortgage-Backed Securities
(Cost $167,153,849) | | | | | | | 159,142,987 | |
| | | | | | | | |
| | |
ASSET-BACKED SECURITIES - 2.0% | | | | | | | | |
| | |
Alzette European SA CLO (Luxembourg)
0.628% due 12/15/20 " § ~ | | | 939,534 | | | | 929,630 | |
AMMC VI Ltd CLO (Cayman)
0.537% due 05/03/18 " § ~ | | | 417,023 | | | | 413,670 | |
Amortizing Residential Collateral Trust
0.790% due 07/25/32 " § | | | 125,612 | | | | 108,730 | |
Aquilae PLC CLO (Ireland)
1.007% due 01/17/23 " § ~ | | | EUR 473,248 | | | | 604,880 | |
Asset-Backed Securities Corp Home Equity
0.290% due 05/25/37 " § | | | $124,116 | | | | 101,668 | |
Bear Stearns Asset-Backed Securities Trust
0.280% due 12/25/36 " § | | | 177,050 | | | | 172,172 | |
0.320% due 11/25/36 " § | | | 1,080,787 | | | | 682,488 | |
0.870% due 10/25/32 " § | | | 55,610 | | | | 51,496 | |
1.210% due 10/25/37 " § | | | 2,259,528 | | | | 1,820,140 | |
Citigroup Mortgage Loan Trust Inc
0.290% due 01/25/37 " § | | | 655,597 | | | | 321,235 | |
Conseco Finance Securitizations Corp 6.681% due 12/01/33 " § | | | 104,440 | | | | 108,768 | |
Countrywide Asset-Backed Certificates
0.400% due 06/25/36 " § | | | 700,658 | | | | 676,789 | |
0.460% due 04/25/36 " § | | | 459,906 | | | | 443,101 | |
Credit-Based Asset Servicing & Securitization LLC
0.280% due 01/25/37 " § | | | 293,409 | | | | 102,699 | |
Duane Street I Ltd CLO (Cayman)
0.562% due 11/08/17 " § ~ | | | 1,302,608 | | | | 1,293,864 | |
Equity One ABS Inc
0.510% due 04/25/34 " § | | | 491,370 | | | | 384,455 | |
| | | | | | | | |
| | | Principal
Amount | | | Value | |
First Franklin Mortgage Loan Trust
0.950% due 12/25/34 " § | | | $5,477 | | | | $5,480 | |
Freddie Mac Structured
Pass-Through Securities
0.470% due 08/25/31 " § | | | 233,590 | | | | 228,614 | |
Harbourmaster Ltd CLO (Netherlands)
0.443% due 06/15/20 " § ~ | | | EUR 452,364 | | | | 583,798 | |
Harvest SA CLO (Luxembourg)
0.936% due 03/29/17 " § ~ | | | 355,877 | | | | 467,069 | |
Home Equity Asset Trust
0.270% due 05/25/37 " § | | | $88,234 | | | | 87,523 | |
HSBC Home Equity Loan Trust
0.521% due 01/20/35 " § | | | 360,816 | | | | 348,985 | |
HSI Asset Securitization Corp Trust
0.260% due 10/25/36 " § | | | 22,393 | | | | 9,236 | |
JPMorgan Mortgage Acquisition Corp
0.270% due 03/25/47 " § | | | 99,467 | | | | 92,106 | |
LCM V Ltd CDO (Cayman)
0.540% due 03/21/19 " § ~ | | | 1,400,000 | | | | 1,355,719 | |
Magnolia Funding Ltd (United Kingdom)
3.000% due 04/20/17 " ~ | | | EUR 406,764 | | | | 537,357 | |
Morgan Stanley IXIS Real Estate Capital Trust
0.260% due 11/25/36 " § | | | $2,227 | | | | 942 | |
Nautique Funding Ltd CDO (Cayman)
0.590% due 04/15/20 " § ~ | | | 962,297 | | | | 926,169 | |
Navigare Funding I Ltd CLO (Cayman)
0.572% due 05/20/19 " § ~ | | | 710,185 | | | | 701,693 | |
New Century Home Equity Loan Trust
0.390% due 05/25/36 " § | | | 999,864 | | | | 603,802 | |
NYLIM Flatiron Ltd CLO (Cayman)
0.532% due 08/08/20 " § ~ | | | 1,300,000 | | | | 1,263,789 | |
Park Place Securities Inc
0.470% due 09/25/35 " § | | | 107,892 | | | | 104,689 | |
Penta SA CLO (Luxembourg)
0.564% due 06/04/24 " § ~ | | | EUR 4,841,537 | | | | 6,007,608 | |
Popular ABS Mortgage
Pass-Through Trust
0.300% due 06/25/47 " § | | | $2,040,293 | | | | 1,774,784 | |
Renaissance Home Equity Loan Trust
0.970% due 12/25/32 " § | | | 217,275 | | | | 150,388 | |
Securitized Asset-Backed Receivables LLC
0.250% due 01/25/37 " § | | | 111,475 | | | | 103,720 | |
SLC Student Loan Trust
0.420% due 08/15/19 " § | | | 31,633 | | | | 31,636 | |
SLM Student Loan Trust
0.453% due 09/15/21 " § ~ | | | EUR 606,528 | | | | 797,039 | |
Small Business Administration
Participation Certificates
5.290% due 12/01/27 " | | | $3,981,041 | | | | 4,562,076 | |
Soundview Home Equity Loan Trust
0.270% due 11/25/36 " § ~ | | | 193,008 | | | | 67,495 | |
Specialty Underwriting &
Residential Finance
0.270% due 01/25/38 " § | | | 39,534 | | | | 37,935 | |
Structured Asset Securities Corp
1.714% due 04/25/35 " § | | | 1,828,115 | | | | 1,762,452 | |
Wood Street BV CLO (Netherlands)
0.696% due 03/29/21 " § ~ | | | EUR 1,219,773 | | | | 1,575,035 | |
| | | | | | | | |
| | | | | | | | |
Total Asset-Backed Securities
(Cost $34,009,781) | | | | | | | 32,402,924 | |
| | | | | | | | |
|
U.S. GOVERNMENT AGENCY ISSUES - 2.1% | |
| | |
Fannie Mae
2.600% due 05/02/22 | | | $3,010,000 | | | | 3,024,147 | |
2.700% due 03/28/22 | | | 18,200,000 | | | | 18,288,216 | |
Freddie Mac
2.000% due 03/14/19 | | | 12,465,000 | | | | 12,502,881 | |
| | | | | | | | |
| | | | | | | | |
Total U.S. Government Agency Issues
(Cost $33,748,784) | | | | | | | 33,815,244 | |
| | | | | | | | |
| | |
| See Notes to Financial Statements | | See explanation of symbols and terms, if any, on page B-143 |
B-34
PACIFIC SELECT FUND
INFLATION MANAGED PORTFOLIO
Schedule of Investments (Continued)
December 31, 2012
| | | | | | | | |
| | | Principal
Amount | | | Value | |
U.S. TREASURY OBLIGATIONS - 89.0% | |
| |
U.S. Treasury Inflation Protected Securities - 89.0% | | | | | |
| | |
0.125% due 04/15/16 ^ ‡ | | | $68,852,286 | | | | $72,520,805 | |
0.125% due 04/15/17 ^ ‡ | | | 63,245,124 | | | | 67,746,406 | |
0.125% due 01/15/22 ^ | | | 4,190,323 | | | | 4,551,412 | |
0.125% due 07/15/22 ^ | | | 118,405,564 | | | | 128,477,746 | |
0.500% due 04/15/15 ^ | | | 26,252,911 | | | | 27,407,134 | |
0.625% due 07/15/21 ^ | | | 144,534,870 | | | | 164,287,618 | |
0.750% due 02/15/42 ^ | | | 8,567,813 | | | | 9,391,415 | |
1.125% due 01/15/21 ^ | | | 27,758,063 | | | | 32,611,393 | |
1.250% due 04/15/14 ^ | | | 2,884,349 | | | | 2,975,393 | |
1.250% due 07/15/20 ^ | | | 48,344,191 | | | | 57,385,482 | |
1.375% due 07/15/18 ^ | | | 3,160,925 | | | | 3,682,397 | |
1.375% due 01/15/20 ^ | | | 17,717,496 | | | | 21,009,314 | |
1.625% due 01/15/15 ^ | | | 45,486,053 | | | | 48,343,041 | |
1.625% due 01/15/18 ^ | | | 88,334 | | | | 102,488 | |
1.750% due 01/15/28 ^ ‡ | | | 22,646,527 | | | | 29,330,785 | |
1.875% due 07/15/13 ^ | | | 28,655,238 | | | | 29,129,732 | |
1.875% due 07/15/15 ^ | | | 4,281,300 | | | | 4,669,293 | |
1.875% due 07/15/19 ^ | | | 8,020,869 | | | | 9,766,078 | |
2.000% due 07/15/14 ^ ‡ | | | 32,765,706 | | | | 34,588,298 | |
2.000% due 01/15/16 ^ | | | 61,683,223 | | | | 68,431,354 | |
2.000% due 01/15/26 ^ ‡ | | | 169,183,284 | | | | 221,966,279 | |
2.125% due 01/15/19 ^ | | | 15,615,764 | | | | 18,969,775 | |
2.125% due 02/15/40 ^ | | | 13,870,181 | | | | 20,333,907 | |
2.375% due 01/15/25 ^ | | | 62,880,703 | | | | 84,903,663 | |
2.375% due 01/15/27 ^ ‡ | | | 88,345,905 | | | | 121,845,224 | |
2.500% due 01/15/29 ^ | | | 1,120,506 | | | | 1,597,773 | |
2.625% due 07/15/17 ^ | | | 5,022,495 | | | | 6,021,108 | |
3.375% due 04/15/32 ^ | | | 964,375 | | | | 1,590,391 | |
3.625% due 04/15/28 ^ | | | 14,302 | | | | 22,700 | |
3.875% due 04/15/29 ^ | | | 81,904,964 | | | | 135,780,083 | |
| | | | | | | | |
| | | | | | | 1,429,438,487 | |
| | | | | | | | |
U.S. Treasury Notes - 0.0% | | | | | | | | |
| | |
0.750% due 12/15/13 | | | 11,000 | | | | 11,060 | |
| | | | | | | | |
| | |
Total U.S. Treasury Obligations
(Cost $1,365,773,780) | | | | | | | 1,429,449,547 | |
| | | | | | | | |
|
FOREIGN GOVERNMENT BONDS & NOTES - 7.0% | |
| | |
Australia Government Bond (Australia)
4.000% due 08/20/20 ^ | | | AUD 6,200,000 | | | | 12,422,534 | |
Canadian Government Bond (Canada)
1.500% due 12/01/44 ^ | | | CAD 5,993,417 | | | | 7,968,346 | |
3.000% due 12/01/36 ^ | | | 3,677,964 | | | | 6,028,725 | |
4.250% due 12/01/21 ^ | | | 882,504 | | | | 1,250,384 | |
Italy Buoni Poliennali del Tesoro (Italy)
2.100% due 09/15/16 ^ | | | EUR 13,156,276 | | | | 17,653,212 | |
2.100% due 09/15/17 ^ | | | 2,418,885 | | | | 3,232,081 | |
2.100% due 09/15/21 ^ | | | 6,657,188 | | | | 8,353,954 | |
New South Wales Treasury Corp (Australia)
2.500% due 11/20/35 ^ | | | AUD 1,100,000 | | | | 1,363,363 | |
2.750% due 11/20/25 ^ | | | 14,400,000 | | | | 19,499,921 | |
United Kingdom Gilt Inflation-Linked
(United Kingdom)
0.125% due 03/22/24 ^ | | | GBP 8,002,147 | | | | 14,162,245 | |
1.250% due 11/22/32 ^ | | | 452,360 | | | | 938,100 | |
1.875% due 11/22/22 ^ | | | 5,611,800 | | | | 11,738,440 | |
2.500% due 07/26/16 ^ ~ | | | 1,300,000 | | | | 7,259,210 | |
| | | | | | | | |
| | |
Total Foreign Government Bonds & Notes
(Cost $98,544,023) | | | | | | | 111,870,515 | |
| | | | | | | | |
| | | | | | | | |
| | | Principal
Amount | | | Value | |
PURCHASED OPTIONS - 0.0% | | | | | |
(See Note (i) in Notes to Schedule of Investments)
(Cost $401,715) | | | | $150,279 | |
| | | | | | | | |
| | |
SHORT-TERM INVESTMENTS - 37.8% | | | | | | | | |
| | |
Commercial Paper - 2.0% | | | | | | | | |
| | |
Abbey National (United Kingdom)
1.019% due 04/03/13 | | | $5,400,000 | | | | 5,393,499 | |
Banco Bilbao Vizcaya Argentaria SA
(United Kingdom)
3.120% due 10/21/13 | | | 4,100,000 | | | | 4,035,102 | |
Santander SA (Spain)
2.200% due 04/02/13 | | | 8,600,000 | | | | 8,575,781 | |
Standard Chartered Bank (United Kingdom)
0.950% due 10/01/13 | | | 14,100,000 | | | | 14,039,598 | |
| | | | | | | | |
| | | | | | | 32,043,980 | |
| | | | | | | | |
Foreign Government Issues - 9.0% | |
| | |
Italy Buoni Ordinari del Tesoro BOT (Italy)
1.716% due 09/13/13 | | | EUR 5,550,000 | | | | 7,268,125 | |
1.741% due 09/13/13 | | | 5,550,000 | | | | 7,268,125 | |
Japan Treasury Discount Bills (Japan)
0.099% due 02/04/13 | | | JPY 10,590,000,000 | | | | 122,225,690 | |
0.100% due 02/12/13 | | | 670,000,000 | | | | 7,732,709 | |
| | | | | | | | |
| | | | | | | 144,494,649 | |
| | | | | | | | |
U.S. Treasury Bills - 0.2% | | | | | | | | |
| | |
0.124% due 03/14/13 ‡ | | | $76,000 | | | | 75,994 | |
0.127% due 12/12/13 ‡ | | | 370,000 | | | | 369,506 | |
0.139% due 05/23/13 ‡ | | | 190,000 | | | | 189,924 | |
0.140% due 05/23/13 ‡ | | | 570,000 | | | | 569,771 | |
0.142% due 12/12/13 ‡ | | | 659,000 | | | | 658,120 | |
0.145% due 12/12/13 ‡ | | | 260,000 | | | | 259,653 | |
0.145% due 04/11/13 ‡ | | | 206,000 | | | | 205,959 | |
0.145% due 12/12/13 ‡ | | | 300,000 | | | | 299,599 | |
0.176% due 07/25/13 ‡ | | | 389,000 | | | | 388,725 | |
0.205% due 06/27/13 ‡ | | | 592,000 | | | | 591,674 | |
| | | | | | | | |
| | | | | | | 3,608,925 | |
| | | | | | | | |
U.S. Government Agency Issues - 16.4% | | | | | | | | |
| | |
Fannie Mae
0.015% due 01/02/13 | | | 46,800,000 | | | | 46,799,980 | |
0.015% due 01/16/13 | | | 2,250,000 | | | | 2,249,986 | |
0.035% due 01/09/13 | | | 1,000,000 | | | | 999,992 | |
0.118% due 05/08/13 | | | 2,800,000 | | | | 2,799,216 | |
Farmer Mac Discount Notes
0.040% due 01/10/13 | | | 50,000,000 | | | | 49,999,500 | |
Federal Home Loan Bank
0.001% due 01/08/13 | | | 10,000,000 | | | | 9,999,998 | |
0.010% due 01/18/13 | | | 34,450,000 | | | | 34,449,837 | |
0.020% due 01/28/13 | | | 35,300,000 | | | | 35,299,471 | |
0.023% due 01/09/13 | | | 700,000 | | | | 699,997 | |
0.150% due 09/03/13 | | | 2,800,000 | | | | 2,797,536 | |
Freddie Mac
0.015% due 01/14/13 | | | 1,100,000 | | | | 1,099,994 | |
0.025% due 01/14/13 | | | 68,000,000 | | | | 67,999,386 | |
0.030% due 01/14/13 | | | 7,200,000 | | | | 7,199,922 | |
| | | | | | | | |
| | | | | | | 262,394,815 | |
| | | | | | | | |
Repurchase Agreements - 10.2% | | | | | | | | |
| | |
Barclays PLC
0.160% due 01/11/13
(Dated 12/21/12, repurchase price of $200,019; collateralized by U.S.
Treasury Notes: 0.250% due 09/15/15 and value $204,711) | | | 200,000 | | | | 200,000 | |
| | |
| See Notes to Financial Statements | | See explanation of symbols and terms, if any, on page B-143 |
B-35
PACIFIC SELECT FUND
INFLATION MANAGED PORTFOLIO
Schedule of Investments (Continued)
December 31, 2012
| | | | | | | | |
| | | Principal
Amount | | | Value | |
Fixed Income Clearing Corp
0.010% due 01/02/13
(Dated 12/31/12, repurchase price of $9,628,555; collateralized by U.S. Treasury Notes: 0.250% due 07/15/15 and value $9,825,000) | | | $9,628,549 | | | | $9,628,549 | |
JPMorgan Chase & Co
0.250% due 01/02/13
(Dated 12/31/12, repurchase price of $400,006; collateralized by U.S.
Treasury Notes: 2.375% due 10/31/14 and value $408,698) | | | 400,000 | | | | 400,000 | |
Royal Bank of Canada
0.210% due 01/04/13
(Dated 12/07/12, repurchase price of $86,014,047; collateralized by Fannie Mae: 3.500% - 4.000% due 08/01/26 - 09/01/41 and value $85,378,911) | | | 86,000,000 | | | | 86,000,000 | |
The Royal Bank of Scotland Group PLC
0.220% due 01/04/13
(Dated 12/06/12, repurchase price of $52,009,216; collateralized by U.S. Treasury Notes: 0.875% due 11/30/16 and value $52,985,129) | | | 52,000,000 | | | | 52,000,000 | |
The Royal Bank of Scotland Group PLC
0.230% due 01/14/13
(Dated 12/10/12, repurchase price of $5,001,118; collateralized by U.S. Treasury Notes: 2.125% due 08/15/21 and value $5,059,705) | | | 5,000,000 | | | | 5,000,000 | |
The Royal Bank of Scotland Group PLC
0.230% due 01/07/13
(Dated 12/10/12, repurchase price of $10,001,789; collateralized by U.S. Treasury Notes: 2.125% due 08/15/21 and value $10,118,351) | | | 10,000,000 | | | | 10,000,000 | |
| | | | | | | | |
| | | | | | | 163,228,549 | |
| | | | | | | | |
Total Short-Term Investments
(Cost $615,504,975) | | | | | | | 605,770,918 | |
| | | | | | | | |
| | |
TOTAL INVESTMENTS - 163.1%
(Cost $2,553,800,143) | | | | | | | 2,617,970,992 | |
| |
OTHER ASSETS & LIABILITIES, NET - (63.1%) | | | | (1,012,543,470 | ) |
| | | | | | | | |
| |
NET ASSETS - 100.0% | | | | $1,605,427,522 | |
| | | | | | | | |
Notes to Schedule of Investments
| (a) | As of December 31, 2012, the portfolio was diversified as a percentage of net assets as follows: |
| | | | |
U.S. Treasury Obligations | | | 89.0% | |
Short-Term Investments | | | 37.8% | |
Corporate Bonds & Notes | | | 14.9% | |
Mortgage-Backed Securities | | | 9.9% | |
Foreign Government Bonds & Notes | | | 7.0% | |
U.S. Government Agency Issues | | | 2.1% | |
Asset-Backed Securities | | | 2.0% | |
Equity Securities | | | 0.2% | |
Senior Loan Notes | | | 0.2% | |
| | | | |
| | | 163.1% | |
Other Assets & Liabilities, Net | | | (63.1% | ) |
| | | | |
| | | 100.0% | |
| | | | |
| (b) | As of December 31, 2012, the portfolio’s Standard & Poor’s quality ratings as a percentage of total fixed income investments were as follows (Unaudited): |
| | | | |
AAA | | | 7.1% | |
A-1 (Short-Term Debt only) | | | 7.6% | |
AA/U.S. Government & Agency Issues | | | 69.4% | |
A | | | 1.3% | |
BBB | | | 1.7% | |
BB | | | 0.7% | |
B | | | 1.4% | |
CCC | | | 1.1% | |
CC | | | 0.2% | |
D | | | 0.1% | |
Not Rated | | | 9.4% | |
| | | | |
| | | 100.0% | |
| | | | |
| (c) | Short-term investments reflect either the stated coupon rate or the annualized effective yield on the date of purchase for discounted investments. |
| (d) | Investments with a total aggregate value of $1,882,272 or 0.1% of the portfolio’s net assets were in default as of December 31, 2012. |
| (e) | As of December 31, 2012, investments with total aggregate values of $478,850, $6,743,755 and $2,341,754 were fully or partially segregated with the broker(s)/custodian as collateral for open futures contracts, swap contracts, and delayed delivery securities, respectively. In addition, $7,000 in cash was segregated as collateral for open futures contracts. |
| (f) | Open futures contracts outstanding as of December 31, 2012 were as follows: |
| | | | | | | | | | | | |
| Long Futures Outstanding | | Number of
Contracts | | | Notional
Amount | | | Unrealized
Appreciation
(Depreciation) | |
Eurodollar (09/15) | | | 179 | | | | $179,000,000 | | | | $43,888 | |
Eurodollar (03/16) | | | 484 | | | | 484,000,000 | | | | 126,470 | |
U.S. Treasury 10-Year Notes (03/13) | | | 89 | | | | 8,900,000 | | | | (11,539 | ) |
| | | | | | | | | | | | |
| |
Total Futures Contracts | | | | $158,819 | |
| | | | | | | | | | | | |
| (g) | The average amount of borrowings by the portfolio on sale-buyback financing transactions (See Note 4 in Notes to Financial Statements) outstanding during the year ended December 31, 2012 was $718,703,234 at a weighted average interest rate of 0.232%. |
| | |
| See Notes to Financial Statements | | See explanation of symbols and terms, if any, on page B-143 |
B-36
PACIFIC SELECT FUND
INFLATION MANAGED PORTFOLIO
Schedule of Investments (Continued)
December 31, 2012
| (h) | Forward foreign currency contracts outstanding as of December 31, 2012 were as follows: |
| | | | | | | | | | | | | | | | | | | | |
Currency
Purchased | | | Currency
Sold | | | Expiration | | | Counterparty | | Unrealized
Appreciation
(Depreciation) | |
| AUD | | | 7,369,000 | | | USD | | | 7,671,908 | | | | 01/13 | | | HSB | | | ($23,545 | ) |
| AUD | | | 237,000 | | | USD | | | 244,800 | | | | 01/13 | | | HSB | | | 1,185 | |
| BRL | | | 136,208 | | | USD | | | 65,000 | | | | 02/13 | | | BRC | | | 1,244 | |
| BRL | | | 229,869 | | | USD | | | 109,728 | | | | 02/13 | | | DUB | | | 2,068 | |
| BRL | | | 15,414,184 | | | USD | | | 7,466,665 | | | | 02/13 | | | HSB | | | 29,959 | |
| BRL | | | 168,200 | | | USD | | | 80,000 | | | | 02/13 | | | UBS | | | 1,803 | |
| EUR | | | 152,000 | | | USD | | | 201,477 | | | | 03/13 | | | HSB | | | (712 | ) |
| GBP | | | 10,927,000 | | | USD | | | 17,683,164 | | | | 01/13 | | | BRC | | | 67,200 | |
| GBP | | | 10,927,000 | | | USD | | | 17,690,813 | | | | 01/13 | | | DUB | | | 59,551 | |
| GBP | | | 84,000 | | | USD | | | 134,643 | | | | 01/13 | | | RBC | | | 1,811 | |
| MXN | | | 27,135,150 | | | USD | | | 2,055,179 | | | | 04/13 | | | HSB | | | 26,487 | |
| MXN | | | 920,689 | | | USD | | | 70,446 | | | | 04/13 | | | JPM | | | 185 | |
| USD | | | 886,791 | | | AUD | | | 848,000 | | | | 01/13 | | | BRC | | | 6,643 | |
| USD | | | 164,555 | | | AUD | | | 156,000 | | | | 01/13 | | | RBS | | | 2,641 | |
| USD | | | 43,553,916 | | | AUD | | | 42,134,000 | | | | 01/13 | | | UBS | | | (177,406 | ) |
| USD | | | 1,720,000 | | | BRL | | | 3,601,336 | | | | 02/13 | | | CSF | | | (31,495 | ) |
| USD | | | 15,439,736 | | | CAD | | | 15,255,000 | | | | 03/13 | | | CIT | | | 128,740 | |
| USD | | | 5,022 | | | CNY | | | 32,000 | | | | 02/13 | | | JPM | | | (104 | ) |
| USD | | | 73,010,195 | | | EUR | | | 55,919,000 | | | | 03/13 | | | BRC | | | (848,893 | ) |
| USD | | | 1,525,276 | | | EUR | | | 1,172,000 | | | | 03/13 | | | UBS | | | (22,728 | ) |
| USD | | | 14,226,133 | | | EUR | | | 10,966,800 | | | | 09/13 | | | BRC | | | (285,434 | ) |
| USD | | | 33,742,077 | | | GBP | | | 21,083,000 | | | | 01/13 | | | GSC | | | (506,201 | ) |
| USD | | | 882,339 | | | GBP | | | 549,000 | | | | 01/13 | | | RBC | | | (9,484 | ) |
| USD | | | 494,488 | | | GBP | | | 306,000 | | | | 01/13 | | | RBS | | | (2,593 | ) |
| USD | | | 17,681,569 | | | GBP | | | 10,927,000 | | | | 02/13 | | | BRC | | | (67,266 | ) |
| USD | | | 17,689,720 | | | GBP | | | 10,927,000 | | | | 02/13 | | | DUB | | | (59,114 | ) |
| USD | | | 2,952,589 | | | GBP | | | 1,817,000 | | | | 03/13 | | | UBS | | | 1,582 | |
| USD | | | 3,132,047 | | | JPY | | | 250,000,000 | | | | 02/13 | | | BOA | | | 245,526 | |
| USD | | | 132,599,092 | | | JPY | | | 10,590,000,000 | | | | 02/13 | | | BRC | | | 10,333,887 | |
| USD | | | 3,883,753 | | | JPY | | | 310,000,000 | | | | 02/13 | | | CIT | | | 304,466 | |
| USD | | | 1,377,759 | | | JPY | | | 110,000,000 | | | | 02/13 | | | UBS | | | 107,690 | |
| USD | | | 402,820 | | | ZAR | | | 3,561,295 | | | | 01/13 | | | JPM | | | (15,705 | ) |
| | | | | | | | | | | | | | | | | | | | |
| | | | |
Total Forward Foreign Currency Contracts | | | | | | | | | | | | | $9,271,988 | |
| | | | | | | | | | | | | | | | | | | | |
| (i) | Purchased options outstanding as of December 31, 2012 were as follows: |
Interest Rate Swaptions
| | | | | | | | | | | | | | | | | | | | | | | | |
| Description | | Pay/Receive
Floating
Rate Based
on 3-Month
USD-LIBOR | | Exercise
Rate | | | Expiration
Date | | | Counter-
party | | Notional
Amount | | | Cost | | | Value | |
Put - OTC 30-Year Interest Rate Swap | | Receive | | | 3.875% | | | | 04/14/14 | | | DUB | | | $7,900,000 | | | | $401,715 | | | | $150,279 | |
| | | | | | | | | | | | | | | | | | | | | | | | |
| | | | | | | |
Total Purchased Options | | | | | | | | | | | | | | | | | | | $401,715 | | | | $150,279 | |
| | | | | | | | | | | | | | | | | | | | | | | | |
| (j) | Transactions in written options for the year ended December 31, 2012 were as follows: |
| | | | | | | | | | | | | | | | |
| | | Number of
Contracts | | | Notional Amount
in $ | | | Notional Amount
in EUR | | | Premium | |
Outstanding, December 31, 2011 | | | - | | | | 1,469,500,000 | | | | - | | | | $8,667,006 | |
Call Options Written | | | 50 | | | | 327,700,000 | | | | - | | | | 1,963,711 | |
Put Options Written | | | 50 | | | | 370,300,000 | | | | 6,100,000 | | | | 3,313,303 | |
Call Options Exercised | | | - | | | | (121,800,000 | ) | | | - | | | | (235,584 | ) |
Put Options Exercised | | | - | | | | (64,100,000 | ) | | | - | | | | (179,480 | ) |
Call Options Closed | | | (50 | ) | | | (323,400,000 | ) | | | - | | | | (1,245,598 | ) |
Put Options Closed | | | (50 | ) | | | (1,326,800,000 | ) | | | - | | | | (9,593,468 | ) |
| | | | | | | | | | | | | | | | |
Outstanding, December 31, 2012 | | | - | | | | 331,400,000 | | | | 6,100,000 | | | | $2,689,890 | |
| | | | | | | | | | | | | | | | |
| | |
| See Notes to Financial Statements | | See explanation of symbols and terms, if any, on page B-143 |
B-37
PACIFIC SELECT FUND
INFLATION MANAGED PORTFOLIO
Schedule of Investments (Continued)
December 31, 2012
| (k) | Premiums received and value of written options outstanding as of December 31, 2012 were as follows: |
Inflation Floor/Cap Options
| | | | | | | | | | | | | | | | | | | | | | | | |
| Description | | Strike
Index | | | Exercise Index | | Expiration
Date | | | Counter-
party | | Notional
Amount | | | Premium | | | Value | |
Floor - OTC U.S. CPI Urban Consumers NSA | | | 215.95 | | | Maximum of [(1+0.00%)10
- Inflation Adjustment] or $0 | | | 03/10/20 | | | DUB | | | $9,800,000 | | | | $73,500 | | | | ($20,762 | ) |
Floor - OTC U.S. CPI Urban Consumers NSA | | | 216.69 | | | Maximum of [(1+0.00%)10
- Inflation Adjustment] or $0 | | | 04/07/20 | | | CIT | | | 90,900,000 | | | | 810,160 | | | | (176,402 | ) |
Floor - OTC U.S. CPI Urban Consumers NSA | | | 217.97 | | | Maximum of [(1+0.00%)10
- Inflation Adjustment] or $0 | | | 09/29/20 | | | CIT | | | 8,700,000 | | | | 112,230 | | | | (17,229 | ) |
| | | | | | | | | | | | | | | | | | | | | | | | |
| | | | | | | | | | | | | | | | | | | $995,890 | | | | ($214,393 | ) |
| | | | | | | | | | | | | | | | | | | | | | | | |
Interest Rate Swaptions
| | | | | | | | | | | | | | | | | | | | | | | | |
| Description | | Pay/Receive
Floating
Rate Based
on 3-Month
USD-LIBOR | | Exercise
Rate | | | Expiration
Date | | | Counter-
party | | Notional
Amount | | | Premium | | | Value | |
Call - OTC 5-Year Interest Rate Swap | | Receive | | | 0.750% | | | | 03/18/13 | | | JPM | | | $19,800,000 | | | | $45,540 | | | | ($17,345 | ) |
Call - OTC 5-Year Interest Rate Swap | | Receive | | | 0.750% | | | | 03/18/13 | | | RBS | | | 35,800,000 | | | | 84,578 | | | | (31,361 | ) |
Call - OTC 7-Year Interest Rate Swap | | Receive | | | 1.200% | | | | 03/18/13 | | | GSC | | | 4,500,000 | | | | 11,531 | | | | (11,986 | ) |
Call - OTC 5-Year Interest Rate Swap | | Receive | | | 1.700% | | | | 03/18/13 | | | CIT | | | 21,600,000 | | | | 254,880 | | | | (842,720 | ) |
Call - OTC 5-Year Interest Rate Swap | | Receive | | | 1.700% | | | | 03/18/13 | | | DUB | | | 8,000,000 | | | | 86,000 | | | | (312,118 | ) |
| | | | | | | | | | | | | | | | | | | | | | | | |
| | | | | | | | | | | | | | | | | | | 482,529 | | | | (1,215,530 | ) |
| | | | | | | | | | | | | | | | | | | | | | | | |
| | | | | | | |
Put - OTC 5-Year Interest Rate Swap | | Pay | | | 1.400% | | | | 03/18/13 | | | JPM | | | 19,800,000 | | | | 51,480 | | | | (6,235 | ) |
Put - OTC 5-Year Interest Rate Swap | | Pay | | | 1.400% | | | | 03/18/13 | | | RBS | | | 35,800,000 | | | | 84,577 | | | | (11,274 | ) |
Put - OTC 7-Year Interest Rate Swap | | Pay | | | 1.650% | | | | 03/18/13 | | | BOA | | | 3,400,000 | | | | 10,200 | | | | (7,542 | ) |
Put - OTC 7-Year Interest Rate Swap | | Pay | | | 1.650% | | | | 03/18/13 | | | GSC | | | 4,500,000 | | | | 12,094 | | | | (9,982 | ) |
Put - OTC 5-Year Interest Rate Swap | | Pay | | | 1.700% | | | | 03/18/13 | | | CIT | | | 21,600,000 | | | | 406,080 | | | | (1,231 | ) |
Put - OTC 5-Year Interest Rate Swap | | Pay | | | 1.700% | | | | 03/18/13 | | | DUB | | | 8,000,000 | | | | 160,000 | | | | (456 | ) |
Put - OTC 5-Year Interest Rate Swap | | Pay | | | 2.000% | | | | 03/18/13 | | | DUB | | | 6,000,000 | | | | 56,358 | | | | (44 | ) |
Put - OTC 5-Year Interest Rate Swap | | Pay | | | 2.850% | | | | 04/14/14 | | | DUB | | | 33,200,000 | | | | 398,400 | | | | (52,068 | ) |
| | | Based on
3-Month
EUR-LIBOR | | | | | | | | | | | | | | | | | |
Put - OTC 10-Year Interest Rate Swap | | Pay | | | 2.150% | | | | 01/07/13 | | | DUB | | | EUR 6,100,000 | | | | 32,282 | | | | (1 | ) |
| | | | | | | | | | | | | | | | | | | | | | | | |
| | | | | | | | | | | | | | | | | | | 1,211,471 | | | | (88,833 | ) |
| | | | | | | | | | | | | | | | | | | | | | | | |
| | | | | | | |
| | | | | | | | | | | | | | | | | | | $1,694,000 | | | | ($1,304,363 | ) |
| | | | | | | | | | | | | | | | | | | | | | | | |
| | | | | | | |
Total Written Options | | | | | | | | | | | | | | | | | | | $2,689,890 | | | | ($1,518,756 | ) |
| | | | | | | | | | | | | | | | | | | | | | | | |
| (l) | Swap agreements outstanding as of December 31, 2012 were as follows: |
Credit Default Swaps on Corporate Issues – Buy Protection (1)
| | | | | | | | | | | | | | | | | | | | | | | | | | | | | | |
| Referenced Obligation | | Fixed Deal
Pay
Rate | | | Expiration
Date | | | Counter-
party | | Implied Credit
Spread at
12/31/12 (3) | | | Notional
Amount (4) | | | Value | | | Upfront
Premiums
Paid
(Received) | | | Unrealized
Appreciation
(Depreciation) | |
Starwoods Hotel & Resorts Worldwide Inc | | | 2.370% | | | | 03/20/13 | | | BOA | | | 0.165% | | | | $3,000,000 | | | | ($16,868 | ) | | | $- | | | | ($16,868 | ) |
Rexam PLC | | | 1.450% | | | | 06/20/13 | | | BRC | | | 0.123% | | | | 4,200,000 | | | | (28,451 | ) | | | - | | | | (28,451 | ) |
DISH DBS Corp | | | 3.650% | | | | 12/20/13 | | | BOA | | | 0.401% | | | | 4,900,000 | | | | (161,416 | ) | | | - | | | | (161,416 | ) |
DISH DBS Corp | | | 3.650% | | | | 12/20/13 | | | CIT | | | 0.401% | | | | 4,100,000 | | | | (135,062 | ) | | | - | | | | (135,062 | ) |
Centex Corp | | | 1.000% | | | | 06/20/14 | | | BNP | | | 0.258% | | | | 3,500,000 | | | | (39,548 | ) | | | (46,651 | ) | | | 7,103 | |
Marsh & McLennan Cos Inc | | | 0.600% | | | | 09/20/15 | | | DUB | | | 0.239% | | | | 3,000,000 | | | | (30,177 | ) | | | - | | | | (30,177 | ) |
Marsh & McLennan Cos Inc | | | 0.830% | | | | 09/20/15 | | | BOA | | | 0.239% | | | | 3,000,000 | | | | (49,229 | ) | | | - | | | | (49,229 | ) |
Cardinal Health Inc | | | 0.590% | | | | 06/20/17 | | | DUB | | | 0.375% | | | | 250,000 | | | | (2,426 | ) | | | - | | | | (2,426 | ) |
Temple-Inland Inc | | | 1.000% | | | | 03/20/18 | | | BOA | | | 0.270% | | | | 4,000,000 | | | | (152,008 | ) | | | 208,974 | | | | (360,982 | ) |
Health Care Properties Inc | | | 2.910% | | | | 03/20/18 | | | GSC | | | 1.165% | | | | 3,000,000 | | | | (266,497 | ) | | | - | | | | (266,497 | ) |
Con-way Inc | | | 3.800% | | | | 03/20/18 | | | UBS | | | 2.567% | | | | 4,000,000 | | | | (242,545 | ) | | | - | | | | (242,545 | ) |
| | | | | | | | | | | | | | | | | | | | | | | | | | | | | | |
| | | | | | | | | | | | | | | | | | | | | ($1,124,227 | ) | | | $162,323 | | | | ($1,286,550 | ) |
| | | | | | | | | | | | | | | | | | | | | | | | | | | | | | |
| | |
| See Notes to Financial Statements | | See explanation of symbols and terms, if any, on page B-143 |
B-38
PACIFIC SELECT FUND
INFLATION MANAGED PORTFOLIO
Schedule of Investments (Continued)
December 31, 2012
Credit Default Swaps on Corporate and Sovereign Issues – Sell Protection (2)
| | | | | | | | | | | | | | | | | | | | | | | | | | | | | | |
| Referenced Obligation | | Fixed Deal
Receive
Rate | | | Expiration
Date | | | Counter-
party | | Implied Credit
Spread at
12/31/12 (3) | | | Notional
Amount (4) | | | Value | | | Upfront
Premiums
Paid
(Received) | | | Unrealized
Appreciation
(Depreciation) | |
Nokia Corp r | | | 5.000% | | | | 09/20/14 | | | GSC | | | 2.669% | | | | EUR 1,700,000 | | | | $92,207 | | | | ($186,163 | ) | | | $278,370 | |
Brazilian Government | | | 1.000% | | | | 06/20/15 | | | BRC | | | 0.604% | | | | $760,000 | | | | 7,672 | | | | (14,482 | ) | | | 22,154 | |
Brazilian Government | | | 1.000% | | | | 06/20/15 | | | HSB | | | 0.604% | | | | 3,000,000 | | | | 30,283 | | | | (42,473 | ) | | | 72,756 | |
Brazilian Government | | | 1.000% | | | | 06/20/15 | | | JPM | | | 0.604% | | | | 1,200,000 | | | | 12,113 | | | | (13,657 | ) | | | 25,770 | |
Brazilian Government | | | 1.000% | | | | 06/20/15 | | | RBS | | | 0.604% | | | | 2,300,000 | | | | 23,217 | | | | (44,419 | ) | | | 67,636 | |
Japanese Government OAT | | | 1.000% | | | | 12/20/15 | | | GSC | | | 0.435% | | | | 600,000 | | | | 10,244 | | | | 12,651 | | | | (2,407 | ) |
Japanese Government OAT | | | 1.000% | | | | 12/20/15 | | | JPM | | | 0.435% | | | | 7,200,000 | | | | 122,932 | | | | 165,512 | | | | (42,580 | ) |
Japanese Government OAT | | | 1.000% | | | | 12/20/15 | | | RBS | | | 0.435% | | | | 4,300,000 | | | | 73,417 | | | | 96,630 | | | | (23,213 | ) |
Brazilian Government | | | 1.000% | | | | 06/20/20 | | | HSB | | | 1.333% | | | | 8,040,000 | | | | (183,712 | ) | | | (234,725 | ) | | | 51,013 | |
| | | | | | | | | | | | | | | | | | | | | | | | | | | | | | |
| | | | | | | | | | | | | | | | | | | | | $188,373 | | | | ($261,126 | ) | | | $449,499 | |
| | | | | | | | | | | | | | | | | | | | | | | | | | | | | | |
| | | | | | | | |
Total Credit Default Swaps | | | | | | | | | | | | | | | | | | | | | ($935,854 | ) | | | ($98,803 | ) | | | ($837,051 | ) |
| | | | | | | | | | | | | | | | | | | | | | | | | | | | | | |
| | (1) | If the portfolio is a buyer of protection and a credit event occurs, as defined under the terms of that particular swap agreement, the portfolio will either (i) receive from the seller of protection an amount equal to the notional amount of the swap and deliver the referenced obligation or underlying investments comprising the referenced index or (ii) receive a net settlement amount in the form of cash or investments equal to the notional amount of the swap less the recovery value of the referenced obligation or underlying investments comprising the referenced index. |
| | (2) | If the portfolio is a seller of protection and a credit event occurs, as defined under the terms of that particular swap agreement, the portfolio will either (i) pay to the buyer of protection an amount equal to the notional amount of the swap and take delivery of the referenced obligation or underlying investments comprising the referenced index or (ii) pay a net settlement amount in the form of cash or investments equal to the notional amount of the swap less the recovery value of the referenced obligation or underlying investments comprising the referenced index. |
| | (3) | An implied credit spread is the spread in yield between a U.S. Treasury security and the referenced obligation or underlying investment that are identical in all respects except for the quality rating. Implied credit spreads, represented in the absolute terms, utilized in determining the value of credit default swap agreements on corporate issues and sovereign issues of an emerging country as of year end serve as an indicator of the current status of the payment/performance risk and represent the likelihood of risk of default for the credit derivative. The implied credit spread of a particular referenced entity reflects the cost of buying/selling protection and may include upfront payments required to be made to enter the agreement. Wider credit spreads, in comparison to narrower credit spreads, represent a deterioration of the referenced entity’s credit soundness and a greater likelihood of risk of default or other credit event occurring as defined under the terms of the agreement. A credit spread identified as “Defaulted” indicates a credit event has occurred for the referenced entity or obligation. |
| | (4) | The maximum potential amount the portfolio could be required to pay as a seller of credit protection or receive as a buyer of credit protection if a credit event occurs as defined under the terms of that particular swap agreement. |
Interest Rate Swaps
| | | | | | | | | | | | | | | | | | | | | | | | | | | | |
| Floating Rate Index | | Counter-
party | | Pay/Receive
Floating Rate | | Fixed
Rate | | | Expiration
Date | | | Notional
Amount | | | Value | | | Upfront
Premiums
Paid
(Received) | | | Unrealized
Appreciation
(Depreciation) | |
OTC - BRL-CDI-Compounded | | MSC | | Pay | | | 8.630% | | | | 01/02/15 | | | | BRL 98,800,000 | | | | $970,656 | | | | $576,804 | | | | $393,852 | |
OTC - BRL-CDI-Compounded | | HSB | | Pay | | | 8.825% | | | | 01/02/15 | | | | 55,200,000 | | | | 651,285 | | | | 326,121 | | | | 325,164 | |
OTC - France CPI excluding Tobacco | | BNP | | Pay | | | 1.900% | | | | 09/01/16 | | | | EUR 9,600,000 | | | | 29,608 | | | | 10,393 | | | | 19,215 | |
OTC - France CPI excluding Tobacco | | BNP | | Pay | | | 2.000% | | | | 09/01/16 | | | | 4,500,000 | | | | 38,929 | | | | 6,152 | | | | 32,777 | |
OTC - BRL-CDI-Compounded | | UBS | | Pay | | | 8.150% | | | | 01/02/17 | | | | BRL 17,500,000 | | | | (28,330 | ) | | | - | | | | (28,330 | ) |
OTC - BRL-CDI-Compounded | | GSC | | Pay | | | 8.300% | | | | 01/02/17 | | | | 12,100,000 | | | | 9,267 | | | | 11,870 | | | | (2,603 | ) |
OTC - U.S. CPI Urban Consumers NSA | | BNP | | Receive | | | 2.250% | | | | 07/15/17 | | | | $28,100,000 | | | | 60,762 | | | | 47,258 | | | | 13,504 | |
OTC - U.S. CPI Urban Consumers NSA | | CIT | | Receive | | | 2.250% | | | | 07/15/17 | | | | 10,600,000 | | | | 22,921 | | | | 2,544 | | | | 20,377 | |
OTC - U.S. CPI Urban Consumers NSA | | RBS | | Receive | | | 2.250% | | | | 07/15/17 | | | | 27,800,000 | | | | 60,114 | | | | 20,533 | | | | 39,581 | |
OTC - France CPI excluding Tobacco | | BNP | | Pay | | | 1.950% | | | | 09/01/17 | | | | EUR 16,100,000 | | | | 19,314 | | | | - | | | | 19,314 | |
CME - 3-Month USD-LIBOR | | CME | | Receive | | | 1.400% | | | | 01/04/18 | | | | $36,300,000 | | | | (5,588 | ) | | | - | | | | (5,588 | ) |
CME - 3-Month USD-LIBOR | | CME | | Receive | | | 1.500% | | | | 01/04/18 | | | | 26,200,000 | | | | (55,403 | ) | | | - | | | | (55,403 | ) |
OTC - U.S. CPI Urban Consumers NSA | | BNP | | Receive | | | 2.500% | | | | 07/15/22 | | | | 9,100,000 | | | | 174,149 | | | | 118,430 | | | | 55,719 | |
OTC - U.S. CPI Urban Consumers NSA | | CIT | | Receive | | | 2.500% | | | | 07/15/22 | | | | 500,000 | | | | 8,230 | | | | 3,815 | | | | 4,415 | |
OTC - U.S. CPI Urban Consumers NSA | | DUB | | Receive | | | 2.500% | | | | 07/15/22 | | | | 4,100,000 | | | | 78,463 | | | | 34,550 | | | | 43,913 | |
CME - 3-Month USD-LIBOR | | CME | | Receive | | | 2.500% | | | | 12/19/42 | | | | 41,000,000 | | | | 2,513,782 | | | | 1,656,965 | | | | 856,817 | |
| | | | | | | | | | | | | | | | | | | | | | | | | | | | |
| | | | | | | | |
Total Interest Rate Swaps | | | | | | | | | | | | | | | | | | | $4,548,159 | | | | $2,815,435 | | | | $1,732,724 | |
| | | | | | | | | | | | | | | | | | | | | | | | | | | | |
| | | | | | | | |
Total Swap Agreements | | | | | | | | | | | | | | | | | | | $3,612,305 | | | | $2,716,632 | | | | $895,673 | |
| | | | | | | | | | | | | | | | | | | | | | | | | | | | |
| | |
| See Notes to Financial Statements | | See explanation of symbols and terms, if any, on page B-143 |
B-39
PACIFIC SELECT FUND
INFLATION MANAGED PORTFOLIO
Schedule of Investments (Continued)
December 31, 2012
| (m) | Fair Value Measurements |
The following is a summary of the portfolio’s investments as categorized under the three-tier hierarchy of inputs used in valuing the portfolio’s assets and liabilities (See Note 3D in Notes to Financial Statements) as of December 31, 2012:
| | | | | | | | | | | | | | | | | | |
| | | | | Total Value at
December 31, 2012 | | | Level 1
Quoted Price | | | Level 2
Significant
Observable Inputs | | | Level 3
Significant
Unobservable Inputs | |
Assets | | Convertible Preferred Stocks (1) | | | $3,920,000 | | | | $3,920,000 | | | | $- | | | | $- | |
| | Corporate Bonds & Notes | | | 238,610,539 | | | | - | | | | 238,610,539 | | | | - | |
| | Senior Loan Notes | | | 2,838,039 | | | | - | | | | 2,838,039 | | | | - | |
| | Mortgage-Backed Securities | | | 159,142,987 | | | | - | | | | 149,099,211 | | | | 10,043,776 | |
| | Asset-Backed Securities | | | 32,402,924 | | | | - | | | | 31,865,567 | | | | 537,357 | |
| | U.S. Government Agency Issues | | | 33,815,244 | | | | - | | | | 33,815,244 | | | | - | |
| | U.S. Treasury Obligations | | | 1,429,449,547 | | | | - | | | | 1,429,449,547 | | | | - | |
| | Foreign Government Bonds & Notes | | | 111,870,515 | | | | - | | | | 111,870,515 | | | | - | |
| | Short-Term Investments | | | 605,770,918 | | | | - | | | | 605,770,918 | | | | - | |
| | Derivatives: | | | | | | | | | | | | | | | | |
| | Credit Contracts | | | | | | | | | | | | | | | | |
| | Swaps | | | 372,085 | | | | - | | | | 372,085 | | | | - | |
| | Foreign Currency Contracts | | | | | | | | | | | | | | | | |
| | Forward Foreign Currency Contracts | | | 11,322,668 | | | | - | | | | 11,322,668 | | | | - | |
| | Interest Rate Contracts | | | | | | | | | | | | | | | | |
| | Futures | | | 170,358 | | | | 170,358 | | | | - | | | | - | |
| | Purchased Options | | | 150,279 | | | | - | | | | 150,279 | | | | - | |
| | Swaps | | | 4,637,480 | | | | - | | | | 4,637,480 | | | | - | |
| | | | | | | | | | | | | | | | | | |
| | Total Interest Rate Contracts | | | 4,958,117 | | | | 170,358 | | | | 4,787,759 | | | | - | |
| | | | | | | | | | | | | | | | | | |
| | Total Assets - Derivatives | | | 16,652,870 | | | | 170,358 | | | | 16,482,512 | | | | - | |
| | | | | | | | | | | | | | | | | | |
| | Total Assets | | | 2,634,473,583 | | | | 4,090,358 | | | | 2,619,802,092 | | | | 10,581,133 | |
| | | | | | | | | | | | | | | | | | |
Liabilities | | Derivatives: | | | | | | | | | | | | | | | | |
| | Credit Contracts | | | | | | | | | | | | | | | | |
| | Swaps | | | (1,307,939 | ) | | | - | | | | (1,307,939 | ) | | | - | |
| | Foreign Currency Contracts | | | | | | | | | | | | | | | | |
| | Forward Foreign Currency Contracts | | | (2,050,680 | ) | | | - | | | | (2,050,680 | ) | | | - | |
| | Interest Rate Contracts | | | | | | | | | | | | | | | | |
| | Futures | | | (11,539 | ) | | | (11,539 | ) | | | - | | | | - | |
| | Written Options | | | (1,518,756 | ) | | | - | | | | (1,304,363 | ) | | | (214,393 | ) |
| | Swaps | | | (89,321 | ) | | | - | | | | (89,321 | ) | | | - | |
| | | | | | | | | | | | | | | | | | |
| | Total Interest Rate Contracts | | | (1,619,616 | ) | | | (11,539 | ) | | | (1,393,684 | ) | | | (214,393 | ) |
| | | | | | | | | | | | | | | | | | |
| | Total Liabilities - Derivatives | | | (4,978,235 | ) | | | (11,539 | ) | | | (4,752,303 | ) | | | (214,393 | ) |
| | | | | | | | | | | | | | | | | | |
| | Total Liabilities | | | (4,978,235 | ) | | | (11,539 | ) | | | (4,752,303 | ) | | | (214,393 | ) |
| | | | | | | | | | | | | | | | | | |
| | Total | | | $2,629,495,348 | | | | $4,078,819 | | | | $2,615,049,789 | | | | $10,366,740 | |
| | | | | | | | | | | | | | | | | | |
Certain of the portfolio’s liabilities are held at carrying amount, which approximates fair value for financial statement purposes. As of December 31, 2012, such liabilities are categorized within the three-tier hierarchy of inputs as follows:
| | | | | | | | | | | | | | | | | | |
| | | | | Total Value at
December 31, 2012 | | | Level 1 | | | Level 2 | | | Level 3 | |
Liabilities | | Sale-Buyback Financing Transactions | | | ($1,029,796,735 | ) | | | $- | | | | ($1,029,796,735 | ) | | | $- | |
| | | | | | | | | | | | | | | | | | |
The following is a reconciliation of investments for significant unobservable inputs (Level 3) used in valuing the portfolio's assets and liabilities (See Note 3D in Notes to Financial Statements) for the year ended December 31, 2012:
| | | | | | | | | | | | | | | | | | | | |
| | | Corporate
Bonds & Notes | | | Mortgage-Backed
Securities | | | Asset-Backed
Securities | | | Liabilities
Derivatives
Interest
Rate Contracts
Written Options | | | Total | |
Value, Beginning of Year | | | $5,285,489 | | | | $21,644,080 | | | | $3,861,361 | | | | ($542,748 | ) | | | $30,248,182 | |
Purchases/Issuances | | | - | | | | - | | | | 768,000 | | | | 43,725 | | | | 811,725 | |
Sales/Settlements (includes paydowns) | | | (5,235,125 | ) | | | (13,610,116 | ) | | | (1,911,611 | ) | | | - | | | | (20,756,852 | ) |
Accrued Discounts (Premiums) | | | (29,742 | ) | | | - | | | | 16,996 | | | | - | | | | (12,746 | ) |
Net Realized Gains (Losses) | | | 20,104 | | | | 70,644 | | | | (64,983 | ) | | | 184,175 | | | | 209,940 | |
Change in Net Unrealized Appreciation (Depreciation) | | | (40,726 | ) | | | (24,621 | ) | | | 149,482 | | | | 100,455 | | | | 184,590 | |
Transfers In | | | - | | | | 1,963,789 | | | | - | | | | - | | | | 1,963,789 | |
Transfers Out | | | - | | | | - | | | | (2,281,888 | ) | | | - | | | | (2,281,888 | ) |
| | | | | | | | | | | | | | | | | | | | |
Value, End of Year | | | $- | | | | $10,043,776 | | | | $537,357 | | | | ($214,393 | ) | | | $10,366,740 | |
| | | | | | | | | | | | | | | | | | | | |
Change in Net Unrealized Appreciation (Depreciation) on
Level 3 Investments Held at the End of Year, if Applicable | | | $- | | | | $22,573 | | | | $86,773 | | | | $227,028 | | | | $336,374 | |
| | | | | | | | | | | | | | | | | | | | |
| | (1) | For equity investments categorized in a single level, refer to the schedule of investments for further industry breakout. |
| | |
| See Notes to Financial Statements | | See explanation of symbols and terms, if any, on page B-143 |
B-40
PACIFIC SELECT FUND
INFLATION PROTECTED PORTFOLIO
Schedule of Investments
December 31, 2012
| | | | | | | | |
| | | Principal
Amount | | | Value | |
U.S. TREASURY OBLIGATIONS - 38.4% | | | | | | | | |
| |
U.S. Treasury Inflation Protected Securities - 38.4% | | | | | |
| | |
0.125% due 04/15/16 ^ ‡ | | | $15,342,427 | | | | $16,159,887 | |
0.125% due 04/15/17 ^ | | | 12,608,287 | | | | 13,505,644 | |
0.125% due 01/15/22 ^ | | | 37,181,043 | | | | 40,385,007 | |
0.125% due 07/15/22 ^ | | | 17,683,722 | | | | 19,188,218 | |
0.625% due 07/15/21 ^ | | | 21,163,131 | | | | 24,056,533 | |
0.750% due 02/15/42 ^ | | | 3,828,713 | | | | 4,199,321 | |
1.125% due 01/15/21 ^ | | | 19,647,421 | | | | 23,082,655 | |
1.250% due 07/15/20 ^ | | | 9,100,720 | | | | 10,798,578 | |
1.375% due 07/15/18 ^ | | | 13,623,417 | | | | 15,863,829 | |
1.375% due 01/15/20 ^ | | | 2,620,790 | | | | 3,107,682 | |
1.625% due 01/15/18 ^ | | | 15,160,254 | | | | 17,589,442 | |
1.750% due 01/15/28 ^ | | | 16,595,675 | | | | 21,493,988 | |
1.875% due 07/15/19 ^ | | | 13,942,972 | | | | 16,975,568 | |
2.000% due 01/15/16 ^ | | | 15,372,549 | | | | 17,051,524 | |
2.000% due 01/15/26 ^ | | | 11,573,117 | | | | 15,181,580 | |
2.125% due 01/15/19 ^ | | | 13,209,047 | | | | 16,045,901 | |
2.125% due 02/15/40 ^ | | | 1,070,230 | | | | 1,568,974 | |
2.125% due 02/15/41 ^ | | | 6,052,599 | | | | 8,937,988 | |
2.375% due 01/15/17 ^ | | | 13,948,128 | | | | 16,214,699 | |
2.375% due 01/15/25 ^ | | | 1,214,908 | | | | 1,640,410 | |
2.375% due 01/15/27 ^ | | | 16,551,932 | | | | 22,830,030 | |
2.500% due 07/15/16 ^ | | | 25,863,584 | | | | 29,730,991 | |
2.500% due 01/15/29 ^ | | | 14,695,872 | | | | 20,955,403 | |
3.375% due 04/15/32 ^ | | | 5,825,349 | | | | 9,606,821 | |
3.625% due 04/15/28 ^ | | | 14,702,456 | | | | 23,335,562 | |
3.875% due 04/15/29 ^ | | | 12,115,217 | | | | 20,087,599 | |
| | | | | | | | |
| | | | | | | 429,593,834 | |
| | | | | | | | |
| | |
Total U.S. Treasury Obligations
(Cost $403,111,023) | | | | | | | 429,593,834 | |
| | | | | | | | |
| |
FOREIGN GOVERNMENT BONDS & NOTES - 19.7% | | | | | |
| | |
Canadian Government (Canada) | | | | | | | | |
4.000% due 12/01/31 ^ | | | CAD 6,685,850 | | | | 11,624,386 | |
4.250% due 12/01/26 ^ | | | 6,956,600 | | | | 11,204,973 | |
Sweden Government (Sweden) | �� | | | | | | | |
0.010% due 04/01/14 ^ | | | SEK 71,000,000 | | | | 13,963,302 | |
4.000% due 12/01/20 ^ | | | 100,000,000 | | | | 25,968,784 | |
United Kingdom Gilt Inflation-Linked (United Kingdom) | | | | | | | | |
0.625% due 03/22/40 ^ ~ | | | GBP 8,222,080 | | | | 15,477,080 | |
1.250% due 11/22/55 ^ | | | 10,220,800 | | | | 24,729,603 | |
2.500% due 07/26/16 ^ ~ | | | 21,000,000 | | | | 117,264,160 | |
| | | | | | | | |
| | |
Total Foreign Government Bonds & Notes
(Cost $211,883,492) | | | | | | | 220,232,288 | |
| | | | | | | | |
| | |
SHORT-TERM INVESTMENTS - 42.0% | | | | | | | | |
| | |
Commercial Paper - 9.6% | | | | | | | | |
| | |
American Honda Finance Corp
0.162% due 03/25/13 | | | $5,750,000 | | | | 5,746,700 | |
Archer-Daniels-Midland Co
0.203% due 01/11/13 | | | 5,750,000 | | | | 5,749,681 | |
Australia & New Zealand Banking Group Ltd (Australia)
0.203% due 03/01/13 | | | 5,750,000 | | | | 5,748,115 | |
Bank of Nova Scotia (Canada)
0.218% due 02/27/13 | | | 5,750,000 | | | | 5,748,043 | |
Bank of Tokyo-Mitsubishi UFJ Ltd
0.172% due 01/28/13 | | | 5,750,000 | | | | 5,749,267 | |
Commonwealth Bank of Australia
(Australia)
0.183% due 02/04/13 | | | 5,000,000 | | | | 4,999,150 | |
General Electric Capital Corp
0.142% due 01/14/13 | | | 4,300,000 | | | | 4,299,783 | |
| | | | | | | | |
| | | Principal
Amount | | | Value | |
Her Majesty RGT Canada (Canada)
0.173% due 07/18/13 | | | $6,000,000 | | | | $5,993,366 | |
HSBC USA Inc
0.244% due 02/27/13 | | | 5,750,000 | | | | 5,747,815 | |
JPMorgan Chase & Co
0.183% due 02/26/13 | | | 5,750,000 | | | | 5,748,390 | |
Mizuho Financial Group Inc
0.254% due 02/15/13 | | | 5,750,000 | | | | 5,748,203 | |
National Australia Bank Ltd
0.188% due 02/19/13 | | | 7,700,000 | | | | 7,698,061 | |
National Australia Funding DE Inc
0.193% due 02/01/13 | | | 1,000,000 | | | | 999,836 | |
New York Life Global Funding
0.172% due 03/19/13 | | | 3,650,000 | | | | 3,648,070 | |
Praxair Inc
0.101% due 01/04/13 | | | 5,750,000 | | | | 5,749,952 | |
Province of Quebec (Canada)
0.162% due 02/21/13 | | | 5,750,000 | | | | 5,748,697 | |
Sumitomo Mitsui Banking Corp (Japan) 0.193% due 01/28/13 | | | 5,750,000 | | | | 5,749,181 | |
The Procter & Gamble Co
0.162% due 02/27/13 | | | 5,300,000 | | | | 5,298,657 | |
The Walt Disney Co
0.152% due 03/28/13 | | | 5,750,000 | | | | 5,747,235 | |
Westpac Banking Corp (New Zealand)
0.244% due 03/19/13 | | | 5,750,000 | | | | 5,748,231 | |
| | | | | | | | |
| | | | | | | 107,666,433 | |
| | | | | | | | |
| | |
| | | Shares | | | | |
| | |
Money Market Fund - 0.1% | | | | | | | | |
| | |
BlackRock Liquidity Funds Treasury Trust Fund Portfolio | | | 1,831,495 | | | | 1,831,495 | |
| | | | | | | | |
| | |
| | | Principal
Amount | | | | |
| | |
U.S. Government Agency Issues - 31.4% | | | | | | | | |
| | |
Fannie Mae | | | | | | | | |
0.091% due 06/03/13 | | | $30,000,000 | | | | 29,988,600 | |
0.101% due 07/01/13 | | | 80,000,000 | | | | 79,956,000 | |
Federal Home Loan Bank | | | | | | | | |
0.071% due 01/11/13 | | | 59,500,000 | | | | 59,498,843 | |
0.076% due 03/06/13 | | | 21,700,000 | | | | 21,698,481 | |
Freddie Mac | | | | | | | | |
0.051% due 04/09/13 | | | 80,000,000 | | | | 79,987,040 | |
0.101% due 07/16/13 | | | 80,000,000 | | | | 79,952,400 | |
| | | | | | | | |
| | | | | | | 351,081,364 | |
| | | | | | | | |
Repurchase Agreement - 0.9% | |
| | |
Barclays Capital
0.160% due 01/02/13
(Dated 12/31/12, repurchase price of $10,000,089; collateralized by U.S. Treasury Notes: 0.250% due 09/15/15 and value $10,200,000) | | | 10,000,000 | | | | 10,000,000 | |
| | | | | | | | |
| | |
Total Short-Term Investments
(Cost $470,590,064) | | | | | | | 470,579,292 | |
| | | | | | | | |
| | |
TOTAL INVESTMENTS - 100.1%
(Cost $1,085,584,579) | | | | | | | 1,120,405,414 | |
| |
OTHER ASSETS & LIABILITIES, NET - (0.1%) | | | | (1,292,574 | ) |
| | | | | | | | |
| | |
NET ASSETS - 100.0% | | | | | | | $1,119,112,840 | |
| | | | | | | | |
| | |
| See Notes to Financial Statements | | See explanation of symbols and terms, if any, on page B-143 |
B-41
PACIFIC SELECT FUND
INFLATION PROTECTED PORTFOLIO
Schedule of Investments (Continued)
December 31, 2012
Notes to Schedule of Investments
| (a) | As of December 31, 2012, the portfolio was diversified as a percentage of net assets as follows: |
| | | | | | |
Short-Term Investments | | | | | 42.0% | |
U.S. Treasury Obligations | | | | | 38.4% | |
Foreign Government Bonds & Notes | | | | | 19.7% | |
| | | | | | |
| | | | | 100.1% | |
Other Assets & Liabilities, Net | | | | | (0.1% | ) |
| | | | | | |
| | | | | 100.0% | |
| | | | | | |
| (b) | As of December 31, 2012, the portfolio’s Standard & Poor’s quality ratings as a percentage of total fixed income investments were as follows (Unaudited): |
| | | | |
AAA | | | 5.6% | |
A-1 (Short-Term Debt only) | | | 10.5% | |
AA/U.S. Government & Agency Issues | | | 69.8% | |
Not Rated | | | 14.1% | |
| | | | |
| | | 100.0% | |
| | | | |
| (c) | Short-term investments reflect either the stated coupon rate or the annualized effective yield on the date of purchase for discounted investments. |
| (d) | As of December 31, 2012, investments with total aggregate values of $1,253,404 were fully or partially segregated with broker(s)/custodian as collateral for open swap contracts. In addition, $510,834 in cash was segregated with the broker(s)/custodian as collateral for open futures contracts. |
| (e) | Open futures contracts outstanding as of December 31, 2012 were as follows: |
| | | | | | | | | | | | |
Short Futures Outstanding | | Number of
Contracts | | | Notional
Amount | | | Unrealized
Appreciation | |
U.S. Treasury 30-Year Bonds (03/13) | | | 52 | | | | $7,670,000 | | | | $77,792 | |
| | | | | | | | | | | | |
| (f) | Forward foreign currency contracts outstanding as of December 31, 2012 were as follows: |
| | | | | | | | | | | | | | | | | | | | |
Currency
Purchased | | | Currency
Sold | | | Expiration | | | Counterparty | | Unrealized
Appreciation
(Depreciation) | |
| CAD | | | 10,335,465 | | | USD | | | 10,300,238 | | | | 02/13 | | | JPM | | | $81,053 | |
| GBP | | | 7,300,000 | | | USD | | | 11,624,323 | | | | 02/13 | | | JPM | | | 232,709 | |
| USD | | | 3,877,346 | | | CAD | | | 3,883,123 | | | | 02/13 | | | CSF | | | (22,994 | ) |
| USD | | | 18,424,798 | | | CAD | | | 18,254,535 | | | | 02/13 | | | JPM | | | 89,326 | |
| USD | | | 7,623,455 | | | CAD | | | 7,550,269 | | | | 02/13 | | | UBS | | | 39,708 | |
| USD | | | 108,653,275 | | | GBP | | | 67,887,379 | | | | 02/13 | | | JPM | | | (1,612,868 | ) |
| USD | | | 56,603,829 | | | GBP | | | 35,365,899 | | | | 02/13 | | | UBS | | | (839,268 | ) |
| USD | | | 36,819,917 | | | SEK | | | 247,803,195 | | | | 02/13 | | | CSF | | | (1,247,053 | ) |
| | | | | | | | | | | | | | | | | | | | |
| | | | |
Total Forward Foreign Currency Contracts | | | | | | | | | | | | | ($3,279,387 | ) |
| | | | | | | | | | | | | | | | | | | | |
| (g) | Transactions in written options for the year ended December 31, 2012 were as follows: |
| | | | | | | | | | | | | | |
| | | Number of
Contracts | | | Premium | | | | | | | |
Outstanding, December 31, 2011 | | | - | | | | $- | | | | | | | |
Call Options Written | | | 4,866 | | | | 1,631,217 | | | | | | | |
Put Options Written | | | 5,672 | | | | 3,381,411 | | | | | | | |
Put Options Exercised | | | (644 | ) | | | (299,783 | ) | | | | | | |
Call Options Expired | | | (3,848 | ) | | | (1,002,479 | ) | | | | | | |
Put Options Expired | | | (894 | ) | | | (418,407 | ) | | | | | | |
Call Options Closed | | | (1,018 | ) | | | (628,738 | ) | | | | | | |
Put Options Closed | | | (4,034 | ) | | | (2,590,108 | ) | | | | | | |
| | | | | | | | | | | | | | |
Outstanding, December 31, 2012 | | | 100 | | | | $73,113 | | | | | | | |
| | | | | | | | | | | | | | |
| (h) | Premiums received and value of written options outstanding as of December 31, 2012 were as follows: |
Options on Exchange-Traded Futures Contracts
| | | | | | | | | | | | | | | | | | | | | | |
| | | | | | | | | | | | | | | | | | | | | | |
| Description | | | | Exercise
Price | | | Expiration
Date | | Counter-
party | | | Number of
Contracts | |
Premium | | | Value | |
Put - CME 30-Year U.S. Treasury Bond Futures (02/13) | | | | | $146.00 | | | 01/25/13 | | | CSF | | | 100 | | | $73,113 | | | | ($81,250 | ) |
| | | | | | | | | | | | | | | | | | | | | | |
| | | | | | | |
Total Written Options | | | | | | | | | | | | | | | | | $73,113 | | | | ($81,250 | ) |
| | | | | | | | | | | | | | | | | | | | | | |
| (i) | Swap agreements outstanding as of December 31, 2012 were as follows: |
Total Return Swaps
| | | | | | | | | | | | | | | | | | | | | | | | | | |
| Receive Total Return | | Pay | | Counter-
party | | | Expiration
Date | | | Notional
Amount | | | Value | | | Upfront
Premiums
Paid
(Received) | | | Unrealized
Depreciation | |
Interest from Barclays U.S. Inflation-Linked Bonds | | 1-Month USD-LIBOR - 8 bp | | | BRC | | | | 01/17/13 | | | | $405,604,288 | | | | ($2,600,524 | ) | | | $- | | | | ($2,600,524 | ) |
| | | | | | | | | | | | | | | | | | | | | | | | | | |
| | | | | | | |
Total Swap Agreements | | | | | | | | | | | | | | | | | ($2,600,524 | ) | | | $- | | | | ($2,600,524 | ) |
| | | | | | | | | | | | | | | | | | | | | | | | | | |
| | |
| See Notes to Financial Statements | | See explanation of symbols and terms, if any, on page B-143 |
B-42
PACIFIC SELECT FUND
INFLATION PROTECTED PORTFOLIO
Schedule of Investments (Continued)
December 31, 2012
| (j) | Fair Value Measurements |
The following is a summary of the portfolio’s investments as categorized under the three-tier hierarchy of inputs used in valuing the portfolio’s assets and liabilities (See Note 3D in Notes to Financial Statements) as of December 31, 2012:
| | | | | | | | | | | | | | | | | | |
| | | | | Total Value at
December 31, 2012 | | | Level 1
Quoted Price | | | Level 2
Significant
Observable Inputs | | | Level 3
Significant
Unobservable Inputs | |
Assets | | U.S. Treasury Obligations | | | $429,593,834 | | | | $- | | | | $429,593,834 | | | | $- | |
| | Foreign Government Bonds & Notes | | | 220,232,288 | | | | - | | | | 220,232,288 | | | | - | |
| | Short-Term Investments | | | 470,579,292 | | | | 1,831,495 | | | | 468,747,797 | | | | - | |
| | Derivatives: | | | | | | | | | | | | | | | | |
| | Foreign Currency Contracts | | | | | | | | | | | | | | | | |
| | Forward Foreign Currency Contracts | | | 442,796 | | | | - | | | | 442,796 | | | | - | |
| | Interest Rate Contracts | | | | | | | | | | | | | | | | |
| | Futures | | | 77,792 | | | | 77,792 | | | | - | | | | - | |
| | | | | | | | | | | | | | | | | | |
| | Total Assets - Derivatives | | | 520,588 | | | | 77,792 | | | | 442,796 | | | | - | |
| | | | | | | | | | | | | | | | | | |
| | Total Assets | | | 1,120,926,002 | | | | 1,909,287 | | | | 1,119,016,715 | | | | - | |
| | | | | | | | | | | | | | | | | | |
Liabilities | | Derivatives: | | | | | | | | | | | | | | | | |
| | Foreign Currency Contracts | | | | | | | | | | | | | | | | |
| | Forward Foreign Currency Contracts | | | (3,722,183 | ) | | | - | | | | (3,722,183 | ) | | | - | |
| | Interest Rate Contracts | | | | | | | | | | | | | | | | |
| | Written Options | | | (81,250 | ) | | | (81,250 | ) | | | - | | | | - | |
| | Swaps | | | (2,600,524 | ) | | | - | | | | (2,600,524 | ) | | | - | |
| | | | | | | | | | | | | | | | | | |
| | Total Interest Rate Contracts | | | (2,681,774 | ) | | | (81,250 | ) | | | (2,600,524 | ) | | | - | |
| | | | | | | | | | | | | | | | | | |
| | Total Liabilities - Derivatives | | | (6,403,957 | ) | | | (81,250 | ) | | | (6,322,707 | ) | | | - | |
| | | | | | | | | | | | | | | | | | |
| | Total Liabilities | | | (6,403,957 | ) | | | (81,250 | ) | | | (6,322,707 | ) | | | - | |
| | | | | | | | | | | | | | | | | | |
| | Total | | | $1,114,522,045 | | | | $1,828,037 | | | | $1,112,694,008 | | | | $- | |
| | | | | | | | | | | | | | | | | | |
| | |
| See Notes to Financial Statements | | See explanation of symbols and terms, if any, on page B-143 |
B-43
PACIFIC SELECT FUND
MANAGED BOND PORTFOLIO
Schedule of Investments
December 31, 2012
| | | | | | | | |
| | | Shares | | | Value | |
PREFERRED STOCKS - 0.1% | | | | | |
| |
Financials - 0.1% | | | | | |
| | |
Ally Financial Inc ~ | | | 2,000 | | | | $1,964,438 | |
DG Funding Trust ~ | | | 233 | | | | 1,710,669 | |
| | | | | | | | |
| | | | | | | 3,675,107 | |
| | | | | | | | |
Total Preferred Stocks
(Cost $3,835,681) | | | | | | | 3,675,107 | |
| | | | | | | | |
| |
CONVERTIBLE PREFERRED STOCKS - 1.2% | | | | | |
| | |
Financials - 1.2% | | | | | | | | |
| | |
Wells Fargo & Co 7.500% | | | 50,000 | | | | 61,250,000 | |
| | | | | | | | |
| | |
Total Convertible Preferred Stocks
(Cost $37,049,553) | | | | | | | 61,250,000 | |
| | | | | | | | |
| | |
| | | Principal
Amount | | | | |
| |
CORPORATE BONDS & NOTES - 22.1% | | | | | |
| | |
Consumer Discretionary - 0.4% | | | | | | | | |
| | |
Corp GEO SAB de CV (Mexico)
9.250% due 06/30/20 ~ | | | $2,600,000 | | | | 2,821,000 | |
Cox Communications Inc
6.800% due 08/01/28 | | | 110,000 | | | | 134,373 | |
DISH DBS Corp
6.625% due 10/01/14 | | | 1,900,000 | | | | 2,047,250 | |
General Motors Co - Escrow Receipts
8.375% due 07/05/33 Y + | | | EUR 7,400,000 | | | | - | |
Marks & Spencer PLC (United Kingdom)
6.250% due 12/01/17 ~ | | | $10,000,000 | | | | 11,327,520 | |
Yum! Brands Inc
6.250% due 03/15/18 | | | 3,200,000 | | | | 3,893,283 | |
| | | | | | | | |
| | | | | | | 20,223,426 | |
| | | | | | | | |
Consumer Staples - 0.9% | |
| | |
Kraft Foods Group Inc
6.125% due 08/23/18 ~ | | | 11,318,000 | | | | 13,877,509 | |
Mondelez International Inc | | | | | | | | |
6.125% due 02/01/18 | | | 3,982,000 | | | | 4,848,869 | |
6.500% due 08/11/17 | | | 5,000,000 | | | | 6,111,155 | |
Reynolds American Inc
7.625% due 06/01/16 | | | 4,100,000 | | | | 4,907,860 | |
Reynolds Group Issuer Inc
6.875% due 02/15/21 | | | 8,000,000 | | | | 8,660,000 | |
The Clorox Co
5.950% due 10/15/17 | | | 5,000,000 | | | | 5,952,085 | |
The Kroger Co
5.500% due 02/01/13 | | | 2,900,000 | | | | 2,911,003 | |
| | | | | | | | |
| | | | | | | 47,268,481 | |
| | | | | | | | |
Energy - 2.4% | |
| | |
AK Transneft OJSC (Ireland)
8.700% due 08/07/18 ~ | | | 2,800,000 | | | | 3,637,200 | |
Cameron International Corp
1.241% due 06/02/14 § | | | 6,100,000 | | | | 6,143,609 | |
Gazprom OAO (Luxembourg)
5.092% due 11/29/15 ~ | | | 500,000 | | | | 536,940 | |
5.875% due 06/01/15 ~ | | | EUR 1,800,000 | | | | 2,607,373 | |
8.146% due 04/11/18 ~ | | | $10,800,000 | | | | 13,375,800 | |
Indian Oil Corp Ltd (India)
4.750% due 01/22/15 ~ | | | 2,500,000 | | | | 2,624,790 | |
NGPL PipeCo LLC
7.119% due 12/15/17 ~ | | | 18,800,000 | | | | 20,586,000 | |
Novatek OAO (Ireland)
5.326% due 02/03/16 ~ | | | 2,000,000 | | | | 2,152,500 | |
| | | | | | | | |
| | | Principal
Amount | | | Value | |
Odebrecht Drilling Norbe VIII/IX Ltd (Cayman)
6.350% due 06/30/21 ~ | | | $4,180,000 | | | | $4,712,950 | |
Petrobras International Finance Co (Cayman) | | | | | | | | |
5.375% due 01/27/21 | | | 17,400,000 | | | | 19,658,102 | |
5.875% due 03/01/18 | | | 11,600,000 | | | | 13,334,165 | |
7.875% due 03/15/19 | | | 2,100,000 | | | | 2,631,695 | |
Petroleos Mexicanos (Mexico)
5.500% due 01/21/21 | | | 6,700,000 | | | | 7,862,450 | |
Ras Laffan Liquefied Natural Gas Co Ltd III (Qatar)
6.750% due 09/30/19 ~ | | | 2,600,000 | | | | 3,272,750 | |
Reliance Holdings USA Inc
4.500% due 10/19/20 ~ | | | 4,000,000 | | | | 4,191,288 | |
TNK-BP Finance SA (Luxembourg) | | | | | | | | |
7.250% due 02/02/20 ~ | | | 1,400,000 | | | | 1,704,500 | |
7.500% due 07/18/16 ~ | | | 400,000 | | | | 465,000 | |
7.875% due 03/13/18 ~ | | | 4,700,000 | | | | 5,728,830 | |
Transocean Inc (Cayman)
4.950% due 11/15/15 | | | 6,400,000 | | | | 7,011,680 | |
| | | | | | | | |
| | | | | | | 122,237,622 | |
| | | | | | | | |
Financials - 16.0% | |
| | |
Abbey National Treasury Services PLC (United Kingdom)
1.893% due 04/25/14 § | | | 9,000,000 | | | | 8,982,306 | |
Allstate Life Global Funding Trusts
5.375% due 04/30/13 | | | 12,018,000 | | | | 12,218,004 | |
Ally Financial Inc | | | | | | | | |
3.510% due 02/11/14 § | | | 29,200,000 | | | | 29,831,304 | |
3.709% due 06/20/14 § | | | 9,500,000 | | | | 9,765,715 | |
4.500% due 02/11/14 | | | 9,600,000 | | | | 9,900,000 | |
5.500% due 02/15/17 | | | 9,200,000 | | | | 9,884,278 | |
7.500% due 09/15/20 | | | 2,900,000 | | | | 3,512,625 | |
American Express Bank FSB
5.500% due 04/16/13 | | | 17,800,000 | | | | 18,058,848 | |
American Express Centurion Bank
6.000% due 09/13/17 | | | 20,500,000 | | | | 24,801,761 | |
American International Group Inc | | | | | | | | |
5.050% due 10/01/15 | | | 7,200,000 | | | | 7,950,845 | |
5.450% due 05/18/17 | | | 4,400,000 | | | | 5,061,857 | |
5.600% due 10/18/16 | | | 6,820,000 | | | | 7,792,839 | |
5.850% due 01/16/18 | | | 23,900,000 | | | | 28,307,327 | |
8.000% due 05/22/68 § ~ | | | EUR 5,600,000 | | | | 8,568,524 | |
Australia & New Zealand Banking Group Ltd (Australia)
2.125% due 01/10/14 ~ | | | $5,400,000 | | | | 5,477,360 | |
Banco do Brasil SA (Brazil)
4.500% due 01/22/15 ~ | | | 1,500,000 | | | | 1,592,250 | |
Banco Santander Brasil SA (Brazil) | | | | | | | | |
2.408% due 03/18/14 § ~ | | | 13,000,000 | | | | 12,957,464 | |
4.250% due 01/14/16 ~ | | | 8,400,000 | | | | 8,757,000 | |
4.500% due 04/06/15 ~ | | | 1,000,000 | | | | 1,040,000 | |
Banco Santander Mexico SA (Mexico)
4.125% due 11/09/22 ~ | | | 8,900,000 | | | | 9,078,000 | |
Bank of America Corp | | | | | | | | |
0.640% due 08/15/16 § | | | 2,800,000 | | | | 2,612,957 | |
1.733% due 01/30/14 § | | | 23,600,000 | | | | 23,803,432 | |
4.500% due 04/01/15 | | | 5,900,000 | | | | 6,291,937 | |
Bank of China Ltd (Hong Kong)
5.550% due 02/11/20 ~ | | | 1,700,000 | | | | 1,919,174 | |
Bank of India (India) | | | | | | | | |
4.750% due 09/30/15 ~ | | | 2,700,000 | | | | 2,830,612 | |
6.250% due 02/16/21 ~ | | | 7,000,000 | | | | 7,652,029 | |
Bank of Montreal (Canada)
2.850% due 06/09/15 ~ | | | 4,200,000 | | | | 4,438,350 | |
Bank of Nova Scotia (Canada)
1.650% due 10/29/15 ~ | | | 4,200,000 | | | | 4,324,849 | |
1.950% due 01/30/17 ~ | | | 600,000 | | | | 625,475 | |
| | |
| See Notes to Financial Statements | | See explanation of symbols and terms, if any, on page B-143 |
B-44
PACIFIC SELECT FUND
MANAGED BOND PORTFOLIO
Schedule of Investments (Continued)
December 31, 2012
| | | | | | | | |
| | | Principal
Amount | | | Value | |
Banque PSA Finance SA (France)
2.254% due 04/04/14 § ~ | | | $9,300,000 | | | | $9,186,810 | |
Barclays Bank PLC (United Kingdom) | | | | | | | | |
2.375% due 01/13/14 | | | 500,000 | | | | 508,570 | |
5.200% due 07/10/14 | | | 400,000 | | | | 425,764 | |
10.179% due 06/12/21 ~ | | | 19,520,000 | | | | 26,681,790 | |
BBVA Bancomer SA (Mexico)
6.500% due 03/10/21 ~ | | | 1,200,000 | | | | 1,338,000 | |
BNP Paribas SA (France)
1.250% due 01/10/14 § | | | 16,200,000 | | | | 16,253,347 | |
BPCE SA (France)
2.375% due 10/04/13 ~ | | | 1,700,000 | | | | 1,718,173 | |
CIT Group Inc
5.250% due 04/01/14 ~ | | | 12,600,000 | | | | 13,104,000 | |
CitiFinancial Inc
6.625% due 06/01/15 | | | 4,000,000 | | | | 4,445,380 | |
Citigroup Inc | | | | | | | | |
0.581% due 06/09/16 § | | | 10,900,000 | | | | 10,308,675 | |
5.500% due 04/11/13 | | | 10,200,000 | | | | 10,305,794 | |
CNA Financial Corp
5.850% due 12/15/14 | | | 9,000,000 | | | | 9,775,692 | |
Credit Suisse (Switzerland)
2.200% due 01/14/14 | | | 3,700,000 | | | | 3,757,420 | |
Daimler Finance North America LLC
6.500% due 11/15/13 | | | 6,500,000 | | | | 6,824,753 | |
Dexia Credit Local SA (France)
2.750% due 04/29/14 ~ | | | 11,000,000 | | | | 11,228,877 | |
Everest Reinsurance Holdings Inc
5.400% due 10/15/14 | | | 2,000,000 | | | | 2,111,986 | |
Export-Import Bank of Korea (South Korea)
| | | | | | | | |
4.000% due 01/29/21 | | | 1,800,000 | | | | 1,942,510 | |
5.125% due 06/29/20 | | | 6,800,000 | | | | 7,840,964 | |
Ford Motor Credit Co LLC | | | | | | | | |
2.750% due 05/15/15 | | | 5,800,000 | | | | 5,922,287 | |
7.000% due 04/15/15 | | | 500,000 | | | | 558,769 | |
8.000% due 12/15/16 | | | 500,000 | | | | 604,817 | |
8.700% due 10/01/14 | | | 700,000 | | | | 787,487 | |
12.000% due 05/15/15 | | | 3,300,000 | | | | 4,075,500 | |
General Electric Capital Corp
3.800% due 06/18/19 ~ | | | 12,300,000 | | | | 13,114,875 | |
GMAC International Finance BV (Netherlands)
7.500% due 04/21/15 | | | EUR 13,000,000 | | | | 18,836,688 | |
Goldman Sachs Capital II
4.000% due 06/01/43 § | | | $7,000,000 | | | | 5,476,310 | |
HSBC Bank PLC (United Kingdom)
2.000% due 01/19/14 ~ | | | 3,900,000 | | | | 3,941,391 | |
ICICI Bank Ltd (India)
4.750% due 11/25/16 ~ | | | 26,700,000 | | | | 28,113,204 | |
ING Bank NV (Netherlands)
2.500% due 01/14/16 ~ | | | 2,500,000 | | | | 2,603,293 | |
Intesa Sanpaolo SPA (Italy)
2.712% due 02/24/14 § ~ | | | 9,100,000 | | | | 9,092,365 | |
JPMorgan Chase & Co | | | | | | | | |
3.150% due 07/05/16 | | | 6,800,000 | | | | 7,208,340 | |
3.700% due 01/20/15 | | | 4,400,000 | | | | 4,634,700 | |
7.900% § ± | | | 3,500,000 | | | | 3,979,752 | |
Lloyds TSB Bank PLC (United Kingdom)
12.000% § ± ~ | | | 5,400,000 | | | | 6,256,580 | |
Merrill Lynch & Co Inc
6.875% due 04/25/18 | | | 10,900,000 | | | | 13,149,629 | |
Metropolitan Life Global Funding
5.125% due 04/10/13 ~ | | | 600,000 | | | | 607,557 | |
National Australia Bank Ltd (Australia)
5.350% due 06/12/13 ~ | | | 6,700,000 | | | | 6,851,608 | |
National Bank of Canada (Canada)
2.200% due 10/19/16 ~ | | | 600,000 | | | | 631,832 | |
New York Life Global Funding
4.650% due 05/09/13 ~ | | | 1,510,000 | | | | 1,531,267 | |
Nordea Bank AB (Sweden)
4.875% due 01/27/20 ~ | | | 22,500,000 | | | | 25,945,200 | |
| | | | | | | | |
| | | Principal
Amount | | | Value | |
Nykredit Realkredit AS (Denmark) | | | | | | | | |
1.319% due 04/01/38 § | | | DKK 29,726,096 | | | | $5,343,261 | |
1.319% due 10/01/38 § | | | 33,899,158 | | | | 6,117,358 | |
Principal Life Income Funding Trusts
5.300% due 04/24/13 | | | $3,800,000 | | | | 3,854,678 | |
Realkredit Danmark AS (Denmark)
1.420% due 01/01/38 § | | | DKK 174,802,217 | | | | 31,606,105 | |
Santander Finance Preferred SAU (Spain)
11.300% § ± | | | GBP 7,500,000 | | | | 12,916,814 | |
Sberbank of Russia (Luxembourg) | | | | | | | | |
4.950% due 02/07/17 ~ | | | $3,400,000 | | | | 3,684,750 | |
5.400% due 03/24/17 ~ | | | 4,400,000 | | | | 4,820,860 | |
6.125% due 02/07/22 ~ | | | 2,700,000 | | | | 3,091,500 | |
SLM Corp | | | | | | | | |
0.615% due 01/27/14 § | | | 9,200,000 | | | | 9,116,041 | |
5.000% due 10/01/13 | | | 1,250,000 | | | | 1,285,938 | |
5.375% due 01/15/13 | | | 770,000 | | | | 771,920 | |
Springleaf Finance Corp
6.900% due 12/15/17 | | | 5,000,000 | | | | 4,500,000 | |
State Bank of India (India)
4.500% due 07/27/15 ~ | | | 8,100,000 | | | | 8,501,436 | |
Sumitomo Mitsui Banking Corp (Japan)
1.950% due 01/14/14 ~ | | | 2,400,000 | | | | 2,424,674 | |
Temasek Financial I Ltd (Singapore) 4.300% due 10/25/19 ~ | | | 4,000,000 | | | | 4,608,984 | |
The Bear Stearns Cos LLC | | | | | | | | |
6.400% due 10/02/17 | | | 19,100,000 | | | | 22,955,392 | |
7.250% due 02/01/18 | | | 13,000,000 | | | | 16,301,714 | |
The Dai-ichi Life Insurance Co Ltd (Japan)
7.250% § ± ~ | | | 4,700,000 | | | | 5,361,205 | |
The Korea Development Bank (South Korea)
3.500% due 08/22/17 | | | 3,100,000 | | | | 3,323,401 | |
The Royal Bank of Scotland Group PLC (United Kingdom) | | | | | | | | |
4.875% due 08/25/14 ~ | | | 1,100,000 | | | | 1,160,477 | |
6.990% § ± ~ | | | 3,000,000 | | | | 2,865,000 | |
7.640% § ± | | | 16,000,000 | | | | 14,560,000 | |
UBS AG (Switzerland) | | | | | | | | |
1.313% due 01/28/14 § | | | 1,300,000 | | | | 1,308,315 | |
5.875% due 12/20/17 | | | 24,700,000 | | | | 29,421,380 | |
Vesey Street Investment Trust I
4.404% due 09/01/16 § | | | 4,300,000 | | | | 4,642,684 | |
Vnesheconombank (Ireland) | | | | | | | | |
5.375% due 02/13/17 ~ | | | 3,200,000 | | | | 3,512,000 | |
5.450% due 11/22/17 ~ | | | 2,100,000 | | | | 2,341,500 | |
Wachovia Bank NA
0.693% due 11/03/14 § | | | 16,758,000 | | | | 16,716,206 | |
Westpac Banking Corp (Australia)
1.041% due 03/31/14 § ~ | | | 17,100,000 | | | | 17,213,168 | |
| | | | | | | | |
| | | | | | | 824,045,839 | |
| | | | | | | | |
Health Care - 0.1% | |
| | |
UnitedHealth Group Inc
6.875% due 02/15/38 | | | 2,700,000 | | | | 3,710,572 | |
| | | | | | | | |
|
Industrials - 0.6% | |
| | |
CSX Corp
5.600% due 05/01/17 | | | 5,000,000 | | | | 5,844,575 | |
International Lease Finance Corp | | | | | | | | |
5.750% due 05/15/16 | | | 1,500,000 | | | | 1,588,248 | |
6.375% due 03/25/13 | | | 4,500,000 | | | | 4,564,125 | |
Masco Corp
6.125% due 10/03/16 | | | 8,200,000 | | | | 9,062,443 | |
Noble Group Ltd (Bermuda)
6.750% due 01/29/20 ~ | | | 8,400,000 | | | | 8,893,500 | |
UAL Equipment Trust AB
10.850% due 02/19/15 Y | | | 533,632 | | | | 232,130 | |
| | |
| See Notes to Financial Statements | | See explanation of symbols and terms, if any, on page B-143 |
B-45
PACIFIC SELECT FUND
MANAGED BOND PORTFOLIO
Schedule of Investments (Continued)
December 31, 2012
| | | | | | | | |
| | | Principal
Amount | | | Value | |
UAL Pass-Through Trust ‘A’ | | | | | | | | |
9.350% due 04/07/16 Y | | | $62,217 | | | | $18,354 | |
9.560% due 10/19/18 Y | | | 718,463 | | | | 211,947 | |
| | | | | | | | |
| | | | | | | 30,415,322 | |
| | | | | | | | |
Information Technology - 0.6% | |
| | |
Baidu Inc (Cayman)
2.250% due 11/28/17 | | | 4,900,000 | | | | 4,940,807 | |
Hewlett-Packard Co
0.592% due 05/24/13 § | | | 25,500,000 | | | | 25,428,651 | |
| | | | | | | | |
| | | | | | | 30,369,458 | |
| | | | | | | | |
Materials - 0.5% | |
| | |
Braskem Finance Ltd (Cayman)
5.750% due 04/15/21 ~ | | | 4,000,000 | | | | 4,230,000 | |
CSN Islands XI Corp (Cayman)
6.875% due 09/21/19 ~ | | | 4,200,000 | | | | 4,725,000 | |
Gerdau Trade Inc (United Kingdom)
5.750% due 01/30/21 ~ | | | 1,200,000 | | | | 1,326,000 | |
Rio Tinto Alcan Inc (Canada)
5.000% due 06/01/15 | | | 2,500,000 | | | | 2,733,913 | |
Rohm & Haas Co
6.000% due 09/15/17 | | | 10,000,000 | | | | 11,855,100 | |
Xstrata Canada Corp (Canada)
5.375% due 06/01/15 | | | 60,000 | | | | 65,247 | |
| | | | | | | | |
| | | | | | | 24,935,260 | |
| | | | | | | | |
Telecommunication Services - 0.2% | |
| | |
BellSouth Corp
5.200% due 09/15/14 | | | 9,100,000 | | | | 9,778,478 | |
Qtel International Finance Ltd (Bermuda) | | | | | | | | |
3.375% due 10/14/16 ~ | | | 300,000 | | | | 315,337 | |
4.750% due 02/16/21 ~ | | | 600,000 | | | | 679,500 | |
Qwest Corp
6.875% due 09/15/33 | | | 1,386,000 | | | | 1,399,860 | |
| | | | | | | | |
| | | | | | | 12,173,175 | |
| | | | | | | | |
Utilities - 0.4% | |
| | |
Centrais Eletricas Brasileiras SA (Brazil)
6.875% due 07/30/19 ~ | | | 6,900,000 | | | | 7,883,250 | |
ENN Energy Holdings Ltd (Cayman)
6.000% due 05/13/21 ~ | | | 1,100,000 | | | | 1,268,918 | |
Korea Hydro & Nuclear Power Co Ltd
(South Korea)
6.250% due 06/17/14 ~ | | | 900,000 | | | | 965,581 | |
Majapahit Holding BV (Netherlands)
7.750% due 10/17/16 ~ | | | 2,800,000 | | | | 3,321,500 | |
TECO Finance Inc
6.750% due 05/01/15 | | | 5,600,000 | | | | 6,307,224 | |
Tokyo Electric Power Co Inc (Japan) | | | | | | | | |
1.500% due 05/30/14 | | | JPY 8,000,000 | | | | 90,747 | |
1.850% due 07/28/14 | | | 36,000,000 | | | | 408,973 | |
| | | | | | | | |
| | | | | | | 20,246,193 | |
| | | | | | | | |
Total Corporate Bonds & Notes
(Cost $1,046,200,977) | | | | | | | 1,135,625,348 | |
| | | | | | | | |
|
SENIOR LOAN NOTES - 0.3% | |
| | |
Consumer Discretionary - 0.0% | | | | | | | | |
| | |
Yell Group PLC Term B1
4.459% due 07/31/14 § | | | $5,303,561 | | | | 1,217,607 | |
| | | | | | | | |
| | |
Financials - 0.3% | | | | | | | | |
| | |
Springleaf Financial Funding Co
5.500% due 05/10/17 § | | | 16,800,000 | | | | 16,731,759 | |
| | | | | | | | |
| | |
Total Senior Loan Notes
(Cost $22,039,065) | | | | | | | 17,949,366 | |
| | | | | | | | |
| | | | | | | | |
| | | Principal
Amount | | | Value | |
| |
MORTGAGE-BACKED SECURITIES - 58.9% | | | | | |
|
Collateralized Mortgage Obligations - Commercial - 3.6% | |
| | |
Banc of America Commercial Mortgage Trust
5.451% due 01/15/49 " | | | $290,000 | | | | $336,380 | |
Banc of America Large Loan Trust
2.509% due 11/15/15 " § ~ | | | 4,302,767 | | | | 4,305,320 | |
BCRR Trust
5.858% due 07/17/40 " § ~ | | | 16,400,000 | | | | 19,656,761 | |
Bear Stearns Commercial Mortgage Securities | | | | | | | | |
5.331% due 02/11/44 " | | | 900,000 | | | | 1,023,712 | |
5.471% due 01/12/45 " § | | | 1,300,000 | | | | 1,518,273 | |
5.700% due 06/11/50 " | | | 6,900,000 | | | | 8,253,742 | |
Citigroup/Deutsche Bank Commercial Mortgage Trust
5.322% due 12/11/49 " | | | 235,000 | | | | 270,516 | |
Commercial Mortgage Pass-Through Certificates | | | | | | | | |
5.467% due 09/15/39 " | | | 35,300,000 | | | | 40,196,586 | |
5.676% due 03/15/39 " § | | | 400,000 | | | | 452,447 | |
Credit Suisse Mortgage Capital Certificates
0.439% due 10/15/21 " § ~ | | | 22,541,862 | | | | 22,011,193 | |
European Loan Conduit (Ireland)
0.342% due 05/15/19 " § ~ | | | EUR 381,773 | | | | 476,206 | |
GMAC Commercial Mortgage Securities Inc (IO)
0.921% due 05/15/35 " § | | | $1,039,418 | | | | 23,420 | |
Greenwich Capital Commercial Funding Corp | | | | | | | | |
4.799% due 08/10/42 " § | | | 200,000 | | | | 214,310 | |
5.444% due 03/10/39 " | | | 18,200,000 | | | | 21,031,847 | |
JPMorgan Chase Commercial Mortgage Securities Corp
5.728% due 02/12/49 " § | | | 5,660,000 | | | | 6,664,958 | |
LB-UBS Commercial Mortgage Trust
5.866% due 09/15/45 " § | | | 1,600,000 | | | | 1,915,290 | |
Merrill Lynch Floating Trust
0.751% due 07/09/21 " § ~ | | | 10,940,775 | | | | 10,899,238 | |
Merrill Lynch/Countrywide Commercial Mortgage Trust
5.700% due 09/12/49 " | | | 5,600,000 | | | | 6,595,126 | |
Morgan Stanley Capital I Trust | | | | | | | | |
5.731% due 07/12/44 " § | | | 6,300,000 | | | | 7,241,491 | |
5.809% due 12/12/49 " | | | 300,000 | | | | 357,321 | |
Morgan Stanley Re-REMIC Trust
5.789% due 08/12/45 " § ~ | | | 700,000 | | | | 821,505 | |
Wachovia Bank Commercial Mortgage Trust | | | | | | | | |
0.289% due 06/15/20 " § ~ | | | 12,533,875 | | | | 12,343,454 | |
5.342% due 12/15/43 " | | | 16,200,000 | | | | 18,647,933 | |
| | | | | | | | |
| | | | | | | 185,257,029 | |
| | | | | | | | |
Collateralized Mortgage Obligations - Residential - 4.8% | |
| | |
Adjustable Rate Mortgage Trust
3.111% due 09/25/35 " § | | | 2,367,583 | | | | 2,182,088 | |
Arran Residential Mortgages Funding PLC (United Kingdom) | | | | | | | | |
1.391% due 05/16/47 " § ~ | | | EUR 135,293 | | | | 178,826 | |
1.591% due 05/16/47 " § ~ | | | 9,300,000 | | | | 12,503,426 | |
Banc of America Funding Corp | | | | | | | | |
2.619% due 05/25/35 " § | | | $5,754,136 | | | | 5,989,791 | |
2.687% due 02/20/36 " § | | | 4,373,351 | | | | 4,354,765 | |
5.621% due 01/20/47 " § | | | 509,371 | | | | 372,349 | |
Banc of America Funding Corp (IO)
4.640% due 01/25/36 " § | | | 747,838 | | | | 3,365 | |
| | |
| See Notes to Financial Statements | | See explanation of symbols and terms, if any, on page B-143 |
B-46
PACIFIC SELECT FUND
MANAGED BOND PORTFOLIO
Schedule of Investments (Continued)
December 31, 2012
| | | | | | | | |
| | | Principal
Amount | | | Value | |
BCAP LLC Trust | | | | | | | | |
0.380% due 01/25/37 " § | | | $3,313,036 | | | | $2,166,522 | |
5.250% due 02/26/36 " ~ | | | 5,716,779 | | | | 5,729,245 | |
5.250% due 08/26/37 " ~ | | | 14,877,861 | | | | 14,781,155 | |
5.430% due 03/26/37 " § ~ | | | 1,000,000 | | | | 830,000 | |
Bear Stearns Adjustable Rate Mortgage Trust | | | | | | | | |
2.240% due 08/25/35 " § | | | 46,045 | | | | 46,487 | |
2.320% due 08/25/35 " § | | | 1,655,625 | | | | 1,681,744 | |
2.470% due 10/25/35 " § | | | 1,256,792 | | | | 1,217,093 | |
2.570% due 03/25/35 " § | | | 6,292,563 | | | | 6,367,687 | |
2.643% due 04/25/33 " § | | | 17,747 | | | | 17,962 | |
2.756% due 08/25/33 " § | | | 5,663,431 | | | | 5,801,936 | |
2.972% due 01/25/35 " § | | | 915,401 | | | | 907,940 | |
3.010% due 02/25/34 " § | | | 830,938 | | | | 822,876 | |
Bear Stearns Alt-A Trust | | | | | | | | |
1.050% due 11/25/34 " § | | | 1,045,471 | | | | 1,034,355 | |
2.662% due 01/25/36 " § Y | | | 4,206,216 | | | | 2,639,272 | |
2.960% due 05/25/35 " § | | | 4,551,243 | | | | 4,177,943 | |
2.964% due 11/25/36 " § | | | 5,088,411 | | | | 3,295,891 | |
3.001% due 09/25/35 " § | | | 7,142,869 | | | | 5,642,888 | |
Bear Stearns Structured Products Inc Trust | | | | | | | | |
2.797% due 01/26/36 " § | | | 2,461,515 | | | | 1,627,420 | |
2.829% due 12/26/46 " § | | | 1,641,373 | | | | 911,888 | |
Citigroup Mortgage Loan Trust Inc | | | | | | | | |
2.340% due 09/25/35 " § | | | 1,956,755 | | | | 1,930,413 | |
2.530% due 10/25/35 " § | | | 211,110 | | | | 196,490 | |
2.689% due 08/25/35 " § | | | 2,064,823 | | | | 1,348,364 | |
Countrywide Alternative Loan Trust
0.490% due 02/25/37 " § | | | 324,684 | | | | 209,380 | |
Countrywide Alternative Loan Trust (IO)
4.790% due 05/25/35 " § | | | 9,872,323 | | | | 1,707,384 | |
Countrywide Home Loan Mortgage
Pass-Through Trust | | | | | | | | |
0.530% due 03/25/35 " § | | | 2,314,466 | | | | 1,767,537 | |
0.550% due 06/25/35 " § ~ | | | 8,007,328 | | | | 6,879,184 | |
2.783% due 02/20/36 " § | | | 2,621,492 | | | | 2,265,865 | |
2.900% due 05/20/34 " § | | | 2,915,255 | | | | 2,875,438 | |
3.026% due 08/25/34 " § | | | 432,256 | | | | 377,466 | |
Credit Suisse First Boston Mortgage Securities Corp
0.839% due 03/25/32 " § ~ | | | 408,391 | | | | 368,762 | |
Downey Savings & Loan Association Mortgage Loan Trust
2.461% due 07/19/44 " § | | | 1,677,424 | | | | 1,608,408 | |
Fannie Mae | | | | | | | | |
0.270% due 07/25/37 " § | | | 672,538 | | | | 646,545 | |
0.609% due 04/18/28 " § | | | 205,667 | | | | 206,793 | |
0.659% due 10/18/30 " § | | | 1,338 | | | | 1,346 | |
0.710% due 03/25/17 " § | | | 40,699 | | | | 40,998 | |
0.810% due 05/25/40 " § | | | 7,511,813 | | | | 7,570,520 | |
5.000% due 03/25/21 " | | | 69,446 | | | | 73,584 | |
6.461% due 10/25/42 " § | | | 1,878,101 | | | | 2,110,612 | |
Fannie Mae (IO)
6.490% due 10/25/35 " § | | | 17,217 | | | | 3,186 | |
First Horizon Alternative Mortgage Securities | | | | | | | | |
2.536% due 06/25/34 " § | | | 8,884,582 | | | | 8,834,442 | |
2.570% due 09/25/35 " § | | | 193,666 | | | | 160,986 | |
2.623% due 03/25/35 " § | | | 1,786,230 | | | | 1,425,240 | |
6.000% due 01/25/35 " | | | 187,129 | | | | 191,665 | |
First Horizon Mortgage Pass-Through Trust
2.613% due 08/25/35 " § | | | 403,697 | | | | 394,407 | |
Freddie Mac | | | | | | | | |
0.559% due 12/15/29 " § | | | 30,099 | | | | 30,212 | |
3.500% due 07/15/32 " | | | 111,782 | | | | 115,441 | |
7.000% due 09/15/21 " | | | 48,044 | | | | 54,211 | |
7.500% due 01/15/23 - 09/20/26 " | | | 1,412,833 | | | | 1,635,383 | |
Freddie Mac Structured Pass-Through Securities | | | | | | | | |
1.360% due 10/25/44 " § | | | 2,837,257 | | | | 2,839,364 | |
1.535% due 07/25/44 " § | | | 14,918,486 | | | | 15,300,012 | |
| | | | | | | | |
| | | Principal
Amount | | | Value | |
Government National Mortgage Association
7.000% due 02/16/29 " | | | $188,567 | | | | $205,322 | |
Greenpoint Mortgage Funding Trust
0.480% due 11/25/45 " § | | | 84,287 | | | | 61,579 | |
Greenpoint Mortgage
Pass-Through Certificates
3.168% due 10/25/33 " § | | | 1,199,218 | | | | 1,190,828 | |
GSR Mortgage Loan Trust
2.660% due 09/25/35 " § | | | 194,311 | | | | 195,740 | |
Harborview Mortgage Loan Trust | | | | | | | | |
0.950% due 02/19/34 " § | | | 44,868 | | | | 44,753 | |
3.103% due 07/19/35 " § | | | 1,718,418 | | | | 1,620,670 | |
Holmes Master Issuer PLC (United Kingdom)
1.560% due 10/15/54 " § ~ | | | EUR 4,900,000 | | | | 6,541,194 | |
Impac CMB Trust
0.750% due 05/25/35 " § | | | $201,970 | | | | 174,469 | |
Imperial Savings Association
7.034% due 02/25/18 " § | | | 882 | | | | 908 | |
IndyMac ARM Trust
1.820% due 01/25/32 " § | | | 42,430 | | | | 39,324 | |
Indymac Index Mortgage Loan Trust 2.651% due 12/25/34 " § | | | 249,975 | | | | 221,765 | |
JPMorgan Mortgage Trust | | | | | | | | |
4.963% due 02/25/35 " § | | | 645,598 | | | | 657,268 | |
5.750% due 01/25/36 " | | | 344,791 | | | | 335,302 | |
MASTR Adjustable Rate Mortgages Trust
2.670% due 04/21/34 " § | | | 132,530 | | | | 136,199 | |
MASTR Alternative Loans Trust
0.610% due 03/25/36 " § Y | | | 950,655 | | | | 179,736 | |
MASTR Asset Securitization Trust
5.500% due 09/25/33 " | | | 71,586 | | | | 75,711 | |
Merrill Lynch Mortgage Investors Inc | | | | | | | | |
0.420% due 02/25/36 " § | | | 1,173,866 | | | | 1,024,873 | |
2.583% due 06/25/35 " § | | | 200,125 | | | | 197,487 | |
Merrill Lynch Mortgage Investors Trust | | | | | | | | |
0.460% due 11/25/35 " § | | | 198,318 | | | | 186,032 | |
1.214% due 10/25/35 " § | | | 466,409 | | | | 459,910 | |
2.420% due 10/25/35 " § | | | 1,578,847 | | | | 1,569,138 | |
2.499% due 12/25/34 " § | | | 542,142 | | | | 553,328 | |
PHH Alternative Mortgage Trust
0.370% due 02/25/37 " § | | | 33,173,340 | | | | 24,953,152 | |
Provident Funding Mortgage Loan Trust
2.610% due 04/25/34 " § | | | 12,051 | | | | 12,175 | |
Residential Accredit Loans Inc Trust | | | | | | | | |
0.390% due 06/25/46 " § | | | 2,455,219 | | | | 1,125,342 | |
0.420% due 04/25/46 " § | | | 243,667 | | | | 115,211 | |
5.750% due 01/25/33 " | | | 76,773 | | | | 79,268 | |
6.000% due 06/25/36 " | | | 9,024,999 | | | | 6,975,977 | |
Residential Asset Securitization Trust
0.610% due 01/25/46 " § | | | 2,221,761 | | | | 1,001,238 | |
Residential Asset Securitization Trust (IO)
4.740% due 11/25/35 " § | | | 7,358,381 | | | | 1,089,096 | |
Residential Funding Mortgage
Securities I Trust
3.320% due 09/25/35 " § | | | 1,406,523 | | | | 1,147,116 | |
Sequoia Mortgage Trust
0.561% due 07/20/33 " § | | | 2,200,034 | | | | 2,178,616 | |
Structured Adjustable Rate Mortgage Loan Trust | | | | | | | | |
2.781% due 01/25/35 " § | | | 1,123,836 | | | | 1,032,814 | |
2.797% due 08/25/35 " § | | | 323,733 | | | | 295,164 | |
Structured Asset Mortgage Investments Inc | | | | | | | | |
0.420% due 05/25/46 " § | | | 1,956,811 | | | | 1,115,476 | |
0.430% due 05/25/36 " § | | | 1,497,659 | | | | 992,035 | |
0.440% due 05/25/45 " § | | | 493,391 | | | | 356,868 | |
0.460% due 07/19/35 " § | | | 1,520,539 | | | | 1,475,736 | |
0.490% due 02/25/36 " § | | | 1,922,524 | | | | 1,295,926 | |
0.790% due 07/19/34 " § | | | 54,421 | | | | 53,771 | |
0.870% due 09/19/32 " § | | | 204,579 | | | | 199,050 | |
1.050% due 10/19/33 " § | | | 6,275 | | | | 5,940 | |
| | |
| See Notes to Financial Statements | | See explanation of symbols and terms, if any, on page B-143 |
B-47
PACIFIC SELECT FUND
MANAGED BOND PORTFOLIO
Schedule of Investments (Continued)
December 31, 2012
| | | | | | | | |
| | | Principal
Amount | | | Value | |
SunTrust Alternative Loan Trust (IO)
4.890% due 12/25/35 " § | | | $20,418,954 | | | | $3,389,301 | |
WaMu Mortgage Pass-Through Certificates | | | | | | | | |
0.480% due 12/25/45 " § | | | 127,308 | | | | 118,457 | |
0.500% due 10/25/45 " § | | | 135,420 | | | | 129,364 | |
0.520% due 01/25/45 " § | | | 1,628,763 | | | | 1,595,229 | |
0.530% due 01/25/45 " § | | | 94,489 | | | | 88,914 | |
1.565% due 08/25/42 " § | | | 90,586 | | | | 87,004 | |
2.261% due 02/27/34 " § | | | 1,577,887 | | | | 1,607,218 | |
Washington Mutual Alternative Mortgage Pass-Through Certificates (IO) | | | | | | | | |
4.640% due 11/25/35 " § | | | 35,794,132 | | | | 5,708,896 | |
4.740% due 11/25/35 " § | | | 9,890,008 | | | | 1,789,394 | |
Washington Mutual MSC Mortgage
Pass-Through Certificates | | | | | | | | |
2.331% due 02/25/33 " § | | | 6,289 | | | | 6,201 | |
2.573% due 02/25/33 " § | | | 79,139 | | | | 79,161 | |
Wells Fargo Mortgage-Backed Securities Trust | | | | | | | | |
2.613% due 02/25/35 " § | | | 103,877 | | | | 103,471 | |
2.619% due 01/25/35 " § | | | 1,796,382 | | | | 1,800,479 | |
2.624% due 12/25/34 " § | | | 1,090,943 | | | | 1,090,688 | |
2.627% due 03/25/36 " § | | | 14,227,217 | | | | 14,002,306 | |
2.723% due 04/25/36 " § | | | 3,052,564 | | | | 2,839,210 | |
2.743% due 10/25/33 " § | | | 262,443 | | | | 267,788 | |
2.760% due 03/25/36 " § | | | 376,857 | | | | 364,586 | |
5.500% due 12/25/35 " | | | 3,956,082 | | | | 3,988,162 | |
5.575% due 04/25/36 " § | | | 1,485,333 | | | | 611,658 | |
| | | | | | | | |
| | | | | | | 249,293,546 | |
| | | | | | | | |
Fannie Mae - 48.1% | |
| | |
1.360% due 08/01/42 - 10/01/44 " § | | | 2,530,668 | | | | 2,573,556 | |
1.820% due 02/01/33 " § | | | 660,943 | | | | 682,890 | |
2.050% due 02/01/33 " § | | | 18,983 | | | | 19,846 | |
2.127% due 09/01/35 " § | | | 660,688 | | | | 693,265 | |
2.150% due 01/01/34 " § | | | 25,531 | | | | 26,814 | |
2.158% due 03/01/34 " § | | | 38,010 | | | | 40,434 | |
2.195% due 01/01/25 " § | | | 82,299 | | | | 82,973 | |
2.220% due 04/01/27 " § | | | 33,800 | | | | 34,256 | |
2.261% due 01/01/23 " § | | | 138,389 | | | | 146,352 | |
2.280% due 12/01/22 " § | | | 28,945 | | | | 30,887 | |
2.299% due 09/01/33 " § | | | 87,191 | | | | 92,589 | |
2.310% due 08/01/22 " | | | 1,200,000 | | | | 1,225,695 | |
2.344% due 03/01/33 " § | | | 758,257 | | | | 783,073 | |
2.354% due 12/01/34 " § | | | 3,215,566 | | | | 3,378,740 | |
2.371% due 08/01/36 " § | | | 1,148,002 | | | | 1,219,572 | |
2.425% due 07/01/35 " § | | | 4,218,290 | | | | 4,446,336 | |
2.450% due 11/01/23 " § | | | 90 | | | | 90 | |
2.492% due 11/01/34 " § | | | 9,225,702 | | | | 9,935,113 | |
2.495% due 07/01/33 " § | | | 71,279 | | | | 74,774 | |
2.500% due 01/01/28 " | | | 40,000,000 | | | | 41,837,500 | |
2.539% due 08/01/35 " § | | | 988,320 | | | | 1,037,464 | |
2.545% due 11/01/34 " § | | | 28,169 | | | | 29,897 | |
2.572% due 04/01/35 " § | | | 2,203,289 | | | | 2,323,445 | |
2.811% due 03/01/33 " § | | | 33,094 | | | | 35,053 | |
2.870% due 09/01/27 " | | | 4,800,000 | | | | 4,737,802 | |
2.920% due 06/01/34 " § | | | 26,203 | | | | 27,858 | |
3.000% due 01/01/28 - 01/01/43 " | | | 119,000,000 | | | | 125,193,909 | |
3.330% due 11/01/21 " | | | 392,860 | | | | 431,926 | |
3.496% due 05/01/36 " § | | | 88,781 | | | | 91,658 | |
3.500% due 07/01/20 - 12/01/99 " | | | 455,200,148 | | | | 484,620,592 | |
3.653% due 05/01/36 " § | | | 79,901 | | | | 81,597 | |
3.763% due 05/01/36 " § | | | 2,623,870 | | | | 2,780,863 | |
4.000% due 07/01/18 - 12/01/99 " | | | 863,519,710 | | | | 925,908,371 | |
4.500% due 03/01/18 - 02/01/43 " | | | 494,348,382 | | | | 534,712,940 | |
4.612% due 09/01/34 " § | | | 1,035,652 | | | | 1,119,760 | |
4.636% due 07/01/33 " § | | | 51,424 | | | | 54,490 | |
4.803% due 04/01/34 " § | | | 436,588 | | | | 470,767 | |
5.000% due 03/01/35 - 02/01/43 " | | | 137,490,492 | | | | 149,078,288 | |
5.034% due 09/01/35 " § | | | 502,651 | | | | 538,353 | |
| | | | | | | | |
| | | Principal
Amount | | | Value | |
5.141% due 12/01/34 " § | | | $24,923 | | | | $26,884 | |
5.267% due 08/01/34 " § | | | 20,494 | | | | 22,048 | |
5.337% due 01/01/36 " § | | | 444,439 | | | | 478,843 | |
5.500% due 08/01/18 - 02/01/43 " | | | 65,862,421 | | | | 71,673,806 | |
6.000% due 04/01/16 - 12/01/99 " | | | 86,121,637 | | | | 94,441,728 | |
6.500% due 12/01/14 - 09/01/37 " | | | 4,454,778 | | | | 4,999,835 | |
7.500% due 01/01/33 " | | | 64,823 | | | | 78,720 | |
8.000% due 05/01/30 - 08/01/30 " | | | 16,143 | | | | 17,385 | |
8.500% due 07/01/32 " | | | 4,952 | | | | 6,144 | |
| | | | | | | | |
| | | | | | | 2,472,345,181 | |
| | | | | | | | |
Federal Housing Authority - 0.0% | |
| | |
6.896% due 07/01/20 " | | | 177,840 | | | | 174,189 | |
7.430% due 10/01/20 - 11/01/22 " | | | 69,258 | | | | 68,286 | |
| | | | | | | | |
| | | | | | | 242,475 | |
| | | | | | | | |
Freddie Mac - 2.2% | |
| | |
2.262% due 01/01/28 " § | | | 20,514 | | | | 21,879 | |
2.361% due 05/01/23 " § | | | 5,577 | | | | 5,644 | |
2.374% due 03/01/32 " § | | | 383,675 | | | | 403,653 | |
2.375% due 05/01/32 - 07/01/32 " § | | | 53,596 | | | | 54,237 | |
2.457% due 09/01/35 " § | | | 703,612 | | | | 742,223 | |
4.000% due 09/01/40 - 01/01/43 " | | | 9,808,602 | | | | 10,479,961 | |
4.500% due 08/01/40 - 01/01/43 " | | | 65,263,508 | | | | 70,260,418 | |
4.645% due 06/01/17 " § | | | 2,794 | | | | 2,798 | |
5.500% due 03/01/23 - 05/01/40 " | | | 24,797,522 | | | | 27,178,778 | |
6.000% due 03/03/18 - 10/01/22 " | | | 1,242,042 | | | | 1,350,486 | |
6.500% due 01/01/15 - 05/01/17 " | | | 700,705 | | | | 749,888 | |
7.000% due 10/01/37 " | | | 321,543 | | | | 371,017 | |
| | | | | | | | |
| | | | | | | 111,620,982 | |
| | | | | | | | |
Government National Mortgage Association - 0.2% | |
| | |
1.625% due 12/20/22 - 03/20/33 " § | | | 3,032,028 | | | | 3,142,152 | |
1.750% due 05/20/22 - 09/20/32 " § | | | 2,999,510 | | | | 3,136,527 | |
2.000% due 10/20/24 - 09/20/30 " § | | | 152,301 | | | | 158,445 | |
2.125% due 03/20/29 " § | | | 42,404 | | | | 44,131 | |
2.250% due 09/20/22 - 07/20/24 " § | | | 90,447 | | | | 94,415 | |
2.500% due 11/20/24 - 02/20/25 " § | | | 177,356 | | | | 184,888 | |
3.000% due 08/20/20 " § | | | 71,998 | | | | 75,200 | |
3.500% due 02/01/43 " | | | 800,000 | | | | 868,062 | |
6.000% due 02/15/38 - 03/15/39 " | | | 218,679 | | | | 244,766 | |
6.500% due 11/15/38 " | | | 162,309 | | | | 187,254 | |
7.500% due 02/15/31 - 12/15/31 " | | | 82,148 | | | | 101,177 | |
8.000% due 12/15/29 - 08/15/32 " | | | 610,550 | | | | 722,557 | |
8.500% due 09/15/16 - 12/15/30 " | | | 685,234 | | | | 738,652 | |
9.000% due 02/15/17 - 04/15/20 " | | | 13,193 | | | | 15,492 | |
10.000% due 05/15/19 - 02/15/25 " | | | 11,638 | | | | 13,095 | |
| | | | | | | | |
| | | | | | | 9,726,813 | |
| | | | | | | | |
Total Mortgage-Backed Securities
(Cost $2,982,265,715) | | | | | | | 3,028,486,026 | |
| | | | | | | | |
|
ASSET-BACKED SECURITIES - 1.6% | |
| | |
Access Group Inc
1.615% due 10/27/25 " § | | | 18,403,485 | | | | 18,704,971 | |
ACE Securities Corp
0.540% due 11/25/35 " § | | | 8,362,941 | | | | 7,870,865 | |
Citibank Omni Master Trust
2.959% due 08/15/18 " § ~ | | | 15,500,000 | | | | 16,130,222 | |
Delta Funding Home Equity Loan Trust
7.030% due 08/15/30 " | | | 82,810 | | | | 83,342 | |
EFS Volunteer No 2 LLC
1.090% due 07/26/27 " § ~ | | | 7,810,516 | | | | 7,903,692 | |
GE-WMC Mortgage Securities LLC
0.250% due 08/25/36 " § | | | 2,160 | | | | 855 | |
Hillmark Funding CDO (Cayman)
0.562% due 05/21/21 " § ~ | | | 18,700,000 | | | | 18,084,732 | |
IMC Home Equity Loan Trust
6.255% due 08/20/29 " § | | | 14,605 | | | | 14,433 | |
| | |
| See Notes to Financial Statements | | See explanation of symbols and terms, if any, on page B-143 |
B-48
PACIFIC SELECT FUND
MANAGED BOND PORTFOLIO
Schedule of Investments (Continued)
December 31, 2012
| | | | | | | | |
| | | Principal
Amount | | | Value | |
Long Beach Mortgage Loan Trust
0.770% due 10/25/34 " § | | | $17,007 | | | | $15,140 | |
Mid-State Trust | | | | | | | | |
7.340% due 07/01/35 " | | | 1,331,313 | | | | 1,383,718 | |
7.791% due 03/15/38 " | | | 569,290 | | | | 595,706 | |
8.330% due 04/01/30 " | | | 1,792,913 | | | | 1,871,612 | |
Penta SA CLO (Luxembourg)
0.564% due 06/04/24 " § ~ | | | EUR 1,742,953 | | | | 2,162,739 | |
Renaissance Home Equity Loan Trust
0.650% due 08/25/33 " § | | | $490,051 | | | | 442,380 | |
Saxon Asset Securities Trust
0.730% due 08/25/32 " § | | | 226 | | | | 225 | |
SLC Student Loan Trust
4.750% due 06/15/33 " § ~ | | | 4,696,178 | | | | 4,490,028 | |
SLM Student Loan Trust
0.765% due 01/25/17 " § | | | 2,459,720 | | | | 2,468,226 | |
Structured Asset Securities Corp
0.790% due 01/25/33 " § | | | 26,167 | | | | 24,011 | |
U.S. Small Business Administration
4.754% due 08/10/14 " | | | 496,606 | | | | 509,604 | |
| | | | | | | | |
| | |
Total Asset-Backed Securities
(Cost $81,501,900) | | | | | | | 82,756,501 | |
| | | | | | | | |
|
U.S. GOVERNMENT AGENCY ISSUES - 4.0% | |
| | |
Fannie Mae | | | | | | | | |
0.875% due 08/28/17 | | | 9,300,000 | | | | 9,337,460 | |
1.125% due 04/27/17 | | | 14,600,000 | | | | 14,882,671 | |
1.250% due 01/30/17 | | | 8,900,000 | | | | 9,133,055 | |
5.000% due 02/13/17 | | | 1,500,000 | | | | 1,766,750 | |
5.000% due 05/11/17 | | | 1,600,000 | | | | 1,895,109 | |
5.375% due 06/12/17 | | | 5,300,000 | | | | 6,379,578 | |
Freddie Mac | | | | | | | | |
1.000% due 03/08/17 | | | 37,200,000 | | | | 37,712,690 | |
1.000% due 06/29/17 | | | 15,900,000 | | | | 16,115,207 | |
1.000% due 07/28/17 | | | 51,300,000 | | | | 51,873,226 | |
1.000% due 09/29/17 | | | 16,000,000 | | | | 16,186,832 | |
1.250% due 05/12/17 | | | 5,600,000 | | | | 5,735,822 | |
1.250% due 08/01/19 | | | 14,300,000 | | | | 14,337,109 | |
1.250% due 10/02/19 | | | 9,300,000 | | | | 9,283,251 | |
1.750% due 05/30/19 | | | 2,200,000 | | | | 2,278,703 | |
2.375% due 01/13/22 | | | 2,500,000 | | | | 2,614,025 | |
3.750% due 03/27/19 | | | 3,700,000 | | | | 4,282,365 | |
5.000% due 02/16/17 | | | 2,000,000 | | | | 2,358,362 | |
5.500% due 08/23/17 | | | 600,000 | | | | 730,485 | |
Small Business Administration Participation Certificates
6.120% due 09/01/21 | | | 755,160 | | | | 835,713 | |
| | | | | | | | |
| | |
Total U.S. Government Agency Issues (Cost $204,847,753) | | | | | | | 207,738,413 | |
| | | | | | | | |
|
U.S. TREASURY OBLIGATIONS - 22.4% | |
| | |
U.S. Treasury Bonds - 0.7% | | | | | | | | |
| | |
2.750% due 11/15/42 | | | 35,700,000 | | | | 34,288,743 | |
| | | | | | | | |
|
U.S. Treasury Inflation Protected Securities - 9.0% | |
| | |
0.125% due 04/15/17 ^ | | | 29,942,136 | | | | 32,073,178 | |
0.125% due 01/15/22 ^ ‡ | | | 108,028,439 | | | | 117,337,466 | |
0.125% due 07/15/22 ^ | | | 18,810,330 | | | | 20,410,675 | |
0.625% due 07/15/21 ^ | | | 5,542,236 | | | | 6,299,965 | |
0.750% due 02/15/42 ^ | | | 13,615,476 | | | | 14,933,413 | |
1.125% due 01/15/21 ^ | | | 42,826,725 | | | | 50,314,721 | |
1.250% due 07/15/20 ^ | | | 10,606,900 | | | | 12,585,755 | |
1.375% due 01/15/20 ^ | | | 5,348,550 | | | | 6,342,209 | |
1.750% due 01/15/28 ^ | | | 38,204,282 | | | | 49,480,505 | |
2.000% due 01/15/26 ^ | | | 27,155,451 | | | | 35,622,439 | |
| | | | | | | | |
| | | Principal
Amount | | | Value | |
2.125% due 01/15/19 ^ | | | $3,663,194 | | | | $4,449,924 | |
2.125% due 02/15/40 ^ | | | 10,060,162 | | | | 14,748,358 | |
2.375% due 01/15/25 ^ | | | 17,548,674 | | | | 23,694,816 | |
2.375% due 01/15/27 ^ | | | 9,061,695 | | | | 12,498,769 | |
2.500% due 01/15/29 ^ ‡ | | | 24,672,689 | | | | 35,181,725 | |
3.625% due 04/15/28 ^ | | | 7,007,980 | | | | 11,122,982 | |
3.875% due 04/15/29 ^ | | | 8,161,238 | | | | 13,531,716 | |
| | | | | | | | |
| | | | | | | 460,628,616 | |
| | | | | | | | |
U.S. Treasury Notes - 12.7% | |
| | |
0.375% due 11/15/15 | | | 72,200,000 | | | | 72,273,355 | |
0.750% due 10/31/17 ‡ | | | 41,400,000 | | | | 41,526,146 | |
0.750% due 12/31/17 | | | 41,000,000 | | | | 41,057,646 | |
1.000% due 06/30/19 | | | 29,100,000 | | | | 28,995,414 | |
1.000% due 11/30/19 ‡ | | | 149,900,000 | | | | 148,330,697 | |
1.125% due 12/31/19 | | | 20,000,000 | | | | 19,928,120 | |
1.250% due 10/31/19 | | | 33,600,000 | | | | 33,854,621 | |
1.500% due 08/31/18 ‡ | | | 73,500,000 | | | | 76,072,500 | |
1.625% due 08/15/22 | | | 39,400,000 | | | | 39,104,500 | |
1.625% due 11/15/22 ‡ | | | 151,700,000 | | | | 149,874,897 | |
3.500% due 02/15/18 | | | 3,600,000 | | | | 4,097,812 | |
| | | | | | | | |
| | | | | | | 655,115,708 | |
| | | | | | | | |
| | |
Total U.S. Treasury Obligations
(Cost $1,112,819,657) | | | | | | | 1,150,033,067 | |
| | | | | | | | |
| |
FOREIGN GOVERNMENT BONDS & NOTES - 21.3% | | | | | |
| | |
Brazil Notas do Tesouro Nacional ‘F’ (Brazil) | | | | | | | | |
10.000% due 01/01/17 | | | BRL 736,765,000 | | | | 379,758,727 | |
10.000% due 01/01/21 | | | 38,133,000 | | | | 19,664,168 | |
Hydro-Quebec (Canada)
8.625% due 06/15/29 | | | $1,000,000 | | | | 1,613,860 | |
Italy Buoni Poliennali del Tesoro (Italy) | | | | | | | | |
2.100% due 09/15/21 ^ | | | EUR 1,717,984 | | | | 2,155,859 | |
2.500% due 03/01/15 | | | 29,200,000 | | | | 38,835,911 | |
3.000% due 04/01/14 | | | 3,700,000 | | | | 4,962,584 | |
3.000% due 04/15/15 | | | 1,000,000 | | | | 1,342,568 | |
3.000% due 11/01/15 | | | 72,200,000 | | | | 97,018,238 | |
3.500% due 06/01/14 | | | 5,500,000 | | | | 7,434,398 | |
3.750% due 08/01/15 | | | 6,600,000 | | | | 9,017,490 | |
3.750% due 04/15/16 | | | 200,000 | | | | 274,290 | |
3.750% due 08/01/16 | | | 3,700,000 | | | | 5,067,611 | |
4.000% due 02/01/17 | | | 1,400,000 | | | | 1,924,526 | |
4.250% due 07/01/14 | | | 5,800,000 | | | | 7,930,761 | |
4.250% due 08/01/14 | | | 1,600,000 | | | | 2,192,134 | |
4.250% due 02/01/15 | | | 4,700,000 | | | | 6,480,209 | |
4.500% due 07/15/15 | | | 10,700,000 | | | | 14,851,906 | |
4.750% due 09/15/16 | | | 4,700,000 | | | | 6,639,000 | |
4.750% due 05/01/17 | | | 2,700,000 | | | | 3,806,566 | |
4.750% due 06/01/17 | | | 6,200,000 | | | | 8,720,513 | |
6.000% due 11/15/14 | | | 2,800,000 | | | | 3,970,650 | |
Italy Certification di Credito del Tesoro (Italy)
2.687% due 09/30/14 | | | 44,500,000 | | | | 56,723,280 | |
Korea Housing Finance Corp (South Korea)
4.125% due 12/15/15 ~ | | | $12,300,000 | | | | 13,326,373 | |
Mexican Bonos (Mexico) | | | | | | | | |
6.000% due 06/18/15 | | | MXN 62,600,000 | | | | 4,986,793 | |
6.250% due 06/16/16 | | | 74,300,000 | | | | 5,992,789 | |
8.000% due 06/11/20 | | | 12,700,000 | | | | 1,157,872 | |
10.000% due 12/05/24 | | | 548,600,000 | | | | 59,493,198 | |
Province of British Columbia (Canada)
4.300% due 06/18/42 | | | CAD 800,000 | | | | 954,129 | |
Province of Ontario (Canada) | | | | | | | | |
1.600% due 09/21/16 | | | $4,400,000 | | | | 4,543,603 | |
1.650% due 09/27/19 | | | 21,400,000 | | | | 21,402,097 | |
2.850% due 06/02/23 | | | CAD 3,600,000 | | | | 3,616,142 | |
3.000% due 07/16/18 | | | $2,500,000 | | | | 2,727,627 | |
3.150% due 06/02/22 | | | CAD 76,700,000 | | | | 79,832,154 | |
| | |
| See Notes to Financial Statements | | See explanation of symbols and terms, if any, on page B-143 |
B-49
PACIFIC SELECT FUND
MANAGED BOND PORTFOLIO
Schedule of Investments (Continued)
December 31, 2012
| | | | | | | | |
| | | Principal
Amount | | | Value | |
4.000% due 06/02/21 | | | CAD 30,800,000 | | | | $34,289,965 | |
4.200% due 03/08/18 | | | 2,000,000 | | | | 2,230,421 | |
4.200% due 06/02/20 | | | 14,400,000 | | | | 16,235,070 | |
4.300% due 03/08/17 | | | 5,900,000 | | | | 6,530,986 | |
4.400% due 06/02/19 | | | 13,500,000 | | | | 15,323,118 | |
4.400% due 04/14/20 | | | $2,400,000 | | | | 2,828,330 | |
4.600% due 06/02/39 | | | CAD 3,300,000 | | | | 3,985,081 | |
5.500% due 06/02/18 | | | 3,800,000 | | | | 4,486,728 | |
Province of Quebec (Canada) | | | | | | | | |
2.750% due 08/25/21 | | | $4,300,000 | | | | 4,495,654 | |
3.000% due 09/01/23 | | | CAD 700,000 | | | | 705,025 | |
3.500% due 07/29/20 | | | $2,400,000 | | | | 2,667,648 | |
3.500% due 12/01/22 | | | CAD 16,200,000 | | | | 17,155,030 | |
4.250% due 12/01/21 | | | 14,000,000 | | | | 15,747,643 | |
4.500% due 12/01/16 | | | 600,000 | | | | 665,598 | |
4.500% due 12/01/17 | | | 300,000 | | | | 337,609 | |
4.500% due 12/01/18 | | | 1,300,000 | | | | 1,475,729 | |
4.500% due 12/01/20 | | | 400,000 | | | | 457,585 | |
7.500% due 07/15/23 | | | $2,495,000 | | | | 3,538,738 | |
Province of Saskatchewan (Canada)
8.500% due 07/15/22 | | | 340,000 | | | | 512,639 | |
Russian Foreign Bond (Russia)
3.250% due 04/04/17 ~ | | | 2,800,000 | | | | 2,982,000 | |
Spain Government Bond (Spain) | | | | | | | | |
3.150% due 01/31/16 | | | EUR 4,800,000 | | | | 6,291,287 | |
3.300% due 10/31/14 | | | 8,400,000 | | | | 11,174,292 | |
3.400% due 04/30/14 | | | 11,400,000 | | | | 15,230,115 | |
3.750% due 10/31/15 | | | 32,700,000 | | | | 43,498,194 | |
4.400% due 01/31/15 | | | 3,300,000 | | | | 4,494,353 | |
| | | | | | | | |
| | |
Total Foreign Government Bonds & Notes
(Cost $1,094,934,700) | | | | | | | 1,095,756,864 | |
| | | | | | | | |
|
MUNICIPAL BONDS - 4.0% | |
| | |
American Municipal Power Inc OH ‘B’
8.084% due 02/15/50 | | | $4,600,000 | | | | 6,761,218 | |
Buckeye Tobacco Settlement Financing Authority of OH ‘A2’
5.875% due 06/01/47 | | | 5,400,000 | | | | 4,849,848 | |
California Infrastructure & Economic Development Bank
6.486% due 05/15/49 | | | 1,700,000 | | | | 2,005,813 | |
California State Public Works Board ‘B2’
7.804% due 03/01/35 | | | 4,700,000 | | | | 5,487,297 | |
Chicago Transit Authority IL ‘A’
6.899% due 12/01/40 | | | 7,200,000 | | | | 8,745,552 | |
Chicago Transit Authority IL ‘B’ | | | | | | | | |
6.200% due 12/01/40 | | | 1,900,000 | | | | 2,150,363 | |
6.300% due 12/01/21 | | | 800,000 | | | | 927,896 | |
6.899% due 12/01/40 | | | 6,800,000 | | | | 8,259,688 | |
Commonwealth of Puerto Rico ‘A’
5.125% due 07/01/31 | | | 335,000 | | | | 334,977 | |
County of Clark NV Airport ‘C’
6.820% due 07/01/45 | | | 3,300,000 | | | | 4,727,283 | |
Golden State Tobacco Securitization Corp CA ‘A1’ | | | | | |
5.125% due 06/01/47 | | | 1,800,000 | | | | 1,553,166 | |
5.750% due 06/01/47 | | | 3,000,000 | | | | 2,845,320 | |
Illinois Municipal Electric Agency
6.832% due 02/01/35 | | | 300,000 | | | | 360,705 | |
Los Angeles Unified School District CA ‘A1’
4.500% due 07/01/24 | | | 7,100,000 | | | | 7,975,856 | |
Los Angeles Wastewater Systems Revenue CA
5.713% due 06/01/39 | | | 1,600,000 | | | | 1,882,080 | |
Metropolitan Pier & Exposition Authority IL ‘A’
13.204% due 06/15/29 | | | 4,000,000 | | | | 1,986,880 | |
Metropolitan Transportation Authority NY ‘E’
7.134% due 11/15/30 | | | 22,300,000 | | | | 26,477,459 | |
| | | | | | | | |
| | | Principal
Amount | | | Value | |
New York State Dormitory Authority
5.051% due 09/15/27 | | | $6,100,000 | | | | $7,179,517 | |
North Carolina Turnpike Authority ‘B’
6.700% due 01/01/39 | | | 400,000 | | | | 464,192 | |
Northern Tobacco
Securitization Corp AK ‘A’
5.000% due 06/01/46 | | | 2,300,000 | | | | 2,026,553 | |
Palomar Community College District CA ‘A’
4.750% due 05/01/32 | | | 400,000 | | | | 444,644 | |
Pennsylvania Economic Development Financing Authority
6.532% due 06/15/39 | | | 1,600,000 | | | | 1,920,000 | |
Port Authority of New York & New Jersey
5.647% due 11/01/40 | | | 2,000,000 | | | | 2,450,120 | |
Public Power Generation Agency NE
7.242% due 01/01/41 | | | 2,100,000 | | | | 2,508,114 | |
Salt River Project Agricultural Improvement & Power Dist Revenue AZ ‘A’
5.000% due 01/01/38 | | | 5,200,000 | | | | 5,874,232 | |
Southern California Public Power Authority
5.943% due 07/01/40 | | | 37,000,000 | | | | 44,414,430 | |
State of California | | | | | | | | |
7.550% due 04/01/39 | | | 3,550,000 | | | | 5,121,940 | |
7.950% due 03/01/36 | | | 1,200,000 | | | | 1,492,428 | |
State of Iowa
6.750% due 06/01/34 | | | 1,000,000 | | | | 1,195,220 | |
State of Texas ‘A’
4.750% due 04/01/35 | | | 1,700,000 | | | | 1,813,526 | |
State of Wisconsin ‘A’
5.050% due 05/01/18 | | | 1,700,000 | | | | 1,965,268 | |
Tobacco Settlement Finance
Authority of WV ‘A’
7.467% due 06/01/47 | | | 9,100,000 | | | | 7,291,648 | |
Tobacco Settlement Financing Corp LA ‘B’
5.875% due 05/15/39 | | | 4,935,000 | | | | 5,055,266 | |
Tobacco Settlement Financing Corp NJ ‘1A’ 5.000% due 06/01/41 | | | 12,400,000 | | | | 11,282,016 | |
Tobacco Settlement Financing Corp RI ‘A’ | | | | | | | | |
6.125% due 06/01/32 | | | 2,735,000 | | | | 2,789,399 | |
6.250% due 06/01/42 | | | 900,000 | | | | 911,979 | |
Washington State Convention Center Public Facilities District
6.790% due 07/01/40 | | | 10,600,000 | | | | 13,047,540 | |
| | | | | | | | |
| | |
Total Municipal Bonds
(Cost $177,043,020) | | | | | | | 206,579,433 | |
| | | | | | | | |
|
SHORT-TERM INVESTMENTS - 1.9% | |
|
Foreign Government Issues - 1.4% | |
| | |
Japan Treasury Discount Bills (Japan) | | | | | | | | |
0.099% due 02/12/13 | | | JPY 3,950,000,000 | | | | 45,581,272 | |
0.099% due 02/25/13 | | | 2,400,000,000 | | | | 27,695,033 | |
| | | | | | | | |
| | | | | | | 73,276,305 | |
| | | | | | | | |
U.S. Treasury Bills - 0.1% | |
| | |
0.140% due 05/23/13 ‡ | | | $240,000 | | | | 239,904 | |
0.147% due 12/12/13 ‡ | | | 1,980,000 | | | | 1,977,355 | |
0.150% due 12/12/13 ‡ | | | 300,000 | | | | 299,599 | |
0.168% due 11/14/13 ‡ | | | 150,000 | | | | 149,816 | |
| | | | | | | | |
| | | | | | | 2,666,674 | |
| | | | | | | | |
Repurchase Agreements - 0.4% | |
| | |
Fixed Income Clearing Corp
0.010% due 01/02/13
(Dated 12/31/12, repurchase price of
$10,496,202; collateralized by U.S.
Treasury Notes: 0.250% due 07/15/15
and value $10,710,000) | | | 10,496,197 | | | | 10,496,197 | |
| | |
| See Notes to Financial Statements | | See explanation of symbols and terms, if any, on page B-143 |
B-50
PACIFIC SELECT FUND
MANAGED BOND PORTFOLIO
Schedule of Investments (Continued)
December 31, 2012
| | | | | | | | |
| | | Principal
Amount | | | Value | |
The Toronto Dominion Bank
0.230% due 01/02/13
(Dated 12/31/12, repurchase price of
$10,800,138; collateralized by U.S.
Treasury Bonds: 3.750% due 08/15/41
and value $10,996,672) | | | $10,800,000 | | | | $10,800,000 | |
| | | | | | | | |
| | | | 21,296,197 | |
| | | | | | | | |
| | |
Total Short-Term Investments
(Cost $102,784,928) | | | | | | | 97,239,176 | |
| | | | | | | | |
| | |
TOTAL INVESTMENTS - 137.8%
(Cost $6,865,322,949) | | | | | | | 7,087,089,301 | |
| |
OTHER ASSETS & LIABILITIES, NET - (37.8%) | | | | (1,944,391,767) | |
| | | | | | | | |
| |
NET ASSETS - 100.0% | | | | $5,142,697,534 | |
| | | | | | | | |
Notes to Schedule of Investments
| (a) | As of December 31, 2012, the portfolio was diversified as a percentage of net assets as follows: |
| | | | |
Mortgage-Backed Securities | | | 58.9% | |
U.S. Treasury Obligations | | | 22.4% | |
Corporate Bonds & Notes | | | 22.1% | |
Foreign Government Bonds & Notes | | | 21.3% | |
Municipal Bonds | | | 4.0% | |
U.S. Government Agency Issues | | | 4.0% | |
Short-Term Investments | | | 1.9% | |
Asset-Backed Securities | | | 1.6% | |
Equity Securities | | | 1.3% | |
Senior Loan Notes | | | 0.3% | |
| | | | |
| | | 137.8% | |
Other Assets & Liabilities, Net | | | (37.8% | ) |
| | | | |
| | | 100.0% | |
| | | | |
| (b) | As of December 31, 2012, the portfolio’s Standard & Poor’s quality ratings as a percentage of total fixed income investments were as follows (Unaudited): |
| | | | |
AAA | | | 2.2% | |
A-1 (Short-Term Debt only) | | | 0.3% | |
AA/U.S. Government & Agency Issues | | | 63.3% | |
A | | | 8.9% | |
BBB | | | 7.5% | |
BB | | | 1.3% | |
B | | | 2.3% | |
CCC | | | 1.0% | |
CC | | | 0.1% | |
D | | | 0.1% | |
Not Rated | | | 13.0% | |
| | | | |
| | | 100.0% | |
| | | | |
| (c) | Short-term investments reflect either the stated coupon rate or the annualized effective yield on the date of purchase for discounted investments. |
| (d) | Investments with a total aggregate value of $3,281,439 or less than 0.1% of the portfolio’s net assets were in default as of December 31, 2012. |
| (e) | As of December 31, 2012, investments with total aggregate values of $4,322,372, $71,476,767, $44,267,670 and $509,319 were fully or partially segregated with the broker(s)/custodian as collateral for open futures contracts, a reverse repurchase agreement, swap contracts, and a delayed delivery security, respectively. |
| (f) | Open futures contracts outstanding as of December 31, 2012 were as follows: |
| | | | | | | | | | | | |
| Long Futures Outstanding | | Number of
Contracts | | | Notional
Amount | | | Unrealized
Appreciation
(Depreciation) | |
Euribor (12/14) | | | 75 | | | | EUR 75,000,000 | | | | $64,249 | |
Euribor (03/15) | | | 18 | | | | 18,000,000 | | | | 1,626 | |
Euribor (06/15) | | | 15 | | | | 15,000,000 | | | | 228 | |
Eurodollar (06/15) | | | 2,217 | | | | $2,217,000,000 | | | | 1,017,943 | |
Eurodollar (09/15) | | | 409 | | | | 409,000,000 | | | | 211,876 | |
Eurodollar (12/15) | | | 1,968 | | | | 1,968,000,000 | | | | 19,126 | |
Eurodollar (03/16) | | | 676 | | | | 676,000,000 | | | | (2,776 | ) |
Eurodollar (06/16) | | | 56 | | | | 56,000,000 | | | | 606 | |
Eurodollar (09/16) | | | 37 | | | | 37,000,000 | | | | 200 | |
U.S. Treasury 10-Year Notes (03/13) | | | 59 | | | | 5,900,000 | | | | (53 | ) |
| | | | | | | | | | | | |
| | | | | | | | | | | 1,313,025 | |
| | | | | | | | | | | | |
| | | |
Short Futures Outstanding | | | | | | | | | |
Euro-Bund 10-Year Notes (03/13) | | | 486 | | | | EUR 48,600,000 | | | | (571,317 | ) |
| | | | | | | | | | | | |
| | | |
Total Futures Contracts | | | | | | | | | | | $741,708 | |
| | | | | | | | | | | | |
| (g) | A reverse repurchase agreement outstanding as of December 31, 2012 was as follows: |
| | | | | | | | | | | | | | | | | | | | |
| Counterparty | | Interest
Rate | | | Settlement
Date | | | Maturity
Date | | | Repurchase
Amount | | | Principal
Amount | |
JPM | | | 0.160% | | | | 12/17/12 | | | | 01/15/13 | | | | $73,851,517 | | | | $73,842,000 | |
| | | | | | | | | | | | | | | | | | | | |
| (h) | The average amount of borrowings by the portfolio on reverse repurchase agreements while outstanding during the year ended December 31, 2012 was $33,780,478 at a weighted average interest rate of 0.148%. The average amount of borrowings by the portfolio on sale-buyback financing transactions (See Note 4 in Notes to Financial Statements) outstanding during the year ended December 31, 2012 was $76,174,590 at a weighted average interest rate of 0.082%. |
| (i) | Forward foreign currency contracts outstanding as of December 31, 2012 were as follows: |
| | | | | | | | | | | | | | | | | | | | |
Currency
Purchased | | | Currency
Sold | | | Expiration | | | Counterparty | | Unrealized
Appreciation
(Depreciation) | |
| CAD | | | 338,000 | | | USD | | | 341,780 | | | | 03/13 | | | HSB | | | ($2,539 | ) |
| CNY | | | 60,000,000 | | | USD | | | 9,457,010 | | | | 02/13 | | | JPM | | | 154,832 | |
| CNY | | | 67,903,046 | | | USD | | | 10,691,709 | | | | 02/13 | | | RBS | | | 186,180 | |
| DKK | | | 1,439,000 | | | USD | | | 255,201 | | | | 02/13 | | | JPM | | | (442 | ) |
| DKK | | | 297,000 | | | USD | | | 52,526 | | | | 02/13 | | | RBC | | | 54 | |
| EUR | | | 113,206,000 | | | USD | | | 150,054,553 | | | | 01/13 | | | BOA | | | (628,204 | ) |
| EUR | | | 4,497,000 | | | USD | | | 5,885,116 | | | | 01/13 | | | JPM | | | 50,703 | |
| EUR | | | 307,000 | | | USD | | | 397,463 | | | | 01/13 | | | RBC | | | 7,762 | |
| EUR | | | 7,395,000 | | | USD | | | 9,667,225 | | | | 01/13 | | | RBS | | | 93,811 | |
| EUR | | | 113,207,000 | | | USD | | | 150,452,103 | | | | 01/13 | | | UBS | | | (1,024,434 | ) |
| EUR | | | 4,513,000 | | | USD | | | 5,951,248 | | | | 02/13 | | | RBS | | | 7,315 | |
| GBP | | | 2,112,000 | | | USD | | | 3,399,370 | | | | 03/13 | | | DUB | | | 30,749 | |
| | |
| See Notes to Financial Statements | | See explanation of symbols and terms, if any, on page B-143 |
B-51
PACIFIC SELECT FUND
MANAGED BOND PORTFOLIO
Schedule of Investments (Continued)
December 31, 2012
| | | | | | | | | | | | | | | | | | | | |
Currency
Purchased | | | Currency
Sold | | | Expiration | | | Counterparty | | Unrealized
Appreciation
(Depreciation) | |
| MXN | | | 406,593,844 | | | USD | | | 30,704,812 | | | | 04/13 | | | DUB | | | $486,939 | |
| MXN | | | 141,710,504 | | | USD | | | 10,995,502 | | | | 04/13 | | | HSB | | | (124,213 | ) |
| MXN | | | 2,039,159 | | | USD | | | 154,443 | | | | 04/13 | | | HSB | | | 1,991 | |
| MXN | | | 5,393,080 | | | USD | | | 419,222 | | | | 04/13 | | | JPM | | | (5,493 | ) |
| MXN | | | 28,588,748 | | | USD | | | 2,184,849 | | | | 04/13 | | | JPM | | | 8,330 | |
| MXN | | | 1,326,722 | | | USD | | | 100,742 | | | | 04/13 | | | MSC | | | 1,037 | |
| MXN | | | 9,325,039 | | | USD | | | 711,563 | | | | 04/13 | | | UBS | | | 3,805 | |
| USD | | | 371,809,606 | | | BRL | | | 764,552,093 | | | | 02/13 | | | HSB | | | (27,124 | ) |
| USD | | | 6,908,958 | | | BRL | | | 14,183,400 | | | | 02/13 | | | UBS | | | 10,920 | |
| USD | | | 4,764,989 | | | CAD | | | 4,709,000 | | | | 03/13 | | | BRC | | | 38,704 | |
| USD | | | 152,532,535 | | | CAD | | | 150,317,000 | | | | 03/13 | | | DUB | | | 1,663,772 | |
| USD | | | 48,921,519 | | | CAD | | | 48,310,000 | | | | 03/13 | | | RBC | | | 434,189 | |
| USD | | | 3,169,751 | �� | | CNY | | | 20,004,296 | | | | 02/13 | | | BRC | | | (34,885 | ) |
| USD | | | 4,500,000 | | | CNY | | | 28,327,500 | | | | 02/13 | | | CSF | | | (37,991 | ) |
| USD | | | 12,600,000 | | | CNY | | | 79,571,250 | | | | 02/13 | | | UBS | | | (147,104 | ) |
| USD | | | 18,517,387 | | | DKK | | | 107,886,000 | | | | 02/13 | | | CIT | | | (582,660 | ) |
| USD | | | 18,522,938 | | | DKK | | | 107,885,000 | | | | 02/13 | | | RBC | | | (576,932 | ) |
| USD | | | 65,752,812 | | | EUR | | | 50,773,000 | | | | 01/13 | | | BNP | | | (1,265,050 | ) |
| USD | | | 227,672,048 | | | EUR | | | 176,502,000 | | | | 01/13 | | | BOA | | | (5,301,907 | ) |
| USD | | | 1,002,728 | | | EUR | | | 775,000 | | | | 01/13 | | | BRC | | | (20,234 | ) |
| USD | | | 9,834,198 | | | EUR | | | 7,468,000 | | | | 01/13 | | | CSF | | | (23,194 | ) |
| USD | | | 281,701 | | | EUR | | | 214,000 | | | | 01/13 | | | MSC | | | (768 | ) |
| USD | | | 26,994,022 | | | EUR | | | 21,780,000 | | | | 01/13 | | | UBS | | | (1,760,459 | ) |
| USD | | | 150,103,798 | | | EUR | | | 113,206,000 | | | | 02/13 | | | BOA | | | 636,694 | |
| USD | | | 1,148,289 | | | EUR | | | 871,000 | | | | 02/13 | | | BRC | | | (1,702 | ) |
| USD | | | 150,497,952 | | | EUR | | | 113,207,000 | | | | 02/13 | | | UBS | | | 1,029,528 | |
| USD | | | 5,048,900 | | | EUR | | | 4,000,000 | | | | 08/13 | | | BNP | | | (242,247 | ) |
| USD | | | 11,810,160 | | | EUR | | | 9,400,000 | | | | 09/13 | | | BOA | | | (626,933 | ) |
| USD | | | 60,967,020 | | | EUR | | | 47,237,546 | | | | 09/13 | | | UBS | | | (1,538,878 | ) |
| USD | | | 2,653,119 | | | EUR | | | 2,100,000 | | | | 04/14 | | | BNP | | | (132,731 | ) |
| USD | | | 2,027,760 | | | EUR | | | 1,600,000 | | | | 04/14 | | | CIT | | | (94,793 | ) |
| USD | | | 3,793,590 | | | EUR | | | 3,000,000 | | | | 06/14 | | | BNP | | | (189,616 | ) |
| USD | | | 3,170,000 | | | EUR | | | 2,500,000 | | | | 06/14 | | | CSF | | | (149,339 | ) |
| USD | | | 2,656,500 | | | EUR | | | 2,100,000 | | | | 07/14 | | | BNP | | | (132,866 | ) |
| USD | | | 2,024,960 | | | EUR | | | 1,600,000 | | | | 08/14 | | | BNP | | | (101,185 | ) |
| USD | | | 15,717,582 | | | GBP | | | 9,814,000 | | | | 03/13 | | | JPM | | | (221,426 | ) |
| USD | | | 22,091,955 | | | JPY | | | 1,811,854,000 | | | | 01/13 | | | DUB | | | 1,176,581 | |
| USD | | | 791,227 | | | JPY | | | 67,750,000 | | | | 01/13 | | | HSB | | | 9,146 | |
| USD | | | 48,504,266 | | | JPY | | | 3,880,000,000 | | | | 02/13 | | | BOA | | | 3,702,616 | |
| USD | | | 23,051,953 | | | JPY | | | 1,840,000,000 | | | | 02/13 | | | CIT | | | 1,807,156 | |
| USD | | | 7,890,801 | | | JPY | | | 630,000,000 | | | | 02/13 | | | UBS | | | 616,767 | |
| USD | | | 61,682,877 | | | MXN | | | 802,247,501 | | | | 04/13 | | | UBS | | | 138,647 | |
| | | | | | | | | | | | | | | | | | | | |
| | | | |
Total Forward Foreign Currency Contracts | | | | | | | | | | | | | ($2,697,121 | ) |
| | | | | | | | | | | | | | | | | | | | |
| (j) | Transactions in written options for the year ended December 31, 2012 were as follows: |
| | | | | | | | | | | | | | | | |
| | | Number of
Contracts | | | Notional Amount
in $ | | | Notional Amount
in EUR | | | Premium | |
Outstanding, December 31, 2011 | | | 877 | | | | 2,992,100,000 | | | | - | | | | $24,762,520 | |
Call Options Written | | | 771 | | | | 549,500,000 | | | | 9,900,000 | | | | 1,564,713 | |
Put Options Written | | | 771 | | | | 1,456,600,000 | | | | 9,900,000 | | | | 7,600,698 | |
Call Options Exercised | | | - | | | | (273,800,000 | ) | | | - | | | | (587,167 | ) |
Call Options Closed | | | (771 | ) | | | (259,600,000 | ) | | | (9,900,000 | ) | | | (855,991 | ) |
Put Options Closed | | | (1,648 | ) | | | (3,870,700,000 | ) | | | - | | | | (28,467,953 | ) |
| | | | | | | | | | | | | | | | |
Outstanding, December 31, 2012 | | | - | | | | 594,100,000 | | | | 9,900,000 | | | | $4,016,820 | |
| | | | | | | | | | | | | | | | |
| | |
| See Notes to Financial Statements | | See explanation of symbols and terms, if any, on page B-143 |
B-52
PACIFIC SELECT FUND
MANAGED BOND PORTFOLIO
Schedule of Investments (Continued)
December 31, 2012
| (k) | Premiums received and value of written options outstanding as of December 31, 2012 were as follows: |
Inflation Floor/Cap Options
| | | | | | | | | | | | | | | | | | | | | | | | |
| Description | | Strike
Index | | | Exercise Index | | Expiration
Date | | | Counter-
party | | Notional
Amount | | | Premium | | | Value | |
Floor - OTC U.S. CPI Urban Consumers NSA | | | 215.95 | | | Maximum of [(1+0.00%)10
- Inflation Adjustment] or $0 | | | 03/10/20 | | | DUB | | | $4,200,000 | | | | $31,500 | | | | ($8,898 | ) |
Floor - OTC U.S. CPI Urban Consumers NSA | | | 215.95 | | | Maximum of [(1+0.00%)10
- Inflation Adjustment] or $0 | | | 03/12/20 | | | CIT | | | 11,600,000 | | | | 98,160 | | | | (22,124 | ) |
Floor - OTC U.S. CPI Urban Consumers NSA | | | 216.69 | | | Maximum of [(1+0.00%)10
- Inflation Adjustment] or $0 | | | 04/07/20 | | | CIT | | | 27,900,000 | | | | 248,820 | | | | (54,143 | ) |
Floor - OTC U.S. CPI Urban Consumers NSA | | | 217.97 | | | Maximum of [(1+0.00%)10
- Inflation Adjustment] or $0 | | | 09/29/20 | | | CIT | | | 12,300,000 | | | | 158,670 | | | | (24,358 | ) |
Floor - OTC U.S. CPI Urban Consumers NSA | | | 218.01 | | | Maximum of [(1+0.00%)10
- Inflation Adjustment] or $0 | | | 10/13/20 | | | DUB | | | 12,500,000 | | | | 122,500 | | | | (29,719 | ) |
| | | | | | | | | | | | | | | | | | | | | | | | |
| | | | | | | | | | | | | | | | | | | $659,650 | | | | ($139,242 | ) |
| | | | | | | | | | | | | | | | | | | | | | | | |
Interest Rate Swaptions
| | | | | | | | | | | | | | | | | | | | | | | | |
| Description | | Pay/Receive
Floating Rate
Based on
3-Month
USD-LIBOR | | Exercise
Rate | | | Expiration
Date | | | Counter-
party | | Notional
Amount | | | Premium | | | Value | |
Call - OTC 10-Year Interest Rate Swap | | Receive | | | 1.500% | | | | 05/30/13 | | | RBS | | | $16,100,000 | | | | $121,555 | | | | ($42,398 | ) |
| | | | | | | | | | | | | | | | | | | | | | | | |
| | | | | | | |
Put - OTC 5-Year Interest Rate Swap | | Pay | | | 1.200% | | | | 03/18/13 | | | BOA | | | 87,100,000 | | | | 374,158 | | | | (76,195 | ) |
Put - OTC 5-Year Interest Rate Swap | | Pay | | | 1.200% | | | | 03/18/13 | | | DUB | | | 44,600,000 | | | | 163,905 | | | | (39,016 | ) |
Put - OTC 5-Year Interest Rate Swap | | Pay | | | 1.200% | | | | 03/18/13 | | | MSC | | | 63,600,000 | | | | 346,536 | | | | (55,637 | ) |
Put - OTC 5-Year Interest Rate Swap | | Pay | | | 1.200% | | | | 03/18/13 | | | RBS | | | 27,900,000 | | | | 141,592 | | | | (24,407 | ) |
Put - OTC 5-Year Interest Rate Swap | | Pay | | | 1.400% | | | | 03/18/13 | | | CSF | | | 1,400,000 | | | | 27,020 | | | | (441 | ) |
Put - OTC 5-Year Interest Rate Swap | | Pay | | | 1.400% | | | | 03/18/13 | | | MSC | | | 19,100,000 | | | | 370,540 | | | | (6,015 | ) |
Put - OTC 7-Year Interest Rate Swap | | Pay | | | 1.650% | | | | 03/18/13 | | | BOA | | | 5,700,000 | | | | 17,100 | | | | (12,644 | ) |
Put - OTC 5-Year Interest Rate Swap | | Pay | | | 2.000% | | | | 03/18/13 | | | DUB | | | 34,300,000 | | | | 322,254 | | | | (251 | ) |
Put - OTC 1-Year Interest Rate Swap | | Pay | | | 2.250% | | | | 05/28/13 | | | BOA | | | 97,900,000 | | | | 484,605 | | | | (39 | ) |
Put - OTC 5-Year Interest Rate Swap | | Pay | | | 1.750% | | | | 05/30/13 | | | RBS | | | 60,600,000 | | | | 449,580 | | | | (32,518 | ) |
Put - OTC 2-Year Interest Rate Swap | | Pay | | | 1.200% | | | | 07/11/13 | | | DUB | | | 67,300,000 | | | | 474,987 | | | | (7,672 | ) |
| | | | | | | |
| | | Based on
3-Month
EUR-LIBOR | | | | | | | | | | | | | | | | | |
Put - OTC 5-Year Interest Rate Swap | | Pay | | | 1.100% | | | | 01/21/13 | | | CIT | | | EUR 7,700,000 | | | | 48,922 | | | | (101 | ) |
Put - OTC 5-Year Interest Rate Swap | | Pay | | | 1.100% | | | | 01/21/13 | | | CSF | | | 2,200,000 | | | | 14,416 | | | | (29 | ) |
| | | | | | | | | | | | | | | | | | | | | | | | |
| | | | | | | |
| | | | | | | | | | | | | | | | | | | 3,235,615 | | | | (254,965 | ) |
| | | | | | | | | | | | | | | | | | | | | | | | |
| | | | | | | |
| | | | | | | | | | | | | | | | | | | $3,357,170 | | | | ($297,363 | ) |
| | | | | | | | | | | | | | | | | | | | | | | | |
| | |
Total Written Options | | | | $4,016,820 | | | | ($436,605 | ) |
| | | | | | | | | | | | | | | | | | | | | | | | |
| (l) | Swap agreements outstanding as of December 31, 2012 were as follows: |
Credit Default Swaps on Corporate Issues – Buy Protection (1)
| | | | | | | | | | | | | | | | | | | | | | | | | | | | | | |
| Referenced Obligation | | Fixed Deal
Pay
Rate | | | Expiration
Date | | | Counter-
party | | Implied Credit
Spread at
12/31/12 (3) | | | Notional
Amount (4) | | | Value | | | Upfront
Premiums
Paid
(Received) | | | Unrealized
Appreciation
(Depreciation) | |
CNA Financial Corp | | | 0.470% | | | | 12/20/14 | | | CIT | | | 0.509% | | | | $4,000,000 | | | | $2,477 | | | | $- | | | | $2,477 | |
Everest Reinsurance Holdings Inc | | | 0.535% | | | | 12/20/14 | | | BRC | | | 0.474% | | | | 2,000,000 | | | | (2,772 | ) | | | - | | | | (2,772 | ) |
CNA Financial Corp | | | 0.630% | | | | 12/20/14 | | | BOA | | | 0.509% | | | | 5,000,000 | | | | (12,955 | ) | | | - | | | | (12,955 | ) |
Masco Corp | | | 0.915% | | | | 12/20/16 | | | CSF | | | 1.689% | | | | 3,200,000 | | | | 93,973 | | | | - | | | | 93,973 | |
Rohm & Haas Co | | | 0.580% | | | | 09/20/17 | | | UBS | | | 0.441% | | | | 5,000,000 | | | | (33,367 | ) | | | - | | | | (33,367 | ) |
Marks & Spencer PLC | | | 0.950% | | | | 12/20/17 | | | RBC | | | 1.683% | | | | 10,000,000 | | | | 344,228 | | | | - | | | | 344,228 | |
| | | | | | | | | | | | | | | | | | | | | | | | | | | | | | |
| | | | | | | | | | | | | | | | | | | | | $391,584 | | | | $- | | | | $391,584 | |
| | | | | | | | | | | | | | | | | | | | | | | | | | | | | | |
Credit Default Swaps on Corporate, Sovereign and U. S. Treasury Obligation Issues – Sell Protection (2)
| | | | | | | | | | | | | | | | | | | | | | | | | | | | | | |
| Referenced Obligation | | Fixed Deal
Receive
Rate | | | Expiration
Date | | | Counter-
party | | Implied Credit
Spread at
12/31/12 (3) | | | Notional
Amount (4) | | | Value | | | Upfront
Premiums
Paid
(Received) | | | Unrealized
Appreciation
(Depreciation) | |
Morgan Stanley | | | 1.000% | | | | 03/20/13 | | | DUB | | | 0.393% | | | | $400,000 | | | | $665 | | | | ($17,772 | ) | | | $18,437 | |
MetLife Inc | | | 1.000% | | | | 09/20/13 | | | JPM | | | 0.279% | | | | 9,030,000 | | | | 50,392 | | | | (506,399 | ) | | | 556,791 | |
General Electric Capital Corp | | | 4.000% | | | | 12/20/13 | | | CIT | | | 0.220% | | | | 4,600,000 | | | | 176,149 | | | | - | | | | 176,149 | |
| | |
| See Notes to Financial Statements | | See explanation of symbols and terms, if any, on page B-143 |
B-53
PACIFIC SELECT FUND
MANAGED BOND PORTFOLIO
Schedule of Investments (Continued)
December 31, 2012
| | | | | | | | | | | | | | | | | | | | | | | | | | | | | | |
| Referenced Obligation | | Fixed Deal
Receive
Rate | | | Expiration
Date | | | Counter-
party | | Implied Credit
Spread at
12/31/12 (3) | | | Notional
Amount (4) | | | Value | | | Upfront
Premiums
Paid
(Received) | | | Unrealized
Appreciation
(Depreciation) | |
General Electric Capital Corp | | | 4.200% | | | | 12/20/13 | | | CIT | | | 0.220% | | | | $11,400,000 | | | | $459,600 | | | | $- | | | | $459,600 | |
General Electric Capital Corp | | | 4.230% | | | | 12/20/13 | | | DUB | | | 0.220% | | | | 7,700,000 | | | | 312,767 | | | | - | | | | 312,767 | |
General Electric Capital Corp | | | 4.325% | | | | 12/20/13 | | | CIT | | | 0.220% | | | | 7,200,000 | | | | 299,374 | | | | - | | | | 299,374 | |
General Electric Capital Corp | | | 4.400% | | | | 12/20/13 | | | BRC | | | 0.220% | | | | 13,400,000 | | | | 567,331 | | | | - | | | | 567,331 | |
General Electric Capital Corp | | | 4.500% | | | | 12/20/13 | | | BRC | | | 0.220% | | | | 16,900,000 | | | | 732,605 | | | | - | | | | 732,605 | |
General Electric Capital Corp | | | 4.700% | | | | 12/20/13 | | | BRC | | | 0.220% | | | | 13,500,000 | | | | 612,519 | | | | - | | | | 612,519 | |
General Electric Capital Corp | | | 4.850% | | | | 12/20/13 | | | CIT | | | 0.220% | | | | 5,900,000 | | | | 276,643 | | | | - | | | | 276,643 | |
General Electric Capital Corp | | | 4.900% | | | | 12/20/13 | | | DUB | | | 0.220% | | | | 2,800,000 | | | | 132,704 | | | | - | | | | 132,704 | |
MetLife Inc | | | 1.000% | | | | 06/20/14 | | | DUB | | | 0.550% | | | | 15,000,000 | | | | 104,470 | | | | (66,241 | ) | | | 170,711 | |
MetLife Inc | | | 1.000% | | | | 12/20/14 | | | CIT | | | 0.730% | | | | 8,600,000 | | | | 48,611 | | | | (221,596 | ) | | | 270,207 | |
MetLife Inc | | | 1.000% | | | | 12/20/14 | | | CSF | | | 0.730% | | | | 17,700,000 | | | | 100,049 | | | | (349,232 | ) | | | 449,281 | |
Berkshire Hathaway Finance Inc | | | 1.000% | | | | 03/20/15 | | | BOA | | | 0.671% | | | | 4,300,000 | | | | 32,737 | | | | (75,980 | ) | | | 108,717 | |
Mexico Government | | | 1.000% | | | | 03/20/15 | | | BRC | | | 0.451% | | | | 3,000,000 | | | | 37,558 | | | | (67,496 | ) | | | 105,054 | |
Mexico Government | | | 1.000% | | | | 03/20/15 | | | CIT | | | 0.451% | | | | 3,000,000 | | | | 37,558 | | | | (68,880 | ) | | | 106,438 | |
Mexico Government | | | 1.000% | | | | 03/20/15 | | | DUB | | | 0.451% | | | | 1,500,000 | | | | 18,779 | | | | (34,440 | ) | | | 53,219 | |
Berkshire Hathaway Finance Inc | | | 1.000% | | | | 03/20/15 | | | GSC | | | 0.671% | | | | 2,200,000 | | | | 16,749 | | | | (38,874 | ) | | | 55,623 | |
China Government | | | 1.000% | | | | 03/20/15 | | | MSC | | | 0.217% | | | | 1,700,000 | | | | 30,187 | | | | (25,506 | ) | | | 55,693 | |
Berkshire Hathaway Finance Inc | | | 1.000% | | | | 03/20/15 | | | UBS | | | 0.671% | | | | 2,200,000 | | | | 16,749 | | | | (39,880 | ) | | | 56,629 | |
China Government | | | 1.000% | | | | 06/20/15 | | | BOA | | | 0.253% | | | | 4,500,000 | | | | 84,689 | | | | 75,362 | | | | 9,327 | |
China Government | | | 1.000% | | | | 06/20/15 | | | CIT | | | 0.253% | | | | 1,000,000 | | | | 18,820 | | | | 16,386 | | | | 2,434 | |
Brazilian Government | | | 1.000% | | | | 06/20/15 | | | CSF | | | 0.604% | | | | 13,400,000 | | | | 135,265 | | | | (282,871 | ) | | | 418,136 | |
Brazilian Government | | | 1.000% | | | | 06/20/15 | | | JPM | | | 0.604% | | | | 8,400,000 | | | | 84,793 | | | | (92,192 | ) | | | 176,985 | |
China Government | | | 1.000% | | | | 06/20/15 | | | RBS | | | 0.253% | | | | 2,200,000 | | | | 41,403 | | | | 37,125 | | | | 4,278 | |
U.S. Treasury Notes | | | 0.250% | | | | 09/20/15 | | | UBS | | | 0.197% | | | | EUR 10,100,000 | | | | 20,320 | | | | (62,585 | ) | | | 82,905 | |
Brazilian Government | | | 1.000% | | | | 09/20/15 | | | BOA | | | 0.648% | | | | $700,000 | | | | 6,915 | | | | (6,372 | ) | | | 13,287 | |
Mexico Government | | | 1.000% | | | | 09/20/15 | | | BOA | | | 0.551% | | | | 300,000 | | | | 3,758 | | | | (4,244 | ) | | | 8,002 | |
Brazilian Government | | | 1.000% | | | | 09/20/15 | | | BRC | | | 0.648% | | | | 2,300,000 | | | | 22,721 | | | | (19,842 | ) | | | 42,563 | |
Brazilian Government | | | 1.000% | | | | 09/20/15 | | | CIT | | | 0.648% | | | | 1,000,000 | | | | 9,879 | | | | (15,694 | ) | | | 25,573 | |
Mexico Government | | | 1.000% | | | | 09/20/15 | | | CIT | | | 0.551% | | | | 1,000,000 | | | | 12,528 | | | | (15,080 | ) | | | 27,608 | |
Indonesia Government | | | 1.000% | | | | 09/20/15 | | | DUB | | | 0.620% | | | | 1,000,000 | | | | 10,633 | | | | (23,587 | ) | | | 34,220 | |
Brazilian Government | | | 1.000% | | | | 09/20/15 | | | HSB | | | 0.648% | | | | 2,600,000 | | | | 25,684 | | | | (25,870 | ) | | | 51,554 | |
Brazilian Government | | | 1.000% | | | | 09/20/15 | | | JPM | | | 0.648% | | | | 2,900,000 | | | | 28,648 | | | | (29,862 | ) | | | 58,510 | |
Brazilian Government | | | 1.000% | | | | 09/20/15 | | | UBS | | | 0.648% | | | | 600,000 | | | | 5,927 | | | | (5,677 | ) | | | 11,604 | |
Mexico Government | | | 1.000% | | | | 09/20/15 | | | UBS | | | 0.551% | | | | 500,000 | | | | 6,264 | | | | (7,073 | ) | | | 13,337 | |
Brazilian Government | | | 1.000% | | | | 12/20/15 | | | BRC | | | 0.684% | | | | 13,000,000 | | | | 125,659 | | | | (75,003 | ) | | | 200,662 | |
Japanese Government | | | 1.000% | | | | 12/20/15 | | | GSC | | | 0.435% | | | | 3,200,000 | | | | 54,636 | | | | 78,276 | | | | (23,640 | ) |
Mexico Government | | | 1.000% | | | | 12/20/15 | | | GSC | | | 0.588% | | | | 4,500,000 | | | | 56,392 | | | | (121,173 | ) | | | 177,565 | |
Brazilian Government | | | 1.000% | | | | 12/20/15 | | | MSC | | | 0.684% | | | | 12,900,000 | | | | 124,692 | | | | (74,426 | ) | | | 199,118 | |
France Government | | | 0.250% | | | | 03/20/16 | | | BOA | | | 0.467% | | | | 1,600,000 | | | | (11,014 | ) | | | (64,735 | ) | | | 53,721 | |
China Government | | | 1.000% | | | | 03/20/16 | | | BNP | | | 0.327% | | | | 400,000 | | | | 8,783 | | | | 4,839 | | | | 3,944 | |
American International Group Inc | | | 1.000% | | | | 03/20/16 | | | BOA | | | 0.827% | | | | 13,000,000 | | | | 75,846 | | | | (458,563 | ) | | | 534,409 | |
Japanese Government | | | 1.000% | | | | 03/20/16 | | | BOA | | | 0.458% | | | | 900,000 | | | | 15,941 | | | | 12,448 | | | | 3,493 | |
Brazilian Government | | | 1.000% | | | | 03/20/16 | | | BRC | | | 0.715% | | | | 6,000,000 | | | | 56,721 | | | | (40,216 | ) | | | 96,937 | |
China Government | | | 1.000% | | | | 03/20/16 | | | BRC | | | 0.327% | | | | 800,000 | | | | 17,565 | | | | 9,560 | | | | 8,005 | |
American International Group Inc | | | 1.000% | | | | 03/20/16 | | | CIT | | | 0.827% | | | | 12,900,000 | | | | 75,263 | | | | (460,757 | ) | | | 536,020 | |
Mexico Government | | | 1.000% | | | | 03/20/16 | | | DUB | | | 0.619% | | | | 12,300,000 | | | | 154,170 | | | | (90,237 | ) | | | 244,407 | |
Mexico Government | | | 1.000% | | | | 03/20/16 | | | HSB | | | 0.619% | | | | 18,000,000 | | | | 225,615 | | | | (133,510 | ) | | | 359,125 | |
Japanese Government | | | 1.000% | | | | 03/20/16 | | | JPM | | | 0.458% | | | | 2,000,000 | | | | 35,423 | | | | 17,580 | | | | 17,843 | |
United Kingdom Index-Linked Treasury Gilt | | | 1.000% | | | | 06/20/16 | | | BOA | | | 0.253% | | | | 6,800,000 | | | | 178,340 | | | | 139,356 | | | | 38,984 | |
Indonesia Government | | | 1.000% | | | | 06/20/16 | | | BRC | | | 0.787% | | | | 6,400,000 | | | | 48,946 | | | | (101,386 | ) | | | 150,332 | |
China Government | | | 1.000% | | | | 06/20/16 | | | CIT | | | 0.376% | | | | 8,100,000 | | | | 177,701 | | | | 87,333 | | | | 90,368 | |
Mexico Government | | | 1.000% | | | | 06/20/16 | | | CIT | | | 0.669% | | | | 6,200,000 | | | | 72,780 | | | | (13,370 | ) | | | 86,150 | |
China Government | | | 1.000% | | | | 06/20/16 | | | DUB | | | 0.376% | | | | 7,500,000 | | | | 164,538 | | | | 79,079 | | | | 85,459 | |
United Kingdom Index-Linked Treasury Gilt | | | 1.000% | | | | 06/20/16 | | | DUB | | | 0.253% | | | | 41,800,000 | | | | 1,096,267 | | | | 860,333 | | | | 235,934 | |
Brazilian Government | | | 1.000% | | | | 06/20/16 | | | HSB | | | 0.771% | | | | 6,400,000 | | | | 52,649 | | | | (218,162 | ) | | | 270,811 | |
China Government | | | 1.000% | | | | 06/20/16 | | | JPM | | | 0.376% | | | | 1,800,000 | | | | 39,489 | | | | 19,376 | | | | 20,113 | |
China Government | | | 1.000% | | | | 06/20/16 | | | RBS | | | 0.376% | | | | 1,800,000 | | | | 39,489 | | | | 18,942 | | | | 20,547 | |
United Kingdom Index-Linked Treasury Gilt | | | 1.000% | | | | 06/20/16 | | | UBS | | | 0.253% | | | | 74,100,000 | | | | 1,943,382 | | | | 1,282,003 | | | | 661,379 | |
U.S. Treasury Notes | | | 0.250% | | | | 09/20/16 | | | UBS | | | 0.255% | | | | EUR 13,600,000 | | | | (2,029 | ) | | | (190,345 | ) | | | 188,316 | |
China Government | | | 1.000% | | | | 09/20/16 | | | DUB | | | 0.417% | | | | $1,500,000 | | | | 32,880 | | | | 8,287 | | | | 24,593 | |
China Government | | | 1.000% | | | | 09/20/16 | | | GSC | | | 0.417% | | | | 500,000 | | | | 10,960 | | | | 2,679 | | | | 8,281 | |
Mexico Government | | | 1.000% | | | | 09/20/16 | | | GSC | | | 0.712% | | | | 2,300,000 | | | | 25,182 | | | | (11,064 | ) | | | 36,246 | |
China Government | | | 1.000% | | | | 09/20/16 | | | JPM | | | 0.417% | | | | 3,200,000 | | | | 70,145 | | | | 18,578 | | | | 51,567 | |
China Government | | | 1.000% | | | | 09/20/16 | | | MSC | | | 0.417% | | | | 1,600,000 | | | | 35,072 | | | | 8,159 | | | | 26,913 | |
Indonesia Government | | | 1.000% | | | | 09/20/16 | | | MSC | | | 0.867% | | | | 4,400,000 | | | | 22,906 | | | | (336,028 | ) | | | 358,934 | |
Mexico Government | | | 1.000% | | | | 09/20/16 | | | MSC | | | 0.712% | | | | 4,600,000 | | | | 50,365 | | | | (20,427 | ) | | | 70,792 | |
China Government | | | 1.000% | | | | 09/20/16 | | | RBS | | | 0.417% | | | | 1,000,000 | | | | 21,920 | | | | 6,952 | | | | 14,968 | |
| | |
| See Notes to Financial Statements | | See explanation of symbols and terms, if any, on page B-143 |
B-54
PACIFIC SELECT FUND
MANAGED BOND PORTFOLIO
Schedule of Investments (Continued)
December 31, 2012
| | | | | | | | | | | | | | | | | | | | | | | | | | | | | | |
| Referenced Obligation | | Fixed Deal
Receive
Rate | | | Expiration
Date | | | Counter-
party | | Implied Credit
Spread at
12/31/12 (3) | | | Notional
Amount (4) | | | Value | | | Upfront
Premiums
Paid
(Received) | | | Unrealized
Appreciation
(Depreciation) | |
China Government | | | 1.000% | | | | 09/20/16 | | | UBS | | | 0.417% | | | | $100,000 | | | | $2,192 | | | | $519 | | | | $1,673 | |
Mexico Government | | | 1.000% | | | | 09/20/16 | | | UBS | | | 0.712% | | | | 1,200,000 | | | | 13,139 | | | | (5,265 | ) | | | 18,404 | |
Japanese Government | | | 1.000% | | | | 03/20/17 | | | BOA | | | 0.616% | | | | 22,400,000 | | | | 366,331 | | | | (161,342 | ) | | | 527,673 | |
Japanese Government | | | 1.000% | | | | 03/20/17 | | | GSC | | | 0.616% | | | | 5,600,000 | | | | 91,583 | | | | (37,492 | ) | | | 129,075 | |
Japanese Government | | | 1.000% | | | | 03/20/17 | | | MSC | | | 0.616% | | | | 10,200,000 | | | | 166,811 | | | | (75,276 | ) | | | 242,087 | |
Mexico Government | | | 1.000% | | | | 06/20/17 | | | CSF | | | 0.840% | | | | 800,000 | | | | 5,895 | | | | (7,643 | ) | | | 13,538 | |
The Goldman Sachs Group Inc | | | 1.000% | | | | 06/20/17 | | | CSF | | | 1.373% | | | | 10,000,000 | | | | (157,534 | ) | | | (945,393 | ) | | | 787,859 | |
Mexico Government | | | 1.000% | | | | 06/20/17 | | | DUB | | | 0.840% | | | | 1,200,000 | | | | 8,842 | | | | (12,050 | ) | | | 20,892 | |
Mexico Government | | | 1.000% | | | | 06/20/17 | | | GSC | | | 0.840% | | | | 2,000,000 | | | | 14,737 | | | | (20,967 | ) | | | 35,704 | |
Panama Government | | | 1.000% | | | | 06/20/17 | | | GSC | | | 0.856% | | | | 7,085,000 | | | | 47,126 | | | | (48,734 | ) | | | 95,860 | |
Russian Foreign Bond | | | 1.000% | | | | 06/20/17 | | | GSC | | | 1.165% | | | | 500,000 | | | | (3,426 | ) | | | (34,502 | ) | | | 31,076 | |
Reynolds American Inc | | | 1.280% | | | | 06/20/17 | | | BOA | | | 0.844% | | | | 3,600,000 | | | | 70,324 | | | | - | | | | 70,324 | |
Reynolds American Inc | | | 1.280% | | | | 06/20/17 | | | CIT | | | 0.844% | | | | 3,500,000 | | | | 68,371 | | | | - | | | | 68,371 | |
UnitedHealth Group Inc | | | 1.000% | | | | 03/20/18 | | | BOA | | | 0.718% | | | | 10,000,000 | | | | 146,811 | | | | (63,269 | ) | | | 210,080 | |
MetLife Inc | | | 1.000% | | | | 03/20/18 | | | DUB | | | 1.590% | | | | 7,200,000 | | | | (207,476 | ) | | | (408,988 | ) | | | 201,512 | |
| | | | | | | | | | | | | | | | | | | | | | | | | | | | | | |
| | | | | | | | | | | | | | | | | | | | | $10,312,843 | | | | ($3,550,396 | ) | | | $13,863,239 | |
| | | | | | | | | | | | | | | | | | | | | | | | | | | | | | |
Credit Default Swaps on Credit Indices – Buy Protection (1)
| | | | | | | | | | | | | | | | | | | | | | | | | | |
| Referenced Obligation | | Fixed Deal
Pay
Rate | | | Expiration
Date | | | Counter-
party | | Notional
Amount (4) | | | Value (5) | | | Upfront
Premiums
Paid
(Received) | | | Unrealized
Depreciation | |
CME - Dow Jones CDX HY17 5Y | | | 5.000% | | | | 12/20/16 | | | CME | | | $2,592,000 | | | | ($75,569 | ) | | | $162,000 | | | | ($237,569 | ) |
CME - Dow Jones CDX IG18 5Y | | | 1.000% | | | | 06/20/17 | | | CME | | | 226,300,000 | | | | (1,595,703 | ) | | | 1,156,888 | | | | (2,752,591 | ) |
CME - Dow Jones CDX HY18 5Y | | | 5.000% | | | | 06/20/17 | | | CME | | | 48,015,000 | | | | (845,888 | ) | | | 1,919,653 | | | | (2,765,541 | ) |
CME - Dow Jones CDX IG19 5Y | | | 1.000% | | | | 12/20/17 | | | CME | | | 417,100,000 | | | | (1,056,165 | ) | | | (747,128 | ) | | | (309,037 | ) |
CME - Dow Jones CDX HY19 5Y | | | 5.000% | | | | 12/20/17 | | | CME | | | 1,300,000 | | | | (7,059 | ) | | | (4,875 | ) | | | (2,184 | ) |
| | | | | | | | | | | | | | | | | | | | | | | | | | |
| | | | | | | | | | | | | | | | | ($3,580,384 | ) | | | $2,486,538 | | | | ($6,066,922 | ) |
| | | | | | | | | | | | | | | | | | | | | | | | | | |
Credit Default Swaps on Credit Indices – Sell Protection (2)
| | | | | | | | | | | | | | | | | | | | | | | | | | |
| Referenced Obligation | | Fixed Deal
Receive
Rate | | | Expiration
Date | | | Counter-
party | | Notional
Amount (4) | | | Value (5) | | | Upfront
Premiums
Paid
(Received) | | | Unrealized
Appreciation
(Depreciation) | |
OTC - Dow Jones CDX IG10 5Y | | | 0.463% | | | | 06/20/13 | | | GSC | | | $6,076,343 | | | | $14,188 | | | | $ - | | | | $14,188 | |
OTC - Dow Jones CDX IG10 5Y | | | 0.530% | | | | 06/20/13 | | | DUB | | | 4,918,944 | | | | 13,170 | | | | - | | | | 13,170 | |
OTC - Dow Jones CDX EM12 5Y | | | 5.000% | | | | 12/20/14 | | | DUB | | | 2,100,000 | | | | 132,303 | | | | 210,450 | | | | (78,147 | ) |
OTC - Dow Jones CDX EM13 5Y | | | 5.000% | | | | 06/20/15 | | | BRC | | | 9,400,000 | | | | 725,813 | | | | 1,038,600 | | | | (312,787 | ) |
OTC - Dow Jones CDX EM13 5Y | | | 5.000% | | | | 06/20/15 | | | CSF | | | 800,000 | | | | 61,771 | | | | 100,000 | | | | (38,229 | ) |
OTC - Dow Jones CDX EM13 5Y | | | 5.000% | | | | 06/20/15 | | | DUB | | | 6,400,000 | | | | 494,171 | | | | 697,200 | | | | (203,029 | ) |
OTC - Dow Jones CDX EM13 5Y | | | 5.000% | | | | 06/20/15 | | | GSC | | | 300,000 | | | | 23,165 | | | | 37,350 | | | | (14,185 | ) |
OTC - Dow Jones CDX EM13 5Y | | | 5.000% | | | | 06/20/15 | | | HSB | | | 35,400,000 | | | | 2,733,383 | | | | 2,948,700 | | | | (215,317 | ) |
OTC - Dow Jones CDX EM13 5Y | | | 5.000% | | | | 06/20/15 | | | JPM | | | 2,500,000 | | | | 193,036 | | | | 287,600 | | | | (94,564 | ) |
OTC - Dow Jones CDX EM13 5Y | | | 5.000% | | | | 06/20/15 | | | MSC | | | 15,000,000 | | | | 1,158,213 | | | | 1,743,250 | | | | (585,037 | ) |
OTC - Dow Jones CDX IG9 10Y | | | 0.548% | | | | 12/20/17 | | | GSC | | | 3,761,546 | | | | 62,203 | | | | - | | | | 62,203 | |
OTC - CMBX NA AAA 3 | | | 0.080% | | | | 12/13/49 | | | BOA | | | 2,400,000 | | | | (103,243 | ) | | | (138,750 | ) | | | 35,507 | |
| | | | | | | | | | | | | | | | | | | | | | | | | | |
| | | | | | | | | | | | | | | | | $5,508,173 | | | | $6,924,400 | | | | ($1,416,227 | ) |
| | | | | | | | | | | | | | | | | | | | | | | | | | |
| | | | | | | |
Total Credit Default Swaps | | | | | | | | | | | | | | | | | $12,632,216 | | | | $5,860,542 | | | | $6,771,674 | |
| | | | | | | | | | | | | | | | | | | | | | | | | | |
| | (1) | If the portfolio is a buyer of protection and a credit event occurs, as defined under the terms of that particular swap agreement, the portfolio will either (i) receive from the seller of protection an amount equal to the notional amount of the swap and deliver the referenced obligation or underlying investments comprising the referenced index or (ii) receive a net settlement amount in the form of cash or investments equal to the notional amount of the swap less the recovery value of the referenced obligation or underlying investments comprising the referenced index. |
| | (2) | If the portfolio is a seller of protection and a credit event occurs, as defined under the terms of that particular swap agreement, the portfolio will either (i) pay to the buyer of protection an amount equal to the notional amount of the swap and take delivery of the referenced obligation or underlying investments comprising the referenced index or (ii) pay a net settlement amount in the form of cash or investments equal to the notional amount of the swap less the recovery value of the referenced obligation or underlying investments comprising the referenced index. |
| | (3) | An implied credit spread is the spread in yield between a U.S. Treasury security and the referenced obligation or underlying investment that are identical in all respects except for the quality rating. Implied credit spreads, represented in the absolute terms, utilized in determining the value of credit default swap agreements on corporate issues, sovereign issues of an emerging country and U.S. Treasury Obligation issues as of year end serve as an indicator of the current status of the payment/performance risk and represent the likelihood of risk of default for the credit derivative. The implied credit spread of a particular referenced entity reflects the cost of buying/selling protection and may include upfront payments required to be made to enter the agreement. Wider credit spreads, in comparison to narrower credit spreads, represent a deterioration of the referenced entity’s credit soundness and a greater likelihood of risk of default or other credit event occurring as defined under the terms of the agreement. A credit spread identified as “Defaulted” indicates a credit event has occurred for the referenced entity or obligation. |
| | |
| See Notes to Financial Statements | | See explanation of symbols and terms, if any, on page B-143 |
B-55
PACIFIC SELECT FUND
MANAGED BOND PORTFOLIO
Schedule of Investments (Continued)
December 31, 2012
| | (4) | The maximum potential amount the portfolio could be required to pay as a seller of credit protection or receive as a buyer of credit protection if a credit event occurs as defined under the terms of that particular swap agreement. |
| | (5) | The quoted market prices and resulting values for credit default swap agreements on credit indices serve as an indicator of the current status of the payment/performance risk and is a representation of the likelihood of an expected liability (or profit) for the credit derivative had the notional amount of the swap agreement been closed/sold as of the year end. Increasing values, in absolute terms when compared to the notional amount of the swap, represent a deterioration of the referenced entity’s credit soundness and a greater likelihood of risk of default or other credit event occurring as defined under the terms of the agreement. |
Interest Rate Swaps
| | | | | | | | | | | | | | | | | | | | | | | | | | | | |
| Floating Rate Index | | Counter-
party | | Pay/Receive
Floating Rate | | Fixed
Rate | | | Expiration
Date | | | Notional
Amount | | | Value | | | Upfront
Premiums
Paid
(Received) | | | Unrealized
Appreciation
(Depreciation) | |
CME- 3-Month USD-LIBOR | | CME | | Pay | | | 1.500% | | | | 03/18/16 | | | | $527,300,000 | | | | $4,006,341 | | | | $2,969,505 | | | | $1,036,836 | |
OTC- 28-Day Mexico Interbank TIIE Banxico | | BRC | | Pay | | | 5.600% | | | | 09/06/16 | | | | MXN 24,100,000 | | | | 26,511 | | | | 12,013 | | | | 14,498 | |
OTC- 28-Day Mexico Interbank TIIE Banxico | | HSB | | Pay | | | 5.600% | | | | 09/06/16 | | | | 337,200,000 | | | | 370,928 | | | | 128,118 | | | | 242,810 | |
OTC- 28-Day Mexico Interbank TIIE Banxico | | BRC | | Pay | | | 5.000% | | | | 09/13/17 | | | | 4,900,000 | | | | (4,446 | ) | | | (2,848 | ) | | | (1,598 | ) |
OTC- 28-Day Mexico Interbank TIIE Banxico | | HSB | | Pay | | | 5.000% | | | | 09/13/17 | | | | 14,800,000 | | | | (13,429 | ) | | | (9,434 | ) | | | (3,995 | ) |
OTC- 28-Day Mexico Interbank TIIE Banxico | | BRC | | Pay | | | 5.500% | | | | 09/13/17 | | | | 33,000,000 | | | | 24,684 | | | | (7,366 | ) | | | 32,050 | |
OTC- 28-Day Mexico Interbank TIIE Banxico | | HSB | | Pay | | | 5.500% | | | | 09/13/17 | | | | 10,000,000 | | | | 7,480 | | | | (2,246 | ) | | | 9,726 | |
OTC- 28-Day Mexico Interbank TIIE Banxico | | MSC | | Pay | | | 5.500% | | | | 09/13/17 | | | | 33,000,000 | | | | 24,684 | | | | (7,734 | ) | | | 32,418 | |
OTC- 1-Day USD-Federal Funds Rate Compounded-OIS | | GSC | | Pay | | | 1.000% | | | | 10/15/17 | | | | $1,700,000 | | | | 668 | | | | (1,608 | ) | | | 2,276 | |
OTC- 1-Day USD-Federal Funds Rate Compounded-OIS | | MSC | | Pay | | | 1.000% | | | | 10/15/17 | | | | 57,700,000 | | | | 22,670 | | | | (173,480 | ) | | | 196,150 | |
OTC- 28-Day Mexico Interbank TIIE Banxico | | MSC | | Pay | | | 6.350% | | | | 06/02/21 | | | | MXN 160,000,000 | | | | 563,363 | | | | 241,346 | | | | 322,017 | |
OTC- 28-Day Mexico Interbank TIIE Banxico | | BOA | | Pay | | | 5.500% | | | | 09/02/22 | | | | 20,400,000 | | | | (33,787 | ) | | | (30,763 | ) | | | (3,024 | ) |
OTC- 28-Day Mexico Interbank TIIE Banxico | | MSC | | Pay | | | 5.500% | | | | 09/02/22 | | | | 67,000,000 | | | | (110,968 | ) | | | (109,423 | ) | | | (1,545 | ) |
OTC- 28-Day Mexico Interbank TIIE Banxico | | BRC | | Pay | | | 5.750% | | | | 09/02/22 | | | | 38,000,000 | | | | (6,777 | ) | | | (5,253 | ) | | | (1,524 | ) |
OTC- 28-Day Mexico Interbank TIIE Banxico | | UBS | | Pay | | | 5.750% | | | | 09/02/22 | | | | 23,000,000 | | | | (4,102 | ) | | | (3,774 | ) | | | (328 | ) |
CME- 3-Month USD-LIBOR | | CME | | Receive | | | 2.500% | | | | 12/19/42 | | | | $300,400,000 | | | | 18,418,053 | | | | 5,300,320 | | | | 13,117,733 | |
| | | | | | | | | | | | | | | | | | | | | | | | | | | | |
| | | | | | | | |
Total Interest Rate Swaps | | | | | | | | | | | | | | | | | | | $23,291,873 | | | | $8,297,373 | | | | $14,994,500 | |
| | | | | | | | | | | | | | | | | | | | | | | | | | | | |
| | | | | | | | |
Total Swap Agreements | | | | | | | | | | | | | | | | | | | $35,924,089 | | | | $14,157,915 | | | | $21,766,174 | |
| | | | | | | | | | | | | | | | | | | | | | | | | | | | |
| | |
| See Notes to Financial Statements | | See explanation of symbols and terms, if any, on page B-143 |
B-56
PACIFIC SELECT FUND
MANAGED BOND PORTFOLIO
Schedule of Investments (Continued)
December 31, 2012
| (m) | Fair Value Measurements |
The following is a summary of the portfolio’s investments as categorized under the three-tier hierarchy of inputs used in valuing the portfolio’s assets and liabilities (See Note 3D in Notes to Financial Statements) as of December 31, 2012:
| | | | | | | | | | | | | | | | | | |
| | | | | Total Value at
December 31, 2012 | | | Level 1
Quoted Price | | | Level 2
Significant
Observable Inputs | | | Level 3
Significant
Unobservable Inputs | |
Assets | | Preferred Stocks | | | | | | | | | | | | | | | | |
| | Financials | | | $3,675,107 | | | | $- | | | | $1,964,438 | | | | $1,710,669 | |
| | Convertible Preferred Stocks (1) | | | 61,250,000 | | | | 61,250,000 | | | | - | | | | - | |
| | Corporate Bonds & Notes | | | 1,135,625,348 | | | | - | | | | 1,135,625,348 | | | | - | |
| | Senior Loan Notes | | | 17,949,366 | | | | - | | | | 17,949,366 | | | | - | |
| | Mortgage-Backed Securities | | | 3,028,486,026 | | | | - | | | | 3,012,632,396 | | | | 15,853,630 | |
| | Asset-Backed Securities | | | 82,756,501 | | | | - | | | | 82,756,501 | | | | - | |
| | U.S. Government Agency Issues | | | 207,738,413 | | | | - | | | | 207,738,413 | | | | - | |
| | U.S. Treasury Obligations | | | 1,150,033,067 | | | | - | | | | 1,150,033,067 | | | | - | |
| | Foreign Government Bonds & Notes | | | 1,095,756,864 | | | | - | | | | 1,095,756,864 | | | | - | |
| | Municipal Bonds | | | 206,579,433 | | | | - | | | | 206,579,433 | | | | - | |
| | Short-Term Investments | | | 97,239,176 | | | | - | | | | 97,239,176 | | | | - | |
| | Derivatives: | | | | | | | | | | | | | | | | |
| | Credit Contracts | | | | | | | | | | | | | | | | |
| | Swaps | | | 16,746,416 | | | | - | | | | 16,746,416 | | | | - | |
| | Foreign Currency Contracts | | | | | | | | | | | | | | | | |
| | Forward Foreign Currency Contracts | | | 12,298,228 | | | | - | | | | 12,298,228 | | | | - | |
| | Interest Rate Contracts | | | | | | | | | | | | | | | | |
| | Futures | | | 1,315,854 | | | | 1,315,854 | | | | - | | | | - | |
| | Swaps | | | 23,465,382 | | | | - | | | | 23,465,382 | | | | - | |
| | | | | | | | | | | | | | | | | | |
| | Total Interest Rate Contracts | | | 24,781,236 | | | | 1,315,854 | | | | 23,465,382 | | | | - | |
| | | | | | | | | | | | | | | | | | |
| | Total Assets - Derivatives | | | 53,825,880 | | | | 1,315,854 | | | | 52,510,026 | | | | - | |
| | | | | | | | | | | | | | | | | | |
| | Total Assets | | | 7,140,915,181 | | | | 62,565,854 | | | | 7,060,785,028 | | | | 17,564,299 | |
| | | | | | | | | | | | | | | | | | |
Liabilities | | Derivatives: | | | | | | | | | | | | | | | | |
| | Credit Contracts | | | | | | | | | | | | | | | | |
| | Swaps | | | (4,114,200 | ) | | | - | | | | (4,114,200 | ) | | | - | |
| | Foreign Currency Contracts | | | | | | | | | | | | | | | | |
| | Forward Foreign Currency Contracts | | | (14,995,349 | ) | | | - | | | | (14,995,349 | ) | | | - | |
| | Interest Rate Contracts | | | | | | | | | | | | | | | | |
| | Futures | | | (574,146 | ) | | | (574,146 | ) | | | - | | | | - | |
| | Written Options | | | (436,605 | ) | | | - | | | | (297,363 | ) | | | (139,242 | ) |
| | Swaps | | | (173,509 | ) | | | - | | | | (173,509 | ) | | | - | |
| | | | | | | | | | | | | | | | | | |
| | Total Interest Rate Contracts | | | (1,184,260 | ) | | | (574,146 | ) | | | (470,872 | ) | | | (139,242 | ) |
| | | | | | | | | | | | | | | | | | |
| | Total Liabilities - Derivatives | | | (20,293,809 | ) | | | (574,146 | ) | | | (19,580,421 | ) | | | (139,242 | ) |
| | | | | | | | | | | | | | | | | | |
| | Total Liabilities | | | (20,293,809 | ) | | | (574,146 | ) | | | (19,580,421 | ) | | | (139,242 | ) |
| | | | | | | | | | | | | | | | | | |
| | Total | | | $7,120,621,372 | | | | $61,991,708 | | | | $7,041,204,607 | | | | $17,425,057 | �� |
| | | | | | | | | | | | | | | | | | |
Certain of the portfolio’s liabilities are held at carrying amount, which approximates fair value for financial statement purposes. As of December 31, 2012, such liabilities are categorized within the three-tier hierarchy of inputs as follows:
| | | | | | | | | | | | | | | | | | |
| | | | | Total Value at
December 31, 2012 | | | Level 1 | | | Level 2 | | | Level 3 | |
Liabilities | | Sale-Buyback Financing Transactions | | | ($194,501,310 | ) | | | $- | | | | ($194,501,310 | ) | | | $- | |
| | Reverse Repurchase Agreements | | | (73,842,000 | ) | | | - | | | | (73,842,000 | ) | | | - | |
| | | | | | | | | | | | | | | | | | |
| | Total | | | ($268,343,310 | ) | | | $- | | | | ($268,343,310 | ) | | | $- | |
| | | | | | | | | | | | | | | | | | |
| | (1) | For equity investments categorized in a single level, refer to the schedule of investments for further industry breakout. |
| | |
| See Notes to Financial Statements | | See explanation of symbols and terms, if any, on page B-143 |
B-57
PACIFIC SELECT FUND
SHORT DURATION BOND PORTFOLIO
Schedule of Investments
December 31, 2012
| | | | | | | | |
| | | Principal
Amount | | | Value | |
CORPORATE BONDS & NOTES - 48.7% | | | | | |
| |
Consumer Discretionary - 2.7% | | | | | |
| | |
CBS Corp
1.950% due 07/01/17 | | | $2,015,000 | | | | $2,054,355 | |
Cox Communications Inc
5.450% due 12/15/14 | | | 3,425,000 | | | | 3,737,004 | |
D.R. Horton Inc
4.750% due 05/15/17 | | | 5,750,000 | | | | 6,138,125 | |
DIRECTV Holdings LLC
4.750% due 10/01/14 | | | 8,125,000 | | | | 8,678,889 | |
Dollar General Corp
4.125% due 07/15/17 | | | 4,480,000 | | | | 4,726,400 | |
Easton-Bell Sports Inc
9.750% due 12/01/16 | | | 1,725,000 | | | | 1,856,704 | |
NBCUniversal Media LLC
2.100% due 04/01/14 | | | 7,050,000 | | | | 7,181,243 | |
Speedway Motorsports Inc
8.750% due 06/01/16 | | | 1,860,000 | | | | 1,997,175 | |
Staples Inc
9.750% due 01/15/14 | | | 5,500,000 | | | | 5,981,080 | |
TCM Sub LLC
3.550% due 01/15/15 ~ | | | 8,005,000 | | | | 8,368,707 | |
The Interpublic Group of Cos Inc
2.250% due 11/15/17 | | | 3,820,000 | | | | 3,767,964 | |
6.250% due 11/15/14 | | | 4,848,000 | | | | 5,272,200 | |
Thomson Reuters Corp (Canada)
5.950% due 07/15/13 | | | 3,500,000 | | | | 3,598,914 | |
Time Warner Cable Inc
7.500% due 04/01/14 | | | 1,530,000 | | | | 1,658,339 | |
8.250% due 02/14/14 | | | 1,168,000 | | | | 1,265,578 | |
| | | | | | | | |
| | | | | | | 66,282,677 | |
| | | | | | | | |
Consumer Staples - 3.2% | | | | | | | | |
| | |
Altria Group Inc
8.500% due 11/10/13 | | | 5,625,000 | | | | 5,994,484 | |
Anheuser-Busch InBev Worldwide Inc
1.500% due 07/14/14 | | | 4,695,000 | | | | 4,764,617 | |
BAT International Finance PLC (United Kingdom)
1.400% due 06/05/15 ~ | | | 7,085,000 | | | | 7,190,871 | |
8.125% due 11/15/13 ~ | | | 7,361,000 | | | | 7,809,697 | |
Bunge Ltd Finance Corp
3.200% due 06/15/17 | | | 2,665,000 | | | | 2,783,241 | |
5.350% due 04/15/14 | | | 7,033,000 | | | | 7,402,901 | |
5.875% due 05/15/13 | | | 3,457,000 | | | | 3,518,638 | |
Coca-Cola Amatil Ltd (Australia)
3.250% due 11/02/14 ~ | | | 8,145,000 | | | | 8,436,404 | |
Heineken NV (Netherlands)
1.400% due 10/01/17 ~ | | | 3,845,000 | | | | 3,836,372 | |
Kraft Foods Group Inc
1.625% due 06/04/15 ~ | | | 5,345,000 | | | | 5,443,204 | |
Molson Coors Brewing Co
2.000% due 05/01/17 | | | 4,415,000 | | | | 4,526,015 | |
Pernod-Ricard SA (France)
2.950% due 01/15/17 ~ | | | 6,600,000 | | | | 6,945,886 | |
Reynolds American Inc
1.050% due 10/30/15 | | | 1,310,000 | | | | 1,310,396 | |
SABMiller Holdings Inc
1.850% due 01/15/15 ~ | | | 7,885,000 | | | | 8,043,764 | |
| | | | | | | | |
| | | | | | | 78,006,490 | |
| | | | | | | | |
Energy - 5.9% | | | | | | | | |
| | |
Anadarko Petroleum Corp
6.375% due 09/15/17 | | | 5,805,000 | | | | 6,938,937 | |
Apache Corp
1.750% due 04/15/17 | | | 1,370,000 | | | | 1,407,790 | |
BG Energy Capital PLC (United Kingdom)
2.875% due 10/15/16 ~ | | | 6,400,000 | | | | 6,758,970 | |
| | | | | | | | |
| | | Principal
Amount | | | Value | |
Bill Barrett Corp
9.875% due 07/15/16 | | | $1,750,000 | | | | $1,907,500 | |
BP Capital Markets PLC (United Kingdom)
1.375% due 11/06/17 | | | 5,600,000 | | | | 5,609,391 | |
Canadian Natural Resources Ltd (Canada)
1.450% due 11/14/14 | | | 2,395,000 | | | | 2,430,166 | |
5.700% due 05/15/17 | | | 5,985,000 | | | | 7,054,897 | |
DCP Midstream LLC
9.700% due 12/01/13 ~ | | | 3,090,000 | | | | 3,329,450 | |
DCP Midstream Operating LP
2.500% due 12/01/17 | | | 2,100,000 | | | | 2,090,441 | |
Devon Energy Corp
1.875% due 05/15/17 | | | 3,020,000 | | | | 3,080,823 | |
Ensco PLC (United Kingdom)
3.250% due 03/15/16 | | | 7,585,000 | | | | 8,047,275 | |
Enterprise Products Operating LLC
1.250% due 08/13/15 | | | 3,930,000 | | | | 3,956,366 | |
5.650% due 04/01/13 | | | 5,950,000 | | | | 6,016,723 | |
6.375% due 02/01/13 | | | 2,622,000 | | | | 2,632,506 | |
Gazprom OAO (Luxembourg)
4.950% due 05/23/16 ~ | | | 4,880,000 | | | | 5,252,100 | |
GlobalSantaFe Corp (Cayman)
5.000% due 02/15/13 | | | 1,800,000 | | | | 1,808,672 | |
Kinder Morgan Energy Partners LP
3.500% due 03/01/16 | | | 1,040,000 | | | | 1,112,328 | |
5.125% due 11/15/14 | | | 2,985,000 | | | | 3,216,391 | |
Korea National Oil Corp (South Korea)
4.000% due 10/27/16 ~ | | | 1,070,000 | | | | 1,160,794 | |
Magellan Midstream Partners LP
6.450% due 06/01/14 | | | 2,610,000 | | | | 2,782,996 | |
Marathon Oil Corp
0.900% due 11/01/15 | | | 4,970,000 | | | | 4,977,057 | |
Noble Corp (Cayman)
5.875% due 06/01/13 | | | 40,000 | | | | 40,837 | |
Noble Holding International Ltd (Cayman)
2.500% due 03/15/17 | | | 770,000 | | | | 795,207 | |
3.450% due 08/01/15 | | | 3,813,000 | | | | 4,020,233 | |
7.375% due 03/15/14 | | | 700,000 | | | | 752,415 | |
Occidental Petroleum Corp
1.750% due 02/15/17 | | | 4,090,000 | | | | 4,196,864 | |
Petrohawk Energy Corp
7.250% due 08/15/18 | | | 7,800,000 | | | | 8,812,775 | |
10.500% due 08/01/14 | | | 1,650,000 | | | | 1,757,889 | |
Phillips 66
1.950% due 03/05/15 ~ | | | 3,415,000 | | | | 3,486,080 | |
Pioneer Natural Resources Co
5.875% due 07/15/16 | | | 5,805,000 | | | | 6,585,854 | |
Regency Energy Partners LP
9.375% due 06/01/16 | | | 488,000 | | | | 525,820 | |
Rowan Cos Inc
5.000% due 09/01/17 | | | 2,035,000 | | | | 2,262,293 | |
Talisman Energy Inc (Canada)
5.125% due 05/15/15 | | | 6,030,000 | | | | 6,502,734 | |
TransCanada PipeLines Ltd (Canada)
0.875% due 03/02/15 | | | 1,455,000 | | | | 1,464,027 | |
Transocean Inc (Cayman)
2.500% due 10/15/17 | | | 2,070,000 | | | | 2,093,375 | |
4.950% due 11/15/15 | | | 4,465,000 | | | | 4,891,742 | |
5.050% due 12/15/16 | | | 1,740,000 | | | | 1,938,544 | |
5.250% due 03/15/13 | | | 4,395,000 | | | | 4,433,825 | |
Williams Partners LP
3.800% due 02/15/15 | | | 3,400,000 | | | | 3,596,734 | |
Woodside Finance Ltd (Australia)
4.500% due 11/10/14 ~ | | | 5,115,000 | | | | 5,412,647 | |
5.000% due 11/15/13 ~ | | | 745,000 | | | | 769,812 | |
| | | | | | | | |
| | | | | | | 145,911,280 | |
| | | | | | | | |
| | |
| See Notes to Financial Statements | | See explanation of symbols and terms, if any, on page B-143 |
B-58
PACIFIC SELECT FUND
SHORT DURATION BOND PORTFOLIO
Schedule of Investments (Continued)
December 31, 2012
| | | | | | | | |
| | | Principal
Amount | | | Value | |
Financials - 19.5% | | | | | | | | |
| | |
ACE INA Holdings Inc
5.875% due 06/15/14 | | | $3,000,000 | | | | $3,222,846 | |
Aflac Inc
2.650% due 02/15/17 | | | 920,000 | | | | 967,766 | |
Ally Financial Inc
3.125% due 01/15/16 | | | 6,000,000 | | | | 6,009,402 | |
American Express Credit Corp
1.750% due 06/12/15 | | | 3,590,000 | | | | 3,667,117 | |
5.125% due 08/25/14 | | | 5,650,000 | | | | 6,055,501 | |
American International Group Inc
3.000% due 03/20/15 | | | 1,390,000 | | | | 1,447,001 | |
4.250% due 09/15/14 | | | 8,475,000 | | | | 8,934,930 | |
American Tower Corp REIT
4.625% due 04/01/15 | | | 11,574,000 | | | | 12,308,486 | |
Bank of America Corp
1.500% due 10/09/15 | | | 9,805,000 | | | | 9,860,996 | |
Bank of Nova Scotia (Canada)
0.750% due 10/09/15 | | | 5,815,000 | | | | 5,786,623 | |
Barclays Bank PLC (United Kingdom)
5.200% due 07/10/14 | | | 14,020,000 | | | | 14,923,028 | |
BB&T Corp
1.600% due 08/15/17 | | | 3,130,000 | | | | 3,169,936 | |
5.700% due 04/30/14 | | | 6,345,000 | | | | 6,764,715 | |
Berkshire Hathaway Inc
2.200% due 08/15/16 | | | 11,000,000 | | | | 11,484,055 | |
Boston Properties LP REIT
5.000% due 06/01/15 | | | 5,860,000 | | | | 6,405,361 | |
Capital One Financial Corp
2.125% due 07/15/14 | | | 647,000 | | | | 658,882 | |
2.150% due 03/23/15 | | | 5,485,000 | | | | 5,601,436 | |
7.375% due 05/23/14 | | | 5,075,000 | | | | 5,522,579 | |
CIT Group Inc
4.750% due 02/15/15 ~ | | | 3,770,000 | | | | 3,939,650 | |
Citigroup Inc
0.593% due 11/05/14 § | | | 6,800,000 | | | | 6,752,087 | |
1.238% due 04/01/14 § | | | 3,518,000 | | | | 3,522,992 | |
CNH Capital LLC
3.875% due 11/01/15 ~ | | | 8,230,000 | | | | 8,528,337 | |
Commonwealth Bank of Australia (Australia)
1.900% due 09/18/17 | | | 3,970,000 | | | | 4,062,120 | |
Daimler Finance North America LLC
0.920% due 03/28/14 § ~ | | | 7,320,000 | | | | 7,337,692 | |
1.875% due 09/15/14 ~ | | | 8,005,000 | | | | 8,139,612 | |
DNB Bank ASA (Norway)
3.200% due 04/03/17 ~ | | | 10,220,000 | | | | 10,892,292 | |
Fifth Third Bancorp
3.625% due 01/25/16 | | | 2,690,000 | | | | 2,875,486 | |
6.250% due 05/01/13 | | | 5,445,000 | | | | 5,548,858 | |
Ford Motor Credit Co LLC
2.750% due 05/15/15 | | | 7,465,000 | | | | 7,622,392 | |
3.000% due 06/12/17 | | | 4,180,000 | | | | 4,297,667 | |
3.875% due 01/15/15 | | | 6,325,000 | | | | 6,598,822 | |
Franklin Resources Inc
1.375% due 09/15/17 | | | 1,875,000 | | | | 1,885,744 | |
General Electric Capital Corp
0.981% due 04/07/14 § | | | 9,860,000 | | | | 9,916,350 | |
1.875% due 09/16/13 | | | 2,125,000 | | | | 2,146,333 | |
Harley-Davidson Financial Services Inc
1.150% due 09/15/15 ~ | | | 5,560,000 | | | | 5,577,853 | |
HSBC USA Inc
1.625% due 01/16/18 | | | 6,730,000 | | | | 6,741,629 | |
2.375% due 02/13/15 | | | 3,900,000 | | | | 4,013,463 | |
Hyundai Capital America
1.625% due 10/02/15 ~ | | | 3,450,000 | | | | 3,472,777 | |
Hyundai Capital Services Inc (South Korea)
3.500% due 09/13/17 ~ | | | 2,410,000 | | | | 2,546,859 | |
4.375% due 07/27/16 ~ | | | 5,000,000 | | | | 5,380,110 | |
| | | | | | | | |
| | | Principal
Amount | | | Value | |
JPMorgan Chase & Co
1.058% due 05/02/14 § | | | $5,140,000 | | | | $5,176,962 | |
2.000% due 08/15/17 | | | 12,075,000 | | | | 12,343,802 | |
KeyCorp
3.750% due 08/13/15 | | | 3,492,000 | | | | 3,738,958 | |
Kilroy Realty LP REIT
5.000% due 11/03/15 | | | 4,780,000 | | | | 5,227,776 | |
MetLife Inc
2.375% due 02/06/14 | | | 1,550,000 | | | | 1,579,444 | |
Metropolitan Life Global Funding I
1.700% due 06/29/15 ~ | | | 11,010,000 | | | | 11,245,724 | |
5.125% due 06/10/14 ~ | | | 3,725,000 | | | | 3,961,433 | |
Morgan Stanley
1.916% due 01/24/14 § | | | 16,825,000 | | | | 16,937,929 | |
National Bank of Canada (Canada)
1.450% due 11/07/17 | | | 10,080,000 | | | | 10,099,233 | |
National Rural Utilities Cooperative Finance Corp
1.000% due 02/02/15 | | | 1,015,000 | | | | 1,022,981 | |
New York Life Global Funding
2.450% due 07/14/16 ~ | | | 7,735,000 | | | | 8,109,622 | |
Nissan Motor Acceptance Corp
1.950% due 09/12/17 ~ | | | 6,340,000 | | | | 6,431,505 | |
Nordea Bank AB (Sweden)
2.125% due 01/14/14 ~ | | | 14,815,000 | | | | 14,960,246 | |
Principal Financial Group Inc
1.850% due 11/15/17 | | | 1,225,000 | | | | 1,232,452 | |
Principal Life Global Funding II
1.000% due 12/11/15 ~ | | | 5,575,000 | | | | 5,570,323 | |
Prudential Financial Inc
2.750% due 01/14/13 | | | 6,325,000 | | | | 6,331,015 | |
5.100% due 09/20/14 | | | 5,249,000 | | | | 5,620,608 | |
Simon Property Group LP REIT
4.200% due 02/01/15 | | | 9,171,000 | | | | 9,729,661 | |
SLM Corp
4.625% due 09/25/17 | | | 10,610,000 | | | | 10,869,807 | |
Societe Generale SA (France)
2.500% due 01/15/14 ~ | | | 2,660,000 | | | | 2,700,272 | |
Sumitomo Mitsui Banking Corp (Japan)
1.900% due 01/12/15 ~ | | | 6,500,000 | | | | 6,633,302 | |
Sun Life Financial Global Funding III LP
0.561% due 10/06/13 § ~ | | | 9,335,000 | | | | 9,315,611 | |
The Goldman Sachs Group Inc
1.312% due 02/07/14 § | | | 3,720,000 | | | | 3,731,882 | |
1.600% due 11/23/15 | | | 11,110,000 | | | | 11,195,003 | |
The Royal Bank of Scotland Group PLC (United Kingdom)
2.550% due 09/18/15 | | | 5,235,000 | | | | 5,360,635 | |
U.S. Bancorp
2.200% due 11/15/16 | | | 9,075,000 | | | | 9,461,159 | |
UBS AG (Switzerland)
1.313% due 01/28/14 § | | | 8,820,000 | | | | 8,876,413 | |
Union Bank NA
2.125% due 06/16/17 | | | 7,260,000 | | | | 7,470,867 | |
Ventas Realty LP REIT
2.000% due 02/15/18 | | | 1,945,000 | | | | 1,947,869 | |
3.125% due 11/30/15 | | | 4,850,000 | | | | 5,116,173 | |
Volkswagen International Finance NV (Netherlands)
1.625% due 03/22/15 ~ | | | 10,995,000 | | | | 11,151,041 | |
WEA Finance LLC
5.750% due 09/02/15 ~ | | | 5,280,000 | | | | 5,898,145 | |
Wells Fargo & Co
1.250% due 02/13/15 | | | 7,870,000 | | | | 7,947,449 | |
2.100% due 05/08/17 | | | 6,630,000 | | | | 6,859,411 | |
| | | | | | | | |
| | | | | | | 478,444,498 | |
| | | | | | | | |
| | |
| See Notes to Financial Statements | | See explanation of symbols and terms, if any, on page B-143 |
B-59
PACIFIC SELECT FUND
SHORT DURATION BOND PORTFOLIO
Schedule of Investments (Continued)
December 31, 2012
| | | | | | | | |
| | | Principal
Amount | | | Value | |
Health Care - 4.5% | |
| | |
AbbVie Inc
1.200% due 11/06/15 ~ | | | $10,165,000 | | | | $10,239,194 | |
Aetna Inc
1.500% due 11/15/17 | | | 1,320,000 | | | | 1,323,704 | |
Agilent Technologies Inc
2.500% due 07/15/13 | | | 3,700,000 | | | | 3,733,285 | |
6.500% due 11/01/17 | | | 5,905,000 | | | | 7,143,367 | |
Baxter International Inc
1.850% due 01/15/17 | | | 1,910,000 | | | | 1,969,496 | |
Boston Scientific Corp
4.500% due 01/15/15 | | | 13,594,000 | | | | 14,455,873 | |
Cardinal Health Inc
1.900% due 06/15/17 | | | 3,390,000 | | | | 3,455,647 | |
Catholic Health Initiatives
1.600% due 11/01/17 | | | 675,000 | | | | 683,013 | |
Celgene Corp
1.900% due 08/15/17 | | | 15,165,000 | | | | 15,448,798 | |
Express Scripts Holding Co
2.750% due 11/21/14 ~ | | | 5,095,000 | | | | 5,258,392 | |
3.125% due 05/15/16 | | | 2,750,000 | | | | 2,900,881 | |
6.250% due 06/15/14 | | | 4,252,000 | | | | 4,580,493 | |
Gilead Sciences Inc
2.400% due 12/01/14 | | | 4,465,000 | | | | 4,606,590 | |
Life Technologies Corp
3.375% due 03/01/13 | | | 6,510,000 | | | | 6,529,908 | |
3.500% due 01/15/16 | | | 4,365,000 | | | | 4,596,445 | |
McKesson Corp
0.950% due 12/04/15 | | | 1,935,000 | | | | 1,938,949 | |
UnitedHealth Group Inc
0.850% due 10/15/15 | | | 2,155,000 | | | | 2,163,357 | |
1.875% due 11/15/16 | | | 2,145,000 | | | | 2,210,305 | |
Watson Pharmaceuticals Inc
1.875% due 10/01/17 | | | 4,955,000 | | | | 5,024,018 | |
5.000% due 08/15/14 | | | 4,245,000 | | | | 4,523,956 | |
WellPoint Inc
1.250% due 09/10/15 | | | 3,630,000 | | | | 3,660,830 | |
6.000% due 02/15/14 | | | 4,017,000 | | | | 4,252,617 | |
| | | | | | | | |
| | | | | | | 110,699,118 | |
| | | | | | | | |
Industrials - 2.2% | |
| | |
CSX Corp
5.750% due 03/15/13 | | | 3,375,000 | | | | 3,409,955 | |
Eaton Corp
1.500% due 11/02/17 ~ | | | 2,745,000 | | | | 2,752,779 | |
ERAC USA Finance LLC
1.400% due 04/15/16 ~ | | | 505,000 | | | | 508,745 | |
2.750% due 07/01/13 ~ | | | 9,825,000 | | | | 9,930,796 | |
2.750% due 03/15/17 ~ | | | 2,050,000 | | | | 2,141,198 | |
GATX Corp
3.500% due 07/15/16 | | | 4,875,000 | | | | 5,084,381 | |
General Electric Co
0.850% due 10/09/15 | | | 10,740,000 | | | | 10,784,345 | |
Heathrow Funding Ltd (United Kingdom)
2.500% due 06/25/17 ~ | | | 6,920,000 | | | | 7,151,163 | |
Roper Industries Inc
1.850% due 11/15/17 | | | 1,100,000 | | | | 1,100,044 | |
6.625% due 08/15/13 | | | 1,770,000 | | | | 1,833,343 | |
Southwest Airlines Co
5.250% due 10/01/14 | | | 4,000,000 | | | | 4,258,940 | |
United Air Lines Inc
9.875% due 08/01/13 ~ | | | 1,556,000 | | | | 1,568,643 | |
Waste Management Inc
5.000% due 03/15/14 | | | 2,925,000 | | | | 3,071,171 | |
| | | | | | | | |
| | | | | | | 53,595,503 | |
| | | | | | | | |
| | | | | | | | |
| | | Principal
Amount | | | Value | |
Information Technology - 1.4% | |
| | |
Altera Corp
1.750% due 05/15/17 | | | $4,020,000 | | | | $4,110,486 | |
Autodesk Inc
1.950% due 12/15/17 | | | 1,945,000 | | | | 1,936,878 | |
Broadcom Corp
1.500% due 11/01/13 | | | 2,045,000 | | | | 2,062,634 | |
2.375% due 11/01/15 | | | 4,385,000 | | | | 4,574,059 | |
Fiserv Inc
3.125% due 06/15/16 | | | 1,435,000 | | | | 1,508,268 | |
Hewlett-Packard Co
2.350% due 03/15/15 | | | 2,910,000 | | | | 2,924,332 | |
2.625% due 12/09/14 | | | 850,000 | | | | 860,407 | |
6.125% due 03/01/14 | | | 5,000,000 | | | | 5,257,570 | |
HP Enterprise Services LLC
6.000% due 08/01/13 | | | 2,950,000 | | | | 3,024,724 | |
Xerox Corp
1.130% due 05/16/14 § | | | 1,845,000 | | | | 1,841,762 | |
2.950% due 03/15/17 | | | 800,000 | | | | 821,368 | |
5.650% due 05/15/13 | | | 5,187,000 | | | | 5,276,408 | |
| | | | | | | | |
| | | | | | | 34,198,896 | |
| | | | | | | | |
Materials - 1.8% | |
| | |
ArcelorMittal (Luxembourg)
5.375% due 06/01/13 | | | 3,765,000 | | | | 3,803,226 | |
Barrick Gold Financeco LLC
6.125% due 09/15/13 | | | 3,540,000 | | | | 3,672,368 | |
CRH America Inc
5.300% due 10/15/13 | | | 1,220,000 | | | | 1,260,543 | |
Eastman Chemical Co
2.400% due 06/01/17 | | | 3,870,000 | | | | 4,001,495 | |
International Paper Co
5.300% due 04/01/15 | | | 3,360,000 | | | | 3,650,106 | |
Rock-Tenn Co
3.500% due 03/01/20 ~ | | | 5,145,000 | | | | 5,284,460 | |
Teck Resources Ltd (Canada)
2.500% due 02/01/18 | | | 1,805,000 | | | | 1,844,046 | |
The Dow Chemical Co
2.500% due 02/15/16 | | | 9,250,000 | | | | 9,621,341 | |
The Sherwin-Williams Co
1.350% due 12/15/17 | | | 10,500,000 | | | | 10,485,436 | |
| | | | | | | | |
| | | | | | | 43,623,021 | |
| | | | | | | | |
Telecommunication Services - 3.5% | |
| | |
America Movil SAB de CV (Mexico)
2.375% due 09/08/16 | | | 3,640,000 | | | | 3,800,488 | |
3.625% due 03/30/15 | | | 2,500,000 | | | | 2,663,093 | |
AT&T Inc
0.875% due 02/13/15 | | | 3,760,000 | | | | 3,779,601 | |
British Telecommunications PLC (United Kingdom)
1.434% due 12/20/13 § | | | 4,285,000 | | | | 4,321,551 | |
5.150% due 01/15/13 | | | 6,500,000 | | | | 6,509,022 | |
CC Holdings GS V LLC
2.381% due 12/15/17 ~ | | | 1,705,000 | | | | 1,714,690 | |
7.750% due 05/01/17 ~ | | | 2,480,000 | | | | 2,634,814 | |
Crown Castle Towers LLC
4.523% due 01/15/35 ~ | | | 7,250,000 | | | | 7,646,988 | |
Digicel Ltd (Bermuda)
12.000% due 04/01/14 ~ | | | 1,650,000 | | | | 1,802,625 | |
GTP Acquisition Partners I LLC
4.347% due 06/15/41 ~ | | | 2,485,000 | | | | 2,640,490 | |
Rogers Communications Inc (Canada)
6.375% due 03/01/14 | | | 12,500,000 | | | | 13,320,862 | |
SBA Tower Trust
2.933% due 12/15/42 ~ | | | 9,280,000 | | | | 9,718,772 | |
Telecom Italia Capital SA (Luxembourg)
5.250% due 11/15/13 | | | 10,175,000 | | | | 10,480,250 | |
| | |
| See Notes to Financial Statements | | See explanation of symbols and terms, if any, on page B-143 |
B-60
PACIFIC SELECT FUND
SHORT DURATION BOND PORTFOLIO
Schedule of Investments (Continued)
December 31, 2012
| | | | | | | | |
| | | Principal
Amount | | | Value | |
Telefonica Emisiones SAU (Spain)
2.582% due 04/26/13 | | | $4,720,000 | | | | $4,748,320 | |
5.855% due 02/04/13 | | | 7,150,000 | | | | 7,192,900 | |
Vivendi SA (France)
2.400% due 04/10/15 ~ | | | 3,520,000 | | | | 3,596,021 | |
| | | | | | | | |
| | | | | | | 86,570,487 | |
| | | | | | | | |
Utilities - 4.0% | | | | | | | | |
| | |
CenterPoint Energy Resources Corp
7.875% due 04/01/13 | | | 10,370,000 | | | | 10,546,456 | |
CMS Energy Corp
2.750% due 05/15/14 | | | 6,235,000 | | | | 6,354,088 | |
Commonwealth Edison Co
1.625% due 01/15/14 | | | 6,000,000 | | | | 6,066,054 | |
1.950% due 09/01/16 | | | 1,605,000 | | | | 1,656,798 | |
Dominion Resources Inc
1.950% due 08/15/16 | | | 2,165,000 | | | | 2,226,250 | |
DTE Energy Co
1.011% due 06/03/13 § | | | 4,645,000 | | | | 4,654,295 | |
Duke Energy Corp
1.625% due 08/15/17 | | | 2,775,000 | | | | 2,784,346 | |
2.150% due 11/15/16 | | | 6,350,000 | | | | 6,570,148 | |
Enel Finance International NV (Netherlands)
3.875% due 10/07/14 ~ | | | 1,855,000 | | | | 1,910,743 | |
5.700% due 01/15/13 ~ | | | 4,825,000 | | | | 4,828,073 | |
Georgia Power Co
1.300% due 09/15/13 | | | 5,150,000 | | | | 5,181,456 | |
Great Plains Energy Inc
2.750% due 08/15/13 | | | 2,915,000 | | | | 2,945,669 | |
Iberdrola Finance Ireland Ltd (Ireland)
3.800% due 09/11/14 ~ | | | 5,195,000 | | | | 5,338,159 | |
Korea Hydro & Nuclear Power Co Ltd
(South Korea)
3.125% due 09/16/15 ~ | | | 4,240,000 | | | | 4,437,999 | |
MidAmerican Energy Holdings Co
5.000% due 02/15/14 | | | 7,054,000 | | | | 7,388,642 | |
Mississippi Power Co
2.350% due 10/15/16 | | | 1,430,000 | | | | 1,498,277 | |
NextEra Energy Capital Holdings Inc
1.200% due 06/01/15 | | | 2,315,000 | | | | 2,332,851 | |
NiSource Finance Corp
5.400% due 07/15/14 | | | 3,539,000 | | | | 3,772,762 | |
6.150% due 03/01/13 | | | 891,000 | | | | 898,435 | |
Progress Energy Inc
6.050% due 03/15/14 | | | 3,448,000 | | | | 3,660,442 | |
PSEG Power LLC
2.750% due 09/15/16 | | | 1,755,000 | | | | 1,827,269 | |
Sempra Energy
1.068% due 03/15/14 § | | | 6,255,000 | | | | 6,289,690 | |
Sierra Pacific Power Co
5.450% due 09/01/13 | | | 2,106,000 | | | | 2,174,060 | |
The Southern Co
1.950% due 09/01/16 | | | 1,995,000 | | | | 2,057,202 | |
| | | | | | | | |
| | | | | | | 97,400,164 | |
| | | | | | | | |
Total Corporate Bonds & Notes
(Cost $1,173,899,892) | | | | | | | 1,194,732,134 | |
| | | | | | | | |
| |
MORTGAGE-BACKED SECURITIES - 23.3% | | | | | |
|
Collateralized Mortgage Obligations - Commercial - 4.4% | |
| | |
Banc of America Merrill Lynch Commercial Mortgage Inc
4.668% due 07/10/43 " | | | 2,070,000 | | | | 2,254,329 | |
Bear Stearns Commercial Mortgage Securities
4.674% due 06/11/41 " | | | 465,000 | | | | 504,776 | |
4.978% due 07/11/42 " § | | | 4,200,000 | | | | 4,461,057 | |
5.116% due 02/11/41 " § | | | 3,695,000 | | | | 4,019,373 | |
| | | | | | | | |
| | | Principal
Amount | | | Value | |
Citigroup Commercial Mortgage Trust
5.360% due 04/15/40 " § | | | $4,070,000 | | | | $4,279,690 | |
Commercial Mortgage Trust
5.167% due 06/10/44 " § | | | 1,555,000 | | | | 1,702,060 | |
5.357% due 07/10/37 " § | | | 12,755,000 | | | | 13,521,754 | |
DBUBS Mortgage Trust
2.238% due 08/10/44 " | | | 1,698,247 | | | | 1,743,656 | |
GE Capital Commercial Mortgage Corp
4.772% due 06/10/48 " § | | | 3,730,000 | | | | 4,028,169 | |
GMAC Commercial Mortgage
Securities Inc Trust
4.079% due 05/10/36 " | | | 1,320,657 | | | | 1,324,747 | |
Greenwich Capital Commercial
Funding Corp
5.867% due 07/10/38 " § | | | 2,415,000 | | | | 2,779,426 | |
JPMorgan Chase Commercial Mortgage
Securities Corp
1.031% due 05/15/45 " | | | 642,343 | | | | 647,582 | |
1.525% due 07/15/46 " ~ | | | 4,497,324 | | | | 4,558,375 | |
5.366% due 06/12/41 " § | | | 5,255,000 | | | | 5,554,719 | |
5.481% due 12/12/44 " § | | | 2,510,000 | | | | 2,826,632 | |
Morgan Stanley Capital I Trust
1.480% due 06/15/44 " ~ | | | 2,896,837 | | | | 2,938,146 | |
4.700% due 07/15/56 " | | | 12,800,000 | | | | 13,706,765 | |
4.780% due 12/13/41 " | | | 5,259,000 | | | | 5,611,758 | |
5.731% due 07/12/44 " § | | | 12,025,000 | | | | 13,822,052 | |
Wachovia Bank Commercial Mortgage Trust
5.088% due 08/15/41 " § | | | 13,000,000 | | | | 13,801,177 | |
WFRBS Commercial Mortgage Trust
1.607% due 06/15/44 " ~ | | | 3,328,180 | | | | 3,385,647 | |
| | | | | | | | |
| | | | | | | 107,471,890 | |
| | | | | | | | |
Collateralized Mortgage Obligations - Residential - 5.4% | |
| | |
Bear Stearns Adjustable Rate Mortgage Trust
2.673% due 04/25/34 " § | | | 400,142 | | | | 395,301 | |
3.472% due 11/25/34 " § | | | 1,348,254 | | | | 1,363,350 | |
Bear Stearns Alt-A Trust
0.850% due 04/25/34 " § | | | 638,769 | | | | 592,502 | |
0.910% due 01/25/35 " § | | | 2,138,963 | | | | 2,072,831 | |
Chase Mortgage Finance Corp
2.936% due 02/25/37 " § | | | 1,309,106 | | | | 1,305,420 | |
3.003% due 02/25/37 " § | | | 1,449,445 | | | | 1,470,892 | |
3.006% due 02/25/37 " § | | | 600,259 | | | | 598,179 | |
3.010% due 02/25/37 " § | | | 2,528,506 | | | | 2,519,222 | |
3.038% due 02/25/37 " § | | | 3,201,615 | | | | 3,218,511 | |
Countrywide Home Loan Mortgage
Pass-Through Trust
2.908% due 02/19/34 " § | | | 1,951,897 | | | | 1,826,806 | |
2.934% due 11/20/34 " § | | | 611,139 | | | | 558,694 | |
Fannie Mae
5.000% due 08/25/19 " | | | 7,889,168 | | | | 8,459,921 | |
FDIC Structured Sale Guaranteed Notes
0.760% due 02/25/48 " § ~ | | | 1,601,494 | | | | 1,605,639 | |
Fosse Master Issuer PLC (United Kingdom)
1.725% due 10/18/54 " § ~ | | | 4,120,000 | | | | 4,205,634 | |
Freddie Mac
0.659% due 05/15/36 " § | | | 861,493 | | | | 872,579 | |
7.000% due 09/15/30 " | | | 1,140,363 | | | | 1,333,075 | |
Government National Mortgage Association
2.000% due 06/16/42 " | | | 9,638,485 | | | | 9,925,244 | |
Harborview Mortgage Loan Trust
0.551% due 06/20/35 " § | | | 960,427 | | | | 882,185 | |
Holmes Master Issuer PLC (United Kingdom)
1.890% due 10/21/54 " § ~ | | | 2,425,000 | | | | 2,470,896 | |
| | |
| See Notes to Financial Statements | | See explanation of symbols and terms, if any, on page B-143 |
B-61
PACIFIC SELECT FUND
SHORT DURATION BOND PORTFOLIO
Schedule of Investments (Continued)
December 31, 2012
| | | | | | | | |
| | | Principal
Amount | | | Value | |
JPMorgan Mortgage Trust
2.991% due 07/25/35 " § | | | $523,672 | | | | $534,153 | |
3.031% due 07/25/35 " § | | | 1,898,934 | | | | 1,939,981 | |
3.048% due 07/25/35 " § | | | 1,943,706 | | | | 1,984,545 | |
MASTR Adjustable Rate Mortgages Trust
2.025% due 09/25/34 " § | | | 847,529 | | | | 777,353 | |
Merrill Lynch Mortgage Investors Inc
2.729% due 12/25/35 " § | | | 5,582,000 | | | | 4,772,016 | |
NCUA Guaranteed Notes Trust
0.578% due 11/06/17 " § | | | 4,504,304 | | | | 4,514,168 | |
0.588% due 03/06/20 " § | | | 4,337,501 | | | | 4,337,762 | |
0.588% due 04/06/20 " § | | | 3,974,538 | | | | 3,990,178 | |
0.612% due 03/11/20 " § | | | 4,866,969 | | | | 4,891,304 | |
0.613% due 02/06/20 " § | | | 4,533,975 | | | | 4,543,905 | |
0.663% due 01/08/20 " § | | | 3,366,864 | | | | 3,370,029 | |
0.658% due 10/07/20 " § | | | 2,831,216 | | | | 2,841,833 | |
1.840% due 10/07/20 " | | | 634,764 | | | | 645,178 | |
Sequoia Mortgage Trust
0.896% due 11/20/34 " § | | | 832,423 | | | | 808,902 | |
Silverstone Master Issuer PLC (United Kingdom)
1.719% due 01/21/55 " § ~ | | | 5,135,000 | | | | 5,184,856 | |
1.869% due 01/21/55 " § ~ | | | 17,190,000 | | | | 17,677,608 | |
Structured Adjustable Rate Mortgage Loan Trust
2.706% due 06/25/34 " § | | | 3,503,749 | | | | 3,507,547 | |
2.804% due 05/25/34 " § | | | 953,742 | | | | 970,832 | |
2.848% due 11/25/34 " § | | | 2,015,298 | | | | 2,044,571 | |
Structured Asset Securities Corp
2.769% due 07/25/33 " § | | | 497,161 | | | | 491,282 | |
WaMu Mortgage
Pass-Through Certificates
0.500% due 07/25/45 " § | | | 3,509,836 | | | | 3,333,920 | |
0.530% due 08/25/45 " § | | | 2,290,591 | | | | 2,158,703 | |
2.494% due 09/25/35 " § | | | 9,000,000 | | | | 8,063,874 | |
2.571% due 06/25/34 " § | | | 844,027 | | | | 862,177 | |
Washington Mutual MSC Mortgage Pass-Through Certificates
7.000% due 03/25/34 " | | | 774,570 | | | | 819,754 | |
Wells Fargo Mortgage-Backed Securities Trust
2.757% due 08/25/33 " § | | | 1,825,658 | | | | 1,880,837 | |
| | | | | | | | |
| | | | | | | 132,624,149 | |
| | | | | | | | |
Fannie Mae - 10.8% | | | | | | | | |
| | |
2.125% due 03/01/35 " § | | | 1,059,583 | | | | 1,119,504 | |
2.196% due 04/01/34 " § | | | 2,402,714 | | | | 2,553,781 | |
2.300% due 06/01/35 " § | | | 1,648,552 | | | | 1,764,421 | |
2.306% due 01/01/35 " § | | | 38,071 | | | | 40,663 | |
2.340% due 02/01/33 - 01/01/34 " § | | | 4,565,643 | | | | 4,852,457 | |
2.382% due 06/01/35 " § | | | 1,371,388 | | | | 1,452,380 | |
2.388% due 06/01/33 " § | | | 1,776,847 | | | | 1,889,427 | |
2.500% due 10/01/27 " | | | 5,736,888 | | | | 6,005,207 | |
2.519% due 05/01/35 " § | | | 3,877,626 | | | | 4,085,347 | |
2.522% due 05/01/35 " § | | | 796,218 | | | | 840,215 | |
2.546% due 12/01/33 " § | | | 2,182,521 | | | | 2,314,992 | |
2.588% due 01/01/35 " § | | | 1,423,443 | | | | 1,513,007 | |
2.643% due 02/01/33 " § | | | 269,204 | | | | 285,578 | |
2.657% due 12/01/33 " § | | | 1,401,419 | | | | 1,487,599 | |
2.703% due 11/01/35 " § | | | 1,172,368 | | | | 1,248,349 | |
2.721% due 10/01/34 " § | | | 1,049,989 | | | | 1,109,017 | |
2.722% due 02/01/34 " § | | | 1,634,167 | | | | 1,735,614 | |
2.734% due 04/01/33 " § | | | 385,961 | | | | 411,078 | |
2.797% due 04/01/35 " § | | | 872,366 | | | | 930,320 | |
2.810% due 07/01/35 " § | | | 1,896,050 | | | | 2,031,355 | |
2.875% due 05/01/33 " § | | | 53,656 | | | | 53,921 | |
2.925% due 05/01/33 - 08/01/33 " § | | | 4,419,036 | | | | 4,708,364 | |
2.943% due 07/01/35 " § | | | 2,088,702 | | | | 2,236,893 | |
3.000% due 09/01/27 " | | | 14,929,395 | | | | 15,783,637 | |
3.500% due 12/01/25 - 02/01/27 " | | | 39,818,126 | | | | 42,276,479 | |
| | | | | | | | |
| | | Principal
Amount | | | Value | |
4.000% due 07/01/25 - 03/01/41 " | | | $13,690,007 | | | | $14,670,387 | |
4.500% due 05/01/25 - 10/01/26 " | | | 44,541,800 | | | | 48,022,413 | |
5.000% due 07/01/24 - 07/01/35 " | | | 11,820,012 | | | | 12,880,459 | |
5.500% due 01/01/18 - 12/01/39 " | | | 74,171,463 | | | | 80,790,232 | |
6.000% due 01/01/18 - 03/01/37 " | | | 4,534,966 | | | | 4,936,100 | |
6.500% due 05/01/33 " | | | 1,612,110 | | | | 1,826,921 | |
7.000% due 05/01/33 - 06/01/33 " | | | 736,410 | | | | 824,633 | |
| | | | | | | | |
| | | | | | | 266,680,750 | |
| | | | | | | | |
Freddie Mac - 2.0% | | | | | | | | |
| | |
2.109% due 02/01/35 " § | | | 648,684 | | | | 677,516 | |
2.381% due 08/01/35 " § | | | 3,040,214 | | | | 3,236,630 | |
2.424% due 09/01/35 " § | | | 2,826,891 | | | | 3,016,763 | |
2.850% due 03/01/35 " § | | | 1,070,928 | | | | 1,141,435 | |
2.904% due 03/01/35 " § | | | 865,371 | | | | 922,853 | |
4.000% due 08/01/26 " | | | 26,679,748 | | | | 28,222,727 | |
5.500% due 03/01/18 - 07/01/38 " | | | 6,507,060 | | | | 7,031,498 | |
6.000% due 04/01/33 " | | | 5,472,293 | | | | 6,086,035 | |
| | | | | | | | |
| | | | | | | 50,335,457 | |
| | | | | | | | |
Government National Mortgage Association - 0.7% | | | | | |
| | |
1.625% due 01/20/35 " § | | | 2,960,666 | | | | 3,078,491 | |
1.750% due 09/20/34 " § | | | 1,693,462 | | | | 1,761,420 | |
3.000% due 09/20/27 " | | | 4,905,767 | | | | 5,249,427 | |
5.500% due 07/15/20 " | | | 1,179,317 | | | | 1,271,550 | |
6.000% due 01/15/22 " | | | 4,524,047 | | | | 4,958,335 | |
| | | | | | | | |
| | | | | | | 16,319,223 | |
| | | | | | | | |
Total Mortgage-Backed Securities
(Cost $569,254,537) | | | | | | | 573,431,469 | |
| | | | | | | | |
| | |
ASSET-BACKED SECURITIES - 11.3% | | | | | | | | |
| | |
Ally Auto Receivables Trust
0.570% due 08/20/15 " | | | 2,810,000 | | | | 2,813,699 | |
Ally Master Owner Trust
1.540% due 09/15/16 " | | | 13,720,000 | | | | 13,906,256 | |
1.810% due 05/15/16 " | | | 8,020,000 | | | | 8,142,842 | |
2.150% due 01/15/16 " | | | 6,395,000 | | | | 6,500,850 | |
American Express Credit Account Master Trust
0.379% due 04/17/17 " § | | | 4,545,000 | | | | 4,555,769 | |
0.990% due 03/15/18 " | | | 4,800,000 | | | | 4,814,546 | |
1.290% due 03/15/18 " ~ | | | 5,485,000 | | | | 5,516,129 | |
AmeriCredit Automobile Receivables Trust
0.960% due 01/09/17 " | | | 4,765,000 | | | | 4,795,415 | |
1.050% due 10/11/16 " | | | 3,130,000 | | | | 3,155,646 | |
1.730% due 02/08/17 " | | | 1,840,000 | | | | 1,867,717 | |
2.330% due 03/08/16 " | | | 3,215,000 | | | | 3,271,401 | |
Bank of America Auto Trust
0.780% due 06/15/16 " | | | 6,520,000 | | | | 6,550,250 | |
Capital Auto Receivables Asset Trust
8.250% due 01/15/15 " ~ | | | 4,255,000 | | | | 4,394,193 | |
CarMax Auto Owner Trust
0.840% due 03/15/17 " | | | 7,585,000 | | | | 7,638,763 | |
0.890% due 09/15/16 " | | | 1,885,000 | | | | 1,898,213 | |
CIT Equipment Collateral
1.100% due 08/22/16 " ~ | | | 2,785,000 | | | | 2,793,381 | |
CNH Equipment Trust
0.860% due 09/15/17 " | | | 7,455,000 | | | | 7,502,246 | |
0.940% due 05/15/17 " | | | 3,375,000 | | | | 3,400,903 | |
1.030% due 11/17/14 " | | | 144,092 | | | | 144,277 | |
3.000% due 08/17/15 " | | | 572,422 | | | | 576,204 | |
Discover Card Master Trust
0.860% due 11/15/17 " | | | 12,595,000 | | | | 12,682,938 | |
Ford Credit Auto Lease Trust
0.850% due 01/15/15 " | | | 2,690,000 | | | | 2,702,366 | |
1.340% due 09/15/14 " | | | 1,670,000 | | | | 1,681,796 | |
Ford Credit Auto Owner Trust
0.580% due 12/15/16 " | | | 2,770,000 | | | | 2,777,349 | |
4.050% due 10/15/16 " | | | 915,000 | | | | 962,893 | |
| | |
| See Notes to Financial Statements | | See explanation of symbols and terms, if any, on page B-143 |
B-62
PACIFIC SELECT FUND
SHORT DURATION BOND PORTFOLIO
Schedule of Investments (Continued)
December 31, 2012
| | | | | | | | |
| | | Principal
Amount | | | Value | |
Ford Credit Floorplan Master Owner Trust
4.200% due 02/15/17 " ~ | | | $4,425,000 | | | | $4,753,295 | |
4.990% due 02/15/17 " ~ | | | 3,165,000 | | | | 3,363,670 | |
GE Capital Credit Card Master Note Trust
0.689% due 05/15/19 " § | | | 2,840,000 | | | | 2,865,924 | |
1.030% due 01/15/18 " | | | 4,300,000 | | | | 4,345,769 | |
GE Equipment Small Ticket LLC
1.040% due 09/21/15 " ~ | | | 3,015,000 | | | | 3,029,318 | |
Honda Auto Receivables Owner Trust
0.560% due 05/15/16 " | | | 13,500,000 | | | | 13,518,880 | |
1.550% due 08/18/17 " | | | 4,520,000 | | | | 4,601,923 | |
Huntington Auto Trust
0.810% due 09/15/16 " | | | 4,930,000 | | | | 4,954,510 | |
Hyundai Auto Lease Securitization Trust
0.920% due 08/17/15 " ~ | | | 10,000,000 | | | | 10,059,855 | |
Hyundai Auto Receivables Trust
1.650% due 02/15/17 " | | | 3,600,000 | | | | 3,672,607 | |
John Deere Owner Trust
1.320% due 05/15/14 " | | | 75,650 | | | | 75,680 | |
Mercedes-Benz Auto Lease Trust
1.240% due 07/17/17 " ~ | | | 2,745,000 | | | | 2,764,805 | |
Mercedes-Benz Auto Receivables Trust
1.220% due 12/15/17 " | | | 5,460,000 | | | | 5,520,273 | |
Motor PLC (United Kingdom)
1.286% due 02/25/20 " ~ | | | 1,085,000 | | | | 1,089,159 | |
Navistar Financial Owner Trust
1.190% due 01/18/19 " ~ | | | 14,015,000 | | | | 14,037,431 | |
NCUA Guaranteed Notes Trust
0.558% due 12/07/20 " § | | | 2,542,343 | | | | 2,549,970 | |
Nissan Auto Lease Trust
0.920% due 02/16/15 " | | | 2,330,000 | | | | 2,339,660 | |
1.040% due 08/15/14 " | | | 5,480,000 | | | | 5,497,755 | |
Nissan Master Owner Trust Receivables
0.679% due 05/15/17 " § | | | 11,635,000 | | | | 11,669,091 | |
Porsche Innovative Lease Owner Trust
1.260% due 11/20/17 " ~ | | | 2,895,000 | | | | 2,918,203 | |
SMART Trust (Australia)
0.970% due 03/14/17 " | | | 2,495,000 | | | | 2,494,002 | |
1.040% due 09/14/14 " ~ | | | 3,604,424 | | | | 3,612,071 | |
1.540% due 03/14/15 " ~ | | | 1,345,000 | | | | 1,352,200 | |
1.590% due 10/14/16 " ~ | | | 6,715,000 | | | | 6,801,202 | |
Toyota Auto Receivables Owner Trust
0.750% due 02/16/16 " | | | 9,160,000 | | | | 9,202,594 | |
Volkswagen Auto Lease Trust
0.870% due 07/20/15 " | | | 8,210,000 | | | | 8,257,836 | |
Wheels SPV LLC
1.190% due 03/20/21 " ~ | | | 4,610,000 | | | | 4,643,243 | |
World Financial Network Credit Card Master Trust
0.339% due 02/15/17 " § ~ | | | 15,000,000 | | | | 14,998,230 | |
World Omni Automobile Lease Securitization Trust
0.930% due 11/16/15 " | | | 3,180,000 | | | | 3,200,722 | |
1.060% due 11/15/17 " | | | 3,405,000 | | | | 3,423,043 | |
| | | | | | | | |
| |
Total Asset-Backed Securities
(Cost $275,099,646) | | | | 276,658,963 | |
| | | | | | | | |
|
U.S. GOVERNMENT AGENCY ISSUES - 5.1% | |
| | |
Fannie Mae
0.500% due 07/02/15 | | | 7,000,000 | | | | 7,028,735 | |
0.750% due 12/19/14 | | | 36,950,000 | | | | 37,296,000 | |
0.875% due 08/28/17 | | | 22,375,000 | | | | 22,465,126 | |
0.875% due 10/26/17 | | | 9,115,000 | | | | 9,162,671 | |
| | | | | | | | |
| | | Principal
Amount | | | Value | |
Federal Home Loan Bank
0.500% due 11/20/15 | | | $34,900,000 | | | | $35,056,492 | |
Freddie Mac
0.500% due 04/17/15 | | | 13,915,000 | | | | 13,979,830 | |
| | | | | | | | |
| | |
Total U.S. Government Agency Issues
(Cost $124,386,027) | | | | | | | 124,988,854 | |
| | | | | | | | |
|
U.S. TREASURY OBLIGATIONS - 7.7% | |
| |
U.S. Treasury Inflation Protected Securities - 4.0% | | | | | |
| | |
0.500% due 04/15/15 ^ | | | 15,215,930 | | | | 15,884,000 | |
1.875% due 07/15/13 ^ | | | 72,570,661 | | | | 73,772,649 | |
2.000% due 07/15/14 ^ | | | 7,465,550 | | | | 7,880,821 | |
| | | | | | | | |
| | | | | | | 97,537,470 | |
| | | | | | | | |
U.S. Treasury Notes - 3.7% | | | | | | | | |
| | |
0.250% due 03/31/14 | | | 92,000,000 | | | | 92,057,500 | |
| | | | | | | | |
| | |
Total U.S. Treasury Obligations
(Cost $189,417,585) | | | | | | | 189,594,970 | |
| | | | | | | | |
|
FOREIGN GOVERNMENT BONDS & NOTES - 0.1% | |
| | |
Mexican Udibonos (Mexico)
3.500% due 12/14/17 ^ | | | MXN 27,502,629 | | | | 2,363,503 | |
| | | | | | | | |
| |
Total Foreign Government Bonds & Notes
(Cost $2,381,068) | | | | 2,363,503 | |
| | | | | | | | |
| | |
SHORT-TERM INVESTMENT - 3.0% | | | | | | | | |
| | |
Repurchase Agreement - 3.0% | | | | | | | | |
| | |
Fixed Income Clearing Corp
0.010% due 01/02/13
(Dated 12/31/12, repurchase price of $74,014,932; collateralized by U.S. Treasury Notes: 2.750% due 11/30/16
and value $75,499,369) | | | $74,014,891 | | | | 74,014,891 | |
| | | | | | | | |
| | |
Total Short-Term Investment
(Cost $74,014,891) | | | | | | | 74,014,891 | |
| | | | | | | | |
| | |
TOTAL INVESTMENTS - 99.2%
(Cost $2,408,453,646) | | | | | | | 2,435,784,784 | |
| |
OTHER ASSETS & LIABILITIES, NET - 0.8% | | | | 19,621,305 | |
| | | | | | | | |
| |
NET ASSETS - 100.0% | | | | $2,455,406,089 | |
| | | | | | | | |
Notes to Schedule of Investments
| (a) | As of December 31, 2012, the portfolio was diversified as a percentage of net assets as follows: |
| | | | |
Corporate Bonds & Notes | | | 48.7% | |
Mortgage-Backed Securities | | | 23.3% | |
Asset-Backed Securities | | | 11.3% | |
U.S. Treasury Obligations | | | 7.7% | |
U.S. Government Agency Issues | | | 5.1% | |
Short-Term Investment | | | 3.0% | |
Foreign Government Bonds & Notes | | | 0.1% | |
| | | | |
| | | 99.2% | |
Other Assets & Liabilities, Net | | | 0.8% | |
| | | | |
| | | 100.0% | |
| | | | |
| | |
| See Notes to Financial Statements | | See explanation of symbols and terms, if any, on page B-143 |
B-63
PACIFIC SELECT FUND
SHORT DURATION BOND PORTFOLIO
Schedule of Investments (Continued)
December 31, 2012
| (b) | As of December 31, 2012, the portfolio’s Standard & Poor’s quality ratings as a percentage of total fixed income investments were as follows (Unaudited): |
| | | | |
AAA | | | 10.1% | |
A-1 (Short-Term Debt only) | | | 3.0% | |
AA/U.S. Government & Agency Issues | | | 33.4% | |
A | | | 18.8% | |
BBB | | | 23.4% | |
BB | | | 3.5% | |
B | | | 0.4% | |
CC | | | 0.2% | |
C | | | 0.3% | |
Not Rated | | | 6.9% | |
| | | | |
| | | 100.0% | |
| | | | |
| (c) | Short-term investments reflect either the stated coupon rate or the annualized effective yield on the date of purchase for discounted investments. |
| (d) | Forward foreign currency contracts outstanding as of December 31, 2012 were as follows: |
| | | | | | | | | | | | | | | | | | | | |
Currency
Purchased | | | Currency
Sold | | | Expiration | | | Counterparty | | Unrealized
Appreciation | |
| USD | | | 2,415,811 | | | MXN | | | 31,170,000 | | | | 03/13 | | | SSB | | | $21,144 | |
| | | | | | | | | | | | | | | | | | | | |
| (e) | Fair Value Measurements |
The following is a summary of the portfolio’s investments as categorized under the three-tier hierarchy of inputs used in valuing the portfolio’s assets and liabilities (See Note 3D in Notes to Financial Statements) as of December 31, 2012:
| | | | | | | | | | | | | | | | | | |
| | | | | Total Value at
December 31, 2012 | | | Level 1
Quoted Price | | | Level 2
Significant
Observable Inputs | | | Level 3
Significant
Unobservable Inputs | |
Assets | | Corporate Bonds & Notes | | | $1,194,732,134 | | | | $- | | | | $1,194,732,134 | | | | $- | |
| | Mortgage-Backed Securities | | | 573,431,469 | | | | - | | | | 548,287,290 | | | | 25,144,179 | |
| | Asset-Backed Securities | | | 276,658,963 | | | | - | | | | 266,098,862 | | | | 10,560,101 | |
| | U.S. Government Agency Issues | | | 124,988,854 | | | | - | | | | 124,988,854 | | | | - | |
| | U.S. Treasury Obligations | | | 189,594,970 | | | | - | | | | 189,594,970 | | | | - | |
| | Foreign Government Bonds & Notes | | | 2,363,503 | | | | - | | | | 2,363,503 | | | | - | |
| | Short-Term Investment | | | 74,014,891 | | | | - | | | | 74,014,891 | | | | - | |
| | Derivatives: | | | | | | | | | | | | | | | | |
| | Foreign Currency Contracts | | | | | | | | | | | | | | | | |
| | Forward Foreign Currency Contracts | | | 21,144 | | | | - | | | | 21,144 | | | | - | |
| | | | | | | | | | | | | | | | | | |
| | Total | | | $2,435,805,928 | | | | $- | | | | $2,400,101,648 | | | | $35,704,280 | |
| | | | | | | | | | | | | | | | | | |
The following is a reconciliation of investments for significant unobservable inputs (Level 3) used in valuing the portfolio’s assets and liabilities (See Note 3D in Notes to Financial Statements) for the year ended December 31, 2012:
| | | | | | | | | | | | |
| | | Mortgage-Backed
Securities | | | Asset-Backed
Securities | | | Total | |
Value, Beginning of Year | | | $25,066,827 | | | | $3,109,120 | | | | $28,175,947 | |
Purchases | | | - | | | | 7,978,667 | | | | 7,978,667 | |
Sales (includes paydowns) | | | (4,842,154 | ) | | | (557,756 | ) | | | (5,399,910 | ) |
Accrued Discounts (Premiums) | | | 6 | | | | 82 | | | | 88 | |
Net Realized Gains (Losses) | | | 20 | | | | - | | | | 20 | |
Change in Net Unrealized Appreciation | | | 28,176 | | | | 29,988 | | | | 58,164 | |
Transfers In | | | 4,891,304 | | | | - | | | | 4,891,304 | |
Transfers Out | | | - | | | | - | | | | - | |
| | | | | | | | | | | | |
Value, End of Year | | | $25,144,179 | | | | $10,560,101 | | | | $35,704,280 | |
| | | | | | | | | | | | |
Change in Net Unrealized Appreciation on Level 3
Investments Held at the End of Year, if Applicable | | | $28,176 | | | | $29,988 | | | | $58,164 | |
| | | | | | | | | | | | |
The significant unobservable inputs were provided by a vendor-priced single broker quote.
| | |
| See Notes to Financial Statements | | See explanation of symbols and terms, if any, on page B-143 |
B-64
PACIFIC SELECT FUND
EMERGING MARKETS DEBT PORTFOLIO
Schedule of Investments
December 31, 2012
| | | | | | | | |
| | | Principal
Amount | | | Value | |
CORPORATE BONDS & NOTES - 40.0% | | | | | | | | |
| | |
Austria - 0.3% | | | | | | | | |
| | |
OGX Austria GmbH
8.375% due 04/01/22 ~ | | | $2,300,000 | | | | $1,926,250 | |
8.500% due 06/01/18 ~ | | | 1,600,000 | | | | 1,448,000 | |
| | | | | | | | |
| | | | | | | 3,374,250 | |
| | | | | | | | |
Azerbaijan - 0.2% | | | | | | | | |
| | |
State Oil Co of the Azerbaijan Republic
5.450% due 02/09/17 ~ | | | 1,620,000 | | | | 1,786,050 | |
| | | | | | | | |
| | |
Barbados - 0.7% | | | | | | | | |
| | |
Columbus International Inc
11.500% due 11/20/14 ~ | | | 5,850,000 | | | | 6,552,000 | |
| | | | | | | | |
| | |
Bermuda - 2.1% | | | | | | | | |
| | |
Central European Media Enterprises Ltd
11.625% due 09/15/16 ~ | | | EUR 2,950,000 | | | | 4,117,751 | |
China Oriental Group Co Ltd | | | | | | | | |
7.000% due 11/17/17 ~ | | | $800,000 | | | | 804,000 | |
8.000% due 08/18/15 ~ | | | 2,332,000 | | | | 2,425,280 | |
Digicel Group Ltd | | | | | | | | |
8.250% due 09/30/20 ~ | | | 3,000,000 | | | | 3,315,000 | |
10.500% due 04/15/18 ~ | | | 1,400,000 | | | | 1,554,000 | |
Digicel Ltd
7.000% due 02/15/20 ~ | | | 1,850,000 | | | | 1,998,000 | |
Qtel International Finance Ltd | | | | | | | | |
4.750% due 02/16/21 ~ | | | 740,000 | | | | 838,050 | |
6.500% due 06/10/14 ~ | | | 280,000 | | | | 300,860 | |
7.875% due 06/10/19 ~ | | | 4,020,000 | | | | 5,286,300 | |
| | | | | | | | |
| | | | | | | 20,639,241 | |
| | | | | | | | |
Cayman - 6.2% | | | | | | | | |
| | |
Agile Property Holdings Ltd
8.875% due 04/28/17 ~ | | | 103,000 | | | | 111,755 | |
9.875% due 03/20/17 ~ | | | 1,350,000 | | | | 1,525,500 | |
Central China Real Estate Ltd
12.250% due 10/20/15 ~ | | | 1,250,000 | | | | 1,393,750 | |
China Shanshui Cement Group Ltd
10.500% due 04/27/17 ~ | | | 2,350,000 | | | | 2,714,250 | |
Country Garden Holdings Co Ltd | | | | | | | | |
11.125% due 02/23/18 ~ | | | 767,000 | | | | 893,555 | |
11.250% due 04/22/17 ~ | | | 1,966,000 | | | | 2,231,410 | |
Dar Al-Arkan International Sukuk Co II 10.750% due 02/18/15 ~ | | | 3,400,000 | | | | 3,719,600 | |
DP World Sukuk Ltd
6.250% due 07/02/17 ~ | | | 1,400,000 | | | | 1,576,750 | |
Dubai DOF Sukuk Ltd
6.396% due 11/03/14 | | | 1,290,000 | | | | 1,394,490 | |
Dubai Holding Commercial Operations MTN Ltd | | | | | | | | |
4.750% due 01/30/14 | | | EUR 4,100,000 | | | | 5,330,621 | |
6.000% due 02/01/17 | | | GBP 2,000,000 | | | | 3,162,804 | |
Emaar Sukuk Ltd | | | | | | | | |
6.400% due 07/18/19 ~ | | | $2,300,000 | | | | 2,507,000 | |
8.500% due 08/03/16 | | | 2,300,000 | | | | 2,616,250 | |
Evergrande Real Estate Group Ltd | | | | | | | | |
7.500% due 01/19/14 ~ | | | CNY 11,800,000 | | | | 1,910,565 | |
9.250% due 01/19/16 ~ | | | 16,100,000 | | | | 2,606,608 | |
13.000% due 01/27/15 ~ | | | $2,900,000 | | | | 3,175,500 | |
Fibria Overseas Finance Ltd
6.750% due 03/03/21 ~ | | | 2,650,000 | | | | 2,961,375 | |
Hidili Industry International Development Ltd 8.625% due 11/04/15 ~ | | | 2,600,000 | | | | 2,054,000 | |
Jafz Sukuk Ltd
7.000% due 06/19/19 ~ | | | 1,230,000 | | | | 1,429,875 | |
| | | | | | | | |
| | | Principal
Amount | | | Value | |
JBS Finance II Ltd
8.250% due 01/29/18 ~ | | | $4,500,000 | | | | $4,815,000 | |
Kuwait Projects Co
9.375% due 07/15/20 | | | 2,100,000 | | | | 2,593,500 | |
Longfor Properties Co Ltd
9.500% due 04/07/16 ~ | | | 2,300,000 | | | | 2,558,750 | |
Marfrig Overseas Ltd
9.500% due 05/04/20 ~ | | | 2,750,000 | | | | 2,385,625 | |
Mongolian Mining Corp
8.875% due 03/29/17 ~ | | | 2,550,000 | | | | 2,741,250 | |
Nile Finance Ltd
5.250% due 08/05/15 ~ | | | 1,790,000 | | | | 1,794,475 | |
Shimao Property Holdings Ltd | | | | | | | | |
9.650% due 08/03/17 ~ | | | 500,000 | | | | 552,083 | |
11.000% due 03/08/18 ~ | | | 850,000 | | | | 986,585 | |
| | | | | | | | |
| | | | | | | 61,742,926 | |
| | | | | | | | |
Chile - 1.1% | | | | | | | | |
| | |
Banco del Estado de Chile | | | | | | | | |
3.875% due 02/08/22 ~ | | | 580,000 | | | | 617,809 | |
4.125% due 10/07/20 ~ | | | 1,390,000 | | | | 1,522,550 | |
Corp Nacional del Cobre de Chile | | | | | | | | |
3.750% due 11/04/20 ~ | | | 1,510,000 | | | | 1,638,790 | |
3.875% due 11/03/21 ~ | | | 1,810,000 | | | | 1,979,206 | |
7.500% due 01/15/19 ~ | | | 770,000 | | | | 995,193 | |
Empresa Nacional del Petroleo | | | | | | | | |
5.250% due 08/10/20 ~ | | | 870,000 | | | | 963,215 | |
6.250% due 07/08/19 ~ | | | 1,470,000 | | | | 1,696,227 | |
Inversiones Alsacia SA
8.000% due 08/18/18 ~ | | | 1,637,231 | | | | 1,651,566 | |
| | | | | | | | |
| | | | | | | 11,064,556 | |
| | | | | | | | |
Colombia - 0.1% | | | | | | | | |
| | |
Ecopetrol SA
7.625% due 07/23/19 | | | 870,000 | | | | 1,128,825 | |
| | | | | | | | |
| | |
El Salvador - 0.2% | | | | | | | | |
| | |
Telemovil Finance Co Ltd
8.000% due 10/01/17 ~ | | | 1,750,000 | | | | 1,903,125 | |
| | | | | | | | |
| | |
Georgia - 0.2% | | | | | | | | |
| | |
Georgian Railway JSC
7.750% due 07/11/22 ~ | | | 1,450,000 | | | | 1,660,250 | |
| | | | | | | | |
| | |
Hong Kong - 0.8% | | | | | | | | |
| | |
Bank of China Ltd
5.550% due 02/11/20 ~ | | | 3,070,000 | | | | 3,465,803 | |
China CITIC Bank International Ltd
6.875% due 06/24/20 | | | 280,000 | | | | 323,443 | |
Fosun International Ltd
7.500% due 05/12/16 ~ | | | 2,300,000 | | | | 2,417,875 | |
Industrial & Commercial Bank of China Asia Ltd
5.125% due 11/30/20 ~ | | | 1,760,000 | | | | 1,949,561 | |
| | | | | | | | |
| | | | | | | 8,156,682 | |
| | | | | | | | |
Indonesia - 0.4% | | | | | | | | |
| | |
P.T. Pertamina Persero
6.000% due 05/03/42 ~ | | | 1,725,000 | | | | 1,951,406 | |
P.T. Perusahaan Listrik Negara | | | | | | | | |
5.250% due 10/24/42 ~ | | | 650,000 | | | | 672,750 | |
5.500% due 11/22/21 ~ | | | 1,100,000 | | | | 1,248,500 | |
| | | | | | | | |
| | | | | | | 3,872,656 | |
| | | | | | | | |
| | |
| See Notes to Financial Statements | | See explanation of symbols and terms, if any, on page B-143 |
B-65
PACIFIC SELECT FUND
EMERGING MARKETS DEBT PORTFOLIO
Schedule of Investments (Continued)
December 31, 2012
| | | | | | | | |
| | | Principal
Amount | | | Value | |
Ireland - 2.9% | | | | | | | | |
| | |
Alfa Bank OJSC
7.500% due 09/26/19 ~ | | | $2,400,000 | | | | $2,545,152 | |
Brunswick Rail Finance Ltd
6.500% due 11/01/17 ~ | | | 1,450,000 | | | | 1,517,860 | |
Metalloinvest Finance Ltd
6.500% due 07/21/16 ~ | | | 2,400,000 | | | | 2,529,000 | |
MTS International Funding Ltd
8.625% due 06/22/20 ~ | | | 4,700,000 | | | | 5,951,375 | |
Rosneft Oil Co
4.199% due 03/06/22 ~ | | | 2,250,000 | | | | 2,295,000 | |
VEB-Leasing
5.125% due 05/27/16 ~ | | | 1,500,000 | | | | 1,588,125 | |
Vnesheconombank
5.450% due 11/22/17 ~ | | | 1,380,000 | | | | 1,538,700 | |
6.800% due 11/22/25 ~ | | | 3,040,000 | | | | 3,739,200 | |
6.902% due 07/09/20 ~ | | | 5,360,000 | | | | 6,552,868 | |
| | | | | | | | |
| | | | | | | 28,257,280 | |
| | | | | | | | |
Kazakhstan - 1.1% | | | | | | | | |
| | |
ATF Bank JSC
9.000% due 05/11/16 ~ | | | 1,175,000 | | | | 1,148,269 | |
Development Bank of Kazakhstan JSC
4.125% due 12/10/22 ~ | | | 2,100,000 | | | | 2,126,250 | |
Halyk Savings Bank of Kazakhstan JSC
7.250% due 05/03/17 ~ | | | 2,350,000 | | | | 2,582,650 | |
Kazkommertsbank JSC
7.500% due 11/29/16 ~ | | | 2,500,000 | | | | 2,297,000 | |
8.000% due 11/03/15 ~ | | | 3,000,000 | | | | 2,895,750 | |
| | | | | | | | |
| | | | | | | 11,049,919 | |
| | | | | | | | |
Luxembourg - 3.9% | | | | | | | | |
| | |
Altice Financing SA
7.875% due 12/15/19 ~ | | | 1,800,000 | | | | 1,912,500 | |
Evraz Group SA
6.750% due 04/27/18 ~ | | | 3,500,000 | | | | 3,613,750 | |
9.500% due 04/24/18 ~ | | | 1,150,000 | | | | 1,316,750 | |
MHP SA
10.250% due 04/29/15 ~ | | | 4,693,000 | | | | 4,986,313 | |
Minerva Luxembourg SA
12.250% due 02/10/22 ~ | | | 3,550,000 | | | | 4,268,875 | |
Promsvyazbank OJSC
8.500% due 04/25/17 ~ | | | 500,000 | | | | 513,750 | |
10.200% due 11/06/19 ~ | | | 1,450,000 | | | | 1,501,638 | |
Russian Standard Bank
9.250% due 07/11/17 ~ | | | 2,400,000 | | | | 2,490,000 | |
Sberbank of Russia
6.125% due 02/07/22 ~ | | | 2,160,000 | | | | 2,473,200 | |
Severstal OAO
6.250% due 07/26/16 ~ | | | 2,350,000 | | | | 2,516,850 | |
6.700% due 10/25/17 ~ | | | 2,300,000 | | | | 2,530,000 | |
TMK OAO
7.750% due 01/27/18 ~ | | | 5,900,000 | | | | 6,224,500 | |
VTB Bank OJSC
6.000% due 04/12/17 ~ | | | 2,350,000 | | | | 2,546,225 | |
6.875% due 05/29/18 ~ | | | 1,720,000 | | | | 1,946,180 | |
| | | | | | | | |
| | | | | | | 38,840,531 | |
| | | | | | | | |
Malaysia - 0.6% | | | | | | | | |
| | |
Axiata SPV1 Labuan Ltd
5.375% due 04/28/20 | | | 1,340,000 | | | | 1,531,928 | |
MMI International Ltd
8.000% due 03/01/17 ~ | | | 1,200,000 | | | | 1,278,000 | |
Petronas Capital Ltd
5.250% due 08/12/19 ~ | | | 1,700,000 | | | | 2,024,074 | |
7.875% due 05/22/22 ~ | | | 680,000 | | | | 973,698 | |
| | | | | | | | |
| | | | | | | 5,807,700 | |
| | | | | | | | |
| | | | | | | | |
| | | Principal
Amount | | | Value | |
Mexico - 2.2% | | | | | | | | |
| | |
Cemex SAB de CV
9.000% due 01/11/18 ~ | | | $2,300,000 | | | | $2,501,250 | |
Comision Federal de Electricidad
4.875% due 05/26/21 ~ | | | 1,410,000 | | | | 1,610,925 | |
5.750% due 02/14/42 ~ | | | 1,870,000 | | | | 2,136,475 | |
Corp GEO SAB de CV
9.250% due 06/30/20 ~ | | | 2,500,000 | | | | 2,712,500 | |
Desarrolladora Homex SAB de CV
9.500% due 12/11/19 ~ | | | 1,000,000 | | | | 1,085,000 | |
9.750% due 03/25/20 ~ | | | 1,400,000 | | | | 1,526,000 | |
Petroleos Mexicanos
5.500% due 06/27/44 | | | 780,000 | | | | 859,950 | |
6.000% due 03/05/20 | | | 820,000 | | | | 984,000 | |
6.500% due 06/02/41 | | | 2,440,000 | | | | 3,074,400 | |
8.000% due 05/03/19 | | | 1,360,000 | | | | 1,785,000 | |
Urbi Desarrollos Urbanos SAB de CV
9.500% due 01/21/20 ~ | | | 900,000 | | | | 859,500 | |
9.750% due 02/03/22 ~ | | | 2,500,000 | | | | 2,375,000 | |
| | | | | | | | |
| | | | | | | 21,510,000 | |
| | | | | | | | |
Netherlands - 5.2% | | | | | | | | |
| | |
DTEK Finance BV
9.500% due 04/28/15 ~ | | | 2,350,000 | | | | 2,379,257 | |
Kazakhstan Temir Zholy Finance BV
6.375% due 10/06/20 ~ | | | 2,580,000 | | | | 3,134,700 | |
6.950% due 07/10/42 ~ | | | 2,000,000 | | | | 2,520,000 | |
Kazkommerts International BV
7.875% due 04/07/14 ~ | | | 1,350,000 | | | | 1,357,425 | |
KazMunaiGaz Finance Sub BV
6.375% due 04/09/21 ~ | | | 3,300,000 | | | | 4,054,875 | |
7.000% due 05/05/20 ~ | | | 3,060,000 | | | | 3,825,000 | |
8.375% due 07/02/13 ~ | | | 930,000 | | | | 962,550 | |
9.125% due 07/02/18 ~ | | | 810,000 | | | | 1,074,263 | |
11.750% due 01/23/15 ~ | | | 1,910,000 | | | | 2,289,613 | |
Lukoil International Finance BV
6.125% due 11/09/20 ~ | | | 400,000 | | | | 464,500 | |
6.656% due 06/07/22 ~ | | | 800,000 | | | | 978,000 | |
Majapahit Holding BV
7.750% due 10/17/16 ~ | | | 1,690,000 | | | | 2,004,763 | |
7.750% due 01/20/20 ~ | | | 1,350,000 | | | | 1,704,375 | |
8.000% due 08/07/19 ~ | | | 1,500,000 | | | | 1,905,000 | |
Marfrig Holding Europe BV
8.375% due 05/09/18 ~ | | | 2,200,000 | | | | 1,886,500 | |
Metinvest BV
8.750% due 02/14/18 ~ | | | 5,000,000 | | | | 4,887,500 | |
10.250% due 05/20/15 ~ | | | 1,200,000 | | | | 1,239,000 | |
OSX 3 Leasing BV
9.250% due 03/20/15 ~ | | | 1,200,000 | | | | 1,243,500 | |
Polish Television Holding BV
11.250% due 05/15/17 § ~ | | | EUR 1,232,000 | | | | 1,780,666 | |
VimpelCom Holdings BV
7.504% due 03/01/22 ~ | | | $8,300,000 | | | | 9,534,625 | |
WPE International Cooperatief UA
10.375% due 09/30/20 ~ | | | 750,000 | | | | 645,686 | |
Zhaikmunai LP
7.125% due 11/13/19 ~ | | | 1,650,000 | | | | 1,732,500 | |
| | | | | | | | |
| | | | | | | 51,604,298 | |
| | | | | | | | |
Peru - 0.1% | | | | | | | | |
| | |
CFG Investment SAC
9.750% due 07/30/19 ~ | | | 1,950,000 | | | | 1,491,750 | |
| | | | | | | | |
| | |
| See Notes to Financial Statements | | See explanation of symbols and terms, if any, on page B-143 |
B-66
PACIFIC SELECT FUND
EMERGING MARKETS DEBT PORTFOLIO
Schedule of Investments (Continued)
December 31, 2012
| | | | | | | | |
| | | Principal
Amount | | | Value | |
| | |
Philippines - 0.6% | | | | | | | | |
| | |
Development Bank of Philippines
5.500% due 03/25/21 | | | $1,630,000 | | | | $1,880,632 | |
Power Sector Assets & Liabilities Management Corp
7.250% due 05/27/19 ~ | | | 300,000 | | | | 388,125 | |
7.390% due 12/02/24 ~ | | | 2,750,000 | | | | 3,856,875 | |
| | | | | | | | |
| | | | | | | 6,125,632 | |
| | | | | | | | |
Singapore - 0.3% | | | | | | | | |
| | |
Yanlord Land Group Ltd
10.625% due 03/29/18 ~ | | | 2,550,000 | | | | 2,919,750 | |
| | | | | | | | |
| | |
South Africa - 1.2% | | | | | | | | |
| | |
African Bank Ltd
8.125% due 02/24/17 ~ | | | 2,347,000 | | | | 2,564,098 | |
Edcon Holdings Proprietary Ltd
5.683% due 06/15/15 § ~ | | | EUR 1,625,000 | | | | 1,999,065 | |
Edcon Proprietary Ltd
3.433% due 06/15/14 § ~ | | | 4,400,000 | | | | 5,604,511 | |
Foodcorp Proprietary Ltd
8.750% due 03/01/18 ~ | | | 1,150,000 | | | | 1,686,815 | |
| | | | | | | | |
| | | | | | | 11,854,489 | |
| | | | | | | | |
Spain - 0.4% | | | | | | | | |
| | |
Cemex Espana Luxembourg
9.250% due 05/12/20 ~ | | | $3,504,000 | | | | 3,836,880 | |
| | | | | | | | |
| | |
Sri Lanka - 0.2% | | | | | | | | |
| | |
Bank of Ceylon
6.875% due 05/03/17 ~ | | | 1,600,000 | | | | 1,732,000 | |
| | | | | | | | |
| | |
Sweden - 1.0% | | | | | | | | |
| | |
Eileme 2 AB
11.625% due 01/31/20 ~ | | | 1,200,000 | | | | 1,410,000 | |
11.750% due 01/31/20 ~ | | | EUR 3,000,000 | | | | 4,652,827 | |
TVN Finance Corp II AB
10.750% due 11/15/17 ~ | | | 2,617,000 | | | | 3,834,285 | |
| | | | | | | | |
| | | | | | | 9,897,112 | |
| | | | | | | | |
Turkey - 0.2% | | | | | | | | |
| | |
Export Credit Bank of Turkey
5.375% due 11/04/16 ~ | | | $1,580,000 | | | | 1,728,520 | |
| | | | | | | | |
| | |
Ukraine - 0.4% | | | | | | | | |
| | |
National JSC Naftogaz of Ukraine
9.500% due 09/30/14 | | | 3,481,000 | | | | 3,589,781 | |
| | | | | | | | |
| | |
United Arab Emirates - 1.8% | | | | | | | | |
| | |
Dolphin Energy Ltd
5.888% due 06/15/19 ~ | | | 1,557,978 | | | | 1,760,515 | |
DP World Ltd
6.850% due 07/02/37 ~ | | | 4,700,000 | | | | 5,528,375 | |
Dubai Electricity & Water Authority
7.375% due 10/21/20 ~ | | | 2,840,000 | | | | 3,507,400 | |
8.500% due 04/22/15 ~ | | | 4,480,000 | | | | 5,084,800 | |
Emirates Airline
5.125% due 06/08/16 ~ | | | 1,920,000 | | | | 2,025,600 | |
| | | | | | | | |
| | | | | | | 17,906,690 | |
| | | | | | | | |
United Kingdom - 3.9% | | | | | | | | |
| | |
Afren PLC
10.250% due 04/08/19 ~ | | | 2,400,000 | | | | 2,819,587 | |
11.500% due 02/01/16 ~ | | | 2,374,000 | | | | 2,765,710 | |
| | | | | | | | |
| | | Principal
Amount | | | Value | |
Atlantic Finance Ltd
10.750% due 05/27/14 § ~ | | | $2,800,000 | | | | $3,066,000 | |
CNPC HK Overseas Capital Ltd
5.950% due 04/28/41 ~ | | | 1,900,000 | | | | 2,474,450 | |
Ferrexpo Finance PLC
7.875% due 04/07/16 ~ | | | 3,550,000 | | | | 3,461,250 | |
Franshion Development Ltd
6.750% due 04/15/21 ~ | | | 1,160,000 | | | | 1,247,000 | |
Oschadbank
8.250% due 03/10/16 | | | 3,460,000 | | | | 3,304,300 | |
Privatbank CJSC
9.375% due 09/23/15 | | | 1,800,000 | | | | 1,697,670 | |
Sinochem Overseas Capital Co Ltd
4.500% due 11/12/20 ~ | | | 3,700,000 | | | | 3,994,342 | |
6.300% due 11/12/40 ~ | | | 670,000 | | | | 805,963 | |
Sinopec Group Overseas Development Ltd
3.900% due 05/17/22 ~ | | | 1,650,000 | | | | 1,784,422 | |
4.875% due 05/17/42 ~ | | | 1,550,000 | | | | 1,782,086 | |
Star Energy Geothermal Wayang Windu Ltd
11.500% due 02/12/15 ~ | | | 2,350,000 | | | | 2,529,070 | |
Ukreximbank
8.375% due 04/27/15 ~ | | | 3,806,000 | | | | 3,791,728 | |
Vedanta Resources PLC
8.250% due 06/07/21 ~ | | | 2,500,000 | | | | 2,781,250 | |
9.500% due 07/18/18 ~ | | | 300,000 | | | | 349,140 | |
| | | | | | | | |
| | | | | | | 38,653,968 | |
| | | | | | | | |
United States - 1.0% | | | | | | | | |
| | |
CEDC Finance Corp International Inc
8.875% due 12/01/16 ~ | | | EUR 1,700,000 | | | | 1,368,789 | |
9.125% due 12/01/16 ~ | | | $500,000 | | | | 305,000 | |
Cemex Finance LLC
9.500% due 12/14/16 ~ | | | 1,200,000 | | | | 1,311,000 | |
NII Capital Corp
7.625% due 04/01/21 | | | 3,400,000 | | | | 2,592,500 | |
Pemex Project Funding Master Trust
5.750% due 03/01/18 | | | 1,130,000 | | | | 1,324,925 | |
Reliance Holdings USA Inc
5.400% due 02/14/22 ~ | | | 1,700,000 | | | | 1,902,936 | |
6.250% due 10/19/40 ~ | | | 1,250,000 | | | | 1,438,039 | |
| | | | | | | | |
| | | | | | | 10,243,189 | |
| | | | | | | | |
Venezuela - 0.6% | | | | | | | | |
| | |
Petroleos de Venezuela SA
5.250% due 04/12/17 ~ | | | 1,760,000 | | | | 1,544,400 | |
5.375% due 04/12/27 ~ | | | 3,600,000 | | | | 2,538,000 | |
5.500% due 04/12/37 ~ | | | 1,350,000 | | | | 931,500 | |
12.750% due 02/17/22 ~ | | | 1,290,000 | | | | 1,453,185 | |
| | | | | | | | |
| | | | | | | 6,467,085 | |
| | | | | | | | |
Vietnam - 0.1% | | | | | | | | |
| | |
Vietnam Joint Stock Commercial Bank for Industry & Trade
8.000% due 05/17/17 ~ | | | 750,000 | | | | 751,875 | |
| | | | | | | | |
| | |
Total Corporate Bonds & Notes
(Cost $372,266,070) | | | | | | | 396,149,010 | |
| | | | | | | | |
| |
FOREIGN GOVERNMENT BONDS & NOTES - 57.9% | | | | | |
| | |
Argentina - 1.7% | | | | | | | | |
| | |
Argentina Boden
7.000% due 10/03/15 | | | 5,430,000 | | | | 4,875,537 | |
Argentina Bonar
7.000% due 09/12/13 | | | 1,738,000 | | | | 1,727,234 | |
Argentine Republic Government
2.500% due 12/31/38 § | | | 1,613,000 | | | | 587,132 | |
8.280% due 12/31/33 | | | 11,113,661 | | | | 7,937,016 | |
8.750% due 06/02/17 | | | 1,333,000 | | | | 1,186,370 | |
| | | | | | | | |
| | | | | | | 16,313,289 | |
| | | | | | | | |
| | |
| See Notes to Financial Statements | | See explanation of symbols and terms, if any, on page B-143 |
B-67
PACIFIC SELECT FUND
EMERGING MARKETS DEBT PORTFOLIO
Schedule of Investments (Continued)
December 31, 2012
| | | | | | | | |
| | | Principal
Amount | | | Value | |
Belarus - 1.0% | | | | | | | | |
| | |
Republic of Belarus
8.750% due 08/03/15 ~ | | | $3,300,000 | | | | $3,397,020 | |
8.950% due 01/26/18 ~ | | | 6,620,000 | | | | 6,851,700 | |
| | | | | | | | |
| | | | | | | 10,248,720 | |
| | | | | | | | |
Bolivia - 0.1% | | | | | | | | |
| | |
Bolivian Government
4.875% due 10/29/22 ~ | | | 1,150,000 | | | | 1,124,125 | |
| | | | | | | | |
| | |
Brazil - 9.4% | | | | | | | | |
| | |
Banco Nacional de Desenvolvimento Economico e Social
5.500% due 07/12/20 ~ | | | 870,000 | | | | 1,028,775 | |
6.500% due 06/10/19 ~ | | | 2,910,000 | | | | 3,579,300 | |
Brazil Letras do Tesouro Nacional
9.248% due 01/01/15 | | | BRL 20,600,000 | | | | 8,659,777 | |
Brazil Notas do Tesouro Nacional ‘B’
6.000% due 05/15/15 ^ | | | 3,690,000 | | | | 4,381,530 | |
6.000% due 08/15/16 ^ | | | 12,020,000 | | | | 14,671,596 | |
6.000% due 08/15/20 ^ | | | 9,760,000 | | | | 12,639,830 | |
6.000% due 08/15/50 ^ | | | 3,290,000 | | | | 5,014,934 | |
Brazilian Government
2.625% due 01/05/23 | | | $1,900,000 | | | | 1,912,350 | |
4.875% due 01/22/21 | | | 7,060,000 | | | | 8,542,600 | |
5.625% due 01/07/41 | | | 4,930,000 | | | | 6,482,950 | |
5.875% due 01/15/19 | | | 2,060,000 | | | | 2,558,520 | |
6.000% due 01/17/17 | | | 1,080,000 | | | | 1,277,100 | |
7.125% due 01/20/37 | | | 5,400,000 | | | | 8,289,000 | |
8.250% due 01/20/34 | | | 3,940,000 | | | | 6,648,750 | |
8.875% due 04/15/24 | | | 1,550,000 | | | | 2,503,250 | |
10.125% due 05/15/27 | | | 2,700,000 | | | | 4,954,500 | |
10.250% due 01/10/28 | | | BRL 580,000 | | | | 374,628 | |
| | | | | | | | |
| | | | | | | 93,519,390 | |
| | | | | | | | |
Chile - 0.1% | | | | | | | | |
| | |
Chile Government
3.250% due 09/14/21 | | | $830,000 | | | | 904,700 | |
| | | | | | | | |
| | |
Colombia - 2.8% | | | | | | | | |
| | |
Colombia Government
4.375% due 07/12/21 | | | 2,110,000 | | | | 2,434,940 | |
6.125% due 01/18/41 | | | 5,520,000 | | | | 7,606,560 | |
7.375% due 01/27/17 | | | 1,590,000 | | | | 1,970,010 | |
7.375% due 03/18/19 | | | 2,870,000 | | | | 3,786,965 | |
7.375% due 09/18/37 | | | 1,690,000 | | | | 2,637,245 | |
8.125% due 05/21/24 | | | 3,760,000 | | | | 5,677,600 | |
10.375% due 01/28/33 | | | 220,000 | | | | 407,000 | |
11.750% due 02/25/20 | | | 2,240,000 | | | | 3,633,280 | |
| | | | | | | | |
| | | | | | | 28,153,600 | |
| | | | | | | | |
Costa Rica - 0.3% | | | | | | | | |
| | |
Costa Rica Government
4.250% due 01/26/23 ~ | | | 2,660,000 | | | | 2,697,240 | |
| | | | | | | | |
| | |
Croatia - 1.5% | | | | | | | | |
| | |
Croatia Government
6.250% due 04/27/17 ~ | | | 2,060,000 | | | | 2,263,940 | |
6.375% due 03/24/21 ~ | | | 6,880,000 | | | | 7,853,425 | |
6.625% due 07/14/20 ~ | | | 2,607,000 | | | | 2,991,532 | |
6.750% due 11/05/19 ~ | | | 1,640,000 | | | | 1,888,050 | |
| | | | | | | | |
| | | | | | | 14,996,947 | |
| | | | | | | | |
Dominican Republic - 0.4% | | | | | | | | |
| | |
Dominican Republic Government
7.500% due 05/06/21 ~ | | | 3,140,000 | | | | 3,670,660 | |
| | | | | | | | |
| | | | | | | | |
| | | Principal
Amount | | | Value | |
Ecuador - 0.2% | | | | | | | | |
| | |
Ecuador Government
9.375% due 12/15/15 ~ | | | $1,470,000 | | | | $1,477,350 | |
| | | | | | | | |
| | |
Egypt - 0.2% | | | | | | | | |
| | |
Egypt Government
5.750% due 04/29/20 ~ | | | 1,820,000 | | | | 1,820,000 | |
6.875% due 04/30/40 ~ | | | 360,000 | | | | 342,900 | |
| | | | | | | | |
| | | | | | | 2,162,900 | |
| | | | | | | | |
El Salvador - 0.8% | | | | | | | | |
| | |
El Salvador Government
5.875% due 01/30/25 ~ | | | 1,330,000 | | | | 1,351,280 | |
7.375% due 12/01/19 ~ | | | 580,000 | | | | 669,030 | |
7.625% due 02/01/41 ~ | | | 1,843,000 | | | | 2,114,843 | |
7.650% due 06/15/35 ~ | | | 3,030,000 | | | | 3,476,925 | |
8.250% due 04/10/32 ~ | | | 360,000 | | | | 436,500 | |
| | | | | | | | |
| | | | | | | 8,048,578 | |
| | | | | | | | |
Gabon - 0.0% | | | | | | | | |
| | |
Gabonese Republic
8.200% due 12/12/17 ~ | | | 220,000 | | | | 268,950 | |
| | | | | | | | |
| | |
Georgia - 0.2% | | | | | | | | |
| | |
Georgia Government
6.875% due 04/12/21 ~ | | | 1,330,000 | | | | 1,549,450 | |
| | | | | | | | |
| | |
Ghana - 0.2% | | | | | | | | |
| | |
Republic of Ghana
8.500% due 10/04/17 ~ | | | 1,540,000 | | | | 1,786,400 | |
| | | | | | | | |
| | |
Hungary - 1.1% | | | | | | | | |
| | |
Hungary Government
6.250% due 01/29/20 | | | 3,150,000 | | | | 3,492,563 | |
6.375% due 03/29/21 | | | 3,808,000 | | | | 4,223,072 | |
7.625% due 03/29/41 | | | 3,090,000 | | | | 3,584,400 | |
| | | | | | | | |
| | | | | | | 11,300,035 | |
| | | | | | | | |
Indonesia - 2.8% | | | | | | | | |
| | |
Indonesia Government
4.875% due 05/05/21 ~ | | | 2,720,000 | | | | 3,138,200 | |
5.875% due 03/13/20 ~ | | | 2,220,000 | | | | 2,680,650 | |
6.625% due 02/17/37 ~ | | | 620,000 | | | | 833,900 | |
6.875% due 01/17/18 ~ | | | 3,800,000 | | | | 4,655,000 | |
7.500% due 01/15/16 ~ | | | 2,330,000 | | | | 2,731,925 | |
7.750% due 01/17/38 ~ | | | 2,840,000 | | | | 4,302,600 | |
8.500% due 10/12/35 ~ | | | 3,800,000 | | | | 6,108,500 | |
11.625% due 03/04/19 ~ | | | 2,030,000 | | | | 3,080,525 | |
| | | | | | | | |
| | | | | | | 27,531,300 | |
| | | | | | | | |
Iraq - 0.9% | | | | | | | | |
| | |
Republic of Iraq
5.800% due 01/15/28 ~ | | | 8,790,000 | | | | 8,372,475 | |
| | | | | | | | |
| | |
Ivory Coast - 1.3% | | | | | | | | |
| | |
Ivory Coast Government
3.750% due 12/31/32 Y ~ | | | 13,340,000 | | | | 12,539,600 | |
| | | | | | | | |
| | |
Jordan - 0.3% | | | | | | | | |
| | |
Jordan Government
3.875% due 11/12/15 ~ | | | 3,170,000 | | | | 3,081,240 | |
| | | | | | | | |
| | |
| See Notes to Financial Statements | | See explanation of symbols and terms, if any, on page B-143 |
B-68
PACIFIC SELECT FUND
EMERGING MARKETS DEBT PORTFOLIO
Schedule of Investments (Continued)
December 31, 2012
| | | | | | | | |
| | | Principal
Amount | | | Value | |
Kazakhstan - 0.2% | | | | | | | | |
| | |
Kazatomprom Natsionalnaya Atomnaya Kompaniya AO
6.250% due 05/20/15 ~ | | | $2,190,000 | | | | $2,382,173 | |
| | | | | | | | |
| | |
Latvia - 0.4% | | | | | | | | |
| | |
Republic of Latvia
2.750% due 01/12/20 ~ | | | 3,500,000 | | | | 3,479,000 | |
| | | | | | | | |
| | |
Lebanon - 1.2% | | | | | | | | |
| | |
Lebanon Government
5.150% due 11/12/18 | | | 560,000 | | | | 561,400 | |
6.100% due 10/04/22 ~ | | | 4,650,000 | | | | 4,708,125 | |
6.375% due 03/09/20 | | | 2,860,000 | | | | 3,010,150 | |
6.600% due 11/27/26 | | | 2,000,000 | | | | 2,035,000 | |
8.250% due 04/12/21 ~ | | | 1,110,000 | | | | 1,287,600 | |
8.500% due 01/19/16 ~ | | | 300,000 | | | | 337,500 | |
| | | | | | | | |
| | | | | | | 11,939,775 | |
| | | | | | | | |
Lithuania - 1.7% | | | | | | | | |
| | |
Lithuania Government
5.125% due 09/14/17 ~ | | | 1,260,000 | | | | 1,425,375 | |
6.125% due 03/09/21 ~ | | | 3,130,000 | | | | 3,869,619 | |
6.625% due 02/01/22 ~ | | | 4,450,000 | | | | 5,707,347 | |
7.375% due 02/11/20 ~ | | | 4,630,000 | | | | 6,053,725 | |
| | | | | | | | |
| | | | | | | 17,056,066 | |
| | | | | | | | |
Malaysia - 0.2% | | | | | | | | |
| | |
Wakala Global Sukuk Bhd
4.646% due 07/06/21 ~ | | | 1,610,000 | | | | 1,862,237 | |
| | | | | | | | |
| | |
Mexico - 5.0% | | | | | | | | |
| | |
Mexican Bonos
7.750% due 05/29/31 | | | MXN 31,600,000 | | | | 2,872,074 | |
8.500% due 05/31/29 | | | 69,500,000 | | | | 6,780,459 | |
10.000% due 11/20/36 | | | 100,000,000 | | | | 11,205,519 | |
Mexico Government
3.625% due 03/15/22 | | | $1,230,000 | | | | 1,348,387 | |
4.750% due 03/08/44 | | | 2,052,000 | | | | 2,323,890 | |
5.125% due 01/15/20 | | | 3,900,000 | | | | 4,680,000 | |
5.625% due 01/15/17 | | | 1,710,000 | | | | 1,992,150 | |
5.750% due 10/12/10 | | | 3,374,000 | | | | 4,082,540 | |
5.950% due 03/19/19 | | | 1,600,000 | | | | 1,976,000 | |
6.050% due 01/11/40 | | | 6,070,000 | | | | 8,170,220 | |
6.750% due 09/27/34 | | | 2,760,000 | | | | 3,988,200 | |
| | | | | | | | |
| | | | | | | 49,419,439 | |
| | | | | | | | |
Mongolia - 0.2% | | | | | | | | |
| | |
Mongolia Government
5.125% due 12/05/22 ~ | | | 1,600,000 | | | | 1,576,000 | |
| | | | | | | | |
| | |
Morocco - 0.4% | | | | | | | | |
| | |
Morocco Government
4.250% due 12/11/22 ~ | | | 2,300,000 | | | | 2,328,750 | |
5.500% due 12/11/42 ~ | | | 1,900,000 | | | | 1,952,250 | |
| | | | | | | | |
| | | | | | | 4,281,000 | |
| | | | | | | | |
Nigeria - 0.2% | | | | | | | | |
| | |
Nigeria Government
6.750% due 01/28/21 ~ | | | 1,410,000 | | | | 1,674,375 | |
| | | | | | | | |
| | | | | | | | |
| | | Principal
Amount | | | Value | |
| | |
Pakistan - 0.4% | | | | | | | | |
| | |
Pakistan Government
6.875% due 06/01/17 ~ | | | $1,500,000 | | | | $1,380,000 | |
7.125% due 03/31/16 ~ | | | 3,120,000 | | | | 2,948,400 | |
| | | | | | | | |
| | | | | | | 4,328,400 | |
| | | | | | | | |
Panama - 1.0% | | | | | | | | |
| | |
Panama Government
6.700% due 01/26/36 | | | 2,840,000 | | | | 4,047,000 | |
7.125% due 01/29/26 | | | 300,000 | | | | 426,750 | |
7.250% due 03/15/15 | | | 1,390,000 | | | | 1,562,360 | |
8.875% due 09/30/27 | | | 1,140,000 | | | | 1,861,050 | |
9.375% due 04/01/29 | | | 1,080,000 | | | | 1,852,200 | |
| | | | | | | | |
| | | | | | | 9,749,360 | |
| | | | | | | | |
Peru - 1.3% | | | | | | | | |
| | |
Peruvian Government
7.125% due 03/30/19 | | | 550,000 | | | | 722,700 | |
7.350% due 07/21/25 | | | 3,770,000 | | | | 5,481,580 | |
8.375% due 05/03/16 | | | 1,380,000 | | | | 1,704,990 | |
8.750% due 11/21/33 | | | 3,105,000 | | | | 5,410,463 | |
| | | | | | | | |
| | | | | | | 13,319,733 | |
| | | | | | | | |
Philippines - 2.9% | | | | | | | | |
| | |
Philippine Government
4.000% due 01/15/21 | | | 4,350,000 | | | | 4,893,750 | |
5.000% due 01/13/37 | | | 1,900,000 | | | | 2,315,625 | |
5.500% due 03/30/26 | | | 2,460,000 | | | | 3,118,050 | |
6.375% due 10/23/34 | | | 2,190,000 | | | | 3,082,425 | |
7.750% due 01/14/31 | | | 1,700,000 | | | | 2,615,875 | |
8.375% due 06/17/19 | | | 1,430,000 | | | | 1,978,763 | |
9.500% due 02/02/30 | | | 3,770,000 | | | | 6,555,087 | |
10.625% due 03/16/25 | | | 2,240,000 | | | | 3,897,600 | |
| | | | | | | | |
| | | | | | | 28,457,175 | |
| | | | | | | | |
Poland - 1.5% | | | | | | | | |
| | |
Poland Government
3.000% due 03/17/23 | | | 3,190,000 | | | | 3,190,000 | |
5.000% due 03/23/22 | | | 7,050,000 | | | | 8,343,675 | |
6.375% due 07/15/19 | | | 2,920,000 | | | | 3,651,372 | |
| | | | | | | | |
| | | | | | | 15,185,047 | |
| | | | | | | | |
Qatar - 0.3% | | | | | | | | |
| | |
Qatar Government
5.750% due 01/20/42 ~ | | | 1,470,000 | | | | 1,918,350 | |
6.400% due 01/20/40 ~ | | | 1,040,000 | | | | 1,459,328 | |
| | | | | | | | |
| | | | | | | 3,377,678 | |
| | | | | | | | |
Romania - 0.6% | | | | | | | | |
| | |
Romanian Government
6.750% due 02/07/22 ~ | | | 4,750,000 | | | | 5,789,063 | |
| | | | | | | | |
| | |
Russia - 2.0% | | | | | | | | |
| | |
Russian Foreign Bond
5.000% due 04/29/20 ~ | | | 700,000 | | | | 828,100 | |
5.625% due 04/04/42 ~ | | | 2,600,000 | | | | 3,237,000 | |
7.500% due 03/31/30 § ~ | | | 10,788,000 | | | | 13,877,683 | |
12.750% due 06/24/28 ~ | | | 1,040,000 | | | | 2,111,200 | |
| | | | | | | | |
| | | | | | | 20,053,983 | |
| | | | | | | | |
Senegal - 0.2% | | | | | | | | |
| | |
Senegal Government
8.750% due 05/13/21 ~ | | | 1,890,000 | | | | 2,249,100 | |
| | | | | | | | |
| | |
| See Notes to Financial Statements | | See explanation of symbols and terms, if any, on page B-143 |
B-69
PACIFIC SELECT FUND
EMERGING MARKETS DEBT PORTFOLIO
Schedule of Investments (Continued)
December 31, 2012
| | | | | | | | |
| | | Principal
Amount | | | Value | |
Serbia - 0.3% | | | | | | | | |
| | |
Republic of Serbia
7.250% due 09/28/21 ~ | | | $2,900,000 | | | | $3,345,875 | |
| | | | | | | | |
| | |
Slovenia - 0.2% | | | | | | | | |
| | |
Slovenia Government
5.500% due 10/26/22 ~ | | | 1,630,000 | | | | 1,715,575 | |
| | | | | | | | |
| | |
South Africa - 1.2% | | | | | | | | |
| | |
South Africa Government
5.500% due 03/09/20 | | | 2,580,000 | | | | 3,070,200 | |
5.875% due 05/30/22 | | | 2,890,000 | | | | 3,594,033 | |
6.250% due 03/08/41 | | | 619,000 | | | | 824,817 | |
6.875% due 05/27/19 | | | 3,090,000 | | | | 3,890,310 | |
| | | | | | | | |
| | | | | | | 11,379,360 | |
| | | | | | | | |
Sri Lanka - 0.5% | | | | | | | | |
| | |
Sri Lanka Government
5.875% due 07/25/22 ~ | | | 900,000 | | | | 963,000 | |
6.250% due 10/04/20 ~ | | | 1,347,000 | | | | 1,471,597 | |
6.250% due 07/27/21 ~ | | | 1,410,000 | | | | 1,543,286 | |
7.400% due 01/22/15 ~ | | | 740,000 | | | | 799,200 | |
| | | | | | | | |
| | | | | | | 4,777,083 | |
| | | | | | | | |
Turkey - 3.5% | | | | | | | | |
| | |
Turkey Government
5.625% due 03/30/21 | | | 850,000 | | | | 1,013,625 | |
6.000% due 01/14/41 | | | 1,323,000 | | | | 1,655,404 | |
6.250% due 09/26/22 | | | 1,100,000 | | | | 1,373,900 | |
6.750% due 04/03/18 | | | 5,801,000 | | | | 7,026,461 | |
6.750% due 05/30/40 | | | 1,510,000 | | | | 2,055,487 | |
6.875% due 03/17/36 | | | 2,620,000 | | | | 3,546,825 | |
7.000% due 09/26/16 | | | 1,620,000 | | | | 1,901,475 | |
7.000% due 03/11/19 | | | 1,156,000 | | | | 1,441,821 | |
7.000% due 06/05/20 | | | 440,000 | | | | 562,100 | |
7.250% due 03/15/15 | | | 1,690,000 | | | | 1,882,998 | |
7.250% due 03/05/38 | | | 970,000 | | | | 1,374,490 | |
7.375% due 02/05/25 | | | 3,770,000 | | | | 5,117,775 | |
7.500% due 07/14/17 | | | 1,820,000 | | | | 2,222,129 | |
7.500% due 11/07/19 | | | 740,000 | | | | 959,040 | |
8.000% due 02/14/34 | | | 1,050,000 | | | | 1,577,625 | |
11.875% due 01/15/30 | | | 630,000 | | | | 1,238,738 | |
| | | | | | | | |
| | | | | | | 34,949,893 | |
| | | | | | | | |
Ukraine - 1.7% | | | | | | | | |
| | |
Financing of Infrastrucural Projects State Enterprise
9.000% due 12/07/17 ~ | | | 1,200,000 | | | | 1,206,000 | |
Ukraine Government
6.250% due 06/17/16 ~ | | | 1,180,000 | | | | 1,177,050 | |
6.580% due 11/21/16 ~ | | | 520,000 | | | | 521,976 | |
6.875% due 09/23/15 ~ | | | 1,440,000 | | | | 1,458,000 | |
7.750% due 09/23/20 ~ | | | 1,180,000 | | | | 1,218,350 | |
7.800% due 11/28/22 ~ | | | 2,100,000 | | | | 2,118,375 | |
7.950% due 02/23/21 ~ | | | 900,000 | | | | 936,000 | |
9.250% due 07/24/17 ~ | | | 7,750,000 | | | | 8,447,500 | |
| | | | | | | | |
| | | | | | | 17,083,251 | |
| | | | | | | | |
United Arab Emirates - 0.3% | | | | | | | | |
| | |
Emirate of Dubai Government
6.700% due 10/05/15 ~ | | | 490,000 | | | | 543,655 | |
7.750% due 10/05/20 ~ | | | 1,980,000 | | | | 2,504,700 | |
| | | | | | | | |
| | | | | | | 3,048,355 | |
| | | | | | | | |
| | | | | | | | |
| | | Principal
Amount | | | Value | |
Uruguay - 1.7% | | | | | | | | |
| | |
Uruguay Government
4.125% due 11/20/45 | | | $3,602,602 | | | | $3,615,211 | |
7.625% due 03/21/36 | | | 1,550,000 | | | | 2,408,700 | |
7.875% due 01/15/33 § | | | 3,825,000 | | | | 5,953,612 | |
8.000% due 11/18/22 | | | 3,310,717 | | | | 4,823,715 | |
| | | | | | | | |
| | | | | | | 16,801,238 | |
| | | | | | | | |
Venezuela - 2.9% | | | | | | | | |
| | |
Venezuela Government
6.000% due 12/09/20 ~ | | | 1,580,000 | | | | 1,327,200 | |
7.000% due 03/31/38 ~ | | | 150,000 | | | | 120,750 | |
7.650% due 04/21/25 | | | 970,000 | | | | 858,450 | |
7.750% due 10/13/19 ~ | | | 2,460,000 | | | | 2,330,850 | |
8.250% due 10/13/24 ~ | | | 1,580,000 | | | | 1,461,500 | |
8.500% due 10/08/14 | | | 2,030,000 | | | | 2,086,840 | |
9.000% due 05/07/23 ~ | | | 2,110,000 | | | | 2,057,250 | |
9.250% due 09/15/27 | | | 2,530,000 | | | | 2,542,650 | |
9.250% due 05/07/28 ~ | | | 2,380,000 | | | | 2,356,200 | |
10.750% due 09/19/13 ~ | | | 700,000 | | | | 722,750 | |
11.750% due 10/21/26 ~ | | | 4,172,000 | | | | 4,724,790 | |
11.950% due 08/05/31 ~ | | | 4,613,000 | | | | 5,270,352 | |
12.750% due 08/23/22 ~ | | | 2,444,000 | | | | 2,859,480 | |
| | | | | | | | |
| | | | | | | 28,719,062 | |
| | | | | | | | |
Vietnam - 0.5% | | | | | | | | |
| | |
Vietnam Government
6.750% due 01/29/20 ~ | | | 2,370,000 | | | | 2,713,650 | |
6.875% due 01/15/16 ~ | | | 1,660,000 | | | | 1,821,850 | |
| | | | | | | | |
| | | | | | | 4,535,500 | |
| | | | | | | | |
Zambia - 0.1% | | | | | | | | |
| | |
Zambia Government
5.375% due 09/20/22 ~ | | | 1,200,000 | | | | 1,200,000 | |
| | | | | | | | |
| | |
Total Foreign Government Bonds & Notes
(Cost $535,765,860) | | | | | | | 573,481,745 | |
| | | | | | | | |
| | |
SHORT-TERM INVESTMENT - 0.3% | | | | | | | | |
| | |
Repurchase Agreement - 0.3% | | | | | | | | |
| | |
Fixed Income Clearing Corp
0.010% due 01/02/13
(Dated 12/31/12, repurchase price of $3,082,376; collateralized by Fannie Mae: 2.500% due 09/13/22
and value $3,144,840) | | | 3,082,374 | | | | 3,082,374 | |
| | | | | | | | |
| | |
Total Short-Term Investment
(Cost $3,082,374) | | | | | | | 3,082,374 | |
| | | | | | | | |
| | |
TOTAL INVESTMENTS - 98.2%
(Cost $911,114,304) | | | | | | | 972,713,129 | |
| |
OTHER ASSETS & LIABILITIES, NET - 1.8% | | | | 17,686,112 | |
| | | | | | | | |
| | |
NET ASSETS - 100.0% | | | | | | | $990,399,241 | |
| | | | | | | | |
| | |
| See Notes to Financial Statements | | See explanation of symbols and terms, if any, on page B-143 |
B-70
PACIFIC SELECT FUND
EMERGING MARKETS DEBT PORTFOLIO
Schedule of Investments (Continued)
December 31, 2012
Notes to Schedule of Investments
| (a) | As of December 31, 2012, the portfolio was diversified as a percentage of net assets as follows: |
| | | | |
Foreign Government Bonds & Notes | | | 57.9% | |
Corporate Bonds & Notes | | | 40.0% | |
Short-Term Investment | | | 0.3% | |
| | | | |
| | | 98.2% | |
Other Assets & Liabilities, Net | | | 1.8% | |
| | | | |
| | | 100.0% | |
| | | | |
| (b) | As of December 31, 2012, the portfolio was diversified by country of incorporation as a percentage of net assets as follows: |
| | | | |
Brazil | | | 9.4% | |
Mexico | | | 7.2% | |
Cayman | | | 6.2% | |
Netherlands | | | 5.2% | |
Luxembourg | | | 3.9% | |
United Kingdom | | | 3.9% | |
Turkey | | | 3.7% | |
Philippines | | | 3.5% | |
Venezuela | | | 3.5% | |
Indonesia | | | 3.2% | |
Others (each less than 3.0%) | | | 48.5% | |
| | | | |
| | | 98.2% | |
Other Assets & Liabilities, Net | | | 1.8% | |
| | | | |
| | | 100.0% | |
| | | | |
| (c) | As of December 31, 2012, the portfolio’s Standard & Poor’s quality ratings as a percentage of total fixed income investments were as follows (Unaudited): |
| | | | |
A-1 (Short-Term Debt only) | | | 0.3% | |
AA | | | 0.7% | |
A | | | 6.5% | |
BBB | | | 26.5% | |
BB | | | 24.1% | |
B | | | 19.8% | |
CC | | | 0.8% | |
Not Rated | | | 21.3% | |
| | | | |
| | | 100.0% | |
| | | | |
| (d) | Short-term investments reflect either the stated coupon rate or the annualized effective yield on the date of purchase for discounted investments. |
| (e) | An investment with a value of $12,539,600 or 1.3% of the portfolio’s net assets was in default as of December 31, 2012. |
| (f) | As of December 31, 2012, $850,000 in cash was segregated with the broker(s)/
custodian as collateral for open forward foreign currency contracts. |
| (g) | Forward foreign currency contracts outstanding as of December 31, 2012 were as follows: |
| | | | | | | | | | | | | | | | | | | | |
Currency
Purchased | | | Currency
Sold | | | Expiration | | | Counterparty | | Unrealized
Appreciation
(Depreciation) | |
| BRL | | | 160,000 | | | USD | | | 78,026 | | | | 01/13 | | | BSC | | | $118 | |
| BRL | | | 152,918 | | | USD | | | 74,196 | | | | 01/13 | | | JPM | | | 489 | |
| BRL | | | 312,918 | | | USD | | | 153,128 | | | | 01/13 | | | SCB | | | (299) | |
| BRL | | | 17,597,423 | | | USD | | | 8,430,000 | | | | 02/13 | | | UBS | | | 128,433 | |
| BRL | | | 312,918 | | | USD | | | 148,746 | | | | 04/13 | | | SCB | | | 2,343 | |
| INR | | | 1,078,849,750 | | | USD | | | 19,731,444 | | | | 01/13 | | | SCB | | | (84,417) | |
| KRW | | | 9,736,625,460 | | | USD | | | 8,923,269 | | | | 01/13 | | | SCB | | | 162,741 | |
| MXN | | | 43,129,982 | | | USD | | | 3,219,136 | | | | 02/13 | | | JPM | | | 104,615 | |
| PLN | | | 44,064,752 | | | USD | | | 13,675,999 | | | | 01/13 | | | BOA | | | 519,057 | |
| PLN | | | 18,884,894 | | | USD | | | 5,813,062 | | | | 01/13 | | | DUB | | | 271,169 | |
| RUB | | | 301,370,689 | | | USD | | | 9,496,327 | | | | 01/13 | | | UBS | | | 320,009 | |
| RUB | | | 154,062,500 | | | USD | | | 4,956,966 | | | | 02/13 | | | BRC | | | 38,020 | |
| RUB | | | 315,382,330 | | | USD | | | 10,070,000 | | | | 03/13 | | | GSC | | | 110,711 | |
| USD | | | 78,297 | | | BRL | | | 160,000 | | | | 01/13 | | | BSC | | | 153 | |
| USD | | | 74,831 | | | BRL | | | 152,918 | | | | 01/13 | | | JPM | | | 146 | |
| USD | | | 150,622 | | | BRL | | | 312,918 | | | | 01/13 | | | SCB | | | (2,207) | |
| USD | | | 663,497 | | | BRL | | | 1,362,690 | | | | 02/13 | | | HSB | | | 758 | |
| USD | | | 21,472,905 | | | BRL | | | 45,629,923 | | | | 03/13 | | | BRC | | | (645,332) | |
| USD | | | 21,739,922 | | | BRL | | | 45,629,922 | | | | 03/13 | | | UBS | | | (378,315) | |
| USD | | | 3,833,759 | | | CNY | | | 24,166,100 | | | | 01/13 | | | MSC | | | (42,355) | |
| USD | | | 30,210,222 | | | EUR | | | 23,157,225 | | | | 01/13 | | | DUB | | | (359,042) | |
| USD | | | 2,776,152 | | | GBP | | | 1,719,304 | | | | 01/13 | | | BRC | | | (16,689) | |
| USD | | | 240,494 | | | MXN | | | 3,130,000 | | | | 01/13 | | | MSC | | | (1,329) | |
| USD | | | 276,484 | | | MXN | | | 3,610,000 | | | | 03/13 | | | JPM | | | (965) | |
| USD | | | 19,516,960 | | | PLN | | | 61,896,088 | | | | 01/13 | | | UBS | | | (422,296) | |
| USD | | | 14,825,405 | | | RUB | | | 459,795,106 | | | | 01/13 | | | BRC | | | (151,178) | |
| | | | | | | | | | | | | | | | | | | | |
| | | | |
Total Forward Foreign Currency Contracts | | | | | | | | | | | | | ($445,662 | ) |
| | | | | | | | | | | | | | | | | | | | |
| | |
| See Notes to Financial Statements | | See explanation of symbols and terms, if any, on page B-143 |
B-71
PACIFIC SELECT FUND
EMERGING MARKETS DEBT PORTFOLIO
Schedule of Investments (Continued)
December 31, 2012
| (h) | Fair Value Measurements |
The following is a summary of the portfolio’s investments as categorized under the three-tier hierarchy of inputs used in valuing the portfolio’s assets and liabilities (See Note 3D in Notes to Financial Statements) as of December 31, 2012:
| | | | | | | | | | | | | | | | | | |
| | | | | Total Value at
December 31, 2012 | | | Level 1
Quoted Price | | | Level 2
Significant
Observable Inputs | | | Level 3
Significant
Unobservable Inputs | �� |
Assets | | Corporate Bonds & Notes | | | $396,149,010 | | | | $- | | | | $396,149,010 | | | | $- | |
| | Foreign Government Bonds & Notes | | | 573,481,745 | | | | - | | | | 573,481,745 | | | | - | |
| | Short-Term Investment | | | 3,082,374 | | | | - | | | | 3,082,374 | | | | - | |
| | Derivatives: | | | | | | | | | | | | | | | | |
| | Foreign Currency Contracts | | | | | | | | | | | | | | | | |
| | Forward Foreign Currency Contracts | | | 1,658,762 | | | | - | | | | 1,658,762 | | | | - | |
| | | | | | | | | | | | | | | | | | |
| | Total Assets | | | 974,371,891 | | | | - | | | | 974,371,891 | | | | - | |
| | | | | | | | | | | | | | | | | | |
Liabilities | | Derivatives: | | | | | | | | | | | | | | | | |
| | Foreign Currency Contracts | | | | | | | | | | | | | | | | |
| | Forward Foreign Currency Contracts | | | (2,104,424 | ) | | | - | | | | (2,104,424 | ) | | | - | |
| | | | | | | | | | | | | | | | | | |
| | Total Liabilities | | | (2,104,424 | ) | | | - | | | | (2,104,424 | ) | | | - | |
| | | | | | | | | | | | | | | | | | |
| | Total | | | $972,267,467 | | | | $- | | | | $972,267,467 | | | | $- | |
| | | | | | | | | | | | | | | | | | |
| | |
| See Notes to Financial Statements | | See explanation of symbols and terms, if any, on page B-143 |
B-72
PACIFIC SELECT FUND
AMERICAN FUNDS® GROWTH PORTFOLIO
Schedule of Investments
December 31, 2012
| | | | | | | | |
| | | Shares | | | Value | |
MUTUAL FUND - 100.0% | | | | | | | | |
| | |
American Funds Insurance Series®
Growth Fund - Class 1 | | | 4,376,028 | | | | $266,500,129 | |
| | | | | | | | |
| | |
TOTAL INVESTMENTS - 100.0%
(Cost $200,329,943) | | | | | | | 266,500,129 | |
| |
OTHER ASSETS & LIABILITIES, NET - (0.0%) | | | | (118,186 | ) |
| | | | | | | | |
| | |
NET ASSETS - 100.0% | | | | | | | $266,381,943 | |
| | | | | | | | |
Notes to Schedule of Investments
| (a) | As of December 31, 2012, the portfolio was diversified as a percentage of net assets as follows: |
| | | | |
Mutual Fund | | | 100.0% | |
Other Assets & Liabilities, Net | | | (0.0% | ) |
| | | | |
| | | 100.0% | |
| | | | |
PACIFIC SELECT FUND
AMERICAN FUNDS® GROWTH-INCOME PORTFOLIO
Schedule of Investments
December 31, 2012
| | | | | | | | |
| | | Shares | | | Value | |
MUTUAL FUND - 100.0% | | | | | | | | |
| | |
American Funds Insurance Series®
Growth-Income Fund - Class 1 | | | 16,818,204 | | | | $647,164,471 | |
| | | | | | | | |
| | |
TOTAL INVESTMENTS - 100.0%
(Cost $555,871,540) | | | | | | | 647,164,471 | |
| |
OTHER ASSETS & LIABILITIES, NET - (0.0%) | | | | (266,426 | ) |
| | | | | | | | |
| | |
NET ASSETS - 100.0% | | | | | | | $646,898,045 | |
| | | | | | | | |
Notes to Schedule of Investments
| (a) | As of December 31, 2012, the portfolio was diversified as a percentage of net assets as follows: |
| | | | |
Mutual Fund | | | 100.0% | |
Other Assets & Liabilities, Net | | | (0.0% | ) |
| | | | |
| | | 100.0% | |
| | | | |
| (b) | Fair Value Measurements |
The following is a summary of the portfolios’ investments as categorized under the three-tier hierarchy of inputs used in valuing the portfolios’ assets and liabilities (See Note 3D in Notes to Financial Statements) as of December 31, 2012:
| | | | | | | | | | | | | | | | | | |
| | | | | Total Value at
December 31, 2012 | | | Level 1
Quoted Price | | | Level 2
Significant
Observable Inputs | | | Level 3
Significant
Unobservable Inputs | |
American Funds Growth Portfolio | | | | | | | | | | | | | | | | |
Assets | | Mutual Fund | | | $266,500,129 | | | | $266,500,129 | | | | $- | | | | $- | |
| | | | | | | | | | | | | | | | | | |
| | | | |
American Funds Growth-Income Portfolio | | | | | | | | | | | | | | | | |
Assets | | Mutual Fund | | | $647,164,471 | | | | $647,164,471 | | | | $- | | | | $- | |
| | | | | | | | | | | | | | | | | | |
American Funds Growth and American Funds Growth-Income Portfolios (each a “Feeder Portfolio”, collectively “the Feeder Portfolios”) invest substantially all of their assets in Class 1 shares of the Growth and Growth-Income Funds of the American Funds Insurance Series, respectively, (each a “Master Fund”, collectively the “Master Funds”) (See Note 1 in Notes to Financial Statements). Each Feeder Portfolio has an investment objective that is consistent with its corresponding Master Fund. The financial statements of the Master Funds, including the Schedule of Investments, are provided separately and should be read in conjunction with the Feeder Portfolios’ financial statements.
| | |
| See Notes to Financial Statements | | See explanation of symbols and terms, if any, on page B-143 |
B-73
PACIFIC SELECT FUND
COMSTOCK PORTFOLIO
Schedule of Investments
December 31, 2012
| | | | | | | | |
| | | Shares | | |
Value | |
COMMON STOCKS - 96.4% | | | | | | | | |
| | |
Consumer Discretionary - 15.9% | | | | | | | | |
| | |
Carnival Corp (Panama) | | | 516,081 | | | | $18,976,298 | |
Comcast Corp ‘A’ | | | 1,293,157 | | | | 48,338,209 | |
General Motors Co * | | | 1,406,903 | | | | 40,561,014 | |
Kohl’s Corp | | | 234,777 | | | | 10,090,716 | |
Lowe’s Cos Inc | | | 719,289 | | | | 25,549,145 | |
Newell Rubbermaid Inc | | | 424,640 | | | | 9,456,733 | |
News Corp ‘B’ | | | 1,261,595 | | | | 33,104,253 | |
Staples Inc | | | 1,038,633 | | | | 11,840,416 | |
Target Corp | | | 287,026 | | | | 16,983,328 | |
Time Warner Cable Inc | | | 478,365 | | | | 46,492,294 | |
Time Warner Inc | | | 379,633 | | | | 18,157,846 | |
Viacom Inc ‘B’ | | | 788,559 | | | | 41,588,602 | |
| | | | | | | | |
| | | | 321,138,854 | |
| | | | | | | | |
Consumer Staples - 6.0% | | | | | | | | |
| | |
Archer-Daniels-Midland Co | | | 486,015 | | | | 13,311,951 | |
CVS Caremark Corp | | | 679,057 | | | | 32,832,406 | |
Kraft Foods Group Inc | | | 196,508 | | | | 8,935,219 | |
Mondelez International Inc ‘A’ | | | 692,693 | | | | 17,642,891 | |
The Procter & Gamble Co | | | 110,822 | | | | 7,523,705 | |
Tyson Foods Inc ‘A’ | | | 581,319 | | | | 11,277,589 | |
Unilever NV ‘NY’ (Netherlands) | | | 646,274 | | | | 24,752,294 | |
Wal-Mart Stores Inc | | | 85,702 | | | | 5,847,447 | |
| | | | | | | | |
| | | | | | | 122,123,502 | |
| | | | | | | | |
Energy - 13.6% | | | | | | | | |
| | |
BP PLC ADR (United Kingdom) | | | 1,058,996 | | | | 44,096,593 | |
Chevron Corp | | | 260,055 | | | | 28,122,348 | |
Halliburton Co | | | 1,113,066 | | | | 38,612,260 | |
Murphy Oil Corp | | | 541,021 | | | | 32,217,801 | |
Noble Corp (Switzerland) | | | 292,819 | | | | 10,195,958 | |
Occidental Petroleum Corp | | | 273,405 | | | | 20,945,557 | |
QEP Resources Inc | | | 839,696 | | | | 25,417,598 | |
Royal Dutch Shell PLC ‘A’ ADR (United Kingdom) | | | 509,514 | | | | 35,130,990 | |
Weatherford International Ltd * (Switzerland) | | | 3,548,887 | | | | 39,712,045 | |
| | | | | | | | |
| | | | | | | 274,451,150 | |
| | | | | | | | |
Financials - 23.6% | | | | | | | | |
| | |
Aflac Inc | | | 163,389 | | | | 8,679,224 | |
Bank of America Corp | | | 2,926,008 | | | | 33,941,693 | |
Citigroup Inc | | | 1,949,788 | | | | 77,133,613 | |
Fifth Third Bancorp | | | 1,350,312 | | | | 20,511,239 | |
JPMorgan Chase & Co | | | 1,482,484 | | | | 65,184,821 | |
MetLife Inc | | | 596,504 | | | | 19,648,842 | |
Morgan Stanley | | | 1,096,006 | | | | 20,955,635 | |
State Street Corp | | | 240,990 | | | | 11,328,940 | |
The Allstate Corp | | | 1,190,899 | | | | 47,838,413 | |
The Bank of New York Mellon Corp | | | 1,656,525 | | | | 42,572,692 | |
The Goldman Sachs Group Inc | | | 157,050 | | | | 20,033,298 | |
The PNC Financial Services Group Inc | | | 487,666 | | | | 28,435,804 | |
The Travelers Cos Inc | | | 330,835 | | | | 23,760,570 | |
U.S. Bancorp | | | 404,970 | | | | 12,934,742 | |
Wells Fargo & Co | | | 1,251,357 | | | | 42,771,382 | |
| | | | | | | | |
| | | | | | | 475,730,908 | |
| | | | | | | | |
Health Care - 14.0% | | | | | | | | |
| | |
Bristol-Myers Squibb Co | | | 1,090,638 | | | | 35,543,892 | |
Cardinal Health Inc | | | 383,658 | | | | 15,799,036 | |
GlaxoSmithKline PLC ADR (United Kingdom) | | | 463,832 | | | | 20,162,777 | |
Merck & Co Inc | | | 937,218 | | | | 38,369,705 | |
Novartis AG (Switzerland) | | | 329,328 | | | | 20,850,254 | |
Pfizer Inc | | | 1,915,437 | | | | 48,039,160 | |
Roche Holding AG ADR (Switzerland) | | | 359,226 | | | | 18,140,913 | |
Sanofi ADR (France) | | | 604,549 | | | | 28,643,532 | |
| | | | | | | | |
| | | Shares | | |
Value | |
UnitedHealth Group Inc | | | 666,539 | | | | $36,153,075 | |
WellPoint Inc | | | 335,857 | | | | 20,460,409 | |
| | | | | | | | |
| | | | | | | 282,162,753 | |
| | | | | | | | |
Industrials - 6.1% | | | | | | | | |
| | |
Emerson Electric Co | | | 459,938 | | | | 24,358,316 | |
General Electric Co | | | 1,959,935 | | | | 41,139,036 | |
Honeywell International Inc | | | 222,499 | | | | 14,122,012 | |
Ingersoll-Rand PLC (Ireland) | | | 631,593 | | | | 30,291,200 | |
Textron Inc | | | 503,390 | | | | 12,479,038 | |
| | | | | | | | |
| | | | | | | 122,389,602 | |
| | | | | | | | |
Information Technology - 9.8% | | | | | | | | |
| | |
Cisco Systems Inc | | | 1,111,311 | | | | 21,837,261 | |
Corning Inc | | | 1,978,921 | | | | 24,973,983 | |
eBay Inc * | | | 649,226 | | | | 33,123,511 | |
Hewlett-Packard Co | | | 2,118,697 | | | | 30,191,432 | |
Intel Corp | | | 543,884 | | | | 11,220,327 | |
Microsoft Corp | | | 1,621,256 | | | | 43,336,173 | |
Yahoo! Inc * | | | 1,718,677 | | | | 34,201,672 | |
| | | | | | | | |
| | | | | | | 198,884,359 | |
| | | | | | | | |
Materials - 2.9% | | | | | | | | |
| | |
Alcoa Inc | | | 2,478,221 | | | | 21,510,959 | |
International Paper Co | | | 941,961 | | | | 37,527,726 | |
| | | | | | | | |
| | | | | | | 59,038,685 | |
| | | | | | | | |
Telecommunication Services - 2.3% | | | | | | | | |
| | |
AT&T Inc | | | 317,421 | | | | 10,700,262 | |
Verizon Communications Inc | | | 436,448 | | | | 18,885,105 | |
Vodafone Group PLC ADR (United Kingdom) | | | 636,754 | | | | 16,039,833 | |
| | | | | | | | |
| | | | | | | 45,625,200 | |
| | | | | | | | |
Utilities - 2.2% | | | | | | | | |
| | |
FirstEnergy Corp | | | 382,460 | | | | 15,971,530 | |
PPL Corp | | | 1,022,634 | | | | 29,278,011 | |
| | | | | | | | |
| | | | | | | 45,249,541 | |
| | | | | | | | |
Total Common Stocks
(Cost $1,646,034,073) | | | | | | | 1,946,794,554 | |
| | | | | | | | |
| | |
| | | Principal
Amount | | | | |
| | |
SHORT-TERM INVESTMENT - 3.7% | | | | | | | | |
| | |
Repurchase Agreement - 3.7% | | | | | | | | |
| | |
Fixed Income Clearing Corp
0.010% due 01/02/13
(Dated 12/31/12, repurchase price of
$74,014,932; collateralized by U.S.
Treasury Notes: 0.250% due 07/15/15
and value $75,500,000) | | | $74,014,891 | | | | 74,014,891 | |
| | | | | | | | |
| | |
Total Short-Term Investment
(Cost $74,014,891) | | | | | | | 74,014,891 | |
| | | | | | | | |
| | |
TOTAL INVESTMENTS - 100.1%
(Cost $1,720,048,964) | | | | | | | 2,020,809,445 | |
| |
OTHER ASSETS & LIABILITIES, NET - (0.1%) | | | | (2,514,449 | ) |
| | | | | | | | |
| | |
NET ASSETS - 100.0% | | | | | | | $2,018,294,996 | |
| | | | | | | | |
| | |
| See Notes to Financial Statements | | See explanation of symbols and terms, if any, on page B-143 |
B-74
PACIFIC SELECT FUND
COMSTOCK PORTFOLIO
Schedule of Investments (Continued)
December 31, 2012
Notes to Schedule of Investments
| (a) | As of December 31, 2012, the portfolio was diversified as a percentage of net assets as follows: |
| | | | |
Financials | | | 23.6% | |
Consumer Discretionary | | | 15.9% | |
Health Care | | | 14.0% | |
Energy | | | 13.6% | |
Information Technology | | | 9.8% | |
Industrials | | | 6.1% | |
Consumer Staples | | | 6.0% | |
Short-Term Investment | | | 3.7% | |
Materials | | | 2.9% | |
Telecommunication Services | | | 2.3% | |
Utilities | | | 2.2% | |
| | | | |
| | | 100.1% | |
Other Assets & Liabilities, Net | | | (0.1% | ) |
| | | | |
| | | 100.0% | |
| | | | |
| (b) | Short-term investments reflect either the stated coupon rate or the annualized effective yield on the date of purchase for discounted investments. |
| (c) | Forward foreign currency contracts outstanding as of December 31, 2012 were as follows: |
| | | | | | | | | | | | | | | | | | | | |
Currency
Purchased | | | Currency
Sold | | | Expiration | | | Counterparty | | Unrealized
Appreciation
(Depreciation) | |
| CHF | | | 2,570,276 | | | USD | | | 2,757,789 | | | | 01/13 | | | SSB | | | $52,963 | |
| EUR | | | 2,272,313 | | | USD | | | 2,931,965 | | | | 01/13 | | | BNY | | | 67,683 | |
| GBP | | | 2,681,125 | | | USD | | | 4,286,668 | | | | 01/13 | | | SSB | | | 68,544 | |
| USD | | | 10,105,508 | | | CHF | | | 9,404,590 | | | | 01/13 | | | BNY | | | (178,979 | ) |
| USD | | | 10,129,051 | | | CHF | | | 9,426,500 | | | | 01/13 | | | CIT | | | (179,397 | ) |
| USD | | | 14,147,792 | | | CHF | | | 13,166,430 | | | | 01/13 | | | SSB | | | (250,495 | ) |
| USD | | | 15,412,688 | | | EUR | | | 11,921,620 | | | | 01/13 | | | BNY | | | (324,873 | ) |
| USD | | | 19,211,088 | | | EUR | | | 14,860,740 | | | | 01/13 | | | CIB | | | (406,364 | ) |
| USD | | | 21,519,649 | | | EUR | | | 16,644,030 | | | | 01/13 | | | CIT | | | (451,898 | ) |
| USD | | | 22,595,617 | | | EUR | | | 17,476,220 | | | | 01/13 | | | SSB | | | (474,493 | ) |
| USD | | | 19,216,390 | | | GBP | | | 12,006,679 | | | | 01/13 | | | BNY | | | (287,229 | ) |
| USD | | | 26,118,984 | | | GBP | | | 16,320,540 | | | | 01/13 | | | CIB | | | (392,059 | ) |
| USD | | | 13,545,057 | | | GBP | | | 8,462,503 | | | | 01/13 | | | CIT | | | (201,411 | ) |
| USD | | | 13,157,521 | | | GBP | | | 8,220,717 | | | | 01/13 | | | SSB | | | (196,191 | ) |
| | | | | | | | | | | | | | | | | | | | |
| | | | |
Total Forward Foreign Currency Contracts | | | | | | | | | | | | | ($3,154,199 | ) |
| | | | | | | | | | | | | | | | | | | | |
| (d) | Fair Value Measurements |
The following is a summary of the portfolio’s investments as categorized under the three-tier hierarchy of inputs used in valuing the portfolio’s assets and liabilities (See Note 3D in Notes to Financial Statements) as of December 31, 2012:
| | | | | | | | | | | | | | | | | | |
| | | | | Total Value at
December 31, 2012 | | | Level 1
Quoted Price | | | Level 2
Significant
Observable Inputs | | | Level 3
Significant
Unobservable Inputs | |
Assets | | Common Stocks | | | | | | | | | | | | | | | | |
| | Consumer Discretionary | | | $321,138,854 | | | | $321,138,854 | | | | $- | | | | $- | |
| | Consumer Staples | | | 122,123,502 | | | | 122,123,502 | | | | - | | | | - | |
| | Energy | | | 274,451,150 | | | | 274,451,150 | | | | - | | | | - | |
| | Financials | | | 475,730,908 | | | | 475,730,908 | | | | - | | | | - | |
| | Health Care | | | 282,162,753 | | | | 261,312,499 | | | | 20,850,254 | | | | - | |
| | Industrials | | | 122,389,602 | | | | 122,389,602 | | | | - | | | | - | |
| | Information Technology | | | 198,884,359 | | | | 198,884,359 | | | | - | | | | - | |
| | Materials | | | 59,038,685 | | | | 59,038,685 | | | | - | | | | - | |
| | Telecommunication Services | | | 45,625,200 | | | | 45,625,200 | | | | - | | | | - | |
| | Utilities | | | 45,249,541 | | | | 45,249,541 | | | | - | | | | - | |
| | | | | | | | | | | | | | | | | | |
| | | | | 1,946,794,554 | | | | 1,925,944,300 | | | | 20,850,254 | | | | - | |
| | Short-Term Investment | | | 74,014,891 | | | | - | | | | 74,014,891 | | | | - | |
| | Derivatives: | | | | | | | | | | | | | | | | |
| | Foreign Currency Contracts | | | | | | | | | | | | | | | | |
| | Forward Foreign Currency Contracts | | | 189,190 | | | | - | | | | 189,190 | | | | - | |
| | | | | | | | | | | | | | | | | | |
| | Total Assets | | | 2,020,998,635 | | | | 1,925,944,300 | | | | 95,054,335 | | | | - | |
| | | | | | | | | | | | | | | | | | |
Liabilities | | Derivatives: | | | | | | | | | | | | | | | | |
| | Foreign Currency Contracts | | | | | | | | | | | | | | | | |
| | Forward Foreign Currency Contracts | | | (3,343,389 | ) | | | - | | | | (3,343,389 | ) | | | - | |
| | | | | | | | | | | | | | | | | | |
| | Total Liabilities | | | (3,343,389 | ) | | | - | | | | (3,343,389 | ) | | | - | |
| | | | | | | | | | | | | | | | | | |
| | Total | | | $2,017,655,246 | | | | $1,925,944,300 | | | | $91,710,946 | | | | $- | |
| | | | | | | | | | | | | | | | | | |
| | |
| See Notes to Financial Statements | | See explanation of symbols and terms, if any, on page B-143 |
B-75
PACIFIC SELECT FUND
DIVIDEND GROWTH PORTFOLIO
Schedule of Investments
December 31, 2012
| | | | | | | | |
| | | Shares | | |
Value | |
COMMON STOCKS - 94.3% | | | | | | | | |
| | |
Consumer Discretionary - 14.0% | | | | | | | | |
| | |
Carnival Corp (Panama) | | | 183,800 | | | | $6,758,326 | |
Family Dollar Stores Inc | | | 80,000 | | | | 5,072,800 | |
Hasbro Inc | | | 110,500 | | | | 3,966,950 | |
Johnson Controls Inc | | | 186,200 | | | | 5,716,340 | |
Kohl’s Corp | | | 172,500 | | | | 7,414,050 | |
Marriott International Inc ‘A’ | | | 105,900 | | | | 3,946,893 | |
Mattel Inc | | | 149,800 | | | | 5,485,676 | |
McDonald’s Corp | | | 77,400 | | | | 6,827,454 | |
Nike Inc ‘B’ | | | 69,400 | | | | 3,581,040 | |
Omnicom Group Inc | | | 178,300 | | | | 8,907,868 | |
Ross Stores Inc | | | 143,200 | | | | 7,754,280 | |
Target Corp | | | 50,000 | | | | 2,958,500 | |
The Home Depot Inc | | | 173,900 | | | | 10,755,715 | |
The McGraw-Hill Cos Inc | | | 127,200 | | | | 6,954,024 | |
The Walt Disney Co | | | 94,100 | | | | 4,685,239 | |
Time Warner Cable Inc | | | 140,600 | | | | 13,664,914 | |
Time Warner Inc | | | 208,600 | | | | 9,977,338 | |
| | | | | | | | |
| | | | 114,427,407 | |
| | | | | | | | |
Consumer Staples - 8.7% | | | | | | | | |
| | |
Colgate-Palmolive Co | | | 38,800 | | | | 4,056,152 | |
Costco Wholesale Corp | | | 41,500 | | | | 4,098,955 | |
General Mills Inc | | | 157,000 | | | | 6,344,370 | |
Kellogg Co | | | 99,400 | | | | 5,551,490 | |
McCormick & Co Inc | | | 73,000 | | | | 4,637,690 | |
PepsiCo Inc | | | 183,400 | | | | 12,550,062 | |
Pernod-Ricard SA (France) | | | 75,553 | | | | 8,884,035 | |
Philip Morris International Inc | | | 92,100 | | | | 7,703,244 | |
Sysco Corp | | | 125,300 | | | | 3,966,998 | |
The Coca-Cola Co | | | 117,000 | | | | 4,241,250 | |
Wal-Mart Stores Inc | | | 102,700 | | | | 7,007,221 | |
Walgreen Co | | | 52,200 | | | | 1,931,922 | |
| | | | | | | | |
| | | | 70,973,389 | |
| | | | | | | | |
Energy - 8.3% | | | | | | | | |
| | |
Baker Hughes Inc | | | 75,300 | | | | 3,075,252 | |
Chevron Corp | | | 107,200 | | | | 11,592,608 | |
Diamond Offshore Drilling Inc | | | 29,600 | | | | 2,011,616 | |
EQT Corp | | | 84,800 | | | | 5,001,504 | |
Exxon Mobil Corp | | | 149,200 | | | | 12,913,260 | |
Occidental Petroleum Corp | | | 83,900 | | | | 6,427,579 | |
Schlumberger Ltd (Netherlands) | | | 133,400 | | | | 9,243,286 | |
Spectra Energy Corp | | | 271,600 | | | | 7,436,408 | |
The Williams Cos Inc | | | 236,506 | | | | 7,743,207 | |
Total SA ADR (France) | | | 29,700 | | | | 1,544,697 | |
WPX Energy Inc * | | | 78,000 | | | | 1,160,640 | |
| | | | | | | | |
| | | | 68,150,057 | |
| | | | | | | | |
Financials - 14.3% | | | | | | | | |
| | |
American Express Co | | | 151,800 | | | | 8,725,464 | |
Aon PLC (United Kingdom) | | | 150,800 | | | | 8,384,480 | |
Franklin Resources Inc | | | 34,500 | | | | 4,336,650 | |
General Growth Properties Inc REIT | | | 188,400 | | | | 3,739,740 | |
JPMorgan Chase & Co | | | 302,900 | | | | 13,318,513 | |
MetLife Inc | | | 71,600 | | | | 2,358,504 | |
Morgan Stanley | | | 76,300 | | | | 1,458,856 | |
Northern Trust Corp | | | 108,900 | | | | 5,462,424 | |
State Street Corp | | | 138,400 | | | | 6,506,184 | |
The Allstate Corp | | | 122,100 | | | | 4,904,757 | |
The Charles Schwab Corp | | | 225,900 | | | | 3,243,924 | |
The Chubb Corp | | | 121,100 | | | | 9,121,252 | |
The Goldman Sachs Group Inc | | | 19,900 | | | | 2,538,444 | |
The PNC Financial Services Group Inc | | | 138,800 | | | | 8,093,428 | |
U.S. Bancorp | | | 418,000 | | | | 13,350,920 | |
Waddell & Reed Financial Inc ‘A’ | | | 116,300 | | | | 4,049,566 | |
| | | | | | | | |
| | | Shares | | |
Value | |
Wells Fargo & Co | | | 369,300 | | | | $12,622,674 | |
Willis Group Holdings PLC (Ireland) | | | 144,300 | | | | 4,838,379 | |
| | | | | | | | |
| | | | 117,054,159 | |
| | | | | | | | |
Health Care - 13.8% | | | | | | | | |
| | |
AmerisourceBergen Corp | | | 138,800 | | | | 5,993,384 | |
Baxter International Inc | | | 93,300 | | | | 6,219,378 | |
C.R. Bard Inc | | | 45,700 | | | | 4,466,718 | |
CIGNA Corp | | | 59,300 | | | | 3,170,178 | |
Covidien PLC (Ireland) | | | 119,100 | | | | 6,876,834 | |
DENTSPLY International Inc | | | 288,300 | | | | 11,419,563 | |
Johnson & Johnson | | | 112,700 | | | | 7,900,270 | |
McKesson Corp | | | 125,700 | | | | 12,187,872 | |
Medtronic Inc | | | 49,100 | | | | 2,014,082 | |
Merck & Co Inc | | | 283,100 | | | | 11,590,114 | |
Pfizer Inc | | | 792,800 | | | | 19,883,424 | |
Stryker Corp | | | 107,300 | | | | 5,882,186 | |
Thermo Fisher Scientific Inc | | | 151,000 | | | | 9,630,780 | |
UnitedHealth Group Inc | | | 106,000 | | | | 5,749,440 | |
| | | | | | | | |
| | | | 112,984,223 | |
| | | | | | | | |
Industrials - 13.1% | | | | | | | | |
| | |
C.H. Robinson Worldwide Inc | | | 61,600 | | | | 3,894,352 | |
Danaher Corp | | | 234,100 | | | | 13,086,190 | |
Deere & Co | | | 38,500 | | | | 3,327,170 | |
Eaton Corp PLC (Ireland) | | | 74,999 | | | | 4,064,946 | |
Equifax Inc | | | 74,500 | | | | 4,031,940 | |
Expeditors International of Washington Inc | | | 83,900 | | | | 3,318,245 | |
Fastenal Co | | | 170,900 | | | | 7,979,321 | |
Fluor Corp | | | 50,800 | | | | 2,983,992 | |
Illinois Tool Works Inc | | | 51,700 | | | | 3,143,877 | |
Iron Mountain Inc | | | 125,211 | | | | 3,887,801 | |
Norfolk Southern Corp | | | 99,200 | | | | 6,134,528 | |
Pall Corp | | | 115,900 | | | | 6,984,134 | |
Republic Services Inc | | | 113,600 | | | | 3,331,888 | |
Robert Half International Inc | | | 114,600 | | | | 3,646,572 | |
Rockwell Collins Inc | | | 52,900 | | | | 3,077,193 | |
Roper Industries Inc | | | 111,000 | | | | 12,374,280 | |
Stanley Black & Decker Inc | | | 31,100 | | | | 2,300,467 | |
United Parcel Service Inc ‘B’ | | | 91,300 | | | | 6,731,549 | |
United Technologies Corp | | | 152,500 | | | | 12,506,525 | |
| | | | | | | | |
| | | | 106,804,970 | |
| | | | | | | | |
Information Technology - 11.4% | | | | | | | | |
| | |
Accenture PLC ‘A’ (Ireland) | | | 205,800 | | | | 13,685,700 | |
Analog Devices Inc | | | 66,800 | | | | 2,809,608 | |
Apple Inc | | | 14,500 | | | | 7,728,935 | |
Applied Materials Inc | | | 325,400 | | | | 3,722,576 | |
Automatic Data Processing Inc | | | 180,400 | | | | 10,284,604 | |
Cisco Systems Inc | | | 252,500 | | | | 4,961,625 | |
International Business Machines Corp | | | 9,400 | | | | 1,800,570 | |
Linear Technology Corp | | | 47,100 | | | | 1,615,530 | |
Microchip Technology Inc | | | 98,800 | | | | 3,219,892 | |
Microsoft Corp | | | 301,900 | | | | 8,069,787 | |
QUALCOMM Inc | | | 68,700 | | | | 4,260,774 | |
Texas Instruments Inc | | | 363,800 | | | | 11,255,972 | |
The Western Union Co | | | 106,800 | | | | 1,453,548 | |
Visa Inc ‘A’ | | | 94,100 | | | | 14,263,678 | |
Xilinx Inc | | | 115,700 | | | | 4,153,630 | |
| | | | | | | | |
| | | | 93,286,429 | |
| | | | | | | | |
Materials - 5.5% | | | | | | | | |
| | |
Air Products & Chemicals Inc | | | 44,000 | | | | 3,696,880 | |
Ecolab Inc | | | 83,400 | | | | 5,996,460 | |
Nucor Corp | | | 106,100 | | | | 4,581,398 | |
Potash Corp of Saskatchewan Inc (NYSE) (Canada) | | | 106,900 | | | | 4,349,761 | |
Praxair Inc | | | 99,800 | | | | 10,923,110 | |
| | |
| See Notes to Financial Statements | | See explanation of symbols and terms, if any, on page B-143 |
B-76
PACIFIC SELECT FUND
DIVIDEND GROWTH PORTFOLIO
Schedule of Investments (Continued)
December 31, 2012
| | | | | | | | |
| | | Shares | | |
Value | |
Sigma-Aldrich Corp | | | 103,000 | | | | $7,578,740 | |
The Sherwin-Williams Co | | | 51,000 | | | | 7,844,820 | |
| | | | | | | | |
| | | | 44,971,169 | |
| | | | | | | | |
Telecommunication Services - 3.7% | | | | | | | | |
| | |
AT&T Inc | | | 267,800 | | | | 9,027,538 | |
Crown Castle International Corp * | | | 210,500 | | | | 15,189,680 | |
Vodafone Group PLC ADR (United Kingdom) | | | 220,600 | | | | 5,556,914 | |
| | | | | | | | |
| | | | 29,774,132 | |
| | | | | | | | |
Utilities - 1.5% | | | | | | | | |
| | |
Entergy Corp | | | 80,800 | | | | 5,151,000 | |
Exelon Corp | | | 57,700 | | | | 1,715,998 | |
Sempra Energy | | | 72,500 | | | | 5,143,150 | |
| | | | | | | | |
| | | | 12,010,148 | |
| | | | | | | | |
| | |
Total Common Stocks
(Cost $646,658,298) | | | | | | | 770,436,083 | |
| | | | | | | | |
| | |
| | | Principal
Amount | | | | |
| | |
SHORT-TERM INVESTMENT - 5.0% | | | | | | | | |
| | |
Repurchase Agreement - 5.0% | | | | | | | | |
| | |
Fixed Income Clearing Corp
0.010% due 01/02/13
(Dated 12/31/12, repurchase price of $40,614,007; collateralized by U.S. Treasury Notes: 0.250% due 07/15/15 and value $41,430,000) | | | $40,613,984 | | | | 40,613,984 | |
| | | | | | | | |
| | |
Total Short-Term Investment
(Cost $40,613,984) | | | | | | | 40,613,984 | |
| | | | | | | | |
| | |
TOTAL INVESTMENTS - 99.3%
(Cost $687,272,282) | | | | | | | 811,050,067 | |
| |
OTHER ASSETS & LIABILITIES, NET - 0.7% | | | | 5,812,327 | |
| | | | | | | | |
| | |
NET ASSETS - 100.0% | | | | | | | $816,862,394 | |
| | | | | | | | |
Notes to Schedule of Investments
| (a) | As of December 31, 2012, the portfolio was diversified as a percentage of net assets as follows: |
| | | | |
Financials | | | 14.3% | |
Consumer Discretionary | | | 14.0% | |
Health Care | | | 13.8% | |
Industrials | | | 13.1% | |
Information Technology | | | 11.4% | |
Consumer Staples | | | 8.7% | |
Energy | | | 8.3% | |
Materials | | | 5.5% | |
Short-Term Investment | | | 5.0% | |
Telecommunication Services | | | 3.7% | |
Utilities | | | 1.5% | |
| | | | |
| | | 99.3% | |
Other Assets & Liabilities, Net | | | 0.7% | |
| | | | |
| | | 100.0% | |
| | | | |
| (b) | Short-term investments reflect either the stated coupon rate or the annualized effective yield on the date of purchase for discounted investments. |
| (c) | Fair Value Measurements |
The following is a summary of the portfolio’s investments as categorized under the three-tier hierarchy of inputs used in valuing the portfolio’s assets and liabilities (See Note 3D in Notes to Financial Statements) as of December 31, 2012:
| | | | | | | | | | | | | | | | | | |
| | | | | Total Value at
December 31, 2012 | | | Level 1
Quoted Price | | | Level 2
Significant
Observable Inputs | | | Level 3
Significant
Unobservable Inputs | |
Assets | | Common Stocks | | | | | | | | | | | | | | | | |
| | Consumer Discretionary | | | $114,427,407 | | | | $114,427,407 | | | | $- | | | | $- | |
| | Consumer Staples | | | 70,973,389 | | | | 62,089,354 | | | | 8,884,035 | | | | - | |
| | Energy | | | 68,150,057 | | | | 68,150,057 | | | | - | | | | - | |
| | Financials | | | 117,054,159 | | | | 117,054,159 | | | | - | | | | - | |
| | Health Care | | | 112,984,223 | | | | 112,984,223 | | | | - | | | | - | |
| | Industrials | | | 106,804,970 | | | | 106,804,970 | | | | - | | | | - | |
| | Information Technology | | | 93,286,429 | | | | 93,286,429 | | | | - | | | | - | |
| | Materials | | | 44,971,169 | | | | 44,971,169 | | | | - | | | | - | |
| | Telecommunication Services | | | 29,774,132 | | | | 29,774,132 | | | | - | | | | - | |
| | Utilities | | | 12,010,148 | | | | 12,010,148 | | | | - | | | | - | |
| | | | | | | | | | | | | | | | | | |
| | | | | 770,436,083 | | | | 761,552,048 | | | | 8,884,035 | | | | - | |
| | Short-Term Investment | | | 40,613,984 | | | | - | | | | 40,613,984 | | | | - | |
| | | | | | | | | | | | | | | | | | |
| | Total | | | $811,050,067 | | | | $761,552,048 | | | | $49,498,019 | | | | $- | |
| | | | | | | | | | | | | | | | | | |
| | |
| See Notes to Financial Statements | | See explanation of symbols and terms, if any, on page B-143 |
B-77
PACIFIC SELECT FUND
EQUITY INDEX PORTFOLIO
Summary Schedule of Investments
December 31, 2012
| | | | | | | | |
| | | Shares | | |
Value | |
COMMON STOCKS - 98.3% | | | | | | | | |
| | |
Consumer Discretionary - 11.3% | | | | | | | | |
| | |
Amazon.com Inc * | | | 55,560 | | | | $13,953,338 | |
Comcast Corp ‘A’ | | | 407,573 | | | | 15,235,079 | |
McDonald’s Corp | | | 153,995 | | | | 13,583,899 | |
The Home Depot Inc | | | 229,336 | | | | 14,184,432 | |
The Walt Disney Co | | | 271,818 | | | | 13,533,818 | |
Other securities | | | | | | | 154,245,927 | |
| | | | | | | | |
| | | | | | | 224,736,493 | |
| | | | | | | | |
Consumer Staples - 10.4% | | | | | | | | |
| | |
Altria Group Inc | | | 310,650 | | | | 9,760,623 | |
CVS Caremark Corp | | | 191,247 | | | | 9,246,792 | |
PepsiCo Inc | | | 237,254 | | | | 16,235,291 | |
Philip Morris International Inc | | | 256,214 | | | | 21,429,739 | |
The Coca-Cola Co | | | 591,588 | | | | 21,445,065 | |
The Procter & Gamble Co | | | 419,334 | | | | 28,468,585 | |
Wal-Mart Stores Inc | | | 256,541 | | | | 17,503,792 | |
Other securities | | | | | | | 83,316,692 | |
| | | | | | | | |
| | | | | | | 207,406,579 | |
| | | | | | | | |
Energy - 10.8% | | | | | | | | |
| | |
Chevron Corp | | | 300,091 | | | | 32,451,841 | |
ConocoPhillips | | | 186,110 | | | | 10,792,519 | |
Exxon Mobil Corp | | | 699,197 | | | | 60,515,500 | |
Occidental Petroleum Corp | | | 124,211 | | | | 9,515,805 | |
Schlumberger Ltd (Netherlands) | | | 203,547 | | | | 14,103,772 | |
Other securities | | | | | | | 87,239,899 | |
| | | | | | | | |
| | | | | | | 214,619,336 | |
| | | | | | | | |
Financials - 15.3% | | | | | | | | |
| | |
American Express Co | | | 149,357 | | | | 8,585,040 | |
Bank of America Corp | | | 1,652,585 | | | | 19,169,986 | |
Berkshire Hathaway Inc ‘B’ * | | | 279,751 | | | | 25,093,665 | |
Citigroup Inc | | | 449,636 | | | | 17,787,600 | |
JPMorgan Chase & Co | | | 582,881 | | | | 25,629,278 | |
The Goldman Sachs Group Inc | | | 67,768 | | | | 8,644,486 | |
U.S. Bancorp | | | 288,456 | | | | 9,213,285 | |
Wells Fargo & Co | | | 750,849 | | | | 25,664,019 | |
Other securities | | | | | | | 164,961,147 | |
| | | | | | | | |
| | | | | | | 304,748,506 | |
| | | | | | | | |
Health Care - 11.8% | | | | | | | | |
| | |
Abbott Laboratories | | | 242,356 | | | | 15,874,318 | |
Amgen Inc | | | 117,710 | | | | 10,160,727 | |
Bristol-Myers Squibb Co | | | 253,234 | | | | 8,252,896 | |
Gilead Sciences Inc * | | | 116,154 | | | | 8,531,511 | |
Johnson & Johnson | | | 424,932 | | | | 29,787,733 | |
Merck & Co Inc | | | 466,134 | | | | 19,083,526 | |
Pfizer Inc | | | 1,129,160 | | | | 28,319,333 | |
UnitedHealth Group Inc | | | 156,706 | | | | 8,499,733 | |
Other securities | | | | | | | 106,201,147 | |
| | | | | | | | |
| | | | | | | 234,710,924 | |
| | | | | | | | |
Industrials - 10.0% | | | | | | | | |
| | |
3M Co | | | 97,593 | | | | 9,061,510 | |
Caterpillar Inc | | | 100,255 | | | | 8,980,843 | |
General Electric Co | | | 1,608,200 | | | | 33,756,118 | |
Union Pacific Corp | | | 72,161 | | | | 9,072,081 | |
United Technologies Corp | | | 129,279 | | | | 10,602,171 | |
Other securities | | | | | | | 126,362,976 | |
| | | | | | | | |
| | | | | | | 197,835,699 | |
| | | | | | | | |
Information Technology - 18.7% | | | | | | | | |
| | |
Apple Inc | | | 144,247 | | | | 76,887,978 | |
Cisco Systems Inc | | | 814,047 | | | | 15,996,024 | |
eBay Inc * | | | 178,543 | | | | 9,109,264 | |
Google Inc ‘A’ * | | | 40,812 | | | | 28,950,808 | |
| | | | | | | | |
| | | Shares | | |
Value | |
Intel Corp | | | 763,216 | | | | $15,745,146 | |
International Business Machines Corp | | | 162,892 | | | | 31,201,963 | |
Microsoft Corp | | | 1,161,490 | | | | 31,046,628 | |
Oracle Corp | | | 576,510 | | | | 19,209,313 | |
QUALCOMM Inc | | | 261,272 | | | | 16,204,089 | |
Visa Inc ‘A’ | | | 79,930 | | | | 12,115,789 | |
Other securities | | | | | | | 115,610,987 | |
| | | | | | | | |
| | | | | | | 372,077,989 | |
| | | | | | | | |
Materials - 3.6% | | | | | | | | |
| | |
Other securities | | | | | | | 70,741,553 | |
| | | | | | | | |
| | |
Telecommunication Services - 3.0% | | | | | | | | |
| | |
AT&T Inc | | | 871,109 | | | | 29,365,084 | |
Verizon Communications Inc | | | 437,588 | | | | 18,934,433 | |
Other securities | | | | | | | 11,469,513 | |
| | | | | | | | |
| | | | | | | 59,769,030 | |
| | | | | | | | |
Utilities - 3.4% | | | | | | | | |
| | |
Other securities | | | | | | | 67,067,207 | |
| | | | | | | | |
| | |
Total Common Stocks
(Cost $1,298,563,811) | | | | | | | 1,953,713,316 | |
| | | | | | | | |
| | |
| | | Principal
Amount | | | | |
| | |
SHORT-TERM INVESTMENT - 1.5% | | | | | | | | |
| | |
Repurchase Agreement - 1.5% | | | | | | | | |
| | |
Fixed Income Clearing Corp
0.010% due 01/02/13
(Dated 12/31/12, repurchase price
of $29,476,503; collateralized by U.S.
Treasury Notes: 0.250% due 07/15/15
and value $30,070,000) | | | $29,476,486 | | | | 29,476,486 | |
| | | | | | | | |
| | |
Total Short-Term Investment
(Cost $29,476,486) | | | | | | | 29,476,486 | |
| | | | | | | | |
| | |
TOTAL INVESTMENTS - 99.8%
(Cost $1,328,040,297) | | | | | | | 1,983,189,802 | |
| |
OTHER ASSETS & LIABILITIES, NET - 0.2% | | | | 4,815,616 | |
| | | | | | | | |
| | |
NET ASSETS - 100.0% | | | | | | | $1,988,005,418 | |
| | | | | | | | |
Notes to Schedule of Investments
| (a) | As of December 31, 2012, the portfolio was diversified as a percentage of net assets as follows: |
| | | | |
Information Technology | | | 18.7% | |
Financials | | | 15.3% | |
Health Care | | | 11.8% | |
Consumer Discretionary | | | 11.3% | |
Energy | | | 10.8% | |
Consumer Staples | | | 10.4% | |
Industrials | | | 10.0% | |
Materials | | | 3.6% | |
Utilities | | | 3.4% | |
Telecommunication Services | | | 3.0% | |
Short-Term Investment | | | 1.5% | |
| | | | |
| | | 99.8% | |
Other Assets & Liabilities, Net | | | 0.2% | |
| | | | |
| | | 100.0% | |
| | | | |
| (b) | Short-term investments reflect either the stated coupon rate or the annualized effective yield on the date of purchase for discounted investments. |
| | |
| See Notes to Financial Statements | | See explanation of symbols and terms, if any, on page B-143 |
B-78
PACIFIC SELECT FUND
EQUITY INDEX PORTFOLIO
Summary Schedule of Investments (Continued)
December 31, 2012
| (c) | Other securities represent the portfolio’s securities not identified as a top-fifty holding in terms of value, and not exceeding one percent of the portfolio’s net assets as of December 31, 2012. |
| (d) | A Summary Schedule of Investments is presented for this portfolio. For information on availability of a complete Schedule of Investments, refer to the WHERE TO GO FOR MORE INFORMATION section of this report. |
| (e) | As of December 31, 2012, $1,962,000 in cash was segregated with the broker(s)/custodian as collateral for open futures contracts. |
| (f) | Open futures contracts outstanding as of December 31, 2012 were as follows: |
| | | | | | | | | | | | |
| Long Futures Outstanding | | Number of
Contracts | | | Notional
Amount | | | Unrealized
Depreciation | |
S&P 500 E-Mini (03/13) | | | 481 | | | | $34,355,699 | | | | ($202,294 | ) |
| | | | | | | | | | | | |
| (g) | Fair Value Measurements |
The following is a summary of the portfolio’s investments as categorized under the three-tier hierarchy of inputs used in valuing the portfolio’s assets and liabilities (See Note 3D in Notes to Financial Statements) as of December 31, 2012:
| | | | | | | | | | | | | | | | | | |
| | | | | Total Value at
December 31, 2012 | | | Level 1
Quoted Price | | | Level 2
Significant
Observable Inputs | | | Level 3
Significant
Unobservable Inputs | |
Assets | | Common Stocks (1) | | | $1,953,713,316 | | | | $1,953,713,316 | | | | $- | | | | $- | |
| | Short-Term Investment | | | 29,476,486 | | | | - | | | | 29,476,486 | | | | - | |
| | | | | | | | | | | | | | | | | | |
| | Total Assets | | | 1,983,189,802 | | | | 1,953,713,316 | | | | 29,476,486 | | | | - | |
| | | | | | | | | | | | | | | | | | |
Liabilities | | Derivatives: | | | | | | | | | | | | | | | | |
| | Equity Contracts | | | | | | | | | | | | | | | | |
| | Futures | | | (202,294 | ) | | | (202,294 | ) | | | - | | | | - | |
| | | | | | | | | | | | | | | | | | |
| | Total Liabilities | | | (202,294 | ) | | | (202,294 | ) | | | - | | | | - | |
| | | | | | | | | | | | | | | | | | |
| | Total | | | $1,982,987,508 | | | | $1,953,511,022 | | | | $29,476,486 | | | | $- | |
| | | | | | | | | | | | | | | | | | |
| | (1) | For equity investments categorized in a single level, refer to the schedule of investments for further industry breakout. |
| | |
| See Notes to Financial Statements | | See explanation of symbols and terms, if any, on page B-143 |
B-79
PACIFIC SELECT FUND
FOCUSED 30 PORTFOLIO
Schedule of Investments
December 31, 2012
| | | | | | | | |
| | | Shares | | |
Value | |
COMMON STOCKS - 99.3% | | | | | | | | |
| | |
Consumer Discretionary - 10.8% | | | | | | | | |
| | |
Amazon.com Inc * | | | 4,339 | | | | $1,089,697 | |
Cie Financiere Richemont SA ‘A’ (Switzerland) | | | 44,122 | | | | 3,528,148 | |
MGM Resorts International * | | | 209,923 | | | | 2,443,504 | |
News Corp ‘A’ | | | 148,167 | | | | 3,784,185 | |
Prada SPA (Italy) | | | 155,300 | | | | 1,502,377 | |
| | | | | | | | |
| | | | 12,347,911 | |
| | | | | | | | |
Consumer Staples - 8.0% | | | | | | | | |
| | |
Davide Campari-Milano SPA (Italy) | | | 228,392 | | | | 1,754,265 | |
Mead Johnson Nutrition Co | | | 45,069 | | | | 2,969,597 | |
Monster Beverage Corp * | | | 59,811 | | | | 3,162,806 | |
Pernod-Ricard SA (France) | | | 10,899 | | | | 1,281,578 | |
| | | | | | | | |
| | | | 9,168,246 | |
| | | | | | | | |
Financials - 7.1% | | | | | | | | |
| | |
AIA Group Ltd (Hong Kong) | | | 518,800 | | | | 2,067,646 | |
Prudential PLC (United Kingdom) | | | 170,982 | | | | 2,385,760 | |
Walker & Dunlop Inc * | | | 216,864 | | | | 3,612,954 | |
| | | | | | | | |
| | | | | | | 8,066,360 | |
| | | | | | | | |
Health Care - 16.3% | | | | | | | | |
| | |
Celgene Corp * | | | 67,263 | | | | 5,294,944 | |
Express Scripts Holding Co * | | | 115,303 | | | | 6,226,362 | |
Gilead Sciences Inc * | | | 17,991 | | | | 1,321,439 | |
Intuitive Surgical Inc * | | | 533 | | | | 261,367 | |
Medivation Inc * | | | 70,201 | | | | 3,591,483 | |
Vertex Pharmaceuticals Inc * | | | 43,268 | | | | 1,814,660 | |
| | | | | | | | |
| | | | 18,510,255 | |
| | | | | | | | |
Industrials - 11.5% | | | | | | | | |
| | |
C.H. Robinson Worldwide Inc | | | 32,892 | | | | 2,079,432 | |
FANUC Corp (Japan) | | | 23,900 | | | | 4,444,536 | |
Iron Mountain Inc | | | 72,307 | | | | 2,245,132 | |
Precision Castparts Corp | | | 4,616 | | | | 874,363 | |
United Parcel Service Inc ‘B’ | | | 46,641 | | | | 3,438,841 | |
| | | | | | | | |
| | | | 13,082,304 | |
| | | | | | | | |
Information Technology -37.5% | | | | | | | | |
| | |
Amphenol Corp ‘A’ | | | 22,475 | | | | 1,454,132 | |
Apple Inc | | | 22,383 | | | | 11,930,810 | |
CoStar Group Inc * | | | 40,380 | | | | 3,608,761 | |
eBay Inc * | | | 153,804 | | | | 7,847,080 | |
EMC Corp * | | | 128,602 | | | | 3,253,631 | |
MasterCard Inc ‘A’ | | | 2,758 | | | | 1,354,950 | |
Microsoft Corp | | | 115,274 | | | | 3,081,274 | |
ON Semiconductor Corp * | | | 206,693 | | | | 1,457,186 | |
TE Connectivity Ltd (Switzerland) | | | 71,736 | | | | 2,662,840 | |
Trimble Navigation Ltd * | | | 51,080 | | | | 3,053,562 | |
VistaPrint NV * (Netherlands) | | | 71,044 | | | | 2,334,506 | |
Workday Inc ‘A’ * | | | 9,429 | | | | 513,881 | |
Yelp Inc * | | | 10,331 | | | | 194,739 | |
| | | | | | | | |
| | | | | | | 42,747,352 | |
| | | | | | | | |
Materials - 1.4% | | | | | | | | |
| | |
Turquoise Hill Resources Ltd (XNYS) * (Canada) | | | 214,598 | | | | 1,633,091 | |
| | | | | | | | |
| | |
Telecommunication Services - 6.7% | | | | | | | | |
| | |
Crown Castle International Corp * | | | 97,385 | | | | 7,027,301 | |
Ziggo NV (Netherlands) | | | 18,516 | | | | 598,418 | |
| | | | | | | | |
| | | | 7,625,719 | |
| | | | | | | | |
Total Common Stocks
(Cost $86,384,226) | | | | 113,181,238 | |
| | | | | | | | |
| | | | | | | | |
| | | Principal
Amount | | |
Value | |
| | |
SHORT-TERM INVESTMENTS - 0.8% | | | | | | | | |
| | |
Commercial Paper - 0.7% | | | | | | | | |
| | |
BNP Paribas Financial Inc
0.160% due 01/02/13 | | | $800,000 | | | | $800,000 | |
| | | | | | | | |
| | |
Repurchase Agreement - 0.1% | | | | | | | | |
| | |
State Street Bank & Trust Co
0.010% due 01/02/13
(Dated 12/31/12, repurchase price of $68,132; collateralized by
Fannie Mae: 2.140% due 11/07/22
and value $70,287) | | | 68,132 | | | | 68,132 | |
| | | | | | | | |
| |
Total Short-Term Investments
(Cost $868,132) | | | | 868,132 | |
| | | | | | | | |
| |
TOTAL INVESTMENTS - 100.1%
(Cost $87,252,358) | | | | 114,049,370 | |
| |
OTHER ASSETS & LIABILITIES, NET - (0.1%) | | | | (125,832 | ) |
| | | | | | | | |
| |
NET ASSETS - 100.0% | | | | $113,923,538 | |
| | | | | | | | |
Notes to Schedule of Investments
| (a) | As of December 31, 2012, the portfolio was diversified as a percentage of net assets as follows: |
| | | | |
Information Technology | | | 37.5% | |
Health Care | | | 16.3% | |
Industrials | | | 11.5% | |
Consumer Discretionary | | | 10.8% | |
Consumer Staples | | | 8.0% | |
Financials | | | 7.1% | |
Telecommunication Services | | | 6.7% | |
Materials | | | 1.4% | |
Short-Term Investments | | | 0.8% | |
| | | | |
| | | 100.1% | |
Other Assets & Liabilities, Net | | | (0.1% | ) |
| | | | |
| | | 100.0% | |
| | | | |
| (b) | Short-term investments reflect either the stated coupon rate or the annualized effective yield on the date of purchase for discounted investments. |
| | |
| See Notes to Financial Statements | | See explanation of symbols and terms, if any, on page B-143 |
B-80
PACIFIC SELECT FUND
FOCUSED 30 PORTFOLIO
Schedule of Investments (Continued)
December 31, 2012
| (c) | Fair Value Measurements |
The following is a summary of the portfolio’s investments as categorized under the three-tier hierarchy of inputs used in valuing the portfolio’s assets and liabilities (See Note 3D in Notes to Financial Statements) as of December 31, 2012:
| | | | | | | | | | | | | | | | | | |
| | | | | Total Value at
December 31, 2012 | | | Level 1
Quoted Price | | | Level 2
Significant
Observable Inputs | | | Level 3
Significant
Unobservable Inputs | |
Assets | | Common Stocks | | | | | | | | | | | | | | | | |
| | Consumer Discretionary | | | $12,347,911 | | | | $7,317,386 | | | | $5,030,525 | | | | $- | |
| | Consumer Staples | | | 9,168,246 | | | | 6,132,403 | | | | 3,035,843 | | | | - | |
| | Financials | | | 8,066,360 | | | | 3,612,954 | | | | 4,453,406 | | | | - | |
| | Health Care | | | 18,510,255 | | | | 18,510,255 | | | | - | | | | - | |
| | Industrials | | | 13,082,304 | | | | 8,637,768 | | | | 4,444,536 | | | | - | |
| | Information Technology | | | 42,747,352 | | | | 42,747,352 | | | | - | | | | - | |
| | Materials | | | 1,633,091 | | | | 1,633,091 | | | | - | | | | - | |
| | Telecommunication Services | | | 7,625,719 | | | | 7,027,301 | | | | 598,418 | | | | - | |
| | | | | | | | | | | | | | | | | | |
| | | | | 113,181,238 | | | | 95,618,510 | | | | 17,562,728 | | | | - | |
| | Short-Term Investments | | | 868,132 | | | | - | | | | 868,132 | | | | - | |
| | | | | | | | | | | | | | | | | | |
| | Total | | | $114,049,370 | | | | $95,618,510 | | | | $18,430,860 | | | | $- | |
| | | | | | | | | | | | | | | | | | |
| | |
| See Notes to Financial Statements | | See explanation of symbols and terms, if any, on page B-143 |
B-81
PACIFIC SELECT FUND
GROWTH LT PORTFOLIO
Schedule of Investments
December 31, 2012
| | | | | | | | |
| | | Shares | | |
Value | |
COMMON STOCKS - 94.3% | | | | | | | | |
| | |
Consumer Discretionary - 18.8% | | | | | | | | |
| | |
Amazon.com Inc * | | | 12,359 | | | | $3,103,839 | |
AutoZone Inc * | | | 21,998 | | | | 7,796,751 | |
CBS Corp ‘B’ | | | 257,258 | | | | 9,788,667 | |
Coach Inc | | | 142,536 | | | | 7,912,173 | |
Limited Brands Inc | | | 315,488 | | | | 14,846,865 | |
Mattel Inc | | | 192,458 | | | | 7,047,812 | |
Nike Inc ‘B’ | | | 173,398 | | | | 8,947,337 | |
Nordstrom Inc | | | 216,466 | | | | 11,580,931 | |
Polaris Industries Inc | | | 13,143 | | | | 1,105,983 | |
Prada SPA (Italy) | | | 654,700 | | | | 6,333,590 | |
priceline.com Inc * | | | 4,051 | | | | 2,516,481 | |
The TJX Cos Inc | | | 94,799 | | | | 4,024,218 | |
The Walt Disney Co | | | 76,421 | | | | 3,805,002 | |
Time Warner Cable Inc | | | 78,412 | | | | 7,620,862 | |
| | | | | | | | |
| | | | | | | 96,430,511 | |
| | | | | | | | |
Consumer Staples - 10.2% | | | | | | | | |
| | |
Anheuser-Busch InBev NV (Belgium) | | | 90,749 | | | | 7,930,430 | |
Colgate-Palmolive Co | | | 45,943 | | | | 4,802,881 | |
Costco Wholesale Corp | | | 59,647 | | | | 5,891,334 | |
Mead Johnson Nutrition Co | | | 62,399 | | | | 4,111,470 | |
Pernod-Ricard SA (France) | | | 83,814 | | | | 9,855,419 | |
Philip Morris International Inc | | | 57,357 | | | | 4,797,340 | |
Reckitt Benckiser Group PLC (United Kingdom) | | | 78,619 | | | | 4,924,987 | |
SABMiller PLC (United Kingdom) | | | 152,834 | | | | 7,193,603 | |
Whole Foods Market Inc | | | 29,707 | | | | 2,713,140 | |
| | | | | | | | |
| | | | | | | 52,220,604 | |
| | | | | | | | |
Energy - 5.1% | | | | | | | | |
| | |
Dresser-Rand Group Inc * | | | 89,898 | | | | 5,046,874 | |
Enterprise Products Partners LP | | | 6,892 | | | | 345,151 | |
EOG Resources Inc | | | 36,290 | | | | 4,383,469 | |
Helmerich & Payne Inc | | | 68,586 | | | | 3,841,502 | |
Kinder Morgan Inc | | | 83,485 | | | | 2,949,525 | |
National Oilwell Varco Inc | | | 53,155 | | | | 3,633,144 | |
Noble Energy Inc | | | 44,079 | | | | 4,484,598 | |
Petroleo Brasileiro SA ADR (Brazil) | | | 75,483 | | | | 1,469,654 | |
| | | | | | | | |
| | | | | | | 26,153,917 | |
| | | | | | | | |
Financials - 2.9% | | | | | | | | |
| | |
Banco do Brasil SA (Brazil) | | | 163,600 | | | | 2,087,056 | |
Prudential PLC (United Kingdom) | | | 248,496 | | | | 3,467,334 | |
Simon Property Group Inc REIT | | | 16,300 | | | | 2,576,867 | |
T. Rowe Price Group Inc | | | 74,299 | | | | 4,839,094 | |
Ventas Inc REIT | | | 30,180 | | | | 1,953,250 | |
| | | | | | | | |
| | | | | | | 14,923,601 | |
| | | | | | | | |
Health Care - 12.7% | | | | | | | | |
| | |
Aetna Inc | | | 70,983 | | | | 3,286,513 | |
AmerisourceBergen Corp | | | 115,551 | | | | 4,989,492 | |
Celgene Corp * | | | 85,483 | | | | 6,729,222 | |
Covidien PLC (Ireland) | | | 77,386 | | | | 4,468,268 | |
Express Scripts Holding Co * | | | 166,555 | | | | 8,993,970 | |
Gilead Sciences Inc * | | | 121,250 | | | | 8,905,813 | |
Medivation Inc * | | | 61,314 | | | | 3,136,824 | |
Perrigo Co | | | 89,039 | | | | 9,262,727 | |
Shire PLC ADR (United Kingdom) | | | 28,212 | | | | 2,600,582 | |
Valeant Pharmaceuticals International Inc (NYSE) * (Canada) | | | 105,647 | | | | 6,314,521 | |
Varian Medical Systems Inc * | | | 43,442 | | | | 3,051,366 | |
Vertex Pharmaceuticals Inc * | | | 82,020 | | | | 3,439,919 | |
| | | | | | | | |
| | | | | | | 65,179,217 | |
| | | | | | | | |
| | | | | | | | |
| | | Shares | | |
Value | |
Industrials - 12.3% | | | | | | | | |
| | |
C.H. Robinson Worldwide Inc | | | 56,081 | | | | $3,545,441 | |
Canadian Pacific Railway Ltd (NYSE) (Canada) | | | 56,495 | | | | 5,741,022 | |
Danaher Corp | | | 151,064 | | | | 8,444,478 | |
FANUC Corp (Japan) | | | 41,300 | | | | 7,680,306 | |
Fastenal Co | | | 79,141 | | | | 3,695,093 | |
Precision Castparts Corp | | | 70,139 | | | | 13,285,730 | |
Sensata Technologies Holding NV * (Netherlands) | | | 191,388 | | | | 6,216,282 | |
Tyco International Ltd (Switzerland) | | | 65,369 | | | | 1,912,043 | |
Union Pacific Corp | | | 15,532 | | | | 1,952,683 | |
Verisk Analytics Inc ‘A’ * | | | 58,951 | | | | 3,006,501 | |
W.W. Grainger Inc | | | 37,838 | | | | 7,657,276 | |
| | | | | | | | |
| | | | | | | 63,136,855 | |
| | | | | | | | |
Information Technology - 27.9% | | | | | | | | |
| | |
Amdocs Ltd (United Kingdom) | | | 145,387 | | | | 4,941,704 | |
Amphenol Corp ‘A’ | | | 86,395 | | | | 5,589,757 | |
ANSYS Inc * | | | 61,520 | | | | 4,142,757 | |
Apple Inc | | | 83,419 | | | | 44,464,830 | |
Atmel Corp * | | | 441,229 | | | | 2,890,050 | |
eBay Inc * | | | 221,958 | | | | 11,324,297 | |
EMC Corp * | | | 88,372 | | | | 2,235,812 | |
Facebook Inc ‘A’ * | | | 72,110 | | | | 1,920,289 | |
Google Inc ‘A’ * | | | 7,252 | | | | 5,144,351 | |
Informatica Corp * | | | 90,221 | | | | 2,735,501 | |
Intuit Inc | | | 126,145 | | | | 7,505,627 | |
LinkedIn Corp ‘A’ * | | | 15,179 | | | | 1,742,853 | |
MasterCard Inc ‘A’ | | | 14,052 | | | | 6,903,467 | |
Motorola Solutions Inc | | | 132,284 | | | | 7,365,573 | |
ON Semiconductor Corp * | | | 593,243 | | | | 4,182,363 | |
Oracle Corp | | | 440,417 | | | | 14,674,694 | |
Taiwan Semiconductor Manufacturing Co Ltd (Taiwan) | | | 1,191,548 | | | | 3,988,007 | |
TE Connectivity Ltd (Switzerland) | | | 209,750 | | | | 7,785,920 | |
Teradata Corp * | | | 21,267 | | | | 1,316,215 | |
VMware Inc ‘A’ * | | | 19,567 | | | | 1,842,037 | |
| | | | | | | | |
| | | | | | | 142,696,104 | |
| | | | | | | | |
Materials - 3.7% | | | | | | | | |
| | |
Ball Corp | | | 180,855 | | | | 8,093,261 | |
Monsanto Co | | | 28,865 | | | | 2,732,072 | |
Praxair Inc | | | 75,408 | | | | 8,253,406 | |
| | | | | | | | |
| | | | | | | 19,078,739 | |
| | | | | | | | |
Telecommunication Services - 0.7% | | | | | | | | |
| | |
Crown Castle International Corp * | | | 50,359 | | | | 3,633,905 | |
| | | | | | | | |
| | |
Total Common Stocks
(Cost $417,416,020) | | | | | | | 483,453,453 | |
| | | | | | | | |
| | |
PURCHASED OPTIONS - 0.2% | | | | | | | | |
(See Note (d) in Notes to Schedule of Investments)
(Cost $1,649,863) | | | | 1,252,310 | |
| | | | | | | | |
| | |
| See Notes to Financial Statements | | See explanation of symbols and terms, if any, on page B-143 |
B-82
PACIFIC SELECT FUND
GROWTH LT PORTFOLIO
Schedule of Investments (Continued)
December 31, 2012
| | | | | | | | |
| | | Principal
Amount | | | Value | |
SHORT-TERM INVESTMENTS - 5.2% | | | | | | | | |
| | |
Commercial Paper - 4.9% | | | | | | | | |
| | |
BNP Paribas Financial Inc
0.160% due 01/02/13 | | | $25,100,000 | | | | $25,099,986 | |
| | | | | | | | |
| | |
Repurchase Agreement - 0.3% | | | | | | | | |
| | |
State Street Bank & Trust Co
0.010% due 01/02/13
(Dated 12/31/12, repurchase price of $1,604,416; collateralized by
Fannie Mae: 2.140% due 11/07/22
and value $1,636,678) | | | 1,604,415 | | | | 1,604,415 | |
| | | | | | | | |
| | |
Total Short-Term Investments
(Cost $26,704,401) | | | | | | | 26,704,401 | |
| | | | | | | | |
| | |
TOTAL INVESTMENTS - 99.7%
(Cost $445,770,284) | | | | | | | 511,410,164 | |
| | |
OTHER ASSETS & LIABILITIES, NET - 0.3% | | | | | | | 1,437,684 | |
| | | | | | | | |
| | |
NET ASSETS - 100.0% | | | | | | | $512,847,848 | |
| | | | | | | | |
Notes to Schedule of Investments
| (a) | As of December 31, 2012, the portfolio was diversified as a percentage of net assets as follows: |
| | | | |
| | | | |
Information Technology | | | 27.9% | |
Consumer Discretionary | | | 18.8% | |
Health Care | | | 12.7% | |
Industrials | | | 12.3% | |
Consumer Staples | | | 10.2% | |
Short-Term Investments | | | 5.2% | |
Energy | | | 5.1% | |
Materials | | | 3.7% | |
Financials | | | 2.9% | |
Telecommunication Services | | | 0.7% | |
Purchased Options | | | 0.2% | |
| | | | |
| | | 99.7% | |
Other Assets & Liabilities, Net | | | 0.3% | |
| | | | |
| | | 100.0% | |
| | | | |
| (b) | Short-term investments reflect either the stated coupon rate or the annualized effective yield on the date of purchase for discounted investments. |
| (c) | Forward foreign currency contracts outstanding as of December 31, 2012 were as follows: |
| | | | | | | | | | | | | | | | | | | | |
Currency
Purchased | | | Currency
Sold | | | Expiration | | | Counterparty | | Unrealized
Appreciation
(Depreciation) | |
| EUR | | | 350,000 | | | USD | | | 461,545 | | | | 01/13 | | | CSF | | | $465 | |
| GBP | | | 870,000 | | | USD | | | 1,411,192 | | | | 01/13 | | | CSF | | | 2,052 | |
| JPY | | | 8,800,000 | | | USD | | | 103,201 | | | | 01/13 | | | CSF | | | (1,623 | ) |
| USD | | | 2,923,006 | | | EUR | | | 2,285,000 | | | | 01/13 | | | CSF | | | (93,261 | ) |
| USD | | | 2,351,898 | | | EUR | | | 1,800,000 | | | | 01/13 | | | JPM | | | (24,439 | ) |
| USD | | | 4,658,025 | | | EUR | | | 3,590,000 | | | | 01/13 | | | RBC | | | (81,164 | ) |
| USD | | | 3,669,255 | | | EUR | | | 2,790,000 | | | | 02/13 | | | HSB | | | (14,741 | ) |
| USD | | | 3,455,400 | | | GBP | | | 2,170,000 | | | | 01/13 | | | CSF | | | (69,590 | ) |
| USD | | | 4,151,994 | | | GBP | | | 2,580,000 | | | | 01/13 | | | JPM | | | (38,850 | ) |
| USD | | | 3,923,283 | | | GBP | | | 2,450,000 | | | | 01/13 | | | RBC | | | (56,469 | ) |
| USD | | | 3,317,976 | | | GBP | | | 2,050,000 | | | | 02/13 | | | HSB | | | (11,749 | ) |
| USD | | | 2,341,609 | | | JPY | | | 187,100,000 | | | | 01/13 | | | CSF | | | 181,920 | |
| USD | | | 1,759,208 | | | JPY | | | 145,000,000 | | | | 01/13 | | | JPM | | | 85,284 | |
| USD | | | 1,911,697 | | | JPY | | | 157,000,000 | | | | 01/13 | | | RBC | | | 99,347 | |
| USD | | | 1,570,268 | | | JPY | | | 132,000,000 | | | | 02/13 | | | HSB | | | 46,161 | |
| | | | | | | | | | | | | | | | | | | | |
| | | | |
Total Forward Foreign Currency Contracts | | | | | | | | | | | | | $23,343 | |
| | | | | | | | | | | | | | | | | | | | |
| (d) | Purchased options outstanding as of December 31, 2012 were as follows: |
Options on Exchange-Traded Futures Contracts
| | | | | | | | | | | | | | | | | | | | | | |
| Description | | Exercise
Price | | | Expiration
Date | | | Counter-
party | | Number of
Contracts | | | Cost | | | Value | |
Put - CME S&P 500 Index Futures (01/13) | | | $140.00 | | | | 01/19/13 | | | GSC | | | 1,490 | | | | $221,980 | | | | $177,310 | |
| | | | | | | | | | | | | | | | | | | | | | |
Options on Securities
| | | | | | | | | | | | | | | | | | | | | | |
| Description | | Strike
Price | | | Expiration
Date | | | Counter-
party | | Number of
Contracts | | | Cost | | | Value | |
Call - CME Microsoft Corp | | | $30.00 | | | | 01/19/13 | | | GSC | | | 2,575 | | | | $584,525 | | | | $7,725 | |
Call - CME Valeant Pharmaceuticals International Inc | | | 52.50 | | | | 01/19/13 | | | GSC | | | 695 | | | | 491,845 | | | | 545,575 | |
Call - CME Google Inc ‘A’ | | | 700.00 | | | | 03/16/13 | | | GSC | | | 141 | | | | 351,513 | | | | 521,700 | |
| | | | | | | | | | | | | | | | | | | | | | |
| | | | | | | | | | | | | | | | | $1,427,883 | | | | $1,075,000 | |
| | | | | | | | | | | | | | | | | | | | | | |
| | |
Total Purchased Options | | | | $1,649,863 | | | | $1,252,310 | |
| | | | | | | | | | | | | | | | | | | | | | |
| | |
| See Notes to Financial Statements | | See explanation of symbols and terms, if any, on page B-143 |
B-83
PACIFIC SELECT FUND
GROWTH LT PORTFOLIO
Schedule of Investments (Continued)
December 31, 2012
| (e) | Transactions in written options for the year ended December 31, 2012 were as follows: |
| | | | | | | | | | | | | | |
| | | Number of
Contracts | | | Premium | | | | | | | |
Outstanding, December 31, 2011 | | | - | | | | $- | | | | | | | |
Call Options Written | | | 1,792 | | | | 1,599,682 | | | | | | | |
Call Options Exercised | | | (313 | ) | | | (38,122 | ) | | | | | | |
Call Options Expired | | | (582 | ) | | | (119,492 | ) | | | | | | |
Call Options Closed | | | (897 | ) | | | (1,442,068 | ) | | | | | | |
| | | | | | | | | | | | | | |
Outstanding, December 31, 2012 | | | - | | | | $- | | | | | | | |
| | | | | | | | | | | | | | |
| (f) | Fair Value Measurements |
The following is a summary of the portfolio’s investments as categorized under the three-tier hierarchy of inputs used in valuing the portfolio’s assets and liabilities (See Note 3D in Notes to Financial Statements) as of December 31, 2012:
| | | | | | | | | | | | | | | | | | |
| | | | | Total Value at
December 31, 2012 | | | Level 1
Quoted Price | | | Level 2
Significant
Observable Inputs | | | Level 3
Significant
Unobservable Inputs | |
Assets | | Common Stocks | | | | | | | | | | | | | | | | |
| | Consumer Discretionary | | | $96,430,511 | | | | $90,096,921 | | | | $6,333,590 | | | | $- | |
| | Consumer Staples | | | 52,220,604 | | | | 22,316,165 | | | | 29,904,439 | | | | - | |
| | Energy | | | 26,153,917 | | | | 26,153,917 | | | | - | | | | - | |
| | Financials | | | 14,923,601 | | | | 9,369,211 | | | | 5,554,390 | | | | - | |
| | Health Care | | | 65,179,217 | | | | 65,179,217 | | | | - | | | | - | |
| | Industrials | | | 63,136,855 | | | | 55,456,549 | | | | 7,680,306 | | | | - | |
| | Information Technology | | | 142,696,104 | | | | 138,708,097 | | | | 3,988,007 | | | | - | |
| | Materials | | | 19,078,739 | | | | 19,078,739 | | | | - | | | | - | |
| | Telecommunication Services | | | 3,633,905 | | | | 3,633,905 | | | | - | | | | - | |
| | | | | | | | | | | | | | | | | | |
| | | | | 483,453,453 | | | | 429,992,721 | | | | 53,460,732 | | | | - | |
| | Short-Term Investments | | | 26,704,401 | | | | - | | | | 26,704,401 | | | | - | |
| | Derivatives: | | | | | | | | | | | | | | | | |
| | Equity Contracts | | | | | | | | | | | | | | | | |
| | Purchased Options | | | 1,252,310 | | | | 1,252,310 | | | | - | | | | - | |
| | Foreign Currency Contracts | | | | | | | | | | | | | | | | |
| | Forward Foreign Currency Contracts | | | 415,229 | | | | - | | | | 415,229 | | | | - | |
| | | | | | | | | | | | | | | | | | |
| | Total Assets - Derivatives | | | 1,667,539 | | | | 1,252,310 | | | | 415,229 | | | | - | |
| | | | | | | | | | | | | | | | | | |
| | Total Assets | | | 511,825,393 | | | | 431,245,031 | | | | 80,580,362 | | | | - | |
| | | | | | | | | | | | | | | | | | |
Liabilities | | Derivatives: | | | | | | | | | | | | | | | | |
| | Foreign Currency Contracts | | | | | | | | | | | | | | | | |
| | Forward Foreign Currency Contracts | | | (391,886 | ) | | | - | | | | (391,886 | ) | | | - | |
| | | | | | | | | | | | | | | | | | |
| | Total Liabilities | | | (391,886 | ) | | | - | | | | (391,886 | ) | | | - | |
| | | | | | | | | | | | | | | | | | |
| | Total | | | $511,433,507 | | | | $431,245,031 | | | | $80,188,476 | | | | $- | |
| | | | | | | | | | | | | | | | | | |
| | |
| See Notes to Financial Statements | | See explanation of symbols and terms, if any, on page B-143 |
B-84
PACIFIC SELECT FUND
LARGE-CAP GROWTH PORTFOLIO
Schedule of Investments
December 31, 2012
| | | | | | | | |
| | | Shares | | |
Value | |
COMMON STOCKS - 97.5% | | | | | | | | |
| | |
Consumer Discretionary - 20.8% | | | | | | | | |
| | |
Amazon.com Inc * | | | 174,100 | | | | $43,723,474 | |
DIRECTV * | | | 491,900 | | | | 24,673,704 | |
Dollar General Corp * | | | 758,000 | | | | 33,420,220 | |
Las Vegas Sands Corp | | | 717,100 | | | | 33,101,336 | |
Lululemon Athletica Inc * | | | 292,109 | | | | 22,267,469 | |
Michael Kors Holdings Ltd *
(United Kingdom) | | | 375,700 | | | | 19,171,971 | |
Nike Inc ‘B’ | | | 535,000 | | | | 27,606,000 | |
priceline.com Inc * | | | 52,600 | | | | 32,675,120 | |
Ralph Lauren Corp | | | 200,700 | | | | 30,088,944 | |
The Interpublic Group of Cos Inc | | | 3,901 | | | | 42,989 | |
| | | | | | | | |
| | | | 266,771,227 | |
| | | | | | | | |
Consumer Staples - 5.5% | |
| | |
CVS Caremark Corp | | | 318,600 | | | | 15,404,310 | |
Monster Beverage Corp * | | | 346,700 | | | | 18,333,496 | |
The Estee Lauder Cos Inc ‘A’ | | | 620,000 | | | | 37,113,200 | |
| | | | | | | | |
| | | | 70,851,006 | |
| | | | | | | | |
Energy - 6.4% | | | | | | | | |
| | |
Cabot Oil & Gas Corp | | | 271,000 | | | | 13,479,540 | |
Concho Resources Inc * | | | 273,100 | | | | 22,000,936 | |
FMC Technologies Inc * | | | 580,400 | | | | 24,858,532 | |
Schlumberger Ltd (Netherlands) | | | 308,400 | | | | 21,369,036 | |
| | | | | | | | |
| | | | 81,708,044 | |
| | | | | | | | |
Health Care - 15.2% | | | | | | | | |
| | |
Agilent Technologies Inc | | | 708,100 | | | | 28,989,614 | |
Allergan Inc | | | 491,100 | | | | 45,048,603 | |
Biogen Idec Inc * | | | 107,900 | | | | 15,825,693 | |
Cardinal Health Inc | | | 754,100 | | | | 31,053,838 | |
Gilead Sciences Inc * | | | 371,300 | | | | 27,271,985 | |
Intuitive Surgical Inc * | | | 26,800 | | | | 13,141,916 | |
UnitedHealth Group Inc | | | 615,300 | | | | 33,373,872 | |
| | | | | | | | |
| | | | 194,705,521 | |
| | | | | | | | |
Industrials - 10.5% | | | | | | | | |
| | |
Cummins Inc | | | 188,400 | | | | 20,413,140 | |
Danaher Corp | | | 550,500 | | | | 30,772,950 | |
IHS Inc ‘A’ * | | | 138,100 | | | | 13,257,600 | |
Precision Castparts Corp | | | 49,100 | | | | 9,300,522 | |
Union Pacific Corp | | | 212,800 | | | | 26,753,216 | |
United Technologies Corp | | | 415,800 | | | | 34,099,758 | |
| | | | | | | | |
| | | | 134,597,186 | |
| | | | | | | | |
Information Technology - 36.2% | | | | | | | | |
| | |
Apple Inc | | | 130,900 | | | | 69,773,627 | |
eBay Inc * | | | 499,700 | | | | 25,494,694 | |
Facebook Inc ‘A’ * | | | 1,148,500 | | | | 30,584,555 | |
Google Inc ‘A’ * | | | 66,300 | | | | 47,031,231 | |
Informatica Corp * | | | 483,200 | | | | 14,650,624 | |
MasterCard Inc ‘A’ | | | 64,900 | | | | 31,884,072 | |
MercadoLibre Inc | | | 136,700 | | | | 10,740,519 | |
NetApp Inc * | | | 852,900 | | | | 28,614,795 | |
QUALCOMM Inc | | | 733,800 | | | | 45,510,276 | |
salesforce.com inc * | | | 174,600 | | | | 29,350,260 | |
ServiceNow Inc * | | | 105,400 | | | | 3,165,162 | |
Teradata Corp * | | | 459,800 | | | | 28,457,022 | |
VeriSign Inc * | | | 218,500 | | | | 8,482,170 | |
Visa Inc ‘A’ | | | 406,500 | | | | 61,617,270 | |
VMware Inc ‘A’ * | | | 304,000 | | | | 28,618,560 | |
| | | | | | | | |
| | | | 463,974,837 | |
| | | | | | | | |
| | | | | | | | |
| | | Shares | | |
Value | |
Materials - 1.5% | | | | | | | | |
| | |
The Sherwin-Williams Co | | | 130,100 | | | | $20,011,982 | |
| | | | | | | | |
| | |
Telecommunication Services -1.4% | | | | | | | | |
| | |
Crown Castle International Corp * | | | 250,800 | | | | 18,097,728 | |
| | | | | | | | |
| | |
Total Common Stocks
(Cost $1,070,023,417) | | | | | | | 1,250,717,531 | |
| | | | | | | | |
| | |
EXCHANGE-TRADED FUND - 0.4% | | | | | | | | |
iShares Russell 1000 Growth Index Fund | | | 87,600 | | | | 5,736,924 | |
| | | | | | | | |
| | |
Total Exchange-Traded Fund
(Cost $5,710,431) | | | | | | | 5,736,924 | |
| | | | | | | | |
| | |
| | | Principal
Amount | | | | |
SHORT-TERM INVESTMENT - 2.1% | | | | | | | | |
| | |
Repurchase Agreement - 2.1% | | | | | | | | |
| | |
Fixed Income Clearing Corp
0.010% due 01/02/13
(Dated 12/31/12, repurchase price of $26,530,212; collateralized by U.S. Treasury Notes: 0.250% due 07/15/15 and value $27,065,000) | | | $26,530,197 | | | | 26,530,197 | |
| | | | | | | | |
| | |
Total Short-Term Investment
(Cost $26,530,197) | | | | | | | 26,530,197 | |
| | | | | | | | |
| | |
TOTAL INVESTMENTS - 100.0%
(Cost $1,102,264,045) | | | | | | | 1,282,984,652 | |
| |
OTHER ASSETS & LIABILITIES, NET - (0.0%) | | | | (267,748 | ) |
| | | | | | | | |
| | |
NET ASSETS - 100.0% | | | | | | | $1,282,716,904 | |
| | | | | | | | |
Notes to Schedule of Investments
| (a) | As of December 31, 2012, the portfolio was diversified as a percentage of net assets as follows: |
| | | | |
Information Technology | | | 36.2% | |
Consumer Discretionary | | | 20.8% | |
Health Care | | | 15.2% | |
Industrials | | | 10.5% | |
Energy | | | 6.4% | |
Consumer Staples | | | 5.5% | |
Short-Term Investment | | | 2.1% | |
Materials | | | 1.5% | |
Telecommunication Services | | | 1.4% | |
Exchange-Traded Fund | | | 0.4% | |
| | | | |
| | | 100.0% | |
Other Assets & Liabilities, Net | | | (0.0% | ) |
| | | | |
| | | 100.0% | |
| | | | |
| (b) | Short-term investments reflect either the stated coupon rate or the annualized effective yield on the date of purchase for discounted investments. |
| | |
| See Notes to Financial Statements | | See explanation of symbols and terms, if any, on page B-143 |
B-85
PACIFIC SELECT FUND
LARGE-CAP GROWTH PORTFOLIO
Schedule of Investments (Continued)
December 31, 2012
| (c) | Fair Value Measurements |
The following is a summary of the portfolio’s investments as categorized under the three-tier hierarchy of inputs used in valuing the portfolio’s assets and liabilities (See Note 3D in Notes to Financial Statements) as of December 31, 2012:
| | | | | | | | | | | | | | | | | | |
| | | | | Total Value at
December 31, 2012 | | | Level 1
Quoted Price | | | Level 2
Significant
Observable Inputs | | | Level 3
Significant
Unobservable Inputs | |
Assets | | Common Stocks (1) | | | $1,250,717,531 | | | | $1,250,717,531 | | | | $- | | | | $- | |
| | Exchange-Traded Fund | | | 5,736,924 | | | | 5,736,924 | | | | - | | | | - | |
| | Short-Term Investment | | | 26,530,197 | | | | - | | | | 26,530,197 | | | | - | |
| | | | | | | | | | | | | | | | | | |
| | Total | | | $1,282,984,652 | | | | $1,256,454,455 | | | | $26,530,197 | | | | $- | |
| | | | | | | | | | | | | | | | | | |
| | (1) | For equity investments categorized in a single level, refer to the schedule of investments for further industry breakout. |
| | |
| See Notes to Financial Statements | | See explanation of symbols and terms, if any, on page B-143 |
B-86
PACIFIC SELECT FUND
LARGE-CAP VALUE PORTFOLIO
Schedule of Investments
December 31, 2012
| | | | | | | | |
| | | Shares | | |
Value | |
COMMON STOCKS - 98.7% | | | | | | | | |
| | |
Consumer Discretionary - 16.9% | | | | | | | | |
| | |
DISH Network Corp ‘A’ | | | 1,809,009 | | | | $65,847,928 | |
McDonald’s Corp | | | 262,139 | | | | 23,123,281 | |
News Corp ‘A’ | | | 4,034,866 | | | | 103,050,478 | |
SES SA FDR (Luxembourg) | | | 1,078,718 | | | | 31,206,056 | |
Target Corp | | | 531,877 | | | | 31,471,162 | |
The Home Depot Inc | | | 849,443 | | | | 52,538,049 | |
Time Warner Cable Inc | | | 851,398 | | | | 82,747,372 | |
Time Warner Inc | | | 1,855,334 | | | | 88,740,625 | |
| | | | | | | | |
| | | | 478,724,951 | |
| | | | | | | | |
Consumer Staples - 12.5% | | | | | | | | |
| | |
Altria Group Inc | | | 1,019,759 | | | | 32,040,828 | |
Anheuser-Busch InBev NV ADR (Belgium) | | | 584,403 | | | | 51,082,666 | |
CVS Caremark Corp | | | 1,760,833 | | | | 85,136,276 | |
Kimberly-Clark Corp | | | 633,162 | | | | 53,457,868 | |
Lorillard Inc | | | 363,729 | | | | 42,436,262 | |
Philip Morris International Inc | | | 1,093,531 | | | | 91,462,933 | |
| | | | | | | | |
| | | | 355,616,833 | |
| | | | | | | | |
Energy - 11.0% | | | | | | | | |
| | |
Apache Corp | | | 296,634 | | | | 23,285,769 | |
Chevron Corp | | | 764,621 | | | | 82,686,115 | |
Exxon Mobil Corp | | | 823,051 | | | | 71,235,064 | |
Halliburton Co | | | 1,116,700 | | | | 38,738,323 | |
Royal Dutch Shell PLC ‘A’ ADR (United Kingdom) | | | 509,144 | | | | 35,105,479 | |
Suncor Energy Inc (NYSE) (Canada) | | | 839,477 | | | | 27,685,951 | |
Transocean Ltd (Switzerland) | | | 728,411 | | | | 32,523,551 | |
| | | | | | | | |
| | | | 311,260,252 | |
| | | | | | | | |
Financials - 24.3% | | | | | | | | |
| | |
American Express Co | | | 1,011,511 | | | | 58,141,652 | |
Capital One Financial Corp | | | 628,156 | | | | 36,389,077 | |
JPMorgan Chase & Co | | | 2,520,452 | | | | 110,824,274 | |
Loews Corp | | | 916,502 | | | | 37,347,457 | |
Marsh & McLennan Cos Inc | | | 1,482,299 | | | | 51,094,847 | |
MetLife Inc | | | 907,317 | | | | 29,887,022 | |
State Street Corp | | | 1,318,073 | | | | 61,962,612 | |
The Bank of New York Mellon Corp | | | 1,215,014 | | | | 31,225,860 | |
The Progressive Corp | | | 1,235,292 | | | | 26,064,661 | |
The Travelers Cos Inc | | | 761,533 | | | | 54,693,300 | |
U.S. Bancorp | | | 2,755,676 | | | | 88,016,291 | |
Wells Fargo & Co | | | 3,072,223 | | | | 105,008,582 | |
| | | | | | | | |
| | | | 690,655,635 | |
| | | | | | | | |
Health Care - 8.7% | | | | | | | | |
| | |
Johnson & Johnson | | | 694,649 | | | | 48,694,895 | |
Merck & Co Inc | | | 1,510,772 | | | | 61,851,006 | |
Novartis AG ADR (Switzerland) | | | 497,632 | | | | 31,500,105 | |
Pfizer Inc | | | 1,287,811 | | | | 32,298,300 | |
Teva Pharmaceutical Industries Ltd ADR (Israel) | | | 887,347 | | | | 33,133,537 | |
WellPoint Inc | | | 638,798 | | | | 38,915,574 | |
| | | | | | | | |
| | | | 246,393,417 | |
| | | | | | | | |
Industrials - 9.6% | | | | | | | | |
| | |
General Electric Co | | | 2,998,964 | | | | 62,948,254 | |
Honeywell International Inc | | | 1,062,241 | | | | 67,420,436 | |
Illinois Tool Works Inc | | | 911,385 | | | | 55,421,322 | |
Raytheon Co | | | 526,560 | | | | 30,308,794 | |
United Technologies Corp | | | 678,813 | | | | 55,669,454 | |
| | | | | | | | |
| | | | 271,768,260 | |
| | | | | | | | |
Information Technology - 7.6% | | | | | | | | |
| | |
International Business Machines Corp | | | 308,664 | | | | 59,124,589 | |
Microsoft Corp | | | 1,331,964 | | | | 35,603,398 | |
| | | | | | | | |
| | | Shares | | |
Value | |
Motorola Solutions Inc | | | 859,054 | | | | $47,832,127 | |
TE Connectivity Ltd (Switzerland) | | | 1,184,128 | | | | 43,954,831 | |
Xerox Corp | | | 4,292,714 | | | | 29,276,310 | |
| | | | | | | | |
| | | | 215,791,255 | |
| | | | | | | | |
Materials - 2.9% | | | | | | | | |
| | |
Air Products & Chemicals Inc | | | 503,690 | | | | 42,320,034 | |
Crown Holdings Inc * | | | 1,089,337 | | | | 40,098,495 | |
| | | | | | | | |
| | | | 82,418,529 | |
| | | | | | | | |
Telecommunication Services - 3.0% | | | | | | | | |
| | |
AT&T Inc | | | 939,370 | | | | 31,666,163 | |
CenturyLink Inc | | | 668,354 | | | | 26,146,008 | |
Verizon Communications Inc | | | 639,989 | | | | 27,692,324 | |
| | | | | | | | |
| | | | 85,504,495 | |
| | | | | | | | |
Utilities - 2.2% | | | | | | | | |
| | |
Sempra Energy | | | 906,036 | | | | 64,274,194 | |
| | | | | | | | |
| | |
Total Common Stocks
(Cost $2,189,024,102) | | | | | | | 2,802,407,821 | |
| | | | | | | | |
| | |
| | | Principal
Amount | | | | |
SHORT-TERM INVESTMENT - 1.1% | | | | | | | | |
| | |
Repurchase Agreement - 1.1% | | | | | | | | |
| | |
The Royal Bank of Scotland Group PLC 0.170% due 01/02/13
(Dated 12/31/12, repurchase price of $30,656,290; collateralized by U.S.
Treasury Notes: 2.125% due 08/15/21
and value $31,269,112) | | | $30,656,000 | | | | 30,656,000 | |
| | | | | | | | |
| | |
Total Short-Term Investment
(Cost $30,656,000) | | | | | | | 30,656,000 | |
| | | | | | | | |
| | |
TOTAL INVESTMENTS - 99.8%
(Cost $2,219,680,102) | | | | | | | 2,833,063,821 | |
| |
OTHER ASSETS & LIABILITIES, NET - 0.2% | | | | 5,007,548 | |
| | | | | | | | |
| | |
NET ASSETS - 100.0% | | | | | | | $2,838,071,369 | |
| | | | | | | | |
Notes to Schedule of Investments
| (a) | As of December 31, 2012, the portfolio was diversified as a percentage of net assets as follows: |
| | | | |
Financials | | | 24.3% | |
Consumer Discretionary | | | 16.9% | |
Consumer Staples | | | 12.5% | |
Energy | | | 11.0% | |
Industrials | | | 9.6% | |
Health Care | | | 8.7% | |
Information Technology | | | 7.6% | |
Telecommunication Services | | | 3.0% | |
Materials | | | 2.9% | |
Utilities | | | 2.2% | |
Short-Term Investment | | | 1.1% | |
| | | | |
| | | 99.8% | |
Other Assets & Liabilities, Net | | | 0.2% | |
| | | | |
| | | 100.0% | |
| | | | |
| (b) | Short-term investments reflect either the stated coupon rate or the annualized effective yield on the date of purchase for discounted investments. |
| | |
| See Notes to Financial Statements | | See explanation of symbols and terms, if any, on page B-143 |
B-87
PACIFIC SELECT FUND
LARGE-CAP VALUE PORTFOLIO
Schedule of Investments (Continued)
December 31, 2012
| (c) | Fair Value Measurements |
The following is a summary of the portfolio’s investments as categorized under the three-tier hierarchy of inputs used in valuing the portfolio’s assets and liabilities (See Note 3D in Notes to Financial Statements) as of December 31, 2012:
| | | | | | | | | | | | | | | | | | |
| | | | | Total Value at
December 31, 2012 | | | Level 1
Quoted Price | | | Level 2
Significant
Observable Inputs | | | Level 3
Significant
Unobservable Inputs | |
Assets | | Common Stocks | | | | | | | | | | | | | | | | |
| | Consumer Discretionary | | | $478,724,951 | | | | $447,518,895 | | | | $31,206,056 | | | | $- | |
| | Consumer Staples | | | 355,616,833 | | | | 355,616,833 | | | | - | | | | - | |
| | Energy | | | 311,260,252 | | | | 311,260,252 | | | | - | | | | - | |
| | Financials | | | 690,655,635 | | | | 690,655,635 | | | | - | | | | - | |
| | Health Care | | | 246,393,417 | | | | 246,393,417 | | | | - | | | | - | |
| | Industrials | | | 271,768,260 | | | | 271,768,260 | | | | - | | | | - | |
| | Information Technology | | | 215,791,255 | | | | 215,791,255 | | | | - | | | | - | |
| | Materials | | | 82,418,529 | | | | 82,418,529 | | | | - | | | | - | |
| | Telecommunication Services | | | 85,504,495 | | | | 85,504,495 | | | | - | | | | - | |
| | Utilities | | | 64,274,194 | | | | 64,274,194 | | | | - | | | | - | |
| | | | | | | | | | | | | | | | | | |
| | | | | 2,802,407,821 | | | | 2,771,201,765 | | | | 31,206,056 | | | | - | |
| | Short-Term Investment | | | 30,656,000 | | | | - | | | | 30,656,000 | | | | - | |
| | | | | | | | | | | | | | | | | | |
| | Total | | | $2,833,063,821 | | | | $2,771,201,765 | | | | $61,862,056 | | | | $- | |
| | | | | | | | | | | | | | | | | | |
| | |
| See Notes to Financial Statements | | See explanation of symbols and terms, if any, on page B-143 |
B-88
PACIFIC SELECT FUND
LONG/SHORT LARGE-CAP PORTFOLIO
Schedule of Investments
December 31, 2012
| | | | | | | | |
| | | Shares | | |
Value | |
COMMON STOCKS - 126.6% | | | | | | | | |
| | |
Consumer Discretionary - 19.2% | | | | | | | | |
| | |
Amazon.com Inc * † | | | 62,830 | | | | $15,779,126 | |
AutoZone Inc * † | | | 17,980 | | | | 6,372,651 | |
BorgWarner Inc * † | | | 8,830 | | | | 632,405 | |
Carnival Corp (Panama) | | | 70,130 | | | | 2,578,680 | |
CBS Corp ‘B’ | | | 527,650 | | | | 20,077,082 | |
Coach Inc | | | 98,450 | | | | 5,464,960 | |
Comcast Corp ‘A’ † | | | 399,900 | | | | 14,948,262 | |
DIRECTV * | | | 16,320 | | | | 818,611 | |
DISH Network Corp ‘A’ † | | | 120,810 | | | | 4,397,484 | |
Expedia Inc | | | 106,120 | | | | 6,521,074 | |
General Motors Co * † | | | 738,550 | | | | 21,292,396 | |
Johnson Controls Inc | | | 724,866 | | | | 22,253,386 | |
Lear Corp | | | 59,280 | | | | 2,776,675 | |
Lennar Corp ‘A’ | | | 52,480 | | | | 2,029,402 | |
Lowe’s Cos Inc | | | 269,070 | | | | 9,557,366 | |
Lululemon Athletica Inc * | | | 44,540 | | | | 3,395,284 | |
Macy’s Inc | | | 41,400 | | | | 1,615,428 | |
Nike Inc ‘B’ | | | 13,280 | | | | 685,248 | |
NVR Inc * † | | | 5,012 | | | | 4,611,040 | |
PulteGroup Inc * | | | 114,400 | | | | 2,077,504 | |
Ross Stores Inc | | | 116,890 | | | | 6,329,594 | |
Royal Caribbean Cruises Ltd † (Liberia) | | | 143,920 | | | | 4,893,280 | |
Target Corp † | | | 253,250 | | | | 14,984,803 | |
The Home Depot Inc | | | 273,820 | | | | 16,935,767 | |
The Ryland Group Inc | | | 13,830 | | | | 504,795 | |
The TJX Cos Inc | | | 174,380 | | | | 7,402,431 | |
The Walt Disney Co | | | 18,810 | | | | 936,550 | |
Time Warner Cable Inc | | | 104,330 | | | | 10,139,833 | |
Time Warner Inc | | | 959,436 | | | | 45,889,824 | |
TRW Automotive Holdings Corp * † | | | 12,640 | | | | 677,630 | |
VF Corp | | | 63,320 | | | | 9,559,420 | |
Viacom Inc ‘B’ † | | | 12,690 | | | | 669,271 | |
Yum! Brands Inc | | | 65,080 | | | | 4,321,312 | |
| | | | | | | | |
| | | | 271,128,574 | |
| | | | | | | | |
Consumer Staples - 11.1% | | | | | | | | |
| | |
Archer-Daniels-Midland Co | | | 247,770 | | | | 6,786,420 | |
Beam Inc | | | 48,750 | | | | 2,978,138 | |
Campbell Soup Co | | | 136,210 | | | | 4,752,367 | |
Coca-Cola Enterprises Inc † | | | 239,670 | | | | 7,604,729 | |
Colgate-Palmolive Co | | | 39,850 | | | | 4,165,919 | |
ConAgra Foods Inc | | | 211,470 | | | | 6,238,365 | |
Constellation Brands Inc ‘A’ * | | | 46,380 | | | | 1,641,388 | |
Costco Wholesale Corp † | | | 18,460 | | | | 1,823,294 | |
CVS Caremark Corp | | | 40,190 | | | | 1,943,187 | |
Dr Pepper Snapple Group Inc † | | | 38,640 | | | | 1,707,115 | |
Energizer Holdings Inc † | | | 31,250 | | | | 2,499,375 | |
General Mills Inc | | | 250,130 | | | | 10,107,753 | |
Kellogg Co | | | 90,960 | | | | 5,080,116 | |
Kraft Foods Group Inc | | | 199,854 | | | | 9,087,361 | |
Mondelez International Inc ‘A’ | | | 546,067 | | | | 13,908,327 | |
PepsiCo Inc | | | 171,410 | | | | 11,729,586 | |
Philip Morris International Inc | | | 235,710 | | | | 19,714,784 | |
The Clorox Co | | | 9,330 | | | | 683,143 | |
The Coca-Cola Co | | | 576,228 | | | | 20,888,265 | |
The Kroger Co | | | 56,800 | | | | 1,477,936 | |
The Procter & Gamble Co | | | 263,327 | | | | 17,877,270 | |
Tyson Foods Inc ‘A’ | | | 115,160 | | | | 2,234,104 | |
Wal-Mart Stores Inc | | | 8,120 | | | | 554,028 | |
Walgreen Co | | | 30,860 | | | | 1,142,129 | |
| | | | | | | | |
| | | | 156,625,099 | |
| | | | | | | | |
Energy - 12.9% | | | | | | | | |
| | |
Anadarko Petroleum Corp | | | 100,670 | | | | 7,480,788 | |
Apache Corp | | | 10,830 | | | | 850,155 | |
Baker Hughes Inc † | | | 39,740 | | | | 1,622,982 | |
Cameron International Corp * | | | 81,830 | | | | 4,620,122 | |
| | | | | | | | |
| | | Shares | | |
Value | |
Cheniere Energy Inc * † | | | 292,740 | | | | $5,497,657 | |
Chesapeake Energy Corp | | | 16,030 | | | | 266,419 | |
Chevron Corp | | | 187,650 | | | | 20,292,471 | |
ConocoPhillips † | | | 94,250 | | | | 5,465,557 | |
Energen Corp † | | | 31,000 | | | | 1,397,790 | |
Ensco PLC ‘A’ † (United Kingdom) | | | 187,940 | | | | 11,141,083 | |
EOG Resources Inc † | | | 105,762 | | | | 12,774,992 | |
Exxon Mobil Corp † | | | 193,797 | | | | 16,773,130 | |
Halliburton Co | | | 136,870 | | | | 4,748,020 | |
Kinder Morgan Inc † | | | 198,050 | | | | 6,997,106 | |
Marathon Oil Corp | | | 12,310 | | | | 377,425 | |
Marathon Petroleum Corp | | | 92,780 | | | | 5,845,140 | |
National Oilwell Varco Inc | | | 71,990 | | | | 4,920,517 | |
Occidental Petroleum Corp | | | 375,446 | | | | 28,762,918 | |
Peabody Energy Corp | | | 44,860 | | | | 1,193,725 | |
Phillips 66 | | | 59,930 | | | | 3,182,283 | |
Range Resources Corp † | | | 23,162 | | | | 1,455,268 | |
Schlumberger Ltd (Netherlands) | | | 321,060 | | | | 22,246,247 | |
Southwestern Energy Co * | | | 53,770 | | | | 1,796,456 | |
The Williams Cos Inc | | | 245,800 | | | | 8,047,492 | |
Valero Energy Corp † | | | 133,150 | | | | 4,543,078 | |
| | | | | | | | |
| | | | | | | 182,298,821 | |
| | | | | | | | |
Financials - 21.0% | | | | | | | | |
| | |
ACE Ltd † (Switzerland) | | | 355,940 | | | | 28,404,012 | |
Alexandria Real Estate Equities Inc REIT † | | | 45,830 | | | | 3,176,936 | |
American Campus Communities Inc REIT | | | 98,450 | | | | 4,541,498 | |
American Express Co † | | | 167,780 | | | | 9,643,994 | |
Ameriprise Financial Inc ‘A’ † | | | 117,730 | | | | 7,373,430 | |
Apartment Investment &
Management Co ‘A’ REIT † | | | 79,150 | | | | 2,141,799 | |
Assurant Inc | | | 22,530 | | | | 781,791 | |
AvalonBay Communities Inc REIT † | | | 35,630 | | | | 4,831,072 | |
AXIS Capital Holdings Ltd † (Bermuda) | | | 177,300 | | | | 6,141,672 | |
Bank of America Corp | | | 2,149,624 | | | | 24,935,638 | |
Berkshire Hathaway Inc ‘B’ * † | | | 63,500 | | | | 5,695,950 | |
Boston Properties Inc REIT | | | 30,680 | | | | 3,246,251 | |
CIT Group Inc * | | | 44,790 | | | | 1,730,686 | |
Citigroup Inc | | | 407,228 | | | | 16,109,940 | |
CME Group Inc ‘A’ † | | | 303,465 | | | | 15,388,710 | |
Comerica Inc | | | 24,080 | | | | 730,587 | |
Digital Realty Trust Inc REIT | | | 36,310 | | | | 2,465,086 | |
Discover Financial Services | | | 8,140 | | | | 313,797 | |
East West Bancorp Inc † | | | 95,810 | | | | 2,058,957 | |
Equity Residential REIT | | | 17,061 | | | | 966,847 | |
Everest Re Group Ltd † (Bermuda) | | | 36,720 | | | | 4,037,364 | |
Extra Space Storage Inc REIT | | | 30,100 | | | | 1,095,339 | |
HCP Inc REIT | | | 37,100 | | | | 1,676,178 | |
Highwoods Properties Inc REIT | | | 67,640 | | | | 2,262,558 | |
Huntington Bancshares Inc | | | 44,390 | | | | 283,652 | |
IntercontinentalExchange Inc * | | | 28,770 | | | | 3,562,014 | |
Invesco Ltd † (Bermuda) | | | 425,340 | | | | 11,097,121 | |
KeyCorp | | | 119,300 | | | | 1,004,506 | |
Kimco Realty Corp REIT † | | | 30,530 | | | | 589,840 | |
LaSalle Hotel Properties REIT | | | 51,500 | | | | 1,307,585 | |
Liberty Property Trust REIT | | | 118,720 | | | | 4,246,614 | |
MetLife Inc | | | 643,140 | | | | 21,185,032 | |
Morgan Stanley | | | 335,253 | | | | 6,410,037 | |
National Retail Properties Inc REIT | | | 31,580 | | | | 985,296 | |
PartnerRe Ltd † (Bermuda) | | | 9,400 | | | | 756,606 | |
Post Properties Inc REIT | | | 62,110 | | | | 3,102,394 | |
Prudential Financial Inc | | | 83,780 | | | | 4,467,987 | |
Public Storage REIT † | | | 32,780 | | | | 4,751,789 | |
Regions Financial Corp | | | 286,810 | | | | 2,042,087 | |
Simon Property Group Inc REIT | | | 45,580 | | | | 7,205,742 | |
SL Green Realty Corp REIT † | | | 9,518 | | | | 729,555 | |
State Street Corp | | | 125,310 | | | | 5,890,823 | |
SunTrust Banks Inc | | | 69,980 | | | | 1,983,933 | |
SVB Financial Group * † | | | 9,920 | | | | 555,222 | |
TD Ameritrade Holding Corp † | | | 277,079 | | | | 4,657,698 | |
| | |
| See Notes to Financial Statements | | See explanation of symbols and terms, if any, on page B-143 |
B-89
PACIFIC SELECT FUND
LONG/SHORT LARGE-CAP PORTFOLIO
Schedule of Investments (Continued)
December 31, 2012
| | | | | | | | |
| | | Shares | | |
Value | |
The Goldman Sachs Group Inc | | | 116,711 | | | | $14,887,655 | |
The Hartford Financial Services Group Inc | | | 154,800 | | | | 3,473,712 | |
The Macerich Co REIT | | | 9,580 | | | | 558,514 | |
The PNC Financial Services Group Inc | | | 47,250 | | | | 2,755,148 | |
Ventas Inc REIT † | | | 26,620 | | | | 1,722,846 | |
Wells Fargo & Co | | | 1,054,184 | | | | 36,032,009 | |
Zions Bancorp | | | 31,550 | | | | 675,170 | |
| | | | | | | | |
| | | | 296,670,679 | |
| | | | | | | | |
Health Care - 15.5% | | | | | | | | |
| | |
Abbott Laboratories | | | 214,250 | | | | 14,033,375 | |
Alexion Pharmaceuticals Inc * † | | | 4,360 | | | | 409,011 | |
Allergan Inc † | | | 37,240 | | | | 3,416,025 | |
AmerisourceBergen Corp † | | | 7,670 | | | | 331,191 | |
Biogen Idec Inc * | | | 134,509 | | | | 19,728,435 | |
Boston Scientific Corp * | | | 506,040 | | | | 2,899,609 | |
C.R. Bard Inc † | | | 870 | | | | 85,034 | |
Cardinal Health Inc † | | | 145,937 | | | | 6,009,686 | |
CareFusion Corp * | | | 270,590 | | | | 7,733,462 | |
Celgene Corp * | | | 172,933 | | | | 13,613,286 | |
Cerner Corp * | | | 26,480 | | | | 2,055,907 | |
CIGNA Corp | | | 22,400 | | | | 1,197,504 | |
Covidien PLC (Ireland) | | | 273,637 | | | | 15,799,800 | |
DaVita HealthCare Partners Inc * † | | | 107,950 | | | | 11,931,713 | |
Dendreon Corp * † | | | 25,770 | | | | 136,066 | |
Humana Inc | | | 149,290 | | | | 10,245,773 | |
Intuitive Surgical Inc * † | | | 1,370 | | | | 671,807 | |
Johnson & Johnson | | | 234,650 | | | | 16,448,965 | |
Merck & Co Inc | | | 999,369 | | | | 40,914,167 | |
Mettler-Toledo International Inc * | | | 25,209 | | | | 4,872,900 | |
Mylan Inc * | | | 32,570 | | | | 895,023 | |
Onyx Pharmaceuticals Inc * | | | 68,690 | | | | 5,188,156 | |
Pfizer Inc | | | 824,450 | | | | 20,677,206 | |
UnitedHealth Group Inc | | | 289,470 | | | | 15,700,853 | |
Vertex Pharmaceuticals Inc * | | | 102,270 | | | | 4,289,204 | |
| | | | | | | | |
| | | | 219,284,158 | |
| | | | | | | | |
Industrials - 14.2% | | | | | | | | |
| | |
3M Co † | | | 55,540 | | | | 5,156,889 | |
CSX Corp | | | 888,690 | | | | 17,533,854 | |
Eaton Corp PLC † (Ireland) | | | 16,830 | | | | 912,186 | |
Emerson Electric Co | | | 509,579 | | | | 26,987,304 | |
Equifax Inc | | | 6,370 | | | | 344,744 | |
FedEx Corp | | | 7,230 | | | | 663,136 | |
Fluor Corp | | | 307,020 | | | | 18,034,355 | |
Fortune Brands Home & Security Inc * † | | | 39,759 | | | | 1,161,758 | |
General Electric Co | | | 340,710 | | | | 7,151,503 | |
Honeywell International Inc | | | 302,034 | | | | 19,170,098 | |
Jacobs Engineering Group Inc * | | | 3,800 | | | | 161,766 | |
Masco Corp | | | 283,180 | | | | 4,717,779 | |
Norfolk Southern Corp | | | 36,700 | | | | 2,269,528 | |
PACCAR Inc | | | 486,328 | | | | 21,986,889 | |
Pentair Ltd † (Switzerland) | | | 121,177 | | | | 5,955,850 | |
Rockwell Collins Inc | | | 2,020 | | | | 117,503 | |
SPX Corp | | | 98,350 | | | | 6,899,253 | |
Tyco International Ltd (Switzerland) | | | 368,850 | | | | 10,788,862 | |
Union Pacific Corp | | | 58,020 | | | | 7,294,274 | |
United Parcel Service Inc ‘B’ | | | 23,530 | | | | 1,734,867 | |
United Technologies Corp | | | 428,440 | | | | 35,136,364 | |
W.W. Grainger Inc | | | 31,020 | | | | 6,277,517 | |
| | | | | | | | |
| | | | 200,456,279 | |
| | | | | | | | |
Information Technology - 22.7% | | | | | | | | |
| | |
Accenture PLC ‘A’ (Ireland) | | | 11,370 | | | | 756,105 | |
Adobe Systems Inc * † | | | 110,760 | | | | 4,173,437 | |
Altera Corp | | | 237,742 | | | | 8,187,834 | |
Analog Devices Inc † | | | 38,080 | | | | 1,601,645 | |
Apple Inc † | | | 125,037 | | | | 66,648,472 | |
ASML Holding NV ‘NY’ † (Netherlands) | | | 33,425 | | | | 2,152,904 | |
Avago Technologies Ltd (Singapore) | | | 14,380 | | | | 455,271 | |
| | | | | | | | |
| | | Shares | | |
Value | |
Broadcom Corp ‘A’ * | | | 325,790 | | | | $10,819,486 | |
Cisco Systems Inc | | | 1,308,781 | | | | 25,717,547 | |
Citrix Systems Inc * | | | 100,860 | | | | 6,631,545 | |
Cognizant Technology Solutions Corp ‘A’ * | | | 70,390 | | | | 5,212,379 | |
Corning Inc | | | 76,110 | | | | 960,508 | |
eBay Inc * | | | 106,830 | | | | 5,450,466 | |
EMC Corp * | | | 45,080 | | | | 1,140,524 | |
Facebook Inc ‘A’ * † | | | 6,430 | | | | 171,231 | |
Fidelity National Information Services Inc | | | 63,430 | | | | 2,207,998 | |
Freescale Semiconductor Ltd * † (Bermuda) | | | 204,170 | | | | 2,247,912 | |
Genpact Ltd † (Bermuda) | | | 40,830 | | | | 632,865 | |
Google Inc ‘A’ * † | | | 54,353 | | | | 38,556,388 | |
Hewlett-Packard Co | | | 265,040 | | | | 3,776,820 | |
International Business Machines Corp | | | 15,950 | | | | 3,055,222 | |
Jack Henry & Associates Inc | | | 16,630 | | | | 652,894 | |
Juniper Networks Inc * † | | | 122,030 | | | | 2,400,330 | |
KLA-Tencor Corp | | | 121,890 | | | | 5,821,466 | |
Lam Research Corp * | | | 437,221 | | | | 15,796,795 | |
LinkedIn Corp ‘A’ * † | | | 14,490 | | | | 1,663,742 | |
LSI Corp * | | | 422,208 | | | | 2,989,233 | |
Marvell Technology Group Ltd (Bermuda) | | | 59,360 | | | | 430,954 | |
MasterCard Inc ‘A’ † | | | 6,910 | | | | 3,394,745 | |
Maxim Integrated Products Inc † | | | 90,970 | | | | 2,674,518 | |
MICROS Systems Inc * | | | 16,150 | | | | 685,406 | |
Microsoft Corp | | | 1,234,953 | | | | 33,010,294 | |
NetApp Inc * | | | 34,160 | | | | 1,146,068 | |
Oracle Corp | | | 618,380 | | | | 20,604,421 | |
Paychex Inc | | | 45,220 | | | | 1,408,151 | |
QUALCOMM Inc | | | 321,148 | | | | 19,917,599 | |
SanDisk Corp * † | | | 12,900 | | | | 561,924 | |
Splunk Inc * | | | 48,230 | | | | 1,399,635 | |
TE Connectivity Ltd (Switzerland) | | | 22,640 | | | | 840,397 | |
Visa Inc ‘A’ † | | | 70,860 | | | | 10,740,959 | |
Xilinx Inc | | | 71,160 | | | | 2,554,644 | |
Yahoo! Inc * | | | 36,390 | | | | 724,161 | |
Zynga Inc ‘A’ * | | | 495,020 | | | | 1,173,197 | |
| | | | | | | | |
| | | | 321,148,092 | |
| | | | | | | | |
Materials - 4.9% | | | | | | | | |
| | |
Air Products & Chemicals Inc † | | | 304,950 | | | | 25,621,899 | |
Alcoa Inc † | | | 695,570 | | | | 6,037,548 | |
Crown Holdings Inc * | | | 58,580 | | | | 2,156,330 | |
E.I. du Pont de Nemours & Co | | | 184,000 | | | | 8,274,480 | |
Freeport-McMoRan Copper & Gold Inc | | | 233,542 | | | | 7,987,137 | |
Georgia Gulf Corp | | | 147,976 | | | | 6,108,449 | |
Monsanto Co | | | 18,000 | | | | 1,703,700 | |
Newmont Mining Corp | | | 7,760 | | | | 360,374 | |
Rock-Tenn Co ‘A’ | | | 15,540 | | | | 1,086,401 | |
The Dow Chemical Co | | | 92,275 | | | | 2,982,328 | |
United States Steel Corp | | | 49,090 | | | | 1,171,778 | |
Walter Energy Inc † | | | 186,670 | | | | 6,697,720 | |
| | | | | | | | |
| | | | | | | 70,188,144 | |
| | | | | | | | |
Telecommunication Services - 1.5% | | | | | | | | |
| | |
AT&T Inc † | | | 190,854 | | | | 6,433,688 | |
Sprint Nextel Corp * | | | 395,500 | | | | 2,242,485 | |
Verizon Communications Inc † | | | 308,634 | | | | 13,354,593 | |
| | | | | | | | |
| | | | | | | 22,030,766 | |
| | | | | | | | |
Utilities - 3.6% | | | | | | | | |
| | |
AGL Resources Inc † | | | 14,110 | | | | 563,977 | |
American Electric Power Co Inc | | | 157,240 | | | | 6,711,003 | |
Edison International | | | 40,900 | | | | 1,848,271 | |
Exelon Corp † | | | 224,429 | | | | 6,674,518 | |
NextEra Energy Inc † | | | 127,298 | | | | 8,807,749 | |
NiSource Inc | | | 257,830 | | | | 6,417,389 | |
NRG Energy Inc | | | 8,830 | | | | 203,002 | |
NV Energy Inc † | | | 334,780 | | | | 6,072,909 | |
| | |
| See Notes to Financial Statements | | See explanation of symbols and terms, if any, on page B-143 |
B-90
PACIFIC SELECT FUND
LONG/SHORT LARGE-CAP PORTFOLIO
Schedule of Investments (Continued)
December 31, 2012
| | | | | | | | |
| | | Shares | | |
Value | |
PG&E Corp † | | | 101,820 | | | | $4,091,128 | |
Sempra Energy | | | 135,490 | | | | 9,611,660 | |
| | | | | | | | |
| | | | | | | 51,001,606 | |
| | | | | | | | |
Total Common Stocks
(Cost $1,652,164,520) | | | | | | | 1,790,832,218 | |
| | | | | | | | |
| | |
EXCHANGE-TRADED FUND - 0.1% | | | | | | | | |
| | |
iShares Dow Jones U.S. Real Estate
Index Fund | | | 11,600 | | | | 750,752 | |
| | | | | | | | |
| | |
Total Exchange-Traded Fund
(Cost $734,530) | | | | | | | 750,752 | |
| | | | | | | | |
| | |
| | | Principal
Amount | | | | |
| | |
SHORT-TERM INVESTMENTS - 2.1% | | | | | | | | |
| | |
U.S. Treasury Bills - 0.1% | | | | | | | | |
| | |
0.114% due 05/30/13 ‡ | | | $90,000 | | | | 89,961 | |
0.176% due 05/30/13 ‡ | | | 435,000 | | | | 434,813 | |
0.181% due 05/30/13 ‡ | | | 25,000 | | | | 24,989 | |
0.186% due 05/30/13 | | | 20,000 | | | | 19,991 | |
0.188% due 05/30/13 | | | 200,000 | | | | 199,914 | |
0.191% due 05/30/13 | | | 10,000 | | | | 9,996 | |
| | | | | | | | |
| | | | | | | 779,664 | |
| | | | | | | | |
Repurchase Agreement - 2.0% | | | | | | | | |
| | |
Fixed Income Clearing Corp
0.010% due 01/02/13
(Dated 12/31/12, repurchase price of $28,932,456; collateralized by U.S. Treasury Notes: 0.250% due 07/15/15 and value $29,515,000) | | | 28,932,440 | | | | 28,932,440 | |
| | | | | | | | |
| | |
Total Short-Term Investments
(Cost $29,711,891) | | | | | | | 29,712,104 | |
| | | | | | | | |
| | |
TOTAL INVESTMENTS - 128.8%
(Cost $1,682,610,941) | | | | | | | 1,821,295,074 | |
| |
TOTAL SECURITIES SOLD SHORT - (29.2%) | | | | | |
(See Securities Sold Short)
| | | | | | | | |
(Proceeds $389,662,981) | | | | | | | (412,238,192 | ) |
| |
OTHER ASSETS & LIABILITIES, NET - 0.4% | | | | 4,721,631 | |
| | | | | | | | |
| | |
NET ASSETS - 100.0% | | | | | | | $1,413,778,513 | |
| | | | | | | | |
| | |
SECURITIES SOLD SHORT | | | | | | | | |
| | |
| | | Shares | | | Value | |
COMMON STOCKS - (29.2%) | | | | | | | | |
| | |
Consumer Discretionary - (3.7%) | | | | | | | | |
| | |
Autoliv Inc | | | 14,890 | | | | ($1,003,437 | ) |
Bed Bath & Beyond Inc | | | 4,470 | | | | (249,918 | ) |
CarMax Inc | | | 52,750 | | | | (1,980,235 | ) |
Choice Hotels International Inc | | | 67,120 | | | | (2,256,574 | ) |
Discovery Communications Inc ‘A’ | | | 16,320 | | | | (1,035,994 | ) |
Ford Motor Co | | | 198,570 | | | | (2,571,481 | ) |
Gannett Co Inc | | | 232,210 | | | | (4,182,102 | ) |
Gentex Corp | | | 130,010 | | | | (2,446,788 | ) |
Harman International Industries Inc | | | 18,460 | | | | (824,054 | ) |
Hasbro Inc | | | 92,740 | | | | (3,329,366 | ) |
Mattel Inc | | | 22,430 | | | | (821,387 | ) |
Netflix Inc | | | 50,480 | | | | (4,683,534 | ) |
| | | | | | | | |
| | | Shares | | |
Value | |
News Corp ‘B’ | | | 235,590 | | | | ($6,181,882) | |
O’Reilly Automotive Inc | | | 3,180 | | | | (284,356) | |
Omnicom Group Inc | | | 172,250 | | | | (8,605,610) | |
priceline.com Inc | | | 1,130 | | | | (701,956) | |
Ralph Lauren Corp | | | 3,285 | | | | (492,487) | |
Scripps Networks Interactive Inc ‘A’ | | | 42,300 | | | | (2,450,016) | |
The Interpublic Group of Cos Inc | | | 126,430 | | | | (1,393,259) | |
The Washington Post Co ‘B’ | | | 11,850 | | | | (4,327,738) | |
Toll Brothers Inc | | | 94,790 | | | | (3,064,561) | |
| | | | | | | | |
| | | | | | | (52,886,735) | |
| | | | | | | | |
Consumer Staples - (3.4%) | | | | | | | | |
| | |
Altria Group Inc | | | 174,770 | | | | (5,491,273) | |
Brown-Forman Corp ‘B’ | | | 50,050 | | | | (3,165,663) | |
Church & Dwight Co Inc | | | 118,460 | | | | (6,345,902) | |
HJ Heinz Co | | | 86,930 | | | | (5,014,122) | |
Mead Johnson Nutrition Co | | | 20,857 | | | | (1,374,268) | |
Safeway Inc | | | 129,000 | | | | (2,333,610) | |
The Clorox Co | | | 12,840 | | | | (940,145) | |
The Estee Lauder Cos Inc ‘A’ | | | 33,200 | | | | (1,987,352) | |
The Hershey Co | | | 207,840 | | | | (15,010,205) | |
Wal-Mart Stores Inc | | | 72,020 | | | | (4,913,925) | |
Whole Foods Market Inc | | | 7,640 | | | | (697,761) | |
| | | | | | | | |
| | | | | | | (47,274,226) | |
| | | | | | | | |
Energy - (1.7%) | | | | | | | | |
| | |
Chesapeake Energy Corp | | | 83,600 | | | | (1,389,432) | |
CONSOL Energy Inc | | | 176,620 | | | | (5,669,502) | |
Diamond Offshore Drilling Inc | | | 48,570 | | | | (3,300,817) | |
Encana Corp (NYSE) (Canada) | | | 94,680 | | | | (1,870,877) | |
Noble Energy Inc | | | 7,050 | | | | (717,267) | |
Spectra Energy Corp | | | 21,460 | | | | (587,575) | |
Tenaris SA ADR (Luxembourg) | | | 28,100 | | | | (1,177,952) | |
Tesoro Corp | | | 25,480 | | | | (1,122,394) | |
TransCanada Corp (NYSE) (Canada) | | | 83,580 | | | | (3,955,005) | |
Ultra Petroleum Corp (Canada) | | | 52,410 | | | | (950,193) | |
WPX Energy Inc | | | 190,502 | | | | (2,834,670) | |
| | | | | | | | |
| | | | (23,575,684) | |
| | | | | | | | |
Financials - (5.8%) | | | | | | | | |
| | |
Aflac Inc | | | 48,680 | | | | (2,585,882) | |
American International Group Inc | | | 19,800 | | | | (698,940) | |
Aon PLC (United Kingdom) | | | 91,000 | | | | (5,059,600) | |
Arch Capital Group Ltd (Bermuda) | | | 23,220 | | | | (1,022,144) | |
Bank of Hawaii Corp | | | 23,500 | | | | (1,035,175) | |
BB&T Corp | | | 87,200 | | | | (2,538,392) | |
BlackRock Inc | | | 14,460 | | | | (2,989,027) | |
Brookfield Office Properties Inc (Canada) | | | 136,280 | | | | (2,318,123) | |
Corporate Office Properties Trust REIT | | | 63,610 | | | | (1,588,978) | |
Cullen/Frost Bankers Inc | | | 20,040 | | | | (1,087,571) | |
DCT Industrial Trust Inc REIT | | | 281,200 | | | | (1,824,988) | |
Douglas Emmett Inc REIT | | | 53,490 | | | | (1,246,317) | |
EastGroup Properties Inc REIT | | | 25,950 | | | | (1,396,369) | |
Federal Realty Investment Trust REIT | | | 15,970 | | | | (1,661,199) | |
Federated Investors Inc ‘B’ | | | 9,970 | | | | (201,693) | |
Franklin Resources Inc | | | 13,040 | | | | (1,639,128) | |
General Growth Properties Inc REIT | | | 61,750 | | | | (1,225,737) | |
Health Care REIT Inc | | | 58,200 | | | | (3,567,078) | |
Lincoln National Corp | | | 51,300 | | | | (1,328,670) | |
Mack-Cali Realty Corp REIT | | | 62,640 | | | | (1,635,530) | |
Mid-America Apartment Communities Inc REIT | | | 47,590 | | | | (3,081,453) | |
Northern Trust Corp | | | 11,620 | | | | (582,859) | |
Realty Income Corp REIT | | | 32,130 | | | | (1,291,947) | |
RenaissanceRe Holdings Ltd (Bermuda) | | | 9,910 | | | | (805,287) | |
Senior Housing Properties Trust REIT | | | 121,210 | | | | (2,865,404) | |
T. Rowe Price Group Inc | | | 10,440 | | | | (679,957) | |
Tanger Factory Outlet Centers Inc REIT | | | 67,880 | | | | (2,321,496) | |
The Allstate Corp | | | 121,550 | | | | (4,882,664) | |
The Bank of New York Mellon Corp | | | 85,470 | | | | (2,196,579) | |
| | |
| See Notes to Financial Statements | | See explanation of symbols and terms, if any, on page B-143 |
B-91
PACIFIC SELECT FUND
LONG/SHORT LARGE-CAP PORTFOLIO
Schedule of Investments (Continued)
December 31, 2012
| | | | | | | | |
| | | Shares | | |
Value | |
The Chubb Corp | | | 47,620 | | | | ($3,586,738) | |
The Progressive Corp | | | 113,370 | | | | (2,392,107) | |
The Travelers Cos Inc | | | 11,080 | | | | (795,766) | |
Torchmark Corp | | | 66,370 | | | | (3,429,338) | |
U.S. Bancorp | | | 33,440 | | | | (1,068,074) | |
UMB Financial Corp | | | 37,100 | | | | (1,626,464) | |
Valley National Bancorp | | | 292,013 | | | | (2,715,721) | |
Vornado Realty Trust REIT | | | 25,450 | | | | (2,038,036) | |
Weingarten Realty Investors REIT | | | 205,250 | | | | (5,494,543) | |
WR Berkley Corp | | | 102,300 | | | | (3,860,802) | |
| | | | | | | | |
| | | | (82,365,776) | |
| | | | | | | | |
Health Care - (2.7%) | | | | | | | | |
| | |
Agilent Technologies Inc | | | 6,510 | | | | (266,520) | |
Alexion Pharmaceuticals Inc | | | 3,300 | | | | (309,573) | |
Amgen Inc | | | 13,050 | | | | (1,126,476) | |
Becton Dickinson & Co | | | 8,340 | | | | (652,105) | |
Bristol-Myers Squibb Co | | | 110,112 | | | | (3,588,550) | |
Edwards Lifesciences Corp | | | 14,060 | | | | (1,267,790) | |
Eli Lilly & Co | | | 173,210 | | | | (8,542,717) | |
Forest Laboratories Inc | | | 36,390 | | | | (1,285,295) | |
Hospira Inc | | | 46,950 | | | | (1,466,718) | |
Life Technologies Corp | | | 15,830 | | | | (776,936) | |
Medivation Inc | | | 33,080 | | | | (1,692,373) | |
Medtronic Inc | | | 22,470 | | | | (921,719) | |
Quality Systems Inc | | | 3,200 | | | | (55,552) | |
St. Jude Medical Inc | | | 12,850 | | | | (464,399) | |
Tenet Healthcare Corp | | | 44,072 | | | | (1,431,018) | |
United Therapeutics Corp | | | 29,290 | | | | (1,564,672) | |
Varian Medical Systems Inc | | | 52,110 | | | | (3,660,206) | |
Zimmer Holdings Inc | | | 128,260 | | | | (8,549,812) | |
| | | | | | | | |
| | | | (37,622,431) | |
| | | | | | | | |
Industrials - (4.8%) | | | | | | | | |
| | |
Caterpillar Inc | | | 8,380 | | | | (750,680) | |
Cummins Inc | | | 22,960 | | | | (2,487,716) | |
Danaher Corp | | | 123,160 | | | | (6,884,644) | |
Dover Corp | | | 72,260 | | | | (4,748,205) | |
Fastenal Co | | | 108,380 | | | | (5,060,262) | |
General Electric Co | | | 351,110 | | | | (7,369,799) | |
Heartland Express Inc | | | 227,462 | | | | (2,972,928) | |
Illinois Tool Works Inc | | | 75,930 | | | | (4,617,303) | |
Knight Transportation Inc | | | 118,837 | | | | (1,738,585) | |
Lockheed Martin Corp | | | 110,128 | | | | (10,163,713) | |
Raytheon Co | | | 97,629 | | | | (5,619,525) | |
Rockwell Automation Inc | | | 59,380 | | | | (4,987,326) | |
Textron Inc | | | 181,650 | | | | (4,503,104) | |
The ADT Corp | | | 19,100 | | | | (887,959) | |
The Boeing Co | | | 35,410 | | | | (2,668,498) | |
United Parcel Service Inc ‘B’ | | | 6,720 | | | | (495,466) | |
Werner Enterprises Inc | | | 115,880 | | | | (2,511,120) | |
| | | | | | | | |
| | | | (68,466,833) | |
| | | | | | | | |
Information Technology - (3.2%) | | | | | | | | |
| | |
AOL Inc | | | 118,300 | | | | (3,502,863) | |
Automatic Data Processing Inc | | | 43,540 | | | | (2,482,215) | |
Cypress Semiconductor Corp | | | 73,220 | | | | (793,705) | |
Electronic Arts Inc | | | 265,520 | | | | (3,858,006) | |
Fiserv Inc | | | 14,720 | | | | (1,163,321) | |
Intel Corp | | | 234,770 | | | | (4,843,305) | |
International Business Machines Corp | | | 16,210 | | | | (3,105,025) | |
Intuit Inc | | | 31,480 | | | | (1,873,060) | |
JDS Uniphase Corp | | | 4,070 | | | | (55,108) | |
Microchip Technology Inc | | | 244,520 | | | | (7,968,907) | |
NVIDIA Corp | | | 101,230 | | | | (1,244,117) | |
Paychex Inc | | | 19,370 | | | | (603,182) | |
SAIC Inc | | | 46,680 | | | | (528,417) | |
Seagate Technology PLC (Ireland) | | | 48,060 | | | | (1,464,869) | |
Taiwan Semiconductor Manufacturing Co Ltd ADR (Taiwan) | | | 480,950 | | | | (8,253,102) | |
| | | | | | | | |
| | | Shares | | |
Value | |
Texas Instruments Inc | | | 66,330 | | | | ($2,052,250) | |
Western Digital Corp | | | 37,520 | | | | (1,594,225) | |
| | | | | | | | |
| | | | (45,385,677) | |
| | | | | | | | |
Materials - (2.3%) | | | | | | | | |
| | |
Cabot Corp | | | 30,820 | | | | (1,226,328) | |
Celanese Corp ‘A’ | | | 13,720 | | | | (610,951) | |
Cliffs Natural Resources Inc | | | 300,038 | | | | (11,569,465) | |
Nucor Corp | | | 96,720 | | | | (4,176,370) | |
OM Group Inc | | | 16,830 | | | | (373,626) | |
Praxair Inc | | | 86,470 | | | | (9,464,141) | |
Sigma-Aldrich Corp | | | 22,020 | | | | (1,620,232) | |
The Sherwin-Williams Co | | | 4,700 | | | | (722,954) | |
Vale SA ADR (Brazil) | | | 7,280 | | | | (152,589) | |
Valspar Corp | | | 28,290 | | | | (1,765,296) | |
Vulcan Materials Co | | | 13,985 | | | | (727,919) | |
| | | | | | | | |
| | | | (32,409,871) | |
| | | | | | | | |
Telecommunication Services - (0.1%) | | | | | | | | |
| | |
Crown Castle International Corp | | | 14,560 | | | | (1,050,650) | |
| | | | | | | | |
| | |
Utilities - (1.5%) | | | | | | | | |
| | |
Consolidated Edison Inc | | | 92,756 | | | | (5,151,668) | |
Dominion Resources Inc | | | 12,740 | | | | (659,932) | |
Duke Energy Corp | | | 75,050 | | | | (4,788,190) | |
Entergy Corp | | | 11,400 | | | | (726,750) | |
National Fuel Gas Co | | | 47,990 | | | | (2,432,613) | |
Public Service Enterprise Group Inc | | | 19,670 | | | | (601,902) | |
Southern Co | | | 140,210 | | | | (6,002,390) | |
Wisconsin Energy Corp | | | 22,710 | | | | (836,864) | |
| | | | | | | | |
| | | | (21,200,309) | |
| | | | | | | | |
| | |
Total Common Stocks
(Proceeds $389,662,981) | | | | | | | (412,238,192) | |
| | | | | | | | |
| |
TOTAL SECURITIES SOLD SHORT - (29.2%) | | | | | |
(Proceeds $389,662,981) | | | | | | | ($412,238,192) | |
| | | | | | | | |
Notes to Schedule of Investments
| (a) | As of December 31, 2012, the portfolio was diversified as a percentage of net assets as follows: |
| | | | | | | | | | | | |
| | | Long | | | Short | | | Net
Exposure | |
Information Technology | | | 22.7% | | | | (3.2% | ) | | | 19.5% | |
Consumer Discretionary | | | 19.2% | | | | (3.7% | ) | | | 15.5% | |
Financials | | | 21.0% | | | | (5.8% | ) | | | 15.2% | |
Health Care | | | 15.5% | | | | (2.7% | ) | | | 12.8% | |
Energy | | | 12.9% | | | | (1.7% | ) | | | 11.2% | |
Industrials | | | 14.2% | | | | (4.8% | ) | | | 9.4% | |
Consumer Staples | | | 11.1% | | | | (3.4% | ) | | | 7.7% | |
Materials | | | 4.9% | | | | (2.3% | ) | | | 2.6% | |
Utilities | | | 3.6% | | | | (1.5% | ) | | | 2.1% | |
Short-Term Investments | | | 2.1% | | | | - | | | | 2.1% | |
Telecommunication Services | | | 1.5% | | | | (0.1% | ) | | | 1.4% | |
Exchange-Traded Fund | | | 0.1% | | | | - | | | | 0.1% | |
| | | | | | | | | | | | |
| | | 128.8% | | | | (29.2% | ) | | | 99.6% | |
| | | | | | | | | | | | |
Securities Sold Short | | | (29.2% | ) | | | | | | | | |
Other Assets & Liabilities, Net | | | 0.4% | | | | | | | | | |
| | | | | | | | | | | | |
| | | 100.0% | | | | | | | | | |
| | | | | | | | | | | | |
| (b) | Short-term investments reflect either the stated coupon rate or the annualized effective yield on the date of purchase for discounted investments. |
| | |
| See Notes to Financial Statements | | See explanation of symbols and terms, if any, on page B-143 |
B-92
PACIFIC SELECT FUND
LONG/SHORT LARGE-CAP PORTFOLIO
Schedule of Investments (Continued)
December 31, 2012
| (c) | The portfolio engages in securities lending to help achieve its stated investment objective. The Fund, on behalf of the portfolio, entered into an agreement with State Street Bank & Trust Co to provide securities lending services to the portfolio, the proceeds of which are used to finance the costs of (i) purchasing long positions in excess of the value of the portfolio’s assets and (ii) borrowing securities sold short. As of December 31, 2012, the total value of securities out on loan was $412,020,312, and the cash collateral was $414,470,167 (See Note 8 in Notes to Financial Statements). |
| (d) | As of December 31, 2012, investments with total aggregate values of $549,763 were fully or partially segregated with broker(s)/custodian as collateral for open futures contracts. In addition, $1,045,000 in cash was segregated as collateral for open futures contracts. |
| (e) | Open futures contracts outstanding as of December 31, 2012 were as follows: |
| | | | | | | | | | | | |
| Long Futures Outstanding | | Number of
Contracts | | | Notional
Amount | | | Unrealized
Depreciation | |
S&P 500 E-Mini (03/13) | | | 441 | | | | $31,360,910 | | | | ($47,705 | ) |
| | | | | | | | | | | | |
| (f) | Fair Value Measurements |
The following is a summary of the portfolio’s investments as categorized under the three-tier hierarchy of inputs used in valuing the portfolio’s assets and liabilities (See Note 3D in Notes to Financial Statements) as of December 31, 2012:
| | | | | | | | | | | | | | | | | | |
| | | | | Total Value at
December 31, 2012 | | | Level 1
Quoted Price | | | Level 2
Significant
Observable Inputs | | | Level 3
Significant
Unobservable Inputs | |
Assets | | Common Stocks - Long (1) | | | $1,790,832,218 | | | | $1,790,832,218 | | | | $- | | | | $- | |
| | Exchange-Traded Fund | | | 750,752 | | | | 750,752 | | | | - | | | | - | |
| | Short-Term Investments | | | 29,712,104 | | | | - | | | | 29,712,104 | | | | - | |
| | | | | | | | | | | | | | | | | | |
| | Total Assets | | | 1,821,295,074 | | | | 1,791,582,970 | | | | 29,712,104 | | | | - | |
| | | | | | | | | | | | | | | | | | |
Liabilities | | Common Stocks - Short (1) | | | (412,238,192 | ) | | | (412,238,192 | ) | | | - | | | | - | |
| | Derivatives: | | | | | | | | | | | | | | | | |
| | Equity Contracts | | | | | | | | | | | | | | | | |
| | Futures | | | (47,705 | ) | | | (47,705 | ) | | | - | | | | - | |
| | | | | | | | | | | | | | | | | | |
| | Total Liabilities | | | (412,285,897 | ) | | | (412,285,897 | ) | | | - | | | | - | |
| | | | | | | | | | | | | | | | | | |
| | Total | | | $1,409,009,177 | | | | $1,379,297,073 | | | | $29,712,104 | | | | $- | |
| | | | | | | | | | | | | | | | | | |
(1) For equity investments categorized in a single level, refer to the schedule of investments for further industry breakout.
| | |
| See Notes to Financial Statements | | See explanation of symbols and terms, if any, on page B-143 |
B-93
PACIFIC SELECT FUND
MAIN STREET® CORE PORTFOLIO
Schedule of Investments
December 31, 2012
| | | | | | | | |
| | | Shares | | | Value | |
PREFERRED STOCKS - 0.4% | | | | | | | | |
| | |
Consumer Staples - 0.4% | | | | | | | | |
| | |
Henkel AG & Co KGaA (Germany) | | | 70,938 | | | | $5,825,655 | |
| | | | | | | | |
| | |
Total Preferred Stocks
(Cost $5,407,982) | | | | | | | 5,825,655 | |
| | | | | | | | |
| | |
COMMON STOCKS - 97.6% | | | | | | | | |
| | |
Consumer Discretionary - 9.1% | | | | | | | | |
| | |
AutoZone Inc * | | | 70,716 | | | | 25,063,872 | |
CarMax Inc * | | | 186,521 | | | | 7,001,998 | |
Ford Motor Co | | | 3,162,860 | | | | 40,959,037 | |
The McGraw-Hill Cos Inc | | | 638,614 | | | | 34,913,028 | |
The TJX Cos Inc | | | 370,325 | | | | 15,720,296 | |
Yum! Brands Inc | | | 115,180 | | | | 7,647,952 | |
| | | | | | | | |
| | | | | | | 131,306,183 | |
| | | | | | | | |
Consumer Staples - 11.2% | | | | | | | | |
| | |
Dr Pepper Snapple Group Inc | | | 749,690 | | | | 33,121,304 | |
Kraft Foods Group Inc | | | 435,406 | | | | 19,797,911 | |
Mondelez International Inc ‘A’ | | | 498,200 | | | | 12,689,154 | |
Philip Morris International Inc | | | 787,138 | | | | 65,836,222 | |
The J.M. Smucker Co | | | 354,365 | | | | 30,560,438 | |
| | | | | | | | |
| | | | | | | 162,005,029 | |
| | | | | | | | |
Energy - 8.3% | | | | | | | | |
| | |
Chevron Corp | | | 454,172 | | | | 49,114,160 | |
National Oilwell Varco Inc | | | 652,382 | | | | 44,590,310 | |
Noble Energy Inc | | | 249,250 | | | | 25,358,695 | |
| | | | | | | | |
| | | | | | | 119,063,165 | |
| | | | | | | | |
Financials - 18.9% | | | | | | | | |
| | |
CIT Group Inc * | | | 1,309,854 | | | | 50,612,759 | |
Citigroup Inc | | | 1,831,919 | | | | 72,470,716 | |
CME Group Inc ‘A’ | | | 424,600 | | | | 21,531,466 | |
Discover Financial Services | | | 532,085 | | | | 20,511,877 | |
JPMorgan Chase & Co | | | 1,448,329 | | | | 63,683,026 | |
Lincoln National Corp | | | 283,210 | | | | 7,335,139 | |
M&T Bank Corp | | | 43,765 | | | | 4,309,539 | |
Marsh & McLennan Cos Inc | | | 685,635 | | | | 23,633,838 | |
MSCI Inc * | | | 296,924 | | | | 9,201,675 | |
| | | | | | | | |
| | | | | | | 273,290,035 | |
| | | | | | | | |
Health Care - 13.2% | | | | | | | | |
| | |
Abbott Laboratories | | | 498,323 | | | | 32,640,156 | |
Bristol-Myers Squibb Co | | | 627,069 | | | | 20,436,179 | |
Covidien PLC (Ireland) | | | 736,156 | | | | 42,505,647 | |
Express Scripts Holding Co * | | | 467,226 | | | | 25,230,204 | |
Pfizer Inc | | | 951,370 | | | | 23,860,360 | |
Sanofi (France) | | | 164,800 | | | | 15,628,843 | |
UnitedHealth Group Inc | | | 119,270 | | | | 6,469,205 | |
Watson Pharmaceuticals Inc * | | | 270,920 | | | | 23,299,120 | |
| | | | | | | | |
| | | | | | | 190,069,714 | |
| | | | | | | | |
Industrials - 11.2% | | | | | | | | |
| | |
CSX Corp | | | 1,474,338 | | | | 29,088,689 | |
L-3 Communications Holdings Inc | | | 146,380 | | | | 11,215,636 | |
The ADT Corp | | | 399,553 | | | | 18,575,219 | |
The Boeing Co | | | 398,068 | | | | 29,998,404 | |
Towers Watson & Co ‘A’ | | | 289,803 | | | | 16,289,827 | |
Tyco International Ltd (Switzerland) | | | 799,106 | | | | 23,373,850 | |
United Parcel Service Inc ‘B’ | | | 447,558 | | | | 32,998,451 | |
| | | | | | | | |
| | | | | | | 161,540,076 | |
| | | | | | | | |
| | | | | | | | |
| | | Shares | | | Value | |
Information Technology - 20.4% | | | | | | | | |
| | |
Amdocs Ltd (United Kingdom) | | | 114,600 | | | | $3,895,254 | |
Apple Inc | | | 175,182 | | | | 93,377,261 | |
Corning Inc | | | 1,102,030 | | | | 13,907,618 | |
eBay Inc * | | | 1,031,335 | | | | 52,618,712 | |
Facebook Inc ‘A’ * | | | 185,017 | | | | 4,927,003 | |
Google Inc ‘A’ * | | | 31,406 | | | | 22,278,474 | |
International Business Machines Corp | | | 342,038 | | | | 65,517,379 | |
QUALCOMM Inc | | | 322,297 | | | | 19,988,860 | |
Western Digital Corp | | | 434,785 | | | | 18,474,015 | |
| | | | | | | | |
| | | | | | | 294,984,576 | |
| | | | | | | | |
Materials - 2.4% | | | | | | | | |
| | |
PPG Industries Inc | | | 37,980 | | | | 5,140,593 | |
Vulcan Materials Co | | | 563,670 | | | | 29,339,024 | |
| | | | | | | | |
| | | | | | | 34,479,617 | |
| | | | | | | | |
Telecommunication Services - 2.1% | | | | | | | | |
| | |
America Movil SAB de CV ‘L’ ADR (Mexico) | | | 1,284,160 | | | | 29,715,462 | |
| | | | | | | | |
| | |
Utilities - 0.8% | | | | | | | | |
| | |
The AES Corp | | | 1,072,952 | | | | 11,480,586 | |
| | | | | | | | |
| | |
Total Common Stocks
(Cost $1,190,590,849) | | | | | | | 1,407,934,443 | |
| | | | | | | | |
| | |
| | | Principal
Amount | | | | |
SHORT-TERM INVESTMENT - 2.4% | | | | | | | | |
| | |
Repurchase Agreement - 2.4% | | | | | | | | |
| | |
Fixed Income Clearing Corp
0.010% due 01/02/13
(Dated 12/31/12, repurchase price of $35,324,651; collateralized by U.S. Treasury Notes: 0.250% due 07/15/15 and value $36,035,000) | | | $35,324,631 | | | | 35,324,631 | |
| | | | | | | | |
| | |
Total Short-Term Investment
(Cost $35,324,631) | | | | | | | 35,324,631 | |
| | | | | | | | |
| | |
TOTAL INVESTMENTS - 100.4%
(Cost $1,231,323,462) | | | | | | | 1,449,084,729 | |
| |
OTHER ASSETS & LIABILITIES, NET - (0.4%) | | | | (6,158,667 | ) |
| | | | | | | | |
| | |
NET ASSETS - 100.0% | | | | | | | $1,442,926,062 | |
| | | | | | | | |
Notes to Schedule of Investments
| (a) | As of December 31, 2012, the portfolio was diversified as a percentage of net assets as follows: |
| | | | |
Information Technology | | | 20.4% | |
Financials | | | 18.9% | |
Health Care | | | 13.2% | |
Consumer Staples | | | 11.6% | |
Industrials | | | 11.2% | |
Consumer Discretionary | | | 9.1% | |
Energy | | | 8.3% | |
Short-Term Investment | | | 2.4% | |
Materials | | | 2.4% | |
Telecommunication Services | | | 2.1% | |
Utilities | | | 0.8% | |
| | | | |
| | | 100.4% | |
Other Assets & Liabilities, Net | | | (0.4% | ) |
| | | | |
| | | 100.0% | |
| | | | |
| | |
| See Notes to Financial Statements | | See explanation of symbols and terms, if any, on page B-143 |
B-94
PACIFIC SELECT FUND
MAIN STREET CORE PORTFOLIO
Schedule of Investments (Continued)
December 31, 2012
| (b) | Short-term investments reflect either the stated coupon rate or the annualized effective yield on the date of purchase for discounted investments. |
| (c) | Fair Value Measurements |
The following is a summary of the portfolio’s investments as categorized under the three-tier hierarchy of inputs used in valuing the portfolio’s assets and liabilities (See Note 3D in Notes to Financial Statements) as of December 31, 2012:
| | | | | | | | | | | | | | | | | | |
| | | | | Total Value at
December 31, 2012 | | | Level 1
Quoted Price | | | Level 2
Significant
Observable Inputs | | | Level 3
Significant
Unobservable Inputs | |
Assets | | Preferred Stocks (1) | | | $5,825,655 | | | | $- | | | | $5,825,655 | | | | $- | |
| | Common Stocks | | | | | | | | | | | | | | | | |
| | Consumer Discretionary | | | 131,306,183 | | | | 131,306,183 | | | | - | | | | - | |
| | Consumer Staples | | | 162,005,029 | | | | 162,005,029 | | | | - | | | | - | |
| | Energy | | | 119,063,165 | | | | 119,063,165 | | | | - | | | | - | |
| | Financials | | | 273,290,035 | | | | 273,290,035 | | | | - | | | | - | |
| | Health Care | | | 190,069,714 | | | | 174,440,871 | | | | 15,628,843 | | | | - | |
| | Industrials | | | 161,540,076 | | | | 161,540,076 | | | | - | | | | - | |
| | Information Technology | | | 294,984,576 | | | | 294,984,576 | | | | - | | | | - | |
| | Materials | | | 34,479,617 | | | | 34,479,617 | | | | - | | | | - | |
| | Telecommunication Services | | | 29,715,462 | | | | 29,715,462 | | | | - | | | | - | |
| | Utilities | | | 11,480,586 | | | | 11,480,586 | | | | - | | | | - | |
| | | | | | | | | | | | | | | | | | |
| | | | | 1,407,934,443 | | | | 1,392,305,600 | | | | 15,628,843 | | | | - | |
| | Short-Term Investment | | | 35,324,631 | | | | - | | | | 35,324,631 | | | | - | |
| | | | | | | | | | | | | | | | | | |
| | Total | | | $1,449,084,729 | | | | $1,392,305,600 | | | | $56,779,129 | | | | $- | |
| | | | | | | | | | | | | | | | | | |
| | (1) | For equity investments categorized in a single level, refer to the schedule of investments for further industry breakout. |
| | |
| See Notes to Financial Statements | | See explanation of symbols and terms, if any, on page B-143 |
B-95
PACIFIC SELECT FUND
MID-CAP EQUITY PORTFOLIO
Schedule of Investments
December 31, 2012
| | | | | | | | |
| | | Shares | | |
Value | |
CONVERTIBLE PREFERRED STOCKS - 0.1% | | | | | |
| |
Industrials - 0.1% | | | | | |
| | |
Better Place LLC ‘B’ 8.000% * ¯ + | | | 4,704,600 | | | | $1,223,196 | |
| | | | | | | | |
| | |
Total Convertible Preferred Stocks
(Cost $11,761,500) | | | | | | | 1,223,196 | |
| | | | | | | | |
| | |
COMMON STOCKS - 97.1% | | | | | | | | |
| | |
Consumer Discretionary - 16.7% | | | | | | | | |
| | |
American Eagle Outfitters Inc | | | 498,900 | | | | 10,232,439 | |
AutoZone Inc * | | | 80,870 | | | | 28,662,754 | |
Big Lots Inc * | | | 229,300 | | | | 6,525,878 | |
Hasbro Inc | | | 570,400 | | | | 20,477,360 | |
Lear Corp | | | 191,700 | | | | 8,979,228 | |
Macy’s Inc | | | 1,018,400 | | | | 39,737,968 | |
Marriott International Inc ‘A’ | | | 284,700 | | | | 10,610,769 | |
Newell Rubbermaid Inc | | | 668,900 | | | | 14,896,403 | |
Ross Stores Inc | | | 275,000 | | | | 14,891,250 | |
The Interpublic Group of Cos Inc | | | 1,508,300 | | | | 16,621,466 | |
Weight Watchers International Inc | | | 145,600 | | | | 7,623,616 | |
| | | | | | | | |
| | | | | | | 179,259,131 | |
| | | | | | | | |
Consumer Staples - 5.9% | | | | | | | | |
| | |
H.J. Heinz Co | | | 231,600 | | | | 13,358,688 | |
Molson Coors Brewing Co ‘B’ | | | 367,400 | | | | 15,721,046 | |
Sysco Corp | | | 1,069,400 | | | | 33,857,204 | |
| | | | | | | | |
| | | | | | | 62,936,938 | |
| | | | | | | | |
Energy - 6.4% | | | | | | | | |
| | |
Cameron International Corp * | | | 215,800 | | | | 12,184,068 | |
EQT Corp | | | 186,200 | | | | 10,982,076 | |
Noble Energy Inc | | | 151,000 | | | | 15,362,740 | |
Peabody Energy Corp | | | 483,300 | | | | 12,860,613 | |
Rosetta Resources Inc * | | | 150,500 | | | | 6,826,680 | |
Rowan Cos PLC ‘A’ * (United Kingdom) | | | 322,700 | | | | 10,090,829 | |
| | | | | | | | |
| | | | | | | 68,307,006 | |
| | | | | | | | |
Financials - 14.6% | | | | | | | | |
| | |
Ameriprise Financial Inc | | | 395,700 | | | | 24,782,691 | |
East West Bancorp Inc | | | 750,900 | | | | 16,136,841 | |
Invesco Ltd (Bermuda) | | | 390,400 | | | | 10,185,536 | |
Kilroy Realty Corp REIT | | | 343,600 | | | | 16,276,332 | |
PartnerRe Ltd (Bermuda) | | | 103,900 | | | | 8,362,911 | |
Realogy Holdings Corp * | | | 200,800 | | | | 8,425,568 | |
Regions Financial Corp | | | 1,852,300 | | | | 13,188,376 | |
Signature Bank * | | | 269,600 | | | | 19,233,264 | |
The Hartford Financial Services Group Inc | | | 294,600 | | | | 6,610,824 | |
The Macerich Co REIT | | | 384,400 | | | | 22,410,520 | |
Willis Group Holdings PLC (Ireland) | | | 316,900 | | | | 10,625,657 | |
| | | | | | | | |
| | | | | | | 156,238,520 | |
| | | | | | | | |
Health Care - 13.6% | | | | | | | | |
| | |
Aetna Inc | | | 352,600 | | | | 16,325,380 | |
AmerisourceBergen Corp | | | 730,100 | | | | 31,525,718 | |
CareFusion Corp * | | | 758,700 | | | | 21,683,646 | |
Henry Schein Inc * | | | 176,000 | | | | 14,160,960 | |
Humana Inc | | | 148,200 | | | | 10,170,966 | |
Vertex Pharmaceuticals Inc * | | | 334,200 | | | | 14,016,348 | |
Zimmer Holdings Inc | | | 567,500 | | | | 37,829,550 | |
| | | | | | | | |
| | | | | | | 145,712,568 | |
| | | | | | | | |
Industrials - 14.7% | | | | | | | | |
| | |
BE Aerospace Inc * | | | 222,500 | | | | 10,991,500 | |
Corrections Corp of America | | | 159,900 | | | | 5,671,653 | |
Dover Corp | | | 416,600 | | | | 27,374,786 | |
Joy Global Inc | | | 166,100 | | | | 10,593,858 | |
| | | | | | | | |
| | | Shares | | |
Value | |
Landstar System Inc | | | 267,700 | | | | $14,043,542 | |
Parker Hannifin Corp | | | 390,200 | | | | 33,190,412 | |
Republic Services Inc | | | 515,000 | | | | 15,104,950 | |
Rockwell Collins Inc | | | 223,500 | | | | 13,000,995 | |
SPX Corp | | | 176,200 | | | | 12,360,430 | |
WESCO International Inc * | | | 222,100 | | | | 14,976,203 | |
| | | | | | | | |
| | | | | | | 157,308,329 | |
| | | | | | | | |
Information Technology - 22.1% | | | | | | | | |
| | |
Amdocs Ltd (United Kingdom) | | | 281,100 | | | | 9,554,589 | |
Autodesk Inc * | | | 325,000 | | | | 11,488,750 | |
Avago Technologies Ltd (Singapore) | | | 401,300 | | | | 12,705,158 | |
BMC Software Inc * | | | 631,000 | | | | 25,025,460 | |
Check Point Software Technologies Ltd * (Israel) | | | 352,100 | | | | 16,774,044 | |
Dell Inc | | | 733,000 | | | | 7,425,290 | |
F5 Networks Inc * | | | 166,400 | | | | 16,165,760 | |
Fidelity National Information Services Inc | | | 798,200 | | | | 27,785,342 | |
Gartner Inc * | | | 262,100 | | | | 12,061,842 | |
Informatica Corp * | | | 255,600 | | | | 7,749,792 | |
Intuit Inc | | | 446,800 | | | | 26,584,600 | |
Marvell Technology Group Ltd (Bermuda) | | | 1,498,100 | | | | 10,876,206 | |
NetApp Inc * | | | 386,500 | | | | 12,967,075 | |
Red Hat Inc * | | | 105,500 | | | | 5,587,280 | |
TE Connectivity Ltd (Switzerland) | | | 234,000 | | | | 8,686,080 | |
Vantiv Inc ‘A’ * | | | 361,000 | | | | 7,371,620 | |
Xilinx Inc | | | 507,900 | | | | 18,233,610 | |
| | | | | | | | |
| | | | | | | 237,042,498 | |
| | | | | | | | |
Materials - 3.1% | | | | | | | | |
| | |
Eastman Chemical Co | | | 374,300 | | | | 25,471,115 | |
Walter Energy Inc | | | 207,700 | | | | 7,452,276 | |
| | | | | | | | |
| | | | | | | 32,923,391 | |
| | | | | | | | |
Total Common Stocks
(Cost $992,424,032) | | | | | | | 1,039,728,381 | |
| | | | | | | | |
| | |
| | | Principal
Amount | | | | |
| | |
SHORT-TERM INVESTMENT - 2.8% | | | | | | | | |
| | |
Repurchase Agreement - 2.8% | | | | | | | | |
| | |
Fixed Income Clearing Corp
0.010% due 01/02/13
(Dated 12/31/12, repurchase price of $30,033,037; collateralized by U.S. Treasury Notes: 0.250% due 07/15/15
and value $30,635,000) | | | $30,033,020 | | | | 30,033,020 | |
| | | | | | | | |
| | |
Total Short-Term Investment
(Cost $30,033,020) | | | | | | | 30,033,020 | |
| | | | | | | | |
| | |
TOTAL INVESTMENTS - 100.0%
(Cost $1,034,218,552) | | | | | | | 1,070,984,597 | |
| | |
OTHER ASSETS & LIABILITIES, NET - 0.0% | | | | | | | 198,497 | |
| | | | | | | | |
| | |
NET ASSETS - 100.0% | | | | | | | $1,071,183,094 | |
| | | | | | | | |
| | |
| See Notes to Financial Statements | | See explanation of symbols and terms, if any, on page B-143 |
B-96
PACIFIC SELECT FUND
MID-CAP EQUITY PORTFOLIO
Schedule of Investments (Continued)
December 31, 2012
Notes to Schedule of Investments
| (a) | As of December 31, 2012, the portfolio was diversified as a percentage of net assets as follows: |
| | | | |
Information Technology | | | 22.1% | |
Consumer Discretionary | | | 16.7% | |
Industrials | | | 14.8% | |
Financials | | | 14.6% | |
Health Care | | | 13.6% | |
Energy | | | 6.4% | |
Consumer Staples | | | 5.9% | |
Materials | | | 3.1% | |
Short-Term Investment | | | 2.8% | |
| | | | |
Other Assets & Liabilities, Net | | | 100.0% | |
| | | 0.0% | |
| | | | |
| | | 100.0% | |
| | | | |
| (b) | Short-term investments reflect either the stated coupon rate or the annualized effective yield on the date of purchase for discounted investments. |
| (c) | An investment with a value of $1,223,196 or 0.1% of the portfolio’s net assets was valued by the Trustee Valuation Committee or determined by a valuation committee established under the Valuation Policy and then subsequently submitted for approval or ratification to either the Trustee Valuation Committee, or to the Board. |
| (d) | Restricted securities as of December 31, 2012 were as follows: |
| | | | | | | | | | | | |
| Issuer and Acquisition Date | | Cost | | | Value | | | Value as a %
of Net Assets | |
Better Place LLC ‘B’ 8.000% Acq. 01/25/10 | | | $11,761,500 | | | | $1,223,196 | | | | 0.1% | |
| | | | | | | | | | | | |
| (e) | Fair Value Measurements |
The following is a summary of the portfolio’s investments as categorized under the three-tier hierarchy of inputs used in valuing the portfolio’s assets and liabilities (See Note 3D in Notes to Financial Statements) as of December 31, 2012:
| | | | | | | | | | | | | | | | | | |
| | | | | Total Value at
December 31, 2012 | | | Level 1
Quoted Price | | | Level 2
Significant
Observable Inputs | | | Level 3
Significant
Unobservable Inputs | |
Assets | | Convertible Preferred Stocks (1) | | | $1,223,196 | | | | $- | | | | $- | | | | $1,223,196 | |
| | Common Stocks (1) | | | 1,039,728,381 | | | | 1,039,728,381 | | | | - | | | | - | |
| | Short-Term Investment | | | 30,033,020 | | | | - | | | | 30,033,020 | | | | - | |
| | | | | | | | | | | | | | | | | | |
| | Total | | | $1,070,984,597 | | | | $1,039,728,381 | | | | $30,033,020 | | | | $1,223,196 | |
| | | | | | | | | | | | | | | | | | |
The following is a reconciliation of investments for significant unobservable inputs (Level 3) used in valuing the portfolio’s assets and liabilities (See Note 3D in Notes to Financial Statements) for the year ended December 31, 2012:
| | | | |
| | | Convertible
Preferred
Stocks (1) | |
Value, Beginning of Year | | | $21,358,884 | |
Purchases | | | - | |
Sales | | | - | |
Net Realized Gains (Losses) | | | - | |
Change in Net Unrealized Depreciation | | | (20,135,688 | ) |
Transfers In | | | - | |
Transfers Out | | | - | |
| | | | |
Value, End of Year | | | $1,223,196 | |
| | | | |
Change in Net Unrealized Depreciation on Level 3
Investments Held at the End of Year, if Applicable | | | ($20,135,688 | ) |
| | | | |
| | (1) | For equity investments categorized in a single level, refer to the schedule of investments for further industry breakout. |
| | |
| See Notes to Financial Statements | | See explanation of symbols and terms, if any, on page B-143 |
B-97
PACIFIC SELECT FUND
MID-CAP GROWTH PORTFOLIO
Schedule of Investments
December 31, 2012
| | | | | | | | |
| | | Shares | | | Value | |
CONVERTIBLE PREFERRED STOCKS - 0.1% | | | | | |
| | |
Industrials - 0.1% | | | | | | | | |
| | |
Better Place LLC ‘B’ 8.000% * ¯ + | | | 2,687,456 | | | | $698,739 | |
| | | | | | | | |
| | |
Total Convertible Preferred Stocks
(Cost $6,718,638) | | | | | | | 698,739 | |
| | | | | | | | |
| | |
COMMON STOCKS - 97.1% | | | | | | | | |
Consumer Discretionary - 13.7% | | | | | | | | |
| | |
Aimia Inc (Canada) | | | 16,469 | | | | 246,199 | |
Coach Inc | | | 198,296 | | | | 11,007,411 | |
Dollar Tree Inc * | | | 273,464 | | | | 11,091,700 | |
Dunkin’ Brands Group Inc | | | 321,192 | | | | 10,657,151 | |
Groupon Inc * | | | 1,750,003 | | | | 8,540,015 | |
Morningstar Inc | | | 174,844 | | | | 10,985,448 | |
New Oriental Education & Technology Group ADR (Cayman) | | | 553,015 | | | | 10,745,081 | |
Tesla Motors Inc * | | | 124,324 | | | | 4,210,854 | |
The McGraw-Hill Cos Inc | | | 269,276 | | | | 14,721,319 | |
Weight Watchers International Inc | | | 307,140 | | | | 16,081,850 | |
| | | | | | | | |
| | | | | | | 98,287,028 | |
| | | | | | | | |
Consumer Staples - 5.6% | | | | | | | | |
| | |
DE Master Blenders 1753 NV * (Netherlands) | | | 1,445,915 | | | | 16,818,934 | |
Mead Johnson Nutrition Co | | | 164,744 | | | | 10,854,982 | |
Monster Beverage Corp * | | | 233,330 | | | | 12,338,490 | |
| | | | | | | | |
| | | | | | | 40,012,406 | |
| | | | | | | | |
Energy - 3.1% | | | | | | | | |
| | |
Range Resources Corp | | | 254,385 | | | | 15,983,009 | |
Ultra Petroleum Corp * (Canada) | | | 346,938 | | | | 6,289,986 | |
| | | | | | | | |
| | | | | | | 22,272,995 | |
| | | | | | | | |
Financials - 8.4% | | | | | | | | |
| | |
Arch Capital Group Ltd * (Bermuda) | | | 234,863 | | | | 10,338,669 | |
Greenhill & Co Inc | | | 125,015 | | | | 6,499,530 | |
IntercontinentalExchange Inc * | | | 82,177 | | | | 10,174,335 | |
MSCI Inc * | | | 590,372 | | | | 18,295,628 | |
The Progressive Corp | | | 685,290 | | | | 14,459,619 | |
| | | | | | | | |
| | | | | | | 59,767,781 | |
| | | | | | | | |
Health Care - 12.8% | | | | | | | | |
| | |
athenahealth Inc * | | | 176,425 | | | | 12,958,416 | |
IDEXX Laboratories Inc * | | | 110,002 | | | | 10,208,186 | |
Illumina Inc * | | | 450,917 | | | | 25,066,476 | |
Intuitive Surgical Inc * | | | 32,970 | | | | 16,167,499 | |
Ironwood Pharmaceuticals Inc ‘A’ * | | | 398,706 | | | | 4,421,649 | |
Qualicorp SA * (Brazil) | | | 1,259,248 | | | | 13,105,827 | |
Techne Corp | | | 137,161 | | | | 9,373,583 | |
| | | | | | | | |
| | | | | | | 91,301,636 | |
| | | | | | | | |
Industrials - 15.9% | | | | | | | | |
| | |
Covanta Holding Corp | | | 531,326 | | | | 9,787,025 | |
Edenred (France) | | | 898,184 | | | | 27,930,939 | |
IHS Inc ‘A’ * | | | 153,922 | | | | 14,776,512 | |
Intertek Group PLC (United Kingdom) | | | 380,932 | | | | 19,224,094 | |
Sensata Technologies Holding NV * (Netherlands) | | | 374,357 | | | | 12,159,115 | |
Stericycle Inc * | | | 111,183 | | | | 10,370,038 | |
Verisk Analytics Inc ‘A’ * | | | 389,623 | | | | 19,870,773 | |
| | | | | | | | |
| | | | | | | 114,118,496 | |
| | | | | | | | |
| | | | | | | | |
| | | Shares | | | Value | |
Information Technology - 29.2% | | | | | | | | |
| | |
Akamai Technologies Inc * | | | 280,838 | | | | $11,489,083 | |
Citrix Systems Inc * | | | 140,753 | | | | 9,254,510 | |
FactSet Research Systems Inc | | | 48,781 | | | | 4,295,655 | |
First Solar Inc * | | | 309,697 | | | | 9,563,443 | |
Gartner Inc * | | | 366,746 | | | | 16,877,651 | |
LinkedIn Corp ‘A’ * | | | 169,156 | | | | 19,422,492 | |
MercadoLibre Inc | | | 99,806 | | | | 7,841,757 | |
Motorola Solutions Inc | | | 499,709 | | | | 27,823,797 | |
Qihoo 360 Technology Co Ltd ADR * (Cayman) | | | 139,153 | | | | 4,131,453 | |
Red Hat Inc * | | | 184,934 | | | | 9,794,105 | |
salesforce.com inc * | | | 121,778 | | | | 20,470,882 | |
SINA Corp * (Cayman) | | | 69,453 | | | | 3,487,930 | |
Solera Holdings Inc | | | 446,308 | | | | 23,864,089 | |
Trimble Navigation Ltd * | | | 134,641 | | | | 8,048,839 | |
Workday Inc ‘A’ * | | | 84,765 | | | | 4,619,692 | |
Yandex NV ‘A’ * (Netherlands) | | | 705,653 | | | | 15,220,935 | |
Youku Tudou Inc ADR * (Cayman) | | | 483,010 | | | | 8,810,102 | |
Zynga Inc ‘A’ * | | | 1,632,531 | | | | 3,869,098 | |
| | | | | | | | |
| | | | | | | 208,885,513 | |
| | | | | | | | |
Materials - 4.8% | | | | | | | | |
| | |
Intrepid Potash Inc | | | 363,112 | | | | 7,730,654 | |
Martin Marietta Materials Inc | | | 157,074 | | | | 14,808,937 | |
Rockwood Holdings Inc | | | 239,567 | | | | 11,848,984 | |
| | | | | | | | |
| | | | | | | 34,388,575 | |
| | | | | | | | |
Utilities - 3.6% | | | | | | | | |
| | |
Brookfield Infrastructure Partners LP (Bermuda) | | | 726,316 | | | | 25,602,639 | |
| | | | | | | | |
| | |
Total Common Stocks
(Cost $632,149,088) | | | | | | | 694,637,069 | |
| | | | | | | | |
| | |
| | | Principal
Amount | | | | |
SHORT-TERM INVESTMENT - 2.8% | | | | | | | | |
| | |
Repurchase Agreement - 2.8% | | | | | | | | |
| | |
Fixed Income Clearing Corp
0.010% due 01/02/13
(Dated 12/31/12, repurchase price of $20,312,522; collateralized by U.S. Treasury Notes: 0.250% due 07/15/15 and value $20,720,000) | | | $20,312,511 | | | | 20,312,511 | |
| | | | | | | | |
| | |
Total Short-Term Investment
(Cost $20,312,511) | | | | | | | 20,312,511 | |
| | | | | | | | |
| | |
TOTAL INVESTMENTS - 100.0%
(Cost $659,180,237) | | | | | | | 715,648,319 | |
| |
OTHER ASSETS & LIABILITIES, NET - 0.0% | | | | 92,698 | |
| | | | | | | | |
| | |
NET ASSETS - 100.0% | | | | | | | $715,741,017 | |
| | | | | | | | |
| | |
| See Notes to Financial Statements | | See explanation of symbols and terms, if any, on page B-143 |
B-98
PACIFIC SELECT FUND
MID-CAP GROWTH PORTFOLIO
Schedule of Investments (Continued)
December 31, 2012
Notes to Schedule of Investments
| (a) | As of December 31, 2012, the portfolio was diversified as a percentage of net assets as follows: |
| | | | |
Information Technology | | | 29.2% | |
Industrials | | | 16.0% | |
Consumer Discretionary | | | 13.7% | |
Health Care | | | 12.8% | |
Financials | | | 8.4% | |
Consumer Staples | | | 5.6% | |
Materials | | | 4.8% | |
Utilities | | | 3.6% | |
Energy | | | 3.1% | |
Short-Term Investment | | | 2.8% | |
| | | | |
| | | 100.0% | |
Other Assets & Liabilities, Net | | | 0.0% | |
| | | | |
| | | 100.0% | |
| | | | |
| (b) | Short-term investments reflect either the stated coupon rate or the annualized effective yield on the date of purchase for discounted investments. |
| (c) | An investment with a value of $698,739 or 0.1% of the portfolio’s net assets was valued by the Trustee Valuation Committee or determined by a valuation committee established under the Valuation Policy and then subsequently submitted for approval or ratification to either the Trustee Valuation Committee, or to the Board. |
| (d) | Restricted securities as of December 31, 2012 were as follows: |
| | | | | | | | | | | | |
| Issuer and Acquisition Date | | Cost | | | Value | | | Value as a %
of Net Assets | |
Better Place LLC ‘B’ 8.000% Acq. 01/25/10 | | | $6,718,638 | | | | $698,739 | | | | 0.1% | |
| | | | | | | | | | | | |
| (e) | Fair Value Measurements |
The following is a summary of the portfolio’s investments as categorized under the three-tier hierarchy of inputs used in valuing the portfolio’s assets and liabilities (See Note 3D in Notes to Financial Statements) as of December 31, 2012:
| | | | | | | | | | | | | | | | | | | | | | | | | | |
| | | Total Value at
December 31, 2012 | | | Level 1
Quoted Price | | | Level 2
Significant
Observable Inputs | | | Level 3
Significant
Unobservable Inputs | |
Assets | | Convertible Preferred Stocks (1) | | $698,739 | | | $- | | | $- | | | $698,739 | |
| | Common Stocks | | | | | | | | | | | | | | | | | | | | | | | | |
| | Consumer Discretionary | | 98,287,028 | | | 98,287,028 | | | - | | | - | |
| | Consumer Staples | | 40,012,406 | | | 23,193,472 | | | 16,818,934 | | | - | |
| | Energy | | 22,272,995 | | | 22,272,995 | | | - | | | - | |
| | Financials | | 59,767,781 | | | 59,767,781 | | | - | | | - | |
| | Health Care | | 91,301,636 | | | 78,195,809 | | | 13,105,827 | | | - | |
| | Industrials | | 114,118,496 | | | 66,963,463 | | | 47,155,033 | | | - | |
| | Information Technology | | 208,885,513 | | | 208,885,513 | | | - | | | - | |
| | Materials | | 34,388,575 | | | 34,388,575 | | | - | | | - | |
| | Utilities | | 25,602,639 | | | 25,602,639 | | | - | | | - | |
| | | | | | | | | | | | | | | | | | | | | | | | | | |
| | | | | 694,637,069 | | | | | | 617,557,275 | | | | | | 77,079,794 | | | | | | - | |
| | Short-Term Investment | | 20,312,511 | | | - | | | 20,312,511 | | | - | |
| | | | | | | | | | | | | | | | | | | | | | | | | | |
| | Total | | $715,648,319 | | | $617,557,275 | | | $97,392,305 | | | $698,739 | |
| | | | | | | | | | | | | | | | | | | | | | | | | | |
During the year ended December 31, 2012, an investment with a value of $13,105,827 was transferred from level 1 to level 2 due to valuation adjustments made to exchange-traded prices as a result of market movements following the close of local trading.
The following is a reconciliation of investments for significant unobservable inputs (Level 3) used in valuing the portfolio’s assets and liabilities (See Note 3D in Notes to Financial Statements) for the year ended December 31, 2012:
| | | | |
| | | Convertible
Preferred
Stocks (1) | |
Value, Beginning of Year | | | $12,201,050 | |
Purchases | | | - | |
Sales | | | - | |
Net Realized Gains (Losses) | | | - | |
Change in Net Unrealized Depreciation | | | (11,502,311 | ) |
Transfers In | | | - | |
Transfers Out | | | - | |
| | | | |
Value, End of Year | | | $698,739 | |
| | | | |
Change in Net Unrealized Depreciation on Level 3
Investments Held at the End of Year, if Applicable | | | ($11,502,311 | ) |
| | | | |
(1) For equity investments categorized in a single level, refer to the schedule of investments for further industry breakout.
| | |
| See Notes to Financial Statements | | See explanation of symbols and terms, if any, on page B-143 |
B-99
PACIFIC SELECT FUND
MID-CAP VALUE PORTFOLIO
Schedule of Investments
December 31, 2012
| | | | | | | | |
| | | Shares | | | Value | |
COMMON STOCKS - 98.8% | | | | | | | | |
| | |
Consumer Discretionary - 15.5% | | | | | | | | |
| | |
Abercrombie & Fitch Co ‘A’ | | | 140,656 | | | | $6,747,268 | |
American Eagle Outfitters Inc | | | 690,500 | | | | 14,162,155 | |
Ascena Retail Group Inc * | | | 445,090 | | | | 8,229,714 | |
Chico’s FAS Inc | | | 655,900 | | | | 12,107,914 | |
Dick’s Sporting Goods Inc | | | 219,500 | | | | 9,985,055 | |
Dollar Tree Inc * | | | 123,700 | | | | 5,017,272 | |
Foot Locker Inc | | | 188,400 | | | | 6,051,408 | |
Guess? Inc | | | 245,200 | | | | 6,017,208 | |
Hanesbrands Inc * | | | 385,300 | | | | 13,801,446 | |
Jarden Corp | | | 183,800 | | | | 9,502,460 | |
Lear Corp | | | 147,100 | | | | 6,890,164 | |
Lennar Corp ‘A’ | | | 313,900 | | | | 12,138,513 | |
Limited Brands Inc | | | 216,000 | | | | 10,164,960 | |
Mattel Inc | | | 322,700 | | | | 11,817,274 | |
Newell Rubbermaid Inc | | | 417,000 | | | | 9,286,590 | |
NVR Inc * | | | 13,300 | | | | 12,236,000 | |
PVH Corp | | | 128,440 | | | | 14,258,124 | |
Regis Corp | | | 324,315 | | | | 5,487,410 | |
Signet Jewelers Ltd (NYSE) (Bermuda) | | | 89,100 | | | | 4,757,940 | |
Staples Inc | | | 838,100 | | | | 9,554,340 | |
Thor Industries Inc | | | 144,100 | | | | 5,393,663 | |
TRW Automotive Holdings Corp * | | | 42,811 | | | | 2,295,098 | |
Wolverine World Wide Inc | | | 156,200 | | | | 6,401,076 | |
Wyndham Worldwide Corp | | | 202,900 | | | | 10,796,309 | |
| | | | | | | | |
| | | | | | | 213,099,361 | |
| | | | | | | | |
Consumer Staples - 3.2% | | | | | | | | |
| | |
Energizer Holdings Inc | | | 128,200 | | | | 10,253,436 | |
Ingredion Inc | | | 119,200 | | | | 7,680,056 | |
Smithfield Foods Inc * | | | 445,700 | | | | 9,613,749 | |
The Clorox Co | | | 57,700 | | | | 4,224,794 | |
The J.M. Smucker Co | | | 71,416 | | | | 6,158,916 | |
Tyson Foods Inc ‘A’ | | | 268,700 | | | | 5,212,780 | |
| | | | | | | | |
| | | | | | | 43,143,731 | |
| | | | | | | | |
Energy - 9.2% | | | | | | | | |
| | |
Africa Oil Corp * (Canada) | | | 1,551,537 | | | | 10,903,030 | |
Arch Coal Inc | | | 637,400 | | | | 4,665,768 | |
Bill Barrett Corp * | | | 304,000 | | | | 5,408,160 | |
Cabot Oil & Gas Corp | | | 152,300 | | | | 7,575,402 | |
Dresser-Rand Group Inc * | | | 126,100 | | | | 7,079,254 | |
HollyFrontier Corp | | | 272,300 | | | | 12,675,565 | |
McDermott International Inc * (Panama) | | | 858,200 | | | | 9,457,364 | |
Oasis Petroleum Inc * | | | 494,432 | | | | 15,722,938 | |
Patterson-UTI Energy Inc | | | 436,200 | | | | 8,126,406 | |
SM Energy Co | | | 347,100 | | | | 18,122,091 | |
Superior Energy Services Inc * | | | 217,300 | | | | 4,502,456 | |
Ultra Petroleum Corp * (Canada) | | | 319,400 | | | | 5,790,722 | |
Whiting Petroleum Corp * | | | 369,850 | | | | 16,040,394 | |
| | | | | | | | |
| | | | | | | 126,069,550 | |
| | | | | | | | |
Financials - 19.9% | | | | | | | | |
| | |
Alleghany Corp * | | | 20,022 | | | | 6,715,779 | |
American Financial Group Inc | | | 142,800 | | | | 5,643,456 | |
Arthur J. Gallagher & Co | | | 184,200 | | | | 6,382,530 | |
Associated Banc-Corp | | | 507,800 | | | | 6,662,336 | |
BioMed Realty Trust Inc REIT | | | 440,787 | | | | 8,520,413 | |
CBRE Group Inc ‘A’ * | | | 294,247 | | | | 5,855,515 | |
CommonWealth REIT | | | 390,795 | | | | 6,190,193 | |
Corporate Office Properties Trust REIT | | | 409,276 | | | | 10,223,714 | |
Discover Financial Services | | | 163,960 | | | | 6,320,658 | |
DuPont Fabros Technology Inc REIT | | | 770,180 | | | | 18,607,549 | |
Eaton Vance Corp | | | 332,000 | | | | 10,574,200 | |
Everest Re Group Ltd (Bermuda) | | | 103,900 | | | | 11,423,805 | |
Fidelity National Financial Inc ‘A’ | | | 635,100 | | | | 14,956,605 | |
First Niagara Financial Group Inc | | | 902,700 | | | | 7,158,411 | |
FirstMerit Corp | | | 556,500 | | | | 7,896,735 | |
| | | | | | | | |
| | | Shares | | | Value | |
| | |
Forest City Enterprises Inc ‘A’ * | | | 1,151,762 | | | | $18,600,956 | |
Hancock Holding Co | | | 270,500 | | | | 8,585,670 | |
HCC Insurance Holdings Inc | | | 361,300 | | | | 13,443,973 | |
Jefferies Group Inc | | | 425,100 | | | | 7,894,107 | |
Kemper Corp | | | 383,300 | | | | 11,307,350 | |
New York Community Bancorp Inc | | | 1,044,700 | | | | 13,685,570 | |
Old Republic International Corp | | | 778,600 | | | | 8,292,090 | |
Omega Healthcare Investors Inc REIT | | | 258,102 | | | | 6,155,733 | |
Protective Life Corp | | | 383,936 | | | | 10,972,891 | |
Regions Financial Corp | | | 547,500 | | | | 3,898,200 | |
Synovus Financial Corp | | | 2,043,601 | | | | 5,006,822 | |
Washington Federal Inc | | | 547,600 | | | | 9,238,012 | |
Webster Financial Corp | | | 428,543 | | | | 8,806,559 | |
WR Berkley Corp | | | 261,775 | | | | 9,879,389 | |
Zions Bancorp | | | 160,000 | | | | 3,424,000 | |
| | | | | | | | |
| | | | | | | 272,323,221 | |
| | | | | | | | |
Health Care - 12.6% | | | | | | | | |
| | |
Alere Inc * | | | 697,658 | | | | 12,906,673 | |
Brookdale Senior Living Inc * | | | 222,342 | | | | 5,629,700 | |
CareFusion Corp * | | | 719,200 | | | | 20,554,736 | |
Endo Health Solutions Inc * | | | 499,873 | | | | 13,131,664 | |
Hospira Inc * | | | 584,929 | | | | 18,273,182 | |
Omnicare Inc | | | 692,603 | | | | 25,002,968 | |
Owens & Minor Inc | | | 642,304 | | | | 18,312,087 | |
Tenet Healthcare Corp * | | | 876,474 | | | | 28,459,111 | |
United Therapeutics Corp * | | | 177,315 | | | | 9,472,167 | |
Universal Health Services Inc ‘B’ | | | 423,269 | | | | 20,465,056 | |
| | | | | | | | |
| | | | | | | 172,207,344 | |
| | | | | | | | |
Industrials - 13.2% | | | | | | | | |
| | |
ACCO Brands Corp * | | | 1,468,400 | | | | 10,778,056 | |
AGCO Corp * | | | 233,000 | | | | 11,444,960 | |
Alliant Techsystems Inc | | | 97,800 | | | | 6,059,688 | |
AMETEK Inc | | | 204,050 | | | | 7,666,159 | |
Con-way Inc | | | 378,700 | | | | 10,535,434 | |
Crane Co | | | 79,100 | | | | 3,660,748 | |
Curtiss-Wright Corp | | | 169,600 | | | | 5,567,968 | |
Delta Air Lines Inc * | | | 1,219,200 | | | | 14,471,904 | |
Dover Corp | | | 199,900 | | | | 13,135,429 | |
FTI Consulting Inc * | | | 41,366 | | | | 1,365,078 | |
IDEX Corp | | | 202,100 | | | | 9,403,713 | |
Jacobs Engineering Group Inc * | | | 152,560 | | | | 6,494,479 | |
KBR Inc | | | 354,100 | | | | 10,594,672 | |
Kennametal Inc | | | 136,300 | | | | 5,452,000 | |
Manpower Inc | | | 196,100 | | | | 8,322,484 | |
Navistar International Corp * | | | 178,900 | | | | 3,894,653 | |
Parker Hannifin Corp | | | 165,500 | | | | 14,077,430 | |
Spirit AeroSystems Holdings Inc ‘A’ * | | | 606,190 | | | | 10,287,044 | |
SPX Corp | | | 177,300 | | | | 12,437,595 | |
The Timken Co | | | 325,620 | | | | 15,574,405 | |
| | | | | | | | |
| | | | | | | 181,223,899 | |
| | | | | | | | |
Information Technology - 12.7% | | | | | | | | |
| | |
Acxiom Corp * | | | 288,478 | | | | 5,036,826 | |
Amdocs Ltd (United Kingdom) | | | 233,200 | | | | 7,926,468 | |
Arrow Electronics Inc * | | | 252,900 | | | | 9,630,432 | |
Atmel Corp * | | | 743,500 | | | | 4,869,925 | |
Check Point Software Technologies Ltd * (Israel) | | | 274,500 | | | | 13,077,180 | |
Compuware Corp * | | | 1,329,000 | | | | 14,446,230 | |
Diebold Inc | | | 284,800 | | | | 8,717,728 | |
Electronic Arts Inc * | | | 871,500 | | | | 12,662,895 | |
Fairchild Semiconductor International Inc * | | | 710,100 | | | | 10,225,440 | |
Ingram Micro Inc ‘A’ * | | | 528,394 | | | | 8,940,426 | |
Microchip Technology Inc | | | 335,000 | | | | 10,917,650 | |
NCR Corp * | | | 631,894 | | | | 16,100,659 | |
ON Semiconductor Corp * | | | 1,448,291 | | | | 10,210,452 | |
Parametric Technology Corp * | | | 567,400 | | | | 12,772,174 | |
Polycom Inc * | | | 843,700 | | | | 8,825,102 | |
| | |
| See Notes to Financial Statements | | See explanation of symbols and terms, if any, on page B-143 |
B-100
PACIFIC SELECT FUND
MID-CAP VALUE PORTFOLIO
Schedule of Investments (Continued)
December 31, 2012
| | | | | | | | |
| | | Shares | | | Value | |
RF Micro Devices Inc * | | | 1,495,700 | | | | $6,700,736 | |
Synopsys Inc * | | | 266,300 | | | | 8,478,992 | |
Take-Two Interactive Software Inc * | | | 430,116 | | | | 4,735,577 | |
| | | | | | | | |
| | | | | | | 174,274,892 | |
| | | | | | | | |
Materials - 7.8% | | | | | | | | |
| | |
Albemarle Corp | | | 194,600 | | | | 12,088,552 | |
Carpenter Technology Corp | | | 164,200 | | | | 8,477,646 | |
Cliffs Natural Resources Inc | | | 126,100 | | | | 4,862,416 | |
Cytec Industries Inc | | | 121,710 | | | | 8,377,299 | |
Georgia Gulf Corp | | | 161,600 | | | | 6,670,848 | |
Huntsman Corp | | | 245,700 | | | | 3,906,630 | |
Martin Marietta Materials Inc | | | 62,800 | | | | 5,920,784 | |
MeadWestvaco Corp | | | 218,500 | | | | 6,963,595 | |
Owens-Illinois Inc * | | | 494,500 | | | | 10,518,015 | |
Packaging Corp of America | | | 374,600 | | | | 14,410,862 | |
Rock-Tenn Co ‘A’ | | | 148,900 | | | | 10,409,599 | |
Rockwood Holdings Inc | | | 281,100 | | | | 13,903,206 | |
| | | | | | | | |
| | | | | | | 106,509,452 | |
| | | | | | | | |
Utilities - 4.7% | | | | | | | | |
| | |
Hawaiian Electric Industries Inc | | | 209,200 | | | | 5,259,288 | |
MDU Resources Group Inc | | | 262,300 | | | | 5,571,252 | |
NV Energy Inc | | | 949,030 | | | | 17,215,404 | |
OGE Energy Corp | | | 147,700 | | | | 8,316,987 | |
PNM Resources Inc | | | 596,200 | | | | 12,228,062 | |
UGI Corp | | | 502,100 | | | | 16,423,691 | |
| | | | | | | | |
| | | | | | | 65,014,684 | |
| | | | | | | | |
Total Common Stocks
(Cost $1,297,799,190) | | | | | | | 1,353,866,134 | |
| | | | | | | | |
| | | | | | | | |
| | | Principal
Amount | | | Value | |
SHORT-TERM INVESTMENT - 1.2% | | | | | | | | |
| | |
Repurchase Agreement - 1.2% | | | | | | | | |
| | |
Fixed Income Clearing Corp
0.010% due 01/02/13
(Dated 12/31/12, repurchase price of $17,143,399; collateralized by U.S. Treasury Notes: 0.250% due 07/15/15 and value $17,490,000) | | | $17,143,390 | | | | $17,143,390 | |
| | | | | | | | |
| | |
Total Short-Term Investment
(Cost $17,143,390) | | | | | | | 17,143,390 | |
| | | | | | | | |
| | |
TOTAL INVESTMENTS - 100.0%
(Cost $1,314,942,580) | | | | | | | 1,371,009,524 | |
| |
OTHER ASSETS & LIABILITIES, NET - 0.0% | | | | 643,232 | |
| | | | | | | | |
| | |
NET ASSETS - 100.0% | | | | | | | $1,371,652,756 | |
| | | | | | | | |
Notes to Schedule of Investments
| (a) | As of December 31, 2012, the portfolio was diversified as a percentage of net assets as follows: |
| | | | |
Financials | | | 19.9% | |
Consumer Discretionary | | | 15.5% | |
Industrials | | | 13.2% | |
Information Technology | | | 12.7% | |
Health Care | | | 12.6% | |
Energy | | | 9.2% | |
Materials | | | 7.8% | |
Utilities | | | 4.7% | |
Consumer Staples | | | 3.2% | |
Short-Term Investment | | | 1.2% | |
| | | | |
| | | 100.0% | |
Other Assets & Liabilities, Net | | | 0.0% | |
| | | | |
| | | 100.0% | |
| | | | |
| (b) | Short-term investments reflect either the stated coupon rate or the annualized effective yield on the date of purchase for discounted investments. |
| (c) | Fair Value Measurements |
The following is a summary of the portfolio’s investments as categorized under the three-tier hierarchy of inputs used in valuing the portfolio’s assets and liabilities (See Note 3D in Notes to Financial Statements) as of December 31, 2012:
| | | | | | | | | | | | | | | | | | |
| | | Total Value at
December 31, 2012 | | | Level 1
Quoted Price | | | Level 2
Significant
Observable Inputs | | | Level 3
Significant
Unobservable Inputs | |
Assets | | Common Stocks (1) | | | $1,353,866,134 | | | | $1,353,866,134 | | | | $- | | | | $- | |
| | Short-Term Investment | | | 17,143,390 | | | | - | | | | 17,143,390 | | | | - | |
| | | | | | | | | | | | | | | | | | |
| | Total | | | $1,371,009,524 | | | | $1,353,866,134 | | | | $17,143,390 | | | | $- | |
| | | | | | | | | | | | | | | | | | |
| | (1) | For equity investments categorized in a single level, refer to the schedule of investments for further industry breakout. |
| | |
| See Notes to Financial Statements | | See explanation of symbols and terms, if any, on page B-143 |
B-101
PACIFIC SELECT FUND
SMALL-CAP EQUITY PORTFOLIO
Summary Schedule of Investments
December 31, 2012
| | | | | | | | |
| | | Shares | | | Value | |
RIGHTS - 0.0% | | | | | | | | |
| | |
Health Care - 0.0% | | | | | | | | |
| | |
Other security | | | | | | | $ - | |
| | | | | | | | |
| | |
Total Rights
(Cost $0) | | | | | | | - | |
| | | | | | | | |
| | |
COMMON STOCKS - 98.5% | | | | | | | | |
| | |
Consumer Discretionary - 16.4% | | | | | | | | |
| | |
Autoliv Inc | | | 122,000 | | | | 8,221,580 | |
Brown Shoe Co Inc | | | 374,142 | | | | 6,872,989 | |
Gentex Corp | | | 356,800 | | | | 6,714,976 | |
Group 1 Automotive Inc | | | 207,795 | | | | 12,881,212 | |
La-Z-Boy Inc | | | 524,582 | | | | 7,422,835 | |
Regis Corp | | | 353,593 | | | | 5,982,794 | |
The Men’s Wearhouse Inc | | | 271,922 | | | | 8,473,090 | |
Thor Industries Inc | | | 375,010 | | | | 14,036,624 | |
Other securities | | | | | | | 93,713,153 | |
| | | | | | | | |
| | | | | | | 164,319,253 | |
| | | | | | | | |
Consumer Staples - 1.3% | | | | | | | | |
| | |
Other securities | | | | | | | 13,439,694 | |
| | | | | | | | |
| | |
Energy - 9.4% | | | | | | | | |
| | |
Atwood Oceanics Inc * | | | 187,600 | | | | 8,590,204 | |
Bristow Group Inc | | | 202,186 | | | | 10,849,301 | |
Energen Corp | | | 118,510 | | | | 5,343,616 | |
Helix Energy Solutions Group Inc * | | | 437,739 | | | | 9,034,933 | |
Oil States International Inc * | | | 115,000 | | | | 8,227,100 | |
Rowan Cos PLC ‘A’ * (United Kingdom) | | | 300,080 | | | | 9,383,502 | |
Tidewater Inc | | | 193,200 | | | | 8,632,176 | |
Unit Corp * | | | 150,000 | | | | 6,757,500 | |
Other securities | | | | | | | 27,650,017 | |
| | | | | | | | |
| | | | | | | 94,468,349 | |
| | | | | | | | |
Financials - 23.4% | | | | | | | | |
| | |
Aspen Insurance Holdings Ltd (Bermuda) | | | 152,880 | | | | 4,904,390 | |
Montpelier Re Holdings Ltd (Bermuda) | | | 241,097 | | | | 5,511,477 | |
Old Republic International Corp | | | 493,000 | | | | 5,250,450 | |
Protective Life Corp | | | 395,900 | | | | 11,314,822 | |
Validus Holdings Ltd (Bermuda) | | | 143,400 | | | | 4,958,772 | |
Other securities | | | | | | | 202,121,831 | |
| | | | | | | | |
| | | | | | | 234,061,742 | |
| | | | | | | | |
Health Care - 3.9% | | | | | | | | |
| | |
STERIS Corp | | | 164,938 | | | | 5,728,297 | |
Teleflex Inc | | | 72,000 | | | | 5,134,320 | |
Other securities | | | | | | | 27,922,473 | |
| | | | | | | | |
| | | | | | | 38,785,090 | |
| | | | | | | | |
Industrials - 25.4% | | | | | | | | |
| | |
AAR Corp | | | 441,008 | | | | 8,238,029 | |
Apogee Enterprises Inc | | | 313,149 | | | | 7,506,181 | |
Astec Industries Inc | | | 186,969 | | | | 6,231,677 | |
Brady Corp ‘A’ | | | 178,760 | | | | 5,970,584 | |
Briggs & Stratton Corp | | | 304,027 | | | | 6,408,889 | |
Carlisle Cos Inc | | | 124,000 | | | | 7,286,240 | |
EMCOR Group Inc | | | 206,865 | | | | 7,159,598 | |
EnPro Industries Inc * | | | 188,121 | | | | 7,694,149 | |
Franklin Electric Co Inc | | | 80,902 | | | | 5,029,677 | |
Gardner Denver Inc | | | 110,000 | | | | 7,535,000 | |
Genesee & Wyoming Inc ‘A’ * | | | 80,120 | | | | 6,095,530 | |
Gibraltar Industries Inc * | | | 537,488 | | | | 8,556,809 | |
Granite Construction Inc | | | 350,031 | | | | 11,768,042 | |
Kennametal Inc | | | 135,980 | | | | 5,439,200 | |
| | | | | | | | |
| | | Shares | | | Value | |
Lincoln Electric Holdings Inc | | | 181,980 | | | | $8,858,786 | |
Mine Safety Appliances Co | | | 146,200 | | | | 6,244,202 | |
Mueller Industries Inc | | | 164,614 | | | | 8,235,638 | |
Simpson Manufacturing Co Inc | | | 168,645 | | | | 5,529,870 | |
SkyWest Inc | | | 421,588 | | | | 5,252,986 | |
Trinity Industries Inc | | | 232,890 | | | | 8,342,120 | |
Universal Forest Products Inc | | | 229,894 | | | | 8,745,168 | |
Other securities | | | | | | | 101,964,941 | |
| | | | | | | | |
| | | | | | | 254,093,316 | |
| | | | | | | | |
Information Technology - 8.2% | | | | | | | | |
| | |
Benchmark Electronics Inc * | | | 489,035 | | | | 8,127,762 | |
Rofin-Sinar Technologies Inc * | | | 322,185 | | | | 6,984,971 | |
Other securities | | | | | | | 67,519,733 | |
| | | | | | | | |
| | | | 82,632,466 | |
| | | | | | | | |
Materials - 6.9% | | | | | | | | |
| | |
A. Schulman Inc | | | 185,306 | | | | 5,360,903 | |
Reliance Steel & Aluminum Co | | | 123,000 | | | | 7,638,300 | |
RPM International Inc | | | 349,100 | | | | 10,249,576 | |
Steel Dynamics Inc | | | 415,000 | | | | 5,697,950 | |
Other securities | | | | | | | 40,444,959 | |
| | | | | | | | |
| | | | | | | 69,391,688 | |
| | | | | | | | |
Telecommunication Services - 0.3% | | | | | | | | |
| | |
Other securities | | | | | | | 2,620,391 | |
| | | | | | | | |
| | |
Utilities - 3.3% | | | | | | | | |
| | |
Other securities | | | | | | | 32,901,308 | |
| | | | | | | | |
| | |
Total Common Stocks
(Cost $883,349,960) | | | | | | | 986,713,297 | |
| | | | | | | | |
| | |
CLOSED-END MUTUAL FUND - 0.0% | | | | | | | | |
| | |
Other security | | | | | | | 117,668 | |
| | | | | | | | |
| | |
Total Closed-End Mutual Fund
(Cost $118,181) | | | | | | | 117,668 | |
| | | | | | | | |
| | |
| | | Principal
Amount | | | | |
SHORT-TERM INVESTMENT - 1.4% | | | | | | | | |
| | |
Repurchase Agreement - 1.4% | | | | | | | | |
| | |
Fixed Income Clearing Corp
0.010% due 01/02/13
(Dated 12/31/12, repurchase price of $13,829,448; collateralized by U.S. Treasury Notes: 0.250% - 2.750% due 07/15/15 - 11/30/16 and value $14,110,550) | | | $13,829,440 | | | | 13,829,440 | |
| | | | | | | | |
| | |
Total Short-Term Investment
(Cost $13,829,440) | | | | | | | 13,829,440 | |
| | | | | | | | |
| | |
TOTAL INVESTMENTS - 99.9%
(Cost $897,297,581) | | | | | | | 1,000,660,405 | |
| |
OTHER ASSETS & LIABILITIES, NET - 0.1% | | | | 1,435,085 | |
| | | | | | | | |
| |
NET ASSETS - 100.0% | | | | $1,002,095,490 | |
| | | | | | | | |
| | |
| See Notes to Financial Statements | | See explanation of symbols and terms, if any, on page B-143 |
B-102
PACIFIC SELECT FUND
SMALL-CAP EQUITY PORTFOLIO
Summary Schedule of Investments (Continued)
December 31, 2012
Notes to Schedule of Investments
| (a) | As of December 31, 2012, the portfolio was diversified as a percentage of net assets as follows: |
| | | | |
Industrials | | | 25.4% | |
Financials | | | 23.4% | |
Consumer Discretionary | | | 16.4% | |
Energy | | | 9.4% | |
Information Technology | | | 8.2% | |
Materials | | | 6.9% | |
Health Care | | | 3.9% | |
Utilities | | | 3.3% | |
Short-Term Investment | | | 1.4% | |
Consumer Staples | | | 1.3% | |
Telecommunication Services | | | 0.3% | |
| | | | |
| | | 99.9% | |
Other Assets & Liabilities, Net | | | 0.1% | |
| | | | |
| | | 100.0% | |
| | | | |
| (b) | Short-term investments reflect either the stated coupon rate or the annualized effective yield on the date of purchase for discounted investments. |
| (c) | Other securities represent the portfolio’s securities not identified as a top-fifty holding in terms of value, and not exceeding one percent of the portfolio’s net assets as of December 31, 2012. |
| (d) | A Summary Schedule of Investments is presented for this portfolio. For information on availability of a complete Schedule of Investments, refer to the WHERE TO GO FOR MORE INFORMATION section of this report. |
| (e) | As of December 31, 2012, $365,000 in cash was segregated with the broker(s)/custodian as collateral for open futures contracts. |
| (f) | Open futures contracts outstanding as of December 31, 2012 were as follows: |
| | | | | | | | | | | | |
| Long Futures Outstanding | | Number of
Contracts | | | Notional
Amount | | | Unrealized
Appreciation | |
Russell 2000 Mini (03/13) | | | 64 | | | | $5,303,135 | | | | $115,105 | |
| | | | | | | | | | | | |
| (g) | Fair Value Measurements |
The following is a summary of the portfolio’s investments as categorized under the three-tier hierarchy of inputs used in valuing the portfolio’s assets and liabilities (See Note 3D in Notes to Financial Statements) as of December 31, 2012:
| | | | | | | | | | | | | | | | | | |
| | | Total Value at
December 31, 2012 | | | Level 1
Quoted Price | | | Level 2
Significant
Observable Inputs | | | Level 3
Significant
Unobservable Inputs | |
Assets | | Common Stocks (1) | | | $986,713,297 | | | | $986,713,297 | | | | $- | | | | $- | |
| | Closed-End Mutual Fund | | | 117,668 | | | | 117,668 | | | | - | | | | - | |
| | Short-Term Investment | | | 13,829,440 | | | | - | | | | 13,829,440 | | | | - | |
| | Derivatives: | | | | | | | | | | | | | | | | |
| | Equity Contracts | | | | | | | | | | | | | | | | |
| | Futures | | | 115,105 | | | | 115,105 | | | | - | | | | - | |
| | | | | | | | | | | | | | | | | | |
| | Total | | | $1,000,775,510 | | | | $986,946,070 | | | | $13,829,440 | | | | $- | |
| | | | | | | | | | | | | | | | | | |
(1) For equity investments categorized in a single level, refer to the schedule of investments for further industry breakout.
| | |
| See Notes to Financial Statements | | See explanation of symbols and terms, if any, on page B-143 |
B-103
PACIFIC SELECT FUND
SMALL-CAP GROWTH PORTFOLIO
Schedule of Investments
December 31, 2012
| | | | | | | | |
| | | Shares | | |
Value | |
COMMON STOCKS - 96.1% | | | | | | | | |
| | |
Consumer Discretionary - 18.0% | | | | | | | | |
| | |
American Axle & Manufacturing Holdings Inc * | | | 283,900 | | | | $3,179,680 | |
ANN Inc * | | | 127,410 | | | | 4,311,554 | |
Brunswick Corp | | | 166,710 | | | | 4,849,594 | |
Dana Holding Corp | | | 242,400 | | | | 3,783,864 | |
Domino’s Pizza Inc | | | 117,405 | | | | 5,112,988 | |
DSW Inc ‘A’ | | | 64,435 | | | | 4,232,735 | |
Fifth & Pacific Cos Inc * | | | 357,300 | | | | 4,448,385 | |
Five Below Inc * | | | 128,600 | | | | 4,120,344 | |
Interval Leisure Group Inc | | | 159,280 | | | | 3,088,439 | |
Life Time Fitness Inc * | | | 93,935 | | | | 4,622,541 | |
Lions Gate Entertainment Corp * (Canada) | | | 200,900 | | | | 3,294,760 | |
LKQ Corp * | | | 250,840 | | | | 5,292,724 | |
Marriott Vacations Worldwide Corp * | | | 136,470 | | | | 5,686,705 | |
Pier 1 Imports Inc | | | 269,720 | | | | 5,394,400 | |
Six Flags Entertainment Corp | | | 91,315 | | | | 5,588,478 | |
Sotheby’s | | | 62,580 | | | | 2,103,940 | |
The Cheesecake Factory Inc | | | 110,715 | | | | 3,622,595 | |
The Children’s Place * | | | 73,320 | | | | 3,247,343 | |
Tupperware Brands Corp | | | 78,225 | | | | 5,014,222 | |
Vitamin Shoppe Inc * | | | 94,785 | | | | 5,436,868 | |
Wolverine World Wide Inc | | | 74,700 | | | | 3,061,206 | |
| | | | | | | | |
| | | | 89,493,365 | |
| | | | | | | | |
Consumer Staples - 3.3% | | | | | | | | |
| | |
B&G Foods Inc | | | 166,200 | | | | 4,705,122 | |
The Fresh Market Inc * | | | 65,985 | | | | 3,173,218 | |
The Hain Celestial Group Inc * | | | 87,095 | | | | 4,722,291 | |
United Natural Foods Inc * | | | 74,230 | | | | 3,977,986 | |
| | | | | | | | |
| | | | 16,578,617 | |
| | | | | | | | |
Energy - 5.1% | | | | | | | | |
| | |
Approach Resources Inc * | | | 70,200 | | | | 1,755,702 | |
Berry Petroleum Co ‘A’ | | | 108,415 | | | | 3,637,323 | |
Dril-Quip Inc * | | | 53,200 | | | | 3,886,260 | |
Energy XXI Ltd (Bermuda) | | | 126,245 | | | | 4,063,827 | |
Hornbeck Offshore Services Inc * | | | 81,600 | | | | 2,802,144 | |
Kodiak Oil & Gas Corp * (Canada) | | | 227,130 | | | | 2,010,100 | |
Northern Oil & Gas Inc * | | | 211,090 | | | | 3,550,534 | |
Rosetta Resources Inc * | | | 83,380 | | | | 3,782,117 | |
| | | | | | | | |
| | | | 25,488,007 | |
| | | | | | | | |
Financials - 8.0% | | | | | | | | |
| | |
Cohen & Steers Inc | | | 107,630 | | | | 3,279,486 | |
DuPont Fabros Technology Inc REIT | | | 161,400 | | | | 3,899,424 | |
Extra Space Storage Inc REIT | | | 124,435 | | | | 4,528,190 | |
Fortress Investment Group LLC ‘A’ | | | 692,610 | | | | 3,040,558 | |
Jones Lang LaSalle Inc | | | 50,665 | | | | 4,252,820 | |
Northwest Bancshares Inc | | | 243,660 | | | | 2,958,032 | |
Ryman Hospitality Properties REIT | | | 94,031 | | | | 3,616,432 | |
Silver Bay Realty Trust Corp REIT * | | | 106,800 | | | | 2,011,044 | |
Texas Capital Bancshares Inc * | | | 108,400 | | | | 4,858,488 | |
Two Harbors Investment Corp REIT | | | 436,545 | | | | 4,836,919 | |
Walter Investment Management Corp * | | | 58,400 | | | | 2,512,368 | |
| | | | | | | | |
| | | | 39,793,761 | |
| | | | | | | | |
Health Care - 18.0% | | | | | | | | |
| | |
Accretive Health Inc * | | | 280,900 | | | | 3,247,204 | |
Acorda Therapeutics Inc * | | | 96,800 | | | | 2,406,448 | |
Align Technology Inc * | | | 109,790 | | | | 3,046,672 | |
Alkermes PLC * (Ireland) | | | 128,815 | | | | 2,385,654 | |
athenahealth Inc * | | | 42,600 | | | | 3,128,970 | |
Bruker Corp * | | | 258,500 | | | | 3,947,295 | |
Centene Corp * | | | 59,800 | | | | 2,451,800 | |
Cepheid Inc * | | | 119,455 | | | | 4,038,774 | |
Cubist Pharmaceuticals Inc * | | | 53,045 | | | | 2,231,073 | |
| | | | | | | | |
| | | Shares | | |
Value | |
Endologix Inc * | | | 244,200 | | | | $3,477,408 | |
Greenway Medical Technologies Inc * | | | 160,095 | | | | 2,459,059 | |
HealthSouth Corp * | | | 185,785 | | | | 3,921,921 | |
HMS Holdings Corp * | | | 139,700 | | | | 3,621,024 | |
Idenix Pharmaceuticals Inc * | | | 326,700 | | | | 1,584,495 | |
Insulet Corp * | | | 197,950 | | | | 4,200,499 | |
Molina Healthcare Inc * | | | 82,700 | | | | 2,237,862 | |
NxStage Medical Inc * | | | 219,865 | | | | 2,473,481 | |
Optimer Pharmaceuticals Inc * | | | 151,650 | | | | 1,372,433 | |
PAREXEL International Corp * | | | 87,065 | | | | 2,576,253 | |
Pharmacyclics Inc * | | | 63,100 | | | | 3,653,490 | |
Questcor Pharmaceuticals Inc | | | 107,300 | | | | 2,867,056 | |
Seattle Genetics Inc * | | | 75,035 | | | | 1,740,812 | |
Synageva BioPharma Corp * | | | 44,200 | | | | 2,046,018 | |
Team Health Holdings Inc * | | | 148,100 | | | | 4,260,837 | |
Tenet Healthcare Corp * | | | 136,125 | | | | 4,419,979 | |
Theravance Inc * | | | 86,995 | | | | 1,937,379 | |
Thoratec Corp * | | | 75,333 | | | | 2,826,494 | |
ViroPharma Inc * | | | 74,390 | | | | 1,693,116 | |
Vivus Inc * | | | 174,800 | | | | 2,345,816 | |
Volcano Corp * | | | 149,725 | | | | 3,535,007 | |
Wright Medical Group Inc * | | | 159,530 | | | | 3,348,535 | |
| | | | | | | | |
| | | | | | | | |
| | | | 89,482,864 | |
| | | | | | | | |
Industrials - 14.1% | | | | | | | | |
| | |
A.O. Smith Corp | | | 80,955 | | | | 5,105,832 | |
Actuant Corp ‘A’ | | | 200,265 | | | | 5,589,396 | |
Alaska Air Group Inc * | | | 112,300 | | | | 4,839,007 | |
Avis Budget Group Inc * | | | 172,120 | | | | 3,411,418 | |
Barnes Group Inc | | | 115,290 | | | | 2,589,413 | |
Beacon Roofing Supply Inc * | | | 129,000 | | | | 4,293,120 | |
Clean Harbors Inc * | | | 58,675 | | | | 3,227,712 | |
Esterline Technologies Corp * | | | 77,790 | | | | 4,948,222 | |
Genesee & Wyoming Inc ‘A’ * | | | 74,850 | | | | 5,694,588 | |
Hub Group Inc ‘A’ * | | | 134,150 | | | | 4,507,440 | |
Lindsay Corp | | | 72,400 | | | | 5,800,688 | |
RBC Bearings Inc * | | | 107,540 | | | | 5,384,528 | |
Tetra Tech Inc * | | | 192,705 | | | | 5,097,047 | |
Towers Watson & Co ‘A’ | | | 48,584 | | | | 2,730,907 | |
United Rentals Inc * | | | 72,765 | | | | 3,312,263 | |
Watsco Inc | | | 50,200 | | | | 3,759,980 | |
| | | | | | | | |
| | | | 70,291,561 | |
| | | | | | | | |
Information Technology - 23.3% | | | | | | | | |
| | |
3D Systems Corp * | | | 90,400 | | | | 4,822,840 | |
Allot Communications Ltd * (Israel) | | | 116,000 | | | | 2,067,120 | |
Applied Micro Circuits Corp * | | | 255,665 | | | | 2,147,586 | |
Aruba Networks Inc * | | | 118,200 | | | | 2,452,650 | |
Aspen Technology Inc * | | | 185,300 | | | | 5,121,692 | |
BroadSoft Inc * | | | 73,355 | | | | 2,664,987 | |
Cadence Design Systems Inc * | | | 446,065 | | | | 6,026,338 | |
Cavium Inc * | | | 101,425 | | | | 3,165,474 | |
Ciena Corp * | | | 190,465 | | | | 2,990,301 | |
Cognex Corp | | | 145,403 | | | | 5,353,739 | |
CommVault Systems Inc * | | | 88,175 | | | | 6,146,679 | |
CoStar Group Inc * | | | 49,875 | | | | 4,457,329 | |
Cypress Semiconductor Corp * | | | 231,000 | | | | 2,504,040 | |
DealerTrack Technologies Inc * | | | 185,265 | | | | 5,320,811 | |
ExactTarget Inc * | | | 223,200 | | | | 4,464,000 | |
Finisar Corp * | | | 232,730 | | | | 3,793,499 | |
Fortinet Inc * | | | 139,960 | | | | 2,948,957 | |
Freescale Semiconductor Ltd * (Bermuda) | | | 269,000 | | | | 2,961,690 | |
Fusion-io Inc * | | | 137,600 | | | | 3,155,168 | |
InterXion Holding NV * (Netherlands) | | | 180,060 | | | | 4,278,226 | |
Microsemi Corp * | | | 287,600 | | | | 6,051,104 | |
OpenTable Inc * | | | 79,540 | | | | 3,881,552 | |
QLIK Technologies Inc * | | | 215,070 | | | | 4,671,320 | |
Radware Ltd * (Israel) | | | 76,200 | | | | 2,514,600 | |
Ruckus Wireless Inc * | | | 165,900 | | | | 3,737,727 | |
Silicon Graphics International Corp * | | | 363,755 | | | | 3,721,214 | |
| | |
| See Notes to Financial Statements | | See explanation of symbols and terms, if any, on page B-143 |
B-104
PACIFIC SELECT FUND
SMALL-CAP GROWTH PORTFOLIO
Schedule of Investments (Continued)
December 31, 2012
| | | | | | | | |
| | | Shares | | |
Value | |
Sourcefire Inc * | | | 67,500 | | | | $3,187,350 | |
Ultimate Software Group Inc * | | | 57,125 | | | | 5,393,171 | |
WEX Inc * | | | 77,085 | | | | 5,809,896 | |
| | | | | | | | |
| | | | 115,811,060 | |
| | | | | | | | |
Materials - 5.0% | | | | | | | | |
| | |
Chemtura Corp * | | | 213,800 | | | | 4,545,388 | |
Cytec Industries Inc | | | 55,000 | | | | 3,785,650 | |
Hecla Mining Co | | | 307,100 | | | | 1,790,393 | |
PolyOne Corp | | | 292,265 | | | | 5,968,051 | |
Rockwood Holdings Inc | | | 84,930 | | | | 4,200,638 | |
Silgan Holdings Inc | | | 110,850 | | | | 4,610,251 | |
| | | | | | | | |
| | | | 24,900,371 | |
| | | | | | | | |
Telecommunication Services - 0.8% | | | | | | | | |
| | |
Cogent Communications Group Inc | | | 164,900 | | | | 3,733,336 | |
| | | | | | | | |
| | |
Utilities - 0.5% | | | | | | | | |
| | |
ITC Holdings Corp | | | 31,235 | | | | 2,402,284 | |
| | | | | | | | |
| | |
Total Common Stocks
(Cost $407,026,126) | | | | | | | 477,975,226 | |
| | | | | | | | |
| | | | | | | | |
| | | Principal
Amount | | | Value | |
SHORT-TERM INVESTMENT - 3.6% | | | | | | | | |
| | |
Repurchase Agreement - 3.6% | | | | | | | | |
| | |
Fixed Income Clearing Corp
0.010% due 01/02/13
(Dated 12/31/12, repurchase price of $18,118,769; collateralized by U.S. Treasury Notes: 0.250% due 07/15/15 and value $18,485,000) | | | $18,118,759 | | | | $18,118,759 | |
| | | | | | | | |
| | |
Total Short-Term Investment
(Cost $18,118,759) | | | | | | | 18,118,759 | |
| | | | | | | | |
| | |
TOTAL INVESTMENTS - 99.7%
(Cost $425,144,885) | | | | | | | 496,093,985 | |
| |
OTHER ASSETS & LIABILITIES, NET - 0.3% | | | | 1,388,073 | |
| | | | | | | | |
| | |
NET ASSETS - 100.0% | | | | | | | $497,482,058 | |
| | | | | | | | |
Notes to Schedule of Investments
| (a) | As of December 31, 2012, the portfolio was diversified as a percentage of net assets as follows: |
| | | | |
Information Technology | | | 23.3% | |
Consumer Discretionary | | | 18.0% | |
Health Care | | | 18.0% | |
Industrials | | | 14.1% | |
Financials | | | 8.0% | |
Energy | | | 5.1% | |
Materials | | | 5.0% | |
Short-Term Investment | | | 3.6% | |
Consumer Staples | | | 3.3% | |
Telecommunication Services | | | 0.8% | |
Utilities | | | 0.5% | |
| | | | |
| | | 99.7% | |
Other Assets & Liabilities, Net | | | 0.3% | |
| | | | |
| | | 100.0% | |
| | | | |
| (b) | Short-term investments reflect either the stated coupon rate or the annualized effective yield on the date of purchase for discounted investments. |
| (c) | Fair Value Measurements |
The following is a summary of the portfolio’s investments as categorized under the three-tier hierarchy of inputs used in valuing the portfolio’s assets and liabilities (See Note 3D in Notes to Financial Statements) as of December 31, 2012:
| | | | | | | | | | | | | | | | | | |
| | | | | Total Value at
December 31, 2012 | | | Level 1
Quoted Price | | | Level 2
Significant
Observable Inputs | | | Level 3
Significant
Unobservable Inputs | |
Assets | | Common Stocks (1) | | | $477,975,226 | | | | $477,975,226 | | | | $- | | | | $- | |
| | Short-Term Investment | | | 18,118,759 | | | | - | | | | 18,118,759 | | | | - | |
| | | | | | | | | | | | | | | | | | |
| | Total | | | $496,093,985 | | | | $477,975,226 | | | | $18,118,759 | | | | $- | |
| | | | | | | | | | | | | | | | | | |
| | (1) | For equity investments categorized in a single level, refer to the schedule of investments for further industry breakout. |
| | |
| See Notes to Financial Statements | | See explanation of symbols and terms, if any, on page B-143 |
B-105
PACIFIC SELECT FUND
SMALL-CAP INDEX PORTFOLIO
Summary Schedule of Investments
December 31, 2012
| | | | | | | | |
| | | Shares | | | Value | |
RIGHTS - 0.0% | | | | | | | | |
| | |
Health Care - 0.0% | | | | | | | | |
| | |
Other security | | | | | | | $- | |
| | | | | | | | |
| | |
Total Rights
(Cost $0) | | | | | | | - | |
| | | | | | | | |
| | |
WARRANTS - 0.0% | | | | | | | | |
| | |
Energy - 0.0% | | | | | | | | |
| | |
Other security | | | | | | | 2,151 | |
| | | | | | | | |
| | |
Total Warrants
(Cost $0) | | | | | | | 2,151 | |
| | | | | | | | |
| | |
COMMON STOCKS - 97.1% | | | | | | | | |
| | |
Consumer Discretionary - 13.6% | | | | | | | | |
| | |
Brunswick Corp | | | 53,980 | | | | 1,570,278 | |
Dana Holding Corp | | | 89,229 | | | | 1,392,865 | |
Domino’s Pizza Inc | | | 35,004 | | | | 1,524,424 | |
Six Flags Entertainment Corp | | | 24,000 | | | | 1,468,800 | |
Sotheby’s | | | 40,918 | | | | 1,375,663 | |
The Warnaco Group Inc * | | | 24,785 | | | | 1,773,862 | |
Other securities | | | | | | | 92,561,901 | |
| | | | | | | | |
| | | | 101,667,793 | |
| | | | | | | | |
Consumer Staples - 3.4% | | | | | | | | |
| | |
United Natural Foods Inc * | | | 29,506 | | | | 1,581,227 | |
Other securities | | | | | | | 23,917,163 | |
| | | | | | | | |
| | | | 25,498,390 | |
| | | | | | | | |
Energy - 5.9% | | | | | | | | |
| | |
Dril-Quip Inc * | | | 24,264 | | | | 1,772,485 | |
Energy XXI Ltd (Bermuda) | | | 47,661 | | | | 1,534,208 | |
Kodiak Oil & Gas Corp * (Canada) | | | 159,287 | | | | 1,409,690 | |
Oasis Petroleum Inc * | | | 48,248 | | | | 1,534,286 | |
Rosetta Resources Inc * | | | 31,956 | | | | 1,449,524 | |
Other securities | | | | | | | 36,117,212 | |
| | | | | | | | |
| | | | 43,817,405 | |
| | | | | | | | |
Financials - 22.2% | | | | | | | | |
| | |
Alterra Capital Holdings Ltd (Bermuda) | | | 51,921 | | | | 1,463,653 | |
First American Financial Corp | | | 64,446 | | | | 1,552,504 | |
Hancock Holding Co | | | 46,212 | | | | 1,466,769 | |
Invesco Mortgage Capital Inc REIT | | | 70,409 | | | | 1,387,761 | |
Ocwen Financial Corp * | | | 65,070 | | | | 2,250,771 | |
Omega Healthcare Investors Inc REIT | | | 68,075 | | | | 1,623,589 | |
Starwood Property Trust Inc REIT | | | 81,797 | | | | 1,878,059 | |
Two Harbors Investment Corp REIT | | | 179,044 | | | | 1,983,808 | |
Other securities | | | | | | | 152,044,115 | |
| | | | | | | | |
| | | | 165,651,029 | |
| | | | | | | | |
Health Care - 11.7% | | | | | | | | |
| | |
Alkermes PLC * (Ireland) | | | 73,965 | | | | 1,369,832 | |
athenahealth Inc * | | | 21,650 | | | | 1,590,192 | |
Cubist Pharmaceuticals Inc * | | | 38,255 | | | | 1,609,005 | |
Pharmacyclics Inc * | | | 32,888 | | | | 1,904,215 | |
Other securities | | | | | | | 81,176,893 | |
| | | | | | | | |
| | | | 87,650,137 | |
| | | | | | | | |
Industrials - 15.1% | | | | | | | | |
| | |
A.O. Smith Corp | | | 23,570 | | | | 1,486,560 | |
Acuity Brands Inc | | | 25,587 | | | | 1,733,008 | |
Alaska Air Group Inc * | | | 43,008 | | | | 1,853,215 | |
CLARCOR Inc | | | 30,352 | | | | 1,450,219 | |
EMCOR Group Inc | | | 40,291 | | | | 1,394,472 | |
| | | | | | | | |
| | | Shares | | | Value | |
Genesee & Wyoming Inc ‘A’ * | | | 26,795 | | | | $2,038,564 | |
HEICO Corp | | | 31,811 | | | | 1,423,860 | |
Hexcel Corp * | | | 60,177 | | | | 1,622,372 | |
Old Dominion Freight Line Inc * | | | 43,068 | | | | 1,476,371 | |
Robbins & Myers Inc | | | 23,258 | | | | 1,382,688 | |
Teledyne Technologies Inc * | | | 22,201 | | | | 1,444,619 | |
The Middleby Corp * | | | 11,305 | | | | 1,449,414 | |
Woodward Inc | | | 41,770 | | | | 1,592,690 | |
Other securities | | | | | | | 91,933,484 | |
| | | | | | | | |
| | | | 112,281,536 | |
| | | | | | | | |
Information Technology - 16.1% | | | | | | | | |
| | |
3D Systems Corp * | | | 28,296 | | | | 1,509,592 | |
Aruba Networks Inc * | | | 67,525 | | | | 1,401,144 | |
Aspen Technology Inc * | | | 56,520 | | | | 1,562,213 | |
CommVault Systems Inc * | | | 26,985 | | | | 1,881,124 | |
CoStar Group Inc * | | | 17,040 | | | | 1,522,865 | |
Cymer Inc * | | | 18,709 | | | | 1,691,855 | |
Parametric Technology Corp * | | | 72,218 | | | | 1,625,627 | |
Ultimate Software Group Inc * | | | 16,087 | | | | 1,518,774 | |
WEX Inc * | | | 23,492 | | | | 1,770,592 | |
Other securities | | | | | | | 105,781,914 | |
| | | | | | | | |
| | | | 120,265,700 | |
| | | | | | | | |
Materials - 5.1% | | | | | | | | |
| | |
Eagle Materials Inc | | | 29,562 | | | | 1,729,377 | |
Louisiana-Pacific Corp * | | | 83,106 | | | | 1,605,608 | |
Other securities | | | | | | | 35,051,639 | |
| | | | | | | | |
| | | | 38,386,624 | |
| | | | | | | | |
Telecommunication Services - 0.7% | | | | | | | | |
| | |
Other securities | | | | | | | 5,084,188 | |
| | | | | | | | |
| | |
Utilities - 3.3% | | | | | | | | |
| | |
Cleco Corp | | | 36,894 | | | | 1,476,129 | |
Piedmont Natural Gas Co Inc | | | 43,528 | | | | 1,362,862 | |
Other securities | | | | | | | 21,554,219 | |
| | | | | | | | |
| | | | 24,393,210 | |
| | | | | | | | |
Total Common Stocks
(Cost $683,829,489) | | | | | | | 724,696,012 | |
| | | | | | | | |
| | |
CLOSED-END MUTUAL FUND - 0.0% | | | | | | | | |
| | |
Other security | | | | | | | 91,682 | |
| | | | | | | | |
| | |
Total Closed-End Mutual Fund
(Cost $98,824) | | | | | | | 91,682 | |
| | | | | | | | |
| | | | | | | | |
| | | Principal
Amount | | | | |
SHORT-TERM INVESTMENT - 2.6% | | | | | | | | |
| | |
Repurchase Agreement - 2.6% | | | | | | | | |
| | |
Fixed Income Clearing Corp
0.010% due 01/02/13
(Dated 12/31/12, repurchase price of $19,381,618; collateralized by U.S. Treasury Notes: 0.250% due 07/15/15 and value $19,770,000) | | | $19,381,607 | | | | 19,381,607 | |
| | | | | | | | |
| | |
Total Short-Term Investment
(Cost $19,381,607) | | | | | | | 19,381,607 | |
| | | | | | | | |
| | |
TOTAL INVESTMENTS - 99.7%
(Cost $703,309,920) | | | | | | | 744,171,452 | |
| |
OTHER ASSETS & LIABILITIES, NET - 0.3% | | | | 1,913,940 | |
| | | | | | | | |
| | |
NET ASSETS - 100.0% | | | | | | | $746,085,392 | |
| | | | | | | | |
| | |
| See Notes to Financial Statements | | See explanation of symbols and terms, if any, on page B-143 |
B-106
PACIFIC SELECT FUND
SMALL-CAP INDEX PORTFOLIO
Summary Schedule of Investments (Continued)
December 31, 2012
Notes to Schedule of Investments
| (a) | As of December 31, 2012, the portfolio was diversified as a percentage of net assets as follows: |
| | | | |
Financials | | | 22.2% | |
Information Technology | | | 16.1% | |
Industrials | | | 15.1% | |
Consumer Discretionary | | | 13.6% | |
Health Care | | | 11.7% | |
Energy | | | 5.9% | |
Materials | | | 5.1% | |
Consumer Staples | | | 3.4% | |
Utilities | | | 3.3% | |
Short-Term Investment | | | 2.6% | |
Telecommunication Services | | | 0.7% | |
| | | | |
| | | 99.7% | |
Other Assets & Liabilities, Net | | | 0.3% | |
| | | | |
| | | 100.0% | |
| | | | |
| (b) | Short-term investments reflect either the stated coupon rate or the annualized effective yield on the date of purchase for discounted investments. |
| (c) | Other securities represent the portfolio’s securities not identified as a top-fifty holding in terms of value, and not exceeding one percent of the portfolio’s net assets as of December 31, 2012. |
| (d) | A Summary Schedule of Investments is presented for this portfolio. For information on availability of a complete Schedule of Investments, refer to the WHERE TO GO FOR MORE INFORMATION section of this report. |
| (e) | As of December 31, 2012, $1,208,000 in cash was segregated with the broker(s)/custodian as collateral for open futures contracts. |
| (f) | Open futures contracts outstanding as of December 31, 2012 were as follows: |
| | | | | | | | | | | | |
| Long Futures Outstanding | | Number of
Contracts | | | Notional
Amount | | | Unrealized
Appreciation | |
| Russell 2000 Mini (03/13) | | | 259 | | | | $21,514,155 | | | | $412,785 | |
| | | | | | | | | | | | |
| (g) | Fair Value Measurements |
The following is a summary of the portfolio’s investments as categorized under the three-tier hierarchy of inputs used in valuing the portfolio’s assets and liabilities (See Note 3D in Notes to Financial Statements) as of December 31, 2012:
| | | | | | | | | | | | | | | | | | |
| | | Total Value at
December 31, 2012 | | | Level 1
Quoted Price | | | Level 2
Significant
Observable Inputs | | | Level 3
Significant
Unobservable Inputs | |
Assets | | Warrants (1) | | | $2,151 | | | | $2,151 | | | | $- | | | | $- | |
| | Common Stocks (1) | | | 724,696,012 | | | | 724,696,012 | | | | - | | | | - | |
| | Closed-End Mutual Fund | | | 91,682 | | | | 91,682 | | | | - | | | | - | |
| | Short-Term Investment | | | 19,381,607 | | | | - | | | | 19,381,607 | | | | - | |
| | Derivatives: | | | | | | | | | | | | | | | | |
| | Equity Contracts | | | | | | | | | | | | | | | | |
| | Futures | | | 412,785 | | | | 412,785 | | | | - | | | | - | |
| | | | | | | | | | | | | | | | | | |
| | Total | | | $744,584,237 | | | | $725,202,630 | | | | $19,381,607 | | | | $- | |
| | | | | | | | | | | | | | | | | | |
| | (1) | For equity investments categorized in a single level, refer to the schedule of investments for further industry breakout. |
| | |
| See Notes to Financial Statements | | See explanation of symbols and terms, if any, on page B-143 |
B-107
PACIFIC SELECT FUND
SMALL-CAP VALUE PORTFOLIO
Schedule of Investments
December 31, 2012
| | | | | | | | |
| | | Shares | | | Value | |
COMMON STOCKS - 95.0% | | | | | | | | |
| | |
Consumer Discretionary - 11.2% | | | | | | | | |
| | |
Aaron’s Inc | | | 163,100 | | | | $4,612,468 | |
Bob Evans Farms Inc | | | 52,100 | | | | 2,094,420 | |
Cinemark Holdings Inc | | | 229,700 | | | | 5,967,606 | |
Cracker Barrel Old Country Store Inc | | | 53,500 | | | | 3,437,910 | |
Group 1 Automotive Inc | | | 78,456 | | | | 4,863,488 | |
Harman International Industries Inc | | | 120,400 | | | | 5,374,656 | |
Hillenbrand Inc | | | 91,500 | | | | 2,068,815 | |
International Game Technology | | | 397,200 | | | | 5,628,324 | |
Meredith Corp | | | 140,400 | | | | 4,836,780 | |
Rent-A-Center Inc | | | 14,000 | | | | 481,040 | |
Sturm Ruger & Co Inc | | | 79,700 | | | | 3,618,380 | |
The Buckle Inc | | | 105,478 | | | | 4,708,538 | |
True Religion Apparel Inc | | | 73,484 | | | | 1,867,963 | |
Wolverine World Wide Inc | | | 129,000 | | | | 5,286,420 | |
| | | | | | | | |
| | | | 54,846,808 | |
| | | | | | | | |
Consumer Staples - 5.8% | | | | | | | | |
| | |
Cal-Maine Foods Inc | | | 78,000 | | | | 3,137,160 | |
Casey’s General Stores Inc | | | 42,725 | | | | 2,268,697 | |
Cott Corp (Canada) | | | 121,900 | | | | 978,857 | |
Fresh Del Monte Produce Inc (Cayman) | | | 61,000 | | | | 1,607,350 | |
Harris Teeter Supermarkets Inc | | | 114,500 | | | | 4,415,120 | |
Ingredion Inc | | | 112,900 | | | | 7,274,147 | |
The Andersons Inc | | | 79,800 | | | | 3,423,420 | |
Universal Corp | | | 95,600 | | | | 4,771,396 | |
Weis Markets Inc | | | 22,100 | | | | 865,657 | |
| | | | | | | | |
| | | | 28,741,804 | |
| | | | | | | | |
Energy -12.3% | | | | | | | | |
| | |
Alliance Resource Partners LP | | | 48,537 | | | | 2,818,543 | |
Berry Petroleum Co ‘A’ | | | 150,900 | | | | 5,062,695 | |
Bristow Group Inc | | | 113,000 | | | | 6,063,580 | |
Buckeye Partners LP | | | 76,200 | | | | 3,460,242 | |
Cimarex Energy Co | | | 73,400 | | | | 4,237,382 | |
CVR Energy Inc * | | | 149,400 | | | | 7,289,226 | |
Delek US Holdings Inc | | | 18,400 | | | | 465,888 | |
Energen Corp | | | 108,700 | | | | 4,901,283 | |
Pioneer Southwest Energy Partners LP | | | 53,306 | | | | 1,210,046 | |
Ship Finance International Ltd (Bermuda) | | | 163,001 | | | | 2,710,707 | |
Sunoco Logistics Partners LP | | | 109,500 | | | | 5,445,435 | |
TC Pipelines LP | | | 20,099 | | | | 811,196 | |
Tidewater Inc | | | 110,200 | | | | 4,923,736 | |
TransMontaigne Partners LP | | | 31,837 | | | | 1,208,851 | |
Western Refining Inc | | | 87,700 | | | | 2,472,263 | |
World Fuel Services Corp | | | 176,981 | | | | 7,286,308 | |
| | | | | | | | |
| | | | 60,367,381 | |
| | | | | | | | |
Financials - 17.7% | | | | | | | | |
| | |
American Financial Group Inc | | | 131,000 | | | | 5,177,120 | |
American Realty Capital Trust Inc REIT | | | 99,463 | | | | 1,148,798 | |
AmTrust Financial Services Inc | | | 96,250 | | | | 2,761,412 | |
Bank of Hawaii Corp | | | 105,200 | | | | 4,634,060 | |
CapitalSource Inc | | | 508,200 | | | | 3,852,156 | |
Cash America International Inc | | | 120,199 | | | | 4,768,294 | |
Community Trust Bancorp Inc | | | 14,600 | | | | 478,588 | |
Duff & Phelps Corp ‘A’ | | | 55,200 | | | | 862,224 | |
First Niagara Financial Group Inc | | | 624,900 | | | | 4,955,457 | |
FirstMerit Corp | | | 53,726 | | | | 762,372 | |
Franklin Street Properties Corp REIT | | | 194,300 | | | | 2,391,833 | |
Fulton Financial Corp | | | 493,900 | | | | 4,746,379 | |
Glacier Bancorp Inc | | | 7,617 | | | | 112,046 | |
Hatteras Financial Corp REIT | | | 93,200 | | | | 2,312,292 | |
Lakeland Financial Corp | | | 17,902 | | | | 462,588 | |
Montpelier Re Holdings Ltd (Bermuda) | | | 58,300 | | | | 1,332,738 | |
Old National Bancorp | | | 196,552 | | | | 2,333,072 | |
Omega Healthcare Investors Inc REIT | | | 206,400 | | | | 4,922,640 | |
| | | | | | | | |
| | | Shares | | | Value | |
Prosperity Bancshares Inc | | | 109,300 | | | | $4,590,600 | |
PS Business Parks Inc REIT | | | 47,900 | | | | 3,112,542 | |
Raymond James Financial Inc | | | 139,400 | | | | 5,371,082 | |
Retail Properties of America Inc ‘A’ REIT | | | 265,087 | | | | 3,173,091 | |
SEI Investments Co | | | 222,402 | | | | 5,190,863 | |
Southside Bancshares Inc | | | 25,500 | | | | 537,030 | |
Starwood Property Trust Inc REIT | | | 209,900 | | | | 4,819,304 | |
Susquehanna Bancshares Inc | | | 342,600 | | | | 3,590,448 | |
Tompkins Financial Corp | | | 13,000 | | | | 515,320 | |
Trustmark Corp | | | 179,700 | | | | 4,036,062 | |
Washington Federal Inc | | | 211,800 | | | | 3,573,066 | |
WesBanco Inc | | | 24,405 | | | | 542,279 | |
| | | | | | | | |
| | | | 87,065,756 | |
| | | | | | | | |
Health Care - 6.2% | | | | | | | | |
| | |
Invacare Corp | | | 84,062 | | | | 1,370,210 | |
Owens & Minor Inc | | | 172,100 | | | | 4,906,571 | |
PerkinElmer Inc | | | 189,600 | | | | 6,017,904 | |
STERIS Corp | | | 158,600 | | | | 5,508,178 | |
Teleflex Inc | | | 81,900 | | | | 5,840,289 | |
The Cooper Cos Inc | | | 73,154 | | | | 6,765,282 | |
The Ensign Group Inc | | | 8,394 | | | | 228,233 | |
| | | | | | | | |
| | | | 30,636,667 | |
| | | | | | | | |
Industrials - 18.6% | | | | | | | | |
| | |
ABM Industries Inc | | | 51,900 | | | | 1,035,405 | |
Alliant Techsystems Inc | | | 101,700 | | | | 6,301,332 | |
Applied Industrial Technologies Inc | | | 40,100 | | | | 1,684,601 | |
Avery Dennison Corp | | | 132,700 | | | | 4,633,884 | |
Barnes Group Inc | | | 152,200 | | | | 3,418,412 | |
Belden Inc | | | 132,500 | | | | 5,961,175 | |
Crane Co | | | 129,050 | | | | 5,972,434 | |
Cubic Corp | | | 32,300 | | | | 1,549,431 | |
Curtiss-Wright Corp | | | 136,400 | | | | 4,478,012 | |
Elbit Systems Ltd (Israel) | | | 24,700 | | | | 989,235 | |
Ennis Inc | | | 51,400 | | | | 795,158 | |
Great Lakes Dredge & Dock Co | | | 121,200 | | | | 1,082,316 | |
ITT Corp | | | 221,104 | | | | 5,187,100 | |
KBR Inc | | | 161,700 | | | | 4,838,064 | |
Kennametal Inc | | | 146,100 | | | | 5,844,000 | |
McGrath RentCorp | | | 23,600 | | | | 684,872 | |
Standex International Corp | | | 16,559 | | | | 849,311 | |
TAL International Group Inc | | | 74,100 | | | | 2,695,758 | |
Textainer Group Holdings Ltd (Bermuda) | | | 58,398 | | | | 1,837,201 | |
The Brink’s Co | | | 148,800 | | | | 4,245,264 | |
Titan International Inc | | | 188,400 | | | | 4,092,048 | |
Trinity Industries Inc | | | 93,296 | | | | 3,341,863 | |
Triumph Group Inc | | | 109,639 | | | | 7,159,427 | |
UniFirst Corp | | | 28,948 | | | | 2,122,467 | |
Valmont Industries Inc | | | 53,900 | | | | 7,360,045 | |
Werner Enterprises Inc | | | 156,254 | | | | 3,386,024 | |
| | | | | | | | |
| | | | 91,544,839 | |
| | | | | | | | |
Information Technology - 3.3% | | | | | | | | |
| | |
AVX Corp | | | 100,400 | | | | 1,082,312 | |
Diebold Inc | | | 151,596 | | | | 4,640,354 | |
Fair Isaac Corp | | | 75,351 | | | | 3,167,002 | |
j2 Global Inc | | | 92,582 | | | | 2,831,158 | |
Jabil Circuit Inc | | | 237,700 | | | | 4,585,233 | |
| | | | | | | | |
| | | | 16,306,059 | |
| | | | | | | | |
Materials - 13.9% | | | | | | | | |
| | |
A. Schulman Inc | | | 81,900 | | | | 2,369,367 | |
AMCOL International Corp | | | 45,196 | | | | 1,386,613 | |
Buckeye Technologies Inc | | | 88,000 | | | | 2,526,480 | |
Cabot Corp | | | 133,900 | | | | 5,327,881 | |
Domtar Corp | | | 11,700 | | | | 977,184 | |
HudBay Minerals Inc (Canada) | | | 465,372 | | | | 4,687,873 | |
IAMGOLD Corp (NYSE) (Canada) | | | 305,200 | | | | 3,500,644 | |
Innophos Holdings Inc | | | 74,200 | | | | 3,450,300 | |
| | |
| See Notes to Financial Statements | | See explanation of symbols and terms, if any, on page B-143 |
B-108
PACIFIC SELECT FUND
SMALL-CAP VALUE PORTFOLIO
Schedule of Investments (Continued)
December 31, 2012
| | | | | | | | |
| | | Shares | | | Value | |
Methanex Corp (NASDAQ) (Canada) | | | 154,676 | | | | $4,929,524 | |
Neenah Paper Inc | | | 54,279 | | | | 1,545,323 | |
NewMarket Corp | | | 20,847 | | | | 5,466,083 | |
Olin Corp | | | 59,678 | | | | 1,288,448 | |
Quaker Chemical Corp | | | 40,200 | | | | 2,165,172 | |
Rentech Nitrogen Partners LP | | | 45,937 | | | | 1,731,366 | |
Rock-Tenn Co ‘A’ | | | 68,500 | | | | 4,788,835 | |
Royal Gold Inc | | | 74,625 | | | | 6,067,759 | |
Sensient Technologies Corp | | | 134,200 | | | | 4,772,152 | |
Sonoco Products Co | | | 171,850 | | | | 5,109,101 | |
Steel Dynamics Inc | | | 302,900 | | | | 4,158,817 | |
Stepan Co | | | 33,972 | | | | 1,886,805 | |
| | | | | | | | |
| | | | | | | 68,135,727 | |
| | | | | | | | |
Utilities - 6.0% | | | | | | | | |
| | |
AGL Resources Inc | | | 84,600 | | | | 3,381,462 | |
Atmos Energy Corp | | | 129,600 | | | | 4,551,552 | |
Avista Corp | | | 81,300 | | | | 1,960,143 | |
El Paso Electric Co | | | 60,447 | | | | 1,928,864 | |
Great Plains Energy Inc | | | 122,000 | | | | 2,477,820 | |
Portland General Electric Co | | | 133,000 | | | | 3,638,880 | |
Suburban Propane Partners LP | | | 56,500 | | | | 2,195,590 | |
UGI Corp | | | 181,000 | | | | 5,920,510 | |
Westar Energy Inc | | | 122,500 | | | | 3,505,950 | |
| | | | | | | | |
| | | | | | | 29,560,771 | |
| | | | | | | | |
Total Common Stocks
(Cost $365,085,033) | | | | | | | 467,205,812 | |
| | | | | | | | |
| | |
CLOSED-END MUTUAL FUND - 0.9% | | | | | | | | |
| | |
Central Fund of Canada Ltd ‘A’ (Canada) | | | 202,300 | | | | 4,254,369 | |
| | | | | | | | |
| | |
Total Closed-End Mutual Fund
(Cost $2,457,563) | | | | | | | 4,254,369 | |
| | | | | | | | |
| | | | | | | | |
| | | Principal
Amount | | | Value | |
SHORT-TERM INVESTMENT - 4.4% | | | | | | | | |
| | |
Repurchase Agreement - 4.4% | | | | | | | | |
| | |
Fixed Income Clearing Corp
0.010% due 01/02/13
(Dated 12/31/12, repurchase price of
$21,500,306; collateralized by U.S. Treasury Notes: 2.750% due 11/30/16 and value $21,932,869) | | | $21,500,294 | | | | $21,500,294 | |
| | | | | | | | |
| | |
Total Short-Term Investment
(Cost $21,500,294) | | | | | | | 21,500,294 | |
| | | | | | | | |
| | |
TOTAL INVESTMENTS - 100.3% (Cost $389,042,890) | | | | | | | 492,960,475 | |
| |
OTHER ASSETS & LIABILITIES, NET - (0.3%) | | | | (1,305,123 | ) |
| | | | | | | | |
| | |
NET ASSETS - 100.0% | | | | | | | $491,655,352 | |
| | | | | | | | |
Notes to Schedule of Investments
| (a) | As of December 31, 2012, the portfolio was diversified as a percentage of net assets as follows: |
| | | | |
Industrials | | | 18.6% | |
Financials | | | 17.7% | |
Materials | | | 13.9% | |
Energy | | | 12.3% | |
Consumer Discretionary | | | 11.2% | |
Health Care | | | 6.2% | |
Utilities | | | 6.0% | |
Consumer Staples | | | 5.8% | |
Short-Term Investment | | | 4.4% | |
Information Technology | | | 3.3% | |
Closed-End Mutual Fund | | | 0.9% | |
| | | | |
| | | 100.3% | |
Other Assets & Liabilities, Net | | | (0.3% | ) |
| | | | |
| | | 100.0% | |
| | | | |
| (b) | Short-term investments reflect either the stated coupon rate or the annualized effective yield on the date of purchase for discounted investments. |
| (c) | Fair Value Measurements |
The following is a summary of the portfolio’s investments as categorized under the three-tier hierarchy of inputs used in valuing the portfolio’s assets and liabilities (See Note 3D in Notes to Financial Statements) as of December 31, 2012:
| | | | | | | | | | | | | | | | | | |
| | | | | Total Value at
December 31, 2012 | | | Level 1
Quoted Price | | | Level 2
Significant
Observable Inputs | | | Level 3
Significant
Unobservable Inputs | |
Assets | | Common Stocks (1) | | | $467,205,812 | | | | $467,205,812 | | | | $- | | | | $- | |
| | Closed-End Mutual Fund | | | 4,254,369 | | | | 4,254,369 | | | | - | | | | - | |
| | Short-Term Investment | | | 21,500,294 | | | | - | | | | 21,500,294 | | | | - | |
| | | | | | | | | | | | | | | | | | |
| | Total | | | $492,960,475 | | | | $471,460,181 | | | | $21,500,294 | | | | $- | |
| | | | | | | | | | | | | | | | | | |
| | (1) | For equity investments categorized in a single level, refer to the schedule of investments for further industry breakout. |
| | |
| See Notes to Financial Statements | | See explanation of symbols and terms, if any, on page B-143 |
B-109
PACIFIC SELECT FUND
HEALTH SCIENCES PORTFOLIO
Schedule of Investments
December 31, 2012
| | | | | | | | |
| | | Shares | | | Value | |
WARRANTS - 0.1% | | | | | | | | |
| | |
Health Care - 0.1% | | | | | | | | |
| | |
ARYx Therapeutics Inc Strike @ $2.64
Exp. 11/13/13 * ¯ + | | | 44,635 | | | | $- | |
Cytori Therapeutics Inc Strike @ $8.50
Exp. 08/11/13 * ¯ + | | | 27,500 | | | | 3 | |
Derma Sciences Strike @ $9.90
Exp. 06/23/16 * ¯ + | | | 57,500 | | | | 113,654 | |
OncoGenex Pharmaceutical Inc
Strike @ $20.00
Exp. 10/19/15 * ¯ + | | | 12,820 | | | | 1,267 | |
SANUWAVE Health Inc Strike @ $4.00 Exp. 04/08/16 * ¯+ | | | 135,383 | | | | 47 | |
| | | | | | | | |
| | | | | | | 114,971 | |
| | | | | | | | |
Total Warrants
(Cost $13,630) | | | | | | | 114,971 | |
| | | | | | | | |
| | |
COMMON STOCKS - 95.8% | | | | | | | | |
| | |
Health Care - 95.8% | | | | | | | | |
| | |
Acadia Healthcare Co Inc * | | | 72,121 | | | | 1,682,583 | |
Achillion Pharmaceuticals Inc * | | | 69,448 | | | | 556,973 | |
Aetna Inc | | | 30,022 | | | | 1,390,019 | |
Agilent Technologies Inc | | | 38,482 | | | | 1,575,453 | |
Alexion Pharmaceuticals Inc * | | | 104,377 | | | | 9,791,606 | |
Allergan Inc | | | 33,895 | | | | 3,109,188 | |
Alnylam Pharmaceuticals Inc * | | | 81,630 | | | | 1,489,747 | |
Amarin Corp PLC ADR * (United Kingdom) | | | 406,296 | | | | 3,286,935 | |
ARIAD Pharmaceuticals Inc * | | | 244,130 | | | | 4,682,413 | |
Biogen Idec Inc * | | | 29,857 | | | | 4,379,126 | |
BioMarin Pharmaceutical Inc * | | | 226,469 | | | | 11,153,598 | |
Bristol-Myers Squibb Co | | | 104,261 | | | | 3,397,866 | |
Catamaran Corp * (Canada) | | | 20,444 | | | | 963,117 | |
Celldex Therapeutics Inc * | | | 317,890 | | | | 2,133,042 | |
Centene Corp * | | | 102,870 | | | | 4,217,670 | |
CFR Pharmaceuticals SA ADR * ~ (Chile) | | | 125,194 | | | | 3,163,841 | |
ChemoCentryx Inc * | | | 151,570 | | | | 1,658,176 | |
CIGNA Corp | | | 29,742 | | | | 1,590,007 | |
Clovis Oncology Inc * | | | 37,335 | | | | 597,360 | |
Corcept Therapeutics Inc * | | | 322,739 | | | | 461,517 | |
Cytori Therapeutics Inc * | | | 54,688 | | | | 154,220 | |
Derma Sciences Inc * | | | 125,228 | | | | 1,391,283 | |
Dynavax Technologies Corp * | | | 142,564 | | | | 407,733 | |
Edwards Lifesciences Corp * | | | 3,257 | | | | 293,684 | |
Elan Corp PLC ADR * (Ireland) | | | 208,133 | | | | 2,125,038 | |
Express Scripts Holding Co * | | | 58,938 | | | | 3,182,652 | |
Fluidigm Corp * | | | 85,260 | | | | 1,220,071 | |
GenMark Diagnostics Inc * | | | 124,203 | | | | 1,117,827 | |
Gilead Sciences Inc * | | | 47,448 | | | | 3,485,056 | |
HCA Holdings Inc | | | 142,543 | | | | 4,300,522 | |
HealthSouth Corp * | | | 41,198 | | | | 869,690 | |
Hikma Pharmaceuticals PLC
(United Kingdom) | | | 142,450 | | | | 1,782,782 | |
Hologic Inc * | | | 119,599 | | | | 2,395,568 | |
Hyperion Therapeutics Inc * | | | 35,500 | | | | 400,440 | |
Idenix Pharmaceuticals Inc * | | | 80,390 | | | | 389,892 | |
Illumina Inc * | | | 61,126 | | | | 3,397,994 | |
Impax Laboratories Inc * | | | 155,732 | | | | 3,190,949 | |
Infinity Pharmaceuticals Inc * | | | 19,488 | | | | 682,080 | |
Isis Pharmaceuticals Inc * | | | 107,082 | | | | 1,120,078 | |
KYTHERA Biopharmaceuticals Inc * | | | 10,510 | | | | 318,873 | |
MAP Pharmaceuticals Inc * | | | 180,151 | | | | 2,830,172 | |
Merck & Co Inc | | | 35,954 | | | | 1,471,957 | |
Merrimack Pharmaceuticals Inc * | | | 190,530 | | | | 1,160,328 | |
Mylan Inc * | | | 114,049 | | | | 3,134,067 | |
Neurocrine Biosciences Inc * | | | 184,970 | | | | 1,383,576 | |
Novadaq Technologies Inc * (Canada) | | | 108,980 | | | | 967,742 | |
| | | | | | | | |
| | | Shares | | | Value | |
Novo Nordisk AS ADR (Denmark) | | | 12,027 | | | | $1,962,927 | |
Onyx Pharmaceuticals Inc * | | | 62,388 | | | | 4,712,166 | |
Orexigen Therapeutics Inc * | | | 91,480 | | | | 482,100 | |
Pacira Pharmaceuticals Inc * | | | 75,519 | | | | 1,319,317 | |
Pfizer Inc | | | 248,875 | | | | 6,241,785 | |
Pharmacyclics Inc * | | | 14,902 | | | | 862,826 | |
Prothena Corp PLC * (Ireland) | | | 5,076 | | | | 37,210 | |
Puma Biotechnology Inc * | | | 81,565 | | | | 1,529,344 | |
QLT Inc * (Canada) | | | 80,370 | | | | 631,708 | |
Regeneron Pharmaceuticals Inc * | | | 9,249 | | | | 1,582,226 | |
Sagent Pharmaceuticals Inc * | | | 31,867 | | | | 512,740 | |
Shire PLC ADR (United Kingdom) | | | 21,371 | | | | 1,969,979 | |
Sino Biopharmaceutical (Cayman) | | | 1,921,387 | | | | 921,069 | |
Sinopharm Group Co Ltd ‘H’ (China) | | | 7,300 | | | | 23,187 | |
Sunesis Pharmaceuticals Inc * | | | 104,821 | | | | 440,248 | |
Synta Pharmaceuticals Corp * | | | 153,086 | | | | 1,380,836 | |
Targacept Inc * | | | 96,895 | | | | 424,400 | |
The Medicines Co * | | | 57,863 | | | | 1,386,976 | |
Tornier NV * (Netherlands) | | | 34,050 | | | | 571,699 | |
UnitedHealth Group Inc | | | 96,838 | | | | 5,252,493 | |
Universal Health Services Inc ‘B’ | | | 59,543 | | | | 2,878,904 | |
Verastem Inc * | | | 37,200 | | | | 326,988 | |
Vertex Pharmaceuticals Inc * | | | 173,404 | | | | 7,272,564 | |
Vocera Communications Inc * | | | 39,744 | | | | 997,574 | |
Waters Corp * | | | 8,961 | | | | 780,682 | |
WuXi PharmaTech Inc ADR * (Cayman) | | | 58,775 | | | | 925,706 | |
XenoPort Inc * | | | 55,560 | | | | 431,701 | |
| | | | | | | | |
| | | | | | | 150,313,866 | |
| | | | | | | | |
Total Common Stocks
(Cost $115,817,007) | | | | | | | 150,313,866 | |
| | | | | | | | |
| | | | | | | | |
| | | Principal Amount | | | | |
SHORT-TERM INVESTMENT - 4.0% | | | | | | | | |
| | |
Repurchase Agreement - 4.0% | | | | | | | | |
| | |
Fixed Income Clearing Corp
0.010% due 01/02/13
(Dated 12/31/12, repurchase price of
$6,313,370; collateralized by U.S.
Treasury Notes: 0.250% due 07/15/15
and value $6,440,000) | | | $6,313,367 | | | | 6,313,367 | |
| | | | | | | | |
| | |
Total Short-Term Investment
(Cost $6,313,367) | | | | | | | 6,313,367 | |
| | | | | | | | |
| | |
TOTAL INVESTMENTS - 99.9%
(Cost $122,144,004) | | | | | | | 156,742,204 | |
| |
OTHER ASSETS & LIABILITIES, NET - 0.1% | | | | 123,976 | |
| | | | | | | | |
| | |
NET ASSETS - 100.0% | | | | | | | $156,866,180 | |
| | | | | | | | |
| | |
| See Notes to Financial Statements | | See explanation of symbols and terms, if any, on page B-143 |
B-110
PACIFIC SELECT FUND
HEALTH SCIENCES PORTFOLIO
Schedule of Investments (Continued)
December 31, 2012
Notes to Schedule of Investments
| (a) | As of December 31, 2012, the portfolio was diversified by health care sector as a percentage of net assets as follows: |
| | | | |
Biotechnology | | | 45.3% | |
Pharmaceuticals | | | 23.8% | |
Managed Health Care | | | 7.9% | |
Health Care Facilities | | | 6.2% | |
Life Sciences Tools & Services | | | 5.0% | |
Health Care Equipment | | | 3.4% | |
Other (each less than 3.0%) | | | 4.3% | |
| | | | |
| | | 95.9% | |
Short-Term Investment | | | 4.0% | |
Other Assets & Liabilities, Net | | | 0.1% | |
| | | | |
| | | 100.0% | |
| | | | |
| (b) | Short-term investments reflect either the stated coupon rate or the annualized effective yield on the date of purchase for discounted investments. |
| (c) | Investments with a total aggregate value of $114,971 or 0.1% of the portfolio’s net assets were valued by the Trustee Valuation Committee or determined by a valuation committee established under the Valuation Policy and then subsequently submitted for approval or ratification to either the Trustee Valuation Committee, or to the Board. |
| (d) | Restricted securities as of December 31, 2012 were as follows: |
| | | | | | | | | | | | |
Issuer and
Acquisition Date | | Cost | | | Value | | | Value as a % of Net Assets | |
ARYx Therapeutics Inc Warrants
(Exp.11/13/13)
Acq. 11/13/08 | | | $5,580 | | | | $- | | | | 0.0% | |
Cytori Therapeutics Inc Warrants
(Exp.08/11/13)
Acq. 08/11/08 | | | - | | | | 3 | | | | 0.0% | |
Derma Sciences Warrants
(Exp.06/23/16)
Acq. 06/17/11 | | | 8,050 | | | | 113,654 | | | | 0.1% | |
OncoGenex Pharmaceutical Inc Warrants
(Exp.10/19/15)
Acq. 10/19/10 | | | - | | | | 1,267 | | | | 0.0% | |
SANUWAVE Health Inc Warrants
(Exp.04/08/16)
Acq. 04/08/11 | | | - | | | | 47 | | | | 0.0% | |
| | | | | | | | | | | | |
| | | $13,630 | | | | $114,971 | | | | 0.1% | |
| | | | | | | | | | | | |
| (e) | Fair Value Measurements |
The following is a summary of the portfolio’s investments as categorized under the three-tier hierarchy of inputs used in valuing the portfolio’s assets and liabilities (See Note 3D in Notes to Financial Statements) as of December 31, 2012:
| | | | | | | | | | | | | | | | | | |
| | | | | Total Value at
December 31, 2012 | | | Level 1
Quoted Price | | | Level 2
Significant
Observable Inputs | | | Level 3
Significant
Unobservable Inputs | |
Assets | | Warrants (1) | | | $114,971 | | | | $- | | | | $114,971 | | | | $- | |
| | Common Stocks | | | | | | | | | | | | | | | | |
| | Health Care | | | 150,313,866 | | | | 144,422,987 | | | | 5,890,879 | | | | - | |
| | Short-Term Investment | | | 6,313,367 | | | | - | | | | 6,313,367 | | | | - | |
| | | | | | | | | | | | | | | | | | |
| | Total | | | $156,742,204 | | | | $144,422,987 | | | | $12,319,217 | | | | $- | |
| | | | | | | | | | | | | | | | | | |
| | (1) | For equity investments categorized in a single level, refer to the schedule of investments for further industry breakout. |
| | |
| See Notes to Financial Statements | | See explanation of symbols and terms, if any, on page B-143 |
B-111
PACIFIC SELECT FUND
REAL ESTATE PORTFOLIO
Schedule of Investments
December 31, 2012
| | | | | | | | |
| | | Shares | | |
Value | |
COMMON STOCKS - 98.3% | | | | | | | | |
| | |
Consumer Discretionary - 3.1% | | | | | | | | |
| | |
Starwood Hotels & Resorts Worldwide Inc | | | 605,789 | | | | $34,748,057 | |
| | | | | | | | |
| | |
Financials - 94.8% | | | | | | | | |
| | |
Acadia Realty Trust REIT | | | 112,007 | | | | 2,809,136 | |
Alexandria Real Estate Equities Inc REIT | | | 53,246 | | | | 3,691,013 | |
Apartment Investment &
Management Co ‘A’ REIT | | | 368,440 | | | | 9,969,986 | |
Ashford Hospitality Trust Inc REIT | | | 542,080 | | | | 5,697,261 | |
AvalonBay Communities Inc REIT | | | 327,105 | | | | 44,352,167 | |
Boston Properties Inc REIT | | | 494,965 | | | | 52,372,247 | |
BRE Properties Inc REIT | | | 186,389 | | | | 9,474,153 | |
Brookfield Office Properties Inc (NYSE) (Canada) | | | 524,775 | | | | 8,926,423 | |
Camden Property Trust REIT | | | 329,376 | | | | 22,466,737 | |
Corporate Office Properties Trust REIT | | | 49,900 | | | | 1,246,502 | |
Cousins Properties Inc REIT | | | 306,381 | | | | 2,558,281 | |
DCT Industrial Trust Inc REIT | | | 2,440,070 | | | | 15,836,054 | |
Digital Realty Trust Inc REIT | | | 158,640 | | | | 10,770,070 | |
Duke Realty Corp REIT | | | 648,490 | | | | 8,994,556 | |
Equity Lifestyle Properties Inc REIT | | | 318,316 | | | | 21,419,484 | |
Equity Residential REIT | | | 1,854,677 | | | | 105,104,546 | |
Essex Property Trust Inc REIT | | | 27,322 | | | | 4,006,771 | |
Federal Realty Investment Trust REIT | | | 142,856 | | | | 14,859,881 | |
Forest City Enterprises Inc ‘A’ * | | | 1,765,263 | | | | 28,508,997 | |
General Growth Properties Inc REIT | | | 1,846,843 | | | | 36,659,833 | |
HCP Inc REIT | | | 1,484,138 | | | | 67,053,355 | |
Healthcare Realty Trust Inc REIT | | | 840,318 | | | | 20,176,035 | |
Host Hotels & Resorts Inc REIT | | | 4,470,159 | | | | 70,047,391 | |
Hudson Pacific Properties Inc REIT | | | 459,570 | | | | 9,678,544 | |
Mack-Cali Realty Corp REIT | | | 816,073 | | | | 21,307,666 | |
Prologis Inc REIT | | | 585,923 | | | | 21,380,330 | |
PS Business Parks Inc REIT | | | 98,228 | | | | 6,382,855 | |
Public Storage REIT | | | 331,657 | | | | 48,076,999 | |
Regency Centers Corp REIT | | | 863,768 | | | | 40,700,748 | |
Retail Opportunity Investments Corp REIT | | | 105,002 | | | | 1,350,326 | |
Senior Housing Properties Trust REIT | | | 1,253,627 | | | | 29,635,742 | |
Simon Property Group Inc REIT | | | 1,083,707 | | | | 171,323,240 | |
SL Green Realty Corp REIT | | | 106,931 | | | | 8,196,261 | |
Sovran Self Storage Inc REIT | | | 61,637 | | | | 3,827,658 | |
Starwood Property Trust Inc REIT | | | 236,509 | | | | 5,430,247 | |
The Macerich Co REIT | | | 391,526 | | | | 22,825,966 | |
UDR Inc REIT | | | 421,945 | | | | 10,033,852 | |
Ventas Inc REIT | | | 229,780 | | | | 14,871,362 | |
Vornado Realty Trust REIT | | | 909,857 | | | | 72,861,349 | |
Winthrop Realty Trust REIT | | | 254,260 | | | | 2,809,573 | |
| | | | | | | | |
| | | | | | | 1,057,693,597 | |
| | | | | | | | |
| | | | | | | | |
| | | Shares | | |
Value | |
Health Care - 0.4% | | | | | | | | |
| | |
Assisted Living Concepts Inc ‘A’ | | | 434,868 | | | | $4,239,963 | |
| | | | | | | | |
| | |
Total Common Stocks
(Cost $908,350,908) | | | | | | | 1,096,681,617 | |
| | | | | | | | |
| | |
| | | Principal
Amount | | | | |
| | |
SHORT-TERM INVESTMENT - 1.5% | | | | | | | | |
| | |
Repurchase Agreement - 1.5% | | | | | | | | |
| | |
Fixed Income Clearing Corp
0.010% due 01/02/13
(Dated 12/31/12, repurchase price of $16,410,146; collateralized by U.S. Treasury Notes: 0.250% due 07/15/15 and value $16,740,000) | | | $16,410,137 | | | | 16,410,137 | |
| | | | | | | | |
| | |
Total Short-Term Investment
(Cost $16,410,137) | | | | | | | 16,410,137 | |
| | | | | | | | |
| | |
TOTAL INVESTMENTS - 99.8%
(Cost $924,761,045) | | | | | | | 1,113,091,754 | |
| |
OTHER ASSETS & LIABILITIES, NET - 0.2% | | | | 2,370,906 | |
| | | | | | | | |
| | |
NET ASSETS - 100.0% | | | | | | | $1,115,462,660 | |
| | | | | | | | |
Notes to Schedule of Investments
| (a) | As of December 31, 2012, the portfolio was diversified by property sector as a percentage of net assets as follows: |
| | | | |
Retail | | | 26.0% | |
Specialized | | | 23.3% | |
Residential | | | 20.3% | |
Office | | | 9.6% | |
Diversified | | | 8.4% | |
Real Estate Operating Companies | | | 3.4% | |
Industrial | | | 3.3% | |
Hotels, Resorts & Cruise Lines | | | 3.1% | |
Other (each less than 3.0%) | | | 0.9% | |
| | | | |
| | | 98.3% | |
Short-Term Investment | | | 1.5% | |
Other Assets & Liabilities, Net | | | 0.2% | |
| | | | |
| | | 100.0% | |
| | | | |
| (b) | Short-term investments reflect either the stated coupon rate or the annualized effective yield on the date of purchase for discounted investments. |
| (c) | Fair Value Measurements |
The following is a summary of the portfolio’s investments as categorized under the three-tier hierarchy of inputs used in valuing the portfolio’s assets and liabilities (See Note 3D in Notes to Financial Statements) as of December 31, 2012:
| | | | | | | | | | | | | | | | | | |
| | | | | Total Value at
December 31, 2012 | | | Level 1
Quoted Price | | | Level 2
Significant
Observable Inputs | | | Level 3
Significant
Unobservable Inputs | |
Assets | | Common Stocks (1) | | | $1,096,681,617 | | | | $1,096,681,617 | | | | $- | | | | $- | |
| | Short-Term Investment | | | 16,410,137 | | | | - | | | | 16,410,137 | | | | - | |
| | | | | | | | | | | | | | | | | | |
| | Total | | | $1,113,091,754 | | | | $1,096,681,617 | | | | $16,410,137 | | | | $- | |
| | | | | | | | | | | | | | | | | | |
| | (1) | For equity investments categorized in a single level, refer to the schedule of investments for further industry breakout. |
| | |
| See Notes to Financial Statements | | See explanation of symbols and terms, if any, on page B-143 |
B-112
PACIFIC SELECT FUND
TECHNOLOGY PORTFOLIO
Schedule of Investments
December 31, 2012
| | | | | | | | |
| | | Shares | | |
Value | |
COMMON STOCKS -97.1% | | | | | | | | |
| | |
Consumer Discretionary -0.2% | | | | | | | | |
| | |
LifeLock Inc * | | | 14,795 | | | | $120,283 | |
| | | | | | | | |
| | |
Health Care - 0.8% | | | | | | | | |
| | |
Stryker Corp | | | 9,672 | | | | 530,219 | |
| | | | | | | | |
| | |
Industrials - 0.2% | | | | | | | | |
| | |
Performant Financial Corp * | | | 12,429 | | | | 125,533 | |
| | | | | | | | |
| | |
Information Technology -95.9% | | | | | | | | |
| | |
Advanced Micro Devices Inc * | | | 202,382 | | | | 485,717 | |
Akamai Technologies Inc * | | | 3,700 | | | | 151,367 | |
Apple Inc | | | 9,200 | | | | 4,903,876 | |
Arrow Electronics Inc * | | | 24,600 | | | | 936,768 | |
Avago Technologies Ltd (Singapore) | | | 22,800 | | | | 721,848 | |
Avnet Inc * | | | 30,700 | | | | 939,727 | |
BMC Software Inc * | | | 3,300 | | | | 130,878 | |
Broadcom Corp ‘A’ * | | | 54,800 | | | | 1,819,908 | |
Cadence Design Systems Inc * | | | 33,700 | | | | 455,287 | |
Check Point Software Technologies Ltd * (Israel) | | | 62,700 | | | | 2,987,028 | |
Cisco Systems Inc | | | 96,700 | | | | 1,900,155 | |
Citrix Systems Inc * | | | 19,700 | | | | 1,295,275 | |
Dell Inc | | | 27,900 | | | | 282,627 | |
Electronics for Imaging Inc * | | | 94,000 | | | | 1,785,060 | |
EMC Corp * | | | 85,300 | | | | 2,158,090 | |
Flextronics International Ltd * (Singapore) | | | 97,100 | | | | 602,991 | |
Fortinet Inc * | | | 6,800 | | | | 143,276 | |
Global Payments Inc | | | 9,700 | | | | 439,410 | |
Intersil Corp ‘A’ | | | 17,700 | | | | 146,733 | |
KLA-Tencor Corp | | | 60,368 | | | | 2,883,176 | |
Lam Research Corp * | | | 89,537 | | | | 3,234,972 | |
LSI Corp * | | | 40,200 | | | | 284,616 | |
Marvell Technology Group Ltd (Bermuda) | | | 69,353 | | | | 503,503 | |
Microsemi Corp * | | | 62,200 | | | | 1,308,688 | |
Microsoft Corp | | | 71,800 | | | | 1,919,214 | |
Murata Manufacturing Co Ltd (Japan) | | | 2,300 | | | | 135,651 | |
NCR Corp * | | | 34,800 | | | | 886,704 | |
NetApp Inc * | | | 71,500 | | | | 2,398,825 | |
Nuance Communications Inc * | | | 144,100 | | | | 3,216,312 | |
NXP Semiconductors * (Netherlands) | | | 46,800 | | | | 1,234,116 | |
Oracle Corp | | | 42,100 | | | | 1,402,772 | |
Parametric Technology Corp * | | | 112,400 | | | | 2,530,124 | |
QUALCOMM Inc | | | 46,529 | | | | 2,885,728 | |
Radware Ltd * (Israel) | | | 9,026 | | | | 297,858 | |
SanDisk Corp * | | | 10,400 | | | | 453,024 | |
Semtech Corp * | | | 14,601 | | | | 422,699 | |
Spansion Inc ‘A’ * | | | 46,625 | | | | 648,554 | |
Symantec Corp * | | | 236,500 | | | | 4,448,565 | |
| | | | | | | | |
| | | Shares | | |
Value | |
Synopsys Inc * | | | 189,382 | | | | $6,029,923 | |
Teradyne Inc * | | | 145,700 | | | | 2,460,873 | |
TIBCO Software Inc * | | | 7,600 | | | | 167,276 | |
VeriFone Systems Inc * | | | 34,400 | | | | 1,020,992 | |
Visa Inc ‘A’ | | | 5,700 | | | | 864,006 | |
Vishay Intertechnology Inc * | | | 18,400 | | | | 195,592 | |
VMware Inc ‘A’ * | | | 13,100 | | | | 1,233,234 | |
| | | | | | | | |
| | | | | | | 65,353,018 | |
| | | | | | | | |
Total Common Stocks
(Cost $61,866,815) | | | | | | | 66,129,053 | |
| | | | | | | | |
| | |
| | | Principal
Amount | | | | |
| | |
SHORT-TERM INVESTMENT - 1.9% | | | | | | | | |
| | |
Repurchase Agreement - 1.9% | | | | | | | | |
| | |
Fixed Income Clearing Corp
0.010% due 01/02/13
(Dated 12/31/12, repurchase price of $1,315,735; collateralized by U.S. Treasury Notes: 2.750% due 11/30/16 and value $1,344,606) | | | $1,315,734 | | | | 1,315,734 | |
| | | | | | | | |
| | |
Total Short-Term Investment
(Cost $1,315,734) | | | | | | | 1,315,734 | |
| | | | | | | | |
| | |
TOTAL INVESTMENTS - 99.0%
(Cost $63,182,549) | | | | | | | 67,444,787 | |
| |
OTHER ASSETS & LIABILITIES, NET - 1.0% | | | | 713,243 | |
| | | | | | | | |
| | |
NET ASSETS - 100.0% | | | | | | | $68,158,030 | |
| | | | | | | | |
Notes to Schedule of Investments
| (a) | As of December 31, 2012, the portfolio was diversified by technology sector as a percentage of net assets as follows: |
| | | | |
Application Software | | | 20.1% | |
Systems Software | | | 18.0% | |
Semiconductor Equipment | | | 12.6% | |
Semiconductors | | | 11.1% | |
Computer Storage & Peripherals | | | 10.0% | |
Computer Hardware | | | 8.9% | |
Communications Equipment | | | 7.5% | |
Data Processing & Outsourced Services | | | 3.4% | |
Other (each less than 3.0%) | | | 5.5% | |
| | | | |
| | | 97.1% | |
Short-Term Investment | | | 1.9% | |
Other Assets & Liabilities, Net | | | 1.0% | |
| | | | |
| | | 100.0% | |
| | | | |
| (b) | Short-term investments reflect either the stated coupon rate or the annualized effective yield on the date of purchase for discounted investments. |
| (c) | Fair Value Measurements |
The following is a summary of the portfolio’s investments as categorized under the three-tier hierarchy of inputs used in valuing the portfolio’s assets and liabilities (See Note 3D in Notes to Financial Statements) as of December 31, 2012:
| | | | | | | | | | | | | | | | | | |
| | | | | Total Value at
December 31, 2012 | | | Level 1
Quoted Price | | | Level 2
Significant
Observable Inputs | | | Level 3
Significant
Unobservable Inputs | |
Assets | | Common Stocks | | | | | | | | | | | | | | | | |
| | Consumer Discretionary | | | $120,283 | | | | $120,283 | | | | $- | | | | $- | |
| | Health Care | | | 530,219 | | | | 530,219 | | | | - | | | | - | |
| | Industrials | | | 125,533 | | | | 125,533 | | | | - | | | | - | |
| | Information Technology | | | 65,353,018 | | | | 65,217,367 | | | | 135,651 | | | | - | |
| | | | | | | | | | | | | | | | | | |
| | | | | 66,129,053 | | | | 65,993,402 | | | | 135,651 | | | | - | |
| | Short-Term Investment | | | 1,315,734 | | | | - | | | | 1,315,734 | | | | - | |
| | | | | | | | | | | | | | | | | | |
| | Total | | | $67,444,787 | | | | $65,993,402 | | | | $1,451,385 | | | | $- | |
| | | | | | | | | | | | | | | | | | |
| | |
| See Notes to Financial Statements | | See explanation of symbols and terms, if any, on page B-143 |
B-113
PACIFIC SELECT FUND
EMERGING MARKETS PORTFOLIO
Schedule of Investments
December 31, 2012
| | | | | | | | |
| | | Shares | | | Value | |
PREFERRED STOCKS - 6.3% | | | | | | | | |
| | |
Brazil - 5.2% | | | | | | | | |
| | |
Banco Bradesco SA ADR | | | 473,500 | | | | $8,224,695 | |
Cia Brasileira de Distribuicao Grupo Pao de Acucar ADR | | | 306,390 | | | | 13,600,652 | |
Cia de Bebidas das Americas ADR | | | 179,350 | | | | 7,530,906 | |
Lojas Americanas SA | | | 2,496,140 | | | | 22,498,418 | |
Petroleo Brasileiro SA ADR | | | 838,700 | | | | 16,186,910 | |
Vale SA ADR | | | 643,940 | | | | 13,071,982 | |
| | | | | | | | |
| | | | 81,113,563 | |
| | | | | | | | |
Colombia - 1.1% | | | | | | | | |
| | |
Banco Davivienda SA | | | 629,601 | | | | 8,372,374 | |
Bancolombia SA ADR | | | 127,210 | | | | 8,469,642 | |
| | | | | | | | |
| | | | 16,842,016 | |
| | | | | | | | |
Total Preferred Stocks
(Cost $79,566,577) | | | | | | | 97,955,579 | |
| | | | | | | | |
| | |
COMMON STOCKS - 91.3% | | | | | | | | |
| | |
Bermuda - 0.7% | | | | | | | | |
| | |
Credicorp Ltd | | | 43,113 | | | | 6,318,641 | |
Dairy Farm International Holdings Ltd | | | 17,000 | | | | 185,571 | |
Jardine Strategic Holdings Ltd | | | 103,000 | | | | 3,687,291 | |
| | | | | | | | |
| | | | 10,191,503 | |
| | | | | | | | |
Brazil - 5.9% | | | | | | | | |
| | |
B2W Cia Global do Varejo * | | | 618,858 | | | | 5,160,493 | |
BM&FBOVESPA SA | | | 4,286,143 | | | | 29,918,714 | |
Embraer SA ADR | | | 433,243 | | | | 12,351,758 | |
Estacio Participacoes SA | | | 588,400 | | | | 12,154,191 | |
Kroton Educacional SA * | | | 615,348 | | | | 13,899,802 | |
Natura Cosmeticos SA | | | 622,450 | | | | 17,860,503 | |
Sul America SA | | | 53,400 | | | | 464,338 | |
| | | | | | | | |
| | | | 91,809,799 | |
| | | | | | | | |
Cayman - 11.5% | | | | | | | | |
| | |
Baidu Inc ADR * | | | 543,900 | | | | 54,547,731 | |
Ctrip.com International Ltd ADR * | | | 733,940 | | | | 16,726,493 | |
Eurasia Drilling Co Ltd GDR ~ | | | 111,300 | | | | 3,994,970 | |
Eurasia Drilling Co Ltd GDR (LI) ~ | | | 126,590 | | | | 4,543,784 | |
Home Inns & Hotels Management Inc ADR * | | | 244,780 | | | | 7,074,142 | |
NetEase Inc ADR * | | | 257,970 | | | | 10,976,623 | |
New Oriental Education & Technology Group ADR | | | 566,260 | | | | 11,002,432 | |
SOHO China Ltd | | | 6,656,000 | | | | 5,376,696 | |
Tencent Holdings Ltd | | | 634,000 | | | | 20,583,752 | |
Tingyi Holding Corp | | | 7,482,000 | | | | 20,834,270 | |
Want Want China Holdings Ltd | | | 12,902,000 | | | | 17,974,745 | |
Youku Tudou Inc ADR * | | | 316,290 | | | | 5,769,130 | |
| | | | | | | | |
| | | | 179,404,768 | |
| | | | | | | | |
Chile - 0.3% | | | | | | | | |
| | |
Banco Santander Chile | | | 58,449,030 | | | | 4,166,770 | |
| | | | | | | | |
| | |
China - 1.5% | | | | | | | | |
| | |
China Oilfield Services Ltd ‘H’ | | | 1,894,000 | | | | 3,917,003 | |
China Shenhua Energy Co Ltd ‘H’ | | | 1,871,000 | | | | 8,359,424 | |
Shandong Weigao Group Medical Polymer Co Ltd ‘H’ | | | 4,174,000 | | | | 4,170,399 | |
Sinopharm Group Co Ltd ‘H’ | | | 1,804,800 | | | | 5,732,510 | |
Tsingtao Brewery Co Ltd ‘H’ | | | 124,000 | | | | 738,493 | |
| | | | | | | | |
| | | | 22,917,829 | |
| | | | | | | | |
| | | | | | | | |
| | | Shares | | | Value | |
Colombia - 1.7% | | | | | | | | |
| | |
Almacenes Exito SA | | | 671,285 | | | | $13,562,898 | |
Almacenes Exito SA GDR ~ | | | 609,222 | | | | 12,239,575 | |
| | | | | | | | |
| | | | 25,802,473 | |
| | | | | | | | |
Denmark - 2.6% | | | | | | | | |
| | |
Carlsberg AS ‘B’ | | | 332,595 | | | | 32,698,941 | |
FLSmidth & Co AS | | | 132,521 | | | | 7,741,645 | |
| | | | | | | | |
| | | | 40,440,586 | |
| | | | | | | | |
Egypt - 0.6% | | | | | | | | |
| | |
Commercial International Bank SAE | | | 1,613,387 | | | | 8,751,864 | |
| | | | | | | | |
| | |
France - 0.1% | | | | | | | | |
| | |
Technip SA | | | 19,590 | | | | 2,255,381 | |
| | | | | | | | |
| | |
Hong Kong - 4.8% | | | | | | | | |
| | |
AIA Group Ltd | | | 4,008,600 | | | | 15,976,032 | |
CNOOC Ltd | | | 7,157,000 | | | | 15,715,030 | |
Hang Lung Group Ltd | | | 1,148,000 | | | | 6,576,726 | |
Hang Lung Properties Ltd | | | 3,668,000 | | | | 14,706,866 | |
Hong Kong Exchanges & Clearing Ltd | | | 1,217,092 | | | | 20,967,392 | |
Sun Art Retail Group Ltd | | | 134,000 | | | | 206,390 | |
| | | | | | | | |
| | | | 74,148,436 | |
| | | | | | | | |
India - 12.8% | | | | | | | | |
| | |
Ambuja Cements Ltd | | | 674,729 | | | | 2,488,933 | |
Asian Paints Ltd | | | 95,081 | | | | 7,742,344 | |
Cipla Ltd | | | 694,491 | | | | 5,270,883 | |
Colgate-Palmolive India Ltd | | | 386,469 | | | | 11,064,396 | |
HDFC Bank Ltd ADR | | | 443,360 | | | | 18,053,619 | |
Hindustan Unilever Ltd | | | 1,535,891 | | | | 14,746,530 | |
Housing Development Finance Corp Ltd | | | 2,022,256 | | | | 30,815,342 | |
ICICI Bank Ltd ADR | | | 430,750 | | | | 18,785,007 | |
Infosys Ltd | | | 951,551 | | | | 40,551,746 | |
Marico Ltd | | | 1,694,336 | | | | 6,761,112 | |
Sun Pharmaceutical Industries Ltd | | | 320,170 | | | | 4,311,082 | |
Sun TV Network Ltd | | | 742,139 | | | | 5,826,426 | |
Tata Consultancy Services Ltd | | | 600,113 | | | | 13,769,962 | |
Ultratech Cement Ltd | | | 29,825 | | | | 1,088,567 | |
Zee Entertainment Enterprises Ltd | | | 4,380,634 | | | | 17,690,952 | |
| | | | | | | | |
| | | | 198,966,901 | |
| | | | | | | | |
Indonesia - 1.4% | | | | | | | | |
| | |
P.T. Astra International Tbk | | | 19,279,200 | | | | 15,253,422 | |
P.T. Semen Gresik Persero Tbk | | | 528,000 | | | | 869,800 | |
P.T. Unilever Indonesia Tbk | | | 2,926,500 | | | | 6,347,019 | |
| | | | | | | | |
| | | | 22,470,241 | |
| | | | | | | | |
Italy - 2.1% | | | | | | | | |
| | |
Prada SPA | | | 2,193,600 | | | | 21,220,959 | |
Saipem SPA | | | 95,152 | | | | 3,691,649 | |
Salvatore Ferragamo Italia SPA | | | 370,324 | | | | 8,147,251 | |
| | | | | | | | |
| | | | 33,059,859 | |
| | | | | | | | |
Luxembourg - 1.3% | | | | | | | | |
| | |
Tenaris SA ADR | | | 481,800 | | | | 20,197,056 | |
| | | | | | | | |
| | |
Malaysia - 0.5% | | | | | | | | |
| | |
Genting Bhd | | | 2,483,900 | | | | 7,500,431 | |
| | | | | | | | |
| | |
Mexico - 8.1% | | | | | | | | |
| | |
America Movil SAB de CV ‘L’ ADR | | | 2,194,400 | | | | 50,778,416 | |
Fomento Economico Mexicano SAB de CV | | | 2,313,792 | | | | 23,169,603 | |
Grupo Financiero Inbursa SAB de CV ‘O’ | | | 2,856,701 | | | | 8,658,746 | |
| | |
| See Notes to Financial Statements | | See explanation of symbols and terms, if any, on page B-143 |
B-114
PACIFIC SELECT FUND
EMERGING MARKETS PORTFOLIO
Schedule of Investments (Continued)
December 31, 2012
| | | | | | | | |
| | | Shares | | | Value | |
Fomento Economico
Mexicano SAB de CV ADR | | | 192,820 | | | | $19,416,974 | |
Grupo Televisa SAB ADR | | | 321,880 | | | | 8,555,570 | |
Wal-Mart de Mexico SAB de CV ‘V’ | | | 4,744,463 | | | | 15,481,727 | |
| | | | | | | | |
| | | | | | | 126,061,036 | |
| | | | | | | | |
Netherlands - 1.5% | | | | | | | | |
| | |
Heineken NV | | | 78,204 | | | | 5,216,435 | |
Yandex NV ‘A’ * | | | 815,240 | | | | 17,584,727 | |
| | | | | | | | |
| | | | | | | 22,801,162 | |
| | | | | | | | |
Nigeria - 1.2% | | | | | | | | |
| | |
Guaranty Trust Bank PLC | | | 27,810,148 | | | | 4,096,275 | |
Nigerian Breweries PLC | | | 10,530,470 | | | | 9,913,411 | |
Zenith Bank PLC | | | 32,492,280 | | | | 4,057,634 | |
| | | | | | | | |
| | | | | | | 18,067,320 | |
| | | | | | | | |
Peru - 0.3% | | | | | | | | |
| | |
Inretail Peru Corp * ~ | | | 255,100 | | | | 5,344,345 | |
| | | | | | | | |
| | |
Philippines - 2.7% | | | | | | | | |
| | |
Jollibee Foods Corp | | | 2,985,438 | | | | 7,448,394 | |
SM Investments Corp | | | 684,870 | | | | 14,720,694 | |
SM Prime Holdings Inc | | | 49,225,775 | | | | 19,823,420 | |
| | | | | | | | |
| | | | | | | 41,992,508 | |
| | | | | | | | |
Russia - 4.2% | | | | | | | | |
| | |
Magnit OJSC (RTS) | | | 226,301 | | | | 35,656,888 | |
NovaTek OAO GDR (LI) ~ | | | 252,066 | | | | 30,365,133 | |
| | | | | | | | |
| | | | | | | 66,022,021 | |
| | | | | | | | |
South Africa - 3.1% | | | | | | | | |
| | |
ABSA Group Ltd | | | 150,068 | | | | 2,925,936 | |
Impala Platinum Holdings Ltd | | | 711,612 | | | | 14,368,468 | |
MTN Group Ltd | | | 1,030,945 | | | | 21,668,935 | |
Standard Bank Group Ltd | | | 666,965 | | | | 9,437,448 | |
| | | | | | | | |
| | | | | | | 48,400,787 | |
| | | | | | | | |
South Korea - 3.7% | | | | | | | | |
| | |
E-Mart Co Ltd * | | | 82,057 | | | | 18,258,783 | |
MegaStudy Co Ltd | | | 18,719 | | | | 1,379,720 | |
NHN Corp * | | | 141,445 | | | | 30,160,015 | |
Shinsegae Co Ltd | | | 39,324 | | | | 8,051,118 | |
| | | | | | | | |
| | | | | | | 57,849,636 | |
| | | | | | | | |
Taiwan - 2.5% | | | | | | | | |
| | |
Epistar Corp | | | 3,269,500 | | | | 5,975,886 | |
HTC Corp | | | 370,458 | | | | 3,844,700 | |
Synnex Technology International Corp | | | 4,004,838 | | | | 7,440,947 | |
Taiwan Semiconductor Manufacturing Co Ltd | | | 6,457,376 | | | | 21,612,273 | |
| | | | | | | | |
| | | | | | | 38,873,806 | |
| | | | | | | | |
Thailand - 0.6% | | | | | | | | |
| | |
Siam Commercial Bank PCL | | | 1,696,100 | | | | 10,067,329 | |
| | | | | | | | |
| | |
Turkey - 4.7% | | | | | | | | |
| | |
Akbank TAS | | | 2,138,128 | | | | 10,572,154 | |
Anadolu Efes Biracilik Ve Malt Sanayii AS | | | 763,635 | | | | 11,020,652 | |
BIM Birlesik Magazalar AS | | | 167,322 | | | | 8,196,311 | |
Enka Insaat ve Sanayi AS | | | 2,967,022 | | | | 8,830,855 | |
Haci Omer Sabanci Holding AS | | | 4,173,248 | | | | 23,067,412 | |
Turkiye Garanti Bankasi AS | | | 2,163,559 | | | | 11,255,805 | |
| | | | | | | | |
| | | | | | | 72,943,189 | |
| | | | | | | | |
United Arab Emirates - 0.8% | | | | | | | | |
| | |
DP World Ltd | | | 1,110,011 | | | | 13,098,640 | |
| | | | | | | | |
| | |
United Kingdom - 9.6% | | | | | | | | |
| | |
Anglo American PLC | | | 971,029 | | | | 30,996,724 | |
BG Group PLC | | | 1,280,930 | | | | 21,478,975 | |
Burberry Group PLC | | | 323,100 | | | | 6,615,328 | |
| | | | | | | | |
| | | Shares | | | Value | |
Genting Singapore PLC | | | 8,089,000 | | | | $9,255,689 | |
Mail.ru Group Ltd GDR (LI) ~ | | | 257,500 | | | | 8,938,518 | |
SABMiller PLC | | | 549,050 | | | | 25,842,731 | |
Tullow Oil PLC | | | 1,387,126 | | | | 28,247,928 | |
Unilever PLC | | | 456,716 | | | | 17,335,943 | |
| | | | | | | | |
| | | | | | | 148,711,836 | |
| | | | | | | | |
United States - 0.5% | | | | | | | | |
| | |
MercadoLibre Inc | | | 93,020 | | | | 7,308,581 | |
| | | | | | | | |
| | |
Total Common Stocks
(Cost $1,168,117,672) | | | | | | | 1,419,626,093 | |
| | | | | | | | |
|
EQUITY-LINKED STRUCTURED SECURITIES - 0.1% | |
| | |
Vietnam - 0.1% | | | | | | | | |
| | |
Vietnam Dairy Products JSC
Exp. 01/31/13 * | | | 357,000 | | | | 1,512,934 | |
| | | | | | | | |
| | |
Total Equity-Linked Structured Securities (Cost $1,469,648) | | | | | | | 1,512,934 | |
| | | | | | | | |
| | |
| | | Principal
Amount | | | | |
SHORT-TERM INVESTMENT - 2.6% | | | | | | | | |
| | |
Repurchase Agreement - 2.6% | | | | | | | | |
| | |
Fixed Income Clearing Corp
0.010% due 01/02/13
(Dated 12/31/12, repurchase price of
$40,757,314; collateralized by U.S.
Treasury Notes: 0.250% due 07/15/15
and value $41,575,000) | | | $40,757,292 | | | | 40,757,292 | |
| | | | | | | | |
| | |
Total Short-Term Investment
(Cost $40,757,292) | | | | | | | 40,757,292 | |
| | | | | | | | |
| | |
TOTAL INVESTMENTS - 100.3%
(Cost $1,289,911,189) | | | | | | | 1,559,851,898 | |
| |
OTHER ASSETS & LIABILITIES, NET - (0.3%) | | | | (3,967,570 | ) |
| | | | | | | | |
| | |
NET ASSETS - 100.0% | | | | | | | $1,555,884,328 | |
| | | | | | | | |
Notes to Schedule of Investments
| (a) | As of December 31, 2012, the portfolio was diversified as a percentage of net assets as follows: |
| | | | |
Consumer Staples | | | 23.9% | |
Financials | | | 20.0% | |
Information Technology | | | 16.0% | |
Consumer Discretionary | | | 13.2% | |
Energy | | | 10.2% | |
Telecommunication Services | | | 4.7% | |
Materials | | | 4.5% | |
Industrials | | | 3.9% | |
Short-Term Investment | | | 2.6% | |
Health Care | | | 1.3% | |
| | | | |
| | | 100.3% | |
Other Assets & Liabilities, Net | | | (0.3% | ) |
| | | | |
| | | 100.0% | |
| | | | |
| | |
| See Notes to Financial Statements | | See explanation of symbols and terms, if any, on page B-143 |
B-115
PACIFIC SELECT FUND
EMERGING MARKETS PORTFOLIO
Schedule of Investments (Continued)
December 31, 2012
| (b) | As of December 31, 2012, the portfolio was diversified by country of incorporation as a percentage of net assets as follows: |
| | | | |
India | | | 12.8% | |
Cayman | | | 11.5% | |
Brazil | | | 11.1% | |
United Kingdom | | | 9.6% | |
Mexico | | | 8.1% | |
Hong Kong | | | 4.8% | |
Turkey | | | 4.7% | |
Russia | | | 4.2% | |
South Korea | | | 3.7% | |
South Africa | | | 3.1% | |
United States (Includes Short-Term Investment) | | | 3.1% | |
Others (each less than 3.0%) | | | 23.6% | |
| | | | |
| | | 100.3% | |
Other Assets & Liabilities, Net | | | (0.3% | ) |
| | | | |
| | | 100.0% | |
| | | | |
| (c) | Short-term investments reflect either the stated coupon rate or the annualized effective yield on the date of purchase for discounted investments. |
| (d) | Fair Value Measurements |
The following is a summary of the portfolio’s investments as categorized under the three-tier hierarchy of inputs used in valuing the portfolio’s assets and liabilities (See Note 3D in Notes to Financial Statements) as of December 31, 2012:
| | | | | | | | | | | | | | | | | | |
| | | | | Total Value at
December 31, 2012 | | | Level 1
Quoted Price | | | Level 2
Significant
Observable Inputs | | | Level 3
Significant
Unobservable Inputs | |
Assets | | Preferred Stocks | | | | | | | | | | | | | | | | |
| | Brazil | | | $81,113,563 | | | | $58,615,145 | | | | $22,498,418 | | | | $- | |
| | Colombia | | | 16,842,016 | | | | 8,469,642 | | | | 8,372,374 | | | | - | |
| | | | | | | | | | | | | | | | | | |
| | | | | 97,955,579 | | | | 67,084,787 | | | | 30,870,792 | | | | - | |
| | Common Stocks | | | | | | | | | | | | | | | | |
| | Bermuda | | | 10,191,503 | | | | 6,318,641 | | | | 3,872,862 | | | | - | |
| | Brazil | | | 91,809,799 | | | | 26,251,560 | | | | 65,558,239 | | | | - | |
| | Cayman | | | 179,404,768 | | | | 106,096,551 | | | | 73,308,217 | | | | - | |
| | Chile | | | 4,166,770 | | | | - | | | | 4,166,770 | | | | - | |
| | China | | | 22,917,829 | | | | - | | | | 22,917,829 | | | | - | |
| | Colombia | | | 25,802,473 | | | | - | | | | 25,802,473 | | | | - | |
| | Denmark | | | 40,440,586 | | | | - | | | | 40,440,586 | | | | - | |
| | Egypt | | | 8,751,864 | | | | - | | | | 8,751,864 | | | | - | |
| | France | | | 2,255,381 | | | | - | | | | 2,255,381 | | | | - | |
| | Hong Kong | | | 74,148,436 | | | | - | | | | 74,148,436 | | | | - | |
| | India | | | 198,966,901 | | | | 36,838,626 | | | | 162,128,275 | | | | - | |
| | Indonesia | | | 22,470,241 | | | | - | | | | 22,470,241 | | | | - | |
| | Italy | | | 33,059,859 | | | | - | | | | 33,059,859 | | | | - | |
| | Luxembourg | | | 20,197,056 | | | | 20,197,056 | | | | - | | | | - | |
| | Malaysia | | | 7,500,431 | | | | - | | | | 7,500,431 | | | | - | |
| | Mexico | | | 126,061,036 | | | | 126,061,036 | | | | - | | | | - | |
| | Netherlands | | | 22,801,162 | | | | 17,584,727 | | | | 5,216,435 | | | | - | |
| | Nigeria | | | 18,067,320 | | | | 18,067,320 | | | | - | | | | - | |
| | Peru | | | 5,344,345 | | | | - | | | | 5,344,345 | | | | - | |
| | Philippines | | | 41,992,508 | | | | - | | | | 41,992,508 | | | | - | |
| | Russia | | | 66,022,021 | | | | - | | | | 66,022,021 | | | | - | |
| | South Africa | | | 48,400,787 | | | | - | | | | 48,400,787 | | | | - | |
| | South Korea | | | 57,849,636 | | | | - | | | | 57,849,636 | | | | - | |
| | Taiwan | | | 38,873,806 | | | | - | | | | 38,873,806 | | | | - | |
| | Thailand | | | 10,067,329 | | | | - | | | | 10,067,329 | | | | - | |
| | Turkey | | | 72,943,189 | | | | - | | | | 72,943,189 | | | | - | |
| | United Arab Emirates | | | 13,098,640 | | | | 13,098,640 | | | | - | | | | - | |
| | United Kingdom | | | 148,711,836 | | | | - | | | | 148,711,836 | | | | - | |
| | United States | | | 7,308,581 | | | | 7,308,581 | | | | - | | | | - | |
| | | | | | | | | | | | | | | | | | |
| | | | | 1,419,626,093 | | | | 377,822,738 | | | | 1,041,803,355 | | | | - | |
| | Equity-Linked Structured Securities | | | 1,512,934 | | | | - | | | | 1,512,934 | | | | - | |
| | Short-Term Investment | | | 40,757,292 | | | | - | | | | 40,757,292 | | | | - | |
| | | | | | | | | | | | | | | | | | |
| | Total | | | $1,559,851,898 | | | | $444,907,525 | | | | $1,114,944,373 | | | | $- | |
| | | | | | | | | | | | | | | | | | |
During the year ended December 31, 2012, investments with a total aggregate value of $127,756,661 were transferred from level 1 to level 2 due to valuation adjustments made to exchange-traded prices as a result of market movements following the close of local trading.
| | |
| See Notes to Financial Statements | | See explanation of symbols and terms, if any, on page B-143 |
B-116
PACIFIC SELECT FUND
INTERNATIONAL LARGE-CAP PORTFOLIO
Schedule of Investments
December 31, 2012
| | | | | | | | |
| | | Shares | | | Value | |
PREFERRED STOCKS - 0.8% | | | | | | | | |
| | |
Brazil - 0.8% | | | | | | | | |
| | |
Itau Unibanco Holding SA ADR | | | 952,287 | | | | $15,674,644 | |
| | | | | | | | |
| | |
Total Preferred Stocks
(Cost $15,590,773) | | | | | | | 15,674,644 | |
| | | | | | | | |
| | |
COMMON STOCKS - 99.3% | | | | | | | | |
| | |
Australia - 1.5% | | | | | | | | |
| | |
QBE Insurance Group Ltd | | | 2,022,544 | | | | 23,149,236 | |
Westpac Banking Corp | | | 263,565 | | | | 7,205,448 | |
| | | | | | | | |
| | | | 30,354,684 | |
| | | | | | | | |
Bermuda - 1.6% | | | | | | | | |
| | |
Li & Fung Ltd | | | 18,040,400 | | | | 32,504,386 | |
| | | | | | | | |
| | |
Brazil - 0.8% | | | | | | | | |
| | |
BM&FBOVESPA SA | | | 1,611,500 | | | | 11,248,810 | |
Tim Participacoes SA ADR | | | 235,186 | | | | 4,661,386 | |
| | | | | | | | |
| | | | 15,910,196 | |
| | | | | | | | |
Canada - 2.7% | | | | | | | | |
| | |
Canadian National Railway Co (NYSE) | | | 514,855 | | | | 46,856,954 | |
Valeant Pharmaceuticals International Inc (NYSE) * | | | 135,190 | | | | 8,080,306 | |
| | | | | | | | |
| | | | 54,937,260 | |
| | | | | | | | |
Czech Republic - 0.7% | | | | | | | | |
| | |
Komercni Banka AS | | | 70,350 | | | | 14,885,207 | |
| | | | | | | | |
| | |
France - 12.1% | | | | | | | | |
| | |
Air Liquide SA | | | 328,161 | | | | 41,124,001 | |
Danone SA | | | 610,804 | | | | 40,355,594 | |
Dassault Systemes SA | | | 104,032 | | | | 11,645,889 | |
Legrand SA | | | 561,207 | | | | 23,686,754 | |
LVMH Moet Hennessy Louis Vuitton SA | | | 232,302 | | | | 43,288,822 | |
Pernod-Ricard SA | | | 343,387 | | | | 40,377,774 | |
Schneider Electric SA | | | 568,530 | | | | 42,402,975 | |
| | | | | | | | |
| | | | 242,881,809 | |
| | | | | | | | |
Germany - 11.7% | | | | | | | | |
| | |
Bayer AG | | | 711,844 | | | | 67,598,504 | |
Beiersdorf AG | | | 478,678 | | | | 39,112,702 | |
Deutsche Boerse AG | | | 90,310 | | | | 5,512,159 | |
Linde AG | | | 314,220 | | | | 54,796,651 | |
Merck KGaA | | | 214,484 | | | | 28,298,569 | |
SAP AG | | | 478,915 | | | | 38,364,219 | |
| | | | | | | | |
| | | | 233,682,804 | |
| | | | | | | | |
Hong Kong - 2.4% | | | | | | | | |
| | |
AIA Group Ltd | | | 5,599,500 | | | | 22,316,468 | |
China Unicom Ltd | | | 10,832,000 | | | | 17,535,951 | |
CNOOC Ltd | | | 3,541,000 | | | | 7,775,174 | |
| | | | | | | | |
| | | | 47,627,593 | |
| | | | | | | | |
India - 1.5% | | | | | | | | |
| | |
ICICI Bank Ltd ADR | | | 687,248 | | | | 29,970,885 | |
| | | | | | | | |
| | |
Israel - 0.8% | | | | | | | | |
| | |
Check Point Software Technologies Ltd * | | | 340,347 | | | | 16,214,131 | |
| | | | | | | | |
| | | | | | | | |
| | | Shares | | | Value | |
Japan - 14.0% | | | | | | | | |
| | |
Canon Inc | | | 760,600 | | | | $29,832,381 | |
Denso Corp | | | 1,178,500 | | | | 41,005,821 | |
FANUC Corp | | | 160,400 | | | | 29,828,598 | |
Honda Motor Co Ltd | | | 1,193,000 | | | | 43,972,086 | |
Hoya Corp | | | 1,129,300 | | | | 22,234,733 | |
Inpex Corp | | | 5,527 | | | | 29,496,782 | |
Lawson Inc | | | 414,000 | | | | 28,140,971 | |
NTT DOCOMO Inc | | | 8,092 | | | | 11,621,314 | |
Shin-Etsu Chemical Co Ltd | | | 710,000 | | | | 43,366,424 | |
| | | | | | | | |
| | | | | | | | |
| | | | 279,499,110 | |
| | | | | | | | |
Mexico - 0.4% | | | | | | | | |
| | |
Grupo Financiero Santander
Mexico SAB de CV ADR ‘B’ * | | | 531,110 | | | | 8,593,360 | |
| | | | | | | | |
| | |
Netherlands - 8.1% | | | | | | | | |
| | |
Akzo Nobel NV | | | 542,856 | | | | 35,821,452 | |
Heineken NV | | | 800,062 | | | | 53,366,471 | |
ING Groep NV CVA * | | | 3,831,816 | | | | 36,642,478 | |
Randstad Holding NV | | | 980,757 | | | | 36,203,761 | |
| | | | | | | | |
| | | | 162,034,162 | |
| | | | | | | | |
Singapore - 1.7% | | | | | | | | |
| | |
DBS Group Holdings Ltd | | | 2,071,000 | | | | 25,351,786 | |
Singapore Telecommunications Ltd | | | 3,067,680 | | | | 8,342,726 | |
Singapore Telecommunications Ltd
Board Lot 10 | | | 29,000 | | | | 78,639 | |
| | | | | | | | |
| | | | 33,773,151 | |
| | | | | | | | |
South Africa - 0.2% | | | | | | | | |
| | |
MTN Group Ltd | | | 217,229 | | | | 4,565,832 | |
| | | | | | | | |
| | |
South Korea - 1.0% | | | | | | | | |
| | |
Samsung Electronics Co Ltd | | | 13,841 | | | | 19,809,588 | |
| | | | | | | | |
| | |
Spain - 2.8% | | | | | | | | |
| | |
Amadeus IT Holding SA ‘A’ | | | 1,135,803 | | | | 28,502,147 | |
Banco Santander SA | | | 2,440,801 | | | | 19,680,384 | |
Red Electrica Corp SA | | | 174,759 | | | | 8,634,417 | |
| | | | | | | | |
| | | | 56,816,948 | |
| | | | | | | | |
Sweden - 1.0% | | | | | | | | |
| | |
Hennes & Mauritz AB ‘B’ | | | 559,489 | | | | 19,441,870 | |
| | | | | | | | |
| | |
Switzerland - 10.2% | | | | | | | | |
| | |
Givaudan SA | | | 4,096 | | | | 4,342,485 | |
Julius Baer Group Ltd | | | 849,567 | | | | 30,566,268 | |
Kuehne + Nagel International AG | | | 83,585 | | | | 10,172,360 | |
Nestle SA | | | 1,017,019 | | | | 66,283,310 | |
Roche Holding AG (XVTX) | | | 162,810 | | | | 33,168,452 | |
Sonova Holding AG | | | 108,553 | | | | 12,026,276 | |
Swiss Re AG | | | 238,553 | | | | 17,410,614 | |
UBS AG (XVTX) | | | 1,893,344 | | | | 29,775,057 | |
| | | | | | | | |
| | | | 203,744,822 | |
| | | | | | | | |
Taiwan - 2.4% | | | | | | | | |
| | |
Hon Hai Precision Industry Co Ltd | | | 6,049,070 | | | | 18,647,421 | |
Taiwan Semiconductor
Manufacturing Co Ltd ADR | | | 1,709,094 | | | | 29,328,053 | |
| | | | | | | | |
| | | | 47,975,474 | |
| | | | | | | | |
| | |
| See Notes to Financial Statements | | See explanation of symbols and terms, if any, on page B-143 |
B-117
PACIFIC SELECT FUND
INTERNATIONAL LARGE-CAP PORTFOLIO
Schedule of Investments (Continued)
December 31, 2012
| | | | | | | | |
| | | Shares | | | Value | |
United Kingdom - 21.7% | |
| | |
Barclays PLC | | | 3,628,024 | | | | $15,667,195 | |
BG Group PLC | | | 879,766 | | | | 14,752,150 | |
Compass Group PLC | | | 3,668,581 | | | | 43,387,429 | |
Delphi Automotive PLC * | | | 579,175 | | | | 22,153,444 | |
Diageo PLC | | | 1,318,510 | | | | 38,385,152 | |
Hays PLC | | | 6,244,012 | | | | 8,387,276 | |
HSBC Holdings PLC (LI) | | | 6,765,053 | | | | 71,552,810 | |
Reckitt Benckiser Group PLC | | | 552,870 | | | | 34,633,837 | |
Rio Tinto PLC | | | 684,326 | | | | 39,877,354 | |
Royal Dutch Shell PLC ‘A’ (LI) | | | 1,004,820 | | | | 35,504,840 | |
Smiths Group PLC | | | 1,154,536 | | | | 22,724,942 | |
Standard Chartered PLC | | | 1,977,083 | | | | 50,116,419 | |
WPP PLC | | | 2,548,766 | | | | 37,052,101 | |
| | | | | | | | |
| | | | 434,194,949 | |
| | | | | | | | |
Total Common Stocks
(Cost $1,669,182,996) | | | | | | | 1,989,418,221 | |
| | | | | | | | |
| | |
TOTAL INVESTMENTS - 100.1%
(Cost $1,684,773,769) | | | | | | | 2,005,092,865 | |
| |
OTHER ASSETS & LIABILITIES, NET - (0.1%) | | | | (2,697,764 | ) |
| | | | | | | | |
| | |
NET ASSETS - 100.0% | | | | | | | $2,002,395,101 | |
| | | | | | | | |
Notes to Schedule of Investments
| (a) | As of December 31, 2012, the portfolio was diversified as a percentage of net assets as follows: |
| | | | |
Financials | | | 21.7% | |
Consumer Staples | | | 17.0% | |
Consumer Discretionary | | | 14.1% | |
Industrials | | | 11.0% | |
Materials | | | 11.0% | |
Information Technology | | | 10.7% | |
Health Care | | | 7.5% | |
Energy | | | 4.4% | |
Telecommunication Services | | | 2.3% | |
Utilities | | | 0.4% | |
| | | | |
| | | 100.1% | |
Other Assets & Liabilities, Net | | | (0.1% | ) |
| | | | |
| | | 100.0% | |
| | | | |
| (b) | As of December 31, 2012, the portfolio was diversified by country of incorporation as a percentage of net assets as follows: |
| | | | |
United Kingdom | | | 21.7% | |
Japan | | | 14.0% | |
France | | | 12.1% | |
Germany | | | 11.7% | |
Switzerland | | | 10.2% | |
Netherlands | | | 8.1% | |
Others (each less than 3.0%) | | | 22.3% | |
| | | | |
| | | 100.1% | |
Other Assets & Liabilities, Net | | | (0.1% | ) |
| | | | |
| | | 100.0% | |
| | | | |
| (c) | Fair Value Measurements |
The following is a summary of the portfolio’s investments as categorized under the three-tier hierarchy of inputs used in valuing the portfolio’s assets and liabilities (See Note 3D in Notes to Financial Statements) as of December 31, 2012:
| | | | | | | | | | | | | | | | | | | | | | | | | | |
| | | | | Total Value at
December 31, 2012 | | | Level 1
Quoted Price | | | Level 2
Significant
Observable Inputs | | | Level 3
Significant
Unobservable Inputs | |
Assets | | Preferred Stocks (1) | | $15,674,644 | | | $15,674,644 | | | $- | | | $- | |
| | Common Stocks | | | | | | | | | | | | | | | | | | | | | | | | |
| | Australia | | 30,354,684 | | | - | | | 30,354,684 | | | - | |
| | Bermuda | | 32,504,386 | | | - | | | 32,504,386 | | | - | |
| | Brazil | | 15,910,196 | | | 4,661,386 | | | 11,248,810 | | | - | |
| | Canada | | 54,937,260 | | | 54,937,260 | | | - | | | - | |
| | Czech Republic | | 14,885,207 | | | - | | | 14,885,207 | | | - | |
| | France | | 242,881,809 | | | - | | | 242,881,809 | | | - | |
| | Germany | | 233,682,804 | | | - | | | 233,682,804 | | | - | |
| | Hong Kong | | 47,627,593 | | | - | | | 47,627,593 | | | - | |
| | India | | 29,970,885 | | | 29,970,885 | | | - | | | - | |
| | Israel | | 16,214,131 | | | 16,214,131 | | | - | | | - | |
| | Japan | | 279,499,110 | | | - | | | 279,499,110 | | | - | |
| | Mexico | | 8,593,360 | | | 8,593,360 | | | - | | | - | |
| | Netherlands | | 162,034,162 | | | - | | | 162,034,162 | | | - | |
| | Singapore | | 33,773,151 | | | - | | | 33,773,151 | | | - | |
| | South Africa | | 4,565,832 | | | - | | | 4,565,832 | | | - | |
| | South Korea | | 19,809,588 | | | - | | | 19,809,588 | | | - | |
| | Spain | | 56,816,948 | | | - | | | 56,816,948 | | | - | |
| | Sweden | | 19,441,870 | | | - | | | 19,441,870 | | | - | |
| | Switzerland | | 203,744,822 | | | - | | | 203,744,822 | | | - | |
| | Taiwan | | 47,975,474 | | | 29,328,053 | | | 18,647,421 | | | - | |
| | United Kingdom | | 434,194,949 | | | 22,153,444 | | | 412,041,505 | | | - | |
| | | | | | | | | | | | | | | | | | | | | | | | | | |
| | | | | 1,989,418,221 | | | | | | 165,858,519 | | | | | | 1,823,559,702 | | | | | | - | |
| | | | | | | | | | | | | | | | | | | | | | | | | | |
| | Total | | $2,005,092,865 | | | $181,533,163 | | | $1,823,559,702 | | | $- | |
| | | | | | | | | | | | | | | | | | | | | | | | | | |
Certain of the portfolio’s liabilities are held at carrying amount, which approximates fair value for financial statement purposes. As of December 31, 2012, such liabilities are categorized within the three-tier hierarchy of inputs as follows:
| | | | | | | | | | | | | | | | | | |
| | | | | Total Value at
December 31, 2012 | | | Level 1 | | | Level 2 | | | Level 3 | |
Liabilities | | Line of Credit | | | ($8,770,184 | ) | | | $- | | | | ($8,770,184 | ) | | | $- | |
| | | | | | | | | | | | | | | | | | |
| | (1) | For equity investments categorized in a single level, refer to the schedule of investments for further geographical region breakout. |
| | |
| See Notes to Financial Statements | | See explanation of symbols and terms, if any, on page B-143 |
B-118
PACIFIC SELECT FUND
INTERNATIONAL SMALL-CAP PORTFOLIO
Schedule of Investments
December 31, 2012
| | | | | | | | |
| | | Shares | | | Value | |
PREFERRED STOCKS - 0.5% | | | | | | | | |
| | |
Germany - 0.5% | | | | | | | | |
| | |
ProSiebenSat.1 Media AG | | | 206,156 | | | | $5,801,010 | |
| | | | | | | | |
| | |
Total Preferred Stocks
(Cost $4,573,901) | | | | | | | 5,801,010 | |
| | | | | | | | |
| | |
COMMON STOCKS - 98.3% | | | | | | | | |
| | |
Australia - 6.6% | | | | | | | | |
| | |
Arrium Ltd | | | 3,109,700 | | | | 3,013,077 | |
Ausdrill Ltd | | | 1,221,800 | | | | 3,660,747 | |
Australand Property Group REIT | | | 587,737 | | | | 2,087,234 | |
Beach Energy Ltd | | | 2,020,690 | | | | 3,160,936 | |
Bradken Ltd | | | 202,009 | | | | 1,168,793 | |
Breville Group Ltd | | | 428,534 | | | | 2,982,835 | |
Caltex Australia Ltd | | | 267,876 | | | | 5,398,759 | |
Charter Hall Retail REIT | | | 1,044,167 | | | | 4,094,583 | |
Commonwealth Property Office Fund REIT | | | 4,181,538 | | | | 4,470,593 | |
Evolution Mining Ltd * | | | 1,421,521 | | | | 2,575,052 | |
Flight Centre Ltd | | | 144,857 | | | | 4,107,993 | |
GrainCorp Ltd ‘A’ | | | 612,581 | | | | 7,895,086 | |
Grange Resources Ltd | | | 4,091,556 | | | | 1,538,305 | |
iiNET Ltd | | | 458,524 | | | | 2,185,742 | |
Imdex Ltd | | | 593,817 | | | | 1,061,311 | |
Investa Office Fund REIT | | | 1,728,994 | | | | 5,389,784 | |
Mount Gibson Iron Ltd | | | 2,685,729 | | | | 2,391,616 | |
NRW Holdings Ltd | | | 867,885 | | | | 1,741,869 | |
Nufarm Ltd | | | 403,181 | | | | 2,447,657 | |
OrotonGroup Ltd | | | 94,014 | | | | 674,198 | |
Perseus Mining Ltd * | | | 1,549,464 | | | | 3,414,892 | |
Resolute Mining Ltd | | | 1,740,405 | | | | 3,006,540 | |
Skilled Group Ltd | | | 925,800 | | | | 2,524,406 | |
Spark Infrastructure Group | | | 4,059,754 | | | | 7,105,773 | |
TPG Telecom Ltd | | | 621,714 | | | | 1,678,874 | |
| | | | | | | | |
| | | | | | | 79,776,655 | |
| | | | | | | | |
Austria - 1.0% | | | | | | | | |
| | |
AMS AG | | | 20,830 | | | | 2,233,822 | |
Oesterreichische Post AG | | | 133,194 | | | | 5,509,897 | |
Vienna Insurance Group AG | | | 74,236 | | | | 3,982,324 | |
| | | | | | | | |
| | | | | | | 11,726,043 | |
| | | | | | | | |
Belgium - 0.2% | | | | | | | | |
| | |
Barco NV | | | 35,700 | | | | 2,570,602 | |
| | | | | | | | |
| | |
Bermuda - 1.2% | | | | | | | | |
| | |
Catlin Group Ltd | | | 410,528 | | | | 3,317,751 | |
First Pacific Co Ltd | | | 2,959,200 | | | | 3,278,667 | |
Giordano International Ltd | | | 3,094,000 | | | | 2,994,360 | |
NWS Holdings Ltd | | | 1,705,000 | | | | 2,910,138 | |
Oriental Watch Holdings | | | 5,210,000 | | | | 1,834,398 | |
| | | | | | | | |
| | | | | | | 14,335,314 | |
| | | | | | | | |
Canada - 9.2% | | | | | | | | |
| | |
Aecon Group Inc | | | 284,200 | | | | 3,042,857 | |
Alamos Gold Inc | | | 152,100 | | | | 2,668,287 | |
Argonaut Gold Inc * | | | 289,800 | | | | 2,759,029 | |
B2Gold Corp * | | | 834,700 | | | | 2,987,365 | |
Calfrac Well Services Ltd | | | 108,125 | | | | 2,722,963 | |
Canadian Apartment Properties REIT | | | 106,200 | | | | 2,658,470 | |
Canyon Services Group Inc | | | 269,900 | | | | 3,079,687 | |
Celestica Inc * | | | 500,000 | | | | 4,056,499 | |
Cineplex Inc | | | 112,000 | | | | 3,583,955 | |
Cogeco Cable Inc | | | 103,600 | | | | 3,962,984 | |
Dundee Precious Metals Inc * | | | 379,500 | | | | 3,231,492 | |
| | | | | | | | |
| | | Shares | | | Value | |
Empire Co Ltd ‘A’ | | | 51,000 | | | | $3,022,469 | |
Ensign Energy Services Inc | | | 192,400 | | | | 2,972,945 | |
Martinrea International Inc * | | | 422,500 | | | | 3,291,822 | |
Methanex Corp (TSE) | | | 102,600 | | | | 3,267,687 | |
Nevsun Resources Ltd | | | 696,300 | | | | 2,975,043 | |
Norbord Inc * | | | 12,800 | | | | 388,491 | |
Pacific Rubiales Energy Corp | | | 114,300 | | | | 2,655,547 | |
Pan American Silver Corp | | | 241,019 | | | | 4,516,532 | |
Parkland Fuel Corp | | | 328,400 | | | | 6,249,736 | |
Poseidon Concepts Corp | | | 423,918 | | | | 596,647 | |
Primero Mining Corp * | | | 409,200 | | | | 2,632,834 | |
Quebecor Inc ‘B’ | | | 106,000 | | | | 4,120,861 | |
Russel Metals Inc | | | 230,800 | | | | 6,406,342 | |
Sandvine Corp * | | | 1,268,100 | | | | 1,682,811 | |
SEMAFO Inc | | | 369,460 | | | | 1,270,286 | |
ShawCor Ltd ‘A’ | | | 103,000 | | | | 4,037,368 | |
TELUS Corp | | | 58,400 | | | | 3,822,097 | |
The Jean Coutu Group PJC Inc ‘A’ | | | 234,000 | | | | 3,418,136 | |
TransForce Inc | | | 209,900 | | | | 4,190,825 | |
TransGlobe Energy Corp * | | | 269,800 | | | | 2,530,646 | |
Trinidad Drilling Ltd | | | 379,900 | | | | 2,627,638 | |
Twin Butte Energy Ltd | | | 1,188,900 | | | | 3,083,706 | |
Westjet Airlines Ltd | | | 224,000 | | | | 4,445,320 | |
Whitecap Resources Inc * | | | 328,700 | | | | 2,858,404 | |
| | | | | | | | |
| | | | | | | 111,817,781 | |
| | | | | | | | |
Cayman - 0.7% | | | | | | | | |
| | |
AMVIG Holdings Ltd | | | 2,232,000 | | | | 817,094 | |
Hutchison Telecommunications Hong Kong Holdings Ltd | | | 7,624,000 | | | | 3,530,928 | |
Polarcus Ltd * | | | 3,842,293 | | | | 4,647,982 | |
| | | | | | | | |
| | | | | | | 8,996,004 | |
| | | | | | | | |
Denmark - 1.5% | | | | | | | | |
| | |
Pandora AS | | | 264,814 | | | | 5,835,130 | |
Royal UNIBREW AS | | | 41,465 | | | | 3,612,724 | |
TDC AS | | | 279,500 | | | | 1,980,736 | |
Topdanmark AS * | | | 19,576 | | | | 4,199,903 | |
Tryg AS | | | 40,602 | | | | 3,069,789 | |
| | | | | | | | |
| | | | | | | 18,698,282 | |
| | | | | | | | |
Finland - 2.2% | | | | | | | | |
| | |
Huhtamaki OYJ | | | 226,304 | | | | 3,671,954 | |
Kemira OYJ | | | 286,133 | | | | 4,498,011 | |
Orion OYJ ‘B’ | | | 286,806 | | | | 8,429,702 | |
Pohjola Bank PLC ‘A’ | | | 221,665 | | | | 3,310,133 | |
Sponda OYJ | | | 698,282 | | | | 3,331,368 | |
Tieto OYJ | | | 179,523 | | | | 3,555,832 | |
| | | | | | | | |
| | | | | | | 26,797,000 | |
| | | | | | | | |
France - 7.7% | | | | | | | | |
| | |
Alten Ltd | | | 83,559 | | | | 2,882,734 | |
Altran Technologies SA * | | | 357,134 | | | | 2,721,830 | |
Arkema SA | | | 33,000 | | | | 3,469,763 | |
AtoS | | | 42,767 | | | | 3,047,383 | |
Cap Gemini SA | | | 199,907 | | | | 8,711,921 | |
CNP Assurances | | | 338,418 | | | | 5,154,898 | |
Eiffage SA | | | 102,595 | | | | 4,657,994 | |
Eramet | | | 23,528 | | | | 3,452,722 | |
Faurecia | | | 174,980 | | | | 2,776,613 | |
Imerys SA | | | 41,979 | | | | 2,723,852 | |
Klepierre REIT | | | 182,022 | | | | 7,336,563 | |
Legrand SA | | | 473 | | | | 19,964 | |
Mercialys SA REIT | | | 205,048 | | | | 4,660,855 | |
Neopost SA | | | 72,429 | | | | 3,829,826 | |
Plastic Omnium SA | | | 98,289 | | | | 2,965,160 | |
Publicis Groupe SA | | | 53,025 | | | | 3,177,032 | |
Remy Cointreau SA | | | 29,945 | | | | 3,273,626 | |
SCOR SE | | | 200,855 | | | | 5,415,932 | |
Societe BIC SA | | | 34,655 | | | | 4,136,956 | |
| | |
| See Notes to Financial Statements | | See explanation of symbols and terms, if any, on page B-143 |
B-119
PACIFIC SELECT FUND
INTERNATIONAL SMALL-CAP PORTFOLIO
Schedule of Investments (Continued)
December 31, 2012
| | | | | | | | |
| | | Shares | | | Value | |
UBISOFT Entertainment * | | | 500,605 | | | | $5,354,594 | |
Valeo SA | | | 117,457 | | | | 5,955,820 | |
Zodiac Aerospace | | | 72,931 | | | | 8,145,165 | |
| | | | | | | | |
| | | | | | | 93,871,203 | |
| | | | | | | | |
Germany - 5.8% | | | | | | | | |
| | |
Axel Springer AG | | | 109,314 | | | | 4,665,310 | |
Bertrandt AG | | | 30,824 | | | | 3,085,706 | |
Brenntag AG | | | 37,569 | | | | 4,935,731 | |
Drillisch AG | | | 185,410 | | | | 2,738,814 | |
Duerr AG | | | 90,365 | | | | 8,068,177 | |
Freenet AG | | | 284,543 | | | | 5,256,155 | |
Gerresheimer AG * | | | 88,632 | | | | 4,692,351 | |
Gildemeister AG | | | 166,046 | | | | 3,351,937 | |
Hannover Rueckversicherung AG | | | 113,372 | | | | 8,824,270 | |
Infineon Technologies AG | | | 301,748 | | | | 2,448,617 | |
Jenoptik AG | | | 188,176 | | | | 1,834,077 | |
Kloeckner & Co SE * | | | 179,800 | | | | 2,128,684 | |
MTU Aero Engines Holding AG | | | 61,650 | | | | 5,603,743 | |
NORMA Group AG | | | 85,500 | | | | 2,402,419 | |
Stada Arzneimittel AG | | | 122,400 | | | | 3,946,307 | |
Suedzucker AG | | | 165,951 | | | | 6,790,484 | |
| | | | | | | | |
| | | | | | | 70,772,782 | |
| | | | | | | | |
Greece - 0.2% | | | | | | | | |
| | |
OPAP SA | | | 307,163 | | | | 2,200,262 | |
| | | | | | | | |
| | |
Hong Kong - 1.3% | | | | | | | | |
| | |
China Overseas Grand Oceans Group Ltd | | | 2,329,000 | | | | 2,834,635 | |
Melco International Development Ltd | | | 2,640,000 | | | | 3,140,820 | |
PCCW Ltd | | | 5,796,000 | | | | 2,560,428 | |
Techtronic Industries Co | | | 1,586,500 | | | | 3,045,056 | |
Television Broadcasts Ltd | | | 562,000 | | | | 4,218,496 | |
| | | | | | | | |
| | | | | | | 15,799,435 | |
| | | | | | | | |
Ireland - 1.3% | | | | | | | | |
| | |
DCC PLC | | | 135,836 | | | | 4,334,837 | |
Paddy Power PLC | | | 47,383 | | | | 3,905,539 | |
Smurfit Kappa Group PLC | | | 430,251 | | | | 5,217,489 | |
United Drug PLC | | | 419,051 | | | | 1,897,829 | |
| | | | | | | | |
| | | | | | | 15,355,694 | |
| | | | | | | | |
Italy - 3.5% | | | | | | | | |
| | |
Ansaldo STS SPA | | | 308,577 | | | | 2,888,820 | |
Banca Generali SPA | | | 190,617 | | | | 3,254,195 | |
Banca Popolare di Milano Scarl * | | | 4,635,100 | | | | 2,788,803 | |
Brembo SPA | | | 418,737 | | | | 5,405,958 | |
Credito Emiliano SPA | | | 58,925 | | | | 323,386 | |
Danieli & Co Officine Meccaniche SPA | | | 91,246 | | | | 2,625,291 | |
De’Longhi SPA | | | 259,182 | | | | 3,726,896 | |
Delclima * | | | 259,182 | | | | 232,348 | |
Finmeccanica SPA * | | | 760,834 | | | | 4,409,390 | |
Lottomatica Group SPA | | | 261,706 | | | | 5,955,573 | |
MARR SPA | | | 119,128 | | | | 1,243,547 | |
Mediolanum SPA | | | 1,056,219 | | | | 5,377,157 | |
Societa Iniziative Autostradali e Servizi SPA | | | 438,844 | | | | 4,102,637 | |
| | | | | | | | |
| | | | | | | 42,334,001 | |
| | | | | | | | |
Japan - 21.0% | | | | | | | | |
| | |
Aeon Credit Service Co Ltd | | | 114,200 | | | | 2,305,717 | |
Ain Pharmaciez Inc | | | 46,500 | | | | 2,530,714 | |
Asahi Holdings Inc | | | 144,800 | | | | 2,449,752 | |
Avex Group Holdings Inc | | | 145,700 | | | | 2,926,876 | |
Bando Chemical Industries Ltd | | | 429,000 | | | | 1,441,878 | |
Cawachi Ltd | | | 12,200 | | | | 240,877 | |
Century Tokyo Leasing Corp | | | 122,200 | | | | 2,522,172 | |
Clarion Co Ltd * | | | 1,526,000 | | | | 2,655,487 | |
Cosmos Initia Co Ltd * | | | 365,200 | | | | 1,903,964 | |
Daicel Corp | | | 823,000 | | | | 5,445,537 | |
| | | | | | | | |
| | | Shares | | | Value | |
Daikyo Inc | | | 1,324,000 | | | | $3,611,503 | |
Daiwabo Holdings Co Ltd | | | 1,398,000 | | | | 2,864,745 | |
DCM Holdings Co Ltd | | | 358,800 | | | | 2,354,720 | |
Fuji Oil Co Ltd | | | 247,900 | | | | 3,584,344 | |
Futaba Industrial Co Ltd * | | | 402,300 | | | | 1,741,063 | |
Geo Holdings Corp | | | 1,817 | | | | 1,896,369 | |
Haseko Corp * | | | 8,612,500 | | | | 6,786,645 | |
Higashi Nihon House Co Ltd | | | 847,000 | | | | 3,567,060 | |
Hino Motors Ltd | | | 421,000 | | | | 3,775,229 | |
HIS Co Ltd | | | 60,600 | | | | 2,054,676 | |
Hitachi Capital Corp | | | 265,800 | | | | 5,473,323 | |
Honeys Co Ltd | | | 262,730 | | | | 3,463,209 | |
Howa Machinery Ltd | | | 2,315,000 | | | | 2,425,547 | |
Idemitsu Kosan Co Ltd | | | 44,700 | | | | 3,893,176 | |
IT Holdings Corp | | | 283,400 | | | | 3,423,223 | |
Japan Airlines Co Ltd * | | | 90,300 | | | | 3,865,024 | |
Japan Aviation Electronics Industry Ltd | | | 316,000 | | | | 2,341,511 | |
JFE Holdings Inc | | | 121,136 | | | | 2,283,751 | |
JVC Kenwood Corp | | | 1,149,500 | | | | 4,265,961 | |
Kanamoto Co Ltd | | | 277,000 | | | | 4,250,318 | |
Kanematsu Corp * | | | 4,134,000 | | | | 5,672,504 | |
Koito Manufacturing Co Ltd | | | 180,000 | | | | 2,624,874 | |
Kyoei Steel Ltd | | | 170,700 | | | | 3,244,256 | |
KYORIN Holdings Inc | | | 186,000 | | | | 3,606,825 | |
Kyowa Exeo Corp | | | 322,400 | | | | 3,228,790 | |
Maruha Nichiro Holdings Inc | | | 2,032,000 | | | | 3,545,194 | |
Meitec Corp | | | 129,900 | | | | 2,857,415 | |
Ministop Co Ltd | | | 106,300 | | | | 1,783,061 | |
Misawa Homes Co Ltd | | | 154,900 | | | | 2,276,863 | |
Mitsubishi Gas Chemical Co Inc | | | 472,000 | | | | 2,892,008 | |
Mitsubishi Steel Manufacturing Co Ltd | | | 981,000 | | | | 1,971,828 | |
MTI Ltd | | | 2,428 | | | | 2,265,114 | |
NET One Systems Co Ltd | | | 217,600 | | | | 2,136,016 | |
Nichiha Corp | | | 379,100 | | | | 4,399,124 | |
Nihon Kohden Corp | | | 82,000 | | | | 2,486,297 | |
Nihon Unisys Ltd | | | 640,400 | | | | 4,244,517 | |
Nippon Carbon Co Ltd | | | 1,291,000 | | | | 2,661,710 | |
Nippon Paint Co Ltd | | | 295,000 | | | | 2,535,674 | |
Nippon Piston Ring Co Ltd | | | 603,000 | | | | 1,174,340 | |
Nissei Build Kogyo Co Ltd | | | 1,201,000 | | | | 2,604,001 | |
Nisshin Steel Holdings Co Ltd * | | | 232,300 | | | | 2,136,823 | |
North Pacific Bank Ltd * | | | 930,900 | | | | 2,610,232 | |
Oenon Holdings Inc | | | 123,000 | | | | 280,882 | |
Oki Electric Industry Co Ltd * | | | 2,039,000 | | | | 2,480,238 | |
Otsuka Corp | | | 32,300 | | | | 2,443,828 | |
PanaHome Corp | | | 364,000 | | | | 2,442,655 | |
Sankyu Inc | | | 777,400 | | | | 2,939,719 | |
Sasebo Heavy Industries Co Ltd | | | 1,074,000 | | | | 1,268,023 | |
SCSK Corp | | | 242,200 | | | | 3,795,203 | |
Seino Holdings Corp | | | 226,000 | | | | 1,432,656 | |
Shinko Electric Industries Co Ltd | | | 563,000 | | | | 4,447,078 | |
Shinko Plantech Co Ltd | | | 277,600 | | | | 2,191,355 | |
Ship Healthcare Holdings Inc | | | 123,300 | | | | 3,269,973 | |
Showa Corp | | | 549,000 | | | | 5,414,072 | |
Skymark Airlines Inc * | | | 213,200 | | | | 1,211,454 | |
Sohgo Security Services Co Ltd | | | 154,900 | | | | 1,927,803 | |
Star Micronics Co Ltd | | | 271,800 | | | | 2,730,477 | |
Suruga Bank Ltd | | | 221,000 | | | | 2,714,671 | |
Taihei Kogyo Co Ltd | | | 329,000 | | | | 1,355,220 | |
Takara Leben Co Ltd | | | 310,400 | | | | 3,372,685 | |
Takashima & Co Ltd | | | 776,000 | | | | 2,417,251 | |
TBK Co Ltd | | | 109,000 | | | | 582,751 | |
The 77 Bank Ltd | | | 976,000 | | | | 3,910,262 | |
The Higo Bank Ltd | | | 242,000 | | | | 1,343,817 | |
The Keiyo Bank Ltd | | | 739,000 | | | | 3,244,488 | |
The Musashino Bank Ltd | | | 114,500 | | | | 3,717,071 | |
The Okinawa Electric Power Co Inc | | | 72,300 | | | | 2,254,781 | |
Toho Holdings Co Ltd | | | 152,700 | | | | 2,671,772 | |
Tokai Carbon Co Ltd | | | 752,000 | | | | 3,156,804 | |
Tokyu REIT Inc | | | 809 | | | | 4,394,223 | |
| | |
| See Notes to Financial Statements | | See explanation of symbols and terms, if any, on page B-143 |
B-120
PACIFIC SELECT FUND
INTERNATIONAL SMALL-CAP PORTFOLIO
Schedule of Investments (Continued)
December 31, 2012
| | | | | | | | |
| | | Shares | | | Value | |
Tosoh Corp | | | 1,465,000 | | | | $3,521,874 | |
Touei Housing Corp | | | 213,900 | | | | 2,957,377 | |
Toyo Engineering Corp | | | 577,000 | | | | 2,724,770 | |
Toyo Tire & Rubber Co Ltd | | | 1,157,000 | | | | 3,450,545 | |
Tsuruha Holdings Inc | | | 57,400 | | | | 4,502,484 | |
United Arrows Ltd | | | 286,700 | | | | 6,587,753 | |
Universal Entertainment Corp | | | 87,300 | | | | 1,497,466 | |
UNY Co Ltd | | | 248,800 | | | | 1,847,807 | |
| | | | | | | | |
| | | | | | | 255,803,125 | |
| | | | | | | | |
Luxembourg - 0.6% | | | | | | | | |
| | |
AZ Electronic Materials SA | | | 369,900 | | | | 2,121,348 | |
Eurofins Scientific | | | 20,133 | | | | 3,258,764 | |
Oriflame Cosmetics SA SDR | | | 63,284 | | | | 2,020,777 | |
| | | | | | | | |
| | | | | | | 7,400,889 | |
| | | | | | | | |
Malaysia - 0.1% | | | | | | | | |
| | |
RHB Capital Bhd | | | 599,200 | | | | 1,508,425 | |
| | | | | | | | |
| | |
Multi-National - 0.3% | | | | | | | | |
| | |
HKT Trust & HKT Ltd | | | 3,081,000 | | | | 3,023,302 | |
| | | | | | | | |
| | |
Netherlands - 0.9% | | | | | | | | |
| | |
Aalberts Industries NV | | | 167,060 | | | | 3,531,668 | |
Arcadis NV | | | 105,145 | | | | 2,463,755 | |
Brunel International NV | | | 67,900 | | | | 3,286,118 | |
Koninklijke Ten Cate NV | | | 85,782 | | | | 2,253,078 | |
| | | | | | | | |
| | | | | | | 11,534,619 | |
| | | | | | | | |
Norway - 1.7% | | | | | | | | |
| | |
Atea ASA | | | 252,100 | | | | 2,730,946 | |
DNO International ASA * | | | 2,642,500 | | | | 4,459,551 | |
Electromagnetic GeoServices ASA * | | | 891,370 | | | | 2,108,442 | |
Fred Olsen Energy ASA | | | 114,849 | | | | 5,022,537 | |
Kongsberg Gruppen ASA | | | 92,669 | | | | 2,081,072 | |
Norwegian Air Shuttle ASA * | | | 178,196 | | | | 4,624,025 | |
| | | | | | | | |
| | | | | | | 21,026,573 | |
| | | | | | | | |
Singapore - 0.2% | | | | | | | | |
| | |
STX OSV Holdings Ltd | | | 2,710,000 | | | | 2,920,326 | |
| | | | | | | | |
| | |
South Korea - 6.0% | | | | | | | | |
| | |
Capro Corp | | | 80,320 | | | | 947,714 | |
Chong Kun Dang Pharm Corp | | | 147,810 | | | | 5,110,179 | |
Daeduck GDS Co Ltd | | | 208,570 | | | | 3,462,924 | |
Daesang Corp | | | 293,540 | | | | 7,217,475 | |
Dongbu Insurance Co Ltd | | | 72,800 | | | | 3,133,950 | |
Eugene Technology Co Ltd | | | 167,709 | | | | 2,208,032 | |
GS Home Shopping Inc | | | 15,289 | | | | 2,177,654 | |
Humax Co Ltd | | | 264,489 | | | | 2,770,956 | |
Huvitz Co Ltd | | | 26,956 | | | | 371,335 | |
Hyundai Corp | | | 35,460 | | | | 690,051 | |
IsuPetasys Co Ltd | | | 767,750 | | | | 3,334,418 | |
Kolon Life Science Inc | | | 43,976 | | | | 3,406,928 | |
LG International Corp | | | 70,560 | | | | 3,214,709 | |
LIG Insurance Co Ltd | | | 150,310 | | | | 3,640,212 | |
LOTTE Himart Co Ltd * | | | 75,644 | | | | 4,878,829 | |
Mando Corp | | | 20,055 | | | | 2,421,282 | |
Meritz Fire & Marine Insurance Co Ltd | | | 266,300 | | | | 3,531,531 | |
Paradise Co Ltd | | | 396,776 | | | | 6,397,745 | |
Seah Besteel Corp | | | 77,565 | | | | 2,091,605 | |
Sejong Industrial Co Ltd | | | 180,830 | | | | 2,024,412 | |
Simm Tech Co Ltd | | | 555,661 | | | | 5,385,221 | |
Youngone Corp | | | 135,580 | | | | 4,188,576 | |
| | | | | | | | |
| | | | | | | 72,605,738 | |
| | | | | | | | |
| | | | | | | | |
| | | Shares | | | Value | |
Spain - 2.7% | | | | | | | | |
| | |
Bolsas y Mercados Espanoles SA | | | 177,378 | | | | $4,287,426 | |
Distribuidora Internacional de
Alimentacion SA | | | 1,361,490 | | | | 8,748,435 | |
Ence Energia y Celulosa SA | | | 945,429 | | | | 2,711,144 | |
Obrascon Huarte Lain SA | | | 130,592 | | | | 3,793,314 | |
Prosegur Cia de Seguridad SA | | | 797,780 | | | | 4,684,628 | |
Red Electrica Corp SA | | | 46,982 | | | | 2,321,266 | |
Viscofan SA | | | 117,009 | | | | 6,528,628 | |
| | | | | | | | |
| | | | | | | 33,074,841 | |
| | | | | | | | |
Sweden - 2.2% | | | | | | | | |
| | |
AarhusKarlshamn AB | | | 110,745 | | | | 4,711,627 | |
BillerudKorsnas AB | | | 466,500 | | | | 4,438,851 | |
Fabege AB | | | 446,885 | | | | 4,523,334 | |
Holmen AB ‘B’ | | | 110,153 | | | | 3,276,906 | |
Intrum Justitia AB | | | 175,384 | | | | 2,623,499 | |
Modern Times Group AB ‘B’ | | | 74,086 | | | | 2,595,619 | |
Saab AB ‘B’ | | | 210,200 | | | | 4,384,766 | |
| | | | | | | | |
| | | | | | | 26,554,602 | |
| | | | | | | | |
Switzerland - 2.6% | | | | | | | | |
| | |
Actelion Ltd | | | 95,426 | | | | 4,583,684 | |
Baloise Holding AG | | | 42,653 | | | | 3,722,282 | |
Banque Cantonale Vaudoise | | | 6,439 | | | | 3,418,219 | |
Flughafen Zuerich AG | | | 7,235 | | | | 3,351,528 | |
Galenica AG | | | 6,112 | | | | 3,547,096 | |
Helvetia Holding AG | | | 12,428 | | | | 4,721,023 | |
OC Oerlikon Corp AG | | | 455,862 | | | | 5,223,132 | |
Temenos Group AG * | | | 171,577 | | | | 3,024,474 | |
| | | | | | | | |
| | | | | | | 31,591,438 | |
| | | | | | | | |
United Kingdom - 17.6% | | | | | | | | |
| | |
Aberdeen Asset Management PLC | | | 540,390 | | | | 3,204,443 | |
Afren PLC * | | | 1,662,819 | | | | 3,645,821 | |
Ashmore Group PLC | | | 642,449 | | | | 3,714,845 | |
Ashtead Group PLC | | | 514,548 | | | | 3,651,240 | |
Aveva Group PLC | | | 133,652 | | | | 4,752,691 | |
Barratt Developments PLC * | | | 422,046 | | | | 1,427,507 | |
Beazley PLC | | | 2,962,101 | | | | 8,539,869 | |
Bellway PLC | | | 560,356 | | | | 9,525,055 | |
Berkeley Group Holdings PLC * | | | 242,129 | | | | 7,075,110 | |
Bodycote PLC | | | 716,308 | | | | 5,312,576 | |
Close Brothers Group PLC | | | 390,964 | | | | 5,489,925 | |
Cobham PLC | | | 834,422 | | | | 3,034,598 | |
De La Rue PLC | | | 267,843 | | | | 3,953,217 | |
Debenhams PLC | | | 1,854,876 | | | | 3,443,428 | |
Dixons Retail PLC * | | | 9,615,074 | | | | 4,459,221 | |
DS Smith PLC | | | 1,426,676 | | | | 4,766,487 | |
easyJet PLC | | | 526,081 | | | | 6,613,792 | |
Elementis PLC | | | 712,245 | | | | 2,701,340 | |
Ferrexpo PLC | | | 850,392 | | | | 3,545,211 | |
Firstgroup PLC | | | 1,220,613 | | | | 4,180,090 | |
Go-Ahead Group PLC | | | 186,593 | | | | 3,869,264 | |
Henderson Group PLC | | | 2,407,961 | | | | 5,342,718 | |
Home Retail Group PLC | | | 1,305,348 | | | | 2,694,120 | |
IG Group Holdings PLC | | | 908,867 | | | | 6,654,410 | |
Intermediate Capital Group PLC | | | 1,223,294 | | | | 6,426,345 | |
International Personal Finance PLC | | | 429,206 | | | | 2,577,685 | |
Jazztel PLC * | | | 360,461 | | | | 2,499,993 | |
Laird PLC | | | 735,110 | | | | 2,438,894 | |
London Stock Exchange Group PLC | | | 340,633 | | | | 5,949,951 | |
Micro Focus International PLC | | | 537,786 | | | | 5,179,625 | |
Mondi PLC | | | 570,699 | | | | 6,155,528 | |
Next PLC | | | 129,133 | | | | 7,970,182 | |
Northgate PLC | | | 690,681 | | | | 3,491,257 | |
Petropavlovsk PLC | | | 274,988 | | | | 1,654,565 | |
QinetiQ Group PLC | | | 1,538,861 | | | | 4,519,471 | |
Rightmove PLC | | | 207,228 | | | | 4,773,448 | |
| | |
| See Notes to Financial Statements | | See explanation of symbols and terms, if any, on page B-143 |
B-121
PACIFIC SELECT FUND
INTERNATIONAL SMALL-CAP PORTFOLIO
Schedule of Investments (Continued)
December 31, 2012
| | | | | | | | |
| | | Shares | | | Value | |
Rockhopper Exploration PLC * | | | 480,700 | | | | $1,218,359 | |
RPC Group PLC | | | 339,408 | | | | 2,226,846 | |
Senior PLC | | | 484,788 | | | | 1,590,737 | |
SIG PLC | | | 1,856,403 | | | | 3,662,176 | |
Spectris PLC | | | 282,367 | | | | 9,458,251 | |
Spirent Communications PLC | | | 853,144 | | | | 2,096,841 | |
Stagecoach Group PLC | | | 616,971 | | | | 3,048,894 | |
Synthomer PLC | | | 730,400 | | | | 2,275,793 | |
Tate & Lyle PLC | | | 232,338 | | | | 2,881,065 | |
Taylor Wimpey PLC | | | 6,714,749 | | | | 7,317,491 | |
Tullett Prebon PLC | | | 949,435 | | | | 3,939,325 | |
Victrex PLC | | | 125,300 | | | | 3,381,600 | |
WH Smith PLC | | | 512,614 | | | | 5,724,511 | |
| | | | | | | | |
| | | | | | | 214,055,811 | |
| | | | | | | | |
| | |
Total Common Stocks
(Cost $1,059,740,187) | | | | | | | 1,196,150,747 | |
| | | | | | | | |
| | | | | | | | |
| | | Principal
Amount | | | | |
SHORT-TERM INVESTMENT - 1.0% | | | | | | | | |
| | |
Repurchase Agreement - 1.0% | | | | | | | | |
| | |
Fixed Income Clearing Corp
0.010% due 01/02/13
(Dated 12/31/12, repurchase price of
$12,280,310; collateralized by U.S.
Treasury Notes: 2.750% due 11/30/16
and value $12,526,069) | | | $12,280,303 | | | | 12,280,303 | |
| | | | | | | | |
| | |
Total Short-Term Investment
(Cost $12,280,303) | | | | | | | 12,280,303 | |
| | | | | | | | |
| | |
TOTAL INVESTMENTS - 99.8%
(Cost $1,076,594,391) | | | | | | | 1,214,232,060 | |
| |
OTHER ASSETS & LIABILITIES, NET - 0.2% | | | | 2,275,268 | |
| | | | | | | | |
| | |
NET ASSETS - 100.0% | | | | | | | $1,216,507,328 | |
| | | | | | | | |
Notes to Schedule of Investments
| (a) | As of December 31, 2012, the portfolio was diversified as a percentage of net assets as follows: |
| | | | |
Industrials | | | 20.1% | |
Consumer Discretionary | | | 19.1% | |
Financials | | | 17.6% | |
Materials | | | 11.9% | |
Information Technology | | | 10.3% | |
Consumer Staples | | | 6.5% | |
Energy | | | 5.7% | |
Health Care | | | 4.2% | |
Telecommunication Services | | | 2.4% | |
Short-Term Investment | | | 1.0% | |
Utilities | | | 1.0% | |
| | | | |
| | | 99.8% | |
Other Assets & Liabilities, Net | | | 0.2% | |
| | | | |
| | | 100.0% | |
| | | | |
| (b) | As of December 31, 2012, the portfolio was diversified by country of incorporation as a percentage of net assets as follows: |
| | | | |
Japan | | | 21.0% | |
United Kingdom | | | 17.6% | |
Canada | | | 9.2% | |
France | | | 7.7% | |
Australia | | | 6.6% | |
Germany | | | 6.3% | |
South Korea | | | 6.0% | |
Italy | | | 3.5% | |
Others (each less than 3.0%) | | | 21.9% | |
| | | | |
| | | 99.8% | |
Other Assets & Liabilities, Net | | | 0.2% | |
| | | | |
| | | 100.0% | |
| | | | |
| (c) | Short-term investments reflect either the stated coupon rate or the annualized effective yield on the date of purchase for discounted investments. |
| (d) | Forward foreign currency contracts outstanding as of December 31, 2012 were as follows: |
| | | | | | | | | | | | | | | | | | |
Currency
Purchased | | | Currency
Sold | | | Expiration | | Counterparty | | Unrealized
Appreciation | |
| USD | | | 25,426,614 | | | JPY | | | 2,094,975,000 | | | 01/13 | | SSB | | | $1,244,392 | |
| | | | | | | | | | | | | | | | | | |
| | |
| See Notes to Financial Statements | | See explanation of symbols and terms, if any, on page B-143 |
B-122
PACIFIC SELECT FUND
INTERNATIONAL SMALL-CAP PORTFOLIO
Schedule of Investments (Continued)
December 31, 2012
| (e) | Fair Value Measurements |
The following is a summary of the portfolio’s investments as categorized under the three-tier hierarchy of inputs used in valuing the portfolio’s assets and liabilities (See Note 3D in Notes to Financial Statements) as of December 31, 2012:
| | | | | | | | | | | | | | | | | | |
| | | | | Total Value at
December 31, 2012 | | | Level 1
Quoted Price | | | Level 2
Significant
Observable Inputs | | | Level 3
Significant
Unobservable Inputs | |
Assets | | Preferred Stocks (1) | | | $5,801,010 | | | | $- | | | | $5,801,010 | | | | $- | |
| | Common Stocks | | | | | | | | | | | | | | | | |
| | Australia | | | 79,776,655 | | | | - | | | | 79,776,655 | | | | - | |
| | Austria | | | 11,726,043 | | | | - | | | | 11,726,043 | | | | - | |
| | Belgium | | | 2,570,602 | | | | - | | | | 2,570,602 | | | | - | |
| | Bermuda | | | 14,335,314 | | | | - | | | | 14,335,314 | | | | - | |
| | Canada | | | 111,817,781 | | | | 111,817,781 | | | | - | | | | - | |
| | Cayman | | | 8,996,004 | | | | - | | | | 8,996,004 | | | | - | |
| | Denmark | | | 18,698,282 | | | | - | | | | 18,698,282 | | | | - | |
| | Finland | | | 26,797,000 | | | | - | | | | 26,797,000 | | | | - | |
| | France | | | 93,871,203 | | | | - | | | | 93,871,203 | | | | - | |
| | Germany | | | 70,772,782 | | | | - | | | | 70,772,782 | | | | - | |
| | Greece | | | 2,200,262 | | | | - | | | | 2,200,262 | | | | - | |
| | Hong Kong | | | 15,799,435 | | | | - | | | | 15,799,435 | | | | - | |
| | Ireland | | | 15,355,694 | | | | - | | | | 15,355,694 | | | | - | |
| | Italy | | | 42,334,001 | | | | - | | | | 42,334,001 | | | | - | |
| | Japan | | | 255,803,125 | | | | - | | | | 255,803,125 | | | | - | |
| | Luxembourg | | | 7,400,889 | | | | - | | | | 7,400,889 | | | | - | |
| | Malaysia | | | 1,508,425 | | | | - | | | | 1,508,425 | | | | - | |
| | Multi-National | | | 3,023,302 | | | | - | | | | 3,023,302 | | | | - | |
| | Netherlands | | | 11,534,619 | | | | - | | | | 11,534,619 | | | | - | |
| | Norway | | | 21,026,573 | | | | - | | | | 21,026,573 | | | | - | |
| | Singapore | | | 2,920,326 | | | | - | | | | 2,920,326 | | | | - | |
| | South Korea | | | 72,605,738 | | | | - | | | | 72,605,738 | | | | - | |
| | Spain | | | 33,074,841 | | | | - | | | | 33,074,841 | | | | - | |
| | Sweden | | | 26,554,602 | | | | - | | | | 26,554,602 | | | | - | |
| | Switzerland | | | 31,591,438 | | | | - | | | | 31,591,438 | | | | - | |
| | United Kingdom | | | 214,055,811 | | | | - | | | | 214,055,811 | | | | - | |
| | | | | | | | | | | | | | | | | | |
| | | | | 1,196,150,747 | | | | 111,817,781 | | | | 1,084,332,966 | | | | - | |
| | Short-Term Investment | | | 12,280,303 | | | | - | | | | 12,280,303 | | | | - | |
| | Derivatives: | | | | | | | | | | | | | | | | |
| | Foreign Currency Contracts | | | | | | | | | | | | | | | | |
| | Forward Foreign Currency Contracts | | | 1,244,392 | | | | - | | | | 1,244,392 | | | | - | |
| | | | | | | | | | | | | | | | | | |
| | Total | | | $1,215,476,452 | | | | $111,817,781 | | | | $1,103,658,671 | | | | $- | |
| | | | | | | | | | | | | | | | | | |
| | (1) | For equity investments categorized in a single level, refer to the schedule of investments for further geographical region breakout. |
| | |
| See Notes to Financial Statements | | See explanation of symbols and terms, if any, on page B-143 |
B-123
PACIFIC SELECT FUND
INTERNATIONAL VALUE PORTFOLIO
Schedule of Investments
December 31, 2012
| | | | | | | | |
| | | Shares | | | Value | |
RIGHTS - 0.0% | | | | | | | | |
| | |
Spain - 0.0% | | | | | | | | |
| | |
Repsol SA
Exp. 02/21/13 * | | | 537,042 | | | | $327,498 | |
| | | | | | | | |
| | |
Total Rights
(Cost $335,866) | | | | | | | 327,498 | |
| | | | | | | | |
| | |
PREFERRED STOCKS - 1.7% | | | | | | | | |
| | |
Germany - 1.7% | | | | | | | | |
| | |
Volkswagen AG | | | 116,312 | | | | 26,461,659 | |
| | | | | | | | |
| | |
Total Preferred Stocks
(Cost $20,762,717) | | | | | | | 26,461,659 | |
| | | | | | | | |
| | |
COMMON STOCKS - 97.6% | | | | | | | | |
| | |
Australia - 2.3% | | | | | | | | |
| | |
Australia & New Zealand Banking Group Ltd | | | 986,300 | | | | 25,822,218 | |
Goodman Group REIT | | | 2,177,780 | | | | 9,907,556 | |
| | | | | | | | |
| | | | | | | 35,729,774 | |
| | | | | | | | |
Belgium - 1.7% | | | | | | | | |
| | |
Solvay SA | | | 180,231 | | | | 25,944,450 | |
| | | | | | | | |
| | |
Canada - 0.7% | | | | | | | | |
| | |
First Quantum Minerals Ltd | | | 483,970 | | | | 10,660,282 | |
| | | | | | | | |
| | |
China - 2.2% | | | | | | | | |
| | |
China Construction Bank Corp ‘H’ | | | 21,786,000 | | | | 17,755,683 | |
China Shenhua Energy Co Ltd ‘H’ | | | 3,485,000 | | | | 15,570,600 | |
| | | | | | | | |
| | | | | | | 33,326,283 | |
| | | | | | | | |
Denmark - 0.5% | | | | | | | | |
| | |
Danske Bank AS * | | | 465,526 | | | | 7,914,173 | |
| | | | | | | | |
| | |
Finland - 0.9% | | | | | | | | |
| | |
UPM-Kymmene OYJ | | | 1,148,290 | | | | 13,645,788 | |
| | | | | | | | |
| | |
France - 13.7% | | | | | | | | |
| | |
AXA SA | | | 729,418 | | | | 13,193,681 | |
BNP Paribas SA | | | 564,581 | | | | 31,823,825 | |
Cie de Saint-Gobain | | | 440,859 | | | | 18,863,730 | |
GDF Suez | | | 446,083 | | | | 9,191,055 | |
Lafarge SA | | | 192,183 | | | | 12,314,730 | |
Renault SA | | | 271,460 | | | | 14,976,969 | |
Sanofi | | | 565,474 | | | | 53,626,848 | |
Schneider Electric SA | | | 301,769 | | | | 22,506,998 | |
Societe Generale SA * | | | 243,055 | | | | 9,142,327 | |
Sodexo | | | 224,388 | | | | 18,802,719 | |
Suez Environnement Co | | | 554,815 | | | | 6,689,819 | |
| | | | | | | | |
| | | | | | | 211,132,701 | |
| | | | | | | | |
Germany - 6.4% | | | | | | | | |
| | |
Allianz SE | | | 270,536 | | | | 37,479,159 | |
BASF SE | | | 256,091 | | | | 24,070,331 | |
Bayer AG | | | 248,033 | | | | 23,553,840 | |
Deutsche Boerse AG | | | 218,932 | | | | 13,362,728 | |
| | | | | | | | |
| | | | | | | 98,466,058 | |
| | | | | | | | |
| | | | | | | | |
| | | Shares | | | Value | |
Hong Kong - 4.3% | | | | | | | | |
| | |
China Overseas Land & Investment Ltd | | | 4,066,000 | | | | $12,316,588 | |
CNOOC Ltd | | | 7,568,000 | | | | 16,617,486 | |
Hutchison Whampoa Ltd | | | 2,453,000 | | | | 26,022,166 | |
Sino Land Co Ltd | | | 6,428,000 | | | | 11,574,722 | |
| | | | | | | | |
| | | | | | | 66,530,962 | |
| | | | | | | | |
Israel - 0.4% | | | | | | | | |
| | |
Teva Pharmaceutical Industries Ltd ADR | | | 160,109 | | | | 5,978,470 | |
| | | | | | | | |
| | |
Italy - 4.0% | | | | | | | | |
| | |
Eni SPA | | | 1,874,619 | | | | 46,245,990 | |
Intesa Sanpaolo SPA | | | 8,473,829 | | | | 14,659,748 | |
| | | | | | | | |
| | | | | | | 60,905,738 | |
| | | | | | | | |
Japan - 20.9% | | | | | | | | |
| | |
Asahi Group Holdings Ltd | | | 374,100 | | | | 7,929,857 | |
Bridgestone Corp | | | 412,800 | | | | 10,700,233 | |
Canon Inc | | | 606,100 | | | | 23,772,556 | |
Fujitsu Ltd | | | 2,324,000 | | | | 9,757,713 | |
Hitachi Ltd | | | 4,603,000 | | | | 27,089,240 | |
Honda Motor Co Ltd | | | 920,700 | | | | 33,935,540 | |
Japan Airlines Co Ltd * | | | 193,400 | | | | 8,277,915 | |
Japan Tobacco Inc | | | 512,200 | | | | 14,439,779 | |
Kirin Holdings Co Ltd | | | 582,000 | | | | 6,838,741 | |
Marubeni Corp | | | 1,350,000 | | | | 9,674,225 | |
Mitsubishi Heavy Industries Ltd | | | 2,005,000 | | | | 9,695,789 | |
Mitsubishi UFJ Financial Group Inc | | | 1,940,100 | | | | 10,439,948 | |
Mitsui & Co Ltd | | | 761,300 | | | | 11,389,263 | |
Mitsui Fudosan Co Ltd | | | 767,000 | | | | 18,738,641 | |
Nippon Telegraph & Telephone Corp | | | 371,900 | | | | 15,622,115 | |
Nissan Motor Co Ltd | | | 1,722,700 | | | | 16,350,917 | |
ORIX Corp | | | 150,520 | | | | 16,984,506 | |
Sumitomo Corp | | | 1,200,300 | | | | 15,385,186 | |
Sumitomo Mitsui Financial Group Inc | | | 1,217,600 | | | | 44,234,218 | |
Yamato Holdings Co Ltd | | | 678,000 | | | | 10,309,340 | |
| | | | | | | | |
| | | | | | | 321,565,722 | |
| | | | | | | | |
Luxembourg - 0.5% | | | | | | | | |
| | |
ArcelorMittal | | | 476,774 | | | | 8,253,461 | |
| | | | | | | | |
| | |
Netherlands - 3.7% | | | | | | | | |
| | |
ASML Holding NV | | | 166,359 | | | | 10,770,025 | |
European Aeronautic Defence &
Space Co NV | | | 425,854 | | | | 16,690,633 | |
ING Groep NV CVA * | | | 1,678,597 | | | | 16,051,907 | |
Unilever NV CVA | | | 372,376 | | | | 14,051,147 | |
| | | | | | | | |
| | | | | | | 57,563,712 | |
| | | | | | | | |
Norway - 1.2% | | | | | | | | |
| | |
Telenor ASA | | | 922,284 | | | | 18,737,771 | |
| | | | | | | | |
| | |
Russia - 0.8% | | | | | | | | |
| | |
Sberbank of Russia ADR | | | 916,302 | | | | 11,508,753 | |
| | | | | | | | |
| | |
South Africa - 0.4% | | | | | | | | |
| | |
African Bank Investments Ltd | | | 1,565,811 | | | | 6,020,765 | |
| | | | | | | | |
| | |
South Korea - 1.3% | | | | | | | | |
| | |
Samsung Electronics Co Ltd | | | 14,024 | | | | 20,071,502 | |
| | | | | | | | |
| | |
| See Notes to Financial Statements | | See explanation of symbols and terms, if any, on page B-143 |
B-124
PACIFIC SELECT FUND
INTERNATIONAL VALUE PORTFOLIO
Schedule of Investments (Continued)
December 31, 2012
| | | | | | | | |
| | | Shares | | | Value | |
Spain - 1.7% | | | | | | | | |
| | |
Iberdrola SA | | | 2,694,329 | | | | $15,024,617 | |
Repsol SA | | | 537,042 | | | | 11,029,052 | |
| | | | | | | | |
| | | | | | | 26,053,669 | |
| | | | | | | | |
Sweden - 2.5% | | | | | | | | |
| | |
Nordea Bank AB | | | 927,666 | | | | 8,884,441 | |
Swedbank AB ‘A’ | | | 471,498 | | | | 9,278,323 | |
Telefonaktiebolaget LM Ericsson ‘B’ | | | 2,048,147 | | | | 20,600,802 | |
| | | | | | | | |
| | | | | | | 38,763,566 | |
| | | | | | | | |
Switzerland - 4.7% | | | | | | | | |
| | |
Credit Suisse Group AG | | | 973,289 | | | | 24,421,123 | |
Roche Holding AG (XVTX) | | | 93,421 | | | | 19,032,184 | |
Swiss Re AG | | | 268,498 | | | | 19,596,128 | |
Zurich Insurance Group AG | | | 34,977 | | | | 9,352,558 | |
| | | | | | | | |
| | | | | | | 72,401,993 | |
| | | | | | | | |
United Kingdom - 22.8% | | | | | | | | |
| | |
Barclays PLC | | | 7,361,166 | | | | 31,788,330 | |
British American Tobacco PLC | | | 143,728 | | | | 7,282,702 | |
Centrica PLC | | | 2,820,899 | | | | 15,324,232 | |
Experian PLC | | | 672,306 | | | | 10,862,621 | |
GlaxoSmithKline PLC | | | 402,199 | | | | 8,732,377 | |
HSBC Holdings PLC (LI) | | | 5,770,406 | | | | 61,032,599 | |
InterContinental Hotels Group PLC | | | 707,316 | | | | 19,890,910 | |
Kingfisher PLC | | | 4,262,338 | | | | 19,687,261 | |
Pearson PLC | | | 774,417 | | | | 15,139,345 | |
Prudential PLC | | | 1,545,779 | | | | 21,568,688 | |
Rio Tinto PLC | | | 451,442 | | | | 26,306,633 | |
Royal Dutch Shell PLC ‘A’ (LI) | | | 1,520,773 | | | | 53,735,796 | |
SABMiller PLC | | | 313,943 | | | | 14,776,695 | |
Vodafone Group PLC | | | 17,477,613 | | | | 43,953,857 | |
| | | | | | | | |
| | | | | | | 350,082,046 | |
| | | | | | | | |
| | |
Total Common Stocks
(Cost $1,354,011,245) | | | | | | | 1,501,257,639 | |
| | | | | | | | |
| | |
| | | Principal
Amount | | | | |
| | |
SHORT-TERM INVESTMENT - 0.7% | | | | | | | | |
| | |
Repurchase Agreement - 0.7% | | | | | | | | |
| | |
Fixed Income Clearing Corp
0.010% due 01/02/13
(Dated 12/31/12, repurchase price of
$10,176,948; collateralized by U.S.
Treasury Notes: 0.250% due 07/15/15
and value $10,385,000) | | | $10,176,943 | | | | 10,176,943 | |
| | | | | | | | |
| | |
Total Short-Term Investment
(Cost $10,176,943) | | | | | | | 10,176,943 | |
| | | | | | | | |
| | |
TOTAL INVESTMENTS - 100.0%
(Cost $1,385,286,771) | | | | | | | 1,538,223,739 | |
| |
OTHER ASSETS & LIABILITIES, NET - 0.0% | | | | 686,600 | |
| | | | | | | | |
| | |
NET ASSETS - 100.0% | | | | | | | $1,538,910,339 | |
| | | | | | | | |
Notes to Schedule of Investments
| (a) | As of December 31, 2012, the portfolio was diversified as a percentage of net assets as follows: |
| | | | |
Financials | | | 33.5% | |
Consumer Discretionary | | | 11.4% | |
Industrials | | | 10.4% | |
Energy | | | 9.3% | |
Materials | | | 7.9% | |
Information Technology | | | 7.3% | |
Health Care | | | 7.2% | |
Telecommunication Services | | | 5.1% | |
Consumer Staples | | | 4.2% | |
Utilities | | | 3.0% | |
Short-Term Investment | | | 0.7% | |
| | | | |
| | | 100.0% | |
Other Assets & Liabilities, Net | | | 0.0% | |
| | | | |
| | | 100.0% | |
| | | | |
| (b) | As of December 31, 2012, the portfolio was diversified by country of incorporation as a percentage of net assets as follows: |
| | | | |
United Kingdom | | | 22.8% | |
Japan | | | 20.9% | |
France | | | 13.7% | |
Germany | | | 8.1% | |
Switzerland | | | 4.7% | |
Hong Kong | | | 4.3% | |
Italy | | | 4.0% | |
Netherlands | | | 3.7% | |
Others (each less than 3.0%) | | | 17.8% | |
| | | | |
| | | 100.0% | |
Other Assets & Liabilities, Net | | | 0.0% | |
| | | | |
| | | 100.0% | |
| | | | |
| (c) | Short-term investments reflect either the stated coupon rate or the annualized effective yield on the date of purchase for discounted investments. |
| | |
| See Notes to Financial Statements | | See explanation of symbols and terms, if any, on page B-143 |
B-125
PACIFIC SELECT FUND
INTERNATIONAL VALUE PORTFOLIO
Schedule of Investments (Continued)
December 31, 2012
| (d) | Forward foreign currency contracts outstanding as of December 31, 2012 were as follows: |
| | | | | | | | | | | | | | | | | | | | |
Currency
Purchased | | | Currency
Sold | | | Expiration | | | Counterparty | | Unrealized
Appreciation
(Depreciation) | |
| AUD | | | 2,915,560 | | | EUR | | | 2,346,905 | | | | 02/13 | | | WBC | | | ($78,405 | ) |
| AUD | | | 2,889,840 | | | JPY | | | 248,831,985 | | | | 02/13 | | | WBC | | | 120,748 | |
| AUD | | | 98,468,943 | | | USD | | | 101,492,333 | | | | 02/13 | | | SCB | | | 512,930 | |
| AUD | | | 3,257,677 | | | USD | | | 3,406,781 | | | | 02/13 | | | SSB | | | (32,111 | ) |
| CHF | | | 2,834,394 | | | USD | | | 3,111,836 | | | | 02/13 | | | RBS | | | (10,931 | ) |
| CHF | | | 62,536,132 | | | USD | | | 67,475,326 | | | | 02/13 | | | WBC | | | 940,913 | |
| EUR | | | 6,016,474 | | | AUD | | | 7,475,469 | | | | 02/13 | | | UBS | | | 199,751 | |
| EUR | | | 8,422,687 | | | USD | | | 11,190,467 | | | | 02/13 | | | BRC | | | (69,802 | ) |
| EUR | | | 2,261,668 | | | USD | | | 2,931,723 | | | | 02/13 | | | CSF | | | 54,408 | |
| EUR | | | 4,129,087 | | | USD | | | 5,403,083 | | | | 02/13 | | | HSB | | | 48,643 | |
| EUR | | | 11,172,278 | | | USD | | | 14,368,734 | | | | 02/13 | | | SSB | | | 382,277 | |
| GBP | | | 3,696,220 | | | EUR | | | 4,614,709 | | | | 02/13 | | | HSB | | | (89,117 | ) |
| GBP | | | 2,370,429 | | | EUR | | | 2,917,149 | | | | 02/13 | | | UBS | | | (1,280 | ) |
| GBP | | | 6,983,745 | | | USD | | | 11,387,555 | | | | 02/13 | | | BRC | | | (43,826 | ) |
| GBP | | | 2,756,128 | | | USD | | | 4,396,345 | | | | 02/13 | | | CSF | | | 80,447 | |
| GBP | | | 1,671,505 | | | USD | | | 2,695,087 | | | | 02/13 | | | HSB | | | 19,945 | |
| GBP | | | 1,128,715 | | | USD | | | 1,810,981 | | | | 02/13 | | | RBS | | | 22,395 | |
| GBP | | | 2,742,750 | | | USD | | | 4,405,652 | | | | 02/13 | | | SSB | | | 49,409 | |
| JPY | | | 228,470,476 | | | GBP | | | 1,814,185 | | | | 02/13 | | | RBC | | | (308,997 | ) |
| JPY | | | 429,676,977 | | | HKD | | | 41,403,267 | | | | 02/13 | | | SGN | | | (381,718 | ) |
| JPY | | | 250,113,684 | | | USD | | | 3,034,208 | | | | 02/13 | | | CSF | | | (146,535 | ) |
| JPY | | | 242,884,720 | | | USD | | | 2,957,929 | | | | 02/13 | | | RBC | | | (153,718 | ) |
| JPY | | | 456,341,747 | | | USD | | | 5,689,011 | | | | 02/13 | | | SGN | | | (420,345 | ) |
| SEK | | | 48,304,330 | | | EUR | | | 5,567,797 | | | | 02/13 | | | CSF | | | 70,809 | |
| SEK | | | 17,383,222 | | | USD | | | 2,587,294 | | | | 02/13 | | | RBC | | | 83,687 | |
| SEK | | | 39,337,370 | | | USD | | | 5,857,026 | | | | 02/13 | | | WBC | | | 187,272 | |
| SGD | | | 37,337,107 | | | USD | | | 30,599,446 | | | | 02/13 | | | SGN | | | (36,344 | ) |
| USD | | | 4,813,313 | | | AUD | | | 4,687,500 | | | | 02/13 | | | SSB | | | (42,530 | ) |
| USD | | | 9,265,207 | | | CAD | | | 9,271,090 | | | | 02/13 | | | SCB | | | (48,995 | ) |
| USD | | | 6,351,107 | | | CHF | | | 5,826,315 | | | | 02/13 | | | BRC | | | (23,041 | ) |
| USD | | | 3,054,671 | | | CHF | | | 2,793,591 | | | | 02/13 | | | CIT | | | (1,594 | ) |
| USD | | | 14,071,807 | | | EUR | | | 10,899,070 | | | | 02/13 | | | CSF | | | (318,481 | ) |
| USD | | | 8,098,529 | | | EUR | | | 6,230,257 | | | | 02/13 | | | HSB | | | (127,421 | ) |
| USD | | | 3,420,592 | | | EUR | | | 2,623,266 | | | | 02/13 | | | RBS | | | (42,965 | ) |
| USD | | | 79,034,076 | | | EUR | | | 60,704,387 | | | | 02/13 | | | WBC | | | (1,115,296 | ) |
| USD | | | 44,694,335 | | | GBP | | | 27,743,569 | | | | 02/13 | | | CSF | | | (369,671 | ) |
| USD | | | 2,993,391 | | | HKD | | | 23,200,000 | | | | 02/13 | | | CSF | | | (253 | ) |
| USD | | | 38,635,170 | | | HKD | | | 299,368,480 | | | | 02/13 | | | CSF | | | 5,740 | |
| USD | | | 2,930,640 | | | HKD | | | 22,710,000 | | | | 02/13 | | | SSB | | | 224 | |
| USD | | | 16,351,738 | | | JPY | | | 1,313,591,229 | | | | 02/13 | | | HSB | | | 1,185,749 | |
| USD | | | 13,201,816 | | | JPY | | | 1,095,442,897 | | | | 02/13 | | | RBC | | | 554,446 | |
| USD | | | 9,017,296 | | | JPY | | | 753,559,812 | | | | 02/13 | | | RBS | | | 317,116 | |
| USD | | | 9,940,548 | | | JPY | | | 798,229,967 | | | | 02/13 | | | WBC | | | 724,631 | |
| USD | | | 3,178,134 | | | NOK | | | 18,154,466 | | | | 02/13 | | | HSB | | | (84,470 | ) |
| USD | | | 3,442,028 | | | SEK | | | 22,817,549 | | | | 02/13 | | | BRC | | | (63,953 | ) |
| USD | | | 912,976 | | | SEK | | | 6,096,750 | | | | 02/13 | | | CSF | | | (23,807 | ) |
| USD | | | 443,664 | | | SEK | | | 2,945,390 | | | | 02/13 | | | SGN | | | (8,903 | ) |
| | | | | | | | | | | | | | | | | | | | |
| | | | |
Total Forward Foreign Currency Contracts | | | | | | | | | | | | | $1,517,031 | |
| | | | | | | | | | | | | | | | | | | | |
| | |
| See Notes to Financial Statements | | See explanation of symbols and terms, if any, on page B-143 |
B-126
PACIFIC SELECT FUND
INTERNATIONAL VALUE PORTFOLIO
Schedule of Investments (Continued)
December 31, 2012
| (e) | Fair Value Measurements |
The following is a summary of the portfolio’s investments as categorized under the three-tier hierarchy of inputs used in valuing the portfolio’s assets and liabilities (See Note 3D in Notes to Financial Statements) as of December 31, 2012:
| | | | | | | | | | | | | | | | | | |
| | | | | Total Value at
December 31, 2012 | | | Level 1
Quoted Price | | | Level 2
Significant
Observable Inputs | | | Level 3
Significant
Unobservable Inputs | |
Assets | | Rights (1) | | | $327,498 | | | | $327,498 | | | | $- | | | | $- | |
| | Preferred Stocks (1) | | | 26,461,659 | | | | - | | | | 26,461,659 | | | | - | |
| | Common Stocks | | | | | | | | | | | | | | | | |
| | Australia | | | 35,729,774 | | | | - | | | | 35,729,774 | | | | - | |
| | Belgium | | | 25,944,450 | | | | - | | | | 25,944,450 | | | | - | |
| | Canada | | | 10,660,282 | | | | 10,660,282 | | | | - | | | | - | |
| | China | | | 33,326,283 | | | | - | | | | 33,326,283 | | | | - | |
| | Denmark | | | 7,914,173 | | | | - | | | | 7,914,173 | | | | - | |
| | Finland | | | 13,645,788 | | | | - | | | | 13,645,788 | | | | - | |
| | France | | | 211,132,701 | | | | - | | | | 211,132,701 | | | | - | |
| | Germany | | | 98,466,058 | | | | - | | | | 98,466,058 | | | | - | |
| | Hong Kong | | | 66,530,962 | | | | - | | | | 66,530,962 | | | | - | |
| | Israel | | | 5,978,470 | | | | 5,978,470 | | | | - | | | | - | |
| | Italy | | | 60,905,738 | | | | - | | | | 60,905,738 | | | | - | |
| | Japan | | | 321,565,722 | | | | - | | | | 321,565,722 | | | | - | |
| | Luxembourg | | | 8,253,461 | | | | - | | | | 8,253,461 | | | | - | |
| | Netherlands | | | 57,563,712 | | | | - | | | | 57,563,712 | | | | - | |
| | Norway | | | 18,737,771 | | | | - | | | | 18,737,771 | | | | - | |
| | Russia | | | 11,508,753 | | | | 11,508,753 | | | | - | | | | - | |
| | South Africa | | | 6,020,765 | | | | - | | | | 6,020,765 | | | | - | |
| | South Korea | | | 20,071,502 | | | | - | | | | 20,071,502 | | | | - | |
| | Spain | | | 26,053,669 | | | | - | | | | 26,053,669 | | | | - | |
| | Sweden | | | 38,763,566 | | | | - | | | | 38,763,566 | | | | - | |
| | Switzerland | | | 72,401,993 | | | | - | | | | 72,401,993 | | | | - | |
| | United Kingdom | | | 350,082,046 | | | | - | | | | 350,082,046 | | | | - | |
| | | | | | | | | | | | | | | | | | |
| | | | | 1,501,257,639 | | | | 28,147,505 | | | | 1,473,110,134 | | | | - | |
| | Short-Term Investment | | | 10,176,943 | | | | - | | | | 10,176,943 | | | | - | |
| | Derivatives: | | | | | | | | | | | | | | | | |
| | Foreign Currency Contracts | | | | | | | | | | | | | | | | |
| | Forward Foreign Currency Contracts | | | 5,561,540 | | | | - | | | | 5,561,540 | | | | - | |
| | | | | | | | | | | | | | | | | | |
| | Total Assets | | | 1,543,785,279 | | | | 28,475,003 | | | | 1,515,310,276 | | | | - | |
| | | | | | | | | | | | | | | | | | |
Liabilities | | Derivatives: | | | | | | | | | | | | | | | | |
| | Foreign Currency Contracts | | | | | | | | | | | | | | | | |
| | Forward Foreign Currency Contracts | | | (4,044,509 | ) | | | - | | | | (4,044,509 | ) | | | - | |
| | | | | | | | | | | | | | | | | | |
| | Total Liabilities | | | (4,044,509 | ) | | | - | | | | (4,044,509 | ) | | | - | |
| | | | | | | | | | | | | | | | | | |
| | Total | | | $1,539,740,770 | | | | $28,475,003 | | | | $1,511,265,767 | | | | $- | |
| | | | | | | | | | | | | | | | | | |
| | (1) | For equity investments categorized in a single level, refer to the schedule of investments for further geographical region breakout. |
| | |
| See Notes to Financial Statements | | See explanation of symbols and terms, if any, on page B-143 |
B-127
PACIFIC SELECT FUND
CURRENCY STRATEGIES PORTFOLIO
Schedule of Investments
December 31, 2012
| | | | | | | | |
| | | Principal
Amount | | | Value | |
FOREIGN GOVERNMENT BONDS & NOTES - 48.4% | |
| |
Canada - 12.7% | | | | | |
| | |
Canadian Government
1.750% due 03/01/13 | | | CAD 183,700,000 | | | | $184,917,033 | |
| | | | | | | | |
| | |
France - 9.8% | | | | | | | | |
| | |
French Treasury
4.500% due 07/12/13 | | | EUR 106,300,000 | | | | 143,567,102 | |
| | | | | | | | |
| | |
Germany - 13.1% | | | | | | | | |
| | |
Bundesobligation
3.500% due 04/12/13 | | | 143,000,000 | | | | 190,525,165 | |
| | | | | | | | |
| | |
United Kingdom - 12.8% | | | | | | | | |
| | |
United Kingdom Gilt
4.500% due 03/07/13 | | | GBP 114,000,000 | | | | 186,562,121 | |
| | | | | | | | |
| |
Total Foreign Government Bonds & Notes
(Cost $702,945,654) | | | | 705,571,421 | |
| | | | | | | | |
| | |
SHORT-TERM INVESTMENTS - 52.2% | | | | | | | | |
| | |
U.S. Treasury Bills - 12.8% | | | | | | | | |
| | |
0.157% due 09/19/13 | | | $187,700,000 | | | | 187,527,316 | |
| | | | | | | | |
| | |
Repurchase Agreement - 39.4% | | | | | | | | |
| | |
Fixed Income Clearing Corp
0.010% due 01/02/13
(Dated 12/31/12, repurchase price of
$574,053,114; collateralized by Freddie
Mac: 2.875% due 02/09/15 and value
$42,353,206; and U.S. Treasury Notes:
4.000% due 02/15/15 and value
$543,181,728) | | | 574,052,795 | | | | 574,052,795 | |
| | | | | | | | |
| |
Total Short-Term Investments
(Cost $761,541,867) | | | | 761,580,111 | |
| | | | | | | | |
| |
TOTAL INVESTMENTS - 100.6%
(Cost $1,464,487,521) | | | | 1,467,151,532 | |
| |
OTHER ASSETS & LIABILITIES, NET - (0.6%) | | | | (8,790,743 | ) |
| | | | | | | | |
| | |
NET ASSETS - 100.0% | | | | | | | $1,458,360,789 | |
| | | | | | | | |
Notes to Schedule of Investments
| (a) | As of December 31, 2012, the portfolio was diversified as a percentage of net assets as follows: |
| | | | |
Short-Term Investments | | | 52.2% | |
Foreign Government Bonds & Notes | | | 48.4% | |
| | | | |
| | | 100.6% | |
Other Assets & Liabilities, Net | | | (0.6% | ) |
| | | | |
| | | 100.0% | |
| | | | |
| (b) | As of December 31, 2012, the portfolio’s Standard & Poor’s quality ratings as a percentage of total fixed income investments were as follows (Unaudited): |
| | | | |
AAA | | | 38.3% | |
A-1 (Short-Term Debt only) | | | 51.9% | |
AA | | | 9.8% | |
| | | | |
| | | 100.0% | |
| | | | |
| (c) | Short-term investments reflect either the stated coupon rate or the annualized effective yield on the date of purchase for discounted investments. |
| | |
| See Notes to Financial Statements | | See explanation of symbols and terms, if any, on page B-143 |
B-128
PACIFIC SELECT FUND
CURRENCY STRATEGIES PORTFOLIO
Schedule of Investments (Continued)
December 31, 2012
| (d) | Forward foreign currency contracts outstanding as of December 31, 2012 were as follows: |
| | | | | | | | | | | | | | | | | | | | |
Currency
Purchased | | | Currency
Sold | | | Expiration | | | Counterparty | | Unrealized
Appreciation
(Depreciation) | |
| AUD | | | 13,925,000 | | | USD | | | 14,665,392 | | | | 01/13 | | | CSF | | | ($216,775 | ) |
| AUD | | | 13,805,000 | | | USD | | | 14,520,789 | | | | 01/13 | | | GSC | | | (196,684 | ) |
| EUR | | | 362,715,000 | | | USD | | | 474,023,166 | | | | 01/13 | | | GSC | | | 4,787,664 | |
| INR | | | 23,986,480,000 | | | USD | | | 438,589,870 | | | | 01/13 | | | GSC | | | (1,769,976 | ) |
| JPY | | | 18,382,161,876 | | | USD | | | 220,210,000 | | | | 01/13 | | | BRC | | | (8,016,605 | ) |
| KRW | | | 250,860,000,000 | | | USD | | | 231,175,414 | | | | 01/13 | | | BRC | | | 2,981,856 | |
| MXN | | | 8,666,470,000 | | | USD | | | 668,683,307 | | | | 01/13 | | | BRC | | | 1,121,466 | |
| MYR | | | 688,598,000 | | | USD | | | 225,503,668 | | | | 01/13 | | | BRC | | | (496,459 | ) |
| NZD | | | 51,110,000 | | | USD | | | 42,692,454 | | | | 01/13 | | | BRC | | | (482,564 | ) |
| PHP | | | 9,357,850,000 | | | USD | | | 228,798,289 | | | | 01/13 | | | GSC | | | (814,589 | ) |
| PLN | | | 716,090,000 | | | USD | | | 226,281,363 | | | | 01/13 | | | MSC | | | 4,810,970 | |
| USD | | | 22,160,147 | | | AUD | | | 21,405,000 | | | | 01/13 | | | GSC | | | (49,739 | ) |
| USD | | | 1,010,172,822 | | | AUD | | | 965,370,000 | | | | 01/13 | | | GSC | | | 8,502,308 | |
| USD | | | 407,335,498 | | | CAD | | | 403,865,000 | | | | 01/13 | | | BRC | | | 1,415,065 | |
| USD | | | 227,689,331 | | | CHF | | | 210,665,000 | | | | 01/13 | | | BRC | | | (2,680,867 | ) |
| USD | | | 226,636,621 | | | CZK | | | 4,364,760,000 | | | | 01/13 | | | MSC | | | (3,006,509 | ) |
| USD | | | 142,813,996 | | | EUR | | | 108,370,000 | | | | 01/13 | | | GSC | | | (242,480 | ) |
| USD | | | 14,605,811 | | | EUR | | | 11,010,000 | | | | 01/13 | | | GSC | | | 71,791 | |
| USD | | | 524,702,344 | | | GBP | | | 325,810,000 | | | | 01/13 | | | CSF | | | (4,544,004 | ) |
| USD | | | 214,299,010 | | | JPY | | | 18,382,161,876 | | | | 01/13 | | | RBS | | | 2,105,614 | |
| USD | | | 14,584,001 | | | MXN | | | 186,560,000 | | | | 01/13 | | | CSF | | | 165,353 | |
| USD | | | 220,970,000 | | | MXN | | | 2,823,598,854 | | | | 01/13 | | | MSC | | | 2,742,742 | |
| USD | | | 22,171,154 | | | NZD | | | 27,110,000 | | | | 01/13 | | | BRC | | | (218,008 | ) |
| USD | | | 909,654,551 | | | NZD | | | 1,098,285,000 | | | | 01/13 | | | CSF | | | 2,620,920 | |
| USD | | | 113,364,483 | | | SEK | | | 748,260,000 | | | | 01/13 | | | SEB | | | (1,667,007 | ) |
| | | | | | | | | | | | | | | | | | | | |
| | | | |
Total Forward Foreign Currency Contracts | | | | | | | | | | | | | $6,923,483 | |
| | | | | | | | | | | | | | | | | | | | |
| (e) | Fair Value Measurements |
The following is a summary of the portfolio’s investments as categorized under the three-tier hierarchy of inputs used in valuing the portfolio’s assets and liabilities (See Note 3D in Notes to Financial Statements) as of December 31, 2012:
| | | | | | | | | | | | | | | | | | |
| | | | | Total Value at
December 31, 2012 | | | Level 1
Quoted Price | | | Level 2
Significant
Observable Inputs | | | Level 3
Significant
Unobservable Inputs | |
Assets | | Foreign Government Bonds & Notes | | | $705,571,421 | | | | $- | | | | $705,571,421 | | | | $- | |
| | Short-Term Investments | | | 761,580,111 | | | | - | | | | 761,580,111 | | | | - | |
| | Derivatives: | | | | | | | | | | | | | | | | |
| | Foreign Currency Contracts | | | | | | | | | | | | | | | | |
| | Forward Foreign Currency Contracts | | | 31,325,749 | | | | - | | | | 31,325,749 | | | | - | |
| | | | | | | | | | | | | | | | | | |
| | Total Assets | | | 1,498,477,281 | | | | - | | | | 1,498,477,281 | | | | - | �� |
| | | | | | | | | | | | | | | | | | |
Liabilities | | Derivatives: | | | | | | | | | | | | | | | | |
| | Foreign Currency Contracts | | | | | | | | | | | | | | | | |
| | Forward Foreign Currency Contracts | | | (24,402,266 | ) | | | - | | | | (24,402,266 | ) | | | - | |
| | | | | | | | | | | | | | | | | | |
| | Total Liabilities | | | (24,402,266 | ) | | | - | | | | (24,402,266 | ) | | | - | |
| | | | | | | | | | | | | | | | | | |
| | Total | | | $1,474,075,015 | | | | $- | | | | $1,474,075,015 | | | | $- | |
| | | | | | | | | | | | | | | | | | |
| | |
| See Notes to Financial Statements | | See explanation of symbols and terms, if any, on page B-143 |
B-129
PACIFIC SELECT FUND
GLOBAL ABSOLUTE RETURN PORTFOLIO
Schedule of Investments
December 31, 2012
| | | | | | | | |
| | | Shares | | |
Value | |
COMMON STOCKS - 1.8% | | | | | |
| |
France - 0.3% | | | | | |
| | |
Sanofi | | | 31,518 | | | | $2,989,016 | |
Total SA | | | 55,087 | | | | 2,851,168 | |
| | | | | | | | |
| | | | | | | 5,840,184 | |
| | | | | | | | |
Germany - 1.1% | | | | | | | | |
| | |
Deutsche Euroshop AG | | | 179,363 | | | | 7,489,986 | |
Deutsche Wohnen AG | | | 382,846 | | | | 7,070,026 | |
GSW Immobilien AG | | | 182,329 | | | | 7,706,696 | |
| | | | | | | | |
| | | | | | | 22,266,708 | |
| | | | | | | | |
Luxembourg - 0.4% | | | | | | | | |
| | |
GAGFAH SA * | | | 644,247 | | | | 7,538,565 | |
| | | | | | | | |
| | |
Total Common Stocks
(Cost $33,357,089) | | | | | | | 35,645,457 | |
| | | | | | | | |
| | |
| | | Principal
Amount | | | | |
| |
FOREIGN GOVERNMENT BONDS & NOTES - 35.5% | | | | | |
| | |
Albania - 0.1% | | | | | | | | |
| | |
Albania Government
7.500% due 11/04/15 | | | EUR 2,000,000 | | | | 2,734,410 | |
| | | | | | | | |
| | |
Cyprus - 1.0% | | | | | | | | |
| | |
Cyprus Government
3.750% due 06/03/13 | | | 14,541,000 | | | | 16,698,262 | |
4.375% due 07/15/14 | | | 1,000,000 | | | | 1,036,622 | |
4.625% due 02/03/20 | | | 2,000,000 | | | | 1,623,539 | |
| | | | | | | | |
| | | | | | | 19,358,423 | |
| | | | | | | | |
Germany - 1.9% | | | | | | | | |
| | |
Bundesrepublik Deutschland
4.750% due 07/04/34 | | | 19,840,000 | | | | 38,419,606 | |
| | | | | | | | |
| | |
Mexico - 8.8% | | | | | | | | |
| | |
Mexican Bonos
6.000% due 06/18/15 | | | MXN 1,800,000,000 | | | | 143,390,220 | |
8.000% due 12/17/15 | | | 430,000,000 | | | | 36,066,136 | |
| | | | | | | | |
| | | | | | | 179,456,356 | |
| | | | | | | | |
Mongolia - 0.2% | | | | | | | | |
| | |
Mongolia Government
4.125% due 01/05/18 ~ | | | $4,790,000 | | | | 4,754,075 | |
| | | | | | | | |
| | |
New Zealand - 0.5% | | | | | | | | |
| | |
New Zealand Government
2.000% due 09/20/25 ^ | | | NZD 12,500,000 | | | | 11,127,649 | |
| | | | | | | | |
| | |
Philippines - 1.6% | | | | | | | | |
| | |
Philippine Government | | | | | | | | |
4.125% due 11/08/17 | | | PHP 94,870,000 | | | | 2,356,288 | |
4.625% due 07/05/17 | | | 86,110,000 | | | | 2,180,466 | |
5.000% due 08/18/18 | | | 122,140,000 | | | | 3,129,473 | |
5.875% due 01/31/18 | | | 91,390,000 | | | | 2,447,273 | |
6.250% due 01/14/36 | | | 402,000,000 | | | | 11,809,798 | |
8.000% due 07/19/31 | | | 343,987,000 | | | | 10,767,185 | |
| | | | | | | | |
| | | | | | | 32,690,483 | |
| | | | | | | | |
| | | | | | | | |
| | | Principal
Amount | | | Value | |
Russia - 2.0% | | | | | | | | |
| | |
Russian Federal Bond
6.880% due 07/15/15 | | | RUB 156,060,000 | | | | $5,185,144 | |
7.000% due 06/03/15 | | | 156,060,000 | | | | 5,205,065 | |
7.100% due 03/13/14 | | | 603,450,000 | | | | 19,974,527 | |
8.100% due 11/26/14 | | | 72,250,000 | | | | 2,453,184 | |
12.000% due 08/20/14 | | | 195,850,000 | | | | 7,009,112 | |
| | | | | | | | |
| | | | | | | 39,827,032 | |
| | | | | | | | |
Serbia - 3.4% | | | | | | | | |
| | |
Serbia Treasury Bills
12.651% due 01/30/14 | | | RSD 500,000,000 | | | | 5,185,722 | |
13.111% due 12/18/14 | | | 559,390,000 | | | | 5,228,787 | |
14.096% due 05/22/14 | | | 5,406,340,000 | | | | 54,073,568 | |
Serbia Treasury Bonds
10.000% due 04/01/14 | | | 280,000,000 | | | | 3,200,146 | |
10.000% due 12/06/15 | | | 157,800,000 | | | | 1,707,822 | |
| | | | | | | | |
| | | | | | | 69,396,045 | |
| | | | | | | | |
Slovenia - 1.9% | | | | | | | | |
| | |
Slovenia Government
4.125% due 01/26/20 | | | EUR 300,000 | | | | 376,986 | |
4.375% due 01/18/21 ~ | | | 4,840,000 | | | | 6,115,515 | |
5.500% due 10/26/22 ~ | | | $30,224,000 | | | | 31,810,760 | |
| | | | | | | | |
| | | | | | | 38,303,261 | |
| | | | | | | | |
Sri Lanka - 1.8% | | | | | | | | |
| | |
Sri Lanka Government
5.875% due 07/25/22 ~ | | | 23,445,000 | | | | 25,086,150 | |
6.250% due 10/04/20 ~ | | | 10,500,000 | | | | 11,471,250 | |
| | | | | | | | |
| | | | | | | 36,557,400 | |
| | | | | | | | |
Turkey - 10.3% | | | | | | | | |
| | |
Turkey Government
3.000% due 07/21/21 ^ | | | TRY 46,705,740 | | | | 30,042,791 | |
4.000% due 04/01/20 ^ | | | 76,373,454 | | | | 51,373,719 | |
7.064% due 07/17/13 | | | 98,841,000 | | | | 53,670,948 | |
7.179% due 09/11/13 | | | 137,559,000 | | | | 73,999,409 | |
| | | | | | | | |
| | | | | | | 209,086,867 | |
| | | | | | | | |
Venezuela - 2.0% | | | | | | | | |
| | |
Venezuela Government
9.250% due 05/07/28 ~ | | | $6,704,000 | | | | 6,636,960 | |
11.750% due 10/21/26 ~ | | | 18,910,000 | | | | 21,415,575 | |
11.950% due 08/05/31 ~ | | | 10,300,000 | | | | 11,767,750 | |
| | | | | | | | |
| | | | | | | 39,820,285 | |
| | | | | | | | |
Total Foreign Government Bonds & Notes
(Cost $702,607,556) | | | | 721,531,892 | |
| | | | | | | | |
| |
PURCHASED OPTIONS - 0.1%
(See Note (h) in Notes to Schedule of Investments)
(Cost $1,880,455) | | | | 1,310,812 | |
| | | | | | | | |
| | |
SHORT-TERM INVESTMENTS - 71.9% | | | | | | | | |
| | |
Foreign Government Issues - 26.5% | | | | | | | | |
| | |
Bank Negara Malaysia Monetary Notes (Malaysia)
2.982% due 04/30/13 | | | MYR 86,246,000 | | | | 27,941,109 | |
2.992% due 01/31/13 | | | 35,478,000 | | | | 11,573,284 | |
3.001% due 04/18/13 | | | 28,621,000 | | | | 9,281,515 | |
3.002% due 04/23/13 | | | 69,104,000 | | | | 22,400,498 | |
3.003% due 05/02/13 | | | 53,546,000 | | | | 17,344,491 | |
3.004% due 04/30/13 | | | 8,059,000 | | | | 2,610,874 | |
Korea Monetary Stabilization Bonds (South Korea)
2.755% due 03/05/13 | | | KRW 19,987,310,000 | | | | 18,583,199 | |
2.755% due 03/27/13 | | | 20,000,000,000 | | | | 18,563,622 | |
2.766% due 01/08/13 | | | 14,000,000,000 | | | | 13,070,194 | |
| | |
| See Notes to Financial Statements | | See explanation of symbols and terms, if any, on page B-143 |
B-130
PACIFIC SELECT FUND
GLOBAL ABSOLUTE RETURN PORTFOLIO
Schedule of Investments (Continued)
December 31, 2012
| | | | | | | | |
| | | Principal
Amount | | | Value | |
2.777% due 01/01/13 | | | KRW 20,000,000,000 | | | | $18,681,550 | |
2.777% due 02/05/13 | | | 10,000,000,000 | | | | 9,316,119 | |
2.779% due 02/05/13 | | | 10,000,000,000 | | | | 9,316,102 | |
2.849% due 01/08/13 | | | 30,000,000,000 | | | | 28,007,117 | |
Nigeria Treasury Bills (Nigeria)
13.114% due 01/24/13 | | | NGN 2,666,753,000 | | | | 16,941,156 | |
13.943% due 04/25/13 | | | 3,160,000,000 | | | | 19,437,086 | |
15.001% due 10/24/13 | | | 3,395,000,000 | | | | 19,655,561 | |
15.122% due 10/10/13 | | | 11,067,300,000 | | | | 64,378,161 | |
15.393% due 10/10/13 | | | 4,064,900,000 | | | | 23,645,405 | |
Philippine Treasury Bills (Philippines)
0.162% due 05/02/13 | | | PHP 177,150,000 | | | | 4,308,719 | |
0.357% due 06/13/13 | | | 300,530,000 | | | | 7,302,010 | |
0.365% due 01/30/13 | | | 183,380,000 | | | | 4,464,582 | |
0.373% due 01/30/13 | | | 183,380,000 | | | | 4,464,553 | |
0.405% due 06/13/13 | | | 107,150,000 | | | | 2,603,435 | |
0.458% due 10/02/13 | | | 317,060,000 | | | | 7,682,986 | |
0.487% due 01/02/13 | | | 600,000,000 | | | | 14,611,678 | |
0.750% due 03/20/13 | | | 200,000,000 | | | | 4,866,533 | |
0.911% due 08/07/13 | | | 136,000,000 | | | | 3,300,548 | |
1.032% due 10/02/13 | | | 100,000,000 | | | | 2,423,196 | |
1.036% due 10/02/13 | | | 28,000,000 | | | | 678,495 | |
1.052% due 09/18/13 | | | 300,000,000 | | | | 7,272,475 | |
Singapore Treasury Bills (Singapore)
0.181% due 04/04/13 | | | SGD 210,000 | | | | 171,819 | |
0.261% due 04/04/13 | | | 49,144,000 | | | | 40,204,704 | |
0.291% due 06/27/13 | | | 30,036,000 | | | | 24,559,542 | |
0.293% due 01/03/13 | | | 49,114,000 | | | | 40,205,650 | |
0.299% due 01/10/13 | | | 22,461,000 | | | | 18,385,941 | |
| | | | | | | | |
| | | | | | | 538,253,909 | |
| | | | | | | | |
U.S. Treasury Bills - 24.6% | | | | | | | | |
| | |
0.011% due 01/10/13 | | | $250,000,000 | | | | 249,999,344 | |
0.053% due 01/17/13 ‡ | | | 250,000,000 | | | | 249,994,166 | |
| | | | | | | | |
| | | | | | | 499,993,510 | |
| | | | | | | | |
Repurchase Agreements - 20.8% | | | | | | | | |
| | |
Bank of America Corp
(0.550)% due 02/04/13
(Dated 01/04/13, repurchase price of $43,492,395; collateralized by European Investment Bank: 3.625% due 01/15/21 and value $43,586,854) | | | EUR 32,965,625 | | | | 43,513,003 | |
Citibank Inc
(0.100)% due 01/04/13
(Dated 12/31/12, repurchase price of $101,371,095; collateralized by French Government: 4.000% due 10/25/38 and value $101,396,943) | | | 76,800,000 | | | | 101,372,221 | |
| | | | | | | | |
| | | Principal
Amount | | | Value | |
Fixed Income Clearing Corp
0.010% due 01/02/13
(Dated 12/31/12, repurchase price of $277,906,808; collateralized by U.S. Treasury Notes: 0.250 - 2.750% due 07/15/15 - 11/30/16 and value $283,466,538) | | | $277,906,653 | | | | $277,906,653 | |
| | | | | | | | |
| | | | | | | 422,791,877 | |
| | | | | | | | |
Total Short-Term Investments
(Cost $1,455,490,128) | | | | | | | 1,461,039,296 | |
| | | | | | | | |
| | |
TOTAL INVESTMENTS - 109.3% (Cost $2,193,335,228) | | | | | | | 2,219,527,457 | |
| |
TOTAL SECURITIES SOLD SHORT - (7.0%)
(See Note (f) in Notes to Schedule
of Investments)
(Proceeds $134,630,905) | | | | (142,909,449 | ) |
| |
OTHER ASSETS & LIABILITIES, NET - (2.3%) | | | | (45,873,737 | ) |
| | | | | | | | |
| |
NET ASSETS - 100.0% | | | | $2,030,744,271 | |
| | | | | | | | |
Notes to Schedule of Investments
| (a) | As of December 31, 2012, the portfolio was diversified as a percentage of net assets as follows: |
| | | | |
Short-Term Investments | | | 71.9% | |
Foreign Government Bonds & Notes | | | 35.5% | |
Equity Securities | | | 1.8% | |
Purchased Options | | | 0.1% | |
| | | | |
| | | 109.3% | |
Securities Sold Short | | | (7.0% | ) |
Other Assets & Liabilities, Net | | | (2.3% | ) |
| | | | |
| | | 100.0% | |
| | | | |
| (b) | As of December 31, 2012, the portfolio’s Standard & Poor’s quality ratings as a percentage of total fixed income investments were as follows (Unaudited): |
| | | | |
A-1 (Short-Term Debt only) | | | 42.3% | |
AA | | | 0.5% | |
A | | | 10.0% | |
BBB | | | 8.0% | |
BB | | | 0.8% | |
B | | | 3.6% | |
CCC | | | 0.9% | |
Not Rated | | | 33.9% | |
| | | | |
| | | 100.0% | |
| | | | |
| (c) | Short-term investments reflect either the stated coupon rate or the annualized effective yield on the date of purchase for discounted investments. |
| (d) | As of December 31, 2012, investments with total aggregate values of $7,919,815 and $4,804,888 were fully or partially segregated with the broker(s)/custodian as collateral for open futures contracts and swap contracts, respectively. |
| (e) | Securities sold short outstanding as of December 31, 2012 were as follows: |
| | | | | | | | | | | | |
| Description | | | | | Principal
Amount | | | Value | |
Foreign Government Bonds & Notes - (7.0%) | | | | | | | | | |
European Investment Bank
3.625% due 01/15/21 | | | EUR | | | | 27,500,000 | | | | ($42,339,758) | |
France Government
4.000% due 10/25/38 | | | | | | | 64,000,000 | | | | (100,569,691) | |
| | | | | | | | | | | | |
| | | |
Total Securities Sold Short
(Proceeds $134,630,905) | | | | | | | | | | | ($142,909,449) | |
| | | | | | | | | | | | |
| | |
| See Notes to Financial Statements | | See explanation of symbols and terms, if any, on page B-143 |
B-131
PACIFIC SELECT FUND
GLOBAL ABSOLUTE RETURN PORTFOLIO
Schedule of Investments (Continued)
December 31, 2012
| (f) | Open futures contracts outstanding as of December 31, 2012 were as follows: |
| | | | | | | | | | | | |
| Long Futures Outstanding | | Number of
Contracts | | | Notional
Amount | | | Unrealized
Appreciation
(Depreciation) | |
Hang Seng China Enterprise Index (01/13) | | | 648 | | | | HKD 364,400,469 | | | | $853,059 | |
| | | | | | | | | | | | |
| | | |
Short Futures Outstanding | | | | | | | | | |
CAC 40 Index (01/13) | | | 444 | | | | EUR 16,296,782 | | | | 166,713 | |
Dow Jones EURO Stoxx 50
Index (03/13) | | | 423 | | | | 11,208,878 | | | | 194,598 | |
Euro-Bobl 5-Year
Notes (03/13) | | | 1,164 | | | | 116,400,000 | | | | (1,000,549 | ) |
Euro-Bund 10-Year
Notes (03/13) | | | 28 | | | | 2,800,000 | | | | (25,545 | ) |
Euro-Schatz 2-Year Notes(03/13) | | | 26 | | | | 2,600,000 | | | | (2,444 | ) |
Japanese Government
10- Year Bond (03/13) | | | 70 | | | | JPY 7,000,000,000 | | | | 874,576 | |
U.S. 10-Year
Deliverable Interest Rate Swap (03/13) | | | 83 | | | | $8,300,000 | | | | 121,412 | |
| | | | | | | | | | | | |
| | | | | | | | | | | 328,761 | |
| | | | | | | | | | | | |
| |
Total Futures Contracts | | | | $1,181,820 | |
| | | | | | | | | | | | |
| (g) | Forward foreign currency contracts outstanding as of December 31, 2012 were as follows: |
| | | | | | | | | | | | | | | | | | | | |
Currency
Purchased | | | Currency
Sold | | | Expiration | | | Counterparty | | Unrealized
Appreciation
(Depreciation) | |
| AUD | | | 35,026,000 | | | USD | | | 36,703,886 | | | | 01/13 | | | BNP | | | ($341,941 | ) |
| BRL | | | 167,600,520 | | | USD | | | 78,811,493 | | | | 02/13 | | | BNP | | | 2,700,323 | |
| CNH | | | 390,750,000 | | | USD | | | 62,107,606 | | | | 02/13 | | | BOA | | | 467,819 | |
| CNH | | | 250,000,000 | | | USD | | | 39,739,310 | | | | 02/13 | | | JPM | | | 296,150 | |
| CNH | | | 270,000,000 | | | USD | | | 42,915,044 | | | | 02/13 | | | SCB | | | 323,253 | |
| CNY | | | 236,906,000 | | | USD | | | 37,595,176 | | | | 02/13 | | | BNP | | | 347,788 | |
| EUR | | | 2,457,036 | | | RSD | | | 279,635,256 | | | | 01/13 | | | CIT | | | (35,970 | ) |
| EUR | | | 24,886,117 | | | USD | | | 32,298,446 | | | | 01/13 | | | BOA | | | 551,962 | |
| INR | | | 2,157,970,000 | | | USD | | | 40,678,040 | | | | 01/13 | | | BOA | | | (1,323,599 | ) |
| INR | | | 277,220,000 | | | USD | | | 5,127,007 | | | | 01/13 | | | DUB | | | (86,853 | ) |
| INR | | | 2,160,000,000 | | | USD | | | 40,747,029 | | | | 01/13 | | | JPM | | | (1,331,729 | ) |
| INR | | | 1,019,946,000 | | | USD | | | 18,682,896 | | | | 01/13 | | | SCB | | | (108,570 | ) |
| INR | | | 4,367,000,000 | | | USD | | | 79,271,724 | | | | 02/13 | | | BNP | | | (107,546 | ) |
| INR | | | 1,238,116,000 | | | USD | | | 23,051,871 | | | | 02/13 | | | BOA | | | (660,534 | ) |
| INR | | | 2,160,000,000 | | | USD | | | 39,212,127 | | | | 02/13 | | | CIT | | | (48,910 | ) |
| INR | | | 4,357,778,000 | | | USD | | | 78,536,494 | | | | 02/13 | | | DUB | | | 460,510 | |
| KRW | | | 80,393,736,150 | | | USD | | | 73,870,933 | | | | 02/13 | | | BOA | | | 1,069,046 | |
| MYR | | | 165,553,000 | | | USD | | | 54,008,743 | | | | 01/13 | | | BOA | | | 106,366 | |
| MYR | | | 182,980,000 | | | USD | | | 59,693,994 | | | | 01/13 | | | SCB | | | 117,563 | |
| NGN | | | 442,500,000 | | | USD | | | 2,500,000 | | | | 10/13 | | | DUB | | | 116,786 | |
| NOK | | | 471,000,000 | | | EUR | | | 63,717,386 | | | | 01/13 | | | CSF | | | 627,552 | |
| PEN | | | 107,100,000 | | | USD | | | 41,237,165 | | | | 01/13 | | | DUB | | | 678,627 | |
| PHP | | | 1,333,577,000 | | | USD | | | 32,393,534 | | | | 02/13 | | | BNP | | | 117,725 | |
| PHP | | | 427,720,000 | | | USD | | | 10,465,378 | | | | 03/13 | | | DUB | | | (47,251 | ) |
| PHP | | | 233,000,000 | | | USD | | | 5,694,037 | | | | 03/13 | | | GSC | | | (18,330 | ) |
| RSD | | | 8,645,471,281 | | | EUR | | | 75,462,984 | | | | 01/13 | | | DUB | | | 1,709,537 | |
| RUB | | | 221,725,000 | | | USD | | | 7,028,291 | | | | 06/13 | | | BOA | | | 45,861 | |
| RUB | | | 212,475,000 | | | USD | | | 6,737,752 | | | | 06/13 | | | CIT | | | 41,278 | |
| RUB | | | 434,200,000 | | | USD | | | 13,575,113 | | | | 09/13 | | | JPM | | | 83,218 | |
| RUB | | | 240,008,000 | | | USD | | | 7,408,798 | | | | 12/13 | | | CSF | | | 44,555 | |
| RUB | | | 194,312,000 | | | USD | | | 6,002,379 | | | | 12/13 | | | GSC | | | 31,903 | |
| SEK | | | 541,000,000 | | | EUR | | | 62,569,538 | | | | 01/13 | | | BNP | | | 591,126 | |
| TRY | | | 17,687,086 | | | USD | | | 9,914,842 | | | | 01/13 | | | JPM | | | (9,406 | ) |
| USD | | | 115,432,501 | | | AUD | | | 111,746,000 | | | | 01/13 | | | BNP | | | (575,659 | ) |
| USD | | | 78,554,159 | | | BRL | | | 167,600,520 | | | | 02/13 | | | BNP | | | (2,957,656 | ) |
| USD | | | 91,920,028 | | | EUR | | | 70,867,208 | | | | 01/13 | | | BOA | | | (1,626,778 | ) |
| USD | | | 269,601,818 | | | EUR | | | 208,260,559 | | | | 01/13 | | | DUB | | | (5,308,269 | ) |
| USD | | | 3,254,184 | | | EUR | | | 2,461,578 | | | | 01/13 | | | DUB | | | 4,828 | |
| | |
| See Notes to Financial Statements | | See explanation of symbols and terms, if any, on page B-143 |
B-132
PACIFIC SELECT FUND
GLOBAL ABSOLUTE RETURN PORTFOLIO
Schedule of Investments (Continued)
December 31, 2012
| | | | | | | | | | | | | | | | | | | | |
Currency
Purchased | | | Currency
Sold | | | Expiration | | | Counterparty | | Unrealized
Appreciation
(Depreciation) | |
| USD | | | 22,302,345 | | | EUR | | | 16,993,389 | | | | 02/13 | | | GSC | | | ($137,414 | ) |
| USD | | | 39,430,449 | | | INR | | | 2,160,000,000 | | | | 01/13 | | | CIT | | | 15,149 | |
| USD | | | 92,952,794 | | | JPY | | | 7,377,795,000 | | | | 01/13 | | | BOA | | | 7,786,735 | |
| USD | | | 11,052,450 | | | NZD | | | 13,315,997 | | | | 01/13 | | | BOA | | | 67,370 | |
| USD | | | 2,752,497 | | | TRY | | | 4,960,000 | | | | 01/13 | | | JPM | | | (25,290 | ) |
| USD | | | 8,618,234 | | | TRY | | | 15,730,000 | | | | 02/13 | | | JPM | | | (142,585 | ) |
| USD | | | 81,981,213 | | | TWD | | | 2,400,000,000 | | | | 01/13 | | | BOA | | | (667,151 | ) |
| USD | | | 72,753,553 | | | TWD | | | 2,108,980,000 | | | | 02/13 | | | SCB | | | 115,088 | |
| USD | | | 26,627,377 | | | ZAR | | | 236,964,988 | | | | 01/13 | | | BNP | | | (1,309,401 | ) |
| USD | | | 53,752,820 | | | ZAR | | | 475,631,826 | | | | 03/13 | | | CSF | | | (1,836,540 | ) |
| | | | | | | | | | | | | | | | | | | | |
| | | | |
Total Forward Foreign Currency Contracts | | | | | | | | | | | | | ($189,264 | ) |
| | | | | | | | | | | | | | | | | | | | |
| (h) | Purchased options outstanding as of December 31, 2012 were as follows: |
Foreign Currency Options
| | | | | | | | | | | | | | | | | | | | | | | | | | |
| Description | | Exercise
Price | | | Expiration
Date | | | Counter-
party | | Notional
Amount | | | Cost | | | Value | |
Put - OTC South Korean Won Versus U.S. dollar | | | $1,120.00 | | | | 06/14/13 | | | BOA | | | KRW | | | | 30,240,000,000 | | | | $286,200 | | | | $203,375 | |
Put - OTC South Korean Won Versus U.S. dollar | | | 1,120.00 | | | | 06/14/13 | | | DUB | | | | | | | 33,600,000,000 | | | | 323,400 | | | | 225,972 | |
Put - OTC South Korean Won Versus U.S. dollar | | | 1,120.00 | | | | 06/14/13 | | | SCB | | | | | | | 28,000,000,000 | | | | 267,250 | | | | 188,310 | |
Put - OTC South Korean Won Versus U.S. dollar | | | 1,120.00 | | | | 06/18/13 | | | DUB | | | | | | | 34,659,520,000 | | | | 340,940 | | | | 239,573 | |
Put - OTC South Korean Won Versus U.S. dollar | | | 1,120.00 | | | | 06/18/13 | | | GSC | | | | | | | 31,818,080,000 | | | | 315,340 | | | | 219,932 | |
Put - OTC South Korean Won Versus U.S. dollar | | | 1,120.00 | | | | 06/18/13 | | | SCB | | | | | | | 33,802,720,000 | | | | 347,325 | | | | 233,650 | |
| | | | | | | | | | | | | | | | | | | | | | | | | | |
Total Purchased Options | | | | | | | | | | | | | | | | | | | | | $1,880,455 | | | | $1,310,812 | |
| | | | | | | | | | | | | | | | | | | | | | | | | | |
| (i) | Swap agreements outstanding as of December 31, 2012 were as follows: |
Credit Default Swaps on Sovereign Issues - Buy Protection (1)
| | | | | | | | | | | | | | | | | | | | | | | | | | | | | | |
| Referenced Obligation | | Fixed Deal
Pay
Rate | | | Expiration
Date | | | Counter-
party | | Implied Credit
Spread at
12/31/12 (3) | | | Notional
Amount (4) | | | Value | | | Upfront
Premiums
Paid
(Received) | | | Unrealized
Appreciation
(Depreciation) | |
France Government | | | 0.250% | | | | 12/20/17 | | | DUB | | | 0.863% | | | | $54,000,000 | | | | $1,603,080 | | | | $2,304,178 | | | | ($701,098 | ) |
Belgium Government | | | 1.000% | | | | 12/20/17 | | | BNP | | | 0.808% | | | | 31,740,000 | | | | (307,095 | ) | | | 360,344 | | | | (667,439 | ) |
Croatia Government | | | 1.000% | | | | 12/20/17 | | | BNP | | | 2.516% | | | | 2,000,000 | | | | 140,475 | | | | 139,006 | | | | 1,469 | |
China Government | | | 1.000% | | | | 12/20/17 | | | BOA | | | 0.608% | | | | 41,000,000 | | | | (799,145 | ) | | | (327,842 | ) | | | (471,303 | ) |
Thailand Government | | | 1.000% | | | | 12/20/17 | | | BOA | | | 0.874% | | | | 11,000,000 | | | | (70,756 | ) | | | 60,005 | | | | (130,761 | ) |
Colombia Government | | | 1.000% | | | | 12/20/17 | | | CSF | | | 0.921% | | | | 40,000,000 | | | | (167,613 | ) | | | 139,810 | | | | (307,423 | ) |
Croatia Government | | | 1.000% | | | | 12/20/17 | | | DUB | | | 2.516% | | | | 4,040,000 | | | | 283,760 | | | | 285,508 | | | | (1,748 | ) |
Thailand Government | | | 1.000% | | | | 12/20/17 | | | DUB | | | 0.874% | | | | 30,000,000 | | | | (192,970 | ) | | | 134,011 | | | | (326,981 | ) |
Croatia Government | | | 1.000% | | | | 12/20/17 | | | GSC | | | 2.516% | | | | 2,000,000 | | | | 140,475 | | | | 135,003 | | | | 5,472 | |
Lebanon Government | | | 5.000% | | | | 12/20/17 | | | JPM | | | 4.174% | | | | 2,500,000 | | | | (95,722 | ) | | | (82,869 | ) | | | (12,853 | ) |
Russian Foreign Bond | | | 1.000% | | | | 06/20/22 | | | DUB | | | 1.817% | | | | 10,000,000 | | | | 676,577 | | | | 773,976 | | | | (97,399 | ) |
Russian Foreign Bond | | | 1.000% | | | | 09/20/22 | | | BNP | | | 1.831% | | | | 17,914,000 | | | | 1,259,061 | | | | 1,498,792 | | | | (239,731 | ) |
Russian Foreign Bond | | | 1.000% | | | | 09/20/22 | | | JPM | | | 1.831% | | | | 16,630,000 | | | | 1,168,817 | | | | 1,391,365 | | | | (222,548 | ) |
France Government | | | 0.250% | | | | 12/20/22 | | | JPM | | | 1.379% | | | | 33,600,000 | | | | 3,312,445 | | | | 3,780,615 | | | | (468,170 | ) |
Belgium Government | | | 1.000% | | | | 12/20/22 | | | BNP | | | 1.221% | | | | 19,170,000 | | | | 366,390 | | | | 922,066 | | | | (555,676 | ) |
Colombia Government | | | 1.000% | | | | 12/20/22 | | | BNP | | | 1.340% | | | | 40,000,000 | | | | 1,194,667 | | | | 1,630,424 | | | | (435,757 | ) |
Mexico Government | | | 1.000% | | | | 12/20/22 | | | BNP | | | 1.344% | | | | 54,100,000 | | | | 1,631,692 | | | | 2,188,058 | | | | (556,366 | ) |
Russian Foreign Bond | | | 1.000% | | | | 12/20/22 | | | BNP | | | 1.845% | | | | 7,100,000 | | | | 517,140 | | | | 623,296 | | | | (106,156 | ) |
South Africa Government | | | 1.000% | | | | 12/20/22 | | | BNP | | | 2.016% | | | | 120,000,000 | | | | 10,416,801 | | | | 12,058,804 | | | | (1,642,003 | ) |
Spain Government | | | 1.000% | | | | 12/20/22 | | | BOA | | | 3.196% | | | | 20,000,000 | | | | 3,308,573 | | | | 4,238,614 | | | | (930,041 | ) |
Brazilian Government | | | 1.000% | | | | 12/20/22 | | | BOA | | | 1.463% | | | | 10,000,000 | | | | 404,517 | | | | 459,127 | | | | (54,610 | ) |
Mexico Government | | | 1.000% | | | | 12/20/22 | | | BOA | | | 1.344% | | | | 41,900,000 | | | | 1,263,733 | | | | 1,737,363 | | | | (473,630 | ) |
South Africa Government | | | 1.000% | | | | 12/20/22 | | | BOA | | | 2.016% | | | | 25,000,000 | | | | 2,170,167 | | | | 2,327,985 | | | | (157,818 | ) |
Brazilian Government | | | 1.000% | | | | 12/20/22 | | | DUB | | | 1.463% | | | | 84,000,000 | | | | 3,397,940 | | | | 4,126,596 | | | | (728,656 | ) |
Colombia Government | | | 1.000% | | | | 12/20/22 | | | DUB | | | 1.340% | | | | 12,300,000 | | | | 367,360 | | | | 541,946 | | | | (174,586 | ) |
Spain Government | | | 1.000% | | | | 12/20/22 | | | DUB | | | 3.196% | | | | 55,000,000 | | | | 9,098,576 | | | | 11,717,316 | | | | (2,618,740 | ) |
South African Government | | | 1.000% | | | | 12/20/22 | | | JPM | | | 2.016% | | | | 31,750,000 | | | | 2,756,112 | | | | 3,009,554 | | | | (253,442 | ) |
South African Government | | | 1.000% | | | | 03/20/23 | | | BNP | | | 2.031% | | | | 50,000,000 | | | | 4,483,833 | | | | 4,657,747 | | | | (173,914 | ) |
| | | | | | | | | | | | | | | | | | | | | | | | | | | | | | |
| | | | | | | | | | | | | | | | | | | | | $48,328,890 | | | | $60,830,798 | | | | ($12,501,908 | ) |
| | | | | | | | | | | | | | | | | | | | | | | | | | | | | | |
| | |
| See Notes to Financial Statements | | See explanation of symbols and terms, if any, on page B-143 |
B-133
PACIFIC SELECT FUND
GLOBAL ABSOLUTE RETURN PORTFOLIO
Schedule of Investments (Continued)
December 31, 2012
Credit Default Swaps on Sovereign Issues - Sell Protection (2)
| | | | | | | | | | | | | | | | | | | | | | | | | | | | | | |
| Referenced Obligation | | Fixed Deal
Receive
Rate | | | Expiration
Date | | | Counter-
party | | Implied Credit
Spread at
12/31/12 (3) | | | Notional
Amount (4) | | | Value | | | Upfront
Premiums
Paid
(Received) | | | Unrealized
Appreciation | |
Argentine Republic Government | | | 5.000% | | | | 09/20/13 | | | BNP | | | 23.167% | | | | $15,000,000 | | | | ($1,749,545 | ) | | | ($2,925,000 | ) | | | $1,175,455 | |
Argentine Republic Government | | | 5.000% | | | | 09/20/13 | | | DUB | | | 23.167% | | | | 6,390,000 | | | | (745,306 | ) | | | (1,278,000 | ) | | | 532,694 | |
South Africa Government | | | 1.000% | | | | 12/20/17 | | | BNP | | | 1.399% | | | | 120,000,000 | | | | (2,263,401 | ) | | | (3,292,102 | ) | | | 1,028,701 | |
South Africa Government | | | 1.000% | | | | 12/20/17 | | | BOA | | | 1.399% | | | | 25,000,000 | | | | (471,542 | ) | | | (585,378 | ) | | | 113,836 | |
South Africa Government | | | 1.000% | | | | 12/20/17 | | | JPM | | | 1.399% | | | | 31,750,000 | | | | (598,857 | ) | | | (763,832 | ) | | | 164,975 | |
South Africa Government | | | 1.000% | | | | 03/20/18 | | | BNP | | | 1.450% | | | | 50,000,000 | | | | (1,113,233 | ) | | | (1,191,402 | ) | | | 78,169 | |
Turkey Government | | | 1.000% | | | | 06/20/22 | | | BNP | | | 1.730% | | | | 10,000,000 | | | | (606,127 | ) | | | (665,505 | ) | | | 59,378 | |
Turkey Government | | | 1.000% | | | | 09/20/22 | | | BNP | | | 1.743% | | | | 34,544,000 | | | | (2,175,190 | ) | | | (2,255,733 | ) | | | 80,543 | |
Turkey Government | | | 1.000% | | | | 12/20/22 | | | BNP | | | 1.755% | | | | 7,100,000 | | | | (463,343 | ) | | | (527,023 | ) | | | 63,680 | |
| | | | | | | | | | | | | | | | | | | | | | | | | | | | | | |
| | | | | | | | | | | | | | | | | | | | | ($10,186,544 | ) | | | ($13,483,975 | ) | | | $3,297,431 | |
| | | | | | | | | | | | | | | | | | | | | | | | | | | | | | |
Credit Default Swaps on Credit Indices - Buy Protection (1)
| | | | | | | | | | | | | | | | | | | | | | | | | | |
| Referenced Obligation | | Fixed Deal
Pay
Rate | | | Expiration
Date | | | Counter-
party | | Notional
Amount (4) | | | Value (5) | | | Upfront
Premiums
Paid
(Received) | | | Unrealized
Depreciation | |
iTraxx FINSEN-18 5Y | | | 1.000% | | | | 12/20/17 | | | BNP | | | $23,900,000 | | | | $600,411 | | | | $1,480,115 | | | | ($879,704 | ) |
iTraxx FINSUB-18 5Y | | | 5.000% | | | | 12/20/17 | | | DUB | | | 15,950,000 | | | | (2,609,209 | ) | | | (1,500,618 | ) | | | (1,108,591 | ) |
| | | | | | | | | | | | | | | | | | | | | | | | | | |
| | | | | | | | | | | | | | | | | ($2,008,798 | ) | | | ($20,503 | ) | | | ($1,988,295 | ) |
| | | | | | | | | | | | | | | | | | | | | | | | | | |
Credit Default Swaps on Credit Indices - Sell Protection (2)
| | | | | | | | | | | | | | | | | | | | | | | | | | |
| | |
| Referenced Obligation | | Fixed Deal
Receive
Rate | | | Expiration
Date | | | Counter-
party | | Notional
Amount (4) | | | Value (5) | | | Upfront
Premiums
Paid
(Received) | | | Unrealized
Appreciation
(Depreciation) | |
Dow Jones CDX HY19 5Y | | | 5.000% | | | | 12/20/17 | | | BOA | | | $61,800,000 | | | | $445,990 | | | | $77,744 | | | | $368,246 | |
Dow Jones CDX HY19 5Y | | | 5.000% | | | | 12/20/17 | | | DUB | | | 18,600,000 | | | | 134,230 | | | | (546,226 | ) | | | 680,456 | |
| | | | | | | | | | | | | | | | | | | | | | | | | | |
| | | | | | | | | | | | | | | | | $580,220 | | | | ($468,482 | ) | | | $1,048,702 | |
| | | | | | | | | | | | | | | | | | | | | | | | | | |
Total Credit Default Swaps | | | | $36,713,768 | | | | $46,857,838 | | | | ($10,144,070 | ) |
| | | | | | | | | | | | | | | | | | | | | | | | | | |
| | (1) | If the portfolio is a buyer of protection and a credit event occurs, as defined under the terms of that particular swap agreement, the portfolio will either (i) receive from the seller of protection an amount equal to the notional amount of the swap and deliver the referenced obligation or underlying investments comprising the referenced index or (ii) receive a net settlement amount in the form of cash or investments equal to the notional amount of the swap less the recovery value of the referenced obligation or underlying investments comprising the referenced index. |
| | (2) | If the portfolio is a seller of protection and a credit event occurs, as defined under the terms of that particular swap agreement, the portfolio will either (i) pay to the buyer of protection an amount equal to the notional amount of the swap and take delivery of the referenced obligation or underlying investments comprising the referenced index or (ii) pay a net settlement amount in the form of cash or investments equal to the notional amount of the swap less the recovery value of the referenced obligation or underlying investments comprising the referenced index. |
| | (3) | An implied credit spread is the spread in yield between a U.S. Treasury security and the referenced obligation or underlying investment that are identical in all respects except for the quality rating. Implied credit spreads, represented in the absolute terms, utilized in determining the value of credit default swap agreements on sovereign issues of an emerging country as of year end serve as an indicator of the current status of the payment/performance risk and represent the likelihood of risk of default for the credit derivative. The implied credit spread of a particular referenced entity reflects the cost of buying/selling protection and may include upfront payments required to be made to enter the agreement. Wider credit spreads, in comparison to narrower credit spreads, represent a deterioration of the referenced entity’s credit soundness and a greater likelihood of risk of default or other credit event occurring as defined under the terms of the agreement. A credit spread identified as “Defaulted” indicates a credit event has occurred for the referenced entity or obligation. |
| | (4) | The maximum potential amount the portfolio could be required to pay as a seller of credit protection or receive as a buyer of credit protection if a credit event occurs as defined under the terms of that particular swap agreement. |
| | (5) | The quoted market prices and resulting values for credit default swap agreements on credit indices serve as an indicator of the current status of the payment/performance risk and is a representation of the likelihood of an expected liability (or profit) for the credit derivative had the notional amount of the swap agreement been closed/sold as of the year end. Increasing values, in absolute terms when compared to the notional amount of the swap, represent a deterioration of the referenced entity’s credit soundness and a greater likelihood of risk of default or other credit event occurring as defined under the terms of the agreement. |
Cross Currency Swaps
| | | | | | | | | | | | | | | | | | | | | | | | | | | | | | |
Notional Amount
on Fixed Rate
Currency
Received | | Notional Amount
on Floating Rate
Currency
Delivered | | | Pay/Receive
Floating
Rate | | | Counter-
party | | | Fixed
rate | | | Expiration
Date | | | Value | | | Upfront
Premiums
Paid
(Received) | | Unrealized
Appreciation
(Depreciation) | |
TRY 50,000,000 | | | $27,624,309 | | | | Receive | | | | BNP | | | | 6.250% | | | | 10/17/20 | | | | ($2,004,360 | ) | | $- | | | ($2,004,360 | ) |
50,121,620 | | | 27,699,155 | | | | Receive | | | | CSF | | | | 6.250% | | | | 10/17/20 | | | | (2,001,578 | ) | | - | | | (2,001,578 | ) |
48,823,375 | | | 27,041,471 | | | | Receive | | | | CSF | | | | 6.330% | | | | 10/16/21 | | | | (2,133,572 | ) | | - | | | (2,133,572 | ) |
| | | | | | | | | | | | | | | | | | | | | | | | | | | | | | |
| | | | | | | | | | | | | | | | | | | | | | | ($6,139,510 | ) | | $- | | | ($6,139,510 | ) |
| | | | | | | | | | | | | | | | | | | | | | | | | | | | | | |
| | |
| See Notes to Financial Statements | | See explanation of symbols and terms, if any, on page B-143 |
B-134
PACIFIC SELECT FUND
GLOBAL ABSOLUTE RETURN PORTFOLIO
Schedule of Investments (Continued)
December 31, 2012
Interest Rate Swaps
| | | | | | | | | | | | | | | | | | | | | | | | | | | | |
| Floating Rate Index | | Counter-
party | | Pay/Receive
Floating
Rate | | Fixed
Rate | | | Expiration
Date | | | Notional
Amount | | | Value | | | Upfront
Premiums
Paid
(Received) | | | Unrealized
Appreciation
(Depreciation) | |
6-Month PLN-WIBOR | | JPM | | Pay | | | 4.190% | | | | 10/03/17 | | | | PLN 200,000,000 | | | | $2,088,317 | | | | $- | | | | $2,088,317 | |
6-Month PLN-WIBOR | | CSF | | Pay | | | 4.210% | | | | 10/03/17 | | | | 125,000,000 | | | | 1,342,077 | | | | - | | | | 1,342,077 | |
6-Month PLN-WIBOR | | DUB | | Pay | | | 4.210% | | | | 10/03/17 | | | | 100,000,000 | | | | 1,073,662 | | | | - | | | | 1,073,662 | |
6-Month PLN-WIBOR | | BNP | | Pay | | | 4.215% | | | | 10/03/17 | | | | 100,000,000 | | | | 1,081,039 | | | | - | | | | 1,081,039 | |
6-Month PLN-WIBOR | | JPM | | Pay | | | 4.246% | | | | 10/08/17 | | | | 74,841,000 | | | | 846,470 | | | | - | | | | 846,470 | |
6-Month PLN-WIBOR | | BNP | | Pay | | | 3.850% | | | | 11/13/17 | | | | 26,000,000 | | | | 157,188 | | | | - | | | | 157,188 | |
6-Month PLN-WIBOR | | BOA | | Pay | | | 3.830% | | | | 11/14/17 | | | | 64,630,000 | | | | 374,644 | | | | - | | | | 374,644 | |
6-Month PLN-WIBOR | | DUB | | Pay | | | 3.790% | | | | 11/16/17 | | | | 67,970,000 | | | | 355,473 | | | | - | | | | 355,473 | |
6-Month PLN-WIBOR | | BOA | | Pay | | | 3.810% | | | | 11/19/17 | | | | 97,000,000 | | | | 537,684 | | | | - | | | | 537,684 | |
6-Month PLN-WIBOR | | BNP | | Pay | | | 3.810% | | | | 11/20/17 | | | | 97,800,000 | | | | 537,794 | | | | - | | | | 537,794 | |
3-Month New Zealand Bank Bills | | DUB | | Pay | | | 3.620% | | | | 10/03/22 | | | | NZD 30,000,000 | | | | (242,323 | ) | | | - | | | | (242,323 | ) |
3-Month New Zealand Bank Bills | | CSF | | Pay | | | 3.640% | | | | 10/03/22 | | | | 25,000,000 | | | | (166,838 | ) | | | - | | | | (166,838 | ) |
3-Month New Zealand Bank Bills | | DUB | | Pay | | | 3.650% | | | | 10/03/22 | | | | 50,000,000 | | | | (298,533 | ) | | | - | | | | (298,533 | ) |
3-Month USD-LIBOR | | CSF | | Receive | | | 1.805% | | | | 10/23/22 | | | | $16,229,000 | | | | (72,258 | ) | | | - | | | | (72,258 | ) |
3-Month New Zealand Bank Bills | | BOA | | Pay | | | 3.775% | | | | 10/30/22 | | | | NZD 34,078,700 | | | | 56,176 | | | | - | | | | 56,176 | |
3-Month New Zealand Bank Bills | | DUB | | Pay | | | 3.788% | | | | 10/30/22 | | | | 25,141,300 | | | | 63,471 | | | | - | | | | 63,471 | |
3-Month USD-LIBOR | | CSF | | Receive | | | 1.750% | | | | 11/06/22 | | | | $626,000 | | | | 1,138 | | | | - | | | | 1,138 | |
| | | | | | | | | | | | | | | | | | | | | | | | | | | | |
| | | | | | | | |
Total Interest Rate Swaps | | | | | | | | | | | | | | | | | | | $7,735,181 | | | | $- | | | | $7,735,181 | |
| | | | | | | | | | | | | | | | | | | | | | | | | | | | |
| | | | | | | | |
Total Swap Agreements | | | | | | | | | | | | | | | | | | | $38,309,439 | | | | $46,857,838 | | | | ($8,548,399 | ) |
| | | | | | | | | | | | | | | | | | | | | | | | | | | | |
| (j) | Fair Value Measurements |
The following is a summary of the portfolio’s investments as categorized under the three-tier hierarchy of inputs used in valuing the portfolio’s assets and liabilities (See Note 3D in Notes to Financial Statements) as of December 31, 2012:
| | | | | | | | | | | | | | | | | | |
| | | | | Total Value at
December 31, 2012 | | | Level 1
Quoted Price | | | Level 2
Significant
Observable Inputs | | | Level 3
Significant
Unobservable Inputs | |
Assets | | Common Stocks (1) | | | $35,645,457 | | | | $- | | | | $35,645,457 | | | | $- | |
| | Foreign Government Bonds & Notes | | | 721,531,892 | | | | - | | | | 721,531,892 | | | | - | |
| | Short-Term Investments | | | 1,461,039,296 | | | | - | | | | 1,461,039,296 | | | | - | |
| | Derivatives: | | | | | | | | | | | | | | | | |
| | Credit Contracts | | | | | | | | | | | | | | | | |
| | Swaps | | | 51,142,822 | | | | - | | | | 51,142,822 | | | | - | |
| | Equity Contracts | | | | | | | | | | | | | | | | |
| | Futures | | | 1,214,370 | | | | 1,214,370 | | | | - | | | | - | |
| | Foreign Currency Contracts | | | | | | | | | | | | | | | | |
| | Forward Foreign Currency Contracts | | | 18,518,118 | | | | - | | | | 18,518,118 | | | | - | |
| | Purchased Options | | | 1,310,812 | | | | - | | | | 1,310,812 | | | | - | |
| | | | | | | | | | | | | | | | | | |
| | Total Foreign Currency Contracts | | | 19,828,930 | | | | - | | | | 19,828,930 | | | | - | |
| | Interest Rate Contracts | | | | | | | | | | | | | | | | |
| | Futures | | | 995,988 | | | | 995,988 | | | | - | | | | - | |
| | Swaps | | | 8,515,133 | | | | - | | | | 8,515,133 | | | | - | |
| | | | | | | | | | | | | | | | | | |
| | Total Interest Rate Contracts | | | 9,511,121 | | | | 995,988 | | | | 8,515,133 | | | | - | |
| | | | | | | | | | | | | | | | | | |
| | Total Assets - Derivatives | | | 81,697,243 | | | | 2,210,358 | | | | 79,486,885 | | | | - | |
| | | | | | | | | | | | | | | | | | |
| | Total Assets | | | 2,299,913,888 | | | | 2,210,358 | | | | 2,297,703,530 | | | | - | |
| | | | | | | | | | | | | | | | | | |
Liabilities | | Securities Sold Short | | | | | | | | | | | | | | | | |
| | Foreign Government Bonds & Notes | | | (142,909,449 | ) | | | - | | | | (142,909,449 | ) | | | - | |
| | Derivatives: | | | | | | | | | | | | | | | | |
| | Credit Contracts | | | | | | | | | | | | | | | | |
| | Swaps | | | (14,429,054 | ) | | | - | | | | (14,429,054 | ) | | | - | |
| | Foreign Currency Contracts | | | | | | | | | | | | | | | | |
| | Forward Foreign Currency Contracts | | | (18,707,382 | ) | | | - | | | | (18,707,382 | ) | | | - | |
| | Swaps | | | (6,139,510 | ) | | | - | | | | (6,139,510 | ) | | | - | |
| | | | | | | | | | | | | | | | | | |
| | Total Foreign Currency Contracts | | | (24,846,892 | ) | | | - | | | | (24,846,892 | ) | | | - | |
| | Interest Rate Contracts | | | | | | | | | | | | | | | | |
| | Futures | | | (1,028,538 | ) | | | (1,028,538 | ) | | | - | | | | - | |
| | Swaps | | | (779,952 | ) | | | - | | | | (779,952 | ) | | | - | |
| | | | | | | | | | | | | | | | | | |
| | Total Interest Rate Contracts | | | (1,808,490 | ) | | | (1,028,538 | ) | | | (779,952 | ) | | | - | |
| | | | | | | | | | | | | | | | | | |
| | Total Liabilities - Derivatives | | | (41,084,436 | ) | | | (1,028,538 | ) | | | (40,055,898 | ) | | | - | |
| | | | | | | | | | | | | | | | | | |
| | Total Liabilities | | | (183,993,885 | ) | | | (1,028,538 | ) | | | (182,965,347 | ) | | | - | |
| | | | | | | | | | | | | | | | | | |
| | Total | | | $2,115,920,003 | | | | $1,181,820 | | | | $2,114,738,183 | | | | $- | |
| | | | | | | | | | | | | | | | | | |
| | (1) | For equity investments categorized in a single level, refer to the schedule of investments for further geographical region breakout. |
| | |
| See Notes to Financial Statements | | See explanation of symbols and terms, if any, on page B-143 |
B-135
PACIFIC SELECT FUND
PRECIOUS METALS PORTFOLIO
Schedule of Investments
December 31, 2012
| | | | | | | | |
| | | Shares | | | Value | |
WARRANTS - 0.0% | | | | | | | | |
| | |
Canada - 0.0% | | | | | | | | |
| | |
Aureus Mining Inc
Exp. 05/16/14 * | | | 562,500 | | | | $1 | |
Torex Gold Resources Inc
Exp. 10/23/13 * | | | 362,500 | | | | 102,040 | |
| | | | | | | | |
| | | | | | | 102,041 | |
| | | | | | | | |
Total Warrants
(Cost $0) | | | | | | | 102,041 | |
| | | | | | | | |
| | |
COMMON STOCKS - 93.5% | | | | | | | | |
| | |
Australia - 8.9% | | | | | | | | |
| | |
Gryphon Minerals Ltd * | | | 3,186,607 | | | | 1,730,133 | |
Newcrest Mining Ltd | | | 2,304,106 | | | | 53,793,864 | |
Perseus Mining Ltd * | | | 3,703,507 | | | | 8,162,227 | |
Regis Resources Ltd * | | | 1,045,796 | | | | 5,645,271 | |
Troy Resources Ltd | | | 934,188 | | | | 3,561,932 | |
| | | | | | | | |
| | | | | | | 72,893,427 | |
| | | | | | | | |
Bermuda - 0.5% | | | | | | | | |
| | |
Continental Gold Ltd * | | | 496,705 | | | | 4,419,261 | |
| | | | | | | | |
| | |
Canada - 59.4% | | | | | | | | |
| | |
Agnico-Eagle Mines Ltd (NYSE) | | | 770,026 | | | | 40,395,564 | |
Alamos Gold Inc | | | 1,109,881 | | | | 19,470,618 | |
Aureus Mining Inc * | | | 2,250,000 | | | | 1,700,246 | |
Aurizon Mines Ltd * | | | 1,886,583 | | | | 6,505,459 | |
Barrick Gold Corp (NYSE) | | | 1,657,387 | | | | 58,025,119 | |
Centerra Gold Inc | | | 1,223,662 | | | | 11,452,994 | |
Detour Gold Corp * | | | 852,653 | | | | 21,335,612 | |
Eldorado Gold Corp | | | 3,247,777 | | | | 41,793,049 | |
First Quantum Minerals Ltd | | | 359,292 | | | | 7,914,032 | |
Franco-Nevada Corp | | | 371,835 | | | | 21,225,285 | |
Goldcorp Inc (NYSE) | | | 1,800,700 | | | | 66,085,690 | |
IAMGOLD Corp (TSE) | | | 2,456,288 | | | | 28,126,189 | |
Kinross Gold Corp | | | 4,017,663 | | | | 39,017,417 | |
MAG Silver Corp * | | | 370,376 | | | | 3,786,794 | |
New Gold Inc * | | | 678,272 | | | | 7,507,565 | |
Osisko Mining Corp * | | | 2,471,960 | | | | 19,881,049 | |
Platinum Group Metals Ltd * | | | 2,665,500 | | | | 2,170,559 | |
Pretium Resources Inc * | | | 100,000 | | | | 1,317,985 | |
Queenston Mining Inc * | | | 842,208 | | | | 4,131,874 | |
Rio Alto Mining Ltd * | | | 750,780 | | | | 3,841,832 | |
SEMAFO Inc | | | 1,287,424 | | | | 4,426,450 | |
Silver Wheaton Corp (NYSE) | | | 250,465 | | | | 9,036,777 | |
Tahoe Resources Inc * | | | 464,997 | | | | 8,508,038 | |
Torex Gold Resources Inc * | | | 3,772,727 | | | | 8,344,224 | |
Yamana Gold Inc | | | 3,046,199 | | | | 52,398,175 | |
| | | | | | | | |
| | | | | | | 488,398,596 | |
| | | | | | | | |
Peru - 2.1% | | | | | | | | |
| | |
Cia de Minas Buenaventura SA ADR | | | 492,043 | | | | 17,688,946 | |
| | | | | | | | |
| | |
South Africa - 3.7% | | | | | | | | |
| | |
AngloGold Ashanti Ltd ADR | | | 547,460 | | | | 17,173,820 | |
Gold Fields Ltd ADR | | | 737,295 | | | | 9,208,815 | |
Impala Platinum Holdings Ltd | | | 200,000 | | | | 4,038,287 | |
| | | | | | | | |
| | | | | | | 30,420,922 | |
| | | | | | | | |
United Kingdom - 12.1% | | | | | | | | |
| | |
African Barrick Gold PLC | | | 531,781 | | | | 3,911,678 | |
Fresnillo PLC | | | 792,915 | | | | 24,603,210 | |
Hochschild Mining PLC | | | 849,937 | | | | 6,604,055 | |
Randgold Resources Ltd ADR | | | 652,673 | | | | 64,777,795 | |
| | | | | | | | |
| | | | | | | 99,896,738 | |
| | | | | | | | |
| | | | | | | | |
| | | Shares | | | Value | |
United States - 6.8% | | | | | | | | |
| | |
Newmont Mining Corp | | | 717,915 | | | | $33,339,973 | |
Royal Gold Inc | | | 280,665 | | | | 22,820,871 | |
| | | | | | | | |
| | | | | | | 56,160,844 | |
| | | | | | | | |
Total Common Stocks
(Cost $897,387,114) | | | | | | | 769,878,734 | |
| | | | | | | | |
| | |
| | | Principal
Amount | | | | |
| | |
SHORT-TERM INVESTMENT - 6.8% | | | | | | | | |
| | |
Repurchase Agreement - 6.8% | | | | | | | | |
| | |
Fixed Income Clearing Corp
0.010% due 01/02/13
(Dated 12/31/12, repurchase price of $55,600,370; collateralized by U.S.
Treasury Notes: 0.250% due 07/15/15
and value $56,715,000) | | | $55,600,339 | | | | 55,600,339 | |
| | | | | | | | |
| | |
Total Short-Term Investment
(Cost $55,600,339) | | | | | | | 55,600,339 | |
| | | | | | | | |
| | |
TOTAL INVESTMENTS - 100.3%
(Cost $952,987,453) | | | | | | | 825,581,114 | |
| |
OTHER ASSETS & LIABILITIES, NET - (0.3%) | | | | (2,758,989 | ) |
| | | | | | | | |
| | |
NET ASSETS - 100.0% | | | | | | | $822,822,125 | |
| | | | | | | | |
Notes to Schedule of Investments
| (a) | As of December 31, 2012, the portfolio was diversified by precious metals sector as a percentage of net assets as follows: |
| | | | |
| | | | |
Gold | | | 85.0% | |
Precious Metals & Minerals | | | 7.1% | |
Diversified Metals & Mining | | | 1.4% | |
| | | | |
| | | 93.5% | |
Short-Term Investment | | | 6.8% | |
Other Assets & Liabilities, Net | | | (0.3% | ) |
| | | | |
| | | 100.0% | |
| | | | |
| (b) | As of December 31, 2012, the portfolio was diversified by country of incorporation as a percentage of net assets as follows: |
| | | | |
| |
Canada | | | 59.4% | |
United States (Includes Short-Term Investment) | | | 13.6% | |
United Kingdom | | | 12.1% | |
Australia | | | 8.9% | |
South Africa | | | 3.7% | |
Others (each less than 3.0%) | | | 2.6% | |
| | | | |
| | | 100.3% | |
Other Assets & Liabilities, Net | | | (0.3% | ) |
| | | | |
| | | 100.0% | |
| | | | |
| (c) | Short-term investments reflect either the stated coupon rate or the annualized effective yield on the date of purchase for discounted investments. |
| | |
| See Notes to Financial Statements | | See explanation of symbols and terms, if any, on page B-143 |
B-136
PACIFIC SELECT FUND
PRECIOUS METALS PORTFOLIO
Schedule of Investments (Continued)
December 31, 2012
| (d) | Fair Value Measurements |
The following is a summary of the portfolio’s investments as categorized under the three-tier hierarchy of inputs used in valuing the portfolio’s assets and liabilities (See Note 3D in Notes to Financial Statements) as of December 31, 2012:
| | | | | | | | | | | | | | | | | | |
| | | | | Total Value at
December 31, 2012 | | | Level 1
Quoted Price | | | Level 2
Significant
Observable Inputs | | | Level 3
Significant
Unobservable Inputs | |
Assets | | Warrants | | | | | | | | | | | | | | | | |
| | Canada | | | $102,041 | | | | $102,040 | | | | $1 | | | | $- | |
| | Common Stocks | | | | | | | | | | | | | | | | |
| | Australia | | | 72,893,427 | | | | - | | | | 72,893,427 | | | | - | |
| | Bermuda | | | 4,419,261 | | | | 4,419,261 | | | | - | | | | - | |
| | Canada | | | 488,398,596 | | | | 486,698,350 | | | | 1,700,246 | | | | - | |
| | Peru | | | 17,688,946 | | | | 17,688,946 | | | | - | | | | - | |
| | South Africa | | | 30,420,922 | | | | 26,382,635 | | | | 4,038,287 | | | | - | |
| | United Kingdom | | | 99,896,738 | | | | 64,777,795 | | | | 35,118,943 | | | | - | |
| | United States | | | 56,160,844 | | | | 56,160,844 | | | | - | | | | - | |
| | | | | | | | | | | | | | | | | | |
| | | | | 769,878,734 | | | | 656,127,831 | | | | 113,750,903 | | | | - | |
| | Short-Term Investment | | | 55,600,339 | | | | - | | | | 55,600,339 | | | | - | |
| | | | | | | | | | | | | | | | | | |
| | Total | | | $825,581,114 | | | | $656,229,871 | | | | $169,351,243 | | | | $- | |
| | | | | | | | | | | | | | | | | | |
| | |
| See Notes to Financial Statements | | See explanation of symbols and terms, if any, on page B-143 |
B-137
PACIFIC SELECT FUND
AMERICAN FUNDS® ASSET ALLOCATION PORTFOLIO
Schedule of Investments
December 31, 2012
| | | | | | | | |
| | | Shares | | |
Value | |
MUTUAL FUND - 100.0% | | | | | | | | |
| | |
American Funds Insurance Series® Asset Allocation Fund - Class 1 | | | 30,999,055 | | | | $571,312,589 | |
| | | | | | | | |
| | |
TOTAL INVESTMENTS - 100.0%
(Cost $509,378,922) | | | | | | | 571,312,589 | |
| |
OTHER ASSETS & LIABILITIES, NET - (0.0%) | | | | (220,726 | ) |
| | | | | | | | |
| | |
NET ASSETS - 100.0% | | | | | | | $571,091,863 | |
| | | | | | | | |
Notes to Schedule of Investments
| (a) | As of December 31, 2012, the portfolio was diversified as a percentage of net assets as follows: |
| | | | |
Mutual Fund | | | 100.0% | |
Other Assets & Liabilities, Net | | | (0.0% | ) |
| | | | |
| | | 100.0% | |
| | | | |
| (b) | Fair Value Measurements |
The following is a summary of the portfolio’s investments as categorized under the three-tier hierarchy of inputs used in valuing the portfolio’s assets and liabilities (See Note 3D in Notes to Financial Statements) as of December 31, 2012:
| | | | | | | | | | | | | | | | | | |
| | | | | Total Value at
December 31, 2012 | | | Level 1
Quoted Price | | | Level 2
Significant
Observable Inputs | | | Level 3
Significant
Unobservable Inputs | |
Assets | | Mutual Fund | | | $571,312,589 | | | | $571,312,589 | | | | $- | | | | $- | |
| | | | | | | | | | | | | | | | | | |
American Funds Asset Allocation Portfolio (a “Feeder Portfolio”) invests substantially all of its assets in Class 1 shares of the Asset Allocation Fund of the American Funds Insurance Series (a “Master Fund”) (See Note 1 in Notes to Financial Statements). The Feeder Portfolio has an investment objective that is consistent with its corresponding Master Fund. The financial statements of the Master Fund, including the Schedule of Investments, are provided separately and should be read in conjunction with the Feeder Portfolio’s financial statements.
| | |
| See Notes to Financial Statements | | See explanation of symbols and terms, if any, on page B-143 |
B-138
PACIFIC SELECT FUND
PACIFIC DYNAMIX - CONSERVATIVE GROWTH PORTFOLIO
Schedule of Investments
December 31, 2012
| | | | | | | | |
| | | Shares | | |
Value | |
AFFILIATED MUTUAL FUNDS - 100.0% | | | | | | | | |
| | |
PD Aggregate Bond Index Portfolio ‘P’ | | | 11,910,892 | | | | $132,964,797 | |
PD High Yield Bond Market Portfolio ‘P’ | | | 1,280,417 | | | | 15,034,145 | |
PD Large-Cap Growth Index Portfolio ‘P’ | | | 1,725,634 | | | | 27,397,501 | |
PD Large-Cap Value Index Portfolio ‘P’ | | | 2,165,818 | | | | 32,934,956 | |
PD Small-Cap Growth Index Portfolio ‘P’ | | | 353,016 | | | | 5,162,566 | |
PD Small-Cap Value Index Portfolio ‘P’ | | | 556,715 | | | | 7,791,712 | |
PD Emerging Markets Portfolio ‘P’ | | | 154,350 | | | | 2,353,618 | |
PD International Large-Cap Portfolio ‘P’ | | | 1,870,550 | | | | 25,320,937 | |
| | | | | | | | |
| | |
Total Affiliated Mutual Funds
(Cost $240,703,870) | | | | | | | 248,960,232 | |
| | | | | | | | |
| | |
TOTAL INVESTMENTS - 100.0%
(Cost $240,703,870) | | | | | | | 248,960,232 | |
| |
OTHER ASSETS & LIABILITIES, NET - (0.0%) | | | | (44,602 | ) |
| | | | | | | | |
| | |
NET ASSETS - 100.0% | | | | | | | $248,915,630 | |
| | | | | | | | |
Notes to Schedule of Investments
| (a) | As of December 31, 2012, the portfolio was diversified as a percentage of net assets as follows: |
| | | | |
Affiliated Fixed Income Funds | | | 59.4% | |
Affiliated Equity Funds | | | 40.6% | |
| | | | |
| | | 100.0% | |
Other Assets & Liabilities, Net | | | (0.0% | ) |
| | | | |
| | | 100.0% | |
| | | | |
PACIFIC SELECT FUND
PACIFIC DYNAMIX - MODERATE GROWTH PORTFOLIO
Schedule of Investments
December 31, 2012
| | | | | | | | |
| | | Shares | | |
Value | |
AFFILIATED MUTUAL FUNDS - 100.0% | | | | | | | | |
| | |
PD Aggregate Bond Index Portfolio ‘P’ | | | 20,131,983 | | | | $224,739,260 | |
PD High Yield Bond Market Portfolio ‘P’ | | | 2,625,789 | | | | 30,830,960 | |
PD Large-Cap Growth Index Portfolio ‘P’ | | | 5,967,200 | | | | 94,739,901 | |
PD Large-Cap Value Index Portfolio ‘P’ | | | 8,169,881 | | | | 124,236,986 | |
PD Small-Cap Growth Index Portfolio ‘P’ | | | 1,371,921 | | | | 20,063,191 | |
PD Small-Cap Value Index Portfolio ‘P’ | | | 2,359,016 | | | | 33,016,492 | |
PD Emerging Markets Portfolio ‘P’ | | | 1,295,722 | | | | 19,757,932 | |
PD International Large-Cap Portfolio ‘P’ | | | 7,188,795 | | | | 97,312,015 | |
| | | | | | | | |
| | |
Total Affiliated Mutual Funds
(Cost $615,097,706) | | | | | | | 644,696,737 | |
| | | | | | | | |
| | |
TOTAL INVESTMENTS - 100.0%
(Cost $615,097,706) | | | | | | | 644,696,737 | |
| |
OTHER ASSETS & LIABILITIES, NET - (0.0%) | | | | (88,634 | ) |
| | | | | | | | |
| | |
NET ASSETS - 100.0% | | | | | | | $644,608,103 | |
| | | | | | | | |
Notes to Schedule of Investments
| (a) | As of December 31, 2012, the portfolio was diversified as a percentage of net assets as follows: |
| | | | |
Affiliated Equity Funds | | | 60.4% | |
Affiliated Fixed Income Funds | | | 39.6% | |
| | | | |
| | | 100.0% | |
Other Assets & Liabilities, Net | | | (0.0% | ) |
| | | | |
| | | 100.0% | |
| | | | |
| (b) | The portfolios’ investments are affiliated mutual funds (See Note 7C in Notes to Financial Statements). |
| (c) | Fair Value Measurements |
The following is a summary of the portfolios’ investments as categorized under the three-tier hierarchy of inputs used in valuing the portfolios’ assets and liabilities (See Note 3D in Notes to Financial Statements) as of December 31, 2012:
| | | | | | | | | | | | | | | | | | |
| | | | | Total Value at
December 31, 2012 | | | Level 1
Quoted Price | | | Level 2
Significant
Observable Inputs | | | Level 3
Significant
Unobservable Inputs | |
Pacific Dynamix - Conservative Growth Portfolio | | | | | | | | | | | | | | | | |
Assets | | Affiliated Mutual Funds | | | $248,960,232 | | | | $248,960,232 | | | | $- | | | | $- | |
| | | | | | | | | | | | | | | | | | |
| | | | |
Pacific Dynamix- Moderate Growth Portfolio | | | | | | | | | | | | | | | | |
Assets | | Affiliated Mutual Funds | | | $644,696,737 | | | | $644,696,737 | | | | $- | | | | $- | |
| | | | | | | | | | | | | | | | | | |
| | |
| See Notes to Financial Statements | | See explanation of symbols and terms, if any, on page B-143 |
B-139
PACIFIC SELECT FUND
PACIFIC DYNAMIX - GROWTH PORTFOLIO
Schedule of Investments
December 31, 2012
| | | | | | | | |
| | | Shares | | |
Value | |
AFFILIATED MUTUAL FUNDS - 100.0% | | | | | | | | |
| | |
PD Aggregate Bond Index Portfolio ‘P’ | | | 4,636,343 | | | | $51,756,859 | |
PD Large-Cap Growth Index Portfolio ‘P’ | | | 3,094,456 | | | | 49,129,992 | |
PD Large-Cap Value Index Portfolio ‘P’ | | | 3,969,630 | | | | 60,364,996 | |
PD Small-Cap Growth Index Portfolio ‘P’ | | | 1,087,891 | | | | 15,909,498 | |
PD Small-Cap Value Index Portfolio ‘P’ | | | 1,535,359 | | | | 21,488,693 | |
PD Emerging Markets Portfolio ‘P’ | | | 903,946 | | | | 13,783,904 | |
PD International Large-Cap Portfolio ‘P’ | | | 3,821,981 | | | | 51,736,725 | |
| | | | | | | | |
| | |
Total Affiliated Mutual Funds
(Cost $248,512,723) | | | | | | | 264,170,667 | |
| | | | | | | | |
| | |
TOTAL INVESTMENTS - 100.0%
(Cost $248,512,723) | | | | | | | 264,170,667 | |
| |
OTHER ASSETS & LIABILITIES, NET - (0.0%) | | | | (39,374 | ) |
| | | | | | | | |
| | |
NET ASSETS - 100.0% | | | | | | | $264,131,293 | |
| | | | | | | | |
Notes to Schedule of Investments
| (a) | As of December 31, 2012, the portfolio was diversified as a percentage of net assets as follows: |
| | | | |
Affiliated Equity Funds | | | 80.4% | |
Affiliated Fixed Income Fund | | | 19.6% | |
| | | | |
| | | 100.0% | |
Other Assets & Liabilities, Net | | | (0.0% | ) |
| | | | |
| | | 100.0% | |
| | | | |
PACIFIC SELECT FUND
PORTFOLIO OPTIMIZATION CONSERVATIVE PORTFOLIO
Schedule of Investments
December 31, 2012
| | | | | | | | |
| | | Shares | | |
Value | |
AFFILIATED MUTUAL FUNDS - 100.0% | | | | | | | | |
| | |
Diversified Bond Portfolio ‘P’ | | | 45,014,184 | | | | $491,654,914 | |
Floating Rate Loan Portfolio ‘P’ | | | 29,085,138 | | | | 222,852,974 | |
High Yield Bond Portfolio ‘P’ | | | 26,919,133 | | | | 183,486,761 | |
Inflation Managed Portfolio ‘P’ | | | 15,959,663 | | | | 190,267,123 | |
Inflation Protected Portfolio ‘P’ | | | 20,752,073 | | | | 227,191,972 | |
Managed Bond Portfolio ‘P’ | | | 48,546,244 | | | | 610,785,390 | |
Short Duration Bond Portfolio ‘P’ | | | 58,454,543 | | | | 565,671,214 | |
Emerging Markets Debt Portfolio ‘P’ | | | 18,240,319 | | | | 197,510,608 | |
Comstock Portfolio ‘P’ | | | 13,985,155 | | | | 129,907,025 | |
Equity Index Portfolio ‘P’ | | | 3,042,683 | | | | 95,218,518 | |
Large-Cap Growth Portfolio ‘P’ | | | 12,670,533 | | | | 76,163,462 | |
Large-Cap Value Portfolio ‘P’ | | | 12,069,938 | | | | 157,340,798 | |
Mid-Cap Equity Portfolio ‘P’ | | | 3,655,110 | | | | 44,252,182 | |
Mid-Cap Value Portfolio ‘P’ | | | 4,416,592 | | | | 63,025,129 | |
International Large-Cap Portfolio ‘P’ | | | 10,725,682 | | | | 76,652,384 | |
International Value Portfolio ‘P’ | | | 4,299,833 | | | | 46,185,384 | |
Currency Strategies Portfolio ‘P’ * | | | 12,322,722 | | | | 121,887,642 | |
Global Absolute Return Portfolio ‘P’ * | | | 22,958,001 | | | | 229,236,674 | |
Precious Metals Portfolio ‘P’ * | | | 5,135,909 | | | | 44,188,227 | |
| | | | | | | | |
| | |
Total Affiliated Mutual Funds
(Cost $3,652,812,593) | | | | | | | 3,773,478,381 | |
| | | | | | | | |
| | |
TOTAL INVESTMENTS - 100.0%
(Cost $3,652,812,593) | | | | | | | 3,773,478,381 | |
| |
OTHER ASSETS & LIABILITIES, NET - (0.0%) | | | | (183,595 | ) |
| | | | | | | | |
| | |
NET ASSETS - 100.0% | | | | | | | $3,773,294,786 | |
| | | | | | | | |
Notes to Schedule of Investments
| (a) | As of December 31, 2012, the portfolio was diversified as a percentage of net assets as follows: |
| | | | |
Affiliated Fixed Income Funds | | | 80.6% | |
Affiliated Equity Funds | | | 19.4% | |
| | | | |
| | | 100.0% | |
Other Assets & Liabilities, Net | | | (0.0% | ) |
| | | | |
| | | 100.0% | |
| | | | |
| (b) | The portfolios’ investments are affiliated mutual funds (See Note 7C in Notes to Financial Statements). |
| (c) | Fair Value Measurements |
The following is a summary of the portfolios’ investments as categorized under the three-tier hierarchy of inputs used in valuing the portfolios’ assets and liabilities (See Note 3D in Notes to Financial Statements) as of December 31, 2012:
| | | | | | | | | | | | | | | | | | |
| | | Total Value at
December 31, 2012 | | | Level 1
Quoted Price | | | Level 2
Significant
Observable Inputs | | | Level 3
Significant
Unobservable Inputs | |
Pacific Dynamix - Growth Portfolio | | | | | | | | | | | | | | | | |
Assets | | Affiliated Mutual Funds | | | $264,170,667 | | | | $264,170,667 | | | | $- | | | | $- | |
| | | | | | | | | | | | | | | | | | |
Portfolio Optimization Conservative Portfolio | | | | | | | | | | | | | | | | |
Assets | | Affiliated Mutual Funds | | | $3,773,478,381 | | | | $3,773,478,381 | | | | $- | | | | $- | |
| | | | | | | | | | | | | | | | | | |
| | |
| See Notes to Financial Statements | | See explanation of symbols and terms, if any, on page B-143 |
B-140
PACIFIC SELECT FUND
PORTFOLIO OPTIMIZATION MODERATE-CONSERVATIVE PORTFOLIO
Schedule of Investments
December 31, 2012
| | | | | | | | |
| | | Shares | | |
Value | |
AFFILIATED MUTUAL FUNDS - 100.0% | | | | | | | | |
| | |
Diversified Bond Portfolio ‘P’ | | | 38,539,401 | | | | $420,935,898 | |
Floating Rate Loan Portfolio ‘P’ | | | 31,305,285 | | | | 239,863,944 | |
High Yield Bond Portfolio ‘P’ | | | 29,229,310 | | | | 199,233,437 | |
Inflation Managed Portfolio ‘P’ | | | 17,134,253 | | | | 204,270,301 | |
Inflation Protected Portfolio ‘P’ | | | 22,472,477 | | | | 246,026,817 | |
Managed Bond Portfolio ‘P’ | | | 40,968,145 | | | | 515,441,409 | |
Short Duration Bond Portfolio ‘P’ | | | 53,180,086 | | | | 514,629,705 | |
Emerging Markets Debt Portfolio ‘P’ | | | 16,583,158 | | | | 179,566,464 | |
American Funds Growth-Income Portfolio ‘P’ | | | 4,050,232 | | | | 42,239,443 | |
Comstock Portfolio ‘P’ | | | 19,049,291 | | | | 176,947,395 | |
Dividend Growth Portfolio ‘P’ | | | 8,182,229 | | | | 89,965,690 | |
Equity Index Portfolio ‘P’ | | | 5,682,774 | | | | 177,838,222 | |
Large-Cap Growth Portfolio ‘P’ | | | 21,713,703 | | | | 130,522,591 | |
Large-Cap Value Portfolio ‘P’ | | | 19,596,325 | | | | 255,452,973 | |
Main Street Core Portfolio ‘P’ | | | 8,238,146 | | | | 177,425,622 | |
Mid-Cap Equity Portfolio ‘P’ | | | 1,542,471 | | | | 18,674,600 | |
Mid-Cap Growth Portfolio ‘P’ | | | 1,142,779 | | | | 8,854,606 | |
Mid-Cap Value Portfolio ‘P’ | | | 6,701,929 | | | | 95,637,068 | |
Small-Cap Equity Portfolio ‘P’ | | | 4,195,908 | | | | 63,050,953 | |
Small-Cap Index Portfolio ‘P’ | | | 4,990,422 | | | | 62,033,955 | |
Emerging Markets Portfolio ‘P’ | | | 3,246,789 | | | | 48,605,357 | |
International Large-Cap Portfolio ‘P’ | | | 17,716,781 | | | | 126,615,121 | |
International Small-Cap Portfolio ‘P’ | | | 11,255,146 | | | | 97,220,275 | |
International Value Portfolio ‘P’ | | | 9,523,863 | | | | 102,297,756 | |
Currency Strategies Portfolio ‘P’ * | | | 14,201,024 | | | | 140,466,473 | |
Global Absolute Return Portfolio ‘P’ * | | | 28,333,360 | | | | 282,909,879 | |
Precious Metals Portfolio ‘P’ * | | | 9,880,800 | | | | 85,012,217 | |
| | | | | | | | |
| | |
Total Affiliated Mutual Funds
(Cost $4,556,410,301) | | | | | | | 4,701,738,171 | |
| | | | | | | | |
| | |
TOTAL INVESTMENTS - 100.0%
(Cost $4,556,410,301) | | | | | | | 4,701,738,171 | |
| |
OTHER ASSETS & LIABILITIES, NET -(0.0%) | | | | (232,653 | ) |
| | | | | | | | |
| | |
NET ASSETS - 100.0% | | | | | | | $4,701,505,518 | |
| | | | | | | | |
Notes to Schedule of Investments
| (a) | As of December 31, 2012, the portfolio was diversified as a percentage of net assets as follows: |
| | | | |
Affiliated Fixed Income Funds | | | 62.6% | |
Affiliated Equity Funds | | | 37.4% | |
| | | | |
| | | 100.0% | |
Other Assets & Liabilities, Net | | | (0.0% | ) |
| | | | |
| | | 100.0% | |
| | | | |
PACIFIC SELECT FUND
PORTFOLIO OPTIMIZATION MODERATE PORTFOLIO
Schedule of Investments
December 31, 2012
| | | | | | | | |
| | | Shares | | | Value | |
AFFILIATED MUTUAL FUNDS - 100.0% | | | | | | | | |
| | |
Diversified Bond Portfolio ‘P’ | | | 114,992,538 | | | | $1,255,974,028 | |
Floating Rate Loan Portfolio ‘P’ | | | 54,979,887 | | | | 421,260,900 | |
High Yield Bond Portfolio ‘P’ | | | 75,798,497 | | | | 516,659,310 | |
Inflation Managed Portfolio ‘P’ | | | 31,192,313 | | | | 371,866,988 | |
Inflation Protected Portfolio ‘P’ | | | 42,140,062 | | | | 461,345,905 | |
Managed Bond Portfolio ‘P’ | | | 113,208,270 | | | | 1,424,331,776 | |
Short Duration Bond Portfolio ‘P’ | | | 92,751,191 | | | | 897,563,752 | |
Emerging Markets Debt Portfolio ‘P’ | | | 41,960,509 | | | | 454,358,593 | |
American Funds Growth-Income Portfolio ‘P’ | | | 19,023,366 | | | | 198,392,670 | |
Comstock Portfolio ‘P’ | | | 74,308,117 | | | | 690,242,379 | |
Dividend Growth Portfolio ‘P’ | | | 17,902,391 | | | | 196,841,356 | |
Equity Index Portfolio ‘P’ | | | 10,015,801 | | | | 313,437,114 | |
Growth LT Portfolio ‘P’ | | | 3,128,488 | | | | 44,615,208 | |
Large-Cap Growth Portfolio ‘P’ | | | 73,902,873 | | | | 444,235,345 | |
Large-Cap Value Portfolio ‘P’ | | | 75,385,119 | | | | 982,702,243 | |
Long/Short Large-Cap Portfolio ‘P’ | | | 57,043,271 | | | | 534,668,857 | |
Main Street Core Portfolio ‘P’ | | | 13,827,383 | | | | 297,801,475 | |
Mid-Cap Equity Portfolio ‘P’ | | | 22,285,759 | | | | 269,812,241 | |
Mid-Cap Growth Portfolio ‘P’ | | | 25,055,191 | | | | 194,135,387 | |
Mid-Cap Value Portfolio ‘P’ | | | 43,911,646 | | | | 626,622,751 | |
Small-Cap Equity Portfolio ‘P’ | | | 7,211,524 | | | | 108,365,930 | |
Small-Cap Growth Portfolio ‘P’ | | | 13,318,138 | | | | 150,582,152 | |
Small-Cap Index Portfolio ‘P’ | | | 15,933,910 | | | | 198,068,111 | |
Small-Cap Value Portfolio ‘P’ | | | 11,191,862 | | | | 152,901,916 | |
Real Estate Portfolio ‘P’ | | | 19,649,414 | | | | 330,609,599 | |
Emerging Markets Portfolio ‘P’ | | | 31,100,943 | | | | 465,589,943 | |
International Large-Cap Portfolio ‘P’ | | | 78,710,422 | | | | 562,513,554 | |
International Small-Cap Portfolio ‘P’ | | | 48,707,844 | | | | 420,731,096 | |
International Value Portfolio ‘P’ | | | 43,619,375 | | | | 468,524,602 | |
Currency Strategies Portfolio ‘P’ * | | | 60,630,298 | | | | 599,711,979 | |
Global Absolute Return Portfolio ‘P’ * | | | 75,678,126 | | | | 755,649,493 | |
Precious Metals Portfolio ‘P’ * | | | 30,573,177 | | | | 263,044,862 | |
| | | | | | | | |
| | |
Total Affiliated Mutual Funds
(Cost $14,782,516,019) | | | | | | | 15,073,161,515 | |
| | | | | | | | |
| | |
TOTAL INVESTMENTS - 100.0%
(Cost $14,782,516,019) | | | | | | | 15,073,161,515 | |
| |
OTHER ASSETS & LIABILITIES, NET - (0.0%) | | | | (750,042 | ) |
| | | | | | | | |
| | |
NET ASSETS - 100.0% | | | | | | | $15,072,411,473 | |
| | | | | | | | |
Notes to Schedule of Investments
| (a) | As of December 31, 2012, the portfolio was diversified as a percentage of net assets as follows: |
| | | | |
Affiliated Equity Funds | | | 52.5% | |
Affiliated Fixed Income Funds | | | 47.5% | |
| | | | |
| | | 100.0% | |
Other Assets & Liabilities, Net | | | (0.0% | ) |
| | | | |
| | | 100.0% | |
| | | | |
| (b) | The portfolios’ investments are affiliated mutual funds (See Note 7C in Notes to Financial Statements). |
| (c) | Fair Value Measurements |
The following is a summary of the portfolios’ investments as categorized under the three-tier hierarchy of inputs used in valuing the portfolios’ assets and liabilities (See Note 3D in Notes to Financial Statements) as of December 31, 2012:
| | | | | | | | | | | | | | | | | | |
| | | | | Total Value at
December 31, 2012 | | | Level 1
Quoted Price | | | Level 2
Significant
Observable Inputs | | | Level 3
Significant
Unobservable Inputs | |
| | | | |
Portfolio Optimization Moderate-Conservative Portfolio | | | | | | | | | | | | | | | | |
Assets | | Affiliated Mutual Funds | | | $4,701,738,171 | | | | $4,701,738,171 | | | | $- | | | | $- | |
| | | | | | | | | | | | | | | | | | |
Portfolio Optimization Moderate Portfolio | | | | | | | | | | | | | | | | |
Assets | | Affiliated Mutual Funds | | | $15,073,161,515 | | | | $15,073,161,515 | | | | $- | | | | $- | |
| | | | | | | | | | | | | | | | | | |
| | |
| See Notes to Financial Statements | | See explanation of symbols and terms, if any, on page B-143 |
B-141
PACIFIC SELECT FUND
PORTFOLIO OPTIMIZATION GROWTH PORTFOLIO
Schedule of Investments
December 31, 2012
| | | | | | | | |
| | | Shares | | | Value | |
AFFILIATED MUTUAL FUNDS - 100.0% | | | | | | | | |
| | |
Diversified Bond Portfolio ‘P’ | | | 83,127,591 | | | | $907,938,008 | |
Inflation Managed Portfolio ‘P’ | | | 10,344,411 | | | | 123,323,487 | |
Inflation Protected Portfolio ‘P’ | | | 14,587,323 | | | | 159,700,805 | |
Managed Bond Portfolio ‘P’ | | | 79,522,847 | | | | 1,000,518,048 | |
Short Duration Bond Portfolio ‘P’ | | | 20,647,352 | | | | 199,806,762 | |
Emerging Markets Debt Portfolio ‘P’ | | | 13,930,925 | | | | 150,847,438 | |
American Funds Growth Portfolio ‘P’ | | | 4,299,161 | | | | 40,267,377 | |
American Funds Growth-Income Portfolio ‘P’ | | | 16,125,083 | | | | 168,166,778 | |
Comstock Portfolio ‘P’ | | | 77,831,211 | | | | 722,968,124 | |
Dividend Growth Portfolio ‘P’ | | | 25,237,831 | | | | 277,496,387 | |
Equity Index Portfolio ‘P’ | | | 14,151,843 | | | | 442,871,476 | |
Growth LT Portfolio ‘P’ | | | 2,638,800 | | | | 37,631,798 | |
Large-Cap Growth Portfolio ‘P’ | | | 60,346,545 | | | | 362,747,307 | |
Large-Cap Value Portfolio ‘P’ | | | 71,694,426 | | | | 934,591,264 | |
Long/Short Large-Cap Portfolio ‘P’ | | | 75,284,353 | | | | 705,643,254 | |
Main Street Core Portfolio ‘P’ | | | 16,417,888 | | | | 353,593,384 | |
Mid-Cap Equity Portfolio ‘P’ | | | 31,391,083 | | | | 380,049,802 | |
Mid-Cap Growth Portfolio ‘P’ | | | 33,987,382 | | | | 263,344,773 | |
Mid-Cap Value Portfolio ‘P’ | | | 29,601,820 | | | | 422,420,376 | |
Small-Cap Equity Portfolio ‘P’ | | | 43,705,236 | | | | 656,748,663 | |
Small-Cap Growth Portfolio ‘P’ | | | 15,802,799 | | | | 178,675,088 | |
Small-Cap Index Portfolio ‘P’ | | | 3,097,016 | | | | 38,497,776 | |
Small-Cap Value Portfolio ‘P’ | | | 9,263,396 | | | | 126,555,435 | |
Real Estate Portfolio ‘P’ | | | 22,708,642 | | | | 382,082,400 | |
Emerging Markets Portfolio ‘P’ | | | 30,848,721 | | | | 461,814,117 | |
International Large-Cap Portfolio ‘P’ | | | 89,129,790 | | | | 636,976,826 | |
International Small-Cap Portfolio ‘P’ | | | 59,517,121 | | | | 514,100,027 | |
International Value Portfolio ‘P’ | | | 46,327,150 | | | | 497,609,371 | |
Currency Strategies Portfolio ‘P’ * | | | 49,780,135 | | | | 492,389,855 | |
Global Absolute Return Portfolio ‘P’ * | | | 63,290,220 | | | | 631,955,699 | |
Precious Metals Portfolio ‘P’ * | | | 38,891,401 | | | | 334,613,019 | |
| | | | | | | | |
| | |
Total Affiliated Mutual Funds
(Cost $12,430,689,261) | | | | | | | 12,605,944,924 | |
| | | | | | | | |
| | |
TOTAL INVESTMENTS - 100.0%
(Cost $12,430,689,261) | | | | | | | 12,605,944,924 | |
| |
OTHER ASSETS & LIABILITIES, NET - (0.0%) | | | | (638,024 | ) |
| | | | | | | | |
| | |
NET ASSETS - 100.0% | | | | | | | $12,605,306,900 | |
| | | | | | | | |
Notes to Schedule of Investments
| (a) | As of December 31, 2012, the portfolio was diversified as a percentage of net assets as follows: |
| | | | |
Affiliated Equity Funds | | | 70.9% | |
Affiliated Fixed Income Funds | | | 29.1% | |
| | | | |
| | | 100.0% | |
Other Assets & Liabilities, Net | | | (0.0% | ) |
| | | | |
| | | 100.0% | |
| | | | |
PACIFIC SELECT FUND
PORTFOLIO OPTIMIZATION AGGRESSIVE-GROWTH PORTFOLIO
Schedule of Investments
December 31, 2012
| | | | | | | | |
| | | Shares | | | Value | |
AFFILIATED MUTUAL FUNDS - 100.0% | | | | | | | | |
| | |
Diversified Bond Portfolio ‘P’ | | | 5,842,287 | | | | $63,810,754 | |
Managed Bond Portfolio ‘P’ | | | 6,125,124 | | | | 77,063,354 | |
American Funds Growth Portfolio ‘P’ | | | 1,728,878 | | | | 16,193,248 | |
American Funds Growth-Income Portfolio ‘P’ | | | 3,395,188 | | | | 35,408,053 | |
Comstock Portfolio ‘P’ | | | 17,237,177 | | | | 160,114,805 | |
Dividend Growth Portfolio ‘P’ | | | 6,463,070 | | | | 71,063,107 | |
Equity Index Portfolio ‘P’ | | | 3,370,721 | | | | 105,484,219 | |
Growth LT Portfolio ‘P’ | | | 551,478 | | | | 7,864,593 | |
Large-Cap Growth Portfolio ‘P’ | | | 20,996,502 | | | | 126,211,442 | |
Large-Cap Value Portfolio ‘P’ | | | 15,336,297 | | | | 199,920,274 | |
Long/Short Large-Cap Portfolio ‘P’ | | | 15,160,370 | | | | 142,098,759 | |
Main Street Core Portfolio ‘P’ | | | 3,550,623 | | | | 76,470,052 | |
Mid-Cap Equity Portfolio ‘P’ | | | 5,234,941 | | | | 63,379,094 | |
Mid-Cap Growth Portfolio ‘P’ | | | 7,741,423 | | | | 59,982,947 | |
Mid-Cap Value Portfolio ‘P’ | | | 8,209,631 | | | | 117,152,100 | |
Small-Cap Equity Portfolio ‘P’ | | | 8,801,129 | | | | 132,252,562 | |
Small-Cap Growth Portfolio ‘P’ | | | 5,420,957 | | | | 61,292,308 | |
Small-Cap Index Portfolio ‘P’ | | | 5,623,989 | | | | 69,909,575 | |
Small-Cap Value Portfolio ‘P’ | | | 3,873,122 | | | | 52,914,141 | |
Real Estate Portfolio ‘P’ | | | 7,131,723 | | | | 119,994,226 | |
Emerging Markets Portfolio ‘P’ | | | 8,787,559 | | | | 131,552,256 | |
International Large-Cap Portfolio ‘P’ | | | 23,729,987 | | | | 169,589,220 | |
International Small-Cap Portfolio ‘P’ | | | 16,191,976 | | | | 139,863,873 | |
International Value Portfolio ‘P’ | | | 10,033,648 | | | | 107,773,461 | |
Currency Strategies Portfolio ‘P’ * | | | 10,482,019 | | | | 103,680,711 | |
Global Absolute Return Portfolio ‘P’ * | | | 13,024,842 | | | | 130,053,631 | |
Precious Metals Portfolio ‘P’ * | | | 10,886,024 | | | | 93,660,941 | |
| | | | | | | | |
| | |
Total Affiliated Mutual Funds
(Cost $2,609,035,471) | | | | | | | 2,634,753,706 | |
| | | | | | | | |
| | |
TOTAL INVESTMENTS - 100.0%
(Cost $2,609,035,471) | | | | | | | 2,634,753,706 | |
| |
OTHER ASSETS & LIABILITIES, NET - (0.0%) | | | | (141,720 | ) |
| | | | | | | | |
| | |
NET ASSETS - 100.0% | | | | | | | $2,634,611,986 | |
| | | | | | | | |
Notes to Schedule of Investments
| (a) | As of December 31, 2012, the portfolio was diversified as a percentage of net assets as follows: |
| | | | |
Affiliated Equity Funds | | | 85.8% | |
Affiliated Fixed Income Funds | | | 14.2% | |
| | | | |
| | | 100.0% | |
Other Assets & Liabilities, Net | | | (0.0% | ) |
| | | | |
| | | 100.0% | |
| | | | |
| (b) | The portfolios’ investments are affiliated mutual funds (See Note 7C in Notes to Financial Statements). |
| (c) | Fair Value Measurements |
The following is a summary of the portfolios’ investments as categorized under the three-tier hierarchy of inputs used in valuing the portfolios’ assets and liabilities (See Note 3D in Notes to Financial Statements) as of December 31, 2012:
| | | | | | | | | | | | | | | | | | |
| | | | | Total Value at
December 31, 2012 | | | Level 1
Quoted Price | | | Level 2
Significant
Observable Inputs | | | Level 3
Significant
Unobservable Inputs | |
Portfolio Optimization Growth Portfolio | | | | | | | | | | | | | | | | |
Assets | | Affiliated Mutual Funds | | | $12,605,944,924 | | | | $12,605,944,924 | | | | $- | | | | $- | |
| | | | | | | | | | | | | | | | | | |
| | | | |
Portfolio Optimization Aggressive-Growth Portfolio | | | | | | | | | | | | | | | | |
Assets | | Affiliated Mutual Funds | | | $2,634,753,706 | | | | $2,634,753,706 | | | | $- | | | | $- | |
| | | | | | | | | | | | | | | | | | |
| | |
| See Notes to Financial Statements | | See explanation of symbols and terms, if any, on page B-143 |
B-142
PACIFIC SELECT FUND
Schedule of Investments (Continued)
Explanation of Symbols and Terms
December 31, 2012
| | |
|
Explanation of Symbols: |
| * | | Non-income producing investments. |
| " | | Pass-through securities backed by a pool of mortgages or other loans on which principal payments are periodically made. Therefore, the effective maturity is shorter than the stated maturity. |
| ^ | | Investments with their principal amount adjusted for inflation. |
| § | | Variable rate investments. The rate shown is based on the latest available information as of December 31, 2012. For Senior Loan Notes, the rate shown may represent a weighted average interest rate. |
| Y | | Investments were in default as of December 31, 2012. |
| ± | | The security is a perpetual bond and has no definite maturity date. |
| µ | | Unsettled position. Contract rates do not take effect until settlement date. |
| † | | Investments (or a portion of investments) in the Long/Short Large-Cap Portfolio were on loan as of December 31, 2012. |
| ~ | | Securities are not registered under the Securities Act of 1933 (1933 Act). These securities are either (1) exempt from registration pursuant to Rule 144A of the 1933 Act and may only be sold to “qualified institutional buyers”, or (2) the securities comply with Regulation S rules governing offers and sales made outside the United States without registration under the 1933 Act and contain certain restrictions as to public resale. |
| ¯ | | Restricted Securities. These securities are not registered and may not be sold to the public. There are legal and/or contractual restrictions on resale. The fund does not have the right to demand that such securities be registered. The values of these securities are determined by valuations provided by pricing services, brokers, dealers, market makers, or in good faith under the procedures established by the Fund’s Board of Trustees (the “Board”). |
| ‡ | | Investments were fully or partially segregated with the broker(s)/ custodian as collateral for securities sold short, delayed delivery securities, futures contracts, and/or swap contracts as of December 31, 2012. |
| + | | The values of these investments were determined by the Trustee Valuation Committee or determined by a valuation committee established under the Valuation Policy and then subsequently submitted for approval or ratification to either the Trustee Valuation Committee, or to the Board. Each determination was made in good faith in accordance with the procedures established by the Board and the provisions of the Investment Company Act of 1940 (See note 3C in Notes to Financial Statements). |
|
Counterparty Abbreviations: |
| BNP | | BNP Paribas |
| BNY | | BNY Mellon |
| BOA | | Bank of America |
| BRC | | Barclays |
| BSC | | Banco Santander Central Hispano |
| CIB | | Canadian Imperial Bank of Commerce |
| CIT | | Citigroup |
| CME | | Chicago Mercantile Exchange |
| CSF | | Credit Suisse |
| DUB | | Deutsche Bank |
| GSC | | Goldman Sachs |
| HSB | | HSBC |
| JPM | | JPMorgan Chase |
| MER | | Merrill Lynch |
| MSC | | Morgan Stanley |
| RBC | | Royal Bank of Canada |
| RBS | | Royal Bank of Scotland |
| SCB | | Standard Chartered Bank |
| SEB | | Skandinaviska Enskilda Bank |
| SGN | | Societe Generale |
| SSB | | State Street Bank |
| UBS | | UBS |
| WBC | | Westpac Banking Corp |
| | |
|
Currency Abbreviations: |
| AUD | | Australian Dollar |
| BRL | | Brazilian Real |
| CAD | | Canadian Dollar |
| CHF | | Swiss Franc |
| CNH | | Renminbi Offshore (Hong Kong) |
| CNY | | Chinese Renminbi |
| CZK | | Czech Koruna |
| DKK | | Danish Krone |
| EUR | | Euro |
| GBP | | British Pound |
| HKD | | Hong Kong Dollar |
| INR | | Indian Rupee |
| JPY | | Japanese Yen |
| KRW | | Korean Won |
| MXN | | Mexican Peso |
| MYR | | Malaysian Ringgit |
| NOK | | Norwegian Krone |
| NGN | | Nigerian Naira |
| NZD | | New Zealand Dollar |
| PEN | | Peruvian Nuevo Sol |
| PHP | | Philippines Peso |
| PLN | | Polish Zloty |
| RSD | | Serbian Dinar |
| RUB | | Russian Ruble |
| SEK | | Swedish Krona |
| SGD | | Singapore Dollar |
| TRY | | Turkish Lira |
| TWD | | Taiwan Dollar |
| USD | | United States Dollar |
| ZAR | | South African Rand |
|
Other Abbreviations: |
| ADR | | American Depositary Receipt |
| CDI | | CHESS Depository Interests (Receipts) |
| CDO | | Collateralized Debt Obligation |
| CLO | | Collateralized Loan Obligation |
| CPI | | Consumer Price Index |
| CVA | | Certificaten Van Aandelen (Dutch Certificate) |
| FDR | | Fiduciary Depositary Receipt |
| GDR | | Global Depositary Receipt |
| IO | | Interest Only |
| LIBOR | | London Interbank Offered Rate |
| NA | | Not Applicable |
| ‘NY’ | | New York Shares |
| OTC | | Over the Counter |
| PO | | Principal Only |
| REIT | | Real Estate Investment Trust |
| SDR | | Swedish Depository Receipt |
| WIBOR | | Warsaw Interbank Offered Rate |
Note:
The countries listed in the Schedules of Investments are based on country of incorporation.
The descriptions and Standard and Poor’s quality ratings of the companies and credit spreads, if any, shown in the Schedules of Investments were obtained from published reports or other sources believed to be reliable, and not audited by the Independent Registered Public Accounting Firm.
| | |
| See Notes to Financial Statements | | |
B-143
PACIFIC SELECT FUND
STATEMENTS OF ASSETS AND LIABILITIES
DECEMBER 31, 2012
(In thousands, except per share amounts)
| | | | | | | | | | | | | | | | | | | | | | | | | | | | |
| | | | | | | Cash
Management
Portfolio | | | Diversified
Bond
Portfolio | | | Floating
Rate Loan
Portfolio | | | High Yield
Bond
Portfolio | | | Inflation
Managed
Portfolio | | | Inflation
Protected
Portfolio | |
ASSETS | | | | | | | | | | | | | | | | | | | | | | | | | | |
Investments, at value | | | | | $625,193 | | | | $3,214,578 | | | | $950,785 | | | | $1,247,155 | | | | $2,454,742 | | | | $1,110,405 | |
Repurchase agreements, at value | | | | | 8,522 | | | | 193,226 | | | | 10,528 | | | | 32,937 | | | | 163,229 | | | | 10,000 | |
Cash (1) | | | | | - | | | | 545 | | | | 4,893 | | | | 386 | | | | 7 | | | | 479 | |
Foreign currency held, at value (1) | | | | | - | | | | 4,316 | | | | - | | | | - | | | | 667 | | | | 1,557 | |
Receivables: | | | | | | | | | | | | | | | | | | | | | | | | | | |
| | Dividends and interest | | | | | - | | | | 23,847 | | | | 5,073 | | | | 21,103 | | | | 9,846 | | | | 3,493 | |
| | Fund shares sold | | | | | 5,365 | | | | 929 | | | | 342 | | | | 434 | | | | 897 | | | | 190 | |
| | Securities sold | | | | | - | | | | 148,892 | | | | 7,264 | | | | 27 | | | | 8,934 | | | | - | |
| | Swap agreements | | | | | - | | | | - | | | | - | | | | - | | | | 97 | | | | - | |
| | Variation margin | | | | | - | | | | 990 | | | | - | | | | - | | | | - | | | | 46 | |
| | Due from adviser | | | | | 146 | | | | - | | | | - | | | | - | | | | - | | | | - | |
Swap contracts, at value | | | | | - | | | | 400 | | | | - | | | | 73 | | | | 5,009 | | | | - | |
Unfunded loan commitment appreciation | | | | | - | | | | - | | | | 3 | | | | - | | | | - | | | | - | |
Forward foreign currency contracts appreciation | | | | | - | | | | 3,688 | | | | - | | | | - | | | | 11,323 | | | | 443 | |
Prepaid expenses and other assets | | | | | 3 | | | | 14 | | | | 5 | | | | 6 | | | | 9 | | | | 8 | |
Total Assets | | | | | 639,229 | | | | 3,591,425 | | | | 978,893 | | | | 1,302,121 | | | | 2,654,760 | | | | 1,126,621 | |
LIABILITIES | | | | | | | | | | | | | | | | | | | | | | | | | | |
Payables: | | | | | | | | | | | | | | | | | | | | | | | | | | |
| | Fund shares redeemed | | | | | 14 | | | | 521 | | | | 411 | | | | 440 | | | | 974 | | | | 657 | |
| | Securities purchased | | | | | - | | | | 330,553 | | | | 8,606 | | | | 1,990 | | | | - | | | | - | |
| | Swap agreements | | | | | - | | | | - | | | | - | | | | - | | | | 1,929 | | | | - | |
| | Sale-buyback financing transactions | | | | | - | | | | - | | | | - | | | | - | | | | 1,029,797 | | | | - | |
| | Due to broker (2) | | | | | - | | | | - | | | | - | | | | - | | | | 10,900 | | | | - | |
| | Variation margin | | | | | - | | | | - | | | | - | | | | - | | | | 21 | | | | - | |
| | Accrued advisory fees | | | | | 86 | | | | 1,102 | | | | 532 | | | | 436 | | | | 549 | | | | 343 | |
| | Accrued service fees | | | | | 35 | | | | 6 | | | | 5 | | | | 22 | | | | 39 | | | | 1 | |
| | Accrued support service expenses | | | | | 6 | | | | 31 | | | | 9 | | | | 12 | | | | 19 | | | | 14 | |
| | Accrued custodian, and portfolio accounting and tax fees | | | | | 25 | | | | 130 | | | | 109 | | | | 58 | | | | 66 | | | | 46 | |
| | Accrued shareholder report expenses | | | | | 9 | | | | 46 | | | | 14 | | | | 18 | | | | 29 | | | | 20 | |
| | Accrued trustees’ fees and expenses and deferred compensation | | | | | 9 | | | | 10 | | | | 3 | | | | 7 | | | | 13 | | | | 4 | |
| | Accrued dividends and interest | | | | | - | | | | - | | | | - | | | | - | | | | 1 | | | | - | |
| | Accrued other | | | | | 8 | | | | 40 | | | | 14 | | | | 17 | | | | 28 | | | | 19 | |
Outstanding options written, at value | | | | | - | | | | - | | | | - | | | | - | | | | 1,519 | | | | 81 | |
Swap contracts, at value | | | | | - | | | | 457 | | | | - | | | | - | | | | 1,397 | | | | 2,601 | |
Forward foreign currency contracts depreciation | | | | | - | | | | 4,737 | | | | - | | | | - | | | | 2,051 | | | | 3,722 | |
Total Liabilities | | | | | 192 | | | | 337,633 | | | | 9,703 | | | | 3,000 | | | | 1,049,332 | | | | 7,508 | |
NET ASSETS | | | | | $639,037 | | | | $3,253,792 | | | | $969,190 | | | | $1,299,121 | | | | $1,605,428 | | | | $1,119,113 | |
NET ASSETS CONSIST OF: | | | | | | | | | | | | | | | | | | | | | | | | | | |
Paid-in capital (3) | | | | | $639,198 | | | | $3,025,682 | | | | $1,188,242 | | | | $1,232,521 | | | | $1,427,914 | | | | $1,000,986 | |
Undistributed/accumulated net investment income (loss) (3) | | | | | (152 | ) | | | 24,398 | | | | 11,192 | | | | 17,977 | | | | 17,511 | | | | 28,573 | |
Undistributed/accumulated net realized gain (loss) (3) | | | | | (9 | ) | | | 59,682 | | | | (241,721 | ) | | | (16,005 | ) | | | 84,328 | | | | 60,480 | |
Net unrealized appreciation (depreciation) on investments
and assets and liabilities in foreign currencies (3) | | | | | - | | | | 144,030 | | | | 11,477 | | | | 64,628 | | | | 75,675 | | | | 29,074 | |
NET ASSETS | | | | | $639,037 | | | | $3,253,792 | | | | $969,190 | | | | $1,299,121 | | | | $1,605,428 | | | | $1,119,113 | |
Class I Shares: | | | | | | | | | | | | | | | | | | | | | | | | | | |
| | Net Assets | | | | | $638,998 | | | | $113,422 | | | | $85,212 | | | | $399,742 | | | | $715,700 | | | | $24,847 | |
| | Shares outstanding, $.001 par value (unlimited shares authorized) | | | | | 63,359 | | | | 13,840 | | | | 14,559 | | | | 63,394 | | | | 67,308 | | | | 2,296 | |
| | Net Asset Value Per Share | | | | | $10.09 | | | | $8.20 | | | | $5.85 | | | | $6.31 | | | | $10.63 | | | | $10.82 | |
Class P Shares: | | | | | | | | | | | | | | | | | | | | | | | | | | |
| | Net Assets | | | | | $39 | | | | $3,140,370 | | | | $883,978 | | | | $899,379 | | | | $889,728 | | | | $1,094,266 | |
| | Shares outstanding, $.001 par value (unlimited shares authorized) | | | | | 4 | | | | 287,516 | | | | 115,370 | | | | 131,947 | | | | 74,631 | | | | 99,952 | |
| | Net Asset Value Per Share | | | | | $10.06 | | | | $10.92 | | | | $7.66 | | | | $6.82 | | | | $11.92 | | | | $10.95 | |
| | | | | | | | | | | | | | | | | | | | | | | | | | | | |
Investments, at cost | | | | | $625,193 | | | | $3,072,065 | | | | $939,312 | | | | $1,182,546 | | | | $2,390,571 | | | | $1,075,585 | |
Repurchase agreements, at cost | | | | | 8,522 | | | | 193,226 | | | | 10,528 | | | | 32,937 | | | | 163,229 | | | | 10,000 | |
Foreign currency held, at cost | | | | | - | | | | 4,232 | | | | - | | | | - | | | | 667 | | | | 1,514 | |
Premiums received from outstanding options written | | | | | - | | | | - | | | | - | | | | - | | | | 2,690 | | | | 73 | |
| (1) | Includes cash collateral segregated for open futures contracts and delayed delivery securities in the Diversified Bond, Inflation Managed and Inflation Protected Portfolios of $342, $7, and $511, respectively. |
| (2) | The Inflation Managed Portfolio received cash collateral to mitigate risk of loss to certain counterparties, which will be repaid based on master netting arrangements between the portfolio and the counterparty. The portfolio invests such cash collateral in investment securities (see Note 5 in Notes to Financial Statements). |
| (3) | Applicable to portfolios electing to be treated as a regulated investment company for Federal income tax purposes (see Note 12 in Notes to Financial Statements). |
| | |
| See Notes to Financial Statements | | |
C-1
PACIFIC SELECT FUND
STATEMENTS OF ASSETS AND LIABILITIES (Continued)
DECEMBER 31, 2012
(In thousands, except per share amounts)
| | | | | | | | | | | | | | | | | | | | | | | | | | | | |
| | | | | | | Managed
Bond
Portfolio | | | Short
Duration
Bond
Portfolio | | | Emerging
Markets Debt
Portfolio | | | American
Funds
Growth
Portfolio | | | American
Funds
Growth-Income
Portfolio | | | Comstock
Portfolio | |
ASSETS | | | | | | | | | | | | | | | | | | | | | | | | | | |
Investments, at value | | | | | $7,065,793 | | | | $2,361,770 | | | | $969,631 | | | | $266,500 | | | | $647,164 | | | | $1,946,794 | |
Repurchase agreements, at value | | | | | 21,296 | | | | 74,015 | | | | 3,082 | | | | - | | | | - | | | | 74,015 | |
Cash (1) | | | | | 152 | | | | 6,200 | | | | 937 | | | | - | | | | - | | | | - | |
Foreign currency held, at value | | | | | 855 | | | | 38 | | | | 1,391 | | | | - | | | | - | | | | - | |
Receivables: | | | | | | | | | | | | | | | | | | | | | | | | | | |
| | Dividends and interest | | | | | 46,328 | | | | 13,344 | | | | 17,046 | | | | - | | | | - | | | | 2,875 | |
| | Fund shares sold | | | | | 1,787 | | | | 1,363 | | | | 132 | | | | - | | | | 1 | | | | 289 | |
| | Securities sold | | | | | 1,243,384 | | | | - | | | | - | | | | 204 | | | | 179 | | | | - | |
| | Swap agreements | | | | | 2,550 | | | | - | | | | - | | | | - | | | | - | | | | - | |
| | Variation margin | | | | | 11 | | | | - | | | | - | | | | - | | | | - | | | | - | |
Swap contracts, at value | | | | | 40,212 | | | | - | | | | - | | | | - | | | | - | | | | - | |
Forward foreign currency contracts appreciation | | | | | 12,298 | | | | 21 | | | | 1,659 | | | | - | | | | - | | | | 189 | |
Prepaid expenses and other assets | | | | | 27 | | | | 12 | | | | 23 | | | | 3 | | | | 5 | | | | 11 | |
Total Assets | | | | | 8,434,693 | | | | 2,456,763 | | | | 993,901 | | | | 266,707 | | | | 647,349 | | | | 2,024,173 | |
LIABILITIES | | | | | | | | | | | | | | | | | | | | | | | | | | |
Payables: | | | | | | | | | | | | | | | | | | | | | | | | | | |
| | Fund shares redeemed | | | | | 1,201 | | | | 337 | | | | 511 | | | | 196 | | | | 172 | | | | 15 | |
| | Securities purchased | | | | | 2,958,112 | | | | - | | | | 111 | | | | - | | | | - | | | | 1,214 | |
| | Reverse repurchase agreements | | | | | 73,842 | | | | - | | | | - | | | | - | | | | - | | | | - | |
| | Swap agreements | | | | | 17,575 | | | | - | | | | - | | | | - | | | | - | | | | - | |
| | Sale-buyback financing transactions | | | | | 194,525 | | | | - | | | | - | | | | - | | | | - | | | | - | |
| | Due to broker (2) | | | | | 24,753 | | | | - | | | | - | | | | - | | | | - | | | | - | |
| | Accrued advisory fees | | | | | 1,722 | | | | 829 | | | | 657 | | | | 92 | | | | 223 | | | | 1,150 | |
| | Accrued service fees | | | | | 83 | | | | 15 | | | | - | | | | 11 | | | | 11 | | | | 7 | |
| | Accrued support service expenses | | | | | 52 | | | | 22 | | | | 9 | | | | 5 | | | | 9 | | | | 21 | |
| | Accrued custodian, and portfolio accounting and tax fees | | | | | 244 | | | | 84 | | | | 87 | | | | 4 | | | | 4 | | | | 59 | |
| | Accrued shareholder report expenses | | | | | 78 | | | | 33 | | | | 9 | | | | 7 | | | | 14 | | | | 31 | |
| | Accrued trustees’ fees and expenses and deferred compensation | | | | | 34 | | | | 8 | | | | 3 | | | | 2 | | | | 4 | | | | 8 | |
| | Accrued dividends and interest | | | | | 6 | | | | - | | | | - | | | | - | | | | - | | | | - | |
| | Accrued other | | | | | 46 | | | | 29 | | | | 10 | | | | 8 | | | | 14 | | | | 30 | |
Outstanding options written, at value | | | | | 437 | | | | - | | | | - | | | | - | | | | - | | | | - | |
Swap contracts, at value | | | | | 4,288 | | | | - | | | | - | | | | - | | | | - | | | | - | |
Forward foreign currency contracts depreciation | | | | | 14,995 | | | | - | | | | 2,105 | | | | - | | | | - | | | | 3,343 | |
Other liabilities | | | | | 2 | | | | - | | | | - | | | | - | | | | - | | | | - | |
Total Liabilities | | | | | 3,291,995 | | | | 1,357 | | | | 3,502 | | | | 325 | | | | 451 | | | | 5,878 | |
NET ASSETS | | | | | $5,142,698 | | | | $2,455,406 | | | | $990,399 | | | | $266,382 | | | | $646,898 | | | | $2,018,295 | |
NET ASSETS CONSIST OF: | | | | | | | | | | | | | | | | | | | | | | | | | | |
Paid-in capital (3), (4) | | | | | $4,636,582 | | | | $2,506,764 | | | | $913,739 | | | | $920,004 | | | | $947,237 | | | | $2,309,499 | |
Accumulated deficit (4) | | | | | | | | | | | | | | | | | (653,622 | ) | | | (300,339 | ) | | | (291,204 | ) |
Undistributed net investment income (3) | | | | | 49,319 | | | | 6,935 | | | | 8,440 | | | | | | | | | | | | | |
Undistributed/accumulated net realized gain (loss) (3) | | | | | 211,583 | | | | (85,645 | ) | | | 7,041 | | | | | | | | | | | | | |
Net unrealized appreciation on investments
and assets and liabilities in foreign currencies (3) | | | | | 245,214 | | | | 27,352 | | | | 61,179 | | | | | | | | | | | | | |
NET ASSETS | | | | | $5,142,698 | | | | $2,455,406 | | | | $990,399 | | | | $266,382 | | | | $646,898 | | | | $2,018,295 | |
Class I Shares: | | | | | | | | | | | | | | | | | | | | | | | | | | |
| | Net Assets | | | | | $1,514,555 | | | | $277,735 | | | | $7,809 | | | | $209,921 | | | | $202,691 | | | | $138,115 | |
| | Shares outstanding, $.001 par value (unlimited shares authorized) | | | | | 131,139 | | | | 29,479 | | | | 722 | | | | 22,363 | | | | 19,382 | | | | 16,803 | |
| | Net Asset Value Per Share | | | | | $11.55 | | | | $9.42 | | | | $10.82 | | | | $9.39 | | | | $10.46 | | | | $8.22 | |
Class P Shares: | | | | | | | | | | | | | | | | | | | | | | | | | | |
| | Net Assets | | | | | $3,628,143 | | | | $2,177,671 | | | | $982,590 | | | | $56,461 | | | | $444,207 | | | | $1,880,180 | |
| | Shares outstanding, $.001 par value (unlimited shares authorized) | | | | | 288,371 | | | | 225,033 | | | | 90,715 | | | | 6,028 | | | | 42,594 | | | | 202,411 | |
| | Net Asset Value Per Share | | | | | $12.58 | | | | $9.68 | | | | $10.83 | | | | $9.37 | | | | $10.43 | | | | $9.29 | |
| | | | | | | | | | | | | | | | | | | | | | | | | | | | |
Investments, at cost | | | | | $6,844,027 | | | | $2,334,439 | | | | $908,032 | | | | $200,330 | | | | $555,872 | | | | $1,646,034 | |
Repurchase agreements, at cost | | | | | 21,296 | | | | 74,015 | | | | 3,082 | | | | - | | | | - | | | | 74,015 | |
Foreign currency held, at cost | | | | | 860 | | | | 38 | | | | 1,386 | | | | - | | | | - | | | | - | |
Premiums received from outstanding options written | | | | | 4,017 | | | | - | | | | - | | | | - | | | | - | | | | - | |
| (1) | Includes cash collateral segregated for open forward foreign currency contracts in the Emerging Markets Debt Portfolio of $850. |
| (2) | The Managed Bond Portfolio received cash collateral to mitigate risk of loss to certain counterparties, which will be repaid based on master netting arrangements between the portfolio and the counterparty. The portfolio invests such cash collateral in investment securities (see Note 5 in Notes to Financial Statements). |
| (3) | Applicable to portfolios electing to be treated as a regulated investment company for Federal income tax purposes (see Note 12 in Notes to Financial Statements). |
| (4) | Applicable to portfolios electing to be treated as a partnership for Federal income tax purposes (see Note 12 in Notes to Financial Statements). |
| | |
| See Notes to Financial Statements | | |
C-2
PACIFIC SELECT FUND
STATEMENTS OF ASSETS AND LIABILITIES (Continued)
DECEMBER 31, 2012
(In thousands, except per share amounts)
| | | | | | | | | | | | | | | | | | | | | | | | | | | | |
| | | | | | | Dividend
Growth
Portfolio | | | Equity Index
Portfolio | | | Focused 30
Portfolio | | | Growth LT
Portfolio | | | Large-Cap
Growth
Portfolio | | | Large-Cap
Value
Portfolio | |
ASSETS | | | | | | | | | | | | | | | | | | | | | | | | | | |
Investments, at value | | | | | $770,436 | | | | $1,953,713 | | | | $113,981 | | | | $509,806 | | | | $1,256,455 | | | | $2,802,408 | |
Repurchase agreements, at value | | | | | 40,614 | | | | 29,476 | | | | 68 | | | | 1,604 | | | | 26,530 | | | | 30,656 | |
Cash (1) | | | | | - | | | | 1,964 | | | | - | | | | - | | | | - | | | | - | |
Foreign currency held, at value | | | | | - | | | | - | | | | - | | | | 21 | | | | - | | | | - | |
Receivables: | | | | | | | | | | | | | | | | | | | | | | | | | | |
| | Dividends and interest | | | | | 1,300 | | | | 2,154 | | | | 58 | | | | 443 | | | | 507 | | | | 7,163 | |
| | Fund shares sold | | | | | 98 | | | | 474 | | | | 18 | | | | 20 | | | | 53 | | | | 413 | |
| | Securities sold | | | | | 5,641 | | | | 288 | | | | - | | | | 1,594 | | | | - | | | | - | |
| | Variation margin | | | | | - | | | | 855 | | | | - | | | | - | | | | - | | | | - | |
Forward foreign currency contracts appreciation | | | | | - | | | | - | | | | - | | | | 415 | | | | - | | | | - | |
Prepaid expenses and other assets | | | | | 4 | | | | 11 | | | | 1 | | | | 4 | | | | 6 | | | | 15 | |
Total Assets | | | | | 818,093 | | | | 1,988,935 | | | | 114,126 | | | | 513,907 | | | | 1,283,551 | | | | 2,840,655 | |
LIABILITIES | | | | | | | | | | | | | | | | | | | | | | | | | | |
Payables: | | | | | | | | | | | | | | | | | | | | | | | | | | |
| | Fund shares redeemed | | | | | 460 | | | | 646 | | | | 114 | | | | 167 | | | | 1 | | | | 938 | |
| | Securities purchased | | | | | 239 | | | | - | | | | - | | | | 181 | | | | - | | | | - | |
| | Accrued advisory fees | | | | | 460 | | | | 84 | | | | 72 | | | | 237 | | | | 738 | | | | 1,423 | |
| | Accrued service fees | | | | | 10 | | | | 47 | | | | 6 | | | | 23 | | | | 8 | | | | 17 | |
| | Accrued support service expenses | | | | | 8 | | | | 20 | | | | 1 | | | | 7 | | | | 12 | | | | 28 | |
| | Accrued custodian, and portfolio accounting and tax fees | | | | | 23 | | | | 56 | | | | 6 | | | | 18 | | | | 33 | | | | 80 | |
| | Accrued shareholder report expenses | | | | | 13 | | | | 30 | | | | 2 | | | | 10 | | | | 17 | | | | 42 | |
| | Accrued trustees’ fees and expenses and deferred compensation | | | | | 5 | | | | 18 | | | | - | | | | 13 | | | | 8 | | | | 17 | |
| | Accrued other | | | | | 13 | | | | 29 | | | | 1 | | | | 11 | | | | 17 | | | | 39 | |
Forward foreign currency contracts depreciation | | | | | - | | | | - | | | | - | | | | 392 | | | | - | | | | - | |
Total Liabilities | | | | | 1,231 | | | | 930 | | | | 202 | | | | 1,059 | | | | 834 | | | | 2,584 | |
NET ASSETS | | | | | $816,862 | | | | $1,988,005 | | | | $113,924 | | | | $512,848 | | | | $1,282,717 | | | | $2,838,071 | |
NET ASSETS CONSIST OF: | | | | | | | | | | | | | | | | | | | | | | | | | | |
Paid-in capital (2) | | | | | $1,165,853 | | | | $1,630,062 | | | | $318,148 | | | | $961,604 | | | | $1,320,505 | | | | $2,806,217 | |
Undistributed/accumulated earnings (deficit) (2) | | | | | (348,991 | ) | | | 357,943 | | | | (204,224 | ) | | | (448,756 | ) | | | (37,788 | ) | | | 31,854 | |
NET ASSETS | | | | | $816,862 | | | | $1,988,005 | | | | $113,924 | | | | $512,848 | | | | $1,282,717 | | | | $2,838,071 | |
Class I Shares: | | | | | | | | | | | | | | | | | | | | | | | | | | |
| | Net Assets | | | | | $181,496 | | | | $852,780 | | | | $113,913 | | | | $422,736 | | | | $142,837 | | | | $308,064 | |
| | Shares outstanding, $.001 par value (unlimited shares authorized) | | | | | 17,897 | | | | 27,803 | | | | 9,129 | | | | 31,610 | | | | 27,640 | | | | 25,622 | |
| | Net Asset Value Per Share | | | | | $10.14 | | | | $30.67 | | | | $12.48 | | | | $13.37 | | | | $5.17 | | | | $12.02 | |
Class P Shares: | | | | | | | | | | | | | | | | | | | | | | | | | | |
| | Net Assets | | | | | $635,366 | | | | $1,135,225 | | | | $11 | | | | $90,112 | | | | $1,139,880 | | | | $2,530,007 | |
| | Shares outstanding, $.001 par value (unlimited shares authorized) | | | | | 57,786 | | | | 36,264 | | | | 1 | | | | 6,319 | | | | 189,630 | | | | 194,082 | |
| | Net Asset Value Per Share | | | | | $11.00 | | | | $31.30 | | | | $12.52 | | | | $14.26 | | | | $6.01 | | | | $13.04 | |
| | | | | | | | | | | | | | | | | | | | | | | | | | | | |
Investments, at cost | | | | | $646,658 | | | | $1,298,564 | | | | $87,184 | | | | $444,166 | | | | $1,075,734 | | | | $2,189,024 | |
Repurchase agreements, at cost | | | | | 40,614 | | | | 29,476 | | | | 68 | | | | 1,604 | | | | 26,530 | | | | 30,656 | |
Foreign currency held, at cost | | | | | - | | | | - | | | | - | | | | 21 | | | | - | | | | - | |
| (1) | Includes cash collateral segregated for open futures contracts in the Equity Index Portfolio of $1,962. |
| (2) | Applicable to portfolios electing to be treated as a partnership for Federal income tax purposes (see Note 12 in Notes to Financial Statements). |
| | |
| See Notes to Financial Statements | | |
C-3
PACIFIC SELECT FUND
STATEMENTS OF ASSETS AND LIABILITIES (Continued)
DECEMBER 31, 2012
(In thousands except per share amounts)
| | | | | | | | | | | | | | | | | | | | | | | | | | | | |
| | | | | | | Long/Short
Large-Cap
Portfolio | | | Main Street
Core
Portfolio | | | Mid-Cap
Equity
Portfolio | | | Mid-Cap
Growth
Portfolio | | | Mid-Cap
Value
Portfolio | | | Small-Cap
Equity
Portfolio | |
ASSETS | | | | | | | | | | | | | | | | | | | | | | | | | | |
Investments, at value | | | | | $1,792,363 | | | | $1,413,760 | | | | $1,040,952 | | | | $695,335 | | | | $1,353,867 | | | | $986,831 | |
Repurchase agreements, at value | | | | | 28,932 | | | | 35,325 | | | | 30,033 | | | | 20,313 | | | | 17,143 | | | | 13,829 | |
Cash (1) | | | | | 1,045 | | | | 2 | | | | - | | | | - | | | | - | | | | 589 | |
Cash collateral received for securities on loan (2) | | | | | 414,470 | | | | - | | | | - | | | | - | | | | - | | | | - | |
Foreign currency held, at value | | | | | - | | | | 40 | | | | - | | | | - | | | | 1 | | | | - | |
Receivables: | | | | | | | | | | | | | | | | | | | | | | | | | | |
| | Dividends and interest | | | | | 1,981 | | | | 1,279 | | | | 811 | | | | 805 | | | | 732 | | | | 1,422 | |
| | Fund shares sold | | | | | 70 | | | | 158 | | | | 109 | | | | 115 | | | | 105 | | | | 2 | |
| | Securities sold | | | | | 5,376 | | | | 11,717 | | | | - | | | | 1,553 | | | | 1,169 | | | | 1,476 | |
| | Variation margin | | | | | 797 | | | | - | | | | - | | | | - | | | | - | | | | 142 | |
Prepaid expenses and other assets | | | | | 8 | | | | 7 | | | | 7 | | | | 4 | | | | 7 | | | | 5 | |
Total Assets | | | | | 2,245,042 | | | | 1,462,288 | | | | 1,071,912 | | | | 718,125 | | | | 1,373,024 | | | | 1,004,296 | |
LIABILITIES | | | | | | | | | | | | | | | | | | | | | | | | | | |
Payable upon return of securities loaned (2) | | | | | 414,470 | | | | - | | | | - | | | | - | | | | - | | | | - | |
Payables: | | | | | | | | | | | | | | | | | | | | | | | | | | |
| | Fund shares redeemed | | | | | 25 | | | | 311 | | | | 37 | | | | 134 | | | | 488 | | | | 1,563 | |
| | Securities purchased | | | | | 2,584 | | | | 18,364 | | | | - | | | | 1,732 | | | | - | | | | 7 | |
| | Securities sold short, at value | | | | | 412,238 | | | | - | | | | - | | | | - | | | | - | | | | - | |
| | Due to custodian | | | | | 3 | | | | - | | | | - | | | | - | | | | - | | | | - | |
| | Accrued advisory fees | | | | | 1,131 | | | | 547 | | | | 585 | | | | 419 | | | | 789 | | | | 544 | |
| | Accrued service fees | | | | | 2 | | | | 29 | | | | 16 | | | | 10 | | | | 3 | | | | 2 | |
| | Accrued support service expenses | | | | | 14 | | | | 14 | | | | 13 | | | | 9 | | | | 12 | | | | 10 | |
| | Accrued custodian, and portfolio accounting and tax fees | | | | | 52 | | | | 39 | | | | 30 | | | | 49 | | | | 39 | | | | 43 | |
| | Accrued shareholder report expenses | | | | | 21 | | | | 20 | | | | 19 | | | | 13 | | | | 18 | | | | 14 | |
| | Accrued trustees’ fees and expenses and deferred compensation | | | | | 5 | | | | 16 | | | | 9 | | | | 4 | | | | 4 | | | | 3 | |
| | Accrued dividends and interest | | | | | 698 | | | | - | | | | - | | | | - | | | | - | | | | - | |
| | Accrued other | | | | | 20 | | | | 20 | | | | 20 | | | | 14 | | | | 18 | | | | 15 | |
Other liabilities | | | | | - | | | | 2 | | | | - | | | | - | | | | - | | | | - | |
Total Liabilities | | | | | 831,263 | | | | 19,362 | | | | 729 | | | | 2,384 | | | | 1,371 | | | | 2,201 | |
NET ASSETS | | | | | $1,413,779 | | | | $1,442,926 | | | | $1,071,183 | | | | $715,741 | | | | $1,371,653 | | | | $1,002,095 | |
NET ASSETS CONSIST OF: | | | | | | | | | | | | | | | | | | | | | | | | | | |
Paid-in capital (3) | | | | | $1,447,349 | | | | $2,008,723 | | | | $3,046,141 | | | | $656,770 | | | | $1,239,180 | | | | $1,033,595 | |
Undistributed/accumulated earnings (deficit) (3) | | | | | (33,570 | ) | | | (565,797 | ) | | | (1,974,958 | ) | | | 58,971 | | | | 132,473 | | | | (31,500 | ) |
NET ASSETS | | | | | $1,413,779 | | | | $1,442,926 | | | | $1,071,183 | | | | $715,741 | | | | $1,371,653 | | | | $1,002,095 | |
Class I Shares: | | | | | | | | | | | | | | | | | | | | | | | | | | |
| | Net Assets | | | | | $31,373 | | | | $537,634 | | | | $295,015 | | | | $189,423 | | | | $46,795 | | | | $41,681 | |
| | Shares outstanding, $.001 par value (unlimited shares authorized) | | | | | 4,441 | | | | 27,453 | | | | 29,662 | | | | 26,477 | | | | 4,791 | | | | 3,574 | |
| | Net Asset Value Per Share | | | | | $7.06 | | | | $19.58 | | | | $9.95 | | | | $7.15 | | | | $9.77 | | | | $11.66 | |
Class P Shares: | | | | | | | | | | | | | | | | | | | | | | | | | | |
| | Net Assets | | | | | $1,382,406 | | | | $905,292 | | | | $776,168 | | | | $526,318 | | | | $1,324,858 | | | | $960,414 | |
| | Shares outstanding, $.001 par value (unlimited shares authorized) | | | | | 147,488 | | | | 42,034 | | | | 64,109 | | | | 67,927 | | | | 92,842 | | | | 63,914 | |
| | Net Asset Value Per Share | | | | | $9.37 | | | | $21.54 | | | | $12.11 | | | | $7.75 | | | | $14.27 | | | | $15.03 | |
| | | | | | | | | | | | | | | | | | | | | | | | | | | | |
Investments, at cost | | | | | $1,653,679 | | | | $1,195,998 | | | | $1,004,186 | | | | $638,867 | | | | $1,297,800 | | | | $883,469 | |
Repurchase agreements, at cost | | | | | 28,932 | | | | 35,325 | | | | 30,033 | | | | 20,313 | | | | 17,143 | | | | 13,829 | |
Foreign currency held, at cost | | | | | - | | | | 40 | | | | - | | | | - | | | | 1 | | | | - | |
Securities on loan, at value | | | | | 412,020 | | | | - | | | | - | | | | - | | | | - | | | | - | |
Proceeds from securities sold short | | | | | 389,663 | | | | - | | | | - | | | | - | | | | - | | | | - | |
| (1) | Includes cash collateral segregated for open futures contracts in the Long/Short Large-Cap and Small-Cap Equity Portfolios of $1,045 and $365, respectively. |
| (2) | Cash collateral is received by the Long/Short Large-Cap Portfolio for securities on loan which is used as collateral to cover securities sold short and is therefore uninvested (See Note 8 in Notes to Financial Statements). |
| (3) | Applicable to portfolios electing to be treated as a partnership for Federal income tax purposes (see Note 12 in Notes to Financial Statements). |
| | |
| See Notes to Financial Statements | | |
C-4
PACIFIC SELECT FUND
STATEMENTS OF ASSETS AND LIABILITIES (Continued)
DECEMBER 31, 2012
(In thousands, except per share amounts)
| | | | | | | | | | | | | | | | | | | | | | | | | | | | |
| | | | | | | Small-Cap
Growth
Portfolio | | | Small-Cap
Index
Portfolio | | | Small-Cap
Value
Portfolio | | | Health
Sciences
Portfolio | | | Real Estate
Portfolio | | | Technology
Portfolio | |
ASSETS | | | | | | | | | | | | | | | | | | | | | | | | | | |
Investments, at value | | | | | $477,975 | | | | $724,789 | | | | $471,460 | | | | $150,429 | | | | $1,096,682 | | | | $66,129 | |
Repurchase agreements, at value | | | | | 18,119 | | | | 19,382 | | | | 21,500 | | | | 6,313 | | | | 16,410 | | | | 1,316 | |
Cash (1) | | | | | - | | | | 1,208 | | | | - | | | | - | | | | - | | | | - | |
Foreign currency held, at value | | | | | - | | | | - | | | | - | | | | - | | | | - | | | | 740 | |
Receivables: | | | | | | | | | | | | | | | | | | | | | | | | | | |
| | Dividends and interest | | | | | 344 | | | | 1,046 | | | | 608 | | | | 20 | | | | 3,593 | | | | 5 | |
| | Fund shares sold | | | | | 102 | | | | 7 | | | | 128 | | | | 496 | | | | 183 | | | | 20 | |
| | Securities sold | | | | | 1,284 | | | | - | | | | 509 | | | | - | | | | 1,438 | | | | 36 | |
| | Variation margin | | | | | - | | | | 563 | | | | - | | | | - | | | | - | | | | - | |
Prepaid expenses and other assets | | | | | 3 | | | | 2 | | | | 2 | | | | 1 | | | | 5 | | | | - | |
Total Assets | | | | | 497,827 | | | | 746,997 | | | | 494,207 | | | | 157,259 | | | | 1,118,311 | | | | 68,246 | |
LIABILITIES | | | | | | | | | | | | | | | | | | | | | | | | | | |
Payables: | | | | | | | | | | | | | | | | | | | | | | | | | | |
| | Fund shares redeemed | | | | | 51 | | | | 504 | | | | 307 | | | | 8 | | | | 622 | | | | 24 | |
| | Securities purchased | | | | | - | | | | - | | | | 1,832 | | | | 244 | | | | 1,374 | | | | - | |
| | Due to custodian | | | | | - | | | | 144 | | | | 57 | | | | - | | | | - | | | | - | |
| | Accrued advisory fees | | | | | 250 | | | | 185 | | | | 310 | | | | 119 | | | | 767 | | | | 52 | |
| | Accrued service fees | | | | | 6 | | | | 20 | | | | 9 | | | | 9 | | | | 15 | | | | 4 | |
| | Accrued support service expenses | | | | | 5 | | | | 5 | | | | 5 | | | | 1 | | | | 9 | | | | 1 | |
| | Accrued custodian, and portfolio accounting and tax fees | | | | | 15 | | | | 31 | | | | 15 | | | | 7 | | | | 30 | | | | 5 | |
| | Accrued shareholder report expenses | | | | | 7 | | | | 8 | | | | 7 | | | | 2 | | | | 13 | | | | 1 | |
| | Accrued trustees’ fees and expenses and deferred compensation | | | | | 3 | | | | 7 | | | | 2 | | | | 1 | | | | 5 | | | | - | |
| | Accrued other | | | | | 8 | | | | 8 | | | | 8 | | | | 2 | | | | 13 | | | | 1 | |
Total Liabilities | | | | | 345 | | | | 912 | | | | 2,552 | | | | 393 | | | | 2,848 | | | | 88 | |
NET ASSETS | | | | | $497,482 | | | | $746,085 | | | | $491,655 | | | | $156,866 | | | | $1,115,463 | | | | $68,158 | |
NET ASSETS CONSIST OF: | | | | | | | | | | | | | | | | | | | | | | | | | | |
Paid-in capital (2) | | | | | $680,358 | | | | $960,648 | | | | $553,387 | | | | $127,851 | | | | $1,479,897 | | | | $107,188 | |
Undistributed/accumulated earnings (deficit) (2) | | | | | (182,876 | ) | | | (214,563 | ) | | | (61,732 | ) | | | 29,015 | | | | (364,434 | ) | | | (39,030 | ) |
NET ASSETS | | | | | $497,482 | | | | $746,085 | | | | $491,655 | | | | $156,866 | | | | $1,115,463 | | | | $68,158 | |
Class I Shares: | | | | | | | | | | | | | | | | | | | | | | | | | | |
| | Net Assets | | | | | $106,933 | | | | $377,576 | | | | $159,284 | | | | $156,854 | | | | $282,777 | | | | $68,148 | |
| | Shares outstanding, $.001 par value (unlimited shares authorized) | | | | | 11,017 | | | | 30,412 | | | | 14,025 | | | | 10,928 | | | | 17,325 | | | | 16,217 | |
| | Net Asset Value Per Share | | | | | $9.71 | | | | $12.42 | | | | $11.36 | | | | $14.35 | | | | $16.32 | | | | $4.20 | |
Class P Shares: | | | | | | | | | | | | | | | | | | | | | | | | | | |
| | Net Assets | | | | | $390,549 | | | | $368,509 | | | | $332,371 | | | | $12 | | | | $832,686 | | | | $10 | |
| | Shares outstanding, $.001 par value (unlimited shares authorized) | | | | | 34,542 | | | | 29,645 | | | | 24,328 | | | | 1 | | | | 49,490 | | | | 2 | |
| | Net Asset Value Per Share | | | | | $11.31 | | | | $12.43 | | | | $13.66 | | | | $15.53 | | | | $16.83 | | | | $5.25 | |
| | | | | | | | | | | | | | | | | | | | | | | | | | | | |
Investments, at cost | | | | | $407,026 | | | | $683,928 | | | | $367,543 | | | | $115,831 | | | | $908,351 | | | | $61,867 | |
Repurchase agreements, at cost | | | | | 18,119 | | | | 19,382 | | | | 21,500 | | | | 6,313 | | | | 16,410 | | | | 1,316 | |
Foreign currency held, at cost | | | | | - | | | | - | | | | - | | | | - | | | | - | | | | 740 | |
| (1) | Includes cash collateral segregated for open futures contracts in the Small-Cap Index Portfolio of $1,208. |
| (2) | Applicable to portfolios electing to be treated as a partnership for Federal income tax purposes (see Note 12 in Notes to Financial Statements). |
| | |
| See Notes to Financial Statements | | |
C-5
PACIFIC SELECT FUND
STATEMENTS OF ASSETS AND LIABILITIES (Continued)
DECEMBER 31, 2012
(In thousands, except per share amounts)
| | | | | | | | | | | | | | | | | | | | | | | | | | | | |
| | | | | | | Emerging
Markets
Portfolio | | | International
Large-Cap
Portfolio | | | International
Small-Cap
Portfolio | | | International
Value
Portfolio | | | Currency
Strategies
Portfolio | | | Global
Absolute
Return
Portfolio | |
ASSETS | | | | | | | | | | | | | | | | | | | | | | | | | | |
Investments, at value | | | | | $1,519,095 | | | | $2,005,093 | | | | $1,201,952 | | | | $1,528,047 | | | | $893,099 | | | | $1,796,735 | |
Repurchase agreements, at value | | | | | 40,757 | | | | - | | | | 12,280 | | | | 10,177 | | | | 574,053 | | | | 422,792 | |
Cash | | | | | - | | | | 167 | | | | 16 | | | | - | | | | 1,120 | | | | 620 | |
Foreign currency held, at value | | | | | 1,086 | | | | - | | | | 302 | | | | 242 | | | | - | | | | 7,319 | |
Receivables: | | | | | | | | | | | | | | | | | | | | | | | | | | |
| | Dividends and interest | | | | | 661 | | | | 2,858 | | | | 2,126 | | | | 2,994 | | | | 11,522 | | | | 6,496 | |
| | Fund shares sold | | | | | 162 | | | | 101 | | | | 15 | | | | - | | | | 1 | | | | 20 | |
| | Securities sold | | | | | 754 | | | | 9,920 | | | | 2,868 | | | | - | | | | - | | | | 43,379 | |
| | Variation margin | | | | | - | | | | - | | | | - | | | | - | | | | - | | | | 1,187 | |
Swap contracts, at value | | | | | - | | | | - | | | | - | | | | - | | | | - | | | | 59,658 | |
Forward foreign currency contracts appreciation | | | | | - | | | | - | | | | 1,244 | | | | 5,562 | | | | 31,326 | | | | 18,518 | |
Prepaid expenses and other assets | | | | | 16 | | | | 36 | | | | 25 | | | | 8 | | | | 37 | | | | 76 | |
Total Assets | | | | | 1,562,531 | | | | 2,018,175 | | | | 1,220,828 | | | | 1,547,030 | | | | 1,511,158 | | | | 2,356,800 | |
LIABILITIES | | | | | | | | | | | | | | | | | | | | | | | | | | |
Payables: | | | | | | | | | | | | | | | | | | | | | | | | | | |
| | Fund shares redeemed | | | | | 134 | | | | 3,526 | | | | 1,340 | | | | 3,084 | | | | 1,910 | | | | 90 | |
| | Securities purchased | | | | | 4,593 | | | | 1,978 | | | | 1,993 | | | | - | | | | - | | | | 120,178 | |
| | Securities sold short, at value | | | | | - | | | | - | | | | - | | | | - | | | | - | | | | 142,909 | |
| | Due to custodian (1) | | | | | - | | | | 8,770 | | | | - | | | | - | | | | - | | | | - | |
| | Due to broker (2) | | | | | - | | | | - | | | | - | | | | - | | | | 25,580 | | | | 19,282 | |
| | Accrued advisory fees | | | | | 1,033 | | | | 1,289 | | | | 840 | | | | 842 | | | | 810 | | | | 1,369 | |
| | Accrued service fees | | | | | 24 | | | | 23 | | | | 2 | | | | 17 | | | | - | | | | - | |
| | Accrued support service expenses | | | | | 14 | | | | 20 | | | | 11 | | | | 15 | | | | 14 | | | | 19 | |
| | Accrued custodian, and portfolio accounting and tax fees | | | | | 182 | | | | 102 | | | | 99 | | | | 62 | | | | 59 | | | | 158 | |
| | Accrued shareholder report expenses | | | | | 21 | | | | 31 | | | | 16 | | | | 22 | | | | 5 | | | | 7 | |
| | Accrued trustees’ fees and expenses and deferred compensation | | | | | 6 | | | | 11 | | | | 4 | | | | 11 | | | | 5 | | | | 6 | |
| | Accrued foreign capital gains tax | | | | | 619 | | | | - | | | | - | | | | - | | | | - | | | | - | |
| | Accrued dividends and interest | | | | | - | | | | - | | | | - | | | | - | | | | - | | | | 1,967 | |
| | Accrued other | | | | | 21 | | | | 30 | | | | 16 | | | | 22 | | | | 11 | | | | 15 | |
Swap contracts, at value | | | | | - | | | | - | | | | - | | | | - | | | | - | | | | 21,349 | |
Forward foreign currency contracts depreciation | | | | | - | | | | - | | | | - | | | | 4,045 | | | | 24,403 | | | | 18,707 | |
Total Liabilities | | | | | 6,647 | | | | 15,780 | | | | 4,321 | | | | 8,120 | | | | 52,797 | | | | 326,056 | |
NET ASSETS | | | | | $1,555,884 | | | | $2,002,395 | | | | $1,216,507 | | | | $1,538,910 | | | | $1,458,361 | | | | $2,030,744 | |
NET ASSETS CONSIST OF: | | | | | | | | | | | | | | | | | | | | | | | | | | |
Paid-in capital (3) | | | | | $1,175,798 | | | | $1,861,897 | | | | $1,316,727 | | | | $2,902,795 | | | | $1,458,705 | | | | $2,033,908 | |
Undistributed/accumulated net investment income (loss) (3) | | | | | (6,161 | ) | | | 10,922 | | | | 3,286 | | | | 10,919 | | | | (10,041 | ) | | | (14,708 | ) |
Undistributed/accumulated net realized gain (loss) (3) | | | | | 117,509 | | | | (190,750 | ) | | | (242,360 | ) | | | (1,529,263 | ) | | | (2 | ) | | | 1,225 | |
Net unrealized appreciation on investments
and assets and liabilities in foreign currencies (3) | | | | | 268,738 | | | | 320,326 | | | | 138,854 | | | | 154,459 | | | | 9,699 | | | | 10,319 | |
NET ASSETS | | | | | $1,555,884 | | | | $2,002,395 | | | | $1,216,507 | | | | $1,538,910 | | | | $1,458,361 | | | | $2,030,744 | |
Class I Shares: | | | | | | | | | | | | | | | | | | | | | | | | | | |
| | Net Assets | | | | | $448,318 | | | | $430,048 | | | | $44,592 | | | | $316,519 | | | | $224 | | | | $923 | |
| | Shares outstanding, $.001 par value (unlimited shares authorized) | | | | | 30,638 | | | | 63,915 | | | | 7,031 | | | | 32,621 | | | | 23 | | | | 92 | |
| | Net Asset Value Per Share | | | | | $14.63 | | | | $6.73 | | | | $6.34 | | | | $9.70 | | | | $9.89 | | | | $9.98 | |
Class P Shares: | | | | | | | | | | | | | | | | | | | | | | | | | | |
| | Net Assets | | | | | $1,107,566 | | | | $1,572,347 | | | | $1,171,915 | | | | $1,222,391 | | | | $1,458,137 | | | | $2,029,821 | |
| | Shares outstanding, $.001 par value (unlimited shares authorized) | | | | | 73,984 | | | | 220,013 | | | | 135,672 | | | | 113,804 | | | | 147,416 | | | | 203,285 | |
| | Net Asset Value Per Share | | | | | $14.97 | | | | $7.15 | | | | $8.64 | | | | $10.74 | | | | $9.89 | | | | $9.99 | |
| | | | | | | | | | | | | | | | | | | | | | | | | | | | |
Investments, at cost | | | | | $1,249,154 | | | | $1,684,774 | | | | $1,064,314 | | | | $1,375,110 | | | | $890,435 | | | | $1,770,543 | |
Repurchase agreements, at cost | | | | | 40,757 | | | | - | | | | 12,280 | | | | 10,177 | | | | 574,053 | | | | 422,792 | |
Foreign currency held, at cost | | | | | 1,670 | | | | - | | | | 303 | | | | 237 | | | | - | | | | 6,440 | |
Proceeds from securities sold short | | | | | - | | | | - | | | | - | | | | - | | | | - | | | | 134,631 | |
| (1) | The International Large-Cap Portfolio had an outstanding committed line of credit of $8,770 (see Note 9 in Notes to Financial Statements). |
| (2) | The Currency Strategies and Global Absolute Return Portfolios received cash collateral to mitigate risk of loss to certain counterparties, which will be repaid based on master netting arrangements between the portfolios and the counterparties. The portfolios invest such cash collateral in investment securities (see Note 5 in Notes to Financial Statements). |
| (3) | Applicable to portfolios electing to be treated as a regulated investment company for Federal income tax purposes (see Note 12 in Notes to Financial Statements). |
| | |
| See Notes to Financial Statements | | |
C-6
PACIFIC SELECT FUND
STATEMENTS OF ASSETS AND LIABILITIES (Continued)
DECEMBER 31, 2012
(In thousands, except per share amounts)
| | | | | | | | | | | | | | | | | | | | | | | | | | | | |
| | | | | | | Precious
Metals
Portfolio | | | American
Funds
Asset
Allocation
Portfolio | | | Pacific
Dynamix –
Conservative
Growth
Portfolio | | | Pacific
Dynamix –
Moderate
Growth
Portfolio | | | Pacific
Dynamix –
Growth
Portfolio | | | Portfolio
Optimization
Conservative
Portfolio | |
ASSETS | | | | | | | | | | | | | | | | | | | | | | | | | | |
Investments, at value | | | | | $769,981 | | | | $571,313 | | | | $- | | | | $- | | | | $- | | | | $- | |
Investments in affiliates, at value | | | | | - | | | | - | | | | 248,960 | | | | 644,697 | | | | 264,171 | | | | 3,773,478 | |
Repurchase agreements, at value | | | | | 55,600 | | | | - | | | | - | | | | - | | | | - | | | | - | |
Foreign currency held, at value | | | | | 51 | | | | - | | | | - | | | | - | | | | - | | | | - | |
Receivables: | | | | | | | | | | | | | | | | | | | | | | | | | | |
| | Dividends and interest | | | | | 398 | | | | - | | | | - | | | | - | | | | - | | | | - | |
| | Fund shares sold | | | | | 121 | | | | 2,784 | | | | 674 | | | | 3,558 | | | | 12 | | | | 4,068 | |
| | Securities sold | | | | | - | | | | - | | | | - | | | | - | | | | 46 | | | | - | |
| | Due from adviser | | | | | - | | | | - | | | | 14 | | | | 50 | | | | 24 | | | | - | |
Prepaid expenses and other assets | | | | | 37 | | | | 2 | | | | 1 | | | | 2 | | | | 1 | | | | 17 | |
Total Assets | | | | | 826,188 | | | | 574,099 | | | | 249,649 | | | | 648,307 | | | | 264,254 | | | | 3,777,563 | |
LIABILITIES | | | | | | | | | | | | | | | | | | | | | | | | | | |
Payables: | | | | | | | | | | | | | | | | | | | | | | | | | | |
| | Fund shares redeemed | | | | | - | | | | 1 | | | | - | | | | - | | | | 48 | | | | - | |
| | Securities purchased | | | | | 2,829 | | | | 2,761 | | | | 664 | | | | 3,534 | | | | - | | | | 3,924 | |
| | Accrued advisory fees | | | | | 476 | | | | 194 | | | | 41 | | | | 107 | | | | 45 | | | | - | |
| | Accrued service fees | | | | | - | | | | 31 | | | | 13 | | | | 35 | | | | 14 | | | | 205 | |
| | Accrued support service expenses | | | | | 8 | | | | 4 | | | | 2 | | | | 4 | | | | 2 | | | | 32 | |
| | Accrued custodian, and portfolio accounting and tax fees | | | | | 39 | | | | 4 | | | | 7 | | | | 7 | | | | 7 | | | | 9 | |
| | Accrued shareholder report expenses | | | | | 3 | | | | 6 | | | | 3 | | | | 6 | | | | 3 | | | | 48 | |
| | Accrued trustees’ fees and expenses and deferred compensation | | | | | 3 | | | | 1 | | | | 1 | | | | 1 | | | | 1 | | | | 10 | |
| | Accrued other | | | | | 8 | | | | 5 | | | | 2 | | | | 5 | | | | 3 | | | | 40 | |
Total Liabilities | | | | | 3,366 | | | | 3,007 | | | | 733 | | | | 3,699 | | | | 123 | | | | 4,268 | |
NET ASSETS | | | | | $822,822 | | | | $571,092 | | | | $248,916 | | | | $644,608 | | | | $264,131 | | | | $3,773,295 | |
NET ASSETS CONSIST OF: | | | | | | | | | | | | | | | | | | | | | | | | | | |
Paid-in capital (1) | | | | | $954,301 | | | | $502,860 | | | | $243,728 | | | | $610,461 | | | | $245,858 | | | | $3,531,750 | |
Undistributed/accumulated earnings (deficit) (1) | | | | | (131,479 | ) | | | 68,232 | | | | 5,188 | | | | 34,147 | | | | 18,273 | | | | 241,545 | |
NET ASSETS | | | | | $822,822 | | | | $571,092 | | | | $248,916 | | | | $644,608 | | | | $264,131 | | | | $3,773,295 | |
Class I Shares: | | | | | | | | | | | | | | | | | | | | | | | | | | |
| | Net Assets | | | | | $2,303 | | | | $571,092 | | | | $248,916 | | | | $644,608 | | | | $264,131 | | | | $3,773,295 | |
| | Shares outstanding, $.001 par value (unlimited shares authorized) | | | | | 268 | | | | 36,958 | | | | 21,333 | | | | 48,376 | | | | 19,471 | | | | 356,351 | |
| | Net Asset Value Per Share | | | | | $8.60 | | | | $15.45 | | | | $11.67 | | | | $13.32 | | | | $13.57 | | | | $10.59 | |
Class P Shares: | | | | | | | | | | | | | | | | | | | | | | | | | | |
| | Net Assets | | | | | $820,519 | | | | | | | | | | | | | | | | | | | | | |
| | Shares outstanding, $.001 par value (unlimited shares authorized) | | | | | 95,367 | | | | | | | | | | | | | | | | | | | | | |
| | Net Asset Value Per Share | | | | | $8.60 | | | | | | | | | | | | | | | | | | | | | |
| | | | | | | | | | | | | | | | | | | | | | | | | | | | |
Investments, at cost | | | | | $897,387 | | | | $509,379 | | | | $- | | | | $- | | | | $- | | | | $- | |
Investments in affiliates, at cost | | | | | - | | | | - | | | | 240,704 | | | | 615,098 | | | | 248,513 | | | | 3,652,813 | |
Repurchase agreements, at cost | | | | | 55,600 | | | | - | | | | - | | | | - | | | | - | | | | - | |
Foreign currency held, at cost | | | | | 51 | | | | - | | | | - | | | | - | | | | - | | | | - | |
| (1) | Applicable to portfolios electing to be treated as a partnership for Federal income tax purposes (see Note 12 in Notes to Financial Statements). |
| | |
| See Notes to Financial Statements | | |
C-7
PACIFIC SELECT FUND
STATEMENTS OF ASSETS AND LIABILITIES (Continued)
DECEMBER 31, 2012
(In thousands, except per share amounts)
| | | | | | | | | | | | | | | | | | | | |
| | | | | | | Portfolio
Optimization
Moderate-
Conservative
Portfolio | | | Portfolio
Optimization
Moderate
Portfolio | | | Portfolio
Optimization
Growth
Portfolio | | | Portfolio
Optimization
Aggressive-
Growth
Portfolio | |
ASSETS | | | | | | | | | | | | | | | | | | |
Investments in affiliates, at value | | | | | $4,701,738 | | | | $15,073,162 | | | | $12,605,945 | | | | $2,634,754 | |
Receivables: | | | | | | | | | | | | | | | | | | |
| | Fund shares sold | | | | | 335 | | | | 37 | | | | 253 | | | | 582 | |
| | Securities sold | | | | | - | | | | 5,253 | | | | 9,546 | | | | 2,069 | |
Prepaid expenses and other assets | | | | | 22 | | | | 74 | | | | 63 | | | | 13 | |
Total Assets | | | | | 4,702,095 | | | | 15,078,526 | | | | 12,615,807 | | | | 2,637,418 | |
LIABILITIES | | | | | | | | | | | | | | | | | | |
Payables: | | | | | | | | | | | | | | | | | | |
| | Fund shares redeemed | | | | | 22 | | | | 4,715 | | | | 9,317 | | | | 2,550 | |
| | Securities purchased | | | | | 133 | | | | - | | | | - | | | | - | |
| | Accrued service fees | | | | | 256 | | | | 821 | | | | 687 | | | | 143 | |
| | Accrued support service expenses | | | | | 42 | | | | 141 | | | | 120 | | | | 25 | |
| | Accrued custodian, and portfolio accounting and tax fees | | | | | 10 | | | | 11 | | | | 11 | | | | 10 | |
| | Accrued shareholder report expenses | | | | | 62 | | | | 210 | | | | 179 | | | | 38 | |
| | Accrued trustees’ fees and expenses and deferred compensation | | | | | 13 | | | | 45 | | | | 39 | | | | 8 | |
| | Accrued other | | | | | 51 | | | | 172 | | | | 147 | | | | 32 | |
Total Liabilities | | | | | 589 | | | | 6,115 | | | | 10,500 | | | | 2,806 | |
NET ASSETS | | | | | $4,701,506 | | | | $15,072,411 | | | | $12,605,307 | | | | $2,634,612 | |
NET ASSETS CONSIST OF: | | | | | | | | | | | | | | | | | | |
Paid-in capital (1) | | | | | $4,396,429 | | | | $14,003,596 | | | | $11,705,475 | | | | $2,463,743 | |
Undistributed earnings (1) | | | | | 305,077 | | | | 1,068,815 | | | | 899,832 | | | | 170,869 | |
NET ASSETS | | | | | $4,701,506 | | | | $15,072,411 | | | | $12,605,307 | | | | $2,634,612 | |
Class I Shares: | | | | | | | | | | | | | | | | | | |
| | Net Assets | | | | | $4,701,506 | | | | $15,072,411 | | | | $12,605,307 | | | | $2,634,612 | |
| | Shares outstanding, $.001 par value (unlimited shares authorized) | | | | | 448,633 | | | | 1,458,625 | | | | 1,237,026 | | | | 262,991 | |
| | Net Asset Value Per Share | | | | | $10.48 | | | | $10.33 | | | | $10.19 | | | | $10.02 | |
| | | | | | | | | | | | | | | | | | |
Investments in affiliates, at cost | | | | | $4,556,410 | | | | $14,782,516 | | | | $12,430,689 | | | | $2,609,035 | |
| (1) | Applicable to portfolios electing to be treated as a partnership for Federal income tax purposes (see Note 12 in Notes to Financial Statements). |
| | |
| See Notes to Financial Statements | | |
C-8
PACIFIC SELECT FUND
STATEMENTS OF OPERATIONS
FOR THE YEAR ENDED DECEMBER 31, 2012
(In thousands)
| | | | | | | | | | | | | | | | | | | | | | | | | | | | |
| | | | | | | Cash
Management
Portfolio | | | Diversified
Bond
Portfolio | | | Floating
Rate Loan
Portfolio | | | High Yield
Bond
Portfolio | | | Inflation
Managed
Portfolio | | | Inflation
Protected
Portfolio | |
INVESTMENT INCOME | | | | | | | | | | | | | | | | | | | | | | | | | | |
Dividends | | | | | $- | | | | $237 | | | | $- | | | | $958 | | | | $240 | | | | $- | |
Interest, net of foreign taxes withheld | | | | | 715 | | | | 115,500 | | | | 57,324 | | | | 91,801 | | | | 61,823 | | | | 15,008 | |
Other | | | | | - | | | | 48 | | | | 174 | | | | 244 | | | | - | | | | - | |
Total Investment Income | | | | | 715 | | | | 115,785 | | | | 57,498 | | | | 93,003 | | | | 62,063 | | | | 15,008 | |
| | | | | | | |
EXPENSES | | | | | | | | | | | | | | | | | | | | | | | | | | |
Advisory fees | | | | | 1,050 | | | | 13,137 | | | | 7,522 | | | | 5,180 | | | | 8,291 | | | | 5,091 | |
Service fees (Class I only, see Note 6 in Notes to Financial Statements) | | | | | 1,350 | | | | 221 | | | | 162 | | | | 746 | | | | 1,412 | | | | 53 | |
Support services expenses | | | | | 26 | | | | 133 | | | | 39 | | | | 51 | | | | 77 | | | | 61 | |
Custodian fees and expenses | | | | | 15 | | | | 107 | | | | 5 | | | | 30 | | | | 93 | | | | 56 | |
Portfolio accounting and tax fees | | | | | 85 | | | | 384 | | | | 427 | | | | 185 | | | | 213 | | | | 154 | |
Shareholder report expenses | | | | | 23 | | | | 111 | | | | 35 | | | | 43 | | | | 95 | | | | 36 | |
Legal and audit fees | | | | | 19 | | | | 605 | | | | 34 | | | | 121 | | | | 54 | | | | 45 | |
Trustees’ fees and expenses | | | | | 10 | | | | 46 | | | | 14 | | | | 18 | | | | 27 | | | | 23 | |
Interest expense and commitment fees | | | | | 1 | | | | 61 | | | | 1 | | | | 3 | | | | 1,703 | | | | 3 | |
Offering expenses | | | | | - | | | | - | | | | - | | | | - | | | | - | | | | 5 | |
Other | | | | | 7 | | | | 35 | | | | 16 | | | | 18 | | | | 32 | | | | 18 | |
Total Expenses | | | | | 2,586 | | | | 14,840 | | | | 8,255 | | | | 6,395 | | | | 11,997 | | | | 5,545 | |
Advisory Fee Waiver (1) | | | | | - | | | | - | | | | (1,004 | ) | | | - | | | | - | | | | - | |
Adviser Reimbursement (2) | | | | | (1,871 | ) | | | - | | | | - | | | | - | | | | - | | | | - | |
Net Expenses | | | | | 715 | | | | 14,840 | | | | 7,251 | | | | 6,395 | | | | 11,997 | | | | 5,545 | |
NET INVESTMENT INCOME (LOSS) | | | | | - | | | | 100,945 | | | | 50,247 | | | | 86,608 | | | | 50,066 | | | | 9,463 | |
| | | | | | | |
NET REALIZED AND UNREALIZED GAIN (LOSS) | | | | | | | | | | | | | | | | | | | | | | | | | | |
Net Realized Gain (Loss) on: | | | | | | | | | | | | | | | | | | | | | | | | | | |
| | Investment security transactions | | | | | - | | | | 71,261 | | | | 5,152 | | | | 25,746 | | | | 63,150 | | | | 63,117 | |
| | Futures contracts and swap transactions | | | | | - | | | | (15,732 | ) | | | - | | | | 29 | | | | 7,917 | | | | 29,591 | |
| | Written option transactions | | | | | - | | | | 3,813 | | | | - | | | | - | | | | 6,386 | | | | 3,550 | |
| | Foreign currency transactions | | | | | - | | | | 8,110 | | | | - | | | | 1 | | | | (2,627 | ) | | | (9,416 | ) |
| | Net Realized Gain (Loss) | | | | | - | | | | 67,452 | | | | 5,152 | | | | 25,776 | | | | 74,826 | | | | 86,842 | |
| | | | | | | |
Change in Net Unrealized Appreciation (Depreciation) on: | | | | | | | | | | | | | | | | | | | | | | | | | | |
| | Investment securities | | | | | - | | | | 103,842 | | | | 25,657 | | | | 75,444 | | | | 78,884 | | | | (2,569 | ) |
| | Unfunded loan commitments | | | | | - | | | | - | | | | 4 | | | | - | | | | - | | | | - | |
| | Short positions | | | | | - | | | | - | | | | - | | | | - | | | | 8 | | | | - | |
| | Futures contracts and swaps | | | | | - | | | | 4,270 | | | | - | | | | 20 | | | | 1,306 | | | | (1,496 | ) |
| | Written options | | | | | - | | | | 121 | | | | - | | | | - | | | | (4,750 | ) | | | (8 | ) |
| | Foreign currencies | | | | | - | | | | (5,977 | ) | | | - | | | | (1 | ) | | | 6,925 | | | | (9,365 | ) |
| | Change in Net Unrealized Appreciation (Depreciation) | | | | | - | | | | 102,256 | | | | 25,661 | | | | 75,463 | | | | 82,373 | | | | (13,438 | ) |
NET GAIN (LOSS) | | | | | - | | | | 169,708 | | | | 30,813 | | | | 101,239 | | | | 157,199 | | | | 73,404 | |
NET INCREASE (DECREASE) IN NET ASSETS
RESULTING FROM OPERATIONS | | | | | $- | | | | $270,653 | | | | $81,060 | | | | $187,847 | | | | $207,265 | | | | $82,867 | |
| | | | | | | | | | | | | | | | | | | | | | | | | | | | |
Foreign taxes withheld on interest | | | | | $- | | | | $2 | | | | $- | | | | $- | | | | $- | | | | $- | |
| (1) | Pacific Life Fund Advisors LLC waived a portion of its advisory fees for the Floating Rate Loan Portfolio (see Note 6 in Notes to Financial Statements). |
| (2) | Pacific Life Fund Advisors LLC reimbursed expenses for the Cash Management Portfolio (See Note 7B in Notes to Financial Statements). |
| | |
| See Notes to Financial Statements | | |
C-9
PACIFIC SELECT FUND
STATEMENTS OF OPERATIONS (Continued)
FOR THE YEAR ENDED DECEMBER 31, 2012
(In thousands)
| | | | | | | | | | | | | | | | | | | | | | | | | | | | |
| | | | | Managed
Bond
Portfolio | | | Short
Duration
Bond
Portfolio | | | Emerging
Markets Debt
Portfolio (1) | | | American
Funds
Growth
Portfolio | | | American
Funds
Growth-Income
Portfolio | | | Comstock
Portfolio | |
INVESTMENT INCOME | | | | | | | | | | | | | | | | | | | | | | | | | | |
Dividends, net of foreign taxes withheld | | | | | $3,939 | | | | $- | | | | $- | | | | $2,987 | | | | $12,616 | | | | $54,819 | |
Interest, net of foreign taxes withheld | | | | | 204,559 | | | | 41,989 | | | | 36,729 | | | | - | | | | - | | | | 6 | |
Other | | | | | 41 | | | | - | | | | - | | | | - | | | | - | | | | - | |
Total Investment Income | | | | | 208,539 | | | | 41,989 | | | | 36,729 | | | | 2,987 | | | | 12,616 | | | | 54,825 | |
| | | | | | | |
EXPENSES | | | | | | | | | | | | | | | | | | | | | | | | | | |
Advisory fees | | | | | 22,171 | | | | 9,464 | | | | 5,010 | | | | 3,571 | | | | 7,087 | | | | 15,581 | |
Service fees (Class I only, see Note 6 in Notes to Financial Statements) | | | | | 2,956 | | | | 508 | | | | 3 | | | | 424 | | | | 399 | | | | 252 | |
Support services expenses | | | | | 229 | | | | 95 | | | | 23 | | | | 22 | | | | 37 | | | | 86 | |
Custodian fees and expenses | | | | | 394 | | | | 62 | | | | 158 | | | | - | | | | - | | | | 52 | |
Portfolio accounting and tax fees | | | | | 596 | | | | 251 | | | | 84 | | | | 17 | | | | 17 | | | | 200 | |
Shareholder report expenses | | | | | 200 | | | | 76 | | | | 20 | | | | 21 | | | | 39 | | | | 79 | |
Legal and audit fees | | | | | 850 | | | | 477 | | | | 19 | | | | 14 | | | | 28 | | | | 155 | |
Trustees’ fees and expenses | | | | | 79 | | | | 34 | | | | 10 | | | | 7 | | | | 14 | | | | 32 | |
Interest expense and commitment fees | | | | | 221 | | | | 4 | | | | 6 | | | | - | | | | - | | | | 4 | |
Offering expenses | | | | | - | | | | - | | | | 37 | | | | - | | | | - | | | | - | |
Other | | | | | 70 | | | | 24 | | | | 6 | | | | 11 | | | | 15 | | | | 40 | |
Total Expenses | | | | | 27,766 | | | | 10,995 | | | | 5,376 | | | | 4,087 | | | | 7,636 | | | | 16,481 | |
Advisory Fee Waivers (2) | | | | | - | | | | - | | | | - | | | | (1,619 | ) | | | (3,224 | ) | | | (336 | ) |
Net Expenses | | | | | 27,766 | | | | 10,995 | | | | 5,376 | | | | 2,468 | | | | 4,412 | | | | 16,145 | |
NET INVESTMENT INCOME | | | | | 180,773 | | | | 30,994 | | | | 31,353 | | | | 519 | | | | 8,204 | | | | 38,680 | |
| | | | | | | |
NET REALIZED AND UNREALIZED GAIN (LOSS) | | | | | | | | | | | | | | | | | | | | | | | | | | |
Net Realized Gain (Loss) on: | | | | | | | | | | | | | | | | | | | | | | | | | | |
| | Investment security transactions (3) | | | | | 221,820 | | | | 12,765 | | | | 4,127 | | | | 40,190 | | | | 50,897 | | | | 219,531 | |
| | Futures contracts and swap transactions | | | | | (41,428 | ) | | | 417 | | | | - | | | | - | | | | - | | | | (1,472 | ) |
| | Written option transactions | | | | | 27,778 | | | | - | | | | - | | | | - | | | | - | | | | - | |
| | Foreign currency transactions | | | | | 28,024 | | | | (40 | ) | | | 2,001 | | | | - | | | | - | | | | (4,197 | ) |
| | Net Realized Gain | | | | | 236,194 | | | | 13,142 | | | | 6,128 | | | | 40,190 | | | | 50,897 | | | | 213,862 | |
| | | | | | | |
Change in Net Unrealized Appreciation (Depreciation) on: | | | | | | | | | | | | | | | | | | | | | | | | | | |
| | Investment securities | | | | | 126,504 | | | | 31,063 | | | | 61,599 | | | | 52,155 | | | | 100,004 | | | | 145,869 | |
| | Short positions | | | | | 2,826 | | | | - | | | | - | | | | - | | | | - | | | | - | |
| | Futures contracts and swaps | | | | | 82,429 | | | | - | | | | - | | | | - | | | | - | | | | - | |
| | Written options | | | | | (15,462 | ) | | | - | | | | - | | | | - | | | | - | | | | - | |
| | Foreign currencies | | | | | (19,813 | ) | | | 62 | | | | (420 | ) | | | - | | | | - | | | | (3,154 | ) |
| | Change in Net Unrealized Appreciation | | | | | 176,484 | | | | 31,125 | | | | 61,179 | | | | 52,155 | | | | 100,004 | | | | 142,715 | |
NET GAIN | | | | | 412,678 | | | | 44,267 | | | | 67,307 | | | | 92,345 | | | | 150,901 | | | | 356,577 | |
NET INCREASE IN NET ASSETS
RESULTING FROM OPERATIONS | | | | | $593,451 | | | | $75,261 | | | | $98,660 | | | | $92,864 | | | | $159,105 | | | | $395,257 | |
| | | | | | | | | | | | | | | | | | | | | | | | | | | | |
Foreign taxes withheld on dividends and interest | | | | | $- | | | | $- | | | | $10 | | | | $- | | | | $- | | | | $1,118 | |
| (1) | Operations commenced on April 30, 2012. |
| (2) | Pacific Life Fund Advisors LLC waived a portion of its advisory fees for the American Funds Growth, American Funds Growth-Income and Comstock Portfolios (see Note 6 in Notes to Financial Statements). |
| (3) | Net realized gain (loss) on investment security transactions for the Managed Bond Portfolio is net of foreign capital gains tax withheld of $77. Net realized gain (loss) on investment transactions for the Emerging Markets Debt Portfolio is net of Brazilian tax on financial operations of $2,594. |
| | |
| See Notes to Financial Statements | | |
C-10
PACIFIC SELECT FUND
STATEMENTS OF OPERATIONS (Continued)
FOR THE YEAR ENDED DECEMBER 31, 2012
(In thousands)
| | | | | | | | | | | | | | | | | | | | | | | | | | | | |
| | | | | | | Dividend
Growth
Portfolio | | | Equity Index
Portfolio | | | Focused 30
Portfolio | | | Growth LT
Portfolio | | | Large-Cap
Growth
Portfolio | | | Large-Cap
Value
Portfolio | |
INVESTMENT INCOME | | | | | | | | | | | | | | | | | | | | | | | | | | |
Dividends, net of foreign taxes withheld | | | | | $21,718 | | | | $50,211 | | | | $1,197 | | | | $10,346 | | | | $10,465 | | | | $81,907 | |
Interest, net of foreign taxes withheld | | | | | 4 | | | | 1 | | | | 4 | | | | 33 | | | | 1 | | | | 51 | |
Other | | | | | - | | | | - | | | | - | | | | 11 | | | | - | | | | - | |
Total Investment Income | | | | | 21,722 | | | | 50,212 | | | | 1,201 | | | | 10,390 | | | | 10,466 | | | | 81,958 | |
| | | | | | | |
EXPENSES | | | | | | | | | | | | | | | | | | | | | | | | | | |
Advisory fees | | | | | 5,995 | | | | 1,092 | | | | 876 | | | | 4,108 | | | | 8,806 | | | | 18,027 | |
Service fees (Class I only, see Note 6 in Notes to Financial Statements) | | | | | 342 | | | | 1,647 | | | | 235 | | | | 855 | | | | 283 | | | | 617 | |
Support services expenses | | | | | 38 | | | | 87 | | | | 7 | | | | 32 | | | | 47 | | | | 116 | |
Custodian fees and expenses | | | | | 22 | | | | 59 | | | | 6 | | | | 35 | | | | 28 | | | | 73 | |
Portfolio accounting and tax fees | | | | | 82 | | | | 186 | | | | 18 | | | | 72 | | | | 107 | | | | 267 | |
Shareholder report expenses | | | | | 33 | | | | 80 | | | | 4 | | | | 34 | | | | 45 | | | | 109 | |
Legal and audit fees | | | | | 174 | | | | 259 | | | | 113 | | | | 166 | | | | 106 | | | | 231 | |
Trustees’ fees and expenses | | | | | 13 | | | | 31 | | | | 2 | | | | 10 | | | | 17 | | | | 44 | |
Interest expense and commitment fees | | | | | 1 | | | | 4 | | | | - | | | | 1 | | | | 5 | | | | 6 | |
Other | | | | | 21 | | | | 41 | | | | 2 | | | | 17 | | | | 22 | | | | 50 | |
Total Expenses | | | | | 6,721 | | | | 3,486 | | | | 1,263 | | | | 5,330 | | | | 9,466 | | | | 19,540 | |
Advisory Fee Waiver (1) | | | | | - | | | | - | | | | - | | | | - | | | | (311 | ) | | | - | |
Net Expenses | | | | | 6,721 | | | | 3,486 | | | | 1,263 | | | | 5,330 | | | | 9,155 | | | | 19,540 | |
NET INVESTMENT INCOME (LOSS) | | | | | 15,001 | | | | 46,726 | | | | (62 | ) | | | 5,060 | | | | 1,311 | | | | 62,418 | |
| | | | | | | |
NET REALIZED AND UNREALIZED GAIN (LOSS) | | | | | | | | | | | | | | | | | | | | | | | | | | |
Net Realized Gain (Loss) on: | | | | | | | | | | | | | | | | | | | | | | | | | | |
| | Investment security transactions | | | | | 64,660 | | | | 192,403 | | | | 170 | | | | 142,118 | | | | 187,962 | | | | 239,735 | |
| | Futures contracts transactions | | | | | 440 | | | | 4,173 | | | | - | | | | (779 | ) | | | - | | | | (1,799 | ) |
| | Written option transactions | | | | | - | | | | - | | | | - | | | | 1,232 | | | | - | | | | - | |
| | Foreign currency transactions | | | | | 7 | | | | - | | | | (1 | ) | | | 39 | | | | - | | | | (22 | ) |
| | Net Realized Gain | | | | | 65,107 | | | | 196,576 | | | | 169 | | | | 142,610 | | | | 187,962 | | | | 237,914 | |
| | | | | | | |
Change in Net Unrealized Appreciation (Depreciation) on: | | | | | | | | | | | | | | | | | | | | | | | | | | |
| | Investment securities | | | | | 48,059 | | | | 96,373 | | | | 22,730 | | | | 7,716 | | | | 26,545 | | | | 176,285 | |
| | Futures contracts | | | | | - | | | | (545 | ) | | | - | | | | - | | | | - | | | | - | |
| | Foreign currencies | | | | | 3 | | | | - | | | | 1 | | | | (1,502 | ) | | | - | | | | 13 | |
| | Change in Net Unrealized Appreciation | | | | | 48,062 | | | | 95,828 | | | | 22,731 | | | | 6,214 | | | | 26,545 | | | | 176,298 | |
NET GAIN | | | | | 113,169 | | | | 292,404 | | | | 22,900 | | | | 148,824 | | | | 214,507 | | | | 414,212 | |
NET INCREASE IN NET ASSETS
RESULTING FROM OPERATIONS | | | | | $128,170 | | | | $339,130 | | | | $22,838 | | | | $153,884 | | | | $215,818 | | | | $476,630 | |
| | | | | | | | | | | | | | | | | | | | | | | | | | | | |
Foreign taxes withheld on dividends and interest | | | | | $84 | | | | $25 | | | | $18 | | | | $191 | | | | $- | | | | $1,596 | |
| (1) | Pacific Life Fund Advisors LLC waived a portion of its advisory fees for the Large-Cap Growth Portfolio (see Note 6 in Notes to Financial Statements). |
| | |
| See Notes to Financial Statements | | |
C-11
PACIFIC SELECT FUND
STATEMENTS OF OPERATIONS (Continued)
FOR THE YEAR ENDED DECEMBER 31, 2012
(In thousands)
| | | | | | | | | | | | | | | | | | | | | | | | | | | | |
| | | | | Long/Short
Large-Cap
Portfolio | | | Main Street
Core
Portfolio | | | Mid-Cap
Equity
Portfolio | | | Mid-Cap
Growth
Portfolio | | | Mid-Cap
Value
Portfolio | | | Small-Cap
Equity
Portfolio | |
INVESTMENT INCOME | | | | | | | | | | | | | | | | | | | | | | | | | | |
Dividends, net of foreign taxes withheld | | | | | $42,502 | | | | $27,564 | | | | $19,493 | | | | $12,319 | | | | $24,189 | | | | $26,683 | |
Interest, net of foreign taxes withheld | | | | | 5 | | | | 2 | | | | 4 | | | | 4 | | | | 3 | | | | 3 | |
Securities lending | | | | | 116 | | | | - | | | | - | | | | - | | | | - | | | | - | |
Total Investment Income | | | | | 42,623 | | | | 27,566 | | | | 19,497 | | | | 12,323 | | | | 24,192 | | | | 26,686 | |
| | | | | | | |
EXPENSES | | | | | | | | | | | | | | | | | | | | | | | | | | |
Advisory fees | | | | | 15,073 | | | | 6,611 | | | | 8,913 | | | | 6,468 | | | | 9,163 | | | | 7,747 | |
Service fees (Class I only, see Note 6 in Notes to Financial Statements) | | | | | 59 | | | | 1,095 | | | | 630 | | | | 409 | | | | 86 | | | | 83 | |
Support services expenses | | | | | 68 | | | | 60 | | | | 67 | | | | 40 | | | | 48 | | | | 42 | |
Custodian fees and expenses | | | | | 59 | | | | 34 | | | | 32 | | | | 37 | | | | 35 | | | | 43 | |
Portfolio accounting and tax fees | | | | | 150 | | | | 122 | | | | 116 | | | | 127 | | | | 109 | | | | 123 | |
Shareholder report expenses | | | | | 54 | | | | 51 | | | | 53 | | | | 36 | | | | 46 | | | | 37 | |
Legal and audit fees | | | | | 43 | | | | 245 | | | | 655 | | | | 261 | | | | 37 | | | | 196 | |
Trustees’ fees and expenses | | | | | 21 | | | | 21 | | | | 20 | | | | 13 | | | | 19 | | | | 15 | |
Interest expense and commitment fees | | | | | 2,044 | | | | 5 | | | | 2 | | | | 2 | | | | 2 | | | | 3 | |
Dividend expenses | | | | | 13,118 | | | | - | | | | - | | | | - | | | | - | | | | - | |
Other | | | | | 28 | | | | 28 | | | | 30 | | | | 21 | | | | 23 | | | | 22 | |
Total Expenses | | | | | 30,717 | | | | 8,272 | | | | 10,518 | | | | 7,414 | | | | 9,568 | | | | 8,311 | |
Advisory Fee Waivers (1) | | | | | (176 | ) | | | - | | | | - | | | | - | | | | - | | | | (369 | ) |
Net Expenses | | | | | 30,541 | | | | 8,272 | | | | 10,518 | | | | 7,414 | | | | 9,568 | | | | 7,942 | |
NET INVESTMENT INCOME | | | | | 12,082 | | | | 19,294 | | | | 8,979 | | | | 4,909 | | | | 14,624 | | | | 18,744 | |
| | | | | | | |
NET REALIZED AND UNREALIZED GAIN (LOSS) | | | | | | | | | | | | | | | | | | | | | | | | | | |
Net Realized Gain (Loss) on: | | | | | | | | | | | | | | | | | | | | | | | | | | |
| | Investment security transactions | | | | | 124,820 | | | | 182,149 | | | | 148,041 | | | | 60,501 | | | | 81,297 | | | | 29,243 | |
| | Closed short positions | | | | | (17,962 | ) | | | - | | | | - | | | | - | | | | - | | | | - | |
| | Futures contracts transactions | | | | | 2,836 | | | | (240 | ) | | | 1,865 | | | | (1,527 | ) | | | (7,559 | ) | | | (526 | ) |
| | Foreign currency transactions | | | | | (1 | ) | | | 4 | | | | - | | | | (92 | ) | | | (6 | ) | | | - | |
| | Net Realized Gain | | | | | 109,693 | | | | 181,913 | | | | 149,906 | | | | 58,882 | | | | 73,732 | | | | 28,717 | |
| | | | | | | |
Change in Net Unrealized Appreciation (Depreciation) on: | | | | | | | | | | | | | | | | | | | | | | | | | | |
| | Investment securities | | | | | 159,984 | | | | 35,165 | | | | (35,474 | ) | | | 12,922 | | | | 80,984 | | | | 108,877 | |
| | Short positions | | | | | (20,926 | ) | | | - | | | | - | | | | - | | | | - | | | | - | |
| | Futures contracts | | | | | (86 | ) | | | - | | | | - | | | | - | | | | - | | | | 114 | |
| | Foreign currencies | | | | | - | | | | 1 | | | | - | | | | 16 | | | | - | | | | - | |
| | Change in Net Unrealized Appreciation (Depreciation) | | | | | 138,972 | | | | 35,166 | | | | (35,474 | ) | | | 12,938 | | | | 80,984 | | | | 108,991 | |
NET GAIN | | | | | 248,665 | | | | 217,079 | | | | 114,432 | | | | 71,820 | | | | 154,716 | | | | 137,708 | |
NET INCREASE IN NET ASSETS
RESULTING FROM OPERATIONS | | | | | $260,747 | | | | $236,373 | | | | $123,411 | | | | $76,729 | | | | $169,340 | | | | $156,452 | |
| | | | | | | | | | | | | | | | | | | | | | | | | | | | |
Foreign taxes withheld on dividends and interest | | | | | $2 | | | | $17 | | | | $- | | | | $204 | | | | $- | | | | $22 | |
| (1) | Pacific Life Fund Advisors LLC waived a portion of its advisory fees for the Long/Short Large-Cap and Small-Cap Equity Portfolios (see Note 6 in Notes to Financial Statements). |
| | |
| See Notes to Financial Statements | | |
C-12
PACIFIC SELECT FUND
STATEMENTS OF OPERATIONS (Continued)
FOR THE YEAR ENDED DECEMBER 31, 2012
(In thousands)
| | | | | | | | | | | | | | | | | | | | | | | | | | | | |
| | | | | | | Small-Cap
Growth
Portfolio | | | Small-Cap
Index
Portfolio | | | Small-Cap
Value
Portfolio | | | Health
Sciences
Portfolio | | | Real Estate
Portfolio | | | Technology
Portfolio | |
INVESTMENT INCOME | | | | | | | | | | | | | | | | | | | | | | | | | | |
Dividends, net of foreign taxes withheld | | | | | $5,126 | | | | $13,298 | | | | $14,739 | | | | $1,063 | | | | $24,757 | | | | $531 | |
Interest, net of foreign taxes withheld | | | | | 1 | | | | 1 | | | | 2 | | | | 1 | | | | 2 | | | | - | |
Total Investment Income | | | | | 5,127 | | | | 13,299 | | | | 14,741 | | | | 1,064 | | | | 24,759 | | | | 531 | |
| | | | | | | |
EXPENSES | | | | | | | | | | | | | | | | | | | | | | | | | | |
Advisory fees | | | | | 3,154 | | | | 1,738 | | | | 3,720 | | | | 1,370 | | | | 7,741 | | | | 711 | |
Service fees (Class I only, see Note 6 in Notes to Financial Statements) | | | | | 221 | | | | 742 | | | | 326 | | | | 304 | | | | 562 | | | | 158 | |
Support services expenses | | | | | 25 | | | | 25 | | | | 23 | | | | 6 | | | | 38 | | | | 3 | |
Custodian fees and expenses | | | | | 14 | | | | 29 | | | | 13 | | | | 6 | | | | 22 | | | | 5 | |
Portfolio accounting and tax fees | | | | | 49 | | | | 77 | | | | 46 | | | | 20 | | | | 79 | | | | 17 | |
Shareholder report expenses | | | | | 20 | | | | 20 | | | | 18 | | | | 5 | | | | 31 | | | | 3 | |
Legal and audit fees | | | | | 266 | | | | 243 | | | | 222 | | | | 33 | | | | 286 | | | | 16 | |
Trustees’ fees and expenses | | | | | 7 | | | | 8 | | | | 7 | | | | 2 | | | | 13 | | | | 1 | |
Interest expense and commitment fees | | | | | 1 | | | | 1 | | | | 1 | | | | - | | | | 1 | | | | 2 | |
Other | | | | | 13 | | | | 12 | | | | 13 | | | | 2 | | | | 16 | | | | 1 | |
Total Expenses | | | | | 3,770 | | | | 2,895 | | | | 4,389 | | | | 1,748 | | | | 8,789 | | | | 917 | |
Net Expenses | | | | | 3,770 | | | | 2,895 | | | | 4,389 | | | | 1,748 | | | | 8,789 | | | | 917 | |
NET INVESTMENT INCOME (LOSS) | | | | | 1,357 | | | | 10,404 | | | | 10,352 | | | | (684 | ) | | | 15,970 | | | | (386 | ) |
| | | | | | | |
NET REALIZED AND UNREALIZED GAIN (LOSS) | | | | | | | | | | | | | | | | | | | | | | | | | | |
Net Realized Gain (Loss) on: | | | | | | | | | | | | | | | | | | | | | | | | | | |
| | Investment security transactions | | | | | 75,128 | | | | 10,953 | | | | 35,325 | | | | 31,553 | | | | 31,712 | | | | 2,310 | |
| | Futures contracts transactions | | | | | 124 | | | | 1,093 | | | | - | | | | - | | | | (1,493 | ) | | | - | |
| | Foreign currency transactions | | | | | - | | | | - | | | | - | | | | 4 | | | | 16 | | | | (2 | ) |
| | Net Realized Gain | | | | | 75,252 | | | | 12,046 | | | | 35,325 | | | | 31,557 | | | | 30,235 | | | | 2,308 | |
| | | | | | | |
Change in Net Unrealized Appreciation (Depreciation) on: | | | | | | | | | | | | | | | | | | | | | | | | | | |
| | Investment securities | | | | | (9,504 | ) | | | 59,804 | | | | 7,199 | | | | 1,515 | | | | 54,814 | | | | 2,783 | |
| | Futures contracts | | | | | - | | | | 412 | | | | - | | | | - | | | | - | | | | - | |
| | Foreign currencies | | | | | - | | | | - | | | | - | | | | - | | | | - | | | | 30 | |
| | Change in Net Unrealized Appreciation (Depreciation) | | | | | (9,504 | ) | | | 60,216 | | | | 7,199 | | | | 1,515 | | | | 54,814 | | | | 2,813 | |
NET GAIN | | | | | 65,748 | | | | 72,262 | | | | 42,524 | | | | 33,072 | | | | 85,049 | | | | 5,121 | |
NET INCREASE IN NET ASSETS
RESULTING FROM OPERATIONS | | | | | $67,105 | | | | $82,666 | | | | $52,876 | | | | $32,388 | | | | $101,019 | | | | $4,735 | |
| | | | | | | | | | | | | | | | | | | | | | | | | | | | |
Foreign taxes withheld on dividends and interest | | | | | $- | | | | $14 | | | | $81 | | | | $16 | | | | $91 | | | | $1 | |
| | |
| See Notes to Financial Statements | | |
C-13
PACIFIC SELECT FUND
STATEMENTS OF OPERATIONS (Continued)
FOR THE YEAR ENDED DECEMBER 31, 2012
(In thousands)
| | | | | | | | | | | | | | | | | | | | | | | | | | | | |
| | | | | | | Emerging
Markets
Portfolio | | | International
Large-Cap
Portfolio | | | International
Small-Cap
Portfolio | | | International
Value
Portfolio | | | Currency
Strategies
Portfolio (1) | | | Global
Absolute
Return
Portfolio (1) | |
INVESTMENT INCOME | | | | | | | | | | | | | | | | | | | | | | | | | | |
Dividends, net of foreign taxes withheld | | | | | $27,452 | | | | $60,022 | | | | $38,313 | | | | $61,265 | | | | $- | | | | $36 | |
Interest, net of foreign taxes withheld | | | | | 1 | | | | 10 | | | | 3 | | | | 3 | | | | 651 | | | | 15,067 | |
Total Investment Income | | | | | 27,453 | | | | 60,032 | | | | 38,316 | | | | 61,268 | | | | 651 | | | | 15,103 | |
| | | | | | | |
EXPENSES | | | | | | | | | | | | | | | | | | | | | | | | | | |
Advisory fees | | | | | 12,149 | | | | 16,720 | | | | 9,935 | | | | 10,272 | | | | 2,412 | | | | 4,081 | |
Service fees (Class I only, see Note 6 in Notes to Financial Statements) (2) | | | | | 853 | | | | 774 | | | | 82 | | | | 602 | | | | - | | | | - | |
Support services expenses | | | | | 58 | | | | 85 | | | | 47 | | | | 61 | | | | 17 | | | | 23 | |
Custodian fees and expenses | | | | | 378 | | | | 162 | | | | 88 | | | | 107 | | | | 25 | | | | 107 | |
Portfolio accounting and tax fees | | | | | 300 | | | | 268 | | | | 225 | | | | 160 | | | | 34 | | | | 50 | |
Shareholder report expenses | | | | | 55 | | | | 79 | | | | 39 | | | | 56 | | | | 5 | | | | 8 | |
Legal and audit fees | | | | | 125 | | | | 126 | | | | 72 | | | | 185 | | | | 10 | | | | 14 | |
Trustees’ fees and expenses | | | | | 20 | | | | 31 | | | | 16 | | | | 22 | | | | 5 | | | | 7 | |
Interest expense and commitment fees | | | | | 3 | | | | 6 | | | | 2 | | | | 2 | | | | 2 | | | | 82 | |
Offering expenses | | | | | - | | | | - | | | | - | | | | - | | | | 11 | | | | 11 | |
Other | | | | | 23 | | | | 38 | | | | 21 | | | | 25 | | | | 3 | | | | 4 | |
Total Expenses | | | | | 13,964 | | | | 18,289 | | | | 10,527 | | | | 11,492 | | | | 2,524 | | | | 4,387 | |
Advisory Fee Waiver (3) | | | | | - | | | | - | | | | (235 | ) | | | - | | | | - | | | | - | |
Net Expenses | | | | | 13,964 | | | | 18,289 | | | | 10,292 | | | | 11,492 | | | | 2,524 | | | | 4,387 | |
NET INVESTMENT INCOME (LOSS) | | | | | 13,489 | | | | 41,743 | | | | 28,024 | | | | 49,776 | | | | (1,873 | ) | | | 10,716 | |
| | | | | | | |
NET REALIZED AND UNREALIZED GAIN (LOSS) | | | | | | | | | | | | | | | | | | | | | | | | | | |
Net Realized Gain (Loss) on: | | | | | | | | | | | | | | | | | | | | | | | | | | |
| | Investment security transactions | | | | | 135,265 | | | | 85,908 | | | | 10,515 | | | | (99,724 | ) | | | (2 | ) | | | 6,462 | |
| | Futures contracts and swap transactions | | | | | - | | | | (4,681 | ) | | | - | | | | (5,799 | ) | | | - | | | | (31,662 | ) |
| | Foreign currency transactions | | | | | (975 | ) | | | (682 | ) | | | (106 | ) | | | (2,577 | ) | | | (24,039 | ) | | | 1,001 | |
| | Net Realized Gain (Loss) | | | | | 134,290 | | | | 80,545 | | | | 10,409 | | | | (108,100 | ) | | | (24,041 | ) | | | (24,199 | ) |
| | | | | | | |
Change in Net Unrealized Appreciation (Depreciation) on: | | | | | | | | | | | | | | | | | | | | | | | | | | |
| | Investment securities (4) | | | | | 148,210 | | | | 318,526 | | | | 169,213 | | | | 309,665 | | | | 2,664 | | | | 26,192 | |
| | Short positions | | | | | - | | | | - | | | | - | | | | - | | | | - | | | | (8,279 | ) |
| | Futures contracts and swaps | | | | | - | | | | - | | | | - | | | | (26 | ) | | | - | | | | (7,367 | ) |
| | Foreign currencies | | | | | (121 | ) | | | 100 | | | | 1,198 | | | | 3,945 | | | | 7,035 | | | | (227 | ) |
| | Change in Net Unrealized Appreciation | | | | | 148,089 | | | | 318,626 | | | | 170,411 | | | | 313,584 | | | | 9,699 | | | | 10,319 | |
NET GAIN (LOSS) | | | | | 282,379 | | | | 399,171 | | | | 180,820 | | | | 205,484 | | | | (14,342 | ) | | | (13,880 | ) |
NET INCREASE (DECREASE) IN NET ASSETS
RESULTING FROM OPERATIONS | | | | | $295,868 | | | | $440,914 | | | | $208,844 | | | | $255,260 | | | | ($16,215 | ) | | | ($3,164 | ) |
| | | | | | | | | | | | | | | | | | | | | | | | | | | | |
Foreign taxes withheld on dividends and interest | | | | | $2,037 | | | | $5,779 | | | | $3,261 | | | | $5,197 | | | | $- | | | | $20 | |
| (1) | Operations commenced on September 28, 2012. |
| (2) | The service fees for the Currency Strategies and Global Absolute Return Portfolios in full dollars were $94 and $303, respectively, and are not shown on the above Statements of Operations due to rounding. |
| (3) | Pacific Life Fund Advisors LLC waived a portion of its advisory fees for the International Small-Cap Portfolio (see Note 6 in Notes to Financial Statements). |
| (4) | Change in net unrealized appreciation (depreciation) on investment securities for the Emerging Markets Portfolio is net of increase in deferred foreign capital gains tax of $507. |
| | |
| See Notes to Financial Statements | | |
C-14
PACIFIC SELECT FUND
STATEMENTS OF OPERATIONS (Continued)
FOR THE YEAR ENDED DECEMBER 31, 2012
(In thousands)
| | | | | | | | | | | | | | | | | | | | | | | | | | | | |
| | | | | | | Precious
Metals
Portfolio (1) | | | American
Funds
Asset
Allocation
Portfolio | | | Pacific
Dynamix –
Conservative
Growth
Portfolio | | | Pacific
Dynamix –
Moderate
Growth
Portfolio | | | Pacific
Dynamix –
Growth
Portfolio | | | Portfolio
Optimization
Conservative
Portfolio | |
INVESTMENT INCOME | | | | | | | | | | | | | | | | | | | | | | | | | | |
Dividends, net of foreign taxes withheld | | | | | $1,520 | | | | $11,020 | | | | $- | | | | $- | | | | $- | | | | $- | |
Dividends from affiliated mutual fund investments | | | | | - | | | | - | | | | 4,352 | | | | 11,200 | | | | 4,468 | | | | 100,273 | |
Interest, net of foreign taxes withheld | | | | | 2 | | | | - | | | | - | | | | - | | | | - | | | | - | |
Total Investment Income | | | | | 1,522 | | | | 11,020 | | | | 4,352 | | | | 11,200 | | | | 4,468 | | | | 100,273 | |
| | | | | | | |
EXPENSES | | | | | | | | | | | | | | | | | | | | | | | | | | |
Advisory fees | | | | | 1,491 | | | | 3,013 | | | | 384 | | | | 915 | | | | 486 | | | | 3,450 | |
Service fees (Class I only, see Note 6 in Notes to Financial Statements) | | | | | 1 | | | | 804 | | | | 384 | | | | 915 | | | | 486 | | | | 6,900 | |
Support services expenses | | | | | 10 | | | | 14 | | | | 7 | | | | 16 | | | | 9 | | | | 140 | |
Custodian fees and expenses | | | | | 19 | | | | - | | | | - | | | | - | | | | - | | | | - | |
Portfolio accounting and tax fees | | | | | 19 | | | | 17 | | | | 28 | | | | 28 | | | | 29 | | | | 33 | |
Shareholder report expenses | | | | | 3 | | | | 13 | | | | 6 | | | | 14 | | | | 8 | | | | 85 | |
Legal and audit fees | | | | | 7 | | | | 11 | | | | 5 | | | | 13 | | | | 7 | | | | 104 | |
Trustees’ fees and expenses | | | | | 3 | | | | 5 | | | | 3 | | | | 6 | | | | 3 | | | | 53 | |
Interest expense and commitment fees | | | | | 1 | | | | - | | | | - | | | | - | | | | - | | | | - | |
Offering expenses | | | | | 11 | | | | - | | | | - | | | | - | | | | - | | | | 7 | |
Other | | | | | 2 | | | | 3 | | | | 1 | | | | 3 | | | | 1 | | | | 30 | |
Total Expenses | | | | | 1,567 | | | | 3,880 | | | | 818 | | | | 1,910 | | | | 1,029 | | | | 10,802 | |
Advisory Fee Waivers (2) | | | | | - | | | | (1,366 | ) | | | - | | | | - | | | | - | | | | (3,450 | ) |
Adviser Reimbursement (3) | | | | | - | | | | - | | | | (76 | ) | | | (240 | ) | | | (164 | ) | | | - | |
Net Expenses | | | | | 1,567 | | | | 2,514 | | | | 742 | | | | 1,670 | | | | 865 | | | | 7,352 | |
NET INVESTMENT INCOME (LOSS) | | | | | (45 | ) | | | 8,506 | | | | 3,610 | | | | 9,530 | | | | 3,603 | | | | 92,921 | |
| | | | | | | |
NET REALIZED AND UNREALIZED GAIN (LOSS) | | | | | | | | | | | | | | | | | | | | | | | | | | |
Net Realized Gain (Loss) on: | | | | | | | | | | | | | | | | | | | | | | | | | | |
| | Investment security transactions | | | | | (4,003 | ) | | | 5,993 | | | | - | | | | - | | | | - | | | | - | |
| | Investment securities from affiliated mutual fund investments | | | | | - | | | | - | | | | 931 | | | | 1,498 | | | | 4,171 | | | | 50,186 | |
| | Foreign currency transactions | | | | | (29 | ) | | | - | | | | - | | | | - | | | | - | | | | - | |
| | Capital gain distributions from affiliated mutual fund investments | | | | | - | | | | - | | | | 1,624 | | | | 5,612 | | | | 3,903 | | | | 66,449 | |
| | Net Realized Gain (Loss) | | | | | (4,032 | ) | | | 5,993 | | | | 2,555 | | | | 7,110 | | | | 8,074 | | | | 116,635 | |
| | | | | | | |
Change in Net Unrealized Appreciation (Depreciation) on: | | | | | | | | | | | | | | | | | | | | | | | | | | |
| | Investment securities | | | | | (127,406 | ) | | | 40,541 | | | | - | | | | - | | | | - | | | | - | |
| | Investment securities from affiliated mutual fund investments | | | | | - | | | | - | | | | 9,974 | | | | 30,919 | | | | 17,283 | | | | 127,051 | |
| | Foreign currencies | | | | | 4 | | | | - | | | | - | | | | - | | | | - | | | | - | |
| | Change in Net Unrealized Appreciation (Depreciation) | | | | | (127,402 | ) | | | 40,541 | | | | 9,974 | | | | 30,919 | | | | 17,283 | | | | 127,051 | |
NET GAIN (LOSS) | | | | | (131,434 | ) | | | 46,534 | | | | 12,529 | | | | 38,029 | | | | 25,357 | | | | 243,686 | |
NET INCREASE (DECREASE) IN NET ASSETS
RESULTING FROM OPERATIONS | | | | | ($131,479 | ) | | | $55,040 | | | | $16,139 | | | | $47,559 | | | | $28,960 | | | | $336,607 | |
| | | | | | | | | | | | | | | | | | | | | | | | | | | | |
Foreign taxes withheld on dividends and interest | | | | | $379 | | | | $- | | | | $- | | | | $- | | | | $- | | | | $- | |
| (1) | Operations commenced on September 28, 2012. |
| (2) | Pacific Life Fund Advisors LLC waived a portion of its advisory fees for the American Funds Asset Allocation and Portfolio Optimization Conservative Portfolios (see Note 6 in Notes to Financial Statements). |
| (3) | Pacific Life Fund Advisors LLC reimbursed expenses for the Pacific Dynamix - Conservative Growth, Pacific Dynamix - Moderate Growth and Pacific Dynamix - Growth Portfolios (see Note 7B in Notes to Financial Statements). |
| | |
| See Notes to Financial Statements | | |
C-15
PACIFIC SELECT FUND
STATEMENTS OF OPERATIONS (Continued)
FOR THE YEAR ENDED DECEMBER 31, 2012
(In thousands)
| | | | | | | | | | | | | | | | | | | | |
| | | | | | | Portfolio
Optimization
Moderate-
Conservative
Portfolio | | | Portfolio
Optimization
Moderate
Portfolio | | | Portfolio
Optimization
Growth
Portfolio | | | Portfolio
Optimization
Aggressive-
Growth
Portfolio | |
INVESTMENT INCOME | | | | | | | | | | | | | | | | | | |
Dividends from affiliated mutual fund investments | | | | | $119,704 | | | | $348,277 | | | | $253,542 | | | | $44,443 | |
Total Investment Income | | | | | 119,704 | | | | 348,277 | | | | 253,542 | | | | 44,443 | |
| | | | | |
EXPENSES | | | | | | | | | | | | | | | | | | |
Advisory fees | | | | | 4,461 | | | | 15,056 | | | | 12,882 | | | | 2,702 | |
Service fees (Class I only, see Note 6 in Notes to Financial Statements) | | | | | 8,922 | | | | 30,112 | | | | 25,763 | | | | 5,404 | |
Support services expenses | | | | | 178 | | | | 614 | | | | 527 | | | | 111 | |
Portfolio accounting and tax fees | | | | | 36 | | | | 39 | | | | 38 | | | | 35 | |
Shareholder report expenses | | | | | 112 | | | | 374 | | | | 320 | | | | 67 | |
Legal and audit fees | | | | | 134 | | | | 456 | | | | 391 | | | | 82 | |
Trustees’ fees and expenses | | | | | 67 | | | | 230 | | | | 198 | | | | 41 | |
Offering expenses | | | | | 7 | | | | 7 | | | | 7 | | | | 7 | |
Other | | | | | 37 | | | | 130 | | | | 113 | | | | 24 | |
Total Expenses | | | | | 13,954 | | | | 47,018 | | | | 40,239 | | | | 8,473 | |
Advisory Fee Waivers (1) | | | | | (4,461 | ) | | | (15,056 | ) | | | (12,882 | ) | | | (2,702 | ) |
Net Expenses | | | | | 9,493 | | | | 31,962 | | | | 27,357 | | | | 5,771 | |
NET INVESTMENT INCOME | | | | | 110,211 | | | | 316,315 | | | | 226,185 | | | | 38,672 | |
| | | | | |
NET REALIZED AND UNREALIZED GAIN (LOSS) | | | | | | | | | | | | | | | | | | |
Net Realized Gain (Loss) on: | | | | | | | | | | | | | | | | | | |
| | Investment securities from affiliated mutual fund investments | | | | | 55,358 | | | | 225,534 | | | | 112,217 | | | | 10,983 | |
| | Capital gain distributions from affiliated mutual fund investments | | | | | 98,913 | | | | 547,353 | | | | 613,504 | | | | 142,109 | |
| | Net Realized Gain | | | | | 154,271 | | | | 772,887 | | | | 725,721 | | | | 153,092 | |
| | | | | |
Change in Net Unrealized Appreciation (Depreciation) on: | | | | | | | | | | | | | | | | | | |
| | Investment securities from affiliated mutual fund investments | | | | | 211,855 | | | | 738,475 | | | | 731,988 | | | | 191,119 | |
| | Change in Net Unrealized Appreciation | | | | | 211,855 | | | | 738,475 | | | | 731,988 | | | | 191,119 | |
NET GAIN | | | | | 366,126 | | | | 1,511,362 | | | | 1,457,709 | | | | 344,211 | |
| | | | | | | | | | | | | | | | | | | | |
NET INCREASE IN NET ASSETS
RESULTING FROM OPERATIONS | | | | | $476,337 | | | | $1,827,677 | | | | $1,683,894 | | | | $382,883 | |
| (1) | Pacific Life Fund Advisors LLC waived its advisory fees for the Portfolio Optimization Portfolios (see Note 6 in Notes to Financial Statements). |
| | |
| See Notes to Financial Statements | | |
C-16
PACIFIC SELECT FUND
STATEMENTS OF CHANGES IN NET ASSETS (1)
(In thousands)
| | | | | | | | | | | | | | | | | | | | | | | | | | | | | | | | |
| | | | | | | Year Ended
December 31,
2012 | | | Year Ended
December 31,
2011 | | | | | Year Ended
December 31,
2012 | | | Year Ended
December 31,
2011 | | | | | Year Ended
December 31,
2012 | | | Year Ended
December 31,
2011 | |
| | | | | | |
Cash Management Portfolio | | | | | Diversified Bond Portfolio | | | | | Floating Rate Loan Portfolio | |
OPERATIONS | | | | | | | | | | | | | | | | | | | | | | | | | | | | | | |
Net investment income (loss) | | | | | $- | | | | $- | | | | | | $100,945 | | | | $101,765 | | | | | | $50,247 | | | | $59,782 | |
Net realized gain (loss) | | | | | - | | | | (4 | ) | | | | | 67,452 | | | | 91,172 | | | | | | 5,152 | | | | (402 | ) |
Change in net unrealized appreciation (depreciation) | | | | | - | | | | - | | | | | | 102,256 | | | | (12,648 | ) | | | | | 25,661 | | | | (33,134 | ) |
Net Increase (Decrease) in Net Assets
Resulting from Operations | | | | | - | | | | (4 | ) | | | | | 270,653 | | | | 180,289 | | | | | | 81,060 | | | | 26,246 | |
DIVIDENDS AND DISTRIBUTIONS TO SHAREHOLDERS | | | | | | | | | | | | | | | | | | | | | | | | | | | | | | |
Net investment income | | | | | | | | | | | | | | | | | | | | | | | | | | | | | | |
| | Class I | | | | | (7 | ) | | | - | | | | | | (3,303 | ) | | | (64,451 | ) | | | | | (4,165 | ) | | | (60,692 | ) |
| | Class P (2) | | | | | - | | | | - | | | | | | (98,551 | ) | | | (24,179 | ) | | | | | (45,048 | ) | | | (13,322 | ) |
Net realized gains | | | | | | | | | | | | | | | | | | | | | | | | | | | | | | |
| | Class I | | | | | - | | | | - | | | | | | (962 | ) | | | - | | | | | | - | | | | - | |
| | Class P | | | | | - | | | | - | | | | | | (21,787 | ) | | | - | | | | | | - | | | | - | |
Net Decrease from Dividends and
Distributions to Shareholders | | | | | (7 | ) | | | - | | | | | | (124,603 | ) | | | (88,630 | ) | | | | | (49,213 | ) | | | (74,014 | ) |
CAPITAL SHARE TRANSACTIONS | | | | | | | | | | | | | | | | | | | | | | | | | | | | | | |
Proceeds from sale of shares | | | | | | | | | | | | | | | | | | | | | | | | | | | | | | |
| | Class I | | | | | 393,703 | | | | 720,592 | | | | | | 38,726 | | | | 58,945 | | | | | | 18,338 | | | | 29,997 | |
| | Class P | | | | | - | | | | 39 | | | | | | 573,083 | | | | 3,169,674 | | | | | | 48,746 | | | | 1,043,685 | |
Dividend and distribution reinvestments | | | | | | | | | | | | | | | | | | | | | | | | | | | | | | |
| | Class I | | | | | 7 | | | | - | | | | | | 4,265 | | | | 64,451 | | | | | | 4,165 | | | | 60,692 | |
| | Class P | | | | | - | | | | - | | | | | | 120,338 | | | | 24,179 | | | | | | 45,048 | | | | 13,322 | |
Cost of shares repurchased | | | | | | | | | | | | | | | | | | | | | | | | | | | | | | |
| | Class I | | | | | (586,156 | ) | | | (750,397 | ) | | | | | (40,333 | ) | | | (2,998,805 | ) | | | | | (18,872 | ) | | | (1,018,268 | ) |
| | Class P | | | | | - | | | | - | | | | | | (643,959 | ) | | | (311,382 | ) | | | | | (212,438 | ) | | | (76,537 | ) |
Net Increase (Decrease) in Net Assets from
Capital Share Transactions | | | | | (192,446 | ) | | | (29,766 | ) | | | | | 52,120 | | | | 7,062 | | | | | | (115,013 | ) | | | 52,891 | |
NET INCREASE (DECREASE) IN NET ASSETS | | | | | (192,453 | ) | | | (29,770 | ) | | | | | 198,170 | | | | 98,721 | | | | | | (83,166 | ) | | | 5,123 | |
NET ASSETS | | | | | | | | | | | | | | | | | | | | | | | | | | | | | | |
Beginning of Year | | | | | 831,490 | | | | 861,260 | | | | | | 3,055,622 | | | | 2,956,901 | | | | | | 1,052,356 | | | | 1,047,233 | |
End of Year | | | | | $639,037 | | | | $831,490 | | | | | | $3,253,792 | | | | $3,055,622 | | | | | | $969,190 | | | | $1,052,356 | |
Undistributed/Accumulated Net Investment Income (Loss) | | | | | ($152 | ) | | | ($145 | ) | | | | | $24,398 | | | | $17,144 | | | | | | $11,192 | | | | $10,158 | |
| (1) | Effective May 1, 2011, the Fund adopted a Multi-Class Plan pursuant to Rule 18f-3 of the Investment Company Act of 1940, as amended, under which, the Fund offers two separate share classes, Class I and Class P (see Note 1 in Notes to Financial Statements). |
| (2) | The net investment income distributed to shareholders for the Class P Shares of the Cash Management Portfolio in full dollars was $98, and is not shown on the above Statements of Changes in Net Assets due to rounding. |
| | |
| See Notes to Financial Statements | | |
C-17
PACIFIC SELECT FUND
STATEMENTS OF CHANGES IN NET ASSETS (1) (Continued)
(In thousands)
| | | | | | | | | | | | | | | | | | | | | | | | | | | | | | | | |
| | | | | | | Year Ended
December 31,
2012 | | | Year Ended
December 31,
2011 | | | | | Year Ended
December 31,
2012 | | | Year Ended
December 31,
2011 | | | | | Year Ended
December 31,
2012 | | | Period Ended
December 31,
2011 | |
| | | | | | | High Yield Bond Portfolio | | | | | Inflation Managed Portfolio | | | | | Inflation Protected Portfolio (2) | |
OPERATIONS | | | | | | | | | | | | | | | | | | | | | | | | | | | | | | |
Net investment income (loss) | | | | | $86,608 | | | | $92,767 | | | | | | $50,066 | | | | $88,578 | | | | | | $9,463 | | | | ($950 | ) |
Net realized gain | | | | | 25,776 | | | | 33,551 | | | | | | 74,826 | | | | 305,354 | | | | | | 86,842 | | | | 56,784 | |
Change in net unrealized appreciation (depreciation) | | | | | 75,463 | | | | (85,344 | ) | | | | | 82,373 | | | | 31,041 | | | | | | (13,438 | ) | | | 42,512 | |
Net Increase in Net Assets
Resulting from Operations | | | | | 187,847 | | | | 40,974 | | | | | | 207,265 | | | | 424,973 | | | | | | 82,867 | | | | 98,346 | |
DIVIDENDS AND DISTRIBUTIONS TO SHAREHOLDERS | | | | | | | | | | | | | | | | | | | | | | | | | | | | | | |
Net investment income | | | | | | | | | | | | | | | | | | | | | | | | | | | | | | |
| | Class I | | | | | (24,933 | ) | | | (68,867 | ) | | | | | (16,363 | ) | | | (76,091 | ) | | | | | (122 | ) | | | (510 | ) |
| | Class P | | | | | (61,115 | ) | | | (19,046 | ) | | | | | (31,781 | ) | | | (10,061 | ) | | | | | (7,655 | ) | | | (24,243 | ) |
Net realized gains | | | | | | | | | | | | | | | | | | | | | | | | | | | | | | |
| | Class I | | | | | - | | | | - | | | | | | (113,636 | ) | | | (205,225 | ) | | | | | (106 | ) | | | (326 | ) |
| | Class P | | | | | - | | | | - | | | | | | (167,504 | ) | | | - | | | | | | (5,649 | ) | | | (24,475 | ) |
Net Decrease from Dividends and
Distributions to Shareholders | | | | | (86,048 | ) | | | (87,913 | ) | | | | | (329,284 | ) | | | (291,377 | ) | | | | | (13,532 | ) | | | (49,554 | ) |
CAPITAL SHARE TRANSACTIONS | | | | | | | | | | | | | | | | | | | | | | | | | | | | | | |
Proceeds from sale of shares | | | | | | | | | | | | | | | | | | | | | | | | | | | | | | |
| | Class I | | | | | 149,488 | | | | 144,182 | | | | | | 69,642 | | | | 104,878 | | | | | | 20,486 | | | | 56,435 | |
| | Class P | | | | | 65,803 | | | | 1,092,067 | | | | | | 233,454 | | | | 2,247,381 | | | | | | 269,125 | | | | 1,544,545 | |
Dividend and distribution reinvestments | | | | | | | | | | | | | | | | | | | | | | | | | | | | | | |
| | Class I | | | | | 24,933 | | | | 68,867 | | | | | | 129,999 | | | | 281,316 | | | | | | 228 | | | | 836 | |
| | Class P | | | | | 61,115 | | | | 19,046 | | | | | | 199,285 | | | | 10,061 | | | | | | 13,304 | | | | 48,718 | |
Cost of shares repurchased | | | | | | | | | | | | | | | | | | | | | | | | | | | | | | |
| | Class I | | | | | (141,532 | ) | | | (1,022,795 | ) | | | | | (106,249 | ) | | | (4,320,130 | ) | | | | | (16,531 | ) | | | (37,480 | ) |
| | Class P | | | | | (326,057 | ) | | | (69,121 | ) | | | | | (1,571,091 | ) | | | (283,626 | ) | | | | | (683,546 | ) | | | (215,134 | ) |
Net Increase (Decrease) in Net Assets from
Capital Share Transactions | | | | | (166,250 | ) | | | 232,246 | | | | | | (1,044,960 | ) | | | (1,960,120 | ) | | | | | (396,934 | ) | | | 1,397,920 | |
NET INCREASE (DECREASE) IN NET ASSETS | | | | | (64,451 | ) | | | 185,307 | | | | | | (1,166,979 | ) | | | (1,826,524 | ) | | | | | (327,599 | ) | | | 1,446,712 | |
NET ASSETS | | | | | | | | | | | | | | | | | | | | | | | | | | | | | | |
Beginning of Year or Period | | | | | 1,363,572 | | | | 1,178,265 | | | | | | 2,772,407 | | | | 4,598,931 | | | | | | 1,446,712 | | | | - | |
End of Year or Period | | | | | $1,299,121 | | | | $1,363,572 | | | | | | $1,605,428 | | | | $2,772,407 | | | | | | $1,119,113 | | | | $1,446,712 | |
Undistributed Net Investment Income | | | | | $17,977 | | | | $16,931 | | | | | | $17,511 | | | | $40,476 | | | | | | $28,573 | | | | $1,580 | |
| (1) | Effective May 1, 2011, the Fund adopted a Multi-Class Plan pursuant to Rule 18f-3 of the Investment Company Act of 1940, as amended, under which, the Fund offers two separate share classes, Class I and Class P (see Note 1 in Notes to Financial Statements). |
| (2) | Operations commenced on May 2, 2011. |
| | |
| See Notes to Financial Statements | | |
C-18
PACIFIC SELECT FUND
STATEMENTS OF CHANGES IN NET ASSETS (1) (Continued)
(In thousands)
| | | | | | | | | | | | | | | | | | | | | | | | | | | | | | |
| | | | | | | Year Ended
December 31,
2012 | | | Year Ended
December 31,
2011 | | | | | Year Ended
December 31,
2012 | | | Year Ended
December 31,
2011 | | | | | Period Ended
December 31,
2012 | | | |
| | | | | | | Managed Bond Portfolio | | | | | Short Duration Bond
Portfolio | | | | | Emerging Markets
Debt Portfolio (2) |
OPERATIONS | | | | | | | | | | | | | | | | | | | | | | | | | | | | |
Net investment income | | | | | $180,773 | | | | $209,726 | | | | | | $30,994 | | | | $23,218 | | | | | | $31,353 | | | |
Net realized gain | | | | | 236,194 | | | | 67,134 | | | | | | 13,142 | | | | 2,222 | | | | | | 6,128 | | | |
Change in net unrealized appreciation (depreciation) | | | | | 176,484 | | | | (37,866 | ) | | | | | 31,125 | | | | (9,927 | ) | | | | | 61,179 | | | |
Net Increase in Net Assets
Resulting from Operations | | | | | 593,451 | | | | 238,994 | | | | | | 75,261 | | | | 15,513 | | | | | | 98,660 | | | |
DIVIDENDS AND DISTRIBUTIONS TO SHAREHOLDERS | | | | | | | | | | | | | | | | | | | | | | | | | | | | |
Net investment income | | | | | | | | | | | | | | | | | | | | | | | | | | | | |
| | Class I | | | | | (75,142 | ) | | | (105,416 | ) | | | | | (2,111 | ) | | | (15,061 | ) | | | | | (156 | ) | | |
| | Class P | | | | | (205,470 | ) | | | (59,211 | ) | | | | | (22,951 | ) | | | (8,448 | ) | | | | | (21,844 | ) | | |
Net realized gains | | | | | | | | | | | | | | | | | | | | | | | | | | | | |
| | Class I | | | | | (1,649 | ) | | | (214,428 | ) | | | | | - | | | | - | | | | | | - | | | |
| | Class P | | | | | (4,212 | ) | | | - | | | | | | - | | | | - | | | | | | - | | | |
Net Decrease from Dividends and
Distributions to Shareholders | | | | | (286,473 | ) | | | (379,055 | ) | | | | | (25,062 | ) | | | (23,509 | ) | | | | | (22,000 | ) | | |
CAPITAL SHARE TRANSACTIONS | | | | | | | | | | | | | | | | | | | | | | | | | | | | |
Proceeds from sale of shares | | | | | | | | | | | | | | | | | | | | | | | | | | | | |
| | Class I | | | | | 112,052 | | | | 119,524 | | | | | | 84,484 | | | | 62,589 | | | | | | 7,934 | | | |
| | Class P | | | | | 386,259 | | | | 5,011,295 | | | | | | 1,075,692 | | | | 1,665,839 | | | | | | 969,780 | | | |
Dividend and distribution reinvestments | | | | | | | | | | | | | | | | | | | | | | | | | | | | |
| | Class I | | | | | 76,791 | | | | 319,844 | | | | | | 2,111 | | | | 15,061 | | | | | | 156 | | | |
| | Class P | | | | | 209,682 | | | | 59,211 | | | | | | 22,951 | | | | 8,448 | | | | | | 21,844 | | | |
Cost of shares repurchased | | | | | | | | | | | | | | | | | | | | | | | | | | | | |
| | Class I | | | | | (167,846 | ) | | | (5,271,347 | ) | | | | | (55,017 | ) | | | (1,471,602 | ) | | | | | (409 | ) | | |
| | Class P | | | | | (1,868,953 | ) | | | (387,003 | ) | | | | | (498,740 | ) | | | (132,630 | ) | | | | | (85,566 | ) | | |
Net Increase (Decrease) in Net Assets from
Capital Share Transactions | | | | | (1,252,015 | ) | | | (148,476 | ) | | | | | 631,481 | | | | 147,705 | | | | | | 913,739 | | | |
NET INCREASE (DECREASE) IN NET ASSETS | | | | | (945,037 | ) | | | (288,537 | ) | | | | | 681,680 | | | | 139,709 | | | | | | 990,399 | | | |
NET ASSETS | | | | | | | | | | | | | | | | | | | | | | | | | | | | |
Beginning of Year or Period | | | | | 6,087,735 | | | | 6,376,272 | | | | | | 1,773,726 | | | | 1,634,017 | | | | | | - | | | |
End of Year or Period | | | | | $5,142,698 | | | | $6,087,735 | | | | | | $2,455,406 | | | | $1,773,726 | | | | | | $990,399 | | | |
Undistributed Net Investment Income | | | | | $49,319 | | | | $139,794 | | | | | | $6,935 | | | | $1,000 | | | | | | $8,440 | | | |
| (1) | Effective May 1, 2011, the Fund adopted a Multi-Class Plan pursuant to Rule 18f-3 of the Investment Company Act of 1940, as amended, under which, the Fund offers two separate share classes, Class I and Class P (see Note 1 in Notes to Financial Statements). |
| (2) | Operations commenced on April 30, 2012. |
| | |
| See Notes to Financial Statements | | |
C-19
PACIFIC SELECT FUND
STATEMENTS OF CHANGES IN NET ASSETS (1) (Continued)
(In thousands)
| | | | | | | | | | | | | | | | | | | | | | | | | | | | | | | | |
| | | | | | | Year Ended
December 31,
2012 | | | Year Ended
December 31,
2011 | | | | | Year Ended
December 31,
2012 | | | Year Ended
December 31,
2011 | | | | | Year Ended
December 31,
2012 | | | Year Ended
December 31,
2011 | |
| | | | | | | American Funds
Growth Portfolio | | | | | American Funds
Growth-Income Portfolio | | | | | Comstock Portfolio | |
OPERATIONS | | | | | | | | | | | | | | | | | | | | | | | | | | | | | | |
Net investment income | | | | | $519 | | | | $2,324 | | | | | | $8,204 | | | | $15,071 | | | | | | $38,680 | | | | $34,091 | |
Net realized gain (loss) | | | | | 40,190 | | | | (64,670 | ) | | | | | 50,897 | | | | (214,656 | ) | | | | | 213,862 | | | | 112,339 | |
Change in net unrealized appreciation (depreciation) | | | | | 52,155 | | | | 31,695 | | | | | | 100,004 | | | | 176,514 | | | | | | 142,715 | | | | (186,507 | ) |
Net Increase (Decrease) in Net Assets
Resulting from Operations | | | | | 92,864 | | | | (30,651 | ) | | | | | 159,105 | | | | (23,071 | ) | | | | | 395,257 | | | | (40,077 | ) |
DIVIDENDS AND DISTRIBUTIONS TO SHAREHOLDERS | | | | | | | | | | | | | | | | | | | | | | | | | | | | | | |
Net investment income | | | | | | | | | | | | | | | | | | | | | | | | | | | | | | |
| | Class I | | | | | (352 | ) | | | (480 | ) | | | | | (2,221 | ) | | | (1,980 | ) | | | | | (2,531 | ) | | | (12,340 | ) |
| | Class P | | | | | (572 | ) | | | (1,470 | ) | | | | | (8,630 | ) | | | (10,150 | ) | | | | | (41,100 | ) | | | (14,130 | ) |
Net realized gains | | | | | | | | | | | | | | | | | | | | | | | | | | | | | | |
| | Class I | | | | | - | | | | - | | | | | | - | | | | - | | | | | | (6,235 | ) | | | (16,362 | ) |
| | Class P | | | | | - | | | | - | | | | | | - | | | | - | | | | | | (106,104 | ) | | | - | |
Net Decrease from Dividends and
Distributions to Shareholders | | | | | (924 | ) | | | (1,950 | ) | | | | | (10,851 | ) | | | (12,130 | ) | | | | | (155,970 | ) | | | (42,832 | ) |
CAPITAL SHARE TRANSACTIONS | | | | | | | | | | | | | | | | | | | | | | | | | | | | | | |
Proceeds from sale of shares | | | | | | | | | | | | | | | | | | | | | | | | | | | | | | |
| | Class I | | | | | 19,002 | | | | 29,679 | | | | | | 12,828 | | | | 13,425 | | | | | | 20,738 | | | | 11,616 | |
| | Class P | | | | | 39,523 | | | | 538,109 | | | | | | 45,006 | | | | 982,214 | | | | | | 396,825 | | | | 2,147,709 | |
Dividend and distribution reinvestments | | | | | | | | | | | | | | | | | | | | | | | | | | | | | | |
| | Class I | | | | | 352 | | | | 480 | | | | | | 2,221 | | | | 1,980 | | | | | | 8,766 | | | | 28,702 | |
| | Class P | | | | | 572 | | | | 1,470 | | | | | | 8,630 | | | | 10,150 | | | | | | 147,204 | | | | 14,130 | |
Cost of shares repurchased | | | | | | | | | | | | | | | | | | | | | | | | | | | | | | |
| | Class I | | | | | (45,712 | ) | | | (822,549 | ) | | | | | (30,363 | ) | | | (1,220,496 | ) | | | | | (18,989 | ) | | | (2,129,067 | ) |
| | Class P | | | | | (550,712 | ) | | | (48 | ) | | | | | (686,834 | ) | | | (68 | ) | | | | | (848,699 | ) | | | (120,659 | ) |
Net Decrease in Net Assets from
Capital Share Transactions | | | | | (536,975 | ) | | | (252,859 | ) | | | | | (648,512 | ) | | | (212,795 | ) | | | | | (294,155 | ) | | | (47,569 | ) |
NET DECREASE IN NET ASSETS | | | | | (445,035 | ) | | | (285,460 | ) | | | | | (500,258 | ) | | | (247,996 | ) | | | | | (54,868 | ) | | | (130,478 | ) |
NET ASSETS | | | | | | | | | | | | | | | | | | | | | | | | | | | | | | |
Beginning of Year | | | | | 711,417 | | | | 996,877 | | | | | | 1,147,156 | | | | 1,395,152 | | | | | | 2,073,163 | | | | 2,203,641 | |
End of Year | | | | | $266,382 | | | | $711,417 | | | | | | $646,898 | | | | $1,147,156 | | | | | | $2,018,295 | | | | $2,073,163 | |
Undistributed/Accumulated Net Investment Income (Loss) | | | | | N/A | | | | N/A | | | | | | N/A | | | | N/A | | | | | | N/A | | | | N/A | |
| (1) | Effective May 1, 2011, the Fund adopted a Multi-Class Plan pursuant to Rule 18f-3 of the Investment Company Act of 1940, as amended, under which, the Fund offers two separate share classes, Class I and Class P (see Note 1 in Notes to Financial Statements). |
| N/A | Not applicable (see Net Assets Consist of in Statements of Assets and Liabilities). |
| | |
| See Notes to Financial Statements | | |
C-20
PACIFIC SELECT FUND
STATEMENTS OF CHANGES IN NET ASSETS (1) (Continued)
(In thousands)
| | | | | | | | | | | | | | | | | | | | | | | | | | | | | | | | |
| | | | | | | Year Ended
December 31,
2012 | | | Year Ended
December 31,
2011 | | | | | Year Ended
December 31,
2012 | | | Year Ended
December 31,
2011 | | | | | Year Ended
December 31,
2012 | | | Year Ended
December 31,
2011 | |
| | | | | | |
Dividend Growth Portfolio | | | | | Equity Index Portfolio | | | | | Focused 30 Portfolio | |
OPERATIONS | | | | | | | | | | | | | | | | | | | | | | | | | | | | | | |
Net investment income (loss) | | | | | $15,001 | | | | $14,266 | | | | | | $46,726 | | | | $47,602 | | | | | | ($62 | ) | | | ($463 | ) |
Net realized gain (loss) | | | | | 65,107 | | | | 17,229 | | | | | | 196,576 | | | | (11,745 | ) | | | | | 169 | | | | 11,619 | |
Change in net unrealized appreciation (depreciation) | | | | | 48,062 | | | | 3,492 | | | | | | 95,828 | | | | 12,491 | | | | | | 22,731 | | | | (23,353 | ) |
Net Increase (Decrease) in Net Assets
Resulting from Operations | | | | | 128,170 | | | | 34,987 | | | | | | 339,130 | | | | 48,348 | | | | | | 22,838 | | | | (12,197 | ) |
DIVIDENDS AND DISTRIBUTIONS TO SHAREHOLDERS | | | | | | | | | | | | | | | | | | | | | | | | | | | | | | |
Net investment income | | | | | | | | | | | | | | | | | | | | | | | | | | | | | | |
| | Class I | | | | | (2,932 | ) | | | (5,620 | ) | | | | | (19,937 | ) | | | (23,460 | ) | | | | | - | | | | - | |
| | Class P | | | | | (13,624 | ) | | | (5,520 | ) | | | | | (32,905 | ) | | | (13,610 | ) | | | | | - | | | | - | |
Net realized gains | | | | | | | | | | | | | | | | | | | | | | | | | | | | | | |
| | Class I | | | | | (3,731 | ) | | | (52,880 | ) | | | | | - | | | | - | | | | | | (11,617 | ) | | | - | |
| | Class P | | | | | (13,498 | ) | | | - | | | | | | - | | | | - | | | | | | (1 | ) | | | - | |
Net Decrease from Dividends and
Distributions to Shareholders | | | | | (33,785 | ) | | | (64,020 | ) | | | | | (52,842 | ) | | | (37,070 | ) | | | | | (11,618 | ) | | | - | |
CAPITAL SHARE TRANSACTIONS | | | | | | | | | | | | | | | | | | | | | | | | | | | | | | |
Proceeds from sale of shares | | | | | | | | | | | | | | | | | | | | | | | | | | | | | | |
| | Class I | | | | | 30,992 | | | | 27,193 | | | | | | 110,885 | | | | 50,799 | | | | | | 30,127 | | | | 12,041 | |
| | Class P | | | | | 29,250 | | | | 918,884 | | | | | | 101,955 | | | | 1,733,955 | | | | | | - | | | | 10 | |
Dividend and distribution reinvestments | | | | | | | | | | | | | | | | | | | | | | | | | | | | | | |
| | Class I | | | | | 6,663 | | | | 58,500 | | | | | | 19,937 | | | | 23,460 | | | | | | 11,617 | | | | - | |
| | Class P | | | | | 27,122 | | | | 5,520 | | | | | | 32,905 | | | | 13,610 | | | | | | 1 | | | | - | |
Cost of shares repurchased | | | | | | | | | | | | | | | | | | | | | | | | | | | | | | |
| | Class I | | | | | (28,419 | ) | | | (984,468 | ) | | | | | (142,381 | ) | | | (1,974,748 | ) | | | | | (40,160 | ) | | | (48,036 | ) |
| | Class P | | | | | (347,194 | ) | | | (72,559 | ) | | | | | (779,703 | ) | | | (142,256 | ) | | | | | - | | | | - | |
Net Increase (Decrease) in Net Assets from
Capital Share Transactions | | | | | (281,586 | ) | | | (46,930 | ) | | | | | (656,402 | ) | | | (295,180 | ) | | | | | 1,585 | | | | (35,985 | ) |
NET INCREASE (DECREASE) IN NET ASSETS | | | | | (187,201 | ) | | | (75,963 | ) | | | | | (370,114 | ) | | | (283,902 | ) | | | | | 12,805 | | | | (48,182 | ) |
NET ASSETS | | | | | | | | | | | | | | | | | | | | | | | | | | | | | | |
Beginning of Year | | | | | 1,004,063 | | | | 1,080,026 | | | | | | 2,358,119 | | | | 2,642,021 | | | | | | 101,119 | | | | 149,301 | |
End of Year | | | | | $816,862 | | | | $1,004,063 | | | | | | $1,988,005 | | | | $2,358,119 | | | | | | $113,924 | | | | $101,119 | |
Undistributed/Accumulated Net Investment Income (Loss) | | | | | N/A | | | | N/A | | | | | | N/A | | | | N/A | | | | | | N/A | | | | N/A | |
| (1) | Effective May 1, 2011, the Fund adopted a Multi-Class Plan pursuant to Rule 18f-3 of the Investment Company Act of 1940, as amended, under which, the Fund offers two separate share classes, Class I and Class P (see Note 1 in Notes to Financial Statements). |
| N/A | Not applicable (see Net Assets Consist of in Statements of Assets and Liabilities). |
| | |
| See Notes to Financial Statements | | |
C-21
PACIFIC SELECT FUND
STATEMENTS OF CHANGES IN NET ASSETS (1) (Continued)
(In thousands)
| | | | | | | | | | | | | | | | | | | | | | | | | | | | | | | | |
| | | | | | | Year Ended
December 31,
2012 | | | Year Ended
December 31,
2011 | | | | | Year Ended
December 31,
2012 | | | Year Ended
December 31,
2011 | | | | | Year Ended
December 31,
2012 | | | Year Ended
December 31,
2011 | |
| | | | | | |
Growth LT Portfolio | | | | | Large-Cap Growth Portfolio | | | | | Large-Cap Value Portfolio | |
OPERATIONS | | | | | | | | | | | | | | | | | | | | | | | | | | | | | | |
Net investment income (loss) | | | | | $5,060 | | | | $8,344 | | | | | | $1,311 | | | | ($2,456 | ) | | | | | $62,418 | | | | $58,685 | |
Net realized gain | | | | | 142,610 | | | | 191,447 | | | | | | 187,962 | | | | 180,858 | | | | | | 237,914 | | | | 78,354 | |
Change in net unrealized appreciation (depreciation) | | | | | 6,214 | | | | (269,969 | ) | | | | | 26,545 | | | | (156,925 | ) | | | | | 176,298 | | | | 9,303 | |
Net Increase (Decrease) in Net
Assets Resulting from Operations | | | | | 153,884 | | | | (70,178 | ) | | | | | 215,818 | | | | 21,477 | | | | | | 476,630 | | | | 146,342 | |
DIVIDENDS AND DISTRIBUTIONS TO SHAREHOLDERS | | | | | | | | | | | | | | | | | | | | | | | | | | | | | | |
Net investment income | | | | | | | | | | | | | | | | | | | | | | | | | | | | | | |
| | Class I | | | | | (3,757 | ) | | | (4,790 | ) | | | | | - | | | | - | | | | | | (5,962 | ) | | | (23,810 | ) |
| | Class P | | | | | (1,587 | ) | | | (2,070 | ) | | | | | (1,150 | ) | | | - | | | | | | (63,013 | ) | | | (21,230 | ) |
Net realized gains | | | | | | | | | | | | | | | | | | | | | | | | | | | | | | |
| | Class I | | | | | (146,739 | ) | | | (54,565 | ) | | | | | (23,548 | ) | | | (159,514 | ) | | | | | (7,725 | ) | | | (12,868 | ) |
| | Class P | | | | | (44,708 | ) | | | - | | | | | | (157,310 | ) | | | - | | | | | | (70,630 | ) | | | - | |
Net Decrease from Dividends and
Distributions to Shareholders | | | | | (196,791 | ) | | | (61,425 | ) | | | | | (182,008 | ) | | | (159,514 | ) | | | | | (147,330 | ) | | | (57,908 | ) |
CAPITAL SHARE TRANSACTIONS | | | | | | | | | | | | | | | | | | | | | | | | | | | | | | |
Proceeds from sale of shares | | | | | | | | | | | | | | | | | | | | | | | | | | | | | | |
| | Class I | | | | | 13,249 | | | | 12,497 | | | | | | 40,036 | | | | 29,937 | | | | | | 22,761 | | | | 28,006 | |
| | Class P | | | | | 3,802 | | | | 706,083 | | | | | | 125,414 | | | | 1,191,978 | | | | | | 503,980 | | | | 2,717,925 | |
Dividend and distribution reinvestments | | | | | | | | | | | | | | | | | | | | | | | | | | | | | | |
| | Class I | | | | | 150,496 | | | | 59,355 | | | | | | 23,548 | | | | 159,514 | | | | | | 13,687 | | | | 36,678 | |
| | Class P | | | | | 46,295 | | | | 2,070 | | | | | | 158,460 | | | | - | | | | | | 133,643 | | | | 21,230 | |
Cost of shares repurchased | | | | | | | | | | | | | | | | | | | | | | | | | | | | | | |
| | Class I | | | | | (66,450 | ) | | | (1,197,418 | ) | | | | | (44,403 | ) | | | (1,348,673 | ) | | | | | (56,740 | ) | | | (2,982,407 | ) |
| | Class P | | | | | (625,103 | ) | | | (41,956 | ) | | | | | (231,546 | ) | | | (121,534 | ) | | | | | (940,878 | ) | | | (180,458 | ) |
Net Increase (Decrease) in Net Assets
from Capital Share Transactions | | | | | (477,711 | ) | | | (459,369 | ) | | | | | 71,509 | | | | (88,778 | ) | | | | | (323,547 | ) | | | (359,026 | ) |
NET INCREASE (DECREASE) IN NET ASSETS | | | | | (520,618 | ) | | | (590,972 | ) | | | | | 105,319 | | | | (226,815 | ) | | | | | 5,753 | | | | (270,592 | ) |
NET ASSETS | | | | | | | | | | | | | | | | | | | | | | | | | | | | | | |
Beginning of Year | | | | | 1,033,466 | | | | 1,624,438 | | | | | | 1,177,398 | | | | 1,404,213 | | | | | | 2,832,318 | | | | 3,102,910 | |
End of Year | | | | | $512,848 | | | | $1,033,466 | | | | | | $1,282,717 | | | | $1,177,398 | | | | | | $2,838,071 | | | | $2,832,318 | |
Undistributed/Accumulated Net Investment Income (Loss) | | | | | N/A | | | | N/A | | | | | | N/A | | | | N/A | | | | | | N/A | | | | N/A | |
| (1) | Effective May 1, 2011, the Fund adopted a Multi-Class Plan pursuant to Rule 18f-3 of the Investment Company Act of 1940, as amended, under which, the Fund offers two separate share classes, Class I and Class P (see Note 1 in Notes to Financial Statements). |
| N/A | Not applicable (see Net Assets Consist of in Statements of Assets and Liabilities). |
| | |
| See Notes to Financial Statements | | |
C-22
PACIFIC SELECT FUND
STATEMENTS OF CHANGES IN NET ASSETS (1) (Continued)
(In thousands)
| | | | | | | | | | | | | | | | | | | | | | | | | | | | | | | | |
| | | | | | | Year Ended
December 31,
2012 | | | Year Ended
December 31,
2011 | | | | | Year Ended
December 31,
2012 | | | Year Ended
December 31,
2011 | | | | | Year Ended
December 31,
2012 | | | Year Ended
December 31,
2011 | |
| | | | | | |
Long/Short Large-Cap Portfolio | | | | | Main Street Core Portfolio | | | | | Mid-Cap Equity Portfolio | |
OPERATIONS | | | | | | | | | | | | | | | | | | | | | | | | | | | | | | |
Net investment income | | | | | $12,082 | | | | $10,596 | | | | | | $19,294 | | | | $13,301 | | | | | | $8,979 | | | | $8,829 | |
Net realized gain | | | | | 109,693 | | | | 168,557 | | | | | | 181,913 | | | | 61,815 | | | | | | 149,906 | | | | 218,572 | |
Change in net unrealized appreciation (depreciation) | | | | | 138,972 | | | | (210,418 | ) | | | | | 35,166 | | | | (69,345 | ) | | | | | (35,474 | ) | | | (321,916 | ) |
Net Increase (Decrease) in Net Assets
Resulting from Operations | | | | | 260,747 | | | | (31,265 | ) | | | | | 236,373 | | | | 5,771 | | | | | | 123,411 | | | | (94,515 | ) |
DIVIDENDS AND DISTRIBUTIONS TO SHAREHOLDERS | | | | | | | | | | | | | | | | | | | | | | | | | | | | | | |
Net investment income | | | | | | | | | | | | | | | | | | | | | | | | | | | | | | |
| | Class I | | | | | (261 | ) | | | (3,210 | ) | | | | | (5,463 | ) | | | (6,760 | ) | | | | | (2,068 | ) | | | (3,100 | ) |
| | Class P | | | | | (12,755 | ) | | | (5,040 | ) | | | | | (12,408 | ) | | | (4,050 | ) | | | | | (7,681 | ) | | | (3,780 | ) |
Net realized gains | | | | | | | | | | | | | | | | | | | | | | | | | | | | | | |
| | Class I | | | | | (3,946 | ) | | | (165,499 | ) | | | | | (23,509 | ) | | | (115,329 | ) | | | | | (66,096 | ) | | | (268,886 | ) |
| | Class P | | | | | (164,610 | ) | | | - | | | | | | (38,304 | ) | | | - | | | | | | (152,476 | ) | | | - | |
Net Decrease from Dividends and
Distributions to Shareholders | | | | | (181,572 | ) | | | (173,749 | ) | | | | | (79,684 | ) | | | (126,139 | ) | | | | | (228,321 | ) | | | (275,766 | ) |
CAPITAL SHARE TRANSACTIONS | | | | | | | | | | | | | | | | | | | | | | | | | | | | | | |
Proceeds from sale of shares | | | | | | | | | | | | | | | | | | | | | | | | | | | | | | |
| | Class I | | | | | 8,562 | | | | 12,518 | | | | | | 19,829 | | | | 16,545 | | | | | | 13,187 | | | | 19,203 | |
| | Class P | | | | | 295,495 | | | | 1,565,662 | | | | | | 131,899 | | | | 921,101 | | | | | | 32,778 | | | | 1,573,316 | |
Dividend and distribution reinvestments | | | | | | | | | | | | | | | | | | | | | | | | | | | | | | |
| | Class I | | | | | 4,207 | | | | 168,709 | | | | | | 28,972 | | | | 122,089 | | | | | | 68,164 | | | | 271,986 | |
| | Class P | | | | | 177,365 | | | | 5,040 | | | | | | 50,712 | | | | 4,050 | | | | | | 160,157 | | | | 3,780 | |
Cost of shares repurchased | | | | | | | | | | | | | | | | | | | | | | | | | | | | | | |
| | Class I | | | | | (8,042 | ) | | | (1,609,665 | ) | | | | | (97,566 | ) | | | (998,571 | ) | | | | | (62,365 | ) | | | (1,728,046 | ) |
| | Class P | | | | | (571,728 | ) | | | (110,367 | ) | | | | | (228,860 | ) | | | (83,255 | ) | | | | | (752,616 | ) | | | (84,650 | ) |
Net Increase (Decrease) in Net Assets from
Capital Share Transactions | | | | | (94,141 | ) | | | 31,897 | | | | | | (95,014 | ) | | | (18,041 | ) | | | | | (540,695 | ) | | | 55,589 | |
NET INCREASE (DECREASE) IN NET ASSETS | | | | | (14,966 | ) | | | (173,117 | ) | | | | | 61,675 | | | | (138,409 | ) | | | | | (645,605 | ) | | | (314,692 | ) |
NET ASSETS | | | | | | | | | | | | | | | | | | | | | | | | | | | | | | |
Beginning of Year | | | | | 1,428,745 | | | | 1,601,862 | | | | | | 1,381,251 | | | | 1,519,660 | | | | | | 1,716,788 | | | | 2,031,480 | |
End of Year | | | | | $1,413,779 | | | | $1,428,745 | | | | | | $1,442,926 | | | | $1,381,251 | | | | | | $1,071,183 | | | | $1,716,788 | |
Undistributed/Accumulated Net Investment Income (Loss) | | | | | N/A | | | | N/A | | | | | | N/A | | | | N/A | | | | | | N/A | | | | N/A | |
| (1) | Effective May 1, 2011, the Fund adopted a Multi-Class Plan pursuant to Rule 18f-3 of the Investment Company Act of 1940, as amended, under which, the Fund offers two separate share classes, Class I and Class P (see Note 1 in Notes to Financial Statements). |
| N/A | Not applicable (see Net Assets Consist of in Statements of Assets and Liabilities). |
| | |
| See Notes to Financial Statements | | |
C-23
PACIFIC SELECT FUND
STATEMENTS OF CHANGES IN NET ASSETS (1) (Continued)
(In thousands)
| | | | | | | | | | | | | | | | | | | | | | | | | | | | | | | | |
| | | | | | | Year Ended
December 31,
2012 | | | Year Ended
December 31,
2011 | | | | | Year Ended
December 31,
2012 | | | Year Ended
December 31,
2011 | | | | | Year Ended
December 31,
2012 | | | Year Ended
December 31,
2011 | |
| | | | | | |
Mid-Cap Growth Portfolio | | | | | Mid-Cap Value Portfolio | | | | | Small-Cap Equity Portfolio | |
OPERATIONS | | | | | | | | | | | | | | | | | | | | | | | | | | | | | | |
Net investment income (loss) | | | | | $4,909 | | | | ($2,873 | ) | | | | | $14,624 | | | | $11,947 | | | | | | $18,744 | | | | $9,382 | |
Net realized gain | | | | | 58,882 | | | | 198,906 | | | | | | 73,732 | | | | 100,829 | | | | | | 28,717 | | | | 43,828 | |
Change in net unrealized appreciation (depreciation) | | | | | 12,938 | | | | (268,190 | ) | | | | | 80,984 | | | | (170,913 | ) | | | | | 108,991 | | | | (88,809 | ) |
Net Increase (Decrease) in Net Assets
Resulting from Operations | | | | | 76,729 | | | | (72,157 | ) | | | | | 169,340 | | | | (58,137 | ) | | | | | 156,452 | | | | (35,599 | ) |
DIVIDENDS AND DISTRIBUTIONS TO SHAREHOLDERS | | | | | | | | | | | | | | | | | | | | | | | | | | | | | | |
Net investment income | | | | | | | | | | | | | | | | | | | | | | | | | | | | | | |
| | Class I | | | | | (823 | ) | | | - | | | | | | (504 | ) | | | (32,907 | ) | | | | | (681 | ) | | | (2,580 | ) |
| | Class P | | | | | (3,087 | ) | | | - | | | | | | (14,454 | ) | | | (4,820 | ) | | | | | (16,911 | ) | | | (4,490 | ) |
Net realized gains | | | | | | | | | | | | | | | | | | | | | | | | | | | | | | |
| | Class I | | | | | (47,680 | ) | | | (74,196 | ) | | | | | (3,727 | ) | | | (212,605 | ) | | | | | (2,166 | ) | | | (161,674 | ) |
| | Class P | | | | | (151,224 | ) | | | - | | | | | | (97,101 | ) | | | - | | | | | | (41,662 | ) | | | - | |
Net Decrease from Dividends and
Distributions to Shareholders | | | | | (202,814 | ) | | | (74,196 | ) | | | | | (115,786 | ) | | | (250,332 | ) | | | | | (61,420 | ) | | | (168,744 | ) |
CAPITAL SHARE TRANSACTIONS | | | | | | | | | | | | | | | | | | | | | | | | | | | | | | |
Proceeds from sale of shares | | | | | | | | | | | | | | | | | | | | | | | | | | | | | | |
| | Class I | | | | | 31,966 | | | | 48,868 | | | | | | 25,117 | | | | 25,060 | | | | | | 16,294 | | | | 20,075 | |
| | Class P | | | | | 37,054 | | | | 954,082 | | | | | | 561,776 | | | | 1,116,315 | | | | | | 89,135 | | | | 1,060,100 | |
Dividend and distribution reinvestments | | | | | | | | | | | | | | | | | | | | | | | | | | | | | | |
| | Class I | | | | | 48,503 | | | | 74,196 | | | | | | 4,231 | | | | 245,512 | | | | | | 2,847 | | | | 164,254 | |
| | Class P | | | | | 154,311 | | | | - | | | | | | 111,555 | | | | 4,820 | | | | | | 58,573 | | | | 4,490 | |
Cost of shares repurchased | | | | | | | | | | | | | | | | | | | | | | | | | | | | | | |
| | Class I | | | | | (61,348 | ) | | | (1,199,366 | ) | | | | | (22,468 | ) | | | (1,192,980 | ) | | | | | (18,343 | ) | | | (1,068,247 | ) |
| | Class P | | | | | (360,896 | ) | | | (48,178 | ) | | | | | (372,801 | ) | | | (56,824 | ) | | | | | (242,567 | ) | | | (64,574 | ) |
Net Increase (Decrease) in Net Assets from
Capital Share Transactions | | | | | (150,410 | ) | | | (170,398 | ) | | | | | 307,410 | | | | 141,903 | | | | | | (94,061 | ) | | | 116,098 | |
NET INCREASE (DECREASE) IN NET ASSETS | | | | | (276,495 | ) | | | (316,751 | ) | | | | | 360,964 | | | | (166,566 | ) | | | | | 971 | | | | (88,245 | ) |
NET ASSETS | | | | | | | | | | | | | | | | | | | | | | | | | | | | | | |
Beginning of Year | | | | | 992,236 | | | | 1,308,987 | | | | | | 1,010,689 | | | | 1,177,255 | | | | | | 1,001,124 | | | | 1,089,369 | |
End of Year | | | | | $715,741 | | | | $992,236 | | | | | | $1,371,653 | | | | $1,010,689 | | | | | | $1,002,095 | | | | $1,001,124 | |
Undistributed/Accumulated Net Investment Income (Loss) | | | | | N/A | | | | N/A | | | | | | N/A | | | | N/A | | | | | | N/A | | | | N/A | |
| (1) | Effective May 1, 2011, the Fund adopted a Multi-Class Plan pursuant to Rule 18f-3 of the Investment Company Act of 1940, as amended, under which, the Fund offers two separate share classes, Class I and Class P (see Note 1 in Notes to Financial Statements). |
| N/A | Not applicable (see Net Assets Consist of in Statements of Assets and Liabilities). |
| | |
| See Notes to Financial Statements | | |
C-24
PACIFIC SELECT FUND
STATEMENTS OF CHANGES IN NET ASSETS (1) (Continued)
(In thousands)
| | | | | | | | | | | | | | | | | | | | | | | | | | | | | | | | |
| | | | | | | Year Ended
December 31,
2012 | | | Year Ended
December 31,
2011 | | | | | Year Ended
December 31,
2012 | | | Year Ended
December 31,
2011 | | | | | Year Ended
December 31,
2012 | | | Year Ended
December 31,
2011 | |
| | | | | | |
Small-Cap Growth Portfolio | | | | | Small-Cap Index Portfolio | | | | | Small-Cap Value Portfolio | |
OPERATIONS | | | | | | | | | | | | | | | | | | | | | | | | | | | | | | |
Net investment income (loss) | | | | | $1,357 | | | | ($3,342 | ) | | | | | $10,404 | | | | $3,518 | | | | | | $10,352 | | | | $8,669 | |
Net realized gain | | | | | 75,252 | | | | 63,463 | | | | | | 12,046 | | | | 10,126 | | | | | | 35,325 | | | | 49,014 | |
Change in net unrealized appreciation (depreciation) | | | | | (9,504 | ) | | | (77,838 | ) | | | | | 60,216 | | | | (34,979 | ) | | | | | 7,199 | | | | (42,569 | ) |
Net Increase (Decrease) in Net Assets
Resulting from Operations | | | | | 67,105 | | | | (17,717 | ) | | | | | 82,666 | | | | (21,335 | ) | | | | | 52,876 | | | | 15,114 | |
DIVIDENDS AND DISTRIBUTIONS TO SHAREHOLDERS | | | | | | | | | | | | | | | | | | | | | | | | | | | | | | |
Net investment income | | | | | | | | | | | | | | | | | | | | | | | | | | | | | | |
| | Class I | | | | | (87 | ) | | | - | | | | | | (3,903 | ) | | | (2,340 | ) | | | | | (3,177 | ) | | | (4,220 | ) |
| | Class P | | | | | (923 | ) | | | - | | | | | | (5,065 | ) | | | (230 | ) | | | | | (7,421 | ) | | | (2,650 | ) |
Net realized gains | | | | | | | | | | | | | | | | | | | | | | | | | | | | | | |
| | Class I | | | | | (15,481 | ) | | | (78,108 | ) | | | | | (5,974 | ) | | | - | | | | | | (17,922 | ) | | | (81,508 | ) |
| | Class P | �� | | | | (47,983 | ) | | | - | | | | | | (4,152 | ) | | | - | | | | | | (31,093 | ) | | | - | |
Net Decrease from Dividends and
Distributions to Shareholders | | | | | (64,474 | ) | | | (78,108 | ) | | | | | (19,094 | ) | | | (2,570 | ) | | | | | (59,613 | ) | | | (88,378 | ) |
CAPITAL SHARE TRANSACTIONS | | | | | | | | | | | | | | | | | | | | | | | | | | | | | | |
Proceeds from sale of shares | | | | | | | | | | | | | | | | | | | | | | | | | | | | | | |
| | Class I | | | | | 16,139 | | | | 26,520 | | | | | | 29,942 | | | | 30,602 | | | | | | 15,328 | | | | 32,450 | |
| | Class P | | | | | 11,714 | | | | 503,364 | | | | | | 305,336 | | | | 62,580 | | | | | | 237 | | | | 361,891 | |
Dividend and distribution reinvestments | | | | | | | | | | | | | | | | | | | | | | | | | | | | | | |
| | Class I | | | | | 15,568 | | | | 78,108 | | | | | | 9,877 | | | | 2,340 | | | | | | 21,099 | | | | 85,728 | |
| | Class P | | | | | 48,906 | | | | - | | | | | | 9,217 | | | | 230 | | | | | | 38,514 | | | | 2,650 | |
Cost of shares repurchased | | | | | | | | | | | | | | | | | | | | | | | | | | | | | | |
| | Class I | | | | | (30,150 | ) | | | (594,464 | ) | | | | | (64,499 | ) | | | (163,525 | ) | | | | | (38,768 | ) | | | (500,947 | ) |
| | Class P | | | | | (118,448 | ) | | | (25,304 | ) | | | | | (18,888 | ) | | | (4,158 | ) | | | | | (32,632 | ) | | | (26,664 | ) |
Net Increase (Decrease) in Net Assets from
Capital Share Transactions | | | | | (56,271 | ) | | | (11,776 | ) | | | | | 270,985 | | | | (71,931 | ) | | | | | 3,778 | | | | (44,892 | ) |
NET INCREASE (DECREASE) IN NET ASSETS | | | | | (53,640 | ) | | | (107,601 | ) | | | | | 334,557 | | | | (95,836 | ) | | | | | (2,959 | ) | | | (118,156 | ) |
NET ASSETS | | | | | | | | | | | | | | | | | | | | | | | | | | | | | | |
Beginning of Year | | | | | 551,122 | | | | 658,723 | | | | | | 411,528 | | | | 507,364 | | | | | | 494,614 | | | | 612,770 | |
End of Year | | | | | $497,482 | | | | $551,122 | | | | | | $746,085 | | | | $411,528 | | | | | | $491,655 | | | | $494,614 | |
Undistributed/Accumulated Net Investment Income (Loss) | | | | | N/A | | | | N/A | | | | | | N/A | | | | N/A | | | | | | N/A | | | | N/A | |
| (1) | Effective May 1, 2011, the Fund adopted a Multi-Class Plan pursuant to Rule 18f-3 of the Investment Company Act of 1940, as amended, under which, the Fund offers two separate share classes, Class I and Class P (see Note 1 in Notes to Financial Statements). |
| N/A | Not applicable (see Net Assets Consist of in Statements of Assets and Liabilities). |
| | |
| See Notes to Financial Statements | | |
C-25
PACIFIC SELECT FUND
STATEMENTS OF CHANGES IN NET ASSETS (1) (Continued)
(In thousands)
| | | | | | | | | | | | | | | | | | | | | | | | | | | | | | | | |
| | | | | | | Year Ended
December 31,
2012 | | | Year Ended
December 31,
2011 | | | | | Year Ended
December 31,
2012 | | | Year Ended
December 31,
2011 | | | | | Year Ended
December 31,
2012 | | | Year Ended
December 31,
2011 | |
| | | | | | |
Health Sciences Portfolio | | | | | Real Estate Portfolio | | | | | Technology Portfolio | |
OPERATIONS | | | | | | | | | | | | | | | | | | | | | | | | | | | | | | |
Net investment income (loss) | | | | | ($684 | ) | | | ($1,234 | ) | | | | | $15,970 | | | | $2,858 | | | | | | ($386 | ) | | | ($425 | ) |
Net realized gain | | | | | 31,557 | | | | 7,834 | | | | | | 30,235 | | | | 49,991 | | | | | | 2,308 | | | | 6,979 | |
Change in net unrealized appreciation (depreciation) | | | | | 1,515 | | | | 5,124 | | | | | | 54,814 | | | | (15,078 | ) | | | | | 2,813 | | | | (11,110 | ) |
Net Increase (Decrease) in Net
Assets Resulting from Operations | | | | | 32,388 | | | | 11,724 | | | | | | 101,019 | | | | 37,771 | | | | | | 4,735 | | | | (4,556 | ) |
DIVIDENDS AND DISTRIBUTIONS TO SHAREHOLDERS | | | | | | | | | | | | | | | | | | | | | | | | | | | | | | |
Net investment income | | | | | | | | | | | | | | | | | | | | | | | | | | | | | | |
| | Class I | | | | | - | | | | - | | | | | | (3,261 | ) | | | - | | | | | | - | | | | - | |
| | Class P | | | | | - | | | | - | | | | | | (10,789 | ) | | | (3,270 | ) | | | | | - | | | | - | |
Net realized gains | | | | | | | | | | | | | | | | | | | | | | | | | | | | | | |
| | Class I | | | | | (7,832 | ) | | | (8,420 | ) | | | | | (12,705 | ) | | | (23,429 | ) | | | | | (6,978 | ) | | | (16,479 | ) |
| | Class P | | | | | (1 | ) | | | - | | | | | | (37,288 | ) | | | - | | | | | | (1 | ) | | | - | |
Net Decrease from Dividends and
Distributions to Shareholders | | | | | (7,833 | ) | | | (8,420 | ) | | | | | (64,043 | ) | | | (26,699 | ) | | | | | (6,979 | ) | | | (16,479 | ) |
CAPITAL SHARE TRANSACTIONS | | | | | | | | | | | | | | | | | | | | | | | | | | | | | | |
Proceeds from sale of shares | | | | | | | | | | | | | | | | | | | | | | | | | | | | | | |
| | Class I | | | | | 30,673 | | | | 43,552 | | | | | | 43,661 | | | | 57,333 | | | | | | 17,758 | | | | 29,017 | |
| | Class P | | | | | - | | | | 10 | | | | | | 527,815 | | | | 373,453 | | | | | | - | | | | 10 | |
Dividend and distribution reinvestments | | | | | | | | | | | | | | | | | | | | | | | | | | | | | | |
| | Class I | | | | | 7,832 | | | | 8,420 | | | | | | 15,966 | | | | 23,429 | | | | | | 6,978 | | | | 16,479 | |
| | Class P | | | | | 1 | | | | - | | | | | | 48,077 | | | | 3,270 | | | | | | 1 | | | | - | |
Cost of shares repurchased | | | | | | | | | | | | | | | | | | | | | | | | | | | | | | |
| | Class I | | | | | (29,881 | ) | | | (37,593 | ) | | | | | (55,399 | ) | | | (468,431 | ) | | | | | (26,742 | ) | | | (42,324 | ) |
| | Class P | | | | | - | | | | - | | | | | | (95,347 | ) | | | (30,711 | ) | | | | | - | | | | - | |
Net Increase (Decrease) in Net Assets from
Capital Share Transactions | | | | | 8,625 | | | | 14,389 | | | | | | 484,773 | | | | (41,657 | ) | | | | | (2,005 | ) | | | 3,182 | |
NET INCREASE (DECREASE) IN NET ASSETS | | | | | 33,180 | | | | 17,693 | | | | | | 521,749 | | | | (30,585 | ) | | | | | (4,249 | ) | | | (17,853 | ) |
NET ASSETS | | | | | | | | | | | | | | | | | | | | | | | | | | | | | | |
Beginning of Year | | | | | 123,686 | | | | 105,993 | | | | | | 593,714 | | | | 624,299 | | | | | | 72,407 | | | | 90,260 | |
End of Year | | | | | $156,866 | | | | $123,686 | | | | | | $1,115,463 | | | | $593,714 | | | | | | $68,158 | | | | $72,407 | |
Undistributed/Accumulated Net Investment Income (Loss) | | | | | N/A | | | | N/A | | | | | | N/A | | | | N/A | | | | | | N/A | | | | N/A | |
| (1) | Effective May 1, 2011, the Fund adopted a Multi-Class Plan pursuant to Rule 18f-3 of the Investment Company Act of 1940, as amended, under which, the Fund offers two separate share classes, Class I and Class P (see Note 1 in Notes to Financial Statements). |
| N/A | Not applicable (see Net Assets Consist of in Statements of Assets and Liabilities). |
| | |
| See Notes to Financial Statements | | |
C-26
PACIFIC SELECT FUND
STATEMENTS OF CHANGES IN NET ASSETS (1) (Continued)
(In thousands)
| | | | | | | | | | | | | | | | | | | | | | | | | | | | | | | | |
| | | | | | | Year Ended
December 31,
2012 | | | Year Ended
December 31,
2011 | | | | | Year Ended
December 31,
2012 | | | Year Ended
December 31,
2011 | | | | | Year Ended
December 31,
2012 | | | Year Ended
December 31,
2011 | |
| | | | | | | Emerging Markets Portfolio | | | | | International Large-Cap Portfolio | | | | | International Small-Cap Portfolio | |
OPERATIONS | | | | | | | | | | | | | | | | | | | | | | | | | | | | | | |
Net investment income | | | | | $13,489 | | | | $14,327 | | | | | | $41,743 | | | | $40,972 | | | | | | $28,024 | | | | $21,055 | |
Net realized gain | | | | | 134,290 | | | | 181,305 | | | | | | 80,545 | | | | 28,122 | | | | | | 10,409 | | | | 73,721 | |
Change in net unrealized appreciation (depreciation) | | | | | 148,089 | | | | (510,526 | ) | | | | | 318,626 | | | | (308,189 | ) | | | | | 170,411 | | | | (249,800 | ) |
Net Increase (Decrease) in Net Assets
Resulting from Operations | | | | | 295,868 | | | | (314,894 | ) | | | | | 440,914 | | | | (239,095 | ) | | | | | 208,844 | | | | (155,024 | ) |
DIVIDENDS AND DISTRIBUTIONS TO SHAREHOLDERS | | | | | | | | | | | | | | | | | | | | | | | | | | | | | | |
Net investment income | | | | | | | | | | | | | | | | | | | | | | | | | | | | | | |
| | Class I | | | | | (3,215 | ) | | | (17,154 | ) | | | | | (6,114 | ) | | | (30,068 | ) | | | | | (1,109 | ) | | | (24,193 | ) |
| | Class P | | | | | (9,785 | ) | | | (3,964 | ) | | | | | (33,919 | ) | | | (8,479 | ) | | | | | (25,922 | ) | | | (7,063 | ) |
Net realized gains | | | | | | | | | | | | | | | | | | | | | | | | | | | | | | |
| | Class I | | | | | (45,694 | ) | | | - | | | | | | - | | | | - | | | | | | - | | | | - | |
| | Class P | | | | | (111,032 | ) | | | - | | | | | | - | | | | - | | | | | | - | | | | - | |
Net Decrease from Dividends and
Distributions to Shareholders | | | | | (169,726 | ) | | | (21,118 | ) | | | | | (40,033 | ) | | | (38,547 | ) | | | | | (27,031 | ) | | | (31,256 | ) |
CAPITAL SHARE TRANSACTIONS | | | | | | | | | | | | | | | | | | | | | | | | | | | | | | |
Proceeds from sale of shares | | | | | | | | | | | | | | | | | | | | | | | | | | | | | | |
| | Class I | | | | | 54,314 | | | | 69,096 | | | | | | 43,774 | | | | 65,315 | | | | | | 12,731 | | | | 14,342 | |
| | Class P | | | | | 46,264 | | | | 1,243,522 | | | | | | 94,348 | | | | 2,190,840 | | | | | | 76,437 | | | | 1,287,789 | |
Dividend and distribution reinvestments | | | | | | | | | | | | | | | | | | | | | | | | | | | | | | |
| | Class I | | | | | 48,909 | | | | 17,154 | | | | | | 6,114 | | | | 30,068 | | | | | | 1,109 | | | | 24,193 | |
| | Class P | | | | | 120,817 | | | | 3,964 | | | | | | 33,919 | | | | 8,479 | | | | | | 25,922 | | | | 7,063 | |
Cost of shares repurchased | | | | | | | | | | | | | | | | | | | | | | | | | | | | | | |
| | Class I | | | | | (71,970 | ) | | | (1,390,570 | ) | | | | | (54,938 | ) | | | (2,192,234 | ) | | | | | (11,838 | ) | | | (988,247 | ) |
| | Class P | | | | | (166,286 | ) | | | (62,759 | ) | | | | | (716,481 | ) | | | (109,429 | ) | | | | | (158,209 | ) | | | (64,924 | ) |
Net Increase (Decrease) in Net Assets from
Capital Share Transactions | | | | | 32,048 | | | | (119,593 | ) | | | | | (593,264 | ) | | | (6,961 | ) | | | | | (53,848 | ) | | | 280,216 | |
NET INCREASE (DECREASE) IN NET ASSETS | | | | | 158,190 | | | | (455,605 | ) | | | | | (192,383 | ) | | | (284,603 | ) | | | | | 127,965 | | | | 93,936 | |
NET ASSETS | | | | | | | | | | | | | | | | | | | | | | | | | | | | | | |
Beginning of Year | | | | | 1,397,694 | | | | 1,853,299 | | | | | | 2,194,778 | | | | 2,479,381 | | | | | | 1,088,542 | | | | 994,606 | |
End of Year | | | | | $1,555,884 | | | | $1,397,694 | | | | | | $2,002,395 | | | | $2,194,778 | | | | | | $1,216,507 | | | | $1,088,542 | |
Undistributed/Accumulated Net Investment Income (Loss) | | | | | ($6,161 | ) | | | ($8,331 | ) | | | | | $10,922 | | | | $9,895 | | | | | | $3,286 | | | | ($176 | ) |
| (1) | Effective May 1, 2011, the Fund adopted a Multi-Class Plan pursuant to Rule 18f-3 of the Investment Company Act of 1940, as amended, under which, the Fund offers two separate share classes, Class I and Class P (see Note 1 in Notes to Financial Statements). |
| | |
| See Notes to Financial Statements | | |
C-27
PACIFIC SELECT FUND
STATEMENTS OF CHANGES IN NET ASSETS (1) (Continued)
(In thousands)
| | | | | | | | | | | | | | | | | | | | | | | | | | | | |
| | | | | | | Year Ended
December 31,
2012 | | | Year Ended
December 31,
2011 | | | | | Period Ended
December 31,
2012 | | | | | | | Period Ended
December 31,
2012 | | | |
| | | | | | | International Value Portfolio | | | | | Currency Strategies Portfolio (2) | | | |
Global Absolute Return Portfolio (2) |
OPERATIONS | | | | | | | | | | | | | | | | | | | | | | | | | | |
Net investment income (loss) | | | | | $49,776 | | | | $44,469 | | | | | | ($1,873 | ) | | | | | | | $10,716 | | | |
Net realized loss | | | | | (108,100 | ) | | | (133,961 | ) | | | | | (24,041 | ) | | | | | | | (24,199 | ) | | |
Change in net unrealized appreciation (depreciation) | | | | | 313,584 | | | | (118,295 | ) | | | | | 9,699 | | | | | | | | 10,319 | | | |
Net Increase (Decrease) in Net Assets
Resulting from Operations | | | | | 255,260 | | | | (207,787 | ) | | | | | (16,215 | ) | | | | | | | (3,164 | ) | | |
DIVIDENDS AND DISTRIBUTIONS TO SHAREHOLDERS | | | | | | | | | | | | | | | | | | | | | | | | | | |
Net investment income | | | | | | | | | | | | | | | | | | | | | | | | | | |
| | Class I | | | | | (10,295 | ) | | | (45,380 | ) | | | | | - | | | | | | | | - | | | |
| | Class P | | | | | (48,122 | ) | | | (7,484 | ) | | | | | - | | | | | | | | - | | | |
Net realized gains | | | | | | | | | | | | | | | | | | | | | | | | | | |
| | Class I | | | | | - | | | | - | | | | | | - | | | | | | | | - | | | |
| | Class P | | | | | - | | | | - | | | | | | - | | | | | | | | - | | | |
Net Decrease from Dividends and
Distributions to Shareholders | | | | | (58,417 | ) | | | (52,864 | ) | | | | | - | | | | | | | | - | | | |
CAPITAL SHARE TRANSACTIONS | | | | | | | | | | | | | | | | | | | | | | | | | | |
Proceeds from sale of shares | | | | | | | | | | | | | | | | | | | | | | | | | | |
| | Class I | | | | | 34,202 | | | | 31,337 | | | | | | 374 | | | | | | | | 1,156 | | | |
| | Class P | | | | | 266,076 | | | | 1,369,823 | | | | | | 1,521,796 | | | | | | | | 2,083,670 | | | |
Dividend and distribution reinvestments | | | | | | | | | | | | | | | | | | | | | | | | | | |
| | Class I | | | | | 10,295 | | | | 45,380 | | | | | | - | | | | | | | | - | | | |
| | Class P | | | | | 48,122 | | | | 7,484 | | | | | | - | | | | | | | | - | | | |
Cost of shares repurchased | | | | | | | | | | | | | | | | | | | | | | | | | | |
| | Class I | | | | | (49,728 | ) | | | (1,377,742 | ) | | | | | (146 | ) | | | | | | | (236 | ) | | |
| | Class P | | | | | (377,455 | ) | | | (68,558 | ) | | | | | (47,448 | ) | | | | | | | (50,682 | ) | | |
Net Increase (Decrease) in Net Assets from
Capital Share Transactions | | | | | (68,488 | ) | | | 7,724 | | | | | | 1,474,576 | | | | | | | | 2,033,908 | | | |
NET INCREASE (DECREASE) IN NET ASSETS | | | | | 128,355 | | | | (252,927 | ) | | | | | 1,458,361 | | | | | | | | 2,030,744 | | | |
NET ASSETS | | | | | | | | | | | | | | | | | | | | | | | | | | |
Beginning of Year or Period | | | | | 1,410,555 | | | | 1,663,482 | | | | | | - | | | | | | | | - | | | |
End of Year or Period | | | | | $1,538,910 | | | | $1,410,555 | | | | | | $1,458,361 | | | | | | | | $2,030,744 | | | |
Undistributed/Accumulated Net Investment Income (Loss) | | | | | $10,919 | | | | $21,936 | | | | | | ($10,041 | ) | | | | | | | ($14,708 | ) | | |
| (1) | Effective May 1, 2011, the Fund adopted a Multi-Class Plan pursuant to Rule 18f-3 of the Investment Company Act of 1940, as amended, under which, the Fund offers two separate share classes, Class I and Class P (see Note 1 in Notes to Financial Statements). |
| (2) | Operations commenced on September 28, 2012. |
| | |
| See Notes to Financial Statements | | |
C-28
PACIFIC SELECT FUND
STATEMENTS OF CHANGES IN NET ASSETS (1) (Continued)
(In thousands)
| | | | | | | | | | | | | | | | | | | | | | | | | | | | | | |
| | | | | | | Period Ended
December 31,
2012 | | | | | | | Year Ended
December 31,
2012 | | | Year Ended
December 31,
2011 | | | | | Year Ended
December 31,
2012 | | | Year Ended
December 31,
2011 | |
| | | | | | | Precious Metals
Portfolio (2) | | | | American Funds Asset
Allocation Portfolio | | | | | Pacific Dynamix –
Conservative Growth Portfolio | |
OPERATIONS | | | | | | | | | | | | | | | | | | | | | | | | | | | | |
Net investment income (loss) | | | | | ($45 | ) | | | | | | | $8,506 | | | | $4,291 | | | | | | $3,610 | | | | $3,465 | |
Net realized gain (loss) | | | | | (4,032 | ) | | | | | | | 5,993 | | | | 5,405 | | | | | | 2,555 | | | | 7,186 | |
Change in net unrealized appreciation (depreciation) | | | | | (127,402 | ) | | | | | | | 40,541 | | | | (8,343 | ) | | | | | 9,974 | | | | (5,468 | ) |
Net Increase (Decrease) in Net Assets
Resulting from Operations | | | | | (131,479 | ) | | | | | | | 55,040 | | | | 1,353 | | | | | | 16,139 | | | | 5,183 | |
DIVIDENDS AND DISTRIBUTIONS TO SHAREHOLDERS | | | | | | | | | | | | | | | | | | | | | | | | | | | | |
Net investment income | | | | | | | | | | | | | | | | | | | | | | | | | | | | |
| | Class I | | | | | - | | | | | | | | (9,011 | ) | | | (8,392 | ) | | | | | (3,424 | ) | | | (3,468 | ) |
| | Class P | | | | | - | | | | | | | | | | | | | | | | | | | | | | | |
Net realized gains | | | | | | | | | | | | | | | | | | | | | | | | | | | | |
| | Class I | | | | | - | | | | | | | | (5,406 | ) | | | (3,462 | ) | | | | | (7,187 | ) | | | (7,041 | ) |
| | Class P | | | | | - | | | | | | | | | | | | | | | | | | | | | | | |
Net Decrease from Dividends and
Distributions to Shareholders | | | | | - | | | | | | | | (14,417 | ) | | | (11,854 | ) | | | | | (10,611 | ) | | | (10,509 | ) |
CAPITAL SHARE TRANSACTIONS | | | | | | | | | | | | | | | | | | | | | | | | | | | | |
Proceeds from sale of shares | | | | | | | | | | | | | | | | | | | | | | | | | | | | |
| | Class I | | | | | 2,650 | | | | | | | | 260,786 | | | | 72,926 | | | | | | 112,650 | | | | 56,815 | |
| | Class P | | | | | 964,577 | | | | | | | | | | | | | | | | | | | | | | | |
Dividend and distribution reinvestments | | | | | | | | | | | | | | | | | | | | | | | | | | | | |
| | Class I | | | | | - | | | | | | | | 14,417 | | | | 11,854 | | | | | | 10,611 | | | | 10,509 | |
| | Class P | | | | | - | | | | | | | | | | | | | | | | | | | | | | | |
Cost of shares repurchased | | | | | | | | | | | | | | | | | | | | | | | | | | | | |
| | Class I | | | | | (159 | ) | | | | | | | (22,893 | ) | | | (24,408 | ) | | | | | (14,364 | ) | | | (57,281 | ) |
| | Class P | | | | | (12,767 | ) | | | | | | | | | | | | | | | | | | | | | | |
Net Increase in Net Assets from
Capital Share Transactions | | | | | 954,301 | | | | | | | | 252,310 | | | | 60,372 | | | | | | 108,897 | | | | 10,043 | |
NET INCREASE IN NET ASSETS | | | | | 822,822 | | | | | | | | 292,933 | | | | 49,871 | | | | | | 114,425 | | | | 4,717 | |
NET ASSETS | | | | | | | | | | | | | | | | | | | | | | | | | | | | |
Beginning of Year or Period | | | | | - | | | | | | | | 278,159 | | | | 228,288 | | | | | | 134,491 | | | | 129,774 | |
End of Year or Period | | | | | $822,822 | | | | | | | | $571,092 | | | | $278,159 | | | | | | $248,916 | | | | $134,491 | |
Undistributed/Accumulated Net Investment Income (Loss) | | | | | N/A | | | | | | | | N/A | | | | N/A | | | | | | N/A | | | | N/A | |
| (1) | Effective May 1, 2011, the Fund adopted a Multi-Class Plan pursuant to Rule 18f-3 of the Investment Company Act of 1940, as amended, under which, the Fund offers two separate share classes, Class I and Class P. American Funds Asset Allocation and Pacific Dynamix — Conservative Growth Portfolios presented on these Statements of Changes in Net Assets offer Class I shares only (see Note 1 in Notes to Financial Statements). |
| (2) | Operations commenced on September 28, 2012. |
| N/A | Not applicable (see Net Assets Consist of in Statements of Assets and Liabilities). |
| | |
| See Notes to Financial Statements | | |
C-29
PACIFIC SELECT FUND
STATEMENTS OF CHANGES IN NET ASSETS (1) (Continued)
(In thousands)
| | | | | | | | | | | | | | | | | | | | | | | | | | | | | | | | |
| | | | | | | Year Ended
December 31,
2012 | | | Year/Period Ended
December 31,
2011 | | | | | Year Ended
December 31,
2012 | | | Year/Period Ended
December 31,
2011 | | | | | Year Ended
December 31,
2012 | | | Period Ended
December 31,
2011 | |
| | | | | | | Pacific Dynamix – Moderate
Growth Portfolio | | | | | Pacific Dynamix – Growth Portfolio | | | | | Portfolio Optimization
Conservative Portfolio (2) | |
OPERATIONS | | | | | | | | | | | | | | | | | | | | | | | | | | | | | | |
Net investment income | | | | | $9,530 | | | | $6,529 | | | | | | $3,603 | | | | $3,224 | | | | | | $92,921 | | | | $30,895 | |
Net realized gain | | | | | 7,110 | | | | 7,476 | | | | | | 8,074 | | | | 4,907 | | | | | | 116,635 | | | | 3,813 | |
Change in net unrealized appreciation (depreciation) | | | | | 30,919 | | | | (14,033 | ) | | | | | 17,283 | | | | (12,250 | ) | | | | | 127,051 | | | | (6,385 | ) |
Net Increase (Decrease) in Net Assets
Resulting from Operations | | | | | 47,559 | | | | (28 | ) | | | | | 28,960 | | | | (4,119 | ) | | | | | 336,607 | | | | 28,323 | |
DIVIDENDS AND DISTRIBUTIONS TO SHAREHOLDERS | | | | | | | | | | | | | | | | | | | | | | | | | | | | | | |
Net investment income - Class I | | | | | (9,034 | ) | | | (6,532 | ) | | | | | (3,594 | ) | | | (3,224 | ) | | | | | (88,317 | ) | | | (30,880 | ) |
Net realized gains - Class I | | | | | (7,475 | ) | | | (4,894 | ) | | | | | (8,562 | ) | | | (3,323 | ) | | | | | (3,812 | ) | | | (376 | ) |
Net Decrease from Dividends and
Distributions to Shareholders | | | | | (16,509 | ) | | | (11,426 | ) | | | | | (12,156 | ) | | | (6,547 | ) | | | | | (92,129 | ) | | | (31,256 | ) |
CAPITAL SHARE TRANSACTIONS | | | | | | | | | | | | | | | | | | | | | | | | | | | | | | |
Proceeds from sale of shares - Class I | | | | | 323,933 | | | | 151,612 | | | | | | 71,416 | | | | 94,708 | | | | | | 498,987 | | | | 3,865,473 | |
Dividend and distribution reinvestments - Class I | | | | | 16,509 | | | | 11,426 | | | | | | 12,156 | | | | 6,547 | | | | | | 92,129 | | | | 31,256 | |
Cost of shares repurchased - Class I | | | | | (16,271 | ) | | | (20,267 | ) | | | | | (25,120 | ) | | | (10,140 | ) | | | | | (614,403 | ) | | | (341,692 | ) |
Net Increase (Decrease) in Net Assets from
Capital Share Transactions | | | | | 324,171 | | | | 142,771 | | | | | | 58,452 | | | | 91,115 | | | | | | (23,287 | ) | | | 3,555,037 | |
NET INCREASE IN NET ASSETS | | | | | 355,221 | | | | 131,317 | | | | | | 75,256 | | | | 80,449 | | | | | | 221,191 | | | | 3,552,104 | |
NET ASSETS | | | | | | | | | | | | | | | | | | | | | | | | | | | | | | |
Beginning of Year or Period | | | | | 289,387 | | | | 158,070 | | | | | | 188,875 | | | | 108,426 | | | | | | 3,552,104 | | | | - | |
End of Year or Period | | | | | $644,608 | | | | $289,387 | | | | | | $264,131 | | | | $188,875 | | | | | | $3,773,295 | | | | $3,552,104 | |
Undistributed/Accumulated Net Investment Income (Loss) | | | | | N/A | | | | N/A | | | | | | N/A | | | | N/A | | | | | | N/A | | | | N/A | |
| | | | | | | Portfolio Optimization
Moderate-Conservative Portfolio (2) | | | | | Portfolio Optimization
Moderate Portfolio (2) | | | | | Portfolio Optimization
Growth Portfolio (2) | |
OPERATIONS | | | | | | | | | | | | | | | | | | | | | | | | | | | | | | |
Net investment income | | | | | $110,211 | | | | $30,739 | | | | | | $316,315 | | | | $99,459 | | | | | | $226,185 | | | | $67,139 | |
Net realized gain (loss) | | | | | 154,271 | | | | 713 | | | | | | 772,887 | | | | (10,432 | ) | | | | | 725,721 | | | | (12,372 | ) |
Change in net unrealized appreciation (depreciation) | | | | | 211,855 | | | | (66,527 | ) | | | | | 738,475 | | | | (447,829 | ) | | | | | 731,988 | | | | (556,732 | ) |
Net Increase (Decrease) in Net Assets
Resulting from Operations | | | | | 476,337 | | | | (35,075 | ) | | | | | 1,827,677 | | | | (358,802 | ) | | | | | 1,683,894 | | | | (501,965 | ) |
DIVIDENDS AND DISTRIBUTIONS TO SHAREHOLDERS | | | | | | | | | | | | | | | | | | | | | | | | | | | | | | |
Net investment income - Class I | | | | | (104,748 | ) | | | (30,724 | ) | | | | | (300,650 | ) | | | (99,410 | ) | | | | | (214,990 | ) | | | (67,107 | ) |
Net realized gains - Class I | | | | | (713 | ) | | | - | | | | | | - | | | | - | | | | | | - | | | | - | |
Net Decrease from Dividends and
Distributions to Shareholders | | | | | (105,461 | ) | | | (30,724 | ) | | | | | (300,650 | ) | | | (99,410 | ) | | | | | (214,990 | ) | | | (67,107 | ) |
CAPITAL SHARE TRANSACTIONS | | | | | | | | | | | | | | | | | | | | | | | | | | | | | | |
Proceeds from sale of shares - Class I | | | | | 538,387 | | | | 4,379,619 | | | | | | 266,050 | | | | 16,043,212 | | | | | | 35,963 | | | | 13,967,454 | |
Dividend and distribution reinvestments - Class I | | | | | 105,461 | | | | 30,724 | | | | | | 300,650 | | | | 99,410 | | | | | | 214,990 | | | | 67,107 | |
Cost of shares repurchased - Class I | | | | | (351,667 | ) | | | (306,095 | ) | | | | | (1,534,049 | ) | | | (1,171,677 | ) | | | | | (1,656,465 | ) | | | (923,574 | ) |
Net Increase (Decrease) in Net Assets from
Capital Share Transactions | | | | | 292,181 | | | | 4,104,248 | | | | | | (967,349 | ) | | | 14,970,945 | | | | | | (1,405,512 | ) | | | 13,110,987 | |
NET INCREASE IN NET ASSETS | | | | | 663,057 | | | | 4,038,449 | | | | | | 559,678 | | | | 14,512,733 | | | | | | 63,392 | | | | 12,541,915 | |
NET ASSETS | | | | | | | | | | | | | | | | | | | | | | | | | | | | | | |
Beginning of Year or Period | | | | | 4,038,449 | | | | - | | | | | | 14,512,733 | | | | - | | | | | | 12,541,915 | | | | - | |
End of Year or Period | | | | | $4,701,506 | | | | $4,038,449 | | | | | | $15,072,411 | | | | $14,512,733 | | | | | | $12,605,307 | | | | $12,541,915 | |
Undistributed/Accumulated Net Investment Income (Loss) | | | | | N/A | | | | N/A | | | | | | N/A | | | | N/A | | | | | | N/A | | | | N/A | |
| (1) | Effective May 1, 2011, the Fund adopted a Multi-Class Plan pursuant to Rule 18f-3 of the Investment Company Act of 1940, as amended, under which, the Fund offers two separate share classes, Class I and Class P. All portfolios presented on these Statements of Changes in Net Assets offer Class I shares only (see Note 1 in Notes to Financial Statements). |
| (2) | Operations commenced on May 2, 2011. |
| N/A | Not applicable (see Net Assets Consist of in Statements of Assets and Liabilities). |
| | |
| See Notes to Financial Statements | | |
C-30
PACIFIC SELECT FUND
STATEMENTS OF CHANGES IN NET ASSETS (1) (Continued)
(In thousands)
| | | | | | | | | | | | | | | | | | | | | | | | |
| | | | | | | Year Ended
December 31,
2012 | | | Period Ended
December 31,
2011 | | | | | | | | | | | | | |
| | | | | | | Portfolio Optimization
Aggressive-Growth Portfolio (2) | | | | | | | | | | | | | |
OPERATIONS | | | | | | | | | | | | | | | | | | | | | | |
Net investment income | | | | | $38,672 | | | | $12,208 | | | | | | | | | | | | | |
Net realized gain (loss) | | | | | 153,092 | | | | (9,858 | ) | | | | | | | | | | | | |
Change in net unrealized appreciation (depreciation) | | | | | 191,119 | | | | (165,401 | ) | | | | | | | | | | | | |
Net Increase (Decrease) in Net Assets
Resulting from Operations | | | | | 382,883 | | | | (163,051 | ) | | | | | | | | | | | | |
DIVIDENDS AND DISTRIBUTIONS TO SHAREHOLDERS | | | | | | | | | | | | | | | | | | | | | | |
Net investment income - Class I | | | | | (36,761 | ) | | | (12,202 | ) | | | | | | | | | | | | |
Net realized gains - Class I | | | | | - | | | | - | | | | | | | | | | | | | |
Net Decrease from Dividends and
Distributions to Shareholders | | | | | (36,761 | ) | | | (12,202 | ) | | | | | | | | | | | | |
CAPITAL SHARE TRANSACTIONS | | | | | | | | | | | | | | | | | | | | | | |
Proceeds from sale of shares - Class I | | | | | 17,103 | | | | 3,135,312 | | | | | | | | | | | | | |
Dividend and distribution reinvestments - Class I | | | | | 36,761 | | | | 12,202 | | | | | | | | | | | | | |
Cost of shares repurchased - Class I | | | | | (428,112 | ) | | | (309,523 | ) | | | | | | | | | | | | |
Net Increase (Decrease) in Net Assets from
Capital Share Transactions | | | | | (374,248 | ) | | | 2,837,991 | | | | | | | | | | | | | |
NET INCREASE (DECREASE) IN NET ASSETS | | | | | (28,126 | ) | | | 2,662,738 | | | | | | | | | | | | | |
NET ASSETS | | | | | | | | | | | | | | | | | | | | | | |
Beginning of Year or Period | | | | | 2,662,738 | | | | - | | | | | | | | | | | | | |
End of Year or Period | | | | | $2,634,612 | | | | $2,662,738 | | | | | | | | | | | | | |
Undistributed/Accumulated Net Investment Income (Loss) | | | | | N/A | | | | N/A | | | | | | | | | | | | | |
| (1) | Effective May 1, 2011, the Fund adopted a Multi-Class Plan pursuant to Rule 18f-3 of the Investment Company Act of 1940, as amended, under which, the Fund offers two separate share classes, Class I and Class P. The portfolio presented on these Statements of Changes in Net Assets offers Class I shares only (see Note 1 in Notes to Financial Statements). |
| (2) | Operations commenced on May 2, 2011. |
| N/A | Not applicable (see Net Assets Consist of in Statements of Assets and Liabilities). |
| | |
| See Notes to Financial Statements | | |
C-31
PACIFIC SELECT FUND
STATEMENT OF CASH FLOWS (1)
FOR THE YEAR ENDED DECEMBER 31, 2012
(In thousands)
| | | | | | | | | | | | |
| | | | | | | Inflation
Managed
Portfolio | | | Long/Short
Large-Cap
Portfolio | |
CASH FLOWS FROM OPERATING ACTIVITIES: | | | | | | | | | | |
Net increase in net assets from operations | | | | | $207,265 | | | | $260,747 | |
Adjustments to reconcile net increase in net assets from operations to net cash
provided by operating activities: | | | | | | | | | | |
| | Purchases of long-term securities | | | | | (1,730,808 | ) | | | (1,486,660 | ) |
| | Proceeds from disposition of long-term securities | | | | | 3,708,562 | | | | 1,807,975 | |
| | Purchases to cover securities sold short | | | | | (1,081 | ) | | | (543,288 | ) |
| | Proceeds from securities sold short | | | | | - | | | | 494,824 | |
| | Proceeds (purchases) of short-term securities, net | | | | | 202,764 | | | | (5,653 | ) |
| | Proceeds (purchases) of foreign currency transactions | | | | | (2,566 | ) | | | - | |
| | (Increase) decrease in deposits with brokers for securities sold short | | | | | 1,081 | | | | - | |
| | (Increase) decrease in cash collateral received for securities on loan (2) | | | | | - | | | | 23,177 | |
| | Decrease in dividends and interest receivable | | | | | 14,333 | | | | 1,258 | |
| | (Increase) decrease in receivable for securities sold | | | | | 72,709 | | | | (3,962 | ) |
| | (Increase) decrease in receivable for swap agreements | | | | | 1,832 | | | | - | |
| | (Increase) decrease in swap premiums | | | | | 8,160 | | | | - | |
| | Increase in prepaid expenses and other assets | | | | | (9 | ) | | | (8 | ) |
| | Increase (decrease) in payable upon return of securities loaned | | | | | - | | | | (23,177 | ) |
| | Decrease in payable for securities purchased | | | | | (1,689,353 | ) | | | (1,950 | ) |
| | Increase (decrease) in payable due to custodian | | | | | - | | | | 3 | |
| | Increase (decrease) in payable due to broker | | | | | (7,265 | ) | | | - | |
| | (Increase) decrease in variation margin | | | | | 454 | | | | (871 | ) |
| | Decrease in accrued advisory fees | | | | | (396 | ) | | | (81 | ) |
| | Increase in accrued service fees | | | | | 9 | | | | 1 | |
| | Increase (decrease) in accrued support service expenses | | | | | (7 | ) | | | 3 | |
| | Increase (decrease) in accrued custodian, and portfolio accounting and tax fees | | | | | (6 | ) | | | 20 | |
| | Decrease in accrued shareholder report expenses | | | | | (36 | ) | | | (10 | ) |
| | Increase (decrease) in accrued trustees’ fees and expenses and deferred compensation | | | | | (6 | ) | | | - | |
| | Decrease in accrued dividends and interest payable (3) | | | | | (132 | ) | | | (290 | ) |
| | Decrease in accrued other payables | | | | | (33 | ) | | | (6 | ) |
| | Change in net unrealized appreciation on investment securities | | | | | (78,892 | ) | | | (139,058 | ) |
| | Change in net unrealized (appreciation) depreciation on written options | | | | | 4,750 | | | | - | |
| | Change in net unrealized (appreciation) depreciation on foreign currencies | | | | | (6,925 | ) | | | - | |
| | Change in net unrealized (appreciation) depreciation on swaps (4) | | | | | (4,811 | ) | | | - | |
| | Net realized gain on investment securities | | | | | (63,150 | ) | | | (106,858 | ) |
| | Net realized (gain) loss on written options | | | | | (6,386 | ) | | | - | |
| | Net realized loss on foreign currency | | | | | 2,627 | | | | 1 | |
| | Net amortization on investments | | | | | 18,406 | | | | 5 | |
Net cash provided by operating activities | | | | | 651,090 | | | | 276,142 | |
| | | |
CASH FLOWS FROM FINANCING ACTIVITIES (5): | | | | | | | | | | |
Proceeds from shares sold | | | | | 302,202 | | | | 303,989 | |
Payments on shares redeemed | | | | | (1,677,056 | ) | | | (580,134 | ) |
Increase (decrease) in payable for reverse repurchase agreements | | | | | (306,962 | ) | | | - | |
Increase (decrease) in payable for sale-buyback financing transactions | | | | | 1,029,797 | | | | - | |
Net cash used in financing activities | | | | | (652,019 | ) | | | (276,145 | ) |
| | | |
NET DECREASE IN CASH AND FOREIGN CURRENCY | | | | | (929 | ) | | | (3 | ) |
| | | |
CASH AND FOREIGN CURRENCY: | | | | | | | | | | |
Beginning of Year | | | | | 1,603 | | | | 1,048 | |
End of Year | | | | | $674 | | | | $1,045 | |
| (1) | Information on financial transactions which have been settled through the receipt or disbursement of cash is presented in the Statement of Cash Flows. The cash amounts shown in the Statement of Cash Flows are the amounts included within the Statements of Assets and Liabilities and include cash and foreign currency, if any, on hand at the custodian bank and do not include any short-term investments. The Inflation Managed and Long/Short Large-Cap Portfolios have not met the exemption criteria under the Financial Accounting Standards Board Accounting Standards Codification Topic 230, Statement of Cash Flows, and therefore includes a Statement of Cash Flows. All other portfolios have met the exemption criteria. |
| (2) | Cash collateral is received by the Long/Short Large-Cap Portfolio for securities on loan which is used as collateral to cover securities sold short and is therefore uninvested (See Note 8 in Notes to Financial Statements). |
| (3) | Interest and commitment fees paid by the Inflation Managed and Long/Short Large-Cap Portfolios were $1,703 and $2,044, respectively. |
| (4) | Excludes centrally cleared swaps included in variation margin. |
| (5) | Reinvestment of dividends for the Inflation Managed and Long/Short Large-Cap Portfolios were $329,284 and $181,572, respectively. |
| | |
| See Notes to Financial Statements | | |
C-32
PACIFIC SELECT FUND
FINANCIAL HIGHLIGHTS (1)
Selected per share, ratios and supplemental data for each year or period ended December 31, were as follows:
| | | | | | | | | | | | | | | | | | | | | | | | | | | | | | | | | | | | | | | | | | | | | | | | | | | | | | | | |
| For the Year or Period Ended | | Net Asset Value,
Beginning of Year or Period | | | Net Investment Income (Loss) | | | Net Realized and Unrealized Gain (Loss) | | | Total from Investment Operations | | | Distributions from Net Investment Income | | | Distributions from Capital Gains | | | Total Distributions | | | Net Asset Value,
End of Year or Period | | | Total Returns (2) | | | Net Assets, End of Year or Period
(in thousands) | | | Ratio of Expenses Before Expense
Reductions to Average Net Assets (3) | | | Ratio of Expenses After Expense
Reductions to Average Net Assets (3), (4) | | | Ratio of Net Investment Income (Loss)
After Expense Reductions To Average
Net Assets (3) | | | Portfolio Turnover Rates | |
Cash Management | | | | | | | | | | | | | | | | | | | | | | | | | | | | | | | | | | | | | | | | | | | | | |
Class I | | | | | | | | | | | | | | | | | | | | | | | | | | | | | | | | | | | | | | | | | | | | | |
| 2012 | | | $10.09 | | | | $- | | | | $- | | | | $- | | | | ($- | ) (5) | | | $- | | | | ($- | ) (5) | | | $10.09 | | | | 0.00 | % | | | $638,998 | | | | 0.38 | % | | | 0.11 | % | | | 0.00 | % | | | N/A | |
| 2011 | | | 10.09 | | | | - | | | | (- | ) (5) | | | (- | ) (5) | | | - | | | | - | | | | - | | | | 10.09 | | | | 0.00 | % | | | 831,451 | | | | 0.37 | % | | | 0.14 | % | | | 0.00 | % | | | N/A | |
| 2010 | | | 10.09 | | | | (0.01 | ) | | | 0.01 | | | | (- | ) (5) | | | (- | ) (5) | | | - | | | | (- | ) (5) | | | 10.09 | | | | (0.05 | %) | | | 861,260 | | | | 0.37 | % | | | 0.32 | % | | | (0.06 | %) | | | N/A | |
| 2009 | | | 10.10 | | | | 0.02 | | | | (0.01 | ) | | | 0.01 | | | | (0.02 | ) | | | - | | | | (0.02 | ) | | | 10.09 | | | | 0.17 | % | | | 1,157,560 | | | | 0.36 | % | | | 0.36 | % | | | 0.20 | % | | | N/A | |
| 2008 | | | 10.08 | | | | 0.23 | | | | 0.01 | | | | 0.24 | | | | (0.22 | ) | | | - | | | | (0.22 | ) | | | 10.10 | | | | 2.36 | % | | | 1,658,923 | | | | 0.35 | % | | | 0.35 | % | | | 2.29 | % | | | N/A | |
Class P | | | | | | | | | | | | | | | | | | | | | | | | | | | | | | | | | | | | | | | | | | | | | |
| 2012 | | | 10.09 | | | | - | | | | - | | | | - | | | | (0.03 | ) | | | - | | | | (0.03 | ) | | | 10.06 | | | | 0.00 | % | | | 39 | | | | 0.18 | % | | | 0.11 | % | | | 0.00 | % | | | N/A | |
| 2011 (6) | | | 10.09 | | | | - | | | | - | | | | - | | | | - | | | | - | | | | - | | | | 10.09 | | | | 0.00 | % | | | 39 | | | | 0.17 | % | | | 0.11 | % | | | 0.00 | % | | | N/A | |
Diversified Bond | | | | | | | | | | | | | | | | | | | | | | | | | | | | | | | | | | | | | | | | | | | | | |
Class I | | | | | | | | | | | | | | | | | | | | | | | | | | | | | | | | | | | | | | | | | | | | | |
| 2012 | | | $7.86 | | | | $0.24 | | | | $0.41 | | | | $0.65 | | | | ($0.24 | ) | | | ($0.07 | ) | | | ($0.31 | ) | | | $8.20 | | | | 8.37 | % | | | $113,422 | | | | 0.64 | % | | | 0.64 | % | | | 2.89 | % | | | 366.17 | % |
| 2011 | | | 10.01 | | | | 0.34 | | | | 0.25 | | | | 0.59 | | | | (2.74 | ) | | | - | | | | (2.74 | ) | | | 7.86 | | | | 5.94 | % | | | 106,167 | | | | 0.66 | % | | | 0.66 | % | | | 3.36 | % | | | 701.34 | % |
| 2010 | | | 9.54 | | | | 0.35 | | | | 0.41 | (7) | | | 0.76 | | | | (0.29 | ) | | | - | | | | (0.29 | ) | | | 10.01 | | | | 8.04 | % (7) | | | 2,956,901 | | | | 0.63 | % | | | 0.63 | % | | | 3.48 | % | | | 889.86 | % |
| 2009 | | | 8.63 | | | | 0.35 | | | | 0.89 | | | | 1.24 | | | | (0.33 | ) | | | - | | | | (0.33 | ) | | | 9.54 | | | | 14.13 | % | | | 2,080,046 | | | | 0.64 | % | | | 0.64 | % | | | 3.79 | % | | | 515.78 | % |
| 2008 | | | 9.77 | | | | 0.42 | | | | (1.19 | ) | | | (0.77 | ) | | | (0.37 | ) | | | - | | | | (0.37 | ) | | | 8.63 | | | | (7.80 | %) | | | 1,859,147 | | | | 0.63 | % | | | 0.63 | % | | | 4.50 | % | | | 720.07 | % |
Class P | | | | | | | | | | | | | | | | | | | | | | | | | | | | | | | | | | | | | | | | | | | | | |
| 2012 | | | 10.44 | | | | 0.33 | | | | 0.56 | | | | 0.89 | | | | (0.34 | ) | | | (0.07 | ) | | | (0.41 | ) | | | 10.92 | | | | 8.58 | % | | | 3,140,370 | | | | 0.45 | % | | | 0.45 | % | | | 3.08 | % | | | 366.17 | % |
| 2011 (6) | | | 10.24 | | | | 0.23 | | | | 0.16 | | | | 0.39 | | | | (0.19 | ) | | | - | | | | (0.19 | ) | | | 10.44 | | | | 3.85 | % | | | 2,949,455 | | | | 0.45 | % | | | 0.45 | % | | | 3.36 | % | | | 701.34 | % |
Floating Rate Loan | | | | | | | | | | | | | | | | | | | | | | | | | | | | | | | | | | | | | | | | | | | | | |
Class I | | | | | | | | | | | | | | | | | | | | | | | | | | | | | | | | | | | | | | | | | | | | | |
| 2012 | | | $5.70 | | | | $0.28 | | | | $0.17 | | | | $0.45 | | | | ($0.30 | ) | | | $- | | | | ($0.30 | ) | | | $5.85 | | | | 8.10 | % | | | $85,212 | | | | 1.01 | % | | | 0.91 | % | | | 4.82 | % | | | 151.82 | % |
| 2011 | | | 7.50 | | | | 0.47 | | | | (0.29 | ) | | | 0.18 | | | | (1.98 | ) | | | - | | | | (1.98 | ) | | | 5.70 | | | | 2.50 | % | | | 79,461 | | | | 1.02 | % | | | 0.92 | % | | | 6.22 | % | | | 80.75 | % |
| 2010 | | | 7.32 | | | | 0.45 | | | | 0.08 | | | | 0.53 | | | | (0.35 | ) | | | - | | | | (0.35 | ) | | | 7.50 | | | | 7.27 | % | | | 1,047,233 | | | | 1.03 | % | | | 0.97 | % | | | 6.03 | % | | | 97.23 | % |
| 2009 | | | 6.16 | | | | 0.31 | | | | 1.17 | | | | 1.48 | | | | (0.32 | ) | | | - | | | | (0.32 | ) | | | 7.32 | | | | 24.31 | % | | | 962,607 | | | | 1.02 | % | | | 1.02 | % | | | 4.44 | % | | | 71.37 | % |
| 2008 | | | 9.41 | | | | 0.62 | | | | (3.28 | ) | | | (2.66 | ) | | | (0.59 | ) | | | - | | | | (0.59 | ) | | | 6.16 | | | | (29.28 | %) | | | 657,136 | | | | 1.02 | % | | | 1.02 | % | | | 7.35 | % | | | 32.13 | % |
Class P | | | | | | | | | | | | | | | | | | | | | | | | | | | | | | | | | | | | | | | | | | | | | |
| 2012 | | | 7.45 | | | | 0.38 | | | | 0.22 | | | | 0.60 | | | | (0.39 | ) | | | - | | | | (0.39 | ) | | | 7.66 | | | | 8.31 | % | | | 883,978 | | | | 0.81 | % | | | 0.71 | % | | | 5.02 | % | | | 151.82 | % |
| 2011 (6) | | | 7.67 | | | | 0.26 | | | | (0.24 | ) | | | 0.02 | | | | (0.24 | ) | | | - | | | | (0.24 | ) | | | 7.45 | | | | 0.32 | % | | | 972,895 | | | | 0.79 | % | | | 0.69 | % | | | 5.14 | % | | | 80.75 | % |
High Yield Bond | | | | | | | | | | | | | | | | | | | | | | | | | | | | | | | | | | | | | | | | | | | | | |
Class I | | | | | | | | | | | | | | | | | | | | | | | | | | | | | | | | | | | | | | | | | | | | | |
| 2012 | | | $5.87 | | | | $0.40 | | | | $0.48 | | | | $0.88 | | | | ($0.44 | ) | | | $- | | | | ($0.44 | ) | | | $6.31 | | | | 15.30 | % | | | $399,742 | | | | 0.64 | % | | | 0.64 | % | | | 6.52 | % | | | 98.32 | % |
| 2011 | | | 6.41 | | | | 0.48 | | | | (0.26 | ) | | | 0.22 | | | | (0.76 | ) | | | - | | | | (0.76 | ) | | | 5.87 | | | | 3.42 | % | | | 340,009 | | | | 0.64 | % | | | 0.64 | % | | | 7.33 | % | | | 91.42 | % |
| 2010 | | | 6.06 | | | | 0.51 | | | | 0.34 | (7) | | | 0.85 | | | | (0.50 | ) | | | - | | | | (0.50 | ) | | | 6.41 | | | | 14.52 | % (7) | | | 1,178,265 | | | | 0.63 | % | | | 0.63 | % | | | 8.06 | % | | | 120.48 | % |
| 2009 | | | 4.66 | | | | 0.50 | | | | 1.33 | | | | 1.83 | | | | (0.43 | ) | | | - | | | | (0.43 | ) | | | 6.06 | | | | 39.87 | % | | | 1,140,825 | | | | 0.64 | % | | | 0.64 | % | | | 9.05 | % | | | 112.27 | % |
| 2008 | | | 6.58 | | | | 0.50 | | | | (1.92 | ) | | | (1.42 | ) | | | (0.50 | ) | | | - | | | | (0.50 | ) | | | 4.66 | | | | (22.20 | %) | | | 651,950 | | | | 0.63 | % | | | 0.63 | % | | | 8.35 | % | | | 43.18 | % |
Class P | | | | | | | | | | | | | | | | | | | | | | | | | | | | | | | | | | | | | | | | | | | | | |
| 2012 | | | 6.34 | | | | 0.45 | | | | 0.51 | | | | 0.96 | | | | (0.48 | ) | | | - | | | | (0.48 | ) | | | 6.82 | | | | 15.53 | % | | | 899,379 | | | | 0.44 | % | | | 0.44 | % | | | 6.75 | % | | | 98.32 | % |
| 2011 (6) | | | 6.76 | | | | 0.31 | | | | (0.43 | ) | | | (0.12 | ) | | | (0.30 | ) | | | - | | | | (0.30 | ) | | | 6.34 | | | | (1.79 | %) | | | 1,023,563 | | | | 0.43 | % | | | 0.43 | % | | | 7.32 | % | | | 91.42 | % |
Inflation Managed | | | | | | | | | | | | | | | | | | | | | | | | | | | | | | | | | | | | | | | | | | | | | |
Class I | | | | | | | | | | | | | | | | | | | | | | | | | | | | | | | | | | | | | | | | | | | | | |
| 2012 | | | $11.85 | | | | $0.29 | | | | $0.80 | | | | $1.09 | | | | ($0.29 | ) | | | ($2.02 | ) | | | ($2.31 | ) | | | $10.63 | | | | 9.87 | % | | | $715,700 | | | | 0.74 | % | | | 0.74 | % | | | 2.62 | % | | | 50.05 | % |
| 2011 | | | 11.80 | | | | 0.32 | | | | 1.03 | | | | 1.35 | | | | (0.75 | ) | | | (0.55 | ) | | | (1.30 | ) | | | 11.85 | | | | 11.85 | % | | | 686,265 | | | | 0.64 | % | | | 0.64 | % | | | 2.68 | % | | | 430.18 | % |
| 2010 | | | 11.06 | | | | 0.19 | | | | 0.78 | | | | 0.97 | | | | (0.23 | ) | | | - | | | | (0.23 | ) | | | 11.80 | | | | 8.78 | % | | | 4,598,931 | | | | 0.63 | % | | | 0.63 | % | | | 1.63 | % | | | 406.13 | % |
| 2009 | | | 9.94 | | | | 0.27 | | | | 1.74 | | | | 2.01 | | | | (0.44 | ) | | | (0.45 | ) | | | (0.89 | ) | | | 11.06 | | | | 20.80 | % | | | 4,333,598 | | | | 0.64 | % | | | 0.64 | % | | | 2.56 | % | | | 623.14 | % |
| 2008 | | | 11.35 | | | | 0.44 | | | | (1.47 | ) | | | (1.03 | ) | | | (0.32 | ) | | | (0.06 | ) | | | (0.38 | ) | | | 9.94 | | | | (9.34 | %) | | | 3,983,585 | | | | 0.64 | % | | | 0.63 | % | | | 3.91 | % | | | 1,070.59 | % |
Class P | | | | | | | | | | | | | | | | | | | | | | | | | | | | | | | | | | | | | | | | | | | | | |
| 2012 | | | 13.09 | | | | 0.29 | | | | 0.94 | | | | 1.23 | | | | (0.38 | ) | | | (2.02 | ) | | | (2.40 | ) | | | 11.92 | | | | 10.09 | % | | | 889,728 | | | | 0.50 | % | | | 0.50 | % | | | 2.31 | % | | | 50.05 | % |
| 2011 (6) | | | 12.36 | | | | 0.15 | | | | 0.70 | | | | 0.85 | | | | (0.12 | ) | | | - | | | | (0.12 | ) | | | 13.09 | | | | 6.94 | % | | | 2,086,142 | | | | 0.43 | % | | | 0.43 | % | | | 1.69 | % | | | 430.18 | % |
| | |
| See Notes to Financial Statements | | See explanation of references on pages C-40 and C-41 |
C-33
PACIFIC SELECT FUND
FINANCIAL HIGHLIGHTS (Continued) (1)
Selected per share, ratios and supplemental data for each year or period ended December 31, were as follows:
| | | | | | | | | | | | | | | | | | | | | | | | | | | | | | | | | | | | | | | | | | | | | | | | | | | | | | | | |
| For the Year or Period Ended | | Net Asset Value,
Beginning of Year or Period | | | Net Investment Income (Loss) | | | Net Realized and Unrealized Gain (Loss) | | | Total from Investment Operations | | | Distributions from Net Investment Income | | | Distributions from Capital Gains | | | Total Distributions | | | Net Asset Value,
End of Year or Period | | | Total Returns (2) | | | Net Assets, End of Year or Period
(in thousands) | | | Ratio of Expenses Before Expense
Reductions to Average Net Assets (3) | | | Ratio of Expenses After Expense
Reductions to Average Net Assets (3), (4) | | | Ratio of Net Investment Income (Loss)
After Expense Reductions To Average
Net Assets (3) | | | Portfolio Turnover Rates | |
Inflation Protected | | | | | | | | | | | | | | | | | | | | | | | | | | | | | | | | | | | | | | | | | | | | | |
Class I | | | | | | | | | | | | | | | | | | | | | | | | | | | | | | | | | | | | | | | | | | | | | |
| 2012 | | | $10.33 | | | | $0.06 | | | | $0.51 | | | | $0.57 | | | | ($0.04 | ) | | | ($0.04 | ) | | | ($0.08 | ) | | | $10.82 | | | | 5.51 | % | | | $24,847 | | | | 0.58 | % | | | 0.58 | % | | | 0.55 | % | | | 151.92 | % |
| 2011 (8) | | | 10.00 | | | | 0.14 | | | | 0.66 | | | | 0.80 | | | | (0.29 | ) | | | (0.18 | ) | | | (0.47 | ) | | | 10.33 | | | | 8.08 | % | | | 19,509 | | | | 0.58 | % | | | 0.58 | % | | | 2.08 | % | | | 226.31 | % |
Class P | | | | | | | | | | | | | | | | | | | | | | | | | | | | | | | | | | | | | | | | | | | | | |
| 2012 | | | 10.44 | | | | 0.07 | | | | 0.53 | | | | 0.60 | | | | (0.05 | ) | | | (0.04 | ) | | | (0.09 | ) | | | 10.95 | | | | 5.72 | % | | | 1,094,266 | | | | 0.38 | % | | | 0.38 | % | | | 0.66 | % | | | 151.92 | % |
| 2011 (6), (8) | | | 10.00 | | | | (0.01 | ) | | | 0.81 | | | | 0.80 | | | | (0.18 | ) | | | (0.18 | ) | | | (0.36 | ) | | | 10.44 | | | | 8.10 | % | | | 1,427,203 | | | | 0.38 | % | | | 0.38 | % | | | (0.15 | %) | | | 226.31 | % |
Managed Bond | | | | | | | | | | | | | | | | | | | | | | | | | | | | | | | | | | | | | | | | | | | | | |
Class I | | | | | | | | | | | | | | | | | | | | | | | | | | | | | | | | | | | | | | | | | | | | | |
| 2012 | | | $10.99 | | | | $0.35 | | | | $0.81 | | | | $1.16 | | | | ($0.59 | ) | | | ($0.01 | ) | | | ($0.60 | ) | | | $11.55 | | | | 10.72 | % | | | $1,514,555 | | | | 0.64 | % | | | 0.64 | % | | | 3.06 | % | | | 662.17 | % |
| 2011 | | | 11.67 | | | | 0.36 | | | | 0.08 | | | | 0.44 | | | | (0.71 | ) | | | (0.41 | ) | | | (1.12 | ) | | | 10.99 | | | | 3.84 | % | | | 1,420,022 | | | | 0.64 | % | | | 0.64 | % | | | 3.07 | % | | | 588.84 | % |
| 2010 | | | 11.08 | | | | 0.37 | | | | 0.62 | (7) | | | 0.99 | | | | (0.40 | ) | | | - | | | | (0.40 | ) | | | 11.67 | | | | 8.96 | % (7) | | | 6,376,272 | | | | 0.63 | % | | | 0.63 | % | | | 3.20 | % | | | 618.75 | % |
| 2009 | | | 10.52 | | | | 0.55 | | | | 1.54 | | | | 2.09 | | | | (0.75 | ) | | | (0.78 | ) | | | (1.53 | ) | | | 11.08 | | | | 21.01 | % | | | 5,005,993 | | | | 0.64 | % | | | 0.64 | % | | | 5.03 | % | | | 744.21 | % |
| 2008 | | | 11.34 | | | | 0.60 | | | | (0.80 | ) | | | (0.20 | ) | | | (0.51 | ) | | | (0.11 | ) | | | (0.62 | ) | | | 10.52 | | | | (1.71 | %) | | | 4,409,227 | | | | 0.64 | % | | | 0.64 | % | | | 5.39 | % | | | 1,137.03 | % |
Class P | | | | | | | | | | | | | | | | | | | | | | | | | | | | | | | | | | | | | | | | | | | | | |
| 2012 | | | 11.97 | | | | 0.41 | | | | 0.88 | | | | 1.29 | | | | (0.67 | ) | | | (0.01 | ) | | | (0.68 | ) | | | 12.58 | | | | 10.94 | % | | | 3,628,143 | | | | 0.44 | % | | | 0.44 | % | | | 3.27 | % | | | 662.17 | % |
| 2011 (6) | | | 11.96 | | | | 0.30 | | | | (0.14 | ) | | | 0.16 | | | | (0.15 | ) | | | - | | | | (0.15 | ) | | | 11.97 | | | | 1.41 | % | | | 4,667,713 | | | | 0.44 | % | | | 0.44 | % | | | 3.77 | % | | | 588.84 | % |
Short Duration Bond | | | | | | | | | | | | | | | | | | | | | | | | | | | | | | | | | | | | | | | | | | | | | |
Class I | | | | | | | | | | | | | | | | | | | | | | | | | | | | | | | | | | | | | | | | | | | | | |
| 2012 | | | $9.20 | | | | $0.11 | | | | $0.18 | | | | $0.29 | | | | ($0.07 | ) | | | $- | | | | ($0.07 | ) | | | $9.42 | | | | 3.19 | % | | | $277,735 | | | | 0.64 | % | | | 0.64 | % | | | 1.16 | % | | | 101.30 | % |
| 2011 | | | 9.45 | | | | 0.11 | | | | (0.03 | ) | | | 0.08 | | | | (0.33 | ) | | | - | | | | (0.33 | ) | | | 9.20 | | | | 0.87 | % | | | 240,422 | | | | 0.66 | % | | | 0.66 | % | | | 1.16 | % | | | 229.73 | % |
| 2010 | | | 9.27 | | | | 0.14 | | | | 0.18 | (7) | | | 0.32 | | | | (0.14 | ) | | | - | | | | (0.14 | ) | | | 9.45 | | | | 3.40 | % (7) | | | 1,634,017 | | | | 0.63 | % | | | 0.63 | % | | | 1.52 | % | | | 170.58 | % |
| 2009 | | | 8.81 | | | | 0.28 | | | | 0.46 | | | | 0.74 | | | | (0.28 | ) | | | - | | | | (0.28 | ) | | | 9.27 | | | | 8.66 | % | | | 1,446,376 | | | | 0.64 | % | | | 0.64 | % | | | 3.06 | % | | | 181.12 | % |
| 2008 | | | 9.65 | | | | 0.36 | | | | (0.84 | ) | | | (0.48 | ) | | | (0.36 | ) | | | - | | | | (0.36 | ) | | | 8.81 | | | | (5.09 | %) | | | 1,572,389 | | | | 0.63 | % | | | 0.63 | % | | | 3.80 | % | | | 117.51 | % |
Class P | | | | | | | | | | | | | | | | | | | | | | | | | | | | | | | | | | | | | | | | | | | | | |
| 2012 | | | 9.45 | | | | 0.13 | | | | 0.20 | | | | 0.33 | | | | (0.10 | ) | | | - | | | | (0.10 | ) | | | 9.68 | | | | 3.40 | % | | | 2,177,671 | | | | 0.44 | % | | | 0.44 | % | | | 1.33 | % | | | 101.30 | % |
| 2011 (6) | | | 9.51 | | | | 0.10 | | | | (0.07 | ) | | | 0.03 | | | | (0.09 | ) | | | - | | | | (0.09 | ) | | | 9.45 | | | | 0.34 | % | | | 1,533,304 | | | | 0.46 | % | | | 0.46 | % | | | 1.58 | % | | | 229.73 | % |
Emerging Markets Debt (9) | | | | | | | | | | | | | | | | | | | | | | | | | | | | | | | | | | | | | | | | | | | | | |
Class I | | | | | | | | | | | | | | | | | | | | | | | | | | | | | | | | | | | | | | | | | | | | | |
| 2012 | | | $10.00 | | | | $0.35 | | | | $0.71 | | | | $1.06 | | | | ($0.24 | ) | | | $- | | | | ($0.24 | ) | | | $10.82 | | | | 10.60 | % | | | $7,809 | | | | 1.03 | % | | | 1.03 | % | | | 4.90 | % | | | 27.11 | % |
Class P | | | | | | | | | | | | | | | | | | | | | | | | | | | | | | | | | | | | | | | | | | | | | |
| 2012 | | | 10.00 | | | | 0.34 | | | | 0.74 | | | | 1.08 | | | | (0.25 | ) | | | - | | | | (0.25 | ) | | | 10.83 | | | | 10.74 | % | | | 982,590 | | | | 0.84 | % | | | 0.84 | % | | | 4.91 | % | | | 27.11 | % |
American Funds Growth (10) | | | | | | | | | | | | | | | | | | | | | | | | | | | | | | | | | | | | | | | | | | | | | |
Class I | | | | | | | | | | | | | | | | | | | | | | | | | | | | | | | | | | | | | | | | | | | | | |
| 2012 | | | $8.01 | | | | $0.04 | | | | $1.36 | | | | $1.40 | | | | ($0.02 | ) | | | $- | | | | ($0.02 | ) | | | $9.39 | | | | 17.45 | % | | | $209,921 | | | | 0.97 | % | | | 0.63 | % | | | 0.40 | % | | | 3.19 | % |
| 2011 | | | 8.42 | | | | 0.01 | | | | (0.40 | ) | | | (0.39 | ) | | | (0.02 | ) | | | - | | | | (0.02 | ) | | | 8.01 | | | | (4.66 | %) | | | 203,021 | | | | 0.97 | % | | | 0.63 | % | | | 0.09 | % | | | 3.15 | % |
| 2010 | | | 7.12 | | | | 0.02 | | | | 1.28 | | | | 1.30 | | | | (- | ) (5) | | | - | | | | (- | ) (5) | | | 8.42 | | | | 18.26 | % | | | 996,877 | | | | 0.97 | % | | | 0.63 | % | | | 0.32 | % | | | 4.44 | % |
| 2009 | | | 6.87 | | | | 0.01 | | | | 2.23 | | | | 2.24 | | | | (0.01 | ) | | | (1.98 | ) | | | (1.99 | ) | | | 7.12 | | | | 38.86 | % | | | 927,858 | | | | 0.98 | % | | | 0.64 | % | | | 0.10 | % | | | 6.22 | % |
| 2008 | | | 14.40 | | | | 0.07 | | | | (5.70 | ) | | | (5.63 | ) | | | (0.06 | ) | | | (1.84 | ) | | | (1.90 | ) | | | 6.87 | | | | (44.19 | %) | | | 1,186,214 | | | | 0.96 | % | | | 0.62 | % | | | 0.62 | % | | | 5.66 | % |
Class P | | | | | | | | | | | | | | | | | | | | | | | | | | | | | | | | | | | | | | | | | | | | | |
| 2012 | | | 8.01 | | | | (0.01 | ) | | | 1.43 | | | | 1.42 | | | | (0.06 | ) | | | - | | | | (0.06 | ) | | | 9.37 | | | | 17.68 | % | | | 56,461 | | | | 0.76 | % | | | 0.42 | % | | | (0.13 | %) | | | 3.19 | % |
| 2011 (6) | | | 9.19 | | | | 0.04 | | | | (1.20 | ) | | | (1.16 | ) | | | (0.02 | ) | | | - | | | | (0.02 | ) | | | 8.01 | | | | (12.58 | %) | | | 508,396 | | | | 0.77 | % | | | 0.42 | % | | | 0.67 | % | | | 3.15 | % |
American Funds Growth-Income (10) | | | | | | | | | | | | | | | | | | | | | | | | | | | | | | | | | | | | | | | | | | | | | |
Class I | | | | | | | | | | | | | | | | | | | | | | | | | | | | | | | | | | | | | | | | | | | | | |
| 2012 | | | $9.03 | | | | $0.12 | | | | $1.43 | | | | $1.55 | | | | ($0.12 | ) | | | $- | | | | ($0.12 | ) | | | $10.46 | | | | 17.06 | % | | | $202,691 | | | | 0.96 | % | | | 0.62 | % | | | 1.22 | % | | | 2.34 | % |
| 2011 | | | 9.34 | | | | 0.03 | | | | (0.24 | ) | | | (0.21 | ) | | | (0.10 | ) | | | - | | | | (0.10 | ) | | | 9.03 | | | | (2.24 | %) | | | 189,047 | | | | 0.96 | % | | | 0.63 | % | | | 0.31 | % | | | 2.35 | % |
| 2010 | | | 8.41 | | | | 0.09 | | | | 0.84 | | | | 0.93 | | | | (- | ) (5) | | | - | | | | (- | ) (5) | | | 9.34 | | | | 11.03 | % | | | 1,395,152 | | | | 0.96 | % | | | 0.62 | % | | | 1.02 | % | | | 3.50 | % |
| 2009 | | | 7.27 | | | | 0.09 | | | | 1.97 | | | | 2.06 | | | | (0.09 | ) | | | (0.83 | ) | | | (0.92 | ) | | | 8.41 | | | | 30.74 | % | | | 1,496,349 | | | | 0.97 | % | | | 0.63 | % | | | 1.23 | % | | | 6.40 | % |
| 2008 | | | 12.47 | | | | 0.14 | | | | (4.75 | ) | | | (4.61 | ) | | | (0.14 | ) | | | (0.45 | ) | | | (0.59 | ) | | | 7.27 | | | | (38.08 | %) | | | 1,158,811 | | | | 0.96 | % | | | 0.62 | % | | | 1.32 | % | | | 15.79 | % |
Class P | | | | | | | | | | | | | | | | | | | | | | | | | | | | | | | | | | | | | | | | | | | | | |
| 2012 | | | 9.05 | | | | 0.08 | | | | 1.48 | | | | 1.56 | | | | (0.18 | ) | | | - | | | | (0.18 | ) | | | 10.43 | | | | 17.30 | % | | | 444,207 | | | | 0.76 | % | | | 0.42 | % | | | 0.77 | % | | | 2.34 | % |
| 2011 (6) | | | 10.01 | | | | 0.16 | | | | (1.02 | ) | | | (0.86 | ) | | | (0.10 | ) | | | - | | | | (0.10 | ) | | | 9.05 | | | | (8.63 | %) | | | 958,109 | | | | 0.76 | % | | | 0.41 | % | | | 2.60 | % | | | 2.35 | % |
| | |
| See Notes to Financial Statements | | See explanation of references on pages C-40 and C-41 |
C-34
PACIFIC SELECT FUND
FINANCIAL HIGHLIGHTS (Continued) (1)
Selected per share, ratios and supplemental data for each year or period ended December 31, were as follows:
| | | | | | | | | | | | | | | | | | | | | | | | | | | | | | | | | | | | | | | | | | | | | | | | | | | | | | | | |
| For the Year or Period Ended | | Net Asset Value,
Beginning of Year or Period | | | Net Investment Income (Loss) | | | Net Realized and Unrealized Gain (Loss) | | | Total from Investment Operations | | | Distributions from Net Investment Income | | | Distributions from Capital Gains | | | Total Distributions | | | Net Asset Value,
End of Year or Period | | | Total Returns (2) | | | Net Assets, End of Year or Period
(in thousands) | | | Ratio of Expenses Before Expense
Reductions to Average Net Assets (3) | | | Ratio of Expenses After Expense
Reductions to Average Net Assets (3), (4) | | | Ratio of Net Investment Income (Loss)
After Expense Reductions To Average
Net Assets (3) | | | Portfolio Turnover Rates | |
Comstock | | | | | | | | | | | | | | | | | | | | | | | | | | | | | | | | | | | | | | | | | | | | | |
Class I | | | | | | | | | | | | | | | | | | | | | | | | | | | | | | | | | | | | | | | | | | | | | |
| 2012 | | | $7.46 | | | | $0.12 | | | | $1.21 | | | | $1.33 | | | | ($0.16 | ) | | | ($0.41 | ) | | | ($0.57 | ) | | | $8.22 | | | | 18.54 | % | | | $138,115 | | | | 0.92 | % | | | 0.91 | % | | | 1.55 | % | | | 29.73 | % |
| 2011 | | | 8.61 | | | | 0.12 | | | | (0.30 | ) | | | (0.18 | ) | | | (0.90 | ) | | | (0.07 | ) | | | (0.97 | ) | | | 7.46 | | | | (2.11 | %) | | | 115,096 | | | | 0.93 | % | | | 0.91 | % | | | 1.34 | % | | | 27.37 | % |
| 2010 | | | 7.55 | | | | 0.10 | | | | 1.06 | | | | 1.16 | | | | (0.10 | ) | | | - | | | | (0.10 | ) | | | 8.61 | | | | 15.42 | % | | | 2,203,641 | | | | 0.92 | % | | | 0.92 | % | | | 1.27 | % | | | 18.86 | % |
| 2009 | | | 5.94 | | | | 0.10 | | | | 1.60 | | | | 1.70 | | | | (0.09 | ) | | | - | | | | (0.09 | ) | | | 7.55 | | | | 28.68 | % | | | 2,107,716 | | | | 0.93 | % | | | 0.93 | % | | | 1.51 | % | | | 33.85 | % |
| 2008 | | | 10.22 | | | | 0.17 | | | | (3.82 | ) | | | (3.65 | ) | | | (0.18 | ) | | | (0.45 | ) | | | (0.63 | ) | | | 5.94 | | | | (36.79 | %) | | | 1,479,533 | | | | 0.92 | % | | | 0.92 | % | | | 2.05 | % | | | 55.85 | % |
Class P | | | | | | | | | | | | | | | | | | | | | | | | | | | | | | | | | | | | | | | | | | | | | |
| 2012 | | | 8.39 | | | | 0.16 | | | | 1.35 | | | | 1.51 | | | | (0.20 | ) | | | (0.41 | ) | | | (0.61 | ) | | | 9.29 | | | | 18.78 | % | | | 1,880,180 | | | | 0.72 | % | | | 0.71 | % | | | 1.74 | % | | | 29.73 | % |
| 2011 (6) | | | 9.45 | | | | 0.10 | | | | (1.10 | ) | | | (1.00 | ) | | | (0.06 | ) | | | - | | | | (0.06 | ) | | | 8.39 | | | | (10.56 | %) | | | 1,958,067 | | | | 0.73 | % | | | 0.71 | % | | | 1.86 | % | | | 27.37 | % |
Dividend Growth | | | | | | | | | | | | | | | | | | | | | | | | | | | | | | | | | | | | | | | | | | | | | |
Class I | | | | | | | | | | | | | | | | | | | | | | | | | | | | | | | | | | | | | | | | | | | | | |
| 2012 | | | $9.21 | | | | $0.15 | | | | $1.17 | | | | $1.32 | | | | ($0.17 | ) | | | ($0.22 | ) | | | ($0.39 | ) | | | $10.14 | | | | 14.55 | % | | | $181,496 | | | | 0.91 | % | | | 0.91 | % | | | 1.55 | % | | | 19.52 | % |
| 2011 | | | 9.73 | | | | 0.12 | | | | 0.20 | | | | 0.32 | | | | (0.34 | ) | | | (0.50 | ) | | | (0.84 | ) | | | 9.21 | | | | 3.27 | % | | | 156,119 | | | | 0.91 | % | | | 0.91 | % | | | 1.16 | % | | | 15.74 | % |
| 2010 | | | 8.86 | | | | 0.11 | | | | 0.84 | | | | 0.95 | | | | (0.08 | ) | | | - | | | | (0.08 | ) | | | 9.73 | | | | 10.77 | % | | | 1,080,026 | | | | 0.90 | % | | | 0.90 | % | | | 1.20 | % | | | 68.99 | % |
| 2009 | | | 6.80 | | | | 0.10 | | | | 2.10 | | | | 2.20 | | | | (0.14 | ) | | | - | | | | (0.14 | ) | | | 8.86 | | | | 32.40 | % | | | 481,930 | | | | 0.90 | % | | | 0.90 | % | | | 1.43 | % | | | 56.09 | % |
| 2008 | | | 13.50 | | | | 0.11 | | | | (4.75 | ) | | | (4.64 | ) | | | (0.11 | ) | | | (1.95 | ) | | | (2.06 | ) | | | 6.80 | | | | (39.07 | %) | | | 680,143 | | | | 0.89 | % | | | 0.89 | % | | | 1.02 | % | | | 46.85 | % |
Class P | | | | | | | | | | | | | | | | | | | | | | | | | | | | | | | | | | | | | | | | | | | | | |
| 2012 | | | 10.00 | | | | 0.18 | | | | 1.28 | | | | 1.46 | | | | (0.24 | ) | | | (0.22 | ) | | | (0.46 | ) | | | 11.00 | | | | 14.78 | % | | | 635,366 | | | | 0.71 | % | | | 0.71 | % | | | 1.68 | % | | | 19.52 | % |
| 2011 (6) | | | 10.61 | | | | 0.11 | | | | (0.65 | ) | | | (0.54 | ) | | | (0.07 | ) | | | - | | | | (0.07 | ) | | | 10.00 | | | | (5.12 | %) | | | 847,944 | | | | 0.71 | % | | | 0.71 | % | | | 1.65 | % | | | 15.74 | % |
Equity Index | | | | | | | | | | | | | | | | | | | | | | | | | | | | | | | | | | | | | | | | | | | | | |
Class I | | | | | | | | | | | | | | | | | | | | | | | | | | | | | | | | | | | | | | | | | | | | | |
| 2012 | | | $27.11 | | | | $0.61 | | | | $3.67 | | | | $4.28 | | | | ($0.72 | ) | | | $- | | | | ($0.72 | ) | | | $30.67 | | | | 15.77 | % | | | $852,780 | | | | 0.28 | % | | | 0.28 | % | | | 2.04 | % | | | 4.16 | % |
| 2011 | | | 27.47 | | | | 0.49 | | | | - | (5) | | | 0.49 | | | | (0.85 | ) | | | - | | | | (0.85 | ) | | | 27.11 | | | | 1.82 | % | | | 765,898 | | | | 0.29 | % | | | 0.29 | % | | | 1.74 | % | | | 3.91 | % |
| 2010 | | | 24.38 | | | | 0.44 | | | | 3.17 | | | | 3.61 | | | | (0.52 | ) | | | - | | | | (0.52 | ) | | | 27.47 | | | | 14.81 | % | | | 2,642,021 | | | | 0.28 | % | | | 0.28 | % | | | 1.75 | % | | | 5.23 | % |
| 2009 | | | 19.59 | | | | 0.44 | | | | 4.72 | | | | 5.16 | | | | (0.37 | ) | | | - | | | | (0.37 | ) | | | 24.38 | | | | 26.36 | % | | | 3,772,752 | | | | 0.28 | % | | | 0.28 | % | | | 2.04 | % | | | 4.53 | % |
| 2008 | | | 33.65 | | | | 0.59 | | | | (12.78 | ) | | | (12.19 | ) | | | (0.53 | ) | | | (1.34 | ) | | | (1.87 | ) | | | 19.59 | | | | (37.35 | %) | | | 1,738,885 | | | | 0.28 | % | | | 0.28 | % | | | 2.17 | % | | | 6.21 | % |
Class P | | | | | | | | | | | | | | | | | | | | | | | | | | | | | | | | | | | | | | | | | | | | | |
| 2012 | | | 27.76 | | | | 0.67 | | | | 3.77 | | | | 4.44 | | | | (0.90 | ) | | | - | | | | (0.90 | ) | | | 31.30 | | | | 16.00 | % | | | 1,135,225 | | | | 0.08 | % | | | 0.08 | % | | | 2.20 | % | | | 4.16 | % |
| 2011 (6) | | | 29.93 | | | | 0.39 | | | | (2.32 | ) | | | (1.93 | ) | | | (0.24 | ) | | | - | | | | (0.24 | ) | | | 27.76 | | | | (6.43 | %) | | | 1,592,221 | | | | 0.09 | % | | | 0.09 | % | | | 2.17 | % | | | 3.91 | % |
Focused 30 | | | | | | | | | | | | | | | | | | | | | | | | | | | | | | | | | | | | | | | | | | | | | |
Class I | | | | | | | | | | | | | | | | | | | | | | | | | | | | | | | | | | | | | | | | | | | | | |
| 2012 | | | $11.28 | | | | ($0.01 | ) | | | $2.52 | | | | $2.51 | | | | $- | | | | ($1.31 | ) | | | ($1.31 | ) | | | $12.48 | | | | 23.21 | % | | | $113,913 | | | | 1.07 | % | | | 1.07 | % | | | (0.05 | %) | | | 20.59 | % |
| 2011 | | | 12.49 | | | | (0.04 | ) | | | (1.17 | ) | | | (1.21 | ) | | | - | | | | - | | | | - | | | | 11.28 | | | | (9.70 | %) | | | 101,110 | | | | 1.10 | % | | | 1.10 | % | | | (0.36 | %) | | | 46.78 | % |
| 2010 | | | 11.32 | | | | (0.03 | ) | | | 1.20 | (7) | | | 1.17 | | | | - | | | | - | | | | - | | | | 12.49 | | | | 10.35 | % (7) | | | 149,301 | | | | 0.99 | % | | | 0.99 | % | | | (0.24 | %) | | | 36.37 | % |
| 2009 | | | 7.53 | | | | (0.01 | ) | | | 3.80 | | | | 3.79 | | | | - | | | | - | | | | - | | | | 11.32 | | | | 50.43 | % | | | 180,909 | | | | 0.97 | % | | | 0.96 | % | | | (0.12 | %) | | | 35.37 | % |
| 2008 | | | 16.12 | | | | (0.01 | ) | | | (7.64 | ) | | | (7.65 | ) | | | (0.01 | ) | | | (0.93 | ) | | | (0.94 | ) | | | 7.53 | | | | (50.14 | %) | | | 355,475 | | | | 0.96 | % | | | 0.96 | % | | | (0.05 | %) | | | 62.01 | % |
Class P | | | | | | | | | | | | | | | | | | | | | | | | | | | | | | | | | | | | | | | | | | | | | |
| 2012 | | | 11.30 | | | | 0.02 | | | | 2.51 | | | | 2.53 | | | | - | | | | (1.31 | ) | | | (1.31 | ) | | | 12.52 | | | | 23.45 | % | | | 11 | | | | 0.88 | % | | | 0.88 | % | | | 0.14 | % | | | 20.59 | % |
| 2011 (6) | | | 13.21 | | | | (0.02 | ) | | | (1.89 | ) | | | (1.91 | ) | | | - | | | | - | | | | - | | | | 11.30 | | | | (14.48 | %) | | | 9 | | | | 0.94 | % | | | 0.94 | % | | | (0.22 | %) | | | 46.78 | % |
Growth LT | | | | | | | | | | | | | | | | | | | | | | | | | | | | | | | | | | | | | | | | | | | | | |
Class I | | | | | | | | | | | | | | | | | | | | | | | | | | | | | | | | | | | | | | | | | | | | | |
| 2012 | | | $17.78 | | | | $0.11 | | | | $2.46 | | | | $2.57 | | | | ($0.13 | ) | | | ($6.85 | ) | | | ($6.98 | ) | | | $13.37 | | | | 18.24 | % | | | $422,736 | | | | 0.80 | % | | | 0.80 | % | | | 0.75 | % | | | 44.46 | % |
| 2011 | | | 19.85 | | | | 0.12 | | | | (1.28 | ) | | | (1.16 | ) | | | (0.21 | ) | | | (0.70 | ) | | | (0.91 | ) | | | 17.78 | | | | (6.06 | %) | | | 404,884 | | | | 0.79 | % | | | 0.79 | % | | | 0.58 | % | | | 91.34 | % |
| 2010 | | | 18.04 | | | | 0.11 | | | | 1.90 | (7) | | | 2.01 | | | | (0.20 | ) | | | - | | | | (0.20 | ) | | | 19.85 | | | | 11.24 | % (7) | | | 1,624,438 | | | | 0.78 | % | | | 0.78 | % | | | 0.61 | % | | | 46.73 | % |
| 2009 | | | 13.29 | | | | 0.09 | | | | 4.82 | | | | 4.91 | | | | (0.16 | ) | | | - | | | | (0.16 | ) | | | 18.04 | | | | 37.28 | % | | | 1,606,364 | | | | 0.78 | % | | | 0.78 | % | | | 0.60 | % | | | 59.65 | % |
| 2008 | | | 26.10 | | | | 0.13 | | | | (9.78 | ) | | | (9.65 | ) | | | (0.10 | ) | | | (3.06 | ) | | | (3.16 | ) | | | 13.29 | | | | (40.95 | %) | | | 1,247,198 | | | | 0.78 | % | | | 0.78 | % | | | 0.68 | % | | | 68.02 | % |
Class P | | | | | | | | | | | | | | | | | | | | | | | | | | | | | | | | | | | | | | | | | | | | | |
| 2012 | | | 18.61 | | | | 0.11 | | | | 2.64 | | | | 2.75 | | | | (0.25 | ) | | | (6.85 | ) | | | (7.10 | ) | | | 14.26 | | | | 18.45 | % | | | 90,112 | | | | 0.59 | % | | | 0.59 | % | | | 0.58 | % | | | 44.46 | % |
| 2011 (6) | | | 21.27 | | | | 0.09 | | | | (2.69 | ) | | | (2.60 | ) | | | (0.06 | ) | | | - | | | | (0.06 | ) | | | 18.61 | | | | (12.19 | %) | | | 628,582 | | | | 0.60 | % | | | 0.60 | % | | | 0.74 | % | | | 91.34 | % |
| | |
| See Notes to Financial Statements | | See explanation of references on pages C-40 and C-41 |
C-35
PACIFIC SELECT FUND
FINANCIAL HIGHLIGHTS (Continued) (1)
Selected per share, ratios and supplemental data for each year or period ended December 31, were as follows:
| | | | | | | | | | | | | | | | | | | | | | | | | | | | | | | | | | | | | | | | | | | | | | | | | | | | | | | | |
| For the Year or Period Ended | | Net Asset Value,
Beginning of Year or Period | | | Net Investment Income (Loss) | | | Net Realized and Unrealized Gain (Loss) | | | Total from Investment Operations | | | Distributions from Net Investment Income | | | Distributions from Capital Gains | | | Total Distributions | | | Net Asset Value,
End of Year or Period | | | Total Returns (2) | | | Net Assets, End of Year or Period
(in thousands) | | | Ratio of Expenses Before Expense
Reductions to Average Net Assets (3) | | | Ratio of Expenses After Expense
Reductions to Average Net Assets (3), (4) | | | Ratio of Net Investment Income (Loss)
After Expense Reductions To Average
Net Assets (3) | | | Portfolio Turnover Rates | |
Large-Cap Growth | | | | | | | | | | | | | | | | | | | | | | | | | | | | | | | | | | | | | | | | | | | | | |
Class I | | | | | | | | | | | | | | | | | | | | | | | | | | | | | | | | | | | | | | | | | | | | | |
| 2012 | | | $5.29 | | | | ($- | ) (5) | | | $0.89 | | | | $0.89 | | | | ($- | ) (5) | | | ($1.01 | ) | | | ($1.01 | ) | | | $5.17 | | | | 18.23 | % | | | $142,837 | | | | 0.94 | % | | | 0.91 | % | | | (0.07 | %) | | | 78.23 | % |
| 2011 | | | 5.92 | | | | (0.02 | ) | | | 0.11 | | | | 0.09 | | | | - | | | | (0.72 | ) | | | (0.72 | ) | | | 5.29 | | | | 1.07 | % | | | 124,777 | | | | 0.94 | % | | | 0.92 | % | | | (0.26 | %) | | | 76.24 | % |
| 2010 | | | 5.17 | | | | - | (5) | | | 0.75 | | | | 0.75 | | | | - | | | | - | | | | - | | | | 5.92 | | | | 14.53 | % | | | 1,404,213 | | | | 0.93 | % | | | 0.91 | % | | | 0.01 | % | | | 98.13 | % |
| 2009 | | | 3.68 | | | | - | (5) | | | 1.49 | | | | 1.49 | | | | (- | ) (5) | | | - | | | | (- | ) (5) | | | 5.17 | | | | 40.50 | % | | | 1,318,154 | | | | 0.95 | % | | | 0.94 | % | | | 0.06 | % | | | 119.32 | % |
| 2008 | | | 9.38 | | | | (0.01 | ) | | | (4.02 | ) | | | (4.03 | ) | | | - | | | | (1.67 | ) | | | (1.67 | ) | | | 3.68 | | | | (50.47 | %) | | | 532,148 | | | | 0.94 | % | | | 0.94 | % | | | (0.15 | %) | | | 184.06 | % |
Class P | | | | | | | | | | | | | | | | | | | | | | | | | | | | | | | | | | | | | | | | | | | | | |
| 2012 | | | 6.00 | | | | 0.01 | | | | 1.01 | | | | 1.02 | | | | (- | ) (5) | | | (1.01 | ) | | | (1.01 | ) | | | 6.01 | | | | 18.47 | % | | | 1,139,880 | | | | 0.74 | % | | | 0.71 | % | | | 0.13 | % | | | 78.23 | % |
| 2011 (6) | | | 6.52 | | | | (- | ) (5) | | | (0.52 | ) | | | (0.52 | ) | | | - | | | | - | | | | - | | | | 6.00 | | | | (8.01 | %) | | | 1,052,621 | | | | 0.74 | % | | | 0.72 | % | | | (0.08 | %) | | | 76.24 | % |
Large-Cap Value | | | | | | | | | | | | | | | | | | | | | | | | | | | | | | | | | | | | | | | | | | | | | |
Class I | | | | | | | | | | | | | | | | | | | | | | | | | | | | | | | | | | | | | | | | | | | | | |
| 2012 | | | $10.82 | | | | $0.22 | | | | $1.52 | | | | $1.74 | | | | ($0.24 | ) | | | ($0.30 | ) | | | ($0.54 | ) | | | $12.02 | | | | 16.40 | % | | | $308,064 | | | | 0.82 | % | | | 0.82 | % | | | 1.87 | % | | | 25.44 | % |
| 2011 | | | 11.29 | | | | 0.21 | | | | 0.32 | | | | 0.53 | | | | (0.95 | ) | | | (0.05 | ) | | | (1.00 | ) | | | 10.82 | | | | 4.72 | % | | | 295,579 | | | | 0.82 | % | | | 0.82 | % | | | 1.76 | % | | | 16.18 | % |
| 2010 | | | 10.50 | | | | 0.17 | | | | 0.79 | | | | 0.96 | | | | (0.17 | ) | | | - | | | | (0.17 | ) | | | 11.29 | | | | 9.08 | % | | | 3,102,910 | | | | 0.82 | % | | | 0.82 | % | | | 1.66 | % | | | 17.37 | % |
| 2009 | | | 8.68 | | | | 0.21 | | | | 1.80 | | | | 2.01 | | | | (0.19 | ) | | | - | | | | (0.19 | ) | | | 10.50 | | | | 23.13 | % | | | 3,278,645 | | | | 0.82 | % | | | 0.82 | % | | | 2.23 | % | | | 20.75 | % |
| 2008 | | | 14.21 | | | | 0.21 | | | | (5.03 | ) | | | (4.82 | ) | | | (0.21 | ) | | | (0.50 | ) | | | (0.71 | ) | | | 8.68 | | | | (34.80 | %) | | | 2,065,312 | | | | 0.82 | % | | | 0.82 | % | | | 1.80 | % | | | 37.42 | % |
Class P | | | | | | | | | | | | | | | | | | | | | | | | | | | | | | | | | | | | | | | | | | | | | |
| 2012 | | | 11.74 | | | | 0.26 | | | | 1.66 | | | | 1.92 | | | | (0.32 | ) | | | (0.30 | ) | | | (0.62 | ) | | | 13.04 | | | | 16.64 | % | | | 2,530,007 | | | | 0.62 | % | | | 0.62 | % | | | 2.07 | % | | | 25.44 | % |
| 2011 (6) | | | 12.48 | | | | 0.17 | | | | (0.81 | ) | | | (0.64 | ) | | | (0.10 | ) | | | - | | | | (0.10 | ) | | | 11.74 | | | | (5.18 | %) | | | 2,536,739 | | | | 0.62 | % | | | 0.62 | % | | | 2.24 | % | | | 16.18 | % |
Long/Short Large-Cap | | | | | | | | | | | | | | | | | | | | | | | | | | | | | | | | | | | | | | | | | | | | | |
Class I | | | | | | | | | | | | | | | | | | | | | | | | | | | | | | | | | | | | | | | | | | | | | |
| 2012 | | | $7.05 | | | | $0.04 | | | | $1.10 | | | | $1.14 | | | | ($0.06 | ) | | | ($1.07 | ) | | | ($1.13 | ) | | | $7.06 | | | | 18.09 | % | | | $31,373 | | | | 2.25 | % (11) | | | 2.23 | % (11) | | | 0.62 | % | | | 138.22 | % (11) |
| 2011 | | | 9.24 | | | | 0.05 | | | | (0.24 | ) | | | (0.19 | ) | | | (0.99 | ) | | | (1.01 | ) | | | (2.00 | ) | | | 7.05 | | | | (2.60 | %) | | | 26,085 | | | | 1.80 | % (11) | | | 1.72 | % (11) | | | 0.50 | % | | | 245.57 | % (11) |
| 2010 | | | 8.30 | | | | 0.08 | | | | 0.93 | | | | 1.01 | | | | (0.07 | ) | | | - | | | | (0.07 | ) | | | 9.24 | | | | 12.22 | % | | | 1,601,862 | | | | 1.70 | % (11) | | | 1.58 | % (11) | | | 0.89 | % | | | 245.15 | % (11) |
| 2009 | | | 6.55 | | | | 0.07 | | | | 1.74 | | | | 1.81 | | | | (0.06 | ) | | | - | | | | (0.06 | ) | | | 8.30 | | | | 27.56 | % | | | 1,480,513 | | | | 1.68 | % (11) | | | 1.53 | % (11) | | | 0.95 | % | | | 267.22 | % (11) |
| 2008 (12) | | | 10.00 | | | | 0.05 | | | | (3.45 | ) | | | (3.40 | ) | | | (0.05 | ) | | | - | | | | (0.05 | ) | | | 6.55 | | | | (33.98 | %) | | | 727,357 | | | | 1.76 | % (11) | | | 1.63 | % (11) | | | 0.95 | % | | | 181.49 | % (11) |
Class P | | | | | | | | | | | | | | | | | | | | | | | | | | | | | | | | | | | | | | | | | | | | | |
| 2012 | | | 9.01 | | | | 0.08 | | | | 1.44 | | | | 1.52 | | | | (0.09 | ) | | | (1.07 | ) | | | (1.16 | ) | | | 9.37 | | | | 18.32 | % | | | 1,382,406 | | | | 2.03 | % (11) | | | 2.02 | % (11) | | | 0.81 | % | | | 138.22 | % (11) |
| 2011 (6) | | | 10.08 | | | | 0.05 | | | | (1.09 | ) | | | (1.04 | ) | | | (0.03 | ) | | | - | | | | (0.03 | ) | | | 9.01 | | | | (10.34 | %) | | | 1,402,660 | | | | 1.95 | % (11) | | | 1.95 | % (11) | | | 0.90 | % | | | 245.57 | % (11) |
Main Street Core | | | | | | | | | | | | | | | | | | | | | | | | | | | | | | | | | | | | | | | | | | | | | |
Class I | | | | | | | | | | | | | | | | | | | | | | | | | | | | | | | | | | | | | | | | | | | | | |
| 2012 | | | $17.71 | | | | $0.23 | | | | $2.70 | | | | $2.93 | | | | ($0.20 | ) | | | ($0.86 | ) | | | ($1.06 | ) | | | $19.58 | | | | 17.02 | % | | | $537,634 | | | | 0.69 | % | | | 0.69 | % | | | 1.19 | % | | | 47.80 | % |
| 2011 | | | 19.40 | | | | 0.16 | | | | (0.07 | ) | | | 0.09 | | | | (0.23 | ) | | | (1.55 | ) | | | (1.78 | ) | | | 17.71 | | | | 0.48 | % | | | 528,925 | | | | 0.70 | % | | | 0.70 | % | | | 0.83 | % | | | 43.35 | % |
| 2010 | | | 16.83 | | | | 0.18 | | | | 2.54 | | | | 2.72 | | | | (0.15 | ) | | | - | | | | (0.15 | ) | | | 19.40 | | | | 16.14 | % | | | 1,519,660 | | | | 0.68 | % | | | 0.68 | % | | | 1.02 | % | | | 61.54 | % |
| 2009 | | | 13.19 | | | | 0.20 | | | | 3.67 | | | | 3.87 | | | | (0.23 | ) | | | - | | | | (0.23 | ) | | | 16.83 | | | | 29.36 | % | | | 1,333,869 | | | | 0.68 | % | | | 0.68 | % | | | 1.43 | % | | | 122.82 | % |
| 2008 | | | 24.96 | | | | 0.27 | | | | (9.12 | ) | | | (8.85 | ) | | | (0.26 | ) | | | (2.66 | ) | | | (2.92 | ) | | | 13.19 | | | | (38.87 | %) | | | 1,431,141 | | | | 0.68 | % | | | 0.68 | % | | | 1.39 | % | | | 132.71 | % |
Class P | | | | | | | | | | | | | | | | | | | | | | | | | | | | | | | | | | | | | | | | | | | | | |
| 2012 | | | 19.43 | | | | 0.29 | | | | 2.97 | | | | 3.26 | | | | (0.29 | ) | | | (0.86 | ) | | | (1.15 | ) | | | 21.54 | | | | 17.25 | % | | | 905,292 | | | | 0.49 | % | | | 0.49 | % | | | 1.39 | % | | | 47.80 | % |
| 2011 (6) | | | 20.50 | | | | 0.14 | | | | (1.12 | ) | | | (0.98 | ) | | | (0.09 | ) | | | - | | | | (0.09 | ) | | | 19.43 | | | | (4.79 | %) | | | 852,326 | | | | 0.49 | % | | | 0.49 | % | | | 1.13 | % | | | 43.35 | % |
Mid-Cap Equity | | | | | | | | | | | | | | | | | | | | | | | | | | | | | | | | | | | | | | | | | | | | | |
Class I | | | | | | | | | | | | | | | | | | | | | | | | | | | | | | | | | | | | | | | | | | | | | |
| 2012 | | | $11.87 | | | | $0.06 | | | | $0.69 | | | | $0.75 | | | | ($0.07 | ) | | | ($2.60 | ) | | | ($2.67 | ) | | | $9.95 | | | | 7.35 | % | | | $295,015 | | | | 0.92 | % | | | 0.92 | % | | | 0.55 | % | | | 103.20 | % |
| 2011 | | | 14.72 | | | | 0.05 | | | | (0.69 | ) | | | (0.64 | ) | | | (0.12 | ) | | | (2.09 | ) | | | (2.21 | ) | | | 11.87 | | | | (5.40 | %) | | | 321,413 | | | | 0.92 | % | | | 0.92 | % | | | 0.33 | % | | | 78.35 | % |
| 2010 | | | 12.03 | | | | 0.12 | | | | 2.70 | | | | 2.82 | | | | (0.13 | ) | | | - | | | | (0.13 | ) | | | 14.72 | | | | 23.49 | % | | | 2,031,480 | | | | 0.88 | % | | | 0.88 | % | | | 0.96 | % | | | 70.08 | % |
| 2009 | | | 8.70 | | | | 0.09 | | | | 3.36 | | | | 3.45 | | | | (0.12 | ) | | | - | | | | (0.12 | ) | | | 12.03 | | | | 39.65 | % | | | 1,924,840 | | | | 0.88 | % | | | 0.88 | % | | | 0.98 | % | | | 70.53 | % |
| 2008 | | | 17.16 | | | | 0.22 | | | | (6.14 | ) | | | (5.92 | ) | | | (0.20 | ) | | | (2.34 | ) | | | (2.54 | ) | | | 8.70 | | | | (39.00 | %) | | | 2,707,175 | | | | 0.88 | % | | | 0.88 | % | | | 1.62 | % | | | 90.83 | % |
Class P | | | | | | | | | | | | | | | | | | | | | | | | | | | | | | | | | | | | | | | | | | | | | |
| 2012 | | | 13.91 | | | | 0.09 | | | | 0.83 | | | | 0.92 | | | | (0.12 | ) | | | (2.60 | ) | | | (2.72 | ) | | | 12.11 | | | | 7.55 | % | | | 776,168 | | | | 0.72 | % | | | 0.72 | % | | | 0.68 | % | | | 103.20 | % |
| 2011 (6) | | | 15.91 | | | | 0.06 | | | | (2.02 | ) | | | (1.96 | ) | | | (0.04 | ) | | | - | | | | (0.04 | ) | | | 13.91 | | | | (12.35 | %) | | | 1,395,375 | | | | 0.72 | % | | | 0.72 | % | | | 0.69 | % | | | 78.35 | % |
| | |
| See Notes to Financial Statements | | See explanation of references on pages C-40 and C-41 |
C-36
PACIFIC SELECT FUND
FINANCIAL HIGHLIGHTS (Continued) (1)
Selected per share, ratios and supplemental data for each year or period ended December 31, were as follows:
| | | | | | | | | | | | | | | | | | | | | | | | | | | | | | | | | | | | | | | | | | | | | | | | | | | | | | | | |
| For the Year or Period Ended | | Net Asset Value,
Beginning of Year or Period | | | Net Investment Income (Loss) | | | Net Realized and Unrealized Gain (Loss) | | | Total from Investment Operations | | | Distributions from Net Investment Income | | | Distributions from Capital Gains | | | Total Distributions | | | Net Asset Value,
End of Year or Period | | | Total Returns (2) | | | Net Assets, End of Year or Period
(in thousands) | | | Ratio of Expenses Before Expense
Reductions to Average Net Assets (3) | | | Ratio of Expenses After Expense
Reductions to Average Net Assets (3), (4) | | | Ratio of Net Investment Income (Loss)
After Expense Reductions To Average
Net Assets (3) | | | Portfolio Turnover Rates | |
Mid-Cap Growth | | | | | | | | | | | | | | | | | | | | | | | | | | | | | | | | | | | | | | | | | | | | | |
Class I | | | | | | | | | | | | | | | | | | | | | | | | | | | | | | | | | | | | | | | | | | | | | |
| 2012 | | | $8.71 | | | | $0.03 | | | | $0.56 | | | | $0.59 | | | | ($0.03 | ) | | | ($2.12 | ) | | | ($2.15 | ) | | | $7.15 | | | | 7.49 | % | | | $189,423 | | | | 0.96 | % | | | 0.96 | % | | | 0.43 | % | | | 27.66 | % |
| 2011 | | | 10.03 | | | | (0.02 | ) | | | (0.68 | ) | | | (0.70 | ) | | | - | | | | (0.62 | ) | | | (0.62 | ) | | | 8.71 | | | | (7.81 | %) | | | 205,205 | | | | 0.95 | % | | | 0.95 | % | | | (0.23 | %) | | | 32.98 | % |
| 2010 | | | 7.53 | | | | 0.02 | | | | 2.50 | (7) | | | 2.52 | | | | (0.02 | ) | | | - | | | | (0.02 | ) | | | 10.03 | | | | 33.32 | % (7) | | | 1,308,987 | | | | 0.96 | % | | | 0.96 | % | | | 0.24 | % | | | 41.35 | % |
| 2009 | | | 4.75 | | | | 0.02 | | | | 2.79 | | | | 2.81 | | | | (0.02 | ) | | | (0.01 | ) | | | (0.03 | ) | | | 7.53 | | | | 59.33 | % | | | 1,174,736 | | | | 0.95 | % | | | 0.95 | % | | | 0.37 | % | | | 38.88 | % |
| 2008 | | | 10.53 | | | | 0.01 | | | | (4.58 | ) | | | (4.57 | ) | | | (0.01 | ) | | | (1.20 | ) | | | (1.21 | ) | | | 4.75 | | | | (48.36 | %) | | | 590,771 | | | | 0.93 | % | | | 0.93 | % | | | 0.16 | % | | | 41.40 | % |
Class P | | | | | | | | | | | | | | | | | | | | | | | | | | | | | | | | | | | | | | | | | | | | | |
| 2012 | | | 9.26 | | | | 0.05 | | | | 0.60 | | | | 0.65 | | | | (0.04 | ) | | | (2.12 | ) | | | (2.16 | ) | | | 7.75 | | | | 7.71 | % | | | 526,318 | | | | 0.76 | % | | | 0.76 | % | | | 0.56 | % | | | 27.66 | % |
| 2011 (6) | | | 11.45 | | | | (0.02 | ) | | | (2.17 | ) | | | (2.19 | ) | | | - | | | | - | | | | - | | | | 9.26 | | | | (19.18 | %) | | | 787,031 | | | | 0.76 | % | | | 0.76 | % | | | (0.24 | %) | | | 32.98 | % |
Mid-Cap Value | | | | | | | | | | | | | | | | | | | | | | | | | | | | | | | | | | | | | | | | | | | | | |
Class I | | | | | | | | | | | | | | | | | | | | | | | | | | | | | | | | | | | | | | | | | | | | | |
| 2012 | | | $9.52 | | | | $0.09 | | | | $1.18 | | | | $1.27 | | | | ($0.10 | ) | | | ($0.92 | ) | | | ($1.02 | ) | | | $9.77 | | | | 14.49 | % | | | $46,795 | | | | 0.91 | % | | | 0.91 | % | | | 0.91 | % | | | 153.81 | % |
| 2011 | | | 14.32 | | | | 0.12 | | | | (0.67 | ) | | | (0.55 | ) | | | (1.51 | ) | | | (2.74 | ) | | | (4.25 | ) | | | 9.52 | | | | (5.69 | %) | | | 38,444 | | | | 0.92 | % | | | 0.92 | % | | | 0.85 | % | | | 136.06 | % |
| 2010 | | | 11.93 | | | | 0.15 | | | | 2.38 | | | | 2.53 | | | | (0.14 | ) | | | - | | | | (0.14 | ) | | | 14.32 | | | | 21.20 | % | | | 1,177,255 | | | | 0.92 | % | | | 0.92 | % | | | 1.20 | % | | | 118.20 | % |
| 2009 (13) | | | 10.00 | | | | 0.11 | | | | 2.84 | | | | 2.95 | | | | (0.07 | ) | | | (0.95 | ) | | | (1.02 | ) | | | 11.93 | | | | 29.33 | % | | | 1,080,860 | | | | 0.93 | % | | | 0.93 | % | | | 0.96 | % | | | 128.86 | % |
Class P | | | | | | | | | | | | | | | | | | | | | | | | | | | | | | | | | | | | | | | | | | | | | |
| 2012 | | | 13.47 | | | | 0.15 | | | | 1.72 | | | | 1.87 | | | | (0.15 | ) | | | (0.92 | ) | | | (1.07 | ) | | | 14.27 | | | | 14.72 | % | | | 1,324,858 | | | | 0.71 | % | | | 0.71 | % | | | 1.11 | % | | | 153.81 | % |
| 2011 (6) | | | 15.73 | | | | 0.12 | | | | (2.31 | ) | | | (2.19 | ) | | | (0.07 | ) | | | - | | | | (0.07 | ) | | | 13.47 | | | | (13.96 | %) | | | 972,245 | | | | 0.73 | % | | | 0.73 | % | | | 1.35 | % | | | 136.06 | % |
Small-Cap Equity | | | | | | | | | | | | | | | | | | | | | | | | | | | | | | | | | | | | | | | | | | | | | |
Class I | | | | | | | | | | | | | | | | | | | | | | | | | | | | | | | | | | | | | | | | | | | | | |
| 2012 | | | $10.82 | | | | $0.18 | | | | $1.45 | | | | $1.63 | | | | ($0.20 | ) | | | ($0.59 | ) | | | ($0.79 | ) | | | $11.66 | | | | 15.93 | % | | | $41,681 | | | | 0.99 | % | | | 0.96 | % | | | 1.61 | % | | | 60.86 | % |
| 2011 | | | 14.26 | | | | 0.08 | | | | (0.49 | ) | | | (0.41 | ) | | | (0.80 | ) | | | (2.23 | ) | | | (3.03 | ) | | | 10.82 | | | | (3.38 | %) | | | 37,873 | | | | 1.01 | % | | | 1.01 | % | | | 0.58 | % | | | 20.02 | % |
| 2010 | | | 11.95 | | | | 0.10 | | | | 2.30 | (7) | | | 2.40 | | | | (0.09 | ) | | | - | | | | (0.09 | ) | | | 14.26 | | | | 20.11 | % (7) | | | 1,089,369 | | | | 0.99 | % | | | 0.99 | % | | | 0.81 | % | | | 133.53 | % |
| 2009 | | | 9.23 | | | | 0.08 | | | | 2.72 | | | | 2.80 | | | | (0.08 | ) | | | - | | | | (0.08 | ) | | | 11.95 | | | | 30.22 | % | | | 710,807 | | | | 1.00 | % | | | 1.00 | % | | | 0.81 | % | | | 78.87 | % |
| 2008 | | | 12.79 | | | | 0.07 | | | | (3.36 | ) | | | (3.29 | ) | | | (0.06 | ) | | | (0.21 | ) | | | (0.27 | ) | | | 9.23 | | | | (26.11 | %) | | | 612,126 | | | | 0.98 | % | | | 0.97 | % | | | 0.63 | % | | | 132.45 | % |
Class P | | | | | | | | | | | | | | | | | | | | | | | | | | | | | | | | | | | | | | | | | | | | | |
| 2012 | | | 13.75 | | | | 0.26 | | | | 1.87 | | | | 2.13 | | | | (0.26 | ) | | | (0.59 | ) | | | (0.85 | ) | | | 15.03 | | | | 16.16 | % | | | 960,414 | | | | 0.80 | % | | | 0.76 | % | | | 1.82 | % | | | 60.86 | % |
| 2011 (6) | | | 15.52 | | | | 0.11 | | | | (1.82 | ) | | | (1.71 | ) | | | (0.06 | ) | | | - | | | | (0.06 | ) | | | 13.75 | | | | (10.99 | %) | | | 963,251 | | | | 0.80 | % | | | 0.80 | % | | | 1.26 | % | | | 20.02 | % |
Small-Cap Growth | | | | | | | | | | | | | | | | | | | | | | | | | | | | | | | | | | | | | | | | | | | | | |
Class I | | | | | | | | | | | | | | | | | | | | | | | | | | | | | | | | | | | | | | | | | | | | | |
| 2012 | | | $10.10 | | | | $0.01 | | | | $1.16 | | | | $1.17 | | | | ($0.01 | ) | | | ($1.55 | ) | | | ($1.56 | ) | | | $9.71 | | | | 12.87 | % | | | $106,933 | | | | 0.88 | % | | | 0.88 | % | | | 0.11 | % | | | 77.89 | % |
| 2011 | | | 11.86 | | | | (0.08 | ) | | | (0.19 | ) | | | (0.27 | ) | | | - | | | | (1.49 | ) | | | (1.49 | ) | | | 10.10 | | | | (3.10 | %) | | | 107,786 | | | | 0.87 | % | | | 0.87 | % | | | (0.66 | %) | | | 56.66 | % |
| 2010 | | | 9.41 | | | | (0.06 | ) | | | 2.51 | | | | 2.45 | | | | - | | | | - | | | | - | | | | 11.86 | | | | 26.01 | % | | | 658,723 | | | | 0.84 | % | | | 0.84 | % | | | (0.55 | %) | | | 56.21 | % |
| 2009 | | | 6.39 | | | | (0.02 | ) | | | 3.04 | | | | 3.02 | | | | - | | | | - | | | | - | | | | 9.41 | | | | 47.44 | % | | | 605,964 | | | | 0.84 | % | | | 0.84 | % | | | (0.31 | %) | | | 88.02 | % |
| 2008 | | | 13.30 | | | | (0.02 | ) | | | (5.84 | ) | | | (5.86 | ) | | | - | | | | (1.05 | ) | | | (1.05 | ) | | | 6.39 | | | | (47.11 | %) | | | 552,477 | | | | 0.83 | % | | | 0.83 | % | | | (0.18 | %) | | | 68.49 | % |
Class P | | | | | | | | | | | | | | | | | | | | | | | | | | | | | | | | | | | | | | | | | | | | | |
| 2012 | | | 11.51 | | | | 0.03 | | | | 1.35 | | | | 1.38 | | | | (0.03 | ) | | | (1.55 | ) | | | (1.58 | ) | | | 11.31 | | | | 13.09 | % | | | 390,549 | | | | 0.67 | % | | | 0.67 | % | | | 0.30 | % | | | 77.89 | % |
| 2011 (6) | | | 13.58 | | | | (0.03 | ) | | | (2.04 | ) | | | (2.07 | ) | | | - | | | | - | | | | - | | | | 11.51 | | | | (15.22 | %) | | | 443,336 | | | | 0.69 | % | | | 0.69 | % | | | (0.35 | %) | | | 56.66 | % |
Small-Cap Index | | | | | | | | | | | | | | | | | | | | | | | | | | | | | | | | | | | | | | | | | | | | | |
Class I | | | | | | | | | | | | | | | | | | | | | | | | | | | | | | | | | | | | | | | | | | | | | |
| 2012 | | | $10.99 | | | | $0.19 | | | | $1.56 | | | | $1.75 | | | | ($0.13 | ) | | | ($0.19 | ) | | | ($0.32 | ) | | | $12.42 | | | | 16.13 | % | | | $377,576 | | | | 0.57 | % | | | 0.57 | % | | | 1.58 | % | | | 23.39 | % |
| 2011 | | | 11.58 | | | | 0.08 | | | | (0.60 | ) | | | (0.52 | ) | | | (0.07 | ) | | | - | | | | (0.07 | ) | | | 10.99 | | | | (4.51 | %) | | | 357,107 | | | | 0.59 | % | | | 0.59 | % | | | 0.72 | % | | | 16.32 | % |
| 2010 | | | 9.23 | | | | 0.09 | | | | 2.35 | (7) | | | 2.44 | | | | (0.09 | ) | | | - | | | | (0.09 | ) | | | 11.58 | | | | 26.42 | % (7) | | | 507,364 | | | | 0.56 | % | | | 0.56 | % | | | 0.91 | % | | | 13.80 | % |
| 2009 | | | 7.80 | | | | 0.10 | | | | 1.97 | | | | 2.07 | | | | (0.10 | ) | | | (0.54 | ) | | | (0.64 | ) | | | 9.23 | | | | 28.19 | % | | | 464,971 | | | | 0.54 | % | | | 0.54 | % | | | 1.22 | % | | | 17.81 | % |
| 2008 | | | 13.66 | | | | 0.16 | | | | (4.61 | ) | | | (4.45 | ) | | | (0.23 | ) | | | (1.18 | ) | | | (1.41 | ) | | | 7.80 | | | | (35.03 | %) | | | 419,520 | | | | 0.53 | % | | | 0.53 | % | | | 1.42 | % | | | 25.38 | % |
Class P | | | | | | | | | | | | | | | | | | | | | | | | | | | | | | | | | | | | | | | | | | | | | |
| 2012 | | | 11.03 | | | | 0.26 | | | | 1.51 | | | | 1.77 | | | | (0.18 | ) | | | (0.19 | ) | | | (0.37 | ) | | | 12.43 | | | | 16.37 | % | | | 368,509 | | | | 0.38 | % | | | 0.38 | % | | | 2.20 | % | | | 23.39 | % |
| 2011 (6) | | | 12.83 | | | | 0.09 | | | | (1.84 | ) | | | (1.75 | ) | | | (0.05 | ) | | | - | | | | (0.05 | ) | | | 11.03 | | | | (13.67 | %) | | | 54,421 | | | | 0.42 | % | | | 0.42 | % | | | 1.20 | % | | | 16.32 | % |
| | |
| See Notes to Financial Statements | | See explanation of references on pages C-40 and C-41 |
C-37
PACIFIC SELECT FUND
FINANCIAL HIGHLIGHTS (Continued) (1)
Selected per share, ratios and supplemental data for each year or period ended December 31, were as follows:
| | | | | | | | | | | | | | | | | | | | | | | | | | | | | | | | | | | | | | | | | | | | | | | | | | | | | | | | |
| For the Year or Period Ended | | Net Asset Value,
Beginning of Year or Period | | | Net Investment Income (Loss) | | | Net Realized and Unrealized Gain (Loss) | | | Total from Investment Operations | | | Distributions from Net Investment Income | | | Distributions from Capital Gains | | | Total Distributions | | | Net Asset Value,
End of Year or Period | | | Total Returns (2) | | | Net Assets, End of Year or Period
(in thousands) | | | Ratio of Expenses Before Expense
Reductions to Average Net Assets (3) | | | Ratio of Expenses After Expense
Reductions to Average Net Assets (3), (4) | | | Ratio of Net Investment Income (Loss)
After Expense Reductions To Average
Net Assets (3) | | | Portfolio Turnover Rates | |
Small-Cap Value | | | | | | | | | | | | | | | | | | | | | | | | | | | | | | | | | | | | | | | | | | | | | |
Class I | | | | | | | | | | | | | | | | | | | | | | | | | | | | | | | | | | | | | | | | | | | | | |
| 2012 | | | $11.80 | | | | $0.22 | | | | $0.93 | | | | $1.15 | | | | ($0.23 | ) | | | ($1.36 | ) | | | ($1.59 | ) | | | $11.36 | | | | 11.09 | % | | | $159,284 | | | | 1.02 | % | | | 1.02 | % | | | 1.94 | % | | | 29.35 | % |
| 2011 | | | 13.70 | | | | 0.18 | | | | 0.16 | | | | 0.34 | | | | (0.31 | ) | | | (1.93 | ) | | | (2.24 | ) | | | 11.80 | | | | 2.31 | % | | | 165,620 | | | | 1.02 | % | | | 1.02 | % | | | 1.35 | % | | | 18.77 | % |
| 2010 | | | 11.15 | | | | 0.23 | | | | 2.59 | | | | 2.82 | | | | (0.27 | ) | | | - | | | | (0.27 | ) | | | 13.70 | | | | 25.34 | % | | | 612,770 | | | | 0.99 | % | | | 0.99 | % | | | 1.94 | % | | | 21.23 | % |
| 2009 | | | 8.95 | | | | 0.27 | | | | 2.17 | | | | 2.44 | | | | (0.24 | ) | | | - | | | | (0.24 | ) | | | 11.15 | | | | 27.18 | % | | | 682,592 | | | | 0.99 | % | | | 0.99 | % | | | 2.77 | % | | | 33.52 | % |
| 2008 | | | 14.40 | | | | 0.31 | | | | (3.99 | ) | | | (3.68 | ) | | | (0.30 | ) | | | (1.47 | ) | | | (1.77 | ) | | | 8.95 | | | | (28.23 | %) | | | 437,945 | | | | 0.98 | % | | | 0.98 | % | | | 2.52 | % | | | 46.91 | % |
Class P | | | | | | | | | | | | | | | | | | | | | | | | | | | | | | | | | | | | | | | | | | | | | |
| 2012 | | | 13.93 | | | | 0.30 | | | | 1.10 | | | | 1.40 | | | | (0.31 | ) | | | (1.36 | ) | | | (1.67 | ) | | | 13.66 | | | | 11.31 | % | | | 332,371 | | | | 0.82 | % | | | 0.82 | % | | | 2.16 | % | | | 29.35 | % |
| 2011 (6) | | | 15.23 | | | | 0.18 | | | | (1.37 | ) | | | (1.19 | ) | | | (0.11 | ) | | | - | | | | (0.11 | ) | | | 13.93 | | | | (7.83 | %) | | | 328,994 | | | | 0.83 | % | | | 0.83 | % | | | 1.98 | % | | | 18.77 | % |
Health Sciences | | | | | | | | | | | | | | | | | | | | | | | | | | | | | | | | | | | | | | | | | | | | | |
Class I | | | | | | | | | | | | | | | | | | | | | | | | | | | | | | | | | | | | | | | | | | | | | |
| 2012 | | | $12.06 | | | | ($0.06 | ) | | | $3.10 | | | | $3.04 | | | | $- | | | | ($0.75 | ) | | | ($0.75 | ) | | | $14.35 | | | | 25.68 | % | | | $156,854 | | | | 1.15 | % | | | 1.15 | % | | | (0.45 | %) | | | 60.94 | % |
| 2011 | | | 11.57 | | | | (0.13 | ) | | | 1.53 | | | | 1.40 | | | | - | | | | (0.91 | ) | | | (0.91 | ) | | | 12.06 | | | | 11.94 | % | | | 123,676 | | | | 1.17 | % | | | 1.17 | % | | | (1.07 | %) | | | 60.30 | % |
| 2010 | | | 9.38 | | | | (0.06 | ) | | | 2.25 | (7) | | | 2.19 | | | | - | | | | - | | | | - | | | | 11.57 | | | | 23.34 | % (7) | | | 105,993 | | | | 1.15 | % | | | 1.15 | % | | | (0.61 | %) | | | 61.99 | % |
| 2009 | | | 7.38 | | | | (0.04 | ) | | | 2.05 | | | | 2.01 | | | | (0.01 | ) | | | - | | | | (0.01 | ) | | | 9.38 | | | | 27.23 | % | | | 90,008 | | | | 1.17 | % | | | 1.17 | % | | | (0.55 | %) | | | 59.57 | % |
| 2008 | | | 12.08 | | | | 0.13 | | | | (3.21 | ) | | | (3.08 | ) | | | (0.12 | ) | | | (1.50 | ) | | | (1.62 | ) | | | 7.38 | | | | (28.16 | %) | | | 82,105 | | | | 1.13 | % | | | 1.13 | % | | | 1.33 | % | | | 99.46 | % |
Class P | | | | | | | | | | | | | | | | | | | | | | | | | | | | | | | | | | | | | | | | | | | | | |
| 2012 | | | 12.97 | | | | (0.04 | ) | | | 3.35 | | | | 3.31 | | | | - | | | | (0.75 | ) | | | (0.75 | ) | | | 15.53 | | | | 25.93 | % | | | 12 | | | | 0.95 | % | | | 0.95 | % | | | (0.24 | %) | | | 60.94 | % |
| 2011 (6) | | | 13.61 | | | | (0.07 | ) | | | (0.57 | ) | | | (0.64 | ) | | | - | | | | - | | | | - | | | | 12.97 | | | | (4.70 | %) | | | 10 | | | | 0.98 | % | | | 0.98 | % | | | (0.88 | %) | | | 60.30 | % |
Real Estate | | | | | | | | | | | | | | | | | | | | | | | | | | | | | | | | | | | | | | | | | | | | | |
Class I | | | | | | | | | | | | | | | | | | | | | | | | | | | | | | | | | | | | | | | | | | | | | |
| 2012 | | | $14.90 | | | | $0.20 | | | | $2.17 | | | | $2.37 | | | | ($0.19 | ) | | | ($0.76 | ) | | | ($0.95 | ) | | | $16.32 | | | | 16.21 | % | | | $282,777 | | | | 1.08 | % | | | 1.08 | % | | | 1.27 | % | | | 30.53 | % |
| 2011 | | | 14.56 | | | | 0.09 | | | | 0.81 | | | | 0.90 | | | | - | | | | (0.56 | ) | | | (0.56 | ) | | | 14.90 | | | | 6.12 | % | | | 254,310 | | | | 1.11 | % | | | 1.11 | % | | | 0.57 | % | | | 21.47 | % |
| 2010 | | | 11.30 | | | | 0.10 | | | | 3.35 | | | | 3.45 | | | | (0.19 | ) | | | - | | | | (0.19 | ) | | | 14.56 | | | | 30.54 | % | | | 624,299 | | | | 1.07 | % | | | 1.07 | % | | | 0.78 | % | | | 18.97 | % |
| 2009 | | | 8.78 | | | | 0.11 | | | | 2.68 | | | | 2.79 | | | | (0.19 | ) | | | (0.08 | ) | | | (0.27 | ) | | | 11.30 | | | | 32.27 | % | | | 610,575 | | | | 1.07 | % | | | 1.07 | % | | | 1.27 | % | | | 30.19 | % |
| 2008 | | | 21.74 | | | | 0.50 | | | | (7.01 | ) | | | (6.51 | ) | | | (0.55 | ) | | | (5.90 | ) | | | (6.45 | ) | | | 8.78 | | | | (39.99 | %) | | | 462,511 | | | | 1.06 | % | | | 1.06 | % | | | 2.99 | % | | | 45.75 | % |
Class P | | | | | | | | | | | | | | | | | | | | | | | | | | | | | | | | | | | | | | | | | | | | | |
| 2012 | | | 15.33 | | | | 0.32 | | | | 2.16 | | | | 2.48 | | | | (0.22 | ) | | | (0.76 | ) | | | (0.98 | ) | | | 16.83 | | | | 16.44 | % | | | 832,686 | | | | 0.88 | % | | | 0.88 | % | | | 1.90 | % | | | 30.53 | % |
| 2011 (6) | | | 16.29 | | | | 0.02 | | | | (0.83 | ) | | | (0.81 | ) | | | (0.15 | ) | | | - | | | | (0.15 | ) | | | 15.33 | | | | (4.98 | %) | | | 339,404 | | | | 0.92 | % | | | 0.92 | % | | | 0.20 | % | | | 21.47 | % |
Technology | | | | | | | | | | | | | | | | | | | | | | | | | | | | | | | | | | | | | | | | | | | | | |
Class I | | | | | | | | | | | | | | | | | | | | | | | | | | | | | | | | | | | | | | | | | | | | | |
| 2012 | | | $4.30 | | | | ($0.02 | ) | | | $0.32 | | | | $0.30 | | | | $- | | | | ($0.40 | ) | | | ($0.40 | ) | | | $4.20 | | | | 7.14 | % | | | $68,148 | | | | 1.16 | % | | | 1.16 | % | | | (0.49 | %) | | | 78.49 | % |
| 2011 | | | 5.53 | | | | (0.02 | ) | | | (0.20 | ) | | | (0.22 | ) | | | - | | | | (1.01 | ) | | | (1.01 | ) | | | 4.30 | | | | (4.90 | %) | | | 72,398 | | | | 1.17 | % | | | 1.17 | % | | | (0.48 | %) | | | 82.88 | % |
| 2010 | | | 4.55 | | | | (0.04 | ) | | | 1.02 | (7) | | | 0.98 | | | | - | | | | - | | | | - | | | | 5.53 | | | | 21.50 | % (7) | | | 90,260 | | | | 1.19 | % | | | 1.19 | % | | | (0.76 | %) | | | 216.41 | % |
| 2009 | | | 2.98 | | | | (0.02 | ) | | | 1.59 | | | | 1.57 | | | | - | | | | - | | | | - | | | | 4.55 | | | | 52.57 | % | | | 82,094 | | | | 1.15 | % | | | 1.15 | % | | | (0.56 | %) | | | 243.87 | % |
| 2008 | | | 7.67 | | | | (0.02 | ) | | | (3.42 | ) | | | (3.44 | ) | | | (0.01 | ) | | | (1.24 | ) | | | (1.25 | ) | | | 2.98 | | | | (51.64 | %) | | | 44,417 | | | | 1.16 | % | | | 1.16 | % | | | (0.31 | %) | | | 283.57 | % |
Class P | | | | | | | | | | | | | | | | | | | | | | | | | | | | | | | | | | | | | | | | | | | | | |
| 2012 | | | 5.27 | | | | (0.02 | ) | | | 0.40 | | | | 0.38 | | | | - | | | | (0.40 | ) | | | (0.40 | ) | | | 5.25 | | | | 7.36 | % | | | 10 | | | | 0.95 | % | | | 0.95 | % | | | (0.27 | %) | | | 78.49 | % |
| 2011 (6) | | | 5.86 | | | | (0.01 | ) | | | (0.58 | ) | | | (0.59 | ) | | | - | | | | - | | | | - | | | | 5.27 | | | | (10.16 | %) | | | 9 | | | | 0.98 | % | | | 0.98 | % | | | (0.27 | %) | | | 82.88 | % |
Emerging Markets | | | | | | | | | | | | | | | | | | | | | | | | | | | | | | | | | | | | | | | | | | | | | |
Class I | | | | | | | | | | | | | | | | | | | | | | | | | | | | | | | | | | | | | | | | | | | | | |
| 2012 | | | $13.68 | | | | $0.11 | | | | $2.57 | | | | $2.68 | | | | ($0.11 | ) | | | ($1.62 | ) | | | ($1.73 | ) | | | $14.63 | | | | 21.52 | % | | | $448,318 | | | | 1.06 | % | | | 1.06 | % | | | 0.74 | % | | | 31.20 | % |
| 2011 | | | 17.08 | | | | 0.13 | | | | (3.20 | ) | | | (3.07 | ) | | | (0.33 | ) | | | - | | | | (0.33 | ) | | | 13.68 | | | | (17.97 | %) | | | 384,254 | | | | 1.06 | % | | | 1.06 | % | | | 0.82 | % | | | 36.35 | % |
| 2010 | | | 13.60 | | | | 0.11 | | | | 3.54 | | | | 3.65 | | | | (0.17 | ) | | | - | | | | (0.17 | ) | | | 17.08 | | | | 27.02 | % | | | 1,853,299 | | | | 1.05 | % | | | 1.05 | % | | | 0.77 | % | | | 32.63 | % |
| 2009 | | | 8.80 | | | | 0.11 | | | | 6.72 | | | | 6.83 | | | | (0.10 | ) | | | (1.93 | ) | | | (2.03 | ) | | | 13.60 | | | | 84.79 | % | | | 1,732,557 | | | | 1.06 | % | | | 1.06 | % | | | 1.02 | % | | | 46.50 | % |
| 2008 | | | 20.96 | | | | 0.27 | | | | (8.91 | ) | | | (8.64 | ) | | | (0.23 | ) | | | (3.29 | ) | | | (3.52 | ) | | | 8.80 | | | | (47.68 | %) | | | 1,021,715 | | | | 1.07 | % | | | 1.06 | % | | | 1.76 | % | | | 64.43 | % |
Class P | | | | | | | | | | | | | | | | | | | | | | | | | | | | | | | | | | | | | | | | | | | | | |
| 2012 | | | 13.95 | | | | 0.14 | | | | 2.63 | | | | 2.77 | | | | (0.13 | ) | | | (1.62 | ) | | | (1.75 | ) | | | 14.97 | | | | 21.77 | % | | | 1,107,566 | | | | 0.86 | % | | | 0.86 | % | | | 0.95 | % | | | 31.20 | % |
| 2011 (6) | | | 17.53 | | | | 0.10 | | | | (3.63 | ) | | | (3.53 | ) | | | (0.05 | ) | | | - | | | | (0.05 | ) | | | 13.95 | | | | (19.94 | %) | | | 1,013,440 | | | | 0.86 | % | | | 0.86 | % | | | 1.00 | % | | | 36.35 | % |
| | |
| See Notes to Financial Statements | | See explanation of references on pages C-40 and C-41 |
C-38
PACIFIC SELECT FUND
FINANCIAL HIGHLIGHTS (Continued) (1)
Selected per share, ratios and supplemental data for each year or period ended December 31, were as follows:
| | | | | | | | | | | | | | | | | | | | | | | | | | | | | | | | | | | | | | | | | | | | | | | | | | | | | | | | |
| For the Year or Period Ended | | Net Asset Value,
Beginning of Year or Period | | | Net Investment Income (Loss) | | | Net Realized and Unrealized Gain (Loss) | | | Total from Investment Operations | | | Distributions from Net Investment Income | | | Distributions from Capital Gains | | | Total Distributions | | | Net Asset Value,
End of Year or Period | | | Total Returns (2) | | | Net Assets, End of Year or Period
(in thousands) | | | Ratio of Expenses Before Expense
Reductions to Average Net Assets (3) | | | Ratio of Expenses After Expense
Reductions to Average Net Assets (3), (4) | | | Ratio of Net Investment Income (Loss)
After Expense Reductions To Average
Net Assets (3) | | | Portfolio Turnover Rates | |
International Large-Cap | | | | | | | | | | | | | | | | | | | | | | | | | | | | | | | | | | | | | | | | | | | | | |
Class I | | | | | | | | | | | | | | | | | | | | | | | | | | | | | | | | | | | | | | | | | | | | | |
| 2012 | | | $5.57 | | | | $0.10 | | | | $1.16 | | | | $1.26 | | | | ($0.10 | ) | | | $- | | | | ($0.10 | ) | | | $6.73 | | | | 22.53 | % | | | $430,048 | | | | 1.00 | % | | | 1.00 | % | | | 1.62 | % | | | 22.67 | % |
| 2011 | | | 6.63 | | | | 0.14 | | | | (0.81 | ) | | | (0.67 | ) | | | (0.39 | ) | | | - | | | | (0.39 | ) | | | 5.57 | | | | (10.12 | %) | | | 361,500 | | | | 1.00 | % | | | 1.00 | % | | | 2.09 | % | | | 26.79 | % |
| 2010 | | | 6.07 | | | | 0.08 | | | | 0.55 | | | | 0.63 | | | | (0.07 | ) | | | - | | | | (0.07 | ) | | | 6.63 | | | | 10.38 | % | | | 2,479,381 | | | | 1.00 | % | | | 1.00 | % | | | 1.31 | % | | | 24.51 | % |
| 2009 | | | 4.61 | | | | 0.09 | | | | 1.45 | | | | 1.54 | | | | (0.08 | ) | | | - | | | | (0.08 | ) | | | 6.07 | | | | 33.61 | % | | | 2,601,657 | | | | 1.00 | % | | | 1.00 | % | | | 1.72 | % | | | 16.29 | % |
| 2008 | | | 9.49 | | | | 0.13 | | | | (2.88 | ) | | | (2.75 | ) | | | (0.15 | ) | | | (1.98 | ) | | | (2.13 | ) | | | 4.61 | | | | (35.35 | %) | | | 2,084,245 | | | | 0.99 | % | | | 0.99 | % | | | 1.90 | % | | | 31.12 | % |
Class P | | | | | | | | | | | | | | | | | | | | | | | | | | | | | | | | | | | | | | | | | | | | | |
| 2012 | | | 5.94 | | | | 0.13 | | | | 1.22 | | | | 1.35 | | | | (0.14 | ) | | | - | | | | (0.14 | ) | | | 7.15 | | | | 22.78 | % | | | 1,572,347 | | | | 0.80 | % | | | 0.80 | % | | | 1.96 | % | | | 22.67 | % |
| 2011 (6) | | | 7.35 | | | | 0.05 | | | | (1.43 | ) | | | (1.38 | ) | | | (0.03 | ) | | | - | | | | (0.03 | ) | | | 5.94 | | | | (18.75 | %) | | | 1,833,278 | | | | 0.80 | % | | | 0.80 | % | | | 1.16 | % | | | 26.79 | % |
International Small-Cap | | | | | | | | | | | | | | | | | | | | | | | | | | | | | | | | | | | | | | | | | | | | | |
Class I | | | | | | | | | | | | | | | | | | | | | | | | | | | | | | | | | | | | | | | | | | | | | |
| 2012 | | | $5.45 | | | | $0.13 | | | | $0.93 | | | | $1.06 | | | | ($0.17 | ) | | | $- | | | | ($0.17 | ) | | | $6.34 | | | | 19.44 | % | | | $44,592 | | | | 1.09 | % | | | 1.07 | % | | | 2.19 | % | | | 57.46 | % |
| 2011 | | | 8.44 | | | | 0.20 | | | | (1.24 | ) | | | (1.04 | ) | | | (1.95 | ) | | | - | | | | (1.95 | ) | | | 5.45 | | | | (12.27 | %) | | | 36,681 | | | | 1.09 | % | | | 1.08 | % | | | 2.27 | % | | | 61.80 | % |
| 2010 | | | 6.94 | | | | 0.09 | | | | 1.60 | | | | 1.69 | | | | (0.19 | ) | | | - | | | | (0.19 | ) | | | 8.44 | | | | 24.86 | % | | | 994,606 | | | | 1.10 | % | | | 1.10 | % | | | 1.25 | % | | | 91.33 | % |
| 2009 | | | 5.40 | | | | 0.09 | | | | 1.54 | | | | 1.63 | | | | (0.09 | ) | | | - | | | | (0.09 | ) | | | 6.94 | | | | 30.28 | % | | | 887,039 | | | | 1.10 | % | | | 1.10 | % | | | 1.56 | % | | | 127.50 | % |
| 2008 | | | 10.67 | | | | 0.17 | | | | (5.27 | ) | | | (5.10 | ) | | | (0.17 | ) | | | - | | | | (0.17 | ) | | | 5.40 | | | | (47.84 | %) | | | 595,375 | | | | 1.09 | % | | | 1.08 | % | | | 2.02 | % | | | 92.42 | % |
Class P | | | | | | | | | | | | | | | | | | | | | | | | | | | | | | | | | | | | | | | | | | | | | |
| 2012 | | | 7.38 | | | | 0.19 | | | | 1.26 | | | | 1.45 | | | | (0.19 | ) | | | - | | | | (0.19 | ) | | | 8.64 | | | | 19.68 | % | | | 1,171,915 | | | | 0.89 | % | | | 0.87 | % | | | 2.39 | % | | | 57.46 | % |
| 2011 (6) | | | 9.33 | | | | 0.09 | | | | (1.99 | ) | | | (1.90 | ) | | | (0.05 | ) | | | - | | | | (0.05 | ) | | | 7.38 | | | | (20.34 | %) | | | 1,051,861 | | | | 0.89 | % | | | 0.87 | % | | | 1.64 | % | | | 61.80 | % |
International Value | | | | | | | | | | | | | | | | | | | | | | | | | | | | | | | | | | | | | | | | | | | | | |
Class I | | | | | | | | | | | | | | | | | | | | | | | | | | | | | | | | | | | | | | | | | | | | | |
| 2012 | | | $8.52 | | | | $0.27 | | | | $1.23 | | | | $1.50 | | | | ($0.32 | ) | | | $- | | | | ($0.32 | ) | | | $9.70 | | | | 17.82 | % | | | $316,519 | | | | 0.89 | % | | | 0.89 | % | | | 3.01 | % | | | 68.03 | % |
| 2011 | | | 10.92 | | | | 0.39 | | | | (1.80 | ) | | | (1.41 | ) | | | (0.99 | ) | | | - | | | | (0.99 | ) | | | 8.52 | | | | (12.90 | %) | | | 283,784 | | | | 0.90 | % | | | 0.90 | % | | | 3.49 | % | | | 65.56 | % |
| 2010 | | | 10.95 | | | | 0.20 | | | | 0.06 | (7) | | | 0.26 | | | | (0.29 | ) | | | - | | | | (0.29 | ) | | | 10.92 | | | | 2.59 | % (7) | | | 1,663,482 | | | | 0.89 | % | | | 0.89 | % | | | 1.89 | % | | | 136.26 | % |
| 2009 | | | 8.73 | | | | 0.27 | | | | 2.17 | | | | 2.44 | | | | (0.22 | ) | | | - | | | | (0.22 | ) | | | 10.95 | | | | 28.00 | % | | | 2,093,731 | | | | 0.90 | % | | | 0.89 | % | | | 2.91 | % | | | 44.16 | % |
| 2008 | | | 18.34 | | | | 0.47 | | | | (8.92 | ) | | | (8.45 | ) | | | (0.40 | ) | | | (0.76 | ) | | | (1.16 | ) | | | 8.73 | | | | (47.78 | %) | | | 2,227,716 | | | | 0.89 | % | | | 0.88 | % | | | 3.30 | % | | | 29.66 | % |
Class P | | | | | | | | | | | | | | | | | | | | | | | | | | | | | | | | | | | | | | | | | | | | | |
| 2012 | | | 9.46 | | | | 0.32 | | | | 1.36 | | | | 1.68 | | | | (0.40 | ) | | | - | | | | (0.40 | ) | | | 10.74 | | | | 18.05 | % | | | 1,222,391 | | | | 0.69 | % | | | 0.69 | % | | | 3.18 | % | | | 68.03 | % |
| 2011 (6) | | | 12.05 | | | | 0.11 | | | | (2.64 | ) | | | (2.53 | ) | | | (0.06 | ) | | | - | | | | (0.06 | ) | | | 9.46 | | | | (20.99 | %) | | | 1,126,771 | | | | 0.69 | % | | | 0.69 | % | | | 1.68 | % | | | 65.56 | % |
Currency Strategies (14) | | | | | | | | | | | | | | | | | | | | | | | | | | | | | | | | | | | | | | | | | | | | | |
Class I | | | | | | | | | | | | | | | | | | | | | | | | | | | | | | | | | | | | | | | | | | | | | |
| 2012 | | | $10.00 | | | | ($0.02 | ) | | | ($0.09 | ) | | | ($0.11 | ) | | | $- | | | | $- | | | | $- | | | | $9.89 | | | | (1.14 | %) | | | $224 | | | | 0.88 | % | | | 0.88 | % | | | (0.70 | %) | | | 0.00 | % |
Class P | | | | | | | | | | | | | | | | | | | | | | | | | | | | | | | | | | | | | | | | | | | | | |
| 2012 | | | 10.00 | | | | (0.01 | ) | | | (0.10 | ) | | | (0.11 | ) | | | - | | | | - | | | | - | | | | 9.89 | | | | (1.09 | %) | | | 1,458,137 | | | | 0.68 | % | | | 0.68 | % | | | (0.50 | %) | | | 0.00 | % |
Global Absolute Return (14) | | | | | | | | | | | | | | | | | | | | | | | | | | | | | | | | | | | | | | | | | | | | | |
Class I | | | | | | | | | | | | | | | | | | | | | | | | | | | | | | | | | | | | | | | | | | | | | |
| 2012 | | | $10.00 | | | | $0.06 | | | | ($0.08 | ) | | | ($0.02 | ) | | | $- | | | | $- | | | | $- | | | | $9.98 | | | | (0.20 | %) | | | $923 | | | | 1.07 | % | | | 1.07 | % | | | 2.44 | % | | | 44.98 | % |
Class P | | | | | | | | | | | | | | | | | | | | | | | | | | | | | | | | | | | | | | | | | | | | | |
| 2012 | | | 10.00 | | | | 0.05 | | | | (0.06 | ) | | | (0.01 | ) | | | - | | | | - | | | | - | | | | 9.99 | | | | (0.15 | %) | | | 2,029,821 | | | | 0.86 | % | | | 0.86 | % | | | 2.10 | % | | | 44.98 | % |
Precious Metals (14) | | | | | | | | | | | | | | | | | | | | | | | | | | | | | | | | | | | | | | | | | | | | | |
Class I | | | | | | | | | | | | | | | | | | | | | | | | | | | | | | | | | | | | | | | | | | | | | |
| 2012 | | | $10.00 | | | | ($- | ) (5) | | | ($1.40 | ) | | | ($1.40 | ) | | | $- | | | | $- | | | | $- | | | | $8.60 | | | | (14.01 | %) | | | $2,303 | | | | 0.92 | % | | | 0.92 | % | | | (0.00 | %) | | | 3.39 | % |
Class P | | | | | | | | | | | | | | | | | | | | | | | | | | | | | | | | | | | | | | | | | | | | | |
| 2012 | | | 10.00 | | | | (- | ) (5) | | | (1.40 | ) | | | (1.40 | ) | | | - | | | | - | | | | - | | | | 8.60 | | | | (13.96 | %) | | | 820,519 | | | | 0.72 | % | | | 0.72 | % | | | (0.02 | %) | | | 3.39 | % |
American Funds Asset Allocation (10) | | | | | | | | | | | | | | | | | | | | | | | | | | | | | | | | | | | | | | | | | | | | | |
Class I | | | | | | | | | | | | | | | | | | | | | | | | | | | | | | | | | | | | | | | | | | | | | |
| 2012 | | | $13.79 | | | | $0.32 | | | | $1.82 | | | | $2.14 | | | | ($0.26 | ) | | | ($0.22 | ) | | | ($0.48 | ) | | | $15.45 | | | | 15.72 | % | | | $571,092 | | | | 0.97 | % | | | 0.63 | % | | | 2.12 | % | | | 5.00 | % |
| 2011 | | | 14.30 | | | | 0.24 | | | | (0.10 | ) | | | 0.14 | | | | (0.45 | ) | | | (0.20 | ) | | | (0.65 | ) | | | 13.79 | | | | 0.93 | % | | | 278,159 | | | | 0.97 | % | | | 0.63 | % | | | 1.67 | % | | | 8.26 | % |
| 2010 | | | 12.76 | | | | 0.24 | | | | 1.30 | | | | 1.54 | | | | - | | | | - | | | | - | | | | 14.30 | | | | 12.04 | % | | | 228,288 | | | | 0.98 | % | | | 0.64 | % | | | 1.87 | % | | | 9.22 | % |
| 2009 (15) | | | 10.00 | | | | 0.38 | | | | 2.60 | | | | 2.98 | | | | (0.22 | ) | | | - | | | | (0.22 | ) | | | 12.76 | | | | 29.81 | % | | | 139,137 | | | | 1.00 | % | | | 0.66 | % | | | 3.50 | % | | | 25.11 | % |
| | |
| See Notes to Financial Statements | | See explanation of references on pages C-40 and C-41 |
C-39
PACIFIC SELECT FUND
FINANCIAL HIGHLIGHTS (Continued) (1)
Selected per share, ratios and supplemental data for each year or period ended December 31, were as follows:
| | | | | | | | | | | | | | | | | | | | | | | | | | | | | | | | | | | | | | | | | | | | | | | | | | | | | | | | |
| For the Year or Period Ended | | Net Asset Value,
Beginning of Year or Period | | | Net Investment Income | | | Net Realized and Unrealized Gain (Loss) | | | Total from Investment Operations | | | Distributions from Net Investment Income | | | Distributions from Capital Gains | | | Total Distributions | | | Net Asset Value,
End of Year or Period | | | Total Returns (2) | | | Net Assets, End of Year or Period
(in thousands) | | | Ratio of Expenses Before Expense
Reductions to Average Net Assets (3) | | | Ratio of Expenses After Expense
Reductions to Average Net Assets (3), (4) | | | Ratio of Net Investment Income
After Expense Reductions To Average
Net Assets (3) | | | Portfolio Turnover Rates | |
Pacific Dynamix - Conservative Growth | | | | | | | | | | | | | | | | | | | | | | | | | | | | | | | | | | | | | | | | | | | | | |
Class I | | | | | | | | | | | | | | | | | | | | | | | | | | | | | | | | | | | | | | | | | | | | | |
| 2012 | | | $11.26 | | | | $0.22 | | | | $0.81 | | | | $1.03 | | | | ($0.16 | ) | | | ($0.46 | ) | | | ($0.62 | ) | | | $11.67 | | | | 9.42 | % | | | $248,916 | | | | 0.43 | % | | | 0.39 | % | | | 1.88 | % | | | 5.98 | % |
| 2011 | | | 11.91 | | | | 0.34 | | | | - | | | | 0.34 | | | | (0.31 | ) | | | (0.68 | ) | | | (0.99 | ) | | | 11.26 | | | | 2.92 | % | | | 134,491 | | | | 0.44 | % | | | 0.39 | % | | | 2.82 | % | | | 47.47 | % |
| 2010 | | | 11.19 | | | | 0.38 | | | | 0.77 | | | | 1.15 | | | | (0.20 | ) | | | (0.23 | ) | | | (0.43 | ) | | | 11.91 | | | | 10.28 | % | | | 129,774 | | | | 0.50 | % | | | 0.41 | % | | | 3.21 | % | | | 21.69 | % |
| 2009 (16) | | | 10.00 | | | | 0.20 | | | | 1.22 | | | | 1.42 | | | | (0.12 | ) | | | (0.11 | ) | | | (0.23 | ) | | | 11.19 | | | | 14.25 | % | | | 41,645 | | | | 0.67 | % | | | 0.46 | % | | | 2.67 | % | | | 7.00 | % |
Pacific Dynamix - Moderate Growth | | | | | | | | | | | | | | | | | | | | | | | | | | | | | | | | | | | | | | | | | | | | | |
Class I | | | | | | | | | | | | | | | | | | | | | | | | | | | | | | | | | | | | | | | | | | | | | |
| 2012 | | | $12.32 | | | | $0.27 | | | | $1.15 | | | | $1.42 | | | | ($0.19 | ) | | | ($0.23 | ) | | | ($0.42 | ) | | | $13.32 | | | | 11.74 | % | | | $644,608 | | | | 0.42 | % | | | 0.37 | % | | | 2.08 | % | | | 2.06 | % |
| 2011 | | | 12.79 | | | | 0.38 | | | | (0.31 | ) | | | 0.07 | | | | (0.29 | ) | | | (0.25 | ) | | | (0.54 | ) | | | 12.32 | | | | 0.48 | % | | | 289,387 | | | | 0.43 | % | | | 0.37 | % | | | 2.97 | % | | | 9.19 | % |
| 2010 | | | 11.77 | | | | 0.27 | | | | 1.13 | | | | 1.40 | | | | (0.20 | ) | | | (0.18 | ) | | | (0.38 | ) | | | 12.79 | | | | 11.92 | % | | | 158,070 | | | | 0.48 | % | | | 0.39 | % | | | 2.19 | % | | | 10.34 | % |
| 2009 (16) | | | 10.00 | | | | 0.18 | | | | 1.78 | | | | 1.96 | | | | (0.11 | ) | | | (0.08 | ) | | | (0.19 | ) | | | 11.77 | | | | 19.60 | % | | | 70,271 | | | | 0.58 | % | | | 0.43 | % | | | 2.41 | % | | | 1.13 | % |
Pacific Dynamix - Growth | | | | | | | | | | | | | | | | | | | | | | | | | | | | | | | | | | | | | | | | | | | | | |
Class I | | | | | | | | | | | | | | | | | | | | | | | | | | | | | | | | | | | | | | | | | | | | | |
| 2012 | | | $12.52 | | | | $0.20 | | | | $1.49 | | | | $1.69 | | | | ($0.18 | ) | | | ($0.46 | ) | | | ($0.64 | ) | | | $13.57 | | | | 13.76 | % | | | $264,131 | | | | 0.42 | % | | | 0.36 | % | | | 1.48 | % | | | 9.74 | % |
| 2011 | | | 13.23 | | | | 0.28 | | | | (0.51 | ) | | | (0.23 | ) | | | (0.22 | ) | | | (0.26 | ) | | | (0.48 | ) | | | 12.52 | | | | (1.85 | %) | | | 188,875 | | | | 0.43 | % | | | 0.36 | % | | | 2.13 | % | | | 5.72 | % |
| 2010 | | | 12.10 | | | | 0.20 | | | | 1.47 | | | | 1.67 | | | | (0.16 | ) | | | (0.38 | ) | | | (0.54 | ) | | | 13.23 | | | | 13.82 | % | | | 108,426 | | | | 0.50 | % | | | 0.38 | % | | | 1.58 | % | | | 22.35 | % |
| 2009 (16) | | | 10.00 | | | | 0.12 | | | | 2.32 | | | | 2.44 | | | | (0.09 | ) | | | (0.25 | ) | | | (0.34 | ) | | | 12.10 | | | | 24.34 | % | | | 53,356 | | | | 0.60 | % | | | 0.42 | % | | | 1.57 | % | | | 13.58 | % |
Portfolio Optimization Conservative | | | | | | | | | | | | | | | | | | | | | | | | | | | | | | | | | | | | | | | | | | | | | |
Class I | | | | | | | | | | | | | | | | | | | | | | | | | | | | | | | | | | | | | | | | | | | | | |
| 2012 | | | $9.86 | | | | $0.28 | | | | $0.72 | | | | $1.00 | | | | ($0.26 | ) | | | ($0.01 | ) | | | ($0.27 | ) | | | $10.59 | | | | 10.11 | % | | | $3,773,295 | | | | 0.31 | % | | | 0.21 | % | | | 2.69 | % | | | 42.11 | % |
| 2011 (8) | | | 10.00 | | | | 0.11 | | | | (0.16 | ) | | | (0.05 | ) | | | (0.09 | ) | | | - | | | | (0.09 | ) | | | 9.86 | | | | (0.52 | %) | | | 3,552,104 | | | | 0.31 | % | | | 0.21 | % | | | 1.73 | % | | | 11.01 | % |
Portfolio Optimization Moderate-Conservative | | | | | | | | | | | | | | | | | | | | | | | | | | | | | | | | | | | | | |
Class I | | | | | | | | | | | | | | | | | | | | | | | | | | | | | | | | | | | | | | | | | | | | | |
| 2012 | | | $9.60 | | | | $0.25 | | | | $0.87 | | | | $1.12 | | | | ($0.24 | ) | | | ($- | ) (5) | | | ($0.24 | ) | | | $10.48 | | | | 11.65 | % | | | $4,701,506 | | | | 0.31 | % | | | 0.21 | % | | | 2.47 | % | | | 37.71 | % |
| 2011 (8) | | | 10.00 | | | | 0.09 | | | | (0.42 | ) | | | (0.33 | ) | | | (0.07 | ) | | | - | | | | (0.07 | ) | | | 9.60 | | | | (3.25 | %) | | | 4,038,449 | | | | 0.31 | % | | | 0.21 | % | | | 1.46 | % | | | 8.08 | % |
Portfolio Optimization Moderate | | | | | | | | | | | | | | | | | | | | | | | | | | | | | | | | | | | | | | | | | | | | | |
Class I | | | | | | | | | | | | | | | | | | | | | | | | | | | | | | | | | | | | | | | | | | | | | |
| 2012 | | | $9.34 | | | | $0.21 | | | | $0.99 | | | | $1.20 | | | | ($0.21 | ) | | | $- | | | | ($0.21 | ) | | | $10.33 | | | | 12.94 | % | | | $15,072,411 | | | | 0.31 | % | | | 0.21 | % | | | 2.10 | % | | | 36.14 | % |
| 2011 (8) | | | 10.00 | | | | 0.08 | | | | (0.68 | ) | | | (0.60 | ) | | | (0.06 | ) | | | - | | | | (0.06 | ) | | | 9.34 | | | | (6.00 | %) | | | 14,512,733 | | | | 0.31 | % | | | 0.21 | % | | | 1.30 | % | | | 8.74 | % |
Portfolio Optimization Growth | | | | | | | | | | | | | | | | | | | | | | | | | | | | | | | | | | | | | | | | | | | | | |
Class I | | | | | | | | | | | | | | | | | | | | | | | | | | | | | | | | | | | | | | | | | | | | | |
| 2012 | | | $9.09 | | | | $0.17 | | | | $1.11 | | | | $1.28 | | | | ($0.18 | ) | | | $- | | | | ($0.18 | ) | | | $10.19 | | | | 14.02 | % | | | $12,605,307 | | | | 0.31 | % | | | 0.21 | % | | | 1.76 | % | | | 33.73 | % |
| 2011 (8) | | | 10.00 | | | | 0.06 | | | | (0.92 | ) | | | (0.86 | ) | | | (0.05 | ) | | | - | | | | (0.05 | ) | | | 9.09 | | | | (8.60 | %) | | | 12,541,915 | | | | 0.31 | % | | | 0.21 | % | | | 1.01 | % | | | 8.06 | % |
Portfolio Optimization Aggressive-Growth | | | | | | | | | | | | | | | | | | | | | | | | | | | | | | | | | | | | | |
Class I | | | | | | | | | | | | | | | | | | | | | | | | | | | | | | | | | | | | | | | | | | | | | |
| 2012 | | | $8.82 | | | | $0.14 | | | | $1.20 | | | | $1.34 | | | | ($0.14 | ) | | | $- | | | | ($0.14 | ) | | | $10.02 | | | | 15.17 | % | | | $2,634,612 | | | | 0.31 | % | | | 0.21 | % | | | 1.43 | % | | | 32.92 | % |
| 2011 (8) | | | 10.00 | | | | 0.05 | | | | (1.19 | ) | | | (1.14 | ) | | | (0.04 | ) | | | - | | | | (0.04 | ) | | | 8.82 | | | | (11.38 | %) | | | 2,662,738 | | | | 0.31 | % | | | 0.21 | % | | | 0.85 | % | | | 12.28 | % |
| (1) | | Effective May 1, 2011, the Fund adopted a Multi-Class Plan (the “Plan”) pursuant to Rule 18f-3 under the Investment Company Act of 1940, as amended, under which the Fund offers two separate share classes, Class I and Class P. Under the Plan, the first thirty-seven portfolios included in this Financial Highlights currently offer both Class I and Class P shares and the remaining nine portfolios currently offer Class I shares only (see Note 1 in the Note to Financial Statements). Per share amounts have been calculated using the average shares method. |
| (2) | | Total returns for periods of less than one full year are not annualized. |
| (3) | | The ratios for periods of less than one full year are annualized. |
| (4) | | The ratios of expenses after expense reductions to average daily net assets are after custodian credits, advisory fee waivers and adviser expense reimbursements, if any, as discussed in Notes 6 and 7B in Notes to the Financial Statements. The expense ratios for the Pacific Dynamix and Portfolio Optimization Portfolios do not include expenses of their respective underlying portfolios (see Note 1 in Notes to Financial Statements) in which the Pacific Dynamix and Portfolio Optimization Portfolios invest. |
| (5) | | Amount represents less than $0.005 per share. |
| (6) | | Operations of Class P commenced on May 2, 2011. |
| (7) | | “Net Realized and Unrealized Gain (Loss)” and “Total Returns” include payments by an affiliate (Pacific Life Fund Advisors LLC) to certain portfolios of the Fund that were made during 2010 to compensate for the valuation of a portfolio holding, the Mellon GSL DBT II Collateral Fund, relating to the operation of the Fund’s securities lending |
| | |
| See Notes to Financial Statements | | |
C-40
PACIFIC SELECT FUND
FINANCIAL HIGHLIGHTS (Continued)
| | program during 2008. The Fund had terminated the securities lending program on April 8, 2011 for all applicable portfolios except for the Long/Short Large-Cap Portfolio (See Note 8 in Notes to Financial Statements). The payments did not have an impact greater than or equal to $0.005 per share on any of the following portfolios: |
| | | | | | | | |
| Portfolio | | Payment by
Affiliate Impact to
Portfolio Per Share | | | Payment by
Affiliate Impact to
Total Return | |
Diversified Bond | | | $0.00 | | | | 0.00 | % |
High Yield Bond | | | $0.00 | | | | 0.00 | % |
Managed Bond | | | $0.00 | | | | 0.01 | % |
Short Duration Bond | | | $0.00 | | | | 0.00 | % |
Focused 30 | | | $0.00 | | | | 0.01 | % |
Growth LT | | | $0.00 | �� | | | 0.00 | % |
Mid-Cap Growth | | | $0.00 | | | | 0.01 | % |
Small-Cap Equity | | | $0.00 | | | | 0.00 | % |
Small-Cap Index | | | $0.00 | | | | 0.00 | % |
Health Sciences | | | $0.00 | | | | 0.01 | % |
Technology | | | $0.00 | | | | 0.02 | % |
International Value | | | $0.00 | | | | 0.01 | % |
| (8) | | The Inflation Protected, Portfolio Optimization Conservative, Portfolio Optimization Moderate-Conservative, Portfolio Optimization Moderate, Portfolio Optimization Growth, and Portfolio Optimization Aggressive-Growth Portfolios commenced operations on May 2, 2011. |
| (9) | | The Emerging Market Debt Portfolio commenced operations on April 30, 2012. |
| (10) | | The expense ratios for the American Funds Growth, American Funds Growth-Income and American Funds Asset Allocation Portfolios do not include expenses of the underlying Master Funds in which the portfolios invest. The portfolio turnover rates for the Master Funds for each year or period ended are as follows: |
| | | | | | | | | | | | |
| | | Growth | | | Growth-
Income | | | Asset
Allocation | |
December 31, 2012 | | | 21% | | | | 25% | | | | 61% | |
December 31, 2011 | | | 19% | | | | 22% | | | | 43% | |
December 31, 2010 | | | 28% | | | | 22% | | | | 46% | |
December 31, 2009 | | | 37% | | | | 24% | | | | 41% | |
December 31, 2008 | | | 26% | | | | 31% | | | | | |
| (11) | | The annualized ratios of expenses, excluding dividend expenses on securities sold short, after and before expense reductions to average net assets for the Long/Short Large-Cap Portfolio for each year or period ended are as follows: |
| | | | | | | | | | | | | | | | |
| | | Class I | | | Class P | |
| | | Before | | | After | | | Before | | | After | |
December 31, 2012 | | | 1.37% | | | | 1.35% | | | | 1.16% | | | | 1.15% | |
December 31, 2011 | | | 1.36% | | | | 1.28% | | | | 1.16% | | | | 1.16% | |
December 31, 2010 | | | 1.36% | | | | 1.24% | | | | | | | | | |
December 31, 2009 | | | 1.32% | | | | 1.16% | | | | | | | | | |
December 31, 2008 | | | 1.37% | | | | 1.23% | | | | | | | | | |
| | | The Portfolio turnover rates, excluding securities sold short, for the same periods above were 78.16%, 149.04%, 154.48%, 163.38% and 105.80%, respectively. |
| (12) | | The Long/Short Large-Cap Portfolio commenced operations on May 1, 2008. |
| (13) | | The Mid-Cap Value Portfolio commenced operations on January 2, 2009. |
| (14) | | The Currency Strategies, Global Absolute Return and Precious Metals Portfolios commenced operations on September 28, 2012. |
| (15) | | The American Funds Asset Allocation Portfolio commenced operations on February 2, 2009. |
| (16) | | The Pacific Dynamix — Conservative Growth, Pacific Dynamix — Moderate Growth, and Pacific Dynamix — Growth Portfolios commenced operations on May 1, 2009. |
| | |
| See Notes to Financial Statements | | |
C-41
PACIFIC SELECT FUND
NOTES TO FINANCIAL STATEMENTS
1. ORGANIZATION
The Pacific Select Fund (the “Fund”) is registered under the Investment Company Act of 1940, as amended (“1940 Act”), as an open-end, management investment company, organized as a Massachusetts business trust. Pacific Life Fund Advisors LLC (“PLFA” or “Adviser”) serves as investment adviser to the Fund. As of December 31, 2012, the Fund was comprised of fifty-four separate portfolios, forty-six of which are presented in this report: the Diversified Bond, Floating Rate Loan, High Yield Bond, Inflation Managed, Inflation Protected, Managed Bond, Short Duration Bond, Emerging Markets Debt, American Funds® Growth, American Funds Growth-Income, Comstock, Dividend Growth, Equity Index, Growth LT, Large-Cap Growth, Large-Cap Value, Long/Short Large-Cap, Main Street® Core, Mid-Cap Equity, Mid-Cap Growth, Mid-Cap Value, Small-Cap Equity, Small-Cap Growth, Small-Cap Index, Small-Cap Value, Real Estate, Emerging Markets, International Large-Cap, International Small-Cap, International Value, Currency Strategies, Global Absolute Return, and Precious Metals Portfolios (collectively the “Portfolio Optimization Underlying Portfolios”); and the Cash Management, Focused 30, Health Sciences, Technology, American Funds Asset Allocation, Pacific Dynamix — Conservative Growth, Pacific Dynamix — Moderate Growth, Pacific Dynamix — Growth, Portfolio Optimization Conservative, Portfolio Optimization Moderate-Conservative, Portfolio Optimization Moderate, Portfolio Optimization Growth, and Portfolio Optimization Aggressive-Growth Portfolios. American Funds is a registered trademark of American Funds Distributors, Inc. (“AFD”) and Main Street is a registered trademark of OppenheimerFunds, Inc.
Effective May 1, 2011, the Fund adopted a Multi-Class Plan (the “Plan”) pursuant to Rule 18f-3 under the 1940 Act pursuant to which the Fund may offer multiple classes of shares. As of May 1, 2011, the Fund offers two separate share classes, Class I and Class P. Each portfolio covered in this report, except for the American Funds Asset Allocation Portfolio; the Pacific Dynamix — Conservative Growth, Pacific Dynamix — Moderate Growth and Pacific Dynamix — Growth Portfolios (collectively, the “Pacific Dynamix Portfolios”); and the Portfolio Optimization Conservative, Portfolio Optimization Moderate-Conservative, Portfolio Optimization Moderate, Portfolio Optimization Growth and Portfolio Optimization Aggressive-Growth Portfolios (collectively, the “Portfolio Optimization Portfolios”), currently offers both Class I and Class P shares. The American Funds Assets Allocation Portfolio, Pacific Dynamix Portfolios and Portfolio Optimization Portfolios currently offer Class I shares only. On May 1, 2011, for the portfolios covered in this report, all existing shares outstanding prior to May 1, 2011 were designated Class I shares.
American Funds Growth, American Funds Growth-Income and American Funds Asset Allocation Portfolios (each a “Feeder Portfolio”, collectively the “Feeder Portfolios”) invest substantially all of their assets in Class 1 shares of the Growth, Growth-Income and Asset Allocation Funds, respectively, each a series of the American Funds Insurance Series® (each a “Master Fund,” collectively the “Master Funds”). Each Master Fund is an open-end investment company and organized as a Massachusetts business trust. Each Feeder Portfolio has an investment objective that is consistent with its corresponding Master Fund. Each Master Fund intends to comply with the requirements under Subchapter M of the Internal Revenue Code applicable to mutual funds and intends to distribute substantially all of its taxable income and capital gains to shareholders, which includes the applicable Feeder Portfolio, to qualify as a regulated investment company. The performance of the Feeder Portfolios is directly affected by the performance of the Master Funds. The financial statements of the Master Funds, including the Schedules of Investments, are provided separately and should be read in conjunction with the Feeder Portfolios’ financial statements. As of December 31, 2012, the American Funds Growth, American Funds Growth-Income and American Funds Asset Allocation Portfolios owned 1.19%, 2.76% and 4.57% of the Growth, Growth-Income and Asset Allocation Master Funds, respectively. American Funds Insurance Series is a registered trademark of AFD.
The Pacific Dynamix Portfolios invest their assets in Class P shares of the PD Aggregate Bond Index, PD High Yield Bond Market, PD Large-Cap Growth Index, PD Large-Cap Value Index, PD Small-Cap Growth Index, PD Small-Cap Value Index, PD Emerging Markets and PD International Large-Cap Portfolios (collectively, the “Pacific Dynamix Underlying Portfolios”) (see Note 7C). Presently, only the Pacific Dynamix Portfolios and the Adviser and certain of its affiliates can invest in the Pacific Dynamix Underlying Portfolios.
The Portfolio Optimization Portfolios invest their assets in Class P shares of the Portfolio Optimization Underlying Portfolios (see Note 7C). Presently, only the Portfolio Optimization Portfolios and the investment adviser and certain of its affiliates can invest in Class P shares of the Portfolio Optimization Underlying Portfolios.
The annual report for the Pacific Dynamix Underlying Portfolios is not included in this report; there is a separate annual report for the Pacific Dynamix Underlying Portfolios, which is available without charge. For information on how to obtain the annual report for the Pacific Dynamix Underlying Portfolios, see the Where to Go for More Information section of this report on page F-24.
Shares of the portfolios within the Fund are offered only to certain separate accounts of Pacific Life Insurance Company (“Pacific Life”) and Pacific Life & Annuity Company (“PL&A”), a wholly-owned subsidiary of Pacific Life. Pacific Life and PL&A determine which portfolios of the Fund to make available.
2. SIGNIFICANT ACCOUNTING POLICIES
The financial statements have been prepared in conformity with accounting principles generally accepted in United States of America (“U.S. GAAP”) for investment companies. In preparing the financial statements, management is required to make estimates and assumptions that affect the reported amounts of assets and liabilities and disclosure of contingent assets and liabilities at the date of the financial statements and the reported amounts of increases and decreases in net assets from operations during the reporting period. Actual results could differ from those estimates. The following is a summary of the significant accounting policies followed by the Fund in the preparation of the financial statements.
Effective January 1, 2012, the Fund implemented Accounting Standards Update (“ASU”) No. 2011-03 issued by the Financial Accounting Standards Board (“FASB”) related to accounting for repurchase agreements and sale-buyback transactions that both entitle and obligate a transferor to repurchase or redeem financial assets before their maturity. This ASU modified the criteria for determining effective control of transferred assets and as a result certain agreements previously accounted for as “purchases and sales” are now required to be accounted for
D-1
PACIFIC SELECT FUND
NOTES TO FINANCIAL STATEMENTS (Continued)
as “secured borrowings”. This ASU had an impact on the interest income and interest expense, and caused the portfolio turnover rate to decrease significantly for certain portfolios (see Note 4 on Sale-Buybacks under “Borrowings and Other Financing Transactions”).
The Fund also implemented the additional disclosure requirements under the ASU No. 2011-04 issued by FASB which requires additional disclosures for fair value measurements categorized within Level 3 of the three-tier hierarchy defined under the Accounting Standards Codification No. 820, Fair Value Measurements and Disclosure, as well as additional disclosure for all transfers in and out of Level 1 and Level 2 (see Note 3D and Notes to Schedules of Investments).
A. INVESTMENT TRANSACTIONS AND INCOME
Investment transactions are recorded on a trade date basis. Securities purchased or sold on a when-issued or delayed-delivery basis as well as certain loan transactions and mortgage securities (such as Government National Mortgage Association (“GNMA”) securities) may be settled a month or more after the trade date. Dividend income is recorded on the ex-dividend date, except certain dividends from foreign securities, which are recorded as soon as a portfolio is informed of the ex-dividend date or upon receipt of the dividend. A portfolio’s estimated components of distributions received from real estate investment trusts may be considered income, return of capital distributions or capital gain distributions. Return of capital distributions are recorded as a reduction of cost of the related investments. Interest income, adjusted for amortization of premium and accretion of discount, is recorded daily on an accrual basis. Investment income is recorded net of foreign taxes withheld, if any. A portfolio may be subject to foreign taxes on income, gains on investments or currency repatriation, a portion of which may be recoverable. A portfolio will accrue such taxes and reclaims as applicable, based upon the current interpretation of tax rules and regulations that exist in the markets in which the portfolio invests. Facility fees and other fees (such as origination fees) received from senior loans purchased (see Note 4) by a portfolio are amortized over the expected term of each applicable senior loan. Commitment fees received by a portfolio relating to unfunded senior loan commitments are amortized to income over the period of the commitment. Consent fees, which are compensation for agreeing to changes in the terms of debt instruments, are recorded as interest income when received. Realized gains and losses from investment transactions are recorded on the basis of identified cost, which is also used for Federal income tax purposes. Gains and losses realized on principal paydowns from mortgage-backed and asset-backed securities are recorded as interest income.
B. DISTRIBUTIONS TO SHAREHOLDERS
Prior to January 1, 2013, each portfolio declared and paid dividends on net investment income, if any, at least annually, except for the Cash Management, Diversified Bond, Floating Rate Loan, High Yield Bond, Inflation Managed, Inflation Protected, Managed Bond, Short Duration Bond, Emerging Markets Debt and Global Absolute Return Portfolios (collectively the “Debt Portfolios”), for which dividends, if any, were declared and paid semi-annually, and realized capital gains, if any, were distributed at least annually for all portfolios. Dividends and capital gains distributions were recorded on the ex-dividend date.
Currently each of the portfolios in the Fund is either qualified as a regulated investment company (the “RIC Portfolios”) under Subchapter M of the Internal Revenue Code or treated as a partnership (the “Partnership Portfolios”) for Federal income tax purposes only. Effective January 1, 2013, each of the RIC Portfolios intends to utilize the consent dividend provision of section 565 of the Internal Revenue Code to effectively distribute income and capital gains for tax purposes even though they are not paid by the Fund. In addition, the Partnership Portfolios are not required to distribute taxable income and capital gains for Federal income tax purposes. Therefore, no dividend income and capital gains distributions will be made by the Fund under the new dividend and distributions policy after December 31, 2012 (see Note 12 for additional information).
C. FOREIGN CURRENCY TRANSLATION
The Fund’s accounting records are maintained in U.S. dollars. The market value of investments and other assets and liabilities, initially expressed in non-U.S. currencies, are translated into U.S. dollars based on the applicable exchange rates at the end of each business day. Purchases and sales of investments and income and expenses, denominated in foreign currencies, are translated into U.S. dollars at the exchange rates in effect on the transaction date.
None of the portfolios separately report the effect of changes in foreign exchange rates from changes in market prices of investments held. Such changes are included with the net realized gain or loss and change in net unrealized appreciation or depreciation on investments. Other foreign currency transactions resulting in realized and unrealized gain or loss, if any, are reported separately as net realized gain or loss on foreign currency transactions and change in net unrealized appreciation or depreciation on foreign currencies.
D. ALLOCATION OF INCOME, EXPENSES, GAINS AND LOSSES
Income, non-class specific expenses, realized and unrealized gains and losses, are allocated on a daily basis to each class of shares based upon the relative portion of net assets of each class. Certain Fund expenses directly attributable to a particular portfolio are charged to that portfolio (such as portfolio-specific transactional fees, proxies, liquidations, litigation, and organizational/start-up costs) and class-specific fees and expenses are charged directly to the respective share class within each portfolio. Generally other portfolio expenses are allocated proportionately among all the portfolios in relation to the net assets of each portfolio.
E. OFFERING COSTS
A new portfolio bears all costs (or the applicable pro-rata share if there is more than one new portfolio) associated with the offering expenses of the portfolio including legal, printing and support services (see Note 6). All such costs are amortized as an expense of the new portfolio on a straight-line basis over twelve months from commencement of operations.
F. RECENT ACCOUNTING PRONOUNCEMENT
In December 2011, the Financial Accounting Standards Board (“FASB”) issued an Accounting Standards Update (“ASU”) that requires disclosures to make financial statements that are prepared under U.S. GAAP more comparable to those prepared under International Financial
D-2
PACIFIC SELECT FUND
NOTES TO FINANCIAL STATEMENTS (Continued)
Reporting Standards. The new disclosure requirements mandate that entities disclose both gross and net information about instruments and transactions eligible for offset in the statement of assets and liabilities such as instruments and transactions subject to an agreement similar to a master netting arrangement. In addition, this ASU requires disclosure of collateral received and posted in connection with master netting agreements or similar arrangements. This ASU is effective for interim and annual reporting periods beginning on or after January 1, 2013. Management is currently evaluating the impact, if any, that the implementation of this ASU will have on the Fund’s financial statement disclosures.
3. VALUATION AND FAIR VALUE MEASUREMENTS
A. VALUATION POLICY
The Fund Board of Trustees (the “Board”) has adopted a policy (“Valuation Policy”) for determining the value of its investments each business day. Under the Valuation Policy, the Board has delegated certain functions to a Trustee Valuation Committee or another valuation committee to determine the fair value of certain investments. Each valuation committee that values the Fund’s investments, which includes using third party pricing services and/or alternate valuation methodologies approved by the Board, does so in accordance with the Valuation Policy. Notes 3B and 3C below describe in greater detail the methodologies used to value the Fund’s investments.
B. NET ASSET VALUE
Each portfolio of the Fund is divided into shares and share classes, if applicable. The price per share of each class of a portfolio’s shares is called its net asset value (“NAV”). The NAV forms the basis for all transactions involving buying, selling, exchanging or reinvesting shares. Each portfolio’s NAV is calculated by taking the total value of a portfolio’s assets (the value of the securities and other investments a portfolio holds), subtracting a portfolio’s liabilities, and dividing by the total number of shares outstanding.
Each portfolio’s NAV is calculated once per day, every day the New York Stock Exchange (“NYSE”) is open, including days when foreign markets are closed. For purposes of calculating the NAV, the value of investments held by each portfolio is generally determined as of the time of the close of the NYSE, which is usually 4:00 p.m. Eastern Time. Information that becomes known to the Fund or its agents after the close of the NYSE on a particular day will not normally be used to retroactively adjust the price of an investment or the NAV determined earlier that day.
Each portfolio’s NAV will not be calculated on days when the NYSE is closed. There may be a delay in calculating the NAV if: (i) the NYSE is closed on a day other than a regular holiday or weekend, (ii) trading on the NYSE is restricted, (iii) an emergency exists (as determined by the Securities and Exchange Commission (“SEC”)), making the sale of securities or other instruments or determinations of NAV not practicable, or (iv) the SEC permits a delay for the protection of shareholders.
Certain portfolios may hold investments that are primarily listed on foreign exchanges. Because those investments trade on days when a portfolio does not calculate its NAVs, the value of those investments may change on days when a shareholder will not be able to purchase or redeem Fund shares.
C. INVESTMENT VALUATION
The value of each security or other investment is the amount which a portfolio might reasonably expect to receive for the investment upon its current sale in the ordinary course of business. For purposes of calculating the NAV, the value of investments held by each portfolio is based primarily on pricing data obtained from various sources approved by the Board.
Money Market Instruments and Short-Term Investments
The investments of the Cash Management Portfolio and money market and short-term investments of other portfolios maturing within 60 days are valued at amortized cost in accordance with the 1940 Act. Amortized cost involves valuing an investment at cost on the date of acquisition and thereafter assuming a constant accretion of a discount or amortization of a premium to maturity, regardless of the impact of fluctuating interest rates on the market value of the instrument. While this method provides consistency in valuation (and may only be used if it approximates market value), it may result in periods during which value, as determined by amortized cost, is higher or lower than the price that would be received if the Fund sold the investment. Portfolio investments in other mutual funds for temporary cash management purposes are valued at their respective NAVs.
Domestic Equity Investments
For domestic equity investments, the portfolios use the last reported sale price or official closing price from an exchange as of the time of the NYSE close and do not normally take into account trading, clearances or settlements that take place after the NYSE close. Investments, for which no sales are reported, are generally valued at the mean between the most recent bid and ask prices obtained from approved pricing services, established market makers, or from broker-dealers.
Foreign Equity Investments
Foreign equity investments are normally priced based on data reflecting the closing of the principal markets or market participants for those investments, which may be earlier than the NYSE close. The Fund then may adjust for market events occurring between the close of certain foreign exchanges and the NYSE close. The Fund has retained an independent statistical service approved by the Board to assist in determining the value of certain foreign equity investments. This service utilizes proprietary computer models based on historical performance of markets and other considerations to determine the appropriate adjustments for market events. Quotations of foreign investments in foreign currencies are converted into U.S. dollar equivalents using a foreign exchange quotation from an approved source.
Exchange Traded Futures, Options and Swaps
Exchange traded futures, options and swaps are normally priced at the settlement price determined by the relevant exchange. Exchange traded futures, options and swaps for which no settlement prices are reported, are generally valued at the mean between the most recent bid and ask prices obtained from approved pricing services, established market makers, or from broker-dealer.
D-3
PACIFIC SELECT FUND
NOTES TO FINANCIAL STATEMENTS (Continued)
Over-the-Counter (“OTC”) Investments and Certain Equity Investments
OTC investments (including swaps and options) are generally valued by approved pricing services that use evaluated prices determined from various observable market and other factors. Certain OTC swap contracts are valued using alternative valuation methodologies pursuant to the Valuation Policy. Forward foreign currency contracts are generally valued using the mean between broker-dealer bid and ask quotations, and foreign currency exchange rates gathered from leading market makers
Domestic and Foreign Fixed Income Investments
Fixed income investments are generally valued by approved pricing and quotation services using the mean between the most recent bid and ask prices which are based upon evaluated prices determined from various observable market and other factors. Certain fixed-income investments are valued by a benchmark, matrix, or other pricing processes approved by the Board.
Pacific Dynamix Portfolios
The investments of each Pacific Dynamix Portfolio consist of Class P shares of the Pacific Dynamix Underlying Portfolios, which are valued at their respective NAVs at the time of computation.
Portfolio Optimization Portfolios
The investments of each Portfolio Optimization Portfolio consist of Class P shares of the Portfolio Optimization Underlying Portfolios, which are valued at their respective NAVs at the time of computation.
Feeder Portfolios
The NAVs of the American Funds Growth Portfolio, the American Funds Growth-Income Portfolio and the American Funds Asset Allocation Portfolio are determined by the Pacific Select Fund based upon the NAVs of the Master Funds at the time of computation. The NAVs of the Master Funds are determined by the management of the Master Funds and not Pacific Select Fund. For more information regarding the determination of the NAV of each Master Fund, see the Master Funds’ prospectus and statement of additional information.
Investment Values Determined by a Valuation Committee
The Valuation Policy includes methodologies approved for valuing investments in circumstances where market quotations are not readily available. In such circumstances, the Valuation Policy provides that the value of such investments may be determined in accordance with Board approved formulas and methodologies (“Alternate Valuation Methodologies”). Under the Valuation Policy these Alternate Valuation Methodologies may include, among others, the use of broker quotes, the use of purchase prices for initial public offerings, proration rates, and benchmark and matrix pricing. In the event market quotations or Alternate Valuation Methodologies are not readily available or are determined to be unreliable, the value of the investments will be determined in good faith by the Trustee Valuation Committee, or determined by a valuation committee established under the Valuation Policy and then subsequently submitted for approval or ratification to either the Trustee Valuation Committee, or to the Board. Valuations determined by a Trustee Valuation Committee or other valuation committee may require subjective inputs about the value of such investments. While these valuations are intended to estimate the value a portfolio might reasonably expect to receive upon the current sale of the investments in the ordinary course of business, such values may differ from the value that a portfolio would actually realize if the investments were sold or values that would be obtained if a different valuation methodology had been used.
Market quotations are considered not readily available if: (i) the market quotations received are deemed unreliable or inaccurate, (ii) approved pricing services do not provide a valuation for a particular investment, or (iii) material events occur after the close of the principal market for a particular investment but prior to the close of the NYSE.
D. FAIR VALUE MEASUREMENTS AND DISCLOSURES
The Fund characterizes its investments as Level 1, Level 2 or Level 3 based upon the various inputs or methodologies used to value the investments. Under the Valuation Policy, a valuation oversight committee (“VOC”) has been established which determines the level in which each portfolio’s investments are characterized. The VOC includes investment, legal and compliance members of the Fund’s adviser, and the Fund’s Chief Compliance Officer (“CCO”). The three-tier hierarchy of inputs is summarized in the three broad levels listed below:
| | — Level 1 – | Quoted prices (unadjusted) in active markets for identical investments |
| | — Level 2 – | Significant observable market-based inputs, other than Level 1 quoted prices, or unobservable inputs that are corroborated by market data |
| | — Level 3 – | Significant unobservable inputs that are not corroborated by observable market data |
The VOC reviews the Valuation Policy periodically (at least annually) to determine the appropriateness of the pricing methodologies used to value the Fund’s investments. The VOC also periodically evaluates how each portfolio’s investments are characterized within the three-tier hierarchy and the appropriateness of third party pricing sources. The VOC also periodically (at least annually) conducts back-testing of the methodologies used to value Level 2 and Level 3 investments to evaluate the unobservable inputs used to value those investments. Such back-testing includes comparing Level 2 and Level 3 investment values to subsequently available exchange-traded prices, transaction prices, and/or observable vendor prices. All changes to the Valuation Policy are reported to the Board on a quarterly basis with material changes, as determined by the Fund’s CCO, requiring approval by the Board. In addition, all investments categorized as Level 3 under the three-tier hierarchy are reported to the Chairman of the Audit Committee on a quarterly basis and such report includes the inputs and methodologies used to value those investments.
The inputs or methodologies used for valuing each portfolio’s investments are not necessarily an indication of the relative risks associated with investing in those investments. For example, money market instruments are valued using amortized cost in accordance with the rules under the 1940 Act. Generally, amortized cost approximates the current fair value of an investment, but since the value is not obtained from a quoted price in an active market, such investments are reflected as Level 2. Foreign investments that are valued with the assistance of a statistical
D-4
PACIFIC SELECT FUND
NOTES TO FINANCIAL STATEMENTS (Continued)
research service approved by the Board and based on significant observable inputs (as described in Note 3C) are reflected as Level 2. For fair valuations using significant unobservable inputs, U.S. GAAP requires a portfolio to present a reconciliation of the beginning to ending balances for reported market values that presents changes attributable to total realized and unrealized gains or losses, purchase and sales, and transfers in and out of Level 3 during the period. Transfers in and out between levels are based on values at the end of the periods. U.S. GAAP also requires a portfolio to disclose about amounts and reasons for all transfers in and out of Level 1 and Level 2 fair value measurements. A reconciliation of Level 3 investments is presented only when a portfolio had an amount of Level 3 investments at the beginning and/or end of the reporting period that was meaningful in relation to its net assets. The amounts and reasons for all transfers in and out of each level within the three-tier hierarchy are disclosed only when a portfolio had an amount of total transfers during the reporting period that was meaningful in relation to its net assets as of the end of the reporting period. A summary of each portfolio’s investments as of December 31, 2012 as categorized under the three-tier hierarchy of inputs, and the reconciliation of Level 3 investments and information on transfers in and out of each level, if applicable, can be found in the Notes to Schedule of Investments section of each portfolio’s Schedule of Investments.
The following is a description of valuation inputs and techniques that the Fund currently utilizes to fair value each major category of assets and liabilities:
Equity Securities (Common and Preferred Stock) and Mutual Funds
Equity securities (foreign or domestic) that are actively traded on a securities exchange are fair valued based on quoted prices from the applicable exchange, and to the extent valuation adjustments are not applied to these securities, they are categorized as Level 1. Equity securities traded on inactive markets and certain foreign equity securities are fair valued using significant other observable inputs which include broker-dealer quotes, recently executed transactions adjusted for changes in the benchmark index, or evaluated price quotes received from pricing vendors that take into account the integrity of the market sector and issuer, the individual characteristics of the security, and information received from broker-dealers and other market sources pertaining to the issuer or security. To the extent that these inputs are observable and timely, the fair values of these securities would be categorized as Level 2; otherwise the fair values would be categorized as Level 3.
Investments in registered mutual funds, including affiliated mutual funds, are valued at their respective NAV and are categorized as Level 1.
U.S. Treasury Obligations
U.S. Treasuries are fair valued based on pricing models that evaluate the mean between the most recently published bid and ask price. The models also take into consideration data received from active market makers and inter-dealer brokers, yield curves, and the spread over comparable U.S. Treasury issues. The spreads change daily in response to market conditions and are generally obtained from the new issue market and broker-dealer sources. To the extent that these inputs are observable and timely, the fair values of U.S. Treasury obligations would be categorized as Level 2; otherwise the fair values would be categorized as Level 3.
Mortgage-Backed Securities and Asset-Backed Securities
Mortgage-backed securities, including government sponsored enterprises, are fair valued using pricing models based on inputs that include issuer type, coupon, and cash flows, mortgage prepayment projection tables and adjustable rate mortgage evaluations that incorporate index data, periodic and life caps, the next coupon reset date, and the convertibility of the bond. To the extent that these inputs are observable and timely, the fair values of mortgage-backed securities would be categorized as Level 2; otherwise the fair value would be categorized as Level 3.
Asset-backed securities and collateralized mortgage obligations are fair valued using pricing models based on a security’s average life volatility. The models also take into account tranche characteristics such as coupon average life, collateral types, ratings, the issuer and tranche type, underlying collateral and performance of the collateral, and discount margin for certain floating rate issues. To the extent that these inputs are observable and timely, the fair values of asset-backed securities and collateralized mortgage obligations would be categorized as Level 2; otherwise the fair values would be categorized as Level 3.
Municipal Bonds
Municipal bonds are fair valued based on pricing models that take into account, among other factors, information received from market makers and broker-dealers, current trades, bid lists, offerings, market movements, the callability of the bond, state of issuance, benchmark yield curves, and bond insurance. To the extent that these inputs are observable and timely, the fair values of municipal bonds would be categorized as Level 2; otherwise the fair values would be categorized as Level 3.
Foreign Government Bonds and Notes
Foreign government bonds and notes are fair valued based on discounted cash flow models that incorporate option adjusted spreads along with benchmark curves and credit spreads. In addition, international bond markets are monitored daily for information pertaining to the issuer and/or the specific issue. To the extent that these inputs are observable and timely, the fair values of foreign government bonds and notes would be categorized as Level 2; otherwise the fair values would be categorized as Level 3.
Corporate Bonds and Notes and U.S. Government & Agency Issues
Corporate bonds held by the Fund are generally comprised of two main categories: investment grade bonds and high yield bonds. Investment grade bonds are reported at fair value using various inputs and techniques, which include broker-dealer quotations, live trading levels, recently executed transactions in securities of the issuer or comparable issuers, issuer credit information, and option-adjusted spread models where applicable. Fair values for high yield bonds are based primarily on broker-dealer quotations from relevant market makers and recently executed transactions in securities of the issuer or comparable issuers. The broker-dealer quotations received are supported by credit analysis of the issuer that takes into consideration credit quality assessments, daily trading activity, and the activity of the underlying equities, listed bonds and sector-specific trends. To the extent that these inputs are observable and timely, the fair values of corporate bonds would be categorized as Level 2; otherwise the fair values would be categorized as Level 3.
D-5
PACIFIC SELECT FUND
NOTES TO FINANCIAL STATEMENTS (Continued)
U.S. Government & Agency Issues are reported at fair value using various inputs and techniques, which include broker-dealer quotations, live trading levels, recently executed transactions in securities of the issuer, issuer credit information, and option-adjusted spread models where applicable. To the extent that these inputs are observable and timely, the fair values of U.S. Government & Agency Issues would be categorized as Level 2; otherwise the fair values would be categorized as Level 3.
Futures Contracts
Futures contracts and options on futures contracts are traded on commodity exchanges and are fair valued based on quoted prices from the applicable exchange, and to the extent valuation adjustments are not applied to futures contracts, they are categorized as Level 1. To the extent that valuation adjustments are observable and timely, the fair values of futures contracts would be categorized as Level 2; otherwise the fair values would be categorized as Level 3.
Options Contracts
Exchange listed options contracts are traded on securities exchanges and are fair valued based on quoted prices from the applicable exchange, and to the extent valuation adjustments are not applied or mean variation to exchange listed options contracts, they are categorized as Level 1. If valuation adjustments are applied and such adjustments are observable and timely, the fair values of exchange listed options contracts would be categorized as Level 2; otherwise the fair values would be categorized as Level 3. OTC options contracts are fair valued based on either broker-dealer quotations or pricing models that incorporate various inputs such as interest rates, credit spreads, currency exchange rates and volatility measurements for in-the-money, at-the-money, and out-of-the-money contracts based on a given strike price. To the extent that these inputs are observable and timely, the fair values of OTC options contracts would be categorized as Level 2; otherwise the fair values would be categorized as Level 3.
Forward Foreign Currency Contracts
Forward foreign currency contracts are fair valued using various inputs and techniques, which include broker-dealer quotations and foreign currency exchange rates gathered from leading market makers. To the extent that these inputs are observable and timely, the fair values of forward foreign currency contracts would be categorized as Level 2; otherwise the fair values would be categorized as Level 3.
Swaps
Interest Rate Swaps – Interest rate swaps that are actively traded and cleared on a securities exchange or swaps trade facility are fair valued based on quoted prices from the applicable exchange, and to the extent valuation adjustments are not applied to these securities, they are categorized as Level 1. Interest rate swaps traded over-the-counter are fair valued using pricing models that are based on real-time snap shots of relevant interest rate curves that are built using the most actively traded securities for a given maturity. The pricing models also incorporate cash and money market rates. In addition, market data pertaining to interest rate swaps are monitored regularly to ensure that interest rates are properly depicting the current market rate. To the extent that these inputs are observable and timely, the fair values of interest rate swaps would be categorized as Level 2; otherwise the fair values would be categorized as Level 3.
Credit Default Swaps – Credit default swaps that are actively traded and cleared on a securities exchange or swaps trade facility are fair valued based on quoted prices from the applicable exchange, and to the extent valuation adjustments are not applied to these securities, they are categorized as Level 1. Credit default swaps traded over-the-counter are fair valued using pricing models that take into account, among other factors, information received from market makers and broker-dealers, default probabilities from index specific credit spread curves, recovery rates, and cash flows. To the extent that these inputs are observable and timely, the fair values of credit default swaps would be categorized as Level 2; otherwise the fair values would be categorized as Level 3.
Total Return Swaps – Total return swaps that are actively traded and cleared on a securities exchange or swaps trade facility are fair valued based on quoted prices from the applicable exchange, and to the extent valuation adjustments are not applied to these securities, they are categorized as Level 1. Total Return swaps traded over-the-counter are fair valued using pricing models that take into account among other factors, index spread curves, nominal values, modified duration values and cash flows. To the extent that these inputs are observable and timely, the fair values of total return swaps would be categorized as Level 2; otherwise the fair values would be categorized as Level 3.
Senior Loan Notes
Floating rate senior loans (“Senior Loans”) are fair valued based on a quoted price received from a single broker-dealer or an average of quoted prices received from multiple broker-dealers or valued relative to other benchmark securities when broker-dealer quotes are unavailable. To the extent that these inputs are observable, the fair values of Senior Loans would be categorized as Level 2; otherwise the fair values would be categorized as Level 3.
Short-Term Investments
Short-term investments maturing within 60 days are valued using amortized cost, which is used if it approximates market value, and are reflected as Level 2. Repurchase agreements are fully collateralized. The collateral is evaluated daily to ensure its market value equals or exceeds the current market value of the repurchase agreements including accrued interest.
Credit-Oriented Investments
For non-publicly traded instruments that represent debt to the Fund, the carrying amount approximates fair value due to the relatively short-term maturity of these financial instruments, and are reflected as Level 2. The Fund may use market transactions for identical or similar instruments or a market yield approach, which utilizes expected future cash flows that are discounted using estimated current market rates. Discounted cash flow calculations may be adjusted to reflect current market conditions and/or the perceived credit risk of the Fund as applicable. Consideration may also include an evaluation of collateral.
D-6
PACIFIC SELECT FUND
NOTES TO FINANCIAL STATEMENTS (Continued)
4. INVESTMENTS AND RISKS
General Investment Risks
An investment in the Fund represents an indirect investment in the assets owned by the Fund. As with any mutual fund, the value of the assets owned by the Fund may move up or down, and as a result, an investment in the Fund at any point in time may be worth more or less than the original amount invested. Events in the financial markets have the potential to cause increased volatility and uncertainty, which may impact the value of the Fund’s investments. Due to interdependencies between markets, events in one market may adversely impact other markets or issuers in unforeseen ways. As a result, the value of the Fund’s investments may be adversely affected by events in the markets, either directly or indirectly, and each portfolio is exposed to potential decreases in the value of those investments. In addition, traditionally liquid investments may experience periods of diminished liquidity. Governmental and regulatory responses to market events may impair either the Adviser’s or a sub-adviser’s ability to pursue certain investment techniques or strategies and may have unexpected consequences on particular markets, strategies, or investments. Future events may impact a portfolio in unforeseen ways, leading a portfolio to alter its existing strategies or, potentially, to liquidate and close.
Fund of Funds Investments
The Pacific Dynamix Portfolios are exposed to the same risks as the Pacific Dynamix Underlying Portfolios in direct proportion to the allocation of assets among those portfolios. The annual report for the Pacific Dynamix Underlying Portfolios contains information about the risks associated with investing in the Pacific Dynamix Underlying Portfolios. Allocations among the Pacific Dynamix Underlying Portfolios are determined using an asset allocation process, which seeks to optimize returns by allocating among different asset classes given various levels of risk tolerance. The allocations of the Pacific Dynamix Portfolios may not effectively decrease risk or increase returns for investors, and the selection and weighting of allocations to asset classes and/or Pacific Dynamix Underlying Portfolios may cause them to underperform other mutual funds with a similar investment objective. Although the Pacific Dynamix Portfolios seek to provide diversification across major asset classes, they may invest a significant portion of their assets in any of the Pacific Dynamix Underlying Portfolios (see Note 7C).
The Portfolio Optimization Portfolios are exposed to the same risks as the Portfolio Optimization Underlying Portfolios in direct proportion to the allocation of assets among those portfolios. Allocations among the Portfolio Optimization Underlying Portfolios are determined using an asset allocation process, which seeks to optimize returns by allocating among different asset classes given the various levels of risk tolerance. The allocations of the Portfolio Optimization Portfolios may not effectively decrease risk or increase returns for investors, and the selection and weighting of allocations to asset classes and/or Portfolio Optimization Underlying Portfolios may cause them to underperform other mutual funds with a similar investment objective. Although the Portfolio Optimization Portfolios seek to provide diversification across major asset classes, they may invest a significant portion of their assets in any of the Portfolio Optimization Underlying Portfolios (see Note 7C).
Equity Investments
The price of equity investments change in response to many factors, including a company’s historical and prospective earnings, cash flows, the value of its assets, investor perceptions, and many of the General Investment Risk factors noted above.
Fixed Income Investments
Fixed income (debt) investments are affected primarily by the financial condition of the companies or other entities that have issued them and by changes in interest rates, although the factors noted above may also have a significant impact on fixed income (debt) investments. There is a risk that an issuer of a portfolio’s fixed income (debt) investments may not be able to meet its financial obligations (e.g., may not be able to make principal and/or interest payments when they are due or otherwise default on other financial terms) and/or go bankrupt. Securities such as high-yield/high-risk bonds, e.g. bonds with low credit ratings by Moody’s (Ba or lower) or Standard & Poor’s (BB and lower) or if unrated are of comparable quality as determined by the manager, are especially subject to credit risk during periods of economic uncertainty or during economic downturns and are more likely to default on their interest and/or principal payments than higher rated securities. Certain asset-backed instruments, such as collateralized debt obligations, collateralized mortgage obligations and other mortgage related securities, structured investment vehicles and other debt investments may have exposure to subprime loans or subprime mortgages, which are loans to persons with lower credit ratings. These instruments may present credit risk that is not transparent and that is greater than indicated by their ratings. The value of these instruments may be more acutely affected by downturns in the credit markets or the real estate market than certain other investments, and it may be difficult to value these instruments because of a thin secondary market.
Foreign Investments
There are certain additional risks involved in investing in foreign securities that are generally not inherent in investments in domestic securities. These risks may involve foreign currency fluctuations, adverse political, social and economic developments and the possible imposition of currency exchange blockages or other foreign governmental laws or restrictions. In addition, the securities of some foreign companies and securities markets are less liquid and at times more volatile than securities of comparable U.S. companies and U.S. securities markets. The markets in emerging markets countries can be extremely volatile.
Illiquid Investments
Each portfolio may not invest in illiquid securities and illiquid bank loans (collectively, “Illiquid Investments”) if as a result of such investment, more than 15% of its net assets (5% of total assets for the Cash Management Portfolio), taken at market value at the time of such investment, would be invested in Illiquid Investments. The term “Illiquid Investments” for this purpose means investments that cannot be disposed of within seven days in the ordinary course of business at approximately the amount at which a portfolio has valued the investments. Illiquid Investments may be difficult to value and difficult to sell, which means a portfolio may not be able to sell such investments quickly for their full value. The value of Illiquid Investments held by each portfolio as of December 31, 2012 was less than 15% of its net assets (5% of total assets for the Cash Management Portfolio).
D-7
PACIFIC SELECT FUND
NOTES TO FINANCIAL STATEMENTS (Continued)
Senior Loan Participations and Assignments
Certain portfolios may invest in Senior Loans, the interest rates of which float or adjust periodically based upon a specified adjustment schedule, benchmark indicator, or prevailing interest rates of domestic or foreign corporations, partnerships and other entities (“Borrower”). Senior Loans generally pay interest at rates which are periodically redetermined by reference to a base lending rate plus a premium. These base lending rates generally include prime rates of one or more major U.S. banks, LIBOR rates or certificates of deposit rates. Senior Loans often require prepayments from excess cash flow or permit the borrower to repay at its election. The degree to which borrowers repay cannot be predicted with accuracy. As a result, the actual maturity may be substantially less than the stated maturities. Senior Loans are exempt from registration under the Securities Act of 1933, may contain certain restrictions on resale, and cannot be sold publicly. A portfolio’s investments in Senior Loans may be in the form of participations in loans or assignments of all or a portion of loans from third parties.
When a portfolio purchases assignments, it acquires all the rights and obligations under the loan agreement of the assigning lender. Assignments may, however, be arranged through private negotiations between potential assignees and potential assignors, and the rights and obligations acquired by the purchaser of an assignment may differ from, and be more limited than those held by the assigning lender.
When a portfolio purchases a participation of a Senior Loan interest, the portfolio typically enters into a contractual agreement with the lender or other third party selling the participation. A participation interest in Senior Loans includes the right to receive payments of principal, interest and any fees to which it is entitled from the lender and only upon receipt by the lender of payments from the Borrower, but not from the Borrower directly. When investing in a participation interest, if a Borrower is unable to meet its obligations under a loan agreement, a portfolio generally has no right to enforce compliance with the terms of the loan agreement. As a result, the portfolio assumes the credit risk of the Borrower, the selling participant, and any other persons that are interpositioned between the portfolio and the Borrower. If the lead lender in a typical lending syndicate becomes insolvent, enters FDIC receivership or, if not FDIC insured, enters into bankruptcy, the portfolio may incur certain costs and delays in receiving payment or may suffer a loss of principal and/or interest. As of December 31, 2012, no participation interest in Senior Loans was held by any of the portfolios covered in this report.
Inflation-Indexed Bonds
Certain portfolios may invest in inflation-indexed bonds. Inflation-indexed bonds are fixed income (debt) securities whose principal value is periodically adjusted to the rate of inflation. The interest rate on these bonds is generally fixed at issuance at a rate lower than typical bonds. Over the life of an inflation-indexed bond, however, interest will be paid based on a principal value, which is adjusted for inflation. Any increase or decrease in the principal amount of an inflation-indexed bond will result in an adjustment to interest income.
Mortgage-Related and Other Asset-Backed Securities
Certain portfolios may invest in mortgage-related and other asset-backed securities. These securities include mortgage pass-through securities, collateralized mortgage obligations (“CMOs”), collateralized loan obligations (“CLOs”), mortgage dollar rolls, CMO residuals, stripped mortgage-backed securities (“SMBS”), and other securities that directly or indirectly represent a participation in, or are secured by and payable from, mortgage loans secured by real property. Mortgage-related and other asset-backed securities are debt securities issued by a corporation, trust or custodian, or by a U.S. Government agency or instrumentality, that are collateralized by a pool of mortgages, mortgage pass-through securities, U.S. Government securities or other assets. The value of some mortgage-related and asset-backed securities may be particularly sensitive to changes in prevailing interest rates. Early repayment of principal on some mortgage-related securities may expose the Fund to a lower rate of return upon reinvestment of principal. The value of these securities may fluctuate in response to the market’s perception of the creditworthiness of the issuers. Additionally, although mortgage and mortgage-related securities are generally supported by some form of government or private guarantee and/or insurance, there is no assurance that private guarantors or issuers will meet their obligations.
SMBS represent a participation in, or are secured by and payable from, mortgage loans on real property, and may be structured in classes with rights to receive varying proportions of principal and interest. SMBS include interest-only securities (“IOs”), which receive all of the interest, and principal-only securities (“POs”), which receive the entire principal. The cash flows and yields on IOs are extremely sensitive to the rate of principal payments (including prepayments) on the underlying mortgage loans. If the underlying mortgages experience higher than anticipated prepayments, an investor in IOs of SMBS may fail to recoup fully its initial investment, even if the IOs are highly rated or are derived from securities guaranteed by the U.S. Government. Unlike other fixed-income and other mortgage-backed securities, the market value of IOs tends to move in the same direction as interest rates. As prepayments on the underlying mortgages of POs increase, the yields on POs increase. Payments received from IOs are recorded as interest income. Because principal will not be received at the maturity of an IO, adjustments are made to the book value of the security on the coupon date until maturity. These adjustments are included in interest income. Payments received from POs are treated as reductions to the cost and par value of the securities. Any excess principal paydown gains or losses associated with the payments received are recorded as interest income.
U.S. Government Agencies or Government-Sponsored Enterprises
Certain portfolios may invest in U.S. Government agencies or government-sponsored enterprises. U.S. Government securities are obligations of and, in certain cases, guaranteed by, the U.S. Government, its agencies or instrumentalities. The U.S. Government does not guarantee the NAV of the Fund’s shares. Some U.S. Government securities, such as Treasury bills, notes and bonds, and securities guaranteed by GNMA (or “Ginnie Mae”), are supported by the full faith and credit of the United States Government; others, such as those of the Federal Home Loan Bank, are supported by the right of the issuer to borrow from the U.S. Department of the Treasury (the “U.S. Treasury”); others, such as those of the Federal National Mortgage Association (“FNMA” or “Fannie Mae”), are supported by the discretionary authority of the U.S. Government to purchase the agency’s obligations. Securities not backed by the full faith and credit of the United States Government may be subject to a greater risk of default. U.S. Government securities may include zero coupon securities, which do not distribute interest on a current basis and tend to be subject to greater risk than interest-paying securities of similar maturities.
D-8
PACIFIC SELECT FUND
NOTES TO FINANCIAL STATEMENTS (Continued)
Government-related guarantors (i.e., not backed by the full faith and credit of the United States Government) include FNMA and the Federal Home Loan Mortgage Corporation (“FHLMC” or “Freddie Mac”). FNMA is a government-sponsored corporation, the common stock of which is owned entirely by private stockholders. FNMA purchases conventional (i.e., not insured or guaranteed by any government agency) residential mortgages from a list of approved seller/servicers which include state and federally chartered savings and loan associations, mutual savings banks, commercial banks and credit unions and mortgage bankers. Pass-through securities issued by FNMA are guaranteed as to timely payment of principal and interest by FNMA, but are not backed by the full faith and credit of the United States Government. FHLMC issues Participation Certificates (“PCs”), which are pass-through securities, each representing an undivided interest in a pool of residential mortgages. FHLMC guarantees the timely payment of interest and ultimate collection of principal, but PCs are not backed by the full faith and credit of the United States Government.
When-Issued Securities
Certain portfolios may purchase and sell securities on a when-issued basis. These transactions are made conditionally because a security, although authorized, has not yet been issued in the market. A commitment by a portfolio is made regarding these transactions to purchase or sell securities for a predetermined price or yield, with payment and delivery taking place beyond the customary settlement period. A portfolio may sell when-issued securities before they are delivered, which may result in a capital gain or loss. Risk may arise upon entering these contracts from the potential inability of a counterparty to meet the terms of their contracts, or if the issuer does not issue the securities due to political, economic, or other factors.
Delayed-Delivery Transactions
Certain portfolios may purchase or sell securities on a delayed-delivery basis. Payment and delivery may take place after the customary settlement period for that security. The price or yield of the underlying securities is fixed at the time the transaction is negotiated. When delayed- delivery purchases are outstanding, a portfolio will set aside, and maintain until the settlement date in a segregated account, liquid assets in an amount sufficient to meet the purchase price. When purchasing a security on a delayed-delivery basis, a portfolio assumes the rights and risks of ownership of the security, including the risk of price and yield fluctuations, and takes such fluctuations into account when determining its NAV. A portfolio may dispose of or renegotiate a delayed-delivery transaction after it is entered into, and may sell delayed- delivery securities before they are delivered, which may result in a capital gain or loss. When a portfolio has sold a security on a delayed- delivery basis, the portfolio does not participate in future gains and losses with respect to the security.
Short Sales
Certain portfolios may enter into short sales. A short sale is a transaction in which a portfolio sells securities it does not own. A portfolio’s use of short sales involves the risk that the price of the security in the open market may be higher when purchased to close out the portfolio’s short position, resulting in a loss to the portfolio. Such a loss is theoretically unlimited because there is no limit on the potential increase in the price of a security or guarantee as to the price at which the manager would be able to purchase the security in the open market.
When a portfolio sells securities short, it must borrow those securities to make delivery to the buyer. The portfolio incurs an expense for such borrowing. The portfolio may not be able to purchase a security that it needs to deliver to close out a short position at an acceptable price. This may result in losses and/or require the portfolio to sell long positions before the manager had intended. A portfolio may not be able to successfully implement its short sale strategy, which may limit its ability to achieve its investment goal, due to limited availability of desired or eligible securities, the cost of borrowing securities, regulatory changes limiting or barring short sales, or for other reasons. Securities sold in short sale transactions and the interest and dividends payable on such securities, if any, are recorded as a liability.
The use of proceeds received from selling short to purchase additional securities (long positions), results in leverage which may increase a portfolio’s exposure to long positions. Leverage could magnify gains or losses and, therefore, increase a portfolio’s volatility.
Repurchase Agreements
Certain portfolios may invest in repurchase agreements. Repurchase agreements permit the investor to maintain liquidity and earn income over periods of time as short as overnight. Repurchase agreements held by a portfolio are fully collateralized by U.S. Government securities, or securities issued by U.S. Government agencies, or securities that are within the three highest credit categories assigned by established rating agencies (Aaa, Aa, or A by Moody’s or AAA, AA or A by Standard & Poor’s ) or, if not rated by Moody’s or Standard & Poor’s, are of equivalent investment quality as determined by the Adviser or the applicable portfolio manager. Such collateral is in the possession of the portfolio’s custodian or a designated broker-dealer. The collateral is evaluated daily to ensure its market value equals or exceeds the current market value of the repurchase agreements including accrued interest. In the event of default on the obligation to repurchase, a portfolio has the right to liquidate the collateral and apply the proceeds in satisfaction of the obligation.
Borrowings and Other Financing Transactions
The following disclosures contain information on a portfolio’s ability to lend or borrow cash or securities to the extent permitted under the 1940 Act, which may be viewed as borrowing or financing transactions by a portfolio. The location and fair value amounts of these instruments are described below. For a detailed description of credit and counterparty risks that can be associated with borrowings and other financing transactions, see Note 5.
Reverse Repurchase Agreements – Certain portfolios may enter into reverse repurchase agreements. In a reverse repurchase agreement, a portfolio sells to a financial institution a security that it holds with an agreement to repurchase the same security at the agreed-upon price and date. Securities sold under reverse repurchase agreements are recorded as a liability. Interest payments made are recorded as a component of interest expense. In periods of increased demand for the security, a portfolio may receive a fee for use of the security by the counterparty, which may result in interest income to the portfolio. A reverse repurchase agreement involves the risk that the market value of the security sold by a
D-9
PACIFIC SELECT FUND
NOTES TO FINANCIAL STATEMENTS (Continued)
portfolio may decline below the repurchase price of the security. A portfolio will segregate assets determined to be liquid by the portfolio manager or otherwise cover its obligations under reverse repurchase agreements.
Sale-Buybacks – Certain portfolios may enter into transactions referred to as sale-buybacks. A sale-buyback transaction consists of a sale of a security by a portfolio to a financial institution, the counterparty, with a simultaneous agreement to repurchase the same or substantially the same security at an agreed-upon price and date. Effective January 1, 2012 such transactions are recorded as secured borrowings; whereas, previously such transactions were recorded as purchases and sales. A portfolio is not entitled to receive principal and interest payments, if any, made on the security sold to the counterparty during the term of the agreement. The agreed-upon proceeds for securities to be repurchased by the portfolio are recorded as a liability. A portfolio will recognize net income represented by the price differential between the price received for the transferred security and the agreed-upon repurchase price. This is commonly referred to as the price drop. A price drop consists of (i) the foregone interest and inflationary income adjustments, if any, a portfolio would have otherwise received had the security not been sold and (ii) the negotiated financing terms between the portfolio and counterparty. Foregone interest and inflationary income adjustments, if any, are recorded as components of interest income. Interest payments based upon negotiated financing terms made by the portfolio to counterparties are recorded as a component of interest expense. In periods of increased demand for the security, a portfolio may receive a fee for use of the security by the counterparty, which may result in interest income to a portfolio. A portfolio will segregate assets determined to be liquid or otherwise cover its obligations under sale-buyback transactions.
Segregation and Collateral
If a portfolio engages in certain transactions such as derivative investments or repurchase agreements, it may require collateral in the form of cash or investments to be held in segregated accounts at the Fund’s custodian, with an exchange or clearing member firm, or segregated on the Fund’s books and records maintained by the custodian and/or the portfolio manager. In each instance that segregation of collateral is required, it is done so in accordance with the 1940 Act and/or any interpretive guidance issued by the SEC. There is a possibility that a portfolio could experience a delay in selling investments that are segregated as collateral.
5. DERIVATIVE INVESTMENTS AND RISKS
A. PRINCIPAL MARKET RISKS MANAGED BY INVESTING IN DERIVATIVES
Derivative instruments are investments whose values are tied to the value of an underlying security or asset, a group of assets, interest rates, exchange rates, currency or an index. Certain portfolios are permitted to invest in derivative instruments, including, but not limited to, futures contracts, options contracts, forward foreign currency contracts, interest rate swaps, and credit default swaps. Derivatives may have little or no initial cash investment value relative to their market value exposure and therefore can produce significant gains or losses in excess of their cost. This is sometimes referred to as leverage. Leverage can magnify a portfolio’s gains and losses and therefore increase its volatility. A portfolio’s investments in derivatives may increase, decrease or change the level or types of exposure to certain risk factors. The primary risks a portfolio may attempt to manage through investing in derivative instruments include, but are not limited to, interest rate, foreign investments and currency, price volatility and credit (including counterparty) risks.
Interest rate risk – A portfolio may be exposed to interest rate risk through investments in fixed income securities. Interest rate risk is the risk that fixed income securities will decline in value as a result of changes in interest rates. For example, the value of bonds, fixed rate loans and short-term money market instruments may decline in value when interest rates rise. Fixed income securities with longer durations tend to be more sensitive to changes in interest rates, making them more volatile than fixed income securities with shorter durations or money market instruments. Therefore, duration is a potentially useful tool to measure the sensitivity of a fixed income security’s yield (market price to interest rate movement). To manage these risks, certain portfolios may invest in derivative instruments tied to interest rates.
Foreign investments and currency risk – A portfolio may be exposed to foreign investments and/or currency risk through direct investment in securities or through options, futures or currency transactions. The prices of foreign securities that are denominated in foreign currencies are affected by the value of the U.S. dollar. With respect to securities denominated in foreign currencies, in general, as the value of the U.S. dollar rises, the U.S. dollar price of a foreign security will fall. As the value of the U.S. dollar falls, the U.S. dollar value of the foreign security will rise. Currency rates in foreign countries may fluctuate significantly over short periods of time for a number of reasons. Foreign investments may be riskier than U.S. investments for many reasons, including changes in currency exchange rates, unstable political and economic conditions, a lack of adequate and timely company information, differences in the way securities markets operate, relatively lower market liquidity, less stringent financial reporting and accounting guidance and controls, less secure foreign banks or securities depositories than those in the U.S., foreign taxation issues and foreign controls on investments. As a result, a portfolio’s investments in foreign currency-denominated securities and other foreign investments may reduce the returns of the portfolio. To manage these risks, certain portfolios may invest in derivative instruments tied to foreign investments and/or currencies.
Price volatility risk – Derivatives tied to equity and fixed income securities are exposed to potential price volatility. Fixed income securities are affected by many factors, including prevailing interest rates, market conditions and market liquidity. Volatility of below investment grade fixed income securities (including loans) may be relatively greater than for investment grade fixed income securities. Equity securities tend to go up or down in value, sometimes rapidly and unpredictably. The prices of equity securities change in response to many factors, including a company’s historical and prospective earnings, the value of its assets, general economic conditions, interest rates, investor perceptions and market liquidity. Due to the complexities of markets, events in one market or sector may adversely impact other markets or sectors.
To manage these risks, certain portfolios may invest in various derivative instruments. Derivative instruments may be used to manage a portfolio’s exposure to price volatility risk but may also be subject to greater price volatility than investments in traditional securities. The value of commodity-linked derivative instruments may be affected by changes in overall market movements, commodity index volatility, changes in interest rates, or factors affecting a particular industry or commodity, such as drought, floods, weather, livestock disease, embargoes, tariffs and international economic, political and regulatory developments.
D-10
PACIFIC SELECT FUND
NOTES TO FINANCIAL STATEMENTS (Continued)
Credit and Counterparty risk – Credit risk is the risk that a fixed income security’s issuer (or borrower or counterparty) will be unable or unwilling to meet its financial obligations (e.g. may not be able to make principal and/or interest payments when they are due or otherwise default on other financial terms) and/or may go bankrupt. This is also sometimes described as counterparty risk. A portfolio may lose money if the issuer or guarantor of fixed income security, or counterparty of a derivative contract, repurchase or reverse repurchase agreement, or a loan of portfolio securities, is unable or unwilling to make timely principal and/or interest payments, or to otherwise honor its obligations. A portfolio may attempt to minimize concentrations of credit risk by undertaking transactions with a large number of borrowers or counterparties on recognized and reputable exchanges. A portfolio’s investments in fixed income (debt) investments may range in quality from those rated in the lowest category in which it is permitted to invest to those rated in the highest category by a rating agency, or if unrated, determined by the manager to be of comparable quality.
Similar to credit risk, a portfolio may be exposed to counterparty risk, or the risk that an institution or other entity with which a portfolio has unsettled or open transactions will default. Financial assets of counterparties, which potentially expose a portfolio to counterparty risk, consist mainly of cash due from counterparties and investments. Certain managers may attempt to minimize credit risks to the portfolios by performing extensive reviews of each counterparty, entering into transactions with counterparties that the manager believes to be creditworthy at the time of the transaction and requiring the posting of collateral in applicable transactions. To manage these risks, certain portfolios may invest in derivative instruments tied to a security issuers’ financial strength.
A portfolio’s transactions in listed securities are settled/paid for upon delivery with their counterparties. Therefore, the risk of counterparty default for listed securities is considered minimal, as delivery of securities sold is only made once a portfolio has received payment. Payment is made on a purchase once the securities have been delivered by the counterparty. The trade will fail if either party fails to meet its obligations.
Credit Related Contingent Features – Certain portfolios are parties to various agreements, including but not limited to International Swaps and Derivatives Agreements, Master Repurchase Agreements, and Master Securities Forward Transactions Agreements (collectively “Master Agreements”), which govern the terms of certain transactions with select counterparties. These Master Agreements generally include provisions for general obligations, representations, agreements, collateral and certain events of default or termination, such as credit related contingent features. These provisions reduce the counterparty risk associated with relevant transactions by allowing a portfolio or its counterparties to elect to terminate early and cause settlement of all outstanding transactions if a triggering event occurs under the applicable Master Agreement. These triggering events include, but are not limited to, bankruptcy, failure to make timely payments, restructuring, obligation acceleration, obligation default, a material decline in net assets, decline in credit rating or repudiation/moratorium. Thus, if a credit related contingent feature is triggered, it would allow a portfolio or its counterparty to close out all transactions under the agreement and demand payment or additional collateral to cover their exposure to the other counterparty. Any election made by a counterparty to early terminate a transaction could have a material adverse impact on a portfolio’s financial statements. To reduce credit and counterparty risk associated with transactions, a portfolio may enter into master netting arrangements to the extent that if an event of default occurs, all amounts with the counterparty are terminated and settled on a net basis. A portfolio’s overall exposure to credit risk, subject to master netting arrangements, can change substantially within a short period, as it is affected by each transaction subject to the arrangement.
B. DERIVATIVE INVESTMENTS
In addition to managing the market risks described above, certain portfolios, if permitted by their investment objectives, may also invest in derivatives for purposes of hedging, duration management, to gain exposure to specific investment opportunities, as a substitute for securities, to increase returns, or to otherwise help achieve a portfolio’s investment goal. Each derivative instrument and the reasons a portfolio invested in derivatives during the reporting period are discussed in further detail below.
Futures Contracts – A futures contract is a commitment to buy or sell a specific amount of a financial instrument or commodity at a negotiated price on a specified future date. Futures contracts are subject to the possibility of illiquid markets, and the possibility of an imperfect correlation between the value of the instruments and the underlying securities. Initial margin deposits are made upon entering into futures contracts and can be funded with either cash or securities. During the period a futures contract is open, changes in the value of the contract are recognized as unrealized appreciation or depreciation by marking-to-market on a daily basis to reflect the market value of the contract at the end of each day’s trading. Variation margin receivables or payables represent the difference between the change in unrealized appreciation and depreciation on the open contracts and the cash deposits made on the margin accounts. When the contract is closed, a portfolio records a realized gain or loss equal to the difference between the proceeds from (or cost of) the closing transaction and the portfolio’s cost of the contract. Futures contracts are valued at the settlement price established each day by the board of trade or exchange on which they are traded.
During the reporting period, the portfolios entered into futures contracts for the following reasons: The Diversified Bond and Inflation Protected Portfolios used futures to manage portfolio risk and duration. The Inflation Managed and Managed Bond Portfolios used financial and money market futures to manage exposure to securities markets and to manage interest rate risk. The Short Duration Bond Portfolio used treasury interest rate futures contracts to manage exposure to changes in interest rates, bond prices, foreign currencies and credit quality, and to adjust portfolio duration and credit exposure to the markets. The Equity Index, Small-Cap Equity and Small-Cap Index Portfolios utilized futures to help provide equity exposure to the portfolios’ cash balances and accruals, and to provide daily liquidity for the portfolio’s inflows and outflows. The Long/Short Large-Cap Portfolio used futures contracts to maintain full exposure (long and short) to the equity markets, to hedge various investments for risk management purposes and to increase returns. The Real Estate Portfolio used futures to maintain full exposure to the equity markets. The Global Absolute Return Portfolio used futures to manage duration and interest rate risk, to maintain full exposure to the equities market, to manage exposure to various markets, to provide daily liquidity for the portfolio’s inflows and outflows, and as a part of the portfolio’s investment strategy. The International Value Portfolio utilized futures to gain market exposure to manage cash inflows. The Comstock, Dividend Growth, Equity Index, Growth LT, Large-Cap Value, Main Street Core, Mid-Cap Equity, Mid-Cap Growth, Mid-Cap Value, Small-Cap Equity, Small-Cap Growth, International Large-Cap, International Value Portfolios utilized futures to gain market exposure with the cash generated during PLFA’s reallocation of assets related to the Portfolio Optimization Portfolios.
D-11
PACIFIC SELECT FUND
NOTES TO FINANCIAL STATEMENTS (Continued)
Options Contracts – An options contract is a commitment that gives the purchaser of the contract the right, but not the obligation, to buy or sell an underlying asset at a specific price on or before a specified future date. On the other hand, the writer of an options contract is obligated, upon the exercise of the option, to buy or sell an underlying asset at a specific price on or before a specified future date. A swaption is an option contract granting the owner the right to enter into an underlying swap. Inflation-capped options are options on U.S. inflation rates at a stated strike price. The seller of an inflation-capped option receives an upfront premium and in return the buyer receives the right to receive a payment at the expiration of the option if the cumulative annualized inflation rate over the life of the option is above (for caps) or below (for floors) the stated strike price. The purpose of inflation-capped options is to protect the buyer from inflation erosion above a certain rate on a given notional exposure. A floor can be used to give downside protection to investments in inflation-linked products below a certain rate on a given notional exposure. Writing put options or purchasing call options tends to increase a portfolio’s exposure to the underlying instrument. Writing call options or purchasing put options tends to decrease a portfolio’s exposure to the underlying instrument. When a portfolio writes or purchases a call, put, or inflation-capped option, an amount equal to the premium received or paid by the portfolio is recorded as a liability or an investment, respectively, and subsequently adjusted to the current market value, based on the quoted daily settlement price of the option written or purchased. Certain options may be written or purchased with premiums to be determined on a future date. The premiums for these options are based upon implied volatility parameters at specified terms. Premiums received or paid from writing or purchasing options, which expire unexercised, are treated by a portfolio on the expiration date as realized gains or losses. The difference between the premium and the amount paid or received on a closing purchase or sale transaction, including brokerage commissions, is also treated as a realized gain or loss. If an option is exercised, the premium paid or realized is added to the cost of the purchase or proceeds from the sale in determining whether the portfolio has realized a gain or loss on investment transactions. A portfolio, as a writer of an option, may have no control over whether the underlying instrument may be sold (call) or purchased (put) and as a result bears the market risk of an unfavorable change in the price of the underlying written option. In addition, an illiquid market may make it difficult for a portfolio to close out an option contract.
The maximum risk of loss associated with writing put options is limited to the exercised fair value of the option contract. The maximum risk of loss associated with writing call options is potentially unlimited. Listed options contracts present minimal counterparty credit risk since they are exchange traded and the exchange’s clearinghouse, as counterparty to all exchange-traded options, guarantees the options against default. A portfolio’s maximum risk of loss from counterparty credit risk related to OTC options contracts is limited to the premium paid.
During the reporting period, the portfolios entered into option contracts for the following reasons: The Diversified Bond and Inflation Protected Portfolios purchased or wrote options to manage portfolio risk and duration. The Inflation Managed and Managed Bond Portfolios purchased or wrote options and swaptions on futures, currencies, volatility and swaps, as a means of capitalizing on anticipated changes in market volatility and to generate income. Both Portfolios also wrote inflation floors to hedge duration. The Growth LT Portfolio purchased or wrote options for purposes of risk management and as part of the portfolio’s investment strategy. The Global Absolute Return Portfolio purchased options for purposes of risk management and as part of the portfolio’s investment strategy.
Forward Foreign Currency Contracts – A forward foreign currency contract (“Forward Contract”) is a commitment to buy or sell a specific amount of a foreign currency at a negotiated price on a specified future date. Forward Contracts can help a portfolio manage the risk of changes in currency exchange rates. These contracts are marked-to-market daily at the applicable forward currency translation rates. A portfolio records realized gains or losses at the time the Forward Contract is closed. A Forward Contract is extinguished through a closing transaction or upon delivery of the currency or entering an offsetting contract. A portfolio’s maximum risk of loss from counterparty credit risk related to Forward Contracts is the fair value of the contract. The risk may be mitigated to some extent if a master netting arrangement between a portfolio and the counterparty is in place and to the extent a portfolio obtains collateral to cover the portfolio’s exposure to the counterparty.
During the reporting period, the portfolios entered into forward foreign currency contracts for the following reasons: The Diversified Bond, Inflation Protected, Short Duration Bond, Comstock, Growth LT, International Small-Cap, and International Value Portfolios used Forward Contracts for hedging purposes to help protect the portfolios’ returns against adverse currency movements. The Inflation Managed and Managed Bond Portfolios used Forward Contracts in connections with settling planned purchases or sales of investments, to hedge against currency exposure associated with some or all of these portfolios’ investments and as a part these portfolios’ investment strategy. The Emerging Markets Debt Portfolio used Forward Contracts to gain market exposure, for hedging purposes to help protect the portfolio’s returns against adverse currency movements, and as a part of the portfolio’s investment strategy. The Currency Strategies Portfolio purchased and sold non-deliverable Forwards Contracts to gain or increase exposure to various currencies (both long and short positions) for hedging purposes to protect the portfolio’s returns against adverse currency movements and as a part of the portfolio’s investment strategy. The Global Absolute Return Portfolio used Forward Contracts for hedging purposes to protect the portfolio’s returns against adverse currency movements, as a substitute for securities, and as part of the portfolio’s investment strategy.
Swaps Agreements – Swaps are privately negotiated agreements between the portfolios and their counterparties to exchange cash flows, assets, foreign currencies or market-linked returns at specified intervals and may be executed in the over-the-counter market or in a multilateral or other trade facility platform, such as a registered commodities exchange (“centrally cleared swaps”). In connection with these agreements, securities may be identified as collateral in accordance with the terms of the respective swap agreements to provide assets of value and recourse in the event of default or bankruptcy/insolvency. Swaps are marked-to-market daily based upon values received from third party vendors or quotations from market makers. Market values greater than zero are recorded as an asset and market values less than zero are recorded as a liability. The change in value of swaps, including accruals of periodic amounts of interest to be paid or received on swaps, is recorded as unrealized appreciation or depreciation. Daily changes in valuation of centrally cleared swaps, if any, are recorded as variation margin receivable or payable. Payments received or made at the beginning of the measurement period are recorded as an asset or liability and represent payments made or received upon entering into the swap agreement to compensate for differences between the stated terms of the swap agreement and prevailing market conditions (credit spreads, currency exchange rates, interest rates, and other relevant factors). These upfront payments are recorded as the calculation of realized gain or loss when the swap is closed. A liquidation payment received or made at the termination of the swap is recorded as realized gain or loss. Net periodic payments received by the portfolios are recorded as realized gain.
D-12
PACIFIC SELECT FUND
NOTES TO FINANCIAL STATEMENTS (Continued)
Interest Rate Swaps – Interest rate swap agreements involve the exchange by a portfolio with another party of their respective commitments to pay or receive interest with respect to the notional amount of principal. Certain forms of interest rate swap agreements may include: (i) interest rate caps, under which, in return for a premium, one party agrees to make payments to the other to the extent that interest rates exceed a specified rate, or “cap”, (ii) interest rate floors, under which, in return for a premium, one party agrees to make payments to the other to the extent that interest rates fall below a specified rate, or “floor”, (iii) interest rate collars, under which a party sells a cap and purchases a floor or vice versa in an attempt to protect itself against interest rate movements exceeding given minimum or maximum levels, (iv) callable interest rate swaps, under which the counterparty may terminate the swap transaction in whole at zero cost by a predetermined date and time prior to the maturity date, (v) spreadlocks, which allow the interest rate swap users to lock in the forward differential (or spread) between the interest rate swap rate and a specified benchmark, or (vi) basis swaps, under which two parties can exchange variable interest rates based on different money markets.
Certain portfolios hold fixed rate bonds whose value may decrease if interest rates rise. To help hedge against this risk and to maintain the ability to generate income at prevailing market rates, certain portfolios enter into interest rate swap agreements.
A portfolio investing in interest rate swaps is subject to the risk that there is no liquid market for these agreements, that the counterparties may default on their obligations to perform or disagree as to the meaning of the contractual terms in the agreements, or that there may be unfavorable changes in interest rates. A portfolio’s maximum risk of loss from counterparty credit risk related to interest rate swaps is the discounted net value of the cash flows to be received from/paid to the counterparty over the contract’s remaining life, to the extent that the amount is positive. The risk may be mitigated to some extent if a master netting arrangement between a portfolio and the counterparty is in place and to the extent a portfolio obtains collateral to cover the portfolio’s exposure to the counterparty.
During the reporting period, the portfolios entered into interest rate swap contracts for the following reasons: The Inflation Managed and Managed Bond Portfolios entered into interest rate swaps to manage nominal or real interest rate risk in various global markets and as a substitute for cash bond exposure. The Global Absolute Return Portfolio entered into interest rate swaps for hedging purposes, to manage interest rate exposure, and as part of the portfolio’s investment strategy.
Credit Default Swaps – Credit default swap agreements involve one party making a stream of payments (referred to as the buyer of protection) to another party (the seller of protection) in exchange for the right to receive a specified return in the event of a default or other credit event for the referenced entity, obligation or index. As a seller of protection, a portfolio generally receives an upfront payment or a fixed rate of income throughout the term of the swap provided there is no credit event. As the seller, a portfolio would effectively add leverage to its portfolio because, in addition to its total net assets, a portfolio would be subject to investment exposure on the notional amount of the swap.
A portfolio investing in credit default swaps is subject to the risk that there is no liquid market for these agreements, that the counterparties may default on their obligations to perform or disagree as to the meaning of the contractual terms in the agreements, or that there may be unfavorable changes in interest rates.
If a portfolio is a seller of protection and a credit event occurs, as defined under the terms of that particular swap agreement, a portfolio will either (i) pay to the buyer of protection an amount equal to the notional amount of the swap and take delivery of the referenced obligation, other deliverable obligations or underlying securities comprising the referenced index or (ii) pay a net settlement amount in the form of cash or securities equal to the notional amount of the swap less the recovery value of the referenced obligation or underlying securities comprising the referenced index. If a portfolio is a buyer of protection and a credit event occurs, as defined under the terms of that particular swap agreement, a portfolio will either (i) receive from the seller of protection an amount equal to the notional amount of the swap and deliver the referenced obligation, other deliverable obligations or underlying securities comprising the referenced index or (ii) receive a net settlement amount in the form of cash or securities equal to the notional amount of the swap less the recovery value of the referenced obligation or underlying securities comprising the referenced index. Recovery values are assumed by market makers considering either industry standard recovery rates or entity specific factors and considerations until a credit event occurs. If a credit event has occurred, the recovery value is determined by a facilitated auction whereby a minimum number of allowable broker bids, together with a specified valuation method, are used to calculate the settlement value.
Credit default swap agreements on corporate issues, sovereign issues of an emerging country or U.S. Treasury obligation issues involve one party making a stream of payments to another party in exchange for the right to receive a specified return in the event of a default or other credit event. If a credit event occurs and cash settlement is not elected, a variety of other deliverable obligations may be delivered in lieu of the specific referenced obligation. The ability to deliver other obligations may result in a cheapest-to-deliver option (the buyer of protection’s right to choose the deliverable obligation with the lowest value following a credit event). A portfolio may use credit default swaps on corporate issues, sovereign issues of an emerging country or U.S. Treasury obligation issues to provide a measure of protection against defaults of the issuers (i.e., to reduce risk where a portfolio owns or has exposure to the referenced obligation) or to take an active long or short position with respect to the likelihood of a particular issuer’s default.
Credit default swap agreements on asset-backed securities involve one party making a stream of payments to another party in exchange for the right to receive a specified return in the event of a default or other credit event. Unlike credit default swaps on corporate and sovereign issues of an emerging country, deliverable obligations in most instances would be limited to the specific referenced obligation as performance for asset-backed securities can vary across deals. Prepayments, principal paydowns, and other writedowns or loss events on the underlying mortgage loans will reduce the outstanding principal balance of the referenced obligation. These reductions may be temporary or permanent as defined under the terms of the swap agreement and the notional amount for the swap agreement will be adjusted by corresponding amounts. A portfolio may use credit default swaps on asset-backed securities to provide a measure of protection against defaults of the referenced obligation or to take an active long or short position with respect to the likelihood of a particular referenced obligation’s default.
Credit default swap agreements on credit indices involve one party making a stream of payments to another party in exchange for the right to receive a specified return in the event of a write-down, principal shortfall, interest shortfall or default of all or part of the referenced entities
D-13
PACIFIC SELECT FUND
NOTES TO FINANCIAL STATEMENTS (Continued)
comprising the credit index. Credit default swap agreements on indices are benchmarks for protecting investors owning bonds against default. A credit index is a list of a basket of credit instruments or exposures designed to be representative of some part of the credit market as a whole. These indices are made up of reference credits that are judged by a poll of dealers to be the most liquid entities in the credit default swap market based on the sector of the index. Components of the indices may include, but are not limited to, investment grade securities, high yield securities, asset-backed securities, emerging markets, and/or various credit ratings within each sector. Credit indices are traded using credit default swaps with standardized terms including a fixed spread and standard maturity dates. An index credit default swap references all the names in the index, and if there is a default, the credit event is settled based on that name’s weight in the index. The composition of the indices changes periodically, usually every six months, and for most indices, each name has an equal weight in the index. A portfolio may use credit default swaps on credit indices to hedge a portfolio of credit default swaps or bonds with a credit default swap on indices which is less expensive than it would be to buy many credit default swaps to achieve a similar effect.
An implied credit spread is the spread in yield between a U.S. Treasury security and the referenced obligation or underlying investment that are identical in all respects except for the quality rating. Wider credit spreads, in absolute terms when compared to the notional amount of the swap, represent a deterioration of the referenced entity’s credit soundness and a greater likelihood or risk of default or other credit event occurring as defined under the terms of the agreement. Implied credit spreads, represented in absolute terms, utilized in determining the market value of credit default swap agreements on corporate issues, sovereign issues of an emerging country or U.S. Treasury obligation issues as of period end, are disclosed in the Notes to Schedules of Investments and serve as an indicator of the current status of the payment/performance risk and represent the likelihood or risk of default for the credit derivative. The implied credit spread of a particular referenced entity reflects the cost of buying/selling protection and may include upfront payments required to be made to enter into the agreement. For credit default swap agreements on asset-backed securities and credit indices, the quoted market prices and resulting values serve as the indicator of the current status of the payment/performance risk.
A portfolio may use pair trades of credit default swaps. Pair trades attempt to match a long position with a short position of two securities in the same market sector for hedging purposes. Pair trades of credit default swaps attempt to gain exposure to credit risk while hedging or offsetting the effects of overall market movements. For example, a portfolio may purchase protection through a credit default swap referenced to the debt of an issuer, and simultaneously selling protection through a credit default swap referenced to the debt of a different issuer with the intent to realize gains from the pricing differences of the two issuers who are expected to have similar market risks.
A portfolio may use spread curve trades by simultaneously purchasing and selling protection through credit default swaps referenced to the same issuer but with different maturities. Spread curves attempt to gain exposure to credit risk on a forward basis by realizing gains on the expected differences in spreads.
A portfolio’s maximum risk of loss from counterparty credit risk related to credit default swaps, either as the buyer or seller of protection, is the fair value of the contract. The risk may be mitigated to some extent if a master netting arrangement between a portfolio and the counterparty is in place and to the extent a portfolio obtains collateral to cover the portfolio’s exposure to the counterparty.
The aggregate fair value of credit default swaps in a net liability position is reflected as unrealized depreciation and is disclosed in the Notes to Schedules of Investments. The collateral posted, net of assets received as collateral, for swap contracts is also disclosed in the Notes to Schedules of Investments. The maximum potential amount of future payments (undiscounted) that a portfolio as a seller of protection could be required to make under a credit default swap agreement is an amount equal to the notional amount of the agreement. Notional amounts of all credit default swap agreements outstanding as of December 31, 2012 for which a portfolio is the seller of protection are disclosed in the Notes to Schedules of Investments. These potential amounts are partially offset by any recovery values of the respective referenced obligations, upfront payments received upon entering into the agreement, or net amounts received from the settlement of buy protection credit default swap agreements entered into by a portfolio for the same referenced entity or entities.
During the reporting period, the portfolios entered into credit default swap contracts for the following reasons: The Diversified Bond Portfolio utilized credit default swaps to manage duration and credit risk, as a substitute for physical securities and as part of the portfolio’s investment strategy. The High Yield Bond Portfolio sold credit protection through credit default swaps on indices to increase exposure to credit for the broader high yield market. The Inflation Managed and Managed Bond Portfolios sold credit protection through credit default swaps to increase exposure to the credit risk of individual securities and to the broader investment grade, high yield, or emerging markets through the use of credit default swaps on credit indices. Both Portfolios also purchased credit protection to reduce credit exposure to individual issuers, reduce broader credit risk, and to take advantage of the basis between the credit default swap and cash bond market. The Global Absolute Return Portfolio entered into credit default swaps for hedging purposes, to increase or decrease credit exposure to various indices, individual issuers and securities or groups of securities, and as part of the portfolio’s investment strategy.
Total Return Swaps – A portfolio investing in total return swaps is subject to the risk that there is no liquid market for these agreements, that the counterparties may default on their obligations to perform or disagree as to the meaning of the contractual terms in the agreements, or that there may be unfavorable changes in the value of the underlying index or reference instrument (generally caused by changes in interest rates or declines in credit quality). A total return swap agreement is one in which one party makes payments based on a set rate, either fixed or variable, while the other party makes payments based on the return of an underlying index or reference instrument, which includes both the income it generates and any capital gains. To the extent the total return of the index or reference instrument underlying the transaction exceeds or falls short of the offsetting interest rate obligation, a portfolio will receive a payment from or make a payment to the counterparty. A portfolio’s maximum risk of loss from counterparty credit risk related to total return swaps is the discounted net value of the cash flows to be received from or paid to the counterparty over the contract’s remaining life, to the extent that the amount is positive. The risk may be mitigated to some extent if a master netting arrangement between a portfolio and the counterparty is in place and to the extent a portfolio obtains collateral to cover a portfolio’s exposure to the counterparty.
D-14
PACIFIC SELECT FUND
NOTES TO FINANCIAL STATEMENTS (Continued)
During the reporting period, the portfolios entered into total return swap contracts for the following reasons: The Diversified Bond Portfolio entered into total return swaps to manage duration and credit risk, as a substitute for physical securities and as part of the portfolio’s investment strategy. The Inflation Protected Portfolio entered into total return swaps to manage duration and portfolio risk.
For financial reporting purposes, the Fund does not offset fair value amounts recognized for derivative instruments and fair value amounts recognized for the right to reclaim cash collateral (receivables) or the obligation to return cash collateral (payables) arising from derivative instruments recognized at fair value executed with the same counterparty under a master netting arrangement. The derivative investments held as of December 31, 2012 as disclosed in the Notes to Schedules of Investments and the amounts of realized gains and losses and changes in net unrealized appreciation and depreciation on derivative investments as disclosed in the Statements of Operations serve as indicators of the volume of derivative activity for each applicable portfolio during the year ended December 31, 2012.
The following is a summary of the location of fair value amounts of derivative investments, if any, disclosed in the Fund’s Statements of Assets and Liabilities:
| | | | |
| | | Location on the Statements of Assets and Liabilities |
| Derivative Investments Risk Type | | Asset Derivative Investments | | Liability Derivative Investments |
Interest rate contracts | | Investments, at value
Receivable: Variation margin
Swap contracts, at value | | Outstanding options written, at value
Payable: Variation margin
Swap contracts, at value |
Foreign exchange contracts | | Investments, at value
Receivable: Variation margin
Forward foreign currency contracts appreciation | | Outstanding options written, at value
Payable: Variation margin
Forward foreign currency contracts depreciation |
Credit contracts | | Swap contracts, at value | | Swap contracts, at value |
Equity contracts | | Investments, at value
Receivable: Variation margin | | Outstanding options written, at value
Payable: Variation margin |
The following is a summary of fair values of derivative investments disclosed in the Statements of Assets and Liabilities, categorized by primary risk exposure as of December 31, 2012:
| | | | | | | | | | | | | | | | | | | | |
| | | | | | Asset Derivative Investments Value | |
| Portfolio | | Total Value at
December 31, 2012 | | | Credit
Contracts | | | Equity
Contracts | | | Foreign Exchange
Contracts | | | Interest Rate
Contracts | |
Diversified Bond | | | $7,080,479 | | | | $399,699 | | | | $- | | | | $3,687,918 | | | | $2,992,862 | * |
High Yield Bond | | | 72,986 | | | | 72,986 | | | | - | | | | - | | | | - | |
Inflation Managed | | | 16,652,870 | | | | 372,085 | | | | - | | | | 11,322,668 | | | | 4,958,117 | * |
Inflation Protected | | | 520,588 | | | | - | | | | - | | | | 442,796 | | | | 77,792 | * |
Managed Bond | | | 53,825,880 | | | | 16,746,416 | | | | - | | | | 12,298,228 | | | | 24,781,236 | * |
Short Duration Bond | | | 21,144 | | | | - | | | | - | | | | 21,144 | | | | - | |
Emerging Markets Debt | | | 1,658,762 | | | | - | | | | - | | | | 1,658,762 | | | | - | |
Comstock | | | 189,190 | | | | - | | | | - | | | | 189,190 | | | | - | |
Growth LT | | | 1,667,539 | | | | - | | | | 1,252,310 | | | | 415,229 | | | | - | |
Small-Cap Equity | | | 115,105 | | | | - | | | | 115,105 | * | | | - | | | | - | |
Small-Cap Index | | | 412,785 | | | | - | | | | 412,785 | * | | | - | | | | - | |
International Small-Cap | | | 1,244,392 | | | | - | | | | - | | | | 1,244,392 | | | | - | |
International Value | | | 5,561,540 | | | | - | | | | - | | | | 5,561,540 | | | | - | |
Currency Strategies | | | 31,325,749 | | | | - | | | | - | | | | 31,325,749 | | | | - | |
Global Absolute Return | | | 81,697,243 | | | | 51,142,822 | | | | 1,214,370 | * | | | 19,828,930 | | | | 9,511,121 | * |
| | | | | | | | | | | | | | | | | | | | |
| | | | | | Liability Derivative Investments Value | |
| Portfolio | | Total Value at
December 31, 2012 | | | Credit
Contracts | | | Equity
Contracts | | | Foreign Exchange
Contracts | | | Interest Rate
Contracts | |
Diversified Bond | | | ($5,469,500 | ) | | | ($457,262 | ) | | | $- | | | | ($4,737,105 | ) | | | ($275,133 | )* |
Inflation Managed | | | (4,978,235 | ) | | | (1,307,939 | ) | | | - | | | | (2,050,680 | ) | | | (1,619,616 | )* |
Inflation Protected | | | (6,403,957 | ) | | | - | | | | - | | | | (3,722,183 | ) | | | (2,681,774 | ) |
Managed Bond | | | (20,293,809 | ) | | | (4,114,200 | ) | | | - | | | | (14,995,349 | ) | | | (1,184,260 | )* |
Emerging Markets Debt | | | (2,104,424 | ) | | | - | | | | - | | | | (2,104,424 | ) | | | - | |
Comstock | | | (3,343,389 | ) | | | - | | | | - | | | | (3,343,389 | ) | | | - | |
Equity Index | | | (202,294 | ) | | | - | | | | (202,294 | )* | | | - | | | | - | |
Growth LT | | | (391,886 | ) | | | - | | | | - | | | | (391,886 | ) | | | - | |
Long/Short Large-Cap | | | (47,705 | ) | | | - | | | | (47,705 | )* | | | - | | | | - | |
International Value | | | (4,044,509 | ) | | | - | | | | - | | | | (4,044,509 | ) | | | - | |
Currency Strategies | | | (24,402,266 | ) | | | - | | | | - | | | | (24,402,266 | ) | | | - | |
Global Absolute Return | | | (41,084,436 | ) | | | (14,429,054 | ) | | | - | | | | (24,846,892 | ) | | | (1,808,490 | )* |
| | * | Includes cumulative appreciation (depreciation) of futures contracts and centrally cleared swaps as reported in the Notes to Schedules of Investments. Only current day’s variation margin is reported within the Statement of Assets and Liabilities. |
D-15
PACIFIC SELECT FUND
NOTES TO FINANCIAL STATEMENTS (Continued)
The following is a summary of the location of realized gains and losses and changes in net unrealized appreciation and depreciation of derivative investments, if any, disclosed in the Fund’s Statements of Operations:
| | |
| Derivative Investments Risk Type | | Location of Gain (Loss) on Derivative Investments Recognized in the Statements of Operations |
Interest rate contracts | | Net realized gain (loss) on investment security transactions |
Equity contracts | | Net realized gain (loss) on futures contracts and swap transactions |
| | Net realized gain (loss) on written option transactions |
| | Change in net unrealized appreciation (depreciation) on investment securities |
| | Change in net unrealized appreciation (depreciation) on futures contracts and swaps |
| | Change in net unrealized appreciation (depreciation) on written options |
Foreign exchange contracts | | Net realized gain (loss) on investment security transactions |
| | Net realized gain (loss) on futures contracts and swap transactions |
| | Net realized gain (loss) on written option transactions |
| | Net realized gain (loss) on foreign currency transactions |
| | Change in net unrealized appreciation (depreciation) on investment securities |
| | Change in net unrealized appreciation (depreciation) on futures contracts and swaps |
| | Change in net unrealized appreciation (depreciation) on written options |
| | Change in net unrealized appreciation (depreciation) on foreign currencies |
Credit contracts | | Net realized gain (loss) on futures contracts and swap transactions |
| | Change in net unrealized appreciation (depreciation) on futures contracts and swaps |
The following is a summary of each portfolio’s realized gain and/or loss and change in net unrealized appreciation and/or depreciation on derivative investments recognized in the Statements of Operations categorized by primary risk exposure for the year ended December 31, 2012:
| | | | | | | | | | | | | | | | | | | | |
| | | Realized Gain (loss) on Derivative Investments Recognized in the Statement of Operations | |
| Portfolio | | Total | | | Credit
Contracts | | | Equity
Contracts | | | Foreign Exchange
Contracts | | | Interest Rate
Contracts | |
Diversified Bond | | | ($6,072,372 | ) | | | ($1,155,749 | ) | | | $ | | | | $8,473,169 | | | | ($13,389,792 | ) |
High Yield Bond | | | 29,167 | | | | 29,167 | | | | - | | | | - | | | | - | |
Inflation Managed | | | 16,510,679 | | | | (4,480,760 | ) | | | - | | | | 3,011,732 | | | | 17,979,707 | |
Inflation Protected | | | 26,253,725 | | | | 7,702,901 | | | | - | | | | (6,622,450 | ) | | | 25,173,274 | |
Managed Bond | | | 22,752,764 | | | | (1,389,865 | ) | | | - | | | | 36,042,201 | | | | (11,899,572 | ) |
Short Duration Bond | | | 237,805 | | | | - | | | | - | | | | (179,103 | ) | | | 416,908 | |
Emerging Markets Debt | | | 2,211,034 | | | | - | | | | - | | | | 2,211,034 | | | | - | |
Comstock | | | (5,555,234 | ) | | | - | | | | (1,472,273 | ) | | | (4,082,961 | ) | | | - | |
Dividend Growth | | | 439,750 | | | | - | | | | 439,750 | | | | - | | | | - | |
Equity Index | | | 4,173,553 | | | | - | | | | 4,173,553 | | | | - | | | | - | |
Growth LT | | | (1,236,173 | ) | | | - | | | | (1,278,549 | ) | | | 42,376 | | | | - | |
Large-Cap Value | | | (1,798,714 | ) | | | - | | | | (1,798,714 | ) | | | - | | | | - | |
Long/Short Large-Cap | | | 2,836,066 | | | | - | | | | 2,836,066 | | | | - | | | | - | |
Main Street Core | | | (239,871 | ) | | | - | | | | (239,871 | ) | | | - | | | | - | |
Mid-Cap Equity | | | 1,864,550 | | | | - | | | | 1,864,550 | | | | - | | | | - | |
Mid-Cap Growth | | | (1,527,058 | ) | | | - | | | | (1,527,058 | ) | | | - | | | | - | |
Mid-Cap Value | | | (7,570,890 | ) | | | - | | | | (7,559,045 | ) | | | (11,845 | ) | | | - | |
Small-Cap Equity | | | (526,004 | ) | | | - | | | | (526,004 | ) | | | - | | | | - | |
Small-Cap Growth | | | 123,659 | | | | - | | | | 123,659 | | | | - | | | | - | |
Small-Cap Index | | | 1,093,005 | | | | - | | | | 1,093,005 | | | | - | | | | - | |
Real Estate | | | (1,493,109 | ) | | | - | | | | (1,493,109 | ) | | | - | | | | - | |
International Large-Cap | | | (4,680,659 | ) | | | - | | | | (4,680,659 | ) | | | - | | | | - | |
International Small-Cap | | | 322,900 | | | | - | | | | - | | | | 322,900 | | | | - | |
International Value | | | (8,451,232 | ) | | | - | | | | (5,798,732 | ) | | | (2,652,500 | ) | | | - | |
Currency Strategies | | | (24,405,610 | ) | | | - | | | | - | | | | (24,405,610 | ) | | | - | |
Global Absolute Return | | | (30,096,447 | ) | | | (32,277,016 | ) | | | - | | | | 1,565,627 | | | | 614,942 | |
D-16
PACIFIC SELECT FUND
NOTES TO FINANCIAL STATEMENTS (Continued)
| | | | | | | | | | | | | | | | | | | | |
| | | Change in Unrealized Appreciation (Depreciation) on Derivative Investments
Recognized in the Statement of Operations | |
| Portfolio | | Total | | | Credit
Contracts | | | Equity
Contracts | | | Foreign Exchange
Contracts | | | Interest Rate
Contracts | |
Diversified Bond | | | ($2,427,815 | ) | | | ($56,694 | ) | | | $- | | | | ($6,596,686 | ) | | | $4,225,565 | |
High Yield Bond | | | 19,861 | | | | 19,861 | | | | - | | | | - | | | | - | |
Inflation Managed | | | 3,826,922 | | | | 6,098,803 | | | | - | | | | 6,863,986 | | | | (9,135,867 | ) |
Inflation Protected | | | (10,972,071 | ) | | | - | | | | - | | | | (9,467,552 | ) | | | (1,504,519 | ) |
Managed Bond | | | 45,438,179 | | | | 15,065,431 | | | | - | | | | (21,391,082 | ) | | | 51,763,830 | |
Short Duration Bond | | | 62,021 | | | | - | | | | - | | | | 62,021 | | | | - | |
Emerging Markets Debt | | | (445,662 | ) | | | - | | | | - | | | | (445,662 | ) | | | - | |
Comstock | | | (3,154,199 | ) | | | - | | | | - | | | | (3,154,199 | ) | | | - | |
Equity Index | | | (544,775 | ) | | | - | | | | (544,775 | ) | | | - | | | | - | |
Growth LT | | | (1,906,463 | ) | | | - | | | | (397,553 | ) | | | (1,508,910 | ) | | | - | |
Long/Short Large-Cap | | | (85,859 | ) | | | - | | | | (85,859 | ) | | | - | | | | - | |
Small-Cap Equity | | | 114,180 | | | | - | | | | 114,180 | | | | - | | | | - | |
Small-Cap Index | | | 411,591 | | | | - | | | | 411,591 | | | | - | | | | - | |
International Small-Cap | | | 1,168,168 | | | | - | | | | - | | | | 1,168,168 | | | | - | |
International Value | | | 3,744,353 | | | | - | | | | (26,428 | ) | | | 3,770,781 | | | | - | |
Currency Strategies | | | 6,923,483 | | | | - | | | | - | | | | 6,923,483 | | | | - | |
Global Absolute Return | | | (8,125,486 | ) | | | (10,144,070 | ) | | | 1,214,370 | | | | (6,898,417 | ) | | | 7,702,631 | |
6. INVESTMENT ADVISORY, SUPPORT SERVICES, AGENCY, AND DISTRIBUTION AGREEMENTS AND SERVICE PLAN
Pursuant to an Investment Advisory Agreement, PLFA, a wholly owned subsidiary of Pacific Life, serves as investment adviser to each portfolio of the Fund. PLFA manages the Cash Management and High Yield Bond Portfolios under the name Pacific Asset Management. With exception of the Cash Management, High Yield Bond, American Funds Growth, American Funds Growth-Income, American Funds Asset Allocation, Pacific Dynamix and Portfolio Optimization Portfolios, PLFA has retained other portfolio management firms to sub-advise each portfolio, as discussed later in this section. PLFA receives advisory fees from each portfolio based on the following advisory fee rates, which are based on an annual percentage of average daily net assets of each portfolio:
| | | | | | |
Cash Management | | 0.20% of first $250 million 0.15% of next $250 million 0.10% of next $3.5 billion 0.08% on excess | | Long/Short Large-Cap (1) | | 1.00% of the first $4 billion 0.98% on excess |
Diversified Bond High Yield Bond Inflation Managed Managed Bond Short Duration Bond | | 0.40% of first $4 billion 0.38% on excess | | Main Street Core | | 0.45% of first $4 billion 0.43% on excess |
Floating Rate Loan (1) American Funds Growth (2) American Funds Growth-Income (2) Small-Cap Equity (1) Small-Cap Value American Funds Asset Allocation (2) | | 0.75% of first $1 billion
0.72% of next $1 billion
0.69% of next $2 billion
0.67% on excess | | Mid-Cap Equity International Value | | 0.65% of first $4 billion 0.63% on excess |
Inflation Protected | | 0.40% of first $200 million 0.35% of next $800 million 0.34% of next $1 billion 0.33% on excess | | Mid-Cap Growth | | 0.70% of first $4 billion 0.68% on excess |
Emerging Markets Debt | | 0.785% of first $1 billion 0.755% of next $1 billion 0.725% of next $2 billion 0.705% on excess | | Mid-Cap Value | | 0.70% of first $1 billion 0.65% of next $1 billion 0.60% on excess |
Comstock (1) Focused 30 Large-Cap Growth (1) | | 0.75% of first $100 million 0.71% of next $900 million 0.68% of next $3 billion 0.66% on excess | | Small-Cap Growth | | 0.60% of first $4 billion 0.58% on excess |
Dividend Growth | | 0.70% of first $100 million 0.66% of next $900 million 0.63% of next $3 billion 0.61% on excess | | Small-Cap Index | | 0.30% of first $4 billion 0.28% on excess |
Equity Index | | 0.05% of first $4 billion 0.03% on excess | | Health Sciences Technology | | 0.90% of first $1 billion 0.87% of next $1 billion 0.84% of next $2 billion 0.82% on excess |
Growth LT | | 0.55% of first $4 billion 0.53% on excess | | Real Estate | | 0.90% of first $100 million 0.82% of next $900 million 0.80% of next $3 billion 0.78% on excess |
Large-Cap Value | | 0.65% of first $100 million 0.61% of next $900 million 0.58% of next $3 billion 0.56% on excess | | Emerging Markets | | 0.80% of first $4 billion 0.78% on excess |
D-17
PACIFIC SELECT FUND
NOTES TO FINANCIAL STATEMENTS (Continued)
| | | | | | |
International Large-Cap | | 0.85% of first $100 million 0.77% of next $900 million 0.75% of next $3 billion 0.73% on excess | | Precious Metals | | 0.75% on first $100 million 0.70% on next $400 million 0.65% on next $500 million 0.60% on excess |
International Small-Cap (1) | | 0.85% of first $1 billion 0.82% of next $1 billion 0.79% of next $2 billion 0.77% on excess | | Pacific Dynamix – Conservative Growth Pacific Dynamix – Moderate Growth Pacific Dynamix – Growth | | 0.20% |
Currency Strategies | | 0.65% on first $3 billion 0.63% on excess | | Portfolio Optimization Conservative (3) Portfolio Optimization Moderate- Conservative (3) Portfolio Optimization Moderate (3) Portfolio Optimization Growth (3) Portfolio Optimization Aggressive-Growth (3) | | 0.10% |
Global Absolute Return | | 0.80% on first $3 billion 0.78% on excess | | |
| | (1) | | PLFA voluntarily agreed to waive 0.10%, 0.10%, 0.015%, 0.025% (0.275% effective January 1, 2013), 0.05% and 0.02% of its advisory fee through April 30, 2013 for the Floating Rate Loan, Small-Cap Equity, Comstock, Large-Cap Growth, Long/Short Large-Cap and International Small-Cap Portfolios, respectively. The agreements can be terminated upon ninety days’ prior written notice by the Funds or if the investment agreements or sub-advisory agreements are terminated. There is no guarantee that PLFA will continue such waivers after that date. |
| | (2) | | PLFA voluntarily agreed to waive a portion of its advisory fees for each Feeder Portfolio so that its total annual investment advisory fee does not exceed 0.41% until the earlier of April 30, 2013 or such time as the Feeder Portfolios no longer invest substantially all of their assets in the Master Funds. There is no guarantee that PLFA will continue to waive its advisory fees after that date. As a shareholder of the Master Funds, each Feeder Portfolio also pays an advisory fee, and other expenses of the Master Fund. |
| | (3) | | PLFA voluntarily agreed to waive its advisory fee of 0.10% through April 30, 2013. |
Pursuant to Portfolio Management or Subadvisory Agreements as of December 31, 2012, the Fund and PLFA engage various investment management firms under PLFA’s supervision to sub-advise thirty of the forty-three portfolios covered in this report. The following firms serve as sub-advisers for the respective portfolios: Western Asset Management Company for the Diversified Bond and Inflation Protected Portfolios; Eaton Vance Management for the Floating Rate Loan and Global Absolute Return Portfolios; Pacific Investment Management Company LLC for the Inflation Managed and Managed Bond Portfolios; T. Rowe Price Associates, Inc. for the Short Duration Bond and Dividend Growth Portfolios; Ashmore Investment Management Limited for the Emerging Markets Debt Portfolio; Invesco Advisers, Inc. for the Comstock Portfolio; BlackRock Investment Management, LLC for the Equity Index and Small-Cap Index Portfolios; Janus Capital Management LLC for the Focused 30 and Growth LT Portfolios; UBS Global Asset Management (Americas) Inc. for the Large-Cap Growth (BlackRock Investment Management, LLC effective January 1, 2013) and Currency Strategies Portfolios; ClearBridge Advisors, LLC for the Large-Cap Value Portfolio; J.P. Morgan Investment Management, Inc. for the Long/Short Large-Cap and International Value Portfolios; OppenheimerFunds, Inc. for the Main Street Core and Emerging Markets Portfolios; Lazard Asset Management LLC for the Mid-Cap Equity Portfolio (Scout Investments, Inc. effective January 1, 2013); Morgan Stanley Investment Management Inc. for the Mid-Cap Growth and Real Estate Portfolios; BlackRock Capital Management, Inc. for the Mid-Cap Value Portfolio; Franklin Advisory Services, LLC and BlackRock Investment Management, LLC (co-sub-advisers) for the Small-Cap Equity Portfolio; Fred Alger Management, Inc. for the Small-Cap Growth Portfolio; NFJ Investment Group LLC for the Small-Cap Value Portfolio; Jennison Associates LLC for the Health Sciences Portfolio; Columbia Management Investment Advisers, LLC for the Technology Portfolio; MFS Investment Management for the International Large-Cap Portfolio; Batterymarch Financial Management, Inc. for the International Small-Cap Portfolio; and Wells Capital Management Incorporated for the Precious Metals Portfolio. PLFA, as Investment Adviser to each portfolio of the Fund, pays the related portfolio management fees to these sub-advisors as compensation for their sub-advisory services provided to the Fund.
Each Feeder Portfolio invests all of its assets in a Master Fund; therefore, PLFA has not retained other management firms to sub-advise the assets of the Feeder Portfolios. PLFA is the adviser to the Feeder Portfolios. Capital Research and Management Company (“CRMC”), pursuant to the Investment Advisory and Service Agreements between the Master Funds (See Note 1) and CRMC, serves as the Investment Adviser to the Master Funds. For the year ended December 31, 2012, CRMC received advisory fees of 0.33%, 0.27% and 0.29% from the Growth, Growth-Income and Asset Allocation Master Funds, respectively, and an administrative fee of 0.01% for administrative services provided by CRMC and its affiliates, based on the annual percentage of average daily net assets of each Master Fund.
Pursuant to an Agreement for Support Services (the “Agreement”), Pacific Life and PLFA provide support services to the Fund that are outside the scope of the investment adviser’s responsibilities under the Advisory Agreement. Under the Agreement, the Fund compensates Pacific Life and PLFA for their expenses in providing support services to the Fund in connection with various matters, including the expense of registering and qualifying the Fund on state and Federal levels, providing legal, compliance, accounting, tax, chief compliance officer services, and on-going compliance and oversight of the Fund’s securities lending program, maintaining the Fund’s legal existence, shareholders’ meetings, and expenses associated with preparing, printing and distributing reports, proxies and prospectuses to existing shareholders. The Fund reimbursed Pacific Life and PLFA for these support services on an approximate cost basis.
Pursuant to a Transfer Agency Agreement, Pacific Life serves as transfer agent and dividend disbursing agent for Class I shares of the Fund, without remuneration from the Fund. Pursuant to a Transfer Agency and Service Agreement, State Street Bank and Trust Company serves as transfer agent and dividend disbursing agent for all Class P shares of the Fund and is compensated by the Fund for these services.
Pursuant to a Distribution Agreement, Pacific Select Distributors, Inc. (the “Distributor”), a wholly-owned subsidiary of Pacific Life, serves as distributor of the Fund’s shares.
The Distributor receives from the Fund a service fee of 0.20% on Class I shares only, based on an annual percentage of average daily net assets of each portfolio for shareholder servicing activities. Class P shares do not incur a service fee. Under the Service Plan, the service fee may be used by the Distributor for services rendered to or procured for shareholders of the Fund, or the variable annuity and variable life
D-18
PACIFIC SELECT FUND
NOTES TO FINANCIAL STATEMENTS (Continued)
insurance contract owners who use the Fund as the underlying investment vehicle for their contracts. These services may include, but are not limited to: providing electronic, telephonic, and technological servicing support in connection with existing investments in the Fund; answering shareholder questions regarding the Fund, the portfolios, its portfolio managers and/or other service providers; payment of compensation to broker-dealers, including the Distributor itself, and other financial institutions and organizations which assist in providing any of these services; and other services as described in the Service Plan. The Service Plan may be terminated at any time by vote of the majority of the independent trustees of the Board.
7. TRANSACTIONS WITH AFFILIATES
A. ADVISORY FEES, SERVICE FEES AND EXPENSES FOR SUPPORT SERVICES
The Adviser, the Distributor and Pacific Life are related parties. The advisory fees earned by the Adviser, including any advisory fee waiver, the service fees earned by to the Distributor (applicable to Class I shares only), and expenses for support services recovered by PLFA and Pacific Life (see Note 6) from each portfolio covered in this report for the year ended December 31, 2012 are presented in the Statements of Operations. The amounts of each of these fees that remained payable as of December 31, 2012 are presented in the Statements of Assets and Liabilities.
B. EXPENSE LIMITATION AGREEMENTS
To help limit the Fund’s expenses, PLFA has entered into expense limitation agreements with the Fund and has contractually agreed to reimburse each portfolio (other than the Pacific Dynamix Portfolios) for its operating expenses that exceed an annual rate based on a percentage of a portfolio’s average daily net assets through April 30, 2014 for the Portfolio Optimization Portfolios and through April 30, 2013 for all other portfolios covered in this report. These operating expenses include, but are not limited to, organizational expenses, domestic custody expenses, expenses for accounting, audit, tax and certain legal services, preparation, printing, filing and distribution to existing shareholders of proxies, prospectuses and shareholder reports and other regulatory documents as applicable, independent trustees’ fees and establishing, overseeing and administering the Fund’s compliance program. These operating expenses do not include advisory fees; service fees; additional costs associated with foreign investing (including foreign taxes on dividends, interest, or gains); interest (including commitment fees); taxes; brokerage commissions and other transactional expenses; dividends on securities sold short; acquired funds’ fees and expenses; extraordinary expenses such as litigation expenses and other expenses not incurred in the ordinary course of each portfolio’s business; and expenses of counsel or other persons or services retained by the independent trustees). The expense cap is 0.03% for the Portfolio Optimization Portfolios and 0.10% for all other portfolios covered in this report. In the case of the Pacific Dynamix Portfolios, PLFA has contractually agreed to reimburse each portfolio for its operating expenses (excluding extraordinary expenses) of each Pacific Dynamix Portfolio and its proportionate share of fees and expenses of the Pacific Dynamix Underlying Portfolios that exceed an annual rate of 0.59% of a portfolio’s average daily net assets through April 30, 2014. There is no guarantee that PLFA will continue to cap or reimburse upon the expiration of the applicable expense cap agreements. PLFA has agreed, temporarily, to reimburse expenses or waive a portion of its fees with respect to the Cash Management Portfolio to the extent necessary to prevent the portfolio’s expenses from exceeding earnings (i.e. a negative yield). However, there can be no assurance that a negative yield will not occur. There is no guarantee that PLFA will continue to waive a portion of its fees in the future.
Any reimbursement, except for the reimbursement of $1,871,198 to the Cash Management Portfolio, is subject to recoupment by PLFA, for a period of time as permitted under regulatory and accounting guidance (currently 3 years from the end of the fiscal year in which the reimbursement took place), to the extent such expenses fall below the expense cap in future years. Any amounts repaid to PLFA will have the effect of increasing such expenses of the applicable portfolios, but not above the expense cap. The amounts of adviser reimbursement to each of the applicable portfolios covered in this report for the year ended December 31, 2012 are presented in the Statements of Operations. Any amounts that remained due from the Adviser as of December 31, 2012 are presented in the Statements of Assets and Liabilities.
The cumulative expense reimbursement amounts, if any, as of December 31, 2012 that are subject to repayment from the portfolios are as follows:
| | | | | | | | | | | | |
| | | Expiration | |
| Portfolio | | 2013 | | | 2014 | | | 2015 | |
Pacific Dynamix – Conservative Growth | | | $62,479 | | | | $63,518 | | | | $76,176 | |
Pacific Dynamix – Moderate Growth | | | 105,002 | | | | 131,597 | | | | 239,686 | |
Pacific Dynamix – Growth | | | 91,537 | | | | 117,915 | | | | 164,359 | |
There was no recoupment of expense reimbursement by PLFA from any portfolios during the year ended December 31, 2012.
C. INVESTMENTS IN AFFILIATED PORTFOLIOS
A summary of holdings and transactions with affiliated mutual fund investments as of and for the year ended December 31, 2012 is as follows:
| | | | | | | | | | | | | | | | | | | | | | | | | | | | | | | | |
| Portfolio/Master Fund | | Beginning
Value as of
January 1,
2012 | | | Purchase
Cost (1) | | | Distributions Received and
Reinvested (2) | | | Sales
Proceeds | | | Net Realized
Gain (3) | | | Change in Unrealized
Appreciation | | | As of December 31, 2012 | |
| | | | | | | | Ending
Value | | | Share
Balance | |
American Funds Growth-Income | | | | | | | | | | | | | | | | | | | | | | | | | | | | | |
American Funds Insurance Series® Growth-Income Fund-Class 1 | | | $1,147,620,269 | | | | $9,379,406 | | | | $12,615,546 | | | | $673,351,352 | | | | $50,897,059 | | | | $100,003,543 | | | | $647,164,471 | | | | 16,818,204 | |
D-19
PACIFIC SELECT FUND
NOTES TO FINANCIAL STATEMENTS (Continued)
| | | | | | | | | | | | | | | | | | | | | | | | | | | | | | | | |
| | | | | | | |
Portfolio/Pacific Dynamix
Underlying Portfolio | | Beginning
Value as of
January 1,
2012 | | | Purchase
Cost (1) | | | Distributions Received and
Reinvested (2). | | | Sales
Proceeds | | | Net
Realized Gain
(Loss) (3) | | | Change in Unrealized
Appreciation
(Decrease) | | | As of December 31, 2012 | |
| | | | | | | | Ending
Value | | | Share
Balance | |
| | | | | |
Pacific Dynamix – Conservative Growth | | | | | | | | | | | | | | | | | | | | | |
PD Aggregate Bond Index ‘P’ | | | $71,128,385 | | | | $63,612,932 | | | | $1,765,170 | | | | $5,542,912 | | | | $410,598 | | | | $1,590,624 | | | | $132,964,797 | | | | 11,910,892 | |
PD High Yield Bond Market ‘P’ | | | 8,030,403 | | | | 6,072,086 | | | | 857,907 | | | | 615,879 | | | | 96,567 | | | | 593,061 | | | | 15,034,145 | | | | 1,280,417 | |
PD Large-Cap Growth Index ‘P’ | | | 15,303,460 | | | | 11,074,235 | | | | 332,786 | | | | 1,554,854 | | | | 259,391 | | | | 1,982,483 | | | | 27,397,501 | | | | 1,725,634 | |
PD Large-Cap Value Index ‘P’ | | | 18,481,779 | | | | 12,420,673 | | | | 576,196 | | | | 1,879,216 | | | | 1,058,396 | | | | 2,277,128 | | | | 32,934,956 | | | | 2,165,818 | |
PD Small-Cap Growth Index ‘P’ | | | 2,657,343 | | | | 2,249,626 | | | | 55,829 | | | | 205,293 | | | | 313,401 | | | | 91,660 | | | | 5,162,566 | | | | 353,016 | |
PD Small-Cap Value Index ‘P’ | | | 4,066,732 | | | | 3,172,850 | | | | 168,674 | | | | 345,098 | | | | 297,536 | | | | 431,018 | | | | 7,791,712 | | | | 556,715 | |
PD Emerging Markets ‘P’ | | | 1,283,468 | | | | 854,080 | | | | 31,956 | | | | 102,647 | | | | (871 | ) | | | 287,632 | | | | 2,353,618 | | | | 154,350 | |
PD International Large-Cap ‘P’ | | | 13,578,082 | | | | 9,576,633 | | | | 563,584 | | | | 1,237,333 | | | | 119,268 | | | | 2,720,703 | | | | 25,320,937 | | | | 1,870,550 | |
Total | | | $134,529,652 | | | | $109,033,115 | | | | $4,352,102 | | | | $11,483,232 | | | | $2,554,286 | | | | $9,974,309 | | | | $248,960,232 | | | | | |
| | | | | | | |
Pacific Dynamix – Moderate Growth | | | | | | | | | | | | | | | | | | | | | | | | | | | | | |
PD Aggregate Bond Index ‘P’ | | | $101,029,332 | | | | $120,870,530 | | | | $2,815,132 | | | | $2,814,492 | | | | $433,939 | | | | $2,404,819 | | | | $224,739,260 | | | | 20,131,983 | |
PD High Yield Bond Market ‘P’ | | | 14,578,711 | | | | 13,637,069 | | | | 1,737,499 | | | | 401,841 | | | | 171,549 | | | | 1,107,973 | | | | 30,830,960 | | | | 2,625,789 | |
PD Large-Cap Growth Index ‘P’ | | | 47,162,002 | | | | 40,906,457 | | | | 1,151,195 | | | | 1,390,882 | | | | 366,446 | | | | 6,544,683 | | | | 94,739,901 | | | | 5,967,200 | |
PD Large-Cap Value Index ‘P’ | | | 57,215,013 | | | | 55,718,420 | | | | 2,145,773 | | | | 1,669,351 | | | | 3,296,180 | | | | 7,530,951 | | | | 124,236,986 | | | | 8,169,881 | |
PD Small-Cap Growth Index ‘P’ | | | 7,940,681 | | | | 10,878,847 | | | | 223,524 | | | | 542,725 | | | | 1,216,330 | | | | 346,534 | | | | 20,063,191 | | | | 1,371,921 | |
PD Small-Cap Value Index ‘P’ | | | 11,043,151 | | | | 18,750,748 | | | | 719,172 | | | | 452,476 | | | | 1,245,452 | | | | 1,710,445 | | | | 33,016,492 | | | | 2,359,016 | |
PD Emerging Markets ‘P’ | | | 7,364,710 | | | | 11,095,037 | | | | 268,385 | | | | 941,939 | | | | 233,602 | | | | 1,738,137 | | | | 19,757,932 | | | | 1,295,722 | |
PD International Large-Cap ‘P’ | | | 43,121,746 | | | | 43,611,293 | | | | 2,139,966 | | | | 1,243,687 | | | | 147,277 | | | | 9,535,420 | | | | 97,312,015 | | | | 7,188,795 | |
Total | | | $289,455,346 | | | | $315,468,399 | | | | $11,200,646 | | | | $9,457,393 | | | | $7,110,777 | | | | $30,918,962 | | | | $644,696,737 | | | | | |
Pacific Dynamix – Growth | | | | | | | | | | | | | | | | | | | | | | | | | | | | | |
PD Aggregate Bond Index ‘P’ | | | $38,146,962 | | | | $19,415,257 | | | | $789,698 | | | | $7,719,973 | | | | $614,809 | | | | $510,106 | | | | $51,756,859 | | | | 4,636,343 | |
PD Large-Cap Growth Index ‘P’ | | | 37,658,985 | | | | 10,906,662 | | | | 598,419 | | | | 5,357,019 | | | | 1,443,961 | | | | 3,878,984 | | | | 49,129,992 | | | | 3,094,456 | |
PD Large-Cap Value Index ‘P’ | | | 44,266,817 | | | | 11,596,194 | | | | 1,080,377 | | | | 3,890,629 | | | | 3,063,697 | | | | 4,248,540 | | | | 60,364,996 | | | | 3,969,630 | |
PD Small-Cap Growth Index ‘P’ | | | 10,912,458 | | | | 4,328,807 | | | | 177,630 | | | | 1,111,661 | | | | 1,231,015 | | | | 371,249 | | | | 15,909,498 | | | | 1,087,891 | |
PD Small-Cap Value Index ‘P’ | | | 13,276,199 | | | | 6,685,121 | | | | 479,262 | | | | 1,315,022 | | | | 1,092,126 | | | | 1,271,007 | | | | 21,488,693 | | | | 1,535,359 | |
PD Emerging Markets ‘P’ | | | 9,124,860 | | | | 3,778,676 | | | | 187,600 | | | | 997,787 | | | | 304,218 | | | | 1,386,337 | | | | 13,783,904 | | | | 903,946 | |
PD International Large-Cap ‘P’ | | | 35,530,473 | | | | 12,323,037 | | | | 1,155,366 | | | | 3,213,997 | | | | 325,054 | | | | 5,616,792 | | | | 51,736,725 | | | | 3,821,981 | |
Total | | | $188,916,754 | | | | $69,033,754 | | | | $4,468,352 | | | | $23,606,088 | | | | $8,074,880 | | | | $17,283,015 | | | | $264,170,667 | | | | | |
| | | | | | | |
Portfolio Optimization Conservative | | | | | | | | | | | | | | | | | | | | | | | | | | | | | |
Diversified Bond ‘P’ | | | $573,655,993 | | | | $66,736,651 | | | | $14,786,904 | | | | $190,794,464 | | | | $12,991,694 | | | | $14,278,136 | | | | $491,654,914 | | | | 45,014,184 | |
Floating Rate Loan ‘P’ | | | 283,651,713 | | | | 16,619,306 | | | | 10,862,530 | | | | 97,108,141 | | | | 2,680,398 | | | | 6,147,168 | | | | 222,852,974 | | | | 29,085,138 | |
High Yield Bond ‘P’ | | | 217,183,953 | | | | 48,196,043 | | | | 11,125,852 | | | | 107,976,691 | | | | 2,528,757 | | | | 12,428,847 | | | | 183,486,761 | | | | 26,919,133 | |
Inflation Managed ‘P’ | | | 356,704,694 | | | | 11,182,953 | | | | 6,146,551 | | | | 203,293,062 | | | | 42,331,371 | | | | (22,805,384 | ) | | | 190,267,123 | | | | 15,959,663 | |
Inflation Protection ‘P’ | | | 248,642,056 | | | | 31,825,780 | | | | 1,242,481 | | | | 66,910,129 | | | | 4,959,432 | | | | 7,432,352 | | | | 227,191,972 | | | | 20,752,073 | |
Managed Bond ‘P’ | | | 754,067,101 | | | | 83,286,837 | | | | 32,415,242 | | | | 294,588,694 | | | | 10,282,190 | | | | 25,322,714 | | | | 610,785,390 | | | | 48,546,244 | |
Short Duration Bond ‘P’ | | | 387,021,749 | | | | 230,380,830 | | | | 5,528,307 | | | | 67,463,052 | | | | 1,065,194 | | | | 9,138,186 | | | | 565,671,214 | | | | 58,454,543 | |
Emerging Markets Debt ‘P’ | | | - | | | | 187,485,735 | | | | 4,357,436 | | | | 9,110,343 | | | | 473,090 | | | | 14,304,690 | | | | 197,510,608 | | | | 18,240,319 | |
Comstock ‘P’ | | | 105,258,611 | | | | 47,636,476 | | | | 2,738,346 | | | | 44,999,441 | | | | 8,442,998 | | | | 10,830,035 | | | | 129,907,025 | | | | 13,985,155 | |
Equity Index ‘P’ | | | 70,092,158 | | | | 49,319,681 | | | | 2,767,910 | | | | 37,866,017 | | | | 4,409,859 | | | | 6,494,927 | | | | 95,218,518 | | | | 3,042,683 | |
Large-Cap Growth ‘P’ | | | 68,501,214 | | | | 25,084,344 | | | | 76,875 | | | | 31,091,323 | | | | 11,277,099 | | | | 2,315,253 | | | | 76,163,462 | | | | 12,670,533 | |
Large-Cap Value ‘P’ | | | 141,427,719 | | | | 35,195,021 | | | | 3,745,947 | | | | 43,007,652 | | | | 7,430,800 | | | | 12,548,963 | | | | 157,340,798 | | | | 12,069,938 | |
Long/Short Large-Cap ‘P’ | | | 69,704,939 | | | | - | | | | - | | | | 76,528,195 | | | | 5,114,049 | | | | 1,709,207 | | | | - | | | | - | |
Mid-Cap Equity ‘P’ | | | 103,306,701 | | | | 14,330,830 | | | | 402,078 | | | | 81,382,843 | | | | 5,112,858 | | | | 2,482,558 | | | | 44,252,182 | | | | 3,655,110 | |
Mid-Cap Value ‘P’ | | | - | | | | 66,914,012 | | | | 642,052 | | | | 7,970,699 | | | | 2,818,180 | | | | 621,584 | | | | 63,025,129 | | | | 4,416,592 | |
International Large-Cap ‘P’ | | | 103,844,286 | | | | 9,828,708 | | | | 1,636,311 | | | | 56,288,876 | | | | (1,440,877 | ) | | | 19,072,832 | | | | 76,652,384 | | | | 10,725,682 | |
International Value ‘P’ | | | 69,303,323 | | | | 7,620,920 | | | | 1,798,297 | | | | 40,228,439 | | | | (3,608,204 | ) | | | 11,299,487 | | | | 46,185,384 | | | | 4,299,833 | |
Currency Strategies ‘P’ | | | - | | | | 125,531,165 | | | | - | | | | 2,617,380 | | | | (35,525 | ) | | | (990,618 | ) | | | 121,887,642 | | | | 12,322,722 | |
Global Absolute Return ‘P’ | | | - | | | | 231,950,577 | | | | - | | | | 2,627,041 | | | | (5,605 | ) | | | (81,257 | ) | | | 229,236,674 | | | | 22,958,001 | |
Precious Metals ‘P’ | | | - | | | | 51,394,400 | | | | - | | | | 1,515,595 | | | | (191,587 | ) | | | (5,498,991 | ) | | | 44,188,227 | | | | 5,135,909 | |
Total | | | $3,552,366,210 | | | | $1,340,520,269 | | | | $100,273,119 | | | | $1,463,368,077 | | | | $116,636,171 | | | | $127,050,689 | | | | $3,773,478,381 | | | | | |
D-20
PACIFIC SELECT FUND
NOTES TO FINANCIAL STATEMENTS (Continued)
| | | | | | | | | | | | | | | | | | | | | | | | | | | | | | | | |
| | | | | | | |
Portfolio/Pacific Dynamix
Underlying Portfolio | | Beginning
Value as of
January 1,
2012 | | | Purchase
Cost (1) | | | Distributions Received and
Reinvested (2). | | | Sales
Proceeds | | | Net
Realized Gain
(Loss) (3) | | | Change in Unrealized
Appreciation
(Decrease) | | | As of December 31, 2012 | |
| | | | | | | | Ending
Value | | | Share
Balance | |
| | | | |
Portfolio Optimization Moderate-Conservative | | | | | | | | | | | | | | | | | |
Diversified Bond ‘P’ | | | $493,005,685 | | | | $52,193,027 | | | | $13,477,438 | | | | $163,523,474 | | | | $12,540,004 | | | | $13,243,218 | | | | $420,935,898 | | | | 38,539,401 | |
Floating Rate Loan ‘P’ | | | 245,207,193 | | | | 30,574,335 | | | | 11,951,912 | | | | 55,352,558 | | | | 1,553,681 | | | | 5,929,381 | | | | 239,863,944 | | | | 31,305,285 | |
High Yield Bond ‘P’ | | | 206,271,405 | | | | 17,363,324 | | | | 13,659,446 | | | | 53,544,573 | | | | 2,091,971 | | | | 13,391,864 | | | | 199,233,437 | | | | 29,229,310 | |
Inflation Managed ‘P’ | | | 329,160,023 | | | | 59,351,853 | | | | 5,295,372 | | | | 208,863,046 | | | | 43,500,605 | | | | (24,174,506 | ) | | | 204,270,301 | | | | 17,134,253 | |
Inflation Protection ‘P’ | | | 205,515,466 | | | | 112,343,286 | | | | 1,496,835 | | | | 86,806,977 | | | | 6,660,250 | | | | 6,817,957 | | | | 246,026,817 | | | | 22,472,477 | |
Managed Bond ‘P’ | | | 697,505,591 | | | | 65,425,400 | | | | 32,070,412 | | | | 318,595,843 | | | | 16,127,017 | | | | 22,908,832 | | | | 515,441,409 | | | | 40,968,145 | |
Short Duration Bond ‘P’ | | | 324,604,521 | | | | 244,853,209 | | | | 5,269,185 | | | | 69,521,003 | | | | 1,210,228 | | | | 8,213,565 | | | | 514,629,705 | | | | 53,180,086 | |
Emerging Markets Debt ‘P’ | | | - | | | | 172,803,524 | | | | 4,003,224 | | | | 11,291,482 | | | | 694,911 | | | | 13,356,287 | | | | 179,566,464 | | | | 16,583,158 | |
American Funds Growth ‘P’ | | | 39,040,256 | | | | - | | | | - | | | | 43,062,326 | | | | 1,628,660 | | | | 2,393,410 | | | | - | | | | - | |
American Funds Growth-Income ‘P’ | | | - | | | | 45,006,386 | | | | 737,645 | | | | 6,740,962 | | | | 419,676 | | | | 2,816,698 | | | | 42,239,443 | | | | 4,050,232 | |
Comstock ‘P’ | | | 161,124,021 | | | | 57,030,620 | | | | 3,855,047 | | | | 74,533,509 | | | | 13,832,894 | | | | 15,638,322 | | | | 176,947,395 | | | | 19,049,291 | |
Dividend Growth ‘P’ | | | 82,408,868 | | | | 5,350,764 | | | | 1,897,346 | | | | 9,750,777 | | | | 2,567,529 | | | | 7,491,960 | | | | 89,965,690 | | | | 8,182,229 | |
Equity Index ‘P’ | | | 123,451,866 | | | | 51,926,038 | | | | 5,037,646 | | | | 20,094,489 | | | | 2,131,631 | | | | 15,385,530 | | | | 177,838,222 | | | | 5,682,774 | |
Growth LT ‘P’ | | | 39,408,776 | | | | 634,871 | | | | - | | | | 44,694,081 | | | | 2,416,715 | | | | 2,233,719 | | | | - | | | | - | |
Large-Cap Growth ‘P’ | | | 79,568,328 | | | | 42,300,780 | | | | 131,210 | | | | 7,026,569 | | | | 16,623,477 | | | | (1,074,635 | ) | | | 130,522,591 | | | | 21,713,703 | |
Large-Cap Value ‘P’ | | | 207,351,450 | | | | 49,586,203 | | | | 6,140,623 | | | | 38,056,925 | | | | 9,419,842 | | | | 21,011,780 | | | | 255,452,973 | | | | 19,596,325 | |
Long/Short Large-Cap ‘P’ | | | 119,969,376 | | | | 2,071,576 | | | | - | | | | 133,519,024 | | | | 6,944,627 | | | | 4,533,445 | | | | - | | | | - | |
Main Street Core ‘P’ | | | 83,126,769 | | | | 95,377,596 | | | | 2,394,090 | | | | 21,252,543 | | | | 9,394,315 | | | | 8,385,395 | | | | 177,425,622 | | | | 8,238,146 | |
Mid-Cap Equity ‘P’ | | | 78,643,844 | | | | 10,923,454 | | | | 188,671 | | | | 76,316,616 | | | | 1,539,028 | | | | 3,696,219 | | | | 18,674,600 | | | | 1,542,471 | |
Mid-Cap Growth ‘P’ | | | 73,332,831 | | | | 17,254,930 | | | | 50,836 | | | | 88,158,406 | | | | (4,570,637 | ) | | | 10,945,052 | | | | 8,854,606 | | | | 1,142,779 | |
Mid-Cap Value ‘P’ | | | 77,558,974 | | | | 14,702,800 | | | | 992,440 | | | | 8,558,095 | | | | 5,075,754 | | | | 5,865,195 | | | | 95,637,068 | | | | 6,701,929 | |
Small-Cap Equity ‘P’ | | | 40,540,644 | | | | 30,369,783 | | | | 1,093,528 | | | | 16,411,502 | | | | 2,977,144 | | | | 4,481,356 | | | | 63,050,953 | | | | 4,195,908 | |
Small-Cap Index ‘P’ | | | - | | | | 59,212,123 | | | | 855,843 | | | | 1,352,441 | | | | 733,353 | | | | 2,585,077 | | | | 62,033,955 | | | | 4,990,422 | |
Emerging Markets ‘P’ | | | 36,393,780 | | | | 8,425,212 | | | | 429,844 | | | | 4,637,868 | | | | 4,110,985 | | | | 3,883,404 | | | | 48,605,357 | | | | 3,246,789 | |
International Large-Cap ‘P’ | | | 148,874,913 | | | | 27,447,035 | | | | 2,649,075 | | | | 78,425,736 | | | | (2,588,317 | ) | | | 28,658,151 | | | | 126,615,121 | | | | 17,716,781 | |
International Small-Cap ‘P’ | | | 73,104,128 | | | | 19,551,490 | | | | 2,132,052 | | | | 11,149,973 | | | | (456,328 | ) | | | 14,038,906 | | | | 97,220,275 | | | | 11,255,146 | |
International Value ‘P’ | | | 73,585,241 | | | | 41,760,844 | | | | 3,893,847 | | | | 29,006,770 | | | | (2,286,339 | ) | | | 14,350,933 | | | | 102,297,756 | | | | 9,523,863 | |
Currency Strategies ‘P’ | | | - | | | | 142,695,724 | | | | - | | | | 694,310 | | | | (5,398 | ) | | | (1,529,543 | ) | | | 140,466,473 | | | | 14,201,024 | |
Global Absolute Return ‘P’ | | | - | | | | 284,718,104 | | | | - | | | | 1,386,328 | | | | (3,292 | ) | | | (418,605 | ) | | | 282,909,879 | | | | 28,333,360 | |
Precious Metals ‘P’ | | | - | | | | 98,691,787 | | | | - | | | | 462,873 | | | | (13,299 | ) | | | (13,203,398 | ) | | | 85,012,217 | | | | 9,880,800 | |
Total | | | $4,038,753,949 | | | | $1,859,946,078 | | | | $119,703,567 | | | | $1,682,791,079 | | | | $154,270,687 | | | | $211,854,969 | | | | $4,701,738,171 | | | | | |
| | | | | | | |
Portfolio Optimization Moderate | | | | | | | | | | | | | | | | | | | | | | | | | | | | | |
Diversified Bond ‘P’ | | | $1,190,680,322 | | | | $100,038,588 | | | | $39,353,229 | | | | $139,794,334 | | | | $18,192,222 | | | | $47,504,001 | | | | $1,255,974,028 | | | | 114,992,538 | |
Floating Rate Loan ‘P’ | | | 444,015,470 | | | | 1,552,774 | | | | 22,233,588 | | | | 59,977,509 | | | | 1,547,705 | | | | 11,888,872 | | | | 421,260,900 | | | | 54,979,887 | |
High Yield Bond ‘P’ | | | 600,106,848 | | | | 244,517 | | | | 36,329,107 | | | | 164,535,557 | | | | 6,659,774 | | | | 37,854,621 | | | | 516,659,310 | | | | 75,798,497 | |
Inflation Managed ‘P’ | | | 892,570,161 | | | | 77,575,587 | | | | 12,744,755 | | | | 657,098,106 | | | | 107,321,878 | | | | (61,247,287 | ) | | | 371,866,988 | | | | 31,192,313 | |
Inflation Protection ‘P’ | | | 593,851,702 | | | | 124,880,077 | | | | 3,521,036 | | | | 293,147,852 | | | | 22,166,211 | | | | 10,074,731 | | | | 461,345,905 | | | | 42,140,062 | |
Managed Bond ‘P’ | | | 2,083,493,596 | | | | 79,558,851 | | | | 80,821,796 | | | | 923,715,750 | | | | 38,855,698 | | | | 65,317,585 | | | | 1,424,331,776 | | | | 113,208,270 | |
Short Duration Bond ‘P’ | | | 441,334,506 | | | | 573,981,262 | | | | 9,389,206 | | | | 142,057,217 | | | | 2,919,601 | | | | 11,996,394 | | | | 897,563,752 | | | | 92,751,191 | |
Emerging Markets Debt ‘P’ | | | - | | | | 457,037,249 | | | | 10,128,707 | | | | 49,955,061 | | | | 3,135,601 | | | | 34,012,097 | | | | 454,358,593 | | | | 41,960,509 | |
American Funds Growth ‘P’ | | | 149,312,814 | | | | - | | | | 269,132 | | | | 168,897,560 | | | | 10,172,753 | | | | 9,142,861 | | | | - | | | | - | |
American Funds Growth-Income ‘P’ | | | 462,470,384 | | | | - | | | | 3,722,204 | | | | 321,653,800 | | | | 17,318,477 | | | | 36,535,405 | | | | 198,392,670 | | | | 19,023,366 | |
Comstock ‘P’ | | | 730,819,262 | | | | 122,098,229 | | | | 15,091,379 | | | | 301,558,568 | | | | 55,115,374 | | | | 68,676,703 | | | | 690,242,379 | | | | 74,308,117 | |
Dividend Growth ‘P’ | | | 298,462,875 | | | | 176,671 | | | | 4,303,367 | | | | 138,644,446 | | | | 14,910,231 | | | | 17,632,658 | | | | 196,841,356 | | | | 17,902,391 | |
Equity Index ‘P’ | | | 593,855,703 | | | | 515,818 | | | | 9,073,828 | | | | 355,144,705 | | | | 28,796,773 | | | | 36,339,697 | | | | 313,437,114 | | | | 10,015,801 | |
Growth LT ‘P’ | | | 286,516,688 | | | | 3,119,946 | | | | 754,936 | | | | 283,179,321 | | | | 26,961,526 | | | | 10,441,433 | | | | 44,615,208 | | | | 3,128,488 | |
Large-Cap Growth ‘P’ | | | 430,630,708 | | | | 38,784,580 | | | | 448,387 | | | | 102,675,797 | | | | 70,721,135 | | | | 6,326,332 | | | | 444,235,345 | | | | 73,902,873 | |
Large-Cap Value ‘P’ | | | 1,053,432,933 | | | | 152,320,209 | | | | 24,570,528 | | | | 399,676,815 | | | | 65,969,110 | | | | 86,086,278 | | | | 982,702,243 | | | | 75,385,119 | |
Long/Short Large-Cap ‘P’ | | | 576,750,188 | | | | 3,300,929 | | | | 4,929,208 | | | | 148,444,616 | | | | 68,160,348 | | | | 29,972,800 | | | | 534,668,857 | | | | 57,043,271 | |
Main Street Core ‘P’ | | | 298,876,402 | | | | 30,737,957 | | | | 4,098,559 | | | | 83,698,558 | | | | 22,964,828 | | | | 24,822,287 | | | | 297,801,475 | | | | 13,827,383 | |
Mid-Cap Equity ‘P’ | | | 425,626,633 | | | | 7,356,607 | | | | 2,638,001 | | | | 194,117,866 | | | | 45,702,750 | | | | (17,393,884 | ) | | | 269,812,241 | | | | 22,285,759 | |
Mid-Cap Growth ‘P’ | | | 263,471,644 | | | | 18,722,370 | | | | 1,138,966 | | | | 110,663,130 | | | | 34,641,425 | | | | (13,175,888 | ) | | | 194,135,387 | | | | 25,055,191 | |
Mid-Cap Value ‘P’ | | | 417,954,758 | | | | 299,743,587 | | | | 6,823,189 | | | | 165,096,092 | | | | 37,214,451 | | | | 29,982,858 | | | | 626,622,751 | | | | 43,911,646 | |
Small-Cap Equity ‘P’ | | | 146,762,174 | | | | 369,233 | | | | 1,955,136 | | | | 59,082,397 | | | | 7,164,768 | | | | 11,197,016 | | | | 108,365,930 | | | | 7,211,524 | |
Small-Cap Growth ‘P’ | | | 140,732,912 | | | | 3,010,308 | | | | 355,746 | | | | 11,454,150 | | | | 18,143,177 | | | | (205,841 | ) | | | 150,582,152 | | | | 13,318,138 | |
Small-Cap Index ‘P’ | | | - | | | | 190,643,217 | | | | 2,760,776 | | | | 6,151,160 | | | | 2,464,429 | | | | 8,350,849 | | | | 198,068,111 | | | | 15,933,910 | |
Small-Cap Value ‘P’ | | | 147,623,308 | | | | 162,397 | | | | 3,386,521 | | | | 11,125,519 | | | | 13,750,990 | | | | (895,781 | ) | | | 152,901,916 | | | | 11,191,862 | |
Real Estate ‘P’ | | | - | | | | 339,361,604 | | | | 4,283,522 | | | | 13,794,385 | | | | 13,677,269 | | | | (12,918,411 | ) | | | 330,609,599 | | | | 19,649,414 | |
Emerging Markets ‘P’ | | | 391,729,755 | | | | 36,577,706 | | | | 4,113,366 | | | | 48,646,754 | | | | 42,052,365 | | | | 39,763,505 | | | | 465,589,943 | | | | 31,100,943 | |
International Large-Cap ‘P’ | | | 667,485,217 | | | | 39,804,802 | | | | 11,756,276 | | | | 272,118,965 | | | | (9,363,880 | ) | | | 124,950,104 | | | | 562,513,554 | | | | 78,710,422 | |
International Small-Cap ‘P’ | | | 391,624,279 | | | | 36,901,963 | | | | 9,275,176 | | | | 81,019,632 | | | | (5,386,244 | ) | | | 69,335,554 | | | | 420,731,096 | | | | 48,707,844 | |
International Value ‘P’ | | | 393,644,027 | | | | 105,031,631 | | | | 18,007,816 | | | | 105,814,136 | | | | (8,787,357 | ) | | | 66,442,621 | | | | 468,524,602 | | | | 43,619,375 | |
Currency Strategies ‘P’ | | | - | | | | 616,257,476 | | | | - | | | | 9,860,485 | | | | (94,016 | ) | | | (6,590,996 | ) | | | 599,711,979 | | | | 60,630,298 | |
Global Absolute Return ‘P’ | | | - | | | | 770,321,973 | | | | - | | | | 13,449,964 | | | | (90,725 | ) | | | (1,131,791 | ) | | | 755,649,493 | | | | 75,678,126 | |
Precious Metals ‘P’ | | | - | | | | 308,559,569 | | | | - | | | | 2,811,101 | | | | (90,897 | ) | | | (42,612,709 | ) | | | 263,044,862 | | | | 30,573,177 | |
Total | | | $14,513,835,269 | | | | $4,538,747,687 | | | | $348,277,443 | | | | $5,839,061,308 | | | | $772,887,750 | | | | $738,474,674 | | | | $15,073,161,515 | | | | | |
D-21
PACIFIC SELECT FUND
NOTES TO FINANCIAL STATEMENTS (Continued)
| | | | | | | | | | | | | | | | | | | | | | | | | | | | | | | | |
| | | | | | | |
Portfolio/Pacific Dynamix
Underlying Portfolio | | Beginning
Value as of
January 1,
2012 | | | Purchase
Cost (1) | | | Distributions Received and
Reinvested (2). | | | Sales
Proceeds | | | Net
Realized Gain
(Loss) (3) | | | Change in Unrealized
Appreciation
(Decrease) | | | As of December 31, 2012 | |
| | | | | | | | Ending
Value | | | Share
Balance | |
| | | | | | | |
Portfolio Optimization Growth | | | | | | | | | | | | | | | | | | | | | | | | | | | | | |
Diversified Bond ‘P’ | | | $638,596,185 | | | | $311,084,606 | | | | $28,497,471 | | | | $110,690,808 | | | | $14,120,759 | | | | $26,329,795 | | | | $907,938,008 | | | | 83,127,591 | |
Inflation Managed ‘P’ | | | 507,685,015 | | | | 85,343,828 | | | | 7,594,205 | | | | 501,837,279 | | | | 59,007,843 | | | | (34,470,125 | ) | | | 123,323,487 | | | | 10,344,411 | |
Inflation Protection ‘P’ | | | 379,193,521 | | | | 75,308 | | | | 1,394,754 | | | | 236,680,999 | | | | 15,263,897 | | | | 454,324 | | | | 159,700,805 | | | | 14,587,323 | |
Managed Bond ‘P’ | | | 1,025,850,739 | | | | 126,900,955 | | | | 55,974,398 | | | | 260,520,809 | | | | 11,382,939 | | | | 40,929,826 | | | | 1,000,518,048 | | | | 79,522,847 | |
Short Duration Bond ‘P’ | | | 380,342,943 | | | | 26,476,979 | | | | 2,764,742 | | | | 219,698,211 | | | | 4,636,410 | | | | 5,283,899 | | | | 199,806,762 | | | | 20,647,352 | |
Emerging Markets Debt ‘P’ | | | - | | | | 152,454,003 | | | | 3,354,528 | | | | 15,209,354 | | | | 985,909 | | | | 9,262,352 | | | | 150,847,438 | | | | 13,930,925 | |
American Funds Growth ‘P’ | | | 261,269,281 | | | | 39,522,574 | | | | 141,372 | | | | 288,186,197 | | | | 10,918,884 | | | | 16,601,463 | | | | 40,267,377 | | | | 4,299,161 | |
American Funds Growth-Income ‘P’ | | | 404,618,019 | | | | - | | | | 3,481,293 | | | | 291,516,627 | | | | 20,161,088 | | | | 31,423,005 | | | | 168,166,778 | | | | 16,125,083 | |
Comstock ‘P’ | | | 770,932,556 | | | | 131,195,111 | | | | 15,826,413 | | | | 323,952,481 | | | | 56,962,198 | | | | 72,004,327 | | | | 722,968,124 | | | | 77,831,211 | |
Dividend Growth ‘P’ | | | 386,482,828 | | | | 23,615,949 | | | | 5,852,650 | | | | 178,108,346 | | | | 17,163,844 | | | | 22,489,462 | | | | 277,496,387 | | | | 25,237,831 | |
Equity Index ‘P’ | | | 643,311,290 | | | | - | | | | 12,948,277 | | | | 288,507,392 | | | | 24,914,234 | | | | 50,205,067 | | | | 442,871,476 | | | | 14,151,843 | |
Growth LT ‘P’ | | | 249,218,403 | | | | 32,068 | | | | 684,595 | | | | 244,633,469 | | | | 21,975,667 | | | | 10,354,534 | | | | 37,631,798 | | | | 2,638,800 | |
Large-Cap Growth ‘P’ | | | 371,100,002 | | | | 94,418 | | | | 366,137 | | | | 76,320,183 | | | | 61,327,727 | | | | 6,179,206 | | | | 362,747,307 | | | | 60,346,545 | |
Large-Cap Value ‘P’ | | | 915,832,970 | | | | 222,588,641 | | | | 23,459,106 | | | | 360,989,750 | | | | 57,820,420 | | | | 75,879,877 | | | | 934,591,264 | | | | 71,694,426 | |
Long/Short Large-Cap ‘P’ | | | 503,425,699 | | | | 262,390,223 | | | | 6,506,303 | | | | 169,596,156 | | | | 86,843,885 | | | | 16,073,300 | | | | 705,643,254 | | | | 75,284,353 | |
Main Street Core ‘P’ | | | 388,572,248 | | | | - | | | | 4,870,574 | | | | 99,220,054 | | | | 26,695,697 | | | | 32,674,919 | | | | 353,593,384 | | | | 16,417,888 | |
Mid-Cap Equity ‘P’ | | | 626,152,494 | | | | 21,869 | | | | 3,803,264 | | | | 291,125,470 | | | | 62,354,902 | | | | (21,157,257 | ) | | | 380,049,802 | | | | 31,391,083 | |
Mid-Cap Growth ‘P’ | | �� | 348,653,635 | | | | 606,801 | | | | 1,545,008 | | | | 112,012,473 | | | | 38,481,759 | | | | (13,929,957 | ) | | | 263,344,773 | | | | 33,987,382 | |
Mid-Cap Value ‘P’ | | | 369,499,733 | | | | 144,450,285 | | | | 4,693,746 | | | | 149,088,916 | | | | 25,154,332 | | | | 27,711,196 | | | | 422,420,376 | | | | 29,601,820 | |
Small-Cap Equity ‘P’ | | | 642,321,480 | | | | 52,478,045 | | | | 11,550,159 | | | | 139,260,852 | | | | 31,826,939 | | | | 57,832,892 | | | | 656,748,663 | | | | 43,705,236 | |
Small-Cap Growth ‘P’ | | | 248,846,509 | | | | 39,050 | | | | 422,115 | | | | 98,651,467 | | | | 22,189,534 | | | | 5,829,347 | | | | 178,675,088 | | | | 15,802,799 | |
Small-Cap Index ‘P’ | | | - | | | | 39,522,574 | | | | 455,576 | | | | 1,680,235 | | | | (17,608 | ) | | | 217,469 | | | | 38,497,776 | | | | 3,097,016 | |
Small-Cap Value ‘P’ | | | 127,945,329 | | | | - | | | | 2,846,198 | | | | 15,251,285 | | | | 11,546,642 | | | | (531,449 | ) | | | 126,555,435 | | | | 9,263,396 | |
Real Estate ‘P’ | | | 259,397,312 | | | | 140,496,895 | | | | 4,950,426 | | | | 60,446,940 | | | | 21,666,084 | | | | 16,018,623 | | | | 382,082,400 | | | | 22,708,642 | |
Emerging Markets ‘P’ | | | 461,370,847 | | | | 832,858 | | | | 4,079,570 | | | | 92,238,233 | | | | 38,746,038 | | | | 49,023,037 | | | | 461,814,117 | | | | 30,848,721 | |
International Large-Cap ‘P’ | | | 707,336,857 | | | | 14,100,501 | | | | 14,083,916 | | | | 229,712,247 | | | | (1,448,825 | ) | | | 132,616,624 | | | | 636,976,826 | | | | 89,129,790 | |
International Small-Cap ‘P’ | | | 461,191,263 | | | | 11,463,653 | | | | 11,414,856 | | | | 47,142,908 | | | | (1,993,072 | ) | | | 79,166,235 | | | | 514,100,027 | | | | 59,517,121 | |
International Value ‘P’ | | | 463,721,461 | | | | 105,824,198 | | | | 19,980,687 | | | | 157,885,286 | | | | (12,207,015 | ) | | | 78,175,326 | | | | 497,609,371 | | | | 46,327,150 | |
Currency Strategies ‘P’ | | | - | | | | 526,967,653 | | | | - | | | | 28,819,065 | | | | (347,234 | ) | | | (5,411,499 | ) | | | 492,389,855 | | | | 49,780,135 | |
Global Absolute Return ‘P’ | | | - | | | | 658,709,567 | | | | - | | | | 25,573,560 | | | | (233,803 | ) | | | (946,505 | ) | | | 631,955,699 | | | | 63,290,220 | |
Precious Metals ‘P’ | | | - | | | | 395,225,740 | | | | - | | | | 6,132,180 | | | | (179,550 | ) | | | (54,300,991 | ) | | | 334,613,019 | | | | 38,891,401 | |
Total | | | $12,542,868,619 | | | | $3,472,514,352 | | | | $253,542,339 | | | | $5,120,689,232 | | | | $725,720,524 | | | | $731,988,322 | | | | $12,605,944,924 | | | | | |
| | | | | | | |
Portfolio Optimization Aggressive-Growth | | | | | | | | | | | | | | | | | | | | | | | | | | | | | |
Diversified Bond ‘P’ | | | $53,513,290 | | | | $43,030,123 | | | | $2,436,312 | | | | $39,156,417 | | | | $3,494,978 | | | | $492,468 | | | | $63,810,754 | | | | 5,842,287 | |
Managed Bond ‘P’ | | | 108,572,429 | | | | 31,086,891 | | | | 4,188,461 | | | | 71,531,997 | | | | 2,618,322 | | | | 2,129,248 | | | | 77,063,354 | | | | 6,125,124 | |
American Funds Growth ‘P’ | | | 58,773,700 | | | | - | | | | 161,281 | | | | 50,565,514 | | | | 2,728,030 | | | | 5,095,751 | | | | 16,193,248 | | | | 1,728,878 | |
American Funds Growth-Income ‘P’ | | | 91,020,698 | | | | - | | | | 688,721 | | | | 66,922,766 | | | | 3,795,380 | | | | 6,826,020 | | | | 35,408,053 | | | | 3,395,188 | |
Comstock ‘P’ | | | 189,926,163 | | | | 38,864,922 | | | | 3,589,059 | | | | 103,655,024 | | | | 14,922,142 | | | | 16,467,543 | | | | 160,114,805 | | | | 17,237,177 | |
Dividend Growth ‘P’ | | | 80,588,988 | | | | 106,664 | | | | 1,570,669 | | | | 20,689,875 | | | | 3,173,649 | | | | 6,313,012 | | | | 71,063,107 | | | | 6,463,070 | |
Equity Index ‘P’ | | | 161,494,696 | | | | 193,311 | | | | 3,077,763 | | | | 78,090,357 | | | | 6,813,160 | | | | 11,995,646 | | | | 105,484,219 | | | | 3,370,721 | |
Growth LT ‘P’ | | | 53,437,338 | | | | 15,121 | | | | 147,507 | | | | 52,596,797 | | | | 4,492,200 | | | | 2,369,224 | | | | 7,864,593 | | | | 551,478 | |
Large-Cap Growth ‘P’ | | | 102,805,478 | | | | 19,150,175 | | | | 127,391 | | | | 14,432,491 | | | | 17,103,022 | | | | 1,457,867 | | | | 126,211,442 | | | | 20,996,502 | |
Large-Cap Value ‘P’ | | | 218,667,845 | | | | 44,289,532 | | | | 5,096,974 | | | | 99,146,352 | | | | 14,401,239 | | | | 16,611,036 | | | | 199,920,274 | | | | 15,336,297 | |
Long/Short Large-Cap ‘P’ | | | 132,817,807 | | | | 27,732,390 | | | | 1,319,779 | | | | 43,640,501 | | | | 18,045,018 | | | | 5,824,266 | | | | 142,098,759 | | | | 15,160,370 | |
Main Street Core ‘P’ | | | 81,744,432 | | | | 5,783,711 | | | | 1,045,151 | | | | 24,688,405 | | | | 6,062,933 | | | | 6,522,230 | | | | 76,470,052 | | | | 3,550,623 | |
Mid-Cap Equity ‘P’ | | | 161,645,661 | | | | 145,193 | | | | 649,670 | | | | 109,673,646 | | | | 9,925,119 | | | | 687,097 | | | | 63,379,094 | | | | 5,234,941 | |
Mid-Cap Growth ‘P’ | | | 101,572,275 | | | | 470,149 | | | | 351,912 | | | | 50,061,751 | | | | 6,275,435 | | | | 1,374,927 | | | | 59,982,947 | | | | 7,741,423 | |
Mid-Cap Value ‘P’ | | | 107,230,908 | | | | 35,965,316 | | | | 1,302,522 | | | | 42,087,501 | | | | 6,671,530 | | | | 8,069,325 | | | | 117,152,100 | | | | 8,209,631 | |
Small-Cap Equity ‘P’ | | | 133,625,292 | | | | 5,917,836 | | | | 2,312,247 | | | | 27,813,015 | | | | 6,322,046 | | | | 11,888,156 | | | | 132,252,562 | | | | 8,801,129 | |
Small-Cap Growth ‘P’ | | | 53,756,820 | | | | 8,664,270 | | | | 144,908 | | | | 8,342,188 | | | | 7,440,569 | | | | (372,071 | ) | | | 61,292,308 | | | | 5,420,957 | |
Small-Cap Index ‘P’ | | | 54,421,223 | | | | 15,958,142 | | | | 992,635 | | | | 9,705,016 | | | | 1,173,310 | | | | 7,069,281 | | | | 69,909,575 | | | | 5,623,989 | |
Small-Cap Value ‘P’ | | | 53,425,895 | | | | 74,919 | | | | 1,188,544 | | | | 6,254,994 | | | | 4,688,695 | | | | (208,918 | ) | | | 52,914,141 | | | | 3,873,122 | |
Real Estate ‘P’ | | | 80,007,087 | | | | 47,956,640 | | | | 1,554,697 | | | | 21,105,266 | | | | 6,836,457 | | | | 4,744,611 | | | | 119,994,226 | | | | 7,131,723 | |
Emerging Markets ‘P’ | | | 125,768,411 | | | | 428,366 | | | | 1,162,105 | | | | 20,762,571 | | | | 11,754,142 | | | | 13,201,803 | | | | 131,552,256 | | | | 8,787,559 | |
International Large-Cap ‘P’ | | | 205,737,617 | | | | 3,166,838 | | | | 3,793,873 | | | | 79,934,617 | | | | (889,541 | ) | | | 37,715,050 | | | | 169,589,220 | | | | 23,729,987 | |
International Small-Cap ‘P’ | | | 125,871,216 | | | | 8,520,262 | | | | 3,099,726 | | | | 18,896,814 | | | | (932,550 | ) | | | 22,202,033 | | | | 139,863,873 | | | | 16,191,976 | |
International Value ‘P’ | | | 126,516,975 | | | | 5,838,465 | | | | 4,441,493 | | | | 44,521,036 | | | | (3,618,987 | ) | | | 19,116,551 | | | | 107,773,461 | | | | 10,033,648 | |
Currency Strategies ‘P’ | | | - | | | | 110,344,471 | | | | - | | | | 5,456,971 | | | | (67,017 | ) | | | (1,139,772 | ) | | | 103,680,711 | | | | 10,482,019 | |
Global Absolute Return ‘P’ | | | - | | | | 137,969,488 | | | | - | | | | 7,645,572 | | | | (75,721 | ) | | | (194,564 | ) | | | 130,053,631 | | | | 13,024,842 | |
Precious Metals ‘P’ | | | - | | | | 110,705,974 | | | | - | | | | 1,844,666 | | | | (61,957 | ) | | | (15,138,410 | ) | | | 93,660,941 | | | | 10,886,024 | |
Total | | | $2,662,942,244 | | | | $702,379,169 | | | | $44,443,400 | | | | $1,119,222,120 | | | | $153,091,603 | | | | $191,119,410 | | | | $2,634,753,706 | | | | | |
| | (1) | Purchased cost excludes distributions received and reinvested. |
| | (2) | Distributions received include distributions from net investment income, if any. |
| | (3) | Net realized gain includes distributions from capital gains, if any. |
D-22
PACIFIC SELECT FUND
NOTES TO FINANCIAL STATEMENTS (Continued)
D. INDEPENDENT TRUSTEES
The Fund pays each independent trustee of the Board retainer fees and specified amounts for various Board and committee services and for chairing the committees. The fees and expenses of the independent trustees of the Board are presented in the Statements of Operations.
Each independent trustee of the Board is eligible to participate in the Fund’s Deferred Compensation Plan (the “Plan”). The Plan allows each independent trustee to voluntarily defer receipt of all or a percentage of fees, which otherwise would be payable for services performed. Amounts in the deferral account are obligations of each portfolio at the time of such deferral and are payable in accordance with the Plan. Deferred amounts are treated as though equivalent dollar amounts had been invested in shares of certain portfolios in the Pacific Life Funds. Pacific Life Funds is a Delaware statutory trust and is registered under the 1940 Act, as an open-end management investment company. PLFA is the Investment Adviser to Pacific Life Funds. An independent trustee who defers compensation has the option to select credit rate options that track the performance, at NAV of the Class A and/or Class P shares of the corresponding series of the Pacific Life Funds without a sales load. The obligation of each portfolio under the Plan (the “DCP Liability”) is recorded as a liability (accrued trustees’ fees and expenses and deferred compensation). Accordingly, the market value appreciation or depreciation on a portfolio’s DCP Liability account will cause the expenses of that portfolio to increase or decrease due to market fluctuation. The change in net unrealized appreciation or depreciation on a portfolio’s DCP Liability account is recorded as an increase or decrease to expense (trustees’ fees and expenses). For the year ended December 31, 2012, such expenses were increased by $18,618 for all applicable portfolios covered in this report as a result of the market value appreciation on such accounts. During the year ended December 31, 2012, the portfolios covered in this report paid $23,860 of deferred compensation to current independent trustees. As of December 31, 2012, the total amount in the DCP Liability accounts for all applicable portfolios covered in this report was $126,748.
E. OFFICERS OF THE FUND
All officers of the Fund are also officers of Pacific Life and PLFA and received no compensation from the Fund.
F. INDEMNIFICATIONS
Under the Fund’s organizational documents, its officers and trustees are indemnified against certain liabilities arising out of performance of their duties to the Fund. In addition, the Fund entered into an agreement with each of the trustees which provides that the Fund will indemnify and hold harmless each trustee against any expenses actually and reasonably incurred by any trustee in any proceeding arising out of or in connection with the trustee’s services to the Fund, to the fullest extent permitted by the Fund’s Declaration of Trust and By-Laws, the general trust law of the Commonwealth of Massachusetts, the Securities Act of 1933, and the 1940 Act, each as now or hereinafter in force. In the normal course of business, the Fund enters into contracts with service providers and others that contain general indemnification clauses. The Fund’s maximum exposure under these arrangements and agreements is dependent on future claims that may be made against the Fund and/ or the trustees and, therefore, cannot be estimated; however, based on experience, the risk of loss from such claims is considered remote.
8. SECURITIES LENDING
The Fund, on behalf of the Long/Short Large-Cap and Global Absolute Return Portfolios, entered into an agreement with State Street Bank and Trust Company (“Agreement”), to provide securities lending services to the portfolios. Under this program, the proceeds (cash collateral) received from borrowers are used to finance the costs of (i) purchasing long positions in excess of the value of the portfolio’s assets and/or (ii) borrowing securities sold short, in order to help achieve the portfolio’s stated investment objective.
Under the Agreement, the borrowers pay the portfolio’s negotiated lenders’ fees and the portfolio receives cash collateral in an amount equal to 102% of the market value of loaned securities, including American Depositary Receipts (“ADRs”) and Global Depositary Receipts (“GDRs”) or foreign securities denominated in U.S. dollars, and 105% of the market value of loaned foreign securities, at the inception of each loan. The borrower of securities is at all times required to post cash collateral to the portfolio in an amount equal to 100% of the market value of the securities loaned based on the previous day’s market value of the securities loaned, marked-to-market daily. Any collateral shortfalls are adjusted the next business day. If the borrower defaults on its obligations to return the securities loaned because of insolvency or other reasons, the portfolio could experience delays and costs in recovering the securities loaned or possible loss of rights to the collateral.
The portfolios retained beneficial ownership and all economic benefits in the securities they have loaned and continues to receive interest paid by the securities and payments equivalent to dividends, and to participate in any changes in their market value, but does not have the proxy voting rights with respect to loaned securities. Each portfolio manager of the portfolio has the responsibility to request that the securities lending agent call back securities which are out on loan to vote on material matters and it is the Fund’s policy that the portfolio managers vote on all material matters. However, the ability to timely recall shares for proxy voting purposes typically is not entirely within the control of the portfolio manager, the Fund or its securities lending agent. Under certain circumstances, the recall of shares in time for such shares to be voted may not be possible due to applicable proxy voting record dates and administrative considerations.
Income generated from securities lending is recorded as an investment income (securities lending). Cash collateral received is recorded as an asset (cash collateral received for securities on loan) and the same amount is recorded as a liability (payable upon return of securities loaned).
9. COMMITTED LINE OF CREDIT
The Fund has an unsecured $75,000,000 committed revolving line of credit agreement with State Street Bank and Trust Company (the “Bank”), which is renewed annually. The interest rate on borrowing is the higher of the Federal funds rate or the Overnight LIBOR rate, plus 1.25%. The Fund pays the Bank a commitment fee equal to 0.10% per annum on the daily unused portion of the committed line up to a maximum of $75,000. As of December 31, 2012, the actual interest rate on borrowing by the Fund was 1.42%. The committed line of credit will expire on August 31, 2013, unless renewed and applies to all portfolios covered in this report except the American Funds Growth, American Funds Growth-Income, American Funds Asset Allocation, Pacific Dynamix and Portfolio Optimization Portfolios. The commitment fees and
D-23
PACIFIC SELECT FUND
NOTES TO FINANCIAL STATEMENTS (Continued)
interest incurred by the Fund are recorded as an expense. The commitment fees are allocated to each applicable portfolio in proportion to its relative average daily net assets and the interest expenses are charged directly to the applicable portfolio. As of December 31, 2012, the International Large-Cap Portfolio had an outstanding loan in the amount of $8,770,184. The weighted average interest rate and the average dollar amount of borrowings on those days that the portfolio had a loan outstanding during the year ended December 31, 2012 for each applicable portfolio were as follows:
| | | | | | | | |
| Portfolio | | Weighted
Average
Interest Rate | | | Average
Dollar Amount
of Borrowing | |
Diversified Bond | |
| 1.39%
|
| | | $1,186,638 | |
Inflation Protected | | | 1.41% | | | | 7,668,975 | |
Comstock | | | 1.42% | | | | 2,930,388 | |
Equity Index | | | 1.44% | | | | 2,995,157 | |
Focus 30 | | | 1.43% | | | | 260,816 | |
Growth LT | | | 1.43% | | | | 123,134 | |
Large-Cap Growth | | | 1.41% | | | | 4,163,291 | |
Large-Cap Value | | | 1.41% | | | | 6,038,241 | |
| | | | | | | | |
| Portfolio | | Weighted Average Interest Rate | | | Average Dollar
Amount of
Borrowing | |
Long/Short Large-Cap | | | 1.42% | | | | $607,922 | |
Main Street Core | | | 1.41% | | | | 2,392,853 | |
Small-Cap Index | | | 1.40% | | | | 3,068,360 | |
Technology | | | 1.42% | | | | 1,104,837 | |
Emerging Market | | | 1.43% | | | | 3,834,407 | |
International Large-Cap | | | 1.43% | | | | 3,900,744 | |
International Small-Cap | | | 1.44% | | | | 1,042,315 | |
International Value | | | 1.44% | | | | 2,147,932 | |
10. UNFUNDED SENIOR LOAN COMMITMENTS
Unfunded loan commitments on senior loan participations and assignments (Note 4), if any, are marked to market daily and valued according to the Fund’s valuation policies and procedures. Any outstanding unfunded loan commitments are presented in the Notes to Schedules of Investments section of each applicable portfolio’s Schedule of Investments. Any applicable net unrealized appreciation or depreciation at the end of the reporting period is recorded as an asset (unfunded loan commitment appreciation) or a liability (unfunded loan commitment depreciation) and any change in net unrealized appreciation or depreciation for the reporting period is recorded as a change in net unrealized appreciation or depreciation on unfunded loan commitment. As of December 31, 2012, the Floating Rate Loan Portfolio had an unfunded loan commitment of $278,571 (see details in the Note (f) in the Notes to Schedule of Investments).
11. PURCHASES AND SALES OF INVESTMENTS
The cost of purchases and proceeds from sales of investments (excluding short-term investments, and the Cash Management Portfolio since it trades exclusively in short-term debt investments) for the year ended December 31, 2012, are summarized in the following table:
| | | | | | | | |
| | | U.S. Government Securities | |
| Portfolio | | Purchases | | | Sales | |
Diversified Bond | | | $11,170,429,905 | | | | $10,926,765,146 | |
Inflation Managed | | | 1,560,844,451 | | | | 2,690,613,946 | |
Inflation Protected | | | 694,953,991 | | | | 899,334,266 | |
Managed Bond | | | 41,137,633,723 | | | | 40,633,107,842 | |
Short Duration Bond | | | 1,726,109,738 | | | | 1,326,673,007 | |
Long/Short Large-Cap | | | - | | |
| 2,740,000
|
|
| | | | | | | | |
| | | Other Securities | |
| Portfolio | | Purchases | | | Sales | |
Diversified Bond | | | $713,641,380 | | | | $708,554,528 | |
Floating Rate Loan | | | 1,500,817,868 | | | | 1,617,154,509 | |
High Yield Bond | | | 1,204,823,274 | | | | 1,324,570,290 | |
Inflation Managed | | | 138,284,522 | | | | 970,100,109 | |
Inflation Protected | | | 653,564,454 | | | | 741,522,662 | |
Managed Bond | | | 11,320,351,593 | | | | 11,778,471,151 | |
Short Duration Bond | | | 1,329,791,618 | | | | 928,164,160 | |
Emerging Markets Debt | | | 1,162,021,504 | | | | 256,175,751 | |
American Funds Growth | | | 15,334,161 | | | | 552,895,056 | |
American Funds Growth-Income | | | 21,994,952 | | | | 673,351,352 | |
Comstock | | | 635,174,312 | | | | 1,071,775,829 | |
Dividend Growth | | | 169,863,259 | | | | 453,958,328 | |
Equity Index | | | 89,895,636 | | | | 758,807,333 | |
Focused 30 | | | 23,259,273 | | | | 31,303,131 | |
Growth LT | | | 317,969,180 | | | | 943,001,991 | |
Large-Cap Growth | | | 960,904,285 | | | | 1,086,079,096 | |
Large-Cap Value | | | 754,389,189 | | | | 1,164,013,075 | |
Long/Short Large-Cap | | | 1,485,937,314 | | | | 1,805,235,450 | |
Main Street Core | | | 684,808,774 | | | | 866,245,556 | |
Mid-Cap Equity | | | 1,379,156,956 | | | | 2,096,845,177 | |
Mid-Cap Growth | | | 241,843,182 | | | | 570,561,690 | |
Mid-Cap Value | | | 2,166,465,824 | | | | 1,970,115,630 | |
Small-Cap Equity | | | 612,652,690 | | | | 743,373,340 | |
| | | | | | | | |
| | | Other Securities | |
| Portfolio | | Purchases | | | Sales | |
Small-Cap Growth | | | $399,140,249 | | | | $522,181,260 | |
Small-Cap Index | | | 382,445,077 | | | | 133,783,528 | |
Small-Cap Value | | | 139,895,831 | | | | 175,909,859 | |
Health Sciences | | | 89,247,328 | | | | 87,884,154 | |
Real Estate | | | 711,259,630 | | | | 277,445,552 | |
Technology | | | 58,638,944 | | | | 68,986,781 | |
Emerging Markets | | | 460,570,472 | | | | 597,218,921 | |
International Large-Cap | | | 488,570,637 | | | | 1,060,197,370 | |
International Small-Cap | | | 664,068,378 | | | | 709,847,923 | |
International Value | | | 1,040,359,849 | | | | 1,106,661,567 | |
Currency Strategies | | | 706,767,452 | | | | - | |
Global Absolute Return | | | 778,434,099 | | | | 183,542,986 | |
Precious Metals | | | 925,925,803 | | | | 24,535,145 | |
American Funds Asset Allocation | | | 266,716,256 | | | | 20,219,882 | |
Pacific Dynamix – Conservative Growth | | | 115,009,540 | | | | 11,483,232 | |
Pacific Dynamix – Moderate Growth | | | 332,281,386 | | | | 9,457,393 | |
Pacific Dynamix – Growth | | | 77,405,626 | | | | 23,606,088 | |
Portfolio Optimization Conservative | | | 1,507,242,282 | | | | 1,463,368,077 | |
Portfolio Optimization Moderate-Conservative | | | 2,078,562,579 | | | | 1,682,791,079 | |
Portfolio Optimization Moderate | | | 5,434,378,272 | | | | 5,839,061,308 | |
Portfolio Optimization Growth | | | 4,339,560,793 | | | | 5,120,689,232 | |
Portfolio Optimization Aggressive Growth | | | 888,931,477 | | | | 1,119,222,120 | |
12. FEDERAL INCOME TAX INFORMATION
Currently each of the portfolios in the Fund is either qualified as a regulated investment company (“RIC”) under Subchapter M of the Internal Revenue Code (the “Code”) or treated as a partnership for Federal income tax purposes only. A portfolio that is qualified as a RIC does not have to pay income tax as long as it distributes sufficient taxable income and net capital gains. Insurance companies whose separate accounts invest in a portfolio taxed as a RIC would take into account for Federal income tax purposes amounts (and in some cases the character of amounts) distributed by such portfolio. A portfolio that is treated as a partnership for tax purposes only is not subject to income tax; and any
D-24
PACIFIC SELECT FUND
NOTES TO FINANCIAL STATEMENTS (Continued)
income, gains, losses, deductions, and credits of the portfolio would instead be “passed through” pro rata directly to the insurance companies whose separate accounts invest in the portfolio and retain the same character for Federal income tax purposes. As a result, the tax treatment to the insurance companies will vary, in some instances favorably when a portfolio is treated as a partnership. However, the variable annuity contract owner or variable life insurance policy holder would not be affected by a portfolio electing to be taxed as a partnership versus a RIC. All portfolios except for the Cash Management, Diversified Bond, Floating Rate Loan, High Yield Bond, Inflation Managed, Inflation Protected, Managed Bond, Short Duration Bond, Emerging Markets Debt, Emerging Markets, International Large-Cap, International Small-Cap, International Value, Currency Strategies and Global Absolute Return Portfolios, elected to be taxed as a partnership (instead of a RIC).
Each of the portfolios electing to be taxed as a RIC declared and paid sufficient dividends on net investment income and capital gains distributions during 2012 to qualify as a RIC, and is not required to pay Federal income tax under the Code. Accordingly, no provision for Federal income taxes is required in the financial statements. Required distributions are based on net investment income and net realized gains determined in accordance with income tax regulations, which may differ from U.S. GAAP for financial reporting purposes. These differences are primarily due to differing treatments for futures and options, swap income, paydown gains/loss, partnership income, foreign currency transactions, passive foreign investment companies, post-October capital losses, capital loss carryforwards, and losses deferred due to wash sales. Permanent book and tax differences relating to shareholder distributions will result in reclassifications of capital accounts (see Note 14). In addition, the year in which amounts are distributed may differ from the year in which the net investment income is earned and the net gains are realized by each portfolio.
Effective January 1, 2013, each portfolio that qualifies as a RIC intends to utilize the consent dividend provision of section 565 of the Code to effectively distribute income and capital gains for tax purposes. Under this provision, the insurance company separate accounts that are the record shareholders of the RIC Portfolios consent to treat specified amounts as dividend income and capital gains for tax purposes even though dividends and capital gains are not actually paid (either in cash or by reinvestment in additional shares) by the RIC Portfolios. In addition, the Partnership Portfolios are not required to distribute taxable income and capital gains for Federal income tax purposes. Each partner, which would be Pacific Life and PL&A through their respective separate accounts, is required to report its respective share of income, gains, losses, deductions and credits of each Partnership Portfolio. Under the Fund’s new dividend and distributions policy, no dividend income and capital gains distributions will be made by any portfolios after December 31, 2012 (see Note 2B).
There were no post-October losses deferred by any portfolios covered in this report as of December 31, 2012. The following table shows the accumulated capital losses and components of distributable earnings on a tax basis, if any, as of December 31, 2012 (only applicable to portfolios electing to be taxed as a RIC for Federal income tax purposes):
| | | | | | | | | | | | |
| | | | | | Distributable Earnings | |
| Portfolio | | Accumulated
Capital Losses | | | Undistributed
Ordinary
Income | | | Undistributed
Long-term
Capital
Gains | |
Cash Management | | | ($9,006 | ) | | | $6,839 | | | | $- | |
Diversified Bond | | | - | | | | 65,479,778 | | | | 23,289,347 | |
Floating Rate Loan | | | (241,719,807 | ) | | | 11,242,139 | | | | - | |
High Yield Bond | | | (15,574,017 | ) | | | 19,285,482 | | | | - | |
Inflation Managed | | | - | | | | 179,743,934 | | | | 11,506,950 | |
Inflation Protected | | | - | | | | 66,822,593 | | | | 23,150,387 | |
Managed Bond | | | - | | | | 229,860,282 | | | | 47,994,819 | |
Short Duration | | | (85,573,831 | ) | | | 7,208,278 | | | | - | |
Emerging Markets Debt | | | - | | | | 16,283,583 | | | | - | |
Emerging Markets | | | - | | | | 4,945,410 | | | | 129,442,875 | |
International Large-Cap | | | (163,926,791 | ) | | | 11,118,080 | | | | - | |
International Small-Cap | | | (242,429,318 | ) | | | 9,349,384 | | | | - | |
International Value | | | (1,505,588,340 | ) | | | 15,816,453 | | | | - | |
Currency Strategies | | | (2,060 | ) | | | - | | | | - | |
Global Absolute Return | | | - | | | | - | | | | 72,847 | |
Accumulated capital losses represent net capital loss carryovers as of December 31, 2012 that may be available to offset future realized capital gains and thereby reduce future capital gains distributions. Under the Regulated Investment Company Modernization Act of 2010 (the “Modernization Act”), the Fund is permitted to carry forward capital losses incurred in taxable years beginning after December 22, 2010 for an unlimited period. Any losses incurred during those future taxable years will be required to be utilized prior to any losses incurred in pre- enactment taxable years. Additionally, post-enactment capital losses that are carried forward will retain their character as either short-term or long-term capital losses rather than being considered all short-term as under the previous law. The Fund’s first fiscal year end subject to the Modernization Act was December 31, 2011. The following table shows the expiration dates for capital losses carryover from pre-enactment
D-25
PACIFIC SELECT FUND
NOTES TO FINANCIAL STATEMENTS (Continued)
taxable years and the amounts of capital losses carryover, if any, by each of the applicable portfolios electing to be taxed as a RIC during the year ended December 31, 2012:
| | | | | | | | | | | | | | | | | | | | | | | | | | | | | | | | |
| | | Pre-Enactment | | | Post-Enactment | | | | |
| | | Net Capital Loss Carryover Expiring in | | | Unlimited Period of Net
Capital Loss Carryover | | | Accumulated Capital Loss
Carryover | |
| Portfolio | | 2014 | | | 2015 | | | 2016 | | | 2017 | | | 2018 | | | Short-Term | | | Long-Term | | |
Cash Management | | | $- | | | | $- | | | | $- | | | | ($4,988 | ) | | | $- | | | | ($4,018 | ) | | | $- | | | | ($9,006 | ) |
Floating Rate Loan | | | - | | | | (2,052,031 | ) | | | (33,649,381 | ) | | | (117,819,019 | ) | | | (84,889,932 | ) | | | (2,953,345 | ) | | | (356,099 | ) | | | (241,719,807 | ) |
High Yield Bond | | | - | | | | - | | | | - | | | | (15,574,017 | ) | | | - | | | | - | | | | - | | | | (15,574,017 | ) |
Short Duration Bond | | | (1,563,775 | ) | | | - | | | | - | | | | (84,010,056 | ) | | | - | | | | - | | | | - | | | | (85,573,831 | ) |
International Large-Cap | | | - | | | | - | | | | - | | | | (132,569,990 | ) | | | (31,356,801 | ) | | | - | | | | - | | | | (163,926,791 | ) |
International Small-Cap | | | - | | | | - | | | | (20,440,446 | ) | | | (221,988,872 | ) | | | - | | | | - | | | | - | | | | (242,429,318 | ) |
International Value | | | - | | | | - | | | | (177,748,089 | ) | | | (948,743,595 | ) | | | (82,194,234 | ) | | | (107,316,470 | ) | | | (189,585,952 | ) | | | (1,505,588,340 | ) |
Currency Strategies | | | - | | | | - | | | | - | | | | - | | | | - | | | | (2,060 | ) | | | - | | | | (2,060 | ) |
The aggregate Federal tax cost of investments and the composition of unrealized appreciation and depreciation on investments and net unrealized appreciation and/or depreciation on derivatives and assets and liabilities in foreign currencies as of December 31, 2012, were as follows:
| | | | | | | | | | | | | | | | | | | | | | | | |
| | | | | | Gross | | | Gross | | | Net Unrealized | | | Net
Unrealized | | | Net | |
| Portfolio | | Total Cost of
Investments on
Tax Basis | | | Unrealized
Appreciation
on Investments | | | Unrealized
Depreciation
on Investments | | | Appreciation
(Depreciation)
on Investments | | | Appreciation
(Depreciation)
on Other (1) | | | Unrealized
Appreciation
(Depreciation) | |
Cash Management | | | $633,714,589 | | | | $- | | | | $- | | | | $- | | | | $- | | | | $- | |
Diversified Bond | | | 3,268,301,580 | | | | 164,681,948 | | | | (25,390,466 | ) | | | 139,291,482 | | | | 1,295,651 | | | | 140,587,133 | |
Floating Rate Loan | | | 949,842,804 | | | | 17,569,514 | | | | (6,099,052 | ) | | | 11,470,462 | | | | 3,483 | | | | 11,473,945 | |
High Yield Bond | | | 1,217,121,139 | | | | 78,480,360 | | | | (15,509,617 | ) | | | 62,970,743 | | | | 19,111 | | | | 62,989,854 | |
Inflation Managed | | | 2,620,551,419 | | | | 24,902,495 | | | | (27,633,201 | ) | | | (2,730,706 | ) | | | 11,252,331 | | | | 8,521,625 | |
Inflation Protected | | | 1,086,763,124 | | | | 33,964,695 | | | | (322,405 | ) | | | 33,642,290 | | | | (5,747,732 | ) | | | 27,894,558 | |
Managed Bond | | | 6,870,464,042 | | | | 278,458,069 | | | | (61,832,810 | ) | | | 216,625,259 | | | | 23,447,787 | | | | 240,073,046 | |
Short Duration Bond | | | 2,408,671,629 | | | | 31,165,212 | | | | (4,052,057 | ) | | | 27,113,155 | | | | 20,664 | | | | 27,133,819 | |
Emerging Markets Debt | | | 911,396,509 | | | | 63,551,282 | | | | (2,234,662 | ) | | | 61,316,620 | | | | (419,567 | ) | | | 60,897,053 | |
American Funds Growth | | | 200,329,943 | | | | 66,196,664 | | | | (26,478 | ) | | | 66,170,186 | | | | - | | | | 66,170,186 | |
American Funds Growth-Income | | | 555,871,540 | | | | 91,364,684 | | | | (71,753 | ) | | | 91,292,931 | | | | - | | | | 91,292,931 | |
Comstock | | | 1,704,522,563 | | | | 385,852,870 | | | | (69,565,988 | ) | | | 316,286,882 | | | | (3,154,198 | ) | | | 313,132,684 | |
Dividend Growth | | | 687,273,504 | | | | 136,024,176 | | | | (12,247,613 | ) | | | 123,776,563 | | | | 471 | | | | 123,777,034 | |
Equity Index | | | 1,328,040,347 | | | | 685,001,996 | | | | (29,852,541 | ) | | | 655,149,455 | | | | (202,294 | ) | | | 654,947,161 | |
Focused 30 | | | 87,475,314 | | | | 31,606,393 | | | | (5,032,337 | ) | | | 26,574,056 | | | | (111 | ) | | | 26,573,945 | |
Growth LT | | | 444,280,235 | | | | 75,120,263 | | | | (9,242,644 | ) | | | 65,877,619 | | | | (349,425 | ) | | | 65,528,194 | |
Large-Cap Growth | | | 1,102,264,045 | | | | 202,250,460 | | | | (21,529,853 | ) | | | 180,720,607 | | | | - | | | | 180,720,607 | |
Large-Cap Value | | | 2,220,289,424 | | | | 649,836,294 | | | | (37,061,897 | ) | | | 612,774,397 | | | | 86,593 | | | | 612,860,990 | |
Long/Short Large-Cap | | | 1,682,610,941 | | | | 174,116,347 | | | | (35,432,214 | ) | | | 138,684,133 | | | | (22,622,873 | ) | | | 116,061,260 | |
Main Street Core | | | 1,228,649,800 | | | | 233,943,910 | | | | (13,508,981 | ) | | | 220,434,929 | | | | 4,607 | | | | 220,439,536 | |
Mid-Cap Equity | | | 1,034,218,552 | | | | 81,465,388 | | | | (44,699,343 | ) | | | 36,766,045 | | | | - | | | | 36,766,045 | |
Mid-Cap Growth | | | 659,180,237 | | | | 139,752,139 | | | | (83,284,057 | ) | | | 56,468,082 | | | | 3,270 | | | | 56,471,352 | |
Mid-Cap Value | | | 1,314,942,580 | | | | 105,532,247 | | | | (49,465,303 | ) | | | 56,066,944 | | | | (7 | ) | | | 56,066,937 | |
Small-Cap Equity | | | 897,297,581 | | | | 138,851,583 | | | | (35,488,759 | ) | | | 103,362,824 | | | | 115,097 | | | | 103,477,921 | |
Small-Cap Growth | | | 425,185,942 | | | | 83,932,124 | | | | (13,024,081 | ) | | | 70,908,043 | | | | - | | | | 70,908,043 | |
Small-Cap Index | | | 703,815,773 | | | | 109,546,236 | | | | (69,190,557 | ) | | | 40,355,679 | | | | 412,778 | | | | 40,768,457 | |
Small-Cap Value | | | 390,536,363 | | | | 110,487,132 | | | | (8,063,020 | ) | | | 102,424,112 | | | | - | | | | 102,424,112 | |
Health Sciences | | | 122,354,259 | | | | 38,253,670 | | | | (3,865,725 | ) | | | 34,387,945 | | | | - | | | | 34,387,945 | |
Real Estate | | | 944,465,044 | | | | 178,426,474 | | | | (9,799,764 | ) | | | 168,626,710 | | | | 19 | | | | 168,626,729 | |
Technology | | | 63,182,549 | | | | 6,846,401 | | | | (2,584,163 | ) | | | 4,262,238 | | | | (330 | ) | | | 4,261,908 | |
Emerging Markets | | | 1,312,886,061 | | | | 316,288,661 | | | | (69,322,824 | ) | | | 246,965,837 | | | | (1,202,363 | ) | | | 245,763,474 | |
International Large-Cap | | | 1,711,596,303 | | | | 337,191,166 | | | | (43,694,604 | ) | | | 293,496,562 | | | | 5,617 | | | | 293,502,179 | |
International Small-Cap | | | 1,081,384,177 | | | | 204,978,184 | | | | (72,130,301 | ) | | | 132,847,883 | | | | 1,216,845 | | | | 134,064,728 | |
International Value | | | 1,411,725,467 | | | | 158,837,803 | | | | (32,339,531 | ) | | | 126,498,272 | | | | 1,521,754 | | | | 128,020,026 | |
Currency Strategies | | | 1,464,487,521 | | | | 5,211,773 | | | | (2,547,762 | ) | | | 2,664,011 | | | | 7,035,300 | | | | 9,699,311 | |
Global Absolute Return | | | 2,192,667,873 | | | | 30,184,187 | | | | (4,635,415 | ) | | | 25,548,772 | | | | (16,441,509 | ) | | | 9,107,263 | |
Precious Metals | | | 952,987,453 | | | | 1,992,079 | | | | (129,398,418 | ) | | | (127,406,339 | ) | | | 4,212 | | | | (127,402,127 | ) |
American Funds Asset Allocation | | | 509,378,922 | | | | 61,985,696 | | | | (52,029 | ) | | | 61,933,667 | | | | - | | | | 61,933,667 | |
Pacific Dynamix – Conservative Growth | | | 240,703,870 | | | | 8,256,362 | | | | - | | | | 8,256,362 | | | | - | | | | 8,256,362 | |
Pacific Dynamix – Moderate Growth | | | 615,097,706 | | | | 29,599,031 | | | | - | | | | 29,599,031 | | | | - | | | | 29,599,031 | |
Pacific Dynamix – Growth | | | 248,512,723 | | | | 15,657,944 | | | | - | | | | 15,657,944 | | | | - | | | | 15,657,944 | |
Portfolio Optimization Conservative | | | 3,652,812,593 | | | | 136,856,469 | | | | (16,190,681 | ) | | | 120,665,788 | | | | - | | | | 120,665,788 | |
Portfolio Optimization Moderate-Conservative | | | 4,556,410,301 | | | | 175,002,365 | | | | (29,674,495 | ) | | | 145,327,870 | | | | - | | | | 145,327,870 | |
Portfolio Optimization Moderate | | | 14,782,516,019 | | | | 522,134,646 | | | | (231,489,150 | ) | | | 290,645,496 | | | | - | | | | 290,645,496 | |
Portfolio Optimization Growth | | | 12,430,689,261 | | | | 428,670,982 | | | | (253,415,319 | ) | | | 175,255,663 | | | | - | | | | 175,255,663 | |
Portfolio Optimization Aggressive-Growth | | | 2,609,035,471 | | | | 82,920,168 | | | | (57,201,933 | ) | | | 25,718,235 | | | | - | | | | 25,718,235 | |
| | (1) | Other includes net appreciation or depreciation on derivatives, securities sold short, unfunded loan commitments, and assets and liabilities in foreign currencies, if any. |
D-26
PACIFIC SELECT FUND
NOTES TO FINANCIAL STATEMENTS (Continued)
The Fund recognizes the financial statement effects of a tax position taken or expected to be taken in a tax return when it is more likely than not, based on the technical merits, that the position will be sustained upon examination by the applicable tax authority. Tax positions not deemed to meet the more-likely-than-not threshold would be recorded as a tax liability for unrecognized tax benefits with a corresponding income tax expense. The Fund is required to analyze all open tax years, as defined by the statute of limitations, for all major jurisdictions. As a result of each portfolio’s evaluation, as of and during the year ended December 31, 2012, the Fund did not record a liability for any unrecognized tax benefits. The Fund’s policy is to recognize interest and penalties on unrecognized tax benefits in income tax expense. During the year ended December 31, 2012, none of the portfolios covered in this report incurred any interest or penalties. The Fund is also not aware of any tax positions for which it is reasonably possible that the total amounts of unrecognized tax benefits will change materially in the next twelve months.
The Fund remains subject to examination by Federal and State tax authorities (principal state jurisdictions include California and Massachusetts) for the tax years ended December 31, 2009 through December 31, 2012 for Federal purposes and December 31, 2008 through December 31, 2012 for State purposes.
13. TAX CHARACTER OF DISTRIBUTIONS
The tax character of income and capital gain distributions to shareholders for the years or periods ended December 31, 2012 and 2011, were as follows:
| | | | | | | | | | | | | | | | | | | | | | | | |
| | | For the Year Ended December 31, 2012 | | | For the Year Ended December 31, 2011 | |
| Portfolio | | Ordinary
Income | | | Long-term
Capital
Gains | | | Total | | | Ordinary
Income | | | Long-term
Capital
Gains | | | Total | |
Cash Management | | | $7,301 | | | | $- | | | | $7,301 | | | | $- | | | | $- | | | | $- | |
Diversified Bond | | | 101,854,462 | | | | 22,748,781 | | | | 124,603,243 | | | | 88,630,598 | | | | - | | | | 88,630,598 | |
Floating Rate Loan | | | 49,212,579 | | | | - | | | | 49,212,579 | | | | 74,014,329 | | | | - | | | | 74,014,329 | |
High Yield Bond | | | 86,047,570 | | | | - | | | | 86,047,570 | | | | 87,913,048 | | | | - | | | | 87,913,048 | |
Inflation Managed | | | 308,066,210 | | | | 21,217,771 | | | | 329,283,981 | | | | 291,376,691 | | | | - | | | | 291,376,691 | |
Inflation Protected | | | 13,531,981 | | | | - | | | | 13,531,981 | | | | 49,554,377 | | | | - | | | | 49,554,377 | |
Managed Bond | | | 280,612,043 | | | | 5,860,476 | | | | 286,472,519 | | | | 274,940,307 | | | | 104,114,540 | | | | 379,054,847 | |
Short Duration Bond | | | 25,062,415 | | | | - | | | | 25,062,415 | | | | 23,509,032 | | | | - | | | | 23,509,032 | |
Emerging Markets Debt | | | 22,000,000 | | | | - | | | | 22,000,000 | | | | | | | | | | | | | |
American Funds Growth | | | 923,561 | | | | - | | | | 923,561 | | | | 1,950,000 | | | | - | | | | 1,950,000 | |
American Fund Growth-Income | | | 10,850,741 | | | | - | | | | 10,850,741 | | | | 12,130,000 | | | | - | | | | 12,130,000 | |
Comstock | | | 48,674,394 | | | | 107,295,427 | | | | 155,969,821 | | | | 40,944,178 | | | | 1,887,603 | | | | 42,831,781 | |
Dividend Growth | | | 25,110,523 | | | | 8,674,556 | | | | 33,785,079 | | | | 24,518,260 | | | | 39,502,192 | | | | 64,020,452 | |
Equity Index | | | 52,842,513 | | | | - | | | | 52,842,513 | | | | 37,070,000 | | | | - | | | | 37,070,000 | |
Focused 30 | | | - | | | | 11,618,000 | | | | 11,618,000 | | | | - | | | | - | | | | - | |
Growth LT | | | 5,343,628 | | | | 191,447,714 | | | | 196,791,342 | | | | 25,226,803 | | | | 36,198,130 | | | | 61,424,933 | |
Large-Cap Growth | | | 42,995,207 | | | | 139,012,560 | | | | 182,007,767 | | | | 69,453,787 | | | | 90,060,062 | | | | 159,513,849 | |
Large-Cap Value | | | 71,289,291 | | | | 76,040,764 | | | | 147,330,055 | | | | 53,645,514 | | | | 4,262,969 | | | | 57,908,483 | |
Long/Short Large-Cap | | | 87,682,789 | | | | 93,889,384 | | | | 181,572,173 | | | | 111,733,228 | | | | 62,015,431 | | | | 173,748,659 | |
Main Street Core | | | 17,871,221 | | | | 61,812,856 | | | | 79,684,077 | | | | 82,420,612 | | | | 43,718,152 | | | | 126,138,764 | |
Mid-Cap Equity | | | 9,749,263 | | | | 218,571,962 | | | | 228,321,225 | | | | 105,664,047 | | | | 170,101,634 | | | | 275,765,681 | |
Mid-Cap Growth | | | 24,450,578 | | | | 178,363,619 | | | | 202,814,197 | | | | 12,027,854 | | | | 62,167,962 | | | | 74,195,816 | |
Mid-Cap Value | | | 42,558,214 | | | | 73,227,428 | | | | 115,785,642 | | | | 180,584,917 | | | | 69,747,470 | | | | 250,332,387 | |
Small-Cap Equity | | | 32,536,302 | | | | 28,884,031 | | | | 61,420,333 | | | | 95,543,415 | | | | 73,200,498 | | | | 168,743,913 | |
Small-Cap Growth | | | 1,010,000 | | | | 63,463,963 | | | | 64,473,963 | | | | 16,669,942 | | | | 61,437,983 | | | | 78,107,925 | |
Small Cap Index | | | 9,106,558 | | | | 9,987,933 | | | | 19,094,491 | | | | 2,570,000 | | | | - | | | | 2,570,000 | |
Small-Cap Value | | | 10,598,656 | | | | 49,014,289 | | | | 59,612,945 | | | | 12,220,507 | | | | 76,157,508 | | | | 88,378,015 | |
Health Sciences | | | - | | | | 7,833,338 | | | | 7,833,338 | | | | 1,913,926 | | | | 6,505,833 | | | | 8,419,759 | |
Real Estate | | | 14,050,000 | | | | 49,993,214 | | | | 64,043,214 | | | | 16,949,861 | | | | 9,749,595 | | | | 26,699,456 | |
Technology | | | 4,099,678 | | | | 2,879,463 | | | | 6,979,141 | | | | 7,578,436 | | | | 8,900,404 | | | | 16,478,840 | |
Emerging Markets | | | 13,000,000 | | | | 156,725,573 | | | | 169,725,573 | | | | 18,580,072 | | | | 2,537,540 | | | | 21,117,612 | |
International Large-Cap | | | 40,033,483 | | | | - | | | | 40,033,483 | | | | 38,547,281 | | | | - | | | | 38,547,281 | |
International Small-Cap | | | 27,031,316 | | | | - | | | | 27,031,316 | | | | 31,256,047 | | | | - | | | | 31,256,047 | |
International Value | | | 58,417,215 | | | | - | | | | 58,417,215 | | | | 52,863,915 | | | | - | | | | 52,863,915 | |
American Funds Asset Allocation | | | 9,011,154 | | | | 5,405,942 | | | | 14,417,096 | | | | 8,391,872 | | | | 3,461,613 | | | | 11,853,485 | |
Pacific Dynamix – Conservative Growth | | | 4,920,041 | | | | 5,691,120 | | | | 10,611,161 | | | | 4,626,761 | | | | 5,882,668 | | | | 10,509,429 | |
Pacific Dynamix – Moderate Growth | | | 10,016,053 | | | | 6,493,049 | | | | 16,509,102 | | | | 6,601,716 | | | | 4,823,861 | | | | 11,425,577 | |
Pacific Dynamix – Growth | | | 4,422,699 | | | | 7,733,852 | | | | 12,156,551 | | | | 3,251,860 | | | | 3,295,132 | | | | 6,546,992 | |
Portfolio Optimization Conservative | | | 92,129,368 | | | | - | | | | 92,129,368 | | | | 31,255,975 | | | | - | | | | 31,255,975 | |
Portfolio Optimization Moderate-Conservative | | | 105,460,917 | | | | - | | | | 105,460,917 | | | | 30,724,278 | | | | - | | | | 30,724,278 | |
Portfolio Optimization Moderate | | | 300,649,697 | | | | - | | | | 300,649,697 | | | | 99,409,891 | | | | - | | | | 99,409,891 | |
Portfolio Optimization Growth | | | 214,990,409 | | | | - | | | | 214,990,409 | | | | 67,106,993 | | | | - | | | | 67,106,993 | |
Portfolio Optimization Aggressive-Growth | | | 36,761,146 | | | | - | | | | 36,761,146 | | | | 12,201,784 | | | | - | | | | 12,201,784 | |
14. RECLASSIFICATION OF ACCOUNTS
During the year ended December 31, 2012, reclassifications as shown in the following table have been made in each portfolio’s capital accounts to report these balances on a tax basis, excluding certain temporary differences, as of December 31, 2012. Additional adjustments may be required in subsequent reporting periods. These reclassifications, which have no impact on the NAV of portfolios, are primarily attributable to reclassifications of foreign currency transactions, non-deductible expenses, treatment of net operating losses and capital gains under Federal tax rules versus U.S. GAAP. The calculation of net investment income per share in the financial highlights excludes these adjustments.
D-27
PACIFIC SELECT FUND
NOTES TO FINANCIAL STATEMENTS (Continued)
| | | | | | | | | | | | |
| Portfolio | | Paid-In
Capital | | | Undistributed/
Accumulated
Net Investment
Income (Loss) | | | Undistributed/
Accumulated
Net Realized
Gain (Loss) | |
Cash Management | | | ($257 | ) | | | $97 | | | | $160 | |
Diversified Bond | | | (1 | ) | | | 8,162,655 | | | | (8,162,654 | ) |
High Yield Bond | | | 56 | | | | 485,134 | | | | (485,190 | ) |
Inflation Managed | | | - | | | | (24,887,011 | ) | | | 24,887,011 | |
Inflation Protected | | | - | | | | 25,307,647 | | | | (25,307,647 | ) |
Managed Bond | | | - | | | | 9,363,996 | | | | (9,363,996 | ) |
Short Duration Bond | | | - | | | | 4,000 | | | | (4,000 | ) |
Emerging Markets Debt | | | - | | | | (912,873 | ) | | | 912,873 | |
Emerging Markets | | | - | | | | 1,680,444 | | | | (1,680,444 | ) |
International Large-Cap | | | - | | | | (682,437 | ) | | | 682,437 | |
International Small-Cap | | | - | | | | 2,469,716 | | | | (2,469,716 | ) |
International Value | | | - | | | | (2,376,093 | ) | | | 2,376,093 | |
Currency Strategies | | | (15,871,736 | ) | | | (8,167,595 | ) | | | 24,039,331 | |
Global Absolute Return | | | - | | | | (25,424,675 | ) | | | 25,424,675 | |
15. SHARES OF BENEFICIAL INTEREST
Change in shares of beneficial interest of each portfolio for the years or periods ended December 31, 2012 and 2011 were as follows:
| | | | | | | | | | | | | | | | | | | | | | | | | | | | |
| | | Cash Management | | | | | Diversified Bond | | | | | Floating Rate Loan | |
| | | 2012 | | | 2011 | | | | | 2012 | | | 2011 | | | | | 2012 | | | 2011 | |
Class I | | | | | | | | | | | | | | | | | | | | | | | | | | | | |
Shares sold | | | 39,036,884 | | | | 71,448,229 | | | | | | 4,749,647 | | | | 5,768,454 | | | | | | 3,114,219 | | | | 4,027,987 | |
Dividend and distribution reinvested | | | 715 | | | | - | | | | | | 526,647 | | | | 7,106,585 | | | | | | 717,415 | | | | 8,975,491 | |
Shares repurchased | | | (58,119,014 | ) | | | (74,403,503 | ) | | | | | (4,947,167 | ) | | | (294,629,540 | ) | | | | | (3,216,713 | ) | | | (138,731,015 | ) |
Net increase (decrease) | | | (19,081,415 | ) | | | (2,955,274 | ) | | | | | 329,127 | | | | (281,754,501 | ) | | | | | 614,921 | | | | (125,727,537 | ) |
Shares outstanding, beginning of year | | | 82,440,261 | | | | 85,395,535 | | | | | | 13,510,811 | | | | 295,265,312 | | | | | | 13,943,674 | | | | 139,671,211 | |
Shares outstanding, end of year | | | 63,358,846 | | | | 82,440,261 | | | | | | 13,839,938 | | | | 13,510,811 | | | | | | 14,558,595 | | | | 13,943,674 | |
| | | | | | | | |
Class P | | | | | | | | | | | | | | | | | | | | | | | | | | | | |
Shares sold | | | - | | | | 3,867 | | | | | | 53,078,803 | | | | 310,108,526 | | | | | | 6,319,130 | | | | 139,140,939 | |
Dividend and distribution reinvested | | | 10 | | | | - | | | | | | 11,216,114 | | | | 2,319,773 | | | | | | 5,968,083 | | | | 1,789,768 | |
Shares repurchased | | | - | | | | - | | | | | | (59,174,866 | ) | | | (30,032,348 | ) | | | | | (27,543,290 | ) | | | (10,304,319 | ) |
Net increase (decrease) | | | 10 | | | | 3,867 | | | | | | 5,120,051 | | | | 282,395,951 | | | | | | (15,256,077 | ) | | | 130,626,388 | |
Shares outstanding, beginning of year or period | | | 3,867 | | | | - | | | | | | 282,395,951 | | | | - | | | | | | 130,626,388 | | | | - | |
Shares outstanding, end of year or period | | | 3,877 | | | | 3,867 | | | | | | 287,516,002 | | | | 282,395,951 | | | | | | 115,370,311 | | | | 130,626,388 | |
| | | High Yield Bond | | | | | Inflation Managed | | | | | Inflation Protected (1) | |
| | | 2012 | | | 2011 | | | | | 2012 | | | 2011 | | | | | 2012 | | | 2011 | |
Class I | | | | | | | | | | | | | | | | | | | | | | | | | | | | |
Shares sold | | | 24,206,688 | | | | 22,605,950 | | | | | | 6,255,108 | | | | 8,606,315 | | | | | | 1,935,542 | | | | 5,471,963 | |
Dividend and distribution reinvested | | | 4,105,818 | | | | 11,121,850 | | | | | | 12,658,961 | | | | 23,956,821 | | | | | | 21,349 | | | | 80,766 | |
Shares repurchased | | | (22,840,759 | ) | | | (159,656,658 | ) | | | | | (9,504,995 | ) | | | (364,496,345 | ) | | | | | (1,548,187 | ) | | | (3,664,940 | ) |
Net increase (decrease) | | | 5,471,747 | | | | (125,928,858 | ) | | | | | 9,409,074 | | | | (331,933,209 | ) | | | | | 408,704 | | | | 1,887,789 | |
Shares outstanding, beginning of year or period | | | 57,922,506 | | | | 183,851,364 | | | | | | 57,898,890 | | | | 389,832,099 | | | | | | 1,887,789 | | | | - | |
Shares outstanding, end of year or period | | | 63,394,253 | | | | 57,922,506 | | | | | | 67,307,964 | | | | 57,898,890 | | | | | | 2,296,493 | | | | 1,887,789 | |
| | | | | | | | |
Class P | | | | | | | | | | | | | | | | | | | | | | | | | | | | |
Shares sold | | | 9,919,417 | | | | 169,358,023 | | | | | | 17,469,962 | | | | 180,543,048 | | | | | | 25,233,770 | | | | 152,248,882 | |
Dividend and distribution reinvested | | | 9,358,333 | | | | 3,010,397 | | | | | | 17,327,987 | | | | 769,268 | | | | | | 1,233,535 | | | | 4,657,498 | |
Shares repurchased | | | (48,808,069 | ) | | | (10,891,160 | ) | | | | | (119,548,407 | ) | | | (21,931,219 | ) | | | | | (63,184,089 | ) | | | (20,237,660 | ) |
Net increase (decrease) | | | (29,530,319 | ) | | | 161,477,260 | | | | | | (84,750,458 | ) | | | 159,381,097 | | | | | | (36,716,784 | ) | | | 136,668,720 | |
Shares outstanding, beginning of year or period | | | 161,477,260 | | | | - | | | | | | 159,381,097 | | | | - | | | | | | 136,668,720 | | | | - | |
Shares outstanding, end of year or period | | | 131,946,941 | | | | 161,477,260 | | | | | | 74,630,639 | | | | 159,381,097 | | | | | | 99,951,936 | | | | 136,668,720 | |
D-28
PACIFIC SELECT FUND
NOTES TO FINANCIAL STATEMENTS (Continued)
| | | | | | | | | | | | | | | | | | | | | | | | | | | | |
| | | | | |
| | | Managed Bond | | | | | Short Duration Bond | | | | | Emerging Markets Debt (2) | |
| | | 2012 | | | 2011 | | | | | 2012 | | | 2011 | | | | | 2012 | | | 2011 | |
Class I | | | | | | | | | | | | | | | | | | | | | | | | | | | | |
Shares sold | | | 9,765,611 | | | | 10,254,718 | | | | | | 9,015,693 | | | | 6,598,638 | | | | | | 745,993 | | | | | |
Dividend and distribution reinvested | | | 6,776,140 | | | | 28,063,362 | | | | | | 224,975 | | | | 1,611,765 | | | | | | 14,477 | | | | | |
Shares repurchased | | | (14,670,699 | ) | | | (455,663,154 | ) | | | | | (5,886,731 | ) | | | (154,994,515 | ) | | | | | (38,959 | ) | | | | |
Net increase (decrease) | | | 1,871,052 | | | | (417,345,074 | ) | | | | | 3,353,937 | | | | (146,784,112 | ) | | | | | 721,511 | | | | | |
Shares outstanding, beginning of year or period | | | 129,267,520 | | | | 546,612,594 | | | | | | 26,125,266 | | | | 172,909,378 | | | | | | - | | | | | |
Shares outstanding, end of year or period | | | 131,138,572 | | | | 129,267,520 | | | | | | 29,479,203 | | | | 26,125,266 | | | | | | 721,511 | | | | | |
| | | | | | | | |
Class P | | | | | | | | | | | | | | | | | | | | | | | | | | | | |
Shares sold | | | 30,792,935 | | | | 417,147,245 | | | | | | 111,895,430 | | | | 175,272,570 | | | | | | 96,718,450 | | | | | |
Dividend and distribution reinvested | | | 17,027,142 | | | | 4,964,255 | | | | | | 2,384,143 | | | | 894,541 | | | | | | 2,024,135 | | | | | |
Shares repurchased | | | (149,354,712 | ) | | | (32,206,236 | ) | | | | | (51,444,895 | ) | | | (13,968,617 | ) | | | | | (8,027,674 | ) | | | | |
Net increase (decrease) | | | (101,534,635 | ) | | | 389,905,264 | | | | | | 62,834,678 | | | | 162,198,494 | | | | | | 90,714,911 | | | | | |
Shares outstanding, beginning of year or period | | | 389,905,264 | | | | - | | | | | | 162,198,494 | | | | - | �� | | | | | - | | | | | |
Shares outstanding, end of year or period | | | 288,370,629 | | | | 389,905,264 | | | | | | 225,033,172 | | | | 162,198,494 | | | | | | 90,714,911 | | | | | |
| | | | | |
| | | American Funds Growth | | | | | American Funds Growth-Income | | | | | Comstock | |
| | | 2012 | | | 2011 | | | | | 2012 | | | 2011 | | | | | 2012 | | | 2011 | |
Class I | | | | | | | | | | | | | | | | | | | | | | | | | | | | |
Shares sold | | | 2,131,117 | | | | 3,476,577 | | | | | | 1,280,061 | | | | 1,437,914 | | | | | | 2,588,086 | | | | 1,328,259 | |
Dividend and distribution reinvested | | | 37,272 | | | | 60,430 | | | | | | 210,196 | | | | 221,069 | | | | | | 1,154,219 | | | | 3,533,502 | |
Shares repurchased | | | (5,165,370 | ) | | | (96,619,504 | ) | | | | | (3,041,034 | ) | | | (130,156,413 | ) | | | | | (2,365,566 | ) | | | (245,259,537 | ) |
Net increase (decrease) | | | (2,996,981 | ) | | | (93,082,497 | ) | | | | | (1,550,777 | ) | | | (128,497,430 | ) | | | | | 1,376,739 | | | | (240,397,776 | ) |
Shares outstanding, beginning of year | | | 25,360,421 | | | | 118,442,918 | | | | | | 20,932,834 | | | | 149,430,264 | | | | | | 15,426,094 | | | | 255,823,870 | |
Shares outstanding, end of year | | | 22,363,440 | | | | 25,360,421 | | | | | | 19,382,057 | | | | 20,932,834 | | | | | | 16,802,833 | | | | 15,426,094 | |
| | | | | | | | |
Class P | | | | | | | | | | | | | | | | | | | | | | | | | | | | |
Shares sold | | | 4,284,148 | | | | 63,275,523 | | | | | | 4,628,019 | | | | 104,793,194 | | | | | | 43,960,355 | | | | 246,278,065 | |
Dividend and distribution reinvested | | | 64,893 | | | | 184,928 | | | | | | 852,285 | | | | 1,131,723 | | | | | | 17,302,912 | | | | 1,700,513 | |
Shares repurchased | | | (61,775,905 | ) | | | (5,548 | ) | | | | | (68,804,257 | ) | | | (7,095 | ) | | | | | (92,305,673 | ) | | | (14,525,222 | ) |
Net increase (decrease) | | | (57,426,864 | ) | | | 63,454,903 | | | | | | (63,323,953 | ) | | | 105,917,822 | | | | | | (31,042,406 | ) | | | 233,453,356 | |
Shares outstanding, beginning of year or period | | | 63,454,903 | | | | - | | | | | | 105,917,822 | | | | - | | | | | | 233,453,356 | | | | - | |
Shares outstanding, end of year or period | | | 6,028,039 | | | | 63,454,903 | | | | | | 42,593,869 | | | | 105,917,822 | | | | | | 202,410,950 | | | | 233,453,356 | |
| | | | | |
| | | Dividend Growth | | | | | Equity Index | | | | | Focused 30 | |
| | | 2012 | | | 2011 | | | | | 2012 | | | 2011 | | | | | 2012 | | | 2011 | |
Class I | | | | | | | | | | | | | | | | | | | | | | | | | | | | |
Shares sold | | | 3,132,058 | | | | 2,871,793 | | | | | | 3,656,043 | | | | 1,803,907 | | | | | | 2,403,873 | | | | 970,318 | |
Dividend and distribution reinvested | | | 685,294 | | | | 6,084,219 | | | | | | 648,909 | | | | 870,951 | | | | | | 1,010,928 | | | | - | |
Shares repurchased | | | (2,872,824 | ) | | | (102,965,394 | ) | | | | | (4,754,199 | ) | | | (70,606,912 | ) | | | | | (3,247,553 | ) | | | (3,958,589 | ) |
Net increase (decrease) | | | 944,528 | | | | (94,009,382 | ) | | | | | (449,247 | ) | | | (67,932,054 | ) | | | | | 167,248 | | | | (2,988,271 | ) |
Shares outstanding, beginning of year | | | 16,952,912 | | | | 110,962,294 | | | | | | 28,252,573 | | | | 96,184,627 | | | | | | 8,961,688 | | | | 11,949,959 | |
Shares outstanding, end of year | | | 17,897,440 | | | | 16,952,912 | | | | | | 27,803,326 | | | | 28,252,573 | | | | | | 9,128,936 | | | | 8,961,688 | |
| | | | | | | | |
Class P | | | | | | | | | | | | | | | | | | | | | | | | | | | | |
Shares sold | | | 2,637,917 | | | | 91,709,365 | | | | | | 3,367,271 | | | | 62,089,643 | | | | | | - | | | | 757 | |
Dividend and distribution reinvested | | | 2,586,547 | | | | 555,373 | | | | | | 1,061,860 | | | | 493,369 | | | | | | 86 | | | | - | |
Shares repurchased | | | (32,229,806 | ) | | | (7,473,875 | ) | | | | | (25,513,161 | ) | | | (5,235,160 | ) | | | | | - | | | | - | |
Net increase (decrease) | | | (27,005,342 | ) | | | 84,790,863 | | | | | | (21,084,030 | ) | | | 57,347,852 | | | | | | 86 | | | | 757 | |
Shares outstanding, beginning of year or period | | | 84,790,863 | | | | - | | | | | | 57,347,852 | | | | - | | | | | | 757 | | | | - | |
Shares outstanding, end of year or period | | | 57,785,521 | | | | 84,790,863 | | | | | | 36,263,822 | | | | 57,347,852 | | | | | | 843 | | | | 757 | |
D-29
PACIFIC SELECT FUND
NOTES TO FINANCIAL STATEMENTS (Continued)
| | | | | | | | | | | | | | | | | | | | | | | | | | | | |
| | | Growth LT | | | | | Large-Cap Growth | | | | | Large-Cap Value | |
| | | 2012 | | | 2011 | | | | | 2012 | | | 2011 | | | | | 2012 | | | 2011 | |
Class I | | | | | | | | | | | | | | | | | | | | | | | | | | | | |
Shares sold | | | 922,796 | | | | 637,685 | | | | | | 7,503,639 | | | | 5,282,534 | | | | | | 1,931,610 | | | | 2,384,019 | |
Dividend and distribution reinvested | | | 12,232,257 | | | | 3,093,668 | | | | | | 4,899,309 | | | | 29,274,715 | | | | | | 1,193,604 | | | | 3,294,650 | |
Shares repurchased | | | (4,316,396 | ) | | | (62,789,886 | ) | | | | | (8,358,560 | ) | | | (248,057,318 | ) | | | | | (4,828,826 | ) | | | (253,267,412 | ) |
Net increase (decrease) | | | 8,838,657 | | | | (59,058,533 | ) | | | | | 4,044,388 | | | | (213,500,069 | ) | | | | | (1,703,612 | ) | | | (247,588,743 | ) |
Shares outstanding, beginning of year | | | 22,770,888 | | | | 81,829,421 | | | | | | 23,596,056 | | | | 237,096,125 | | | | | | 27,325,575 | | | | 274,914,318 | |
Shares outstanding, end of year | | | 31,609,545 | | | | 22,770,888 | | | | | | 27,640,444 | | | | 23,596,056 | | | | | | 25,621,963 | | | | 27,325,575 | |
| | | | | | | | |
Class P | | | | | | | | | | | | | | | | | | | | | | | | | | | | |
Shares sold | | | 206,749 | | | | 35,860,424 | | | | | | 20,484,444 | | | | 195,554,911 | | | | | | 39,650,098 | | | | 230,221,200 | |
Dividend and distribution reinvested | | | 3,528,659 | | | | 111,972 | | | | | | 28,330,818 | | | | - | | | | | | 10,830,484 | | | | 1,823,205 | |
Shares repurchased | | | (31,189,670 | ) | | | (2,199,368 | ) | | | | | (34,751,741 | ) | | | (19,988,275 | ) | | | | | (72,498,343 | ) | | | (15,944,539 | ) |
Net increase (decrease) | | | (27,454,262 | ) | | | 33,773,028 | | | | | | 14,063,521 | | | | 175,566,636 | | | | | | (22,017,761 | ) | | | 216,099,866 | |
Shares outstanding, beginning of year or period | | | 33,773,028 | | | | - | | | | | | 175,566,636 | | | | - | | | | | | 216,099,866 | | | | - | |
Shares outstanding, end of year or period | | | 6,318,766 | | | | 33,773,028 | | | | | | 189,630,157 | | | | 175,566,636 | | | | | | 194,082,105 | | | | 216,099,866 | |
| | | | | |
| | | Long/Short Large-Cap | | | | | Main Street Core | | | | | Mid-Cap Equity | |
| | | 2012 | | | 2011 | | | | | 2012 | | | 2011 | | | | | 2012 | | | 2011 | |
Class I | | | | | | | | | | | | | | | | | | | | | | | | | | | | |
Shares sold | | | 1,197,642 | | | | 1,433,131 | | | | | | 1,025,116 | | | | 907,480 | | | | | | 1,178,965 | | | | 1,425,050 | |
Dividend and distribution reinvested | | | 654,080 | | | | 20,027,848 | | | | | | 1,585,421 | | | | 6,816,758 | | | | | | 7,129,292 | | | | 21,079,048 | |
Shares repurchased | | | (1,113,444 | ) | | | (191,054,690 | ) | | | | | (5,021,056 | ) | | | (56,182,824 | ) | | | | | (5,732,016 | ) | | | (133,452,638 | ) |
Net increase (decrease) | | | 738,278 | | | | (169,593,711 | ) | | | | | (2,410,519 | ) | | | (48,458,586 | ) | | | | | 2,576,241 | | | | (110,948,540 | ) |
Shares outstanding, beginning of year | | | 3,702,452 | | | | 173,296,163 | | | | | | 29,863,273 | | | | 78,321,859 | | | | | | 27,086,256 | | | | 138,034,796 | |
Shares outstanding, end of year | | | 4,440,730 | | | | 3,702,452 | | | | | | 27,452,754 | | | | 29,863,273 | | | | | | 29,662,497 | | | | 27,086,256 | |
| | | | | | | | |
Class P | | | | | | | | | | | | | | | | | | | | | | | | | | | | |
Shares sold | | | 29,964,787 | | | | 167,409,861 | | | | | | 6,192,229 | | | | 48,096,937 | | | | | | 2,580,520 | | | | 106,173,157 | |
Dividend and distribution reinvested | | | 20,827,011 | | | | 563,780 | | | | | | 2,522,466 | | | | 209,777 | | | | | | 13,765,536 | | | | 272,830 | |
Shares repurchased | | | (59,016,995 | ) | | | (12,260,450 | ) | | | | | (10,553,483 | ) | | | (4,433,886 | ) | | | | | (52,574,962 | ) | | | (6,107,716 | ) |
Net increase (decrease) | | | (8,225,197 | ) | | | 155,713,191 | | | | | | (1,838,788 | ) | | | 43,872,828 | | | | | | (36,228,906 | ) | | | 100,338,271 | |
Shares outstanding, beginning of year or period | | | 155,713,191 | | | | - | | | | | | 43,872,828 | | | | - | | | | | | 100,338,271 | | | | - | |
Shares outstanding, end of year or period | | | 147,487,994 | | | | 155,713,191 | | | | | | 42,034,040 | | | | 43,872,828 | | | | | | 64,109,365 | | | | 100,338,271 | |
| | | | | |
| | | Mid-Cap Growth | | | | | Mid-Cap Value | | | | | Small-Cap Equity | |
| | | 2012 | | | 2011 | | | | | 2012 | | | 2011 | | | | | 2012 | | | 2011 | |
Class I | | | | | | | | | | | | | | | | | | | | | | | | | | | | |
Shares sold | | | 3,651,097 | | | | 4,899,726 | | | | | | 2,586,743 | | | | 1,976,962 | | | | | | 1,434,582 | | | | 1,526,546 | |
Dividend and distribution reinvested | | | 6,928,314 | | | | 7,369,683 | | | | | | 472,440 | | | | 21,005,026 | | | | | | 267,794 | | | | 13,665,173 | |
Shares repurchased | | | (7,668,288 | ) | | | (119,263,824 | ) | | | | | (2,306,969 | ) | | | (101,175,693 | ) | | | | | (1,629,029 | ) | | | (88,093,449 | ) |
Net increase (decrease) | | | 2,911,123 | | | | (106,994,415 | ) | | | | | 752,214 | | | | (78,193,705 | ) | | | | | 73,347 | | | | (72,901,730 | ) |
Shares outstanding, beginning of year | | | 23,566,050 | | | | 130,560,465 | | | | | | 4,038,693 | | | | 82,232,398 | | | | | | 3,500,324 | | | | 76,402,054 | |
Shares outstanding, end of year | | | 26,477,173 | | | | 23,566,050 | | | | | | 4,790,907 | | | | 4,038,693 | | | | | | 3,573,671 | | | | 3,500,324 | |
| | | | | | | | |
Class P | | | | | | | | | | | | | | | | | | | | | | | | | | | | |
Shares sold | | | 4,140,992 | | | | 89,696,259 | | | | | | 38,839,956 | | | | 76,022,895 | | | | | | 6,162,809 | | | | 74,605,023 | |
Dividend and distribution reinvested | | | 20,342,186 | | | | - | | | | | | 8,567,820 | | | | 360,985 | | | | | | 4,282,480 | | | | 329,539 | |
Shares repurchased | | | (41,569,349 | ) | | | (4,683,313 | ) | | | | | (26,752,865 | ) | | | (4,197,172 | ) | | | | | (16,601,032 | ) | | | (4,865,023 | ) |
Net increase (decrease) | | | (17,086,171 | ) | | | 85,012,946 | | | | | | 20,654,911 | | | | 72,186,708 | | | | | | (6,155,743 | ) | | | 70,069,539 | |
Shares outstanding, beginning of year or period | | | 85,012,946 | | | | - | | | | | | 72,186,708 | | | | - | | | | | | 70,069,539 | | | | - | |
Shares outstanding, end of year or period | | | 67,926,775 | | | | 85,012,946 | | | | | | 92,841,619 | | | | 72,186,708 | | | | | | 63,913,796 | | | | 70,069,539 | |
| | | | | |
| | | Small-Cap Growth | | | | | Small-Cap Index | | | | | Small-Cap Value | |
| | | 2012 | | | 2011 | | | | | 2012 | | | 2011 | | | | | 2012 | | | 2011 | |
Class I | | | | | | | | | | | | | | | | | | | | | | | | | | | | |
Shares sold | | | 1,531,319 | | | | 2,346,384 | | | | | | 2,501,834 | | | | 2,635,607 | | | | | | 1,322,002 | | | | 2,489,567 | |
Dividend and distribution reinvested | | | 1,740,674 | | | | 7,240,243 | | | | | | 849,480 | | | | 214,596 | | | | | | 2,007,983 | | | | 7,001,111 | |
Shares repurchased | | | (2,927,794 | ) | | | (54,450,075 | ) | | | | | (5,435,215 | ) | | | (14,151,764 | ) | | | | | (3,342,834 | ) | | | (40,173,270 | ) |
Net increase (decrease) | | | 344,199 | | | | (44,863,448 | ) | | | | | (2,083,901 | ) | | | (11,301,561 | ) | | | | | (12,849 | ) | | | (30,682,592 | ) |
Shares outstanding, beginning of year | | | 10,673,167 | | | | 55,536,615 | | | | | | 32,496,265 | | | | 43,797,826 | | | | | | 14,037,267 | | | | 44,719,859 | |
Shares outstanding, end of year | | | 11,017,366 | | | | 10,673,167 | | | | | | 30,412,364 | | | | 32,496,265 | | | | | | 14,024,418 | | | | 14,037,267 | |
| | | | | | | | |
Class P | | | | | | | | | | | | | | | | | | | | | | | | | | | | |
Shares sold | | | 948,522 | | | | 40,755,437 | | | | | | 25,501,663 | | | | 5,286,410 | | | | | | 17,914 | | | | 25,379,175 | |
Dividend and distribution reinvested | | | 4,687,012 | | | | - | | | | | | 783,563 | | | | 21,020 | | | | | | 3,052,075 | | | | 192,017 | |
Shares repurchased | | | (9,602,786 | ) | | | (2,246,291 | ) | | | | | (1,574,861 | ) | | | (372,458 | ) | | | | | (2,366,039 | ) | | | (1,946,763 | ) |
Net increase (decrease) | | | (3,967,252 | ) | | | 38,509,146 | | | | | | 24,710,365 | | | | 4,934,972 | | | | | | 703,950 | | | | 23,624,429 | |
Shares outstanding, beginning of year or period | | | 38,509,146 | | | | - | | | | | | 4,934,972 | | | | - | | | | | | 23,624,429 | | | | - | |
Shares outstanding, end of year or period | | | 34,541,894 | | | | 38,509,146 | | | | | | 29,645,337 | | | | 4,934,972 | | | | | | 24,328,379 | | | | 23,624,429 | |
D-30
PACIFIC SELECT FUND
NOTES TO FINANCIAL STATEMENTS (Continued)
| | | | | | | | | | | | | | | | | | | | | | | | | | | | |
| | | Health Sciences | | | | | Real Estate | | | | | Technology | |
| | | 2012 | | | 2011 | | | | | 2012 | | | 2011 | | | | | 2012 | | | 2011 | |
Class I | | | | | | | | | | | | | | | | | | | | | | | | | | | | |
Shares sold | | | 2,198,968 | | | | 3,630,876 | | | | | | 2,684,293 | | | | 3,909,620 | | | | | | 3,774,859 | | | | 5,723,742 | |
Dividend and distribution reinvested | | | 585,608 | | | | 686,095 | | | | | | 1,013,087 | | | | 1,553,525 | | | | | | 1,677,100 | | | | 3,640,770 | |
Shares repurchased | | | (2,112,286 | ) | | | (3,223,924 | ) | | | | | (3,441,290 | ) | | | (31,259,677 | ) | | | | | (6,069,494 | ) | | | (8,855,435 | ) |
Net increase (decrease) | | | 672,290 | | | | 1,093,047 | | | | | | 256,090 | | | | (25,796,532 | ) | | | | | (617,535 | ) | | | 509,077 | |
Shares outstanding, beginning of year | | | 10,255,609 | | | | 9,162,562 | | | | | | 17,069,105 | | | | 42,865,637 | | | | | | 16,834,670 | | | | 16,325,593 | |
Shares outstanding, end of year | | | 10,927,899 | | | | 10,255,609 | | | | | | 17,325,195 | | | | 17,069,105 | | | | | | 16,217,135 | | | | 16,834,670 | |
| | | | | | | | |
Class P | | | | | | | | | | | | | | | | | | | | | | | | | | | | |
Shares sold | | | - | | | | 735 | | | | | | 30,096,848 | | | | 23,988,366 | | | | | | - | | | | 1,706 | |
Dividend and distribution reinvested | | | 38 | | | | - | | | | | | 2,955,899 | | | | 214,737 | | | | | | 131 | | | | - | |
Shares repurchased | | | - | | | | - | | | | | | (5,704,480 | ) | | | (2,061,591 | ) | | | | | - | | | | - | |
Net increase | | | 38 | | | | 735 | | | | | | 27,348,267 | | | | 22,141,512 | | | | | | 131 | | | | 1,706 | |
Shares outstanding, beginning of year or period | | | 735 | | | | - | | | | | | 22,141,512 | | | | - | | | | | | 1,706 | | | | - | |
Shares outstanding, end of year or period | | | 773 | | | | 735 | | | | | | 49,489,779 | | | | 22,141,512 | | | | | | 1,837 | | | | 1,706 | |
| | | | | |
| | | Emerging Markets | | | | | International Large-Cap | | | | | International Small-Cap | |
| | | 2012 | | | 2011 | | | | | 2012 | | | 2011 | | | | | 2012 | | | 2011 | |
Class I | | | | | | | | | | | | | | | | | | | | | | | | | | | | |
Shares sold | | | 3,740,858 | | | | 4,490,658 | | | | | | 6,994,152 | | | | 10,715,463 | | | | | | 2,105,832 | | | | 1,715,659 | |
Dividend and distribution reinvested | | | 3,881,489 | | | | 1,114,578 | | | | | | 905,376 | | | | 5,180,899 | | | | | | 174,691 | | | | 3,422,310 | |
Shares repurchased | | | (5,076,303 | ) | | | (86,003,004 | ) | | | | | (8,890,514 | ) | | | (324,746,063 | ) | | | | | (1,980,898 | ) | | | (116,278,413 | ) |
Net increase (decrease) | | | 2,546,044 | | | | (80,397,768 | ) | | | | | (990,986 | ) | | | (308,849,701 | ) | | | | | 299,625 | | | | (111,140,444 | ) |
Shares outstanding, beginning of year | | | 28,091,749 | | | | 108,489,517 | | | | | | 64,905,930 | | | | 373,755,631 | | | | | | 6,731,701 | | | | 117,872,145 | |
Shares outstanding, end of year | | | 30,637,793 | | | | 28,091,749 | | | | | | 63,914,944 | | | | 64,905,930 | | | | | | 7,031,326 | | | | 6,731,701 | |
| | | | | | | | |
Class P | | | | | | | | | | | | | | | | | | | | | | | | | | | | |
Shares sold | | | 3,097,173 | | | | 76,403,870 | | | | | | 14,765,673 | | | | 324,046,377 | | | | | | 9,501,023 | | | | 149,425,357 | |
Dividend and distribution reinvested | | | 9,346,753 | | | | 286,707 | | | | | | 5,003,777 | | | | 1,448,358 | | | | | | 3,037,027 | | | | 974,269 | |
Shares repurchased | | | (11,094,485 | ) | | | (4,056,006 | ) | | | | | (108,149,322 | ) | | | (17,102,202 | ) | | | | | (19,365,590 | ) | | | (7,899,999 | ) |
Net increase (decrease) | | | 1,349,441 | | | | 72,634,571 | | | | | | (88,379,872 | ) | | | 308,392,533 | | | | | | (6,827,540 | ) | | | 142,499,627 | |
Shares outstanding, beginning of year or period | | | 72,634,571 | | | | - | | | | | | 308,392,533 | | | | - | | | | | | 142,499,627 | | | | - | |
Shares outstanding, end of year or period | | | 73,984,012 | | | | 72,634,571 | | | | | | 220,012,661 | | | | 308,392,533 | | | | | | 135,672,087 | | | | 142,499,627 | |
| | | | | |
| | | International Value | | | | | Currency Strategies (3) | | | | | Global Absolute Return (3) | |
| | | 2012 | | | 2011 | | | | | 2012 | | | 2011 | | | | | 2012 | | | 2011 | |
Class I | | | | | | | | | | | | | | | | | | | | | | | | | | | | |
Shares sold | | | 3,701,300 | | | | 2,947,991 | | | | | | 37,563 | | | | | | | | | | 116,347 | | | | | |
Dividend and distribution reinvested | | | 1,099,204 | | | | 4,842,838 | | | | | | - | | | | | | | | | | - | | | | | |
Shares repurchased | | | (5,496,929 | ) | | | (126,874,377 | ) | | | | | (14,893 | ) | | | | | | | | | (23,875 | ) | | | | |
Net increase (decrease) | | | (696,425 | ) | | | (119,083,548 | ) | | | | | 22,670 | | | | | | | | | | 92,472 | | | | | |
Shares outstanding, beginning of year or period | | | 33,317,131 | | | | 152,400,679 | | | | | | - | | | | | | | | | | - | | | | | |
Shares outstanding, end of year or period | | | 32,620,706 | | | | 33,317,131 | | | | | | 22,670 | | | | | | | | | | 92,472 | | | | | |
| | | | | | | | |
Class P | | | | | | | | | | | | | | | | | | | | | | | | | | | | |
Shares sold | | | 27,033,053 | | | | 125,008,775 | | | | | | 152,215,939 | | | | | | | | | | 208,393,712 | | | | | |
Dividend and distribution reinvested | | | 4,759,674 | | | | 808,141 | | | | | | - | | | | | | | | | | - | | | | | |
Shares repurchased | | | (37,154,179 | ) | | | (6,651,595 | ) | | | | | (4,799,741 | ) | | | | | | | | | (5,109,162 | ) | | | | |
Net increase (decrease) | | | (5,361,452 | ) | | | 119,165,321 | | | | | | 147,416,198 | | | | | | | | | | 203,284,550 | | | | | |
Shares outstanding, beginning of year or period | | | 119,165,321 | | | | - | | | | | | - | | | | | | | | | | - | | | | | |
Shares outstanding, end of year or period | | | 113,803,869 | | | | 119,165,321 | | | | | | 147,416,198 | | | | | | | | | | 203,284,550 | | | | | |
D-31
PACIFIC SELECT FUND
NOTES TO FINANCIAL STATEMENTS (Continued)
| | | | | | | | | | | | | | | | | | | | | | | | | | | | |
| | | Precious Metals (3) | | | | | American Funds Asset Allocation | | | | | Pacific Dynamix-Conservative Growth | |
| | | 2012 | | | 2011 | | | | | 2012 | | | 2011 | | | | | 2012 | | | 2011 | |
Class I | | | | | | | | | | | | | | | | | | | | | | | | | | | | |
Shares sold | | | 285,606 | | | | | | | | | | 17,337,949 | | | | 5,084,986 | | | | | | 9,687,834 | | | | 4,747,995 | |
Dividend and distribution reinvested | | | - | | | | | | | | | | 965,854 | | | | 839,023 | | | | | | 941,186 | | | | 925,626 | |
Shares repurchased | | | (17,818 | ) | | | | | | | | | (1,511,973 | ) | | | (1,721,959 | ) | | | | | (1,237,359 | ) | | | (4,632,190 | ) |
Net increase | | | 267,788 | | | | | | | | | | 16,791,830 | | | | 4,202,050 | | | | | | 9,391,661 | | | | 1,041,431 | |
Shares outstanding, beginning of year or period | | | - | | | | | | | | | | 20,166,642 | | | | 15,964,592 | | | | | | 11,941,443 | | | | 10,900,012 | |
Shares outstanding, end of year or period | | | 267,788 | | | | | | | | | | 36,958,472 | | | | 20,166,642 | | | | | | 21,333,104 | | | | 11,941,443 | |
| | | | | | | | |
Class P | | | | | | | | | | | | | | | | | | | | | | | | | | | | |
Shares sold | | | 96,697,682 | | | | | | | | | | | | | | | | | | | | | | | | | |
Dividend and distribution reinvested | | | - | | | | | | | | | | | | | | | | | | | | | | | | | |
Shares repurchased | | | (1,330,371 | ) | | | | | | | | | | | | | | | | | | | | | | | | |
Net increase | | | 95,367,311 | | | | | | | | | | | | | | | | | | | | | | | | | |
Shares outstanding, beginning of year or period | | | - | | | | | | | | | | | | | | | | | | | | | | | | | |
Shares outstanding, end of year or period | | | 95,367,311 | | | | | | | | | | | | | | | | | | | | | | | | | |
| | | | | |
| | | Pacific Dynamix-Moderate Growth | | | | | Pacific Dynamix-Growth | | | | | Portfolio Optimization Conservative (1) | |
| | | 2012 | | | 2011 | | | | | 2012 | | | 2011 | | | | | 2012 | | | 2011 | |
Class I | | | | | | | | | | | | | | | | | | | | | | | | | | | | |
Shares sold | | | 24,860,845 | | | | 11,791,521 | | | | | | 5,339,729 | | | | 7,155,085 | | | | | | 47,290,784 | | | | 391,749,983 | |
Dividend and distribution reinvested | | | 1,280,211 | | | | 918,483 | | | | | | 924,091 | | | | 513,957 | | | | | | 8,722,880 | | | | 3,171,453 | |
Shares repurchased | | | (1,256,113 | ) | | | (1,575,529 | ) | | | | | (1,883,780 | ) | | | (771,091 | ) | | | | | (59,910,579 | ) | | | (34,673,857 | ) |
Net increase (decrease) | | | 24,884,943 | | | | 11,134,475 | | | | | | 4,380,040 | | | | 6,897,951 | | | | | | (3,896,915 | ) | | | 360,247,579 | |
Shares outstanding, beginning of year or period | | | 23,491,204 | | | | 12,356,729 | | | | | | 15,090,616 | | | | 8,192,665 | | | | | | 360,247,579 | | | | - | |
Shares outstanding, end of year or period | | | 48,376,147 | | | | 23,491,204 | | | | | | 19,470,656 | | | | 15,090,616 | | | | | | 356,350,664 | | | | 360,247,579 | |
| | | | | |
| | | Portfolio Optimization
Moderate-Conservative (1) | | | | | Portfolio Optimization Moderate (1) | | | | | Portfolio Optimization Growth (1) | |
| | | 2012 | | | 2011 | | | | | 2012 | | | 2011 | | | | | 2012 | | | 2011 | |
Class I | | | | | | | | | | | | | | | | | | | | | | | | | | | | |
Shares sold | | | 52,340,901 | | | | 449,192,256 | | | | | | 26,975,509 | | | | 1,669,381,567 | | | | | | 3,678,543 | | | | 1,473,100,618 | |
Dividend and distribution reinvested | | | 10,080,271 | | | | 3,199,736 | | | | | | 29,141,323 | | | | 10,642,244 | | | | | | 21,138,867 | | | | 7,369,721 | |
Shares repurchased | | | (34,401,825 | ) | | | (31,777,976 | ) | | | | | (152,116,543 | ) | | | (125,399,352 | ) | | | | | (167,291,178 | ) | | | (100,970,640 | ) |
Net increase (decrease) | | | 28,019,347 | | | | 420,614,016 | | | | | | (95,999,711 | ) | | | 1,554,624,459 | | | | | | (142,473,768 | ) | | | 1,379,499,699 | |
Shares outstanding, beginning of year or period | | | 420,614,016 | | | | - | | | | | | 1,554,624,459 | | | | - | | | | | | 1,379,499,699 | | | | - | |
Shares outstanding, end of year or period | | | 448,633,363 | | | | 420,614,016 | | | | | | 1,458,624,748 | | | | 1,554,624,459 | | | | | | 1,237,025,931 | | | | 1,379,499,699 | |
| | | | | | | |
| | | Portfolio Optimization
Aggressive-Growth (1) | | | | | | | | | | | | | | | | | |
| | | 2012 | | | 2011 | | | | | | | | | | | | | | | | | |
Class I | | | | | | | | | | | | | | | | | | | | | | | | | | | | |
Shares sold | | | 1,775,612 | | | | 335,025,263 | | | | | | | | | | | | | | | | | | | | | |
Dividend and distribution reinvested | | | 3,678,340 | | | | 1,380,306 | | | | | | | | | | | | | | | | | | | | | |
Shares repurchased | | | (44,314,453 | ) | | | (34,553,953 | ) | | | | | | | | | | | | | | | | | | | | |
Net increase (decrease) | | | (38,860,501 | ) | | | 301,851,616 | | | | | | | | | | | | | | | | | | | | | |
Shares outstanding, beginning of year or period | | | 301,851,616 | | | | - | | | | | | | | | | | | | | | | | | | | | |
Shares outstanding, end of year or period | | | 262,991,115 | | | | 301,851,616 | | | | | | | | | | | | | | | | | | | | | |
| | (1) | Operations commenced on May 2, 2011. |
| | (2) | Operations commenced on April 30, 2012. |
| | (3) | Operations commenced on September 28, 2012. |
D-32
REPORT OF INDEPENDENT REGISTERED PUBLIC ACCOUNTING FIRM
The Board of Trustees and Shareholders of
Pacific Select Fund:
We have audited the accompanying statements of assets and liabilities, including the schedules of investments (as to the Equity Index, Small-Cap Equity, and Small-Cap Index Portfolios, the summary schedules of investments), of the Cash Management, Diversified Bond, Floating Rate Loan, High Yield Bond, Inflation Managed, Inflation Protected, Managed Bond, Short Duration Bond, Emerging Markets Debt, American Funds® Growth, American Funds Growth-Income, Comstock, Dividend Growth, Equity Index, Focused 30, Growth LT, Large-Cap Growth, Large-Cap Value, Long/Short Large-Cap, Main Street® Core, Mid-Cap Equity, Mid-Cap Growth, Mid-Cap Value, Small-Cap Equity, Small-Cap Growth, Small-Cap Index, Small-Cap Value, Health Sciences, Real Estate, Technology, Emerging Markets, International Large-Cap, International Small-Cap, International Value, Currency Strategies, Global Absolute Return, Precious Metals, American Funds Asset Allocation, Pacific Dynamix – Conservative Growth, Pacific Dynamix – Moderate Growth, Pacific Dynamix – Growth, Portfolio Optimization Conservative, Portfolio Optimization Moderate-Conservative, Portfolio Optimization Moderate, Portfolio Optimization Growth, and Portfolio Optimization Aggressive-Growth Portfolios (collectively the “Funds”) (forty-six of fifty-four portfolios comprising Pacific Select Fund) as of December 31, 2012, the related statements of operations for the year then ended (as to the Emerging Markets Debt, Currency Strategies, Global Absolute Return, and Precious Metals Portfolios, for the period from commencement of operations through December 31, 2012), the statements of changes in net assets for each of the two years in the period then ended (as to the Emerging Markets Debt, Currency Strategies, Global Absolute Return, and Precious Metals Portfolios, for the period from commencement of operations through December 31, 2012; as to the Inflation Protected, Portfolio Optimization Conservative, Portfolio Optimization Moderate-Conservative, Portfolio Optimization Moderate, Portfolio Optimization Growth, and Portfolio Optimization Aggressive-Growth Portfolios, for the year ended December 31, 2012 and the period from commencement of operations through December 31, 2011), the statements of cash flows for the year then ended for the Inflation Managed and Long/Short Large-Cap Portfolios, and the financial highlights for each of the periods presented. These financial statements and financial highlights are the responsibility of the Funds’ management. Our responsibility is to express an opinion on these financial statements and financial highlights based on our audits.
We conducted our audits in accordance with the standards of the Public Company Accounting Oversight Board (United States). Those standards require that we plan and perform the audit to obtain reasonable assurance about whether the financial statements and financial highlights are free of material misstatement. The Funds are not required to have, nor were we engaged to perform, an audit of their internal control over financial reporting. Our audits included consideration of internal control over financial reporting as a basis for designing audit procedures that are appropriate in the circumstances, but not for the purpose of expressing an opinion on the effectiveness of the Funds’ internal control over financial reporting. Accordingly, we express no such opinion. An audit also includes examining, on a test basis, evidence supporting the amounts and disclosures in the financial statements, assessing the accounting principles used and significant estimates made by management, as well as evaluating the overall financial statement presentation. Our procedures included confirmation of investments owned as of December 31, 2012, by correspondence with the custodian, agent banks, transfer agent, and brokers; where replies were not received from brokers, we performed other auditing procedures. We believe that our audits provide a reasonable basis for our opinion.
In our opinion, such financial statements and financial highlights referred to above present fairly, in all material respects, the financial position of each of the respective Funds as of December 31, 2012, and the results of their operations, the changes in their net assets, the cash flows for the Inflation Managed and Long/Short Large-Cap Portfolios, and the financial highlights for each of the periods presented, in conformity with accounting principles generally accepted in the United States of America.

Costa Mesa, California
February 27, 2013
E-1
PACIFIC SELECT FUND
DISCLOSURE OF FUND EXPENSES
(Unaudited)
We believe it is important for you to understand the impact of fees and expenses regarding your investment. All mutual funds have operating expenses. As a shareholder of a mutual fund, you incur ongoing costs, which include advisory fees, service fees, and other fund expenses. The following example is intended to help you understand your ongoing costs (in dollars) of investing in each portfolio and to compare these costs with those of other mutual funds. The example is based on an investment of $1,000.00 made at the beginning of the period and held for the entire six-month period from July 1, 2012 to December 31, 2012. These examples do not reflect fees and expenses of any variable annuity contract or variable life insurance policy (each a “Variable Contract”), and would be higher if they did.
ACTUAL EXPENSES
The first section of the table below for each portfolio provides information about actual account values and actual expenses based on each portfolio’s actual performance and each portfolio’s actual expenses, after any applicable fee waivers (Note 6 to Financial Statements) and other expense reductions (Note 7B to Financial Statements). The “Ending Account Value at 12/31/12” column shown is derived from the portfolio’s actual performance; the “Annualized Expense Ratio” column shows the portfolio’s actual annualized expense ratio; and the “Expenses Paid During the Period 07/01/12-12/31/12” column shows the dollar amount that would have been paid by you. All the information illustrated in the following table is based on the past six-month period from July 1, 2012 to December 31, 2012.
You may use the information in the first section, together with the amount you invested, to estimate the expenses that you paid over the period. To do so, for each portfolio in your account, simply divide that portfolio’s value by $1,000.00 (for example, an $8,600.00 portfolio value divided by $1,000.00 = 8.6), then multiply this result by the number given for your portfolio(s) in the first section under the heading entitled “Expenses Paid During the Period 07/01/12-12/31/12.”
HYPOTHETICAL EXAMPLE FOR COMPARISON PURPOSE
The second section of the table for each portfolio provides information about hypothetical account values and hypothetical expenses based on a 5% per year hypothetical rate of return and the actual portfolio’s expenses, after any applicable fee waivers and other expense reductions. It assumes that the portfolio had an annual 5% rate of return before expenses, but that the expense ratio is unchanged. The hypothetical account values and expenses may not be used to estimate the actual ending account values or expenses you paid for the period.
You may use the hypothetical example information to compare the ongoing costs of investing in the portfolio to other mutual funds. To do so, compare this 5% hypothetical example with the 5% hypothetical examples that appear in the shareholder reports of other mutual funds.
Please note that the expenses shown in the table are meant to highlight your ongoing costs only and do not reflect any transaction or Variable Contract costs. Therefore, the second section of the table is useful in comparing ongoing costs only, and will not help you determine the relative total costs of owning different mutual funds. In addition, if these other costs were included, your costs would have been higher.
| | | | | | | | | | | | | | | | |
| Portfolio | | Beginning
Account
Value at
07/01/12 | | | Ending
Account
Value at
12/31/12 | | | Annualized
Expense
Ratio | | | Expenses
Paid During
the Period
07/01/12-
12/31/12 (1) | |
Cash Management | | | | | | | | | | | | | | | | |
Actual | | | | | | | | | | | | | | | | |
Class I | | | $1,000.00 | | | | $1,000.00 | | | | 0.12% | | | | $0.60 | |
Class P | | | 1,000.00 | | | | 1,000.00 | | | | 0.12% | | | | 0.60 | |
Hypothetical | | | | | | | | | | | | | | | | |
Class I | | | $1,000.00 | | | | $1,024.53 | | | | 0.12% | | | | $0.61 | |
Class P | | | 1,000.00 | | | | 1,024.53 | | | | 0.12% | | | | 0.61 | |
| | | | |
Diversified Bond | | | | | | | | | | | | | | | | |
Actual | | | | | | | | | | | | | | | | |
Class I | | | $1,000.00 | | | | $1,035.90 | | | | 0.64% | | | | $3.28 | |
Class P | | | 1,000.00 | | | | 1,037.00 | | | | 0.44% | | | | 2.25 | |
Hypothetical | | | | | | | | | | | | | | | | |
Class I | | | $1,000.00 | | | | $1,021.92 | | | | 0.64% | | | | $3.25 | |
Class P | | | 1,000.00 | | | | 1,022.92 | | | | 0.44% | | | | 2.24 | |
| | | | |
Floating Rate Loan | | | | | | | | | | | | | | | | |
Actual | | | | | | | | | | | | | | | | |
Class I | | | $1,000.00 | | | | $1,041.40 | | | | 0.91% | | | | $4.67 | |
Class P | | | 1,000.00 | | | | 1,042.40 | | | | 0.71% | | | | 3.65 | |
Hypothetical | | | | | | | | | | | | | | | | |
Class I | | | $1,000.00 | | | | $1,020.56 | | | | 0.91% | | | | $4.62 | |
Class P | | | 1,000.00 | | | | 1,021.57 | | | | 0.71% | | | | 3.61 | |
| | | | | | | | | | | | | | | | |
| Portfolio | | Beginning
Account
Value at
07/01/12 | | | Ending
Account
Value at
12/31/12 | | | Annualized
Expense
Ratio | | | Expenses
Paid During
the Period
07/01/12-
12/31/12 (1) | |
High Yield Bond | | | | | | | | | | | | | | | | |
Actual | | | | | | | | | | | | | | | | |
Class I | | | $1,000.00 | | | | $1,081.90 | | | | 0.63% | | | | $3.30 | |
Class P | | | 1,000.00 | | | | 1,082.90 | | | | 0.44% | | | | 2.30 | |
Hypothetical | | | | | | | | | | | | | | | | |
Class I | | | $1,000.00 | | | | $1,021.97 | | | | 0.63% | | | | $3.20 | |
Class P | | | 1,000.00 | | | | 1,022.92 | | | | 0.44% | | | | 2.24 | |
| | | | |
Inflation Managed | | | | | | | | | | | | | | | | |
Actual | | | | | | | | | | | | | | | | |
Class I | | | $1,000.00 | | | | $1,039.30 | | | | 0.63% | | | | $3.23 | |
Class P | | | 1,000.00 | | | | 1,040.40 | | | | 0.43% | | | | 2.21 | |
Hypothetical | | | | | | | | | | | | | | | | |
Class I | | | $1,000.00 | | | | $1,021.97 | | | | 0.63% | | | | $3.20 | |
Class P | | | 1,000.00 | | | | 1,022.97 | | | | 0.43% | | | | 2.19 | |
| | | | |
Inflation Protected | | | | | | | | | | | | | | | | |
Actual | | | | | | | | | | | | | | | | |
Class I | | | $1,000.00 | | | | $1,019.60 | | | | 0.58% | | | | $2.94 | |
Class P | | | 1,000.00 | | | | 1,020.70 | | | | 0.38% | | | | 1.93 | |
Hypothetical | | | | | | | | | | | | | | | | |
Class I | | | $1,000.00 | | | | $1,022.22 | | | | 0.58% | | | | $2.95 | |
Class P | | | 1,000.00 | | | | 1,023.23 | | | | 0.38% | | | | 1.93 | |
F-1
PACIFIC SELECT FUND
DISCLOSURE OF FUND EXPENSES (Continued)
(Unaudited)
| | | | | | | | | | | | | | | | |
| Portfolio | | Beginning
Account
Value at
07/01/12 | | | Ending
Account
Value at
12/31/12 | | | Annualized
Expense
Ratio | | | Expenses
Paid During
the Period
07/01/12-
12/31/12 (1) | |
Managed Bond | | | | | | | | | | | | | | | | |
Actual | | | | | | | | | | | | | | | | |
Class I | | | $1,000.00 | | | | $1,047.20 | | | | 0.64% | | | | $3.29 | |
Class P | | | 1,000.00 | | | | 1,048.20 | | | | 0.44% | | | | 2.27 | |
Hypothetical | | | | | | | | | | | | | | | | |
Class I | | | $1,000.00 | | | | $1,021.92 | | | | 0.64% | | | | $3.25 | |
Class P | | | 1,000.00 | | | | 1,022.92 | | | | 0.44% | | | | 2.24 | |
| | | |
Short Duration Bond | | | | | | | | | | | | | |
Actual | | | | | | | | | | | | | | | | |
Class I | | | $1,000.00 | | | | $1,014.70 | | | | 0.64% | | | | $3.24 | |
Class P | | | 1,000.00 | | | | 1,015.70 | | | | 0.44% | | | | 2.23 | |
Hypothetical | | | | | | | | | | | | | | | | |
Class I | | | $1,000.00 | | | | $1,021.92 | | | | 0.64% | | | | $3.25 | |
Class P | | | 1,000.00 | | | | 1,022.92 | | | | 0.44% | | | | 2.24 | |
| | | |
Emerging Markets Debt | | | | | | | | | | | | | |
Actual | | | | | | | | | | | | | | | | |
Class I | | | $1,000.00 | | | | $1,106.00 | | | | 1.03% | | | | $5.45 | |
Class P | | | 1,000.00 | | | | 1,107.40 | | | | 0.84% | | | | 4.45 | |
Hypothetical | | | | | | | | | | | | | | | | |
Class I | | | $1,000.00 | | | | $1,019.96 | | | | 1.03% | | | | $5.23 | |
Class P | | | 1,000.00 | | | | 1,020.91 | | | | 0.84% | | | | 4.27 | |
| | | |
American Funds Growth (2) | | | | | | | | | | | | | |
Actual | | | | | | | | | | | | | | | | |
Class I | | | $1,000.00 | | | | $1,087.60 | | | | 0.63% | | | | $3.31 | |
Class P | | | 1,000.00 | | | | 1,088.70 | | | | 0.43% | | | | 2.26 | |
Hypothetical | | | | | | | | | | | | | | | | |
Class I | | | $1,000.00 | | | | $1,021.97 | | | | 0.63% | | | | $3.20 | |
Class P | | | 1,000.00 | | | | 1,022.97 | | | | 0.43% | | | | 2.19 | |
| | |
American Funds Growth-Income (2) | | | | | | | | | |
Actual | | | | | | | | | | | | | | | | |
Class I | | | $1,000.00 | | | | $1,081.40 | | | | 0.63% | | | | $3.30 | |
Class P | | | 1,000.00 | | | | 1,082.50 | | | | 0.43% | | | | 2.25 | |
Hypothetical | | | | | | | | | | | | | | | | |
Class I | | | $1,000.00 | | | | $1,021.97 | | | | 0.63% | | | | $3.20 | |
Class P | | | 1,000.00 | | | | 1,022.97 | | | | 0.43% | | | | 2.19 | |
| | | | |
Comstock | | | | | | | | | | | | | | | | |
Actual | | | | | | | | | | | | | | | | |
Class I | | | $1,000.00 | | | | $1,093.50 | | | | 0.91% | | | | $4.79 | |
Class P | | | 1,000.00 | | | | 1,094.60 | | | | 0.71% | | | | 3.74 | |
Hypothetical | | | | | | | | | | | | | | | | |
Class I | | | $1,000.00 | | | | $1,020.56 | | | | 0.91% | | | | $4.62 | |
Class P | | | 1,000.00 | | | | 1,021.57 | | | | 0.71% | | | | 3.61 | |
| | | | |
Dividend Growth | | | | | | | | | | | | | | | | |
Actual | | | | | | | | | | | | | | | | |
Class I | | | $1,000.00 | | | | $1,063.30 | | | | 0.90% | | | | $4.67 | |
Class P | | | 1,000.00 | | | | 1,064.40 | | | | 0.70% | | | | 3.63 | |
Hypothetical | | | | | | | | | | | | | | | | |
Class I | | | $1,000.00 | | | | $1,020.61 | | | | 0.90% | | | | $4.57 | |
Class P | | | 1,000.00 | | | | 1,021.62 | | | | 0.70% | | | | 3.56 | |
| | | | |
Equity Index | | | | | | | | | | | | | | | | |
Actual | | | | | | | | | | | | | | | | |
Class I | | | $1,000.00 | | | | $1,058.80 | | | | 0.28% | | | | $1.45 | |
Class P | | | 1,000.00 | | | | 1,059.90 | | | | 0.08% | | | | 0.41 | |
Hypothetical | | | | | | | | | | | | | | | | |
Class I | | | $1,000.00 | | | | $1,023.73 | | | | 0.28% | | | | $1.42 | |
Class P | | | 1,000.00 | | | | 1,024.73 | | | | 0.08% | | | | 0.41 | |
| | | | | | | | | | | | | | | | |
| Portfolio | | Beginning
Account
Value at
07/01/12 | | | Ending
Account
Value at
12/31/12 | | | Annualized
Expense
Ratio | | | Expenses
Paid During
the Period
07/01/12-
12/31/12 (1) | |
Focused 30 | | | | | | | | | | | | | | | | |
Actual | | | | | | | | | | | | | | | | |
Class I | | | $1,000.00 | | | | $1,061.00 | | | | 1.02% | | | | $5.28 | |
Class P | | | 1,000.00 | | | | 1,061.90 | | | | 0.85% | | | | 4.41 | |
Hypothetical | | | | | | | | | | | | | | | | |
Class I | | | $1,000.00 | | | | $1,020.01 | | | | 1.02% | | | | $5.18 | |
Class P | | | 1,000.00 | | | | 1,020.86 | | | | 0.85% | | | | 4.32 | |
| | | | |
Growth LT | | | | | | | | | | | | | | | | |
Actual | | | | | | | | | | | | | | | | |
Class I | | | $1,000.00 | | | | $1,077.60 | | | | 0.80% | | | | $4.18 | |
Class P | | | 1,000.00 | | | | 1,078.90 | | | | 0.57% | | | | 2.98 | |
Hypothetical | | | | | | | | | | | | | | | | |
Class I | | | $1,000.00 | | | | $1,021.11 | | | | 0.80% | | | | $4.06 | |
Class P | | | 1,000.00 | | | | 1,022.27 | | | | 0.57% | | | | 2.90 | |
| | | | |
Large-Cap Growth | | | | | | | | | | | | | | | | |
Actual | | | | | | | | | | | | | | | | |
Class I | | | $1,000.00 | | | | $1,063.30 | | | | 0.91% | | | | $4.72 | |
Class P | | | 1,000.00 | | | | 1,064.40 | | | | 0.71% | | | | 3.68 | |
Hypothetical | | | | | | | | | | | | | | | | |
Class I | | | $1,000.00 | | | | $1,020.56 | | | | 0.91% | | | | $4.62 | |
Class P | | | 1,000.00 | | | | 1,021.57 | | | | 0.71% | | | | 3.61 | |
| | | | |
Large-Cap Value | | | | | | | | | | | | | | | | |
Actual | | | | | | | | | | | | | | | | |
Class I | | | $1,000.00 | | | | $1,062.10 | | | | 0.82% | | | | $4.25 | |
Class P | | | 1,000.00 | | | | 1,063.20 | | | | 0.62% | | | | 3.22 | |
Hypothetical | | | | | | | | | | | | | | | | |
Class I | | | $1,000.00 | | | | $1,021.01 | | | | 0.82% | | | | $4.17 | |
Class P | | | 1,000.00 | | | | 1,022.02 | | | | 0.62% | | | | 3.15 | |
| | |
Long/Short Large-Cap | | | | | | | | | |
Actual | | | | | | | | | | | | | | | | |
Class I | | | $1,000.00 | | | | $1,081.60 | | | | 2.40% | | | | $12.56 | |
Class P | | | 1,000.00 | | | | 1,082.70 | | | | 2.19% | | | | 11.47 | |
Hypothetical | | | | | | | | | | | | | | | | |
Class I | | | $1,000.00 | | | | $1,013.07 | | | | 2.40% | | | | $12.14 | |
Class P | | | 1,000.00 | | | | 1,014.13 | | | | 2.19% | | | | 11.09 | |
| | | | |
Main Street Core | | | | | | | | | | | | | | | | |
Actual | | | | | | | | | | | | | | | | |
Class I | | | $1,000.00 | | | | $1,073.50 | | | | 0.68% | | | | $3.54 | |
Class P | | | 1,000.00 | | | | 1,074.60 | | | | 0.48% | | | | 2.50 | |
Hypothetical | | | | | | | | | | | | | | | | |
Class I | | | $1,000.00 | | | | $1,021.72 | | | | 0.68% | | | | $3.46 | |
Class P | | | 1,000.00 | | | | 1,022.72 | | | | 0.48% | | | | 2.44 | |
| | | | |
Mid-Cap Equity | | | | | | | | | | | | | | | | |
Actual | | | | | | | | | | | | | | | | |
Class I | | | $1,000.00 | | | | $1,041.40 | | | | 0.91% | | | | $4.67 | |
Class P | | | 1,000.00 | | | | 1,042.50 | | | | 0.70% | | | | 3.59 | |
Hypothetical | | | | | | | | | | | | | | | | |
Class I | | | $1,000.00 | | | | $1,020.56 | | | | 0.91% | | | | $4.62 | |
Class P | | | 1,000.00 | | | | 1,021.62 | | | | 0.70% | | | | 3.56 | |
| | | | |
Mid-Cap Growth | | | | | | | | | | | | | | | | |
Actual | | | | | | | | | | | | | | | | |
Class I | | | $1,000.00 | | | | $1,013.40 | | | | 0.95% | | | | $4.81 | |
Class P | | | 1,000.00 | | | | 1,014.40 | | | | 0.75% | | | | 3.80 | |
Hypothetical | | | | | | | | | | | | | | | | |
Class I | | | $1,000.00 | | | | $1,020.36 | | | | 0.95% | | | | $4.82 | |
Class P | | | 1,000.00 | | | | 1,021.37 | | | | 0.75% | | | | 3.81 | |
F-2
PACIFIC SELECT FUND
DISCLOSURE OF FUND EXPENSES (Continued)
(Unaudited)
| | | | | | | | | | | | | | | | |
| Portfolio | | Beginning
Account
Value at
07/01/12 | | | Ending
Account
Value at
12/31/12 | | | Annualized
Expense
Ratio | | | Expenses
Paid During
the Period
07/01/12-
12/31/12 (1) | |
Mid-Cap Value | | | | | | | | | | | | | | | | |
Actual | | | | | | | | | | | | | | | | |
Class I | | | $1,000.00 | | | | $1,090.50 | | | | 0.91% | | | | $4.78 | |
Class P | | | 1,000.00 | | | | 1,091.60 | | | | 0.71% | | | | 3.73 | |
Hypothetical | | | | | | | | | | | | | | | | |
Class I | | | $1,000.00 | | | | $1,020.56 | | | | 0.91% | | | | $4.62 | |
Class P | | | 1,000.00 | | | | 1,021.57 | | | | 0.71% | | | | 3.61 | |
| | | | |
Small-Cap Equity | | | | | | | | | | | | | | | | |
Actual | | | | | | | | | | | | | | | | |
Class I | | | $1,000.00 | | | | $1,127.10 | | | | 0.92% | | | | $4.92 | |
Class P | | | 1,000.00 | | | | 1,128.30 | | | | 0.72% | | | | 3.85 | |
Hypothetical | | | | | | | | | | | | | | | | |
Class I | | | $1,000.00 | | | | $1,020.51 | | | | 0.92% | | | | $4.67 | |
Class P | | | 1,000.00 | | | | 1,021.52 | | | | 0.72% | | | | 3.66 | |
| | | | |
Small-Cap Growth | | | | | | | | | | | | | | | | |
Actual | | | | | | | | | | | | | | | | |
Class I | | | $1,000.00 | | | | $1,056.20 | | | | 0.85% | | | | $4.39 | |
Class P | | | 1,000.00 | | | | 1,057.30 | | | | 0.66% | | | | 3.41 | |
Hypothetical | | | | | | | | | | | | | | | | |
Class I | | | $1,000.00 | | | | $1,020.86 | | | | 0.85% | | | | $4.32 | |
Class P | | | 1,000.00 | | | | 1,021.82 | | | | 0.66% | | | | 3.35 | |
| | | | |
Small-Cap Index | | | | | | | | | | | | | | | | |
Actual | | | | | | | | | | | | | | | | |
Class I | | | $1,000.00 | | | | $1,073.20 | | | | 0.54% | | | | $2.81 | |
Class P | | | 1,000.00 | | | | 1,074.10 | | | | 0.37% | | | | 1.93 | |
Hypothetical | | | | | | | | | | | | | | | | |
Class I | | | $1,000.00 | | | | $1,022.42 | | | | 0.54% | | | | $2.75 | |
Class P | | | 1,000.00 | | | | 1,023.28 | | | | 0.37% | | | | 1.88 | |
| | | | |
Small-Cap Value | | | | | | | | | | | | | | | | |
Actual | | | | | | | | | | | | | | | | |
Class I | | | $1,000.00 | | | | $1,092.90 | | | | 1.00% | | | | $5.26 | |
Class P | | | 1,000.00 | | | | 1,094.00 | | | | 0.80% | | | | 4.21 | |
Hypothetical | | | | | | | | | | | | | | | | |
Class I | | | $1,000.00 | | | | $1,020.11 | | | | 1.00% | | | | $5.08 | |
Class P | | | 1,000.00 | | | | 1,021.11 | | | | 0.80% | | | | 4.06 | |
| | | | |
Health Sciences | | | | | | | | | | | | | | | | |
Actual | | | | | | | | | | | | | | | | |
Class I | | | $1,000.00 | | | | $1,023.90 | | | | 1.14% | | | | $5.80 | |
Class P | | | 1,000.00 | | | | 1,024.90 | | | | 0.96% | | | | 4.89 | |
Hypothetical | | | | | | | | | | | | | | | | |
Class I | | | $1,000.00 | | | | $1,019.41 | | | | 1.14% | | | | $5.79 | |
Class P | | | 1,000.00 | | | | 1,020.31 | | | | 0.96% | | | | 4.88 | |
| | | | |
Real Estate | | | | | | | | | | | | | | | | |
Actual | | | | | | | | | | | | | | | | |
Class I | | | $1,000.00 | | | | $1,014.80 | | | | 1.05% | | | | $5.32 | |
Class P | | | 1,000.00 | | | | 1,015.70 | | | | 0.87% | | | | 4.41 | |
Hypothetical | | | | | | | | | | | | | | | | |
Class I | | | $1,000.00 | | | | $1,019.86 | | | | 1.05% | | | | $5.33 | |
Class P | | | 1,000.00 | | | | 1,020.76 | | | | 0.87% | | | | 4.42 | |
| | | | |
Technology | | | | | | | | | | | | | | | | |
Actual | | | | | | | | | | | | | | | | |
Class I | | | $1,000.00 | | | | $999.30 | | | | 1.16% | | | | $5.83 | |
Class P | | | 1,000.00 | | | | 1,000.20 | | | | 0.98% | | | | 4.93 | |
Hypothetical | | | | | | | | | | | | | | | | |
Class I | | | $1,000.00 | | | | $1,019.30 | | | | 1.16% | | | | $5.89 | |
Class P | | | 1,000.00 | | | | 1,020.21 | | | | 0.98% | | | | 4.98 | |
| | | | | | | | | | | | | | | | |
| Portfolio | | Beginning
Account
Value at
07/01/12 | | | Ending
Account
Value at
12/31/12 | | | Annualized
Expense
Ratio | | | Expenses
Paid During
the Period
07/01/12-
12/31/12 (1) | |
Emerging Markets | | | | | | | | | | | | | | | | |
Actual | | | | | | | | | | | | | | | | |
Class I | | | $1,000.00 | | | | $1,124.60 | | | | 1.06% | | | | $5.66 | |
Class P | | | 1,000.00 | | | | 1,125.70 | | | | 0.86% | | | | 4.60 | |
Hypothetical | | | | | | | | | | | | | | | | |
Class I | | | $1,000.00 | | | | $1,019.81 | | | | 1.06% | | | | $5.38 | |
Class P | | | 1,000.00 | | | | 1,020.81 | | | | 0.86% | | | | 4.37 | |
| | |
International Large-Cap | | | | | | | | | |
Actual | | | | | | | | | | | | | | | | |
Class I | | | $1,000.00 | | | | $1,152.90 | | | | 1.00% | | | | $5.41 | |
Class P | | | 1,000.00 | | | | 1,154.00 | | | | 0.80% | | | | 4.33 | |
Hypothetical | | | | | | | | | | | | | | | | |
Class I | | | $1,000.00 | | | | $1,020.11 | | | | 1.00% | | | | $5.08 | |
Class P | | | 1,000.00 | | | | 1,021.11 | | | | 0.80% | | | | 4.06 | |
|
International Small-Cap | |
Actual | | | | | | | | | | | | | | | | |
Class I | | | $1,000.00 | | | | $1,149.70 | | | | 1.07% | | | | $5.78 | |
Class P | | | 1,000.00 | | | | 1,150.80 | | | | 0.87% | | | | 4.70 | |
Hypothetical | | | | | | | | | | | | | | | | |
Class I | | | $1,000.00 | | | | $1,019.76 | | | | 1.07% | | | | $5.43 | |
Class P | | | 1,000.00 | | | | 1,020.76 | | | | 0.87% | | | | 4.42 | |
|
International Value | |
Actual | | | | | | | | | | | | | | | | |
Class I | | | $1,000.00 | | | | $1,136.60 | | | | 0.89% | | | | $4.78 | |
Class P | | | 1,000.00 | | | | 1,137.80 | | | | 0.69% | | | | 3.71 | |
Hypothetical | | | | | | | | | | | | | | | | |
Class I | | | $1,000.00 | | | | $1,020.66 | | | | 0.89% | | | | $4.52 | |
Class P | | | 1,000.00 | | | | 1,021.67 | | | | 0.69% | | | | 3.51 | |
|
Currency Strategies (3) | |
Actual | | | | | | | | | | | | | | | | |
Class I | | | $1,000.00 | | | | $988.60 | | | | 0.88% | | | | $2.27 | |
Class P | | | 1,000.00 | | | | 989.10 | | | | 0.68% | | | | 1.76 | |
Hypothetical | | | | | | | | | | | | | | | | |
Class I | | | $1,000.00 | | | | $1,020.71 | | | | 0.88% | | | | $4.47 | |
Class P | | | 1,000.00 | | | | 1,021.72 | | | | 0.68% | | | | 3.46 | |
|
Global Absolute Return (3) | |
Actual | | | | | | | | | | | | | | | | |
Class I | | | $1,000.00 | | | | $998.00 | | | | 1.07% | | | | $2.77 | |
Class P | | | 1,000.00 | | | | 998.50 | | | | 0.86% | | | | 2.23 | |
Hypothetical | | | | | | | | | | | | | | | | |
Class I | | | $1,000.00 | | | | $1.019.76 | | | | 1.07% | | | | $5.43 | |
Class P | | | 1,000.00 | | | | 1,020.81 | | | | 0.86% | | | | 4.37 | |
|
Precious Metals (3) | |
Actual | | | | | | | | | | | | | | | | |
Class I | | | $1,000.00 | | | | $859.90 | | | | 0.92% | | | | $2.22 | |
Class P | | | 1,000.00 | | | | 860.40 | | | | 0.72% | | | | 1.74 | |
Hypothetical | | | | | | | | | | | | | | | | |
Class I | | | $1,000.00 | | | | $1,020.51 | | | | 0.92% | | | | $4.67 | |
Class P | | | 1,000.00 | | | | 1,021.52 | | | | 0.72% | | | | 3.66 | |
|
American Funds Asset Allocation (2) | |
Actual | | | | | | | | | | | | | | | | |
Class I | | | $1,000.00 | | | | $1,074.60 | | | | 0.63% | | | | $3.29 | |
Hypothetical | | | | | | | | | | | | | | | | |
Class I | | | $1,000.00 | | | | $1,021.97 | | | | 0.63% | | | | $3.20 | |
F-3
PACIFIC SELECT FUND
DISCLOSURE OF FUND EXPENSES (Continued)
(Unaudited)
| | | | | | | | | | | | | | | | |
| Portfolio | | Beginning
Account
Value at
07/01/12 | | | Ending
Account
Value at
12/31/12 | | | Annualized
Expense
Ratio | | | Expenses
Paid During
the Period
07/01/12-
12/31/12 (1) | |
Pacific Dynamix - Conservative Growth (4) | |
Actual | | | | | | | | | | | | | | | | |
Class I | | | $1,000.00 | | | | $1,045.40 | | | | 0.39% | | | | $2.01 | |
Hypothetical | | | | | | | | | | | | | | | | |
Class I | | | $1,000.00 | | | | $1,023.18 | | | | 0.39% | | | | $1.98 | |
|
Pacific Dynamix - Moderate Growth (4) | |
Actual | | | | | | | | | | | | | | | | |
Class I | | | $1,000.00 | | | | $1,059.60 | | | | 0.36% | | | | $1.86 | |
Hypothetical | | | | | | | | | | | | | | | | |
Class I | | | $1,000.00 | | | | $1,023.33 | | | | 0.36% | | | | $1.83 | |
|
Pacific Dynamix - Growth (4) | |
Actual | | | | | | | | | | | | | | | | |
Class I | | | $1,000.00 | | | | $1,071.30 | | | | 0.35% | | | | $1.82 | |
Hypothetical | | | | | | | | | | | | | | | | |
Class I | | | $1,000.00 | | | | $1,023.38 | | | | 0.35% | | | | $1.78 | |
|
Portfolio Optimization Conservative (5) | |
Actual | | | | | | | | | | | | | | | | |
Class I | | | $1,000.00 | | | | $1,046.50 | | | | 0.21% | | | | $1.08 | |
Hypothetical | | | | | | | | | | | | | | | | |
Class I | | | $1,000.00 | | | | $1,024.08 | | | | 0.21% | | | | $1.07 | |
| | | | | | | | | | | | | | | | |
| Portfolio | | Beginning
Account
Value at
07/01/12 | | | Ending
Account
Value at
12/31/12 | | | Annualized
Expense
Ratio | | | Expenses
Paid During
the Period
07/01/12-
12/31/12 (1) | |
Portfolio Optimization Moderate-Conservative (5) | |
Actual | | | | | | | | | | | | | | | | |
Class I | | | $1,000.00 | | | | $1,053.80 | | | | 0.21% | | | | $1.08 | |
Hypothetical | | | | | | | | | | | | | | | | |
Class I | | | $1,000.00 | | | | $1,024.08 | | | | 0.21% | | | | $1.07 | |
|
Portfolio Optimization Moderate (5) | |
Actual | | | | | | | | | | | | | | | | |
Class I | | | $1,000.00 | | | | $1,061.60 | | | | 0.21% | | | | $1.09 | |
Hypothetical | | | | | | | | | | | | | | | | |
Class I | | | $1,000.00 | | | | $1,024.08 | | | | 0.21% | | | | $1.07 | |
|
Portfolio Optimization Growth (5) | |
Actual | | | | | | | | | | | | | | | | |
Class I | | | $1,000.00 | | | | $1,068.40 | | | | 0.21% | | | | $1.09 | |
Hypothetical | | | | | | | | | | | | | | | | |
Class I | | | $1,000.00 | | | | $1,024.08 | | | | 0.21% | | | | $1.07 | |
|
Portfolio Optimization Aggressive-Growth (5) | |
Actual | | | | | | | | | | | | | | | | |
Class I | | | $1,000.00 | | | | $1,074.20 | | | | 0.21% | | | | $1.09 | |
Hypothetical | | | | | | | | | | | | | | | | |
Class I | | | $1,000.00 | | | | $1,024.08 | | | | 0.21% | | | | $1.07 | |
| (1) | Expenses paid during the six-month period are equal to the portfolio’s annualized expense ratio (shown in the table above), multiplied by the average account value over the period, multiplied by the number of days in the most recent fiscal half-year, then divided by 366 days. |
| (2) | The annualized expense ratios for the American Funds Growth, American Funds Growth-Income and American Funds Asset Allocation Portfolios do not include expenses of the underlying Master Funds (see Note 1 in Notes to Financial Statements) in which the portfolios invest. |
| (3) | The Currency Strategies, Global Absolute Return and Precious Metals Portfolios commenced operations on September 28, 2012. The actual fund return and expenses paid during the period by these portfolios were for the period from September 28, 2012 to December 31, 2012 instead of the six-month period. The hypothetical return and expenses paid during the period are based on the entire six-month period for comparison purposes. |
| (4) | The annualized expense ratios for all the Pacific Dynamix Portfolios do not include expenses of the Pacific Dynamix Underlying Portfolios (see Note 1 in Notes to Financial Statements) in which the Pacific Dynamix Portfolios invest. |
| (5) | The annualized expense ratios for the Portfolio Optimization Portfolios do not include expenses of the Portfolio Optimization Underlying Funds (see Note 1 in Notes to Financial Statements) in which the Portfolio Optimization Portfolios invest. |
F-4
PACIFIC SELECT FUND
TRUSTEES AND OFFICERS INFORMATION
(Unaudited)
The business and affairs of the Fund are managed under the direction of the Board of Trustees under the Fund’s Declaration of Trust. Information pertaining to the trustees and officers of the Fund is set forth below, effective January 1, 2013. Trustees who are not deemed to be “interested persons” of the Fund, as defined in the 1940 Act, are referred to as “Independent Trustees.” Certain trustees and officers are deemed to be “interested persons” of the Fund and thus are referred to as “Interested Persons”, because of their positions with Pacific Life Insurance Company (“Pacific Life”) and Pacific Life Fund Advisors LLC, a wholly-owned subsidiary of Pacific Life. The Fund’s Statement of Additional Information includes additional information about the trustees. For information on availability of the Fund’s Statement of Additional Information, refer to the WHERE TO GO FOR MORE INFORMATION section of this report.
The address of each trustee and officer is c/o Pacific Select Fund, 700 Newport Center Drive, Newport Beach, CA 92660.
| | | | | | |
Name and Age | | Position(s) with the Fund and
Length of Time Served* | | Current Directorship(s) Held and Principal Occupation(s)
(and certain additional occupation information) During Past 5 years | | Number of
Portfolios in
Fund Complex
Overseen** |
| | |
INDEPENDENT TRUSTEES | | | | |
| | | |
Frederick L. Blackmon Year of birth 1952 | | Trustee since 1/01/05 | | Trustee (9/05 to present) of Pacific Life Funds; Director (2005 to present) of Trustmark Mutual Holding Company; Former Executive Vice President and Chief Financial Officer (1995 to 2003) of Zurich Life and has been retired since that time; Executive Vice President and Chief Financial Officer (1989 to 1995) of Alexander Hamilton Life Insurance Company (subsidiary of Household International); Member of Board of Trustees (2010 to present) of Cranbrook Educational Community; Former Member of Board of Governors (1994 to 1999) of Cranbrook Schools; and Former Member of Board of Regents (1993 to 1996) Eastern Michigan University. | | 87 |
| | | |
Gale K. Caruso Year of birth 1957 | | Trustee since 1/01/06 | | Trustee (1/06 to present) of Pacific Life Funds; Former Member of the Board of Directors (2005 to 2009) of LandAmerica Financial Group, Inc.; Former President and Chief Executive Officer (1999 to 2003) of Zurich Life; Former Chairman, President and Chief Executive Officer of Scudder Canada Investor Services, Ltd. and Managing Director of Scudder Kemper Investments; Former Member of the Advisory Council of the Trust for Public Land in Maine; Former Member of the Board of Directors of Make-A-Wish of Maine; and Former Member, Board of Directors of the Illinois Life Insurance Council. | | 87 |
| | | |
Lucie H. Moore Year of birth 1956 | | Trustee since 10/01/98 | | Trustee (6/01 to present) of Pacific Life Funds; Former Partner (1984 to 1994) with Gibson, Dunn & Crutcher (Law); Former Member of the Board of Trustees (2007 to 2011) of Sage Hill School; Former Member (2000 to 2009) and Former Vice Chairman (2001 to 2007) of the Board of Trustees of The Pegasus School; Former Member of the Board of Directors (2005 to 2010) of HomeWord; and Former Member of the Advisory Board (1993 to 2004) of Court Appointed Special Advocates (CASA) of Orange County. | | 87 |
| | | |
Nooruddin (Rudy) S. Veerjee Year of birth 1958 | | Trustee since 1/01/05 | | Trustee (9/05 to present) of Pacific Life Funds; Former President (1997 to 2000) of Transamerica Insurance and Investment Group and has been retired since that time; Former President (1994 to 1997) of Transamerica Asset Management; Former Chairman and Chief Executive Officer (1995 to 2000) of Transamerica Premier Funds (Mutual Fund); and Former Director (1994 to 2000) of various Transamerica Life Companies. | | 87 |
| | | |
G. Thomas Willis Year of birth 1942 | | Trustee since 11/17/03 | | Trustee (2/04 to present) of Pacific Life Funds; Certified Public Accountant in California (1967 to present); Former Audit Partner (1976 to 2002) of PricewaterhouseCoopers LLP (Accounting and Auditing) and has been retired since that time. | | 87 |
F-5
PACIFIC SELECT FUND
TRUSTEES AND OFFICERS INFORMATION (Continued)
(Unaudited)
| | | | | | |
Name and Age | | Position(s) with the Fund and Length of Time Served* | | Current Directorship(s) Held and Principal Occupation(s) (and certain additional occupation information) During Past 5 years | | Number of Portfolios in Fund Complex Overseen** |
| | |
INTERESTED PERSONS | | | | |
| | | |
James T. Morris Year of birth 1960 | | Chairman of the Board and Trustee since 1/11/07, (Chief Executive Officer 1/11/07 to 12/31/09) | | Director (4/07 to present), Chairman (5/08 to present), Chief Executive Officer (4/07 to present) and President (4/07 to 3/12) of Pacific Mutual Holding Company and Pacific LifeCorp; Director (4/07 to present), Chairman (5/08 to present), Chief Executive Officer (4/07 to present) and President (4/07 to 3/12) of Pacific Life; Chief Executive Officer (5/07 to present) and President (5/07 to 3/12) of Pacific Life Fund Advisors LLC; Chairman of the Board and Trustee (1/07 to present) and Chief Executive Officer (1/07 to 12/09) of Pacific Life Funds. | | 87 |
| | | |
Mary Ann Brown Year of birth 1951 | | Chief Executive Officer since 1/01/10, (President 1/11/07 to 12/31/09) | | Executive Vice President (4/10 to present) and Senior Vice President (5/06 to 3/10) of Pacific LifeCorp; Executive Vice President (4/10 to present) and Senior Vice President (3/05 to 3/10) of Pacific Life; Executive Vice President (4/10 to present) and Senior Vice President (5/07 to 3/10) of Pacific Life Fund Advisors LLC; and Chief Executive Officer (1/10 to present) and President (1/07 to 12/09) of Pacific Life Funds. | | 87 |
| | | |
Robin S. Yonis Year of birth 1954 | | Vice President and General Counsel since 4/04/05 | | Vice President, Fund Advisor General Counsel, and Assistant Secretary (5/07 to present) of Pacific Life Fund Advisors LLC; and Vice President and General Counsel (6/01 to present) of Pacific Life Funds. | | 87 |
| | | |
Brian D. Klemens Year of birth 1956 | | Vice President and Treasurer since 4/29/96 | | Vice President and Controller (10/07 to present) of Pacific Mutual Holding Company and Pacific LifeCorp; Vice President and Controller (10/07 to present) of Pacific Life; Vice President and Controller (10/07 to present) of Pacific Life Fund Advisors LLC; Vice President (5/00 to present) and Controller (10/07 to present) of Pacific Select Distributors, Inc.; and Vice President and Treasurer (6/01 to present) of Pacific Life Funds. | | 87 |
| | | |
Sharon E. Pacheco Year of birth 1957 | | Vice President and Chief Compliance Officer since 6/04/04 | | Vice President and Chief Compliance Officer (1/03 to present) of Pacific Mutual Holding Company and Pacific LifeCorp; Vice President (2/00 to present) and Chief Compliance Officer (1/03 to present) of Pacific Life; Vice President and Chief Compliance Officer (5/07 to present) of Pacific Life Fund Advisors LLC; and Vice President and Chief Compliance Officer (6/04 to present) of Pacific Life Funds. | | 87 |
| | | |
Howard T. Hirakawa Year of birth 1962 | | Vice President since 6/20/06 | | Vice President (5/07 to present) of Pacific Life Fund Advisors LLC; and Vice President (6/06 to present) of Pacific Life Funds. | | 87 |
| | | |
Jane M. Guon Year of birth 1964 | | Vice President since 1/01/11 and Secretary since 1/01/11 | | Vice President and Secretary (1/11 to present), Assistant Vice President (4/06 to 12/10) and Assistant Secretary (6/98 to 12/10) of Pacific Mutual Holding Company and Pacific LifeCorp; Director, Vice President, and Secretary (1/11 to present), Assistant Vice President (4/06 to 12/10) and Assistant Secretary (2/95 to 12/10) of Pacific Life; Vice President and Secretary (1/11 to present) and Assistant Vice President and Assistant Secretary (05/07 to 12/10) of Pacific Life Fund Advisors LLC; Vice President and Secretary (1/11 to present), Assistant Vice President (5/06 to 12/10) and Assistant Secretary (5/99 to 12/10) of Pacific Select Distributors, Inc.; and Vice President (1/11 to present) and Secretary (1/11 to present) of Pacific Life Funds. | | 87 |
| | | |
Laurene E. MacElwee Year of birth 1966 | | Vice President since 12/13/11 and Assistant Secretary since 4/04/05 (Assistant Vice President 4/04/05 to 12/12/11) | | Vice President (4/11 to present), Assistant Secretary (5/07 to present) and Assistant Vice President (5/07 to 3/11) of Pacific Life Fund Advisors LLC; and Vice President (4/05 to present) and Assistant Secretary (6/01 to present) of Pacific Life Funds. | | 87 |
F-6
PACIFIC SELECT FUND
TRUSTEES AND OFFICERS INFORMATION (Continued)
(Unaudited)
| | | | | | |
Name and Age | | Position(s) with the Fund and Length of Time Served* | | Current Directorship(s) Held and Principal Occupation(s) (and certain additional occupation information) During Past 5 years | | Number of Portfolios in Fund Complex Overseen** |
| | |
INTERESTED PERSONS (Continued) | | | | |
| | | |
Eddie Tung Year of birth 1957 | | Assistant Vice President and Assistant Treasurer since 11/14/05 | | Assistant Vice President (4/03 to present) of Pacific Life; Assistant Vice President (5/07 to present) of Pacific Life Fund Advisors LLC; and Vice President and Assistant Treasurer (11/05 to present) of Pacific Life Funds. | | 87 |
| | | |
Carleton J. Muench Year of birth 1973 | | Assistant Vice President since 11/30/06 | | Assistant Vice President (5/07 to present) of Pacific Life Fund Advisors LLC; and Vice President (11/06 to present) of Pacific Life Funds. | | 87 |
| | | |
Kevin W. Steiner Year of birth 1975 | | Assistant Vice President since 1/01/13 | | Assistant Vice President (4/12 to present), Mutual Funds Compliance Director (4/08 to 3/12) and Mutual Funds Compliance Manager (10/06 to 3/08) of Pacific Life Fund Advisors LLC; and Vice President (1/13 to present) of Pacific Life Funds. | | 87 |
| | * | A trustee serves until he or she resigns, retires, or his or her successor is elected and qualified. |
| | ** | As of December 31, 2012, the “Fund Complex” consisted of Pacific Select Fund (54 portfolios) and Pacific Life Funds (33 funds). |
F-7
PACIFIC SELECT FUND
APPROVAL OF INVESTMENT ADVISORY AGREEMENT AND PORTFOLIO MANAGEMENT AGREEMENTS
(Unaudited)
The Board of Trustees (the “Trustees” or “Board”) of Pacific Select Fund (the “Fund”) oversees the management of each of the separate portfolios of the Fund (each a “Portfolio” and collectively, the “Portfolios”) and, as required by Section 15(c) of the Investment Company Act of 1940, as amended (the “1940 Act”), initially approves and determines annually whether to renew the investment advisory agreement (the “Advisory Agreement”) with Pacific Life Fund Advisors LLC (“PLFA”) and each portfolio management agreement (the “Portfolio Management Agreements,” together with the Advisory Agreement, the “Agreements”) with the various sub-advisers or “Portfolio Managers.” PLFA serves as the investment adviser for all of the Portfolios and directly manages the High Yield Bond, Cash Management and Floating Rate Income Portfolios (the “PAM Managed Portfolios”) under the name Pacific Asset Management (“PAM”) and the Portfolio Optimization Conservative, Portfolio Optimization Moderate-Conservative, Portfolio Optimization Moderate, Portfolio Optimization Growth, Portfolio Optimization Aggressive-Growth, Pacific Dynamix – Conservative Growth, Pacific Dynamix – Moderate Growth and Pacific Dynamix – Growth Portfolios (the “Asset Allocation Portfolios,” and together with the PAM Managed Portfolios, the “Directly Managed Portfolios”). For the other Portfolios, with the exception of the American Funds Growth-Income Portfolio, the American Funds Growth Portfolio, and the American Funds Asset Allocation Portfolio (collectively, the “Feeder Portfolios”), PLFA has retained other firms to serve as Portfolio Managers under PLFA’s supervision. Each of the Feeder Portfolios invests all of its assets in a master fund; and therefore, PLFA has not retained other portfolio managers to manage the assets of these Portfolios. The Board, including all of the Trustees who are not “interested persons,” as that term is defined in the 1940 Act (“Independent Trustees”), last renewed the Agreements at an in-person meeting of the Trustees held on December 12, 2012.1 Also, as discussed below, at the in-person meeting on December 12, 2012, the Board, including all of the Independent Trustees, approved new Portfolio Management Agreements effective on or about January 1, 2013 and May 1, 2013 with respect to the Large-Cap Growth Portfolio and the Growth LT Portfolio, respectively. As discussed below, at an in-person meeting on September 12, 2012, the Board, including all of the Independent Trustees, approved a new Portfolio Management Agreement effective on or about January 1, 2013 with respect to the Mid-Cap Equity Portfolio. As discussed below, at an in-person meeting on June 20, 2012, the Board, including all of the Independent Trustees, approved the Advisory Agreement and new Portfolio Management Agreements effective on or about October 1, 2012 with respect to the Precious Metals, Currency Strategies, and Global Absolute Return Portfolios.
At the December 12, 2012 meeting and other meetings, the Board considered information (both written and oral) provided to assist it in its review of the Agreements and made assessments with respect to each Agreement. The Board requested, received and reviewed written materials from PLFA and each Portfolio Manager that was submitted in response to requests from the Independent Trustees and supporting materials relating to those questions and responses. In addition, the Board received in-person presentations about the Portfolios throughout the year, and the Independent Trustees were advised by independent legal counsel with respect to these and other relevant matters. The Board reviewed a variety of factors and considered a significant amount of information, including information received on an ongoing basis at Board and committee meetings, including reports on Portfolio performance, expenses, fee comparisons, investment advisory, compliance, and other services provided to the Portfolios by PLFA and the Portfolio Managers. The Board also reviewed financial and profitability information regarding PLFA and the Portfolio Managers, and information regarding the organization and operations of each entity such as their compliance monitoring, portfolio trading and brokerage practices and the personnel providing investment management and administrative services to each Portfolio. The Board reviewed data provided by PLFA that was gathered from various independent providers of investment company data, to provide the Board with information concerning the Portfolios’ investment performance, management fees and expense information. Additionally, the Independent Trustees retained an independent consultant (“Independent Consultant”) to assist the Trustees with certain of their analyses and to provide other relevant information. In connection with the analysis, the Independent Consultant utilized and provided the Independent Trustees with data obtained from independent service providers as well as from other sources.
The Trustees’ determinations were made on the basis of each Trustee’s business judgment after consideration of all the information presented. In reviewing the materials presented and in considering the information in the management presentations, the Trustees did not identify any single issue or particular information that, in isolation, would be a controlling factor in making a final decision regarding the proposed Agreements. Individual Trustees may have given different weights to certain factors and assigned various degrees of materiality to information received in connection with the approval process. The following summary describes the most important, but not all, of the factors considered by the Trustees in approving the Agreements, and in the case of the Independent Trustees, certain factors were considered in light of the legal advice furnished to them by independent legal counsel and information from the Independent Consultant that they had retained. This discussion is not intended to be all-inclusive.
Annual Consideration and Approval of Investment Advisory and Portfolio Management Agreements
In evaluating the Advisory Agreement and each Portfolio Management Agreement, the Board, including all the Independent Trustees, considered the following factors, among others:
1. Nature, Extent and Quality of Services
Portfolio Oversight and Supervision – PLFA, its personnel and its resources. The Trustees considered the depth and quality of PLFA’s investment management process, including its monitoring and oversight of the Portfolio Managers and PAM; the experience, capability and integrity of its senior management and other personnel; the low turnover rates of its key personnel; and the overall financial strength and stability of its organization. The Trustees considered the high quality of the products and services provided by PLFA and its affiliates, such as the many educational services and tools offered to assist intermediaries in effectively understanding and meeting shareholder and/or contract holder needs. The Trustees also noted that PLFA regularly informs the Trustees about matters relevant to the Trust, its shareholders and investing.
1 At the December 12th meeting, the Board did not consider the continuance of the Portfolio Management Agreements relating to the Emerging Markets Debt, Mid-Cap Equity, Precious Metals, Currency Strategies and Global Absolute Return Portfolios, as those agreements were not up for renewal at that time. Additionally, new Portfolio Management Agreements with respect to the Growth LT and Large-Cap Growth Portfolios were approved by the Board at the December 12th meeting and the Board did not consider the continuance of the existing Portfolio Management Agreements with respect to those Portfolios at that time.
F-8
PACIFIC SELECT FUND
APPROVAL OF INVESTMENT ADVISORY AGREEMENT AND PORTFOLIO MANAGEMENT AGREEMENTS (Continued)
(Unaudited)
The Trustees also considered that the investment, legal, compliance and accounting professionals of PLFA and its affiliates have access to and utilize a variety of resources and systems relating to investment management, compliance, trading, performance analysis, security valuation and portfolio accounting. The Trustees further considered PLFA’s continuing need to attract and retain qualified personnel and to maintain and enhance its resources and systems to provide appropriate investment management, compliance and monitoring services for the Portfolios. The Board noted that PLFA monitors numerous investment, performance and compliance metrics for the Portfolios.
The Trustees considered PLFA’s continued development and use of analytical tools for assessing Portfolio performance and the performance of the Portfolio Managers, conducting an attribution analysis on performance and reporting on performance to the Trustees. The Trustees noted that PLFA uses these tools to identify Portfolios that are underperforming applicable benchmarks or peer groups, and then conducts various analyses to try to assess the sources of and reasons for underperformance. The Trustees noted that PLFA has developed processes to oversee and monitor the performance of Portfolio Managers, including the use of analytical methods to review Portfolio performance and execution of investment strategies. The Board noted that PLFA provides the Board with analysis of this data over rolling periods to assist the Board in identifying trends in Portfolio performance and other areas, and periodically provides the Trustees with information on economic and market trends to provide a context for assessing recent performance. The Board also noted that PLFA conducts periodic due diligence on Portfolio Managers involving onsite visits, in-person meetings and telephonic meetings to gather information that PLFA uses to gain an in-depth understanding of a Portfolio Manager’s investment process and to seek to identify issues that may be relevant to a Portfolio Manager’s services to a Portfolio or a Portfolio’s performance, including, but not limited to, the financial strength of a Portfolio Manager, significant staffing changes that could affect a Portfolio, material changes in a Portfolio Manager’s assets under management, compliance and regulatory concerns, best execution review and portfolio security valuation support. The Trustees also noted that PLFA appeared to have implemented effective methods for monitoring investment style consistency by Portfolio Managers and for analyzing the use of derivatives by Portfolio Managers. With respect to the PAM Managed Portfolios, the Board considered that PLFA provided oversight, diligence and reporting with regard to its PAM unit that is similar to the process it employs with regard to the Portfolio Managers. The Board also considered that PLFA manages directly the Asset Allocation Portfolios.
The Trustees considered the time and attention paid by PLFA to matters involving the valuation of Fund securities, including researching and evaluating information concerning securities that are not actively or publicly traded, valuing securities subject to a trading halt, the value of equity securities traded on foreign exchanges, oversight of and due diligence on pricing vendors and the development of alternate valuation methodologies. The Trustees also considered PLFA’s oversight of transition management when overseeing significant changes in the Portfolios, such as cash movements between the Portfolios arising from reallocations by funds of funds and the transition from one Portfolio Manager to another, including steps taken by PLFA to reduce transaction costs associated with a Portfolio transition.
The Trustees considered PLFA’s policies, procedures and systems to ensure compliance with applicable laws and regulations with respect to the Directly Managed Portfolios, its compliance monitoring of the Portfolio Managers and its commitment to those programs; PLFA’s efforts to keep the Trustees informed about the Portfolio Managers; and its attention to matters that may involve conflicts of interest with each Portfolio. In this regard, the Trustees reviewed information throughout the year on PLFA’s compliance policies and procedures, its compliance history, and reports from the Trust’s Chief Compliance Officer (“CCO”) on compliance by PLFA, the Portfolio Managers, and the Portfolios with applicable laws and regulations. The Trustees also reviewed information on any responses by PLFA to regulatory and compliance developments throughout the year. The Trustees further considered the monitoring and additional services provided by PLFA to the Portfolios, including risk management analysis, preparation of periodic performance and financial reports, review of trade execution and coordination of other service providers to the Trust.
The Trustees noted that the Portfolios are used as the investment options for variable products of Pacific Life and Pacific Life & Annuity Company (“PL&A”), and they believe the Portfolios provide a broad range of investment options for contract holders of Pacific Life and PL&A, including investment options that provide exposure to major asset classes such as equity and debt, and many different investment styles within those asset classes, and target risk funds that also provide investors with asset allocation for different profiles. The Trustees further noted that the offering of the Portfolios as investment options assisted in distinguishing these variable products in the marketplace. The Trustees considered that they had received reports concerning the positioning of these variable products in the marketplace.
Portfolio Management – PLFA and the Portfolio Managers. The Trustees considered various materials relating to PLFA, including PAM, and the Portfolio Managers, including copies of each existing Advisory Agreement and Portfolio Management Agreement; copies of the Form ADV for PLFA and each Portfolio Manager; financial information relating to PLFA and each Portfolio Manager; and other information deemed relevant to the Trustees’ evaluation of PLFA and each Portfolio Manager, including qualitative assessments from senior management of PLFA.
The Trustees considered the benefits to shareholders of retaining PLFA and each Portfolio Manager and continuing the Advisory Agreement and Portfolio Management Agreements particularly in light of the nature, extent, and quality of the services that have been provided by PLFA and the Portfolio Managers. The Trustees noted the portfolio management services that have been provided by PLFA or PAM to the Directly Managed Portfolios and the portfolio management services that have been provided by the Portfolio Managers to the other Portfolios. The Trustees considered the quality of the portfolio management services which have benefited and should continue to benefit the Portfolios and their shareholders, the organizational depth and resources of PLFA and the Portfolio Managers, including the background and experience of PLFA and each of the Portfolio Manager’s management, and the expertise of PLFA, its PAM unit, and each Portfolio Manager’s portfolio management team, as well as the investment methodology used by PLFA, its PAM unit, and the Portfolio Manager.
The Trustees further noted the compliance monitoring conducted by PLFA and PAM on an ongoing basis and also noted the development of procedures and systems necessary to maintain compliance with applicable laws and regulations as well as the resources that PLFA dedicates to these programs. The Trustees considered that the CCO had in place a systematic process for periodically reviewing PLFA’s and each Portfolio Manager’s written compliance policies and procedures, including the assessment of PLFA’s and each Portfolio Manager’s compliance
F-9
PACIFIC SELECT FUND
APPROVAL OF INVESTMENT ADVISORY AGREEMENT AND PORTFOLIO MANAGEMENT AGREEMENTS (Continued)
(Unaudited)
program as required under Rule 38a-1 of the 1940 Act and PLFA’s and each Portfolio Manager’s code of ethics. The Trustees also considered that PLFA and each Portfolio Manager continues to cooperate with the CCO in reviewing its compliance operations.
In making their assessments, the Trustees considered that PLFA has historically exercised diligence in monitoring the performance of the Portfolio Managers and PAM, and has recommended and taken measures to attempt to remedy relative underperformance by a Portfolio when PLFA and the Trustees believed it to be appropriate.
The Board concluded that it was satisfied with the nature, extent and quality of the investment management services provided by PLFA and the Portfolio Managers.
2. Investment Results
The Trustees considered the investment results of each Portfolio in light of its objective and market conditions over the past year. The Trustees compared each Portfolio’s total returns with both the total returns of appropriate peer funds, based on information provided by PLFA using data from independent sources, and with one or more relevant benchmark indices. The Independent Trustees also considered information provided by an Independent Consultant who provided a presentation and analysis to the Trustees regarding peer group performance utilizing data from independent sources. The information provided to the Trustees included each Portfolio’s performance record for the prior ten calendar years, as applicable, and three-month, year-to-date, one-, three-, five- and ten-year or since inception periods, as applicable. In reviewing the performance data drawn from independent sources, as well as the performance of the respective benchmark indices, the Trustees took into consideration the goals and objectives of each Portfolio and noted that some Portfolios had outperformed their peer groups over certain periods and/or exceeded their respective benchmark indices while others underperformed their peer groups over certain periods and/or trailed their respective benchmark indices. The Trustees discussed with PLFA the fact that certain periods of underperformance may be transitory while other periods of underperformance may be reflective of broader issues which may warrant consideration of corrective action. The Trustees discussed these Portfolios with representatives of PLFA, including an assessment of the approach used by the Portfolio Managers as well as oversight and monitoring by PLFA as the investment adviser, to gain an understanding of underperformance and to assess whether any actions would be appropriate.
The Trustees also reviewed the monitoring of the Portfolio Managers’ investment results by PLFA, including PLFA’s historical practice of recommending to the Trustees the use of a new manager if performance lagged and could not be improved within a reasonable timeframe, and reviewed the monitoring of the PAM unit’s investment results by PLFA. Generally, the Trustees noted that there continues to be a strong record of well-managed Portfolios that work well in the Asset Allocation Portfolios and that the Asset Allocation Portfolios provide a range of professionally managed asset allocation investment options. The Trustees also noted that the Portfolios continue to deliver the investment style as disclosed to shareholders. The Trustees also noted the use by investors of the Asset Allocation Portfolios and the benefits the Asset Allocation Portfolios provide for shareholders generally.
The Board concluded that PLFA continues to have a strong record of effectively managing a multi-manager fund group and asset allocation funds designed to give shareholders a reasonable array of choices through which to implement their investment programs. The Board further concluded that PLFA was implementing each Portfolio’s investment objective either directly or through the selection of Portfolio Managers and that PLFA’s record in managing each Portfolio indicates that its continued management as well as the continuation of the respective Portfolio Management Agreements will benefit each Portfolio and its shareholders.
3. Advisory Fees and Total Expense Ratios
The Trustees requested, received and reviewed information from PLFA relating to the advisory fees and the sub-advisory fees, including the portion of the advisory fees paid to each Portfolio Manager as compared to the portion retained by PLFA, and operating expense ratios for each of the Portfolios. The Independent Trustees also requested and reviewed information from the Independent Consultant along with their analysis of advisory fees, sub-advisory fees and certain other expenses. The Trustees reviewed the advisory fees, sub-advisory fees and operating expense ratios of each Portfolio and compared such amounts with the average fee and expense levels of other funds in applicable peer fund groups. During their review, the Trustees noted that all of the Portfolios were subject to contractual expense limitations agreed to by PLFA. The Trustees also reviewed written materials prepared by PLFA based on peer fund group information retrieved from the independent sources. The Independent Trustees requested and reviewed an analysis provided by the Independent Consultant of the asset-based breakpoint schedule for the Portfolios. The Independent Trustees noted that the breakpoints offer meaningful potential savings to shareholders of many of the Portfolios.
The Trustees also considered information from the Portfolio Managers regarding the comparative sub-advisory fees charged under other investment advisory contracts for similarly managed accounts, such as contracts of each Portfolio Manager with other similarly managed registered investment companies or other types of clients. The Trustees noted that in many cases there were differences in the level of services provided to the Portfolios by the Portfolio Managers and that the level of services provided by these Portfolio Managers on these other accounts were due to the different nature of the accounts or because there were other reasons to support the difference in fees, such as an affiliation between the Portfolio Manager and the account. These differences often explained variations in fee schedules. The Trustees were mindful that, with regard to the sub-advised Portfolios, the fee rates were the result of arms’-length negotiations between PLFA and the Portfolio Managers, and that any sub-advisory fees are paid by PLFA and are not paid directly by a Portfolio. The Trustees observed that certain of the Portfolios’ contractual advisory fees were higher than the average of their respective Morningstar category while others were either lower or approximately equal to these averages.
The Board concluded that the advisory fees, sub-advisory fees and total expenses of each Portfolio were fair and reasonable.
4. Costs, Level of Profits and Economies of Scale
The Trustees reviewed information provided by PLFA and the Portfolio Managers regarding PLFA’s costs of sponsoring the Portfolios and information regarding the profitability of PLFA and the Portfolio Managers.
F-10
PACIFIC SELECT FUND
APPROVAL OF INVESTMENT ADVISORY AGREEMENT AND PORTFOLIO MANAGEMENT AGREEMENTS (Continued)
(Unaudited)
PLFA and the Portfolio Managers’ Costs and Profitability. The Trustees noted that, based on the data available, PLFA appears to be providing products that are competitively priced with other funds, especially multi-manager and asset allocation funds and funds that support variable annuity and variable life insurance products. The Trustees noted PLFA’s willingness to sponsor new funds that PLFA believed would improve the menu of offerings for contract owners or that would benefit the Asset Allocation Portfolios, despite the potential subsidies required by PLFA during a new fund’s start-up phase. Based on information received, the Trustees further noted that Pacific Life’s overall profitability on variable annuity and variable life insurance products, which are supported by the Trust, appeared reasonable at the current time. The Trustees also noted that analysis of the Trust’s profitability to PLFA supported a conclusion that PLFA’s costs and profitability are reasonable, whether considered inclusive or exclusive of distribution costs.
The Trustees also reviewed information provided regarding the structure and manner in which PLFA’s and the Portfolio Managers’ investment professionals were compensated and their respective views of the relationship of such compensation to the attraction and retention of quality personnel. The Trustees considered PLFA’s willingness to invest in technology, infrastructure and staff to reinforce and offer new services and to accommodate changing regulatory requirements.
With respect to the Portfolio Managers, the Trustees noted that it was difficult in many cases to accurately determine or evaluate the profitability of the Portfolio Management Agreements to the Portfolio Managers because of, among other things, the differences in the types of information provided by the Portfolio Managers, the fact that many Portfolio Managers manage substantial assets other than the Portfolios and, further, that any such assessment would involve assumptions regarding the Portfolio Managers’ expense allocation policies, capital structure, cost of capital, business mix and other factors.
Accordingly, in the case of the Portfolio Managers, the Trustees focused their consideration on the data described above in light of the arms’-length nature of the relationship (for the Portfolios that are sub-advised) between PLFA and such Portfolio Managers with respect to the negotiation of portfolio sub-advisory fees and the fact that such fees are paid by PLFA.
Economies of Scale. The Trustees considered information relating to economies of scale provided by PLFA and the Independent Consultant, and PLFA’s general willingness to discuss and evaluate the topic of economies of scale with the Trustees.
The Trustees considered that the advisory fee schedules contained breakpoints reducing the rate of the advisory fee as Portfolio assets grow for all Portfolios except the Asset Allocation Portfolios. The Independent Trustees agreed that the breakpoints appear to be providing for shared economies of scale and potential future economies of scale as the asset levels of a Portfolio increase. The Independent Trustees noted that the Asset Allocation Portfolios are funds-of-funds that invest in other Portfolios that have advisory fee schedules containing breakpoints that reduce the total advisory fees paid by shareholders of the Asset Allocation Portfolios as assets grow. The Trustees also considered PLFA’s willingness to reduce its own fees through certain advisory fee waivers and expense limitation agreements, whereby PLFA will reimburse the Portfolios for certain expenses that exceed stated expense caps.
The Trustees noted that PLFA and its affiliates had consistently reinvested in the business in the form of improvements in technology, product innovations, personnel and resources. The Trustees further noted that Pacific Life and PL&A had also consistently reinvested in the business with respect to the variable products to which the Fund serves as the underlying investment vehicle.
The Trustees additionally noted that economies of scale were difficult to measure with precision particularly on a Portfolio by Portfolio basis. This analysis was complicated by the additional services and content provided by PLFA and its affiliates through reinvestment in the ability to provide and expand those services through, for example, continuing investments in technology and shareholder services, as discussed above. The Trustees considered that the Portfolios are well managed, and provide shareholders with a wide choice of premier Portfolio Managers and sophisticated asset allocation investment options at reasonable fee levels. The Board noted that PLFA had taken steps to ensure that shareholders benefit by negotiating favorable terms with service providers, and to provide certain support services to the Portfolios on an approximate cost basis as opposed to an asset-based charge.
The Board determined that PLFA and its affiliates are sharing economies of scale given its commitment to competitive total expenses of the Portfolios, and the consistent reinvestment in the business in the form of improvements in technology and other resources and investments in personnel. The Board concluded that the Portfolios’ cost structures were reasonable and that overall profitability appeared reasonable at the current time. The Board further concluded that PLFA was sharing economies of scale with each Portfolio and its shareholders to their benefit.
5. Ancillary Benefits
The Trustees requested and received from PLFA and the Portfolio Managers information concerning other benefits received by PLFA, the Portfolio Managers, and their affiliates as a result of their respective relationship with the Portfolios, including various service arrangements with PLFA affiliates and reimbursement at an approximate cost basis for support services in the case of PLFA, as well as commissions paid to broker-dealers affiliated with certain Portfolio Managers and the use of soft-dollars by certain of the Portfolio Managers. The Trustees also considered information concerning other significant economic relations between the Portfolio Managers and their affiliates and with PLFA and its affiliates and noted PLFA’s processes and procedures to identify and disclose such relationships to the Board. The Trustees also considered information provided to them as to how conflicts of interest that may arise from these relationships are managed.
The Board concluded that such benefits were consistent with those generally derived by investment advisers to mutual funds or were otherwise not unusual.
6. Conclusion
Based on their review, including their consideration of each of the factors referred to above, and assisted by the advice of the Independent Consultant and independent counsel to the Independent Trustees, the Board, including the Independent Trustees, concluded that the Advisory Agreement and each applicable Portfolio Management Agreement are fair and reasonable with respect to each Portfolio and its shareholders, and that the renewal of the Advisory Agreement and each applicable Portfolio Management Agreement would be in the best interests of the Portfolios and their shareholders. The Board did not indicate that any single factor was determinative of its decision to approve the Advisory
F-11
PACIFIC SELECT FUND
APPROVAL OF INVESTMENT ADVISORY AGREEMENT AND PORTFOLIO MANAGEMENT AGREEMENTS (Continued)
(Unaudited)
Agreement and each applicable Portfolio Management Agreement, but indicated that the Board based its determination on the total mix of information available to it.
Other Advisory Agreement and Portfolio Management Agreement Approvals
In addition to considering the existing Portfolio Management Agreements during the period, the Board considered and approved changes with respect the Portfolio Managers for certain Portfolios as discussed below. Under the 1940 Act, a change in a Portfolio Manager, a change in the compensation paid to a Portfolio Manager, or an assignment of any Portfolio Management Agreement requires shareholder approval of a new Portfolio Management Agreement. However, under an exemptive order issued to Pacific Life Insurance Company and the Fund by the Securities and Exchange Commission (“SEC”) on October 13, 1999 and relied upon by PLFA, in accordance with the terms of the exemptive order, PLFA can hire, terminate and replace, as applicable, Portfolio Managers and enter into new Portfolio Management Agreements (except, as a general matter, Portfolio Managers affiliated with PLFA) without shareholder approval.
Growth LT Portfolio
At an in-person meeting on December 12, 2012, the Board, including all of the Independent Trustees, approved, effective no later than May 1, 2013, a new Portfolio Management Agreement with Massachusetts Financial Services Company, doing business as MFS Investment Management (“MFS”) with respect to the Growth LT Portfolio (the “MFS Portfolio Management Agreement”), and appointed MFS as the new Portfolio Manager for this Portfolio. The Board also approved a change to the name of the Portfolio and effective May 1, 2013, the Portfolio will be named the Growth Portfolio. In connection with this matter, also at the December 12, 2012 meeting, the Board terminated the Portfolio Management Agreement for the Portfolio with the current portfolio manager upon the effectiveness of the MFS Portfolio Management Agreement. MFS’s appointment as new Portfolio Manager was made in accordance with the exemptive order issued by the SEC with regard to the Fund and does not require shareholder approval.
In evaluating the MFS Portfolio Management Agreement, the Board, including the Independent Trustees, considered the factors, among others, described below. Additionally, the Board considered the various screening processes that PLFA utilizes in identifying a proposed new portfolio manager, including screening for qualified firms through the use of quantitative data and information gathered from independent third-party databases, as well as the due diligence conducted by PLFA on the investment resources and personnel of a portfolio manager and an assessment of the investment strategies used by a portfolio manager and the due diligence conducted by the Fund’s Chief Compliance Officer (“CCO”). In addition, the Board reviewed the specific criteria and information evaluated by PLFA during the selection process of MFS, including information about other firms considered by PLFA, and PLFA’s analysis in reaching its conclusion to recommend MFS as the new Portfolio Manager.
In evaluating the MFS Portfolio Management Agreement, the Board, including all the Independent Trustees, considered the following factors, among others:
1. Nature, Extent and Quality of Services to be Provided
The Trustees considered the benefits to shareholders of retaining MFS as the Portfolio Manager, particularly in light of the nature, extent, and quality of the services expected to be provided by MFS. In this regard, the Trustees considered various materials relating to the proposed Portfolio Manager, including copies of the proposed MFS Portfolio Management Agreement; copies of MFS’s Form ADV; financial information; and other information deemed relevant to the Trustees’ evaluation, including comprehensive assessments from senior management of PLFA.
The Trustees considered that under the MFS Portfolio Management Agreement, MFS would be responsible for providing the investment management services for the Portfolio’s assets, including investment research, advice and supervision, and determining which securities would be purchased or sold by the Portfolio. The Trustees considered the quality of the management services expected to be provided to the Growth LT Portfolio over both the short- and long-term, the organizational depth and resources of MFS, including the background and experience of MFS’s management and the expertise of the portfolio management team, as well as the investment strategies, processes and philosophy to be used with respect to the investment strategy.
In addition, the Trustees considered MFS’s written compliance policies and procedures and noted that the Trust’s CCO had previously provided an assessment of MFS’s compliance program, as required under Rule 38a-1 of the 1940 Act and its code of ethics.
In making these assessments, the Trustees took note of the extensive due diligence PLFA conducted with respect to MFS, and were aided by the assessment and recommendation of PLFA and the in-person presentation and materials provided by MFS.
The Board concluded it was satisfied with the nature, extent and quality of the investment management services anticipated to be provided to the Growth LT Portfolio by MFS under the MFS Portfolio Management Agreement.
2. Performance
The Trustees considered PLFA’s efforts and process to search for and screen advisory firms that are qualified to manage a growth portfolio and PLFA’s identification of MFS to serve as Portfolio Manager with regard to the day-to-day investment activities of the Growth LT Portfolio. The Trustees considered factors concerning performance in connection with its consideration of this matter and in connection with approval of the related MFS Portfolio Management Agreement, as described below.
The Trustees considered information about the historical performance of an account managed by the same MFS portfolio management team that would manage the Growth LT Portfolio using similar investment strategies as those proposed for the Growth LT Portfolio (the “Comparable Performance”). The Trustees considered the Comparable Performance against a pertinent benchmark and against the applicable peer group for the year-to-date, one-, three-, five-, and ten-year periods as of September 30, 2012. The Trustees also considered the Comparable Performance against a pertinent benchmark and an applicable peer group for the previous nine calendar years. The Trustees also considered information about the historical performance of additional accounts managed by MFS using similar investment strategies as those proposed for the Growth LT Portfolio against a pertinent benchmark for the one-, three-, five- and ten-year periods (as available) as of September 30, 2012.
F-12
PACIFIC SELECT FUND
APPROVAL OF INVESTMENT ADVISORY AGREEMENT AND PORTFOLIO MANAGEMENT AGREEMENTS (Continued)
(Unaudited)
Additionally, the Trustees considered performance information presented by PLFA for another potential manager of the Portfolio. The Trustees also considered the need for MFS to adhere to the Portfolio’s general investment mandate in order to function appropriately in the Portfolio Optimization Portfolios.
The Board determined that MFS’s performance record was acceptable.
3. Advisory and Portfolio Management Fees
The Trustees considered information regarding the comparative advisory fees charged under other investment advisory contracts of the Portfolio Manager with regard to other investment accounts with substantially similar investment strategies as the Growth LT Portfolio. The Trustees also considered that the proposed sub-advisory fees payable to MFS under the Portfolio Management Agreement contain breakpoints and were lower than the sub-advisory fees paid to the current portfolio manager. The Trustees considered that the advisory fee schedule would remain unchanged from the current fee schedule for the Portfolio and that the total advisory fees paid by shareholders would not increase. The Trustees noted that in certain cases there were differences in the level of services proposed to be provided to the Growth LT Portfolio by MFS and that the level of services provided by MFS on these other accounts was due to the different nature of the accounts or an affiliation between MFS and the account. These differences often explained differences in fee schedules. The Trustees noted that the fee rates were the result of arms’-length negotiations between PLFA and MFS, and that the Growth LT Portfolio’s sub-advisory fees are paid by PLFA and are not paid directly by the Growth LT Portfolio. Additionally, the Trustees considered that there are certain costs associated with a manager change, but that the ongoing operating expenses paid by the shareholders were not expected to materially increase as a result of this portfolio manager change.
The Board concluded that the compensation payable under the MFS Portfolio Management Agreement is fair and reasonable.
4. Costs, Level of Profits and Economies of Scale
The Trustees considered information about the profitability of other investment accounts managed by MFS using similar investment strategies as those proposed for the Growth LT Portfolio in assessing the projected profitability of the MFS Portfolio Management Agreement to MFS to the extent practicable based on the information provided by MFS. The Trustees considered that it was difficult to accurately determine or evaluate the projected profitability of the MFS Portfolio Management Agreement to MFS because it managed substantial assets and had multiple business lines and, further, that any such assessment would involve assumptions regarding its allocation policies, capital structure, cost of capital, business mix and other factors. The Trustees focused their consideration on other information provided in connection with this matter, given the arms’-length nature of the relationship between PLFA and MFS with respect to the negotiation of Portfolio sub-advisory fees, the fact that such fees are paid by PLFA and the fact that the projected profitability of the MFS Portfolio Management Agreement to MFS is an estimate because it had not yet begun to manage the Portfolio.
The Board concluded that the Growth LT Portfolio’s fee structure reflected in the MFS Portfolio Management Agreement is fair and reasonable.
5. Ancillary Benefits
The Trustees received from PLFA and MFS information concerning other benefits that may be received by MFS and its affiliates as a result of their relationship with the Growth LT Portfolio, including commissions that may be paid to broker-dealers affiliated with the Portfolio Manager and the anticipated use of soft-dollars by the Portfolio Manager. In this regard, the Trustees noted that MFS represented that it does not anticipate utilizing an affiliated broker-dealer and that it anticipates using soft dollar credits generated by Portfolio commissions to pay for research services. The potential benefits that may be derived by MFS from its relationship with the Growth LT Portfolio could include larger assets under management and reputational benefits, which are consistent with those generally derived by sub-advisers to mutual funds. The Trustees considered potential benefits to be derived by MFS from its relationship with the Growth LT Portfolio and that such benefits were consistent with those generally derived by sub-advisers to mutual funds or were otherwise not unusual.
6. Conclusion
Based on their review, including the consideration of each of the factors referred to above, the Board found that: (i) the MFS Portfolio Management Agreement is in the best interests of the Growth LT Portfolio and its shareholders; and (ii) the compensation payable under the MFS Portfolio Management Agreement is fair and reasonable. No single factor was determinative of the Board’s findings, but rather the Trustees based their determination on the total mix of information available to them.
Large-Cap Growth Portfolio
At an in-person meeting on December 12, 2012, the Board, including all of the Independent Trustees, approved, effective no later than January 1, 2013, a new Interim Portfolio Management Agreement with BlackRock Investment Management, LLC (“BlackRock”) with respect to the Large-Cap Growth Portfolio (the “BlackRock Interim Portfolio Management Agreement”), and appointed BlackRock as the new Interim Portfolio Manager for this Portfolio. In connection with this matter, also at the December 12, 2012 meeting, the Board also approved the termination of the Portfolio Management Agreement for the Portfolio with the prior portfolio manager upon the effectiveness of the BlackRock Interim Portfolio Management Agreement. In evaluating the BlackRock Interim Portfolio Management Agreement, the Board, including the Independent Trustees, considered the interim nature of the BlackRock Interim Portfolio Management Agreement and the factors described below.
In evaluating the BlackRock Interim Portfolio Management Agreement, the Board, including all the Independent Trustees, considered the following factors, among others:
1. Nature, Extent and Quality of Services to be Provided
The Trustees considered the benefits to shareholders of retaining BlackRock as the Interim Portfolio Manager, particularly in light of the nature, extent, and quality of the services expected to be provided by BlackRock. In this regard, the Trustees considered various materials
F-13
PACIFIC SELECT FUND
APPROVAL OF INVESTMENT ADVISORY AGREEMENT AND PORTFOLIO MANAGEMENT AGREEMENTS (Continued)
(Unaudited)
relating to the proposed Interim Portfolio Manager, including copies of the proposed BlackRock Interim Portfolio Management Agreement; copies of BlackRock’s Form ADV; financial information; and other information deemed relevant to the Trustees’ evaluation, including comprehensive assessments from senior management of PLFA. The Trustees also considered the fact that BlackRock already serves as a portfolio manager to other Portfolios in the Fund and that PLFA and the Board have developed substantial knowledge about BlackRock from this relationship.
The Trustees considered that under the BlackRock Interim Portfolio Management Agreement, BlackRock would be responsible for providing the investment management services for the Portfolio’s assets, including investment research, advice and supervision, and determining which securities would be purchased or sold by the Portfolio. The Trustees considered the quality of the management services expected to be provided to the Large-Cap Growth Portfolio, the organizational depth and resources of BlackRock, including the background and experience of BlackRock’s management and the expertise of the portfolio management team, as well as the investment strategies, processes and philosophy to be used with respect to the investment strategy.
In addition, the Trustees considered BlackRock’s written compliance policies and procedures and noted that the Fund’s CCO had previously provided an assessment of BlackRock’s compliance program, as required under Rule 38a-1 of the 1940 Act, and its code of ethics.
In making these assessments, the Trustees took note of the due diligence PLFA conducted with respect to BlackRock, their prior knowledge of and working relationship with BlackRock, including the fact that BlackRock already manages the proposed strategy for another Portfolio within the Fund and were aided by the assessment and recommendation of PLFA and the in-person presentation and materials provided by BlackRock.
The Board concluded it was satisfied with the nature, extent and quality of the investment management services anticipated to be provided to the Large-Cap Growth Portfolio by BlackRock under the BlackRock Interim Portfolio Management Agreement.
2. Performance
The Trustees considered PLFA’s ongoing efforts to search for and screen advisory firms that are qualified to manage, on a longer term basis, a large-cap growth portfolio. The Trustees considered that while that search process was underway, it would be appropriate to engage BlackRock to serve as Interim Portfolio Manager with regard to the day-to-day investment activities of the Large-Cap Growth Portfolio using an index strategy. The Trustees considered that the performance objective during this interim period was to retain benchmark large-cap market exposure without assuming additional risk and considered that BlackRock’s large-cap index strategy was the appropriate means to achieve that objective.
The Trustees considered information about the historical performance of accounts managed by the same BlackRock portfolio management team that would manage the Large-Cap Growth Portfolio using similar investment strategies as those proposed for the Large-Cap Growth Portfolio (the “Comparable Performance”). The Trustees considered the Comparable Performance against a pertinent benchmark for one-, three-, and five-year and since inception periods (as available) as of June 30, 2012 and noted that the strategy seeks to replicate the performance of a benchmark index.
The Board determined that BlackRock’s performance record was acceptable.
3. Advisory and Portfolio Management Fees
The Trustees considered information regarding the comparative advisory fees charged under other investment advisory contracts of the Interim Portfolio Manager with regard to other investment accounts with substantially similar investment strategies as the Large-Cap Growth Portfolio. The Trustees noted that in certain cases there were differences in the level of services proposed to be provided to the Large-Cap Growth Portfolio by BlackRock and that the level of services provided by BlackRock on these other accounts was due to the different nature of the accounts or an affiliation between BlackRock and the account. These differences often explained differences in fee schedules. The Trustees noted that the fee rates were the result of arms’-length negotiations between PLFA and BlackRock, and that the Large-Cap Growth Portfolio’s sub-advisory fees are paid by PLFA and are not paid directly by the Large-Cap Growth Portfolio. The Trustees considered that PLFA had agreed to waive a portion of its advisory fee while BlackRock serves as Interim Portfolio Manager.
The Board concluded that the compensation payable under the BlackRock Interim Portfolio Management Agreement is fair and reasonable.
4. Costs, Level of Profits and Economies of Scale
The Trustees considered the projected profitability of the BlackRock Interim Portfolio Management Agreement to BlackRock to the extent practicable based on the financial information provided by BlackRock. Given the short-term interim nature of the proposed engagement, the Trustees did not consider this information as particularly meaningful.
The Board concluded that the Large-Cap Growth Portfolio’s fee structure reflected in the BlackRock Interim Portfolio Management Agreement is fair and reasonable.
5. Ancillary Benefits
The Trustees received from PLFA and BlackRock information concerning other benefits that may be received by BlackRock and its affiliates as a result of their relationship with the Large-Cap Growth Portfolio, including commissions that may be paid to broker-dealers affiliated with the Interim Portfolio Manager and the anticipated use of soft-dollars by the Interim Portfolio Manager. In this regard, the Trustees noted that BlackRock represented that it does not anticipate utilizing an affiliated broker-dealer or soft dollar credits generated by Portfolio commissions to pay for research services. The potential benefits that may be derived by BlackRock from its relationship with the Large-Cap Growth Portfolio could include larger assets under management and reputational benefits, which are consistent with those generally derived by investment advisers to mutual funds. The Trustees considered potential benefits to be derived by BlackRock from its relationship with the Large-Cap Growth Portfolio and that such benefits were consistent with those generally derived by sub-advisers to mutual funds or were otherwise not unusual.
F-14
PACIFIC SELECT FUND
APPROVAL OF INVESTMENT ADVISORY AGREEMENT AND PORTFOLIO MANAGEMENT AGREEMENTS (Continued)
(Unaudited)
6. Conclusion
Based on their review, including the consideration of each of the factors referred to above, the Board found that: (i) the BlackRock Interim Portfolio Management Agreement is in the best interests of the Large-Cap Growth Portfolio and its shareholders; and (ii) the compensation payable under the BlackRock Interim Portfolio Management Agreement is fair and reasonable. No single factor was determinative of the Board’s findings, but rather the Trustees based their determination on the total mix of information available to them.
Mid-Cap Equity Portfolio
At an in-person meeting on September 12, 2012, the Board, including all of the Independent Trustees, approved, effective no later than January 1, 2013, a new Portfolio Management Agreement with Scout Investments, Inc. (“Scout”) with respect to the Mid-Cap Equity Portfolio (the “Scout Portfolio Management Agreement”), and appointed Scout as the new Portfolio Manager for this Portfolio. In connection with this matter, also at the September 12, 2012 meeting, the Board terminated the Portfolio Management Agreement for the Portfolio with the prior portfolio manager upon the effectiveness of the Scout Portfolio Management Agreement. Scout’s appointment as Portfolio Manager was made in accordance with the exemptive order issued by the SEC with regard to the Fund and does not require shareholder approval.
In evaluating the Scout Portfolio Management Agreement, the Board, including the Independent Trustees, considered the factors described below. Additionally, the Board considered the various screening processes that PLFA utilizes in identifying a proposed new portfolio manager, including screening for qualified firms through the use of quantitative data and information gathered from independent third-party databases, as well as the due diligence conducted by PLFA on the investment resources and personnel of a portfolio manager and an assessment of the investment strategies used by a portfolio manager and the due diligence conducted by the Fund’s Chief Compliance Officer (“CCO”). In addition, the Board reviewed the specific criteria and information evaluated by PLFA during the selection process of Scout, including information about other firms considered by PLFA, and PLFA’s analysis in reaching its conclusion to recommend Scout as the new Portfolio Manager.
In evaluating the Scout Portfolio Management Agreement, the Board, including all the Independent Trustees, considered the following factors, among others:
1. Nature, Extent and Quality of Services to be Provided
The Trustees considered the benefits to shareholders of retaining Scout as the Portfolio Manager, particularly in light of the nature, extent, and quality of the services expected to be provided by Scout. In this regard, the Trustees considered various materials relating to the proposed Portfolio Manager, including copies of the proposed Scout Portfolio Management Agreement; copies of Scout’s Form ADV; financial information; and other information deemed relevant to the Trustees’ evaluation, including comprehensive assessments from senior management of PLFA.
The Trustees considered that under the Scout Portfolio Management Agreement, Scout would be responsible for providing the investment management services for the Portfolio’s assets, including investment research, advice and supervision, and determining which securities would be purchased or sold by the Portfolio. The Trustees considered the quality of the management services expected to be provided to the Mid-Cap Equity Portfolio over both the short- and long-term, the organizational depth and resources of Scout, including the background and experience of Scout’s management and the expertise of the portfolio management team, as well as the investment strategies, processes and philosophy to be used with respect to the investment strategy.
In addition, the Trustees considered Scout’s written compliance policies and procedures and noted that the Trust’s CCO had provided an assessment of Scout’s compliance program, as required under Rule 38a-1 of the 1940 Act, and its code of ethics.
In making these assessments, the Trustees took note of the extensive due diligence PLFA conducted with respect to Scout, and were aided by the assessment and recommendation of PLFA and the in-person presentation and materials provided by Scout.
The Board concluded it was satisfied with the nature, extent and quality of the investment management services anticipated to be provided to the Mid-Cap Equity Portfolio by Scout under the Scout Portfolio Management Agreement.
2. Performance
The Trustees considered PLFA’s efforts and process to search for and screen advisory firms that are qualified to manage a mid-cap equity portfolio, and the identification by PLFA of Scout to serve as Portfolio Manager with regard to the day-to-day investment activities of the Mid-Cap Equity Portfolio. The Trustees considered factors concerning performance in connection with its consideration of this matter and in connection with approval of the related Scout Portfolio Management Agreement, as described below.
The Trustees considered information about the historical performance of an account managed by the same Scout portfolio management team that would manage the Mid-Cap Equity Portfolio using similar investment strategies as those proposed for the Mid-Cap Equity Portfolio (the “Comparable Performance”). The Trustees considered the Comparable Performance against a pertinent benchmark and against the applicable peer group for the year-to-date, one-, three-, and five-year periods as of June 30, 2012. The Trustees also considered the Comparable Performance against a pertinent benchmark and an applicable peer group for the previous five calendar years. Additionally, the Trustees considered performance information presented by PLFA for another potential manager of the Portfolio and the performance of an account managed by the lead portfolio manager of the Scout portfolio management team when the individual worked at another advisory firm prior to joining Scout. The Trustees also considered the need for Scout to adhere to the Portfolio’s general investment mandate in order to function appropriately in the Portfolio Optimization Portfolios.
The Board determined that Scout’s performance record was acceptable.
3. Advisory and Portfolio Management Fees
The Trustees considered information regarding the comparative advisory fees charged under other investment advisory contracts of the Portfolio Manager with regard to other investment accounts with substantially similar investment strategies as the Mid-Cap Equity Portfolio. The Trustees noted that in certain cases there were differences in the level of services proposed to be provided to the Mid-Cap Equity Portfolio by Scout and that the level of services provided by Scout on these other accounts was due to the different nature of the accounts or an affiliation
F-15
PACIFIC SELECT FUND
APPROVAL OF INVESTMENT ADVISORY AGREEMENT AND PORTFOLIO MANAGEMENT AGREEMENTS (Continued)
(Unaudited)
between Scout and the account. These differences often explained differences in fee schedules. The Trustees noted that the fee rates were the result of arms’-length negotiations between PLFA and Scout, and that the Mid-Cap Equity Portfolio’s sub-advisory fees are paid by PLFA and are not paid directly by the Mid-Cap Equity Portfolio. Additionally, the Trustees considered that there are certain costs associated with a manager change, but that the advisory fee rates and ongoing operating expenses paid by the shareholders were not expected to materially increase as a result of this portfolio manager change.
The Board concluded that the compensation payable under the Scout Portfolio Management Agreement is fair and reasonable.
4. Costs, Level of Profits and Economies of Scale
The Trustees considered the projected profitability of the Scout Portfolio Management Agreement to Scout to the extent practicable based on the financial information provided by Scout. The Trustees considered that it was difficult to accurately determine or evaluate the projected profitability of the Scout Portfolio Management Agreement to Scout because it managed substantial assets or had multiple business lines and, further, that any such assessment would involve assumptions regarding its allocation policies, capital structure, cost of capital, business mix and other factors. The Trustees focused their consideration on other information provided in connection with this matter, given the arms’-length nature of the relationship between PLFA and Scout with respect to the negotiation of Portfolio sub-advisory fees, the fact that such fees are paid by PLFA and the fact that the projected profitability of the Scout Portfolio Management Agreement to Scout is an estimate.
The Board concluded that the Mid-Cap Equity Portfolio’s fee structure reflected in the Scout Portfolio Management Agreement is fair and reasonable.
5. Ancillary Benefits
The Trustees received from PLFA and Scout information concerning other benefits that may be received by Scout and its affiliates as a result of their relationship with the Mid-Cap Equity Portfolio, including commissions that may be paid to broker-dealers affiliated with the Portfolio Manager and the anticipated use of soft dollars by the Portfolio Manager. In this regard, the Trustees noted that Scout represented that it does not anticipate utilizing an affiliated broker-dealer and that it anticipates using soft dollar credits generated by Portfolio commissions to pay for research services. The potential benefits that may be derived by Scout from its relationship with the Mid-Cap Equity Portfolio could include larger assets under management and reputational benefits, which are consistent with those generally derived by sub-advisers to mutual funds. The Trustees considered potential benefits to be derived by Scout from its relationship with the Mid-Cap Equity Portfolio and that such benefits were consistent with those generally derived by sub-advisers to mutual funds or were otherwise not unusual.
6. Conclusion
Based on their review, including the consideration of each of the factors referred to above, the Board found that: (i) the Scout Portfolio Management Agreement is in the best interests of the Mid-Cap Equity Portfolio and its shareholders; and (ii) the compensation payable under the Scout Portfolio Management Agreement is fair and reasonable. No single factor was determinative of the Board’s findings, but rather the Trustees based their determination on the total mix of information available to them.
Precious Metals Portfolio
At the June 20, 2012 meeting, the Board, including all of the Independent Trustees, approved, effective on or about October 1, 2012, the Advisory Agreement with PLFA with respect to the Precious Metals Portfolio (the “Precious Metals Advisory Agreement”) and the Portfolio Management Agreement with Wells Capital Management, Inc. (“Wells Capital”) with respect to the Portfolio (the “Wells Capital Portfolio Management Agreement”), and appointed Wells Capital as the Portfolio Manager for this Portfolio.
In evaluating the Precious Metals Advisory Agreement and Wells Capital Portfolio Management Agreement, the Board, including the Independent Trustees, considered the factors described below. Additionally, in its evaluation of the Wells Capital Portfolio Management Agreement, the Board considered the various screening processes that PLFA utilizes in identifying a proposed new portfolio manager, including screening for qualified firms through the use of quantitative data and information gathered from independent third-party databases, as well as the due diligence conducted by PLFA on the investment resources and personnel of a portfolio manager and an assessment of the investment strategies used by a portfolio manager and the due diligence conducted by the Fund’s Chief Compliance Officer (“CCO”). In addition, the Board reviewed the specific criteria and information evaluated by PLFA during the selection process of Wells Capital, including information about other firms considered by PLFA, and PLFA’s analysis in reaching its conclusion to recommend Wells Capital as the new portfolio manager.
In evaluating the Precious Metals Advisory Agreement and Wells Capital Portfolio Management Agreement, the Board, including all the Independent Trustees, considered the following factors, among others:
1. Nature, Extent and Quality of Services
Portfolio Oversight and Supervision – PLFA, its personnel and its resources. The Trustees considered the depth and quality of PLFA’s investment management process, including its sophisticated monitoring and oversight of Portfolio Managers; the experience, capability and integrity of its senior management and other personnel; the low turnover rates of its key personnel; and the overall financial strength and stability of its organization. The Trustees considered the high quality of the products and services provided by PLFA and its affiliates, such as the many educational services and tools offered to assist intermediaries in effectively understanding and meeting shareholder needs. The Trustees also noted that PLFA regularly informs the Trustees about matters relevant to the Fund and its shareholders and investing.
The Trustees also considered that PLFA’s investment, legal, compliance and accounting professionals have access to and utilize a variety of resources and systems relating to investment management, compliance, trading, performance analysis, security valuation and portfolio accounting. The Trustees further considered PLFA’s continuing need to attract and retain qualified personnel and to maintain and enhance its
F-16
PACIFIC SELECT FUND
APPROVAL OF INVESTMENT ADVISORY AGREEMENT AND PORTFOLIO MANAGEMENT AGREEMENTS (Continued)
(Unaudited)
resources and systems to provide the appropriate investment management, compliance and monitoring services required for the Portfolio. The Board noted that PLFA monitors numerous investment, performance and compliance metrics for the portfolios of the Trust.
The Trustees considered the benefits to shareholders of retaining PLFA to serve as the investment adviser to the Precious Metals Portfolio in light of the nature, extent, and quality of services expected to be provided by PLFA. The Trustees considered the ability of PLFA to provide an appropriate level of support and resources to the Precious Metals Portfolio and whether PLFA has sufficiently qualified personnel. The Trustees based this review on information and materials provided to them throughout the year by PLFA. The Trustees considered PLFA’s continued development and use of analytical tools for assessing Portfolio performance and the performance of Portfolio Managers, conducting an attribution analysis on performance and reporting on performance to the Trustees. The Trustees noted that PLFA uses these tools to monitor and identify when a Portfolio is underperforming applicable benchmarks or peer groups, and then conducts various analyses to try to assess the sources of and reasons for underperformance. The Trustees noted that PLFA has developed processes to oversee and monitor a Portfolio Manager’s execution of investment strategies. The Board noted that PLFA provides the Board with analysis of this data over rolling periods to assist the Board in identifying trends in Portfolio performance and other areas, and periodically provides the Trustees with information on economic and market trends to provide a context for assessing recent performance. The Board also noted that PLFA conducts periodic due diligence on a Portfolio Manager involving on-site visits, in-person meetings and telephonic meetings to gather information that PLFA uses to attempt to gain an in-depth understanding of a Portfolio Manager’s investment process and to seek to identify issues that may be relevant to a Portfolio Manager’s services to a Portfolio or a Portfolio’s performance. The Trustees also considered the background and experience of PLFA’s senior management, and the experience of and significant amount of attention expected to be given to the Precious Metals Portfolio by PLFA’s management and staff. The Trustees also considered PLFA’s compliance operations with respect to the Trust, including the measures taken by PLFA to assist the Fund in complying with Rule 38a-1 under the 1940 Act. The Trustees further considered the monitoring and additional services provided by PLFA to the Portfolio, including assistance with security valuation, risk management analysis, preparation of periodic performance and financial reports, review of trade execution and coordination of other service providers to the Trust.
The Board concluded that it was satisfied with the nature, extent and quality of the investment management services to be provided by PLFA to the Portfolio under the Precious Metals Advisory Agreement.
Wells Capital. The Trustees considered the benefits to shareholders of retaining Wells Capital as the Portfolio Manager, particularly in light of the nature, extent, and quality of the services expected to be provided by Wells Capital. In this regard, the Trustees considered various materials relating to the proposed Portfolio Manager, including copies of the proposed Wells Capital Portfolio Management Agreement; copies of Wells Capital’s Form ADV; financial information; and other information deemed relevant to the Trustees’ evaluation, including qualitative assessments from senior management of PLFA.
The Trustees considered that under the Wells Capital Portfolio Management Agreement, Wells Capital would be responsible for providing the investment management services for the Portfolio’s assets, including investment research, advice and supervision, and determining which securities would be purchased or sold by the Portfolio. The Trustees considered the quality of the management services expected to be provided to the Precious Metals Portfolio over both the short- and long-term, the organizational depth and resources of Wells Capital, including the background and experience of Wells Capital’s management and the expertise of the portfolio management team, as well as the investment strategies, processes and philosophy to be used with respect to the investment strategy.
In addition, the Trustees considered Wells Capital’s written compliance policies and procedures and noted that the Trust’s CCO had provided an assessment of Wells Capital’s compliance program, as required under Rule 38a-1 of the 1940 Act, and its code of ethics.
In making these assessments, the Trustees took note of the extensive due diligence PLFA conducted with respect to Wells Capital, and were aided by the assessment and recommendation of PLFA and the in-person presentation and materials provided by Wells Capital. The Trustees also considered that PLFA has historically exercised diligence in monitoring the performance of the Portfolio Managers, and has recommended and taken measures to attempt to remedy relative underperformance by a Portfolio when PLFA and the Board believed appropriate.
The Board concluded it was satisfied with the nature, extent and quality of the investment management services anticipated to be provided to the Precious Metals Portfolio by PLFA under the Precious Metals Advisory Agreement and by Wells Capital under the Wells Capital Portfolio Management Agreement.
2. Performance
The Trustees considered PLFA’s efforts and process to search for and screen advisory firms that are qualified to manage a precious metals portfolio, and the identification by PLFA of Wells Capital to serve as Portfolio Manager with regard to the day-to-day investment activities of the Precious Metals Portfolio. Because this consideration related to a newly organized portfolio, no actual performance record for this Portfolio was available. However, the Trustees considered factors concerning performance in connection with its consideration of this matter and in connection with approval of the related Wells Capital Portfolio Management Agreement, as described below.
The Trustees considered information about the historical performance of an account managed by the same Wells Capital portfolio management team that would manage the Precious Metals Portfolio using similar investment strategies as those proposed for the Precious Metals Portfolio (the “Comparable Performance”). The Trustees considered the Comparable Performance against a pertinent benchmark and against the applicable peer group for the year-to-date, one-, three-, five- and ten-year periods as of March 31, 2012. The Trustees also considered the Comparable Performance against a pertinent benchmark and an applicable peer group for the previous six calendar years as of December 31, 2011. Additionally, the Trustees considered performance information presented by PLFA for another potential portfolio manager. The Trustees also considered the need for Wells Capital to adhere to the Portfolio’s general investment mandate in order to function appropriately in the Portfolio Optimization Portfolios.
The Board determined that Wells Capital’s performance record was acceptable.
F-17
PACIFIC SELECT FUND
APPROVAL OF INVESTMENT ADVISORY AGREEMENT AND PORTFOLIO MANAGEMENT AGREEMENTS (Continued)
(Unaudited)
3. Advisory and Portfolio Management Fees
PLFA. The Trustees requested, received and reviewed information from PLFA relating to the proposed advisory fee for the Precious Metals Portfolio. The Trustees reviewed the proposed advisory fees for the Portfolio and compared such amounts with the average fees of other funds in an applicable peer fund group. The Trustees also noted that the Portfolio would be subject to contractual expense limitations agreed to by PLFA. The Trustees considered that the proposed advisory fee was in line with industry averages for Precious Metals products based on the data presented to the Board. The Trustees also considered that PLFA agreed to an asset-based breakpoint schedule for the Precious Metals Portfolio so that the advisory fee as a percentage of the Portfolio’s net assets would decrease as the Portfolio becomes larger. The Trustees noted that the proposed breakpoints appear to offer meaningful potential savings to shareholders of the Precious Metals Portfolio as asset levels increase.
The Board concluded that the compensation payable under the Precious Metals Advisory Agreement is fair and reasonable.
Wells Capital. The Trustees considered information regarding the comparative sub-advisory fees charged under other investment advisory contracts of the Portfolio Manager with regard to other investment accounts with substantially similar investment strategies as the Precious Metals Portfolio. The Trustees noted that, in certain cases, there were differences in the level of services proposed to be provided to the Precious Metals Portfolio by Wells Capital and that the level of services provided by Wells Capital on these other accounts was due to the different nature of the accounts or an affiliation between Wells Capital and the account. These differences often explained differences in fee schedules. The Trustees noted that the fee rates were the result of arm’s-length negotiations between PLFA and Wells Capital, and that the Precious Metals Portfolio’s sub-advisory fees are paid by PLFA and are not paid directly by the Precious Metals Portfolio. The Trustees also considered that the sub-advisory fees payable to Wells Capital under the Wells Capital Portfolio Management Agreement contained breakpoints.
The Board concluded that the compensation payable under the Wells Capital Portfolio Management Agreement is fair and reasonable.
4. Costs, Level of Profits and Economies of Scale
Costs and Profitability. The Trustees reviewed information regarding PLFA’s projected costs of sponsoring the Portfolio and information regarding the anticipated projected profitability of the proposed Portfolio to PLFA. The Trustees considered the projected cost of services to be provided and projected profits to be realized by PLFA from the relationship with the Precious Metals Portfolio based on the projected assets, income and expenses of PLFA in its relationship with the Portfolio. The Trustees noted that this projected information contains estimates, because there is no actual operating history for the Precious Metals Portfolio. The Trustees also considered the overall financial soundness of PLFA.
The Trustees considered the projected profitability of the Wells Capital Portfolio Management Agreement to Wells Capital to the extent practicable based on the financial information provided by Wells Capital. The Trustees considered that it was difficult to accurately determine or evaluate the projected profitability of the Wells Capital Portfolio Management Agreement to Wells Capital, because it managed substantial assets or had multiple business lines and, further, that any such assessment would involve assumptions regarding its allocation policies, capital structure, cost of capital, business mix and other factors. The Trustees focused their consideration on other information provided in connection with this matter, given the arm’s-length nature of the relationship between PLFA and Wells Capital with respect to the negotiation of portfolio sub-advisory fees, the fact that such fees are paid by PLFA and the fact that the projected profitability of the Wells Capital Portfolio Management Agreement to Wells Capital is an estimate.
Economies of Scale. The Trustees considered the extent to which economies of scale may be realized by the Precious Metals Portfolio as assets grow. Because the Precious Metals Portfolio has no operating history and no assets, no economies of scale exist at this time with respect to the Portfolio. However, the Trustees considered that by utilizing an advisory fee schedule with breakpoints whereby the advisory fee as a percentage of the Portfolio’s net assets decreases as the Portfolio becomes larger represents a good faith attempt to share economies of scale and potential future economies of scale as the asset levels of the Portfolio increase. The Trustees also noted that there would be an expense limitation agreement in place for the Precious Metals Portfolio.
The Board concluded that the Precious Metals Portfolio’s fee structure reflected in the Precious Metals Advisory Agreement and Wells Capital Portfolio Management Agreement is fair and reasonable.
5. Ancillary Benefits
The Trustees received from PLFA information concerning other benefits that may be received by PLFA and Wells Capital and their affiliates as a result of their relationship with the Precious Metals Portfolio, including fees for administrative services and reimbursement at an approximate cost basis for certain support services, as well as commissions that may be paid to broker-dealers affiliated with the Portfolio Manager and the anticipated use of soft-dollars by the Portfolio Manager. In this regard, the Trustees noted that Wells Capital represented that it is restricted in the use of any affiliated broker-dealer and that it anticipates using soft dollar credits generated by Portfolio commissions to pay for research services. The potential benefits that may be derived by PLFA from its relationship with the Precious Metals Portfolio could include larger assets under management and reputational benefits, which are consistent with those generally derived by investment advisers to mutual funds. The Trustees considered potential benefits to be derived by Wells Capital from its relationship with the Precious Metals Portfolio and that such benefits were consistent with those generally derived by sub-advisers to mutual funds or were otherwise not unusual.
6. Conclusion
Based on their review, including the consideration of each of the factors referred to above, the Board found that: (i) the compensation payable under the Precious Metals Advisory Agreement and the Wells Capital Portfolio Management Agreement is fair and reasonable; and (ii) the Precious Metals Advisory Agreement and Wells Capital Portfolio Management Agreement are in the best interests of the Precious Metals Portfolio and its shareholders. No single factor was determinative of the Board’s findings, but rather the Trustees based their determination on the total mix of information available to them.
F-18
PACIFIC SELECT FUND
APPROVAL OF INVESTMENT ADVISORY AGREEMENT AND PORTFOLIO MANAGEMENT AGREEMENTS (Continued)
(Unaudited)
Currency Strategies Portfolio
At the June 20, 2012 meeting, the Board, including all of the Independent Trustees, approved, effective on or about October 1, 2012, the Advisory Agreement with PLFA with respect to the Currency Strategies Portfolio (the “Currency Strategies Advisory Agreement”) and the Portfolio Management Agreement with UBS Global Asset Management (Americas) Inc. (“UBS”) with respect to the Portfolio (the “UBS Portfolio Management Agreement”), and appointed UBS as the Portfolio Manager for this Portfolio.
In evaluating the Currency Strategies Advisory Agreement and UBS Portfolio Management Agreement, the Board, including the Independent Trustees, considered the factors described below. Additionally, in its evaluation of the UBS Portfolio Management Agreement, the Board considered the various screening processes that PLFA utilizes in identifying a proposed new portfolio manager, including screening for qualified firms through the use of quantitative data and information gathered from independent third-party databases, as well as the due diligence conducted by PLFA on the investment resources and personnel of a portfolio manager and an assessment of the investment strategies used by a portfolio manager and the due diligence conducted by the Fund’s Chief Compliance Officer (“CCO”). In addition, the Board reviewed the specific criteria and information evaluated by PLFA during the selection process of UBS, including information about other firms considered by PLFA, and PLFA’s analysis in reaching its conclusion to recommend UBS as the new portfolio manager.
In evaluating the Currency Strategies Advisory Agreement and UBS Portfolio Management Agreement, the Board, including all the Independent Trustees, considered the following factors, among others:
1. Nature, Extent and Quality of Services
Portfolio Oversight and Supervision – PLFA, its personnel and its resources. The Trustees considered the depth and quality of PLFA’s investment management process, including its sophisticated monitoring and oversight of Portfolio Managers; the experience, capability and integrity of its senior management and other personnel; the low turnover rates of its key personnel; and the overall financial strength and stability of its organization. The Trustees considered the high quality of the products and services provided by PLFA and its affiliates, such as the many educational services and tools offered to assist intermediaries in effectively understanding and meeting shareholder needs. The Trustees also noted that PLFA regularly informs the Trustees about matters relevant to the Fund and its shareholders and investing.
The Trustees also considered that PLFA’s investment, legal, compliance and accounting professionals have access to and utilize a variety of resources and systems relating to investment management, compliance, trading, performance analysis, security valuation and portfolio accounting. The Trustees further considered PLFA’s continuing need to attract and retain qualified personnel and to maintain and enhance its resources and systems to provide the appropriate investment management, compliance and monitoring services required for the Portfolio. The Board noted that PLFA monitors numerous investment, performance and compliance metrics for the portfolios of the Trust.
The Trustees considered the benefits to shareholders of retaining PLFA to serve as the investment adviser to the Currency Strategies Portfolio in light of the nature, extent, and quality of services expected to be provided by PLFA. The Trustees considered the ability of PLFA to provide an appropriate level of support and resources to the Currency Strategies Portfolio and whether PLFA has sufficiently qualified personnel. The Trustees based this review on information and materials provided to them throughout the year by PLFA. The Trustees considered PLFA’s continued development and use of analytical tools for assessing Portfolio performance and the performance of Portfolio Managers, conducting an attribution analysis on performance and reporting on performance to the Trustees. The Trustees noted that PLFA uses these tools to monitor and identify when a Portfolio is underperforming applicable benchmarks or peer groups, and then conducts various analyses to try to assess the sources of and reasons for underperformance. The Trustees noted that PLFA has developed processes to oversee and monitor a Portfolio Manager’s execution of investment strategies. The Board noted that PLFA provides the Board with analysis of this data over rolling periods to assist the Board in identifying trends in Portfolio performance and other areas, and periodically provides the Trustees with information on economic and market trends to provide a context for assessing recent performance. The Board also noted that PLFA conducts periodic due diligence on a Portfolio Manager involving on-site visits, in-person meetings and telephonic meetings to gather information that PLFA uses to attempt to gain an in-depth understanding of a Portfolio Manager’s investment process and to seek to identify issues that may be relevant to a Portfolio Manager’s services to a Portfolio or a Portfolio’s performance. The Trustees also considered the background and experience of PLFA’s senior management, and the experience of and significant amount of attention expected to be given to the Currency Strategies Portfolio by PLFA’s management and staff. The Trustees also considered PLFA’s compliance operations with respect to the Trust, including the measures taken by PLFA to assist the Fund in complying with Rule 38a-1 under the 1940 Act. The Trustees further considered the monitoring and additional services provided by PLFA to the Portfolio, including assistance with security valuation, risk management analysis, preparation of periodic performance and financial reports, review of trade execution and coordination of other service providers to the Trust.
The Board concluded that it was satisfied with the nature, extent and quality of the investment management services to be provided by PLFA to the Portfolio under the Currency Strategies Advisory Agreement.
UBS. The Trustees considered the benefits to shareholders of retaining UBS as the Portfolio Manager, particularly in light of the nature, extent, and quality of the services expected to be provided by UBS. In this regard, the Trustees considered various materials relating to the proposed Portfolio Manager, including copies of the proposed UBS Portfolio Management Agreement; copies of UBS’s Form ADV; financial information; and other information deemed relevant to the Trustees’ evaluation, including qualitative assessments from senior management of PLFA.
The Trustees considered that under the UBS Portfolio Management Agreement, UBS would be responsible for providing the investment management services for the Portfolio’s assets, including investment research, advice and supervision, and determining which securities would be purchased or sold by the Portfolio. The Trustees considered the quality of the management services expected to be provided to the Currency Strategies Portfolio over both the short- and long-term, the organizational depth and resources of UBS, including the background and experience of UBS’s management and the expertise of the portfolio management team, as well as the investment strategies, processes and philosophy to be used with respect to the investment strategy.
F-19
PACIFIC SELECT FUND
APPROVAL OF INVESTMENT ADVISORY AGREEMENT AND PORTFOLIO MANAGEMENT AGREEMENTS (Continued)
(Unaudited)
In addition, the Trustees considered that they had previously reviewed and approved UBS’s written compliance policies and procedures and that the Trust’s CCO previously provided an assessment of UBS’s compliance program, as required under Rule 38a-1 of the 1940 Act, and its code of ethics.
In making these assessments, the Trustees took note of the extensive due diligence PLFA conducted with respect to UBS, and were aided by the assessment and recommendation of PLFA and the in-person presentation and materials provided by UBS. The Trustees also considered that PLFA has historically exercised diligence in monitoring the performance of the Portfolio Managers, and has recommended and taken measures to attempt to remedy relative underperformance by a Portfolio when PLFA and the Board believed appropriate.
The Board concluded it was satisfied with the nature, extent and quality of the investment management services anticipated to be provided to the Currency Strategies Portfolio by PLFA under the Currency Strategies Advisory Agreement and UBS under the UBS Portfolio Management Agreement.
2. Performance
The Trustees considered PLFA’s efforts and process to search for and screen advisory firms that are qualified to manage a currency strategies portfolio, and the identification by PLFA of UBS to serve as Portfolio Manager with regard to the day-to-day investment activities of the Currency Strategies Portfolio. Because this consideration related to a newly organized portfolio, no actual performance record for this Portfolio was available. However, the Trustees considered factors concerning performance in connection with its consideration of this matter and in connection with approval of the related UBS Portfolio Management Agreement, as described below.
The Trustees considered information about the historical performance of accounts managed by the same UBS portfolio management team that would manage the Currency Strategies Portfolio using similar, though not identical, investment strategies as those proposed for the Currency Strategies Portfolio (the “Comparable Performance”). The Trustees considered the Comparable Performance against a pertinent benchmark and against the applicable peer group for the year-to-date, one-, three- and five-year periods as of March 31, 2012. The Trustees also considered the Comparable Performance against a pertinent benchmark and an applicable peer group for the previous six calendar years as of December 31, 2011. The Trustees also considered the need for UBS to adhere to the Portfolio’s general investment mandate in order to function appropriately in the Portfolio Optimization Portfolios.
The Board determined that UBS’s performance record was acceptable.
3. Advisory and Portfolio Management Fees
PLFA. The Trustees requested, received and reviewed information from PLFA relating to the proposed advisory fee for the Currency Strategies Portfolio. The Trustees reviewed the proposed advisory fees for the Portfolio and compared such amounts with the average fees of other funds in an applicable peer fund group. The Trustees also noted that the Portfolio would be subject to contractual expense limitations agreed to by PLFA. The Trustees considered that the proposed advisory fee was in line with industry averages for Currency Strategies products based on the data presented to the Board. The Trustees also considered that PLFA agreed to an asset-based breakpoint schedule for the Currency Strategies Portfolio so that the advisory fee as a percentage of the Portfolio’s net assets would decrease as the Portfolio becomes larger. The Trustees noted that the proposed breakpoints appear to offer meaningful potential savings to shareholders of the Currency Strategies Portfolio as asset levels increase.
The Board concluded that the compensation payable under the Currency Strategies Advisory Agreement is fair and reasonable.
UBS. The Trustees considered information regarding the comparative sub-advisory fees charged under other investment advisory contracts of the Portfolio Manager with regard to other investment accounts with substantially similar investment strategies as the Currency Strategies Portfolio. The Trustees noted that in certain cases there were differences in the level of services proposed to be provided to the Currency Strategies Portfolio by UBS and that the level of services provided by UBS on these other accounts was due to the different nature of the accounts or an affiliation between UBS and the account. These differences often explained differences in fee schedules. The Trustees noted that the fee rates were the result of arm’s-length negotiations between PLFA and UBS, and that the Currency Strategies Portfolio’s sub-advisory fees are paid by PLFA and are not paid directly by the Currency Strategies Portfolio. The Trustees also considered that the sub-advisory fees payable to UBS under the UBS Portfolio Management Agreement contained breakpoints.
The Board concluded that the compensation payable under the UBS Portfolio Management Agreement is fair and reasonable.
4. Costs, Level of Profits and Economies of Scale
Costs and Profitability. The Trustees reviewed information regarding PLFA’s projected costs of sponsoring the Portfolio and information regarding the anticipated projected profitability of the proposed Portfolio to PLFA. The Trustees considered the projected cost of services to be provided and projected profits to be realized by PLFA from the relationship with the Currency Strategies Portfolio based on the projected assets, income and expenses of PLFA in its relationship with the Portfolio. The Trustees noted that this projected information contains estimates because there is no actual operating history for the Currency Strategies Portfolio. The Trustees also considered the overall financial soundness of PLFA.
The Trustees considered the projected profitability of the UBS Portfolio Management Agreement to UBS to the extent practicable based on the financial information provided by UBS. The Trustees considered that it was difficult to accurately determine or evaluate the projected profitability of the UBS Portfolio Management Agreement to UBS because it managed substantial assets or had multiple business lines and, further, that any such assessment would involve assumptions regarding its allocation policies, capital structure, cost of capital, business mix and other factors. The Trustees focused their consideration on other information provided in connection with this matter, given the arm’s-length nature of the relationship between PLFA and UBS with respect to the negotiation of portfolio sub-advisory fees, the fact that such fees are paid by PLFA and the fact that the projected profitability of the UBS Portfolio Management Agreement to UBS is an estimate.
F-20
PACIFIC SELECT FUND
APPROVAL OF INVESTMENT ADVISORY AGREEMENT AND PORTFOLIO MANAGEMENT AGREEMENTS (Continued)
(Unaudited)
Economies of Scale. The Trustees considered the extent to which economies of scale may be realized by the Currency Strategies Portfolio as assets grow. Because the Currency Strategies Portfolio has no operating history and no assets, no economies of scale exist at this time with respect to the Portfolio. However, the Trustees considered that by utilizing an advisory fee schedule with breakpoints whereby the advisory fee as a percentage of the Portfolio’s net assets decreases as the Portfolio becomes larger represents a good faith attempt to share economies of scale and potential future economies of scale as the asset levels of the Portfolio increase. The Trustees also noted that there would be an expense limitation agreement in place for the Currency Strategies Portfolio.
The Board concluded that the Currency Strategies Portfolio’s fee structure reflected in the Currency Strategies Advisory Agreement and UBS Portfolio Management Agreement is fair and reasonable.
5. Ancillary Benefits
The Trustees received from PLFA information concerning other benefits that may be received by PLFA and UBS and their affiliates as a result of their relationship with the Currency Strategies Portfolio, including fees for administrative services and reimbursement at an approximate cost basis for certain support services, as well as commissions that may be paid to broker-dealers affiliated with the Portfolio Manager and the anticipated use of soft-dollars by the Portfolio Manager. In this regard, the Trustees noted that UBS represented that they do not anticipate utilizing an affiliated broker-dealer for foreign exchange trades, which are expected to be the primary investments of the Portfolio, or utilizing soft dollar credits generated by Portfolio commissions to pay for research services. The potential benefits that may be derived by PLFA from its relationship with the Currency Strategies Portfolio could include larger assets under management and reputational benefits, which are consistent with those generally derived by investment advisers to mutual funds. The Trustees considered potential benefits to be derived by UBS from its relationship with the Currency Strategies Portfolio and that such benefits were consistent with those generally derived by sub-advisers to mutual funds or were otherwise not unusual.
6. Conclusion
Based on their review, including the consideration of each of the factors referred to above, the Board found that: (i) the compensation payable under the Currency Strategies Advisory Agreement and the UBS Portfolio Management Agreement is fair and reasonable; and (ii) the Currency Strategies Advisory Agreement and UBS Portfolio Management Agreement are in the best interests of the Currency Strategies Portfolio and its shareholders. No single factor was determinative of the Board’s findings, but rather the Trustees based their determination on the total mix of information available to them.
Global Absolute Return Portfolio
At the June 20, 2012 meeting, the Board, including all of the Independent Trustees, approved, effective on or about October 1, 2012, the Advisory Agreement with PLFA with respect to the Global Absolute Return Portfolio (the “Global Absolute Return Advisory Agreement”) and the Portfolio Management Agreement with Eaton Vance Management (“Eaton Vance”) with respect to the Portfolio (the “Eaton Vance Portfolio Management Agreement”), and appointed Eaton Vance as the Portfolio Manager for this Portfolio.
In evaluating the Global Absolute Return Advisory Agreement and Eaton Vance Portfolio Management Agreement, the Board, including the Independent Trustees, considered the factors described below. Additionally, in its evaluation of the Eaton Vance Portfolio Management Agreement, the Board considered the various screening processes that PLFA utilizes in identifying a proposed new portfolio manager, including screening for qualified firms through the use of quantitative data and information gathered from independent third-party databases, as well as the due diligence conducted by PLFA on the investment resources and personnel of a portfolio manager and an assessment of the investment strategies used by a portfolio manager and the due diligence conducted by the Fund’s Chief Compliance Officer (“CCO”). In addition, the Board reviewed the specific criteria and information evaluated by PLFA during the selection process of Eaton Vance and PLFA’s analysis in reaching its conclusion to recommend Eaton Vance as the new portfolio manager.
In evaluating the Global Absolute Return Advisory Agreement and Eaton Vance Portfolio Management Agreement, the Board, including all the Independent Trustees, considered the following factors, among others:
1. Nature, Extent and Quality of Services
Portfolio Oversight and Supervision – PLFA, its personnel and its resources. The Trustees considered the depth and quality of PLFA’s investment management process, including its sophisticated monitoring and oversight of Portfolio Managers; the experience, capability and integrity of its senior management and other personnel; the low turnover rates of its key personnel; and the overall financial strength and stability of its organization. The Trustees considered the high quality of the products and services provided by PLFA and its affiliates, such as the many educational services and tools offered to assist intermediaries in effectively understanding and meeting shareholder needs. The Trustees also noted that PLFA regularly informs the Trustees about matters relevant to the Fund and its shareholders and investing.
The Trustees also considered that PLFA’s investment, legal, compliance and accounting professionals have access to and utilize a variety of resources and systems relating to investment management, compliance, trading, performance analysis, security valuation and portfolio accounting. The Trustees further considered PLFA’s continuing need to attract and retain qualified personnel and to maintain and enhance its resources and systems to provide the appropriate investment management, compliance and monitoring services required for the Portfolio. The Board noted that PLFA monitors numerous investment, performance and compliance metrics for the portfolios of the Trust.
The Trustees considered the benefits to shareholders of retaining PLFA to serve as the investment adviser to the Global Absolute Return Portfolio in light of the nature, extent, and quality of services expected to be provided by PLFA. The Trustees considered the ability of PLFA to provide an appropriate level of support and resources to the Global Absolute Return Portfolio and whether PLFA has sufficiently qualified personnel. The Trustees based this review on information and materials provided to them throughout the year by PLFA. The Trustees considered PLFA’s continued development and use of analytical tools for assessing Portfolio performance and the performance of Portfolio Managers, conducting an attribution analysis on performance and reporting on performance to the Trustees. The Trustees noted that PLFA uses these tools to monitor and identify when a Portfolio is underperforming applicable benchmarks or peer groups, and then conducts various
F-21
PACIFIC SELECT FUND
APPROVAL OF INVESTMENT ADVISORY AGREEMENT AND PORTFOLIO MANAGEMENT AGREEMENTS (Continued)
(Unaudited)
analyses to try to assess the sources of and reasons for underperformance. The Trustees noted that PLFA has developed processes to oversee and monitor a Portfolio Manager’s execution of investment strategies. The Board noted that PLFA provides the Board with analysis of this data over rolling periods to assist the Board in identifying trends in Portfolio performance and other areas, and periodically provides the Trustees with information on economic and market trends to provide a context for assessing recent performance. The Board also noted that PLFA conducts periodic due diligence on a Portfolio Manager involving on-site visits, in-person meetings and telephonic meetings to gather information that PLFA uses to attempt to gain an in-depth understanding of a Portfolio Manager’s investment process and to seek to identify issues that may be relevant to a Portfolio Manager’s services to a Portfolio or a Portfolio’s performance. The Trustees also considered the background and experience of PLFA’s senior management, and the experience of and significant amount of attention expected to be given to the Global Absolute Return Portfolio by PLFA’s management and staff. The Trustees also considered PLFA’s compliance operations with respect to the Trust, including the measures taken by PLFA to assist the Fund in complying with Rule 38a-1 under the 1940 Act. The Trustees further considered the monitoring and additional services provided by PLFA to the Portfolio, including assistance with security valuation, risk management analysis, preparation of periodic performance and financial reports, review of trade execution and coordination of other service providers to the Trust.
The Board concluded that it was satisfied with the nature, extent and quality of the investment management services to be provided by PLFA to the Portfolio under the Global Absolute Return Advisory Agreement.
Eaton Vance. The Trustees considered the benefits to shareholders of retaining Eaton Vance as the Portfolio Manager, particularly in light of the nature, extent, and quality of the services expected to be provided by Eaton Vance. In this regard, the Trustees considered various materials relating to the proposed Portfolio Manager, including copies of the proposed Eaton Vance Portfolio Management Agreement; copies of Eaton Vance’s Form ADV; financial information; and other information deemed relevant to the Trustees’ evaluation, including qualitative assessments from senior management of PLFA.
The Trustees considered that under the Eaton Vance Portfolio Management Agreement, Eaton Vance would be responsible for providing the investment management services for the Portfolio’s assets, including investment research, advice and supervision, and determining which securities would be purchased or sold by the Portfolio. The Trustees considered the quality of the management services expected to be provided to the Global Absolute Return Portfolio over both the short- and long-term, the organizational depth and resources of Eaton Vance, including the background and experience of Eaton Vance’s management and the expertise of the portfolio management team, as well as the investment strategies, processes and philosophy to be used with respect to the investment strategy.
In addition, the Trustees considered that they had previously reviewed and approved Eaton Vance’s written compliance policies and procedures and that the Trust’s CCO previously provided an assessment of Eaton Vance’s compliance program, as required under Rule 38a-1 of the 1940 Act, and its code of ethics.
In making these assessments, the Trustees took note of the extensive due diligence PLFA conducted with respect to Eaton Vance, and were aided by the assessment and recommendation of PLFA and the in-person presentation and materials provided by Eaton Vance. The Trustees also considered that PLFA has historically exercised diligence in monitoring the performance of the Portfolio Managers, and has recommended and taken measures to attempt to remedy relative underperformance by a Portfolio when PLFA and the Board believed appropriate.
The Board concluded it was satisfied with the nature, extent and quality of the investment management services anticipated to be provided to the Global Absolute Return Portfolio by PLFA under the Global Absolute Return Advisory Agreement and Eaton Vance under the Eaton Vance Portfolio Management Agreement.
2. Performance
The Trustees considered PLFA’s efforts and process to search for and screen advisory firms that are qualified to manage a global absolute return portfolio, and the identification by PLFA of Eaton Vance to serve as Portfolio Manager with regard to the day-to-day investment activities of the Global Absolute Return Portfolio. Because this consideration related to a newly organized portfolio, no actual performance record for this Portfolio was available. However, the Trustees considered factors concerning performance in connection with its consideration of this matter and in connection with approval of the related Eaton Vance Portfolio Management Agreement, as described below.
The Trustees considered information about the historical performance of accounts managed by the same Eaton Vance portfolio management team that would manage the Global Absolute Return Portfolio using similar investment strategies as those proposed for the Global Absolute Return Portfolio (the “Comparable Performance”). The Trustees considered the Comparable Performance against a pertinent benchmark and against the applicable peer group for the year-to-date, one-, three-, five- and ten-year periods as of March 31, 2012. The Trustees also considered the Comparable Performance against a pertinent benchmark and an applicable peer group for the previous ten calendar years as of December 31, 2011. The Trustees also considered the need for Eaton Vance to adhere to the Portfolio’s general investment mandate in order to function appropriately in the Portfolio Optimization Portfolios.
The Board determined that Eaton Vance’s performance record was acceptable.
3. Advisory and Portfolio Management Fees
PLFA. The Trustees requested, received and reviewed information from PLFA relating to the proposed advisory fee for the Global Absolute Return Portfolio. The Trustees reviewed the proposed advisory fees for the Portfolio and compared such amounts with the average fees of other funds in an applicable peer fund group. The Trustees also noted that the Portfolio would be subject to contractual expense limitations agreed to by PLFA. The Trustees considered that the proposed advisory fee was in line with industry averages for Global Absolute Return products based on the data presented to the Board. The Trustees also considered that PLFA agreed to an asset-based breakpoint schedule for the Global Absolute Return Portfolio so that the advisory fee as a percentage of the Portfolio’s net assets would decrease as the Portfolio becomes larger. The Trustees noted that the proposed breakpoints appear to offer meaningful potential savings to shareholders of the Global Absolute Return Portfolio as asset levels increase.
F-22
PACIFIC SELECT FUND
APPROVAL OF INVESTMENT ADVISORY AGREEMENT AND PORTFOLIO MANAGEMENT AGREEMENTS (Continued)
(Unaudited)
The Board concluded that the compensation payable under the Global Absolute Return Advisory Agreement is fair and reasonable.
Eaton Vance. The Trustees considered information regarding the comparative sub-advisory fees charged under other investment advisory contracts of the Portfolio Manager with regard to other investment accounts with substantially similar investment strategies as the Global Absolute Return Portfolio. The Trustees noted that in certain cases there were differences in the level of services proposed to be provided to the Global Absolute Return Portfolio by Eaton Vance and that the level of services provided by Eaton Vance on these other accounts was due to the different nature of the accounts or an affiliation between Eaton Vance and the account. These differences often explained differences in fee schedules. The Trustees noted that the fee rates were the result of arm’s-length negotiations between PLFA and Eaton Vance, and that the Global Absolute Return Portfolio’s sub-advisory fees are paid by PLFA and are not paid directly by the Global Absolute Return Portfolio. The Trustees also considered that the sub-advisory fees payable to Eaton Vance under the Eaton Vance Portfolio Management Agreement contained breakpoints.
The Board concluded that the compensation payable under the Eaton Vance Portfolio Management Agreement is fair and reasonable.
4. Costs, Level of Profits and Economies of Scale
Costs and Profitability. The Trustees reviewed information regarding PLFA’s projected costs of sponsoring the Portfolio and information regarding the anticipated projected profitability of the proposed Portfolio to PLFA. The Trustees considered the projected cost of services to be provided and projected profits to be realized by PLFA from the relationship with the Global Absolute Return Portfolio based on the projected assets, income and expenses of PLFA in its relationship with the Portfolio. The Trustees noted that this projected information contains estimates because there is no actual operating history for the Global Absolute Return Portfolio. The Trustees also considered the overall financial soundness of PLFA.
The Trustees considered the projected profitability of the Eaton Vance Portfolio Management Agreement to Eaton Vance to the extent practicable based on the financial information provided by Eaton Vance. The Trustees considered that it was difficult to accurately determine or evaluate the projected profitability of the Eaton Vance Portfolio Management Agreement to Eaton Vance because it managed substantial assets or had multiple business lines and, further, that any such assessment would involve assumptions regarding its allocation policies, capital structure, cost of capital, business mix and other factors. The Trustees focused their consideration on other information provided in connection with this matter, given the arm’s-length nature of the relationship between PLFA and Eaton Vance with respect to the negotiation of portfolio sub-advisory fees, the fact that such fees are paid by PLFA and the fact that the projected profitability of the Eaton Vance Portfolio Management Agreement to Eaton Vance is an estimate.
Economies of Scale. The Trustees considered the extent to which economies of scale may be realized by the Global Absolute Return Portfolio as assets grow. Because the Global Absolute Return Portfolio has no operating history and no assets, no economies of scale exist at this time with respect to the Portfolio. However, the Trustees considered that by utilizing an advisory fee schedule with breakpoints whereby the advisory fee as a percentage of the Portfolio’s net assets decreases as the Portfolio becomes larger represents a good faith attempt to share economies of scale and potential future economies of scale as the asset levels of the Portfolio increase. The Trustees also noted that there would be an expense limitation agreement in place for the Global Absolute Return Portfolio.
The Board concluded that the Global Absolute Return Portfolio’s fee structure reflected in the Global Absolute Return Advisory Agreement and Eaton Vance Portfolio Management Agreement is fair and reasonable.
5. Ancillary Benefits
The Trustees received from PLFA information concerning other benefits that may be received by PLFA and Eaton Vance and their affiliates as a result of their relationship with the Global Absolute Return Portfolio, including fees for administrative services and reimbursement at an approximate cost basis for certain support services, as well as commissions that may be paid to broker-dealers affiliated with the Portfolio Manager and the anticipated use of soft-dollars by the Portfolio Manager. In this regard, the Trustees noted that Eaton Vance represented that they do not anticipate utilizing an affiliated broker-dealer for trades or utilizing soft dollar credits generated by Portfolio commissions to pay for research services. The potential benefits that may be derived by PLFA from its relationship with the Global Absolute Return Portfolio could include larger assets under management and reputational benefits, which are consistent with those generally derived by investment advisers to mutual funds. The Trustees considered potential benefits to be derived by Eaton Vance from its relationship with the Global Absolute Return Portfolio and that such benefits were consistent with those generally derived by sub-advisers to mutual funds or were otherwise not unusual.
6. Conclusion
Based on their review, including the consideration of each of the factors referred to above, the Board found that: (i) the compensation payable under the Global Absolute Return Advisory Agreement and the Eaton Vance Portfolio Management Agreement is fair and reasonable; and (ii) the Global Absolute Return Advisory Agreement and Eaton Vance Portfolio Management Agreement are in the best interests of the Global Absolute Return Portfolio and its shareholders. No single factor was determinative of the Board’s findings, but rather the Trustees based their determination on the total mix of information available to them.
F-23
PACIFIC SELECT FUND
WHERE TO GO FOR MORE INFORMATION
(Unaudited)
Availability of Quarterly Holdings
The Fund files Form N-Q (complete schedules of portfolio holdings) with the Securities and Exchange Commission (the “SEC”) for the first and third quarters of each fiscal year not later than 60 days after the close of the applicable quarter end. The fund’s Form N-Q, (when required) is filed pursuant to applicable regulations and is available after filing (i) on the SEC’s Web site at http://www. sec.gov; (ii) for review and copying at the SEC’s Public Reference Room in Washington D.C. (information on the operations of the Public Reference Room may be obtained by calling the SEC at 1-800-SEC-0330); and (iii) on the fund’s Webpage at http://www.PacificLife.com. The SEC may charge you a fee for this information.
Availability of Proxy Voting Record
By August 31 of each year, the Fund files information regarding how the Fund’s managers voted proxies relating to portfolio securities during the most recent twelve-month period ended June 30. Such information is available after filing on the Fund’s Website and on the SEC’s Website noted below.
Information Relating to Investments Held by the Fund
For complete descriptions of the various securities and other instruments held by the Fund and their risks, please see the Fund’s prospectus and Statement of Additional Information (“SAI”). For a description of bond ratings, see the Fund’s SAI. The prospectus and SAI are available as noted below.
Availability of Proxy Voting Policies
A description of the Proxy Voting Policies and Procedures that the Fund uses to determine how to vote proxies relating to portfolio securities is described in the Fund’s SAI.
Availability of a Complete Schedule of Investments
The Fund’s annual and semi-annual reports may contain a summary schedule of investments (“SOI”) for certain portfolios. A complete schedule for each summary SOI presented is available as noted below.
How to obtain Information
The Fund’s prospectus, SAI (including Proxy Voting Policies), the Pacific Dynamix Underlying Portfolios annual and semi-annual reports, and complete Schedules of Investments are available:
| | • | | On the Fund’s website at http://www.PacificLife.com |
| | • | | On the SEC’ website at http://www. sec.gov |
| | • | | Upon request, without charge by calling the applicable toll-free numbers below: |
Pacific Life’s Annuity Contract Owners: 1-800-722-4448
Pacific Life’s Annuity Registered Representative: 1-800-722-2333
Pacific Life Insurance Policy Owners: 1-800-800-7681
PL&A’s Annuity Contract Owners: 1-800-748-6907
PL&A’s Life Insurance Policy Owners: 1-888-595-6997
7 a.m. through 5 p.m. Pacific Time
F-24
Pacific Life Insurance Company/
Pacific Life & Annuity Company
Mailing Address:
P.O. Box 2378
Omaha, Nebraska 68103-2378
Annual Report
as of December 31, 2012
• Pacific Select Fund
| | |
| Form Nos. | | 15-20951-15 |
| | 1331-13A |

Pacific Dynamix Underlying Portfolios
Annual Report
As of December 31, 2012
TABLE OF CONTENTS
PACIFIC SELECT FUND
PACIFIC SELECT FUND PERFORMANCE DISCUSSION
This Annual Report for Pacific Select Fund (Fund) is provided for the general information of investors with beneficial interests in the Fund as it relates specifically to the underlying portfolios (Pacific Dynamix Underlying Portfolios) of the Pacific Dynamix-Conservative Growth, Pacific Dynamix-Moderate Growth and Pacific Dynamix-Growth Portfolios (the Pacific Dynamix Portfolios). This report is not authorized for distribution to prospective investors unless preceded or accompanied by a current Fund prospectus which contains information about the Fund and each of its portfolios, including their investment objectives, risks, charges and expenses. You should read the prospectus carefully before investing. There is no assurance that a portfolio will achieve its investment objective. Each portfolio is subject to market risk. The value of a portfolio changes as its asset values go up or down. The value of a portfolio’s shares will fluctuate, and when redeemed, may be worth more or less than their original cost. The total return for each Pacific Dynamix Underlying Portfolio of the Fund includes reinvestment of all dividends and capital gain distributions, if any. Past performance is not predictive of future performance. This report shows you the performance of the Fund’s Pacific Dynamix Underlying Portfolios compared to benchmark indices. Index performance is provided for illustrative and comparative purposes only and does not predict or depict the performance of the Pacific Dynamix Underlying Portfolios. Indices are unmanaged, do not incur transaction costs and cannot be purchased directly by investors. Index returns include reinvested dividends.
Pacific Life Fund Advisors LLC (PLFA) is the adviser to the Fund and supervises the management of the Pacific Dynamix Underlying Portfolios of the Fund (subject to the review of the Fund’s Board) and directly manages the three Pacific Dynamix Portfolios. PLFA has written the general market conditions commentary which expresses PLFA’s opinions and views on how the market generally performed for the year ended December 31, 2012. PLFA also supervises the management of other portfolios; however, this report pertains to the Pacific Dynamix Underlying Portfolios of the Pacific Dynamix Portfolios.
PLFA has retained other firms to serve as portfolio managers for the Pacific Dynamix Underlying Portfolios under its supervision. Each of these portfolio managers has written a separate commentary specific to each Pacific Dynamix Underlying Portfolio(s) and as such, is based on their opinions of how their Pacific Dynamix Underlying Portfolio(s) performed during the year. The views expressed in the commentaries reflect those of the portfolio managers for the year ended December 31, 2012.
All views are subject to change at any time based upon market or other conditions, and the Fund, its adviser and the portfolio managers disclaim any responsibility to update such views. Any references to “we,” “I,” or “ours” are references to the portfolio manager or adviser, as applicable. The adviser and portfolio managers may include statements that constitute “forward-looking statements” under the United States (U.S.) securities laws. Forward-looking statements include information concerning possible or assumed future results of the Fund’s investment operations, asset levels, earnings, expenses, industry or market conditions, regulatory developments and other aspects of the Fund’s operations or general economic conditions. In addition, when used in this report, words such as “believes,” “expects,” “anticipates,” “intends,” “plans,” “estimates,” “projects” and future or conditional verbs such as “will,” “may,” “could,” “should” and “would,” or any other statement that necessarily depends on future events, are intended to identify forward-looking statements. Forward-looking statements are not guarantees of performance or economic results. They involve risks, uncertainties and assumptions. Although such statements are based on expectations that the adviser or a portfolio manager believes to be reasonable, actual results may differ materially from expectations. Investors must not rely on any forward-looking statements.
In connection with any forward-looking statements and any investment in the Fund, investors should carefully consider the investment objectives, policies and risks described in the Fund’s current prospectus, as supplemented and the Statement of Additional Information, as supplemented. The portfolio managers and their Pacific Dynamix Underlying Portfolios as of December 31, 2012, are listed below:
| | |
| Pacific Dynamix Underlying Portfolio | | Portfolio Manager |
PD Aggregate Bond Index PD High Yield Bond Market | | SSgA Funds Management, Inc. (SSgA FM) |
PD Large-Cap Growth Index PD Large-Cap Value Index PD Small-Cap Growth Index PD Small-Cap Value Index | | BlackRock Investment Management, LLC (BlackRock) |
PD Emerging Markets PD International Large-Cap | | Dimensional Fund Advisors LP (DFA) |
Market Conditions (for the year ended December 31, 2012)
Executive Summary
In 2012, financial markets experienced pockets of volatility but finished the calendar year with solid gains. While the geopolitical and economic uncertainty that overwhelmed investors in 2011 lingered in 2012, no major disruptions caused the markets to veer off-course for a prolonged period. Nonetheless, the short-term “risk-on” and “risk-off” trend persisted with macro headlines primarily driving market sentiments.
Several key events caused volatility to rise in the first-half of the year. Without a solid economic foundation, markets continue to rely on support from policy actions. In order for the Federal Reserve (Fed) to continue with its low interest rate policies (toward which markets have reacted positively), inflation had to remain tamed. Earlier in the year, tensions over Iran’s nuclear program pushed oil prices higher, which created some concerns over inflation and the ability of the central bank to maintain its support. Additionally, the euro crisis appeared to have reached peak levels around the start of the reporting period. Amid this challenging environment, European countries saw changes in their political landscape. This included France electing a new president, as its citizens voted in favor of François Hollande’s anti-austerity push. The backlash from anti-austerity
| | |
| | See explanation of benchmark definitions on page A-8 and A-9 |
A-1
PACIFIC SELECT FUND PERFORMANCE DISCUSSION (Continued)
supporters (a united front against rampant unemployment and government spending cuts accompanied by strikes and demonstrations) caused additional concerns of unwinding the progress in Europe. Additionally, the economic drag from Europe had global implications that caused global economic growth projections to be revised downward. Concerns over China and its exports to Europe also weighed on its ability to sustain its dominant growth.
Despite the headwinds around the globe, financial markets marched higher over the second-half of the year. Although oil prices fluctuated since the sanctions against Iranian oil began, a dramatic impact on world oil supply and prices did not materialize. Without the threat of uncontrolled inflation, the Fed continued to provide further support by extending “Operation Twist” (its program to keep long-term rates low by selling its short-term assets and buying long-term Treasuries). The Fed also launched a third round of quantitative easing in September to purchase an additional $40 billion in mortgage-backed securities (MBS) per month. From abroad, the political and economic disturbances in Europe finally led to the European Central Bank (ECB) to pledge full support to preserve the euro, which helped unfreeze capital flow throughout the European banking system.
Throughout the reporting period, central banks continued to play a vital role in sustaining the financial market recovery by providing unprecedented liquidity in the global banking system. While such efforts may have helped rejuvenate financial markets, political upheaval introduced uncertainty in the marketplace. Both U.S. and European politicians continued to muddle through their respective fiscal and economic issues. In the U.S., fears of the “fiscal cliff” scenario developed from the inability of Congress to promptly settle budgetary disagreements. In the eurozone, European politicians have struggled to agree and settle on the appropriate policy actions to recover their economies.
The global economy maintained a steady but slow recovery throughout the reporting period. Various risks continued to linger and influenced markets to varying degrees. The following sections highlight how specific market segments responded to the events that unfolded over the year.
Fixed Income
As the overall market sentiment improved relative to the prior reporting period, the broad, fixed income segment fell behind the broad, equity market. For the 2012 calendar year, the overall fixed income market (as measured by the Barclays U.S. Aggregate Bond Index) gained 4.21%. Short-term Treasuries and credits barely budged in 2012 as the Fed continued to maintain a near zero interest rate policy for the Federal Funds (Fed Funds). Long-term Treasuries benefited moderately from the Fed’s efforts to keep long-term yields low. Treasury yields (which have an inverse relationship to prices) continued to hit historic low levels, as the 10-Year Treasury yield dipped below 1.50% during the reporting period. The Barclays Long Term U.S. Treasury Index increased 3.56% for the calendar year.
In this environment, the riskier sectors within the fixed income segment performed relatively well. Emerging markets debt delivered strong results over the reporting period, as the J.P. Morgan Emerging Markets Bond Index Global Diversified Index returned 17.44% for the calendar year. The high yield market also experienced a strong rally with lower-rated credits outpacing those in the investment grade tiers. Additionally, the collateralized loan obligation market showed some revival throughout the calendar year, which boded well for bank loans. Throughout this low, Treasury yield environment, investors looked across the riskier spectrum to obtain yields.
Domestic Equity
The broad, domestic equity market experienced modest swings throughout the year but managed to finish the reporting period with a gain of 16.00% for the S&P 500 Index. Results were relatively mixed for the various categories within the domestic equities segment. One common theme among domestic equities was the double-digit returns across the market capitalization and style groups. With respect to market capitalization, mid-capitalization stocks outpaced those of large- and small-capitalizations. Value styles outperformed those of growth, which were primarily driven by the strong performances of the financials sector over the calendar year. The sector’s strong performance followed a dismal year in 2011, which then recovered as the central banks moved aggressively to support the global banking system. For the year, cyclical sectors (e.g. consumer discretionary) generally outpaced those of the defensive sectors (e.g. utilities). High dividend-paying sectors that typically include utilities stocks lost momentum during the reporting period after a strong rally in the prior year.
For majority of the year, equity investors appeared to have focused more on the potential for capital appreciation. During uncertain environments (as in the second quarter of 2012), investors may lean toward capital protection where more conservative stocks such as those paying dividends and/or in defensive sectors tend to hold well. Over the past couple of years, real estate investment trusts (REITs) have displayed some hybrid characteristics for capital appreciation and capital protection. REITs have generally kept up with the overall equity market and maintained their gains during turbulent moments, delivering positive returns for all four quarters of the reporting period, which helped the Financial Times Stock Exchange National Association of Real Estate Investment Trust (FTSE NAREIT) Equity REITs Index gain 18.06% for the calendar year.
International Equity
After a difficult year for foreign stocks in 2011, international stocks (both developed and emerging markets) experienced a strong recovery over the reporting period. The Morgan Stanley Capital International Europe, Australasia, and Far East (MSCI EAFE) Index and the MSCI Emerging Markets Index returned 17.32% and 18.22%, respectively. In the foreign equity market, smaller-capitalization stocks outperformed their larger counterparts. Similar to the U.S. equity market, financials led the pace among the sector groups. Performances were largely boosted by the ECB’s vow to aggressively intervene to support the euro.
Europe’s troubles have impacted many of its trading partners, which led to concerns over countries such as China that exports to those regions. Many economists and market participants had considered the probability of a hard-landing scenario where China’s economic growth would
| | |
| | See explanation of benchmark definitions on page A-8 and A-9 |
A-2
PACIFIC SELECT FUND PERFORMANCE DISCUSSION (Continued)
experience a significant drop. However, China has displayed some resiliency despite the impact on their exports, which have eased some concerns.
Concluding Remarks
Economic reports indicated that, the world economy grew at approximately 3.20% in 2012 (International Monetary Fund–World Economic Outlook Update–January 2013). Emerging markets, particularly China, contributed to that growth. Developed nations, on the other hand, crawled at a sluggish pace or contracted. Despite the dismal economic indicators, equity markets thrived over the calendar year. Perhaps, this was driven more out of relief of avoiding meltdown scenarios that markets had feared rather than reactions to signs of a strong and prosperous fundamental outlook.
The question remains on the sustainability of the market rise. Heading into 2013, equity valuations indicate that stock markets are trading near their three-year fair value range. However, these valuation levels remain below their long-term historical levels (e.g. 10-year averages). These trading ranges may be a reflection of the general market environment. Over the past few years, the world has been dealing with various crises, which may be causing a hesitation to push valuations back to longer-term historic levels.
More clarity has developed in 2013, but challenges still linger. The crisis level in the eurozone appears to have dwindled, but economic activity is expected to remain weak in the region. Although the situation in the U.S. is relatively better than its developed counterparts in Europe, economic growth is expected to remain modest. The benign economic activity in developed nations is anticipated to dampen demand for exports from emerging markets. This may have some varying implications to these emerging markets nations. Nonetheless, growth in countries such as China is expected to remain solid.
Performances in 2012 showed investors that markets can diverge from economic fundamentals. The level of uncertainty and risks throughout the globe may have caused some investors to reduce or avoid equity exposure in 2012. Those investors would have missed out on the impressive performance delivered from equities. This validates the importance of proper asset allocation to navigate through various market conditions.
PD Aggregate Bond Index Portfolio (managed by SSgA Funds Management, Inc.)
Q. How did the portfolio perform for the year ended December 31, 2012?
A. For the year ended December 31, 2012, the PD Aggregate Bond Index Portfolio’s Class P returned 3.94%, compared to a 4.21% return for its benchmark, the Barclays U.S. Aggregate Bond Index.
The following graph compares the performance of a hypothetical $10,000 investment in Class P shares of the portfolio to its benchmark for the period from inception on May 1, 2009 through December 31, 2012. The portfolio’s performance reflects reinvestments of all dividends and capital gains distributions, if any.
Performance Comparison
| | | | | | | | |
| Average Annual Total Returns for the periods ended December 31, 2012 | |
| | | 1 Year | | | Since Inception (5/1/09) | |
| | |
Portfolio’s Class P | | | 3.94% | | | | 5.94% | |
Barclays U.S. Aggregate Bond Index | | | 4.21% | | | | 6.53% | |
Performance data quoted represents past performance. Investment return and principal value will fluctuate so that shares of the portfolio when redeemed may be worth more or less than their original cost. Past performance is not predictive of future performance. | |
Q. Discuss both positive and negative factors that materially affected the portfolio’s performance during the year, including relevant market conditions, investment strategies and techniques, and particular sectors or securities.
A. For the reporting period, the portfolio’s Class P underperformed the benchmark. The portfolio seeks to replicate as closely as possible, the total return of its benchmark. The SSgA FM passive portfolio management team uses a stratified sampling approach to match the benchmark’s major risk characteristics and does not over or underweight sectors or securities in an effort to add value above the portfolio’s benchmark. There is no attempt to manage volatility, use defensive strategies, or reduce the effects of any long-term period of poor bond market performance.
Breaking 2011’s trend, 2012 saw excess returns on all the credit-exposed components of the benchmark return to positive territory. Even though the reporting period can be characterized as a “risk-on” year which usually means that Treasuries underperform, economic uncertainty during the year allowed Treasuries to hold their own and even manage a small rally. Of course, the appreciation for Treasuries was nothing like 2011, where they benefited from a “risk off” year. This low yield environment during the reporting period had the effect of encouraging an active, new issue credit market and also enticed investors looking for higher returns into these assets.
| | |
| | See explanation of benchmark definitions on page A-8 and A-9 |
A-3
PACIFIC SELECT FUND PERFORMANCE DISCUSSION (Continued)
PD High Yield Bond Market Portfolio (managed by SSgA Funds Management, Inc.)
Q. How did the portfolio perform for the year ended December 31, 2012?
A. For the year ended December 31, 2012, the PD High Yield Bond Market Portfolio’s Class P returned 14.91%, compared to a 15.78% return for its benchmark, the Barclays U.S. High-Yield 2% Issuer Capped Bond Index.
The following graph compares the performance of a hypothetical $10,000 investment in Class P shares of the portfolio to its benchmark for the period from inception on May 1, 2009 through December 31, 2012. The portfolio’s performance reflects reinvestments of all dividends and capital gains distributions, if any.
Performance Comparison
| | | | | | | | |
Average Annual Total Returns for the periods ended December 31, 2012 | |
| | | 1 Year | | | Since Inception (5/1/09) | |
| | |
Portfolio’s Class P | | | 14.91% | | | | 14.35% | |
Barclays U.S. High-Yield 2% Issuer
Capped Bond Index | | | 15.78% | | | | 18.45% | |
Performance data quoted represents past performance. Investment return and principal value will fluctuate so that shares of the portfolio when redeemed may be worth more or less than their original cost. Past performance is not predictive of future performance. | |
Q. Discuss both positive and negative factors that materially affected the portfolio’s performance during the year, including relevant market conditions, investment strategies and techniques, and particular sectors or securities.
A. For the reporting period, the portfolio’s Class P underperformed the benchmark. The portfolio seeks to replicate as closely as possible, the total return of its benchmark. The SSgA FM passive portfolio management team uses a stratified sampling approach to match the index’s major risk characteristics and does not over or underweight sectors or securities in an effort to add value above the portfolio’s benchmark. There is no attempt to manage volatility, use defensive strategies, or reduce the effects of any long-term period of poor bond market performance.
The top three performing industries within the benchmark as measured by changes in option adjusted spreads (OAS) were non-captive consumer, home construction, and insurance-property and casualty (P&C), while the bottom three sectors within the benchmark by changes in OAS were supermarkets, railroads and automotive.
Whereas 2011 was a “risk-off” year and the high yield sector underperformed, 2012 was a “risk-on” year. During the reporting period, the high yield sector experienced a broad-based rally. The portfolio’s benchmark experienced a contraction in OAS spreads for 2012, and all but one industry appreciated with supermarkets being the exception, compared to 2011, where the high yield market experienced the exact opposite—a broad-based decline where the index OAS widened, and all but one industry depreciated with environmental being the exception. In addition to the rally being broad from an industry standpoint, it was also broad from a credit perspective as the lower part of the credit spectrum outperformed the more highly-rated benchmark index components.
PD Large-Cap Growth Index Portfolio (managed by BlackRock Investment Management, LLC)
Q. How did the portfolio perform for the year ended December 31, 2012?
A. For the year ended December 31, 2012, the PD Large-Cap Growth Index Portfolio’s Class P returned 15.02%, compared to a 15.26% return for its benchmark, the Russell 1000 Growth Index.
| | |
| | See explanation of benchmark definitions on page A-8 and A-9 |
A-4
PACIFIC SELECT FUND PERFORMANCE DISCUSSION (Continued)
The following graph compares the performance of a hypothetical $10,000 investment in Class P shares of the portfolio to its benchmark for the period from inception on May 1, 2009 through December 31, 2012. The portfolio’s performance reflects reinvestments of all dividends and capital gains distributions, if any.
Performance Comparison
| | | | | | | | |
Average Annual Total Returns for the periods ended December 31, 2012 | |
| | | 1 Year | | | Since Inception (5/1/09) | |
| | |
Portfolio’s Class P | | | 15.02% | | | | 16.77% | |
Russell 1000 Growth Index | | | 15.26% | | | | 17.44% | |
Performance data quoted represents past performance. Investment return and principal value will fluctuate so that shares of the portfolio when redeemed may be worth more or less than their original cost. Past performance is not predictive of future performance. | |
Q. Discuss both positive and negative factors that materially affected the portfolio’s performance during the year, including relevant market conditions, investment strategies and techniques, and particular sectors or securities.
A. For the reporting period, the portfolio’s Class P underperformed the benchmark. The portfolio seeks to replicate as closely as possible, the total return of the benchmark as represented by the Russell 1000 Growth Index. In accordance with BlackRock’s passive investment strategy, the portfolio was positioned to match the risk characteristics of the benchmark throughout the reporting period. Following a tumultuous 2011, equity markets began 2012 with a strong rally amid lower volatility.
From a sector perspective, global central bank stimulus drove financials and consumer discretionary stocks higher in 2012. Telecommunication services performed well, and health care stocks rebounded after valuations had been pushed down amid regulatory uncertainty. While most of the Russell 1000 Growth Index sectors moved higher for the year, energy stocks were hindered by declining oil prices in the latter part of the year, and utilities became less favorable as investors sought riskier investments.
PD Large-Cap Value Index Portfolio (managed by BlackRock Investment Management, LLC)
Q. How did the portfolio perform for the year ended December 31, 2012?
A. For the year ended December 31, 2012, the PD Large-Cap Value Index Portfolio’s Class P returned 17.17%, compared to a 17.51% return for its benchmark, the Russell 1000 Value Index.
The following graph compares the performance of a hypothetical $10,000 investment in Class P shares of the portfolio to its benchmark for the period from inception on May 1, 2009 through December 31, 2012. The portfolio’s performance reflects reinvestments of all dividends and capital gains distributions, if any.
Performance Comparison
| | | | | | | | |
| Average Annual Total Returns for the periods ended December 31, 2012 | |
| | | 1 Year | | | Since Inception (5/1/09) | |
| | |
Portfolio’s Class P | | | 17.17% | | | | 16.18% | |
Russell 1000 Value Index | | | 17.51% | | | | 16.85% | |
Performance data quoted represents past performance. Investment return and principal value will fluctuate so that shares of the portfolio when redeemed may be worth more or less than their original cost. Past performance is not predictive of future performance. | |
| | |
| | See explanation of benchmark definitions on page A-8 and A-9 |
A-5
PACIFIC SELECT FUND PERFORMANCE DISCUSSION (Continued)
Q. Discuss both positive and negative factors that materially affected the portfolio’s performance during the year, including relevant market conditions, investment strategies and techniques, and particular sectors or securities.
A. For the reporting period, the portfolio’s Class P underperformed the benchmark. The portfolio seeks to replicate as closely as possible, the total return of the benchmark as represented by the Russell 1000 Value Index. In accordance with BlackRock’s passive investment strategy, the portfolio was positioned to match the risk characteristics of the benchmark throughout the reporting period. Following a tumultuous 2011, equity markets began 2012 with a strong rally amid lower volatility.
From a sector perspective, global central bank stimulus drove financials and consumer discretionary stocks higher in 2012. Telecommunication services performed well, and health care stocks rebounded after valuations had been pushed down amid regulatory uncertainty. While all of the Russell 1000 Value Index sectors moved higher for the year, energy stocks were hindered by declining oil prices in the latter part of the year, and utilities became less favorable as investors sought riskier investments.
PD Small-Cap Growth Index Portfolio (managed by BlackRock Investment Management, LLC)
Q. How did the portfolio perform for the year ended December 31, 2012?
A. For the year ended December 31, 2012, the PD Small-Cap Growth Index Portfolio’s Class P returned 14.30%, compared to a 14.59% return for its benchmark, the Russell 2000 Growth Index.
The following graph compares the performance of a hypothetical $10,000 investment in Class P shares of the portfolio to its benchmark for the period from inception on May 1, 2009 through December 31, 2012. The portfolio’s performance reflects reinvestments of all dividends and capital gains distributions, if any.
Performance Comparison
| | | | | | | | |
| Average Annual Total Returns for the periods ended December 31, 2012 | |
| | | 1 Year | | | Since Inception (5/1/09) | |
| | |
Portfolio’s Class P | | | 14.30% | | | | 17.78% | |
Russell 2000 Growth Index | | | 14.59% | | | | 18.44% | |
Performance data quoted represents past performance. Investment return and principal value will fluctuate so that shares of the portfolio when redeemed may be worth more or less than their original cost. Past performance is not predictive of future performance. | |
Q. Discuss both positive and negative factors that materially affected the portfolio’s performance during the year, including relevant market conditions, investment strategies and techniques, and particular sectors or securities.
A. For the reporting period, the portfolio’s Class P underperformed the benchmark. The portfolio seeks to replicate as closely as possible, the total return of the benchmark as represented by the Russell 2000 Growth Index. In accordance with BlackRock’s passive investment strategy, the portfolio was positioned to match the risk characteristics of the benchmark throughout the reporting period. Following a tumultuous 2011, equity markets began 2012 with a strong rally amid lower volatility.
From a sector perspective, global central bank stimulus drove financials and consumer discretionary stocks higher in 2012. Telecommunication services performed well, and health care stocks rebounded after valuations had been pushed down amid regulatory uncertainty. While all of the Russell 2000 Growth Index sectors moved higher for the year, energy stocks were hindered by declining oil prices in the latter part of the year, and utilities became less favorable as investors sought riskier investments.
PD Small-Cap Value Index Portfolio (managed by BlackRock Investment Management, LLC)
Q. How did the portfolio perform for the year ended December 31, 2012?
A. For the year ended December 31, 2012, the PD Small-Cap Value Index Portfolio’s Class P returned 17.62%, compared to a 18.05% return for its benchmark, the Russell 2000 Value Index.
| | |
| | See explanation of benchmark definitions on page A-8 and A-9 |
A-6
PACIFIC SELECT FUND PERFORMANCE DISCUSSION (Continued)
The following graph compares the performance of a hypothetical $10,000 investment in Class P shares of the portfolio to its benchmark for the period from inception on May 1, 2009 through December 31, 2012. The portfolio’s performance reflects reinvestments of all dividends and capital gains distributions, if any.
Performance Comparison
| | | | | | | | |
Average Annual Total Returns for the periods ended December 31, 2012 | |
| | | 1 Year | | | Since Inception (5/1/09) | |
| | |
Portfolio’s Class P | | | 17.62% | | | | 16.79% | |
Russell 2000 Value Index | | | 18.05% | | | | 17.36% | |
Performance data quoted represents past performance. Investment return and principal value will fluctuate so that shares of the portfolio when redeemed may be worth more or less than their original cost. Past performance is not predictive of future performance. | |
Q. Discuss both positive and negative factors that materially affected the portfolio’s performance during the year, including relevant market conditions, investment strategies and techniques, and particular sectors or securities.
A. For the reporting period, the portfolio’s Class P underperformed the benchmark. The portfolio seeks to replicate as closely as possible, the total return of the benchmark as represented by the Russell 2000 Value Index. In accordance with BlackRock’s passive investment strategy, the portfolio was positioned to match the risk characteristics of the benchmark throughout the reporting period. Following a tumultuous 2011, equity markets began 2012 with a strong rally amid lower volatility.
From a sector perspective, global central bank stimulus drove financials and consumer discretionary stocks higher in 2012. Telecommunication services performed well, and health care stocks rebounded after valuations had been pushed down amid regulatory uncertainty. While all of the Russell 2000 Value Index sectors moved higher for the year, energy stocks were hindered by declining oil prices in the latter part of the year, and utilities became less favorable as investors sought riskier investments.
PD Emerging Markets Portfolio (managed by Dimensional Fund Advisors LP)
Q. How did the portfolio perform for the year ended December 31, 2012?
A. For the year ended December 31, 2012, the PD Emerging Markets Portfolio’s Class P returned 17.42%, compared to a 18.22% return for its benchmark, the MSCI Emerging Markets Index.
The following graph compares the performance of a hypothetical $10,000 investment in Class P shares of the portfolio to its benchmark for the period from inception on May 1, 2009 through December 31, 2012. The portfolio’s performance reflects reinvestments of all dividends and capital gains distributions, if any.
Performance Comparison
| | | | | | | | |
| Average Annual Total Returns for the periods ended December 31, 2012 | |
| | | 1 Year | | | Since Inception (5/1/09) | |
| | |
Portfolio’s Class P | | | 17.42% | | | | 14.69% | |
MSCI Emerging Markets Index | | | 18.22% | | | | 16.27% | |
Performance data quoted represents past performance. Investment return and principal value will fluctuate so that shares of the portfolio when redeemed may be worth more or less than their original cost. Past performance is not predictive of future performance. | |
| | |
| | See explanation of benchmark definitions on page A-8 and A-9 |
A-7
PACIFIC SELECT FUND PERFORMANCE DISCUSSION (Continued)
Q. Discuss both positive and negative factors that materially affected the portfolio’s performance during the year, including relevant market conditions, investment strategies and techniques, and particular sectors or securities.
A. For the reporting period, the portfolio’s Class P underperformed the benchmark. The portfolio seeks to capture the returns of large-capitalization equity securities in select emerging markets countries. Dimensional employs a disciplined quantitative approach, emphasizing broad diversification and consistent exposure to large-capitalization emerging markets equities but does not attempt to track a specific benchmark index. At the end of the reporting period, the portfolio held approximately 660 securities invested in 20 emerging markets countries. With the portfolio’s diversified approach, performance was generally determined by structural trends in emerging country equity markets rather than the behavior of a limited number of securities.
From a sector standpoint, the portfolio’s holdings in the materials, financials and information technology sectors underperformed. This was offset by the portfolio’s holdings in consumer staples and industrials sectors which outperformed those in the benchmark. At the country level, the portfolio’s holdings in Russia were relative underperformers, although holdings in Mexico and Brazil outperformed. In addition, although the portfolio’s average cash level was only around 1%, given the strong performance of emerging markets, the portfolio’s holdings in cash, detracted from the portfolio’s overall relative performance.
PD International Large-Cap Portfolio (managed by Dimensional Fund Advisors LP)
Q. How did the portfolio perform for the year ended December 31, 2012?
A. For the year ended December 31, 2012, the PD International Large-Cap Portfolio’s Class P returned 17.12%, compared to a 16.41% return for its benchmark, the MSCI World ex USA Index.
The following graph compares the performance of a hypothetical $10,000 investment in Class P shares of the portfolio to its benchmark for the period from inception on May 1, 2009 through December 31, 2012. The portfolio’s performance reflects reinvestments of all dividends and capital gains distributions, if any.
Performance Comparison
| | | | | | | | |
| Average Annual Total Returns for the periods ended December 31, 2012 | |
| | | 1 Year | | | Since Inception (5/1/09) | |
| | |
Portfolio’s Class P | | | 17.12% | | | | 10.80% | |
MSCI World ex USA Index | | | 16.41% | | | | 12.05% | |
Performance data quoted represents past performance. Investment return and principal value will fluctuate so that shares of the portfolio when redeemed may be worth more or less than their original cost. Past performance is not predictive of future performance. | |
Q. Discuss both positive and negative factors that materially affected the portfolio’s performance during the year, including relevant market conditions, investment strategies and techniques, and particular sectors or securities.
A. For the reporting period, the portfolio’s Class P outperformed the benchmark. The portfolio seeks to capture the returns of large-capitalization equity securities in select international developed countries. Dimensional employs a disciplined, quantitative approach, emphasizing broad diversification but does not attempt to track a specific benchmark index. At the end of the reporting period, the portfolio held approximately 1,200 securities invested in 23 developed countries. With the portfolio’s diversified approach, performance was generally determined by broad structural trends in international equity markets rather than by the behavior of a limited number of securities.
The portfolio’s outperformance relative to the benchmark was primarily attributable to differences in the valuation timing and methodology between the portfolio and the benchmark. The portfolio prices foreign exchange rates at the closing of the U.S. markets while the benchmark uses rates at 4:00 P.M. London time. The portfolio also may use fair value pricing to price certain portfolio securities at the closing of the U.S. markets while the benchmark uses local market closing prices. To a lesser extent, the portfolio’s exclusion of REITs detracted from its performance as they were strong relative performers.
Benchmark Definitions
Barclays U.S. Aggregate Bond Index covers the U.S. dollar-denominated, investment-grade, fixed-rate, taxable bond market of SEC-registered securities. The index includes bonds from the Treasury, government-related, corporate, mortgage-backed securities, asset-backed securities, and corporate mortgage-backed securities sectors. The total return is equal to the change in price plus the coupon return.
Barclays U.S. High-Yield 2% Issuer Capped Bond Index is an index that is an issuer-constrained version of the U.S. Corporate High-Yield Index that covers the U.S. dollar-denominated, non-investment grade fixed-rate taxable corporate bond market and limits issuer exposures to a maximum of 2% and redistributes the excess market value index-wide on a prorata basis. The total return is equal to the change in price plus the coupon return.
A-8
PACIFIC SELECT FUND PERFORMANCE DISCUSSION (Continued)
MSCI Emerging Markets Index is an index typically made up of stocks from approximately 26 emerging markets countries. Results include reinvested dividends after deducting withholding taxes.
MSCI World ex USA Index is a free float-adjusted market capitalization weighted index that is designed to measure the equity market performance of developed markets. The MSCI World ex USA Index consists of 23 developed market country indices. Results include reinvested dividends after deducting withholding taxes.
Russell 1000 Growth Index is an index of large companies that have higher price-to-book ratios and forecasted growth values than the Russell 1000 Value Index. Results include reinvested dividends.
Russell 1000 Value Index measures the performance of the large-capitalization value segment of the U.S. equity universe. It is an index of companies with a less-than average growth orientation. Companies in this index have lower price-to book and price-earnings ratios, higher dividend yields and lower forecasted growth rates than companies in the Russell 1000 Growth Index. Results include reinvested dividends.
Russell 2000 Growth Index measures the performance of the small-capitalization growth segment of the U.S. equity universe. It is an index of approximately 1,200 small companies with higher price-to-book ratios and forecasted growth values than companies in the Russell 2000 Value Index. Results include reinvested dividends.
Russell 2000 Value Index measures the performance of the small-capitalization value segment of the U.S. equity universe. It is an index of companies that have lower price-to-book ratios and lower forecasted growth values than companies in the Russell 2000 Growth Index. Results include reinvested dividends.
A-9
PACIFIC SELECT FUND
PD AGGREGATE BOND INDEX PORTFOLIO
Schedule of Investments
December 31, 2012
| | | | | | | | |
| | | Principal
Amount | | | Value | |
CORPORATE BONDS & NOTES - 23.0% | | | | | | | | |
| | |
Consumer Discretionary - 1.5% | | | | | | | | |
| | |
Amazon.com Inc
1.200% due 11/29/17 | | | $100,000 | | | | $99,531 | |
AutoZone Inc
4.000% due 11/15/20 | | | 50,000 | | | | 54,264 | |
CBS Corp | | | | | | | | |
5.900% due 10/15/40 | | | 50,000 | | | | 58,404 | |
8.875% due 05/15/19 | | | 25,000 | | | | 33,738 | |
Comcast Corp | | | | | | | | |
4.950% due 06/15/16 | | | 200,000 | | | | 225,568 | |
5.700% due 07/01/19 | | | 100,000 | | | | 121,919 | |
5.875% due 02/15/18 | | | 200,000 | | | | 241,195 | |
6.950% due 08/15/37 | | | 200,000 | | | | 271,433 | |
Cox Communications Inc
5.450% due 12/15/14 | | | 8,000 | | | | 8,729 | |
DIRECTV Holdings LLC | | | | | | | | |
2.400% due 03/15/17 | | | 100,000 | | | | 102,501 | |
3.550% due 03/15/15 | | | 88,000 | | | | 92,615 | |
3.800% due 03/15/22 | | | 100,000 | | | | 103,253 | |
5.200% due 03/15/20 | | | 35,000 | | | | 39,745 | |
6.000% due 08/15/40 | | | 50,000 | | | | 55,526 | |
6.375% due 03/01/41 | | | 50,000 | | | | 57,910 | |
Discovery Communications LLC | | | | | | | | |
4.950% due 05/15/42 | | | 100,000 | | | | 106,982 | |
5.050% due 06/01/20 | | | 50,000 | | | | 57,898 | |
Ford Motor Co
7.450% due 07/16/31 | | | 100,000 | | | | 127,500 | |
Johnson Controls Inc
5.000% due 03/30/20 | | | 50,000 | | | | 56,864 | |
Kohl’s Corp
3.250% due 02/01/23 | | | 100,000 | | | | 97,187 | |
Lowe’s Cos Inc | | | | | | | | |
5.500% due 10/15/35 | | | 100,000 | | | | 121,976 | |
6.875% due 02/15/28 | | | 50,000 | | | | 65,462 | |
Macy’s Retail Holdings Inc | | | | | | | | |
3.875% due 01/15/22 | | | 100,000 | | | | 106,674 | |
5.750% due 07/15/14 | | | 60,000 | | | | 64,368 | |
McDonald’s Corp | | | | | | | | |
3.500% due 07/15/20 | | | 50,000 | | | | 55,461 | |
3.700% due 02/15/42 | | | 200,000 | | | | 198,652 | |
4.875% due 07/15/40 | | | 10,000 | | | | 11,983 | |
NBCUniversal Media LLC | | | | | | | | |
2.875% due 01/15/23 | | | 75,000 | | | | 75,391 | |
3.650% due 04/30/15 | | | 100,000 | | | | 106,434 | |
6.400% due 04/30/40 | | | 125,000 | | | | 160,529 | |
Newell Rubbermaid Inc
4.000% due 06/15/22 | | | 61,000 | | | | 64,518 | |
News America Inc | | | | | | | | |
6.400% due 12/15/35 | | | 50,000 | | | | 62,116 | |
6.900% due 03/01/19 | | | 150,000 | | | | 188,097 | |
6.900% due 08/15/39 | | | 150,000 | | | | 196,554 | |
Nordstrom Inc
6.750% due 06/01/14 | | | 20,000 | | | | 21,703 | |
Omnicom Group Inc
4.450% due 08/15/20 | | | 50,000 | | | | 55,677 | |
Princeton University
5.700% due 03/01/39 | | | 50,000 | | | | 67,643 | |
Reed Elsevier Capital Inc
8.625% due 01/15/19 | | | 50,000 | | | | 64,505 | |
Staples Inc
9.750% due 01/15/14 | | | 50,000 | | | | 54,373 | |
Starwood Hotels & Resorts Worldwide Inc
3.125% due 02/15/23 | | | 118,000 | | | | 117,080 | |
Target Corp | | | | | | | | |
6.000% due 01/15/18 | | | 100,000 | | | | 123,052 | |
7.000% due 01/15/38 | | | 125,000 | | | | 183,756 | |
| | | | | | | | |
| | | Principal
Amount | | | Value | |
The Home Depot Inc | | | | | | | | |
4.400% due 04/01/21 | | | $100,000 | | | | $118,030 | |
5.400% due 03/01/16 | | | 50,000 | | | | 57,149 | |
5.875% due 12/16/36 | | | 75,000 | | | | 98,650 | |
The Interpublic Group of Cos Inc
2.250% due 11/15/17 | | | 50,000 | | | | 49,319 | |
The Walt Disney Co | | | | | | | | |
1.125% due 02/15/17 | | | 100,000 | | | | 100,144 | |
2.750% due 08/16/21 | | | 50,000 | | | | 52,248 | |
Thomson Reuters Corp (Canada) | | | | | | | | |
4.700% due 10/15/19 | | | 25,000 | | | | 28,773 | |
5.850% due 04/15/40 | | | 25,000 | | | | 30,963 | |
Time Warner Cable Inc | | | | | | | | |
4.000% due 09/01/21 | | | 100,000 | | | | 109,856 | |
5.000% due 02/01/20 | | | 300,000 | | | | 349,534 | |
5.875% due 11/15/40 | | | 50,000 | | | | 58,311 | |
6.750% due 06/15/39 | | | 50,000 | | | | 63,471 | |
7.500% due 04/01/14 | | | 100,000 | | | | 108,388 | |
Time Warner Inc | | | | | | | | |
3.150% due 07/15/15 | | | 100,000 | | | | 105,807 | |
4.700% due 01/15/21 | | | 50,000 | | | | 56,965 | |
6.100% due 07/15/40 | | | 50,000 | | | | 60,589 | |
6.200% due 03/15/40 | | | 50,000 | | | | 61,284 | |
6.250% due 03/29/41 | | | 50,000 | | | | 61,790 | |
7.700% due 05/01/32 | | | 150,000 | | | | 209,871 | |
TJX Cos Inc
4.200% due 08/15/15 | | | 25,000 | | | | 27,177 | |
Trustees of Dartmouth College
4.750% due 06/01/19 | | | 25,000 | | | | 29,372 | |
Viacom Inc | | | | | | | | |
1.250% due 02/27/15 | | | 50,000 | | | | 50,515 | |
4.375% due 03/15/43 ~ | | | 70,000 | | | | 68,928 | |
5.625% due 09/15/19 | | | 25,000 | | | | 29,902 | |
Yale University
2.900% due 10/15/14 | | | 50,000 | | | | 52,196 | |
Yum! Brands Inc | | | | | | | | |
4.250% due 09/15/15 | | | 25,000 | | | | 27,013 | |
6.875% due 11/15/37 | | | 25,000 | | | | 34,164 | |
| | | | | | | | |
| | | | | | | 6,279,175 | |
| | | | | | | | |
Consumer Staples - 1.8% | | | | | | | | |
| | |
Altria Group Inc | | | | | | | | |
4.750% due 05/05/21 | | | 200,000 | | | | 226,829 | |
7.750% due 02/06/14 | | | 100,000 | | | | 107,508 | |
9.950% due 11/10/38 | | | 50,000 | | | | 82,433 | |
Anheuser-Busch InBev Worldwide Inc | | | | | | | | |
1.375% due 07/15/17 | | | 150,000 | | | | 151,693 | |
2.500% due 07/15/22 | | | 100,000 | | | | 100,719 | |
3.750% due 07/15/42 | | | 100,000 | | | | 100,570 | |
4.125% due 01/15/15 | | | 150,000 | | | | 160,357 | |
5.375% due 01/15/20 | | | 200,000 | | | | 243,568 | |
6.375% due 01/15/40 | | | 50,000 | | | | 69,531 | |
Archer-Daniels-Midland Co
4.016% due 04/16/43 ~ | | | 50,000 | | | | 47,867 | |
Beam Inc
5.875% due 01/15/36 | | | 100,000 | | | | 116,144 | |
Bunge Ltd Finance Corp | | | | | | | | |
3.200% due 06/15/17 | | | 100,000 | | | | 104,437 | |
8.500% due 06/15/19 | | | 10,000 | | | | 12,874 | |
Campbell Soup Co
2.500% due 08/02/22 | | | 100,000 | | | | 99,198 | |
Colgate-Palmolive Co
0.600% due 11/15/14 | | | 100,000 | | | | 100,416 | |
ConAgra Foods Inc
5.875% due 04/15/14 | | | 100,000 | | | | 106,431 | |
Costco Wholesale Corp
1.125% due 12/15/17 | | | 150,000 | | | | 151,128 | |
CVS Caremark Corp | | | | | | | | |
2.750% due 12/01/22 | | | 50,000 | | | | 50,233 | |
5.750% due 06/01/17 | | | 100,000 | | | | 119,638 | |
6.125% due 09/15/39 | | | 50,000 | | | | 64,044 | |
| | |
| See Notes to Financial Statements | | See explanation of symbols and terms, if any, on page B-81 |
B-1
PACIFIC SELECT FUND
PD AGGREGATE BOND INDEX PORTFOLIO
Schedule of Investments (Continued)
December 31, 2012
| | | | | | | | |
| | | Principal
Amount | | | Value | |
Diageo Capital PLC (United Kingdom) | | | | | | | | |
5.750% due 10/23/17 | | | $100,000 | | | | $120,565 | |
7.375% due 01/15/14 | | | 100,000 | | | | 106,979 | |
Dr Pepper Snapple Group Inc
3.200% due 11/15/21 | | | 50,000 | | | | 51,813 | |
General Mills Inc | | | | | | | | |
5.400% due 06/15/40 | | | 45,000 | | | | 55,283 | |
5.650% due 02/15/19 | | | 100,000 | | | | 121,653 | |
Kellogg Co | | | | | | | | |
3.250% due 05/21/18 | | | 65,000 | | | | 70,864 | |
7.450% due 04/01/31 | | | 25,000 | | | | 34,502 | |
Kimberly-Clark Corp | | | | | | | | |
6.625% due 08/01/37 | | | 100,000 | | | | 145,525 | |
7.500% due 11/01/18 | | | 50,000 | | | | 66,749 | |
Kraft Foods Group Inc
3.500% due 06/06/22 ~ | | | 200,000 | | | | 213,663 | |
Lorillard Tobacco Co
3.500% due 08/04/16 | | | 45,000 | | | | 47,646 | |
Molson Coors Brewing Co
5.000% due 05/01/42 | | | 100,000 | | | | 112,174 | |
Mondelez International Inc | | | | | | | | |
5.375% due 02/10/20 | | | 100,000 | | | | 120,806 | |
6.125% due 02/01/18 | | | 100,000 | | | | 121,770 | |
6.500% due 02/09/40 | | | 100,000 | | | | 134,453 | |
PepsiCo Inc | | | | | | | | |
0.700% due 08/13/15 | | | 100,000 | | | | 100,184 | |
1.250% due 08/13/17 | | | 100,000 | | | | 100,452 | |
3.100% due 01/15/15 | | | 100,000 | | | | 105,001 | |
5.000% due 06/01/18 | | | 100,000 | | | | 118,702 | |
Philip Morris International Inc | | | | | | | | |
4.500% due 03/20/42 | | | 200,000 | | | | 217,565 | |
6.375% due 05/16/38 | | | 100,000 | | | | 136,289 | |
6.875% due 03/17/14 | | | 100,000 | | | | 107,707 | |
Reynolds American Inc
6.750% due 06/15/17 | | | 100,000 | | | | 120,843 | |
Safeway Inc
3.950% due 08/15/20 | | | 60,000 | | | | 60,057 | |
Sysco Corp
2.600% due 06/12/22 | | | 100,000 | | | | 102,148 | |
The Clorox Co | | | | | | | | |
3.550% due 11/01/15 | | | 25,000 | | | | 26,550 | |
3.800% due 11/15/21 | | | 100,000 | | | | 108,991 | |
The Coca-Cola Co | | | | | | | | |
0.750% due 03/13/15 | | | 100,000 | | | | 100,816 | |
1.800% due 09/01/16 | | | 100,000 | | | | 103,347 | |
3.300% due 09/01/21 | | | 100,000 | | | | 110,331 | |
The Hershey Co
1.500% due 11/01/16 | | | 100,000 | | | | 102,066 | |
The Kroger Co | | | | | | | | |
2.200% due 01/15/17 | | | 50,000 | | | | 51,705 | |
3.900% due 10/01/15 | | | 100,000 | | | | 107,974 | |
The Pepsi Bottling Group Inc
7.000% due 03/01/29 | | | 100,000 | | | | 143,722 | |
The Procter & Gamble Co | | | | | | | | |
3.500% due 02/15/15 | | | 150,000 | | | | 159,335 | |
5.500% due 02/01/34 | | | 50,000 | | | | 63,792 | |
Tyson Foods Inc
4.500% due 06/15/22 | | | 100,000 | | | | 108,637 | |
Unilever Capital Corp | | | | | | | | |
0.850% due 08/02/17 | | | 100,000 | | | | 99,068 | |
5.900% due 11/15/32 | | | 50,000 | | | | 68,670 | |
Wal-Mart Stores Inc | | | | | | | | |
1.500% due 10/25/15 | | | 100,000 | | | | 102,989 | |
3.200% due 05/15/14 | | | 250,000 | | | | 259,789 | |
3.250% due 10/25/20 | | | 100,000 | | | | 108,958 | |
5.000% due 10/25/40 | | | 100,000 | | | | 121,113 | |
6.500% due 08/15/37 | | | 150,000 | | | | 211,109 | |
Walgreen Co | | | | | | | | |
1.800% due 09/15/17 | | | 75,000 | | | | 75,476 | |
3.100% due 09/15/22 | | | 75,000 | | | | 75,720 | |
5.250% due 01/15/19 | | | 25,000 | | | | 29,340 | |
| | | | | | | | |
| | | | | | | 7,248,509 | |
| | | | | | | | |
| | | | | | | | |
| | | Principal
Amount | | | Value | |
Energy - 2.5% | | | | | | | | |
| | |
Anadarko Petroleum Corp | | | | | | | | |
6.200% due 03/15/40 | | | $100,000 | | | | $123,456 | |
6.375% due 09/15/17 | | | 100,000 | | | | 119,534 | |
6.450% due 09/15/36 | | | 50,000 | | | | 62,689 | |
Apache Corp | | | | | | | | |
1.750% due 04/15/17 | | | 100,000 | | | | 102,758 | |
5.100% due 09/01/40 | | | 100,000 | | | | 113,780 | |
5.250% due 02/01/42 | | | 25,000 | | | | 28,974 | |
5.625% due 01/15/17 | | | 50,000 | | | | 58,602 | |
6.000% due 01/15/37 | | | 25,000 | | | | 31,600 | |
Baker Hughes Inc
5.125% due 09/15/40 | | | 50,000 | | | | 60,238 | |
BP Capital Markets PLC (United Kingdom) | | | | | | | | |
1.846% due 05/05/17 | | | 100,000 | | | | 102,300 | |
3.561% due 11/01/21 | | | 100,000 | | | | 108,150 | |
3.625% due 05/08/14 | | | 250,000 | | | | 260,317 | |
Buckeye Partners LP
5.500% due 08/15/19 | | | 25,000 | | | | 27,335 | |
Burlington Resources Finance Co (Canada)
7.400% due 12/01/31 | | | 100,000 | | | | 142,657 | |
Canadian Natural Resources Ltd (Canada)
6.750% due 02/01/39 | | | 90,000 | | | | 121,271 | |
Cenovus Energy Inc (Canada) | | | | | | | | |
4.450% due 09/15/42 | | | 100,000 | | | | 104,073 | |
5.700% due 10/15/19 | | | 50,000 | | | | 60,671 | |
Chevron Corp | | | | | | | | |
2.355% due 12/05/22 | | | 250,000 | | | | 250,659 | |
4.950% due 03/03/19 | | | 50,000 | | | | 59,684 | |
ConocoPhillips | | | | | | | | |
4.600% due 01/15/15 | | | 100,000 | | | | 108,116 | |
5.750% due 02/01/19 | | | 150,000 | | | | 184,595 | |
6.500% due 02/01/39 | | | 50,000 | | | | 70,969 | |
Devon Energy Corp
6.300% due 01/15/19 | | | 50,000 | | | | 62,082 | |
Devon Financing Corp LLC
7.875% due 09/30/31 | | | 150,000 | | | | 218,311 | |
Diamond Offshore Drilling Inc
5.700% due 10/15/39 | | | 25,000 | | | | 32,101 | |
Ecopetrol SA (Colombia)
7.625% due 07/23/19 | | | 100,000 | | | | 129,750 | |
El Paso Natural Gas Co LLC
5.950% due 04/15/17 | | | 50,000 | | | | 58,041 | |
Enbridge Energy Partners LP | | | | | | | | |
5.200% due 03/15/20 | | | 15,000 | | | | 16,930 | |
7.500% due 04/15/38 | | | 50,000 | | | | 63,988 | |
Encana Corp (Canada)
5.900% due 12/01/17 | | | 100,000 | | | | 119,192 | |
Energy Transfer Partners LP | | | | | | | | |
6.125% due 02/15/17 | | | 50,000 | | | | 57,898 | |
6.500% due 02/01/42 | | | 100,000 | | | | 122,539 | |
9.000% due 04/15/19 | | | 50,000 | | | | 65,966 | |
Ensco PLC (United Kingdom)
4.700% due 03/15/21 | | | 100,000 | | | | 112,621 | |
Enterprise Products Operating LLC | | | | | | | | |
6.125% due 10/15/39 | | | 115,000 | | | | 139,050 | |
6.500% due 01/31/19 | | | 100,000 | | | | 125,392 | |
9.750% due 01/31/14 | | | 25,000 | | | | 27,360 | |
EOG Resources Inc
5.625% due 06/01/19 | | | 100,000 | | | | 122,823 | |
EQT Corp
8.125% due 06/01/19 | | | 25,000 | | | | 30,963 | |
Halliburton Co | | | | | | | | |
3.250% due 11/15/21 | | | 100,000 | | | | 107,185 | |
7.450% due 09/15/39 | | | 25,000 | | | | 38,085 | |
Hess Corp | | | | | | | | |
5.600% due 02/15/41 | | | 50,000 | | | | 59,188 | |
7.125% due 03/15/33 | | | 50,000 | | | | 66,744 | |
| | |
| See Notes to Financial Statements | | See explanation of symbols and terms, if any, on page B-81 |
B-2
PACIFIC SELECT FUND
PD AGGREGATE BOND INDEX PORTFOLIO
Schedule of Investments (Continued)
December 31, 2012
| | | | | | | | |
| | | Principal
Amount | | | Value | |
Husky Energy Inc (Canada)
5.900% due 06/15/14 | | | $50,000 | | | | $53,611 | |
Kinder Morgan Energy Partners LP | | | | | | | | |
3.950% due 09/01/22 | | | 100,000 | | | | 107,018 | |
5.300% due 09/15/20 | | | 50,000 | | | | 58,320 | |
5.625% due 02/15/15 | | | 35,000 | | | | 38,367 | |
6.850% due 02/15/20 | | | 50,000 | | | | 63,037 | |
6.950% due 01/15/38 | | | 200,000 | | | | 263,386 | |
Magellan Midstream Partners LP
6.400% due 07/15/18 | | | 100,000 | | | | 122,474 | |
Marathon Oil Corp | | | | | | | | |
0.900% due 11/01/15 | | | 100,000 | | | | 100,142 | |
2.800% due 11/01/22 | | | 100,000 | | | | 100,712 | |
6.000% due 10/01/17 | | | 50,000 | | | | 60,141 | |
Nabors Industries Inc
4.625% due 09/15/21 | | | 150,000 | | | | 161,564 | |
Nexen Inc (Canada)
6.200% due 07/30/19 | | | 50,000 | | | | 61,441 | |
Noble Energy Inc
4.150% due 12/15/21 | | | 100,000 | | | | 110,483 | |
Noble Holding International Ltd (Cayman)
2.500% due 03/15/17 | | | 200,000 | | | | 206,547 | |
Occidental Petroleum Corp | | | | | | | | |
1.500% due 02/15/18 | | | 150,000 | | | | 152,051 | |
4.100% due 02/01/21 | | | 100,000 | | | | 114,427 | |
Petro-Canada (Canada)
6.800% due 05/15/38 | | | 200,000 | | | | 272,985 | |
Petrobras International Finance Co (Cayman) | | | | | | | | |
3.500% due 02/06/17 | | | 100,000 | | | | 105,093 | |
3.875% due 01/27/16 | | | 100,000 | | | | 105,976 | |
5.375% due 01/27/21 | | | 100,000 | | | | 112,978 | |
5.750% due 01/20/20 | | | 25,000 | | | | 28,561 | |
6.875% due 01/20/40 | | | 50,000 | | | | 63,852 | |
7.875% due 03/15/19 | | | 100,000 | | | | 125,319 | |
Petroleos Mexicanos (Mexico) | | | | | | | | |
4.875% due 03/15/15 | | | 50,000 | | | | 54,125 | |
4.875% due 01/24/22 | | | 100,000 | | | | 113,100 | |
5.500% due 01/21/21 | | | 100,000 | | | | 117,350 | |
6.500% due 06/02/41 | | | 300,000 | | | | 378,000 | |
Phillips 66
4.300% due 04/01/22 ~ | | | 100,000 | | | | 111,837 | |
Pioneer Natural Resources Co
3.950% due 07/15/22 | | | 100,000 | | | | 104,877 | |
Plains All American Pipeline LP | | | | | | | | |
5.000% due 02/01/21 | | | 50,000 | | | | 57,961 | |
6.700% due 05/15/36 | | | 100,000 | | | | 127,872 | |
Rowan Cos Inc
7.875% due 08/01/19 | | | 30,000 | | | | 37,065 | |
Shell International Finance BV (Netherlands) | | | | | | | | |
3.100% due 06/28/15 | | | 100,000 | | | | 105,992 | |
3.625% due 08/21/42 | | | 100,000 | | | | 99,224 | |
4.300% due 09/22/19 | | | 100,000 | | | | 115,925 | |
6.375% due 12/15/38 | | | 50,000 | | | | 70,310 | |
Southern Natural Gas Co LLC
4.400% due 06/15/21 | | | 100,000 | | | | 111,302 | |
Spectra Energy Capital LLC
6.200% due 04/15/18 | | | 25,000 | | | | 30,464 | |
Statoil ASA (Norway) | | | | | | | | |
3.150% due 01/23/22 | | | 100,000 | | | | 105,778 | |
5.250% due 04/15/19 | | | 100,000 | | | | 119,979 | |
Talisman Energy Inc (Canada)
6.250% due 02/01/38 | | | 100,000 | | | | 119,886 | |
Total Capital SA (France) | | | | | | | | |
3.000% due 06/24/15 | | | 100,000 | | | | 105,681 | |
4.125% due 01/28/21 | | | 100,000 | | | | 113,397 | |
TransCanada PipeLines Ltd (Canada) | | | | | | | | |
2.500% due 08/01/22 | | | 100,000 | | | | 100,296 | |
7.125% due 01/15/19 | | | 100,000 | | | | 127,456 | |
7.625% due 01/15/39 | | | 50,000 | | | | 75,280 | |
| | | | | | | | |
| | | Principal
Amount | | | Value | |
Transocean Inc (Cayman) | | | | | | | | |
6.000% due 03/15/18 | | | $100,000 | | | | $116,068 | |
6.800% due 03/15/38 | | | 100,000 | | | | 122,514 | |
Valero Energy Corp | | | | | | | | |
6.125% due 02/01/20 | | | 50,000 | | | | 60,839 | |
6.625% due 06/15/37 | | | 250,000 | | | | 308,256 | |
Weatherford International Ltd (Bermuda) | | | | | | | | |
6.750% due 09/15/40 | | | 100,000 | | | | 113,490 | |
9.625% due 03/01/19 | | | 100,000 | | | | 130,534 | |
Western Gas Partners LP
4.000% due 07/01/22 | | | 100,000 | | | | 105,457 | |
Williams Partners LP | | | | | | | | |
3.800% due 02/15/15 | | | 50,000 | | | | 52,893 | |
4.000% due 11/15/21 | | | 100,000 | | | | 107,048 | |
6.300% due 04/15/40 | | | 20,000 | | | | 24,472 | |
| | | | | | | | |
| | | | | | | 10,311,850 | |
| | | | | | | | |
Financials - 8.9% | | | | | | | | |
| | |
Abbey National Treasury Services PLC (United Kingdom)
4.000% due 04/27/16 | | | 100,000 | | | | 105,794 | |
ACE INA Holdings Inc | | | | | | | | |
2.600% due 11/23/15 | | | 100,000 | | | | 105,045 | |
5.900% due 06/15/19 | | | 15,000 | | | | 18,539 | |
Aflac Inc | | | | | | | | |
4.000% due 02/15/22 | | | 100,000 | | | | 107,964 | |
6.900% due 12/17/39 | | | 15,000 | | | | 19,963 | |
African Development Bank (Multi-National)
2.500% due 03/15/16 | | | 100,000 | | | | 106,236 | |
Alleghany Corp
4.950% due 06/27/22 | | | 100,000 | | | | 109,627 | |
American Express Co | | | | | | | | |
2.650% due 12/02/22 ~ | | | 150,000 | | | | 149,545 | |
4.050% due 12/03/42 ~ | | | 125,000 | | | | 125,692 | |
7.000% due 03/19/18 | | | 100,000 | | | | 126,440 | |
American Express Credit Corp | | | | | | | | |
2.750% due 09/15/15 | | | 100,000 | | | | 104,899 | |
2.800% due 09/19/16 | | | 200,000 | | | | 211,736 | |
American International Group Inc | | | | | | | | |
4.875% due 06/01/22 | | | 100,000 | | | | 114,259 | |
5.050% due 10/01/15 | | | 100,000 | | | | 110,428 | |
5.850% due 01/16/18 | | | 200,000 | | | | 236,881 | |
8.175% due 05/15/68 § | | | 150,000 | | | | 196,125 | |
American Tower Corp REIT
4.700% due 03/15/22 | | | 200,000 | | | | 221,467 | |
Ameriprise Financial Inc
7.300% due 06/28/19 | | | 20,000 | | | | 25,875 | |
Aon Corp
5.000% due 09/30/20 | | | 50,000 | | | | 57,102 | |
Asian Development Bank (Multi-National) | | | | | | | | |
0.875% due 06/10/14 | | | 200,000 | | | | 201,634 | |
1.875% due 10/23/18 | | | 100,000 | | | | 104,808 | |
2.625% due 02/09/15 | | | 150,000 | | | | 157,061 | |
2.750% due 05/21/14 | | | 50,000 | | | | 51,694 | |
AvalonBay Communities Inc REIT
2.950% due 09/15/22 | | | 35,000 | | | | 34,897 | |
AXA SA (France)
8.600% due 12/15/30 | | | 25,000 | | | | 31,353 | |
Axis Specialty Finance LLC
5.875% due 06/01/20 | | | 50,000 | | | | 56,800 | |
Bank of America Corp | | | | | | | | |
3.750% due 07/12/16 | | | 200,000 | | | | 213,906 | |
4.500% due 04/01/15 | | | 200,000 | | | | 213,286 | |
5.625% due 07/01/20 | | | 200,000 | | | | 237,289 | |
5.650% due 05/01/18 | | | 150,000 | | | | 174,655 | |
5.700% due 01/24/22 | | | 150,000 | | | | 180,527 | |
6.500% due 08/01/16 | | | 200,000 | | | | 231,079 | |
Bank of Montreal (Canada)
2.500% due 01/11/17 | | | 200,000 | | | | 209,784 | |
| | |
| See Notes to Financial Statements | | See explanation of symbols and terms, if any, on page B-81 |
B-3
PACIFIC SELECT FUND
PD AGGREGATE BOND INDEX PORTFOLIO
Schedule of Investments (Continued)
December 31, 2012
| | | | | | | | |
| | | Principal
Amount | | | Value | |
Bank of Nova Scotia (Canada) | | | | | | | | |
2.550% due 01/12/17 | | | $200,000 | | | | $210,586 | |
3.400% due 01/22/15 | | | 50,000 | | | | 52,740 | |
Barclays Bank PLC (United Kingdom) | | | | | | | | |
2.375% due 01/13/14 | | | 100,000 | | | | 101,714 | |
5.000% due 09/22/16 | | | 150,000 | | | | 168,231 | |
BB&T Corp | | | | | | | | |
2.150% due 03/22/17 | | | 100,000 | | | | 103,498 | |
3.950% due 04/29/16 | | | 50,000 | | | | 54,552 | |
Berkshire Hathaway Finance Corp | | | | | | | | |
2.450% due 12/15/15 | | | 100,000 | | | | 105,194 | |
5.750% due 01/15/40 | | | 25,000 | | | | 30,632 | |
Berkshire Hathaway Inc
3.400% due 01/31/22 | | | 100,000 | | | | 107,814 | |
BioMed Realty LP REIT
4.250% due 07/15/22 | | | 100,000 | | | | 104,410 | |
BlackRock Inc | | | | | | | | |
3.500% due 12/10/14 | | | 25,000 | | | | 26,415 | |
5.000% due 12/10/19 | | | 100,000 | | | | 119,732 | |
BNP Paribas SA (France) | | | | | | | | |
2.375% due 09/14/17 | | | 100,000 | | | | 101,511 | |
3.250% due 03/11/15 | | | 100,000 | | | | 104,417 | |
Boston Properties LP REIT | | | | | | | | |
3.700% due 11/15/18 | | | 100,000 | | | | 108,723 | |
5.875% due 10/15/19 | | | 25,000 | | | | 29,829 | |
Canadian Imperial Bank of Commerce (Canada)
2.350% due 12/11/15 | | | 100,000 | | | | 105,003 | |
Capital One Bank USA NA
8.800% due 07/15/19 | | | 50,000 | | | | 67,744 | |
Capital One Financial Corp | | | | | | | | |
4.750% due 07/15/21 | | | 100,000 | | | | 115,407 | |
6.150% due 09/01/16 | | | 100,000 | | | | 114,467 | |
7.375% due 05/23/14 | | | 15,000 | | | | 16,323 | |
Caterpillar Financial Services Corp
2.650% due 04/01/16 | | | 200,000 | | | | 210,120 | |
Citigroup Inc | | | | | | | | |
3.953% due 06/15/16 | | | 250,000 | | | | 269,238 | |
4.450% due 01/10/17 | | | 150,000 | | | | 166,275 | |
4.500% due 01/14/22 | | | 60,000 | | | | 66,998 | |
4.875% due 05/07/15 | | | 100,000 | | | | 106,363 | |
5.000% due 09/15/14 | | | 100,000 | | | | 105,252 | |
6.000% due 08/15/17 | | | 100,000 | | | | 117,897 | |
6.125% due 11/21/17 | | | 100,000 | | | | 119,103 | |
6.125% due 08/25/36 | | | 100,000 | | | | 109,072 | |
8.125% due 07/15/39 | | | 200,000 | | | | 299,665 | |
CME Group Inc
3.000% due 09/15/22 | | | 50,000 | | | | 50,779 | |
CNA Financial Corp | | | | | | | | |
6.500% due 08/15/16 | | | 50,000 | | | | 57,718 | |
7.350% due 11/15/19 | | | 15,000 | | | | 18,825 | |
Comerica Inc
3.000% due 09/16/15 | | | 100,000 | | | | 105,652 | |
Commonwealth Bank of Australia (Australia)
1.900% due 09/18/17 | | | 250,000 | | | | 255,801 | |
Cooperatieve Centrale Raiffeisen-Boerenleenbank BA (Netherlands) | | | | | | | | |
1.850% due 01/10/14 | | | 100,000 | | | | 101,355 | |
3.875% due 02/08/22 | | | 100,000 | | | | 107,704 | |
Corp Andina de Fomento (Multi-National) | | | | | | | | |
3.750% due 01/15/16 | | | 100,000 | | | | 106,006 | |
8.125% due 06/04/19 | | | 25,000 | | | | 32,285 | |
Council Of Europe Development Bank (Multi-National)
1.500% due 02/22/17 | | | 100,000 | | | | 102,350 | |
Credit Suisse NY (Switzerland) | | | | | | | | |
4.375% due 08/05/20 | | | 350,000 | | | | 399,386 | |
5.500% due 05/01/14 | | | 300,000 | | | | 319,301 | |
| | | | | | | | |
| | | Principal
Amount | | | Value | |
Daimler Finance North America LLC
8.500% due 01/18/31 | | | $50,000 | | | | $77,873 | |
DDR Corp REIT
4.750% due 04/15/18 | | | 25,000 | | | | 27,729 | |
Deutsche Bank AG (Germany)
3.250% due 01/11/16 | | | 300,000 | | | | 317,616 | |
Digital Realty Trust LP REIT
3.625% due 10/01/22 | | | 35,000 | | | | 34,405 | |
Duke Realty LP REIT | | | | | | | | |
3.875% due 10/15/22 | | | 25,000 | | | | 25,479 | |
6.750% due 03/15/20 | | | 25,000 | | | | 30,247 | |
ERP Operating LP REIT | | | | | | | | |
4.625% due 12/15/21 | | | 200,000 | | | | 225,462 | |
4.750% due 07/15/20 | | | 100,000 | | | | 112,547 | |
European Bank for Reconstruction & Development (Multi-National) | | | | | | | | |
1.000% due 02/16/17 | | | 250,000 | | | | 252,994 | |
5.000% due 05/19/14 | | | 100,000 | | | | 106,288 | |
European Investment Bank (Multi-National) | | | | | | | | |
1.000% due 07/15/15 | | | 350,000 | | | | 354,465 | |
1.125% due 08/15/14 | | | 200,000 | | | | 202,283 | |
1.500% due 05/15/14 | | | 350,000 | | | | 355,409 | |
2.250% due 03/15/16 | | | 500,000 | | | | 525,208 | |
2.875% due 01/15/15 | | | 50,000 | | | | 52,456 | |
2.875% due 09/15/20 | | | 100,000 | | | | 108,217 | |
3.000% due 04/08/14 | | | 100,000 | | | | 103,281 | |
4.875% due 02/15/36 | | | 25,000 | | | | 29,677 | |
5.125% due 05/30/17 | | | 500,000 | | | | 591,154 | |
Export-Import Bank of Korea (South Korea) | | | | | | | | |
5.000% due 04/11/22 | | | 200,000 | | | | 232,108 | |
5.875% due 01/14/15 | | | 100,000 | | | | 109,723 | |
Fifth Third Bancorp | | | | | | | | |
5.450% due 01/15/17 | | | 50,000 | | | | 56,056 | |
8.250% due 03/01/38 | | | 25,000 | | | | 35,777 | |
First Horizon National Corp
5.375% due 12/15/15 | | | 50,000 | | | | 54,691 | |
Ford Motor Credit Co LLC | | | | | | | | |
3.875% due 01/15/15 | | | 250,000 | | | | 260,823 | |
5.875% due 08/02/21 | | | 250,000 | | | | 291,355 | |
6.625% due 08/15/17 | | | 250,000 | | | | 292,318 | |
Franklin Resources Inc
2.800% due 09/15/22 | | | 25,000 | | | | 25,329 | |
General Electric Capital Corp | | | | | | | | |
1.600% due 11/20/17 | | | 150,000 | | | | 150,217 | |
2.150% due 01/09/15 | | | 100,000 | | | | 102,758 | |
3.350% due 10/17/16 | | | 400,000 | | | | 429,616 | |
4.625% due 01/07/21 | | | 200,000 | | | | 227,029 | |
5.300% due 02/11/21 | | | 100,000 | | | | 116,164 | |
5.900% due 05/13/14 | | | 300,000 | | | | 321,621 | |
6.750% due 03/15/32 | | | 200,000 | | | | 259,931 | |
6.875% due 01/10/39 | | | 200,000 | | | | 272,088 | |
Genworth Financial Inc
7.700% due 06/15/20 | | | 150,000 | | | | 166,077 | |
Goldman Sachs Capital I
6.345% due 02/15/34 | | | 100,000 | | | | 103,872 | |
Health Care REIT Inc
6.200% due 06/01/16 | | | 100,000 | | | | 114,158 | |
Healthcare Realty Trust Inc REIT
6.500% due 01/17/17 | | | 25,000 | | | | 28,602 | |
Hospitality Properties Trust REIT
7.875% due 08/15/14 | | | 25,000 | | | | 26,695 | |
HSBC Bank USA NA
4.875% due 08/24/20 | | | 100,000 | | | | 111,523 | |
HSBC Finance Corp | | | | | | | | |
5.500% due 01/19/16 | | | 200,000 | | | | 223,599 | |
6.676% due 01/15/21 | | | 211,000 | | | | 250,500 | |
HSBC Holdings PLC (United Kingdom) | | | | | | | | |
4.875% due 01/14/22 | | | 100,000 | | | | 116,152 | |
6.500% due 09/15/37 | | | 100,000 | | | | 124,920 | |
| | |
| See Notes to Financial Statements | | See explanation of symbols and terms, if any, on page B-81 |
B-4
PACIFIC SELECT FUND
PD AGGREGATE BOND INDEX PORTFOLIO
Schedule of Investments (Continued)
December 31, 2012
| | | | | | | | |
| | | Principal
Amount | | | Value | |
Inter-American Development Bank (Multi-National) | | | | | | | | |
1.125% due 03/15/17 | | | $200,000 | | | | $203,686 | |
1.125% due 09/12/19 | | | 175,000 | | | | 174,166 | |
4.250% due 09/10/18 | | | 125,000 | | | | 147,548 | |
International Bank for Reconstruction & Development (Multi-National) | | | | | | | | |
0.875% due 04/17/17 | | | 100,000 | | | | 101,313 | |
2.125% due 03/15/16 | | | 250,000 | | | | 263,302 | |
2.375% due 05/26/15 | | | 100,000 | | | | 104,902 | |
International Finance Corp (Multi-National) | | | | | | | | |
2.125% due 11/17/17 | | | 200,000 | | | | 212,187 | |
2.750% due 04/20/15 | | | 100,000 | | | | 105,562 | |
Jefferies Group Inc
8.500% due 07/15/19 | | | 125,000 | | | | 150,000 | |
JPMorgan Chase & Co | | | | | | | | |
1.100% due 10/15/15 | | | 100,000 | | | | 100,057 | |
2.000% due 08/15/17 | | | 250,000 | | | | 255,565 | |
2.050% due 01/24/14 | | | 100,000 | | | | 101,591 | |
3.450% due 03/01/16 | | | 400,000 | | | | 425,021 | |
4.350% due 08/15/21 | | | 200,000 | | | | 223,826 | |
4.400% due 07/22/20 | | | 50,000 | | | | 56,483 | |
5.125% due 09/15/14 | | | 100,000 | | | | 106,398 | |
5.500% due 10/15/40 | | | 100,000 | | | | 122,359 | |
5.600% due 07/15/41 | | | 100,000 | | | | 123,960 | |
6.125% due 06/27/17 | | | 100,000 | | | | 116,907 | |
6.300% due 04/23/19 | | | 100,000 | | | | 123,449 | |
6.400% due 05/15/38 | | | 300,000 | | | | 402,487 | |
KeyCorp
5.100% due 03/24/21 | | | 100,000 | | | | 116,589 | |
Kimco Realty Corp REIT
6.875% due 10/01/19 | | | 25,000 | | | | 30,900 | |
Kreditanstalt fuer Wiederaufbau (Germany) | | | | | | | | |
1.000% due 01/12/15 | | �� | 200,000 | | | | 202,381 | |
1.250% due 10/26/15 | | | 100,000 | | | | 102,014 | |
1.375% due 01/13/14 | | | 200,000 | | | | 202,224 | |
2.000% due 10/04/22 | | | 250,000 | | | | 250,779 | |
2.375% due 08/25/21 | | | 250,000 | | | | 260,674 | |
2.625% due 02/16/16 | | | 500,000 | | | | 531,302 | |
3.500% due 03/10/14 | | | 250,000 | | | | 259,406 | |
4.000% due 01/27/20 | | | 100,000 | | | | 116,418 | |
4.500% due 07/16/18 | | | 100,000 | | | | 118,080 | |
Landwirtschaftliche Rentenbank (Germany) | | | | | | | | |
3.125% due 07/15/15 | | | 150,000 | | | | 159,911 | |
5.125% due 02/01/17 | | | 100,000 | | | | 117,359 | |
Lincoln National Corp
8.750% due 07/01/19 | | | 115,000 | | | | 153,877 | |
Lloyds TSB Bank PLC (United Kingdom)
4.875% due 01/21/16 | | | 125,000 | | | | 137,928 | |
Mack-Cali Realty LP REIT
7.750% due 08/15/19 | | | 25,000 | | | | 31,001 | |
Markel Corp
7.125% due 09/30/19 | | | 25,000 | | | | 30,124 | |
Marsh & McLennan Cos Inc
5.750% due 09/15/15 | | | 25,000 | | | | 28,042 | |
Merrill Lynch & Co Inc | | | | | | | | |
5.000% due 01/15/15 | | | 100,000 | | | | 106,876 | |
6.050% due 05/16/16 | | | 100,000 | | | | 110,143 | |
6.110% due 01/29/37 | | | 250,000 | | | | 273,101 | |
6.875% due 04/25/18 | | | 200,000 | | | | 241,278 | |
MetLife Inc | | | | | | | | |
5.875% due 02/06/41 | | | 50,000 | | | | 63,367 | |
6.375% due 06/15/34 | | | 100,000 | | | | 130,584 | |
6.750% due 06/01/16 | | | 250,000 | | | | 296,243 | |
Morgan Stanley | | | | | | | | |
2.875% due 07/28/14 | | | 100,000 | | | | 102,240 | |
4.750% due 04/01/14 | | | 50,000 | | | | 51,789 | |
4.875% due 11/01/22 | | | 100,000 | | | | 103,628 | |
5.500% due 07/28/21 | | | 50,000 | | | | 56,812 | |
5.750% due 01/25/21 | | | 200,000 | | | | 228,572 | |
| | | | | | | | |
| | | Principal
Amount | | | Value | |
5.950% due 12/28/17 | | | $200,000 | | | | $226,649 | |
6.000% due 04/28/15 | | | 350,000 | | | | 381,406 | |
6.250% due 08/09/26 | | | 100,000 | | | | 117,484 | |
6.375% due 07/24/42 | | | 100,000 | | | | 117,332 | |
National Australia Bank Ltd (Australia)
2.000% due 03/09/15 | | | 250,000 | | | | 256,101 | |
National Rural Utilities Cooperative Finance Corp | | | | | | | | |
4.750% due 03/01/14 | | | 50,000 | | | | 52,417 | |
8.000% due 03/01/32 | | | 50,000 | | | | 75,284 | |
Nomura Holdings Inc (Japan) | | | | | | | | |
5.000% due 03/04/15 | | | 35,000 | | | | 37,126 | |
6.700% due 03/04/20 | | | 5,000 | | | | 5,839 | |
Nordic Investment Bank (Multi-National)
2.625% due 10/06/14 | | | 100,000 | | | | 104,095 | |
Northern Trust Corp
3.375% due 08/23/21 | | | 50,000 | | | | 54,046 | |
Oesterreichische Kontrollbank AG (Austria)
1.750% due 10/05/15 | | | 100,000 | | | | 103,151 | |
PNC Funding Corp | | | | | | | | |
3.625% due 02/08/15 | | | 100,000 | | | | 105,908 | |
5.125% due 02/08/20 | | | 100,000 | | | | 119,012 | |
Principal Financial Group Inc
1.850% due 11/15/17 | | | 100,000 | | | | 100,608 | |
Private Export Funding Corp | | | | | | | | |
1.375% due 02/15/17 | | | 100,000 | | | | 102,916 | |
2.450% due 07/15/24 | | | 100,000 | | | | 101,948 | |
4.300% due 12/15/21 | | | 25,000 | | | | 30,229 | |
ProLogis LP REIT | | | | | | | | |
6.625% due 05/15/18 | | | 60,000 | | | | 72,527 | |
7.625% due 08/15/14 | | | 25,000 | | | | 27,358 | |
Protective Life Corp
8.450% due 10/15/39 | | | 25,000 | | | | 32,628 | |
Prudential Financial Inc | | | | | | | | |
5.625% due 05/12/41 | | | 50,000 | | | | 57,047 | |
5.875% due 09/15/42 § | | | 100,000 | | | | 105,375 | |
6.200% due 01/15/15 | | | 30,000 | | | | 33,147 | |
6.625% due 06/21/40 | | | 50,000 | | | | 62,873 | |
7.375% due 06/15/19 | | | 70,000 | | | | 88,943 | |
Realty Income Corp REIT
5.875% due 03/15/35 | | | 50,000 | | | | 57,526 | |
Royal Bank of Canada (Canada) | | | | | | | | |
0.800% due 10/30/15 | | | 100,000 | | | | 99,946 | |
1.200% due 09/19/17 | | | 100,000 | | | | 100,318 | |
2.625% due 12/15/15 | | | 100,000 | | | | 105,614 | |
Santander Holdings USA Inc
3.000% due 09/24/15 | | | 30,000 | | | | 30,568 | |
Simon Property Group LP REIT | | | | | | | | |
2.150% due 09/15/17 | | | 200,000 | | | | 207,600 | |
5.650% due 02/01/20 | | | 75,000 | | | | 90,060 | |
6.750% due 02/01/40 | | | 25,000 | | | | 33,908 | |
SLM Corp | | | | | | | | |
6.250% due 01/25/16 | | | 200,000 | | | | 218,500 | |
8.450% due 06/15/18 | | | 100,000 | | | | 117,500 | |
Sumitomo Mitsui Banking Corp (Japan)
1.350% due 07/18/15 | | | 250,000 | | | | 252,953 | |
SunTrust Banks Inc | | | | | | | | |
3.500% due 01/20/17 | | | 200,000 | | | | 214,923 | |
5.000% due 09/01/15 | | | 4,000 | | | | 4,373 | |
Svensk Exportkredit AB (Sweden) | | | | | | | | |
2.125% due 07/13/16 | | | 100,000 | | | | 103,984 | |
3.250% due 09/16/14 | | | 25,000 | | | | 26,173 | |
TD Ameritrade Holding Corp
4.150% due 12/01/14 | | | 50,000 | | | | 53,312 | |
The Allstate Corp
6.200% due 05/16/14 | | | 175,000 | | | | 188,003 | |
The Bank of New York Mellon Corp | | | | | | | | |
0.700% due 10/23/15 | | | 90,000 | | | | 89,720 | |
2.500% due 01/15/16 | | | 100,000 | | | | 104,841 | |
4.300% due 05/15/14 | | | 60,000 | | | | 63,079 | |
| | |
| See Notes to Financial Statements | | See explanation of symbols and terms, if any, on page B-81 |
B-5
PACIFIC SELECT FUND
PD AGGREGATE BOND INDEX PORTFOLIO
Schedule of Investments (Continued)
December 31, 2012
| | | | | | | | |
| | | Principal
Amount | | | Value | |
The Bear Stearns Cos LLC
5.700% due 11/15/14 | | | $100,000 | | | | $108,716 | |
The Charles Schwab Corp
3.225% due 09/01/22 ~ | | | 25,000 | | | | 25,394 | |
The Chubb Corp
5.750% due 05/15/18 | | | 50,000 | | | | 61,500 | |
The Goldman Sachs Group Inc | | | | | | | | |
3.300% due 05/03/15 | | | 300,000 | | | | 312,832 | |
3.625% due 02/07/16 | | | 300,000 | | | | 317,716 | |
5.250% due 07/27/21 | | | 50,000 | | | | 57,043 | |
5.375% due 03/15/20 | | | 100,000 | | | | 114,679 | |
5.625% due 01/15/17 | | | 225,000 | | | | 247,017 | |
5.750% due 01/24/22 | | | 100,000 | | | | 118,315 | |
6.125% due 02/15/33 | | | 200,000 | | | | 234,276 | |
6.150% due 04/01/18 | | | 100,000 | | | | 117,568 | |
6.250% due 02/01/41 | | | 100,000 | | | | 122,799 | |
6.750% due 10/01/37 | | | 50,000 | | | | 56,710 | |
The Hartford Financial Services Group Inc | | | | | | | | |
6.300% due 03/15/18 | | | 85,000 | | | | 101,345 | |
6.625% due 04/15/42 | | | 150,000 | | | | 190,886 | |
The Korea Development Bank (South Korea)
8.000% due 01/23/14 | | | 100,000 | | | | 107,414 | |
The NASDAQ OMX Group Inc
5.250% due 01/16/18 | | | 50,000 | | | | 54,686 | |
The Progressive Corp
3.750% due 08/23/21 | | | 100,000 | | | | 110,023 | |
The Royal Bank of Scotland Group PLC
(United Kingdom) | | | | | | | | |
3.950% due 09/21/15 | | | 250,000 | | | | 265,611 | |
6.400% due 10/21/19 | | | 50,000 | | | | 59,119 | |
The Toronto-Dominion Bank (Canada)
2.375% due 10/19/16 | | | 100,000 | | | | 105,149 | |
The Travelers Cos Inc | | | | | | | | |
5.750% due 12/15/17 | | | 50,000 | | | | 60,770 | |
6.250% due 06/15/37 | | | 25,000 | | | | 33,876 | |
Torchmark Corp
9.250% due 06/15/19 | | | 50,000 | | | | 67,485 | |
Toyota Motor Credit Corp | | | | | | | | |
0.875% due 07/17/15 | | | 100,000 | | | | 100,467 | |
1.250% due 10/05/17 | | | 100,000 | | | | 100,790 | |
2.050% due 01/12/17 | | | 100,000 | | | | 103,494 | |
4.250% due 01/11/21 | | | 100,000 | | | | 114,328 | |
U.S. Bancorp | | | | | | | | |
2.200% due 11/15/16 | | | 45,000 | | | | 46,915 | |
4.200% due 05/15/14 | | | 150,000 | | | | 157,536 | |
U.S. Bank NA
6.300% due 02/04/14 | | | 100,000 | | | | 106,075 | |
UBS AG (Switzerland) | | | | | | | | |
3.875% due 01/15/15 | | | 150,000 | | | | 158,568 | |
5.750% due 04/25/18 | | | 100,000 | | | | 118,809 | |
Ventas Realty LP REIT
4.000% due 04/30/19 | | | 100,000 | | | | 107,558 | |
Wachovia Bank NA
6.600% due 01/15/38 | | | 100,000 | | | | 137,378 | |
Wachovia Corp | | | | | | | | |
5.625% due 10/15/16 | | | 100,000 | | | | 114,720 | |
5.750% due 02/01/18 | | | 100,000 | | | | 119,896 | |
Wells Fargo & Co | | | | | | | | |
1.250% due 02/13/15 | | | 250,000 | | | | 252,460 | |
2.625% due 12/15/16 | | | 300,000 | | | | 316,812 | |
4.600% due 04/01/21 | | | 200,000 | | | | 230,225 | |
5.000% due 11/15/14 | | | 100,000 | | | | 107,328 | |
WestLB AG (Germany)
4.796% due 07/15/15 | | | 100,000 | | | | 111,001 | |
Westpac Banking Corp (Australia) | | | | | | | | |
1.125% due 09/25/15 | | | 100,000 | | | | 100,986 | |
3.000% due 08/04/15 | | | 100,000 | | | | 105,675 | |
4.875% due 11/19/19 | | | 25,000 | | | | 29,185 | |
| | | | | | | | |
| | | Principal
Amount | | | Value | |
Willis Group Holdings PLC (Ireland)
5.750% due 03/15/21 | | | $100,000 | | | | $113,887 | |
WR Berkley Corp
6.250% due 02/15/37 | | | 50,000 | | | | 58,557 | |
| | | | | | | | |
| | | | | | | 36,497,309 | |
| | | | | | | | |
Health Care - 1.7% | | | | | | | | |
| | |
Abbott Laboratories | | | | | | | | |
5.125% due 04/01/19 | | | 80,000 | | | | 95,460 | |
6.150% due 11/30/37 | | | 25,000 | | | | 34,667 | |
AbbVie Inc | | | | | | | | |
1.750% due 11/06/17 ~ | | | 200,000 | | | | 202,335 | |
4.400% due 11/06/42 ~ | | | 125,000 | | | | 133,027 | |
Aetna Inc | | | | | | | | |
2.750% due 11/15/22 | | | 125,000 | | | | 124,088 | |
3.950% due 09/01/20 | | | 50,000 | | | | 54,533 | |
Amgen Inc | | | | | | | | |
2.500% due 11/15/16 | | | 200,000 | | | | 210,267 | |
3.875% due 11/15/21 | | | 100,000 | | | | 109,908 | |
5.150% due 11/15/41 | | | 74,000 | | | | 83,355 | |
5.700% due 02/01/19 | | | 100,000 | | | | 120,978 | |
6.400% due 02/01/39 | | | 25,000 | | | | 32,394 | |
AstraZeneca PLC (United Kingdom) | | | | | | | | |
4.000% due 09/18/42 | | | 25,000 | | | | 25,313 | |
5.900% due 09/15/17 | | | 100,000 | | | | 121,589 | |
6.450% due 09/15/37 | | | 25,000 | | | | 33,887 | |
Baxter International Inc
4.250% due 03/15/20 | | | 100,000 | | | | 114,043 | |
Becton Dickinson & Co
3.125% due 11/08/21 | | | 100,000 | | | | 106,941 | |
Boston Scientific Corp
6.400% due 06/15/16 | | | 100,000 | | | | 115,008 | |
Bristol-Myers Squibb Co | | | | | | | | |
3.250% due 08/01/42 | | | 100,000 | | | | 91,644 | |
5.450% due 05/01/18 | | | 25,000 | | | | 30,224 | |
Cardinal Health Inc
3.200% due 06/15/22 | | | 100,000 | | | | 103,174 | |
Celgene Corp
3.250% due 08/15/22 | | | 100,000 | | | | 102,031 | |
CIGNA Corp
4.500% due 03/15/21 | | | 100,000 | | | | 112,102 | |
Covidien International Finance SA (Luxembourg)
2.800% due 06/15/15 | | | 100,000 | | | | 104,646 | |
Eli Lilly & Co | | | | | | | | |
4.200% due 03/06/14 | | | 50,000 | | | | 52,179 | |
5.500% due 03/15/27 | | | 100,000 | | | | 126,274 | |
Express Scripts Holding Co | | | | | | | | |
2.650% due 02/15/17 ~ | | | 100,000 | | | | 104,008 | |
2.750% due 11/21/14 ~ | | | 100,000 | | | | 103,207 | |
6.125% due 11/15/41 ~ | | | 50,000 | | | | 63,844 | |
Gilead Sciences Inc
4.400% due 12/01/21 | | | 100,000 | | | | 114,088 | |
GlaxoSmithKline Capital Inc
6.375% due 05/15/38 | | | 100,000 | | | | 138,265 | |
GlaxoSmithKline Capital PLC (United Kingdom)
1.500% due 05/08/17 | | | 200,000 | | | | 203,053 | |
Humana Inc
4.625% due 12/01/42 | | | 100,000 | | | | 101,078 | |
Johnson & Johnson | | | | | | | | |
3.550% due 05/15/21 | | | 50,000 | | | | 56,291 | |
4.850% due 05/15/41 | | | 50,000 | | | | 61,890 | |
5.550% due 08/15/17 | | | 50,000 | | | | 60,367 | |
5.950% due 08/15/37 | | | 100,000 | | | | 138,802 | |
Life Technologies Corp
4.400% due 03/01/15 | | | 25,000 | | | | 26,658 | |
McKesson Corp
6.500% due 02/15/14 | | | 100,000 | | | | 106,467 | |
| | |
| See Notes to Financial Statements | | See explanation of symbols and terms, if any, on page B-81 |
B-6
PACIFIC SELECT FUND
PD AGGREGATE BOND INDEX PORTFOLIO
Schedule of Investments (Continued)
December 31, 2012
| | | | | | | | |
| | | Principal
Amount | | | Value | |
Medco Health Solutions Inc
4.125% due 09/15/20 | | | $50,000 | | | | $54,685 | |
Medtronic Inc | | | | | | | | |
3.000% due 03/15/15 | | | 50,000 | | | | 52,563 | |
4.450% due 03/15/20 | | | 25,000 | | | | 29,060 | |
4.500% due 03/15/42 | | | 100,000 | | | | 113,721 | |
Merck & Co Inc | | | | | | | | |
1.100% due 01/31/18 | | | 100,000 | | | | 100,005 | |
2.400% due 09/15/22 | | | 100,000 | | | | 100,127 | |
4.000% due 06/30/15 | | | 50,000 | | | | 54,295 | |
6.000% due 09/15/17 | | | 50,000 | | | | 61,323 | |
6.550% due 09/15/37 | | | 100,000 | | | | 143,433 | |
Novartis Capital Corp | | | | | | | | |
2.400% due 09/21/22 | | | 75,000 | | | | 75,274 | |
4.125% due 02/10/14 | | | 100,000 | | | | 104,031 | |
4.400% due 04/24/20 | | | 50,000 | | | | 58,361 | |
Pfizer Inc | | | | | | | | |
5.350% due 03/15/15 | | | 100,000 | | | | 110,182 | |
6.200% due 03/15/19 | | | 150,000 | | | | 189,707 | |
7.200% due 03/15/39 | | | 50,000 | | | | 76,725 | |
Quest Diagnostics Inc | | | | | | | | |
4.750% due 01/30/20 | | | 15,000 | | | | 16,576 | |
5.750% due 01/30/40 | | | 10,000 | | | | 11,467 | |
6.950% due 07/01/37 | | | 100,000 | | | | 128,748 | |
Sanofi (France)
4.000% due 03/29/21 | | | 100,000 | | | | 114,073 | |
Teva Pharmaceutical Finance II BV (Netherlands)
3.000% due 06/15/15 | | | 200,000 | | | | 210,383 | |
Thermo Fisher Scientific Inc | | | | | | | | |
3.150% due 01/15/23 | | | 100,000 | | | | 102,294 | |
3.200% due 03/01/16 | | | 100,000 | | | | 106,252 | |
UnitedHealth Group Inc
6.875% due 02/15/38 | | | 250,000 | | | | 343,571 | |
Watson Pharmaceuticals Inc | | | | | | | | |
4.625% due 10/01/42 | | | 100,000 | | | | 104,215 | |
5.000% due 08/15/14 | | | 20,000 | | | | 21,314 | |
WellPoint Inc | | | | | | | | |
1.875% due 01/15/18 | | | 75,000 | | | | 75,993 | |
3.300% due 01/15/23 | | | 75,000 | | | | 77,023 | |
4.625% due 05/15/42 | | | 100,000 | | | | 103,382 | |
4.650% due 01/15/43 | | | 50,000 | | | | 52,157 | |
5.875% due 06/15/17 | | | 100,000 | | | | 118,769 | |
Wyeth LLC | | | | | | | | |
5.950% due 04/01/37 | | | 50,000 | | | | 66,756 | |
6.500% due 02/01/34 | | | 100,000 | | | | 136,809 | |
Zimmer Holdings Inc
3.375% due 11/30/21 | | | 100,000 | | | | 103,731 | |
| | | | | | | | |
| | | | | | | 6,935,090 | |
| | | | | | | | |
Industrials - 1.5% | | | | | | | | |
| | |
3M Co
2.000% due 06/26/22 | | | 100,000 | | | | 99,357 | |
ABB Finance USA Inc
2.875% due 05/08/22 | | | 100,000 | | | | 102,476 | |
Boeing Capital Corp
3.250% due 10/27/14 | | | 100,000 | | | | 104,974 | |
Burlington Northern Santa Fe LLC | | | | | | | | |
4.700% due 10/01/19 | | | 100,000 | | | | 115,350 | |
5.650% due 05/01/17 | | | 100,000 | | | | 117,789 | |
5.750% due 05/01/40 | | | 100,000 | | | | 123,394 | |
Canadian National Railway Co (Canada)
6.200% due 06/01/36 | | | 50,000 | | | | 68,323 | |
Canadian Pacific Railway Ltd (Canada)
4.500% due 01/15/22 | | | 50,000 | | | | 55,582 | |
Caterpillar Inc | | | | | | | | |
3.900% due 05/27/21 | | | 200,000 | | | | 224,556 | |
6.050% due 08/15/36 | | | 125,000 | | | | 164,649 | |
Continental Airlines Pass-Through Trust ‘A’
4.000% due 04/29/26 | | | 30,000 | | | | 31,575 | |
| | | | | | | | |
| | | Principal
Amount | | | Value | |
Continental Airlines Pass-Through Trust
9.000% due 01/08/18 | | | $42,872 | | | | $49,624 | |
CSX Corp | | | | | | | | |
5.500% due 04/15/41 | | | 75,000 | | | | 89,948 | |
6.250% due 04/01/15 | | | 100,000 | | | | 112,028 | |
7.375% due 02/01/19 | | | 50,000 | | | | 63,615 | |
Danaher Corp | | | | | | | | |
2.300% due 06/23/16 | | | 50,000 | | | | 52,325 | |
3.900% due 06/23/21 | | | 50,000 | | | | 56,302 | |
Deere & Co
4.375% due 10/16/19 | | | 50,000 | | | | 57,929 | |
Delta Air Lines Pass-Through Trust ‘A’
4.950% due 11/23/20 | | | 86,933 | | | | 94,757 | |
Dover Corp
5.375% due 03/01/41 | | | 50,000 | | | | 63,460 | |
Eaton Corp
4.150% due 11/02/42 ~ | | | 100,000 | | | | 101,234 | |
Embraer SA (Brazil)
5.150% due 06/15/22 | | | 100,000 | | | | 109,750 | |
Emerson Electric Co | | | | | | | | |
4.125% due 04/15/15 | | | 100,000 | | | | 107,841 | |
4.250% due 11/15/20 | | | 25,000 | | | | 28,869 | |
FedEx Corp
3.875% due 08/01/42 | | | 100,000 | | | | 97,875 | |
General Dynamics Corp
1.000% due 11/15/17 | | | 50,000 | | | | 49,766 | |
General Electric Co | | | | | | | | |
2.700% due 10/09/22 | | | 100,000 | | | | 102,027 | |
4.125% due 10/09/42 | | | 100,000 | | | | 102,971 | |
5.250% due 12/06/17 | | | 100,000 | | | | 118,004 | |
Honeywell International Inc
5.000% due 02/15/19 | | | 100,000 | | | | 118,996 | |
Illinois Tool Works Inc
4.875% due 09/15/41 | | | 100,000 | | | | 117,358 | |
Ingersoll-Rand Global Holding Co Ltd (Bermuda)
9.500% due 04/15/14 | | | 100,000 | | | | 110,705 | |
John Deere Capital Corp | | | | | | | | |
0.875% due 04/17/15 | | | 100,000 | | | | 100,490 | |
1.400% due 03/15/17 | | | 100,000 | | | | 101,026 | |
2.750% due 03/15/22 | | | 100,000 | | | | 102,000 | |
Koninklijke Philips Electronics NV (Netherlands) | | | | | | | | |
5.750% due 03/11/18 | | | 50,000 | | | | 60,289 | |
6.875% due 03/11/38 | | | 100,000 | | | | 135,415 | |
L-3 Communications Corp
5.200% due 10/15/19 | | | 100,000 | | | | 114,099 | |
Lockheed Martin Corp
4.250% due 11/15/19 | | | 100,000 | | | | 112,832 | |
Norfolk Southern Corp | | | | | | | | |
3.000% due 04/01/22 | | | 100,000 | | | | 102,663 | |
4.837% due 10/01/41 | | | 50,000 | | | | 55,841 | |
5.900% due 06/15/19 | | | 50,000 | | | | 60,983 | |
Northrop Grumman Corp
3.500% due 03/15/21 | | | 100,000 | | | | 106,720 | |
Owens Corning
4.200% due 12/15/22 | | | 138,000 | | | | 140,466 | |
Pentair Finance SA (Luxembourg)
1.350% due 12/01/15 ~ | | | 50,000 | | | | 49,987 | |
Pitney Bowes Inc
5.600% due 03/15/18 | | | 50,000 | | | | 52,999 | |
Precision Castparts Corp
2.500% due 01/15/23 | | | 100,000 | | | | 100,737 | |
Raytheon Co | | | | | | | | |
2.500% due 12/15/22 | | | 125,000 | | | | 123,421 | |
4.400% due 02/15/20 | | | 25,000 | | | | 28,631 | |
Republic Services Inc | | | | | | | | |
3.800% due 05/15/18 | | | 100,000 | | | | 110,030 | |
5.500% due 09/15/19 | | | 27,000 | | | | 31,995 | |
| | |
| See Notes to Financial Statements | | See explanation of symbols and terms, if any, on page B-81 |
B-7
PACIFIC SELECT FUND
PD AGGREGATE BOND INDEX PORTFOLIO
Schedule of Investments (Continued)
December 31, 2012
| | | | | | | | |
| | | Principal
Amount | | | Value | |
Rockwell Collins Inc
5.250% due 07/15/19 | | | $100,000 | | | | $119,845 | |
Ryder System Inc
2.500% due 03/01/17 | | | 50,000 | | | | 50,878 | |
Stanley Black & Decker Inc
2.900% due 11/01/22 | | | 50,000 | | | | 50,576 | |
The ADT Corp
4.875% due 07/15/42 ~ | | | 100,000 | | | | 95,005 | |
The Boeing Co
5.875% due 02/15/40 | | | 50,000 | | | | 67,587 | |
U.S. Airways Pass-Through Trust ‘A’
4.625% due 06/03/25 | | | 100,000 | | | | 101,750 | |
Union Pacific Corp | | | | | | | | |
4.750% due 09/15/41 | | | 100,000 | | | | 112,279 | |
6.125% due 02/15/20 | | | 100,000 | | | | 125,311 | |
United Parcel Service Inc | | | | | | | | |
1.125% due 10/01/17 | | | 50,000 | | | | 50,129 | |
5.500% due 01/15/18 | | | 50,000 | | | | 60,121 | |
6.200% due 01/15/38 | | | 50,000 | | | | 67,122 | |
United Technologies Corp | | | | | | | | |
3.100% due 06/01/22 | | | 200,000 | | | | 211,988 | |
4.500% due 04/15/20 | | | 30,000 | | | | 35,270 | |
6.050% due 06/01/36 | | | 50,000 | | | | 65,868 | |
6.125% due 02/01/19 | | | 100,000 | | | | 124,694 | |
6.125% due 07/15/38 | | | 25,000 | | | | 33,313 | |
URS Corp
5.000% due 04/01/22 ~ | | | 100,000 | | | | 103,028 | |
Waste Management Inc
7.750% due 05/15/32 | | | 100,000 | | | | 141,252 | |
| | | | | | | | |
| | | | | | | 6,320,049 | |
| | | | | | | | |
Information Technology - 1.0% | | | | | | | | |
| | |
Adobe Systems Inc
4.750% due 02/01/20 | | | 100,000 | | | | 111,996 | |
Arrow Electronics Inc
6.000% due 04/01/20 | | | 25,000 | | | | 28,309 | |
Avnet Inc
6.000% due 09/01/15 | | | 100,000 | | | | 109,145 | |
Cisco Systems Inc | | | | | | | | |
1.625% due 03/14/14 | | | 200,000 | | | | 203,053 | |
4.950% due 02/15/19 | | | 200,000 | | | | 236,904 | |
Corning Inc
1.450% due 11/15/17 | | | 100,000 | | | | 100,473 | |
Dell Inc
5.875% due 06/15/19 | | | 100,000 | | | | 115,382 | |
eBay Inc
1.350% due 07/15/17 | | | 100,000 | | | | 101,240 | |
Fiserv Inc
3.125% due 06/15/16 | | | 50,000 | | | | 52,553 | |
Google Inc
1.250% due 05/19/14 | | | 50,000 | | | | 50,635 | |
Hewlett-Packard Co | | | | | | | | |
2.600% due 09/15/17 | | | 150,000 | | | | 146,232 | |
3.000% due 09/15/16 | | | 100,000 | | | | 100,699 | |
3.750% due 12/01/20 | | | 50,000 | | | | 48,481 | |
4.750% due 06/02/14 | | | 200,000 | | | | 208,552 | |
6.000% due 09/15/41 | | | 55,000 | | | | 54,489 | |
Intel Corp | | | | | | | | |
3.300% due 10/01/21 | | | 150,000 | | | | 159,188 | |
4.800% due 10/01/41 | | | 185,000 | | | | 203,810 | |
International Business Machines Corp | | | | | | | | |
0.750% due 05/11/15 | | | 250,000 | | | | 251,661 | |
1.875% due 05/15/19 | | | 100,000 | | | | 101,566 | |
1.950% due 07/22/16 | | | 100,000 | | | | 103,988 | |
5.600% due 11/30/39 | | | 26,000 | | | | 33,540 | |
8.375% due 11/01/19 | | | 100,000 | | | | 142,180 | |
Juniper Networks Inc
3.100% due 03/15/16 | | | 100,000 | | | | 103,710 | |
| | | | | | | | |
| | | Principal
Amount | | | Value | |
Microsoft Corp | | | | | | | | |
2.950% due 06/01/14 | | | $100,000 | | | | $103,720 | |
3.500% due 11/15/42 | | | 100,000 | | | | 96,786 | |
5.200% due 06/01/39 | | | 135,000 | | | | 165,350 | |
Oracle Corp | | | | | | | | |
2.500% due 10/15/22 | | | 125,000 | | | | 126,246 | |
3.750% due 07/08/14 | | | 100,000 | | | | 105,026 | |
5.000% due 07/08/19 | | | 100,000 | | | | 120,164 | |
6.500% due 04/15/38 | | | 100,000 | | | | 139,171 | |
Texas Instruments Inc
1.375% due 05/15/14 | | | 100,000 | | | | 101,360 | |
The Western Union Co
5.930% due 10/01/16 | | | 100,000 | | | | 109,931 | |
Tyco Electronics Group SA (Luxembourg)
4.875% due 01/15/21 | | | 30,000 | | | | 33,681 | |
Xerox Corp | | | | | | | | |
5.625% due 12/15/19 | | | 100,000 | | | | 111,798 | |
8.250% due 05/15/14 | | | 40,000 | | | | 43,646 | |
| | | | | | | | |
| | | | | | | 4,024,665 | |
| | | | | | | | |
Materials - 1.1% | | | | | | | | |
| | |
Agrium Inc (Canada)
6.125% due 01/15/41 | | | 25,000 | | | | 30,084 | |
Air Products & Chemicals Inc
4.375% due 08/21/19 | | | 25,000 | | | | 28,864 | |
Alcoa Inc | | | | | | | | |
5.400% due 04/15/21 | | | 100,000 | | | | 104,158 | |
6.750% due 07/15/18 | | | 100,000 | | | | 114,333 | |
Barrick Gold Corp (Canada) | | | | | | | | |
2.900% due 05/30/16 | | | 100,000 | | | | 104,978 | |
3.850% due 04/01/22 | | | 100,000 | | | | 105,943 | |
5.250% due 04/01/42 | | | 100,000 | | | | 110,077 | |
Barrick PD Australia Finance Property Ltd (Australia)
5.950% due 10/15/39 | | | 25,000 | | | | 28,898 | |
Bemis Co Inc
5.650% due 08/01/14 | | | 5,000 | | | | 5,354 | |
BHP Billiton Finance USA Ltd (Australia) | | | | | | | | |
1.000% due 02/24/15 | | | 100,000 | | | | 100,788 | |
1.125% due 11/21/14 | | | 100,000 | | | | 101,253 | |
1.875% due 11/21/16 | | | 100,000 | | | | 103,173 | |
6.500% due 04/01/19 | | | 75,000 | | | | 95,703 | |
Cabot Corp
5.000% due 10/01/16 | | | 25,000 | | | | 27,933 | |
Celulosa Arauco y Constitucion SA (Chile)
4.750% due 01/11/22 | | | 100,000 | | | | 105,283 | |
Cliffs Natural Resources Inc
5.900% due 03/15/20 | | | 25,000 | | | | 26,601 | |
CRH America Inc
6.000% due 09/30/16 | | | 50,000 | | | | 56,214 | |
Eastman Chemical Co
4.800% due 09/01/42 | | | 100,000 | | | | 107,071 | |
Ecolab Inc
4.350% due 12/08/21 | | | 100,000 | | | | 111,710 | |
EI du Pont de Nemours & Co | | | | | | | | |
3.250% due 01/15/15 | | | 100,000 | | | | 105,308 | |
4.625% due 01/15/20 | | | 150,000 | | | | 176,953 | |
Freeport-McMoRan Copper & Gold Inc
1.400% due 02/13/15 | | | 100,000 | | | | 99,842 | |
Georgia-Pacific LLC
8.875% due 05/15/31 | | | 100,000 | | | | 150,036 | |
International Paper Co | | | | | | | | |
4.750% due 02/15/22 | | | 25,000 | | | | 28,311 | |
7.500% due 08/15/21 | | | 40,000 | | | | 52,386 | |
7.950% due 06/15/18 | | | 100,000 | | | | 129,384 | |
Monsanto Co
3.600% due 07/15/42 | | | 50,000 | | | | 49,837 | |
Newmont Mining Corp | | | | | | | | |
3.500% due 03/15/22 | | | 100,000 | | | | 103,223 | |
6.250% due 10/01/39 | | | 25,000 | | | | 30,134 | |
| | |
| See Notes to Financial Statements | | See explanation of symbols and terms, if any, on page B-81 |
B-8
PACIFIC SELECT FUND
PD AGGREGATE BOND INDEX PORTFOLIO
Schedule of Investments (Continued)
December 31, 2012
| | | | | | | | |
| | | Principal
Amount | | | Value | |
Nucor Corp
4.125% due 09/15/22 | | | $50,000 | | | | $55,345 | |
Potash Corp of Saskatchewan Inc (Canada) | | | | | | | | |
3.750% due 09/30/15 | | | 20,000 | | | | 21,524 | |
5.625% due 12/01/40 | | | 25,000 | | | | 30,409 | |
PPG Industries Inc
3.600% due 11/15/20 | | | 50,000 | | | | 53,960 | |
Praxair Inc | | | | | | | | |
1.050% due 11/07/17 | | | 50,000 | | | | 50,049 | |
2.200% due 08/15/22 | | | 100,000 | | | | 97,995 | |
Rio Tinto Finance USA Ltd (Australia) | | | | | | | | |
1.875% due 11/02/15 | | | 100,000 | | | | 102,693 | |
3.500% due 11/02/20 | | | 100,000 | | | | 106,082 | |
7.125% due 07/15/28 | | | 50,000 | | | | 67,821 | |
Rio Tinto Finance USA PLC (United Kingdom) | | | | | | | | |
1.625% due 08/21/17 | | | 100,000 | | | | 101,325 | |
4.750% due 03/22/42 | | | 100,000 | | | | 110,677 | |
Southern Copper Corp
7.500% due 07/27/35 | | | 50,000 | | | | 64,541 | |
Teck Resources Ltd (Canada) | | | | | | | | |
3.150% due 01/15/17 | | | 100,000 | | | | 104,875 | |
6.250% due 07/15/41 | | | 50,000 | | | | 58,864 | |
The Dow Chemical Co | | | | | | | | |
4.125% due 11/15/21 | | | 200,000 | | | | 219,281 | |
5.700% due 05/15/18 | | | 250,000 | | | | 297,557 | |
7.600% due 05/15/14 | | | 58,000 | | | | 63,344 | |
9.400% due 05/15/39 | | | 50,000 | | | | 82,386 | |
Vale Overseas Ltd (Cayman) | | | | | | | | |
4.375% due 01/11/22 | | | 100,000 | | | | 107,139 | |
6.875% due 11/21/36 | | | 50,000 | | | | 62,077 | |
6.875% due 11/10/39 | | | 45,000 | | | | 56,500 | |
8.250% due 01/17/34 | | | 100,000 | | | | 137,462 | |
Valspar Corp
7.250% due 06/15/19 | | | 25,000 | | | | 30,556 | |
| | | | | | | | |
| | | | | | | 4,476,294 | |
| | | | | | | | |
Telecommunication Services - 1.3% | | | | | | | | |
| | |
America Movil SAB de CV (Mexico) | | | | | | | | |
2.375% due 09/08/16 | | | 200,000 | | | | 208,818 | |
5.000% due 03/30/20 | | | 50,000 | | | | 58,373 | |
6.125% due 03/30/40 | | | 50,000 | | | | 66,096 | |
AT&T Inc | | | | | | | | |
2.625% due 12/01/22 | | | 125,000 | | | | 125,325 | |
2.950% due 05/15/16 | | | 400,000 | | | | 423,720 | |
3.000% due 02/15/22 | | | 100,000 | | | | 104,094 | |
4.300% due 12/15/42 ~ | | | 393,000 | | | | 395,109 | |
4.350% due 06/15/45 ~ | | | 177,000 | | | | 177,981 | |
4.450% due 05/15/21 | | | 50,000 | | | | 57,788 | |
5.350% due 09/01/40 | | | 161,000 | | | | 187,665 | |
5.625% due 06/15/16 | | | 50,000 | | | | 57,420 | |
6.550% due 02/15/39 | | | 100,000 | | | | 131,523 | |
British Telecommunications PLC (United Kingdom) | | | | | | | | |
2.000% due 06/22/15 | | | 200,000 | | | | 205,728 | |
9.625% due 12/15/30 | | | 50,000 | | | | 79,484 | |
Cellco Partnership
8.500% due 11/15/18 | | | 150,000 | | | | 206,527 | |
CenturyLink Inc
6.450% due 06/15/21 | | | 250,000 | | | | 276,450 | |
Deutsche Telekom International Finance BV (Netherlands)
8.750% due 06/15/30 | | | 185,000 | | | | 277,350 | |
Embarq Corp
7.995% due 06/01/36 | | | 50,000 | | | | 55,263 | |
France Telecom SA (France) | | | | | | | | |
2.750% due 09/14/16 | | | 100,000 | | | | 105,035 | |
8.500% due 03/01/31 | | | 50,000 | | | | 74,892 | |
Qwest Corp
6.750% due 12/01/21 | | | 100,000 | | | | 117,285 | |
| | | | | | | | |
| | | Principal
Amount | | | Value | |
Rogers Communications Inc (Canada)
6.375% due 03/01/14 | | | $50,000 | | | | $53,284 | |
Telecom Italia Capital SA (Luxembourg) | | | | | | | | |
6.175% due 06/18/14 | | | 100,000 | | | | 105,650 | |
7.175% due 06/18/19 | | | 100,000 | | | | 116,550 | |
Telefonica Emisiones SAU (Spain) | | | | | | | | |
3.992% due 02/16/16 | | | 50,000 | | | | 52,150 | |
4.949% due 01/15/15 | | | 50,000 | | | | 52,500 | |
5.462% due 02/16/21 | | | 40,000 | | | | 42,750 | |
Telefonica Europe BV (Netherlands)
8.250% due 09/15/30 | | | 150,000 | | | | 178,313 | |
Verizon Communications Inc | | | | | | | | |
1.950% due 03/28/14 | | | 250,000 | | | | 254,598 | |
3.500% due 11/01/21 | | | 200,000 | | | | 218,987 | |
5.850% due 09/15/35 | | | 100,000 | | | | 125,722 | |
6.350% due 04/01/19 | | | 100,000 | | | | 126,453 | |
7.350% due 04/01/39 | | | 100,000 | | | | 148,364 | |
Verizon Global Funding Corp
7.750% due 12/01/30 | | | 50,000 | | | | 73,253 | |
Vodafone Group PLC (United Kingdom) | | | | | | | | |
4.150% due 06/10/14 | | | 50,000 | | | | 52,478 | |
5.450% due 06/10/19 | | | 150,000 | | | | 182,469 | |
5.625% due 02/27/17 | | | 100,000 | | | | 117,421 | |
7.875% due 02/15/30 | | | 50,000 | | | | 72,517 | |
| | | | | | | | |
| | | | | | | 5,365,385 | |
| | | | | | | | |
Utilities - 1.7% | | | | | | | | |
| | |
AGL Capital Corp
3.500% due 09/15/21 | | | 50,000 | | | | 54,164 | |
Alabama Power Co
4.100% due 01/15/42 | | | 100,000 | | | | 102,787 | |
Alliant Energy Corp
4.000% due 10/15/14 | | | 50,000 | | | | 52,712 | |
Ameren Corp
8.875% due 05/15/14 | | | 25,000 | | | | 27,367 | |
American Water Capital Corp
4.300% due 12/01/42 | | | 100,000 | | | | 103,958 | |
Appalachian Power Co
4.600% due 03/30/21 | | | 50,000 | | | | 57,634 | |
Arizona Public Service Co
4.500% due 04/01/42 | | | 100,000 | | | | 106,454 | |
Avista Corp
5.125% due 04/01/22 | | | 15,000 | | | | 18,115 | |
Baltimore Gas & Electric Co
3.500% due 11/15/21 | | | 25,000 | | | | 26,802 | |
Carolina Power & Light Co
5.250% due 12/15/15 | | | 100,000 | | | | 113,485 | |
CenterPoint Energy Houston Electric LLC
2.250% due 08/01/22 | | | 100,000 | | | | 98,427 | |
CenterPoint Energy Resources Corp
5.850% due 01/15/41 | | | 50,000 | | | | 63,341 | |
Commonwealth Edison Co | | | | | | | | |
3.800% due 10/01/42 | | | 100,000 | | | | 98,279 | |
4.000% due 08/01/20 | | | 100,000 | | | | 111,870 | |
Consolidated Edison Co of New York Inc | | | | | | | | |
5.850% due 03/15/36 | | | 25,000 | | | | 31,868 | |
6.650% due 04/01/19 | | | 150,000 | | | | 191,203 | |
Constellation Energy Group Inc
4.550% due 06/15/15 | | | 125,000 | | | | 134,988 | |
Consumers Energy Co
6.700% due 09/15/19 | | | 25,000 | | | | 32,542 | |
Dominion Resources Inc | | | | | | | | |
5.150% due 07/15/15 | | | 50,000 | | | | 55,232 | |
5.200% due 08/15/19 | | | 120,000 | | | | 142,743 | |
DTE Energy Co
7.625% due 05/15/14 | | | 100,000 | | | | 109,219 | |
Duke Energy Carolinas LLC | | | | | | | | |
5.300% due 02/15/40 | | | 25,000 | | | | 30,030 | |
6.100% due 06/01/37 | | | 25,000 | | | | 31,680 | |
7.000% due 11/15/18 | | | 100,000 | | | | 130,978 | |
| | |
| See Notes to Financial Statements | | See explanation of symbols and terms, if any, on page B-81 |
B-9
PACIFIC SELECT FUND
PD AGGREGATE BOND INDEX PORTFOLIO
Schedule of Investments (Continued)
December 31, 2012
| | | | | | | | |
| | | Principal
Amount | | | Value | |
Duke Energy Corp
3.550% due 09/15/21 | | | $100,000 | | | | $105,476 | |
Duke Energy Indiana Inc
4.200% due 03/15/42 | | | 125,000 | | | | 127,798 | |
Entergy Corp
4.700% due 01/15/17 | | | 150,000 | | | | 162,591 | |
Entergy Gulf States Louisiana LLC
5.590% due 10/01/24 | | | 50,000 | | | | 58,232 | |
Exelon Generation Co LLC | | | | | | | | |
6.200% due 10/01/17 | | | 25,000 | | | | 29,544 | |
6.250% due 10/01/39 | | | 25,000 | | | | 29,096 | |
FirstEnergy Corp
7.375% due 11/15/31 | | | 50,000 | | | | 64,623 | |
Florida Power & Light Co | | | | | | | | |
5.690% due 03/01/40 | | | 35,000 | | | | 45,661 | |
5.950% due 02/01/38 | | | 125,000 | | | | 166,535 | |
Florida Power Corp
6.350% due 09/15/37 | | | 25,000 | | | | 33,597 | |
Georgia Power Co | | | | | | | | |
2.850% due 05/15/22 | | | 100,000 | | | | 103,116 | |
4.250% due 12/01/19 | | | 25,000 | | | | 28,553 | |
Great Plains Energy Inc
4.850% due 06/01/21 | | | 100,000 | | | | 110,258 | |
Jersey Central Power & Light Co
5.625% due 05/01/16 | | | 50,000 | | | | 56,759 | |
Louisville Gas & Electric Co
1.625% due 11/15/15 | | | 50,000 | | | | 51,485 | |
Metropolitan Edison Co
7.700% due 01/15/19 | | | 50,000 | | | | 63,880 | |
MidAmerican Energy Co
6.750% due 12/30/31 | | | 100,000 | | | | 136,052 | |
MidAmerican Energy Holdings Co
6.125% due 04/01/36 | | | 100,000 | | | | 126,337 | |
Nevada Power Co
6.750% due 07/01/37 | | | 50,000 | | | | 69,409 | |
NextEra Energy Capital Holdings Inc
4.500% due 06/01/21 | | | 50,000 | | | | 55,597 | |
Nisource Finance Corp | | | | | | | | |
5.250% due 02/15/43 | | | 100,000 | | | | 105,948 | |
6.125% due 03/01/22 | | | 50,000 | | | | 59,970 | |
Northern States Power Co | | | | | | | | |
2.150% due 08/15/22 | | | 100,000 | | | | 98,839 | |
3.400% due 08/15/42 | | | 125,000 | | | | 117,896 | |
4.850% due 08/15/40 | | | 50,000 | | | | 57,818 | |
5.350% due 11/01/39 | | | 10,000 | | | | 12,518 | |
NSTAR Electric Co
2.375% due 10/15/22 | | | 100,000 | | | | 99,479 | |
NSTAR LLC
4.500% due 11/15/19 | | | 15,000 | | | | 17,049 | |
Ohio Edison Co
6.875% due 07/15/36 | | | 150,000 | | | | 194,413 | |
Ohio Power Co
5.375% due 10/01/21 | | | 30,000 | | | | 36,381 | |
Oncor Electric Delivery Co LLC | | | | | | | | |
5.300% due 06/01/42 | | | 100,000 | | | | 114,438 | |
7.000% due 05/01/32 | | | 50,000 | | | | 63,617 | |
ONEOK Partners LP
8.625% due 03/01/19 | | | 150,000 | | | | 199,271 | |
Pacific Gas & Electric Co | | | | | | | | |
2.450% due 08/15/22 | | | 100,000 | | | | 99,956 | |
4.800% due 03/01/14 | | | 50,000 | | | | 52,404 | |
6.050% due 03/01/34 | | | 100,000 | | | | 128,941 | |
6.250% due 03/01/39 | | | 25,000 | | | | 33,049 | |
PacifiCorp
4.100% due 02/01/42 | | | 50,000 | | | | 51,835 | |
Pepco Holdings Inc
2.700% due 10/01/15 | | | 100,000 | | | | 103,572 | |
PPL Electric Utilities Corp | | | | | | | | |
2.500% due 09/01/22 | | | 100,000 | | | | 100,555 | |
5.200% due 07/15/41 | | | 25,000 | | | | 29,896 | |
| | | | | | | | |
| | | Principal
Amount | | | Value | |
Progress Energy Inc | | | | | | | | |
6.000% due 12/01/39 | | | $25,000 | | | | $30,291 | |
7.750% due 03/01/31 | | | 100,000 | | | | 136,701 | |
PSEG Power LLC
4.150% due 09/15/21 | | | 100,000 | | | | 109,668 | |
Public Service Co of Colorado
5.125% due 06/01/19 | | | 15,000 | | | | 18,072 | |
Public Service Co of Oklahoma
5.150% due 12/01/19 | | | 20,000 | | | | 23,365 | |
Puget Sound Energy Inc
5.795% due 03/15/40 | | | 25,000 | | | | 31,916 | |
San Diego Gas & Electric Co
3.000% due 08/15/21 | | | 100,000 | | | | 105,964 | |
Sempra Energy | | | | | | | | |
2.000% due 03/15/14 | | | 100,000 | | | | 101,543 | |
6.000% due 10/15/39 | | | 25,000 | | | | 31,635 | |
9.800% due 02/15/19 | | | 50,000 | | | | 70,045 | |
South Carolina Electric & Gas Co
5.450% due 02/01/41 | | | 50,000 | | | | 61,309 | |
Southern California Edison Co | | | | | | | | |
3.875% due 06/01/21 | | | 100,000 | | | | 112,919 | |
4.500% due 09/01/40 | | | 50,000 | | | | 56,438 | |
5.750% due 03/15/14 | | | 50,000 | | | | 53,089 | |
Southern Power Co
5.150% due 09/15/41 | | | 40,000 | | | | 45,086 | |
Southwestern Electric Power Co
6.200% due 03/15/40 | | | 50,000 | | | | 62,630 | |
Tampa Electric Co
6.100% due 05/15/18 | | | 35,000 | | | | 43,580 | |
The Southern Co
4.150% due 05/15/14 | | | 50,000 | | | | 52,394 | |
TransAlta Corp (Canada)
4.750% due 01/15/15 | | | 25,000 | | | | 26,504 | |
Union Electric Co
8.450% due 03/15/39 | | | 100,000 | | | | 171,395 | |
Virginia Electric & Power Co | | | | | | | | |
2.950% due 01/15/22 | | | 100,000 | | | | 105,400 | |
5.000% due 06/30/19 | | | 35,000 | | | | 41,774 | |
8.875% due 11/15/38 | | | 25,000 | | | | 42,643 | |
Wisconsin Electric Power Co
4.250% due 12/15/19 | | | 25,000 | | | | 28,746 | |
| | | | | | | | |
| | | | | | | 6,891,429 | |
| | | | | | | | |
Total Corporate Bonds & Notes
(Cost $89,253,123) | | | | | | | 94,349,755 | |
| | | | | | | | |
| |
MORTGAGE-BACKED SECURITIES - 30.9% | | | | | |
| |
Collateralized Mortgage Obligations - Commercial - 1.7% | | | | | |
| | |
Banc of America Commercial Mortgage Trust | | | | | | | | |
5.356% due 10/10/45 " | | | 50,000 | | | | 57,433 | |
5.369% due 10/10/45 " | | | 50,000 | | | | 54,601 | |
5.625% due 04/10/49 " § | | | 100,000 | | | | 117,349 | |
5.634% due 04/10/49 " § | | | 15,609 | | | | 15,975 | |
Banc of America Merrill Lynch Commercial Mortgage Inc
4.668% due 07/10/43 " | | | 100,000 | | | | 108,905 | |
Bear Stearns Commercial Mortgage Securities | | | | | | | | |
4.750% due 02/13/46 " § | | | 100,000 | | | | 106,407 | |
5.537% due 10/12/41 " | | | 100,000 | | | | 115,443 | |
5.540% due 09/11/41 " | | | 700,000 | | | | 805,785 | |
Citigroup Commercial Mortgage Trust
5.702% due 12/10/49 " § | | | 200,000 | | | | 236,416 | |
Citigroup/Deutsche Bank Commercial Mortgage Trust | | | | | | | | |
5.293% due 12/11/49 " | | | 100,000 | | | | 104,066 | |
5.304% due 01/15/46 " § | | | 100,000 | | | | 112,224 | |
5.617% due 10/15/48 " | | | 100,000 | | | | 115,202 | |
| | |
| See Notes to Financial Statements | | See explanation of symbols and terms, if any, on page B-81 |
B-10
PACIFIC SELECT FUND
PD AGGREGATE BOND INDEX PORTFOLIO
Schedule of Investments (Continued)
December 31, 2012
| | | | | | | | |
| | | Principal
Amount | | | Value | |
Commercial Mortgage Pass-Through Certificates | | | | | | | | |
4.982% due 05/10/43 " § | | | $100,000 | | | | $109,559 | |
5.676% due 03/15/39 " § | | | 100,000 | | | | 113,112 | |
Credit Suisse First Boston Mortgage Securities Corp
5.014% due 02/15/38 " § | | | 50,000 | | | | 53,929 | |
Greenwich Capital Commercial Funding Corp | | | | | | | | |
4.799% due 08/10/42 " § | | | 100,000 | | | | 107,155 | |
5.444% due 03/10/39 " | | | 100,000 | | | | 115,560 | |
5.867% due 07/10/38 " § | | | 100,000 | | | | 115,090 | |
GS Mortgage Securities Corp II | | | | | | | | |
5.396% due 08/10/38 " § | | | 100,000 | | | | 105,769 | |
5.553% due 04/10/38 " § | | | 100,000 | | | | 112,810 | |
JPMorgan Chase Commercial Mortgage Securities Corp | | | | | | | | |
4.404% due 01/12/39 " | | | 505,000 | | | | 523,245 | |
5.335% due 08/12/37 " § | | | 100,000 | | | | 109,531 | |
5.336% due 05/15/47 " | | | 100,000 | | | | 114,801 | |
5.429% due 12/12/43 " | | | 100,000 | | | | 114,562 | |
5.814% due 06/12/43 " § | | | 200,000 | | | | 228,717 | |
LB-UBS Commercial Mortgage Trust | | | | | | | | |
4.786% due 10/15/29 " § | | | 500,000 | | | | 532,039 | |
5.661% due 03/15/39 " § | | | 84,000 | | | | 95,525 | |
5.865% due 06/15/38 " § | | | 250,000 | | | | 289,314 | |
5.866% due 09/15/45 " § | | | 100,000 | | | | 119,706 | |
Merrill Lynch Mortgage Trust
5.684% due 05/12/39 " § | | | 255,000 | | | | 293,143 | |
Morgan Stanley Capital I Trust | | | | | | | | |
4.989% due 08/13/42 " | | | 50,000 | | | | 54,719 | |
5.162% due 10/12/52 " § | | | 200,000 | | | | 222,619 | |
5.208% due 11/14/42 " § | | | 100,000 | | | | 110,643 | |
5.439% due 02/12/44 " | | | 70,000 | | | | 73,281 | |
5.514% due 11/12/49 " § | | | 100,000 | | | | 116,293 | |
5.569% due 12/15/44 " | | | 450,000 | | | | 510,497 | |
5.809% due 12/12/49 " | | | 125,000 | | | | 148,884 | |
5.882% due 06/11/49 " § | | | 100,000 | | | | 118,294 | |
UBS-Barclays Commercial Mortgage Trust
3.525% due 05/10/63 " | | | 250,000 | | | | 272,217 | |
Wachovia Bank Commercial Mortgage Trust
5.795% due 07/15/45 " § | | | 100,000 | | | | 111,598 | |
| | | | | | | | |
| | | | | | | 6,942,418 | |
| | | | | | | | |
Fannie Mae - 14.2% | | | | | | | | |
| | |
2.846% due 05/01/22 - 01/01/43 " | | | 8,042,715 | | | | 8,478,001 | |
3.041% due 03/01/41 " § | | | 654,383 | | | | 686,203 | |
3.047% due 07/01/41 " § | | | 1,022,071 | | | | 1,069,353 | |
3.307% due 01/01/41 " § | | | 414,216 | | | | 437,557 | |
3.496% due 08/01/39 " § | | | 83,558 | | | | 89,290 | |
3.500% due 11/01/25 - 01/01/43 " | | | 8,348,079 | | | | 8,910,343 | |
4.000% due 09/01/18 - 01/01/43 " | | | 8,520,236 | | | | 9,155,338 | |
4.500% due 05/01/18 - 01/01/43 " | | | 11,028,143 | | | | 11,981,109 | |
4.780% due 06/01/38 " § | | | 21,887 | | | | 23,370 | |
5.000% due 12/01/17 - 01/01/43 " | | | 7,525,111 | | | | 8,184,587 | |
5.500% due 02/01/24 - 07/01/41 " | | | 5,015,509 | | | | 5,466,326 | |
5.700% due 09/01/37 " § | | | 115,313 | | | | 124,993 | |
6.000% due 09/01/34 - 09/01/39 " | | | 2,522,889 | | | | 2,763,345 | |
6.500% due 09/01/36 - 07/01/38 " | | | 630,169 | | | | 713,649 | |
| | | | | | | | |
| | | | | | | 58,083,464 | |
| | | | | | | | |
Freddie Mac - 8.1% | | | | | | | | |
| | |
2.846% due 11/01/37 " § | | | 89,521 | | | | 95,437 | |
3.000% due 09/01/26 - 01/01/43 " | | | 5,152,787 | | | | 5,405,890 | |
3.500% due 03/01/26 - 01/01/43 " | | | 3,185,428 | | | | 3,387,122 | |
4.000% due 02/01/25 - 01/01/43 " | | | 6,431,151 | | | | 6,914,661 | |
4.500% due 03/01/23 - 10/01/41 " | | | 5,476,611 | | | | 5,978,031 | |
5.000% due 03/01/19 - 03/01/41 " | | | 3,769,423 | | | | 4,104,272 | |
5.500% due 12/01/16 - 04/01/40 " | | | 3,124,738 | | | | 3,385,877 | |
| | | | | | | | |
| | | Principal
Amount | | | Value | |
6.000% due 03/01/23 - 01/01/43 " | | | $2,898,697 | | | | $3,155,388 | |
6.500% due 08/01/37 - 04/01/39 " | | | 497,759 | | | | 566,535 | |
| | | | | | | | |
| | | | | | | 32,993,213 | |
| | | | | | | | |
Government National Mortgage Association - 6.9% | | | | | |
| | |
3.000% due 11/15/42 - 01/01/43 " | | | 1,999,132 | | | | 2,128,181 | |
3.500% due 10/15/41 - 01/01/43 " | | | 4,647,586 | | | | 5,053,713 | |
4.000% due 06/15/39 - 04/20/42 " | | | 5,060,375 | | | | 5,550,895 | |
4.500% due 02/15/39 - 01/01/43 " | | | 6,608,627 | | | | 7,268,347 | |
5.000% due 05/15/38 - 11/15/41 " | | | 4,187,991 | | | | 4,599,539 | |
5.500% due 04/15/37 - 04/15/40 " | | | 2,142,823 | | | | 2,353,521 | |
6.000% due 08/15/35 - 12/15/40 " | | | 974,995 | | | | 1,090,275 | |
6.500% due 10/15/37 - 02/15/39 " | | | 288,441 | | | | 329,568 | |
| | | | | | | | |
| | | | | | | 28,374,039 | |
| | | | | | | | |
Total Mortgage-Backed Securities
(Cost $123,610,877) | | | | | | | 126,393,134 | |
| | | | | | | | |
| | |
ASSET-BACKED SECURITIES - 0.2% | | | | | | | | |
| | |
Chase Issuance Trust
1.580% due 08/16/21 " | | | 200,000 | | | | 201,674 | |
Citibank Credit Card Issuance Trust | | | | | | | | |
4.850% due 03/10/17 " | | | 250,000 | | | | 273,367 | |
5.650% due 09/20/19 " | | | 100,000 | | | | 121,201 | |
6.150% due 06/15/39 " | | | 250,000 | | | | 332,215 | |
| | | | | | | | |
| | |
Total Asset-Backed Securities
(Cost $918,937) | | | | | | | 928,457 | |
| | | | | | | | |
| |
U.S. GOVERNMENT AGENCY ISSUES - 4.3% | | | | | |
| | |
Fannie Mae | | | | | | | | |
0.375% due 03/16/15 | | | 500,000 | | | | 500,939 | |
0.500% due 05/27/15 | | | 500,000 | | | | 502,115 | |
0.750% due 12/19/14 | | | 750,000 | | | | 757,023 | |
0.850% due 07/18/16 | | | 100,000 | | | | 100,034 | |
0.875% due 08/28/14 | | | 500,000 | | | | 505,242 | |
0.875% due 10/26/17 | | | 400,000 | | | | 402,092 | |
1.200% due 03/08/17 | | | 100,000 | | | | 100,206 | |
1.250% due 02/27/14 | | | 200,000 | | | | 202,726 | |
1.250% due 09/28/16 | | | 700,000 | | | | 718,818 | |
1.250% due 01/30/17 | | | 500,000 | | | | 513,093 | |
1.625% due 10/26/15 | | | 200,000 | | | | 207,045 | |
1.750% due 01/30/19 | | | 100,000 | | | | 101,038 | |
2.000% due 09/21/15 | | | 100,000 | | | | 104,442 | |
2.500% due 05/15/14 | | | 200,000 | | | | 206,269 | |
2.625% due 11/20/14 | | | 250,000 | | | | 261,276 | |
2.750% due 02/05/14 | | | 325,000 | | | | 334,399 | |
5.000% due 03/15/16 | | | 200,000 | | | | 229,042 | |
5.000% due 05/11/17 | | | 150,000 | | | | 177,666 | |
5.375% due 06/12/17 | | | 200,000 | | | | 240,739 | |
5.625% due 07/15/37 | | | 100,000 | | | | 144,245 | |
7.125% due 01/15/30 | | | 275,000 | | | | 432,506 | |
Federal Farm Credit Bank | | | | | | | | |
2.625% due 04/17/14 | | | 400,000 | | | | 409,172 | |
3.000% due 09/22/14 | | | 50,000 | | | | 52,399 | |
5.125% due 08/25/16 | | | 150,000 | | | | 174,994 | |
Federal Home Loan Bank | | | | | | | | |
0.375% due 01/29/14 | | | 50,000 | | | | 50,112 | |
0.375% due 08/28/14 | | | 250,000 | | | | 250,088 | |
0.450% due 08/07/14 | | | 200,000 | | | | 200,051 | |
1.375% due 05/28/14 | | | 250,000 | | | | 254,364 | |
2.500% due 06/13/14 | | | 250,000 | | | | 258,240 | |
4.750% due 12/16/16 | | | 50,000 | | | | 58,049 | |
5.000% due 11/17/17 | | | 800,000 | | | | 960,138 | |
5.250% due 06/18/14 | | | 100,000 | | | | 107,395 | |
5.375% due 06/13/14 | | | 400,000 | | | | 429,670 | |
5.375% due 05/18/16 | | | 300,000 | | | | 349,712 | |
5.375% due 08/15/18 | | | 200,000 | | | | 247,047 | |
5.500% due 07/15/36 | | | 100,000 | | | | 137,898 | |
| | |
| See Notes to Financial Statements | | See explanation of symbols and terms, if any, on page B-81 |
B-11
PACIFIC SELECT FUND
PD AGGREGATE BOND INDEX PORTFOLIO
Schedule of Investments (Continued)
December 31, 2012
| | | | | | | | |
| | | Principal
Amount | | | Value | |
Financing Corp Strips
10.700% due 10/06/17 | | | $50,000 | | | | $72,161 | |
Freddie Mac | | | | | | | | |
0.350% due 11/26/14 | | | 250,000 | | | | 250,049 | |
0.375% due 04/28/14 | | | 400,000 | | | | 400,923 | |
0.400% due 02/27/14 | | | 100,000 | | | | 100,049 | |
0.500% due 04/17/15 | | | 250,000 | | | | 251,165 | |
0.550% due 02/27/15 | | | 100,000 | | | | 100,071 | |
0.625% due 12/29/14 | | | 500,000 | | | | 503,480 | |
0.800% due 01/13/15 | | | 100,000 | | | | 100,477 | |
0.850% due 01/09/15 | | | 100,000 | | | | 100,012 | |
1.000% due 06/30/15 | | | 100,000 | | | | 100,730 | |
1.000% due 02/24/16 | | | 100,000 | | | | 100,912 | |
1.000% due 07/28/17 | | | 250,000 | | | | 252,794 | |
1.100% due 07/25/17 | | | 100,000 | | | | 100,063 | |
1.375% due 02/25/14 | | | 1,000,000 | | | | 1,013,730 | |
2.000% due 08/25/16 | | | 200,000 | | | | 210,673 | |
2.250% due 01/23/17 | | | 100,000 | | | | 102,296 | |
2.375% due 01/13/22 | | | 450,000 | | | | 470,525 | |
2.500% due 01/07/14 | | | 200,000 | | | | 204,827 | |
2.875% due 02/09/15 | | | 100,000 | | | | 105,415 | |
3.750% due 03/27/19 | | | 200,000 | | | | 231,479 | |
4.750% due 11/17/15 | | | 100,000 | | | | 112,505 | |
4.875% due 06/13/18 | | | 400,000 | | | | 483,457 | |
5.000% due 04/18/17 | | | 300,000 | | | | 354,616 | |
5.125% due 11/17/17 | | | 200,000 | | | | 241,292 | |
6.250% due 07/15/32 | | | 125,000 | | | | 186,259 | |
6.750% due 03/15/31 | | | 100,000 | | | | 153,856 | |
Tennessee Valley Authority | | | | | | | | |
3.500% due 12/15/42 | | | 100,000 | | | | 99,484 | |
3.875% due 02/15/21 | | | 65,000 | | | | 75,488 | |
5.250% due 09/15/39 | | | 25,000 | | | | 32,924 | |
5.375% due 04/01/56 | | | 50,000 | | | | 68,159 | |
6.750% due 11/01/25 | | | 150,000 | | | | 219,275 | |
7.125% due 05/01/30 | | | 50,000 | | | | 76,776 | |
| | | | | | | | |
| | |
Total U.S. Government Agency Issues
(Cost $17,110,643) | | | | | | | 17,556,206 | |
| | | | | | | | |
| | |
U.S. TREASURY OBLIGATIONS - 35.8% | | | | | | | | |
| | |
U.S. Treasury Bonds - 5.5% | | | | | | | | |
| | |
2.750% due 08/15/42 | | | 950,000 | | | | 914,079 | |
2.750% due 11/15/42 | | | 600,000 | | | | 576,281 | |
3.000% due 05/15/42 | | | 850,000 | | | | 862,883 | |
3.125% due 11/15/41 | | | 350,000 | | | | 365,039 | |
3.125% due 02/15/42 | | | 650,000 | | | | 677,320 | |
3.500% due 02/15/39 | | | 300,000 | | | | 337,969 | |
3.750% due 08/15/41 | | | 1,600,000 | | | | 1,874,250 | |
3.875% due 08/15/40 | | | 600,000 | | | | 718,781 | |
4.250% due 05/15/39 | | | 450,000 | | | | 572,203 | |
4.250% due 11/15/40 | | | 750,000 | | | | 954,610 | |
4.375% due 02/15/38 | | | 150,000 | | | | 193,898 | |
4.375% due 11/15/39 | | | 275,000 | | | | 356,598 | |
4.375% due 05/15/40 | | | 525,000 | | | | 681,187 | |
4.375% due 05/15/41 | | | 775,000 | | | | 1,006,531 | |
4.500% due 02/15/36 | | | 250,000 | | | | 327,891 | |
4.500% due 05/15/38 | | | 200,000 | | | | 263,344 | |
4.500% due 08/15/39 | | | 700,000 | | | | 924,547 | |
4.625% due 02/15/40 | | | 625,000 | | | | 841,699 | |
4.750% due 02/15/41 | | | 500,000 | | | | 687,031 | |
5.000% due 05/15/37 | | | 50,000 | | | | 70,305 | |
5.250% due 11/15/28 | | | 300,000 | | | | 413,766 | |
5.375% due 02/15/31 | | | 1,225,000 | | | | 1,744,668 | |
5.500% due 08/15/28 | | | 200,000 | | | | 282,156 | |
6.125% due 11/15/27 | | | 250,000 | | | | 370,742 | |
6.125% due 08/15/29 | | | 50,000 | | | | 75,617 | |
6.250% due 08/15/23 | | | 250,000 | | | | 358,086 | |
6.250% due 05/15/30 | | | 1,050,000 | | | | 1,620,445 | |
6.375% due 08/15/27 | | | 145,000 | | | | 219,335 | |
| | | | | | | | |
| | | Principal
Amount | | | Value | |
6.500% due 11/15/26 | | | $100,000 | | | | $151,625 | |
6.625% due 02/15/27 | | | 100,000 | | | | 153,578 | |
6.750% due 08/15/26 | | | 100,000 | | | | 154,266 | |
6.875% due 08/15/25 | | | 100,000 | | | | 153,781 | |
7.250% due 05/15/16 | | | 250,000 | | | | 306,914 | |
7.250% due 08/15/22 | | | 200,000 | | | | 300,844 | |
7.500% due 11/15/24 | | | 100,000 | | | | 159,047 | |
7.625% due 11/15/22 | | | 500,000 | | | | 773,203 | |
7.625% due 02/15/25 | | | 150,000 | | | | 241,570 | |
8.000% due 11/15/21 | | | 150,000 | | | | 231,434 | |
8.125% due 08/15/19 | | | 200,000 | | | | 290,922 | |
8.125% due 08/15/21 | | | 200,000 | | | | 308,781 | |
8.750% due 05/15/17 | | | 200,000 | | | | 270,391 | |
8.750% due 05/15/20 | | | 100,000 | | | | 153,453 | |
8.750% due 08/15/20 | | | 50,000 | | | | 77,352 | |
9.125% due 05/15/18 | | | 100,000 | | | | 143,891 | |
9.250% due 02/15/16 | | | 100,000 | | | | 127,422 | |
11.250% due 02/15/15 | | | 100,000 | | | | 123,141 | |
| | | | | | | | |
| | | | | | | 22,412,876 | |
| | | | | | | | |
U.S. Treasury Notes - 30.3% | | | | | | | | |
| | |
0.250% due 03/31/14 | | | 2,000,000 | | | | 2,001,250 | |
0.250% due 09/15/14 | | | 1,250,000 | | | | 1,250,440 | |
0.250% due 09/30/14 | | | 750,000 | | | | 750,264 | |
0.250% due 11/30/14 | | | 750,000 | | | | 750,147 | |
0.250% due 12/15/14 | | | 500,000 | | | | 500,078 | |
0.250% due 01/15/15 | | | 1,750,000 | | | | 1,749,727 | |
0.250% due 02/15/15 | | | 500,000 | | | | 499,805 | |
0.375% due 03/15/15 | | | 1,500,000 | | | | 1,503,165 | |
0.375% due 04/15/15 | | | 500,000 | | | | 501,015 | |
0.500% due 08/15/14 | | | 2,000,000 | | | | 2,008,984 | |
0.500% due 10/15/14 | | | 2,000,000 | | | | 2,009,298 | |
0.500% due 07/31/17 | | | 500,000 | | | | 496,875 | |
0.625% due 07/15/14 | | | 3,000,000 | | | | 3,018,867 | |
0.625% due 08/31/17 | | | 500,000 | | | | 499,453 | |
0.625% due 09/30/17 | | | 2,100,000 | | | | 2,095,735 | |
0.625% due 11/30/17 | | | 500,000 | | | | 498,203 | |
0.750% due 06/15/14 | | | 300,000 | | | | 302,379 | |
0.750% due 12/31/17 | | | 1,250,000 | | | | 1,251,757 | |
0.875% due 11/30/16 | | | 1,150,000 | | | | 1,166,262 | |
0.875% due 12/31/16 | | | 2,750,000 | | | | 2,787,383 | |
0.875% due 01/31/17 | | | 1,500,000 | | | | 1,519,921 | |
0.875% due 02/28/17 | | | 500,000 | | | | 506,484 | |
0.875% due 04/30/17 | | | 3,500,000 | | | | 3,542,658 | |
1.000% due 01/15/14 | | | 1,000,000 | | | | 1,008,516 | |
1.000% due 05/15/14 | | | 500,000 | | | | 505,430 | |
1.000% due 08/31/16 | | | 350,000 | | | | 356,645 | |
1.000% due 09/30/16 | | | 400,000 | | | | 407,562 | |
1.000% due 10/31/16 | | | 1,000,000 | | | | 1,018,906 | |
1.250% due 08/31/15 | | | 350,000 | | | | 358,559 | |
1.250% due 09/30/15 | | | 800,000 | | | | 820,062 | |
1.250% due 10/31/15 | | | 3,000,000 | | | | 3,076,407 | |
1.375% due 11/30/15 | | | 200,000 | | | | 205,906 | |
1.375% due 09/30/18 | | | 600,000 | | | | 616,453 | |
1.375% due 11/30/18 | | | 500,000 | | | | 513,047 | |
1.375% due 12/31/18 | | | 650,000 | | | | 666,656 | |
1.375% due 02/28/19 | | | 1,250,000 | | | | 1,280,274 | |
1.500% due 06/30/16 | | | 2,500,000 | | | | 2,591,212 | |
1.500% due 03/31/19 | | | 3,000,000 | | | | 3,092,580 | |
1.625% due 08/15/22 | | | 2,025,000 | | | | 2,009,812 | |
1.625% due 11/15/22 | | | 850,000 | | | | 839,774 | |
1.750% due 01/31/14 | | | 250,000 | | | | 254,209 | |
1.750% due 03/31/14 | | | 500,000 | | | | 509,570 | |
1.750% due 07/31/15 | | | 400,000 | | | | 414,656 | |
1.750% due 05/31/16 | | | 450,000 | | | | 470,039 | |
1.750% due 05/15/22 | | | 1,250,000 | | | | 1,259,570 | |
1.875% due 02/28/14 | | | 2,425,000 | | | | 2,472,079 | |
1.875% due 04/30/14 | | | 2,125,000 | | | | 2,171,901 | |
1.875% due 06/30/15 | | | 500,000 | | | | 519,453 | |
1.875% due 08/31/17 | | | 400,000 | | | | 422,406 | |
| | |
| See Notes to Financial Statements | | See explanation of symbols and terms, if any, on page B-81 |
B-12
PACIFIC SELECT FUND
PD AGGREGATE BOND INDEX PORTFOLIO
Schedule of Investments (Continued)
December 31, 2012
| | | | | | | | |
| | | Principal
Amount | | | Value | |
1.875% due 09/30/17 | | | $600,000 | | | | $633,469 | |
1.875% due 10/31/17 | | | 1,700,000 | | | | 1,795,360 | |
2.000% due 01/31/16 | | | 1,050,000 | | | | 1,102,008 | |
2.000% due 04/30/16 | | | 300,000 | | | | 315,586 | |
2.000% due 11/15/21 | | | 1,000,000 | | | | 1,036,953 | |
2.000% due 02/15/22 | | | 600,000 | | | | 619,922 | |
2.125% due 11/30/14 | | | 2,950,000 | | | | 3,054,979 | |
2.125% due 05/31/15 | | | 1,700,000 | | | | 1,773,977 | |
2.125% due 12/31/15 | | | 200,000 | | | | 210,484 | |
2.125% due 02/29/16 | | | 250,000 | | | | 263,633 | |
2.125% due 08/15/21 | | | 1,600,000 | | | | 1,680,750 | |
2.250% due 05/31/14 | | | 1,000,000 | | | | 1,028,594 | |
2.250% due 01/31/15 | | | 1,040,000 | | | | 1,082,738 | |
2.250% due 03/31/16 | | | 250,000 | | | | 264,902 | |
2.250% due 11/30/17 | | | 700,000 | | | | 752,555 | |
2.250% due 07/31/18 | | | 1,400,000 | | | | 1,507,407 | |
2.375% due 08/31/14 | | | 1,200,000 | | | | 1,242,610 | |
2.375% due 09/30/14 | | | 300,000 | | | | 311,180 | |
2.375% due 10/31/14 | | | 4,950,000 | | | | 5,141,426 | |
2.375% due 02/28/15 | | | 1,500,000 | | | | 1,567,617 | |
2.375% due 03/31/16 | | | 1,100,000 | | | | 1,169,609 | |
2.375% due 07/31/17 | | | 400,000 | | | | 431,281 | |
2.375% due 05/31/18 | | | 300,000 | | | | 324,891 | |
2.500% due 03/31/15 | | | 100,000 | | | | 104,984 | |
2.500% due 04/30/15 | | | 500,000 | | | | 525,547 | |
2.500% due 06/30/17 | | | 300,000 | | | | 324,984 | |
2.625% due 06/30/14 | | | 300,000 | | | | 310,746 | |
2.625% due 07/31/14 | | | 700,000 | | | | 726,442 | |
2.625% due 12/31/14 | | | 400,000 | | | | 418,938 | |
2.625% due 02/29/16 | | | 100,000 | | | | 107,016 | |
2.625% due 04/30/16 | | | 500,000 | | | | 536,328 | |
2.625% due 01/31/18 | | | 1,000,000 | | | | 1,094,141 | |
2.625% due 04/30/18 | | | 500,000 | | | | 547,734 | |
2.625% due 08/15/20 | | | 800,000 | | | | 877,625 | |
2.625% due 11/15/20 | | | 1,000,000 | | | | 1,096,641 | |
2.750% due 11/30/16 | | | 500,000 | | | | 543,125 | |
2.750% due 05/31/17 | | | 400,000 | | | | 437,312 | |
2.750% due 12/31/17 | | | 1,000,000 | | | | 1,100,156 | |
2.750% due 02/28/18 | | | 100,000 | | | | 110,133 | |
2.750% due 02/15/19 | | | 1,050,000 | | | | 1,162,055 | |
2.875% due 03/31/18 | | | 1,000,000 | | | | 1,108,281 | |
3.000% due 08/31/16 | | | 400,000 | | | | 436,469 | |
3.000% due 09/30/16 | | | 1,500,000 | | | | 1,639,453 | |
3.000% due 02/28/17 | | | 1,200,000 | | | | 1,319,813 | |
3.125% due 10/31/16 | | | 200,000 | | | | 219,844 | |
3.125% due 01/31/17 | | | 950,000 | | | | 1,048,711 | |
3.125% due 04/30/17 | | | 250,000 | | | | 276,992 | |
3.125% due 05/15/19 | | | 460,000 | | | | 520,591 | |
3.125% due 05/15/21 | | | 1,750,000 | | | | 1,982,696 | |
3.250% due 06/30/16 | | | 250,000 | | | | 274,258 | |
3.250% due 07/31/16 | | | 250,000 | | | | 274,726 | |
3.250% due 12/31/16 | | | 350,000 | | | | 387,598 | |
3.250% due 03/31/17 | | | 150,000 | | | | 166,805 | |
3.375% due 11/15/19 | | | 750,000 | | | | 861,504 | |
3.500% due 02/15/18 | | | 900,000 | | | | 1,024,453 | |
3.500% due 05/15/20 | | | 650,000 | | | | 754,254 | |
3.625% due 08/15/19 | | | 675,000 | | | | 785,479 | |
3.625% due 02/15/20 | | | 750,000 | | | | 875,508 | |
3.625% due 02/15/21 | | | 700,000 | | | | 821,024 | |
3.750% due 11/15/18 | | | 375,000 | | | | 436,465 | |
3.875% due 05/15/18 | | | 200,000 | | | | 232,344 | |
4.000% due 02/15/14 | | | 200,000 | | | | 208,500 | |
4.000% due 02/15/15 | | | 2,350,000 | | | | 2,534,696 | |
4.000% due 08/15/18 | | | 150,000 | | | | 176,180 | |
4.125% due 05/15/15 | | | 1,050,000 | | | | 1,144,418 | |
4.250% due 08/15/14 | | | 1,000,000 | | | | 1,064,922 | |
4.250% due 11/15/14 | | | 200,000 | | | | 214,867 | |
4.250% due 08/15/15 | | | 250,000 | | | | 275,488 | |
4.250% due 11/15/17 | | | 900,000 | | | | 1,053,633 | |
4.500% due 11/15/15 | | | 1,500,000 | | | | 1,677,304 | |
| | | | | | | | |
| | | Principal
Amount | | | Value | |
4.500% due 02/15/16 | | | $300,000 | | | | $338,133 | |
4.500% due 05/15/17 | | | 1,000,000 | | | | 1,167,735 | |
4.625% due 11/15/16 | | | 100,000 | | | | 115,703 | |
4.625% due 02/15/17 | | | 300,000 | | | | 349,641 | |
4.750% due 05/15/14 | | | 1,100,000 | | | | 1,168,020 | |
4.875% due 08/15/16 | | | 200,000 | | | | 231,516 | |
5.125% due 05/15/16 | | | 600,000 | | | | 693,844 | |
| | | | | | | | |
| | | | | | | 124,269,540 | |
| | | | | | | | |
Total U.S. Treasury Obligations
(Cost $141,729,881) | | | | | | | 146,682,416 | |
| | | | | | | | |
| |
FOREIGN GOVERNMENT BONDS & NOTES - 1.8% | | | | | |
| | |
Brazilian Government (Brazil) | | | | | | | | |
2.625% due 01/05/23 | | | 250,000 | | | | 251,625 | |
5.625% due 01/07/41 | | | 25,000 | | | | 32,875 | |
7.125% due 01/20/37 | | | 200,000 | | | | 307,000 | |
8.000% due 01/15/18 | | | 152,778 | | | | 177,796 | |
8.875% due 10/14/19 | | | 100,000 | | | | 145,125 | |
10.125% due 05/15/27 | | | 100,000 | | | | 183,500 | |
Canada Government (Canada) | | | | | | | | |
0.875% due 02/14/17 | | | 100,000 | | | | 100,879 | |
2.375% due 09/10/14 | | | 50,000 | | | | 51,796 | |
China Development Bank Corp (China)
5.000% due 10/15/15 | | | 100,000 | | | | 110,577 | |
Colombia Government (Colombia) | | | | | | | | |
4.375% due 07/12/21 | | | 100,000 | | | | 115,400 | |
6.125% due 01/18/41 | | | 100,000 | | | | 137,800 | |
7.375% due 03/18/19 | | | 100,000 | | | | 131,950 | |
Export Development Canada (Canada)
1.500% due 05/15/14 | | | 100,000 | | | | 101,705 | |
Hydro-Quebec (Canada) | | | | | | | | |
2.000% due 06/30/16 | | | 100,000 | | | | 104,277 | |
8.400% due 01/15/22 | | | 100,000 | | | | 143,584 | |
Israel Government AID Bond (Israel)
5.500% due 04/26/24 | | | 25,000 | | | | 33,119 | |
Israel Government (Israel)
5.125% due 03/26/19 | | | 100,000 | | | | 116,945 | |
Italy Government (Italy) | | | | | | | | |
4.500% due 01/21/15 | | | 2,000 | | | | 2,091 | |
5.250% due 09/20/16 | | | 450,000 | | | | 478,683 | |
5.375% due 06/15/33 | | | 100,000 | | | | 100,707 | |
Japan Bank for International Cooperation (Japan) | | | | | | | | |
1.875% due 09/24/15 | | | 100,000 | | | | 103,775 | |
2.125% due 02/07/19 | | | 200,000 | | | | 208,069 | |
Japan Finance Organization for Municipalities (Japan)
5.000% due 05/16/17 | | | 100,000 | | | | 116,982 | |
Mexico Government (Mexico) | | | | | | | | |
3.625% due 03/15/22 | | | 296,000 | | | | 324,490 | |
4.750% due 03/08/44 | | | 264,000 | | | | 298,980 | |
5.750% due 10/12/10 | | | 34,000 | | | | 41,140 | |
5.875% due 02/17/14 | | | 200,000 | | | | 210,500 | |
6.750% due 09/27/34 | | | 125,000 | | | | 180,625 | |
Panama Government (Panama) | | | | | | | | |
5.200% due 01/30/20 | | | 25,000 | | | | 29,988 | |
6.700% due 01/26/36 | | | 100,000 | | | | 142,500 | |
Peruvian Government (Peru)
7.125% due 03/30/19 | | | 200,000 | | | | 262,800 | |
Poland Government (Poland)
6.375% due 07/15/19 | | | 200,000 | | | | 250,094 | |
Province of British Columbia (Canada) | | | | | | | | |
1.200% due 04/25/17 | | | 100,000 | | | | 101,868 | |
2.650% due 09/22/21 | | | 100,000 | | | | 105,299 | |
Province of Manitoba (Canada)
2.625% due 07/15/15 | | | 100,000 | | | | 105,457 | |
Province of Ontario (Canada) | | | | | | | | |
1.100% due 10/25/17 | | | 250,000 | | | | 250,474 | |
1.375% due 01/27/14 | | | 150,000 | | | | 151,671 | |
| | |
| See Notes to Financial Statements | | See explanation of symbols and terms, if any, on page B-81 |
B-13
PACIFIC SELECT FUND
PD AGGREGATE BOND INDEX PORTFOLIO
Schedule of Investments (Continued)
December 31, 2012
| | | | | | | | |
| | | Principal
Amount | | | Value | |
2.300% due 05/10/16 | | | $100,000 | | | | $105,275 | |
2.700% due 06/16/15 | | | 125,000 | | | | 131,668 | |
2.950% due 02/05/15 | | | 200,000 | | | | 210,304 | |
4.000% due 10/07/19 | | | 150,000 | | | | 172,300 | |
Province of Quebec (Canada) | | | | | | | | |
2.750% due 08/25/21 | | | 100,000 | | | | 104,550 | |
5.125% due 11/14/16 | | | 100,000 | | | | 116,501 | |
7.500% due 09/15/29 | | | 25,000 | | | | 38,041 | |
Republic of South Korea (South Korea) | | | | | | | | |
5.750% due 04/16/14 | | | 50,000 | | | | 53,122 | |
7.125% due 04/16/19 | | | 100,000 | | | | 129,966 | |
South Africa Government (South Africa) | | | | | | | | |
4.665% due 01/17/24 | | | 100,000 | | | | 113,500 | |
6.875% due 05/27/19 | | | 100,000 | | | | 125,900 | |
Uruguay Government (Uruguay) | | | | | | | | |
4.125% due 11/20/45 | | | 143,467 | | | | 143,969 | |
6.875% due 09/28/25 | | | 100,000 | | | | 140,500 | |
| | | | | | | | |
| | |
Total Foreign Government Bonds & Notes
(Cost $6,914,804) | | | | | | | 7,297,742 | |
| | | | | | | | |
| | |
MUNICIPAL BONDS - 0.9% | | | | | | | | |
| | |
American Municipal Power Inc OH ‘B’
6.449% due 02/15/44 | | | 25,000 | | | | 29,917 | |
Bay Area Toll Authority CA | | | | | | | | |
6.263% due 04/01/49 | | | 25,000 | | | | 34,647 | |
7.043% due 04/01/50 | | | 50,000 | | | | 72,937 | |
Central Puget Sound Regional Transit Authority WA
5.491% due 11/01/39 | | | 25,000 | | | | 31,186 | |
City of New York NY
5.517% due 10/01/37 | | | 40,000 | | | | 49,468 | |
City of New York NY ‘D’
5.985% due 12/01/36 | | | 100,000 | | | | 126,981 | |
City of San Francisco CA Public Utilities Commission Water Revenue | | | | | | | | |
6.000% due 11/01/40 | | | 25,000 | | | | 31,248 | |
Commonwealth of Massachusetts | | | | | | | | |
4.910% due 05/01/29 | | | 100,000 | | | | 117,008 | |
5.456% due 12/01/39 | | | 25,000 | | | | 31,447 | |
Dallas Independent School District TX ‘C’
6.450% due 02/15/35 | | | 50,000 | | | | 62,914 | |
Denver City & County School District No. 1 CO ‘C’
5.664% due 12/01/33 | | | 100,000 | | | | 125,695 | |
Government Development Bank for Puerto Rico ‘A’ | | | | | | | | |
3.448% due 02/01/15 | | | 100,000 | | | | 99,243 | |
Illinois State Toll Highway Authority ‘B’
5.851% due 12/01/34 | | | 25,000 | | | | 31,121 | |
Los Angeles Unified School District CA
6.758% due 07/01/34 | | | 100,000 | | | | 133,579 | |
Metropolitan Transportation Authority NY | | | | | | | | |
5.871% due 11/15/39 | | | 25,000 | | | | 29,470 | |
6.668% due 11/15/39 | | | 55,000 | | | | 71,723 | |
Municipal Electric Authority GA
6.637% due 04/01/57 | | | 25,000 | | | | 29,888 | |
New Jersey Transportation Trust Fund Authority
6.104% due 12/15/28 | | | 150,000 | | | | 171,411 | |
New York City Municipal Water Finance Authority NY | | | | | | | | |
5.952% due 06/15/42 | | | 50,000 | | | | 66,799 | |
6.011% due 06/15/42 | | | 10,000 | | | | 13,451 | |
New York City Transitional Finance Authority Revenue NY
5.572% due 11/01/38 | | | 30,000 | | | | 37,419 | |
New York State Urban Development Corp
5.770% due 03/15/39 | | | 25,000 | | | | 30,656 | |
| | | | | | | | |
| | | Principal
Amount | | | Value | |
Orange County Local Transportation Authority Revenue CA ‘A’
6.908% due 02/15/41 | | | $100,000 | | | | $140,063 | |
Pennsylvania Turnpike Commission | | | | | | | | |
6.105% due 12/01/39 | | | 25,000 | | | | 31,506 | |
Pennsylvania Turnpike Commission ‘B’ | | | | | | | | |
5.511% due 12/01/45 | | | 75,000 | | | | 89,345 | |
Philadelphia Authority for Industrial Development PA
3.964% due 04/15/26 | | | 55,000 | | | | 55,303 | |
Port Authority of New York & New Jersey
5.647% due 11/01/40 | | | 150,000 | | | | 183,759 | |
San Diego County Regional Transportation Commission Build America Bonds CA
5.911% due 04/01/48 | | | 50,000 | | | | 66,143 | |
State of California | | | | | | | | |
4.850% due 10/01/14 | | | 50,000 | | | | 53,180 | |
5.750% due 03/01/17 | | | 50,000 | | | | 57,401 | |
6.200% due 10/01/19 | | | 25,000 | | | | 30,497 | |
7.500% due 04/01/34 | | | 50,000 | | | | 69,587 | |
7.550% due 04/01/39 | | | 150,000 | | | | 216,420 | |
7.600% due 11/01/40 | | | 270,000 | | | | 394,705 | |
7.625% due 03/01/40 | | | 40,000 | | | | 57,828 | |
State of Connecticut | | | | | | | | |
5.090% due 10/01/30 | | | 50,000 | | | | 57,498 | |
State of Connecticut ‘B’ | | | | | | | | |
5.459% due 11/01/30 | | | 50,000 | | | | 59,692 | |
State of Illinois | | | | | | | | |
5.100% due 06/01/33 | | | 100,000 | | | | 99,016 | |
5.665% due 03/01/18 | | | 200,000 | | | | 228,058 | |
6.725% due 04/01/35 | | | 100,000 | | | | 114,550 | |
State of Utah ‘D’
4.554% due 07/01/24 | | | 15,000 | | | | 17,604 | |
State of Washington ‘D’
5.481% due 08/01/39 | | | 25,000 | | | | 31,512 | |
Texas State Transportation Commission
5.178% due 04/01/30 | | | 25,000 | | | | 30,606 | |
University of California
4.858% due 05/15/12 | | | 100,000 | | | | 105,542 | |
| | | | | | | | |
| | |
Total Municipal Bonds
(Cost $3,197,184) | | | | | | | 3,618,023 | |
| | | | | | | | |
| | |
| | | Shares | | | | |
| | |
SHORT-TERM INVESTMENT - 8.3% | | | | | | | | |
| | |
Money Market Fund - 8.3% | | | | | | | | |
| | |
Federated Prime Obligations Fund | | | 33,868,457 | | | | 33,868,457 | |
| | | | | | | | |
| | |
Total Short-Term Investment
(Cost $33,868,457) | | | | | | | 33,868,457 | |
| | | | | | | | |
| | |
TOTAL INVESTMENTS - 105.2%
(Cost $416,603,906) | | | | | | | 430,694,190 | |
| |
OTHER ASSETS & LIABILITIES, NET - (5.2%) | | | | (21,233,262 | ) |
| | | | | | | | |
| | |
NET ASSETS - 100.0% | | | | | | | $409,460,928 | |
| | | | | | | | |
| | |
| See Notes to Financial Statements | | See explanation of symbols and terms, if any, on page B-81 |
B-14
PACIFIC SELECT FUND
PD AGGREGATE BOND INDEX PORTFOLIO
Schedule of Investments (Continued)
December 31, 2012
Notes to Schedule of Investments
| (a) | As of December 31, 2012, the portfolio was diversified as a percentage of net assets as follows: |
| | | | |
U.S. Treasury Obligations | | | 35.8% | |
Mortgage-Backed Securities | | | 30.9% | |
Corporate Bonds & Notes | | | 23.0% | |
Short-Term Investment | | | 8.3% | |
U.S. Government Agency Issues | | | 4.3% | |
Foreign Government Bonds & Notes | | | 1.8% | |
Municipal Bonds | | | 0.9% | |
Asset-Backed Securities | | | 0.2% | |
| | | | |
| | | 105.2% | |
Other Assets & Liabilities, Net | | | (5.2% | ) |
| | | | |
| | | 100.0% | |
| | | | |
| (b) | As of December 31, 2012, the portfolio’s Standard & Poor’s quality ratings as a percentage of total fixed income investments were as follows (Unaudited): |
| | | | |
AAA | | | 3.5% | |
AA/U.S. Government & Agency Issues | | | 75.0% | |
A | | | 11.7% | |
BBB | | | 9.0% | |
BB | | | 0.5% | |
Not Rated | | | 0.3% | |
| | | | |
| | | 100.0% | |
| | | | |
| (c) | Fair Value Measurements |
The following is a summary of the portfolio’s investments as categorized under the three-tier hierarchy of inputs used in valuing the portfolio’s assets and liabilities (See Note 3D in Notes to Financial Statements) as of December 31, 2012:
| | | | | | | | | | | | | | | | | | |
| | | | | Total Value at
December 31, 2012 | | | Level 1
Quoted Price | | | Level 2
Significant
Observable Inputs | | | Level 3
Significant
Unobservable Inputs | |
Assets | | Corporate Bonds & Notes | | | $94,349,755 | | | | $- | | | | $94,072,049 | | | | $277,706 | |
| | Mortgage-Backed Securities | | | 126,393,134 | | | | - | | | | 126,393,134 | | | | - | |
| | Asset-Backed Securities | | | 928,457 | | | | - | | | | 928,457 | | | | - | |
| | U.S. Government Agency Issues | | | 17,556,206 | | | | - | | | | 17,556,206 | | | | - | |
| | U.S. Treasury Obligations | | | 146,682,416 | | | | - | | | | 146,682,416 | | | | - | |
| | Foreign Government Bonds & Notes | | | 7,297,742 | | | | - | | | | 7,297,742 | | | | - | |
| | Municipal Bonds | | | 3,618,023 | | | | - | | | | 3,618,023 | | | | - | |
| | Short-Term Investment | | | 33,868,457 | | | | 33,868,457 | | | | - | | | | - | |
| | | | | | | | | | | | | | | | | | |
| | Total | | | $430,694,190 | | | | $33,868,457 | | | | $396,548,027 | | | | $277,706 | |
| | | | | | | | | | | | | | | | | | |
| | |
| See Notes to Financial Statements | | See explanation of symbols and terms, if any, on page B-81 |
B-15
PACIFIC SELECT FUND
PD HIGH YIELD BOND MARKET PORTFOLIO
Schedule of Investments
December 31, 2012
| | | | | | | | |
| | | Principal
Amount | | | Value | |
CORPORATE BONDS & NOTES - 97.6% | | | | | | | | |
| |
Consumer Discretionary - 20.0% | | | | | |
| | |
Affinia Group Inc
9.000% due 11/30/14 | | | $50,000 | | | | $50,125 | |
Affinion Group Inc
7.875% due 12/15/18 | | | 100,000 | | | | 76,750 | |
Allbritton Communications Co
8.000% due 05/15/18 | | | 25,000 | | | | 27,250 | |
Allison Transmission Inc
7.125% due 05/15/19 ~ | | | 50,000 | | | | 53,625 | |
Altegrity Inc
10.500% due 11/01/15 ~ | | | 50,000 | | | | 44,000 | |
AMC Entertainment Inc | | | | | | | | |
8.750% due 06/01/19 | | | 100,000 | | | | 111,250 | |
9.750% due 12/01/20 | | | 100,000 | | | | 116,000 | |
AMC Networks Inc | | | | | | | | |
4.750% due 12/15/22 | | | 68,000 | | | | 68,680 | |
7.750% due 07/15/21 | | | 100,000 | | | | 115,000 | |
American Axle & Manufacturing Inc | | | | | | | | |
7.875% due 03/01/17 | | | 100,000 | | | | 103,750 | |
9.250% due 01/15/17 ~ | | | 65,000 | | | | 72,475 | |
Ameristar Casinos Inc
7.500% due 04/15/21 | | | 70,000 | | | | 76,212 | |
ARAMARK Corp
8.500% due 02/01/15 | | | 125,000 | | | | 125,782 | |
Armored Autogroup Inc
9.250% due 11/01/18 | | | 25,000 | | | | 21,313 | |
AutoNation Inc
5.500% due 02/01/20 | | | 100,000 | | | | 107,875 | |
Beazer Homes USA Inc | | | | | | | | |
6.875% due 07/15/15 | | | 50,000 | | | | 50,375 | |
9.125% due 05/15/19 | | | 50,000 | | | | 52,562 | |
Belo Corp
8.000% due 11/15/16 | | | 25,000 | | | | 27,344 | |
Best Buy Co Inc
5.500% due 03/15/21 | | | 100,000 | | | | 85,250 | |
Boyd Gaming Corp
9.125% due 12/01/18 | | | 100,000 | | | | 102,500 | |
Brookfield Residential Properties Inc (Canada)
6.500% due 12/15/20 ~ | | | 140,000 | | | | 144,200 | |
Brunswick Corp
11.250% due 11/01/16 ~ | | | 100,000 | | | | 113,375 | |
Burger King Corp
9.875% due 10/15/18 | | | 100,000 | | | | 115,000 | |
Burlington Coat Factory Warehouse Corp 10.000% due 02/15/19 | | | 100,000 | | | | 108,500 | |
Cablevision Systems Corp | | | | | | | | |
5.875% due 09/15/22 | | | 100,000 | | | | 100,625 | |
7.750% due 04/15/18 | | | 100,000 | | | | 111,750 | |
8.000% due 04/15/20 | | | 100,000 | | | | 113,125 | |
Caesars Entertainment Operating Co Inc | | | | | | | | |
5.625% due 06/01/15 | | | 100,000 | | | | 88,000 | |
6.500% due 06/01/16 | | | 100,000 | | | | 61,000 | |
8.500% due 02/15/20 | | | 100,000 | | | | 99,562 | |
9.000% due 02/15/20 ~ | | | 100,000 | | | | 100,500 | |
10.000% due 12/15/18 | | | 450,000 | | | | 299,125 | |
10.750% due 02/01/16 | | | 50,000 | | | | 40,750 | |
11.250% due 06/01/17 | | | 200,000 | | | | 215,250 | |
12.750% due 04/15/18 | | | 150,000 | | | | 111,375 | |
Carlson Wagonlit BV (Netherlands)
6.875% due 06/15/19 ~ | | | 200,000 | | | | 212,000 | |
CCO Holdings LLC | | | | | | | | |
5.125% due 02/15/23 | | | 125,000 | | | | 125,312 | |
5.250% due 09/30/22 | | | 100,000 | | | | 101,750 | |
7.000% due 01/15/19 | | | 150,000 | | | | 162,562 | |
7.375% due 06/01/20 | | | 250,000 | | | | 278,750 | |
7.875% due 04/30/18 | | | 150,000 | | | | 162,187 | |
8.125% due 04/30/20 | | | 206,000 | | | | 231,750 | |
| | | | | | | | |
| | | Principal
Amount | | | Value | |
Cengage Learning Acquisitions Inc | | | | | | | | |
10.500% due 01/15/15 ~ | | | $100,000 | | | | $34,500 | |
11.500% due 04/15/20 ~ | | | 100,000 | | | | 86,750 | |
12.000% due 06/30/19 ~ | | | 100,000 | | | | 46,000 | |
Cequel Communications Holdings I LLC | | | | | | | | |
6.375% due 09/15/20 ~ | | | 67,000 | | | | 70,099 | |
8.625% due 11/15/17 ~ | | | 135,000 | | | | 145,125 | |
CHC Helicopter SA (Luxembourg)
9.250% due 10/15/20 | | | 100,000 | | | | 105,750 | |
Chrysler Group LLC
8.250% due 06/15/21 | | | 340,000 | | | | 375,700 | |
Cinemark USA Inc
8.625% due 06/15/19 | | | 150,000 | | | | 166,875 | |
CityCenter Holdings LLC | | | | | | | | |
7.625% due 01/15/16 | | | 100,000 | | | | 107,500 | |
10.750% due 01/15/17 | | | 118,045 | | | | 122,818 | |
CKE Restaurants Inc
11.375% due 07/15/18 | | | 80,000 | | | | 92,400 | |
Claire’s Stores Inc | | | | | | | | |
8.875% due 03/15/19 | | | 50,000 | | | | 47,500 | |
9.000% due 03/15/19 ~ | | | 150,000 | | | | 161,625 | |
Clear Channel Communications Inc | | | | | | | | |
5.500% due 12/15/16 | | | 100,000 | | | | 60,000 | |
9.000% due 12/15/19 ~ | | | 200,000 | | | | 184,000 | |
9.000% due 03/01/21 | | | 150,000 | | | | 134,625 | |
10.750% due 08/01/16 | | | 150,000 | | | | 114,000 | |
Clear Channel Worldwide Holdings Inc | | | | | | | | |
6.500% due 11/15/22 ~ | | | 257,000 | | | | 267,062 | |
7.625% due 03/15/20 | | | 200,000 | | | | 202,500 | |
Cooper-Standard Automotive Inc
8.500% due 05/01/18 | | | 25,000 | | | | 27,000 | |
Cumulus Media Holdings Inc
7.750% due 05/01/19 | | | 100,000 | | | | 98,750 | |
D.R. Horton Inc
5.250% due 02/15/15 | | | 150,000 | | | | 158,625 | |
Dana Holding Corp
6.500% due 02/15/19 | | | 100,000 | | | | 107,250 | |
Delphi Corp
6.125% due 05/15/21 | | | 150,000 | | | | 167,250 | |
DineEquity Inc
9.500% due 10/30/18 | | | 50,000 | | | | 57,062 | |
DISH DBS Corp | | | | | | | | |
4.625% due 07/15/17 | | | 250,000 | | | | 261,875 | |
5.000% due 03/15/23 ~ | | | 239,000 | | | | 240,195 | |
6.625% due 10/01/14 | | | 100,000 | | | | 107,750 | |
6.750% due 06/01/21 | | | 350,000 | | | | 400,750 | |
7.125% due 02/01/16 | | | 200,000 | | | | 225,000 | |
Dollar General Corp
4.125% due 07/15/17 | | | 100,000 | | | | 105,500 | |
Easton-Bell Sports Inc
9.750% due 12/01/16 | | | 10,000 | | | | 10,764 | |
Exide Technologies
8.625% due 02/01/18 | | | 100,000 | | | | 85,250 | |
Gannett Co Inc
6.375% due 09/01/15 | | | 50,000 | | | | 55,250 | |
Hanesbrands Inc
8.000% due 12/15/16 | | | 82,000 | | | | 90,200 | |
Icahn Enterprises LP | | | | | | | | |
7.750% due 01/15/16 | | | 50,000 | | | | 52,062 | |
8.000% due 01/15/18 | | | 335,000 | | | | 361,381 | |
Interactive Data Corp
10.250% due 08/01/18 | | | 60,000 | | | | 67,800 | |
Isle of Capri Casinos Inc
7.750% due 03/15/19 | | | 50,000 | | | | 54,125 | |
J.C. Penney Co Inc | | | | | | | | |
5.650% due 06/01/20 | | | 150,000 | | | | 130,875 | |
6.375% due 10/15/36 | | | 51,000 | | | | 38,505 | |
7.400% due 04/01/37 | | | 63,000 | | | | 52,920 | |
Jaguar Land Rover PLC (United Kingdom)
7.750% due 05/15/18 ~ | | | 150,000 | | | | 164,250 | |
| | |
| See Notes to Financial Statements | | See explanation of symbols and terms, if any, on page B-81 |
B-16
PACIFIC SELECT FUND
PD HIGH YIELD BOND MARKET PORTFOLIO
Schedule of Investments (Continued)
December 31, 2012
| | | | | | | | |
| | | Principal
Amount | | | Value | |
Jarden Corp | | | | | | | | |
6.125% due 11/15/22 | | | $100,000 | | | | $108,500 | |
7.500% due 05/01/17 | | | 75,000 | | | | 84,844 | |
Jo-Ann Stores Inc
8.125% due 03/15/19 ~ | | | 50,000 | | | | 51,125 | |
K Hovnanian Enterprises Inc | | | | | | | | |
7.250% due 10/15/20 ~ | | | 100,000 | | | | 108,000 | |
9.125% due 11/15/20 ~ | | | 100,000 | | | | 106,500 | |
KB Home | | | | | | | | |
6.250% due 06/15/15 | | | 24,000 | | | | 25,620 | |
8.000% due 03/15/20 | | | 100,000 | | | | 114,000 | |
Lamar Media Corp | | | | | | | | |
7.875% due 04/15/18 | | | 130,000 | | | | 144,300 | |
9.750% due 04/01/14 | | | 75,000 | | | | 82,500 | |
Landry’s Inc
9.375% due 05/01/20 ~ | | | 100,000 | | | | 106,000 | |
Laureate Education Inc
9.250% due 09/01/19 ~ | | | 213,000 | | | | 223,650 | |
Lear Corp
7.875% due 03/15/18 | | | 45,000 | | | | 49,163 | |
Lennar Corp
5.600% due 05/31/15 | | | 250,000 | | | | 267,500 | |
Levi Strauss & Co
7.625% due 05/15/20 | | | 100,000 | | | | 109,500 | |
Libbey Glass Inc
6.875% due 05/15/20 | | | 100,000 | | | | 108,000 | |
Liberty Interactive LLC
8.250% due 02/01/30 | | | 100,000 | | | | 109,500 | |
Limited Brands Inc | | | | | | | | |
6.625% due 04/01/21 | | | 250,000 | | | | 287,500 | |
6.900% due 07/15/17 | | | 100,000 | | | | 115,250 | |
8.500% due 06/15/19 | | | 100,000 | | | | 122,500 | |
LIN Television Corp
8.375% due 04/15/18 | | | 50,000 | | | | 55,000 | |
Live Nation Entertainment Inc
8.125% due 05/15/18 ~ | | | 25,000 | | | | 27,063 | |
Marina District Finance Co Inc
9.500% due 10/15/15 | | | 100,000 | | | | 97,500 | |
Mediacom Broadband LLC
6.375% due 04/01/23 ~ | | | 100,000 | | | | 102,250 | |
Mediacom LLC
9.125% due 08/15/19 | | | 50,000 | | | | 55,625 | |
MGM Resorts International | | | | | | | | |
6.625% due 12/15/21 | | | 119,000 | | | | 119,149 | |
7.625% due 01/15/17 | | | 200,000 | | | | 215,000 | |
7.750% due 03/15/22 | | | 100,000 | | | | 107,500 | |
8.625% due 02/01/19 ~ | | | 100,000 | | | | 112,000 | |
10.000% due 11/01/16 | | | 250,000 | | | | 290,625 | |
Michaels Stores Inc
7.750% due 11/01/18 | | | 200,000 | | | | 220,500 | |
Mohegan Tribal Gaming Authority
10.500% due 12/15/16 ~ | | | 200,000 | | | | 198,000 | |
Nara Cable Funding Ltd (Ireland)
8.875% due 12/01/18 ~ | | | 200,000 | | | | 204,500 | |
NCL Corp Ltd (Bermuda)
11.750% due 11/15/16 | | | 200,000 | | | | 227,000 | |
Netflix Inc
8.500% due 11/15/17 | | | 25,000 | | | | 26,688 | |
Party City Holdings Inc
8.875% due 08/01/20 ~ | | | 125,000 | | | | 134,687 | |
Penn National Gaming Inc
8.750% due 08/15/19 | | | 75,000 | | | | 85,875 | |
Penske Automotive Group Inc
5.750% due 10/01/22 ~ | | | 100,000 | | | | 103,500 | |
Petco Animal Supplies Inc
9.250% due 12/01/18 ~ | | | 50,000 | | | | 55,750 | |
Pinnacle Entertainment Inc
7.750% due 04/01/22 | | | 100,000 | | | | 107,000 | |
ProQuest LLC
9.000% due 10/15/18 ~ | | | 50,000 | | | | 47,500 | |
| | | | | | | | |
| | | Principal
Amount | | | Value | |
PulteGroup Inc
6.000% due 02/15/35 | | | $100,000 | | | | $93,500 | |
PVH Corp | | | | | | | | |
4.500% due 12/15/22 | | | 56,000 | | | | 56,840 | |
7.375% due 05/15/20 | | | 100,000 | | | | 112,625 | |
Quebecor Media Inc (Canada) | | | | | | | | |
5.750% due 01/15/23 ~ | | | 100,000 | | | | 105,875 | |
7.750% due 03/15/16 | | | 54,000 | | | | 55,485 | |
Quiksilver Inc
6.875% due 04/15/15 | | | 100,000 | | | | 98,750 | |
Radio One Inc
12.500% due 05/24/16 | | | 53,451 | | | | 48,240 | |
Regal Entertainment Group
9.125% due 08/15/18 | | | 50,000 | | | | 56,000 | |
Royal Caribbean Cruises Ltd (Liberia) | | | | | | | | |
5.250% due 11/15/22 | | | 144,000 | | | | 153,000 | |
7.250% due 06/15/16 | | | 100,000 | | | | 113,500 | |
Sabre Holdings Corp
8.350% due 03/15/16 | | | 50,000 | | | | 53,500 | |
Sabre Inc
8.500% due 05/15/19 ~ | | | 100,000 | | | | 106,875 | |
Salem Communications Corp
9.625% due 12/15/16 | | | 19,000 | | | | 21,138 | |
Sally Holdings LLC | | | | | | | | |
5.750% due 06/01/22 | | | 50,000 | | | | 54,500 | |
6.875% due 11/15/19 | | | 100,000 | | | | 111,000 | |
Scientific Games Corp
8.125% due 09/15/18 | | | 100,000 | | | | 110,500 | |
Sealy Mattress Co
10.875% due 04/15/16 ~ | | | 44,000 | | | | 46,750 | |
Sears Holdings Corp
6.625% due 10/15/18 | | | 100,000 | | | | 91,500 | �� |
Seneca Gaming Corp
8.250% due 12/01/18 ~ | | | 100,000 | | | | 106,000 | |
Serta Simmons Holdings LLC
8.125% due 10/01/20 ~ | | | 200,000 | | | | 201,000 | |
Service Corp International | | | | | | | | |
7.000% due 06/15/17 | | | 100,000 | | | | 115,500 | |
7.000% due 05/15/19 | | | 100,000 | | | | 110,000 | |
ServiceMaster Co | | | | | | | | |
7.000% due 08/15/20 ~ | | | 78,000 | | | | 78,585 | |
8.000% due 02/15/20 | | | 100,000 | | | | 104,750 | |
Shea Homes LP
8.625% due 05/15/19 | | | 100,000 | | | | 111,000 | |
Sinclair Television Group Inc
6.125% due 10/01/22 ~ | | | 200,000 | | | | 213,250 | |
Sirius XM Radio Inc
5.250% due 08/15/22 ~ | | | 200,000 | | | | 203,000 | |
Six Flags Entertainment Corp
5.250% due 01/15/21 ~ | | | 74,000 | | | | 74,185 | |
Spanish Broadcasting System Inc
12.500% due 04/15/17 ~ | | | 100,000 | | | | 107,750 | |
Stanadyne Corp
10.000% due 08/15/14 | | | 25,000 | | | | 23,313 | |
Standard Pacific Corp
8.375% due 05/15/18 | | | 150,000 | | | | 174,750 | |
Studio City Finance Ltd (United Kingdom)
8.500% due 12/01/20 ~ | | | 250,000 | | | | 262,656 | |
Taylor Morrison Communities Inc
7.750% due 04/15/20 ~ | | | 50,000 | | | | 53,250 | |
Tenneco Inc
6.875% due 12/15/20 | | | 100,000 | | | | 109,375 | |
The Goodyear Tire & Rubber Co | | | | | | | | |
7.000% due 05/15/22 | | | 100,000 | | | | 107,750 | |
8.250% due 08/15/20 | | | 100,000 | | | | 110,250 | |
The Gymboree Corp
9.125% due 12/01/18 | | | 50,000 | | | | 44,750 | |
The Jones Group Inc
6.125% due 11/15/34 | | | 100,000 | | | | 86,500 | |
| | |
| See Notes to Financial Statements | | See explanation of symbols and terms, if any, on page B-81 |
B-17
PACIFIC SELECT FUND
PD HIGH YIELD BOND MARKET PORTFOLIO
Schedule of Investments (Continued)
December 31, 2012
| | | | | | | | |
| | | Principal
Amount | | | Value | |
The McClatchy Co
9.000% due 12/15/22 ~ | | | $196,000 | | | | $201,145 | |
The Ryland Group Inc
6.625% due 05/01/20 | | | 100,000 | | | | 111,500 | |
Toll Brothers Finance Corp
8.910% due 10/15/17 | | | 100,000 | | | | 126,354 | |
Toys R Us Inc | | | | | | | | |
7.375% due 09/01/16 ~ | | | 100,000 | | | | 102,750 | |
10.375% due 08/15/17 | | | 100,000 | | | | 104,750 | |
Toys R Us Property Co I LLC
10.750% due 07/15/17 | | | 100,000 | | | | 108,250 | |
Toys R Us Property Co II LLC
8.500% due 12/01/17 | | | 25,000 | | | | 26,625 | |
Travelport LLC
9.000% due 03/01/16 | | | 100,000 | | | | 78,000 | |
TRW Automotive Inc
8.875% due 12/01/17 ~ | | | 100,000 | | | | 110,500 | |
Unitymedia Hessen GmbH & Co KG (Germany)
5.500% due 01/15/23 ~ | | | 200,000 | | | | 207,500 | |
Univision Communications Inc | | | | | | | | |
6.750% due 09/15/22 ~ | | | 200,000 | | | | 207,500 | |
6.875% due 05/15/19 ~ | | | 50,000 | | | | 52,250 | |
7.875% due 11/01/20 ~ | | | 100,000 | | | | 108,750 | |
8.500% due 05/15/21 ~ | | | 50,000 | | | | 51,875 | |
Videotron Ltd (Canada)
5.000% due 07/15/22 | | | 200,000 | | | | 210,750 | |
Virgin Media Finance PLC (United Kingdom)
5.250% due 02/15/22 | | | 200,000 | | | | 213,000 | |
Visant Corp
10.000% due 10/01/17 | | | 20,000 | | | | 18,050 | |
Visteon Corp
6.750% due 04/15/19 | | | 90,000 | | | | 96,300 | |
VWR Funding Inc
7.250% due 09/15/17 ~ | | | 150,000 | | | | 158,250 | |
WideOpenWest Finance LLC
10.250% due 07/15/19 ~ | | | 82,000 | | | | 87,535 | |
WMG Acquisition Corp
11.500% due 10/01/18 | | | 100,000 | | | | 116,000 | |
Wynn Las Vegas LLC | | | | | | | | |
5.375% due 03/15/22 | | | 100,000 | | | | 106,750 | |
7.750% due 08/15/20 | | | 180,000 | | | | 206,100 | |
YCC Holdings LLC
10.250% due 02/15/16 | | | 100,000 | | | | 103,760 | |
| | | | | | | | |
| | | | | | | 21,947,884 | |
| | | | | | | | |
Consumer Staples - 4.8% | | | | | | | | |
| | |
Alliance One International Inc
10.000% due 07/15/16 | | | 100,000 | | | | 105,750 | |
Bumble Bee Acquisition Corp
9.000% due 12/15/17 ~ | | | 23,000 | | | | 24,840 | |
C&S Group Enterprises LLC
8.375% due 05/01/17 ~ | | | 90,000 | | | | 95,625 | |
Central Garden & Pet Co
8.250% due 03/01/18 | | | 50,000 | | | | 53,125 | |
Constellation Brands Inc | | | | | | | | |
6.000% due 05/01/22 | | | 100,000 | | | | 115,000 | |
7.250% due 05/15/17 | | | 200,000 | | | | 236,500 | |
Cott Beverages Inc
8.375% due 11/15/17 | | | 25,000 | | | | 27,313 | |
Dean Foods Co
9.750% due 12/15/18 | | | 100,000 | | | | 115,500 | |
Del Monte Corp
7.625% due 02/15/19 | | | 100,000 | | | | 104,750 | |
Dole Food Co Inc
8.000% due 10/01/16 ~ | | | 100,000 | | | | 104,500 | |
Harbinger Group Inc
7.875% due 07/15/19 ~ | | | 120,000 | | | | 119,550 | |
| | | | | | | | |
| | | Principal
Amount | | | Value | |
Innovation Ventures LLC
9.500% due 08/15/19 ~ | | | $100,000 | | | | $94,500 | |
JBS USA LLC | | | | | | | | |
8.250% due 02/01/20 ~ | | | 150,000 | | | | 159,750 | |
11.625% due 05/01/14 | | | 100,000 | | | | 112,000 | |
Michael Foods Group Inc
9.750% due 07/15/18 | | | 50,000 | | | | 55,500 | |
NBTY Inc
9.000% due 10/01/18 | | | 200,000 | | | | 227,000 | |
New Albertsons Inc
7.750% due 06/15/26 | | | 100,000 | | | | 56,750 | |
Pinnacle Foods Finance LLC | | | | | | | | |
8.250% due 09/01/17 | | | 100,000 | | | | 107,000 | |
9.250% due 04/01/15 | | | 19,000 | | | | 19,380 | |
Post Holdings Inc
7.375% due 02/15/22 ~ | | | 150,000 | | | | 165,094 | |
Revlon Consumer Products Corp
9.750% due 11/15/15 | | | 50,000 | | | | 52,875 | |
Reynolds Group Issuer Inc | | | | | | | | |
5.750% due 10/15/20 ~ | | | 335,000 | | | | 346,725 | |
6.875% due 02/15/21 | | | 150,000 | | | | 162,375 | |
7.875% due 08/15/19 | | | 200,000 | | | | 223,500 | |
8.250% due 02/15/21 | | | 100,000 | | | | 102,000 | |
8.500% due 05/15/18 | | | 100,000 | | | | 103,000 | |
9.000% due 04/15/19 | | | 200,000 | | | | 209,000 | |
9.875% due 08/15/19 | | | 200,000 | | | | 215,000 | |
Rite Aid Corp | | | | | | | | |
8.000% due 08/15/20 | | | 100,000 | | | | 114,750 | |
9.500% due 06/15/17 | | | 250,000 | | | | 262,187 | |
10.250% due 10/15/19 | | | 50,000 | | | | 57,250 | |
Smithfield Foods Inc | | | | | | | | |
6.625% due 08/15/22 | | | 100,000 | | | | 110,750 | |
7.750% due 07/01/17 | | | 100,000 | | | | 117,000 | |
Spectrum Brands Escrow Corp
6.375% due 11/15/20 ~ | | | 100,000 | | | | 105,250 | |
Spectrum Brands Inc
9.500% due 06/15/18 | | | 150,000 | | | | 171,000 | |
Stater Bros Holdings Inc
7.375% due 11/15/18 | | | 50,000 | | | | 54,250 | |
SUPERVALU Inc
8.000% due 05/01/16 | | | 250,000 | | | | 239,375 | |
The Pantry Inc
8.375% due 08/01/20 ~ | | | 100,000 | | | | 105,000 | |
Tops Holding Corp | | | | | | | | |
8.875% due 12/15/17 ~ | | | 100,000 | | | | 104,250 | |
10.125% due 10/15/15 | | | 100,000 | | | | 105,562 | |
U.S. Foods Inc
8.500% due 06/30/19 ~ | | | 220,000 | | | | 225,500 | |
| | | | | | | | |
| | | | | | | 5,286,026 | |
| | | | | | | | |
Energy - 14.8% | | | | | | | | |
| | |
Access Midstream Partners LP | | | | | | | | |
4.875% due 05/15/23 | | | 210,000 | | | | 213,412 | |
6.125% due 07/15/22 | | | 100,000 | | | | 108,250 | |
Afren PLC (United Kingdom)
11.500% due 02/01/16 ~ | | | 100,000 | | | | 116,500 | |
Alpha Natural Resources Inc | | | | | | | | |
6.000% due 06/01/19 | | | 100,000 | | | | 92,500 | |
6.250% due 06/01/21 | | | 100,000 | | | | 92,000 | |
Antero Resources Finance Corp
7.250% due 08/01/19 | | | 75,000 | | | | 82,125 | |
Arch Coal Inc | | | | | | | | |
7.250% due 06/15/21 | | | 150,000 | | | | 139,125 | |
8.750% due 08/01/16 | | | 200,000 | | | | 209,000 | |
Atlas Pipeline Partners LP
6.625% due 10/01/20 ~ | | | 100,000 | | | | 104,000 | |
Basic Energy Services Inc
7.750% due 10/15/22 ~ | | | 100,000 | | | | 98,000 | |
Berry Petroleum Co | | | | | | | | |
6.375% due 09/15/22 | | | 90,000 | | | | 94,050 | |
6.750% due 11/01/20 | | | 50,000 | | | | 54,000 | |
| | |
| See Notes to Financial Statements | | See explanation of symbols and terms, if any, on page B-81 |
B-18
PACIFIC SELECT FUND
PD HIGH YIELD BOND MARKET PORTFOLIO
Schedule of Investments (Continued)
December 31, 2012
| | | | | | | | |
| | | Principal
Amount | | | Value | |
Bill Barrett Corp
7.625% due 10/01/19 | | | $100,000 | | | | $106,000 | |
BreitBurn Energy Partners LP
7.875% due 04/15/22 ~ | | | 100,000 | | | | 104,250 | |
Bristow Group Inc
6.250% due 10/15/22 | | | 100,000 | | | | 107,375 | |
Calumet Specialty Products Partners LP
9.375% due 05/01/19 | | | 100,000 | | | | 109,000 | |
Carrizo Oil & Gas Inc
8.625% due 10/15/18 | | | 100,000 | | | | 108,500 | |
CCS Inc (Canada)
11.000% due 11/15/15 ~ | | | 50,000 | | | | 50,125 | |
Chaparral Energy Inc
9.875% due 10/01/20 | | | 100,000 | | | | 114,250 | |
Chesapeake Energy Corp | | | | | | | | |
6.125% due 02/15/21 | | | 200,000 | | | | 208,500 | |
6.500% due 08/15/17 | | | 400,000 | | | | 436,000 | |
6.625% due 08/15/20 | | | 100,000 | | | | 107,750 | |
Chesapeake Oilfield Operating LLC
6.625% due 11/15/19 ~ | | | 100,000 | | | | 94,750 | |
Cie Generale de Geophysique-Veritas (France)
9.500% due 05/15/16 | | | 125,000 | | | | 134,687 | |
Cimarex Energy Co
5.875% due 05/01/22 | | | 100,000 | | | | 110,000 | |
CITIC Resources Finance Ltd (United Kingdom)
6.750% due 05/15/14 ~ | | | 100,000 | | | | 106,000 | |
Cloud Peak Energy Resources LLC
8.250% due 12/15/17 | | | 25,000 | | | | 26,875 | |
Coffeyville Resources LLC
10.875% due 04/01/17 ~ | | | 50,000 | | | | 55,250 | |
Comstock Resources Inc
7.750% due 04/01/19 | | | 100,000 | | | | 102,000 | |
Concho Resources Inc | | | | | | | | |
5.500% due 04/01/23 | | | 100,000 | | | | 105,250 | |
6.500% due 01/15/22 | | | 200,000 | | | | 221,000 | |
7.000% due 01/15/21 | | | 30,000 | | | | 33,600 | |
Connacher Oil & Gas Ltd (Canada)
8.500% due 08/01/19 ~ | | | 100,000 | | | | 69,000 | |
CONSOL Energy Inc | | | | | | | | |
8.000% due 04/01/17 | | | 185,000 | | | | 201,187 | |
8.250% due 04/01/20 | | | 75,000 | | | | 81,563 | |
Continental Resources Inc | | | | | | | | |
5.000% due 09/15/22 | | | 200,000 | | | | 216,500 | |
7.125% due 04/01/21 | | | 10,000 | | | | 11,350 | |
7.375% due 10/01/20 | | | 25,000 | | | | 28,375 | |
Copano Energy LLC
7.750% due 06/01/18 | | | 50,000 | | | | 52,938 | |
Crosstex Energy LP
8.875% due 02/15/18 | | | 105,000 | | | | 113,925 | |
CVR Refining LLC
6.500% due 11/01/22 ~ | | | 100,000 | | | | 100,000 | |
Denbury Resources Inc | | | | | | | | |
6.375% due 08/15/21 | | | 100,000 | | | | 110,500 | |
8.250% due 02/15/20 | | | 110,000 | | | | 124,300 | |
Drill Rigs Holdings Inc
6.500% due 10/01/17 ~ | | | 56,000 | | | | 56,000 | |
El Paso LLC | | | | | | | | |
6.500% due 09/15/20 | | | 100,000 | | | | 113,316 | |
7.750% due 01/15/32 | | | 150,000 | | | | 176,644 | |
Enbridge Energy Partners LP
8.050% due 10/01/77 § | | | 50,000 | | | | 56,830 | |
Energy Transfer Equity LP
7.500% due 10/15/20 | | | 195,000 | | | | 226,200 | |
Energy XXI Gulf Coast Inc
9.250% due 12/15/17 | | | 100,000 | | | | 114,750 | |
Enterprise Products Operating LLC
7.034% due 01/15/68 § | | | 100,000 | | | | 114,623 | |
| | | | | | | | |
| | | Principal
Amount | | | Value | |
EP Energy LLC
9.375% due 05/01/20 | | | $250,000 | | | | $283,125 | |
EPE Holdings LLC
8.125% due 12/15/17 ~ | | | 100,000 | | | | 99,375 | |
EXCO Resources Inc
7.500% due 09/15/18 | | | 35,000 | | | | 34,125 | |
Expro Finance Luxembourg SCA (Luxembourg)
8.500% due 12/15/16 ~ | | | 150,000 | | | | 157,500 | |
Exterran Holdings Inc
7.250% due 12/01/18 | | | 50,000 | | | | 53,250 | |
Foresight Energy LLC
9.625% due 08/15/17 ~ | | | 95,000 | | | | 102,125 | |
Forest Oil Corp | | | | | | | | |
7.500% due 09/15/20 ~ | | | 100,000 | | | | 105,500 | |
8.500% due 02/15/14 | | | 50,000 | | | | 53,250 | |
FTS International Services LLC
8.125% due 11/15/18 ~ | | | 18,000 | | | | 18,675 | |
Halcon Resources Corp
9.750% due 07/15/20 ~ | | | 95,000 | | | | 103,075 | |
Harvest Operations Corp (Canada)
6.875% due 10/01/17 | | | 125,000 | | | | 139,375 | |
Helix Energy Solutions Group Inc
9.500% due 01/15/16 ~ | | | 29,000 | | | | 29,798 | |
Hercules Offshore Inc
10.250% due 04/01/19 ~ | | | 100,000 | | | | 110,000 | |
Hiland Partners LP
7.250% due 10/01/20 ~ | | | 100,000 | | | | 107,500 | |
Hilcorp Energy I LP
7.625% due 04/15/21 ~ | | | 100,000 | | | | 109,500 | |
Holly Energy Partners LP
6.500% due 03/01/20 ~ | | | 100,000 | | | | 107,500 | |
HollyFrontier Corp
9.875% due 06/15/17 | | | 25,000 | | | | 27,188 | |
Inergy Midstream LP
6.000% due 12/15/20 ~ | | | 27,000 | | | | 27,945 | |
Key Energy Services Inc
6.750% due 03/01/21 ~ | | | 100,000 | | | | 100,000 | |
Kinder Morgan Finance Co LLC
6.000% due 01/15/18 ~ | | | 150,000 | | | | 165,564 | |
Kinder Morgan Finance Co ULC (Canada)
5.700% due 01/05/16 | | | 100,000 | | | | 109,789 | |
Kodiak Oil & Gas Corp (Canada)
8.125% due 12/01/19 | | | 100,000 | | | | 110,750 | |
Laredo Petroleum Inc
9.500% due 02/15/19 | | | 50,000 | | | | 56,125 | |
Linn Energy LLC | | | | | | | | |
6.250% due 11/01/19 ~ | | | 250,000 | | | | 252,500 | |
6.500% due 05/15/19 | | | 100,000 | | | | 101,500 | |
8.625% due 04/15/20 | | | 175,000 | | | | 191,625 | |
MarkWest Energy Partners LP | | | | | | | | |
6.250% due 06/15/22 | | | 100,000 | | | | 110,500 | |
6.500% due 08/15/21 | | | 150,000 | | | | 164,625 | |
MEG Energy Corp (Canada)
6.500% due 03/15/21 ~ | | | 100,000 | | | | 105,750 | |
Midstates Petroleum Co Inc
10.750% due 10/01/20 ~ | | | 59,000 | | | | 62,983 | |
MIE Holdings Corp (Cayman)
9.750% due 05/12/16 ~ | | | 200,000 | | | | 219,000 | |
Milagro Oil & Gas Inc
10.500% due 05/15/16 | | | 50,000 | | | | 37,250 | |
Newfield Exploration Co | | | | | | | | |
5.625% due 07/01/24 | | | 56,000 | | | | 60,620 | |
5.750% due 01/30/22 | | | 100,000 | | | | 110,500 | |
6.875% due 02/01/20 | | | 200,000 | | | | 215,000 | |
NGPL PipeCo LLC | | | | | | | | |
7.119% due 12/15/17 ~ | | | 100,000 | | | | 109,500 | |
9.625% due 06/01/19 ~ | | | 150,000 | | | | 173,250 | |
NuStar Logistics LP
4.750% due 02/01/22 | | | 100,000 | | | | 95,138 | |
| | |
| See Notes to Financial Statements | | See explanation of symbols and terms, if any, on page B-81 |
B-19
PACIFIC SELECT FUND
PD HIGH YIELD BOND MARKET PORTFOLIO
Schedule of Investments (Continued)
December 31, 2012
| | | | | | | | |
| | | Principal
Amount | | | Value | |
Oasis Petroleum Inc
6.500% due 11/01/21 | | | $100,000 | | | | $106,750 | |
Offshore Group Investment Ltd (Cayman) | | | | | | | | |
7.500% due 11/01/19 ~ | | | 260,000 | | | | 263,900 | |
11.500% due 08/01/15 | | | 97,000 | | | | 105,972 | |
Oil States International Inc
6.500% due 06/01/19 | | | 100,000 | | | | 107,000 | |
Pacific Drilling V Ltd (Luxembourg)
7.250% due 12/01/17 ~ | | | 100,000 | | | | 104,250 | |
Parker Drilling Co
9.125% due 04/01/18 | | | 10,000 | | | | 10,725 | |
PBF Holding Co LLC
8.250% due 02/15/20 ~ | | | 130,000 | | | | 140,725 | |
Peabody Energy Corp | | | | | | | | |
6.000% due 11/15/18 | | | 200,000 | | | | 213,500 | |
6.250% due 11/15/21 | | | 150,000 | | | | 160,125 | |
7.375% due 11/01/16 | | | 100,000 | | | | 115,000 | |
Penn Virginia Corp
7.250% due 04/15/19 | | | 100,000 | | | | 96,000 | |
Penn Virginia Resource Partners LP | | | | | | | | |
8.250% due 04/15/18 | | | 125,000 | | | | 133,125 | |
8.375% due 06/01/20 ~ | | | 100,000 | | | | 108,250 | |
PetroBakken Energy Ltd (Canada)
8.625% due 02/01/20 ~ | | | 200,000 | | | | 204,000 | |
Plains Exploration & Production Co | | | | | | | | |
6.125% due 06/15/19 | | | 200,000 | | | | 219,000 | |
6.750% due 02/01/22 | | | 400,000 | | | | 451,000 | |
Precision Drilling Corp (Canada)
6.625% due 11/15/20 | | | 100,000 | | | | 108,000 | |
QEP Resources Inc | | | | | | | | |
5.250% due 05/01/23 | | | 159,000 | | | | 170,925 | |
6.875% due 03/01/21 | | | 50,000 | | | | 57,875 | |
Quicksilver Resources Inc
11.750% due 01/01/16 | | | 150,000 | | | | 148,875 | |
Range Resources Corp | | | | | | | | |
5.000% due 08/15/22 | | | 200,000 | | | | 210,000 | |
5.750% due 06/01/21 | | | 50,000 | | | | 53,750 | |
6.750% due 08/01/20 | | | 100,000 | | | | 109,000 | |
Regency Energy Partners LP | | | | | | | | |
5.500% due 04/15/23 | | | 100,000 | | | | 107,250 | |
6.875% due 12/01/18 | | | 100,000 | | | | 109,500 | |
9.375% due 06/01/16 | | | 16,000 | | | | 17,240 | |
Rockies Express Pipeline LLC
3.900% due 04/15/15 ~ | | | 250,000 | | | | 250,000 | |
Rosetta Resources Inc
9.500% due 04/15/18 | | | 25,000 | | | | 27,875 | |
Sabine Pass LNG LP
7.500% due 11/30/16 | | | 200,000 | | | | 221,500 | |
Samson Investment Co
9.750% due 02/15/20 ~ | | | 235,000 | | | | 249,687 | |
SandRidge Energy Inc | | | | | | | | |
7.500% due 02/15/23 | | | 100,000 | | | | 107,500 | |
8.125% due 10/15/22 | | | 100,000 | | | | 110,000 | |
8.750% due 01/15/20 | | | 150,000 | | | | 165,000 | |
9.875% due 05/15/16 | | | 50,000 | | | | 54,125 | |
Seadrill Ltd (Bermuda)
5.625% due 09/15/17 ~ | | | 100,000 | | | | 99,750 | |
SESI LLC | | | | | | | | |
6.375% due 05/01/19 | | | 100,000 | | | | 107,500 | |
7.125% due 12/15/21 | | | 50,000 | | | | 55,875 | |
SM Energy Co
6.500% due 01/01/23 | | | 200,000 | | | | 215,000 | |
Stone Energy Corp
8.625% due 02/01/17 | | | 100,000 | | | | 107,875 | |
Swift Energy Co
7.125% due 06/01/17 | | | 50,000 | | | | 51,750 | |
Targa Resources Partners LP | | | | | | | | |
5.250% due 05/01/23 ~ | | | 77,000 | | | | 80,080 | |
7.875% due 10/15/18 | | | 100,000 | | | | 110,000 | |
| | | | | | | | |
| | | Principal
Amount | | | Value | |
Teekay Corp
8.500% due 01/15/20 | | | $25,000 | | | | $26,500 | |
Tesoro Corp
4.250% due 10/01/17 | | | 125,000 | | | | 130,000 | |
Unit Corp
6.625% due 05/15/21 ~ | | | 100,000 | | | | 103,125 | |
W&T Offshore Inc
8.500% due 06/15/19 | | | 100,000 | | | | 108,000 | |
Whiting Petroleum Corp
6.500% due 10/01/18 | | | 25,000 | | | | 27,000 | |
WPX Energy Inc
5.250% due 01/15/17 | | | 150,000 | | | | 159,750 | |
| | | | | | | | |
| | | | | | | 16,232,529 | |
| | | | | | | | |
Financials - 11.9% | | | | | | | | |
| | |
Agile Property Holdings Ltd (Cayman)
8.875% due 04/28/17 ~ | | | 100,000 | | | | 108,500 | |
Ally Financial Inc | | | | | | | | |
3.125% due 01/15/16 | | | 100,000 | | | | 100,157 | |
4.500% due 02/11/14 | | | 300,000 | | | | 309,375 | |
4.625% due 06/26/15 | | | 100,000 | | | | 104,309 | |
5.500% due 02/15/17 | | | 250,000 | | | | 268,594 | |
6.750% due 12/01/14 | | | 150,000 | | | | 162,033 | |
8.000% due 12/31/18 | | | 100,000 | | | | 117,500 | |
8.000% due 03/15/20 | | | 300,000 | | | | 369,000 | |
8.000% due 11/01/31 | | | 275,000 | | | | 349,395 | |
8.300% due 02/12/15 | | | 75,000 | | | | 83,719 | |
Atlantic Finance Ltd (United Kingdom)
10.750% due 05/27/14 § ~ | | | 200,000 | | | | 214,728 | |
Capital One Capital V
10.250% due 08/15/39 | | | 300,000 | | | | 300,000 | |
CBRE Services Inc
6.625% due 10/15/20 | | | 100,000 | | | | 109,875 | |
CIT Group Inc | | | | | | | | |
4.250% due 08/15/17 | | | 108,000 | | | | 111,681 | |
4.750% due 02/15/15 ~ | | | 100,000 | | | | 104,500 | |
5.000% due 08/15/22 | | | 100,000 | | | | 107,022 | |
5.250% due 04/01/14 ~ | | | 400,000 | | | | 416,000 | |
5.250% due 03/15/18 | | | 150,000 | | | | 161,250 | |
5.375% due 05/15/20 | | | 100,000 | | | | 109,750 | |
6.625% due 04/01/18 ~ | | | 250,000 | | | | 283,750 | |
CNG Holdings Inc
9.375% due 05/15/20 ~ | | | 100,000 | | | | 102,000 | |
CNH Capital LLC
3.875% due 11/01/15 ~ | | | 117,000 | | | | 121,241 | |
Country Garden Holdings Co Ltd (Cayman)
11.125% due 02/23/18 ~ | | | 200,000 | | | | 233,000 | |
Crescent Resources LLC
10.250% due 08/15/17 ~ | | | 100,000 | | | | 106,000 | |
Dresdner Funding Trust I
8.151% due 06/30/31 ~ | | | 100,000 | | | | 99,050 | |
E*TRADE Financial Corp | | | | | | | | |
6.000% due 11/15/17 | | | 60,000 | | | | 61,650 | |
6.375% due 11/15/19 | | | 100,000 | | | | 103,000 | |
6.750% due 06/01/16 | | | 100,000 | | | | 105,750 | |
Evergrande Real Estate Group Ltd (Cayman)
13.000% due 01/27/15 ~ | | | 100,000 | | | | 109,500 | |
Felcor Lodging LP REIT | | | | | | | | |
5.625% due 03/01/23 ~ | | | 48,000 | | | | 47,880 | |
6.750% due 06/01/19 | | | 100,000 | | | | 106,750 | |
10.000% due 10/01/14 | | | 39,000 | | | | 45,240 | |
Fifth Third Capital Trust IV
6.500% due 04/15/67 § | | | 100,000 | | | | 100,375 | |
First Data Corp | | | | | | | | |
6.750% due 11/01/20 ~ | | | 250,000 | | | | 253,750 | |
7.375% due 06/15/19 ~ | | | 100,000 | | | | 104,000 | |
8.250% due 01/15/21 ~ | | | 312,000 | | | | 313,560 | |
8.875% due 08/15/20 ~ | | | 100,000 | | | | 109,500 | |
9.875% due 09/24/15 | | | 26,000 | | | | 26,650 | |
| | |
| See Notes to Financial Statements | | See explanation of symbols and terms, if any, on page B-81 |
B-20
PACIFIC SELECT FUND
PD HIGH YIELD BOND MARKET PORTFOLIO
Schedule of Investments (Continued)
December 31, 2012
| | | | | | | | |
| | | Principal
Amount | | | Value | |
10.550% due 09/24/15 | | | $105,275 | | | | $108,302 | |
11.250% due 03/31/16 | | | 200,000 | | | | 197,000 | |
12.625% due 01/15/21 | | | 212,000 | | | | 224,190 | |
General Motors Financial Co Inc | | | | | | | | |
4.750% due 08/15/17 ~ | | | 67,000 | | | | 70,499 | |
6.750% due 06/01/18 | | | 100,000 | | | | 114,808 | |
Genworth Financial Inc
6.150% due 11/15/66 § | | | 50,000 | | | | 37,313 | |
HBOS PLC (United Kingdom) | | | | | | | | |
6.000% due 11/01/33 ~ | | | 100,000 | | | | 91,397 | |
6.750% due 05/21/18 ~ | | | 200,000 | | | | 216,250 | |
Host Hotels & Resorts LP REIT | | | | | | | | |
5.250% due 03/15/22 | | | 150,000 | | | | 165,000 | |
5.875% due 06/15/19 | | | 100,000 | | | | 109,500 | |
6.750% due 06/01/16 | | | 107,000 | | | | 109,943 | |
Hub International Ltd
8.125% due 10/15/18 ~ | | | 150,000 | | | | 154,500 | |
iStar Financial Inc REIT
9.000% due 06/01/17 | | | 100,000 | | | | 109,500 | |
Kaisa Group Holdings Ltd (Cayman)
13.500% due 04/28/15 ~ | | | 100,000 | | | | 109,500 | |
Leucadia National Corp
8.125% due 09/15/15 | | | 100,000 | | | | 113,000 | |
Liberty Mutual Group Inc
10.750% due 06/15/88 § ~ | | | 225,000 | | | | 337,500 | |
Longfor Properties Co Ltd (Cayman)
9.500% due 04/07/16 ~ | | | 100,000 | | | | 111,250 | |
Mizuho Capital Investment USD 2 Ltd (Cayman)
14.950% § ± ~ | | | 100,000 | | | | 118,198 | |
MPT Operating Partnership LP REIT
6.375% due 02/15/22 | | | 100,000 | | | | 105,500 | |
MUFG Capital Financial 1 Ltd (Cayman)
6.346% § ± | | | 250,000 | | | | 275,824 | |
National Money Mart Co (Canada)
10.375% due 12/15/16 | | | 50,000 | | | | 55,500 | |
Nationstar Mortgage LLC
10.875% due 04/01/15 | | | 100,000 | | | | 107,500 | |
Neuberger Berman Group LLC
5.625% due 03/15/20 ~ | | | 100,000 | | | | 105,250 | |
Nuveen Investments Inc | | | | | | | | |
9.125% due 10/15/17 ~ | | | 200,000 | | | | 197,500 | |
9.500% due 10/15/20 ~ | | | 143,000 | | | | 143,000 | |
Onex USI Aquisition Corp
7.750% due 01/15/21 ~ | | | 167,000 | | | | 165,330 | |
PHH Corp
9.250% due 03/01/16 | | | 100,000 | | | | 117,250 | |
Provident Funding Associates LP
10.250% due 04/15/17 ~ | | | 50,000 | | | | 55,375 | |
RBS Capital Trust II
6.425% § ± | | | 100,000 | | | | 88,000 | |
Realogy Group LLC | | | | | | | | |
7.625% due 01/15/20 ~ | | | 100,000 | | | | 113,750 | |
7.875% due 02/15/19 ~ | | | 100,000 | | | | 109,500 | |
11.500% due 04/15/17 | | | 100,000 | | | | 108,750 | |
Regions Bank
7.500% due 05/15/18 | | | 100,000 | | | | 120,875 | |
Regions Financial Corp
7.375% due 12/10/37 | | | 100,000 | | | | 110,000 | |
Regions Financing Trust II
6.625% due 05/01/77 § | | | 100,000 | | | | 100,250 | |
Renhe Commercial Holdings Co Ltd (Cayman)
13.000% due 03/10/16 ~ | | | 100,000 | | | | 74,000 | |
Resona Preferred Global Securities Ltd (Cayman)
7.191% § ± ~ | | | 100,000 | | | | 109,171 | |
SMFG Preferred Capital USD 3 Ltd (Cayman)
9.500% § ± ~ | | | 175,000 | | | | 224,962 | |
| | | | | | | | |
| | | Principal
Amount | | | Value | |
Springleaf Finance Corp
6.900% due 12/15/17 | | | $350,000 | | | | $315,000 | |
Synovus Financial Corp
5.125% due 06/15/17 | | | 50,000 | | | | 49,750 | |
The Rouse Co LLC REIT
6.750% due 11/09/15 | | | 100,000 | | | | 105,125 | |
The Royal Bank of Scotland Group PLC (United Kingdom) | | | | | | | | |
5.000% due 10/01/14 | | | 400,000 | | | | 411,175 | |
6.125% due 12/15/22 | | | 170,000 | | | | 179,915 | |
7.640% § ± | | | 100,000 | | | | 91,000 | |
7.648% § ± | | | 50,000 | | | | 51,000 | |
TransUnion LLC
11.375% due 06/15/18 | | | 150,000 | | | | 175,500 | |
UBS Preferred Funding Trust V
6.243% § ± | | | 100,000 | | | | 102,500 | |
Weyerhaeuser Co REIT | | | | | | | | |
7.375% due 10/01/19 | | | 100,000 | | | | 123,668 | |
7.375% due 03/15/32 | | | 200,000 | | | | 252,185 | |
Woori Bank Co Ltd (South Korea)
6.208% due 05/02/67 § ~ | | | 100,000 | | | | 108,000 | |
XL Group PLC (Ireland)
6.500% § ± | | | 100,000 | | | | 94,000 | |
| | | | | | | | |
| | | | | | | 13,083,789 | |
| | | | | | | | |
Health Care - 7.7% | | | | | | | | |
| | |
Accellent Inc
10.000% due 11/01/17 | | | 100,000 | | | | 82,750 | |
Alere Inc
9.000% due 05/15/16 | | | 100,000 | | | | 106,000 | |
Apria Healthcare Group Inc | | | | | | | | |
11.250% due 11/01/14 | | | 50,000 | | | | 51,813 | |
12.375% due 11/01/14 | | | 100,000 | | | | 99,500 | |
Bausch & Lomb Inc
9.875% due 11/01/15 | | | 30,000 | | | | 31,050 | |
Biomet Inc | | | | | | | | |
6.500% due 08/01/20 ~ | | | 235,000 | | | | 250,569 | |
6.500% due 10/01/20 ~ | | | 100,000 | | | | 99,875 | |
Capella Healthcare Inc
9.250% due 07/01/17 | | | 100,000 | | | | 107,750 | |
Catalent Pharma Solutions Inc
7.875% due 10/15/18 ~ | | | 100,000 | | | | 101,250 | |
Centene Corp
5.750% due 06/01/17 | | | 25,000 | | | | 27,000 | |
CHS/Community Health Systems Inc | | | | | | | | |
7.125% due 07/15/20 | | | 100,000 | | | | 106,875 | |
8.000% due 11/15/19 | | | 300,000 | | | | 326,250 | |
ConvaTec Healthcare E SA (Luxembourg)
10.500% due 12/15/18 ~ | | | 150,000 | | | | 166,125 | |
DaVita HealthCare Partners Inc | | | | | | | | |
5.750% due 08/15/22 | | | 118,000 | | | | 124,932 | |
6.625% due 11/01/20 | | | 150,000 | | | | 163,875 | |
DJO Finance LLC
9.875% due 04/15/18 ~ | | | 200,000 | | | | 207,500 | |
Elan Finance PLC (Ireland)
6.250% due 10/15/19 ~ | | | 200,000 | | | | 210,000 | |
Emergency Medical Services Corp
8.125% due 06/01/19 | | | 100,000 | | | | 110,312 | |
Endo Health Solutions Inc
7.000% due 07/15/19 | | | 95,000 | | | | 101,769 | |
ExamWorks Group Inc
9.000% due 07/15/19 | | | 100,000 | | | | 107,500 | |
Fresenius Medical Care U.S. Finance Inc
5.750% due 02/15/21 ~ | | | 100,000 | | | | 107,500 | |
Fresenius Medical Care U.S. Finance II Inc
5.625% due 07/31/19 ~ | | | 200,000 | | | | 215,750 | |
Grifols Inc
8.250% due 02/01/18 | | | 100,000 | | | | 110,625 | |
HCA Holdings Inc
7.750% due 05/15/21 | | | 100,000 | | | | 109,000 | |
| | |
| See Notes to Financial Statements | | See explanation of symbols and terms, if any, on page B-81 |
B-21
PACIFIC SELECT FUND
PD HIGH YIELD BOND MARKET PORTFOLIO
Schedule of Investments (Continued)
December 31, 2012
| | | | | | | | |
| | | Principal
Amount | | | Value | |
HCA Inc | | | | | | | | |
4.750% due 05/01/23 | | | $150,000 | | | | $153,000 | |
5.875% due 03/15/22 | | | 250,000 | | | | 273,125 | |
5.875% due 05/01/23 | | | 100,000 | | | | 103,750 | |
6.375% due 01/15/15 | | | 150,000 | | | | 162,937 | |
6.500% due 02/15/16 | | | 100,000 | | | | 109,250 | |
6.500% due 02/15/20 | | | 160,000 | | | | 180,400 | |
7.250% due 09/15/20 | | | 400,000 | | | | 445,000 | |
7.500% due 02/15/22 | | | 400,000 | | | | 460,000 | |
Health Management Associates Inc
7.375% due 01/15/20 | | | 200,000 | | | | 217,000 | |
Health Net Inc
6.375% due 06/01/17 | | | 100,000 | | | | 106,625 | |
HealthSouth Corp
7.750% due 09/15/22 | | | 90,000 | | | | 99,113 | |
Hologic Inc
6.250% due 08/01/20 ~ | | | 159,000 | | | | 172,117 | |
Iasis Healthcare LLC
8.375% due 05/15/19 | | | 100,000 | | | | 95,000 | |
IMS Health Inc
12.500% due 03/01/18 ~ | | | 100,000 | | | | 121,500 | |
inVentiv Health Inc | | | | | | | | |
9.000% due 01/15/18 ~ | | | 30,000 | | | | 30,375 | |
10.250% due 08/15/18 ~ | | | 50,000 | | | | 43,625 | |
Kindred Healthcare Inc
8.250% due 06/01/19 | | | 100,000 | | | | 97,750 | |
Kinetic Concepts Inc
10.500% due 11/01/18 ~ | | | 200,000 | | | | 210,750 | |
LifePoint Hospitals Inc
6.625% due 10/01/20 | | | 50,000 | | | | 54,250 | |
MedAssets Inc
8.000% due 11/15/18 | | | 50,000 | | | | 54,500 | |
MultiPlan Inc
9.875% due 09/01/18 ~ | | | 25,000 | | | | 28,000 | |
Omnicare Inc
7.750% due 06/01/20 | | | 100,000 | | | | 111,500 | |
Phibro Animal Health Corp
9.250% due 07/01/18 ~ | | | 25,000 | | | | 25,125 | |
Sky Growth Acquisition Corp
7.375% due 10/15/20 ~ | | | 100,000 | | | | 100,000 | |
Tenet Healthcare Corp | | | | | | | | |
4.750% due 06/01/20 ~ | | | 100,000 | | | | 101,750 | |
6.250% due 11/01/18 | | | 140,000 | | | | 154,350 | |
6.750% due 02/01/20 ~ | | | 100,000 | | | | 103,375 | |
8.000% due 08/01/20 | | | 100,000 | | | | 108,188 | |
8.875% due 07/01/19 | | | 150,000 | | | | 168,750 | |
United Surgical Partners International Inc
9.000% due 04/01/20 | | | 100,000 | | | | 111,500 | |
Universal Health Services Inc
7.000% due 10/01/18 | | | 65,000 | | | | 71,988 | |
Universal Hospital Services Inc
7.625% due 08/15/20 ~ | | | 100,000 | | | | 105,625 | |
Valeant Pharmaceuticals International | | | | | | | | |
6.500% due 07/15/16 ~ | | | 350,000 | | | | 369,687 | |
6.750% due 10/01/17 ~ | | | 100,000 | | | | 108,500 | |
7.000% due 10/01/20 ~ | | | 10,000 | | | | 10,925 | |
7.250% due 07/15/22 ~ | | | 100,000 | | | | 109,750 | |
Vanguard Health Holding Co II LLC
8.000% due 02/01/18 | | | 150,000 | | | | 156,000 | |
VPI Escrow Corp
6.375% due 10/15/20 ~ | | | 120,000 | | | | 129,300 | |
Warner Chilcott Co LLC
7.750% due 09/15/18 | | | 100,000 | | | | 107,000 | |
| | | | | | | | |
| | | | | | | 8,496,950 | |
| | | | | | | | |
Industrials - 11.0% | | | | | | | | |
| | |
313 Group Inc
6.375% due 12/01/19 ~ | | | 125,000 | | | | 124,531 | |
AAR Corp
7.250% due 01/15/22 ~ | | | 100,000 | | | | 106,375 | |
| | | | | | | | |
| | | Principal
Amount | | | Value | |
Abengoa Finance SAU (Spain)
8.875% due 11/01/17 ~ | | | $100,000 | | | | $94,500 | |
ADS Waste Holdings Inc
8.250% due 10/01/20 ~ | | | 200,000 | | | | 211,000 | |
Aguila 3 SA (Luxembourg)
7.875% due 01/31/18 ~ | | | 150,000 | | | | 159,750 | |
Air Canada (Canada)
9.250% due 08/01/15 ~ | | | 105,000 | | | | 110,250 | |
Air Lease Corp
5.625% due 04/01/17 | | | 250,000 | | | | 266,250 | |
Air Medical Group Holdings Inc
9.250% due 11/01/18 ~ | | | 100,000 | | | | 111,000 | |
Aircastle Ltd (Bermuda) | | | | | | | | |
6.250% due 12/01/19 ~ | | | 70,000 | | | | 73,325 | |
6.750% due 04/15/17 | | | 150,000 | | | | 161,250 | |
Algeco Scotsman Global Finance PLC (United Kingdom) | | | | | | | | |
8.500% due 10/15/18 ~ | | | 200,000 | | | | 208,000 | |
10.750% due 10/15/19 ~ | | | 200,000 | | | | 198,000 | |
Alliant Techsystems Inc
6.875% due 09/15/20 | | | 100,000 | | | | 110,375 | |
American Airlines Inc
13.000% due 08/01/16 | | | 63,011 | | | | 66,792 | |
Aviation Capital Group Corp
6.750% due 04/06/21 ~ | | | 150,000 | | | | 155,299 | |
Avis Budget Car Rental LLC
9.625% due 03/15/18 | | | 100,000 | | | | 112,000 | |
AWAS Aviation Capital Ltd (Ireland)
7.000% due 10/17/16 ~ | | | 80,800 | | | | 85,648 | |
BE Aerospace Inc | | | | | | | | |
5.250% due 04/01/22 | | | 112,000 | | | | 119,280 | |
6.875% due 10/01/20 | | | 125,000 | | | | 139,687 | |
Belden Inc
5.500% due 09/01/22 ~ | | | 80,000 | | | | 82,600 | |
Bombardier Inc (Canada)
7.750% due 03/15/20 ~ | | | 150,000 | | | | 171,000 | |
Case New Holland Inc
7.875% due 12/01/17 | | | 250,000 | | | | 296,875 | |
Cenveo Corp
8.875% due 02/01/18 | | | 100,000 | | | | 95,500 | |
Ceridian Corp | | | | | | | | |
8.875% due 07/15/19 ~ | | | 100,000 | | | | 109,000 | |
11.250% due 11/15/15 | | | 100,000 | | | | 100,500 | |
CEVA Group PLC (United Kingdom) | | | | | | | | |
8.375% due 12/01/17 ~ | | | 100,000 | | | | 99,500 | |
11.500% due 04/01/18 ~ | | | 100,000 | | | | 84,500 | |
Clean Harbors Inc | | | | | | | | |
5.125% due 06/01/21 ~ | | | 53,000 | | | | 55,120 | |
5.250% due 08/01/20 | | | 54,000 | | | | 56,565 | |
Colt Defense LLC
8.750% due 11/15/17 | | | 25,000 | | | | 16,438 | |
Continental Airlines Inc
6.750% due 09/15/15 ~ | | | 150,000 | | | | 158,250 | |
Covanta Holding Corp
6.375% due 10/01/22 | | | 100,000 | | | | 109,040 | |
CSC Holdings LLC | | | | | | | | |
6.750% due 11/15/21 ~ | | | 200,000 | | | | 222,750 | |
7.625% due 07/15/18 | | | 100,000 | | | | 116,000 | |
Deluxe Corp
7.000% due 03/15/19 | | | 100,000 | | | | 106,250 | |
Dematic SA (Luxembourg)
7.750% due 12/15/20 ~ | | | 100,000 | | | | 100,500 | |
DynCorp International Inc
10.375% due 07/01/17 | | | 50,000 | | | | 46,000 | |
EnergySolutions Inc
10.750% due 08/15/18 | | | 25,000 | | | | 23,750 | |
FGI Operating Co LLC
7.875% due 05/01/20 ~ | | | 50,000 | | | | 51,750 | |
Florida East Coast Railway Corp
8.125% due 02/01/17 | | | 100,000 | | | | 106,500 | |
| | |
| See Notes to Financial Statements | | See explanation of symbols and terms, if any, on page B-81 |
B-22
PACIFIC SELECT FUND
PD HIGH YIELD BOND MARKET PORTFOLIO
Schedule of Investments (Continued)
December 31, 2012
| | | | | | | | |
| | | Principal
Amount | | | Value | |
FTI Consulting Inc
6.750% due 10/01/20 | | | $50,000 | | | | $53,625 | |
General Cable Corp
5.750% due 10/01/22 ~ | | | 75,000 | | | | 78,000 | |
GeoEye Inc
9.625% due 10/01/15 | | | 50,000 | | | | 55,500 | |
Great Lakes Dredge & Dock Corp
7.375% due 02/01/19 | | | 100,000 | | | | 107,750 | |
Griffon Corp
7.125% due 04/01/18 | | | 100,000 | | | | 106,500 | |
H&E Equipment Services Inc
7.000% due 09/01/22 ~ | | | 100,000 | | | | 107,000 | |
HD Supply Inc | | | | | | | | |
8.125% due 04/15/19 ~ | | | 79,000 | | | | 90,257 | |
11.000% due 04/15/20 ~ | | | 100,000 | | | | 118,500 | |
11.500% due 07/15/20 ~ | | | 100,000 | | | | 112,875 | |
Huntington Ingalls Industries Inc | | | | | | | | |
6.875% due 03/15/18 | | | 100,000 | | | | 109,250 | |
7.125% due 03/15/21 | | | 50,000 | | | | 54,625 | |
Interline Brands Inc
10.000% due 11/15/18 ~ | | | 100,000 | | | | 109,000 | |
International Lease Finance Corp | | | | | | | | |
4.875% due 04/01/15 | | | 300,000 | | | | 311,649 | |
5.750% due 05/15/16 | | | 100,000 | | | | 105,883 | |
5.875% due 08/15/22 | | | 150,000 | | | | 159,011 | |
6.250% due 05/15/19 | | | 250,000 | | | | 267,500 | |
8.625% due 09/15/15 | | | 100,000 | | | | 112,750 | |
8.750% due 03/15/17 | | | 200,000 | | | | 232,000 | |
Iron Mountain Inc | | | | | | | | |
5.750% due 08/15/24 | | | 178,000 | | | | 181,115 | |
8.375% due 08/15/21 | | | 80,000 | | | | 89,200 | |
Jaguar Holding Co I
9.375% due 10/15/17 ~ | | | 150,000 | | | | 158,250 | |
JMC Steel Group Inc
8.250% due 03/15/18 ~ | | | 50,000 | | | | 52,500 | |
Kratos Defense & Security Solutions Inc
10.000% due 06/01/17 | | | 100,000 | | | | 110,250 | |
Marquette Transportation Co
10.875% due 01/15/17 | | | 25,000 | | | | 26,125 | |
Masco Corp | | | | | | | | |
4.800% due 06/15/15 | | | 100,000 | | | | 104,802 | |
5.950% due 03/15/22 | | | 100,000 | | | | 110,937 | |
6.125% due 10/03/16 | | | 50,000 | | | | 55,259 | |
7.125% due 03/15/20 | | | 100,000 | | | | 116,417 | |
Meritor Inc
10.625% due 03/15/18 | | | 100,000 | | | | 104,750 | |
Mueller Water Products Inc
8.750% due 09/01/20 | | | 45,000 | | | | 51,525 | |
Navios Martime Acquisition Corp
8.625% due 11/01/17 | | | 100,000 | | | | 94,250 | |
Navios Martime Holdings Inc
8.875% due 11/01/17 | | | 25,000 | | | | 25,063 | |
Navistar International Corp
8.250% due 11/01/21 | | | 203,000 | | | | 196,910 | |
Nielsen Finance LLC | | | | | | | | |
4.500% due 10/01/20 ~ | | | 150,000 | | | | 150,000 | |
7.750% due 10/15/18 | | | 100,000 | | | | 112,250 | |
Nortek Inc
8.500% due 04/15/21 | | | 100,000 | | | | 111,500 | |
Oshkosh Corp
8.500% due 03/01/20 | | | 25,000 | | | | 27,813 | |
Ply Gem Industries Inc
8.250% due 02/15/18 | | | 100,000 | | | | 108,500 | |
Polypore International Inc
7.500% due 11/15/17 | | | 25,000 | | | | 27,375 | |
RBS Global Inc
8.500% due 05/01/18 | | | 125,000 | | | | 136,094 | |
RR Donnelley & Sons Co | | | | | | | | |
6.125% due 01/15/17 | | | 184,000 | | | | 178,940 | |
7.250% due 05/15/18 | | | 75,000 | | | | 72,750 | |
| | | | | | | | |
| | | Principal
Amount | | | Value | |
Schaeffler Finance BV (Netherlands)
7.750% due 02/15/17 ~ | | | $100,000 | | | | $111,500 | |
Sensata Technologies BV (Netherlands)
6.500% due 05/15/19 ~ | | | 60,000 | | | | 64,200 | |
Sequa Corp
7.000% due 12/15/17 ~ | | | 62,500 | | | | 63,203 | |
Severstal Columbus LLC
10.250% due 02/15/18 | | | 100,000 | | | | 105,750 | |
Spirit Aerosystems Inc
6.750% due 12/15/20 | | | 25,000 | | | | 26,875 | |
SPL Logistics Escrow LLC
8.875% due 08/01/20 ~ | | | 100,000 | | | | 106,500 | |
SPX Corp
6.875% due 09/01/17 | | | 100,000 | | | | 112,000 | |
Swift Services Holdings Inc
10.000% due 11/15/18 | | | 100,000 | | | | 110,250 | |
Terex Corp
6.000% due 05/15/21 | | | 105,000 | | | | 111,037 | |
The Hertz Corp | | | | | | | | |
6.750% due 04/15/19 | | | 100,000 | | | | 109,625 | |
6.750% due 04/15/19 ~ | | | 100,000 | | | | 109,625 | |
7.500% due 10/15/18 | | | 100,000 | | | | 111,000 | |
The Manitowoc Co Inc | | | | | | | | |
8.500% due 11/01/20 | | | 50,000 | | | | 56,375 | |
9.500% due 02/15/18 | | | 100,000 | | | | 111,750 | |
Tomkins LLC
9.000% due 10/01/18 | | | 54,000 | | | | 60,750 | |
TransDigm Inc
7.750% due 12/15/18 | | | 150,000 | | | | 166,687 | |
Triumph Group Inc
8.625% due 07/15/18 | | | 50,000 | | | | 55,750 | |
UCI International Inc
8.625% due 02/15/19 | | | 50,000 | | | | 49,813 | |
United Rentals North America Inc | | | | | | | | |
5.750% due 07/15/18 ~ | | | 100,000 | | | | 108,250 | |
7.625% due 04/15/22 ~ | | | 220,000 | | | | 246,950 | |
8.250% due 02/01/21 | | | 100,000 | | | | 113,250 | |
8.375% due 09/15/20 | | | 100,000 | | | | 111,250 | |
9.250% due 12/15/19 | | | 100,000 | | | | 114,500 | |
USG Corp | | | | | | | | |
8.375% due 10/15/18 ~ | | | 100,000 | | | | 111,500 | |
9.750% due 01/15/18 | | | 100,000 | | | | 113,750 | |
Western Express Inc
12.500% due 04/15/15 ~ | | | 25,000 | | | | 15,500 | |
| | | | | | | | |
| | | | | | | 12,093,590 | |
| | | | | | | | |
Information Technology - 4.1% | | | | | | | | |
| | |
Advanced Micro Devices Inc | | | | | | | | |
7.750% due 08/01/20 | | | 100,000 | | | | 84,250 | |
8.125% due 12/15/17 | | | 10,000 | | | | 9,175 | |
Alcatel-Lucent USA Inc
6.450% due 03/15/29 | | | 100,000 | | | | 76,500 | |
Alliance Data Systems Corp
5.250% due 12/01/17 ~ | | | 100,000 | | | | 102,000 | |
Amkor Technology Inc | | | | | | | | |
6.625% due 06/01/21 | | | 50,000 | | | | 50,125 | |
7.375% due 05/01/18 | | | 25,000 | | | | 26,000 | |
Aspect Software Inc
10.625% due 05/15/17 | | | 100,000 | | | | 91,500 | |
Audatex North America Inc
6.750% due 06/15/18 ~ | | | 100,000 | | | | 107,500 | |
Brocade Communications Systems Inc
6.875% due 01/15/20 | | | 100,000 | | | | 108,250 | |
CDW LLC
8.500% due 04/01/19 | | | 200,000 | | | | 217,500 | |
CommScope Inc
8.250% due 01/15/19 ~ | | | 150,000 | | | | 165,000 | |
CoreLogic Inc
7.250% due 06/01/21 | | | 100,000 | | | | 109,250 | |
| | |
| See Notes to Financial Statements | | See explanation of symbols and terms, if any, on page B-81 |
B-23
PACIFIC SELECT FUND
PD HIGH YIELD BOND MARKET PORTFOLIO
Schedule of Investments (Continued)
December 31, 2012
| | | | | | | | |
| | | Principal
Amount | | | Value | |
Earthlink Inc
8.875% due 05/15/19 | | | $100,000 | | | | $105,250 | |
Emdeon Inc
11.000% due 12/31/19 | | | 100,000 | | | | 116,000 | |
Epicor Software Corp
8.625% due 05/01/19 | | | 100,000 | | | | 105,500 | |
Equinix Inc | | | | | | | | |
7.000% due 07/15/21 | | | 100,000 | | | | 111,375 | |
8.125% due 03/01/18 | | | 50,000 | | | | 55,313 | |
Fidelity National Information Services Inc | | | | | | | | |
5.000% due 03/15/22 | | | 100,000 | | | | 107,750 | |
7.625% due 07/15/17 | | | 50,000 | | | | 54,625 | |
Freescale Semiconductor Inc | | | | | | | | |
8.050% due 02/01/20 | | | 100,000 | | | | 100,000 | |
9.250% due 04/15/18 ~ | | | 100,000 | | | | 109,750 | |
10.125% due 03/15/18 ~ | | | 150,000 | | | | 166,500 | |
10.750% due 08/01/20 | | | 67,000 | | | | 72,193 | |
GXS Worldwide Inc
9.750% due 06/15/15 | | | 55,000 | | | | 57,544 | |
IAC/InterActiveCorp
4.750% due 12/15/22 ~ | | | 153,000 | | | | 153,000 | |
iGate Corp
9.000% due 05/01/16 | | | 100,000 | | | | 108,875 | |
Infor U.S. Inc
9.375% due 04/01/19 | | | 164,000 | | | | 184,910 | |
JDA Software Group Inc
8.000% due 12/15/14 | | | 25,000 | | | | 26,125 | |
Lender Processing Services Inc
5.750% due 04/15/23 | | | 100,000 | | | | 104,250 | |
NCR Corp | | | | | | | | |
4.625% due 02/15/21 ~ | | | 45,000 | | | | 45,225 | |
5.000% due 07/15/22 ~ | | | 113,000 | | | | 115,401 | |
Nokia OYJ (Finland) | | | | | | | | |
5.375% due 05/15/19 | | | 100,000 | | | | 95,750 | |
6.625% due 05/15/39 | | | 150,000 | | | | 135,375 | |
Nuance Communications Inc
5.375% due 08/15/20 ~ | | | 120,000 | | | | 126,000 | |
NXP BV (Netherlands)
9.750% due 08/01/18 ~ | | | 100,000 | | | | 116,375 | |
Sanmina Corp
7.000% due 05/15/19 ~ | | | 50,000 | | | | 51,250 | |
Seagate HDD (Cayman)
7.000% due 11/01/21 | | | 100,000 | | | | 107,750 | |
Seagate Technology HDD Holdings (Cayman)
6.800% due 10/01/16 | | | 100,000 | | | | 112,500 | |
Sophia LP
9.750% due 01/15/19 ~ | | | 100,000 | | | | 108,250 | |
STATS ChipPAC Ltd (Singapore)
7.500% due 08/12/15 ~ | | | 100,000 | | | | 107,000 | |
SunGard Data Systems Inc | | | | | | | | |
7.375% due 11/15/18 | | | 150,000 | | | | 161,437 | |
7.625% due 11/15/20 | | | 100,000 | | | | 109,750 | |
ViaSat Inc
6.875% due 06/15/20 ~ | | | 100,000 | | | | 105,000 | |
Viasystems Inc
7.875% due 05/01/19 ~ | | | 100,000 | | | | 98,500 | |
| | | | | | | | |
| | | | | | | 4,481,573 | |
| | | | | | | | |
Materials - 10.6% | | | | | | | | |
| | |
Ainsworth Lumber Co Ltd (Canada)
7.500% due 12/15/17 ~ | | | 100,000 | | | | 105,125 | |
AK Steel Corp
7.625% due 05/15/20 | | | 100,000 | | | | 87,500 | |
Aleris International Inc
7.625% due 02/15/18 | | | 100,000 | | | | 102,250 | |
ArcelorMittal (Luxembourg) | | | | | | | | |
4.250% due 02/25/15 | | | 250,000 | | | | 252,628 | |
5.000% due 02/25/17 | | | 300,000 | | | | 303,010 | |
6.750% due 02/25/22 | | | 200,000 | | | | 210,061 | |
| | | | | | | | |
| | | Principal
Amount | | | Value | |
7.500% due 10/15/39 | | | $250,000 | | | | $235,156 | |
10.350% due 06/01/19 | | | 300,000 | | | | 360,003 | |
Ardagh Packaging Finance PLC (Ireland) | | | | | | | | |
7.375% due 10/15/17 ~ | | | 250,000 | | | | 273,125 | |
9.125% due 10/15/20 ~ | | | 50,000 | | | | 54,750 | |
Ashland Inc
4.750% due 08/15/22 ~ | | | 100,000 | | | | 104,500 | |
Associated Materials LLC
9.125% due 11/01/17 | | | 100,000 | | | | 102,000 | |
Ball Corp | | | | | | | | |
5.000% due 03/15/22 | | | 100,000 | | | | 107,500 | |
7.125% due 09/01/16 | | | 125,000 | | | | 134,375 | |
Berry Plastics Corp
9.750% due 01/15/21 | | | 200,000 | | | | 231,500 | |
Boise Paper Holdings LLC
9.000% due 11/01/17 | | | 15,000 | | | | 16,463 | |
Building Materials Corp of America | | | | | | | | |
6.750% due 05/01/21 ~ | | | 100,000 | | | | 110,750 | |
6.875% due 08/15/18 ~ | | | 100,000 | | | | 108,500 | |
Calcipar SA (Luxembourg)
6.875% due 05/01/18 ~ | | | 100,000 | | | | 102,500 | |
Cascades Inc (Canada)
7.750% due 12/15/17 | | | 100,000 | | | | 106,250 | |
Celanese U.S. Holdings LLC | | | | | | | | |
4.625% due 11/15/22 | | | 100,000 | | | | 105,250 | |
5.875% due 06/15/21 | | | 100,000 | | | | 112,125 | |
6.625% due 10/15/18 | | | 5,000 | | | | 5,525 | |
Chemtura Corp
7.875% due 09/01/18 | | | 100,000 | | | | 107,750 | |
China Oriental Group Co Ltd (Bermuda)
8.000% due 08/18/15 ~ | | | 100,000 | | | | 104,000 | |
China Shanshui Cement Group Ltd (Cayman)
8.500% due 05/25/16 ~ | | | 200,000 | | | | 217,000 | |
Clearwater Paper Corp
7.125% due 11/01/18 | | | 50,000 | | | | 54,750 | |
Commercial Metals Co
7.350% due 08/15/18 | | | 100,000 | | | | 109,000 | |
Consolidated Minerals Ltd (United Kingdom)
8.875% due 05/01/16 ~ | | | 100,000 | | | | 86,500 | |
Crown Americas LLC | | | | | | | | |
6.250% due 02/01/21 | | | 100,000 | | | | 110,125 | |
7.625% due 05/15/17 | | | 100,000 | | | | 106,125 | |
Eldorado Gold Corp (Canada)
6.125% due 12/15/20 ~ | | | 60,000 | | | | 61,350 | |
FMG Resources Property Ltd (Australia) | | | | | | | | |
6.000% due 04/01/17 ~ | | | 150,000 | | | | 153,750 | |
6.875% due 02/01/18 ~ | | | 100,000 | | | | 103,625 | |
7.000% due 11/01/15 ~ | | | 200,000 | | | | 211,000 | |
8.250% due 11/01/19 ~ | | | 200,000 | | | | 214,000 | |
Georgia Gulf Corp
9.000% due 01/15/17 ~ | | | 72,000 | | | | 80,460 | |
Graphic Packaging International Inc | | | | | | | | |
7.875% due 10/01/18 | | | 5,000 | | | | 5,550 | |
9.500% due 06/15/17 | | | 50,000 | | | | 54,250 | |
Hanson Ltd (United Kingdom)
6.125% due 08/15/16 | | | 125,000 | | | | 137,812 | |
Hexion U.S. Finance Corp | | | | | | | | |
8.875% due 02/01/18 | | | 85,000 | | | | 87,763 | |
9.000% due 11/15/20 | | | 100,000 | | | | 91,750 | |
HudBay Minerals Inc (Canada)
9.500% due 10/01/20 ~ | | | 100,000 | | | | 106,125 | |
Huntsman International LLC | | | | | | | | |
8.625% due 03/15/20 | | | 25,000 | | | | 28,438 | |
8.625% due 03/15/21 | | | 100,000 | | | | 114,750 | |
Ineos Finance PLC (United Kingdom)
9.000% due 05/15/15 ~ | | | 50,000 | | | | 53,375 | |
INEOS Group Holdings SA (Luxembourg)
8.500% due 02/15/16 ~ | | | 175,000 | | | | 175,000 | |
| | |
| See Notes to Financial Statements | | See explanation of symbols and terms, if any, on page B-81 |
B-24
PACIFIC SELECT FUND
PD HIGH YIELD BOND MARKET PORTFOLIO
Schedule of Investments (Continued)
December 31, 2012
| | | | | | | | |
| | | Principal
Amount | | | Value | |
Inmet Mining Corp (Canada) | | | | | | | | |
7.500% due 06/01/21 ~ | | | $54,000 | | | | $56,295 | |
8.750% due 06/01/20 ~ | | | 179,000 | | | | 196,452 | |
Koppers Inc
7.875% due 12/01/19 | | | 10,000 | | | | 11,050 | |
Lafarge SA (France)
6.500% due 07/15/16 | | | 200,000 | | | | 224,500 | |
Longview Fibre Paper & Packaging Inc
8.000% due 06/01/16 ~ | | | 60,000 | | | | 63,300 | |
Louisiana-Pacific Corp
7.500% due 06/01/20 | | | 100,000 | | | | 113,500 | |
LyondellBasell Industries NV (Netherlands) | | | | | | | | |
5.000% due 04/15/19 | | | 400,000 | | | | 444,000 | |
6.000% due 11/15/21 | | | 120,000 | | | | 141,300 | |
MacDermid Inc
9.500% due 04/15/17 ~ | | | 100,000 | | | | 104,625 | |
Midwest Vanadium Property Ltd (Australia)
11.500% due 02/15/18 ~ | | | 50,000 | | | | 29,750 | |
Mirabela Nickel Ltd (Australia)
8.750% due 04/15/18 ~ | | | 100,000 | | | | 86,500 | |
Molycorp Inc
10.000% due 06/01/20 ~ | | | 100,000 | | | | 93,500 | |
Momentive Performance Materials Inc | | | | | | | | |
8.875% due 10/15/20 ~ | | | 100,000 | | | | 101,375 | |
9.000% due 01/15/21 | | | 100,000 | | | | 73,500 | |
10.000% due 10/15/20 ~ | | | 100,000 | | | | 99,000 | |
Murray Energy Corp
10.250% due 10/15/15 ~ | | | 100,000 | | | | 97,500 | |
New Gold Inc (Canada)
6.250% due 11/15/22 ~ | | | 100,000 | | | | 104,000 | |
NOVA Chemicals Corp (Canada)
8.375% due 11/01/16 | | | 50,000 | | | | 55,000 | |
Novelis Inc (Canada)
8.750% due 12/15/20 | | | 200,000 | | | | 224,000 | |
Olin Corp
5.500% due 08/15/22 | | | 100,000 | | | | 104,750 | |
Owens-Brockway Glass Container Inc
7.375% due 05/15/16 | | | 70,000 | | | | 80,150 | |
Packaging Dynamics Corp
8.750% due 02/01/16 ~ | | | 100,000 | | | | 105,000 | |
Polymer Group Inc
7.750% due 02/01/19 | | | 200,000 | | | | 215,500 | |
PolyOne Corp
7.375% due 09/15/20 | | | 10,000 | | | | 10,975 | |
PQ Corp
8.750% due 05/01/18 ~ | | | 200,000 | | | | 211,000 | |
Resolute Forest Products
10.250% due 10/15/18 | | | 30,000 | | | | 34,500 | |
Rock Tenn Co
4.000% due 03/01/23 ~ | | | 200,000 | | | | 203,360 | |
Rockwood Specialties Group Inc
4.625% due 10/15/20 | | | 98,000 | | | | 101,797 | |
Ryerson Inc
9.000% due 10/15/17 ~ | | | 75,000 | | | | 76,781 | |
Sappi Papier Holding GmbH (Austria)
8.375% due 06/15/19 ~ | | | 200,000 | | | | 219,250 | |
Sawgrass Merger Sub Inc
8.750% due 12/15/20 ~ | | | 100,000 | | | | 101,250 | |
Sealed Air Corp
8.375% due 09/15/21 ~ | | | 250,000 | | | | 286,875 | |
Silgan Holdings Inc
5.000% due 04/01/20 | | | 100,000 | | | | 104,250 | |
Steel Dynamics Inc
7.625% due 03/15/20 | | | 150,000 | | | | 166,500 | |
Stora Enso OYJ (Finland)
7.250% due 04/15/36 ~ | | | 100,000 | | | | 93,500 | |
Taminco Global Chemical Corp
9.750% due 03/31/20 ~ | | | 150,000 | | | | 165,000 | |
Tekni-Plex Inc
9.750% due 06/01/19 ~ | | | 100,000 | | | | 109,500 | |
| | | | | | | | |
| | | Principal
Amount | | | Value | |
Texas Industries Inc
9.250% due 08/15/20 | | | $35,000 | | | | $37,713 | |
The Scotts Miracle-Gro Co
7.250% due 01/15/18 | | | 50,000 | | | | 54,000 | |
Thompson Creek Metals Co Inc (Canada) | | | | | | | | |
7.375% due 06/01/18 | | | 100,000 | | | | 82,500 | |
9.750% due 12/01/17 | | | 100,000 | | | | 106,500 | |
Tronox Finance LLC
6.375% due 08/15/20 ~ | | | 55,000 | | | | 55,756 | |
United States Steel Corp | | | | | | | | |
7.000% due 02/01/18 | | | 100,000 | | | | 107,250 | |
7.500% due 03/15/22 | | | 100,000 | | | | 105,750 | |
Verso Paper Holdings LLC | | | | | | | | |
8.750% due 02/01/19 | | | 100,000 | | | | 39,000 | |
11.750% due 01/15/19 | | | 100,000 | | | | 105,500 | |
Vulcan Materials Co | | | | | | | | |
6.400% due 11/30/17 | | | 100,000 | | | | 109,750 | |
7.500% due 06/15/21 | | | 80,000 | | | | 91,600 | |
Walter Energy Inc
9.875% due 12/15/20 ~ | | | 68,000 | | | | 76,160 | |
| | | | | | | | |
| | | | | | | 11,585,658 | |
| | | | | | | | |
Telecommunication Services - 7.7% | | | | | | | | |
| | |
Avaya Inc | | | | | | | | |
7.000% due 04/01/19 ~ | | | 50,000 | | | | 47,000 | |
9.750% due 11/01/15 | | | 100,000 | | | | 89,500 | |
10.125% due 11/01/15 | | | 150,000 | | | | 135,000 | |
Cincinnati Bell Inc | | | | | | | | |
8.375% due 10/15/20 | | | 100,000 | | | | 108,750 | |
8.750% due 03/15/18 | | | 100,000 | | | | 103,750 | |
Clearwire Communications LLC | | | | | | | | |
12.000% due 12/01/15 ~ | | | 230,000 | | | | 248,400 | |
12.000% due 12/01/17 ~ | | | 100,000 | | | | 118,500 | |
Cricket Communications Inc | | | | | | | | |
7.750% due 05/15/16 | | | 125,000 | | | | 132,969 | |
7.750% due 10/15/20 | | | 125,000 | | | | 128,125 | |
Crown Castle International Corp | | | | | | | | |
5.250% due 01/15/23 ~ | | | 200,000 | | | | 214,750 | |
7.125% due 11/01/19 | | | 100,000 | | | | 111,000 | |
Frontier Communications Corp | | | | | | | | |
8.250% due 05/01/14 | | | 5,000 | | | | 5,413 | |
8.500% due 04/15/20 | | | 300,000 | | | | 346,500 | |
9.000% due 08/15/31 | | | 100,000 | | | | 110,500 | |
9.250% due 07/01/21 | | | 300,000 | | | | 353,250 | |
GCI Inc
6.750% due 06/01/21 | | | 100,000 | | | | 98,500 | |
Hughes Satellite Systems Corp | | | | | | | | |
6.500% due 06/15/19 | | | 55,000 | | | | 60,913 | |
7.625% due 06/15/21 | | | 95,000 | | | | 108,537 | |
Inmarsat Finance PLC (United Kingdom)
7.375% due 12/01/17 ~ | | | 100,000 | | | | 108,000 | |
Integra Telecom Holdings Inc
10.750% due 04/15/16 ~ | | | 10,000 | | | | 10,500 | |
Intelsat Jackson Holdings SA (Luxembourg) | | | | | | | | |
6.625% due 12/15/22 ~ | | | 150,000 | | | | 155,437 | |
7.250% due 04/01/19 | | | 350,000 | | | | 378,000 | |
7.500% due 04/01/21 | | | 200,000 | | | | 221,500 | |
Intelsat Luxembourg SA (Luxembourg)
11.250% due 02/04/17 | | | 450,000 | | | | 477,562 | |
Level 3 Communications Inc | | | | | | | | |
8.875% due 06/01/19 ~ | | | 100,000 | | | | 106,875 | |
11.875% due 02/01/19 | | | 100,000 | | | | 115,750 | |
Level 3 Financing Inc | | | | | | | | |
8.125% due 07/01/19 | | | 100,000 | | | | 109,500 | |
8.625% due 07/15/20 | | | 200,000 | | | | 222,750 | |
MetroPCS Wireless Inc
7.875% due 09/01/18 | | | 200,000 | | | | 217,500 | |
PAETEC Holding Corp
9.875% due 12/01/18 | | | 50,000 | | | | 57,500 | |
| | |
| See Notes to Financial Statements | | See explanation of symbols and terms, if any, on page B-81 |
B-25
PACIFIC SELECT FUND
PD HIGH YIELD BOND MARKET PORTFOLIO
Schedule of Investments (Continued)
December 31, 2012
| | | | | | | | |
| | | Principal
Amount | | | Value | |
Sable International Finance Ltd (Cayman)
8.750% due 02/01/20 ~ | | | $200,000 | | | | $230,000 | |
SBA Telecommunications Inc
5.750% due 07/15/20 ~ | | | 133,000 | | | | 141,811 | |
Sprint Capital Corp | | | | | | | | |
6.875% due 11/15/28 | | | 150,000 | | | | 156,750 | |
8.750% due 03/15/32 | | | 200,000 | | | | 245,500 | |
Sprint Nextel Corp | | | | | | | | |
6.000% due 12/01/16 | | | 200,000 | | | | 218,500 | |
6.000% due 11/15/22 | | | 200,000 | | | | 206,500 | |
7.000% due 03/01/20 ~ | | | 200,000 | | | | 233,000 | |
7.000% due 08/15/20 | | | 100,000 | | | | 109,750 | |
8.375% due 08/15/17 | | | 275,000 | | | | 321,062 | |
9.000% due 11/15/18 ~ | | | 200,000 | | | | 247,500 | |
9.125% due 03/01/17 | | | 200,000 | | | | 236,500 | |
11.500% due 11/15/21 | | | 100,000 | | | | 136,375 | |
Telesat (Canada)
6.000% due 05/15/17 ~ | | | 133,000 | | | | 140,315 | |
tw telecom holdings Inc
5.375% due 10/01/22 ~ | | | 100,000 | | | | 105,125 | |
UPC Holding BV (Netherlands)
9.875% due 04/15/18 ~ | | | 50,000 | | | | 56,750 | |
UPCB Finance III Ltd (Cayman)
6.625% due 07/01/20 ~ | | | 200,000 | | | | 215,250 | |
West Corp
7.875% due 01/15/19 | | | 175,000 | | | | 182,000 | |
Windstream Corp | | | | | | | | |
7.500% due 04/01/23 | | | 100,000 | | | | 105,750 | |
7.750% due 10/01/21 | | | 100,000 | | | | 108,500 | |
8.125% due 09/01/18 | | | 200,000 | | | | 219,500 | |
Zayo Group LLC | | | | | | | | |
8.125% due 01/01/20 | | | 23,000 | | | | 25,703 | |
10.125% due 07/01/20 | | | 100,000 | | | | 114,250 | |
| | | | | | | | |
| | | | | | | 8,458,622 | |
| | | | | | | | |
Utilities - 5.0% | | | | | | | | |
| | |
AES Corp | | | | | | | | |
7.375% due 07/01/21 | | | 200,000 | | | | 223,000 | |
8.000% due 10/15/17 | | | 300,000 | | | | 348,000 | |
Ameren Energy Generating Co
7.000% due 04/15/18 | | | 100,000 | | | | 73,000 | |
AmeriGas Finance LLC
7.000% due 05/20/22 | | | 200,000 | | | | 223,500 | |
AmeriGas Partners LP
6.500% due 05/20/21 | | | 48,000 | | | | 52,320 | |
Atlantic Power Corp (Canada)
9.000% due 11/15/18 | | | 100,000 | | | | 105,000 | |
Calpine Construction Finance Co LP
8.000% due 06/01/16 ~ | | | 100,000 | | | | 106,750 | |
Calpine Corp | | | | | | | | |
7.250% due 10/15/17 ~ | | | 225,000 | | | | 240,750 | |
7.500% due 02/15/21 ~ | | | 225,000 | | | | 249,750 | |
CMS Energy Corp | | | | | | | | |
2.750% due 05/15/14 | | | 100,000 | | | | 101,910 | |
5.050% due 03/15/22 | | | 100,000 | | | | 111,833 | |
8.750% due 06/15/19 | | | 25,000 | | | | 32,627 | |
DPL Inc
6.500% due 10/15/16 | | | 100,000 | | | | 106,250 | |
Duquesne Light Holdings Inc
5.900% due 12/01/21 ~ | | | 100,000 | | | | 118,781 | |
EDP Finance BV (Netherlands)
4.900% due 10/01/19 ~ | | | 250,000 | | | | 249,184 | |
Energy Future Holdings Corp | | | | | | | | |
10.000% due 01/15/20 | | | 250,000 | | | | 280,625 | |
11.250% due 11/01/17 | | | 195,888 | | | | 184,135 | |
Energy Future Intermediate Holding Co LLC | | | | | | | | |
10.000% due 12/01/20 | | | 46,000 | | | | 52,095 | |
11.750% due 03/01/22 ~ | | | 200,000 | | | | 223,000 | |
Ferrellgas LP
6.500% due 05/01/21 | | | 100,000 | | | | 99,500 | |
| | | | | | | | |
| | | Principal
Amount | | | Value | |
GenOn Energy Inc | | | | | | | | |
7.625% due 06/15/14 | | | $250,000 | | | | $268,125 | |
9.500% due 10/15/18 | | | 45,000 | | | | 53,325 | |
InterGen NV (Netherlands)
9.000% due 06/30/17 ~ | | | 150,000 | | | | 135,000 | |
NRG Energy Inc | | | | | | | | |
6.625% due 03/15/23 ~ | | | 100,000 | | | | 107,500 | |
7.625% due 01/15/18 | | | 200,000 | | | | 223,000 | |
7.875% due 05/15/21 | | | 200,000 | | | | 223,000 | |
8.250% due 09/01/20 | | | 150,000 | | | | 168,750 | |
Puget Energy Inc | | | | | | | | |
5.625% due 07/15/22 | | | 100,000 | | | | 107,990 | |
6.500% due 12/15/20 | | | 100,000 | | | | 112,848 | |
Suburban Propane Partners LP | | | | | | | | |
7.375% due 08/01/21 | | | 100,000 | | | | 109,250 | |
7.500% due 10/01/18 | | | 97,000 | | | | 105,003 | |
Texas Competitive Electric
Holdings Co LLC | | | | | | | | |
10.250% due 11/01/15 | | | 500,000 | | | | 148,750 | |
11.500% due 10/01/20 ~ | | | 200,000 | | | | 157,500 | |
Wind Acquisition Finance SA (Luxembourg) | | | | | | | | |
7.250% due 02/15/18 ~ | | | 100,000 | | | | 101,750 | |
11.750% due 07/15/17 ~ | | | 190,000 | | | | 199,975 | |
Wind Acquisition Holdings Finance SA (Luxembourg)
12.250% due 07/15/17 ~ | | | 119,523 | | | | 122,511 | |
| | | | | | | | |
| | | | | | | 5,526,287 | |
| | | | | | | | |
Total Corporate Bonds & Notes
(Cost $102,093,285) | | | | | | | 107,192,908 | |
| | | | | | | | |
| | |
| | | Shares | | | | |
| |
SHORT-TERM INVESTMENT - 1.0% | | | | | |
| |
Money Market Fund - 1.0% | | | | | |
| | |
Federated Prime Obligations Fund | | | 1,129,537 | | | | 1,129,537 | |
| | | | | | | | |
| | |
Total Short-Term Investment
(Cost $1,129,537) | | | | | | | 1,129,537 | |
| | | | | | | | |
| | |
TOTAL INVESTMENTS - 98.6%
(Cost $103,222,822) | | | | | | | 108,322,445 | |
| |
OTHER ASSETS & LIABILITIES, NET - 1.4% | | | | 1,523,208 | |
| | | | | | | | |
| |
NET ASSETS - 100.0% | | | | $109,845,653 | |
| | | | | | | | |
Notes to Schedule of Investments
| (a) | As of December 31, 2012, the portfolio was diversified as a percentage of net assets as follows: |
| | | | |
Consumer Discretionary | | | 20.0% | |
Energy | | | 14.8% | |
Financials | | | 11.9% | |
Industrials | | | 11.0% | |
Materials | | | 10.6% | |
Health Care | | | 7.7% | |
Telecommunication Services | | | 7.7% | |
Utilities | | | 5.0% | |
Consumer Staples | | | 4.8% | |
Information Technology | | | 4.1% | |
Short-Term Investment | | | 1.0% | |
| | | | |
| | | 98.6% | |
Other Assets & Liabilities, Net | | | 1.4% | |
| | | | |
| | | 100.0% | |
| | | | |
| | |
| See Notes to Financial Statements | | See explanation of symbols and terms, if any, on page B-81 |
B-26
PACIFIC SELECT FUND
PD HIGH YIELD BOND MARKET PORTFOLIO
Schedule of Investments (Continued)
December 31, 2012
| (b) | As of December 31, 2012, the portfolio’s Standard & Poor’s quality ratings as a percentage of total fixed income investments were as follows (Unaudited): |
| | | | |
BBB | | | 4.3% | |
BB | | | 39.0% | |
B | | | 41.8% | |
CCC | | | 9.1% | |
CC | | | 3.5% | |
C | | | 0.6% | |
D | | | 0.3% | |
Not Rated | | | 1.4% | |
| | | | |
| | | 100.0% | |
| | | | |
| (c) | Fair Value Measurements |
The following is a summary of the portfolio’s investments as categorized under the three-tier hierarchy of inputs used in valuing the portfolio’s assets and liabilities (See Note 3D in Notes to Financial Statements) as of December 31, 2012:
| | | | | | | | | | | | | | | | | | |
| | | | | Total Value at
December 31, 2012 | | | Level 1
Quoted Price | | | Level 2
Significant
Observable Inputs | | | Level 3
Significant
Unobservable Inputs | |
Assets | | Corporate Bonds & Notes | | | $107,192,908 | | | | $- | | | | $107,192,908 | | | | $- | |
| | Short-Term Investment | | | 1,129,537 | | | | 1,129,537 | | | | - | | | | - | |
| | | | | | | | | | | | | | | | | | |
| | Total | | | $108,322,445 | | | | $1,129,537 | | | | $107,192,908 | | | | $- | |
| | | | | | | | | | | | | | | | | | |
| | |
| See Notes to Financial Statements | | See explanation of symbols and terms, if any, on page B-81 |
B-27
PACIFIC SELECT FUND
PD LARGE-CAP GROWTH INDEX PORTFOLIO
Schedule of Investments
December 31, 2012
| | | | | | | | |
| | |
Shares | | | Value | |
COMMON STOCKS - 97.1% | | | | | | | | |
| | |
Consumer Discretionary - 16.3% | | | | | | | | |
| | |
Aaron’s Inc | | | 1,359 | | | | $38,433 | |
Advance Auto Parts Inc | | | 1,728 | | | | 125,021 | |
Allison Transmission Holdings Inc | | | 648 | | | | 13,232 | |
Amazon.com Inc * | | | 8,504 | | | | 2,135,695 | |
AMC Networks Inc ‘A’ * | | | 1,343 | | | | 66,479 | |
American Eagle Outfitters Inc | | | 3,575 | | | | 73,323 | |
Apollo Group Inc ‘A’ * | | | 2,258 | | | | 47,237 | |
Ascena Retail Group Inc * | | | 2,890 | | | | 53,436 | |
AutoNation Inc * | | | 454 | | | | 18,024 | |
AutoZone Inc * | | | 895 | | | | 317,215 | |
Bally Technologies Inc * | | | 941 | | | | 42,072 | |
Bed Bath & Beyond Inc * | | | 5,465 | | | | 305,548 | |
Big Lots Inc * | | | 1,401 | | | | 39,872 | |
BorgWarner Inc * | | | 2,694 | | | | 192,944 | |
Brinker International Inc | | | 1,786 | | | | 55,348 | |
Cablevision Systems Corp ‘A’ | | | 477 | | | | 7,126 | |
CarMax Inc * | | | 994 | | | | 37,315 | |
Carter’s Inc * | | | 1,138 | | | | 63,330 | |
CBS Corp ‘B’ | | | 2,590 | | | | 98,549 | |
Charter Communications Inc ‘A’ * | | | 1,147 | | | | 87,447 | |
Chico’s FAS Inc | | | 2,798 | | | | 51,651 | |
Chipotle Mexican Grill Inc * | | | 745 | | | | 221,608 | |
Choice Hotels International Inc | | | 50 | | | | 1,681 | |
Cinemark Holdings Inc | | | 2,701 | | | | 70,172 | |
Clear Channel Outdoor Holdings Inc ‘A’ * | | | 464 | | | | 3,257 | |
Coach Inc | | | 6,755 | | | | 374,970 | |
Comcast Corp ‘A’ | | | 30,047 | | | | 1,123,157 | |
D.R. Horton Inc | | | 429 | | | | 8,486 | |
Darden Restaurants Inc | | | 3,024 | | | | 136,292 | |
Deckers Outdoor Corp * | | | 556 | | | | 22,390 | |
Delphi Automotive PLC * (United Kingdom) | | | 7,716 | | | | 295,137 | |
Dick’s Sporting Goods Inc | | | 2,183 | | | | 99,305 | |
DIRECTV * | | | 14,218 | | | | 713,175 | |
Discovery Communications Inc ‘A’ * | | | 5,622 | | | | 356,885 | |
DISH Network Corp ‘A’ | | | 3,749 | | | | 136,464 | |
Dollar General Corp * | | | 4,342 | | | | 191,439 | |
Dollar Tree Inc * | | | 5,453 | | | | 221,174 | |
DSW Inc ‘A’ | | | 713 | | | | 46,837 | |
Dunkin’ Brands Group Inc | | | 1,694 | | | | 56,207 | |
Expedia Inc | | | 1,285 | | | | 78,963 | |
Family Dollar Stores Inc | | | 2,272 | | | | 144,068 | |
Foot Locker Inc | | | 729 | | | | 23,415 | |
Fossil Inc * | | | 1,284 | | | | 119,540 | |
Garmin Ltd (Switzerland) | | | 183 | | | | 7,470 | |
Gentex Corp | | | 3,391 | | | | 63,819 | |
Genuine Parts Co | | | 3,665 | | | | 233,021 | |
GNC Holdings Inc ‘A’ | | | 1,624 | | | | 54,047 | |
Groupon Inc * | | | 995 | | | | 4,856 | |
H&R Block Inc | | | 4,045 | | | | 75,116 | |
Hanesbrands Inc * | | | 2,294 | | | | 82,171 | |
Harley-Davidson Inc | | | 5,442 | | | | 265,787 | |
Hasbro Inc | | | 2,450 | | | | 87,955 | |
HomeAway Inc * | | | 720 | | | | 15,840 | |
International Game Technology | | | 3,479 | | | | 49,297 | |
ITT Educational Services Inc * | | | 611 | | | | 10,576 | |
Jarden Corp | | | 420 | | | | 21,714 | |
John Wiley & Sons Inc ‘A’ | | | 469 | | | | 18,258 | |
Kohl’s Corp | | | 392 | | | | 16,848 | |
Lamar Advertising Co ‘A’ * | | | 1,563 | | | | 60,566 | |
Las Vegas Sands Corp | | | 9,341 | | | | 431,181 | |
Liberty Global Inc ‘A’ * | | | 6,166 | | | | 388,396 | |
Liberty Interactive Corp ‘A’ * | | | 1,887 | | | | 37,136 | |
Liberty Media Corp ‘A’ * | | | 171 | | | | 19,838 | |
Liberty Ventures ‘A’ * | | | 148 | | | | 10,028 | |
Limited Brands Inc | | | 5,675 | | | | 267,065 | |
LKQ Corp * | | | 6,931 | | | | 146,244 | |
| | | | | | | | |
| | |
Shares | | | Value | |
Lowe’s Cos Inc | | | 3,692 | | | | $131,140 | |
Macy’s Inc | | | 1,334 | | | | 52,053 | |
Marriott International Inc ‘A’ | | | 5,510 | | | | 205,358 | |
Mattel Inc | | | 6,197 | | | | 226,934 | |
McDonald’s Corp | | | 23,888 | | | | 2,107,160 | |
Michael Kors Holdings Ltd * (United Kingdom) | | | 1,993 | | | | 101,703 | |
Morningstar Inc | | | 569 | | | | 35,750 | |
Netflix Inc * | | | 1,305 | | | | 121,078 | |
News Corp ‘A’ | | | 16,938 | | | | 432,597 | |
Nike Inc ‘B’ | | | 17,002 | | | | 877,303 | |
Nordstrom Inc | | | 3,697 | | | | 197,789 | |
NVR Inc * | | | 106 | | | | 97,520 | |
O’Reilly Automotive Inc * | | | 2,795 | | | | 249,929 | |
Omnicom Group Inc | | | 6,409 | | | | 320,194 | |
Pandora Media Inc * | | | 2,429 | | | | 22,298 | |
Panera Bread Co ‘A’ * | | | 666 | | | | 105,781 | |
Penn National Gaming Inc * | | | 139 | | | | 6,826 | |
PetSmart Inc | | | 2,548 | | | | 174,130 | |
Polaris Industries Inc | | | 1,521 | | | | 127,992 | |
priceline.com Inc * | | | 1,171 | | | | 727,425 | |
PVH Corp | | | 1,527 | | | | 169,512 | |
Ralph Lauren Corp | | | 1,449 | | | | 217,234 | |
Regal Entertainment Group ‘A’ | | | 764 | | | | 10,658 | |
Ross Stores Inc | | | 5,325 | | | | 288,349 | |
Sally Beauty Holdings Inc * | | | 3,412 | | | | 80,421 | |
Scripps Networks Interactive Inc ‘A’ | | | 1,997 | | | | 115,666 | |
Sirius XM Radio Inc | | | 89,353 | | | | 258,230 | |
Starbucks Corp | | | 17,829 | | | | 955,991 | |
Starwood Hotels & Resorts Worldwide Inc | | | 4,646 | | | | 266,495 | |
Target Corp | | | 876 | | | | 51,833 | |
Tempur-Pedic International Inc * | | | 1,415 | | | | 44,558 | |
Tesla Motors Inc * | | | 1,663 | | | | 56,326 | |
The Gap Inc | | | 7,121 | | | | 221,036 | |
The Goodyear Tire & Rubber Co * | | | 5,753 | | | | 79,449 | |
The Home Depot Inc | | | 35,980 | | | | 2,225,363 | |
The Interpublic Group of Cos Inc | | | 586 | | | | 6,458 | |
The Madison Square Garden Co ‘A’ * | | | 66 | | | | 2,927 | |
The McGraw-Hill Cos Inc | | | 6,575 | | | | 359,455 | |
The TJX Cos Inc | | | 17,417 | | | | 739,352 | |
The Walt Disney Co | | | 15,461 | | | | 769,803 | |
Thor Industries Inc | | | 70 | | | | 2,620 | |
Tiffany & Co | | | 2,502 | | | | 143,465 | |
Time Warner Cable Inc | | | 7,346 | | | | 713,958 | |
Tractor Supply Co | | | 1,694 | | | | 149,682 | |
TripAdvisor Inc * | | | 2,038 | | | | 85,514 | |
Tupperware Brands Corp | | | 1,315 | | | | 84,292 | |
Ulta Salon Cosmetics & Fragrance Inc | | | 1,478 | | | | 145,228 | |
Under Armour Inc ‘A’ * | | | 1,826 | | | | 88,616 | |
Urban Outfitters Inc * | | | 2,502 | | | | 98,479 | |
VF Corp | | | 2,060 | | | | 310,998 | |
Viacom Inc ‘B’ | | | 12,407 | | | | 654,345 | |
Virgin Media Inc | | | 6,530 | | | | 239,977 | |
Visteon Corp * | | | 69 | | | | 3,714 | |
Weight Watchers International Inc | | | 635 | | | | 33,249 | |
Williams-Sonoma Inc | | | 1,174 | | | | 51,386 | |
Wyndham Worldwide Corp | | | 3,430 | | | | 182,510 | |
Wynn Resorts Ltd | | | 1,874 | | | | 210,806 | |
Yum! Brands Inc | | | 10,826 | | | | 718,846 | |
| | | | | | | | |
| | | | 27,838,909 | |
| | | | | | | | |
Consumer Staples - 12.1% | | | | | | | | |
| | |
Altria Group Inc | | | 37,117 | | | | 1,166,216 | |
Avon Products Inc | | | 7,827 | | | | 112,396 | |
Brown-Forman Corp ‘B’ | | | 3,073 | | | | 194,367 | |
Campbell Soup Co | | | 3,228 | | | | 112,625 | |
Church & Dwight Co Inc | | | 2,015 | | | | 107,943 | |
Coca-Cola Enterprises Inc | | | 540 | | | | 17,134 | |
Colgate-Palmolive Co | | | 10,287 | | | | 1,075,403 | |
Costco Wholesale Corp | | | 10,184 | | | | 1,005,874 | |
| | |
| See Notes to Financial Statements | | See explanation of symbols and terms, if any, on page B-81 |
B-28
PACIFIC SELECT FUND
PD LARGE-CAP GROWTH INDEX PORTFOLIO
Schedule of Investments (Continued)
December 31, 2012
| | | | | | | | |
| | |
Shares | | | Value | |
CVS Caremark Corp | | | 6,085 | | | | $294,210 | |
Dean Foods Co * | | | 3,722 | | | | 61,450 | |
Dr Pepper Snapple Group Inc | | | 4,980 | | | | 220,016 | |
Flowers Foods Inc | | | 2,636 | | | | 61,340 | |
General Mills Inc | | | 11,914 | | | | 481,445 | |
Green Mountain Coffee Roasters Inc * | | | 2,738 | | | | 113,244 | |
H.J. Heinz Co | | | 4,685 | | | | 270,231 | |
Herbalife Ltd (Cayman) | | | 2,747 | | | | 90,486 | |
Hillshire Brands Co | | | 2,378 | | | | 66,917 | |
Hormel Foods Corp | | | 1,812 | | | | 56,552 | |
Ingredion Inc | | | 374 | | | | 24,097 | |
Kellogg Co | | | 5,368 | | | | 299,803 | |
Kimberly-Clark Corp | | | 8,240 | | | | 695,703 | |
Kraft Foods Group Inc | | | 738 | | | | 33,557 | |
Lorillard Inc | | | 3,068 | | | | 357,943 | |
McCormick & Co Inc | | | 3,117 | | | | 198,023 | |
Mead Johnson Nutrition Co | | | 4,793 | | | | 315,811 | |
Mondelez International Inc ‘A’ | | | 2,176 | | | | 55,423 | |
Monster Beverage Corp * | | | 3,388 | | | | 179,157 | |
Nu Skin Enterprises Inc ‘A’ | | | 1,264 | | | | 46,831 | |
PepsiCo Inc | | | 36,762 | | | | 2,515,624 | |
Philip Morris International Inc | | | 36,843 | | | | 3,081,548 | |
Reynolds American Inc | | | 2,600 | | | | 107,718 | |
Safeway Inc | | | 816 | | | | 14,761 | |
Sysco Corp | | | 7,257 | | | | 229,757 | |
The Clorox Co | | | 195 | | | | 14,278 | |
The Coca-Cola Co | | | 91,314 | | | | 3,310,132 | |
The Estee Lauder Cos Inc ‘A’ | | | 5,410 | | | | 323,843 | |
The Fresh Market Inc * | | | 651 | | | | 31,307 | |
The Hershey Co | | | 3,528 | | | | 254,792 | |
The Kroger Co | | | 12,402 | | | | 322,700 | |
The Procter & Gamble Co | | | 4,702 | | | | 319,219 | |
Wal-Mart Stores Inc | | | 31,346 | | | | 2,138,738 | |
WhiteWave Foods Co ‘A’ * | | | 311 | | | | 4,833 | |
Whole Foods Market Inc | | | 4,315 | | | | 394,089 | |
| | | | | | | | |
| | | | 20,777,536 | |
| | | | | | | | |
Energy - 3.9% | | | | | | | | |
| | |
Atwood Oceanics Inc * | | | 424 | | | | 19,415 | |
Cabot Oil & Gas Corp | | | 4,933 | | | | 245,367 | |
Cameron International Corp * | | | 4,447 | | | | 251,078 | |
CARBO Ceramics Inc | | | 470 | | | | 36,820 | |
Cheniere Energy Inc * | | | 3,338 | | | | 62,688 | |
Cobalt International Energy Inc * | | | 4,075 | | | | 100,082 | |
Concho Resources Inc * | | | 2,445 | | | | 196,969 | |
Continental Resources Inc * | | | 992 | | | | 72,902 | |
Dresser-Rand Group Inc * | | | 1,778 | | | | 99,817 | |
EOG Resources Inc | | | 6,337 | | | | 765,446 | |
FMC Technologies Inc * | | | 5,621 | | | | 240,748 | |
Golar LNG Ltd (NOTC) (Bermuda) | | | 1,023 | | | | 37,626 | |
Halliburton Co | | | 6,922 | | | | 240,124 | |
Helmerich & Payne Inc | | | 504 | | | | 28,229 | |
Kinder Morgan Inc | | | 11,484 | | | | 405,730 | |
Kosmos Energy Ltd * (Bermuda) | | | 1,670 | | | | 20,625 | |
Laredo Petroleum Holdings Inc * | | | 405 | | | | 7,355 | |
National Oilwell Varco Inc | | | 2,284 | | | | 156,111 | |
Noble Energy Inc | | | 928 | | | | 94,415 | |
Oceaneering International Inc | | | 2,546 | | | | 136,949 | |
Oil States International Inc * | | | 1,111 | | | | 79,481 | |
Pioneer Natural Resources Co | | | 2,415 | | | | 257,415 | |
Range Resources Corp | | | 3,813 | | | | 239,571 | |
RPC Inc | | | 1,343 | | | | 16,438 | |
Schlumberger Ltd (Netherlands) | | | 31,346 | | | | 2,171,964 | |
SEACOR Holdings Inc | | | 224 | | | | 18,771 | |
SM Energy Co | | | 1,257 | | | | 65,628 | |
Southwestern Energy Co * | | | 2,840 | | | | 94,884 | |
The Williams Cos Inc | | | 15,864 | | | | 519,387 | |
Whiting Petroleum Corp * | | | 400 | | | | 17,348 | |
World Fuel Services Corp | | | 537 | | | | 22,108 | |
| | | | | | | | |
| | | | 6,721,491 | |
| | | | | | | | |
| | | | | | | | |
| | |
Shares | | | Value | |
Financials - 4.5% | | | | | | | | |
| | |
Affiliated Managers Group Inc * | | | 901 | | | | $117,265 | |
Alexander & Baldwin Inc * | | | 56 | | | | 1,645 | |
Allied World Assurance Co Holdings AG (Switzerland) | | | 441 | | | | 34,751 | |
American Campus Communities Inc REIT | | | 226 | | | | 10,425 | |
American Express Co | | | 15,134 | | | | 869,902 | |
American Tower Corp REIT | | | 9,275 | | | | 716,679 | |
Aon PLC (United Kingdom) | | | 655 | | | | 36,418 | |
Apartment Investment & Management Co ‘A’ REIT | | | 2,406 | | | | 65,106 | |
Arch Capital Group Ltd * (Bermuda) | | | 378 | | | | 16,640 | |
Arthur J. Gallagher & Co | | | 2,787 | | | | 96,570 | |
BlackRock Inc | | | 1,602 | | | | 331,149 | |
Boston Properties Inc REIT | | | 595 | | | | 62,957 | |
BRE Properties Inc REIT | | | 510 | | | | 25,923 | |
Brown & Brown Inc | | | 233 | | | | 5,932 | |
Camden Property Trust REIT | | | 1,421 | | | | 96,926 | |
CBOE Holdings Inc | | | 1,794 | | | | 52,851 | |
CBRE Group Inc ‘A’ * | | | 7,712 | | | | 153,469 | |
Digital Realty Trust Inc REIT | | | 2,863 | | | | 194,369 | |
Eaton Vance Corp | | | 2,715 | | | | 86,473 | |
Endurance Specialty Holdings Ltd (Bermuda) | | | 84 | | | | 3,334 | |
Equity Lifestyle Properties Inc REIT | | | 810 | | | | 54,505 | |
Equity Residential REIT | | | 572 | | | | 32,415 | |
Erie Indemnity Co ‘A’ | | | 607 | | | | 42,017 | |
Essex Property Trust Inc REIT | | | 828 | | | | 121,426 | |
Extra Space Storage Inc REIT | | | 1,546 | | | | 56,259 | |
Federal Realty Investment Trust REIT | | | 1,180 | | | | 122,744 | |
Federated Investors Inc ‘B’ | | | 1,814 | | | | 36,697 | |
Franklin Resources Inc | | | 759 | | | | 95,406 | |
HCP Inc REIT | | | 764 | | | | 34,518 | |
Home Properties Inc REIT | | | 614 | | | | 37,644 | |
IntercontinentalExchange Inc * | | | 1,710 | | | | 211,715 | |
Kilroy Realty Corp REIT | | | 121 | | | | 5,732 | |
Lazard Ltd ‘A’ (Bermuda) | | | 2,688 | | | | 80,210 | |
Leucadia National Corp | | | 1,066 | | | | 25,360 | |
LPL Financial Holdings Inc | | | 993 | | | | 27,963 | |
Marsh & McLennan Cos Inc | | | 10,170 | | | | 350,560 | |
Mid-America Apartment Communities Inc REIT | | | 912 | | | | 59,052 | |
Moody’s Corp | | | 4,611 | | | | 232,026 | |
MSCI Inc * | | | 2,858 | | | | 88,569 | |
People’s United Financial Inc | | | 1,782 | | | | 21,544 | |
Plum Creek Timber Co Inc REIT | | | 3,796 | | | | 168,429 | |
Post Properties Inc REIT | | | 540 | | | | 26,973 | |
Public Storage REIT | | | 3,354 | | | | 486,196 | |
Rayonier Inc REIT | | | 2,280 | | | | 118,172 | |
Realogy Holdings Corp * | | | 295 | | | | 12,378 | |
Regency Centers Corp REIT | | | 1,273 | | | | 59,984 | |
SEI Investments Co | | | 3,227 | | | | 75,318 | |
Signature Bank * | | | 205 | | | | 14,625 | |
Simon Property Group Inc REIT | | | 5,994 | | | | 947,591 | |
T. Rowe Price Group Inc | | | 5,996 | | | | 390,519 | |
Tanger Factory Outlet Centers Inc REIT | | | 2,178 | | | | 74,488 | |
Taubman Centers Inc REIT | | | 358 | | | | 28,182 | |
The Hanover Insurance Group Inc | | | 494 | | | | 19,138 | |
The St. Joe Co * | | | 145 | | | | 3,347 | |
The Travelers Cos Inc | | | 3,969 | | | | 285,054 | |
Validus Holdings Ltd (Bermuda) | | | 340 | | | | 11,757 | |
Waddell & Reed Financial Inc ‘A’ | | | 2,030 | | | | 70,685 | |
Weyerhaeuser Co REIT | | | 4,043 | | | | 112,476 | |
| | | | | | | | |
| | | | 7,620,458 | |
| | | | | | | | |
Health Care - 11.6% | | | | | | | | |
| | |
Abbott Laboratories ‡ | | | 35,061 | | | | 2,296,495 | |
Agilent Technologies Inc | | | 8,172 | | | | 334,562 | |
Alexion Pharmaceuticals Inc * | | | 4,515 | | | | 423,552 | |
| | |
| See Notes to Financial Statements | | See explanation of symbols and terms, if any, on page B-81 |
B-29
PACIFIC SELECT FUND
PD LARGE-CAP GROWTH INDEX PORTFOLIO
Schedule of Investments (Continued)
December 31, 2012
| | | | | | | | |
| | |
Shares | | | Value | |
Allergan Inc | | | 7,134 | | | | $654,402 | |
AmerisourceBergen Corp | | | 5,542 | | | | 239,304 | |
Amgen Inc | | | 18,281 | | | | 1,578,016 | |
ARIAD Pharmaceuticals Inc * | | | 3,896 | | | | 74,725 | |
Baxter International Inc | | | 11,842 | | | | 789,388 | |
Becton Dickinson & Co | | | 4,441 | | | | 347,242 | |
Biogen Idec Inc * | | | 5,631 | | | | 825,899 | |
BioMarin Pharmaceutical Inc * | | | 2,872 | | | | 141,446 | |
Bristol-Myers Squibb Co | | | 36,051 | | | | 1,174,902 | |
Bruker Corp * | | | 2,121 | | | | 32,388 | |
C.R. Bard Inc | | | 1,973 | | | | 192,841 | |
Cardinal Health Inc | | | 4,393 | | | | 180,904 | |
Catamaran Corp * (Canada) | | | 4,810 | | | | 226,599 | |
Celgene Corp * | | | 10,354 | | | | 815,067 | |
Cerner Corp * | | | 3,406 | | | | 264,442 | |
Charles River Laboratories International Inc * | | | 712 | | | | 26,679 | |
Covance Inc * | | | 65 | | | | 3,755 | |
Covidien PLC (Ireland) | | | 588 | | | | 33,951 | |
DaVita HealthCare Partners Inc * | | | 2,210 | | | | 244,271 | |
DENTSPLY International Inc | | | 1,486 | | | | 58,860 | |
Edwards Lifesciences Corp * | | | 2,694 | | | | 242,918 | |
Eli Lilly & Co | | | 8,767 | | | | 432,388 | |
Endo Health Solutions Inc * | | | 1,767 | | | | 46,419 | |
Express Scripts Holding Co * | | | 18,934 | | | | 1,022,436 | |
Gilead Sciences Inc * | | | 17,802 | | | | 1,307,557 | |
HCA Holdings Inc | | | 2,514 | | | | 75,847 | |
Henry Schein Inc * | | | 1,200 | | | | 96,552 | |
IDEXX Laboratories Inc * | | | 1,294 | | | | 120,083 | |
Illumina Inc * | | | 2,902 | | | | 161,322 | |
Incyte Corp Ltd * | | | 2,262 | | | | 37,572 | |
Intuitive Surgical Inc * | | | 933 | | | | 457,515 | |
Johnson & Johnson | | | 14,525 | | | | 1,018,202 | |
Laboratory Corp of America Holdings * | | | 2,276 | | | | 197,147 | |
Life Technologies Corp * | | | 396 | | | | 19,436 | |
McKesson Corp | | | 5,533 | | | | 536,480 | |
Medivation Inc * | | | 1,705 | | | | 87,228 | |
Medtronic Inc | | | 1,488 | | | | 61,038 | |
Mettler-Toledo International Inc * | | | 739 | | | | 142,849 | |
Mylan Inc * | | | 8,769 | | | | 240,972 | |
Myriad Genetics Inc * | | | 1,996 | | | | 54,391 | |
Onyx Pharmaceuticals Inc * | | | 1,513 | | | | 114,277 | |
Patterson Cos Inc | | | 2,034 | | | | 69,624 | |
Perrigo Co | | | 2,196 | | | | 228,450 | |
Quest Diagnostics Inc | | | 434 | | | | 25,289 | |
Regeneron Pharmaceuticals Inc * | | | 1,816 | | | | 310,663 | |
ResMed Inc | | | 3,356 | | | | 139,509 | |
Salix Pharmaceuticals Ltd * | | | 1,366 | | | | 55,296 | |
Sirona Dental Systems Inc * | | | 247 | | | | 15,922 | |
St. Jude Medical Inc | | | 5,688 | | | | 205,564 | |
Stryker Corp | | | 5,358 | | | | 293,725 | |
Techne Corp | | | 866 | | | | 59,182 | |
Tenet Healthcare Corp * | | | 139 | | | | 4,513 | |
The Cooper Cos Inc | | | 342 | | | | 31,628 | |
Thoratec Corp * | | | 1,380 | | | | 51,778 | |
United Therapeutics Corp * | | | 1,188 | | | | 63,463 | |
Universal Health Services Inc ‘B’ | | | 119 | | | | 5,754 | |
Varian Medical Systems Inc * | | | 2,621 | | | | 184,099 | |
Vertex Pharmaceuticals Inc * | | | 4,962 | | | | 208,106 | |
Warner Chilcott PLC ‘A’ (Ireland) | | | 3,858 | | | | 46,450 | |
Waters Corp * | | | 2,089 | | | | 181,994 | |
Watson Pharmaceuticals Inc * | | | 2,995 | | | | 257,570 | |
WellPoint Inc | | | 473 | | | | 28,815 | |
Zimmer Holdings Inc | | | 406 | | | | 27,064 | |
| | | | | | | | |
| | | | 19,926,777 | |
| | | | | | | | |
Industrials - 12.4% | | | | | | | | |
| | |
3M Co | | | 14,663 | | | | 1,361,460 | |
AMETEK Inc | | | 5,668 | | | | 212,947 | |
Armstrong World Industries Inc | | | 482 | | | | 24,452 | |
| | | | | | | | |
| | |
Shares | | | Value | |
BE Aerospace Inc * | | | 2,301 | | | | $113,669 | |
C.H. Robinson Worldwide Inc | | | 3,823 | | | | 241,690 | |
Carlisle Cos Inc | | | 123 | | | | 7,227 | |
Caterpillar Inc | | | 15,338 | | | | 1,373,978 | |
Chicago Bridge & Iron Co NV (Netherlands) | | | 1,410 | | | | 65,354 | |
Cintas Corp | | | 1,161 | | | | 47,485 | |
Clean Harbors Inc * | | | 1,117 | | | | 61,446 | |
Colfax Corp * | | | 205 | | | | 8,272 | |
Con-way Inc | | | 712 | | | | 19,808 | |
Copa Holdings SA ‘A’ (Panama) | | | 629 | | | | 62,554 | |
Copart Inc * | | | 2,395 | | | | 70,652 | |
Covanta Holding Corp | | | 185 | | | | 3,408 | |
CSX Corp | | | 16,537 | | | | 326,275 | |
Cummins Inc | | | 4,518 | | | | 489,525 | |
Danaher Corp | | | 4,653 | | | | 260,103 | |
Deere & Co | | | 9,349 | | | | 807,941 | |
Delta Air Lines Inc * | | | 12,764 | | | | 151,509 | |
Donaldson Co Inc | | | 3,501 | | | | 114,973 | |
Eaton Corp PLC (Ireland) | | | 1,994 | | | | 108,075 | |
Emerson Electric Co | | | 14,503 | | | | 768,079 | |
Equifax Inc | | | 2,547 | | | | 137,844 | |
Expeditors International of Washington Inc | | | 4,514 | | | | 178,529 | |
Fastenal Co | | | 6,960 | | | | 324,962 | |
FedEx Corp | | | 467 | | | | 42,833 | |
Flowserve Corp | | | 1,109 | | | | 162,801 | |
Fluor Corp | | | 2,970 | | | | 174,458 | |
Fortune Brands Home & Security Inc * | | | 635 | | | | 18,555 | |
General Cable Corp * | | | 57 | | | | 1,733 | |
Graco Inc | | | 1,421 | | | | 73,167 | |
Hertz Global Holdings Inc * | | | 3,355 | | | | 54,586 | |
Honeywell International Inc | | | 18,316 | | | | 1,162,517 | |
Hubbell Inc ‘B’ | | | 1,153 | | | | 97,578 | |
IDEX Corp | | | 399 | | | | 18,565 | |
IHS Inc ‘A’ * | | | 1,184 | | | | 113,664 | |
Illinois Tool Works Inc | | | 9,449 | | | | 574,594 | |
Ingersoll-Rand PLC (Ireland) | | | 5,758 | | | | 276,154 | |
Iron Mountain Inc | | | 3,646 | | | | 113,208 | |
ITT Corp | | | 548 | | | | 12,856 | |
JB Hunt Transport Services Inc | | | 2,111 | | | | 126,048 | |
Joy Global Inc | | | 2,488 | | | | 158,685 | |
Kansas City Southern | | | 2,017 | | | | 168,379 | |
Kirby Corp * | | | 977 | | | | 60,467 | |
Landstar System Inc | | | 1,109 | | | | 58,178 | |
Lennox International Inc | | | 1,198 | | | | 62,919 | |
Lincoln Electric Holdings Inc | | | 1,968 | | | | 95,802 | |
Lockheed Martin Corp | | | 5,460 | | | | 503,903 | |
Masco Corp | | | 8,395 | | | | 139,861 | |
Matson Inc | | | 56 | | | | 1,384 | |
MRC Global Inc * | | | 304 | | | | 8,445 | |
MSC Industrial Direct Co Inc ‘A’ | | | 1,071 | | | | 80,732 | |
Nielsen Holdings NV * (Netherlands) | | | 707 | | | | 21,627 | |
Nordson Corp | | | 1,402 | | | | 88,494 | |
PACCAR Inc | | | 1,895 | | | | 85,673 | |
Pall Corp | | | 2,722 | | | | 164,028 | |
Parker Hannifin Corp | | | 1,598 | | | | 135,926 | |
Pitney Bowes Inc | | | 2,382 | | | | 25,344 | |
Polypore International Inc * | | | 1,094 | | | | 50,871 | |
Precision Castparts Corp | | | 3,416 | | | | 647,059 | |
Robert Half International Inc | | | 3,361 | | | | 106,947 | |
Rockwell Automation Inc | | | 3,355 | | | | 281,786 | |
Rockwell Collins Inc | | | 3,409 | | | | 198,302 | |
Rollins Inc | | | 1,524 | | | | 33,589 | |
Roper Industries Inc | | | 2,290 | | | | 255,289 | |
Snap-on Inc | | | 271 | | | | 21,406 | |
Southwest Airlines Co | | | 3,566 | | | | 36,516 | |
Spirit AeroSystems Holdings Inc ‘A’ * | | | 696 | | | | 11,811 | |
SPX Corp | | | 349 | | | | 24,482 | |
Stericycle Inc * | | | 2,000 | | | | 186,540 | |
Textron Inc | | | 445 | | | | 11,032 | |
The Babcock & Wilcox Co | | | 2,789 | | | | 73,072 | |
| | |
| See Notes to Financial Statements | | See explanation of symbols and terms, if any, on page B-81 |
B-30
PACIFIC SELECT FUND
PD LARGE-CAP GROWTH INDEX PORTFOLIO
Schedule of Investments (Continued)
December 31, 2012
| | | | | | | | |
| | |
Shares | | | Value | |
The Boeing Co | | | 15,899 | | | | $1,198,149 | |
The Dun & Bradstreet Corp | | | 713 | | | | 56,077 | |
The Manitowoc Co Inc | | | 2,405 | | | | 37,710 | |
The Timken Co | | | 170 | | | | 8,131 | |
The Toro Co | | | 1,407 | | | | 60,473 | |
TransDigm Group Inc | | | 1,201 | | | | 163,768 | |
Triumph Group Inc | | | 385 | | | | 25,141 | |
Union Pacific Corp | | | 11,194 | | | | 1,407,310 | |
United Continental Holdings Inc * | | | 7,806 | | | | 182,504 | |
United Parcel Service Inc ‘B’ | | | 17,028 | | | | 1,255,474 | |
United Rentals Inc * | | | 2,204 | | | | 100,326 | |
United Technologies Corp | | | 21,422 | | | | 1,756,818 | |
Valmont Industries Inc | | | 549 | | | | 74,966 | |
Verisk Analytics Inc ‘A’ * | | | 2,982 | | | | 152,082 | |
W.W. Grainger Inc | | | 1,373 | | | | 277,854 | |
WABCO Holdings Inc * | | | 1,406 | | | | 91,657 | |
Wabtec Corp | | | 1,132 | | | | 99,095 | |
Waste Connections Inc | | | 197 | | | | 6,657 | |
Xylem Inc | | | 503 | | | | 13,631 | |
| | | | | | | | |
| | | | 21,131,906 | |
| | | | | | | | |
Information Technology - 30.0% | | | | | | | | |
| | |
Accenture PLC ‘A’ (Ireland) | | | 15,135 | | | | 1,006,477 | |
Acme Packet Inc * | | | 1,410 | | | | 31,189 | |
Adobe Systems Inc * | | | 6,683 | | | | 251,815 | |
Advanced Micro Devices Inc * | | | 15,021 | | | | 36,050 | |
Akamai Technologies Inc * | | | 3,892 | | | | 159,222 | |
Alliance Data Systems Corp * | | | 1,184 | | | | 171,396 | |
Altera Corp | | | 7,584 | | | | 261,193 | |
Amphenol Corp ‘A’ | | | 3,809 | | | | 246,442 | |
Analog Devices Inc | | | 576 | | | | 24,227 | |
ANSYS Inc * | | | 2,190 | | | | 147,475 | |
AOL Inc * | | | 402 | | | | 11,903 | |
Apple Inc | | | 21,979 | | | | 11,715,466 | |
Atmel Corp * | | | 706 | | | | 4,624 | |
Autodesk Inc * | | | 5,432 | | | | 192,021 | |
Automatic Data Processing Inc | | | 11,497 | | | | 655,444 | |
Avago Technologies Ltd (Singapore) | | | 5,395 | | | | 170,806 | |
BMC Software Inc * | | | 3,787 | | | | 150,192 | |
Broadcom Corp ‘A’ * | | | 8,031 | | | | 266,710 | |
Broadridge Financial Solutions Inc | | | 2,936 | | | | 67,176 | |
CA Inc | | | 517 | | | | 11,364 | |
Cadence Design Systems Inc * | | | 6,457 | | | | 87,234 | |
Citrix Systems Inc * | | | 4,377 | | | | 287,788 | |
Cognizant Technology Solutions Corp ‘A’ * | | | 7,158 | | | | 530,050 | |
Compuware Corp * | | | 216 | | | | 2,348 | |
Concur Technologies Inc * | | | 1,071 | | | | 72,314 | |
Cypress Semiconductor Corp * | | | 2,064 | | | | 22,374 | |
Diebold Inc | | | 92 | | | | 2,816 | |
Dolby Laboratories Inc ‘A’ | | | 675 | | | | 19,798 | |
DST Systems Inc | | | 139 | | | | 8,423 | |
eBay Inc * | | | 27,225 | | | | 1,389,019 | |
EchoStar Corp ‘A’ * | | | 228 | | | | 7,802 | |
EMC Corp * | | | 49,356 | | | | 1,248,707 | |
Equinix Inc * | | | 1,130 | | | | 233,006 | |
F5 Networks Inc * | | | 1,866 | | | | 181,282 | |
Facebook Inc ‘A’ * | | | 9,901 | | | | 263,664 | |
FactSet Research Systems Inc | | | 1,056 | | | | 92,991 | |
Fiserv Inc * | | | 2,653 | | | | 209,667 | |
FleetCor Technologies Inc * | | | 1,154 | | | | 61,912 | |
FLIR Systems Inc | | | 2,937 | | | | 65,524 | |
Fortinet Inc * | | | 3,070 | | | | 64,685 | |
Freescale Semiconductor Ltd * (Bermuda) | | | 1,213 | | | | 13,355 | |
Fusion-io Inc * | | | 1,595 | | | | 36,573 | |
Gartner Inc * | | | 2,193 | | | | 100,922 | |
Genpact Ltd (Bermuda) | | | 2,392 | | | | 37,076 | |
Global Payments Inc | | | 1,847 | | | | 83,669 | |
Google Inc ‘A’ * | | | 6,085 | | | | 4,316,516 | |
Harris Corp | | | 797 | | | | 39,021 | |
IAC/InterActiveCorp | | | 295 | | | | 13,954 | |
| | | | | | | | |
| | |
Shares | | | Value | |
Informatica Corp * | | | 2,545 | | | | $77,164 | |
Intel Corp | | | 87,866 | | | | 1,812,676 | |
International Business Machines Corp | | | 25,622 | | | | 4,907,894 | |
Intuit Inc | | | 6,903 | | | | 410,729 | |
IPG Photonics Corp | | | 749 | | | | 49,921 | |
Jabil Circuit Inc | | | 838 | | | | 16,165 | |
Jack Henry & Associates Inc | | | 2,053 | | | | 80,601 | |
Lam Research Corp * | | | 1,355 | | | | 48,956 | |
Lender Processing Services Inc | | | 2,024 | | | | 49,831 | |
Linear Technology Corp | | | 5,412 | | | | 185,632 | |
LinkedIn Corp ‘A’ * | | | 1,455 | | | | 167,063 | |
LSI Corp * | | | 13,375 | | | | 94,695 | |
MasterCard Inc ‘A’ | | | 2,549 | | | | 1,252,273 | |
Maxim Integrated Products Inc | | | 3,435 | | | | 100,989 | |
Microchip Technology Inc | | | 4,551 | | | | 148,317 | |
MICROS Systems Inc * | | | 1,889 | | | | 80,169 | |
Microsoft Corp | | | 176,933 | | | | 4,729,419 | |
Motorola Solutions Inc | | | 6,865 | | | | 382,243 | |
National Instruments Corp | | | 2,210 | | | | 57,040 | |
NCR Corp * | | | 3,733 | | | | 95,117 | |
NetApp Inc * | | | 5,726 | | | | 192,107 | |
NetSuite Inc * | | | 738 | | | | 49,667 | |
NeuStar Inc ‘A’ * | | | 1,572 | | | | 65,914 | |
Nuance Communications Inc * | | | 5,681 | | | | 126,800 | |
Oracle Corp | | | 89,813 | | | | 2,992,569 | |
Palo Alto Networks Inc * | | | 111 | | | | 5,941 | |
Paychex Inc | | | 7,101 | | | | 221,125 | |
QUALCOMM Inc | | | 40,296 | | | | 2,499,158 | |
Rackspace Hosting Inc * | | | 2,564 | | | | 190,428 | |
Red Hat Inc * | | | 4,534 | | | | 240,121 | |
Riverbed Technology Inc * | | | 3,727 | | | | 73,496 | |
Rovi Corp * | | | 498 | | | | 7,684 | |
SAIC Inc | | | 2,314 | | | | 26,194 | |
salesforce.com inc * | | | 3,261 | | | | 548,174 | |
ServiceNow Inc * | | | 290 | | | | 8,709 | |
Silicon Laboratories Inc * | | | 920 | | | | 38,465 | |
Skyworks Solutions Inc * | | | 3,973 | | | | 80,652 | |
SolarWinds Inc * | | | 1,448 | | | | 75,948 | |
Solera Holdings Inc | | | 1,634 | | | | 87,370 | |
Splunk Inc * | | | 397 | | | | 11,521 | |
Stratasys Ltd * (Israel) | | | 291 | | | | 23,324 | |
Symantec Corp * | | | 988 | | | | 18,584 | |
Synopsys Inc * | | | 240 | | | | 7,642 | |
Teradata Corp * | | | 3,966 | | | | 245,456 | |
Teradyne Inc * | | | 496 | | | | 8,377 | |
Texas Instruments Inc | | | 18,077 | | | | 559,302 | |
The Western Union Co | | | 14,409 | | | | 196,106 | |
TIBCO Software Inc * | | | 3,878 | | | | 85,355 | |
Total System Services Inc | | | 3,269 | | | | 70,022 | |
Trimble Navigation Ltd * | | | 2,941 | | | | 175,813 | |
Vantiv Inc ‘A’ * | | | 921 | | | | 18,807 | |
VeriFone Systems Inc * | | | 2,531 | | | | 75,120 | |
VeriSign Inc * | | | 3,417 | | | | 132,648 | |
Visa Inc ‘A’ | | | 12,284 | | | | 1,862,009 | |
VMware Inc ‘A’ * | | | 2,079 | | | | 195,717 | |
Western Digital Corp | | | 2,116 | | | | 89,909 | |
Workday Inc ‘A’ * | | | 459 | | | | 25,016 | |
Xilinx Inc | | | 6,204 | | | | 222,724 | |
Zebra Technologies Corp ‘A’ * | | | 180 | | | | 7,070 | |
Zynga Inc ‘A’ * | | | 2,870 | | | | 6,802 | |
| | | | | | | | |
| | | | 51,388,422 | |
| | | | | | | | |
Materials - 3.9% | | | | | | | | |
| | |
Airgas Inc | | | 1,614 | | | | 147,342 | |
Albemarle Corp | | | 1,183 | | | | 73,488 | |
Allied Nevada Gold Corp * | | | 2,114 | | | | 63,695 | |
Aptargroup Inc | | | 520 | | | | 24,814 | |
Ball Corp | | | 3,683 | | | | 164,814 | |
Carpenter Technology Corp | | | 65 | | | | 3,356 | |
Celanese Corp ‘A’ | | | 3,677 | | | | 163,737 | |
| | |
| See Notes to Financial Statements | | See explanation of symbols and terms, if any, on page B-81 |
B-31
PACIFIC SELECT FUND
PD LARGE-CAP GROWTH INDEX PORTFOLIO
Schedule of Investments (Continued)
December 31, 2012
| | | | | | | | |
| | |
Shares | | | Value | |
CF Industries Holdings Inc | | | 343 | | | | $69,684 | |
Compass Minerals International Inc | | | 778 | | | | 58,124 | |
Crown Holdings Inc * | | | 862 | | | | 31,730 | |
E.I. du Pont de Nemours & Co | | | 22,026 | | | | 990,509 | |
Eastman Chemical Co | | | 2,944 | | | | 200,339 | |
Ecolab Inc | | | 6,113 | | | | 439,525 | |
FMC Corp | | | 3,224 | | | | 188,669 | |
International Flavors & Fragrances Inc | | | 1,906 | | | | 126,825 | |
Intrepid Potash Inc | | | 636 | | | | 13,540 | |
LyondellBasell Industries NV ‘A’ (Netherlands) | | | 543 | | | | 31,000 | |
Martin Marietta Materials Inc | | | 557 | | | | 52,514 | |
Molycorp Inc * | | | 403 | | | | 3,804 | |
Monsanto Co | | | 12,539 | | | | 1,186,816 | |
NewMarket Corp | | | 208 | | | | 54,538 | |
Owens-Illinois Inc * | | | 2,879 | | | | 61,236 | |
Packaging Corp of America | | | 2,116 | | | | 81,403 | |
PPG Industries Inc | | | 3,580 | | | | 484,553 | |
Praxair Inc | | | 7,021 | | | | 768,448 | |
Rock-Tenn Co ‘A’ | | | 203 | | | | 14,192 | |
Rockwood Holdings Inc | | | 475 | | | | 23,494 | |
Royal Gold Inc | | | 1,506 | | | | 122,453 | |
RPM International Inc | | | 1,221 | | | | 35,849 | |
Sigma-Aldrich Corp | | | 2,842 | | | | 209,114 | |
Silgan Holdings Inc | | | 1,154 | | | | 47,995 | |
Southern Copper Corp | | | 2,854 | | | | 108,052 | |
Steel Dynamics Inc | | | 1,148 | | | | 15,762 | |
Tahoe Resources Inc * (Canada) | | | 386 | | | | 7,072 | |
The Scotts Miracle-Gro Co ‘A’ | | | 878 | | | | 38,676 | |
The Sherwin-Williams Co | | | 2,042 | | | | 314,100 | |
The Valspar Corp | | | 2,189 | | | | 136,594 | |
Westlake Chemical Corp | | | 106 | | | | 8,406 | |
WR Grace & Co * | | | 1,603 | | | | 107,770 | |
| | | | | | | | |
| | | | | | | 6,674,032 | |
| | | | | | | | |
Telecommunication Services - 2.2% | | | | | | | | |
| | |
Crown Castle International Corp * | | | 6,888 | | | | 497,038 | |
Level 3 Communications Inc * | | | 1,971 | | | | 45,550 | |
SBA Communications Corp ‘A’ * | | | 2,851 | | | | 202,478 | |
tw telecom Inc * | | | 3,538 | | | | 90,113 | |
Verizon Communications Inc | | | 66,781 | | | | 2,889,614 | |
Windstream Corp | | | 8,217 | | | | 68,036 | |
| | | | | | | | |
| | | | | | | 3,792,829 | |
| | | | | | | | |
Utilities - 0.2% | | | | | | | | |
| | |
Aqua America Inc | | | 358 | | | | 9,101 | |
ITC Holdings Corp | | | 1,208 | | | | 92,907 | |
ONEOK Inc | | | 4,886 | | | | 208,877 | |
Questar Corp | | | 957 | | | | 18,910 | |
| | | | | | | | |
| | | | | | | 329,795 | |
| | | | | | | | |
Total Common Stocks
(Cost $143,806,222) | | | | | | | 166,202,155 | |
| | | | | | | | |
| | |
EXCHANGE-TRADED FUND - 0.1% | | | | | | | | |
| | |
iShares Russell 1000 Growth Index Fund | | | 2,389 | | | | 156,456 | |
| | | | | | | | |
| | |
Total Exchange-Traded Fund
(Cost $160,689) | | | | | | | 156,456 | |
| | | | | | | | |
| | | | | | | | |
| | | Principal
Amount | | | Value | |
SHORT-TERM INVESTMENT - 2.7% | | | | | | | | |
| | |
Repurchase Agreement - 2.7% | | | | | | | | |
| | |
Fixed Income Clearing Corp
0.010% due 01/02/13
(Dated 12/31/12, repurchase price of $4,683,286; collateralized by U.S. Treasury Notes: 0.250% due 07/15/15 and value $4,780,000) | | | $4,683,284 | | | | $4,683,284 | |
| | | | | | | | |
| | |
Total Short-Term Investment
(Cost $4,683,284) | | | | | | | 4,683,284 | |
| | | | | | | | |
| | |
TOTAL INVESTMENTS - 99.9%
(Cost $148,650,195) | | | | | | | 171,041,895 | |
| | |
OTHER ASSETS & LIABILITIES, NET - 0.1% | | | | | | | 225,760 | |
| | | | | | | | |
| | |
NET ASSETS - 100.0% | | | | | | | $171,267,655 | |
| | | | | | | | |
Notes to Schedule of Investments
| (a) | As of December 31, 2012, the portfolio was diversified as a percentage of net assets as follows: |
| | | | |
Information Technology | | | 30.0% | |
Consumer Discretionary | | | 16.3% | |
Industrials | | | 12.4% | |
Consumer Staples | | | 12.1% | |
Health Care | | | 11.6% | |
Financials | | | 4.5% | |
Energy | | | 3.9% | |
Materials | | | 3.9% | |
Short-Term Investment | | | 2.7% | |
Telecommunication Services | | | 2.2% | |
Utilities | | | 0.2% | |
Exchange-Traded Fund | | | 0.1% | |
| | | | |
| | | 99.9% | |
Other Assets & Liabilities, Net | | | 0.1% | |
| | | | |
| | | 100.0% | |
| | | | |
| (b) | Short-term investments reflect either the stated coupon rate or the annualized effective yield on the date of purchase for discounted investments. |
| (c) | As of December 31, 2012, an investment with a value of $884,250 was fully or partially segregated with the broker(s)/custodian as collateral for open futures contracts. |
| (d) | Open futures contracts outstanding as of December 31, 2012 were as follows: |
| | | | | | | | | | | | |
| Long Futures Outstanding | | Number of
Contracts | | | Notional
Amount | | | Unrealized
Depreciation | |
NASDAQ 100 E-Mini (03/13) | | | 27 | | | | $1,447,612 | | | | ($13,777) | |
S&P 500 E-Mini (03/13) | | | 49 | | | | 3,486,109 | | | | (6,864) | |
| | | | | | | | | | | | |
| | | |
Total Futures Contracts | | | | | | | | | | | ($20,641) | |
| | | | | | | | | | | | |
| | |
| See Notes to Financial Statements | | See explanation of symbols and terms, if any, on page B-81 |
B-32
PACIFIC SELECT FUND
PD LARGE-CAP GROWTH INDEX PORTFOLIO
Schedule of Investments (Continued)
December 31, 2012
| (e) | Fair Value Measurements |
The following is a summary of the portfolio’s investments as categorized under the three-tier hierarchy of inputs used in valuing the portfolio’s assets and liabilities (See Note 3D in Notes to Financial Statements) as of December 31, 2012:
| | | | | | | | | | | | | | | | | | |
| | | | | Total Value at
December 31, 2012 | | | Level 1
Quoted Price | | | Level 2
Significant
Observable Inputs | | | Level 3
Significant
Unobservable Inputs | |
Assets | | Common Stocks (1) | | | $166,202,155 | | | | $166,202,155 | | | | $- | | | | $- | |
| | Exchange-Traded Fund | | | 156,456 | | | | 156,456 | | | | - | | | | - | |
| | Short-Term Investment | | | 4,683,284 | | | | - | | | | 4,683,284 | | | | - | |
| | | | | | | | | | | | | | | | | | |
| | Total Assets | | | 171,041,895 | | | | 166,358,611 | | | | 4,683,284 | | | | - | |
| | | | | | | | | | | | | | | | | | |
Liabilities | | Derivatives: | | | | | | | | | | | | | | | | |
| | Equity Contracts | | | | | | | | | | | | | | | | |
| | Futures | | | (20,641 | ) | | | (20,641 | ) | | | - | | | | - | |
| | | | | | | | | | | | | | | | | | |
| | Total Liabilities | | | (20,641 | ) | | | (20,641 | ) | | | - | | | | - | |
| | | | | | | | | | | | | | | | | | |
| | Total | | | $171,021,254 | | | | $166,337,970 | | | | $4,683,284 | | | | $- | |
| | | | | | | | | | | | | | | | | | |
| | (1) | For equity investments categorized in a single level, refer to the schedule of investments for further industry breakout. |
| | |
| See Notes to Financial Statements | | See explanation of symbols and terms, if any, on page B-81 |
B-33
PACIFIC SELECT FUND
PD LARGE-CAP VALUE INDEX PORTFOLIO
Schedule of Investments
December 31, 2012
| | | | | | | | |
| | | Shares | | | Value | |
COMMON STOCKS - 95.3% | | | | | | | | |
| | |
Consumer Discretionary - 7.9% | | | | | | | | |
| | |
Aaron’s Inc | | | 536 | | | | $15,158 | |
Abercrombie & Fitch Co ‘A’ | | | 2,358 | | | | 113,113 | |
American Eagle Outfitters Inc | | | 1,186 | | | | 24,325 | |
AutoNation Inc * | | | 461 | | | | 18,302 | |
Best Buy Co Inc | | | 7,485 | | | | 88,697 | |
Cablevision Systems Corp ‘A’ | | | 4,972 | | | | 74,282 | |
CarMax Inc * | | | 5,185 | | | | 194,645 | |
Carnival Corp (Panama) | | | 11,539 | | | | 424,289 | |
CBS Corp ‘B’ | | | 14,936 | | | | 568,315 | |
Chico’s FAS Inc | | | 1,372 | | | | 25,327 | |
Choice Hotels International Inc | | | 662 | | | | 22,256 | |
Clear Channel Outdoor Holdings Inc ‘A’ * | | | 387 | | | | 2,717 | |
Comcast Corp ‘A’ | | | 39,063 | | | | 1,460,175 | |
D.R. Horton Inc | | | 7,158 | | | | 141,585 | |
Deckers Outdoor Corp * | | | 417 | | | | 16,793 | |
DeVry Inc | | | 1,807 | | | | 42,880 | |
Dillard’s Inc ‘A’ | | | 823 | | | | 68,943 | |
DISH Network Corp ‘A’ | | | 1,245 | | | | 45,318 | |
DreamWorks Animation SKG Inc ‘A’ * | | | 1,871 | | | | 31,002 | |
DSW Inc ‘A’ | | | 67 | | | | 4,401 | |
Expedia Inc | | | 919 | | | | 56,473 | |
Foot Locker Inc | | | 3,351 | | | | 107,634 | |
Ford Motor Co | | | 104,146 | | | | 1,348,691 | |
GameStop Corp ‘A’ | | | 3,460 | | | | 86,811 | |
Gannett Co Inc | | | 6,529 | | | | 117,587 | |
Garmin Ltd (Switzerland) | | | 2,808 | | | | 114,623 | |
General Motors Co * | | | 21,259 | | | | 612,897 | |
Guess? Inc | | | 1,707 | | | | 41,890 | |
H&R Block Inc | | | 2,890 | | | | 53,667 | |
Harman International Industries Inc | | | 1,959 | | | | 87,450 | |
Hasbro Inc | | | 311 | | | | 11,165 | |
HomeAway Inc * | | | 141 | | | | 3,102 | |
Hyatt Hotels Corp ‘A’ * | | | 1,249 | | | | 48,174 | |
International Game Technology | | | 3,315 | | | | 46,974 | |
J.C. Penney Co Inc | | | 4,435 | | | | 87,414 | |
Jarden Corp | | | 1,707 | | | | 88,252 | |
John Wiley & Sons Inc ‘A’ | | | 739 | | | | 28,769 | |
Johnson Controls Inc | | | 18,886 | | | | 579,800 | |
Kohl’s Corp | | | 6,289 | | | | 270,301 | |
Lamar Advertising Co ‘A’ * | | | 290 | | | | 11,238 | |
Lear Corp | | | 2,769 | | | | 129,700 | |
Leggett & Platt Inc | | | 3,896 | | | | 106,049 | |
Lennar Corp ‘A’ | | | 4,494 | | | | 173,783 | |
Liberty Interactive Corp ‘A’ * | | | 13,296 | | | | 261,665 | |
Liberty Media Corp ‘A’ * | | | 2,818 | | | | 326,916 | |
Liberty Ventures ‘A’ * | | | 997 | | | | 67,557 | |
Lowe’s Cos Inc | | | 27,244 | | | | 967,707 | |
Macy’s Inc | | | 9,958 | | | | 388,561 | |
Marriott International Inc ‘A’ | | | 565 | | | | 21,058 | |
Mattel Inc | | | 2,140 | | | | 78,367 | |
MGM Resorts International * | | | 11,045 | | | | 128,564 | |
Mohawk Industries Inc * | | | 1,583 | | | | 143,214 | |
Newell Rubbermaid Inc | | | 8,052 | | | | 179,318 | |
News Corp ‘A’ | | | 38,148 | | | | 974,300 | |
NVR Inc * | | | 15 | | | | 13,800 | |
Penn National Gaming Inc * | | | 1,686 | | | | 82,799 | |
PulteGroup Inc * | | | 9,506 | | | | 172,629 | |
PVH Corp | | | 145 | | | | 16,096 | |
Regal Entertainment Group ‘A’ | | | 1,479 | | | | 20,632 | |
Royal Caribbean Cruises Ltd (Liberia) | | | 4,206 | | | | 143,004 | |
Sally Beauty Holdings Inc * | | | 267 | | | | 6,293 | |
Sears Holdings Corp * | | | 1,015 | | | | 41,980 | |
Sears Hometown & Outlet Stores Inc * | | | 206 | | | | 6,707 | |
Service Corp International | | | 6,034 | | | | 83,330 | |
Signet Jewelers Ltd (NYSE) (Bermuda) | | | 2,365 | | | | 126,291 | |
Staples Inc | | | 19,141 | | | | 218,207 | |
| | | | | | | | |
| | | Shares | | | Value | |
Target Corp | | | 17,328 | | | | $1,025,298 | |
The Interpublic Group of Cos Inc | | | 11,571 | | | | 127,512 | |
The Madison Square Garden Co ‘A’ * | | | 1,592 | | | | 70,605 | |
The Walt Disney Co | | | 31,359 | | | | 1,561,365 | |
The Washington Post Co ‘B’ | | | 119 | | | | 43,460 | |
The Wendy’s Co | | | 7,644 | | | | 35,927 | |
Thomson Reuters Corp (NYSE) (Canada) | | | 10,309 | | | | 299,580 | |
Thor Industries Inc | | | 1,089 | | | | 40,761 | |
Tiffany & Co | | | 560 | | | | 32,110 | |
Time Warner Inc | | | 26,648 | | | | 1,274,574 | |
Toll Brothers Inc * | | | 3,993 | | | | 129,094 | |
TRW Automotive Holdings Corp * | | | 2,797 | | | | 149,947 | |
Visteon Corp * | | | 1,380 | | | | 74,272 | |
Whirlpool Corp | | | 2,146 | | | | 218,355 | |
Williams-Sonoma Inc | | | 1,080 | | | | 47,272 | |
| | | | | | | | |
| | | | 17,194,094 | |
| | | | | | | | |
Consumer Staples - 6.9% | | | | | | | | |
| | |
Altria Group Inc | | | 12,656 | | | | 397,651 | |
Archer-Daniels-Midland Co | | | 18,284 | | | | 500,799 | |
Avon Products Inc | | | 2,753 | | | | 39,533 | |
Beam Inc | | | 4,377 | | | | 267,391 | |
Brown-Forman Corp ‘B’ | | | 524 | | | | 33,143 | |
Bunge Ltd (Bermuda) | | | 4,052 | | | | 294,540 | |
Campbell Soup Co | | | 1,020 | | | | 35,588 | |
Church & Dwight Co Inc | | | 1,479 | | | | 79,230 | |
Coca-Cola Enterprises Inc | | | 7,724 | | | | 245,082 | |
Colgate-Palmolive Co | | | 1,101 | | | | 115,098 | |
ConAgra Foods Inc | | | 11,534 | | | | 340,253 | |
Constellation Brands Inc ‘A’ * | | | 4,099 | | | | 145,064 | |
CVS Caremark Corp | | | 28,390 | | | | 1,372,656 | |
Dean Foods Co * | | | 723 | | | | 11,937 | |
Energizer Holdings Inc | | | 1,817 | | | | 145,324 | |
General Mills Inc | | | 3,902 | | | | 157,680 | |
Green Mountain Coffee Roasters Inc * | | | 571 | | | | 23,617 | |
H.J. Heinz Co | | | 3,350 | | | | 193,228 | |
Hillshire Brands Co | | | 473 | | | | 13,310 | |
Hormel Foods Corp | | | 1,629 | | | | 50,841 | |
Ingredion Inc | | | 1,669 | | | | 107,534 | |
Kellogg Co | | | 378 | | | | 21,111 | |
Kimberly-Clark Corp | | | 1,155 | | | | 97,517 | |
Kraft Foods Group Inc | | | 15,555 | | | | 707,286 | |
Molson Coors Brewing Co ‘B’ | | | 3,558 | | | | 152,247 | |
Mondelez International Inc ‘A’ | | | 46,661 | | | | 1,188,456 | |
Philip Morris International Inc | | | 3,836 | | | | 320,843 | |
Ralcorp Holdings Inc * | | | 1,534 | | | | 137,523 | |
Reynolds American Inc | | | 6,070 | | | | 251,480 | |
Safeway Inc | | | 5,759 | | | | 104,180 | |
Smithfield Foods Inc * | | | 4,240 | | | | 91,457 | |
Sysco Corp | | | 7,695 | | | | 243,624 | |
The Clorox Co | | | 3,388 | | | | 248,069 | |
The J.M. Smucker Co | | | 3,111 | | | | 268,293 | |
The Procter & Gamble Co | | | 70,511 | | | | 4,786,992 | |
Tyson Foods Inc ‘A’ | | | 8,073 | | | | 156,616 | |
Wal-Mart Stores Inc | | | 9,901 | | | | 675,545 | |
Walgreen Co | | | 23,952 | | | | 886,463 | |
WhiteWave Foods Co ‘A’ * | | | 272 | | | | 4,227 | |
| | | | | | | | |
| | | | 14,911,428 | |
| | | | | | | | |
Energy - 15.4% | | | | | | | | |
| | |
Alpha Natural Resources Inc * | | | 6,091 | | | | 59,326 | |
Anadarko Petroleum Corp | | | 13,869 | | | | 1,030,605 | |
Apache Corp | | | 10,851 | | | | 851,803 | |
Atwood Oceanics Inc * | | | 1,104 | | | | 50,552 | |
Baker Hughes Inc | | | 12,174 | | | | 497,186 | |
Cameron International Corp * | | | 1,588 | | | | 89,658 | |
Cheniere Energy Inc * | | | 2,037 | | | | 38,255 | |
Chesapeake Energy Corp | | | 18,393 | | | | 305,692 | |
Chevron Corp | | | 54,760 | | | | 5,921,746 | |
Cimarex Energy Co | | | 2,381 | | | | 137,455 | |
| | |
| See Notes to Financial Statements | | See explanation of symbols and terms, if any, on page B-81 |
B-34
PACIFIC SELECT FUND
PD LARGE-CAP VALUE INDEX PORTFOLIO
Schedule of Investments (Continued)
December 31, 2012
| | | | | | | | |
| | | Shares | | | Value | |
Cobalt International Energy Inc * | | | 314 | | | | $7,712 | |
ConocoPhillips | | | 35,104 | | | | 2,035,681 | |
CONSOL Energy Inc | | | 6,320 | | | | 202,872 | |
Denbury Resources Inc * | | | 10,851 | | | | 175,786 | |
Devon Energy Corp | | | 11,228 | | | | 584,305 | |
Diamond Offshore Drilling Inc | | | 1,912 | | | | 129,940 | |
Energen Corp | | | 2,005 | | | | 90,405 | |
EQT Corp | | | 3,656 | | | | 215,631 | |
EXCO Resources Inc | | | 3,364 | | | | 22,774 | |
Exxon Mobil Corp | | | 129,805 | | | | 11,234,623 | |
Halliburton Co | | | 17,452 | | | | 605,410 | |
Helmerich & Payne Inc | | | 2,050 | | | | 114,821 | |
Hess Corp | | | 8,451 | | | | 447,565 | |
HollyFrontier Corp | | | 5,743 | | | | 267,337 | |
Laredo Petroleum Holdings Inc * | | | 35 | | | | 636 | |
Marathon Oil Corp | | | 19,583 | | | | 600,415 | |
Marathon Petroleum Corp | | | 9,460 | | | | 595,980 | |
McDermott International Inc * (Panama) | | | 6,550 | | | | 72,181 | |
Murphy Oil Corp | | | 5,392 | | | | 321,094 | |
Nabors Industries Ltd * (Bermuda) | | | 8,066 | | | | 116,554 | |
National Oilwell Varco Inc | | | 9,135 | | | | 624,377 | |
Newfield Exploration Co * | | | 3,747 | | | | 100,345 | |
Noble Energy Inc | | | 3,841 | | | | 390,783 | |
Occidental Petroleum Corp | | | 22,516 | | | | 1,724,951 | |
Oil States International Inc * | | | 216 | | | | 15,453 | |
Patterson-UTI Energy Inc | | | 4,340 | | | | 80,854 | |
Peabody Energy Corp | | | 7,565 | | | | 201,305 | |
Phillips 66 | | | 17,359 | | | | 921,763 | |
Pioneer Natural Resources Co | | | 565 | | | | 60,223 | |
Plains Exploration & Production Co * | | | 3,581 | | | | 168,092 | |
QEP Resources Inc | | | 4,956 | | | | 150,018 | |
Rowan Cos PLC ‘A’ * (United Kingdom) | | | 3,451 | | | | 107,913 | |
RPC Inc | | | 189 | | | | 2,313 | |
SandRidge Energy Inc * | | | 13,603 | | | | 86,379 | |
SEACOR Holdings Inc | | | 329 | | | | 27,570 | |
SM Energy Co | | | 294 | | | | 15,350 | |
Southwestern Energy Co * | | | 6,342 | | | | 211,886 | |
Spectra Energy Corp | | | 18,123 | | | | 496,208 | |
Superior Energy Services Inc * | | | 4,379 | | | | 90,733 | |
Teekay Corp | | | 1,012 | | | | 32,485 | |
Tesoro Corp | | | 3,898 | | | | 171,707 | |
Tidewater Inc | | | 1,425 | | | | 63,669 | |
Ultra Petroleum Corp * (Canada) | | | 4,251 | | | | 77,071 | |
Unit Corp * | | | 1,351 | | | | 60,863 | |
Valero Energy Corp | | | 15,351 | | | | 523,776 | |
Whiting Petroleum Corp * | | | 2,804 | | | | 121,609 | |
World Fuel Services Corp | | | 1,364 | | | | 56,156 | |
WPX Energy Inc * | | | 5,524 | | | | 82,197 | |
| | | | | | | | |
| | | | 33,490,049 | |
| | | | | | | | |
Financials - 26.2% | | | | | | | | |
| | |
ACE Ltd (Switzerland) | | | 9,403 | | | | 750,359 | |
Affiliated Managers Group Inc * | | | 363 | | | | 47,244 | |
Aflac Inc | | | 12,983 | | | | 689,657 | |
Alexander & Baldwin Inc * | | | 1,066 | | | | 31,308 | |
Alexandria Real Estate Equities Inc REIT | | | 1,725 | | | | 119,577 | |
Alleghany Corp * | | | 470 | | | | 157,647 | |
Allied World Assurance Co Holdings AG (Switzerland) | | | 502 | | | | 39,558 | |
American Campus Communities Inc REIT | | | 2,298 | | | | 106,007 | |
American Capital Agency Corp REIT | | | 9,486 | | | | 274,525 | |
American Capital Ltd * | | | 9,242 | | | | 110,904 | |
American Express Co | | | 9,925 | | | | 570,489 | |
American Financial Group Inc | | | 2,375 | | | | 93,860 | |
American International Group Inc * | | | 17,900 | | | | 631,870 | |
American National Insurance Co | | | 198 | | | | 13,521 | |
Ameriprise Financial Inc | | | 5,759 | | | | 360,686 | |
Annaly Capital Management Inc REIT | | | 27,062 | | | | 379,951 | |
Aon PLC (United Kingdom) | | | 8,293 | | | | 461,091 | |
| | | | | | | | |
| | | Shares | | | Value | |
Apartment Investment &
Management Co ‘A’ REIT | | | 1,147 | | | | $31,038 | |
Arch Capital Group Ltd * (Bermuda) | | | 3,341 | | | | 147,071 | |
Ares Capital Corp | | | 6,891 | | | | 120,593 | |
Aspen Insurance Holdings Ltd (Bermuda) | | | 1,989 | | | | 63,807 | |
Associated Banc-Corp | | | 4,837 | | | | 63,461 | |
Assurant Inc | | | 2,254 | | | | 78,214 | |
Assured Guaranty Ltd (Bermuda) | | | 4,785 | | | | 68,091 | |
AvalonBay Communities Inc REIT | | | 3,189 | | | | 432,397 | |
AXIS Capital Holdings Ltd (Bermuda) | | | 3,042 | | | | 105,375 | |
Bank of America Corp | | | 299,157 | | | | 3,470,221 | |
Bank of Hawaii Corp | | | 1,266 | | | | 55,767 | |
BankUnited Inc | | | 976 | | | | 23,853 | |
BB&T Corp | | | 19,397 | | | | 564,647 | |
Berkshire Hathaway Inc ‘B’ * | | | 49,436 | | | | 4,434,409 | |
BioMed Realty Trust Inc REIT | | | 4,285 | | | | 82,829 | |
BlackRock Inc | | | 1,596 | | | | 329,909 | |
BOK Financial Corp | | | 720 | | | | 39,211 | |
Boston Properties Inc REIT | | | 3,457 | | | | 365,785 | |
Brandywine Realty Trust REIT | | | 3,931 | | | | 47,919 | |
BRE Properties Inc REIT | | | 1,527 | | | | 77,617 | |
Brown & Brown Inc | | | 2,961 | | | | 75,387 | |
Camden Property Trust REIT | | | 564 | | | | 38,470 | |
Capital One Financial Corp | | | 16,112 | | | | 933,368 | |
CapitalSource Inc | | | 6,555 | | | | 49,687 | |
Capitol Federal Financial Inc | | | 4,585 | | | | 53,599 | |
CBL & Associates Properties Inc REIT | | | 4,130 | | | | 87,597 | |
CBOE Holdings Inc | | | 339 | | | | 9,987 | |
Chimera Investment Corp REIT | | | 28,558 | | | | 74,536 | |
Cincinnati Financial Corp | | | 4,056 | | | | 158,833 | |
CIT Group Inc * | | | 5,577 | | | | 215,495 | |
Citigroup Inc | | | 81,396 | | | | 3,220,026 | |
City National Corp | | | 1,297 | | | | 64,227 | |
CME Group Inc ‘A’ | | | 9,227 | | | | 467,901 | |
CNA Financial Corp | | | 750 | | | | 21,008 | |
Comerica Inc | | | 5,463 | | | | 165,747 | |
Commerce Bancshares Inc | | | 2,192 | | | | 76,852 | |
CommonWealth REIT | | | 2,335 | | | | 36,986 | |
Corporate Office Properties Trust REIT | | | 2,243 | | | | 56,030 | |
Cullen/Frost Bankers Inc | | | 1,481 | | | | 80,374 | |
DDR Corp REIT | | | 6,601 | | | | 103,372 | |
Discover Financial Services | | | 14,724 | | | | 567,610 | |
Douglas Emmett Inc REIT | | | 3,881 | | | | 90,427 | |
Duke Realty Corp REIT | | | 7,405 | | | | 102,707 | |
E*TRADE Financial Corp * | | | 7,957 | | | | 71,215 | |
East West Bancorp Inc | | | 4,019 | | | | 86,368 | |
Endurance Specialty Holdings Ltd (Bermuda) | | | 1,083 | | | | 42,984 | |
Equity Lifestyle Properties Inc REIT | | | 194 | | | | 13,054 | |
Equity Residential REIT | | | 8,332 | | | | 472,174 | |
Everest Re Group Ltd (Bermuda) | | | 1,465 | | | | 161,077 | |
Extra Space Storage Inc REIT | | | 1,057 | | | | 38,464 | |
Federal Realty Investment Trust REIT | | | 387 | | | | 40,256 | |
Federated Investors Inc ‘B’ | | | 465 | | | | 9,407 | |
Fidelity National Financial Inc ‘A’ | | | 6,190 | | | | 145,775 | |
Fifth Third Bancorp | | | 25,548 | | | | 388,074 | |
First Citizens BancShares Inc ‘A’ | | | 140 | | | | 22,890 | |
First Horizon National Corp | | | 7,046 | | | | 69,826 | |
First Niagara Financial Group Inc | | | 9,804 | | | | 77,746 | |
First Republic Bank | | | 2,835 | | | | 92,931 | |
Forest City Enterprises Inc ‘A’ * | | | 3,944 | | | | 63,696 | |
Franklin Resources Inc | | | 2,969 | | | | 373,203 | |
Fulton Financial Corp | | | 5,586 | | | | 53,681 | |
General Growth Properties Inc REIT | | | 14,663 | | | | 291,061 | |
Genworth Financial Inc ‘A’ * | | | 13,661 | | | | 102,594 | |
Hatteras Financial Corp REIT | | | 2,719 | | | | 67,458 | |
HCC Insurance Holdings Inc | | | 2,812 | | | | 104,635 | |
HCP Inc REIT | | | 11,673 | | | | 527,386 | |
Health Care REIT Inc | | | 7,192 | | | | 440,798 | |
Home Properties Inc REIT | | | 642 | | | | 39,361 | |
| | |
| See Notes to Financial Statements | | See explanation of symbols and terms, if any, on page B-81 |
B-35
PACIFIC SELECT FUND
PD LARGE-CAP VALUE INDEX PORTFOLIO
Schedule of Investments (Continued)
December 31, 2012
| | | | | | | | |
| | | Shares | | | Value | |
Hospitality Properties Trust REIT | | | 3,435 | | | | $80,448 | |
Host Hotels & Resorts Inc REIT | | | 19,970 | | | | 312,930 | |
Hudson City Bancorp Inc | | | 14,675 | | | | 119,308 | |
Huntington Bancshares Inc | | | 24,021 | | | | 153,494 | |
Interactive Brokers Group Inc ‘A’ | | | 1,131 | | | | 15,472 | |
Invesco Ltd (Bermuda) | | | 12,447 | | | | 324,742 | |
Janus Capital Group Inc | | | 5,252 | | | | 44,747 | |
Jefferies Group Inc | | | 3,933 | | | | 73,036 | |
Jones Lang LaSalle Inc | | | 1,216 | | | | 102,071 | |
JPMorgan Chase & Co | | | 105,671 | | | | 4,646,354 | |
Kemper Corp | | | 1,372 | | | | 40,474 | |
KeyCorp | | | 26,472 | | | | 222,894 | |
Kilroy Realty Corp REIT | | | 1,916 | | | | 90,761 | |
Kimco Realty Corp REIT | | | 11,302 | | | | 218,355 | |
Legg Mason Inc | | | 3,924 | | | | 100,925 | |
Leucadia National Corp | | | 4,191 | | | | 99,704 | |
Liberty Property Trust REIT | | | 2,879 | | | | 102,982 | |
Lincoln National Corp | | | 7,927 | | | | 205,309 | |
Loews Corp | | | 8,661 | | | | 352,936 | |
LPL Financial Holdings Inc | | | 222 | | | | 6,252 | |
M&T Bank Corp | | | 3,514 | | | | 346,024 | |
Mack-Cali Realty Corp REIT | | | 2,442 | | | | 63,761 | |
Markel Corp * | | | 268 | | | | 116,157 | |
Marsh & McLennan Cos Inc | | | 3,157 | | | | 108,822 | |
MBIA Inc * | | | 4,018 | | | | 31,541 | |
Mercury General Corp | | | 391 | | | | 15,519 | |
MetLife Inc | | | 23,617 | | | | 777,944 | |
MFA Financial Inc REIT | | | 9,922 | | | | 80,467 | |
Mid-America Apartment Communities Inc REIT | | | 54 | | | | 3,497 | |
Morgan Stanley | | | 42,774 | | | | 817,839 | |
National Retail Properties Inc REIT | | | 2,974 | | | | 92,789 | |
New York Community Bancorp Inc | | | 12,198 | | | | 159,794 | |
Northern Trust Corp | | | 5,987 | | | | 300,308 | |
NYSE Euronext | | | 7,056 | | | | 222,546 | |
Old Republic International Corp | | | 7,213 | | | | 76,818 | |
PartnerRe Ltd (Bermuda) | | | 1,793 | | | | 144,319 | |
People’s United Financial Inc | | | 7,311 | | | | 88,390 | |
Piedmont Office Realty Trust Inc ‘A’ REIT | | | 4,801 | | | | 86,658 | |
Popular Inc * | | | 2,863 | | | | 59,522 | |
Post Properties Inc REIT | | | 887 | | | | 44,306 | |
Principal Financial Group Inc | | | 8,336 | | | | 237,743 | |
ProAssurance Corp | | | 1,704 | | | | 71,892 | |
Prologis Inc REIT | | | 12,783 | | | | 466,452 | |
Protective Life Corp | | | 2,253 | | | | 64,391 | |
Prudential Financial Inc | | | 12,969 | | | | 691,637 | |
Raymond James Financial Inc | | | 3,159 | | | | 121,716 | |
Rayonier Inc REIT | | | 704 | | | | 36,488 | |
Realogy Holdings Corp * | | | 1,020 | | | | 42,799 | |
Realty Income Corp REIT | | | 3,706 | | | | 149,018 | |
Regency Centers Corp REIT | | | 979 | | | | 46,130 | |
Regions Financial Corp | | | 39,224 | | | | 279,275 | |
Reinsurance Group of America Inc | | | 2,048 | | | | 109,609 | |
RenaissanceRe Holdings Ltd (Bermuda) | | | 1,438 | | | | 116,852 | |
Retail Properties of America Inc ‘A’ REIT | | | 2,415 | | | | 28,908 | |
Senior Housing Properties Trust REIT | | | 4,904 | | | | 115,931 | |
Signature Bank * | | | 1,119 | | | | 79,829 | |
Simon Property Group Inc REIT | | | 1,338 | | | | 211,524 | |
SL Green Realty Corp REIT | | | 2,488 | | | | 190,705 | |
SLM Corp | | | 13,546 | | | | 232,043 | |
StanCorp Financial Group Inc | | | 1,257 | | | | 46,094 | |
State Street Corp | | | 13,565 | | | | 637,691 | |
SunTrust Banks Inc | | | 14,943 | | | | 423,634 | |
SVB Financial Group * | | | 1,229 | | | | 68,787 | |
Synovus Financial Corp | | | 8,925 | | | | 21,866 | |
Taubman Centers Inc REIT | | | 972 | | | | 76,516 | |
TCF Financial Corp | | | 4,527 | | | | 55,003 | |
TD Ameritrade Holding Corp | | | 6,446 | | | | 108,357 | |
TFS Financial Corp * | | | 2,266 | | | | 21,799 | |
The Allstate Corp | | | 13,619 | | | | 547,075 | |
| | | | | | | | |
| | | Shares | | | Value | |
The Bank of New York Mellon Corp | | | 33,113 | | | | $851,004 | |
The Charles Schwab Corp | | | 29,834 | | | | 428,416 | |
The Chubb Corp | | | 7,493 | | | | 564,373 | |
The Goldman Sachs Group Inc | | | 13,655 | | | | 1,741,832 | |
The Hanover Insurance Group Inc | | | 671 | | | | 25,995 | |
The Hartford Financial Services Group Inc | | | 12,243 | | | | 274,733 | |
The Howard Hughes Corp * | | | 767 | | | | 56,006 | |
The Macerich Co REIT | | | 3,682 | | | | 214,661 | |
The NASDAQ OMX Group Inc | | | 3,238 | | | | 80,982 | |
The PNC Financial Services Group Inc | | | 14,251 | | | | 830,976 | |
The Progressive Corp | | | 16,970 | | | | 358,067 | |
The St. Joe Co * | | | 1,598 | | | | 36,882 | |
The Travelers Cos Inc | | | 6,112 | | | | 438,964 | |
Torchmark Corp | | | 2,735 | | | | 141,317 | |
U.S. Bancorp | | | 52,584 | | | | 1,679,533 | |
UDR Inc REIT | | | 6,866 | | | | 163,273 | |
Unum Group | | | 7,940 | | | | 165,311 | |
Validus Holdings Ltd (Bermuda) | | | 2,461 | | | | 85,101 | |
Valley National Bancorp | | | 5,510 | | | | 51,243 | |
Ventas Inc REIT | | | 8,023 | | | | 519,249 | |
Vornado Realty Trust REIT | | | 5,155 | | | | 412,812 | |
Washington Federal Inc | | | 3,003 | | | | 50,661 | |
Weingarten Realty Investors REIT | | | 3,368 | | | | 90,161 | |
Wells Fargo & Co | | | 136,005 | | | | 4,648,651 | |
Weyerhaeuser Co REIT | | | 10,149 | | | | 282,345 | |
White Mountains Insurance Group Ltd (Bermuda) | | | 165 | | | | 84,975 | |
WR Berkley Corp | | | 3,082 | | | | 116,315 | |
XL Group PLC (Ireland) | | | 8,657 | | | | 216,944 | |
Zions Bancorp | | | 5,119 | | | | 109,547 | |
| | | | | | | | |
| | | | 56,957,116 | |
| | | | | | | | |
Health Care - 11.0% | | | | | | | | |
| | |
Abbott Laboratories | | | 2,273 | | | | 148,881 | |
Aetna Inc | | | 9,646 | | | | 446,610 | |
Alere Inc * | | | 2,202 | | | | 40,737 | |
Allscripts Healthcare Solutions Inc * | | | 4,771 | | | | 44,943 | |
Baxter International Inc | | | 1,301 | | | | 86,725 | |
Becton Dickinson & Co | | | 388 | | | | 30,338 | |
Bio-Rad Laboratories Inc ‘A’ * | | | 563 | | | | 59,143 | |
Boston Scientific Corp * | | | 39,696 | | | | 227,458 | |
Bristol-Myers Squibb Co | | | 4,317 | | | | 140,691 | |
Brookdale Senior Living Inc * | | | 2,703 | | | | 68,440 | |
Cardinal Health Inc | | | 4,422 | | | | 182,098 | |
CareFusion Corp * | | | 6,164 | | | | 176,167 | |
Charles River Laboratories International Inc * | | | 506 | | | | 18,960 | |
CIGNA Corp | | | 8,006 | | | | 428,001 | |
Community Health Systems Inc | | | 2,528 | | | | 77,711 | |
Covance Inc * | | | 1,444 | | | | 83,420 | |
Coventry Health Care Inc | | | 3,718 | | | | 166,678 | |
Covidien PLC (Ireland) | | | 12,707 | | | | 733,702 | |
DENTSPLY International Inc | | | 2,183 | | | | 86,469 | |
Eli Lilly & Co | | | 18,092 | | | | 892,297 | |
Endo Health Solutions Inc * | | | 1,191 | | | | 31,288 | |
Forest Laboratories Inc * | | | 7,378 | | | | 260,591 | |
HCA Holdings Inc | | | 1,596 | | | | 48,151 | |
Health Management Associates Inc ‘A’ * | | | 7,131 | | | | 66,461 | |
Health Net Inc * | | | 2,317 | | | | 56,303 | |
Henry Schein Inc * | | | 1,079 | | | | 86,816 | |
Hill-Rom Holdings Inc | | | 1,751 | | | | 49,903 | |
Hologic Inc * | | | 7,350 | | | | 147,220 | |
Hospira Inc * | | | 4,588 | | | | 143,329 | |
Humana Inc | | | 4,531 | | | | 310,963 | |
Johnson & Johnson | | | 59,084 | | | | 4,141,788 | |
Life Technologies Corp * | | | 4,493 | | | | 220,516 | |
LifePoint Hospitals Inc * | | | 1,362 | | | | 51,415 | |
MEDNAX Inc * | | | 1,367 | | | | 108,704 | |
Medtronic Inc | | | 27,038 | | | | 1,109,099 | |
Merck & Co Inc | | | 84,432 | | | | 3,456,646 | |
| | |
| See Notes to Financial Statements | | See explanation of symbols and terms, if any, on page B-81 |
B-36
PACIFIC SELECT FUND
PD LARGE-CAP VALUE INDEX PORTFOLIO
Schedule of Investments (Continued)
December 31, 2012
| | | | | | | | |
| | | Shares | | | Value | |
Mylan Inc * | | | 927 | | | | $25,474 | |
Omnicare Inc | | | 3,139 | | | | 113,318 | |
Patterson Cos Inc | | | 212 | | | | 7,257 | |
PerkinElmer Inc | | | 3,165 | | | | 100,457 | |
Pfizer Inc | | | 207,865 | | | | 5,213,254 | |
QIAGEN NV (XNGS) * (Netherlands) | | | 6,544 | | | | 118,774 | |
Quest Diagnostics Inc | | | 3,886 | | | | 226,437 | |
Sirona Dental Systems Inc * | | | 1,260 | | | | 81,220 | |
St. Jude Medical Inc | | | 1,999 | | | | 72,244 | |
Stryker Corp | | | 2,272 | | | | 124,551 | |
Teleflex Inc | | | 1,135 | | | | 80,937 | |
Tenet Healthcare Corp * | | | 2,706 | | | | 87,864 | |
The Cooper Cos Inc | | | 924 | | | | 85,451 | |
Thermo Fisher Scientific Inc | | | 10,198 | | | | 650,428 | |
UnitedHealth Group Inc | | | 28,800 | | | | 1,562,112 | |
Universal Health Services Inc ‘B’ | | | 2,342 | | | | 113,236 | |
VCA Antech Inc * | | | 2,452 | | | | 51,615 | |
WellPoint Inc | | | 7,940 | | | | 483,705 | |
Zimmer Holdings Inc | | | 4,402 | | | | 293,437 | |
| | | | | | | | |
| | | | 23,920,433 | |
| | | | | | | | |
Industrials - 8.7% | | | | | | | | |
| | |
3M Co | | | 1,947 | | | | 180,779 | |
AECOM Technology Corp * | | | 3,142 | | | | 74,780 | |
AGCO Corp * | | | 2,701 | | | | 132,673 | |
Air Lease Corp * | | | 1,894 | | | | 40,721 | |
Alliant Techsystems Inc | | | 927 | | | | 57,437 | |
Avery Dennison Corp | | | 2,880 | | | | 100,570 | |
Carlisle Cos Inc | | | 1,573 | | | | 92,429 | |
Chicago Bridge & Iron Co NV (Netherlands) | | | 1,037 | | | | 48,065 | |
Cintas Corp | | | 1,684 | | | | 68,876 | |
CNH Global NV (Netherlands) | | | 780 | | | | 31,426 | |
Colfax Corp * | | | 952 | | | | 38,413 | |
Con-way Inc | | | 702 | | | | 19,530 | |
Copa Holdings SA ‘A’ (Panama) | | | 170 | | | | 16,906 | |
Corrections Corp of America | | | 2,778 | | | | 98,536 | |
Covanta Holding Corp | | | 2,835 | | | | 52,221 | |
Crane Co | | | 1,361 | | | | 62,987 | |
CSX Corp | | | 9,323 | | | | 183,943 | |
Danaher Corp | | | 10,622 | | | | 593,770 | |
Delta Air Lines Inc * | | | 8,526 | | | | 101,204 | |
Dover Corp | | | 5,099 | | | | 335,055 | |
Eaton Corp PLC (Ireland) | | | 10,443 | | | | 566,011 | |
Emerson Electric Co | | | 3,240 | | | | 171,590 | |
Engility Holdings Inc * | | | 486 | | | | 9,360 | |
Equifax Inc | | | 346 | | | | 18,726 | |
Exelis Inc | | | 5,190 | | | | 58,491 | |
Expeditors International of Washington Inc | | | 575 | | | | 22,741 | |
FedEx Corp | | | 8,204 | | | | 752,471 | |
Flowserve Corp | | | 110 | | | | 16,148 | |
Fluor Corp | | | 1,198 | | | | 70,371 | |
Fortune Brands Home & Security Inc * | | | 3,704 | | | | 108,231 | |
Gardner Denver Inc | | | 1,392 | | | | 95,352 | |
GATX Corp | | | 1,305 | | | | 56,506 | |
General Cable Corp * | | | 1,276 | | | | 38,803 | |
General Dynamics Corp | | | 8,820 | | | | 610,961 | |
General Electric Co | | | 294,117 | | | | 6,173,516 | |
GrafTech International Ltd * | | | 3,262 | | | | 30,630 | |
Harsco Corp | | | 2,241 | | | | 52,663 | |
Hertz Global Holdings Inc * | | | 3,013 | | | | 49,022 | |
Hubbell Inc ‘B’ | | | 280 | | | | 23,696 | |
Huntington Ingalls Industries Inc | | | 1,391 | | | | 60,286 | |
IDEX Corp | | | 1,882 | | | | 87,569 | |
Illinois Tool Works Inc | | | 671 | | | | 40,804 | |
Ingersoll-Rand PLC (Ireland) | | | 1,495 | | | | 71,700 | |
Iron Mountain Inc | | | 316 | | | | 9,812 | |
ITT Corp | | | 1,964 | | | | 46,075 | |
Jacobs Engineering Group Inc * | | | 3,584 | | | | 152,571 | |
Kansas City Southern | | | 677 | | | | 56,516 | |
KAR Auction Services Inc | | | 858 | | | | 17,366 | |
| | | | | | | | |
| | | Shares | | | Value | |
KBR Inc | | | 4,124 | | | | $123,390 | |
Kennametal Inc | | | 2,225 | | | | 89,000 | |
Kirby Corp * | | | 401 | | | | 24,818 | |
L-3 Communications Holdings Inc | | | 2,706 | | | | 207,334 | |
Lockheed Martin Corp | | | 790 | | | | 72,909 | |
Manpower Inc | | | 2,229 | | | | 94,599 | |
Matson Inc | | | 1,094 | | | | 27,044 | |
MRC Global Inc * | | | 265 | | | | 7,362 | |
Navistar International Corp * | | | 1,945 | | | | 42,343 | |
Nielsen Holdings NV * (Netherlands) | | | 2,539 | | | | 77,668 | |
Nordson Corp | | | 142 | | | | 8,963 | |
Norfolk Southern Corp | | | 9,045 | | | | 559,343 | |
Northrop Grumman Corp | | | 6,983 | | | | 471,911 | |
Oshkosh Corp * | | | 2,548 | | | | 75,548 | |
Owens Corning * | | | 3,380 | | | | 125,026 | |
PACCAR Inc | | | 7,666 | | | | 346,580 | |
Parker Hannifin Corp | | | 2,308 | | | | 196,318 | |
Pentair Ltd (Switzerland) | | | 5,835 | | | | 286,790 | |
Pitney Bowes Inc | | | 1,808 | | | | 19,237 | |
Quanta Services Inc * | | | 5,805 | | | | 158,418 | |
Raytheon Co | | | 9,255 | | | | 532,718 | |
Regal-Beloit Corp | | | 1,079 | | | | 76,037 | |
Republic Services Inc | | | 8,421 | | | | 246,988 | |
RR Donnelley & Sons Co | | | 5,040 | | | | 45,360 | |
Ryder System Inc | | | 1,426 | | | | 71,200 | |
Snap-on Inc | | | 1,293 | | | | 102,134 | |
Southwest Airlines Co | | | 17,188 | | | | 176,005 | |
Spirit AeroSystems Holdings Inc ‘A’ * | | | 2,542 | | | | 43,138 | |
SPX Corp | | | 989 | | | | 69,378 | |
Stanley Black & Decker Inc | | | 4,745 | | | | 350,988 | |
Terex Corp * | | | 3,069 | | | | 86,270 | |
Textron Inc | | | 7,303 | | | | 181,041 | |
The ADT Corp | | | 6,427 | | | | 298,791 | |
The Boeing Co | | | 2,018 | | | | 152,076 | |
The Dun & Bradstreet Corp | | | 404 | | | | 31,775 | |
The Manitowoc Co Inc | | | 864 | | | | 13,548 | |
The Shaw Group Inc * | | | 1,832 | | | | 85,390 | |
The Timken Co | | | 2,214 | | | | 105,896 | |
Towers Watson & Co ‘A’ | | | 1,688 | | | | 94,882 | |
Trinity Industries Inc | | | 2,231 | | | | 79,914 | |
Triumph Group Inc | | | 913 | | | | 59,619 | |
Tyco International Ltd (Switzerland) | | | 12,852 | | | | 375,921 | |
URS Corp | | | 2,105 | | | | 82,642 | |
UTi Worldwide Inc (United Kingdom) | | | 2,922 | | | | 39,155 | |
Verisk Analytics Inc ‘A’ * | | | 576 | | | | 29,376 | |
WABCO Holdings Inc * | | | 141 | | | | 9,192 | |
Waste Connections Inc | | | 3,226 | | | | 109,007 | |
Waste Management Inc | | | 12,853 | | | | 433,660 | |
WESCO International Inc * | | | 1,212 | | | | 81,725 | |
Xylem Inc | | | 4,591 | | | | 124,416 | |
| | | | | | | | |
| | | | 19,001,152 | |
| | | | | | | | |
Information Technology - 6.1% | | | | | | | | |
| | |
Activision Blizzard Inc | | | 11,768 | | | | 124,976 | |
Adobe Systems Inc * | | | 5,884 | | | | 221,709 | |
Akamai Technologies Inc * | | | 362 | | | | 14,809 | |
Amdocs Ltd (United Kingdom) | | | 4,687 | | | | 159,311 | |
Analog Devices Inc | | | 7,580 | | | | 318,815 | |
AOL Inc * | | | 1,706 | | | | 50,515 | |
Applied Materials Inc | | | 33,386 | | | | 381,936 | |
Arrow Electronics Inc * | | | 3,100 | | | | 118,048 | |
Atmel Corp * | | | 11,293 | | | | 73,969 | |
Avago Technologies Ltd (Singapore) | | | 391 | | | | 12,379 | |
Avnet Inc * | | | 4,030 | | | | 123,358 | |
AVX Corp | | | 1,372 | | | | 14,790 | |
Booz Allen Hamilton Holding Corp | | | 704 | | | | 9,800 | |
Broadcom Corp ‘A’ * | | | 5,816 | | | | 193,149 | |
Brocade Communications Systems Inc * | | | 12,754 | | | | 67,979 | |
CA Inc | | | 9,293 | | | | 204,260 | |
Cisco Systems Inc | | | 148,706 | | | | 2,922,073 | |
| | |
| See Notes to Financial Statements | | See explanation of symbols and terms, if any, on page B-81 |
B-37
PACIFIC SELECT FUND
PD LARGE-CAP VALUE INDEX PORTFOLIO
Schedule of Investments (Continued)
December 31, 2012
| | | | | | | | |
| | | Shares | | | Value | |
Computer Sciences Corp | | | 4,311 | | | | $172,656 | |
Compuware Corp * | | | 5,760 | | | | 62,611 | |
CoreLogic Inc * | | | 2,717 | | | | 73,142 | |
Corning Inc | | | 42,136 | | | | 531,756 | |
Cree Inc * | | | 3,228 | | | | 109,687 | |
Cypress Semiconductor Corp * | | | 1,757 | | | | 19,046 | |
Dell Inc | | | 40,939 | | | | 414,712 | |
Diebold Inc | | | 1,631 | | | | 49,925 | |
Dolby Laboratories Inc ‘A’ | | | 587 | | | | 17,217 | |
DST Systems Inc | | | 779 | | | | 47,207 | |
EchoStar Corp ‘A’ * | | | 781 | | | | 26,726 | |
Electronic Arts Inc * | | | 8,831 | | | | 128,314 | |
Fairchild Semiconductor International Inc * | | | 3,506 | | | | 50,486 | |
Fidelity National Information Services Inc | | | 6,967 | | | | 242,521 | |
Fiserv Inc * | | | 665 | | | | 52,555 | |
FLIR Systems Inc | | | 851 | | | | 18,986 | |
Freescale Semiconductor Ltd * (Bermuda) | | | 66 | | | | 727 | |
Genpact Ltd (Bermuda) | | | 683 | | | | 10,587 | |
Harris Corp | | | 2,223 | | | | 108,838 | |
Hewlett-Packard Co | | | 54,897 | | | | 782,282 | |
IAC/InterActiveCorp | | | 1,849 | | | | 87,458 | |
Ingram Micro Inc ‘A’ * | | | 4,236 | | | | 71,673 | |
Intel Corp | | | 35,897 | | | | 740,555 | |
Itron Inc * | | | 1,101 | | | | 49,050 | |
Jabil Circuit Inc | | | 4,206 | | | | 81,134 | |
JDS Uniphase Corp * | | | 6,429 | | | | 87,049 | |
Juniper Networks Inc * | | | 14,706 | | | | 289,267 | |
KLA-Tencor Corp | | | 4,647 | | | | 221,941 | |
Lam Research Corp * | | | 3,465 | | | | 125,190 | |
Lexmark International Inc ‘A’ | | | 1,994 | | | | 46,241 | |
Marvell Technology Group Ltd (Bermuda) | | | 13,058 | | | | 94,801 | |
Maxim Integrated Products Inc | | | 4,060 | | | | 119,364 | |
Micron Technology Inc * | | | 27,488 | | | | 174,549 | |
Molex Inc | | | 3,837 | | | | 104,865 | |
NetApp Inc * | | | 3,318 | | | | 111,319 | |
NVIDIA Corp | | | 17,187 | | | | 211,228 | |
ON Semiconductor Corp * | | | 12,622 | | | | 88,985 | |
Palo Alto Networks Inc * | | | 42 | | | | 2,248 | |
Paychex Inc | | | 622 | | | | 19,369 | |
PMC-Sierra Inc * | | | 5,754 | | | | 29,978 | |
Polycom Inc * | | | 4,992 | | | | 52,216 | |
Rovi Corp * | | | 2,479 | | | | 38,251 | |
SAIC Inc | | | 5,103 | | | | 57,766 | |
SanDisk Corp * | | | 6,766 | | | | 294,727 | |
ServiceNow Inc * | | | 86 | | | | 2,583 | |
Silicon Laboratories Inc * | | | 99 | | | | 4,139 | |
Skyworks Solutions Inc * | | | 614 | | | | 12,464 | |
Stratasys Ltd * (Israel) | | | 479 | | | | 38,392 | |
Symantec Corp * | | | 18,873 | | | | 355,001 | |
Synopsys Inc * | | | 3,751 | | | | 119,432 | |
Tech Data Corp * | | | 1,033 | | | | 47,032 | |
Teradyne Inc * | | | 4,562 | | | | 77,052 | |
Texas Instruments Inc | | | 10,423 | | | | 322,488 | |
Total System Services Inc | | | 608 | | | | 13,023 | |
VeriSign Inc * | | | 375 | | | | 14,558 | |
Vishay Intertechnology Inc * | | | 3,750 | | | | 39,863 | |
Western Digital Corp | | | 3,658 | | | | 155,428 | |
Workday Inc ‘A’ * | | | 167 | | | | 9,102 | |
Xerox Corp | | | 35,341 | | | | 241,026 | |
Yahoo! Inc * | | | 33,835 | | | | 673,316 | |
Zebra Technologies Corp ‘A’ * | | | 1,215 | | | | 47,725 | |
| | | | | | | | |
| | | | 13,303,705 | |
| | | | | | | | |
Materials - 3.7% | | | | | | | | |
| | |
Air Products & Chemicals Inc | | | 5,870 | | | | 493,197 | |
Albemarle Corp | | | 1,081 | | | | 67,152 | |
Alcoa Inc | | | 29,624 | | | | 257,136 | |
Allegheny Technologies Inc | | | 2,977 | | | | 90,382 | |
Aptargroup Inc | | | 1,230 | | | | 58,696 | |
Ashland Inc | | | 2,180 | | | | 175,294 | |
| | | | | | | | |
| | | Shares | | | Value | |
Bemis Co Inc | | | 2,865 | | | | $95,863 | |
Cabot Corp | | | 1,763 | | | | 70,150 | |
Carpenter Technology Corp | | | 1,141 | | | | 58,910 | |
CF Industries Holdings Inc | | | 1,418 | | | | 288,081 | |
Cliffs Natural Resources Inc | | | 3,959 | | | | 152,659 | |
Commercial Metals Co | | | 3,228 | | | | 47,968 | |
Crown Holdings Inc * | | | 3,144 | | | | 115,731 | |
Cytec Industries Inc | | | 1,278 | | | | 87,965 | |
Domtar Corp | | | 1,004 | | | | 83,854 | |
Eastman Chemical Co | | | 765 | | | | 52,058 | |
Freeport-McMoRan Copper & Gold Inc | | | 26,350 | | | | 901,170 | |
Greif Inc ‘A’ | | | 889 | | | | 39,560 | |
Huntsman Corp | | | 5,315 | | | | 84,508 | |
International Paper Co | | | 12,143 | | | | 483,777 | |
Intrepid Potash Inc | | | 805 | | | | 17,138 | |
Kronos Worldwide Inc | | | 605 | | | | 11,797 | |
LyondellBasell Industries NV ‘A’ (Netherlands) | | | 8,268 | | | | 472,020 | |
Martin Marietta Materials Inc | | | 626 | | | | 59,019 | |
MeadWestvaco Corp | | | 4,804 | | | | 153,103 | |
Molycorp Inc * | | | 1,562 | | | | 14,745 | |
Newmont Mining Corp | | | 13,621 | | | | 632,559 | |
Nucor Corp | | | 8,804 | | | | 380,157 | |
Owens-Illinois Inc * | | | 1,184 | | | | 25,184 | |
Packaging Corp of America | | | 238 | | | | 9,156 | |
Reliance Steel & Aluminum Co | | | 2,088 | | | | 129,665 | |
Rock-Tenn Co ‘A’ | | | 1,738 | | | | 121,504 | |
Rockwood Holdings Inc | | | 1,335 | | | | 66,029 | |
RPM International Inc | | | 2,259 | | | | 66,324 | |
Sealed Air Corp | | | 5,395 | | | | 94,466 | |
Sonoco Products Co | | | 2,796 | | | | 83,125 | |
Southern Copper Corp | | | 1,150 | | | | 43,539 | |
Steel Dynamics Inc | | | 4,777 | | | | 65,588 | |
Tahoe Resources Inc * (Canada) | | | 1,750 | | | | 32,060 | |
The Dow Chemical Co | | | 33,186 | | | | 1,072,572 | |
The Mosaic Co | | | 8,234 | | | | 466,291 | |
The Scotts Miracle-Gro Co ‘A’ | | | 150 | | | | 6,608 | |
United States Steel Corp | | | 4,003 | | | | 95,552 | |
Vulcan Materials Co | | | 3,594 | | | | 187,068 | |
Walter Energy Inc | | | 1,752 | | | | 62,862 | |
Westlake Chemical Corp | | | 429 | | | | 34,020 | |
WR Grace & Co * | | | 179 | | | | 12,034 | |
| | | | | | | | |
| | | | 8,118,296 | |
| | | | | | | | |
Telecommunication Services - 3.2% | | | | | | | | |
| | |
AT&T Inc ‡ | | | 162,752 | | | | 5,486,370 | |
CenturyLink Inc | | | 17,248 | | | | 674,742 | |
Clearwire Corp ‘A’ * | | | 9,971 | | | | 28,816 | |
Frontier Communications Corp | | | 27,740 | | | | 118,727 | |
Level 3 Communications Inc * | | | 2,162 | | | | 49,964 | |
MetroPCS Communications Inc * | | | 8,440 | | | | 83,893 | |
NII Holdings Inc * | | | 4,754 | | | | 33,896 | |
Sprint Nextel Corp * | | | 83,264 | | | | 472,107 | |
Telephone & Data Systems Inc | | | 2,642 | | | | 58,494 | |
U.S. Cellular Corp * | | | 390 | | | | 13,744 | |
Windstream Corp | | | 6,645 | | | | 55,021 | |
| | | | | | | | |
| | | | 7,075,774 | |
| | | | | | | | |
Utilities - 6.2% | | | | | | | | |
| | |
AGL Resources Inc | | | 3,259 | | | | 130,262 | |
Alliant Energy Corp | | | 3,083 | | | | 135,375 | |
Ameren Corp | | | 6,739 | | | | 207,022 | |
American Electric Power Co Inc | | | 13,447 | | | | 573,918 | |
American Water Works Co Inc | | | 4,895 | | | | 181,751 | |
Aqua America Inc | | | 3,430 | | | | 87,191 | |
Atmos Energy Corp | | | 2,502 | | | | 87,870 | |
Calpine Corp * | | | 11,238 | | | | 203,745 | |
CenterPoint Energy Inc | | | 11,867 | | | | 228,440 | |
CMS Energy Corp | | | 7,266 | | | | 177,145 | |
Consolidated Edison Inc | | | 8,133 | | | | 451,707 | |
| | |
| See Notes to Financial Statements | | See explanation of symbols and terms, if any, on page B-81 |
B-38
PACIFIC SELECT FUND
PD LARGE-CAP VALUE INDEX PORTFOLIO
Schedule of Investments (Continued)
December 31, 2012
| | | | | | | | |
| | | Shares | | | Value | |
Dominion Resources Inc | | | 15,866 | | | | $821,859 | |
DTE Energy Co | | | 4,724 | | | | 283,676 | |
Duke Energy Corp | | | 19,539 | | | | 1,246,588 | |
Edison International | | | 9,047 | | | | 408,834 | |
Entergy Corp | | | 4,920 | | | | 313,650 | |
Exelon Corp | | | 23,666 | | | | 703,827 | |
FirstEnergy Corp | | | 11,612 | | | | 484,917 | |
Great Plains Energy Inc | | | 3,790 | | | | 76,975 | |
Hawaiian Electric Industries Inc | | | 2,686 | | | | 67,526 | |
Integrys Energy Group Inc | | | 2,175 | | | | 113,578 | |
MDU Resources Group Inc | | | 5,247 | | | | 111,446 | |
National Fuel Gas Co | | | 2,014 | | | | 102,090 | |
NextEra Energy Inc | | | 11,579 | | | | 801,151 | |
NiSource Inc | | | 7,891 | | | | 196,407 | |
Northeast Utilities | | | 8,708 | | | | 340,309 | |
NRG Energy Inc | | | 8,966 | | | | 206,128 | |
NV Energy Inc | | | 6,557 | | | | 118,944 | |
OGE Energy Corp | | | 2,739 | | | | 154,233 | |
Pepco Holdings Inc | | | 6,343 | | | | 124,386 | |
PG&E Corp | | | 11,726 | | | | 471,151 | |
Pinnacle West Capital Corp | | | 3,041 | | | | 155,030 | |
PPL Corp | | | 16,105 | | | | 461,086 | |
Public Service Enterprise Group Inc | | | 14,047 | | | | 429,838 | |
Questar Corp | | | 3,840 | | | | 75,878 | |
SCANA Corp | | | 3,256 | | | | 148,604 | |
Sempra Energy | | | 6,691 | | | | 474,660 | |
Southern Co | | | 24,116 | | | | 1,032,406 | |
TECO Energy Inc | | | 5,994 | | | | 100,459 | |
The AES Corp | | | 17,821 | | | | 190,685 | |
UGI Corp | | | 3,122 | | | | 102,121 | |
Vectren Corp | | | 2,280 | | | | 67,032 | |
Westar Energy Inc | | | 3,507 | | | | 100,370 | |
Wisconsin Energy Corp | | | 6,400 | | | | 235,840 | |
Xcel Energy Inc | | | 13,521 | | | | 361,146 | |
| | | | | | | | |
| | | | | | | 13,547,256 | |
| | | | | | | | |
Total Common Stocks
(Cost $188,819,665) | | | | | | | 207,519,303 | |
| | | | | | | | |
| | |
EXCHANGE-TRADED FUND - 0.4%
| | | | | | | | |
| | |
iShares Russell 1000 Value Index Fund | | | 11,839 | | | | 862,116 | |
| | | | | | | | |
| | |
Total Exchange-Traded Fund
(Cost $800,493) | | | | | | | 862,116 | |
| | | | | | | | |
| | |
| | | Principal
Amount | | | | |
| | |
SHORT-TERM INVESTMENT - 3.7% | | | | | | | | |
| | |
Repurchase Agreement - 3.7% | | | | | | | | |
| | |
Fixed Income Clearing Corp
0.010% due 01/02/13
(Dated 12/31/12, repurchase price of $7,955,514; collateralized by U.S. Treasury Notes: 0.250% due 07/15/15 and value $8,115,000) | | | $7,955,510 | | | | 7,955,510 | |
| | | | | | | | |
| | |
Total Short-Term Investment
(Cost $7,955,510) | | | | | | | 7,955,510 | |
| | | | | | | | |
| | |
TOTAL INVESTMENTS - 99.4%
(Cost $197,575,668) | | | | | | | 216,336,929 | |
| | |
OTHER ASSETS & LIABILITIES, NET - 0.6% | | | | | | | 1,202,381 | |
| | | | | | | | |
| | |
NET ASSETS - 100.0% | | | | | | | $217,539,310 | |
| | | | | | | | |
Notes to Schedule of Investments
| (a) | As of December 31, 2012, the portfolio was diversified as a percentage of net assets as follows: |
| | | | |
Financials | | | 26.2% | |
Energy | | | 15.4% | |
Health Care | | | 11.0% | |
Industrials | | | 8.7% | |
Consumer Discretionary | | | 7.9% | |
Consumer Staples | | | 6.9% | |
Utilities | | | 6.2% | |
Information Technology | | | 6.1% | |
Materials | | | 3.7% | |
Short-Term Investment | | | 3.7% | |
Telecommunication Services | | | 3.2% | |
Exchange-Traded Fund | | | 0.4% | |
| | | | |
| | | 99.4% | |
Other Assets & Liabilities, Net | | | 0.6% | |
| | | | |
| | | 100.0% | |
| | | | |
| (b) | Short-term investments reflect either the stated coupon rate or the annualized effective yield on the date of purchase for discounted investments. |
| (c) | As of December 31, 2012, an investment with a value of $817,468 was fully or partially segregated with the broker(s)/custodian as collateral for open futures contracts. |
| (d) | Open futures contracts outstanding as of December 31, 2012 were as follows: |
| | | | | | | | | | | | |
| Long Futures Outstanding | | Number of
Contracts | | | Notional
Amount | | | Unrealized
Depreciation | |
S&P 500 E-Mini (03/13) | | | 118 | | | | $8,391,806 | | | | ($13,216 | ) |
| | | | | | | | | | | | |
| | |
| See Notes to Financial Statements | | See explanation of symbols and terms, if any, on page B-81 |
B-39
PACIFIC SELECT FUND
PD LARGE-CAP VALUE INDEX PORTFOLIO
Schedule of Investments (Continued)
December 31, 2012
| (e) | Fair Value Measurements |
The following is a summary of the portfolio’s investments as categorized under the three-tier hierarchy of inputs used in valuing the portfolio’s assets and liabilities (See Note 3D in Notes to Financial Statements) as of December 31, 2012:
| | | | | | | | | | | | | | | | | | |
| | | | | Total Value at
December 31, 2012 | | | Level 1
Quoted Price | | | Level 2
Significant
Observable Inputs | | | Level 3 Significant Unobservable Inputs | |
Assets | | Common Stocks (1) | | | $207,519,303 | | | | $207,519,303 | | | | $ - | | | | $- | |
| | Exchange-Traded Fund | | | 862,116 | | | | 862,116 | | | | - | | | | - | |
| | Short-Term Investment | | | 7,955,510 | | | | - | | | | 7,955,510 | | | | - | |
| | | | | | | | | | | | | | | | | | |
| | Total Assets | | | 216,336,929 | | | | 208,381,419 | | | | 7,955,510 | | | | - | |
| | | | | | | | | | | | | | | | | | |
Liabilities | | Derivatives: | | | | | | | | | | | | | | | | |
| | Equity Contracts | | | | | | | | | | | | | | | | |
| | Futures | | | (13,216 | ) | | | (13,216 | ) | | | - | | | | - | |
| | | | | | | | | | | | | | | | | | |
| | Total Liabilities | | | (13,216 | ) | | | (13,216 | ) | | | - | | | | - | |
| | | | | | | | | | | | | | | | | | |
| | Total | | | $216,323,713 | | | | $208,368,203 | | | | $7,955,510 | | | | $- | |
| | | | | | | | | | | | | | | | | | |
| | (1) | For equity investments categorized in a single level, refer to the schedule of investments for further industry breakout. |
| | |
| See Notes to Financial Statements | | See explanation of symbols and terms, if any, on page B-81 |
B-40
PACIFIC SELECT FUND
PD SMALL-CAP GROWTH INDEX PORTFOLIO
Schedule of Investments
December 31, 2012
| | | | | | | | |
| | |
Shares | | |
Value | |
RIGHTS - 0.0% | | | | | | | | |
| | |
Health Care - 0.0% | | | | | | | | |
| | |
Allos Therapeutics Inc
Exp. 11/30/13 * + | | | 3,907 | | | | $- | |
| | | | | | | | |
| | |
Total Rights
(Cost $0) | | | | | | | - | |
| | | | | | | | |
| | |
WARRANTS - 0.0% | | | | | | | | |
| | |
Energy - 0.0% | | | | | | | | |
| | |
Magnum Hunter Resources Corp
Strike @ $10.50
Exp. 10/14/13 * | | | 475 | | | | 242 | |
| | | | | | | | |
| | |
Total Warrants
(Cost $0) | | | | | | | 242 | |
| | | | | | | | |
| | |
COMMON STOCKS - 97.2% | | | | | | | | |
| | |
Consumer Discretionary - 15.8% | | | | | | | | |
| | |
1-800-FLOWERS.COM Inc ‘A’ * | | | 107 | | | | 393 | |
Aeropostale Inc * | | | 5,602 | | | | 72,882 | |
AFC Enterprises Inc * | | | 1,672 | | | | 43,689 | |
America’s Car-Mart Inc * | | | 547 | | | | 22,164 | |
American Greetings Corp ‘A’ | | | 160 | | | | 2,702 | |
American Public Education Inc * | | | 1,239 | | | | 44,740 | |
Ameristar Casinos Inc | | | 1,973 | | | | 51,772 | |
ANN Inc * | | | 3,361 | | | | 113,736 | |
Arbitron Inc | | | 1,821 | | | | 85,004 | |
Arctic Cat Inc * | | | 870 | | | | 29,049 | |
Asbury Automotive Group Inc * | | | 1,697 | | | | 54,355 | |
Barnes & Noble Inc * | | | 160 | | | | 2,414 | |
bebe stores Inc | | | 220 | | | | 878 | |
Belo Corp ‘A’ | | | 2,382 | | | | 18,270 | |
Biglari Holdings Inc * | | | 10 | | | | 3,900 | |
BJ’s Restaurants Inc * | | | 1,689 | | | | 55,568 | |
Bloomin’ Brands Inc * | | | 932 | | | | 14,576 | |
Blue Nile Inc * | | | 854 | | | | 32,879 | |
Blyth Inc | | | 728 | | | | 11,320 | |
Bob Evans Farms Inc | | | 277 | | | | 11,135 | |
Body Central Corp * | | | 1,123 | | | | 11,185 | |
Boyd Gaming Corp * | | | 277 | | | | 1,839 | |
Bravo Brio Restaurant Group Inc * | | | 1,339 | | | | 17,983 | |
Bridgepoint Education Inc * | | | 1,213 | | | | 12,494 | |
Brunswick Corp | | | 6,151 | | | | 178,933 | |
Buffalo Wild Wings Inc * | | | 1,278 | | | | 93,064 | |
Cabela’s Inc * | | | 2,912 | | | | 121,576 | |
Caesars Entertainment Corp * | | | 2,289 | | | | 15,840 | |
CafePress Inc * | | | 345 | | | | 1,991 | |
Capella Education Co * | | | 874 | | | | 24,673 | |
Caribou Coffee Co Inc * | | | 1,453 | | | | 23,524 | |
Carmike Cinemas Inc * | | | 394 | | | | 5,910 | |
Carrols Restaurant Group Inc * | | | 746 | | | | 4,461 | |
Cavco Industries Inc * | | | 427 | | | | 21,341 | |
CEC Entertainment Inc | | | 1,259 | | | | 41,786 | |
Cherokee Inc | | | 493 | | | | 6,759 | |
Churchill Downs Inc | | | 293 | | | | 19,470 | |
Chuy’s Holdings Inc * | | | 330 | | | | 7,372 | |
Citi Trends Inc * | | | 67 | | | | 922 | |
Coinstar Inc * | | | 2,154 | | | | 112,030 | |
Collectors Universe | | | 340 | | | | 3,410 | |
Conn’s Inc * | | | 110 | | | | 3,375 | |
Cooper Tire & Rubber Co | | | 3,718 | | | | 94,288 | |
Core-Mark Holding Co Inc | | | 124 | | | | 5,871 | |
Cracker Barrel Old Country Store Inc | | | 1,325 | | | | 85,145 | |
| | | | | | | | |
| | |
Shares | | |
Value | |
Crocs Inc * | | | 6,194 | | | | $89,132 | |
Crown Media Holdings Inc ‘A’ * | | | 462 | | | | 855 | |
Dana Holding Corp | | | 1,057 | | | | 16,500 | |
Del Frisco’s Restaurant Group Inc * | | | 281 | | | | 4,381 | |
Denny’s Corp * | | | 5,153 | | | | 25,147 | |
Destination Maternity Corp | | | 397 | | | | 8,559 | |
DineEquity Inc * | | | 1,052 | | | | 70,484 | |
Domino’s Pizza Inc | | | 3,985 | | | | 173,547 | |
Dorman Products Inc | | | 1,679 | | | | 59,336 | |
Drew Industries Inc | | | 623 | | | | 20,092 | |
Einstein Noah Restaurant Group Inc | | | 366 | | | | 4,469 | |
Ethan Allen Interiors Inc | | | 1,445 | | | | 37,151 | |
Express Inc * | | | 6,161 | | | | 92,969 | |
Fiesta Restaurant Group Inc * | | | 998 | | | | 15,289 | |
Fifth & Pacific Cos Inc * | | | 418 | | | | 5,204 | |
Five Below Inc * | | | 390 | | | | 12,496 | |
Francesca’s Holdings Corp * | | | 2,393 | | | | 62,122 | |
Fuel Systems Solutions Inc * | | | 201 | | | | 2,955 | |
G-III Apparel Group Ltd * | | | 143 | | | | 4,895 | |
Geeknet Inc * | | | 309 | | | | 4,975 | |
Genesco Inc * | | | 1,684 | | | | 92,620 | |
Gentherm Inc * | | | 2,023 | | | | 26,906 | |
Global Sources Ltd * (Bermuda) | | | 192 | | | | 1,244 | |
Gordmans Stores Inc * | | | 598 | | | | 8,982 | |
Grand Canyon Education Inc * | | | 2,746 | | | | 64,449 | |
hhgregg Inc * | | | 51 | | | | 358 | |
Hibbett Sports Inc * | | | 1,813 | | | | 95,545 | |
Hillenbrand Inc | | | 3,795 | | | | 85,805 | |
Hot Topic Inc | | | 2,901 | | | | 27,995 | |
HSN Inc | | | 2,457 | | | | 135,332 | |
Ignite Restaurant Group Inc * | | | 442 | | | | 5,746 | |
Interval Leisure Group Inc | | | 2,663 | | | | 51,636 | |
iRobot Corp * | | | 1,891 | | | | 35,437 | |
Jack in the Box Inc * | | | 2,458 | | | | 70,299 | |
Jamba Inc * | | | 5,357 | | | | 12,000 | |
Jos. A. Bank Clothiers Inc * | | | 1,777 | | | | 75,665 | |
K12 Inc * | | | 1,839 | | | | 37,589 | |
Kayak Software Corp * | | | 174 | | | | 6,911 | |
La-Z-Boy Inc | | | 1,055 | | | | 14,928 | |
LeapFrog Enterprises Inc * | | | 3,489 | | | | 30,110 | |
Libbey Inc * | | | 1,411 | | | | 27,303 | |
Life Time Fitness Inc * | | | 2,732 | | | | 134,442 | |
LifeLock Inc * | | | 1,134 | | | | 9,219 | |
Lions Gate Entertainment Corp * (Canada) | | | 5,839 | | | | 95,760 | |
Lumber Liquidators Holdings Inc * | | | 1,896 | | | | 100,166 | |
Mac-Gray Corp | | | 104 | | | | 1,305 | |
Maidenform Brands Inc * | | | 1,150 | | | | 22,414 | |
Marine Products Corp | | | 386 | | | | 2,208 | |
Matthews International Corp ‘A’ | | | 913 | | | | 29,307 | |
Mattress Firm Holding Corp * | | | 758 | | | | 18,594 | |
MDC Partners Inc ‘A’ (Canada) | | | 668 | | | | 7,548 | |
Meritage Homes Corp * | | | 517 | | | | 19,310 | |
Monro Muffler Brake Inc | | | 2,127 | | | | 74,381 | |
Morgans Hotel Group Co * | | | 695 | | | | 3,850 | |
Movado Group Inc | | | 82 | | | | 2,516 | |
MTR Gaming Group Inc * | | | 1,544 | | | | 6,438 | |
Multimedia Games Holding Co Inc * | | | 1,881 | | | | 27,670 | |
Nathan’s Famous Inc * | | | 181 | | | | 6,100 | |
National American University Holdings Inc | | | 320 | | | | 1,232 | |
National CineMedia Inc | | | 1,293 | | | | 18,270 | |
New York & Co Inc * | | | 1,208 | | | | 4,602 | |
Nexstar Broadcasting Group Inc ‘A’ * | | | 206 | | | | 2,182 | |
NutriSystem Inc | | | 1,965 | | | | 16,093 | |
Orbitz Worldwide Inc * | | | 1,658 | | | | 4,510 | |
Outdoor Channel Holdings Inc | | | 286 | | | | 2,174 | |
Overstock.com Inc * | | | 809 | | | | 11,577 | |
Oxford Industries Inc | | | 965 | | | | 44,737 | |
Papa John’s International Inc * | | | 1,233 | | | | 67,741 | |
Penske Automotive Group Inc | | | 756 | | | | 22,748 | |
PetMed Express Inc | | | 1,395 | | | | 15,485 | |
| | |
| See Notes to Financial Statements | | See explanation of symbols and terms, if any, on page B-81 |
B-41
PACIFIC SELECT FUND
PD SMALL-CAP GROWTH INDEX PORTFOLIO
Schedule of Investments (Continued)
December 31, 2012
| | | | | | | | |
| | |
Shares | | |
Value | |
Pier 1 Imports Inc | | | 6,688 | | | | $133,760 | |
Pinnacle Entertainment Inc * | | | 264 | | | | 4,179 | |
Pool Corp | | | 3,266 | | | | 138,217 | |
Premier Exhibitions Inc * | | | 1,822 | | | | 4,938 | |
ReachLocal Inc * | | | 686 | | | | 8,856 | |
Red Robin Gourmet Burgers Inc * | | | 452 | | | | 15,951 | |
Rentrak Corp * | | | 378 | | | | 7,367 | |
Restoration Hardware Holdings Inc * | | | 89 | | | | 3,002 | |
RG Barry Corp | | | 523 | | | | 7,411 | |
rue21 Inc * | | | 1,060 | | | | 30,093 | |
Ruth’s Hospitality Group Inc * | | | 2,426 | | | | 17,637 | |
Scientific Games Corp ‘A’ * | | | 475 | | | | 4,118 | |
Select Comfort Corp * | | | 3,904 | | | | 102,168 | |
SHFL Entertainment Inc * | | | 3,778 | | | | 54,781 | |
Shutterfly Inc * | | | 620 | | | | 18,519 | |
Sinclair Broadcast Group Inc ‘A’ | | | 271 | | | | 3,420 | |
Six Flags Entertainment Corp | | | 2,730 | | | | 167,076 | |
Skullcandy Inc * | | | 1,148 | | | | 8,943 | |
Smith & Wesson Holding Corp * | | | 4,470 | | | | 37,727 | |
Sonic Corp * | | | 3,146 | | | | 32,750 | |
Sotheby’s | | | 1,641 | | | | 55,170 | |
Steiner Leisure Ltd * (Bahamas) | | | 1,046 | | | | 50,407 | |
Steven Madden Ltd * | | | 2,700 | | | | 114,129 | |
Strayer Education Inc | | | 819 | | | | 46,003 | |
Sturm Ruger & Co Inc | | | 1,321 | | | | 59,973 | |
Systemax Inc | | | 43 | | | | 415 | |
Teavana Holdings Inc * | | | 622 | | | | 9,641 | |
Tenneco Inc * | | | 4,178 | | | | 146,690 | |
Texas Roadhouse Inc | | | 4,301 | | | | 72,257 | |
The Buckle Inc | | | 1,909 | | | | 85,218 | |
The Cato Corp ‘A’ | | | 1,881 | | | | 51,596 | |
The Cheesecake Factory Inc | | | 3,720 | | | | 121,718 | |
The Children’s Place * | | | 632 | | | | 27,991 | |
The Finish Line Inc ‘A’ | | | 1,324 | | | | 25,063 | |
The Men’s Wearhouse Inc | | | 736 | | | | 22,934 | |
The Ryland Group Inc | | | 1,740 | | | | 63,510 | |
The Warnaco Group Inc * | | | 2,479 | | | | 177,422 | |
Tilly’s Inc ‘A’ * | | | 649 | | | | 8,755 | |
Tower International Inc * | | | 386 | | | | 3,107 | |
Town Sports International Holdings Inc | | | 1,585 | | | | 16,880 | |
True Religion Apparel Inc | | | 1,776 | | | | 45,146 | |
Tumi Holdings Inc * | | | 1,486 | | | | 30,983 | |
Universal Technical Institute Inc | | | 982 | | | | 9,859 | |
US Auto Parts Network Inc * | | | 1,078 | | | | 1,973 | |
Vail Resorts Inc | | | 876 | | | | 47,383 | |
Valassis Communications Inc | | | 1,683 | | | | 43,388 | |
Value Line Inc | | | 89 | | | | 798 | |
Vera Bradley Inc * | | | 1,386 | | | | 34,789 | |
Vitacost.com Inc * | | | 1,533 | | | | 10,394 | |
Vitamin Shoppe Inc * | | | 2,025 | | | | 116,154 | |
Weyco Group Inc | | | 22 | | | | 514 | |
Winmark Corp | | | 150 | | | | 8,550 | |
Winnebago Industries Inc * | | | 564 | | | | 9,661 | |
Wolverine World Wide Inc | | | 3,351 | | | | 137,324 | |
World Wrestling Entertainment Inc ‘A’ | | | 1,723 | | | | 13,594 | |
Zagg Inc * | | | 1,758 | | | | 12,939 | |
Zumiez Inc * | | | 1,507 | | | | 29,251 | |
| | | | | | | | |
| | | | 6,489,157 | |
| | | | | | | | |
Consumer Staples - 4.5% | | | | | | | | |
| | |
Alico Inc | | | 101 | | | | 3,700 | |
Annie’s Inc * | | | 252 | | | | 8,424 | |
Arden Group Inc ‘A’ | | | 52 | | | | 4,678 | |
B&G Foods Inc | | | 3,620 | | | | 102,482 | |
Cal-Maine Foods Inc | | | 853 | | | | 34,308 | |
Calavo Growers Inc | | | 815 | | | | 20,546 | |
Casey’s General Stores Inc | | | 2,619 | | | | 139,069 | |
Central Garden & Pet Co ‘A’ * | | | 408 | | | | 4,264 | |
Coca-Cola Bottling Co Consolidated | | | 316 | | | | 21,014 | |
Craft Brew Alliance Inc * | | | 304 | | | | 1,970 | |
| | | | | | | | |
| | |
Shares | | |
Value | |
Darling International Inc * | | | 2,463 | | | | $39,506 | |
Elizabeth Arden Inc * | | | 1,480 | | | | 66,615 | |
Farmer Bros. Co * | | | 35 | | | | 505 | |
Harris Teeter Supermarkets Inc | | | 420 | | | | 16,195 | |
Inter Parfums Inc | | | 808 | | | | 15,724 | |
Inventure Foods Inc * | | | 886 | | | | 5,750 | |
J&J Snack Foods Corp | | | 1,016 | | | | 64,963 | |
Lancaster Colony Corp | | | 1,268 | | | | 87,733 | |
Lifeway Foods Inc | | | 317 | | | | 2,771 | |
Limoneira Co | | | 573 | | | | 11,110 | |
Medifast Inc * | | | 956 | | | | 25,229 | |
National Beverage Corp | | | 776 | | | | 11,322 | |
Natural Grocers by Vitamin Cottage Inc * | | | 198 | | | | 3,780 | |
Nature’s Sunshine Products Inc | | | 479 | | | | 6,936 | |
Orchids Paper Products Co | | | 173 | | | | 3,498 | |
Pilgrim’s Pride Corp * | | | 3,359 | | | | 24,353 | |
Post Holdings Inc * | | | 1,274 | | | | 43,634 | |
Prestige Brands Holdings Inc * | | | 2,283 | | | | 45,728 | |
PriceSmart Inc | | | 1,250 | | | | 96,312 | |
Rite Aid Corp * | | | 4,048 | | | | 5,505 | |
Roundy’s Inc | | | 1,406 | | | | 6,257 | |
Sanderson Farms Inc | | | 1,581 | | | | 75,177 | |
Snyder’s-Lance Inc | | | 2,700 | | | | 65,097 | |
Spectrum Brands Holdings Inc * | | | 1,325 | | | | 59,532 | |
Star Scientific Inc * | | | 10,037 | | | | 26,899 | |
SUPERVALU Inc | | | 11,165 | | | | 27,578 | |
Susser Holdings Corp * | | | 334 | | | | 11,520 | |
Synutra International Inc * | | | 1,184 | | | | 5,482 | |
The Boston Beer Co Inc ‘A’ * | | | 536 | | | | 72,065 | |
The Chefs’ Warehouse Inc * | | | 768 | | | | 12,142 | |
The Female Health Co | | | 1,344 | | | | 9,650 | |
The Hain Celestial Group Inc * | | | 2,536 | | | | 137,502 | |
The Pantry Inc * | | | 146 | | | | 1,771 | |
Tootsie Roll Industries Inc | | | 1,526 | | | | 39,554 | |
TreeHouse Foods Inc * | | | 1,667 | | | | 86,901 | |
United Natural Foods Inc * | | | 3,360 | | | | 180,062 | |
USANA Health Sciences Inc * | | | 411 | | | | 13,534 | |
Vector Group Ltd | | | 2,876 | | | | 42,766 | |
WD-40 Co | | | 1,092 | | | | 51,444 | |
Westway Group Inc * | | | 86 | | | | 574 | |
| | | | | | | | |
| | | | 1,843,131 | |
| | | | | | | | |
Energy - 5.5% | | | | | | | | |
| | |
Abraxas Petroleum Corp * | | | 5,709 | | | | 12,503 | |
Alon USA Energy Inc | | | 545 | | | | 9,859 | |
Apco Oil and Gas International Inc (Cayman) | | | 612 | | | | 7,534 | |
Approach Resources Inc * | | | 2,291 | | | | 57,298 | |
Berry Petroleum Co ‘A’ | | | 3,609 | | | | 121,082 | |
Bonanza Creek Energy Inc * | | | 99 | | | | 2,751 | |
BPZ Resources Inc * | | | 2,104 | | | | 6,628 | |
C&J Energy Services Inc * | | | 942 | | | | 20,196 | |
Carrizo Oil & Gas Inc * | | | 2,350 | | | | 49,162 | |
Ceres Inc * | | | 444 | | | | 2,016 | |
Clayton Williams Energy Inc * | | | 34 | | | | 1,360 | |
Clean Energy Fuels Corp * | | | 4,570 | | | | 56,896 | |
Contango Oil & Gas Co | | | 804 | | | | 34,057 | |
Crosstex Energy Inc | | | 2,595 | | | | 37,212 | |
CVR Energy Inc * | | | 783 | | | | 38,203 | |
Diamondback Energy Inc * | | | 464 | | | | 8,872 | |
Dril-Quip Inc * | | | 2,765 | | | | 201,983 | |
Endeavour International Corp * | | | 3,008 | | | | 15,581 | |
Energy XXI Ltd (Bermuda) | | | 3,953 | | | | 127,247 | |
Evolution Petroleum Corp * | | | 1,101 | | | | 8,951 | |
Forum Energy Technologies Inc * | | | 1,529 | | | | 37,843 | |
FX Energy Inc * | | | 3,641 | | | | 14,965 | |
GasLog Ltd (Bermuda) | | | 690 | | | | 8,577 | |
Geospace Technologies Corp * | | | 876 | | | | 77,850 | |
Gevo Inc * | | | 1,968 | | | | 3,031 | |
Global Geophysical Services Inc * | | | 1,291 | | | | 4,970 | |
| | |
| See Notes to Financial Statements | | See explanation of symbols and terms, if any, on page B-81 |
B-42
PACIFIC SELECT FUND
PD SMALL-CAP GROWTH INDEX PORTFOLIO
Schedule of Investments (Continued)
December 31, 2012
| | | | | | | | |
| | |
Shares | | |
Value | |
Goodrich Petroleum Corp * | | | 1,803 | | | | $16,804 | |
Gulfmark Offshore Inc ‘A’ | | | 403 | | | | 13,883 | |
Gulfport Energy Corp * | | | 1,290 | | | | 49,304 | |
Halcon Resources Corp * | | | 6,721 | | | | 46,509 | |
Harvest Natural Resources Inc * | | | 141 | | | | 1,279 | |
Heckmann Corp * | | | 688 | | | | 2,773 | |
ION Geophysical Corp * | | | 9,088 | | | | 59,163 | |
Isramco Inc * | | | 73 | | | | 7,591 | |
KiOR Inc ‘A’ * | | | 1,836 | | | | 11,769 | |
Kodiak Oil & Gas Corp * (Canada) | | | 18,147 | | | | 160,601 | |
Lufkin Industries Inc | | | 2,313 | | | | 134,455 | |
Magnum Hunter Resources Corp * | | | 3,594 | | | | 14,340 | |
Matador Resources Co * | | | 812 | | | | 6,658 | |
Matrix Service Co * | | | 317 | | | | 3,646 | |
Midstates Petroleum Co Inc * | | | 744 | | | | 5,126 | |
Mitcham Industries Inc * | | | 544 | | | | 7,415 | |
Northern Oil & Gas Inc * | | | 4,374 | | | | 73,571 | |
Oasis Petroleum Inc * | | | 5,498 | | �� | | 174,836 | |
Panhandle Oil & Gas Inc ‘A’ | | | 479 | | | | 13,522 | |
PHI Inc * | | | 76 | | | | 2,545 | |
Pioneer Energy Services Corp * | | | 924 | | | | 6,708 | |
Renewable Energy Group Inc * | | | 117 | | | | 686 | |
Rentech Inc | | | 8,472 | | | | 22,281 | |
REX American Resources Corp * | | | 44 | | | | 849 | |
RigNet Inc * | | | 832 | | | | 16,998 | |
Rosetta Resources Inc * | | | 3,640 | | | | 165,110 | |
Sanchez Energy Corp * | | | 796 | | | | 14,328 | |
Saratoga Resources Inc * | | | 1,316 | | | | 4,659 | |
Solazyme Inc * | | | 2,279 | | | | 17,913 | |
Synergy Resources Corp * | | | 131 | | | | 706 | |
Targa Resources Corp | | | 1,995 | | | | 105,416 | |
TGC Industries Inc | | | 1,023 | | | | 8,378 | |
Uranerz Energy Corp * | | | 4,706 | | | | 6,541 | |
Uranium Energy Corp * | | | 2,818 | | | | 7,214 | |
Vaalco Energy Inc * | | | 3,980 | | | | 34,427 | |
W&T Offshore Inc | | | 164 | | | | 2,629 | |
Warren Resources Inc * | | | 1,043 | | | | 2,931 | |
Western Refining Inc | | | 2,346 | | | | 66,134 | |
Willbros Group Inc * | | | 609 | | | | 3,264 | |
ZaZa Energy Corp * | | | 904 | | | | 1,853 | |
| | | | | | | | |
| | | | 2,261,442 | |
| | | | | | | | |
Financials - 7.6% | | | | | | | | |
| | |
Acadia Realty Trust REIT | | | 3,545 | | | | 88,909 | |
Alexander’s Inc REIT | | | 148 | | | | 48,958 | |
American Safety Insurance Holdings Ltd * (Bermuda) | | | 67 | | | | 1,268 | |
AmREIT Inc ‘B’ | | | 91 | | | | 1,561 | |
AmTrust Financial Services Inc | | | 306 | | | | 8,779 | |
Apollo Residential Mortgage Inc REIT | | | 182 | | | | 3,675 | |
Arrow Financial Corp | | | 43 | | | | 1,073 | |
Associated Estates Realty Corp REIT | | | 1,563 | | | | 25,196 | |
Bank of the Ozarks Inc | | | 1,473 | | | | 49,301 | |
Beneficial Mutual Bancorp Inc * | | | 279 | | | | 2,650 | |
BGC Partners Inc ‘A’ | | | 6,840 | | | | 23,666 | |
BofI Holding Inc * | | | 48 | | | | 1,338 | |
Bridge Capital Holdings * | | | 176 | | | | 2,739 | |
Cascade Bancorp * | | | 15 | | | | 94 | |
Cash America International Inc | | | 850 | | | | 33,719 | |
Clifton Savings Bancorp Inc | | | 54 | | | | 609 | |
Cohen & Steers Inc | | | 1,275 | | | | 38,849 | |
Coresite Realty Corp REIT | | | 707 | | | | 19,556 | |
Credit Acceptance Corp * | | | 541 | | | | 55,009 | |
DFC Global Corp * | | | 2,382 | | | | 44,091 | |
Diamond Hill Investment Group Inc | | | 186 | | | | 12,622 | |
Donegal Group Inc ‘A’ | | | 51 | | | | 716 | |
Duff & Phelps Corp ‘A’ | | | 590 | | | | 9,216 | |
DuPont Fabros Technology Inc REIT | | | 2,022 | | | | 48,852 | |
Eagle Bancorp Inc * | | | 64 | | | | 1,278 | |
EastGroup Properties Inc REIT | | | 1,871 | | | | 100,678 | |
| | | | | | | | |
| | |
Shares | | |
Value | |
eHealth Inc * | | | 1,354 | | | | $37,208 | |
Encore Capital Group Inc * | | | 1,201 | | | | 36,775 | |
Epoch Holding Corp | | | 1,096 | | | | 30,578 | |
Evercore Partners Inc ‘A’ | | | 181 | | | | 5,464 | |
Ezcorp Inc ‘A’ * | | | 2,284 | | | | 45,360 | |
FelCor Lodging Trust Inc REIT * | | | 5,189 | | | | 24,233 | |
Financial Engines Inc * | | | 3,186 | | | | 88,411 | |
First American Financial Corp | | | 695 | | | | 16,743 | |
First Cash Financial Services Inc * | | | 1,976 | | | | 98,049 | |
First Federal Bancshares of Arkansas Inc * | | | 79 | | | | 770 | |
FNB United Corp * | | | 508 | | | | 5,893 | |
GAMCO Investors Inc ‘A’ | | | 443 | | | | 23,510 | |
Glimcher Realty Trust REIT | | | 8,728 | | | | 96,794 | |
Green Dot Corp ‘A’ * | | | 1,671 | | | | 20,386 | |
Greenhill & Co Inc | | | 2,004 | | | | 104,188 | |
Greenlight Capital Re Ltd ‘A’ * (Cayman) | | | 555 | | | | 12,809 | |
Gyrodyne Co of America Inc REIT | | | 79 | | | | 5,693 | |
Hallmark Financial Services Inc * | | | 90 | | | | 845 | |
Heritage Financial Group Inc | | | 70 | | | | 965 | |
HFF Inc ‘A’ | | | 1,929 | | | | 28,742 | |
Highwoods Properties Inc REIT | | | 3,326 | | | | 111,255 | |
Hingham Institution for Savings | | | 9 | | | | 563 | |
Homeowners Choice Inc | | | 130 | | | | 2,703 | |
ICG Group Inc * | | | 199 | | | | 2,275 | |
Inland Real Estate Corp REIT | | | 2,549 | | | | 21,361 | |
Investors Bancorp Inc | | | 524 | | | | 9,317 | |
JAVELIN Mortgage Investment Corp | | | 116 | | | | 2,214 | |
Ladenburg Thalmann Financial Services Inc * | | | 7,246 | | | | 10,144 | |
LTC Properties Inc REIT | | | 504 | | | | 17,736 | |
Main Street Capital Corp | | | 178 | | | | 5,431 | |
MarketAxess Holdings Inc | | | 2,513 | | | | 88,709 | |
Meadowbrook Insurance Group Inc | | | 287 | | | | 1,659 | |
Meridian Interstate Bancorp Inc * | | | 48 | | | | 805 | |
MicroFinancial Inc | | | 244 | | | | 1,776 | |
Monmouth Real Estate Investment Corp ‘A’ REIT | | | 1,323 | | | | 13,706 | |
Montpelier Re Holdings Ltd (Bermuda) | | | 475 | | | | 10,858 | |
National Health Investors Inc REIT | | | 1,714 | | | | 96,892 | |
Nationstar Mortgage Holdings Inc * | | | 1,328 | | | | 41,141 | |
Netspend Holdings Inc * | | | 1,966 | | | | 23,238 | |
Ocwen Financial Corp * | | | 454 | | | | 15,704 | |
OFS Capital Corp * | | | 85 | | | | 1,164 | |
Omega Healthcare Investors Inc REIT | | | 7,796 | | | | 185,935 | |
Oritani Financial Corp | | | 1,110 | | | | 17,005 | |
Penns Woods Bancorp Inc | | | 18 | | | | 673 | |
Portfolio Recovery Associates Inc * | | | 1,179 | | | | 125,988 | |
Potlatch Corp REIT | | | 1,791 | | | | 70,189 | |
PS Business Parks Inc REIT | | | 1,075 | | | | 69,853 | |
Pzena Investment Management Inc ‘A’ | | | 419 | | | | 2,263 | |
Regional Management Corp * | | | 326 | | | | 5,395 | |
Ryman Hospitality Properties REIT | | | 1,517 | | | | 58,344 | |
Saul Centers Inc REIT | | | 545 | | | | 23,321 | |
Sovran Self Storage Inc REIT | | | 1,848 | | | | 114,761 | |
Spirit Realty Capital Inc REIT | | | 484 | | | | 8,606 | |
State Auto Financial Corp | | | 194 | | | | 2,898 | |
Stifel Financial Corp * | | | 1,819 | | | | 58,153 | |
Strategic Hotels & Resorts Inc REIT * | | | 10,645 | | | | 68,128 | |
Sun Communities Inc REIT | | | 2,074 | | | | 82,732 | |
Tejon Ranch Co * | | | 907 | | | | 25,469 | |
Texas Capital Bancshares Inc * | | | 2,414 | | | | 108,195 | |
The Navigators Group Inc * | | | 300 | | | | 15,321 | |
Tower Group Inc | | | 1,321 | | | | 23,474 | |
Tree.com Inc | | | 266 | | | | 4,796 | |
UMH Properties Inc REIT | | | 238 | | | | 2,459 | |
Universal Health Realty Income Trust REIT | | | 508 | | | | 25,710 | |
Universal Insurance Holdings Inc | | | 195 | | | | 854 | |
Urstadt Biddle Properties Inc ‘A’ REIT | | | 1,301 | | | | 25,604 | |
Virtus Investment Partners Inc * | | | 218 | | | | 26,365 | |
Washington REIT | | | 1,534 | | | | 40,114 | |
| | |
| See Notes to Financial Statements | | See explanation of symbols and terms, if any, on page B-81 |
B-43
PACIFIC SELECT FUND
PD SMALL-CAP GROWTH INDEX PORTFOLIO
Schedule of Investments (Continued)
December 31, 2012
| | | | | | | | |
| | |
Shares | | |
Value | |
Westamerica Bancorp | | | 1,066 | | | | $45,401 | |
Westwood Holdings Group Inc | | | 452 | | | | 18,487 | |
WisdomTree Investments Inc * | | | 4,026 | | | | 24,639 | |
World Acceptance Corp * | | | 720 | | | | 53,683 | |
Zillow Inc ‘A’ * | | | 244 | | | | 6,771 | |
| | | | | | | | |
| | | | 3,128,055 | |
| | | | | | | | |
Health Care - 19.7% | |
| | |
Abaxis Inc | | | 1,491 | | | | 55,316 | |
ABIOMED Inc * | | | 2,306 | | | | 31,039 | |
Acadia Healthcare Co Inc * | | | 1,854 | | | | 43,254 | |
Accretive Health Inc * | | | 3,883 | | | | 44,888 | |
Accuray Inc * | | | 4,915 | | | | 31,603 | |
Achillion Pharmaceuticals Inc * | | | 4,104 | | | | 32,914 | |
Acorda Therapeutics Inc * | | | 2,763 | | | | 68,688 | |
Acura Pharmaceuticals Inc * | | | 747 | | | | 1,658 | |
Aegerion Pharmaceuticals Inc * | | | 1,722 | | | | 43,722 | |
Affymax Inc * | | | 2,493 | | | | 47,367 | |
Agenus Inc * | | | 1,009 | | | | 4,137 | |
Air Methods Corp | | | 2,643 | | | | 97,500 | |
Akorn Inc * | | | 3,910 | | | | 52,238 | |
Align Technology Inc * | | | 4,947 | | | | 137,279 | |
Alkermes PLC * (Ireland) | | | 8,430 | | | | 156,124 | |
Alnylam Pharmaceuticals Inc * | | | 3,197 | | | | 58,345 | |
AMAG Pharmaceuticals Inc * | | | 1,167 | | | | 17,167 | |
Amicus Therapeutics Inc * | | | 2,202 | | | | 5,901 | |
AMN Healthcare Services Inc * | | | 1,686 | | | | 19,473 | |
Ampio Pharmaceuticals Inc * | | | 1,799 | | | | 6,458 | |
AmSurg Corp * | | | 710 | | | | 21,307 | |
Anacor Pharmaceuticals Inc * | | | 1,137 | | | | 5,912 | |
Analogic Corp | | | 843 | | | | 62,635 | |
Anika Therapeutics Inc * | | | 814 | | | | 8,091 | |
Antares Pharma Inc * | | | 7,363 | | | | 28,053 | |
Arena Pharmaceuticals Inc * | | | 13,225 | | | | 119,290 | |
ArQule Inc * | | | 4,123 | | | | 11,503 | |
Array BioPharma Inc * | | | 8,024 | | | | 29,849 | |
ArthroCare Corp * | | | 1,573 | | | | 54,410 | |
athenahealth Inc * | | | 2,466 | | | | 181,128 | |
AtriCure Inc * | | | 1,018 | | | | 7,024 | |
Atrion Corp | | | 107 | | | | 20,972 | |
Auxilium Pharmaceuticals Inc * | | | 3,327 | | | | 61,649 | |
AVANIR Pharmaceuticals Inc ‘A’ * | | | 8,632 | | | | 22,702 | |
AVEO Pharmaceuticals Inc * | | | 2,488 | | | | 20,028 | |
BG Medicine Inc * | | | 782 | | | | 1,806 | |
Bio-Reference Labs Inc * | | | 1,690 | | | | 48,486 | |
BioCryst Pharmaceuticals Inc * | | | 3,311 | | | | 4,702 | |
BioDelivery Sciences International Inc * | | | 1,860 | | | | 8,017 | |
BioScrip Inc * | | | 814 | | | | 8,767 | |
BioSpecifics Technologies Corp * | | | 335 | | | | 5,008 | |
Biotime Inc * | | | 2,116 | | | | 6,644 | |
Cadence Pharmaceuticals Inc * | | | 4,148 | | | | 19,869 | |
Cambrex Corp * | | | 1,076 | | | | 12,245 | |
Cantel Medical Corp | | | 1,457 | | | | 43,317 | |
Capital Senior Living Corp * | | | 1,674 | | | | 31,287 | |
Cardiovascular Systems Inc * | | | 1,157 | | | | 14,520 | |
Celldex Therapeutics Inc * | | | 4,286 | | | | 28,759 | |
Cempra Inc * | | | 251 | | | | 1,606 | |
Centene Corp * | | | 3,546 | | | | 145,386 | |
Cepheid Inc * | | | 4,515 | | | | 152,652 | |
Cerus Corp * | | | 3,369 | | | | 10,646 | |
Chemed Corp | | | 1,324 | | | | 90,813 | |
ChemoCentryx Inc * | | | 393 | | | | 4,299 | |
Clovis Oncology Inc * | | | 948 | | | | 15,168 | |
Computer Programs & Systems Inc | | | 760 | | | | 38,258 | |
Conceptus Inc * | | | 2,156 | | | | 45,298 | |
Corcept Therapeutics Inc * | | | 3,555 | | | | 5,084 | |
Coronado Biosciences Inc * | | | 1,269 | | | | 5,723 | |
Corvel Corp * | | | 424 | | | | 19,008 | |
Cubist Pharmaceuticals Inc * | | | 4,361 | | | | 183,424 | |
Cumberland Pharmaceuticals Inc * | | | 410 | | | | 1,722 | |
| | | | | | | | |
| | |
Shares | | |
Value | |
Curis Inc * | | | 4,214 | | | | $14,454 | |
Cyberonics Inc * | | | 1,895 | | | | 99,544 | |
Cynosure Inc ‘A’ * | | | 428 | | | | 10,319 | |
Cytori Therapeutics Inc * | | | 3,361 | | | | 9,478 | |
Dendreon Corp * | | | 8,525 | | | | 45,012 | |
Depomed Inc * | | | 3,824 | | | | 23,671 | |
Derma Sciences Inc * | | | 44 | | | | 489 | |
DexCom Inc * | | | 4,716 | | | | 64,185 | |
Discovery Laboratories Inc * | | | 3,054 | | | | 6,444 | |
Durata Therapeutics Inc * | | | 470 | | | | 3,591 | |
Dyax Corp * | | | 6,814 | | | | 23,713 | |
Dynavax Technologies Corp * | | | 10,632 | | | | 30,408 | |
Emergent BioSolutions Inc * | | | 361 | | | | 5,790 | |
Emeritus Corp * | | | 2,115 | | | | 52,283 | |
Endocyte Inc * | | | 2,039 | | | | 18,310 | |
Endologix Inc * | | | 3,806 | | | | 54,197 | |
EnteroMedics Inc * | | | 1,954 | | | | 5,471 | |
Epocrates Inc * | | | 1,215 | | | | 10,716 | |
Exact Sciences Corp * | | | 4,388 | | | | 46,469 | |
Exactech Inc * | | | 127 | | | | 2,153 | |
ExamWorks Group Inc * | | | 384 | | | | 5,372 | |
Exelixis Inc * | | | 12,645 | | | | 57,788 | |
Fluidigm Corp * | | | 1,667 | | | | 23,855 | |
Furiex Pharmaceuticals Inc * | | | 518 | | | | 9,977 | |
Genomic Health Inc * | | | 1,107 | | | | 30,177 | |
Globus Medical Inc ‘A’ * | | | 477 | | | | 5,004 | |
Greenway Medical Technologies Inc * | | | 434 | | | | 6,666 | |
GTx Inc * | | | 1,592 | | | | 6,686 | |
Haemonetics Corp * | | | 3,485 | | | | 142,327 | |
Halozyme Therapeutics Inc * | | | 6,195 | | | | 41,568 | |
Hansen Medical Inc * | | | 3,750 | | | | 7,800 | |
Harvard Bioscience Inc * | | | 112 | | | | 491 | |
HealthSouth Corp * | | | 5,545 | | | | 117,055 | |
HealthStream Inc * | | | 1,341 | | | | 32,600 | |
HeartWare International Inc * | | | 971 | | | | 81,515 | |
Hi-Tech Pharmacal Co Inc | | | 287 | | | | 10,039 | |
HMS Holdings Corp * | | | 5,916 | | | | 153,343 | |
Horizon Pharma Inc * | | | 1,562 | | | | 3,639 | |
Hyperion Therapeutics Inc * | | | 217 | | | | 2,448 | |
ICU Medical Inc * | | | 780 | | | | 47,525 | |
Idenix Pharmaceuticals Inc * | | | 5,511 | | | | 26,728 | |
ImmunoCellular Therapeutics Ltd * | | | 3,475 | | | | 6,672 | |
ImmunoGen Inc * | | | 4,491 | | | | 57,260 | |
Immunomedics Inc * | | | 4,554 | | | | 13,298 | |
Impax Laboratories Inc * | | | 4,609 | | | | 94,438 | |
Infinity Pharmaceuticals Inc * | | | 1,950 | | | | 68,250 | |
Insulet Corp * | | | 3,287 | | | | 69,750 | |
Integra LifeSciences Holdings Corp * | | | 766 | | | | 29,851 | |
Intercept Pharmaceuticals Inc * | | | 262 | | | | 8,971 | |
InterMune Inc * | | | 2,532 | | | | 24,535 | |
IPC The Hospitalist Co Inc * | | | 1,139 | | | | 45,230 | |
Ironwood Pharmaceuticals Inc ‘A’ * | | | 5,183 | | | | 57,479 | |
Isis Pharmaceuticals Inc * | | | 6,909 | | | | 72,268 | |
Jazz Pharmaceuticals PLC * (Ireland) | | | 2,858 | | | | 152,046 | |
Keryx Biopharmaceuticals Inc * | | | 4,954 | | | | 12,980 | |
KYTHERA Biopharmaceuticals Inc * | | | 284 | | | | 8,617 | |
Landauer Inc | | | 648 | | | | 39,664 | |
Lexicon Pharmaceuticals Inc * | | | 6,348 | | | | 14,093 | |
LHC Group Inc * | | | 58 | | | | 1,235 | |
Ligand Pharmaceuticals Inc ‘B’ * | | | 1,200 | | | | 24,888 | |
Luminex Corp * | | | 2,874 | | | | 48,168 | |
Magellan Health Services Inc * | | | 92 | | | | 4,508 | |
MAKO Surgical Corp * | | | 2,719 | | | | 34,994 | |
MannKind Corp * | | | 7,818 | | | | 18,060 | |
MAP Pharmaceuticals Inc * | | | 1,938 | | | | 30,446 | |
Masimo Corp | | | 3,435 | | | | 72,169 | |
MedAssets Inc * | | | 1,339 | | | | 22,455 | |
Medidata Solutions Inc * | | | 1,527 | | | | 59,843 | |
Merge Healthcare Inc * | | | 3,222 | | | | 7,958 | |
Meridian Bioscience Inc | | | 2,842 | | | | 57,551 | |
| | |
| See Notes to Financial Statements | | See explanation of symbols and terms, if any, on page B-81 |
B-44
PACIFIC SELECT FUND
PD SMALL-CAP GROWTH INDEX PORTFOLIO
Schedule of Investments (Continued)
December 31, 2012
| | | | | | | | |
| | |
Shares | | |
Value | |
Merit Medical Systems Inc * | | | 159 | | | | $2,210 | |
Merrimack Pharmaceuticals Inc * | | | 1,046 | | | | 6,370 | |
Molina Healthcare Inc * | | | 176 | | | | 4,763 | |
Momenta Pharmaceuticals Inc * | | | 1,255 | | | | 14,784 | |
MWI Veterinary Supply Inc * | | | 874 | | | | 96,140 | |
National Research Corp | | | 168 | | | | 9,106 | |
Natus Medical Inc * | | | 1,243 | | | | 13,897 | |
Navidea Biopharmaceuticals Inc * | | | 6,654 | | | | 18,831 | |
Nektar Therapeutics * | | | 5,612 | | | | 41,585 | |
Neogen Corp * | | | 1,619 | | | | 73,373 | |
Neurocrine Biosciences Inc * | | | 4,577 | | | | 34,236 | |
NewLink Genetics Corp * | | | 891 | | | | 11,138 | |
Novavax Inc * | | | 8,982 | | | | 16,976 | |
NPS Pharmaceuticals Inc * | | | 3,950 | | | | 35,945 | |
NuVasive Inc * | | | 744 | | | | 11,502 | |
NxStage Medical Inc * | | | 3,565 | | | | 40,106 | |
Obagi Medical Products Inc * | | | 1,194 | | | | 16,226 | |
Omeros Corp * | | | 1,801 | | | | 9,347 | |
Omnicell Inc * | | | 254 | | | | 3,777 | |
OncoGenex Pharmaceutical Inc * | | | 1,010 | | | | 13,251 | |
Oncothyreon Inc * | | | 4,060 | | | | 7,795 | |
Opko Health Inc * | | | 7,373 | | | | 35,464 | |
Optimer Pharmaceuticals Inc * | | | 3,247 | | | | 29,385 | |
OraSure Technologies Inc * | | | 3,745 | | | | 26,889 | |
Orexigen Therapeutics Inc * | | | 5,025 | | | | 26,482 | |
Orthofix International NV * (Netherlands) | | | 1,029 | | | | 40,471 | |
Osiris Therapeutics Inc * | | | 1,147 | | | | 10,300 | |
Owens & Minor Inc | | | 3,749 | | | | 106,884 | |
Pacira Pharmaceuticals Inc * | | | 1,270 | | | | 22,187 | |
Pain Therapeutics Inc * | | | 2,564 | | | | 6,948 | |
PAREXEL International Corp * | | | 4,122 | | | | 121,970 | |
PDI Inc * | | | 60 | | | | 456 | |
PDL BioPharma Inc | | | 8,355 | | | | 58,903 | |
Pernix Therapeutics Holdings * | | | 639 | | | | 4,952 | |
Pharmacyclics Inc * | | | 3,745 | | | | 216,836 | |
PhotoMedex Inc * | | | 767 | | | | 11,129 | |
POZEN Inc * | | | 1,805 | | | | 9,043 | |
Progenics Pharmaceuticals Inc * | | | 2,906 | | | | 8,660 | |
PSS World Medical Inc * | | | 3,475 | | | | 100,358 | |
Quality Systems Inc | | | 2,731 | | | | 47,410 | |
Questcor Pharmaceuticals Inc | | | 3,704 | | | | 98,971 | |
Quidel Corp * | | | 1,935 | | | | 36,126 | |
Raptor Pharmaceutical Corp * | | | 3,577 | | | | 20,925 | |
Regulus Therapeutics Inc * | | | 732 | | | | 4,612 | |
Repligen Corp * | | | 1,921 | | | | 12,083 | |
Repros Therapeutics Inc * | | | 1,175 | | | | 18,506 | |
Rigel Pharmaceuticals Inc * | | | 4,792 | | | | 31,148 | |
Rochester Medical Corp * | | | 612 | | | | 6,169 | |
Rockwell Medical Technologies Inc * | | | 1,382 | | | | 11,125 | |
RTI Biologics Inc * | | | 265 | | | | 1,132 | |
Sagent Pharmaceuticals Inc * | | | 654 | | | | 10,523 | |
Sangamo Biosciences Inc * | | | 3,633 | | | | 21,834 | |
Santarus Inc * | | | 3,771 | | | | 41,406 | |
SciClone Pharmaceuticals Inc * | | | 3,922 | | | | 16,904 | |
Seattle Genetics Inc * | | | 6,546 | | | | 151,867 | |
Sequenom Inc * | | | 6,032 | | | | 28,471 | |
SIGA Technologies Inc * | | | 2,472 | | | | 6,477 | |
Skilled Healthcare Group Inc ‘A’ * | | | 1,208 | | | | 7,695 | |
Spectranetics Corp * | | | 2,358 | | | | 34,828 | |
Spectrum Pharmaceuticals Inc | | | 4,103 | | | | 45,913 | |
Staar Surgical Co * | | | 2,502 | | | | 15,262 | |
STERIS Corp | | | 2,936 | | | | 101,967 | |
Sucampo Pharmaceuticals Inc ‘A’ * | | | 696 | | | | 3,410 | |
Sunesis Pharmaceuticals Inc * | | | 2,070 | | | | 8,694 | |
Sunrise Senior Living Inc * | | | 3,227 | | | | 46,404 | |
SurModics Inc * | | | 192 | | | | 4,293 | |
Symmetry Medical Inc * | | | 786 | | | | 8,269 | |
Synageva BioPharma Corp * | | | 722 | | | | 33,421 | |
Synergy Pharmaceuticals Inc * | | | 2,841 | | | | 14,944 | |
Synta Pharmaceuticals Corp * | | | 2,749 | | | | 24,796 | |
| | | | | | | | |
| | |
Shares | | |
Value | |
Team Health Holdings Inc * | | | 1,952 | | | | $56,159 | |
TESARO Inc * | | | 245 | | | | 4,153 | |
The Ensign Group Inc | | | 740 | | | | 20,121 | |
The Medicines Co * | | | 3,792 | | | | 90,894 | |
The Providence Service Corp * | | | 209 | | | | 3,551 | |
Theravance Inc * | | | 4,179 | | | | 93,066 | |
Threshold Pharmaceuticals Inc * | | | 3,127 | | | | 13,165 | |
Tornier NV * (Netherlands) | | | 768 | | | | 12,895 | |
Transcept Pharmaceuticals Inc * | | | 115 | | | | 512 | |
Trius Therapeutics Inc * | | | 1,866 | | | | 8,919 | |
U.S. Physical Therapy Inc | | | 807 | | | | 22,225 | |
Unilife Corp * | | | 5,566 | | | | 12,635 | |
Utah Medical Products Inc | | | 212 | | | | 7,643 | |
Vanda Pharmaceuticals Inc * | | | 1,964 | | | | 7,267 | |
Vanguard Health Systems Inc * | | | 1,890 | | | | 23,153 | |
Vascular Solutions Inc * | | | 1,112 | | | | 17,570 | |
Ventrus Biosciences Inc * | | | 815 | | | | 1,760 | |
Verastem Inc * | | | 467 | | | | 4,105 | |
Vical Inc * | | | 4,823 | | | | 14,035 | |
Vivus Inc * | | | 6,870 | | | | 92,195 | |
Vocera Communications Inc * | | | 212 | | | | 5,321 | |
Volcano Corp * | | | 3,664 | | | | 86,507 | |
WellCare Health Plans Inc * | | | 1,436 | | | | 69,919 | |
West Pharmaceutical Services Inc | | | 1,488 | | | | 81,468 | |
XenoPort Inc * | | | 2,548 | | | | 19,798 | |
XOMA Corp * | | | 5,012 | | | | 12,004 | |
Young Innovations Inc | | | 164 | | | | 6,463 | |
Zeltiq Aesthetics Inc * | | | 433 | | | | 2,005 | |
ZIOPHARM Oncology Inc * | | | 4,602 | | | | 19,144 | |
Zogenix Inc * | | | 3,645 | | | | 4,848 | |
| | | | | | | | |
| | | | 8,106,875 | |
| | | | | | | | |
Industrials - 17.5% | | | | | | | | |
| | |
A.O. Smith Corp | | | 740 | | | | 46,672 | |
AAON Inc | | | 1,273 | | | | 26,568 | |
Acacia Research Corp * | | | 3,420 | | | | 87,723 | |
ACCO Brands Corp * | | | 3,574 | | | | 26,233 | |
Aceto Corp | | | 446 | | | | 4,478 | |
Acorn Energy Inc | | | 1,255 | | | | 9,802 | |
Actuant Corp ‘A’ | | | 972 | | | | 27,129 | |
Acuity Brands Inc | | | 2,917 | | | | 197,568 | |
Aegion Corp * | | | 382 | | | | 8,477 | |
Aerovironment Inc * | | | 713 | | | | 15,501 | |
Alaska Air Group Inc * | | | 4,638 | | | | 199,851 | |
Allegiant Travel Co | | | 1,028 | | | | 75,465 | |
Altra Holdings Inc | | | 1,010 | | | | 22,270 | |
Ameresco Inc ‘A’ * | | | 1,064 | | | | 10,438 | |
American Science & Engineering Inc | | | 108 | | | | 7,043 | |
American Superconductor Corp * | | | 256 | | | | 671 | |
American Woodmark Corp * | | | 105 | | | | 2,921 | |
Applied Industrial Technologies Inc | | | 2,676 | | | | 112,419 | |
ARC Document Solutions Inc * | | | 406 | | | | 1,039 | |
Argan Inc | | | 141 | | | | 2,538 | |
Astronics Corp * | | | 827 | | | | 18,922 | |
AT Cross Co ‘A’ * | | | 602 | | | | 6,490 | |
Avis Budget Group Inc * | | | 7,308 | | | | 144,845 | |
AZZ Inc | | | 1,737 | | | | 66,753 | |
Barrett Business Services Inc | | | 480 | | | | 18,283 | |
Beacon Roofing Supply Inc * | | | 3,228 | | | | 107,428 | |
Belden Inc | | | 2,789 | | | | 125,477 | |
Blount International Inc * | | | 3,360 | | | | 53,155 | |
BlueLinx Holdings Inc * | | | 317 | | | | 891 | |
Builders FirstSource Inc * | | | 3,110 | | | | 17,354 | |
CAI International Inc * | | | 393 | | | | 8,626 | |
Capstone Turbine Corp * | | | 20,577 | | | | 18,314 | |
Cascade Corp | | | 36 | | | | 2,315 | |
Casella Waste Systems Inc ‘A’ * | | | 124 | | | | 543 | |
CDI Corp | | | 154 | | | | 2,638 | |
Ceco Environmental Corp | | | 394 | | | | 3,920 | |
Celadon Group Inc | | | 1,375 | | | | 24,846 | |
| | |
| See Notes to Financial Statements | | See explanation of symbols and terms, if any, on page B-81 |
B-45
PACIFIC SELECT FUND
PD SMALL-CAP GROWTH INDEX PORTFOLIO
Schedule of Investments (Continued)
December 31, 2012
| | | | | | | | |
| | |
Shares | | |
Value | |
Chart Industries Inc * | | | 2,058 | | | | $137,207 | |
CIRCOR International Inc | | | 81 | | | | 3,207 | |
CLARCOR Inc | | | 3,459 | | | | 165,271 | |
Coleman Cable Inc | | | 591 | | | | 5,479 | |
Comfort Systems USA Inc | | | 748 | | | | 9,096 | |
Commercial Vehicle Group Inc * | | | 1,677 | | | | 13,768 | |
CPI Aerostructures Inc * | | | 430 | | | | 4,304 | |
Cubic Corp | | | 584 | | | | 28,014 | |
Deluxe Corp | | | 2,357 | | | | 75,990 | |
DigitalGlobe Inc * | | | 1,725 | | | | 42,159 | |
DXP Enterprises Inc * | | | 603 | | | | 29,589 | |
Dycom Industries Inc * | | | 2,027 | | | | 40,135 | |
Dynamic Materials Corp | | | 344 | | | | 4,782 | |
Echo Global Logistics Inc * | | | 1,008 | | | | 18,114 | |
Edgen Group Inc * | | | 226 | | | | 1,596 | |
EnergySolutions Inc * | | | 1,476 | | | | 4,605 | |
EnerNOC Inc * | | | 643 | | | | 7,555 | |
EnerSys * | | | 1,204 | | | | 45,307 | |
Enphase Energy Inc * | | | 428 | | | | 1,562 | |
EnPro Industries Inc * | | | 742 | | | | 30,348 | |
ESCO Technologies Inc | | | 589 | | | | 22,034 | |
Exponent Inc * | | | 919 | | | | 51,308 | |
Federal Signal Corp * | | | 423 | | | | 3,219 | |
Flow International Corp * | | | 708 | | | | 2,478 | |
Forward Air Corp | | | 1,999 | | | | 69,985 | |
Franklin Covey Co * | | | 664 | | | | 8,566 | |
Franklin Electric Co Inc | | | 1,527 | | | | 94,934 | |
FuelCell Energy Inc * | | | 2,685 | | | | 2,462 | |
GenCorp Inc * | | | 3,261 | | | | 29,838 | |
Generac Holdings Inc | | | 780 | | | | 26,762 | |
Genesee & Wyoming Inc ‘A’ * | | | 3,052 | | | | 232,196 | |
GP Strategies Corp * | | | 920 | | | | 18,998 | |
Graham Corp | | | 683 | | | | 13,318 | |
Great Lakes Dredge & Dock Co | | | 479 | | | | 4,277 | |
H&E Equipment Services Inc | | | 1,105 | | | | 16,652 | |
Hawaiian Holdings Inc * | | | 1,918 | | | | 12,601 | |
Healthcare Services Group Inc | | | 4,623 | | | | 107,392 | |
Heartland Express Inc | | | 2,545 | | | | 33,263 | |
HEICO Corp | | | 3,625 | | | | 162,255 | |
Heritage-Crystal Clean Inc * | | | 517 | | | | 7,760 | |
Herman Miller Inc | | | 4,009 | | | | 85,873 | |
Hexcel Corp * | | | 6,853 | | | | 184,757 | |
Hill International Inc * | | | 133 | | | | 487 | |
HNI Corp | | | 2,968 | | | | 89,218 | |
Houston Wire & Cable Co | | | 439 | | | | 5,387 | |
Hub Group Inc ‘A’ * | | | 2,549 | | | | 85,646 | |
Huron Consulting Group Inc * | | | 1,576 | | | | 53,095 | |
II-VI Inc * | | | 3,079 | | | | 56,253 | |
InnerWorkings Inc * | | | 2,185 | | | | 30,109 | |
Insperity Inc | | | 1,563 | | | | 50,891 | |
Insteel Industries Inc | | | 49 | | | | 612 | |
Interface Inc | | | 4,029 | | | | 64,786 | |
Intersections Inc | | | 388 | | | | 3,678 | |
John Bean Technologies Corp | | | 1,985 | | | | 35,273 | |
Kaman Corp | | | 1,815 | | | | 66,792 | |
Kforce Inc | | | 1,805 | | | | 25,866 | |
Knight Transportation Inc | | | 3,986 | | | | 58,315 | |
Knoll Inc | | | 2,295 | | | | 35,251 | |
Lindsay Corp | | | 875 | | | | 70,105 | |
LMI Aerospace Inc * | | | 67 | | | | 1,296 | |
MasTec Inc * | | | 3,775 | | | | 94,111 | |
McGrath RentCorp | | | 875 | | | | 25,392 | |
Meritor Inc * | | | 1,621 | | | | 7,667 | |
Met-Pro Corp | | | 56 | | | | 543 | |
Mine Safety Appliances Co | | | 1,901 | | | | 81,192 | |
Mistras Group Inc * | | | 1,073 | | | | 26,492 | |
Moog Inc ‘A’ * | | | 350 | | | | 14,360 | |
Mueller Industries Inc | | | 226 | | | | 11,307 | |
Mueller Water Products Inc ‘A’ | | | 7,071 | | | | 39,668 | |
Multi-Color Corp | | | 59 | | | | 1,415 | |
| | | | | | | | |
| | |
Shares | | |
Value | |
MYR Group Inc * | | | 778 | | | | $17,310 | |
National Presto Industries Inc | | | 38 | | | | 2,626 | |
Nortek Inc * | | | 530 | | | | 35,112 | |
Odyssey Marine Exploration Inc * | | | 5,029 | | | | 14,936 | |
Old Dominion Freight Line Inc * | | | 4,900 | | | | 167,972 | |
Omega Flex Inc | | | 191 | | | | 2,361 | |
On Assignment Inc * | | | 2,956 | | | | 59,948 | |
Pacer International Inc * | | | 343 | | | | 1,338 | |
Park-Ohio Holdings Corp * | | | 562 | | | | 11,976 | |
Patrick Industries Inc * | | | 278 | | | | 4,326 | |
Performant Financial Corp * | | | 355 | | | | 3,585 | |
PGT Inc * | | | 661 | | | | 2,974 | |
Powell Industries Inc * | | | 266 | | | | 11,047 | |
Preformed Line Products Co | | | 11 | | | | 654 | |
Primoris Services Corp | | | 539 | | | | 8,107 | |
Proto Labs Inc * | | | 350 | | | | 13,797 | |
Quality Distribution Inc * | | | 533 | | | | 3,198 | |
Rand Logistics Inc * | | | 58 | | | | 377 | |
Raven Industries Inc | | | 2,491 | | | | 65,663 | |
RBC Bearings Inc * | | | 1,523 | | | | 76,257 | |
Republic Airways Holdings Inc * | | | 1,867 | | | | 10,605 | |
Rexnord Corp * | | | 424 | | | | 9,031 | |
Roadrunner Transportation Systems Inc * | | | 513 | | | | 9,306 | |
Robbins & Myers Inc | | | 1,087 | | | | 64,622 | |
RPX Corp * | | | 1,344 | | | | 12,150 | |
Saia Inc * | | | 210 | | | | 4,855 | |
Sauer-Danfoss Inc | | | 806 | | | | 43,016 | |
SeaCube Container Leasing Ltd (Bermuda) | | | 94 | | | | 1,772 | |
SIFCO Industries Inc | | | 62 | | | | 977 | |
Simpson Manufacturing Co Inc | | | 293 | | | | 9,607 | |
SkyWest Inc | | | 215 | | | | 2,679 | |
Spirit Airlines Inc * | | | 2,867 | | | | 50,803 | |
Standard Parking Corp * | | | 1,069 | | | | 23,507 | |
Standex International Corp | | | 194 | | | | 9,950 | |
Steelcase Inc ‘A’ | | | 738 | | | | 9,402 | |
Sterling Construction Co Inc * | | | 106 | | | | 1,054 | |
Sun Hydraulics Corp | | | 1,421 | | | | 37,060 | |
Swift Transportation Co * | | | 5,441 | | | | 49,622 | |
Sypris Solutions Inc | | | 514 | | | | 2,035 | |
TAL International Group Inc | | | 1,011 | | | | 36,780 | |
Taser International Inc * | | | 3,541 | | | | 31,657 | |
Team Inc * | | | 1,368 | | | | 52,039 | |
Teledyne Technologies Inc * | | | 879 | | | | 57,197 | |
Tennant Co | | | 1,295 | | | | 56,915 | |
Tetra Tech Inc * | | | 3,559 | | | | 94,136 | |
Textainer Group Holdings Ltd (Bermuda) | | | 953 | | | | 29,981 | |
The Advisory Board Co * | | | 2,359 | | | | 110,378 | |
The Brink’s Co | | | 3,256 | | | | 92,894 | |
The Corporate Executive Board Co | | | 2,308 | | | | 109,538 | |
The Gorman-Rupp Co | | | 1,042 | | | | 31,083 | |
The KEYW Holding Corp * | | | 734 | | | | 9,314 | |
The Middleby Corp * | | | 1,286 | | | | 164,878 | |
Thermon Group Holdings Inc * | | | 1,008 | | | | 22,710 | |
Titan International Inc | | | 3,288 | | | | 71,415 | |
Titan Machinery Inc * | | | 1,164 | | | | 28,751 | |
TMS International Corp ‘A’ * | | | 440 | | | | 5,509 | |
TRC Cos Inc * | | | 882 | | | | 5,133 | |
Trex Co Inc * | | | 1,029 | | | | 38,310 | |
TriMas Corp * | | | 2,039 | | | | 57,010 | |
TrueBlue Inc * | | | 2,032 | | | | 32,004 | |
United Stationers Inc | | | 166 | | | | 5,144 | |
US Airways Group Inc * | | | 11,185 | | | | 150,997 | |
US Ecology Inc | | | 792 | | | | 18,644 | |
USG Corp * | | | 5,106 | | | | 143,325 | |
Vicor Corp * | | | 248 | | | | 1,344 | |
Wabash National Corp * | | | 4,709 | | | | 42,240 | |
WageWorks Inc * | | | 305 | | | | 5,429 | |
Watsco Inc | | | 2,025 | | | | 151,672 | |
Werner Enterprises Inc | | | 2,622 | | | | 56,819 | |
Wesco Aircraft Holdings Inc * | | | 278 | | | | 3,672 | |
| | |
| See Notes to Financial Statements | | See explanation of symbols and terms, if any, on page B-81 |
B-46
PACIFIC SELECT FUND
PD SMALL-CAP GROWTH INDEX PORTFOLIO
Schedule of Investments (Continued)
December 31, 2012
| | | | | | | | |
| | |
Shares | | |
Value | |
Woodward Inc | | | 4,759 | | | | $181,461 | |
XPO Logistics Inc * | | | 1,215 | | | | 21,117 | |
Zipcar Inc * | | | 1,547 | | | | 12,747 | |
| | | | | | | | |
| | | | 7,187,689 | |
| | | | | | | | |
Information Technology - 20.8% | | | | | | | | |
| | |
3D Systems Corp * | | | 3,222 | | | | 171,894 | |
ACI Worldwide Inc * | | | 2,736 | | | | 119,536 | |
Actuate Corp * | | | 3,172 | | | | 17,763 | |
ADTRAN Inc | | | 4,392 | | | | 85,820 | |
Advent Software Inc * | | | 2,171 | | | | 46,416 | |
Ambarella Inc * (Cayman) | | | 147 | | | | 1,639 | |
Ambient Corp * | | | 180 | | | | 542 | |
American Software Inc ‘A’ | | | 1,620 | �� | | | 12,571 | |
Anaren Inc * | | | 121 | | | | 2,353 | |
Angie’s List Inc * | | | 2,449 | | | | 29,364 | |
Anixter International Inc | | | 1,187 | | | | 75,944 | |
ARRIS Group Inc * | | | 1,021 | | | | 15,254 | |
Aruba Networks Inc * | | | 7,696 | | | | 159,692 | |
Aspen Technology Inc * | | | 6,078 | | | | 167,996 | |
ATMI Inc * | | | 142 | | | | 2,965 | |
Audience Inc * | | | 63 | | | | 655 | |
AVG Technologies NV * (Netherlands) | | | 526 | | | | 8,327 | |
Aware Inc | | | 721 | | | | 3,951 | |
Badger Meter Inc | | | 999 | | | | 47,363 | |
Bankrate Inc * | | | 2,796 | | | | 34,810 | |
Bazaarvoice Inc * | | | 664 | | | | 6,208 | |
Blackbaud Inc | | | 3,108 | | | | 70,956 | |
Blucora Inc * | | | 434 | | | | 6,818 | |
Bottomline Technologies Inc * | | | 693 | | | | 18,288 | |
Brightcove Inc * | | | 409 | | | | 3,697 | |
BroadSoft Inc * | | | 1,892 | | | | 68,736 | |
Cabot Microelectronics Corp | | | 1,618 | | | | 57,455 | |
CACI International Inc ‘A’ * | | | 125 | | | | 6,879 | |
CalAmp Corp * | | | 1,975 | | | | 16,432 | |
Calix Inc * | | | 970 | | | | 7,459 | |
Callidus Software Inc * | | | 2,420 | | | | 10,987 | |
Carbonite Inc * | | | 749 | | | | 6,928 | |
Cardtronics Inc * | | | 3,035 | | | | 72,051 | |
Cass Information Systems Inc | | | 700 | | | | 29,540 | |
Cavium Inc * | | | 3,422 | | | | 106,801 | |
Ceva Inc * | | | 1,209 | | | | 19,042 | |
Ciena Corp * | | | 5,161 | | | | 81,028 | |
Cirrus Logic Inc * | | | 4,441 | | | | 128,656 | |
Cognex Corp | | | 2,947 | | | | 108,509 | |
Coherent Inc | | | 473 | | | | 23,943 | |
CommVault Systems Inc * | | | 3,073 | | | | 214,219 | |
Computer Task Group Inc * | | | 802 | | | | 14,620 | |
comScore Inc * | | | 2,429 | | | | 33,472 | |
Comverse Inc * | | | 1,508 | | | | 43,023 | |
Comverse Technology Inc * | | | 15,089 | | | | 57,942 | |
Constant Contact Inc * | | | 2,097 | | | | 29,798 | |
Cornerstone OnDemand Inc * | | | 2,312 | | | | 68,273 | |
CoStar Group Inc * | | | 1,940 | | | | 173,378 | |
Cray Inc * | | | 2,542 | | | | 40,545 | |
CSG Systems International Inc * | | | 1,343 | | | | 24,416 | |
Cymer Inc * | | | 656 | | | | 59,322 | |
Daktronics Inc | | | 589 | | | | 6,520 | |
Datalink Corp * | | | 1,026 | | | | 8,772 | |
DealerTrack Technologies Inc * | | | 2,608 | | | | 74,902 | |
Demand Media Inc * | | | 1,534 | | | | 14,251 | |
Demandware Inc * | | | 428 | | | | 11,693 | |
Dice Holdings Inc * | | | 2,912 | | | | 26,732 | |
Digimarc Corp | | | 497 | | | | 10,288 | |
DTS Inc * | | | 1,262 | | | | 21,075 | |
E2open Inc * | | | 237 | | | | 3,356 | |
Ebix Inc | | | 1,462 | | | | 23,494 | |
Echelon Corp * | | | 1,465 | | | | 3,589 | |
Electro Rent Corp | | | 126 | | | | 1,938 | |
Electronics for Imaging Inc * | | | 262 | | | | 4,975 | |
| | | | | | | | |
| | |
Shares | | |
Value | |
Ellie Mae Inc * | | | 1,734 | | | | $48,118 | |
Eloqua Inc * | | | 472 | | | | 11,134 | |
Envestnet Inc * | | | 1,438 | | | | 20,060 | |
Envivio Inc * | | | 130 | | | | 221 | |
EPAM Systems Inc * | | | 325 | | | | 5,882 | |
EPIQ Systems Inc | | | 181 | | | | 2,313 | |
Exa Corp * | | | 309 | | | | 3,007 | |
ExactTarget Inc * | | | 672 | | | | 13,440 | |
Exar Corp * | | | 314 | | | | 2,795 | |
ExlService Holdings Inc * | | | 1,605 | | | | 42,532 | |
Extreme Networks Inc * | | | 6,452 | | | | 23,485 | |
Fair Isaac Corp | | | 2,360 | | | | 99,191 | |
FalconStor Software Inc * | | | 2,188 | | | | 5,098 | |
FARO Technologies Inc * | | | 1,164 | | | | 41,532 | |
FEI Co | | | 2,450 | | | | 135,877 | |
FleetMatics Group PLC * (Ireland) | | | 443 | | | | 11,146 | |
Forrester Research Inc | | | 966 | | | | 25,889 | |
Global Cash Access Holdings Inc * | | | 3,641 | | | | 28,545 | |
Globecomm Systems Inc * | | | 1,223 | | | | 13,820 | |
Glu Mobile Inc * | | | 3,634 | | | | 8,322 | |
GSI Group Inc * (Canada) | | | 104 | | | | 901 | |
GT Advanced Technologies Inc * | | | 6,922 | | | | 20,904 | |
Guidance Software Inc * | | | 990 | | | | 11,751 | |
Guidewire Software Inc * | | | 1,409 | | | | 41,875 | |
Heartland Payment Systems Inc | | | 2,673 | | | | 78,853 | |
Higher One Holdings Inc * | | | 2,218 | | | | 23,378 | |
Hittite Microwave Corp * | | | 2,165 | | | | 134,446 | |
iGate Corp * | | | 2,204 | | | | 34,757 | |
Immersion Corp * | | | 1,817 | | | | 12,483 | |
Imperva Inc * | | | 671 | | | | 21,157 | |
Infinera Corp * | | | 6,799 | | | | 39,502 | |
Infoblox Inc * | | | 519 | | | | 9,326 | |
Innodata Inc * | | | 1,486 | | | | 5,617 | |
Inphi Corp * | | | 668 | | | | 6,399 | |
Interactive Intelligence Group Inc * | | | 1,009 | | | | 33,842 | |
InterDigital Inc | | | 2,819 | | | | 115,861 | |
Intermec Inc * | | | 543 | | | | 5,354 | |
Intermolecular Inc * | | | 949 | | | | 8,446 | |
Internap Network Services Corp * | | | 1,851 | | | | 12,846 | |
InvenSense Inc * | | | 2,513 | | | | 27,919 | |
iPass Inc * | | | 3,194 | | | | 5,845 | |
Ixia * | | | 2,898 | | | | 49,208 | |
j2 Global Inc | | | 2,633 | | | | 80,517 | |
Jive Software Inc * | | | 1,118 | | | | 16,245 | |
Key Tronic Corp * | | | 118 | | | | 1,208 | |
KVH Industries Inc * | | | 868 | | | | 12,135 | |
Lionbridge Technologies Inc * | | | 3,878 | | | | 15,590 | |
Liquidity Services Inc * | | | 1,621 | | | | 66,234 | |
Littelfuse Inc | | | 1,349 | | | | 83,247 | |
LivePerson Inc * | | | 3,783 | | | | 49,709 | |
LogMeIn Inc * | | | 1,520 | | | | 34,063 | |
Loral Space & Communications Inc | | | 714 | | | | 39,027 | |
M/A-COM Technology Solutions Holdings Inc * | | | 66 | | | | 988 | |
Manhattan Associates Inc * | | | 1,397 | | | | 84,295 | |
Market Leader Inc * | | | 1,260 | | | | 8,253 | |
Mattersight Corp * | | | 624 | | | | 3,101 | |
MAXIMUS Inc | | | 2,337 | | | | 147,745 | |
MaxLinear Inc ‘A’ * | | | 232 | | | | 1,165 | |
Maxwell Technologies Inc * | | | 2,009 | | | | 16,655 | |
Measurement Specialties Inc * | | | 915 | | | | 31,439 | |
MeetMe Inc * | | | 199 | | | | 695 | |
MEMC Electronic Materials Inc * | | | 3,590 | | | | 11,524 | |
Mentor Graphics Corp * | | | 3,463 | | | | 58,940 | |
Mesa Laboratories Inc | | | 174 | | | | 8,719 | |
Micrel Inc | | | 3,332 | | | | 31,654 | |
Microsemi Corp * | | | 6,109 | | | | 128,533 | |
MicroStrategy Inc ‘A’ * | | | 586 | | | | 54,721 | |
Millennial Media Inc * | | | 757 | | | | 9,485 | |
MIPS Technologies Inc * | | | 2,540 | | | | 19,863 | |
| | |
| See Notes to Financial Statements | | See explanation of symbols and terms, if any, on page B-81 |
B-47
PACIFIC SELECT FUND
PD SMALL-CAP GROWTH INDEX PORTFOLIO
Schedule of Investments (Continued)
December 31, 2012
| | | | | | | | |
| | |
Shares | | |
Value | |
MoneyGram International Inc * | | | 451 | | | | $5,994 | |
Monolithic Power Systems Inc | | | 2,096 | | | | 46,699 | |
Monotype Imaging Holdings Inc | | | 2,515 | | | | 40,190 | |
Move Inc * | | | 2,693 | | | | 20,440 | |
MTS Systems Corp | | | 1,105 | | | | 56,278 | |
Multi-Fineline Electronix Inc * | | | 129 | | | | 2,607 | |
Neonode Inc * | | | 1,503 | | | | 7,305 | |
NETGEAR Inc * | | | 1,169 | | | | 46,082 | |
NetScout Systems Inc * | | | 2,527 | | | | 65,677 | |
NIC Inc | | | 4,429 | | | | 72,370 | |
Numerex Corp ‘A’ * | | | 680 | | | | 8,935 | |
NVE Corp * | | | 332 | | | | 18,423 | |
OpenTable Inc * | | | 1,553 | | | | 75,786 | |
OSI Systems Inc * | | | 1,367 | | | | 87,543 | |
Parametric Technology Corp * | | | 8,231 | | | | 185,280 | |
ParkerVision Inc * | | | 5,285 | | | | 10,729 | |
PDF Solutions Inc * | | | 1,659 | | | | 22,861 | |
Pegasystems Inc | | | 1,187 | | | | 26,921 | |
Peregrine Semiconductor Corp * | | | 157 | | | | 2,404 | |
Perficient Inc * | | | 1,688 | | | | 19,885 | |
Pervasive Software Inc * | | | 71 | | | | 633 | |
Plantronics Inc | | | 982 | | | | 36,206 | |
Plexus Corp * | | | 1,054 | | | | 27,193 | |
PLX Technology Inc * | | | 2,864 | | | | 10,396 | |
Power Integrations Inc | | | 1,952 | | | | 65,607 | |
PRGX Global Inc * | | | 1,598 | | | | 10,307 | |
Procera Networks Inc * | | | 1,326 | | | | 24,597 | |
Proofpoint Inc * | | | 417 | | | | 5,133 | |
PROS Holdings Inc * | | | 1,503 | | | | 27,490 | |
QAD Inc ‘A’ | | | 389 | | | | 5,602 | |
QLIK Technologies Inc * | | | 5,877 | | | | 127,648 | |
QLogic Corp * | | | 1,647 | | | | 16,025 | |
Qualys Inc * | | | 433 | | | | 6,404 | |
Quantum Corp * | | | 967 | | | | 1,199 | |
QuickLogic Corp * | | | 2,755 | | | | 5,978 | |
Rambus Inc * | | | 612 | | | | 2,987 | |
RealD Inc * | | | 2,452 | | | | 27,487 | |
RealPage Inc * | | | 2,467 | | | | 53,213 | |
Responsys Inc * | | | 2,465 | | | | 14,691 | |
RF Micro Devices Inc * | | | 2,406 | | | | 10,779 | |
Rogers Corp * | | | 472 | | | | 23,440 | |
Rosetta Stone Inc * | | | 377 | | | | 4,652 | |
Ruckus Wireless Inc * | | | 250 | | | | 5,633 | |
Saba Software Inc * | | | 2,047 | | | | 17,891 | |
Sapient Corp * | | | 8,486 | | | | 89,612 | |
SciQuest Inc * | | | 1,224 | | | | 19,413 | |
Semtech Corp * | | | 4,505 | | | | 130,420 | |
ServiceSource International Inc * | | | 3,433 | | | | 20,083 | |
ShoreTel Inc * | | | 2,925 | | | | 12,402 | |
Silicon Graphics International Corp * | | | 122 | | | | 1,248 | |
Silicon Image Inc * | | | 4,792 | | | | 23,768 | |
Sonus Networks Inc * | | | 1,372 | | | | 2,332 | |
Sourcefire Inc * | | | 2,035 | | | | 96,093 | |
Spark Networks Inc * | | | 787 | | | | 6,139 | |
SPS Commerce Inc * | | | 849 | | | | 31,642 | |
SS&C Technologies Holdings Inc * | | | 640 | | | | 14,797 | |
Stamps.com Inc * | | | 922 | | | | 23,234 | |
SunPower Corp * | | | 1,248 | | | | 7,014 | |
Super Micro Computer Inc * | | | 1,793 | | | | 18,289 | |
support.com Inc * | | | 2,387 | | | | 9,978 | |
Synacor Inc * | | | 447 | | | | 2,445 | |
Synaptics Inc * | | | 2,318 | | | | 69,470 | |
Synchronoss Technologies Inc * | | | 1,904 | | | | 40,155 | |
Syntel Inc | | | 1,060 | | | | 56,805 | |
Take-Two Interactive Software Inc * | | | 5,390 | | | | 59,344 | |
Tangoe Inc * | | | 2,053 | | | | 24,369 | |
Telular Corp | | | 656 | | | | 6,212 | |
Tessco Technologies Inc | | | 175 | | | | 3,875 | |
The Active Network Inc * | | | 2,701 | | | | 13,262 | |
The Hackett Group Inc | | | 1,631 | | | | 6,981 | |
| | | | | | | | |
| | |
Shares | | |
Value | |
TiVo Inc * | | | 4,302 | | | | $53,001 | |
TNS Inc * | | | 1,681 | | | | 34,847 | |
Travelzoo Inc * | | | 503 | | | | 9,552 | |
Trulia Inc * | | | 349 | | | | 5,668 | |
Tyler Technologies Inc * | | | 2,071 | | | | 100,319 | |
Ubiquiti Networks Inc | | | 705 | | | | 8,559 | |
Ultimate Software Group Inc * | | | 1,832 | | | | 172,959 | |
Ultratech Inc * | | | 1,801 | | | | 67,177 | |
Unisys Corp * | | | 1,541 | | | | 26,659 | |
Universal Display Corp * | | | 2,735 | | | | 70,071 | |
Unwired Planet Inc * | | | 1,319 | | | | 1,583 | |
ValueClick Inc * | | | 3,102 | | | | 60,210 | |
VASCO Data Security International Inc * | | | 885 | | | | 7,222 | |
Veeco Instruments Inc * | | | 690 | | | | 20,369 | |
Verint Systems Inc * | | | 1,498 | | | | 43,981 | |
ViaSat Inc * | | | 2,581 | | | | 100,401 | |
VirnetX Holding Corp * | | | 2,891 | | | | 84,648 | |
Virtusa Corp * | | | 1,278 | | | | 20,998 | |
VistaPrint NV * (Netherlands) | | | 2,351 | | | | 77,254 | |
Vocus Inc * | | | 1,422 | | | | 24,714 | |
Volterra Semiconductor Corp * | | | 1,744 | | | | 29,944 | |
Web.com Group Inc * | | | 2,408 | | | | 35,638 | |
Websense Inc * | | | 2,560 | | | | 38,502 | |
WEX Inc * | | | 2,674 | | | | 201,539 | |
XO Group Inc * | | | 1,790 | | | | 16,647 | |
Yelp Inc * | | | 589 | | | | 11,103 | |
Zix Corp * | | | 4,212 | | | | 11,794 | |
Zygo Corp * | | | 200 | | | | 3,140 | |
| | | | | | | | |
| | | | 8,566,169 | |
| | | | | | | | |
Materials - 4.7% | | | | | | | | |
| | |
ADA-ES Inc * | | | 629 | | | | 10,618 | |
AEP Industries Inc * | | | 284 | | | | 16,821 | |
AK Steel Holding Corp | | | 1,585 | | | | 7,291 | |
AMCOL International Corp | | | 1,632 | | | | 50,070 | |
American Vanguard Corp | | | 1,915 | | | | 59,499 | |
Arabian American Development Co * | | | 1,403 | | | | 11,659 | |
Balchem Corp | | | 2,012 | | | | 73,237 | |
Berry Plastics Group Inc * | | | 816 | | | | 13,121 | |
Buckeye Technologies Inc | | | 1,590 | | | | 45,649 | |
Calgon Carbon Corp * | | | 3,297 | | | | 46,751 | |
Chemtura Corp * | | | 4,723 | | | | 100,411 | |
Clearwater Paper Corp * | | | 1,282 | | | | 50,203 | |
Coeur d’Alene Mines Corp * | | | 2,548 | | | | 62,681 | |
Deltic Timber Corp | | | 749 | | | | 52,894 | |
Eagle Materials Inc | | | 3,368 | | | | 197,028 | |
Flotek Industries Inc * | | | 3,411 | | | | 41,614 | |
General Moly Inc * | | | 682 | | | | 2,735 | |
Georgia Gulf Corp | | | 1,494 | | | | 61,672 | |
Globe Specialty Metals Inc | | | 310 | | | | 4,263 | |
Gold Reserve Inc * (Canada) | | | 431 | | | | 1,427 | |
Gold Resource Corp | | | 2,050 | | | | 31,590 | |
GSE Holding Inc * | | | 511 | | | | 3,168 | |
H.B. Fuller Co | | | 3,436 | | | | 119,642 | |
Handy & Harman Ltd * | | | 297 | | | | 4,476 | |
Hawkins Inc | | | 625 | | | | 24,150 | |
Haynes International Inc | | | 695 | | | | 36,050 | |
Headwaters Inc * | | | 4,223 | | | | 36,149 | |
Innophos Holdings Inc | | | 1,499 | | | | 69,703 | |
Innospec Inc | | | 190 | | | | 6,553 | |
KMG Chemicals Inc | | | 543 | | | | 9,541 | |
Koppers Holdings Inc | | | 1,428 | | | | 54,478 | |
Landec Corp * | | | 436 | | | | 4,138 | |
LSB Industries Inc * | | | 744 | | | | 26,352 | |
Materion Corp | | | 135 | | | | 3,480 | |
Metals USA Holdings Corp | | | 187 | | | | 3,271 | |
Midway Gold Corp * (Canada) | | | 8,857 | | | | 12,311 | |
Myers Industries Inc | | | 2,307 | | | | 34,951 | |
Neenah Paper Inc | | | 660 | | | | 18,790 | |
Noranda Aluminum Holding Corp | | | 2,292 | | | | 14,004 | |
| | |
| See Notes to Financial Statements | | See explanation of symbols and terms, if any, on page B-81 |
B-48
PACIFIC SELECT FUND
PD SMALL-CAP GROWTH INDEX PORTFOLIO
Schedule of Investments (Continued)
December 31, 2012
| | | | | | | | |
| | |
Shares | | |
Value | |
Olin Corp | | | 3,786 | | | | $81,740 | |
OMNOVA Solutions Inc * | | | 3,173 | | | | 22,243 | |
Paramount Gold & Silver Corp * | | | 8,946 | | | | 20,755 | |
PH Glatfelter Co | | | 488 | | | | 8,530 | |
PolyOne Corp | | | 4,847 | | | | 98,976 | |
Quaker Chemical Corp | | | 250 | | | | 13,465 | |
Schweitzer-Mauduit International Inc | | | 1,591 | | | | 62,097 | |
Stepan Co | | | 1,089 | | | | 60,483 | |
SunCoke Energy Inc * | | | 3,393 | | | | 52,897 | |
U.S. Antimony Corp * | | | 3,748 | | | | 6,596 | |
U.S. Silica Holdings Inc | | | 810 | | | | 13,551 | |
United States Lime & Minerals Inc * | | | 111 | | | | 5,230 | |
Wausau Paper Corp | | | 2,894 | | | | 25,062 | |
Zep Inc | | | 620 | | | | 8,953 | |
| | | | | | | | |
| | | | | | | 1,903,019 | |
| | | | | | | | |
Telecommunication Services - 0.8% | | | | | | | | |
| | |
8x8 Inc * | | | 4,863 | | | | 35,938 | |
Atlantic Tele-Network Inc | | | 613 | | | | 22,503 | |
Boingo Wireless Inc * | | | 1,070 | | | | 8,079 | |
Cbeyond Inc * | | | 136 | | | | 1,229 | |
Cincinnati Bell Inc * | | | 4,883 | | | | 26,759 | |
Cogent Communications Group Inc | | | 3,218 | | | | 72,856 | |
Consolidated Communications Holdings Inc | | | 1,788 | | | | 28,465 | |
Fairpoint Communications Inc * | | | 1,256 | | | | 9,973 | |
General Communication Inc ‘A’ * | | | 2,529 | | | | 24,253 | |
HickoryTech Corp | | | 925 | | | | 9,000 | |
IDT Corp ‘B’ | | | 1,006 | | | | 9,597 | |
inContact Inc * | | | 2,412 | | | | 12,494 | |
Iridium Communications Inc * | | | 463 | | | | 3,121 | |
Leap Wireless International Inc * | | | 948 | | | | 6,304 | |
Lumos Networks Corp | | | 1,064 | | | | 10,661 | |
magicJack VocalTec Ltd * (Israel) | | | 678 | | | | 12,346 | |
nTelos Holdings Corp | | | 983 | | | | 12,887 | |
ORBCOMM Inc * | | | 1,127 | | | | 4,418 | |
Premiere Global Services Inc * | | | 798 | | | | 7,804 | |
Primus Telecommunications Group Inc | | | 850 | | | | 9,240 | |
Towerstream Corp * | | | 3,299 | | | | 10,722 | |
| | | | | | | | |
| | | | | | | 338,649 | |
| | | | | | | | |
Utilities - 0.3% | | | | | | | | |
| | |
American DG Energy Inc * | | | 1,625 | | | | 3,754 | |
American States Water Co | | | 147 | | | | 7,053 | |
Atlantic Power Corp (Canada) | | | 706 | | | | 8,070 | |
Cadiz Inc * | | | 855 | | | | 6,772 | |
California Water Service Group | | | 1,456 | | | | 26,718 | |
Connecticut Water Service Inc | | | 475 | | | | 14,145 | |
Ormat Technologies Inc | | | 350 | | | | 6,748 | |
Otter Tail Corp | | | 162 | | | | 4,050 | |
Piedmont Natural Gas Co Inc | | | 432 | | | | 13,526 | |
SJW Corp | | | 304 | | | | 8,086 | |
South Jersey Industries Inc | | | 463 | | | | 23,303 | |
York Water Co | | | 643 | | | | 11,297 | |
| | | | | | | | |
| | | | | | | 133,522 | |
| | | | | | | | |
Total Common Stocks
(Cost $36,181,335) | | | | | | | 39,957,708 | |
| | | | | | | | |
| | |
EXCHANGE-TRADED FUND - 0.3% | | | | | | | | |
| | |
iShares Russell 2000 Growth Index Fund | | | 1,406 | | | | 134,006 | |
| | | | | | | | |
| | |
Total Exchange-Traded Fund
(Cost $133,783) | | | | | | | 134,006 | |
| | | | | | | | |
| | | | | | | | |
| | | Principal
Amount | | |
Value | |
SHORT-TERM INVESTMENT - 3.5% | | | | | | | | |
| | |
Repurchase Agreement - 3.5% | | | | | | | | |
| | |
Fixed Income Clearing Corp
0.010% due 01/02/13
(Dated 12/31/12, repurchase price of $1,459,015; collateralized by U.S. Treasury Notes: 0.250% due 07/15/15 and value $1,490,000) | | | $1,459,014 | | | | $1,459,014 | |
| | | | | | | | |
| | |
Total Short-Term Investment
(Cost $1,459,014) | | | | | | | 1,459,014 | |
| | | | | | | | |
| | |
TOTAL INVESTMENTS - 101.0%
(Cost $37,774,132) | | | | | | | 41,550,970 | |
| |
OTHER ASSETS & LIABILITIES, NET - (1.0%) | | | | (415,671 | ) |
| | | | | | | | |
| | |
NET ASSETS - 100.0% | | | | | | | $41,135,299 | |
| | | | | | | | |
Notes to Schedule of Investments
| (a) | As of December 31, 2012, the portfolio was diversified as a percentage of net assets as follows: |
| | | | |
Information Technology | | | 20.8% | |
Health Care | | | 19.7% | |
Industrials | | | 17.5% | |
Consumer Discretionary | | | 15.8% | |
Financials | | | 7.6% | |
Energy | | | 5.5% | |
Materials | | | 4.7% | |
Consumer Staples | | | 4.5% | |
Short-Term Investment | | | 3.5% | |
Telecommunication Services | | | 0.8% | |
Exchange-Traded Fund | | | 0.3% | |
Utilities | | | 0.3% | |
| | | | |
| | | 101.0% | |
Other Assets & Liabilities, Net | | | (1.0% | ) |
| | | | |
| | | 100.0% | |
| | | | |
| (b) | Short-term investments reflect either the stated coupon rate or the annualized effective yield on the date of purchase for discounted investments. |
| (c) | As of December 31, 2012, $101,600 in cash was segregated with the broker(s)/custodian as collateral for open futures contracts. |
| (d) | Open futures contracts outstanding as of December 31, 2012 were as follows: |
| | | | | | | | | | | | |
| Long Futures Outstanding | | Number of Contracts | | | Notional Amount | | | Unrealized
Appreciation | |
Russell 2000 Mini (03/13) | | | 12 | | | | $993,014 | | | | $22,906 | |
| | | | | | | | | | | | |
| | |
| See Notes to Financial Statements | | See explanation of symbols and terms, if any, on page B-81 |
B-49
PACIFIC SELECT FUND
PD SMALL-CAP GROWTH INDEX PORTFOLIO
Schedule of Investments (Continued)
December 31, 2012
| (e) | Fair Value Measurements |
The following is a summary of the portfolio’s investments as categorized under the three-tier hierarchy of inputs used in valuing the portfolio’s assets and liabilities (See Note 3D in Notes to Financial Statements) as of December 31, 2012:
| | | | | | | | | | | | | | | | | | |
| | | | | Total Value at December 31, 2012 | | | Level 1
Quoted Price | | | Level 2
Significant
Observable Inputs | | | Level 3
Significant
Unobservable Inputs | |
Assets | | Warrants (1) | | | $242 | | | | $242 | | | | $- | | | | $- | |
| | Common Stocks (1) | | | 39,957,708 | | | | 39,957,708 | | | | - | | | | - | |
| | Exchange-Traded Fund | | | 134,006 | | | | 134,006 | | | | - | | | | - | |
| | Short-Term Investment | | | 1,459,014 | | | | - | | | | 1,459,014 | | | | - | |
| | Derivatives: | | | | | | | | | | | | | | | | |
| | Equity Contracts | | | | | | | | | | | | | | | | |
| | Futures | | | 22,906 | | | | 22,906 | | | | - | | | | - | |
| | | | | | | | | | | | | | | | | | |
| | Total | | | $41,573,876 | | | | $40,114,862 | | | | $1,459,014 | | | | $- | |
| | | | | | | | | | | | | | | | | | |
| | (1) | For equity investments categorized in a single level, refer to the schedule of investments for further industry breakout. |
| | |
| See Notes to Financial Statements | | See explanation of symbols and terms, if any, on page B-81 |
B-50
PACIFIC SELECT FUND
PD SMALL-CAP VALUE INDEX PORTFOLIO
Schedule of Investments
December 31, 2012
| | | | | | | | |
| | | Shares | | | Value | |
RIGHTS - 0.0% | | | | | | | | |
| | |
Health Care - 0.0% | | | | | | | | |
| | |
Allos Therapeutics Inc
Exp. 11/30/13 * + | | | 1,071 | | | | $ - | |
| | | | | | | | |
| | |
Total Rights
(Cost $0) | | | | | | | - | |
| | | | | | | | |
| | |
COMMON STOCKS - 95.1% | | | | | | | | |
| | |
Consumer Discretionary - 11.4% | | | | | | | | |
| | |
1-800-FLOWERS.COM Inc ‘A’ * | | | 2,348 | | | | 8,617 | |
American Axle & Manufacturing Holdings Inc * | | | 6,370 | | | | 71,344 | |
American Greetings Corp ‘A’ | | | 2,814 | | | | 47,528 | |
Ameristar Casinos Inc | | | 387 | | | | 10,155 | |
Asbury Automotive Group Inc * | | | 305 | | | | 9,769 | |
Ascent Capital Group Inc ‘A’ * | | | 1,345 | | | | 83,309 | |
Barnes & Noble Inc * | | | 2,475 | | | | 37,348 | |
Bassett Furniture Industries Inc | | | 1,082 | | | | 13,493 | |
Beasley Broadcasting Group Inc ‘A’ | | | 370 | | | | 1,809 | |
Beazer Homes USA Inc * | | | 2,343 | | | | 39,573 | |
bebe stores Inc | | | 3,203 | | | | 12,780 | |
Belo Corp ‘A’ | | | 5,720 | | | | 43,872 | |
Big 5 Sporting Goods Corp | | | 1,600 | | | | 20,960 | |
Biglari Holdings Inc * | | | 102 | | | | 39,782 | |
Black Diamond Inc * | | | 2,019 | | | | 16,556 | |
Bloomin’ Brands Inc * | | | 452 | | | | 7,069 | |
Bluegreen Corp * | | | 1,377 | | | | 12,916 | |
Bob Evans Farms Inc | | | 2,409 | | | | 96,842 | |
Boyd Gaming Corp * | | | 4,888 | | | | 32,456 | |
Brown Shoe Co Inc | | | 4,100 | | | | 75,317 | |
Cabela’s Inc * | | | 418 | | | | 17,451 | |
Caesars Entertainment Corp * | | | 380 | | | | 2,630 | |
Callaway Golf Co | | | 6,188 | | | | 40,222 | |
Career Education Corp * | | | 4,980 | | | | 17,530 | |
Carmike Cinemas Inc * | | | 1,162 | | | | 17,430 | |
Carriage Services Inc | | | 1,526 | | | | 18,114 | |
Carrols Restaurant Group Inc * | | | 446 | | | | 2,667 | |
Casual Male Retail Group Inc * | | | 4,036 | | | | 16,951 | |
Cavco Industries Inc * | | | 65 | | | | 3,249 | |
Central European Media Enterprises Ltd ‘A’ * (Bermuda) | | | 3,533 | | | | 21,657 | |
Cherokee Inc | | | 61 | | | | 836 | |
Churchill Downs Inc | | | 833 | | | | 55,353 | |
Chuy’s Holdings Inc * | | | 176 | | | | 3,932 | |
Citi Trends Inc * | | | 1,338 | | | | 18,411 | |
Columbia Sportswear Co | | | 1,165 | | | | 62,164 | |
Conn’s Inc * | | | 1,460 | | | | 44,793 | |
Cooper Tire & Rubber Co | | | 804 | | | | 20,389 | |
Core-Mark Holding Co Inc | | | 912 | | | | 43,183 | |
Corinthian Colleges Inc * | | | 7,533 | | | | 18,381 | |
Crown Media Holdings Inc ‘A’ * | | | 2,516 | | | | 4,655 | |
CSS Industries Inc | | | 900 | | | | 19,701 | |
Culp Inc | | | 838 | | | | 12,578 | |
Cumulus Media Inc ‘A’ * | | | 5,941 | | | | 15,862 | |
Daily Journal Corp * | | | 94 | | | | 8,700 | |
Dana Holding Corp | | | 12,668 | | | | 197,747 | |
Del Frisco’s Restaurant Group Inc * | | | 144 | | | | 2,245 | |
Delta Apparel Inc * | | | 639 | | | | 8,933 | |
Denny’s Corp * | | | 1,982 | | | | 9,672 | |
Destination Maternity Corp | | | 720 | | | | 15,523 | |
Digital Generation Inc * | | | 2,612 | | | | 28,366 | |
Drew Industries Inc | | | 979 | | | | 31,573 | |
Education Management Corp * | | | 2,560 | | | | 11,213 | |
Einstein Noah Restaurant Group Inc | | | 74 | | | | 904 | |
Entercom Communications Corp ‘A’ * | | | 2,349 | | | | 16,396 | |
| | | | | | | | |
| | | Shares | | | Value | |
Entravision Communications Corp ‘A’ | | | 4,996 | | | | $8,293 | |
Ethan Allen Interiors Inc | | | 315 | | | | 8,099 | |
Exide Technologies * | | | 7,539 | | | | 25,783 | |
Federal-Mogul Corp * | | | 1,777 | | | | 14,252 | |
Fiesta Restaurant Group Inc * | | | 142 | | | | 2,175 | |
Fifth & Pacific Cos Inc * | | | 9,803 | | | | 122,047 | |
Fisher Communications Inc | | | 835 | | | | 22,537 | |
Five Below Inc * | | | 521 | | | | 16,693 | |
Flexsteel Industries Inc | | | 431 | | | | 9,245 | |
Fred’s Inc ‘A’ | | | 3,499 | | | | 46,572 | |
Frisch’s Restaurants Inc | | | 299 | | | | 5,531 | |
Fuel Systems Solutions Inc * | | | 1,115 | | | | 16,390 | |
G-III Apparel Group Ltd * | | | 1,386 | | | | 47,443 | |
Global Sources Ltd * (Bermuda) | | | 1,539 | | | | 9,973 | |
Group 1 Automotive Inc | | | 2,188 | | | | 135,634 | |
Harte-Hanks Inc | | | 4,290 | | | | 25,311 | |
Haverty Furniture Cos Inc | | | 1,849 | | | | 30,157 | |
Helen of Troy Ltd * (Bermuda) | | | 3,027 | | | | 101,072 | |
hhgregg Inc * | | | 1,407 | | | | 9,877 | |
Hooker Furniture Corp | | | 1,038 | | | | 15,082 | |
Hovnanian Enterprises Inc ‘A’ * | | | 10,070 | | | | 70,490 | |
Iconix Brand Group Inc * | | | 6,762 | | | | 150,928 | |
International Speedway Corp ‘A’ | | | 2,646 | | | | 73,083 | |
Isle of Capri Casinos Inc * | | | 2,014 | | | | 11,278 | |
Jack in the Box Inc * | | | 818 | | | | 23,395 | |
JAKKS Pacific Inc | | | 2,076 | | | | 25,992 | |
Johnson Outdoors Inc ‘A’ * | | | 544 | | | | 10,836 | |
Jos. A. Bank Clothiers Inc * | | | 189 | | | | 8,048 | |
Journal Communications Inc ‘A’ * | | | 3,866 | | | | 20,915 | |
K-Swiss Inc ‘A’ * | | | 2,554 | | | | 8,581 | |
Kayak Software Corp * | | | 85 | | | | 3,376 | |
KB Home | | | 7,376 | | | | 116,541 | |
Kirkland’s Inc * | | | 1,304 | | | | 13,809 | |
Krispy Kreme Doughnuts Inc * | | | 5,683 | | | | 53,307 | |
La-Z-Boy Inc | | | 3,482 | | | | 49,270 | |
Life Time Fitness Inc * | | | 305 | | | | 15,009 | |
LifeLock Inc * | | | 127 | | | | 1,033 | |
Lifetime Brands Inc | | | 928 | | | | 9,846 | |
LIN TV Corp ‘A’ * | | | 2,934 | | | | 22,093 | |
Lincoln Educational Services Corp | | | 2,205 | | | | 12,326 | |
Lithia Motors Inc ‘A’ | | | 2,071 | | | | 77,497 | |
Live Nation Entertainment Inc * | | | 13,379 | | | | 124,558 | |
Luby’s Inc * | | | 1,922 | | | | 12,858 | |
M.D.C. Holdings Inc | | | 3,661 | | | | 134,578 | |
M/I Homes Inc * | | | 2,043 | | | | 54,139 | |
Mac-Gray Corp | | | 981 | | | | 12,312 | |
Maidenform Brands Inc * | | | 623 | | | | 12,142 | |
Marcus Corp | | | 1,889 | | | | 23,556 | |
Marine Products Corp | | | 421 | | | | 2,408 | |
MarineMax Inc * | | | 1,962 | | | | 17,540 | |
Marriott Vacations Worldwide Corp * | | | 2,543 | | | | 105,967 | |
Martha Stewart Living Omnimedia Inc ‘A’ * | | | 2,709 | | | | 6,637 | |
Matthews International Corp ‘A’ | | | 1,406 | | | | 45,133 | |
MDC Partners Inc ‘A’ (Canada) | | | 1,539 | | | | 17,391 | |
Meredith Corp | | | 3,468 | | | | 119,473 | |
Meritage Homes Corp * | | | 2,218 | | | | 82,842 | |
Modine Manufacturing Co * | | | 4,505 | | | | 36,626 | |
Monarch Casino & Resort Inc * | | | 846 | | | | 9,230 | |
Morgans Hotel Group Co * | | | 1,172 | | | | 6,493 | |
Movado Group Inc | | | 1,575 | | | | 48,321 | |
NACCO Industries Inc ‘A’ | | | 531 | | | | 32,226 | |
National American University Holdings Inc | | | 524 | | | | 2,017 | |
National CineMedia Inc | | | 3,561 | | | | 50,317 | |
New York & Co Inc * | | | 1,044 | | | | 3,978 | |
Nexstar Broadcasting Group Inc ‘A’ * | | | 796 | | | | 8,430 | |
Office Depot Inc * | | | 27,147 | | | | 89,042 | |
OfficeMax Inc | | | 8,276 | | | | 80,774 | |
Orchard Supply Hardware Stores Corp ‘A’ * | | | 180 | | | | 1,334 | |
Orient-Express Hotels Ltd ‘A’ * (Bermuda) | | | 9,259 | | | | 108,238 | |
Outdoor Channel Holdings Inc | | | 1,026 | | | | 7,798 | |
| | |
| See Notes to Financial Statements | | See explanation of symbols and terms, if any, on page B-81 |
B-51
PACIFIC SELECT FUND
PD SMALL-CAP VALUE INDEX PORTFOLIO
Schedule of Investments (Continued)
December 31, 2012
| | | | | | | | |
| | | Shares | | | Value | |
Penske Automotive Group Inc | | | 3,008 | | | | $90,511 | |
Perfumania Holdings Inc * | | | 517 | | | | 2,544 | |
Perry Ellis International Inc | | | 1,142 | | | | 22,726 | |
Pinnacle Entertainment Inc * | | | 5,237 | | | | 82,902 | |
Quiksilver Inc * | | | 12,463 | | | | 52,968 | |
RadioShack Corp | | | 9,572 | | | | 20,293 | |
Reading International Inc ‘A’ * | | | 1,535 | | | | 9,225 | |
Red Lion Hotels Corp * | | | 1,321 | | | | 10,423 | |
Red Robin Gourmet Burgers Inc * | | | 784 | | | | 27,667 | |
Regis Corp | | | 5,496 | | | | 92,992 | |
Rent-A-Center Inc | | | 5,672 | | | | 194,890 | |
Rentrak Corp * | | | 353 | | | | 6,880 | |
Restoration Hardware Holdings Inc * | | | 400 | | | | 13,492 | |
RG Barry Corp | | | 58 | | | | 822 | |
Ruby Tuesday Inc * | | | 6,091 | | | | 47,875 | |
Saga Communications Inc ‘A’ | | | 337 | | | | 15,670 | |
Saks Inc * | | | 10,525 | | | | 110,618 | |
Salem Communications Corp ‘A’ | | | 942 | | | | 5,143 | |
Scholastic Corp | | | 2,485 | | | | 73,457 | |
Scientific Games Corp ‘A’ * | | | 4,310 | | | | 37,368 | |
Sealy Corp * | | | 4,666 | | | | 10,125 | |
Shiloh Industries Inc | | | 541 | | | | 5,572 | |
Shoe Carnival Inc | | | 1,376 | | | | 28,194 | |
Shutterfly Inc * | | | 2,565 | | | | 76,617 | |
Shutterstock Inc * | | | 489 | | | | 12,714 | |
Sinclair Broadcast Group Inc ‘A’ | | | 4,421 | | | | 55,793 | |
Skechers U.S.A. Inc ‘A’ * | | | 3,617 | | | | 66,914 | |
Sonic Automotive Inc ‘A’ | | | 4,075 | | | | 85,127 | |
Sonic Corp * | | | 1,047 | | | | 10,899 | |
Sotheby’s | | | 4,204 | | | | 141,338 | |
Spartan Motors Inc | | | 3,258 | | | | 16,062 | |
Speedway Motorsports Inc | | | 1,121 | | | | 19,999 | |
Stage Stores Inc | | | 2,932 | | | | 72,655 | |
Standard Motor Products Inc | | | 1,914 | | | | 42,529 | |
Standard Pacific Corp * | | | 11,078 | | | | 81,423 | |
Stein Mart Inc | | | 2,629 | | | | 19,823 | |
Steinway Musical Instruments Inc * | | | 640 | | | | 13,536 | |
Stewart Enterprises Inc ‘A’ | | | 7,210 | | | | 55,084 | |
Stoneridge Inc * | | | 2,693 | | | | 13,788 | |
Superior Industries International Inc | | | 2,181 | | | | 44,492 | |
Systemax Inc | | | 994 | | | | 9,592 | |
The Bon-Ton Stores Inc | | | 1,216 | | | | 14,738 | |
The Children’s Place * | | | 1,442 | | | | 63,866 | |
The E.W. Scripps Co ‘A’ * | | | 2,879 | | | | 31,122 | |
The Finish Line Inc ‘A’ | | | 3,017 | | | | 57,112 | |
The Jones Group Inc | | | 7,835 | | | | 86,655 | |
The McClatchy Co ‘A’ * | | | 5,577 | | | | 18,237 | |
The Men’s Wearhouse Inc | | | 3,851 | | | | 119,997 | |
The New York Times Co ‘A’ * | | | 13,027 | | | | 111,120 | |
The Pep Boys-Manny Moe & Jack | | | 5,038 | | | | 49,524 | |
The Ryland Group Inc | | | 1,863 | | | | 67,999 | |
The Warnaco Group Inc * | | | 487 | | | | 34,855 | |
The Wet Seal Inc ‘A’ * | | | 8,713 | | | | 24,048 | |
Tuesday Morning Corp * | | | 4,029 | | | | 25,181 | |
Unifi Inc * | | | 1,353 | | | | 17,603 | |
Universal Electronics Inc * | | | 1,411 | | | | 27,303 | |
Universal Technical Institute Inc | | | 714 | | | | 7,169 | |
Vail Resorts Inc | | | 2,232 | | | | 120,729 | |
Valassis Communications Inc | | | 1,484 | | | | 38,258 | |
Value Line Inc | | | 36 | | | | 323 | |
VOXX International Corp * | | | 1,750 | | | | 11,777 | |
West Marine Inc * | | | 1,413 | | | | 15,190 | |
Weyco Group Inc | | | 561 | | | | 13,105 | |
Winnebago Industries Inc * | | | 2,025 | | | | 34,688 | |
WMS Industries Inc * | | | 5,266 | | | | 92,155 | |
World Wrestling Entertainment Inc ‘A’ | | | 218 | | | | 1,720 | |
| | | | | | | | |
| | | | 7,082,299 | |
| | | | | | | | |
| | | | | | | | |
| | | Shares | | | Value | |
Consumer Staples - 2.4% | | | | | | | | |
| | |
Alico Inc | | | 192 | | | | $7,033 | |
Alliance One International Inc * | | | 8,270 | | | | 30,103 | |
Annie’s Inc * | | | 137 | | | | 4,580 | |
Arden Group Inc ‘A’ | | | 34 | | | | 3,059 | |
Cal-Maine Foods Inc | | | 189 | | | | 7,602 | |
Central European Distribution Corp * | | | 6,325 | | | | 13,725 | |
Central Garden & Pet Co ‘A’ * | | | 3,162 | | | | 33,043 | |
Chiquita Brands International Inc * | | | 4,368 | | | | 36,036 | |
Craft Brew Alliance Inc * | | | 579 | | | | 3,752 | |
Darling International Inc * | | | 7,841 | | | | 125,770 | |
Diamond Foods Inc | | | 2,131 | | | | 29,131 | |
Dole Food Co Inc * | | | 3,414 | | | | 39,159 | |
Elizabeth Arden Inc * | | | 354 | | | | 15,934 | |
Farmer Bros. Co * | | | 608 | | | | 8,773 | |
Fresh Del Monte Produce Inc (Cayman) | | | 3,649 | | | | 96,151 | |
Griffin Land & Nurseries Inc | | | 268 | | | | 7,236 | |
Harbinger Group Inc * | | | 3,906 | | | | 30,037 | |
Harris Teeter Supermarkets Inc | | | 3,633 | | | | 140,088 | |
Ingles Markets Inc ‘A’ | | | 1,168 | | | | 20,160 | |
Inter Parfums Inc | | | 454 | | | | 8,835 | |
John B Sanfilippo & Son Inc | | | 764 | | | | 13,890 | |
Nash Finch Co | | | 1,151 | | | | 24,493 | |
Natural Grocers by Vitamin Cottage Inc * | | | 409 | | | | 7,808 | |
Nature’s Sunshine Products Inc | | | 440 | | | | 6,371 | |
Nutraceutical International Corp | | | 837 | | | | 13,844 | |
Oil-Dri Corp of America | | | 465 | | | | 12,834 | |
Omega Protein Corp * | | | 1,882 | | | | 11,518 | |
Orchids Paper Products Co | | | 273 | | | | 5,520 | |
Pilgrim’s Pride Corp * | | | 1,104 | | | | 8,004 | |
Post Holdings Inc * | | | 736 | | | | 25,208 | |
Prestige Brands Holdings Inc * | | | 1,648 | | | | 33,009 | |
Revlon Inc ‘A’ * | | | 1,088 | | | | 15,776 | |
Rite Aid Corp * | | | 57,523 | | | | 78,231 | |
Seneca Foods Corp ‘A’ * | | | 793 | | | | 24,107 | |
Smart Balance Inc * | | | 5,651 | | | | 72,898 | |
Snyder’s-Lance Inc | | | 477 | | | | 11,500 | |
Spartan Stores Inc | | | 2,088 | | | | 32,072 | |
Spectrum Brands Holdings Inc * | | | 360 | | | | 16,175 | |
SUPERVALU Inc | | | 4,956 | | | | 12,241 | |
Susser Holdings Corp * | | | 618 | | | | 21,315 | |
The Andersons Inc | | | 1,776 | | | | 76,190 | |
The Pantry Inc * | | | 2,016 | | | | 24,454 | |
Tootsie Roll Industries Inc | | | 140 | | | | 3,629 | |
TreeHouse Foods Inc * | | | 1,120 | | | | 58,386 | |
Universal Corp | | | 2,224 | | | | 111,000 | |
Vector Group Ltd | | | 1,321 | | | | 19,643 | |
Village Super Market Inc ‘A’ | | | 812 | | | | 26,682 | |
Weis Markets Inc | | | 1,061 | | | | 41,559 | |
Westway Group Inc * | | | 1,032 | | | | 6,883 | |
| | | | | | | | |
| | | | 1,475,447 | |
| | | | | | | | |
Energy - 6.1% | | | | | | | | |
| | |
Adams Resources & Energy Inc | | | 227 | | | | 7,961 | |
Alon USA Energy Inc | | | 219 | | | | 3,962 | |
Amyris Inc * | | | 2,913 | | | | 9,089 | |
Arch Coal Inc | | | 20,285 | | | | 148,486 | |
Basic Energy Services Inc * | | | 2,928 | | | | 33,408 | |
Bill Barrett Corp * | | | 4,599 | | | | 81,816 | |
Bolt Technology Corp | | | 823 | | | | 11,744 | |
Bonanza Creek Energy Inc * | | | 809 | | | | 22,482 | |
BPZ Resources Inc * | | | 7,042 | | | | 22,182 | |
Bristow Group Inc | | | 3,413 | | | | 183,142 | |
C&J Energy Services Inc * | | | 2,946 | | | | 63,162 | |
Cal Dive International Inc * | | | 9,236 | | | | 15,978 | |
Callon Petroleum Co * | | | 3,795 | | | | 17,837 | |
Carrizo Oil & Gas Inc * | | | 524 | | | | 10,962 | |
Clayton Williams Energy Inc * | | | 515 | | | | 20,600 | |
Cloud Peak Energy Inc * | | | 5,832 | | | | 112,733 | |
| | |
| See Notes to Financial Statements | | See explanation of symbols and terms, if any, on page B-81 |
B-52
PACIFIC SELECT FUND
PD SMALL-CAP VALUE INDEX PORTFOLIO
Schedule of Investments (Continued)
December 31, 2012
| | | | | | | | |
| | | Shares | | | Value | |
Comstock Resources Inc * | | | 4,590 | | | | $69,447 | |
Contango Oil & Gas Co | | | 95 | | | | 4,024 | |
Crimson Exploration Inc * | | | 1,952 | | | | 5,348 | |
Crosstex Energy Inc | | | 389 | | | | 5,578 | |
CVR Energy Inc * | | | 530 | | | | 25,859 | |
Dawson Geophysical Co * | | | 763 | | | | 20,128 | |
Delek US Holdings Inc | | | 1,666 | | | | 42,183 | |
Diamondback Energy Inc * | | | 719 | | | | 13,747 | |
Emerald Oil Inc * | | | 1,554 | | | | 8,143 | |
Endeavour International Corp * | | | 312 | | | | 1,616 | |
Energy XXI Ltd (Bermuda) | | | 2,054 | | | | 66,118 | |
EPL Oil & Gas Inc * | | | 2,653 | | | | 59,825 | |
Exterran Holdings Inc * | | | 6,186 | | | | 135,597 | |
Forbes Energy Services Ltd * | | | 1,411 | | | | 3,570 | |
Forest Oil Corp * | | | 11,241 | | | | 75,202 | |
Frontline Ltd * (Bermuda) | | | 4,958 | | | | 16,163 | |
GasLog Ltd (Bermuda) | | | 1,414 | | | | 17,576 | |
Gastar Exploration Ltd * (Canada) | | | 5,463 | | | | 6,610 | |
Gevo Inc * | | | 503 | | | | 775 | |
Green Plains Renewable Energy Inc * | | | 2,400 | | | | 18,984 | |
Gulf Island Fabrication Inc | | | 1,387 | | | | 33,330 | |
Gulfmark Offshore Inc ‘A’ | | | 2,004 | | | | 69,038 | |
Gulfport Energy Corp * | | | 3,539 | | | | 135,261 | |
Halcon Resources Corp * | | | 1,359 | | | | 9,404 | |
Hallador Energy Co | | | 596 | | | | 4,923 | |
Harvest Natural Resources Inc * | | | 3,531 | | | | 32,026 | |
Heckmann Corp * | | | 12,556 | | | | 50,601 | |
Helix Energy Solutions Group Inc * | | | 10,097 | | | | 208,402 | |
Hercules Offshore Inc * | | | 15,134 | | | | 93,528 | |
Hornbeck Offshore Services Inc * | | | 3,373 | | | | 115,829 | |
Key Energy Services Inc * | | | 14,437 | | | | 100,337 | |
Knightsbridge Tankers Ltd (Bermuda) | | | 2,347 | | | | 12,322 | |
Magnum Hunter Resources Corp * | | | 9,219 | | | | 36,784 | |
Matador Resources Co * | | | 248 | | | | 2,034 | |
Matrix Service Co * | | | 2,002 | | | | 23,023 | |
McMoRan Exploration Co * | | | 9,702 | | | | 155,717 | |
Midstates Petroleum Co Inc * | | | 1,251 | | | | 8,619 | |
Miller Energy Resources Inc * | | | 2,973 | | | | 11,773 | |
Mitcham Industries Inc * | | | 433 | | | | 5,902 | |
Natural Gas Services Group Inc * | | | 1,185 | | | | 19,458 | |
Newpark Resources Inc * | | | 8,599 | | | | 67,502 | |
Nordic American Tankers Ltd (Bermuda) | | | 5,048 | | | | 44,170 | |
Parker Drilling Co * | | | 11,217 | | | | 51,598 | |
PDC Energy Inc * | | | 2,864 | | | | 95,113 | |
Penn Virginia Corp | | | 5,198 | | | | 22,923 | |
PetroQuest Energy Inc * | | | 5,452 | | | | 26,987 | |
PHI Inc * | | | 1,140 | | | | 38,179 | |
Pioneer Energy Services Corp * | | | 4,663 | | | | 33,853 | |
Quicksilver Resources Inc * | | | 11,177 | | | | 31,966 | |
Renewable Energy Group Inc * | | | 621 | | | | 3,639 | |
Resolute Energy Corp * | | | 4,585 | | | | 37,276 | |
REX American Resources Corp * | | | 483 | | | | 9,317 | |
Rex Energy Corp * | | | 4,124 | | | | 53,694 | |
Scorpio Tankers Inc * | | | 5,320 | | | | 37,825 | |
SemGroup Corp ‘A’ * | | | 4,036 | | | | 157,727 | |
Ship Finance International Ltd (Bermuda) | | | 4,697 | | | | 78,111 | |
Stone Energy Corp * | | | 4,730 | | | | 97,060 | |
Swift Energy Co * | | | 4,091 | | | | 62,961 | |
Synergy Resources Corp * | | | 3,575 | | | | 19,269 | |
Teekay Tankers Ltd ‘A’ | | | 6,062 | | | | 17,580 | |
Tesco Corp * (Canada) | | | 2,925 | | | | 33,316 | |
TETRA Technologies Inc * | | | 7,412 | | | | 56,257 | |
Triangle Petroleum Corp * | | | 4,262 | | | | 25,529 | |
Uranium Energy Corp * | | | 4,320 | | | | 11,059 | |
Vantage Drilling Co * (Cayman) | | | 18,144 | | | | 33,204 | |
W&T Offshore Inc | | | 3,088 | | | | 49,501 | |
Warren Resources Inc * | | | 5,542 | | | | 15,573 | |
Western Refining Inc | | | 2,262 | | | | 63,766 | |
Westmoreland Coal Co * | | | 1,044 | | | | 9,751 | |
| | | | | | | | |
| | | Shares | | | Value | |
Willbros Group Inc * | | | 2,870 | | | | $15,383 | |
ZaZa Energy Corp * | | | 1,371 | | | | 2,811 | |
| | | | | | | | |
| | | | 3,793,248 | |
| | | | | | | | |
Financials - 35.1% | | | | | | | | |
| | |
1st Source Corp | | | 1,426 | | | | 31,500 | |
1st United Bancorp Inc | | | 2,873 | | | | 17,956 | |
Access National Corp | | | 738 | | | | 9,594 | |
AG Mortgage Investment Trust Inc REIT | | | 2,170 | | | | 50,952 | |
Agree Realty Corp REIT | | | 1,102 | | | | 29,523 | |
Alliance Financial Corp | | | 461 | | | | 20,058 | |
Alterra Capital Holdings Ltd (Bermuda) | | | 8,234 | | | | 232,116 | |
American Assets Trust Inc REIT | | | 3,139 | | | | 87,672 | |
American Capital Mortgage Investment Corp REIT | | | 3,500 | | | | 82,495 | |
American Equity Investment Life Holding Co | | | 5,714 | | | | 69,768 | |
American National Bankshares Inc | | | 753 | | | | 15,203 | |
American Realty Capital Trust Inc REIT | | | 15,176 | | | | 175,283 | |
American Safety Insurance Holdings Ltd * (Bermuda) | | | 786 | | | | 14,871 | |
Ameris Bancorp * | | | 2,295 | | | | 28,665 | |
AMERISAFE Inc * | | | 1,751 | | | | 47,715 | |
Ames National Corp | | | 790 | | | | 17,301 | |
AmREIT Inc ‘B’ | | | 269 | | | | 4,613 | |
AmTrust Financial Services Inc | | | 2,218 | | | | 63,634 | |
Anworth Mortgage Asset Corp REIT | | | 13,242 | | | | 76,539 | |
Apollo Commercial Real Estate Finance Inc REIT | | | 2,257 | | | | 36,631 | |
Apollo Investment Corp | | | 19,525 | | | | 163,229 | |
Apollo Residential Mortgage Inc REIT | | | 2,104 | | | | 42,480 | |
Ares Commercial Real Estate Corp REIT | | | 740 | | | | 12,151 | |
Argo Group International Holdings Ltd (Bermuda) | | | 2,490 | | | | 83,639 | |
Arlington Asset Investment Corp ‘A’ | | | 1,061 | | | | 22,037 | |
ARMOUR Residential REIT Inc | | | 28,501 | | | | 184,401 | |
Arrow Financial Corp | | | 937 | | | | 23,378 | |
Artio Global Investors Inc | | | 3,092 | | | | 5,875 | |
Ashford Hospitality Trust Inc REIT | | | 5,081 | | | | 53,401 | |
Asset Acceptance Capital Corp * | | | 1,575 | | | | 7,088 | |
Associated Estates Realty Corp REIT | | | 2,646 | | | | 42,654 | |
Asta Funding Inc | | | 940 | | | | 8,939 | |
Astoria Financial Corp | | | 8,359 | | | | 78,240 | |
AV Homes Inc * | | | 948 | | | | 13,481 | |
Baldwin & Lyons Inc ‘B’ | | | 900 | | | | 21,474 | |
BancFirst Corp | | | 619 | | | | 26,221 | |
Banco Latinoamericano de Comercio Exterior SA ‘E’ (Multi-National) | | | 2,727 | | | | 58,794 | |
BancorpSouth Inc | | | 9,083 | | | | 132,067 | |
Bank Mutual Corp | | | 4,458 | | | | 19,169 | |
Bank of Kentucky Financial Corp | | | 564 | | | | 13,948 | |
Bank of Marin Bancorp | | | 516 | | | | 19,329 | |
Bank of the Ozarks Inc | | | 782 | | | | 26,174 | |
BankFinancial Corp | | | 2,026 | | | | 15,033 | |
Banner Corp | | | 1,855 | | | | 57,004 | |
Bar Harbor Bankshares | | | 374 | | | | 12,585 | |
BBCN Bancorp Inc | | | 7,529 | | | | 87,111 | |
Beneficial Mutual Bancorp Inc * | | | 2,761 | | | | 26,230 | |
Berkshire Bancorp Inc | | | 427 | | | | 3,501 | |
Berkshire Hills Bancorp Inc | | | 2,380 | | | | 56,787 | |
BlackRock Kelso Capital Corp | | | 4,905 | | | | 49,344 | |
BofI Holding Inc * | | | 1,004 | | | | 27,981 | |
Boston Private Financial Holdings Inc | | | 7,543 | | | | 67,962 | |
Bridge Bancorp Inc | | | 827 | | | | 16,821 | |
Bridge Capital Holdings * | | | 642 | | | | 9,990 | |
Brookline Bancorp Inc | | | 6,758 | | | | 57,443 | |
Bryn Mawr Bank Corp | | | 1,100 | | | | 24,497 | |
BSB Bancorp Inc * | | | 786 | | | | 9,613 | |
C&F Financial Corp | | | 308 | | | | 11,994 | |
Calamos Asset Management Inc ‘A’ | | | 1,851 | | | | 19,565 | |
California First National Bancorp | | | 231 | | | | 3,453 | |
Camden National Corp | | | 740 | | | | 25,138 | |
| | |
| See Notes to Financial Statements | | See explanation of symbols and terms, if any, on page B-81 |
B-53
PACIFIC SELECT FUND
PD SMALL-CAP VALUE INDEX PORTFOLIO
Schedule of Investments (Continued)
December 31, 2012
| | | | | | | | |
| | | Shares | | | Value | |
Campus Crest Communities Inc REIT | | | 3,668 | | | | $44,970 | |
Cape Bancorp Inc | | | 1,081 | | | | 9,394 | |
Capital Bank Financial Corp ‘A’ * | | | 913 | | | | 15,585 | |
Capital City Bank Group Inc * | | | 1,119 | | | | 12,723 | |
Capital Southwest Corp | | | 287 | | | | 28,594 | |
CapLease Inc REIT | | | 6,312 | | | | 35,158 | |
Capstead Mortgage Corp REIT | | | 9,525 | | | | 109,252 | |
Cardinal Financial Corp | | | 2,819 | | | | 45,865 | |
Cascade Bancorp * | | | 521 | | | | 3,261 | |
Cash America International Inc | | | 1,643 | | | | 65,178 | |
Cathay General Bancorp | | | 7,568 | | | | 147,576 | |
Cedar Realty Trust Inc REIT | | | 5,778 | | | | 30,508 | |
Center Bancorp Inc | | | 1,143 | | | | 13,236 | |
Centerstate Banks Inc | | | 2,896 | | | | 24,703 | |
Central Pacific Financial Corp * | | | 2,084 | | | | 32,490 | |
Century Bancorp Inc ‘A’ | | | 331 | | | | 10,906 | |
Charter Financial Corp | | | 627 | | | | 6,646 | |
Chatham Lodging Trust REIT | | | 1,276 | | | | 19,625 | |
Chemical Financial Corp | | | 2,653 | | | | 63,035 | |
Chesapeake Lodging Trust REIT | | | 3,773 | | | | 78,780 | |
CIFC Corp * | | | 621 | | | | 4,968 | |
Citizens & Northern Corp | | | 1,176 | | | | 22,226 | |
Citizens Inc * | | | 3,706 | | | | 40,951 | |
Citizens Republic Bancorp Inc * | | | 3,864 | | | | 73,300 | |
City Holding Co | | | 1,418 | | | | 49,417 | |
Clifton Savings Bancorp Inc | | | 744 | | | | 8,385 | |
CNB Financial Corp | | | 1,197 | | | | 19,607 | |
CNO Financial Group Inc | | | 19,230 | | | | 179,416 | |
CoBiz Financial Inc | | | 3,361 | | | | 25,107 | |
Colonial Properties Trust REIT | | | 8,411 | | | | 179,743 | |
Colony Financial Inc REIT | | | 4,986 | | | | 97,227 | |
Columbia Banking System Inc | | | 3,829 | | | | 68,692 | |
Community Bank System Inc | | | 3,808 | | | | 104,187 | |
Community Trust Bancorp Inc | | | 1,347 | | | | 44,155 | |
Consolidated-Tomoka Land Co | | | 397 | | | | 12,311 | |
Coresite Realty Corp REIT | | | 996 | | | | 27,549 | |
Cousins Properties Inc REIT | | | 8,757 | | | | 73,121 | |
Cowen Group Inc ‘A’ * | | | 8,421 | | | | 20,631 | |
Crawford & Co ‘B’ | | | 2,521 | | | | 20,118 | |
Crescent Financial Bancshares Inc * | | | 301 | | | | 1,382 | |
CreXus Investment Corp REIT | | | 6,464 | | | | 79,184 | |
CubeSmart REIT | | | 11,804 | | | | 171,984 | |
CVB Financial Corp | | | 8,512 | | | | 88,525 | |
CYS Investments Inc REIT | | | 16,855 | | | | 199,058 | |
DCT Industrial Trust Inc REIT | | | 23,678 | | | | 153,670 | |
DFC Global Corp * | | | 914 | | | | 16,918 | |
DiamondRock Hospitality Co REIT | | | 17,997 | | | | 161,973 | |
Dime Community Bancshares Inc | | | 3,032 | | | | 42,114 | |
Donegal Group Inc ‘A’ | | | 727 | | | | 10,207 | |
Doral Financial Corp * | | | 12,445 | | | | 9,011 | |
Duff & Phelps Corp ‘A’ | | | 2,181 | | | | 34,067 | |
DuPont Fabros Technology Inc REIT | | | 3,105 | | | | 75,017 | |
Dynex Capital Inc REIT | | | 5,165 | | | | 48,758 | |
Eagle Bancorp Inc * | | | 1,666 | | | | 33,270 | |
Eastern Insurance Holdings Inc | | | 639 | | | | 10,914 | |
EastGroup Properties Inc REIT | | | 162 | | | | 8,717 | |
Education Realty Trust Inc REIT | | | 10,818 | | | | 115,104 | |
EMC Insurance Group Inc | | | 454 | | | | 10,842 | |
Employers Holdings Inc | | | 1,127 | | | | 23,194 | |
Encore Capital Group Inc * | | | 437 | | | | 13,381 | |
Enstar Group Ltd * (Bermuda) | | | 810 | | | | 90,704 | |
Enterprise Bancorp Inc | | | 587 | | | | 9,697 | |
Enterprise Financial Services Corp | | | 1,717 | | | | 22,441 | |
EPR Properties REIT | | | 4,491 | | | | 207,080 | |
Equity One Inc REIT | | | 5,272 | | | | 110,765 | |
ESB Financial Corp | | | 999 | | | | 13,856 | |
ESSA Bancorp Inc | | | 863 | | | | 9,398 | |
EverBank Financial Corp | | | 2,153 | | | | 32,101 | |
Evercore Partners Inc ‘A’ | | | 2,509 | | | | 75,747 | |
Excel Trust Inc REIT | | | 4,174 | | | | 52,885 | |
| | | | | | | | |
| | | Shares | | | Value | |
Ezcorp Inc ‘A’ * | | | 1,442 | | | | $28,638 | |
F.N.B. Corp | | | 13,476 | | | | 143,115 | |
Farmers National Banc Corp | | | 1,817 | | | | 11,265 | |
FBL Financial Group Inc ‘A’ | | | 927 | | | | 31,713 | |
FBR & Co * | | | 3,566 | | | | 13,800 | |
Federal Agricultural Mortgage Corp ‘C’ | | | 958 | | | | 31,135 | |
FelCor Lodging Trust Inc REIT * | | | 4,831 | | | | 22,561 | |
Fidelity Southern Corp * | | | 942 | | | | 8,996 | |
Fidus Investment Corp | | | 1,145 | | | | 18,835 | |
Fifth Street Finance Corp | | | 10,110 | | | | 105,346 | |
Financial Institutions Inc | | | 1,330 | | | | 24,778 | |
First American Financial Corp | | | 9,281 | | | | 223,579 | |
First Bancorp NC | | | 1,458 | | | | 18,692 | |
First BanCorp PR * | | | 6,774 | | | | 31,025 | |
First Busey Corp | | | 7,173 | | | | 33,354 | |
First California Financial Group Inc * | | | 2,159 | | | | 16,667 | |
First Commonwealth Financial Corp | | | 10,153 | | | | 69,243 | |
First Community Bancshares Inc | | | 1,706 | | | | 27,245 | |
First Connecticut Bancorp Inc | | | 1,722 | | | | 23,678 | |
First Defiance Financial Corp | | | 936 | | | | 17,962 | |
First Federal Bancshares of Arkansas Inc * | | | 231 | | | | 2,252 | |
First Financial Bancorp | | | 5,648 | | | | 82,574 | |
First Financial Bankshares Inc | | | 3,039 | | | | 118,551 | |
First Financial Corp | | | 1,077 | | | | 32,568 | |
First Financial Holdings Inc | | | 1,591 | | | | 20,810 | |
First Financial Northwest Inc * | | | 1,536 | | | | 11,597 | |
First Industrial Realty Trust Inc REIT * | | | 9,387 | | | | 132,169 | |
First Interstate Bancsystem Inc | | | 1,564 | | | | 24,133 | |
First Merchants Corp | | | 2,760 | | | | 40,958 | |
First Midwest Bancorp Inc | | | 7,231 | | | | 90,532 | |
First Pactrust Bancorp Inc | | | 1,018 | | | | 12,491 | |
First Potomac Realty Trust REIT | | | 4,844 | | | | 59,872 | |
FirstMerit Corp | | | 10,589 | | | | 150,258 | |
Flushing Financial Corp | | | 2,983 | | | | 45,759 | |
FNB United Corp * | | | 253 | | | | 2,935 | |
Forestar Group Inc * | | | 3,313 | | | | 57,414 | |
Fortegra Financial Corp * | | | 623 | | | | 5,538 | |
Fox Chase Bancorp Inc | | | 1,222 | | | | 20,346 | |
Franklin Financial Corp | | | 1,255 | | | | 20,808 | |
Franklin Street Properties Corp REIT | | | 6,997 | | | | 86,133 | |
FXCM Inc ‘A’ | | | 2,269 | | | | 22,849 | |
Gain Capital Holdings Inc | | | 1,466 | | | | 5,996 | |
German American Bancorp Inc | | | 1,217 | | | | 26,433 | |
Getty Realty Corp REIT | | | 2,445 | | | | 44,157 | |
GFI Group Inc | | | 6,641 | | | | 21,517 | |
Glacier Bancorp Inc | | | 6,944 | | | | 102,146 | |
Gladstone Capital Corp | | | 2,089 | | | | 17,046 | |
Gladstone Commercial Corp REIT | | | 1,014 | | | | 18,201 | |
Gladstone Investment Corp | | | 2,509 | | | | 17,463 | |
Glimcher Realty Trust REIT | | | 1,341 | | | | 14,872 | |
Global Indemnity PLC * (Ireland) | | | 989 | | | | 21,887 | |
Golub Capital BDC Inc | | | 1,520 | | | | 24,290 | |
Government Properties Income Trust REIT | | | 4,127 | | | | 98,924 | |
Gramercy Capital Corp REIT * | | | 4,408 | | | | 12,960 | |
Great Southern Bancorp Inc | | | 980 | | | | 24,941 | |
Greenlight Capital Re Ltd ‘A’ * (Cayman) | | | 1,954 | | | | 45,098 | |
GSV Capital Corp * | | | 1,858 | | | | 15,663 | |
Guaranty Bancorp * | | | 7,321 | | | | 14,276 | |
Gyrodyne Co of America Inc REIT | | | 7 | | | | 504 | |
Hallmark Financial Services Inc * | | | 1,279 | | | | 12,010 | |
Hancock Holding Co | | | 7,339 | | | | 232,940 | |
Hanmi Financial Corp * | | | 3,036 | | | | 41,259 | |
Harris & Harris Group Inc * | | | 2,973 | | | | 9,811 | |
Healthcare Realty Trust Inc REIT | | | 8,356 | | | | 200,628 | |
Heartland Financial USA Inc | | | 1,400 | | | | 36,610 | |
Hercules Technology Growth Capital Inc | | | 5,099 | | | | 56,752 | |
Heritage Commerce Corp * | | | 1,993 | | | | 13,911 | |
Heritage Financial Corp | | | 1,490 | | | | 21,888 | |
Heritage Financial Group Inc | | | 744 | | | | 10,260 | |
Heritage Oaks Bancorp * | | | 1,933 | | | | 11,211 | |
| | |
| See Notes to Financial Statements | | See explanation of symbols and terms, if any, on page B-81 |
B-54
PACIFIC SELECT FUND
PD SMALL-CAP VALUE INDEX PORTFOLIO
Schedule of Investments (Continued)
December 31, 2012
| | | | | | | | |
| | | Shares | | | Value | |
Hersha Hospitality Trust REIT | | | 16,491 | | | | $82,455 | |
HFF Inc ‘A’ | | | 460 | | | | 6,854 | |
Highwoods Properties Inc REIT | | | 1,172 | | | | 39,203 | |
Hilltop Holdings Inc * | | | 3,828 | | | | 51,831 | |
Hingham Institution for Savings | | | 112 | | | | 7,011 | |
Home Bancorp Inc * | | | 656 | | | | 11,972 | |
Home BancShares Inc | | | 2,127 | | | | 70,234 | |
Home Federal Bancorp Inc | | | 1,401 | | | | 17,414 | |
Home Loan Servicing Solutions Ltd (Cayman) | | | 2,797 | | | | 52,863 | |
Homeowners Choice Inc | | | 666 | | | | 13,846 | |
HomeStreet Inc * | | | 839 | | | | 21,436 | |
HomeTrust Bancshares Inc * | | | 2,039 | | | | 27,547 | |
Horace Mann Educators Corp | | | 3,828 | | | | 76,407 | |
Horizon Bancorp | | | 630 | | | | 12,380 | |
Horizon Technology Finance Corp | | | 751 | | | | 11,182 | |
Hudson Pacific Properties Inc REIT | | | 3,407 | | | | 71,751 | |
Hudson Valley Holding Corp | | | 1,495 | | | | 23,277 | |
IBERIABANK Corp | | | 2,840 | | | | 139,501 | |
ICG Group Inc * | | | 3,300 | | | | 37,719 | |
Independence Holding Co | | | 797 | | | | 7,587 | |
Independent Bank Corp | | | 2,142 | | | | 62,011 | |
Infinity Property & Casualty Corp | | | 1,140 | | | | 66,394 | |
Inland Real Estate Corp REIT | | | 4,042 | | | | 33,872 | |
International Bancshares Corp | | | 5,142 | | | | 92,813 | |
INTL FCStone Inc * | | | 1,327 | | | | 23,103 | |
Invesco Mortgage Capital Inc REIT | | | 11,121 | | | | 219,195 | |
Investment Technology Group Inc * | | | 3,741 | | | | 33,669 | |
Investors Bancorp Inc | | | 3,524 | | | | 62,657 | |
Investors Real Estate Trust REIT | | | 8,686 | | | | 75,829 | |
Investors Title Co | | | 125 | | | | 7,500 | |
iStar Financial Inc REIT * | | | 8,034 | | | | 65,477 | |
JAVELIN Mortgage Investment Corp | | | 527 | | | | 10,060 | |
JMP Group Inc | | | 1,560 | | | | 9,469 | |
Kansas City Life Insurance Co | | | 397 | | | | 15,150 | |
KBW Inc | | | 3,350 | | | | 51,255 | |
KCAP Financial Inc | | | 2,147 | | | | 19,731 | |
Kearny Financial Corp | | | 1,454 | | | | 14,177 | |
Kennedy-Wilson Holdings Inc | | | 4,109 | | | | 57,444 | |
Kite Realty Group Trust REIT | | | 6,222 | | | | 34,781 | |
Knight Capital Group Inc ‘A’ * | | | 17,371 | | | | 60,972 | |
Lakeland Bancorp Inc | | | 2,852 | | | | 29,033 | |
Lakeland Financial Corp | | | 1,574 | | | | 40,672 | |
LaSalle Hotel Properties REIT | | | 8,195 | | | | 208,071 | |
Lexington Realty Trust REIT | | | 12,659 | | | | 132,287 | |
LTC Properties Inc REIT | | | 2,274 | | | | 80,022 | |
Maiden Holdings Ltd (Bermuda) | | | 4,837 | | | | 44,452 | |
Main Street Capital Corp | | | 2,705 | | | | 82,530 | |
MainSource Financial Group Inc | | | 1,948 | | | | 24,681 | |
Manning & Napier Inc | | | 1,307 | | | | 16,468 | |
Marlin Business Services Corp | | | 790 | | | | 15,847 | |
MB Financial Inc | | | 5,253 | | | | 103,747 | |
MCG Capital Corp | | | 7,074 | | | | 32,540 | |
Meadowbrook Insurance Group Inc | | | 4,515 | | | | 26,097 | |
Medallion Financial Corp | | | 1,722 | | | | 20,216 | |
Medical Properties Trust Inc REIT | | | 13,042 | | | | 155,982 | |
Medley Capital Corp | | | 2,765 | | | | 40,258 | |
Mercantile Bank Corp | | | 827 | | | | 13,646 | |
Merchants Bancshares Inc | | | 491 | | | | 13,144 | |
Meridian Interstate Bancorp Inc * | | | 749 | | | | 12,568 | |
Metro Bancorp Inc * | | | 1,359 | | | | 17,966 | |
MetroCorp Bancshares Inc * | | | 1,520 | | | | 16,705 | |
MGIC Investment Corp * | | | 18,178 | | | | 48,353 | |
MicroFinancial Inc | | | 523 | | | | 3,807 | |
Middleburg Financial Corp | | | 514 | | | | 9,077 | |
Midsouth Bancorp Inc | | | 811 | | | | 13,260 | |
MidWestOne Financial Group Inc | | | 653 | | | | 13,393 | |
Monmouth Real Estate Investment Corp ‘A’ REIT | | | 2,143 | | | | 22,201 | |
Montpelier Re Holdings Ltd (Bermuda) | | | 4,221 | | | | 96,492 | |
| | | | | | | | |
| | | Shares | | | Value | |
MVC Capital Inc | | | 2,305 | | | | $28,006 | |
NASB Financial Inc * | | | 413 | | | | 8,826 | |
National Bank Holdings Corp ‘A’ | | | 703 | | | | 13,350 | |
National Bankshares Inc | | | 685 | | | | 22,187 | |
National Financial Partners Corp * | | | 3,918 | | | | 67,155 | |
National Interstate Corp | | | 623 | | | | 17,955 | |
National Penn Bancshares Inc | | | 11,915 | | | | 111,048 | |
National Western Life Insurance Co ‘A’ | | | 203 | | | | 32,021 | |
NBT Bancorp Inc | | | 3,207 | | | | 65,006 | |
Nelnet Inc ‘A’ | | | 2,288 | | | | 68,160 | |
New Mountain Finance Corp | | | 1,843 | | | | 27,461 | |
New York Mortgage Trust Inc REIT | | | 4,778 | | | | 30,197 | |
NewStar Financial Inc * | | | 2,516 | | | | 35,249 | |
NGP Capital Resources Co | | | 2,149 | | | | 15,516 | |
Nicholas Financial Inc (Canada) | | | 957 | | | | 11,867 | |
Northfield Bancorp Inc | | | 1,415 | | | | 21,579 | |
Northrim BanCorp Inc | | | 622 | | | | 14,088 | |
NorthStar Realty Finance Corp REIT | | | 15,618 | | | | 109,951 | |
Northwest Bancshares Inc | | | 9,423 | | | | 114,395 | |
OceanFirst Financial Corp | | | 1,385 | | | | 19,044 | |
Ocwen Financial Corp * | | | 9,671 | | | | 334,520 | |
OFS Capital Corp * | | | 516 | | | | 7,064 | |
Old National Bancorp | | | 9,783 | | | | 116,124 | |
OmniAmerican Bancorp Inc * | | | 1,078 | | | | 24,934 | |
One Liberty Properties Inc REIT | | | 1,105 | | | | 22,420 | |
OneBeacon Insurance Group Ltd ‘A’ (Bermuda) | | | 2,225 | | | | 30,928 | |
Oppenheimer Holdings Inc ‘A’ | | | 989 | | | | 17,080 | |
Oriental Financial Group Inc | | | 4,392 | | | | 58,633 | |
Oritani Financial Corp | | | 2,858 | | | | 43,785 | |
Pacific Continental Corp | | | 1,751 | | | | 17,037 | |
Pacific Mercantile Bancorp * | | | 987 | | | | 6,208 | |
PacWest Bancorp | | | 2,927 | | | | 72,531 | |
Park National Corp | | | 1,094 | | | | 70,705 | |
Park Sterling Corp * | | | 4,291 | | | | 22,442 | |
Parkway Properties Inc REIT | | | 2,010 | | | | 28,120 | |
Peapack Gladstone Financial Corp | | | 852 | | | | 11,996 | |
Pebblebrook Hotel Trust REIT | | | 5,766 | | | | 133,195 | |
PennantPark Investment Corp | | | 6,323 | | | | 69,521 | |
Penns Woods Bancorp Inc | | | 342 | | | | 12,794 | |
Pennsylvania REIT | | | 5,347 | | | | 94,321 | |
PennyMac Mortgage Investment Trust REIT | | | 5,628 | | | | 142,332 | |
Peoples Bancorp Inc | | | 1,028 | | | | 21,002 | |
Peoples Federal Bancshares Inc | | | 585 | | | | 10,173 | |
PHH Corp * | | | 5,413 | | | | 123,146 | |
PICO Holdings Inc * | | | 2,196 | | | | 44,513 | |
Pinnacle Financial Partners Inc * | | | 3,338 | | | | 62,888 | |
Piper Jaffray Cos * | | | 1,466 | | | | 47,103 | |
Platinum Underwriters Holdings Ltd (Bermuda) | | | 3,166 | | | | 145,636 | |
Potlatch Corp REIT | | | 1,431 | | | | 56,081 | |
Preferred Bank * | | | 1,129 | | | | 16,032 | |
Primerica Inc | | | 4,228 | | | | 126,882 | |
PrivateBancorp Inc | | | 5,829 | | | | 89,300 | |
Prospect Capital Corp | | | 18,298 | | | | 198,899 | |
Prosperity Bancshares Inc | | | 4,571 | | | | 191,982 | |
Provident Financial Holdings Inc | | | 935 | | | | 16,363 | |
Provident Financial Services Inc | | | 5,775 | | | | 86,163 | |
Provident New York Bancorp | | | 3,810 | | | | 35,471 | |
PS Business Parks Inc REIT | | | 295 | | | | 19,169 | |
Pzena Investment Management Inc ‘A’ | | | 368 | | | | 1,987 | |
Radian Group Inc | | | 12,767 | | | | 78,006 | |
RAIT Financial Trust REIT | | | 4,808 | | | | 27,165 | |
Ramco-Gershenson Properties Trust REIT | | | 4,395 | | | | 58,497 | |
Redwood Trust Inc REIT | | | 7,535 | | | | 127,266 | |
Renasant Corp | | | 2,422 | | | | 46,357 | |
Republic Bancorp Inc ‘A’ | | | 958 | | | | 20,243 | |
Resource America Inc ‘A’ | | | 1,168 | | | | 7,791 | |
Resource Capital Corp REIT | | | 9,601 | | | | 53,766 | |
Retail Opportunity Investments Corp REIT | | | 4,978 | | | | 64,017 | |
| | |
| See Notes to Financial Statements | | See explanation of symbols and terms, if any, on page B-81 |
B-55
PACIFIC SELECT FUND
PD SMALL-CAP VALUE INDEX PORTFOLIO
Schedule of Investments (Continued)
December 31, 2012
| | | | | | | | |
| | | Shares | | | Value | |
RLI Corp | | | 2,049 | | | | $132,488 | |
RLJ Lodging Trust REIT | | | 10,200 | | | | 197,574 | |
Rockville Financial Inc | | | 2,756 | | | | 35,552 | |
Roma Financial Corp | | | 699 | | | | 10,569 | |
Rouse Properties Inc REIT | | | 2,069 | | | | 35,007 | |
Ryman Hospitality Properties REIT | | | 897 | | | | 34,499 | |
S&T Bancorp Inc | | | 2,789 | | | | 50,397 | |
S.Y. Bancorp Inc | | | 1,171 | | | | 26,254 | |
Sabra Health Care REIT Inc | | | 3,548 | | | | 77,063 | |
Safeguard Scientifics Inc * | | | 2,004 | | | | 29,559 | |
Safety Insurance Group Inc | | | 1,239 | | | | 57,205 | |
Sandy Spring Bancorp Inc | | | 2,329 | | | | 45,229 | |
SCBT Financial Corp | | | 1,600 | | | | 64,288 | |
SeaBright Holdings Inc | | | 1,906 | | | | 21,099 | |
Seacoast Banking Corp of Florida * | | | 7,055 | | | | 11,359 | |
Select Income REIT | | | 1,081 | | | | 26,776 | |
Selective Insurance Group Inc | | | 5,291 | | | | 101,958 | |
SI Financial Group Inc | | | 1,015 | | | | 11,673 | |
Sierra Bancorp | | | 1,170 | | | | 13,373 | |
Simmons First National Corp ‘A’ | | | 1,650 | | | | 41,844 | |
Simplicity Bancorp Inc | | | 869 | | | | 12,992 | |
Solar Capital Ltd | | | 3,733 | | | | 89,256 | |
Solar Senior Capital Ltd | | | 914 | | | | 17,055 | |
Southside Bancshares Inc | | | 1,671 | | | | 35,191 | |
Southwest Bancorp Inc * | | | 1,872 | | | | 20,966 | |
Sovran Self Storage Inc REIT | | | 245 | | | | 15,215 | |
Spirit Realty Capital Inc REIT | | | 2,540 | | | | 45,161 | |
STAG Industrial Inc REIT | | | 3,003 | | | | 53,964 | |
Starwood Property Trust Inc REIT | | | 12,980 | | | | 298,021 | |
State Auto Financial Corp | | | 1,214 | | | | 18,137 | |
State Bank Financial Corp | | | 3,060 | | | | 48,593 | |
StellarOne Corp | | | 2,224 | | | | 31,447 | |
Stellus Capital Investment Corp | | | 624 | | | | 10,221 | |
Sterling Bancorp | | | 2,979 | | | | 27,139 | |
Sterling Financial Corp | | | 2,583 | | | | 53,933 | |
Stewart Information Services Corp | | | 1,767 | | | | 45,942 | |
Stifel Financial Corp * | | | 2,638 | | | | 84,337 | |
Strategic Hotels & Resorts Inc REIT * | | | 2,664 | | | | 17,050 | |
Suffolk Bancorp * | | | 935 | | | | 12,249 | |
Summit Hotel Properties Inc REIT | | | 4,107 | | | | 39,016 | |
Sun Bancorp Inc * | | | 3,827 | | | | 13,548 | |
Sunstone Hotel Investors Inc REIT * | | | 13,073 | | | | 140,012 | |
Susquehanna Bancshares Inc | | | 18,055 | | | | 189,216 | |
SWS Group Inc * | | | 2,803 | | | | 14,828 | |
Symetra Financial Corp | | | 7,402 | | | | 96,078 | |
Taylor Capital Group Inc * | | | 1,569 | | | | 28,320 | |
TCP Capital Corp | | | 567 | | | | 8,358 | |
Terreno Realty Corp REIT | | | 1,189 | | | | 18,358 | |
Territorial Bancorp Inc | | | 1,063 | | | | 24,290 | |
Texas Capital Bancshares Inc * | | | 507 | | | | 22,724 | |
The Bancorp Inc * | | | 2,789 | | | | 30,595 | |
The First Bancorp Inc | | | 854 | | | | 14,065 | |
The First Marblehead Corp * | | | 5,549 | | | | 4,311 | |
The First of Long Island Corp | | | 744 | | | | 21,070 | |
The Navigators Group Inc * | | | 556 | | | | 28,395 | |
The Phoenix Cos Inc * | | | 559 | | | | 13,824 | |
THL Credit Inc | | | 1,486 | | | | 21,978 | |
Thomas Properties Group Inc | | | 3,097 | | | | 16,755 | |
TICC Capital Corp | | | 4,030 | | | | 40,784 | |
Tompkins Financial Corp | | | 1,069 | | | | 42,375 | |
Tower Group Inc | | | 1,545 | | | | 27,455 | |
TowneBank | | | 2,538 | | | | 39,314 | |
Tree.com Inc | | | 241 | | | | 4,345 | |
Triangle Capital Corp | | | 2,631 | | | | 67,064 | |
TriCo Bancshares | | | 1,540 | | | | 25,795 | |
TrustCo Bank Corp NY | | | 9,135 | | | | 48,233 | |
Trustmark Corp | | | 6,254 | | | | 140,465 | |
Two Harbors Investment Corp REIT | | | 28,278 | | | | 313,320 | |
UMB Financial Corp | | | 3,117 | | | | 136,649 | |
UMH Properties Inc REIT | | | 1,034 | | | | 10,681 | |
| | | | | | | | |
| | | Shares | | | Value | |
Umpqua Holdings Corp | | | 10,761 | | | | $126,872 | |
Union First Market Bankshares Corp | | | 1,953 | | | | 30,799 | |
United Bankshares Inc | | | 1,794 | | | | 43,630 | |
United Community Banks Inc * | | | 3,542 | | | | 33,366 | |
United Financial Bancorp Inc | | | 2,032 | | | | 31,943 | |
United Fire Group Inc | | | 1,941 | | | | 42,391 | |
Universal Health Realty Income Trust REIT | | | 434 | | | | 21,965 | |
Universal Insurance Holdings Inc | | | 1,793 | | | | 7,853 | |
Univest Corp of Pennsylvania | | | 1,647 | | | | 28,164 | |
Urstadt Biddle Properties Inc ‘A’ REIT | | | 567 | | | | 11,159 | |
ViewPoint Financial Group | | | 3,227 | | | | 67,573 | |
Virginia Commerce Bancorp Inc * | | | 2,582 | | | | 23,109 | |
Virtus Investment Partners Inc * | | | 276 | | | | 33,379 | |
Walker & Dunlop Inc * | | | 1,095 | | | | 18,243 | |
Walter Investment Management Corp * | | | 3,420 | | | | 147,128 | |
Washington Banking Co | | | 1,484 | | | | 20,212 | |
Washington REIT | | | 4,340 | | | | 113,491 | |
Washington Trust Bancorp Inc | | | 1,388 | | | | 36,518 | |
Waterstone Financial Inc * | | | 700 | | | | 5,460 | |
Webster Financial Corp | | | 6,927 | | | | 142,350 | |
WesBanco Inc | | | 2,458 | | | | 54,617 | |
West Bancorp Inc | | | 1,505 | | | | 16,224 | |
West Coast Bancorp | | | 1,858 | | | | 41,155 | |
Westamerica Bancorp | | | 1,227 | | | | 52,258 | |
Western Alliance Bancorp * | | | 7,030 | | | | 74,026 | |
Western Asset Mortgage Capital Corp REIT | | | 1,802 | | | | 35,626 | |
Westfield Financial Inc | | | 2,353 | | | | 17,012 | |
Whitestone REIT | | | 1,332 | | | | 18,715 | |
Wilshire Bancorp Inc * | | | 5,958 | | | | 34,973 | |
Winthrop Realty Trust REIT | | | 2,811 | | | | 31,062 | |
Wintrust Financial Corp | | | 3,493 | | | | 128,193 | |
WSFS Financial Corp | | | 734 | | | | 31,012 | |
| | | | | | | | |
| | | | 21,869,225 | |
| | | | | | | | |
Health Care - 4.2% | | | | | | | | |
| | |
Affymetrix Inc * | | | 6,801 | | | | 21,559 | |
Agenus Inc * | | | 911 | | | | 3,735 | |
Almost Family Inc | | | 793 | | | | 16,066 | |
Alphatec Holdings Inc * | | | 5,243 | | | | 8,651 | |
AMAG Pharmaceuticals Inc * | | | 430 | | | | 6,325 | |
Amedisys Inc * | | | 2,862 | | | | 32,255 | |
AMN Healthcare Services Inc * | | | 1,900 | | | | 21,945 | |
AmSurg Corp * | | | 2,034 | | | | 61,040 | |
AngioDynamics Inc * | | | 2,318 | | | | 25,475 | |
Arena Pharmaceuticals Inc * | | | 2,401 | | | | 21,657 | |
ArthroCare Corp * | | | 460 | | | | 15,911 | |
Assisted Living Concepts Inc ‘A’ | | | 1,863 | | | | 18,164 | |
Astex Pharmaceuticals Inc * | | | 8,970 | | | | 26,103 | |
AVANIR Pharmaceuticals Inc ‘A’ * | | | 1,072 | | | | 2,819 | |
AVEO Pharmaceuticals Inc * | | | 311 | | | | 2,504 | |
BioScrip Inc * | | | 3,079 | | | | 33,161 | |
Cambrex Corp * | | | 1,376 | | | | 15,659 | |
Capital Senior Living Corp * | | | 363 | | | | 6,784 | |
Cerus Corp * | | | 646 | | | | 2,041 | |
Chindex International Inc * | | | 1,110 | | | | 11,655 | |
Codexis Inc * | | | 2,591 | | | | 5,726 | |
CONMED Corp | | | 2,703 | | | | 75,549 | |
Cornerstone Therapeutics Inc * | | | 784 | | | | 3,708 | |
Cross Country Healthcare Inc * | | | 2,611 | | | | 12,533 | |
CryoLife Inc | | | 2,650 | | | | 16,509 | |
Cumberland Pharmaceuticals Inc * | | | 481 | | | | 2,020 | |
Curis Inc * | | | 1,676 | | | | 5,749 | |
Cynosure Inc ‘A’ * | | | 587 | | | | 14,153 | |
Cytori Therapeutics Inc * | | | 1,247 | | | | 3,517 | |
Derma Sciences Inc * | | | 1,030 | | | | 11,443 | |
Durata Therapeutics Inc * | | | 171 | | | | 1,306 | |
Dynavax Technologies Corp * | | | 2,067 | | | | 5,912 | |
Emergent BioSolutions Inc * | | | 1,986 | | | | 31,855 | |
Enzon Pharmaceuticals Inc | | | 3,605 | | | | 15,970 | |
Epocrates Inc * | | | 91 | | | | 803 | |
| | |
| See Notes to Financial Statements | | See explanation of symbols and terms, if any, on page B-81 |
B-56
PACIFIC SELECT FUND
PD SMALL-CAP VALUE INDEX PORTFOLIO
Schedule of Investments (Continued)
December 31, 2012
| | | | | | | | |
| | | Shares | | | Value | |
Exactech Inc * | | | 635 | | | | $10,763 | |
ExamWorks Group Inc * | | | 2,280 | | | | 31,897 | |
Five Star Quality Care Inc * | | | 2,945 | | | | 14,754 | |
Gentiva Health Services Inc * | | | 2,887 | | | | 29,014 | |
Geron Corp * | | | 12,710 | | | | 17,921 | |
Globus Medical Inc ‘A’ * | | | 240 | | | | 2,518 | |
Greatbatch Inc * | | | 2,247 | | | | 52,220 | |
Greenway Medical Technologies Inc * | | | 164 | | | | 2,519 | |
GTx Inc * | | | 389 | | | | 1,634 | |
Hanger Inc * | | | 3,266 | | | | 89,358 | |
Harvard Bioscience Inc * | | | 2,213 | | | | 9,693 | |
HealthSouth Corp * | | | 1,437 | | | | 30,335 | |
Healthways Inc * | | | 3,172 | | | | 33,940 | |
Hi-Tech Pharmacal Co Inc | | | 634 | | | | 22,177 | |
Horizon Pharma Inc * | | | 1,672 | | | | 3,896 | |
Hyperion Therapeutics Inc * | | | 63 | | | | 711 | |
ICU Medical Inc * | | | 113 | | | | 6,885 | |
Idenix Pharmaceuticals Inc * | | | 1,060 | | | | 5,141 | |
ImmunoGen Inc * | | | 1,776 | | | | 22,644 | |
Integra LifeSciences Holdings Corp * | | | 791 | | | | 30,825 | |
Intercept Pharmaceuticals Inc * | | | 81 | | | | 2,773 | |
InterMune Inc * | | | 2,779 | | | | 26,929 | |
Invacare Corp | | | 3,020 | | | | 49,226 | |
Kindred Healthcare Inc * | | | 5,048 | | | | 54,619 | |
KYTHERA Biopharmaceuticals Inc * | | | 85 | | | | 2,579 | |
Lannett Co Inc * | | | 1,481 | | | | 7,346 | |
Lexicon Pharmaceuticals Inc * | | | 11,604 | | | | 25,761 | |
LHC Group Inc * | | | 1,346 | | | | 28,670 | |
Magellan Health Services Inc * | | | 2,483 | | | | 121,667 | |
Maxygen Inc | | | 2,654 | | | | 6,529 | |
MedAssets Inc * | | | 3,710 | | | | 62,217 | |
Merge Healthcare Inc * | | | 1,299 | | | | 3,209 | |
Merit Medical Systems Inc * | | | 3,784 | | | | 52,598 | |
Molina Healthcare Inc * | | | 2,635 | | | | 71,303 | |
Momenta Pharmaceuticals Inc * | | | 2,772 | | | | 32,654 | |
National Healthcare Corp | | | 1,018 | | | | 47,866 | |
Natus Medical Inc * | | | 1,098 | | | | 12,276 | |
Nektar Therapeutics * | | | 3,201 | | | | 23,719 | |
NPS Pharmaceuticals Inc * | | | 2,781 | | | | 25,307 | |
NuVasive Inc * | | | 3,103 | | | | 47,972 | |
Omnicell Inc * | | | 2,825 | | | | 42,008 | |
Orthofix International NV * (Netherlands) | | | 360 | | | | 14,159 | |
Owens & Minor Inc | | | 887 | | | | 25,288 | |
Pacific Biosciences of California Inc * | | | 3,525 | | | | 5,993 | |
Palomar Medical Technologies Inc * | | | 1,879 | | | | 17,306 | |
PDI Inc * | | | 847 | | | | 6,437 | |
PDL BioPharma Inc | | | 1,829 | | | | 12,894 | |
PharMerica Corp * | | | 2,811 | | | | 40,029 | |
PhotoMedex Inc * | | | 192 | | | | 2,786 | |
Regulus Therapeutics Inc * | | | 164 | | | | 1,033 | |
Repligen Corp * | | | 297 | | | | 1,868 | |
Rigel Pharmaceuticals Inc * | | | 1,507 | | | | 9,796 | |
Rochester Medical Corp * | | | 103 | | | | 1,038 | |
Rockwell Medical Technologies Inc * | | | 97 | | | | 781 | |
RTI Biologics Inc * | | | 5,042 | | | | 21,529 | |
Select Medical Holdings Corp | | | 3,373 | | | | 31,807 | |
Sequenom Inc * | | | 2,619 | | | | 12,362 | |
Skilled Healthcare Group Inc ‘A’ * | | | 129 | | | | 822 | |
Solta Medical Inc * | | | 6,588 | | | | 17,590 | |
STERIS Corp | | | 1,467 | | | | 50,949 | |
Sunrise Senior Living Inc * | | | 1,097 | | | | 15,775 | |
Supernus Pharmaceuticals Inc * | | | 398 | | | | 2,854 | |
SurModics Inc * | | | 954 | | | | 21,331 | |
Symmetry Medical Inc * | | | 2,433 | | | | 25,595 | |
Targacept Inc * | | | 2,630 | | | | 11,519 | |
TESARO Inc * | | | 79 | | | | 1,339 | |
The Ensign Group Inc | | | 632 | | | | 17,184 | |
The Providence Service Corp * | | | 944 | | | | 16,039 | |
Tornier NV * (Netherlands) | | | 448 | | | | 7,522 | |
Transcept Pharmaceuticals Inc * | | | 1,033 | | | | 4,597 | |
| | | | | | | | |
| | | Shares | | | Value | |
Triple-S Management Corp ‘B’ * | | | 1,842 | | | | $34,022 | |
Universal American Corp | | | 3,621 | | | | 31,104 | |
Vanguard Health Systems Inc * | | | 398 | | | | 4,876 | |
Vical Inc * | | | 650 | | | | 1,892 | |
ViroPharma Inc * | | | 6,301 | | | | 143,411 | |
Vocera Communications Inc * | | | 397 | | | | 9,965 | |
WellCare Health Plans Inc * | | | 2,136 | | | | 104,002 | |
West Pharmaceutical Services Inc | | | 1,173 | | | | 64,222 | |
Wright Medical Group Inc * | | | 3,757 | | | | 78,859 | |
XenoPort Inc * | | | 598 | | | | 4,646 | |
XOMA Corp * | | | 878 | | | | 2,103 | |
Young Innovations Inc | | | 294 | | | | 11,587 | |
Zeltiq Aesthetics Inc * | | | 933 | | | | 4,320 | |
| | | | | | | | |
| | | | 2,619,566 | |
| | | | | | | | |
Industrials - 12.5% | | | | | | | | |
| | |
A.O. Smith Corp | | | 2,703 | | | | 170,478 | |
AAR Corp | | | 3,849 | | | | 71,899 | |
ABM Industries Inc | | | 5,132 | | | | 102,383 | |
ACCO Brands Corp * | | | 5,895 | | | | 43,269 | |
Accuride Corp * | | | 4,549 | | | | 14,602 | |
Aceto Corp | | | 1,980 | | | | 19,879 | |
Actuant Corp ‘A’ | | | 5,621 | | | | 156,882 | |
Aegion Corp * | | | 3,225 | | | | 71,563 | |
Aerovironment Inc * | | | 667 | | | | 14,501 | |
Air Transport Services Group Inc * | | | 5,115 | | | | 20,511 | |
Aircastle Ltd (Bermuda) | | | 5,604 | | | | 70,274 | |
Alamo Group Inc | | | 667 | | | | 21,771 | |
Alaska Air Group Inc * | | | 366 | | | | 15,771 | |
Albany International Corp ‘A’ | | | 2,622 | | | | 59,467 | |
Altra Holdings Inc | | | 1,175 | | | | 25,909 | |
AMERCO | | | 830 | | | | 105,252 | |
Ameresco Inc ‘A’ * | | | 458 | | | | 4,493 | |
American Railcar Industries Inc | | | 911 | | | | 28,906 | |
American Science & Engineering Inc | | | 654 | | | | 42,647 | |
American Superconductor Corp * | | | 3,366 | | | | 8,819 | |
American Woodmark Corp * | | | 780 | | | | 21,700 | |
Ampco-Pittsburgh Corp | | | 819 | | | | 16,364 | |
API Technologies Corp * | | | 3,125 | | | | 9,188 | |
Apogee Enterprises Inc | | | 2,729 | | | | 65,414 | |
Applied Industrial Technologies Inc | | | 321 | | | | 13,485 | |
ARC Document Solutions Inc * | | | 2,948 | | | | 7,547 | |
Argan Inc | | | 740 | | | | 13,320 | |
Arkansas Best Corp | | | 2,452 | | | | 23,417 | |
Astec Industries Inc | | | 1,912 | | | | 63,727 | |
AT Cross Co ‘A’ * | | | 45 | | | | 485 | |
Atlas Air Worldwide Holdings Inc * | | | 2,524 | | | | 111,838 | |
Barnes Group Inc | | | 5,187 | | | | 116,500 | |
Belden Inc | | | 482 | | | | 21,685 | |
BlueLinx Holdings Inc * | | | 1,899 | | | | 5,336 | |
Brady Corp ‘A’ | | | 4,683 | | | | 156,412 | |
Briggs & Stratton Corp | | | 4,653 | | | | 98,085 | |
CAI International Inc * | | | 822 | | | | 18,043 | |
Cascade Corp | | | 839 | | | | 53,948 | |
Casella Waste Systems Inc ‘A’ * | | | 3,264 | | | | 14,296 | |
CBIZ Inc * | | | 3,570 | | | | 21,099 | |
CDI Corp | | | 1,099 | | | | 18,826 | |
Ceco Environmental Corp | | | 96 | | | | 955 | |
Cenveo Inc * | | | 5,188 | | | | 14,008 | |
CIRCOR International Inc | | | 1,535 | | | | 60,771 | |
Columbus McKinnon Corp * | | | 1,834 | | | | 30,298 | |
Comfort Systems USA Inc | | | 2,544 | | | | 30,935 | |
Compx International Inc | | | 68 | | | | 963 | |
Consolidated Graphics Inc * | | | 715 | | | | 24,968 | |
Courier Corp | | | 936 | | | | 10,296 | |
CRA International Inc * | | | 999 | | | | 19,750 | |
Cubic Corp | | | 712 | | | | 34,155 | |
Curtiss-Wright Corp | | | 4,480 | | | | 147,078 | |
Deluxe Corp | | | 1,618 | | | | 52,164 | |
DigitalGlobe Inc * | | | 1,070 | | | | 26,151 | |
| | |
| See Notes to Financial Statements | | See explanation of symbols and terms, if any, on page B-81 |
B-57
PACIFIC SELECT FUND
PD SMALL-CAP VALUE INDEX PORTFOLIO
Schedule of Investments (Continued)
December 31, 2012
| | | | | | | | |
| | | Shares | | | Value | |
Douglas Dynamics Inc | | | 2,133 | | | | $30,694 | |
Dycom Industries Inc * | | | 400 | | | | 7,920 | |
Dynamic Materials Corp | | | 822 | | | | 11,426 | |
Edgen Group Inc * | | | 1,006 | | | | 7,102 | |
EMCOR Group Inc | | | 6,383 | | | | 220,916 | |
Encore Wire Corp | | | 1,573 | | | | 47,678 | |
Energy Recovery Inc * | | | 4,223 | | | | 14,358 | |
EnergySolutions Inc * | | | 5,568 | | | | 17,372 | |
EnerNOC Inc * | | | 1,463 | | | | 17,190 | |
EnerSys * | | | 2,919 | | | | 109,842 | |
Ennis Inc | | | 2,485 | | | | 38,443 | |
Enphase Energy Inc * | | | 161 | | | | 588 | |
EnPro Industries Inc * | | | 922 | | | | 37,710 | |
ESCO Technologies Inc | | | 1,739 | | | | 65,056 | |
Esterline Technologies Corp * | | | 2,930 | | | | 186,377 | |
Federal Signal Corp * | | | 5,339 | | | | 40,630 | |
Flow International Corp * | | | 3,622 | | | | 12,677 | |
Franklin Covey Co * | | | 385 | | | | 4,967 | |
Franklin Electric Co Inc | | | 114 | | | | 7,087 | |
FreightCar America Inc | | | 1,131 | | | | 25,357 | |
FTI Consulting Inc * | | | 4,011 | | | | 132,363 | |
FuelCell Energy Inc * | | | 10,767 | | | | 9,873 | |
Furmanite Corp * | | | 3,583 | | | | 19,241 | |
G&K Services Inc ‘A’ | | | 1,818 | | | | 62,085 | |
Genco Shipping & Trading Ltd * | | | 2,991 | | | | 10,439 | |
GenCorp Inc * | | | 1,190 | | | | 10,889 | |
Generac Holdings Inc | | | 1,295 | | | | 44,431 | |
GeoEye Inc * | | | 1,457 | | | | 44,774 | |
Gibraltar Industries Inc * | | | 2,912 | | | | 46,359 | |
Global Power Equipment Group Inc | | | 1,656 | | | | 28,400 | |
GP Strategies Corp * | | | 139 | | | | 2,870 | |
Granite Construction Inc | | | 3,695 | | | | 124,226 | |
Great Lakes Dredge & Dock Co | | | 5,069 | | | | 45,266 | |
Griffon Corp | | | 4,341 | | | | 49,748 | |
H&E Equipment Services Inc | | | 1,223 | | | | 18,431 | |
Hardinge Inc | | | 1,121 | | | | 11,143 | |
Hawaiian Holdings Inc * | | | 2,234 | | | | 14,677 | |
Heartland Express Inc | | | 1,047 | | | | 13,684 | |
Heidrick & Struggles International Inc | | | 1,732 | | | | 26,430 | |
Hill International Inc * | | | 2,091 | | | | 7,653 | |
HNI Corp | | | 233 | | | | 7,004 | |
Houston Wire & Cable Co | | | 1,100 | | | | 13,497 | |
Hudson Global Inc * | | | 3,195 | | | | 14,314 | |
Hurco Cos Inc * | | | 619 | | | | 14,237 | |
Hyster-Yale Materials Handling Inc | | | 1,044 | | | | 50,947 | |
ICF International Inc * | | | 1,898 | | | | 44,489 | |
II-VI Inc * | | | 748 | | | | 13,666 | |
Insteel Industries Inc | | | 1,604 | | | | 20,018 | |
International Shipholding Corp | | | 525 | | | | 8,652 | |
Intersections Inc | | | 317 | | | | 3,005 | |
JetBlue Airways Corp * | | | 22,402 | | | | 127,915 | |
Kadant Inc * | | | 1,106 | | | | 29,320 | |
Kaydon Corp | | | 3,067 | | | | 73,393 | |
Kelly Services Inc ‘A’ | | | 2,540 | | | | 39,980 | |
Kforce Inc | | | 247 | | | | 3,540 | |
Kimball International Inc ‘B’ | | | 3,143 | | | | 36,490 | |
Knoll Inc | | | 1,403 | | | | 21,550 | |
Korn/Ferry International * | | | 4,568 | | | | 72,448 | |
Kratos Defense & Security Solutions Inc * | | | 3,860 | | | | 19,416 | |
Layne Christensen Co * | | | 1,888 | | | | 45,822 | |
LB Foster Co ‘A’ | | | 867 | | | | 37,662 | |
LMI Aerospace Inc * | | | 763 | | | | 14,756 | |
LSI Industries Inc | | | 1,875 | | | | 13,144 | |
Lydall Inc * | | | 1,645 | | | | 23,589 | |
Marten Transport Ltd | | | 1,500 | | | | 27,585 | |
McGrath RentCorp | | | 1,158 | | | | 33,605 | |
Meritor Inc * | | | 7,001 | | | | 33,115 | |
Met-Pro Corp | | | 1,304 | | | | 12,636 | |
Metalico Inc * | | | 3,967 | | | | 7,775 | |
Michael Baker Corp | | | 832 | | | | 20,742 | |
| | | | | | | | |
| | | Shares | | | Value | |
Miller Industries Inc | | | 1,030 | | | | $15,708 | |
Mobile Mini Inc * | | | 3,656 | | | | 76,155 | |
Moog Inc ‘A’ * | | | 3,831 | | | | 157,186 | |
Mueller Industries Inc | | | 1,586 | | | | 79,348 | |
Mueller Water Products Inc ‘A’ | | | 5,239 | | | | 29,391 | |
Multi-Color Corp | | | 1,199 | | | | 28,764 | |
MYR Group Inc * | | | 884 | | | | 19,669 | |
National Presto Industries Inc | | | 416 | | | | 28,746 | |
Navigant Consulting Inc * | | | 4,952 | | | | 55,264 | |
NCI Building Systems Inc * | | | 1,709 | | | | 23,755 | |
NL Industries Inc | | | 622 | | | | 7,122 | |
NN Inc * | | | 1,636 | | | | 14,986 | |
Northwest Pipe Co * | | | 879 | | | | 20,973 | |
Orbital Sciences Corp * | | | 5,636 | | | | 77,608 | |
Orion Marine Group Inc * | | | 2,610 | | | | 19,079 | |
Pacer International Inc * | | | 2,978 | | | | 11,614 | |
Park-Ohio Holdings Corp * | | | 46 | | | | 980 | |
Patriot Transportation Holding Inc * | | | 612 | | | | 17,399 | |
Pendrell Corp * | | | 15,308 | | | | 19,441 | |
Performant Financial Corp * | | | 366 | | | | 3,697 | |
PGT Inc * | | | 928 | | | | 4,176 | |
Pike Electric Corp | | | 1,654 | | | | 15,796 | |
PMFG Inc * | | | 1,997 | | | | 18,153 | |
Powell Industries Inc * | | | 491 | | | | 20,391 | |
Preformed Line Products Co | | | 202 | | | | 12,003 | |
Primoris Services Corp | | | 2,104 | | | | 31,644 | |
Quad/Graphics Inc | | | 2,396 | | | | 48,854 | |
Quality Distribution Inc * | | | 1,281 | | | | 7,686 | |
Quanex Building Products Corp | | | 3,516 | | | | 71,762 | |
Rand Logistics Inc * | | | 1,535 | | | | 9,978 | |
Republic Airways Holdings Inc * | | | 2,098 | | | | 11,917 | |
Resources Connection Inc | | | 4,058 | | | | 48,453 | |
Rexnord Corp * | | | 2,148 | | | | 45,752 | |
Roadrunner Transportation Systems Inc * | | | 624 | | | | 11,319 | |
Robbins & Myers Inc | | | 2,172 | | | | 129,125 | |
RPX Corp * | | | 157 | | | | 1,419 | |
Rush Enterprises Inc ‘A’ * | | | 3,160 | | | | 65,317 | |
Saia Inc * | | | 1,257 | | | | 29,062 | |
Schawk Inc | | | 1,138 | | | | 14,976 | |
Seaboard Corp | | | 29 | | | | 73,367 | |
SeaCube Container Leasing Ltd (Bermuda) | | | 887 | | | | 16,720 | |
SIFCO Industries Inc | | | 137 | | | | 2,158 | |
Simpson Manufacturing Co Inc | | | 3,438 | | | | 112,732 | |
SkyWest Inc | | | 4,596 | | | | 57,266 | |
Standex International Corp | | | 939 | | | | 48,161 | |
Steelcase Inc ‘A’ | | | 6,278 | | | | 79,982 | |
Sterling Construction Co Inc * | | | 1,408 | | | | 13,996 | |
Swisher Hygiene Inc * | | | 10,835 | | | | 18,961 | |
Sykes Enterprises Inc * | | | 3,720 | | | | 56,618 | |
Sypris Solutions Inc | | | 366 | | | | 1,449 | |
TAL International Group Inc | | | 1,388 | | | | 50,495 | |
Teledyne Technologies Inc * | | | 2,292 | | | | 149,140 | |
Tetra Tech Inc * | | | 1,131 | | | | 29,915 | |
The Dolan Co * | | | 2,935 | | | | 11,417 | |
The Eastern Co | | | 595 | | | | 9,413 | |
The Geo Group Inc | | | 5,869 | | | | 165,506 | |
The Greenbrier Cos Inc * | | | 2,179 | | | | 35,234 | |
The KEYW Holding Corp * | | | 1,377 | | | | 17,474 | |
TMS International Corp ‘A’ * | | | 574 | | | | 7,186 | |
TRC Cos Inc * | | | 241 | | | | 1,403 | |
TriMas Corp * | | | 238 | | | | 6,654 | |
TrueBlue Inc * | | | 1,049 | | | | 16,522 | |
Tutor Perini Corp * | | | 3,406 | | | | 46,662 | |
Twin Disc Inc | | | 819 | | | | 14,275 | |
UniFirst Corp | | | 1,384 | | | | 101,475 | |
United Stationers Inc | | | 3,659 | | | | 113,392 | |
Universal Forest Products Inc | | | 1,882 | | | | 71,591 | |
Universal Truckload Services Inc | | | 524 | | | | 9,563 | |
US Ecology Inc | | | 657 | | | | 15,466 | |
Viad Corp | | | 1,932 | | | | 52,473 | |
| | |
| See Notes to Financial Statements | | See explanation of symbols and terms, if any, on page B-81 |
B-58
PACIFIC SELECT FUND
PD SMALL-CAP VALUE INDEX PORTFOLIO
Schedule of Investments (Continued)
December 31, 2012
| | | | | | | | |
| | | Shares | | | Value | |
Vicor Corp * | | | 1,556 | | | | $8,434 | |
VSE Corp | | | 373 | | | | 9,142 | |
WageWorks Inc * | | | 266 | | | | 4,735 | |
Watts Water Technologies Inc ‘A’ | | | 2,683 | | | | 115,342 | |
Werner Enterprises Inc | | | 590 | | | | 12,785 | |
Wesco Aircraft Holdings Inc * | | | 1,234 | | | | 16,301 | |
Willis Lease Finance Corp * | | | 480 | | | | 6,869 | |
Zipcar Inc * | | | 448 | | | | 3,692 | |
| | | | | | | | |
| | | | 7,791,801 | |
| | | | | | | | |
Information Technology - 11.5% | | | | | | | | |
| | |
Accelrys Inc * | | | 5,300 | | | | 47,965 | |
Actuate Corp * | | | 296 | | | | 1,658 | |
Acxiom Corp * | | | 7,359 | | | | 128,488 | |
Advanced Energy Industries Inc * | | | 3,788 | | | | 52,312 | |
Aeroflex Holding Corp * | | | 1,899 | | | | 13,293 | |
Agilysys Inc * | | | 1,404 | | | | 11,751 | |
Alpha & Omega Semiconductor Ltd * (Bermuda) | | | 1,652 | | | | 13,877 | |
Ambarella Inc * (Cayman) | | | 365 | | | | 4,070 | |
Amkor Technology Inc * | | | 6,999 | | | | 29,746 | |
ANADIGICS Inc * | | | 6,769 | | | | 17,058 | |
Anaren Inc * | | | 1,163 | | | | 22,620 | |
Anixter International Inc | | | 1,054 | | | | 67,435 | |
Applied Micro Circuits Corp * | | | 6,229 | | | | 52,324 | |
ARRIS Group Inc * | | | 9,391 | | | | 140,302 | |
Aspen Technology Inc * | | | 504 | | | | 13,931 | |
ATMI Inc * | | | 2,854 | | | | 59,592 | |
Audience Inc * | | | 496 | | | | 5,153 | |
AVG Technologies NV * (Netherlands) | | | 59 | | | | 934 | |
Aviat Networks Inc * | | | 5,895 | | | | 19,395 | |
Avid Technology Inc * | | | 2,874 | | | | 21,785 | |
Aware Inc | | | 164 | | | | 899 | |
Axcelis Technologies Inc * | | | 10,338 | | | | 14,370 | |
AXT Inc * | | | 3,099 | | | | 8,708 | |
Bankrate Inc * | | | 529 | | | | 6,586 | |
Bazaarvoice Inc * | | | 48 | | | | 449 | |
Bel Fuse Inc ‘B’ | | | 1,020 | | | | 19,941 | |
Benchmark Electronics Inc * | | | 5,501 | | | | 91,427 | |
Black Box Corp | | | 1,565 | | | | 38,092 | |
Blucora Inc * | | | 3,234 | | | | 50,806 | |
Bottomline Technologies Inc * | | | 2,382 | | | | 62,861 | |
Brightcove Inc * | | | 33 | | | | 298 | |
Brooks Automation Inc | | | 6,334 | | | | 50,989 | |
CACI International Inc ‘A’ * | | | 1,989 | | | | 109,455 | |
Calix Inc * | | | 2,478 | | | | 19,056 | |
Ceva Inc * | | | 548 | | | | 8,631 | |
Checkpoint Systems Inc * | | | 3,842 | | | | 41,263 | |
CIBER Inc * | | | 7,015 | | | | 23,430 | |
Ciena Corp * | | | 2,310 | | | | 36,267 | |
Coherent Inc | | | 1,603 | | | | 81,144 | |
Cohu Inc | | | 2,346 | | | | 25,431 | |
Computer Task Group Inc * | | | 336 | | | | 6,125 | |
Comtech Telecommunications Corp | | | 1,709 | | | | 43,374 | |
Convergys Corp | | | 10,447 | | | | 171,435 | |
CSG Systems International Inc * | | | 1,388 | | | | 25,234 | |
CTS Corp | | | 3,283 | | | | 34,898 | |
Cymer Inc * | | | 2,050 | | | | 185,381 | |
Daktronics Inc | | | 2,634 | | | | 29,158 | |
DealerTrack Technologies Inc * | | | 436 | | | | 12,522 | |
Demand Media Inc * | | | 703 | | | | 6,531 | |
Demandware Inc * | | | 31 | | | | 847 | |
Digi International Inc * | | | 2,481 | | | | 23,495 | |
Digital River Inc * | | | 3,523 | | | | 50,696 | |
Diodes Inc * | | | 3,395 | | | | 58,903 | |
DSP Group Inc * | | | 2,100 | | | | 12,096 | |
E2open Inc * | | | 117 | | | | 1,657 | |
Earthlink Inc | | | 10,147 | | | | 65,550 | |
Ebix Inc | | | 678 | | | | 10,895 | |
Echelon Corp * | | | 1,644 | | | | 4,028 | |
| | | | | | | | |
| | | Shares | | | Value | |
Electro Rent Corp | | | 1,630 | | | | $25,069 | |
Electro Scientific Industries Inc | | | 2,206 | | | | 21,950 | |
Electronics for Imaging Inc * | | | 4,089 | | | | 77,650 | |
Eloqua Inc * | | | 244 | | | | 5,756 | |
Emulex Corp * | | | 8,301 | | | | 60,597 | |
Entegris Inc * | | | 13,135 | | | | 120,579 | |
Entropic Communications Inc * | | | 8,487 | | | | 44,896 | |
Envivio Inc * | | | 526 | | | | 894 | |
EPIQ Systems Inc | | | 2,800 | | | | 35,784 | |
ePlus Inc | | | 381 | | | | 15,751 | |
Euronet Worldwide Inc * | | | 4,847 | | | | 114,389 | |
Exa Corp * | | | 142 | | | | 1,382 | |
Exar Corp * | | | 3,056 | | | | 27,198 | |
Fabrinet * (Cayman) | | | 2,125 | | | | 27,922 | |
FEI Co | | | 223 | | | | 12,368 | |
Finisar Corp * | | | 8,731 | | | | 142,315 | |
First Solar Inc * | | | 5,753 | | | | 177,653 | |
FleetMatics Group PLC * (Ireland) | | | 224 | | | | 5,636 | |
FormFactor Inc * | | | 4,669 | | | | 21,291 | |
Gerber Scientific Inc Escrow Shares * + | | | 1,382 | | | | - | |
Globecomm Systems Inc * | | | 520 | | | | 5,876 | |
Glu Mobile Inc * | | | 359 | | | | 822 | |
GSI Group Inc * (Canada) | | | 2,656 | | | | 23,001 | |
GSI Technology Inc * | | | 1,978 | | | | 12,402 | |
GT Advanced Technologies Inc * | | | 1,788 | | | | 5,400 | |
Harmonic Inc * | | | 11,234 | | | | 56,956 | |
Imation Corp * | | | 2,968 | | | | 13,861 | |
Immersion Corp * | | | 224 | | | | 1,539 | |
Infinera Corp * | | | 1,047 | | | | 6,083 | |
Infoblox Inc * | | | 37 | | | | 665 | |
Inphi Corp * | | | 1,338 | | | | 12,818 | |
Insight Enterprises Inc * | | | 4,233 | | | | 73,527 | |
Integrated Device Technology Inc * | | | 13,602 | | | | 99,295 | |
Integrated Silicon Solution Inc * | | | 2,631 | | | | 23,679 | |
Intermec Inc * | | | 4,995 | | | | 49,251 | |
Internap Network Services Corp * | | | 2,520 | | | | 17,489 | |
International Rectifier Corp * | | | 6,608 | | | | 117,160 | |
Intersil Corp ‘A’ | | | 12,189 | | | | 101,047 | |
Intevac Inc * | | | 2,232 | | | | 10,200 | |
IntraLinks Holdings Inc * | | | 3,511 | | | | 21,663 | |
iPass Inc * | | | 396 | | | | 725 | |
IXYS Corp | | | 2,362 | | | | 21,589 | |
j2 Global Inc | | | 766 | | | | 23,424 | |
Kemet Corp * | | | 4,320 | | | | 21,730 | |
Key Tronic Corp * | | | 843 | | | | 8,632 | |
Keynote Systems Inc | | | 1,511 | | | | 21,290 | |
Kopin Corp * | | | 6,434 | | | | 21,425 | |
KVH Industries Inc * | | | 192 | | | | 2,684 | |
Lattice Semiconductor Corp * | | | 11,251 | | | | 44,891 | |
Limelight Networks Inc * | | | 5,778 | | | | 12,827 | |
Littelfuse Inc | | | 199 | | | | 12,280 | |
Loral Space & Communications Inc | | | 58 | | | | 3,170 | |
LTX-Credence Corp * | | | 4,723 | | | | 30,983 | |
M/A-COM Technology Solutions Holdings Inc * | | | 467 | | | | 6,991 | |
ManTech International Corp ‘A’ | | | 2,208 | | | | 57,276 | |
Marchex Inc ‘B’ | | | 2,172 | | | | 8,927 | |
Market Leader Inc * | | | 320 | | | | 2,096 | |
Mattersight Corp * | | | 64 | | | | 318 | |
Mattson Technology Inc * | | | 5,604 | | | | 4,707 | |
MaxLinear Inc ‘A’ * | | | 1,758 | | | | 8,825 | |
Measurement Specialties Inc * | | | 165 | | | | 5,669 | |
MeetMe Inc * | | | 1,596 | | | | 5,570 | |
MEMC Electronic Materials Inc * | | | 17,154 | | | | 55,064 | |
Mentor Graphics Corp * | | | 4,104 | | | | 69,850 | |
Mercury Systems Inc * | | | 2,982 | | | | 27,434 | |
Methode Electronics Inc | | | 3,569 | | | | 35,797 | |
Millennial Media Inc * | | | 64 | | | | 802 | |
Mindspeed Technologies Inc * | | | 3,472 | | | | 16,249 | |
MIPS Technologies Inc * | | | 1,075 | | | | 8,407 | |
| | |
| See Notes to Financial Statements | | See explanation of symbols and terms, if any, on page B-81 |
B-59
PACIFIC SELECT FUND
PD SMALL-CAP VALUE INDEX PORTFOLIO
Schedule of Investments (Continued)
December 31, 2012
| | | | | | | | |
| | | Shares | | | Value | |
MKS Instruments Inc | | | 5,023 | | | | $129,493 | |
ModusLink Global Solutions Inc * | | | 3,786 | | | | 10,979 | |
MoneyGram International Inc * | | | 1,479 | | | | 19,656 | |
Monster Worldwide Inc * | | | 11,602 | | | | 65,203 | |
MoSys Inc * | | | 3,227 | | | | 11,230 | |
Multi-Fineline Electronix Inc * | | | 668 | | | | 13,500 | |
Nanometrics Inc * | | | 2,230 | | | | 32,157 | |
NeoPhotonics Corp * | | | 1,787 | | | | 10,257 | |
NETGEAR Inc * | | | 2,006 | | | | 79,077 | |
Newport Corp * | | | 3,642 | | | | 48,985 | |
Oclaro Inc * | | | 7,022 | | | | 11,025 | |
OCZ Technology Group Inc * | | | 6,464 | | | | 12,346 | |
OmniVision Technologies Inc * | | | 5,012 | | | | 70,569 | |
Oplink Communications Inc * | | | 1,837 | | | | 28,620 | |
Park Electrochemical Corp | | | 1,986 | | | | 51,100 | |
PC Connection Inc | | | 855 | | | | 9,833 | |
PCTEL Inc | | | 1,773 | | | | 12,766 | |
Peregrine Semiconductor Corp * | | | 408 | | | | 6,246 | |
Perficient Inc * | | | 712 | | | | 8,387 | |
Pericom Semiconductor Corp * | | | 2,273 | | | | 18,252 | |
Pervasive Software Inc * | | | 1,178 | | | | 10,496 | |
Photronics Inc * | | | 5,820 | | | | 34,687 | |
Plantronics Inc | | | 2,708 | | | | 99,844 | |
Plexus Corp * | | | 1,879 | | | | 48,478 | |
PLX Technology Inc * | | | 343 | | | | 1,245 | |
Power-One Inc * | | | 6,464 | | | | 26,567 | |
Progress Software Corp * | | | 6,027 | | | | 126,507 | |
Proofpoint Inc * | | | 34 | | | | 419 | |
QAD Inc ‘A’ | | | 49 | | | | 706 | |
QLogic Corp * | | | 7,046 | | | | 68,558 | |
Qualys Inc * | | | 216 | | | | 3,195 | |
Quantum Corp * | | | 21,220 | | | | 26,313 | |
QuickLogic Corp * | | | 517 | | | | 1,122 | |
QuinStreet Inc * | | | 3,146 | | | | 21,141 | |
Radisys Corp * | | | 2,094 | | | | 6,240 | |
Rambus Inc * | | | 9,789 | | | | 47,770 | |
RealD Inc * | | | 576 | | | | 6,457 | |
RealNetworks Inc * | | | 2,102 | | | | 15,891 | |
RF Micro Devices Inc * | | | 23,335 | | | | 104,541 | |
Richardson Electronics Ltd | | | 1,236 | | | | 13,992 | |
Rofin-Sinar Technologies Inc * | | | 2,729 | | | | 59,165 | |
Rogers Corp * | | | 894 | | | | 44,396 | |
Rosetta Stone Inc * | | | 538 | | | | 6,639 | |
Rubicon Technology Inc * | | | 1,633 | | | | 9,978 | |
Ruckus Wireless Inc * | | | 439 | | | | 9,891 | |
Rudolph Technologies Inc * | | | 3,059 | | | | 41,144 | |
Sanmina Corp * | | | 7,787 | | | | 86,202 | |
Sapiens International Corp NV * (Netherlands) | | | 1,314 | | | | 5,256 | |
ScanSource Inc * | | | 2,632 | | | | 83,619 | |
SeaChange International Inc * | | | 2,754 | | | | 26,631 | |
ShoreTel Inc * | | | 589 | | | | 2,497 | |
Sigma Designs Inc * | | | 3,072 | | | | 15,821 | |
Silicon Graphics International Corp * | | | 2,914 | | | | 29,810 | |
Silicon Image Inc * | | | 1,273 | | | | 6,314 | |
Sonus Networks Inc * | | | 18,702 | | | | 31,793 | |
Spansion Inc ‘A’ * | | | 4,595 | | | | 63,916 | |
SS&C Technologies Holdings Inc * | | | 2,373 | | | | 54,864 | |
STEC Inc * | | | 3,410 | | | | 16,811 | |
STR Holdings Inc * | | | 2,796 | | | | 7,046 | |
SunPower Corp * | | | 2,057 | | | | 11,560 | |
Super Micro Computer Inc * | | | 307 | | | | 3,131 | |
Supertex Inc | | | 992 | | | | 17,410 | |
support.com Inc * | | | 1,351 | | | | 5,647 | |
Sycamore Networks Inc | | | 1,874 | | | | 4,198 | |
Symmetricom Inc * | | | 4,008 | | | | 23,126 | |
Synacor Inc * | | | 39 | | | | 213 | |
SYNNEX Corp * | | | 2,505 | | | | 86,122 | |
TechTarget Inc * | | | 1,495 | | | | 8,297 | |
TeleNav Inc * | | | 1,594 | | | | 12,720 | |
| | | | | | | | |
| | | Shares | | | Value | |
TeleTech Holdings Inc * | | | 2,185 | | | | $38,893 | |
Tellabs Inc | | | 35,032 | | | | 79,873 | |
Telular Corp | | | 630 | | | | 5,966 | |
Tessco Technologies Inc | | | 255 | | | | 5,646 | |
Tessera Technologies Inc | | | 4,964 | | | | 81,509 | |
TiVo Inc * | | | 5,964 | | | | 73,476 | |
TriQuint Semiconductor Inc * | | | 16,141 | | | | 78,122 | |
Trulia Inc * | | | 180 | | | | 2,923 | |
TTM Technologies Inc * | | | 5,066 | | | | 46,607 | |
Ultra Clean Holdings Inc * | | | 2,601 | | | | 12,771 | |
Unisys Corp * | | | 2,070 | | | | 35,811 | |
United Online Inc | | | 8,740 | | | | 48,857 | |
Unwired Planet Inc * | | | 542 | | | | 650 | |
ValueClick Inc * | | | 2,865 | | | | 55,610 | |
VASCO Data Security International Inc * | | | 1,489 | | | | 12,150 | |
Veeco Instruments Inc * | | | 2,764 | | | | 81,593 | |
Viasystems Group Inc * | | | 356 | | | | 4,343 | |
Vishay Precision Group Inc * | | | 1,141 | | | | 15,084 | |
WebMD Health Corp * | | | 4,840 | | | | 69,406 | |
Westell Technologies Inc ‘A’ * | | | 4,325 | | | | 8,001 | |
Zygo Corp * | | | 1,276 | | | | 20,033 | |
| | | | | | | | |
| | | | 7,153,454 | |
| | | | | | | | |
Materials - 5.5% | | | | | | | | |
| | |
A. Schulman Inc | | | 2,817 | | | | 81,496 | |
A.M. Castle & Co * | | | 1,608 | | | | 23,750 | |
AK Steel Holding Corp | | | 10,847 | | | | 49,896 | |
AMCOL International Corp | | | 140 | | | | 4,295 | |
Berry Plastics Group Inc * | | | 1,649 | | | | 26,516 | |
Boise Inc | | | 9,609 | | | | 76,392 | |
Buckeye Technologies Inc | | | 1,581 | | | | 45,390 | |
Calgon Carbon Corp * | | | 864 | | | | 12,251 | |
Century Aluminum Co * | | | 4,907 | | | | 42,985 | |
Chase Corp | | | 613 | | | | 11,402 | |
Chemtura Corp * | | | 2,880 | | | | 61,229 | |
Clearwater Paper Corp * | | | 444 | | | | 17,387 | |
Coeur d’Alene Mines Corp * | | | 5,062 | | | | 124,525 | |
Ferro Corp * | | | 8,339 | | | | 34,857 | |
FutureFuel Corp | | | 1,858 | | | | 21,999 | |
General Moly Inc * | | | 5,467 | | | | 21,923 | |
Georgia Gulf Corp | | | 1,204 | | | | 49,701 | |
Globe Specialty Metals Inc | | | 5,462 | | | | 75,102 | |
Gold Reserve Inc * (Canada) | | | 4,400 | | | | 14,564 | |
Golden Minerals Co * | | | 3,178 | | | | 14,587 | |
Golden Star Resources Ltd (XASE) * (Canada) | | | 24,693 | | | | 45,435 | |
Graphic Packaging Holding Co * | | | 16,013 | | | | 103,444 | |
Handy & Harman Ltd * | | | 65 | | | | 980 | |
Haynes International Inc | | | 208 | | | | 10,789 | |
Hecla Mining Co | | | 27,287 | | | | 159,083 | |
Horsehead Holding Corp * | | | 4,174 | | | | 42,617 | |
Innospec Inc | | | 1,932 | | | | 66,635 | |
Kaiser Aluminum Corp | | | 1,842 | | | | 113,633 | |
KapStone Paper and Packaging Corp | | | 3,862 | | | | 85,698 | |
Kraton Performance Polymers Inc * | | | 3,079 | | | | 73,988 | |
Landec Corp * | | | 1,849 | | | | 17,547 | |
Louisiana-Pacific Corp * | | | 13,147 | | | | 254,000 | |
LSB Industries Inc * | | | 766 | | | | 27,132 | |
Materion Corp | | | 1,772 | | | | 45,682 | |
McEwen Mining Inc * | | | 20,727 | | | | 79,384 | |
Metals USA Holdings Corp | | | 843 | | | | 14,744 | |
Minerals Technologies Inc | | | 3,383 | | | | 135,049 | |
Neenah Paper Inc | | | 604 | | | | 17,196 | |
Olin Corp | | | 2,426 | | | | 52,377 | |
Olympic Steel Inc | | | 853 | | | | 18,885 | |
OM Group Inc * | | | 3,086 | | | | 68,509 | |
PH Glatfelter Co | | | 3,394 | | | | 59,327 | |
PolyOne Corp | | | 1,849 | | | | 37,757 | |
Quaker Chemical Corp | | | 899 | | | | 48,420 | |
Resolute Forest Products * | | | 7,714 | | | | 102,133 | |
| | |
| See Notes to Financial Statements | | See explanation of symbols and terms, if any, on page B-81 |
B-60
PACIFIC SELECT FUND
PD SMALL-CAP VALUE INDEX PORTFOLIO
Schedule of Investments (Continued)
December 31, 2012
| | | | | | | | |
| | | Shares | | | Value | |
Revett Minerals Inc * (Canada) | | | 2,440 | | | | $6,881 | |
RTI International Metals Inc * | | | 2,891 | | | | 79,676 | |
Schnitzer Steel Industries Inc ‘A’ | | | 2,409 | | | | 73,065 | |
Schweitzer-Mauduit International Inc | | | 771 | | | | 30,092 | |
Sensient Technologies Corp | | | 4,783 | | | | 170,083 | |
Spartech Corp * | | | 2,968 | | | | 26,920 | |
Stepan Co | | | 88 | | | | 4,888 | |
Stillwater Mining Co * | | | 11,074 | | | | 141,526 | |
SunCoke Energy Inc * | | | 1,984 | | | | 30,931 | |
Texas Industries Inc * | | | 2,158 | | | | 110,080 | |
Tredegar Corp | | | 2,330 | | | | 47,579 | |
UFP Technologies Inc * | | | 527 | | | | 9,444 | |
United States Lime & Minerals Inc * | | | 11 | | | | 518 | |
Universal Stainless & Alloy Products Inc * | | | 660 | | | | 24,268 | |
Vista Gold Corp * (Canada) | | | 5,596 | | | | 15,109 | |
Wausau Paper Corp | | | 233 | | | | 2,018 | |
Worthington Industries Inc | | | 5,002 | | | | 130,002 | |
Zep Inc | | | 1,250 | | | | 18,050 | |
Zoltek Cos Inc * | | | 2,649 | | | | 20,530 | |
| | | | | | | | |
| | | | 3,432,351 | |
| | | | | | | | |
Telecommunication Services - 0.5% | | | | | | | | |
| | |
Cbeyond Inc * | | | 2,527 | | | | 22,844 | |
Cincinnati Bell Inc * | | | 12,180 | | | | 66,746 | |
Consolidated Communications Holdings Inc | | | 1,490 | | | | 23,721 | |
Fairpoint Communications Inc * | | | 356 | | | | 2,827 | |
Hawaiian Telcom Holdco Inc * | | | 1,030 | | | | 20,085 | |
IDT Corp ‘B’ | | | 208 | | | | 1,984 | |
inContact Inc * | | | 442 | | | | 2,290 | |
Iridium Communications Inc * | | | 4,118 | | | | 27,755 | |
Leap Wireless International Inc * | | | 3,861 | | | | 25,676 | |
magicJack VocalTec Ltd * (Israel) | | | 426 | | | | 7,757 | |
Neutral Tandem Inc | | | 2,785 | | | | 7,157 | |
ORBCOMM Inc * | | | 1,660 | | | | 6,507 | |
Premiere Global Services Inc * | | | 3,710 | | | | 36,284 | |
Shenandoah Telecommunications Co | | | 2,299 | | | | 35,198 | |
USA Mobility Inc | | | 1,910 | | | | 22,309 | |
Vonage Holdings Corp * | | | 7,549 | | | | 17,891 | |
| | | | | | | | |
| | | | | | | 327,031 | |
| | | | | | | | |
Utilities - 5.9% | | | | | | | | |
| | |
ALLETE Inc | | | 3,649 | | | | 149,536 | |
American DG Energy Inc * | | | 228 | | | | 527 | |
American States Water Co | | | 1,629 | | | | 78,159 | |
Artesian Resources Corp ‘A’ | | | 718 | | | | 16,105 | |
Atlantic Power Corp (Canada) | | | 9,938 | | | | 113,591 | |
Avista Corp | | | 5,611 | | | | 135,281 | |
Black Hills Corp | | | 4,212 | | | | 153,064 | |
Cadiz Inc * | | | 82 | | | | 649 | |
California Water Service Group | | | 2,020 | | | | 37,067 | |
CH Energy Group Inc | | | 1,422 | | | | 92,743 | |
Chesapeake Utilities Corp | | | 924 | | | | 41,950 | |
Cleco Corp | | | 5,833 | | | | 233,378 | |
Connecticut Water Service Inc | | | 352 | | | | 10,483 | |
Consolidated Water Co Ltd (Cayman) | | | 1,399 | | | | 10,353 | |
Delta Natural Gas Co Inc | | | 653 | | | | 12,766 | |
El Paso Electric Co | | | 3,826 | | | | 122,088 | |
Genie Energy Ltd ‘B’ | | | 1,425 | | | | 10,118 | |
IDACORP Inc | | | 4,792 | | | | 207,733 | |
MGE Energy Inc | | | 2,218 | | | | 113,007 | |
Middlesex Water Co | | | 1,514 | | | | 29,614 | |
New Jersey Resources Corp | | | 3,991 | | | | 158,123 | |
Northwest Natural Gas Co | | | 2,575 | | | | 113,815 | |
NorthWestern Corp | | | 3,486 | | | | 121,069 | |
NRG Energy Inc l | | | - | | | | 11 | |
Ormat Technologies Inc | | | 1,205 | | | | 23,232 | |
Otter Tail Corp | | | 3,248 | | | | 81,200 | |
Piedmont Natural Gas Co Inc | | | 6,316 | | | | 197,754 | |
PNM Resources Inc | | | 7,616 | | | | 156,204 | |
Portland General Electric Co | | | 7,222 | | | | 197,594 | |
| | | | | | | | |
| | | Shares | | | Value | |
SJW Corp | | | 935 | | | | $24,871 | |
South Jersey Industries Inc | | | 2,285 | | | | 115,004 | |
Southwest Gas Corp | | | 4,426 | | | | 187,707 | |
The Empire District Electric Co | | | 4,025 | | | | 82,030 | |
The Laclede Group Inc | | | 2,171 | | | | 83,822 | |
UIL Holdings Corp | | | 4,844 | | | | 173,464 | |
Unitil Corp | | | 1,294 | | | | 33,540 | |
UNS Energy Corp | | | 3,851 | | | | 163,359 | |
WGL Holdings Inc | | | 4,950 | | | | 193,991 | |
York Water Co | | | 297 | | | | 5,218 | |
| | | | | | | | |
| | | | | | | 3,680,220 | |
| | | | | | | | |
Total Common Stocks
(Cost $54,576,909) | | | | | | | 59,224,642 | |
| | | | | | | | |
| | |
EXCHANGE-TRADED FUND - 1.8%
| | | | | | | | |
| | |
iShares Russell 2000 Value Index Fund | | | 14,451 | | | | 1,091,195 | |
| | | | | | | | |
| | |
Total Exchange-Traded Fund
(Cost $1,079,631) | | | | | | | 1,091,195 | |
| | | | | | | | |
| | |
CLOSED-END MUTUAL FUND - 0.0% | | | | | | | | |
| | |
Firsthand Technology Value Fund Inc * | | | 823 | | | | 14,353 | |
| | | | | | | | |
| | |
Total Closed-End Mutual Fund
(Cost $15,515) | | | | | | | 14,353 | |
| | | | | | | | |
| | |
| | | Principal
Amount | | | | |
| | |
SHORT-TERM INVESTMENT - 2.6% | | | | | | | | |
| | |
Repurchase Agreement - 2.6% | | | | | | | | |
| | |
Fixed Income Clearing Corp
0.010% due 01/02/13
(Dated 12/31/12, repurchase price of $1,643,174; collateralized by U.S. Treasury Notes: 0.250% due 07/15/15 and value $1,680,000) | | | $1,643,174 | | | | 1,643,174 | |
| | | | | | | | |
| | |
Total Short-Term Investment
(Cost $1,643,174) | | | | | | | 1,643,174 | |
| | | | | | | | |
| | |
TOTAL INVESTMENTS - 99.5%
(Cost $57,315,229) | | | | | | | 61,973,364 | |
| | |
OTHER ASSETS & LIABILITIES, NET - 0.5% | | | | | | | 323,205 | |
| | | | | | | | |
| | |
NET ASSETS - 100.0% | | | | | | | $62,296,569 | |
| | | | | | | | |
| | |
| See Notes to Financial Statements | | See explanation of symbols and terms, if any, on page B-81 |
B-61
PACIFIC SELECT FUND
PD SMALL-CAP VALUE INDEX PORTFOLIO
Schedule of Investments (Continued)
December 31, 2012
Notes to Schedule of Investments
| (a) | As of December 31, 2012, the portfolio was diversified as a percentage of net assets as follows: |
| | | | |
Financials | | | 35.1% | |
Industrials | | | 12.5% | |
Information Technology | | | 11.5% | |
Consumer Discretionary | | | 11.4% | |
Energy | | | 6.1% | |
Utilities | | | 5.9% | |
Materials | | | 5.5% | |
Health Care | | | 4.2% | |
Short-Term Investment | | | 2.6% | |
Consumer Staples | | | 2.4% | |
Exchange-Traded Fund | | | 1.8% | |
Telecommunication Services | | | 0.5% | |
| | | | |
| | | 99.5% | |
Other Assets & Liabilities, Net | | | 0.5% | |
| | | | |
| | | 100.0% | |
| | | | |
| (b) | Short-term investments reflect either the stated coupon rate or the annualized effective yield on the date of purchase for discounted investments. |
| (c) | As of December 31, 2012, $96,880 in cash was segregated with the broker(s)/custodian as collateral for open futures contracts. |
| (d) | Open futures contracts outstanding as of December 31, 2012 were as follows: |
| | | | | | | | | | | | |
Long Futures Outstanding
| | Number of
Contracts | | | Notional
Amount | | | Unrealized
Appreciation | |
Russell 2000 Mini (03/13) | | | 20 | | | | $1,660,256 | | | | $32,944 | |
| | | | | | | | | | | | |
| (e) | Fair Value Measurements |
The following is a summary of the portfolio’s investments as categorized under the three-tier hierarchy of inputs used in valuing the portfolio’s assets and liabilities (See Note 3D in Notes to Financial Statements) as of December 31, 2012:
| | | | | | | | | | | | | | | | | | |
| | | | | Total Value at
December 31, 2012 | | | Level 1
Quoted Price | | | Level 2
Significant
Observable Inputs | | | Level 3
Significant
Unobservable Inputs | |
Assets | | Common Stocks (1) | | | $59,224,642 | | | | $59,224,642 | | | | $- | | | | $- | |
| | Exchange-Traded Fund | | | 1,091,195 | | | | 1,091,195 | | | | - | | | | - | |
| | Closed-End Mutual Fund | | | 14,353 | | | | 14,353 | | | | - | | | | - | |
| | Short-Term Investment | | | 1,643,174 | | | | - | | | | 1,643,174 | | | | - | |
| | Derivatives: | | | | | | | | | | | | | | | | |
| | Equity Contracts | | | | | | | | | | | | | | | | |
| | Futures | | | 32,944 | | | | 32,944 | | | | - | | | | - | |
| | | | | | | | | | | | | | | | | | |
| | Total | | | $62,006,308 | | | | $60,363,134 | | | | $1,643,174 | | | | $- | |
| | | | | | | | | | | | | | | | | | |
| | (1) | For equity investments categorized in a single level, refer to the schedule of investments for further industry breakout. |
B-62
| | |
| See Notes to Financial Statements | | See explanation of symbols and terms, if any, on page B-81 |
PACIFIC SELECT FUND
PD EMERGING MARKETS PORTFOLIO
Schedule of Investments
December 31, 2012
| | | | | | | | |
| | |
Shares | | | Value | |
PREFERRED STOCKS - 6.7% | | | | | | | | |
| | |
Brazil - 6.6% | | | | | | | | |
| | |
AES Tiete SA | | | 2,800 | | | | $32,367 | |
Banco Bradesco SA | | | 1,300 | | | | 22,641 | |
Banco Bradesco SA ADR | | | 27,246 | | | | 473,263 | |
Banco do Estado do Rio Grande do Sul SA ‘B’ | | | 5,200 | | | | 39,988 | |
Braskem SA ADR | | | 2,100 | | | | 28,035 | |
Centrais Eletricas Brasileiras SA ‘B’ | | | 3,500 | | | | 17,854 | |
Centrais Eletricas Brasileiras SA ADR | | | 800 | | | | 4,008 | |
Cia Brasileira de Distribuicao Grupo Pao de Acucar ADR | | | 1,400 | | | | 62,146 | |
Cia de Bebidas das Americas | | | 700 | | | | 29,478 | |
Cia de Bebidas das Americas ADR | | | 9,650 | | | | 405,204 | |
Cia Energetica de Minas Gerais | | | 3,987 | | | | 43,302 | |
Cia Energetica de Sao Paulo ‘B’ | | | 3,500 | | | | 33,524 | |
Gerdau SA | | | 11,561 | | | | 103,177 | |
Gerdau SA ADR | | | 6,842 | | | | 61,510 | |
Gol Linhas Aereas Inteligentes SA ADR * | | | 952 | | | | 6,245 | |
Itau Unibanco Holding SA | | | 2,700 | | | | 44,598 | |
Itau Unibanco Holding SA ADR | | | 30,500 | | | | 502,030 | |
Klabin SA | | | 10,800 | | | | 68,199 | |
Lojas Americanas SA | | | 6,123 | | | | 55,188 | |
Petroleo Brasileiro SA | | | 882 | | | | 8,532 | |
Petroleo Brasileiro SA ADR | | | 32,154 | | | | 620,572 | |
Telefonica Brasil SA | | | 1,800 | | | | 43,407 | |
Ultrapar Participacoes SA ADR | | | 3,300 | | | | 73,524 | |
Usinas Siderurgicas de Minas Gerais SA ‘A’ | | | 7,505 | | | | 48,926 | |
Vale SA | | | 500 | | | | 10,173 | |
Vale SA ADR | | | 28,066 | | | | 569,740 | |
| | | | | | | | |
| | | | 3,407,631 | |
| | | | | | | | |
Colombia - 0.1% | | | | | | | | |
| | |
Bancolombia SA ADR | | | 800 | | | | 53,264 | |
| | | | | | | | |
| | |
Total Preferred Stocks
(Cost $3,490,328) | | | | | | | 3,460,895 | |
| | | | | | | | |
| | |
COMMON STOCKS - 93.0% | | | | | | | | |
| | |
Bermuda - 0.9% | | | | | | | | |
| | |
Brilliance China Automotive Holdings Ltd * | | | 60,000 | | | | 75,324 | |
China Resources Gas Group Ltd | | | 26,000 | | | | 53,776 | |
COSCO Pacific Ltd | | | 24,182 | | | | 35,089 | |
Credicorp Ltd | | | 788 | | | | 115,489 | |
Kunlun Energy Co Ltd | | | 54,000 | | | | 113,223 | |
VimpelCom Ltd ADR | | | 6,000 | | | | 62,940 | |
| | | | | | | | |
| | | | 455,841 | |
| | | | | | | | |
Brazil - 6.7% | | | | | | | | |
| | |
AES Tiete SA | | | 1,400 | | | | 14,304 | |
All America Latina Logistica SA | | | 3,300 | | | | 13,524 | |
Amil Participacoes SA | | | 3,700 | | | | 55,770 | |
Banco Bradesco SA | | | 8,943 | | | | 144,068 | |
Banco do Brasil SA | | | 8,337 | | | | 106,356 | |
Banco Santander Brasil SA ADR | | | 13,939 | | | | 101,336 | |
BM&FBOVESPA SA | | | 33,327 | | | | 232,634 | |
BR Malls Participacoes SA | | | 4,100 | | | | 54,317 | |
BRF - Brasil Foods SA | | | 3,100 | | | | 65,232 | |
BRF - Brasil Foods SA ADR | | | 7,300 | | | | 154,103 | |
CCR SA | | | 9,200 | | | | 87,243 | |
Centrais Eletricas Brasileiras SA ADR | | | 2,651 | | | | 8,271 | |
CETIP SA - Mercados Organizados | | | 2,800 | | | | 34,949 | |
Cia de Saneamento Basico do Estado de Sao Paulo ADR | | | 1,300 | | | | 108,641 | |
Cia Hering | | | 2,200 | | | | 45,481 | |
Cia Paranaense de Energia ADR | | | 2,200 | | | | 33,770 | |
| | | | | | | | |
| | |
Shares | | | Value | |
Cia Siderurgica Nacional SA ADR | | | 8,700 | | | | $51,330 | |
Cielo SA | | | 4,100 | | | | 114,800 | |
Cosan SA Industria e Comercio | | | 3,876 | | | | 79,682 | |
CPFL Energia SA ADR | | | 1,160 | | | | 24,314 | |
Cyrela Brazil Realty SA Empreendimentos e Participacoes | | | 4,100 | | | | 36,145 | |
Duratex SA | | | 3,000 | | | | 21,918 | |
EcoRodovias Infraestrutura e Logistica SA | | | 6,000 | | | | 50,770 | |
Embraer SA ADR | | | 2,500 | | | | 71,275 | |
Fibria Celulose SA ADR * | | | 2,900 | | | | 32,973 | |
Hypermarcas SA * | | | 6,300 | | | | 52,188 | |
Itau Unibanco Holding SA | | | 2,600 | | | | 40,338 | |
JBS SA * | | | 10,139 | | | | 30,110 | |
Localiza Rent a Car SA | | | 2,700 | | | | 49,626 | |
Lojas Americanas SA | | | 2,083 | | | | 18,157 | |
Lojas Renner SA | | | 1,600 | | | | 62,602 | |
MRV Engenharia e Participacoes SA | | | 6,400 | | | | 38,433 | |
Multiplan Empreendimentos Imobiliarios SA | | | 700 | | | | 20,660 | |
Natura Cosmeticos SA | | | 1,821 | | | | 52,251 | |
Odontoprev SA | | | 7,400 | | | | 39,097 | |
OGX Petroleo e Gas Participacoes SA * | | | 10,000 | | | | 21,925 | |
Oi SA | | | 1,200 | | | | 5,239 | |
Oi SA ADR | | | 15,540 | | | | 62,315 | |
Oi SA ADR ‘C’ | | | 1,164 | | | | 5,005 | |
Petroleo Brasileiro SA | | | 4,478 | | | | 43,842 | |
Petroleo Brasileiro SA ADR | | | 22,016 | | | | 428,651 | |
Porto Seguro SA | | | 2,300 | | | | 26,453 | |
Raia Drogasil SA | | | 3,300 | | | | 37,303 | |
Souza Cruz SA | | | 4,300 | | | | 65,117 | |
Telefonica Brasil SA ADR | | | 1,590 | | | | 38,255 | |
Tim Participacoes SA | | | 7,200 | | | | 28,702 | |
Totvs SA | | | 1,828 | | | | 35,999 | |
Tractebel Energia SA | | | 2,200 | | | | 35,844 | |
Transmissora Alianca de Energia Eletrica SA | | | 1,200 | | | | 12,783 | |
Vale SA ADR | | | 20,878 | | | | 437,603 | |
WEG SA | | | 3,200 | | | | 42,476 | |
| | | | | | | | |
| | | | 3,474,180 | |
| | | | | | | | |
Cayman - 2.6% | | | | | | | | |
| | |
Agile Property Holdings Ltd | | | 10,000 | | | | 14,316 | |
Belle International Holdings Ltd | | | 63,000 | | | | 139,130 | |
China Mengniu Dairy Co Ltd | | | 29,000 | | | | 82,511 | |
China Resources Cement Holdings Ltd | | | 52,000 | | | | 35,029 | |
China Resources Land Ltd | | | 30,000 | | | | 82,685 | |
Country Garden Holdings Co Ltd * | | | 65,044 | | | | 34,808 | |
ENN Energy Holdings Ltd | | | 10,000 | | | | 43,722 | |
Eurasia Drilling Co Ltd GDR ~ | | | 1,015 | | | | 36,432 | |
Eurasia Drilling Co Ltd GDR (LI) ~ | | | 388 | | | | 13,927 | |
Evergrande Real Estate Group Ltd | | | 38,000 | | | | 21,558 | |
GCL-Poly Energy Holdings Ltd | | | 89,000 | | | | 18,363 | |
Geely Automobile Holdings Ltd | | | 145,000 | | | | 69,163 | |
Hengan International Group Co Ltd | | | 6,000 | | | | 54,114 | |
Longfor Properties Co Ltd | | | 31,500 | | | | 62,463 | |
Parkson Retail Group Ltd | | | 47,500 | | | | 38,790 | |
Shimao Property Holdings Ltd | | | 24,926 | | | | 48,126 | |
SOHO China Ltd | | | 8,500 | | | | 6,866 | |
Tencent Holdings Ltd | | | 11,100 | | | | 360,378 | |
Tingyi Holding Corp | | | 18,000 | | | | 50,123 | |
Want Want China Holdings Ltd | | | 89,000 | | | | 123,993 | |
| | | | | | | | |
| | | | 1,336,497 | |
| | | | | | | | |
Chile - 2.1% | | | | | | | | |
| | |
Aguas Andinas SA ‘A’ | | | 15,289 | | | | 10,909 | |
Banco de Chile ADR | | | 770 | | | | 74,305 | |
Banco de Credito e Inversiones | | | 840 | | | | 58,727 | |
Banco Santander Chile SA ADR | | | 1,558 | | | | 44,387 | |
CAP SA | | | 1,029 | | | | 34,968 | |
Cencosud SA | | | 15,223 | | | | 82,692 | |
Cia Cervecerias Unidas SA ADR | | | 2,000 | | | | 63,260 | |
| | |
| See Notes to Financial Statements | | See explanation of symbols and terms, if any, on page B-81 |
B-63
PACIFIC SELECT FUND
PD EMERGING MARKETS PORTFOLIO
Schedule of Investments (Continued)
December 31, 2012
| | | | | | | | |
| | |
Shares | | | Value | |
Cia General de Electricidad SA | | | 3,373 | | | | $19,501 | |
Colbun SA * | | | 179,217 | | | | 49,518 | |
Corpbanca SA | | | 3,670,204 | | | | 49,578 | |
E.CL SA | | | 14,388 | | | | 34,009 | |
Empresa Nacional de Electricidad SA ADR | | | 1,700 | | | | 82,977 | |
Empresas CMPC SA | | | 13,812 | | | | 51,223 | |
Empresas COPEC SA | | | 5,905 | | | | 83,900 | |
Enersis SA ADR | | | 4,200 | | | | 76,524 | |
ENTEL Chile SA | | | 966 | | | | 19,966 | |
Latam Airlines Group SA | | | 4,238 | | | | 99,847 | |
SACI Falabella | | | 4,670 | | | | 48,201 | |
Sigdo Koppers SA | | | 8,610 | | | | 20,776 | |
Sociedad Quimica y Minera de Chile SA ADR | | | 1,300 | | | | 74,932 | |
| | | | | | | | |
| | | | 1,080,200 | |
| | | | | | | | |
China - 9.1% | | | | | | | | |
| | |
Agricultural Bank of China Ltd ‘H’ | | | 254,000 | | | | 128,062 | |
Aluminum Corp of China Ltd ADR * | | | 2,300 | | | | 27,393 | |
Anhui Conch Cement Co Ltd ‘H’ | | | 12,000 | | | | 44,647 | |
Bank of China Ltd ‘H’ | | | 957,400 | | | | 435,920 | |
Bank of Communications Co Ltd ‘H’ | | | 87,925 | | | | 67,069 | |
BBMG Corp ‘H’ | | | 36,500 | | | | 33,842 | |
Byd Co Ltd ‘H’ * | | | 11,000 | | | | 33,692 | |
China BlueChemical Ltd ‘H’ | | | 22,000 | | | | 14,775 | |
China Citic Bank Corp Ltd ‘H’ | | | 105,000 | | | | 63,280 | |
China Coal Energy Co Ltd ‘H’ | | | 52,000 | | | | 58,140 | |
China Communications Construction Co Ltd ‘H’ | | | 42,000 | | | | 41,188 | |
China Communications
Services Corp Ltd ‘H’ | | | 68,000 | | | | 39,598 | |
China Construction Bank Corp ‘H’ | | | 789,340 | | | | 643,315 | |
China COSCO Holdings Co Ltd ‘H’ * | | | 8,500 | | | | 4,270 | |
China Life Insurance Co Ltd ‘H’ | | | 17,000 | | | | 56,179 | |
China Life Insurance Co Ltd ADR | | | 4,353 | | | | 216,301 | |
China Longyuan Power Group Corp ���H’ | | | 30,000 | | | | 21,074 | |
China Merchants Bank Co Ltd ‘H’ | | | 32,300 | | | | 72,350 | |
China Minsheng Banking Corp Ltd ‘H’ | | | 43,500 | | | | 51,372 | |
China National Building Material Co Ltd ‘H’ | | | 20,000 | | | | 29,999 | |
China Oilfield Services Ltd ‘H’ | | | 14,000 | | | | 28,954 | |
China Pacific Insurance Group Co Ltd ‘H’ | | | 12,200 | | | | 45,756 | |
China Petroleum & Chemical Corp ‘H’ | | | 94,000 | | | | 107,923 | |
China Petroleum & Chemical Corp ADR | | | 1,400 | | | | 160,888 | |
China Railway Construction Corp Ltd ‘H’ | | | 70,000 | | | | 80,505 | |
China Railway Group Ltd ‘H’ | | | 115,000 | | | | 67,679 | |
China Shenhua Energy Co Ltd ‘H’ | | | 33,500 | | | | 149,674 | |
China Shipping Container Lines Co Ltd ‘H’ * | | | 95,000 | | | | 27,947 | |
China Shipping Development Co Ltd ‘H’ | | | 24,000 | | | | 14,097 | |
China Telecom Corp Ltd ADR | | | 1,100 | | | | 62,535 | |
CSR Corp Ltd ‘H’ | | | 40,000 | | | | 35,506 | |
Dongfeng Motor Group Co Ltd ‘H’ | | | 28,000 | | | | 44,092 | |
Great Wall Motor Co Ltd ‘H’ | | | 31,000 | | | | 98,338 | |
Guangzhou Automobile Group Co Ltd ‘H’ | | | 42,000 | | | | 37,844 | |
Guangzhou R&F Properties Co Ltd ‘H’ | | | 40,000 | | | | 67,555 | |
Huaneng Power International Inc ‘H’ | | | 86,000 | | | | 79,469 | |
Industrial & Commercial Bank of China ‘H’ | | | 775,045 | | | | 558,938 | |
Jiangxi Copper Co Ltd ‘H’ | | | 15,000 | | | | 40,224 | |
Maanshan Iron & Steel ‘H’ * | | | 60,000 | | | | 18,649 | |
PetroChina Co Ltd ‘H’ | | | 70,000 | | | | 100,174 | |
PetroChina Co Ltd ADR | | | 1,750 | | | | 251,615 | |
PICC Property & Casualty Co Ltd ‘H’ | | | 16,000 | | | | 22,704 | |
Ping An Insurance Group Co ‘H’ | | | 17,000 | | | | 144,662 | |
Shandong Weigao Group Medical Polymer Co Ltd ‘H’ | | | 52,000 | | | | 51,955 | |
Sinopec Shanghai Petrochemical Co Ltd ADR | | | 619 | | | | 22,476 | |
Sinopharm Group Co Ltd ‘H’ | | | 2,000 | | | | 6,353 | |
Weichai Power Co Ltd ‘H’ | | | 7,200 | | | | 32,743 | |
Yanzhou Coal Mining Co Ltd ADR | | | 1,600 | | | | 27,328 | |
Zhaojin Mining Industry Co Ltd ‘H’ | | | 29,000 | | | | 45,943 | |
Zhuzhou CSR Times Electric Co Ltd ‘H’ | | | 8,000 | | | | 30,209 | |
Zijin Mining Group Co Ltd ‘H’ | | | 112,000 | | | | 45,168 | |
| | | | | | | | |
| | |
Shares | | | Value | |
Zoomlion Heavy Industry Science & Technology Co Ltd ‘H’ | | | 36,800 | | | | $55,553 | |
ZTE Corp ‘H’ | | | 12,000 | | | | 20,803 | |
| | | | | | | | |
| | | | 4,666,725 | |
| | | | | | | | |
Colombia - 0.5% | | | | | | | | |
| | |
Almacenes Exito SA | | | 2,928 | | | | 59,158 | |
Ecopetrol SA ADR | | | 2,968 | | | | 177,101 | |
| | | | | | | | |
| | | | 236,259 | |
| | | | | | | | |
Czech Republic - 0.4% | | | | | | | | |
| | |
CEZ AS | | | 3,220 | | | | 115,815 | |
Komercni Banka AS | | | 225 | | | | 47,607 | |
Telefonica Czech Republic AS | | | 1,470 | | | | 25,020 | |
| | | | | | | | |
| | | | 188,442 | |
| | | | | | | | |
Egypt - 0.3% | | | | | | | | |
| | |
Commercial International Bank SAE GDR | | | 5,790 | | | | 31,509 | |
Orascom Construction Industries GDR * | | | 1,234 | | | | 49,620 | |
Orascom Telecom Holding SAE GDR * | | | 16,470 | | | | 51,669 | |
| | | | | | | | |
| | | | 132,798 | |
| | | | | | | | |
Hong Kong - 3.3% | | | | | | | | |
| | |
Beijing Enterprises Holdings Ltd | | | 9,500 | | | | 62,223 | |
China Agri-Industries Holdings Ltd | | | 24,700 | | | | 13,890 | |
China Everbright Ltd | | | 8,000 | | | | 15,725 | |
China Merchants Holdings International Co Ltd | | | 14,000 | | | | 45,592 | |
China Mobile Ltd | | | 9,000 | | | | 105,425 | |
China Mobile Ltd ADR | | | 9,949 | | | | 584,205 | |
China Overseas Land & Investment Ltd | | | 34,000 | | | | 102,992 | |
China Resources Enterprise Ltd | | | 10,000 | | | | 36,325 | |
China Resources Power Holdings Co Ltd | | | 10,000 | | | | 25,588 | |
China Taiping Insurance Holdings Co Ltd * | | | 15,400 | | | | 31,340 | |
China Unicom Ltd | | | 10,000 | | | | 16,189 | |
China Unicom Ltd ADR | | | 5,300 | | | | 86,337 | |
Citic Pacific Ltd | | | 11,000 | | | | 16,641 | |
CNOOC Ltd | | | 40,000 | | | | 87,830 | |
CNOOC Ltd ADR | | | 1,380 | | | | 303,600 | |
Fosun International Ltd | | | 71,500 | | | | 45,944 | |
Lenovo Group Ltd | | | 72,000 | | | | 65,822 | |
Shanghai Industrial Holdings Ltd | | | 5,169 | | | | 18,263 | |
Sino-Ocean Land Holdings Ltd | | | 25,000 | | | | 19,184 | |
| | | | | | | | |
| | | | 1,683,115 | |
| | | | | | | | |
Hungary - 0.3% | | | | | | | | |
| | |
MOL Hungarian Oil & Gas PLC | | | 390 | | | | 31,646 | |
OTP Bank PLC | | | 4,369 | | | | 83,042 | |
Richter Gedeon Nyrt | | | 182 | | | | 30,020 | |
| | | | | | | | |
| | | | 144,708 | |
| | | | | | | | |
India - 7.6% | | | | | | | | |
| | |
ABB Ltd (XNSE) | | | 2,249 | | | | 29,016 | |
ACC Ltd | | | 728 | | | | 19,097 | |
Adani Enterprises Ltd | | | 1,199 | | | | 5,953 | |
Adani Ports & Special Economic Zone | | | 9,699 | | | | 23,946 | |
Adani Power Ltd * | | | 10,755 | | | | 12,251 | |
Ambuja Cements Ltd | | | 13,048 | | | | 48,131 | |
Apollo Hospitals Enterprise Ltd | | | 2,321 | | | | 33,566 | |
Asian Paints Ltd | | | 642 | | | | 52,277 | |
Axis Bank Ltd | | | 4,230 | | | | 105,481 | |
Bajaj Auto Ltd | | | 565 | | | | 21,967 | |
Bank of India | | | 6,327 | | | | 40,211 | |
Bharat Heavy Electricals Ltd | | | 6,715 | | | | 28,403 | |
Bharti Airtel Ltd | | | 15,159 | | | | 88,184 | |
Bosch Ltd | | | 146 | | | | 25,464 | |
Cairn India Ltd | | | 5,368 | | | | 31,367 | |
Cipla Ltd | | | 9,033 | | | | 68,557 | |
DLF Ltd | | | 14,014 | | | | 59,612 | |
Dr Reddy’s Laboratories Ltd ADR | | | 1,900 | | | | 63,251 | |
| | |
| See Notes to Financial Statements | | See explanation of symbols and terms, if any, on page B-81 |
B-64
PACIFIC SELECT FUND
PD EMERGING MARKETS PORTFOLIO
Schedule of Investments (Continued)
December 31, 2012
| | | | | | | | |
| | |
Shares | | | Value | �� |
Federal Bank Ltd | | | 1,667 | | | | $16,482 | |
GAIL India Ltd | | | 5,282 | | | | 34,566 | |
GAIL India Ltd GDR ~ | | | 280 | | | | 10,833 | |
Godrej Consumer Products Ltd | | | 2,985 | | | | 39,599 | |
HCL Technologies Ltd | | | 2,226 | | | | 25,167 | |
HDFC Bank Ltd | | | 19,271 | | | | 239,207 | |
Hero MotoCorp Ltd | | | 938 | | | | 32,732 | |
Hindalco Industries Ltd | | | 15,938 | | | | 38,336 | |
Hindustan Unilever Ltd | | | 13,439 | | | | 129,032 | |
Hindustan Zinc Ltd | | | 9,344 | | | | 23,239 | |
ICICI Bank Ltd ADR | | | 4,200 | | | | 183,162 | |
Idea Cellular Ltd * | | | 30,201 | | | | 57,474 | |
IDFC Ltd | | | 16,783 | | | | 52,810 | |
Indian Oil Corp Ltd | | | 7,289 | | | | 36,170 | |
Infosys Ltd ADR | | | 6,000 | | | | 253,800 | |
ITC Ltd | | | 23,162 | | | | 121,169 | |
Jaiprakash Associates Ltd | | | 49,050 | | | | 88,420 | |
Jindal Steel & Power Ltd | | | 5,356 | | | | 43,896 | |
JSW Steel Ltd | | | 858 | | | | 12,796 | |
Kotak Mahindra Bank Ltd | | | 2,754 | | | | 32,822 | |
Larsen & Toubro Ltd | | | 3,830 | | | | 113,596 | |
Mahindra & Mahindra Ltd | | | 4,278 | | | | 73,448 | |
National Aluminium Co Ltd | | | 5,262 | | | | 4,752 | |
Nestle India Ltd | | | 608 | | | | 55,312 | |
NHPC Ltd | | | 64,839 | | | | 30,128 | |
NTPC Ltd | | | 11,174 | | | | 32,054 | |
Oil & Natural Gas Corp Ltd | | | 8,392 | | | | 41,511 | |
Oil India Ltd | | | 4,590 | | | | 39,488 | |
Oracle Financial Services Software Ltd * | | | 841 | | | | 50,388 | |
Power Grid Corp of India Ltd | | | 22,814 | | | | 47,973 | |
Ranbaxy Laboratories Ltd * | | | 5,898 | | | | 54,410 | |
Reliance Capital Ltd | | | 6,056 | | | | 53,592 | |
Reliance Communications Ltd | | | 17,316 | | | | 23,445 | |
Reliance Industries Ltd GDR (LI) ~ | | | 8,064 | | | | 248,698 | |
Reliance Infrastructure Ltd | | | 4,162 | | | | 40,084 | |
Reliance Power Ltd * | | | 15,483 | | | | 26,511 | |
Sesa Goa Ltd | | | 3,750 | | | | 13,428 | |
Shriram Transport Finance Co Ltd | | | 534 | | | | 7,286 | |
State Bank of India | | | 1,890 | | | | 83,543 | |
Sterlite Industries India Ltd ADR | | | 4,900 | | | | 42,189 | |
Sun Pharmaceutical Industries Ltd | | | 7,057 | | | | 95,022 | |
Tata Consultancy Services Ltd | | | 6,638 | | | | 152,313 | |
Tata Motors Ltd ADR | | | 3,200 | | | | 91,904 | |
Tata Power Co Ltd | | | 7,070 | | | | 14,336 | |
Tata Steel Ltd | | | 5,646 | | | | 44,138 | |
Ultratech Cement Ltd | | | 342 | | | | 12,483 | |
United Spirits Ltd | | | 921 | | | | 31,925 | |
Wipro Ltd | | | 6,066 | | | | 43,994 | |
Yes Bank Ltd | | | 7,759 | | | | 65,785 | |
Zee Entertainment Enterprises Ltd | | | 13,255 | | | | 53,530 | |
| | | | | | | | |
| | | | 3,915,712 | |
| | | | | | | | |
Indonesia - 3.1% | | | | | | | | |
| | |
P.T. Adaro Energy Tbk | | | 212,500 | | | | 35,182 | |
P.T. Astra Agro Lestari Tbk | | | 500 | | | | 1,026 | |
P.T. Astra International Tbk | | | 255,000 | | | | 201,752 | |
P.T. Bank Central Asia Tbk | | | 156,000 | | | | 147,803 | |
P.T. Bank Danamon Indonesia Tbk | | | 99,000 | | | | 58,077 | |
P.T. Bank Mandiri Persero Tbk | | | 175,629 | | | | 148,525 | |
P.T. Bank Negara Indonesia Persero Tbk | | | 179,000 | | | | 68,980 | |
P.T. Bank Rakyat Indonesia Persero Tbk | | | 176,000 | | | | 128,176 | |
P.T. Bank Tabungan Pensiunan Nasional Tbk * | | | 16,500 | | | | 8,989 | |
P.T. Bhakti Investama Tbk | | | 545,500 | | | | 30,646 | |
P.T. Bumi Resources Tbk | | | 122,000 | | | | 7,500 | |
P.T. Bumi Serpong Damai Tbk | | | 255,000 | | | | 30,190 | |
P.T. Charoen Pokphand Indonesia Tbk | | | 88,000 | | | | 33,620 | |
P.T. Global Mediacom Tbk | | | 105,000 | | | | 26,202 | |
P.T. Gudang Garam Tbk | | | 8,500 | | | | 49,805 | |
P.T. Indo Tambangraya Megah Tbk | | | 7,000 | | | | 30,223 | |
| | | | | | | | |
| | |
Shares | | | Value | |
P.T. Indocement Tunggal Prakarsa Tbk | | | 22,000 | | | | $51,398 | |
P.T. Indofood Sukses Makmur Tbk | | | 69,000 | | | | 41,943 | |
P.T. Kalbe Farma Tbk | | | 140,000 | | | | 15,460 | |
P.T. Lippo Karawaci Tbk | | | 146,500 | | | | 15,217 | |
P.T. Mayora Indah Tbk | | | 3,000 | | | | 6,235 | |
P.T. Perusahaan Gas Negara Persero Tbk | | | 102,500 | | | | 49,053 | |
P.T. Perusahaan Perkebunan London Sumatra Indonesia Tbk | | | 49,000 | | | | 11,887 | |
P.T. Semen Gresik Persero Tbk | | | 62,000 | | | | 102,136 | |
P.T. Tambang Batubara Bukit Asam Persero Tbk | | | 24,000 | | | | 37,781 | |
P.T. Telekomunikasi Indonesia Persero Tbk ADR | | | 3,100 | | | | 114,545 | |
P.T. Unilever Indonesia Tbk | | | 18,500 | | | | 40,123 | |
P.T. United Tractors Tbk | | | 22,696 | | | | 46,649 | |
P.T. Vale Indonesia Tbk | | | 39,500 | | | | 9,691 | |
P.T. XL Axiata Tbk | | | 47,000 | | | | 27,909 | |
| | | | | | | | |
| | | | 1,576,723 | |
| | | | | | | | |
Luxembourg - 0.0% | | | | | | | | |
| | |
Kernel Holding SA * | | | 891 | | | | 19,321 | |
| | | | | | | | |
| | |
Malaysia - 4.1% | | | | | | | | |
| | |
AirAsia Bhd | | | 48,800 | | | | 43,954 | |
Alliance Financial Group Bhd | | | 20,300 | | | | 29,232 | |
AMMB Holdings Bhd | | | 26,900 | | | | 59,750 | |
Axiata Group Bhd | | | 49,400 | | | | 106,745 | |
British American Tobacco Malaysia Bhd | | | 3,600 | | | | 73,077 | |
Bumi Armada Bhd * | | | 22,100 | | | | 28,796 | |
CIMB Group Holdings Bhd | | | 63,000 | | | | 157,362 | |
Dialog Group Bhd | | | 40,800 | | | | 32,267 | |
DiGi.Com Bhd | | | 40,900 | | | | 70,808 | |
Gamuda Bhd | | | 22,900 | | | | 27,302 | |
Genting Bhd | | | 22,300 | | | | 67,337 | |
Genting Malaysia Bhd | | | 61,900 | | | | 72,143 | |
Hong Leong Bank Bhd | | | 5,900 | | | | 28,576 | |
IJM Corp Bhd | | | 29,500 | | | | 48,182 | |
IOI Corp Bhd | | | 42,246 | | | | 70,449 | |
Kuala Lumpur Kepong Bhd | | | 8,500 | | | | 66,872 | |
Malayan Banking Bhd | | | 57,090 | | | | 171,781 | |
Malaysia Airports Holdings Bhd | | | 9,000 | | | | 15,352 | |
Maxis Bhd | | | 27,900 | | | | 60,782 | |
MISC Bhd * | | | 23,160 | | | | 32,644 | |
Parkson Holdings Bhd | | | 18,000 | | | | 30,731 | |
Petronas Chemicals Group Bhd | | | 48,500 | | | | 101,427 | |
Petronas Dagangan Bhd | | | 3,500 | | | | 26,797 | |
Petronas Gas Bhd | | | 5,700 | | | | 36,430 | |
PPB Group Bhd | | | 8,300 | | | | 31,522 | |
Public Bank Bhd | | | 12,300 | | | | 65,663 | |
RHB Capital Bhd | | | 22,181 | | | | 55,838 | |
Sapurakencana Petroleum Bhd * | | | 23,500 | | | | 24,313 | |
Sime Darby Bhd | | | 41,100 | | | | 128,084 | |
Telekom Malaysia Bhd | | | 29,300 | | | | 57,913 | |
Tenaga Nasional Bhd | | | 43,900 | | | | 99,604 | |
UEM Land Holdings Bhd * | | | 41,900 | | | | 28,979 | |
UMW Holdings Bhd | | | 20,500 | | | | 80,137 | |
YTL Corp Bhd | | | 112,608 | | | | 70,078 | |
YTL Power International Bhd | | | 55,000 | | | | 28,130 | |
| | | | | | | | |
| | | | 2,129,057 | |
| | | | | | | | |
Mexico - 5.9% | | | | | | | | |
| | |
Alfa SAB de CV ‘A’ | | | 43,000 | | | | 91,414 | |
America Movil SAB de CV ‘L’ | | | 42,272 | | | | 48,694 | |
America Movil SAB de CV ‘L’ ADR | | | 21,818 | | | | 504,869 | |
Arca Continental SAB de CV | | | 7,000 | | | | 52,112 | |
Cemex SAB de CV * | | | 67,100 | | | | 66,081 | |
Cemex SAB de CV ADR * | | | 14,150 | | | | 139,660 | |
Coca-Cola Femsa SAB de CV ADR | | | 600 | | | | 89,424 | |
El Puerto de Liverpool SAB de CV ‘C1’ | | | 1,400 | | | | 14,813 | |
| | |
| See Notes to Financial Statements | | See explanation of symbols and terms, if any, on page B-81 |
B-65
PACIFIC SELECT FUND
PD EMERGING MARKETS PORTFOLIO
Schedule of Investments (Continued)
December 31, 2012
| | | | | | | | |
| | |
Shares | | | Value | |
Fomento Economico Mexicano SAB de CV ADR | | | 3,600 | | | | $362,520 | |
Grupo Aeroportuario del Pacifico
SAB de CV ADR | | | 711 | | | | 40,648 | |
Grupo Aeroportuario del Sureste
SAB de CV ADR | | | 411 | | | | 46,854 | |
Grupo Bimbo SAB de CV ‘A’ | | | 31,900 | | | | 82,598 | |
Grupo Carso SAB de CV ‘A1’ | | | 6,500 | | | | 31,946 | |
Grupo Financiero Banorte SAB de CV ‘O’ | | | 25,848 | | | | 166,910 | |
Grupo Financiero Inbursa SAB de CV ‘O’ | | | 42,900 | | | | 130,031 | |
Grupo Mexico SAB de CV ‘B’ | | | 55,162 | | | | 198,990 | |
Grupo Modelo SAB de CV ‘C’ | | | 10,549 | | | | 94,625 | |
Grupo Televisa SAB ADR | | | 8,100 | | | | 215,298 | |
Impulsora del Desarrollo y el Empleo en America Latina SAB de CV * | | | 11,300 | | | | 20,762 | |
Industrias CH SAB de CV ‘B’ * | | | 5,900 | | | | 44,507 | |
Industrias Penoles SAB de CV | | | 1,775 | | | | 89,532 | |
Kimberly-Clark de Mexico SAB de CV ‘A’ | | | 27,000 | | | | 69,347 | |
Mexichem SAB de CV | | | 14,220 | | | | 78,997 | |
Minera Frisco SAB de CV ‘A1’ * | | | 9,900 | | | | 41,740 | |
Organizacion Soriana SAB de CV ‘B’ | | | 20,692 | | | | 78,918 | |
Wal-Mart de Mexico SAB de CV ‘V’ | | | 78,000 | | | | 254,523 | |
| | | | | | | | |
| | | | 3,055,813 | |
| | | | | | | | |
Netherlands - 0.0% | | | | | | | | |
| | |
X5 Retail Group NV GDR * | | | 1,178 | | | | 21,137 | |
| | | | | | | | |
| | |
Peru - 0.2% | | | | | | | | |
| | |
Cia de Minas Buenaventura SA ADR | | | 2,748 | | | | 98,791 | |
| | | | | | | | |
| | |
Philippines - 1.1% | | | | | | | | |
| | |
Aboitiz Equity Ventures Inc | | | 15,700 | | | | 20,238 | |
Aboitiz Power Corp | | | 21,700 | | | | 19,531 | |
Alliance Global Group Inc | | | 169,300 | | | | 69,190 | |
Ayala Corp | | | 5,030 | | | | 63,280 | |
Ayala Land Inc | | | 55,300 | | | | 35,731 | |
Bank of the Philippine Islands | | | 8,000 | | | | 18,551 | |
BDO Unibank Inc * | | | 17,853 | | | | 31,718 | |
DMCI Holdings Inc | | | 7,400 | | | | 9,715 | |
Energy Development Corp | | | 104,000 | | | | 17,115 | |
International Container Terminal Services Inc | | | 6,520 | | | | 11,766 | |
Manila Electric Co | | | 3,410 | | | | 21,739 | |
Metropolitan Bank & Trust | | | 5,000 | | | | 12,462 | |
Philippine Long Distance Telephone Co | | | 425 | | | | 26,239 | |
San Miguel Corp | | | 15,060 | | | | 38,683 | |
SM Investments Corp | | | 4,390 | | | | 94,359 | |
SM Prime Holdings Inc | | | 64,000 | | | | 25,773 | |
Universal Robina Corp | | | 31,820 | | | | 64,624 | |
| | | | | | | | |
| | | | 580,714 | |
| | | | | | | | |
Poland - 1.6% | | | | | | | | |
| | |
Bank Pekao SA | | | 1,394 | | | | 76,050 | |
BRE Bank SA * | | | 215 | | | | 22,782 | |
KGHM Polska Miedz SA | | | 2,314 | | | | 143,867 | |
Lubelski Wegiel Bogdanka SA | | | 391 | | | | 17,221 | |
PGE SA | | | 15,890 | | | | 93,688 | |
Polski Koncern Naftowy Orlen SA * | | | 4,829 | | | | 78,044 | |
Polskie Gornictwo Naftowe i Gazownictwo SA * | | | 22,886 | | | | 38,946 | |
Powszechna Kasa Oszczednosci Bank Polski SA | | | 11,486 | | | | 138,552 | |
Powszechny Zaklad Ubezpieczen SA | | | 800 | | | | 113,599 | |
Synthos SA | | | 25,885 | | | | 45,642 | |
Tauron Polska Energia SA | | | 22,376 | | | | 34,384 | |
Telekomunikacja Polska SA | | | 7,313 | | | | 28,969 | |
| | | | | | | | |
| | | | 831,744 | |
| | | | | | | | |
| | | | | | | | |
| | |
Shares | | | Value | |
Russia - 4.5% | | | | | | | | |
| | |
Federal Hydrogenerating Co JSC ADR | | | 17,420 | | | | $40,807 | |
Gazprom OAO ADR (LI) | | | 75,276 | | | | 721,812 | |
Lukoil OAO ADR (LI) | | | 6,170 | | | | 412,503 | |
Mechel ADR | | | 1,900 | | | | 13,167 | |
MMC Norilsk Nickel OJSC ADR | | | 5,966 | | | | 111,493 | |
Novolipetsk Steel OJSC GDR ~ | | | 1,300 | | | | 26,325 | |
Rosneft OAO GDR * ~ | | | 19,300 | | | | 174,265 | |
Rostelecom OJSC ADR (LI) * | | | 848 | | | | 20,582 | |
Sberbank of Russia ADR | | | 30,125 | | | | 374,462 | |
Severstal OAO GDR ~ | | | 3,870 | | | | 47,098 | |
Tatneft ADR | | | 2,499 | | | | 110,430 | |
Uralkali OJSC GDR (LI) ~ | | | 4,563 | | | | 175,801 | |
VTB Bank OJSC GDR ~ | | | 11,312 | | | | 39,139 | |
VTB Bank OJSC GDR (LI) ~ | | | 10,700 | | | | 37,354 | |
| | | | | | | | |
| | | | 2,305,238 | |
| | | | | | | | |
South Africa - 7.8% | | | | | | | | |
| | |
ABSA Group Ltd | | | 5,010 | | | | 97,682 | |
African Bank Investments Ltd | | | 13,123 | | | | 50,460 | |
African Rainbow Minerals Ltd | | | 1,851 | | | | 42,296 | |
Anglo American Platinum Ltd | | | 1,008 | | | | 53,504 | |
AngloGold Ashanti Ltd ADR | | | 5,546 | | | | 173,978 | |
ArcelorMittal South Africa Ltd * | | | 3,427 | | | | 14,771 | |
Aspen Pharmacare Holdings Ltd * | | | 4,869 | | | | 97,310 | |
Assore Ltd | | | 620 | | | | 29,931 | |
Barloworld Ltd | | | 4,976 | | | | 51,289 | |
Bidvest Group Ltd | | | 4,150 | | | | 106,171 | |
Discovery Holdings Ltd | | | 4,168 | | | | 30,681 | |
Exxaro Resources Ltd | | | 2,483 | | | | 50,827 | |
FirstRand Ltd | | | 48,300 | | | | 178,600 | |
Gold Fields Ltd ADR | | | 10,500 | | | | 131,145 | |
Harmony Gold Mining Co Ltd ADR | | | 5,600 | | | | 50,176 | |
Impala Platinum Holdings Ltd | | | 6,119 | | | | 123,551 | |
Imperial Holdings Ltd | | | 2,312 | | | | 54,851 | |
Investec Ltd | | | 8,531 | | | | 59,594 | |
Kumba Iron Ore Ltd | | | 1,066 | | | | 72,847 | |
Liberty Holdings Ltd | | | 2,176 | | | | 28,571 | |
Life Healthcare Group Holdings Ltd | | | 11,043 | | | | 44,363 | |
Massmart Holdings Ltd | | | 1,068 | | | | 24,137 | |
Mediclinic International Ltd | | | 2,620 | | | | 16,958 | |
MMI Holdings Ltd | | | 15,327 | | | | 40,200 | |
Mondi Ltd | | | 4,228 | | | | 45,997 | |
Mr Price Group Ltd | | | 1,970 | | | | 32,909 | |
MTN Group Ltd | | | 22,984 | | | | 483,090 | |
Nampak Ltd | | | 4,696 | | | | 17,664 | |
Naspers Ltd ‘N’ | | | 5,411 | | | | 347,672 | |
Nedbank Group Ltd | | | 3,927 | | | | 87,819 | |
Netcare Ltd | | | 22,886 | | | | 53,043 | |
Pick n Pay Stores Ltd | | | 1,971 | | | | 10,417 | |
PPC Ltd | | | 640 | | | | 2,588 | |
Sanlam Ltd | | | 26,468 | | | | 141,593 | |
Sasol Ltd | | | 1,209 | | | | 52,488 | |
Sasol Ltd ADR | | | 5,366 | | | | 232,294 | |
Shoprite Holdings Ltd | | | 6,798 | | | | 165,222 | |
Standard Bank Group Ltd | | | 16,965 | | | | 240,052 | |
Steinhoff International Holdings Ltd * | | | 27,465 | | | | 89,764 | |
The Foschini Group Ltd | | | 4,177 | | | | 69,558 | |
The Spar Group Ltd | | | 2,292 | | | | 35,679 | |
Tiger Brands Ltd | | | 2,572 | | | | 99,036 | |
Truworths International Ltd | | | 6,686 | | | | 86,673 | |
Vodacom Group Ltd | | | 4,355 | | | | 64,463 | |
Woolworths Holdings Ltd | | | 7,243 | | | | 60,835 | |
| | | | | | | | |
| | | | 4,042,749 | |
| | | | | | | | |
South Korea - 14.8% | | | | | | | | |
| | |
Amorepacific Corp | | | 28 | | | | 31,833 | |
BS Financial Group Inc * | | | 1,610 | | | | 20,004 | |
Cheil Industries Inc | | | 540 | | | | 47,788 | |
| | |
| See Notes to Financial Statements | | See explanation of symbols and terms, if any, on page B-81 |
B-66
PACIFIC SELECT FUND
PD EMERGING MARKETS PORTFOLIO
Schedule of Investments (Continued)
December 31, 2012
| | | | | | | | |
| | |
Shares | | | Value | |
Cheil Worldwide Inc | | | 760 | | | | $15,337 | |
CJ CheilJedang Corp | | | 236 | | | | 78,386 | |
Coway Co Ltd * | | | 1,260 | | | | 51,403 | |
Daelim Industrial Co Ltd | | | 470 | | | | 38,611 | |
Daewoo International Corp | | | 650 | | | | 24,220 | |
Daewoo Securities Co Ltd | | | 3,091 | | | | 35,062 | |
Daewoo Shipbuilding & Marine Engineering Co Ltd | | | 1,510 | | | | 38,741 | |
Dongbu Insurance Co Ltd | | | 1,180 | | | | 50,798 | |
Doosan Corp | | | 175 | | | | 21,232 | |
Doosan Heavy Industries & Construction Co Ltd | | | 682 | | | | 28,923 | |
Doosan Infracore Co Ltd * | | | 1,790 | | | | 28,664 | |
E-Mart Co Ltd * | | | 206 | | | | 45,838 | |
GS Engineering & Construction Corp | | | 488 | | | | 26,403 | |
GS Holdings | | | 712 | | | | 48,218 | |
Hana Financial Group Inc | | | 2,850 | | | | 93,171 | |
Hankook Tire Co Ltd * | | | 1,286 | | | | 56,829 | |
Hanwha Chemical Corp | | | 1,080 | | | | 18,661 | |
Hanwha Corp | | | 1,700 | | | | 54,685 | |
Hanwha Life Insurance Co Ltd | | | 5,790 | | | | 42,086 | |
Honam Petrochemical Corp | | | 244 | | | | 56,549 | |
Hyundai Department Store Co Ltd | | | 294 | | | | 43,806 | |
Hyundai Engineering & Construction Co Ltd | | | 436 | | | | 28,721 | |
Hyundai Glovis Co Ltd | | | 175 | | | | 36,422 | |
Hyundai Heavy Industries Co Ltd | | | 604 | | | | 137,816 | |
Hyundai Hysco | | | 1,220 | | | | 52,122 | |
Hyundai Marine & Fire Insurance Co Ltd | | | 1,790 | | | | 55,880 | |
Hyundai Merchant Marine Co Ltd * | | | 220 | | | | 4,873 | |
Hyundai Mipo Dockyard | | | 263 | | | | 31,577 | |
Hyundai Mobis | | | 912 | | | | 247,359 | |
Hyundai Motor Co | | | 1,890 | | | | 389,010 | |
Hyundai Steel Co | | | 734 | | | | 60,666 | |
Hyundai Wia Corp * | | | 198 | | | | 32,270 | |
Industrial Bank of Korea | | | 2,980 | | | | 33,193 | |
Kangwon Land Inc | | | 1,080 | | | | 29,653 | |
KB Financial Group Inc | | | 1,770 | | | | 63,154 | |
KB Financial Group Inc ADR * | | | 3,700 | | | | 132,830 | |
KCC Corp | | | 151 | | | | 42,067 | |
Kia Motors Corp | | | 3,622 | | | | 192,731 | |
Korea Electric Power Corp ADR * | | | 5,300 | | | | 74,041 | |
Korea Exchange Bank * | | | 3,170 | | | | 22,681 | |
Korea Gas Corp | | | 550 | | | | 38,811 | |
Korea Zinc Co Ltd | | | 171 | | | | 65,179 | |
Korean Air Lines Co Ltd * | | | 518 | | | | 22,017 | |
KT Corp ADR * | | | 100 | | | | 1,674 | |
KT&G Corp | | | 1,422 | | | | 107,840 | |
Kumho Petro Chemical Co Ltd | | | 349 | | | | 42,998 | |
LG Chem Ltd | | | 717 | | | | 222,913 | |
LG Corp | | | 1,093 | | | | 66,992 | |
LG Display Co Ltd * | | | 2,120 | | | | 61,271 | |
LG Display Co Ltd ADR * | | | 3,700 | | | | 53,576 | |
LG Electronics Inc | | | 2,069 | | | | 142,947 | |
LG Household & Health Care Ltd | | | 101 | | | | 62,146 | |
LG Uplus Corp | | | 2,390 | | | | 17,451 | |
Lotte Confectionery Co Ltd | | | 32 | | | | 48,885 | |
Lotte Shopping Co Ltd | | | 119 | | | | 42,023 | |
LS Corp | | | 365 | | | | 32,340 | |
Macquarie Korea Infrastructure Fund | | | 1,290 | | | | 8,249 | |
Mando Corp | | | 157 | | | | 18,955 | |
NCSoft Corp | | | 291 | | | | 41,214 | |
Neo Holdings Co Ltd * + | | | 175 | | | | - | |
NHN Corp * | | | 433 | | | | 92,328 | |
OCI Co Ltd | | | 339 | | | | 52,752 | |
Orion Corp | | | 48 | | | | 49,363 | |
POSCO | | | 172 | | | | 56,239 | |
POSCO ADR | | | 2,696 | | | | 221,476 | |
S-Oil Corp | | | 399 | | | | 39,060 | |
Samsung C&T Corp | | | 1,942 | | | | 114,353 | |
Samsung Electro-Mechanics Co Ltd | | | 648 | | | | 60,410 | |
| | | | | | | | |
| | |
Shares | | | Value | |
Samsung Electronics Co Ltd | | | 1,351 | | | | $1,933,585 | |
Samsung Engineering Co Ltd | | | 386 | | | | 60,156 | |
Samsung Fire & Marine Insurance Co Ltd | | | 425 | | | | 86,645 | |
Samsung Heavy Industries Co Ltd | | | 2,510 | | | | 91,341 | |
Samsung Life Insurance Co Ltd | | | 950 | | | | 83,983 | |
Samsung SDI Co Ltd | | | 434 | | | | 61,357 | |
Samsung Securities Co Ltd | | | 1,636 | | | | 82,283 | |
Samsung Techwin Co Ltd | | | 505 | | | | 28,301 | |
Shinhan Financial Group Co Ltd | | | 1,290 | | | | 46,923 | |
Shinhan Financial Group Co Ltd ADR * | | | 4,200 | | | | 153,888 | |
Shinsegae Co Ltd | | | 36 | | | | 7,371 | |
SK C&C Co Ltd | | | 172 | | | | 16,637 | |
SK Holdings Co Ltd | | | 452 | | | | 75,754 | |
SK Hynix Inc * | | | 8,000 | | | | 194,089 | |
SK Innovation Co Ltd | | | 698 | | | | 114,511 | |
SK Telecom Co Ltd ADR | | | 3,000 | | | | 47,490 | |
Woori Finance Holdings Co Ltd | | | 5,310 | | | | 58,970 | |
Woori Investment & Securities Co Ltd | | | 1,550 | | | | 17,349 | |
| | | | | | | | |
| | | | 7,608,409 | |
| | | | | | | | |
Taiwan - 11.4% | | | | | | | | |
| | |
Acer Inc * | | | 36,156 | | | | 31,539 | |
Advanced Semiconductor Engineering Inc ADR | | | 12,085 | | | | 51,724 | |
Asia Cement Corp | | | 39,009 | | | | 50,358 | |
Asustek Computer Inc | | | 8,667 | | | | 97,866 | |
AU Optronics Corp ADR * | | | 16,068 | | | | 72,306 | |
Catcher Technology Co Ltd | | | 9,000 | | | | 45,044 | |
Cathay Financial Holding Co Ltd | | | 124,769 | | | | 135,555 | |
Chang Hwa Commercial Bank | | | 90,000 | | | | 49,635 | |
Cheng Shin Rubber Industry Co Ltd | | | 38,416 | | | | 100,006 | |
China Airlines Ltd * | | | 38,436 | | | | 15,905 | |
China Development Financial Holding Corp * | | | 144,834 | | | | 38,544 | |
China Life Insurance Co Ltd * | | | 28,196 | | | | 25,867 | |
China Petrochemical Development Corp | | | 18,095 | | | | 11,282 | |
China Steel Corp | | | 153,754 | | | | 145,149 | |
Chinatrust Financial Holding Co Ltd | | | 127,489 | | | | 75,586 | |
Chunghwa Telecom Co Ltd ADR | | | 4,506 | | | | 145,724 | |
Compal Electronics Inc | | | 45,092 | | | | 30,511 | |
Delta Electronics Inc | | | 22,000 | | | | 81,175 | |
E.Sun Financial Holding Co Ltd | | | 83,437 | | | | 46,847 | |
Epistar Corp | | | 8,000 | | | | 14,622 | |
Eva Airways Corp * | | | 13,000 | | | | 7,619 | |
Evergreen Marine Corp Taiwan Ltd * | | | 35,000 | | | | 20,979 | |
Far Eastern Department Stores Co Ltd | | | 19,760 | | | | 20,571 | |
Far Eastern New Century Corp | | | 46,572 | | | | 53,500 | |
Far EasTone Telecommunications Co Ltd | | | 20,000 | | | | 51,101 | |
First Financial Holding Co Ltd | | | 123,814 | | | | 75,749 | |
Formosa Chemicals & Fibre Corp | | | 43,540 | | | | 112,859 | |
Formosa Petrochemical Corp | | | 13,000 | | | | 38,633 | |
Formosa Plastics Corp | | | 60,820 | | | | 165,280 | |
Foxconn Technology Co Ltd | | | 8,820 | | | | 27,774 | |
Fubon Financial Holding Co Ltd | | | 61,343 | | | | 74,459 | |
Giant Manufacturing Co Ltd | | | 6,000 | | | | 34,514 | |
Hiwin Technologies Corp | | | 4,200 | | | | 31,141 | |
Hon Hai Precision Industry Co Ltd | | | 137,365 | | | | 423,454 | |
Hotai Motor Co Ltd | | | 5,000 | | | | 40,314 | |
HTC Corp | | | 11,572 | | | | 120,097 | |
Hua Nan Financial Holdings Co Ltd | | | 107,803 | | | | 62,541 | |
InnoLux Corp * | | | 57,510 | | | | 31,156 | |
Largan Precision Co Ltd | | | 2,000 | | | | 54,231 | |
Lite-On Technology Corp | | | 55,087 | | | | 73,330 | |
Macronix International | | | 24,911 | | | | 7,479 | |
MediaTek Inc | | | 17,020 | | | | 190,389 | |
Mega Financial Holding Co Ltd | | | 157,081 | | | | 122,788 | |
Nan Ya Plastics Corp | | | 75,410 | | | | 146,036 | |
Novatek Microelectronics Corp | | | 6,000 | | | | 24,637 | |
Pegatron Corp * | | | 20,090 | | | | 26,138 | |
Pou Chen Corp | | | 24,000 | | | | 25,280 | |
| | |
| See Notes to Financial Statements | | See explanation of symbols and terms, if any, on page B-81 |
B-67
PACIFIC SELECT FUND
PD EMERGING MARKETS PORTFOLIO
Schedule of Investments (Continued)
December 31, 2012
| | | | | | | | |
| | |
Shares | | | Value | |
Powertech Technology Inc | | | 13,300 | | | | $21,826 | |
President Chain Store Corp | | | 13,000 | | | | 69,727 | |
Quanta Computer Inc | | | 27,000 | | | | 63,829 | |
Radiant Opto-Electronics Corp | | | 11,330 | | | | 46,985 | |
Realtek Semiconductor Corp | | | 30,000 | | | | 63,440 | |
Ruentex Development Co Ltd | | | 12,000 | | | | 24,828 | |
Ruentex Industries Ltd | | | 3,438 | | | | 8,564 | |
Shin Kong Financial Holding Co Ltd * | | | 84,000 | | | | 23,799 | |
Siliconware Precision Industries Co | | | 31,000 | | | | 33,178 | |
Simplo Technology Co Ltd | | | 15,000 | | | | 75,765 | |
SinoPac Financial Holdings Co Ltd | | | 112,975 | | | | 48,710 | |
Synnex Technology International Corp | | | 21,000 | | | | 39,018 | |
Taishin Financial Holding Co Ltd | | | 50,130 | | | | 19,962 | |
Taiwan Business Bank * | | | 134,160 | | | | 40,515 | |
Taiwan Cement Corp | | | 41,693 | | | | 55,952 | |
Taiwan Cooperative Financial Holding | | | 50,001 | | | | 28,243 | |
Taiwan Fertilizer Co Ltd | | | 11,000 | | | | 29,235 | |
Taiwan Glass Industry Corp | | | 9,471 | | | | 9,839 | |
Taiwan Mobile Co Ltd | | | 23,400 | | | | 86,458 | |
Taiwan Semiconductor Manufacturing Co Ltd | | | 338,779 | | | | 1,133,864 | |
Teco Electric & Machinery Co Ltd | | | 69,000 | | | | 53,013 | |
Tripod Technology Corp | | | 10,000 | | | | 21,584 | |
TSRC Corp | | | 9,000 | | | | 18,310 | |
Uni-President Enterprises Corp | | | 50,797 | | | | 93,440 | |
Unimicron Technology Corp | | | 59,000 | | | | 62,915 | |
United Microelectronics Corp | | | 317,000 | | | | 128,241 | |
Walsin Lihwa Corp * | | | 67,000 | | | | 22,975 | |
Wintek Corp * | | | 14,299 | | | | 7,653 | |
Wistron Corp | | | 30,104 | | | | 31,366 | |
WPG Holdings Ltd | | | 44,000 | | | | 57,883 | |
Yuanta Financial Holding Co Ltd | | | 123,210 | | | | 63,753 | |
Yulon Motor Co Ltd | | | 25,000 | | | | 48,122 | |
| | | | | | | | |
| | | | | | | 5,860,286 | |
| | | | | | | | |
Thailand - 2.7% | | | | | | | | |
| | |
Advanced Info Service PCL | | | 11,600 | | | | 79,795 | |
Bangkok Bank PCL NVDR | | | 10,100 | | | | 64,836 | |
Bangkok Dusit Medical Services PCL ‘F’ | | | 9,700 | | | | 36,163 | |
Bank of Ayudhya PCL | | | 34,200 | | | | 36,529 | |
Banpu PCL | | | 1,150 | | | | 15,181 | |
BEC World PCL | | | 2,000 | | | | 4,675 | |
Big C Supercenter PCL | | | 9,100 | | | | 61,714 | |
Charoen Pokphand Foods PCL | | | 36,400 | | | | 40,354 | |
CP ALL PCL | | | 75,600 | | | | 113,413 | |
IRPC PCL | | | 203,300 | | | | 27,747 | |
Kasikornbank PCL | | | 19,000 | | | | 120,634 | |
Krung Thai Bank PCL | | | 102,375 | | | | 67,292 | |
Land and Houses PCL NVDR | | | 52,900 | | | | 16,921 | |
PTT Exploration & Production PCL | | | 22,241 | | | | 119,493 | |
PTT Global Chemical PCL | | | 33,800 | | | | 78,305 | |
PTT PCL | | | 14,500 | | | | 158,108 | |
Siam Cement PCL NVDR | | | 5,300 | | | | 76,495 | |
Siam City Cement PCL | | | 100 | | | | 1,380 | |
Siam Commercial Bank PCL | | | 14,900 | | | | 88,440 | |
Thai Oil PCL | | | 18,400 | | | | 40,951 | |
Thai Union Frozen Products PCL | | | 10,400 | | | | 24,554 | |
TMB Bank PCL | | | 327,600 | | | | 20,032 | |
Total Access Communication PCL | | | 10,500 | | | | 30,506 | |
True Corp PCL * | | | 249,700 | | | | 44,584 | |
| | | | | | | | |
| | | | | | | 1,368,102 | |
| | | | | | | | |
Turkey - 1.9% | | | | | | | | |
| | |
Akbank TAS | | | 31,155 | | | | 154,048 | |
Anadolu Efes Biracilik Ve Malt Sanayii AS | | | 3,568 | | | | 51,493 | |
Arcelik AS | | | 5,881 | | | | 38,711 | |
BIM Birlesik Magazalar AS | | | 1,514 | | | | 74,164 | |
Enka Insaat ve Sanayi AS | | | 2,147 | | | | 6,390 | |
Eregli Demir ve Celik Fabrikalari TAS | | | 14,794 | | | | 20,379 | |
KOC Holding AS | | | 10,429 | | | | 54,257 | |
| | | | | | | | |
| | |
Shares | | | Value | |
Tupras Turkiye Petrol Rafinerileri AS | | | 2,068 | | | | $59,828 | |
Turk Hava Yollari * | | | 15,721 | | | | 55,319 | |
Turk Telekomunikasyon AS | | | 10,513 | | | | 40,843 | |
Turkcell Iletisim Hizmetleri AS ADR * | | | 4,700 | | | | 75,858 | |
Turkiye Garanti Bankasi AS | | | 29,338 | | | | 152,629 | |
Turkiye Halk Bankasi AS | | | 3,821 | | | | 37,613 | |
Turkiye Is Bankasi ‘C’ | | | 20,672 | | | | 71,851 | |
Turkiye Vakiflar Bankasi Tao ‘D’ | | | 14,891 | | | | 38,612 | |
Yapi ve Kredi Bankasi AS * | | | 22,801 | | | | 66,656 | |
| | | | | | | | |
| | | | | | | 998,651 | |
| | | | | | | | |
United Kingdom - 0.1% | | | | | | | | |
| | |
Mail.ru Group Ltd GDR (LI) ~ | | | 1,351 | | | | 46,897 | |
| | | | | | | | |
| | |
Total Common Stocks
(Cost $40,359,613) | | | | | | | 47,858,109 | |
| | | | | | | | |
| | |
TOTAL INVESTMENTS - 99.7%
(Cost $43,849,941) | | | | | | | 51,319,004 | |
| |
OTHER ASSETS & LIABILITIES, NET - 0.3% | | | | 133,586 | |
| | | | | | | | |
| | |
NET ASSETS - 100.0% | | | | | | | $51,452,590 | |
| | | | | | | | |
Notes to Schedule of Investments
| (a) | As of December 31, 2012, the portfolio was diversified as a percentage of net assets as follows: |
| | | | |
Financials | | | 24.8% | |
Information Technology | | | 13.4% | |
Materials | | | 12.8% | |
Energy | | | 11.9% | |
Consumer Staples | | | 9.3% | |
Consumer Discretionary | | | 8.2% | |
Industrials | | | 7.1% | |
Telecommunication Services | | | 7.1% | |
Utilities | | | 3.6% | |
Health Care | | | 1.5% | |
| | | | |
| | | 99.7% | |
Other Assets & Liabilities, Net | | | 0.3% | |
| | | | |
| | | 100.0% | |
| | | | |
| (b) | As of December 31, 2012, the portfolio was diversified by country of incorporation as a percentage of net assets as follows: |
| | | | |
South Korea | | | 14.8% | |
Brazil | | | 13.3% | |
Taiwan | | | 11.4% | |
China | | | 9.1% | |
South Africa | | | 7.8% | |
India | | | 7.6% | |
Mexico | | | 5.9% | |
Russia | | | 4.5% | |
Malaysia | | | 4.1% | |
Hong Kong | | | 3.3% | |
Indonesia | | | 3.1% | |
Others (each less than 3.0%) | | | 14.8% | |
| | | | |
| | | 99.7% | |
Other Assets & Liabilities, Net | | | 0.3% | |
| | | | |
| | | 100.0% | |
| | | | |
| | |
| See Notes to Financial Statements | | See explanation of symbols and terms, if any, on page B-81 |
B-68
PACIFIC SELECT FUND
PD EMERGING MARKETS PORTFOLIO
Schedule of Investments (Continued)
December 31, 2012
| (c) | Fair Value Measurements |
The following is a summary of the portfolio’s investments as categorized under the three-tier hierarchy of inputs used in valuing the portfolio’s assets and liabilities (See Note 3D in Notes to Financial Statements) as of December 31, 2012:
| | | | | | | | | | | | | | | | | | |
| | | | | Total Value at
December 31, 2012 | | | Level 1
Quoted Price | | | Level 2 Significant Observable Inputs | | | Level 3 Significant Unobservable Inputs | |
Assets | | Preferred Stocks | | | | | | | | | | | | | | | | |
| | Brazil | | | $3,407,631 | | | | $2,806,277 | | | | $601,354 | | | | $- | |
| | Colombia | | | 53,264 | | | | 53,264 | | | | - | | | | - | |
| | | | | | | | | | | | | | | | | | |
| | | | | 3,460,895 | | | | 2,859,541 | | | | 601,354 | | | | - | |
| | Common Stocks | | | | | | | | | | | | | | | | |
| | Bermuda | | | 455,841 | | | | 178,429 | | | | 277,412 | | | | - | |
| | Brazil | | | 3,474,180 | | | | 1,557,842 | | | | 1,916,338 | | | | - | |
| | Cayman | | | 1,336,497 | | | | - | | | | 1,336,497 | | | | - | |
| | Chile | | | 1,080,200 | | | | 516,232 | | | | 563,968 | | | | - | |
| | China | | | 4,666,725 | | | | 768,536 | | | | 3,898,189 | | | | - | |
| | Colombia | | | 236,259 | | | | 177,101 | | | | 59,158 | | | | - | |
| | Czech Republic | | | 188,442 | | | | - | | | | 188,442 | | | | - | |
| | Egypt | | | 132,798 | | | | - | | | | 132,798 | | | | - | |
| | Hong Kong | | | 1,683,115 | | | | 974,142 | | | | 708,973 | | | | - | |
| | Hungary | | | 144,708 | | | | - | | | | 144,708 | | | | - | |
| | India | | | 3,915,712 | | | | 634,306 | | | | 3,281,406 | | | | - | |
| | Indonesia | | | 1,576,723 | | | | 114,545 | | | | 1,462,178 | | | | - | |
| | Luxembourg | | | 19,321 | | | | - | | | | 19,321 | | | | - | |
| | Malaysia | | | 2,129,057 | | | | - | | | | 2,129,057 | | | | - | |
| | Mexico | | | 3,055,813 | | | | 3,055,813 | | | | - | | | | - | |
| | Netherlands | | | 21,137 | | | | - | | | | 21,137 | | | | - | |
| | Peru | | | 98,791 | | | | 98,791 | | | | - | | | | - | |
| | Philippines | | | 580,714 | | | | - | | | | 580,714 | | | | - | |
| | Poland | | | 831,744 | | | | - | | | | 831,744 | | | | - | |
| | Russia | | | 2,305,238 | | | | 125,729 | | | | 2,179,509 | | | | - | |
| | South Africa | | | 4,042,749 | | | | 587,593 | | | | 3,455,156 | | | | - | |
| | South Korea | | | 7,608,409 | | | | 684,975 | | | | 6,923,434 | | | | - | |
| | Taiwan | | | 5,860,286 | | | | 269,754 | | | | 5,590,532 | | | | - | |
| | Thailand | | | 1,368,102 | | | | - | | | | 1,368,102 | | | | - | |
| | Turkey | | | 998,651 | | | | 75,858 | | | | 922,793 | | | | - | |
| | United Kingdom | | | 46,897 | | | | - | | | | 46,897 | | | | - | |
| | | | | | | | | | | | | | | | | | |
| | | | | 47,858,109 | | | | 9,819,646 | | | | 38,038,463 | | | | - | |
| | | | | | | | | | | | | | | | | | |
| | Total | | | $51,319,004 | | | | $12,679,187 | | | | $38,639,817 | | | | $- | |
| | | | | | | | | | | | | | | | | | |
During the year ended December 31, 2012, investments with a total aggregate value of $2,355,852 were transferred from level 1 to level 2 due to valuation adjustments made to exchange-traded prices as a result of market movements following the close of local trading.
| | |
| See Notes to Financial Statements | | See explanation of symbols and terms, if any, on page B-81 |
B-69
PACIFIC SELECT FUND
PD INTERNATIONAL LARGE-CAP PORTFOLIO
Schedule of Investments
December 31, 2012
| | | | | | | | |
| | |
Shares | | |
Value | |
RIGHTS - 0.0% | | | | | | | | |
| | |
Singapore - 0.0% | | | | | | | | |
| | |
Olam International Ltd
Exp. 02/14/13 * + | | | 5,634 | | | | $- | |
| | | | | | | | |
| | |
Spain - 0.0% | | | | | | | | |
| | |
Grifols SA
Exp. 01/02/13 * | | | 2,817 | | | | 3,551 | |
Repsol SA
Exp. 02/21/13 * | | | 6,507 | | | | 3,968 | |
| | | | | | | | |
| | | | 7,519 | |
| | | | | | | | |
Total Rights
(Cost $6,277) | | | | | | | 7,519 | |
| | | | | | | | |
| | |
PREFERRED STOCKS - 0.0% | | | | | | | | |
| | |
Germany - 0.0% | | | | | | | | |
| | |
Porsche Automobil Holding SE | | | 364 | | | | 29,661 | |
| | | | | | | | |
| | |
Total Preferred Stocks
(Cost $22,181) | | | | | | | 29,661 | |
| | | | | | | | |
| | |
COMMON STOCKS - 99.1% | | | | | | | | |
| | |
Australia - 7.7% | | | | | | | | |
| | |
Adelaide Brighton Ltd | | | 2,560 | | | | 8,399 | |
AGL Energy Ltd | | | 8,058 | | | | 129,401 | |
ALS Ltd | | | 4,800 | | | | 54,562 | |
Alumina Ltd ADR | | | 4,800 | | | | 18,528 | |
Amcor Ltd | | | 17,972 | | | | 151,969 | |
AMP Ltd | | | 39,119 | | | | 198,839 | |
Ansell Ltd | | | 3,557 | | | | 57,005 | |
APA Group | | | 6,221 | | | | 35,909 | |
Asciano Ltd | | | 13,837 | | | | 67,622 | |
ASX Ltd | | | 2,531 | | | | 82,573 | |
Atlas Iron Ltd | | | 8,247 | | | | 15,723 | |
Aurizon Holdings Ltd | | | 25,016 | | | | 98,248 | |
Australia & New Zealand Banking Group Ltd | | | 38,975 | | | | 1,020,400 | |
Australian Infrastructure Fund | | | 4,334 | | | | 14,026 | |
Bank of Queensland Ltd | | | 5,274 | | | | 40,488 | |
Bendigo and Adelaide Bank Ltd | | | 5,226 | | | | 46,598 | |
BHP Billiton Ltd ADR | | | 23,501 | | | | 1,843,418 | |
Boral Ltd | | | 16,558 | | | | 76,162 | |
Brambles Ltd | | | 20,138 | | | | 160,261 | |
Caltex Australia Ltd | | | 1,123 | | | | 22,633 | |
carsales.com Ltd | | | 4,885 | | | | 37,522 | |
Challenger Ltd | | | 4,422 | | | | 16,503 | |
Coca-Cola Amatil Ltd | | | 7,742 | | | | 108,848 | |
Cochlear Ltd | | | 610 | | | | 50,465 | |
Commonwealth Bank of Australia | | | 22,710 | | | | 1,475,182 | |
Computershare Ltd | | | 8,854 | | | | 83,373 | |
Crown Ltd | | | 4,092 | | | | 45,584 | |
CSL Ltd | | | 6,940 | | | | 392,055 | |
Downer EDI Ltd * | | | 9,372 | | | | 40,340 | |
DUET Group | | | 20,610 | | | | 44,786 | |
Echo Entertainment Group Ltd | | | 8,968 | | | | 32,337 | |
Flight Centre Ltd | | | 1,911 | | | | 54,194 | |
Fortescue Metals Group Ltd | | | 19,802 | | | | 98,244 | |
GrainCorp Ltd ‘A’ | | | 2,443 | | | | 31,486 | |
Harvey Norman Holdings Ltd | | | 7,845 | | | | 15,586 | |
Iluka Resources Ltd | | | 5,605 | | | | 54,317 | |
Incitec Pivot Ltd | | | 24,011 | | | | 81,595 | |
Insurance Australia Group Ltd | | | 30,184 | | | | 148,443 | |
Leighton Holdings Ltd | | | 1,306 | | | | 24,571 | |
Lend Lease Group | | | 6,871 | | | �� | 66,940 | |
| | | | | | | | |
| | |
Shares | | |
Value | |
Macquarie Group Ltd | | | 4,437 | | | | $165,014 | |
Metcash Ltd | | | 14,229 | | | | 49,552 | |
Mineral Resources Ltd | | | 2,018 | | | | 20,816 | |
Monadelphous Group Ltd | | | 628 | | | | 16,107 | |
National Australia Bank Ltd | | | 32,442 | | | | 848,449 | |
New Hope Corp Ltd | | | 4,341 | | | | 19,011 | |
Newcrest Mining Ltd | | | 7,988 | | | | 186,496 | |
Orica Ltd | | | 4,410 | | | | 115,968 | |
Origin Energy Ltd | | | 16,016 | | | | 195,999 | |
OZ Minerals Ltd | | | 2,731 | | | | 19,446 | |
PanAust Ltd | | | 5,908 | | | | 20,919 | |
Primary Health Care Ltd | | | 3,958 | | | | 16,539 | |
Qantas Airways Ltd * | | | 14,454 | | | | 22,726 | |
QBE Insurance Group Ltd | | | 18,081 | | | | 206,948 | |
Ramsay Health Care Ltd | | | 1,365 | | | | 38,780 | |
Regis Resources Ltd * | | | 9,382 | | | | 50,645 | |
Rio Tinto Ltd | | | 6,592 | | | | 458,829 | |
Santos Ltd | | | 13,904 | | | | 162,837 | |
Seek Ltd | | | 4,733 | | | | 34,882 | |
Shopping Centres Australasia Property Group REIT * | | | 3,415 | | | | 5,319 | |
Sims Metal Management Ltd ADR | | | 1,200 | | | | 11,832 | |
Sonic Healthcare Ltd | | | 6,663 | | | | 93,042 | |
SP AusNet | | | 14,345 | | | | 16,476 | |
Spark Infrastructure Group | | | 12,774 | | | | 22,358 | |
Suncorp Group Ltd | | | 17,606 | | | | 187,186 | |
Sydney Airport | | | 2,779 | | | | 9,808 | |
Tabcorp Holdings Ltd | | | 12,038 | | | | 38,472 | |
Tatts Group Ltd | | | 22,316 | | | | 70,264 | |
Telstra Corp Ltd | | | 60,977 | | | | 277,781 | |
Toll Holdings Ltd | | | 9,685 | | | | 46,364 | |
Transurban Group | | | 18,144 | | | | 115,235 | |
Treasury Wine Estates Ltd | | | 6,471 | | | | 31,868 | |
UGL Ltd | | | 1,497 | | | | 17,025 | |
Wesfarmers Ltd | | | 14,207 | | | | 548,224 | |
Westpac Banking Corp | | | 19,227 | | | | 525,636 | |
Westpac Banking Corp ADR | | | 4,800 | | | | 661,968 | |
Whitehaven Coal Ltd | | | 2,727 | | | | 10,084 | |
Woodside Petroleum Ltd | | | 10,064 | | | | 358,675 | |
Woolworths Ltd | | | 17,519 | | | | 535,452 | |
WorleyParsons Ltd | | | 3,138 | | | | 77,412 | |
| | | | | | | | |
| | | | 13,355,579 | |
| | | | | | | | |
Austria - 0.3% | | | | | | | | |
| | |
Andritz AG | | | 804 | | | | 51,656 | |
Erste Group Bank AG * | | | 2,763 | | | | 88,348 | |
IMMOFINANZ AG * | | | 18,349 | | | | 77,356 | |
OMV AG | | | 1,646 | | | | 59,770 | |
Raiffeisen Bank International AG | | | 893 | | | | 37,328 | |
Telekom Austria AG | | | 2,991 | | | | 22,634 | |
Verbund AG | | | 352 | | | | 8,718 | |
Vienna Insurance Group AG | | | 926 | | | | 49,674 | |
Voestalpine AG | | | 1,616 | | | | 59,423 | |
| | | | | | | | |
| | | | 454,907 | |
| | | | | | | | |
Belgium - 1.0% | | | | | | | | |
| | |
Ageas | | | 4,360 | | | | 130,084 | |
Anheuser-Busch InBev NV | | | 1,314 | | | | 114,829 | |
Anheuser-Busch InBev NV ADR | | | 9,999 | | | | 874,012 | |
Belgacom SA | | | 2,231 | | | | 65,762 | |
Colruyt SA | | | 935 | | | | 46,424 | |
Delhaize Group SA | | | 473 | | | | 18,946 | |
Delhaize Group SA ADR | | | 749 | | | | 30,372 | |
KBC Groep NV | | | 2,290 | | | | 79,709 | |
Solvay SA | | | 879 | | | | 126,533 | |
Telenet Group Holding NV | | | 849 | | | | 39,448 | |
UCB SA | | | 1,905 | | | | 109,593 | |
Umicore SA | | | 1,982 | | | | 109,289 | |
| | | | | | | | |
| | | | 1,745,001 | |
| | | | | | | | |
| | |
| See Notes to Financial Statements | | See explanation of symbols and terms, if any, on page B-81 |
B-70
PACIFIC SELECT FUND
PD INTERNATIONAL LARGE-CAP PORTFOLIO
Schedule of Investments (Continued)
December 31, 2012
| | | | | | | | |
| | |
Shares | | |
Value | |
Bermuda - 0.5% | | | | | | | | |
| | |
Biosensors International Group Ltd * | | | 13,000 | | | | $12,925 | |
Cheung Kong Infrastructure Holdings Ltd | | | 5,000 | | | | 30,715 | |
Esprit Holdings Ltd | | | 29,079 | | | | 40,734 | |
First Pacific Co Ltd | | | 20,000 | | | | 22,159 | |
Golar LNG Ltd (NOTC) | | | 834 | | | | 30,675 | |
Hongkong Land Holdings Ltd | | | 19,000 | | | | 133,623 | |
Kerry Properties Ltd | | | 7,000 | | | | 36,516 | |
Li & Fung Ltd | | | 84,000 | | | | 151,347 | |
Noble Group Ltd | | | 56,000 | | | | 54,001 | |
NWS Holdings Ltd | | | 12,000 | | | | 20,482 | |
Orient Overseas International Ltd | | | 3,500 | | | | 23,068 | |
Seadrill Ltd | | | 5,495 | | | | 202,514 | |
Shangri-La Asia Ltd (XHKG) | | | 28,666 | | | | 57,762 | |
VTech Holdings Ltd | | | 2,200 | | | | 24,719 | |
Yue Yuen Industrial Holdings Ltd | | | 9,000 | | | | 30,383 | |
| | | | | | | | |
| | | | 871,623 | |
| | | | | | | | |
Canada - 10.7% | | | | | | | | |
| | |
Agnico-Eagle Mines Ltd (TSE) | | | 2,500 | | | | 131,019 | |
Agrium Inc (TSE) | | | 2,451 | | | | 244,287 | |
Aimia Inc | | | 3,814 | | | | 57,016 | |
Alamos Gold Inc | | | 2,400 | | | | 42,103 | |
Alimentation Couche Tard Inc ‘B’ | | | 1,500 | | | | 73,786 | |
AltaGas Ltd | | | 1,600 | | | | 53,998 | |
ARC Resources Ltd | | | 3,678 | | | | 90,369 | |
Atco Ltd ‘I’ | | | 300 | | | | 24,345 | |
AuRico Gold Inc (TSE) * | | | 2,600 | | | | 21,407 | |
Bank of Montreal | | | 9,182 | | | | 561,887 | |
Bank of Nova Scotia | | | 17,470 | | | | 1,009,266 | |
Barrick Gold Corp (TSE) | | | 14,145 | | | | 495,153 | |
Baytex Energy Corp | | | 1,147 | | | | 49,434 | |
BCE Inc | | | 3,250 | | | | 139,286 | |
Bell Aliant Inc | | | 1,465 | | | | 38,764 | |
Bombardier Inc ‘B’ | | | 20,500 | | | | 77,491 | |
Bonavista Energy Corp | | | 3,500 | | | | 52,146 | |
Brookfield Asset Management Inc ‘A’ | | | 8,200 | | | | 300,400 | |
Brookfield Office Properties Inc (TSE) | | | 4,700 | | | �� | 80,137 | |
CAE Inc | | | 5,800 | | | | 58,717 | |
Cameco Corp | | | 6,948 | | | | 136,898 | |
Canadian Imperial Bank of Commerce | | | 6,037 | | | | 485,351 | |
Canadian National Railway Co (TSE) | | | 6,206 | | | | 563,575 | |
Canadian Natural Resources Ltd (TSE) | | | 15,801 | | | | 454,952 | |
Canadian Oil Sands Ltd | | | 7,419 | | | | 150,439 | |
Canadian Pacific Railway Ltd | | | 2,300 | | | | 233,307 | |
Canadian Tire Corp Ltd ‘A’ | | | 800 | | | | 55,800 | |
Canadian Utilities Ltd ‘A’ | | | 1,000 | | | | 72,323 | |
Canadian Western Bank | | | 700 | | | | 20,014 | |
Catamaran Corp * | | | 2,600 | | | | 122,276 | |
Cenovus Energy Inc (TSE) | | | 10,684 | | | | 357,565 | |
Centerra Gold Inc | | | 1,100 | | | | 10,296 | |
CGI Group Inc ‘A’ * | | | 3,600 | | | | 83,024 | |
CI Financial Corp | | | 2,900 | | | | 72,682 | |
Constellation Software Inc | | | 300 | | | | 36,189 | |
Crescent Point Energy Corp | | | 4,707 | | | | 178,021 | |
Dollarama Inc | | | 700 | | | | 41,499 | |
Eldorado Gold Corp | | | 8,749 | | | | 112,584 | |
Empire Co Ltd ‘A’ | | | 800 | | | | 47,411 | |
Enbridge Inc | | | 11,300 | | | | 488,716 | |
Encana Corp (TSE) | | | 10,648 | | | | 210,455 | |
Enerplus Corp | | | 1,296 | | | | 16,807 | |
Ensign Energy Services Inc | | | 2,900 | | | | 44,811 | |
Fairfax Financial Holdings Ltd | | | 248 | | | | 89,394 | |
Finning International Inc | | | 1,800 | | | | 44,462 | |
First Capital Realty Inc | | | 2,400 | | | | 45,409 | |
First Majestic Silver Corp * | | | 1,600 | | | | 32,267 | |
First Quantum Minerals Ltd | | | 7,200 | | | | 158,593 | |
Fortis Inc | | | 3,000 | | | | 103,207 | |
Franco-Nevada Corp | | | 350 | | | | 19,979 | |
| | | | | | | | |
| | |
Shares | | |
Value | |
George Weston Ltd | | | 700 | | | | $49,740 | |
Gibson Energy Inc | | | 1,700 | | | | 41,103 | |
Gildan Activewear Inc | | | 1,400 | | | | 51,133 | |
Goldcorp Inc (TSE) | | | 12,030 | | | | 442,281 | |
Great-West Lifeco Inc | | | 5,200 | | | | 127,295 | |
Husky Energy Inc | | | 5,156 | | | | 152,394 | |
IAMGOLD Corp (TSE) | | | 5,000 | | | | 57,253 | |
IGM Financial Inc | | | 1,200 | | | | 50,186 | |
Imperial Oil Ltd | | | 4,851 | | | | 208,434 | |
Industrial Alliance Insurance & Financial Services Inc | | | 900 | | | | 28,392 | |
Inmet Mining Corp | | | 367 | | | | 27,306 | |
Intact Financial Corp | | | 1,750 | | | | 113,951 | |
Keyera Corp | | | 900 | | | | 44,543 | |
Kinross Gold Corp | | | 15,359 | | | | 149,158 | |
Loblaw Cos Ltd | | | 2,200 | | | | 92,738 | |
Lundin Mining Corp * | | | 6,500 | | | | 33,457 | |
Magna International Inc | | | 3,200 | | | | 159,823 | |
Manulife Financial Corp | | | 27,476 | | | | 373,179 | |
MEG Energy Corp * | | | 2,100 | | | | 64,265 | |
Methanex Corp (TSE) | | | 1,400 | | | | 44,588 | |
Metro Inc | | | 1,400 | | | | 89,134 | |
National Bank of Canada | | | 2,200 | | | | 170,833 | |
New Gold Inc * | | | 6,100 | | | | 67,519 | |
Nexen Inc | | | 7,766 | | | | 207,442 | |
Onex Corp | | | 1,600 | | | | 67,349 | |
Open Text Corp * | | | 600 | | | | 33,556 | |
Osisko Mining Corp * | | | 7,100 | | | | 57,103 | |
Pacific Rubiales Energy Corp | | | 3,450 | | | | 80,154 | |
Pan American Silver Corp | | | 3,400 | | | | 63,714 | |
Paramount Resources Ltd ‘A’ * | | | 200 | | | | 6,434 | |
Pembina Pipeline Corp (NYSE) | | | 1,701 | | | | 48,717 | |
Pembina Pipeline Corp (TSE) | | | 2,915 | | | | 83,403 | |
Pengrowth Energy Corp | | | 9,300 | | | | 46,280 | |
Penn West Petroleum Ltd | | | 7,139 | | | | 77,512 | |
Peyto Exploration & Development Corp | | | 2,400 | | | | 55,470 | |
Potash Corp of Saskatchewan Inc (TSE) | | | 12,151 | | | | 494,493 | |
Precision Drilling Corp | | | 2,800 | | | | 23,139 | |
Progressive Waste Solutions Ltd | | | 2,300 | | | | 49,667 | |
Quebecor Inc ‘B’ | | | 1,100 | | | | 42,764 | |
Research In Motion Ltd (TSE) * | | | 4,057 | | | | 48,128 | |
Ritchie Bros Auctioneers Inc | | | 804 | | | | 16,772 | |
Rogers Communications Inc ‘B’ | | | 5,500 | | | | 249,703 | |
Royal Bank of Canada | | | 20,781 | | | | 1,251,189 | |
Saputo Inc | | | 1,400 | | | | 70,809 | |
Shaw Communications Inc ‘B’ | | | 5,381 | | | | 123,557 | |
ShawCor Ltd ‘A’ | | | 1,100 | | | | 43,118 | |
Shoppers Drug Mart Corp | | | 2,879 | | | | 123,878 | |
Silver Wheaton Corp (TSE) | | | 5,700 | | | | 205,491 | |
SNC-Lavalin Group Inc | | | 1,825 | | | | 73,976 | |
Sun Life Financial Inc | | | 8,561 | | | | 226,956 | |
Suncor Energy Inc (TSE) | | | 21,925 | | | | 720,988 | |
Talisman Energy Inc | | | 13,660 | | | | 154,494 | |
Teck Resources Ltd ‘B’ | | | 8,150 | | | | 296,192 | |
TELUS Corp - Non-Voting Shares | | | 2,400 | | | | 156,059 | |
The Jean Coutu Group PJC Inc ‘A’ | | | 3,100 | | | | 45,283 | |
The Toronto-Dominion Bank | | | 13,435 | | | | 1,131,243 | |
Thomson Reuters Corp (TSE) | | | 5,700 | | | | 164,920 | |
Tim Hortons Inc | | | 2,100 | | | | 103,089 | |
Tourmaline Oil Corp * | | | 1,800 | | | | 56,514 | |
TransAlta Corp | | | 3,800 | | | | 57,762 | |
TransCanada Corp (TSE) | | | 10,270 | | | | 485,468 | |
Trican Well Service Ltd | | | 1,800 | | | | 23,742 | |
Trilogy Energy Corp | | | 300 | | | | 8,780 | |
Turquoise Hill Resources Ltd (XTSE) * | | | 6,580 | | | | 50,274 | |
Uranium One Inc * | | | 6,200 | | | | 14,648 | |
Valeant Pharmaceuticals International Inc (TSE) * | | | 4,000 | | | | 238,625 | |
Veresen Inc | | | 2,500 | | | | 29,733 | |
Vermilion Energy Inc | | | 1,433 | | | | 74,870 | |
| | |
| See Notes to Financial Statements | | See explanation of symbols and terms, if any, on page B-81 |
B-71
PACIFIC SELECT FUND
PD INTERNATIONAL LARGE-CAP PORTFOLIO
Schedule of Investments (Continued)
December 31, 2012
| | | | | | | | |
| | |
Shares | | |
Value | |
West Fraser Timber Co Ltd | | | 600 | | | | $42,254 | |
Yamana Gold Inc | | | 10,900 | | | | 187,493 | |
| | | | | | | | |
| | | | 18,641,227 | |
| | | | | | | | |
Cayman - 0.2% | | | | | | | | |
| | |
AAC Technologies Holdings Inc | | | 14,000 | | | | 49,320 | |
ASM Pacific Technology Ltd | | | 2,500 | | | | 30,688 | |
Foxconn International Holdings Ltd * | | | 27,000 | | | | 13,212 | |
Lifestyle International Holdings Ltd | | | 8,500 | | | | 21,019 | |
MGM China Holdings Ltd | | | 21,200 | | | | 38,796 | |
Sands China Ltd | | | 32,400 | | | | 145,345 | |
Stella International Holdings Ltd | | | 2,000 | | | | 5,422 | |
Veripos Inc * | | | 318 | | | | 1,253 | |
Wynn Macau Ltd * | | | 16,800 | | | | 46,300 | |
| | | | | | | | |
| | | | 351,355 | |
| | | | | | | | |
Cyprus - 0.0% | | | | | | | | |
| | |
ProSafe SE | | | 2,381 | | | | 20,478 | |
| | | | | | | | |
| | |
Denmark - 1.1% | | | | | | | | |
| | |
A.P. Moller - Maersk AS ‘A’ | | | 8 | | | | 56,970 | |
A.P. Moller - Maersk AS ‘B’ | | | 18 | | | | 137,780 | |
Carlsberg AS ‘B’ | | | 1,388 | | | | 136,461 | |
Chr. Hansen Holding AS | | | 1,134 | | | | 36,972 | |
Coloplast AS ‘B’ | | | 1,635 | | | | 80,132 | |
Danske Bank AS * | | | 9,237 | | | | 157,034 | |
DSV AS | | | 2,337 | | | | 60,940 | |
FLSmidth & Co AS | | | 1,028 | | | | 60,054 | |
GN Store Nord AS | | | 3,676 | | | | 53,921 | |
H Lundbeck AS | | | 193 | | | | 2,825 | |
Jyske Bank AS * | | | 263 | | | | 7,339 | |
Novo Nordisk AS ‘B’ | | | 2,505 | | | | 409,116 | |
Novo Nordisk AS ADR | | | 3,237 | | | | 528,311 | |
Novozymes AS ‘B’ | | | 3,215 | | | | 90,986 | |
Pandora AS | | | 612 | | | | 13,485 | |
TDC AS | | | 7,713 | | | | 54,660 | |
Topdanmark AS * | | | 155 | | | | 33,254 | |
Tryg AS | | | 237 | | | | 17,919 | |
William Demant Holding AS * | | | 289 | | | | 24,803 | |
| | | | | | | | |
| | | | 1,962,962 | |
| | | | | | | | |
Finland - 0.6% | | | | | | | | |
| | |
Elisa OYJ | | | 1,458 | | | | 32,581 | |
Fortum OYJ | | | 5,460 | | | | 102,678 | |
Kesko OYJ ‘B’ | | | 886 | | | | 29,041 | |
Kone OYJ ‘B’ | | | 1,825 | | | | 135,137 | |
Metso OYJ | | | 1,470 | | | | 64,037 | |
Neste Oil OYJ | | | 1,924 | | | | 25,086 | |
Nokia OYJ | | | 25,194 | | | | 99,078 | |
Nokia OYJ ADR | | | 19,600 | | | | 77,420 | |
Nokian Renkaat OYJ | | | 1,166 | | | | 46,918 | |
Orion OYJ ‘A’ | | | 400 | | | | 11,647 | |
Orion OYJ ‘B’ | | | 905 | | | | 26,599 | |
Pohjola Bank PLC ‘A’ | | | 1,724 | | | | 25,745 | |
Sampo OYJ ‘A’ | | | 4,964 | | | | 160,518 | |
Stora Enso OYJ ‘R’ | | | 8,421 | | | | 59,560 | |
UPM-Kymmene OYJ | | | 5,343 | | | | 63,494 | |
Wartsila OYJ Abp | | | 2,439 | | | | 107,875 | |
| | | | | | | | |
| | | | 1,067,414 | |
| | | | | | | | |
France - 8.0% | | | | | | | | |
| | |
Accor SA | | | 1,698 | | | | 60,908 | |
Aeroports de Paris | | | 429 | | | | 33,123 | |
Air Liquide SA | | | 4,573 | | | | 573,073 | |
Alcatel-Lucent * | | | 26,368 | | | | 35,212 | |
Alcatel-Lucent ADR * | | | 8,000 | | | | 11,120 | |
Alstom SA | | | 3,380 | | | | 138,502 | |
Arkema SA | | | 677 | | | | 71,183 | |
AtoS | | | 1,082 | | | | 77,098 | |
| | | | | | | | |
| | |
Shares | | |
Value | |
AXA SA | | | 23,917 | | | | $432,610 | |
AXA SA ADR | | | 2,200 | | | | 40,084 | |
BioMerieux | | | 397 | | | | 38,374 | |
BNP Paribas SA | | | 14,788 | | | | 833,558 | |
Bollore SA | | | 70 | | | | 23,773 | |
Bouygues SA | | | 2,949 | | | | 86,956 | |
Bureau Veritas SA | | | 697 | | | | 77,494 | |
Cap Gemini SA | | | 2,159 | | | | 94,089 | |
Carrefour SA | | | 7,802 | | | | 202,036 | |
Casino Guichard Perrachon SA | | | 644 | | | | 61,949 | |
Christian Dior SA | | | 815 | | | | 140,902 | |
Cie de Saint-Gobain | | | 4,950 | | | | 211,804 | |
Cie Generale d’Optique Essilor International SA | | | 2,737 | | | | 277,506 | |
Cie Generale de Geophysique-Veritas * | | | 1,488 | | | | 44,846 | |
Cie Generale de Geophysique-Veritas ADR * | | | 1,300 | | | | 39,676 | |
Cie Generale des Etablissements Michelin | | | 2,517 | | | | 238,619 | |
CNP Assurances | | | 1,696 | | | | 25,834 | |
Credit Agricole SA * | | | 11,109 | | | | 90,195 | |
Danone SA | | | 7,977 | | | | 527,037 | |
Dassault Systemes SA | | | 716 | | | | 80,153 | |
Edenred | | | 2,872 | | | | 89,311 | |
Eiffage SA | | | 228 | | | | 10,352 | |
Electricite de France SA | | | 3,041 | | | | 56,995 | |
Euler Hermes SA | | | 181 | | | | 15,766 | |
Eutelsat Communications SA | | | 1,857 | | | | 61,659 | |
France Telecom SA | | | 19,811 | | | | 221,856 | |
France Telecom SA ADR | | | 5,000 | | | | 55,250 | |
GDF Suez | | | 19,650 | | | | 404,867 | |
Groupe Eurotunnel SA | | | 5,804 | | | | 44,814 | |
Hermes International | | | 179 | | | | 53,501 | |
Iliad SA | | | 314 | | | | 54,050 | |
Imerys SA | | | 397 | | | | 25,760 | |
JCDecaux SA | | | 767 | | | | 18,511 | |
L’Oreal SA | | | 3,654 | | | | 510,428 | |
Lafarge SA | | | 2,329 | | | | 149,238 | |
Lagardere SCA | | | 2,244 | | | | 76,194 | |
Legrand SA | | | 3,354 | | | | 141,562 | |
LVMH Moet Hennessy Louis Vuitton SA | | | 3,706 | | | | 690,603 | |
Natixis | | | 16,008 | | | | 55,382 | |
Pernod-Ricard SA | | | 2,964 | | | | 348,527 | |
Peugeot SA * | | | 494 | | | | 3,662 | |
PPR | | | 1,084 | | | | 202,039 | |
Publicis Groupe SA | | | 2,454 | | | | 147,033 | |
Remy Cointreau SA | | | 189 | | | | 20,662 | |
Renault SA | | | 3,215 | | | | 177,378 | |
Rexel SA | | | 956 | | | | 19,535 | |
Safran SA | | | 3,784 | | | | 165,117 | |
Sanofi | | | 13,155 | | | | 1,247,557 | |
Sanofi ADR | | | 7,424 | | | | 351,749 | |
Schneider Electric SA | | | 7,921 | | | | 590,776 | |
SCOR SE | | | 2,828 | | | | 76,255 | |
SEB SA | | | 126 | | | | 9,315 | |
Societe BIC SA | | | 302 | | | | 36,051 | |
Societe Generale SA * | | | 9,224 | | | | 346,954 | |
Sodexo | | | 1,471 | | | | 123,263 | |
Suez Environnement Co | | | 2,691 | | | | 32,447 | |
Technip SA | | | 1,500 | | | | 172,694 | |
Thales SA | | | 962 | | | | 33,210 | |
Total SA | | | 24,574 | | | | 1,271,890 | |
Total SA ADR | | | 5,720 | | | | 297,497 | |
Valeo SA | | | 1,356 | | | | 68,758 | |
Vallourec SA | | | 1,352 | | | | 70,556 | |
Veolia Environnement SA | | | 2,650 | | | | 32,303 | |
Veolia Environnement SA ADR | | | 1,468 | | | | 17,968 | |
Vinci SA | | | 6,508 | | | | 309,731 | |
Vivendi SA | | | 18,950 | | | | 426,748 | |
Zodiac Aerospace | | | 339 | | | | 37,861 | |
| | | | | | | | |
| | | | 13,941,349 | |
| | | | | | | | |
| | |
| See Notes to Financial Statements | | See explanation of symbols and terms, if any, on page B-81 |
B-72
PACIFIC SELECT FUND
PD INTERNATIONAL LARGE-CAP PORTFOLIO
Schedule of Investments (Continued)
December 31, 2012
| | | | | | | | |
| | |
Shares | | |
Value | |
Germany - 7.4% | | | | | | | | |
| | |
Adidas AG | | | 2,930 | | | | $261,116 | |
Allianz SE | | | 6,559 | | | | 908,662 | |
Axel Springer AG | | | 500 | | | | 21,339 | |
BASF SE | | | 12,988 | | | | 1,220,759 | |
Bayer AG | | | 11,848 | | | | 1,125,116 | |
Bayerische Motoren Werke AG | | | 4,481 | | | | 432,157 | |
Beiersdorf AG | | | 1,506 | | | | 123,055 | |
Bilfinger SE | | | 810 | | | | 78,255 | |
Brenntag AG | | | 743 | | | | 97,614 | |
Celesio AG | | | 645 | | | | 11,108 | |
Commerzbank AG * | | | 58,930 | | | | 112,147 | |
Continental AG | | | 1,166 | | | | 134,912 | |
Daimler AG (XETR) | | | 13,088 | | | | 715,191 | |
Deutsche Bank AG (NYSE) | | | 4,451 | | | | 197,135 | |
Deutsche Bank AG (XETR) | | | 9,200 | | | | 400,821 | |
Deutsche Boerse AG | | | 2,956 | | | | 180,422 | |
Deutsche Lufthansa AG | | | 2,294 | | | | 43,119 | |
Deutsche Post AG | | | 11,888 | | | | 260,672 | |
Deutsche Telekom AG | | | 31,209 | | | | 354,573 | |
Deutsche Telekom AG ADR | | | 11,200 | | | | 127,254 | |
E.ON AG | | | 26,207 | | | | 488,042 | |
Fielmann AG | | | 308 | | | | 29,677 | |
Fraport AG Frankfurt Airport Services Worldwide | | | 260 | | | | 15,141 | |
Fresenius Medical Care AG & Co KGaA | | | 2,255 | | | | 155,803 | |
Fresenius Medical Care AG & Co KGaA ADR | | | 2,000 | | | | 68,600 | |
Fresenius SE & Co KGaA | | | 1,784 | | | | 205,326 | |
GEA Group AG | | | 2,492 | | | | 80,489 | |
Hannover Rueckversicherung AG | | | 877 | | | | 68,261 | |
HeidelbergCement AG | | | 1,947 | | | | 117,955 | |
Henkel AG & Co KGaA | | | 1,803 | | | | 123,489 | |
Hochtief AG * | | | 592 | | | | 34,398 | |
Infineon Technologies AG | | | 14,377 | | | | 116,666 | |
K+S AG | | | 2,593 | | | | 119,883 | |
Kabel Deutschland Holding AG | | | 1,321 | | | | 98,782 | |
Lanxess AG | | | 1,155 | | | | 101,012 | |
Linde AG | | | 2,587 | | | | 451,145 | |
MAN SE | | | 803 | | | | 85,864 | |
Merck KGaA | | | 908 | | | | 119,800 | |
Metro AG | | | 2,643 | | | | 73,268 | |
MTU Aero Engines Holding AG | | | 396 | | | | 35,995 | |
Muenchener Rueckversicherungs AG | | | 2,525 | | | | 453,348 | |
Puma SE | | | 40 | | | | 11,873 | |
Rhoen Klinikum AG | | | 1,552 | | | | 31,414 | |
RWE AG | | | 7,019 | | | | 289,763 | |
Salzgitter AG | | | 284 | | | | 14,799 | |
SAP AG | | | 6,877 | | | | 550,893 | |
SAP AG ADR | | | 6,395 | | | | 514,030 | |
SGL Carbon SE | | | 623 | | | | 24,714 | |
Siemens AG | | | 6,139 | | | | 667,245 | |
Siemens AG ADR | | | 5,113 | | | | 559,720 | |
Sky Deutschland AG * | | | 1,760 | | | | 9,605 | |
Software AG | | | 714 | | | | 30,329 | |
Suedzucker AG | | | 534 | | | | 21,851 | |
Symrise AG | | | 2,124 | | | | 76,045 | |
ThyssenKrupp AG | | | 4,670 | | | | 109,728 | |
United Internet AG | | | 2,231 | | | | 48,156 | |
Volkswagen AG | | | 451 | | | | 96,889 | |
Wacker Chemie AG | | | 156 | | | | 10,221 | |
| | | | | | | | |
| | | | 12,915,646 | |
| | | | | | | | |
Greece - 0.0% | | | | | | | | |
| | |
Coca Cola Hellenic Bottling Co SA * | | | 2,142 | | | | 50,675 | |
Coca Cola Hellenic Bottling Co SA ADR * | | | 543 | | | | 12,798 | |
| | | | | | | | |
| | | | 63,473 | |
| | | | | | | | |
| | | | | | | | |
| | |
Shares | | |
Value | |
Hong Kong - 2.3% | | | | | | | | |
| | |
AIA Group Ltd | | | 143,000 | | | | $569,918 | |
Bank of East Asia Ltd | | | 20,000 | | | | 77,678 | |
BOC Holdings Ltd | | | 61,000 | | | | 191,374 | |
Cathay Pacific Airways Ltd | | | 18,000 | | | | 33,464 | |
Cheung Kong Holdings Ltd | | | 20,000 | | | | 309,577 | |
CLP Holdings Ltd | | | 25,000 | | | | 210,417 | |
Galaxy Entertainment Group Ltd * | | | 17,000 | | | | 67,699 | |
Hang Lung Group Ltd | | | 17,000 | | | | 97,391 | |
Hang Lung Properties Ltd | | | 31,000 | | | | 124,295 | |
Hang Seng Bank Ltd | | | 10,700 | | | | 165,297 | |
Henderson Land Development Co Ltd | | | 14,000 | | | | 99,729 | |
Hong Kong & China Gas Co Ltd | | | 83,003 | | | | 227,643 | |
Hong Kong Exchanges & Clearing Ltd | | | 14,300 | | | | 246,353 | |
Hopewell Holdings Ltd | | | 4,500 | | | | 19,458 | |
Hutchison Whampoa Ltd | | | 30,000 | | | | 318,249 | |
Hysan Development Co Ltd | | | 13,000 | | | | 62,953 | |
MTR Corp Ltd | | | 18,002 | | | | 71,261 | |
New World Development Co Ltd | | | 49,000 | | | | 77,028 | |
PCCW Ltd | | | 60,000 | | | | 26,505 | |
Power Assets Holdings Ltd | | | 23,000 | | | | 197,410 | |
Sino Land Co Ltd | | | 48,400 | | | | 87,153 | |
SJM Holdings Ltd | | | 32,000 | | | | 75,304 | |
Sun Hung Kai Properties Ltd | | | 23,492 | | | | 355,789 | |
Swire Properties Ltd | | | 13,800 | | | | 46,408 | |
Techtronic Industries Co | | | 11,500 | | | | 22,073 | |
Television Broadcasts Ltd | | | 3,000 | | | | 22,519 | |
Wharf Holdings Ltd | | | 22,000 | | | | 174,215 | |
Wheelock & Co Ltd | | | 11,000 | | | | 55,835 | |
Wing Hang Bank Ltd | | | 5,500 | | | | 57,980 | |
| | | | | | | | |
| | | | 4,090,975 | |
| | | | | | | | |
Ireland - 0.3% | | | | | | | | |
| | |
CRH PLC | | | 1,776 | | | | 36,854 | |
CRH PLC ADR | | | 6,600 | | | | 134,244 | |
Dragon Oil PLC | | | 2,170 | | | | 19,860 | |
Elan Corp PLC * | | | 6,738 | | | | 69,586 | |
James Hardie Industries PLC | | | 8,726 | | | | 84,417 | |
Kerry Group PLC ‘A’ | | | 1,729 | | | | 91,777 | |
Paddy Power PLC | | | 520 | | | | 42,861 | |
Prothena Corp PLC * | | | 164 | | | | 1,205 | |
The Governor & Co of the Bank of Ireland Group * | | | 138,822 | | | | 20,754 | |
| | | | | | | | |
| | | | 501,558 | |
| | | | | | | | |
Israel - 0.4% | | | | | | | | |
| | |
Bank Hapoalim BM * | | | 11,935 | | | | 51,345 | |
Bank Leumi Le-Israel BM * | | | 13,343 | | | | 45,626 | |
Bezeq The Israeli Telecommunication Corp Ltd | | | 24,671 | | | | 28,491 | |
Israel Chemicals Ltd | | | 5,804 | | | | 69,970 | |
Mellanox Technologies Ltd * | | | 374 | | | | 22,513 | |
Mizrahi Tefahot Bank Ltd * | | | 1,124 | | | | 11,612 | |
NICE Systems Ltd ADR * | | | 800 | | | | 26,784 | |
Teva Pharmaceutical Industries Ltd ADR | | | 13,926 | | | | 519,997 | |
| | | | | | | | |
| | | | 776,338 | |
| | | | | | | | |
Italy - 1.9% | | | | | | | | |
| | |
Assicurazioni Generali SPA | | | 15,842 | | | | 288,970 | |
Atlantia SPA | | | 5,783 | | | | 104,886 | |
Autogrill SPA | | | 2,362 | | | | 27,597 | |
Banca Monte dei Paschi di Siena SPA * | | | 29,374 | | | | 9,071 | |
Banco Popolare SCARL * | | | 8,388 | | | | 14,040 | |
Davide Campari-Milano SPA | | | 7,247 | | | | 55,664 | |
Enel Green Power SPA | | | 18,054 | | | | 33,765 | |
Enel SPA | | | 92,791 | | | | 386,046 | |
ENI SPA | | | 27,073 | | | | 667,879 | |
ENI SPA ADR | | | 4,742 | | | | 233,022 | |
Fiat Industrial SPA | | | 10,888 | | | | 119,381 | |
| | |
| See Notes to Financial Statements | | See explanation of symbols and terms, if any, on page B-81 |
B-73
PACIFIC SELECT FUND
PD INTERNATIONAL LARGE-CAP PORTFOLIO
Schedule of Investments (Continued)
December 31, 2012
| | | | | | | | |
| | |
Shares | | |
Value | |
Fiat SPA * | | | 15,939 | | | | $80,510 | |
Finmeccanica SPA * | | | 2,366 | | | | 13,712 | |
Intesa Sanpaolo SPA | | | 144,057 | | | | 249,219 | |
Lottomatica Group SPA | | | 1,730 | | | | 39,369 | |
Luxottica Group SPA ADR | | | 1,300 | | | | 53,755 | |
Mediobanca SPA | | | 3,553 | | | | 22,008 | |
Mediolanum SPA | | | 2,708 | | | | 13,786 | |
Parmalat SPA | | | 12,375 | | | | 28,908 | |
Pirelli & C SPA | | | 2,205 | | | | 25,298 | |
Prysmian SPA | | | 3,662 | | | | 74,090 | |
Saipem SPA | | | 3,670 | | | | 142,387 | |
Snam SPA | | | 22,266 | | | | 103,538 | |
Telecom Italia SPA | | | 88,111 | | | | 79,646 | |
Telecom Italia SPA ADR | | | 2,600 | | | | 23,530 | |
Terna Rete Elettrica Nazionale SPA | | | 19,461 | | | | 77,937 | |
Tod’s SPA | | | 214 | | | | 27,285 | |
UniCredit SPA * | | | 58,689 | | | | 289,812 | |
Unione di Banche Italiane SCPA | | | 8,378 | | | | 39,078 | |
| | | | | | | | |
| | | | 3,324,189 | |
| | | | | | | | |
Japan - 18.3% | | | | | | | | |
| | |
Advantest Corp | | | 1,100 | | | | 17,360 | |
Advantest Corp ADR | | | 429 | | | | 6,915 | |
Aeon Co Ltd | | | 8,500 | | | | 97,160 | |
Aeon Mall Co Ltd | | | 700 | | | | 17,110 | |
Air Water Inc | | | 3,000 | | | | 38,185 | |
Aisin Seiki Co Ltd | | | 2,400 | | | | 74,850 | |
Ajinomoto Co Inc | | | 9,000 | | | | 119,080 | |
Alfresa Holdings Corp | | | 400 | | | | 15,631 | |
All Nippon Airways Co Ltd | | | 21,000 | | | | 44,027 | |
Amada Co Ltd | | | 5,000 | | | | 32,534 | |
Anritsu Corp | | | 4,000 | | | | 47,531 | |
Aozora Bank Ltd | | | 14,000 | | | | 43,017 | |
Asahi Glass Co Ltd | | | 17,000 | | | | 123,511 | |
Asahi Group Holdings Ltd | | | 6,300 | | | | 133,542 | |
Asahi Kasei Corp | | | 21,000 | | | | 124,012 | |
Asics Corp | | | 1,200 | | | | 18,282 | |
Astellas Pharma Inc | | | 6,100 | | | | 274,020 | |
Azbil Corp | | | 800 | | | | 16,128 | |
Benesse Holdings Inc | | | 1,200 | | | | 49,738 | |
Bridgestone Corp | | | 8,900 | | | | 230,698 | |
Brother Industries Ltd | | | 5,300 | | | | 57,183 | |
Calbee Inc | | | 300 | | | | 21,117 | |
Canon Inc | | | 7,500 | | | | 294,166 | |
Canon Inc ADR | | | 8,890 | | | | 348,577 | |
Casio Computer Co Ltd | | | 6,200 | | | | 54,369 | |
Central Japan Railway Co | | | 2,000 | | | | 162,271 | |
Chiyoda Corp | | | 2,000 | | | | 28,638 | |
Chubu Electric Power Co Inc | | | 9,400 | | | | 125,427 | |
Chugai Pharmaceutical Co Ltd | | | 2,700 | | | | 51,746 | |
Citizen Holdings Co Ltd | | | 2,800 | | | | 14,801 | |
Coca-Cola West Co Ltd | | | 2,500 | | | | 38,491 | |
Cosmo Oil Co Ltd | | | 12,000 | | | | 26,632 | |
Dai Nippon Printing Co Ltd | | | 8,000 | | | | 62,694 | |
Daicel Corp | | | 2,000 | | | | 13,233 | |
Daido Steel Co Ltd | | | 7,000 | | | | 35,136 | |
Daihatsu Motor Co Ltd | | | 3,000 | | | | 59,339 | |
Daiichi Sankyo Co Ltd | | | 10,600 | | | | 162,599 | |
Daikin Industries Ltd | | | 3,700 | | | | 127,134 | |
Dainippon Sumitomo Pharma Co Ltd | | | 1,700 | | | | 20,424 | |
Daito Trust Construction Co Ltd | | | 1,200 | | | | 112,923 | |
Daiwa House Industry Co Ltd | | | 8,000 | | | | 137,654 | |
Daiwa Securities Group Inc | | | 25,000 | | | | 139,242 | |
Dena Co Ltd | | | 1,100 | | | | 36,169 | |
Denki Kagaku Kogyo KK | | | 3,000 | | | | 10,268 | |
Denso Corp | | | 6,900 | | | | 240,085 | |
Dentsu Inc | | | 3,200 | | | | 85,958 | |
DIC Corp | | | 4,000 | | | | 7,416 | |
Disco Corp | | | 300 | | | | 15,532 | |
Don Quijote Co Ltd | | | 900 | | | | 32,971 | |
| | | | | | | | |
| | |
Shares | | |
Value | |
Dowa Holdings Co Ltd | | | 4,000 | | | | $25,913 | |
East Japan Railway Co | | | 4,600 | | | | 297,419 | |
Ebara Corp | | | 3,000 | | | | 12,611 | |
Eisai Co Ltd | | | 3,600 | | | | 150,315 | |
Electric Power Development Co Ltd | | | 1,400 | | | | 33,188 | |
FamilyMart Co Ltd | | | 900 | | | | 37,048 | |
FANUC Corp | | | 2,700 | | | | 502,102 | |
Fast Retailing Co Ltd | | | 700 | | | | 177,781 | |
Fuji Electric Co Ltd | | | 7,000 | | | | 17,269 | |
Fuji Heavy Industries Ltd | | | 9,000 | | | | 113,321 | |
FUJIFILM Holdings Corp | | | 6,300 | | | | 126,892 | |
Fujitsu Ltd | | | 27,000 | | | | 113,364 | |
Fukuoka Financial Group Inc | | | 13,000 | | | | 52,032 | |
Furukawa Electric Co Ltd * | | | 5,000 | | | | 11,234 | |
Glory Ltd | | | 1,300 | | | | 30,114 | |
Gree Inc | | | 2,000 | | | | 31,009 | |
GS Yuasa Corp | | | 3,000 | | | | 12,075 | |
Hakuhodo DY Holdings Inc | | | 420 | | | | 27,187 | |
Hamamatsu Photonics KK | | | 800 | | | | 28,862 | |
Hankyu Hanshin Holdings Inc | | | 9,000 | | | | 46,463 | |
Hino Motors Ltd | | | 6,000 | | | | 53,804 | |
Hirose Electric Co Ltd | | | 400 | | | | 47,890 | |
Hisamitsu Pharmaceutical Co Inc | | | 800 | | | | 39,666 | |
Hitachi Chemical Co Ltd | | | 800 | | | | 11,924 | |
Hitachi Construction Machinery Co Ltd | | | 800 | | | | 16,794 | |
Hitachi High-Technologies Corp | | | 1,400 | | | | 28,964 | |
Hitachi Ltd | | | 34,000 | | | | 200,094 | |
Hitachi Ltd ADR | | | 3,200 | | | | 188,576 | |
Hitachi Metals Ltd | | | 1,000 | | | | 8,457 | |
Hitachi Transport System Ltd | | | 700 | | | | 10,173 | |
Hokkaido Electric Power Co Inc | | | 3,000 | | | | 36,429 | |
Hokuhoku Financial Group Inc | | | 14,000 | | | | 20,709 | |
Hokuriku Electric Power Co | | | 3,100 | | | | 36,651 | |
Honda Motor Co Ltd | | | 13,700 | | | | 504,960 | |
Honda Motor Co Ltd ADR | | | 9,500 | | | | 350,930 | |
House Foods Corp | | | 900 | | | | 13,568 | |
HOYA Corp | | | 5,850 | | | | 115,180 | |
Ibiden Co Ltd | | | 1,100 | | | | 17,559 | |
Idemitsu Kosan Co Ltd | | | 500 | | | | 43,548 | |
IHI Corp | | | 8,000 | | | | 20,563 | |
Inpex Corp | | | 32 | | | | 170,779 | |
Isetan Mitsukoshi Holdings Ltd | | | 3,800 | | | | 36,986 | |
Isuzu Motors Ltd | | | 17,000 | | | | 101,266 | |
ITOCHU Corp | | | 20,600 | | | | 217,451 | |
Itochu Techno-Solutions Corp | | | 1,100 | | | | 45,329 | |
Izumi Co Ltd | | | 600 | | | | 12,653 | |
J Front Retailing Co Ltd | | | 6,000 | | | | 33,080 | |
Japan Exchange Group Inc | | | 100 | | | | 4,992 | |
Japan Tobacco Inc | | | 13,100 | | | | 369,311 | |
JFE Holdings Inc | | | 7,900 | | | | 148,937 | |
JGC Corp | | | 4,000 | | | | 124,609 | |
JSR Corp | | | 2,700 | | | | 51,008 | |
JTEKT Corp | | | 1,300 | | | | 12,398 | |
Jupiter Telecommunications Co Ltd | | | 2 | | | | 2,484 | |
JX Holdings Inc | | | 34,000 | | | | 191,496 | |
K’s Holdings Corp | | | 400 | | | | 10,152 | |
Kagome Co Ltd | | | 1,300 | | | | 24,816 | |
Kajima Corp | | | 18,333 | | | | 60,550 | |
Kakaku.com Inc | | | 1,200 | | | | 39,515 | |
Kamigumi Co Ltd | | | 2,000 | | | | 15,877 | |
Kaneka Corp | | | 2,000 | | | | 10,059 | |
Kansai Paint Co Ltd | | | 4,000 | | | | 43,081 | |
Kao Corp | | | 7,000 | | | | 182,381 | |
Kawasaki Heavy Industries Ltd | | | 23,000 | | | | 62,504 | |
Kawasaki Kisen Kaisha Ltd * | | | 5,000 | | | | 7,646 | |
KDDI Corp | | | 4,100 | | | | 289,604 | |
Keihan Electric Railway Co Ltd | | | 11,000 | | | | 49,803 | |
Keikyu Corp | | | 8,000 | | | | 70,803 | |
Keio Corp | | | 5,000 | | | | 37,281 | |
Keisei Electric Railway Co Ltd | | | 6,000 | | | | 50,647 | |
| | |
| See Notes to Financial Statements | | See explanation of symbols and terms, if any, on page B-81 |
B-74
PACIFIC SELECT FUND
PD INTERNATIONAL LARGE-CAP PORTFOLIO
Schedule of Investments (Continued)
December 31, 2012
| | | | | | | | |
| | |
Shares | | |
Value | |
Kewpie Corp | | | 700 | | | | $9,661 | |
Keyence Corp | | | 740 | | | | 204,233 | |
Kikkoman Corp | | | 2,000 | | | | 28,570 | |
Kintetsu Corp | | | 19,000 | | | | 77,727 | |
Kirin Holdings Co Ltd | | | 13,000 | | | | 152,755 | |
Kobayashi Pharmaceutical Co Ltd | | | 700 | | | | 33,241 | |
Kobe Steel Ltd * | | | 26,000 | | | | 33,199 | |
Koito Manufacturing Co Ltd | | | 2,000 | | | | 29,165 | |
Komatsu Ltd | | | 12,500 | | | | 319,868 | |
Konami Corp | | | 900 | | | | 20,235 | |
Konami Corp ADR | | | 721 | | | | 16,165 | |
Konica Minolta Holdings Inc | | | 6,000 | | | | 43,227 | |
Kubota Corp | | | 8,000 | | | | 91,883 | |
Kubota Corp ADR | | | 1,400 | | | | 80,668 | |
Kuraray Co Ltd | | | 3,700 | | | | 48,442 | |
Kurita Water Industries Ltd | | | 1,500 | | | | 32,956 | |
Kyocera Corp | | | 1,600 | | | | 145,090 | |
Kyocera Corp ADR | | | 673 | | | | 61,479 | |
Kyowa Hakko Kirin Co Ltd | | | 4,000 | | | | 39,502 | |
Kyushu Electric Power Co Inc | | | 4,900 | | | | 55,935 | |
Lawson Inc | | | 1,100 | | | | 74,771 | |
Lion Corp | | | 7,000 | | | | 35,497 | |
LIXIL Group Corp | | | 4,200 | | | | 93,530 | |
Makita Corp | | | 1,600 | | | | 74,420 | |
Makita Corp ADR | | | 200 | | | | 9,290 | |
Marubeni Corp | | | 26,000 | | | | 186,318 | |
Marui Group Co Ltd | | | 1,600 | | | | 12,803 | |
Mazda Motor Corp * | | | 42,000 | | | | 85,765 | |
McDonald’s Holdings Co Japan Ltd | | | 800 | | | | 21,103 | |
MEDIPAL Holdings Corp | | | 4,000 | | | | 44,073 | |
MEIJI Holdings Co Ltd | | | 1,100 | | | | 47,677 | |
Minebea Co Ltd | | | 3,000 | | | | 10,677 | |
Miraca Holdings Inc | | | 400 | | | | 16,106 | |
MISUMI Group Inc | | | 1,200 | | | | 32,566 | |
Mitsubishi Chemical Holdings Corp | | | 19,000 | | | | 94,776 | |
Mitsubishi Corp | | | 19,800 | | | | 380,590 | |
Mitsubishi Electric Corp | | | 26,000 | | | | 221,298 | |
Mitsubishi Estate Co Ltd | | | 16,000 | | | | 382,501 | |
Mitsubishi Gas Chemical Co Inc | | | 5,000 | | | | 30,636 | |
Mitsubishi Heavy Industries Ltd | | | 45,000 | | | | 217,611 | |
Mitsubishi Logistics Corp | | | 3,000 | | | | 43,033 | |
Mitsubishi Materials Corp | | | 16,000 | | | | 54,537 | |
Mitsubishi Motors Corp * | | | 40,000 | | | | 41,347 | |
Mitsubishi Tanabe Pharma Corp | | | 3,100 | | | | 40,419 | |
Mitsubishi UFJ Financial Group Inc | | | 120,300 | | | | 647,351 | |
Mitsubishi UFJ Financial Group Inc ADR | | | 61,180 | | | | 331,596 | |
Mitsui & Co Ltd | | | 17,000 | | | | 254,325 | |
Mitsui & Co Ltd ADR | | | 300 | | | | 90,150 | |
Mitsui Chemicals Inc | | | 11,000 | | | | 28,732 | |
Mitsui Fudosan Co Ltd | | | 11,000 | | | | 268,742 | |
Mitsui Mining & Smelting Co Ltd | | | 6,000 | | | | 14,809 | |
Mitsui OSK Lines Ltd | | | 11,000 | | | | 32,780 | |
Mizuho Financial Group Inc | | | 213,300 | | | | 390,263 | |
Mizuho Financial Group Inc ADR | | | 50,432 | | | | 184,581 | |
MS&AD Insurance Group Holdings | | | 7,800 | | | | 155,832 | |
Murata Manufacturing Co Ltd | | | 3,200 | | | | 188,732 | |
Nabtesco Corp | | | 1,100 | | | | 24,343 | |
Nagase & Co Ltd | | | 2,000 | | | | 22,144 | |
Nagoya Railroad Co Ltd | | | 8,000 | | | | 21,304 | |
Namco Bandai Holdings Inc | | | 2,700 | | | | 35,016 | |
Nankai Electric Railway Co Ltd | | | 6,000 | | | | 27,105 | |
NEC Corp * | | | 39,000 | | | | 82,121 | |
NGK Insulators Ltd | | | 4,000 | | | | 47,042 | |
NGK Spark Plug Co Ltd | | | 2,000 | | | | 26,579 | |
NHK Spring Co Ltd | | | 4,000 | | | | 32,962 | |
Nichirei Corp | | | 9,000 | | | | 47,014 | |
Nidec Corp | | | 600 | | | | 35,085 | |
Nidec Corp ADR | | | 3,016 | | | | 43,943 | |
Nikon Corp | | | 5,100 | | | | 150,570 | |
Nintendo Co Ltd | | | 1,600 | | | | 170,720 | |
| | | | | | | | |
| | |
Shares | | |
Value | |
Nippon Electric Glass Co Ltd | | | 3,000 | | | | $17,046 | |
Nippon Express Co Ltd | | | 17,000 | | | | 70,217 | |
Nippon Kayaku Co Ltd | | | 3,000 | | | | 33,055 | |
Nippon Meat Packers Inc | | | 3,000 | | | | 41,302 | |
Nippon Paint Co Ltd | | | 2,000 | | | | 17,191 | |
Nippon Paper Group Inc | | | 400 | | | | 5,560 | |
Nippon Shokubai Co Ltd | | | 5,000 | | | | 50,976 | |
Nippon Steel & Sumitomo Metal Corp | | | 111,630 | | | | 274,586 | |
Nippon Telegraph & Telephone Corp | | | 4,000 | | | | 168,025 | |
Nippon Telegraph & Telephone Corp ADR | | | 4,100 | | | | 86,223 | |
Nippon Yusen KK | | | 18,000 | | | | 42,363 | |
Nishi-Nippon Railroad Co Ltd | | | 5,000 | | | | 19,797 | |
Nissan Chemical Industries Ltd | | | 4,000 | | | | 47,366 | |
Nissan Motor Co Ltd | | | 33,300 | | | | 316,065 | |
Nisshin Seifun Group Inc | | | 4,000 | | | | 50,052 | |
Nisshinbo Holdings Inc | | | 4,000 | | | | 33,848 | |
Nissin Foods Holdings Co Ltd | | | 1,000 | | | | 37,918 | |
Nitori Holdings Co Ltd | | | 450 | | | | 32,943 | |
Nitto Denko Corp | | | 2,100 | | | | 103,321 | |
NKSJ Holdings Inc | | | 5,250 | | | | 111,808 | |
NOK Corp | | | 2,000 | | | | 30,984 | |
Nomura Holdings Inc | | | 30,700 | | | | 181,261 | |
Nomura Holdings Inc ADR | | | 19,971 | | | | 117,230 | |
Nomura Real Estate Holdings Inc | | | 2,000 | | | | 38,154 | |
Nomura Research Institute Ltd | | | 1,400 | | | | 28,980 | |
NSK Ltd | | | 3,000 | | | | 21,379 | |
NTT Data Corp | | | 14 | | | | 43,772 | |
NTT DOCOMO Inc | | | 134 | | | | 192,444 | |
NTT DOCOMO Inc ADR | | | 8,600 | | | | 123,926 | |
Obayashi Corp | | | 11,000 | | | | 61,917 | |
Obic Co Ltd | | | 160 | | | | 31,844 | |
Odakyu Electric Railway Co Ltd | | | 10,000 | | | | 104,032 | |
OJI Holdings Corp | | | 14,000 | | | | 48,347 | |
Olympus Corp * | | | 3,400 | | | | 65,991 | |
Omron Corp | | | 2,300 | | | | 55,149 | |
Ono Pharmaceutical Co Ltd | | | 800 | | | | 40,825 | |
Oracle Corp Japan | | | 600 | | | | 25,007 | |
Oriental Land Co Ltd | | | 600 | | | | 72,503 | |
Osaka Gas Co Ltd | | | 27,000 | | | | 98,070 | |
Otsuka Corp | | | 400 | | | | 30,264 | |
Otsuka Holdings Co Ltd | | | 5,000 | | | | 140,374 | |
Panasonic Corp | | | 18,300 | | | | 111,191 | |
Panasonic Corp ADR | | | 13,000 | | | | 78,910 | |
Park24 Co Ltd | | | 3,000 | | | | 47,311 | |
Rakuten Inc * | | | 12,300 | | | | 95,924 | |
Renesas Electronics Corp * | | | 1,200 | | | | 4,250 | |
Rengo Co Ltd | | | 6,000 | | | | 30,289 | |
Resona Holdings Inc | | | 26,800 | | | | 121,506 | |
Ricoh Co Ltd | | | 11,000 | | | | 116,864 | |
Rinnai Corp | | | 500 | | | | 33,970 | |
Rohm Co Ltd | | | 1,900 | | | | 61,724 | |
Ryohin Keikaku Co Ltd | | | 800 | | | | 44,685 | |
Sankyo Co Ltd | | | 900 | | | | 35,613 | |
Sanrio Co Ltd | | | 300 | | | | 9,547 | |
Santen Pharmaceutical Co Ltd | | | 800 | | | | 30,629 | |
Sapporo Holdings Ltd | | | 2,000 | | | | 6,464 | |
Sawai Pharmaceutical Co Ltd | | | 200 | | | | 20,062 | |
SBI Holdings Inc | | | 2,220 | | | | 19,816 | |
Secom Co Ltd | | | 2,500 | | | | 125,998 | |
Sega Sammy Holdings Inc | | | 3,100 | | | | 52,358 | |
Seiko Epson Corp | | | 1,000 | | | | 8,157 | |
Sekisui Chemical Co Ltd | | | 3,000 | | | | 25,980 | |
Sekisui House Ltd | | | 10,000 | | | | 109,460 | |
Senshu Ikeda Holdings Inc | | | 2,140 | | | | 12,220 | |
Seven & I Holdings Co Ltd | | | 9,900 | | | | 278,635 | |
Sharp Corp | | | 10,000 | | | | 35,069 | |
Shikoku Electric Power Co Inc | | | 1,700 | | | | 27,112 | |
Shimadzu Corp | | | 6,000 | | | | 40,476 | |
Shimamura Co Ltd | | | 200 | | | | 19,369 | |
Shimano Inc | | | 1,200 | | | | 76,515 | |
| | |
| See Notes to Financial Statements | | See explanation of symbols and terms, if any, on page B-81 |
B-75
PACIFIC SELECT FUND
PD INTERNATIONAL LARGE-CAP PORTFOLIO
Schedule of Investments (Continued)
December 31, 2012
| | | | | | | | |
| | |
Shares | | |
Value | |
Shimizu Corp | | | 8,000 | | | | $30,087 | |
Shin-Etsu Chemical Co Ltd | | | 5,400 | | | | 329,829 | |
Shinsei Bank Ltd | | | 30,000 | | | | 60,070 | |
Shionogi & Co Ltd | | | 5,400 | | | | 89,952 | |
Shiseido Co Ltd | | | 5,500 | | | | 77,344 | |
Showa Denko KK | | | 29,000 | | | | 44,343 | |
Showa Shell Sekiyu KK | | | 2,700 | | | | 15,330 | |
SMC Corp | | | 900 | | | | 163,272 | |
Softbank Corp | | | 12,400 | | | | 453,738 | |
Sojitz Corp | | | 7,500 | | | | 11,095 | |
Sony Corp | | | 5,300 | | | | 59,304 | |
Sony Corp ADR | | | 8,700 | | | | 97,440 | |
Sony Financial Holdings Inc | | | 3,700 | | | | 66,556 | |
Sotetsu Holdings Inc | | | 8,000 | | | | 27,883 | |
Square Enix Holdings Co Ltd | | | 1,700 | | | | 21,481 | |
Stanley Electric Co Ltd | | | 2,400 | | | | 34,163 | |
Sugi Holdings Co Ltd | | | 1,100 | | | | 38,647 | |
Sumco Corp * | | | 4,900 | | | | 47,672 | |
Sumitomo Chemical Co Ltd | | | 18,000 | | | | 56,791 | |
Sumitomo Corp | | | 16,300 | | | | 208,930 | |
Sumitomo Electric Industries Ltd | | | 10,000 | | | | 115,722 | |
Sumitomo Heavy Industries Ltd | | | 11,000 | | | | 52,538 | |
Sumitomo Metal Mining Co Ltd | | | 7,000 | | | | 98,780 | |
Sumitomo Mitsui Financial Group Inc | | | 17,100 | | | | 621,226 | |
Sumitomo Mitsui Financial Group Inc ADR | | | 6,000 | | | | 44,040 | |
Sumitomo Mitsui Trust Holdings Inc | | | 39,000 | | | | 137,025 | |
Sumitomo Realty & Development Co Ltd | | | 6,000 | | | | 199,364 | |
Sumitomo Rubber Industries Ltd | | | 2,000 | | | | 24,165 | |
Sundrug Co Ltd | | | 1,000 | | | | 34,160 | |
Suruga Bank Ltd | | | 4,000 | | | | 49,134 | |
Suzuken Co Ltd | | | 900 | | | | 25,362 | |
Suzuki Motor Corp | | | 5,300 | | | | 138,551 | |
Sysmex Corp | | | 500 | | | | 22,908 | |
T&D Holdings Inc | | | 9,100 | | | | 110,911 | |
Taiheiyo Cement Corp | | | 10,000 | | | | 27,517 | |
Taisei Corp | | | 10,000 | | | | 33,058 | |
Taiyo Nippon Sanso Corp | | | 1,000 | | | | 5,713 | |
Takashimaya Co Ltd | | | 5,000 | | | | 35,636 | |
Takeda Pharmaceutical Co Ltd | | | 11,400 | | | | 509,462 | |
TDK Corp | | | 1,600 | | | | 58,182 | |
Teijin Ltd | | | 9,000 | | | | 22,197 | |
Terumo Corp | | | 2,200 | | | | 87,413 | |
The 77 Bank Ltd | | | 4,000 | | | | 16,026 | |
The Awa Bank Ltd | | | 5,000 | | | | 28,562 | |
The Bank of Kyoto Ltd | | | 6,000 | | | | 50,481 | |
The Bank of Yokohama Ltd | | | 11,000 | | | | 51,060 | |
The Chiba Bank Ltd | | | 7,000 | | | | 40,955 | |
The Chugoku Bank Ltd | | | 4,000 | | | | 55,838 | |
The Chugoku Electric Power Co Inc | | | 4,800 | | | | 75,273 | |
The Dai-ichi Life Insurance Co Ltd | | | 138 | | | | 194,172 | |
The Gunma Bank Ltd | | | 3,000 | | | | 14,596 | |
The Hachijuni Bank Ltd | | | 6,000 | | | | 30,119 | |
The Hiroshima Bank Ltd | | | 5,000 | | | | 20,950 | |
The Iyo Bank Ltd | | | 5,000 | | | | 39,463 | |
The Japan Steel Works Ltd | | | 8,000 | | | | 51,826 | |
The Joyo Bank Ltd | | | 8,000 | | | | 37,805 | |
The Kansai Electric Power Co Inc | | | 13,400 | | | | 140,790 | |
The Nanto Bank Ltd | | | 7,000 | | | | 31,842 | |
The Nishi-Nippon City Bank Ltd | | | 6,000 | | | | 14,781 | |
The Shiga Bank Ltd | | | 2,000 | | | | 12,409 | |
The Shizuoka Bank Ltd | | | 7,000 | | | | 68,365 | |
The Yokohama Rubber Co Ltd | | | 6,000 | | | | 43,428 | |
THK Co Ltd | | | 700 | | | | 12,579 | |
Tobu Railway Co Ltd | | | 12,000 | | | | 63,504 | |
Toho Co Ltd | | | 1,000 | | | | 17,612 | |
Toho Gas Co Ltd | | | 5,000 | | | | 26,840 | |
Tohoku Electric Power Co Inc * | | | 5,000 | | | | 46,530 | |
Tokai Rika Co Ltd | | | 1,400 | | | | 19,487 | |
Tokio Marine Holdings Inc | | | 10,300 | | | | 287,185 | |
Tokyo Electric Power Co Inc * | | | 17,600 | | | | 42,184 | |
| | | | | | | | |
| | |
Shares | | |
Value | |
Tokyo Electron Ltd | | | 2,700 | | | | $124,236 | |
Tokyo Gas Co Ltd | | | 34,000 | | | | 155,446 | |
Tokyo Tatemono Co Ltd | | | 3,000 | | | | 15,406 | |
Tokyu Corp | | | 12,000 | | | | 67,390 | |
Tokyu Land Corp | | | 4,000 | | | | 29,241 | |
TonenGeneral Sekiyu KK | | | 4,000 | | | | 34,468 | |
Toppan Printing Co Ltd | | | 11,000 | | | | 67,774 | |
Toray Industries Inc | | | 25,000 | | | | 152,444 | |
Toshiba Corp | | | 56,000 | | | | 221,436 | |
Tosoh Corp | | | 10,000 | | | | 24,040 | |
TOTO Ltd | | | 5,000 | | | | 37,558 | |
Toyo Seikan Kaisha Ltd | | | 3,100 | | | | 41,761 | |
Toyo Suisan Kaisha Ltd | | | 1,000 | | | | 26,650 | |
Toyoda Gosei Co Ltd | | | 2,000 | | | | 40,688 | |
Toyota Motor Corp | | | 7,760 | | | | 362,210 | |
Toyota Motor Corp ADR | | | 15,703 | | | | 1,464,305 | |
Toyota Tsusho Corp | | | 3,400 | | | | 83,946 | |
Trend Micro Inc * | | | 1,800 | | | | 54,322 | |
Tsumura & Co | | | 1,500 | | | | 45,206 | |
Ube Industries Ltd | | | 14,000 | | | | 33,668 | |
Unicharm Corp | | | 1,500 | | | | 78,085 | |
UNY Co Ltd | | | 5,200 | | | | 38,620 | |
Ushio Inc | | | 900 | | | | 9,829 | |
USS Co Ltd | | | 270 | | | | 27,987 | |
Wacoal Holdings Corp | | | 3,000 | | | | 31,050 | |
West Japan Railway Co | | | 2,800 | | | | 110,271 | |
Yahoo! Japan Corp | | | 265 | | | | 85,772 | |
Yakult Honsha Co Ltd | | | 1,700 | | | | 74,491 | |
Yamada Denki Co Ltd | | | 1,410 | | | | 54,374 | |
Yamaguchi Financial Group Inc | | | 2,000 | | | | 17,670 | |
Yamaha Corp | | | 1,400 | | | | 14,827 | |
Yamaha Motor Co Ltd | | | 2,800 | | | | 31,037 | |
Yamato Holdings Co Ltd | | | 5,300 | | | | 80,589 | |
Yamato Kogyo Co Ltd | | | 1,300 | | | | 38,053 | |
Yamazaki Baking Co Ltd | | | 2,000 | | | | 22,274 | |
Yaskawa Electric Corp | | | 2,000 | | | | 19,289 | |
Yokogawa Electric Corp | | | 3,800 | | | | 41,338 | |
Zeon Corp | | | 4,000 | | | | 34,650 | |
| | | | | | | | |
| | | | 31,871,121 | |
| | | | | | | | |
Luxembourg - 0.4% | | | | | | | | |
| | |
ArcelorMittal | | | 8,057 | | | | 139,475 | |
ArcelorMittal ‘NY’ (NYSE) | | | 4,480 | | | | 78,266 | |
L’Occitane International SA | | | 7,500 | | | | 23,849 | |
Millicom International Cellular SA SDR | | | 823 | | | | 71,532 | |
Samsonite International SA | | | 3,300 | | | | 6,903 | |
SES SA FDR | | | 3,224 | | | | 93,267 | |
Subsea 7 SA | | | 5,114 | | | | 122,312 | |
Tenaris SA | | | 441 | | | | 9,193 | |
Tenaris SA ADR | | | 2,949 | | | | 123,622 | |
| | | | | | | | |
| | | | 668,419 | |
| | | | | | | | |
Mauritius - 0.0% | | | | | | | | |
| | |
Golden Agri-Resources Ltd | | | 113,000 | | | | 60,832 | |
| | | | | | | | |
| | |
Netherlands - 2.4% | | | | | | | | |
| | |
Aegon NV | | | 8,184 | | | | 52,155 | |
Aegon NV ‘NY’ | | | 15,969 | | | | 102,840 | |
Akzo Nobel NV | | | 3,347 | | | | 220,859 | |
ASML Holding NV | | | 3,752 | | | | 242,903 | |
ASML Holding NV ‘NY’ | | | 1,848 | | | | 119,030 | |
DE Master Blenders 1753 NV * | | | 7,034 | | | | 81,820 | |
Delta Lloyd NV | | | 419 | | | | 6,973 | |
European Aeronautic Defence & Space Co NV | | | 5,977 | | | | 234,259 | |
Fugro NV CVA | | | 1,073 | | | | 62,857 | |
Gemalto NV | | | 1,235 | | | | 111,812 | |
Heineken NV | | | 3,768 | | | | 251,337 | |
ING Groep NV ADR * | | | 39,158 | | | | 371,609 | |
| | |
| See Notes to Financial Statements | | See explanation of symbols and terms, if any, on page B-81 |
B-76
PACIFIC SELECT FUND
PD INTERNATIONAL LARGE-CAP PORTFOLIO
Schedule of Investments (Continued)
December 31, 2012
| | | | | | | | |
| | |
Shares | | |
Value | |
ING Groep NV CVA * | | | 13,872 | | | | $132,654 | |
Koninklijke Ahold NV | | | 12,671 | | | | 168,305 | |
Koninklijke Boskalis Westminster NV | | | 815 | | | | 37,155 | |
Koninklijke DSM NV | | | 2,177 | | | | 131,130 | |
Koninklijke KPN NV | | | 13,215 | | | | 65,351 | |
Koninklijke Philips Electronics NV | | | 8,583 | | | | 230,267 | |
Koninklijke Philips Electronics NV ‘NY’ | | | 4,897 | | | | 129,966 | |
Koninklijke Vopak NV | | | 897 | | | | 63,247 | |
QIAGEN NV (XETR) * | | | 2,422 | | | | 43,927 | |
Randstad Holding NV | | | 1,612 | | | | 59,506 | |
Reed Elsevier NV | | | 7,802 | | | | 115,594 | |
Reed Elsevier NV ADR | | | 1,235 | | | | 36,531 | |
SBM Offshore NV * | | | 51 | | | | 723 | |
STMicroelectronics NV | | | 6,811 | | | | 49,659 | |
STMicroelectronics NV ‘NY’ | | | 2,700 | | | | 19,548 | |
TNT Express NV | | | 4,920 | | | | 55,655 | |
Unilever NV ‘NY’ | | | 7,632 | | | | 292,306 | |
Unilever NV CVA | | | 15,780 | | | | 595,439 | |
Wolters Kluwer NV | | | 3,874 | | | | 80,106 | |
| | | | | | | | |
| | | | 4,165,523 | |
| | | | | | | | |
New Zealand - 0.1% | | | | | | | | |
| | |
Auckland International Airport Ltd | | | 15,829 | | | | 35,004 | |
Contact Energy Ltd * | | | 4,031 | | | | 17,399 | |
Fletcher Building Ltd (NZX) | | | 7,843 | | | | 54,881 | |
Telecom Corp of New Zealand Ltd | | | 28,553 | | | | 53,997 | |
| | | | | | | | |
| | | | 161,281 | |
| | | | | | | | |
Norway - 0.8% | | | | | | | | |
| | |
Aker Solutions ASA | | | 2,264 | | | | 46,589 | |
DNB ASA | | | 12,632 | | | | 161,019 | |
DNO International ASA * | | | 880 | | | | 1,485 | |
Fred Olsen Energy ASA | | | 553 | | | | 24,184 | |
Gjensidige Forsikring ASA | | | 3,349 | | | | 48,197 | |
Marine Harvest ASA * | | | 33,007 | | | | 30,590 | |
Norsk Hydro ASA | | | 11,226 | | | | 57,189 | |
Orkla ASA | | | 11,071 | | | | 96,924 | |
Petroleum Geo-Services ASA | | | 4,001 | | | | 69,225 | |
Schibsted ASA | | | 1,909 | | | | 81,409 | |
Statoil ASA | | | 12,466 | | | | 312,823 | |
Statoil ASA ADR | | | 3,728 | | | | 93,349 | |
Storebrand ASA * | | | 4,286 | | | | 21,028 | |
Telenor ASA | | | 11,151 | | | | 226,552 | |
TGS Nopec Geophysical Co ASA | | | 1,334 | | | | 43,716 | |
Yara International ASA | | | 2,454 | | | | 121,807 | |
| | | | | | | | |
| | | | 1,436,086 | |
| | | | | | | | |
Papua New Guinea - 0.1% | | | | | | | | |
| | |
Oil Search Ltd | | | 15,238 | | | | 111,982 | |
| | | | | | | | |
| | |
Portugal - 0.1% | | | | | | | | |
| | |
Banco Espirito Santo SA * | | | 29,373 | | | | 35,459 | |
EDP - Energias de Portugal SA | | | 33,081 | | | | 99,438 | |
Galp Energia SGPS SA | | | 3,121 | | | | 48,485 | |
Jeronimo Martins SGPS SA | | | 2,513 | | | | 48,492 | |
Portugal Telecom SGPS SA | | | 7,542 | | | | 37,727 | |
| | | | | | | | |
| | | | 269,601 | |
| | | | | | | | |
Singapore - 1.4% | | | | | | | | |
| | |
CapitaLand Ltd | | | 34,000 | | | | 104,305 | |
City Developments Ltd | | | 6,000 | | | | 63,999 | |
ComfortDelGro Corp Ltd | | | 22,831 | | | | 33,462 | |
DBS Group Holdings Ltd | | | 25,182 | | | | 308,261 | |
Fraser and Neave Ltd | | | 13,000 | | | | 103,470 | |
Jardine Cycle & Carriage Ltd | | | 2,000 | | | | 79,573 | |
Keppel Corp Ltd | | | 18,800 | | | | 170,826 | |
Keppel Land Ltd | | | 7,000 | | | | 23,398 | |
Olam International Ltd | | | 18,000 | | | | 23,085 | |
Oversea-Chinese Banking Corp Ltd | | | 36,832 | | | | 296,337 | |
| | | | | | | | |
| | |
Shares | | |
Value | |
SATS Ltd | | | 8,000 | | | | $19,035 | |
SembCorp Industries Ltd | | | 11,000 | | | | 47,930 | |
SembCorp Marine Ltd | | | 12,000 | | | | 45,684 | |
Singapore Airlines Ltd | | | 10,000 | | | | 88,439 | |
Singapore Exchange Ltd | | | 11,000 | | | | 63,771 | |
Singapore Press Holdings Ltd | | | 28,000 | | | | 92,638 | |
Singapore Technologies Engineering Ltd | | | 17,000 | | | | 53,662 | |
Singapore Telecommunications Ltd | | | 118,000 | | | | 320,908 | |
SMRT Corp Ltd | | | 24,000 | | | | 33,233 | |
StarHub Ltd | | | 8,000 | | | | 24,981 | |
United Industrial Corp Ltd | | | 9,000 | | | | 21,016 | |
United Overseas Bank Ltd | | | 17,090 | | | | 279,907 | |
UOL Group Ltd | | | 4,000 | | | | 19,745 | |
Venture Corp Ltd | | | 2,000 | | | | 13,233 | |
Wilmar International Ltd | | | 28,000 | | | | 77,387 | |
| | | | | | | | |
| | | | 2,408,285 | |
| | | | | | | | |
Spain - 2.8% | | | | | | | | |
| | |
Abertis Infraestructuras SA | | | 4,243 | | | | 70,712 | |
Acciona SA | | | 165 | | | | 12,512 | |
Acerinox SA | | | 977 | | | | 10,778 | |
ACS Actividades de Construccion
y Servicios SA | | | 1,418 | | | | 36,290 | |
Amadeus IT Holding SA ‘A’ | | | 4,276 | | | | 107,303 | |
Banco Bilbao Vizcaya Argentaria SA | | | 64,792 | | | | 594,813 | |
Banco Bilbao Vizcaya Argentaria SA ADR | | | 14,058 | | | | 132,426 | |
Banco de Sabadell SA * | | | 34,627 | | | | 91,753 | |
Banco Popular Espanol SA * | | | 95,608 | | | | 73,678 | |
Banco Santander SA | | | 119,481 | | | | 963,385 | |
Banco Santander SA ADR | | | 29,287 | | | | 239,275 | |
CaixaBank SA | | | 10,335 | | | | 36,126 | |
Distribuidora Internacional de Alimentacion SA | | | 11,300 | | | | 72,610 | |
Ebro Foods SA | | | 1,575 | | | | 31,746 | |
EDP Renovaveis SA * | | | 3,839 | | | | 20,472 | |
Enagas SA | | | 2,188 | | | | 46,821 | |
Ferrovial SA | | | 7,257 | | | | 106,998 | |
Gas Natural SDG SA | | | 4,312 | | | | 78,849 | |
Grifols SA * | | | 2,817 | | | | 99,112 | |
Iberdrola SA | | | 58,045 | | | | 323,681 | |
Inditex SA | | | 3,200 | | | | 448,313 | |
International Consolidated Airlines Group SA * | | | 13,807 | | | | 42,563 | |
Mapfre SA | | | 13,005 | | | | 40,140 | |
Prosegur Cia de Seguridad SA | | | 6,890 | | | | 40,459 | |
Red Electrica Corp SA | | | 1,198 | | | | 59,190 | |
Repsol SA | | | 6,507 | | | | 133,632 | |
Repsol SA ADR | | | 5,199 | | | | 108,659 | |
Telefonica SA | | | 30,227 | | | | 410,444 | |
Telefonica SA ADR | | | 28,381 | | | | 382,860 | |
Zardoya Otis SA | | | 1,233 | | | | 17,772 | |
| | | | | | | | |
| | | | 4,833,372 | |
| | | | | | | | |
Sweden - 2.8% | | | | | | | | |
| | |
Alfa Laval AB | | | 4,126 | | | | 86,484 | |
Assa Abloy AB ‘B’ | | | 4,433 | | | | 166,927 | |
Atlas Copco AB ‘A’ | | | 10,318 | | | | 285,634 | |
Atlas Copco AB ‘B’ | | | 5,210 | | | | 127,822 | |
Boliden AB | | | 3,407 | | | | 64,757 | |
Electrolux AB ‘B’ | | | 4,287 | | | | 112,592 | |
Elekta AB ‘B’ | | | 4,940 | | | | 77,902 | |
Getinge AB ‘B’ | | | 2,355 | | | | 79,778 | |
Hennes & Mauritz AB ‘B’ | | | 13,754 | | | | 477,942 | |
Hexagon AB ‘B’ | | | 2,882 | | | | 72,446 | |
Husqvarna AB ‘B’ | | | 5,332 | | | | 32,321 | |
Lundin Petroleum AB * | | | 2,639 | | | | 60,892 | |
Meda AB ‘A’ | | | 4,084 | | | | 42,091 | |
Modern Times Group AB ‘B’ | | | 338 | | | | 11,842 | |
Nordea Bank AB | | | 37,732 | | | | 361,367 | |
Ratos AB ‘B’ | | | 1,948 | | | | 18,764 | |
| | |
| See Notes to Financial Statements | | See explanation of symbols and terms, if any, on page B-81 |
B-77
PACIFIC SELECT FUND
PD INTERNATIONAL LARGE-CAP PORTFOLIO
Schedule of Investments (Continued)
December 31, 2012
| | | | | | | | |
| | |
Shares | | |
Value | |
Sandvik AB | | | 14,298 | | | | $229,805 | |
Scania AB ‘B’ | | | 5,185 | | | | 107,838 | |
Securitas AB ‘B’ | | | 3,834 | | | | 33,679 | |
Skandinaviska Enskilda Banken AB ‘A’ | | | 22,396 | | | | 190,984 | |
Skanska AB ‘B’ | | | 4,284 | | | | 70,484 | |
SKF AB ‘B’ | | | 5,104 | | | | 129,154 | |
SSAB AB ‘A’ | | | 1,095 | | | | 9,656 | |
Svenska Cellulosa AB ‘A’ | | | 303 | | | | 6,633 | |
Svenska Cellulosa AB ‘B’ | | | 7,840 | | | | 171,623 | |
Svenska Handelsbanken AB ‘A’ | | | 6,983 | | | | 250,201 | |
Swedbank AB ‘A’ | | | 12,310 | | | | 242,241 | |
Swedish Match AB | | | 2,730 | | | | 91,949 | |
Tele2 AB ‘B’ | | | 5,478 | | | | 99,351 | |
Telefonaktiebolaget LM Ericsson ‘A’ | | | 2,410 | | | | 23,702 | |
Telefonaktiebolaget LM Ericsson ‘B’ | | | 23,835 | | | | 239,739 | |
Telefonaktiebolaget LM Ericsson ADR | | | 19,502 | | | | 196,970 | |
TeliaSonera AB | | | 32,832 | | | | 223,635 | |
Trelleborg AB ‘B’ | | | 3,548 | | | | 44,266 | |
Volvo AB ‘A’ | | | 6,806 | | | | 94,447 | |
Volvo AB ‘B’ | | | 21,193 | | | | 292,245 | |
| | | | | | | | |
| | | | 4,828,163 | |
| | | | | | | | |
Switzerland - 7.7% | | | | | | | | |
| | |
ABB Ltd (XVTX) | | | 2,834 | | | | 58,845 | |
ABB Ltd ADR | | | 29,541 | | | | 614,157 | |
Actelion Ltd | | | 1,653 | | | | 79,400 | |
Adecco SA | | | 1,567 | | | | 83,060 | |
Aryzta AG | | | 1,452 | | | | 74,499 | |
Baloise Holding AG | | | 636 | | | | 55,503 | |
Banque Cantonale Vaudoise | | | 27 | | | | 14,333 | |
Barry Callebaut AG | | | 39 | | | | 37,659 | |
Cie Financiere Richemont SA ‘A’ | | | 7,312 | | | | 584,693 | |
Clariant AG | | | 1,895 | | | | 25,822 | |
Credit Suisse Group AG | | | 9,937 | | | | 249,333 | |
Credit Suisse Group AG ADR | | | 6,776 | | | | 166,419 | |
Dufry AG * | | | 246 | | | | 32,551 | |
EMS-Chemie Holding AG | | | 77 | | | | 18,161 | |
Galenica AG | | | 61 | | | | 35,401 | |
Geberit AG | | | 639 | | | | 141,461 | |
Givaudan SA | | | 104 | | | | 110,258 | |
Holcim Ltd | | | 3,082 | | | | 226,998 | |
Julius Baer Group Ltd | | | 2,899 | | | | 104,302 | |
Kuehne + Nagel International AG | | | 626 | | | | 76,185 | |
Lindt & Spruengli AG | | | 2 | | | | 75,476 | |
Nestle SA | | | 46,484 | | | | 3,029,553 | |
Novartis AG | | | 14,218 | | | | 900,163 | |
Novartis AG ADR | | | 19,486 | | | | 1,233,464 | |
Partners Group Holding AG | | | 230 | | | | 53,123 | |
PSP Swiss Property AG | | | 103 | | | | 9,775 | |
Roche Holding AG (XSWX) | | | 381 | | | | 78,615 | |
Roche Holding AG (XVTX) | | | 10,328 | | | | 2,104,071 | |
Schindler Holding AG | | | 240 | | | | 34,016 | |
SGS SA | | | 82 | | | | 182,159 | |
Sika AG | | | 36 | | | | 83,434 | |
Sonova Holding AG | | | 611 | | | | 67,691 | |
Sulzer AG | | | 437 | | | | 69,255 | |
Swiss Life Holding AG | | | 454 | | | | 60,593 | |
Swiss Re AG | | | 5,109 | | | | 372,877 | |
Swisscom AG | | | 317 | | | | 136,720 | |
Syngenta AG | | | 400 | | | | 161,353 | |
Syngenta AG ADR | | | 4,185 | | | | 338,148 | |
The Swatch Group AG | | | 475 | | | | 244,451 | |
The Swatch Group AG (Registered) | | | 587 | | | | 51,266 | |
UBS AG (NYSE) | | | 15,158 | | | | 238,587 | |
UBS AG (XVTX) | | | 39,086 | | | | 614,673 | |
Zurich Insurance Group AG | | | 1,905 | | | | 509,381 | |
| | | | | | | | |
| | | | 13,437,884 | |
| | | | | | | | |
| | | | | | | | |
| | |
Shares | | |
Value | |
United Kingdom - 19.8% | | | | | | | | |
| | |
Aberdeen Asset Management PLC | | | 12,855 | | | | $76,229 | |
Admiral Group PLC | | | 2,694 | | | | 51,587 | |
Aggreko PLC | | | 3,734 | | | | 107,085 | |
AMEC PLC | | | 3,498 | | | | 57,230 | |
Anglo American PLC | | | 16,790 | | | | 535,962 | |
Antofagasta PLC | | | 4,782 | | | | 106,260 | |
ARM Holdings PLC | | | 1,325 | | | | 16,943 | |
ARM Holdings PLC ADR | | | 6,134 | | | | 232,049 | |
Ashmore Group PLC | | | 1,763 | | | | 10,194 | |
Associated British Foods PLC | | | 4,306 | | | | 109,605 | |
AstraZeneca PLC ADR | | | 18,224 | | | | 861,449 | |
Aviva PLC | | | 39,049 | | | | 235,731 | |
Babcock International Group PLC | | | 6,031 | | | | 93,594 | |
BAE Systems PLC | | | 42,946 | | | | 235,944 | |
Barclays PLC | | | 33,323 | | | | 143,902 | |
Barclays PLC ADR | | | 34,642 | | | | 600,000 | |
BG Group PLC | | | 44,604 | | | | 747,932 | |
BHP Billiton PLC | | | 5,427 | | | | 190,702 | |
BHP Billiton PLC ADR | | | 12,984 | | | | 913,684 | |
BP PLC ADR | | | 45,953 | | | | 1,913,483 | |
British American Tobacco PLC | | | 16,938 | | | | 858,249 | |
British American Tobacco PLC ADR | | | 5,542 | | | | 561,128 | |
British Sky Broadcasting Group PLC | | | 6,583 | | | | 82,234 | |
British Sky Broadcasting Group PLC ADR | | | 1,754 | | | | 88,384 | |
BT Group PLC | | | 59,434 | | | | 224,036 | |
BT Group PLC ADR | | | 5,292 | | | | 201,255 | |
Bunzl PLC | | | 4,019 | | | | 65,621 | |
Burberry Group PLC | | | 5,625 | | | | 115,169 | |
Capita PLC | | | 9,500 | | | | 117,635 | |
Carnival PLC | | | 1,157 | | | | 44,726 | |
Carnival PLC ADR | | | 1,664 | | | | 64,480 | |
Centrica PLC | | | 69,624 | | | | 378,225 | |
Cobham PLC | | | 11,849 | | | | 43,092 | |
Compass Group PLC | | | 26,542 | | | | 313,906 | |
Croda International PLC | | | 2,177 | | | | 84,342 | |
Diageo PLC ADR | | | 8,999 | | | | 1,049,103 | |
Eurasian Natural Resources Corp PLC | | | 3,202 | | | | 15,405 | |
Evraz PLC | | | 3,743 | | | | 16,521 | |
Experian PLC | | | 12,974 | | | | 209,624 | |
Fresnillo PLC | | | 3,109 | | | | 96,469 | |
G4S PLC | | | 18,242 | | | | 76,172 | |
Genting Singapore PLC | | | 84,000 | | | | 96,115 | |
GKN PLC | | | 21,789 | | | | 81,300 | |
GlaxoSmithKline PLC | | | 1,836 | | | | 39,863 | |
GlaxoSmithKline PLC ADR | | | 33,938 | | | | 1,475,285 | |
Hargreaves Lansdown PLC | | | 2,130 | | | | 23,669 | |
HSBC Holdings PLC (LI) | | | 6,138 | | | | 64,921 | |
HSBC Holdings PLC ADR | | | 51,541 | | | | 2,735,281 | |
ICAP PLC | | | 3,061 | | | | 15,660 | |
IMI PLC | | | 3,116 | | | | 55,421 | |
Imperial Tobacco Group PLC | | | 14,239 | | | | 549,837 | |
Informa PLC | | | 7,398 | | | | 54,730 | |
Inmarsat PLC | | | 1,411 | | | | 13,621 | |
InterContinental Hotels Group PLC | | | 4,182 | | | | 116,757 | |
Intertek Group PLC | | | 2,073 | | | | 104,616 | |
Investec PLC | | | 5,925 | | | | 40,355 | |
ITV PLC | | | 51,218 | | | | 87,866 | |
J. Sainsbury PLC | | | 14,201 | | | | 79,901 | |
John Wood Group PLC | | | 6,020 | | | | 71,130 | |
Johnson Matthey PLC | | | 2,480 | | | | 95,245 | |
Kazakhmys PLC | | | 2,794 | | | | 36,740 | |
Kingfisher PLC | | | 34,614 | | | | 159,878 | |
Legal & General Group PLC | | | 86,091 | | | | 207,842 | |
Lloyds Banking Group PLC * | | | 541,138 | | | | 433,602 | |
Lloyds Banking Group PLC ADR * | | | 13,200 | | | | 42,240 | |
London Stock Exchange Group PLC | | | 2,376 | | | | 41,502 | |
Marks & Spencer Group PLC | | | 25,531 | | | | 159,178 | |
Meggitt PLC | | | 11,661 | | | | 72,693 | |
| | |
| See Notes to Financial Statements | | See explanation of symbols and terms, if any, on page B-81 |
B-78
PACIFIC SELECT FUND
PD INTERNATIONAL LARGE-CAP PORTFOLIO
Schedule of Investments (Continued)
December 31, 2012
| | | | | | | | |
| | |
Shares | | |
Value | |
Melrose Industries PLC | | | 13,185 | | | | $49,121 | |
Mondi PLC | | | 4,039 | | | | 43,564 | |
National Grid PLC | | | 31,746 | | | | 363,632 | |
National Grid PLC ADR | | | 3,865 | | | | 222,006 | |
Next PLC | | | 2,140 | | | | 132,082 | |
Old Mutual PLC | | | 61,677 | | | | 183,199 | |
Pearson PLC | | | 4,231 | | | | 82,713 | |
Pearson PLC ADR | | | 8,321 | | | | 162,592 | |
Pennon Group PLC | | | 6,143 | | | | 62,562 | |
Petrofac Ltd | | | 3,498 | | | | 94,771 | |
Prudential PLC | | | 15,432 | | | | 215,327 | |
Prudential PLC ADR | | | 8,983 | | | | 256,465 | |
Randgold Resources Ltd | | | 1,178 | | | | 116,099 | |
Reckitt Benckiser Group PLC | | | 9,768 | | | | 611,904 | |
Reed Elsevier PLC | | | 4,850 | | | | 50,925 | |
Reed Elsevier PLC ADR | | | 2,500 | | | | 105,100 | |
Resolution Ltd | | | 19,782 | | | | 78,968 | |
Rexam PLC | | | 13,607 | | | | 95,618 | |
Rio Tinto PLC | | | 309 | | | | 18,006 | |
Rio Tinto PLC ADR | | | 19,162 | | | | 1,113,121 | |
Rolls-Royce Holdings PLC * | | | 27,380 | | | | 394,498 | |
Royal Dutch Shell PLC ‘A’ (LI) | | | 955 | | | | 33,745 | |
Royal Dutch Shell PLC ‘B’ | | | 21,504 | | | | 761,077 | |
Royal Dutch Shell PLC ADR | | | 34,467 | | | | 2,443,366 | |
RSA Insurance Group PLC | | | 56,542 | | | | 114,119 | |
SABMiller PLC | | | 13,620 | | | | 641,067 | |
Schroders PLC | | | 1,739 | | | | 48,361 | |
Serco Group PLC | | | 5,706 | | | | 49,124 | |
Severn Trent PLC | | | 3,779 | | | | 96,819 | |
Shire PLC ADR | | | 2,516 | | | | 231,925 | |
Smith & Nephew PLC ADR | | | 2,696 | | | | 149,358 | |
Smiths Group PLC | | | 4,855 | | | | 95,562 | |
SSE PLC | | | 12,858 | | | | 297,162 | |
Standard Chartered PLC | | | 34,893 | | | | 884,491 | |
Standard Life PLC | | | 34,125 | | | | 182,273 | |
Tate & Lyle PLC | | | 5,200 | | | | 64,482 | |
TESCO PLC | | | 119,155 | | | | 654,556 | |
The Royal Bank of Scotland Group PLC * | | | 16,107 | | | | 86,750 | |
The Royal Bank of Scotland Group
PLC ADR * | | | 7,236 | | | | 78,076 | |
The Sage Group PLC | | | 14,615 | | | | 70,015 | |
The Weir Group PLC | | | 3,809 | | | | 118,229 | |
Travis Perkins PLC | | | 2,944 | | | | 52,275 | |
TUI Travel PLC | | | 6,714 | | | | 31,245 | |
Tullow Oil PLC | | | 11,720 | | | | 238,670 | |
Unilever PLC | | | 2,665 | | | | 101,158 | |
Unilever PLC ADR | | | 16,603 | | | | 642,868 | |
United Utilities Group PLC | | | 8,138 | | | | 89,300 | |
Vedanta Resources PLC | | | 1,430 | | | | 27,949 | |
Vodafone Group PLC | | | 173,902 | | | | 437,340 | |
Vodafone Group PLC ADR | | | 53,441 | | | | 1,346,179 | |
Whitbread PLC | | | 2,413 | | | | 96,198 | |
WM Morrison Supermarkets PLC | | | 34,221 | | | | 146,368 | |
WPP PLC | | | 3,258 | | | | 47,362 | |
Wolseley PLC | | | 3,460 | | | | 164,458 | |
WPP PLC ADR | | | 3,170 | | | | 231,093 | |
Xstrata PLC * | | | 19,537 | | | | 347,486 | |
| | | | | | | | |
| | | | | | | 34,453,368 | |
| | | | | | | | |
Total Common Stocks
(Cost $159,823,648) | | | | | | | 172,789,991 | |
| | | | | | | | |
| | | | | | | | |
| | | Principal
Amount | | |
Value | |
SHORT-TERM INVESTMENT - 0.5% | | | | | | | | |
| | |
Repurchase Agreement - 0.5% | | | | | | | | |
| | |
Fixed Income Clearing Corp
0.010% due 01/02/13
(Dated 12/31/12, repurchase price of
$805,987; collateralized by U.S.
Treasury Notes: 0.250% due 07/15/15
and value $825,000) | | | $805,986 | | | | $805,986 | |
| | | | | | | | |
| | |
Total Short-Term Investment
(Cost $805,986) | | | | | | | 805,986 | |
| | | | | | | | |
| | |
TOTAL INVESTMENTS - 99.6%
(Cost $160,658,092) | | | | | | | 173,633,157 | |
| |
OTHER ASSETS & LIABILITIES, NET - 0.4% | | | | 735,273 | |
| | | | | | | | |
| | |
NET ASSETS - 100.0% | | | | | | | $174,368,430 | |
| | | | | | | | |
Notes to Schedule of Investments
| (a) | As of December 31, 2012, the portfolio was diversified as a percentage of net assets as follows: |
| | | | |
Financials | | | 23.8% | |
Industrials | | | 12.0% | |
Consumer Staples | | | 10.9% | |
Materials | | | 10.7% | |
Consumer Discretionary | | | 10.0% | |
Energy | | | 9.9% | |
Health Care | | | 9.2% | |
Telecommunication Services | | | 4.6% | |
Information Technology | | | 4.4% | |
Utilities | | | 3.6% | |
Short-Term Investment | | | 0.5% | |
| | | | |
| | | 99.6% | |
Other Assets & Liabilities, Net | | | 0.4% | |
| | | | |
| | | 100.0% | |
| | | | |
| (b) | As of December 31, 2012, the portfolio was diversified by country of incorporation as a percentage of net assets as follows: |
| | | | |
United Kingdom | | | 19.8% | |
Japan | | | 18.3% | |
Canada | | | 10.7% | |
France | | | 8.0% | |
Switzerland | | | 7.7% | |
Australia | | | 7.7% | |
Germany | | | 7.4% | |
Others (each less than 3.0%) | | | 20.0% | |
| | | | |
| | | 99.6% | |
Other Assets & Liabilities, Net | | | 0.4% | |
| | | | |
| | | 100.0% | |
| | | | |
| (c) | Short-term investments reflect either the stated coupon rate or the annualized effective yield on the date of purchase for discounted investments. |
| | |
| See Notes to Financial Statements | | See explanation of symbols and terms, if any, on page B-81 |
B-79
PACIFIC SELECT FUND
PD INTERNATIONAL LARGE-CAP PORTFOLIO
Schedule of Investments (Continued)
December 31, 2012
| (d) | Fair Value Measurements |
The following is a summary of the portfolio’s investments as categorized under the three-tier hierarchy of inputs used in valuing the portfolio’s assets and liabilities (See Note 3D in Notes to Financial Statements) as of December 31, 2012:
| | | | | | | | | | | | | | | | | | |
| | | | | Total Value at
December 31, 2012 | | | Level 1
Quoted Price | | | Level 2
Significant
Observable Inputs | | | Level 3 Significant Unobservable Inputs | |
Assets | | Rights | | | | | | | | | | | | | | | | |
| | Spain | | | $7,519 | | | | $3,968 | | | | $3,551 | | | | $- | |
| | Preferred Stocks (1) | | | 29,661 | | | | - | | | | 29,661 | | | | - | |
| | Common Stocks | | | | | | | | | | | | | | | | |
| | Australia | | | 13,355,579 | | | | 2,541,065 | | | | 10,814,514 | | | | - | |
| | Austria | | | 454,907 | | | | - | | | | 454,907 | | | | - | |
| | Belgium | | | 1,745,001 | | | | 904,384 | | | | 840,617 | | | | - | |
| | Bermuda | | | 871,623 | | | | 30,675 | | | | 840,948 | | | | - | |
| | Canada | | | 18,641,227 | | | | 18,641,227 | | | | - | | | | - | |
| | Cayman | | | 351,355 | | | | - | | | | 351,355 | | | | - | |
| | Cyprus | | | 20,478 | | | | - | | | | 20,478 | | | | - | |
| | Denmark | | | 1,962,962 | | | | 528,311 | | | | 1,434,651 | | | | - | |
| | Finland | | | 1,067,414 | | | | 77,420 | | | | 989,994 | | | | - | |
| | France | | | 13,941,349 | | | | 813,344 | | | | 13,128,005 | | | | - | |
| | Germany | | | 12,915,646 | | | | 1,466,739 | | | | 11,448,907 | | | | - | |
| | Greece | | | 63,473 | | | | 12,798 | | | | 50,675 | | | | - | |
| | Hong Kong | | | 4,090,975 | | | | - | | | | 4,090,975 | | | | - | |
| | Ireland | | | 501,558 | | | | 135,449 | | | | 366,109 | | | | - | |
| | Israel | | | 776,338 | | | | 546,781 | | | | 229,557 | | | | - | |
| | Italy | | | 3,324,189 | | | | 310,307 | | | | 3,013,882 | | | | - | |
| | Japan | | | 31,871,121 | | | | 3,724,944 | | | | 28,146,177 | | | | - | |
| | Luxembourg | | | 668,419 | | | | 201,888 | | | | 466,531 | | | | - | |
| | Mauritius | | | 60,832 | | | | - | | | | 60,832 | | | | - | |
| | Netherlands | | | 4,165,523 | | | | 1,071,830 | | | | 3,093,693 | | | | - | |
| | New Zealand | | | 161,281 | | | | - | | | | 161,281 | | | | - | |
| | Norway | | | 1,436,086 | | | | 93,349 | | | | 1,342,737 | | | | - | |
| | Papua New Guinea | | | 111,982 | | | | - | | | | 111,982 | | | | - | |
| | Portugal | | | 269,601 | | | | - | | | | 269,601 | | | | - | |
| | Singapore | | | 2,408,285 | | | | - | | | | 2,408,285 | | | | - | |
| | Spain | | | 4,833,372 | | | | 863,220 | | | | 3,970,152 | | | | - | |
| | Sweden | | | 4,828,163 | | | | 196,970 | | | | 4,631,193 | | | | - | |
| | Switzerland | | | 13,437,884 | | | | 2,590,775 | | | | 10,847,109 | | | | - | |
| | United Kingdom | | | 34,453,368 | | | | 17,798,144 | | | | 16,655,224 | | | | - | |
| | | | | | | | | | | | | | | | | | |
| | | | | 172,789,991 | | | | 52,549,620 | | | | 120,240,371 | | | | - | |
| | Short-Term Investment | | | 805,986 | | | | - | | | | 805,986 | | | | - | |
| | | | | | | | | | | | | | | | | | |
| | Total | | | $173,633,157 | | | | $52,553,588 | | | | $121,079,569 | | | | $- | |
| | | | | | | | | | | | | | | | | | |
| | (1) | For equity investments categorized in a single level, refer to the schedule of investments for further geographical region breakout. |
| | |
| See Notes to Financial Statements | | See explanation of symbols and terms, if any, on page B-81 |
B-80
PACIFIC SELECT FUND
Schedule of Investments (Continued)
Explanation of Symbols and Terms
December 31, 2012
| | |
|
Explanation of Symbols: |
| * | | Non-income producing investments. |
| " | | Pass-through securities backed by a pool of mortgages or other loans on which principal payments are periodically made. Therefore, the effective maturity is shorter than the stated maturity. |
| § | | Variable rate investments. The rate shown is based on the latest available information as of December 31, 2012. |
| ± | | The security is a perpetual bond and has no definite maturity date. |
| ~ | | Securities are not registered under the Securities Act of 1933 (1933 Act). These securities are either (1) exempt from registration pursuant to Rule 144A of the 1933 Act and may only be sold to "qualified institutional buyers", or (2) the securities comply with Regulation S rules governing offers and sales made outside the United States without registration under the 1933 Act and contain certain restrictions as to public resale. |
| ‡ | | Investments were fully or partially segregated with the broker(s)/ custodian as collateral for futures contracts as of December 31, 2012. |
| + | | The values of these investments were determined by the Trustee Valuation Committee or determined by a valuation committee established under the Valuation Policy and then subsequently submitted for approval or ratification to either the Trustee Valuation Committee, or to the Board. Each determination was made in good faith in accordance with the Valuation Policy established by the Board and the provisions of the Investment Company Act of 1940 (See note 3C in Notes to Financial Statements). |
| l | | Total shares owned by the portfolio as of December 31, 2012 were less than one share. |
| | |
|
Other Abbreviations: |
| ADR | | American Depositary Receipt |
| CVA | | Certificaten Van Aandelen (Dutch Certificate) |
| FDR | | Fiduciary Depositary Receipt |
| GDR | | Global Depositary Receipt |
| NVDR | | Non Voting Depository Receipt |
| 'NY' | | New York Shares |
| REIT | | Real Estate Investment Trust |
| SDR | | Swedish Depository Receipt |
Note:
The countries listed in the Schedules of Investments are based on country of incorporation.
The descriptions and Standard and Poor’s quality ratings of the companies shown in the schedules of investments were obtained from published reports or other sources believed to be reliable, and not audited by the Independent Registered Public Accounting Firm.
| | |
| See Notes to Financial Statements | | |
B-81
PACIFIC SELECT FUND
STATEMENTS OF ASSETS AND LIABILITIES
DECEMBER 31, 2012
| | | | | | | | | | | | | | | | | | | | | | | | | | | | |
| | | | | | | PD Aggregate
Bond Index
Portfolio | | | PD High Yield
Bond Market
Portfolio | | | PD Large-Cap
Growth Index
Portfolio | | | PD Large-Cap
Value Index
Portfolio | | | PD Small-Cap
Growth Index
Portfolio | | | PD Small-Cap
Value Index
Portfolio | |
ASSETS | | | | | | | | | | | | | | | | | | | | | | | | | | |
Investments, at value | | | | | $430,694,190 | | | | $108,322,445 | | | | $166,358,611 | | | | $208,381,419 | | | | $40,091,956 | | | | $60,330,190 | |
Repurchase agreements, at value | | | | | - | | | | - | | | | 4,683,284 | | | | 7,955,510 | | | | 1,459,014 | | | | 1,643,174 | |
Cash (1) | | | | | - | | | | 3,213 | | | | - | | | | - | | | | 163,073 | | | | 126,280 | |
Foreign currency held, at value | | | | | - | | | | - | | | | - | | | | - | | | | - | | | | 79 | |
Receivables: | | | | | | | | | | | | | | | | | | | | | | | | | | |
| | Dividends and interest | | | | | 2,399,356 | | | | 1,952,902 | | | | 140,553 | | | | 284,251 | | | | 9,730 | | | | 148,466 | |
| | Fund shares sold | | | | | 2,659,339 | | | | 67,795 | | | | - | | | | 757,826 | | | | 45,326 | | | | 284,812 | |
| | Securities sold | | | | | 417,783 | | | | 482,723 | | | | 227 | | | | 193 | | | | 1,031,502 | | | | 5,962 | |
| | Variation margin | | | | | - | | | | - | | | | 125,840 | | | | 209,194 | | | | 26,280 | | | | 43,800 | |
| | Due from adviser | | | | | 20,868 | | | | 5,412 | | | | 2,658 | | | | 3,476 | | | | 338 | | | | - | |
Prepaid expenses and other assets | | | | | 1,511 | | |
| 457
|
| | | 689 | | |
| 845
|
| |
| 183
|
| |
| 251
|
|
Total Assets | | | | | 436,193,047 | | | | 110,834,947 | | | | 171,311,862 | | | | 217,592,714 | | | | 42,827,402 | | | | 62,583,014 | |
LIABILITIES | | | | | | | | | | | | | | | | | | | | | | | | | | |
Payables: | | | | | | | | | | | | | | | | | | | | | | | | | | |
| | Fund shares redeemed | | | | | 9,197 | | | | - | | | | 8,738 | | | | 10,577 | | | | 2,759 | | | | 3,679 | |
| | Securities purchased | | | | | 26,615,917 | | | | 938,153 | | | | - | | | | - | | | | 1,672,363 | | | | 257,017 | |
| | Due to adviser | | | | | - | | | | - | | | | - | | | | - | | | | - | | | | 5,496 | |
| | Accrued advisory fees | | | | | 48,378 | | | | 25,200 | | | | 20,243 | | | | 25,179 | | | | 4,750 | | | | 7,068 | |
| | Accrued support service expenses | | | | | 2,897 | | | | 876 | | | | 1,281 | | | | 1,565 | | | | 338 | | | | 464 | |
| | Accrued custodian, and portfolio accounting and tax fees | | | | | 45,454 | | | | 21,066 | | | | 8,407 | | | | 9,697 | | | | 9,425 | | | | 9,876 | |
| | Accrued shareholder report expenses | | | | | 4,319 | | | | 1,309 | | | | 1,911 | | | | 2,332 | | | | 505 | | | | 693 | |
| | Accrued trustees’ fees and expenses | | | | | 935 | | | | 283 | | | | 414 | | | | 505 | | | | 109 | | | | 150 | |
| | Accrued other | | | | | 5,022 | | | | 2,407 | | | | 3,213 | | | | 3,549 | | | | 1,854 | | | | 2,002 | |
Total Liabilities | | | | | 26,732,119 | | | | 989,294 | | | | 44,207 | | | | 53,404 | | | | 1,692,103 | | | | 286,445 | |
NET ASSETS | | | | | $409,460,928 | | | | $109,845,653 | | | | $171,267,655 | | | | $217,539,310 | | | | $41,135,299 | | | | $62,296,569 | |
NET ASSETS CONSIST OF: | | | | | | | | | | | | | | | | | | | | | | | | | | |
Paid-in capital | | | | | $396,293,852 | | | | $105,818,505 | | | | $149,117,329 | | | | $193,064,675 | | | | $37,134,545 | | | | $57,445,930 | |
Undistributed earnings | | | | | 13,167,076 | | | | 4,027,148 | | | | 22,150,326 | | | | 24,474,635 | | | | 4,000,754 | | | | 4,850,639 | |
NET ASSETS | | | | | $409,460,928 | | | | $109,845,653 | | | | $171,267,655 | | | | $217,539,310 | | | | $41,135,299 | | | | $62,296,569 | |
Shares outstanding, $.001 par value (unlimited Class P shares authorized) | | | | | 36,679,217 | | | | 9,355,257 | | | | 10,787,290 | | | | 14,305,329 | | | | 2,812,828 | | | | 4,451,090 | |
Net Asset Value Per Share | | | | | $11.16 | | | | $11.74 | | | | $15.88 | | | | $15.21 | | | | $14.62 | | | | $14.00 | |
| | | | | | | | | | | | | | | | | | | | | | | | | | |
Investments, at cost | | | | | $416,603,906 | | | | $103,222,822 | | | | $143,966,911 | | | | $189,620,158 | | | | $36,315,118 | | | | $55,672,055 | |
Repurchase agreements, at cost | | | | | - | | | | - | | | | 4,683,284 | | | | 7,955,510 | | | | 1,459,014 | | | | 1,643,174 | |
Foreign currency held, at cost | | | | | - | | | | - | | | | - | | | | - | | | | - | | | | 79 | |
| (1) | Includes cash collateral segregated for open futures contracts in the PD Small-Cap Growth Index and PD Small-Cap Value Index Portfolios of $101,600 and $96,880, respectively. |
| | |
| See Notes to Financial Statements | | |
C-1
PACIFIC SELECT FUND
STATEMENTS OF ASSETS AND LIABILITIES (Continued)
DECEMBER 31, 2012
| | | | | | | | | | | | |
| | | | | | | PD Emerging
Markets
Portfolio | | | PD International
Large-Cap
Portfolio | |
ASSETS | | | | | | | | | | |
Investments, at value | | | |
| $51,319,004
|
| | | $172,827,171 | |
Repurchase agreements, at value | | | |
| -
|
| | | 805,986 | |
Cash | | | | | 51,566 | | | | 47,807 | |
Foreign currency held, at value | | | | | 120,060 | | | | 384,053 | |
Receivables: | | | | | | | | | | |
| | Dividends and interest | | | | | 41,888 | | | | 391,590 | |
| | Fund shares sold | | | |
| -
|
| | | 383,216 | |
| | Securities sold | | | | | - | | | | 3,021 | |
| | Due from adviser | | | |
| -
|
| | | 5,375 | |
Prepaid expenses and other assets | | | | | 216 | | |
| 1,915
|
|
Total Assets | | | | | 51,532,734 | | | | 174,850,134 | |
LIABILITIES | | | | | | | | | | |
Payables: | | | | | | | | | | |
| | Fund shares redeemed | | | | | 2,299 | | | | 8,738 | |
| | Securities purchased | | | | | - | | | | 406,674 | |
| | Accrued advisory fees | | | | | 25,387 | | | | 33,056 | |
| | Accrued support service expenses | | | | | 405 | | | | 1,260 | |
| | Accrued custodian, and portfolio accounting and tax fees | | | | | 18,903 | | | | 26,601 | |
| | Accrued shareholder report expenses | | | | | 604 | | | | 1,878 | |
| | Accrued trustees’ fees and expenses | | | | | 131 | | | | 407 | |
| | Accrued foreign capital gains tax | | | | | 30,574 | | | | - | |
| | Accrued other | | | | | 1,841 | | | | 3,090 | |
Total Liabilities | | | | | 80,144 | | | | 481,704 | |
NET ASSETS | | | | | $51,452,590 | | | | $174,368,430 | |
NET ASSETS CONSIST OF: | | | | | | | | | | |
Paid-in capital | | | | | $44,256,838 | | | | $161,733,161 | |
Undistributed earnings | | | | | 7,195,752 | | | | 12,635,269 | |
NET ASSETS | | | | | $51,452,590 | | | | $174,368,430 | |
Shares outstanding, $.001 par value (unlimited Class P shares authorized) | | | | | 3,374,261 | | | | 12,881,326 | |
Net Asset Value Per Share | | | | | $15.25 | | | | $13.54 | |
| | | | | | | | | | |
Investments, at cost | | | | | $43,849,941 | | | | $159,852,106 | |
Repurchase agreements, at cost | | | | | - | | | | 805,986 | |
Foreign currency held, at cost | | | | | 117,906 | | | | 384,616 | |
| | |
| See Notes to Financial Statements | | |
C-2
PACIFIC SELECT FUND
STATEMENTS OF OPERATIONS
FOR THE YEAR ENDED DECEMBER 31, 2012
| | | | | | | | | | | | | | | | | | | | | | | | | | | | |
| | | | | | | PD Aggregate
Bond Index
Portfolio | | | PD High Yield
Bond Market
Portfolio | | | PD Large-Cap
Growth Index
Portfolio | | | PD Large-Cap
Value Index
Portfolio | | | PD Small-Cap
Growth Index
Portfolio | | | PD Small-Cap
Value Index
Portfolio | |
INVESTMENT INCOME | | | | | | | | | | | | | | | | | | | | | | | | | | |
Dividends, net of foreign taxes withheld | | | | | $27,999 | | | | $2,563 | | | | $2,589,346 | | | | $4,449,630 | | | | $520,479 | | | | $1,467,156 | |
Interest, net of foreign taxes withheld | | | | | 6,607,555 | | | | 6,807,568 | | | | 506 | | | | 648 | | | | 112 | | | | 159 | |
Total Investment Income | | | | | 6,635,554 | | | | 6,810,131 | | | | 2,589,852 | | | | 4,450,278 | | | | 520,591 | | | | 1,467,315 | |
| | | | | | | |
EXPENSES | | | | | | | | | | | | | | | | | | | | | | | | | | |
Advisory fees | | | | | 450,376 | | | | 270,516 | | | | 192,246 | | | | 234,825 | | | | 50,858 | | | | 69,822 | |
Support services expenses | | | | | 11,075 | | | | 3,494 | | | | 5,016 | | | | 6,084 | | | | 1,365 | | | | 1,817 | |
Custodian fees and expenses | | | | | 24,114 | | | | 2,842 | | | | 12,577 | | | | 14,932 | | | | 17,333 | | | | 25,937 | |
Portfolio accounting and tax fees | | | | | 145,952 | | | | 77,181 | | | | 20,655 | | | | 25,192 | | | | 19,282 | | | | 24,297 | |
Shareholder report expenses | | | | | 10,952 | | | | 3,426 | | | | 4,868 | | | | 5,866 | | | | 1,342 | | | | 1,767 | |
Legal and audit fees | | | | | 8,568 | | | | 2,644 | | | | 3,842 | | | | 4,679 | | | | 1,041 | | | | 1,403 | |
Trustees’ fees and expenses | | | | | 4,278 | | | | 1,331 | | | | 1,922 | | | | 2,351 | | | | 519 | | | | 708 | |
Transfer agency fees and expenses | | | | | 6,293 | | | | 5,242 | | | | 6,189 | | | | 6,167 | | | | 5,333 | | | | 5,371 | |
Interest expense and commitment fees | | | | | 12 | | | | 1 | | | | 193 | | | | 249 | | | | 55 | | | | 72 | |
Other | | | | | 1,912 | | | | 663 | | | | 1,505 | | | | 1,778 | | | | 421 | | | | 752 | |
Total Expenses | | | | | 663,532 | | | | 367,340 | | | | 249,013 | | | | 302,123 | | | | 97,549 | | | | 131,946 | |
Adviser Reimbursement (1) | | | | | (136,128 | ) | | | (47,932 | ) | | | (15,942 | ) | | | (17,489 | ) | | | (21,359 | ) | | | (27,181 | ) |
Net Expenses | | | | | 527,404 | | | | 319,408 | | | | 233,071 | | | | 284,634 | | | | 76,190 | | | | 104,765 | |
NET INVESTMENT INCOME | | | | | 6,108,150 | | | | 6,490,723 | | | | 2,356,781 | | | | 4,165,644 | | | | 444,401 | | | | 1,362,550 | |
| | | | | | | |
NET REALIZED AND UNREALIZED GAIN (LOSS) | | | | | | | | | | | | | | | | | | | | | | | | | | |
Net Realized Gain (Loss) on: | | | | | | | | | | | | | | | | | | | | | | | | | | |
| | Investment security transactions | | | | | 1,009,440 | | | | 738,551 | | | | (948,667 | ) | | | 4,416,276 | | | | 2,231,940 | | | | 2,294,868 | |
| | Futures contracts transactions | | | | | - | | | | - | | | | 636,745 | | | | 784,671 | | | | 103,490 | | | | 82,026 | |
| | Foreign currency transactions | | | | | - | | | | - | | | | - | | | | - | | | | - | | | | 12 | |
| | Net Realized Gain (Loss) | | | | | 1,009,440 | | | | 738,551 | | | | (311,922 | ) | | | 5,200,947 | | | | 2,335,430 | | | | 2,376,906 | |
| | | | | | | |
Change in Net Unrealized Appreciation (Depreciation) on: | | | | | | | | | | | | | | | | | | | | | | | | | | |
| | Investment securities | | | | | 4,217,253 | | | | 5,638,103 | | | | 14,547,782 | | | | 15,958,657 | | | | 1,780,613 | | | | 4,126,410 | |
| | Futures contracts | | | | | - | | | | - | | | | (34,026 | ) | | | (45,678 | ) | | | 24,697 | | | | 33,789 | |
| | Foreign currencies | | | | | - | | | | - | | | | - | | | | - | | | | - | | | | (4 | ) |
| | Change in Net Unrealized Appreciation | | | | | 4,217,253 | | | | 5,638,103 | | | | 14,513,756 | | | | 15,912,979 | | | | 1,805,310 | | | | 4,160,195 | |
NET GAIN | | | | | 5,226,693 | | | | 6,376,654 | | | | 14,201,834 | | | | 21,113,926 | | | | 4,140,740 | | | | 6,537,101 | |
NET INCREASE IN NET ASSETS
RESULTING FROM OPERATIONS | | | | | $11,334,843 | | | | $12,867,377 | | | | $16,558,615 | | | | $25,279,570 | | | | $4,585,141 | | | | $7,899,651 | |
| | | | | | | | | | | | | | | | | | | | | | | | | | | | |
Foreign taxes withheld on dividends and interest | | | | | $30 | | | | $2,256 | | | | $676 | | | | $7,114 | | | | $225 | | | | $1,962 | |
| (1) | See Note 7B in Notes to Financial Statements. |
| | |
| See Notes to Financial Statements | | |
C-3
PACIFIC SELECT FUND
STATEMENTS OF OPERATIONS (Continued)
FOR THE YEAR ENDED DECEMBER 31, 2012
| | | | | | | | | | | | |
| | | | | | | PD Emerging
Markets
Portfolio | | | PD International
Large-Cap
Portfolio | |
INVESTMENT INCOME | | | | | | | | | | |
Dividends, net of foreign taxes withheld | | | | | $1,049,131 | | | | $4,318,430 | |
Interest, net of foreign taxes withheld | | | | | 79 | | | | 148 | |
Total Investment Income | | | | | 1,049,210 | | | | 4,318,578 | |
| | | |
EXPENSES | | | | | | | | | | |
Advisory fees | | | | | 260,343 | | | | 320,184 | |
Support services expenses | | | | | 1,607 | | | | 4,914 | |
Custodian fees and expenses | | | | | 27,588 | | | | 48,817 | |
Portfolio accounting and tax fees | | | | | 74,111 | | | | 109,602 | |
Shareholder report expenses | | | | | 1,594 | | | | 4,719 | |
Legal and audit fees | | | | | 1,220 | | | | 3,780 | |
Trustees’ fees and expenses | | | | | 602 | | | | 1,890 | |
Transfer agency fees and expenses | | | | | 5,163 | | | | 6,055 | |
Interest expense and commitment fees | | | | | 287 | | | | 2,621 | |
Other | | | | | 293 | | | | 2,785 | |
Total Expenses | | | | | 372,808 | | | | 505,367 | |
Adviser Reimbursement (1) | | | | | - | | | | (100,661 | ) |
Net Expenses | | | | | 372,808 | | | | 404,706 | |
NET INVESTMENT INCOME | | | | | 676,402 | | | | 3,913,872 | |
| | | |
NET REALIZED AND UNREALIZED GAIN (LOSS) | | | | | | | | | | |
Net Realized Gain (Loss) on: | | | | | | | | | | |
| | Investment security transactions (2) | | | | | (189,522 | ) | | | (341,367 | ) |
| | Foreign currency transactions | | | | | (12,714 | ) | | | (28,359 | ) |
| | Net Realized Loss | | | | | (202,236 | ) | | | (369,726 | ) |
| | | |
Change in Net Unrealized Appreciation (Depreciation) on: | | | | | | | | | | |
| | Investment securities (3) | | | | | 6,267,196 | | | | 18,815,603 | |
| | Foreign currencies | | | | | 3,125 | | | | 3,473 | |
| | Change in Net Unrealized Appreciation | | | | | 6,270,321 | | | | 18,819,076 | |
NET GAIN | | | | | 6,068,085 | | | | 18,449,350 | |
NET INCREASE IN NET ASSETS
RESULTING FROM OPERATIONS | | | | | $6,744,487 | | | | $22,363,222 | |
| | | | | | | | | | | | |
Foreign taxes withheld on dividends and interest | | | | | $141,164 | | | | $375,898 | |
| (1) | See Note 7B in Notes to Financial Statements. |
| (2) | Net realized gain (loss) on investment security transactions for the PD Emerging Markets Portfolio is net of foreign capital gains tax withheld of $2. |
| (3) | Change in net unrealized appreciation (depreciation) on investment securities for the PD Emerging Markets Portfolio is net of increase in deferred foreign capital gains tax of $30,574. |
| | |
| See Notes to Financial Statements | | |
C-4
PACIFIC SELECT FUND
STATEMENTS OF CHANGES IN NET ASSETS (1)
| | | | | | | | | | | | | | | | | | | | | | | | | | | | | | |
| | | | | Year Ended
December 31,
2012 | | | Year Ended
December 31,
2011 | | | | | Year Ended
December 31,
2012 | | | Year Ended
December 31,
2011 | | | | | Year Ended
December 31,
2012 | | | Year Ended
December 31,
2011 | |
| | | | | PD Aggregate Bond
Index Portfolio | | | | | PD High Yield Bond
Market Portfolio | | | | | PD Large-Cap
Growth Index Portfolio | |
OPERATIONS | | | | | | | | | | | | | | | | | | | | | | | | | | | | | | |
Net investment income | | | | | $6,108,150 | | | | $4,947,566 | | | | | | $6,490,723 | | | | $4,566,022 | | | | | | $2,356,781 | | | | $1,126,551 | |
Net realized gain (loss) | | | | | 1,009,440 | | | | 991,285 | | | | | | 738,551 | | | | 1,058,412 | | | | | | (311,922 | ) | | | 3,146,382 | |
Change in net unrealized appreciation (depreciation) | | | | | 4,217,253 | | | | 7,424,641 | | | | | | 5,638,103 | | | | (3,456,129 | ) | | | | | 14,513,756 | | | | (2,042,253 | ) |
Net Increase in Net Assets
Resulting from Operations | | | | | 11,334,843 | | | | 13,363,492 | | | | | | 12,867,377 | | | | 2,168,305 | | | | | | 16,558,615 | | | | 2,230,680 | |
| | | | | | | | | |
DIVIDENDS AND DISTRIBUTIONS TO SHAREHOLDERS | | | | | | | | | | | | | | | | | | | | | | | | | | | | | | |
Net investment income | | | | | (5,370,000 | ) | | | (7,296,006 | ) | | | | | (6,500,220 | ) | | | (5,690,297 | ) | | | | | (2,082,400 | ) | | | (1,176,464 | ) |
Net realized gains | | | | | (405,475 | ) | | | (821,415 | ) | | | | | (609,911 | ) | | | (1,097,619 | ) | | | | | - | | | | (3,396,485 | ) |
Net Decrease from Dividends and
Distributions to Shareholders | | | | | (5,775,475 | ) | | | (8,117,421 | ) | | | | | (7,110,131 | ) | | | (6,787,916 | ) | | | | | (2,082,400 | ) | | | (4,572,949 | ) |
| | | | | | | | | |
CAPITAL SHARE TRANSACTIONS | | | | | | | | | | | | | | | | | | | | | | | | | | | | | | |
Proceeds from sale of shares | | | | | 203,898,718 | | | | 82,553,018 | | | | | | 19,709,154 | | | | 41,861,497 | | | | | | 62,887,354 | | | | 48,944,574 | |
Dividend and distribution reinvestments | | | | | 5,775,475 | | | | 8,117,421 | | | | | | 7,110,131 | | | | 6,787,916 | | | | | | 2,082,400 | | | | 4,572,949 | |
Cost of shares repurchased | | | | | (16,077,377 | ) | | | (49,554,171 | ) | | | | | (1,017,720 | ) | | | (4,493,854 | ) | | | | | (8,302,755 | ) | | | (14,518,753 | ) |
Net Increase in Net Assets from
Capital Share Transactions | | | | | 193,596,816 | | | | 41,116,268 | | | | | | 25,801,565 | | | | 44,155,559 | | | | | | 56,666,999 | | | | 38,998,770 | |
NET INCREASE IN NET ASSETS | | | | | 199,156,184 | | | | 46,362,339 | | | | | | 31,558,811 | | | | 39,535,948 | | | | | | 71,143,214 | | | | 36,656,501 | |
| | | | | | | | | |
NET ASSETS | | | | | | | | | | | | | | | | | | | | | | | | | | | | | | |
Beginning of Year | | | | | 210,304,744 | | | | 163,942,405 | | | | | | 78,286,842 | | | | 38,750,894 | | | | | | 100,124,441 | | | | 63,467,940 | |
End of Year | | | | | $409,460,928 | | | | $210,304,744 | | | | | | $109,845,653 | | | | $78,286,842 | | | | | | $171,267,655 | | | | $100,124,441 | |
| | | | | | |
| | | | | PD Large-Cap Value
Index Portfolio | | | | | PD Small-Cap Growth
Index Portfolio | | | | | PD Small-Cap Value
Index Portfolio | |
OPERATIONS | | | | | | | | | | | | | | | | | | | | | | | | | | | | | | |
Net investment income | | | | | $4,165,644 | | | | $2,167,633 | | | | | | $444,401 | | | | $110,629 | | | | | | $1,362,550 | | | | $554,159 | |
Net realized gain | | | | | 5,200,947 | | | | 5,693,730 | | | | | | 2,335,430 | | | | 2,246,765 | | | | | | 2,376,906 | | | | 2,071,070 | |
Change in net unrealized appreciation (depreciation) | | | | | 15,912,979 | | | | (6,346,168 | ) | | | | | 1,805,310 | | | | (3,100,556 | ) | | | | | 4,160,195 | | | | (4,066,725 | ) |
Net Increase (Decrease) in Net Assets
Resulting from Operations | | | | | 25,279,570 | | | | 1,515,195 | | | | | | 4,585,141 | | | | (743,162 | ) | | | | | 7,899,651 | | | | (1,441,496 | ) |
| | | | | | | | | |
DIVIDENDS AND DISTRIBUTIONS TO SHAREHOLDERS | | | | | | | | | | | | | | | | | | | | | | | | | | | | | | |
Net investment income | | | | | (3,802,347 | ) | | | (2,030,533 | ) | | | | | (457,051 | ) | | | (153,565 | ) | | | | | (1,367,985 | ) | | | (643,836 | ) |
Net realized gains | | | | | (5,693,731 | ) | | | (109,671 | ) | | | | | (2,341,186 | ) | | | (2,205,530 | ) | | | | | (2,185,500 | ) | | | (2,128,972 | ) |
Net Decrease from Dividends and
Distributions to Shareholders | | | | | (9,496,078 | ) | | | (2,140,204 | ) | | | | | (2,798,237 | ) | | | (2,359,095 | ) | | | | | (3,553,485 | ) | | | (2,772,808 | ) |
| | | | | | | | | |
CAPITAL SHARE TRANSACTIONS | | | | | | | | | | | | | | | | | | | | | | | | | | | | | | |
Proceeds from sale of shares | | | | | 79,735,285 | | | | 56,108,459 | | | | | | 17,457,279 | | | | 11,726,621 | | | | | | 28,608,720 | | | | 15,655,746 | |
Dividend and distribution reinvestments | | | | �� | 9,496,078 | | | | 2,140,204 | | | | | | 2,798,237 | | | | 2,359,095 | | | | | | 3,553,485 | | | | 2,772,808 | |
Cost of shares repurchased | | | | | (7,439,195 | ) | | | (15,149,930 | ) | | | | | (8,904,762 | ) | | | (3,080,420 | ) | | | | | (8,317,313 | ) | | | (3,103,220 | ) |
Net Increase in Net Assets from
Capital Share Transactions | | | | | 81,792,168 | | | | 43,098,733 | | | | | | 11,350,754 | | | | 11,005,296 | | | | | | 23,844,892 | | | | 15,325,334 | |
NET INCREASE IN NET ASSETS | | | | | 97,575,660 | | | | 42,473,724 | | | | | | 13,137,658 | | | | 7,903,039 | | | | | | 28,191,058 | | | | 11,111,030 | |
| | | | | | | | | |
NET ASSETS | | | | | | | | | | | | | | | | | | | | | | | | | | | | | | |
Beginning of Year | | | | | 119,963,650 | | | | 77,489,926 | | | | | | 27,997,641 | | | | 20,094,602 | | | | | | 34,105,511 | | | | 22,994,481 | |
End of Year | | | | | $217,539,310 | | | | $119,963,650 | | | | | | $41,135,299 | | | | $27,997,641 | | | | | | $62,296,569 | | | | $34,105,511 | |
| (1) | Effective May 1, 2011, the Fund adopted a Multi-Class Plan pursuant to Rule 18f-3 of the Investment Company Act of 1940, as amended. The portfolios covered in this report currently offer Class P shares only (see Note 1 in Notes to Financial Statements). |
| | |
| See Notes to Financial Statements | | |
C-5
PACIFIC SELECT FUND
STATEMENTS OF CHANGES IN NET ASSETS (1) (Continued)
| | | | | | | | | | | | | | | | | | | | |
| | | | | Year Ended
December 31,
2012 | | | Year Ended
December 31,
2011 | | | | | Year Ended
December 31,
2012 | | | Year Ended
December 31,
2011 | |
| | | | | PD Emerging Markets
Portfolio | | | | | PD International
Large-Cap Portfolio | |
OPERATIONS | | | | | | | | | | | | | | | | | | | | |
Net investment income | | | | | $676,402 | | | | $422,163 | | | | | | $3,913,872 | | | | $2,040,157 | |
Net realized gain (loss) | | | | | (202,236 | ) | | | 503,219 | | | | | | (369,726 | ) | | | (37,247 | ) |
Change in net unrealized appreciation (depreciation) | | | | | 6,270,321 | | | | (6,954,845 | ) | | | | | 18,819,076 | | | | (12,506,217 | ) |
Net Increase (Decrease) in Net Assets
Resulting from Operations | | | | | 6,744,487 | | | | (6,029,463 | ) | | | | | 22,363,222 | | | | (10,503,307 | ) |
| | | | | | |
DIVIDENDS AND DISTRIBUTIONS TO SHAREHOLDERS | | | | | | | | | | | | | | | | | | | | |
Net investment income | | | | | (699,139 | ) | | | (444,945 | ) | | | | | (3,859,121 | ) | | | (2,054,303 | ) |
Net realized gains | | | | | (454,750 | ) | | | (53,047 | ) | | | | | - | | | | - | |
Net Decrease from Dividends and
Distributions to Shareholders | | | | | (1,153,889 | ) | | | (497,992 | ) | | | | | (3,859,121 | ) | | | (2,054,303 | ) |
| | | | | | |
CAPITAL SHARE TRANSACTIONS | | | | | | | | | | | | | | | | | | | | |
Proceeds from sale of shares | | | | | 15,727,794 | | | | 13,508,497 | | | | | | 65,510,962 | | | | 58,944,629 | |
Dividend and distribution reinvestments | | | | | 1,153,889 | | | | 497,992 | | | | | | 3,859,121 | | | | 2,054,303 | |
Cost of shares repurchased | | | | | (2,042,373 | ) | | | (1,905,383 | ) | | | | | (7,574,280 | ) | | | (7,950,086 | ) |
Net Increase in Net Assets from
Capital Share Transactions | | | | | 14,839,310 | | | | 12,101,106 | | | | | | 61,795,803 | | | | 53,048,846 | |
NET INCREASE IN NET ASSETS | | | | | 20,429,908 | | | | 5,573,651 | | | | | | 80,299,904 | | | | 40,491,236 | |
| | | | | | |
NET ASSETS | | | | | | | | | | | | | | | | | | | | |
Beginning of Year | | | | | 31,022,682 | | | | 25,449,031 | | | | | | 94,068,526 | | | | 53,577,290 | |
End of Year | | | | | $51,452,590 | | | | $31,022,682 | | | | | | $174,368,430 | | | | $94,068,526 | |
| (1) | Effective May 1, 2011, the Fund adopted a Multi-Class Plan pursuant to Rule 18f-3 of the Investment Company Act of 1940, as amended. The portfolios covered in this report currently offer Class P shares only (see Note 1 in Notes to Financial Statements). |
| | |
| See Notes to Financial Statements | | |
C-6
PACIFIC SELECT FUND
FINANCIAL HIGHLIGHTS (1)
Selected per share, ratios and supplemental data for each year or period ended December 31 were as follows:
| | | | | | | | | | | | | | | | | | | | | | | | | | | | | | | | | | | | | | | | | | | | | | | | | | | | | | | | |
| For the Year or Period Ended | | Net Asset Value,
Beginning of Year or Period | | | Net Investment Income | | | Net Realized and Unrealized Gain (Loss) | | | Total from Investment Operations | | | Distributions from Net Investment Income | | | Distributions from Capital Gains | | | Total Distributions | | | Net Asset Value,
End of Year or Period | | | Total Returns (2) | | | Net Assets,
End of Year or Period | | | Ratio of Expenses Before Expense
Reductions to Average Net Assets (3) | | | Ratio of Expenses After Expense
Reductions to Average Net Assets (3), (4) | | | Ratio of Net Investment Income After Expense
Reductions To Average Net Assets (3) | | | Portfolio Turnover Rates | |
PD Aggregate Bond Index | | | | | | | | | | | | | | | | | | | | | | | | | | | | | | | | | | | | | | | | | | | | | |
| 2012 | | | $10.92 | | | | $0.22 | | | | $0.20 | | | | $0.42 | | | | ($0.17 | ) | | | ($0.01 | ) | | | ($0.18 | ) | | | $11.16 | | | | 3.94 | % | | | $409,460,928 | | | | 0.21 | % | | | 0.17 | % | | | 1.97 | % | | | 71.99 | % |
| 2011 | | | 10.59 | | | | 0.30 | | | | 0.50 | | | | 0.80 | | | | (0.42 | ) | | | (0.05 | ) | | | (0.47 | ) | | | 10.92 | | | | 7.65 | % | | | 210,304,744 | | | | 0.24 | % | | | 0.17 | % | | | 2.78 | % | | | 114.95 | % |
| 2010 | | | 10.23 | | | | 0.31 | | | | 0.33 | | | | 0.64 | | | | (0.27 | ) | | | (0.01 | ) | | | (0.28 | ) | | | 10.59 | | | | 6.23 | % | | | 163,942,405 | | | | 0.28 | % | | | 0.17 | % | | | 2.88 | % | | | 148.73 | % |
| 2009 (5) | | | 10.00 | | | | 0.19 | | | | 0.21 | | | | 0.40 | | | | (0.14 | ) | | | (0.03 | ) | | | (0.17 | ) | | | 10.23 | | | | 3.97 | % | | | 67,711,104 | | | | 0.28 | % | | | 0.17 | % | | | 2.80 | % | | | 324.46 | % |
PD High Yield Bond Market | | | | | | | | | | | | | | | | | | | | | | | | | | | | | | | | | | | | | | | | | | | | | |
| 2012 | | | $10.96 | | | | $0.81 | | | | $0.80 | | | | $1.61 | | | | ($0.76 | ) | | | ($0.07 | ) | | | ($0.83 | ) | | | $11.74 | | | | 14.91 | % | | | $109,845,653 | | | | 0.39 | % | | | 0.34 | % | | | 6.90 | % | | | 38.44 | % |
| 2011 | | | 11.42 | | | | 0.84 | | | | (0.26 | ) | | | 0.58 | | | | (0.87 | ) | | | (0.17 | ) | | | (1.04 | ) | | | 10.96 | | | | 5.03 | % | | | 78,286,842 | | | | 0.45 | % | | | 0.34 | % | | | 7.23 | % | | | 44.79 | % |
| 2010 | | | 11.30 | | | | 1.00 | | | | 0.43 | | | | 1.43 | | | | (1.02 | ) | | | (0.29 | ) | | | (1.31 | ) | | | 11.42 | | | | 13.05 | % | | | 38,750,894 | | | | 0.52 | % | | | 0.34 | % | | | 8.57 | % | | | 40.05 | % |
| 2009 (5) | | | 10.00 | | | | 0.66 | | | | 1.31 | | | | 1.97 | | | | (0.63 | ) | | | (0.04 | ) | | | (0.67 | ) | | | 11.30 | | | | 19.88 | % | | | 27,986,392 | | | | 0.57 | % | | | 0.34 | % | | | 9.00 | % | | | 31.24 | % |
PD Large-Cap Growth Index | | | | | | | | | | | | | | | | | | | | | | | | | | | | | | | | | | | | | | | | | | | | | |
| 2012 | | | $13.97 | | | | $0.27 | | | | $1.84 | | | | $2.11 | | | | ($0.20 | ) | | | $- | | | | ($0.20 | ) | | | $15.88 | | | | 15.02 | % | | | $171,267,655 | | | | 0.18 | % | | | 0.17 | % | | | 1.72 | % | | | 17.11 | % |
| 2011 | | | 14.31 | | | | 0.21 | | | | 0.13 | | | | 0.34 | | | | (0.18 | ) | | | (0.50 | ) | | | (0.68 | ) | | | 13.97 | | | | 2.39 | % | | | 100,124,441 | | | | 0.20 | % | | | 0.17 | % | | | 1.40 | % | | | 37.49 | % |
| 2010 | | | 12.75 | | | | 0.19 | | | | 1.87 | | | | 2.06 | | | | (0.15 | ) | | | (0.35 | ) | | | (0.50 | ) | | | 14.31 | | | | 16.17 | % | | | 63,467,940 | | | | 0.24 | % | | | 0.17 | % | | | 1.44 | % | | | 56.10 | % |
| 2009 (5) | | | 10.00 | | | | 0.12 | | | | 2.80 | | | | 2.92 | | | | (0.09 | ) | | | (0.08 | ) | | | (0.17 | ) | | | 12.75 | | | | 29.12 | % | | | 29,230,133 | | | | 0.45 | % | | | 0.17 | % | | | 1.57 | % | | | 80.71 | % |
PD Large-Cap Value Index | | | | | | | | | | | | | | | | | | | | | | | | | | | | | | | | | | | | | | | | | | | | | |
| 2012 | | | $13.72 | | | | $0.37 | | | | $1.93 | | | | $2.30 | | | | ($0.28 | ) | | | ($0.53 | ) | | | ($0.81 | ) | | | $15.21 | | | | 17.17 | % | | | $217,539,310 | | | | 0.18 | % | | | 0.17 | % | | | 2.48 | % | | | 15.56 | % |
| 2011 | | | 13.95 | | | | 0.32 | | | | (0.29 | ) | | | 0.03 | | | | (0.24 | ) | | | (0.02 | ) | | | (0.26 | ) | | | 13.72 | | | | 0.19 | % | | | 119,963,650 | | | | 0.20 | % | | | 0.17 | % | | | 2.30 | % | | | 35.63 | % |
| 2010 | | | 12.62 | | | | 0.29 | | | | 1.59 | | | | 1.88 | | | | (0.21 | ) | | | (0.34 | ) | | | (0.55 | ) | | | 13.95 | | | | 14.89 | % | | | 77,489,926 | | | | 0.24 | % | | | 0.17 | % | | | 2.20 | % | | | 54.98 | % |
| 2009 (5) | | | 10.00 | | | | 0.18 | | | | 2.67 | | | | 2.85 | | | | (0.12 | ) | | | (0.11 | ) | | | (0.23 | ) | | | 12.62 | | | | 28.54 | % | | | 32,920,484 | | | | 0.42 | % | | | 0.17 | % | | | 2.25 | % | | | 88.66 | % |
PD Small-Cap Growth Index | | | | | | | | | | | | | | | | | | | | | | | | | | | | | | | | | | | | | | | | | | | | | |
| 2012 | | | $13.73 | | | | $0.18 | | | | $1.78 | | | | $1.96 | | | | ($0.18 | ) | | | ($0.89 | ) | | | ($1.07 | ) | | | $14.62 | | | | 14.30 | % | | | $41,135,299 | | | | 0.27 | % | | | 0.21 | % | | | 1.22 | % | | | 79.07 | % |
| 2011 | | | 15.52 | | | | 0.07 | | | | (0.58 | ) | | | (0.51 | ) | | | (0.09 | ) | | | (1.19 | ) | | | (1.28 | ) | | | 13.73 | | | | (3.27 | %) | | | 27,997,641 | | | | 0.31 | % | | | 0.21 | % | | | 0.45 | % | | | 67.66 | % |
| 2010 | | | 12.66 | | | | 0.09 | | | | 3.49 | | | | 3.58 | | | | (0.07 | ) | | | (0.65 | ) | | | (0.72 | ) | | | 15.52 | | | | 28.24 | % | | | 20,094,602 | | | | 0.46 | % | | | 0.21 | % | | | 0.63 | % | | | 69.43 | % |
| 2009 (5) | | | 10.00 | | | | 0.04 | | | | 2.82 | | | | 2.86 | | | | (0.03 | ) | | | (0.17 | ) | | | (0.20 | ) | | | 12.66 | | | | 28.60 | % | | | 11,785,105 | | | | 0.70 | % | | | 0.21 | % | | | 0.56 | % | | | 70.15 | % |
PD Small-Cap Value Index | | | | | | | | | | | | | | | | | | | | | | | | | | | | | | | | | | | | | | | | | | | | | |
| 2012 | | | $12.63 | | | | $0.38 | | | | $1.85 | | | | $2.23 | | | | ($0.33 | ) | | | ($0.53 | ) | | | ($0.86 | ) | | | $14.00 | | | | 17.62 | % | | | $62,296,569 | | | | 0.26 | % | | | 0.21 | % | | | 2.73 | % | | | 62.67 | % |
| 2011 | | | 14.60 | | | | 0.27 | | | | (1.11 | ) | | | (0.84 | ) | | | (0.27 | ) | | | (0.86 | ) | | | (1.13 | ) | | | 12.63 | | | | (5.82 | %) | | | 34,105,511 | | | | 0.32 | % | | | 0.21 | % | | | 1.93 | % | | | 62.96 | % |
| 2010 | | | 12.65 | | | | 0.26 | | | | 2.74 | | | | 3.00 | | | | (0.23 | ) | | | (0.82 | ) | | | (1.05 | ) | | | 14.60 | | | | 23.67 | % | | | 22,994,481 | | | | 0.45 | % | | | 0.21 | % | | | 1.93 | % | | | 61.82 | % |
| 2009 (5) | | | 10.00 | | | | 0.17 | | | | 2.73 | | | | 2.90 | | | | (0.13 | ) | | | (0.12 | ) | | | (0.25 | ) | | | 12.65 | | | | 29.01 | % | | | 13,168,196 | | | | 0.74 | % | | | 0.21 | % | | | 2.12 | % | | | 74.74 | % |
PD Emerging Markets | | | | | | | | | | | | | | | | | | | | | | | | | | | | | | | | | | | | | | | | | | | | | |
| 2012 | | | $13.32 | | | | $0.22 | | | | $2.07 | | | | $2.29 | | | | ($0.21 | ) | | | ($0.15 | ) | | | ($0.36 | ) | | | $15.25 | | | | 17.42 | % | | | $51,452,590 | | | | 0.86 | % | | | 0.86 | % | | | 1.56 | % | | | 2.59 | % |
| 2011 | | | 16.55 | | | | 0.22 | | | | (3.24 | ) | | | (3.02 | ) | | | (0.19 | ) | | | (0.02 | ) | | | (0.21 | ) | | | 13.32 | | | | (18.20 | %) | | | 31,022,682 | | | | 0.92 | % | | | 0.92 | % | | | 1.45 | % | | | 6.32 | % |
| 2010 | | | 14.21 | | | | 0.20 | | | | 2.64 | | | | 2.84 | | | | (0.19 | ) | | | (0.31 | ) | | | (0.50 | ) | | | 16.55 | | | | 20.04 | % | | | 25,449,031 | | | | 0.85 | % | | | 0.85 | % | | | 1.34 | % | | | 7.25 | % |
| 2009 (5) | | | 10.00 | | | | 0.11 | | | | 4.23 | | | | 4.34 | | | | (0.11 | ) | | | (0.02 | ) | | | (0.13 | ) | | | 14.21 | | | | 43.43 | % | | | 17,805,640 | | | | 0.98 | % | | | 0.97 | % | | | 1.33 | % | | | 8.14 | % |
PD International Large-Cap | | | | | | | | | | | | | | | | | | | | | | | | | | | | | | | | | | | | | | | | | | | | | |
| 2012 | | | $11.82 | | | | $0.37 | | | | $1.66 | | | | $2.03 | | | | ($0.31 | ) | | | $- | | | | ($0.31 | ) | | | $13.54 | | | | 17.12 | % | | | $174,368,430 | | | | 0.37 | % | | | 0.30 | % | | | 2.90 | % | | | 2.10 | % |
| 2011 | | | 13.77 | | | | 0.37 | | | | (2.05 | ) | | | (1.68 | ) | | | (0.27 | ) | | | - | | | | (0.27 | ) | | | 11.82 | | | | (12.16 | %) | | | 94,068,526 | | | | 0.46 | % | | | 0.30 | % | | | 2.78 | % | | | 0.61 | % |
| 2010 | | | 13.01 | | | | 0.30 | | | | 0.69 | | | | 0.99 | | | | (0.23 | ) | | | (- | ) (6) | | | (0.23 | ) | | | 13.77 | | | | 7.61 | % | | | 53,577,290 | | | | 0.46 | % | | | 0.30 | % | | | 2.35 | % | | | 3.25 | % |
| 2009 (5) | | | 10.00 | | | | 0.14 | | | | 3.02 | | | | 3.16 | | | | (0.09 | ) | | | (0.06 | ) | | | (0.15 | ) | | | 13.01 | | | | 31.59 | % | | | 24,829,572 | | | | 0.64 | % | | | 0.30 | % | | | 1.68 | % | | | 5.62 | % |
| (1) | | Effective May 1, 2011, the Fund adopted a Multi-Class Plan pursuant to Rule 18f-3 of the Investment Company Act of 1940, as amended. The portfolios covered in this report currently offer Class P shares only (see Note 1 in Notes to Financial Statements). Per share amounts have been calculated using the average shares method. |
| (2) | | Total returns for periods of less than one full year are not annualized. |
| (3) | | The ratios for periods of less than one full year are annualized. |
| (4) | | The ratios of expenses after expense reductions to average daily net assets are after adviser expense reimbursements, if any, as discussed in Note 7B in Notes to the Financial Statements. |
| (5) | | Operations commenced on May 1, 2009. |
| (6) | | Amount represents less than $0.005 per share. |
| | |
| See Notes to Financial Statements | | |
C-7
PACIFIC SELECT FUND
NOTES TO FINANCIAL STATEMENTS
1. ORGANIZATION
The Pacific Select Fund (the “Fund”) is registered under the Investment Company Act of 1940, as amended (“1940 Act”), as an open-end, management investment company, organized as a Massachusetts business trust. Pacific Life Fund Advisors LLC (“PLFA” or “Adviser”) serves as investment adviser to the Fund. As of December 31, 2012, the Fund was comprised of fifty-four separate portfolios, eight of which are presented in this report: PD Aggregate Bond Index, PD High Yield Bond Market, PD Large-Cap Growth Index, PD Large-Cap Value Index, PD Small-Cap Growth Index, PD Small-Cap Value Index, PD Emerging Markets, and PD International Large-Cap Portfolios (collectively, the “Pacific Dynamix Underlying Portfolios”).
Effective May 1, 2011, the Fund adopted a Multi-Class Plan pursuant to Rule 18f-3 under the 1940 Act pursuant to which the Fund may offer multiple classes of shares. The Pacific Dynamix Underlying Portfolios currently offer Class P shares only.
Presently only the Pacific Dynamix — Conservative Growth, Pacific Dynamix — Moderate Growth and Pacific Dynamix — Growth Portfolios (collectively, the “Pacific Dynamix Portfolios”) and the Adviser and certain of its affiliates can invest in the Class P shares of the Pacific Dynamix Underlying Portfolios.
The annual report for the Pacific Dynamix Portfolios is not included in this report; there is a separate annual report for the Pacific Dynamix Portfolios, which is available without charge. For information on how to obtain such annual report, see the Where to Go for More Information section of this report on page F-10.
2. SIGNIFICANT ACCOUNTING POLICIES
The financial statements have been prepared in conformity with accounting principles generally accepted in United States of America (“U.S. GAAP”) for investment companies. In preparing the financial statements, management is required to make estimates and assumptions that affect the reported amounts of assets and liabilities and disclosures of contingent assets and liabilities at the date of the financial statements and the reported amounts of increases and decreases in net assets from operations during the reporting period. Actual results could differ from those estimates. The following is a summary of the significant accounting policies followed by the Fund in the preparation of the financial statements.
A. INVESTMENT TRANSACTIONS AND INCOME
Investment transactions are recorded on a trade date basis. Securities purchased or sold on a when-issued or delayed-delivery basis as well as certain loan transactions and mortgage securities (such as Government National Mortgage Association (“GNMA”) securities) may be settled a month or more after the trade date. Dividend income is recorded on the ex-dividend date, except certain dividends from foreign securities, which are recorded as soon as a portfolio is informed of the ex-dividend date or upon receipt of the dividend. Interest income, adjusted for amortization of premium and accretion of discount, is recorded daily on an accrual basis. Investment income is recorded net of foreign taxes withheld, if any. A portfolio may be subject to foreign taxes on income, gains on investments or currency repatriation, a portion of which may be recoverable. A portfolio will accrue such taxes and reclaims as applicable, based upon the current interpretation of tax rules and regulations that exist in the markets in which the portfolio invests. Consent fees, which are compensation for agreeing to changes in the terms of debt instruments, are recorded as interest income when received. Realized gains and losses from investment transactions are recorded on the basis of identified cost, which is also used for Federal income tax purposes. Gains and losses realized on principal paydowns from mortgage-backed and asset-backed securities are recorded as interest income.
B. DISTRIBUTIONS TO SHAREHOLDERS
Prior to January 1, 2013, each portfolio covered in this report declared and paid dividends on net investment income, if any, at least annually, except for the PD Aggregate Bond Index and PD High Yield Bond Market Portfolios, for which dividends, if any, were declared and paid semi-annually and realized capital gains, if any, were distributed at least annually for all portfolios. Dividends and capital gains distributions are recorded on the ex-dividend date.
Currently each Pacific Dynamix Underlying Portfolio covered in this report is treated as a partnership for Federal income tax purposes. As partnerships, none of these portfolios are required to distribute taxable income and capital gains (see Note 10). Effective January 1, 2013, no dividend income and capital gains distributions will be made by the Pacific Dynamix Underlying Portfolios under the new dividend and distributions policy.
C. FOREIGN CURRENCY TRANSLATION
The Fund’s accounting records are maintained in U.S. dollars. The market value of investments and other assets and liabilities, initially expressed in non-U.S. currencies, are translated into U.S. dollars based on the applicable exchange rates at the end of each business day. Purchases and sales of investments and income and expenses, denominated in foreign currencies, are translated into U.S. dollars at the exchange rates in effect on the transaction date.
None of the portfolios separately report the effect of changes in foreign exchange rates from changes in market prices of investments held. Such changes are included with the net realized gain or loss and change in net unrealized appreciation or depreciation on investments. Other foreign currency transactions resulting in realized and unrealized gain or loss, if any, are reported separately as net realized gain or loss on foreign currency transactions and change in net unrealized appreciation or depreciation on foreign currencies.
D. EXPENSE ALLOCATION
General expenses of the Fund are allocated to each portfolio in proportion to its relative average daily net assets. Expenses directly attributable to a particular portfolio are charged directly to that portfolio.
D-1
PACIFIC SELECT FUND
NOTES TO FINANCIAL STATEMENTS (Continued)
E. RECENT ACCOUNTING PRONOUNCEMENT
In December 2011, the Financial Accounting Standards Board (“FASB”) issued an Accounting Standards Update (“ASU”) that requires disclosures to make financial statements that are prepared under U.S. GAAP more comparable to those prepared under International Financial Reporting Standards. The new disclosure requirements mandate that entities disclose both gross and net information about instruments and transactions eligible for offset in the statement of assets and liabilities such as instruments and transactions subject to an agreement similar to a master netting arrangement. In addition, this ASU requires disclosure of collateral received and posted in connection with master netting agreements or similar arrangements. This ASU is effective for interim and annual reporting periods beginning on or after January 1, 2013. Management is currently evaluating the impact, if any, that the implementation of this ASU will have on the Fund’s financial statement disclosures.
3. VALUATION AND FAIR VALUE MEASUREMENTS
A. VALUATION POLICY
The Fund Board of Trustees (the “Board”) has adopted a policy (“Valuation Policy”) for determining the value of its investments each business day. Under the Valuation Policy, the Board has delegated certain functions to a Trustee Valuation Committee or another valuation committee to determine the fair value of certain investments. Each valuation committee that values the Fund’s investments, which includes using third party pricing services and/or alternate valuation methodologies approved by the Board, does so in accordance with the Valuation Policy. Notes 3B and 3C below describe in greater detail the methodologies used to value the Fund’s investments.
B. NET ASSET VALUE
Each portfolio of the Fund covered in this report is divided into shares. The price per share of each class of a portfolio’s shares is called its net asset value (“NAV”). The NAV forms the basis for all transactions involving buying, selling, exchanging or reinvesting shares. Each portfolio’s NAV is calculated by taking the total value of a portfolio’s assets (the value of the securities and other investments a portfolio holds), subtracting a portfolio’s liabilities, and dividing by the total number of shares outstanding.
Each portfolio’s NAV is calculated once per day, every day the New York Stock Exchange (“NYSE”) is open, including days when foreign markets are closed. For purposes of calculating the NAV, the value of all investments held by each portfolio is generally determined as of the time of the close of the NYSE, which is usually 4:00 p.m. Eastern Time. Information that becomes known to the Fund or its agents after the close of the NYSE on a particular day will not normally be used to retroactively adjust the price of an investment or the NAV determined earlier that day.
Each portfolio’s NAV will not be calculated on days when the NYSE is closed. There may be a delay in calculating the NAV if: (i) the NYSE is closed on a day other than a regular holiday or weekend, (ii) trading on the NYSE is restricted, (iii) an emergency exists (as determined by the Securities and Exchange Commission (“SEC”)), making the sale of securities or other instruments or determinations of NAV not practicable, or (iv) the SEC permits a delay for the protection of shareholders.
Certain portfolios may hold investments that are primarily listed on foreign exchanges. Because those investments trade on days when a portfolio does not calculate its NAVs, the value of those investments may change on days when a shareholder will not be able to purchase or redeem Fund shares.
C. INVESTMENT VALUATION
The value of each security or other investment is the amount which a portfolio might reasonably expect to receive for the investment upon its current sale in the ordinary course of business. For purposes of calculating the NAV, the value of investments held by each portfolio is based primarily on pricing data obtained from various sources approved by the Board.
Money Market Instruments and Short-Term Investments
Money market instruments and short-term investments maturing within 60 days are valued at amortized cost in accordance with the 1940 Act. Amortized cost involves valuing an investment at cost on the date of acquisition and thereafter assuming a constant accretion of a discount or amortization of a premium to maturity, regardless of the impact of fluctuating interest rates on the market value of the instrument. While this method provides consistency in valuation (and may only be used if it approximates market value), it may result in periods during which value, as determined by amortized cost, is higher or lower than the price that would be received if the Fund sold the investment. Portfolio investments in other mutual funds for temporary cash management purposes are valued at their respective NAVs.
Domestic Equity Investments
For domestic equity investments the portfolios use the last reported sale price or official closing price from an exchange as of the time of the NYSE close and do not normally take into account trading, clearances or settlements that take place after the NYSE close. Investments, for which no sales are reported, are generally valued at the mean between the most recent bid and ask prices obtained from approved pricing services, established market makers, or from broker-dealers.
Foreign Equity Investments
Foreign equity investments are normally priced based on data reflecting the closing of the principal markets or market participants for those investments, which may be earlier than the NYSE close. The Fund then may adjust for market events occurring between the close of certain foreign exchanges and the NYSE close. The Fund has retained an independent statistical service approved by the Board to assist in determining the value of certain foreign equity investments. This service utilizes proprietary computer models based on historical performance of markets and other considerations to determine the appropriate adjustments for market events. Quotations of foreign investments in foreign currencies are converted into U.S. dollar equivalents using a foreign exchange quotation from an approved source.
D-2
PACIFIC SELECT FUND
NOTES TO FINANCIAL STATEMENTS (Continued)
Exchange Traded Futures, Options and Swaps
Exchange traded futures, options and swaps are normally priced at the settlement price determined by the relevant exchange. Exchange traded futures, options and swaps for which no settlement prices are reported, are generally valued at the mean between the most recent bid and ask prices obtained from approved pricing services, established market makers, or from broker-dealer.
Over-the-Counter (“OTC”) Investments and Certain Equity Investments
OTC investments (including swaps and options) are generally valued by approved pricing services that use evaluated prices determined from various observable market and other factors. Certain OTC swap contracts are valued using alternative valuation methodologies pursuant to the Valuation Policy. Forward foreign currency contracts are generally valued using the mean between broker-dealer bid and ask quotations, and foreign currency exchange rates gathered from leading market makers.
Domestic and Foreign Fixed Income Investments
Fixed income investments are generally valued by approved pricing and quotation services using the mean between the most recent bid and ask prices which are based upon evaluated prices determined from various observable market and other factors. Certain fixed-income investments are valued by a benchmark, matrix, or other pricing processes approved by the Board.
Investment Values Determined by a Valuation Committee
The Valuation Policy includes methodologies approved for valuing investments in circumstances where market quotations are not readily available. In such circumstances, the Valuation Policy provides that the value of such investments may be determined in accordance with Board approved formulas and methodologies (“Alternate Valuation Methodologies”). Under the Valuation Policy these Alternate Valuation Methodologies may include, among others, the use of broker quotes, the use of a purchase price for initial public offerings, proration rates, and benchmark and matrix pricing. In the event market quotations or Alternate Valuation Methodologies are not readily available or are determined to be unreliable, the value of the investments will be determined in good faith by the Trustee Valuation Committee or determined by a valuation committee established under the Valuation Policy and then subsequently submitted for approval or ratification to either the Trustee Valuation Committee, or to the Board. Valuations determined by a Trustee Valuation Committee or other valuation committee may require subjective inputs about the value of such investments. While these valuations are intended to estimate the value a portfolio might reasonably expect to receive upon the current sale of the investments in the ordinary course of business, such values may differ from the value that a portfolio would actually realize if the investments were sold or values that would be obtained if a different valuation methodology had been used.
Market quotations are considered not readily available if: (i) the market quotations received are deemed unreliable or inaccurate, (ii) approved pricing services do not provide a valuation for a particular investment, or (iii) material events occur after the close of the principal market for a particular investment but prior to the close of the NYSE.
D. FAIR VALUE MEASUREMENTS AND DISCLOSURES
The Fund characterizes its investments as Level 1, Level 2 or Level 3 based upon the various inputs or methodologies used to value the investments. Under the Valuation Policy, a valuation oversight committee (“VOC”) has been established which determines the level in which each portfolio’s investments are characterized. The VOC includes investment, legal and compliance members of the Fund’s adviser, and the Fund’s Chief Compliance Officer (“CCO”). The three-tier hierarchy of inputs is summarized in the three broad levels listed below:
| | — Level 1 – | Quoted prices (unadjusted) in active markets for identical investments |
| | — Level 2 – | Significant observable market-based inputs, other than Level 1 quoted prices, or unobservable inputs that are corroborated by market data |
| | — Level 3 – | Significant unobservable inputs that are not corroborated by observable market data |
The VOC reviews the Valuation Policy periodically (at least annually) to determine the appropriateness of the pricing methodologies used to value the Fund’s investments. The VOC also periodically evaluates how each portfolio’s investments are characterized within the three-tier hierarchy and the appropriateness of third party pricing sources. The VOC also periodically (at least annually) conducts back-testing of the methodologies used to value Level 2 and Level 3 investments to evaluate the unobservable inputs used to value those investments. Such back-testing includes comparing Level 2 and Level 3 investment values to subsequently available exchange-traded prices, transaction prices, and/or observable vendor prices. All changes to the Valuation Policy are reported to the Board on a quarterly basis with material changes, as determined by the Fund’s CCO, requiring approval by the Board. In addition, all investments categorized as Level 3 under the three-tier hierarchy are reported to the Chairman of the Audit Committee on a quarterly basis and such report includes the inputs and methodologies used to value those investments.
The inputs or methodologies used for valuing each portfolio’s investments are not necessarily an indication of the relative risks associated with investing in those investments. For example, money market instruments are valued using amortized cost in accordance with the rules under the 1940 Act. Generally, amortized cost approximates the current fair value of an investment, but since the value is not obtained from a quoted price in an active market, such investments are reflected as Level 2. Foreign investments that are valued with the assistance of a statistical research service approved by the Board and based on significant observable inputs (as described in Note 3C) are reflected as Level 2. For fair valuations using significant unobservable inputs, U.S. GAAP requires a portfolio to present a reconciliation of the beginning to ending balances for reported market values that presents changes attributable to total realized and unrealized gains or losses, purchase and sales, and transfers in and out of Level 3 during the period. Transfers in and out between levels are based on values at the end of the period. U.S. GAAP also requires a portfolio to disclose about amounts and reasons for all transfers in and out of Level 1 and Level 2 fair value measurements. A reconciliation of Level 3 investments is presented only when a portfolio had an amount of Level 3 investments at the beginning and/or end of the reporting period that was meaningful in relation to its net assets. The amounts and reasons for all transfers in and out of each level within the three-tier hierarchy are disclosed only when a portfolio had an amount of total transfers during the reporting period that was meaningful in relation to its net assets as of the end of the reporting period. A summary of each portfolio’s investments as of December 31, 2012 as
D-3
PACIFIC SELECT FUND
NOTES TO FINANCIAL STATEMENTS (Continued)
categorized under the three-tier hierarchy of inputs, and the reconciliation of Level 3 investments and information on transfers in and out of each level, if applicable, can be found in the Notes to Schedule of Investments section of each portfolio’s Schedule of Investments.
The following is a description of valuation inputs and techniques that the Fund currently utilizes to fair value each major category of assets and liabilities:
Equity Securities (Common and Preferred Stock) and Mutual Funds
Equity securities (foreign or domestic) that are actively traded on a securities exchange are fair valued based on quoted prices from the applicable exchange, and to the extent valuation adjustments are not applied to these securities, they are categorized as Level 1. Equity securities traded on inactive markets and certain foreign equity securities are fair valued using significant other observable inputs which include broker-dealer quotes, recently executed transactions adjusted for changes in the benchmark index, or evaluated price quotes received from pricing vendors that take into account the integrity of the market sector and issuer, the individual characteristics of the security, and information received from broker-dealers and other market sources pertaining to the issuer or security. To the extent that these inputs are observable and timely, the fair values of these securities would be categorized as Level 2; otherwise the fair values would be categorized as Level 3.
Investments in registered mutual funds are valued at their respective NAV and are categorized as Level 1.
U.S. Treasury Obligations
U.S. Treasuries are fair valued based on pricing models that evaluate the mean between the most recently published bid and ask price. The models also take into consideration data received from active market makers and inter-dealer brokers, yield curves, and the spread over comparable U.S. Treasury issues. The spreads change daily in response to market conditions and are generally obtained from the new issue market and broker-dealer sources. To the extent that these inputs are observable and timely, the fair values of U.S. Treasury obligations would be categorized as Level 2; otherwise the fair values would be categorized as Level 3.
Mortgage-Backed Securities and Asset-Backed Securities
Mortgage-backed securities, including government sponsored enterprises, are fair valued using pricing models based on inputs that include issuer type, coupon, and cash flows, mortgage prepayment projection tables and adjustable rate mortgage evaluations that incorporate index data, periodic and life caps, the next coupon reset date, and the convertibility of the bond. To the extent that these inputs are observable and timely, the fair values of mortgage-backed securities would be categorized as Level 2; otherwise the fair value would be categorized as Level 3.
Asset-backed securities and collateralized mortgage obligations are fair valued using pricing models based on a security’s average life volatility. The models also take into account tranche characteristics such as coupon average life, collateral types, ratings, the issuer and tranche type, underlying collateral and performance of the collateral, and discount margin for certain floating rate issues. To the extent that these inputs are observable and timely, the fair values of asset-backed securities and collateralized mortgage obligations would be categorized as Level 2; otherwise the fair values would be categorized as Level 3.
Municipal Bonds
Municipal bonds are fair valued based on pricing models that take into account, among other factors, information received from market makers and broker-dealers, current trades, bid lists, offerings, market movements, the callability of the bond, state of issuance, benchmark yield curves, and bond insurance. To the extent that these inputs are observable and timely, the fair values of municipal bonds would be categorized as Level 2; otherwise the fair values would be categorized as Level 3.
Foreign Government Bonds and Notes
Foreign government bonds and notes are fair valued based on discounted cash flow models that incorporate option adjusted spreads along with benchmark curves and credit spreads. In addition, international bond markets are monitored daily for information pertaining to the issuer and/or the specific issue. To the extent that these inputs are observable and timely, the fair values of foreign government bonds and notes would be categorized as Level 2; otherwise the fair values would be categorized as Level 3.
Corporate Bonds and Notes and U.S. Government & Agency Issues
Corporate bonds held by the Fund are generally comprised of two main categories: investment grade bonds and high yield bonds. Investment grade bonds are reported at fair value using various inputs and techniques, which include broker-dealer quotations, live trading levels, recently executed transactions in securities of the issuer or comparable issuers, issuer credit information, and option-adjusted spread models where applicable. Fair values for high yield bonds are based primarily on broker-dealer quotations from relevant market makers and recently executed transactions in securities of the issuer or comparable issuers. The broker-dealer quotations received are supported by credit analysis of the issuer that takes into consideration credit quality assessments, daily trading activity, and the activity of the underlying equities, listed bonds and sector-specific trends. To the extent that these inputs are observable and timely, the fair values of corporate bonds would be categorized as Level 2; otherwise the fair values would be categorized as Level 3.
U.S. Government & Agency Issues are reported at fair value using various inputs and techniques, which include broker-dealer quotations, live trading levels, recently executed transactions in securities of the issuer, issuer credit information, and option-adjusted spread models where applicable. To the extent that these inputs are observable and timely, the fair values of U.S. Government & Agency Issues would be categorized as Level 2; otherwise the fair values would be categorized as Level 3.
Futures Contracts
Futures contracts and options on futures contracts are traded on commodity exchanges and are fair valued based on quoted prices from the applicable exchange, and to the extent valuation adjustments are not applied to futures contracts, they are categorized as Level 1. To the extent that valuation adjustments are observable and timely, the fair values of futures contracts would be categorized as Level 2; otherwise the fair values would be categorized as Level 3.
D-4
PACIFIC SELECT FUND
NOTES TO FINANCIAL STATEMENTS (Continued)
Short-Term Investments
Short-term investments maturing within 60 days are valued using amortized cost, which is used if it approximates market value, and are reflected as Level 2. Repurchase agreements are fully collateralized. The collateral is evaluated daily to ensure its market value equals or exceeds the current market value of the repurchase agreements including accrued interest.
4. INVESTMENTS AND RISKS
General Investment Risks
An investment in the Fund represents an indirect investment in the assets owned by the Fund. As with any mutual fund, the value of the assets owned by the Fund may move up or down, and as a result, an investment in the Fund at any point in time may be worth more or less than the original amount invested. Events in the financial markets have the potential to cause increased volatility and uncertainty, which may impact the value of the Fund’s investments. Due to interdependencies between markets, events in one market may adversely impact other markets or issuers in unforeseen ways. As a result, the value of the Fund’s investments may be adversely affected by events in the markets, either directly or indirectly, and each portfolio is exposed to potential decreases in the value of those investments. In addition, traditionally liquid investments may experience periods of diminished liquidity. Governmental and regulatory responses to market events may impair either the Adviser’s or a sub-adviser’s ability to pursue certain investment techniques or strategies and may have unexpected consequences on particular markets, strategies, or investments. Future events may impact a portfolio in unforeseen ways, leading a portfolio to alter its existing strategies or, potentially, to liquidate and close.
Equity Investments
The price of equity investments change in response to many factors, including a company’s historical and prospective earnings, cash flows, the value of its assets, investor perceptions, and many of the General Investment Risk factors noted above.
Fixed Income Investments
Fixed income (debt) investments are affected primarily by the financial condition of the companies or other entities that have issued them and by changes in interest rates, although the factors noted above may also have a significant impact on fixed income (debt) investments. There is a risk that an issuer of a portfolio’s fixed income (debt) investments may not be able to meet its financial obligations (e.g., may not be able to make principal and/or interest payments when they are due or otherwise default on other financial terms) and/or go bankrupt. Securities such as high-yield/high-risk bonds, e.g. bonds with low credit ratings by Moody’s (Ba or lower) or Standard & Poor’s (BB and lower) or if unrated are of comparable quality as determined by the manager, are especially subject to credit risk during periods of economic uncertainty or during economic downturns and are more likely to default on their interest and/or principal payments than higher rated securities. Certain asset-backed instruments, such as collateralized debt obligations, collateralized mortgage obligations and other mortgage related securities, structured investment vehicles and other debt investments may have exposure to subprime loans or subprime mortgages, which are loans to persons with lower credit ratings. These instruments may present credit risk that is not transparent and that is greater than indicated by their ratings. The value of these instruments may be more acutely affected by downturns in the credit markets or the real estate market than certain other investments, and it may be difficult to value these instruments because of a thin secondary market.
Foreign Investments
There are certain additional risks involved in investing in foreign securities that are generally not inherent in investments in domestic securities. These risks may involve foreign currency fluctuations, adverse political, social and economic developments and the possible imposition of currency exchange blockages or other foreign governmental laws or restrictions. In addition, the securities of some foreign companies and securities markets are less liquid and at times more volatile than securities of comparable U.S. companies and U.S. securities markets. The markets in emerging markets countries can be extremely volatile.
Illiquid Investments
Each portfolio may not invest in illiquid securities and illiquid bank loans (collectively, “Illiquid Investments”) if as a result of such investment, more than 15% of its net assets, taken at market value at the time of such investment, would be invested in Illiquid Investments. The term “Illiquid Investments” for this purpose means investments that cannot be disposed of within seven days in the ordinary course of business at approximately the amount at which a portfolio has valued the investments. Illiquid Investments may be difficult to value and difficult to sell, which means a portfolio may not be able to sell such investments quickly for their full value. The value of Illiquid Investments held by each portfolio as of December 31, 2012 was less than 15% of its net assets.
Mortgage-Related and Other Asset-Backed Securities
Certain portfolios may invest in mortgage-related and other asset-backed securities. These securities include mortgage pass-through securities, collateralized mortgage obligations (“CMOs”), collateralized loan obligations (“CLOs”), mortgage dollar rolls, CMO residuals, stripped mortgage-backed securities (“SMBS”), and other securities that directly or indirectly represent a participation in, or are secured by and payable from, mortgage loans secured by real property. Mortgage-related and other asset-backed securities are debt securities issued by a corporation, trust or custodian, or by a U.S. Government agency or instrumentality, that are collateralized by a pool of mortgages, mortgage pass-through securities, U.S. Government securities or other assets. The value of some mortgage-related and asset-backed securities may be particularly sensitive to changes in prevailing interest rates. Early repayment of principal on some mortgage-related securities may expose the Fund to a lower rate of return upon reinvestment of principal. The value of these securities may fluctuate in response to the market’s perception of the creditworthiness of the issuers. Additionally, although mortgage and mortgage-related securities are generally supported by some form of government or private guarantee and/or insurance, there is no assurance that private guarantors or issuers will meet their obligations.
D-5
PACIFIC SELECT FUND
NOTES TO FINANCIAL STATEMENTS (Continued)
SMBS represent a participation in, or are secured by and payable from, mortgage loans on real property, and may be structured in classes with rights to receive varying proportions of principal and interest. SMBS include interest-only securities (“IOs”), which receive all of the interest, and principal-only securities (“POs”), which receive the entire principal. The cash flows and yields on IOs are extremely sensitive to the rate of principal payments (including prepayments) on the underlying mortgage loans. If the underlying mortgages experience higher than anticipated prepayments, an investor in IOs of SMBS may fail to recoup fully its initial investment, even if the IOs are highly rated or are derived from securities guaranteed by the U.S. Government. Unlike other fixed-income and other mortgage-backed securities, the market value of IOs tends to move in the same direction as interest rates. As prepayments on the underlying mortgages of POs increase, the yields on POs increase. Payments received from IOs are recorded as interest income. Because principal will not be received at the maturity of an IO, adjustments are made to the book value of the security on the coupon date until maturity. These adjustments are included in interest income. Payments received from POs are treated as reductions to the cost and par value of the securities. Any excess principal paydown gains or losses associated with the payments received are recorded as interest income.
U.S. Government Agencies or Government-Sponsored Enterprises
Certain portfolios may invest in U.S. Government agencies or government-sponsored enterprises. U.S. Government securities are obligations of and, in certain cases, guaranteed by, the U.S. Government, its agencies or instrumentalities. The U.S. Government does not guarantee the NAV of the Fund’s shares. Some U.S. Government securities, such as Treasury bills, notes and bonds, and securities guaranteed by GNMA (or “Ginnie Mae”), are supported by the full faith and credit of the United States Government; others, such as those of the Federal Home Loan Bank, are supported by the right of the issuer to borrow from the U.S. Department of the Treasury (the “U.S. Treasury”); others, such as those of the Federal National Mortgage Association (“FNMA” or “Fannie Mae”), are supported by the discretionary authority of the U.S. Government to purchase the agency’s obligations. Securities not backed by the full faith and credit of the United States Government may be subject to a greater risk of default. U.S. Government securities may include zero coupon securities, which do not distribute interest on a current basis and tend to be subject to greater risk than interest-paying securities of similar maturities.
Government-related guarantors (i.e., not backed by the full faith and credit of the United States Government) include FNMA and the Federal Home Loan Mortgage Corporation (“FHLMC” or “Freddie Mac”). FNMA is a government-sponsored corporation, the common stock of which is owned entirely by private stockholders. FNMA purchases conventional (i.e., not insured or guaranteed by any government agency) residential mortgages from a list of approved seller/servicers which include state and federally chartered savings and loan associations, mutual savings banks, commercial banks and credit unions and mortgage bankers. Pass-through securities issued by FNMA are guaranteed as to timely payment of principal and interest by FNMA, but are not backed by the full faith and credit of the United States Government. FHLMC issues Participation Certificates (“PCs”), which are pass-through securities, each representing an undivided interest in a pool of residential mortgages. FHLMC guarantees the timely payment of interest and ultimate collection of principal, but PCs are not backed by the full faith and credit of the United States Government.
When-Issued Securities
Certain portfolios may purchase and sell securities on a when-issued basis. These transactions are made conditionally because a security, although authorized, has not yet been issued in the market. A commitment by a portfolio is made regarding these transactions to purchase or sell securities for a predetermined price or yield, with payment and delivery taking place beyond the customary settlement period. A portfolio may sell when-issued securities before they are delivered, which may result in a capital gain or loss. Risk may arise upon entering these contracts from the potential inability of a counterparty to meet the terms of their contracts, or if the issuer does not issue the securities due to political, economic, or other factors.
Delayed-Delivery Transactions
Certain portfolios may purchase or sell securities on a delayed-delivery basis. Payment and delivery may take place after the customary settlement period for that security. The price or yield of the underlying securities is fixed at the time the transaction is negotiated. When delayed- delivery purchases are outstanding, a portfolio will set aside, and maintain until the settlement date in a segregated account, liquid assets in an amount sufficient to meet the purchase price. When purchasing a security on a delayed-delivery basis, a portfolio assumes the rights and risks of ownership of the security, including the risk of price and yield fluctuations, and takes such fluctuations into account when determining its NAV. A portfolio may dispose of or renegotiate a delayed-delivery transaction after it is entered into, and may sell delayed-delivery securities before they are delivered, which may result in a capital gain or loss. When a portfolio has sold a security on a delayed-delivery basis, the portfolio does not participate in future gains and losses with respect to the security.
Repurchase Agreements
Certain portfolios may invest in repurchase agreements. Repurchase agreements permit the investor to maintain liquidity and earn income over periods of time as short as overnight. Repurchase agreements held by a portfolio are fully collateralized by U.S. Government securities, or securities issued by U.S. Government agencies, or securities that are within the three highest credit categories assigned by established rating agencies (Aaa, Aa, or A by Moody’s or AAA, AA or A by Standard & Poor’s) or, if not rated by Moody’s or Standard & Poor’s, are of equivalent investment quality as determined by the Adviser or the applicable portfolio manager. Such collateral is in the possession of the portfolio’s custodian or a designated broker-dealer. The collateral is evaluated daily to ensure its market value equals or exceeds the current market value of the repurchase agreements including accrued interest. In the event of default on the obligation to repurchase, a portfolio has the right to liquidate the collateral and apply the proceeds in satisfaction of the obligation.
Segregation and Collateral
If a portfolio engages in certain transactions such as derivative investments or repurchase agreements, it may require collateral in the form of cash or investments to be held in segregated accounts at the Fund’s custodian, with an exchange or clearing member firm, or segregated on
D-6
PACIFIC SELECT FUND
NOTES TO FINANCIAL STATEMENTS (Continued)
the Fund’s books and records maintained by the custodian and/or the portfolio manager. In each instance that segregation of collateral is required, it is done so in accordance with the 1940 Act and/or any interpretive guidance issued by the SEC. There is a possibility that a portfolio could experience a delay in selling investments that are segregated as collateral.
5. DERIVATIVE INVESTMENTS AND RISKS
A. PRINCIPAL MARKET RISKS MANAGED BY INVESTING IN DERIVATIVES
Derivative instruments are investments whose values are tied to the value of an underlying security or asset, a group of assets, interest rates, exchange rates, currency or an index. Certain Pacific Dynamix Underlying Portfolios are permitted to invest in derivative instruments, including but not limited to, futures contracts. Derivatives may have little or no initial cash investment value relative to their market value exposure and therefore can produce significant gains or losses in excess of their cost. This is sometimes referred to as leverage. Leverage can magnify a portfolio’s gains and losses and therefore increase its volatility. A portfolio’s investments in derivatives may increase, decrease or change the level or types of exposure to certain risk factors. The primary risks a portfolio may attempt to manage through investing in derivative instruments include, but are not limited to, interest rate, foreign investments and currency, price volatility and credit (including counterparty) risks.
Interest rate risk – A portfolio may be exposed to interest rate risk through investments in fixed income securities. Interest rate risk is the risk that fixed income securities will decline in value as a result of changes in interest rates. For example, the value of bonds, fixed rate loans and short-term money market instruments may decline in value when interest rates rise. Fixed income securities with longer durations tend to be more sensitive to changes in interest rates, making them more volatile than fixed income securities with shorter durations or money market instruments. Therefore, duration is a potentially useful tool to measure the sensitivity of a fixed income security’s yield (market price to interest rate movement). To manage these risks, certain portfolios may invest in derivative instruments tied to interest rates.
Foreign investments and currency risk – A portfolio may be exposed to foreign investments and/or currency risk through direct investment in securities or through options, futures or currency transactions. The prices of foreign securities that are denominated in foreign currencies are affected by the value of the U.S. dollar. With respect to securities denominated in foreign currencies, in general, as the value of the U.S. dollar rises, the U.S. dollar price of a foreign security will fall. As the value of the U.S. dollar falls, the U.S. dollar value of the foreign security will rise. Currency rates in foreign countries may fluctuate significantly over short periods of time for a number of reasons. Foreign investments may be riskier than U.S. investments for many reasons, including changes in currency exchange rates, unstable political and economic conditions, a lack of adequate and timely company information, differences in the way securities markets operate, relatively lower market liquidity, less stringent financial reporting and accounting guidance and controls, less secure foreign banks or securities depositories than those in the U.S., foreign taxation issues and foreign controls on investments. As a result, a portfolio’s investments in foreign currency-denominated securities and other foreign investments may reduce the returns of the portfolio. To manage these risks, certain portfolios may invest in derivative instruments tied to foreign investments and/or currencies.
Price volatility risk – Derivatives tied to equity and fixed income securities are exposed to potential price volatility. Fixed income securities are affected by many factors, including prevailing interest rates, market conditions and market liquidity. Volatility of below investment grade fixed income securities (including loans) may be relatively greater than for investment grade fixed income securities. Equity securities tend to go up or down in value, sometimes rapidly and unpredictably. The prices of equity securities change in response to many factors, including a company’s historical and prospective earnings, the value of its assets, general economic conditions, interest rates, investor perceptions and market liquidity. Due to the complexities of markets, events in one market or sector may adversely impact other markets or sectors.
To manage these risks, certain portfolios may invest in various derivative instruments. Derivative instruments may be used to manage a portfolio’s exposure to price volatility risk but may also be subject to greater price volatility than investments in traditional securities. The value of commodity-linked derivative instruments may be affected by changes in overall market movements, commodity index volatility, changes in interest rates, or factors affecting a particular industry or commodity, such as drought, floods, weather, livestock disease, embargoes, tariffs and international economic, political and regulatory developments.
Credit and Counterparty risk – Credit risk is the risk that a fixed income security’s issuer (or borrower or counterparty) will be unable or unwilling to meet its financial obligations (e.g. may not be able to make principal and/or interest payments when they are due or otherwise default on other financial terms) and/or may go bankrupt. This is also sometimes described as counterparty risk. A portfolio may lose money if the issuer or guarantor of fixed income security, or counterparty of a derivative contract, repurchase or reverse repurchase agreement, or a loan of portfolio securities, is unable or unwilling to make timely principal and/or interest payments, or to otherwise honor its obligations. A portfolio may attempt to minimize concentrations of credit risk by undertaking transactions with a large number of borrowers or counterparties on recognized and reputable exchanges. A portfolio’s investments in fixed income (debt) investments may range in quality from those rated in the lowest category in which it is permitted to invest to those rated in the highest category by a rating agency, or if unrated, determined by the manager to be of comparable quality.
Similar to credit risk, a portfolio may be exposed to counterparty risk, or the risk that an institution or other entity with which a portfolio has unsettled or open transactions will default. Financial assets of counterparties, which potentially expose a portfolio to counterparty risk, consist mainly of cash due from counterparties and investments. Certain managers may attempt to minimize credit risk, to the portfolios by performing extensive reviews of each counterparty, entering into transactions with counterparties that the manager believes to be creditworthy at the time of the transaction and requiring the posting of collateral in applicable transactions. To manage these risks, certain portfolios may invest in derivative instruments tied to a security issuers’ financial strength.
A portfolio’s transactions in listed securities are settled/paid for upon delivery with their counterparties. Therefore, the risk of counterparty default for listed securities is considered minimal, as delivery of securities sold is only made once a portfolio has received payment. Payment is made on a purchase once the securities have been delivered by the counterparty. The trade will fail if either party fails to meet its obligations.
D-7
PACIFIC SELECT FUND
NOTES TO FINANCIAL STATEMENTS (Continued)
Credit Related Contingent Features – Certain portfolios are parties to various agreements, including but not limited to International Swaps and Derivatives Agreements, Master Repurchase Agreements, and Master Securities Forward Transactions Agreements (collectively “Master Agreements”), which govern the terms of certain transactions with select counterparties. These Master Agreements generally include provisions for general obligations, representations, agreements, collateral and certain events of default or termination, such as credit related contingent features. These provisions reduce the counterparty risk associated with relevant transactions by allowing a portfolio or its counterparties to elect to terminate early and cause settlement of all outstanding transactions if a triggering event occurs under the applicable Master Agreement. These triggering events include, but are not limited to, bankruptcy, failure to make timely payments, restructuring, obligation acceleration, obligation default, a material decline in net assets, decline in credit rating or repudiation/moratorium. Thus, if a credit related contingent feature is triggered, it would allow a portfolio or its counterparty to close out all transactions under the agreement and demand payment or additional collateral to cover their exposure to the other counterparty. Any election made by a counterparty to early terminate a transaction could have a material adverse impact on a portfolio’s financial statements. To reduce credit and counterparty risk associated with transactions, a portfolio may enter into master netting arrangements to the extent that if an event of default occurs, all amounts with the counterparty are terminated and settled on a net basis. A portfolio’s overall exposure to credit risk, subject to master netting arrangements, can change substantially within a short period, as it is affected by each transaction subject to the arrangement.
B. DERIVATIVE INVESTMENTS
In addition to managing the market risks described above, certain portfolios, if permitted by their investment objectives, may also invest in derivatives for purposes of hedging, duration management, to gain exposure to specific investment opportunities, as a substitute for securities, to increase returns, or to otherwise help achieve a portfolio’s investment goal. Each derivative instrument and the reasons a portfolio invested in derivatives during the reporting period are discussed in further detail below.
Futures Contracts – A futures contract is a commitment to buy or sell a specific amount of a financial instrument or commodity at a negotiated price on a specified future date. Futures contracts are subject to the possibility of illiquid markets, and the possibility of an imperfect correlation between the value of the instruments and the underlying securities. Initial margin deposits are made upon entering into futures contracts and can be funded with either cash or securities. During the period a futures contract is open, changes in the value of the contract are recognized as unrealized appreciation or depreciation by marking-to-market on a daily basis to reflect the market value of the contract at the end of each day’s trading. Variation margin receivables or payables represent the difference between the change in unrealized appreciation and depreciation on the open contracts and the cash deposits made on the margin accounts. When the contract is closed, a portfolio records a realized gain or loss equal to the difference between the proceeds from (or cost of) the closing transaction and the portfolio’s cost of the contract. Futures contracts are valued at the settlement price established each day by the board of trade or exchange on which they are traded.
During the reporting period, the portfolios entered into futures contracts for the following reasons: The PD Large-Cap Growth Index, PD Large-Cap Value Index, PD Small-Cap Growth Index and PD Small-Cap Value Index Portfolios utilized futures to help provide equity exposure to the portfolio’s cash balances and accruals, and to provide daily liquidity for the portfolio’s inflows and outflows.
The derivative investments held as of December 31, 2012 as disclosed in the Notes to Schedules of Investments and the amounts of realized gains and losses and changes in net unrealized appreciation and depreciation on derivative investments as disclosed in the Statements of Operations serve as indicators of the volume of derivative activity for each applicable portfolio during the year ended December 31, 2012.
The following is a summary of the location of fair value amounts of derivative investments, if any, disclosed in the Fund’s Statements of Assets and Liabilities:
| | | | |
| | | Location on the Statements of Assets and Liabilities |
| Derivative Investments Risk Type | | Asset Derivative Investments | | Liability Derivative Investments |
Equity contracts | | Receivable: Variation margin | | Payable: Variation margin |
The following is a summary of fair values of derivative investments disclosed in the Statements of Assets and Liabilities, categorized by primary risk exposure as of December 31, 2012:
| | | | | | | | |
| | | Total Value of Equity Contracts*
as of December 31, 2012 | |
| Portfolio | | Assets | | | Liabilities | |
PD Large-Cap Growth Index | | | $- | | | | ($20,641 | ) |
PD Large-Cap Value Index | | | - | | | | (13,216 | ) |
PD Small-Cap Growth Index | | | 22,906 | | | | - | |
PD Small-Cap Value Index | | | 32,944 | | | | - | |
| * | Includes cumulative appreciation (depreciation) of futures contracts as reported in the Notes to Schedules of Investments. Only current day’s variation margin is reported within the Statement of Assets and Liabilities. |
D-8
PACIFIC SELECT FUND
NOTES TO FINANCIAL STATEMENTS (Continued)
The following is a summary of the location of realized gains and losses and changes in net unrealized appreciation and depreciation of derivative investments, if any, disclosed in the Fund’s Statements of Operations:
| | |
| Derivative Investment Risk Type | | Location of Gain (Loss) on Derivative Investments Recognized in the Statements of Operations |
Equity contracts | | Net realized gain (loss) on futures contracts transactions |
| | Change in net unrealized appreciation (depreciation) on futures contracts |
The following is a summary of each portfolio’s realized gain and/or loss and change in net unrealized appreciation and/or depreciation on derivative investments in equity futures contracts recognized in the Statements of Operations as of December 31, 2012:
| | | | | | | | |
| |
| | | Realized Gain and Unrealized Appreciation (Depreciation)
on Derivative Investments in Equity Futures Contracts
Recognized in the Statements of Operations | |
| Portfolio | | Realized Gain | | | Change in Unrealized
Appreciation (Depreciation) | |
PD Large-Cap Growth Index | | | $636,745 | | | | ($34,026 | ) |
PD Large-Cap Value Index | | | 784,671 | | | | (45,678 | ) |
PD Small-Cap Growth Index | | | 103,490 | | | | 24,697 | |
PD Small-Cap Value Index | | | 82,026 | | | | 33,789 | |
6. INVESTMENT ADVISORY, SUPPORT SERVICES, AGENCY, AND DISTRIBUTION AGREEMENTS
Pursuant to an Investment Advisory Agreement, PLFA, a wholly owned subsidiary of Pacific Life Insurance Company (“Pacific Life”), serves as investment adviser to each portfolio of the Fund. PLFA receives advisory fees from each portfolio based on the following advisory fee rates, which are based on an annual percentage of average daily net assets of each portfolio:
| | |
PD Aggregate Bond Index | | 0.16% of first $50 million
0.15% of next $50 million
0.14% on excess |
PD High Yield Bond Market | | 0.35% of first $50 million 0.22% of next $50 million 0.14% on excess |
PD Large-Cap Growth Index PD Large-Cap Value Index PD Small-Cap Growth Index PD Small-Cap Value Index | | 0.14% of first $300 million 0.12% on excess |
PD Emerging Markets | | 0.60% of first $50 million 0.35% on excess |
PD International Large-Cap | | 0.25% of first $100 million 0.20% on excess |
Pursuant to Portfolio Management or Subadvisory Agreements as of December 31, 2012, the Fund and PLFA engage various investment management firms under PLFA’s supervision, to sub-advise each Pacific Dynamix Underlying Portfolio. The following firms serve as sub-advisers for the respective portfolios: BlackRock Investment Management, LLC for the PD Large-Cap Growth Index, PD Large-Cap Value Index, PD Small-Cap Growth Index and PD Small-Cap Value Index Portfolios; SSgA Funds Management, Inc. for the PD Aggregate Bond Index and PD High Yield Bond Market Portfolios; and Dimensional Fund Advisors LP for the PD Emerging Markets and PD International Large-Cap Portfolios. PLFA, as Investment Adviser to each portfolio of the Fund, pays the related portfolio management fees to these sub-advisors as compensation for their sub-advisory services provided to the Fund.
Pursuant to an Agreement for Support Services (the “Agreement”), Pacific Life and PLFA provide support services to the Fund that are outside the scope of the investment adviser’s responsibilities under the Advisory Agreement. Under the Agreement, the Fund compensates Pacific Life and PLFA for their expenses in providing support services to the Fund in connection with various matters, including the expense of registering and qualifying the Fund on state and Federal levels, providing legal, compliance, accounting, tax, chief compliance officer services, and on-going compliance, maintaining the Fund’s legal existence, shareholders’ meetings, and expenses associated with preparing, printing and distributing reports, proxies and prospectuses to existing shareholders. The Fund reimbursed Pacific Life and PLFA for these support services on an approximate cost basis.
Pursuant to a Transfer Agency and Service Agreement, State Street Bank and Trust Company serves as transfer agent and dividend disbursing agent for all Class P shares of the Pacific Dynamix Underlying Portfolios and is compensated by the Fund for these services.
7. TRANSACTIONS WITH AFFILIATES
A. ADVISORY FEES AND EXPENSES FOR SUPPORT SERVICES
The Adviser and Pacific Life are related parties. The advisory fees earned by the Adviser and expenses for support services recovered by PLFA and Pacific Life (see Note 6) from each portfolio covered in this report for the year ended December 31, 2012 are presented in the Statements of Operations. The amounts of each of these fees that remained payable as of December 31, 2012 are presented in the Statements of Assets and Liabilities.
D-9
PACIFIC SELECT FUND
NOTES TO FINANCIAL STATEMENTS (Continued)
B. EXPENSE LIMITATION AGREEMENTS
To help limit the Fund’s expenses, PLFA has entered into expense limitation agreements with the Fund and has contractually agreed to reimburse each Pacific Dynamix Underlying Portfolio through April 30, 2013 to the extent the total net operating expenses (including advisory fees and organizational expenses, but not including extraordinary expenses such as litigation or other expenses not incurred in the ordinary course of each portfolio’s business of a Pacific Dynamix Underlying Portfolio) exceeds the annualized expense ratios as follows: 0.17% for the PD Aggregate Bond Index, PD Large-Cap Growth Index, and PD Large-Cap Value Index Portfolios; 0.34% for the PD High Yield Bond Market Portfolio; 0.21% for the PD Small-Cap Growth Index and PD Small-Cap Value Index Portfolios; 0.97% for the PD Emerging Markets Portfolio; and 0.30% for the PD International Large-Cap Portfolio.
Any expense reimbursements are subject to recoupment by PLFA for a period of time as permitted under regulatory and accounting guidance (currently 3 years from the end of the fiscal year in which the reimbursement took place) to the extent such expenses fall below the expense cap in future years. Any amounts repaid to PLFA will have the effect of increasing such expenses of the applicable portfolio, but not above the expense cap. The amounts of adviser reimbursement to each of the applicable portfolios covered in this report for the year ended December 31, 2012 are presented in the Statements of Operations. Any amounts that remained due from the Adviser as of December 31, 2012 are presented in the Statements of Assets and Liabilities.
The cumulative expense reimbursement amounts, if any, as of December 31, 2012 that are subject to repayment from the portfolios are as follows:
| | | | | | | | | | | | |
| | | Expiration | |
| Portfolio | | 2013 | | | 2014 | | | 2015 | |
PD Aggregate Bond Index | | | $110,894 | | | | $125,051 | | | | $136,128 | |
PD High Yield Bond Market | | | 56,698 | | | | 67,270 | | | | 47,932 | |
PD Large-Cap Growth Index | | | 28,860 | | | | 27,630 | | | | 15,942 | |
PD Large-Cap Value Index | | | 32,445 | | | | 29,532 | | | | 17,489 | |
PD Small-Cap Growth Index | | | 38,021 | | | | 25,175 | | | | 21,359 | |
PD Small-Cap Value Index | | | 41,193 | | | | 30,356 | | | | 27,181 | |
PD International Large-Cap | | | 60,583 | | | | 120,039 | | | | 100,661 | |
There was no recoupment of expense reimbursement by PLFA from any of the Pacific Dynamix Underlying Portfolios during the year ended December 31, 2012.
C. INVESTMENTS BY AFFILIATED PARTY
As of December 31, 2012, Pacific Life owned the following percentages of shares outstanding of each of the following portfolios:
| | | | |
| Portfolio | | Ownership Percentage | |
PD High Yield Bond Market | | | 58.25 | % |
PD Emerging Markets | | | 30.24 | % |
D. INDEPENDENT TRUSTEES
The Fund pays each independent trustee of the Board retainer fees and specified amounts for various Board and committee services and for chairing the committees. The fees and expenses of the independent trustees of the Board are presented in the Statements of Operations.
Each independent trustee of the Board is eligible to participate in the Fund’s Deferred Compensation Plan (the “Plan”). The Plan allows each independent trustee to voluntarily defer receipt of all or a percentage of fees, which otherwise would be payable for services performed. Amounts in the deferral account are obligations of each portfolio at the time of such deferral and are payable in accordance with the Plan. Deferred amounts are treated as though equivalent dollar amounts had been invested in shares of certain portfolios in the Pacific Life Funds. Pacific Life Funds is a Delaware statutory trust and is registered under the 1940 Act, as an open-end management investment company. PLFA is the Investment Adviser to Pacific Life Funds. An independent trustee who defers compensation has the option to select credit rate options that track the performance, at NAV of the Class A and/or Class P shares of the corresponding series of the Pacific Life Funds without a sales load. The obligation of each portfolio under the Plan (the “DCP Liability”) is recorded as a liability (accrued trustees’ fees and expenses and deferred compensation). Accordingly, the market value appreciation or depreciation on a portfolio’s DCP Liability account will cause the expenses of that portfolio to increase or decrease due to market fluctuation. The change in net unrealized appreciation or depreciation on a portfolio’s DCP Liability account, if any, is recorded as an increase or decrease to expense (trustees’ fees and expenses). None of the independent trustees have deferred their compensation since the commencement of operations of all the portfolios covered in this report, therefore there is no accrued deferred compensation shown in the Statements of Assets and Liabilities.
E. OFFICERS OF THE FUND
All officers of the Fund are also officers of Pacific Life and PLFA and received no compensation from the Fund.
F. INDEMNIFICATIONS
Under the Fund’s organizational documents, its officers and trustees are indemnified against certain liabilities arising out of performance of their duties to the Fund. In addition, the Fund entered into an agreement with each of the trustees which provides that the Fund will indemnify and hold harmless each trustee against any expenses actually and reasonably incurred by any trustee in any proceeding arising out of or in connection with the trustee’s services to the Fund, to the fullest extent permitted by the Fund’s Declaration of Trust and By-Laws, the general trust law of the Commonwealth of Massachusetts, the Securities Act of 1933, and the 1940 Act, each as now or hereinafter in force. In the
D-10
PACIFIC SELECT FUND
NOTES TO FINANCIAL STATEMENTS (Continued)
normal course of business, the Fund enters into contracts with service providers and others that contain general indemnification clauses. The Fund’s maximum exposure under these arrangements and agreements is dependent on future claims that may be made against the Fund and/ or the trustees and, therefore, cannot be estimated; however, based on experience, the risk of loss from such claims is considered remote.
8. COMMITTED LINE OF CREDIT
The Fund has an unsecured $75,000,000 committed revolving line of credit agreement with State Street Bank and Trust Company (the “Bank”), which is renewed annually. The interest rate on borrowing is the higher of the Federal funds rate or the Overnight LIBOR rate, plus 1.25%. The Fund pays the Bank a commitment fee equal to 0.10% per annum on the daily unused portion of the committed line up to a maximum of $75,000. As of December 31, 2012, the actual interest rate on borrowing by the Fund was 1.42%. The committed line of credit will expire on August 31, 2013, unless renewed, and applies to all portfolios covered in this report except the PD Aggregate Bond and PD High Yield Bond Market Portfolios. The commitment fees and interest incurred by each applicable portfolio covered in this report are recorded as an expense. The commitment fees are allocated to each applicable portfolio in proportion to its relative average daily net assets and the interest expenses are charged directly to the applicable portfolio. As of December 31, 2012, the portfolios covered in this report had no borrowings outstanding in connection with this line of credit. The weighted average interest rate and the average dollar amount of borrowings on those days that the PD Emerging Markets Portfolio and PD International Large-Cap Portfolio had a loan outstanding during the year ended December 31, 2012 were 1.41% and 1.42% and $223,391 and $817,470, respectively. No other portfolios covered in this report had a loan outstanding during the same period.
9. PURCHASES AND SALES OF SECURITIES
The cost of purchases and proceeds from sales of investments (excluding short-term investments) for the year ended December 31, 2012, are summarized in the following table:
| | | | | | | | |
| | | U.S. Government Securities | |
| Portfolio | | Purchases | | | Sales | |
PD Aggregate Bond Index | | | $369,490,806 | | | | $209,263,321 | |
| | | | | | | | |
| | | Other Securities | |
| Portfolio | | Purchases | | | Sales | |
PD Aggregate Bond Index | | | $66,145,784 | | | | $11,138,034 | |
PD High Yield Bond Market | | | 60,839,590 | | | | 35,146,521 | |
PD Large-Cap Growth Index | | | 78,239,678 | | | | 22,848,510 | |
PD Large-Cap Value Index | | | 96,732,106 | | | | 25,316,304 | |
| | | | | | | | |
| | | Other Securities | |
| Portfolio | | Purchases | | | Sales | |
PD Small-Cap Growth Index | | | $36,376,679 | | | | $28,001,376 | |
PD Small-Cap Value Index | | | 50,766,771 | | | | 30,433,191 | |
PD Emerging Markets | | | 15,516,746 | | | | 1,112,740 | |
PD International Large-Cap | | | 63,707,585 | | | | 2,811,793 | |
10. FEDERAL INCOME TAX INFORMATION
Currently each Pacific Dynamix Underlying Portfolio is treated as a partnership for Federal income tax purposes only. A portfolio that is treated as a partnership for tax purposes only is not subject to income tax; and any income, gains, losses, deductions, and credits of the portfolio would instead be “passed through” pro rata directly to the insurance companies whose separate accounts invest in the portfolio and retain the same character for Federal income tax purposes. As a result, the tax treatment to the insurance companies will vary, in some instances favorably, when a portfolio is treated as a partnership. However, the variable annuity contract owner or variable life insurance policy holder would not be affected by a portfolio electing to be taxed as a partnership versus a regulated investment company.
Effective January 1, 2013, no dividend income and capital gains distributions will be made by the Pacific Dynamix Underlying Portfolios under the new dividend and distributions policy since partnerships are not required to distribute taxable income and capital gains for Federal income tax purposes (see Note 2B). Each partner, which would be Pacific Life and Pacific Life & Annuity Company through their respective separate accounts, is required to report its respective share of income, gains, losses, deductions and credits of each Pacific Dynamix Underlying Portfolio.
The aggregate Federal tax cost of investments and the composition of unrealized appreciation and depreciation on investments and net unrealized appreciation and/or depreciation on derivatives and assets and liabilities in foreign currencies as of December 31, 2012, were as follows:
| | | | | | | | | | | | | | | | | | | | | | | | |
| | | | | | Gross | | | Gross | | | Net Unrealized | | | Net Unrealized | | | Net | |
| Portfolio | | Total Cost of
Investments on
Tax Basis | | | Unrealized
Appreciation on Investments | | | Unrealized
Depreciation on Investments | | | Appreciation
(Depreciation)
on Investments | | | Appreciation
(Depreciation)
on Other (1) | | | Unrealized
Appreciation
(Depreciation) | |
PD Aggregate Bond Index | | | $416,603,906 | | | | $14,547,680 | | | | ($457,396 | ) | | | $14,090,284 | | | | $- | | | | $14,090,284 | |
PD High Yield Bond Market | | | 103,222,822 | | | | 6,334,851 | | | | (1,235,228 | ) | | | 5,099,623 | | | | - | | | | 5,099,623 | |
PD Large-Cap Growth Index | | | 148,650,195 | | | | 24,462,704 | | | | (2,071,004 | ) | | | 22,391,700 | | | | (20,641 | ) | | | 22,371,059 | |
PD Large-Cap Value Index | | | 197,575,668 | | | | 23,372,745 | | | | (4,611,484 | ) | | | 18,761,261 | | | | (13,216 | ) | | | 18,748,045 | |
PD Small-Cap Growth Index | | | 37,774,132 | | | | 5,811,686 | | | | (2,034,848 | ) | | | 3,776,838 | | | | 22,906 | | | | 3,799,744 | |
PD Small-Cap Value Index | | | 57,315,229 | | | | 7,200,937 | | | | (2,542,802 | ) | | | 4,658,135 | | | | 32,943 | | | | 4,691,078 | |
PD Emerging Markets | | | 43,849,941 | | | | 10,650,863 | | | | (3,181,800 | ) | | | 7,469,063 | | | | (28,404 | ) | | | 7,440,659 | |
PD International Large-Cap | | | 160,658,092 | | | | 21,398,649 | | | | (8,423,584 | ) | | | 12,975,065 | | | | 1,715 | | | | 12,976,780 | |
| | (1) | Other includes net appreciation or depreciation on derivatives and assets and liabilities in foreign currencies, if any. |
The Fund recognizes the financial statement effects of a tax position taken or expected to be taken in a tax return when it is more likely than not, based on the technical merits, that the position will be sustained upon examination by the applicable tax authority. Tax positions not
D-11
PACIFIC SELECT FUND
NOTES TO FINANCIAL STATEMENTS (Continued)
deemed to meet the more-likely-than-not threshold would be recorded as a tax liability for unrecognized tax benefits with a corresponding income tax expense. The Fund is required to analyze all open tax years, as defined by the statute of limitations, for all major jurisdictions. As a result of each portfolio’s evaluation, as of and during the year ended December 31, 2012, the Fund did not record a liability for any unrecognized tax benefits. The Fund’s policy is to recognize interest and penalties on unrecognized tax benefits in income tax expense. During the year ended December 31, 2012, none of the Pacific Dynamix Underlying Portfolios incurred any interest or penalties. The Fund is additionally not aware of any tax positions for which it is reasonably possible that the total amounts of unrecognized tax benefits will change materially in the next twelve months.
The Fund remains subject to examination by Federal and State tax authorities (principal state jurisdictions include California and Massachusetts) for the tax years ended December 31, 2009 through December 31, 2012.
11. TAX CHARACTER OF DISTRIBUTIONS
The tax character of income and capital gain distributions to shareholders for the years ended December 31, 2012 and 2011, were as follows:
| | | | | | | | | | | | | | | | | | | | | | | | |
| | | For the Year Ended December 31, 2012 | | | For the Year Ended December 31, 2011 | |
| Portfolio | | Ordinary
Income | | | Long-term
Capital
Gains | | | Total | | | Ordinary
Income | | | Long-term
Capital
Gains | | | Total | |
PD Aggregate Bond Index | | | $5,638,049 | | | | $137,426 | | | | $5,775,475 | | | | $7,714,482 | | | | $402,939 | | | | $8,117,421 | |
PD High Yield Bond Market | | | 6,510,420 | | | | 599,711 | | | | 7,110,131 | | | | 5,766,216 | | | | 1,021,700 | | | | 6,787,916 | |
PD Large-Cap Growth Index | | | 2,082,400 | | | | - | | | | 2,082,400 | | | | 2,192,500 | | | | 2,380,449 | | | | 4,572,949 | |
PD Large-Cap Value Index | | | 5,066,014 | | | | 4,430,064 | | | | 9,496,078 | | | | 2,030,533 | | | | 109,671 | | | | 2,140,204 | |
PD Small-Cap Growth Index | | | 457,051 | | | | 2,341,186 | | | | 2,798,237 | | | | 531,340 | | | | 1,827,755 | | | | 2,359,095 | |
PD Small-Cap Value Index | | | 1,938,256 | | | | 1,615,229 | | | | 3,553,485 | | | | 1,209,700 | | | | 1,563,108 | | | | 2,772,808 | |
PD Emerging Markets | | | 699,139 | | | | 454,750 | | | | 1,153,889 | | | | 444,945 | | | | 53,047 | | | | 497,992 | |
PD International Large-Cap | | | 3,859,121 | | | | - | | | | 3,859,121 | | | | 2,054,303 | | | | - | | | | 2,054,303 | |
12. SHARES OF BENEFICIAL INTEREST
Change in shares of beneficial interest of each portfolio for the years ended December 31, 2012 and 2011 were as follows:
| | | | | | | | | | | | | | | | | | | | | | | | | | | | |
| | | PD Aggregate Bond Index | | PD High Yield Bond Market | | | | | PD Large-Cap Growth Index | |
| | | 2012 | | | 2011 | | | | | 2012 | | | 2011 | | | | | 2012 | | | 2011 | |
Class P | | | | | | | | | | | | | | | | | | | | | | | | | | | | |
Shares sold | | | 18,342,074 | | | | 7,605,690 | | | | | | 1,684,947 | | | | 3,516,194 | | | | | | 4,026,812 | | | | 3,360,265 | |
Dividend and distribution reinvested | | | 520,670 | | | | 748,000 | | | | | | 613,741 | | | | 613,438 | | | | | | 129,854 | | | | 328,896 | |
Shares repurchased | | | (1,441,672 | ) | | | (4,579,643 | ) | | | | | (87,472 | ) | | | (378,899 | ) | | | | | (535,682 | ) | | | (957,723 | ) |
Net increase | | | 17,421,072 | | | | 3,774,047 | | | | | | 2,211,216 | | | | 3,750,733 | | | | | | 3,620,984 | | | | 2,731,438 | |
Shares outstanding, beginning of year | | | 19,258,145 | | | | 15,484,098 | | | | | | 7,144,041 | | | | 3,393,308 | | | | | | 7,166,306 | | | | 4,434,868 | |
Shares outstanding, end of year | | | 36,679,217 | | | | 19,258,145 | | | | | | 9,355,257 | | | | 7,144,041 | | | | | | 10,787,290 | | | | 7,166,306 | |
| | | | |
| | | PD Large-Cap Value Index | | PD Small-Cap Growth Index | | | | | PD Small-Cap Value Index | |
| | | 2012 | | | 2011 | | | | | 2012 | | | 2011 | | | | | 2012 | | | 2011 | |
Class P | | | | | | | | | | | | | | | | | | | | | | | | | | | | |
Shares sold | | | 5,404,096 | | | | 4,070,207 | | | | | | 1,180,930 | | | | 779,729 | | | | | | 2,101,777 | | | | 1,131,285 | |
Dividend and distribution reinvested | | | 663,163 | | | | 156,542 | | | | | | 191,348 | | | | 170,896 | | | | | | 253,055 | | | | 219,835 | |
Shares repurchased | | | (504,521 | ) | | | (1,037,585 | ) | | | | | (598,234 | ) | | | (206,680 | ) | | | | | (604,857 | ) | | | (224,503 | ) |
Net increase | | | 5,562,738 | | | | 3,189,164 | | | | | | 774,044 | | | | 743,945 | | | | | | 1,749,975 | | | | 1,126,617 | |
Shares outstanding, beginning of year | | | 8,742,591 | | | | 5,553,427 | | | | | | 2,038,784 | | | | 1,294,839 | | | | | | 2,701,115 | | | | 1,574,498 | |
Shares outstanding, end of year | | | 14,305,329 | | | | 8,742,591 | | | | | | 2,812,828 | | | | 2,038,784 | | | | | | 4,451,090 | | | | 2,701,115 | |
| | | | | |
| | | PD Emerging Markets | | PD International Large-Cap | | | | | | | | | |
| | | 2012 | | | 2011 | | | | | 2012 | | | 2011 | | | | | | | | | |
Class P | | | | | | | | | | | | | | | | | | | | | | | | | | | | |
Shares sold | | | 1,103,589 | | | | 894,257 | | | | | | 5,243,502 | | | | 4,471,584 | | | | | | | | | | | |
Dividend and distribution reinvested | | | 80,793 | | | | 37,650 | | | | | | 283,889 | | | | 176,658 | | | | | | | | | | | |
Shares repurchased | | | (138,797 | ) | | | (140,508 | ) | | | | | (604,599 | ) | | | (581,968 | ) | | | | | | | | | | |
Net increase | | | 1,045,585 | | | | 791,399 | | | | | | 4,922,792 | | | | 4,066,274 | | | | | | | | | | | |
Shares outstanding, beginning of year | | | 2,328,676 | | | | 1,537,277 | | | | | | 7,958,534 | | | | 3,892,260 | | | | | | | | | | | |
Shares outstanding, end of year | | | 3,374,261 | | | | 2,328,676 | | | | | | 12,881,326 | | | | 7,958,534 | | | | | | | | | | | |
D-12
REPORT OF INDEPENDENT REGISTERED PUBLIC ACCOUNTING FIRM
The Board of Trustees and Shareholders of
Pacific Select Fund:
We have audited the accompanying statements of assets and liabilities, including the schedules of investments, of the PD Aggregate Bond Index, PD High Yield Bond Market, PD Large-Cap Growth Index, PD Large-Cap Value Index, PD Small-Cap Growth Index, PD Small-Cap Value Index, PD Emerging Markets, and PD International Large-Cap Portfolios (collectively the “Funds”) (eight of fifty-four portfolios comprising Pacific Select Fund) as of December 31, 2012, the related statements of operations for the year then ended, the statements of changes in net assets for each of the two years in the period then ended, and the financial highlights for each of the periods presented. These financial statements and financial highlights are the responsibility of the Funds’ management. Our responsibility is to express an opinion on these financial statements and financial highlights based on our audits.
We conducted our audits in accordance with the standards of the Public Company Accounting Oversight Board (United States). Those standards require that we plan and perform the audit to obtain reasonable assurance about whether the financial statements and financial highlights are free of material misstatement. The Funds are not required to have, nor were we engaged to perform, an audit of their internal control over financial reporting. Our audits included consideration of internal control over financial reporting as a basis for designing audit procedures that are appropriate in the circumstances, but not for the purpose of expressing an opinion on the effectiveness of the Funds’ internal control over financial reporting. Accordingly, we express no such opinion. An audit also includes examining, on a test basis, evidence supporting the amounts and disclosures in the financial statements, assessing the accounting principles used and significant estimates made by management, as well as evaluating the overall financial statement presentation. Our procedures included confirmation of securities owned as of December 31, 2012, by correspondence with the custodian and brokers; where replies were not received from brokers, we performed other auditing procedures. We believe that our audits provide a reasonable basis for our opinion.
In our opinion, such financial statements and financial highlights referred to above present fairly, in all material respects, the financial position of each of the respective Funds as of December 31, 2012, and the results of their operations, the changes in their net assets, and the financial highlights for each of the periods presented, in conformity with accounting principles generally accepted in the United States of America.

Costa Mesa, California
February 27, 2013
E-1
PACIFIC SELECT FUND
DISCLOSURE OF FUND EXPENSES
(Unaudited)
We believe it is important for you to understand the impact of fees and expenses regarding your investment. All mutual funds have operating expenses. As a shareholder of a mutual fund, you incur ongoing costs, which include advisory fees and other fund expenses. The following example is intended to help you understand your ongoing costs (in dollars) of investing in each portfolio and to compare these costs with those of other mutual funds. The example is based on an investment of $1,000.00 made at the beginning of the period and held for the entire six-month period from July 1, 2012 to December 31, 2012.
ACTUAL EXPENSES
The first line of the table below for each portfolio provides information about actual account values and actual expenses based on each portfolio’s actual performance and each portfolio’s actual expenses and expense reductions (Note 7B to Financial Statements). The “Ending Account Value at 12/31/12” column shown is derived from the portfolio’s actual performance; the “Annualized Expense Ratio” column shows the portfolio’s actual annualized expense ratio; and the “Expenses Paid During the Period 07/01/12-12/31/12” column shows the dollar amount that would have been paid by you. All the information illustrated in the following table is based on the past six-month period from July 1, 2012 to December 31, 2012.
You may use the information in the first line, together with the amount you invested, to estimate the expenses that you paid over the period. To do so, for each portfolio in your account, simply divide that portfolio’s value by $1,000.00 (for example, an $8,600.00 portfolio value divided by $1,000.00 = 8.6), then multiply this result by the number given for your portfolio(s) in the first line under the heading entitled “Expenses Paid During the Period 07/01/12-12/31/12.”
HYPOTHETICAL EXAMPLE FOR COMPARISON PURPOSE
The second line of the table for each portfolio provides information about hypothetical account values and hypothetical expenses based on a 5% per year hypothetical rate of return and the actual portfolio’s expenses, after any expense reductions. It assumes that the portfolio had an annual 5% rate of return before expenses, but that the expense ratio is unchanged. The hypothetical account values and expenses may not be used to estimate the actual ending account values or expenses you paid for the period.
You may use the hypothetical example information to compare the ongoing costs of investing in the portfolio to other mutual funds. To do so, compare this 5% hypothetical example with the 5% hypothetical examples that appear in the shareholder reports of other mutual funds.
Please note that the expenses shown in the table are meant to highlight your ongoing costs only and do not reflect any transaction costs. Therefore, the second line of the table is useful in comparing ongoing costs only, and will not help you determine the relative total costs of owning different mutual funds. In addition, if these other costs were included, your costs would have been higher.
| | | | | | | | | | | | | | | | |
| Portfolio | | Beginning
Account
Value at
07/01/12 | | | Ending
Account
Value at
12/31/12 | | | Annualized
Expense
Ratio | | | Expenses
Paid During
the Period
07/01/12-
12/31/12 (1) | |
PD Aggregate Bond Index | |
Actual | | | $1,000.00 | | | | $1,015.50 | | | | 0.17% | | | | $0.86 | |
Hypothetical | | | 1,000.00 | | | | 1,024.28 | | | | 0.17% | | | | 0.87 | |
|
PD High Yield Bond Market | |
Actual | | | $1,000.00 | | | | $1,077.00 | | | | 0.34% | | | | $1.78 | |
Hypothetical | | | 1,000.00 | | | | 1,023.43 | | | | 0.34% | | | | 1.73 | |
|
PD Large-Cap Growth Index | |
Actual | | | $1,000.00 | | | | $1,046.10 | | | | 0.17% | | | | $0.87 | |
Hypothetical | | | 1,000.00 | | | | 1,024.28 | | | | 0.17% | | | | 0.87 | |
|
PD Large-Cap Value Index | |
Actual | | | $1,000.00 | | | | $1,079.40 | | | | 0.17% | | | | $0.89 | |
Hypothetical | | | 1,000.00 | | | | 1,024.28 | | | | 0.17% | | | | 0.87 | |
| | | | | | | | | | | | | | | | |
| Portfolio | | Beginning
Account
Value at
07/01/12 | | | Ending
Account
Value at
12/31/12 | | | Annualized
Expense
Ratio | | | Expenses
Paid During
the Period
07/01/12-
12/31/12 (1) | |
PD Small-Cap Growth Index | |
Actual | | | $1,000.00 | | | | $1,051.70 | | | | 0.21% | | | | $1.08 | |
Hypothetical | | | 1,000.00 | | | | 1,024.08 | | | | 0.21% | | | | 1.07 | |
|
PD Small-Cap Value Index | |
Actual | | | $1,000.00 | | | | $1,088.30 | | | | 0.21% | | | | $1.10 | |
Hypothetical | | | 1,000.00 | | | | 1,024.08 | | | | 0.21% | | | | 1.07 | |
|
PD Emerging Markets | |
Actual | | | $1,000.00 | | | | $1,133.80 | | | | 0.91% | | | | $4.88 | |
Hypothetical | | | 1,000.00 | | | | 1,020.56 | | | | 0.91% | | | | 4.62 | |
|
PD International Large-Cap | |
Actual | | | $1,000.00 | | | | $1,137.10 | | | | 0.30% | | | | $1.61 | |
Hypothetical | | | 1,000.00 | | | | 1,023.63 | | | | 0.30% | | | | 1.53 | |
| (1) | Expenses paid during the six-month period are equal to the portfolio’s annualized expense ratio (shown in the table above), multiplied by the average account value over the period, multiplied by the number of days in the most recent fiscal half-year, then divided by 366 days. |
F-1
PACIFIC SELECT FUND
TRUSTEES AND OFFICERS INFORMATION
(Unaudited)
The business and affairs of the Fund are managed under the direction of the Board of Trustees under the Fund’s Declaration of Trust. Information pertaining to the trustees and officers of the Fund is set forth below, effective January 1, 2013. Trustees who are not deemed to be “interested persons” of the Fund, as defined in the 1940 Act, are referred to as “Independent Trustees.” Certain trustees and officers are deemed to be “interested persons” of the Fund and thus are referred to as “Interested Persons”, because of their positions with Pacific Life Insurance Company (“Pacific Life”) and Pacific Life Fund Advisors LLC, a wholly-owned subsidiary of Pacific Life. The Fund’s Statement of Additional Information includes additional information about the trustees. For information on availability of the Fund’s Statement of Additional Information, refer to the WHERE TO GO FOR MORE INFORMATION section of this report.
The address of each trustee and officer is c/o Pacific Select Fund, 700 Newport Center Drive, Newport Beach, CA 92660.
| | | | | | |
Name and Age | | Position(s) with the Fund and
Length of Time Served* | | Current Directorship(s) Held and Principal Occupation(s)
(and certain additional occupation information) During Past 5 years | | Number of
Portfolios in
Fund Complex
Overseen** |
| | |
INDEPENDENT TRUSTEES | | | | |
| | | |
Frederick L. Blackmon Year of birth 1952 | | Trustee since 1/01/05 | | Trustee (9/05 to present) of Pacific Life Funds; Director (2005 to present) of Trustmark Mutual Holding Company; Former Executive Vice President and Chief Financial Officer (1995 to 2003) of Zurich Life and has been retired since that time; Executive Vice President and Chief Financial Officer (1989 to 1995) of Alexander Hamilton Life Insurance Company (subsidiary of Household International); Member of Board of Trustees (2010 to present) of Cranbrook Educational Community; Former Member of Board of Governors (1994 to 1999) of Cranbrook Schools; and Former Member of Board of Regents (1993 to 1996) Eastern Michigan University. | | 87 |
| | | |
Gale K. Caruso Year of birth 1957 | | Trustee since 1/01/06 | | Trustee (1/06 to present) of Pacific Life Funds; Former Member of the Board of Directors (2005 to 2009) of LandAmerica Financial Group, Inc.; Former President and Chief Executive Officer (1999 to 2003) of Zurich Life; Former Chairman, President and Chief Executive Officer of Scudder Canada Investor Services, Ltd. and Managing Director of Scudder Kemper Investments; Former Member of the Advisory Council of the Trust for Public Land in Maine; Former Member of the Board of Directors of Make-A-Wish of Maine; and Former Member, Board of Directors of the Illinois Life Insurance Council. | | 87 |
| | | |
Lucie H. Moore Year of birth 1956 | | Trustee since 10/01/98 | | Trustee (6/01 to present) of Pacific Life Funds; Former Partner (1984 to 1994) with Gibson, Dunn & Crutcher (Law); Former Member of the Board of Trustees (2007 to 2011) of Sage Hill School; Former Member (2000 to 2009) and Former Vice Chairman (2001 to 2007) of the Board of Trustees of The Pegasus School; Former Member of the Board of Directors (2005 to 2010) of HomeWord; and Former Member of the Advisory Board (1993 to 2004) of Court Appointed Special Advocates (CASA) of Orange County. | | 87 |
| | | |
Nooruddin (Rudy) S. Veerjee Year of birth 1958 | | Trustee since 1/01/05 | | Trustee (9/05 to present) of Pacific Life Funds; Former President (1997 to 2000) of Transamerica Insurance and Investment Group and has been retired since that time; Former President (1994 to 1997) of Transamerica Asset Management; Former Chairman and Chief Executive Officer (1995 to 2000) of Transamerica Premier Funds (Mutual Fund); and Former Director (1994 to 2000) of various Transamerica Life Companies. | | 87 |
| | | |
G. Thomas Willis Year of birth 1942 | | Trustee since 11/17/03 | | Trustee (2/04 to present) of Pacific Life Funds; Certified Public Accountant in California (1967 to present); Former Audit Partner (1976 to 2002) of PricewaterhouseCoopers LLP (Accounting and Auditing) and has been retired since that time. | | 87 |
F-2
PACIFIC SELECT FUND
TRUSTEES AND OFFICERS INFORMATION (Continued)
(Unaudited)
| | | | | | |
Name and Age | | Position(s) with the Fund and Length of Time Served* | | Current Directorship(s) Held and Principal Occupation(s) (and certain additional occupation information) During Past 5 years | | Number of Portfolios in Fund Complex Overseen** |
| | |
INTERESTED PERSONS | | | | |
| | | |
James T. Morris Year of birth 1960 | | Chairman of the Board and Trustee since 1/11/07, (Chief Executive Officer 1/11/07 to 12/31/09) | | Director (4/07 to present), Chairman (5/08 to present), Chief Executive Officer (4/07 to present) and President (4/07 to 3/12) of Pacific Mutual Holding Company and Pacific LifeCorp; Director (4/07 to present), Chairman (5/08 to present), Chief Executive Officer (4/07 to present) and President (4/07 to 3/12) of Pacific Life; Chief Executive Officer (5/07 to present) and President (5/07 to 3/12) of Pacific Life Fund Advisors LLC; Chairman of the Board and Trustee (1/07 to present) and Chief Executive Officer (1/07 to 12/09) of Pacific Life Funds. | | 87 |
| | | |
Mary Ann Brown Year of birth 1951 | | Chief Executive Officer since 1/01/10, (President 1/11/07 to 12/31/09) | | Executive Vice President (4/10 to present) and Senior Vice President (5/06 to 3/10) of Pacific LifeCorp; Executive Vice President (4/10 to present) and Senior Vice President (3/05 to 3/10) of Pacific Life; Executive Vice President (4/10 to present) and Senior Vice President (5/07 to 3/10) of Pacific Life Fund Advisors LLC; and Chief Executive Officer (1/10 to present) and President (1/07 to 12/09) of Pacific Life Funds. | | 87 |
| | | |
Robin S. Yonis Year of birth 1954 | | Vice President and General Counsel since 4/04/05 | | Vice President, Fund Advisor General Counsel, and Assistant Secretary (5/07 to present) of Pacific Life Fund Advisors LLC; and Vice President and General Counsel (6/01 to present) of Pacific Life Funds. | | 87 |
| | | |
Brian D. Klemens Year of birth 1956 | | Vice President and Treasurer since 4/29/96 | | Vice President and Controller (10/07 to present) of Pacific Mutual Holding Company and Pacific LifeCorp; Vice President and Controller (10/07 to present) of Pacific Life; Vice President and Controller (10/07 to present) of Pacific Life Fund Advisors LLC; Vice President (5/00 to present) and Controller (10/07 to present) of Pacific Select Distributors, Inc.; and Vice President and Treasurer (6/01 to present) of Pacific Life Funds. | | 87 |
| | | |
Sharon E. Pacheco Year of birth 1957 | | Vice President and Chief Compliance Officer since 6/04/04 | | Vice President and Chief Compliance Officer (1/03 to present) of Pacific Mutual Holding Company and Pacific LifeCorp; Vice President (2/00 to present) and Chief Compliance Officer (1/03 to present) of Pacific Life; Vice President and Chief Compliance Officer (5/07 to present) of Pacific Life Fund Advisors LLC; and Vice President and Chief Compliance Officer (6/04 to present) of Pacific Life Funds. | | 87 |
| | | |
Howard T. Hirakawa Year of birth 1962 | | Vice President since 6/20/06 | | Vice President (5/07 to present) of Pacific Life Fund Advisors LLC; and Vice President (6/06 to present) of Pacific Life Funds. | | 87 |
| | | |
Jane M. Guon Year of birth 1964 | | Vice President since 1/01/11 and Secretary since 1/01/11 | | Vice President and Secretary (1/11 to present), Assistant Vice President (4/06 to 12/10) and Assistant Secretary (6/98 to 12/10) of Pacific Mutual Holding Company and Pacific LifeCorp; Director, Vice President, and Secretary (1/11 to present), Assistant Vice President (4/06 to 12/10) and Assistant Secretary (2/95 to 12/10) of Pacific Life; Vice President and Secretary (1/11 to present) and Assistant Vice President and Assistant Secretary (05/07 to 12/10) of Pacific Life Fund Advisors LLC; Vice President and Secretary (1/11 to present), Assistant Vice President (5/06 to 12/10) and Assistant Secretary (5/99 to 12/10) of Pacific Select Distributors, Inc.; and Vice President (1/11 to present) and Secretary (1/11 to present) of Pacific Life Funds. | | 87 |
| | | |
Laurene E. MacElwee Year of birth 1966 | | Vice President since 12/13/11 and Assistant Secretary since 4/04/05 (Assistant Vice President 4/04/05 to 12/12/11) | | Vice President (4/11 to present), Assistant Secretary (5/07 to present) and Assistant Vice President (5/07 to 3/11) of Pacific Life Fund Advisors LLC; and Vice President (4/05 to present) and Assistant Secretary (6/01 to present) of Pacific Life Funds. | | 87 |
F-3
PACIFIC SELECT FUND
TRUSTEES AND OFFICERS INFORMATION (Continued)
(Unaudited)
| | | | | | |
Name and Age | | Position(s) with the Fund and Length of Time Served* | | Current Directorship(s) Held and Principal Occupation(s) (and certain additional occupation information) During Past 5 years | | Number of Portfolios in Fund Complex Overseen** |
| | |
INTERESTED PERSONS (Continued) | | | | |
| | | |
Eddie Tung Year of birth 1957 | | Assistant Vice President and Assistant Treasurer since 11/14/05 | | Assistant Vice President (4/03 to present) of Pacific Life; Assistant Vice President (5/07 to present) of Pacific Life Fund Advisors LLC; and Vice President and Assistant Treasurer (11/05 to present) of Pacific Life Funds. | | 87 |
| | | |
Carleton J. Muench Year of birth 1973 | | Assistant Vice President since 11/30/06 | | Assistant Vice President (5/07 to present) of Pacific Life Fund Advisors LLC; and Vice President (11/06 to present) of Pacific Life Funds. | | 87 |
| | | |
Kevin W. Steiner Year of birth 1975 | | Assistant Vice President since 1/01/13 | | Assistant Vice President (4/12 to present), Mutual Funds Compliance Director (4/08 to 3/12) and Mutual Funds Compliance Manager (10/06 to 3/08) of Pacific Life Fund Advisors LLC; and Vice President (1/13 to present) of Pacific Life Funds. | | 87 |
| | * | A trustee serves until he or she resigns, retires, or his or her successor is elected and qualified. |
| | ** | As of December 31, 2012, the “Fund Complex” consisted of Pacific Select Fund (54 portfolios) and Pacific Life Funds (33 funds). |
F-4
PACIFIC SELECT FUND
APPROVAL OF INVESTMENT ADVISORY AGREEMENT AND PORTFOLIO MANAGEMENT AGREEMENTS
(Unaudited)
The Board of Trustees (the “Trustees” or “Board”) of Pacific Select Fund (the “Fund”) oversees the management of each of the separate portfolios of the Fund (each a “Portfolio” and collectively, the “Portfolios”) and, as required by Section 15(c) of the Investment Company Act of 1940, as amended (the “1940 Act”), initially approves and determines annually whether to renew the investment advisory agreement (the “Advisory Agreement”) with Pacific Life Fund Advisors LLC (“PLFA”) and each portfolio management agreement (the “Portfolio Management Agreements,” together with the Advisory Agreement, the “Agreements”) with the various sub-advisers or “Portfolio Managers.” PLFA serves as the investment adviser for all of the Portfolios and directly manages the High Yield Bond, Cash Management and Floating Rate Income Portfolios (the “PAM Managed Portfolios”) under the name Pacific Asset Management (“PAM”) and the Portfolio Optimization Conservative, Portfolio Optimization Moderate-Conservative, Portfolio Optimization Moderate, Portfolio Optimization Growth, Portfolio Optimization Aggressive-Growth, Pacific Dynamix — Conservative Growth, Pacific Dynamix — Moderate Growth and Pacific Dynamix — Growth Portfolios (the “Asset Allocation Portfolios,” and together with the PAM Managed Portfolios, the “Directly Managed Portfolios”). For the other Portfolios, with the exception of the American Funds Growth-Income Portfolio, the American Funds Growth Portfolio, and the American Funds Asset Allocation Portfolio (collectively, the “Feeder Portfolios”), PLFA has retained other firms to serve as Portfolio Managers under PLFA’s supervision. Each of the Feeder Portfolios invests all of its assets in a master fund; and therefore, PLFA has not retained other portfolio managers to manage the assets of these Portfolios. The Board, including all of the Trustees who are not “interested persons,” as that term is defined in the 1940 Act (“Independent Trustees”), last renewed the Agreements at an in-person meeting of the Trustees held on December 12, 2012.
At the December 12, 2012 meeting, the Board considered information (both written and oral) provided to assist it in its review of the Agreements and made assessments with respect to each Agreement. The Board requested, received and reviewed written materials from PLFA and each Portfolio Manager that was submitted in response to requests from the Independent Trustees and supporting materials relating to those questions and responses. In addition, the Board received in-person presentations about the Portfolios throughout the year, and the Independent Trustees were advised by independent legal counsel with respect to these and other relevant matters. The Board reviewed a variety of factors and considered a significant amount of information, including information received on an ongoing basis at Board and committee meetings, including reports on Portfolio performance, expenses, fee comparisons, investment advisory, compliance, and other services provided to the Portfolios by PLFA and the Portfolio Managers. The Board also reviewed financial and profitability information regarding PLFA and the Portfolio Managers, and information regarding the organization and operations of each entity such as their compliance monitoring, portfolio trading and brokerage practices and the personnel providing investment management and administrative services to each Portfolio. The Board reviewed data provided by PLFA that was gathered from various independent providers of investment company data, to provide the Board with information concerning the Portfolios’ investment performance, management fees and expense information. Additionally, the Independent Trustees retained an independent consultant (“Independent Consultant”) to assist the Trustees with certain of their analyses and to provide other relevant information. In connection with the analysis, the Independent Consultant utilized and provided the Independent Trustees with data obtained from independent service providers as well as from other sources.
The Trustees’ determinations were made on the basis of each Trustee’s business judgment after consideration of all the information presented. In reviewing the materials presented and in considering the information in the management presentations, the Trustees did not identify any single issue or particular information that, in isolation, would be a controlling factor in making a final decision regarding the proposed Agreements. Individual Trustees may have given different weights to certain factors and assigned various degrees of materiality to information received in connection with the approval process. The following summary describes the most important, but not all, of the factors considered by the Trustees in approving the Agreements, and in the case of the Independent Trustees, certain factors were considered in light of the legal advice furnished to them by independent legal counsel and information from the Independent Consultant that they had retained. This discussion is not intended to be all-inclusive.
Annual Consideration and Approval of Investment Advisory and Portfolio Management Agreements
In evaluating the Advisory Agreement and each Portfolio Management Agreement, the Board, including all the Independent Trustees, considered the following factors, among others:
1. Nature, Extent and Quality of Services
Portfolio Oversight and Supervision – PLFA, its personnel and its resources. The Trustees considered the depth and quality of PLFA’s investment management process, including its monitoring and oversight of the Portfolio Managers and PAM; the experience, capability and integrity of its senior management and other personnel; the low turnover rates of its key personnel; and the overall financial strength and stability of its organization. The Trustees considered the high quality of the products and services provided by PLFA and its affiliates, such as the many educational services and tools offered to assist intermediaries in effectively understanding and meeting shareholder and/or contract holder needs. The Trustees also noted that PLFA regularly informs the Trustees about matters relevant to the Trust, its shareholders and investing.
The Trustees also considered that the investment, legal, compliance and accounting professionals of PLFA and its affiliates have access to and utilize a variety of resources and systems relating to investment management, compliance, trading, performance analysis, security valuation and portfolio accounting. The Trustees further considered PLFA’s continuing need to attract and retain qualified personnel and to maintain and enhance its resources and systems to provide appropriate investment management, compliance and monitoring services for the Portfolios. The Board noted that PLFA monitors numerous investment, performance and compliance metrics for the Portfolios.
The Trustees considered PLFA’s continued development and use of analytical tools for assessing Portfolio performance and the performance of the Portfolio Managers, conducting an attribution analysis on performance and reporting on performance to the Trustees. The Trustees noted that PLFA uses these tools to identify Portfolios that are underperforming applicable benchmarks or peer groups, and then conducts various analyses to try to assess the sources of and reasons for underperformance. The Trustees noted that PLFA has developed processes to oversee and monitor the performance of Portfolio Managers, including the use of analytical methods to review Portfolio performance and execution of investment strategies. The Board noted that PLFA provides the Board with analysis of this data over rolling periods to assist the Board in identifying trends in Portfolio performance and other areas, and periodically provides the Trustees with information on economic and market
F-5
PACIFIC SELECT FUND
APPROVAL OF INVESTMENT ADVISORY AGREEMENT AND PORTFOLIO MANAGEMENT AGREEMENTS (Continued)
(Unaudited)
trends to provide a context for assessing recent performance. The Board also noted that PLFA conducts periodic due diligence on Portfolio Managers involving onsite visits, in-person meetings and telephonic meetings to gather information that PLFA uses to gain an in-depth understanding of a Portfolio Manager’s investment process and to seek to identify issues that may be relevant to a Portfolio Manager’s services to a Portfolio or a Portfolio’s performance, including, but not limited to, the financial strength of a Portfolio Manager, significant staffing changes that could affect a Portfolio, material changes in a Portfolio Manager’s assets under management, compliance and regulatory concerns, best execution review and portfolio security valuation support. The Trustees also noted that PLFA appeared to have implemented effective methods for monitoring investment style consistency by Portfolio Managers and for analyzing the use of derivatives by Portfolio Managers. With respect to the PAM Managed Portfolios, the Board considered that PLFA provided oversight, diligence and reporting with regard to its PAM unit that is similar to the process it employs with regard to the Portfolio Managers. The Board also considered that PLFA manages directly the Asset Allocation Portfolios.
The Trustees considered the time and attention paid by PLFA to matters involving the valuation of Fund securities, including researching and evaluating information concerning securities that are not actively or publicly traded, valuing securities subject to a trading halt, the value of equity securities traded on foreign exchanges, oversight of and due diligence on pricing vendors and the development of alternate valuation methodologies. The Trustees also considered PLFA’s oversight of transition management when overseeing significant changes in the Portfolios, such as cash movements between the Portfolios arising from reallocations by funds of funds and the transition from one Portfolio Manager to another, including steps taken by PLFA to reduce transaction costs associated with a Portfolio transition.
The Trustees considered PLFA’s policies, procedures and systems to ensure compliance with applicable laws and regulations with respect to the Directly Managed Portfolios, its compliance monitoring of the Portfolio Managers and its commitment to those programs; PLFA’s efforts to keep the Trustees informed about the Portfolio Managers; and its attention to matters that may involve conflicts of interest with each Portfolio. In this regard, the Trustees reviewed information throughout the year on PLFA’s compliance policies and procedures, its compliance history, and reports from the Trust’s Chief Compliance Officer (“CCO”) on compliance by PLFA, the Portfolio Managers, and the Portfolios with applicable laws and regulations. The Trustees also reviewed information on any responses by PLFA to regulatory and compliance developments throughout the year. The Trustees further considered the monitoring and additional services provided by PLFA to the Portfolios, including risk management analysis, preparation of periodic performance and financial reports, review of trade execution and coordination of other service providers to the Trust.
The Trustees noted that the Portfolios are used as the investment options for variable products of Pacific Life and Pacific Life & Annuity Company (“PL&A”), and they believe the Portfolios provide a broad range of investment options for contract holders of Pacific Life and PL&A, including investment options that provide exposure to major asset classes such as equity and debt, and many different investment styles within those asset classes, and target risk funds that also provide investors with asset allocation for different profiles. The Trustees further noted that the offering of the Portfolios as investment options assisted in distinguishing these variable products in the marketplace. The Trustees considered that they had received reports concerning the positioning of these variable products in the marketplace.
Portfolio Management – PLFA and the Portfolio Managers. The Trustees considered various materials relating to PLFA, including PAM, and the Portfolio Managers, including copies of each existing Advisory Agreement and Portfolio Management Agreement; copies of the Form ADV for PLFA and each Portfolio Manager; financial information relating to PLFA and each Portfolio Manager; and other information deemed relevant to the Trustees’ evaluation of PLFA and each Portfolio Manager, including qualitative assessments from senior management of PLFA.
The Trustees considered the benefits to shareholders of retaining PLFA and each Portfolio Manager and continuing the Advisory Agreement and Portfolio Management Agreements particularly in light of the nature, extent, and quality of the services that have been provided by PLFA and the Portfolio Managers. The Trustees noted the portfolio management services that have been provided by PLFA or PAM to the Directly Managed Portfolios and the portfolio management services that have been provided by the Portfolio Managers to the other Portfolios. The Trustees considered the quality of the portfolio management services which have benefited and should continue to benefit the Portfolios and their shareholders, the organizational depth and resources of PLFA and the Portfolio Managers, including the background and experience of PLFA and each of the Portfolio Manager’s management, and the expertise of PLFA, its PAM unit, and each Portfolio Manager’s portfolio management team, as well as the investment methodology used by PLFA, its PAM unit, and the Portfolio Manager.
The Trustees further noted the compliance monitoring conducted by PLFA and PAM on an ongoing basis and also noted the development of procedures and systems necessary to maintain compliance with applicable laws and regulations as well as the resources that PLFA dedicates to these programs. The Trustees considered that the CCO had in place a systematic process for periodically reviewing PLFA’s and each Portfolio Manager’s written compliance policies and procedures, including the assessment of PLFA’s and each Portfolio Manager’s compliance program as required under Rule 38a-1 of the 1940 Act and PLFA’s and each Portfolio Manager’s code of ethics. The Trustees also considered that PLFA and each Portfolio Manager continues to cooperate with the CCO in reviewing its compliance operations.
In making their assessments, the Trustees considered that PLFA has historically exercised diligence in monitoring the performance of the Portfolio Managers and PAM, and has recommended and taken measures to attempt to remedy relative underperformance by a Portfolio when PLFA and the Trustees believed it to be appropriate.
The Board concluded that it was satisfied with the nature, extent and quality of the investment management services provided by PLFA and the Portfolio Managers.
2. Investment Results
The Trustees considered the investment results of each Portfolio in light of its objective and market conditions over the past year. The Trustees compared each Portfolio’s total returns with both the total returns of appropriate peer funds, based on information provided by PLFA using data from independent sources, and with one or more relevant benchmark indices. The Independent Trustees also considered information provided by an Independent Consultant who provided a presentation and analysis to the Trustees regarding peer group performance utilizing
F-6
PACIFIC SELECT FUND
APPROVAL OF INVESTMENT ADVISORY AGREEMENT AND PORTFOLIO MANAGEMENT AGREEMENTS (Continued)
(Unaudited)
data from independent sources. The information provided to the Trustees included each Portfolio’s performance record for the prior ten calendar years, as applicable, and three-month, year-to-date, one-, three-, five- and ten-year or since inception periods, as applicable. In reviewing the performance data drawn from independent sources, as well as the performance of the respective benchmark indices, the Trustees took into consideration the goals and objectives of each Portfolio and noted that some Portfolios had outperformed their peer groups over certain periods and/or exceeded their respective benchmark indices while others underperformed their peer groups over certain periods and/or trailed their respective benchmark indices. The Trustees discussed with PLFA the fact that certain periods of underperformance may be transitory while other periods of underperformance may be reflective of broader issues which may warrant consideration of corrective action. The Trustees discussed these Portfolios with representatives of PLFA, including an assessment of the approach used by the Portfolio Managers as well as oversight and monitoring by PLFA as the investment adviser, to gain an understanding of underperformance and to assess whether any actions would be appropriate.
The Trustees also reviewed the monitoring of the Portfolio Managers’ investment results by PLFA, including PLFA’s historical practice of recommending to the Trustees the use of a new manager if performance lagged and could not be improved within a reasonable timeframe, and reviewed the monitoring of the PAM unit’s investment results by PLFA. Generally, the Trustees noted that there continues to be a strong record of well-managed Portfolios that work well in the Asset Allocation Portfolios and that the Asset Allocation Portfolios provide a range of professionally managed asset allocation investment options. The Trustees also noted that the Portfolios continue to deliver the investment style as disclosed to shareholders. The Trustees also noted the use by investors of the Asset Allocation Portfolios and the benefits the Asset Allocation Portfolios provide for shareholders generally.
The Board concluded that PLFA continues to have a strong record of effectively managing a multi-manager fund group and asset allocation funds designed to give shareholders a reasonable array of choices through which to implement their investment programs. The Board further concluded that PLFA was implementing each Portfolio’s investment objective either directly or through the selection of Portfolio Managers and that PLFA’s record in managing each Portfolio indicates that its continued management as well as the continuation of the respective Portfolio Management Agreements will benefit each Portfolio and its shareholders.
3. Advisory Fees and Total Expense Ratios
The Trustees requested, received and reviewed information from PLFA relating to the advisory fees and the sub-advisory fees, including the portion of the advisory fees paid to each Portfolio Manager as compared to the portion retained by PLFA, and operating expense ratios for each of the Portfolios. The Independent Trustees also requested and reviewed information from the Independent Consultant along with their analysis of advisory fees, sub-advisory fees and certain other expenses. The Trustees reviewed the advisory fees, sub-advisory fees and operating expense ratios of each Portfolio and compared such amounts with the average fee and expense levels of other funds in applicable peer fund groups. During their review, the Trustees noted that all of the Portfolios were subject to contractual expense limitations agreed to by PLFA. The Trustees also reviewed written materials prepared by PLFA based on peer fund group information retrieved from the independent sources. The Independent Trustees requested and reviewed an analysis provided by the Independent Consultant of the asset-based breakpoint schedule for the Portfolios. The Independent Trustees noted that the breakpoints offer meaningful potential savings to shareholders of many of the Portfolios.
The Trustees also considered information from the Portfolio Managers regarding the comparative sub-advisory fees charged under other investment advisory contracts for similarly managed accounts, such as contracts of each Portfolio Manager with other similarly managed registered investment companies or other types of clients. The Trustees noted that in many cases there were differences in the level of services provided to the Portfolios by the Portfolio Managers and that the level of services provided by these Portfolio Managers on these other accounts were due to the different nature of the accounts or because there were other reasons to support the difference in fees, such as an affiliation between the Portfolio Manager and the account. These differences often explained variations in fee schedules. The Trustees were mindful that, with regard to the sub-advised Portfolios, the fee rates were the result of arms’-length negotiations between PLFA and the Portfolio Managers, and that any sub-advisory fees are paid by PLFA and are not paid directly by a Portfolio. The Trustees observed that certain of the Portfolios’ contractual advisory fees were higher than the average of their respective Morningstar category while others were either lower or approximately equal to these averages.
The Board concluded that the advisory fees, sub-advisory fees and total expenses of each Portfolio were fair and reasonable.
4. Costs, Level of Profits and Economies of Scale
The Trustees reviewed information provided by PLFA and the Portfolio Managers regarding PLFA’s costs of sponsoring the Portfolios and information regarding the profitability of PLFA and the Portfolio Managers.
PLFA and the Portfolio Managers’ Costs and Profitability. The Trustees noted that, based on the data available, PLFA appears to be providing products that are competitively priced with other funds, especially multi-manager and asset allocation funds and funds that support variable annuity and variable life insurance products. The Trustees noted PLFA’s willingness to sponsor new funds that PLFA believed would improve the menu of offerings for contract owners or that would benefit the Asset Allocation Portfolios, despite the potential subsidies required by PLFA during a new fund’s start-up phase. Based on information received, the Trustees further noted that Pacific Life’s overall profitability on variable annuity and variable life insurance products, which are supported by the Trust, appeared reasonable at the current time. The Trustees also noted that analysis of the Trust’s profitability to PLFA supported a conclusion that PLFA’s costs and profitability are reasonable, whether considered inclusive or exclusive of distribution costs.
The Trustees also reviewed information provided regarding the structure and manner in which PLFA’s and the Portfolio Managers’ investment professionals were compensated and their respective views of the relationship of such compensation to the attraction and retention of quality personnel. The Trustees considered PLFA’s willingness to invest in technology, infrastructure and staff to reinforce and offer new services and to accommodate changing regulatory requirements.
F-7
PACIFIC SELECT FUND
APPROVAL OF INVESTMENT ADVISORY AGREEMENT AND PORTFOLIO MANAGEMENT AGREEMENTS (Continued)
(Unaudited)
With respect to the Portfolio Managers, the Trustees noted that it was difficult in many cases to accurately determine or evaluate the profitability of the Portfolio Management Agreements to the Portfolio Managers because of, among other things, the differences in the types of information provided by the Portfolio Managers, the fact that many Portfolio Managers manage substantial assets other than the Portfolios and, further, that any such assessment would involve assumptions regarding the Portfolio Managers’ expense allocation policies, capital structure, cost of capital, business mix and other factors.
Accordingly, in the case of the Portfolio Managers, the Trustees focused their consideration on the data described above in light of the arms’-length nature of the relationship (for the Portfolios that are sub-advised) between PLFA and such Portfolio Managers with respect to the negotiation of portfolio sub-advisory fees and the fact that such fees are paid by PLFA.
Economies of Scale. The Trustees considered information relating to economies of scale provided by PLFA and the Independent Consultant, and PLFA’s general willingness to discuss and evaluate the topic of economies of scale with the Trustees.
The Trustees considered that the advisory fee schedules contained breakpoints reducing the rate of the advisory fee as Portfolio assets grow for all Portfolios except the Asset Allocation Portfolios. The Independent Trustees agreed that the breakpoints appear to be providing for shared economies of scale and potential future economies of scale as the asset levels of a Portfolio increase. The Independent Trustees noted that the Asset Allocation Portfolios are funds-of-funds that invest in other Portfolios that have advisory fee schedules containing breakpoints that reduce the total advisory fees paid by shareholders of the Asset Allocation Portfolios as assets grow. The Trustees also considered PLFA’s willingness to reduce its own fees through certain advisory fee waivers and expense limitation agreements, whereby PLFA will reimburse the Portfolios for certain expenses that exceed stated expense caps.
The Trustees noted that PLFA and its affiliates had consistently reinvested in the business in the form of improvements in technology, product innovations, personnel and resources. The Trustees further noted that Pacific Life and PL&A had also consistently reinvested in the business with respect to the variable products to which the Fund serves as the underlying investment vehicle.
The Trustees additionally noted that economies of scale were difficult to measure with precision particularly on a Portfolio by Portfolio basis. This analysis was complicated by the additional services and content provided by PLFA and its affiliates through reinvestment in the ability to provide and expand those services through, for example, continuing investments in technology and shareholder services, as discussed above. The Trustees considered that the Portfolios are well managed, and provide shareholders with a wide choice of premier Portfolio Managers and sophisticated asset allocation investment options at reasonable fee levels. The Board noted that PLFA had taken steps to ensure that shareholders benefit by negotiating favorable terms with service providers, and to provide certain support services to the Portfolios on an approximate cost basis as opposed to an asset-based charge.
The Board determined that PLFA and its affiliates are sharing economies of scale given its commitment to competitive total expenses of the Portfolios, and the consistent reinvestment in the business in the form of improvements in technology and other resources and investments in personnel. The Board concluded that the Portfolios’ cost structures were reasonable and that overall profitability appeared reasonable at the current time. The Board further concluded that PLFA was sharing economies of scale with each Portfolio and its shareholders to their benefit.
5. Ancillary Benefits
The Trustees requested and received from PLFA and the Portfolio Managers information concerning other benefits received by PLFA, the Portfolio Managers, and their affiliates as a result of their respective relationship with the Portfolios, including various service arrangements with PLFA affiliates and reimbursement at an approximate cost basis for support services in the case of PLFA, as well as commissions paid to broker-dealers affiliated with certain Portfolio Managers and the use of soft-dollars by certain of the Portfolio Managers. The Trustees also considered information concerning other significant economic relations between the Portfolio Managers and their affiliates and with PLFA and its affiliates and noted PLFA’s processes and procedures to identify and disclose such relationships to the Board. The Trustees also considered information provided to them as to how conflicts of interest that may arise from these relationships are managed.
The Board concluded that such benefits were consistent with those generally derived by investment advisers to mutual funds or were otherwise not unusual.
6. Conclusion
Based on their review, including their consideration of each of the factors referred to above, and assisted by the advice of the Independent Consultant and independent counsel to the Independent Trustees, the Board, including the Independent Trustees, concluded that the Advisory Agreement and each applicable Portfolio Management Agreement are fair and reasonable with respect to each Portfolio and its shareholders, and that the renewal of the Advisory Agreement and each applicable Portfolio Management Agreement would be in the best interests of the Portfolios and their shareholders. The Board did not indicate that any single factor was determinative of its decision to approve the Advisory Agreement and each applicable Portfolio Management Agreement, but indicated that the Board based its determination on the total mix of information available to it.
F-8
PACIFIC SELECT FUND
WHERE TO GO FOR MORE INFORMATION
(Unaudited)
Availability of Quarterly Holdings
The Fund files Form N-Q (complete schedules of portfolio holdings) with the Securities and Exchange Commission (the “SEC”) for the first and third quarters of each fiscal year not later than 60 days after the close of the applicable quarter end. The Fund’s Form N-Q, (when required) is filed pursuant to applicable regulations and is available after filing (i) on the SEC’s Web site at http://www.sec.gov; (ii) for review and copying at the SEC’s Public Reference Room in Washington, D.C. (Information on the operation of the Public Reference Room may be obtained by calling the SEC at 1-800-SEC-0330); and (iii) on the Fund’s Webpage at http://www.PacificLife.com. The SEC may charge you a fee for this information.
Availability of Proxy Voting Record
By August 31 of each year, the Fund files information regarding how the Fund’s managers voted proxies relating to portfolio securities during the most recent twelve-month period ended June 30. Such information is available after filing on the Fund’s Website and on the SEC’s Website noted below.
Information Relating to Investments Held by the Fund
For complete descriptions of the various securities and other instruments held by the Fund and their risks, please see the Fund’s prospectus and Statement of Additional Information (“SAI”). For a description of bond ratings, see the Fund’s SAI. The prospectus and SAI are available as noted below.
Availability of Proxy Voting Policies
A description of the Proxy Voting Policies and Procedures that the Fund uses to determine how to vote proxies relating to portfolio securities is described in the Fund’s SAI.
How to obtain Information
The Fund’s prospectus, SAI (including Proxy Voting Policies), annual and semi-annual reports, and complete schedules of investments are available:
| | • | | On the Fund’s website at http://www.PacificLife.com |
| | • | | On the SEC’s website at http://www.sec.gov |
| | • | | Upon request, without charge by calling the applicable toll-free numbers below: |
Pacific Life’s Annuity Contract Owners: 1-800-722-4448
Pacific Life’s Annuity Registered Representative: 1-800-722-2333
Pacific Life Insurance Policy Owners: 1-800-800-7681
PL&A’s Annuity Contract Owners: 1-800-748-6907
PL&A’s Life Insurance Policy Owners: 1-888-595-6997
7 a.m. through 5 p.m. Pacific Time
F-9
| | |
Form Nos.: 15-31114-02 4732-13A |
Item 2. Code of Ethics.
As of the end of the period covered by this report, the Registrant has adopted a code of ethics that applies to the Registrant’s principal executive officer, principal financial officer, principal accounting officer or controller, or persons performing similar functions. There were no substantive amendments or waivers to the Code of Ethics during the period covered by this report.
A copy of this code of ethics is filed as Exhibit 99 to this Form N-CSR.
Item 3. Audit Committee Financial Expert.
The Registrant’s Board has determined that G. Thomas Willis, a member of the Registrant’s Audit Committee, is an “audit committee financial expert” and “independent,” as such terms are defined in this Item. This designation does not increase the designee’s duties, obligations or liability as compared to his duties, obligations and liability as a member of the Audit Committee and of the Board; nor does it reduce the responsibility of the other Audit Committee members. There may be other individuals who, through education or experience, would qualify as “audit committee financial experts” if the Board had designated them as such. Most importantly, the board believes each member of the Audit Committee contributes significantly to the effective oversight of the Registrant’s financial statements and condition. Mr. Willis is a retired partner of PricewaterhouseCoopers LLP.
Item 4. Principal Accountant Fees and Services.
| | (a) | Audit Fees. The aggregate audit fees billed to the Registrant by the principal accountant for the fiscal years ended December 31, 2012 and 2011 were $1,350,000 and $1,134,000 respectively. |
| | (b) | Audit-Related Fees. For the fiscal years ended December 31, 2012 and December 31, 2011 there were no audit-related fees. |
| | (c) | Tax Fees. There were no fees billed to the Registrant for professional services for tax compliance, tax advice or tax planning for the fiscal years ended December 31, 2012 and 2011. |
| | (d) | All Other Fees. There were no other fees billed to the Registrant by the principal accountant for the fiscal years ending December 31, 2012 and 2011. |
| | (e)(1) | The Audit Committee is required to pre-approve audit and non-audit services performed for the Registrant by the independent auditor as outlined below in order to assure that the provision of such services does not impair the auditor’s independence: |
Pre-Approval Requirements for Services to Registrant. Before the Auditor is engaged by the Registrant to render audit related or permissible non-audit services, either: (i) The Audit Committee shall pre-approve such engagement; or (ii) Such engagement shall be entered into pursuant to pre-approval policies and procedures established by the Audit committee. Any such policies and procedures must (1) be detailed as to the particular service and (2) not involve any delegation of the Audit Committee’s responsibilities to the Adviser. The Audit Committee may delegate to one or more of its members the authority to grant pre-approvals. The pre-approval policies and procedures shall include the requirement that the decisions of any member to whom authority is delegated pursuant to the Audit Committee Charter shall be presented to the full Audit Committee at its next scheduled meeting. (iii) De Minimis Exceptions to Pre-Approval Requirements. Pre-approval for a service provided to the Registrant other than audit, review or attest services is not required if: (1) the aggregate amount of all such non-audit services provided to the Registrant constitutes not more than 5 percent of the total amount of revenues paid by the Registrant to the Auditor during the fiscal year in which the non-audit services are provided; (2) such services were not recognized by the Registrant at the time of the engagement to be non-audit services; and (3) such services are promptly brought to the attention of the Audit Committee and are approved by the Audit Committee or by one or more members of the Audit Committee to whom authority to grant such approvals has been delegated by the Audit Committee.
Pre-Approval of Non-Audit Services Provided to the Adviser and Others. The Audit Committee shall pre-approve any non-audit services proposed to be provided by the Auditor to (i) the Adviser and (ii) any entity in the investment company complex, if the nature of the services provided relate directly
to the operations or financial reporting of the Registrant. Pursuant to the Audit Committee Charter, “Investment company complex” means the Registrant and its portfolios, the Pacific Life Funds, the Adviser and any entity controlled by or under common control with the Adviser if such entity is an investment adviser or is engaged in the business of providing administrative, custodian, underwriting or transfer agent services to the Trusts or the Adviser. Application of De Minimis Exception: The De Minimis exceptions set forth above also apply to pre-approvals under this section of the Audit Committee Charter, except that the “total amount of revenues” calculation for the services pursuant to the Audit Committee Charter is based on the total amount of revenues paid to the Auditor by the Registrant and any other entity that has its services approved under this section of the Audit Committee Charter (i.e., the Adviser or any control person).
| | (e)(2) | No services included in (b)-(d) above were approved pursuant to paragraph (c)(7)(i)(C) of Rule 2-01 of Regulation S-X. |
| | (g) | The aggregate fees billed for the years ended December 31, 2012 and 2011 by the Registrant’s principal accountant for non-audit services rendered to the Registrant, its investment adviser, and any entity controlling, controlled by, or under common control with the investment adviser that provides ongoing services to the Registrant were $170,394 and $120,300, respectively. |
| | (h) | The Registrant’s Audit Committee has considered whether the provision of non-audit services that were rendered to the Registrant’s investment adviser, and any entity controlling, controlled by, or under common control with the investment adviser that provides ongoing services to the Registrant which were not pre-approved (not requiring pre-approval) is compatible with maintaining the principal accountant’s independence. |
Item 5. Audit Committee of Listed Registrants—not applicable.
Item 6. Investments.
PACIFIC SELECT FUND
EQUITY INDEX PORTFOLIO
Schedule of Investments
December 31, 2012
| | | | | | | | |
| | | Shares | | | Value | |
COMMON STOCKS - 98.3% | |
|
Consumer Discretionary - 11.3% | |
| | |
Abercrombie & Fitch Co ‘A’ | | | 12,274 | | | | $588,784 | |
Amazon.com Inc * | | | 55,560 | | | | 13,953,338 | |
Apollo Group Inc ‘A’ * | | | 15,380 | | | | 321,750 | |
AutoNation Inc * | | | 6,064 | | | | 240,741 | |
AutoZone Inc * | | | 5,673 | | | | 2,010,681 | |
Bed Bath & Beyond Inc * | | | 35,204 | | | | 1,968,256 | |
Best Buy Co Inc | | | 41,251 | | | | 488,824 | |
Big Lots Inc * | | | 9,000 | | | | 256,140 | |
BorgWarner Inc * | | | 17,916 | | | | 1,283,144 | |
Cablevision Systems Corp ‘A’ | | | 32,908 | | | | 491,646 | |
CarMax Inc * | | | 35,026 | | | | 1,314,876 | |
Carnival Corp (Panama) | | | 68,418 | | | | 2,515,730 | |
CBS Corp ‘B’ | | | 90,710 | | | | 3,451,516 | |
Chipotle Mexican Grill Inc * | | | 4,841 | | | | 1,440,004 | |
Coach Inc | | | 43,592 | | | | 2,419,792 | |
Comcast Corp ‘A’ | | | 407,573 | | | | 15,235,079 | |
D.R. Horton Inc | | | 42,713 | | | | 844,863 | |
Darden Restaurants Inc | | | 19,691 | | | | 887,473 | |
Delphi Automotive PLC * (United Kingdom) | | | 45,227 | | | | 1,729,933 | |
DIRECTV * | | | 92,710 | | | | 4,650,334 | |
Discovery Communications Inc ‘A’ * | | | 36,683 | | | | 2,328,637 | |
Dollar General Corp * | | | 40,348 | | | | 1,778,943 | |
Dollar Tree Inc * | | | 34,929 | | | | 1,416,720 | |
Expedia Inc | | | 14,296 | | | | 878,489 | |
Family Dollar Stores Inc | | | 14,742 | | | | 934,790 | |
Ford Motor Co | | | 584,474 | | | | 7,568,938 | |
Fossil Inc * | | | 8,304 | | | | 773,102 | |
GameStop Corp ‘A’ | | | 18,709 | | | | 469,409 | |
Gannett Co Inc | | | 35,377 | | | | 637,140 | |
Garmin Ltd (Switzerland) | | | 16,686 | | | | 681,123 | |
Genuine Parts Co | | | 23,775 | | | | 1,511,615 | |
H&R Block Inc | | | 41,460 | | | | 769,912 | |
Harley-Davidson Inc | | | 34,767 | | | | 1,698,020 | |
Harman International Industries Inc | | | 10,482 | | | | 467,916 | |
Hasbro Inc | | | 17,632 | | | | 632,989 | |
International Game Technology | | | 40,734 | | | | 577,201 | |
J.C. Penney Co Inc | | | 22,131 | | | | 436,202 | |
Johnson Controls Inc | | | 104,786 | | | | 3,216,930 | |
Kohl’s Corp | | | 32,527 | | | | 1,398,010 | |
Leggett & Platt Inc | | | 21,663 | | | | 589,667 | |
Lennar Corp ‘A’ | | | 25,119 | | | | 971,352 | |
Limited Brands Inc | | | 36,659 | | | | 1,725,173 | |
Lowe’s Cos Inc | | | 172,564 | | | | 6,129,473 | |
Macy’s Inc | | | 60,704 | | | | 2,368,670 | |
Marriott International Inc ‘A’ | | | 37,836 | | | | 1,410,148 | |
Mattel Inc | | | 52,561 | | | | 1,924,784 | |
McDonald’s Corp | | | 153,995 | | | | 13,583,899 | |
Netflix Inc * | | | 8,519 | | | | 790,393 | |
Newell Rubbermaid Inc | | | 44,090 | | | | 981,884 | |
News Corp ‘A’ | | | 309,330 | | | | 7,900,288 | |
Nike Inc ‘B’ | | | 111,998 | | | | 5,779,097 | |
Nordstrom Inc | | | 23,364 | | | | 1,249,974 | |
O’Reilly Automotive Inc * | | | 17,615 | | | | 1,575,133 | |
Omnicom Group Inc | | | 40,625 | | | | 2,029,625 | |
PetSmart Inc | | | 16,538 | | | | 1,130,207 | |
priceline.com Inc * | | | 7,644 | | | | 4,748,453 | |
PulteGroup Inc * | | | 52,015 | | | | 944,592 | |
Ralph Lauren Corp | | | 9,385 | | | | 1,406,999 | |
Ross Stores Inc | | | 34,132 | | | | 1,848,248 | |
Scripps Networks Interactive Inc ‘A’ | | | 13,303 | | | | 770,510 | |
Staples Inc | | | 103,626 | | | | 1,181,336 | |
Starbucks Corp | | | 114,093 | | | | 6,117,667 | |
Starwood Hotels & Resorts Worldwide Inc | | | 30,023 | | | | 1,722,119 | |
Target Corp | | | 99,853 | | | | 5,908,302 | |
The Gap Inc | | | 45,606 | | | | 1,415,610 | |
The Goodyear Tire & Rubber Co * | | | 37,354 | | | | 515,859 | |
| | | | | | | | |
| | | Shares | | | Value | |
The Home Depot Inc | | | 229,336 | | | | $14,184,432 | |
The Interpublic Group of Cos Inc | | | 66,247 | | | | 730,042 | |
The McGraw-Hill Cos Inc | | | 42,648 | | | | 2,331,566 | |
The TJX Cos Inc | | | 111,909 | | | | 4,750,537 | |
The Walt Disney Co | | | 271,818 | | | | 13,533,818 | |
The Washington Post Co ‘B’ | | | 700 | | | | 255,647 | |
Tiffany & Co | | | 18,207 | | | | 1,043,989 | |
Time Warner Cable Inc | | | 46,312 | | | | 4,501,063 | |
Time Warner Inc | | | 145,100 | | | | 6,940,133 | |
TripAdvisor Inc * | | | 16,717 | | | | 701,445 | |
Urban Outfitters Inc * | | | 16,848 | | | | 663,137 | |
VF Corp | | | 13,500 | | | | 2,038,095 | |
Viacom Inc ‘B’ | | | 70,912 | | | | 3,739,899 | |
Whirlpool Corp | | | 11,918 | | | | 1,212,657 | |
Wyndham Worldwide Corp | | | 21,576 | | | | 1,148,059 | |
Wynn Resorts Ltd | | | 12,176 | | | | 1,369,678 | |
Yum! Brands Inc | | | 69,335 | | | | 4,603,844 | |
| | | | | | | | |
| | | | 224,736,493 | |
| | | | | | | | |
Consumer Staples - 10.4% | |
| | |
Altria Group Inc | | | 310,650 | | | | 9,760,623 | |
Archer-Daniels-Midland Co | | | 100,912 | | | | 2,763,980 | |
Avon Products Inc | | | 65,985 | | | | 947,545 | |
Beam Inc | | | 24,364 | | | | 1,488,397 | |
Brown-Forman Corp ‘B’ | | | 23,219 | | | | 1,468,602 | |
Campbell Soup Co | | | 27,503 | | | | 959,580 | |
Coca-Cola Enterprises Inc | | | 41,487 | | | | 1,316,382 | |
Colgate-Palmolive Co | | | 68,124 | | | | 7,121,683 | |
ConAgra Foods Inc | | | 62,552 | | | | 1,845,284 | |
Constellation Brands Inc ‘A’ * | | | 23,163 | | | | 819,739 | |
Costco Wholesale Corp | | | 66,289 | | | | 6,547,364 | |
CVS Caremark Corp | | | 191,247 | | | | 9,246,792 | |
Dean Foods Co * | | | 28,174 | | | | 465,153 | |
Dr Pepper Snapple Group Inc | | | 31,992 | | | | 1,413,407 | |
General Mills Inc | | | 98,991 | | | | 4,000,226 | |
H.J. Heinz Co | | | 49,135 | | | | 2,834,107 | |
Hormel Foods Corp | | | 20,658 | | | | 644,736 | |
Kellogg Co | | | 37,886 | | | | 2,115,933 | |
Kimberly-Clark Corp | | | 60,044 | | | | 5,069,515 | |
Kraft Foods Group Inc | | | 90,797 | | | | 4,128,540 | |
Lorillard Inc | | | 19,880 | | | | 2,319,400 | |
McCormick & Co Inc | | | 20,261 | | | | 1,287,181 | |
Mead Johnson Nutrition Co | | | 31,145 | | | | 2,052,144 | |
Molson Coors Brewing Co ‘B’ | | | 23,854 | | | | 1,020,713 | |
Mondelez International Inc ‘A’ | | | 272,427 | | | | 6,938,716 | |
Monster Beverage Corp * | | | 22,928 | | | | 1,212,433 | |
PepsiCo Inc | | | 237,254 | | | | 16,235,291 | |
Philip Morris International Inc | | | 256,214 | | | | 21,429,739 | |
Reynolds American Inc | | | 49,796 | | | | 2,063,048 | |
Safeway Inc | | | 36,534 | | | | 660,900 | |
Sysco Corp | | | 90,070 | | | | 2,851,616 | |
The Clorox Co | | | 19,978 | | | | 1,462,789 | |
The Coca-Cola Co | | | 591,588 | | | | 21,445,065 | |
The Estee Lauder Cos Inc ‘A’ | | | 36,777 | | | | 2,201,471 | |
The Hershey Co | | | 22,980 | | | | 1,659,616 | |
The J.M. Smucker Co | | | 16,673 | | | | 1,437,879 | |
The Kroger Co | | | 78,921 | | | | 2,053,524 | |
The Procter & Gamble Co | | | 419,334 | | | | 28,468,585 | |
Tyson Foods Inc ‘A’ | | | 44,189 | | | | 857,267 | |
Wal-Mart Stores Inc | | | 256,541 | | | | 17,503,792 | |
Walgreen Co | | | 131,681 | | | | 4,873,514 | |
Whole Foods Market Inc | | | 26,435 | | | | 2,414,308 | |
| | | | | | | | |
| | | | 207,406,579 | |
| | | | | | | | |
Energy - 10.8% | |
| | |
Anadarko Petroleum Corp | | | 76,607 | | | | 5,692,666 | |
Apache Corp | | | 59,975 | | | | 4,708,038 | |
Baker Hughes Inc | | | 67,366 | | | | 2,751,227 | |
Cabot Oil & Gas Corp | | | 32,183 | | | | 1,600,782 | |
Cameron International Corp * | | | 37,795 | | | | 2,133,906 | |
| | |
| See Notes to Financial Statements | | See explanation of symbols and terms, if any, on page B-143 |
1
PACIFIC SELECT FUND
EQUITY INDEX PORTFOLIO
Schedule of Investments (Continued)
December 31, 2012
| | | | | | | | |
| | | Shares | | | Value | |
Chesapeake Energy Corp | | | 79,382 | | | | $1,319,329 | |
Chevron Corp | | | 300,091 | | | | 32,451,841 | |
ConocoPhillips | | | 186,110 | | | | 10,792,519 | |
CONSOL Energy Inc | | | 34,912 | | | | 1,120,675 | |
Denbury Resources Inc * | | | 59,430 | | | | 962,766 | |
Devon Energy Corp | | | 57,718 | | | | 3,003,645 | |
Diamond Offshore Drilling Inc | | | 10,609 | | | | 720,988 | |
Ensco PLC ‘A’ (United Kingdom) | | | 35,584 | | | | 2,109,420 | |
EOG Resources Inc | | | 41,521 | | | | 5,015,322 | |
EQT Corp | | | 22,941 | | | | 1,353,060 | |
Exxon Mobil Corp | | | 699,197 | | | | 60,515,500 | |
FMC Technologies Inc * | | | 36,427 | | | | 1,560,168 | |
Halliburton Co | | | 142,241 | | | | 4,934,340 | |
Helmerich & Payne Inc | | | 16,227 | | | | 908,874 | |
Hess Corp | | | 45,538 | | | | 2,411,692 | |
Kinder Morgan Inc | | | 96,914 | | | | 3,423,972 | |
Marathon Oil Corp | | | 108,258 | | | | 3,319,190 | |
Marathon Petroleum Corp | | | 51,978 | | | | 3,274,614 | |
Murphy Oil Corp | | | 28,308 | | | | 1,685,741 | |
Nabors Industries Ltd * (Bermuda) | | | 44,314 | | | | 640,337 | |
National Oilwell Varco Inc | | | 65,433 | | | | 4,472,346 | |
Newfield Exploration Co * | | | 20,599 | | | | 551,641 | |
Noble Corp (Switzerland) | | | 38,734 | | | | 1,348,718 | |
Noble Energy Inc | | | 27,258 | | | | 2,773,229 | |
Occidental Petroleum Corp | | | 124,211 | | | | 9,515,805 | |
Peabody Energy Corp | | | 41,143 | | | | 1,094,815 | |
Phillips 66 | | | 95,948 | | | | 5,094,839 | |
Pioneer Natural Resources Co | | | 18,877 | | | | 2,012,099 | |
QEP Resources Inc | | | 27,305 | | | | 826,522 | |
Range Resources Corp | | | 24,908 | | | | 1,564,970 | |
Rowan Cos PLC ‘A’ * (United Kingdom) | | | 18,952 | | | | 592,629 | |
Schlumberger Ltd (Netherlands) | | | 203,547 | | | | 14,103,772 | |
Southwestern Energy Co * | | | 53,521 | | | | 1,788,137 | |
Spectra Energy Corp | | | 102,023 | | | | 2,793,390 | |
Tesoro Corp | | | 21,486 | | | | 946,458 | |
The Williams Cos Inc | | | 103,263 | | | | 3,380,831 | |
Valero Energy Corp | | | 84,820 | | | | 2,894,058 | |
WPX Energy Inc * | | | 30,542 | | | | 454,465 | |
| | | | | | | | |
| | | | 214,619,336 | |
| | | | | | | | |
Financials - 15.3% | |
| | |
ACE Ltd (Switzerland) | | | 52,082 | | | | 4,156,144 | |
Aflac Inc | | | 71,866 | | | | 3,817,522 | |
American Express Co | | | 149,357 | | | | 8,585,040 | |
American International Group Inc * | | | 226,324 | | | | 7,989,237 | |
American Tower Corp REIT | | | 60,598 | | | | 4,682,407 | |
Ameriprise Financial Inc | | | 31,617 | | | | 1,980,173 | |
Aon PLC (United Kingdom) | | | 48,928 | | | | 2,720,397 | |
Apartment Investment & Management Co ‘A’ REIT | | | 22,202 | | | | 600,786 | |
Assurant Inc | | | 12,168 | | | | 422,230 | |
AvalonBay Communities Inc REIT | | | 17,524 | | | | 2,376,079 | |
Bank of America Corp | | | 1,652,585 | | | | 19,169,986 | |
BB&T Corp | | | 107,215 | | | | 3,121,029 | |
Berkshire Hathaway Inc ‘B’ * | | | 279,751 | | | | 25,093,665 | |
BlackRock Inc | | | 19,255 | | | | 3,980,201 | |
Boston Properties Inc REIT | | | 23,114 | | | | 2,445,692 | |
Capital One Financial Corp | | | 89,162 | | | | 5,165,155 | |
CBRE Group Inc ‘A’ * | | | 46,184 | | | | 919,062 | |
Cincinnati Financial Corp | | | 22,372 | | | | 876,088 | |
Citigroup Inc | | | 449,636 | | | | 17,787,600 | |
CME Group Inc ‘A’ | | | 46,993 | | | | 2,383,015 | |
Comerica Inc | | | 29,304 | | | | 889,083 | |
Discover Financial Services | | | 77,493 | | | | 2,987,355 | |
E*TRADE Financial Corp * | | | 39,103 | | | | 349,972 | |
Equity Residential REIT | | | 49,299 | | | | 2,793,774 | |
Fifth Third Bancorp | | | 137,857 | | | | 2,094,048 | |
First Horizon National Corp | | | 38,078 | | | | 377,353 | |
Franklin Resources Inc | | | 21,136 | | | | 2,656,795 | |
Genworth Financial Inc ‘A’ * | | | 75,108 | | | | 564,061 | |
| | | | | | | | |
| | | Shares | | | Value | |
HCP Inc REIT | | | 69,274 | | | | $3,129,799 | |
Health Care REIT Inc | | | 39,785 | | | | 2,438,423 | |
Host Hotels & Resorts Inc REIT | | | 111,000 | | | | 1,739,370 | |
Hudson City Bancorp Inc | | | 72,699 | | | | 591,043 | |
Huntington Bancshares Inc | | | 131,277 | | | | 838,860 | |
IntercontinentalExchange Inc * | | | 11,118 | | | | 1,376,520 | |
Invesco Ltd (Bermuda) | | | 68,034 | | | | 1,775,007 | |
JPMorgan Chase & Co | | | 582,881 | | | | 25,629,278 | |
KeyCorp | | | 143,351 | | | | 1,207,015 | |
Kimco Realty Corp REIT | | | 62,426 | | | | 1,206,070 | |
Legg Mason Inc | | | 18,108 | | | | 465,738 | |
Leucadia National Corp | | | 30,233 | | | | 719,243 | |
Lincoln National Corp | | | 42,307 | | | | 1,095,751 | |
Loews Corp | | | 47,761 | | | | 1,946,261 | |
M&T Bank Corp | | | 18,626 | | | | 1,834,102 | |
Marsh & McLennan Cos Inc | | | 83,418 | | | | 2,875,418 | |
MetLife Inc | | | 167,243 | | | | 5,508,984 | |
Moody’s Corp | | | 29,765 | | | | 1,497,775 | |
Morgan Stanley | | | 211,816 | | | | 4,049,922 | |
Northern Trust Corp | | | 33,475 | | | | 1,679,106 | |
NYSE Euronext | | | 37,408 | | | | 1,179,848 | |
People’s United Financial Inc | | | 53,776 | | | | 650,152 | |
Plum Creek Timber Co Inc REIT | | | 24,782 | | | | 1,099,577 | |
Principal Financial Group Inc | | | 42,430 | | | | 1,210,104 | |
Prologis Inc REIT | | | 70,619 | | | | 2,576,887 | |
Prudential Financial Inc | | | 71,246 | | | | 3,799,549 | |
Public Storage REIT | | | 22,095 | | | | 3,202,891 | |
Regions Financial Corp | | | 216,658 | | | | 1,542,605 | |
Simon Property Group Inc REIT | | | 47,424 | | | | 7,497,260 | |
SLM Corp | | | 71,077 | | | | 1,217,549 | |
State Street Corp | | | 71,352 | | | | 3,354,258 | |
SunTrust Banks Inc | | | 82,552 | | | | 2,340,349 | |
T. Rowe Price Group Inc | | | 39,050 | | | | 2,543,327 | |
The Allstate Corp | | | 73,964 | | | | 2,971,134 | |
The Bank of New York Mellon Corp | | | 179,336 | | | | 4,608,935 | |
The Charles Schwab Corp | | | 168,009 | | | | 2,412,609 | |
The Chubb Corp | | | 40,214 | | | | 3,028,918 | |
The Goldman Sachs Group Inc | | | 67,768 | | | | 8,644,486 | |
The Hartford Financial Services Group Inc | | | 66,811 | | | | 1,499,239 | |
The NASDAQ OMX Group Inc | | | 18,096 | | | | 452,581 | |
The PNC Financial Services Group Inc | | | 81,099 | | | | 4,728,883 | |
The Progressive Corp | | | 85,480 | | | | 1,803,628 | |
The Travelers Cos Inc | | | 58,541 | | | | 4,204,415 | |
Torchmark Corp | | | 14,624 | | | | 755,622 | |
U.S. Bancorp | | | 288,456 | | | | 9,213,285 | |
Unum Group | | | 42,355 | | | | 881,831 | |
Ventas Inc REIT | | | 45,289 | | | | 2,931,104 | |
Vornado Realty Trust REIT | | | 25,948 | | | | 2,077,916 | |
Wells Fargo & Co | | | 750,849 | | | | 25,664,019 | |
Weyerhaeuser Co REIT | | | 82,965 | | | | 2,308,086 | |
XL Group PLC (Ireland) | | | 46,237 | | | | 1,158,699 | |
Zions Bancorp | | | 28,090 | | | | 601,126 | |
| | | | | | | | |
| | | | 304,748,506 | |
| | | | | | | | |
Health Care - 11.8% | |
| | |
Abbott Laboratories | | | 242,356 | | | | 15,874,318 | |
Aetna Inc | | | 51,261 | | | | 2,373,384 | |
Agilent Technologies Inc | | | 53,380 | | | | 2,185,377 | |
Alexion Pharmaceuticals Inc * | | | 29,770 | | | | 2,792,724 | |
Allergan Inc | | | 47,136 | | | | 4,323,785 | |
AmerisourceBergen Corp | | | 36,189 | | | | 1,562,641 | |
Amgen Inc | | | 117,710 | | | | 10,160,727 | |
Baxter International Inc | | | 84,213 | | | | 5,613,639 | |
Becton Dickinson & Co | | | 30,247 | | | | 2,365,013 | |
Biogen Idec Inc * | | | 36,267 | | | | 5,319,281 | |
Boston Scientific Corp * | | | 211,150 | | | | 1,209,890 | |
Bristol-Myers Squibb Co | | | 253,234 | | | | 8,252,896 | |
C.R. Bard Inc | | | 11,774 | | | | 1,150,791 | |
Cardinal Health Inc | | | 52,132 | | | | 2,146,796 | |
CareFusion Corp * | | | 33,885 | | | | 968,433 | |
| | |
| See Notes to Financial Statements | | See explanation of symbols and terms, if any, on page B-143 |
2
PACIFIC SELECT FUND
EQUITY INDEX PORTFOLIO
Schedule of Investments (Continued)
December 31, 2012
| | | | | | | | |
| | | Shares | | | Value | |
Celgene Corp * | | | 64,907 | | | | $5,109,479 | |
Cerner Corp * | | | 22,335 | | | | 1,734,089 | |
CIGNA Corp | | | 43,905 | | | | 2,347,161 | |
Coventry Health Care Inc | | | 20,577 | | | | 922,467 | |
Covidien PLC (Ireland) | | | 72,653 | | | | 4,194,984 | |
DaVita HealthCare Partners Inc * | | | 12,886 | | | | 1,424,290 | |
DENTSPLY International Inc | | | 21,767 | | | | 862,191 | |
Edwards Lifesciences Corp * | | | 17,683 | | | | 1,594,476 | |
Eli Lilly & Co | | | 156,553 | | | | 7,721,194 | |
Express Scripts Holding Co * | | | 125,152 | | | | 6,758,208 | |
Forest Laboratories Inc * | | | 35,902 | | | | 1,268,059 | |
Gilead Sciences Inc * | | | 116,154 | | | | 8,531,511 | |
Hospira Inc * | | | 25,209 | | | | 787,529 | |
Humana Inc | | | 24,315 | | | | 1,668,738 | |
Intuitive Surgical Inc * | | | 6,105 | | | | 2,993,709 | |
Johnson & Johnson | | | 424,932 | | | | 29,787,733 | |
Laboratory Corp of America Holdings * | | | 14,546 | | | | 1,259,975 | |
Life Technologies Corp * | | | 26,452 | | | | 1,298,264 | |
McKesson Corp | | | 36,174 | | | | 3,507,431 | |
Medtronic Inc | | | 155,170 | | | | 6,365,073 | |
Merck & Co Inc | | | 466,134 | | | | 19,083,526 | |
Mylan Inc * | | | 62,415 | | | | 1,715,164 | |
Patterson Cos Inc | | | 12,930 | | | | 442,594 | |
PerkinElmer Inc | | | 17,552 | | | | 557,100 | |
Perrigo Co | | | 13,512 | | | | 1,405,653 | |
Pfizer Inc | | | 1,129,160 | | | | 28,319,333 | |
Quest Diagnostics Inc | | | 24,341 | | | | 1,418,350 | |
St. Jude Medical Inc | | | 47,354 | | | | 1,711,374 | |
Stryker Corp | | | 44,313 | | | | 2,429,239 | |
Tenet Healthcare Corp * | | | 16,263 | | | | 528,060 | |
Thermo Fisher Scientific Inc | | | 55,291 | | | | 3,526,460 | |
UnitedHealth Group Inc | | | 156,706 | | | | 8,499,733 | |
Varian Medical Systems Inc * | | | 16,826 | | | | 1,181,858 | |
Waters Corp * | | | 13,365 | | | | 1,164,359 | |
Watson Pharmaceuticals Inc * | | | 19,567 | | | | 1,682,762 | |
WellPoint Inc | | | 46,529 | | | | 2,834,547 | |
Zimmer Holdings Inc | | | 26,621 | | | | 1,774,556 | |
| | | | | | | | |
| | | | 234,710,924 | |
| | | | | | | | |
Industrials - 10.0% | |
| | |
3M Co | | | 97,593 | | | | 9,061,510 | |
Avery Dennison Corp | | | 15,373 | | | | 536,825 | |
C.H. Robinson Worldwide Inc | | | 24,669 | | | | 1,559,574 | |
Caterpillar Inc | | | 100,255 | | | | 8,980,843 | |
Cintas Corp | | | 16,363 | | | | 669,247 | |
CSX Corp | | | 158,332 | | | | 3,123,890 | |
Cummins Inc | | | 27,084 | | | | 2,934,551 | |
Danaher Corp | | | 89,308 | | | | 4,992,317 | |
Deere & Co | | | 60,041 | | | | 5,188,743 | |
Dover Corp | | | 27,504 | | | | 1,807,288 | |
Eaton Corp PLC (Ireland) | | | 70,771 | | | | 3,835,788 | |
Emerson Electric Co | | | 111,110 | | | | 5,884,386 | |
Equifax Inc | | | 18,300 | | | | 990,396 | |
Expeditors International of Washington Inc | | | 32,074 | | | | 1,268,527 | |
Fastenal Co | | | 41,332 | | | | 1,929,791 | |
FedEx Corp | | | 44,770 | | | | 4,106,304 | |
Flowserve Corp | | | 7,689 | | | | 1,128,745 | |
Fluor Corp | | | 25,539 | | | | 1,500,161 | |
General Dynamics Corp | | | 50,863 | | | | 3,523,280 | |
General Electric Co | | | 1,608,200 | | | | 33,756,118 | |
Honeywell International Inc | | | 120,093 | | | | 7,622,303 | |
Illinois Tool Works Inc | | | 65,440 | | | | 3,979,406 | |
Ingersoll-Rand PLC (Ireland) | | | 42,998 | | | | 2,062,184 | |
Iron Mountain Inc | | | 25,510 | | | | 792,085 | |
Jacobs Engineering Group Inc * | | | 19,925 | | | | 848,207 | |
Joy Global Inc | | | 16,168 | | | | 1,031,195 | |
L-3 Communications Holdings Inc | | | 14,469 | | | | 1,108,615 | |
Lockheed Martin Corp | | | 41,167 | | | | 3,799,302 | |
Masco Corp | | | 54,515 | | | | 908,220 | |
Norfolk Southern Corp | | | 48,520 | | | | 3,000,477 | |
| | | | | | | | |
| | | Shares | | | Value | |
Northrop Grumman Corp | | | 37,689 | | | | $2,547,023 | |
PACCAR Inc | | | 54,142 | | | | 2,447,760 | |
Pall Corp | | | 17,093 | | | | 1,030,024 | |
Parker Hannifin Corp | | | 22,863 | | | | 1,944,727 | |
Pentair Ltd (Switzerland) | | | 32,319 | | | | 1,588,479 | |
Pitney Bowes Inc | | | 30,590 | | | | 325,478 | |
Precision Castparts Corp | | | 22,306 | | | | 4,225,203 | |
Quanta Services Inc * | | | 32,534 | | | | 887,853 | |
Raytheon Co | | | 50,643 | | | | 2,915,011 | |
Republic Services Inc | | | 45,812 | | | | 1,343,666 | |
Robert Half International Inc | | | 21,606 | | | | 687,503 | |
Rockwell Automation Inc | | | 21,404 | | | | 1,797,722 | |
Rockwell Collins Inc | | | 21,561 | | | | 1,254,203 | |
Roper Industries Inc | | | 15,068 | | | | 1,679,781 | |
Ryder System Inc | | | 7,821 | | | | 390,503 | |
Snap-on Inc | | | 8,874 | | | | 700,957 | |
Southwest Airlines Co | | | 113,497 | | | | 1,162,209 | |
Stanley Black & Decker Inc | | | 25,872 | | | | 1,913,752 | |
Stericycle Inc * | | | 13,148 | | | | 1,226,314 | |
Textron Inc | | | 43,130 | | | | 1,069,193 | |
The ADT Corp | | | 35,600 | | | | 1,655,044 | |
The Boeing Co | | | 104,043 | | | | 7,840,680 | |
The Dun & Bradstreet Corp | | | 6,846 | | | | 538,438 | |
Tyco International Ltd (Switzerland) | | | 71,343 | | | | 2,086,783 | |
Union Pacific Corp | | | 72,161 | | | | 9,072,081 | |
United Parcel Service Inc ‘B’ | | | 109,767 | | | | 8,093,121 | |
United Technologies Corp | | | 129,279 | | | | 10,602,171 | |
W.W. Grainger Inc | | | 9,182 | | | | 1,858,161 | |
Waste Management Inc | | | 66,805 | | | | 2,254,001 | |
Xylem Inc | | | 28,324 | | | | 767,580 | |
| | | | | | | | |
| | | | 197,835,699 | |
| | | | | | | | |
Information Technology - 18.7% | |
| | |
Accenture PLC ‘A’ (Ireland) | | | 97,885 | | | | 6,509,353 | |
Adobe Systems Inc * | | | 75,858 | | | | 2,858,329 | |
Advanced Micro Devices Inc * | | | 91,546 | | | | 219,710 | |
Akamai Technologies Inc * | | | 27,185 | | | | 1,112,138 | |
Altera Corp | | | 49,097 | | | | 1,690,901 | |
Amphenol Corp ‘A’ | | | 24,597 | | | | 1,591,426 | |
Analog Devices Inc | | | 46,161 | | | | 1,941,532 | |
Apple Inc | | | 144,247 | | | | 76,887,978 | |
Applied Materials Inc | | | 183,965 | | | | 2,104,560 | |
Autodesk Inc * | | | 34,554 | | | | 1,221,484 | |
Automatic Data Processing Inc | | | 74,409 | | | | 4,242,057 | |
BMC Software Inc * | | | 21,942 | | | | 870,220 | |
Broadcom Corp ‘A’ * | | | 79,504 | | | | 2,640,328 | |
CA Inc | | | 51,569 | | | | 1,133,487 | |
Cisco Systems Inc | | | 814,047 | | | | 15,996,024 | |
Citrix Systems Inc * | | | 28,576 | | | | 1,878,872 | |
Cognizant Technology Solutions Corp ‘A’ * | | | 46,038 | | | | 3,409,114 | |
Computer Sciences Corp | | | 23,710 | | | | 949,586 | |
Corning Inc | | | 226,895 | | | | 2,863,415 | |
Dell Inc | | | 223,975 | | | | 2,268,867 | |
eBay Inc * | | | 178,543 | | | | 9,109,264 | |
Electronic Arts Inc * | | | 47,033 | | | | 683,389 | |
EMC Corp * | | | 322,965 | | | | 8,171,015 | |
F5 Networks Inc * | | | 12,125 | | | | 1,177,944 | |
Fidelity National Information Services Inc | | | 38,252 | | | | 1,331,552 | |
First Solar Inc * | | | 9,109 | | | | 281,286 | |
Fiserv Inc * | | | 20,511 | | | | 1,620,984 | |
FLIR Systems Inc | | | 23,168 | | | | 516,878 | |
Google Inc ‘A’ * | | | 40,812 | | | | 28,950,808 | |
Harris Corp | | | 17,388 | | | | 851,316 | |
Hewlett-Packard Co | | | 301,354 | | | | 4,294,295 | |
Intel Corp | | | 763,216 | | | | 15,745,146 | |
International Business Machines Corp | | | 162,892 | | | | 31,201,963 | |
Intuit Inc | | | 42,640 | | | | 2,537,080 | |
Jabil Circuit Inc | | | 28,528 | | | | 550,305 | |
JDS Uniphase Corp * | | | 35,730 | | | | 483,784 | |
Juniper Networks Inc * | | | 79,235 | | | | 1,558,552 | |
| | |
| See Notes to Financial Statements | | See explanation of symbols and terms, if any, on page B-143 |
3
PACIFIC SELECT FUND
EQUITY INDEX PORTFOLIO
Schedule of Investments (Continued)
December 31, 2012
| | | | | | | | |
| | | Shares | | | Value | |
KLA-Tencor Corp | | | 25,542 | | | | $1,219,886 | |
Lam Research Corp * | | | 26,370 | | | | 952,748 | |
Linear Technology Corp | | | 35,420 | | | | 1,214,906 | |
LSI Corp * | | | 85,372 | | | | 604,434 | |
MasterCard Inc ‘A’ | | | 16,394 | | | | 8,054,044 | |
Microchip Technology Inc | | | 29,776 | | | | 970,400 | |
Micron Technology Inc * | | | 155,383 | | | | 986,682 | |
Microsoft Corp | | | 1,161,490 | | | | 31,046,628 | |
Molex Inc | | | 21,186 | | | | 579,013 | |
Motorola Solutions Inc | | | 43,078 | | | | 2,398,583 | |
NetApp Inc * | | | 55,043 | | | | 1,846,693 | |
NVIDIA Corp | | | 95,649 | | | | 1,175,526 | |
Oracle Corp | | | 576,510 | | | | 19,209,313 | |
Paychex Inc | | | 49,539 | | | | 1,542,644 | |
QUALCOMM Inc | | | 261,272 | | | | 16,204,089 | |
Red Hat Inc * | | | 29,605 | | | | 1,567,881 | |
SAIC Inc | | | 43,269 | | | | 489,805 | |
salesforce.com inc * | | | 20,021 | | | | 3,365,530 | |
SanDisk Corp * | | | 37,028 | | | | 1,612,940 | |
Seagate Technology PLC (Ireland) | | | 51,635 | | | | 1,573,835 | |
Symantec Corp * | | | 106,595 | | | | 2,005,052 | |
TE Connectivity Ltd (Switzerland) | | | 64,894 | | | | 2,408,865 | |
Teradata Corp * | | | 25,896 | | | | 1,602,703 | |
Teradyne Inc * | | | 28,586 | | | | 482,818 | |
Texas Instruments Inc | | | 171,982 | | | | 5,321,123 | |
The Western Union Co | | | 91,738 | | | | 1,248,554 | |
Total System Services Inc | | | 24,671 | | | | 528,453 | |
VeriSign Inc * | | | 23,860 | | | | 926,245 | |
Visa Inc ‘A’ | | | 79,930 | | | | 12,115,789 | |
Western Digital Corp | | | 33,705 | | | | 1,432,125 | |
Xerox Corp | | | 194,270 | | | | 1,324,921 | |
Xilinx Inc | | | 40,053 | | | | 1,437,903 | |
Yahoo! Inc * | | | 159,443 | | | | 3,172,916 | |
| | | | | | | | |
| | | | 372,077,989 | |
| | | | | | | | |
Materials - 3.6% | |
| | |
Air Products & Chemicals Inc | | | 32,614 | | | | 2,740,228 | |
Airgas Inc | | | 10,755 | | | | 981,824 | |
Alcoa Inc | | | 163,590 | | | | 1,419,961 | |
Allegheny Technologies Inc | | | 16,329 | | | | 495,748 | |
Ball Corp | | | 23,665 | | | | 1,059,009 | |
Bemis Co Inc | | | 15,819 | | | | 529,304 | |
CF Industries Holdings Inc | | | 9,631 | | | | 1,956,634 | |
Cliffs Natural Resources Inc | | | 21,757 | | | | 838,950 | |
E.I. du Pont de Nemours & Co | | | 142,943 | | | | 6,428,147 | |
Eastman Chemical Co | | | 23,486 | | | | 1,598,222 | |
Ecolab Inc | | | 40,395 | | | | 2,904,401 | |
FMC Corp | | | 21,062 | | | | 1,232,548 | |
Freeport-McMoRan Copper & Gold Inc | | | 145,511 | | | | 4,976,476 | |
International Flavors & Fragrances Inc | | | 12,511 | | | | 832,482 | |
International Paper Co | | | 67,286 | | | | 2,680,674 | |
LyondellBasell Industries NV ‘A’ (Netherlands) | | | 58,174 | | | | 3,321,154 | |
MeadWestvaco Corp | | | 26,736 | | | | 852,076 | |
Monsanto Co | | | 81,955 | | | | 7,757,041 | |
Newmont Mining Corp | | | 76,077 | | | | 3,533,016 | |
Nucor Corp | | | 48,659 | | | | 2,101,096 | |
Owens-Illinois Inc * | | | 25,172 | | | | 535,408 | |
PPG Industries Inc | | | 23,499 | | | | 3,180,590 | |
Praxair Inc | | | 45,590 | | | | 4,989,825 | |
Sealed Air Corp | | | 29,703 | | | | 520,100 | |
Sigma-Aldrich Corp | | | 18,449 | | | | 1,357,477 | |
The Dow Chemical Co | | | 183,831 | | | | 5,941,418 | |
The Mosaic Co | | | 42,390 | | | | 2,400,546 | |
The Sherwin-Williams Co | | | 13,109 | | | | 2,016,426 | |
United States Steel Corp | | | 22,100 | | | | 527,527 | |
Vulcan Materials Co | | | 19,851 | | | | 1,033,245 | |
| | | | | | | | |
| | | | 70,741,553 | |
| | | | | | | | |
| | | | | | | | |
| | | Shares | | | Value | |
Telecommunication Services - 3.0% | |
| | |
AT&T Inc | | | 871,109 | | | | $29,365,084 | |
CenturyLink Inc | | | 95,674 | | | | 3,742,767 | |
Crown Castle International Corp * | | | 44,924 | | | | 3,241,716 | |
Frontier Communications Corp | | | 152,383 | | | | 652,199 | |
MetroPCS Communications Inc * | | | 48,211 | | | | 479,217 | |
Sprint Nextel Corp * | | | 460,353 | | | | 2,610,202 | |
Verizon Communications Inc | | | 437,588 | | | | 18,934,433 | |
Windstream Corp | | | 89,784 | | | | 743,412 | |
| | | | | | | | |
| | | | 59,769,030 | |
| | | | | | | | |
Utilities - 3.4% | |
| | |
AGL Resources Inc | | | 18,060 | | | | 721,858 | |
Ameren Corp | | | 37,062 | | | | 1,138,545 | |
American Electric Power Co Inc | | | 74,362 | | | | 3,173,770 | |
CenterPoint Energy Inc | | | 65,546 | | | | 1,261,760 | |
CMS Energy Corp | | | 40,460 | | | | 986,415 | |
Consolidated Edison Inc | | | 44,873 | | | | 2,492,246 | |
Dominion Resources Inc | | | 88,073 | | | | 4,562,181 | |
DTE Energy Co | | | 26,351 | | | | 1,582,378 | |
Duke Energy Corp | | | 107,960 | | | | 6,887,848 | |
Edison International | | | 49,915 | | | | 2,255,659 | |
Entergy Corp | | | 27,221 | | | | 1,735,339 | |
Exelon Corp | | | 130,930 | | | | 3,893,858 | |
FirstEnergy Corp | | | 64,080 | | | | 2,675,981 | |
Integrys Energy Group Inc | | | 11,887 | | | | 620,739 | |
NextEra Energy Inc | | | 64,867 | | | | 4,488,148 | |
NiSource Inc | | | 47,413 | | | | 1,180,110 | |
Northeast Utilities | | | 48,088 | | | | 1,879,279 | |
NRG Energy Inc | | | 49,574 | | | | 1,139,706 | |
ONEOK Inc | | | 31,388 | | | | 1,341,837 | |
Pepco Holdings Inc | | | 35,176 | | | | 689,801 | |
PG&E Corp | | | 65,885 | | | | 2,647,259 | |
Pinnacle West Capital Corp | | | 16,821 | | | | 857,535 | |
PPL Corp | | | 89,129 | | | | 2,551,763 | |
Public Service Enterprise Group Inc | | | 77,511 | | | | 2,371,837 | |
SCANA Corp | | | 20,164 | | | | 920,285 | |
Sempra Energy | | | 34,461 | | | | 2,444,663 | |
Southern Co | | | 133,991 | | | | 5,736,155 | |
TECO Energy Inc | | | 31,138 | | | | 521,873 | |
The AES Corp | | | 94,955 | | | | 1,016,018 | |
Wisconsin Energy Corp | | | 35,203 | | | | 1,297,231 | |
Xcel Energy Inc | | | 74,696 | | | | 1,995,130 | |
| | | | | | | | |
| | | | 67,067,207 | |
| | | | | | | | |
Total Common Stocks
(Cost $1,298,563,811) | | | | | | | 1,953,713,316 | |
| | | | | | | | |
| | |
| | | Principal Amount | | | | |
|
SHORT-TERM INVESTMENT - 1.5% | |
|
Repurchase Agreement - 1.5% | |
| | |
Fixed Income Clearing Corp
0.010% due 01/02/13
(Dated 12/31/12, repurchase price
of $29,476,503; collateralized by U.S.
Treasury Notes: 0.250% due 07/15/15
and value $30,070,000) | | | $29,476,486 | | | | 29,476,486 | |
| | | | | | | | |
Total Short-Term Investment
(Cost $29,476,486) | | | | | | | 29,476,486 | |
| | | | | | | | |
| | |
TOTAL INVESTMENTS - 99.8%
(Cost $1,328,040,297) | | | | | | | 1,983,189,802 | |
| |
OTHER ASSETS & LIABILITIES, NET - 0.2% | | | | 4,815,616 | |
| | | | | | | | |
| | |
NET ASSETS - 100.0% | | | | | | | $1,988,005,418 | |
| | | | | | | | |
| | |
| See Notes to Financial Statements | | See explanation of symbols and terms, if any, on page B-143 |
4
PACIFIC SELECT FUND
EQUITY INDEX PORTFOLIO
Schedule of Investments (Continued)
December 31, 2012
Notes to Schedule of Investments
| (a) | As of December 31, 2012, the portfolio was diversified as a percentage of net assets as follows: |
| | | | |
Information Technology | | | 18.7% | |
Financials | | | 15.3% | |
Health Care | | | 11.8% | |
Consumer Discretionary | | | 11.3% | |
Energy | | | 10.8% | |
Consumer Staples | | | 10.4% | |
Industrials | | | 10.0% | |
Materials | | | 3.6% | |
Utilities | | | 3.4% | |
Telecommunication Services | | | 3.0% | |
Short-Term Investment | | | 1.5% | |
| | | | |
| | | 99.8% | |
Other Assets & Liabilities, Net | | | 0.2% | |
| | | | |
| | | 100.0% | |
| | | | |
| (b) | Short-term investments reflect either the stated coupon rate or the annualized effective yield on the date of purchase for discounted investments. |
| (c) | As of December 31, 2012, $1,962,000 in cash was segregated with the broker(s)/custodian as collateral for open futures contracts. |
| (d) | Open futures contracts outstanding as of December 31, 2012 were as follows: |
| | | | | | | | | | | | |
| Long Futures Outstanding | | Number of
Contracts | | | Notional
Amount | | | Unrealized
Depreciation | |
S&P 500 E-Mini (03/13) | | | 481 | | | | $34,355,699 | | | | ($202,294 | ) |
| | | | | | | | | | | | |
| (e) | Fair Value Measurements |
The following is a summary of the portfolio’s investments as categorized under the three-tier hierarchy of inputs used in valuing the portfolio’s assets and liabilities (See Note 3D in Notes to Financial Statements) as of December 31, 2012:
| | | | | | | | | | | | | | | | | | |
| | | | | Total Value at
December 31, 2012 | | | Level 1
Quoted Price | | | Level 2
Significant
Observable Inputs | | | Level 3
Significant
Unobservable Inputs | |
Assets | | Common Stocks (1) | | | $1,953,713,316 | | | | $1,953,713,316 | | | | $- | | | | $- | |
| | Short-Term Investment | | | 29,476,486 | | | | - | | | | 29,476,486 | | | | - | |
| | | | | | | | | | | | | | | | | | |
| | Total Assets | | | 1,983,189,802 | | | | 1,953,713,316 | | | | 29,476,486 | | | | - | |
| | | | | | | | | | | | | | | | | | |
Liabilities | | Derivatives: | | | | | | | | | | | | | | | | |
| | Equity Contracts | | | | | | | | | | | | | | | | |
| | Futures | | | (202,294 | ) | | | (202,294 | ) | | | - | | | | - | |
| | | | | | | | | | | | | | | | | | |
| | Total Liabilities | | | (202,294 | ) | | | (202,294 | ) | | | - | | | | - | |
| | | | | | | | | | | | | | | | | | |
| | Total | | | $1,982,987,508 | | | | $1,953,511,022 | | | | $29,476,486 | | | | $- | |
| | | | | | | | | | | | | | | | | | |
| | (1) | For equity investments categorized in a single level, refer to the schedule of investments for further industry breakout. |
| | |
| See Notes to Financial Statements | | See explanation of symbols and terms, if any, on page B-143 |
5
PACIFIC SELECT FUND
SMALL-CAP EQUITY PORTFOLIO
Schedule of Investments
December 31, 2012
| | | | | | | | |
| | | Shares | | | Value | |
RIGHTS - 0.0% | | | | | | | | |
| | |
Health Care - 0.0% | | | | | | | | |
| | |
Allos Therapeutics Inc
Exp. 11/30/13 * + | | | 7,990 | | | | $- | |
| | | | | | | | |
| | |
Total Rights
(Cost $0) | | | | | | | - | |
| | | | | | | | |
| | |
COMMON STOCKS - 98.5% | | | | | | | | |
| | |
Consumer Discretionary - 16.4% | | | | | | | | |
| | |
1-800-FLOWERS.COM Inc ‘A’ * | | | 18,692 | | | | 68,600 | |
American Axle & Manufacturing Holdings Inc * | | | 51,830 | | | | 580,496 | |
American Greetings Corp ‘A’ | | | 22,930 | | | | 387,288 | |
Ameristar Casinos Inc | | | 3,307 | | | | 86,776 | |
Asbury Automotive Group Inc * | | | 2,452 | | | | 78,538 | |
Ascent Capital Group Inc ‘A’ * | | | 10,941 | | | | 677,686 | |
Autoliv Inc | | | 122,000 | | | | 8,221,580 | |
Barnes & Noble Inc * | | | 20,143 | | | | 303,958 | |
Bassett Furniture Industries Inc | | | 8,789 | | | | 109,599 | |
Beasley Broadcasting Group Inc ‘A’ | | | 3,040 | | | | 14,866 | |
Beazer Homes USA Inc * | | | 19,075 | | | | 322,177 | |
bebe stores Inc | | | 26,017 | | | | 103,808 | |
Belo Corp ‘A’ | | | 46,177 | | | | 354,178 | |
Big 5 Sporting Goods Corp | | | 12,993 | | | | 170,208 | |
Biglari Holdings Inc * | | | 830 | | | | 323,717 | |
Black Diamond Inc * | | | 16,133 | | | | 132,291 | |
Bloomin’ Brands Inc * | | | 3,813 | | | | 59,635 | |
Bluegreen Corp * | | | 11,244 | | | | 105,469 | |
Bob Evans Farms Inc | | | 19,557 | | | | 786,191 | |
Boyd Gaming Corp * | | | 40,137 | | | | 266,510 | |
Brown Shoe Co Inc | | | 374,142 | | | | 6,872,989 | |
Brunswick Corp | | | 168,300 | | | | 4,895,847 | |
Cabela’s Inc * | | | 3,374 | | | | 140,864 | |
Caesars Entertainment Corp * | | | 2,903 | | | | 20,089 | |
Callaway Golf Co | | | 50,297 | | | | 326,930 | |
Career Education Corp * | | | 40,651 | | | | 143,092 | |
Carmike Cinemas Inc * | | | 9,524 | | | | 142,860 | |
Carriage Services Inc | | | 12,495 | | | | 148,316 | |
Carrols Restaurant Group Inc * | | | 3,363 | | | | 20,111 | |
Casual Male Retail Group Inc * | | | 32,849 | | | | 137,966 | |
Cavco Industries Inc * | | | 456 | | | | 22,791 | |
Central European Media Enterprises Ltd ‘A’ * (Bermuda) | | | 28,288 | | | | 173,405 | |
Cherokee Inc | | | 557 | | | | 7,636 | |
Churchill Downs Inc | | | 6,753 | | | | 448,737 | |
Chuy’s Holdings Inc * | | | 1,332 | | | | 29,757 | |
Citi Trends Inc * | | | 10,826 | | | | 148,966 | |
Columbia Sportswear Co | | | 9,482 | | | | 505,960 | |
Conn’s Inc * | | | 11,859 | | | | 363,834 | |
Cooper Tire & Rubber Co | | | 6,540 | | | | 165,854 | |
Core-Mark Holding Co Inc | | | 7,396 | | | | 350,201 | |
Corinthian Colleges Inc * | | | 61,443 | | | | 149,921 | |
Crown Media Holdings Inc ‘A’ * | | | 20,671 | | | | 38,241 | |
CSS Industries Inc | | | 7,319 | | | | 160,213 | |
Culp Inc | | | 6,782 | | | | 101,798 | |
Cumulus Media Inc ‘A’ * | | | 47,541 | | | | 126,934 | |
Daily Journal Corp * | | | 729 | | | | 67,469 | |
Dana Holding Corp | | | 102,980 | | | | 1,607,518 | |
Del Frisco’s Restaurant Group Inc * | | | 1,172 | | | | 18,271 | |
Delta Apparel Inc * | | | 5,409 | | | | 75,618 | |
Denny’s Corp * | | | 15,958 | | | | 77,875 | |
Destination Maternity Corp | | | 5,787 | | | | 124,768 | |
Digital Generation Inc * | | | 21,340 | | | | 231,752 | |
Drew Industries Inc | | | 139,484 | | | | 4,498,359 | |
Education Management Corp * | | | 20,471 | | | | 89,663 | |
Einstein Noah Restaurant Group Inc | | | 675 | | | | 8,242 | |
| | | | | | | | |
| | | Shares | | | Value | |
Entercom Communications Corp ‘A’ * | | | 18,938 | | | | $132,187 | |
Entravision Communications Corp ‘A’ | | | 40,516 | | | | 67,257 | |
Ethan Allen Interiors Inc | | | 19,551 | | | | 502,656 | |
Exide Technologies * | | | 61,003 | | | | 208,630 | |
Federal-Mogul Corp * | | | 14,170 | | | | 113,643 | |
Fiesta Restaurant Group Inc * | | | 1,220 | | | | 18,690 | |
Fifth & Pacific Cos Inc * | | | 79,742 | | | | 992,788 | |
Fisher Communications Inc | | | 6,860 | | | | 185,151 | |
Five Below Inc * | | | 4,258 | | | | 136,426 | |
Flexsteel Industries Inc | | | 3,365 | | | | 72,179 | |
Fred’s Inc ‘A’ | | | 55,441 | | | | 737,920 | |
Frisch’s Restaurants Inc | | | 2,530 | | | | 46,805 | |
Fuel Systems Solutions Inc * | | | 9,084 | | | | 133,535 | |
G-III Apparel Group Ltd * | | | 11,276 | | | | 385,977 | |
GameStop Corp ‘A’ | | | 189,800 | | | | 4,762,082 | |
Gentex Corp | | | 356,800 | | | | 6,714,976 | |
Global Sources Ltd * (Bermuda) | | | 12,891 | | | | 83,534 | |
Group 1 Automotive Inc | | | 207,795 | | | | 12,881,212 | |
Harman International Industries Inc | | | 63,000 | | | | 2,812,320 | |
Harte-Hanks Inc | | | 34,464 | | | | 203,338 | |
Haverty Furniture Cos Inc | | | 14,949 | | | | 243,818 | |
Helen of Troy Ltd * (Bermuda) | | | 24,599 | | | | 821,361 | |
hhgregg Inc * | | | 11,585 | | | | 81,327 | |
Hillenbrand Inc | | | 194,800 | | | | 4,404,428 | |
Hooker Furniture Corp | | | 8,363 | | | | 121,514 | |
Hovnanian Enterprises Inc ‘A’ * | | | 81,866 | | | | 573,062 | |
Iconix Brand Group Inc * | | | 54,990 | | | | 1,227,377 | |
International Speedway Corp ‘A’ | | | 21,487 | | | | 593,471 | |
Isle of Capri Casinos Inc * | | | 16,078 | | | | 90,037 | |
Jack in the Box Inc * | | | 6,574 | | | | 188,016 | |
JAKKS Pacific Inc | | | 17,057 | | | | 213,554 | |
Johnson Outdoors Inc ‘A’ * | | | 4,282 | | | | 85,297 | |
Jos. A. Bank Clothiers Inc * | | | 49,556 | | | | 2,110,094 | |
Journal Communications Inc ‘A’ * | | | 31,538 | | | | 170,621 | |
K-Swiss Inc ‘A’ * | | | 19,840 | | | | 66,662 | |
Kayak Software Corp * | | | 709 | | | | 28,161 | |
KB Home | | | 59,981 | | | | 947,700 | |
Kirkland’s Inc * | | | 10,665 | | | | 112,942 | |
Krispy Kreme Doughnuts Inc * | | | 46,278 | | | | 434,088 | |
La-Z-Boy Inc | | | 524,582 | | | | 7,422,835 | |
Life Time Fitness Inc * | | | 2,491 | | | | 122,582 | |
LifeLock Inc * | | | 1,012 | | | | 8,228 | |
Lifetime Brands Inc | | | 7,682 | | | | 81,506 | |
LIN TV Corp ‘A’ * | | | 23,829 | | | | 179,432 | |
Lincoln Educational Services Corp | | | 18,051 | | | | 100,905 | |
Lithia Motors Inc ‘A’ | | | 16,842 | | | | 630,228 | |
Live Nation Entertainment Inc * | | | 108,720 | | | | 1,012,183 | |
Luby’s Inc * | | | 15,743 | | | | 105,321 | |
M.D.C. Holdings Inc | | | 91,350 | | | | 3,358,026 | |
M/I Homes Inc * | | | 16,640 | | | | 440,960 | |
Mac-Gray Corp | | | 7,959 | | | | 99,885 | |
Maidenform Brands Inc * | | | 227,247 | | | | 4,429,044 | |
Marcus Corp | | | 15,400 | | | | 192,038 | |
Marine Products Corp | | | 3,719 | | | | 21,273 | |
MarineMax Inc * | | | 15,966 | | | | 142,736 | |
Marriott Vacations Worldwide Corp * | | | 20,698 | | | | 862,486 | |
Martha Stewart Living Omnimedia Inc ‘A’ * | | | 22,179 | | | | 54,339 | |
Matthews International Corp ‘A’ | | | 11,518 | | | | 369,728 | |
MDC Partners Inc ‘A’ (Canada) | | | 12,475 | | | | 140,967 | |
Meredith Corp | | | 28,206 | | | | 971,697 | |
Meritage Homes Corp * | | | 18,030 | | | | 673,420 | |
Modine Manufacturing Co * | | | 36,499 | | | | 296,737 | |
Monarch Casino & Resort Inc * | | | 6,801 | | | | 74,199 | |
Morgans Hotel Group Co * | | | 9,126 | | | | 50,558 | |
Movado Group Inc | | | 12,725 | | | | 390,403 | |
NACCO Industries Inc ‘A’ | | | 4,312 | | | | 261,695 | |
National American University Holdings Inc | | | 4,768 | | | | 18,357 | |
National CineMedia Inc | | | 28,966 | | | | 409,290 | |
New York & Co Inc * | | | 8,720 | | | | 33,223 | |
Nexstar Broadcasting Group Inc ‘A’ * | | | 6,563 | | | | 69,502 | |
| | |
| See Notes to Financial Statements | | See explanation of symbols and terms, if any, on page B-143 |
6
PACIFIC SELECT FUND
SMALL-CAP EQUITY PORTFOLIO
Schedule of Investments (Continued)
December 31, 2012
| | | | | | | | |
| | | Shares | | | Value | |
Office Depot Inc * | | | 220,682 | | | | $723,837 | |
OfficeMax Inc | | | 67,311 | | | | 656,955 | |
Orchard Supply Hardware Stores Corp ‘A’ * | | | 1,366 | | | | 10,122 | |
Orient-Express Hotels Ltd ‘A’ * (Bermuda) | | | 75,348 | | | | 880,818 | |
Outdoor Channel Holdings Inc | | | 8,299 | | | | 63,072 | |
Penske Automotive Group Inc | | | 24,466 | | | | 736,182 | |
Perfumania Holdings Inc * | | | 4,033 | | | | 19,842 | |
Perry Ellis International Inc | | | 9,249 | | | | 184,055 | |
Pier 1 Imports Inc | | | 180,200 | | | | 3,604,000 | |
Pinnacle Entertainment Inc * | | | 42,700 | | | | 675,941 | |
Quiksilver Inc * | | | 101,333 | | | | 430,665 | |
RadioShack Corp | | | 77,394 | | | | 164,075 | |
Reading International Inc ‘A’ * | | | 12,870 | | | | 77,349 | |
Red Lion Hotels Corp * | | | 10,409 | | | | 82,127 | |
Red Robin Gourmet Burgers Inc * | | | 6,357 | | | | 224,339 | |
Regis Corp | | | 353,593 | | | | 5,982,794 | |
Rent-A-Center Inc | | | 46,122 | | | | 1,584,752 | |
Rentrak Corp * | | | 2,915 | | | | 56,813 | |
Restoration Hardware Holdings Inc * | | | 3,248 | | | | 109,555 | |
RG Barry Corp | | | 352 | | | | 4,988 | |
Ruby Tuesday Inc * | | | 49,611 | | | | 389,942 | |
Saga Communications Inc ‘A’ | | | 2,713 | | | | 126,155 | |
Saks Inc * | | | 85,587 | | | | 899,519 | |
Salem Communications Corp ‘A’ | | | 8,166 | | | | 44,586 | |
Scholastic Corp | | | 20,203 | | | | 597,201 | |
Scientific Games Corp ‘A’ * | | | 35,069 | | | | 304,048 | |
Sealy Corp * | | | 38,171 | | | | 82,831 | |
Shiloh Industries Inc | | | 4,500 | | | | 46,350 | |
Shoe Carnival Inc | | | 11,059 | | | | 226,599 | |
Shutterfly Inc * | | | 20,828 | | | | 622,132 | |
Shutterstock Inc * | | | 3,964 | | | | 103,064 | |
Sinclair Broadcast Group Inc ‘A’ | | | 35,984 | | | | 454,118 | |
Skechers U.S.A. Inc ‘A’ * | | | 29,414 | | | | 544,159 | |
Sonic Automotive Inc ‘A’ | | | 33,120 | | | | 691,877 | |
Sonic Corp * | | | 8,530 | | | | 88,797 | |
Sotheby’s | | | 34,182 | | | | 1,149,199 | |
Spartan Motors Inc | | | 26,533 | | | | 130,808 | |
Speedway Motorsports Inc | | | 9,044 | | | | 161,345 | |
Stage Stores Inc | | | 23,851 | | | | 591,028 | |
Standard Motor Products Inc | | | 15,429 | | | | 342,832 | |
Standard Pacific Corp * | | | 90,055 | | | | 661,904 | |
Stein Mart Inc | | | 21,405 | | | | 161,394 | |
Steinway Musical Instruments Inc * | | | 5,193 | | | | 109,832 | |
Stewart Enterprises Inc ‘A’ | | | 58,587 | | | | 447,605 | |
Stoneridge Inc * | | | 21,805 | | | | 111,642 | |
Superior Industries International Inc | | | 17,720 | | | | 361,488 | |
Systemax Inc | | | 7,837 | | | | 75,627 | |
The Bon-Ton Stores Inc | | | 10,023 | | | | 121,479 | |
The Cato Corp ‘A’ | | | 125,000 | | | | 3,428,750 | |
The Children’s Place * | | | 11,729 | | | | 519,477 | |
The E.W. Scripps Co ‘A’ * | | | 23,320 | | | | 252,089 | |
The Finish Line Inc ‘A’ | | | 24,557 | | | | 464,864 | |
The Jones Group Inc | | | 63,751 | | | | 705,086 | |
The McClatchy Co ‘A’ * | | | 45,746 | | | | 149,589 | |
The Men’s Wearhouse Inc | | | 271,922 | | | | 8,473,090 | |
The New York Times Co ‘A’ * | | | 105,933 | | | | 903,608 | |
The Pep Boys-Manny Moe & Jack | | | 41,000 | | | | 403,030 | |
The Ryland Group Inc | | | 15,150 | | | | 552,975 | |
The Warnaco Group Inc * | | | 3,917 | | | | 280,340 | |
The Wet Seal Inc ‘A’ * | | | 70,378 | | | | 194,243 | |
Thor Industries Inc | | | 375,010 | | | | 14,036,624 | |
Tuesday Morning Corp * | | | 32,842 | | | | 205,262 | |
Unifi Inc * | | | 10,912 | | | | 141,965 | |
Universal Electronics Inc * | | | 11,595 | | | | 224,363 | |
Universal Technical Institute Inc | | | 5,677 | | | | 56,997 | |
Vail Resorts Inc | | | 18,152 | | | | 981,842 | |
Valassis Communications Inc | | | 12,006 | | | | 309,515 | |
Value Line Inc | | | 191 | | | | 1,713 | |
VOXX International Corp * | | | 13,838 | | | | 93,130 | |
West Marine Inc * | | | 11,689 | | | | 125,657 | |
| | | | | | | | |
| | | Shares | | | Value | |
Weyco Group Inc | | | 4,586 | | | | $107,129 | |
Winnebago Industries Inc * | | | 157,567 | | | | 2,699,123 | |
WMS Industries Inc * | | | 42,801 | | | | 749,017 | |
World Wrestling Entertainment Inc ‘A’ | | | 1,888 | | | | 14,896 | |
| | | | | | | | |
| | | | | | | 164,319,253 | |
| | | | | | | | |
Consumer Staples - 1.3% | | | | | | | | |
| | |
Alico Inc | | | 1,539 | | | | 56,374 | |
Alliance One International Inc * | | | 66,985 | | | | 243,825 | |
Annie’s Inc * | | | 1,193 | | | | 39,882 | |
Arden Group Inc ‘A’ | | | 262 | | | | 23,572 | |
Cal-Maine Foods Inc | | | 1,660 | | | | 66,765 | |
Central European Distribution Corp * | | | 50,994 | | | | 110,657 | |
Central Garden & Pet Co ‘A’ * | | | 25,582 | | | | 267,332 | |
Chiquita Brands International Inc * | | | 35,507 | | | | 292,933 | |
Craft Brew Alliance Inc * | | | 4,748 | | | | 30,767 | |
Darling International Inc * | | | 63,713 | | | | 1,021,957 | |
Diamond Foods Inc | | | 17,173 | | | | 234,755 | |
Dole Food Co Inc * | | | 27,812 | | | | 319,004 | |
Elizabeth Arden Inc * | | | 2,881 | | | | 129,674 | |
Farmer Bros. Co * | | | 5,033 | | | | 72,626 | |
Fresh Del Monte Produce Inc (Cayman) | | | 29,652 | | | | 781,330 | |
Griffin Land & Nurseries Inc | | | 2,040 | | | | 55,080 | |
Harbinger Group Inc * | | | 32,169 | | | | 247,380 | |
Harris Teeter Supermarkets Inc | | | 29,511 | | | | 1,137,944 | |
Ingles Markets Inc ‘A’ | | | 9,500 | | | | 163,970 | |
Inter Parfums Inc | | | 3,665 | | | | 71,321 | |
John B Sanfilippo & Son Inc | | | 6,170 | | | | 112,171 | |
Lancaster Colony Corp | | | 20,930 | | | | 1,448,147 | |
Nash Finch Co | | | 9,440 | | | | 200,883 | |
Natural Grocers by Vitamin Cottage Inc * | | | 3,369 | | | | 64,314 | |
Nature’s Sunshine Products Inc | | | 3,568 | | | | 51,665 | |
Nutraceutical International Corp | | | 6,785 | | | | 112,224 | |
Oil-Dri Corp of America | | | 3,810 | | | | 105,156 | |
Omega Protein Corp * | | | 15,394 | | | | 94,211 | |
Orchids Paper Products Co | | | 2,252 | | | | 45,535 | |
Pilgrim’s Pride Corp * | | | 9,059 | | | | 65,678 | |
Post Holdings Inc * | | | 5,987 | | | | 205,055 | |
Prestige Brands Holdings Inc * | | | 13,359 | | | | 267,581 | |
Revlon Inc ‘A’ * | | | 8,765 | | | | 127,092 | |
Rite Aid Corp * | | | 467,864 | | | | 636,295 | |
Seneca Foods Corp ‘A’ * | | | 6,455 | | | | 196,232 | |
Smart Balance Inc * | | | 45,897 | | | | 592,071 | |
Snyder’s-Lance Inc | | | 3,944 | | | | 95,090 | |
Spartan Stores Inc | | | 16,743 | | | | 257,172 | |
Spectrum Brands Holdings Inc * | | | 2,932 | | | | 131,735 | |
SUPERVALU Inc | | | 39,813 | | | | 98,338 | |
Susser Holdings Corp * | | | 5,043 | | | | 173,933 | |
The Andersons Inc | | | 14,438 | | | | 619,390 | |
The Pantry Inc * | | | 16,365 | | | | 198,507 | |
Tootsie Roll Industries Inc | | | 1,237 | | | | 32,063 | |
TreeHouse Foods Inc * | | | 9,098 | | | | 474,279 | |
Universal Corp | | | 18,043 | | | | 900,526 | |
Vector Group Ltd | | | 10,669 | | | | 158,648 | |
Village Super Market Inc ‘A’ | | | 6,593 | | | | 216,646 | |
Weis Markets Inc | | | 8,640 | | | | 338,429 | |
Westway Group Inc * | | | 8,018 | | | | 53,480 | |
| | | | | | | | |
| | | | | | | 13,439,694 | |
| | | | | | | | |
Energy - 9.4% | | | | | | | | |
| | |
Adams Resources & Energy Inc | | | 1,833 | | | | 64,283 | |
Alon USA Energy Inc | | | 1,875 | | | | 33,919 | |
Amyris Inc * | | | 23,022 | | | | 71,829 | |
Arch Coal Inc | | | 164,955 | | | | 1,207,471 | |
Atwood Oceanics Inc * | | | 187,600 | | | | 8,590,204 | |
Basic Energy Services Inc * | | | 24,039 | | | | 274,285 | |
Bill Barrett Corp * | | | 37,400 | | | | 665,346 | |
Bolt Technology Corp | | | 6,589 | | | | 94,025 | |
Bonanza Creek Energy Inc * | | | 6,592 | | | | 183,192 | |
BPZ Resources Inc * | | | 57,118 | | | | 179,922 | |
| | |
| See Notes to Financial Statements | | See explanation of symbols and terms, if any, on page B-143 |
7
PACIFIC SELECT FUND
SMALL-CAP EQUITY PORTFOLIO
Schedule of Investments (Continued)
December 31, 2012
| | | | | | | | |
| | | Shares | | | Value | |
Bristow Group Inc | | | 202,186 | | | | $10,849,301 | |
C&J Energy Services Inc * | | | 24,015 | | | | 514,882 | |
Cal Dive International Inc * | | | 74,241 | | | | 128,437 | |
Callon Petroleum Co * | | | 30,765 | | | | 144,595 | |
Carrizo Oil & Gas Inc * | | | 4,226 | | | | 88,408 | |
Clayton Williams Energy Inc * | | | 4,145 | | | | 165,800 | |
Cloud Peak Energy Inc * | | | 47,461 | | | | 917,421 | |
Comstock Resources Inc * | | | 37,350 | | | | 565,105 | |
Contango Oil & Gas Co | | | 788 | | | | 33,380 | |
Crimson Exploration Inc * | | | 17,014 | | | | 46,618 | |
Crosstex Energy Inc | | | 3,292 | | | | 47,207 | |
CVR Energy Inc * | | | 4,317 | | | | 210,626 | |
Dawson Geophysical Co * | | | 6,084 | | | | 160,496 | |
Delek US Holdings Inc | | | 13,614 | | | | 344,706 | |
Diamondback Energy Inc * | | | 5,800 | | | | 110,896 | |
Emerald Oil Inc * | | | 12,315 | | | | 64,531 | |
Endeavour International Corp * | | | 2,479 | | | | 12,841 | |
Energen Corp | | | 118,510 | | | | 5,343,616 | |
Energy XXI Ltd (Bermuda) | | | 16,701 | | | | 537,605 | |
EPL Oil & Gas Inc * | | | 21,564 | | | | 486,268 | |
Exterran Holdings Inc * | | | 50,328 | | | | 1,103,190 | |
Forbes Energy Services Ltd * | | | 10,980 | | | | 27,779 | |
Forest Oil Corp * | | | 91,447 | | | | 611,780 | |
Frontline Ltd * (Bermuda) | | | 40,333 | | | | 131,486 | |
GasLog Ltd (Bermuda) | | | 11,697 | | | | 145,394 | |
Gastar Exploration Ltd * (Canada) | | | 47,093 | | | | 56,983 | |
Gevo Inc * | | | 2,671 | | | | 4,113 | |
Green Plains Renewable Energy Inc * | | | 19,209 | | | | 151,943 | |
Gulf Island Fabrication Inc | | | 11,242 | | | | 270,145 | |
Gulfmark Offshore Inc ‘A’ | | | 16,314 | | | | 562,017 | |
Gulfport Energy Corp * | | | 28,751 | | | | 1,098,863 | |
Halcon Resources Corp * | | | 10,841 | | | | 75,020 | |
Hallador Energy Co | | | 5,242 | | | | 43,299 | |
Harvest Natural Resources Inc * | | | 28,700 | | | | 260,309 | |
Heckmann Corp * | | | 102,068 | | | | 411,334 | |
Helix Energy Solutions Group Inc * | | | 437,739 | | | | 9,034,933 | |
Hercules Offshore Inc * | | | 123,112 | | | | 760,832 | |
Hornbeck Offshore Services Inc * | | | 27,451 | | | | 942,667 | |
Key Energy Services Inc * | | | 117,473 | | | | 816,437 | |
Knightsbridge Tankers Ltd (Bermuda) | | | 19,366 | | | | 101,672 | |
Magnum Hunter Resources Corp * | | | 74,228 | | | | 296,170 | |
Matador Resources Co * | | | 1,882 | | | | 15,432 | |
Matrix Service Co * | | | 16,087 | | | | 185,000 | |
McMoRan Exploration Co * | | | 78,862 | | | | 1,265,735 | |
Midstates Petroleum Co Inc * | | | 9,972 | | | | 68,707 | |
Miller Energy Resources Inc * | | | 24,334 | | | | 96,363 | |
Mitcham Industries Inc * | | | 3,624 | | | | 49,395 | |
Natural Gas Services Group Inc * | | | 9,581 | | | | 157,320 | |
Newpark Resources Inc * | | | 69,974 | | | | 549,296 | |
Nordic American Tankers Ltd (Bermuda) | | | 41,029 | | | | 359,004 | |
Oil States International Inc * | | | 115,000 | | | | 8,227,100 | |
Parker Drilling Co * | | | 91,322 | | | | 420,081 | |
PDC Energy Inc * | | | 23,269 | | | | 772,763 | |
Penn Virginia Corp | | | 42,933 | | | | 189,335 | |
PetroQuest Energy Inc * | | | 44,097 | | | | 218,280 | |
PHI Inc * | | | 9,340 | | | | 312,797 | |
Pioneer Energy Services Corp * | | | 37,993 | | | | 275,829 | |
Quicksilver Resources Inc * | | | 90,957 | | | | 260,137 | |
Renewable Energy Group Inc * | | | 4,902 | | | | 28,726 | |
Resolute Energy Corp * | | | 37,257 | | | | 302,899 | |
REX American Resources Corp * | | | 3,758 | | | | 72,492 | |
Rex Energy Corp * | | | 33,544 | | | | 436,743 | |
Rowan Cos PLC ‘A’ * (United Kingdom) | | | 300,080 | | | | 9,383,502 | |
Scorpio Tankers Inc * | | | 43,138 | | | | 306,711 | |
SemGroup Corp ‘A’ * | | | 32,800 | | | | 1,281,824 | |
Ship Finance International Ltd (Bermuda) | | | 37,974 | | | | 631,508 | |
Stone Energy Corp * | | | 38,459 | | | | 789,179 | |
Swift Energy Co * | | | 33,282 | | | | 512,210 | |
Synergy Resources Corp * | | | 28,747 | | | | 154,946 | |
Teekay Tankers Ltd ‘A’ | | | 49,234 | | | | 142,779 | |
| | | | | | | | |
| | | Shares | | | Value | |
Tesco Corp * (Canada) | | | 23,607 | | | | $268,884 | |
TETRA Technologies Inc * | | | 60,317 | | | | 457,806 | |
Tidewater Inc | | | 193,200 | | | | 8,632,176 | |
Triangle Petroleum Corp * | | | 34,363 | | | | 205,834 | |
Unit Corp * | | | 150,000 | | | | 6,757,500 | |
Uranium Energy Corp * | | | 35,260 | | | | 90,266 | |
Vantage Drilling Co * (Cayman) | | | 147,386 | | | | 269,716 | |
W&T Offshore Inc | | | 25,171 | | | | 403,491 | |
Warren Resources Inc * | | | 44,988 | | | | 126,416 | |
Western Refining Inc | | | 18,480 | | | | 520,951 | |
Westmoreland Coal Co * | | | 8,534 | | | | 79,708 | |
Willbros Group Inc * | | | 23,057 | | | | 123,586 | |
ZaZa Energy Corp * | | | 10,898 | | | | 22,341 | |
| | | | | | | | |
| | | | | | | 94,468,349 | |
| | | | | | | | |
Financials - 23.4% | | | | | | | | |
| | |
1st Source Corp | | | 11,713 | | | | 258,740 | |
1st United Bancorp Inc | | | 23,074 | | | | 144,213 | |
Access National Corp | | | 6,191 | | | | 80,483 | |
AG Mortgage Investment Trust Inc REIT | | | 17,730 | | | | 416,300 | |
Agree Realty Corp REIT | | | 8,979 | | | | 240,547 | |
Alliance Financial Corp | | | 3,751 | | | | 163,206 | |
Alterra Capital Holdings Ltd (Bermuda) | | | 66,953 | | | | 1,887,405 | |
American Assets Trust Inc REIT | | | 25,600 | | | | 715,008 | |
American Capital Mortgage Investment Corp REIT | | | 28,787 | | | | 678,510 | |
American Equity Investment Life Holding Co | | | 46,513 | | | | 567,924 | |
American National Bankshares Inc | | | 6,303 | | | | 127,258 | |
American Realty Capital Trust Inc REIT | | | 123,352 | | | | 1,424,716 | |
American Safety Insurance Holdings Ltd * (Bermuda) | | | 6,600 | | | | 124,872 | |
Ameris Bancorp * | | | 18,480 | | | | 230,815 | |
AMERISAFE Inc * | | | 14,497 | | | | 395,043 | |
Ames National Corp | | | 6,573 | | | | 143,949 | |
AmREIT Inc ‘B’ | | | 2,189 | | | | 37,541 | |
AmTrust Financial Services Inc | | | 18,161 | | | | 521,039 | |
Anworth Mortgage Asset Corp REIT | | | 108,247 | | | | 625,668 | |
Apollo Commercial Real Estate Finance Inc REIT | | | 17,866 | | | | 289,965 | |
Apollo Investment Corp | | | 158,593 | | | | 1,325,838 | |
Apollo Residential Mortgage Inc REIT | | | 17,132 | | | | 345,895 | |
Ares Commercial Real Estate Corp REIT | | | 6,049 | | | | 99,325 | |
Argo Group International Holdings Ltd (Bermuda) | | | 20,334 | | | | 683,019 | |
Arlington Asset Investment Corp ‘A’ | | | 8,835 | | | | 183,503 | |
ARMOUR Residential REIT Inc | | | 231,917 | | | | 1,500,503 | |
Arrow Financial Corp | | | 7,753 | | | | 193,437 | |
Arthur J. Gallagher & Co | | | 77,100 | | | | 2,671,515 | |
Artio Global Investors Inc | | | 25,929 | | | | 49,265 | |
Ashford Hospitality Trust Inc REIT | | | 41,337 | | | | 434,452 | |
Aspen Insurance Holdings Ltd (Bermuda) | | | 152,880 | | | | 4,904,390 | |
Associated Estates Realty Corp REIT | | | 21,732 | | | | 350,320 | |
Astoria Financial Corp | | | 68,009 | | | | 636,564 | |
Asset Acceptance Capital Corp * | | | 12,540 | | | | 56,430 | |
Asta Funding Inc | | | 7,619 | | | | 72,457 | |
AV Homes Inc * | | | 7,613 | | | | 108,257 | |
Baldwin & Lyons Inc ‘B’ | | | 7,545 | | | | 180,024 | |
BancFirst Corp | | | 5,107 | | | | 216,333 | |
Banco Latinoamericano de Comercio Exterior SA ‘E’ (Multi-National) | | | 22,080 | | | | 476,045 | |
BancorpSouth Inc | | | 73,714 | | | | 1,071,802 | |
Bank Mutual Corp | | | 36,595 | | | | 157,359 | |
Bank of Kentucky Financial Corp | | | 4,682 | | | | 115,786 | |
Bank of Marin Bancorp | | | 4,174 | | | | 156,358 | |
Bank of the Ozarks Inc | | | 6,250 | | | | 209,188 | |
BankFinancial Corp | | | 16,352 | | | | 121,332 | |
Banner Corp | | | 15,001 | | | | 460,981 | |
Bar Harbor Bankshares | | | 3,026 | | | | 101,825 | |
BBCN Bancorp Inc | | | 60,799 | | | | 703,444 | |
Beneficial Mutual Bancorp Inc * | | | 22,274 | | | | 211,603 | |
| | |
| See Notes to Financial Statements | | See explanation of symbols and terms, if any, on page B-143 |
8
PACIFIC SELECT FUND
SMALL-CAP EQUITY PORTFOLIO
Schedule of Investments (Continued)
December 31, 2012
| | | | | | | | |
| | | Shares | | | Value | |
Berkshire Bancorp Inc | | | 3,714 | | | | $30,455 | |
Berkshire Hills Bancorp Inc | | | 19,222 | | | | 458,637 | |
BlackRock Kelso Capital Corp | | | 35,092 | | | | 353,026 | |
BofI Holding Inc * | | | 8,086 | | | | 225,357 | |
Boston Private Financial Holdings Inc | | | 60,944 | | | | 549,105 | |
Bridge Bancorp Inc | | | 6,840 | | | | 139,126 | |
Bridge Capital Holdings * | | | 5,331 | | | | 82,950 | |
Brookline Bancorp Inc | | | 54,795 | | | | 465,758 | |
Bryn Mawr Bank Corp | | | 8,957 | | | | 199,472 | |
BSB Bancorp Inc * | | | 6,201 | | | | 75,838 | |
C&F Financial Corp | | | 2,540 | | | | 98,908 | |
Calamos Asset Management Inc ‘A’ | | | 15,261 | | | | 161,309 | |
California First National Bancorp | | | 1,939 | | | | 28,988 | |
Camden National Corp | | | 6,051 | | | | 205,553 | |
Campus Crest Communities Inc REIT | | | 29,766 | | | | 364,931 | |
Cape Bancorp Inc | | | 8,688 | | | | 75,499 | |
Capital Bank Financial Corp ‘A’ * | | | 4,906 | | | | 83,745 | |
Capital City Bank Group Inc * | | | 9,378 | | | | 106,628 | |
Capital Southwest Corp | | | 2,351 | | | | 234,230 | |
CapLease Inc REIT | | | 51,502 | | | | 286,866 | |
Capstead Mortgage Corp REIT | | | 77,392 | | | | 887,686 | |
Cardinal Financial Corp | | | 22,823 | | | | 371,330 | |
Cascade Bancorp * | | | 4,786 | | | | 29,960 | |
Cash America International Inc | | | 13,358 | | | | 529,912 | |
Cathay General Bancorp | | | 61,344 | | | | 1,196,208 | |
Cedar Realty Trust Inc REIT | | | 46,772 | | | | 246,956 | |
Center Bancorp Inc | | | 9,479 | | | | 109,767 | |
Centerstate Banks Inc | | | 23,664 | | | | 201,854 | |
Central Pacific Financial Corp * | | | 16,826 | | | | 262,317 | |
Century Bancorp Inc ‘A’ | | | 2,674 | | | | 88,108 | |
Charter Financial Corp | | | 5,204 | | | | 55,162 | |
Chatham Lodging Trust REIT | | | 10,648 | | | | 163,766 | |
Chemical Financial Corp | | | 199,249 | | | | 4,734,156 | |
Chesapeake Lodging Trust REIT | | | 30,723 | | | | 641,496 | |
CIFC Corp * | | | 5,140 | | | | 41,120 | |
Citizens & Northern Corp | | | 9,553 | | | | 180,552 | |
Citizens Inc * | | | 30,133 | | | | 332,970 | |
Citizens Republic Bancorp Inc * | | | 31,218 | | | | 592,205 | |
City Holding Co | | | 11,555 | | | | 402,692 | |
Clifton Savings Bancorp Inc | | | 6,190 | | | | 69,761 | |
CNB Financial Corp | | | 9,800 | | | | 160,524 | |
CNO Financial Group Inc | | | 156,332 | | | | 1,458,578 | |
CoBiz Financial Inc | | | 27,666 | | | | 206,665 | |
Colonial Properties Trust REIT | | | 68,457 | | | | 1,462,926 | |
Colony Financial Inc REIT | | | 40,544 | | | | 790,608 | |
Columbia Banking System Inc | | | 31,068 | | | | 557,360 | |
Community Bank System Inc | | | 30,838 | | | | 843,728 | |
Community Trust Bancorp Inc | | | 10,992 | | | | 360,318 | |
Consolidated-Tomoka Land Co | | | 3,221 | | | | 99,883 | |
Coresite Realty Corp REIT | | | 8,122 | | | | 224,655 | |
Cousins Properties Inc REIT | | | 71,327 | | | | 595,580 | |
Cowen Group Inc ‘A’ * | | | 68,495 | | | | 167,813 | |
Crawford & Co ‘B’ | | | 20,677 | | | | 165,002 | |
Crescent Financial Bancshares Inc * | | | 2,466 | | | | 11,319 | |
CreXus Investment Corp REIT | | | 52,507 | | | | 643,211 | |
CubeSmart REIT | | | 96,027 | | | | 1,399,113 | |
CVB Financial Corp | | | 69,038 | | | | 717,995 | |
CYS Investments Inc REIT | | | 137,108 | | | | 1,619,246 | |
DCT Industrial Trust Inc REIT | | | 192,718 | | | | 1,250,740 | |
DFC Global Corp * | | | 7,410 | | | | 137,159 | |
DiamondRock Hospitality Co REIT | | | 146,461 | | | | 1,318,149 | |
Dime Community Bancshares Inc | | | 24,526 | | | | 340,666 | |
Donegal Group Inc ‘A’ | | | 6,391 | | | | 89,730 | |
Doral Financial Corp * | | | 100,008 | | | | 72,416 | |
Duff & Phelps Corp ‘A’ | | | 17,933 | | | | 280,113 | |
DuPont Fabros Technology Inc REIT | | | 25,296 | | | | 611,151 | |
Dynex Capital Inc REIT | | | 42,037 | | | | 396,829 | |
Eagle Bancorp Inc * | | | 13,455 | | | | 268,696 | |
Eastern Insurance Holdings Inc | | | 5,627 | | | | 96,109 | |
EastGroup Properties Inc REIT | | | 1,346 | | | | 72,428 | |
| | | | | | | | |
| | | Shares | | | Value | |
Education Realty Trust Inc REIT | | | 88,038 | | | | $936,724 | |
EMC Insurance Group Inc | | | 3,989 | | | | 95,257 | |
Encore Capital Group Inc * | | | 3,598 | | | | 110,171 | |
Enstar Group Ltd * (Bermuda) | | | 6,594 | | | | 738,396 | |
Enterprise Bancorp Inc | | | 4,854 | | | | 80,188 | |
Enterprise Financial Services Corp | | | 14,006 | | | | 183,058 | |
EPR Properties REIT | | | 36,480 | | | | 1,682,093 | |
Equity One Inc REIT | | | 42,956 | | | | 902,506 | |
ESB Financial Corp | | | 8,206 | | | | 113,817 | |
ESSA Bancorp Inc | | | 7,044 | | | | 76,709 | |
EverBank Financial Corp | | | 17,608 | | | | 262,535 | |
Evercore Partners Inc ‘A’ | | | 20,343 | | | | 614,155 | |
Excel Trust Inc REIT | | | 33,810 | | | | 428,373 | |
Ezcorp Inc ‘A’ * | | | 11,755 | | | | 233,454 | |
F.N.B. Corp | | | 109,168 | | | | 1,159,364 | |
Farmers National Banc Corp | | | 14,932 | | | | 92,578 | |
FBL Financial Group Inc ‘A’ | | | 7,545 | | | | 258,114 | |
FBR & Co * | | | 29,703 | | | | 114,951 | |
Federal Agricultural Mortgage Corp ‘C’ | | | 7,783 | | | | 252,948 | |
FelCor Lodging Trust Inc REIT * | | | 39,265 | | | | 183,368 | |
Fidelity Southern Corp * | | | 7,485 | | | | 71,482 | |
Fidus Investment Corp | | | 9,480 | | | | 155,946 | |
Fifth Street Finance Corp | | | 81,965 | | | | 854,075 | |
Financial Institutions Inc | | | 10,875 | | | | 202,601 | |
First American Financial Corp | | | 75,528 | | | | 1,819,470 | |
First Bancorp NC | | | 11,977 | | | | 153,545 | |
First BanCorp PR * | | | 55,505 | | | | 254,213 | |
First Busey Corp | | | 58,335 | | | | 271,258 | |
First California Financial Group Inc * | | | 17,819 | | | | 137,563 | |
First Commonwealth Financial Corp | | | 82,308 | | | | 561,341 | |
First Community Bancshares Inc | | | 13,818 | | | | 220,673 | |
First Connecticut Bancorp Inc | | | 13,793 | | | | 189,654 | |
First Defiance Financial Corp | | | 7,590 | | | | 145,652 | |
First Federal Bancshares of Arkansas Inc * | | | 1,981 | | | | 19,315 | |
First Financial Bancorp | | | 45,907 | | | | 671,160 | |
First Financial Bankshares Inc | | | 24,630 | | | | 960,816 | |
First Financial Corp | | | 8,825 | | | | 266,868 | |
First Financial Holdings Inc | | | 12,827 | | | | 167,777 | |
First Financial Northwest Inc * | | | 12,276 | | | | 92,684 | |
First Industrial Realty Trust Inc REIT * | | | 76,422 | | | | 1,076,022 | |
First Interstate Bancsystem Inc | | | 12,613 | | | | 194,619 | |
First Merchants Corp | | | 22,300 | | | | 330,932 | |
First Midwest Bancorp Inc | | | 58,377 | | | | 730,880 | |
First Pactrust Bancorp Inc | | | 8,218 | | | | 100,835 | |
First Potomac Realty Trust REIT | | | 39,434 | | | | 487,404 | |
FirstMerit Corp | | | 85,677 | | | | 1,215,757 | |
Flushing Financial Corp | | | 24,207 | | | | 371,335 | |
FNB United Corp * | | | 2,039 | | | | 23,652 | |
Forestar Group Inc * | | | 26,920 | | | | 466,524 | |
Fortegra Financial Corp * | | | 5,358 | | | | 47,633 | |
Fox Chase Bancorp Inc | | | 9,792 | | | | 163,037 | |
Franklin Financial Corp | | | 10,197 | | | | 169,066 | |
Franklin Street Properties Corp REIT | | | 56,687 | | | | 697,817 | |
FXCM Inc ‘A’ | | | 18,677 | | | | 188,077 | |
Gain Capital Holdings Inc | | | 11,841 | | | | 48,430 | |
German American Bancorp Inc | | | 9,913 | | | | 215,310 | |
Getty Realty Corp REIT | | | 19,967 | | | | 360,604 | |
GFI Group Inc | | | 54,443 | | | | 176,395 | |
Glacier Bancorp Inc | | | 56,157 | | | | 826,070 | |
Gladstone Capital Corp | | | 16,795 | | | | 137,047 | |
Gladstone Commercial Corp REIT | | | 8,213 | | | | 147,423 | |
Gladstone Investment Corp | | | 20,502 | | | | 142,694 | |
Glimcher Realty Trust REIT | | | 11,282 | | | | 125,117 | |
Global Indemnity PLC * (Ireland) | | | 8,147 | | | | 180,293 | |
Golub Capital BDC Inc | | | 12,374 | | | | 197,737 | |
Government Properties Income Trust REIT | | | 33,610 | | | | 805,632 | |
Gramercy Capital Corp REIT * | | | 35,643 | | | | 104,790 | |
Great Southern Bancorp Inc | | | 8,064 | | | | 205,229 | |
Greenlight Capital Re Ltd ‘A’ * (Cayman) | | | 16,124 | | | | 372,142 | |
GSV Capital Corp * | | | 15,334 | | | | 129,266 | |
| | |
| See Notes to Financial Statements | | See explanation of symbols and terms, if any, on page B-143 |
9
PACIFIC SELECT FUND
SMALL-CAP EQUITY PORTFOLIO
Schedule of Investments (Continued)
December 31, 2012
| | | | | | | | |
| | | Shares | | | Value | |
Guaranty Bancorp * | | | 60,045 | | | | $117,088 | |
Gyrodyne Co of America Inc REIT | | | 24 | | | | 1,729 | |
Hallmark Financial Services Inc * | | | 10,693 | | | | 100,407 | |
Hancock Holding Co | | | 59,470 | | | | 1,887,578 | |
Hanmi Financial Corp * | | | 24,531 | | | | 333,376 | |
Harris & Harris Group Inc * | | | 25,067 | | | | 82,721 | |
HCC Insurance Holdings Inc | | | 67,900 | | | | 2,526,559 | |
Healthcare Realty Trust Inc REIT | | | 67,994 | | | | 1,632,536 | |
Heartland Financial USA Inc | | | 11,389 | | | | 297,822 | |
Hercules Technology Growth Capital Inc | | | 41,654 | | | | 463,609 | |
Heritage Commerce Corp * | | | 16,340 | | | | 114,053 | |
Heritage Financial Corp | | | 12,070 | | | | 177,308 | |
Heritage Financial Group Inc | | | 5,794 | | | | 79,899 | |
Heritage Oaks Bancorp * | | | 15,657 | | | | 90,811 | |
Hersha Hospitality Trust REIT | | | 134,189 | | | | 670,945 | |
HFF Inc ‘A’ | | | 3,898 | | | | 58,080 | |
Highwoods Properties Inc REIT | | | 7,382 | | | | 246,928 | |
Hilltop Holdings Inc * | | | 31,432 | | | | 425,589 | |
Hingham Institution for Savings | | | 808 | | | | 50,581 | |
Home Bancorp Inc * | | | 5,275 | | | | 96,269 | |
Home BancShares Inc | | | 17,253 | | | | 569,694 | |
Home Federal Bancorp Inc | | | 11,381 | | | | 141,466 | |
Home Loan Servicing Solutions Ltd (Cayman) | | | 22,573 | | | | 426,630 | |
Homeowners Choice Inc | | | 5,426 | | | | 112,807 | |
HomeStreet Inc * | | | 6,858 | | | | 175,222 | |
HomeTrust Bancshares Inc * | | | 16,302 | | | | 220,240 | |
Horace Mann Educators Corp | | | 31,201 | | | | 622,772 | |
Horizon Bancorp | | | 5,097 | | | | 100,156 | |
Horizon Technology Finance Corp | | | 6,119 | | | | 91,112 | |
Hudson Pacific Properties Inc REIT | | | 27,713 | | | | 583,636 | |
Hudson Valley Holding Corp | | | 12,360 | | | | 192,445 | |
IBERIABANK Corp | | | 23,003 | | | | 1,129,907 | |
ICG Group Inc * | | | 26,769 | | | | 305,970 | |
Independence Holding Co | | | 6,358 | | | | 60,528 | |
Independent Bank Corp | | | 17,234 | | | | 498,924 | |
Infinity Property & Casualty Corp | | | 9,346 | | | | 544,311 | |
Inland Real Estate Corp REIT | | | 32,839 | | | | 275,191 | |
International Bancshares Corp | | | 41,684 | | | | 752,396 | |
INTL FCStone Inc * | | | 10,838 | | | | 188,690 | |
Invesco Mortgage Capital Inc REIT | | | 90,283 | | | | 1,779,478 | |
Investment Technology Group Inc * | | | 30,380 | | | | 273,420 | |
Investors Bancorp Inc | | | 28,627 | | | | 508,988 | |
Investors Real Estate Trust REIT | | | 70,675 | | | | 616,993 | |
Investors Title Co | | | 1,083 | | | | 64,980 | |
iStar Financial Inc REIT * | | | 65,408 | | | | 533,075 | |
JAVELIN Mortgage Investment Corp | | | 4,227 | | | | 80,693 | |
JMP Group Inc | | | 13,102 | | | | 79,529 | |
Kansas City Life Insurance Co | | | 3,189 | | | | 121,692 | |
KBW Inc | | | 27,396 | | | | 419,159 | |
KCAP Financial Inc | | | 17,542 | | | | 161,211 | |
Kearny Financial Corp | | | 11,925 | | | | 116,269 | |
Kennedy-Wilson Holdings Inc | | | 33,362 | | | | 466,401 | |
Kite Realty Group Trust REIT | | | 49,814 | | | | 278,460 | |
Knight Capital Group Inc ‘A’ * | | | 141,415 | | | | 496,367 | |
Lakeland Bancorp Inc | | | 23,215 | | | | 236,329 | |
Lakeland Financial Corp | | | 12,809 | | | | 330,985 | |
LaSalle Hotel Properties REIT | | | 66,674 | | | | 1,692,853 | |
Lexington Realty Trust REIT | | | 103,065 | | | | 1,077,029 | |
LTC Properties Inc REIT | | | 18,516 | | | | 651,578 | |
Maiden Holdings Ltd (Bermuda) | | | 40,228 | | | | 369,695 | |
Main Street Capital Corp | | | 21,968 | | | | 670,244 | |
MainSource Financial Group Inc | | | 15,661 | | | | 198,425 | |
Manning & Napier Inc | | | 10,691 | | | | 134,707 | |
Marlin Business Services Corp | | | 6,498 | | | | 130,350 | |
MB Financial Inc | | | 42,587 | | | | 841,093 | |
MCG Capital Corp | | | 57,391 | | | | 263,999 | |
Meadowbrook Insurance Group Inc | | | 37,436 | | | | 216,380 | |
Medallion Financial Corp | | | 14,182 | | | | 166,497 | |
Medical Properties Trust Inc REIT | | | 105,987 | | | | 1,267,605 | |
Medley Capital Corp | | | 22,401 | | | | 326,159 | |
| | | | | | | | |
| | | Shares | | | Value | |
Mercantile Bank Corp | | | 6,815 | | | | $112,448 | |
Merchants Bancshares Inc | | | 4,107 | | | | 109,944 | |
Meridian Interstate Bancorp Inc * | | | 6,114 | | | | 102,593 | |
Metro Bancorp Inc * | | | 11,093 | | | | 146,649 | |
MetroCorp Bancshares Inc * | | | 12,484 | | | | 137,199 | |
MGIC Investment Corp * | | | 147,142 | | | | 391,398 | |
MicroFinancial Inc | | | 4,237 | | | | 30,845 | |
Middleburg Financial Corp | | | 4,202 | | | | 74,207 | |
Midsouth Bancorp Inc | | | 6,682 | | | | 109,251 | |
MidWestOne Financial Group Inc | | | 5,299 | | | | 108,683 | |
Monmouth Real Estate Investment
Corp ‘A’ REIT | | | 17,551 | | | | 181,828 | |
Montpelier Re Holdings Ltd (Bermuda) | | | 241,097 | | | | 5,511,477 | |
MVC Capital Inc | | | 18,951 | | | | 230,255 | |
NASB Financial Inc * | | | 3,347 | | | | 71,525 | |
National Bank Holdings Corp ‘A’ | | | 5,461 | | | | 103,704 | |
National Bankshares Inc | | | 5,562 | | | | 180,153 | |
National Financial Partners Corp * | | | 31,701 | | | | 543,355 | |
National Interstate Corp | | | 5,246 | | | | 151,190 | |
National Penn Bancshares Inc | | | 96,407 | | | | 898,513 | |
National Western Life Insurance Co ‘A’ | | | 1,659 | | | | 261,691 | |
NBT Bancorp Inc | | | 26,017 | | | | 527,365 | |
Nelnet Inc ‘A’ | | | 18,604 | | | | 554,213 | |
New Mountain Finance Corp | | | 14,972 | | | | 223,083 | |
New York Mortgage Trust Inc REIT | | | 38,690 | | | | 244,521 | |
NewStar Financial Inc * | | | 20,481 | | | | 286,939 | |
NGP Capital Resources Co | | | 17,530 | | | | 126,567 | |
Nicholas Financial Inc (Canada) | | | 7,888 | | | | 97,811 | |
Northfield Bancorp Inc | | | 11,492 | | | | 175,253 | |
Northrim BanCorp Inc | | | 5,126 | | | | 116,104 | |
NorthStar Realty Finance Corp REIT | | | 126,895 | | | | 893,341 | |
Northwest Bancshares Inc | | | 76,277 | | | | 926,003 | |
OceanFirst Financial Corp | | | 11,404 | | | | 156,805 | |
Ocwen Financial Corp * | | | 78,580 | | | | 2,718,082 | |
OFS Capital Corp * | | | 4,142 | | | | 56,704 | |
Old National Bancorp | | | 79,194 | | | | 940,033 | |
Old Republic International Corp | | | 493,000 | | | | 5,250,450 | |
OmniAmerican Bancorp Inc * | | | 8,707 | | | | 201,393 | |
One Liberty Properties Inc REIT | | | 9,128 | | | | 185,207 | |
OneBeacon Insurance Group Ltd ‘A’ (Bermuda) | | | 18,584 | | | | 258,318 | |
Oppenheimer Holdings Inc ‘A’ | | | 8,170 | | | | 141,096 | |
Oriental Financial Group Inc | | | 233,634 | | | | 3,119,014 | |
Oritani Financial Corp | | | 23,263 | | | | 356,389 | |
Pacific Continental Corp | | | 14,297 | | | | 139,110 | |
Pacific Mercantile Bancorp * | | | 8,715 | | | | 54,817 | |
PacWest Bancorp | | | 23,719 | | | | 587,757 | |
Park National Corp | | | 8,894 | | | | 574,819 | |
Park Sterling Corp * | | | 34,130 | | | | 178,500 | |
Parkway Properties Inc REIT | | | 16,397 | | | | 229,394 | |
Peapack Gladstone Financial Corp | | | 6,927 | | | | 97,532 | |
Pebblebrook Hotel Trust REIT | | | 46,955 | | | | 1,084,661 | |
PennantPark Investment Corp | | | 51,569 | | | | 567,001 | |
Penns Woods Bancorp Inc | | | 2,832 | | | | 105,945 | |
Pennsylvania REIT | | | 43,521 | | | | 767,710 | |
PennyMac Mortgage Investment Trust REIT | | | 46,094 | | | | 1,165,717 | |
Peoples Bancorp Inc | | | 8,512 | | | | 173,900 | |
Peoples Federal Bancshares Inc | | | 4,593 | | | | 79,872 | |
PHH Corp * | | | 44,029 | | | | 1,001,660 | |
PICO Holdings Inc * | | | 17,796 | | | | 360,725 | |
Pinnacle Financial Partners Inc * | | | 26,918 | | | | 507,135 | |
Piper Jaffray Cos * | | | 11,846 | | | | 380,612 | |
Platinum Underwriters Holdings Ltd (Bermuda) | | | 25,805 | | | | 1,187,030 | |
Potlatch Corp REIT | | | 11,746 | | | | 460,326 | |
Preferred Bank * | | | 9,270 | | | | 131,634 | |
Primerica Inc | | | 34,406 | | | | 1,032,524 | |
PrivateBancorp Inc | | | 47,126 | | | | 721,970 | |
Prospect Capital Corp | | | 148,627 | | | | 1,615,576 | |
Prosperity Bancshares Inc | | | 37,060 | | | | 1,556,520 | |
Protective Life Corp | | | 395,900 | | | | 11,314,822 | |
| | |
| See Notes to Financial Statements | | See explanation of symbols and terms, if any, on page B-143 |
10
PACIFIC SELECT FUND
SMALL-CAP EQUITY PORTFOLIO
Schedule of Investments (Continued)
December 31, 2012
| | | | | | | | |
| | | Shares | | | Value | |
Provident Financial Holdings Inc | | | 7,603 | | | | $133,053 | |
Provident Financial Services Inc | | | 46,953 | | | | 700,539 | |
Provident New York Bancorp | | | 30,985 | | | | 288,470 | |
PS Business Parks Inc REIT | | | 2,380 | | | | 154,652 | |
Pzena Investment Management Inc ‘A’ | | | 3,563 | | | | 19,240 | |
Radian Group Inc | | | 104,013 | | | | 635,519 | |
RAIT Financial Trust REIT | | | 39,002 | | | | 220,361 | |
Ramco-Gershenson Properties Trust REIT | | | 35,823 | | | | 476,804 | |
Redwood Trust Inc REIT | | | 61,364 | | | | 1,036,438 | |
Renasant Corp | | | 19,684 | | | | 376,752 | |
Republic Bancorp Inc ‘A’ | | | 7,903 | | | | 166,990 | |
Resource America Inc ‘A’ | | | 9,505 | | | | 63,398 | |
Resource Capital Corp REIT | | | 77,773 | | | | 435,529 | |
Retail Opportunity Investments Corp REIT | | | 40,400 | | | | 519,544 | |
RLI Corp | | | 32,837 | | | | 2,123,240 | |
RLJ Lodging Trust REIT | | | 83,020 | | | | 1,608,097 | |
Rockville Financial Inc | | | 22,462 | | | | 289,760 | |
Roma Financial Corp | | | 5,785 | | | | 87,469 | |
Rouse Properties Inc REIT | | | 17,023 | | | | 288,029 | |
Ryman Hospitality Properties REIT | | | 7,357 | | | | 282,950 | |
S&T Bancorp Inc | | | 22,641 | | | | 409,123 | |
S.Y. Bancorp Inc | | | 9,607 | | | | 215,389 | |
Sabra Health Care REIT Inc | | | 28,842 | | | | 626,448 | |
Safeguard Scientifics Inc * | | | 16,265 | | | | 239,909 | |
Safety Insurance Group Inc | | | 10,278 | | | | 474,535 | |
Sandy Spring Bancorp Inc | | | 18,874 | | | | 366,533 | |
SCBT Financial Corp | | | 12,858 | | | | 516,634 | |
SeaBright Holdings Inc | | | 16,049 | | | | 177,662 | |
Seacoast Banking Corp of Florida * | | | 57,102 | | | | 91,934 | |
Select Income REIT | | | 8,792 | | | | 217,778 | |
Selective Insurance Group Inc | | | 43,382 | | | | 835,971 | |
SI Financial Group Inc | | | 8,287 | | | | 95,301 | |
Sierra Bancorp | | | 9,641 | | | | 110,197 | |
Simmons First National Corp ‘A’ | | | 13,375 | | | | 339,190 | |
Simplicity Bancorp Inc | | | 7,028 | | | | 105,069 | |
Solar Capital Ltd | | | 30,509 | | | | 729,470 | |
Solar Senior Capital Ltd | | | 7,664 | | | | 143,010 | |
Southside Bancshares Inc | | | 13,488 | | | | 284,057 | |
Southwest Bancorp Inc * | | | 15,197 | | | | 170,206 | |
Sovran Self Storage Inc REIT | | | 2,004 | | | | 124,448 | |
Spirit Realty Capital Inc REIT | | | 20,743 | | | | 368,811 | |
STAG Industrial Inc REIT | | | 24,429 | | | | 438,989 | |
StanCorp Financial Group Inc | | | 126,300 | | | | 4,631,421 | |
Starwood Property Trust Inc REIT | | | 105,478 | | | | 2,421,775 | |
State Auto Financial Corp | | | 10,280 | | | | 153,583 | |
State Bank Financial Corp | | | 24,625 | | | | 391,045 | |
StellarOne Corp | | | 17,999 | | | | 254,506 | |
Stellus Capital Investment Corp | | | 1,300 | | | | 21,294 | |
Sterling Bancorp | | | 24,539 | | | | 223,550 | |
Sterling Financial Corp | | | 20,930 | | | | 437,018 | |
Stewart Information Services Corp | | | 14,368 | | | | 373,568 | |
Stifel Financial Corp * | | | 21,404 | | | | 684,286 | |
Strategic Hotels & Resorts Inc REIT * | | | 21,794 | | | | 139,482 | |
Suffolk Bancorp * | | | 7,629 | | | | 99,940 | |
Summit Hotel Properties Inc REIT | | | 33,056 | | | | 314,032 | |
Sun Bancorp Inc * | | | 30,998 | | | | 109,733 | |
Sunstone Hotel Investors Inc REIT * | | | 106,396 | | | | 1,139,501 | |
Susquehanna Bancshares Inc | | | 146,434 | | | | 1,534,628 | |
SWS Group Inc * | | | 22,793 | | | | 120,575 | |
Symetra Financial Corp | | | 60,186 | | | | 781,214 | |
Taylor Capital Group Inc * | | | 12,714 | | | | 229,488 | |
TCP Capital Corp | | | 4,593 | | | | 67,701 | |
Terreno Realty Corp REIT | | | 9,764 | | | | 150,756 | |
Territorial Bancorp Inc | | | 8,525 | | | | 194,796 | |
Texas Capital Bancshares Inc * | | | 4,082 | | | | 182,955 | |
The Bancorp Inc * | | | 22,801 | | | | 250,127 | |
The First Bancorp Inc | | | 7,094 | | | | 116,838 | |
The First Marblehead Corp * | | | 47,129 | | | | 36,615 | |
The First of Long Island Corp | | | 6,106 | | | | 172,922 | |
The Hanover Insurance Group Inc | | | 122,270 | | | | 4,736,740 | |
| | | | | | | | |
| | | Shares | | | Value | |
The Navigators Group Inc * | | | 4,663 | | | | $238,139 | |
The Phoenix Cos Inc * | | | 4,580 | | | | 113,263 | |
THL Credit Inc | | | 12,393 | | | | 183,292 | |
Thomas Properties Group Inc | | | 25,295 | | | | 136,846 | |
TICC Capital Corp | | | 32,985 | | | | 333,808 | |
Tompkins Financial Corp | | | 8,687 | | | | 344,353 | |
Tower Group Inc | | | 12,993 | | | | 230,886 | |
TowneBank | | | 20,737 | | | | 321,216 | |
Tree.com Inc | | | 2,008 | | | | 36,204 | |
Triangle Capital Corp | | | 21,418 | | | | 545,945 | |
TriCo Bancshares | | | 12,552 | | | | 210,246 | |
TrustCo Bank Corp NY | | | 592,275 | | | | 3,127,212 | |
Trustmark Corp | | | 50,679 | | | | 1,138,250 | |
Two Harbors Investment Corp REIT | | | 229,789 | | | | 2,546,062 | |
UMB Financial Corp | | | 25,241 | | | | 1,106,565 | |
UMH Properties Inc REIT | | | 8,411 | | | | 86,886 | |
Umpqua Holdings Corp | | | 87,185 | | | | 1,027,911 | |
Union First Market Bankshares Corp | | | 15,971 | | | | 251,863 | |
United Bankshares Inc | | | 20,808 | | | | 506,051 | |
United Community Banks Inc * | | | 32,502 | | | | 306,169 | |
United Financial Bancorp Inc | | | 16,010 | | | | 251,677 | |
United Fire Group Inc | | | 15,830 | | | | 345,727 | |
Universal Health Realty Income Trust REIT | | | 3,503 | | | | 177,287 | |
Universal Insurance Holdings Inc | | | 15,553 | | | | 68,122 | |
Univest Corp of Pennsylvania | | | 13,385 | | | | 228,884 | |
Urstadt Biddle Properties Inc ‘A’ REIT | | | 4,244 | | | | 83,522 | |
Validus Holdings Ltd (Bermuda) | | | 143,400 | | | | 4,958,772 | |
ViewPoint Financial Group | | | 26,212 | | | | 548,879 | |
Virginia Commerce Bancorp Inc * | | | 21,143 | | | | 189,230 | |
Virtus Investment Partners Inc * | | | 2,257 | | | | 272,962 | |
Walker & Dunlop Inc * | | | 8,947 | | | | 149,057 | |
Walter Investment Management Corp * | | | 27,806 | | | | 1,196,214 | |
Washington Banking Co | | | 12,305 | | | | 167,594 | |
Washington REIT | | | 35,374 | | | | 925,030 | |
Washington Trust Bancorp Inc | | | 11,336 | | | | 298,250 | |
Waterstone Financial Inc * | | | 5,784 | | | | 45,115 | |
Webster Financial Corp | | | 56,205 | | | | 1,155,013 | |
WesBanco Inc | | | 19,758 | | | | 439,023 | |
West Bancorp Inc | | | 12,482 | | | | 134,556 | |
West Coast Bancorp | | | 14,907 | | | | 330,190 | |
Westamerica Bancorp | | | 9,863 | | | | 420,065 | |
Western Alliance Bancorp * | | | 56,850 | | | | 598,631 | |
Western Asset Mortgage Capital Corp REIT | | | 14,495 | | | | 286,566 | |
Westfield Financial Inc | | | 19,112 | | | | 138,180 | |
Whitestone REIT | | | 10,485 | | | | 147,314 | |
Wilshire Bancorp Inc * | | | 48,118 | | | | 282,453 | |
Winthrop Realty Trust REIT | | | 22,846 | | | | 252,448 | |
Wintrust Financial Corp | | | 28,300 | | | | 1,038,610 | |
WSFS Financial Corp | | | 5,964 | | | | 251,979 | |
| | | | | | | | |
| | | | | | | 234,061,742 | |
| | | | | | | | |
Health Care - 3.9% | | | | | | | | |
| | |
Affymetrix Inc * | | | 55,143 | | | | 174,803 | |
Agenus Inc * | | | 7,776 | | | | 31,882 | |
Almost Family Inc | | | 6,506 | | | | 131,812 | |
Alphatec Holdings Inc * | | | 43,166 | | | | 71,224 | |
AMAG Pharmaceuticals Inc * | | | 3,389 | | | | 49,852 | |
Amedisys Inc * | | | 23,278 | | | | 262,343 | |
AMN Healthcare Services Inc * | | | 15,410 | | | | 177,985 | |
AmSurg Corp * | | | 16,581 | | | | 497,596 | |
AngioDynamics Inc * | | | 18,880 | | | | 207,491 | |
Arena Pharmaceuticals Inc * | | | 19,518 | | | | 176,052 | |
ArthroCare Corp * | | | 3,719 | | | | 128,640 | |
Assisted Living Concepts Inc ‘A’ | | | 15,411 | | | | 150,257 | |
Astex Pharmaceuticals Inc * | | | 72,908 | | | | 212,162 | |
AVANIR Pharmaceuticals Inc ‘A’ * | | | 9,119 | | | | 23,983 | |
AVEO Pharmaceuticals Inc * | | | 2,201 | | | | 17,718 | |
BioScrip Inc * | | | 24,864 | | | | 267,785 | |
Cambrex Corp * | | | 11,325 | | | | 128,878 | |
Capital Senior Living Corp * | | | 3,031 | | | | 56,649 | |
| | |
| See Notes to Financial Statements | | See explanation of symbols and terms, if any, on page B-143 |
11
PACIFIC SELECT FUND
SMALL-CAP EQUITY PORTFOLIO
Schedule of Investments (Continued)
December 31, 2012
| | | | | | | | |
| | | Shares | | | Value | |
Cerus Corp * | | | 5,425 | | | | $17,143 | |
Chindex International Inc * | | | 8,960 | | | | 94,080 | |
Codexis Inc * | | | 20,093 | | | | 44,406 | |
CONMED Corp | | | 21,942 | | | | 613,279 | |
Cornerstone Therapeutics Inc * | | | 6,594 | | | | 31,190 | |
Cross Country Healthcare Inc * | | | 20,674 | | | | 99,235 | |
CryoLife Inc | | | 21,652 | | | | 134,892 | |
Cumberland Pharmaceuticals Inc * | | | 4,261 | | | | 17,896 | |
Curis Inc * | | | 13,873 | | | | 47,584 | |
Cynosure Inc ‘A’ * | | | 4,750 | | | | 114,523 | |
Cytori Therapeutics Inc * | | | 10,362 | | | | 29,221 | |
Derma Sciences Inc * | | | 8,281 | | | | 92,002 | |
Durata Therapeutics Inc * | | | 984 | | | | 7,518 | |
Dynavax Technologies Corp * | | | 16,141 | | | | 46,163 | |
Emergent BioSolutions Inc * | | | 15,866 | | | | 254,491 | |
Enzon Pharmaceuticals Inc | | | 29,429 | | | | 130,370 | |
Epocrates Inc * | | | 897 | | | | 7,912 | |
Exactech Inc * | | | 5,151 | | | | 87,309 | |
ExamWorks Group Inc * | | | 18,330 | | | | 256,437 | |
Five Star Quality Care Inc * | | | 19,644 | | | | 98,416 | |
Gentiva Health Services Inc * | | | 23,795 | | | | 239,140 | |
Geron Corp * | | | 102,299 | | | | 144,242 | |
Globus Medical Inc ‘A’ * | | | 2,231 | | | | 23,403 | |
Greatbatch Inc * | | | 18,276 | | | | 424,734 | |
Greenway Medical Technologies Inc * | | | 1,407 | | | | 21,612 | |
GTx Inc * | | | 3,397 | | | | 14,267 | |
Hanger Inc * | | | 26,550 | | | | 726,408 | |
Harvard Bioscience Inc * | | | 18,218 | | | | 79,795 | |
HealthSouth Corp * | | | 11,616 | | | | 245,214 | |
Healthways Inc * | | | 25,841 | | | | 276,499 | |
Hi-Tech Pharmacal Co Inc | | | 5,147 | | | | 180,042 | |
Hill-Rom Holdings Inc | | | 151,900 | | | | 4,329,150 | |
Horizon Pharma Inc * | | | 13,050 | | | | 30,407 | |
Hyperion Therapeutics Inc * | | | 276 | | | | 3,113 | |
ICU Medical Inc * | | | 902 | | | | 54,959 | |
Idenix Pharmaceuticals Inc * | | | 8,166 | | | | 39,605 | |
ImmunoGen Inc * | | | 14,549 | | | | 185,500 | |
Integra LifeSciences Holdings Corp * | | | 6,460 | | | | 251,746 | |
Intercept Pharmaceuticals Inc * | | | 650 | | | | 22,256 | |
InterMune Inc * | | | 22,424 | | | | 217,289 | |
Invacare Corp | | | 24,565 | | | | 400,409 | |
Kindred Healthcare Inc * | | | 41,083 | | | | 444,518 | |
KYTHERA Biopharmaceuticals Inc * | | | 676 | | | | 20,510 | |
Lannett Co Inc * | | | 12,902 | | | | 63,994 | |
Lexicon Pharmaceuticals Inc * | | | 94,289 | | | | 209,322 | |
LHC Group Inc * | | | 10,942 | | | | 233,065 | |
Magellan Health Services Inc * | | | 20,187 | | | | 989,163 | |
Maxygen Inc | | | 21,439 | | | | 52,740 | |
MedAssets Inc * | | | 30,134 | | | | 505,347 | |
Merge Healthcare Inc * | | | 11,075 | | | | 27,355 | |
Merit Medical Systems Inc * | | | 30,928 | | | | 429,899 | |
Molina Healthcare Inc * | | | 21,451 | | | | 580,464 | |
Momenta Pharmaceuticals Inc * | | | 22,380 | | | | 263,636 | |
National Healthcare Corp | | | 8,245 | | | | 387,680 | |
Natus Medical Inc * | | | 8,876 | | | | 99,234 | |
Nektar Therapeutics * | | | 26,070 | | | | 193,179 | |
NPS Pharmaceuticals Inc * | | | 22,500 | | | | 204,750 | |
NuVasive Inc * | | | 25,239 | | | | 390,195 | |
Omnicell Inc * | | | 22,929 | | | | 340,954 | |
Orthofix International NV * (Netherlands) | | | 2,855 | | | | 112,287 | |
Owens & Minor Inc | | | 7,115 | | | | 202,849 | |
Pacific Biosciences of California Inc * | | | 29,325 | | | | 49,853 | |
Palomar Medical Technologies Inc * | | | 15,163 | | | | 139,651 | |
PDI Inc * | | | 7,118 | | | | 54,097 | |
PDL BioPharma Inc | | | 15,521 | | | | 109,423 | |
PharMerica Corp * | | | 22,964 | | | | 327,007 | |
PhotoMedex Inc * | | | 1,548 | | | | 22,461 | |
Regulus Therapeutics Inc * | | | 1,212 | | | | 7,636 | |
Repligen Corp * | | | 2,715 | | | | 17,077 | |
Rigel Pharmaceuticals Inc * | | | 12,157 | | | | 79,021 | |
| | | | | | | | |
| | | Shares | | | Value | |
Rochester Medical Corp * | | | 1,061 | | | | $10,695 | |
Rockwell Medical Technologies Inc * | | | 875 | | | | 7,044 | |
RTI Biologics Inc * | | | 40,881 | | | | 174,562 | |
Select Medical Holdings Corp | | | 27,588 | | | | 260,155 | |
Sequenom Inc * | | | 21,195 | | | | 100,040 | |
Skilled Healthcare Group Inc ‘A’ * | | | 1,162 | | | | 7,402 | |
Solta Medical Inc * | | | 53,408 | | | | 142,599 | |
STERIS Corp | | | 164,938 | | | | 5,728,297 | |
Sunrise Senior Living Inc * | | | 9,101 | | | | 130,872 | |
Supernus Pharmaceuticals Inc * | | | 3,204 | | | | 22,973 | |
SurModics Inc * | | | 7,767 | | | | 173,670 | |
Symmetry Medical Inc * | | | 19,694 | | | | 207,181 | |
Targacept Inc * | | | 21,655 | | | | 94,849 | |
Teleflex Inc | | | 72,000 | | | | 5,134,320 | |
TESARO Inc * | | | 684 | | | | 11,594 | |
The Ensign Group Inc | | | 5,207 | | | | 141,578 | |
The Providence Service Corp * | | | 7,675 | | | | 130,398 | |
Tornier NV * (Netherlands) | | | 3,652 | | | | 61,317 | |
Transcept Pharmaceuticals Inc * | | | 8,943 | | | | 39,796 | |
Triple-S Management Corp ‘B’ * | | | 15,002 | | | | 277,087 | |
Universal American Corp | | | 29,460 | | | | 253,061 | |
Vanguard Health Systems Inc * | | | 3,283 | | | | 40,217 | |
Vical Inc * | | | 5,297 | | | | 15,414 | |
ViroPharma Inc * | | | 51,220 | | | | 1,165,767 | |
Vocera Communications Inc * | | | 3,205 | | | | 80,446 | |
WellCare Health Plans Inc * | | | 17,367 | | | | 845,599 | |
West Pharmaceutical Services Inc | | | 59,269 | | | | 3,244,978 | |
Wright Medical Group Inc * | | | 30,533 | | | | 640,888 | |
XenoPort Inc * | | | 4,829 | | | | 37,521 | |
XOMA Corp * | | | 7,755 | | | | 18,573 | |
Young Innovations Inc | | | 2,373 | | | | 93,520 | |
Zeltiq Aesthetics Inc * | | | 7,417 | | | | 34,341 | |
| | | | | | | | |
| | | | | | | 38,785,090 | |
| | | | | | | | |
Industrials - 25.4% | | | | | | | | |
| | |
A.O. Smith Corp | | | 62,546 | | | | 3,944,776 | |
AAR Corp | | | 441,008 | | | | 8,238,029 | |
ABM Industries Inc | | | 41,703 | | | | 831,975 | |
ACCO Brands Corp * | | | 47,563 | | | | 349,112 | |
Accuride Corp * | | | 36,878 | | | | 118,378 | |
Aceto Corp | | | 16,180 | | | | 162,447 | |
Actuant Corp ‘A’ | | | 45,702 | | | | 1,275,543 | |
Aegion Corp * | | | 26,193 | | | | 581,223 | |
Aerovironment Inc * | | | 5,389 | | | | 117,157 | |
Air Transport Services Group Inc * | | | 41,922 | | | | 168,107 | |
Aircastle Ltd (Bermuda) | | | 45,578 | | | | 571,548 | |
Alamo Group Inc | | | 5,423 | | | | 177,007 | |
Alaska Air Group Inc * | | | 3,067 | | | | 132,157 | |
Albany International Corp ‘A’ | | | 21,350 | | | | 484,218 | |
Altra Holdings Inc | | | 9,533 | | | | 210,203 | |
AMERCO | | | 6,744 | | | | 855,207 | |
Ameresco Inc ‘A’ * | | | 3,750 | | | | 36,787 | |
American Railcar Industries Inc | | | 7,357 | | | | 233,438 | |
American Science & Engineering Inc | | | 5,314 | | | | 346,526 | |
American Superconductor Corp * | | | 27,194 | | | | 71,248 | |
American Woodmark Corp * | | | 22,480 | | | | 625,394 | |
Ampco-Pittsburgh Corp | | | 6,763 | | | | 135,125 | |
API Technologies Corp * | | | 24,433 | | | | 71,833 | |
Apogee Enterprises Inc | | | 313,149 | | | | 7,506,181 | |
Applied Industrial Technologies Inc | | | 58,694 | | | | 2,465,735 | |
ARC Document Solutions Inc * | | | 24,117 | | | | 61,739 | |
Argan Inc | | | 6,019 | | | | 108,342 | |
Arkansas Best Corp | | | 19,896 | | | | 190,007 | |
Astec Industries Inc | | | 186,969 | | | | 6,231,677 | |
AT Cross Co ‘A’ * | | | 457 | | | | 4,926 | |
Atlas Air Worldwide Holdings Inc * | | | 20,522 | | | | 909,330 | |
Barnes Group Inc | | | 42,177 | | | | 947,295 | |
Belden Inc | | | 3,906 | | | | 175,731 | |
BlueLinx Holdings Inc * | | | 15,277 | | | | 42,928 | |
Brady Corp ‘A’ | | | 178,760 | | | | 5,970,584 | |
| | |
| See Notes to Financial Statements | | See explanation of symbols and terms, if any, on page B-143 |
12
PACIFIC SELECT FUND
SMALL-CAP EQUITY PORTFOLIO
Schedule of Investments (Continued)
December 31, 2012
| | | | | | | | |
| | | Shares | | | Value | |
Briggs & Stratton Corp | | | 304,027 | | | | $6,408,889 | |
CAI International Inc * | | | 6,695 | | | | 146,955 | |
Carlisle Cos Inc | | | 124,000 | | | | 7,286,240 | |
Cascade Corp | | | 6,827 | | | | 438,976 | |
Casella Waste Systems Inc ‘A’ * | | | 26,864 | | | | 117,664 | |
CBIZ Inc * | | | 29,363 | | | | 173,535 | |
CDI Corp | | | 8,988 | | | | 153,964 | |
Ceco Environmental Corp | | | 915 | | | | 9,104 | |
Cenveo Inc * | | | 41,286 | | | | 111,472 | |
CIRCOR International Inc | | | 70,481 | | | | 2,790,343 | |
Columbus McKinnon Corp * | | | 14,969 | | | | 247,288 | |
Comfort Systems USA Inc | | | 20,699 | | | | 251,700 | |
Compx International Inc | | | 782 | | | | 11,069 | |
Consolidated Graphics Inc * | | | 5,826 | | | | 203,444 | |
Courier Corp | | | 7,684 | | | | 84,524 | |
CRA International Inc * | | | 8,019 | | | | 158,536 | |
Cubic Corp | | | 5,750 | | | | 275,827 | |
Curtiss-Wright Corp | | | 36,440 | | | | 1,196,325 | |
Deluxe Corp | | | 13,122 | | | | 423,053 | |
DigitalGlobe Inc * | | | 8,695 | | | | 212,506 | |
Douglas Dynamics Inc | | | 17,336 | | | | 249,465 | |
Dycom Industries Inc * | | | 3,341 | | | | 66,152 | |
Dynamic Materials Corp | | | 6,670 | | | | 92,713 | |
Edgen Group Inc * | | | 8,671 | | | | 61,217 | |
EMCOR Group Inc | | | 206,865 | | | | 7,159,598 | |
Encore Wire Corp | | | 12,803 | | | | 388,059 | |
Energy Recovery Inc * | | | 34,080 | | | | 115,872 | |
EnergySolutions Inc * | | | 44,602 | | | | 139,158 | |
EnerNOC Inc * | | | 11,989 | | | | 140,871 | |
EnerSys * | | | 32,128 | | | | 1,208,977 | |
Ennis Inc | | | 20,216 | | | | 312,741 | |
Enphase Energy Inc * | | | 1,301 | | | | 4,749 | |
EnPro Industries Inc * | | | 188,121 | | | | 7,694,149 | |
ESCO Technologies Inc | | | 14,140 | | | | 528,977 | |
Esterline Technologies Corp * | | | 23,814 | | | | 1,514,809 | |
Federal Signal Corp * | | | 43,534 | | | | 331,294 | |
Flow International Corp * | | | 29,348 | | | | 102,718 | |
Franklin Covey Co * | | | 3,228 | | | | 41,641 | |
Franklin Electric Co Inc | | | 80,902 | | | | 5,029,677 | |
FreightCar America Inc | | | 9,185 | | | | 205,928 | |
FTI Consulting Inc * | | | 32,604 | | | | 1,075,932 | |
FuelCell Energy Inc * | | | 86,752 | | | | 79,552 | |
Furmanite Corp * | | | 29,287 | | | | 157,271 | |
G&K Services Inc ‘A’ | | | 14,657 | | | | 500,537 | |
Gardner Denver Inc | | | 110,000 | | | | 7,535,000 | |
Genco Shipping & Trading Ltd * | | | 23,851 | | | | 83,240 | |
GenCorp Inc * | | | 9,706 | | | | 88,810 | |
Generac Holdings Inc | | | 10,490 | | | | 359,912 | |
General Cable Corp * | | | 52,100 | | | | 1,584,361 | |
Genesee & Wyoming Inc ‘A’ * | | | 80,120 | | | | 6,095,530 | |
GeoEye Inc * | | | 11,821 | | | | 363,259 | |
Gibraltar Industries Inc * | | | 537,488 | | | | 8,556,809 | |
Global Power Equipment Group Inc | | | 13,354 | | | | 229,021 | |
GP Strategies Corp * | | | 1,151 | | | | 23,768 | |
Graco Inc | | | 79,400 | | | | 4,088,306 | |
Granite Construction Inc | | | 350,031 | | | | 11,768,042 | |
Great Lakes Dredge & Dock Co | | | 41,197 | | | | 367,889 | |
Griffon Corp | | | 35,254 | | | | 404,011 | |
H&E Equipment Services Inc | | | 10,052 | | | | 151,484 | |
Hardinge Inc | | | 9,235 | | | | 91,796 | |
Hawaiian Holdings Inc * | | | 18,575 | | | | 122,038 | |
Heartland Express Inc | | | 8,631 | | | | 112,807 | |
Heidrick & Struggles International Inc | | | 13,925 | | | | 212,495 | |
Hill International Inc * | | | 17,080 | | | | 62,513 | |
HNI Corp | | | 1,948 | | | | 58,557 | |
Houston Wire & Cable Co | | | 8,972 | | | | 110,086 | |
Hudson Global Inc * | | | 25,947 | | | | 116,243 | |
Hurco Cos Inc * | | | 4,917 | | | | 113,091 | |
Hyster-Yale Materials Handling Inc | | | 8,493 | | | | 414,458 | |
ICF International Inc * | | | 15,404 | | | | 361,070 | |
| | | | | | | | |
| | | Shares | | | Value | |
II-VI Inc * | | | 6,042 | | | | $110,387 | |
Insperity Inc | | | 130,000 | | | | 4,232,800 | |
Insteel Industries Inc | | | 12,987 | | | | 162,078 | |
International Shipholding Corp | | | 4,131 | | | | 68,079 | |
Intersections Inc | | | 2,390 | | | | 22,657 | |
JetBlue Airways Corp * | | | 181,890 | | | | 1,038,592 | |
Kadant Inc * | | | 9,068 | | | | 240,393 | |
Kaydon Corp | | | 197,620 | | | | 4,729,047 | |
Kelly Services Inc ‘A’ | | | 20,647 | | | | 324,984 | |
Kennametal Inc | | | 135,980 | | | | 5,439,200 | |
Kforce Inc | | | 1,826 | | | | 26,167 | |
Kimball International Inc ‘B’ | | | 25,323 | | | | 294,000 | |
Knoll Inc | | | 11,366 | | | | 174,582 | |
Korn/Ferry International * | | | 37,136 | | | | 588,977 | |
Kratos Defense & Security Solutions Inc * | | | 31,077 | | | | 156,317 | |
Layne Christensen Co * | | | 15,426 | | | | 374,389 | |
LB Foster Co ‘A’ | | | 7,114 | | | | 309,032 | |
Lincoln Electric Holdings Inc | | | 181,980 | | | | 8,858,786 | |
LMI Aerospace Inc * | | | 6,173 | | | | 119,386 | |
LSI Industries Inc | | | 15,346 | | | | 107,575 | |
Lydall Inc * | | | 13,351 | | | | 191,453 | |
Marten Transport Ltd | | | 12,005 | | | | 220,772 | |
McGrath RentCorp | | | 122,825 | | | | 3,564,381 | |
Meritor Inc * | | | 57,309 | | | | 271,072 | |
Met-Pro Corp | | | 10,581 | | | | 102,530 | |
Metalico Inc * | | | 30,452 | | | | 59,686 | |
Michael Baker Corp | | | 6,705 | | | | 167,156 | |
Miller Industries Inc | | | 8,532 | | | | 130,113 | |
Mine Safety Appliances Co | | | 146,200 | | | | 6,244,202 | |
Mobile Mini Inc * | | | 29,708 | | | | 618,818 | |
Moog Inc ‘A’ * | | | 31,154 | | | | 1,278,249 | |
Mueller Industries Inc | | | 164,614 | | | | 8,235,638 | |
Mueller Water Products Inc ‘A’ | | | 42,883 | | | | 240,574 | |
Multi-Color Corp | | | 9,866 | | | | 236,685 | |
MYR Group Inc * | | | 7,162 | | | | 159,354 | |
National Presto Industries Inc | | | 3,340 | | | | 230,794 | |
Navigant Consulting Inc * | | | 40,199 | | | | 448,621 | |
NCI Building Systems Inc * | | | 14,039 | | | | 195,142 | |
NL Industries Inc | | | 5,375 | | | | 61,544 | |
NN Inc * | | | 13,446 | | | | 123,165 | |
Nordson Corp | | | 55,000 | | | | 3,471,600 | |
Northwest Pipe Co * | | | 7,285 | | | | 173,820 | |
Orbital Sciences Corp * | | | 45,817 | | | | 630,900 | |
Orion Marine Group Inc * | | | 21,195 | | | | 154,935 | |
Pacer International Inc * | | | 24,097 | | | | 93,978 | |
Park-Ohio Holdings Corp * | | | 410 | | | | 8,737 | |
Patriot Transportation Holding Inc * | | | 4,863 | | | | 138,255 | |
Pendrell Corp * | | | 127,900 | | | | 162,433 | |
Pentair Ltd (Switzerland) | | | 94,800 | | | | 4,659,420 | |
Performant Financial Corp * | | | 3,081 | | | | 31,118 | |
PGT Inc * | | | 8,210 | | | | 36,945 | |
Pike Electric Corp | | | 13,296 | | | | 126,977 | |
PMFG Inc * | | | 16,200 | | | | 147,258 | |
Powell Industries Inc * | | | 106,465 | | | | 4,421,491 | |
Preformed Line Products Co | | | 1,608 | | | | 95,547 | |
Primoris Services Corp | | | 17,071 | | | | 256,748 | |
Quad/Graphics Inc | | | 19,497 | | | | 397,544 | |
Quality Distribution Inc * | | | 10,626 | | | | 63,756 | |
Quanex Building Products Corp | | | 28,583 | | | | 583,379 | |
Rand Logistics Inc * | | | 12,618 | | | | 82,017 | |
Republic Airways Holdings Inc * | | | 16,616 | | | | 94,379 | |
Resources Connection Inc | | | 33,008 | | | | 394,115 | |
Rexnord Corp * | | | 17,441 | | | | 371,493 | |
Roadrunner Transportation Systems Inc * | | | 5,066 | | | | 91,897 | |
Robbins & Myers Inc | | | 17,658 | | | | 1,049,768 | |
RPX Corp * | | | 1,078 | | | | 9,745 | |
Rush Enterprises Inc ‘A’ * | | | 25,704 | | | | 531,302 | |
Saia Inc * | | | 10,163 | | | | 234,969 | |
Schawk Inc | | | 279,993 | | | | 3,684,708 | |
Seaboard Corp | | | 236 | | | | 597,052 | |
| | |
| See Notes to Financial Statements | | See explanation of symbols and terms, if any, on page B-143 |
13
PACIFIC SELECT FUND
SMALL-CAP EQUITY PORTFOLIO
Schedule of Investments (Continued)
December 31, 2012
| | | | | | | | |
| | | Shares | | | Value | |
SeaCube Container Leasing Ltd (Bermuda) | | | 7,360 | | | | $138,736 | |
SIFCO Industries Inc | | | 1,265 | | | | 19,924 | |
Simpson Manufacturing Co Inc | | | 168,645 | | | | 5,529,870 | |
SkyWest Inc | | | 421,588 | | | | 5,252,986 | |
Standex International Corp | | | 7,572 | | | | 388,368 | |
Steelcase Inc ‘A’ | | | 51,046 | | | | 650,326 | |
Sterling Construction Co Inc * | | | 11,360 | | | | 112,918 | |
Swisher Hygiene Inc * | | | 88,227 | | | | 154,397 | |
Sykes Enterprises Inc * | | | 30,181 | | | | 459,355 | |
Sypris Solutions Inc | | | 3,134 | | | | 12,411 | |
TAL International Group Inc | | | 11,323 | | | | 411,931 | |
Teledyne Technologies Inc * | | | 18,626 | | | | 1,211,994 | |
Tetra Tech Inc * | | | 9,164 | | | | 242,388 | |
The Dolan Co * | | | 23,762 | | | | 92,434 | |
The Eastern Co | | | 4,933 | | | | 78,040 | |
The Geo Group Inc | | | 47,705 | | | | 1,345,281 | |
The Greenbrier Cos Inc * | | | 17,730 | | | | 286,694 | |
The KEYW Holding Corp * | | | 11,053 | | | | 140,263 | |
TMS International Corp ‘A’ * | | | 4,755 | | | | 59,533 | |
TRC Cos Inc * | | | 2,137 | | | | 12,437 | |
TriMas Corp * | | | 1,970 | | | | 55,081 | |
Trinity Industries Inc | | | 232,890 | | | | 8,342,120 | |
TrueBlue Inc * | | | 8,583 | | | | 135,182 | |
Tutor Perini Corp * | | | 27,621 | | | | 378,408 | |
Twin Disc Inc | | | 6,721 | | | | 117,147 | |
UniFirst Corp | | | 11,243 | | | | 824,337 | |
United Stationers Inc | | | 29,739 | | | | 921,612 | |
Universal Forest Products Inc | | | 229,894 | | | | 8,745,168 | |
Universal Truckload Services Inc | | | 4,339 | | | | 79,187 | |
US Ecology Inc | | | 5,365 | | | | 126,292 | |
Viad Corp | | | 15,763 | | | | 428,123 | |
Vicor Corp * | | | 12,687 | | | | 68,764 | |
VSE Corp | | | 3,037 | | | | 74,437 | |
Wabash National Corp * | | | 382,571 | | | | 3,431,662 | |
WageWorks Inc * | | | 1,988 | | | | 35,386 | |
Watts Water Technologies Inc ‘A’ | | | 109,830 | | | | 4,721,592 | |
Werner Enterprises Inc | | | 4,783 | | | | 103,648 | |
Wesco Aircraft Holdings Inc * | | | 10,192 | | | | 134,636 | |
Willis Lease Finance Corp * | | | 3,891 | | | | 55,680 | |
Zipcar Inc * | | | 3,753 | | | | 30,925 | |
| | | | | | | | |
| | | | | | | 254,093,316 | |
| | | | | | | | |
Information Technology - 8.2% | | | | | | | | |
| | |
Accelrys Inc * | | | 42,946 | | | | 388,661 | |
Actuate Corp * | | | 2,698 | | | | 15,109 | |
Acxiom Corp * | | | 59,699 | | | | 1,042,345 | |
Advanced Energy Industries Inc * | | | 30,798 | | | | 425,320 | |
Aeroflex Holding Corp * | | | 15,322 | | | | 107,254 | |
Agilysys Inc * | | | 11,191 | | | | 93,669 | |
Alpha & Omega Semiconductor Ltd * (Bermuda) | | | 13,152 | | | | 110,477 | |
Ambarella Inc * (Cayman) | | | 2,941 | | | | 32,792 | |
Amkor Technology Inc * | | | 57,072 | | | | 242,556 | |
ANADIGICS Inc * | | | 54,705 | | | | 137,857 | |
Anaren Inc * | | | 9,413 | | | | 183,083 | |
Anixter International Inc | | | 8,564 | | | | 547,925 | |
Applied Micro Circuits Corp * | | | 50,606 | | | | 425,090 | |
ARRIS Group Inc * | | | 76,341 | | | | 1,140,535 | |
Aspen Technology Inc * | | | 4,039 | | | | 111,638 | |
ATMI Inc * | | | 23,196 | | | | 484,332 | |
Audience Inc * | | | 3,995 | | | | 41,508 | |
AVG Technologies NV * (Netherlands) | | | 472 | | | | 7,472 | |
Aviat Networks Inc * | | | 47,590 | | | | 156,571 | |
Avid Technology Inc * | | | 22,949 | | | | 173,953 | |
Aware Inc | | | 1,565 | | | | 8,576 | |
Axcelis Technologies Inc * | | | 83,837 | | | | 116,533 | |
AXT Inc * | | | 25,194 | | | | 70,795 | |
Bankrate Inc * | | | 4,543 | | | | 56,560 | |
Bazaarvoice Inc * | | | 473 | | | | 4,423 | |
Bel Fuse Inc ‘B’ | | | 8,196 | | | | 160,232 | |
| | | | | | | | |
| | | Shares | | | Value | |
Benchmark Electronics Inc * | | | 489,035 | | | | $8,127,762 | |
Black Box Corp | | | 12,714 | | | | 309,459 | |
Blucora Inc * | | | 26,328 | | | | 413,613 | |
Bottomline Technologies Inc * | | | 19,319 | | | | 509,828 | |
Brightcove Inc * | | | 180 | | | | 1,627 | |
Brooks Automation Inc | | | 51,544 | | | | 414,929 | |
CACI International Inc ‘A’ * | | | 16,161 | | | | 889,340 | |
Calix Inc * | | | 20,264 | | | | 155,830 | |
Ceva Inc * | | | 4,416 | | | | 69,552 | |
Checkpoint Systems Inc * | | | 31,176 | | | | 334,830 | |
CIBER Inc * | | | 56,834 | | | | 189,826 | |
Ciena Corp * | | | 18,927 | | | | 297,154 | |
Coherent Inc | | | 13,031 | | | | 659,629 | |
Cohu Inc | | | 364,047 | | | | 3,946,269 | |
Computer Task Group Inc * | | | 2,748 | | | | 50,096 | |
Comtech Telecommunications Corp | | | 13,893 | | | | 352,604 | |
Convergys Corp | | | 84,883 | | | | 1,392,930 | |
CSG Systems International Inc * | | | 11,270 | | | | 204,889 | |
CTS Corp | | | 26,475 | | | | 281,429 | |
Cymer Inc * | | | 16,659 | | | | 1,506,473 | |
Daktronics Inc | | | 21,560 | | | | 238,669 | |
DealerTrack Technologies Inc * | | | 3,574 | | | | 102,645 | |
Demand Media Inc * | | | 6,120 | | | | 56,855 | |
Demandware Inc * | | | 267 | | | | 7,294 | |
Digi International Inc * | | | 20,005 | | | | 189,447 | |
Digital River Inc * | | | 28,609 | | | | 411,684 | |
Diodes Inc * | | | 27,609 | | | | 479,016 | |
DSP Group Inc * | | | 17,017 | | | | 98,018 | |
E2open Inc * | | | 891 | | | | 12,617 | |
Earthlink Inc | | | 82,343 | | | | 531,936 | |
Ebix Inc | | | 5,541 | | | | 89,044 | |
Echelon Corp * | | | 14,080 | | | | 34,496 | |
Electro Rent Corp | | | 13,378 | | | | 205,754 | |
Electro Scientific Industries Inc | | | 17,847 | | | | 177,578 | |
Electronics for Imaging Inc * | | | 33,135 | | | | 629,234 | |
Eloqua Inc * | | | 1,926 | | | | 45,434 | |
Emulex Corp * | | | 67,494 | | | | 492,706 | |
Entegris Inc * | | | 106,744 | | | | 979,910 | |
Entropic Communications Inc * | | | 68,437 | | | | 362,032 | |
Envivio Inc * | | | 4,455 | | | | 7,573 | |
EPIQ Systems Inc | | | 22,625 | | | | 289,147 | |
ePlus Inc | | | 3,086 | | | | 127,575 | |
Euronet Worldwide Inc * | | | 39,381 | | | | 929,392 | |
Exa Corp * | | | 1,133 | | | | 11,024 | |
Exar Corp * | | | 25,071 | | | | 223,132 | |
Fabrinet * (Cayman) | | | 17,235 | | | | 226,468 | |
FEI Co | | | 1,809 | | | | 100,327 | |
Finisar Corp * | | | 70,971 | | | | 1,156,827 | |
First Solar Inc * | | | 46,791 | | | | 1,444,906 | |
FleetMatics Group PLC * (Ireland) | | | 1,784 | | | | 44,885 | |
FormFactor Inc * | | | 38,447 | | | | 175,318 | |
Gerber Scientific Inc Escrow Shares * + | | | 12,750 | | | | - | |
Globecomm Systems Inc * | | | 4,112 | | | | 46,466 | |
Glu Mobile Inc * | | | 3,136 | | | | 7,181 | |
GSI Group Inc * (Canada) | | | 21,577 | | | | 186,857 | |
GSI Technology Inc * | | | 16,253 | | | | 101,906 | |
GT Advanced Technologies Inc * | | | 14,668 | | | | 44,297 | |
Harmonic Inc * | | | 91,304 | | | | 462,911 | |
Imation Corp * | | | 23,857 | | | | 111,412 | |
Immersion Corp * | | | 1,581 | | | | 10,861 | |
Infinera Corp * | | | 8,947 | | | | 51,982 | |
Infoblox Inc * | | | 333 | | | | 5,984 | |
Ingram Micro Inc ‘A’ * | | | 232,900 | | | | 3,940,668 | |
Inphi Corp * | | | 10,894 | | | | 104,365 | |
Insight Enterprises Inc * | | | 34,420 | | | | 597,875 | |
Integrated Device Technology Inc * | | | 110,579 | | | | 807,227 | |
Integrated Silicon Solution Inc * | | | 21,347 | | | | 192,123 | |
Intermec Inc * | | | 40,504 | | | | 399,369 | |
Internap Network Services Corp * | | | 20,362 | | | | 141,312 | |
International Rectifier Corp * | | | 53,731 | | | | 952,651 | |
| | |
| See Notes to Financial Statements | | See explanation of symbols and terms, if any, on page B-143 |
14
PACIFIC SELECT FUND
SMALL-CAP EQUITY PORTFOLIO
Schedule of Investments (Continued)
December 31, 2012
| | | | | | | | |
| | | Shares | | | Value | |
Intersil Corp ‘A’ | | | 99,060 | | | | $821,207 | |
Intevac Inc * | | | 17,836 | | | | 81,511 | |
IntraLinks Holdings Inc * | | | 28,433 | | | | 175,432 | |
iPass Inc * | | | 3,364 | | | | 6,156 | |
IXYS Corp | | | 19,204 | | | | 175,525 | |
j2 Global Inc | | | 6,248 | | | | 191,064 | |
Kemet Corp * | | | 34,789 | | | | 174,989 | |
Key Tronic Corp * | | | 6,820 | | | | 69,837 | |
Keynote Systems Inc | | | 12,144 | | | | 171,109 | |
Kopin Corp * | | | 52,313 | | | | 174,202 | |
KVH Industries Inc * | | | 1,806 | | | | 25,248 | |
Lattice Semiconductor Corp * | | | 91,632 | | | | 365,612 | |
Limelight Networks Inc * | | | 46,521 | | | | 103,277 | |
Littelfuse Inc | | | 1,619 | | | | 99,908 | |
Loral Space & Communications Inc | | | 461 | | | | 25,198 | |
LTX-Credence Corp * | | | 38,015 | | | | 249,378 | |
M/A-COM Technology Solutions Holdings Inc * | | | 4,010 | | | | 60,030 | |
ManTech International Corp ‘A’ | | | 17,917 | | | | 464,767 | |
Marchex Inc ‘B’ | | | 17,735 | | | | 72,891 | |
Market Leader Inc * | | | 2,740 | | | | 17,947 | |
Mattersight Corp * | | | 338 | | | | 1,680 | |
Mattson Technology Inc * | | | 47,544 | | | | 39,937 | |
MaxLinear Inc ‘A’ * | | | 14,149 | | | | 71,028 | |
Measurement Specialties Inc * | | | 1,334 | | | | 45,836 | |
MeetMe Inc * | | | 12,766 | | | | 44,553 | |
MEMC Electronic Materials Inc * | | | 140,082 | | | | 449,663 | |
Mentor Graphics Corp * | | | 33,295 | | | | 566,681 | |
Mercury Systems Inc * | | | 24,275 | | | | 223,330 | |
Methode Electronics Inc | | | 28,757 | | | | 288,433 | |
Millennial Media Inc * | | | 556 | | | | 6,967 | |
Mindspeed Technologies Inc * | | | 27,986 | | | | 130,974 | |
MIPS Technologies Inc * | | | 8,554 | | | | 66,892 | |
MKS Instruments Inc | | | 40,833 | | | | 1,052,675 | |
ModusLink Global Solutions Inc * | | | 30,544 | | | | 88,578 | |
MoneyGram International Inc * | | | 11,960 | | | | 158,948 | |
Monster Worldwide Inc * | | | 94,359 | | | | 530,298 | |
MoSys Inc * | | | 26,376 | | | | 91,788 | |
Multi-Fineline Electronix Inc * | | | 151,281 | | | | 3,057,389 | |
Nanometrics Inc * | | | 18,143 | | | | 261,622 | |
NeoPhotonics Corp * | | | 14,820 | | | | 85,067 | |
NETGEAR Inc * | | | 16,279 | | | | 641,718 | |
Newport Corp * | | | 29,599 | | | | 398,107 | |
Oclaro Inc * | | | 57,032 | | | | 89,540 | |
OCZ Technology Group Inc * | | | 52,008 | | | | 99,335 | |
OmniVision Technologies Inc * | | | 40,753 | | | | 573,802 | |
Oplink Communications Inc * | | | 14,913 | | | | 232,345 | |
Park Electrochemical Corp | | | 16,153 | | | | 415,617 | |
PC Connection Inc | | | 6,773 | | | | 77,889 | |
PCTEL Inc | | | 14,393 | | | | 103,630 | |
Peregrine Semiconductor Corp * | | | 3,126 | | | | 47,859 | |
Perficient Inc * | | | 5,756 | | | | 67,806 | |
Pericom Semiconductor Corp * | | | 18,338 | | | | 147,254 | |
Pervasive Software Inc * | | | 9,573 | | | | 85,295 | |
Photronics Inc * | | | 46,805 | | | | 278,958 | |
Plantronics Inc | | | 22,018 | | | | 811,804 | |
Plexus Corp * | | | 15,301 | | | | 394,766 | |
PLX Technology Inc * | | | 3,234 | | | | 11,739 | |
Power-One Inc * | | | 52,735 | | | | 216,741 | |
Progress Software Corp * | | | 48,816 | | | | 1,024,648 | |
Proofpoint Inc * | | | 366 | | | | 4,505 | |
QAD Inc ‘A’ | | | 465 | | | | 6,696 | |
QLogic Corp * | | | 57,235 | | | | 556,897 | |
Qualys Inc * | | | 1,697 | | | | 25,099 | |
Quantum Corp * | | | 172,817 | | | | 214,293 | |
QuickLogic Corp * | | | 4,619 | | | | 10,023 | |
QuinStreet Inc * | | | 25,381 | | | | 170,560 | |
Radisys Corp * | | | 17,029 | | | | 50,746 | |
Rambus Inc * | | | 79,453 | | | | 387,731 | |
RealD Inc * | | | 4,513 | | | | 50,591 | |
RealNetworks Inc * | | | 17,067 | | | | 129,027 | |
| | | | | | | | |
| | | Shares | | | Value | |
RF Micro Devices Inc * | | | 189,694 | | | | $849,829 | |
Richardson Electronics Ltd | | | 10,001 | | | | 113,211 | |
Rofin-Sinar Technologies Inc * | | | 322,185 | | | | 6,984,971 | |
Rogers Corp * | | | 7,312 | | | | 363,114 | |
Rosetta Stone Inc * | | | 4,330 | | | | 53,432 | |
Rubicon Technology Inc * | | | 13,305 | | | | 81,294 | |
Ruckus Wireless Inc * | | | 3,575 | | | | 80,545 | |
Rudolph Technologies Inc * | | | 24,904 | | | | 334,959 | |
Sanmina Corp * | | | 63,307 | | | | 700,808 | |
Sapiens International Corp NV * (Netherlands) | | | 10,953 | | | | 43,812 | |
ScanSource Inc * | | | 21,352 | | | | 678,353 | |
SeaChange International Inc * | | | 22,334 | | | | 215,970 | |
ShoreTel Inc * | | | 4,868 | | | | 20,640 | |
Sigma Designs Inc * | | | 25,381 | | | | 130,712 | |
Silicon Graphics International Corp * | | | 23,485 | | | | 240,252 | |
Silicon Image Inc * | | | 11,038 | | | | 54,748 | |
Sonus Networks Inc * | | | 151,596 | | | | 257,713 | |
Spansion Inc ‘A’ * | | | 37,406 | | | | 520,317 | |
SS&C Technologies Holdings Inc * | | | 19,115 | | | | 441,939 | |
STEC Inc * | | | 27,475 | | | | 135,452 | |
STR Holdings Inc * | | | 23,050 | | | | 58,086 | |
SunPower Corp * | | | 16,292 | | | | 91,561 | |
Super Micro Computer Inc * | | | 2,528 | | | | 25,786 | |
Supertex Inc | | | 7,984 | | | | 140,119 | |
support.com Inc * | | | 11,642 | | | | 48,664 | |
Sycamore Networks Inc | | | 15,773 | | | | 35,332 | |
Symmetricom Inc * | | | 32,506 | | | | 187,560 | |
Synacor Inc * | | | 484 | | | | 2,647 | |
SYNNEX Corp * | | | 20,378 | | | | 700,596 | |
TechTarget Inc * | | | 12,375 | | | | 68,681 | |
TeleNav Inc * | | | 12,703 | | | | 101,370 | |
TeleTech Holdings Inc * | | | 17,807 | | | | 316,965 | |
Tellabs Inc | | | 284,772 | | | | 649,280 | |
Telular Corp | | | 5,332 | | | | 50,494 | |
Tessco Technologies Inc | | | 2,108 | | | | 46,671 | |
Tessera Technologies Inc | | | 40,327 | | | | 662,169 | |
TiVo Inc * | | | 48,481 | | | | 597,286 | |
TriQuint Semiconductor Inc * | | | 131,179 | | | | 634,906 | |
Trulia Inc * | | | 1,439 | | | | 23,369 | |
TTM Technologies Inc * | | | 41,194 | | | | 378,985 | |
Ultra Clean Holdings Inc * | | | 21,050 | | | | 103,355 | |
Unisys Corp * | | | 16,726 | | | | 289,360 | |
United Online Inc | | | 70,503 | | | | 394,112 | |
Unwired Planet Inc * | | | 3,210 | | | | 3,852 | |
ValueClick Inc * | | | 23,246 | | | | 451,205 | |
VASCO Data Security International Inc * | | | 12,197 | | | | 99,528 | |
Veeco Instruments Inc * | | | 22,469 | | | | 663,285 | |
Viasystems Group Inc * | | | 2,953 | | | | 36,027 | |
Vishay Precision Group Inc * | | | 9,459 | | | | 125,048 | |
WebMD Health Corp * | | | 39,335 | | | | 564,064 | |
Westell Technologies Inc ‘A’ * | | | 35,215 | | | | 65,148 | |
Zygo Corp * | | | 10,351 | | | | 162,511 | |
| | | | | | | | |
| | | | | | | 82,632,466 | |
| | | | | | | | |
Materials - 6.9% | | | | | | | | |
| | |
A. Schulman Inc | | | 185,306 | | | | 5,360,903 | |
A.M. Castle & Co * | | | 12,892 | | | | 190,415 | |
AK Steel Holding Corp | | | 88,260 | | | | 405,996 | |
AMCOL International Corp | | | 1,159 | | | | 35,558 | |
Aptargroup Inc | | | 22,330 | | | | 1,065,588 | |
Berry Plastics Group Inc * | | | 13,449 | | | | 216,260 | |
Boise Inc | | | 78,121 | | | | 621,062 | |
Buckeye Technologies Inc | | | 12,740 | | | | 365,765 | |
Cabot Corp | | | 109,600 | | | | 4,360,984 | |
Calgon Carbon Corp * | | | 6,943 | | | | 98,452 | |
Century Aluminum Co * | | | 39,951 | | | | 349,971 | |
Chase Corp | | | 4,984 | | | | 92,702 | |
Chemtura Corp * | | | 23,433 | | | | 498,186 | |
Clearwater Paper Corp * | | | 3,674 | | | | 143,874 | |
| | |
| See Notes to Financial Statements | | See explanation of symbols and terms, if any, on page B-143 |
15
PACIFIC SELECT FUND
SMALL-CAP EQUITY PORTFOLIO
Schedule of Investments (Continued)
December 31, 2012
| | | | | | | | |
| | | Shares | | | Value | |
Coeur d’Alene Mines Corp * | | | 41,162 | | | | $1,012,585 | |
Ferro Corp * | | | 67,147 | | | | 280,674 | |
FutureFuel Corp | | | 15,048 | | | | 178,168 | |
General Moly Inc * | | | 44,734 | | | | 179,383 | |
Georgia Gulf Corp | | | 9,802 | | | | 404,627 | |
Globe Specialty Metals Inc | | | 44,434 | | | | 610,967 | |
Gold Reserve Inc * (Canada) | | | 35,304 | | | | 116,856 | |
Golden Minerals Co * | | | 25,643 | | | | 117,701 | |
Golden Star Resources Ltd (XASE) * (Canada) | | | 202,083 | | | | 371,833 | |
Graphic Packaging Holding Co * | | | 130,168 | | | | 840,885 | |
H.B. Fuller Co | | | 127,800 | | | | 4,449,996 | |
Handy & Harman Ltd * | | | 594 | | | | 8,952 | |
Haynes International Inc | | | 1,696 | | | | 87,972 | |
Hecla Mining Co | | | 221,808 | | | | 1,293,141 | |
Horsehead Holding Corp * | | | 33,984 | | | | 346,977 | |
Innospec Inc | | | 15,707 | | | | 541,734 | |
Kaiser Aluminum Corp | | | 14,987 | | | | 924,548 | |
KapStone Paper and Packaging Corp | | | 31,386 | | | | 696,455 | |
Kraton Performance Polymers Inc * | | | 25,045 | | | | 601,831 | |
Landec Corp * | | | 15,011 | | | | 142,454 | |
Louisiana-Pacific Corp * | | | 106,873 | | | | 2,064,786 | |
LSB Industries Inc * | | | 6,223 | | | | 220,419 | |
Materion Corp | | | 14,423 | | | | 371,825 | |
McEwen Mining Inc * | | | 168,551 | | | | 645,550 | |
Metals USA Holdings Corp | | | 6,801 | | | | 118,949 | |
Minerals Technologies Inc | | | 27,523 | | | | 1,098,718 | |
Neenah Paper Inc | | | 4,886 | | | | 139,104 | |
Olin Corp | | | 19,632 | | | | 423,855 | |
Olympic Steel Inc | | | 7,019 | | | | 155,401 | |
OM Group Inc * | | | 25,118 | | | | 557,620 | |
PH Glatfelter Co | | | 27,549 | | | | 481,556 | |
PolyOne Corp | | | 15,037 | | | | 307,056 | |
Quaker Chemical Corp | | | 7,259 | | | | 390,970 | |
Reliance Steel & Aluminum Co | | | 123,000 | | | | 7,638,300 | |
Resolute Forest Products * | | | 62,758 | | | | 830,916 | |
Revett Minerals Inc * (Canada) | | | 19,872 | | | | 56,039 | |
RPM International Inc | | | 349,100 | | | | 10,249,576 | |
RTI International Metals Inc * | | | 23,539 | | | | 648,735 | |
Schnitzer Steel Industries Inc ‘A’ | | | 19,597 | | | | 594,377 | |
Schweitzer-Mauduit International Inc | | | 6,261 | | | | 244,367 | |
Sensient Technologies Corp | | | 132,966 | | | | 4,728,271 | |
Spartech Corp * | | | 24,198 | | | | 219,476 | |
Steel Dynamics Inc | | | 415,000 | | | | 5,697,950 | |
Stepan Co | | | 684 | | | | 37,989 | |
Stillwater Mining Co * | | | 90,046 | | | | 1,150,788 | |
SunCoke Energy Inc * | | | 16,067 | | | | 250,485 | |
Texas Industries Inc * | | | 17,544 | | | | 894,919 | |
Tredegar Corp | | | 18,773 | | | | 383,345 | |
UFP Technologies Inc * | | | 4,180 | | | | 74,906 | |
United States Lime & Minerals Inc * | | | 69 | | | | 3,251 | |
Universal Stainless & Alloy Products Inc * | | | 5,336 | | | | 196,205 | |
Vista Gold Corp * (Canada) | | | 44,643 | | | | 120,536 | |
Wausau Paper Corp | | | 1,505 | | | | 13,033 | |
Worthington Industries Inc | | | 40,685 | | | | 1,057,403 | |
Zep Inc | | | 10,061 | | | | 145,281 | |
Zoltek Cos Inc * | | | 21,455 | | | | 166,276 | |
| | | | | | | | |
| | | | | | | 69,391,688 | |
| | | | | | | | |
Telecommunication Services - 0.3% | | | | | | | | |
| | |
Cbeyond Inc * | | | 20,874 | | | | 188,701 | |
Cincinnati Bell Inc * | | | 99,767 | | | | 546,723 | |
Consolidated Communications Holdings Inc | | | 12,550 | | | | 199,796 | |
Fairpoint Communications Inc * | | | 3,190 | | | | 25,329 | |
Hawaiian Telcom Holdco Inc * | | | 8,707 | | | | 169,786 | |
IDT Corp ‘B’ | | | 1,823 | | | | 17,391 | |
inContact Inc * | | | 3,975 | | | | 20,590 | |
Iridium Communications Inc * | | | 35,098 | | | | 236,560 | |
Leap Wireless International Inc * | | | 31,949 | | | | 212,461 | |
magicJack VocalTec Ltd * (Israel) | | | 3,408 | | | | 62,060 | |
Neutral Tandem Inc | | | 23,520 | | | | 60,446 | |
| | | | | | | | |
| | | Shares | | | Value | |
ORBCOMM Inc * | | | 14,366 | | | | $56,315 | |
Premiere Global Services Inc * | | | 29,900 | | | | 292,422 | |
Shenandoah Telecommunications Co | | | 19,047 | | | | 291,610 | |
USA Mobility Inc | | | 12,026 | | | | 140,464 | |
Vonage Holdings Corp * | | | 42,083 | | | | 99,737 | |
| | | | | | | | |
| | | | | | | 2,620,391 | |
| | | | | | | | |
Utilities - 3.3% | | | | | | | | |
| | |
ALLETE Inc | | | 29,637 | | | | 1,214,524 | |
American DG Energy Inc * | | | 2,646 | | | | 6,112 | |
American States Water Co | | | 13,188 | | | | 632,760 | |
Artesian Resources Corp ‘A’ | | | 5,900 | | | | 132,337 | |
Atlantic Power Corp (Canada) | | | 80,719 | | | | 922,618 | |
Avista Corp | | | 45,592 | | | | 1,099,223 | |
Black Hills Corp | | | 34,244 | | | | 1,244,427 | |
Cadiz Inc * | | | 578 | | | | 4,578 | |
California Water Service Group | | | 16,520 | | | | 303,142 | |
CH Energy Group Inc | | | 11,547 | | | | 753,095 | |
Chesapeake Utilities Corp | | | 7,501 | | | | 340,545 | |
Cleco Corp | | | 47,423 | | | | 1,897,394 | |
Connecticut Water Service Inc | | | 2,788 | | | | 83,027 | |
Consolidated Water Co Ltd (Cayman) | | | 11,455 | | | | 84,767 | |
Delta Natural Gas Co Inc | | | 5,411 | | | | 105,785 | |
El Paso Electric Co | | | 31,116 | | | | 992,912 | |
Genie Energy Ltd ‘B’ | | | 11,277 | | | | 80,067 | |
IDACORP Inc | | | 38,961 | | | | 1,688,959 | |
MGE Energy Inc | | | 17,994 | | | | 916,794 | |
Middlesex Water Co | | | 12,333 | | | | 241,233 | |
New Jersey Resources Corp | | | 32,402 | | | | 1,283,767 | |
Northwest Natural Gas Co | | | 20,890 | | | | 923,338 | |
NorthWestern Corp | | | 28,313 | | | | 983,311 | |
NV Energy Inc | | | 164,700 | | | | 2,987,658 | |
Ormat Technologies Inc | | | 9,958 | | | | 191,990 | |
Otter Tail Corp | | | 26,359 | | | | 658,975 | |
Piedmont Natural Gas Co Inc | | | 51,278 | | | | 1,605,514 | |
PNM Resources Inc | | | 61,960 | | | | 1,270,800 | |
Portland General Electric Co | | | 58,730 | | | | 1,606,853 | |
SJW Corp | | | 7,691 | | | | 204,581 | |
South Jersey Industries Inc | | | 18,553 | | | | 933,773 | |
Southwest Gas Corp | | | 35,950 | | | | 1,524,640 | |
The Empire District Electric Co | | | 32,704 | | | | 666,508 | |
The Laclede Group Inc | | | 17,622 | | | | 680,385 | |
UIL Holdings Corp | | | 39,358 | | | | 1,409,410 | |
Unitil Corp | | | 10,608 | | | | 274,959 | |
UNS Energy Corp | | | 31,314 | | | | 1,328,340 | |
WGL Holdings Inc | | | 40,195 | | | | 1,575,242 | |
York Water Co | | | 2,673 | | | | 46,965 | |
| | | | | | | | |
| | | | | | | 32,901,308 | |
| | | | | | | | |
Total Common Stocks
(Cost $883,349,960) | | | | | | | 986,713,297 | |
| | | | | | | | |
| | |
CLOSED-END MUTUAL FUND - 0.0% | | | | | | | | |
| | |
Firsthand Technology Value Fund Inc * | | | 6,747 | | | | 117,668 | |
| | | | | | | | |
| | |
Total Closed-End Mutual Fund
(Cost $118,181) | | | | | | | 117,668 | |
| | | | | | | | |
| | |
| See Notes to Financial Statements | | See explanation of symbols and terms, if any, on page B-143 |
16
PACIFIC SELECT FUND
SMALL-CAP EQUITY PORTFOLIO
Schedule of Investments (Continued)
December 31, 2012
| | | | | | | | |
| | | Principal Amount | | | Value | |
SHORT-TERM INVESTMENT - 1.4% | | | | | | | | |
| | |
Repurchase Agreement - 1.4% | | | | | | | | |
| | |
Fixed Income Clearing Corp
0.010% due 01/02/13
(Dated 12/31/12, repurchase price of
$13,829,448; collateralized by U.S. Treasury Notes: 0.250% - 2.750%
due 07/15/15 - 11/30/16 and
value $14,110,550) | | | $13,829,440 | | | | $13,829,440 | |
| | | | | | | | |
| | |
Total Short-Term Investment
(Cost $13,829,440) | | | | | | | 13,829,440 | |
| | | | | | | | |
| | |
TOTAL INVESTMENTS - 99.9%
(Cost $897,297,581) | | | | | | | 1,000,660,405 | |
| |
OTHER ASSETS & LIABILITIES, NET - 0.1% | | | | 1,435,085 | |
| | | | | | | | |
| | |
NET ASSETS - 100.0% | | | | | | | $1,002,095,490 | |
| | | | | | | | |
Notes to Schedule of Investments
| (a) | As of December 31, 2012, the portfolio was diversified as a percentage of net assets as follows: |
| | | | |
Industrials | | | 25.4% | |
Financials | | | 23.4% | |
Consumer Discretionary | | | 16.4% | |
Energy | | | 9.4% | |
Information Technology | | | 8.2% | |
Materials | | | 6.9% | |
Health Care | | | 3.9% | |
Utilities | | | 3.3% | |
Short-Term Investment | | | 1.4% | |
Consumer Staples | | | 1.3% | |
Telecommunication Services | | | 0.3% | |
| | | | |
| | | 99.9% | |
Other Assets & Liabilities, Net | | | 0.1 % | |
| | | | |
| | | 100.0% | |
| | | | |
| (b) | Short-term investments reflect either the stated coupon rate or the annualized effective yield on the date of purchase for discounted investments. |
| (c) | As of December 31, 2012, $365,000 in cash was segregated with the broker(s)/custodian as collateral for open futures contracts. |
| (d) | Open futures contracts outstanding as of December 31, 2012 were as follows: |
| | | | | | | | | | | | |
| Long Futures Outstanding | | Number of Contracts | | | Notional Amount | | | Unrealized Appreciation | |
Russell 2000 Mini (03/13) | | | 64 | | | | $5,303,135 | | | | $115,105 | |
| | | | | | | | | | | | |
| (e) | Fair Value Measurements |
The following is a summary of the portfolio's investments as categorized under the three-tier hierarchy of inputs used in valuing the portfolio's assets and liabilities (See Note 3D in Notes to Financial Statements) as of December 31, 2012:
| | | | | | | | | | | | | | | | | | |
| | | | | Total Value at December 31, 2012 | | | Level 1 Quoted Price | | | Level 2 Significant Observable Inputs | | | Level 3 Significant Unobservable Inputs | |
Assets | | Common Stocks (1) | | | $986,713,297 | | | | $986,713,297 | | | | $- | | | | $- | |
| | Closed-End Mutual Fund | | | 117,668 | | | | 117,668 | | | | - | | | | - | |
| | Short-Term Investment | | | 13,829,440 | | | | - | | | | 13,829,440 | | | | - | |
| | Derivatives: | | | | | | | | | | | | | | | | |
| | Equity Contracts | | | | | | | | | | | | | | | | |
| | Futures | | | 115,105 | | | | 115,105 | | | | - | | | | - | |
| | | | | | | | | | | | | | | | | | |
| | Total | | | $1,000,775,510 | | | | $986,946,070 | | | | $13,829,440 | | | | $- | |
| | | | | | | | | | | | | | | | | | |
| | (1) | For equity investments categorized in a single level, refer to the schedule of investments for further industry breakout. |
17
| | |
| See Notes to Financial Statements | | See explanation of symbols and terms, if any, on page B-143 |
PACIFIC SELECT FUND
SMALL-CAP INDEX PORTFOLIO
Schedule of Investments
December 31, 2012
| | | | | | | | |
| | | Shares | | | Value | |
RIGHTS - 0.0% | | | | | | | | |
| | |
Health Care - 0.0% | | | | | | | | |
| | |
Allos Therapeutics Inc
Exp. 11/30/13 * + | | | 41,902 | | | | $- | |
| | | | | | | | |
| | |
Total Rights
(Cost $0) | | | | | | | - | |
| | | | | | | | |
| | |
WARRANTS - 0.0% | | | | | | | | |
| | |
Energy - 0.0% | | | | | | | | |
| | |
Magnum Hunter Resources Corp
Strike @ $10.50
Exp. 10/14/13 * | | | 4,217 | | | | 2,151 | |
| | | | | | | | |
| | |
Total Warrants
(Cost $0) | | | | | | | 2,151 | |
| | | | | | | | |
| | |
COMMON STOCKS - 97.1% | | | | | | | | |
| | |
Consumer Discretionary - 13.6% | | | | | | | | |
| | |
1-800-FLOWERS.COM Inc ‘A’ * | | | 15,980 | | | | 58,647 | |
Aeropostale Inc * | | | 49,217 | | | | 640,313 | |
AFC Enterprises Inc * | | | 14,682 | | | | 383,641 | |
America’s Car-Mart Inc * | | | 4,839 | | | | 196,076 | |
American Axle & Manufacturing Holdings Inc * | | | 40,265 | | | | 450,968 | |
American Greetings Corp ‘A’ | | | 19,099 | | | | 322,582 | |
American Public Education Inc * | | | 10,845 | | | | 391,613 | |
Ameristar Casinos Inc | | | 19,946 | | | | 523,383 | |
ANN Inc * | | | 29,453 | | | | 996,690 | |
Arbitron Inc | | | 15,955 | | | | 744,779 | |
Arctic Cat Inc * | | | 7,615 | | | | 254,265 | |
Asbury Automotive Group Inc * | | | 16,842 | | | | 539,449 | |
Ascent Capital Group Inc ‘A’ * | | | 8,527 | | | | 528,162 | |
Barnes & Noble Inc * | | | 17,041 | | | | 257,149 | |
Bassett Furniture Industries Inc | | | 6,916 | | | | 86,243 | |
Beasley Broadcasting Group Inc ‘A’ | | | 2,670 | | | | 13,056 | |
Beazer Homes USA Inc * | | | 14,954 | | | | 252,573 | |
bebe stores Inc | | | 22,453 | | | | 89,587 | |
Belo Corp ‘A’ | | | 56,636 | | | | 434,398 | |
Big 5 Sporting Goods Corp | | | 10,116 | | | | 132,520 | |
Biglari Holdings Inc * | | | 721 | | | | 281,204 | |
BJ’s Restaurants Inc * | | | 14,806 | | | | 487,117 | |
Black Diamond Inc * | | | 12,815 | | | | 105,083 | |
Bloomin’ Brands Inc * | | | 10,924 | | | | 170,851 | |
Blue Nile Inc * | | | 7,465 | | | | 287,402 | |
Bluegreen Corp * | | | 8,866 | | | | 83,163 | |
Blyth Inc | | | 6,377 | | | | 99,162 | |
Bob Evans Farms Inc | | | 17,660 | | | | 709,932 | |
Body Central Corp * | | | 9,601 | | | | 95,626 | |
Boyd Gaming Corp * | | | 33,627 | | | | 223,283 | |
Bravo Brio Restaurant Group Inc * | | | 11,759 | | | | 157,923 | |
Bridgepoint Education Inc * | | | 10,620 | | | | 109,386 | |
Brown Shoe Co Inc | | | 25,867 | | | | 475,177 | |
Brunswick Corp | | | 53,980 | | | | 1,570,278 | |
Buffalo Wild Wings Inc * | | | 11,222 | | | | 817,186 | |
Cabela’s Inc * | | | 28,217 | | | | 1,178,060 | |
Caesars Entertainment Corp * | | | 22,443 | | | | 155,306 | |
CafePress Inc * | | | 2,797 | | | | 16,139 | |
Callaway Golf Co | | | 39,437 | | | | 256,341 | |
Capella Education Co * | | | 7,629 | | | | 215,367 | |
Career Education Corp * | | | 31,771 | | | | 111,834 | |
Caribou Coffee Co Inc * | | | 12,714 | | | | 205,840 | |
Carmike Cinemas Inc * | | | 10,639 | | | | 159,585 | |
Carriage Services Inc | | | 9,627 | | | | 114,272 | |
Carrols Restaurant Group Inc * | | | 8,971 | | | | 53,647 | |
| | | | | | | | |
| | | Shares | | | Value | |
Casual Male Retail Group Inc * | | | 25,670 | | | | $107,814 | |
Cavco Industries Inc * | | | 4,161 | | | | 207,967 | |
CEC Entertainment Inc | | | 11,028 | | | | 366,019 | |
Central European Media Enterprises Ltd ‘A’ * (Bermuda) | | | 22,388 | | | | 137,238 | |
Cherokee Inc | | | 4,947 | | | | 67,823 | |
Churchill Downs Inc | | | 7,839 | | | | 520,902 | |
Chuy’s Holdings Inc * | | | 3,951 | | | | 88,265 | |
Citi Trends Inc * | | | 9,082 | | | | 124,968 | |
Coinstar Inc * | | | 18,880 | | | | 981,949 | |
Collectors Universe | | | 3,290 | | | | 32,999 | |
Columbia Sportswear Co | | | 7,330 | | | | 391,129 | |
Conn’s Inc * | | | 10,191 | | | | 312,660 | |
Cooper Tire & Rubber Co | | | 37,702 | | | | 956,123 | |
Core-Mark Holding Co Inc | | | 6,848 | | | | 324,253 | |
Corinthian Colleges Inc * | | | 47,602 | | | | 116,149 | |
Cracker Barrel Old Country Store Inc | | | 11,656 | | | | 749,015 | |
Crocs Inc * | | | 54,325 | | | | 781,737 | |
Crown Media Holdings Inc ‘A’ * | | | 21,462 | | | | 39,705 | |
CSS Industries Inc | | | 5,657 | | | | 123,832 | |
Culp Inc | | | 5,223 | | | | 78,397 | |
Cumulus Media Inc ‘A’ * | | | 37,801 | | | | 100,929 | |
Daily Journal Corp * | | | 546 | | | | 50,532 | |
Dana Holding Corp | | | 89,229 | | | | 1,392,865 | |
Del Frisco’s Restaurant Group Inc * | | | 3,320 | | | | 51,759 | |
Delta Apparel Inc * | | | 4,245 | | | | 59,345 | |
Denny’s Corp * | | | 57,807 | | | | 282,098 | |
Destination Maternity Corp | | | 8,025 | | | | 173,019 | |
Digital Generation Inc * | | | 16,742 | | | | 181,818 | |
DineEquity Inc * | | | 9,206 | | | | 616,802 | |
Domino’s Pizza Inc | | | 35,004 | | | | 1,524,424 | |
Dorman Products Inc | | | 14,787 | | | | 522,573 | |
Drew Industries Inc | | | 11,591 | | | | 373,810 | |
Education Management Corp * | | | 16,377 | | | | 71,731 | |
Einstein Noah Restaurant Group Inc | | | 3,674 | | | | 44,860 | |
Entercom Communications Corp ‘A’ * | | | 14,744 | | | | 102,913 | |
Entravision Communications Corp ‘A’ | | | 30,144 | | | | 50,039 | |
Ethan Allen Interiors Inc | | | 14,564 | | | | 374,440 | |
Exide Technologies * | | | 46,826 | | | | 160,145 | |
Express Inc * | | | 53,964 | | | | 814,317 | |
Federal-Mogul Corp * | | | 11,298 | | | | 90,610 | |
Fiesta Restaurant Group Inc * | | | 9,645 | | | | 147,761 | |
Fifth & Pacific Cos Inc * | | | 65,669 | | | | 817,579 | |
Fisher Communications Inc | | | 5,369 | | | | 144,909 | |
Five Below Inc * | | | 6,650 | | | | 213,066 | |
Flexsteel Industries Inc | | | 2,732 | | | | 58,601 | |
Francesca’s Holdings Corp * | | | 21,077 | | | | 547,159 | |
Fred’s Inc ‘A’ | | | 22,059 | | | | 293,605 | |
Frisch’s Restaurants Inc | | | 1,811 | | | | 33,504 | |
Fuel Systems Solutions Inc * | | | 8,871 | | | | 130,404 | |
G-III Apparel Group Ltd * | | | 10,001 | | | | 342,334 | |
Geeknet Inc * | | | 2,648 | | | | 42,633 | |
Genesco Inc * | | | 14,747 | | | | 811,085 | |
Gentherm Inc * | | | 17,957 | | | | 238,828 | |
Global Sources Ltd * (Bermuda) | | | 11,588 | | | | 75,090 | |
Gordmans Stores Inc * | | | 5,200 | | | | 78,104 | |
Grand Canyon Education Inc * | | | 24,116 | | | | 566,003 | |
Group 1 Automotive Inc | | | 13,803 | | | | 855,648 | |
Harte-Hanks Inc | | | 26,592 | | | | 156,893 | |
Haverty Furniture Cos Inc | | | 11,514 | | | | 187,793 | |
Helen of Troy Ltd * (Bermuda) | | | 19,084 | | | | 637,215 | |
hhgregg Inc * | | | 9,707 | | | | 68,143 | |
Hibbett Sports Inc * | | | 15,922 | | | | 839,089 | |
Hillenbrand Inc | | | 33,341 | | | | 753,840 | |
Hooker Furniture Corp | | | 6,552 | | | | 95,201 | |
Hot Topic Inc | | | 25,433 | | | | 245,428 | |
Hovnanian Enterprises Inc ‘A’ * | | | 63,705 | | | | 445,935 | |
HSN Inc | | | 21,585 | | | | 1,188,902 | |
Iconix Brand Group Inc * | | | 42,728 | | | | 953,689 | |
Ignite Restaurant Group Inc * | | | 4,014 | | | | 52,182 | |
| | |
| See Notes to Financial Statements | | See explanation of symbols and terms, if any, on page B-143 |
18
PACIFIC SELECT FUND
SMALL-CAP INDEX PORTFOLIO
Schedule of Investments (Continued)
December 31, 2012
| | | | | | | | |
| | | Shares | | | Value | |
International Speedway Corp ‘A’ | | | 16,687 | | | | $460,895 | |
Interval Leisure Group Inc | | | 23,517 | | | | 455,995 | |
iRobot Corp * | | | 16,688 | | | | 312,733 | |
Isle of Capri Casinos Inc * | | | 12,374 | | | | 69,294 | |
Jack in the Box Inc * | | | 26,721 | | | | 764,221 | |
JAKKS Pacific Inc | | | 13,112 | | | | 164,162 | |
Jamba Inc * | | | 46,434 | | | | 104,012 | |
Johnson Outdoors Inc ‘A’ * | | | 3,297 | | | | 65,676 | |
Jos. A. Bank Clothiers Inc * | | | 16,755 | | | | 713,428 | |
Journal Communications Inc ‘A’ * | | | 24,520 | | | | 132,653 | |
K-Swiss Inc ‘A’ * | | | 15,929 | | | | 53,521 | |
K12 Inc * | | | 16,218 | | | | 331,496 | |
Kayak Software Corp * | | | 2,041 | | | | 81,069 | |
KB Home | | | 46,643 | | | | 736,959 | |
Kirkland’s Inc * | | | 8,039 | | | | 85,133 | |
Krispy Kreme Doughnuts Inc * | | | 36,186 | | | | 339,425 | |
La-Z-Boy Inc | | | 31,302 | | | | 442,923 | |
LeapFrog Enterprises Inc * | | | 30,675 | | | | 264,725 | |
Libbey Inc * | | | 12,340 | | | | 238,779 | |
Life Time Fitness Inc * | | | 25,864 | | | | 1,272,767 | |
LifeLock Inc * | | | 10,510 | | | | 85,446 | |
Lifetime Brands Inc | | | 5,744 | | | | 60,944 | |
LIN TV Corp ‘A’ * | | | 18,145 | | | | 136,632 | |
Lincoln Educational Services Corp | | | 13,946 | | | | 77,958 | |
Lions Gate Entertainment Corp * (Canada) | | | 51,318 | | | | 841,615 | |
Lithia Motors Inc ‘A’ | | | 13,120 | | | | 490,950 | |
Live Nation Entertainment Inc * | | | 84,471 | | | | 786,425 | |
Luby’s Inc * | | | 12,388 | | | | 82,876 | |
Lumber Liquidators Holdings Inc * | | | 16,653 | | | | 879,778 | |
M.D.C. Holdings Inc | | | 23,152 | | | | 851,068 | |
M/I Homes Inc * | | | 12,980 | | | | 343,970 | |
Mac-Gray Corp | | | 7,189 | | | | 90,222 | |
Maidenform Brands Inc * | | | 14,054 | | | | 273,912 | |
Marcus Corp | | | 11,713 | | | | 146,061 | |
Marine Products Corp | | | 6,194 | | | | 35,430 | |
MarineMax Inc * | | | 12,312 | | | | 110,069 | |
Marriott Vacations Worldwide Corp * | | | 16,071 | | | | 669,679 | |
Martha Stewart Living Omnimedia Inc ‘A’ * | | | 16,863 | | | | 41,314 | |
Matthews International Corp ‘A’ | | | 16,945 | | | | 543,934 | |
Mattress Firm Holding Corp * | | | 6,605 | | | | 162,021 | |
MDC Partners Inc ‘A’ (Canada) | | | 15,513 | | | | 175,297 | |
Meredith Corp | | | 21,935 | | | | 755,661 | |
Meritage Homes Corp * | | | 18,486 | | | | 690,452 | |
Modine Manufacturing Co * | | | 28,394 | | | | 230,843 | |
Monarch Casino & Resort Inc * | | | 5,375 | | | | 58,641 | |
Monro Muffler Brake Inc | | | 18,642 | | | | 651,911 | |
Morgans Hotel Group Co * | | | 13,417 | | | | 74,330 | |
Movado Group Inc | | | 10,614 | | | | 325,638 | |
MTR Gaming Group Inc * | | | 13,941 | | | | 58,134 | |
Multimedia Games Holding Co Inc * | | | 16,681 | | | | 245,378 | |
NACCO Industries Inc ‘A’ | | | 3,359 | | | | 203,858 | |
Nathan’s Famous Inc * | | | 1,536 | | | | 51,763 | |
National American University Holdings Inc | | | 5,460 | | | | 21,021 | |
National CineMedia Inc | | | 33,828 | | | | 477,990 | |
New York & Co Inc * | | | 16,712 | | | | 63,673 | |
Nexstar Broadcasting Group Inc ‘A’ * | | | 6,663 | | | | 70,561 | |
NutriSystem Inc | | | 17,224 | | | | 141,065 | |
Office Depot Inc * | | | 171,413 | | | | 562,235 | |
OfficeMax Inc | | | 52,533 | | | | 512,722 | |
Orbitz Worldwide Inc * | | | 14,656 | | | | 39,864 | |
Orchard Supply Hardware Stores Corp ‘A’ * | | | 1,120 | | | | 8,299 | |
Orient-Express Hotels Ltd ‘A’ * (Bermuda) | | | 58,521 | | | | 684,110 | |
Outdoor Channel Holdings Inc | | | 8,839 | | | | 67,176 | |
Overstock.com Inc * | | | 6,910 | | | | 98,882 | |
Oxford Industries Inc | | | 8,452 | | | | 391,835 | |
Papa John’s International Inc * | | | 10,800 | | | | 593,352 | |
Penske Automotive Group Inc | | | 25,641 | | | | 771,538 | |
Perfumania Holdings Inc * | | | 3,117 | | | | 15,336 | |
Perry Ellis International Inc | | | 7,200 | | | | 143,280 | |
PetMed Express Inc | | | 12,276 | | | | 136,264 | |
| | | | | | | | |
| | | Shares | | | Value | |
Pier 1 Imports Inc | | | 58,729 | | | | $1,174,580 | |
Pinnacle Entertainment Inc * | | | 35,528 | | | | 562,408 | |
Pool Corp | | | 28,681 | | | | 1,213,780 | |
Premier Exhibitions Inc * | | | 15,507 | | | | 42,024 | |
Quiksilver Inc * | | | 79,108 | | | | 336,209 | |
RadioShack Corp | | | 60,982 | | | | 129,282 | |
ReachLocal Inc * | | | 6,038 | | | | 77,951 | |
Reading International Inc ‘A’ * | | | 9,871 | | | | 59,325 | |
Red Lion Hotels Corp * | | | 8,072 | | | | 63,688 | |
Red Robin Gourmet Burgers Inc * | | | 8,836 | | | | 311,822 | |
Regis Corp | | | 34,730 | | | | 587,632 | |
Rent-A-Center Inc | | | 35,823 | | | | 1,230,878 | |
Rentrak Corp * | | | 5,604 | | | | 109,222 | |
Restoration Hardware Holdings Inc * | | | 3,296 | | | | 111,174 | |
RG Barry Corp | | | 5,164 | | | | 73,174 | |
Ruby Tuesday Inc * | | | 38,914 | | | | 305,864 | |
rue21 Inc * | | | 9,372 | | | | 266,071 | |
Ruth’s Hospitality Group Inc * | | | 21,513 | | | | 156,400 | |
Saga Communications Inc ‘A’ | | | 2,129 | | | | 98,999 | |
Saks Inc * | | | 66,406 | | | | 697,927 | |
Salem Communications Corp ‘A’ | | | 6,240 | | | | 34,070 | |
Scholastic Corp | | | 15,617 | | | | 461,639 | |
Scientific Games Corp ‘A’ * | | | 31,366 | | | | 271,943 | |
Sealy Corp * | | | 30,244 | | | | 65,629 | |
Select Comfort Corp * | | | 34,294 | | | | 897,474 | |
SHFL Entertainment Inc * | | | 33,196 | | | | 481,342 | |
Shiloh Industries Inc | | | 3,761 | | | | 38,738 | |
Shoe Carnival Inc | | | 8,627 | | | | 176,767 | |
Shutterfly Inc * | | | 21,618 | | | | 645,730 | |
Shutterstock Inc * | | | 3,047 | | | | 79,222 | |
Sinclair Broadcast Group Inc ‘A’ | | | 30,504 | | | | 384,960 | |
Six Flags Entertainment Corp | | | 24,000 | | | | 1,468,800 | |
Skechers U.S.A. Inc ‘A’ * | | | 22,836 | | | | 422,466 | |
Skullcandy Inc * | | | 9,656 | | | | 75,220 | |
Smith & Wesson Holding Corp * | | | 39,087 | | | | 329,894 | |
Sonic Automotive Inc ‘A’ | | | 25,742 | | | | 537,750 | |
Sonic Corp * | | | 34,324 | | | | 357,313 | |
Sotheby’s | | | 40,918 | | | | 1,375,663 | |
Spartan Motors Inc | | | 20,348 | | | | 100,316 | |
Speedway Motorsports Inc | | | 6,976 | | | | 124,452 | |
Stage Stores Inc | | | 18,526 | | | | 459,074 | |
Standard Motor Products Inc | | | 12,031 | | | | 267,329 | |
Standard Pacific Corp * | | | 70,222 | | | | 516,132 | |
Stein Mart Inc | | | 16,686 | | | | 125,812 | |
Steiner Leisure Ltd * (Bahamas) | | | 9,168 | | | | 441,806 | |
Steinway Musical Instruments Inc * | | | 4,030 | | | | 85,235 | |
Steven Madden Ltd * | | | 23,707 | | | | 1,002,095 | |
Stewart Enterprises Inc ‘A’ | | | 45,403 | | | | 346,879 | |
Stoneridge Inc * | | | 16,960 | | | | 86,835 | |
Strayer Education Inc | | | 7,159 | | | | 402,121 | |
Sturm Ruger & Co Inc | | | 11,598 | | | | 526,549 | |
Superior Industries International Inc | | | 13,571 | | | | 276,848 | |
Systemax Inc | | | 6,667 | | | | 64,337 | |
Teavana Holdings Inc * | | | 5,452 | | | | 84,506 | |
Tenneco Inc * | | | 36,646 | | | | 1,286,641 | |
Texas Roadhouse Inc | | | 37,836 | | | | 635,645 | |
The Bon-Ton Stores Inc | | | 7,661 | | | | 92,851 | |
The Buckle Inc | | | 16,756 | | | | 747,988 | |
The Cato Corp ‘A’ | | | 16,503 | | | | 452,677 | |
The Cheesecake Factory Inc | | | 32,680 | | | | 1,069,290 | |
The Children’s Place * | | | 14,679 | | | | 650,133 | |
The E.W. Scripps Co ‘A’ * | | | 18,224 | | | | 197,001 | |
The Finish Line Inc ‘A’ | | | 30,781 | | | | 582,684 | |
The Jones Group Inc | | | 49,542 | | | | 547,935 | |
The McClatchy Co ‘A’ * | | | 35,324 | | | | 115,509 | |
The Men’s Wearhouse Inc | | | 30,724 | | | | 957,360 | |
The New York Times Co ‘A’ * | | | 82,278 | | | | 701,831 | |
The Pep Boys-Manny Moe & Jack | | | 32,081 | | | | 315,356 | |
The Ryland Group Inc | | | 26,976 | | | | 984,624 | |
The Warnaco Group Inc * | | | 24,785 | | | | 1,773,862 | |
| | |
| See Notes to Financial Statements | | See explanation of symbols and terms, if any, on page B-143 |
19
PACIFIC SELECT FUND
SMALL-CAP INDEX PORTFOLIO
Schedule of Investments (Continued)
December 31, 2012
| | | | | | | | |
| | | Shares | | | Value | |
The Wet Seal Inc ‘A’ * | | | 55,080 | | | | $152,021 | |
Tilly’s Inc ‘A’ * | | | 5,649 | | | | 76,205 | |
Tower International Inc * | | | 3,346 | | | | 26,935 | |
Town Sports International Holdings Inc | | | 13,897 | | | | 148,003 | |
True Religion Apparel Inc | | | 15,504 | | | | 394,112 | |
Tuesday Morning Corp * | | | 25,240 | | | | 157,750 | |
Tumi Holdings Inc * | | | 13,076 | | | | 272,635 | |
Unifi Inc * | | | 8,475 | | | | 110,260 | |
Universal Electronics Inc * | | | 9,096 | | | | 176,008 | |
Universal Technical Institute Inc | | | 13,214 | | | | 132,669 | |
US Auto Parts Network Inc * | | | 9,055 | | | | 16,571 | |
Vail Resorts Inc | | | 21,757 | | | | 1,176,836 | |
Valassis Communications Inc | | | 24,072 | | | | 620,576 | |
Value Line Inc | | | 486 | | | | 4,359 | |
Vera Bradley Inc * | | | 12,204 | | | | 306,320 | |
Vitacost.com Inc * | | | 13,372 | | | | 90,662 | |
Vitamin Shoppe Inc * | | | 17,789 | | | | 1,020,377 | |
VOXX International Corp * | | | 11,035 | | | | 74,266 | |
West Marine Inc * | | | 9,055 | | | | 97,341 | |
Weyco Group Inc | | | 3,830 | | | | 89,469 | |
Winmark Corp | | | 1,332 | | | | 75,924 | |
Winnebago Industries Inc * | | | 17,740 | | | | 303,886 | |
WMS Industries Inc * | | | 33,234 | | | | 581,595 | |
Wolverine World Wide Inc | | | 29,374 | | | | 1,203,747 | |
World Wrestling Entertainment Inc ‘A’ | | | 16,328 | | | | 128,828 | |
Zagg Inc * | | | 15,215 | | | | 111,982 | |
Zumiez Inc * | | | 13,322 | | | | 258,580 | |
| | | | | | | | |
| | | | | | | 101,667,793 | |
| | | | | | | | |
Consumer Staples - 3.4% | | | | | | | | |
| | |
Alico Inc | | | 2,069 | | | | 75,787 | |
Alliance One International Inc * | | | 52,885 | | | | 192,501 | |
Annie’s Inc * | | | 3,055 | | | | 102,129 | |
Arden Group Inc ‘A’ | | | 673 | | | | 60,550 | |
B&G Foods Inc | | | 31,803 | | | | 900,343 | |
Cal-Maine Foods Inc | | | 8,721 | | | | 350,759 | |
Calavo Growers Inc | | | 7,257 | | | | 182,949 | |
Casey’s General Stores Inc | | | 23,027 | | | | 1,222,734 | |
Central European Distribution Corp * | | | 40,804 | | | | 88,545 | |
Central Garden & Pet Co ‘A’ * | | | 23,534 | | | | 245,930 | |
Chiquita Brands International Inc * | | | 27,680 | | | | 228,360 | |
Coca-Cola Bottling Co Consolidated | | | 2,781 | | | | 184,936 | |
Craft Brew Alliance Inc * | | | 6,277 | | | | 40,675 | |
Darling International Inc * | | | 71,053 | | | | 1,139,690 | |
Diamond Foods Inc | | | 13,404 | | | | 183,233 | |
Dole Food Co Inc * | | | 21,487 | | | | 246,456 | |
Elizabeth Arden Inc * | | | 15,201 | | | | 684,197 | |
Farmer Bros. Co * | | | 4,268 | | | | 61,587 | |
Fresh Del Monte Produce Inc (Cayman) | | | 23,065 | | | | 607,763 | |
Griffin Land & Nurseries Inc | | | 1,737 | | | | 46,899 | |
Harbinger Group Inc * | | | 25,013 | | | | 192,350 | |
Harris Teeter Supermarkets Inc | | | 26,570 | | | | 1,024,539 | |
Ingles Markets Inc ‘A’ | | | 7,346 | | | | 126,792 | |
Inter Parfums Inc | | | 9,939 | | | | 193,413 | |
Inventure Foods Inc * | | | 8,068 | | | | 52,361 | |
J&J Snack Foods Corp | | | 8,910 | | | | 569,705 | |
John B Sanfilippo & Son Inc | | | 4,870 | | | | 88,537 | |
Lancaster Colony Corp | | | 11,173 | | | | 773,060 | |
Lifeway Foods Inc | | | 2,797 | | | | 24,446 | |
Limoneira Co | | | 5,040 | | | | 97,726 | |
Medifast Inc * | | | 8,437 | | | | 222,652 | |
Nash Finch Co | | | 7,382 | | | | 157,089 | |
National Beverage Corp | | | 6,889 | | | | 100,511 | |
Natural Grocers by Vitamin Cottage Inc * | | | 4,293 | | | | 81,953 | |
Nature’s Sunshine Products Inc | | | 6,810 | | | | 98,609 | |
Nutraceutical International Corp | | | 5,075 | | | | 83,940 | |
Oil-Dri Corp of America | | | 2,992 | | | | 82,579 | |
Omega Protein Corp * | | | 11,795 | | | | 72,185 | |
Orchids Paper Products Co | | | 3,417 | | | | 69,092 | |
Pilgrim’s Pride Corp * | | | 36,219 | | | | 262,588 | |
| | | | | | | | |
| | | Shares | | | Value | |
Post Holdings Inc * | | | 15,801 | | | | $541,184 | |
Prestige Brands Holdings Inc * | | | 30,365 | | | | 608,211 | |
PriceSmart Inc | | | 10,999 | | | | 847,473 | |
Revlon Inc ‘A’ * | | | 6,769 | | | | 98,150 | |
Rite Aid Corp * | | | 397,325 | | | | 540,362 | |
Roundy’s Inc | | | 12,349 | | | | 54,953 | |
Sanderson Farms Inc | | | 13,877 | | | | 659,851 | |
Seneca Foods Corp ‘A’ * | | | 4,998 | | | | 151,939 | |
Smart Balance Inc * | | | 35,656 | | | | 459,962 | |
Snyder’s-Lance Inc | | | 26,705 | | | | 643,858 | |
Spartan Stores Inc | | | 13,078 | | | | 200,878 | |
Spectrum Brands Holdings Inc * | | | 13,864 | | | | 622,910 | |
Star Scientific Inc * | | | 88,455 | | | | 237,059 | |
SUPERVALU Inc | | | 128,323 | | | | 316,958 | |
Susser Holdings Corp * | | | 6,821 | | | | 235,256 | |
Synutra International Inc * | | | 10,481 | | | | 48,527 | |
The Andersons Inc | | | 11,197 | | | | 480,351 | |
The Boston Beer Co Inc ‘A’ * | | | 4,688 | | | | 630,302 | |
The Chefs’ Warehouse Inc * | | | 6,779 | | | | 107,176 | |
The Female Health Co | | | 11,387 | | | | 81,759 | |
The Hain Celestial Group Inc * | | | 22,285 | | | | 1,208,293 | |
The Pantry Inc * | | | 14,058 | | | | 170,524 | |
Tootsie Roll Industries Inc | | | 14,350 | | | | 371,952 | |
TreeHouse Foods Inc * | | | 21,670 | | | | 1,129,657 | |
United Natural Foods Inc * | | | 29,506 | | | | 1,581,227 | |
Universal Corp | | | 13,994 | | | | 698,441 | |
USANA Health Sciences Inc * | | | 3,609 | | | | 118,844 | |
Vector Group Ltd | | | 33,778 | | | | 502,279 | |
Village Super Market Inc ‘A’ | | | 5,087 | | | | 167,159 | |
WD-40 Co | | | 9,601 | | | | 452,303 | |
Weis Markets Inc | | | 6,717 | | | | 263,105 | |
Westway Group Inc * | | | 7,097 | | | | 47,337 | |
| | | | | | | | |
| | | | | | | 25,498,390 | |
| | | | | | | | |
Energy - 5.9% | | | | | | | | |
| | |
Abraxas Petroleum Corp * | | | 50,150 | | | | 109,828 | |
Adams Resources & Energy Inc | | | 1,367 | | | | 47,941 | |
Alon USA Energy Inc | | | 6,221 | | | | 112,538 | |
Amyris Inc * | | | 18,647 | | | | 58,179 | |
Apco Oil and Gas International Inc (Cayman) | | | 5,587 | | | | 68,776 | |
Approach Resources Inc * | | | 20,035 | | | | 501,075 | |
Arch Coal Inc | | | 128,121 | | | | 937,846 | |
Basic Energy Services Inc * | | | 18,649 | | | | 212,785 | |
Berry Petroleum Co ‘A’ | | | 31,634 | | | | 1,061,321 | |
Bill Barrett Corp * | | | 29,014 | | | | 516,159 | |
Bolt Technology Corp | | | 5,169 | | | | 73,762 | |
Bonanza Creek Energy Inc * | | | 5,970 | | | | 165,906 | |
BPZ Resources Inc * | | | 63,501 | | | | 200,028 | |
Bristow Group Inc | | | 21,582 | | | | 1,158,090 | |
C&J Energy Services Inc * | | | 26,916 | | | | 577,079 | |
Cal Dive International Inc * | | | 58,068 | | | | 100,458 | |
Callon Petroleum Co * | | | 23,939 | | | | 112,513 | |
Carrizo Oil & Gas Inc * | | | 23,874 | | | | 499,444 | |
Ceres Inc * | | | 3,488 | | | | 15,835 | |
Clayton Williams Energy Inc * | | | 3,596 | | | | 143,840 | |
Clean Energy Fuels Corp * | | | 40,340 | | | | 502,233 | |
Cloud Peak Energy Inc * | | | 36,828 | | | | 711,885 | |
Comstock Resources Inc * | | | 29,044 | | | | 439,436 | |
Contango Oil & Gas Co | | | 7,722 | | | | 327,104 | |
Crimson Exploration Inc * | | | 13,504 | | | | 37,001 | |
Crosstex Energy Inc | | | 25,230 | | | | 361,798 | |
CVR Energy Inc * | | | 10,159 | | | | 495,658 | |
Dawson Geophysical Co * | | | 4,825 | | | | 127,283 | |
Delek US Holdings Inc | | | 10,516 | | | | 266,265 | |
Diamondback Energy Inc * | | | 8,530 | | | | 163,094 | |
Dril-Quip Inc * | | | 24,264 | | | | 1,772,485 | |
Emerald Oil Inc * | | | 9,151 | | | | 47,951 | |
Endeavour International Corp * | | | 28,508 | | | | 147,671 | |
Energy XXI Ltd (Bermuda) | | | 47,661 | | | | 1,534,208 | |
EPL Oil & Gas Inc * | | | 16,712 | | | | 376,856 | |
| | |
| See Notes to Financial Statements | | See explanation of symbols and terms, if any, on page B-143 |
20
PACIFIC SELECT FUND
SMALL-CAP INDEX PORTFOLIO
Schedule of Investments (Continued)
December 31, 2012
| | | | | | | | |
| | | Shares | | | Value | |
Evolution Petroleum Corp * | | | 9,963 | | | | $80,999 | |
Exterran Holdings Inc * | | | 39,122 | | | | 857,554 | |
Forbes Energy Services Ltd * | | | 8,803 | | | | 22,272 | |
Forest Oil Corp * | | | 71,014 | | | | 475,084 | |
Forum Energy Technologies Inc * | | | 13,423 | | | | 332,219 | |
Frontline Ltd * (Bermuda) | | | 31,490 | | | | 102,657 | |
FX Energy Inc * | | | 31,920 | | | | 131,191 | |
GasLog Ltd (Bermuda) | | | 14,631 | | | | 181,863 | |
Gastar Exploration Ltd * (Canada) | | | 35,364 | | | | 42,790 | |
Geospace Technologies Corp * | | | 7,703 | | | | 684,566 | |
Gevo Inc * | | | 19,191 | | | | 29,554 | |
Global Geophysical Services Inc * | | | 12,016 | | | | 46,262 | |
Goodrich Petroleum Corp * | | | 15,801 | | | | 147,265 | |
Green Plains Renewable Energy Inc * | | | 14,897 | | | | 117,835 | |
Gulf Island Fabrication Inc | | | 8,659 | | | | 208,076 | |
Gulfmark Offshore Inc ‘A’ | | | 16,197 | | | | 557,987 | |
Gulfport Energy Corp * | | | 33,645 | | | | 1,285,912 | |
Halcon Resources Corp * | | | 67,412 | | | | 466,491 | |
Hallador Energy Co | | | 3,960 | | | | 32,710 | |
Harvest Natural Resources Inc * | | | 23,579 | | | | 213,862 | |
Heckmann Corp * | | | 84,843 | | | | 341,917 | |
Helix Energy Solutions Group Inc * | | | 63,784 | | | | 1,316,502 | |
Hercules Offshore Inc * | | | 95,649 | | | | 591,111 | |
Hornbeck Offshore Services Inc * | | | 21,313 | | | | 731,888 | |
ION Geophysical Corp * | | | 79,695 | | | | 518,814 | |
Isramco Inc * | | | 613 | | | | 63,746 | |
Key Energy Services Inc * | | | 91,481 | | | | 635,793 | |
KiOR Inc ‘A’ * | | | 15,634 | | | | 100,214 | |
Knightsbridge Tankers Ltd (Bermuda) | | | 15,129 | | | | 79,427 | |
Kodiak Oil & Gas Corp * (Canada) | | | 159,287 | | | | 1,409,690 | |
Lufkin Industries Inc | | | 20,284 | | | | 1,179,109 | |
Magnum Hunter Resources Corp * | | | 88,852 | | | | 354,519 | |
Matador Resources Co * | | | 8,425 | | | | 69,085 | |
Matrix Service Co * | | | 15,735 | | | | 180,952 | |
McMoRan Exploration Co * | | | 61,289 | | | | 983,688 | |
Midstates Petroleum Co Inc * | | | 14,729 | | | | 101,483 | |
Miller Energy Resources Inc * | | | 18,727 | | | | 74,159 | |
Mitcham Industries Inc * | | | 7,757 | | | | 105,728 | |
Natural Gas Services Group Inc * | | | 7,355 | | | | 120,769 | |
Newpark Resources Inc * | | | 54,482 | | | | 427,684 | |
Nordic American Tankers Ltd (Bermuda) | | | 32,023 | | | | 280,201 | |
Northern Oil & Gas Inc * | | | 38,336 | | | | 644,811 | |
Oasis Petroleum Inc * | | | 48,248 | | | | 1,534,286 | |
Panhandle Oil & Gas Inc ‘A’ | | | 4,211 | | | | 118,877 | |
Parker Drilling Co * | | | 71,415 | | | | 328,509 | |
PDC Energy Inc * | | | 18,096 | | | | 600,968 | |
Penn Virginia Corp | | | 32,731 | | | | 144,344 | |
PetroQuest Energy Inc * | | | 34,209 | | | | 169,335 | |
PHI Inc * | | | 7,881 | | | | 263,935 | |
Pioneer Energy Services Corp * | | | 37,137 | | | | 269,615 | |
Quicksilver Resources Inc * | | | 71,046 | | | | 203,192 | |
Renewable Energy Group Inc * | | | 4,588 | | | | 26,886 | |
Rentech Inc | | | 79,157 | | | | 208,183 | |
Resolute Energy Corp * | | | 29,173 | | | | 237,176 | |
REX American Resources Corp * | | | 3,465 | | | | 66,840 | |
Rex Energy Corp * | | | 26,282 | | | | 342,192 | |
RigNet Inc * | | | 7,355 | | | | 150,263 | |
Rosetta Resources Inc * | | | 31,956 | | | | 1,449,524 | |
Sanchez Energy Corp * | | | 6,905 | | | | 124,290 | |
Saratoga Resources Inc * | | | 12,017 | | | | 42,540 | |
Scorpio Tankers Inc * | | | 33,407 | | | | 237,524 | |
SemGroup Corp ‘A’ * | | | 25,614 | | | | 1,000,995 | |
Ship Finance International Ltd (Bermuda) | | | 29,385 | | | | 488,673 | |
Solazyme Inc * | | | 20,306 | | | | 159,605 | |
Stone Energy Corp * | | | 29,806 | | | | 611,619 | |
Swift Energy Co * | | | 25,880 | | | | 398,293 | |
Synergy Resources Corp * | | | 23,823 | | | | 128,406 | |
Targa Resources Corp | | | 17,500 | | | | 924,700 | |
Teekay Tankers Ltd ‘A’ | | | 39,003 | | | | 113,109 | |
Tesco Corp * (Canada) | | | 18,175 | | | | 207,013 | |
| | | | | | | | |
| | | Shares | | | Value | |
TETRA Technologies Inc * | | | 47,164 | | | | $357,975 | |
TGC Industries Inc | | | 9,050 | | | | 74,119 | |
Triangle Petroleum Corp * | | | 26,740 | | | | 160,173 | |
Uranerz Energy Corp * | | | 39,851 | | | | 55,393 | |
Uranium Energy Corp * | | | 51,028 | | | | 130,632 | |
Vaalco Energy Inc * | | | 35,202 | | | | 304,497 | |
Vantage Drilling Co * (Cayman) | | | 114,833 | | | | 210,144 | |
W&T Offshore Inc | | | 20,964 | | | | 336,053 | |
Warren Resources Inc * | | | 43,542 | | | | 122,353 | |
Western Refining Inc | | | 34,896 | | | | 983,718 | |
Westmoreland Coal Co * | | | 6,341 | | | | 59,225 | |
Willbros Group Inc * | | | 23,866 | | | | 127,922 | |
ZaZa Energy Corp * | | | 15,385 | | | | 31,539 | |
| | | | | | | | |
| | | | | | | 43,817,405 | |
| | | | | | | | |
Financials - 22.2% | | | | | | | | |
| | |
1st Source Corp | | | 9,029 | | | | 199,451 | |
1st United Bancorp Inc | | | 18,312 | | | | 114,450 | |
Acadia Realty Trust REIT | | | 30,604 | | | | 767,548 | |
Access National Corp | | | 4,589 | | | | 59,657 | |
AG Mortgage Investment Trust Inc REIT | | | 13,801 | | | | 324,047 | |
Agree Realty Corp REIT | | | 6,864 | | | | 183,887 | |
Alexander’s Inc REIT | | | 1,272 | | | | 420,778 | |
Alliance Financial Corp | | | 2,921 | | | | 127,093 | |
Alterra Capital Holdings Ltd (Bermuda) | | | 51,921 | | | | 1,463,653 | |
American Assets Trust Inc REIT | | | 20,046 | | | | 559,885 | |
American Capital Mortgage Investment Corp REIT | | | 22,228 | | | | 523,914 | |
American Equity Investment Life Holding Co | | | 36,138 | | | | 441,245 | |
American National Bankshares Inc | | | 4,789 | | | | 96,690 | |
American Realty Capital Trust Inc REIT | | | 96,164 | | | | 1,110,694 | |
American Safety Insurance Holdings Ltd * (Bermuda) | | | 5,509 | | | | 104,230 | |
Ameris Bancorp * | | | 14,617 | | | | 182,566 | |
AMERISAFE Inc * | | | 11,087 | | | | 302,121 | |
Ames National Corp | | | 5,159 | | | | 112,982 | |
AmREIT Inc ‘B’ | | | 2,191 | | | | 37,576 | |
AmTrust Financial Services Inc | | | 16,456 | | | | 472,123 | |
Anworth Mortgage Asset Corp REIT | | | 84,864 | | | | 490,514 | |
Apollo Commercial Real Estate Finance Inc REIT | | | 14,130 | | | | 229,330 | |
Apollo Investment Corp | | | 123,511 | | | | 1,032,552 | |
Apollo Residential Mortgage Inc REIT | | | 14,952 | | | | 301,881 | |
Ares Commercial Real Estate Corp REIT | | | 4,767 | | | | 78,274 | |
Argo Group International Holdings Ltd (Bermuda) | | | 15,655 | | | | 525,851 | |
Arlington Asset Investment Corp ‘A’ | | | 6,672 | | | | 138,577 | |
ARMOUR Residential REIT Inc | | | 180,460 | | | | 1,167,576 | |
Arrow Financial Corp | | | 6,347 | | | | 158,358 | |
Artio Global Investors Inc | | | 19,510 | | | | 37,069 | |
Ashford Hospitality Trust Inc REIT | | | 32,358 | | | | 340,083 | |
Asset Acceptance Capital Corp * | | | 9,865 | | | | 44,393 | |
Associated Estates Realty Corp REIT | | | 30,302 | | | | 488,468 | |
Asta Funding Inc | | | 6,358 | | | | 60,465 | |
Astoria Financial Corp | | | 52,781 | | | | 494,030 | |
AV Homes Inc * | | | 6,044 | | | | 85,946 | |
Baldwin & Lyons Inc ‘B’ | | | 5,685 | | | | 135,644 | |
BancFirst Corp | | | 3,914 | | | | 165,797 | |
Banco Latinoamericano de Comercio Exterior SA ‘E’ (Multi-National) | | | 17,284 | | | | 372,643 | |
BancorpSouth Inc | | | 57,169 | | | | 831,237 | |
Bank Mutual Corp | | | 28,729 | | | | 123,535 | |
Bank of Kentucky Financial Corp | | | 3,601 | | | | 89,053 | |
Bank of Marin Bancorp | | | 3,101 | | | | 116,163 | |
Bank of the Ozarks Inc | | | 17,762 | | | | 594,494 | |
BankFinancial Corp | | | 12,753 | | | | 94,627 | |
Banner Corp | | | 11,614 | | | | 356,898 | |
Bar Harbor Bankshares | | | 2,305 | | | | 77,563 | |
BBCN Bancorp Inc | | | 47,439 | | | | 548,869 | |
Beneficial Mutual Bancorp Inc * | | | 19,933 | | | | 189,363 | |
| | |
| See Notes to Financial Statements | | See explanation of symbols and terms, if any, on page B-143 |
21
PACIFIC SELECT FUND
SMALL-CAP INDEX PORTFOLIO
Schedule of Investments (Continued)
December 31, 2012
| | | | | | | | |
| | | Shares | | | Value | |
Berkshire Bancorp Inc | | | 2,633 | | | | $21,591 | |
Berkshire Hills Bancorp Inc | | | 14,825 | | | | 353,724 | |
BGC Partners Inc ‘A’ | | | 61,106 | | | | 211,427 | |
BlackRock Kelso Capital Corp | | | 24,681 | | | | 248,291 | |
BofI Holding Inc * | | | 6,691 | | | | 186,478 | |
Boston Private Financial Holdings Inc | | | 47,277 | | | | 425,966 | |
Bridge Bancorp Inc | | | 5,324 | | | | 108,290 | |
Bridge Capital Holdings * | | | 5,711 | | | | 88,863 | |
Brookline Bancorp Inc | | | 42,738 | | | | 363,273 | |
Bryn Mawr Bank Corp | | | 6,945 | | | | 154,665 | |
BSB Bancorp Inc * | | | 5,013 | | | | 61,309 | |
C&F Financial Corp | | | 1,987 | | | | 77,374 | |
Calamos Asset Management Inc ‘A’ | | | 11,787 | | | | 124,589 | |
California First National Bancorp | | | 1,474 | | | | 22,036 | |
Camden National Corp | | | 4,775 | | | | 162,207 | |
Campus Crest Communities Inc REIT | | | 23,174 | | | | 284,113 | |
Cape Bancorp Inc | | | 7,092 | | | | 61,629 | |
Capital Bank Financial Corp ‘A’ * | | | 5,411 | | | | 92,366 | |
Capital City Bank Group Inc * | | | 7,112 | | | | 80,863 | |
Capital Southwest Corp | | | 1,813 | | | | 180,629 | |
CapLease Inc REIT | | | 39,811 | | | | 221,747 | |
Capstead Mortgage Corp REIT | | | 60,586 | | | | 694,921 | |
Cardinal Financial Corp | | | 17,668 | | | | 287,458 | |
Cascade Bancorp * | | | 3,653 | | | | 22,868 | |
Cash America International Inc | | | 17,824 | | | | 707,078 | |
Cathay General Bancorp | | | 47,752 | | | | 931,164 | |
Cedar Realty Trust Inc REIT | | | 37,389 | | | | 197,414 | |
Center Bancorp Inc | | | 7,198 | | | | 83,353 | |
Centerstate Banks Inc | | | 18,426 | | | | 157,174 | |
Central Pacific Financial Corp * | | | 13,010 | | | | 202,826 | |
Century Bancorp Inc ‘A’ | | | 2,158 | | | | 71,106 | |
Charter Financial Corp | | | 4,223 | | | | 44,764 | |
Chatham Lodging Trust REIT | | | 8,684 | | | | 133,560 | |
Chemical Financial Corp | | | 16,724 | | | | 397,362 | |
Chesapeake Lodging Trust REIT | | | 23,692 | | | | 494,689 | |
CIFC Corp * | | | 3,926 | | | | 31,408 | |
Citizens & Northern Corp | | | 7,434 | | | | 140,503 | |
Citizens Inc * | | | 23,505 | | | | 259,730 | |
Citizens Republic Bancorp Inc * | | | 24,247 | | | | 459,966 | |
City Holding Co | | | 8,953 | | | | 312,012 | |
Clifton Savings Bancorp Inc | | | 5,482 | | | | 61,782 | |
CNB Financial Corp | | | 7,865 | | | | 128,829 | |
CNO Financial Group Inc | | | 121,548 | | | | 1,134,043 | |
CoBiz Financial Inc | | | 21,596 | | | | 161,322 | |
Cohen & Steers Inc | | | 11,297 | | | | 344,220 | |
Colonial Properties Trust REIT | | | 53,346 | | | | 1,140,004 | |
Colony Financial Inc REIT | | | 31,618 | | | | 616,551 | |
Columbia Banking System Inc | | | 24,316 | | | | 436,229 | |
Community Bank System Inc | | | 23,992 | | | | 656,421 | |
Community Trust Bancorp Inc | | | 8,604 | | | | 282,039 | |
Consolidated-Tomoka Land Co | | | 2,564 | | | | 79,510 | |
Coresite Realty Corp REIT | | | 12,455 | | | | 344,505 | |
Cousins Properties Inc REIT | | | 55,742 | | | | 465,446 | |
Cowen Group Inc ‘A’ * | | | 54,106 | | | | 132,560 | |
Crawford & Co ‘B’ | | | 15,889 | | | | 126,794 | |
Credit Acceptance Corp * | | | 4,779 | | | | 485,929 | |
Crescent Financial Bancshares Inc * | | | 1,776 | | | | 8,152 | |
CreXus Investment Corp REIT | | | 41,169 | | | | 504,320 | |
CubeSmart REIT | | | 74,792 | | | | 1,089,719 | |
CVB Financial Corp | | | 53,655 | | | | 558,012 | |
CYS Investments Inc REIT | | | 106,790 | | | | 1,261,190 | |
DCT Industrial Trust Inc REIT | | | 150,262 | | | | 975,200 | |
DFC Global Corp * | | | 26,656 | | | | 493,403 | |
Diamond Hill Investment Group Inc | | | 1,659 | | | | 112,580 | |
DiamondRock Hospitality Co REIT | | | 113,954 | | | | 1,025,586 | |
Dime Community Bancshares Inc | | | 19,151 | | | | 266,007 | |
Donegal Group Inc ‘A’ | | | 4,906 | | | | 68,880 | |
Doral Financial Corp * | | | 78,282 | | | | 56,684 | |
Duff & Phelps Corp ‘A’ | | | 19,075 | | | | 297,951 | |
DuPont Fabros Technology Inc REIT | | | 37,131 | | | | 897,085 | |
| | | | | | | | |
| | | Shares | | | Value | |
Dynex Capital Inc REIT | | | 33,346 | | | | $314,786 | |
Eagle Bancorp Inc * | | | 11,049 | | | | 220,649 | |
Eastern Insurance Holdings Inc | | | 4,010 | | | | 68,491 | |
EastGroup Properties Inc REIT | | | 17,312 | | | | 931,559 | |
Education Realty Trust Inc REIT | | | 68,558 | | | | 729,457 | |
eHealth Inc * | | | 11,908 | | | | 327,232 | |
EMC Insurance Group Inc | | | 2,966 | | | | 70,828 | |
Employers Holdings Inc | | | 11,612 | | | | 238,975 | |
Encore Capital Group Inc * | | | 13,355 | | | | 408,930 | |
Enstar Group Ltd * (Bermuda) | | | 5,086 | | | | 569,530 | |
Enterprise Bancorp Inc | | | 3,789 | | | | 62,594 | |
Enterprise Financial Services Corp | | | 10,710 | | | | 139,980 | |
Epoch Holding Corp | | | 9,732 | | | | 271,523 | |
EPR Properties REIT | | | 28,458 | | | | 1,312,198 | |
Equity One Inc REIT | | | 33,561 | | | | 705,117 | |
ESB Financial Corp | | | 6,112 | | | | 84,773 | |
ESSA Bancorp Inc | | | 5,782 | | | | 62,966 | |
EverBank Financial Corp | | | 13,691 | | | | 204,133 | |
Evercore Partners Inc ‘A’ | | | 17,422 | | | | 525,970 | |
Excel Trust Inc REIT | | | 26,362 | | | | 334,007 | |
Ezcorp Inc ‘A’ * | | | 29,120 | | | | 578,323 | |
F.N.B. Corp | | | 84,727 | | | | 899,801 | |
Farmers National Banc Corp | | | 11,302 | | | | 70,072 | |
FBL Financial Group Inc ‘A’ | | | 5,855 | | | | 200,300 | |
FBR & Co * | | | 21,955 | | | | 84,966 | |
Federal Agricultural Mortgage Corp ‘C’ | | | 6,027 | | | | 195,877 | |
FelCor Lodging Trust Inc REIT * | | | 75,132 | | | | 350,866 | |
Fidelity Southern Corp * | | | 5,942 | | | | 56,746 | |
Fidus Investment Corp | | | 7,167 | | | | 117,897 | |
Fifth Street Finance Corp | | | 63,889 | | | | 665,723 | |
Financial Engines Inc * | | | 28,055 | | | | 778,526 | |
Financial Institutions Inc | | | 8,576 | | | | 159,771 | |
First American Financial Corp | | | 64,446 | | | | 1,552,504 | |
First Bancorp NC | | | 9,362 | | | | 120,021 | |
First BanCorp PR * | | | 43,210 | | | | 197,902 | |
First Busey Corp | | | 44,736 | | | | 208,022 | |
First California Financial Group Inc * | | | 14,009 | | | | 108,149 | |
First Cash Financial Services Inc * | | | 17,425 | | | | 864,628 | |
First Commonwealth Financial Corp | | | 63,902 | | | | 435,812 | |
First Community Bancshares Inc | | | 10,776 | | | | 172,093 | |
First Connecticut Bancorp Inc | | | 10,626 | | | | 146,107 | |
First Defiance Financial Corp | | | 5,826 | | | | 111,801 | |
First Federal Bancshares of Arkansas Inc * | | | 2,085 | | | | 20,329 | |
First Financial Bancorp | | | 35,726 | | | | 522,314 | |
First Financial Bankshares Inc | | | 19,174 | | | | 747,978 | |
First Financial Corp | | | 6,788 | | | | 205,269 | |
First Financial Holdings Inc | | | 10,013 | | | | 130,970 | |
First Financial Northwest Inc * | | | 9,626 | | | | 72,676 | |
First Industrial Realty Trust Inc REIT * | | | 59,519 | | | | 838,028 | |
First Interstate Bancsystem Inc | | | 9,871 | | | | 152,310 | |
First Merchants Corp | | | 17,471 | | | | 259,270 | |
First Midwest Bancorp Inc | | | 45,428 | | | | 568,759 | |
First Pactrust Bancorp Inc | | | 6,629 | | | | 81,338 | |
First Potomac Realty Trust REIT | | | 31,314 | | | | 387,041 | |
FirstMerit Corp | | | 66,519 | | | | 943,905 | |
Flushing Financial Corp | | | 18,955 | | | | 290,770 | |
FNB United Corp * | | | 6,133 | | | | 71,143 | |
Forestar Group Inc * | | | 21,036 | | | | 364,554 | |
Fortegra Financial Corp * | | | 4,323 | | | | 38,431 | |
Fox Chase Bancorp Inc | | | 7,414 | | | | 123,443 | |
Franklin Financial Corp | | | 8,010 | | | | 132,806 | |
Franklin Street Properties Corp REIT | | | 44,672 | | | | 549,912 | |
FXCM Inc ‘A’ | | | 14,039 | | | | 141,373 | |
Gain Capital Holdings Inc | | | 9,213 | | | | 37,681 | |
GAMCO Investors Inc ‘A’ | | | 3,933 | | | | 208,724 | |
German American Bancorp Inc | | | 7,816 | | | | 169,764 | |
Getty Realty Corp REIT | | | 15,637 | | | | 282,404 | |
GFI Group Inc | | | 42,309 | | | | 137,081 | |
Glacier Bancorp Inc | | | 43,677 | | | | 642,489 | |
Gladstone Capital Corp | | | 13,292 | | | | 108,463 | |
| | |
| See Notes to Financial Statements | | See explanation of symbols and terms, if any, on page B-143 |
22
PACIFIC SELECT FUND
SMALL-CAP INDEX PORTFOLIO
Schedule of Investments (Continued)
December 31, 2012
| | | | | | | | |
| | | Shares | | | Value | |
Gladstone Commercial Corp REIT | | | 6,414 | | | | $115,131 | |
Gladstone Investment Corp | | | 15,997 | | | | 111,339 | |
Glimcher Realty Trust REIT | | | 84,603 | | | | 938,247 | |
Global Indemnity PLC * (Ireland) | | | 6,326 | | | | 139,994 | |
Golub Capital BDC Inc | | | 9,650 | | | | 154,207 | |
Government Properties Income Trust REIT | | | 26,096 | | | | 625,521 | |
Gramercy Capital Corp REIT * | | | 27,855 | | | | 81,894 | |
Great Southern Bancorp Inc | | | 6,168 | | | | 156,976 | |
Green Dot Corp ‘A’ * | | | 14,757 | | | | 180,035 | |
Greenhill & Co Inc | | | 17,646 | | | | 917,416 | |
Greenlight Capital Re Ltd ‘A’ * (Cayman) | | | 17,149 | | | | 395,799 | |
GSV Capital Corp * | | | 11,982 | | | | 101,008 | |
Guaranty Bancorp * | | | 46,774 | | | | 91,209 | |
Gyrodyne Co of America Inc REIT | | | 703 | | | | 50,658 | |
Hallmark Financial Services Inc * | | | 8,846 | | | | 83,064 | |
Hancock Holding Co | | | 46,212 | | | | 1,466,769 | |
Hanmi Financial Corp * | | | 19,034 | | | | 258,672 | |
Harris & Harris Group Inc * | | | 19,130 | | | | 63,129 | |
Healthcare Realty Trust Inc REIT | | | 52,871 | | | | 1,269,433 | |
Heartland Financial USA Inc | | | 8,910 | | | | 232,996 | |
Hercules Technology Growth Capital Inc | | | 32,175 | | | | 358,108 | |
Heritage Commerce Corp * | | | 12,985 | | | | 90,635 | |
Heritage Financial Corp | | | 9,372 | | | | 137,675 | |
Heritage Financial Group Inc | | | 5,189 | | | | 71,556 | |
Heritage Oaks Bancorp * | | | 12,273 | | | | 71,183 | |
Hersha Hospitality Trust REIT | | | 104,563 | | | | 522,815 | |
HFF Inc ‘A’ | | | 19,910 | | | | 296,659 | |
Highwoods Properties Inc REIT | | | 37,787 | | | | 1,263,975 | |
Hilltop Holdings Inc * | | | 24,099 | | | | 326,300 | |
Hingham Institution for Savings | | | 685 | | | | 42,881 | |
Home Bancorp Inc * | | | 4,066 | | | | 74,205 | |
Home BancShares Inc | | | 13,456 | | | | 444,317 | |
Home Federal Bancorp Inc | | | 8,905 | | | | 110,689 | |
Home Loan Servicing Solutions Ltd (Cayman) | | | 17,543 | | | | 331,563 | |
Homeowners Choice Inc | | | 5,187 | | | | 107,838 | |
HomeStreet Inc * | | | 5,313 | | | | 135,747 | |
HomeTrust Bancshares Inc * | | | 12,538 | | | | 169,388 | |
Horace Mann Educators Corp | | | 24,084 | | | | 480,717 | |
Horizon Bancorp | | | 3,969 | | | | 77,991 | |
Horizon Technology Finance Corp | | | 4,732 | | | | 70,459 | |
Hudson Pacific Properties Inc REIT | | | 21,883 | | | | 460,856 | |
Hudson Valley Holding Corp | | | 9,720 | | | | 151,340 | |
IBERIABANK Corp | | | 17,845 | | | | 876,546 | |
ICG Group Inc * | | | 22,571 | | | | 257,987 | |
Independence Holding Co | | | 4,833 | | | | 46,010 | |
Independent Bank Corp | | | 13,260 | | | | 383,877 | |
Infinity Property & Casualty Corp | | | 7,170 | | | | 417,581 | |
Inland Real Estate Corp REIT | | | 46,892 | | | | 392,955 | |
International Bancshares Corp | | | 32,376 | | | | 584,387 | |
INTL FCStone Inc * | | | 8,461 | | | | 147,306 | |
Invesco Mortgage Capital Inc REIT | | | 70,409 | | | | 1,387,761 | |
Investment Technology Group Inc * | | | 23,461 | | | | 211,149 | |
Investors Bancorp Inc | | | 26,843 | | | | 477,269 | |
Investors Real Estate Trust REIT | | | 54,725 | | | | 477,749 | |
Investors Title Co | | | 723 | | | | 43,380 | |
iStar Financial Inc REIT * | | | 51,321 | | | | 418,266 | |
JAVELIN Mortgage Investment Corp | | | 4,055 | | | | 77,410 | |
JMP Group Inc | | | 10,448 | | | | 63,419 | |
Kansas City Life Insurance Co | | | 2,501 | | | | 95,438 | |
KBW Inc | | | 21,172 | | | | 323,932 | |
KCAP Financial Inc | | | 13,436 | | | | 123,477 | |
Kearny Financial Corp | | | 9,197 | | | | 89,671 | |
Kennedy-Wilson Holdings Inc | | | 26,042 | | | | 364,067 | |
Kite Realty Group Trust REIT | | | 39,008 | | | | 218,055 | |
Knight Capital Group Inc ‘A’ * | | | 110,002 | | | | 386,107 | |
Ladenburg Thalmann Financial Services Inc * | | | 65,093 | | | | 91,130 | |
Lakeland Bancorp Inc | | | 17,680 | | | | 179,982 | |
Lakeland Financial Corp | | | 9,972 | | | | 257,676 | |
LaSalle Hotel Properties REIT | | | 51,842 | | | | 1,316,268 | |
Lexington Realty Trust REIT | | | 79,951 | | | | 835,488 | |
| | | | | | | | |
| | | Shares | | | Value | |
LTC Properties Inc REIT | | | 18,535 | | | | $652,247 | |
Maiden Holdings Ltd (Bermuda) | | | 30,677 | | | | 281,922 | |
Main Street Capital Corp | | | 18,619 | | | | 568,066 | |
MainSource Financial Group Inc | | | 12,382 | | | | 156,880 | |
Manning & Napier Inc | | | 8,395 | | | | 105,777 | |
MarketAxess Holdings Inc | | | 22,162 | | | | 782,319 | |
Marlin Business Services Corp | | | 4,961 | | | | 99,518 | |
MB Financial Inc | | | 33,060 | | | | 652,935 | |
MCG Capital Corp | | | 44,886 | | | | 206,476 | |
Meadowbrook Insurance Group Inc | | | 31,291 | | | | 180,862 | |
Medallion Financial Corp | | | 11,508 | | | | 135,104 | |
Medical Properties Trust Inc REIT | | | 82,768 | | | | 989,905 | |
Medley Capital Corp | | | 17,493 | | | | 254,698 | |
Mercantile Bank Corp | | | 5,303 | | | | 87,499 | |
Merchants Bancshares Inc | | | 2,979 | | | | 79,748 | |
Meridian Interstate Bancorp Inc * | | | 5,108 | | | | 85,712 | |
Metro Bancorp Inc * | | | 8,510 | | | | 112,502 | |
MetroCorp Bancshares Inc * | | | 9,796 | | | | 107,658 | |
MGIC Investment Corp * | | | 114,119 | | | | 303,557 | |
MicroFinancial Inc | | | 5,338 | | | | 38,861 | |
Middleburg Financial Corp | | | 3,206 | | | | 56,618 | |
Midsouth Bancorp Inc | | | 5,234 | | | | 85,576 | |
MidWestOne Financial Group Inc | | | 4,093 | | | | 83,947 | |
Monmouth Real Estate Investment Corp ‘A’ REIT | | | 25,082 | | | | 259,850 | |
Montpelier Re Holdings Ltd (Bermuda) | | | 30,500 | | | | 697,230 | |
MVC Capital Inc | | | 14,844 | | | | 180,355 | |
NASB Financial Inc * | | | 2,528 | | | | 54,023 | |
National Bank Holdings Corp ‘A’ | | | 4,178 | | | | 79,340 | |
National Bankshares Inc | | | 4,400 | | | | 142,516 | |
National Financial Partners Corp * | | | 24,617 | | | | 421,935 | |
National Health Investors Inc REIT | | | 14,965 | | | | 845,971 | |
National Interstate Corp | | | 3,922 | | | | 113,032 | |
National Penn Bancshares Inc | | | 74,985 | | | | 698,860 | |
National Western Life Insurance Co ‘A’ | | | 1,279 | | | | 201,749 | |
Nationstar Mortgage Holdings Inc * | | | 11,630 | | | | 360,297 | |
NBT Bancorp Inc | | | 20,322 | | | | 411,927 | |
Nelnet Inc ‘A’ | | | 14,598 | | | | 434,874 | |
Netspend Holdings Inc * | | | 17,473 | | | | 206,531 | |
New Mountain Finance Corp | | | 11,682 | | | | 174,062 | |
New York Mortgage Trust Inc REIT | | | 30,133 | | | | 190,441 | |
NewStar Financial Inc * | | | 15,987 | | | | 223,978 | |
NGP Capital Resources Co | | | 13,642 | | | | 98,495 | |
Nicholas Financial Inc (Canada) | | | 6,096 | | | | 75,590 | |
Northfield Bancorp Inc | | | 8,852 | | | | 134,993 | |
Northrim BanCorp Inc | | | 3,956 | | | | 89,603 | |
NorthStar Realty Finance Corp REIT | | | 98,866 | | | | 696,017 | |
Northwest Bancshares Inc | | | 59,486 | | | | 722,160 | |
OceanFirst Financial Corp | | | 8,718 | | | | 119,872 | |
Ocwen Financial Corp * | | | 65,070 | | | | 2,250,771 | |
OFS Capital Corp * | | | 3,884 | | | | 53,172 | |
Old National Bancorp | | | 61,515 | | | | 730,183 | |
Omega Healthcare Investors Inc REIT | | | 68,075 | | | | 1,623,589 | |
OmniAmerican Bancorp Inc * | | | 6,712 | | | | 155,249 | |
One Liberty Properties Inc REIT | | | 7,144 | | | | 144,952 | |
OneBeacon Insurance Group Ltd ‘A’ (Bermuda) | | | 14,305 | | | | 198,839 | |
Oppenheimer Holdings Inc ‘A’ | | | 6,358 | | | | 109,803 | |
Oriental Financial Group Inc | | | 27,578 | | | | 368,166 | |
Oritani Financial Corp | | | 27,596 | | | | 422,771 | |
Pacific Continental Corp | | | 10,943 | | | | 106,475 | |
Pacific Mercantile Bancorp * | | | 6,540 | | | | 41,137 | |
PacWest Bancorp | | | 18,429 | | | | 456,671 | |
Park National Corp | | | 6,931 | | | | 447,951 | |
Park Sterling Corp * | | | 26,117 | | | | 136,592 | |
Parkway Properties Inc REIT | | | 12,769 | | | | 178,638 | |
Peapack Gladstone Financial Corp | | | 5,414 | | | | 76,229 | |
Pebblebrook Hotel Trust REIT | | | 36,537 | | | | 844,005 | |
PennantPark Investment Corp | | | 39,725 | | | | 436,776 | |
Penns Woods Bancorp Inc | | | 2,328 | | | | 87,090 | |
Pennsylvania REIT | | | 33,931 | | | | 598,543 | |
PennyMac Mortgage Investment Trust REIT | | | 35,994 | | | | 910,288 | |
| | |
| See Notes to Financial Statements | | See explanation of symbols and terms, if any, on page B-143 |
23
PACIFIC SELECT FUND
SMALL-CAP INDEX PORTFOLIO
Schedule of Investments (Continued)
December 31, 2012
| | | | | | | | |
| | | Shares | | | Value | |
Peoples Bancorp Inc | | | 6,599 | | | | $134,818 | |
Peoples Federal Bancshares Inc | | | 3,551 | | | | 61,752 | |
PHH Corp * | | | 34,288 | | | | 780,052 | |
PICO Holdings Inc * | | | 13,781 | | | | 279,341 | |
Pinnacle Financial Partners Inc * | | | 20,857 | | | | 392,946 | |
Piper Jaffray Cos * | | | 9,288 | | | | 298,423 | |
Platinum Underwriters Holdings Ltd (Bermuda) | | | 19,882 | | | | 914,572 | |
Portfolio Recovery Associates Inc * | | | 10,382 | | | | 1,109,421 | |
Potlatch Corp REIT | | | 24,509 | | | | 960,508 | |
Preferred Bank * | | | 7,235 | | | | 102,737 | |
Primerica Inc | | | 26,755 | | | | 802,918 | |
PrivateBancorp Inc | | | 36,553 | | | | 559,992 | |
Prospect Capital Corp | | | 115,541 | | | | 1,255,931 | |
Prosperity Bancshares Inc | | | 28,780 | | | | 1,208,760 | |
Provident Financial Holdings Inc | | | 5,836 | | | | 102,130 | |
Provident Financial Services Inc | | | 36,472 | | | | 544,162 | |
Provident New York Bancorp | | | 23,989 | | | | 223,338 | |
PS Business Parks Inc REIT | | | 11,189 | | | | 727,061 | |
Pzena Investment Management Inc ‘A’ | | | 6,402 | | | | 34,571 | |
Radian Group Inc | | | 80,786 | | | | 493,602 | |
RAIT Financial Trust REIT | | | 30,487 | | | | 172,252 | |
Ramco-Gershenson Properties Trust REIT | | | 28,069 | | | | 373,598 | |
Redwood Trust Inc REIT | | | 47,979 | | | | 810,365 | |
Regional Management Corp * | | | 2,992 | | | | 49,518 | |
Renasant Corp | | | 15,325 | | | | 293,320 | |
Republic Bancorp Inc ‘A’ | | | 6,178 | | | | 130,541 | |
Resource America Inc ‘A’ | | | 7,465 | | | | 49,792 | |
Resource Capital Corp REIT | | | 60,268 | | | | 337,501 | |
Retail Opportunity Investments Corp REIT | | | 31,406 | | | | 403,881 | |
RLI Corp | | | 12,927 | | | | 835,860 | |
RLJ Lodging Trust REIT | | | 64,872 | | | | 1,256,571 | |
Rockville Financial Inc | | | 17,383 | | | | 224,241 | |
Roma Financial Corp | | | 4,779 | | | | 72,258 | |
Rouse Properties Inc REIT | | | 13,465 | | | | 227,828 | |
Ryman Hospitality Properties REIT | | | 17,275 | | | | 664,396 | |
S&T Bancorp Inc | | | 17,681 | | | | 319,496 | |
S.Y. Bancorp Inc | | | 7,558 | | | | 169,450 | |
Sabra Health Care REIT Inc | | | 22,648 | | | | 491,915 | |
Safeguard Scientifics Inc * | | | 12,662 | | | | 186,764 | |
Safety Insurance Group Inc | | | 7,869 | | | | 363,312 | |
Sandy Spring Bancorp Inc | | | 14,656 | | | | 284,620 | |
Saul Centers Inc REIT | | | 4,565 | | | | 195,336 | |
SCBT Financial Corp | | | 9,990 | | | | 401,398 | |
SeaBright Holdings Inc | | | 12,422 | | | | 137,512 | |
Seacoast Banking Corp of Florida * | | | 45,182 | | | | 72,743 | |
Select Income REIT | | | 6,855 | | | | 169,798 | |
Selective Insurance Group Inc | | | 33,451 | | | | 644,601 | |
SI Financial Group Inc | | | 6,377 | | | | 73,336 | |
Sierra Bancorp | | | 7,482 | | | | 85,519 | |
Simmons First National Corp ‘A’ | | | 10,403 | | | | 263,820 | |
Simplicity Bancorp Inc | | | 5,407 | | | | 80,835 | |
Solar Capital Ltd | | | 23,855 | | | | 570,373 | |
Solar Senior Capital Ltd | | | 5,947 | | | | 110,971 | |
Southside Bancshares Inc | | | 10,440 | | | | 219,866 | |
Southwest Bancorp Inc * | | | 11,971 | | | | 134,075 | |
Sovran Self Storage Inc REIT | | | 17,650 | | | | 1,096,065 | |
Spirit Realty Capital Inc REIT | | | 19,921 | | | | 354,195 | |
STAG Industrial Inc REIT | | | 18,770 | | | | 337,297 | |
Starwood Property Trust Inc REIT | | | 81,797 | | | | 1,878,059 | |
State Auto Financial Corp | | | 9,073 | | | | 135,551 | |
State Bank Financial Corp | | | 19,325 | | | | 306,881 | |
StellarOne Corp | | | 14,156 | | | | 200,166 | |
Stellus Capital Investment Corp | | | 1,300 | | | | 21,294 | |
Sterling Bancorp | | | 19,225 | | | | 175,140 | |
Sterling Financial Corp | | | 16,387 | | | | 342,161 | |
Stewart Information Services Corp | | | 11,079 | | | | 288,054 | |
Stifel Financial Corp * | | | 32,520 | | | | 1,039,664 | |
Strategic Hotels & Resorts Inc REIT * | | | 109,553 | | | | 701,139 | |
Suffolk Bancorp * | | | 5,990 | | | | 78,469 | |
Summit Hotel Properties Inc REIT | | | 25,430 | | | | 241,585 | |
| | | | | | | | |
| | | Shares | | | Value | |
Sun Bancorp Inc * | | | 24,849 | | | | $87,965 | |
Sun Communities Inc REIT | | | 18,028 | | | | 719,137 | |
Sunstone Hotel Investors Inc REIT * | | | 83,045 | | | | 889,412 | |
Susquehanna Bancshares Inc | | | 113,817 | | | | 1,192,802 | |
SWS Group Inc * | | | 17,967 | | | | 95,045 | |
Symetra Financial Corp | | | 46,766 | | | | 607,023 | |
Taylor Capital Group Inc * | | | 9,895 | | | | 178,605 | |
TCP Capital Corp | | | 3,586 | | | | 52,858 | |
Tejon Ranch Co * | | | 7,931 | | | | 222,702 | |
Terreno Realty Corp REIT | | | 8,120 | | | | 125,373 | |
Territorial Bancorp Inc | | | 6,672 | | | | 152,455 | |
Texas Capital Bancshares Inc * | | | 24,298 | | | | 1,089,036 | |
The Bancorp Inc * | | | 17,346 | | | | 190,286 | |
The First Bancorp Inc | | | 5,623 | | | | 92,611 | |
The First Marblehead Corp * | | | 34,457 | | | | 26,770 | |
The First of Long Island Corp | | | 4,809 | | | | 136,191 | |
The Navigators Group Inc * | | | 6,104 | | | | 311,731 | |
The Phoenix Cos Inc * | | | 3,554 | | | | 87,890 | |
THL Credit Inc | | | 9,235 | | | | 136,586 | |
Thomas Properties Group Inc | | | 19,715 | | | | 106,658 | |
TICC Capital Corp | | | 25,437 | | | | 257,422 | |
Tompkins Financial Corp | | | 6,723 | | | | 266,500 | |
Tower Group Inc | | | 21,100 | | | | 374,947 | |
TowneBank | | | 15,942 | | | | 246,942 | |
Tree.com Inc | | | 3,831 | | | | 69,073 | |
Triangle Capital Corp | | | 16,725 | | | | 426,320 | |
TriCo Bancshares | | | 9,732 | | | | 163,011 | |
TrustCo Bank Corp NY | | | 57,450 | | | | 303,336 | |
Trustmark Corp | | | 39,397 | | | | 884,857 | |
Two Harbors Investment Corp REIT | | | 179,044 | | | | 1,983,808 | |
UMB Financial Corp | | | 19,620 | | | | 860,141 | |
UMH Properties Inc REIT | | | 8,354 | | | | 86,297 | |
Umpqua Holdings Corp | | | 67,745 | | | | 798,714 | |
Union First Market Bankshares Corp | | | 12,530 | | | | 197,598 | |
United Bankshares Inc | | | 15,589 | | | | 379,124 | |
United Community Banks Inc * | | | 25,531 | | | | 240,502 | |
United Financial Bancorp Inc | �� | | 12,342 | | | | 194,016 | |
United Fire Group Inc | | | 12,222 | | | | 266,928 | |
Universal Health Realty Income Trust REIT | | | 7,164 | | | | 362,570 | |
Universal Insurance Holdings Inc | | | 12,379 | | | | 54,220 | |
Univest Corp of Pennsylvania | | | 10,304 | | | | 176,198 | |
Urstadt Biddle Properties Inc ‘A’ REIT | | | 14,879 | | | | 292,819 | |
ViewPoint Financial Group | | | 20,318 | | | | 425,459 | |
Virginia Commerce Bancorp Inc * | | | 16,219 | | | | 145,160 | |
Virtus Investment Partners Inc * | | | 3,673 | | | | 444,213 | |
Walker & Dunlop Inc * | | | 7,080 | | | | 117,953 | |
Walter Investment Management Corp * | | | 21,595 | | | | 929,017 | |
Washington Banking Co | | | 9,416 | | | | 128,246 | |
Washington REIT | | | 40,339 | | | | 1,054,865 | |
Washington Trust Bancorp Inc | | | 8,862 | | | | 233,159 | |
Waterstone Financial Inc * | | | 4,396 | | | | 34,289 | |
Webster Financial Corp | | | 43,605 | | | | 896,083 | |
WesBanco Inc | | | 15,327 | | | | 340,566 | |
West Bancorp Inc | | | 9,690 | | | | 104,458 | |
West Coast Bancorp | | | 11,557 | | | | 255,988 | |
Westamerica Bancorp | | | 16,913 | | | | 720,325 | |
Western Alliance Bancorp * | | | 43,983 | | | | 463,141 | |
Western Asset Mortgage Capital Corp REIT | | | 11,261 | | | | 222,630 | |
Westfield Financial Inc | | | 15,073 | | | | 108,978 | |
Westwood Holdings Group Inc | | | 4,146 | | | | 169,571 | |
Whitestone REIT | | | 8,089 | | | | 113,650 | |
Wilshire Bancorp Inc * | | | 37,858 | | | | 222,226 | |
Winthrop Realty Trust REIT | | | 17,854 | | | | 197,287 | |
Wintrust Financial Corp | | | 22,013 | | | | 807,877 | |
WisdomTree Investments Inc * | | | 35,385 | | | | 216,556 | |
World Acceptance Corp * | | | 6,337 | | | | 472,487 | |
WSFS Financial Corp | | | 4,579 | | | | 193,463 | |
Zillow Inc ‘A’ * | | | 2,067 | | | | 57,359 | |
| | | | | | | | |
| | | | | | | 165,651,029 | |
| | | | | | | | |
| | |
| See Notes to Financial Statements | | See explanation of symbols and terms, if any, on page B-143 |
24
PACIFIC SELECT FUND
SMALL-CAP INDEX PORTFOLIO
Schedule of Investments (Continued)
December 31, 2012
| | | | | | | | |
| | | Shares | | | Value | |
Health Care - 11.7% | | | | | | | | |
| | |
Abaxis Inc | | | 13,111 | | | | $486,418 | |
ABIOMED Inc * | | | 20,398 | | | | 274,557 | |
Acadia Healthcare Co Inc * | | | 16,344 | | | | 381,306 | |
Accretive Health Inc * | | | 33,924 | | | | 392,161 | |
Accuray Inc * | | | 43,349 | | | | 278,734 | |
Achillion Pharmaceuticals Inc * | | | 36,041 | | | | 289,049 | |
Acorda Therapeutics Inc * | | | 24,187 | | | | 601,289 | |
Acura Pharmaceuticals Inc * | | | 6,687 | | | | 14,845 | |
Aegerion Pharmaceuticals Inc * | | | 15,090 | | | | 383,135 | |
Affymax Inc * | | | 21,833 | | | | 414,827 | |
Affymetrix Inc * | | | 43,023 | | | | 136,383 | |
Agenus Inc * | | | 14,863 | | | | 60,938 | |
Air Methods Corp | | | 23,292 | | | | 859,242 | |
Akorn Inc * | | | 34,328 | | | | 458,622 | |
Align Technology Inc * | | | 43,442 | | | | 1,205,515 | |
Alkermes PLC * (Ireland) | | | 73,965 | | | | 1,369,832 | |
Almost Family Inc | | | 5,047 | | | | 102,252 | |
Alnylam Pharmaceuticals Inc * | | | 28,062 | | | | 512,131 | |
Alphatec Holdings Inc * | | | 32,994 | | | | 54,440 | |
AMAG Pharmaceuticals Inc * | | | 12,598 | | | | 185,317 | |
Amedisys Inc * | | | 18,122 | | | | 204,235 | |
Amicus Therapeutics Inc * | | | 18,565 | | | | 49,754 | |
AMN Healthcare Services Inc * | | | 26,720 | | | | 308,616 | |
Ampio Pharmaceuticals Inc * | | | 15,256 | | | | 54,769 | |
AmSurg Corp * | | | 19,132 | | | | 574,151 | |
Anacor Pharmaceuticals Inc * | | | 9,386 | | | | 48,807 | |
Analogic Corp | | | 7,417 | | | | 551,083 | |
AngioDynamics Inc * | | | 14,808 | | | | 162,740 | |
Anika Therapeutics Inc * | | | 7,259 | | | | 72,154 | |
Antares Pharma Inc * | | | 64,605 | | | | 246,145 | |
Arena Pharmaceuticals Inc * | | | 131,137 | | | | 1,182,856 | |
ArQule Inc * | | | 35,747 | | | | 99,734 | |
Array BioPharma Inc * | | | 69,876 | | | | 259,939 | |
ArthroCare Corp * | | | 16,691 | | | | 577,342 | |
Assisted Living Concepts Inc ‘A’ | | | 12,037 | | | | 117,361 | |
Astex Pharmaceuticals Inc * | | | 57,071 | | | | 166,077 | |
athenahealth Inc * | | | 21,650 | | | | 1,590,192 | |
AtriCure Inc * | | | 8,672 | | | | 59,837 | |
Atrion Corp | | | 950 | | | | 186,200 | |
Auxilium Pharmaceuticals Inc * | | | 29,315 | | | | 543,207 | |
AVANIR Pharmaceuticals Inc ‘A’ * | | | 82,074 | | | | 215,855 | |
AVEO Pharmaceuticals Inc * | | | 23,878 | | | | 192,218 | |
BG Medicine Inc * | | | 6,710 | | | | 15,500 | |
Bio-Reference Labs Inc * | | | 14,879 | | | | 426,878 | |
BioCryst Pharmaceuticals Inc * | | | 30,318 | | | | 43,052 | |
BioDelivery Sciences International Inc * | | | 16,203 | | | | 69,835 | |
BioScrip Inc * | | | 26,639 | | | | 286,902 | |
BioSpecifics Technologies Corp * | | | 2,866 | | | | 42,847 | |
Biotime Inc * | | | 18,809 | | | | 59,060 | |
Cadence Pharmaceuticals Inc * | | | 36,889 | | | | 176,698 | |
Cambrex Corp * | | | 17,960 | | | | 204,385 | |
Cantel Medical Corp | | | 12,905 | | | | 383,666 | |
Capital Senior Living Corp * | | | 17,150 | | | | 320,533 | |
Cardiovascular Systems Inc * | | | 9,912 | | | | 124,396 | |
Celldex Therapeutics Inc * | | | 37,380 | | | | 250,820 | |
Cempra Inc * | | | 2,230 | | | | 14,272 | |
Centene Corp * | | | 31,141 | | | | 1,276,781 | |
Cepheid Inc * | | | 39,631 | | | | 1,339,924 | |
Cerus Corp * | | | 33,374 | | | | 105,462 | |
Chemed Corp | | | 11,652 | | | | 799,211 | |
ChemoCentryx Inc * | | | 3,164 | | | | 34,614 | |
Chindex International Inc * | | | 6,928 | | | | 72,744 | |
Clovis Oncology Inc * | | | 8,398 | | | | 134,368 | |
Codexis Inc * | | | 16,514 | | | | 36,496 | |
Computer Programs & Systems Inc | | | 6,716 | | | | 338,083 | |
Conceptus Inc * | | | 18,911 | | | | 397,320 | |
CONMED Corp | | | 17,055 | | | | 476,687 | |
Corcept Therapeutics Inc * | | | 29,785 | | | | 42,593 | |
| | | | | | | | |
| | | Shares | | | Value | |
Cornerstone Therapeutics Inc * | | | 4,748 | | | | $22,458 | |
Coronado Biosciences Inc * | | | 10,681 | | | | 48,171 | |
Corvel Corp * | | | 3,836 | | | | 171,968 | |
Cross Country Healthcare Inc * | | | 15,952 | | | | 76,570 | |
CryoLife Inc | | | 16,990 | | | | 105,848 | |
Cubist Pharmaceuticals Inc * | | | 38,255 | | | | 1,609,005 | |
Cumberland Pharmaceuticals Inc * | | | 7,044 | | | | 29,585 | |
Curis Inc * | | | 47,636 | | | | 163,391 | |
Cyberonics Inc * | | | 16,652 | | | | 874,730 | |
Cynosure Inc ‘A’ * | | | 7,418 | | | | 178,848 | |
Cytori Therapeutics Inc * | | | 36,721 | | | | 103,553 | |
Dendreon Corp * | | | 82,146 | | | | 433,731 | |
Depomed Inc * | | | 33,664 | | | | 208,380 | |
Derma Sciences Inc * | | | 6,784 | | | | 75,370 | |
DexCom Inc * | | | 41,457 | | | | 564,230 | |
Discovery Laboratories Inc * | | | 26,394 | | | | 55,691 | |
Durata Therapeutics Inc * | | | 4,948 | | | | 37,803 | |
Dyax Corp * | | | 59,684 | | | | 207,700 | |
Dynavax Technologies Corp * | | | 106,299 | | | | 304,015 | |
Emergent BioSolutions Inc * | | | 15,448 | | | | 247,786 | |
Emeritus Corp * | | | 18,551 | | | | 458,581 | |
Endocyte Inc * | | | 17,823 | | | | 160,051 | |
Endologix Inc * | | | 33,443 | | | | 476,228 | |
EnteroMedics Inc * | | | 16,592 | | | | 46,458 | |
Enzon Pharmaceuticals Inc | | | 23,055 | | | | 102,134 | |
Epocrates Inc * | | | 11,189 | | | | 98,687 | |
Exact Sciences Corp * | | | 38,744 | | | | 410,299 | |
Exactech Inc * | | | 5,139 | | | | 87,106 | |
ExamWorks Group Inc * | | | 17,654 | | | | 246,979 | |
Exelixis Inc * | | | 110,562 | | | | 505,268 | |
Five Star Quality Care Inc * | | | 12,333 | | | | 61,788 | |
Fluidigm Corp * | | | 14,559 | | | | 208,339 | |
Furiex Pharmaceuticals Inc * | | | 4,381 | | | | 84,378 | |
Genomic Health Inc * | | | 9,723 | | | | 265,049 | |
Gentiva Health Services Inc * | | | 18,604 | | | | 186,970 | |
Geron Corp * | | | 80,137 | | | | 112,993 | |
Globus Medical Inc ‘A’ * | | | 5,681 | | | | 59,594 | |
Greatbatch Inc * | | | 14,310 | | | | 332,564 | |
Greenway Medical Technologies Inc * | | | 4,706 | | | | 72,284 | |
GTx Inc * | | | 16,324 | | | | 68,561 | |
Haemonetics Corp * | | | 30,595 | | | | 1,249,500 | |
Halozyme Therapeutics Inc * | | | 54,712 | | | | 367,118 | |
Hanger Inc * | | | 20,661 | | | | 565,285 | |
Hansen Medical Inc * | | | 32,951 | | | | 68,538 | |
Harvard Bioscience Inc * | | | 15,412 | | | | 67,505 | |
HealthSouth Corp * | | | 57,708 | | | | 1,218,216 | |
HealthStream Inc * | | | 11,904 | | | | 289,386 | |
Healthways Inc * | | | 20,316 | | | | 217,381 | |
HeartWare International Inc * | | | 8,519 | | | | 715,170 | |
Hi-Tech Pharmacal Co Inc | | | 6,447 | | | | 225,516 | |
HMS Holdings Corp * | | | 51,901 | | | | 1,345,274 | |
Horizon Pharma Inc * | | | 22,915 | | | | 53,392 | |
Hyperion Therapeutics Inc * | | | 2,137 | | | | 24,105 | |
ICU Medical Inc * | | | 7,535 | | | | 459,108 | |
Idenix Pharmaceuticals Inc * | | | 54,892 | | | | 266,226 | |
ImmunoCellular Therapeutics Ltd * | | | 30,074 | | | | 57,742 | |
ImmunoGen Inc * | | | 50,573 | | | | 644,806 | |
Immunomedics Inc * | | | 40,133 | | | | 117,188 | |
Impax Laboratories Inc * | | | 40,430 | | | | 828,411 | |
Infinity Pharmaceuticals Inc * | | | 17,103 | | | | 598,605 | |
Insulet Corp * | | | 28,892 | | | | 613,088 | |
Integra LifeSciences Holdings Corp * | | | 11,743 | | | | 457,625 | |
Intercept Pharmaceuticals Inc * | | | 2,300 | | | | 78,752 | |
InterMune Inc * | | | 39,767 | | | | 385,342 | |
Invacare Corp | | | 19,236 | | | | 313,547 | |
IPC The Hospitalist Co Inc * | | | 10,085 | | | | 400,475 | |
Ironwood Pharmaceuticals Inc ‘A’ * | | | 45,660 | | | | 506,369 | |
Isis Pharmaceuticals Inc * | | | 60,510 | | | | 632,935 | |
Jazz Pharmaceuticals PLC * (Ireland) | | | 25,112 | | | | 1,335,958 | |
Keryx Biopharmaceuticals Inc * | | | 44,071 | | | | 115,466 | |
| | |
| See Notes to Financial Statements | | See explanation of symbols and terms, if any, on page B-143 |
25
PACIFIC SELECT FUND
SMALL-CAP INDEX PORTFOLIO
Schedule of Investments (Continued)
December 31, 2012
| | | | | | | | |
| | | Shares | | | Value | |
Kindred Healthcare Inc * | | | 31,848 | | | | $344,595 | |
KYTHERA Biopharmaceuticals Inc * | | | 2,400 | | | | 72,816 | |
Landauer Inc | | | 5,648 | | | | 345,714 | |
Lannett Co Inc * | | | 9,812 | | | | 48,668 | |
Lexicon Pharmaceuticals Inc * | | | 127,781 | | | | 283,674 | |
LHC Group Inc * | | | 8,989 | | | | 191,466 | |
Ligand Pharmaceuticals Inc ‘B’ * | | | 10,423 | | | | 216,173 | |
Luminex Corp * | | | 25,114 | | | | 420,911 | |
Magellan Health Services Inc * | | | 16,524 | | | | 809,676 | |
MAKO Surgical Corp * | | | 23,704 | | | | 305,070 | |
MannKind Corp * | | | 69,359 | | | | 160,219 | |
MAP Pharmaceuticals Inc * | | | 17,125 | | | | 269,034 | |
Masimo Corp | | | 30,159 | | | | 633,641 | |
Maxygen Inc | | | 17,008 | | | | 41,840 | |
MedAssets Inc * | | | 35,199 | | | | 590,287 | |
Medidata Solutions Inc * | | | 13,403 | | | | 525,264 | |
Merge Healthcare Inc * | | | 35,378 | | | | 87,384 | |
Meridian Bioscience Inc | | | 24,950 | | | | 505,237 | |
Merit Medical Systems Inc * | | | 25,531 | | | | 354,881 | |
Merrimack Pharmaceuticals Inc * | | | 9,197 | | | | 56,010 | |
Molina Healthcare Inc * | | | 18,145 | | | | 491,004 | |
Momenta Pharmaceuticals Inc * | | | 28,488 | | | | 335,589 | |
MWI Veterinary Supply Inc * | | | 7,676 | | | | 844,360 | |
National Healthcare Corp | | | 6,404 | | | | 301,116 | |
National Research Corp | | | 1,523 | | | | 82,547 | |
Natus Medical Inc * | | | 17,884 | | | | 199,943 | |
Navidea Biopharmaceuticals Inc * | | | 58,056 | | | | 164,298 | |
Nektar Therapeutics * | | | 69,292 | | | | 513,454 | |
Neogen Corp * | | | 14,229 | | | | 644,858 | |
Neurocrine Biosciences Inc * | | | 39,962 | | | | 298,916 | |
NewLink Genetics Corp * | | | 7,792 | | | | 97,400 | |
Novavax Inc * | | | 77,853 | | | | 147,142 | |
NPS Pharmaceuticals Inc * | | | 51,945 | | | | 472,699 | |
NuVasive Inc * | | | 26,045 | | | | 402,656 | |
NxStage Medical Inc * | | | 31,122 | | | | 350,122 | |
Obagi Medical Products Inc * | | | 10,499 | | | | 142,681 | |
Omeros Corp * | | | 15,386 | | | | 79,853 | |
Omnicell Inc * | | | 20,265 | | | | 301,341 | |
OncoGenex Pharmaceutical Inc * | | | 8,909 | | | | 116,886 | |
Oncothyreon Inc * | | | 34,973 | | | | 67,148 | |
Opko Health Inc * | | | 64,728 | | | | 311,342 | |
Optimer Pharmaceuticals Inc * | | | 28,339 | | | | 256,468 | |
OraSure Technologies Inc * | | | 32,626 | | | | 234,255 | |
Orexigen Therapeutics Inc * | | | 43,931 | | | | 231,516 | |
Orthofix International NV * (Netherlands) | | | 11,272 | | | | 443,328 | |
Osiris Therapeutics Inc * | | | 10,047 | | | | 90,222 | |
Owens & Minor Inc | | | 38,326 | | | | 1,092,674 | |
Pacific Biosciences of California Inc * | | | 23,908 | | | | 40,644 | |
Pacira Pharmaceuticals Inc * | | | 11,348 | | | | 198,250 | |
Pain Therapeutics Inc * | | | 22,527 | | | | 61,048 | |
Palomar Medical Technologies Inc * | | | 11,849 | | | | 109,129 | |
PAREXEL International Corp * | | | 36,210 | | | | 1,071,454 | |
PDI Inc * | | | 5,898 | | | | 44,825 | |
PDL BioPharma Inc | | | 84,858 | | | | 598,249 | |
Pernix Therapeutics Holdings * | | | 5,482 | | | | 42,485 | |
Pharmacyclics Inc * | | | 32,888 | | | | 1,904,215 | |
PharMerica Corp * | | | 17,878 | | | | 254,583 | |
PhotoMedex Inc * | | | 8,022 | | | | 116,399 | |
POZEN Inc * | | | 16,218 | | | | 81,252 | |
Progenics Pharmaceuticals Inc * | | | 24,343 | | | | 72,542 | |
PSS World Medical Inc * | | | 30,485 | | | | 880,407 | |
Quality Systems Inc | | | 23,857 | | | | 414,158 | |
Questcor Pharmaceuticals Inc | | | 32,489 | | | | 868,106 | |
Quidel Corp * | | | 17,121 | | | | 319,649 | |
Raptor Pharmaceutical Corp * | | | 30,890 | | | | 180,706 | |
Regulus Therapeutics Inc * | | | 3,700 | | | | 23,310 | |
Repligen Corp * | | | 18,892 | | | | 118,831 | |
Repros Therapeutics Inc * | | | 10,247 | | | | 161,390 | |
Rigel Pharmaceuticals Inc * | | | 51,509 | | | | 334,808 | |
Rochester Medical Corp * | | | 6,317 | | | | 63,675 | |
| | | | | | | | |
| | | Shares | | | Value | |
Rockwell Medical Technologies Inc * | | | 12,797 | | | | $103,016 | |
RTI Biologics Inc * | | | 33,648 | | | | 143,677 | |
Sagent Pharmaceuticals Inc * | | | 5,779 | | | | 92,984 | |
Sangamo Biosciences Inc * | | | 31,987 | | | | 192,242 | |
Santarus Inc * | | | 33,337 | | | | 366,040 | |
SciClone Pharmaceuticals Inc * | | | 35,006 | | | | 150,876 | |
Seattle Genetics Inc * | | | 57,463 | | | | 1,333,142 | |
Select Medical Holdings Corp | | | 21,349 | | | | 201,321 | |
Sequenom Inc * | | | 69,036 | | | | 325,850 | |
SIGA Technologies Inc * | | | 20,994 | | | | 55,004 | |
Skilled Healthcare Group Inc ‘A’ * | | | 11,867 | | | | 75,593 | |
Solta Medical Inc * | | | 41,625 | | | | 111,139 | |
Spectranetics Corp * | | | 20,895 | | | | 308,619 | |
Spectrum Pharmaceuticals Inc | | | 35,928 | | | | 402,034 | |
Staar Surgical Co * | | | 21,903 | | | | 133,608 | |
STERIS Corp | | | 34,947 | | | | 1,213,709 | |
Sucampo Pharmaceuticals Inc ‘A’ * | | | 6,864 | | | | 33,634 | |
Sunesis Pharmaceuticals Inc * | | | 18,023 | | | | 75,697 | |
Sunrise Senior Living Inc * | | | 35,310 | | | | 507,758 | |
Supernus Pharmaceuticals Inc * | | | 2,558 | | | | 18,341 | |
SurModics Inc * | | | 7,838 | | | | 175,258 | |
Symmetry Medical Inc * | | | 22,084 | | | | 232,324 | |
Synageva BioPharma Corp * | | | 6,391 | | | | 295,839 | |
Synergy Pharmaceuticals Inc * | | | 25,227 | | | | 132,694 | |
Synta Pharmaceuticals Corp * | | | 24,000 | | | | 216,480 | |
Targacept Inc * | | | 16,884 | | | | 73,952 | |
Team Health Holdings Inc * | | | 17,105 | | | | 492,111 | |
TESARO Inc * | | | 2,719 | | | | 46,087 | |
The Ensign Group Inc | | | 10,554 | | | | 286,963 | |
The Medicines Co * | | | 33,251 | | | | 797,026 | |
The Providence Service Corp * | | | 7,949 | | | | 135,053 | |
Theravance Inc * | | | 36,743 | | | | 818,267 | |
Threshold Pharmaceuticals Inc * | | | 27,796 | | | | 117,021 | |
Tornier NV * (Netherlands) | | | 9,533 | | | | 160,059 | |
Transcept Pharmaceuticals Inc * | | | 7,802 | | | | 34,719 | |
Triple-S Management Corp ‘B’ * | | | 11,819 | | | | 218,297 | |
Trius Therapeutics Inc * | | | 15,864 | | | | 75,830 | |
U.S. Physical Therapy Inc | | | 7,261 | | | | 199,968 | |
Unilife Corp * | | | 47,481 | | | | 107,782 | |
Universal American Corp | | | 22,695 | | | | 194,950 | |
Utah Medical Products Inc | | | 1,912 | | | | 68,928 | |
Vanda Pharmaceuticals Inc * | | | 17,293 | | | | 63,984 | |
Vanguard Health Systems Inc * | | | 19,232 | | | | 235,592 | |
Vascular Solutions Inc * | | | 9,535 | | | | 150,653 | |
Ventrus Biosciences Inc * | | | 7,712 | | | | 16,658 | |
Verastem Inc * | | | 3,788 | | | | 33,297 | |
Vical Inc * | | | 45,912 | | | | 133,604 | |
ViroPharma Inc * | | | 39,860 | | | | 907,214 | |
Vivus Inc * | | | 60,250 | | | | 808,555 | |
Vocera Communications Inc * | | | 4,233 | | | | 106,248 | |
Volcano Corp * | | | 32,196 | | | | 760,148 | |
WellCare Health Plans Inc * | | | 26,051 | | | | 1,268,423 | |
West Pharmaceutical Services Inc | | | 20,458 | | | | 1,120,075 | |
Wright Medical Group Inc * | | | 23,742 | | | | 498,345 | |
XenoPort Inc * | | | 26,044 | | | | 202,362 | |
XOMA Corp * | | | 48,571 | | | | 116,328 | |
Young Innovations Inc | | | 3,251 | | | | 128,122 | |
Zeltiq Aesthetics Inc * | | | 10,443 | | | | 48,351 | |
ZIOPHARM Oncology Inc * | | | 40,894 | | | | 170,119 | |
Zogenix Inc * | | | 32,413 | | | | 43,109 | |
| | | | | | | | |
| | | | | | | 87,650,137 | |
| | | | | | | | |
Industrials - 15.1% | | | | | | | | |
| | |
A.O. Smith Corp | | | 23,570 | | | | 1,486,560 | |
AAON Inc | | | 11,145 | | | | 232,596 | |
AAR Corp | | | 24,293 | | | | 453,793 | |
ABM Industries Inc | | | 32,399 | | | | 646,360 | |
Acacia Research Corp * | | | 30,061 | | | | 771,065 | |
ACCO Brands Corp * | | | 68,253 | | | | 500,977 | |
Accuride Corp * | | | 29,084 | | | | 93,360 | |
| | |
| See Notes to Financial Statements | | See explanation of symbols and terms, if any, on page B-143 |
26
PACIFIC SELECT FUND
SMALL-CAP INDEX PORTFOLIO
Schedule of Investments (Continued)
December 31, 2012
| | | | | | | | |
| | | Shares | | | Value | |
Aceto Corp | | | 16,262 | | | | $163,270 | |
Acorn Energy Inc | | | 11,056 | | | | 86,347 | |
Actuant Corp ‘A’ | | | 43,994 | | | | 1,227,873 | |
Acuity Brands Inc | | | 25,587 | | | | 1,733,008 | |
Aegion Corp * | | | 23,676 | | | | 525,370 | |
Aerovironment Inc * | | | 10,461 | | | | 227,422 | |
Air Transport Services Group Inc * | | | 32,875 | | | | 131,829 | |
Aircastle Ltd (Bermuda) | | | 35,404 | | | | 443,966 | |
Alamo Group Inc | | | 4,140 | | | | 135,130 | |
Alaska Air Group Inc * | | | 43,008 | | | | 1,853,215 | |
Albany International Corp ‘A’ | | | 16,578 | | | | 375,989 | |
Allegiant Travel Co | | | 9,053 | | | | 664,581 | |
Altra Holdings Inc | | | 16,157 | | | | 356,262 | |
AMERCO | | | 5,240 | | | | 664,484 | |
Ameresco Inc ‘A’ * | | | 12,318 | | | | 120,840 | |
American Railcar Industries Inc | | | 5,732 | | | | 181,876 | |
American Science & Engineering Inc | | | 5,070 | | | | 330,615 | |
American Superconductor Corp * | | | 24,275 | | | | 63,601 | |
American Woodmark Corp * | | | 5,855 | | | | 162,886 | |
Ampco-Pittsburgh Corp | | | 5,232 | | | | 104,535 | |
API Technologies Corp * | | | 19,742 | | | | 58,041 | |
Apogee Enterprises Inc | | | 17,090 | | | | 409,647 | |
Applied Industrial Technologies Inc | | | 25,479 | | | | 1,070,373 | |
ARC Document Solutions Inc * | | | 22,565 | | | | 57,766 | |
Argan Inc | | | 6,021 | | | | 108,378 | |
Arkansas Best Corp | | | 15,535 | | | | 148,359 | |
Astec Industries Inc | | | 12,146 | | | | 404,826 | |
Astronics Corp * | | | 7,316 | | | | 167,390 | |
AT Cross Co ‘A’ * | | | 5,760 | | | | 62,093 | |
Atlas Air Worldwide Holdings Inc * | | | 15,949 | | | | 706,700 | |
Avis Budget Group Inc * | | | 64,155 | | | | 1,271,552 | |
AZZ Inc | | | 15,275 | | | | 587,018 | |
Barnes Group Inc | | | 32,699 | | | | 734,420 | |
Barrett Business Services Inc | | | 4,190 | | | | 159,597 | |
Beacon Roofing Supply Inc * | | | 28,292 | | | | 941,558 | |
Belden Inc | | | 27,463 | | | | 1,235,560 | |
Blount International Inc * | | | 29,617 | | | | 468,541 | |
BlueLinx Holdings Inc * | | | 14,466 | | | | 40,649 | |
Brady Corp ‘A’ | | | 29,619 | | | | 989,275 | |
Briggs & Stratton Corp | | | 29,413 | | | | 620,026 | |
Builders FirstSource Inc * | | | 27,185 | | | | 151,692 | |
CAI International Inc * | | | 8,685 | | | | 190,636 | |
Capstone Turbine Corp * | | | 179,705 | | | | 159,937 | |
Cascade Corp | | | 5,579 | | | | 358,730 | |
Casella Waste Systems Inc ‘A’ * | | | 21,754 | | | | 95,283 | |
CBIZ Inc * | | | 22,859 | | | | 135,097 | |
CDI Corp | | | 8,259 | | | | 141,477 | |
Ceco Environmental Corp | | | 4,322 | | | | 43,004 | |
Celadon Group Inc | | | 12,029 | | | | 217,364 | |
Cenveo Inc * | | | 32,015 | | | | 86,441 | |
Chart Industries Inc * | | | 18,063 | | | | 1,204,260 | |
CIRCOR International Inc | | | 10,450 | | | | 413,715 | |
CLARCOR Inc | | | 30,352 | | | | 1,450,219 | |
Coleman Cable Inc | | | 5,021 | | | | 46,545 | |
Columbus McKinnon Corp * | | | 11,691 | | | | 193,135 | |
Comfort Systems USA Inc | | | 22,553 | | | | 274,244 | |
Commercial Vehicle Group Inc * | | | 14,548 | | | | 119,439 | |
Compx International Inc | | | 349 | | | | 4,940 | |
Consolidated Graphics Inc * | | | 4,498 | | | | 157,070 | |
Courier Corp | | | 6,008 | | | | 66,088 | |
CPI Aerostructures Inc * | | | 3,978 | | | | 39,820 | |
CRA International Inc * | | | 6,026 | | | | 119,134 | |
Cubic Corp | | | 9,602 | | | | 460,608 | |
Curtiss-Wright Corp | | | 28,307 | | | | 929,319 | |
Deluxe Corp | | | 30,867 | | | | 995,152 | |
DigitalGlobe Inc * | | | 21,878 | | | | 534,698 | |
Douglas Dynamics Inc | | | 13,290 | | | | 191,243 | |
DXP Enterprises Inc * | | | 5,344 | | | | 262,230 | |
Dycom Industries Inc * | | | 20,248 | | | | 400,910 | |
Dynamic Materials Corp | | | 8,156 | | | | 113,368 | |
| | | | | | | | |
| | | Shares | | | Value | |
Echo Global Logistics Inc * | | | 8,774 | | | | $157,669 | |
Edgen Group Inc * | | | 8,620 | | | | 60,857 | |
EMCOR Group Inc | | | 40,291 | | | | 1,394,472 | |
Encore Wire Corp | | | 9,914 | | | | 300,493 | |
Energy Recovery Inc * | | | 25,593 | | | | 87,016 | |
EnergySolutions Inc * | | | 48,693 | | | | 151,922 | |
EnerNOC Inc * | | | 15,086 | | | | 177,261 | |
EnerSys * | | | 28,961 | | | | 1,089,802 | |
Ennis Inc | | | 15,860 | | | | 245,354 | |
Enphase Energy Inc * | | | 4,734 | | | | 17,279 | |
EnPro Industries Inc * | | | 12,368 | | | | 505,851 | |
ESCO Technologies Inc | | | 16,142 | | | | 603,872 | |
Esterline Technologies Corp * | | | 18,509 | | | | 1,177,357 | |
Exponent Inc * | | | 8,040 | | | | 448,873 | |
Federal Signal Corp * | | | 37,817 | | | | 287,787 | |
Flow International Corp * | | | 28,746 | | | | 100,611 | |
Forward Air Corp | | | 17,580 | | | | 615,476 | |
Franklin Covey Co * | | | 8,270 | | | | 106,683 | |
Franklin Electric Co Inc | | | 14,156 | | | | 880,079 | |
FreightCar America Inc | | | 7,307 | | | | 163,823 | |
FTI Consulting Inc * | | | 25,309 | | | | 835,197 | |
FuelCell Energy Inc * | | | 92,736 | | | | 85,039 | |
Furmanite Corp * | | | 22,546 | | | | 121,072 | |
G&K Services Inc ‘A’ | | | 11,472 | | | | 391,769 | |
Genco Shipping & Trading Ltd * | | | 18,374 | | | | 64,125 | |
GenCorp Inc * | | | 36,376 | | | | 332,840 | |
Generac Holdings Inc | | | 14,949 | | | | 512,900 | |
Genesee & Wyoming Inc ‘A’ * | | | 26,795 | | | | 2,038,564 | |
GeoEye Inc * | | | 9,214 | | | | 283,146 | |
Gibraltar Industries Inc * | | | 18,541 | | | | 295,173 | |
Global Power Equipment Group Inc | | | 10,220 | | | | 175,273 | |
GP Strategies Corp * | | | 8,866 | | | | 183,083 | |
Graham Corp | | | 5,993 | | | | 116,864 | |
Granite Construction Inc | | | 23,398 | | | | 786,641 | |
Great Lakes Dredge & Dock Co | | | 35,656 | | | | 318,408 | |
Griffon Corp | | | 27,638 | | | | 316,731 | |
H&E Equipment Services Inc | | | 17,294 | | | | 260,621 | |
Hardinge Inc | | | 7,084 | | | | 70,415 | |
Hawaiian Holdings Inc * | | | 31,105 | | | | 204,360 | |
Healthcare Services Group Inc | | | 40,591 | | | | 942,929 | |
Heartland Express Inc | | | 28,589 | | | | 373,658 | |
HEICO Corp | | | 31,811 | | | | 1,423,860 | |
Heidrick & Struggles International Inc | | | 10,887 | | | | 166,136 | |
Heritage-Crystal Clean Inc * | | | 4,716 | | | | 70,787 | |
Herman Miller Inc | | | 35,160 | | | | 753,127 | |
Hexcel Corp * | | | 60,177 | | | | 1,622,372 | |
Hill International Inc * | | | 13,277 | | | | 48,594 | |
HNI Corp | | | 27,539 | | | | 827,822 | |
Houston Wire & Cable Co | | | 10,791 | | | | 132,406 | |
Hub Group Inc ‘A’ * | | | 22,348 | | | | 750,893 | |
Hudson Global Inc * | | | 20,023 | | | | 89,703 | |
Hurco Cos Inc * | | | 3,894 | | | | 89,562 | |
Huron Consulting Group Inc * | | | 13,785 | | | | 464,417 | |
Hyster-Yale Materials Handling Inc | | | 6,578 | | | | 321,006 | |
ICF International Inc * | | | 12,038 | | | | 282,171 | |
II-VI Inc * | | | 31,756 | | | | 580,182 | |
InnerWorkings Inc * | | | 19,174 | | | | 264,218 | |
Insperity Inc | | | 13,763 | | | | 448,123 | |
Insteel Industries Inc | | | 10,648 | | | | 132,887 | |
Interface Inc | | | 35,358 | | | | 568,557 | |
International Shipholding Corp | | | 3,289 | | | | 54,203 | |
Intersections Inc | | | 5,392 | | | | 51,116 | |
JetBlue Airways Corp * | | | 141,162 | | | | 806,035 | |
John Bean Technologies Corp | | | 17,343 | | | | 308,185 | |
Kadant Inc * | | | 7,082 | | | | 187,744 | |
Kaman Corp | | | 15,936 | | | | 586,445 | |
Kaydon Corp | | | 19,362 | | | | 463,333 | |
Kelly Services Inc ‘A’ | | | 16,249 | | | | 255,759 | |
Kforce Inc | | | 17,304 | | | | 247,966 | |
Kimball International Inc ‘B’ | | | 19,779 | | | | 229,634 | |
| | |
| See Notes to Financial Statements | | See explanation of symbols and terms, if any, on page B-143 |
27
PACIFIC SELECT FUND
SMALL-CAP INDEX PORTFOLIO
Schedule of Investments (Continued)
December 31, 2012
| | | | | | | | |
| | | Shares | | | Value | |
Knight Transportation Inc | | | 35,093 | | | | $513,411 | |
Knoll Inc | | | 28,852 | | | | 443,167 | |
Korn/Ferry International * | | | 28,802 | | | | 456,800 | |
Kratos Defense & Security Solutions Inc * | | | 24,207 | | | | 121,761 | |
Layne Christensen Co * | | | 12,054 | | | | 292,551 | |
LB Foster Co ‘A’ | | | 5,538 | | | | 240,571 | |
Lindsay Corp | | | 7,681 | | | | 615,402 | |
LMI Aerospace Inc * | | | 5,547 | | | | 107,279 | |
LSI Industries Inc | | | 11,883 | | | | 83,300 | |
Lydall Inc * | | | 10,403 | | | | 149,179 | |
Marten Transport Ltd | | | 9,445 | | | | 173,694 | |
MasTec Inc * | | | 33,103 | | | | 825,258 | |
McGrath RentCorp | | | 14,934 | | | | 433,385 | |
Meritor Inc * | | | 58,418 | | | | 276,317 | |
Met-Pro Corp | | | 8,934 | | | | 86,570 | |
Metalico Inc * | | | 24,490 | | | | 48,000 | |
Michael Baker Corp | | | 5,072 | | | | 126,445 | |
Miller Industries Inc | | | 6,506 | | | | 99,217 | |
Mine Safety Appliances Co | | | 16,719 | | | | 714,068 | |
Mistras Group Inc * | | | 9,375 | | | | 231,469 | |
Mobile Mini Inc * | | | 23,057 | | | | 480,277 | |
Moog Inc ‘A’ * | | | 27,260 | | | | 1,118,478 | |
Mueller Industries Inc | | | 11,967 | | | | 598,709 | |
Mueller Water Products Inc ‘A’ | | | 94,869 | | | | 532,215 | |
Multi-Color Corp | | | 8,084 | | | | 193,935 | |
MYR Group Inc * | | | 12,429 | | | | 276,545 | |
National Presto Industries Inc | | | 2,934 | | | | 202,739 | |
Navigant Consulting Inc * | | | 31,457 | | | | 351,060 | |
NCI Building Systems Inc * | | | 10,726 | | | | 149,091 | |
NL Industries Inc | | | 4,109 | | | | 47,048 | |
NN Inc * | | | 10,246 | | | | 93,853 | |
Nortek Inc * | | | 4,663 | | | | 308,924 | |
Northwest Pipe Co * | | | 5,661 | | | | 135,071 | |
Odyssey Marine Exploration Inc * | | | 44,372 | | | | 131,785 | |
Old Dominion Freight Line Inc * | | | 43,068 | | | | 1,476,371 | |
Omega Flex Inc | | | 1,637 | | | | 20,233 | |
On Assignment Inc * | | | 26,001 | | | | 527,300 | |
Orbital Sciences Corp * | | | 35,548 | | | | 489,496 | |
Orion Marine Group Inc * | | | 16,460 | | | | 120,323 | |
Pacer International Inc * | | | 21,431 | | | | 83,581 | |
Park-Ohio Holdings Corp * | | | 5,155 | | | | 109,853 | |
Patrick Industries Inc * | | | 2,548 | | | | 39,647 | |
Patriot Transportation Holding Inc * | | | 3,814 | | | | 108,432 | |
Pendrell Corp * | | | 94,655 | | | | 120,212 | |
Performant Financial Corp * | | | 5,457 | | | | 55,116 | |
PGT Inc * | | | 11,950 | | | | 53,775 | |
Pike Electric Corp | | | 10,274 | | | | 98,117 | |
PMFG Inc * | | | 12,579 | | | | 114,343 | |
Powell Industries Inc * | | | 5,391 | | | | 223,888 | |
Preformed Line Products Co | | | 1,377 | | | | 81,821 | |
Primoris Services Corp | | | 18,136 | | | | 272,765 | |
Proto Labs Inc * | | | 3,015 | | | | 118,851 | |
Quad/Graphics Inc | | | 15,108 | | | | 308,052 | |
Quality Distribution Inc * | | | 13,135 | | | | 78,810 | |
Quanex Building Products Corp | | | 22,269 | | | | 454,510 | |
Rand Logistics Inc * | | | 10,466 | | | | 68,029 | |
Raven Industries Inc | | | 21,911 | | | | 577,574 | |
RBC Bearings Inc * | | | 13,348 | | | | 668,334 | |
Republic Airways Holdings Inc * | | | 29,364 | | | | 166,788 | |
Resources Connection Inc | | | 25,589 | | | | 305,533 | |
Rexnord Corp * | | | 17,353 | | | | 369,619 | |
Roadrunner Transportation Systems Inc * | | | 8,458 | | | | 153,428 | |
Robbins & Myers Inc | | | 23,258 | | | | 1,382,688 | |
RPX Corp * | | | 12,957 | | | | 117,131 | |
Rush Enterprises Inc ‘A’ * | | | 19,949 | | | | 412,346 | |
Saia Inc * | | | 9,607 | | | | 222,114 | |
Sauer-Danfoss Inc | | | 7,135 | | | | 380,795 | |
Schawk Inc | | | 7,166 | | | | 94,305 | |
Seaboard Corp | | | 183 | | | | 462,968 | |
SeaCube Container Leasing Ltd (Bermuda) | | | 6,545 | | | | 123,373 | |
| | | | | | | | |
| | | Shares | | | Value | |
SIFCO Industries Inc | | | 1,518 | | | | $23,909 | |
Simpson Manufacturing Co Inc | | | 24,216 | | | | 794,043 | |
SkyWest Inc | | | 30,692 | | | | 382,422 | |
Spirit Airlines Inc * | | | 25,190 | | | | 446,367 | |
Standard Parking Corp * | | | 9,304 | | | | 204,595 | |
Standex International Corp | | | 7,599 | | | | 389,753 | |
Steelcase Inc ‘A’ | | | 45,942 | | | | 585,301 | |
Sterling Construction Co Inc * | | | 10,005 | | | | 99,450 | |
Sun Hydraulics Corp | | | 12,579 | | | | 328,060 | |
Swift Transportation Co * | | | 47,502 | | | | 433,218 | |
Swisher Hygiene Inc * | | | 69,026 | | | | 120,796 | |
Sykes Enterprises Inc * | | | 23,631 | | | | 359,664 | |
Sypris Solutions Inc | | | 6,674 | | | | 26,429 | |
TAL International Group Inc | | | 17,682 | | | | 643,271 | |
Taser International Inc * | | | 31,161 | | | | 278,579 | |
Team Inc * | | | 11,989 | | | | 456,062 | |
Teledyne Technologies Inc * | | | 22,201 | | | | 1,444,619 | |
Tennant Co | | | 11,348 | | | | 498,745 | |
Tetra Tech Inc * | | | 38,260 | | | | 1,011,977 | |
Textainer Group Holdings Ltd (Bermuda) | | | 8,359 | | | | 262,974 | |
The Advisory Board Co * | | | 20,693 | | | | 968,225 | |
The Brink’s Co | | | 28,544 | | | | 814,360 | |
The Corporate Executive Board Co | | | 20,256 | | | | 961,350 | |
The Dolan Co * | | | 18,335 | | | | 71,323 | |
The Eastern Co | | | 3,707 | | | | 58,645 | |
The Geo Group Inc | | | 37,107 | | | | 1,046,417 | |
The Gorman-Rupp Co | | | 9,134 | | | | 272,467 | |
The Greenbrier Cos Inc * | | | 13,842 | | | | 223,825 | |
The KEYW Holding Corp * | | | 14,790 | | | | 187,685 | |
The Middleby Corp * | | | 11,305 | | | | 1,449,414 | |
Thermon Group Holdings Inc * | | | 8,877 | | | | 199,999 | |
Titan International Inc | | | 28,867 | | | | 626,991 | |
Titan Machinery Inc * | | | 10,205 | | | | 252,063 | |
TMS International Corp ‘A’ * | | | 7,471 | | | | 93,537 | |
TRC Cos Inc * | | | 9,728 | | | | 56,617 | |
Trex Co Inc * | | | 9,011 | | | | 335,480 | |
TriMas Corp * | | | 19,433 | | | | 543,347 | |
TrueBlue Inc * | | | 24,324 | | | | 383,103 | |
Tutor Perini Corp * | | | 21,614 | | | | 296,112 | |
Twin Disc Inc | | | 5,193 | | | | 90,514 | |
UniFirst Corp | | | 8,742 | | | | 640,963 | |
United Stationers Inc | | | 24,545 | | | | 760,650 | |
Universal Forest Products Inc | | | 11,890 | | | | 452,296 | |
Universal Truckload Services Inc | | | 3,301 | | | | 60,243 | |
US Airways Group Inc * | | | 98,172 | | | | 1,325,322 | |
US Ecology Inc | | | 11,054 | | | | 260,211 | |
USG Corp * | | | 44,781 | | | | 1,257,003 | |
Viad Corp | | | 12,148 | | | | 329,940 | |
Vicor Corp * | | | 12,003 | | | | 65,056 | |
VSE Corp | | | 2,474 | | | | 60,638 | |
Wabash National Corp * | | | 41,297 | | | | 370,434 | |
WageWorks Inc * | | | 4,177 | | | | 74,351 | |
Watsco Inc | | | 17,796 | | | | 1,332,920 | |
Watts Water Technologies Inc ‘A’ | | | 16,982 | | | | 730,056 | |
Werner Enterprises Inc | | | 26,756 | | | | 579,803 | |
Wesco Aircraft Holdings Inc * | | | 10,620 | | | | 140,290 | |
Willis Lease Finance Corp * | | | 3,131 | | | | 44,805 | |
Woodward Inc | | | 41,770 | | | | 1,592,690 | |
XPO Logistics Inc * | | | 10,600 | | | | 184,228 | |
Zipcar Inc * | | | 16,489 | | | | 135,869 | |
| | | | | | | | |
| | | | | | | 112,281,536 | |
| | | | | | | | |
Information Technology - 16.1% | | | | | | | | |
| | |
3D Systems Corp * | | | 28,296 | | | | 1,509,592 | |
Accelrys Inc * | | | 33,302 | | | | 301,383 | |
ACI Worldwide Inc * | | | 23,990 | | | | 1,048,123 | |
Actuate Corp * | | | 29,578 | | | | 165,637 | |
Acxiom Corp * | | | 46,427 | | | | 810,615 | |
ADTRAN Inc | | | 38,475 | | | | 751,801 | |
Advanced Energy Industries Inc * | | | 24,065 | | | | 332,338 | |
| | |
| See Notes to Financial Statements | | See explanation of symbols and terms, if any, on page B-143 |
28
PACIFIC SELECT FUND
SMALL-CAP INDEX PORTFOLIO
Schedule of Investments (Continued)
December 31, 2012
| | | | | | | | |
| | | Shares | | | Value | |
Advent Software Inc * | | | 19,024 | | | | $406,733 | |
Aeroflex Holding Corp * | | | 12,057 | | | | 84,399 | |
Agilysys Inc * | | | 8,730 | | | | 73,070 | |
Alpha & Omega Semiconductor Ltd * (Bermuda) | | | 10,438 | | | | 87,679 | |
Ambarella Inc * (Cayman) | | | 3,482 | | | | 38,824 | |
Ambient Corp * | | | 1,678 | | | | 5,051 | |
American Software Inc ‘A’ | | | 14,172 | | | | 109,975 | |
Amkor Technology Inc * | | | 44,347 | | | | 188,475 | |
ANADIGICS Inc * | | | 42,512 | | | | 107,130 | |
Anaren Inc * | | | 8,432 | | | | 164,002 | |
Angie’s List Inc * | | | 21,448 | | | | 257,162 | |
Anixter International Inc | | | 17,048 | | | | 1,090,731 | |
Applied Micro Circuits Corp * | | | 39,291 | | | | 330,044 | |
ARRIS Group Inc * | | | 68,191 | | | | 1,018,774 | |
Aruba Networks Inc * | | | 67,525 | | | | 1,401,144 | |
Aspen Technology Inc * | | | 56,520 | | | | 1,562,213 | |
ATMI Inc * | | | 19,180 | | | | 400,478 | |
Audience Inc * | | | 3,682 | | | | 38,256 | |
AVG Technologies NV * (Netherlands) | | | 4,907 | | | | 77,678 | |
Aviat Networks Inc * | | | 36,901 | | | | 121,404 | |
Avid Technology Inc * | | | 18,098 | | | | 137,183 | |
Aware Inc | | | 7,087 | | | | 38,837 | |
Axcelis Technologies Inc * | | | 65,058 | | | | 90,431 | |
AXT Inc * | | | 19,665 | | | | 55,259 | |
Badger Meter Inc | | | 8,777 | | | | 416,118 | |
Bankrate Inc * | | | 27,824 | | | | 346,409 | |
Bazaarvoice Inc * | | | 6,264 | | | | 58,568 | |
Bel Fuse Inc ‘B’ | | | 6,368 | | | | 124,494 | |
Benchmark Electronics Inc * | | | 34,708 | | | | 576,847 | |
Black Box Corp | | | 9,889 | | | | 240,698 | |
Blackbaud Inc | | | 27,288 | | | | 622,985 | |
Blucora Inc * | | | 24,312 | | | | 381,942 | |
Bottomline Technologies Inc * | | | 21,097 | | | | 556,750 | |
Brightcove Inc * | | | 3,525 | | | | 31,866 | |
BroadSoft Inc * | | | 16,567 | | | | 601,879 | |
Brooks Automation Inc | | | 40,163 | | | | 323,312 | |
Cabot Microelectronics Corp | | | 14,214 | | | | 504,739 | |
CACI International Inc ‘A’ * | | | 13,684 | | | | 753,031 | |
CalAmp Corp * | | | 17,698 | | | | 147,247 | |
Calix Inc * | | | 23,661 | | | | 181,953 | |
Callidus Software Inc * | | | 20,526 | | | | 93,188 | |
Carbonite Inc * | | | 6,932 | | | | 64,121 | |
Cardtronics Inc * | | | 26,616 | | | | 631,864 | |
Cass Information Systems Inc | | | 6,186 | | | | 261,049 | |
Cavium Inc * | | | 30,034 | | | | 937,361 | |
Ceva Inc * | | | 14,115 | | | | 222,311 | |
Checkpoint Systems Inc * | | | 24,560 | | | | 263,774 | |
CIBER Inc * | | | 43,486 | | | | 145,243 | |
Ciena Corp * | | | 59,792 | | | | 938,734 | |
Cirrus Logic Inc * | | | 39,016 | | | | 1,130,294 | |
Cognex Corp | | | 25,874 | | | | 952,681 | |
Coherent Inc | | | 14,261 | | | | 721,892 | |
Cohu Inc | | | 14,864 | | | | 161,126 | |
CommVault Systems Inc * | | | 26,985 | | | | 1,881,124 | |
Computer Task Group Inc * | | | 9,207 | | | | 167,844 | |
comScore Inc * | | | 21,422 | | | | 295,195 | |
Comtech Telecommunications Corp | | | 10,678 | | | | 271,008 | |
Comverse Inc * | | | 13,222 | | | | 377,224 | |
Comverse Technology Inc * | | | 132,221 | | | | 507,729 | |
Constant Contact Inc * | | | 18,472 | | | | 262,487 | |
Convergys Corp | | | 65,995 | | | | 1,082,978 | |
Cornerstone OnDemand Inc * | | | 20,302 | | | | 599,518 | |
CoStar Group Inc * | | | 17,040 | | | | 1,522,865 | |
Cray Inc * | | | 22,530 | | | | 359,354 | |
CSG Systems International Inc * | | | 20,429 | | | | 371,399 | |
CTS Corp | | | 20,508 | | | | 218,000 | |
Cymer Inc * | | | 18,709 | | | | 1,691,855 | |
Daktronics Inc | | | 21,953 | | | | 243,020 | |
Datalink Corp * | | | 9,334 | | | | 79,806 | |
| | | | | | | | |
| | | Shares | | | Value | |
DealerTrack Technologies Inc * | | | 25,600 | | | | $735,232 | |
Demand Media Inc * | | | 17,950 | | | | 166,756 | |
Demandware Inc * | | | 3,991 | | | | 109,034 | |
Dice Holdings Inc * | | | 25,583 | | | | 234,852 | |
Digi International Inc * | | | 15,578 | | | | 147,524 | |
Digimarc Corp | | | 4,345 | | | | 89,942 | |
Digital River Inc * | | | 22,412 | | | | 322,509 | |
Diodes Inc * | | | 21,368 | | | | 370,735 | |
DSP Group Inc * | | | 12,546 | | | | 72,265 | |
DTS Inc * | | | 11,061 | | | | 184,719 | |
E2open Inc * | | | 2,637 | | | | 37,340 | |
Earthlink Inc | | | 64,292 | | | | 415,326 | |
Ebix Inc | | | 17,007 | | | | 273,302 | |
Echelon Corp * | | | 23,469 | | | | 57,499 | |
Electro Rent Corp | | | 11,499 | | | | 176,855 | |
Electro Scientific Industries Inc | | | 13,907 | | | | 138,375 | |
Electronics for Imaging Inc * | | | 27,958 | | | | 530,922 | |
Ellie Mae Inc * | | | 15,255 | | | | 423,326 | |
Eloqua Inc * | | | 5,594 | | | | 131,962 | |
Emulex Corp * | | | 52,807 | | | | 385,491 | |
Entegris Inc * | | | 82,923 | | | | 761,233 | |
Entropic Communications Inc * | | | 53,615 | | | | 283,623 | |
Envestnet Inc * | | | 12,919 | | | | 180,220 | |
Envivio Inc * | | | 4,678 | | | | 7,953 | |
EPAM Systems Inc * | | | 3,034 | | | | 54,915 | |
EPIQ Systems Inc | | | 19,119 | | | | 244,341 | |
ePlus Inc | | | 2,419 | | | | 100,001 | |
Euronet Worldwide Inc * | | | 30,608 | | | | 722,349 | |
Exa Corp * | | | 3,479 | | | | 33,851 | |
ExactTarget Inc * | | | 5,983 | | | | 119,660 | |
Exar Corp * | | | 22,451 | | | | 199,814 | |
ExlService Holdings Inc * | | | 14,032 | | | | 371,848 | |
Extreme Networks Inc * | | | 56,351 | | | | 205,118 | |
Fabrinet * (Cayman) | | | 13,282 | | | | 174,525 | |
Fair Isaac Corp | | | 20,709 | | | | 870,399 | |
FalconStor Software Inc * | | | 18,753 | | | | 43,694 | |
FARO Technologies Inc * | | | 10,186 | | | | 363,436 | |
FEI Co | | | 22,919 | | | | 1,271,088 | |
Finisar Corp * | | | 55,119 | | | | 898,440 | |
First Solar Inc * | | | 36,339 | | | | 1,122,148 | |
FleetMatics Group PLC * (Ireland) | | | 5,226 | | | | 131,486 | |
FormFactor Inc * | | | 29,539 | | | | 134,698 | |
Forrester Research Inc | | | 8,440 | | | | 226,192 | |
Gerber Scientific Inc Escrow Shares * + | | | 9,525 | | | | - | |
Global Cash Access Holdings Inc * | | | 22,379 | | | | 175,451 | |
Globecomm Systems Inc * | | | 13,805 | | | | 155,997 | |
Glu Mobile Inc * | | | 33,498 | | | | 76,710 | |
GSI Group Inc * (Canada) | | | 17,428 | | | | 150,926 | |
GSI Technology Inc * | | | 12,240 | | | | 76,745 | |
GT Advanced Technologies Inc * | | | 72,171 | | | | 217,956 | |
Guidance Software Inc * | | | 8,823 | | | | 104,729 | |
Guidewire Software Inc * | | | 12,309 | | | | 365,823 | |
Harmonic Inc * | | | 71,464 | | | | 362,322 | |
Heartland Payment Systems Inc | | | 23,432 | | | | 691,244 | |
Higher One Holdings Inc * | | | 19,249 | | | | 202,884 | |
Hittite Microwave Corp * | | | 19,008 | | | | 1,180,397 | |
iGate Corp * | | | 19,289 | | | | 304,188 | |
Imation Corp * | | | 18,374 | | | | 85,807 | |
Immersion Corp * | | | 17,395 | | | | 119,504 | |
Imperva Inc * | | | 5,857 | | | | 184,671 | |
Infinera Corp * | | | 66,660 | | | | 387,295 | |
Infoblox Inc * | | | 4,754 | | | | 85,429 | |
Innodata Inc * | | | 13,566 | | | | 51,279 | |
Inphi Corp * | | | 13,992 | | | | 134,043 | |
Insight Enterprises Inc * | | | 26,738 | | | | 464,439 | |
Integrated Device Technology Inc * | | | 85,924 | | | | 627,245 | |
Integrated Silicon Solution Inc * | | | 16,439 | | | | 147,951 | |
Interactive Intelligence Group Inc * | | | 8,898 | | | | 298,439 | |
InterDigital Inc | | | 24,753 | | | | 1,017,348 | |
Intermec Inc * | | | 36,304 | | | | 357,957 | |
| | |
| See Notes to Financial Statements | | See explanation of symbols and terms, if any, on page B-143 |
29
PACIFIC SELECT FUND
SMALL-CAP INDEX PORTFOLIO
Schedule of Investments (Continued)
December 31, 2012
| | | | | | | | |
| | | Shares | | | Value | |
Intermolecular Inc * | | | 8,469 | | | | $75,374 | |
Internap Network Services Corp * | | | 32,184 | | | | 223,357 | |
International Rectifier Corp * | | | 41,739 | | | | 740,032 | |
Intersil Corp ‘A’ | | | 77,013 | | | | 638,438 | |
Intevac Inc * | | | 13,660 | | | | 62,426 | |
IntraLinks Holdings Inc * | | | 22,385 | | | | 138,115 | |
InvenSense Inc * | | | 22,011 | | | | 244,542 | |
iPass Inc * | | | 31,608 | | | | 57,843 | |
Ixia * | | | 25,432 | | | | 431,835 | |
IXYS Corp | | | 14,709 | | | | 134,440 | |
j2 Global Inc | | | 28,012 | | | | 856,607 | |
Jive Software Inc * | | | 9,703 | | | | 140,985 | |
Kemet Corp * | | | 26,786 | | | | 134,734 | |
Key Tronic Corp * | | | 6,511 | | | | 66,673 | |
Keynote Systems Inc | | | 9,369 | | | | 132,009 | |
Kopin Corp * | | | 40,120 | | | | 133,600 | |
KVH Industries Inc * | | | 8,994 | | | | 125,736 | |
Lattice Semiconductor Corp * | | | 71,136 | | | | 283,833 | |
Limelight Networks Inc * | | | 36,396 | | | | 80,799 | |
Lionbridge Technologies Inc * | | | 34,161 | | | | 137,327 | |
Liquidity Services Inc * | | | 14,183 | | | | 579,517 | |
Littelfuse Inc | | | 13,088 | | | | 807,660 | |
LivePerson Inc * | | | 33,206 | | | | 436,327 | |
LogMeIn Inc * | | | 13,275 | | | | 297,493 | |
Loral Space & Communications Inc | | | 6,652 | | | | 363,598 | |
LTX-Credence Corp * | | | 29,478 | | | | 193,376 | |
M/A-COM Technology Solutions Holdings Inc * | | | 3,708 | | | | 55,509 | |
Manhattan Associates Inc * | | | 12,238 | | | | 738,441 | |
ManTech International Corp ‘A’ | | | 13,882 | | | | 360,099 | |
Marchex Inc ‘B’ | | | 13,274 | | | | 54,556 | |
Market Leader Inc * | | | 13,376 | | | | 87,613 | |
Mattersight Corp * | | | 6,170 | | | | 30,665 | |
Mattson Technology Inc * | | | 35,686 | | | | 29,976 | |
MAXIMUS Inc | | | 20,535 | | | | 1,298,223 | |
MaxLinear Inc ‘A’ * | | | 13,281 | | | | 66,671 | |
Maxwell Technologies Inc * | | | 17,628 | | | | 146,136 | |
Measurement Specialties Inc * | | | 9,174 | | | | 315,219 | |
MeetMe Inc * | | | 11,466 | | | | 40,016 | |
MEMC Electronic Materials Inc * | | | 139,085 | | | | 446,463 | |
Mentor Graphics Corp * | | | 56,176 | | | | 956,116 | |
Mercury Systems Inc * | | | 18,607 | | | | 171,184 | |
Mesa Laboratories Inc | | | 1,549 | | | | 77,620 | |
Methode Electronics Inc | | | 22,558 | | | | 226,257 | |
Micrel Inc | | | 29,487 | | | | 280,127 | |
Microsemi Corp * | | | 53,637 | | | | 1,128,522 | |
MicroStrategy Inc ‘A’ * | | | 5,162 | | | | 482,028 | |
Millennial Media Inc * | | | 7,033 | | | | 88,123 | |
Mindspeed Technologies Inc * | | | 22,307 | | | | 104,397 | |
MIPS Technologies Inc * | | | 28,865 | | | | 225,724 | |
MKS Instruments Inc | | | 31,708 | | | | 817,432 | |
ModusLink Global Solutions Inc * | | | 23,380 | | | | 67,802 | |
MoneyGram International Inc * | | | 13,266 | | | | 176,305 | |
Monolithic Power Systems Inc | | | 18,555 | | | | 413,405 | |
Monotype Imaging Holdings Inc | | | 22,239 | | | | 355,379 | |
Monster Worldwide Inc * | | | 73,183 | | | | 411,288 | |
MoSys Inc * | | | 19,910 | | | | 69,287 | |
Move Inc * | | | 23,577 | | | | 178,949 | |
MTS Systems Corp | | | 9,705 | | | | 494,276 | |
Multi-Fineline Electronix Inc * | | | 5,233 | | | | 105,759 | |
Nanometrics Inc * | | | 14,087 | | | | 203,135 | |
Neonode Inc * | | | 13,880 | | | | 67,457 | |
NeoPhotonics Corp * | | | 11,682 | | | | 67,055 | |
NETGEAR Inc * | | | 22,903 | | | | 902,836 | |
NetScout Systems Inc * | | | 22,161 | | | | 575,964 | |
Newport Corp * | | | 23,167 | | | | 311,596 | |
NIC Inc | | | 38,910 | | | | 635,789 | |
Numerex Corp ‘A’ * | | | 6,020 | | | | 79,103 | |
NVE Corp * | | | 2,905 | | | | 161,198 | |
Oclaro Inc * | | | 44,705 | | | | 70,187 | |
OCZ Technology Group Inc * | | | 41,503 | | | | 79,271 | |
| | | | | | | | |
| | | Shares | | | Value | |
OmniVision Technologies Inc * | | | 31,612 | | | | $445,097 | |
OpenTable Inc * | | | 13,648 | | | | 666,022 | |
Oplink Communications Inc * | | | 11,603 | | | | 180,775 | |
OSI Systems Inc * | | | 12,007 | | | | 768,928 | |
Parametric Technology Corp * | | | 72,218 | | | | 1,625,627 | |
Park Electrochemical Corp | | | 12,474 | | | | 320,956 | |
ParkerVision Inc * | | | 46,979 | | | | 95,367 | |
PC Connection Inc | | | 5,397 | | | | 62,066 | |
PCTEL Inc | | | 10,938 | | | | 78,754 | |
PDF Solutions Inc * | | | 14,661 | | | | 202,029 | |
Pegasystems Inc | | | 10,445 | | | | 236,893 | |
Peregrine Semiconductor Corp * | | | 3,636 | | | | 55,667 | |
Perficient Inc * | | | 19,232 | | | | 226,553 | |
Pericom Semiconductor Corp * | | | 14,467 | | | | 116,170 | |
Pervasive Software Inc * | | | 7,892 | | | | 70,318 | |
Photronics Inc * | | | 36,457 | | | | 217,284 | |
Plantronics Inc | | | 25,658 | | | | 946,010 | |
Plexus Corp * | | | 21,194 | | | | 546,805 | |
PLX Technology Inc * | | | 27,230 | | | | 98,845 | |
Power Integrations Inc | | | 17,091 | | | | 574,429 | |
Power-One Inc * | | | 40,924 | | | | 168,198 | |
PRGX Global Inc * | | | 13,745 | | | | 88,655 | |
Procera Networks Inc * | | | 11,659 | | | | 216,274 | |
Progress Software Corp * | | | 37,927 | | | | 796,088 | |
Proofpoint Inc * | | | 3,876 | | | | 47,714 | |
PROS Holdings Inc * | | | 13,314 | | | | 243,513 | |
QAD Inc ‘A’ | | | 3,823 | | | | 55,051 | |
QLIK Technologies Inc * | | | 51,515 | | | | 1,118,906 | |
QLogic Corp * | | | 58,845 | | | | 572,562 | |
Qualys Inc * | | | 4,959 | | | | 73,344 | |
Quantum Corp * | | | 141,442 | | | | 175,388 | |
QuickLogic Corp * | | | 26,287 | | | | 57,043 | |
QuinStreet Inc * | | | 20,033 | | | | 134,622 | |
Radisys Corp * | | | 14,014 | | | | 41,762 | |
Rambus Inc * | | | 67,036 | | | | 327,136 | |
RealD Inc * | | | 24,988 | | | | 280,115 | |
RealNetworks Inc * | | | 12,653 | | | | 95,657 | |
RealPage Inc * | | | 21,603 | | | | 465,977 | |
Responsys Inc * | | | 21,936 | | | | 130,739 | |
RF Micro Devices Inc * | | | 168,578 | | | | 755,229 | |
Richardson Electronics Ltd | | | 7,781 | | | | 88,081 | |
Rofin-Sinar Technologies Inc * | | | 17,168 | | | | 372,202 | |
Rogers Corp * | | | 9,856 | | | | 489,449 | |
Rosetta Stone Inc * | | | 6,358 | | | | 78,458 | |
Rubicon Technology Inc * | | | 10,283 | | | | 62,829 | |
Ruckus Wireless Inc * | | | 4,926 | | | | 110,983 | |
Rudolph Technologies Inc * | | | 19,558 | | | | 263,055 | |
Saba Software Inc * | | | 18,184 | | | | 158,928 | |
Sanmina Corp * | | | 49,148 | | | | 544,068 | |
Sapiens International Corp NV * (Netherlands) | | | 8,289 | | | | 33,156 | |
Sapient Corp * | | | 74,443 | | | | 786,118 | |
ScanSource Inc * | | | 16,557 | | | | 526,016 | |
SciQuest Inc * | | | 10,896 | | | | 172,811 | |
SeaChange International Inc * | | | 17,150 | | | | 165,841 | |
Semtech Corp * | | | 39,568 | | | | 1,145,494 | |
ServiceSource International Inc * | | | 29,935 | | | | 175,120 | |
ShoreTel Inc * | | | 29,061 | | | | 123,219 | |
Sigma Designs Inc * | | | 19,767 | | | | 101,800 | |
Silicon Graphics International Corp * | | | 19,453 | | | | 199,004 | |
Silicon Image Inc * | | | 50,248 | | | | 249,230 | |
Sonus Networks Inc * | | | 129,242 | | | | 219,711 | |
Sourcefire Inc * | | | 17,850 | | | | 842,877 | |
Spansion Inc ‘A’ * | | | 29,040 | | | | 403,946 | |
Spark Networks Inc * | | | 6,627 | | | | 51,691 | |
SPS Commerce Inc * | | | 7,457 | | | | 277,922 | |
SS&C Technologies Holdings Inc * | | | 20,438 | | | | 472,527 | |
Stamps.com Inc * | | | 8,087 | | | | 203,792 | |
STEC Inc * | | | 21,713 | | | | 107,045 | |
STR Holdings Inc * | | | 18,439 | | | | 46,466 | |
| | |
| See Notes to Financial Statements | | See explanation of symbols and terms, if any, on page B-143 |
30
PACIFIC SELECT FUND
SMALL-CAP INDEX PORTFOLIO
Schedule of Investments (Continued)
December 31, 2012
| | | | | | | | |
| | | Shares | | | Value | |
SunPower Corp * | | | 24,346 | | | | $136,825 | |
Super Micro Computer Inc * | | | 17,494 | | | | 178,439 | |
Supertex Inc | | | 6,270 | | | | 110,039 | |
support.com Inc * | | | 29,512 | | | | 123,360 | |
Sycamore Networks Inc | | | 12,735 | | | | 28,526 | |
Symmetricom Inc * | | | 24,749 | | | | 142,802 | |
Synacor Inc * | | | 4,179 | | | | 22,859 | |
Synaptics Inc * | | | 20,350 | | | | 609,890 | |
Synchronoss Technologies Inc * | | | 16,649 | | | | 351,127 | |
SYNNEX Corp * | | | 15,833 | | | | 544,339 | |
Syntel Inc | | | 9,330 | | | | 499,995 | |
Take-Two Interactive Software Inc * | | | 47,191 | | | | 519,573 | |
Tangoe Inc * | | | 17,968 | | | | 213,280 | |
TechTarget Inc * | | | 9,141 | | | | 50,733 | |
TeleNav Inc * | | | 9,960 | | | | 79,481 | |
TeleTech Holdings Inc * | | | 13,900 | | | | 247,420 | |
Tellabs Inc | | | 221,106 | | | | 504,122 | |
Telular Corp | | | 10,223 | | | | 96,812 | |
Tessco Technologies Inc | | | 3,342 | | | | 73,992 | |
Tessera Technologies Inc | | | 31,340 | | | | 514,603 | |
The Active Network Inc * | | | 23,486 | | | | 115,316 | |
The Hackett Group Inc | | | 15,205 | | | | 65,077 | |
TiVo Inc * | | | 75,326 | | | | 928,016 | |
TNS Inc * | | | 14,822 | | | | 307,260 | |
Travelzoo Inc * | | | 4,389 | | | | 83,347 | |
TriQuint Semiconductor Inc * | | | 101,938 | | | | 493,380 | |
Trulia Inc * | | | 4,105 | | | | 66,665 | |
TTM Technologies Inc * | | | 32,245 | | | | 296,654 | |
Tyler Technologies Inc * | | | 18,188 | | | | 881,027 | |
Ubiquiti Networks Inc | | | 6,491 | | | | 78,801 | |
Ultimate Software Group Inc * | | | 16,087 | | | | 1,518,774 | |
Ultra Clean Holdings Inc * | | | 16,076 | | | | 78,933 | |
Ultratech Inc * | | | 15,831 | | | | 590,496 | |
Unisys Corp * | | | 26,478 | | | | 458,069 | |
United Online Inc | | | 54,677 | | | | 305,644 | |
Universal Display Corp * | | | 23,973 | | | | 614,188 | |
Unwired Planet Inc * | | | 29,768 | | | | 35,722 | |
ValueClick Inc * | | | 45,282 | | | | 878,924 | |
VASCO Data Security International Inc * | | | 16,956 | | | | 138,361 | |
Veeco Instruments Inc * | | | 23,488 | | | | 693,366 | |
Verint Systems Inc * | | | 13,092 | | | | 384,381 | |
ViaSat Inc * | | | 22,679 | | | | 882,213 | |
Viasystems Group Inc * | | | 2,317 | | | | 28,267 | |
VirnetX Holding Corp * | | | 25,371 | | | | 742,863 | |
Virtusa Corp * | | | 11,177 | | | | 183,638 | |
Vishay Precision Group Inc * | | | 7,379 | | | | 97,550 | |
VistaPrint NV * (Netherlands) | | | 20,614 | | | | 677,376 | |
Vocus Inc * | | | 12,520 | | | | 217,598 | |
Volterra Semiconductor Corp * | | | 15,367 | | | | 263,851 | |
Web.com Group Inc * | | | 21,308 | | | | 315,358 | |
WebMD Health Corp * | | | 30,692 | | | | 440,123 | |
Websense Inc * | | | 22,387 | | | | 336,700 | |
Westell Technologies Inc ‘A’ * | | | 26,988 | | | | 49,928 | |
WEX Inc * | | | 23,492 | | | | 1,770,592 | |
XO Group Inc * | | | 15,504 | | | | 144,187 | |
Yelp Inc * | | | 5,184 | | | | 97,718 | |
Zix Corp * | | | 36,893 | | | | 103,300 | |
Zygo Corp * | | | 9,777 | | | | 153,499 | |
| | | | | | | | |
| | | | | | | 120,265,700 | |
| | | | | | | | |
Materials - 5.1% | | | | | | | | |
| | |
A. Schulman Inc | | | 17,826 | | | | 515,706 | |
A.M. Castle & Co * | | | 10,190 | | | | 150,506 | |
ADA-ES Inc * | | | 5,545 | | | | 93,600 | |
AEP Industries Inc * | | | 2,503 | | | | 148,253 | |
AK Steel Holding Corp | | | 81,906 | | | | 376,768 | |
AMCOL International Corp | | | 15,223 | | | | 467,042 | |
American Vanguard Corp | | | 16,848 | | | | 523,467 | |
Arabian American Development Co * | | | 12,548 | | | | 104,274 | |
Balchem Corp | | | 17,631 | | | | 641,768 | |
| | | | | | | | |
| | | Shares | | | Value | |
Berry Plastics Group Inc * | | | 17,570 | | | | $282,526 | |
Boise Inc | | | 60,708 | | | | 482,629 | |
Buckeye Technologies Inc | | | 23,801 | | | | 683,327 | |
Calgon Carbon Corp * | | | 34,305 | | | | 486,445 | |
Century Aluminum Co * | | | 31,006 | | | | 271,613 | |
Chase Corp | | | 3,856 | | | | 71,722 | |
Chemtura Corp * | | | 59,635 | | | | 1,267,840 | |
Clearwater Paper Corp * | | | 14,094 | | | | 551,921 | |
Coeur d’Alene Mines Corp * | | | 54,233 | | | | 1,334,132 | |
Deltic Timber Corp | | | 6,587 | | | | 465,174 | |
Eagle Materials Inc | | | 29,562 | | | | 1,729,377 | |
Ferro Corp * | | | 52,778 | | | | 220,612 | |
Flotek Industries Inc * | | | 29,881 | | | | 364,548 | |
FutureFuel Corp | | | 11,663 | | | | 138,090 | |
General Moly Inc * | | | 41,158 | | | | 165,044 | |
Georgia Gulf Corp | | | 20,699 | | | | 854,455 | |
Globe Specialty Metals Inc | | | 37,109 | | | | 510,249 | |
Gold Reserve Inc * (Canada) | | | 32,132 | | | | 106,357 | |
Gold Resource Corp | | | 18,155 | | | | 279,768 | |
Golden Minerals Co * | | | 19,914 | | | | 91,405 | |
Golden Star Resources Ltd (XASE) * (Canada) | | | 157,589 | | | | 289,964 | |
Graphic Packaging Holding Co * | | | 101,096 | | | | 653,080 | |
GSE Holding Inc * | | | 4,857 | | | | 30,113 | |
H.B. Fuller Co | | | 30,173 | | | | 1,050,624 | |
Handy & Harman Ltd * | | | 3,198 | | | | 48,194 | |
Hawkins Inc | | | 5,497 | | | | 212,404 | |
Haynes International Inc | | | 7,399 | | | | 383,786 | |
Headwaters Inc * | | | 37,306 | | | | 319,339 | |
Hecla Mining Co | | | 172,119 | | | | 1,003,454 | |
Horsehead Holding Corp * | | | 26,645 | | | | 272,045 | |
Innophos Holdings Inc | | | 13,200 | | | | 613,800 | |
Innospec Inc | | | 13,897 | | | | 479,307 | |
Kaiser Aluminum Corp | | | 11,634 | | | | 717,701 | |
KapStone Paper and Packaging Corp | | | 24,386 | | | | 541,125 | |
KMG Chemicals Inc | | | 4,610 | | | | 80,998 | |
Koppers Holdings Inc | | | 12,509 | | | | 477,218 | |
Kraton Performance Polymers Inc * | | | 19,452 | | | | 467,431 | |
Landec Corp * | | | 15,516 | | | | 147,247 | |
Louisiana-Pacific Corp * | | | 83,106 | | | | 1,605,608 | |
LSB Industries Inc * | | | 11,308 | | | | 400,529 | |
Materion Corp | | | 12,257 | | | | 315,985 | |
McEwen Mining Inc * | | | 130,892 | | | | 501,316 | |
Metals USA Holdings Corp | | | 7,065 | | | | 123,567 | |
Midway Gold Corp * (Canada) | | | 76,110 | | | | 105,793 | |
Minerals Technologies Inc | | | 21,386 | | | | 853,729 | |
Myers Industries Inc | | | 20,393 | | | | 308,954 | |
Neenah Paper Inc | | | 9,615 | | | | 273,739 | |
Noranda Aluminum Holding Corp | | | 20,726 | | | | 126,636 | |
Olin Corp | | | 48,455 | | | | 1,046,143 | |
Olympic Steel Inc | | | 5,553 | | | | 122,943 | |
OM Group Inc * | | | 19,477 | | | | 432,389 | |
OMNOVA Solutions Inc * | | | 28,093 | | | | 196,932 | |
Paramount Gold & Silver Corp * | | | 78,377 | | | | 181,835 | |
PH Glatfelter Co | | | 25,922 | | | | 453,116 | |
PolyOne Corp | | | 54,116 | | | | 1,105,049 | |
Quaker Chemical Corp | | | 7,831 | | | | 421,778 | |
Resolute Forest Products * | | | 48,658 | | | | 644,232 | |
Revett Minerals Inc * (Canada) | | | 15,083 | | | | 42,534 | |
RTI International Metals Inc * | | | 18,259 | | | | 503,218 | |
Schnitzer Steel Industries Inc ‘A’ | | | 15,167 | | | | 460,015 | |
Schweitzer-Mauduit International Inc | | | 18,827 | | | | 734,818 | |
Sensient Technologies Corp | | | 30,142 | | | | 1,071,849 | |
Spartech Corp * | | | 18,770 | | | | 170,244 | |
Stepan Co | | | 10,140 | | | | 563,176 | |
Stillwater Mining Co * | | | 69,967 | | | | 894,178 | |
SunCoke Energy Inc * | | | 42,289 | | | | 659,285 | |
Texas Industries Inc * | | | 13,634 | | | | 695,470 | |
Tredegar Corp | | | 14,692 | | | | 300,011 | |
U.S. Antimony Corp * | | | 33,083 | | | | 58,226 | |
U.S. Silica Holdings Inc | | | 7,201 | | | | 120,473 | |
| | |
| See Notes to Financial Statements | | See explanation of symbols and terms, if any, on page B-143 |
31
PACIFIC SELECT FUND
SMALL-CAP INDEX PORTFOLIO
Schedule of Investments (Continued)
December 31, 2012
| | | | | | | | |
| | | Shares | | | Value | |
UFP Technologies Inc * | | | 3,312 | | | | $59,351 | |
United States Lime & Minerals Inc * | | | 990 | | | | 46,649 | |
Universal Stainless & Alloy Products Inc * | | | 4,184 | | | | 153,846 | |
Vista Gold Corp * (Canada) | | | 35,151 | | | | 94,908 | |
Wausau Paper Corp | | | 26,854 | | | | 232,556 | |
Worthington Industries Inc | | | 31,624 | | | | 821,908 | |
Zep Inc | | | 13,172 | | | | 190,204 | |
Zoltek Cos Inc * | | | 16,385 | | | | 126,984 | |
| | | | | | | | |
| | | | | | | 38,386,624 | |
| | | | | | | | |
Telecommunication Services - 0.7% | | | | | | | | |
| | |
8x8 Inc * | | | 42,903 | | | | 317,053 | |
Atlantic Tele-Network Inc | | | 5,541 | | | | 203,410 | |
Boingo Wireless Inc * | | | 9,682 | | | | 73,099 | |
Cbeyond Inc * | | | 16,490 | | | | 149,070 | |
Cincinnati Bell Inc * | | | 119,681 | | | | 655,852 | |
Cogent Communications Group Inc | | | 28,224 | | | | 638,991 | |
Consolidated Communications Holdings Inc | | | 24,572 | | | | 391,186 | |
Fairpoint Communications Inc * | | | 12,988 | | | | 103,125 | |
General Communication Inc ‘A’ * | | | 22,409 | | | | 214,902 | |
Hawaiian Telcom Holdco Inc * | | | 6,249 | | | | 121,856 | |
HickoryTech Corp | | | 8,334 | | | | 81,090 | |
IDT Corp ‘B’ | | | 9,541 | | | | 91,021 | |
inContact Inc * | | | 22,880 | | | | 118,518 | |
Iridium Communications Inc * | | | 30,337 | | | | 204,471 | |
Leap Wireless International Inc * | | | 32,561 | | | | 216,531 | |
Lumos Networks Corp | | | 9,197 | | | | 92,154 | |
magicJack VocalTec Ltd * (Israel) | | | 8,602 | | | | 156,643 | |
Neutral Tandem Inc | | | 16,948 | | | | 43,556 | |
nTelos Holdings Corp | | | 9,236 | | | | 121,084 | |
ORBCOMM Inc * | | | 21,030 | | | | 82,438 | |
Premiere Global Services Inc * | | | 30,473 | | | | 298,026 | |
Primus Telecommunications Group Inc | | | 7,397 | | | | 80,405 | |
Shenandoah Telecommunications Co | | | 14,420 | | | | 220,770 | |
Towerstream Corp * | | | 29,469 | | | | 95,774 | |
USA Mobility Inc | | | 11,861 | | | | 138,537 | |
Vonage Holdings Corp * | | | 73,682 | | | | 174,626 | |
| | | | | | | | |
| | | | | | | 5,084,188 | |
| | | | | | | | |
Utilities - 3.3% | | | | | | | | |
| | |
ALLETE Inc | | | 23,057 | | | | 944,876 | |
American DG Energy Inc * | | | 14,450 | | | | 33,380 | |
American States Water Co | | | 11,407 | | | | 547,308 | |
Artesian Resources Corp ‘A’ | | | 4,592 | | | | 102,999 | |
Atlantic Power Corp (Canada) | | | 68,661 | | | | 784,795 | |
Avista Corp | | | 35,466 | | | | 855,085 | |
Black Hills Corp | | | 26,656 | | | | 968,679 | |
Cadiz Inc * | | | 8,096 | | | | 64,120 | |
California Water Service Group | | | 25,484 | | | | 467,631 | |
CH Energy Group Inc | | | 8,985 | | | | 586,002 | |
Chesapeake Utilities Corp | | | 5,796 | | | | 263,138 | |
Cleco Corp | | | 36,894 | | | | 1,476,129 | |
Connecticut Water Service Inc | | | 6,351 | | | | 189,133 | |
Consolidated Water Co Ltd (Cayman) | | | 8,987 | | | | 66,504 | |
Delta Natural Gas Co Inc | | | 4,091 | | | | 79,979 | |
El Paso Electric Co | | | 24,129 | | | | 769,956 | |
Genie Energy Ltd ‘B’ | | | 8,770 | | | | 62,267 | |
IDACORP Inc | | | 30,273 | | | | 1,312,335 | |
MGE Energy Inc | | | 13,954 | | | | 710,956 | |
Middlesex Water Co | | | 9,574 | | | | 187,267 | |
New Jersey Resources Corp | | | 25,122 | | | | 995,334 | |
Northwest Natural Gas Co | | | 16,197 | | | | 715,907 | |
NorthWestern Corp | | | 21,995 | | | | 763,886 | |
Ormat Technologies Inc | | | 10,613 | | | | 204,619 | |
Otter Tail Corp | | | 21,871 | | | | 546,775 | |
Piedmont Natural Gas Co Inc | | | 43,528 | | | | 1,362,862 | |
PNM Resources Inc | | | 48,092 | | | | 986,367 | |
Portland General Electric Co | | | 45,650 | | | | 1,248,984 | |
SJW Corp | | | 8,643 | | | | 229,904 | |
South Jersey Industries Inc | | | 18,395 | | | | 925,820 | |
| | | | | | | | |
| | | Shares | | | Value | |
Southwest Gas Corp | | | 27,934 | | | | $1,184,681 | |
The Empire District Electric Co | | | 25,470 | | | | 519,079 | |
The Laclede Group Inc | | | 13,766 | | | | 531,505 | |
UIL Holdings Corp | | | 30,632 | | | | 1,096,932 | |
Unitil Corp | | | 8,299 | | | | 215,110 | |
UNS Energy Corp | | | 24,365 | | | | 1,033,563 | |
WGL Holdings Inc | | | 31,215 | | | | 1,223,316 | |
York Water Co | | | 7,742 | | | | 136,027 | |
| | | | | | | | |
| | | | | | | 24,393,210 | |
| | | | | | | | |
Total Common Stocks
(Cost $683,829,489) | | | | | | | 724,696,012 | |
| | | | | | | | |
| | |
CLOSED-END MUTUAL FUND - 0.0% | | | | | | | | |
| | |
Firsthand Technology Value Fund Inc * | | | 5,257 | | | | 91,682 | |
| | | | | | | | |
| | |
Total Closed-End Mutual Fund
(Cost $98,824) | | | | | | | 91,682 | |
| | | | | | | | |
| | |
| | | Principal Amount | | | | |
SHORT-TERM INVESTMENT - 2.6% | | | | | | | | |
| | |
Repurchase Agreement - 2.6% | | | | | | | | |
| | |
Fixed Income Clearing Corp
0.010% due 01/02/13
(Dated 12/31/12, repurchase price of
$19,381,618; collateralized by U.S.
Treasury Notes: 0.250% due 07/15/15
and value $19,770,000) | | | $19,381,607 | | | | 19,381,607 | |
| | | | | | | | |
| | |
Total Short-Term Investment
(Cost $19,381,607) | | | | | | | 19,381,607 | |
| | | | | | | | |
| | |
TOTAL INVESTMENTS - 99.7%
(Cost $703,309,920) | | | | | | | 744,171,452 | |
| |
OTHER ASSETS & LIABILITIES, NET - 0.3% | | | | 1,913,940 | |
| | | | | | | | |
| | |
NET ASSETS - 100.0% | | | | | | | $746,085,392 | |
| | | | | | | | |
Notes to Schedule of Investments
| (a) | As of December 31, 2012, the portfolio was diversified as a percentage of net assets as follows: |
| | | | |
Financials | | | 22.2% | |
Information Technology | | | 16.1% | |
Industrials | | | 15.1% | |
Consumer Discretionary | | | 13.6% | |
Health Care | | | 11.7% | |
Energy | | | 5.9% | |
Materials | | | 5.1% | |
Consumer Staples | | | 3.4% | |
Utilities | | | 3.3% | |
Short-Term Investment | | | 2.6% | |
Telecommunication Services | | | 0.7% | |
| | | | |
| | | 99.7% | |
Other Assets & Liabilities, Net | | | 0.3% | |
| | | | |
| | | 100.0% | |
| | | | |
| (b) | Short-term investments reflect either the stated coupon rate or the annualized effective yield on the date of purchase for discounted investments. |
| (c) | As of December 31, 2012, $1,208,000 in cash was segregated with the broker(s)/custodian as collateral for open futures contracts. |
| | |
| See Notes to Financial Statements | | See explanation of symbols and terms, if any, on page B-143 |
32
PACIFIC SELECT FUND
SMALL-CAP INDEX PORTFOLIO
Schedule of Investments (Continued)
December 31, 2012
| (d) | Open futures contracts outstanding as of December 31, 2012 were as follows: |
| | | | | | | | | | | | |
| Long Futures Outstanding | | Number of
Contracts | | | Notional
Amount | | | Unrealized
Appreciation | |
Russell 2000 Mini (03/13) | | | 259 | | | | $21,514,155 | | | | $412,785 | |
| | | | | | | | | | | | |
| (e) | Fair Value Measurements |
The following is a summary of the portfolio's investments as categorized under the three-tier hierarchy of inputs used in valuing the portfolio's assets and liabilities (See Note 3D in Notes to Financial Statements) as of December 31, 2012:
| | | | | | | | | | | | | | | | | | |
| | | | | Total Value at
December 31, 2012 | | | Level 1 Quoted Price | | | Level 2 Significant
Observable Inputs | | | Level 3 Significant
Unobservable Inputs | |
Assets | | Warrants (1) | | | $2,151 | | | | $2,151 | | | | $- | | | | $- | |
| | Common Stocks (1) | | | 724,696,012 | | | | 724,696,012 | | | | - | | | | - | |
| | Closed-End Mutual Fund | | | 91,682 | | | | 91,682 | | | | - | | | | - | |
| | Short-Term Investment | | | 19,381,607 | | | | - | | | | 19,381,607 | | | | - | |
| | Derivatives: | | | | | | | | | | | | | | | | |
| | Equity Contracts | | | | | | | | | | | | | | | | |
| | Futures | | | 412,785 | | | | 412,785 | | | | - | | | | - | |
| | | | | | | | | | | | | | | | | | |
| | Total | | | $744,584,237 | | | | $725,202,630 | | | | $19,381,607 | | | | $- | |
| | | | | | | | | | | | | | | | | | |
| | (1) | For equity investments categorized in a single level, refer to the schedule of investments for further industry breakout. |
| | |
| See Notes to Financial Statements | | See explanation of symbols and terms, if any, on page B-143 |
33
Item 7. Disclosure of Proxy Voting Policies and Procedures for Closed-End Management Investment Companies—not applicable.
Item 8. Portfolio Managers of Closed-End Management Investment Companies—not applicable.
Item 9. Purchases of Equity Securities by Closed-End Management Investment Company and Affiliated Purchasers—not applicable.
Item 10. Submission of Matters to a Vote of Security Holders.
There have been no material changes to the procedures by which shareholders may recommend nominees to the Registrant’s Board of Directors.
Item 11. Controls and Procedures.
(a) The Chief Executive Officer and Treasurer have concluded that Registrant’s disclosure controls and procedures (as defined in Rule 30a-3(c) under the Investment Company Act) and internal control over financial reporting (as defined in Rule 30a-3(d) under the Investment Company Act) provide reasonable assurances that material information relating to Registrant is made known to them by the appropriate persons, based on their evaluation of these controls and procedures as of a date within 90 days of the filing of this report.
(b) There were no changes in Registrant’s internal control over financial reporting that occurred during the Registrant’s second fiscal quarter of the period covered by this report that have materially affected, or are reasonably likely to materially affect, the Registrant’s internal control over financial reporting.
Item 12. Exhibits.
| | (a)(1) | Code of Ethics, subject to the disclosure of Item 2 hereof — attached hereto as Exhibit 99.CODE |
| | (a)(2) | Separate certifications pursuant to Rule 30a-2(a) under the Investment Company Act of 1940 (17 CFR 270.30a-2(a)) are attached hereto as Exhibit 99.CERT. |
| | (b) | Certification pursuant to Rule 30a-2(b) under the Investment Company Act of 1940 (17 CFR 270.30b-2(a)) is attached hereto as Exhibit 99.906.CERT pursuant to Section 906 of the Sarbanes Oxley Act of 2002. |
Signatures
Pursuant to the requirements of the Securities Exchange Act of 1934 and the Investment Company Act of 1940, the registrant has duly caused this report to be signed on its behalf by the undersigned, thereunto duly authorized.
| | | | |
| Pacific Select Fund | | |
| | |
| By: | | /s/ Mary Ann Brown | | |
| | Mary Ann Brown | | |
| | Chief Executive Officer |
| | |
| Date: | | March 8, 2013 | | |
Pursuant to the requirements of the Securities Exchange Act of 1934 and the Investment Company Act of 1940, this report has been signed below by the following persons on behalf of the registrant and in the capacities and on the dates indicated.
| | | | |
| By: | | /s/ Mary Ann Brown | | |
| | Mary Ann Brown | | |
| | Chief Executive Officer | | |
| | |
| Date: | | March 8, 2013 | | |
| | |
| By: | | /s/ Brian D. Klemens | | |
| | Brian D. Klemens | | |
| | Treasurer (Principal Financial and Accounting Officer) | | |
| | |
| Date: | | March 8, 2013 | | |