UNITED STATES
SECURITIES AND EXCHANGE COMMISSION
Washington, D.C. 20549
FORM N-CSR
CERTIFIED SHAREHOLDER REPORT OF REGISTERED
MANAGEMENT INVESTMENT COMPANIES
Investment Company Act file number: 811-05151
J.P. Morgan Mutual Fund Group
(Exact name of registrant as specified in charter)
245 Park Avenue
New York, NY 10167
(Address of principal executive offices) (Zip code)
Stephen M. Benham
245 Park Avenue
New York, NY 10167
(Name and Address of Agent for Service)
Registrant’s telephone number, including area code: (800) 480-4111
Date of fiscal year end: Last day of February
Date of reporting period: March 1, 2007 through August 31, 2007
Form N-CSR is to be used by management investment companies to file reports with the Commission not later than 10 days after the transmission to stockholders of any report that is required to be transmitted to stockholders under Rule 30e-1 under the Investment Company Act of 1940 (17 CFR 270.30e-1). The Commission may use the information provided on Form N-CSR in its regulatory, disclosure review, inspection, and policymaking roles.
A registrant is required to disclose the information specified by Form N-CSR, and the Commission will make this information public. A registrant is not required to respond to the collection of information contained in Form N-CSR unless the Form displays a currently valid Office of Management and Budget (“OMB”) control number. Please direct comments concerning the accuracy of the information collection burden estimate and any suggestions for reducing the burden to Secretary, Securities and Exchange Commission, 450 Fifth Street, NW, Washington, DC 20549-0609. The OMB has reviewed this collection of information under the clearance requirements of 44 U.S.C. Section 3507.
ITEM 1. REPORTS TO STOCKHOLDERS.
The following is a copy of the report transmitted to shareholders pursuant to Rule 30e-1 under the Investment Company Act of 1940 (17 CFR 270.30e-1).
SEMI-ANNUAL REPORT
SIX MONTHS ENDED AUGUST 31, 2007 (UNAUDITED)
JPMorgan Emerging Markets Debt Fund
JPMorgan Enhanced Income Fund
JPMorgan Real Return Fund
JPMorgan Short Term Bond Fund
JPMorgan Short Term Bond Fund II
JPMorgan Strategic Income Fund

| President’s Letter | 1 | |||||
| Fund Commentaries: | ||||||
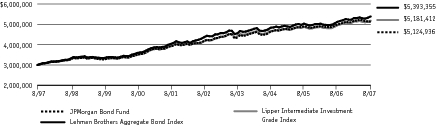
| JPMorgan Bond Fund | 2 | |||||
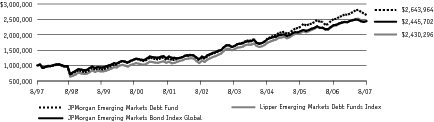
| JPMorgan Emerging Markets Debt Fund | 4 | |||||
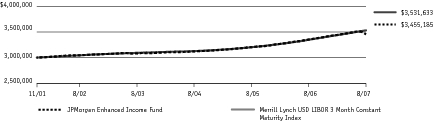
| JPMorgan Enhanced Income Fund | 6 | |||||
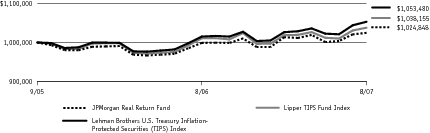
| JPMorgan Real Return Fund | 8 | |||||
| JPMorgan Short Term Bond Fund | 10 | |||||
| JPMorgan Short Term Bond Fund II | 12 | |||||
| JPMorgan Strategic Income Fund | 14 | |||||
| Schedules of Portfolio Investments | 16 | |||||
| Financial Statements | 104 | |||||
| Financial Highlights | 124 | |||||
| Notes to Financial Statements | 142 | |||||
| Trustees | 153 | |||||
| Officers | 155 | |||||
| Schedule of Shareholder Expenses | 156 | |||||
| Board Approval of Investment Advisory Agreements | 159 |
SEPTEMBER 12, 2007 (Unaudited)
 | “Although the spreads of sectors and companies most directly involved in mortgage-related activities and housing saw the widest swings, almost every part of the market experienced volatility.” |
| • | The unemployment rate remained unchanged at 4.6%. |
| • | The income and consumption report showed wages and salaries up 7.2% over the prior July, the highest growth rate in this cycle. |
| • | The July core consumer price index showed a year-over-year increase of 2.2%, unchanged from the previous month, while the core personal consumption expenditures deflator, the Fed’s preferred inflation gauge, remained steady at 1.9%, within the Fed’s inflation “comfort zone.” |

President
JPMorgan Funds
AS OF AUGUST 31, 2007 (Unaudited)
| Fund Inception | July 26, 1993 | |||||
| Fiscal Year End | Last Day of February | |||||
| Net Asset as of 8/31/2007 (In Thousands) | $2,342,656 | |||||
| Primary Benchmark | Lehman Brothers Aggregate Bond Index | |||||
| Average Credit Quality | AA | |||||
| Duration | 5.0 Years | |||||
Q: | HOW DID THE FUND PERFORM? |
A: | The JPMorgan Bond Fund, which seeks to provide high total return consistent with moderate risk of capital and maintenance of liquidity, returned –1.04%* (Institutional Class Shares) for the six months ended August 31, 2007, compared to the 1.54% return for the Lehman Brothers Aggregate Bond Index over the same period.** |
Q: | WHY DID THE FUND PERFORM THIS WAY? |
A: | The Fund underperformed its benchmark for the period due primarily to exposure to emerging markets, specifically our positions in Argentina and Venezuela for which spreads widened rapidly and dramatically during the period. Toward the end of the period, almost every part of the market experienced volatility as concerns about the sub-prime mortgages affected other sectors in general. Our overweight position in investment-grade corporate bonds also detracted from performance as spreads increased dramatically. An additional detractor was our overweight position in mortgage pass-through securities for which spreads widened in part due to increased volatility in the market. In the period, the Fund benefited modestly from actively trading duration with a bias toward the longer end of intermediate maturities. |
Q: | HOW WAS THE FUND MANAGED? |
A: | The advisor seeks to diversify returns from high-conviction insights across a global set of opportunities. We do this by balancing top-down macroeconomic themes with bottom-up security selection and interest rate management. Specifically, we seek to outperform the broad market through allocations to extended sectors, including emerging markets debt and high-yield debt. |
| Mortgage Pass-Through Securities | 33.4 | % | ||||
| Corporate Bonds | 28.2 | |||||
| Collateralized Mortgage Obligations | 19.1 | |||||
| Asset-Backed Securities | 7.3 | |||||
| Others (less than 5.0%) | 12.0 |
| * | The return shown is based on net asset value calculated for shareholder transactions and may differ from the return shown in the financial highlights which reflect adjustments made to the net asset value in accordance with accounting principles generally accepted in the United States of America. |
| ** | The advisor seeks to achieve the Fund’s objective. There can be no guarantee it will be achieved. |
| *** | Percentages indicated are based upon total investments as of August 31, 2007. The Fund’s composition is subject to change. |
| INCEPTION DATE OF CLASS | 1 YEAR | 5 YEAR | 10 YEAR | |||||||||||||||
|---|---|---|---|---|---|---|---|---|---|---|---|---|---|---|---|---|---|---|
CLASS A SHARES | 9/10/01 | |||||||||||||||||
| Without Sales Charge | 2.41 | % | 3.95 | % | 5.33 | % | ||||||||||||
| With Sales Charge * | (1.41 | ) | 3.16 | 4.93 | ||||||||||||||
CLASS B SHARES | 9/10/01 | |||||||||||||||||
| Without CDSC | 1.78 | 3.13 | 4.82 | |||||||||||||||
| With CDSC ** | (3.22 | ) | 2.78 | 4.82 | ||||||||||||||
CLASS C SHARES | 3/31/03 | |||||||||||||||||
| Without CDSC | 1.68 | 3.21 | 4.86 | |||||||||||||||
| With CDSC *** | 0.68 | 3.21 | 4.86 | |||||||||||||||
SELECT CLASS SHARES | 9/10/01 | 2.55 | 3.97 | 5.33 | ||||||||||||||
INSTITUTIONAL CLASS SHARES | 7/26/93 | 2.69 | 4.14 | 5.50 | ||||||||||||||
ULTRA SHARES | 9/10/01 | 2.81 | 4.22 | 5.61 | ||||||||||||||
| * | Sales Charge for Class A Shares is 3.75%. |
| ** | Assumes 5% CDSC (contingent deferred sales charge) for the one year period, a 2% CDSC for the five year period and 0% CDSC thereafter. |
| *** | Assumes 1% CDSC for the one year period and 0% CDSC thereafter. |
AS OF AUGUST 31, 2007 (Unaudited)
| Fund Inception | April 17, 1997 | |||||
| Fiscal Year End | Last Day of February | |||||
| Net Asset as of 8/31/2007 (In Thousands) | $241,883 | |||||
| Primary Benchmark | JPMorgan Emerging Markets Bond Index Global | |||||
| Average Credit Quality | BB | |||||
| Duration | 6.9 Years | |||||
Q: | HOW DID THE FUND PERFORM? |
A: | The JPMorgan Emerging Markets Debt Fund, which seeks to provide high total return from a portfolio of fixed income securities of emerging markets issuers, returned –1.65%* (Select Class Shares) for the six months ended August 31, 2007, compared to the –0.16% return for the JPMorgan Emerging Markets Bond Index Global over the same period.** |
Q: | WHY DID THE FUND PERFORM THIS WAY? |
A: | The Fund underperformed its benchmark primarily due to our positions in Latin American economies, specifically in Argentina and Venezuela. Markets in these countries were volatile, causing the spreads to rise rapidly and dramatically, which severely affected the Fund’s performance. The Fund’s exposure in Asia’s emerging market economies contributed modestly to performance relative to its benchmark. |
Q: | HOW WAS THE FUND MANAGED? |
A: | The Fund was managed using the expertise of our sector-specialist teams in identifying relative-value security selection opportunities (i.e., overweighting undervalued names and underweighting those that are overvalued). For the period, the Fund was positioned with a bias toward countries that provided strong insulation from a higher-rate environment (e.g., those with a relatively lower need for current financing). The Fund also favored countries that exported commodities or with trade surpluses. While committed to investing based upon the long-term outlook of emerging markets countries, the Fund continued to follow its fundamental investment process with caution, given the volatility in the market. |
| Foreign Government Securities | 59.0 | % | ||||
| Corporate Bonds | 35.1 | |||||
| Others (less than 5.0%) | 5.9 |
| Russia | 14.7 | % | ||||
| Brazil | 14.4 | |||||
| Argentina | 11.8 | |||||
| Venezuela | 8.6 | |||||
| Ukraine | 7.2 | |||||
| Mexico | 6.0 | |||||
| United States | 5.0 | |||||
| Turkey | 4.6 | |||||
| Peru | 4.0 | |||||
| Colombia | 3.8 | |||||
| Guatemala | 2.8 | |||||
| El Salvador | 2.2 | |||||
| Indonesia | 1.9 | |||||
| Dominican Republic | 1.8 | |||||
| Costa Rica | 1.7 | |||||
| Chile | 1.6 | |||||
| Egypt | 1.5 | |||||
| Trinidad & Tobago | 1.5 | |||||
| Uruguay | 1.3 | |||||
| Others (less than 1.0%) | 3.6 |
| * | The return shown is based on net asset value calculated for shareholder transactions and may differ from the return shown in the financial highlights which reflect adjustments made to the net asset value in accordance with accounting principles generally accepted in the United States of America. |
| ** | The advisor seeks to achieve the Fund’s objective. There can be no guarantee it will be achieved. |
| *** | Percentages indicated are based upon total investments as of August 31, 2007. The Fund’s composition is subject to change. |
| INCEPTION DATE OF CLASS | 1 YEAR | 5 YEAR | 10 YEAR | |||||||||||||||
|---|---|---|---|---|---|---|---|---|---|---|---|---|---|---|---|---|---|---|
CLASS A SHARES | 6/30/06 | |||||||||||||||||
| Without Sales Charge | 5.07 | % | 15.87 | % | 10.17 | % | ||||||||||||
| With Sales Charge * | 1.09 | 15.00 | 9.75 | |||||||||||||||
CLASS C SHARES | 6/30/06 | |||||||||||||||||
| Without CDSC | 4.50 | 15.74 | 10.11 | |||||||||||||||
| With CDSC ** | 3.50 | 15.74 | 10.11 | |||||||||||||||
R CLASS SHARES | 5/15/06 | 5.60 | 16.02 | 10.24 | ||||||||||||||
SELECT CLASS SHARES | 4/17/97 | 5.41 | 15.96 | 10.21 | ||||||||||||||
| * | Sales Charge for Class A Shares is 3.75%. |
| ** | Assumes 1% CDSC (contingent deferred sales charge) for the one year period and 0% CDSC thereafter. |
AS OF AUGUST 31, 2007 (Unaudited)
| Fund Inception | November 30, 2001 | |||||
| Fiscal Year End | Last Day of February | |||||
| Net Asset as of 8/31/2007 (In Thousands) | $189,621 | |||||
| Primary Benchmark | Merrill Lynch USD LIBOR 3 Month Constant Maturity Index | |||||
| Average Credit Quality | AA | |||||
| Duration | 0.3 Years | |||||
Q: | HOW DID THE FUND PERFORM? |
A: | The JPMorgan Enhanced Income Fund, which seeks to provide high current income consistent with principal preservation, returned 0.37%* (Institutional Class Shares) for the six months ended August 31, 2007, compared to the 2.68% return for the Merrill Lynch USD LIBOR 3 Month Constant Maturity Index over the same period.** |
Q: | WHY DID THE FUND PERFORM THIS WAY? |
A: | The Fund underperformed its benchmark for the period primarily due to its allocation in asset-backed securities (ABS) and mortgage-backed securities (MBS). The spreads for ABS and MBS widened as the market in general became more risk averse in response to the volatility and credit issues facing the sub-prime market. Although the Fund’s sub-prime holdings were primarily in AAA and AA-rated securities, such holdings still negatively affected performance. Our overweight position in investment-grade corporate bonds also detracted from performance as spreads increased dramatically. The Fund benefited from our duration positioning and curve management in the period. |
Q: | HOW WAS THE FUND MANAGED? |
A: | The advisor balances top-down macroeconomic themes with bottom-up security selection, and uses interest rate management in an effort to enhance returns and control risks. Specifically, we sought to outperform the market through allocations to a broader range of sectors and tactically managing duration. The Fund typically maintains a duration of 1.5 years or less. |
| Corporate Bonds | 25.2 | % | ||||
| Asset-Backed Securities | 16.9 | |||||
| Collateralized Mortgage Obligations | 16.1 | |||||
| Mortgage Pass-Through Securities | 12.0 | |||||
| Short-Term Investments | 27.7 | |||||
| Other (less than 5.0%). | 2.1 |
| * | The return shown is based on net asset value calculated for shareholder transactions and may differ from the return shown in the financial highlights which reflect adjustments made to the net asset value in accordance with accounting principles generally accepted in the United States of America. |
| ** | The advisor seeks to achieve the Fund’s objective. There can be no guarantee it will be achieved. |
| *** | Percentages indicated are based upon total investments as of August 31, 2007. The Fund’s composition is subject to change. |
| INCEPTION DATE | 1 YEAR | 5 YEAR | SINCE INCEPTION | |||||||||||||||
|---|---|---|---|---|---|---|---|---|---|---|---|---|---|---|---|---|---|---|
INSTITUTIONAL CLASS SHARES | 11/30/01 | 3.04 | % | 2.54 | % | 2.49 | % | |||||||||||
AS OF AUGUST 31, 2007 (Unaudited)
| Fund Inception | September 1, 2005 | |||||
| Fiscal Year End | Last Day of February | |||||
| Net Asset as of 8/31/2007 (In Thousands) | $70,570 | |||||
| Primary Benchmark | Lehman Brothers U.S. Treasury Inflation-Protected Securities (TIPS) Index | |||||
| Average Credit Quality | AAA | |||||
| Duration | 8.3 Years | |||||
Q: | HOW DID THE FUND PERFORM? |
A: | The JPMorgan Real Return Fund, which seeks to maximize inflation protected return, returned 1.10%* (Select Class Shares) for the six months ended August 31, 2007, compared to the 2.62% return for the Lehman Brothers U.S. Treasury Inflation-Protected Securities (TIPS) Index over the same period.** |
Q: | WHY DID THE FUND PERFORM THIS WAY? |
A: | The Fund underperformed its benchmark for the period due primarily to exposure to emerging markets, specifically the Fund’s positions in Argentina and Venezuela for which the spreads widened rapidly and dramatically during the period. Toward the end of the period, almost every part of the market experienced volatility as concerns about sub-prime mortgages affected other sectors in general. An additional detractor was our overweight position in mortgage pass-through securities for which spreads widened in part due to increased volatility in the market. In the period, the Fund benefited modestly from actively trading duration with a bias toward the longer end of intermediate maturities. Our Treasury Inflation-Protected Securities (TIPS) exposure also modestly benefited the Fund’s returns. |
Q: | HOW WAS THE FUND MANAGED? |
A: | The advisor seeks to invest in a portfolio of inflation-linked securities, such as TIPS, as well as non-inflation linked instruments. The Fund also seeks opportunistic, relative-value investments in both inflation-linked and non-inflation linked securities both domestically and globally. The Fund balances top-down macroeconomic themes with bottom-up security selection. In addition, we employ interest rate management in an effort to enhance returns and control risks. |
| U.S. Treasury Obligations | 72.2 | % | ||||
| Mortgage Pass-Through Securities | 15.1 | |||||
| Others (less than 5.0%) | 12.7 |
| * | The return shown is based on net asset value calculated for shareholder transactions and may differ from the return shown in the financial highlights which reflect adjustments made to the net asset value in accordance with accounting principles generally accepted in the United States of America. |
| ** | The advisor seeks to achieve the Fund’s objective. There can be no guarantee it will be achieved. |
| *** | Percentages indicated are based upon total investments as of August 31, 2007. The Fund’s composition is subject to change. |
| INCEPTION DATE OF CLASS | 1 YEAR | SINCE INCEPTION | ||||||||||||
|---|---|---|---|---|---|---|---|---|---|---|---|---|---|---|
CLASS A SHARES | 9/1/05 | |||||||||||||
| Without Sales Charge | 2.30 | % | 0.93 | % | ||||||||||
| With Sales Charge* | (1.53 | ) | (0.99 | ) | ||||||||||
CLASS C SHARES | 9/1/05 | |||||||||||||
| Without CDSC | 1.79 | 0.43 | ||||||||||||
| With CDSC** | 0.79 | 0.43 | ||||||||||||
SELECT CLASS SHARES | 9/1/05 | 2.58 | 1.24 | |||||||||||
INSTITUTIONAL CLASS SHARES | 9/1/05 | 2.71 | 1.40 | |||||||||||
| * | Sales Charge for Class A Shares is 3.75%. |
| ** | Assumes 1% CDSC for the one year period and 0% CDSC thereafter. |
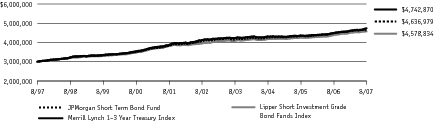
AS OF AUGUST 31, 2007 (Unaudited)
| Fund Inception | September 13, 1993 | |||||
| Fiscal Year End | Last Day of February | |||||
| Net Asset as of 8/31/2007 (In Thousands) | $1,999,775 | |||||
| Primary Benchmark | Merrill Lynch 1–3 Year Treasury Index | |||||
| Average Credit Quality | AA | |||||
| Duration | 1.9 Years | |||||
Q: | HOW DID THE FUND PERFORM? |
A: | The JPMorgan Short Term Bond Fund, which seeks to provide high total return, consistent with low volatility of principal, returned 0.48%* (Institutional Class Shares) for the six months ended August 31, 2007, compared to the 3.06% return for the Merrill Lynch 1–3 Year Treasury Index over the same period.** |
Q: | WHY DID THE FUND PERFORM THIS WAY? |
A: | The Fund underperformed its benchmark for the period primarily due to the Fund’s allocation in asset-backed securities (ABS) and mortgage-backed securities (MBS). The spreads for ABS and MBS widened as the market in general became more risk averse in response to the volatility and credit issues facing the sub-prime market. Although the Fund’s sub-prime holdings were primarily in AAA and AA-rated securities, such holdings still negatively affected performance. Our overweight position in investment-grade corporate bonds also detracted from performance as spreads increased dramatically. In addition, the Fund underperformed its benchmark due to exposure to emerging markets, specifically the Fund’s positions in Argentina and Venezuela for which the spreads widened rapidly and dramatically during the period. The Fund benefited from our duration positioning and curve management in the period. |
Q: | HOW WAS THE FUND MANAGED? |
A: | The advisor balances top-down macroeconomic themes with bottom-up security selection. In addition, we employ interest rate management in an effort to enhance returns and control risks. |
| Mortgage Pass-Through Securities | 27.7 | % | ||||
| Corporate Bonds | 26.5 | |||||
| Asset-Backed Securities | 12.7 | |||||
| Commercial Mortgage-Backed Securities | 8.7 | |||||
| Collateralized Mortgage Obligations | 7.2 | |||||
| Short-Term Investments | 15.3 | |||||
| Others (less than 5.0%) | 1.9 |
| * | The return shown is based on net asset value calculated for shareholder transactions and may differ from the return shown in the financial highlights which reflect adjustments made to the net asset value in accordance with accounting principles generally accepted in the United States of America. |
| ** | The advisor seeks to achieve the Fund’s objective. There can be no guarantee it will be achieved. |
| *** | Percentages indicated are based upon total investments as of August 31, 2007. The Fund’s composition is subject to change. |
| INCEPTION DATE OF CLASS | 1 YEAR | 5 YEAR | 10 YEAR | |||||||||||||||
|---|---|---|---|---|---|---|---|---|---|---|---|---|---|---|---|---|---|---|
CLASS A SHARES | 9/10/01 | |||||||||||||||||
| Without Sales Charge | 2.79 | % | 2.22 | % | 4.05 | % | ||||||||||||
| With Sales Charge * | 0.46 | 1.76 | 3.81 | |||||||||||||||
SELECT CLASS SHARES | 9/10/01 | 3.08 | 2.42 | 4.18 | ||||||||||||||
INSTITUTIONAL CLASS SHARES | 9/13/93 | 3.33 | 2.67 | 4.45 | ||||||||||||||
| * | Sales Charge for Class A Shares is 2.25% |
AS OF AUGUST 31, 2007 (Unaudited)
| Fund Inception | November 30, 1990 | |||||
| Fiscal Year End | Last Day of February | |||||
| Net Asset as of 8/31/2007 (In Thousands) | $318,423 | |||||
| Primary Benchmark | Lehman Brothers 1–3 Year U.S. Government Bond Index | |||||
| Average Credit Quality | AA | |||||
| Duration | 2.0 Years | |||||
Q: | HOW DID THE FUND PERFORM? |
A: | The JPMorgan Short Term Bond Fund II, which seeks a high level of income, consistent with preservation of capital, returned 1.60%* (Select Class Shares) for the six months ended August 31, 2007, compared to the 2.90% return for the Lehman Brothers 1–3 Year U.S. Government Bond Index over the same period.** |
Q: | WHY DID THE FUND PERFORM THIS WAY? |
A: | The Fund underperformed its benchmark for the period primarily due to the Fund’s allocation in asset-backed securities (ABS) and mortgage-backed securities (MBS). The spreads for ABS and MBS widened as the market in general became more risk averse in response to the volatility and credit issues facing the sub-prime market. Although the Fund’s sub-prime holdings were primarily in AAA and AA-rated securities, such holdings still negatively affected performance. The Fund’s overweight position in investment-grade corporate bonds also detracted from performance as spreads increased dramatically. The Fund benefited from our duration positioning and curve management in the period. The Fund also benefited from tactically trading mortgages and relative value coupon selection. |
Q: | HOW WAS THE FUND MANAGED? |
A: | The advisor balances top-down macroeconomic themes with bottom-up security selection across a global set of opportunities, and we employ interest rate management in an effort to enhance returns and control risks. Specifically, we seek to outperform the market through allocations to a broader range of sectors, including emerging market debt while tactically managing duration. |
| Corporate Bonds | 32.5 | % | ||||
| Mortgage Pass-Through Securities | 20.0 | |||||
| Asset-Backed Securities | 16.2 | |||||
| Commercial Mortgage-Backed Securities | 14.9 | |||||
| Collateralized Mortgage Obligations | 9.8 | |||||
| Others (less than 5.0%) | 6.6 |
| * | The return shown is based on net asset value calculated for shareholder transactions and may differ from the return shown in the financial highlights which reflect adjustments made to the net asset value in accordance with accounting principles generally accepted in the United States of America. |
| ** | The advisor seeks to achieve the Fund’s objective. There can be no guarantee it will be achieved. |
| *** | Percentages indicated are based upon total investments as of August 31, 2007. The Fund’s composition is subject to change. |
| INCEPTION DATE OF CLASS | 1 YEAR | 5 YEAR | 10 YEAR | |||||||||||||||
|---|---|---|---|---|---|---|---|---|---|---|---|---|---|---|---|---|---|---|
CLASS A SHARES | 5/6/96 | |||||||||||||||||
| Without Sales Charge | 3.94 | % | 2.28 | % | 3.90 | % | ||||||||||||
| With Sales Charge * | 1.57 | 1.81 | 3.67 | |||||||||||||||
CLASS M SHARES | 7/1/99 | |||||||||||||||||
| Without Sales Charge | 3.67 | 2.02 | �� | 3.69 | ||||||||||||||
| With Sales Charge ** | 2.11 | 1.71 | 3.54 | |||||||||||||||
SELECT CLASS SHARES | 11/30/90 | 4.29 | 2.54 | 4.20 | ||||||||||||||
| * | Sales Charge for Class A Shares is 2.25%. |
| ** | Sales Charge for Class M Shares is 1.50%. |

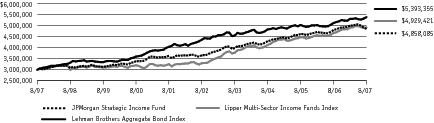
AS OF AUGUST 31, 2007 (Unaudited)
| Fund Inception | March 17, 1997 | |||||
| Fiscal Year End | Last Day of February | |||||
| Net Asset as of 8/31/2007 (In Thousands) | $18,420 | |||||
| Primary Benchmark | Lehman Brothers Aggregate Bond Index | |||||
| Average Credit Quality | A+ | |||||
| Duration | 5.0 Years | |||||
Q: | HOW DID THE FUND PERFORM? |
A: | The JPMorgan Strategic Income Fund, which seeks to provide high total return primarily from a portfolio of fixed income investments of foreign and domestic issuers and counterparties, returned –2.88%* (Institutional Class Shares) for the six months ended August 31, 2007, compared to the 1.54% return for the Lehman Brothers Aggregate Bond Index over the same period.** |
Q: | WHY DID THE FUND PERFORM THIS WAY? |
A: | The Fund underperformed its benchmark for the period due primarily to exposure to emerging markets, specifically the Fund’s positions in Argentina and Venezuela for which the spreads widened rapidly and dramatically during the period. Toward the end of the period, almost every part of the market experienced volatility as concerns about sub-prime mortgages affected other sectors in general. Our overweight position in investment-grade corporate bonds also detracted from performance as spreads increased dramatically. Although the Fund’s sub-prime holdings were primarily in AAA and AA-rated securities, such holdings still negatively affected performance. An additional detractor was our high-yield exposure for which spreads widened in part due to increased volatility in the market. In the period, the Fund benefited modestly from actively trading duration with a bias toward the longer end of intermediate maturities. The Fund’s Treasury and government agency allocation modestly contributed to performance during the market’s flight to quality. |
Q: | HOW WAS THE FUND MANAGED? |
A: | The advisor balances top-down macroeconomic themes with bottom-up security selection across a global set of opportunities. In addition, we employ interest rate management in an effort to enhance returns and control risks. This includes aggressive strategic allocations to high beta sectors that are actively managed. |
| Mortgage Pass-Through Securities | 36.9 | % | ||||
| Corporate Bonds | 27.5 | |||||
| Foreign Government Securities | 9.8 | |||||
| Collateralized Mortgage Obligations | 5.1 | |||||
| Asset-Backed Securities | 5.0 | |||||
| Others (less than 5.0%) | 15.7 |
| United States | 81.2 | % | ||||
| United Kingdom | 2.0 | |||||
| Iceland | 1.9 | |||||
| Argentina | 1.8 | |||||
| Russia | 1.4 | |||||
| Colombia | 1.3 | |||||
| Luxembourg | 1.3 | |||||
| Mexico | 1.2 | |||||
| Egypt | 1.1 | |||||
| Peru | 1.1 | |||||
| Cayman Islands | 1.0 | |||||
| Other (less than 1.0%) | 4.7 |
| * | The return shown is based on net asset value calculated for shareholder transactions and may differ from the return shown in the financial highlights which reflect adjustments made to the net asset value in accordance with accounting principles generally accepted in the United States of America. |
| ** | The advisor seeks to achieve the Fund’s objective. There can be no guarantee it will be achieved. |
| *** | Portfolio composition percentages are based on total investments as of August 31, 2007. The Fund’s composition is subject to change. |
| INCEPTION DATE OF CLASS | 1 YEAR | 5 YEAR | 10 YEAR | |||||||||||||||
|---|---|---|---|---|---|---|---|---|---|---|---|---|---|---|---|---|---|---|
CLASS A SHARES | 9/10/01 | |||||||||||||||||
| Without Sales Charge | 0.67 | % | 5.26 | % | 4.42 | % | ||||||||||||
| With Sales Charge * | (3.05 | ) | 4.45 | 4.02 | ||||||||||||||
CLASS B SHARES | 2/19/05 | |||||||||||||||||
| Without CDSC | 0.14 | 4.98 | 4.28 | |||||||||||||||
| With CDSC ** | (4.86 | ) | 4.65 | 4.28 | ||||||||||||||
CLASS C SHARES | 2/19/05 | |||||||||||||||||
| Without CDSC | 0.26 | 5.01 | 4.30 | |||||||||||||||
| With CDSC *** | (0.74 | ) | 5.01 | 4.30 | ||||||||||||||
SELECT CLASS SHARES | 9/10/01 | 0.82 | 5.49 | 4.59 | ||||||||||||||
INSTITUTIONAL CLASS SHARES | 3/17/97 | 1.19 | 5.83 | 4.94 | ||||||||||||||
| * | Sales Charge for Class A Shares is 3.75%. |
| ** | Assumes 5% CDSC (contingent deferred sales charge) for the one year period, a 2% CDSC for the five year period and 0% CDSC thereafter. |
| *** | Assumes 1% CDSC for the one year period and 0% CDSC thereafter. |
AS OF AUGUST 31, 2007 (Unaudited)
| PRINCIPAL AMOUNT($) | | SECURITY DESCRIPTION | | VALUE($) | |||||||
|---|---|---|---|---|---|---|---|---|---|---|---|
Long-Term Investments — 144.2% | |||||||||||
Asset-Backed Securities — 10.8% | |||||||||||
| 5,000 | Accredited Mortgage Loan Trust, Series 2006-1, Class A3, FRN, 5.69%, 04/25/36 (m) | 4,862 | |||||||||
| 1,211 | American Express Credit Account Master Trust, Series 2004-C, Class C, FRN, 6.11%, 02/15/12 (e) (m) | 1,207 | |||||||||
| 5,000 | Asset Backed Securities Corp. Home Equity, Series 2006-HE5, Class M2, FRN, 5.81%, 07/25/36 (m) | 4,085 | |||||||||
| 6,000 | Bank of America Credit Card Trust, Series 2006-C4, Class C4, FRN, 5.84%, 11/15/11 (m) | 5,875 | |||||||||
| 1,011 | Capital Auto Receivables Asset Trust, Series 2006-1, Class A2A, 5.03%, 09/15/08 (m) | 1,010 | |||||||||
| Capital One Auto Finance Trust, | |||||||||||
| 1,835 | Series 2004-A, Class A4, FRN, 5.71%, 03/15/11 (m) | 1,836 | |||||||||
| 8,000 | Series 2007-B, Class A3A, 5.03%, 04/15/12 (m) | 7,957 | |||||||||
| 7,580 | Capital One Multi-Asset Execution Trust, Series 2003-A, FRN, 6.86%, 12/15/10 (i) | 7,611 | |||||||||
| Capital One Prime Auto Receivables Trust, | |||||||||||
| 1,500 | Series 2005-1, Class A4, FRN, 5.63%, 04/15/11 (m) | 1,500 | |||||||||
| 5,000 | Series 2007-1, Class A2, 5.43%, 02/15/10 (m) | 4,997 | |||||||||
| 10,000 | Series 2007-1, Class A3, 5.47%, 06/15/11 (m) | 9,994 | |||||||||
| Carmax Auto Owner Trust, | |||||||||||
| 5,000 | Series 2006-1, Class A4, 5.41%, 06/15/11 (m) | 5,004 | |||||||||
| 5,000 | Series 2007-1, Class A4, 5.24%, 06/15/12 (m) | 4,975 | |||||||||
| CARSS Finance LP (Cayman Islands), | |||||||||||
| 33 | Series 2004-A, Class B1, FRN, 5.89%, 01/15/11 (e) (m) | 33 | |||||||||
| 82 | Series 2004-A, Class B2, FRN, 6.56%, 01/15/11 (e) (m) | 82 | |||||||||
| Citibank Credit Card Issuance Trust, | |||||||||||
| 1,555 | Series 2004-A8, Class A8, 4.90%, 12/12/16 (m) | 1,508 | |||||||||
| 1,145 | Series 2005-A9, Class A9, 5.10%, 11/20/17 (m) | 1,116 | |||||||||
| 9,950 | Series 2006-C4, Class C4, FRN, 5.55%, 01/09/12 (m) | 9,752 | |||||||||
| Citigroup Mortgage Loan Trust, Inc., | |||||||||||
| 1,437 | Series 2003-HE3, Class A, FRN, 5.88%, 12/25/33 (m) | 1,399 | |||||||||
| 277 | Series 2006-WF2, Class A2A, SUB, 5.91%, 05/25/36 (m) | 276 | |||||||||
| 5,658 | Series 2007-AHL2, Class A3A, FRN, 5.57%, 05/25/37 (m) | 5,573 | |||||||||
| 9,000 | Series 2007-WFH2, Class A3, FRN, 5.69%, 03/25/37 (m) | 8,744 | |||||||||
| 1,347 | CNH Equipment Trust, Series 2005-B, Class A3, 4.27%, 01/15/10 (m) | 1,339 | |||||||||
| Countrywide Asset Backed Certificates, | |||||||||||
| 4,775 | Series 2003-5, Class MF1, VAR, 5.41%, 01/25/34 (m) | 4,668 | |||||||||
| 18 | Series 2004-1, Class 3A, FRN, 5.79%, 04/25/34 (m) | 17 | |||||||||
| 1,320 | Series 2004-1, Class M1, FRN, 6.01%, 03/25/34 (m) | 1,248 | |||||||||
| 1,080 | Series 2004-1, Class M2, FRN, 6.06%, 03/25/34 (m) | 994 | |||||||||
| 830 | Series 2005-3, Class AF3, VAR, 4.82%, 09/25/31 (m) | 821 | |||||||||
| 940 | Series 2005-11, Class AF3, VAR, 4.78%, 02/25/36 (m) | 914 | |||||||||
| Countrywide Home Equity Loan Trust, | |||||||||||
| 332 | Series 2004-I, Class A, FRN, 5.90%, 02/15/34 (m) | 326 | |||||||||
| 397 | Series 2004-K, Class 2A, FRN, 5.91%, 02/15/34 (m) | 392 | |||||||||
| 435 | Credit-Based Asset Servicing and Securitization LLC, Series 2006-CB1, Class AF1, SUB, 5.46%, 01/25/36 (m) | 432 | |||||||||
| 255 | Daimler Chrysler Auto Trust, Series 2006-B, Class A2, 5.30%, 10/08/08 (m) | 255 | |||||||||
| 6,000 | First Franklin Mortgage Loan Asset Backed Certificates, Series 2006-FF10, Class M1, FRN, 5.78%, 07/25/36 (m) | 4,814 | |||||||||
| Ford Credit Auto Owner Trust, | |||||||||||
| 3,704 | Series 2006-B, Class A2A, 5.42%, 07/15/09 (m) | 3,701 | |||||||||
| 5,000 | Series 2006-C, Class A3, 5.16%, 11/15/10 (m) | 4,984 | |||||||||
| 4,000 | Series 2007-A, Class A2A, 5.42%, 04/15/10 (m) | 3,999 | |||||||||
| 1,593 | GE Equipment Small Ticket LLC, Series 2005-1A, Class A3, 4.38%, 07/22/09 (e) (m) | 1,586 | |||||||||
| GSAMP Trust, | |||||||||||
| 85 | Series 2004-OPT, Class A1, FRN, 5.84%, 11/25/34 (m) | 84 | |||||||||
| 1,951 | Series 2005-WMC2, Class A2B, FRN, 5.77%, 11/25/35 (m) | 1,923 | |||||||||
| 6,000 | Series 2006-NC1, Class A2, FRN, 5.69%, 02/25/36 (m) | 5,792 | |||||||||
| Harley-Davidson Motorcycle Trust, | |||||||||||
| 10,000 | Series 2007-1, Class A3, 5.22%, 03/15/12 (m) | 9,985 | |||||||||
| 6,412 | Helios Finance LP (Cayman Islands), Series 2007-S1, Class B1, FRN, 6.21%, 10/20/14 (e) (i) (m) | 6,193 | |||||||||
| Home Equity Asset Trust, | |||||||||||
| 1,465 | Series 2005-8, Class M2, FRN, 5.96%, 02/25/36 (m) | 1,309 | |||||||||
| 7,000 | Series 2006-3, Class2A3, FRN, 5.69%, 07/25/36 (m) | 6,762 | |||||||||
| PRINCIPAL AMOUNT($) | | SECURITY DESCRIPTION | | VALUE($) | |||||||
|---|---|---|---|---|---|---|---|---|---|---|---|
Long-Term Investments — Continued | |||||||||||
Asset-Backed Securities — Continued | |||||||||||
| 5,200 | Series 2007-2, Class M3, FRN, 6.26%, 07/25/37 (m) | 4,236 | |||||||||
| Household Automotive Trust, | |||||||||||
| 169 | Series 2006-1, Class A2, 5.40%, 06/17/09 (m) | 169 | |||||||||
| 1,134 | Series 2006-2, Class A2, 5.61%, 06/17/09 (m) | 1,134 | |||||||||
| HSI Asset Securitization Corp. Trust, | |||||||||||
| 5,000 | Series 2006-OPT2, Class 2A3, FRN, 5.69%, 01/25/36 (m) | 4,664 | |||||||||
| 1,174 | Lehman XS Trust, Series 2005-7N, Class 1A1A, FRN, 5.78%, 11/25/35 (m) | 1,145 | |||||||||
| Long Beach Mortgage Loan Trust, | |||||||||||
| 2,000 | Series 2003-4, Class M1, FRN, 6.19%, 08/25/33 (m) | 1,921 | |||||||||
| 2,030 | Series 2004-1, Class M1, FRN, 6.01%, 02/25/34 (m) | 1,929 | |||||||||
| 1,360 | Series 2004-1, Class M2, FRN, 6.06%, 02/25/34 (m) | 1,302 | |||||||||
| 1,500 | Series 2004-3, Class M1, FRN, 6.08%, 07/25/34 (m) | 1,404 | |||||||||
| MASTR Asset Backed Securities Trust, | |||||||||||
| 4,596 | Series 2006-AB1, Class A1, FRN, 5.65%, 02/25/36 (m) | 4,566 | |||||||||
| 5,000 | Series 2006-NC1, Class A3, FRN, 5.70%, 01/25/36 (m) | 4,763 | |||||||||
| 3,000 | MBNA Credit Card Master Note Trust, Series 2001-C2, Class C2, FRN, 6.76%, 12/15/10 (e) (m) | 3,010 | |||||||||
| 5,000 | Merrill Lynch Mortgage Investors, Inc., Series 2006-WMC1, Class A2C, FRN 5.71%, 01/25/37 (m) | 4,895 | |||||||||
| 13,000 | Nationstar Home Equity Loan Trust, Series 2007-C, Class 2AV2, FRN, 5.64%, 06/25/37 (m) | 12,740 | |||||||||
| New Century Home Equity Loan Trust, | |||||||||||
| 1,350 | Series 2005-1, Class M1, FRN, 5.96%, 03/25/35 (m) | 1,202 | |||||||||
| 203 | Series 2005-2, Class A2B, FRN, 5.69%, 06/25/35 (m) | 203 | |||||||||
| 803 | Series 2005-B, Class A2B, FRN, 5.69%, 10/25/35 (m) | 797 | |||||||||
| 4,000 | Newcastle Mortgage Securities Trust, Series 2006-1, Class A2, FRN, 5.63%, 03/25/36 (m) | 3,938 | |||||||||
| Option One Mortgage Loan Trust, | |||||||||||
| 529 | Series 2003-1, Class A2, FRN, 5.93%, 02/25/33 (m) | 516 | |||||||||
| 311 | Series 2003-5, Class A2, FRN, 5.83%, 08/25/33 (m) | 302 | |||||||||
| 3,000 | Series 2007-3, Class M2, FRN, 5.98%, 04/25/37 (m) | 2,434 | |||||||||
| 5,922 | Series 2007-4, Class 2A1, FRN, 5.60%, 04/25/37 (m) | 5,873 | |||||||||
| 2,000 | Peco Energy Transition Trust, Series 2000-A, Class A3, 7.63%, 03/01/10 (m) | 2,073 | |||||||||
| 2,650 | PSE&G Transition Funding LLC, Series 2001-1, Class A6, 6.61%, 06/15/15 (m) | 2,832 | |||||||||
| Residential Asset Mortgage Products, Inc., | �� | ||||||||||
| 3,550 | Series 2005-EFC5, Class M1, FRN, 5.91%, 10/01/35 (m) | 3,357 | |||||||||
| 2,000 | Series 2006-RS1, Class AI2, FRN, 5.74%, 02/25/34 (m) | 1,889 | |||||||||
| Residential Asset Securities Corp., | |||||||||||
| 358 | Series 2002-KS4, Class AIIB, FRN, 6.01%, 07/25/32 (m) | 349 | |||||||||
| 609 | Series 2003-KS5, Class AIIB, FRN, 6.09%, 07/25/33 (m) | 601 | |||||||||
| 100 | Series 2005-KS2, Class AI2, FRN, 5.71%, 05/25/34 (m) | 100 | |||||||||
| 4,870 | Series 2005-KS10, Class M1, FRN, 5.92%, 11/25/35 (m) | 4,324 | |||||||||
| 962 | Specialty Underwriting & Residential Finance, Series 2005-BC3, Class A2B, FRN, 5.76%, 06/25/36 (m) | 958 | |||||||||
| 6,365 | Structured Asset Securities Corp., Series 2006-WF2, Class M2, FRN, 5.80%, 07/25/36 (m) | 5,231 | |||||||||
| Triad Auto Receivables Owner Trust, | |||||||||||
| 2,289 | Series 2003-B, Class A4, 3.20%, 12/13/10 (m) | 2,254 | |||||||||
| 8,000 | Series 2006-C, Class A3, 5.26%, 11/14/11 (m) | 7,984 | |||||||||
| Wachovia Asset Securitization, Inc., | |||||||||||
| 863 | Series 2002-HE2, Class A, FRN, 5.94%, 12/25/32 (m) | 853 | |||||||||
| 553 | Series 2003-HE3, Class A, FRN, 5.76%, 11/25/33 (m) | 545 | |||||||||
| 3,900 | Wachovia Auto Loan Owner Trust, Series 2006-1, Class A2, 5.28%, 04/20/10 (e) (m) | 3,895 | |||||||||
| Total Asset-Backed Securities (Cost $261,445) | 252,322 | ||||||||||
Collateralized Mortgage Obligations — 28.2% | |||||||||||
Agency CMO — 7.1% | |||||||||||
| Federal Home Loan Mortgage Corp. REMICS, | |||||||||||
| 497 | Series 2508, Class PE, 5.50%, 05/15/28 (m) | 498 | |||||||||
| 8,127 | Series 2564, Class LS, IF, IO, 2.04%, 01/15/17 (m) | 387 | |||||||||
| 3,591 | Series 2643, Class PI, IO, 5.00%, 03/15/28 (m) | 326 | |||||||||
| 11,482 | Series 2701, Class ST, IF, IO, 1.39%, 08/15/21 (m) | 522 | |||||||||
| 2,731 | Series 2751, Class AI, IO, 5.00%, 04/15/22 (m) | 75 | |||||||||
| 3,540 | Series 2772, Class GI, IO, 5.00%, 11/15/22 (m) | 123 | |||||||||
AS OF AUGUST 31, 2007 (Unaudited) (continued)
| PRINCIPAL AMOUNT($) | | SECURITY DESCRIPTION | | VALUE($) | |||||||
|---|---|---|---|---|---|---|---|---|---|---|---|
Long-Term Investments — Continued | |||||||||||
Agency CMO — Continued | |||||||||||
| 7,064 | Series 2779, Class SM, IF, IO, 1.54%, 10/15/18 (m) | 390 | |||||||||
| 2,609 | Series 2781, Class PL, IO, 5.00%, 10/15/23 (m) | 89 | |||||||||
| 26,122 | Series 2791, Class SI, IF, IO, 1.54%, 12/15/31 (m) | 1,624 | |||||||||
| 21,016 | Series 2813, Class SB, IF, IO, 1.44%, 02/15/34 (m) | 1,412 | |||||||||
| 17,134 | Series 2861, Class GS, IF, IO, 1.59%, 01/15/21 (m) | 406 | |||||||||
| 3,810 | Series 2891, Class LI, IO, 5.00%, 06/15/24 (m) | 178 | |||||||||
| 7,674 | Series 2894, Class S, IF, IO, 1.59%, 03/15/31 (m) | 470 | |||||||||
| 5,380 | Series 2931, Class GA, 5.00%, 11/15/28 (m) | 5,368 | |||||||||
| 4,953 | Series 2971, Class Pl, IO, 5.50%, 03/15/26 (m) | 397 | |||||||||
| 641 | Series 2980, Class QB, 6.50%, 05/15/35 (m) | 663 | |||||||||
| 8,328 | Series 3029, Class S, IF, IO 1.59%, 08/15/35 (m) | 776 | |||||||||
| 43,667 | Series 3117, Class ES, IF, IO, 1.54%, 02/15/36 (m) | 3,769 | |||||||||
| 8,570 | Series 3149, Class IU, IO, 6.00%, 09/15/25 (m) | 786 | |||||||||
| 16,712 | Series 3174, Class SA, IF, IO, 2.09%, 04/15/36 (m) | 1,570 | |||||||||
| 31,606 | Series 3199, Class AD, 6.50%, 12/15/33 (m) | 32,313 | |||||||||
| 3,520 | Series 3115, Class DO, PO, 07/15/35 (m) | 2,531 | |||||||||
| 48,652 | Series 3316, Class SB, IF, IO, 1.59%, 08/15/35 (m) | 4,171 | |||||||||
| Federal Home Loan Mortgage Corp. STRIPS, | |||||||||||
| 18,003 | Series 237, Class S22, IF, IO, 1.54%, 05/15/36 (m) | 1,624 | |||||||||
| 16,203 | Series 237, Class S23, IF, IO, 1.49%, 05/15/36 (m) | 1,429 | |||||||||
| 51,630 | Series 239, Class S29, IF,IO, 2.43%, 08/01/36 (m) | 5,045 | |||||||||
| 80,116 | Series 239, Class S30, IF, IO, 2.38%, 08/01/36 (m) | 7,679 | |||||||||
| 44,101 | Series 240, Class S22, IF, IO, 1.54%, 07/01/36 (m) | 3,986 | |||||||||
| 79,179 | Series 242, Class S29, IF, IO, 2.14%, 11/15/36 (m) | 7,303 | |||||||||
| Federal National Mortgage Association REMICS, | |||||||||||
| 6,404 | Series 2004-61, Class TS, IF, IO, 1.60%, 10/25/31 (m) | 269 | |||||||||
| 5,078 | Series 2004-87, Class JI, IO, 5.00%, 11/25/30 (m) | 469 | |||||||||
| 1,769 | Series 2006-59, Class DA, 6.50%, 12/25/33 (m) | 1,805 | |||||||||
| 7,667 | Series 2006-63, Class AB, 6.50%, 10/25/33 (m) | 7,819 | |||||||||
| 18,693 | Series 2006-78, Class BC, 6.50%, 01/25/34 (m) | 19,093 | |||||||||
| 14,600 | Series 2006-104, Class FC, FRN, 5.76%, 11/25/36 (m) | 14,610 | |||||||||
| 6,239 | Series 2006-115, Class BF, FRN, 5.75%, 12/25/36 (m) | 6,195 | |||||||||
| 4,039 | Series 2007-50, Class CS, IF, 7.68%, 09/25/32 (m) | 4,006 | |||||||||
| 45,322 | Series 2007-55, Class S, IF, IO, 1.26%, 06/25/37 (m) | 2,369 | |||||||||
| Federal National Mortgage Association STRIPS, | |||||||||||
| 65,605 | Series 367, Class 2, IO, 5.50%, 01/25/36 (m) | 17,389 | |||||||||
| 16,882 | Series 378, Class 5, IO, 5.00%, 07/01/36 (m) | 4,155 | |||||||||
| Federal National Mortgage Association Whole Loan, | |||||||||||
| 169 | Series 2003-W3, Class 2A5, 5.36%, 06/25/42 (m) | 168 | |||||||||
| 2,222 | Series 2003-W6, Class 1A41, 5.40%, 10/25/42 (m) | 2,209 | |||||||||
| Government National Mortgage Association, | |||||||||||
| 646 | Series 2004-39, Class IM, IO, 5.50%, 01/20/27 (m) | 17 | |||||||||
| 3,117 | Series 2004-44, Class PK, IO, 5.50%, 10/20/27 (m) | 117 | |||||||||
| 137 | Series 2004-46, Class IH, IO, 5.50%, 04/20/25 (m) | — | (h) | ||||||||
| 166,600 | |||||||||||
Non-Agency CMO — 21.1% | |||||||||||
| Adjustable Rate Mortgage Trust, | |||||||||||
| 357 | Series 2005-4, Class 7A2, FRN, 5.74%, 08/25/35 (m) | 356 | |||||||||
| 1,584 | Series 2005-5, Class 6A21, FRN, 5.74%, 09/25/35 (m) | 1,577 | |||||||||
| 291 | Series 2005-6A Class 2A1, FRN, 5.82%, 11/25/35 (m) | 291 | |||||||||
| 10,793 | American Home Mortgage Assets, Series 2006-2, Class 2A1, FRN, 5.70%, 09/25/46 (m) | 10,614 | |||||||||
| 2,380 | Citicorp Mortgage Securities, Inc., Series 2003-11, Class 2A1, 5.50%, 12/25/33 (m) | 2,354 | |||||||||
| 31,228 | CitiMortgage Alternative Loan Trust, Series 2006-A6, Class 1A4, 6.00%, 11/25/36 (m) | 31,193 | |||||||||
| Countrywide Alternative Loan Trust, | |||||||||||
| 4,657 | Series 2004-28CB, Class 3A1, 6.00%, 01/25/35 (m) | 4,620 | |||||||||
| 3,915 | Series 2005-51, Class 1A1, FRN, 5.86%, 11/20/35 (m) | 3,817 | |||||||||
| 9,137 | Series 2006-OA1, Class 2A1, FRN, 5.75%, 03/20/46 (m) | 8,962 | |||||||||
| 11,602 | Series 2006-OA2, Class A1, FRN, 5.75%, 05/20/46 (m) | 11,399 | |||||||||
| 3,090 | Series 2006-OA9, Class 1A1, FRN, 5.74%, 07/20/46 (m) | 3,020 | |||||||||
| PRINCIPAL AMOUNT($) | | SECURITY DESCRIPTION | | VALUE($) | |||||||
|---|---|---|---|---|---|---|---|---|---|---|---|
Long-Term Investments — Continued | |||||||||||
Non-Agency CMO — Continued | |||||||||||
| 3,027 | Series 2006-OA9, Class 2A1B, FRN, 5.74%, 07/20/46 (m) | 2,967 | |||||||||
| 9,548 | Series 2006-OA10, Class 3A1, FRN, 5.70%, 08/25/46 (m) | 9,277 | |||||||||
| 4,641 | Series 2006-OA12, Class A2, FRN, 5.75%, 09/20/46 (m) | 4,554 | |||||||||
| 9,780 | Series 2006-OA19, Class A1, FRN, 5.72%, 02/20/47 (m) | 9,537 | |||||||||
| 24,770 | Series 2007-18CB, Class 2A25, 6.00%, 08/25/37 (m) | 24,457 | |||||||||
| 12,244 | Series 2007-OH1, Class A1D, FRN, 5.72%, 04/25/47 (m) | 11,916 | |||||||||
| 8,665 | Countrywide Home Loan Mortgage Pass-Through Trust, Series 2002-22, Class A20, 6.25%, 10/25/32 (m) | 8,633 | |||||||||
| CS First Boston Mortgage Securities Corp., | |||||||||||
| 431 | Series 2003-29, Class 7A1, 6.50%, 12/25/33 (m) | 434 | |||||||||
| 62 | Series 2004-4, Class 1A1, 6.00%, 08/25/34 (m) | 62 | |||||||||
| 2,290 | Series 2004-5, Class 1A8, 6.00%, 09/25/34 (m) | 2,295 | |||||||||
| 6,000 | Deutsche ALT-A Securities, Inc. Alternate Loan Trust, Series 2006-AR1, Class 1A2, FRN, 5.72%, 02/25/36 (m) | 5,963 | |||||||||
| 9,685 | Downey Savings & Loan Association Mortgage Loan Trust, Series 2005- AR6, Class 2A1A, FRN, 5.83%, 10/19/45 (m) | 9,512 | |||||||||
| 3,000 | Granite Master Issuer plc (United Kingdom), Series 2006-2, Class A4, FRN, 5.40%, 12/20/54 (m) | 2,964 | |||||||||
| Greenpoint Mortgage Funding Trust, | |||||||||||
| 1,054 | Series 2005-AR4, Class 4A1A, FRN, 5.82%, 10/25/45 (m) | 1,034 | |||||||||
| 12,572 | Series 2006-OH1, Class A1, FRN, 5.69%, 01/25/37 (m) | 12,461 | |||||||||
| Harborview Mortgage Loan Trust, | |||||||||||
| 4,039 | Series 2005-3, Class 2A1A, FRN, 5.78%, 06/19/35 (m) | 3,958 | |||||||||
| 1,031 | Series 2005-8, Class 1A2A, FRN, 5.87%, 09/19/35 (m) | 1,013 | |||||||||
| 5,427 | Series 2005-13, Class 2A11, FRN, 5.82%, 02/19/36 (m) | 5,376 | |||||||||
| 2,416 | Series 2006-8, Class 2A1A, FRN, 5.70%, 08/21/36 (m) | 2,356 | |||||||||
| 11,247 | Series 2006-14, Class 2A1A, FRN, 5.69%, 03/19/38 (m) | 10,966 | |||||||||
| Indymac Index Mortgage Loan Trust, | |||||||||||
| 1,413 | Series 2004-AR7, Class A1, FRN, 5.95%, 09/25/34 (m) | 1,405 | |||||||||
| 774 | Series 2005-AR14, Class 2A1A, FRN, 5.81%, 08/25/35 (m) | 760 | |||||||||
| 10,003 | Series 2006-AR2, Class 1A1A, FRN, 5.73%, 04/25/46 (m) | 9,707 | |||||||||
| 24,550 | Series 2006-AR2, Class 4A1, VAR, 5.96%, 09/25/36 (m) | 24,553 | |||||||||
| 10,500 | K2 Corp. Commercial Mortgage Trust, 5.61%, 02/15/10 (i) | 9,712 | |||||||||
| Lehman Mortgage Trust, | |||||||||||
| 3,574 | Series 2005-3, Class 2A3, 5.50%, 01/25/36 (m) | 3,558 | |||||||||
| 14,000 | Series 2007-8, Class 2A1, 6.50%, 09/25/37 (m) | 13,961 | |||||||||
| 1,041 | Medallion Trust (Australia), Series 2004-1G, Class A1, FRN, 5.64%, 05/25/35 (m) | 1,031 | |||||||||
| 13,075 | Permanent Master Issuer plc (United Kingdom), Series 2006-1, Class 2A, FRN, 5.40%, 10/17/15 (m) | 13,022 | |||||||||
| RESI Finance LP (Cayman Islands), | |||||||||||
| 6,387 | Series 2003-C, Class B3, FRN, 6.75%, 09/10/35 (e) (m) | 6,463 | |||||||||
| 1,223 | Series 2003-C, Class B4, FRN, 6.95%, 09/10/35 (e) (m) | 1,260 | |||||||||
| 1,358 | Series 2003-D, Class B3, FRN, 6.65%, 12/10/35 (e) (m) | 1,362 | |||||||||
| 1,965 | Series 2003-D, Class B4, FRN, 6.85%, 12/10/35 (e) (m) | 1,970 | |||||||||
| 2,318 | Series 2005-A, Class B3, FRN, 5.93%, 03/10/37 (e) (m) | 2,248 | |||||||||
| 776 | Series 2005-A, Class B4, FRN, 6.03%, 03/10/37 (e) (m) | 753 | |||||||||
| Residential Accredit Loans, Inc., | |||||||||||
| 901 | Series 2005-QO4, Class 2AI, FRN, 5.79%, 12/25/45 (m) | 881 | |||||||||
| 7,082 | Series 2006-QS11, Class 1A1, 6.50%, 08/25/36 (m) | 7,104 | |||||||||
| 42,000 | Residential Funding Mortgage Securities I, Series 2007-S8, Class 1A1, 6.00%, 09/25/37 (m) | 41,226 | |||||||||
| 234 | SACO I, Inc., Series 1997-2, Class 1A5, 7.00%, 08/25/36 (e) (i) | 236 | |||||||||
| Structured Asset Mortgage Investments, Inc., | |||||||||||
| 1,177 | Series 2005-AR2, Class 2A1, FRN, 5.74%, 05/25/45 (m) | 1,149 | |||||||||
| 7,800 | Series 2006-AR1, Class 3A1, FRN, 5.74%, 02/25/36 (m) | 7,630 | |||||||||
| 1,569 | Washington Mutual Alternative Mortgage Pass-Through Certificates, Series 2006-AR6, Class 1A, FRN, 5.70%, 07/25/46 (m) | 1,544 | |||||||||
| Washington Mutual, Inc., | |||||||||||
| 838 | Series 2005-AR2, Class 2A21, FRN, 5.84%, 01/25/45 (m) | 822 | |||||||||
AS OF AUGUST 31, 2007 (Unaudited) (continued)
| PRINCIPAL AMOUNT($) | | SECURITY DESCRIPTION | | VALUE($) | |||||||
|---|---|---|---|---|---|---|---|---|---|---|---|
Long-Term Investments — Continued | |||||||||||
Non-Agency CMO — Continued | |||||||||||
| 1,217 | Series 2005-AR9, Class A1A, FRN, 5.83%, 07/25/45 (m) | 1,202 | |||||||||
| 1,285 | Series 2005-AR15, Class A1A1, FRN, 5.77%, 11/25/45 (m) | 1,250 | |||||||||
| 768 | Series 2005-AR17, Class A1A1, FRN, 5.78%, 12/25/45 (m) | 749 | |||||||||
| 6,308 | Series 2007-HY4, Class 5A1, VAR, 5.70%, 11/25/36 (m) | 6,227 | |||||||||
| Wells Fargo Mortgage Backed Securities Trust, | |||||||||||
| 1,934 | Series 2003-2, Class A6, 5.25%, 03/25/18 (m) | 1,917 | |||||||||
| 19,550 | Series 2003-M, Class A1, FRN, 4.71%, 12/25/33 (m) | 18,786 | |||||||||
| 3,287 | Series 2006-AR3, Class A1, FRN, 5.70%, 03/25/36 (m) | 3,273 | |||||||||
| 35,814 | Series 2007-10, Class 1A1, 6.00%, 07/25/37 (m) | 35,009 | |||||||||
| 31,760 | Series 2007-11, Class A96, 6.00%, 08/25/37 (m) | 31,293 | |||||||||
| 35,000 | Series 2007-AR4, Class A1, VAR, 6.03%, 08/25/37 (m) | 34,904 | |||||||||
| 494,905 | |||||||||||
| Total Collateralized Mortgage Obligations (Cost $658,013) | 661,505 | ||||||||||
Commercial Mortgage-Backed Securities — 7.2% | |||||||||||
| Bear Stearns Commercial Mortgage Securities, | |||||||||||
| 4,655 | Series 2005-PWR9, Class A4A, 4.87%, 09/11/42 (m) | 4,450 | |||||||||
| 4,155 | Series 2005-T18, Class A4, VAR, 4.93%, 02/13/42 (m) | 3,995 | |||||||||
| 2,515 | Series 2005-T20, Class A4A, VAR, 5.30%, 10/12/42 (m) | 2,459 | |||||||||
| 5,000 | Series 2006-PW12, Class A4, VAR, 5.90%, 09/11/38 (m) | 5,045 | |||||||||
| 5,790 | Citigroup Commercial Mortgage Trust, Series 2006-C4, Class A3, VAR, 5.91%, 03/15/49 (m) | 5,844 | |||||||||
| 10,000 | Commercial Mortgage Pass Through Certificates, Series 2006-C7, Class A4, VAR, 5.96%, 06/10/46 (m) | 10,127 | |||||||||
| Credit Suisse Mortgage Capital Certificates, | |||||||||||
| 8,610 | Series 2006-C3, Class A3, VAR, 6.02%, 06/15/38 (m) | 8,747 | |||||||||
| 13,500 | Series 2007-C1, Class A3, 5.38%, 02/15/40 (m) | 13,163 | |||||||||
| 17,235 | Series 2007-C4, Class A3, VAR, 1.00%, 09/15/39 | 17,333 | |||||||||
| Greenwich Capital Commercial Funding Corp., | |||||||||||
| 5,405 | Series 2005-GG3, Class A4, VAR, 4.80%, 08/10/42 (m) | 5,162 | |||||||||
| 5,405 | Series 2005-GG3, Class AJ, VAR, 4.86%, 08/10/42 (m) | 5,030 | |||||||||
| LB-UBS Commercial Mortgage Trust, | |||||||||||
| 1,200 | Series 2003-C1, Class A2, 3.32%, 03/15/27 (m) | 1,185 | |||||||||
| 2,170 | Series 2006-C1, Class A4, 5.16%, 02/15/31 (m) | 2,103 | |||||||||
| 4,060 | Series 2006-C4, Class A4, VAR, 6.08%, 06/15/38 (m) | 4,144 | |||||||||
| 20,000 | Series 2007-C1, Class A4, 5.42%, 02/15/40 (m) | 19,573 | |||||||||
| 6,106 | Lehman Brothers Floating Rate Commercial Mortgage Trust, Series 2006-LLFA, Class A2, FRN, 5.73%, 09/15/21 (e) (m) | 6,100 | |||||||||
| 7,610 | Merrill Lynch Mortgage Trust, Series 2006-C1, Class A4, VAR, 5.84%, 05/12/39 (m) | 7,658 | |||||||||
| Morgan Stanley Capital I, | |||||||||||
| 10,585 | Series 2006-IQ12, Class A4, 5.33%, 12/15/43 (m) | 10,318 | |||||||||
| 21,741 | Series 2007-IQ13, Class A4, 5.36%, 03/15/44 (m) | 21,156 | |||||||||
| 1,755 | Morgan Stanley Dean Witter Capital I, Series 2003-HQ2, Class A2, 4.92%, 03/12/35 (m) | 1,705 | |||||||||
| Wachovia Bank Commercial Mortgage Trust, | |||||||||||
| 370 | Series 2005-C17, Class A4, VAR, 5.08%, 03/15/42 (m) | 358 | |||||||||
| 5,605 | Series 2006-C26, Class A3, VAR, 6.01%, 06/15/45 (m) | 5,733 | |||||||||
| 7,000 | Series 2007-C30, Class A5, 5.34%, 12/15/43 (m) | 6,798 | |||||||||
| Total Commercial Mortgage-Backed Securities (Cost $169,915) | 168,186 | ||||||||||
Corporate Bonds — 41.8% | |||||||||||
Aerospace & Defense — 0.2% | |||||||||||
| L-3 Communications Corp., | |||||||||||
| 1,145 | 5.88%, 01/15/15 (m) | 1,085 | |||||||||
| 500 | Series B, 6.38%, 10/15/15 (m) | 484 | |||||||||
| 3,500 | United Technologies Corp., FRN,5.43%, 06/01/09 (m) | 3,497 | |||||||||
| 5,066 | |||||||||||
Auto Components — 0.1% | |||||||||||
| 13 | Goodyear Tire & Rubber Co. (The), 9.00%, 07/01/15 (m) | 13 | |||||||||
| TRW Automotive, Inc., | |||||||||||
| 800 | 7.00%, 03/15/14 (e) (m) | 744 | |||||||||
| 825 | 7.25%, 03/15/17 (e) (m) | 751 | |||||||||
| 1,508 | |||||||||||
Automobiles — 0.7% | |||||||||||
| DaimlerChrysler N.A. Holding Corp., | |||||||||||
| 3,425 | FRN, 5.79%, 03/13/09 (m) | 3,415 | |||||||||
| PRINCIPAL AMOUNT($) | | SECURITY DESCRIPTION | | VALUE($) | |||||||
|---|---|---|---|---|---|---|---|---|---|---|---|
Long-Term Investments — Continued | |||||||||||
Automobiles — Continued | |||||||||||
| 10,280 | 5.88%, 03/15/11 (m) | 10,377 | |||||||||
| 2,000 | FRN, 5.89%, 10/31/08 (m) | 2,000 | |||||||||
| 15,792 | |||||||||||
Beverages — 0.0% (g) | |||||||||||
| 985 | Constellation Brands, Inc., 7.25%, 09/01/16 (m) | 956 | |||||||||
Building Products — 0.1% | |||||||||||
| 3,100 | Owens Corning, Inc., 7.00%, 12/01/36 (m) | 3,021 | |||||||||
Capital Markets — 6.1% | |||||||||||
| 1,320 | Arch Western Finance LLC, 6.75%, 07/01/13 (m) | 1,249 | |||||||||
| Bear Stearns Cos., Inc. (The), | |||||||||||
| 5,000 | FRN, 5.59%, 08/21/09 (m) | 4,889 | |||||||||
| 18,625 | FRN, 5.63%, 05/18/10 (m) | 17,929 | |||||||||
| Credit Suisse, Nassau Branch (linked to Republic of Turkey Government Bond, 14.00%, 01/19/11) (Turkey), | |||||||||||
| TRY 4,715 | 14.00%, 01/19/11 | 3,385 | |||||||||
| 2,395 | 14.00%, 01/19/11 | 1,719 | |||||||||
| Credit Suisse USA, Inc., | |||||||||||
| $ 1,845 | 5.50%, 08/16/11 (m) | 1,858 | |||||||||
| 2,000 | FRN, 5.44%, 06/05/09 (m) | 1,996 | |||||||||
| 3,000 | FRN, 5.49%, 12/09/08 (m) | 3,003 | |||||||||
| Goldman Sachs Group, Inc. (The), | |||||||||||
| 4,120 | 5.63%, 01/15/17 (m) | 3,938 | |||||||||
| 5,340 | 5.95%, 01/15/27 (m) | 4,963 | |||||||||
| 6,525 | FRN, 5.45%, 06/23/09 (m) | 6,468 | |||||||||
| 6,375 | Lehman Brothers Holdings Capital Trust V, 5.86% to 05/31/12; thereafter variable, 12/31/49 (m) | 5,855 | |||||||||
| Lehman Brothers Holdings, Inc., | |||||||||||
| 4,665 | 5.25%, 02/06/12 (m) | 4,526 | |||||||||
| 3,835 | 5.75%, 01/03/17 (m) | 3,579 | |||||||||
| BRL 11,490 | 10.00%, 01/03/12 (linked to Brazilian Real Notes, 10.00%, 01/03/12) (Brazil) | 5,581 | |||||||||
| $ 7,000 | FRN, 5.60%, 08/21/09 (m) | 6,810 | |||||||||
| 12,000 | FRN, 5.65%, 05/25/10 (m) | 11,511 | |||||||||
| 3,100 | Links Finance LLC, FRN, 5.61%, 09/15/08 (e) (i) | 3,102 | |||||||||
| Merrill Lynch & Co., Inc., | |||||||||||
| 3,015 | 6.05%, 08/15/12 (m) | 3,067 | |||||||||
| 2,730 | 6.11%, 01/29/37 (m) | 2,532 | |||||||||
| 4,885 | 6.22%, 09/15/26 (m) | 4,690 | |||||||||
| 10,000 | FRN, 5.46%, 03/23/10 (m) | 9,905 | |||||||||
| 7,250 | FRN, 5.56%, 11/01/11 (m) | 7,104 | |||||||||
| 1,900 | FRN, 5.61%, 02/06/09 (m) | 1,900 | |||||||||
| Morgan Stanley, | |||||||||||
| 5,850 | 5.45%, 01/09/17 (m) | 5,605 | |||||||||
| 1,800 | 5.63%, 01/09/12 (m) | 1,802 | |||||||||
| 7,000 | FRN, 5.46%, 05/07/10 (m) | 6,895 | |||||||||
| 7,000 | FRN, 5.47%, 02/09/09 (m) | 6,951 | |||||||||
| 142,812 | |||||||||||
Chemicals — 0.2% | |||||||||||
| 12 | Equistar Chemicals LP/Equistar Funding Corp., 10.13%, 09/01/08 (m) | 12 | |||||||||
| 1,025 | Huntsman LLC, 11.50%, 07/15/12 (m) | 1,115 | |||||||||
| 1,000 | Ineos Group Holdings plc (United Kingdom), 8.50%, 02/15/16 (e) (m) | 920 | |||||||||
| Nalco Co., | |||||||||||
| 835 | 7.75%, 11/15/11 (m) | 850 | |||||||||
| 1,000 | 8.88%, 11/15/13 | 1,022 | |||||||||
| 1,100 | Terra Capital, Inc., 7.00%, 02/01/17 (m) | 1,056 | |||||||||
| 4,975 | |||||||||||
Commercial Banks — 6.3% | |||||||||||
| 7,000 | Banco Sabadell S.A. (Spain), FRN, 5.46%, 04/23/10 (e) (m) | 6,913 | |||||||||
| Barclays Bank plc (United Kingdom), | |||||||||||
| 4,035 | 5.93% to 12/15/16; thereafter variable, 12/31/49 (e) (m) | 3,823 | |||||||||
| 3,300 | 6.28% to 12/15/34; thereafter variable, 12/31/49 (m) | 2,903 | |||||||||
| 6,130 | Zero Coupon, 04/07/10 (e) (i) | 6,107 | �� | ||||||||
| 620 | BB&T Capital Trust I, 5.85%, 08/18/35 (m) | 563 | |||||||||
| 4,300 | BNP Paribas (France), 7.20% to 06/25/37; thereafter variable, 12/31/49 (e) (m) | 4,251 | |||||||||
| 6,195 | Commonwealth Bank of Australia (Australia), 6.02% to 03/15/16; thereafter variable, 03/29/49 (e) (m) | 5,968 | |||||||||
| 6,505 | Credit Agricole S.A. (France), 6.64% to 05/31/17; thereafter variable, 05/29/49 (e) (m) | 6,204 | |||||||||
| 4,770 | DBS Capital Funding Corp. (Cayman Islands), 7.66% to 03/15/11; thereafter variable, 03/31/49 (e) (m) | 5,142 | |||||||||
| Glitnir Banki HF (Iceland), | |||||||||||
| 1,500 | FRN, 5.52%, 10/15/08 (e) (m) | 1,499 | |||||||||
| 2,650 | FRN, 5.62%, 04/20/10 (e) (m) | 2,646 | |||||||||
| 6,675 | FRN, 5.80%, 01/21/11 (e) (m) | 6,710 | |||||||||
| HBOS plc (United Kingdom), | |||||||||||
| 5,000 | 5.92% to 10/01/15; thereafter variable, 09/29/49 (e) (m) | 4,545 | |||||||||
| 2,015 | 6.66% to 05/21/37; thereafter variable, 05/29/49 (e) (m) | 1,773 | |||||||||
AS OF AUGUST 31, 2007 (Unaudited) (continued)
| PRINCIPAL AMOUNT($) | | SECURITY DESCRIPTION | | VALUE($) | |||||||
|---|---|---|---|---|---|---|---|---|---|---|---|
Long-Term Investments — Continued | |||||||||||
Commercial Banks — Continued | |||||||||||
| 7,855 | HBOS Treasury Services plc (United Kingdom), 5.25%, 02/21/17 (e) (m) | 7,920 | |||||||||
| 2,675 | ICICI Bank Ltd. (India), FRN, 5.90%, 01/12/10 (e) (m) | 2,641 | |||||||||
| 1,720 | Industrial Bank of Korea (South Korea), VAR, 4.00%, 05/19/14 (e) (m) | 1,689 | |||||||||
| 7,500 | Korea Development Bank (South Korea), FRN, 5.50%, 04/03/10 (m) | 7,503 | |||||||||
| 4,250 | Landsbanki Islands HF (Iceland), 6.10%, 08/25/11 (e) (m) | 4,381 | |||||||||
| 5,195 | Regions Financing Trust II, VAR, 6.63%, 05/15/47 (m) | 4,786 | |||||||||
| 7,700 | Shinsei Finance II (Cayman Islands), 7.16% to 07/25/16; thereafter variable, 07/29/49 (e) (m) | 7,074 | |||||||||
| 5,140 | Societe Generale (France), 5.92% to 04/05/17; thereafter variable, 04/29/49 (e) (m) | 4,915 | |||||||||
| 2,200 | Standard Chartered plc (United Kingdom), 6.41% to 01/30/17; thereafter variable, 12/21/49 (e) (m) | 2,034 | |||||||||
| 3,705 | SunTrust Preferred Capital I, 5.85% to 12/15/11; thereafter variable, 12/31/49 (m) | 3,609 | |||||||||
| 4,500 | VTB 24 Capital plc (Ireland), FRN, 6.18%, 12/07/09 | 4,443 | |||||||||
| VTB Capital S.A. for Vneshtorgbank (Luxembourg), | |||||||||||
| 8,525 | FRN, 5.96%, 08/01/08 (e) (m) | 8,453 | |||||||||
| 5,175 | FRN, 6.11%, 09/21/07 | 5,175 | |||||||||
| 8,280 | FRN, 6.11%, 09/21/07 (e) (m) | 8,292 | |||||||||
| 7,600 | Wachovia Capital Trust III, 5.80% to 03/15/11; thereafter variable, 03/15/42 (m) | 7,581 | |||||||||
| 2,070 | Wells Fargo Bank N.A., 6.45%, 02/01/11 (m) | 2,146 | |||||||||
| Woori Bank (South Korea), | |||||||||||
| 2,335 | VAR, 5.75%, 03/13/14 (e) (m) | 2,344 | |||||||||
| 4,615 | VAR, 6.21%, 05/02/37 (e) (m) | 4,343 | |||||||||
| 148,376 | |||||||||||
Commercial Services & Supplies — 0.1% | |||||||||||
| 725 | ACCO Brands Corp., 7.63%, 08/15/15 (m) | 678 | |||||||||
| 1,065 | Allied Waste North America, Inc., 7.25%, 03/15/15 (m) | 1,065 | |||||||||
| 415 | Corrections Corp. of America, 6.25%, 03/15/13 (m) | 402 | |||||||||
| 830 | Quebecor World Capital Corp. (Canada), 8.75%, 03/15/16 (e) (m) | 747 | |||||||||
| 2,892 | |||||||||||
Communications Equipment — 0.2% | |||||||||||
| Cisco Systems, Inc., | |||||||||||
| 4,000 | FRN, 5.58%, 02/20/09 (m) | 4,007 | |||||||||
Consumer Finance — 1.5% | |||||||||||
| 4,722 | American General Finance Corp., 4.50%, 11/15/07 (m) | 4,709 | |||||||||
| 3,810 | Capital One Capital III, 7.69%, 08/15/36 (m) | 3,528 | |||||||||
| 8,575 | Discover Financial Services, FRN, 5.89%, 06/11/10 (e) (m) | 8,578 | |||||||||
| Ford Motor Credit Co. LLC, | |||||||||||
| 2,600 | 7.80%, 06/01/12 (m) | 2,395 | |||||||||
| 195 | FRN, 6.93%, 01/15/10 (m) | 183 | |||||||||
| 2,250 | General Electric Capital Corp., FRN, 5.39%, 10/26/09 (m) | 2,246 | |||||||||
| 1,290 | GMAC LLC, 6.88%, 08/28/12 (m) | 1,140 | |||||||||
| 2,000 | HSBC Finance Corp., FRN, 5.49%, 09/15/08 (m) | 2,003 | |||||||||
| 3,500 | International Lease Finance Corp., FRN, 5.72%, 05/24/10 (m) | 3,488 | |||||||||
| SLM Corp., | |||||||||||
| 1,655 | 3.63%, 03/17/08 (m) | 1,630 | |||||||||
| 4,500 | FRN, 5.50%, 07/27/09 (m) | 4,318 | |||||||||
| 34,218 | |||||||||||
Containers & Packaging — 0.0% (g) | |||||||||||
| 615 | Owens-Brockway Glass Container, Inc., 8.25%, 05/15/13 (m) | 630 | |||||||||
Diversified Consumer Services — 0.0% (g) | |||||||||||
| 750 | Service Corp. International, 7.38%, 10/01/14 (m) | 754 | |||||||||
Diversified Financial Services — 7.6% | |||||||||||
| 15,000 | ABX Financing Co. (Cayman Islands), 5.75%, 10/15/16 (e) (m) | 14,978 | |||||||||
| Caterpillar Financial Services Corp., | |||||||||||
| 2,250 | FRN, 5.55%, 08/11/09 (m) | 2,251 | |||||||||
| 4,250 | FRN, 5.57%, 05/18/09 (m) | 4,255 | |||||||||
| CIT Group, Inc., | |||||||||||
| 4,000 | FRN, 5.47%, 06/08/09 (m) | 3,760 | |||||||||
| 3,500 | FRN, 5.64%, 08/17/09 (m) | 3,320 | |||||||||
| 3,100 | CIT Group Holdings, Inc., FRN, 5.51%, 01/30/09 (m) | 2,954 | |||||||||
| Citigroup Funding, Inc., | |||||||||||
| 5,250 | VAR, 1.00%, 03/12/12 (e) (i) | 5,508 | |||||||||
| 5,155 | Zero Coupon, 09/24/07 | 5,183 | |||||||||
| 4,870 | Citigroup, Inc., 6.00%, 08/15/17 (m) | 4,929 | |||||||||
| 5,000 | Glen Meadow Pass-Through Trust, VAR, 6.51%, 02/12/67 (e) (m) | 4,737 | |||||||||
| 8,035 | Goldman Sachs Capital II, 5.79% to 06/01/12; thereafter variable, 12/29/49 (m) | 7,373 | |||||||||
| PRINCIPAL AMOUNT($) | | SECURITY DESCRIPTION | | VALUE($) | |||||||
|---|---|---|---|---|---|---|---|---|---|---|---|
Long-Term Investments — Continued | |||||||||||
Diversified Financial Services — Continued | |||||||||||
| 2,305 | IIRSA Norte Finance Ltd. (Peru), 8.75%, 05/30/24 | 2,691 | |||||||||
| K2 Corp., | |||||||||||
| 17,500 | VAR, 0.00%, 02/15/10 (m) | 16,187 | |||||||||
| 9,000 | VAR, 5.36%, 02/15/09 (i) | 8,325 | |||||||||
| Kaupthing Bank (Iceland), | |||||||||||
| 17,400 | 5.75%, 10/04/11 (e) (m) | 17,531 | |||||||||
| 9,600 | FRN, 6.06%, 01/15/10 (e) (m) | 9,695 | |||||||||
| 3,816 | Mizuho Capital Investment 1 Ltd. (Cayman Islands), 6.69% to 06/30/16; thereafter variable, 03/29/49 (e) (m) | 3,679 | |||||||||
| 1,815 | Mizuho JGB Investment LLC, 9.87% to 06/30/08; thereafter variable, 12/29/49 (e) (m) | 1,882 | |||||||||
| 7,073 | Mizuho Preferred Capital Co. LLC, 8.79% to 06/30/08; thereafter variable, 12/29/49 (e) (m) | 7,274 | |||||||||
| 3,275 | MUFG Capital Finance 1 Ltd. (Cayman Islands), 6.35% to 07/25/16; thereafter variable, 07/29/49 (m) | 3,126 | |||||||||
| 6,425 | Pemex Finance Ltd. (Cayman Islands), 7.16%, 10/15/09 | 6,586 | |||||||||
| Preferred Term Securities XXV Ltd. (Cayman Islands), | |||||||||||
| 2,450 | FRN, 5.71%, 06/22/37 (e) (m) | 2,425 | |||||||||
| 2,450 | FRN, 5.86%, 06/22/37 (e) (m) | 2,444 | |||||||||
| 7,650 | QBE Capital Funding II LP (Jersey Island), 6.80% to 06/01/17; thereafter variable, 06/29/49 (e) (m) | 7,236 | |||||||||
| 5,720 | SMFG Preferred Capital USD 1 Ltd. (Cayman Islands), 6.08% to 01/25/17; thereafter variable, 01/29/49 (e) (m) | 5,335 | |||||||||
| 1,250 | TIAA Global Markets, Inc., FRN, 5.46%, 01/12/11 (e) (m) | 1,251 | |||||||||
| 3,240 | TRAINS HY1-2006, 7.55%, 05/01/16 (e) (m) | 3,128 | |||||||||
| 1,045 | Visant Corp., 7.63%, 10/01/12 (m) | 1,048 | |||||||||
| 15,000 | Xstrata Finance Dubai Ltd. (United Arab Emirates), FRN, 5.85%, 11/13/09 (e) (m) | 14,907 | |||||||||
| 2,000 | ZFS Finance USA Trust I, VAR, 6.50%, 05/09/37 (e) (m) | 1,871 | |||||||||
| 3,020 | ZFS Finance USA Trust II, VAR, 6.45%, 12/15/65 (e) (m) | 2,838 | |||||||||
| 178,707 | |||||||||||
Diversified Telecommunication Services — 1.8% | |||||||||||
| 5,750 | AT&T, Inc., FRN, 5.65%, 05/15/08 (m) | 5,747 | |||||||||
| 4,700 | BellSouth Corp., FRN, 5.66%, 08/15/08 (m) | 4,693 | |||||||||
| 1,220 | Consolidated Communications Holdings, Inc., 9.75%, 04/01/12 (m) | 1,220 | |||||||||
| 1,000 | Insight Midwest LP/Insight Capital, Inc., 9.75%, 10/01/09 (m) | 1,000 | |||||||||
| 187 | Qwest Communications International, Inc., FRN, 9.06%, 02/15/09 (m) | 188 | |||||||||
| 340 | Qwest Corp., 8.88%, 03/15/12 (m) | 368 | |||||||||
| 5,395 | Sprint Capital Corp., 6.13%, 11/15/08 (m) | 5,422 | |||||||||
| Telefonica Emisiones SAU (Spain), | |||||||||||
| 9,610 | 5.86%, 02/04/13 (m) | 9,652 | |||||||||
| 10,000 | FRN, 5.66%, 06/19/09 (m) | 9,972 | |||||||||
| Verizon Communications, Inc., | |||||||||||
| 1,915 | 4.90%, 09/15/15 (m) | 1,817 | |||||||||
| 990 | 5.85%, 09/15/35 (m) | 926 | |||||||||
| 1,370 | 6.25%, 04/01/37 (m) | 1,348 | |||||||||
| 42,353 | |||||||||||
Electric Utilities — 0.4% | |||||||||||
| Appalachian Power Co., | |||||||||||
| 925 | 5.80%, 10/01/35 (m) | 843 | |||||||||
| 1,445 | 6.38%, 04/01/36 (m) | 1,424 | |||||||||
| 6,000 | TXU Electric Delivery Co., FRN, 5.74%, 09/16/08 (e) (m) | 5,928 | |||||||||
| 8,195 | |||||||||||
Electronic Equipment & Instruments — 0.0% (g) | |||||||||||
| 835 | NXP BV/NXP Funding LLC (Netherlands), 9.50%, 10/15/15 (m) | 722 | |||||||||
Food & Staples Retailing — 0.9% | |||||||||||
| 8,000 | CVS/Caremark Corp., FRN, 5.66%, 06/01/10 (m) | 7,966 | |||||||||
| 3,104 | CVS Lease Pass-Through, 6.04%, 12/10/28 (e) (m) | 3,027 | |||||||||
| Wal-Mart Stores, Inc., | |||||||||||
| 2,785 | 5.25%, 09/01/35 (m) | 2,432 | |||||||||
| 4,960 | 5.38%, 04/05/17 (m) | 4,881 | |||||||||
| 1,500 | 6.50%, 08/15/37 (m) | 1,538 | |||||||||
| 19,844 | |||||||||||
Food Products — 0.7% | |||||||||||
| 7,205 | General Mills, Inc., 5.65%, 09/10/12 (m) | 7,254 | |||||||||
| 10,000 | Tate & Lyle International Finance plc (United Kingdom), 5.00%, 11/15/14 (e) (m) | 9,398 | |||||||||
| 16,652 | |||||||||||
Gas Utilities — 0.1% | |||||||||||
| 3,520 | Nakilat, Inc. (Qatar), 6.07%, 12/31/33 (e) (m) | 3,404 | |||||||||
Health Care Equipment & Supplies — 0.0% (g) | |||||||||||
| 615 | Fresenius Medical Care Capital Trust II, 7.88%, 02/01/08 (m) | 617 | |||||||||
Health Care Providers & Services — 0.5% | |||||||||||
| 1,100 | Community Health Systems, Inc., 8.88%, 07/15/15 (e) (m) | 1,099 | |||||||||
AS OF AUGUST 31, 2007 (Unaudited) (continued)
| PRINCIPAL AMOUNT($) | | SECURITY DESCRIPTION | | VALUE($) | |||||||
|---|---|---|---|---|---|---|---|---|---|---|---|
Long-Term Investments — Continued | |||||||||||
Health Care Providers & Services — Continued | |||||||||||
| HCA, Inc., | |||||||||||
| 470 | 9.25%, 11/15/16 (e) (m) | 483 | |||||||||
| 2,500 | 9.63%, 11/15/16 (e) (m) | 2,584 | |||||||||
| 7,250 | UnitedHealth Group, Inc., FRN, 5.54%, 06/21/10 (e) (m) | 7,251 | |||||||||
| 11,417 | |||||||||||
Hotels, Restaurants & Leisure — 0.1% | |||||||||||
| MGM Mirage, Inc., | |||||||||||
| 1,190 | 5.88%, 02/27/14 (m) | 1,092 | |||||||||
| 830 | 6.75%, 04/01/13 (m) | 805 | |||||||||
| 1,897 | |||||||||||
Household Durables — 0.2% | |||||||||||
| Beazer Homes USA, Inc., | |||||||||||
| 1,025 | 6.50%, 11/15/13 (m) | 784 | |||||||||
| 200 | 6.88%, 07/15/15 (m) | 153 | |||||||||
| 580 | Jarden Corp., 7.50%, 05/01/17 (m) | 542 | |||||||||
| 645 | K. Hovnanian Enterprises, Inc., 8.63%, 01/15/17 (m) | 510 | |||||||||
| 1,055 | Sealy Mattress Co., 8.25%, 06/15/14 (m) | 1,031 | |||||||||
| 1,620 | Simmons Co., SUB, 10.00%, 12/15/14 (m) | 1,260 | |||||||||
| 4,280 | |||||||||||
Household Products — 0.0% (g) | |||||||||||
| 585 | Spectrum Brands, Inc., 7.38%, 02/01/15 (m) | 430 | |||||||||
Independent Power Producers & Energy Traders — 0.1% | |||||||||||
| 1,225 | NRG Energy, Inc., 7.38%, 02/01/16 (m) | 1,210 | |||||||||
Insurance — 3.1% | |||||||||||
| 1,765 | American International Group, Inc., 6.25%, 05/01/36 (m) | 1,786 | |||||||||
| 1,190 | AXA S.A. (France), 6.38% to 12/14/36; thereafter variable, 12/31/49 (e) (m) | 1,073 | |||||||||
| 3,260 | Chubb Corp., VAR, 6.38%, 03/29/37 (m) | 3,198 | |||||||||
| 1,900 | Hartford Financial Services Group, Inc., 5.25%, 10/15/11 (m) | 1,914 | |||||||||
| 3,750 | Liberty Mutual Group, Inc., 7.50%, 08/15/36 (e) (m) | 3,629 | |||||||||
| 4,195 | Lincoln National Corp., VAR, 7.00%, 05/17/66 (m) | 4,251 | |||||||||
| 4,275 | MetLife, Inc., 6.40%, 12/15/36 (m) | 3,889 | |||||||||
| 6,500 | Metropolitan Life Global Funding I, FRN, 5.56%, 05/17/10 (e) (m) | 6,441 | |||||||||
| 1,855 | Nationwide Financial Services, 6.75%, 05/15/37 (m) | 1,642 | |||||||||
| 7,500 | Nationwide Life Global Funding I, FRN, 5.41%, 10/09/09 (e) (m) | 7,501 | |||||||||
| Protective Life Secured Trust, | |||||||||||
| 4,505 | 3.70%, 11/24/08 (m) | 4,402 | |||||||||
| 3,390 | 4.00%, 10/07/09 (m) | 3,333 | |||||||||
| 6,000 | Stancorp Financial Group, Inc., VAR, 6.90%, 05/29/67 (m) | 5,857 | |||||||||
| 7,630 | Stingray Pass-Through Trust (Cayman Islands), 5.90%, 01/12/15 (e) (m) | 5,532 | |||||||||
| 8,745 | Swiss RE Capital I LP, 6.85% to 05/25/16; thereafter variable, 05/29/49 (e) (m) | 8,666 | |||||||||
| 3,160 | Travelers Cos, Inc. (The), VAR, 6.25%, 03/15/37 (m) | 2,978 | |||||||||
| 6,645 | XL Capital Ltd. (Cayman Islands), 6.50% to 04/15/17; thereafter variable, 12/31/49 (m) | 5,866 | |||||||||
| 71,958 | |||||||||||
IT Services — 0.2% | |||||||||||
| Iron Mountain, Inc., | |||||||||||
| 1,795 | 6.63%, 01/01/16 (m) | 1,615 | |||||||||
| 480 | 7.75%, 01/15/15 (m) | 467 | |||||||||
| SunGard Data Systems, Inc., | |||||||||||
| 830 | 9.13%, 08/15/13 (m) | 857 | |||||||||
| 900 | 10.25%, 08/15/15 (m) | 927 | |||||||||
| 3,866 | |||||||||||
Leisure Equipment & Products — 0.0% (g) | |||||||||||
| 1,000 | Steinway Musical Instruments, Inc., 7.00%, 03/01/14 (e) (m) | 950 | |||||||||
Media — 2.6% | |||||||||||
| 1,285 | CCO Holdings LLC/CCO Holdings Capital Corp., 8.75%, 11/15/13 (m) | 1,259 | |||||||||
| 455 | Charter Communications Operating LLC/Charter Communications Operating Capital, 8.00%, 04/30/12 (e) (m) | 446 | |||||||||
| Comcast Corp., | |||||||||||
| 3,380 | 6.95%, 08/15/37 (m) | 3,462 | |||||||||
| 7,775 | FRN, 5.66%, 07/14/09 (m) | 7,761 | |||||||||
| 1,900 | Dex Media, Inc., SUB, 0.00%, 11/15/13 (m) | 1,753 | |||||||||
| 750 | Dex Media East LLC/Dex Media East Finance Co., 12.13%, 11/15/12 (m) | 801 | |||||||||
| 3,000 | Dex Media West LLC/Dex Media Finance Co., 9.88%, 08/15/13 (m) | 3,165 | |||||||||
| 1,500 | DIRECTV Holdings LLC, 6.38%, 06/15/15 (m) | 1,402 | |||||||||
| 1,815 | Echostar DBS Corp., 7.13%, 02/01/16 (m) | 1,774 | |||||||||
| 8 | Sinclair Broadcast Group, Inc., 8.00%, 03/15/12 (m) | 8 | |||||||||
| 2,870 | Time Warner Cable, Inc., 6.55%, 05/01/37 (e) (m) | 2,790 | |||||||||
| Time Warner, Inc., | |||||||||||
| 13,365 | 5.50%, 11/15/11 (m) | 13,335 | |||||||||
| 1,430 | 6.50%, 11/15/36 (m) | 1,372 | |||||||||
| 7,550 | FRN, 5.73%, 11/13/09 (m) | 7,486 | |||||||||
| PRINCIPAL AMOUNT($) | | SECURITY DESCRIPTION | | VALUE($) | |||||||
|---|---|---|---|---|---|---|---|---|---|---|---|
Long-Term Investments — Continued | |||||||||||
Media — Continued | |||||||||||
| Viacom, Inc., | |||||||||||
| 2,625 | 5.75%, 04/30/11 (m) | 2,643 | |||||||||
| 4,900 | FRN, 5.71%, 06/16/09 (m) | 4,875 | |||||||||
| 4,650 | Walt Disney Co. (The), FRN, 5.46%, 09/10/09 (m) | 4,649 | |||||||||
| 1,000 | WMG Acquisition Corp., 7.38%, 04/15/14 (m) | 880 | |||||||||
| 380 | WMG Holdings Corp., SUB, 0.00%, 12/15/14 (m) | 269 | |||||||||
| 60,130 | |||||||||||
Multi-Utilities — 0.6% | |||||||||||
| Dominion Resources, Inc., | |||||||||||
| 1,220 | 5.00%, 03/15/13 (m) | 1,177 | |||||||||
| 6,135 | 5.15%, 07/15/15 (m) | 5,870 | |||||||||
| 1,600 | FRN, 5.66%, 09/28/07 (m) | 1,600 | |||||||||
| MidAmerican Energy Holdings Co., | |||||||||||
| 3,975 | 6.13%, 04/01/36 (m) | 3,833 | |||||||||
| 2,620 | 6.50%, 09/15/37 (e) (m) | 2,641 | |||||||||
| 15,121 | |||||||||||
Office Electronics — 0.3% | |||||||||||
| 7,240 | Xerox Corp., 5.50%, 05/15/12 (m) | 7,157 | |||||||||
Oil, Gas & Consumable Fuels — 3.2% | |||||||||||
| 5,000 | Anadarko Petroleum Corp., FRN, 5.76%, 09/15/09 (m) | 4,972 | |||||||||
| 4,785 | BP Canada Finance Co. (Canada), 3.38%, 10/31/07 (m) | 4,774 | |||||||||
| 1,980 | Canadian Natural Resources Ltd. (Canada), 6.25%, 03/15/38 (m) | 1,900 | |||||||||
| 960 | Chesapeake Energy Corp., 6.50%, 08/15/17 (m) | 914 | |||||||||
| 12,675 | Citic Resources Finance Ltd. (Bermuda), 6.75%, 05/15/14 (e) (m) | 12,057 | |||||||||
| 1,650 | EnCana Corp. (Canada), 6.63%, 08/15/37 (m) | 1,677 | |||||||||
| 5,220 | Enterprise Products Operating LP, 6.30%, 09/15/17 (m) | 5,235 | |||||||||
| Gaz Capital S.A. for Gazprom (Russia), | |||||||||||
| 1,350 | 6.51%, 03/07/22 (e) | 1,305 | |||||||||
| 11,110 | 7.29%, 08/16/37 (e) (m) | 11,388 | |||||||||
| 4,124 | Gazprom International S.A. (Russia), 7.20%, 02/01/20 | 4,191 | |||||||||
| Kinder Morgan Energy Partners LP, | |||||||||||
| 3,420 | 5.85%, 09/15/12 (m) | 3,426 | |||||||||
| 3,335 | 6.50%, 02/01/37 (m) | 3,176 | |||||||||
| 3,115 | Nexen, Inc. (Canada), 6.40%, 05/15/37 (m) | 3,030 | |||||||||
| 3,415 | ONEOK Partners LP, 5.90%, 04/01/12 (m) | 3,475 | |||||||||
| 5,520 | Qatar Petroleum (Qatar), 5.58%, 05/30/11 (e) (m) | 5,584 | |||||||||
| 2,995 | Ras Laffan Liquefied Natural Gas Co. Ltd. III (Qatar), 5.83%, 09/30/16 (e) (m) | 3,041 | |||||||||
| 40 | Suncor Energy, Inc. (Canada), 7.15%, 02/01/32 (m) | 44 | |||||||||
| 3,385 | Valero Energy Corp., 6.63%, 06/15/37 (m) | 3,373 | |||||||||
| 73,562 | |||||||||||
Paper & Forest Products — 0.1% | |||||||||||
| 1,200 | Georgia Pacific Corp., 7.70%, 06/15/15 (m) | 1,164 | |||||||||
Personal Products — 0.1% | |||||||||||
| 500 | Del Laboratories, Inc., 8.00%, 02/01/12 (m) | 452 | |||||||||
| 670 | Playtex Products, Inc., 8.00%, 03/01/11 (m) | 692 | |||||||||
| 1,144 | |||||||||||
Real Estate Investment Trusts (REITs) — 0.3% | |||||||||||
| 6,600 | iStar Financial, Inc., FRN, 5.75%, 03/03/08 (m) | 6,539 | |||||||||
Semiconductors & Semiconductor Equipment — 0.0% (g) | |||||||||||
| 585 | Freescale Semiconductor, Inc., 9.13%, 12/15/14 (m) | 524 | |||||||||
Software — 0.0% (g) | |||||||||||
| 700 | Open Solutions, Inc., 9.75%, 02/01/15 (e) (m) | 665 | |||||||||
Specialty Retail — 0.1% | |||||||||||
| 3,575 | Home Depot, Inc. 5.88%, 12/16/36 (m) | 3,080 | |||||||||
Thrifts & Mortgage Finance — 2.7% | |||||||||||
| 5,800 | Bancaja US Debt S.A.U. (Spain), FRN, 5.51%, 07/10/09 (e) (m) | 5,752 | |||||||||
| 5,000 | CAM US Finance S.A. Sociedad Unipersonal (Spain), FRN, 5.51%, 02/01/10 (e) (m) | 4,999 | |||||||||
| Countrywide Financial Corp., | |||||||||||
| 5,290 | 5.80%, 06/07/12 (m) | 4,971 | |||||||||
| 4,500 | FRN, 5.58%, 03/24/09 (m) | 4,120 | |||||||||
| Residential Capital LLC, | |||||||||||
| 7,865 | 7.13%, 11/21/08 (m) | 6,567 | |||||||||
| 6,455 | 7.50%, 06/01/12 (m) | 4,906 | |||||||||
| 5,475 | FRN, 5.86%, 06/09/08 (m) | 4,654 | |||||||||
| 2,400 | FRN, 7.46%, 04/17/09 (m) | 1,920 | |||||||||
| 3,000 | FRN, 7.60%, 05/22/09 (m) | 2,370 | |||||||||
| 2,100 | FRN, 7.80%, 11/21/08 (m) | 1,764 | |||||||||
| 1,250 | Sovereign Bancorp, Inc., FRN, 5.64%, 03/01/09 (m) | 1,247 | |||||||||
| 4,000 | Washington Mutual Bank, FRN, 5.45%, 05/01/09 (m) | 3,917 | |||||||||
| 2,900 | Washington Mutual Preferred Funding, 6.53% to 03/15/11; thereafter variable, 03/29/49 (e) (m) | 2,707 | |||||||||
| Washington Mutual Preferred Funding II, | |||||||||||
| 10,500 | 6.66% to 12/15/16; thereafter variable, 12/31/49 (e) (m) | 9,184 | |||||||||
AS OF AUGUST 31, 2007 (Unaudited) (continued)
| PRINCIPAL AMOUNT($) | | SECURITY DESCRIPTION | | VALUE($) | |||||||
|---|---|---|---|---|---|---|---|---|---|---|---|
Long-Term Investments — Continued | |||||||||||
Thrifts & Mortgage Finance — Continued | |||||||||||
| 4,500 | 6.90% to 06/15/012; thereafter variable, 06/29/49 (e) (m) | 4,226 | |||||||||
| 63,304 | |||||||||||
Wireless Telecommunication Services — 0.6% | |||||||||||
| 5,100 | America Movil S.A.B. de C.V. (Mexico), FRN, 5.46%, 06/27/08 (e) (m) | 5,095 | |||||||||
| 635 | Cricket Communications, Inc., 9.38%, 11/01/14 (m) | 622 | |||||||||
| 420 | Dobson Cellular Systems, Inc., 8.38%, 11/01/11 (m) | 444 | |||||||||
| 530 | Intelsat Bermuda Ltd. (Bermuda), 9.25%, 06/15/16 (m) | 546 | |||||||||
| 560 | MetroPCS Wireless, Inc., 9.25%, 11/01/14 (e) (m) | 552 | |||||||||
| 7,730 | Sprint Nextel Corp., 6.00%, 12/01/16 (m) | 7,514 | |||||||||
| 14,773 | |||||||||||
| Total Corporate Bonds (Cost $1,005,498) | 978,672 | ||||||||||
Foreign Government Securities — 4.3% | |||||||||||
| EGP 35,725 | Credit Suisse First Boston, Zero Coupon, 05/06/08 (linked to Egypt Treasury Bill, Zero Coupon, 05/06/08) (Egypt) | 5,984 | |||||||||
| $2,715 | Federal Republic of Brazil (Brazil), 12.25%, 03/06/30 | 4,534 | |||||||||
| 2,000 | National Agricultural Cooperative Federation (South Korea), VAR, 5.75%, 06/18/14 | 2,015 | |||||||||
| 22,170 | Petroleos de Venezuela S.A. (Venezuela), 5.50%, 04/12/37 | 12,449 | |||||||||
| Republic of Argentina (Argentina), | |||||||||||
| ARS 15,000 | 11.31%, 01/20/10 | 4,500 | |||||||||
| $13,110 | FRN, 5.37%, 08/03/12 | 7,253 | |||||||||
| COP 9,555,000 | Republic of Colombia (Colombia), 12.00%, 10/22/15 | 4,801 | |||||||||
| Republic of Guatemala (Guatemala), | |||||||||||
| $ 4,000 | 10.25%, 11/08/11 | 4,540 | |||||||||
| 3,860 | 9.25%, 08/01/13 | 4,362 | |||||||||
| Republic of Peru (Peru), | |||||||||||
| 6,652 | 6.55%, 03/14/37 | 6,632 | |||||||||
| PEN 17,680 | 6.90%, 08/12/37 (e) (m) | 5,547 | |||||||||
| $12,330 | Republic of Venezuela (Venezuela), 9.38%, 01/13/34 | 12,238 | |||||||||
| 2,770 | Russian Federation (Russia), 12.75%, 06/24/28 | 4,882 | |||||||||
| 3,220 | Ukraine Government International Bond (Ukraine), 6.58%, 11/21/16 (e) | 3,168 | |||||||||
| United Mexican States (Mexico), | |||||||||||
| 6,860 | 8.00%, 09/24/22 | 8,379 | |||||||||
| 8,550 | FRN, 6.06%, 01/13/09 (m) | 8,580 | |||||||||
| Total Foreign Government Securities (Cost $103,674) | 99,864 | ||||||||||
Mortgage Pass-Through Securities — 49.4% | |||||||||||
| Federal Home Loan Mortgage Corp., | |||||||||||
| 49,500 | TBA, 5.00%, 09/15/37 | 47,056 | |||||||||
| 32,200 | TBA. 5.50%, 09/15/37 | 31,445 | |||||||||
| 10,545 | TBA, 5.50%, 10/15/37 | 10,298 | |||||||||
| 48,500 | TBA, 6.00%, 09/15/37 | 48,455 | |||||||||
| 1,910 | TBA, 6.00%, 10/15/37 | 1,908 | |||||||||
| Federal Home Loan Mortgage Corp., Gold Pool, | |||||||||||
| 318 | 6.00%, 02/01/11 – 04/01/11 (m) | 325 | |||||||||
| 187 | 6.00%, 01/01/35 (m) | 187 | |||||||||
| 66 | 7.00%, 12/01/25 – 02/01/26 (m) | 68 | |||||||||
| 144 | 7.50%, 10/01/26 – 02/01/27 (m) | 151 | |||||||||
| 127 | 8.00%, 04/01/26 – 07/01/26 (m) | 137 | |||||||||
| 1 | Federal Home Loan Mortgage Corp., Non Gold Pool, 9.75%, 11/01/08 (m) | 1 | |||||||||
| Federal National Mortgage Association, Various Pools, | |||||||||||
| 1,132 | 4.96%, 11/01/08 (m) | 1,124 | |||||||||
| 7,202 | 6.00%, 10/01/23 – 03/01/35 (m) | 7,217 | |||||||||
| 2,052 | 6.50%, 04/01/29 – 03/01/35 (m) | 2,087 | |||||||||
| 100,194 | 7.00%, 02/01/35 – 05/01/37 (m) | 103,001 | |||||||||
| 982 | 7.50%, 03/01/35 – 07/01/36 (m) | 1,016 | |||||||||
| 824 | 8.00%, 08/01/22 – 07/01/36 (m) | 867 | |||||||||
| —(h) | 8.50%, 10/01/25 (m) | — | (h) | ||||||||
| 22,200 | TBA, 4.50%, 09/25/22 | 21,291 | |||||||||
| —(h) | TBA, 4.50%, 09/25/37 | — | (h) | ||||||||
| 10,895 | TBA, 5.00%, 09/25/22 | 10,636 | |||||||||
| 3,000 | TBA, 5.00%, 10/25/22 | 2,929 | |||||||||
| 157,350 | TBA, 5.00%, 10/25/37 | 149,532 | |||||||||
| 7,000 | TBA, 5.50%, 10/25/22 | 6,958 | |||||||||
| 94,711 | TBA, 5.50%, 09/25/37 | 92,491 | |||||||||
| 58,000 | TBA, 6.00%, 10/25/22 | 58,616 | |||||||||
| 284,335 | TBA, 6.00%, 09/25/37 | 283,980 | |||||||||
| 1,200 | TBA, 6.50%, 10/25/37 | 1,218 | |||||||||
| 176,800 | TBA, 7.00%, 09/25/37 | 181,717 | |||||||||
| 6,000 | TBA, 7.00%, 10/25/37 | 6,161 | |||||||||
| Government National Mortgage Association, Various Pools, | |||||||||||
| 1,121 | 7.00%, 09/15/31 (m) | 1,169 | |||||||||
| 3 | 9.00%, 02/15/10 (m) | 4 | |||||||||
| 8 | 9.00%, 04/15/11 (m) | 9 | |||||||||
| —(h) | TBA, 5.50%, 09/15/37 | — | (h) | ||||||||
| 85,000 | TBA, 6.00%, 10/15/37 | 85,345 | |||||||||
| 500 | TBA, 6.50%, 09/15/37 | 509 | |||||||||
| Total Mortgage Pass-Through Securities (Cost $1,153,390) | 1,157,908 | ||||||||||
| PRINCIPAL AMOUNT($) | | SECURITY DESCRIPTION | | VALUE($) | |||||||
|---|---|---|---|---|---|---|---|---|---|---|---|
Long-Term Investments — Continued | |||||||||||
Private Placements — 0.6% | |||||||||||
| 10,383 | 200 East 57th St., 200 East Tenants Corp., Secured by First Mortgage Agreement on Co-op Apartment Building in New York City, 6.50%, 01/01/14 (f) (i) | 10,744 | |||||||||
| 719 | 200 East 57th St., 200 East Tenants Corp., Secured by Second Mortgage Agreement and Apartment on Co-op Apartment Building in New York City, 6.72%, 01/01/13 (f) (i) | 740 | |||||||||
| 2,917 | 81 Irving Place, Irving Tenants Corp., Secured by First Mortgage and Agreement on Co-op Apartment Building in New York City, 6.95%, 01/01/29 (f) (i) | 3,089 | |||||||||
| Total Private Placements (Cost $14,018) | 14,573 | ||||||||||
Supranational — 0.2% | |||||||||||
| 5,000 | European Investment Bank, 4.88%, 02/16/16 (m) (Cost $4,994) | 4,939 | |||||||||
U.S. Government Agency Securities — 0.5% | |||||||||||
| Federal Home Loan Mortgage Corp., | |||||||||||
| 4,640 | 6.25%, 07/15/32 (m) | 5,217 | |||||||||
| 2,315 | 6.75%, 03/15/31 (m) | 2,742 | |||||||||
| Federal National Mortgage Association, | |||||||||||
| 2,600 | 5.25%, 08/01/12 (m) | 2,638 | |||||||||
| 15 | 7.13%, 01/15/30 (m) | 18 | |||||||||
| 1,600 | Tennessee Valley Authority, 6.79%, 05/23/12 (m) | 1,736 | |||||||||
| Total U.S. Government Agency Securities (Cost $12,174) | 12,351 | ||||||||||
U.S. Treasury Obligations — 0.7% | |||||||||||
| 350 | U.S. Treasury Bonds, 7.25%, 05/15/16 (k) (m) | 417 | |||||||||
| U.S. Treasury Notes, | |||||||||||
| 1,500 | 3.38%, 10/15/09 (k) (m) | 1,475 | |||||||||
| 2,220 | 3.50%, 02/15/10 (k) (m) | 2,184 | |||||||||
| 1,075 | 3.88%, 05/15/09 (k) (m) | 1,069 | |||||||||
| 495 | 4.00%, 02/15/15 (k) (m) | 481 | |||||||||
| 2,795 | 4.13%, 08/15/08 (k) (m) | 2,789 | |||||||||
| 160 | 4.38%, 01/31/08 (k) (m) | 160 | |||||||||
| 1,125 | 4.38%, 11/15/08 (k) (m) | 1,126 | |||||||||
| 1,275 | 4.50%, 09/30/11 (k) (m) | 1,287 | |||||||||
| 250 | 4.50%, 02/15/16 (m) | 250 | |||||||||
| 3,465 | 4.63%, 07/31/09 (k) (m) | 3,494 | |||||||||
| 1,320 | 4.88%, 08/15/09 (k) (m) | 1,336 | |||||||||
| 1,000 | 5.00%, 07/31/08 (k) (m) | 1,005 | |||||||||
| Total U.S. Treasury Obligations (Cost $16,975) | 17,073 | ||||||||||
| SHARES | | | | | ||||||
|---|---|---|---|---|---|---|---|---|---|---|
Preferred Stocks — 0.5% | ||||||||||
Insurance — 0.5% | ||||||||||
| 200 | Aspen Insurance Holdings Ltd. (Bermuda), 7.40%, to 01/01/17; thereafter variable, 12/31/49 (m) | 5,000 | ||||||||
| 6,730 | Axis Capital Holdings Ltd. (Bermuda), 7.50%, to 12/01/15; thereafter variable, 12/31/49 (m) | 6,709 | ||||||||
| Total Preferred Stocks (Cost $12,164) | 11,709 | |||||||||
| Total Long-Term Investments (Cost $3,412,260) | 3,379,102 | |||||||||
| NUMBER OF CONTRACTS | | | | | |||||||
|---|---|---|---|---|---|---|---|---|---|---|---|
Options Purchased — 1.1% | |||||||||||
Call Options Purchased — 0.4% | |||||||||||
| 467 | 90 Day Eurodollar Futures, Expiring 09/17/07 @ $94.50, American Style | 96 | |||||||||
| 111 | 90 Day Eurodollar Futures, Expiring 09/17/07 @ $94.75, American Style | 7 | |||||||||
| 1,072 | 90 Day Eurodollar Futures, Expiring 09/17/07 @ $95.75, American Style | 7 | |||||||||
| 305 | 90 Day Eurodollar Futures, Expiring 12/17/07 @ $95.00, American Style | 194 | |||||||||
NOTIONAL AMOUNT($) | |||||||||||
Call Options Purchased on Interest Rate Swaps: | |||||||||||
| 1,252,469 | Expiring 05/30/08. If exercised the Fund receives 3.96% and pays floating 3 month LIBOR expiring 06/03/10, European Style | 3,494 | |||||||||
| 367,210 | Expiring 11/02/09. If exercised the Fund receives 4.49% and pays floating 3 month LIBOR expiring 11/04/19, European Style | 4,721 | |||||||||
| Total Call Options Purchased | 8,519 | ||||||||||
Receiver/Payer Straddles on Interest Rate Swaps — 0.6% | |||||||||||
| 60,987 | Expiring 06/09/08. If exercised the Fund pays/receives 5.88% and receives/pays floating 3 month LIBOR expiring 06/11/18, European Style | 3,593 | |||||||||
| 286,190 | Expiring 10/02/08. If exercised the Fund pays/receives 4.46% and receives/pays floating 3 month LIBOR expiring 10/06/18, European Style | 1,860 | |||||||||
| 22,180 | Expiring 01/25/27. If exercised the Fund pays/receives 5.47% and receives/pays floating 3 month LIBOR expiring 01/27/37, European Style | 1,371 | |||||||||
| 27,725 | Expiring 01/25/27. If exercised the Fund pays/receives 5.47% and receives/pays floating 3 month LIBOR expiring 01/27/37, European Style | 1,714 | |||||||||
AS OF AUGUST 31, 2007 (Unaudited) (continued)
| NUMBER OF CONTRACTS | | SECURITY DESCRIPTION | | VALUE($) | |||||||
|---|---|---|---|---|---|---|---|---|---|---|---|
Options Purchased — Continued | |||||||||||
Receiver/Payer Straddles on Interest Rate Swaps — Continued | |||||||||||
| 62,338 | Expiring 03/22/27. If exercised the Fund pays/receives 5.38% and receives/pays floating 3 month LIBOR expiring 03/24/37, European Style | 3,864 | |||||||||
| Total Receiver/Payer Straddles on Interest Rate Swaps | 12,402 | ||||||||||
| NUMBER OF CONTRACTS | | | | | ||||||
|---|---|---|---|---|---|---|---|---|---|---|
Put Options Purchased — 0.1% | ||||||||||
| 1,500 | 1 Year Mid-Curve, Expiring 12/14/07 @ 94.63, American Style | 103 | ||||||||
| 686 | 30 Day Federal Fund Futures, Expiring 11/30/07 @ $94.75, American Style | 7 | ||||||||
| 4,662 | 90 Day Eurodollar Futures, Expiring 09/17/07 @ $94.38, American Style | 466 | ||||||||
| 500 | 90 Day Eurodollar Futures, Expiring 03/17/08 @ $94.50, American Style | 28 | ||||||||
| 1,000 | 90 Day Eurodollar Futures, Expiring 03/17/08 @ $94.63, American Style | 106 | ||||||||
| NOTIONAL AMOUNT($) | | | | | ||||||
|---|---|---|---|---|---|---|---|---|---|---|
Put Options Purchased on Interest Rate Swaps: | ||||||||||
| 128,520 | Expiring 09/06/07. If exercised the Fund pays 5.70% and receives floating 3 month LIBOR expiring 09/10/12, European Style | — | (h) | |||||||
| 63,450 | Expiring 10/04/07. If exercised the Fund pays 5.30% and receives floating 3 month LIBOR expiring 10/09/12, European Style | 101 | ||||||||
| 104,167 | Expiring 10/04/07. If exercised the Fund pays 5.69% and receives floating 3 month LIBOR expiring 10/09/12, European Style | 20 | ||||||||
| 54,800 | Expiring 10/04/07. If exercised the Fund pays 5.71% and receives floating 3 month LIBOR expiring 10/09/12, European Style | 9 | ||||||||
| 110,240 | Expiring 10/04/07. If exercised the Fund pays 5.80% and receives floating 3 month LIBOR expiring 10/09/12, European Style | 11 | ||||||||
| 936,354 | Expiring 02/28/08. If exercised the Fund pays 4.20% and receives floating 3 month LIBOR expiring 03/03/10, European Style | 2,594 | ||||||||
| Total Put Options Purchased | 3,445 | |||||||||
| Total Options Purchased (Cost $30,198) | 24,366 | |||||||||
| SHARES | | | | | |||||||
|---|---|---|---|---|---|---|---|---|---|---|---|
Short-Term Investment — 2.6% | |||||||||||
Investment Company — 2.6% | |||||||||||
| 61,335 | JPMorgan Prime Money Market Fund, Institutional Class (b) (m) (Cost $61,335) | 61,335 | |||||||||
Total Investments — 147.9% (Cost $3,503,793) | 3,464,803 | ||||||||||
Liabilities in Excess of Other Assets — (47.9)% | (1,122,147 | ) | |||||||||
NET ASSETS — 100.0% | $ | 2,342,656 | |||||||||
| NUMBER OF CONTRACTS | | DESCRIPTION | | EXPIRATION DATE | | NOTIONAL VALUE AT 08/31/07 | | UNREALIZED APPRECIATION (DEPRECIATION) | ||||||||||
|---|---|---|---|---|---|---|---|---|---|---|---|---|---|---|---|---|---|---|
Long Futures Outstanding | ||||||||||||||||||
| 4 | 10 Year Japan Bonds | September, 2007 | $ | 4,676 | $ | 132 | ||||||||||||
| 1,729 | 2 Year U.S. Treasury Notes | December, 2007 | 356,444 | 29 | ||||||||||||||
| 1,766 | 5 Year U.S. Treasury Notes | December, 2007 | 188,438 | 117 | ||||||||||||||
| 2,693 | 10 Year U.S. Treasury Notes | December, 2007 | 293,663 | 255 | ||||||||||||||
| 53 | U.K. Treasury Gilt | December, 2007 | 11,439 | (10 | ) | |||||||||||||
| 882 | U.S. Treasury Bonds | December, 2007 | 98,398 | 266 | ||||||||||||||
| 118 | Eurodollar | March, 2008 | 28,131 | (52 | ) | |||||||||||||
Short Futures Outstanding | ||||||||||||||||||
| (51) | 10 Year Swap Future | September, 2007 | (5,399 | ) | (56 | ) | ||||||||||||
| (188) | Eurodollar | September, 2007 | (44,411 | ) | 111 | |||||||||||||
| (447) | U.S. Treasury Bonds | December, 2007 | (49,868 | ) | (161 | ) | ||||||||||||
| (2,872) | 5 Year U.S. Treasury Notes | December, 2007 | (306,451 | ) | (939 | ) | ||||||||||||
| (1,801) | 10 Year U.S. Treasury Notes | December, 2007 | (196,393 | ) | (259 | ) | ||||||||||||
| (187) | Eurodollar | December, 2007 | (44,443 | ) | (75 | ) | ||||||||||||
| (922) | Eurodollar | June, 2008 | (220,000 | ) | (1,506 | ) | ||||||||||||
| (135) | Eurodollar | September, 2008 | (32,211 | ) | (110 | ) | ||||||||||||
| $ | (2,258 | ) | ||||||||||||||||
| CONTRACTS TO BUY | | | SETTLEMENT DATE | | SETTLEMENT VALUE | | VALUE AT 08/31/07 | | NET UNREALIZED APPRECIATION (DEPRECIATION) | |||||||||||||
|---|---|---|---|---|---|---|---|---|---|---|---|---|---|---|---|---|---|---|---|---|---|---|
| 7,100,000 | TRY | 09/28/07 | $ | 5,386 | $ | 5,418 | $ | 32 | ||||||||||||||
| CONTRACTS TO SELL | | | SETTLEMENT DATE | | SETTLEMENT VALUE | | VALUE AT 08/31/07 | | NET UNREALIZED APPRECIATION (DEPRECIATION) | |||||||||||||
|---|---|---|---|---|---|---|---|---|---|---|---|---|---|---|---|---|---|---|---|---|---|---|
| 7,100,000 | TRY | 09/28/07 | $ | 5,412 | $ | 5,419 | $ | (7 | ) | |||||||||||||
| PRINCIPAL AMOUNT | | SECURITY DESCRIPTION | | VALUE | ||||||
|---|---|---|---|---|---|---|---|---|---|---|
| $(71,850) | FNMA, TBA, 5.00%, 09/25/37 | $ | (68,280 | ) | ||||||
| (30,984) | FNMA, TBA, 5.50%, 09/25/22 | (30,800 | ) | |||||||
| (34,620) | FNMA, TBA, 5.50%, 10/25/37 | (33,808 | ) | |||||||
| (14,700) | FNMA, TBA, 6.00%, 09/25/22 | (14,856 | ) | |||||||
| (253,100) | FNMA, TBA, 6.00%, 10/25/36 | (252,705 | ) | |||||||
| (49,595) | FNMA, TBA, 6.50%, 09/25/37 | (50,339 | ) | |||||||
| (16,000) | GNMA, TBA, 6.00%, 09/15/37 | (16,075 | ) | |||||||
| (Proceeds received $470,323) | $ | (466,863 | ) | |||||||
AS OF AUGUST 31, 2007 (Unaudited) (continued)
| DESCRIPTION | | EXERCISE PRICE | | EXPIRATION DATE | | NUMBER OF CONTRACTS | | VALUE | ||||||||||
|---|---|---|---|---|---|---|---|---|---|---|---|---|---|---|---|---|---|---|
| 30 Day Federal Funds Futures, American Style | $ | 95.00 | 09/28/07 | 374 | $ | (132 | ) | |||||||||||
| 90 Day Eurodollar Futures, American Style | 95.00 | 09/17/07 | 305 | (6 | ) | |||||||||||||
| 90 Day Eurodollar Futures, American Style | 96.00 | 09/17/07 | 2,144 | (13 | ) | |||||||||||||
| 90 Day Eurodollar Futures, American Style | 95.38 | 12/17/07 | 305 | (90 | ) | |||||||||||||
| 10 Year U.S. Treasury Note Futures, American Style | 111.00 | 10/26/07 | 883 | (345 | ) | |||||||||||||
| 10 Year U.S. Treasury Note Futures, American Style | 111.00 | 11/20/07 | 1,820 | (996 | ) | |||||||||||||
| 10 Year U.S. Treasury Note Futures, American Style | 112.00 | 11/20/07 | 1,302 | (468 | ) | |||||||||||||
| (Premiums Received $2,209) | $ | (2,050 | ) | |||||||||||||||
| COUNTERPARTY | | EXERCISE RATE* | | OPTION EXPIRATION DATE | | SWAP EXPIRATION DATE | | NOTIONAL AMOUNT | | VALUE | ||||||||||||
|---|---|---|---|---|---|---|---|---|---|---|---|---|---|---|---|---|---|---|---|---|---|---|
| Barclays Bank plc | 5.46% semi-annually | 05/30/08 | 06/03/10 | $ | 1,252,469 | $ | (2,442 | ) | ||||||||||||||
| (Premiums Received $2,129) | ||||||||||||||||||||||
| DESCRIPTION | | EXERCISE PRICE | | EXPIRATION DATE | | NOTIONAL AMOUNT | | VALUE | ||||||||||
|---|---|---|---|---|---|---|---|---|---|---|---|---|---|---|---|---|---|---|
| FNMA, 30 Year Fixed, 5.50% | $ | 94.96 | 10/04/07 | $ | 80,000 | $ | (4 | ) | ||||||||||
| FNMA, 30 Year Fixed, 5.50% | 95.33 | 10/04/07 | 80,000 | (9 | ) | |||||||||||||
| FNMA, 30 Year Fixed, 5.50% | 96.61 | 10/04/07 | 70,500 | (80 | ) | |||||||||||||
| FNMA, 30 Year Fixed, 5.50%, TBA | 95.45 | 09/06/07 | 105,000 | — | ||||||||||||||
| FNMA, 30 Year Fixed, 5.50%, TBA | 95.19 | 10/04/07 | 40,000 | (3 | ) | |||||||||||||
| (Premiums Received $1,445) | $ | (96 | ) | |||||||||||||||
| DESCRIPTION | | EXERCISE PRICE | | EXPIRATION DATE | | NUMBER OF CONTRACTS | | VALUE | ||||||||||
|---|---|---|---|---|---|---|---|---|---|---|---|---|---|---|---|---|---|---|
| 90 Day Eurodollar Futures, American Style | $ | 94.50 | 09/17/07 | 467 | $ | (105 | ) | |||||||||||
| 90 Day Eurodollar Futures, American Style | 94.75 | 09/17/07 | 194 | (137 | ) | |||||||||||||
| 10 Year U.S. Treasury Note Futures, American Style | 106.00 | 11/20/07 | 1,047 | (229 | ) | |||||||||||||
| (Premiums Received $932) | $ | (471 | ) | |||||||||||||||
| COUNTERPARTY | | EXERCISE RATE** | | OPTION EXPIRATION DATE | | SWAP EXPIRATION DATE | | NOTIONAL AMOUNT | | VALUE | ||||||||||||
|---|---|---|---|---|---|---|---|---|---|---|---|---|---|---|---|---|---|---|---|---|---|---|
| Bank of America | 5.99% semi-annually | 11/02/09 | 11/04/19 | $ | 367,210 | $ | (7,100 | ) | ||||||||||||||
| Barclays Bank plc | �� | 5.20% semi-annually | 02/28/08 | 03/03/10 | 936,354 | (2,069 | ) | |||||||||||||||
| (Premiums Received $8,850) | $ | (9,169 | ) | |||||||||||||||||||
| COUNTERPARTY | | EXERCISE RATE*** | | OPTION EXPIRATION DATE | | SWAP EXPIRATION DATE | | NOTIONAL AMOUNT | | VALUE | ||||||||||||
|---|---|---|---|---|---|---|---|---|---|---|---|---|---|---|---|---|---|---|---|---|---|---|
| Barclays Bank plc | 5.96% semi-annually | 10/02/08 | 10/06/18 | $ | 245,390 | $ | (2,256 | ) | ||||||||||||||
| Barclays Bank plc | 6.02% semi-annually | 07/28/14 | 07/30/24 | 14,568 | (1,308 | ) | ||||||||||||||||
| Lehman Brothers Special Financing | 5.36% semi-annually | 03/15/12 | 03/19/42 | 23,219 | (3,548 | ) | ||||||||||||||||
| (Premiums Received $7,944) | $ | (7,112 | ) | |||||||||||||||||||
| * | The Fund would receive a floating rate based on 3-month USD LIBOR, if exercised. |
| ** | The Fund would pay a floating rate based on 3-month USD LIBOR, if exercised. |
| *** | The Fund would pay or receive a floating rate based on 3-month USD LIBOR, if exercised. |
| **** | European Style |
AS OF AUGUST 31, 2007 (Unaudited) (continued)
| RATE TYPE (r) | ||||||||||||||||||||||
|---|---|---|---|---|---|---|---|---|---|---|---|---|---|---|---|---|---|---|---|---|---|---|
| SWAP COUNTERPARTY | | PAYMENTS MADE BY THE FUND | | PAYMENTS RECEIVED BY THE FUND | | TERMINATION DATE | | NOTIONAL AMOUNT | | VALUE | ||||||||||||
| Bank of America | 5.30% semi-annually | 3 month LIBOR quarterly | 07/31/12 | $ | 30 | $ | — (h) | |||||||||||||||
| Bank of America | 5.55% semi-annually | 3 month LIBOR quarterly | 06/14/12 | 47,700 | (1,201 | ) | ||||||||||||||||
| Bank of America | 5.89% semi-annually | 3 month LIBOR quarterly | 11/04/19 | 195,235 | (6,106 | ) | ||||||||||||||||
| Barclays Bank plc | 3 month LIBOR quarterly | 5.37% semi-annually | 08/28/17 | 10,587 | 110 | |||||||||||||||||
| Barclays Bank plc | 5.10% semi-annually | 3 month LIBOR quarterly | 07/18/12 | 41,680 | (245 | ) | ||||||||||||||||
| Barclays Bank plc | 5.51% semi-annually | 3 month LIBOR quarterly | 08/03/17 | 18,283 | (393 | ) | ||||||||||||||||
| Barclays Bank plc | 5.72% semi-annually | 3 month LIBOR quarterly | 10/06/18 | 21,503 | (637 | ) | ||||||||||||||||
| Barclays Bank plc | 4.70% semi-annually | 3 month LIBOR quarterly | 03/03/10 | 458,813 | 248 | |||||||||||||||||
| Barclays Bank plc | 4.71% semi-annually | 3 month LIBOR quarterly | 06/03/10 | 500,987 | 297 | |||||||||||||||||
| Barclays Bank plc | 5.28% semi-annually | 3 month LIBOR quarterly | 03/26/32 | 4,738 | 56 | |||||||||||||||||
| Barclays Bank plc | 5.87% semi-annually | 3 month LIBOR quarterly | 10/06/18 | 107,588 | (4,356 | ) | ||||||||||||||||
| BNP Paribas | 5.57% semi-annually | 3 month LIBOR quarterly | 07/17/12 | 17,000 | (448 | ) | ||||||||||||||||
| Citibank, N.A. | 4.94% semi-annually | 3 month LIBOR quarterly | 04/03/10 | 16,000 | (210 | ) | ||||||||||||||||
| Citibank, N.A. | 5.49% semi-annually | 3 month LIBOR quarterly | 06/12/10 | 6,800 | (108 | ) | ||||||||||||||||
| Citibank, N.A. | 5.50% semi-annually | 3 month LIBOR quarterly | 06/13/10 | 6,800 | (109 | ) | ||||||||||||||||
| Credit Suisse International | 3 month LIBOR quarterly | 5.28% semi-annually | 08/29/17 | 9,249 | 33 | |||||||||||||||||
| Credit Suisse International | 3 month LIBOR quarterly | 5.50% semi-annually | 08/03/17 | 12,730 | 262 | |||||||||||||||||
| Credit Suisse International | 5.41% semi-annually | 3 month LIBOR quarterly | 01/26/32 | 2,033 | 13 | |||||||||||||||||
| Deutsche Bank AG, New York | 3 month LIBOR quarterly | 5.11% semi-annually | 08/28/12 | 6,600 | 41 | |||||||||||||||||
| Deutsche Bank AG, New York | 3 month LIBOR quarterly | 5.15% semi-annually | 08/14/12 | 55,815 | 411 | |||||||||||||||||
| Deutsche Bank AG, New York | 3 month LIBOR quarterly | 5.37% semi-annually | 08/28/17 | 18,900 | 196 | |||||||||||||||||
| Deutsche Bank AG, New York | 5.43% semi-annually | 3 month LIBOR quarterly | 08/14/17 | 31,680 | (473 | ) | ||||||||||||||||
| Deutsche Bank AG, New York | 3 month LIBOR quarterly | 5.50% semi-annually | 08/06/17 | 6,477 | 134 | |||||||||||||||||
| Deutsche Bank AG, New York | 5.20% semi-annually | 3 month LIBOR quarterly | 02/08/10 | 12,800 | (94 | ) | ||||||||||||||||
| Deutsche Bank AG, New York | 5.21% semi-annually | 3 month LIBOR quarterly | 02/16/10 | 26,100 | (193 | ) | ||||||||||||||||
| Deutsche Bank AG, New York | 5.30% semi-annually | 3 month LIBOR quarterly | 01/26/17 | 7,800 | (46 | ) | ||||||||||||||||
| Deutsche Bank AG, New York | 5.42% semi-annually | 3 month LIBOR quarterly | 01/26/32 | 2,588 | 14 | |||||||||||||||||
| Deutsche Bank AG, New York | 5.51% semi-annually | 3 month LIBOR quarterly | 06/13/10 | 62,000 | (1,008 | ) | ||||||||||||||||
| Goldman Sachs Capital Management | 5.53% semi-annually | 3 month LIBOR quarterly | 07/31/17 | 24,398 | (568 | ) | ||||||||||||||||
| Goldman Sachs Capital Management | 5.24% semi-annually | 3 month LIBOR quarterly | 01/24/17 | 14,000 | (22 | ) | ||||||||||||||||
| Lehman Brothers Special Financing | 5.28% semi-annually | 3 month LIBOR quarterly | 08/29/17 | 3,700 | (11 | ) | ||||||||||||||||
| Lehman Brothers Special Financing | 5.37% semi-annually | 3 month LIBOR quarterly | 07/18/17 | 73,753 | (133 | ) | ||||||||||||||||
| Lehman Brothers Special Financing | 5.02% semi-annually | 3 month LIBOR quarterly | 11/06/11 | 9,650 | (150 | ) | ||||||||||||||||
| Merrill Lynch Capital Services, Inc. | 4.98% semi-annually | 3 month LIBOR quarterly | 08/31/12 | 24,000 | (13 | ) | ||||||||||||||||
| Union Bank of Switzerland AG | 5.23% semi-annually | 3 month LIBOR quarterly | 06/12/17 | 7,915 | (1 | ) | ||||||||||||||||
| Union Bank of Switzerland AG | 5.23% semi-annually | 3 month LIBOR quarterly | 06/22/17 | 5,085 | (2 | ) | ||||||||||||||||
| Union Bank of Switzerland AG | 5.56% semi-annually | 3 month LIBOR quarterly | 06/12/17 | 37,880 | (949 | ) | ||||||||||||||||
| Union Bank of Switzerland AG | 5.69% semi-annually | 3 month LIBOR quarterly | 06/22/17 | 9,710 | (344 | ) | ||||||||||||||||
| $ | (16,005 | ) | ||||||||||||||||||||
| REFERENCED OBLIGATION | SWAP COUNTERPARTY | | BUY/SELL PROTECTION | | FUND PAYS/RECEIVES FIXED RATE (r) | | TERMINATION DATE | | NOTIONAL AMOUNT | | VALUE | |||||||||||||
|---|---|---|---|---|---|---|---|---|---|---|---|---|---|---|---|---|---|---|---|---|---|---|---|---|
| AutoZone, Inc., 5.88%, 10/15/12 | Bank of America | Buy | 58 BPS quarterly | 03/20/14 | $ | 5,700 | $ | (20 | ) | |||||||||||||||
| Banca Italease, S.p.A. 4.61%, 02/08/12 | Deutsche Bank AG, New York | Sell | 85 BPS quarterly | 06/20/08 | 23,500 | (205 | ) | |||||||||||||||||
| Bank TuranAlem Finance BV, 8.50%, 02/10/15 | HSBC Bank, N.A. | Sell | 190 BPS quarterly | 09/14/07 | 6,300 | 13 | ||||||||||||||||||
| Barrick Gold, 4.88%, 11/15/14 | Lehman Brothers Special Financing | Buy | 45 BPS quarterly | 09/20/16 | 15,000 | 47 | ||||||||||||||||||
| Brunswick Corp., 7.13%, 08/01/27 | Bear Stearns Credit Products, Inc. | Buy | 72 BPS quarterly | 12/20/12 | 5,000 | (12 | ) | |||||||||||||||||
| Brunswick Corp., 7.13%, 08/01/27 | Credit Suisse International | Buy | 94 BPS quarterly | 06/20/14 | 5,000 | (48 | ) | |||||||||||||||||
| CenturyTel, Inc., 7.88%, 08/15/12 | Citibank, N.A. | Buy | 95 BPS quarterly | 09/20/14 | 5,000 | (111 | ) | |||||||||||||||||
| Citadel Finance Ltd., 6.25%, 12/15/11 | Merrill Lynch International | Sell | 267 BPS quarterly | 09/20/12 | 7,000 | (3 | ) | |||||||||||||||||
| Computer Sciences Corp., 7.38%, 06/15/11 | Morgan Stanley Capital Services | Buy | 88 BPS quarterly | 06/20/14 | 5,200 | (120 | ) | |||||||||||||||||
| Computer Sciences Corp., 7.38%, 06/15/11 | Merrill Lynch International | Buy | 70 BPS quarterly | 09/20/14 | 4,000 | (42 | ) | |||||||||||||||||
| Countrywide Financial Corp., 0.00%, 02/08/31 | Lehman Brothers Special Financing | Sell | 500 BPS quarterly | 09/20/08 | 11,300 | 112 | ||||||||||||||||||
| Countrywide Financial Corp., 0.00%, 02/08/31 | Union Bank of Switzerland AG | Sell | 615 BPS quarterly | 09/20/08 | 10,000 | 216 | ||||||||||||||||||
| Dow Jones CDX.EM.7 | Deutsche Bank AG, New York (1) | Buy | 125 BPS quarterly | 06/20/12 | 4,970 | 94 | ||||||||||||||||||
| Dow Jones CDX.EM.7 | Morgan Stanley Capital Services (2) | Buy | 125 BPS quarterly | 06/20/12 | 8,140 | 154 | ||||||||||||||||||
| Dow Jones CDX.NA.HY.8 | Goldman Sachs Capital Management (3) | Sell | 275 BPS quarterly | 06/20/12 | 3,000 | (140 | ) | |||||||||||||||||
| Dow Jones CDX.NA.HY.8 | Lehman Brothers Special Financing (4) | Sell | 275 BPS quarterly | 06/20/12 | 11,000 | (522 | ) | |||||||||||||||||
| Dow Jones CDX.NA.HY.8 | Union Bank of Switzerland AG (5) | Sell | 275 BPS quarterly | 06/20/12 | 6,000 | (280 | ) | |||||||||||||||||
| Dow Jones CDX.NA.IG.8 | Goldman Sachs Capital Management (6) | Buy | 35 BPS quarterly | 06/20/12 | 98,000 | 1,325 | ||||||||||||||||||
| Gannett Co., Inc, 6.38%, 04/01/12 | Bank of America | Buy | 67 BPS quarterly | 03/20/17 | 10,350 | 158 | ||||||||||||||||||
| Gazprom, 8.63%, 04/28/34 | Deutsche Bank AG, New York | Sell | 39 BPS semi-annually | 04/20/08 | 14,560 | (6 | ) | |||||||||||||||||
| Government of Jamaica, 11.63%, 01/15/22 | Bear Stearns | Buy | 341 BPS semi-annually | 07/20/17 | 3,430 | 321 | ||||||||||||||||||
| Government of Jamaica, 11.63%, 01/15/22 | Bear Stearns | Buy | 397 BPS semi-annually | 08/20/17 | 910 | 56 | ||||||||||||||||||
| Government of Ukraine, 7.65%, 06/11/13 | Morgan Stanley Capital Services | Sell | 190 BPS semi-annually | 07/20/10 | 11,000 | 229 | ||||||||||||||||||
| Government of Ukraine, 7.65%, 06/11/13 | Morgan Stanley Capital Services | Sell | 170 BPS semi-annually | 08/20/10 | 8,500 | 121 | ||||||||||||||||||
| Government of Ukraine, 7.65%, 06/11/13 | Union Bank of Switzerland AG | Sell | 184 BPS semi-annually | 08/20/10 | 7,250 | 135 | ||||||||||||||||||
| Government of Ukraine, 7.65%, 06/11/13 | Morgan Stanley Capital Services | Sell | 176 BPS semi-annually | 09/20/10 | 7,000 | 109 | ||||||||||||||||||
| Government of Ukraine, 7.65%, 06/11/13 | Morgan Stanley Capital Services | Sell | 203 BPS semi-annually | 08/20/11 | 12,700 | 236 | ||||||||||||||||||
| Government of Ukraine, 7.65%, 06/11/13 | Lehman Brothers Special Financing | Sell | 169 BPS semi-annually | 11/20/11 | 1,500 | (3 | ) | |||||||||||||||||
| Government of Ukraine, 7.65%, 06/11/13 | Morgan Stanley Capital Services | Sell | 162 BPS semi-annually | 11/20/11 | 7,540 | (37 | ) | |||||||||||||||||
| Government of Ukraine, 7.65%, 06/11/13 | Morgan Stanley Capital Services | Sell | 145 BPS semi-annually | 02/20/12 | 16,230 | (186 | ) | |||||||||||||||||
| Hannover Finance SA, 5.75%, 02/26/24 | Morgan Stanley Capital Services | Buy | 9.5 BPS quarterly | 12/20/11 | 10,000 | 88 | ||||||||||||||||||
| ICICI Bank Ltd., 5.75%, 11/16/10 | Deutsche Bank AG, New York | Sell | 26 BPS quarterly | 03/20/08 | 8,000 | (13 | ) | |||||||||||||||||
| Ingersoll-Rand Co., 9.00%, 08/15/21 | Credit Suisse International | Buy | 66 BPS quarterly | 06/20/14 | 2,550 | (25 | ) | |||||||||||||||||
| Ingersoll-Rand Co., 9.00%, 08/15/21 | Deutsche Bank AG, New York | Buy | 68 BPS quarterly | 06/20/14 | 5,100 | (57 | ) | |||||||||||||||||
| Ingersoll-Rand Co., 9.00%, 08/15/21 | Citibank, N.A. | Buy | 78 BPS quarterly | 09/20/14 | 3,800 | (61 | ) | |||||||||||||||||
| iStar Financial, Inc., 6.00%, 12/15/10 | Goldman Sachs Capital Management | Sell | 198 BPS quarterly | 09/20/12 | 10,000 | 107 | ||||||||||||||||||
| Kaupthing Bunadarbanki HF, 5.77%, 12/01/09 | Morgan Stanley Capital Services | Sell | 31 BPS quarterly | 12/20/07 | EUR 17,200 | (20 | ) | |||||||||||||||||
| Kaupthing Bunadarbanki HF, 5.77%, 12/01/09 | Deutsche Bank AG, New York | Buy | 52 BPS quarterly | 12/20/11 | $ | 10,000 | 188 | |||||||||||||||||
| Kazkommertsbank International BV, 7.88%, 04/07/14 | Morgan Stanley Capital Services | Sell | 175 BPS semi-annually | 08/20/08 | 9,050 | (129 | ) | |||||||||||||||||
| Kazkommertsbank International BV, 7.88%, 04/07/14 | Morgan Stanley Capital Services | Buy | 300 BPS semi-annually | 08/20/12 | 1,810 | 86 | ||||||||||||||||||
| Kazkommertzbank International BV, 7.88%, 04/07/14 | Deutsche Bank AG, New York | Sell | 235 BPS semi-annually | 03/20/12 | 2,180 | (123 | ) | |||||||||||||||||
| Kazkommertzbank International BV, 7.88%, 04/07/14 | Morgan Stanley Capital Services | Sell | 230 BPS semi-annually | 03/20/12 | 11,180 | (652 | ) | |||||||||||||||||
AS OF AUGUST 31, 2007 (Unaudited) (continued)
| REFERENCED OBLIGATION | | SWAP COUNTERPARTY | | BUY/SELL PROTECTION | | FUND PAYS/RECEIVES FIXED RATE (r) | | TERMINATION DATE | | NOTIONAL AMOUNT | | VALUE | ||||||||||||||
|---|---|---|---|---|---|---|---|---|---|---|---|---|---|---|---|---|---|---|---|---|---|---|---|---|---|---|
| Kazkommertzbank International BV, 7.88%, 04/07/14 | Morgan Stanley Capital Services | Sell | 220 BPS semi-annually | 03/20/12 | $ | 4,180 | $ | (260 | ) | |||||||||||||||||
| Kazkommertzbank International BV, 8.00%, 11/03/15 | Morgan Stanley Capital Services | Sell | 230 BPS semi-annually | 03/20/12 | 4,850 | (283 | ) | |||||||||||||||||||
| Kroger Co., 5.50%, 02/01/13 | Lehman Brothers Special Financing | Buy | 58 BPS quarterly | 03/20/14 | 5,300 | (26 | ) | |||||||||||||||||||
| Kroger Co., 5.50%, 02/01/13 | Goldman Sachs Capital Management | Buy | 65 BPS quarterly | 06/20/14 | 3,000 | (22 | ) | |||||||||||||||||||
| Landsbanki Island, 4.42%, 10/19/10 | Morgan Stanley Capital Services | Sell | 45 BPS quarterly | 09/20/07 | EUR 6,800 | 9 | ||||||||||||||||||||
| Liz Claiborne, 5.00%, 07/08/13 | Lehman Brothers Special Financing | Sell | 78 BPS quarterly | 09/20/12 | $ | 5,000 | (39 | ) | ||||||||||||||||||
| Marriot International, Inc., 4.63%, 06/15/12 | Credit Suisse International | Buy | 54 BPS quarterly | 06/20/14 | 4,000 | 1 | ||||||||||||||||||||
| Marsh & McLennan Co, Inc., 5.38%, 07/15/14 | Bank of America | Buy | 101 BPS quarterly | 09/20/14 | 4,000 | (68 | ) | |||||||||||||||||||
| Marsh & McLennan Co, Inc., 5.38%, 07/15/14 | Bank of America | Buy | 100 BPS quarterly | 09/20/14 | 4,000 | (66 | ) | |||||||||||||||||||
| MBIA Insurance Corp., 5.38%, 10/06/10 | Bear Stearns | Sell | 128 BPS quarterly | 09/20/12 | 5,000 | 12 | ||||||||||||||||||||
| MBIA Insurance Corp., 5.38%, 10/06/10 | Goldman Sachs Capital Management | Sell | 102 BPS quarterly | 09/20/12 | 5,000 | (46 | ) | |||||||||||||||||||
| MBIA Insurance Corp., 5.38%, 10/06/10 | Deutsche Bank AG, New York | Sell | 150 BPS quarterly | 09/20/12 | 2,500 | 30 | ||||||||||||||||||||
| McKesson Corp., 7.75%, 02/01/12 | Lehman Brothers Special Financing | Buy | 80 BPS quarterly | 06/20/17 | 4,450 | (50 | ) | |||||||||||||||||||
| Mittal Steel Co. NV, 9.75%, 04/01/14 | Morgan Stanley Capital Services | Sell | 17 BPS quarterly | 06/20/08 | 10,900 | 2 | ||||||||||||||||||||
| Mohawk Industries, 7.20%, 04/15/12 | Morgan Stanley Capital Services | Buy | 96 BPS quarterly | 06/20/14 | 5,000 | (52 | ) | |||||||||||||||||||
| New York Times Co. (The), 4.61%, 09/26/12 | Bank of America | Buy | 64 BPS quarterly | 06/20/17 | 5,000 | 27 | ||||||||||||||||||||
| New York Times Co. (The), 4.61%, 09/26/12 | Bank of America | Buy | 94 BPS quarterly | 09/20/17 | 3,000 | (50 | ) | |||||||||||||||||||
| Pemex, 9.50%, 09/15/27 | Citibank, N.A. | Buy | 116.5 BPS semi-annually | 05/20/10 | 15,000 | (281 | ) | |||||||||||||||||||
| Pemex, 9.50%, 09/15/27 | Citibank, N.A. | Buy | 125 BPS semi-annually | 06/20/10 | 11,000 | (234 | ) | |||||||||||||||||||
| Petroleos De Venezuela S.A., 5.25%, 04/12/17 | Union Bank of Switzerland AG | Sell | 278 BPS semi-annually | 06/20/12 | 2,400 | (198 | ) | |||||||||||||||||||
| Petroleos De Venezuela S.A., 5.25%, 04/12/18 | Union Bank of Switzerland AG | Sell | 344 BPS semi-annually | 07/20/12 | 1,740 | (108 | ) | |||||||||||||||||||
| Petroleos De Venezuela S.A., 5.25%, 04/12/27 | Union Bank of Switzerland AG | Sell | 355 BPS semi-annually | 07/20/12 | 3,590 | (203 | ) | |||||||||||||||||||
| Petroleos De Venezuela S.A., 5.38%, 04/12/27 | Bear Stearns | Sell | 342 BPS semi-annually | 07/20/12 | 1,170 | (53 | ) | |||||||||||||||||||
| Petroleos De Venezuela S.A., 5.38%, 04/12/27 | Bear Stearns | Sell | 361 BPS semi-annually | 07/20/12 | 1,800 | (97 | ) | |||||||||||||||||||
| Petroleos De Venezuela S.A., 5.38%, 04/12/37 | Bear Stearns | Sell | 257 BPS semi-annually | 05/20/12 | 1,250 | (108 | ) | |||||||||||||||||||
| Petroleos De Venezuela S.A., 5.38%, 04/12/37 | Deutsche Bank AG, New York | Sell | 258.5 BPS semi-annually | 05/20/12 | 2,790 | (239 | ) | |||||||||||||||||||
| Petroleos De Venezuela S.A., 5.38%, 04/12/27 | Morgan Stanley Capital Services | Sell | 355 BPS semi-annually | 07/20/12 | 4,060 | (229 | ) | |||||||||||||||||||
| Petroleos De Venezuela S.A., 5.38%, 04/12/27 | Morgan Stanley Capital Services | Sell | 340 BPS semi-annually | 07/20/12 | 2,900 | (185 | ) | |||||||||||||||||||
| Petroleos De Venezuela S.A., 5.50%, 04/12/37 | Lehman Brothers Special Financing | Sell | 340 BPS semi-annually | 07/20/12 | 2,900 | (185 | ) | |||||||||||||||||||
| Petroleos De Venezuela S.A., 5.50%, 04/12/37 | Lehman Brothers Special Financing | Sell | 341 BPS semi-annually | 07/20/12 | 2,900 | (184 | ) | |||||||||||||||||||
| Petroleos De Venezuela S.A., 5.50%, 04/12/37 | Lehman Brothers Special Financing | Sell | 328 BPS semi-annually | 07/20/12 | 690 | (47 | ) | |||||||||||||||||||
| Republic of Argentina, 8.28% 12/31/33 | Lehman Brothers Special Financing | Sell | 343 BPS semi-annually | 09/20/10 | 6,250 | 20 | ||||||||||||||||||||
| Republic of Argentina, 8.28% 12/31/33 | Citibank, N.A. | Sell | 296.5 BPS semi-annually | 10/20/10 | 2,850 | (46 | ) | |||||||||||||||||||
| Republic of Argentina, 8.28% 12/31/33 | Lehman Brothers Special Financing | Sell | 303.5 BPS semi-annually | 10/20/10 | 1,540 | (21 | ) | |||||||||||||||||||
| Republic of Argentina, 8.28% 12/31/33 | Morgan Stanley Capital Services | Sell | 338 BPS semi-annually | 10/20/10 | 5,250 | (1 | ) | |||||||||||||||||||
| Republic of Argentina, 8.28% 12/31/33 | Morgan Stanley Capital Services | Sell | 400 BPS semi-annually | 10/20/10 | 1,600 | 26 | ||||||||||||||||||||
| Republic of Argentina, 8.28% 12/31/33 | Lehman Brothers Special Financing | Sell | 292 BPS semi-annually | 02/20/11 | 9,040 | (321 | ) | |||||||||||||||||||
| Republic of Argentina, 8.28% 12/31/33 | Lehman Brothers Special Financing | Sell | 260 BPS semi-annually | 08/20/11 | 3,620 | (209 | ) | |||||||||||||||||||
| Republic of Argentina, 8.28% 12/31/33 | Lehman Brothers Special Financing | Sell | 259 BPS semi-annually | 08/20/11 | 3,610 | (209 | ) | |||||||||||||||||||
| Republic of Argentina, 8.28% 12/31/33 | Lehman Brothers Special Financing | Buy | 208.5 BPS semi-annually | 09/20/11 | 8,240 | 562 | ||||||||||||||||||||
| Republic of Argentina, 8.28% 12/31/33 | Deutsche Bank AG, New York | Sell | 196 BPS semi-annually | 04/20/12 | 1,870 | (172 | ) | |||||||||||||||||||
| Republic of Argentina, 8.28% 12/31/33 | Citibank, N.A. | Sell | 216 BPS semi-annually | 06/20/12 | 4,810 | (441 | ) | |||||||||||||||||||
| Republic of Argentina, 8.28% 12/31/33 | Deutsche Bank AG, New York | Sell | 214 BPS semi-annually | 06/20/12 | 12,790 | (1,183 | ) | |||||||||||||||||||
| Republic of Argentina, 8.28% 12/31/33 | Morgan Stanley Capital Services | Sell | 216 BPS semi-annually | 06/20/12 | 7,550 | (692 | ) | |||||||||||||||||||
| Republic of Argentina, 8.28% 12/31/33 | Morgan Stanley Capital Services | Sell | 202 BPS semi-annually | 06/20/12 | 3,710 | (361 | ) | |||||||||||||||||||
| Republic of Argentina, 8.28% 12/31/33 | Bear Stearns | Buy | 258 BPS semi-annually | 07/20/12 | 1,170 | 92 | ||||||||||||||||||||
| REFERENCED OBLIGATION | | SWAP COUNTERPARTY | | BUY/SELL PROTECTION | | FUND PAYS/RECEIVES FIXED RATE (r) | | TERMINATION DATE | | NOTIONAL AMOUNT | | VALUE | ||||||||||||||
|---|---|---|---|---|---|---|---|---|---|---|---|---|---|---|---|---|---|---|---|---|---|---|---|---|---|---|
| Republic of Argentina, 8.28% 12/31/33 | Lehman Brothers Special Financing | Buy | 258 BPS semi-annually | 07/20/12 | $ | 3,720 | $ | 294 | ||||||||||||||||||
| Republic of Argentina, 8.28% 12/31/33 | Lehman Brothers Special Financing | Buy | 263 BPS semi-annually | 07/20/12 | 2,900 | 223 | ||||||||||||||||||||
| Republic of Argentina, 8.28% 12/31/33 | Lehman Brothers Special Financing | Buy | 258 BPS semi-annually | 07/20/12 | 690 | 54 | ||||||||||||||||||||
| Republic of Argentina, 8.28% 12/31/33 | Morgan Stanley Capital Services | Buy | 262 BPS semi-annually | 07/20/12 | 2,900 | 224 | ||||||||||||||||||||
| Republic of Argentina, 8.28% 12/31/33 | Union Bank of Switzerland AG | Buy | 262 BPS semi-annually | 07/20/12 | 1,740 | 135 | ||||||||||||||||||||
| Republic of Argentina, 8.28% 12/31/33 | Deutsche Bank AG, New York | Sell | 308 BPS semi-annually | 08/20/12 | 5,370 | (340 | ) | |||||||||||||||||||
| Republic of Argentina, 8.28% 12/31/33 | Deutsche Bank AG, New York | Sell | 365 BPS semi-annually | 08/20/12 | 2,320 | (95 | ) | |||||||||||||||||||
| Republic of Argentina, 8.28% 12/31/33 | Lehman Brothers Special Financing | Sell | 425 BPS semi-annually | 08/20/12 | 820 | (14 | ) | |||||||||||||||||||
| Republic of Argentina, 8.28% 12/31/33 | Lehman Brothers Special Financing | Sell | 365 BPS semi-annually | 08/20/12 | 8,570 | (350 | ) | |||||||||||||||||||
| Republic of Argentina, 8.28% 12/31/33 | Lehman Brothers Special Financing | Sell | 375 BPS semi-annually | 08/20/12 | 1,730 | (64 | ) | |||||||||||||||||||
| Republic of Argentina, 8.28% 12/31/33 | Bear Stearns | Sell | 341 BPS semi-annually | 07/20/17 | 3,430 | (425 | ) | |||||||||||||||||||
| Republic of Argentina, 8.28% 12/31/33 | Bear Stearns | Sell | 407 BPS semi-annually | 08/20/17 | 910 | (81 | ) | |||||||||||||||||||
| Republic of Brazil, 12.25%, 03/06/30 | Lehman Brothers Special Financing | Buy | 300 BPS semi-annually | 09/20/10 | 6,250 | (484 | ) | |||||||||||||||||||
| Republic of Brazil, 12.25%, 03/06/30 | Lehman Brothers Special Financing | Buy | 261.50 BPS semi-annually | 10/20/10 | 1,540 | (98 | ) | |||||||||||||||||||
| Republic of Brazil, 12.25%, 03/06/30 | Morgan Stanley Capital Services | Buy | 290 BPS semi-annually | 10/20/10 | 5,250 | (382 | ) | |||||||||||||||||||
| Republic of Brazil, 12.25%, 03/06/30 | Morgan Stanley Capital Services | Buy | 335 BPS semi-annually | 10/20/10 | 1,600 | (140 | ) | |||||||||||||||||||
| Republic of Brazil, 12.25%, 03/06/30 | Lehman Brothers Special Financing | Buy | 165 BPS semi-annually | 02/20/11 | 9,040 | (245 | ) | |||||||||||||||||||
| Republic of Brazil, 12.25%, 03/06/30 | Lehman Brothers Special Financing | Buy | 140 BPS semi-annually | 08/20/11 | 3,620 | (69 | ) | |||||||||||||||||||
| Republic of Brazil, 12.25%, 03/06/30 | Lehman Brothers Special Financing | Buy | 140 BPS semi-annually | 08/20/11 | 3,610 | (68 | ) | |||||||||||||||||||
| Republic of Brazil, 12.25%, 03/06/30 | Lehman Brothers Special Financing | Sell | 120 BPS semi-annually | 09/20/11 | 4,190 | 70 | ||||||||||||||||||||
| Republic of Brazil, 12.25%, 03/06/30 | Lehman Brothers Special Financing | Sell | 119 BPS semi-annually | 09/20/11 | 4,050 | 66 | ||||||||||||||||||||
| Republic of Brazil, 12.25%, 03/06/30 | Bear Stearns | Buy | 103 BPS semi-annually | 12/20/11 | 4,545 | (25 | ) | |||||||||||||||||||
| Republic of Brazil, 12.25%, 03/06/30 | Deutsche Bank AG, New York | Buy | 108.5 BPS semi-annually | 12/20/11 | 845 | (7 | ) | |||||||||||||||||||
| Republic of Brazil, 12.25%, 03/06/30 | Lehman Brothers Special Financing | Buy | 111 BPS semi-annually | 12/20/11 | 10,880 | (96 | ) | |||||||||||||||||||
| Republic of Brazil, 12.25%, 03/06/30 | Union Bank of Switzerland AG | Buy | 103 BPS semi-annually | 12/20/11 | 9,090 | (51 | ) | |||||||||||||||||||
| Republic of Brazil, 12.25%, 03/06/30 | Union Bank of Switzerland AG | Buy | 102 BPS semi-annually | 12/20/11 | 9,705 | (51 | ) | |||||||||||||||||||
| Republic of Brazil, 12.25%, 03/06/30 | Deutsche Bank AG, New York | Buy | 81 BPS semi-annually | 04/20/12 | 1,870 | 8 | ||||||||||||||||||||
| Republic of Brazil, 12.25%, 03/06/30 | Citibank, N.A. | Buy | 69.5 BPS semi-annually | 06/20/12 | 4,810 | 58 | ||||||||||||||||||||
| Republic of Brazil, 12.25%, 03/06/30 | Deutsche Bank AG, New York | Buy | 73.21 BPS semi-annually | 06/20/12 | 12,790 | 133 | ||||||||||||||||||||
| Republic of Brazil, 12.25%, 03/06/30 | Morgan Stanley Capital Services | Buy | 69 BPS semi-annually | 06/20/12 | 7,550 | 93 | ||||||||||||||||||||
| Republic of Brazil, 12.25%, 03/06/30 | Morgan Stanley Capital Services | Buy | 65.67 BPS semi-annually | 06/20/12 | 3,710 | 51 | ||||||||||||||||||||
| Republic of Brazil, 12.25%, 03/06/30 | Deutsche Bank AG, New York | Buy | 89 BPS semi-annually | 08/20/12 | 5,370 | 33 | ||||||||||||||||||||
| Republic of Colombia, 10.38%, 01/28/33 | Deutsche Bank AG, New York | Buy | 91.42 BPS semi-annually | 04/20/12 | 220 | 3 | ||||||||||||||||||||
| Republic of Colombia, 10.38%, 01/28/33 | Lehman Brothers Special Financing | Buy | 98 BPS semi-annually | 04/20/12 | 10,040 | 144 | ||||||||||||||||||||
| Republic of Colombia, 10.38%, 01/28/33 | Lehman Brothers Special Financing | Buy | 98 BPS semi-annually | 04/20/12 | 10,040 | 144 | ||||||||||||||||||||
| Republic of Colombia, 10.38%, 01/28/33 | Lehman Brothers Special Financing | Buy | 96 BPS semi-annually | 04/20/12 | 1,370 | 21 | ||||||||||||||||||||
| Republic of Colombia, 10.38%, 01/28/33 | Morgan Stanley Capital Services | Buy | 100 BPS semi-annually | 04/20/12 | 5,020 | 68 | ||||||||||||||||||||
| Republic of Colombia, 10.38%, 01/28/33 | Lehman Brothers Special Financing | Buy | 82.5 BPS semi-annually | 06/20/12 | 13,050 | 297 | ||||||||||||||||||||
| Republic of Indonesia, 6.75%, 03/10/14 | Morgan Stanley Capital Services | Sell | 127 BPS quarterly | 12/20/11 | 4,270 | (52 | ) | |||||||||||||||||||
| Republic of Indonesia, 6.75%, 03/10/14 | Deutsche Bank AG, New York | Sell | 101 BPS quarterly | 06/20/12 | 920 | (28 | ) | |||||||||||||||||||
| Republic of Indonesia, 6.75%, 03/10/14 | Deutsche Bank AG, New York | Sell | 115 BPS quarterly | 09/20/12 | 1,630 | (45 | ) | |||||||||||||||||||
| Republic of Indonesia, 6.75%, 03/10/14 | Citibank, N.A. | Sell | 185 BPS quarterly | 06/20/11 | 4,085 | 60 | ||||||||||||||||||||
| Republic of Indonesia, 6.75%, 03/10/14 | Deutsche Bank AG, New York | Sell | 205 BPS quarterly | 06/20/11 | 5,055 | 108 | ||||||||||||||||||||
| Republic of Indonesia, 6.75%, 03/10/14 | Deutsche Bank AG, New York | Sell | 185 BPS quarterly | 06/20/11 | 10,070 | 147 | ||||||||||||||||||||
| Republic of Indonesia, 6.75%, 03/10/14 | Deutsche Bank AG, New York | Sell | 176.5 BPS quarterly | 09/20/11 | 5,050 | 50 | ||||||||||||||||||||
| Republic of Kazakhstan, 11.13%, 05/11/07 | Citibank, N.A. | Sell | 60 BPS semi-annually | 03/20/12 | 5,150 | (32 | ) | |||||||||||||||||||
| Republic of Kazakhstan, 11.13%, 05/11/07 | Deutsche Bank AG, New York | Sell | 54.8 BPS semi-annually | 03/20/12 | 9,930 | (84 | ) | |||||||||||||||||||
| Republic of Kazakhstan, 11.13%, 05/11/07 | Deutsche Bank AG, New York | Sell | 53.51 BPS semi-annually | 03/20/12 | 9,550 | (86 | ) | |||||||||||||||||||
AS OF AUGUST 31, 2007 (Unaudited) (continued)
| REFERENCED OBLIGATION | | SWAP COUNTERPARTY | | BUY/SELL PROTECTION | | FUND PAYS/RECEIVES FIXED RATE (r) | | TERMINATION DATE | | NOTIONAL AMOUNT | | VALUE | ||||||||||||||
|---|---|---|---|---|---|---|---|---|---|---|---|---|---|---|---|---|---|---|---|---|---|---|---|---|---|---|
| Republic of Kazakhstan, 11.13%, 05/11/07 | Deutsche Bank AG, New York | Sell | 61 BPS semi-annually | 03/20/12 | $ | 3,710 | $ | (21 | ) | |||||||||||||||||
| Republic of Kazakhstan, 11.13%, 05/11/07 | Barclays Bank plc | Sell | 68 BPS semi-annually | 08/20/12 | 3,330 | (23 | ) | |||||||||||||||||||
| Republic of Kazakhstan, 11.13%, 05/11/07 | Deutsche Bank AG, New York | Sell | 65.5 BPS semi-annually | 08/20/12 | 9,160 | (74 | ) | |||||||||||||||||||
| Republic of Kazakhstan, 11.13%, 05/11/07 | Deutsche Bank AG, New York | Sell | 71 BPS semi-annually | 08/20/12 | 4,340 | (25 | ) | |||||||||||||||||||
| Republic of Panama, 8.88%, 09/30/27 | Lehman Brothers Special Financing | Buy | 63 BPS semi-annually | 06/20/12 | 27,210 | 524 | ||||||||||||||||||||
| Republic of Peru, 8.75%, 11/21/33 | Lehman Brothers Special Financing | Sell | 62 BPS semi-annually | 06/20/12 | 27,210 | (479 | ) | |||||||||||||||||||
| Republic of Peru, 8.75%, 11/21/33 | Lehman Brothers Special Financing | Sell | 108.5 BPS semi-annually | 05/20/17 | 12,010 | (329 | ) | |||||||||||||||||||
| Republic of Peru, 8.75%, 11/21/33 | Lehman Brothers Special Financing | Sell | 90 BPS semi-annually | 06/20/17 | 7,705 | (320 | ) | |||||||||||||||||||
| Republic of Philippines, 10.63%, 03/16/25 | Citibank, N.A. | Buy | 199 BPS quarterly | 06/20/11 | 4,085 | (77 | ) | |||||||||||||||||||
| Republic of Philippines, 10.63%, 03/16/25 | Deutsche Bank AG, New York | Buy | 199 BPS quarterly | 06/20/11 | 10,070 | (194 | ) | |||||||||||||||||||
| Republic of Philippines, 10.63%, 03/16/25 | Deutsche Bank AG, New York | Buy | 221 BPS quarterly | 06/20/11 | 5,055 | (137 | ) | |||||||||||||||||||
| Republic of Philippines, 10.63%, 03/16/25 | Deutsche Bank AG, New York | Buy | 190 BPS quarterly | 09/20/11 | 5,050 | (74 | ) | |||||||||||||||||||
| Republic of Philippines, 10.63%, 03/16/25 | Deutsche Bank AG, New York | Buy | 116 BPS quarterly | 09/20/12 | 1,630 | 45 | ||||||||||||||||||||
| Republic of Philippines, 10.63%, 03/16/25 | Deutsche Bank AG, New York | Buy | 103 BPS quarterly | 06/20/12 | 920 | 27 | ||||||||||||||||||||
| Republic of Philippines, 10.63%, 03/16/25 | Morgan Stanley Capital Services | Buy | 132 BPS quarterly | 12/20/11 | 4,270 | 45 | ||||||||||||||||||||
| Republic of Turkey, 11.88%, 01/15/30 | Morgan Stanley Capital Services | Buy | 145 BPS semi-annually | 07/20/12 | 1,720 | 35 | ||||||||||||||||||||
| Republic of Turkey, 11.88%, 01/15/30 | Morgan Stanley Capital Services | Buy | 146 BPS semi-annually | 07/20/12 | 17,000 | 341 | ||||||||||||||||||||
| Republic of Turkey, 11.88%, 01/15/30 | Deutsche Bank AG, New York | Buy | 239 BPS semi-annually | 08/20/12 | 4,400 | (79 | ) | |||||||||||||||||||
| Republic of Turkey, 11.88%, 01/15/30 | Morgan Stanley Capital Services | Buy | 194 BPS semi-annually | 08/20/12 | 4,130 | 9 | ||||||||||||||||||||
| Republic of Venezuela, 9.25%, 09/15/27 | Barclays Bank plc | Sell | 172.1 BPS semi-annually | 03/20/12 | 4,050 | (317 | ) | |||||||||||||||||||
| Republic of Venezuela, 9.25%, 09/15/27 | Deutsche Bank AG, New York | Sell | 162 BPS semi-annually | 04/20/12 | 220 | (19 | ) | |||||||||||||||||||
| Republic of Venezuela, 9.25%, 09/15/27 | Lehman Brothers Special Financing | Sell | 161 BPS semi-annually | 04/20/12 | 10,040 | (868 | ) | |||||||||||||||||||
| Republic of Venezuela, 9.25%, 09/15/27 | Lehman Brothers Special Financing | Sell | 161 BPS semi-annually | 04/20/12 | 10,040 | (868 | ) | |||||||||||||||||||
| Republic of Venezuela, 9.25%, 09/15/27 | Lehman Brothers Special Financing | Sell | 160.5 BPS semi-annually | 04/20/12 | 1,370 | (119 | ) | |||||||||||||||||||
| Republic of Venezuela, 9.25%, 09/15/27 | Morgan Stanley Capital Services | Sell | 169 BPS semi-annually | 04/20/12 | 5,020 | (419 | ) | |||||||||||||||||||
| Republic of Venezuela, 9.25%, 09/15/27 | Lehman Brothers Special Financing | Sell | 218 BPS semi-annually | 06/20/12 | 13,050 | (953 | ) | |||||||||||||||||||
| Republic of Venezuela, 9.25%, 09/15/27 | Union Bank of Switzerland AG | Buy | 203 BPS semi-annually | 06/20/12 | 2,400 | 189 | ||||||||||||||||||||
| Republic of Venezuela, 9.25%, 09/15/27 | Bear Stearns | Buy | 266 BPS semi-annually | 07/20/12 | 1,800 | 107 | ||||||||||||||||||||
| Republic of Venezuela, 9.25%, 09/15/27 | Bear Stearns | Sell | 250.4 BPS semi-annually | 07/20/12 | 2,500 | (163 | ) | |||||||||||||||||||
| Republic of Venezuela, 9.25%, 09/15/27 | Lehman Brothers Special Financing | Sell | 268 BPS semi-annually | 07/20/12 | 820 | (48 | ) | |||||||||||||||||||
| Republic of Venezuela, 9.25%, 09/15/27 | Morgan Stanley Capital Services | Buy | 257 BPS semi-annually | 07/20/12 | 4,060 | 254 | ||||||||||||||||||||
| Republic of Venezuela, 9.25%, 09/15/27 | Union Bank of Switzerland AG | Buy | 255 BPS semi-annually | 07/20/12 | 3,590 | 228 | ||||||||||||||||||||
| Republic of Venezuela, 9.25%, 09/15/27 | Union Bank of Switzerland AG | Sell | 251 BPS semi-annually | 07/20/12 | 4,570 | (296 | ) | |||||||||||||||||||
| Republic of Venezuela, 9.25%, 09/15/27 | Lehman Brothers Special Financing | Sell | 301.3 BPS semi-annually | 08/20/12 | 2,340 | (119 | ) | |||||||||||||||||||
| Republic of Venezuela, 9.25%, 09/15/27 | Lehman Brothers Special Financing | Buy | 385 BPS semi-annually | 08/20/12 | 820 | 17 | ||||||||||||||||||||
| Republic of Venezuela, 9.25%, 09/15/27 | Morgan Stanley Capital Services | Sell | 330 BPS semi-annually | 08/20/12 | 3,930 | (159 | ) | |||||||||||||||||||
| Russia AG Bank, 7.18%, 05/16/13 | Credit Suisse International | Sell | 72 BPS semi-annually | 03/20/09 | 1,875 | (12 | ) | |||||||||||||||||||
| Russia AG Bank, 7.18%, 05/16/13 | Union Bank of Switzerland AG | Sell | 76 BPS semi-annually | 02/20/09 | 18,385 | (92 | ) | |||||||||||||||||||
| Russian Federation, 7.50%, 03/31/30 | Credit Suisse International | Buy | 30 BPS semi-annually | 03/20/09 | 1,875 | 7 | ||||||||||||||||||||
| Russian Federation, 7.50%, 03/31/30 | Barclays Bank plc | Sell | 86.5 BPS semi-annually | 09/20/12 | 8,600 | 13 | ||||||||||||||||||||
| Russian Federation, 7.50%, 03/31/30 | Union Bank of Switzerland AG | Buy | 31 BPS semi-annually | 02/20/09 | 18,385 | 55 | ||||||||||||||||||||
| Russian Federation, 7.50%, 03/31/30 | Deutsche Bank AG, New York | Sell | 119 BPS semi-annually | 04/20/10 | 10,000 | 148 | ||||||||||||||||||||
| Russian Federation, 7.50%, 03/31/30 | Morgan Stanley Capital Services | Sell | 140 BPS semi-annually | 04/20/10 | 9,000 | 183 | ||||||||||||||||||||
| Russian Federation, 7.50%, 03/31/30 | Deutsche Bank AG, New York | Sell | 105 BPS semi-annually | 06/20/10 | 8,000 | 91 | ||||||||||||||||||||
| Russian Federation, 7.50%, 03/31/30 | Deutsche Bank AG, New York | Sell | 104 BPS semi-annually | 06/20/10 | 10,000 | 111 | ||||||||||||||||||||
| Russian Federation, 7.50%, 03/31/30 | Deutsche Bank AG, New York | Sell | 101 BPS semi-annually | 07/20/10 | 6,000 | 78 | ||||||||||||||||||||
| Russian Federation, 7.50%, 03/31/30 | Morgan Stanley Capital Services | Buy | 90 BPS semi-annually | 07/20/10 | 11,000 | (105 | ) | |||||||||||||||||||
| Russian Federation, 7.50%, 03/31/30 | Morgan Stanley Capital Services | Buy | 75 BPS semi-annually | 08/20/10 | 8,500 | (41 | ) | |||||||||||||||||||
| REFERENCED OBLIGATION | | SWAP COUNTERPARTY | | BUY/SELL PROTECTION | | FUND PAYS/RECEIVES FIXED RATE (r) | | TERMINATION DATE | | NOTIONAL AMOUNT | | VALUE | ||||||||||||||
|---|---|---|---|---|---|---|---|---|---|---|---|---|---|---|---|---|---|---|---|---|---|---|---|---|---|---|
| Russian Federation, 7.50%, 03/31/30 | Union Bank of Switzerland AG | Buy | 90 BPS semi-annually | 08/20/10 | $ | 7,250 | $ | (70 | ) | |||||||||||||||||
| Russian Federation, 7.50%, 03/31/30 | Morgan Stanley Capital Services | Buy | 64 BPS semi-annually | 09/20/10 | 7,000 | (8 | ) | |||||||||||||||||||
| Russian Federation, 7.50%, 03/31/30 | Morgan Stanley Capital Services | Buy | 53 BPS semi-annually | 08/20/11 | 12,700 | 73 | ||||||||||||||||||||
| Russian Federation, 7.50%, 03/31/30 | Morgan Stanley Capital Services | Buy | 50 BPS semi-annually | 11/20/11 | 7,540 | 71 | ||||||||||||||||||||
| Russian Federation, 7.50%, 03/31/30 | Bear Stearns | Sell | 45.5 BPS semi-annually | 12/20/11 | 9,090 | (106 | ) | |||||||||||||||||||
| Russian Federation, 7.50%, 03/31/30 | Deutsche Bank AG, New York | Sell | 52.5 BPS semi-annually | 12/20/11 | 21,760 | (192 | ) | |||||||||||||||||||
| Russian Federation, 7.50%, 03/31/30 | Deutsche Bank AG, New York | Sell | 51 BPS semi-annually | 12/20/11 | 1,690 | (16 | ) | |||||||||||||||||||
| Russian Federation, 7.50%, 03/31/30 | Union Bank of Switzerland AG | Sell | 46 BPS semi-annually | 12/20/11 | 18,180 | (208 | ) | |||||||||||||||||||
| Russian Federation, 7.50%, 03/31/30 | Union Bank of Switzerland AG | Sell | 45.5 BPS semi-annually | 12/20/11 | 19,410 | (226 | ) | |||||||||||||||||||
| SafeWay, Inc., 5.80%, 08/15/12 | Morgan Stanley Capital Services | Buy | 65 BPS quarterly | 06/20/14 | 5,250 | (38 | ) | |||||||||||||||||||
| Sara Lee, 6.13%, 11/01/32 | Goldman Sachs Capital Management | Buy | 81 BPS quarterly | 03/20/17 | 5,550 | (90 | ) | |||||||||||||||||||
| Southwest Airlines, 6.50%, 03/01/12 | Bank of America | Buy | 58 BPS quarterly | 06/20/14 | 6,900 | 28 | ||||||||||||||||||||
| Southwest Airlines, 6.50%, 03/01/12 | Goldman Sachs Capital Management | Buy | 69 BPS quarterly | 06/20/14 | 5,200 | (13 | ) | |||||||||||||||||||
| Tate & Lyle, 6.50%, 06/28/12 | Lehman Brothers Special Financing | Buy | 42 BPS quarterly | 12/20/14 | 10,000 | 318 | ||||||||||||||||||||
| Texas Instruments, 8.75%, 04/01/07 | Lehman Brothers Special Financing | Buy | 36 BPS quarterly | 06/20/14 | 10,000 | (24 | ) | |||||||||||||||||||
| United Mexican States, 7.50%, 04/08/33 | Deutsche Bank AG, New York | Buy | 108 BPS semi-annually | 04/20/10 | 10,000 | (190 | ) | |||||||||||||||||||
| United Mexican States, 7.50%, 04/08/33 | Morgan Stanley Capital Services | Buy | 112 BPS semi-annually | 04/20/10 | 9,000 | (181 | ) | |||||||||||||||||||
| United Mexican States, 7.50%, 04/08/33 | Deutsche Bank AG, New York | Buy | 106 BPS semi-annually | 06/20/10 | 8,000 | (152 | ) | |||||||||||||||||||
| United Mexican States, 7.50%, 04/08/33 | Deutsche Bank AG, New York | Buy | 105 BPS semi-annually | 06/20/10 | 10,000 | (187 | ) | |||||||||||||||||||
| United Mexican States, 7.50%, 04/08/33 | Deutsche Bank AG, New York | Buy | 96 BPS semi-annually | 07/20/10 | 6,000 | (113 | ) | |||||||||||||||||||
| United Mexican States, 8.30%, 08/15/31 | Citibank, N.A. | Sell | 100 BPS semi-annually | 05/20/10 | 15,000 | 256 | ||||||||||||||||||||
| United Mexican States, 8.30%, 08/15/31 | Citibank, N.A. | Sell | 105 BPS semi-annually | 06/20/10 | 11,000 | 205 | ||||||||||||||||||||
| VTB Capital SA, 6.25%, 06/30/35 | Morgan Stanley Capital Services | Sell | 40 BPS semi-annually | 03/20/08 | 9,550 | 7 | ||||||||||||||||||||
| VTB Capital SA, 6.25%, 06/30/35 | Morgan Stanley Capital Services | Sell | 64 BPS semi-annually | 05/20/12 | 4,700 | (87 | ) | |||||||||||||||||||
| Western Union, 5.93%, 10/01/16 | Bear Stearns | Buy | 99 BPS quarterly | 09/20/14 | 4,750 | (129 | ) | |||||||||||||||||||
| $ | (11,131 | ) | ||||||||||||||||||||||||
| (1) | Premium paid of $296. | |
| (2) | Premium paid of $279. | |
| (3) | Premium received of $353. | |
| (4) | Premium received of $983. | |
| (5) | Premium received of $301. | |
| (6) | Premium paid of $1,361. |
AS OF AUGUST 31, 2007 (Unaudited) (continued)
| SWAP COUNTERPARTY | | REFERENCED OBLIGATION | | PRICE LOCK | | TERMINATION DATE | | NOTIONAL AMOUNT | | VALUE | | |||||||||||||||
|---|---|---|---|---|---|---|---|---|---|---|---|---|---|---|---|---|---|---|---|---|---|---|---|---|---|---|
| Bank of America (2) | BA Covered Bond Issuer, 5.50%, 06/14/12 | $ | 100.83 | 09/06/07 | $ | 47,700 | $ | 768 | ||||||||||||||||||
| Barclays Bank plc (2) | Nationwide Building Society, 5.50%, 07/18/12 | 101.54 | 09/13/07 | 41,410 | 1,138 | |||||||||||||||||||||
| Citibank, N.A. (1) | FNMA, 30 Year, 5.50% | 96.01 | 09/06/07 | 73,330 | (1,185 | ) | ||||||||||||||||||||
| Citibank, N.A. (1) | FNMA, 30 Year, 6.50%, TBA | 101.33 | 09/06/07 | 87,900 | (134 | ) | ||||||||||||||||||||
| Citibank, N.A. (1) | FNMA, 30 Year, 6.00%, TBA | 98.51 | 09/06/07 | 127,100 | (1,717 | ) | ||||||||||||||||||||
| Citibank, N.A. (1) | FNMA, 30 Year, 6.00%, TBA | 98.51 | 09/06/07 | 68,500 | (925 | ) | ||||||||||||||||||||
| Citibank, N.A. (2) | FNMA, 30 Year, 5.00%, TBA | 93.72 | 09/06/07 | 21,850 | 279 | |||||||||||||||||||||
| Citibank, N.A. (2) | FNMA, 30 Year, 6.50%, TBA | 101.33 | 09/06/07 | 117,000 | 178 | |||||||||||||||||||||
| Deutsche Bank AG, New York (1) | FNMA, 30 Year, 5.50% | 96.83 | 09/06/07 | 56,800 | (443 | ) | ||||||||||||||||||||
| Deutsche Bank AG, New York (1) | FNMA, 30 Year, 5.50% | 96.84 | 09/06/07 | 80,000 | (625 | ) | ||||||||||||||||||||
| Deutsche Bank AG, New York (1) | FNMA, 30 Year, 6.00% | 98.95 | 09/06/07 | 8,000 | (73 | ) | ||||||||||||||||||||
| Deutsche Bank AG, New York (1) | FHLMC Gold, 30 Year, 6.00%, TBA | 99.50 | 09/06/07 | 93,145 | (342 | ) | ||||||||||||||||||||
| Deutsche Bank AG, New York (1) | FNMA, 30 Year, 6.00% | 99.41 | 09/06/07 | 595,000 | (2,694 | ) | ||||||||||||||||||||
| Deutsche Bank AG, New York (1) | FNMA, 30 Year, 6.00%, TBA | 98.56 | 09/06/07 | 169,000 | (2,190 | ) | ||||||||||||||||||||
| Deutsche Bank AG, New York (2) | �� | FHLMC Gold, 30 Year, 5.50%, TBA | 97.03 | 09/06/07 | 31,650 | 185 | ||||||||||||||||||||
| Deutsche Bank AG, New York (2) | FHLMC Gold, 30 Year, 6.50% | 100.84 | 09/06/07 | 68,500 | 436 | |||||||||||||||||||||
| Deutsche Bank AG, New York (2) | FNMA, 15 Year, 5.00%, TBA | 97.20 | 09/11/07 | 63,000 | 261 | |||||||||||||||||||||
| Deutsche Bank AG, New York (2) | FNMA, 15 Year, 6.00% | 100.76 | 09/11/07 | 88,000 | 223 | |||||||||||||||||||||
| Deutsche Bank AG, New York (2) | FNMA, 30 Year, 5.00% | 94.29 | 09/06/07 | 77,000 | 571 | |||||||||||||||||||||
| Deutsche Bank AG, New York (2) | FNMA, 30 Year, 5.50% | 97.00 | 09/06/07 | 350,000 | 2,186 | |||||||||||||||||||||
| Deutsche Bank AG, New York (2) | FNMA, 30 Year, 5.50% | 97.00 | 09/06/07 | 26,000 | 162 | |||||||||||||||||||||
| Deutsche Bank AG, New York (2) | FNMA, 30 Year, 6.00% | 100.03 | 09/12/07 | 12,000 | 43 | |||||||||||||||||||||
| Deutsche Bank AG, New York (2) | FNMA, 30 Year, 6.50% | 101.91 | 09/12/07 | 18,000 | (8 | ) | ||||||||||||||||||||
| Deutsche Bank AG, New York (2) | FNMA, 30 Year, 6.50%, TBA | 101.34 | 09/06/07 | 297,750 | 418 | |||||||||||||||||||||
| Deutsche Bank AG, New York (2) | FNMA, 30 Year, 6.50%, TBA | 101.34 | 09/06/07 | 83,500 | 117 | |||||||||||||||||||||
| Deutsche Bank AG, New York (2) | FNMA, 30 Year, 7.00%, TBA | 102.72 | 09/06/07 | 104,500 | 82 | |||||||||||||||||||||
| Deutsche Bank AG, New York (2) | FNMA, 30 Year, 5.50%, TBA | 95.97 | 10/04/07 | 47,244 | 773 | |||||||||||||||||||||
| Deutsche Bank AG, New York (1) | FNMA, 30 Year, 5.00% | 95.21 | 10/04/07 | 70,500 | 140 | |||||||||||||||||||||
| Deutsche Bank AG, New York (2) | FNMA, 30 Year, 5.00% | 95.21 | 10/04/07 | 357,100 | (708 | ) | ||||||||||||||||||||
| Deutsche Bank AG, New York (2) | FHLMC, 4.50%, 01/15/14 | 97.20 | 09/21/07 | 10,495 | 79 | |||||||||||||||||||||
| Lehman Brothers Special Financing (1) | FNMA, 30 Year, 6.00% | 99.97 | 10/04/07 | 484,100 | — | |||||||||||||||||||||
| Lehman Brothers Special Financing (1) | FNMA, 15 Year, 6.00% | 100.28 | 09/11/07 | 87,000 | (638 | ) | ||||||||||||||||||||
| Lehman Brothers Special Financing (1) | FNMA, 30 Year, 5.00% | 93.88 | 09/06/07 | 25,000 | (281 | ) | ||||||||||||||||||||
| Lehman Brothers Special Financing (1) | FNMA, 30 Year, 5.50% | 96.44 | 09/06/07 | 82,000 | (973 | ) | ||||||||||||||||||||
| Lehman Brothers Special Financing (1) | FNMA, 30 Year, 5.50% | 96.48 | 09/06/07 | 32,000 | (365 | ) | ||||||||||||||||||||
| Lehman Brothers Special Financing (1) | FNMA, 30 Year, 5.50% | 96.48 | 09/06/07 | 58,915 | (671 | ) | ||||||||||||||||||||
| Lehman Brothers Special Financing (1) | FNMA, 30 Year, 5.50% | 96.58 | 09/06/07 | 46,000 | (481 | ) | ||||||||||||||||||||
| Lehman Brothers Special Financing (1) | GNMA, 30 Year, 6.00% | 100.04 | 09/12/07 | 18,000 | (73 | ) | ||||||||||||||||||||
| Lehman Brothers Special Financing (1) | FNMA, 30 Year, 6.50% | 101.33 | 09/06/07 | 169,000 | (257 | ) | ||||||||||||||||||||
| Lehman Brothers Special Financing (2) | FNMA, 30 Year, 6.00% | 99.97 | 10/04/07 | 315,000 | — | |||||||||||||||||||||
| Lehman Brothers Special Financing (2) | FNMA, 30 Year, 5.00% | 94.06 | 09/06/07 | 53,000 | 521 | |||||||||||||||||||||
| Lehman Brothers Special Financing (2) | FNMA, 30 Year, 5.00% | 95.31 | 10/04/07 | 132,300 | (391 | ) | ||||||||||||||||||||
| Lehman Brothers Special Financing (2) | FNMA, 30 Year, 6.50% | 101.33 | 09/06/07 | 67,800 | 103 | |||||||||||||||||||||
| Lehman Brothers Special Financing (2) | FNMA, 30 Year, 7.00% | 102.66 | 09/06/07 | 43,000 | 60 | |||||||||||||||||||||
| Lehman Brothers Special Financing (2) | FNMA, 30 Year, 5.50%, TBA | 95.97 | 10/04/07 | 2,500 | 41 | |||||||||||||||||||||
| Lehman Brothers Special Financing (2) | FNMA, 30 Year, 5.50%, TBA | 95.97 | 10/04/07 | 50,000 | 818 | |||||||||||||||||||||
| Lehman Brothers Special Financing (2) | FNMA, 30 Year, 6.00%, TBA | 100.06 | 09/11/07 | 198,000 | 1,885 | |||||||||||||||||||||
| SWAP COUNTERPARTY | | REFERENCED OBLIGATION | | PRICE LOCK | | TERMINATION DATE | | NOTIONAL AMOUNT | | VALUE | | |||||||||||||||
|---|---|---|---|---|---|---|---|---|---|---|---|---|---|---|---|---|---|---|---|---|---|---|---|---|---|---|
| Lehman Brothers Special Financing (2) | FNMA, 30 Year, 5.50%, TBA | $ | 95.94 | 10/04/07 | $ | 426,500 | $ | 7,112 | ||||||||||||||||||
| Morgan Stanley Capital Services (1) | FNMA, 30 Year, 5.00% | 93.93 | 09/06/07 | 223,000 | (2,394 | ) | ||||||||||||||||||||
| Morgan Stanley Capital Services (1) | FNMA, 30 Year, 5.50% | 96.71 | 09/06/07 | 138,000 | (1,261 | ) | ||||||||||||||||||||
| Morgan Stanley Capital Services (1) | FNMA, 30 Year, 6.00% | 101.25 | 09/06/07 | 2,000 | (5 | ) | ||||||||||||||||||||
| Morgan Stanley Capital Services (1) | FNMA, 30 Year, 6.50% | 101.34 | 09/06/07 | 23,000 | (32 | ) | ||||||||||||||||||||
| Morgan Stanley Capital Services (2) | FNMA, 30 Year, 6.00% | 100.06 | 10/04/07 | 272,100 | (592 | ) | ||||||||||||||||||||
| Union Bank of Switzerland AG (2) | Northern Rock plc, 5.63%, 06/22/17 | 101.47 | 09/20/07 | 14,795 | 24 | |||||||||||||||||||||
| Union Bank of Switzerland AG (2) | Tennessee Valley Authority, 5.50%, 07/18/17 | 102.90 | 09/18/07 | 21,715 | — | |||||||||||||||||||||
| Union Bank of Switzerland AG (2) | FNMA, 5.38%, 06/12/17 | 101.86 | 09/27/07 | 45,730 | 112 | |||||||||||||||||||||
| Union Bank of Switzerland AG (1) | FNMA, 30 Year, 5.50% | 96.72 | 09/06/07 | 139,000 | (1,259 | ) | ||||||||||||||||||||
| Union Bank of Switzerland AG (1) | FNMA, 30 Year, 5.50%, TBA | 96.03 | 10/04/07 | 267,500 | 4,211 | |||||||||||||||||||||
| Union Bank of Switzerland AG (1) | FNMA, 30 Year, 6.00%, TBA | 98.56 | 09/06/07 | 182,000 | (2,359 | ) | ||||||||||||||||||||
| Union Bank of Switzerland AG (2) | FHLMC Gold, 30 Year, 6.00%, TBA | 99.56 | 09/06/07 | 81,100 | 247 | |||||||||||||||||||||
| Union Bank of Switzerland AG (2) | FNMA, 30 Year, 5.00% | 94.29 | 09/06/07 | 107,500 | 764 | |||||||||||||||||||||
| Union Bank of Switzerland AG (2) | FNMA, 30 Year, 6.00% | 99.47 | 09/06/07 | 34,000 | 133 | |||||||||||||||||||||
| Union Bank of Switzerland AG (2) | FNMA, 30 Year, 6.00% | 101.31 | 09/06/07 | 91,000 | 156 | |||||||||||||||||||||
| $ | 1,150 | |||||||||||||||||||||||||
| (1) | Fund pays the excess of the market price over the price lock or receives the excess of the price lock over the market price. |
| (2) | Fund pays the excess of the price lock over the market price or receives the excess of the market price over the price lock. |
AS OF AUGUST 31, 2007 (Unaudited) (continued)
| SWAP COUNTERPARTY | | REFERENCED OBLIGATION | | PAYMENTS MADE BY THE FUND (r) | | PAYMENTS RECEIVED BY THE FUND (r) | | TERMINATION DATE | | NOTIONAL AMOUNT | | VALUE | ||||||||||||||
|---|---|---|---|---|---|---|---|---|---|---|---|---|---|---|---|---|---|---|---|---|---|---|---|---|---|---|
| Deutsche Bank AG, New York | Lehman AAA 8.5 Year + CMBS Index | Spread Lock with Carry Amount + 10 BPS | Total Return on Lehman AAA 8.5 Year + CMBS Index | 09/01/07 | $ | 37,300 | $ | (224 | ) | |||||||||||||||||
| Morgan Stanley Capital Services | TransCredit Bank, 7.30%, 02/26/09 | 3 Month LIBOR + 20 BPS | Total Return on TransCredit Bank, 7.30%, 02/26/09 | 02/26/09 | 18,700 | 330 | ||||||||||||||||||||
| Morgan Stanley Capital Services | OGK/Rushydro’s, 12/13/13 | 3 Month LIBOR + 20 BPS | Total Return on OGK/Rushydro’s, 12/13/13 | 12/25/10 | 3,840 | 57 | ||||||||||||||||||||
| $ | 163 | |||||||||||||||||||||||||
| RATE TYPE (r) | ||||||||||||||||||||||
|---|---|---|---|---|---|---|---|---|---|---|---|---|---|---|---|---|---|---|---|---|---|---|
| SWAP COUNTERPARTY | | PAYMENTS MADE BY THE FUND | | PAYMENTS RECEIVED BY THE FUND | | TERMINATION DATE | | NOTIONAL AMOUNT | | VALUE | ||||||||||||
| Merrill Lynch Capital Services | 4.77% semi-annually | 3 month LIBOR quarterly | 06/18/08 | $ | 397,000 | $ | (132 | ) | ||||||||||||||
AS OF AUGUST 31, 2007 (Unaudited)
| PRINCIPAL AMOUNT($) | | SECURITY DESCRIPTION | | VALUE($) | |||||||
|---|---|---|---|---|---|---|---|---|---|---|---|
Long-Term Investments — 96.4% | |||||||||||
Corporate Bonds — 35.1% | |||||||||||
Bermuda — 0.3% | |||||||||||
| 715 | Citic Resources Finance Ltd., 6.75%, 05/15/14 (e) (m) | 680 | |||||||||
Botswana — 0.6% | |||||||||||
| Barclays Bank plc, | |||||||||||
| 1,030 | VAR, 0.00%, 05/10/10 | 1,044 | |||||||||
| 400 | VAR, 0.00%, 05/28/10 | 400 | |||||||||
| 1,444 | |||||||||||
Brazil — 5.7% | |||||||||||
| BRL 1,730 | Citibank N.A., Brazilian Real Notes, 15.00%, 07/02/10 | 999 | |||||||||
| 15,925 | Lehman Brothers Holdings, Inc., 10.00%, 01/03/12 (linked to Brazilian Real Notes, 10.00%, 01/03/12) (m) | 7,735 | |||||||||
| Morgan Stanley & Co., Inc., | |||||||||||
| $3,600 | 12.15%, 01/05/22 (linked to Republic of Brazil Government Bond, 12.15%, 01/05/22) (e) (m) | 3,849 | |||||||||
| 1,000 | 14.40%, 08/04/16 (linked to Republic of Brazil Government Bond, 14.40%, 08/04/16) (e) | 1,212 | |||||||||
| 13,795 | |||||||||||
Dominican Republic — 1.6% | |||||||||||
| Citigroup Funding, Inc., | |||||||||||
| 1,030 | Zero Coupon, 10/08/07 (linked to Dominican Republic Government Bond, Zero Coupon, 10/05/07) (e) (m) | 1,010 | |||||||||
| 2,615 | VAR, 1.00%, 03/12/12 (linked to Dominican Republic Government Bond, 1.00%, 03/12/12) (e) (i) | 2,744 | |||||||||
| 3,754 | |||||||||||
Egypt — 0.8% | |||||||||||
| 1,845 | Citigroup Funding, Inc., Zero Coupon, 10/04/07 (linked to Egypt Treasury Bill, Zero Coupon, 10/02/07) (e) (m) | 2,035 | |||||||||
Ghana — 0.6% | |||||||||||
| 1,550 | Barclays Bank plc, Zero Coupon, 04/07/10 (linked to Government of Ghana, Zero Coupon, 04/07/10) (e) (i) | 1,544 | |||||||||
Indonesia — 1.9% | |||||||||||
| 3,160 | Deutsche Bank Financial, Inc., 15.00%, 07/20/18 (linked to Indonesia Government Bond, 15.00%, 07/15/18) | 4,601 | |||||||||
Ireland — 0.3% | |||||||||||
| 640 | BW Group Ltd., 6.63%, 06/28/17 (e) | 640 | |||||||||
Luxembourg — 0.9% | |||||||||||
| 1,945 | ALROSA Finance S.A., 8.88%, 11/17/14 (e) | 2,120 | |||||||||
Mexico — 1.2% | |||||||||||
| MXN 40,000 | Depfa Bank plc, Zero Coupon, 06/15/15 | 1,931 | |||||||||
| $1,065 | Pemex Project Funding Master Trust, 5.75%, 12/15/15 | 1,053 | > | ||||||||
| 2,984 | |||||||||||
Peru — 1.5% | |||||||||||
| 3,070 | IIRSA Norte Finance Ltd., 8.75%, 05/30/24 | 3,584 | |||||||||
Russia — 9.6% | |||||||||||
| Gaz Capital for Gazprom | |||||||||||
| 1,590 | 6.21%, 11/22/16 (e) | 1,532 | |||||||||
| 885 | 6.51%, 03/07/22 (e) | 855 | |||||||||
| 5230 | 7.29%, 08/16/37 (e) (m) | 5,361 | |||||||||
| 1,620 | 8.63%, 04/28/34 (e) | 1,988 | |||||||||
| 2,370 | Gazprom International S.A., 7.20%, 02/01/20 | 2,409 | |||||||||
| Gazstream S.A. for OAO Gazprom, | |||||||||||
| 3,406 | 5.63%, 07/22/13 (e) | 3,325 | |||||||||
| 2,625 | 5.63%, 07/22/13 | 2,575 | |||||||||
| 720 | RSHB Capital S.A. for OJSC Russian Agricultural Bank, 7.18%, 05/16/13 | 735 | |||||||||
| 2,980 | TransCapitalInvest Ltd. for OJSC AK Transneft, 5.67%, 03/05/14 (e) | 2,906 | |||||||||
| 1,600 | VTB Capital S.A. for Vneshtorgbank, 6.25%, 06/30/35 | 1,560 | |||||||||
| 23,246 | |||||||||||
Trinidad & Tobago — 1.4% | |||||||||||
| 3,452 | National Gas Co. of Trinidad & Tobago Ltd., 6.05%, 01/15/36 | 3,313 | |||||||||
Turkey — 3.4% | |||||||||||
| TRY 11,535 | Credit Suisse, Nassau Branch, 14.00%, 01/19/11 (linked to Republic of Turkey Government Bond, 14.00%, 01/19/11) | 8,280 | |||||||||
Uganda — 0.4% | |||||||||||
| $1,030 | Citigroup Funding, Inc., VAR, 0.00%, 03/17/08 (linked to Uganda Treasury Bill, 0.00%, 03/13/08) (i) | 1,035 | |||||||||
Ukraine — 4.0% | |||||||||||
| Credit Suisse First Boston International for CJSC The EXIM of Ukraine, | |||||||||||
| 320 | 6.80%, 10/04/12 | 302 | |||||||||
| 7,855 | 7.65%, 09/07/11 | 7,619 | |||||||||
| 1,695 | Dresdner Kleinwort Wasserstein for CJSC The EXIM of Ukraine, 7.75%, 09/23/09 | 1,684 | |||||||||
| 9,605 | |||||||||||
Venezuela — 0.9% | |||||||||||
| 3,900 | Petroleos de Venezuela S.A., 5.38%, 04/12/27 | 2,262 | |||||||||
| Total Corporate Bonds (Cost $68,599) | 84,922 | ||||||||||
AS OF AUGUST 31, 2007 (Unaudited) (continued)
| PRINCIPAL AMOUNT($) | | SECURITY DESCRIPTION | | VALUE($) | |||||||
|---|---|---|---|---|---|---|---|---|---|---|---|
Long-Term Investments — Continued | |||||||||||
Foreign Government Securities — 59.0% | |||||||||||
Argentina — 10.9% | |||||||||||
| ARS 16,141 | Central Bank of Argentina, VAR, 0.00%, 02/04/18 | 6,224 | |||||||||
| $750 | Province of Buenos Aires, 9.38%, 09/14/18 | 596 | |||||||||
| Republic of Argentina, | |||||||||||
| 3,900 | 7.00%, 10/03/15 (m) | 3,126 | |||||||||
| ARS 11,773 | 11.31%, 01/20/10 | 3,532 | |||||||||
| 14,400 | VAR, 0.00%, 03/25/10 | 4,331 | |||||||||
| 11,300 | VAR, 0.00%, 09/30/14 (m) | 3,339 | |||||||||
| 6,030 | VAR, 0.00%, 12/31/33 (m) | 2,136 | |||||||||
| $16,800 | VAR, 0.00%, 12/15/35 | 1,974 | |||||||||
| ARS 8,480 | VAR, 0.00%, 12/31/38 (m) | 1,115 | |||||||||
| 26,373 | |||||||||||
Barbados — 0.2% | |||||||||||
| $390 | Government of Barbados, 6.63%, 12/05/35 (e) | 387 | |||||||||
Brazil — 8.7% | |||||||||||
| 300 | Banco Nacional de Desenvolvimento Economico e Social, VAR, 5.17%, 06/16/08 | 295 | |||||||||
| Federal Republic of Brazil, | |||||||||||
| 6,900 | 7.13%, 01/20/37 | 7,504 | |||||||||
| 1,600 | 8.75%, 02/04/25 | 1,995 | |||||||||
| 800 | 8.88%, 10/14/19 | 974 | |||||||||
| 6,195 | 12.25%, 03/06/30 | 10,346 | |||||||||
| 21,114 | |||||||||||
Chile — 1.6% | |||||||||||
| 3,650 | Government of Chile, 7.13%, 01/11/12 | 3,935 | |||||||||
Colombia — 3.8% | |||||||||||
| COP 3,692,000 | Bogota Distrio Capital, 9.75%, 07/26/28 (e) (m) | 1,585 | |||||||||
| Republic of Colombia, | |||||||||||
| $2,055 | 7.38%, 01/27/17 | 2,183 | |||||||||
| 1,500 | 10.75%, 01/15/13 | 1,807 | |||||||||
| COP 6,935,000 | 12.00%, 10/22/15 | 3,485 | |||||||||
| 9,060 | |||||||||||
Costa Rica — 1.7% | |||||||||||
| $3,268 | Republic of Costa Rica, 10.00%, 08/01/20 | 4,216 | |||||||||
Dominican Republic — 0.2% | |||||||||||
| Government of Dominican Republic, | |||||||||||
| 322 | 9.04%, 01/23/18 (e) | 352 | |||||||||
| 30 | 9.04%, 01/23/18 | 33 | |||||||||
| 45 | 9.50%, 09/27/11 | 48 | |||||||||
| 433 | |||||||||||
Egypt — 0.7% | |||||||||||
| Arab Republic of Egypt, | |||||||||||
| EGP10,000 | 8.75%, 07/18/12 (e) (m) | 1,738 | |||||||||
El Salvador — 2.2% | |||||||||||
| Republic of El Salvador, | |||||||||||
| $675 | 7.63%, 09/21/34 (e) | 742 | |||||||||
| 205 | 7.65%, 06/15/35 | 223 | |||||||||
| 2,148 | 7.75%, 01/24/23 | 2,395 | |||||||||
| 1,735 | 8.25%, 04/10/32 (e) (m) | 2,004 | |||||||||
| 5,364 | |||||||||||
Guatemala — 2.8% | |||||||||||
| Republic of Guatemala, | |||||||||||
| 2,935 | 8.13%, 10/06/34 | 3,353 | |||||||||
| 2,910 | 10.25%, 11/08/11 | 3,303 | |||||||||
| 6,656 | |||||||||||
Iraq — 0.3% | |||||||||||
| 1,250 | Republic of Iraq, 5.80%, 01/15/28 (e) | 713 | |||||||||
Mexico — 4.8% | |||||||||||
| United Mexican States, | |||||||||||
| 1,250 | 8.00%, 09/24/22 | 1,527 | |||||||||
| MXN 12,496 | 8.00%, 12/24/08 | 1,139 | |||||||||
| $6,050 | 8.30%, 08/15/31 | 7,797 | |||||||||
| 875 | 8.30%, 08/15/31 | 1,128 | |||||||||
| 11,591 | |||||||||||
Peru — 2.5% | |||||||||||
| Republic of Peru, | |||||||||||
| 1,193 | 6.55%, 03/14/37 | 1,189 | |||||||||
| 570 | 7.35%, 07/21/25 | 627 | |||||||||
| 3,375 | 9.88%, 02/06/15 | 4,163 | |||||||||
| 5,979 | |||||||||||
Russia — 5.1% | |||||||||||
| Russian Federation, | |||||||||||
| 3,989 | 8.25%, 03/31/10 | 4,100 | |||||||||
| 1,750 | 11.00%, 07/24/18 | 2,450 | |||||||||
| 3,334 | 12.75%, 06/24/28 | 5,876 | |||||||||
| 12,426 | |||||||||||
Trinidad & Tobago — 0.1% | |||||||||||
| Government of Trinidad & Tobago | |||||||||||
| 307 | 5.88%, 05/17/27 | 289 | |||||||||
Turkey — 1.2% | |||||||||||
| Republic of Turkey, | |||||||||||
| 620 | 8.00%, 02/14/34 | 666 | |||||||||
| 2,000 | 12.38%, 06/15/09 | 2,217 | |||||||||
| 2,883 | |||||||||||
Ukraine — 3.2% | |||||||||||
| Government of Ukraine, | |||||||||||
| 2,390 | 6.58%, 11/21/16 (e) | 2,351 | |||||||||
| 2,065 | 7.65%, 06/11/13 | 2,168 | |||||||||
| 3,000 | FRN, 8.69%, 08/05/09 | 3,154 | |||||||||
| 7,673 | |||||||||||
| PRINCIPAL AMOUNT($) | | SECURITY DESCRIPTION | | VALUE($) | |||||||
|---|---|---|---|---|---|---|---|---|---|---|---|
Long-Term Investments — Continued | |||||||||||
Uruguay — 1.3% | |||||||||||
| Republic of Uruguay, | |||||||||||
| UYU 50,960 | 5.00%, 09/14/18 (m) | 2,425 | |||||||||
| $465 | 7.50%, 03/15/15 | 486 | |||||||||
| 240 | 9.25%, 05/17/17 | 280 | |||||||||
| 3,191 | |||||||||||
Venezuela — 7.7% | |||||||||||
| Republic of Venezuela, | |||||||||||
| 2,022 | 9.25%, 09/15/27 | 2,007 | |||||||||
| 2,395 | 9.38%, 01/13/34 | 2,377 | |||||||||
| 12,116 | 10.75%, 09/19/13 | 13,012 | |||||||||
| 1,020 | 13.63%, 08/15/18 | 1,301 | |||||||||
| 18,697 | |||||||||||
| Total Foreign Government Securities (Cost $164,478) | 142,718 | ||||||||||
U.S. Treasury Obligations — 1.4% | |||||||||||
United States — 1.4% | |||||||||||
| U.S. Treasury Notes, | |||||||||||
| 3,000 | 4.75%, 08/15/17 | 3,049 | |||||||||
| 205 | 4.88%, 04/30/08 (k) (m) | 206 | |||||||||
| Total U.S. Treasury Obligations (Cost $3,257) | 3,255 | ||||||||||
| SHARES | | SECURITY DESCRIPTION | | VALUE($) | |||||||
|---|---|---|---|---|---|---|---|---|---|---|---|
Warrants — 0.9% | |||||||||||
| Republic of Argentina, | |||||||||||
| ARS 43,114 | Expires 12/15/35 (linked to GDP) (a) (m) | 1,261 | |||||||||
| EUR 6,430 | Expires 12/15/35 (linked to GDP) (a) | 911 | |||||||||
| $1 | Republic of Venezuela Oil Price Index, expires 04/15/20 (a) | 46 | |||||||||
| Total Warrants (Cost $1,974) | 2,218 | ||||||||||
| Total Long-Term Investments (Cost $238,308) | 233,113 | ||||||||||
Short-Term Investment — 3.6% | |||||||||||
Investment Company — 3.6% | |||||||||||
| 8,749 | JPMorgan Prime Money Market Fund, Institutional Class (b) (m) (Cost $8,749) | 8,749 | |||||||||
Total Investments — 100.0% (Cost $247,057) | 241,862 | ||||||||||
Other Assets in Excess of Liabilities — 0.0% (g) | 21 | ||||||||||
NET ASSETS — 100.0% | $ | 241,883 | |||||||||
| NUMBER OF CONTRACTS | | Description | | Expiration Date | | Notional Value at 08/31/07 | | Net Unrealized Appreciation (Depreciation) | ||||||||||
|---|---|---|---|---|---|---|---|---|---|---|---|---|---|---|---|---|---|---|
Long Futures Outstanding | ||||||||||||||||||
| 23 | 2 Year U.S. Treasury Notes | December, 2007 | $ | 4,742 | $ | 1 | ||||||||||||
| 9 | 5 Year U.S. Treasury Notes | December, 2007 | 960 | 1 | ||||||||||||||
| 216 | 10 Year U.S. Treasury Notes | December, 2007 | 23,554 | 34 | ||||||||||||||
| 37 | U.S. Treasury Bonds | December, 2007 | 4,128 | 8 | ||||||||||||||
| $ | 44 | |||||||||||||||||
| CONTRACTS TO BUY | | | SETTLEMENT DATE | | SETTLEMENT VALUE | | VALUE AT 08/31/07 | | NET UNREALIZED APPRECIATION (DEPRECIATION) | |||||||||||||
|---|---|---|---|---|---|---|---|---|---|---|---|---|---|---|---|---|---|---|---|---|---|---|
| 8,500,000 | TRY | 9/28/2007 | $ | 6,449 | $ | 6,487 | $ | 38 | ||||||||||||||
| CONTRACTS TO SELL | | | SETTLEMENT DATE | | SETTLEMENT VALUE | | VALUE AT 08/31/07 | | NET UNREALIZED APPRECIATION (DEPRECIATION) | |||||||||||||
|---|---|---|---|---|---|---|---|---|---|---|---|---|---|---|---|---|---|---|---|---|---|---|
| 1,600,000 | EUR | 09/28/07 | $ | (2,158 | ) | $ | (2,182 | ) | $ | (24 | ) | |||||||||||
| 8,500,000 | TRY | 09/28/07 | (6,479 | ) | (6,487 | ) | (8 | ) | ||||||||||||||
| $ | (32 | ) | ||||||||||||||||||||
AS OF AUGUST 31, 2007 (Unaudited) (continued)
| REFERENCED OBLIGATION | | Swap Counterparty | | Buy/Sell Protection | | Fund Pays/Receives Fixed Rate (r) | | Termination Date | | Notional Amount | | Value | ||||||||||||||
|---|---|---|---|---|---|---|---|---|---|---|---|---|---|---|---|---|---|---|---|---|---|---|---|---|---|---|
| Bank TuranAlem Finance BV, 8.50%, 02/10/15 | HSBC | Sell | 190 BPS quarterly | 09/14/07 | $ | 1,470 | $ | 3 | ||||||||||||||||||
| Gazprom International S.A., 7.20%, 02/01/20 | Lehman Brothers Special Financing | Buy | 112 BPS semi-annually | 04/20/11 | 5,180 | 76 | ||||||||||||||||||||
| Gazprom International S.A., 8.63%, 04/28/34 | Deutsche Bank AG, New York | Sell | 39 BPS semi-annually | 04/20/08 | 2,340 | (1 | ) | |||||||||||||||||||
| Government of Jamaica, 11.63%, 01/15/22 | Bear Stearns | Buy | 341 BPS semi-annually | 07/20/17 | 800 | 75 | ||||||||||||||||||||
| Government of Jamaica, 11.63%, 01/15/22 | Bear Stearns | Buy | 397 BPS semi-annually | 08/20/17 | 210 | 13 | ||||||||||||||||||||
| Government of Ukraine, 7.65%, 06/11/13 | Morgan Stanley Capital Services | Sell | 190 BPS semi-annually | 07/20/10 | 500 | 10 | ||||||||||||||||||||
| Government of Ukraine, 7.65%, 06/11/13 | Morgan Stanley Capital Services | Sell | 170 BPS semi-annually | 08/20/10 | 750 | 11 | ||||||||||||||||||||
| Government of Ukraine, 7.65%, 06/11/13 | Union Bank of Switzerland AG | Sell | 184 BPS semi-annually | 08/20/10 | 300 | 6 | ||||||||||||||||||||
| Government of Ukraine, 7.65%, 06/11/13 | Morgan Stanley Capital Services | Sell | 176 BPS semi-annually | 09/20/10 | 400 | 6 | ||||||||||||||||||||
| Government of Ukraine, 7.65%, 06/11/13 | Morgan Stanley Capital Services | Sell | 203 BPS semi-annually | 08/20/11 | 660 | 12 | ||||||||||||||||||||
| Government of Ukraine, 7.65%, 06/11/13 | Citibank, N.A. | Sell | 175 BPS semi-annually | 10/20/11 | 3,030 | 12 | ||||||||||||||||||||
| Government of Ukraine, 7.65%, 06/11/13 | Citibank, N.A. | Sell | 189 BPS semi-annually | 10/20/11 | 1,670 | 11 | ||||||||||||||||||||
| Government of Ukraine, 7.65%, 06/11/13 | Morgan Stanley Capital Services | Sell | 162 BPS semi-annually | 11/20/11 | 740 | (4 | ) | |||||||||||||||||||
| Government of Ukraine, 7.65%, 06/11/13 | Barclays Bank plc | Sell | 156 BPS semi-annually | 04/20/12 | 530 | (7 | ) | |||||||||||||||||||
| Government of Ukraine, 7.65%, 06/11/13 | Deutsche Bank AG, New York | Sell | 158 BPS semi-annually | 04/20/12 | 350 | (4 | ) | |||||||||||||||||||
| Government of Ukraine, 7.65%, 06/11/13 | Citibank, N.A. | Sell | 137.75 BPS semi-annually | 06/20/12 | 2,860 | (65 | ) | |||||||||||||||||||
| Kazommertzbank International BV, 7.88%, 04/07/14 | Morgan Stanley Capital Services | Sell | 175 BPS semi-annually | 08/20/08 | 2,100 | (30 | ) | |||||||||||||||||||
| Kazommertzbank International BV, 7.88%, 04/07/14 | Deutsche Bank AG, New York | Sell | 235 BPS semi-annually | 03/20/12 | 350 | (20 | ) | |||||||||||||||||||
| Kazommertzbank International BV, 7.88%, 04/07/14 | Morgan Stanley Capital Services | Sell | 220 BPS semi-annually | 03/20/12 | 640 | (40 | ) | |||||||||||||||||||
| Kazommertzbank International BV, 7.88%, 04/07/14 | Morgan Stanley Capital Services | Sell | 230 BPS semi-annually | 03/20/12 | 2,240 | (131 | ) | |||||||||||||||||||
| Kazommertzbank International BV, 7.88%, 04/07/14 | Morgan Stanley Capital Services | Buy | 300 BPS semi-annually | 08/20/12 | 420 | 20 | ||||||||||||||||||||
| Kazommertzbank International BV, 8.00%, 11/03/15 | Morgan Stanley Capital Services | Sell | 230 BPS semi-annually | 03/20/12 | 750 | (44 | ) | |||||||||||||||||||
| Pemex, 9.50%, 09/15/27 | Citibank, N.A. | Buy | 125 BPS semi-annually | 06/20/10 | 1,000 | (21 | ) | |||||||||||||||||||
| Petroleos De Venezuela S.A., 5.25%, 04/12/17 | Union Bank of Switzerland AG | Sell | 278 BPS semi-annually | 06/20/12 | 510 | (42 | ) | |||||||||||||||||||
| Petroleos De Venezuela S.A., 5.25%, 04/12/17 | Union Bank of Switzerland AG | Sell | 344 BPS semi-annually | 07/20/12 | 520 | (32 | ) | |||||||||||||||||||
| Petroleos De Venezuela S.A., 5.25%, 04/12/27 | Union Bank of Switzerland AG | Sell | 355 BPS semi-annually | 07/20/12 | 770 | (43 | ) | |||||||||||||||||||
| Petroleos De Venezuela S.A., 5.38%, 04/12/27 | Bear Stearns | Sell | 342 BPS semi-annually | 07/20/12 | 350 | (16 | ) | |||||||||||||||||||
| Petroleos De Venezuela S.A., 5.38%, 04/12/27 | Bear Stearns | Sell | 361 BPS semi-annually | 07/20/12 | 380 | (21 | ) | |||||||||||||||||||
| Petroleos De Venezuela S.A., 5.38%, 04/12/27 | Morgan Stanley Capital Services | Sell | 340 BPS semi-annually | 07/20/12 | 870 | (56 | ) | |||||||||||||||||||
| Petroleos De Venezuela S.A., 5.38%, 04/12/27 | Morgan Stanley Capital Services | Sell | 355 BPS semi-annually | 07/20/12 | 960 | (54 | ) | |||||||||||||||||||
| Petroleos De Venezuela S.A., 5.50%, 04/12/37 | Lehman Brothers Special Financing | Sell | 265 BPS semi-annually | 05/20/12 | 3,100 | (258 | ) | |||||||||||||||||||
| Petroleos De Venezuela S.A., 5.50%, 04/12/37 | Lehman Brothers Special Financing | Sell | 328 BPS semi-annually | 07/20/12 | 190 | (13 | ) | |||||||||||||||||||
| Petroleos De Venezuela S.A., 5.50%, 04/12/37 | Lehman Brothers Special Financing | Sell | 340 BPS semi-annually | 07/20/12 | 870 | (55 | ) | |||||||||||||||||||
| Petroleos De Venezuela S.A., 5.50%, 04/12/37 | Lehman Brothers Special Financing | Sell | 341 BPS semi-annually | 07/20/12 | 870 | (55 | ) | |||||||||||||||||||
| Petroleos De Venezuela S.A., 5.50%, 04/12/37 | Lehman Brothers Special Financing | Sell | 355 BPS semi-annually | 07/20/12 | 170 | (10 | ) | |||||||||||||||||||
| Republic of Argentina, 8.28%, 12/31/33 | Lehman Brothers Special Financing | Sell | 343 BPS semi-annually | 09/20/10 | 350 | 1 | ||||||||||||||||||||
| Republic of Argentina, 8.28%, 12/31/33 | Citibank, N.A. | Sell | 296.5 BPS semi-annually | 10/20/10 | 160 | (3 | ) | |||||||||||||||||||
| Republic of Argentina, 8.28%, 12/31/33 | Lehman Brothers Special Financing | Sell | 303.5 BPS semi-annually | 10/20/10 | 750 | (10 | ) | |||||||||||||||||||
| Republic of Argentina, 8.28%, 12/31/33 | Morgan Stanley Capital Services | Sell | 338 BPS semi-annually | 10/20/10 | 400 | — | (h) | |||||||||||||||||||
| Republic of Argentina, 8.28%, 12/31/33 | Lehman Brothers Special Financing | Sell | 295 BPS semi-annually | 03/20/11 | 840 | (20 | ) | |||||||||||||||||||
| Republic of Argentina, 8.28%, 12/31/33 | Lehman Brothers Special Financing | Buy | 208.5 BPS semi-annually | 09/20/11 | 550 | 38 | ||||||||||||||||||||
| REFERENCED OBLIGATION | | SWAP COUNTERPARTY | | BUY/SELL PROTECTION | | FUND PAYS/RECEIVES FIXED RATE (r) | | Termination Date | | Notional Amount | | Value | ||||||||||||||
|---|---|---|---|---|---|---|---|---|---|---|---|---|---|---|---|---|---|---|---|---|---|---|---|---|---|---|
| Republic of Argentina, 8.28%, 12/31/33 | Deutsche Bank AG, New York | Sell | 196 BPS semi-annually | 04/20/12 | $ | 1,990 | $ | (183 | ) | |||||||||||||||||
| Republic of Argentina, 8.28%, 12/31/33 | Citibank, N.A. | Sell | 216 BPS semi-annually | 06/20/12 | 720 | (66 | ) | |||||||||||||||||||
| Republic of Argentina, 8.28%, 12/31/33 | Deutsche Bank AG, New York | Sell | 214 BPS semi-annually | 06/20/12 | 1,140 | (105 | ) | |||||||||||||||||||
| Republic of Argentina, 8.28%, 12/31/33 | Morgan Stanley Capital Services | Sell | 202 BPS semi-annually | 06/20/12 | 2,150 | (209 | ) | |||||||||||||||||||
| Republic of Argentina, 8.28%, 12/31/33 | Morgan Stanley Capital Services | Sell | 216 BPS semi-annually | 06/20/12 | 1,430 | (131 | ) | |||||||||||||||||||
| Republic of Argentina, 8.28%, 12/31/33 | Bear Stearns | Buy | 258 BPS semi-annually | 07/20/12 | 350 | 28 | ||||||||||||||||||||
| Republic of Argentina, 8.28%, 12/31/33 | Deutsche Bank AG, New York | Sell | 208 BPS quarterly | 07/20/12 | 830 | (82 | ) | |||||||||||||||||||
| Republic of Argentina, 8.28%, 12/31/33 | Deutsche Bank AG, New York | Sell | 232.67 BPS semi-annually | 07/20/12 | 1,450 | (129 | ) | |||||||||||||||||||
| Republic of Argentina, 8.28%, 12/31/33 | Lehman Brothers Special Financing | Buy | 258 BPS semi-annually | 07/20/12 | 190 | 15 | ||||||||||||||||||||
| Republic of Argentina, 8.28%, 12/31/33 | Lehman Brothers Special Financing | Buy | 263 BPS semi-annually | 07/20/12 | 870 | 67 | ||||||||||||||||||||
| Republic of Argentina, 8.28%, 12/31/33 | Lehman Brothers Special Financing | Buy | 258 BPS semi-annually | 07/20/12 | 1,070 | 85 | ||||||||||||||||||||
| Republic of Argentina, 8.28%, 12/31/33 | Morgan Stanley Capital Services | Buy | 262 BPS semi-annually | 07/20/12 | 870 | 67 | ||||||||||||||||||||
| Republic of Argentina, 8.28%, 12/31/33 | Union Bank of Switzerland AG | Buy | 262 BPS semi-annually | 07/20/12 | 520 | 40 | ||||||||||||||||||||
| Republic of Argentina, 8.28%, 12/31/33 | Deutsche Bank AG, New York | Sell | 308 BPS semi-annually | 08/20/12 | 2,390 | (151 | ) | |||||||||||||||||||
| Republic of Argentina, 8.28%, 12/31/33 | Deutsche Bank AG, New York | Sell | 365 BPS semi-annually | 08/20/12 | 540 | (22 | ) | |||||||||||||||||||
| Republic of Argentina, 8.28%, 12/31/33 | Lehman Brothers Special Financing | Sell | 365 BPS semi-annually | 08/20/12 | 2,000 | (82 | ) | |||||||||||||||||||
| Republic of Argentina, 8.28%, 12/31/33 | Lehman Brothers Special Financing | Sell | 375 BPS semi-annually | 08/20/12 | 450 | (17 | ) | |||||||||||||||||||
| Republic of Argentina, 8.28%, 12/31/33 | Lehman Brothers Special Financing | Sell | 425 BPS semi-annually | 08/20/12 | 200 | (3 | ) | |||||||||||||||||||
| Republic of Argentina, 8.28%, 12/31/33 | Bear Stearns | Sell | 341 BPS semi-annually | 07/20/17 | 800 | (99 | ) | |||||||||||||||||||
| Republic of Argentina, 8.28%, 12/31/33 | Bear Stearns | Sell | 407 BPS semi-annually | 08/20/17 | 210 | (19 | ) | |||||||||||||||||||
| Republic of Brazil, 12.25%, 03/06/30 | Lehman Brothers Special Financing | Buy | 300 BPS semi-annually | 09/20/10 | 350 | (27 | ) | |||||||||||||||||||
| Republic of Brazil, 12.25%, 03/06/30 | Lehman Brothers Special Financing | Buy | 261.5 BPS semi-annually | 10/20/10 | 750 | (48 | ) | |||||||||||||||||||
| Republic of Brazil, 12.25%, 03/06/30 | Morgan Stanley Capital Services | Buy | 290 BPS semi-annually | 10/20/10 | 400 | (29 | ) | |||||||||||||||||||
| Republic of Brazil, 12.25%, 03/06/30 | Lehman Brothers Special Financing | Buy | 142 BPS semi-annually | 03/20/11 | 840 | (22 | ) | |||||||||||||||||||
| Republic of Brazil, 12.25%, 03/06/30 | Lehman Brothers Special Financing | Sell | 119 BPS semi-annually | 09/20/11 | 270 | 5 | ||||||||||||||||||||
| Republic of Brazil, 12.25%, 03/06/30 | Lehman Brothers Special Financing | Sell | 120 BPS semi-annually | 09/20/11 | 280 | 5 | ||||||||||||||||||||
| Republic of Brazil, 12.25%, 03/06/30 | Bear Stearns | Buy | 103 BPS semi-annually | 12/20/11 | 300 | (2 | ) | |||||||||||||||||||
| Republic of Brazil, 12.25%, 03/06/30 | Deutsche Bank AG, New York | Buy | 108.5 BPS semi-annually | 12/20/11 | 790 | (6 | ) | |||||||||||||||||||
| Republic of Brazil, 12.25%, 03/06/30 | Lehman Brothers Special Financing | Buy | 111 BPS semi-annually | 12/20/11 | 680 | (6 | ) | |||||||||||||||||||
| Republic of Brazil, 12.25%, 03/06/30 | Union Bank of Switzerland AG | Buy | 102 BPS semi-annually | 12/20/11 | 635 | (3 | ) | |||||||||||||||||||
| Republic of Brazil, 12.25%, 03/06/30 | Union Bank of Switzerland AG | Buy | 103 BPS semi-annually | 12/20/11 | 600 | (3 | ) | |||||||||||||||||||
| Republic of Brazil, 12.25%, 03/06/30 | Deutsche Bank AG, New York | Buy | 81 BPS semi-annually | 04/20/12 | 1,990 | 9 | ||||||||||||||||||||
| Republic of Brazil, 12.25%, 03/06/30 | Citibank, N.A. | Buy | 70 BPS semi-annually | 06/20/12 | 720 | 9 | ||||||||||||||||||||
| Republic of Brazil, 12.25%, 03/06/30 | Deutsche Bank AG, New York | Buy | 73.21 BPS semi-annually | 06/20/12 | 1,140 | 12 | ||||||||||||||||||||
| Republic of Brazil, 12.25%, 03/06/30 | Morgan Stanley Capital Services | Buy | 65.67 BPS semi-annually | 06/20/12 | 2,150 | 30 | ||||||||||||||||||||
| Republic of Brazil, 12.25%, 03/06/30 | Morgan Stanley Capital Services | Buy | 69 BPS semi-annually | 06/20/12 | 1,430 | 18 | ||||||||||||||||||||
| Republic of Brazil, 12.25%, 03/06/30 | Deutsche Bank AG, New York | Buy | 66 BPS semi-annually | 07/20/12 | 830 | 12 | ||||||||||||||||||||
| Republic of Brazil, 12.25%, 03/06/30 | Deutsche Bank AG, New York | Buy | 71.33 BPS semi-annually | 07/20/12 | 1,450 | 18 | ||||||||||||||||||||
| Republic of Brazil, 12.25%, 03/06/30 | Deutsche Bank AG, New York | Buy | 89 BPS semi-annually | 08/20/12 | 2,390 | 15 | ||||||||||||||||||||
| Republic of Colombia, 10.38%, 01/28/33 | Lehman Brothers Special Financing | Buy | 96 BPS semi-annually | 04/20/12 | 210 | 3 | ||||||||||||||||||||
| Republic of Colombia, 10.38%, 01/28/33 | Deutsche Bank AG, New York | Buy | 91.42 BPS semi-annually | 04/20/12 | 410 | 6 | ||||||||||||||||||||
| Republic of Colombia, 10.38%, 01/28/33 | Lehman Brothers Special Financing | Buy | 98 BPS semi-annually | 04/20/12 | 1,500 | 22 | ||||||||||||||||||||
| Republic of Colombia, 10.38%, 01/28/33 | Lehman Brothers Special Financing | Buy | 98 BPS semi-annually | 04/20/12 | 1,500 | 22 | ||||||||||||||||||||
| Republic of Colombia, 10.38%, 01/28/33 | Morgan Stanley Capital Services | Buy | 100 BPS semi-annually | 04/20/12 | 750 | 10 | ||||||||||||||||||||
| Republic of Colombia, 10.38%, 01/28/33 | Lehman Brothers Special Financing | Buy | 82.5 BPS semi-annually | 06/20/12 | 3,990 | 91 | ||||||||||||||||||||
| Republic of Indonesia, 6.75%, 03/10/14 | Citibank, N.A. | Sell | 185 BPS quarterly | 06/20/11 | 300 | 4 | ||||||||||||||||||||
| Republic of Indonesia, 6.75%, 03/10/14 | Deutsche Bank AG, New York | Sell | 185 BPS quarterly | 06/20/11 | 730 | 11 | ||||||||||||||||||||
AS OF AUGUST 31, 2007 (Unaudited) (continued)
| REFERENCED OBLIGATION | | SWAP COUNTERPARTY | | BUY/SELL PROTECTION | | FUND PAYS/RECEIVES FIXED RATE (r) | | Termination Date | | Notional Amount | | Value | ||||||||||||||
|---|---|---|---|---|---|---|---|---|---|---|---|---|---|---|---|---|---|---|---|---|---|---|---|---|---|---|
| Republic of Indonesia, 6.75%, 03/10/14 | Deutsche Bank AG, New York | Sell | 205 BPS quarterly | 06/20/11 | $ | 365 | $ | 8 | ||||||||||||||||||
| Republic of Indonesia, 6.75%, 03/10/14 | Morgan Stanley Capital Services | Sell | 127 BPS quarterly | 12/20/11 | 400 | (5 | ) | |||||||||||||||||||
| Republic of Indonesia, 6.75, 03/10/14 | Deutsche Bank AG, New York | Sell | 101 BPS quarterly | 06/20/12 | 690 | (21 | ) | |||||||||||||||||||
| Republic of Indonesia, 6.75, 03/10/14 | Deutsche Bank AG, New York | Sell | 115 BPS quarterly | 09/20/12 | 3,820 | (106 | ) | |||||||||||||||||||
| Republic of Kazakhstan, 11.13%, 05/11/07 | Citibank, N.A. | Sell | 63 BPS semi-annually | 05/20/11 | 1,600 | (4 | ) | |||||||||||||||||||
| Republic of Kazakhstan, 11.13%, 05/11/07 | Citibank, N.A. | Sell | 60 BPS semi-annually | 03/20/12 | 870 | (5 | ) | |||||||||||||||||||
| Republic of Kazakhstan, 11.13%, 05/11/07 | Deutsche Bank AG, New York | Sell | 53.51 BPS semi-annually | 03/20/12 | 1,510 | (14 | ) | |||||||||||||||||||
| Republic of Kazakhstan, 11.13%, 05/11/07 | Deutsche Bank AG, New York | Sell | 61 BPS semi-annually | 03/20/12 | 620 | (4 | ) | |||||||||||||||||||
| Republic of Kazakhstan, 11.13%, 05/11/07 | Barclays Bank plc | Sell | 68 BPS semi-annually | 08/20/12 | 3,010 | (21 | ) | |||||||||||||||||||
| Republic of Kazakhstan, 11.13%, 05/11/07 | Deutsche Bank AG, New York | Sell | 65.5 BPS semi-annually | 08/20/12 | 2,210 | (18 | ) | |||||||||||||||||||
| Republic of Kazakhstan, 11.13%, 05/11/07 | Deutsche Bank AG, New York | Sell | 71 BPS semi-annually | 08/20/12 | 1,090 | (6 | ) | |||||||||||||||||||
| Republic of Panama, 8.88%, 09/30/27 | Lehman Brothers Special Financing | Buy | 63 BPS semi-annually | 06/20/12 | 5,340 | 103 | ||||||||||||||||||||
| Republic of Peru, 8.75%, 11/21/33 | Lehman Brothers Special Financing | Sell | 108.5 BPS semi-annually | 05/20/17 | 2,155 | (59 | ) | |||||||||||||||||||
| Republic of Peru, 8.75%, 11/21/33 | Lehman Brothers Special Financing | Sell | 62 BPS semi-annually | 06/20/12 | 5,340 | (94 | ) | |||||||||||||||||||
| Republic of Peru, 8.75%, 11/21/33 | Lehman Brothers Special Financing | Sell | 90 BPS semi-annually | 06/20/17 | 1,380 | (57 | ) | |||||||||||||||||||
| Republic of Philippines, 10.63%, 03/16/25 | Citibank, N.A. | Buy | 199 BPS quarterly | 06/20/11 | 300 | (6 | ) | |||||||||||||||||||
| Republic of Philippines, 10.63%, 03/16/25 | Deutsche Bank AG, New York | Buy | 199 BPS quarterly | 06/20/11 | 730 | (14 | ) | |||||||||||||||||||
| Republic of Philippines, 10.63%, 03/16/25 | Deutsche Bank AG, New York | Buy | 221 BPS quarterly | 06/20/11 | 365 | (10 | ) | |||||||||||||||||||
| Republic of Philippines, 10.63%, 03/16/25 | Morgan Stanley Capital Services | Buy | 132 BPS quarterly | 12/20/11 | 400 | 4 | ||||||||||||||||||||
| Republic of Philippines, 10.63%, 03/16/25 | Deutsche Bank AG, New York | Buy | 103 BPS quarterly | 06/20/12 | 690 | 20 | ||||||||||||||||||||
| Republic of Philippines, 10.63%, 03/16/25 | Deutsche Bank AG, New York | Buy | 116 BPS quarterly | 09/20/12 | 3,820 | 105 | ||||||||||||||||||||
| Republic of Turkey, 11.88%, 01/15/30 | Morgan Stanley Capital Services | Buy | 145 BPS semi-annually | 07/20/12 | 370 | 7 | ||||||||||||||||||||
| Republic of Turkey, 11.88%, 01/15/30 | Morgan Stanley Capital Services | Buy | 146 BPS semi-annually | 07/20/12 | 3,850 | 77 | ||||||||||||||||||||
| Republic of Turkey, 11.88%, 01/15/30 | Deutsche Bank AG, New York | Buy | 239 BPS semi-annually | 08/20/12 | 1,000 | (18 | ) | |||||||||||||||||||
| Republic of Turkey, 11.88%, 01/15/30 | Morgan Stanley Capital Services | Buy | 194 BPS semi-annually | 08/20/12 | 1,170 | 3 | ||||||||||||||||||||
| Republic of Venezuela, 9.25%, 09/15/27 | Barclays Bank plc | Sell | 172.10 BPS semi-annually | 03/20/12 | 1,520 | (119 | ) | |||||||||||||||||||
| Republic of Venezuela, 9.25%, 09/15/27 | Deutsche Bank AG, New York | Sell | 160.41 BPS semi-annually | 04/20/12 | 870 | (75 | ) | |||||||||||||||||||
| Republic of Venezuela, 9.25%, 09/15/27 | Deutsche Bank AG, New York | Sell | 162 BPS semi-annually | 04/20/12 | 410 | (35 | ) | |||||||||||||||||||
| Republic of Venezuela, 9.25%, 09/15/27 | Lehman Brothers Special Financing | Sell | 160.5 BPS semi-annually | 04/20/12 | 210 | (18 | ) | |||||||||||||||||||
| Republic of Venezuela, 9.25%, 09/15/27 | Lehman Brothers Special Financing | Sell | 161 BPS semi-annually | 04/20/12 | 1,500 | (130 | ) | |||||||||||||||||||
| Republic of Venezuela, 9.25%, 09/15/27 | Lehman Brothers Special Financing | Sell | 161 BPS semi-annually | 04/20/12 | 1,500 | (130 | ) | |||||||||||||||||||
| Republic of Venezuela, 9.25%, 09/15/27 | Morgan Stanley Capital Services | Sell | 169 BPS semi-annually | 04/20/12 | 750 | (63 | ) | |||||||||||||||||||
| Republic of Venezuela, 9.25%, 09/15/27 | Lehman Brothers Special Financing | Sell | 218 BPS semi-annually | 06/20/12 | 3,990 | (291 | ) | |||||||||||||||||||
| Republic of Venezuela, 9.25%, 09/15/27 | Lehman Brothers Special Financing | Sell | 222 BPS semi-annually | 06/20/12 | 860 | (62 | ) | |||||||||||||||||||
| Republic of Venezuela, 9.25%, 09/15/27 | Union Bank of Switzerland AG | Buy | 203 BPS semi-annually | 06/20/12 | 510 | 40 | ||||||||||||||||||||
| Republic of Venezuela, 9.25%, 09/15/27 | Bear Stearns | Sell | 250.4 BPS semi-annually | 07/20/12 | 1,550 | (101 | ) | |||||||||||||||||||
| Republic of Venezuela, 9.25%, 09/15/27 | Bear Stearns | Buy | 266 BPS semi-annually | 07/20/12 | 380 | 23 | ||||||||||||||||||||
| Republic of Venezuela, 9.25%, 09/15/27 | Lehman Brothers Special Financing | Buy | 260 BPS semi-annually | 07/20/12 | 170 | 10 | ||||||||||||||||||||
| Republic of Venezuela, 9.25%, 09/15/27 | Lehman Brothers Special Financing | Sell | 268 BPS semi-annually | 07/20/12 | 200 | (12 | ) | |||||||||||||||||||
| Republic of Venezuela, 9.25%, 09/15/27 | Morgan Stanley Capital Services | Buy | 257 BPS semi-annually | 07/20/12 | 960 | 60 | ||||||||||||||||||||
| Republic of Venezuela, 9.25%, 09/15/27 | Union Bank of Switzerland AG | Sell | 251 BPS semi-annually | 07/20/12 | 1,550 | (101 | ) | |||||||||||||||||||
| Republic of Venezuela, 9.25%, 09/15/27 | Union Bank of Switzerland AG | Buy | 255 BPS semi-annually | 07/20/12 | 770 | 49 | ||||||||||||||||||||
| Republic of Venezuela, 9.25%, 09/15/27 | Lehman Brothers Special Financing | Sell | 301.3 BPS semi-annually | 08/20/12 | 1,680 | (86 | ) | |||||||||||||||||||
| Republic of Venezuela, 9.25%, 09/15/27 | Lehman Brothers Special Financing | Buy | 385 BPS semi-annually | 08/20/12 | 200 | 4 | ||||||||||||||||||||
| Republic of Venezuela, 9.25%, 09/15/27 | Lehman Brothers Special Financing | Sell | 570 BPS semi-annually | 08/20/12 | 670 | 31 | ||||||||||||||||||||
| Republic of Venezuela, 9.25%, 09/15/27 | Morgan Stanley Capital Services | Sell | 340 BPS semi-annually | 08/20/12 | 90 | (3 | ) | |||||||||||||||||||
| Russian AG Bank, 7.18%, 05/16/13 | Union Bank of Switzerland AG | Sell | 76 BPS semi-annually | 02/20/09 | 1,190 | (6 | ) | |||||||||||||||||||
| REFERENCED OBLIGATION | | SWAP COUNTERPARTY | | BUY/SELL PROTECTION | | FUND PAYS/RECEIVES FIXED RATE (r) | | Termination Date | | Notional Amount | | Value | ||||||||||||||
|---|---|---|---|---|---|---|---|---|---|---|---|---|---|---|---|---|---|---|---|---|---|---|---|---|---|---|
| Russian AG Bank, 7.18%, 05/16/13 | Credit Suisse International | Sell | 72 BPS semi-annually | 03/20/09 | $ | 120 | $ | (1 | ) | |||||||||||||||||
| Russian Federation, 7.50%, 03/31/30 | Union Bank of Switzerland AG | Buy | 31 BPS semi-annually | 02/20/09 | 1,190 | 4 | ||||||||||||||||||||
| Russian Federation, 7.50%, 03/31/30 | Credit Suisse International | Buy | 30 BPS semi-annually | 03/20/09 | 120 | — | ||||||||||||||||||||
| Russian Federation, 7.50%, 03/31/30 | Morgan Stanley Capital Services | Sell | 101 BPS semi-annually | 07/20/10 | 2,000 | 26 | ||||||||||||||||||||
| Russian Federation, 7.50%, 03/31/30 | Morgan Stanley Capital Services | Buy | 90 BPS semi-annually | 07/20/10 | 500 | (5 | ) | |||||||||||||||||||
| Russian Federation, 7.50%, 03/31/30 | Deutsche Bank AG, New York | Sell | 77 BPS semi-annually | 08/20/10 | 70 | — | (h) | |||||||||||||||||||
| Russian Federation, 7.50%, 03/31/30 | Morgan Stanley Capital Services | Buy | 75 BPS semi-annually | 08/20/10 | 750 | (4 | ) | |||||||||||||||||||
| Russian Federation, 7.50%, 03/31/30 | Union Bank of Switzerland AG | Buy | 90 BPS semi-annually | 08/20/10 | 300 | (3 | ) | |||||||||||||||||||
| Russian Federation, 7.50%, 03/31/30 | Morgan Stanley Capital Services | Buy | 64 BPS semi-annually | 09/20/10 | 400 | — | (h) | |||||||||||||||||||
| Russian Federation, 7.50%, 03/31/30 | Morgan Stanley Capital Services | Buy | 53 BPS quarterly | 08/20/11 | 660 | 4 | ||||||||||||||||||||
| Russian Federation, 7.50%, 03/31/30 | Morgan Stanley Capital Services | Buy | 50 BPS semi-annually | 11/20/11 | 740 | 7 | ||||||||||||||||||||
| Russian Federation, 7.50%, 03/31/30 | Bear Stearns | Sell | 45.5 BPS semi-annually | 12/20/11 | 600 | (7 | ) | |||||||||||||||||||
| Russian Federation, 7.50%, 03/31/30 | Deutsche Bank AG, New York | Sell | 51 BPS semi-annually | 12/20/11 | 1,580 | (15 | ) | |||||||||||||||||||
| Russian Federation, 7.50%, 03/31/30 | Deutsche Bank AG, New York | Sell | 53 BPS semi-annually | 12/20/11 | 1,360 | (12 | ) | |||||||||||||||||||
| Russian Federation, 7.50%, 03/31/30 | Union Bank of Switzerland AG | Sell | 46 BPS semi-annually | 12/20/11 | 1,200 | (14 | ) | |||||||||||||||||||
| Russian Federation, 7.50%, 03/31/30 | Union Bank of Switzerland AG | Sell | 45.5 BPS semi-annually | 12/20/11 | 1,270 | (15 | ) | |||||||||||||||||||
| Russian Federation, 7.50%, 03/31/30 | Barclays Bank plc | Buy | 47.5 BPS semi-annually | 04/20/12 | 530 | 7 | ||||||||||||||||||||
| Russian Federation, 7.50%, 03/31/30 | Deutsche Bank AG, New York | Buy | 49.5 BPS semi-annually | 04/20/12 | 350 | 4 | ||||||||||||||||||||
| United Mexican States, 7.50%, 04/08/33 | Morgan Stanley Capital Services | Buy | 96 BPS semi-annually | 07/20/10 | 2,000 | (38 | ) | |||||||||||||||||||
| United Mexican States, 7.50%, 04/08/33 | Deutsche Bank AG, New York | Buy | 81 BPS semi-annually | 08/20/10 | 70 | (1 | ) | |||||||||||||||||||
| United Mexican States, 8.30%, 08/15/31 | Citibank, N.A. | Sell | 105 BPS semi-annually | 06/20/10 | 1,000 | 19 | ||||||||||||||||||||
| VTB Capital SA, 6.25%, 06/30/35 | Morgan Stanley Capital Services | Sell | 40 BPS semi-annually | 03/20/08 | 1,360 | 1 | ||||||||||||||||||||
| VTB Capital SA, 6.25%, 06/30/35 | Morgan Stanley Capital Services | Sell | 64 BPS semi-annually | 05/20/12 | 790 | (15 | ) | |||||||||||||||||||
| VTB Capital SA, 7.50%, 10/12/11 | Lehman Brothers Special Financing | Sell | 109 BPS semi-annually | 04/20/11 | 5,180 | (20 | ) | |||||||||||||||||||
| $ | (2,829 | ) | ||||||||||||||||||||||||
| SWAP COUNTERPARTY | | REFERENCED OBLIGATION | | PAYMENTS MADE BY THE FUND (r) | | PAYMENTS RECEIVED BY THE FUND (r) | | TERMINATION DATE | | NOTIONAL AMOUNT | | Value | ||||||||||||||
|---|---|---|---|---|---|---|---|---|---|---|---|---|---|---|---|---|---|---|---|---|---|---|---|---|---|---|
| Morgan Stanley Capital Services | TransCredit Bank, 7.30%, 02/26/09 | 3 Month Libor + 20 BPS | Total Return on TransCredit Bank, 7.30%, 02/26/09 | 02/26/09 | $ | 1,200 | $ | 21 | ||||||||||||||||||
| Morgan Stanley Capital Services | OGK/Rushydro’s, 12/13/13 | Total Return on OGK/ Rushydro’s, 12/13/13 | 3 Month LIBOR + 20 BPS | 12/25/10 | 3,830 | 120 | ||||||||||||||||||||
| $ | 141 | |||||||||||||||||||||||||
AS OF AUGUST 31, 2007 (Unaudited)
| PRINCIPAL AMOUNT($) | | SECURITY DESCRIPTION | | VALUE($) | |||||||
|---|---|---|---|---|---|---|---|---|---|---|---|
Long-Term Investments — 82.1% | |||||||||||
Asset-Backed Securities — 18.3% | |||||||||||
| 570 | American Express Credit Account Master Trust, Series 2004-C, Class C, FRN, 6.11%, 02/15/12 (e) | 568 | |||||||||
| 500 | Ameriquest Mortgage Securities, Inc., Series 2005-R2, Class M2, FRN, 5.99%, 04/25/35 | 471 | |||||||||
| 1,400 | Arkle Master Issuer plc (United Kingdom), Series 2006-1A, Class 3A, FRN, 5.57%, 08/17/11 (e) | 1,382 | |||||||||
| 400 | Asset Backed Funding Certificates, Series 2005-HE1, Class M2, FRN, 5.95%, 12/25/34 | 380 | |||||||||
| 346 | Bear Stearns Asset Backed Securities, Inc., Series 2005-HE3, Class M1, FRN, 5.93%, 03/25/35 | 327 | |||||||||
| Capital One Auto Finance Trust, | |||||||||||
| 750 | Series 2007-B, Class A3B, 5.61%, 04/15/12 | 750 | |||||||||
| 750 | Series 2007-B, Class A4, 5.64%, 04/15/14 | 750 | |||||||||
| 1,650 | Capital One Multi-Asset Execution Trust, Series 2003-A, FRN, 6.86%, 12/15/10 (i) | 1,657 | |||||||||
| 400 | Carrington Mortgage Loan Trust, Series 2006-OPT1, Class A3, FRN, 5.69%, 02/25/36 | 386 | |||||||||
| 36 | CARSS Finance LP (Cayman Islands), Series 2004-A, Class B1, FRN, 5.89%, 01/15/11 (e) | 36 | |||||||||
| Citigroup Mortgage Loan Trust, Inc., | |||||||||||
| 768 | Series 2003-HE3, Class A, FRN, 5.70%, 12/25/33 | 748 | |||||||||
| 1,050 | Series 2005-OPT4, Class M2, FRN, 5.93%, 07/25/35 | 948 | |||||||||
| 900 | Series 2006-WMC1, Class A2C, FRN, 5.70%, 12/25/35 | 878 | |||||||||
| Countrywide Asset-Backed Certificates, | |||||||||||
| 117 | Series 2004-6, Class 2A4, FRN, 5.96%, 11/25/34 | 116 | |||||||||
| 200 | Series 2005-BC1, Class M2, FRN, 5.95%, 05/25/35 | 181 | |||||||||
| 746 | Countrywide Home Equity Loan Trust, Series 2003-C, Class A, FRN, 5.88%, 05/15/29 | 733 | |||||||||
| 2,600 | Credit-Based Asset Servicing and Securitization LLC, Series 2006-CB8, Class A2B, 5.61%, 10/25/36 | 2,497 | |||||||||
| 760 | Equifirst Loan Securitization, Series 2007-1, Class A2A, FRN, 5.56%, 04/25/37 | 751 | |||||||||
| 678 | Fifth Third Home Equity Loan Trust, Series 2003-1, Class A, FRN, 5.79%, 09/20/23 | 657 | |||||||||
| 2,500 | First Franklin Mortgage Loan Asset Backed Certificates, Series 2006-FF13, Class A2C, FRN, 5.66%, 10/25/36 | 2,337 | |||||||||
| 578 | Fleet Home Equity Trust, Series 2003-1, Class A, FRN, 5.79%, 01/20/33 | 568 | |||||||||
| 400 | GE-WMC Mortgage Securities LLC, Series 2006-1, Class A2B, FRN, 5.65%, 08/25/36 | 387 | |||||||||
| 950 | GMAC Mortgage Corp. Loan Trust, Series 2004-HE4, Class A2, FRN, 5.69%, 03/25/35 | 949 | |||||||||
| 500 | Helios Finance LP (Cayman Islands), Series 2007-S1, Class B1, FRN, 6.21%, 10/20/14 (e) (i) | 483 | |||||||||
| 2,300 | Holmes Master Issuer plc (United Kingdom), Series 2006-1A, Class 2A, FRN, 5.42%, 07/15/21 (e) | 2,271 | |||||||||
| 800 | HSI Asset Securitization Corp. Trust, Series 2006-OPT3, Class 3A3, FRN, 5.69%, 02/25/36 | 764 | |||||||||
| 2,300 | Long Beach Mortgage Loan Trust, Series 2006-10, Class 2A3, FRN, 5.66%, 11/25/36 | 2,030 | |||||||||
| Morgan Stanley ABS Capital I, | |||||||||||
| 150 | Series 2005-HE2, Class M3, FRN, 5.99%, 01/25/35 | 137 | |||||||||
| 100 | Series 2005-HE2, Class M4, FRN, 6.14%, 01/25/35 | 87 | |||||||||
| 639 | Nationstar NIM Trust, (Cayman Islands) Series 2007-C, Class A, 8.00%, 06/25/37 (e) (i) | 569 | |||||||||
| 413 | New Century Home Equity Loan Trust, Series 2004-3, Class M1, FRN, 6.13%, 11/25/34 | 396 | |||||||||
| 406 | Nomura Asset Acceptance Corp., Series 2006-WF1, Class A1, FRN, 5.60%, 06/25/36 | 406 | |||||||||
| Option One Mortgage Loan Trust, | |||||||||||
| 92 | Series 2002-1, Class A, FRN, 6.09%, 02/25/32 | 90 | |||||||||
| 300 | Series 2005-2, Class M1, FRN, 5.95%, 05/25/35 | 281 | |||||||||
| 550 | Park Place Securities, Inc., Series 2004-WHQ2, Class M2, FRN, 6.14%, 02/25/35 | 512 | |||||||||
| 350 | Residential Asset Securities Corp., Series 2005-KS11, Class M2, FRN, 5.92%, 12/25/35 | 314 | |||||||||
| 189 | Residential Funding Mortgage Securities II, Series 2003-HS4, Class AIB, FRN, 5.77%, 01/25/29 | 185 | |||||||||
| PRINCIPAL AMOUNT($) | | SECURITY DESCRIPTION | | VALUE($) | |||||||
|---|---|---|---|---|---|---|---|---|---|---|---|
Long-Term Investments — Continued | |||||||||||
Asset-Backed Securities — Continued | |||||||||||
| Securitized Asset Backed Receivables LLC Trust, | |||||||||||
| 500 | Series 2005-OP1, Class M2, FRN, 5.96%, 01/25/35 | 451 | |||||||||
| 1,505 | Series 2006-OP1, Class A2B, FRN, 5.70%, 10/25/35 | 1,494 | |||||||||
| 1,550 | Shiprock Finance SF2 (Cayman Islands), Series 2007-2A, Class A, FRN, 5.43%, 02/29/08 (e) (i) | 1,543 | |||||||||
| Soundview Home Equity Loan Trust, | |||||||||||
| 625 | Series 2007-NS1, Class M3, FRN, 6.10%, 01/25/37 | 509 | |||||||||
| 650 | Series 2007-NS1, Class M4, 6.41%, 01/25/37 | 467 | |||||||||
| 621 | Wachovia Asset Securitization, Inc., Series 2004-HE1, Class A, FRN, 5.73%, 06/25/34 | 611 | |||||||||
| 1,800 | Wells Fargo Home Equity Trust, Series 2006-3, Class A2, FRN, 5.66%, 01/25/37 | 1,745 | |||||||||
| 1,000 | William Street Funding Corp., Series 2005-1, Class A, FRN, 5.63%, 01/23/11 (e) | 989 | |||||||||
| Total Asset-Backed Securities (Cost $36,416) | 34,791 | ||||||||||
Collateralized Mortgage Obligations — 19.1% | |||||||||||
Agency CMO — 2.6% | |||||||||||
| Federal Home Loan Mortgage Corp. REMICS, | |||||||||||
| 2,084 | Series 2638, Class KI, IO, 5.00%, 11/15/27 | 156 | |||||||||
| 2,530 | Series 2645, Class SB, IF, IO, 1.49%, 07/15/27 | 140 | |||||||||
| 934 | Series 2686, Class FL, FRN, 6.01%, 03/15/28 | 933 | |||||||||
| 956 | Series 2827, Class AS, IF, IO, 1.49%, 06/15/22 | 46 | |||||||||
| 1,507 | Series 2928, Class IN, IO, 5.00%, 10/15/24 | 95 | |||||||||
| 1,320 | Series 2975, Class IO, IO, 5.50%, 06/15/26 | 102 | |||||||||
| Federal National Mortgage Association, REMICS, | |||||||||||
| 243 | Series 2002-36, Class FS, FRN, 2.00%, 04/25/32 | 244 | |||||||||
| 362 | Series 2002-36, Class FT, FRN, 6.00%, 06/25/32 | 363 | |||||||||
| 5,000 | Series 2002-81, Class SJ, IF, IO, 2.00%, 04/25/32 | 408 | |||||||||
| 724 | Series 2003-121, Class FC, FRN, 5.91%, 02/25/28 | 723 | |||||||||
| 1,906 | Series 2005-51, Class KI, IO, 5.50%, 01/25/25 | 124 | |||||||||
| 1,296 | Series 2005-63, Class PK, IO, 5.50%, 10/25/24 | 81 | |||||||||
| 1,529 | Series 2006-115, Class BF, FRN, 5.75%, 12/25/36 | 1,518 | |||||||||
| 4,933 | |||||||||||
Non-Agency CMO — 16.5% | |||||||||||
| Adjustable Rate Mortgage Trust, | |||||||||||
| 264 | Series 2004-5, Class 7A2, FRN, 5.88%, 04/25/35 | 263 | |||||||||
| 485 | Series 2005-1 Class 5A2, FRN, 5.83%, 05/25/35 | 482 | |||||||||
| 1,116 | Series 2005-11, Class 5A1, FRN, 5.78, 02/25/36 | 1,109 | |||||||||
| 329 | Series 2005-8, Class 7A2, FRN, 5.78%, 11/25/35 | 327 | |||||||||
| 612 | American Home Mortgage Assets, Series 2006-2, Class 2A1, FRN, 5.69%, 09/25/46 | 602 | |||||||||
| 1,249 | Banc of America Funding Corp., Series 2007-A, Class 2A1, FRN, 5.67%, 02/20/47 | 1,234 | |||||||||
| Countrywide Alternative Loan Trust, | |||||||||||
| 1,231 | Series 2006-OA2, Class A1, FRN, 5.75%, 05/20/46 | 1,209 | |||||||||
| 2,801 | Series 2006-OA19, Class A1, FRN, 5.72%, 02/20/47 | 2,731 | |||||||||
| 873 | Series 2006-OA21, Class, A1, FRN, 5.73%, 03/20/47 | 855 | |||||||||
| 698 | Series 2007-OA10, Class 2A1, FRN, 5.75%, 09/25/47 | 684 | |||||||||
| Countrywide Home Loan Mortgage Pass Through Trust, | |||||||||||
| 1,323 | Series 2005-2, Class 2A3, FRN, 5.84%, 03/25/35 | 1,290 | |||||||||
| 17 | Series 2002-31, Class A3, 5.75%, 01/25/33 | 17 | |||||||||
| 663 | Downey Savings & Loan Association Mortgage Loan Trust, Series 2005-AR5, Class 2A1A, FRN, 5.87%, 08/19/45 | 652 | |||||||||
| Harborview Mortgage Loan Trust, | |||||||||||
| 380 | Series 2005-3, Class 2A1A, FRN, 5.78%, 06/19/35 | 373 | |||||||||
| 954 | Series 2005-8, Class 1A2A, FRN, 5.87%, 09/19/35 | 937 | |||||||||
| 284 | Series 2005-10, Class 2A1A, FRN, 5.85%, 11/19/35 | 278 | |||||||||
| 752 | Series 2005-15, Class 2A11, FRN, 5.81%, 10/20/45 | 735 | |||||||||
| 1,172 | Series 2006-14, Class 2A1A, FRN, 5.69%, 03/19/38 | 1,142 | |||||||||
| 697 | Series 2007-1, Class 2A1A, FRN, 5.67%, 04/19/38 | 678 | |||||||||
| 2,100 | Series 2007-5, Class A1A, 5.73%, 09/19/37 | 2,047 | |||||||||
| Indymac Index Mortgage Loan Trust, | |||||||||||
| 527 | Series 2004-AR7, Class A1, FRN, 5.94%, 09/25/34 | 524 | |||||||||
| 223 | Series 2004-AR8, Class 2A1, FRN, 5.92%, 11/25/34 | 220 | |||||||||
| 1,351 | Lehman Mortgage Trust, Series 2005-3, Class 2A3, 5.50%, 01/25/36 | 1,345 | |||||||||
| Lehman XS Trust, | |||||||||||
| 604 | Series 2005-2, Class 1A1, FRN, 5.78%, 08/25/35 | 601 | |||||||||
AS OF AUGUST 31, 2007 (Unaudited) (continued)
| PRINCIPAL AMOUNT($) | | SECURITY DESCRIPTION | | VALUE($) | |||||||
|---|---|---|---|---|---|---|---|---|---|---|---|
Long-Term Investments — Continued | |||||||||||
Non-Agency CMO — Continued | |||||||||||
| 676 | Series 2005-5N, Class 3A1A, FRN, 5.81%, 11/25/35 | 662 | |||||||||
| 1,434 | Series 2006-2N, Class 1A1, FRN, 5.77%, 02/25/46 | 1,401 | |||||||||
| 769 | Residential Accredit Loans, Inc., Series 2006-QA9, Class A1, FRN, 5.69%, 11/25/36 | 751 | |||||||||
| 925 | Structured Adjustable Rate Mortgage Loan Trust, Series 2005-19XS, Class 1A1, FRN, 5.83%, 10/25/35 | 909 | |||||||||
| Thornburg Mortgage Securities Trust, | |||||||||||
| 544 | Series 2003-2, Class A1, FRN, 5.84%, 04/25/43 | 543 | |||||||||
| 1,115 | Series 2004-3, Class A, FRN, 5.87%, 09/25/34 | 1,113 | |||||||||
| 4,044 | Series 2006-6, Class A1, FRN, 5.61%, 12/25/36 | 3,993 | |||||||||
| WaMu Pass Through Certificates, | |||||||||||
| 715 | Series 2005-AR9, Class A1A, FRN, 5.83%, 07/25/45 | 706 | |||||||||
| 881 | Series 2005-AR13, Class A1A1, FRN, 5.79%, 10/25/45 | 864 | |||||||||
| 31,277 | |||||||||||
| Total Collateralized Mortgage Obligations (Cost $36,730) | 36,210 | ||||||||||
Commercial Mortgage-Backed Securities — 2.2% | |||||||||||
| 250 | Citigroup/Deutsche Bank Commercial Mortgage Trust, Series 2007-CD4, Class A2A, 5.24%, 12/11/49 | 247 | |||||||||
| 500 | CS First Boston Mortgage Securities Corp., Series 2001-CK6, Class A3, 6.39%, 08/15/36 | 515 | |||||||||
| 500 | Greenwich Capital Commercial Funding Corp., Series 2007-GG9, Class A2, 5.38%, 03/10/39 | 497 | |||||||||
| LB-UBS Commercial Mortgage Trust, | |||||||||||
| 1,450 | Series 2003-C5, Class A2, 3.48%, 07/15/27 | 1,424 | |||||||||
| 750 | Series 2007-C1, Class A2, 5.32%, 02/15/40 | 744 | |||||||||
| 423 | Lehman Brothers Floating Rate Commercial Mortgage Trust, Series 2006-LLFA, Class A2, FRN, 5.73%, 09/15/21 (e) | 422 | |||||||||
| 300 | Wachovia Bank Commercial Mortgage Trust, Series 2007-C30, Class A3, 5.25%, 12/15/43 | 296 | |||||||||
| Total Commercial Mortgage-Backed Securities (Cost $4,186) | 4,145 | ||||||||||
Corporate Bonds — 28.6% | |||||||||||
Automobiles — 0.9% | |||||||||||
| DaimlerChrysler N.A. Holding Corp., | |||||||||||
| 825 | FRN, 5.79%, 03/13/09 | 822 | |||||||||
| 900 | FRN, 5.84%, 09/10/07 (m) | 900 | |||||||||
| 1,722 | |||||||||||
Building Products — 0.3% | |||||||||||
| 500 | Masco Corp., FRN, 5.66%, 03/12/10 | 493 | |||||||||
Capital Markets — 5.0% | |||||||||||
| 2,650 | Bear Stearns Cos., Inc., (The), FRN, 5.63%, 05/18/10 | 2,551 | |||||||||
| Goldman Sachs Group, Inc., (The), | |||||||||||
| 1,350 | FRN, 5.46%, 06/28/10 | 1,338 | |||||||||
| 800 | FRN, 5.61%, 11/16/09 | 795 | |||||||||
| Lehman Brothers Holdings, Inc., | |||||||||||
| 900 | FRN, 5.60%, 08/21/09 | 876 | |||||||||
| 1,400 | FRN, 5.63%, 11/16/09 | 1,353 | |||||||||
| 300 | 6.37% to 05/31/12; thereafter variable, 12/31/49 | 269 | |||||||||
| 2,100 | Links Finance LLC, FRN, 5.61%, 09/15/08 (e) (i) | 2,101 | |||||||||
| 250 | Morgan Stanley, FRN, 5.46%, 05/07/10 | 246 | |||||||||
| 9,529 | |||||||||||
Commercial Banks — 6.2% | |||||||||||
| 3,050 | BAC Capital Trust XIII, FRN, 5.76%, 03/15/43 | 2,745 | |||||||||
| 1,200 | Banco Sabadell S.A. (Spain), FRN, 5.46%, 04/23/10 (e) | 1,185 | |||||||||
| 1,450 | DnB NORBank ASA (Norway), FRN, 5.43%, 10/13/09 (e) | 1,450 | |||||||||
| 1,600 | Glitnir Banki HF (Iceland), FRN, VAR, 5.52%, 10/15/08 (e) | 1,599 | |||||||||
| 400 | ICICI Bank Ltd. (India), FRN, 5.90%, 01/12/10 (e) | 395 | |||||||||
| 1,300 | ING Bank NV (Netherlands), FRN, FRN, 5.61%, 10/14/14 | 1,299 | |||||||||
| 600 | Landsbanki Islands HF (Iceland), FRN, 6.20%, 08/25/09 (e) | 603 | |||||||||
| VTB Capital S.A. for Vneshtorgbank (Luxembourg), | |||||||||||
| 1,000 | FRN, 5.96%, 08/01/08 (e) | 992 | |||||||||
| 650 | FRN, 6.11%, 09/01/07 (e) | 651 | |||||||||
| 900 | Wells Fargo & Co., VAR, 5.51%, 06/18/10 | 894 | |||||||||
| 11,813 | |||||||||||
Computers & Peripherals — 0.6% | |||||||||||
| 1,200 | Hewlett-Packard Co., FRN, 5.42%, 06/15/10 | 1,192 | |||||||||
| PRINCIPAL AMOUNT($) | | SECURITY DESCRIPTION | | VALUE($) | |||||||
|---|---|---|---|---|---|---|---|---|---|---|---|
Long-Term Investments — Continued | |||||||||||
Consumer Finance — 2.3% | |||||||||||
| 1,400 | Aiful Corp. (Japan), 6.00%, 12/12/11 (e) | 1,405 | |||||||||
| 1,000 | Capital One Financial Corp., FRN, 5.64%, 09/10/09 | 990 | |||||||||
| 450 | Discover Financial Services, FRN, 5.89%, 06/11/10 (e) | 450 | |||||||||
| 1,550 | International Lease Finance Corp., FRN, 5.72%, 05/24/10 | 1,545 | |||||||||
| 4,390 | |||||||||||
Diversified Financial Services — 5.1% | |||||||||||
| 1,750 | BNP US Funding LLC, 7.74% to 12/05/07; thereafter variable, 12/31/49 (e) | 1,764 | |||||||||
| 700 | Goldman Sachs Capital III, 6.13% to 09/01/12; thereafter variable, 12/31/49 | 635 | |||||||||
| 1,500 | K2 (USA) LLC, 5.36%, 02/15/09 (i) | 1,387 | |||||||||
| 500 | Meridian Funding Co. LLC, FRN, 5.59%, 07/21/11 (e) (i) | 501 | |||||||||
| 900 | Preferred Term Securities XXII Ltd. (Cayman Islands), FRN, 5.76%, 09/22/36 (e) (i) | 899 | |||||||||
| 1,700 | RACERS, FRN, Series 2005-16, Class C, FRN, 5.36%, 09/20/07 (e) (i) | 1,700 | |||||||||
| 1,700 | Sigma Finance Corp. (Cayman Islands), FRN, 5.33%, 09/15/08 (e) (i) | 1,700 | |||||||||
| 550 | Xstrata Finance Dubai Ltd. (United Arab Emirates), FRN, 5.85%, 11/13/09 (e) | 547 | |||||||||
| 600 | ZFS Finance USA Trust III, FRN, 6.51%, 12/15/65 (e) | 571 | |||||||||
| 9,704 | |||||||||||
Electric Utilities — 0.8% | |||||||||||
| 250 | Oncor Electric Delivery Co., FRN, 5.74%, 09/16/08 (e) | 247 | |||||||||
| 500 | Pepco Holdings, Inc., FRN, 5.99%, 06/01/10 | 501 | |||||||||
| 850 | PSEG Funding Trust I, 5.38%, 11/16/07 | 849 | |||||||||
| 1,597 | |||||||||||
Food & Staples Retailing — 0.3% | |||||||||||
| 600 | CVS/Caremark Corp., FRN, 5.66%, 06/01/10 | 597 | |||||||||
Insurance — 0.4% | |||||||||||
| 700 | Aleutian Investments LLC, FRN, 4.45%, 05/20/14 (e) (i) | 670 | |||||||||
Media — 0.4% | |||||||||||
| 500 | COX Communications, Inc., FRN, 5.91%, 12/14/07 (m) | 500 | |||||||||
| 200 | Viacom, Inc., FRN, 5.71%, 06/16/09 | 199 | |||||||||
| 699 | |||||||||||
Multi-Utilities — 0.8% | |||||||||||
| Dominion Resources, Inc., | |||||||||||
| 750 | FRN, 5.66%, 09/28/07 (m) | 750 | |||||||||
| 700 | FRN, 5.75%, 11/14/08 | 701 | |||||||||
| 1,451 | |||||||||||
Oil, Gas & Consumable Fuels — 0.3% | |||||||||||
| Pemex Project Funding Master Trust, | |||||||||||
| 400 | FRN, 6.66%, 06/15/10 (e) | 406 | |||||||||
| 150 | FRN, 7.16%, 10/15/09 (e) | 154 | |||||||||
| 560 | |||||||||||
Real Estate Investment Trusts (REITs) — 0.6% | |||||||||||
| iStar Financial, Inc., | |||||||||||
| 650 | FRN, 5.70%, 09/15/09 | 622 | |||||||||
| 425 | FRN, 5.91%, 03/16/09 | 412 | |||||||||
| 1,034 | |||||||||||
Specialty Retail — 0.2% | |||||||||||
| 350 | Home Depot, Inc. FRN, 5.48%, 12/16/09 | 346 | |||||||||
Thrifts & Mortgage Finance — 4.2% | |||||||||||
| 2,900 | CAM U.S. Finance S.A. Sociedad Unipersonal (Spain), FRN, 5.51%, 02/01/10 (e) | 2,899 | |||||||||
| Countrywide Financial Corp., | |||||||||||
| 1,210 | FRN, 5.58%, 03/24/09 | 1,108 | |||||||||
| 950 | FRN, 5.63%, 12/19/08 | 884 | |||||||||
| 1,000 | Residential Capital LLC, FRN, 7.46%, 04/17/09 | 800 | |||||||||
| 300 | Sovereign Bancorp, Inc., FRN, 5.64%, 03/01/09 | 299 | |||||||||
| 950 | Washington Mutual Bank, FRN, 5.45%, 11/06/09 | 928 | |||||||||
| 1,150 | Washington Mutual, Inc., FRN, 5.64%, 08/24/09 | 1,123 | |||||||||
| 8,041 | |||||||||||
Wireless Telecommunication Services — 0.2% | |||||||||||
| 400 | America Movil S.A.B. de CV (Mexico), FRN, 5.46%, 06/27/08 (e) (m) | 400 | |||||||||
| Total Corporate Bonds (Cost $55,569) | 54,238 | ||||||||||
Foreign Government Securities — 0.3% | |||||||||||
| 500 | United Mexican States (Mexico), FRN, 6.06%, 01/13/09 (Cost $502) | 502 | |||||||||
AS OF AUGUST 31, 2007 (Unaudited) (continued)
| PRINCIPAL AMOUNT($) | | SECURITY DESCRIPTION | | VALUE($) | |||||||
|---|---|---|---|---|---|---|---|---|---|---|---|
Long-Term Investments — Continued | |||||||||||
Mortgage Pass-Through Securities — 13.6% | |||||||||||
| Federal National Mortgage Association Pool, | |||||||||||
| 5,400 | 6.00%, 09/25/22 | 5,457 | |||||||||
| 9,100 | 6.50%, 09/25/37 – 10/25/37 | 9,236 | |||||||||
| 10,813 | 7.00%, 09/25/36 – 10/25/37 | 11,113 | |||||||||
| Total Mortgage Pass-Through Securities (Cost $25,734) | 25,806 | ||||||||||
| Total Long-Term Investments (Cost $159,137) | 155,692 | ||||||||||
Short-Term Investments — 31.4% | |||||||||||
Commercial Paper — 15.5% | |||||||||||
| 5,500 | Atlantic Asset Corp., 5.75%, 09/04/07 (m) | 5,496 | |||||||||
| 5,500 | Atlantis One Funding Corp., 5.70%, 09/04/07 (m) | 5,497 | |||||||||
| 5,500 | Clipper Receivables Corp., 5.75%, 09/04/07 (m) | 5,496 | |||||||||
| 5,500 | Ebbets Funding LLC, 6.51%, 09/04/07 (m) | 5,496 | |||||||||
| 5,500 | Galleon Capital LLC, 5.75%, 09/04/07 (m) | 5,496 | |||||||||
| 2,000 | Gotham Funding Corp., 6.13%, 09/21/07 (m) | 1,994 | |||||||||
| Total Commercial Paper (Cost $29,480) | 29,475 | ||||||||||
| SHARES | | | | | ||||||
|---|---|---|---|---|---|---|---|---|---|---|
Investment Company — 15.7% | ||||||||||
| 29,692 | JPMorgan Prime Money Market Fund, Institutional Class (b) (m) (Cost $29,692) | 29,692 | ||||||||
| PRINCIPAL AMOUNT($) | | | ||||||||
|---|---|---|---|---|---|---|---|---|---|---|
U.S. Treasury Obligations — 0.2% | ||||||||||
| 340 | U.S. Treasury Bill, 4.59%, 11/01/07 (k) (n) | 338 | ||||||||
| 60 | U.S. Treasury Note, 3.00%, 11/15/07 (k) | 60 | ||||||||
| Total U.S. Treasury Obligations (Cost $398) | 398 | |||||||||
| Total Short-Term Investments (Cost $59,570) | 59,565 | |||||||||
Total Investments — 113.5% (Cost $218,707) | 215,257 | |||||||||
Liabilities in Excess of Other Assets — (13.5)% | (25,636 | ) | ||||||||
NET ASSETS — 100.0% | $ | 189,621 | ||||||||
| NUMBER OF CONTRACTS | | DESCRIPTION | | EXPIRATION DATE | | NOTIONAL VALUE AT 08/31/07 | | UNREALIZED APPRECIATION (DEPRECIATION) | ||||||||||
|---|---|---|---|---|---|---|---|---|---|---|---|---|---|---|---|---|---|---|
Long Futures Outstanding | ||||||||||||||||||
| 85 | 2 Year U.S. Treasury Notes | December, 2007 | $ | 17,523 | $ | (16 | ) | |||||||||||
| 17 | 5 Year U.S. Treasury Notes | December, 2007 | 1,814 | (1 | ) | |||||||||||||
| 5 | 10 Year U.S. Treasury Notes | December, 2007 | 545 | 1 | ||||||||||||||
Short Futures Outstanding | ||||||||||||||||||
| (2) | Eurodollar | September, 2007 | (473 | ) | 1 | |||||||||||||
| (9) | 2 Year U.S. Treasury Notes | December, 2007 | (1,855 | ) | — | (h) | ||||||||||||
| (83) | 5 Year U.S. Treasury Notes | December, 2007 | (8,856 | ) | (34 | ) | ||||||||||||
| (12) | Eurodollar | December, 2007 | (2,852 | ) | 1 | |||||||||||||
| (12) | Eurodollar | March, 2008 | (2,861 | ) | (1 | ) | ||||||||||||
| $ | (49 | ) | ||||||||||||||||
| Rate Type (r) | ||||||||||||||||||||||
|---|---|---|---|---|---|---|---|---|---|---|---|---|---|---|---|---|---|---|---|---|---|---|
| SWAP COUNTERPARTY | | PAYMENTS MADE BY THE FUND | | PAYMENTS RECEIVED BY THE FUND | | TERMINATION DATE | | NOTIONAL AMOUNT | | Value | ||||||||||||
| Merrill Lynch Capital Services | 5.12% quarterly | 3 month LIBOR quarterly | 02/23/12 | $ | 1,330 | $ | (9 | ) | ||||||||||||||
| REFERENCED OBLIGATION | | SWAP COUNTERPARTY | | BUY/SELL PROTECTION | | FUND PAYS/RECEIVES FIXED RATE | | TERMINATION DATE | | NOTIONAL AMOUNT | | VALUE | ||||||||||||||
|---|---|---|---|---|---|---|---|---|---|---|---|---|---|---|---|---|---|---|---|---|---|---|---|---|---|---|
| Aiful Corp., 4.45%, 02/16/10 | Morgan Stanley Capital Services | Buy | 52.5 BPS quarterly | 12/20/11 | $ | 1,400 | $ | 17 | ||||||||||||||||||
| Ambac Financial Corp., 9.38%, 08/01/11 | Deutsche Bank AG, New York | Sell | 105 BPS quarterly | 09/20/08 | 2,400 | (24 | ) | |||||||||||||||||||
| Banca Italease S.p.A., 4.61%, 02/08/12 | Deutsche Bank AG, New York | Sell | 85 BPS quarterly | 06/20/08 | 1,800 | (16 | ) | |||||||||||||||||||
| CDX.NA.IG.8 | Goldman Sachs Capital Management (1) | Buy | 35 BPS quarterly | 06/20/12 | 3,500 | 47 | ||||||||||||||||||||
| FHLMC, 5.08%, 02/07/19 | Deutsche Bank AG, New York | Sell | 3 BPS quarterly | 06/20/08 | 4,800 | (1 | ) | |||||||||||||||||||
| Goldman Sachs Group, Inc., 6.60%, 01/15/12 | Deutsche Bank AG, New York | Sell | 5.5 BPS quarterly | 11/20/07 | 3,350 | (1 | ) | |||||||||||||||||||
| Hess Corp., 6.65%, 08/15/11 | Morgan Stanley Capital Services | Sell | 20 BPS quarterly | 06/20/08 | 1,300 | 2 | ||||||||||||||||||||
| ICICI Bank, Ltd., 5.75%, 11/16/10 | Deutsche Bank AG, New York | Sell | 26 BPS quarterly | 03/20/08 | 700 | (1 | ) | |||||||||||||||||||
| ITRAXX Series 7 Main | Deutsche Bank AG, New York (2) | Sell | 30 BPS quarterly | 06/20/12 | EUR 4,760 | (39 | ) | |||||||||||||||||||
| Merrill Lynch & Co., 6.00%, 02/17/09 | Deutsche Bank AG, New York | Sell | 9.5 BPS quarterly | 12/20/07 | $ | 1,000 | (1 | ) | ||||||||||||||||||
| Merrill Lynch & Co., 6.00%, 02/17/09 | Bear Stearns Credit Products | Sell | 10 BPS quarterly | 03/20/08 | 3,900 | (7 | ) | |||||||||||||||||||
| Montpelier Re Holdings, Ltd., 6.13%, 08/15/13 | Deutsche Bank AG, New York | Sell | 40 BPS quarterly | 12/20/07 | 1,800 | 1 | ||||||||||||||||||||
| Morgan Stanley, 6.60%, 04/01/12 | Royal Bank of Scotland | Sell | 20 BPS quarterly | 09/20/08 | 1,500 | (5 | ) | |||||||||||||||||||
| Mors Mittal Steel Co. N.V., 9.75%, 04/01/14 | Morgan Stanley Capital Services | Sell | 17 BPS quarterly | 06/20/08 | 1,000 | — | (h) | |||||||||||||||||||
| Proctor & Gamble Co., 4.95%, 08/15/14 | Lehman Brothers Special Financing | Sell | 5 BPS quarterly | 09/20/07 | 3,600 | 1 | ||||||||||||||||||||
| Wells Fargo & Co., 5.56%, 10/28/15 | Royal Bank of Scotland | Sell | 2.5 BPS semi-annually | 12/20/07 | 6,000 | (5 | ) | |||||||||||||||||||
| $ | (32 | ) | ||||||||||||||||||||||||
| (1) | Premiums paid of $97 |
| (2) | Premiums paid of $92 |
| SWAP COUNTERPARTY | | REFERENCED OBLIGATION | | PRICE LOCK | | TERMINATION DATE | | NOTIONAL AMOUNT | | VALUE | | |||||||||||||||
|---|---|---|---|---|---|---|---|---|---|---|---|---|---|---|---|---|---|---|---|---|---|---|---|---|---|---|
| Citibank, N.A. (a) | FNMA 30 Year, 6.00%, TBA | $98.51 | 09/06/07 | $ | 6,200 | $ | (84 | ) | ||||||||||||||||||
| (a) | Fund pays the excess of the market price over the price lock or receives the excess of the price lock over the market price. |
| SWAP COUNTERPARTY | | Referenced Obligation | | Payments made by the Fund (r) | | PAYMENTS RECEIVED BY THE FUND (r) | | TERMINATION DATE | | Notional Amount | | Value | ||||||||||||||
|---|---|---|---|---|---|---|---|---|---|---|---|---|---|---|---|---|---|---|---|---|---|---|---|---|---|---|
| Deutsche Bank AG, New York | Lehman AAA 8.5 Year + CMBS Index | Spread Lock with Carry Amount + 35 BPS | Total Return on Lehman AAA 8.5 Year + CMBS Index | 11/01/07 | 2,000 | (12 | ) | |||||||||||||||||||
| Morgan Stanley Capital Services | Lehman AAA 8.5 Year + CMBS Index | Spread Lock with Carry Amount + 30 BPS | Total Return on Lehman AAA 8.5 Year + CMBS Index | 09/01/07 | $ | 1,600 | $ | (12 | ) | |||||||||||||||||
| $ | (24 | ) | ||||||||||||||||||||||||
AS OF AUGUST 31, 2007 (Unaudited)
| PRINCIPAL AMOUNT($) | | SECURITY DESCRIPTION | | VALUE($) | |||||||
|---|---|---|---|---|---|---|---|---|---|---|---|
Long-Term Investments — 111.4% | |||||||||||
Asset-Backed Securities — 2.9% | |||||||||||
| 976 | GSAMP Trust, Series 2005-WMC2, Class A2B, FRN, 5.77%, 11/25/35 (m) | 961 | |||||||||
| 933 | Residential Asset Securities Corp, Series 2005-KS10, Class 1A2, FRN, 5.76%, 11/25/35 (m) | 914 | |||||||||
| 250 | Soundview Home Equity Loan Trust, Series 2005-OPT4, Class M2, FRN, 6.06%, 12/25/35 (m) | 196 | |||||||||
| Total Asset-Backed Securities (Cost $2,159) | 2,071 | ||||||||||
Collateralized Mortgage Obligations — 4.4% | |||||||||||
Non-Agency CMO — 4.4% | |||||||||||
| Adjustable Rate Mortgage Trust, | |||||||||||
| 269 | Series 2005-12, Class 5A1, FRN, 5.76%, 03/25/36 (m) | 267 | |||||||||
| 609 | Series 2006-3, Class 4A11, FRN, 5.69%, 08/25/36 (m) | 602 | |||||||||
| 442 | Downey Savings & Loan Association Mortgage Loan Trust, Series 2005- AR6, Class 2A1A, FRN, 5.83%, 10/19/45 (m) | 434 | |||||||||
| Harborview Mortgage Loan Trust, | |||||||||||
| 387 | Series 2005-8, Class 1A2A, FRN, 5.87%, 09/19/35 (m) | 380 | |||||||||
| 448 | Series 2005-11, Class 2A1A, FRN, 5.85%, 08/19/45 (m) | 439 | |||||||||
| 183 | Series 2006-8, Class 2A1A, FRN, 5.70%, 08/21/36 (m) | 179 | |||||||||
| 436 | Indymac Index Mortgage Loan Trust, Series 2005-AR18, Class 2A1A, FRN, 5.82%, 10/25/36 (m) | 428 | |||||||||
| 413 | Residential Accredit Loans, Inc., Series 2006-QO4, Class 2A1, FRN, 5.70%, 04/25/46 (m) | 402 | |||||||||
| Total Collateralized Mortgage Obligations (Cost $3,188) | 3,131 | ||||||||||
Corporate Bonds — 2.2% | |||||||||||
Capital Markets — 1.1% | |||||||||||
| BRL 500 | Lehman Brothers Holdings, Inc., 10.00%, 01/03/12 (linked to Brazilian Real Notes, 10.00%, 01/03/12) (Brazil) | 243 | |||||||||
| $500 | Merrill Lynch & Co., Inc., FRN, 5.45%, 10/27/08 (m) | 499 | |||||||||
| 742 | �� | ||||||||||
Commercial Banks — 0.3% | |||||||||||
| 200 | VTB Capital S.A. for Vneshtorgbank (Luxembourg), FRN, 6.11%, 09/21/07 (m) | 200 | |||||||||
Diversified Financial Services — 0.5% | |||||||||||
| Citigroup Funding, Inc., | |||||||||||
| 105 | Zero Coupon, 05/12/08 (linked to Dominican Republic Notes, Zero Coupon, 05/12/08) (Dominican Republic) (e) (m) | 103 | |||||||||
| 50 | Zero Coupon, 05/12/08 (linked to Dominican Republic Notes, Zero Coupon, 05/12/08) (Dominican Republic) (e) (m) | 49 | |||||||||
| 170 | VAR, 0.00%, 06/20/12 (linked to Ghana Treasury Bonds, 0.00%, 06/20/12) (Ghana) (e) (m) | 170 | |||||||||
| 322 | |||||||||||
Diversified Telecommunication Services — 0.3% | |||||||||||
| 250 | AT&T, Inc., FRN, 5.79%, 11/14/08 (m) | 251 | |||||||||
| Total Corporate Bonds (Cost $1,526) | 1,515 | ||||||||||
Foreign Government Securities — 1.2% | |||||||||||
| EGP 1,075 | Credit Suisse First Boston, Zero Coupon, 05/06/08 (linked to Egypt Treasury Bill, Zero Coupon, 05/06/08) (Egypt) | 180 | |||||||||
| PEN 600 | Peruvian Government International Bond (Peru), 6.90%, 08/12/37 (e) (m) | 188 | |||||||||
| ARS 1,600 | Republic of Argentina (Argentina), VAR, 0.00%, 03/25/10 | 481 | |||||||||
| Total Foreign Government Securities (Cost $977) | 849 | ||||||||||
Mortgage Pass-Through Securities — 17.4% | |||||||||||
| Federal National Mortgage Association Various Pools, | |||||||||||
| $5,050 | TBA, 5.50%, 09/25/37 – 10/25/37 | 4,931 | |||||||||
| 3,950 | TBA, 6.00%, 09/25/37 | 3,945 | |||||||||
| 3,385 | TBA, 6.50%, 09/25/37 – 10/25/37 | 3,436 | |||||||||
| Total Mortgage Pass-Through Securities (Cost $12,119) | 12,312 | ||||||||||
U.S. Treasury Obligations — 83.3% | |||||||||||
| U.S. Treasury Inflation Indexed Bonds, | |||||||||||
| 2,216 | 2.38%, 01/15/25 (m) | 2,202 | |||||||||
| 919 | 2.38%, 01/15/27 (m) | 916 | |||||||||
| 589 | 3.88%, 04/15/29 (m) | 735 | |||||||||
| U.S. Treasury Inflation Indexed Notes, | |||||||||||
| 4,718 | 0.88%, 04/15/10 (m) | 4,510 | |||||||||
| 4,103 | 1.63%, 01/15/15 (m) | 3,886 | |||||||||
| 8,547 | 1.88%, 07/15/13 (m) | 8,336 | |||||||||
| 5,934 | 1.88%, 07/15/15 (m) | 5,721 | |||||||||
| 2,977 | 2.00%, 01/15/14 (m) | 2,906 | |||||||||
| 5,060 | 2.00%, 07/15/14 (m) | 4,944 | |||||||||
| 3,401 | 2.00%, 01/15/16 | 3,298 | |||||||||
| PRINCIPAL AMOUNT($) | | SECURITY DESCRIPTION | | VALUE($) | |||||||
|---|---|---|---|---|---|---|---|---|---|---|---|
Long-Term Investments — Continued | |||||||||||
U.S. Treasury Obligations — Continued | |||||||||||
| 4,723 | 2.38%, 04/15/11 | 4,712 | |||||||||
| 480 | 2.50%, 07/15/16 | 485 | |||||||||
| 302 | 2.64%, 07/15/17 | 309 | |||||||||
| 7,254 | 3.00%, 07/15/12 (k) (m) | 7,487 | |||||||||
| 2,382 | 3.50%, 01/15/11 (m) | 2,466 | |||||||||
| 3,900 | 3.88%, 01/15/09 (m) | 3,954 | |||||||||
| 1,839 | 4.25%, 01/15/10 (m) | 1,910 | |||||||||
| Total U.S. Treasury Obligations (Cost $59,337) | 58,777 | ||||||||||
| Total Long-Term Investments (Cost $79,306) | 78,655 | ||||||||||
NUMBER OF CONTRACTS | |||||||||||
Options Purchased — 1.3% | |||||||||||
Call Options Purchased — 0.4% | |||||||||||
| 17 | 90 Day Eurodollar Futures, Expiring 09/17/07 @ $94.50, American Style | 4 | |||||||||
| 2 | 90 Day Eurodollar Futures, Expiring 09/17/07 @ $94.75, American Style | — | (h) | ||||||||
| 24 | 90 Day Eurodollar Futures, Expiring 09/17/07 @ $95.00, American Style | 1 | |||||||||
| 27 | 90 Day Eurodollar Futures, Expiring 09/17/07 @ $95.75, American Style | — | (h) | ||||||||
| 6 | 90 Day Eurodollar Futures, Expiring 12/17/07 @ $95.00, American Style | 4 | |||||||||
| 60 | 90 Day Sterling Futures, Expiring 09/19/07 @ $94.38, American Style | — | |||||||||
| 8 | 90 Day Sterling Futures, Expiring 09/19/07 @ $94.50, American Style | — | |||||||||
| 6,574 | NZD Call/MXN Put Futures, Expiring 12/28/07 @ 1 NZD to 6 MXN, One Touch, European Style | — | (h) | ||||||||
| 39,119 | USD Call/JPY Put Futures, Expiring 10/04/07 @ 1 USD to 117 JPY, Vanilla, European Style | — | (h) | ||||||||
| NOTIONAL AMOUNT($) | | | | | ||||||
|---|---|---|---|---|---|---|---|---|---|---|
| Call Options Purchased on Interest Rate Swaps: | ||||||||||
| 46,874 | Expiring 05/30/08. If exercised the Fund receives 3.96% and pays floating 3 month LIBOR expiring 06/03/10, European Style | 131 | ||||||||
| 12,685 | Expiring 11/02/09. If exercised the Fund receives 4.49% and pays floating 3 month LIBOR expiring 11/04/19, European Style | 163 | ||||||||
| Total Call Options Purchased | 303 | |||||||||
Receiver/Payer Straddles on Interest Rate Swaps — 0.7% | ||||||||||
| 2,110 | Expiring 06/09/08. If exercised the Fund pays/receives 5.88% and receives/pays floating 3 month LIBOR expiring 06/11/18, European Style | 124 | ||||||||
| 13,495 | Expiring 10/02/08. If exercised the Fund pays/receives 4.46% and receives/pays floating 3 month LIBOR expiring 10/06/18, European Style | 88 | ||||||||
| 1,155 | Expiring 01/25/27. If exercised the Fund pays/receives 5.47% and receives/pays floating 3 month LIBOR expiring 01/27/37, European Style | 71 | ||||||||
| 925 | Expiring 01/25/27. If exercised the Fund pays/receives 5.47% and receives/pays floating 3 month LIBOR expiring 01/27/37, European Style | 57 | ||||||||
| 2,193 | Expiring 03/22/27. If exercised the Fund pays/receives 5.38% and receives/pays floating 3 month LIBOR expiring 03/24/37, European Style | 136 | ||||||||
| Total Receiver/Payer Straddles on Interest Rate Swaps | 476 | |||||||||
NUMBER OF CONTRACTS | ||||||||||
Put Options Purchased — 0.2% | ||||||||||
| 16 | 30 Day Fed Funds expiring 11/30/07 @ $94.75, American Style | — | (h) | |||||||
| 174 | 90 Day Eurodollar Futures expiring 09/17/07 @ $94.38, American Style | 17 | ||||||||
| 46,000 | CAD Put/JPY Call, Expiring 12/19/07 @ 1 CAD to 111.5 JPY, Vanilla, European Style | 2 | ||||||||
| 10,000 | EUR Put/PLN Call Futures, Expiring 09/07/07 @ 1 EUR to 4.25 PLN, Vanilla, European Style | — | ||||||||
| 60,000 | GBP Put/USD Call, Expiring 12/27/07 @ 1 GBP to 11.5 USD, Vanilla, European Style | 1 | ||||||||
| 95,904 | NZD Put/JPY Call, Expiring 01/23/08 @ 1 NZD to 75 JPY, Vanilla, European Style | 2 | ||||||||
| 36,671 | NZD Put/MXN Call, Expiring 01/03/08 @ 1 NZD to 6.9 MXN, Vanilla, European Style | — | (h) | |||||||
| 39,119 | USD Put/JPY Call, Expiring 10/04/07 @ 1 USD to 108 JPY, Vanilla, European Style | — | (h) | |||||||
AS OF AUGUST 31, 2007 (Unaudited) (continued)
| NOTIONAL AMOUNT($) | | SECURITY DESCRIPTION | | VALUE($) | |||||||
|---|---|---|---|---|---|---|---|---|---|---|---|
Options Purchased — Continued | |||||||||||
| 130,657 | USD Put/JPY Call, Expiring 12/28/07 @ 1 USD to 110 JPY, KnockIn 122 JPY, European Style | 2 | |||||||||
| Put Options Purchased on Interest Rate Swaps: | |||||||||||
| 35,081 | Expiring 02/28/08. If exercised the Fund pays 4.20% and receives floating 3 month LIBOR expiring 03/03/10, European Style | 97 | |||||||||
| Total Put Options Purchased | 121 | ||||||||||
| Total Options Purchased (Cost $1,082) | 900 | ||||||||||
| SHARES | | | | | Short-Term Investments — 2.7%||||||
|---|---|---|---|---|---|---|---|---|---|---|
Investment Company — 2.5% | ||||||||||
| 1,734 | JPMorgan Prime Money Market Fund, Institutional Class (b)(m) (Cost $1,734) | 1,734 | ||||||||
| PRINCIPAL AMOUNT($) | | | | | ||||||
|---|---|---|---|---|---|---|---|---|---|---|
U.S. Treasury Obligations — 0.2% | ||||||||||
| 140 | U.S. Treasury Bill, 4.85%, 01/17/08 (k) (m) (n) (Cost $137) | 137 | ||||||||
| Total Short-Term Investments (Cost $1,871) | 1,871 | |||||||||
Total Investments — 115.4% (Cost $82,259) | 81,426 | |||||||||
Liabilities in Excess of Other Assets — (15.4)% | (10,856 | ) | ||||||||
NET ASSETS — 100.0% | $ | 70,570 | ||||||||
| NUMBER OF CONTRACTS | | DESCRIPTION | | EXPIRATION DATE | | NOTIONAL VALUE AT 08/31/07 | | UNREALIZED APPRECIATION (DEPRECIATION) | ||||||||||
|---|---|---|---|---|---|---|---|---|---|---|---|---|---|---|---|---|---|---|
Long Futures Outstanding | ||||||||||||||||||
| 5 | 3 Year Australia Bonds | September, 2007 | $ | 384 | $ | (1 | ) | |||||||||||
| 5 | 10 Year Japan Bonds | September, 2007 | 5,845 | 114 | ||||||||||||||
| 45 | Euro-Schatz | September, 2007 | 6,336 | (1 | ) | |||||||||||||
| 6 | 2 Year U.S. Treasury Notes | December, 2007 | 1,237 | (1 | ) | |||||||||||||
| 12 | 5 Year U.S. Treasury Notes | December, 2007 | 1,281 | (2 | ) | |||||||||||||
| 24 | 10 Year U.S. Treasury Notes | December, 2007 | 2,617 | — | (h) | |||||||||||||
| 7 | U.K. Treasury Gilt | December, 2007 | 1,511 | 2 | ||||||||||||||
| 9 | U.S. Treasury Bonds | December, 2007 | 1,004 | 3 | ||||||||||||||
| 1 | Eurodollar | December, 2009 | 238 | — | (h) | |||||||||||||
Short Futures Outstanding | ||||||||||||||||||
| (2) | 10 Year Australia Bonds | September, 2007 | (154 | ) | — | (h) | ||||||||||||
| (3) | 10 Year Swap Future | September, 2007 | (318 | ) | (3 | ) | ||||||||||||
| (13) | Euro-Bobl | September, 2007 | (1,913 | ) | 12 | |||||||||||||
| (15) | Euro-Bund | September, 2007 | (2,325 | ) | 5 | |||||||||||||
| (26) | 3 Month Euroyen TFX | December, 2007 | (5,565 | ) | (3 | ) | ||||||||||||
| (16) | 2 Year U.S. Treasury Notes | December, 2007 | (3,299 | ) | 5 | |||||||||||||
| (69) | 5 Year U.S. Treasury Notes | December, 2007 | (7,363 | ) | (27 | ) | ||||||||||||
| (26) | 10 Year U.S. Treasury Notes | December, 2007 | (2,835 | ) | (2 | ) | ||||||||||||
| (3) | 90 Day UK Liffe | June, 2008 | (711 | ) | — | (h) | ||||||||||||
| (3) | 90 Day UK Liffe | September, 2008 | (711 | ) | — | (h) | ||||||||||||
| (2) | 90 Day Sterling LIBOR | December, 2008 | (474 | ) | — | (h) | ||||||||||||
| (3) | Eurodollar | December, 2008 | (716 | ) | (3 | ) | ||||||||||||
| (3) | 90 Day Sterling LIBOR | March, 2009 | (712 | ) | (1 | ) | ||||||||||||
| (1) | 90 Day Sterling LIBOR | June, 2009 | (237 | ) | — | (h) | ||||||||||||
| $ | 97 | |||||||||||||||||
| CONTRACTS TO BUY | SETTLEMENT DATE | | SETTLEMENT VALUE | | VALUE AT 08/31/07 | | NET UNREALIZED APPRECIATION (DEPRECIATION) | | ||||||||||||||||
|---|---|---|---|---|---|---|---|---|---|---|---|---|---|---|---|---|---|---|---|---|---|---|---|---|
| 423,595 | AUD | 11/16/07 | $ | 354 | $ | 346 | $ | (8 | ) | |||||||||||||||
| 2,140 | AUD for | |||||||||||||||||||||||
| 2,462 | NZD | 09/20/07 | 2 | # | 2 | # | — | (h) | ||||||||||||||||
| 304,869 | CAD | 11/16/07 | 288 | 289 | 1 | |||||||||||||||||||
| 28,724 | CAD for | |||||||||||||||||||||||
| 32,011 | AUD | 11/16/07 | 26 | # | 27 | # | 1 | |||||||||||||||||
| 14,337 | CAD for | |||||||||||||||||||||||
| 6,801 | GBP | 11/16/07 | 14 | # | 14 | # | — | (h) | ||||||||||||||||
| 626,760 | CHF | 11/16/07 | 526 | 522 | (4 | ) | ||||||||||||||||||
| 277,345 | CHF for | |||||||||||||||||||||||
| 171,651 | EUR | 11/16/07 | 234 | # | 231 | # | (3 | ) | ||||||||||||||||
| 8,097 | CHF for | |||||||||||||||||||||||
| 3,367 | GBP | 11/16/07 | 7 | # | 7 | # | — | (h) | ||||||||||||||||
| 185,639 | EUR | 09/20/07 | 252 | 253 | 1 | |||||||||||||||||||
| 279,900 | EUR | 11/16/07 | 379 | 382 | 3 | |||||||||||||||||||
| 88,556 | EUR for | |||||||||||||||||||||||
| 126,582 | CAD | 11/16/07 | 120 | # | 121 | # | 1 | |||||||||||||||||
| 69,218 | EUR for | |||||||||||||||||||||||
| 46,772 | GBP | 09/20/07 | 94 | # | 94 | # | — | (h) | ||||||||||||||||
| 5,025 | EUR for | |||||||||||||||||||||||
| 3,427 | GBP | 11/16/07 | 7 | # | 7 | # | — | (h) | ||||||||||||||||
| 10,118 | EUR for | |||||||||||||||||||||||
| 81,036 | NOK | 11/16/07 | 14 | # | 14 | # | — | (h) | ||||||||||||||||
| 84,093 | EUR for | |||||||||||||||||||||||
| 161,625 | NZD | 11/16/07 | 113 | # | 115 | # | 2 | |||||||||||||||||
| 69,113 | GBP | 09/20/07 | 140 | 139 | (1 | ) | ||||||||||||||||||
| 748,730 | GBP | 11/16/07 | 1,502 | 1,507 | 5 | |||||||||||||||||||
| 116,915 | GBP for | |||||||||||||||||||||||
| 171,591 | EUR | 11/16/07 | 234 | # | 235 | # | 1 | |||||||||||||||||
| 5,322 | GBP for | |||||||||||||||||||||||
| 1,203,917 | JPY | 09/20/07 | 10 | # | 11 | # | 1 | |||||||||||||||||
| 10,170,327 | JPY | 09/20/07 | 87 | 88 | 1 | |||||||||||||||||||
| 100,664,308 | JPY | 11/16/07 | 878 | 878 | — | (h) | ||||||||||||||||||
| 9,348,952 | JPY for | |||||||||||||||||||||||
| 41,277 | GBP | 11/16/07 | 83 | # | 82 | # | (1 | ) | ||||||||||||||||
| 162,082 | NOK for | |||||||||||||||||||||||
| 20,236 | EUR | 11/16/07 | 28 | # | 28 | # | — | (h) | ||||||||||||||||
| 481,283 | NOK for | |||||||||||||||||||||||
| 563,280 | SEK | 11/16/07 | 82 | # | 83 | # | 1 | |||||||||||||||||
| 5,032,850 | NOK | 11/16/07 | 862 | 864 | 2 | |||||||||||||||||||
| 302,848 | NZD | 11/16/07 | $ | 221 | $ | 211 | $ | (10 | ) | |||||||||||||||
AS OF AUGUST 31, 2007 (Unaudited) (continued)
| CONTRACTS TO BUY | SETTLEMENT DATE | | SETTLEMENT VALUE | | VALUE AT 08/31/07 | | NET UNREALIZED APPRECIATION (DEPRECIATION) | | ||||||||||||||||
|---|---|---|---|---|---|---|---|---|---|---|---|---|---|---|---|---|---|---|---|---|---|---|---|---|
| 297,908 | NZD for | |||||||||||||||||||||||
| 149,112 | EUR | 11/16/07 | 204 | # | 208 | # | 4 | |||||||||||||||||
| 3,378,108 | SEK | 11/16/07 | 497 | 492 | (5 | ) | ||||||||||||||||||
| 251,404 | ZAR | 09/20/07 | 35 | 35 | — | (h) | ||||||||||||||||||
| 39,469 | ZAR for | |||||||||||||||||||||||
| 4042 | EUR | 09/20/07 | 6 | # | 6 | # | — | (h) | ||||||||||||||||
| $ | 7,299 | $ | 7,291 | $ | (8 | ) | ||||||||||||||||||
| CONTRACTS TO SELL | SETTLEMENT DATE | | SETTLEMENT VALUE | | VALUE AT 08/31/07 | | NET UNREALIZED APPRECIATION (DEPRECIATION) | | ||||||||||||||||
|---|---|---|---|---|---|---|---|---|---|---|---|---|---|---|---|---|---|---|---|---|---|---|---|---|
| 38,522 | AUD | 09/20/07 | $ | 32 | $ | 32 | $ | — | (h) | |||||||||||||||
| 93,502 | AUD | 11/16/07 | 74 | 76 | (2 | ) | ||||||||||||||||||
| 17,207 | CAD | 09/20/07 | 16 | 16 | — | (h) | ||||||||||||||||||
| 530,097 | CAD | 11/16/07 | 502 | 503 | (1 | ) | ||||||||||||||||||
| 40,000 | CHF | 09/20/07 | 32 | 33 | (1 | ) | ||||||||||||||||||
| 1,205,950 | CHF | 11/16/07 | 1,011 | 1,004 | 7 | |||||||||||||||||||
| 274,962 | EUR | 09/20/07 | 370 | 375 | (5 | ) | ||||||||||||||||||
| 721,875 | EUR | 11/16/07 | 987 | 986 | 1 | |||||||||||||||||||
| 77,125 | GBP | 09/20/07 | 157 | 156 | 1 | |||||||||||||||||||
| 362,092 | GBP | 11/16/07 | 725 | 729 | (4 | ) | ||||||||||||||||||
| 27,859,980 | JPY | 09/20/07 | 239 | 241 | (2 | ) | ||||||||||||||||||
| 1,251,442 | JPY | 11/16/07 | 1,077 | 1,092 | (15 | ) | ||||||||||||||||||
| 80,806 | NOK | 11/16/07 | 14 | 14 | — | (h) | ||||||||||||||||||
| 783,513 | NZD | 11/16/07 | 566 | 547 | 19 | |||||||||||||||||||
| 13,789 | SEK | 09/20/07 | 2 | 2 | — | (h) | ||||||||||||||||||
| 1,506,235 | SEK | 11/16/07 | 222 | 219 | 3 | |||||||||||||||||||
| 79,237 | ZAR | 09/20/07 | 12 | 11 | 1 | |||||||||||||||||||
| $ | 6,038 | $ | 6,036 | $ | 2 | |||||||||||||||||||
| PRINCIPAL AMOUNT | | SECURITY DESCRIPTION | | VALUE | ||||||
|---|---|---|---|---|---|---|---|---|---|---|
| $(240) | FNMA, TBA, 5.00%, 09/25/37 | $ | (228 | ) | ||||||
| (450) | FNMA, TBA, 5.00%, 10/25/37 | (428 | ) | |||||||
| (3,650) | FNMA, TBA, 6.00%, 10/25/37 | (3,644 | ) | |||||||
| (Proceeds received $4,305) | $ | (4,300 | ) | |||||||
| DESCRIPTION | | EXERCISE PRICE | | EXPIRATION DATE | | NUMBER OF CONTRACTS | | VALUE | ||||||||||
|---|---|---|---|---|---|---|---|---|---|---|---|---|---|---|---|---|---|---|
| 10 Year U.S. Treasury Note Futures, American Style | $ | 111.00 | 10/26/07 | 33 | $ | (13 | ) | |||||||||||
| 10 Year U.S. Treasury Note Futures, European Style | 111.00 | 11/20/07 | 71 | (39 | ) | |||||||||||||
| 10 Year U.S. Treasury Note Futures, European Style | 112.00 | 11/20/07 | 50 | — | ||||||||||||||
| 30 Day Federal Funds Futures, American Style | 95.00 | 09/28/07 | 7 | (2 | ) | |||||||||||||
| 90 Day Eurodollar Futures, American Style | 95.00 | 09/17/07 | 6 | — | (h) | |||||||||||||
| 90 Day Eurodollar Futures, American Style | 95.50 | 09/17/07 | 24 | — | (h) | |||||||||||||
| 90 Day Eurodollar Futures, American Style | 96.00 | 09/17/07 | 54 | — | (h) | |||||||||||||
| 90 Day Eurodollar Futures, American Style | 95.38 | 12/17/07 | 6 | (2 | ) | |||||||||||||
| 90 Day Sterling Futures, American Style | 94.63 | 09/19/07 | 16 | — | ||||||||||||||
| (Premiums received of $79) | $ | (56 | ) | |||||||||||||||
| COUNTERPARTY | | EXERCISE RATE* | | OPTION EXPIRATION DATE | | SWAP EXPIRATION DATE | | NOTIONAL AMOUNT | | VALUE | ||||||||||||
|---|---|---|---|---|---|---|---|---|---|---|---|---|---|---|---|---|---|---|---|---|---|---|
| Barclays Bank plc | 5.46% semi-annually | 05/30/08 | 06/03/10 | $ | 46,874 | $ | (92 | ) | ||||||||||||||
| (Premiums received of $80) | ||||||||||||||||||||||
| DESCRIPTION | | EXERCISE PRICE | | EXPIRATION DATE | | NUMBER OF CONTRACTS | | VALUE | ||||||||||
|---|---|---|---|---|---|---|---|---|---|---|---|---|---|---|---|---|---|---|
| 10 Year U.S. Treasury Note Futures, European Style | $106.00 | 11/20/07 | 39 | $ (9) | ||||||||||||||
| 90 Day Eurodollar Futures, American Style | 94.50 | 09/17/07 | 17 | (4) | ||||||||||||||
| 90 Day Eurodollar Futures, American Style | 94.75 | 09/17/07 | 4 | (3) | ||||||||||||||
| 90 Day Sterling Futures, American Style | 94.00 | 12/19/07 | 18 | (17) | ||||||||||||||
| CAD Put/JPY Call, Vanilla, European Style | 106.00 | 12/19/07 | 46,000 | (1) | ||||||||||||||
| EUR Put/PLN Call, Vanilla, European Style | 4.60 | 09/07/07 | 10,000 | — | ||||||||||||||
| GBP Put/USD Call, Vanilla, European Style | 11.00 | 12/27/07 | 60,000 | — | ||||||||||||||
| NZD Put/JPY Call, Vanilla, European Style | 70.00 | 01/23/08 | 95,904 | (1) | ||||||||||||||
| (Premiums received of $40) | $ (35) | |||||||||||||||||
| COUNTERPARTY | | EXERCISE RATE** | | OPTION EXPIRATION DATE | | SWAP EXPIRATION DATE | | NOTIONAL AMOUNT | | VALUE | ||||||||||||
|---|---|---|---|---|---|---|---|---|---|---|---|---|---|---|---|---|---|---|---|---|---|---|
| Bank of America | 5.99% semi-annually | 11/02/09 | 11/04/19 | $ | 12,685 | $ | (245 | ) | ||||||||||||||
| Barclays Bank plc | 5.20% semi-annually | 02/28/08 | 03/03/10 | 35,081 | (78 | ) | ||||||||||||||||
| (Premiums received of $311) | $ | (323 | ) | |||||||||||||||||||
AS OF AUGUST 31, 2007 (Unaudited) (continued)
| COUNTERPARTY | | EXERCISE RATE*** | | OPTION EXPIRATION DATE | | SWAP EXPIRATION DATE | | NOTIONAL AMOUNT | | VALUE | ||||||||||||
|---|---|---|---|---|---|---|---|---|---|---|---|---|---|---|---|---|---|---|---|---|---|---|
| Barclays Bank plc | 5.96% semi-annually | 10/02/08 | 10/06/18 | $ | 11,571 | $ | (106 | ) | ||||||||||||||
| Barclays Bank plc | 6.02% semi-annually | 07/28/14 | 07/30/24 | 558 | (50 | ) | ||||||||||||||||
| Lehman Brothers Special Financing | 5.36% semi-annually | 03/15/12 | 03/19/42 | 947 | (145 | ) | ||||||||||||||||
| (Premiums received of $342) | $ | (301 | ) | |||||||||||||||||||
| * | The Fund would receive a floating rate based on 3-month USD LIBOR, if exercised. |
| ** | The Fund would pay a floating rate based on 3-month USD LIBOR, if exercised. |
| *** | The Fund would pay or receive a floating rate based on 3-month USD LIBOR, if exercised. |
| **** | European Style |
| RATE TYPE (r) | ||||||||||||||||||||||
|---|---|---|---|---|---|---|---|---|---|---|---|---|---|---|---|---|---|---|---|---|---|---|
| SWAP COUNTERPARTY | | PAYMENTS MADE BY THE FUND | | PAYMENTS RECEIVED BY THE FUND | | TERMINATION DATE | | NOTIONAL AMOUNT | | VALUE | ||||||||||||
| Bank of America | 5.55% semi-annually | 3 month LIBOR quarterly | 06/14/12 | $ | 1,230 | $ | (31 | ) | ||||||||||||||
| Bank of America | 5.89% semi-annually | 3 month LIBOR quarterly | 11/04/19 | 6,796 | (213 | ) | ||||||||||||||||
| Barclays Bank plc | 6 month GBP LIBOR semi-annually | 6.06% semi-annually | 05/30/09 | GBP 1,100 | (1 | ) | ||||||||||||||||
| Barclays Bank plc | 4.7% semi-annually | 3 month LIBOR quarterly | 03/03/10 | $ | 17,190 | 9 | ||||||||||||||||
| Barclays Bank plc | 4.71% semi-annually | 3 month LIBOR quarterly | 06/03/10 | 18,750 | 11 | |||||||||||||||||
| Barclays Bank plc | 5.62% semi-annually | 6 month GBP LIBOR semi-annually | 05/30/17 | GBP 270 | — | (h) | ||||||||||||||||
| Barclays Bank plc | 3.29% termination date + 2 | Inflation-linked termination + 2 | 06/22/17 | GBP 160 | — | (h) | ||||||||||||||||
| Barclays Bank plc | 5.51% semi-annually | 3 month LIBOR quarterly | 08/03/17 | $ | 664 | (14 | ) | |||||||||||||||
| Barclays Bank plc | 3 month LIBOR quarterly | 5.37% semi-annually | 08/28/17 | 447 | 5 | |||||||||||||||||
| Barclays Bank plc | 5.72% quarterly | 3 month LIBOR quarterly | 10/06/18 | 811 | (24 | ) | ||||||||||||||||
| Barclays Bank plc | 5.87% quarterly | 3 month LIBOR quarterly | 10/06/18 | 5,063 | (205 | ) | ||||||||||||||||
| Barclays Bank plc | Inflation-linked termination + 2 | 3.43% termination date + 2 | 06/22/27 | GBP 90 | 1 | |||||||||||||||||
| Barclays Bank plc | 5.28% semi-annually | 3 month LIBOR quarterly | 03/26/32 | 167 | 2 | |||||||||||||||||
| BNP Paribas | 3 month JIBAR quarterly | 8.24% quarterly | 02/21/12 | ZAR 1,750 | (15 | ) | ||||||||||||||||
| BNP Paribas | 4.18% annually | 6 month EURIBOR semi-annually | 02/23/12 | EUR 170 | (2 | ) | ||||||||||||||||
| BNP Paribas | 3 month JIBAR quarterly | 8.40% quarterly | 02/28/12 | ZAR 2,070 | (16 | ) | ||||||||||||||||
| BNP Paribas | 4.10% annually | 6 month EURIBOR semi-annually | 03/02/12 | EUR 200 | 5 | |||||||||||||||||
| Citibank, N.A. | 6 month JPY LIBOR semi-annually | 1.05% semi-annually | 03/10/09 | JPY 243,000 | 1 | |||||||||||||||||
| Citibank, N.A. | 6 month JPY LIBOR semi-annually | 1.30% semi-annually | 03/20/12 | JPY 100,000 | 2 | |||||||||||||||||
| Citibank, N.A. | 6 month JPY LIBOR semi-annually | 1.86% semi-annually | 05/29/17 | JPY 88,840 | 11 | |||||||||||||||||
| Credit Suisse International | 6 month GBP LIBOR semi-annually | 5.66% semi-annually | 02/21/09 | GBP 1,430 | (24 | ) | ||||||||||||||||
| Credit Suisse International | 3 month LIBOR quarterly | 5.50% semi-annually | 08/03/17 | $ | 600 | 12 | ||||||||||||||||
| Credit Suisse International | 3 month LIBOR quarterly | 5.28% semi-annually | 08/29/17 | 413 | 1 | |||||||||||||||||
| Credit Suisse International | 5.41% semi-annually | 3 month LIBOR quarterly | 01/26/32 | 85 | 1 | |||||||||||||||||
| Deutsche Bank AG, New York | 0.96% semi-annually | 6 month JPY LIBOR semi-annually | 12/08/08 | JPY 303,000 | 1 | |||||||||||||||||
| Deutsche Bank AG, New York | 3 month LIBOR quarterly | 5.15% semi-annually | 08/14/12 | $ | 1,095 | 8 | ||||||||||||||||
| Deutsche Bank AG, New York | 6 month JPY LIBOR semi-annually | 1.79% semi-annually | 12/08/16 | JPY 65,000 | 3 | |||||||||||||||||
| Deutsche Bank AG, New York | 1.80% semi-annually | 6 month JPY LIBOR semi-annually | 12/12/16 | JPY 81,000 | (4 | ) | ||||||||||||||||
| Deutsche Bank AG, New York | 3 month LIBOR quarterly | 5.50% semi-annually | 08/06/17 | $ | 254 | 5 | ||||||||||||||||
| Deutsche Bank AG, New York | 5.43% semi-annually | 3 month LIBOR quarterly | 08/14/17 | 620 | (9 | ) | ||||||||||||||||
| Deutsche Bank AG, New York | Inflation-linked annually | 3.14% annually | 08/11/21 | AUD 450 | (9 | ) | ||||||||||||||||
| Deutsche Bank AG, New York | 6 month JPY LIBOR semi-annually | 2.25% semi-annually | 12/12/26 | JPY 46,000 | — | (h) | ||||||||||||||||
| Deutsche Bank AG, New York | 5.42% semi-annually | 3 month LIBOR quarterly | 01/26/32 | $ | 108 | 1 | ||||||||||||||||
| Goldman Sachs Capital Management | 1.88% semi-annually | 6 month JPY LIBOR semi-annually | 09/20/14 | JPY 123,000 | (25 | ) | ||||||||||||||||
| Goldman Sachs Capital Management | 5.53% semi-annually | 3 month LIBOR quarterly | 07/31/17 | $ | 859 | (20 | ) | |||||||||||||||
| Goldman Sachs Capital Management | 1.82% semi-annually | 6 month JPY LIBOR semi-annually | 08/28/17 | JPY 43,000 | (2 | ) | ||||||||||||||||
| HSBC Bank plc | 10.02% quarterly | 3 month JIBAR quarterly | 07/25/09 | ZAR 3,900 | 2 | |||||||||||||||||
| RATE TYPE (r) | ||||||||||||||||||
|---|---|---|---|---|---|---|---|---|---|---|---|---|---|---|---|---|---|---|
| SWAP COUNTERPARTY | PAYMENTS MADE BY THE FUND | | PAYMENTS RECEIVED BY THE FUND | | TERMINATION DATE | | NOTIONAL AMOUNT | | VALUE | |||||||||
| HSBC Bank plc | 6 month BUBOR semi-annually | 7.14% annually | 07/31/09 | HUF 379,000 | $ | (4 | ) | |||||||||||
| HSBC Bank plc | 10.23% quarterly | 3 month JIBAR quarterly | 08/03/09 | ZAR 3,900 | — | (h) | ||||||||||||
| HSBC Bank plc | 4.77% annually | 6 month EURIBOR semi-annually | 07/27/17 | EUR 190 | (3 | ) | ||||||||||||
| HSBC Bank plc | 6 month WIBOR semi-annually | 5.60% annually | 07/27/17 | PLN 730 | (2 | ) | ||||||||||||
| Merrill Lynch Capital Services | 6 month CAD-BA-CDOR semi-annually | 4.72% semi-annually | 08/21/12 | CAD 820 | (5 | ) | ||||||||||||
| Merrill Lynch Capital Services | 4.95% semi-annually | 6 month CAD-BA-CDOR semi-annually | 08/21/17 | CAD 460 | — | (h) | ||||||||||||
| Morgan Stanley Capital Services | 6 month WIBOR semi-annually | 4.62% annually | 01/29/09 | PLN 5,090 | 21 | |||||||||||||
| Morgan Stanley Capital Services | 6 month WIBOR semi-annually | 4.88% annually | 04/06/09 | PLN 18,595 | (52 | ) | ||||||||||||
| Morgan Stanley Capital Services | 6 month LIBOR semi-annually | 6.25% semi-annually | 06/13/09 | GBP 1,850 | 13 | |||||||||||||
| Morgan Stanley Capital Services | 3 month GBP LIBOR quarterly | 5.93% annually | 06/17/09 | GBP 1,500 | (4 | ) | ||||||||||||
| Morgan Stanley Capital Services | 3 month USD-LIBOR-BBA v.s 3 month AUD-BBR quarterly | 0.99% quarterly | 01/25/11 | AUD 6,760 | (1 | ) | ||||||||||||
| Morgan Stanley Capital Services | 5.03% annually | 6 month WIBOR semi-annually | 01/29/17 | PLN 1,230 | 11 | |||||||||||||
| Morgan Stanley Capital Services | 5.15% annually | 6 month WIBOR semi-annually | 04/06/17 | PLN 4,511 | 63 | |||||||||||||
| Morgan Stanley Capital Services | 5.90% semi-annually | 6 month LIBOR semi-annually | 06/13/17 | GBP 420 | (19 | ) | ||||||||||||
| Morgan Stanley Capital Services | 4.92% annually | 6 month LIBOR semi-annually | 06/26/17 | EUR 190 | (7 | ) | ||||||||||||
| Morgan Stanley Capital Services | 6 month WIBOR semi-annually | 5.68% annually | 06/26/17 | PLN 770 | — | (h) | ||||||||||||
| Union Bank of Switzerland AG | 5.24% semi-annually | 3 month LIBOR quarterly | 05/23/09 | USD 890 | (16 | ) | ||||||||||||
| Union Bank of Switzerland AG | 1.21% semi-annually | 6 month JPY LIBOR semi-annually | 06/25/09 | JPY 315,000 | (11 | ) | ||||||||||||
| Union Bank of Switzerland AG | 1.83% semi-annually | 6 month JPY LIBOR semi-annually | 09/20/14 | JPY 124,000 | (18 | ) | ||||||||||||
| Union Bank of Switzerland AG | 6 month JPY LIBOR semi-annually | 1.81% semi-annually | 05/23/17 | JPY 21,500 | 1 | |||||||||||||
| Union Bank of Switzerland AG | 5.23% semi-annually | 3 month LIBOR quarterly | 06/12/17 | $ | 210 | — | (h) | |||||||||||
| Union Bank of Switzerland AG | 5.56% semi-annually | 3 month LIBOR quarterly | 06/12/17 | 1,015 | (25 | ) | ||||||||||||
| Union Bank of Switzerland AG | 6 month JPY LIBOR semi-annually | 2.13% semi-annually | 06/25/17 | JPY 68,500 | 20 | |||||||||||||
| $ | (571 | ) | ||||||||||||||||
| REFERENCED OBLIGATION | | SWAP COUNTERPARTY | | BUY/SELL PROTECTION | | FUND PAYS/RECEIVES FIXED RATE (R) | | TERMINATION DATE | | NOTIONAL AMOUNT | | VALUE | ||||||||||||||
|---|---|---|---|---|---|---|---|---|---|---|---|---|---|---|---|---|---|---|---|---|---|---|---|---|---|---|
| Bank TuranAlem Finance BV, 8.50%, 02/10/15 | HSBC Bank plc | Sell | 190 BPS quarterly | 09/14/07 | $ | 190 | $ | — | (h) | |||||||||||||||||
| CDX.EM.7 | Goldman Sachs International (1) | Buy | 125 BPS quarterly | 06/20/12 | 20 | 1 | ||||||||||||||||||||
| CDX.NA.IG.8 | Goldman Sachs International (2) | Buy | 35 BPS quarterly | 06/20/12 | 2,000 | 27 | ||||||||||||||||||||
| Gazprom, 8.63%, 04/28/34 | Barclays Bank plc | Sell | 156 BPS semi-annually | 10/20/10 | 1,000 | 21 | ||||||||||||||||||||
| Government of Indonesia, 6.75%, 03/10/14 | Deutsche Bank AG, New York | Sell | 185 BPS quarterly | 06/20/11 | 430 | 6 | ||||||||||||||||||||
| Government of Jamaica, 11.63%, 01/15/22 | Bear Stearns | Buy | 341 BPS semi-annually | 07/20/17 | 100 | 9 | ||||||||||||||||||||
| Government of Jamaica, 11.63%, 01/15/22 | Bear Stearns | Buy | 397 BPS semi-annually | 08/20/17 | 30 | 2 | ||||||||||||||||||||
| Government of Ukraine, 7.65%, 06/11/13 | Deutsche Bank AG, New York | Sell | 176 BPS semi-annually | 02/20/11 | 300 | 4 | ||||||||||||||||||||
| Government of Ukraine, 7.65%, 06/11/13 | Morgan Stanley Capital Services | Sell | 206 BPS semi-annually | 06/20/11 | 980 | 15 | ||||||||||||||||||||
| Government of Ukraine, 7.65%, 06/11/13 | Morgan Stanley Capital Services | Sell | 162 BPS semi-annually | 11/20/11 | 160 | (1 | ) | |||||||||||||||||||
| Government of Ukraine, 7.65%, 06/11/13 | Barclays Bank plc | Sell | 156 BPS semi-annually | 04/20/12 | 70 | (1 | ) | |||||||||||||||||||
| Government of Ukraine, 7.65%, 06/11/13 | Deutsche Bank AG, New York | Sell | 158 BPS semi-annually | 04/20/12 | 50 | (1 | ) | |||||||||||||||||||
| Kazkommertsbank International BV, 7.88%, 04/07/14 | Deutsche Bank AG, New York | Sell | 235 BPS quarterly | 03/20/12 | 70 | (4 | ) | |||||||||||||||||||
| Kazkommertsbank International BV, 7.88%, 04/07/14 | Morgan Stanley Capital Services | Sell | 175 BPS semi-annually | 08/20/08 | 300 | (4 | ) | |||||||||||||||||||
| Kazkommertsbank International BV, 7.88%, 04/07/14 | Morgan Stanley Capital Services | Sell | 220 BPS semi-annually | 03/20/12 | 140 | (9 | ) | |||||||||||||||||||
AS OF AUGUST 31, 2007 (Unaudited) (continued)
| REFERENCED OBLIGATION | | SWAP COUNTERPARTY | | BUY/SELL PROTECTION | | FUND PAYS/RECEIVES FIXED RATE (r) | | TERMINATION DATE | | NOTIONAL AMOUNT | | VALUE | ||||||||||||||
|---|---|---|---|---|---|---|---|---|---|---|---|---|---|---|---|---|---|---|---|---|---|---|---|---|---|---|
| Kazkommertsbank International BV, 7.88%, 04/07/14 | Morgan Stanley Capital Services | Sell | 230 BPS quarterly | 03/20/12 | $ | 310 | $ | (18 | ) | |||||||||||||||||
| Kazkommertsbank International BV, 7.88%, 04/07/14 | Morgan Stanley Capital Services | Buy | 300 BPS semi-annually | 08/20/12 | 60 | 3 | ||||||||||||||||||||
| Kazkommertsbank International BV, 7.88%, 04/07/14 | Morgan Stanley Capital Services | Sell | 230 BPS quarterly | 03/20/12 | 160 | (9 | ) | |||||||||||||||||||
| Petroleos De Venezuela S.A., 5.50%, 04/12/37 | Lehman Brothers Special Financing | Sell | 265 BPS semi-annually | 05/20/12 | 220 | (18 | ) | |||||||||||||||||||
| Petroleos De Venezuela S.A., 5.25%, 04/12/17 | Union Bank of Switzerland AG | Sell | 278 BPS semi-annually | 06/20/12 | 70 | (6 | ) | |||||||||||||||||||
| Petroleos De Venezuela S.A., 5.25%, 04/12/17 | Union Bank of Switzerland AG | Sell | 355 BPS semi-annually | 07/20/12 | 100 | (6 | ) | |||||||||||||||||||
| Petroleos De Venezuela S.A., 5.25%, 04/12/17 | Union Bank of Switzerland AG | Sell | 344 BPS semi-annually | 07/20/12 | 70 | (4 | ) | |||||||||||||||||||
| Petroleos De Venezuela S.A., 5.38%, 04/12/27 | Bear Stearns | Sell | 342 BPS semi-annually | 07/20/12 | 40 | (2 | ) | |||||||||||||||||||
| Petroleos De Venezuela S.A., 5.38%, 04/12/27 | Bear Stearns | Sell | 361 BPS semi-annually | 07/20/12 | 50 | (3 | ) | |||||||||||||||||||
| Petroleos De Venezuela S.A., 5.38%, 04/12/27 | Morgan Stanley Capital Services | Sell | 340 BPS semi-annually | 07/20/12 | 110 | (7 | ) | |||||||||||||||||||
| Petroleos De Venezuela S.A., 5.38%, 04/12/27 | Morgan Stanley Capital Services | Sell | 355 BPS semi-annually | 07/20/12 | 130 | (7 | ) | |||||||||||||||||||
| Petroleos De Venezuela S.A., 5.50%, 04/12/37 | Lehman Brothers Special Financing | Sell | 340 BPS semi-annually | 07/20/12 | 120 | (8 | ) | |||||||||||||||||||
| Petroleos De Venezuela S.A., 5.50%, 04/12/37 | Lehman Brothers Special Financing | Sell | 341 BPS semi-annually | 07/20/12 | 110 | (7 | ) | |||||||||||||||||||
| Petroleos De Venezuela S.A., 5.50%, 04/12/37 | Lehman Brothers Special Financing | Sell | 355 BPS semi-annually | 07/20/12 | 10 | — | (h) | |||||||||||||||||||
| Petroleos De Venezuela S.A., 5.50%, 04/12/37 | Lehman Brothers Special Financing | Sell | 328 BPS semi-annually | 07/20/12 | 30 | (2 | ) | |||||||||||||||||||
| Republic of Argentina, 8.28%, 12/31/33 | Lehman Brothers Special Financing | Sell | 303.5 BPS semi-annually | 10/20/10 | 440 | (6 | ) | |||||||||||||||||||
| Republic of Argentina, 8.28%, 12/31/33 | Morgan Stanley Capital Services | Sell | 338 BPS semi-annually | 10/20/10 | 300 | — | (h) | |||||||||||||||||||
| Republic of Argentina, 8.28%, 12/31/33 | Morgan Stanley Capital Services | Sell | 400 BPS semi-annually | 10/20/10 | 100 | 2 | ||||||||||||||||||||
| Republic of Argentina, 8.28%, 12/31/33 | Lehman Brothers Special Financing | Buy | 208.5 BPS semi-annually | 09/20/11 | 280 | 19 | ||||||||||||||||||||
| Republic of Argentina, 8.28%, 12/31/33 | Citibank, N.A. | Sell | 216 BPS semi-annually | 06/20/12 | 150 | (14 | ) | |||||||||||||||||||
| Republic of Argentina, 8.28%, 12/31/33 | Deutsche Bank AG, New York | Sell | 214 BPS semi-annually | 06/20/12 | 340 | (31 | ) | |||||||||||||||||||
| Republic of Argentina, 8.28%, 12/31/33 | Morgan Stanley Capital Services | Sell | 216 BPS semi-annually | 06/20/12 | 300 | (28 | ) | |||||||||||||||||||
| Republic of Argentina, 8.28%, 12/31/33 | Morgan Stanley Capital Services | Sell | 202 BPS semi-annually | 06/20/12 | 290 | (28 | ) | |||||||||||||||||||
| Republic of Argentina, 8.28%, 12/31/33 | Bear Stearns | Buy | 258 BPS semi-annually | 07/20/12 | 40 | 3 | ||||||||||||||||||||
| Republic of Argentina, 8.28%, 12/31/33 | Lehman Brothers Special Financing | Buy | 258 BPS semi-annually | 07/20/12 | 150 | 12 | ||||||||||||||||||||
| Republic of Argentina, 8.28%, 12/31/33 | Lehman Brothers Special Financing | Buy | 263 BPS semi-annually | 07/20/12 | 110 | 9 | ||||||||||||||||||||
| Republic of Argentina, 8.28%, 12/31/33 | Lehman Brothers Special Financing | Buy | 258 BPS semi-annually | 07/20/12 | 30 | 2 | ||||||||||||||||||||
| Republic of Argentina, 8.28%, 12/31/33 | Morgan Stanley Capital Services | Buy | 262 BPS semi-annually | 07/20/12 | 110 | 9 | ||||||||||||||||||||
| Republic of Argentina, 8.28%, 12/31/33 | Union Bank of Switzerland AG | Buy | 262 BPS semi-annually | 07/20/12 | 70 | 6 | ||||||||||||||||||||
| Republic of Argentina, 8.28%, 12/31/33 | Deutsche Bank AG, New York | Sell | 365 BPS semi-annually | 08/20/12 | 70 | (3 | ) | |||||||||||||||||||
| Republic of Argentina, 8.28%, 12/31/33 | Deutsche Bank AG, New York | Sell | 308 BPS semi-annually | 08/20/12 | 170 | (11 | ) | |||||||||||||||||||
| Republic of Argentina, 8.28%, 12/31/33 | Lehman Brothers Special Financing | Sell | 375 BPS semi-annually | 08/20/12 | 40 | (1 | ) | |||||||||||||||||||
| Republic of Argentina, 8.28%, 12/31/33 | Lehman Brothers Special Financing | Sell | 365 BPS semi-annually | 08/20/12 | 250 | (10 | ) | |||||||||||||||||||
| Republic of Argentina, 8.28%, 12/31/33 | Lehman Brothers Special Financing | Sell | 425 BPS semi-annually | 08/20/12 | 30 | — | (h) | |||||||||||||||||||
| Republic of Argentina, 8.28%, 12/31/33 | Bear Stearns | Sell | 341 BPS semi-annually | 07/20/17 | 100 | (12 | ) | |||||||||||||||||||
| Republic of Argentina, 8.28%, 12/31/33 | Bear Stearns | Sell | 407 BPS semi-annually | 08/20/17 | 30 | (3 | ) | |||||||||||||||||||
| Republic of Brazil, 12.25%, 03/06/30 | Lehman Brothers Special Financing | Buy | 261.5 BPS semi-annually | 10/20/10 | 440 | (28 | ) | |||||||||||||||||||
| Republic of Brazil, 12.25%, 03/06/30 | Morgan Stanley Capital Services | Buy | 290 BPS semi-annually | 10/20/10 | 300 | (22 | ) | |||||||||||||||||||
| Republic of Brazil, 12.25%, 03/06/30 | Morgan Stanley Capital Services | Buy | 335 BPS semi-annually | 10/20/10 | 100 | (9 | ) | |||||||||||||||||||
| Republic of Brazil, 12.25%, 03/06/30 | Lehman Brothers Special Financing | Sell | 120 BPS semi-annually | 09/20/11 | 140 | 2 | ||||||||||||||||||||
| Republic of Brazil, 12.25%, 03/06/30 | Lehman Brothers Special Financing | Sell | 119 BPS semi-annually | 09/20/11 | 140 | 2 | ||||||||||||||||||||
| Republic of Brazil, 12.25%, 03/06/30 | Bear Stearns | Buy | 103 BPS semi-annually | 12/20/11 | 140 | (1 | ) | |||||||||||||||||||
| Republic of Brazil, 12.25%, 03/06/30 | Lehman Brothers Special Financing | Buy | 111 BPS semi-annually | 12/20/11 | 350 | (3 | ) | |||||||||||||||||||
| Republic of Brazil, 12.25%, 03/06/30 | Union Bank of Switzerland AG | Buy | 103 BPS semi-annually | 12/20/11 | 280 | (2 | ) | |||||||||||||||||||
| REFERENCED OBLIGATION | | SWAP COUNTERPARTY | | BUY/SELL PROTECTION | | FUND PAYS/RECEIVES FIXED RATE (r) | | TERMINATION DATE | | NOTIONAL AMOUNT | | VALUE | ||||||||||||||
|---|---|---|---|---|---|---|---|---|---|---|---|---|---|---|---|---|---|---|---|---|---|---|---|---|---|---|
| Republic of Brazil, 12.25%, 03/06/30 | Union Bank of Switzerland AG | Buy | 102 BPS semi-annually | 12/20/11 | $ | 295 | $ | (2 | ) | |||||||||||||||||
| Republic of Brazil, 12.25%, 03/06/30 | Citibank, N.A. | Buy | 69.5 BPS semi-annually | 06/20/12 | 150 | 2 | ||||||||||||||||||||
| Republic of Brazil, 12.25%, 03/06/30 | Deutsche Bank AG, New York | Buy | 73.21 BPS semi-annually | 06/20/12 | 340 | 4 | ||||||||||||||||||||
| Republic of Brazil, 12.25%, 03/06/30 | Morgan Stanley Capital Services | Buy | 69 BPS semi-annually | 06/20/12 | 300 | 4 | ||||||||||||||||||||
| Republic of Brazil, 12.25%, 03/06/30 | Morgan Stanley Capital Services | Buy | 65.67 BPS semi-annually | 06/20/12 | 290 | 4 | ||||||||||||||||||||
| Republic of Brazil, 12.25%, 03/06/30 | Deutsche Bank AG, New York | Buy | 89 BPS semi-annually | 08/20/12 | 170 | 1 | ||||||||||||||||||||
| Republic of Colombia, 10.38%, 01/28/33 | Lehman Brothers Special Financing | Buy | 98 BPS semi-annually | 04/20/12 | 310 | 4 | ||||||||||||||||||||
| Republic of Colombia, 10.38%, 01/28/33 | Lehman Brothers Special Financing | Buy | 96 BPS semi-annually | 04/20/12 | 40 | 1 | ||||||||||||||||||||
| Republic of Colombia, 10.38%, 01/28/33 | Lehman Brothers Special Financing | Buy | 98 BPS semi-annually | 04/20/12 | 300 | 4 | ||||||||||||||||||||
| Republic of Colombia, 10.38%, 01/28/33 | Morgan Stanley Capital Services | Buy | 100 BPS semi-annually | 04/20/12 | 150 | 2 | ||||||||||||||||||||
| Republic of Colombia, 10.38%, 01/28/33 | Lehman Brothers Special Financing | Buy | 82.5 BPS semi-annually | 06/20/12 | 390 | 9 | ||||||||||||||||||||
| Republic of Indonesia, 6.75%, 03/10/14 | Deutsche Bank AG, New York | Sell | 176.5 BPS quarterly | 09/20/11 | 400 | 4 | ||||||||||||||||||||
| Republic of Indonesia, 6.75%, 03/10/14 | Deutsche Bank AG, New York | Sell | 101 BPS quarterly | 06/20/12 | 20 | (1 | ) | |||||||||||||||||||
| Republic of Indonesia, 6.75%, 03/10/14 | Deutsche Bank AG, New York | Sell | 115 BPS quarterly | 09/20/12 | 50 | (1 | ) | |||||||||||||||||||
| Republic of Kazakhstan, 11.13%, 05/11/07 | Citibank, N.A. | Sell | 60 BPS semi-annually | 03/20/12 | 170 | (1 | ) | |||||||||||||||||||
| Republic of Kazakhstan, 11.13%, 05/11/07 | Deutsche Bank AG, New York | Sell | 54.8 BPS semi-annually | 03/20/12 | 320 | (3 | ) | |||||||||||||||||||
| Republic of Kazakhstan, 11.13%, 05/11/07 | Deutsche Bank AG, New York | Sell | 53.51 BPS semi-annually | 03/20/12 | 310 | (3 | ) | |||||||||||||||||||
| Republic of Kazakhstan, 11.13%, 05/11/07 | Deutsche Bank AG, New York | Sell | 61 BPS semi-annually | 03/20/12 | 130 | (1 | ) | |||||||||||||||||||
| Republic of Kazakhstan, 11.13%, 05/11/07 | Barclays Bank plc | Sell | 68 BPS semi-annually | 08/20/12 | 30 | — | (h) | |||||||||||||||||||
| Republic of Kazakhstan, 11.13%, 05/11/07 | Deutsche Bank AG, New York | Sell | 65.5 BPS semi-annually | 08/20/12 | 260 | (2 | ) | |||||||||||||||||||
| Republic of Kazakhstan, 11.13%, 05/11/07 | Deutsche Bank AG, New York | Sell | 71 BPS semi-annually | 08/20/12 | 120 | (1 | ) | |||||||||||||||||||
| Republic of Panama, 8.88%, 09/30/27 | Lehman Brothers Special Financing | Buy | 63 BPS semi-annually | 06/20/12 | 790 | 15 | ||||||||||||||||||||
| Republic of Peru, 8.75%, 11/21/33 | Lehman Brothers Special Financing | Sell | 62 BPS semi-annually | 06/20/12 | 790 | (14 | ) | |||||||||||||||||||
| Republic of Philippines, 10.63%, 03/16/25 | Deutsche Bank AG, New York | Buy | 199 BPS quarterly | 06/20/11 | 430 | (8 | ) | |||||||||||||||||||
| Republic of Philippines, 10.63%, 03/16/25 | Deutsche Bank AG, New York | Buy | 190 BPS quarterly | 09/20/11 | 400 | (6 | ) | |||||||||||||||||||
| Republic of Philippines, 10.63%, 03/16/25 | Deutsche Bank AG, New York | Buy | 103 BPS quarterly | 06/20/12 | 20 | 1 | ||||||||||||||||||||
| Republic of Philippines, 10.63%, 03/16/25 | Deutsche Bank AG, New York | Buy | 116 BPS quarterly | 09/20/12 | 50 | 1 | ||||||||||||||||||||
| Republic of Turkey, 11.88%, 01/15/30 | Morgan Stanley Capital Services | Buy | 145 BPS semi-annually | 07/20/12 | 50 | 1 | ||||||||||||||||||||
| Republic of Turkey, 11.88%, 01/15/30 | Morgan Stanley Capital Services | Buy | 146 BPS semi-annually | 07/20/12 | 500 | 10 | ||||||||||||||||||||
| Republic of Turkey, 11.88%, 01/15/30 | Deutsche Bank AG, New York | Buy | 239 BPS semi-annually | 08/20/12 | 130 | (2 | ) | |||||||||||||||||||
| Republic of Turkey, 11.88%, 01/15/30 | Morgan Stanley Capital Services | Buy | 194 BPS semi-annually | 08/20/12 | 130 | — | (h) | |||||||||||||||||||
| Republic of Venezuela, 9.25%, 09/15/27 | Barclays Bank plc | Sell | 172.1 BPS semi-annually | 03/20/12 | 310 | (10 | ) | |||||||||||||||||||
| Republic of Venezuela, 9.25%, 09/15/27 | Lehman Brothers Special Financing | Sell | 161 BPS semi-annually | 04/20/12 | 310 | (27 | ) | |||||||||||||||||||
| Republic of Venezuela, 9.25%, 09/15/27 | Lehman Brothers Special Financing | Sell | 160.5 BPS semi-annually | 04/20/12 | 40 | (3 | ) | |||||||||||||||||||
| Republic of Venezuela, 9.25%, 09/15/27 | Lehman Brothers Special Financing | Sell | 161 BPS semi-annually | 04/20/12 | 300 | (26 | ) | |||||||||||||||||||
| Republic of Venezuela, 9.25%, 09/15/27 | Morgan Stanley Capital Services | Sell | 169 BPS semi-annually | 04/20/12 | 150 | (13 | ) | |||||||||||||||||||
| Republic of Venezuela, 9.25%, 09/15/27 | Lehman Brothers Special Financing | Sell | 218 BPS semi-annually | 06/20/12 | 390 | (28 | ) | |||||||||||||||||||
| Republic of Venezuela, 9.25%, 09/15/27 | Union Bank of Switzerland AG | Buy | 203 BPS semi-annually | 06/20/12 | 70 | 6 | ||||||||||||||||||||
| Republic of Venezuela, 9.25%, 09/15/27 | Bear Stearns | Buy | 266 BPS semi-annually | 07/20/12 | 50 | 3 | ||||||||||||||||||||
| Republic of Venezuela, 9.25%, 09/15/27 | Bear Stearns | Sell | 250.4 BPS semi-annually | 07/20/12 | 135 | (9 | ) | |||||||||||||||||||
| Republic of Venezuela, 9.25%, 09/15/27 | Lehman Brothers Special Financing | Buy | 260 BPS semi-annually | 07/20/12 | 10 | 1 | ||||||||||||||||||||
| Republic of Venezuela, 9.25%, 09/15/27 | Lehman Brothers Special Financing | Sell | 268 BPS semi-annually | 07/20/12 | 30 | (2 | ) | |||||||||||||||||||
| Republic of Venezuela, 9.25%, 09/15/27 | Morgan Stanley Capital Services | Buy | 257 BPS semi-annually | 07/20/12 | 130 | 8 | ||||||||||||||||||||
| Republic of Venezuela, 9.25%, 09/15/27 | Union Bank of Switzerland AG | Buy | 255 BPS semi-annually | 07/20/12 | 100 | 6 | ||||||||||||||||||||
| Republic of Venezuela, 9.25%, 09/15/27 | Union Bank of Switzerland AG | Sell | 251 BPS semi-annually | 07/20/12 | 135 | (9 | ) | |||||||||||||||||||
| Republic of Venezuela, 9.25%, 09/15/27 | Deutsche Bank AG, New York | Sell | 340 BPS semi-annually | 08/20/12 | 60 | (2 | ) | |||||||||||||||||||
| Republic of Venezuela, 9.25%, 09/15/27 | Lehman Brothers Special Financing | Buy | 385 BPS semi-annually | 08/20/12 | 30 | 1 | ||||||||||||||||||||
AS OF AUGUST 31, 2007 (Unaudited) (continued)
| REFERENCED OBLIGATION | | SWAP COUNTERPARTY | | BUY/SELL PROTECTION | | FUND PAYS/RECEIVES FIXED RATE (r) | | TERMINATION DATE | | NOTIONAL AMOUNT | | VALUE | ||||||||||||||
|---|---|---|---|---|---|---|---|---|---|---|---|---|---|---|---|---|---|---|---|---|---|---|---|---|---|---|
| Republic of Venezuela, 9.25%, 09/15/27 | Lehman Brothers Special Financing | Sell | 301.3 BPS semi-annually | 08/20/12 | $ | 70 | $ | (4 | ) | |||||||||||||||||
| Russian AG Bank, 7.18%, 05/16/13 | Union Bank of Switzerland AG | Sell | 76 BPS semi-annually | 02/20/09 | 610 | (3 | ) | |||||||||||||||||||
| Russian AG Bank, 7.18%, 05/16/13 | Credit Suisse International | Sell | 72 BPS semi-annually | 03/20/09 | 60 | — | (h) | |||||||||||||||||||
| Russian Federation, 7.50%, 03/31/30 | Union Bank of Switzerland AG | Buy | 31 BPS semi-annually | 02/20/09 | 610 | 2 | ||||||||||||||||||||
| Russian Federation, 7.50%, 03/31/30 | Credit Suisse International | Buy | 30 BPS semi-annually | 03/20/09 | 60 | — | (h) | |||||||||||||||||||
| Russian Federation, 7.50%, 03/31/30 | Barclays Bank plc | Buy | 77 BPS semi-annually | 10/20/10 | 1,000 | (3 | ) | |||||||||||||||||||
| Russian Federation, 7.50%, 03/31/30 | Deutsche Bank AG, New York | Buy | 53 BPS semi-annually | 02/20/11 | 300 | 1 | ||||||||||||||||||||
| Russian Federation, 7.50%, 03/31/30 | Lehman Brothers Special Financing | Sell | 54 BPS semi-annually | 03/20/11 | 960 | (4 | ) | |||||||||||||||||||
| Russian Federation, 7.50%, 03/31/30 | Morgan Stanley Capital Services | Buy | 69 BPS semi-annually | 06/20/11 | 980 | 1 | ||||||||||||||||||||
| Russian Federation, 7.50%, 03/31/30 | Morgan Stanley Capital Services | Buy | 50 BPS semi-annually | 11/20/11 | 160 | 2 | ||||||||||||||||||||
| Russian Federation, 7.50%, 03/31/30 | Bear Stearns | Sell | 45.5 BPS semi-annually | 12/20/11 | 280 | (3 | ) | |||||||||||||||||||
| Russian Federation, 7.50%, 03/31/30 | Deutsche Bank AG, New York | Sell | 52.5 BPS semi-annually | 12/20/11 | 700 | (6 | ) | |||||||||||||||||||
| Russian Federation, 7.50%, 03/31/30 | Union Bank of Switzerland AG | Sell | 46 BPS semi-annually | 12/20/11 | 560 | (6 | ) | |||||||||||||||||||
| Russian Federation, 7.50%, 03/31/30 | Union Bank of Switzerland AG | Sell | 45.5 BPS semi-annually | 12/20/11 | 590 | (7 | ) | |||||||||||||||||||
| Russian Federation, 7.50%, 03/31/30 | Barclays Bank plc | Buy | 47.5 BPS semi-annually | 04/20/12 | 70 | 1 | ||||||||||||||||||||
| Russian Federation, 7.50%, 03/31/30 | Deutsche Bank AG, New York | Buy | 49.5 BPS semi-annually | 04/20/12 | 50 | 1 | ||||||||||||||||||||
| Russian Federation, 7.50%, 03/31/30 | Barclays Bank plc | Sell | 86.5 BPS semi-annually | 09/20/12 | 570 | 1 | ||||||||||||||||||||
| United Mexican States, 7.50%, 04/08/33 | Lehman Brothers Special Financing | Buy | 53 BPS semi-annually | 03/20/11 | 960 | (4 | ) | |||||||||||||||||||
| VTB Capital SA, 6.25%, 06/30/35 | Morgan Stanley Capital Services | Sell | 40 BPS quarterly | 03/20/08 | 320 | — | (h) | |||||||||||||||||||
| VTB Capital SA, 6.25%, 06/30/35 | Morgan Stanley Capital Services | Sell | 64 BPS semi-annually | 05/20/12 | 140 | (3 | ) | |||||||||||||||||||
| $ | (291 | ) | ||||||||||||||||||||||||
| (1) | Premiums paid of $1 |
| (2) | Premiums paid of $28 |
| SWAP COUNTERPARTY | | REFERENCED OBLIGATION | | PRICE LOCK | | TERMINATION DATE | | NOTIONAL AMOUNT | | VALUE | ||||||||||||
|---|---|---|---|---|---|---|---|---|---|---|---|---|---|---|---|---|---|---|---|---|---|---|
| Bank of America (b) | BA Covered Bond Issuer, 5.50%, 06/14/12 | $ | 100.83 | 09/06/07 | $ | 1,230 | $ | 20 | ||||||||||||||
| Credit Suisse International (b) | U.S. Treasury TIPS, 2.00%, 01/15/26 | 94.16 | 09/27/07 | 6,900 | (20 | ) | ||||||||||||||||
| Credit Suisse International (b) | U.S. Treasury TIPS, 3.88%, 04/15/29 | 125.14 | 09/27/07 | 5,405 | (17 | ) | ||||||||||||||||
| Union Bank of Switzerland AG (b) | FNMA, 5.38%, 06/12/17 | 101.86 | 09/27/07 | 1,225 | 3 | |||||||||||||||||
| $ | (14 | ) | ||||||||||||||||||||
| (a) | Fund pays the excess of the market price over the price lock or receives the excess of the price lock over the market price. |
| (b) | Fund pays the excess of the price lock over the market price or receives the excess of the market price over the price lock. |
| SWAP COUNTERPARTY | | REFERENCED OBLIGATION | | PAYMENTS MADE BY THE FUND (r) | | PAYMENTS RECEIVED BY THE FUND (r) | | TERMINATION DATE | | NOTIONAL AMOUNT | | VALUE | ||||||||||||||
|---|---|---|---|---|---|---|---|---|---|---|---|---|---|---|---|---|---|---|---|---|---|---|---|---|---|---|
| Morgan Stanley Capital Services | TransCredit Bank, 7.30%, 02/26/09 | 3 Month LIBOR + 20 BPS | Total Return on TransCredit Bank, 7.30%, 02/26/09 | 02/26/09 | $ | 100 | $ | 2 | ||||||||||||||||||
| Morgan Stanley Capital Services | OGK/Rushydro’s 12/13/13 | Total Return on OGK/Rushydro’s 12/13/13 | 3 Month LIBOR + 20 BPS | 12/25/10 | 570 | 21 | ||||||||||||||||||||
| $ | 23 | |||||||||||||||||||||||||
AS OF AUGUST 31, 2007 (Unaudited)
| PRINCIPAL AMOUNT($) | | SECURITY DESCRIPTION | | VALUE($) | |||||||
|---|---|---|---|---|---|---|---|---|---|---|---|
Long-Term Investments — 104.6% | |||||||||||
Asset-Backed Securities — 15.8% | |||||||||||
| 1,424 | American Express Credit Account Master Trust, Series 2004-C, Class C, FRN, 6.11%, 02/15/12 (e) (m) | 1,420 | |||||||||
| AmeriCredit Automobile Receivables Trust, | |||||||||||
| 2,502 | Series 2004-BM, Class A4, 2.67%, 03/07/11 (m) | 2,475 | |||||||||
| 3,360 | Series 2005-CF, Class A3, 4.47%, 05/06/10 (m) | 3,349 | |||||||||
| 4,158 | Asset Backed Securities Corp. Home Equity, Series 2006-HE5, Class M2, FRN, 5.81%, 07/25/36 (m) | 3,397 | |||||||||
| 3,500 | Bank of America Credit Card Trust, Series 2006-C4, Class C4, FRN, 5.84%, 11/15/11 (m) | 3,427 | |||||||||
| Capital One Auto Finance Trust, | |||||||||||
| 549 | Series 2003-B, Class A4, 3.18%, 09/15/10 (m) | 548 | |||||||||
| 5,500 | Series 2006-B, Class A3A, 5.45%, 02/15/11 (m) | 5,498 | |||||||||
| 12,000 | Series 2006-C, Class A3A, 5.07%, 07/15/11 (m) | 11,953 | |||||||||
| 13,750 | Series 2007-B, Class A3A, 5.03%, 04/15/12 (m) | 13,676 | |||||||||
| 6,600 | Capital One Prime Auto Receivables Trust, Series 2006-2, Class A4, 4.94%, 07/15/12 (m) | 6,543 | |||||||||
| CARSS Finance LP (Cayman Islands), | |||||||||||
| 69 | Series 2004-A, Class B1, FRN, 5.89%, 01/15/11 (e) (m) | 69 | |||||||||
| 77 | Series 2004-A, Class B2, FRN, 6.56%, 01/15/11 (e) (m) | 77 | |||||||||
| 5,600 | Citibank Credit Card Issuance Trust, Series 2006-C4, Class C4, FRN, 5.55%, 01/09/12 (m) | 5,489 | |||||||||
| Citigroup Mortgage Loan Trust, Inc., | |||||||||||
| 5,650 | Series 2005-WF2, Class AF4, SUB, 4.96%, 08/25/35 (m) | 5,537 | |||||||||
| 10,250 | Series 2006-WFH2, Class A2A, FRN, 5.66%, 08/25/36 (m) | 10,002 | |||||||||
| 945 | Series 2007-WFH2, Class M7, FRN, 7.16%, 03/25/37 (m) | 668 | |||||||||
| 2,837 | CNH Equipment Trust, Series 2005-B, Class A3, 4.27%, 01/15/10 (m) | 2,820 | |||||||||
| Countrywide Asset-Backed Certificates, | |||||||||||
| 3,942 | Series 2005-4, Class AF3, VAR, 4.46%, 10/25/35 (m) | 3,859 | |||||||||
| 3,750 | Series 2006-3, Class 2A2, FRN, 5.69%, 06/25/36 (m) | 3,635 | |||||||||
| 9,000 | Series 2006-11, Class 1AF2, VAR, 6.02%, 09/25/46 (m) | 8,919 | |||||||||
| First Franklin Mortgage Loan Asset Backed Certificates, | |||||||||||
| 5,450 | Series 2006-FF4, Class A2, FRN, 5.70%, 03/25/36 (m) | 5,257 | |||||||||
| 6,000 | Series 2006-FF11, Class 2A3, FRN, 5.66%, 08/25/36 (m) | 5,574 | |||||||||
| 12,000 | Ford Credit Auto Owner Trust, Series 2006-C, Class A3, 5.16%, 11/15/10 (m) | 11,962 | |||||||||
| 12,000 | GE-WMC Mortgage Securities LLC, Series 2006-1, Class A2B, FRN, 5.66%, 08/25/36 (m) | 11,597 | |||||||||
| 9,885 | GS Auto Loan Trust, Series 2006-1, Class A3, 5.37%, 12/15/10 (m) | 9,875 | |||||||||
| 9,000 | GSAA Trust, Series 2006-11, Class 2A2, FRN, 5.67%, 07/25/36 (m) | 8,933 | |||||||||
| 7,000 | GSAMP Trust, Series 2006-NC1, Class A2, FRN, 5.69%, 02/25/36 (m) | 6,757 | |||||||||
| 2,100 | Helios Finance LP (Cayman Islands), Series 2007-S1, Class B1, FRN, 6.21%, 10/20/14 (e) (i) (m) | 2,028 | |||||||||
| 9,500 | Holmes Master Issuer plc (United Kingdom), Series 2006-1A, Class 2A, FRN, 5.42%, 07/15/21 (e) (m) | 9,381 | |||||||||
| 6,550 | Home Equity Asset Trust, Series 2006-3, Class 2A3, FRN, 5.69%, 07/25/36 (m) | 6,327 | |||||||||
| Household Automotive Trust, | |||||||||||
| 792 | Series 2003-2, Class A4, 3.02%, 12/17/10 (m) | 786 | |||||||||
| 9,000 | Series 2006-2, Class A3, 5.61%, 08/17/11 (m) | 9,016 | |||||||||
| 7,000 | Series 2006-3, Class A3, 5.28%, 09/17/11 (m) | 6,992 | |||||||||
| HSI Asset Securitization Corp. Trust, | |||||||||||
| 8,300 | Series 2006-OPT1, Class 2A3, FRN, 5.70%, 12/25/35 (m) | 7,916 | |||||||||
| 8,650 | Series 2006-OPT2, Class 2A3, FRN, 5.70%, 01/25/36 (m) | 8,069 | |||||||||
| 7,100 | Hyundai Auto Receivables Trust, Series 2006-B, Class A3, 5.11%, 04/15/11 (m) | 7,073 | |||||||||
| Long Beach Mortgage Loan Trust, | |||||||||||
| 4,000 | Series 2004-3, Class M1, FRN, 6.08%, 07/25/34 (m) | 3,744 | |||||||||
| 8,850 | Series 2006-2, Class 2A3, FRN, 5.70%, 03/25/36 (m) | 8,620 | |||||||||
| 2,400 | Series 2006-5, Class M1, FRN, 5.79%, 06/25/36 (m) | 1,893 | |||||||||
| 2,000 | Series 2006-5, Class M2, FRN, 5.81%, 06/25/36 (m) | 1,493 | |||||||||
| 4,500 | Series 2006-8, Class 2A3, FRN, 5.67%, 09/25/36 (m) | 4,210 | |||||||||
| 2,551 | Series 2006-8, Class M2, FRN, 5.82%, 09/25/36 (m) | 1,914 | |||||||||
| 1,500 | Series 2006-9, Class M2, FRN, 5.82%, 10/25/36 (m) | 1,100 | |||||||||
| 7,250 | MASTR Asset Backed Securities Trust, Series 2006-NC1, Class A3, FRN, 5.69%, 01/25/36 (m) | 6,906 | |||||||||
AS OF AUGUST 31, 2007 (Unaudited) (continued)
| PRINCIPAL AMOUNT($) | | SECURITY DESCRIPTION | | VALUE($) | |||||||
|---|---|---|---|---|---|---|---|---|---|---|---|
Long-Term Investments — Continued | |||||||||||
Asset-Backed Securities — Continued | |||||||||||
| 4,300 | Merrill Lynch Mortgage Investors, Inc., Series 2006-WMC1, Class A2C, FRN, 5.71%, 01/25/37 (m) | 4,209 | |||||||||
| 1,750 | Morgan Stanley ABS Capital I, Series 2006-HE6, Class M2, FRN, 5.81%, 09/25/36 (m) | 1,385 | |||||||||
| 2,097 | New Century Home Equity Loan Trust, Series 2005-A, Class A2, SUB, 4.46%, 08/25/35 | 2,076 | |||||||||
| 6,200 | Residential Asset Mortgage Products, Inc., Series 2006-EFC1, Class A2, FRN, 5.71%, 02/25/36 | 6,014 | |||||||||
| 8,000 | Residential Asset Securities Corp., Series 2006-KS2, Class A3, FRN, 5.70%, 03/25/36 | 7,692 | |||||||||
| 6,150 | Securitized Asset Backed Receivables LLC Trust, Series 2006-WM1, Class A2B, FRN, 5.69%, 12/25/35 | 6,037 | |||||||||
| 6,000 | Structured Asset Securities Corp., Series 2006-WF2, Class M2, FRN, 5.80%, 07/25/36 | 4,931 | |||||||||
| Triad Auto Receivables Owner Trust, | |||||||||||
| 1,394 | Series 2003-B, Class A4, 3.20%, 12/13/10 | 1,374 | |||||||||
| 8,000 | Series 2006-C, Class A3, 5.26%, 11/14/11 | 7,984 | |||||||||
| 10,000 | USAA Auto Owner Trust, Series 2006-4, Class A3, 5.01%, 06/15/11 | 9,958 | |||||||||
| 6,500 | Volkswagen Auto Lease Trust, Series 2006-4, Class A3, 5.50%, 09/21/09 | 6,503 | |||||||||
| 11,500 | Wachovia Auto Loan Owner Trust, Series 2006-1, Class A4, 5.08%, 04/20/12 (e) | 11,434 | |||||||||
| 5,000 | Wells Fargo Home Equity Trust, Series 2006-2, Class M1, FRN, 5.78%, 07/25/36 | 4,252 | |||||||||
| 1,269 | World Omni Auto Receivables Trust, Series 2003-B, Class A4, 2.87%, 11/15/10 | 1,264 | |||||||||
| Total Asset-Backed Securities (Cost $326,843) | 315,897 | ||||||||||
Collateralized Mortgage Obligations — 8.8% | |||||||||||
Agency CMO — 4.4% | |||||||||||
| Federal Home Loan Mortgage Corp. REMICS, | |||||||||||
| 7,923 | Series 2564, Class LS, IF, IO, 2.04%, 01/15/17 (m) | 377 | |||||||||
| 5,737 | Series 2632, Class IA, IO, 5.00%, 06/15/22 (m) | 88 | |||||||||
| 4,257 | Series 2643, Class PI, IO, 5.00%, 03/15/28 (m) | 386 | |||||||||
| 3,650 | Series 2750, Class IQ, IO, 5.00%, 10/15/21 (m) | 93 | |||||||||
| 1,069 | Series 2781, Class PI, IO, 5.00%, 10/15/23 (m) | 36 | |||||||||
| 20,897 | Series 2791, Class SI, IF, IO, 1.54%, 12/15/31 (m) | 1,300 | |||||||||
| 8,563 | Series 2813, Class SB, IF, IO, 1.44%, 02/15/34 (m) | 575 | |||||||||
| 9,785 | Series 2814, Class S, IF, IO, 1.49%, 10/15/30 (m) | 385 | |||||||||
| 11,808 | Series 2850, Class SM, IF, IO, 1.54%, 12/15/30 (m) | 489 | |||||||||
| 7,781 | Series 2852, Class IO, IO, 5.00%, 11/15/25 (m) | 575 | |||||||||
| 7,511 | Series 2894, Class S, IF, IO, 1.59%, 03/15/31 (m) | 460 | |||||||||
| 8,870 | Series 2980, Class LI, IO, 5.50%, 04/15/25 (m) | 622 | |||||||||
| 11,868 | Series 3019, Class FN, FRN, 5.91%, 08/15/35 (m) | 11,734 | |||||||||
| 16,660 | Series 3126, Class BS, IF, IO, 1.59%, 02/15/36 (m) | 1,372 | |||||||||
| Federal Home Loan Mortgage Corp. STRIPS, | |||||||||||
| 44,509 | Series 239, Class S30, IF, IO, 2.38%, 08/01/36 (m) | 4,266 | |||||||||
| 41,345 | Series 240, Class S22, IF, IO, 1.54%, 07/01/36 (m) | 3,737 | |||||||||
| 38,419 | Federal National Mortgage Association STRIPS, Series 367, Class 2, IO, 5.50%, 01/25/36 (m) | 10,183 | |||||||||
| Federal National Mortgage Association REMICS, | |||||||||||
| 2,126 | Series 2003-3, Class HS, IF, IO, 2.15%, 09/25/16 (m) | 91 | |||||||||
| 10,772 | Series 2004-61, Class TS, IF, IO, 1.60%, 10/25/31 (m) | 452 | |||||||||
| 3,812 | Series 2005-51, Class KI, IO, 5.50%, 01/25/25 (m) | 249 | |||||||||
| 9,624 | Series 2006-43, Class G, 6.50%, 09/25/33 (m) | 9,817 | |||||||||
| 3,538 | Series 2006-59, Class DA, 6.50%, 12/25/33 (m) | 3,610 | |||||||||
| 17,359 | Series 2006-63, Class AB, 6.50%, 10/25/33 (m) | 17,703 | |||||||||
| 9,945 | Series 2006-63, Class AE, 6.50%, 10/25/33 (m) | 10,143 | |||||||||
| 6,034 | Series 2006-63, Class SC, IF, 6.27%, 07/25/36 (m) | 6,149 | |||||||||
| 36,997 | Series 2007-55, Class S, IF, IO, 1.26%, 06/25/37 (m) | 1,934 | |||||||||
| Government National Mortgage Association, | |||||||||||
| 18,860 | Series 2003-85, Class CS, IF, IO, 1.66%, 02/20/24 (m) | 488 | |||||||||
| 260 | Series 2004-39, Class IM, IO, 5.50%, 01/20/27 (m) | 7 | |||||||||
| 7,553 | Series 2004-44, Class PK, IO, 5.50%, 10/20/27 (m) | 283 | |||||||||
| 56 | Series 2004-46, Class IH, IO, 5.50%, 04/20/25 (m) | — | (h) | ||||||||
| 87,604 | |||||||||||
| PRINCIPAL AMOUNT($) | | SECURITY DESCRIPTION | | VALUE($) | |||||||
|---|---|---|---|---|---|---|---|---|---|---|---|
Long-Term Investments — Continued | |||||||||||
Non-Agency CMO — 4.4% | |||||||||||
| 3,012 | Banc of America Alternative Loan Trust, Series 2003-7, Class 1A1, 5.50%, 09/25/33 (m) | 2,993 | |||||||||
| 4,406 | Banc of America Funding Corp. , Series 2005-6, Class 2A8, 5.50%, 10/25/35 (m) | 4,349 | |||||||||
| 1,749 | Citicorp Mortgage Securities, Inc., Series 2005-6, Class 1A6, 5.50%, 09/25/35 (m) | 1,737 | |||||||||
| 14,011 | Countrywide Alternative Loan Trust, Series 2005-J14, Class A3, 5.50%, 12/25/35 (m) | 13,654 | |||||||||
| 7,669 | Countrywide Home Loan Mortgage Pass Through Trust , Series 2005-J4, Class A4, 5.50%, 11/25/35 (m) | 7,542 | |||||||||
| 4,159 | First Horizon Asset Securities, Inc., Series 2005-6, Class 1A1, 5.50%, 11/25/35 (m) | 4,091 | |||||||||
| 3,966 | Lehman Mortgage Trust, Series 2005-3, Class 2A3, 5.50%, 01/25/36 (m) | 3,948 | |||||||||
| Residential Accredit Loans, Inc., | |||||||||||
| 3,928 | Series 2005-QS17, Class A10, 6.00%, 12/25/35 | 3,929 | |||||||||
| 7,852 | Series 2006-QS10, Class A1, 6.00%, 08/25/36 | 7,869 | |||||||||
| 12,290 | Series 2006-QS16, Class A7, 6.00%, 11/25/36 | 12,265 | |||||||||
| 3,200 | Residential Asset Securitization Trust, Series 2006-A8, Class 1A1, 6.00%, 08/25/36 | 3,198 | |||||||||
| 5,765 | Residential Funding Mortgage Securities I , Series 2005-S7, Class A5, 5.50%, 11/25/35 | 5,675 | |||||||||
| 4,057 | Structured Adjustable Rate Mortgage Loan Trust, Series 2004-6, Class 5A1, VAR, 4.97%, 06/25/34 | 4,031 | |||||||||
| 7,254 | Washington Mutual Alternative Mortgage Pass-Through Certificates, Series 2006-5, Class 2CB1, 6.00%, 07/25/36 | 7,231 | |||||||||
| Wells Fargo Mortgage Backed Securities Trust, | |||||||||||
| 2,880 | Series 2003-N, Class 1A4, FRN, 4.60%, 12/25/33 | 2,845 | |||||||||
| 1,510 | Series 2004-F, Class A8, FRN, 4.73%, 06/25/34 | 1,491 | |||||||||
| 2,602 | Series 2004-S, Class A3, FRN, 3.54%, 09/25/34 | 2,602 | |||||||||
| 89,450 | |||||||||||
| Total Collateralized Mortgage Obligations (Cost $175,282) | 177,054 | ||||||||||
Commercial Mortgage-Backed Securities — 10.8% | |||||||||||
| 2,035 | Banc of America Commercial Mortgage, Inc., Series 2004-5, Class A2, 4.18%, 11/10/41 (m) | 1,991 | |||||||||
| 3,950 | Bear Stearns Commercial Mortgage Securities, Series 2007-PW15, Class A2, 5.21%, 02/11/44 (m) | 3,894 | |||||||||
| 14,138 | CalSTRS Trust, Series 2002-C6, Class A2, 3.99%, 11/20/12 (e) (m) | 14,069 | |||||||||
| 2,250 | Citigroup/Deutsche Bank Commercial Mortgage Trust, 2007-CD4, Class A2A, 5.24%, 12/11/49 (m) | 2,227 | |||||||||
| Credit Suisse Mortgage Capital Certificates, | |||||||||||
| 9,650 | Series 2006-C1, Class A2, VAR, 5.51%, 02/15/39 (m) | 9,670 | |||||||||
| 15,000 | Series 2007-C4, Class A2, VAR, 1.00%, 09/15/39 | 15,157 | |||||||||
| CS First Boston Mortgage Securities Corp., | |||||||||||
| 7,650 | Series 2001-CK6, Class A3, 6.39%, 08/15/36 (m) | 7,873 | |||||||||
| 11,500 | Series 2001-CP4, Class A4, 6.18%, 12/15/35 (m) | 11,749 | |||||||||
| 4,800 | Series 2002-CKN2, Class A3, 6.13%, 04/15/37 (m) | 4,906 | |||||||||
| 6,200 | Series 2004-C3, Class A3, 4.30%, 07/15/36 (m) | 6,080 | |||||||||
| Greenwich Capital Commercial Funding Corp., | |||||||||||
| 4,500 | Series 2003-C1, Class A2, 3.29%, 07/05/35 (m) | 4,352 | |||||||||
| 4,100 | Series 2005-GG3, Class A2, 4.31%, 08/10/42 (m) | 4,009 | |||||||||
| 8,100 | Series 2007-GG9, Class A2, 5.38%, 03/10/39 (m) | 8,048 | |||||||||
| 11,850 | GS Mortgage Securities Corp. II, Series 2004-GG2, Class A3, 4.60%, 08/10/38 (m) | 11,690 | |||||||||
| LB-UBS Commercial Mortgage Trust , | |||||||||||
| 5,000 | Series 2003-C1, Class A2, 3.32%, 03/15/27 (m) | 4,936 | |||||||||
| 11,000 | Series 2003-C5, Class A2, 3.48%, 07/15/27 (m) | 10,804 | |||||||||
| 2,300 | Series 2004-C2, Class A2, 3.25%, 03/15/29 (m) | 2,232 | |||||||||
| 11,800 | Series 2004-C7, Class A2, 3.99%, 10/15/29 (m) | 11,484 | |||||||||
| 1,800 | Series 2006-C1, Class A2, 5.08%, 02/15/31 (m) | 1,785 | |||||||||
| 10,600 | Series 2006-C6, Class A2, 5.26%, 09/15/39 (m) | 10,533 | |||||||||
| 13,000 | Series 2007-C1, Class A2, 5.32%, 02/15/40 (m) | 12,902 | |||||||||
| Merrill Lynch Mortgage Trust, | |||||||||||
| 2,550 | Series 2005-CKI1, Class A2, VAR, 5.40%, 11/12/37 (m) | 2,544 | |||||||||
| 10,000 | Series 2006-C1, Class A2, VAR, 5.80%, 05/12/39 (m) | 10,075 | |||||||||
| Morgan Stanley Capital I, | |||||||||||
| 8,613 | Series 1998-HF2, Class A2, VAR, 6.48%, 11/15/30 (m) | 8,629 | |||||||||
| 6,400 | Series 2006-T21, Class A2, 5.09%, 10/12/52 (m) | 6,341 | |||||||||
| 5,000 | Series 2006-T23, Class A2, VAR, 5.91%, 08/12/41 (m) | 5,062 | |||||||||
| 11,150 | Series 2007-IQ14, Class A2, 5.61%, 04/15/49 (m) | 11,156 | |||||||||
AS OF AUGUST 31, 2007 (Unaudited) (continued)
| PRINCIPAL AMOUNT($) | | SECURITY DESCRIPTION | | VALUE($) | |||||||
|---|---|---|---|---|---|---|---|---|---|---|---|
Long-Term Investments — Continued | |||||||||||
Commercial Mortgage-Backed Securities — Continued | |||||||||||
| Wachovia Bank Commercial Mortgage Trust, | |||||||||||
| 9,200 | Series 2005-C17, Class A2, 4.78%, 03/15/42 | 9,078 | |||||||||
| 2,800 | Series 2007-C30, Class A3, 5.25%, 12/15/43 | 2,762 | |||||||||
| Total Commercial Mortgage-Backed Securities (Cost $217,936) | 216,038 | ||||||||||
Corporate Bonds — 32.9% | |||||||||||
Automobiles — 0.2% | |||||||||||
| 3,000 | DaimlerChrysler NA Holding Corp., 5.75%, 05/18/09 (m) | 3,020 | |||||||||
Beverages — 0.3% | |||||||||||
| 5,400 | Miller Brewing Co., 4.25%, 08/15/08 (e) (m) | 5,326 | |||||||||
Capital Markets — 4.2% | |||||||||||
| Bear Stearns Cos., Inc. (The), | |||||||||||
| 5,700 | 4.55%, 06/23/10 (m) | 5,484 | |||||||||
| 7,500 | 5.85%, 07/19/10 (m) | 7,450 | |||||||||
| Goldman Sachs Group, Inc. (The), | |||||||||||
| 3,050 | 5.30%, 02/14/12 (m) | 3,009 | |||||||||
| 3,000 | FRN, 5.44%, 12/23/09 (m) | 2,981 | |||||||||
| 8,900 | FRN, 5.45%, 12/22/08 (m) | 8,875 | |||||||||
| 3,300 | FRN, 5.45%, 06/23/09 (m) | 3,271 | |||||||||
| 2,500 | Lehman Brothers Holdings Capital Trust V, 5.86% to 05/31/12; thereafter variable, 11/29/49 (m) | 2,296 | |||||||||
| Lehman Brothers Holdings, Inc., | |||||||||||
| 4,000 | 7.88%, 08/15/10 (m) | 4,232 | |||||||||
| 18,000 | FRN, 5.63%, 11/16/09 (m) | 17,401 | |||||||||
| 16,200 | Links Finance LLC, FRN, 5.61%, 09/15/08 (e) (i) | 16,209 | |||||||||
| 10,000 | Merrill Lynch & Co., Inc., FRN, 5.67%, 08/14/09 (m) | 9,971 | |||||||||
| 2,270 | Morgan Stanley, FRN, 5.47%, 02/09/09 (m) | 2,254 | |||||||||
| 83,433 | |||||||||||
Chemicals — 0.4% | |||||||||||
| 4,000 | Huntsman LLC, 11.50%, 07/15/12 (m) | 4,350 | |||||||||
| 3,860 | Nalco Co., 7.75%, 11/15/11 (m) | 3,928 | |||||||||
| 8,278 | |||||||||||
Commercial Banks — 6.7% | |||||||||||
| 4,300 | Artesia Bank S.C. (Belgium), 7.25% to 09/17/07; thereafter variable, 09/29/49 (e) (m) | 4,303 | |||||||||
| 6,900 | BAC Capital Trust XIV, 5.63% to 03/15/12; thereafter variable, 12/31/49 (m) | 6,417 | |||||||||
| 3,350 | Citibank Korea, Inc. (South Korea), VAR, 4.68%, 06/18/13 | 3,325 | |||||||||
| 11,900 | Commonwealth Bank of Australia (Australia), 8.50%, 06/01/10 (m) | 13,017 | |||||||||
| 8,100 | DBS Bank Ltd. (Singapore), VAR, 5.13%, 05/16/17 (e) (m) | 7,890 | |||||||||
| 5,100 | DBS Capital Funding Corp. (Cayman Islands), 7.66% to 03/15/11; thereafter variable, 03/31/49 (e) (m) | 5,498 | |||||||||
| 2,050 | Deutsche Bank Capital Funding Trust I, 7.87% to 06/30/09; thereafter variable, 12/29/49 (e) (m) | 2,149 | |||||||||
| 2,800 | Glitnir Banki HF (Iceland), VAR, 6.69%, 06/15/16 (e) (m) | 2,929 | |||||||||
| 1,700 | Hana Bank (South Korea), 4.13%, 03/11/09 | 1,676 | |||||||||
| 11,800 | HSBC Capital Funding LP, 9.55% to 06/30/10; thereafter variable, 12/29/49 (e) (m) | 13,068 | |||||||||
| 7,000 | ICICI Bank Ltd. (Singapore), 5.75%, 11/16/10 (e) (m) | 7,005 | |||||||||
| 2,000 | KBC Bank Funding Trust III, 9.86% to 11/02/09; thereafter variable, 11/29/49 (e) (m) | 2,191 | |||||||||
| Landsbanki Islands HF (Iceland), | |||||||||||
| 2,750 | 6.10%, 08/25/11 (e) (m) | 2,835 | |||||||||
| 2,700 | FRN, 6.21%, 08/25/09 (e) (m) | 2,714 | |||||||||
| 9,000 | Mellon Capital IV, 6.24% to 06/20/12; thereafter variable, 06/29/49 (m) | 8,884 | |||||||||
| 5,650 | Public Bank Berhad (Malaysia), VAR, 5.63%, 09/22/14 | 5,697 | |||||||||
| 11,550 | Royal Bank of Scotland Group plc ADR (United Kingdom), 9.12%, 12/31/49 | 12,621 | |||||||||
| 3,500 | Santander U.S. Debt S.A. Unipersonal (Spain), FRN, 5.42%, 11/20/09 (e) | 3,483 | |||||||||
| 1,200 | Shinhan Bank (South Korea), VAR, 4.63%, 11/03/14 (e) (m) | 1,203 | |||||||||
| 1,000 | SunTrust Preferred Capital I, 5.85% to 12/15/11; thereafter variable, 12/31/49 | 974 | |||||||||
| 2,000 | Unicredito Italiano Capital Trust II, 9.20% to 10/05/10; thereafter variable, 10/29/49 (e) | 2,219 | |||||||||
| VTB Capital S.A. for Vneshtorgbank (Luxembourg), | |||||||||||
| 3,100 | FRN, 5.96%, 08/01/08 (e) (m) | 3,074 | |||||||||
| 4,450 | FRN, 6.11%, 09/21/07 (e) (m) | 4,457 | |||||||||
| 750 | FRN, 6.11%, 09/21/07 (m) | 750 | |||||||||
| Wachovia Capital Trust III, | |||||||||||
| 9,100 | 5.80% to 03/15/11; thereafter variable, 03/15/42 | 9,077 | |||||||||
| Woori Bank (South Korea), | |||||||||||
| 800 | VAR, 4.88%, 07/02/13 | 796 | |||||||||
| 1,430 | VAR, 5.75%, 03/13/14 (e) | 1,436 | |||||||||
| 4,000 | VAR, 6.13%, 05/03/16 (e) | 4,003 | |||||||||
| 133,691 | |||||||||||
| PRINCIPAL AMOUNT($) | | SECURITY DESCRIPTION | | VALUE($) | |||||||
|---|---|---|---|---|---|---|---|---|---|---|---|
Long-Term Investments — Continued | |||||||||||
Commercial Services & Supplies — 0.3% | |||||||||||
| 3,000 | Allied Waste North America, 6.50%, 11/15/10 (m) | 2,970 | |||||||||
| 3,980 | Corrections Corp. of America, 7.50%, 05/01/11 (m) | 4,000 | |||||||||
| 6,970 | |||||||||||
Consumer Finance — 2.0% | |||||||||||
| 2,700 | Capital One Financial Corp., 5.70%, 09/15/11 (m) | 2,659 | |||||||||
| 4,000 | Ford Motor Credit Co. LLC, 7.38%, 10/28/09 (m) | 3,785 | |||||||||
| 3,350 | GMAC LLC, 5.85%, 01/14/09 (m) | 3,182 | |||||||||
| 7,000 | HSBC Finance Corp., FRN, 5.81%, 11/16/09 (m) | 7,034 | |||||||||
| International Lease Finance Corp., | |||||||||||
| 16,800 | 5.30%, 05/01/12 (m) | 16,520 | |||||||||
| 7,400 | 5.35%, 03/01/12 (m) | 7,313 | |||||||||
| 40,493 | |||||||||||
Containers & Packaging — 0.1% | |||||||||||
| 2,242 | Owens Brockway Glass Container, Inc., 8.88%, 02/15/09 | 2,278 | |||||||||
Diversified Financial Services — 8.7% | |||||||||||
| 5,750 | BNP US Funding LLC, 7.74% to 12/05/07; thereafter variable, 12/29/49 (e) (m) | 5,795 | |||||||||
| CIT Group, Inc., | |||||||||||
| 3,300 | 5.40%, 02/13/12 (m) | 3,032 | |||||||||
| 7,300 | 5.75%, 09/25/07 (m) | 7,299 | |||||||||
| 11,000 | FRN, 5.51%, 01/30/09 (m) | 10,480 | |||||||||
| 9,250 | FRN, 5.64%, 08/17/09 (m) | 8,776 | |||||||||
| 29,000 | General Electric Capital Corp., 4.13%, 09/01/09 (m) | 28,617 | |||||||||
| 9,350 | Goldman Sachs Capital II, 5.79% to 06/01/12; thereafter variable, 12/29/49 (m) | 8,580 | |||||||||
| 1,900 | ILFC E-Capital Trust I, VAR, 5.90%, 12/21/65 (e) (m) | 1,869 | |||||||||
| K2 (USA) LLC, | |||||||||||
| 1,000 | VAR, 0.00%, 02/05/10 (m) | 925 | |||||||||
| 9,446 | 5.36%, 02/15/09 (i) | 8,738 | |||||||||
| 7,500 | 5.37%, 02/15/10 (i) | 6,937 | |||||||||
| 4,396 | Mizuho JGB Investment LLC, 9.87% to 06/30/08; thereafter variable, 12/29/49 (e) (m) | 4,558 | |||||||||
| 13,250 | Mizuho Preferred Capital Co. LLC, 8.79% to 06/30/08; thereafter variable, 12/29/49 (e) (m) | 13,627 | |||||||||
| 10,540 | Natexis Ambs Co. LLC, 8.44% to 06/30/08; thereafter variable, 12/29/49 (e) (m) | 10,798 | |||||||||
| 3,467 | Pemex Finance Ltd. (Cayman Islands), 8.88%, 11/15/10 | 3,631 | |||||||||
| 5,100 | Premium Asset Trust, 4.13%, 03/12/09 (e) | 4,884 | |||||||||
| 12,100 | RACERS, FRN, 5.36%, 09/20/07 (e) (i) | 12,100 | |||||||||
| Sigma Finance Corp. (Cayman Islands), | |||||||||||
| 11,900 | VAR, 0.00%, 08/15/11 (e) (i) | 11,893 | |||||||||
| 6,600 | FRN, 5.33%, 09/15/08 (e) (i) | 6,600 | |||||||||
| 1,700 | Tokai Preferred Capital Co. LLC, 9.98% to 06/30/08; thereafter variable, 12/29/49 (e) | 1,764 | |||||||||
| 1,600 | Two-Rock Pass Through Trust (Bermuda), 6.44% to 02/11/10; thereafter variable, 12/31/49 (e) | 1,575 | |||||||||
| 4,300 | Xstrata Finance Dubai Ltd. (United Arab Emirates), FRN, 5.85%, 11/13/09 (e) | 4,273 | |||||||||
| 7,950 | ZFS Finance USA Trust I, VAR, 5.88%, 05/09/32 (e) | 7,758 | |||||||||
| 174,509 | |||||||||||
Diversified Telecommunication Services — 0.7% | |||||||||||
| 5,600 | Deutsche Telekom International Finance BV (Netherlands), 8.00%, 06/15/10 (m) | 5,961 | |||||||||
| 1,000 | Qwest Communications International, Inc., FRN, 9.06%, 02/15/09 | 1,003 | |||||||||
| 2,500 | Qwest Corp., 7.88%, 09/01/11 | 2,616 | |||||||||
| 4,650 | Telefonica Emisones SAU (Spain), 5.98%, 06/20/11 | 4,711 | |||||||||
| 14,291 | |||||||||||
Electric Utilities — 1.5% | |||||||||||
| 3,000 | Alabama Power Capital Trust V, VAR, 5.50%, 10/01/42 (m) | 3,020 | |||||||||
| Appalachian Power Co., | |||||||||||
| 2,640 | 3.60%, 05/15/08 (m) | 2,599 | |||||||||
| 1,450 | 5.55%, 04/01/11 (m) | 1,454 | |||||||||
| 3,550 | 5.65%, 08/15/12 (m) | 3,583 | |||||||||
| 6,050 | FPL Group Capital, Inc. , 5.55%, 02/16/08 (m) | 6,052 | |||||||||
| 8,350 | MidAmerican Energy Co., 5.65%, 07/15/12 (m) | 8,506 | |||||||||
| 5,200 | PSEG Funding Trust I, 5.38%, 11/16/07 (m) | 5,196 | |||||||||
| 30,410 | |||||||||||
Food & Staples Retailing — 0.2% | |||||||||||
| 4,800 | CVS/Caremark Corp., 4.00%, 09/15/09 (m) | 4,690 | |||||||||
Food Products — 0.3% | |||||||||||
| 2,400 | Dean Holding Co., 6.63%, 05/15/09 (m) | 2,376 | |||||||||
| 4,050 | Kraft Foods, Inc., 6.00%, 02/11/13 (m) | 4,132 | |||||||||
| 6,508 | |||||||||||
Health Care Equipment & Supplies — 0.1% | |||||||||||
| 2,500 | Fresenius Medical Care Capital Trust II, 7.88%, 02/01/08 (m) | 2,506 | |||||||||
AS OF AUGUST 31, 2007 (Unaudited) (continued)
| PRINCIPAL AMOUNT($) | | SECURITY DESCRIPTION | | VALUE($) | |||||||
|---|---|---|---|---|---|---|---|---|---|---|---|
Long-Term Investments — Continued | |||||||||||
Hotels, Restaurants & Leisure — 0.2% | |||||||||||
| 4,015 | MGM Mirage, Inc., 6.00%, 10/01/09 (m) | 3,980 | |||||||||
Independent Power Producers & Energy Traders — 0.2% | |||||||||||
| 4,383 | AES Corp. (The), 9.50%, 06/01/09 (m) | 4,525 | |||||||||
Insurance — 1.2% | |||||||||||
| 4,378 | Allstate Corp. (The), 7.20%, 12/01/09 (m) | 4,584 | |||||||||
| 10,300 | Genworth Financial, Inc., 5.23%, 05/16/09 (m) | 10,222 | |||||||||
| 8,450 | Hartford Financial Services Group, Inc., 5.66%, 11/16/08 (m) | 8,517 | |||||||||
| 23,323 | |||||||||||
Media — 2.1% | |||||||||||
| Comcast Cable Communications LLC, | |||||||||||
| 2,600 | 6.20%, 11/15/08 (m) | 2,621 | |||||||||
| 3,200 | 6.75%, 01/30/11 (m) | 3,324 | |||||||||
| 9,800 | COX Communications, Inc., 4.63%, 01/15/10 (m) | 9,645 | |||||||||
| Dex Media East LLC/Dex Media East Finance Co., | |||||||||||
| 4,000 | 9.88%, 11/15/09 (m) | 4,090 | |||||||||
| 850 | 12.13%, 11/15/12 (m) | 907 | |||||||||
| 4,350 | Echostar DBS Corp., 5.75%, 10/01/08 (m) | 4,323 | |||||||||
| 3,250 | RH Donnelley, Inc., 10.88%, 12/15/12 | 3,445 | |||||||||
| 4,100 | Time Warner Entertainment Co., LP, 7.25%, 09/01/08 (m) | 4,129 | |||||||||
| 9,100 | Time Warner, Inc., 5.50%, 11/15/11 | 9,079 | |||||||||
| 41,563 | |||||||||||
Multi-Utilities — 0.3% | |||||||||||
| Dominion Resources, Inc., | |||||||||||
| 4,300 | SUB, 5.69%, 05/15/08 (m) | 4,300 | |||||||||
| 2,000 | VAR, 6.30%, 09/30/66 (m) | 1,982 | |||||||||
| 6,282 | |||||||||||
Oil, Gas & Consumable Fuels — 1.6% | |||||||||||
| 6,200 | Pemex Project Funding Master Trust, FRN, 6.66%, 06/15/10 (e) | 6,299 | |||||||||
| 12,622 | Qatar Petroleum (Qatar), 5.58%, 05/30/11 (e) | 12,768 | |||||||||
| 3,600 | Valero Energy Corp. 3.50%, 04/01/09 | 3,518 | |||||||||
| 8,550 | XTO Energy, Inc., 5.90%, 08/01/12 | 8,684 | |||||||||
| 31,269 | |||||||||||
Personal Products — 0.1% | |||||||||||
| 1,500 | Playtex Products, Inc., 8.00%, 03/01/11 | 1,549 | |||||||||
Real Estate Investment Trusts (REITs) — 0.4% | |||||||||||
| iStar Financial, Inc., | |||||||||||
| 6,138 | 4.88%, 01/15/09 (m) | 6,020 | |||||||||
| 1,450 | 5.38%, 04/15/10 (m) | 1,413 | |||||||||
| 7,433 | |||||||||||
Real Estate Management & Development — 0.5% | |||||||||||
| 9,450 | Socgen Real Estate Co. LLC, 7.64% to 10/01/07; thereafter variable, 12/29/49 (e) | 9,470 | |||||||||
Thrifts & Mortgage Finance — 0.6% | |||||||||||
| 4,250 | Countrywide Financial Corp., 5.80%, 06/07/12 (m) | 3,994 | |||||||||
| 4,000 | Washington Mutual Bank, FRN, 5.45%, 05/01/09 | 3,917 | |||||||||
| 4,100 | Washington Mutual Preferred Funding II, 6.90% to 06/15/12; thereafter variable, 06/29/49 (e) | 3,850 | |||||||||
| 11,761 | |||||||||||
| Total Corporate Bonds (Cost $665,607) | 657,558 | ||||||||||
Foreign Government Securities — 0.7% | |||||||||||
| 3,170 | National Agricultural Cooperative Federation (South Korea), VAR, 5.75%, 06/18/14 | 3,194 | |||||||||
| 7,250 | Republic of Chile (Chile), FRN, 5.76%, 01/28/08 (m) | 7,257 | |||||||||
| 3,400 | United Mexican States (Mexico), FRN, 6.06%, 01/13/09 | 3,412 | |||||||||
| Total Foreign Government Securities (Cost $13,968) | 13,863 | ||||||||||
Mortgage Pass-Through Securities — 34.3% | |||||||||||
| Federal National Mortgage Association Various Pools, | |||||||||||
| 67,078 | 6.00%, 08/01/22 (m) | 67,812 | |||||||||
| 738 | 7.00%, 09/01/15 – 06/01/26 (m) | 762 | |||||||||
| 164,668 | 7.00%, 08/01/31 – 04/01/37 (m) | 169,288 | |||||||||
| 52,910 | TBA, 5.00%, 08/01/23 | 50,281 | |||||||||
| 125,470 | TBA, 5.50%, 10/25/37 | 122,529 | |||||||||
| 47,000 | TBA, 6.00%, 09/25/22 – 10/25/22 | 47,499 | |||||||||
| 43,000 | TBA, 6.00%, 10/25/36 | 42,933 | |||||||||
| 119,855 | TBA, 6.50%, 09/25/37 – 10/25/37 | 121,641 | |||||||||
| 62,200 | TBA, 7.00%, 09/25/36 – 10/25/37 | 63,924 | |||||||||
| Total Mortgage Pass-Through Securities (Cost $683,341) | 686,669 | ||||||||||
Municipal Bond — 0.2% | |||||||||||
Florida — 0.2% | |||||||||||
| 3,000 | Miami-Dade County Educational Facilities Authority, University of Miami, Series C, Rev., 5.26%, 04/01/09 (m) (Cost $3,000) | 3,010 | |||||||||
U.S. Government Agency Securities — 1.1% | |||||||||||
| 22,600 | Federal National Mortgage Association, 4.75%, 03/12/10 (m) (Cost $22,584) | 22,610 | |||||||||
| PRINCIPAL AMOUNT($) | | SECURITY DESCRIPTION | | VALUE($) | |||||||
|---|---|---|---|---|---|---|---|---|---|---|---|
Long-Term Investments — Continued | |||||||||||
U.S. Treasury Obligations — 0.0% (g) | |||||||||||
| U.S. Treasury Notes | |||||||||||
| 70 | 3.00%, 11/15/07 (m) | 70 | |||||||||
| 185 | 4.25%, 11/30/07 (m) | 185 | |||||||||
| Total U.S. Treasury Obligations (Cost $255) | 255 | ||||||||||
| Total Long-Term Investments (Cost $2,108,816) | 2,092,954 | ||||||||||
| NUMBER OF CONTRACTS | | | | | |||||||
|---|---|---|---|---|---|---|---|---|---|---|---|
Options Purchased — 0.4% | |||||||||||
Call Options Purchased — 0.2% | |||||||||||
| 240 | 30 Day Fed Funds expiring 09/28/07 @ $94.75, American Style | 258 | |||||||||
| 176 | 90 Day Eurodollar Futures expiring 09/17/07 @ $95.75, American Style | 1 | |||||||||
| NOTIONAL AMOUNT($) | | | | | ||||||
|---|---|---|---|---|---|---|---|---|---|---|
Call Options Purchased on Interest Rate Swaps: | ||||||||||
| 535,429 | Expiring 05/30/08. If exercised the Fund receives 3.96% and pays floating 3 month LIBOR expiring 06/03/10, European Style | 1,494 | ||||||||
| 125,450 | Expiring 11/02/09. If exercised the Fund receives 4.49% and pays floating 3 month LIBOR expiring 11/04/19, European Style | 1,613 | ||||||||
| Total Call Options Purchased | 3,366 | |||||||||
Receiver/Payer Straddle on Interest Rate Swaps — 0.1% | ||||||||||
| 22,160 | Expiring 06/09/08. If exercised the Fund pays/receives 5.88% and receives/pays floating 3 month LIBOR expiring 06/11/18, European Style | 1,305 | ||||||||
| 88,300 | Expiring 10/02/08. If exercised the Fund pays/receives 4.46% and receives/pays floating 3 month LIBOR expiring 10/06/18, European Style | 574 | ||||||||
| Total Receiver/Payer Straddle on Interest Rate Swaps | 1,879 | |||||||||
| NUMBER OF CONTRACTS | | | | | ||||||
|---|---|---|---|---|---|---|---|---|---|---|
Put Options Purchased — 0.1% | ||||||||||
| 974 | 30 Day Fed Funds expiring 09/28/07 @ $94.81, American Style | 30 | ||||||||
| 216 | 30 Day Fed Funds expiring 11/30/07 @ $94.75, American Style | 2 | ||||||||
| 434 | 30 Day Fed Funds expiring 11/30/07 @ $94.88, American Style | 36 | ||||||||
| NUMBER OF CONTRACTS | | | | | ||||||
|---|---|---|---|---|---|---|---|---|---|---|
Put Options Purchased — Continued | ||||||||||
| 263 | 30 Day Fed Funds expiring 11/30/07 @ $95.00, American Style | 47 | ||||||||
| 105 | 30 Day Fed Funds expiring 12/31/07 @ $94.75, American Style | 1 | ||||||||
| 1,926 | 90 Day Eurodollar Futures expiring 09/17/07 @ $94.38, American Style | 193 | ||||||||
| NOTIONAL AMOUNT($) | | | | | ||||||
|---|---|---|---|---|---|---|---|---|---|---|
| Put Options Purchased on Interest Rate Swaps: | ||||||||||
| 62,040 | Expiring 09/06/07. If exercised the Fund pays 5.71% and receives floating 3 month LIBOR expiring 09/10/12, European Style | — | ||||||||
| 36,450 | Expiring 10/04/07. If exercised the Fund pays 5.30% and receives floating 3 month LIBOR expiring 10/09/12, European Style | 58 | ||||||||
| 48,177 | Expiring 10/04/07. If exercised the Fund pays 5.69% and receives floating 3 month LIBOR expiring 10/09/12, European Style | 9 | ||||||||
| 25,345 | Expiring 10/04/07. If exercised the Fund pays 5.71% and receives floating 3 month LIBOR expiring 10/09/12, European Style | 4 | ||||||||
| 50,986 | Expiring 10/04/07. If exercised the Fund pays 5.80% and receives floating 3 month LIBOR expiring 10/09/12, European Style | 5 | ||||||||
| 399,336 | Expiring 02/28/08. If exercised the Fund pays 4.20% and receives floating 3 month LIBOR expiring 03/03/10, European Style | 1,106 | ||||||||
| Total Put Options Purchased | 1,491 | |||||||||
| Total Options Purchased (Cost $8,899) | 6,736 | |||||||||
| PRINCIPAL AMOUNT($) | | | | | |||||||
|---|---|---|---|---|---|---|---|---|---|---|---|
Short-Term Investments — 19.0% | |||||||||||
Commercial Paper — 4.8% (n) | |||||||||||
| 28,000 | ABN Amro North America Finance, Inc., 5.31%, 10/12/07 (m) | 27,825 | |||||||||
| 5,000 | Bank of America Corp., 5.41%, 10/22/07 (m) | 4,961 | |||||||||
| 14,250 | COX Communications Corp., VAR, 5.94%, 01/15/08 (m) | 14,249 | |||||||||
| 20,000 | Gotham Funding Corp. 6.13%, 09/21/07 (m) | 19,929 | |||||||||
| 30,000 | HBOS Treasury Services plc, 5.32%, 10/12/07 (m) | 29,813 | |||||||||
| Total Commercial Paper (Cost $96,798) | 96,777 | ||||||||||
AS OF AUGUST 31, 2007 (Unaudited) (continued)
| SHARES | | SECURITY DESCRIPTION | | VALUE($) | |||||||
|---|---|---|---|---|---|---|---|---|---|---|---|
Short-Term Investments — Continued | |||||||||||
Investment Company — 13.8% | |||||||||||
| 275,364 | JPMorgan Prime Money Market Fund, Institutional Class (b) (m) (Cost $275,364) | 275,364 | |||||||||
| PRINCIPAL AMOUNT($) | | | | | ||||||
|---|---|---|---|---|---|---|---|---|---|---|
U.S. Treasury Obligation — 0.4% | ||||||||||
| 7,625 | U.S. Treasury Bill, 4.68%, 11/01/07 (k) (m) (n) (Cost $7,565) | 7,577 | ||||||||
| Total Short-Term Investments (Cost $379,727) | 379,718 | |||||||||
Total Investments — 124.0% (Cost $2,497,442) | 2,479,408 | |||||||||
Liabilities in Excess of Other Assets — (24.0)% | (479,633 | ) | ||||||||
NET ASSETS — 100.0% | $ | 1,999,775 | ||||||||
| NUMBER OF CONTRACTS | | DESCRIPTION | | EXPIRATION DATE | | NOTIONAL VALUE AT 08/31/07 | | UNREALIZED APPRECIATION (DEPRECIATION) | ||||||||||
|---|---|---|---|---|---|---|---|---|---|---|---|---|---|---|---|---|---|---|
Long Futures Outstanding | ||||||||||||||||||
| 8 | 10 Year Japan Bonds | September, 2007 | $ | 9,351 | $ | 266 | ||||||||||||
| 193 | Eurodollar | September, 2007 | 45,593 | (25 | ) | |||||||||||||
| 140 | 3 Month Euroyen TFX | December, 2007 | 29,967 | 38 | ||||||||||||||
| 1,746 | 2 Year U.S. Treasury Notes | December, 2007 | 359,949 | (69 | ) | |||||||||||||
| 228 | 5 Year U.S. Treasury Notes | December, 2007 | 24,328 | (19 | ) | |||||||||||||
| 480 | 10 Year U.S. Treasury Notes | December, 2007 | 52,343 | 54 | ||||||||||||||
| 15 | U.K. Treasury Gilt | December, 2007 | 3,238 | (3 | ) | |||||||||||||
| 215 | U.K. 90 Day Liffe | March, 2008 | 50,865 | (9 | ) | |||||||||||||
Short Futures Outstanding | ||||||||||||||||||
| (13) | 10 Year Swap Future | September, 2007 | (1,376 | ) | (14 | ) | ||||||||||||
| (89) | Eurodollar | September, 2007 | (21,025 | ) | 12 | |||||||||||||
| (938) | 5 Year U.S. Treasury Notes | December, 2007 | (100,088 | ) | 24 | |||||||||||||
| (551) | 10 Year U.S. Treasury Notes | December, 2007 | (60,085 | ) | 39 | |||||||||||||
| (161) | Eurodollar | December, 2007 | (38,264 | ) | 19 | |||||||||||||
| (331) | Eurodollar | March, 2008 | (78,910 | ) | 62 | |||||||||||||
| (158) | Eurodollar | June, 2008 | (37,701 | ) | 35 | |||||||||||||
| (26) | Eurodollar | September, 2008 | (6,204 | ) | 6 | |||||||||||||
| (140) | 3 Month Euroyen TFX | December, 2008 | (29,902 | ) | (97 | ) | ||||||||||||
| $ | 319 | |||||||||||||||||
| PRINCIPAL AMOUNT | | SECURITY DESCRIPTION | | VALUE | ||||||
|---|---|---|---|---|---|---|---|---|---|---|
| $ (20,610) | FNMA, TBA, 5.00%, 09/25/37 | $ | (19,586 | ) | ||||||
| (95,670) | FNMA, TBA, 5.50%, 09/25/37 | (93,428 | ) | |||||||
| (153,100) | FNMA, TBA, 6.00%, 09/25/37 | (152,908 | ) | |||||||
| (Proceeds received $263,489) | $ | (265,922 | ) | |||||||
Call Options Written
| DESCRIPTION | | EXERCISE PRICE | | EXPIRATION DATE | | NUMBERS OF CONTRACTS | | VALUE | ||||||||||
|---|---|---|---|---|---|---|---|---|---|---|---|---|---|---|---|---|---|---|
| 10 Year U.S. Treasury Note Futures | $ | 111.00 | 10/26/07 | 373 | $ | (146 | ) | |||||||||||
| 10 Year U.S. Treasury Note Futures | 111.00 | 11/20/07 | 767 | (419 | ) | |||||||||||||
| 10 Year U.S. Treasury Note Futures | 112.00 | 11/20/07 | 549 | (197 | ) | |||||||||||||
| 30 Day Federal Funds Futures, American Style | 91.81 | 09/28/07 | 240 | (200 | ) | |||||||||||||
| 90 Day Eurodollar Futures, American Style | 96.00 | 09/17/07 | 352 | (2 | ) | |||||||||||||
| (Premiums received of $809) | $ | (964 | ) | |||||||||||||||
| COUNTERPARTY | | EXERCISE RATE* | | OPTION EXPIRATION DATE | | SWAP EXPIRATION DATE | | NOTIONAL AMOUNT | | VALUE | ||||||||||||
|---|---|---|---|---|---|---|---|---|---|---|---|---|---|---|---|---|---|---|---|---|---|---|
| Barclays Bank plc | 5.46% semi-annually | 05/30/08 | 06/03/10 | $ 535,429 | $ (1,044) | |||||||||||||||||
| (Premiums received of $910) | ||||||||||||||||||||||
| DESCRIPTION | | EXERCISE PRICE | | EXPIRATION DATE | | NUMBER OF CONTRACTS | | VALUE | ||||||||||
|---|---|---|---|---|---|---|---|---|---|---|---|---|---|---|---|---|---|---|
| 10 Year U.S. Treasury Note Futures | $ | 106.00 | 11/20/07 | 441 | $ | (96 | ) | |||||||||||
| (Premiums received of $328) | ||||||||||||||||||
| DESCRIPTION | | EXERCISE PRICE | | EXPIRATION DATE | | NOTIONAL AMOUNT | | VALUE | ||||||||||
|---|---|---|---|---|---|---|---|---|---|---|---|---|---|---|---|---|---|---|
| European Put Bond Option on FNMA, 30 Year Fixed, 5.50% | $ | 96.61 | 10/04/07 | $ | 40,500 | $ | (46 | ) | ||||||||||
| European Put Bond Option on FNMA, 30 Year Fixed, 5.50% | 94.96 | 10/04/07 | 37,000 | (2 | ) | |||||||||||||
| European Put Bond Option on FNMA, 30 Year Fixed, 5.50% | 95.33 | 10/04/07 | 37,000 | (4 | ) | |||||||||||||
| FNMA, 30 Year Fixed, 5.50%, TBA | 95.38 | 09/06/07 | 47,000 | — | ||||||||||||||
| FNMA, 30 Year Fixed, 5.50%, TBA | 95.19 | 10/04/07 | 18,500 | (1 | ) | |||||||||||||
| (Premiums received of $709) | $ | (53 | ) | |||||||||||||||
| COUNTERPARTY | | EXERCISE RATE** | | OPTION EXPIRATION DATE | | SWAP EXPIRATION DATE | | NOTIONAL AMOUNT | | VALUE | | |||||||||||||||
|---|---|---|---|---|---|---|---|---|---|---|---|---|---|---|---|---|---|---|---|---|---|---|---|---|---|---|
| Barclays Bank plc | 5.20% semi-annually | 02/28/08 | 03/03/10 | $ 399,336 | $ (883) | |||||||||||||||||||||
| Bank of America | 5.99% semi-annually | 11/02/09 | 11/04/19 | 125,450 | (2,426) | |||||||||||||||||||||
| (Premiums received of $3,182) | $ (3,309) | |||||||||||||||||||||||||
AS OF AUGUST 31, 2007 (Unaudited) (continued)
| NAME OF ISSUER | | EXERCISE RATE*** | | OPTION EXPIRATION DATE | | SWAP EXPIRATION DATE | | NOTIONAL AMOUNT | | VALUE | | |||||||||||||||
|---|---|---|---|---|---|---|---|---|---|---|---|---|---|---|---|---|---|---|---|---|---|---|---|---|---|---|
| Barclays Bank plc | 5.96% semi-annually | 10/02/08 | 10/06/18 | $ 75,712 | $ (696 | ) | ||||||||||||||||||||
| Barclays Bank plc | 6.02% semi-annually | 07/28/14 | 07/30/24 | 6,123 | (550 | ) | ||||||||||||||||||||
| Lehman Brothers Special Financing | 5.36% semi-annually | 03/15/12 | 03/19/42 | 8,192 | (1,252 | ) | ||||||||||||||||||||
| (Premiums received of $2,750) | $(2,498 | ) | ||||||||||||||||||||||||
| * | The Fund would receive a floating rate based on 3-month USD LIBOR, if exercised. |
| ** | The Fund would pay a floating rate based on 3-month USD LIBOR, if exercised. |
| *** | The Fund would pay or receive a floating rate based on 3-month USD LIBOR, if exercised. |
| **** | European Style |
| RATE TYPE (r) | ||||||||||||||||||||||
|---|---|---|---|---|---|---|---|---|---|---|---|---|---|---|---|---|---|---|---|---|---|---|
| SWAP COUNTERPARTY | | PAYMENTS MADE BY THE FUND | | PAYMENTS RECEIVED BY THE FUND | | TERMINATION DATE | | NOTIONAL AMOUNT | | VALUE | ||||||||||||
| Bank of America | 5.55% semi-annually | 3 month LIBOR quarterly | 07/31/17 | $ | 10,920 | $ | (274 | ) | ||||||||||||||
| Bank of America | 5.89% semi-annually | 3 month LIBOR quarterly | 11/04/19 | 65,077 | (2,035 | ) | ||||||||||||||||
| Barclays Bank plc | 4.70% semi-annually | 3 month LIBOR quarterly | 03/03/10 | 195,675 | 106 | |||||||||||||||||
| Barclays Bank plc | 4.71% semi-annually | 3 month LIBOR quarterly | 06/03/10 | 214,172 | 127 | |||||||||||||||||
| Barclays Bank plc | 5.51% semi-annually | 3 month LIBOR quarterly | 08/03/17 | 7,243 | (156 | ) | ||||||||||||||||
| Barclays Bank plc | 3 month LIBOR quarterly | 5.37% quarterly | 08/28/17 | 2,851 | 30 | |||||||||||||||||
| Barclays Bank plc | 5.72% semi-annually | 3 month LIBOR quarterly | 10/06/18 | 9,591 | (284 | ) | ||||||||||||||||
| Barclays Bank plc | 5.87% semi-annually | 3 month LIBOR quarterly | 10/06/18 | 33,220 | (1,345 | ) | ||||||||||||||||
| BNP Paribas | 5.03% semi-annually | 3 month LIBOR quarterly | 04/23/12 | 16,300 | (250 | ) | ||||||||||||||||
| Credit Suisse International | 5.14% semi-annually | 3 month LIBOR quarterly | 07/30/09 | 157,350 | (705 | ) | ||||||||||||||||
| Credit Suisse International | 5.28% semi-annually | 3 month LIBOR quarterly | 07/30/12 | 3,230 | (44 | ) | ||||||||||||||||
| Credit Suisse International | 3 month LIBOR quarterly | 5.50% semi-annually | 08/03/17 | 3,928 | 81 | |||||||||||||||||
| Credit Suisse International | 3 month LIBOR quarterly | 5.28% semi-annually | 08/29/17 | 3,462 | 12 | |||||||||||||||||
| Deutsche Bank AG, New York | 3 month LIBOR quarterly | 5.50% semi-annually | 08/06/17 | 2,237 | 46 | |||||||||||||||||
| Goldman Sachs Capital Management | 5.53% semi-annually | 3 month LIBOR quarterly | 07/31/17 | 6,691 | (156 | ) | ||||||||||||||||
| Lehman Brothers Special Financing | 5.28% semi-annually | 3 month LIBOR quarterly | 08/29/17 | 1,600 | (5 | ) | ||||||||||||||||
| Merrill Lynch Capital Services | 4.98% semi-annually | 3 month LIBOR quarterly | 08/31/12 | 18,000 | (10 | ) | ||||||||||||||||
| Merrill Lynch Capital Services | 5.90% semi-annually | 3 month LIBOR quarterly | 06/15/17 | 9,000 | (469 | ) | ||||||||||||||||
| Union Bank of Switzerland AG | 5.23% semi-annually | 3 month LIBOR quarterly | 06/22/17 | 1,510 | (1 | ) | ||||||||||||||||
| Union Bank of Switzerland AG | 5.69% semi-annually | 3 month LIBOR quarterly | 06/22/17 | 2,885 | (102 | ) | ||||||||||||||||
| $ | (5,434 | ) | ||||||||||||||||||||
| REFERENCED OBLIGATION | | SWAP COUNTERPARTY | | BUY/SELL PROTECTION | | FUND PAYS/RECEIVES FIXED RATE (r) | | TERMINATION DATE | | NOTIONAL AMOUNT | | VALUE | ||||||||||||||
|---|---|---|---|---|---|---|---|---|---|---|---|---|---|---|---|---|---|---|---|---|---|---|---|---|---|---|
| Ambac Financial Corp., 9.38%, 08/01/11 | Deutsche Bank AG, New York | Sell | 105 BPS quarterly | 09/20/08 | $ | 20,650 | $ | (207 | ) | |||||||||||||||||
| AutoZone, Inc. 5.88%, 03/20/14 | Bank of America | Buy | 58 BPS quarterly | 03/20/14 | 4,250 | (15 | ) | |||||||||||||||||||
| Banca Italease S.p.A., 4.61%, 02/08/12 | Deutsche Bank AG, New York | Sell | 85 BPS quarterly | 06/20/08 | 18,600 | (162 | ) | |||||||||||||||||||
| Bank TuranAlem Finance BV, 8.50%, 02/10/15 | HSBC Bank, N.A. | Sell | 190 BPS quarterly | 09/14/07 | 5,250 | 11 | ||||||||||||||||||||
| Berkshire Hathaway, Inc., 9.75%, 01/15/18 | Deutsche Bank AG, New York | Sell | 20 BPS quarterly | 03/20/10 | 6,000 | 2 | ||||||||||||||||||||
| CDX ..EM.7 | Morgan Stanley Capital Services (1) | Buy | 125 BPS quarterly | 06/20/12 | 780 | 15 | ||||||||||||||||||||
| CDX NA.IG.8 | Goldman Sachs Capital Management (1) | Buy | 35 BPS quarterly | 06/20/12 | 30,000 | 406 | ||||||||||||||||||||
| CDX NA.IG.8 | Lehman Brothers Special Financing (1) | Buy | 35 BPS quarterly | 06/20/12 | 112,000 | 1,553 | ||||||||||||||||||||
| CDX.NA.HY.8, 06/20/12 | Credit Suisse International (2) | Sell | 275 BPS semi-annually | 06/20/12 | 10,000 | (480 | ) | |||||||||||||||||||
| REFERENCED OBLIGATION | | SWAP COUNTERPARTY | | BUY/SELL PROTECTION | | FUND PAYS/RECEIVES FIXED RATE (r) | | TERMINATION DATE | | NOTIONAL AMOUNT | | VALUE | ||||||||||||||
|---|---|---|---|---|---|---|---|---|---|---|---|---|---|---|---|---|---|---|---|---|---|---|---|---|---|---|
| CDX.NA.IG.8, 06/20/12 | Lehman Brothers Special Financing (2) | Sell | 75 BPS quarterly | 06/20/12 | $ | 18,650 | $ | (507 | ) | |||||||||||||||||
| Computer Sciences Corp., 5.00%, 02/15/13 | Merrill Lynch International | Buy | 70 BPS quarterly | 09/20/14 | 5,200 | (54 | ) | |||||||||||||||||||
| Corning, Inc., 6.30%, 03/01/09 | Goldman Sachs Capital Management | Sell | 43 BPS quarterly | 06/20/11 | 2,000 | 17 | ||||||||||||||||||||
| Countrywide Financial Corp., 0.00%, 02/08/31 | Lehman Brothers Special Financing | Sell | 500 BPS quarterly | 09/20/08 | 9,150 | 90 | ||||||||||||||||||||
| FHLMC, 5.08%, 02/07/19 | Deutsche Bank AG, New York | Sell | 3 BPS quarterly | 06/20/08 | 51,600 | (14 | ) | |||||||||||||||||||
| Gannett Co., Inc., 6.38%, 03/31/12 | Lehman Brothers Special Financing | Buy | 63 BPS quarterly | 03/20/14 | 4,950 | (3 | ) | |||||||||||||||||||
| Gannett Co., Inc., 6.38%, 04/01/12 | Merrill Lynch International | Buy | 63 BPS quarterly | 06/20/17 | 3,200 | 64 | ||||||||||||||||||||
| Gazprom, 8.63%, 04/28/34 | Deutsche Bank AG, New York | Sell | 39 BPS semi-annually | 04/20/08 | 4,980 | (2 | ) | |||||||||||||||||||
| Gazprom, 9.63%, 03/01/13 | Union Bank of Switzerland AG | Sell | 39 BPS semi-annually | 12/20/07 | 13,000 | 10 | ||||||||||||||||||||
| General Electric Capital Corp., 3.50%, 05/01/08 | Citibank, N.A. | Sell | 14 BPS quarterly | 12/20/07 | 15,000 | (2 | ) | |||||||||||||||||||
| Goldman Sachs Co., 6.60%, 01/15/12 | Deutsche Bank AG, New York | Sell | 5.5 BPS quarterly | 11/20/07 | 33,650 | (16 | ) | |||||||||||||||||||
| Government of Jamaica, 11.63%, 01/15/22 | Bear Stearns Credit Products | Buy | 341 BPS semi-annually | 07/20/17 | 2,860 | 268 | ||||||||||||||||||||
| Government of Jamaica, 11.63%, 01/15/22 | Bear Stearns Credit Products | Buy | 397 BPS semi-annually | 08/20/17 | 760 | 46 | ||||||||||||||||||||
| Government of Ukraine, 7.65%, 06/11/13 | Citibank, N.A. | Sell | 137.8 BPS semi-annually | 06/20/12 | 4,650 | (106 | ) | |||||||||||||||||||
| Hess Corp., 6.65%, 08/15/11 | Morgan Stanley Capital Services | Sell | 20 BPS quarterly | 06/20/08 | 12,600 | 14 | ||||||||||||||||||||
| ICICI Bank Ltd., 5.75%, 11/16/10 | Deutsche Bank AG, New York | Sell | 26 BPS quarterly | 03/20/08 | 7,600 | (12 | ) | |||||||||||||||||||
| Ingersoll, 9.00%, 08/15/21 | Credit Suisse International | Buy | 66 BPS quarterly | 06/20/14 | 4,200 | (42 | ) | |||||||||||||||||||
| International Lease Corp., 6.38%, 03/15/09 | Union Bank of Switzerland AG | Buy | 20 BPS quarterly | 06/20/12 | 16,800 | 230 | ||||||||||||||||||||
| iTRAXX Crossover | Deutsche Bank AG, New York (2) | Sell | 230 BPS quarterly | 06/20/12 | EUR 16,000 | (822 | ) | |||||||||||||||||||
| iTRAXX HIVOL | Deutsche Bank AG, New York (2) | Sell | 55 BPS quarterly | 06/20/12 | 28,350 | (35 | ) | |||||||||||||||||||
| iTRAXX Series 7 Crossover | Deutsche Bank AG, New York (2) | Sell | 230 BPS quarterly | 06/20/12 | 16,000 | (824 | ) | |||||||||||||||||||
| iTRAXX Series 7 Main | Deutsche Bank AG, New York (2) | Sell | 30 BPS quarterly | 06/20/12 | 15,300 | (135 | ) | |||||||||||||||||||
| Kaupthing Bunadarbanki HF, 5.77%, 12/01/09 | Morgan Stanley Capital Services | Sell | 31 BPS quarterly | 12/20/07 | 11,000 | (13 | ) | |||||||||||||||||||
| Kommertzbank International BV, 7.88%, 04/07/14 | Morgan Stanley Capital Services | Sell | 175 BPS semi-annually | 08/20/08 | $ | 7,550 | (107 | ) | ||||||||||||||||||
| Kommertzbank International BV, 7.88%, 04/07/14 | Deutsche Bank AG, New York | Sell | 235 BPS semi-annually | 03/20/12 | 1,780 | (100 | ) | |||||||||||||||||||
| Kommertzbank International BV, 7.88%, 04/07/14 | Morgan Stanley Capital Services | Sell | 220 BPS semi-annually | 03/20/12 | 3,420 | (213 | ) | |||||||||||||||||||
| Kommertzbank International BV, 7.88%, 04/07/14 | Morgan Stanley Capital Services | Sell | 230 BPS semi-annually | 03/20/12 | 9,880 | (576 | ) | |||||||||||||||||||
| Kommertzbank International BV, 7.88%, 04/07/14 | Morgan Stanley Capital Services | Buy | 300 BPS semi-annually | 08/20/12 | 1,510 | 72 | ||||||||||||||||||||
| Kommertzbank International BV, 8.00%, 11/03/15 | Morgan Stanley Capital Services | Sell | 230 BPS semi-annually | 03/20/12 | 3,960 | (231 | ) | |||||||||||||||||||
| Kroger Co., 5.50%, 02/01/13 | Lehman Brothers Special Financing | Buy | 58 BPS quarterly | 03/20/14 | 3,450 | (17 | ) | |||||||||||||||||||
| Landsbanki Island, 4.42%, 10/19/10 | Morgan Stanley Capital Services | Sell | 45 BPS quarterly | 09/20/07 | EUR 6,000 | 8 | ||||||||||||||||||||
| Marriott International, Inc., 4.63%, 06/15/12 | Morgan Stanley Capital Services | Buy | 58 BPS quarterly | 06/20/14 | $ | 2,900 | (6 | ) | ||||||||||||||||||
| Marsh & McLennan Co., Inc., 5.38%, 07/15/14 | Merrill Lynch International | Buy | 101 BPS quarterly | 09/20/14 | 4,000 | (68 | ) | |||||||||||||||||||
| MBIA Insurance Corp., 5.38%, 10/06/10 | Bear Stearns Credit Products | Sell | 128 BPS quarterly | 09/20/12 | 4,250 | 10 | ||||||||||||||||||||
| McKesson Corp., 7.75%, 02/01/12 | Lehman Brothers Special Financing | Buy | 80 BPS quarterly | 06/20/17 | 3,100 | (35 | ) | |||||||||||||||||||
| Merrill Lynch & Co., 6.00%, 02/17/09 | Deutsche Bank AG, New York | Sell | 9.5 BPS quarterly | 12/20/07 | 12,500 | (8 | ) | |||||||||||||||||||
| Montpelier Re Holdings Ltd., 6.13%, 08/15/13 | Deutsche Bank AG, New York | Sell | 40 BPS quarterly | 12/20/07 | 8,400 | 6 | ||||||||||||||||||||
| Mors Mittal Steel Co., N.V., 9.75%, 04/01/14 | Morgan Stanley Capital Services | Sell | 17 BPS quarterly | 06/20/08 | 9,400 | 2 | ||||||||||||||||||||
| New York Times, 4.61%, 09/26/12 | Barclays Bank plc | Buy | 65 BPS quarterly | 06/20/17 | 2,850 | 13 | ||||||||||||||||||||
| Pemex, 9.50%, 09/15/27 | Citibank, N.A. | Buy | 116.5 BPS semi-annually | 05/20/10 | 7,000 | (131 | ) | |||||||||||||||||||
AS OF AUGUST 31, 2007 (Unaudited) (continued)
| REFERENCED OBLIGATION | | SWAP COUNTERPARTY | | BUY/SELL PROTECTION | | FUND PAYS/RECEIVES FIXED RATE (r) | | TERMINATION DATE | | NOTIONAL AMOUNT | | VALUE | ||||||||||||||
|---|---|---|---|---|---|---|---|---|---|---|---|---|---|---|---|---|---|---|---|---|---|---|---|---|---|---|
| Pemex, 9.50%, 09/15/27 | Citibank, N.A. | Buy | 125 BPS semi-annually | 06/20/10 | $ | 5,000 | $ | (106 | ) | |||||||||||||||||
| Petroleos De Venezuela S.A., 5.25%, 04/12/17 | Union Bank of Switzerland AG | Sell | 278 BPS semi-annually | 06/20/12 | 1,900 | (157 | ) | |||||||||||||||||||
| Petroleos De Venezuela S.A., 5.25%, 04/12/17 | Union Bank of Switzerland AG | Sell | 344 BPS semi-annually | 07/20/12 | 1,810 | (113 | ) | |||||||||||||||||||
| Petroleos De Venezuela S.A., 5.25%, 04/12/27 | Union Bank of Switzerland AG | Sell | 355 BPS semi-annually | 07/20/12 | 2,850 | (161 | ) | |||||||||||||||||||
| Petroleos De Venezuela S.A., 5.38%, 04/12/27 | Bear Stearns Credit Products | Sell | 257 BPS semi-annually | 05/20/12 | 2,830 | (245 | ) | |||||||||||||||||||
| Petroleos De Venezuela S.A., 5.38%, 04/12/27 | Deutsche Bank AG, New York | Sell | 258.5 BPS semi-annually | 05/20/12 | 6,340 | (544 | ) | |||||||||||||||||||
| Petroleos De Venezuela S.A., 5.38%, 04/12/27 | Bear Stearns Credit Products | Sell | 342 BPS semi-annually | 07/20/12 | 1,200 | (55 | ) | |||||||||||||||||||
| Petroleos De Venezuela S.A., 5.38%, 04/12/27 | Bear Stearns Credit Products | Sell | 361 BPS semi-annually | 07/20/12 | 1,420 | (77 | ) | |||||||||||||||||||
| Petroleos De Venezuela S.A., 5.38%, 04/12/27 | Morgan Stanley Capital Services | Sell | 340 BPS semi-annually | 07/20/12 | 3,010 | (192 | ) | |||||||||||||||||||
| Petroleos De Venezuela S.A., 5.38%, 04/12/27 | Morgan Stanley Capital Services | Sell | 355 BPS semi-annually | 07/20/12 | 3,560 | (201 | ) | |||||||||||||||||||
| Petroleos De Venezuela S.A., 5.50%, 04/12/37 | Lehman Brothers Special Financing | Sell | 340 BPS semi-annually | 07/20/12 | 3,000 | (191 | ) | |||||||||||||||||||
| Petroleos De Venezuela S.A., 5.50%, 04/12/37 | Lehman Brothers Special Financing | Sell | 328 BPS semi-annually | 07/20/12 | 720 | (49 | ) | |||||||||||||||||||
| Petroleos De Venezuela S.A., 5.50%, 04/12/37 | Lehman Brothers Special Financing | Sell | 341 BPS semi-annually | 07/20/12 | 3,010 | (191 | ) | |||||||||||||||||||
| Petroleos De Venezuela S.A., 5.50%, 04/12/37 | Lehman Brothers Special Financing | Sell | 355 BPS semi-annually | 07/20/12 | 270 | (15 | ) | |||||||||||||||||||
| Proctor & Gamble Corp., 4.95%, 08/15/14 | Lehman Brothers Special Financing | Sell | 5 BPS quarterly | 09/20/07 | 35,800 | 4 | ||||||||||||||||||||
| Republic of Argentina, 8.28%, 12/31/33 | Lehman Brothers Special Financing | Sell | 343 BPS semi-annually | 09/20/10 | 1,440 | 4 | ||||||||||||||||||||
| Republic of Argentina, 8.28%, 12/31/33 | Citibank, N.A. | Sell | 296.5 BPS semi-annually | 10/20/10 | 3,000 | (48 | ) | |||||||||||||||||||
| Republic of Argentina, 8.28%, 12/31/33 | Lehman Brothers Special Financing | Sell | 303.5 BPS semi-annually | 10/20/10 | 3,160 | (44 | ) | |||||||||||||||||||
| Republic of Argentina, 8.28%, 12/31/33 | Morgan Stanley Capital Services | Sell | 400 BPS semi-annually | 10/20/10 | 1,450 | 23 | ||||||||||||||||||||
| Republic of Argentina, 8.28%, 12/31/33 | Lehman Brothers Special Financing | Sell | 259 BPS semi-annually | 08/20/11 | 4,130 | (239 | ) | |||||||||||||||||||
| Republic of Argentina, 8.28%, 12/31/33 | Lehman Brothers Special Financing | Sell | 260 BPS semi-annually | 08/20/11 | 3,620 | (209 | ) | |||||||||||||||||||
| Republic of Argentina, 8.28%, 12/31/33 | Lehman Brothers Special Financing | Buy | 208.5 BPS semi-annually | 09/20/11 | 4,840 | 330 | ||||||||||||||||||||
| Republic of Argentina, 8.28%, 12/31/33 | Deutsche Bank AG, New York | Sell | 196 BPS semi-annually | 04/20/12 | 3,240 | (297 | ) | |||||||||||||||||||
| Republic of Argentina, 8.28%, 12/31/33 | Citibank, N.A. | Sell | 216 BPS semi-annually | 06/20/12 | 3,070 | (282 | ) | |||||||||||||||||||
| Republic of Argentina, 8.28%, 12/31/33 | Bear Stearns Credit Products | Buy | 258 BPS semi-annually | 07/20/12 | 1,200 | 95 | ||||||||||||||||||||
| Republic of Argentina, 8.28%, 12/31/33 | Deutsche Bank AG, New York | Sell | 232.7 BPS semi-annually | 07/20/12 | 4,320 | (385 | ) | |||||||||||||||||||
| Republic of Argentina, 8.28%, 12/31/33 | Lehman Brothers Special Financing | Buy | 258 BPS semi-annually | 07/20/12 | 3,730 | 294 | ||||||||||||||||||||
| Republic of Argentina, 8.28%, 12/31/33 | Lehman Brothers Special Financing | Buy | 258 BPS semi-annually | 07/20/12 | 720 | 57 | ||||||||||||||||||||
| Republic of Argentina, 8.28%, 12/31/33 | Lehman Brothers Special Financing | Buy | 263 BPS semi-annually | 07/20/12 | 3,010 | 232 | ||||||||||||||||||||
| Republic of Argentina, 8.28%, 12/31/33 | Morgan Stanley Capital Services | Buy | 262 BPS semi-annually | 07/20/12 | 3,010 | 233 | ||||||||||||||||||||
| Republic of Argentina, 8.28%, 12/31/33 | Union Bank of Switzerland AG | Buy | 262 BPS semi-annually | 07/20/12 | 1,810 | 140 | ||||||||||||||||||||
| Republic of Argentina, 8.28%, 12/31/33 | Deutsche Bank AG, New York | Sell | 308 BPS semi-annually | 08/20/12 | 6,040 | (383 | ) | |||||||||||||||||||
| Republic of Argentina, 8.28%, 12/31/33 | Lehman Brothers Special Financing | Sell | 425 BPS semi-annually | 08/20/12 | 730 | (13 | ) | |||||||||||||||||||
| Republic of Argentina, 8.28%, 12/31/33 | Bear Stearns Credit Products | Sell | 341 BPS semi-annually | 07/20/17 | 2,860 | (355 | ) | |||||||||||||||||||
| Republic of Argentina, 8.28%, 12/31/33 | Bear Stearns Credit Products | Sell | 407 BPS semi-annually | 08/20/17 | 760 | (67 | ) | |||||||||||||||||||
| Republic of Brazil, 12.25%, 03/06/30 | Lehman Brothers Special Financing | Buy | 300 BPS semi-annually | 09/20/10 | 1,440 | (112 | ) | |||||||||||||||||||
| Republic of Brazil, 12.25%, 03/06/30 | Lehman Brothers Special Financing | Buy | 261.5 BPS semi-annually | 10/20/10 | 3,160 | (201 | ) | |||||||||||||||||||
| Republic of Brazil, 12.25%, 03/06/30 | Morgan Stanley Capital Services | Buy | 335 BPS semi-annually | 10/20/10 | 1,450 | (127 | ) | |||||||||||||||||||
| Republic of Brazil, 12.25%, 03/06/30 | Lehman Brothers Special Financing | Buy | 140 BPS semi-annually | 08/20/11 | 3,620 | (69 | ) | |||||||||||||||||||
| Republic of Brazil, 12.25%, 03/06/30 | Lehman Brothers Special Financing | Buy | 140 BPS semi-annually | 08/20/11 | 4,130 | (78 | ) | |||||||||||||||||||
| Republic of Brazil, 12.25%, 03/06/30 | Lehman Brothers Special Financing | Sell | 119 BPS semi-annually | 09/20/11 | 2,380 | 39 | ||||||||||||||||||||
| Republic of Brazil, 12.25%, 03/06/30 | Lehman Brothers Special Financing | Sell | 120 BPS semi-annually | 09/20/11 | 2,460 | 41 | ||||||||||||||||||||
| Republic of Brazil, 12.25%, 03/06/30 | Bear Stearns Credit Products | Buy | 103 BPS semi-annually | 12/20/11 | 2,885 | (16 | ) | |||||||||||||||||||
| Republic of Brazil, 12.25%, 03/06/30 | Deutsche Bank AG, New York | Buy | 108.5 BPS semi-annually | 12/20/11 | 8,450 | (66 | ) | |||||||||||||||||||
| Republic of Brazil, 12.25%, 03/06/30 | Lehman Brothers Special Financing | Buy | 111 BPS semi-annually | 12/20/11 | 6,130 | (54 | ) | |||||||||||||||||||
| Republic of Brazil, 12.25%, 03/06/30 | Deutsche Bank AG, New York | Buy | 81 BPS semi-annually | 04/20/12 | 3,240 | 14 | ||||||||||||||||||||
| Republic of Brazil, 12.25%, 03/06/30 | Citibank, N.A. | Buy | 69.5 BPS semi-annually | 06/20/12 | 3,070 | 37 | ||||||||||||||||||||
| REFERENCED OBLIGATION | | SWAP COUNTERPARTY | | BUY/SELL PROTECTION | | FUND PAYS/RECEIVES FIXED RATE (r) | | TERMINATION DATE | | NOTIONAL AMOUNT | | VALUE | ||||||||||||||
|---|---|---|---|---|---|---|---|---|---|---|---|---|---|---|---|---|---|---|---|---|---|---|---|---|---|---|
| Republic of Brazil, 12.25%, 03/06/30 | Deutsche Bank AG, New York | Buy | 71.3 BPS semi-annually | 07/20/12 | $ | 4,320 | $ | 54 | ||||||||||||||||||
| Republic of Brazil, 12.25%, 03/06/30 | Deutsche Bank AG, New York | Buy | 89 BPS semi-annually | 08/20/12 | 6,040 | 37 | ||||||||||||||||||||
| Republic of Colombia, 10.38%, 01/28/33 | Deutsche Bank AG, New York | Buy | 91.4 BPS semi-annually | 04/20/12 | 370 | 6 | ||||||||||||||||||||
| Republic of Colombia, 10.38%, 01/28/33 | Lehman Brothers Special Financing | Buy | 98 BPS semi-annually | 04/20/12 | 7,580 | 109 | ||||||||||||||||||||
| Republic of Colombia, 10.38%, 01/28/33 | Morgan Stanley Capital Services | Buy | 100 BPS semi-annually | 04/20/12 | 3,790 | 51 | ||||||||||||||||||||
| Republic of Colombia, 10.38%, 01/28/33 | Lehman Brothers Special Financing | Buy | 82.5 BPS semi-annually | 06/20/12 | 10,380 | 236 | ||||||||||||||||||||
| Republic of Kazakhstan, 11.13%, 05/11/07 | Citibank, N.A. | Sell | 60 BPS semi-annually | 03/20/12 | 4,220 | (26 | ) | |||||||||||||||||||
| Republic of Kazakhstan, 11.13%, 05/11/07 | Deutsche Bank AG, New York | Sell | 53.5 BPS semi-annually | 03/20/12 | 7,810 | (71 | ) | |||||||||||||||||||
| Republic of Kazakhstan, 11.13%, 05/11/07 | Deutsche Bank AG, New York | Sell | 54.8 BPS semi-annually | 03/20/12 | 8,120 | (69 | ) | |||||||||||||||||||
| Republic of Kazakhstan, 11.13%, 05/11/07 | Deutsche Bank AG, New York | Sell | 61 BPS semi-annually | 03/20/12 | 3,050 | (17 | ) | |||||||||||||||||||
| Republic of Kazakhstan, 11.13%, 05/11/07 | Barclays Bank plc | Sell | 68 BPS semi-annually | 08/20/12 | 3,450 | (24 | ) | |||||||||||||||||||
| Republic of Turkey, 11.88%, 01/15/30 | Morgan Stanley Capital Services | Buy | 145 BPS semi-annually | 07/20/12 | 1,410 | 28 | ||||||||||||||||||||
| Republic of Turkey, 11.88%, 01/15/30 | Morgan Stanley Capital Services | Buy | 146 BPS semi-annually | 07/20/12 | 14,010 | 281 | ||||||||||||||||||||
| Republic of Turkey, 11.88%, 01/15/30 | Deutsche Bank AG, New York | Buy | 239 BPS semi-annually | 08/20/12 | 3,700 | (67 | ) | |||||||||||||||||||
| Republic of Venezuela, 9.25%, 09/15/27 | Barclays Bank plc | Sell | 172.1 BPS semi-annually | 03/20/12 | 2,140 | (167 | ) | |||||||||||||||||||
| Republic of Venezuela, 9.25%, 09/15/27 | Deutsche Bank AG, New York | Sell | 160.4 BPS semi-annually | 04/20/12 | 4,180 | (362 | ) | |||||||||||||||||||
| Republic of Venezuela, 9.25%, 09/15/27 | Deutsche Bank AG, New York | Sell | 162 BPS semi-annually | 04/20/12 | 370 | (32 | ) | |||||||||||||||||||
| Republic of Venezuela, 9.25%, 09/15/27 | Lehman Brothers Special Financing | Sell | 161 BPS semi-annually | 04/20/12 | 7,580 | (655 | ) | |||||||||||||||||||
| Republic of Venezuela, 9.25%, 09/15/27 | Morgan Stanley Capital Services | Sell | 169 BPS semi-annually | 04/20/12 | 3,790 | (316 | ) | |||||||||||||||||||
| Republic of Venezuela, 9.25%, 09/15/27 | Lehman Brothers Special Financing | Sell | 218 BPS semi-annually | 06/20/12 | 10,380 | (758 | ) | |||||||||||||||||||
| Republic of Venezuela, 9.25%, 09/15/27 | Lehman Brothers Special Financing | Sell | 222 BPS semi-annually | 06/20/12 | 440 | (31 | ) | |||||||||||||||||||
| Republic of Venezuela, 9.25%, 09/15/27 | Union Bank of Switzerland AG | Buy | 203 BPS semi-annually | 06/20/12 | 1,900 | 149 | ||||||||||||||||||||
| Republic of Venezuela, 9.25%, 09/15/27 | Bear Stearns Credit Products | Sell | 250.4 BPS semi-annually | 07/20/12 | 1,155 | (75 | ) | |||||||||||||||||||
| Republic of Venezuela, 9.25%, 09/15/27 | Bear Stearns Credit Products | Buy | 266 BPS semi-annually | 07/20/12 | 1,420 | 84 | ||||||||||||||||||||
| Republic of Venezuela, 9.25%, 09/15/27 | Lehman Brothers Special Financing | Sell | 268 BPS semi-annually | 07/20/12 | 730 | (43 | ) | |||||||||||||||||||
| Republic of Venezuela, 9.25%, 09/15/27 | Lehman Brothers Special Financing | Buy | 260 BPS semi-annually | 07/20/12 | 270 | 17 | ||||||||||||||||||||
| Republic of Venezuela, 9.25%, 09/15/27 | Morgan Stanley Capital Services | Buy | 257 BPS semi-annually | 07/20/12 | 3,560 | 223 | ||||||||||||||||||||
| Republic of Venezuela, 9.25%, 09/15/27 | Union Bank of Switzerland AG | Sell | 251 BPS semi-annually | 07/20/12 | 4,415 | (286 | ) | |||||||||||||||||||
| Republic of Venezuela, 9.25%, 09/15/27 | Union Bank of Switzerland AG | Buy | 255 BPS semi-annually | 07/20/12 | 2,850 | 181 | ||||||||||||||||||||
| Republic of Venezuela, 9.25%, 09/15/27 | Deutsche Bank AG, New York | Sell | 340 BPS semi-annually | 08/20/12 | 1,600 | (59 | ) | |||||||||||||||||||
| Republic of Venezuela, 9.25%, 09/15/27 | Lehman Brothers Special Financing | Sell | 301.3 BPS semi-annually | 08/20/12 | 2,910 | (148 | ) | |||||||||||||||||||
| Republic of Venezuela, 9.25%, 09/15/27 | Lehman Brothers Special Financing | Buy | 385 BPS semi-annually | 08/20/12 | 730 | 15 | ||||||||||||||||||||
| Residential Capital Corp., 6.50%, 04/17/13 | Lehman Brothers Special Financing | Sell | 775 BPS quarterly | 03/20/08 | 10,000 | (1,214 | ) | |||||||||||||||||||
| Russia AG Bank, 7.18%, 05/16/13 | Union Bank of Switzerland AG | Sell | 76 BPS semi-annually | 02/20/09 | 14,290 | (71 | ) | |||||||||||||||||||
| Russia AG Bank, 7.18%, 05/16/13 | Credit Suisse International | Sell | 72 BPS semi-annually | 03/20/09 | 1,465 | (9 | ) | |||||||||||||||||||
| Russian Federation, 7.50%, 03/31/30 | Union Bank of Switzerland AG | Buy | 31 BPS semi-annually | 02/20/09 | 14,290 | 43 | ||||||||||||||||||||
| Russian Federation, 7.50%, 03/31/30 | Credit Suisse International | Buy | 30 BPS semi-annually | 03/20/09 | 1,465 | 5 | ||||||||||||||||||||
| Russian Federation, 7.50%, 03/31/30 | Morgan Stanley Capital Services | Sell | 140 BPS semi-annually | 04/20/10 | 7,000 | 142 | ||||||||||||||||||||
| Russian Federation, 7.50%, 03/31/30 | Union Bank of Switzerland AG | Sell | 125 BPS semi-annually | 04/20/10 | 11,100 | 182 | ||||||||||||||||||||
| Russian Federation, 7.50%, 03/31/30 | Deutsche Bank AG, New York | Sell | 104 BPS semi-annually | 06/20/10 | 4,000 | 44 | ||||||||||||||||||||
| Russian Federation, 7.50%, 03/31/30 | Deutsche Bank AG, New York | Sell | 101 BPS semi-annually | 07/20/10 | 10,000 | 130 | ||||||||||||||||||||
| Russian Federation, 7.50%, 03/31/30 | Bear Stearns Credit Products | Sell | 45.5 BPS semi-annually | 12/20/11 | 5,770 | (67 | ) | |||||||||||||||||||
| Russian Federation, 7.50%, 03/31/30 | Deutsche Bank AG, New York | Sell | 51 BPS semi-annually | 12/20/11 | 14,480 | (137 | ) | |||||||||||||||||||
| Russian Federation, 7.50%, 03/31/30 | Deutsche Bank AG, New York | Sell | 52.5 BPS semi-annually | 12/20/11 | 14,680 | (130 | ) | |||||||||||||||||||
| SafeWay, Inc., 5.80%, 08/15/12 | Morgan Stanley Capital Services | Buy | 65 BPS quarterly | 06/20/14 | 3,750 | (27 | ) | |||||||||||||||||||
| Sara Lee, 6.25%, 09/15/11 | Bear Stearns Credit Products | Buy | 74 BPS quarterly | �� | 03/20/17 | 4,200 | (46 | ) | ||||||||||||||||||
| Southwest Airlines Co., 6.50%, 03/01/12 | Goldman Sachs Capital Management | Buy | 69 BPS quarterly | 06/20/14 | 6,500 | (16 | ) | |||||||||||||||||||
AS OF AUGUST 31, 2007 (Unaudited) (continued)
| REFERENCED OBLIGATION | | SWAP COUNTERPARTY | | BUY/SELL PROTECTION | | FUND PAYS/RECEIVES FIXED RATE (r) | | TERMINATION DATE | | NOTIONAL AMOUNT | | VALUE | ||||||||||||||
|---|---|---|---|---|---|---|---|---|---|---|---|---|---|---|---|---|---|---|---|---|---|---|---|---|---|---|
| United Mexican States, 7.50%, 04/08/33 | Morgan Stanley Capital Services | Buy | 112 BPS semi-annually | 04/20/10 | $ | 7,000 | $ | (141 | ) | |||||||||||||||||
| United Mexican States, 7.50%, 04/08/33 | Union Bank of Switzerland AG | Buy | 113 BPS semi-annually | 04/20/10 | 11,100 | (226 | ) | |||||||||||||||||||
| United Mexican States, 7.50%, 04/08/33 | Deutsche Bank AG, New York | Buy | 105 BPS semi-annually | 06/20/10 | 4,000 | (75 | ) | |||||||||||||||||||
| United Mexican States, 7.50%, 04/08/33 | Deutsche Bank AG, New York | Buy | 96 BPS semi-annually | 07/20/10 | 10,000 | (188 | ) | |||||||||||||||||||
| United Mexican States, 8.30%, 08/15/31 | Citibank, N.A. | Sell | 100 BPS semi-annually | 05/20/10 | 7,000 | 120 | ||||||||||||||||||||
| United Mexican States, 8.30%, 08/15/31 | Citibank, N.A. | Sell | 105 BPS semi-annually | 06/20/10 | 5,000 | 93 | ||||||||||||||||||||
| VTB Capital SA, 6.25%, 06/30/35 | Morgan Stanley Capital Services | Sell | 40 BPS semi-annually | 03/20/08 | 7,670 | 6 | ||||||||||||||||||||
| VTB Capital SA, 6.25%, 06/30/35 | Morgan Stanley Capital Services | Sell | 64 BPS semi-annually | 05/20/12 | 3,650 | (68 | ) | |||||||||||||||||||
| Western Union, 5.93%, 10/01/16 | Bear Stearns Credit Products | Buy | 99 BPS quarterly | 09/20/14 | 3,800 | (103 | ) | |||||||||||||||||||
| $ | (9,393 | ) | ||||||||||||||||||||||||
| (1) | Premiums paid of $2,556 |
| (2) | Premiums received of $2,845 |
| SWAP COUNTERPARTY | | REFERENCED OBLIGATION | | PRICE LOCK | | TERMINATION DATE | | NOTIONAL AMOUNT | | VALUE | ||||||||||||
|---|---|---|---|---|---|---|---|---|---|---|---|---|---|---|---|---|---|---|---|---|---|---|
| BNP Paribas (a) | U.S. Treasury Note, 4.63%, 02/29/12 | $ | 99.92 | 09/18/07 | $ | 267,200 | $ | (4,156 | ) | |||||||||||||
| Citibank, N.A. (a) | FNMA 30 Year, 6.00%, TBA | 98.51 | 09/06/07 | 69,000 | (932 | ) | ||||||||||||||||
| Citibank, N.A. (a) | FNMA 30 Year, 6.50%, TBA | 101.33 | 09/06/07 | 53,000 | (81 | ) | ||||||||||||||||
| Citibank, N.A. (b) | FNMA 30 Year, 5.00%, TBA | 93.72 | 09/06/07 | 18,700 | 239 | |||||||||||||||||
| Citibank, N.A. (b) | FNMA 30 Year, 5.50%, TBA | 97.84 | 09/06/07 | 55,000 | (120 | ) | ||||||||||||||||
| Citibank, N.A. (b) | U.S. Treasury Note, 4.50%, 05/15/10 | 100.63 | 10/04/07 | 232,200 | 541 | |||||||||||||||||
| Credit Suisse International (b) | U.S. Treasury Note, 4.50%, 03/31/09 | 99.86 | 09/17/07 | 715,600 | 4,130 | |||||||||||||||||
| Deutsche Bank AG, New York (a) | FNMA 30 Year, 5.50%, TBA | 96.84 | 09/06/07 | 90,000 | (703 | ) | ||||||||||||||||
| Deutsche Bank AG, New York (a) | FNMA 30 Year, 6.00%, TBA | 98.95 | 09/06/07 | 50,000 | (457 | ) | ||||||||||||||||
| Deutsche Bank AG, New York (a) | FNMA 30 Year, 6.00%, TBA | 98.56 | 09/06/07 | 50,100 | (649 | ) | ||||||||||||||||
| Deutsche Bank AG, New York (a) | FNMA 30 Year, 6.00%, TBA | 99.41 | 09/06/07 | 210,000 | (951 | ) | ||||||||||||||||
| Deutsche Bank AG, New York (b) | FNMA 30 Year, 5.50%, TBA | 96.39 | 09/06/07 | 99,700 | 1,230 | |||||||||||||||||
| Deutsche Bank AG, New York (b) | FNMA 30 Year, 5.50%, TBA | 97.00 | 09/06/07 | 61,000 | 381 | |||||||||||||||||
| Deutsche Bank AG, New York (b) | FNMA 30 Year, 6.50%, TBA | 101.34 | 09/06/07 | 328,200 | 461 | |||||||||||||||||
| Deutsche Bank AG, New York (b) | FNMA 30 Year, 7.00%, TBA | 102.72 | 09/06/07 | 79,500 | 62 | |||||||||||||||||
| Deutsche Bank AG, New York (b) | FNMA 30 Year, 5.00%, TBA | 95.22 | 10/04/07 | 70,300 | (139 | ) | ||||||||||||||||
| Lehman Brothers Special Financing (a) | FNMA 30 Year, 5.50%, TBA | 96.44 | 09/06/07 | 43,000 | (510 | ) | ||||||||||||||||
| Lehman Brothers Special Financing (a) | FNMA 30 Year, 5.50%, TBA | 96.48 | 09/06/07 | 144,000 | (1,641 | ) | ||||||||||||||||
| Lehman Brothers Special Financing (a) | FNMA 30 Year, 6.50%, TBA | 101.53 | 09/06/07 | 40,800 | 19 | |||||||||||||||||
| Lehman Brothers Special Financing (a) | FNMA 15 Year, 6.00%, TBA | 100.77 | 09/11/07 | 34,000 | (85 | ) | ||||||||||||||||
| Lehman Brothers Special Financing (b) | FNMA 30 Year, 5.00%, TBA | 95.31 | 10/04/07 | 179,700 | (531 | ) | ||||||||||||||||
| Lehman Brothers Special Financing (b) | FNMA 30 Year, 5.50%, TBA | 95.94 | 10/04/07 | 170,000 | 2,835 | |||||||||||||||||
| Lehman Brothers Special Financing (b) | FNMA 30 Year, 6.00%, TBA | 99.97 | 10/04/07 | 28,000 | — | |||||||||||||||||
| Morgan Stanley Capital Services (a) | FNMA 30 Year, 5.00%, TBA | 93.93 | 09/06/07 | 102,000 | (1,095 | ) | ||||||||||||||||
| Morgan Stanley Capital Services (a) | FNMA 30 Year, 6.50%, TBA | 101.34 | 09/06/07 | 7,500 | (11 | ) | ||||||||||||||||
| Morgan Stanley Capital Services (b) | FNMA 30 Year, 6.00%, TBA | 100.06 | 10/04/07 | 30,000 | (65 | ) | ||||||||||||||||
| Union Bank of Switzerland AG (a) | FNMA 30 Year, 6.00%, TBA | 98.50 | 09/06/07 | 102,200 | (1,388 | ) | ||||||||||||||||
| Union Bank of Switzerland AG (a) | FNMA 30 Year, 5.50%, TBA | 96.72 | 09/06/07 | 44,000 | (399 | ) | ||||||||||||||||
| Union Bank of Switzerland AG (b) | FNMA 30 Year, 6.50%, TBA | 101.31 | 09/06/07 | 59,000 | 101 | |||||||||||||||||
| Union Bank of Switzerland AG (b) | Northern Rock plc, 5.63%, 06/22/17 | 101.47 | 09/20/07 | 4,395 | 7 | |||||||||||||||||
| Union Bank of Switzerland AG (b) | FNMA 30 Year, 5.50%, TBA | 95.91 | 10/04/07 | 66,000 | 1,121 | |||||||||||||||||
| $ | (2,786 | ) | ||||||||||||||||||||
| (a) | Fund pays the excess of the market price over the price lock or receives the excess of the price lock over the market price. |
| (b) | Fund pays the excess of the price lock over the market price or receives the excess of the market price over the price lock. |
| SWAP COUNTERPARTY | | REFERENCED OBLIGATION | | PAYMENTS MADE BY THE FUND (r) | | PAYMENTS RECEIVED BY THE FUND (r) | | TERMINATION DATE | | NOTIONAL AMOUNT | | VALUE | ||||||||||||||
|---|---|---|---|---|---|---|---|---|---|---|---|---|---|---|---|---|---|---|---|---|---|---|---|---|---|---|
| Deutsche Bank AG, New York | Lehman AAA 8.5 Year + CMBS Index | Spread Lock With Carry Amount + 35 BPS | Total Return on Lehman AAA 8.5 Year + CMBS Index | 11/01/07 | $ | 43,400 | $ | (251 | ) | |||||||||||||||||
| Morgan Stanley Capital Services | Lehman AAA 8.5 Year + CMBS Index | Spread Lock With Carry Amount + 30 BPS | Total Return on Lehman AAA 8.5 Year + CMBS Index | 09/01/07 | 14,200 | (103 | ) | |||||||||||||||||||
| $ | (354 | ) | ||||||||||||||||||||||||
AS OF AUGUST 31, 2007 (Unaudited)
| PRINCIPAL AMOUNT($) | | SECURITY DESCRIPTION | | VALUE($) | |||||||
|---|---|---|---|---|---|---|---|---|---|---|---|
Long-Term Investments — 110.0% | |||||||||||
Asset-Backed Securities — 18.4% | |||||||||||
| 842 | American Express Credit Account Master Trust, Series 2004-C, Class C, FRN, 6.11%, 02/15/12 (e) (m) | 839 | |||||||||
| AmeriCredit Automobile Receivables Trust, | |||||||||||
| 1,295 | Series 2004-BM, Class A4, 2.67%, 03/07/11 (m) | 1,282 | |||||||||
| 1,801 | Series 2005-CF, Class A3, 4.47%, 05/06/10 (m) | 1,795 | |||||||||
| Capital One Auto Finance Trust, | |||||||||||
| 483 | Series 2003-B, Class A4, 3.18%, 09/15/10 (m) | 482 | |||||||||
| 2,650 | Series 2007-B, Class A3A, 5.03%, 04/15/12 (m) | 2,636 | |||||||||
| 72 | CARSS Finance LP (Cayman Islands), Series 2004-A, Class B1, FRN, 5.89%, 01/15/11 (e) (m) | 72 | |||||||||
| 1,700 | Citibank Credit Card Issuance Trust, Series 2006-C4, Class C4, FRN, 5.55%, 01/09/12 (m) | 1,666 | |||||||||
| 3,050 | Citigroup Mortgage Loan Trust, Inc., Series 2005-WF2, Class AF4, SUB, 4.96%, 08/25/35 (m) | 2,989 | |||||||||
| 946 | CNH Equipment Trust, Series 2005-B, Class A3, 4.27%, 01/15/10 (m) | 940 | |||||||||
| 3,218 | Countrywide Asset Backed Certificates, Series 2005-4, Class AF3, VAR, 4.46%, 10/25/35 (m) | 3,151 | |||||||||
| 4,550 | First Franklin Mortgage Loan Asset-Backed Certificates, Series 2006-FF4, Class A2, FRN, 5.69%, 03/25/36 (m) | 4,389 | |||||||||
| 3,350 | GSAMP Trust, Series 2006-NC1, Class A2, FRN, 5.69%, 02/25/36 (m) | 3,234 | |||||||||
| 500 | Helios Finance LP (Cayman Islands), Series 2007-S1, Class B1, FRN, 6.21%, 10/20/14 (e) (i) (m) | 483 | |||||||||
| 3,200 | Home Equity Asset Trust, Series 2006-3, Class 2A3, FRN, 5.69%, 07/25/36 (m) | 3,091 | |||||||||
| 4,419 | HSI Asset Securitization Corp. Trust, Series 2006-OPT2, Class 2A3, FRN, 5.69%, 01/25/36 (m) | 4,122 | |||||||||
| 4,250 | Long Beach Mortgage Loan Trust, Series 2006-2, Class 2A3, FRN, 5.69%, 03/25/36 (m) | 4,139 | |||||||||
| 3,550 | MASTR Asset Backed Securities Trust, Series 2006-NC1, Class A3, FRN, 5.69%, 01/25/36 (m) | 3,382 | |||||||||
| 2,100 | Merrill Lynch Mortgage Investors, Inc., Series 2006-WMC1, Class A2C, FRN, 5.70%, 01/25/37 (m) | 2,056 | |||||||||
| 2,650 | Morgan Stanley ABS Capital I, Series 2006-HE6, Class M2, FRN, 5.81%, 09/25/36 (m) | 2,098 | |||||||||
| 1,277 | Nationstar NIM Trust (Cayman Islands), Series 2007-C, Class A, 8.00%, 06/25/37 (e) (i) (m) | 1,139 | |||||||||
| 1,315 | New Century Home Equity Loan Trust, Series 2005-A, Class A2, SUB, 4.46%, 08/25/35 (m) | 1,301 | |||||||||
| 3,000 | Residential Asset Mortgage Products, Inc., Series 2006-EFC1, Class A2, FRN, 5.70%, 02/25/36 (m) | 2,910 | |||||||||
| 3,850 | Residential Asset Securities Corp., Series 2006-KS2, Class A3, FRN, 5.69%, 03/25/35 (m) | 3,702 | |||||||||
| 2,950 | Securitized Asset Backed Receivables LLC Trust, Series 2006-WM1, Class A2B, FRN, 5.69%, 12/25/35 | 2,896 | |||||||||
| 2,103 | Triad Auto Receivables Owner Trust, Series 2003-B, Class A4, 3.20%, 12/13/10 | 2,071 | |||||||||
| 1,881 | World Omni Auto Receivables Trust, Series 2003-B, Class A4, 2.87%, 11/15/10 | 1,874 | |||||||||
| Total Asset-Backed Securities (Cost $60,997) | 58,739 | ||||||||||
Collateralized Mortgage Obligations — 11.1% | |||||||||||
Agency CMO — 5.6% | |||||||||||
| Federal Home Loan Mortgage Corp. REMICS, | |||||||||||
| 4,266 | Series 2564, Class LS, IF, IO, 2.04%, 01/15/17 (m) | 203 | |||||||||
| 3,999 | Series 2632, Class IA, IO, 5.00%, 06/15/22 (m) | 61 | |||||||||
| 2,394 | Series 2643, Class PI, IO, 5.00%, 03/15/28 (m) | 217 | |||||||||
| 1,600 | Series 2781, Class PI, IO, 5.00%, 10/15/23 (m) | 54 | |||||||||
| 11,755 | Series 2791, Class SI, IF, IO, 1.54%, 12/15/31 (m) | 731 | |||||||||
| 12,863 | Series 2813, Class SB, IF, IO, 1.44%, 02/15/34 (m) | 864 | |||||||||
| 17,712 | Series 2850, Class SM, IF, IO, 1.54%, 12/15/30 (m) | 733 | |||||||||
| 4,064 | Series 2894, Class S, IF, IO, 1.59%, 03/15/31 (m) | 249 | |||||||||
| 3,802 | Series 2980, Series LI, IO, 5.50%, 04/15/25 (m) | 266 | |||||||||
| 27,563 | Federal Home Loan Mortgage Corp. STRIPS, Series 240, Class S22, IF, IO, 1.54%, 07/15/36 (m) | 2,491 | |||||||||
| Federal National Mortgage Association, | |||||||||||
| 3,189 | Series 2003-3, Class HS, IF, IO, 2.14%, 09/25/16 (m) | 136 | |||||||||
| 3,925 | Series 2004-61, Class TS, IF, IO, 1.60%, 10/25/31 (m) | 165 | |||||||||
| 5,718 | Series 2005-51, Class KI, IO, 5.50%, 01/25/25 (m) | 374 | |||||||||
| PRINCIPAL AMOUNT($) | | SECURITY DESCRIPTION | | VALUE($) | |||||||
|---|---|---|---|---|---|---|---|---|---|---|---|
Long-Term Investments — Continued | |||||||||||
Agency CMO — Continued | |||||||||||
| 2,913 | Series 2006-43, Class G, 6.50%, 09/25/33 (m) | 2,972 | |||||||||
| 4,882 | Series 2006-63, Class AB, 6.50%, 10/25/33 (m) | 4,979 | |||||||||
| 3,146 | Series 2006-63, Class AE, 6.50%, 10/25/33 (m) | 3,209 | |||||||||
| Government National Mortgage Association, | |||||||||||
| 10 | Series 2002-24, Class FA, FRN, 6.09%, 04/16/32 (m) | 10 | |||||||||
| 398 | Series 2004-39, Class IM, IO, 5.50%, 01/20/27 (m) | 11 | |||||||||
| 1,902 | Series 2004-44, Class PK, IO, 5.50%, 10/20/27 (m) | 71 | |||||||||
| 83 | Series 2004-46, Class IH, IO, 5.50%, 04/20/25 (m) | — | (h) | ||||||||
| 17,796 | |||||||||||
Non-Agency CMO — 5.5% | |||||||||||
| 1,775 | Banc of America Alternative Loan Trust, Series 2003-7, Class 1A1, 5.50%, 09/25/33 (m) | 1,764 | |||||||||
| 3,755 | Countrywide Home Loan Mortgage Pass Through Trust, Series 2005-J4, Class A4, 5.50%, 11/25/35 (m) | 3,692 | |||||||||
| 2,179 | Lehman Mortgage Trust, Series 2005-3, Class 2A3, 5.50%, 01/25/36 (m) | 2,169 | |||||||||
| 1,395 | Residential Asset Securitization Trust, Series 2006-A8, Class 1A1, 6.00%, 08/25/36 (m) | 1,394 | |||||||||
| 2,989 | Residential Funding Mortgage Section I, Series 2005-S7, Class A5, 5.50%, 11/25/35 (m) | 2,942 | |||||||||
| 2,422 | Structured Adjustable Rate Mortgage Loan Trust, Series 2004-6, Class 5A1, VAR, 4.97%, 06/25/34 | 2,407 | |||||||||
| Wells Fargo Mortgage Backed Securities Trust, | |||||||||||
| 1,767 | Series 2003-N, Class 1A4, FRN, 4.60%, 12/25/33 | 1,746 | |||||||||
| 1,569 | Series 2004-S, Class A3, FRN, 3.54%, 09/25/34 | 1,568 | |||||||||
| 17,682 | |||||||||||
| Total Collateralized Mortgage Obligations (Cost $35,612) | 35,478 | ||||||||||
Commercial Mortgage-Backed Securities — 17.0% | |||||||||||
| 1,142 | Banc of America Commercial Mortgage, Inc., Series 2004-5, Class A2, 4.18%, 11/10/41 (m) | 1,117 | |||||||||
| 8,940 | CalSTRS Trust, Series 2002-C6, Class A2, 3.99%, 11/20/12 (e) (m) | 8,897 | |||||||||
| CS First Boston Mortgage Securities Corp., | |||||||||||
| 1,800 | Series 2001-CK6, Class A3, 6.39%, 08/15/36 (m) | 1,852 | |||||||||
| 2,300 | Series 2001-CP4, Class A4, 6.18%, 12/15/35 (m) | 2,350 | |||||||||
| 3,700 | Series 2004-C3, Class A3, 4.30%, 07/15/36 (m) | 3,628 | |||||||||
| Greenwich Capital Commercial Funding Corp., | |||||||||||
| 1,350 | Series 2003-C1, Class A2, 3.29%, 07/05/35 (m) | 1,306 | |||||||||
| 1,800 | Series 2007-GG9, Class A2, 5.38%, 03/10/39 (m) | 1,788 | |||||||||
| 2,000 | GS Mortgage Securities Corp. II, Series 2004-GG2, Class A3, 4.60%, 08/10/38 (m) | 1,973 | |||||||||
| LB-UBS Commercial Mortgage Trust, | |||||||||||
| 3,050 | Series 2003-C1, Class A2, 3.32%, 03/15/27 (m) | 3,011 | |||||||||
| 5,600 | Series 2003-C5, Class A2, 3.48%, 07/15/27 (m) | 5,500 | |||||||||
| 3,400 | Series 2004-C2, Class A2, 3.25%, 03/15/29 (m) | 3,300 | |||||||||
| 5,200 | Series 2004-C7, Class A2, 3.99%, 10/15/29 (m) | 5,061 | |||||||||
| 2,900 | Series 2007-C1, Class A2, 5.32%, 02/15/40 (m) | 2,878 | |||||||||
| 1,300 | Merrill Lynch Mortgage Trust, Series 2005-CKI1, Class A2, VAR, 5.40%, 11/12/37 (m) | 1,297 | |||||||||
| Morgan Stanley Capital I, | |||||||||||
| 5,223 | Series 1998-HF2, Class A2, VAR, 6.48%, 11/15/30 (m) | 5,233 | |||||||||
| 3,100 | Series 2006-T21, Class A2, 5.09%, 10/12/52 (m) | 3,072 | |||||||||
| 1,950 | Wachovia Bank Commercial Mortgage Trust, Series 2005-C17, Class A2, 4.78%, 03/15/42 | 1,924 | |||||||||
| Total Commercial Mortgage-Backed Securities (Cost $55,528) | 54,187 | ||||||||||
Corporate Bonds — 37.2% | |||||||||||
Automobiles — 0.4% | |||||||||||
| 1,300 | DaimlerChrysler N.A. Holding Corp., 5.75%, 05/18/09 (m) | 1,309 | |||||||||
Beverages — 0.5% | |||||||||||
| 1,600 | Miller Brewing Co., 4.25%, 08/15/08 (e) (m) | 1,578 | |||||||||
Capital Markets — 3.0% | |||||||||||
| Bear Stearns Cos., Inc. (The), | |||||||||||
| 1,500 | 4.55%, 06/23/10 (m) | 1,443 | |||||||||
| 850 | 5.85%, 07/19/10 (m) | 845 | |||||||||
| 600 | Goldman Sachs Group, Inc. (The), 5.30%, 02/14/12 (m) | 592 | |||||||||
| 500 | Lehman Brothers Holdings Capital Trust V, 5.86% to 05/31/12; thereafter variable, 11/29/49 (m) | 459 | |||||||||
| 3,800 | Links Finance LLC, FRN, 5.61%, 09/15/08 (e) (i) | 3,802 | |||||||||
| 2,350 | Morgan Stanley, 4.25%, 05/15/10 (m) | 2,285 | |||||||||
| 9,426 | |||||||||||
AS OF AUGUST 31, 2007 (Unaudited) (continued)
| PRINCIPAL AMOUNT($) | | SECURITY DESCRIPTION | | VALUE($) | |||||||
|---|---|---|---|---|---|---|---|---|---|---|---|
Long-Term Investments — Continued | |||||||||||
Commercial Banks — 9.0% | |||||||||||
| 2,700 | Artesia Bank S.C. (Belgium), | ||||||||||
| 7.25% to 09/17/07; thereafter variable, 09/29/49 (e) (m) | 2,702 | ||||||||||
| 1,600 | BAC Capital Trust XIV, | ||||||||||
| 5.63% to 03/15/12; thereafter variable, 12/31/49 (m) | 1,488 | ||||||||||
| 1,500 | DBS Bank Ltd. (Singapore), | ||||||||||
| VAR, 5.12%, 05/16/17 (e) (m) | 1,461 | ||||||||||
| 1,400 | DBS Capital Funding Corp. (Cayman Islands), | ||||||||||
| 7.66% to 03/15/11; thereafter variable, 03/31/49 (e) (m) | 1,509 | ||||||||||
| 1,150 | Deutsche Bank Capital Funding Trust I, | ||||||||||
| 7.87% to 06/30/09; thereafter variable, 12/31/49 (e) (m) | 1,206 | ||||||||||
| 900 | Glitnir Banki HF (Iceland), | ||||||||||
| VAR, 6.69%, 06/15/16 (e) (m) | 941 | ||||||||||
| 1,000 | Hana Bank (South Korea), | ||||||||||
| 4.13%, 03/11/09 | 986 | ||||||||||
| 2,300 | HSBC Capital Funding LP, | ||||||||||
| 9.55% to 06/30/10; thereafter variable, 12/31/49 (e) (m) | 2,547 | ||||||||||
| 1,350 | ICICI Bank Ltd. (Singapore), | ||||||||||
| 5.75%, 11/16/10 (e) (m) | 1,351 | ||||||||||
| Landsbanki Islands HF (Iceland), | |||||||||||
| 850 | 6.10%, 08/25/11 (e) (m) | 876 | |||||||||
| 1,000 | FRN, 6.20%, 08/25/09 (e) (m) | 1,006 | |||||||||
| 1,550 | Mellon Capital IV, | ||||||||||
| 6.24% to 06/20/12; thereafter variable, 06/29/49 (m) | 1,530 | ||||||||||
| 3,050 | Public Bank Berhad (Malaysia), | ||||||||||
| VAR, 5.63%, 09/22/14 | 3,075 | ||||||||||
| 2,450 | Royal Bank of Scotland Group plc ADR (United Kingdom), | ||||||||||
| 9.12%, 12/31/49 | 2,677 | ||||||||||
| 1,750 | VTB Capital S.A. for Vneshtorgbank (Luxembourg), | ||||||||||
| FRN, 6.11%, 09/21/07 (e) (m) | 1,753 | ||||||||||
| 1,950 | Wachovia Capital Trust III, | ||||||||||
| 5.80% to 03/15/11; thereafter variable, 03/15/42 | 1,945 | ||||||||||
| Woori Bank (South Korea), | |||||||||||
| 1,150 | VAR, 4.88%, 07/02/13 | 1,145 | |||||||||
| 600 | VAR, 6.12%, 05/03/16 (e) | 601 | |||||||||
| 28,799 | |||||||||||
Consumer Finance — 0.9% | |||||||||||
| 800 | Capital One Financial Corp., | ||||||||||
| 5.70%, 09/15/11 (m) | 788 | ||||||||||
| 1,700 | International Lease Finance Corp., | ||||||||||
| 5.35%, 03/01/12 (m) | 1,680 | ||||||||||
| 2,468 | |||||||||||
Diversified Financial Services — 10.7% | |||||||||||
| 3,250 | BNP US Funding LLC, | ||||||||||
| 7.74% to 12/05/07; thereafter variable, 12/29/49 (e) (m) | 3,275 | ||||||||||
| CIT Group, Inc., | |||||||||||
| 1,500 | 5.40%, 02/13/12 (m) | 1,378 | |||||||||
| 1,914 | 5.75%, 09/25/07 (m) | 1,914 | |||||||||
| 3,000 | General Electric Capital Corp., | ||||||||||
| 4.13%, 09/01/09 (m) | 2,960 | ||||||||||
| 1,800 | Goldman Sachs Capital II, | ||||||||||
| 5.79% to 06/01/12; thereafter variable, 12/29/49 (m) | 1,652 | ||||||||||
| 400 | ILFC E-Capital Trust I, | ||||||||||
| VAR, 5.90%, 12/21/65 (e) (m) | 393 | ||||||||||
| 4,000 | K2 Corp., | ||||||||||
| VAR, 5.36%, 02/15/09 (i) | 3,700 | ||||||||||
| 3,800 | Mizuho JGB Investment LLC, | ||||||||||
| 9.87% to 06/30/08; thereafter variable, 12/29/49 (e) (m) | 3,941 | ||||||||||
| 6,050 | Natexis Ambs Co. LLC, | ||||||||||
| 8.44% to 06/30/08; thereafter variable, 12/29/49 (e) (m) | 6,198 | ||||||||||
| 3,100 | RACERS, | ||||||||||
| FRN, 5.36%, 09/20/07 (e) (i) | 3,100 | ||||||||||
| 2,900 | Sigma Finance Corp. (Cayman Islands), | ||||||||||
| VAR, 0.00%, 08/15/11 (i) | 2,898 | ||||||||||
| 1,300 | Xstrata Finance Dubai Ltd. (United Arab Emirates), | ||||||||||
| FRN, 5.85%, 11/13/09 (e) | 1,292 | ||||||||||
| 1,500 | ZFS Finance USA Trust I, | ||||||||||
| VAR, 5.87%, 05/09/32 (e) | 1,464 | ||||||||||
| 34,165 | |||||||||||
Diversified Telecommunication Services — 0.6% | |||||||||||
| 1,900 | Telefonica Emisones SAU (Spain), | ||||||||||
| 5.98%, 06/20/11 | 1,925 | ||||||||||
Electric Utilities — 2.2% | |||||||||||
| 1,400 | Alabama Power Capital Trust V, | ||||||||||
| VAR, 5.50%, 10/01/42 (m) | 1,409 | ||||||||||
| Appalachian Power Co., | |||||||||||
| 1,000 | 3.60%, 05/15/08 (m) | 984 | |||||||||
| 650 | 5.55%, 04/01/11 (m) | 652 | |||||||||
| 200 | 5.65%, 08/15/12 (m) | 202 | |||||||||
| PRINCIPAL AMOUNT($) | | SECURITY DESCRIPTION | | VALUE($) | |||||||
|---|---|---|---|---|---|---|---|---|---|---|---|
Long-Term Investments — Continued | |||||||||||
Electric Utilities — Continued | |||||||||||
| 2,800 | PSEG Funding Trust I, | ||||||||||
| 5.38%, 11/16/07 (m) | 2,798 | ||||||||||
| 1,000 | PSEG Power LLC, | ||||||||||
| 3.75%, 04/01/09 (m) | 978 | ||||||||||
| 7,023 | |||||||||||
Food & Staples Retailing — 0.4% | |||||||||||
| 1,400 | CVS Caremark Corp., | ||||||||||
| 4.00%, 09/15/09 (m) | 1,368 | ||||||||||
Food Products — 0.2% | |||||||||||
| 600 | Kraft Foods, Inc., | ||||||||||
| 6.00%, 02/11/13 (m) | 612 | ||||||||||
Insurance — 1.0% | |||||||||||
| 900 | Allstate Corp. (The), | ||||||||||
| 7.20%, 12/01/09 (m) | 942 | ||||||||||
| 2,150 | Hartford Financial Services Group, Inc., | ||||||||||
| 5.66%, 11/16/08 (m) | 2,167 | ||||||||||
| 3,109 | |||||||||||
Media — 2.9% | |||||||||||
| Comcast Cable Communications LLC, | |||||||||||
| 1,200 | 6.20%, 11/15/08 (m) | 1,210 | |||||||||
| 1,000 | 6.75%, 01/30/11 (m) | 1,038 | |||||||||
| 2,850 | COX Communications, Inc., | ||||||||||
| 4.63%, 01/15/10 (m) | 2,805 | ||||||||||
| 1,800 | Time Warner Entertainment Co., LP, | ||||||||||
| 7.25%, 09/01/08 (m) | 1,813 | ||||||||||
| 2,500 | Time Warner, Inc., | ||||||||||
| 5.50%, 11/15/11 | 2,494 | ||||||||||
| 9,360 | |||||||||||
Multi-Utilities — 1.1% | |||||||||||
| 2,100 | Dominion Resources, Inc., | ||||||||||
| SUB, 5.69%, 05/15/08 (m) | 2,100 | ||||||||||
| 1,450 | Midamerican Energy Holdings Co., | ||||||||||
| 5.65%, 07/15/12 (m) | 1,477 | ||||||||||
| 3,577 | |||||||||||
Oil, Gas & Consumable Fuels — 2.2% | |||||||||||
| 2,450 | Pemex Project Funding Master Trust, | ||||||||||
| FRN, 6.66%, 06/15/10 (e) (m) | 2,489 | ||||||||||
| 3,022 | Qatar Petroleum (Qatar), | ||||||||||
| 5.58%, 05/30/11 (e) (m) | 3,057 | ||||||||||
| 1,450 | XTO Energy, Inc., | ||||||||||
| 5.90%, 08/01/12 | 1,473 | ||||||||||
| 7,019 | |||||||||||
Real Estate Investment Trusts (REITs) — 0.8% | |||||||||||
| iStar Financial, Inc., | |||||||||||
| 1,750 | 4.88%, 01/15/09 (m) | 1,716 | |||||||||
| 800 | 5.38%, 04/15/10 (m) | 780 | |||||||||
| 2,496 | |||||||||||
Real Estate Management & Development — 0.9% | |||||||||||
| 2,750 | Socgen Real Estate Co. LLC, | ||||||||||
| 7.64% to 09/30/07; thereafter variable, 12/29/49 (e) | 2,756 | ||||||||||
Thrifts & Mortgage Finance — 0.4% | |||||||||||
| 725 | Countrywide Financial Corp., | ||||||||||
| 5.80%, 06/07/12 (m) | 681 | ||||||||||
| 700 | Washington Mutual Preferred Funding II, | ||||||||||
| 6.90% to 06/15/12, thereafter variable, 12/31/49 (e) | 658 | ||||||||||
| 1,339 | |||||||||||
| Total Corporate Bonds (Cost $119,956) | 118,329 | ||||||||||
Foreign Government Securities — 3.4% | |||||||||||
| 4,670 | National Agricultural Cooperative Federation (South Korea), | ||||||||||
| VAR, 5.75%, 06/18/14 | 4,705 | ||||||||||
| 4,550 | Republic of Chile (Chile), | ||||||||||
| FRN, 5.76%, 01/28/08 (m) | 4,555 | ||||||||||
| 1,500 | United Mexican States (Mexico), | ||||||||||
| FRN, 6.06%, 01/13/09 | 1,505 | ||||||||||
| Total Foreign Government Securities (Cost $10,913) | 10,765 | ||||||||||
Mortgage Pass-Through Securities — 22.9% | |||||||||||
| Federal National Mortgage Association Various Pools, | |||||||||||
| 13,021 | 6.00%, 08/01/22 (m) | 13,164 | |||||||||
| 64 | 7.00%, 07/01/35 (m) | 66 | |||||||||
| 14,511 | 7.00%, 04/01/37 (m) | 14,918 | |||||||||
| 900 | TBA, 5.00%, 09/25/37 | 855 | |||||||||
| 1,000 | TBA, 5.00%, 10/25/37 | 950 | |||||||||
| 7,800 | TBA, 5.50%, 10/25/37 | 7,617 | |||||||||
| 1,900 | TBA, 6.00%, 10/25/36 | 1,897 | |||||||||
| 18,495 | TBA, 6.50%, 09/25/37 | 18,773 | |||||||||
| 5,000 | TBA, 6.50%, 10/25/37 | 5,074 | |||||||||
| 8,200 | TBA, 7.00%, 09/25/36 | 8,428 | |||||||||
| 1,000 | TBA, 7.00%, 10/25/37 | 1,027 | |||||||||
AS OF AUGUST 31, 2007 (Unaudited) (continued)
| PRINCIPAL AMOUNT($) | | SECURITY DESCRIPTION | | VALUE($) | |||||||
|---|---|---|---|---|---|---|---|---|---|---|---|
Long-Term Investments — Continued | |||||||||||
Mortgage Pass-Through Securities — Continued | |||||||||||
| 13 | Government National Mortgage Association Pool, | ||||||||||
| 8.50%, 08/15/30 (m) | 14 | ||||||||||
| Total Mortgage Pass-Through Securities (Cost $72,305) | 72,783 | ||||||||||
| Total Long-Term Investments (Cost $355,311) | 350,281 | ||||||||||
| NUMBER OF CONTRACTS | | | | | |||||||
|---|---|---|---|---|---|---|---|---|---|---|---|
Options Purchased — 0.4% | |||||||||||
Call Options Purchased — 0.2% | |||||||||||
| 40 | 30 Day Fed Funds expiring 09/28/07 @ $94.75, American Style | 43 | |||||||||
| 53 | 90 Day Eurodollar Futures expiring 09/17/07 @ $95.75, American Style | — | (h) | ||||||||
| NOTIONAL AMOUNT($) | | | | | ||||||
|---|---|---|---|---|---|---|---|---|---|---|
Call Options Purchased on Interest Rate Swaps: | ||||||||||
| 85,529 | Expiring 05/30/08. If exercised the Fund receives 3.96% and pays floating 3 month LIBOR expiring 06/03/10, European Style | 239 | ||||||||
| 19,400 | Expiring 11/02/09. If exercised the Fund receives 4.49% and pays floating 3 month LIBOR expiring 11/04/19, European Style | 249 | ||||||||
| Total Call Options Purchased | 531 | |||||||||
Receiver/Payer Straddles on Interest Rate Swaps — 0.2% | ||||||||||
| 50,780 | Expiring 10/02/08. If exercised the Fund receives/pays 4.46% and pays/receives floating 3 month LIBOR expiring 10/06/18, European Style | 330 | ||||||||
| 3,189 | Expiring 06/09/08. If exercised the Fund receives/pays 5.88% and pays/receives floating 3 month LIBOR expiring 06/11/18, European Style | 188 | ||||||||
| Total Receiver/Payer Straddles on Interest Rate Swaps | 518 | |||||||||
| NUMBER OF CONTRACTS | | | | | ||||||
|---|---|---|---|---|---|---|---|---|---|---|
Put Options Purchased — 0.0% (g) | ||||||||||
| 159 | 30 Day Fed Funds expiring 09/28/07 @ $94.81, American Style | 5 | ||||||||
| 37 | 30 Day Fed Funds expiring 11/30/07 @ $94.75, American Style | — | (h) | |||||||
| 71 | 30 Day Fed Funds expiring 11/30/07 @ $94.88, American Style | 6 | ||||||||
| 43 | 30 Day Fed Funds expiring 11/30/07 @ $95.00, American Style | 8 | ||||||||
| NUMBER OF CONTRACTS | | SECURITY DESCRIPTION | | VALUE($) | ||||||
|---|---|---|---|---|---|---|---|---|---|---|
Put Options Purchased — Continued | ||||||||||
| 18 | 30 Day Fed Funds expiring 12/31/07 @ $94.75, American Style | — | (h) | |||||||
| 308 | 90 Day Eurodollar Futures expiring 09/17/07 @ $94.38, American Style | 31 | ||||||||
| NOTIONAL AMOUNT($) | | | | | ||||||
|---|---|---|---|---|---|---|---|---|---|---|
Put Options Purchased on Interest Rate Swaps: | ||||||||||
| 63,978 | Expiring 02/28/08. If exercised the Fund pays 4.20% and receives floating 3 month LIBOR expiring 03/03/10, European Style | 177 | ||||||||
| Total Put Options Purchased | 227 | |||||||||
| Total Options Purchased (Cost $1,825) | 1,276 | |||||||||
| SHARES | | | |||||||||
|---|---|---|---|---|---|---|---|---|---|---|---|
Short-Term Investments — 3.7% | |||||||||||
Investment Company — 3.4% | |||||||||||
| 10,930 | JPMorgan Prime Money Market Fund, Institutional Class (b) (m) (Cost $10,930) | 10,930 | |||||||||
| PRINCIPAL AMOUNT($) | | | | | ||||||
|---|---|---|---|---|---|---|---|---|---|---|
U.S. Treasury Obligation — 0.3% | ||||||||||
| U.S. Treasury Bill, | ||||||||||
| 900 | 4.68%, 11/01/07 (k) (m) (n) (Cost $893) | 894 | ||||||||
| Total Short-Term Investments (Cost $11,823) | 11,824 | |||||||||
Total Investments — 114.1% (Cost $368,959) | 363,381 | |||||||||
Liabilities in Excess of Other Assets — (14.1)% | (44,958 | ) | ||||||||
NET ASSETS — 100.0% | $ | 318,423 | ||||||||
| PRINCIPAL AMOUNT | | SECURITY DESCRIPTION | | VALUE | ||||||
|---|---|---|---|---|---|---|---|---|---|---|
| $ (4,000) | FNMA, TBA, 5.50%, 09/25/37 | $ | (3,906 | ) | ||||||
| (Proceeds received $3,889) | ||||||||||
| NUMBER OF CONTRACTS | | DESCRIPTION | | EXPIRATION DATE | | NOTIONAL VALUE AT 08/31/07 | | UNREALIZED APPRECIATION (DEPRECIATION) | ||||||||||
|---|---|---|---|---|---|---|---|---|---|---|---|---|---|---|---|---|---|---|
Long Futures Outstanding | ||||||||||||||||||
| 31 | Eurodollar | September, 2007 | $ | 7,323 | $ | (4 | ) | |||||||||||
| 482 | 2 Year U.S. Treasury Notes | December, 2007 | 99,367 | (13 | ) | |||||||||||||
| 36 | 5 Year U.S. Treasury Notes | December, 2007 | 3,841 | (3 | ) | |||||||||||||
| 73 | 10 Year U.S. Treasury Notes | December, 2007 | 7,960 | 1 | ||||||||||||||
Short Futures Outstanding | ||||||||||||||||||
| (21) | 10 Year Swap Future | September, 2007 | (2,223 | ) | (31 | ) | ||||||||||||
| (72) | Eurodollar | September, 2007 | (17,009 | ) | 9 | |||||||||||||
| (277) | 5 Year U.S. Treasury Notes | December, 2007 | (29,557 | ) | (112 | ) | ||||||||||||
| (56) | Eurodollar | December, 2007 | (13,309 | ) | 6 | |||||||||||||
| (60) | Eurodollar | March, 2008 | (14,304 | ) | 11 | |||||||||||||
| (48) | Eurodollar | June, 2008 | (11,453 | ) | 11 | |||||||||||||
| $ | (125 | ) | ||||||||||||||||
| DESCRIPTION | | EXERCISE PRICE | | EXPIRATION DATE | | NUMBER OF CONTRACTS | | VALUE | ||||||||||
|---|---|---|---|---|---|---|---|---|---|---|---|---|---|---|---|---|---|---|
| 10 Year U.S. Treasury Note Futures | $ | 111.00 | 10/26/07 | 61 | $ | (24 | ) | |||||||||||
| 10 Year U.S. Treasury Note Futures | 111.00 | 11/20/07 | 126 | (69 | ) | |||||||||||||
| 10 Year U.S. Treasury Note Futures | 112.00 | 11/20/07 | 90 | (32 | ) | |||||||||||||
| 30 Day Federal Funds Futures, American Style | 91.81 | 09/28/07 | 40 | (33 | ) | |||||||||||||
| 90 Day Eurodollar Futures, American Style | 96.00 | 09/17/07 | 106 | (1 | ) | |||||||||||||
| (Premiums received of $141) | $ | (159 | ) | |||||||||||||||
| COUNTERPARTY | | EXERCISE RATE** | | OPTION EXPIRATION DATE | | SWAP EXPIRATION DATE | | NOTIONAL AMOUNT | | VALUE | ||||||||||||
|---|---|---|---|---|---|---|---|---|---|---|---|---|---|---|---|---|---|---|---|---|---|---|
| Barclays Bank plc | 5.46% | 05/30/08 | 06/03/10 | $ | 85,529 | $ | (167 | ) | ||||||||||||||
| (Premiums received of $145) | ||||||||||||||||||||||
AS OF AUGUST 31, 2007 (Unaudited) (continued)
| DESCRIPTION | | EXERCISE PRICE | | EXPIRATION DATE | | NUMBER OF CONTRACTS | | VALUE | ||||||||||
|---|---|---|---|---|---|---|---|---|---|---|---|---|---|---|---|---|---|---|
| 10 Year U.S. Treasury Note Futures | $ | 106.00 | 11/20/07 | 73 | $ | (16 | ) | |||||||||||
| (Premiums received of $54) | ||||||||||||||||||
| COUNTERPARTY | | EXERCISE RATE** | | OPTION EXPIRATION DATE | | SWAP EXPIRATION DATE | | NOTIONAL AMOUNT | | VALUE | ||||||||||||
|---|---|---|---|---|---|---|---|---|---|---|---|---|---|---|---|---|---|---|---|---|---|---|
| Barclays Bank plc | 5.20% | 02/28/08 | 03/03/10 | $ | 63,978 | $ | (142 | ) | ||||||||||||||
| Bank of America | 5.99% | 11/02/09 | 11/04/19 | 19,400 | (375 | ) | ||||||||||||||||
| (Premiums received of $497) | $ | (517 | ) | |||||||||||||||||||
| NAME OF ISSUER | | EXERCISE RATE*** | | OPTION EXPIRATION DATE | | SWAP EXPIRATION DATE | | NOTIONAL AMOUNT | | VALUE | ||||||||||||
|---|---|---|---|---|---|---|---|---|---|---|---|---|---|---|---|---|---|---|---|---|---|---|
| Barclays Bank plc | 5.96% | 10/02/08 | 10/06/18 | $ | 43,541 | $ | (400 | ) | ||||||||||||||
| Barclays Bank plc | 6.02% | 07/28/14 | 07/30/14–07/30/24 | 1,017 | (91 | ) | ||||||||||||||||
| Lehman Brothers Special Financing | 5.36% | 03/15/12 | 03/19/42 | 2,321 | (355 | ) | ||||||||||||||||
| (Premiums received of $1,009) | $ | (846 | ) | |||||||||||||||||||
| * | The Fund would receive a floating rate based on 3-month USD LIBOR, if exercised. |
| ** | The Fund would pay a floating rate based on 3-month USD LIBOR, if exercised. |
| *** | The Fund would pay or receive a floating rate based on 3-month USD LIBOR, if exercised. |
| **** | European Style |
| RATE TYPE (r) | ||||||||||||||||||||||
|---|---|---|---|---|---|---|---|---|---|---|---|---|---|---|---|---|---|---|---|---|---|---|
| SWAP COUNTERPARTY | | Payments made by the Fund | | Payments received by the Fund | | Termination Date | | Notional Amount | | Value | ||||||||||||
| Bank of America | 5.89% semi-annually | 3 month LIBOR quarterly | 11/04/19 | $ | 11,378 | $ | (357 | ) | ||||||||||||||
| Barclays Bank plc | 4.70% semi-annually | 3 month LIBOR quarterly | 03/03/10 | 31,349 | 17 | |||||||||||||||||
| Barclays Bank plc | 4.71% semi-annually | 3 month LIBOR quarterly | 06/03/10 | 34,212 | 20 | |||||||||||||||||
| Barclays Bank plc | 5.51% semi-annually | 3 month LIBOR quarterly | 08/03/17 | 1,289 | (28 | ) | ||||||||||||||||
| Barclays Bank plc | 3 month LIBOR quarterly | 5.37% semi-annually | 08/28/17 | 1,336 | 14 | |||||||||||||||||
| Barclays Bank plc | 5.72% semi-annually | 3 month LIBOR quarterly | 10/06/18 | 1,773 | (52 | ) | ||||||||||||||||
| Barclays Bank plc | 5.87% semi-annually | 3 month LIBOR quarterly | 10/06/18 | 18,995 | (769 | ) | ||||||||||||||||
| Credit Suisse International | 5.14% semi-annually | 3 month LIBOR quarterly | 07/30/09 | 29,250 | (131 | ) | ||||||||||||||||
| Credit Suisse International | 3 month LIBOR quarterly | 5.50% semi-annually | 08/03/17 | 2,259 | 47 | |||||||||||||||||
| Credit Suisse International | 3 month LIBOR quarterly | 5.28% semi-annually | 08/29/17 | 1,494 | 5 | |||||||||||||||||
| Deutsche Bank AG, New York | 5.55% semi-annually | 3 month LIBOR quarterly | 07/12/12 | 4,600 | (117 | ) | ||||||||||||||||
| Deutsche Bank AG, New York | �� | 5.74% semi-annually | 3 month LIBOR quarterly | 07/12/17 | 2,620 | (102 | ) | |||||||||||||||
| Deutsche Bank AG, New York | 3 month LIBOR quarterly | 5.50% semi-annually | 08/06/17 | 634 | 13 | |||||||||||||||||
| Goldman Sachs Capital Management | 5.53% semi-annually | 3 month LIBOR quarterly | 07/31/17 | 297 | (7 | ) | ||||||||||||||||
| $ | (1,447 | ) | ||||||||||||||||||||
| REFERENCED OBLIGATION | | SWAP COUNTERPARTY | | BUY/SELL PROTECTION | | FUND PAYS/RECEIVES FIXED RATE (r) | | TERMINATION DATE | | NOTIONAL AMOUNT | | VALUE | ||||||||||||||
|---|---|---|---|---|---|---|---|---|---|---|---|---|---|---|---|---|---|---|---|---|---|---|---|---|---|---|
| Ambac Financial Corp., 9.38%, 08/01/11 | Deutsche Bank AG, New York | Sell | 105 BPS quarterly | 09/20/08 | $ | 3,400 | $ | (34 | ) | |||||||||||||||||
| AutoZone, Inc., 5.88%, 10/15/12 | Bank of America | Buy | 58 BPS quarterly | 03/20/14 | 950 | (3 | ) | |||||||||||||||||||
| Banca Italease S.p.A., 4.61%, 02/08/12 | Deutsche Bank AG, New York | Sell | 85 BPS quarterly | 06/20/08 | 3,100 | (27 | ) | |||||||||||||||||||
| Berkshire Hathaway, Inc., 9.75%, 01/15/18 | Deutsche Bank AG, New York | Sell | 20 BPS quarterly | 03/20/10 | 8,800 | 3 | ||||||||||||||||||||
| Computer Sciences Corp., 5.00%, 02/15/13 | Merrill Lynch International | Buy | 70 BPS quarterly | 09/20/14 | 800 | (8 | ) | |||||||||||||||||||
| Corning, Inc., 6.30%, 03/01/09 | Goldman Sachs Capital Management | Sell | 43 BPS quarterly | 06/20/11 | 3,000 | 26 | ||||||||||||||||||||
| Countrywide Financial, 0.00%, 02/08/31 | Lehman Brothers Special Financing | Sell | 500 BPS quarterly | 09/20/08 | 1,600 | 16 | ||||||||||||||||||||
| CDX.NA.IG.8 | Goldman Sachs Capital Management (1) | Buy | 35 BPS quarterly | 06/20/12 | 5,000 | 68 | ||||||||||||||||||||
| CDX.NA.IG.HVOL.8 | Lehman Brothers Special Financing (2) | Sell | 75 BPS quarterly | 06/20/12 | 3,550 | (96 | ) | |||||||||||||||||||
| FHLMC, 5.08%, 02/07/19 | Deutsche Bank AG, New York | Sell | 3 BPS quarterly | 06/20/08 | 9,600 | (3 | ) | |||||||||||||||||||
| Gannett Co., Inc., 6.38%, 03/31/12 | Lehman Brothers Special Financing | Buy | 63 BPS quarterly | 03/20/14 | 1,350 | (1 | ) | |||||||||||||||||||
| Gannett Co., Inc., 6.38%, 03/31/12 | Merrill Lynch International | Buy | 63 BPS quarterly | 06/20/17 | 550 | 11 | ||||||||||||||||||||
| Gazprom, 8.63%, 04/28/34 | Deutsche Bank AG, New York | Sell | 39 BPS semi-annually | 04/20/08 | 2,490 | (1 | ) | |||||||||||||||||||
| Gazprom, 9.63%, 03/01/13 | Union Bank of Switzerland AG | Sell | 39 BPS semi-annually | 12/20/07 | 4,000 | 3 | ||||||||||||||||||||
| General Electric Capital Corp., 3.50%, 05/01/08 | Citibank, N.A. | Sell | 14 BPS quarterly | 12/20/07 | 23,000 | (3 | ) | |||||||||||||||||||
| Goldman Sachs Co., 6.60%, 01/15/12 | Deutsche Bank AG, New York | Sell | 5.5 BPS quarterly | 11/20/07 | 9,000 | (4 | ) | |||||||||||||||||||
| Hess Corp., 6.65%, 08/15/11 | Morgan Stanley Capital Services | Sell | 20 BPS quarterly | 06/20/08 | 2,500 | 3 | ||||||||||||||||||||
| Ingersoll, 9.00%, 08/15/21 | Credit Suisse International | Buy | 66 BPS quarterly | 06/20/14 | 800 | (8 | ) | |||||||||||||||||||
| Kroger Co., 5.50%, 02/01/13 | Lehman Brothers Special Financing | Buy | 58 BPS quarterly | 03/20/14 | 950 | (4 | ) | |||||||||||||||||||
| Marriott International, Inc., 4.63%, 06/15/12 | Morgan Stanley Capital Services | Buy | 58 BPS quarterly | 06/20/14 | 600 | (1 | ) | |||||||||||||||||||
| Marsh & McLennan Co., Inc., 5.38%, 07/15/14 | Merrill Lynch International | Buy | 101 BPS quarterly | 09/20/14 | 750 | (13 | ) | |||||||||||||||||||
| MBIA Insurance Corp., 5.38%, 10/06/10 | Bear Stearns Credit Products | Sell | 128 BPS quarterly | 09/20/12 | 750 | 2 | ||||||||||||||||||||
| McKesson Corp., 7.75%, 02/12/12 | Lehman Brothers Special Financing | Buy | 80 BPS quarterly | 06/20/17 | 650 | (7 | ) | |||||||||||||||||||
| Merrill Lynch & Co., 6.00%, 02/17/09 | Deutsche Bank AG, New York | Sell | 9.5 BPS quarterly | 12/20/07 | 6,000 | (4 | ) | |||||||||||||||||||
| Montpelier Re Holdings Ltd., 6.13%, 08/15/13 | Deutsche Bank AG, New York | Sell | 40 BPS quarterly | 12/20/07 | 2,600 | 2 | ||||||||||||||||||||
| Mors Mittal Steel Co., N.V., 9.75%, 04/01/14 | Morgan Stanley Capital Services | Sell | 17 BPS quarterly | 06/20/08 | 1,900 | — | (h) | |||||||||||||||||||
| New York Times, 4.61%, 09/26/12 | Barclays Bank plc | Buy | 65 BPS quarterly | 06/20/17 | 650 | 3 | ||||||||||||||||||||
| Proctor & Gamble Corp., 4.95%, 08/15/14 | Lehman Brothers Special Financing | Sell | 5 BPS quarterly | 09/20/07 | 7,200 | 1 | ||||||||||||||||||||
| Republic of Kazakhstan, 11.13%, 05/11/07 | Citibank, N.A. | Sell | 60 BPS semi-annually | 03/20/12 | 860 | (5 | ) | |||||||||||||||||||
| Republic of Kazakhstan, 11.13%, 05/11/07 | Deutsche Bank AG, New York | Sell | 54.8 BPS semi-annually | 03/20/12 | 1,690 | (14 | ) | |||||||||||||||||||
| Republic of Kazakhstan, 11.13%, 05/11/07 | Deutsche Bank AG, New York | Sell | 53.51 BPS semi-annually | 03/20/12 | 1,630 | (15 | ) | |||||||||||||||||||
| Republic of Kazakhstan, 11.13%, 05/11/07 | Deutsche Bank AG, New York | Sell | 61 BPS semi-annually | 03/20/12 | 620 | (4 | ) | |||||||||||||||||||
| Republic of Kazakhstan, 11.13%, 05/11/07 | Deutsche Bank AG, New York | Sell | 71 BPS semi-annually | 08/20/12 | 1,110 | (6 | ) | |||||||||||||||||||
| Russia AG Bank, 7.18%, 05/16/13 | Union Bank of Switzerland AG | Sell | 76 BPS semi-annually | 02/20/09 | 3,240 | (16 | ) | |||||||||||||||||||
| Russia AG Bank, 7.18%, 05/16/13 | Credit Suisse International | Sell | 72 BPS semi-annually | 03/20/09 | 330 | (2 | ) | |||||||||||||||||||
| Russian Federation, 7.50%, 03/31/30 | Union Bank of Switzerland AG | Buy | 31 BPS semi-annually | 02/20/09 | 3,240 | 10 | ||||||||||||||||||||
| Russian Federation, 7.50%, 03/31/30 | Credit Suisse International | Buy | 30 BPS semi-annually | 03/20/09 | 330 | 1 | ||||||||||||||||||||
| Russian Federation, 7.50%, 03/31/30 | Morgan Stanley Capital Services | Sell | 140 BPS semi-annually | 04/20/10 | 10,000 | 203 | ||||||||||||||||||||
| Russian Federation, 7.50%, 03/31/30 | Deutsche Bank AG, New York | Sell | 104 BPS semi-annually | 06/20/10 | 4,000 | 44 | ||||||||||||||||||||
| Safeway, Inc., 5.80%, 08/15/12 | Morgan Stanley Capital Services | Buy | 65 BPS quarterly | 06/20/14 | 850 | (6 | ) | |||||||||||||||||||
| Sara Lee, 6.25%, 09/15/11 | Bear Stearns Credit Products | Buy | 74 BPS quarterly | 03/20/17 | 900 | (10 | ) | |||||||||||||||||||
| Southwest Airlines Co., 6.50%, 03/01/12 | Goldman Sachs Capital Management | Buy | 69 BPS quarterly | 06/20/14 | 1,100 | (3 | ) | |||||||||||||||||||
| United Mexican States, 7.50%, 04/08/33 | Morgan Stanley Capital Services | Buy | 112 BPS semi-annually | 04/20/10 | 10,000 | (201 | ) | |||||||||||||||||||
| United Mexican States, 7.50%, 04/08/33 | Deutsche Bank AG, New York | Buy | 105 BPS semi-annually | 06/20/10 | 4,000 | (75 | ) | |||||||||||||||||||
| VTB Capital SA, 6.25%, 06/30/35 | Morgan Stanley Capital Services | Sell | 40 BPS semi-annually | 03/20/08 | 1,650 | 1 | ||||||||||||||||||||
AS OF AUGUST 31, 2007 (Unaudited) (continued)
| REFERENCED OBLIGATION | | SWAP COUNTERPARTY | | BUY/SELL PROTECTION | | FUND PAYS/RECEIVES FIXED RATE (r) | | TERMINATION DATE | | NOTIONAL AMOUNT | | VALUE | ||||||||||||||
|---|---|---|---|---|---|---|---|---|---|---|---|---|---|---|---|---|---|---|---|---|---|---|---|---|---|---|
| VTB Capital SA, 6.25%, 06/30/35 | Morgan Stanley Capital Services | Sell | 64 BPS semi-annually | 05/20/12 | $ | 710 | $ | (13 | ) | |||||||||||||||||
| Western Union, 5.93%, 10/01/16 | Bear Stearns Credit Products | Buy | 99 BPS quarterly | 09/20/14 | 700 | (19 | ) | |||||||||||||||||||
| $ | (209 | ) | ||||||||||||||||||||||||
| (1) | Premiums paid of $140 |
| (2) | Premiums received of $39 |
| SWAP COUNTERPARTY | | REFERENCED OBLIGATION | | PRICE LOCK | | TERMINATION DATE | | NOTIONAL AMOUNT | | VALUE | ||||||||||||
|---|---|---|---|---|---|---|---|---|---|---|---|---|---|---|---|---|---|---|---|---|---|---|
| Citibank, N.A. (a) | FNMA 30 Year, 6.00%, TBA | $ | 98.51 | 09/06/07 | $ | 16,700 | $ | (226 | ) | |||||||||||||
| Credit Suisse International (b) | U.S. Treasury Note, 4.50% 03/31/09 | 99.86 | 09/17/07 | 104,600 | 604 | |||||||||||||||||
| $ | 378 | |||||||||||||||||||||
| (a) | Fund pays the excess of the market price over the price lock or receives the excess of the price lock over the market price. |
| (b) | Fund pays the excess of the price lock over the market price or receives the excess of the market price over the price lock. |
| SWAP COUNTERPARTY | | REFERENCED OBLIGATION | | PAYMENTS MADE BY THE FUND (r) | | PAYMENTS RECEIVED BY THE FUND (r) | | TERMINATION DATE | | NOTIONAL AMOUNT | | VALUE | ||||||||||||||
|---|---|---|---|---|---|---|---|---|---|---|---|---|---|---|---|---|---|---|---|---|---|---|---|---|---|---|
| Deutsche Bank AG, New York | Lehman AAA 8.5 Year + CMBS Index | Spread Lock With Carry Amount + 35 BPS | Total Return on Lehman AAA 8.5 Year + CMBS Index | 11/01/07 | $ | 8,400 | $ | (49 | ) | |||||||||||||||||
| Morgan Stanley Capital Services | Lehman AAA 8.5 Year + CMBS Index | Spread Lock With Carry Amount + 30 BPS | Total Return on Lehman AAA 8.5 Year + CMBS Index | 09/01/07 | 3,000 | (22 | ) | |||||||||||||||||||
| $ | (71 | ) | ||||||||||||||||||||||||
AS OF AUGUST 31, 2007 (Unaudited)
| PRINCIPAL AMOUNT($) | | SECURITY DESCRIPTION | | VALUE($) | |||||||
|---|---|---|---|---|---|---|---|---|---|---|---|
Long-Term Investments — 147.3% | |||||||||||
Asset-Backed Securities — 7.8% | |||||||||||
| 65 | Carmax Auto Owner Trust, Series 2006-2, Class A3, 5.15%, 02/15/11 (m) | 65 | |||||||||
| 125 | Citibank Credit Card Issuance Trust, Series 2006-C4, Class C4, FRN, 5.55%, 01/09/12 (m) | 122 | |||||||||
| Citigroup Mortgage Loan Trust, Inc., | |||||||||||
| 250 | Series 2006-WFH2, Class A2A, FRN, 5.66%, 08/25/36 (m) | 244 | |||||||||
| 250 | Series 2007-WFH2, Class M1, FRN, 5.91%, 03/25/37 (m) | 204 | |||||||||
| 80 | Countrywide Asset-Backed Certificates, Series 2003-5, Class MF1, VAR, 5.41%, 01/25/34 (m) | 78 | |||||||||
| 95 | Credit-Based Asset Servicing and Securitization LLC, Series 2007-CB2, Class A2A, SUB, 5.89%, 02/25/37 (m) | 95 | |||||||||
| 250 | GE-WMC Mortgage Securities LLC, Series 2006-1, Class A2B, FRN, 5.66%, 08/25/36 (m) | 241 | |||||||||
| 56 | Harley-Davidson Motorcycle Trust, Series 2006-3, Class A2, 5.42%, 02/15/10 (m) | 56 | |||||||||
| 94 | Lehman XS Trust, Series 2006-12N, Class A1A1, FRN, 5.59%, 08/25/46 (m) | 94 | |||||||||
| 225 | MASTR Asset Backed Securities Trust, Series 2006-HE3, Class A3, FRN, 5.66%, 08/25/36 (m) | 215 | |||||||||
| Option One Mortgage Loan Trust, | |||||||||||
| 7 | Series 2003-4, Class A2, FRN, 5.83%, 07/25/33 (m) | 7 | |||||||||
| 2 | Series 2003-5, Class A2, FRN , 5.83%, 08/25/33 (m) | 2 | |||||||||
| Residential Asset Securities Corp., | |||||||||||
| 1 | Series 2002-KS4, Class AIIB, FRN, 6.01%, 07/25/32 (m) | 1 | |||||||||
| 2 | Series 2003-KS5, Class AIIB, FRN, 6.09%, 07/25/33 (m) | 2 | |||||||||
| 9 | Triad Auto Receivables Owner Trust, Series 2003-B, Class A4, 3.20%, 12/13/10 (m) | 9 | |||||||||
| 3 | Wachovia Asset Securitization, Inc., Series 2002-HE2, Class A, FRN, 5.94%, 12/25/32 (m) | 3 | |||||||||
| Total Asset-Backed Securities (Cost $1,513) | 1,438 | ||||||||||
Collateralized Mortgage Obligations — 8.1% | |||||||||||
Agency CMO — 2.5% | |||||||||||
| 61 | Federal Home Loan Mortgage Corp. REMICS, Series 2931, Class GA, 5.00%, 11/15/28 (m) | 60 | |||||||||
| Federal National Mortgage Association REMICS, | |||||||||||
| 37 | Series 2006-43, Class G, 6.50%, 09/25/33 (m) | 38 | |||||||||
| 42 | Series 2006-59, Class DA, 6.50%, 12/25/33 (m) | 43 | |||||||||
| 36 | Series 2006-63, Class AB, 6.50%, 10/25/33 (m) | 37 | |||||||||
| 43 | Series 2006-63, Class AE, 6.50%, 10/25/33 (m) | 44 | |||||||||
| 41 | Series 2006-78, Class BC, 6.50%, 01/25/34 (m) | 42 | |||||||||
| 156 | Series 2006-115, Class BF, FRN, 5.75%, 12/25/36 (m) | 155 | |||||||||
| 43 | Federal National Mortgage Association Whole Loan, Series 2003-W3, Class 2A5, 5.36%, 06/25/42 (m) | 43 | |||||||||
| 462 | |||||||||||
Non-Agency CMO — 5.6% | |||||||||||
| 80 | Citicorp Mortgage Securities, Inc., Series 2003-11, Class 2A1, 5.50%, 12/25/33 (m) | 79 | |||||||||
| Countrywide Alternative Loan Trust, | |||||||||||
| 54 | Series 2006-12CB, Class A6, 6.00%, 05/25/36 (m) | 54 | |||||||||
| 66 | Series 2006-23CB, Class 2A1, 6.50%, 08/25/36 (m) | 67 | |||||||||
| 1,293 | CS First Boston Mortgage Securities Corp. Series 1997-2, Class X, IO, VAR, 0.89%, 06/25/20 (e) (m) | — | (h) | ||||||||
| 1 | DLJ Mortgage Acceptance Corp., Series 1997-D, Class CTFS, HB, VAR, 72.97%, 07/28/27 (e) (i) | 1 | |||||||||
| 206 | Harborview Mortgage Loan Trust, Series 2006-9, Class 2A1A, FRN, 5.72%, 11/19/36 (m) | 201 | |||||||||
| 78 | Lehman Mortgage Trust, Series 2005-3, Class 2A3, 5.50%, 01/25/36 (m) | 78 | |||||||||
| 14 | MASTR Alternative Loans Trust, Series 2004-13, Class 10A1, 8.00%, 01/25/35 (m) | 15 | |||||||||
| Residential Accredit Loans, Inc., | |||||||||||
| 36 | Series 2006-QS6, Class 1A2, 6.00%, 06/25/36 (m) | 35 | |||||||||
| 71 | Series 2006-QS11, Class 1A1, 6.50%, 08/25/36 (m) | 71 | |||||||||
| 85 | Series 2006-QS16, Class A7, 6.00%, 11/25/36 (m) | 84 | |||||||||
| 53 | Residential Asset Securitization Trust, Series 2006-A2, Class A3, 6.00%, 05/25/36 (m) | 53 | |||||||||
| 206 | Thornburg Mortgage Securities Trust, Series 2006-6, Class A1, FRN, 5.62%, 12/25/36 (m) | 204 | |||||||||
AS OF AUGUST 31, 2007 (Unaudited) (continued)
| PRINCIPAL AMOUNT($) | | SECURITY DESCRIPTION | | VALUE($) | |||||||
|---|---|---|---|---|---|---|---|---|---|---|---|
Long-Term Investments — Continued | |||||||||||
Non-Agency CMO — Continued | |||||||||||
| 44 | Washington Mutual Alternative Mortgage Pass-Through Certificates, Series 2006-5, Class 2CB1, 6.00%, 07/25/36 (m) | 43 | |||||||||
| 49 | Wells Fargo Mortgage Backed Securities Trust, Series 2006-AR3, Class A1, FRN, 5.70%, 03/25/36 (m) | 49 | |||||||||
| 1,034 | |||||||||||
| Total Collateralized Mortgage Obligations (Cost $1,655) | 1,496 | ||||||||||
Commercial Mortgage-Backed Securities — 5.6% | |||||||||||
| 25 | Bear Stearns Commercial Mortgage Securities, Series 2004-PWR6, Class A4, 4.52% 11/11/41 (m) | 24 | |||||||||
| 185 | Citigroup/Deutsche Bank Commercial Mortgage Trust, Series 2007-CD4, Class A4, 5.32% 12/11/49 (m) | 180 | |||||||||
| 150 | CS First Boston Mortgage Securities Corp., Series 2001-CK1, Class A3, 6.38% 12/18/35 (m) | 154 | |||||||||
| 45 | Greenwich Capital Commercial Funding Corp., Series 2003-C1, Class A4, 4.11% 07/05/35 (m) | 42 | |||||||||
| 60 | LB-UBS Commercial Mortgage Trust, Series 2001-C2, Class A2, 6.65% 11/15/27 (m) | 62 | |||||||||
| 94 | Lehman Brothers Floating Rate Commercial Mortgage Trust, Series 2006-LLFA, Class A2, FRN, 5.73% 09/15/21 (e) (m) | 94 | |||||||||
| 110 | Merrill Lynch/Countrywide Commercial Mortgage Trust, Series 2007-6, Class A4, VAR, 5.49% 03/12/51 (m) | 108 | |||||||||
| Morgan Stanley Capital I, | |||||||||||
| 100 | Series 2007-HQ11, Class A4, VAR, 5.45% 02/12/44 (m) | 98 | |||||||||
| 250 | Series 2007-IQ13, Class A4, 5.36% 03/15/44 (m) | 243 | |||||||||
| 20 | Morgan Stanley Dean Witter Capital I, Series 2003-HQ2, Class A2, 4.92% 03/12/35 (m) | 19 | |||||||||
| Total Commercial Mortgage-Backed Securities (Cost $1,041) | 1,024 | ||||||||||
Corporate Bonds — 43.5% | |||||||||||
Aerospace & Defense — 0.1% | |||||||||||
| 25 | L-3 Communications Corp., 5.88%, 01/15/15 (m) | 24 | |||||||||
Auto Components — 0.2% | |||||||||||
| 1 | Goodyear Tire & Rubber Co. (The), 9.00%, 07/01/15 (m) | 1 | |||||||||
| 20 | Tenneco, Inc., 8.63%, 11/15/14 (m) | 20 | |||||||||
| 15 | United Components, Inc., 9.38%, 06/15/13 (m) | 15 | |||||||||
| 36 | |||||||||||
Building Products — 0.2% | |||||||||||
| 35 | Owens Corning, Inc., 7.00%, 12/01/36 (m) | 34 | |||||||||
Capital Markets — 4.4% | |||||||||||
| 45 | Arch Western Finance LLC, 6.75%, 07/01/13 (m) | 42 | |||||||||
| TRY 350 | Credit Suisse, Nassau Branch, 14.00%, 01/19/11 (linked to Republic of Turkey Government Bond, 14.00%, 01/19/11) (Turkey) (m) | 251 | |||||||||
| $90 | Goldman Sachs Group, Inc. (The), 5.95%, 01/15/27 (m) | 84 | |||||||||
| 60 | Lehman Brothers Holdings Capital Trust V, 5.86% to 05/31/12; thereafter variable, 11/29/49 (m) | 55 | |||||||||
| Lehman Brothers Holdings, Inc., | |||||||||||
| 85 | 5.50%, 04/04/16 (m) | 80 | |||||||||
| BRL 620 | 10.00%, 01/03/12 (linked to Brazilian Real Notes, 10.00%, 01/03/12) (Brazil) | 301 | |||||||||
| 813 | |||||||||||
Chemicals — 0.6% | |||||||||||
| $1 | Equistar Chemicals LP/Equistar Funding Corp., 10.13%, 09/01/08 (m) | 1 | |||||||||
| 15 | Huntsman LLC, 11.50%, 07/15/12 (m) | 16 | |||||||||
| 20 | Ineos Group Holdings plc (United Kingdom), 8.50%, 02/15/16 (e) (m) | 18 | |||||||||
| 20 | Lyondell Chemical Co., 10.50%, 06/01/13 (m) | 22 | |||||||||
| 25 | Nalco Co., 7.75%, 11/15/11 (m) | 25 | |||||||||
| 30 | PolyOne Corp., 8.88%, 05/01/12 (m) | 31 | |||||||||
| 113 | |||||||||||
Commercial Banks — 7.3% | |||||||||||
| Barclays Bank plc (United Kingdom), | |||||||||||
| 160 | 5.93% to 12/15/16; thereafter variable, 12/31/49 (e) (m) | 151 | |||||||||
| 320 | Zero Coupon, 04/07/10 (e) (i) | 319 | |||||||||
| 10 | Cadets Trust, 4.80%, 07/15/13 (e) (m) | 10 | |||||||||
| 100 | Credit Agricole S.A. (France), 6.64% to 05/31/17; thereafter variable, 05/29/49 (e) (m) | 95 | |||||||||
| 285 | Glitnir Banki HF (Iceland), FRN, 5.80%, 01/21/11 (e) (m) | 286 | |||||||||
| 100 | ICICI Bank Ltd. (India), FRN, 5.90%, 01/12/10 (e) (m) | 99 | |||||||||
| 55 | Regions Financing Trust II, VAR, 6.63%, 05/15/47 (m) | 51 | |||||||||
| PRINCIPAL AMOUNT($) | | SECURITY DESCRIPTION | | VALUE($) | |||||||
|---|---|---|---|---|---|---|---|---|---|---|---|
Long-Term Investments — Continued | |||||||||||
Commercial Banks — Continued | |||||||||||
| 100 | Shinsei Finance II (Cayman Islands), 7.16% to 07/25/16; thereafter variable, 07/29/49 (e) (m) | 92 | |||||||||
| 250 | VTB Capital S.A. for Vneshtorgbank (Luxembourg), FRN, 5.96%, 08/01/08 (e) (m) | 248 | |||||||||
| 1,351 | |||||||||||
Commercial Services & Supplies — 0.5% | |||||||||||
| 25 | ACCO Brands Corp., 7.63%, 08/15/15 (m) | 23 | |||||||||
| 25 | Allied Waste North America, Inc., 7.38%, 04/15/14 (m) | 24 | |||||||||
| 20 | Corrections Corp. of America, 6.25%, 03/15/13 (m) | 20 | |||||||||
| 25 | Quebecor World Capital Corp. (Canada), 8.75%, 03/15/16 (e) (m) | 23 | |||||||||
| 90 | |||||||||||
Consumer Finance — 1.2% | |||||||||||
| Ford Motor Credit Co., | |||||||||||
| 10 | 7.25%, 10/25/11 (m) | 9 | |||||||||
| 55 | FRN, 6.93%, 01/15/10 (m) | 52 | |||||||||
| 55 | GMAC LLC, 6.88%, 08/28/12 (m) | 48 | |||||||||
| 125 | SLM Corp., FRN, 5.50%, 07/27/09 (m) | 120 | |||||||||
| 229 | |||||||||||
Containers & Packaging — 0.3% | |||||||||||
| 15 | Crown Americas LLC and Crown Americas Capital Corp., 7.75%, 11/15/15 (m) | 15 | |||||||||
| 35 | Owens-Brockway Glass Container, Inc., 8.25%, 05/15/13 (m) | 36 | |||||||||
| 5 | Packaging Dynamics Finance Corp., 10.00%, 05/01/16 (e) (m) | 5 | |||||||||
| 56 | |||||||||||
Diversified Consumer Services — 0.1% | |||||||||||
| 15 | Service Corp. International, 7.38%, 10/01/14 (m) | 15 | |||||||||
Diversified Financial Services — 7.3% | |||||||||||
| 125 | CIT Group, Inc., FRN, 5.64%, 08/17/09 (m) | 119 | |||||||||
| 40 | Citigroup, Inc., 6.00%, 08/15/17 (m) | 41 | |||||||||
| Citigroup Funding, Inc., | |||||||||||
| 250 | VAR, 1.00%, 03/12/12 (e) (i) | 262 | |||||||||
| 245 | Zero Coupon, 09/24/07 | 247 | |||||||||
| 25 | General Electric Capital Corp., 6.15%, 08/07/37 (m) | 26 | |||||||||
| 55 | Goldman Sachs Capital II, 5.79% to 06/01/12; thereafter variable, 12/29/49 (m) | 50 | |||||||||
| Kaupthing Bank HF (Iceland), | |||||||||||
| 160 | 5.75%, 10/04/11 (e) (m) | 161 | |||||||||
| 100 | FRN, 6.06%, 01/15/10 (e) (m) | 101 | |||||||||
| 44 | Mizuho Capital Investment 1 Ltd. (Cayman Islands), 6.69% to 06/30/16; thereafter variable, 03/29/49 (e) (m) | 42 | |||||||||
| 100 | SMFG Preferred Capital USD 1 Ltd. (Cayman Islands), 6.08% to 01/25/17; thereafter variable, 01/29/49 (e) (m) | 93 | |||||||||
| 162 | TRAINS, Series HY1-2006, 7.55%, 05/01/16 (e) (m) | 156 | |||||||||
| 45 | Visant Corp., 7.63%, 10/01/12 (m) | 45 | |||||||||
| 1,343 | |||||||||||
Diversified Telecommunication Services — 0.4% | |||||||||||
| 10 | Citizens Communications Co., 6.25%, 01/15/13 (m) | 10 | |||||||||
| 29 | Consolidated Communications Holdings, Inc., 9.75%, 04/01/12 (m) | 29 | |||||||||
| 20 | Qwest Communications International, Inc., FRN, 9.06%, 02/15/09 (m) | 20 | |||||||||
| Qwest Corp., | |||||||||||
| 5 | 7.50%, 10/01/14 (m) | 5 | |||||||||
| 10 | 8.88%, 03/15/12 (m) | 11 | |||||||||
| 20 | Wind Acquisition Finance S.A. (Luxembourg), 10.75%, 12/01/15 (e) (m) | 20 | |||||||||
| 95 | |||||||||||
Electric Utilities — 1.6% | |||||||||||
| 95 | Midamerican Energy Co., 5.95%, 07/15/17 (m) | 97 | |||||||||
| 125 | Ohio Power, Co., FRN, 5.54%, 04/05/10 (m) | 124 | |||||||||
| 75 | TXU Electric Delivery Co., FRN, 5.74%, 09/16/08 (e) (m) | 74 | |||||||||
| 295 | |||||||||||
Food & Staples Retailing — 1.0% | |||||||||||
| 100 | CVS/Caremark Corp., FRN, 5.66%, 06/01/10 (m) | 100 | |||||||||
| 44 | CVS Lease Pass-Through, 6.04%, 12/10/28 (e) (m) | 43 | |||||||||
| Wal-Mart Stores, Inc., | |||||||||||
| 20 | 5.25%, 09/01/35 (m) | 18 | |||||||||
| 15 | 6.50%, 08/15/37 (m) | 15 | |||||||||
| 176 | |||||||||||
Health Care Equipment & Supplies — 0.2% | |||||||||||
| 35 | Fresenius Medical Care Capital Trust II, 7.88%, 02/01/08 (m) | 35 | |||||||||
Health Care Providers & Services — 0.6% | |||||||||||
| 35 | 9.25%, 11/15/16 (e) (m) HCA, Inc. | 36 | |||||||||
| 40 | 9.63%, 11/15/16 (e) (m) | 41 | |||||||||
AS OF AUGUST 31, 2007 (Unaudited) (continued)
| PRINCIPAL AMOUNT($) | | SECURITY DESCRIPTION | | VALUE($) | |||||||
|---|---|---|---|---|---|---|---|---|---|---|---|
Long-Term Investments — Continued | |||||||||||
Health Care Providers & Services — Continued | |||||||||||
| 15 | Select Medical Corp., 7.63%, 02/01/15 (m) | 13 | |||||||||
| 30 | Tenet Healthcare Corp., 9.25%, 02/01/15 (m) | 26 | |||||||||
| 116 | |||||||||||
Hotels, Restaurants & Leisure — 0.3% | |||||||||||
| MGM Mirage, Inc., | |||||||||||
| 5 | 5.88%, 02/27/14 (m) | 5 | |||||||||
| 25 | 6.75%, 04/01/13 (m) | 24 | |||||||||
| 15 | 6.88%, 04/01/16 (m) | 14 | |||||||||
| 20 | Vail Resorts, Inc., 6.75%, 02/15/14 (m) | 19 | |||||||||
| 62 | |||||||||||
Household Durables — 0.6% | |||||||||||
| 25 | ALH Finance LLC/ALH Finance Corp., 8.50%, 01/15/13 (m) | 24 | |||||||||
| 20 | Ames True Temper, FRN, 9.36%, 01/15/12 (m) | 20 | |||||||||
| Beazer Homes USA, Inc. , | |||||||||||
| 10 | 6.50%, 11/15/13 (m) | 8 | |||||||||
| 10 | 6.88%, 07/15/15 (m) | 8 | |||||||||
| 10 | DR Horton, Inc., 5.63%, 09/15/14 (m) | 9 | |||||||||
| 15 | Jarden Corp., 7.50%, 05/01/17 (m) | 14 | |||||||||
| 25 | Sealy Mattress Co., 8.25%, 06/15/14 (m) | 24 | |||||||||
| 107 | |||||||||||
Household Products — 0.0% (g) | |||||||||||
| 10 | Spectrum Brands, Inc., 7.38%, 02/01/15 (m) | 7 | |||||||||
Independent Power Producers & Energy Traders — 0.2% | |||||||||||
| 15 | AES Corp. (The), 8.88%, 02/15/11 (m) | 15 | |||||||||
| 25 | NRG Energy, Inc., 7.38%, 02/01/16 (m) | 25 | |||||||||
| 40 | |||||||||||
Insurance — 2.4% | |||||||||||
| 30 | Chubb Corp., VAR, 6.38%, 03/29/37 (m) | 29 | |||||||||
| 36 | Liberty Mutual Group, Inc., 7.50%, 08/15/36 (e) (m) | 35 | |||||||||
| 65 | Lincoln National Corp., VAR, 7.00%, 05/17/66 (m) | 66 | |||||||||
| 50 | Nationwide Financial Services, 6.75%, 05/15/37 (m) | 44 | |||||||||
| 40 | Reinsurance Group of America, Inc., VAR, 6.75%, 12/15/65 (m) | 37 | |||||||||
| 100 | Swiss RE Capital I LP (United Kingdom), 6.85% to 05/25/16; thereafter variable, 05/29/49 (e) (m) | 99 | |||||||||
| 60 | Travelers Cos, Inc., VAR, 6.25%, 03/15/37 (m) | 57 | |||||||||
| 80 | XL Capital Ltd. (Cayman Islands), 6.50% to 04/15/17; thereafter variable, 12/31/49 (m) | 71 | |||||||||
| 438 | |||||||||||
Internet & Catalog Retail — 0.1% | |||||||||||
| 20 | Brookstone Co., Inc., 12.00%, 10/15/12 (m) | 19 | |||||||||
IT Services — 0.2% | |||||||||||
| 35 | Iron Mountain, Inc., 7.75%, 01/15/15 (m) | 34 | |||||||||
Leisure Equipment & Products — 0.1% | |||||||||||
| 15 | Steinway Musical Instruments, Inc., 7.00%, 03/01/14 (e) (m) | 14 | |||||||||
Machinery — 0.3% | |||||||||||
| 50 | Terex Corp., 7.38%, 01/15/14 (m) | 50 | |||||||||
Media — 2.0% | |||||||||||
| 5 | Cablevision Systems Corp., 8.00%, 04/15/12 (m) | 5 | |||||||||
| 65 | Charter Communications Operating LLC/Charter Communications Operating Capital, 8.00%, 04/30/12 (e) (m) | 64 | |||||||||
| 50 | DIRECTV Holdings LLC, 6.38%, 06/15/15 (m) | 47 | |||||||||
| Echostar DBS Corp., | |||||||||||
| 5 | 6.63%, 10/01/14 (m) | 5 | |||||||||
| 40 | 7.13%, 02/01/16 (m) | 39 | |||||||||
| 30 | RH Donnelley Finance Corp. I, 10.88%, 12/15/12 (e) (m) | 32 | |||||||||
| 10 | TCI Communications, Inc., 7.88%, 02/15/26 (m) | 11 | |||||||||
| 45 | Time Warner, Inc., 5.88%, 11/15/16 (m) | 44 | |||||||||
| 65 | Time Warner Cable, Inc., 6.55%, 05/01/37 (e) (m) | 63 | |||||||||
| 30 | Videotron Ltee (Canada), 6.88%, 01/15/14 (m) | 28 | |||||||||
| 25 | WMG Acquisition Corp., 7.38%, 04/15/14 (m) | 22 | |||||||||
| 360 | |||||||||||
Multi-Utilities — 0.6% | |||||||||||
| 50 | Dominion Resources, Inc., 6.30%, 03/15/33 (m) | 49 | |||||||||
| 55 | MidAmerican Energy Holdings Co., 6.50%, 09/15/37 (e) (m) | 56 | |||||||||
| 105 | |||||||||||
Oil, Gas & Consumable Fuels — 2.8% | |||||||||||
| 25 | Canadian Natural Resources Ltd. (Canada), 6.25%, 03/15/38 (m) | 24 | |||||||||
| 40 | Chesapeake Energy Corp., 7.00%, 08/15/14 (m) | 40 | |||||||||
| 25 | Denbury Resources, Inc., 7.50%, 04/01/13 (m) | 25 | |||||||||
| 34 | Gaz Capital S.A. (Luxembourg), 8.63%, 04/28/34 (m) | 42 | |||||||||
| 59 | Gazprom International S.A. (Luxembourg), 7.20%, 02/01/20 (m) | 60 | |||||||||
| 25 | Kinder Morgan Energy Partners LP, 6.50%, 02/01/37 (m) | 24 | |||||||||
| PRINCIPAL AMOUNT($) | | SECURITY DESCRIPTION | | VALUE($) | |||||||
|---|---|---|---|---|---|---|---|---|---|---|---|
Long-Term Investments — Continued | |||||||||||
Oil, Gas & Consumable Fuels — Continued | |||||||||||
| 120 | Morgan Stanley Bank AG for OAO Gazprom (Russia), 9.63%, 03/01/13 (e) (m) | 137 | |||||||||
| 15 | Newfield Exploration Co., 6.63%, 04/15/16 (m) | 14 | |||||||||
| 30 | Nexen, Inc. (Canada), 6.40%, 05/15/37 (m) | 29 | |||||||||
| 40 | ONEOK Partners LP, 5.90%, 04/01/12 (m) | 40 | |||||||||
| 75 | Valero Energy Corp., 6.63%, 06/15/37 (m) | 75 | |||||||||
| 510 | |||||||||||
Paper & Forest Products — 0.4% | |||||||||||
| 75 | Georgia-Pacific Corp., 9.50%, 12/01/11 (m) | 80 | |||||||||
Personal Products — 0.1% | |||||||||||
| 10 | Del Laboratories, Inc., FRN, 10.36%, 11/01/11 (m) | 10 | |||||||||
Real Estate Investment Trusts (REITs) — 0.4% | |||||||||||
| 20 | Host Marriott LP REIT, 6.75%, 06/01/16 (m) | 20 | |||||||||
| 60 | WEA Finance LLC/WCI Finance LLC (Australia), 5.70%, 10/01/16 (e) (m) | 58 | |||||||||
| 78 | |||||||||||
Road & Rail — 0.2% | |||||||||||
| 20 | Hertz Corp., 8.88%, 01/01/14 (m) | 21 | |||||||||
| 25 | United Rentals North America, Inc., 6.50%, 02/15/12 (m) | 25 | |||||||||
| 46 | |||||||||||
Specialty Retail — 0.2% | |||||||||||
| 40 | Home Depot, Inc. 5.88%, 12/16/36 (m) | 34 | |||||||||
Thrifts & Mortgage Finance — 5.4% | |||||||||||
| 200 | CAM US Finance S.A. Sociedad Unipersonal (Spain), FRN, 5.51%, 02/01/10 (e) (m) | 200 | |||||||||
| 105 | Countrywide Financial Corp., 5.80%, 06/07/12 (m) | 99 | |||||||||
| Residential Capital LLC, | |||||||||||
| 150 | FRN, 5.86%, 06/09/08 (m) | 128 | |||||||||
| 300 | FRN, 7.60%, 05/22/09 (m) | 237 | |||||||||
| Washington Mutual, Inc., | |||||||||||
| 50 | FRN, 5.64%, 08/24/09 (m) | 49 | |||||||||
| 100 | Washington Mutual Preferred Funding Delaware, 6.53% to 03/15/11; thereafter variable, 03/29/49 (e) (m) | 93 | |||||||||
| Washington Mutual Preferred Funding II, | |||||||||||
| 100 | 6.67% to 12/15/16; thereafter variable, 12/31/49 (e) (m) | 87 | |||||||||
| 100 | 6.90% to 06/15/12; thereafter variable, 06/29/49 (e) (m) | 94 | |||||||||
| 987 | |||||||||||
Wireless Telecommunication Services — 1.2% | |||||||||||
| 100 | America Movil S.A.B. de C.V. (Mexico), FRN, 5.46%, 06/27/08 (e) (m) | 100 | |||||||||
| 15 | Intelsat Bermuda Ltd. (Bermuda), 9.25%, 06/15/16 (m) | 16 | |||||||||
| 100 | Sprint Nextel Corp., 6.00%, 12/01/16 (m) | 97 | |||||||||
| 213 | |||||||||||
| Total Corporate Bonds (Cost $8,257) | 8,015 | ||||||||||
Foreign Government Securities — 15.5% | |||||||||||
Argentina — 2.9% | |||||||||||
| Republic of Argentina | |||||||||||
| 340 | 7.00%, 10/03/15 (m) | 272 | |||||||||
| ARS 700 | 11.31%, 01/20/10 (m) | 210 | |||||||||
| 200 | VAR, 0.00%, 03/25/10 (m) | 60 | |||||||||
| 542 | |||||||||||
Barbados — 0.1% | |||||||||||
| $15 | Barbados Government International Bond 7.25%, 12/15/21 (m) | 17 | |||||||||
Brazil — 1.0% | |||||||||||
| 110 | Federal Repubic of Brazil, 12.25%, 03/06/30 (m) | 184 | |||||||||
Colombia — 2.1% | |||||||||||
| Republic of Colombia, | |||||||||||
| 65 | 8.25%, 12/22/14 (m) | 72 | |||||||||
| 20 | 10.38%, 01/28/33 (m) | 29 | |||||||||
| 40 | 10.75%, 01/15/13 (m) | 48 | |||||||||
| COP 456,000 | 12.00%, 10/22/15 (m) | 229 | |||||||||
| 378 | |||||||||||
Dominican Republic — 0.8% | |||||||||||
| Government of Dominican Republic, | |||||||||||
| $101 | 9.04%, 01/23/18 (e) (m) | 111 | |||||||||
| 39 | 9.50%, 09/27/11 (m) | 40 | |||||||||
| 151 | |||||||||||
Egypt — 1.7% | |||||||||||
| EGP 1,900 | Credit Suisse First Boston, Zero Coupon, 05/06/08 (linked to Egypt Treasury Bill, Zero Coupon, 05/06/08) (Egypt) (m) | 318 | |||||||||
Indonesia — 0.7% | |||||||||||
| $119 | Government of Indonesia, 7.25%, 04/20/15 (m) | 123 | |||||||||
Mexico — 1.3% | |||||||||||
| United Mexican States, | |||||||||||
| 40 | 7.50%, 01/14/12 (m) | 43 | |||||||||
| 25 | 8.00%, 09/24/22 (m) | 31 | |||||||||
AS OF AUGUST 31, 2007 (Unaudited) (continued)
| PRINCIPAL AMOUNT($) | | SECURITY DESCRIPTION | | VALUE($) | |||||||
|---|---|---|---|---|---|---|---|---|---|---|---|
Long-Term Investments — Continued | |||||||||||
Mexico — Continued | |||||||||||
| 35 | 8.30%, 08/15/31 (m) | 45 | |||||||||
| 125 | FRN, 6.06%, 01/13/09 (m) | 125 | |||||||||
| 244 | |||||||||||
Peru — 1.7% | |||||||||||
| Government of Peru, | |||||||||||
| 70 | 6.55%, 03/14/37 (m) | 70 | |||||||||
| PEN 770 | 6.90%, 08/12/37 (e) (m) | 242 | |||||||||
| 312 | |||||||||||
Philippines — 0.3% | |||||||||||
| $40 | Bangko Sentral Pilipinas 8.60%, 06/15/27 (m) | 45 | |||||||||
Russia — 1.5% | |||||||||||
| Russian Federation, | |||||||||||
| 79 | 8.25%, 03/31/10 (m) | 81 | |||||||||
| 50 | 11.00%, 07/24/18 (m) | 70 | |||||||||
| 75 | 12.75%, 06/24/28 (m) | 132 | |||||||||
| 283 | |||||||||||
Trinidad & Tobago — 0.4% | |||||||||||
| 50 | Trinidad & Tobago Government International Bond, 9.75%, 07/01/20 (m) | 64 | |||||||||
Venezuela — 1.0% | |||||||||||
| 195 | Venezuela Government International Bond, 9.38%, 01/13/34 (m) | 193 | |||||||||
| Total Foreign Government Securities (Cost $2,925) | 2,854 | ||||||||||
Mortgage Pass-Through Securities — 58.4% | |||||||||||
| Federal Home Loan Mortgage Corp. Gold Pools, | |||||||||||
| 9 | 6.00%, 05/01/17 (m) | 9 | |||||||||
| 30 | 6.00%, 01/01/35 (m) | 30 | |||||||||
| Federal Home Loan Mortgage Corp. Various Pools, | |||||||||||
| 15 | ARM, 5.42%, 06/01/37 (m) | 15 | |||||||||
| 30 | ARM, 5.45%, 07/01/37 | 30 | |||||||||
| 25 | ARM, 5.60%, 06/01/37 (m) | 24 | |||||||||
| 2,270 | TBA, 5.00%, 09/15/37 – 10/15/37 | 2,158 | |||||||||
| 885 | TBA, 5.50%, 09/15/37 – 10/15/37 | 864 | |||||||||
| Federal National Mortgage Association Various Pools, | |||||||||||
| 583 | 6.00%, 03/01/33 – 01/01/35 (m) | 584 | |||||||||
| 256 | 6.50%, 01/01/35 – 02/01/35 (m) | 261 | |||||||||
| 490 | 7.00%, 04/01/37 (m) | 504 | |||||||||
| 850 | TBA, 4.50%, 09/25/22 | 815 | |||||||||
| 1,425 | TBA, 5.00%, 09/25/37 | 1,354 | |||||||||
| 65 | TBA, 5.50%, 10/25/37 | 64 | |||||||||
| 1,765 | TBA, 6.00%, 09/25/22 – 10/25/22 | 1,784 | |||||||||
| 635 | TBA, 6.00%, 09/25/37 | 634 | |||||||||
| 500 | TBA, 6.50%, 10/25/37 | 507 | |||||||||
| 500 | TBA, 7.00%, 09/25/36 | 514 | |||||||||
| Government National Mortgage Association Pools, | |||||||||||
| 390 | TBA, 6.00%, 10/15/37 | 391 | |||||||||
| 210 | TBA, 6.50%, 09/15/37 | 214 | |||||||||
| Total Mortgage Pass-Through Securities (Cost $10,757) | 10,756 | ||||||||||
Private Placements — 6.5% | |||||||||||
| 1,143 | 270 5th Ave., Secured by First Mortgage and Agreement on Co-op Apartment Building in Brooklyn, New York, 6.93%, 08/01/18 (f) (i) (Cost $1,143) | 1,200 | |||||||||
U.S. Treasury Obligations — 1.9% | |||||||||||
| 125 | U.S. Treasury Bond, 5.50%, 08/15/28 (k) (m) | 135 | |||||||||
| U.S. Treasury Notes, | |||||||||||
| 40 | 4.13%, 08/15/10 (k) (m) | 40 | |||||||||
| 15 | 4.50%, 05/15/10 (m) | 15 | |||||||||
| 10 | 4.50%, 11/30/11 (k) (m) | 10 | |||||||||
| 10 | 5.13%, 06/30/08 (k) (m) | 10 | |||||||||
| 140 | 5.13%, 06/30/11 (k) (m) | 145 | |||||||||
| Total U.S. Treasury Obligations (Cost $338) | 355 | ||||||||||
| SHARES | | | | | ||||||
|---|---|---|---|---|---|---|---|---|---|---|
Warrant — 0.0% (g) | ||||||||||
| —(h) | Startec Global Communications Corp., expires 05/15/08 (a) (e) (m) (Cost $— (h)) | — | ||||||||
| Total Long-Term Investments (Cost $27,629) | 27,138 | |||||||||
| NUMBER OF CONTRACTS | | | | | |||||||
|---|---|---|---|---|---|---|---|---|---|---|---|
Options Purchased — 4.5% | |||||||||||
Call Options Purchased — 1.5% | |||||||||||
| 12 | 90 Day Eurodollar Futures expiring 09/17/07 @ $94.50, American Style | 2 | |||||||||
| 2 | 90 Day Eurodollar Futures expiring 09/17/07 @ $94.75, American Style | 1 | |||||||||
| 29 | 90 Day Eurodollar Futures expiring 09/17/07 @ $95.75, American Style | 3 | |||||||||
| 5 | 90 Day Eurodollar Futures expiring 12/17/07 @ $95.00, American Style | 1 | |||||||||
| NOTIONAL AMOUNT($) | | SECURITY DESCRIPTION | | VALUE($) | |||||||
|---|---|---|---|---|---|---|---|---|---|---|---|
Long-Term Investments — Continued | |||||||||||
Call Options Purchased — Continued | |||||||||||
| Call Options Purchased on Interest Rate Swaps: | |||||||||||
| 32,258 | Expiring 05/30/08. If exercised the Fund receives 3.96% and pays floating 3 month LIBOR expiring 06/03/10, European Style | 90 | |||||||||
| 13,610 | Expiring 11/02/09. If exercised the Fund receives 4.49% and pays floating 3 month LIBOR expiring 11/04/19, European Style | 175 | |||||||||
| Total Call Options Purchased | 272 | ||||||||||
Receiver/Payer Straddle on Interest Rate Swaps — 2.6% | |||||||||||
| 2,164 | Expiring 06/09/08. If exercised the Fund receives/pays 5.88% and pays/receives floating 3 month LIBOR expiring 06/11/18, European Style | 127 | |||||||||
| 14,140 | Expiring 10/02/08. If exercised the Fund receives/pays 4.46% and pays/receives floating 3 month LIBOR expiring 10/06/18, European Style | 92 | |||||||||
| 915 | Expiring 01/25/27. If exercised the Fund receives/pays 5.47% and pays/receives floating 3 month LIBOR expiring 01/27/37, European Style | 57 | |||||||||
| 1,140 | Expiring 01/25/27. If exercised the Fund receives/pays 5.47% and pays/receives floating 3 month LIBOR expiring 01/27/37, European Style | 70 | |||||||||
| 2,124 | Expiring 03/22/27. If exercised the Fund receives/pays 5.38% and pays/receives floating 3 month LIBOR expiring 03/24/37, European Style | 132 | |||||||||
| Total Receiver/Payer Straddle on Interest Rate Swaps | 478 | ||||||||||
| NUMBER OF CONTRACTS | | | | | ||||||
|---|---|---|---|---|---|---|---|---|---|---|
Put Options Purchased — 0.4% | ||||||||||
| 13 | 30 Day Fed Funds expiring 11/30/07 @ $94.75, American Style | — | (h) | |||||||
| 120 | 90 Day Eurodollar Futures expiring 09/17/07 @ $94.38, American Style | 12 | ||||||||
| NOTIONAL AMOUNT($) | | SECURITY DESCRIPTION | | VALUE($) | ||||||
|---|---|---|---|---|---|---|---|---|---|---|
Put Options Purchased — Continued | ||||||||||
| Put Options Purchased on Interest Rate Swaps: | ||||||||||
| 24,336 | Expiring 02/28/08. If exercised the Fund pays 4.20% and receives floating 3 month LIBOR expiring 03/03/10, European Style | 67 | ||||||||
| Total Put Options Purchased | 79 | |||||||||
| Total Options Purchased (Cost $1,004) | 829 | |||||||||
| SHARES | | | |||||||||
|---|---|---|---|---|---|---|---|---|---|---|---|
Short-Term Investments — 6.4% | |||||||||||
Investment Company — 6.3% | |||||||||||
| 1,147 | JPMorgan Prime Money Market Fund, Institutional Class (b) (m) (Cost $1,147) | 1,147 | |||||||||
| PRINCIPAL AMOUNT($) | | | | | ||||||
|---|---|---|---|---|---|---|---|---|---|---|
U.S. Treasury Obligation — 0.1% | ||||||||||
| 20 | U.S. Treasury Bill, 4.64%, 11/01/07 (k) (m) (n) (Cost $20) | 20 | ||||||||
| Total Short-Term Investments (Cost $1,167) | 1,167 | |||||||||
Total Investments — 158.2% (Cost $29,800) | 29,134 | |||||||||
Liabilities in Excess of Other Assets — (58.2)% | (10,714 | ) | ||||||||
NET ASSETS — 100.0% | $ | 18,420 | ||||||||
AS OF AUGUST 31, 2007 (Unaudited) (continued)
| NUMBER OF CONTRACTS | | DESCRIPTION | | EXPIRATION DATE | | NOTIONAL VALUE AT 08/31/07 | | UNREALIZED APPRECIATION (DEPRECIATION) | ||||||||||
|---|---|---|---|---|---|---|---|---|---|---|---|---|---|---|---|---|---|---|
Long Futures Outstanding | ||||||||||||||||||
| 4 | 10 Year Swap Future | September, 2007 | $ | 423 | $ | 4 | ||||||||||||
| 6 | 2 Year U.S. Treasury Notes | December, 2007 | 1,237 | — | (h) | |||||||||||||
| 4 | 5 Year U.S. Treasury Notes | December, 2007 | 427 | — | (h) | |||||||||||||
| 20 | 10 Year U.S. Treasury Notes | December, 2007 | 2,181 | 1 | ||||||||||||||
| 1 | U.K. Treasury Gilt | December, 2007 | 216 | — | (h) �� | |||||||||||||
| 1 | Eurodollar | September, 2008 | 239 | 1 | ||||||||||||||
Short Futures Outstanding | ||||||||||||||||||
| (6) | 10 Year Swap Future | September, 2007 | (635 | ) | (9 | ) | ||||||||||||
| (1) | U.S. Long Bond | December, 2007 | (112 | ) | — | (h) | ||||||||||||
| (12) | 5 Year U.S. Treasury Notes | December, 2007 | (1,280 | ) | (4 | ) | ||||||||||||
| (8) | 10 Year U.S. Treasury Notes | December, 2007 | (872 | ) | (1 | ) | ||||||||||||
| $ | (8 | ) | ||||||||||||||||
| CONTRACTS TO BUY | SETTLEMENT DATE | | SETTLEMENT VALUE | | VALUE AT 8/31/07 | | NET UNREALIZED APPRECIATION (DEPRECIATION) | | ||||||||||||||||
|---|---|---|---|---|---|---|---|---|---|---|---|---|---|---|---|---|---|---|---|---|---|---|---|---|
| 300,000 | TRY | 09/28/07 | $ | 228 | $ | 229 | $ | 1 | ||||||||||||||||
| CONTRACTS TO SELL | SETTLEMENT DATE | | SETTLEMENT VALUE | | VALUE AT 8/31/07 | | NET UNREALIZED APPRECIATION (DEPRECIATION) | | ||||||||||||||||
|---|---|---|---|---|---|---|---|---|---|---|---|---|---|---|---|---|---|---|---|---|---|---|---|---|
| 300,000 | TRY | 09/28/07 | $ | 229 | $ | 229 | $ | — | (h) | |||||||||||||||
| PRINCIPAL AMOUNT | | SECURITY DESCRIPTION | | VALUE | ||||||
|---|---|---|---|---|---|---|---|---|---|---|
| $ (750) | FNMA, TBA, 5.00%, 10/25/37 | $ | (713 | ) | ||||||
| (695) | FNMA, TBA, 6.00%, 10/25/36 | (694 | ) | |||||||
| (725) | FNMA, TBA, 6.50%, 09/25/37 | (736 | ) | |||||||
| (Proceeds received $2,126) | $ | (2,143 | ) | |||||||
Call Options Written
| DESCRIPTION | | EXERCISE PRICE | | EXPIRATION DATE | | NUMBER OF CONTRACTS | | VALUE | ||||||||||
|---|---|---|---|---|---|---|---|---|---|---|---|---|---|---|---|---|---|---|
| 10 Year U.S. Treasury Note Futures | $ | 111.00 | 10/26/07 | 26 | $ | (10 | ) | |||||||||||
| 10 Year U.S. Treasury Note Futures | 111.00 | 11/20/07 | 53 | (29 | ) | |||||||||||||
| 10 Year U.S. Treasury Note Futures | 112.00 | 11/20/07 | 38 | — | ||||||||||||||
| 30 Day Federal Funds Futures, American Style | 95.00 | 09/28/07 | 5 | (2 | ) | |||||||||||||
| 90 Day Eurodollar Futures, American Style | 95.00 | 09/17/07 | 5 | — | (h) | |||||||||||||
| 90 Day Eurodollar Futures, American Style | 96.00 | 09/17/07 | 58 | — | (h) | |||||||||||||
| 90 Day Eurodollar Futures, American Style | 95.38 | 12/17/07 | 5 | (2 | ) | |||||||||||||
| (Premiums received of $62) | $ | (43 | ) | |||||||||||||||
| COUNTERPARTY | | EXERCISE RATE* | | OPTION EXPIRATION DATE | | SWAP EXPIRATION DATE | | NOTIONAL AMOUNT | | VALUE | | |||||||||||||||
|---|---|---|---|---|---|---|---|---|---|---|---|---|---|---|---|---|---|---|---|---|---|---|---|---|---|---|
| Barclays Bank plc | 5.46% semi-annually | 05/30/08 | 06/03/10 | $ | 32,258 | $ | (63 | ) | ||||||||||||||||||
| (Premiums received of $55) | ||||||||||||||||||||||||||
| DESCRIPTION | | EXERCISE PRICE | | EXPIRATION DATE | | NUMBER OF CONTRACTS | | VALUE | | |||||||||||||
|---|---|---|---|---|---|---|---|---|---|---|---|---|---|---|---|---|---|---|---|---|---|---|
| 10 Year U.S. Treasury Note Futures | $ | 106.00 | 11/20/07 | 31 | $ | (7 | ) | |||||||||||||||
| 90 Day Eurodollar Futures, American Style | 94.50 | 09/17/07 | 12 | (3 | ) | |||||||||||||||||
| 90 Day Eurodollar Futures, American Style | 94.75 | 09/17/07 | 3 | (2 | ) | |||||||||||||||||
| (Premiums received of $26) | $ | (12 | ) | |||||||||||||||||||
| COUNTERPARTY | | EXERCISE RATE** | | OPTION EXPIRATION DATE | | SWAP EXPIRATION DATE | | NOTIONAL AMOUNT | | VALUE | | |||||||||||||||
|---|---|---|---|---|---|---|---|---|---|---|---|---|---|---|---|---|---|---|---|---|---|---|---|---|---|---|
| Bank of America | 5.99% semi-annually | 11/02/09 | 11/04/19 | $ | 13,610 | $ | (263 | ) | ||||||||||||||||||
| Barclays Bank plc | 5.20% semi-annually | 02/28/08 | 03/03/10 | 24,336 | (54 | ) | ||||||||||||||||||||
| (Premiums received of $307) | $ | (317 | ) | |||||||||||||||||||||||
| NAME OF ISSUER | | EXERCISE RATE** | | OPTION EXPIRATION DATE | | SWAP EXPIRATION DATE | | NOTIONAL AMOUNT | | VALUE | | |||||||||||||||
|---|---|---|---|---|---|---|---|---|---|---|---|---|---|---|---|---|---|---|---|---|---|---|---|---|---|---|
| Barclays Bank plc | 5.96% semi-annually | 10/02/08 | 10/06/18 | $ | 12,124 | $ | (111 | ) | ||||||||||||||||||
| Barclays Bank plc | 6.02% semi-annually | 07/28/14 | 07/30/24 | 428 | (38 | ) | ||||||||||||||||||||
| Lehman Brothers Special Financing | 5.36% semi-annually | 03/15/12 | 03/19/42 | 973 | (149 | ) | ||||||||||||||||||||
| (Premiums received of $340) | $ | (298 | ) | |||||||||||||||||||||||
| * | The Fund would receive a floating rate based on 3-month USD LIBOR, if exercised. |
| ** | The Fund would pay a floating rate based on 3-month USD LIBOR, if exercised. |
| *** | The Fund would pay or receive a floating rate based on 3-month USD LIBOR, if exercised. |
| **** | European Style |
AS OF AUGUST 31, 2007 (Unaudited) (continued)
| RATE TYPE (r) | ||||||||||||||||||||||
|---|---|---|---|---|---|---|---|---|---|---|---|---|---|---|---|---|---|---|---|---|---|---|
| SWAP COUNTERPARTY | | PAYMENTS MADE BY THE FUND | | PAYMENTS RECEIVED BY THE FUND | | TERMINATION DATE | | NOTIONAL AMOUNT | | VALUE | ||||||||||||
| Bank of America | 5.55% semi-annually | 3 month LIBOR quarterly | 06/14/12 | $ | 920 | $ | (23 | ) | ||||||||||||||
| Bank of America | 5.89% semi-annually | 3 month LIBOR quarterly | 11/04/19 | 7,389 | (231 | ) | ||||||||||||||||
| Barclays Bank plc | 4.70% semi-annually | 3 month LIBOR quarterly | 03/03/10 | 11,925 | 6 | |||||||||||||||||
| Barclays Bank plc | 4.71% semi-annually | 3 month LIBOR quarterly | 06/03/10 | 12,903 | 8 | |||||||||||||||||
| Barclays Bank plc | 5.51% semi-annually | 3 month LIBOR quarterly | 08/03/17 | 609 | (13 | ) | ||||||||||||||||
| Barclays Bank plc | 3 month LIBOR quarterly | 5.37% semi-annually | 08/28/17 | 567 | 6 | |||||||||||||||||
| Barclays Bank plc | 5.72% semi-annually | 3 month LIBOR quarterly | 10/06/18 | 817 | (24 | ) | ||||||||||||||||
| Barclays Bank plc | 5.87% semi-annually | 3 month LIBOR quarterly | 10/06/18 | 5,306 | (215 | ) | ||||||||||||||||
| Barclays Bank plc | 5.28% semi-annually | 3 month LIBOR quarterly | 03/26/32 | 161 | 2 | |||||||||||||||||
| Credit Suisse International | 3 month LIBOR quarterly | 5.50% semi-annually | 08/03/17 | 629 | 13 | |||||||||||||||||
| Credit Suisse International | 3 month LIBOR quarterly | 5.28% semi-annually | 08/29/17 | 426 | 2 | |||||||||||||||||
| Credit Suisse International | 5.41% semi-annually | 3 month LIBOR quarterly | 01/26/32 | 84 | 1 | |||||||||||||||||
| Deutsche Bank AG, New York | 3 month LIBOR quarterly | 5.15% semi-annually | 08/14/12 | 900 | 7 | |||||||||||||||||
| Deutsche Bank AG, New York | 3 month LIBOR quarterly | 5.50% semi-annually | 08/06/17 | 262 | 5 | |||||||||||||||||
| Deutsche Bank AG, New York | 5.43% semi-annually | 3 month LIBOR quarterly | 08/14/17 | 510 | (8 | ) | ||||||||||||||||
| Deutsche Bank AG, New York | 5.42% semi-annually | 3 month LIBOR quarterly | 01/26/32 | 106 | 1 | |||||||||||||||||
| Goldman Sachs Capital Management | 5.53% semi-annually | 3 month LIBOR quarterly | 07/31/17 | 691 | (16 | ) | ||||||||||||||||
| Union Bank of Switzerland AG | 5.23% semi-annually | 3 month LIBOR quarterly | 06/12/17 | 125 | — | (h) | ||||||||||||||||
| Union Bank of Switzerland AG | 5.56% semi-annually | 3 month LIBOR quarterly | 06/12/17 | 610 | (15 | ) | ||||||||||||||||
| $ | (494 | ) | ||||||||||||||||||||
| REFERENCED OBLIGATION | | SWAP COUNTERPARTY | | BUY/SELL PROTECTION | | FUND PAYS/RECEIVES FIXED RATE (r) | | TERMINATION DATE | | NOTIONAL AMOUNT | | VALUE | ||||||||||||||
|---|---|---|---|---|---|---|---|---|---|---|---|---|---|---|---|---|---|---|---|---|---|---|---|---|---|---|
| Bank TuranAlem Finance BV, 8.50%, 02/10/15 | HSBC Bank, N.A. | Sell | 190 BPS quarterly | 09/14/07 | $ | 220 | $ | — | (h) | |||||||||||||||||
| CDX ..EM.7 | Lehman Brothers Special Financing (1) | Buy | 125 BPS quarterly | 06/20/12 | 70 | 1 | ||||||||||||||||||||
| CDX ..EM.7 | Morgan Stanley Capital Services (1) | Buy | 125 BPS quarterly | 06/20/12 | 70 | 1 | ||||||||||||||||||||
| CDX NA.HY.8 | Credit Suisse International (2) | Sell | 275 BPS quarterly | 06/20/12 | 500 | (23 | ) | |||||||||||||||||||
| CDX NA.HY.8 | Lehman Brothers Special Financing (2) | Sell | 275 BPS quarterly | 06/20/12 | 500 | (24 | ) | |||||||||||||||||||
| CDX NA.IG.8 | Goldman Sachs Capital Management (1) | Buy | 35 BPS quarterly | 06/20/12 | 1,000 | 14 | ||||||||||||||||||||
| Countrywide Financial, 4.00%, 03/22/11 | Goldman Sachs Capital Management | Sell | 400 BPS quarterly | 09/20/08 | 200 | — | (h) | |||||||||||||||||||
| Government of Jamaica, 11.63%, 01/15/22 | Bear Stearns Credit Products | Buy | 341 BPS semi-annually | 07/20/17 | 120 | 11 | ||||||||||||||||||||
| Government of Jamaica, 11.63%, 01/15/22 | Bear Stearns Credit Products | Buy | 397 BPS semi-annually | 08/20/17 | 30 | 2 | ||||||||||||||||||||
| Government of Ukraine, 7.65%, 06/11/13 | Barclays Bank plc | Sell | 156 BPS semi-annually | 04/20/12 | 350 | (5 | ) | |||||||||||||||||||
| Government of Ukraine, 7.65%, 06/11/13 | Deutsche Bank AG, New York | Sell | 158 BPS semi-annually | 04/20/12 | 220 | (3 | ) | |||||||||||||||||||
| Government of Ukraine, 7.65%, 06/11/13 | Citibank, N.A. | Sell | 137.75 BPS semi-annually | 06/20/12 | 580 | (13 | ) | |||||||||||||||||||
| Hanover Finance S.A., 5.75%, 02/26/24 | Morgan Stanley Capital Services | Buy | 9.5 BPS quarterly | 12/20/11 | 200 | 2 | ||||||||||||||||||||
| Kazkommertzbank International BV, 7.88%, 04/07/14 | Morgan Stanley Capital Services | Sell | 175 BPS semi-annually | 08/20/08 | 300 | (4 | ) | |||||||||||||||||||
| Kazkommertzbank International BV, 7.88%, 04/07/14 | Morgan Stanley Capital Services | Buy | 300 BPS semi-annually | 08/20/12 | 60 | 3 | ||||||||||||||||||||
| Petroleos De Venezuela S.A., 5.25%, 04/12/17 | Union Bank of Switzerland AG | Sell | 278 BPS semi-annually | 06/20/12 | 90 | (7 | ) | |||||||||||||||||||
| Petroleos De Venezuela S.A., 5.25%, 04/12/17 | Union Bank of Switzerland AG | Sell | 344 BPS semi-annually | 07/20/12 | 120 | (7 | ) | |||||||||||||||||||
| Petroleos De Venezuela S.A., 5.25%, 04/12/17 | Union Bank of Switzerland AG | Sell | 355 BPS semi-annually | 07/20/12 | 140 | (7 | ) | |||||||||||||||||||
| Petroleos De Venezuela S.A., 5.38%, 04/12/27 | Bear Stearns Credit Products | Sell | 342 BPS semi-annually | 07/20/12 | 80 | (4 | ) | |||||||||||||||||||
| Petroleos De Venezuela S.A., 5.38%, 04/12/27 | Bear Stearns Credit Products | Sell | 361 BPS semi-annually | 07/20/12 | 70 | (4 | ) | |||||||||||||||||||
| REFERENCED OBLIGATION | | SWAP COUNTERPARTY | | BUY/SELL PROTECTION | | FUND PAYS/RECEIVES FIXED RATE (r) | | TERMINATION DATE | | NOTIONAL AMOUNT | | VALUE | ||||||||||||||
|---|---|---|---|---|---|---|---|---|---|---|---|---|---|---|---|---|---|---|---|---|---|---|---|---|---|---|
| Petroleos De Venezuela S.A., 5.38%, 04/12/27 | Morgan Stanley Capital Services | Sell | 340 BPS semi-annually | 07/20/12 | $ | 190 | $ | (12 | ) | |||||||||||||||||
| Petroleos De Venezuela S.A., 5.50%, 04/12/37 | Lehman Brothers Special Financing | Sell | 265 BPS semi-annually | 05/20/12 | 75 | (6 | ) | |||||||||||||||||||
| Petroleos De Venezuela S.A., 5.50%, 04/12/37 | Lehman Brothers Special Financing | Sell | 328 BPS semi-annually | 07/20/12 | 50 | (3 | ) | |||||||||||||||||||
| Petroleos De Venezuela S.A., 5.50%, 04/12/37 | Lehman Brothers Special Financing | Sell | 341 BPS semi-annually | 07/20/12 | 190 | (12 | ) | |||||||||||||||||||
| Petroleos De Venezuela S.A., 5.50%, 04/12/37 | Lehman Brothers Special Financing | Sell | 355 BPS semi-annually | 07/20/12 | 130 | (7 | ) | |||||||||||||||||||
| Republic of Argentina, 8.28%, 12/31/33 | Deutsche Bank AG, New York | Sell | 196 BPS semi-annually | 04/20/12 | 220 | (20 | ) | |||||||||||||||||||
| Republic of Argentina, 8.28%, 12/31/33 | Citibank, N.A. | Sell | 216 BPS semi-annually | 06/20/12 | 470 | (43 | ) | |||||||||||||||||||
| Republic of Argentina, 8.28%, 12/31/33 | Deutsche Bank AG, New York | Sell | 214 BPS semi-annually | 06/20/12 | 110 | (10 | ) | |||||||||||||||||||
| Republic of Argentina, 8.28%, 12/31/33 | Morgan Stanley Capital Services | Sell | 202 BPS semi-annually | 06/20/12 | 260 | (25 | ) | |||||||||||||||||||
| Republic of Argentina, 8.28%, 12/31/33 | Morgan Stanley Capital Services | Sell | 216 BPS semi-annually | 06/20/12 | 120 | (11 | ) | |||||||||||||||||||
| Republic of Argentina, 8.28%, 12/31/33 | Bear Stearns Credit Products | Buy | 258 BPS semi-annually | 07/20/12 | 80 | 6 | ||||||||||||||||||||
| Republic of Argentina, 8.28%, 12/31/33 | Lehman Brothers Special Financing | Buy | 258 BPS semi-annually | 07/20/12 | 40 | 3 | ||||||||||||||||||||
| Republic of Argentina, 8.28%, 12/31/33 | Lehman Brothers Special Financing | Buy | 258 BPS semi-annually | 07/20/12 | 50 | 4 | ||||||||||||||||||||
| Republic of Argentina, 8.28%, 12/31/33 | Lehman Brothers Special Financing | Buy | 263 BPS semi-annually | 07/20/12 | 190 | 15 | ||||||||||||||||||||
| Republic of Argentina, 8.28%, 12/31/33 | Morgan Stanley Capital Services | Buy | 262 BPS semi-annually | 07/20/12 | 190 | 15 | ||||||||||||||||||||
| Republic of Argentina, 8.28%, 12/31/33 | Union Bank of Switzerland AG | Buy | 262 BPS semi-annually | 07/20/12 | 120 | 9 | ||||||||||||||||||||
| Republic of Argentina, 8.28%, 12/31/33 | Deutsche Bank AG, New York | Sell | 365 BPS semi-annually | 08/20/12 | 80 | (3 | ) | |||||||||||||||||||
| Republic of Argentina, 8.28%, 12/31/33 | Lehman Brothers Special Financing | Sell | 375 BPS semi-annually | 08/20/12 | 60 | (2 | ) | |||||||||||||||||||
| Republic of Argentina, 8.28%, 12/31/33 | Lehman Brothers Special Financing | Sell | 425 BPS semi-annually | 08/20/12 | 40 | (1 | ) | |||||||||||||||||||
| Republic of Argentina, 8.28%, 12/31/33 | Lehman Brothers Special Financing | Sell | 365 BPS semi-annually | 08/20/12 | 290 | (12 | ) | |||||||||||||||||||
| Republic of Argentina, 8.28%, 12/31/33 | Bear Stearns Credit Products | Sell | 341 BPS semi-annually | 07/20/17 | 120 | (15 | ) | |||||||||||||||||||
| Republic of Argentina, 8.28%, 12/31/33 | Bear Stearns Credit Products | Sell | 407 BPS semi-annually | 08/20/17 | 30 | (3 | ) | |||||||||||||||||||
| Republic of Brazil, 12.25%, 03/06/30 | Deutsche Bank AG, New York | Buy | 81 BPS semi-annually | 04/20/12 | 220 | 1 | ||||||||||||||||||||
| Republic of Brazil, 12.25%, 03/06/30 | Citibank, N.A. | Buy | 69.5 BPS semi-annually | 06/20/12 | 470 | 6 | ||||||||||||||||||||
| Republic of Brazil, 12.25%, 03/06/30 | Deutsche Bank AG, New York | Buy | 73.21 BPS semi-annually | 06/20/12 | 110 | 1 | ||||||||||||||||||||
| Republic of Brazil, 12.25%, 03/06/30 | Morgan Stanley Capital Services | Buy | 65.67 BPS semi-annually | 06/20/12 | 260 | 4 | ||||||||||||||||||||
| Republic of Brazil, 12.25%, 03/06/30 | Morgan Stanley Capital Services | Buy | 69 BPS semi-annually | 06/20/12 | 120 | 1 | ||||||||||||||||||||
| Republic of Colombia, 10.38%, 01/28/33 | Lehman Brothers Special Financing | Buy | 96 BPS semi-annually | 04/20/12 | 20 | — | (h) | |||||||||||||||||||
| Republic of Colombia, 10.38%, 01/28/33 | Lehman Brothers Special Financing | Buy | 98 BPS semi-annually | 04/20/12 | 110 | 2 | ||||||||||||||||||||
| Republic of Colombia, 10.38%, 01/28/33 | Lehman Brothers Special Financing | Buy | 98 BPS semi-annually | 04/20/12 | 110 | 2 | ||||||||||||||||||||
| Republic of Colombia, 10.38%, 01/28/33 | Morgan Stanley Capital Services | Buy | 100 BPS semi-annually | 04/20/12 | 50 | 1 | ||||||||||||||||||||
| Republic of Colombia, 10.38%, 01/28/33 | Lehman Brothers Special Financing | Buy | 82.5 BPS semi-annually | 06/20/12 | 710 | 16 | ||||||||||||||||||||
| Republic of Indonesia, 6.75%, 03/10/14 | Deutsche Bank AG, New York | Sell | 101 BPS quarterly | 06/20/12 | 1,110 | (33 | ) | |||||||||||||||||||
| Republic of Kazakhstan, 11.13%, 05/11/07 | Barclays Bank plc | Sell | 53 BPS semi-annually | 08/20/12 | 130 | (2 | ) | |||||||||||||||||||
| Republic of Kazakhstan, 11.13%, 05/11/07 | Barclays Bank plc | Sell | 68 BPS semi-annually | 08/20/12 | 150 | (1 | ) | |||||||||||||||||||
| Republic of Kazakhstan, 11.13%, 05/11/07 | Citibank, N.A. | Sell | 52.67 BPS semi-annually | 08/20/12 | 620 | (9 | ) | |||||||||||||||||||
| Republic of Kazakhstan, 11.13%, 05/11/07 | Credit Suisse International | Sell | 53 BPS semi-annually | 08/20/12 | 210 | (3 | ) | |||||||||||||||||||
| Republic of Kazakhstan, 11.13%, 05/11/07 | Deutsche Bank AG, New York | Sell | 65.5 BPS semi-annually | 08/20/12 | 310 | (3 | ) | |||||||||||||||||||
| Republic of Kazakhstan, 11.13%, 05/11/07 | Deutsche Bank AG, New York | Sell | 71 BPS semi-annually | 08/20/12 | 150 | (1 | ) | |||||||||||||||||||
| Republic of Panama, 8.88%, 09/30/27 | Lehman Brothers Special Financing | Buy | 63 BPS semi-annually | 06/20/12 | 940 | 18 | ||||||||||||||||||||
| Republic of Peru, 8.75%, 11/21/33 | Lehman Brothers Special Financing | Sell | 62 BPS semi-annually | 06/20/12 | 940 | (17 | ) | |||||||||||||||||||
| Republic of Peru, 8.75%, 11/21/33 | Lehman Brothers Special Financing | Sell | 108.5 BPS semi-annually | 05/20/17 | 130 | (4 | ) | |||||||||||||||||||
| Republic of Peru, 8.75%, 11/21/33 | Lehman Brothers Special Financing | Sell | 90 BPS semi-annually | 06/20/17 | 80 | (3 | ) | |||||||||||||||||||
| Republic of Philippines, 10.63%, 03/16/25 | Deutsche Bank AG, New York | Buy | 103 BPS quarterly | 06/20/12 | 1,110 | 32 | ||||||||||||||||||||
| Republic of Turkey, 11.88%, 01/15/30 | Morgan Stanley Capital Services | Buy | 145 BPS semi-annually | 07/20/12 | 70 | 1 | ||||||||||||||||||||
| Republic of Turkey, 11.88%, 01/15/30 | Morgan Stanley Capital Services | Buy | 146 BPS semi-annually | 07/20/12 | 600 | 12 | ||||||||||||||||||||
| Republic of Turkey, 11.88%, 01/15/30 | Deutsche Bank AG, New York | Buy | 239 BPS semi-annually | 08/20/12 | 150 | (3 | ) | |||||||||||||||||||
AS OF AUGUST 31, 2007 (Unaudited) (continued)
| REFERENCED OBLIGATION | | SWAP COUNTERPARTY | | BUY/SELL PROTECTION | | FUND PAYS/RECEIVES FIXED RATE (r) | | TERMINATION DATE | | NOTIONAL AMOUNT | | VALUE | ||||||||||||||
|---|---|---|---|---|---|---|---|---|---|---|---|---|---|---|---|---|---|---|---|---|---|---|---|---|---|---|
| Republic of Turkey, 11.88%, 01/15/30 | Morgan Stanley Capital Services | Buy | 194 BPS semi-annually | 08/20/12 | $ | 120 | $ | — | (h) | |||||||||||||||||
| Republic of Venezuela, 9.25%, 09/15/27 | Deutsche Bank AG, New York | Sell | 160.42 BPS semi-annually | 04/20/12 | 170 | (15 | ) | |||||||||||||||||||
| Republic of Venezuela, 9.25%, 09/15/27 | Lehman Brothers Special Financing | Sell | 160.5 BPS semi-annually | 04/20/12 | 20 | (2 | ) | |||||||||||||||||||
| Republic of Venezuela, 9.25%, 09/15/27 | Lehman Brothers Special Financing | Sell | 161 BPS semi-annually | 04/20/12 | 110 | (10 | ) | |||||||||||||||||||
| Republic of Venezuela, 9.25%, 09/15/27 | Lehman Brothers Special Financing | Sell | 161 BPS semi-annually | 04/20/12 | 110 | (10 | ) | |||||||||||||||||||
| Republic of Venezuela, 9.25%, 09/15/27 | Morgan Stanley Capital Services | Sell | 169 BPS semi-annually | 04/20/12 | 50 | (4 | ) | |||||||||||||||||||
| Republic of Venezuela, 9.25%, 09/15/27 | Lehman Brothers Special Financing | Sell | 218 BPS semi-annually | 06/20/12 | 710 | (52 | ) | |||||||||||||||||||
| Republic of Venezuela, 9.25%, 09/15/27 | Union Bank of Switzerland AG | Buy | 203 BPS semi-annually | 06/20/12 | 90 | 7 | ||||||||||||||||||||
| Republic of Venezuela, 9.25%, 09/15/27 | Bear Stearns Credit Products | Sell | 250.4 BPS semi-annually | 07/20/12 | 165 | (11 | ) | |||||||||||||||||||
| Republic of Venezuela, 9.25%, 09/15/27 | Bear Stearns Credit Products | Buy | 266 BPS semi-annually | 07/20/12 | 70 | 4 | ||||||||||||||||||||
| Republic of Venezuela, 9.25%, 09/15/27 | Lehman Brothers Special Financing | Sell | 268 BPS semi-annually | 07/20/12 | 40 | (2 | ) | |||||||||||||||||||
| Republic of Venezuela, 9.25%, 09/15/27 | Lehman Brothers Special Financing | Buy | 260 BPS semi-annually | 07/20/12 | 130 | 8 | ||||||||||||||||||||
| Republic of Venezuela, 9.25%, 09/15/27 | Union Bank of Switzerland AG | Sell | 251 BPS semi-annually | 07/20/12 | 235 | (15 | ) | |||||||||||||||||||
| Republic of Venezuela, 9.25%, 09/15/27 | Union Bank of Switzerland AG | Buy | 255 BPS semi-annually | 07/20/12 | 140 | 8 | ||||||||||||||||||||
| Republic of Venezuela, 9.25%, 09/15/27 | Lehman Brothers Special Financing | Buy | 385 BPS semi-annually | 08/20/12 | 40 | 1 | ||||||||||||||||||||
| Russian Federation, 7.50%, 03/31/30 | Barclays Bank plc | Buy | 47.5 BPS semi-annually | 04/20/12 | 350 | 4 | ||||||||||||||||||||
| Russian Federation, 7.50%, 03/31/30 | Deutsche Bank AG, New York | Buy | 49.5 BPS semi-annually | 04/20/12 | 220 | 3 | ||||||||||||||||||||
| VTB Capital SA, 6.25%, 06/30/35 | Morgan Stanley Capital Services | Sell | 64 BPS semi-annually | 05/20/12 | 50 | (1 | ) | |||||||||||||||||||
| $ | (269 | ) | ||||||||||||||||||||||||
| (1) | Premiums paid of $19 |
| (2) | Premiums received of $60 |
| SWAP COUNTERPARTY | | REFERENCED OBLIGATION | | PRICE LOCK | | TERMINATION DATE | | NOTIONAL AMOUNT | | VALUE | ||||||||||||
|---|---|---|---|---|---|---|---|---|---|---|---|---|---|---|---|---|---|---|---|---|---|---|
| Bank of America (b) | Bank of America Covered Bond, 5.50%, 06/14/12 | $ | 100.83 | 09/06/07 | $ | 920 | $ | 15 | ||||||||||||||
| Barclays Bank plc (a) | U.S. Treasury Note, 4.63%, 07/31/12 | 100.22 | 09/05/07 | 1,000 | (13 | ) | ||||||||||||||||
| Union Bank of Switzerland AG (b) | FNMA, 5.38%, 06/12/17 | 101.86 | 09/27/07 | 735 | 2 | |||||||||||||||||
| $ | 4 | |||||||||||||||||||||
| (a) | Fund pays the excess of the market price over the price lock or receives the excess of the price lock over the market price. |
| (b) | Fund pays the excess of the price lock over the market price or receives the excess of the market price over the price lock. |
| SWAP COUNTERPARTY | | REFERENCED OBLIGATION | | PAYMENTS MADE BY THE FUND (r) | | PAYMENTS RECEIVED BY THE FUND (r) | | TERMINATION DATE | | NOTIONAL AMOUNT | | VALUE | ||||||||||||||
|---|---|---|---|---|---|---|---|---|---|---|---|---|---|---|---|---|---|---|---|---|---|---|---|---|---|---|
| Morgan Stanley Capital Services | TransCredit Bank, 7.30%, 02/26/09 | 3 month LIBOR + 20 BPS | Total Return on TransCredit Bank, 7.30%, 02/26/09 | 02/26/09 | $ | 200 | $ | 3 | ||||||||||||||||||
| Morgan Stanley Capital Services | OGK/Rushydro’s 12/13/13 | Total Return on OGK/ Rushydro’s 12/13/13 | 3 month LIBOR + 20 BPS | 12/25/10 | 580 | 9 | ||||||||||||||||||||
| $ | 12 | |||||||||||||||||||||||||
AS OF AUGUST 31, 2007 (Unaudited)
| (a)— | Non-income producing security. |
| (b)— | Investment in affiliate. Money market fund registered under the Investment Company Act of 1940, as amended, and advised by J.P. Morgan Investment Management Inc. or JPMorgan Investment Advisors Inc. |
| (e)— | Security is a 144A or private placement security and can only be sold to qualified institutional buyers. Unless otherwise indicated, this security has been determined to be liquid under procedures established by the Board of Trustees. |
| (g)— | Amount rounds to less than 0.1%. |
| (h)— | Amount rounds to less than one thousand. |
| (f)— | Fair Valued Investment. The following are approximately the market value and percentage of the investments based on net assets that are fair valued (amounts in thousands) |
| Fund | | Market Value | | Percentage | ||||||
|---|---|---|---|---|---|---|---|---|---|---|
| Bond Fund | $ | 14,573 | 0.6 | % | ||||||
| Strategic Income Fund | 1,200 | 6.5 | ||||||||
| (i)— | Security has been deemed illiquid pursuant to procedures approved by the Board of Trustees and may be difficult to sell. |
| (k)— | Security is fully or partially segregated with the broker as collateral for futures or with brokers as initial margin for futures contracts. |
| (m)— | All or a portion of this security is reserved for current or potential holdings of futures, swaps, options, TBA’s, when-issued securities, delayed delivery securities, and reverse repurchase agreements. |
| (n)— | The rate shown is the effective yield at the date of purchase. |
| (r)— | Rates shown are per annum and payments are as described. |
| ADR— | American Depositary Receipt |
| AMBAC— | American Municipal Bond Assurance Corp. |
| ARM— | Adjustable Rate Mortgage |
| ARS— | Argentine Peso |
| AUD— | Australian Dollar |
| BPS— | Basis Points |
| BRL— | Brazilian Real |
| BUBOR— | Budapest Interbank Offered Rate |
| CAD— | Canadian Dollar |
| CAD-BA— | Canadian Bank Bill Overnight Rate |
| CHF— | Swiss Franc |
| CMBS— | Commercial Mortgage Backed Security |
| CMO— | Collateralized Mortgage Obligation |
| COP— | Colombian Peso |
| EGP— | Egyptian Pound |
| EUR— | Euro |
| EURIBOR— | Euro Interbank Offered Rate |
| FHLMC— | Federal Home Loan Mortgage Corporation |
| FNMA— | Federal National Mortgage Association |
| FRN— | Floating Rate Note. The rate shown is the rate in effect as of August 31, 2007. |
| GBP— | British Pound |
| GDP— | Gross Domestic Product |
| GNMA— | Government National Mortgage Association |
| HB— | High Coupon Bonds (a.k.a. “IOettes”) represent the right to receive interest payments on an underlying pool of mortgages with similar features as those associated with IO securities. Unlike IO’s the owner also has a right to receive a very small portion of principal. The high interest rates result from taking interest payments from other classes in the Real Estate Mortgage Investment Conduit trust and allocating them to the small principal of the HB class. |
| HUF— | Hungarian Forint |
| IF— | Inverse Floaters represent securities that pay interest at a rate that increases (decreases) with a decline (incline) in a specified index. The principal shown is the rate in effect as of August 31, 2007. The rate may be subject to a cap and floor. |
| IO— | Interest Only represents the right to receive the monthly interest payment on an underlying pool of mortgage loans. The face amount shown represents the par value on the underlying pool. The yields on these securities exceed yields on other mortgage-backed securities because their cash flow patterns are more volatile and there is a greater risk that the initial investment will not be fully recouped. These securities are subject to accelerated principal paydowns as a result of prepayment or refinancing of the underlying pool of mortgage instruments. As a result, interest income may be reduced considerably. |
| JIBAR— | Johannesburg Interbank Offered Rate |
| JPY— | Japanese Yen |
| LIBOR— | London Interbank Offered Rate |
| MBIA— | Municipal Bond Insurance Association |
| MXN— | Mexican Peso |
| NIM— | Net Interest Margin |
| NOK— | Norwegian Krone |
| NZD— | New Zealand Dollar |
| PEN— | Peruvian Nuevo Sol |
| PLN— | Polish Zloty |
| PO— | Principal Only represents the right to receive the principal portion only on an underlying pool of mortgage loans. The market value of these securities is extremely volatile in response to changes in market interest rates. As prepayments on the underlying mortgages of these securities increase, the yield on these securities increases. |
| RACERS— | Restructured Asset Certificates with Enhanced Returns. |
| REMICS— | Real Estate Mortgage Investment Conduits |
| Rev.— | Revenue Bond |
| SEK— | Swedish Krona |
| STRIPS— | Separate Trading of Registered Interest and Principal Securities. The STRIPS Program lets investors hold and trade individual interest and principal components of eligible notes and bonds as separate securities. |
| SUB— | Step-Up Bond. The interest rate shown is the rate in effect as of August 31, 2007. |
AS OF AUGUST 31, 2007 (Unaudited)
| TBA— | To Be Announced |
| TIPS— | Treasury Inflation Protected Securities |
| TRAINS— | Targeted Return Index |
| TFX— | Tokyo Financial Exchange |
| TRY— | New Turkish Lira |
| USD— | United States Dollar |
| UYU— | Uruguayan Peso |
| VAR— | Variable Rate Note. The interest rate shown is the rate in effect as of August 31, 2007. |
| WIBOR— | Warsaw Interbank Offered Rate |
| ZAR— | South African Rand |
AS OF AUGUST 31, 2007 (Unaudited)
| | Bond Fund | | Emerging Markets Debt Fund | | Enhanced Income Fund | | Real Return Fund | |||||||||||
|---|---|---|---|---|---|---|---|---|---|---|---|---|---|---|---|---|---|---|
ASSETS: | ||||||||||||||||||
| Investments in non-affiliates, at value | $ | 3,403,468 | $ | 233,113 | $ | 185,565 | $ | 79,692 | ||||||||||
| Investments in affiliates, at value | 61,335 | 8,749 | 29,692 | 1,734 | ||||||||||||||
| Total investment securities, at value | 3,464,803 | 241,862 | 215,257 | 81,426 | ||||||||||||||
| Cash | — | — | — | 1,122 | ||||||||||||||
| Foreign currency, at value | 501 | 692 | 2 | 475 | ||||||||||||||
| Receivables: | ||||||||||||||||||
| Investment securities sold | 4,032,072 | 1,329 | 10,268 | 37,996 | ||||||||||||||
| Fund shares sold | 5,146 | 1,304 | 4 | 45 | ||||||||||||||
| Interest and dividends | 19,799 | 3,776 | 813 | 248 | ||||||||||||||
| Tax reclaims | 161 | 28 | — | — | ||||||||||||||
| Variation margin on futures contracts | 2,049 | — | 42 | 43 | ||||||||||||||
| Unrealized appreciation on forward foreign currency exchange contracts | 32 | 38 | — | 56 | ||||||||||||||
| Outstanding swap contracts, at value | 36,953 | 1,655 | 68 | 511 | ||||||||||||||
| Prepaid expenses and other assets | — | — | — | — | (b) | |||||||||||||
| Total Assets | 7,561,516 | 250,684 | 226,454 | 121,922 | ||||||||||||||
LIABILITIES: | ||||||||||||||||||
| Payables: | ||||||||||||||||||
| Due to custodian | 35,729 | 51 | 395 | — | ||||||||||||||
| Dividends | 6,557 | 777 | 260 | 21 | ||||||||||||||
| Investment securities purchased | 4,618,831 | 3,061 | 35,839 | 44,752 | ||||||||||||||
| Securities sold short, at value | 466,863 | — | — | 4,300 | ||||||||||||||
| Fund shares redeemed | 2,643 | 124 | — | — | (b) | |||||||||||||
| Variation margin on futures contracts | 2,681 | 108 | 29 | — | ||||||||||||||
| Unrealized depreciation on forward foreign currency exchange contracts | 7 | 32 | — | 62 | ||||||||||||||
| Outstanding options written, at fair value | 21,340 | — | — | 807 | ||||||||||||||
| Outstanding swap contracts, at value | 62,908 | 4,343 | 217 | 1,364 | ||||||||||||||
| Accrued liabilities: | ||||||||||||||||||
| Investment advisory fees | 542 | 142 | 17 | — | ||||||||||||||
| Administration fees | 184 | 21 | 4 | 1 | ||||||||||||||
| Shareholder servicing fees | 401 | 47 | — | 8 | ||||||||||||||
| Distribution fees | 13 | 4 | — | — | (b) | |||||||||||||
| Custodian and accounting fees | 78 | 22 | 8 | 11 | ||||||||||||||
| Trustees’ and Chief Compliance Officer’s fees | 13 | 1 | 2 | — | (b) | |||||||||||||
| Other | 70 | 68 | 62 | 26 | ||||||||||||||
| Total Liabilities | 5,218,860 | 8,801 | 36,833 | 51,352 | ||||||||||||||
| Net Assets | $ | 2,342,656 | $ | 241,883 | $ | 189,621 | $ | 70,570 | ||||||||||
| | Bond Fund | | Emerging Markets Debt Fund | | Enhanced Income Fund | | Real Return Fund | |||||||||||
|---|---|---|---|---|---|---|---|---|---|---|---|---|---|---|---|---|---|---|
NET ASSETS: | ||||||||||||||||||
| Paid in capital | $ | 2,442,110 | $ | 245,982 | $ | 202,342 | $ | 74,322 | ||||||||||
| Accumulated undistributed (distributions in excess of) net investment income | (2,528 | ) | 961 | 8 | 25 | |||||||||||||
| Accumulated net realized gains (losses) | (35,059 | ) | 2,772 | (8,891 | ) | (2,212 | ) | |||||||||||
| Net unrealized appreciation (depreciation) | (61,867 | ) | (7,832 | ) | (3,838 | ) | (1,565 | ) | ||||||||||
| Total Net Assets | $ | 2,342,656 | $ | 241,883 | $ | 189,621 | $ | 70,570 | ||||||||||
| Net Assets: | ||||||||||||||||||
| Class A | $ | 26,057 | $ | 5,982 | $ | — | $ | 522 | ||||||||||
| Class B | 3,999 | — | — | — | ||||||||||||||
| Class C | 7,128 | 3,663 | — | 56 | ||||||||||||||
| R Class | — | 19,772 | — | — | ||||||||||||||
| Select Class | 1,716,159 | 212,466 | — | 63,782 | ||||||||||||||
| Institutional Class | 430,382 | — | 189,621 | 6,210 | ||||||||||||||
| Ultra | 158,931 | — | — | — | ||||||||||||||
| Total | $ | 2,342,656 | $ | 241,883 | $ | 189,621 | $ | 70,570 | ||||||||||
| Outstanding units of beneficial interest (shares) ($0.0001 par value; unlimited number of shares authorized): | ||||||||||||||||||
| Class A | 2,880 | 714 | — | 56 | ||||||||||||||
| Class B | 445 | — | — | — | ||||||||||||||
| Class C | 789 | 438 | — | 6 | ||||||||||||||
| R Class | — | 2,359 | — | — | ||||||||||||||
| Select Class | 191,640 | 25,344 | — | 6,838 | ||||||||||||||
| Institutional Class | 48,074 | — | 19,924 | 665 | ||||||||||||||
| Ultra | 17,753 | — | — | — | ||||||||||||||
| Net Asset Value: | ||||||||||||||||||
| Class A — Redemption price per share | $ | 9.05 | $ | 8.37 | $ | — | $ | 9.30 | ||||||||||
| Class B — Offering price per share (a) | 8.98 | — | — | — | ||||||||||||||
| Class C — Offering price per share (a) | 9.03 | 8.37 | — | 9.27 | ||||||||||||||
| R Class — Offering and redemption price per share | — | 8.38 | — | — | ||||||||||||||
| Select Class — Offering and redemption price per share | 8.96 | 8.38 | — | 9.33 | ||||||||||||||
| Institutional Class — Offering and redemption price per share | 8.95 | — | 9.52 | 9.34 | ||||||||||||||
| Ultra — Offering and redemption price per share | 8.95 | — | — | — | ||||||||||||||
| Class A maximum sales charge | 3.75 | % | 3.75 | % | — | 3.75 | % | |||||||||||
| Class A maximum public offering price per share (net asset value per share/100% – maximum sales charge) | $ | 9.40 | $ | 8.70 | $ | — | $ | 9.66 | ||||||||||
| Cost of investments | $ | 3,503,793 | $ | 247,057 | $ | 218,707 | $ | 82,259 | ||||||||||
| Cost of foreign currency | 510 | 677 | 2 | 467 | ||||||||||||||
| Proceeds received from short positions | 470,323 | — | — | 4,305 | ||||||||||||||
| Premiums received from options written | 23,509 | — | — | 852 | ||||||||||||||
| Premiums paid on swaps | 1,936 | — | 189 | 29 | ||||||||||||||
| Premiums received from swaps | 1,637 | — | — | — | ||||||||||||||
| (a) | Redemption price for Class B and Class C Shares varies based upon length of time the shares are held. |
| (b) | Amount rounds to less than $1,000. |
AS OF AUGUST 31, 2007 (Unaudited) (continued)
| | Short Term Bond Fund | | Short Term Bond Fund II | | Strategic Income Fund | |||||||||
|---|---|---|---|---|---|---|---|---|---|---|---|---|---|---|
ASSETS: | ||||||||||||||
| Investments in non-affiliates, at value | $ | 2,204,044 | $ | 352,451 | $ | 27,987 | ||||||||
| Investments in affiliates, at value | 275,364 | 10,930 | 1,147 | |||||||||||
| Total investment securities, at value | 2,479,408 | 363,381 | 29,134 | |||||||||||
| Cash | — | — | — | |||||||||||
| Foreign currency, at value | 1,132 | — | 26 | |||||||||||
| Receivables: | ||||||||||||||
| Investment securities sold | 984,288 | 98,168 | 20,564 | |||||||||||
| Fund shares sold | 3,386 | 37 | 78 | |||||||||||
| Interest and dividends | 15,172 | 2,641 | 184 | |||||||||||
| Variation margin on futures contracts | 335 | 117 | 19 | |||||||||||
| Unrealized appreciation on forward foreign currency exchange contracts | — | — | 1 | |||||||||||
| Outstanding swap contracts, at value | 18,145 | 1,117 | 298 | |||||||||||
| Due from advisor | — | — | 9 | |||||||||||
| Total Assets | 3,501,866 | 465,461 | 50,313 | |||||||||||
LIABILITIES: | ||||||||||||||
| Payables: | ||||||||||||||
| Due to Custodian | 3,881 | 74 | 78 | |||||||||||
| Dividends | 7,522 | 1,085 | 39 | |||||||||||
| Investment securities purchased | 1,179,078 | 136,889 | 27,637 | |||||||||||
| Securities sold short, at value | 265,922 | 3,906 | 2,143 | |||||||||||
| Fund shares redeemed | 426 | 313 | 59 | |||||||||||
| Variation margin on futures contracts | 316 | 215 | 21 | |||||||||||
| Unrealized depreciation on forward foreign currency exchange contracts | — | — | — | (b) | ||||||||||
| Outstanding options written, at fair value | 7,964 | 1,705 | 733 | |||||||||||
| Outstanding swap contracts, at value | 36,112 | 2,466 | 1,045 | |||||||||||
| Accrued liabilities: | ||||||||||||||
| Investment advisory fees | 371 | 55 | — | (b) | ||||||||||
| Administration fees | 87 | 23 | — | |||||||||||
| Shareholder servicing fees | 316 | 47 | 3 | |||||||||||
| Distribution fees | 2 | 52 | 6 | |||||||||||
| Custodian and accounting fees | 37 | 27 | 35 | |||||||||||
| Trustees’ and Chief Compliance Officer’s fees | 11 | 7 | — | (b) | ||||||||||
| Other | 46 | 174 | 94 | |||||||||||
| Total Liabilities | 1,502,091 | 147,038 | 31,893 | |||||||||||
| Net Assets | $ | 1,999,775 | $ | 318,423 | $ | 18,420 | ||||||||
| | Short Term Bond Fund | | Short Term Bond Fund II | | Strategic Income Fund | |||||||||
|---|---|---|---|---|---|---|---|---|---|---|---|---|---|---|
NET ASSETS: | ||||||||||||||
| Paid in capital | $ | 2,064,375 | $ | 356,985 | $ | 41,289 | ||||||||
| Accumulated undistributed (distributions in excess of) net investment income | (50 | ) | (1 | ) | 40 | |||||||||
| Accumulated net realized gains (losses) | (27,450 | ) | (31,532 | ) | (21,570 | ) | ||||||||
| Net unrealized appreciation (depreciation) | (37,100 | ) | (7,029 | ) | (1,339 | ) | ||||||||
| Total Net Assets | $ | 1,999,775 | $ | 318,423 | $ | 18,420 | ||||||||
| Net Assets: | ||||||||||||||
| Class A | $ | 11,163 | $ | 26,019 | $ | 6,998 | ||||||||
| Class B | — | — | 4,361 | |||||||||||
| Class C | — | — | 2,303 | |||||||||||
| Class M | — | 153,898 | — | |||||||||||
| Select Class | 1,495,105 | 138,506 | 1,659 | |||||||||||
| Institutional Class | 493,507 | — | 3,099 | |||||||||||
| Total | $ | 1,999,775 | $ | 318,423 | $ | 18,420 | ||||||||
| Outstanding units of beneficial interest (shares) ($0.0001 par value; unlimited number of shares authorized): | ||||||||||||||
| Class A | 1,198 | 2,665 | 803 | |||||||||||
| Class B | — | — | 500 | |||||||||||
| Class C | — | — | 264 | |||||||||||
| Class M | — | 15,759 | — | |||||||||||
| Select Class | 160,372 | 14,155 | 190 | |||||||||||
| Institutional Class | 52,936 | — | 355 | |||||||||||
| Net Asset Value: | ||||||||||||||
| Class A — Redemption price per share | $ | 9.32 | $ | 9.76 | $ | 8.72 | ||||||||
| Class B — Offering price per share (a) | — | — | 8.72 | |||||||||||
| Class C — Offering price per share (a) | — | — | 8.72 | |||||||||||
| Class M — Offering price per share | — | 9.77 | — | |||||||||||
| Select Class — Offering and redemption price per share | 9.32 | 9.79 | 8.72 | |||||||||||
| Institutional Class — Offering and redemption price per share | 9.32 | — | 8.72 | |||||||||||
| Class A maximum sales charge | 2.25 | % | 2.25 | % | 3.75 | % | ||||||||
| Class A maximum public offering price per share (net asset value per share/100% – maximum sales charge) | $ | 9.53 | $ | 9.98 | $ | 9.06 | ||||||||
| Class M maximum sales charge | — | 1.50 | % | — | ||||||||||
| Class M maximum public offering price per share (net asset value per share/100% – maximum sales charge) | $ | — | $ | 9.92 | $ | — | ||||||||
| Cost of investments | $ | 2,497,442 | $ | 368,959 | $ | 29,800 | ||||||||
| Cost of foreign currency | 1,131 | — | 26 | |||||||||||
| Proceeds received from short positions | 263,489 | 3,889 | 2,126 | |||||||||||
| Premiums received from options written | 8,688 | 1,846 | 790 | |||||||||||
| Premiums paid on swaps | 2,556 | 140 | 19 | |||||||||||
| Premiums received from swaps | 2,845 | 39 | 60 | |||||||||||
| (a) | Redemption price for Class B and Class C Shares varies based upon length of time the shares are held. |
| (b) | Amount rounds to less than $1,000. |
FOR THE SIX MONTHS ENDED AUGUST 31, 2007 (Unaudited)
| | Bond Fund | | Emerging Markets Debt Fund | | Enhanced Income Fund | | Real Return Fund | |||||||||||
|---|---|---|---|---|---|---|---|---|---|---|---|---|---|---|---|---|---|---|
INVESTMENT INCOME: | ||||||||||||||||||
| Interest income | $ | 65,875 | $ | 6,869 | $ | 5,058 | $ | 2,755 | ||||||||||
| Dividend income from affiliates (b) | 2,192 | 224 | 356 | 104 | ||||||||||||||
| Foreign taxes withheld | — | (6 | ) | — | (a) | — | ||||||||||||
| Total investment income | 68,067 | 7,087 | 5,414 | 2,859 | ||||||||||||||
EXPENSES: | ||||||||||||||||||
| Investment advisory fees | 3,488 | 714 | 239 | 122 | ||||||||||||||
| Administration fees | 1,158 | 101 | 95 | 35 | ||||||||||||||
| Distribution fees: | ||||||||||||||||||
| Class A | 32 | 7 | — | 1 | ||||||||||||||
| Class B | 14 | — | — | — | ||||||||||||||
| Class C | 25 | 9 | — | — | (a) | |||||||||||||
| Shareholder servicing fees: | ||||||||||||||||||
| Class A | 32 | 7 | — | 1 | ||||||||||||||
| Class B | 5 | — | — | — | ||||||||||||||
| Class C | 8 | 3 | — | — | (a) | |||||||||||||
| R Class | — | 4 | — | — | ||||||||||||||
| Select Class | 2,127 | 224 | — | 79 | ||||||||||||||
| Institutional Class | 212 | — | 96 | 3 | ||||||||||||||
| Custodian and accounting fees | 170 | 44 | 18 | 31 | ||||||||||||||
| Interest expense | 7 | — | — | — | ||||||||||||||
| Professional fees | 132 | 55 | 43 | 79 | ||||||||||||||
| Trustees’ and Chief Compliance Officers’ fees | 19 | 2 | 2 | 1 | ||||||||||||||
| Printing and mailing costs | 122 | 26 | 4 | 1 | ||||||||||||||
| Registration and filing fees | 43 | 23 | 6 | 12 | ||||||||||||||
| Transfer agent fees | 83 | 42 | 4 | 24 | ||||||||||||||
| Other | 9 | 3 | 1 | 2 | ||||||||||||||
| Total expenses | 7,686 | 1,264 | 508 | 391 | ||||||||||||||
| Less amounts waived | (561 | ) | (13 | ) | (316 | ) | (166 | ) | ||||||||||
| Less earnings credits | (52 | ) | (1 | ) | (1 | ) | (1 | ) | ||||||||||
| Less expense reimbursements | — | — | — | — | (a) | |||||||||||||
| Net expenses | 7,073 | 1,250 | 191 | 224 | ||||||||||||||
| Net investment income (loss) | 60,994 | 5,837 | 5,223 | 2,635 | ||||||||||||||
| | Bond Fund | | Emerging Markets Debt Fund | | Enhanced Income Fund | | Real Return Fund | |||||||||||
|---|---|---|---|---|---|---|---|---|---|---|---|---|---|---|---|---|---|---|
REALIZED/UNREALIZED GAINS (LOSSES): | ||||||||||||||||||
| Net realized gain (loss) on transactions from: | ||||||||||||||||||
| Investments | $ | (16,642 | ) | $ | (668 | ) | $ | (1,225 | ) | $ | (10 | ) | ||||||
| Securities sold short | 14,117 | — | — | 213 | ||||||||||||||
| Written options | (3,465 | ) | — | (4 | ) | 79 | ||||||||||||
| Futures | (19,916 | ) | 1,103 | (445 | ) | (474 | ) | |||||||||||
| Swaps | 22,967 | 186 | 565 | 319 | ||||||||||||||
| Foreign currency transactions | 9 | 164 | — | (a) | 29 | |||||||||||||
| Net realized gain (loss) | (2,930 | ) | 785 | (1,109 | ) | 156 | ||||||||||||
| Change in net unrealized appreciation (depreciation) of: | ||||||||||||||||||
| Investments | (51,964 | ) | (10,594 | ) | (3,626 | ) | (761 | ) | ||||||||||
| Securities sold short | 7,389 | — | — | 49 | ||||||||||||||
| Written options | (5,202 | ) | — | — | (190 | ) | ||||||||||||
| Futures | (2,523 | ) | (64 | ) | 35 | 122 | ||||||||||||
| Swaps | (36,891 | ) | (3,038 | ) | (425 | ) | (905 | ) | ||||||||||
| Foreign currency translations | (57 | ) | (32 | ) | (1 | ) | 9 | |||||||||||
| Change in net unrealized appreciation (depreciation) | (89,248 | ) | (13,728 | ) | (4,017 | ) | (1,676 | ) | ||||||||||
| Net realized/unrealized gains (losses) | (92,178 | ) | (12,943 | ) | (5,126 | ) | (1,520 | ) | ||||||||||
| Change in net assets resulting from operations | $ | (31,184 | ) | $ | (7,106 | ) | $ | 97 | $ | 1,115 | ||||||||
| (a) | Amount rounds to less than $1,000. |
| (b) | Includes reimbursements of investment advisory, administration and shareholder servicing fees. Please see Fees and Other Transactions with Affiliates in the Notes to Financial Statements. |
FOR THE SIX MONTHS ENDED AUGUST 31, 2007 (Unaudited) (continued)
| | Short Term Bond Fund | | Short Term Bond Fund II | | Strategic Income Fund | |||||||||
|---|---|---|---|---|---|---|---|---|---|---|---|---|---|---|
INVESTMENT INCOME: | ||||||||||||||
| Interest income | $ | 45,997 | $ | 8,649 | $ | 712 | ||||||||
| Dividend income | 257 | — | — | |||||||||||
| Dividend income from affiliates (b) | 5,894 | 300 | 13 | |||||||||||
| Foreign taxes withheld | — | (3 | ) | — | ||||||||||
| Total investment income | 52,148 | 8,946 | 725 | |||||||||||
EXPENSES: | ||||||||||||||
| Investment advisory fees | 2,335 | 426 | 51 | |||||||||||
| Administration fees | 930 | 170 | 11 | |||||||||||
| Distribution fees: | ||||||||||||||
| Class A | 13 | 35 | 10 | |||||||||||
| Class B | — | — | 19 | |||||||||||
| Class C | — | — | 10 | |||||||||||
| Class M | — | 292 | 5 | |||||||||||
| Shareholder servicing fees: | ||||||||||||||
| Class A | 13 | 35 | 10 | |||||||||||
| Class B | — | — | 6 | |||||||||||
| Class C | — | — | 3 | |||||||||||
| Class M | — | 209 | 3 | |||||||||||
| Select Class | 1,719 | 182 | 2 | |||||||||||
| Institutional Class | 241 | — | 2 | |||||||||||
| Custodian and accounting fees | 93 | 36 | 32 | |||||||||||
| Interest expense | 1 | — | — | (a) | ||||||||||
| Professional fees | 107 | 85 | 50 | |||||||||||
| Trustees’ and Chief Compliance Officers’ fees | 15 | 3 | — | (a) | ||||||||||
| Printing and mailing costs | 79 | 30 | 19 | |||||||||||
| Registration and filing fees | 15 | 1 | 32 | |||||||||||
| Transfer agent fees | 38 | 31 | 28 | |||||||||||
| Other | 7 | 50 | 2 | |||||||||||
| Total expenses | 5,606 | 1,585 | 295 | |||||||||||
| Less amounts waived | (1,021 | ) | (276 | ) | (64 | ) | ||||||||
| Less earnings credits | (39 | ) | (4 | ) | — | (a) | ||||||||
| Less expense reimbursements | — | — | (88 | ) | ||||||||||
| Net expenses | 4,546 | 1,305 | 143 | |||||||||||
| Net investment income (loss) | 47,602 | 7,641 | 582 | |||||||||||
| | Short Term Bond Fund | | Short Term Bond Fund II | | Strategic Income Fund | |||||||||
|---|---|---|---|---|---|---|---|---|---|---|---|---|---|---|
REALIZED/UNREALIZED GAINS (LOSSES): | ||||||||||||||
| Net realized gain (loss) on transactions from: | ||||||||||||||
| Investments | $ | (5,392 | ) | $ | (1,700 | ) | $ | 78 | ||||||
| Securities sold short | 8,781 | 1,255 | 114 | |||||||||||
| Written options | (2,759 | ) | 214 | 103 | ||||||||||
| Futures | (9,668 | ) | (482 | ) | (144 | ) | ||||||||
| Swaps | 7,220 | 2,945 | 347 | |||||||||||
| Foreign currency transactions | (201 | ) | — | (2 | ) | |||||||||
| Net realized gain (loss) | (2,019 | ) | 2,232 | 496 | ||||||||||
| Change in net unrealized appreciation (depreciation) of: | ||||||||||||||
| Investments | (15,373 | ) | (2,182 | ) | (822 | ) | ||||||||
| Securities sold short | (2,492 | ) | 99 | (19 | ) | |||||||||
| Written options | (1,547 | ) | (483 | ) | (211 | ) | ||||||||
| Futures | 938 | 307 | (11 | ) | ||||||||||
| Swaps | (22,600 | ) | (2,591 | ) | (710 | ) | ||||||||
| Foreign currency translations | 19 | — | (4 | ) | ||||||||||
| Change in net unrealized appreciation (depreciation) | (41,055 | ) | (4,850 | ) | (1,777 | ) | ||||||||
| Net realized/unrealized gains (losses) | (43,074 | ) | (2,618 | ) | (1,281 | ) | ||||||||
| Change in net assets resulting from operations | $ | 4,528 | $ | 5,023 | $ | (699 | ) | |||||||
| (a) | Amount rounds to less than $1,000. |
| (b) | Includes reimbursements of investment advisory, administration and shareholder servicing fees. Please see Fees and Other Transactions with Affiliates in the Notes to Financial Statements. |
FOR THE PERIODS INDICATED
| Bond Fund | Emerging Markets Debt Fund | ||||||||||||||||||||||||||
|---|---|---|---|---|---|---|---|---|---|---|---|---|---|---|---|---|---|---|---|---|---|---|---|---|---|---|---|
| | Six Months Ended 8/31/2007 (Unaudited) | | Period Ended 2/28/2007 (a) | | Year Ended 8/31/2006 | | Six Months Ended 8/31/2007 (Unaudited) | | Period Ended 2/28/2007 (a) | | Year Ended 8/31/2006 (b) (c) | ||||||||||||||||
CHANGE IN NET ASSETS RESULTING FROM OPERATIONS: | |||||||||||||||||||||||||||
| Net investment income (loss) | $ | 60,994 | $ | 47,835 | $ | 54,198 | $ | 5,837 | $ | 3,194 | $ | 4,266 | |||||||||||||||
| Net realized gain (loss) | (2,930 | ) | (3,874 | ) | (31,678 | ) | 785 | 3,159 | 137 | ||||||||||||||||||
| Change in net unrealized appreciation (depreciation) | (89,248 | ) | 28,712 | 7,040 | (13,728 | ) | 2,325 | 1,186 | |||||||||||||||||||
| Change in net assets resulting from operations | (31,184 | ) | 72,673 | 29,560 | (7,106 | ) | 8,678 | 5,589 | |||||||||||||||||||
DISTRIBUTIONS TO SHAREHOLDERS: | |||||||||||||||||||||||||||
Class A | |||||||||||||||||||||||||||
| From net investment income | (653 | ) | (440 | ) | (450 | ) | (129 | ) | (30 | ) | — | (d) | |||||||||||||||
| From net realized gains | — | — | (198 | ) | — | (3 | ) | — | |||||||||||||||||||
Class B | |||||||||||||||||||||||||||
| From net investment income | (86 | ) | (68 | ) | (97 | ) | — | — | — | ||||||||||||||||||
| From net realized gains | — | — | (68 | ) | — | — | — | ||||||||||||||||||||
Class C | |||||||||||||||||||||||||||
| From net investment income | (148 | ) | (90 | ) | (55 | ) | (59 | ) | (16 | ) | — | (d) | |||||||||||||||
| From net realized gains | — | — | (24 | ) | — | (2 | ) | — | |||||||||||||||||||
R Class | |||||||||||||||||||||||||||
| From net investment income | — | — | — | (441 | ) | (172 | ) | (33 | ) | ||||||||||||||||||
| From net investment income | — | — | — | — | (21 | ) | — | ||||||||||||||||||||
Select Class | |||||||||||||||||||||||||||
| From net investment income | (44,697 | ) | (35,814 | ) | (35,004 | ) | (4,551 | ) | (3,055 | ) | (4,005 | ) | |||||||||||||||
| From net realized gains | — | — | (5,719 | ) | — | (378 | ) | (6,019 | ) | ||||||||||||||||||
Institutional Class | |||||||||||||||||||||||||||
| From net investment income | (11,327 | ) | (9,118 | ) | (11,743 | ) | — | — | — | ||||||||||||||||||
| From net realized gains | — | — | (6,859 | ) | — | — | — | ||||||||||||||||||||
Ultra | |||||||||||||||||||||||||||
| From net investment income | (4,426 | ) | (4,125 | ) | (6,786 | ) | — | — | — | ||||||||||||||||||
| From net realized gains | — | — | (3,926 | ) | — | — | — | ||||||||||||||||||||
| Total distributions to shareholders | (61,337 | ) | (49,655 | ) | (70,929 | ) | (5,180 | ) | (3,677 | ) | (10,057 | ) | |||||||||||||||
CAPITAL TRANSACTIONS: | |||||||||||||||||||||||||||
| Change in net assets from capital transactions | 385,218 | 286,861 | 1,184,150 | 116,691 | 12,560 | 89,788 | |||||||||||||||||||||
| Voluntary contribution from Advisor | — | — | — | — | — | 149 | |||||||||||||||||||||
NET ASSETS: | |||||||||||||||||||||||||||
| Change in net assets | 292,697 | 309,879 | 1,142,781 | 104,405 | 17,561 | 85,469 | |||||||||||||||||||||
| Beginning of period | 2,049,959 | 1,740,080 | 597,299 | 137,478 | 119,917 | 34,448 | |||||||||||||||||||||
| End of period | $ | 2,342,656 | $ | 2,049,959 | $ | 1,740,080 | $ | 241,883 | $ | 137,478 | $ | 119,917 | |||||||||||||||
| Accumulated undistributed (distributions in excess of) net investment income | $ | (2,528 | ) | $ | (2,185 | ) | $ | 961 | $ | 961 | $ | 304 | $ | 96 | |||||||||||||
| (a) | The Fund changed its fiscal year end from August 31 to the last day of February. |
| (b) | Class A and Class C Shares commenced operations on June 30, 2006 for the Emerging Markets Debt Fund. |
| (c) | R Class Shares commenced operations on May 15, 2006 for the Emerging Markets Debt Fund. |
| (d) | Amount rounds to less than $1,000. |
| Enhanced Income Fund | Real Return Fund | ||||||||||||||||||||||||||
|---|---|---|---|---|---|---|---|---|---|---|---|---|---|---|---|---|---|---|---|---|---|---|---|---|---|---|---|
| | Six Months Ended 8/31/2007 (Unaudited) | | Period Ended 2/28/2007 (a) | | Year Ended 8/31/2006 | | Six Months Ended 8/31/2007 (Unaudited) | | Period Ended 2/28/2007 (a) | | Year Ended 8/31/2006 | ||||||||||||||||
CHANGE IN NET ASSETS RESULTING FROM OPERATIONS: | |||||||||||||||||||||||||||
| Net investment income (loss) | $ | 5,223 | $ | 4,782 | $ | 7,038 | $ | 2,635 | $ | 384 | $ | 2,917 | |||||||||||||||
| Net realized gain (loss) | (1,109 | ) | (267 | ) | (611 | ) | 156 | (747 | ) | (1,595 | ) | ||||||||||||||||
| Change in net unrealized appreciation (depreciation) | (4,017 | ) | 147 | (213 | ) | (1,676 | ) | 1,035 | (924 | ) | |||||||||||||||||
| Change in net assets resulting from operations | 97 | 4,662 | 6,214 | 1,115 | 672 | 398 | |||||||||||||||||||||
DISTRIBUTIONS TO SHAREHOLDERS: | |||||||||||||||||||||||||||
Class A | |||||||||||||||||||||||||||
| From net investment income | — | — | — | (25 | ) | (4 | ) | (12 | ) | ||||||||||||||||||
Class C | |||||||||||||||||||||||||||
| From net investment income | — | — | — | (1 | ) | — | (b) | (1 | ) | ||||||||||||||||||
Select Class | |||||||||||||||||||||||||||
| From net investment income | — | — | — | (2,425 | ) | (421 | ) | (2,740 | ) | ||||||||||||||||||
Institutional Class | |||||||||||||||||||||||||||
| From net investment income | (5,214 | ) | (4,780 | ) | (6,984 | ) | (240 | ) | (45 | ) | (22 | ) | |||||||||||||||
| Total distributions to shareholders | (5,214 | ) | (4,780 | ) | (6,984 | ) | (2,691 | ) | (470 | ) | (2,775 | ) | |||||||||||||||
CAPITAL TRANSACTIONS: | |||||||||||||||||||||||||||
| Change in net assets from capital transactions | 11,636 | 51,982 | (31,336 | ) | 3,623 | 7,887 | 62,811 | ||||||||||||||||||||
NET ASSETS: | |||||||||||||||||||||||||||
| Change in net assets | 6,519 | 51,864 | (32,106 | ) | 2,047 | 8,089 | 60,434 | ||||||||||||||||||||
| Beginning of period | 183,102 | 131,238 | 163,344 | 68,523 | 60,434 | — | |||||||||||||||||||||
| End of period | $ | 189,621 | $ | 183,102 | $ | 131,238 | $ | 70,570 | $ | 68,523 | $ | 60,434 | |||||||||||||||
| Accumulated undistributed (distributions in excess of) net investment income | $ | 8 | $ | (1 | ) | $ | (1 | ) | $ | 25 | $ | 81 | $ | 23 | |||||||||||||
| (a) | The Fund changed its fiscal year end from August 31 to the last day of February. |
| (b) | Amount rounds to less than $1,000. |
FOR THE PERIODS INDICATED (continued)
| Short Term Bond Fund | Short Term Bond Fund II | ||||||||||||||||||||||||||
|---|---|---|---|---|---|---|---|---|---|---|---|---|---|---|---|---|---|---|---|---|---|---|---|---|---|---|---|
| | Six Months Ended 8/31/2007 (Unaudited) | | Period Ended 2/28/2007 (a) | | Year Ended 8/31/2006 | | Six Months Ended 8/31/2007 (Unaudited) | | Period Ended 2/28/2007 (a) | | Year Ended 8/31/2006 | ||||||||||||||||
CHANGE IN NET ASSETS RESULTING FROM OPERATIONS: | |||||||||||||||||||||||||||
| Net investment income (loss) | $ | 47,602 | $ | 32,784 | $ | 33,666 | $ | 7,641 | $ | 10,472 | $ | 31,910 | |||||||||||||||
| Net realized gain (loss) | (2,019 | ) | (7,569 | ) | (7,631 | ) | 2,232 | (5,863 | ) | (14,116 | ) | ||||||||||||||||
| Change in net unrealized appreciation (depreciation) | (41,055 | ) | 10,895 | (835 | ) | (4,850 | ) | 6,622 | (649 | ) | |||||||||||||||||
| Change in net assets resulting from operations | 4,528 | 36,110 | 25,200 | 5,023 | 11,231 | 17,145 | |||||||||||||||||||||
| Net equalization credits (debits) | — | — | — | (77 | ) | (294 | ) | (370 | ) | ||||||||||||||||||
DISTRIBUTIONS TO SHAREHOLDERS: | |||||||||||||||||||||||||||
Class A | |||||||||||||||||||||||||||
| From net investment income | (248 | ) | (203 | ) | (203 | ) | (635 | ) | (641 | ) | (1,562 | ) | |||||||||||||||
Class M | |||||||||||||||||||||||||||
| From net investment income | — | — | — | (3,520 | ) | (4,320 | ) | (10,192 | ) | ||||||||||||||||||
Select Class | |||||||||||||||||||||||||||
| From net investment income | (34,373 | ) | (23,067 | ) | (14,040 | ) | (3,453 | ) | (5,787 | ) | (18,630 | ) | |||||||||||||||
Institutional Class | |||||||||||||||||||||||||||
| From net investment income | (12,480 | ) | (10,655 | ) | (19,301 | ) | — | — | — | ||||||||||||||||||
| Total distributions to shareholders | (47,101 | ) | (33,925 | ) | (33,544 | ) | (7,608 | ) | (10,748 | ) | (30,384 | ) | |||||||||||||||
CAPITAL TRANSACTIONS: | |||||||||||||||||||||||||||
| Change in net assets from capital transactions | 389,050 | 624,844 | 400,725 | (31,036 | ) | (265,006 | ) | (214,576 | ) | ||||||||||||||||||
NET ASSETS: | |||||||||||||||||||||||||||
| Change in net assets | 346,477 | 627,029 | 392,381 | (33,698 | ) | (264,817 | ) | (228,185 | ) | ||||||||||||||||||
| Beginning of period | 1,653,298 | 1,026,269 | 633,888 | 352,121 | 616,938 | 845,123 | |||||||||||||||||||||
| End of period | $ | 1,999,775 | $ | 1,653,298 | $ | 1,026,269 | $ | 318,423 | $ | 352,121 | $ | 616,938 | |||||||||||||||
| Accumulated undistributed (distributions in excess of) net investment income | $ | (50 | ) | $ | (551 | ) | $ | 1,310 | $ | (1 | ) | $ | (34 | ) | $ | 190 | |||||||||||
| (a) | The Fund changed its fiscal year end from August 31 to the last day of February. |
| Strategic Income Fund | |||||||||||||||
|---|---|---|---|---|---|---|---|---|---|---|---|---|---|---|---|
| | Six Months Ended 8/31/2007 (Unaudited) | | Period Ended 2/28/2007 (a) | | Year Ended 8/31/2006 | ||||||||||
CHANGE IN NET ASSETS RESULTING FROM OPERATIONS: | |||||||||||||||
| Net investment income (loss) | $ | 582 | $ | 573 | $ | 994 | |||||||||
| Net realized gain (loss) | 496 | (160 | ) | (447 | ) | ||||||||||
| Change in net unrealized appreciation (depreciation) | (1,777 | ) | 546 | 156 | |||||||||||
| Change in net assets resulting from operations | (699 | ) | 959 | 703 | |||||||||||
| Net equalization credits (debits) | (9 | ) | (2 | ) | 5 | ||||||||||
DISTRIBUTIONS TO SHAREHOLDERS: | |||||||||||||||
Class A | |||||||||||||||
| From net investment income | (186 | ) | (185 | ) | (265 | ) | |||||||||
Class B | |||||||||||||||
| From net investment income | (111 | ) | (133 | ) | (314 | ) | |||||||||
Class C | |||||||||||||||
| From net investment income | (59 | ) | (73 | ) | (136 | ) | |||||||||
Class M | |||||||||||||||
| From net investment income | (40 | ) | (77 | ) | (207 | ) | |||||||||
Select Class | |||||||||||||||
| From net investment income | (44 | ) | (48 | ) | (113 | ) | |||||||||
Institutional Class | |||||||||||||||
| From net investment income | (98 | ) | (101 | ) | (151 | ) | |||||||||
| Total distributions to shareholders | (538 | ) | (617 | ) | (1,186 | ) | |||||||||
CAPITAL TRANSACTIONS: | |||||||||||||||
| Change in net assets from capital transactions | (4,939 | ) | (783 | ) | 3,224 | ||||||||||
NET ASSETS: | |||||||||||||||
| Change in net assets | (6,185 | ) | (443 | ) | 2,746 | ||||||||||
| Beginning of period | 24,605 | 25,048 | 22,302 | ||||||||||||
| End of period | $ | 18,420 | $ | 24,605 | $ | 25,048 | |||||||||
| Accumulated undistributed (distributions in excess of) net investment income | $ | 40 | $ | (4 | ) | $ | 73 | ||||||||
| (a) | The Fund changed its fiscal year end from August 31 to the last day of February. |
FOR THE PERIODS INDICATED (continued)
| Bond Fund | Emerging Markets Debt Fund | ||||||||||||||||||||||||||
|---|---|---|---|---|---|---|---|---|---|---|---|---|---|---|---|---|---|---|---|---|---|---|---|---|---|---|---|
| | Six Months Ended 8/31/2007 (Unaudited) | | Period Ended 2/28/2007 (a) | | Year Ended 8/31/2006 | | Six Months Ended 8/31/2007 (Unaudited) | | Period Ended 2/28/2007 (a) | | Year Ended 8/31/2006 (b) (c) | ||||||||||||||||
CAPITAL TRANSACTIONS: | |||||||||||||||||||||||||||
Class A | |||||||||||||||||||||||||||
| Proceeds from shares issued | $ | 13,952 | $ | 9,853 | $ | 13,249 | $ | 7,288 | $ | 2,130 | $ | 40 | |||||||||||||||
| Dividends and distributions reinvested | 518 | 365 | 575 | 88 | 8 | — | (d) | ||||||||||||||||||||
| Cost of shares redeemed | (7,623 | ) | (3,778 | ) | (5,735 | ) | (3,143 | ) | (55 | ) | — | ||||||||||||||||
| Redemption fees | — | — | — | 1 | — | (d) | — | (d) | |||||||||||||||||||
| Change in net assets from Class A capital transactions | $ | 6,847 | $ | 6,440 | $ | 8,089 | $ | 4,234 | $ | 2,083 | $ | 40 | |||||||||||||||
Class B | |||||||||||||||||||||||||||
| Proceeds from shares issued | $ | 1,176 | $ | 1,112 | $ | 1,245 | $ | — | $ | — | $ | — | |||||||||||||||
| Dividends and distributions reinvested | 61 | 44 | 87 | — | — | — | |||||||||||||||||||||
| Cost of shares redeemed | (653 | ) | (444 | ) | (665 | ) | — | — | — | ||||||||||||||||||
| Change in net assets from Class B capital transactions | $ | 584 | $ | 712 | $ | 667 | $ | — | $ | — | $ | — | |||||||||||||||
Class C | |||||||||||||||||||||||||||
| Proceeds from shares issued | $ | 3,128 | $ | 2,903 | $ | 2,350 | $ | 2,683 | $ | 1,292 | $ | 26 | |||||||||||||||
| Dividends and distributions reinvested | 86 | 54 | 67 | 47 | 15 | — | (d) | ||||||||||||||||||||
| Cost of shares redeemed | (962 | ) | (431 | ) | (225 | ) | (197 | ) | (16 | ) | — | ||||||||||||||||
| Redemption fees | — | — | — | — | (d) | — | (d) | — | (d) | ||||||||||||||||||
| Change in net assets from Class C capital transactions | $ | 2,252 | $ | 2,526 | $ | 2,192 | $ | 2,533 | $ | 1,291 | $ | 26 | |||||||||||||||
R Class | |||||||||||||||||||||||||||
| Proceeds from shares issued | $ | — | $ | — | $ | — | $ | 12,414 | $ | 5,842 | $ | 2,254 | |||||||||||||||
| Dividends and distributions reinvested | — | — | — | 441 | 193 | 33 | |||||||||||||||||||||
| Cost of shares redeemed | — | — | — | (626 | ) | (130 | ) | — | |||||||||||||||||||
| Redemption fees | — | — | — | 2 | — | (d) | — | (d) | |||||||||||||||||||
| Change in net assets from R Class capital transactions | $ | — | $ | — | $ | — | $ | 12,231 | $ | 5,905 | $ | 2,287 | |||||||||||||||
Select Class | |||||||||||||||||||||||||||
| Proceeds from shares issued | $ | 531,913 | $ | 450,726 | $ | 597,386 | $ | 114,757 | $ | 31,105 | $ | 118,045 | |||||||||||||||
| Subscriptions in-kind (Note 8) | — | — | 744,265 | — | — | — | |||||||||||||||||||||
| Dividends and distributions reinvested | 12,507 | 3,800 | 10,560 | 1,436 | 1,367 | 7,995 | |||||||||||||||||||||
| Cost of shares redeemed | (220,028 | ) | (321,936 | ) | (226,087 | ) | (18,526 | ) | (29,193 | ) | (38,629 | ) | |||||||||||||||
| Redemption fees | — | — | — | 26 | 2 | 24 | |||||||||||||||||||||
| Change in net assets from Select Class capital transactions | $ | 324,392 | $ | 132,590 | $ | 1,126,124 | $ | 97,693 | $ | 3,281 | $ | 87,435 | |||||||||||||||
Institutional Class | |||||||||||||||||||||||||||
| Proceeds from shares issued | $ | 97,441 | $ | 241,014 | $ | 115,518 | $ | — | $ | — | $ | — | |||||||||||||||
| Dividends and distributions reinvested | 6,336 | 5,432 | 12,418 | — | — | — | |||||||||||||||||||||
| Cost of shares redeemed | (55,622 | ) | (116,742 | ) | (108,417 | ) | — | — | — | ||||||||||||||||||
| Change in net assets from Institutional Class capital transactions | $ | 48,155 | $ | 129,704 | $ | 19,519 | $ | — | $ | — | $ | — | |||||||||||||||
Ultra | |||||||||||||||||||||||||||
| Proceeds from shares issued | $ | 6,740 | $ | 24,334 | $ | 54,168 | $ | — | $ | — | $ | — | |||||||||||||||
| Dividends and distributions reinvested | 2,297 | 2,196 | 5,728 | — | — | — | |||||||||||||||||||||
| Cost of shares redeemed | (6,049 | ) | (11,641 | ) | (32,337 | ) | — | — | — | ||||||||||||||||||
| Change in net assets from Ultra capital transactions | $ | 2,988 | $ | 14,889 | $ | 27,559 | $ | — | $ | — | $ | — | |||||||||||||||
Total change in net assets from capital transactions | $ | 385,218 | $ | 286,861 | $ | 1,184,150 | $ | 116,691 | $ | 12,560 | $ | 89,788 | |||||||||||||||
| (a) | The Fund changed its fiscal year end from August 31 to the last day of February. |
| (b) | Commencement of offering of Class A Shares and Class C Shares was June 30, 2006. |
| (c) | Commencement of offering of R Class Shares on May 15, 2006. |
| (d) | Amount rounds to less than $1,000. |
| Bond Fund | Emerging Markets Debt Fund | ||||||||||||||||||||||||||
|---|---|---|---|---|---|---|---|---|---|---|---|---|---|---|---|---|---|---|---|---|---|---|---|---|---|---|---|
| | Six Months Ended 8/31/2007 (Unaudited) | | Period Ended 2/28/2007 (a) | | Year Ended 8/31/2006 | | Six Months Ended 8/31/2007 (Unaudited) | | Period Ended 2/28/2007 (a) | | Year Ended 8/31/2006 (b) (c) | ||||||||||||||||
SHARE TRANSACTIONS: | |||||||||||||||||||||||||||
Class A | |||||||||||||||||||||||||||
| Issued | 1,495 | 1,053 | 1,415 | 813 | 247 | 5 | |||||||||||||||||||||
| Reinvested | 56 | 39 | 62 | 10 | 1 | — | (d) | ||||||||||||||||||||
| Redeemed | (827 | ) | (404 | ) | (615 | ) | (356 | ) | (6 | ) | — | ||||||||||||||||
| Change in Class A Shares | 724 | 688 | 862 | 467 | 242 | 5 | |||||||||||||||||||||
Class B | |||||||||||||||||||||||||||
| Issued | 127 | 120 | 134 | — | — | — | |||||||||||||||||||||
| Reinvested | 7 | 5 | 9 | — | — | — | |||||||||||||||||||||
| Redeemed | (71 | ) | (48 | ) | (71 | ) | — | — | — | ||||||||||||||||||
| Change in Class B Shares | 63 | 77 | 72 | — | — | — | |||||||||||||||||||||
Class C | |||||||||||||||||||||||||||
| Issued | 336 | 311 | 251 | 302 | 150 | 3 | |||||||||||||||||||||
| Reinvested | 9 | 6 | 7 | 6 | 2 | — | (d) | ||||||||||||||||||||
| Redeemed | (104 | ) | (46 | ) | (24 | ) | (23 | ) | (2 | ) | — | ||||||||||||||||
| Change in Class C Shares | 241 | 271 | 234 | 285 | 150 | 3 | |||||||||||||||||||||
R Class | |||||||||||||||||||||||||||
| Issued | — | — | — | 1,396 | 686 | 285 | |||||||||||||||||||||
| Reinvested | — | — | — | 51 | 22 | 4 | |||||||||||||||||||||
| Redeemed | — | — | — | (69 | ) | (16 | ) | — | |||||||||||||||||||
| Change in R Class Shares | — | — | — | 1,378 | 692 | 289 | |||||||||||||||||||||
Select Class | |||||||||||||||||||||||||||
| Issued | 57,465 | 48,649 | 64,971 | 12,951 | 3,581 | 13,930 | |||||||||||||||||||||
| Subscriptions in-kind (Note 8) | — | — | 80,114 | — | — | — | |||||||||||||||||||||
| Reinvested | 1,369 | 410 | 1,138 | 164 | 158 | 969 | |||||||||||||||||||||
| Redeemed | (24,009 | ) | (34,689 | ) | (24,545 | ) | (2,128 | ) | (3,373 | ) | (4,616 | ) | |||||||||||||||
| Change in Select Class Shares | 34,825 | 14,370 | 121,678 | 10,987 | 366 | 10,283 | |||||||||||||||||||||
Institutional Class | |||||||||||||||||||||||||||
| Issued | 10,622 | 25,948 | 12,514 | — | — | — | |||||||||||||||||||||
| Reinvested | 693 | 586 | 1,339 | — | — | — | |||||||||||||||||||||
| Redeemed | (6,084 | ) | (12,543 | ) | (11,627 | ) | — | — | — | ||||||||||||||||||
| Change in Institutional Class Shares | 5,231 | 13,991 | 2,226 | — | — | — | |||||||||||||||||||||
Ultra | |||||||||||||||||||||||||||
| Issued | 732 | 2,614 | 5,754 | — | — | — | |||||||||||||||||||||
| Reinvested | 251 | 237 | 617 | — | — | — | |||||||||||||||||||||
| Redeemed | (661 | ) | (1,255 | ) | (3,479 | ) | — | — | — | ||||||||||||||||||
| Change in Ultra Shares | 322 | 1,596 | 2,892 | — | — | — | |||||||||||||||||||||
| (a) | The Fund changed its fiscal year end from August 31 to the last day of February. |
| (b) | Commencement of offering of Class A Shares and Class C Shares was June 30, 2006. |
| (c) | Commencement of offering of R Class Shares on May 15, 2006. |
| (d) | Amount rounds to less than 1,000. |
FOR THE PERIODS INDICATED (continued)
| Enhanced Income Fund | Real Return Fund | ||||||||||||||||||||||||||
|---|---|---|---|---|---|---|---|---|---|---|---|---|---|---|---|---|---|---|---|---|---|---|---|---|---|---|---|
| | Six Months Ended 8/31/2007 (Unaudited) | | Period Ended 2/28/2007 (a) | | Year Ended 8/31/2006 | | Six Months Ended 8/31/2007 (Unaudited) | | Period Ended 2/28/2007 (a) | | Year Ended 8/31/2006 (b) | ||||||||||||||||
CAPITAL TRANSACTIONS: | |||||||||||||||||||||||||||
Class A | |||||||||||||||||||||||||||
| Proceeds from shares issued | $ | — | $ | — | $ | — | $ | 179 | $ | 67 | $ | 691 | |||||||||||||||
| Dividends and distributions reinvested | — | — | — | 17 | 3 | 6 | |||||||||||||||||||||
| Cost of shares redeemed | — | — | — | (287 | ) | (24 | ) | (107 | ) | ||||||||||||||||||
| Change in net assets from Class A capital transactions | $ | — | $ | — | $ | — | $ | (91 | ) | $ | 46 | $ | 590 | ||||||||||||||
Class C | |||||||||||||||||||||||||||
| Proceeds from shares issued | $ | — | $ | — | $ | — | $ | 44 | $ | 3 | $ | 24 | |||||||||||||||
| Dividends and distributions reinvested | — | — | — | 1 | — | (c) | 1 | ||||||||||||||||||||
| Cost of shares redeemed | — | — | — | (15 | ) | — | — | (c) | |||||||||||||||||||
| Change in net assets from Class C capital transactions | $ | — | $ | — | $ | — | $ | 30 | $ | 3 | $ | 25 | |||||||||||||||
Select Class | |||||||||||||||||||||||||||
| Proceeds from shares issued | $ | — | $ | — | $ | — | $ | 2,521 | $ | 2,300 | $ | 60,834 | |||||||||||||||
| Dividends and distributions reinvested | — | — | — | 2,425 | 421 | 1,957 | |||||||||||||||||||||
| Cost of shares redeemed | — | — | — | (1,502 | ) | — | (1,530 | ) | |||||||||||||||||||
| Change in net assets from Select Class capital transactions | $ | — | $ | — | $ | — | $ | 3,444 | $ | 2,721 | $ | 61,261 | |||||||||||||||
Institutional Class | |||||||||||||||||||||||||||
| Proceeds from shares issued | $ | 93,764 | $ | 73,528 | $ | 93,886 | $ | 200 | $ | 5,110 | $ | 928 | |||||||||||||||
| Dividends and distributions reinvested | 3,749 | 3,669 | 6,204 | 40 | 7 | 22 | |||||||||||||||||||||
| Cost of shares redeemed | (85,877 | ) | (25,215 | ) | (131,426 | ) | — | — | (15 | ) | |||||||||||||||||
| Change in net assets from Institutional Class capital transactions | $ | 11,636 | $ | 51,982 | $ | (31,336 | ) | $ | 240 | $ | 5,117 | $ | 935 | ||||||||||||||
Total change in net assets from capital transactions | $ | 11,636 | $ | 51,982 | $ | (31,336 | ) | $ | 3,623 | $ | 7,887 | $ | 62,811 | ||||||||||||||
| (a) | The Fund changed its fiscal year end from August 31 to the last day of February. |
| (b) | Commencement of operations was September 1, 2005. |
| (c) | Amount rounds to less than $1,000. |
| Enhanced Income Fund | Real Return Fund | ||||||||||||||||||||||||||
|---|---|---|---|---|---|---|---|---|---|---|---|---|---|---|---|---|---|---|---|---|---|---|---|---|---|---|---|
| | Six Months Ended 8/31/2007 (Unaudited) | | Period Ended 2/28/2007 (a) | | Year Ended 8/31/2006 | | Six Months Ended 8/31/2007 (Unaudited) | | Period Ended 2/28/2007 (a) | | Year Ended 8/31/2006 (b) | ||||||||||||||||
SHARE TRANSACTIONS: | |||||||||||||||||||||||||||
Class A | |||||||||||||||||||||||||||
| Issued | — | — | — | 19 | 7 | 72 | |||||||||||||||||||||
| Reinvested | — | — | — | 2 | — | (c) | — | (c) | |||||||||||||||||||
| Redeemed | — | — | — | (31 | ) | (2 | ) | (11 | ) | ||||||||||||||||||
| Change in Class A Shares | — | — | (10 | ) | 5 | 61 | |||||||||||||||||||||
Class C | |||||||||||||||||||||||||||
| Issued | — | — | — | 5 | — | (c) | 3 | ||||||||||||||||||||
| Reinvested | — | — | — | — | (c) | — | (c) | — | (c) | ||||||||||||||||||
| Redeemed | — | — | — | (2 | ) | — | — | (c) | |||||||||||||||||||
| Change in Class C Shares | — | — | — | 3 | — | (c) | 3 | ||||||||||||||||||||
Select Class | |||||||||||||||||||||||||||
| Issued | — | — | — | 268 | 247 | 6,135 | |||||||||||||||||||||
| Reinvested | — | — | — | 259 | 44 | 207 | |||||||||||||||||||||
| Redeemed | — | — | — | (161 | ) | — | (161 | ) | |||||||||||||||||||
| Change in Select Class Shares | — | — | — | 366 | 291 | 6,181 | |||||||||||||||||||||
Institutional Class | |||||||||||||||||||||||||||
| Issued | 9,601 | 7,523 | 9,579 | 22 | 539 | 98 | |||||||||||||||||||||
| Reinvested | 387 | 376 | 635 | 4 | 1 | 2 | |||||||||||||||||||||
| Redeemed | (8,836 | ) | (2,575 | ) | (13,408 | ) | — | — | (1 | ) | |||||||||||||||||
| Change in Institutional Class Shares | 1,152 | 5,324 | (3,194 | ) | 26 | 540 | 99 | ||||||||||||||||||||
| (a) | The Fund changed its fiscal year end from August 31 to the last day of February. |
| (b) | Commencement of operations was September 1, 2005. |
| (c) | Amount rounds to less than 1,000. |
FOR THE PERIODS INDICATED (continued)
| Short Term Bond Fund | Short Term Bond Fund II | ||||||||||||||||||||||||||
|---|---|---|---|---|---|---|---|---|---|---|---|---|---|---|---|---|---|---|---|---|---|---|---|---|---|---|---|
| | Six Months Ended 8/31/2007 (Unaudited) | | Period Ended 2/28/2007 (a) | | Year Ended 8/31/2006 | | Six Months Ended 8/31/2007 (Unaudited) | | Period Ended 2/28/2007 (a) | | Year Ended 8/31/2006 | ||||||||||||||||
CAPITAL TRANSACTIONS: | |||||||||||||||||||||||||||
Class A | |||||||||||||||||||||||||||
| Proceeds from shares issued | $ | 5,150 | $ | 4,315 | $ | 3,712 | $ | 5,813 | $ | 1,081 | $ | 4,577 | |||||||||||||||
| Dividends and distributions reinvested | 234 | 193 | 197 | 598 | 582 | 1,410 | |||||||||||||||||||||
| Cost of shares redeemed | (2,490 | ) | (1,831 | ) | (1,428 | ) | (4,822 | ) | (9,574 | ) | (14,049 | ) | |||||||||||||||
| Change in net assets from Class A capital transactions | $ | 2,894 | $ | 2,677 | $ | 2,481 | $ | 1,589 | $ | (7,911 | ) | $ | (8,062 | ) | |||||||||||||
Class M | |||||||||||||||||||||||||||
| Proceeds from shares issued | $ | — | $ | — | $ | — | $ | — | (b) | $ | — | $ | 388 | ||||||||||||||
| Dividends and distributions reinvested | — | — | — | — | (b) | — | 1 | ||||||||||||||||||||
| Cost of shares redeemed | — | — | — | (20,637 | ) | (33,459 | ) | (157,508 | ) | ||||||||||||||||||
| Change in net assets from Class M capital transactions | $ | — | $ | — | $ | — | $ | (20,637 | ) | $ | (33,459 | ) | $ | (157,119 | ) | ||||||||||||
Select Class | |||||||||||||||||||||||||||
| Proceeds from shares issued | $ | 443,472 | $ | 704,823 | $ | 560,733 | $ | 8,301 | $ | 12,169 | $ | 103,808 | |||||||||||||||
| Dividends and distributions reinvested | 2,192 | 1,999 | 2,346 | 159 | 270 | 728 | |||||||||||||||||||||
| Cost of shares redeemed | (108,942 | ) | (158,187 | ) | (79,887 | ) | (20,448 | ) | (236,075 | ) | (153,931 | ) | |||||||||||||||
| Change in net assets from Select Class capital transactions | $ | 336,722 | $ | 548,635 | $ | 483,192 | $ | (11,988 | ) | $ | (223,636 | ) | $ | (49,395 | ) | ||||||||||||
Institutional Class | |||||||||||||||||||||||||||
| Proceeds from shares issued | $ | 89,243 | $ | 240,826 | $ | 141,259 | $ | — | $ | — | $ | — | |||||||||||||||
| Dividends and distributions reinvested | 6,808 | 7,005 | 13,896 | — | — | — | |||||||||||||||||||||
| Cost of shares redeemed | (46,617 | ) | (174,299 | ) | (240,103 | ) | — | — | — | ||||||||||||||||||
| Change in net assets from Institutional Class capital transactions | $ | 49,434 | $ | 73,532 | $ | (84,948 | ) | $ | — | $ | — | $ | — | ||||||||||||||
Total change in net assets from capital transactions | $ | 389,050 | $ | 624,844 | $ | 400,725 | $ | (31,036 | ) | $ | (265,006 | ) | $ | (214,576 | ) | ||||||||||||
| (a) | The Fund changed its fiscal year end from August 31 to the last day of February. |
| (b) | Amount rounds to less than $1,000. |
| Short Term Bond Fund | Short Term Bond Fund II | ||||||||||||||||||||||||||
|---|---|---|---|---|---|---|---|---|---|---|---|---|---|---|---|---|---|---|---|---|---|---|---|---|---|---|---|
| | Six Months Ended 8/31/2007 (Unaudited) | | Period Ended 2/28/2007 (a) | | Year Ended 8/31/2006 | | Six Months Ended 8/31/2007 (Unaudited) | | Period Ended 2/28/2007 (a) | | Year Ended 8/31/2006 | ||||||||||||||||
SHARE TRANSACTIONS: | |||||||||||||||||||||||||||
Class A | |||||||||||||||||||||||||||
| Issued | 543 | 454 | 389 | 591 | 110 | 464 | |||||||||||||||||||||
| Reinvested | 25 | 20 | 21 | 61 | 59 | 143 | |||||||||||||||||||||
| Redeemed | (264 | ) | (192 | ) | (150 | ) | (491 | ) | (973 | ) | (1,423 | ) | |||||||||||||||
| Change in Class A Shares | 304 | 282 | 260 | 161 | (804 | ) | (816 | ) | |||||||||||||||||||
Class M | |||||||||||||||||||||||||||
| Issued | — | — | — | — | (b) | — | 39 | ||||||||||||||||||||
| Reinvested | — | — | — | — | (b) | — | — | (b) | |||||||||||||||||||
| Redeemed | — | — | — | (2,101 | ) | (3,403 | ) | (15,882 | ) | ||||||||||||||||||
| Change in Class M Shares | — | — | — | (2,101 | ) | (3,403 | ) | (15,843 | ) | ||||||||||||||||||
Select Class | |||||||||||||||||||||||||||
| Issued | 46,688 | 73,963 | 58,968 | 845 | 1,234 | 10,490 | |||||||||||||||||||||
| Reinvested | 232 | 210 | 247 | 16 | 28 | 74 | |||||||||||||||||||||
| Redeemed | (11,475 | ) | (16,585 | ) | (8,372 | ) | (2,078 | ) | (23,939 | ) | (15,572 | ) | |||||||||||||||
| Change in Select Class Shares | 35,445 | 57,588 | 50,843 | (1,217 | ) | (22,677 | ) | (5,008 | ) | ||||||||||||||||||
Institutional Class | |||||||||||||||||||||||||||
| Issued | 9,391 | 25,250 | 14,788 | — | — | — | |||||||||||||||||||||
| Reinvested | 719 | 736 | 1,460 | — | — | — | |||||||||||||||||||||
| Redeemed | (4,904 | ) | (18,245 | ) | (25,159 | ) | — | — | — | ||||||||||||||||||
| Change in Institutional Class Shares | 5,206 | 7,741 | (8,911 | ) | — | — | — | ||||||||||||||||||||
| (a) | The Fund changed its fiscal year end from August 31 to the last day of February. |
| (b) | Amount rounds to less than 1,000. |
FOR THE PERIODS INDICATED (continued)
| Strategic Income Fund | |||||||||||||||
|---|---|---|---|---|---|---|---|---|---|---|---|---|---|---|---|
| | Six Months Ended 8/31/2007 (Unaudited) | | Period Ended 2/28/2007 (a) | | Year Ended 8/31/2006 | ||||||||||
CAPITAL TRANSACTIONS: | |||||||||||||||
Class A | |||||||||||||||
| Proceeds from shares issued | $ | 1,213 | $ | 1,526 | $ | 4,254 | |||||||||
| Dividends and distributions reinvested | 106 | 105 | 156 | ||||||||||||
| Cost of shares redeemed | (1,578 | ) | (683 | ) | (1,650 | ) | |||||||||
| Redemption fees | — | — | 1 | ||||||||||||
| Change in net assets from Class A capital transactions | $ | (259 | ) | $ | 948 | $ | 2,761 | ||||||||
Class B | |||||||||||||||
| Proceeds from shares issued | $ | 306 | $ | 315 | $ | 909 | |||||||||
| Dividends and distributions reinvested | 69 | 78 | 179 | ||||||||||||
| Cost of shares redeemed | (1,229 | ) | (971 | ) | (1,660 | ) | |||||||||
| Redemption fees | — | — | 2 | ||||||||||||
| Change in net assets from Class B capital transactions | $ | (854 | ) | $ | (578 | ) | $ | (570 | ) | ||||||
Class C | |||||||||||||||
| Proceeds from shares issued | $ | 378 | $ | 428 | $ | 1,583 | |||||||||
| Dividends and distributions reinvested | 37 | 46 | 89 | ||||||||||||
| Cost of shares redeemed | (1,062 | ) | (707 | ) | (970 | ) | |||||||||
| Redemption fees | — | — | 1 | ||||||||||||
| Change in net assets from Class C capital transactions | $ | (647 | ) | $ | (233 | ) | $ | 703 | |||||||
Class M | |||||||||||||||
| Proceeds from shares issued | $ | — | $ | — | $ | 7 | |||||||||
| Dividends and distributions reinvested | — | (b) | — | 18 | |||||||||||
| Cost of shares redeemed | (2,948 | ) | (509 | ) | (1,518 | ) | |||||||||
| Redemption fees | — | — | 1 | ||||||||||||
| Change in net assets from Class M capital transactions | $ | (2,948 | ) | $ | (509 | ) | $ | (1,492 | ) | ||||||
Select Class | |||||||||||||||
| Proceeds from shares issued | $ | 241 | $ | 191 | $ | 984 | |||||||||
| Dividends and distributions reinvested | 37 | 40 | 94 | ||||||||||||
| Cost of shares redeemed | (147 | ) | (425 | ) | (1,123 | ) | |||||||||
| Redemption fees | — | — | — | (b) | |||||||||||
| Change in net assets from Select Class capital transactions | $ | 131 | $ | (194 | ) | $ | (45 | ) | |||||||
Institutional Class | |||||||||||||||
| Proceeds from shares issued | $ | 866 | $ | 106 | $ | 2,481 | |||||||||
| Dividends and distributions reinvested | 53 | 60 | 144 | ||||||||||||
| Cost of shares redeemed | (1,281 | ) | (383 | ) | (759 | ) | |||||||||
| Redemption fees | — | — | 1 | ||||||||||||
| Change in net assets from Institutional Class capital transactions | $ | (362 | ) | $ | (217 | ) | $ | 1,867 | |||||||
Total change in net assets from capital transactions | $ | (4,939 | ) | $ | (783 | ) | $ | 3,224 | |||||||
| (a) | The Fund changed its fiscal year end from August 31 to the last day of February. |
| (b) | Amount rounds to less than $1,000. |
| Strategic Income Fund | |||||||||||||||
|---|---|---|---|---|---|---|---|---|---|---|---|---|---|---|---|
| | Six Months Ended 8/31/2007 (Unaudited) | | Period Ended 2/28/2007 (a) | | Year Ended 8/31/2006 | ||||||||||
SHARE TRANSACTIONS: | |||||||||||||||
Class A | |||||||||||||||
| Issued | 133 | 166 | 469 | ||||||||||||
| Reinvested | 12 | 11 | 17 | ||||||||||||
| Redeemed | (176 | ) | (74 | ) | (180 | ) | |||||||||
| Change in Class A Shares | (31 | ) | 103 | 306 | |||||||||||
Class B | |||||||||||||||
| Issued | 33 | 34 | 100 | ||||||||||||
| Reinvested | 8 | 9 | 20 | ||||||||||||
| Redeemed | (136 | ) | (106 | ) | (182 | ) | |||||||||
| Change in Class B Shares | (95 | ) | (63 | ) | (62 | ) | |||||||||
Class C | |||||||||||||||
| Issued | 42 | 47 | 175 | ||||||||||||
| Reinvested | 4 | 5 | 10 | ||||||||||||
| Redeemed | (117 | ) | (77 | ) | (107 | ) | |||||||||
| Change in Class C Shares | (71 | ) | (25 | ) | 78 | ||||||||||
Class M | |||||||||||||||
| Issued | — | — | 1 | ||||||||||||
| Reinvested | — | (b) | — | 2 | |||||||||||
| Redeemed | (324 | ) | (55 | ) | (166 | ) | |||||||||
| Change in Class M Shares | (324 | ) | (55 | ) | (163 | ) | |||||||||
Select Class | |||||||||||||||
| Issued | 26 | 21 | 108 | ||||||||||||
| Reinvested | 4 | 4 | 10 | ||||||||||||
| Redeemed | (16 | ) | (46 | ) | (124 | ) | |||||||||
| Change in Select Class Shares | 14 | (21 | ) | (6 | ) | ||||||||||
Institutional Class | |||||||||||||||
| Issued | 99 | 11 | 271 | ||||||||||||
| Reinvested | 6 | 7 | 16 | ||||||||||||
| Redeemed | (148 | ) | (42 | ) | (84 | ) | |||||||||
| Change in Institutional Class Shares | (43 | ) | (24 | ) | 203 | ||||||||||
| (a) | The Fund changed its fiscal year end from August 31 to the last day of February. |
| (b) | Amount rounds to less than 1,000. |
FOR THE PERIODS INDICATED
| | | | | Per share operating performance | | ||||||||||||||||||||||||||||||
|---|---|---|---|---|---|---|---|---|---|---|---|---|---|---|---|---|---|---|---|---|---|---|---|---|---|---|---|---|---|---|---|---|---|---|---|
| Investment operations | Distributions | ||||||||||||||||||||||||||||||||||
| | Net asset value, beginning of period | | Net investment income (loss) | | Net realized and unrealized gains (losses) on investments | | Total from investment operations | | Net investment income | | Net realized gains | | Tax return of capital | | Total distributions | ||||||||||||||||||||
Bond Fund | |||||||||||||||||||||||||||||||||||
| Six Months Ended August 31, 2007 (Unaudited) | $ | 9.40 | $ | 0.23 | $ | (0.35 | ) | $ | (0.12 | ) | $ | (0.23 | ) | $ | — | $ | — | $ | (0.23 | ) | |||||||||||||||
| September 1, 2006 through February 28, 2007 (d) | 9.29 | 0.22 | 0.12 | 0.34 | (0.23 | ) | — | — | (0.23 | ) | |||||||||||||||||||||||||
| Year Ended August 31, 2006 | 9.85 | 0.41 | (0.28 | ) | 0.13 | (0.42 | ) | (0.27 | ) | — | (0.69 | ) | |||||||||||||||||||||||
| Year Ended August 31, 2005 | 10.05 | 0.36 | 0.13 | 0.49 | (0.39 | ) | (0.30 | ) | — | (0.69 | ) | ||||||||||||||||||||||||
| Year Ended August 31, 2004 | 10.03 | 0.32 | 0.32 | 0.64 | (0.32 | ) | (0.30 | ) | — | (0.62 | ) | ||||||||||||||||||||||||
| Year Ended August 31, 2003 | 10.07 | 0.40 | 0.04 | 0.44 | (0.40 | ) | (0.08 | ) | — | (0.48 | ) | ||||||||||||||||||||||||
| November 1, 2001 to August 31, 2002 (e) | 10.08 | 0.31 | 0.05 | 0.36 | (0.31 | ) | (0.06 | ) | — | (0.37 | ) | ||||||||||||||||||||||||
Emerging Markets Debt Fund | |||||||||||||||||||||||||||||||||||
| Six Months Ended August 31, 2007 (Unaudited) | 8.73 | 0.23 | (0.39 | ) | (0.16 | ) | (0.20 | ) | — | — | (0.20 | ) | |||||||||||||||||||||||
| September 1, 2006 through February 28, 2007 (d) | 8.39 | 0.21 | 0.37 | 0.58 | (0.21 | ) | (0.03 | ) | — | (0.24 | ) | ||||||||||||||||||||||||
| June 30, 2006 (f) through August 31, 2006 | 7.93 | 0.08 | 0.46 | 0.54 | (0.08 | ) | — | — | (0.08 | ) | |||||||||||||||||||||||||
Real Return Fund | |||||||||||||||||||||||||||||||||||
| Six Months Ended August 31, 2007 (Unaudited) | 9.52 | 0.34 | (0.21 | ) | 0.13 | (0.35 | ) | — | — | (0.35 | ) | ||||||||||||||||||||||||
| September 1, 2006 through February 28, 2007 (d) | 9.51 | 0.04 | 0.03 | 0.07 | (0.06 | ) | — | — | (0.06 | ) | |||||||||||||||||||||||||
| Year ended August 31, 2006 (g) | 10.00 | 0.42 | (0.46 | ) | (0.04 | ) | (0.45 | ) | — | — | (0.45 | ) | |||||||||||||||||||||||
Short Term Bond Fund | |||||||||||||||||||||||||||||||||||
| Six Months Ended August 31, 2007 (Unaudited) | 9.52 | 0.23 | (0.20 | ) | 0.03 | (0.23 | ) | — | — | (0.23 | ) | ||||||||||||||||||||||||
| September 1, 2006 through February 28, 2007 (d) | 9.50 | 0.22 | 0.03 | 0.25 | (0.23 | ) | — | — | (0.23 | ) | |||||||||||||||||||||||||
| Year Ended August 31, 2006 | 9.64 | 0.42 | (0.15 | ) | 0.27 | (0.41 | ) | — | — | (0.41 | ) | ||||||||||||||||||||||||
| Year Ended August 31, 2005 | 9.84 | 0.31 | (0.19 | ) | 0.12 | (0.32 | ) | — | — | (0.32 | ) | ||||||||||||||||||||||||
| Year Ended August 31, 2004 | 9.85 | 0.20 | (0.01 | ) | 0.19 | �� | (0.20 | ) | — | — | (0.20 | ) | |||||||||||||||||||||||
| Year Ended August 31, 2003 | 10.03 | 0.24 | (0.03 | ) | 0.21 | (0.25 | ) | (0.14 | ) | — | (0.39 | ) | |||||||||||||||||||||||
| November 1, 2001 to August 31, 2002 (e) | 10.01 | 0.27 | 0.05 | 0.32 | (0.26 | ) | (0.04 | ) | — | (0.30 | ) | ||||||||||||||||||||||||
Short Term Bond Fund II | |||||||||||||||||||||||||||||||||||
| Six Months Ended August 31, 2007 (Unaudited) | 9.84 | 0.22 | (0.08 | ) | 0.14 | (0.22 | ) | — | — | (0.22 | ) | ||||||||||||||||||||||||
| September 1, 2006 through February 28, 2007 (d) | 9.84 | 0.22 | (h) | 0.02 | 0.24 | (0.24 | ) | — | — | (0.24 | ) | ||||||||||||||||||||||||
| Year Ended August 31, 2006 | 10.02 | 0.45 | (0.20 | ) | 0.25 | (0.43 | ) | — | — | (0.43 | ) | ||||||||||||||||||||||||
| Year Ended August 31, 2005 | 10.21 | 0.31 | (0.20 | ) | 0.11 | (0.30 | ) | — | — | (0.30 | ) | ||||||||||||||||||||||||
| Year Ended August 31, 2004 | 10.23 | 0.21 | (h) | (0.02 | ) | 0.19 | (0.21 | ) | — | — | (i) | (0.21 | ) | ||||||||||||||||||||||
| Year Ended August 31, 2003 | 10.33 | 0.23 | (h) | (0.04 | ) | 0.19 | (0.24 | ) | (0.05 | ) | — | (i) | (0.29 | ) | |||||||||||||||||||||
| November 1, 2001 through August 31, 2002 (e) | 10.38 | 0.25 | 0.06 | 0.31 | (0.25 | ) | (0.11 | ) | — | (0.36 | ) | ||||||||||||||||||||||||
Strategic Income Fund | |||||||||||||||||||||||||||||||||||
| Six Months Ended August 31, 2007 (Unaudited) | 9.24 | 0.24 | (h) | (0.53 | ) | (0.29 | ) | (0.23 | ) | — | — | (0.23 | ) | ||||||||||||||||||||||
| September 1, 2006 through February 28, 2007 (d) | 9.11 | 0.22 | (h) | 0.15 | 0.37 | (0.24 | ) | — | — | (0.24 | ) | ||||||||||||||||||||||||
| Year Ended August 31, 2006 | 9.33 | 0.43 | (h) | (0.14 | ) | 0.29 | �� | (0.51 | ) | — | — | (0.51 | ) | ||||||||||||||||||||||
| Year Ended August 31, 2005 | 9.08 | 0.30 | 0.33 | 0.63 | (0.38 | ) | — | — | (0.38 | ) | |||||||||||||||||||||||||
| Year Ended August 31, 2004 | 8.92 | 0.48 | (h) | 0.15 | 0.63 | (0.47 | ) | — | — | (0.47 | ) | ||||||||||||||||||||||||
| Year Ended August 31, 2003 | 8.64 | 0.40 | (h) | 0.31 | 0.71 | (0.43 | ) | — | — | (0.43 | ) | ||||||||||||||||||||||||
| November 1, 2001 to August 31, 2002 (e) | 8.91 | 0.55 | (0.33 | ) | 0.22 | (0.47 | ) | (0.02 | ) | — | (0.49 | ) | |||||||||||||||||||||||
| (a) | Annualized for periods less than one year. |
| (b) | Not annualized for periods less than one year. |
| (c) | Includes adjustments in accordance with accounting principles generally accepted in the United States of America and as such, the net asset value for financial reporting purposes and the returns based upon those net asset values may differ from the net asset value and returns for shareholder transactions. |
| (d) | The Fund changed its fiscal year end from August 31 to the last day in February. |
| (e) | The Fund changed its fiscal year end from October 31 to August 31. |
| (f) | Commencement of offering of class of shares. |
| (g) | Commencement of operations was September 1, 2005. |
| (h) | Calculated based on average shares outstanding. |
| (i) | Amount rounds to less than $0.01. |
| (j) | Includes interest expense of 0.01%. |
| (k) | Due to the size of net assets and fixed expenses, ratios may appear disproportionate. |
| | Ratios/Supplemental data | | ||||||||||||||||||||||||||||||
|---|---|---|---|---|---|---|---|---|---|---|---|---|---|---|---|---|---|---|---|---|---|---|---|---|---|---|---|---|---|---|---|---|
| Ratios to average net assets (a) | ||||||||||||||||||||||||||||||||
| Redemption fees | | Net asset value, end of period | | Total return (excludes sales charge) (b)(c) | | Net assets end of period (000’s) | | Net expenses | | Net investment income (loss) | | Expenses without waivers, reimbursements and earnings credits | | Portfolio turnover rate (b) | ||||||||||||||||||
| $— | $ | 9.05 | (1.26 | )% | $ | 26,057 | 0.75 | % | 5.11 | % | 0.95 | % | 379 | % | ||||||||||||||||||
| — | 9.40 | 3.72 | % | 20,271 | 0.75 | 4.89 | 0.95 | 357 | ||||||||||||||||||||||||
| — | 9.29 | 1.42 | 13,632 | 0.75 | 4.55 | 0.97 | 711 | |||||||||||||||||||||||||
| — | 9.85 | 5.06 | 5,963 | 0.75 | 3.63 | 1.31 | 559 | |||||||||||||||||||||||||
| — | 10.05 | 6.61 | 3,004 | 0.75 | 3.19 | 1.88 | 571 | |||||||||||||||||||||||||
| — | 10.03 | 4.32 | 2,000 | 0.75 | 3.86 | 1.59 | 679 | |||||||||||||||||||||||||
| — | 10.07 | 3.72 | 1,000 | 0.75 | 3.59 | 5.64 | 572 | |||||||||||||||||||||||||
| — | (i) | 8.37 | (1.89 | ) | 5,982 | 1.47 | 5.70 | 1.49 | 44 | |||||||||||||||||||||||
| — | (i) | 8.73 | 6.96 | 2,154 | 1.50 | 5.20 | 1.59 | 68 | ||||||||||||||||||||||||
| — | (i) | 8.39 | 6.82 | 41 | 1.50 | 6.17 | 1.71 | 270 | ||||||||||||||||||||||||
| — | 9.30 | 1.40 | 522 | 0.90 | 7.34 | 1.37 | 173 | |||||||||||||||||||||||||
| — | 9.52 | 0.78 | 630 | 0.90 | 0.85 | 1.34 | 154 | |||||||||||||||||||||||||
| — | 9.51 | (0.33 | ) | 584 | 0.90 | 3.96 | 1.45 | 223 | ||||||||||||||||||||||||
| — | 9.32 | 0.25 | 11,163 | 0.75 | 4.84 | 0.89 | 217 | |||||||||||||||||||||||||
| — | 9.52 | 2.64 | 8,510 | 0.75 | 4.77 | 0.89 | 143 | |||||||||||||||||||||||||
| — | 9.50 | 2.93 | 5,819 | 0.75 | 4.49 | 0.91 | 540 | |||||||||||||||||||||||||
| — | 9.64 | 1.29 | 3,393 | 0.75 | 3.20 | 1.21 | 194 | |||||||||||||||||||||||||
| — | 9.84 | 1.92 | 3,000 | 0.75 | 2.00 | 1.17 | 261 | |||||||||||||||||||||||||
| — | 9.85 | 2.08 | 9,000 | 0.75 | 2.39 | 1.10 | 386 | |||||||||||||||||||||||||
| — | 10.03 | 3.18 | 10,000 | 0.75 | 3.01 | 1.00 | 215 | |||||||||||||||||||||||||
| — | 9.76 | 1.48 | 26,019 | 0.75 | 4.50 | 0.99 | 208 | |||||||||||||||||||||||||
| — | 9.84 | 2.42 | 24,652 | 0.75 | 4.53 | 0.98 | 246 | |||||||||||||||||||||||||
| — | 9.84 | 2.56 | 32,557 | 0.75 | 4.46 | 0.95 | 479 | |||||||||||||||||||||||||
| — | 10.02 | 1.09 | 41,311 | 0.75 | 2.94 | 1.00 | 201 | |||||||||||||||||||||||||
| — | 10.21 | 1.85 | 55,000 | 0.75 | 2.03 | 1.10 | 253 | |||||||||||||||||||||||||
| — | 10.23 | 1.88 | 44,000 | 0.75 | 2.31 | 0.96 | 319 | |||||||||||||||||||||||||
| — | 10.33 | 3.06 | 70,000 | 0.75 | 2.66 | 1.00 | 192 | |||||||||||||||||||||||||
| — | 8.72 | (3.24 | ) | 6,998 | 1.15 | 5.27 | 2.46 | 322 | ||||||||||||||||||||||||
| — | 9.24 | 4.05 | 7,705 | 1.15 | 4.78 | 3.74 | 223 | |||||||||||||||||||||||||
| — | (i) | 9.11 | 3.24 | 6,660 | 1.15 | 4.67 | 3.77 | 299 | ||||||||||||||||||||||||
| — | 9.33 | 7.04 | 3,965 | 1.17 | 4.29 | 2.11 | 461 | |||||||||||||||||||||||||
| — | 9.08 | 7.20 | 802 | 1.27 | (j) | 5.31 | 4.23 | 152 | ||||||||||||||||||||||||
| — | 8.92 | 8.33 | 300 | 1.25 | 4.45 | 7.26 | 248 | |||||||||||||||||||||||||
| — | 8.64 | 2.54 | 70 | 1.25 | 6.20 | 35.90 | (k) | 178 | ||||||||||||||||||||||||
FOR THE PERIODS INDICATED (continued)
| | | | | Per share operating performance | | ||||||||||||||||||||||||||||||
|---|---|---|---|---|---|---|---|---|---|---|---|---|---|---|---|---|---|---|---|---|---|---|---|---|---|---|---|---|---|---|---|---|---|---|---|
| Investment operations | Distributions | ||||||||||||||||||||||||||||||||||
| | Net asset value, beginning of period | | Net investment income (loss) | | Net realized and unrealized gains (losses) on investments | | Total from investment operations | | Net investment income | | Net realized gains | | Tax return of capital | | Total distributions | ||||||||||||||||||||
Bond Fund | |||||||||||||||||||||||||||||||||||
| Six Months Ended August 31, 2007 (Unaudited) | $ | 9.34 | $ | 0.20 | $ | (0.36 | ) | $ | (0.16 | ) | $ | (0.20 | ) | $ | — | $ | — | $ | (0.20 | ) | |||||||||||||||
| September 1, 2006 through February 28, 2007 (d) | 9.23 | 0.19 | 0.12 | 0.31 | (0.20 | ) | — | — | (0.20 | ) | |||||||||||||||||||||||||
| Year Ended August 31, 2006 | 9.78 | 0.36 | (0.28 | ) | 0.08 | (0.36 | ) | (0.27 | ) | — | (0.63 | ) | |||||||||||||||||||||||
| Year Ended August 31, 2005 | 9.97 | 0.29 | 0.12 | 0.41 | (0.30 | ) | (0.30 | ) | — | (0.60 | ) | ||||||||||||||||||||||||
| Year Ended August 31, 2004 | 9.95 | 0.25 | 0.32 | 0.57 | (0.25 | ) | (0.30 | ) | — | (h) | (0.55 | ) | |||||||||||||||||||||||
| Year Ended August 31, 2003 | 10.05 | 0.33 | (0.03 | ) | 0.30 | (0.32 | ) | (0.08 | ) | — | (0.40 | ) | |||||||||||||||||||||||
| November 1, 2001 to August 31, 2002 (e) | 10.08 | 0.24 | 0.03 | 0.27 | (0.24 | ) | (0.06 | ) | — | (0.30 | ) | ||||||||||||||||||||||||
Strategic Income Fund | |||||||||||||||||||||||||||||||||||
| Six Months Ended August 31, 2007 (Unaudited) | 9.24 | 0.22 | (g) | (0.54 | ) | (0.32 | ) | (0.20 | ) | — | — | (0.20 | ) | ||||||||||||||||||||||
| September 1, 2006 through February 28, 2007 (d) | 9.11 | 0.20 | (g) | 0.14 | 0.34 | (0.21 | ) | — | — | (0.21 | ) | ||||||||||||||||||||||||
| Year Ended August 31, 2006 | 9.32 | 0.39 | (g) | (0.14 | ) | 0.25 | (0.46 | ) | — | — | (0.46 | ) | |||||||||||||||||||||||
| February 18, 2005 (f) to August 31, 2005 | 9.26 | 0.19 | 0.06 | 0.25 | (0.19 | ) | — | — | (0.19 | ) | |||||||||||||||||||||||||
| (a) | Annualized for periods less than one year. |
| (b) | Not annualized for periods less than one year. |
| (c) | Includes adjustments in accordance with accounting principles generally accepted in the United States of America and as such, the net asset value for financial reporting purposes and the returns based upon those net asset values may differ from the net asset value and returns for shareholder transactions. |
| (d) | The Fund changed its fiscal year end from August 31 to the last day in February. |
| (e) | The Fund changed its fiscal year end from October 31 to August 31. |
| (f) | Commencement of offering of class of shares. |
| (g) | Calculated based upon average shares outstanding. |
| (h) | Amount rounds to less than $0.01. |
| | Ratios/Supplemental data | | ||||||||||||||||||||||||||||||
|---|---|---|---|---|---|---|---|---|---|---|---|---|---|---|---|---|---|---|---|---|---|---|---|---|---|---|---|---|---|---|---|---|
| Ratios to average net assets (a) | ||||||||||||||||||||||||||||||||
| Redemption fees | | Net asset value, end of period | | Total return (excludes sales charge) (b)(c) | | Net assets end of period (000’s) | | Net expenses | | Net investment income (loss) | | Expenses without waivers, reimbursements and earnings credits | | Portfolio turnover rate (b) | ||||||||||||||||||
| $— | $ | 8.98 | (1.70 | )% | $ | 3,999 | 1.40 | % | 4.45 | % | 1.45 | % | 379 | % | ||||||||||||||||||
| — | 9.34 | 3.42 | 3,564 | 1.40 | 4.23 | 1.45 | 357 | |||||||||||||||||||||||||
| — | 9.23 | 0.90 | 2,814 | 1.40 | 3.99 | 1.47 | 711 | |||||||||||||||||||||||||
| — | 9.78 | 4.23 | 2,283 | 1.44 | 2.93 | 1.90 | 559 | |||||||||||||||||||||||||
| — | 9.97 | 5.89 | 1,972 | 1.50 | 2.48 | 2.36 | 571 | |||||||||||||||||||||||||
| — | 9.95 | 2.94 | 2,000 | 1.50 | 3.19 | 2.14 | 679 | |||||||||||||||||||||||||
| — | 10.05 | 2.83 | 1,000 | 1.50 | 2.80 | 6.02 | 572 | |||||||||||||||||||||||||
| — | 8.72 | (3.51 | ) | 4,361 | 1.65 | 4.73 | 2.97 | 322 | ||||||||||||||||||||||||
| — | 9.24 | 3.79 | 5,498 | 1.65 | 4.28 | 4.23 | 223 | |||||||||||||||||||||||||
| — | (h) | 9.11 | 2.80 | 5,996 | 1.65 | 4.21 | 4.08 | 299 | ||||||||||||||||||||||||
| — | 9.32 | 2.77 | 6,715 | 1.65 | 3.91 | 2.43 | 461 | |||||||||||||||||||||||||
FOR THE PERIODS INDICATED (continued)
| | | | | Per share operating performance | | ||||||||||||||||||||||||||
|---|---|---|---|---|---|---|---|---|---|---|---|---|---|---|---|---|---|---|---|---|---|---|---|---|---|---|---|---|---|---|---|
| Investment operations | Distributions | ||||||||||||||||||||||||||||||
| | Net asset value, beginning of period | | Net investment income (loss) | | Net realized and unrealized gains (losses) on investments | | Total from investment operations | | Net investment income | | Net realized gains | | Total distributions | ||||||||||||||||||
Bond Fund | |||||||||||||||||||||||||||||||
| Six Months Ended August 31, 2007 (Unaudited) | $ | 9.39 | $ | 0.21 | $ | (0.36 | ) | $ | (0.15 | ) | $ | (0.21 | ) | $ | — | $ | (0.21 | ) | |||||||||||||
| September 1, 2006 through February 28, 2007 (d) | 9.27 | 0.19 | 0.13 | 0.32 | (0.20 | ) | — | (0.20 | ) | ||||||||||||||||||||||
| Year Ended August 31, 2006 | 9.83 | 0.32 | (0.25 | ) | 0.07 | (0.36 | ) | (0.27 | ) | (0.63 | ) | ||||||||||||||||||||
| Year Ended August 31, 2005 | 10.03 | 0.28 | 0.12 | 0.40 | (0.30 | ) | (0.30 | ) | (0.60 | ) | |||||||||||||||||||||
| Year Ended August 31, 2004 | 10.01 | 0.24 | 0.33 | 0.57 | (0.25 | ) | (0.30 | ) | (0.55 | ) | |||||||||||||||||||||
| March 31, 2003 (e) through August 31, 2003 | 10.22 | 0.14 | (0.21 | ) | (0.07 | ) | (0.14 | ) | — | (0.14 | ) | ||||||||||||||||||||
Emerging Markets Debt Fund | |||||||||||||||||||||||||||||||
| Six Months Ended August 31, 2007 (Unaudited) | 8.73 | 0.19 | (0.37 | ) | (0.18 | ) | (0.18 | ) | — | (0.18 | ) | ||||||||||||||||||||
| September 1, 2006 through February 28, 2007 (d) | 8.39 | 0.20 | 0.36 | 0.56 | (0.19 | ) | (0.03 | ) | (0.22 | ) | |||||||||||||||||||||
| June 30, 2006 (e) through August 31, 2006 | 7.93 | 0.07 | 0.47 | 0.54 | (0.08 | ) | — | (0.08 | ) | ||||||||||||||||||||||
Real Return Fund | |||||||||||||||||||||||||||||||
| Six Months Ended August 31, 2007 (Unaudited) | 9.49 | 0.33 | (0.22 | ) | 0.11 | (0.33 | ) | — | (0.33 | ) | |||||||||||||||||||||
| September 1, 2006 through February 28, 2007 (d) | 9.50 | 0.02 | 0.02 | 0.04 | (0.05 | ) | — | (0.05 | ) | ||||||||||||||||||||||
| Year ended August 31, 2006 (f) | 10.00 | 0.41 | (0.50 | ) | (0.09 | ) | (0.41 | ) | — | (0.41 | ) | ||||||||||||||||||||
Strategic Income Fund | |||||||||||||||||||||||||||||||
| Six Months Ended August 31, 2007 (Unaudited) | 9.24 | 0.22 | (g) | (0.54 | ) | (0.32 | ) | (0.20 | ) | — | (0.20 | ) | |||||||||||||||||||
| September 1, 2006 through February 28, 2007 (d) | 9.12 | 0.20 | (g) | 0.13 | 0.33 | (0.21 | ) | — | (0.21 | ) | |||||||||||||||||||||
| Year Ended August 31, 2006 | 9.33 | 0.38 | (g) | (0.13 | ) | 0.25 | (0.46 | ) | — | (0.46 | ) | ||||||||||||||||||||
| February 18, 2005 (e) through August 31, 2005 | 9.26 | 0.19 | 0.07 | 0.26 | (0.19 | ) | — | (0.19 | ) | ||||||||||||||||||||||
| (a) | Annualized for periods less than one year. |
| (b) | Not annualized for periods less than one year. |
| (c) | Includes adjustments in accordance with accounting principles generally accepted in the United States of America and as such, the net asset value for financial reporting purposes and the returns based upon those net asset values may differ from the net asset value and returns for shareholder transactions. |
| (d) | The Fund changed its fiscal year end from August 31 to the last day in February. |
| (e) | Commencement of offering of class of shares. |
| (f) | Commencement of operations was September 1, 2005. |
| (g) | Calculated based on average shares outstanding. |
| (h) | Amount rounds to less than $0.01. |
| | Ratios/Supplemental data | | ||||||||||||||||||||||||||||||
|---|---|---|---|---|---|---|---|---|---|---|---|---|---|---|---|---|---|---|---|---|---|---|---|---|---|---|---|---|---|---|---|---|
| Ratios to average net assets (a) | ||||||||||||||||||||||||||||||||
| Redemption fees | | Net asset value, end of period | | Total return (excludes sales charge) (b)(c) | | Net assets end of period (000’s) | | Net expenses | | Net investment income (loss) | | Expenses without waivers, reimbursements and earnings credits | | Portfolio turnover rate (b) | ||||||||||||||||||
| $— | $ | 9.03 | (1.68 | )% | $ | 7,128 | 1.40 | % | 4.46 | % | 1.45 | % | 379 | % | ||||||||||||||||||
| — | 9.39 | 3.53 | 5,146 | 1.40 | 4.26 | 1.45 | 357 | |||||||||||||||||||||||||
| — | 9.27 | 0.87 | 2,574 | 1.39 | 3.90 | 1.46 | 711 | |||||||||||||||||||||||||
| — | 9.83 | 4.13 | 425 | 1.42 | 2.96 | 1.82 | 559 | |||||||||||||||||||||||||
| — | 10.03 | 5.84 | 211 | 1.50 | 2.45 | 2.36 | 571 | |||||||||||||||||||||||||
| — | 10.01 | (0.69 | ) | 200 | 1.50 | 3.02 | 1.78 | 679 | ||||||||||||||||||||||||
| — | (h) | 8.37 | (2.09 | ) | 3,663 | 1.97 | 5.13 | 1.98 | 44 | |||||||||||||||||||||||
| — | (h) | 8.73 | 6.73 | 1,332 | 2.00 | 4.66 | 2.09 | 68 | ||||||||||||||||||||||||
| — | (h) | 8.39 | 6.77 | 27 | 2.00 | 5.87 | 2.20 | 270 | ||||||||||||||||||||||||
| — | 9.27 | 1.20 | 56 | 1.40 | 6.69 | 1.88 | 173 | |||||||||||||||||||||||||
| — | 9.49 | 0.48 | 27 | 1.40 | 0.41 | 1.85 | 154 | |||||||||||||||||||||||||
| — | 9.50 | (0.80 | ) | 24 | 1.40 | 4.58 | 1.95 | 223 | ||||||||||||||||||||||||
| — | 8.72 | (3.51 | ) | 2,303 | 1.65 | 4.72 | 2.98 | 322 | ||||||||||||||||||||||||
| — | 9.24 | 3.67 | 3,096 | 1.65 | 4.28 | 4.22 | 223 | |||||||||||||||||||||||||
| — | (h) | 9.12 | 2.82 | 3,285 | 1.65 | 4.20 | 4.16 | 299 | ||||||||||||||||||||||||
| — | 9.33 | 2.88 | 2,631 | 1.65 | 3.91 | 2.42 | 461 | |||||||||||||||||||||||||
FOR THE PERIODS INDICATED (continued)
| | | | | Per share operating performance | | ||||||||||||||||||||||||||||||
|---|---|---|---|---|---|---|---|---|---|---|---|---|---|---|---|---|---|---|---|---|---|---|---|---|---|---|---|---|---|---|---|---|---|---|---|
| Investment operations | Distributions | ||||||||||||||||||||||||||||||||||
| | Net asset value, beginning of period | | Net investment income (loss) | | Net realized and unrealized gains (losses) on investments | | Total from investment operations | | Net investment income | | Net realized gains | | Tax return of capital | | Total distributions | ||||||||||||||||||||
Short Term Bond Fund II | |||||||||||||||||||||||||||||||||||
| Six Months Ended August 31, 2007 (Unaudited) | $ | 9.85 | $ | 0.21 | $ | (0.08 | ) | $ | 0.13 | $ | (0.21 | ) | $ | — | $ | — | $ | (0.21 | ) | ||||||||||||||||
| September 1, 2006 through February 28, 2007 (d) | 9.84 | 0.21 | (f) | 0.02 | 0.23 | (0.22 | ) | — | — | (0.22 | ) | ||||||||||||||||||||||||
| Year Ended August 31, 2006 | 10.02 | 0.41 | (0.19 | ) | 0.22 | (0.40 | ) | — | — | (0.40 | ) | ||||||||||||||||||||||||
| Year Ended August 31, 2005 | 10.21 | 0.28 | (0.20 | ) | 0.08 | (0.27 | ) | — | — | (0.27 | ) | ||||||||||||||||||||||||
| Year Ended August 31, 2004 | 10.23 | 0.18 | (f) | (0.02 | ) | 0.16 | (0.18 | ) | — | — | (g) | (0.18 | ) | ||||||||||||||||||||||
| Year Ended August 31, 2003 | 10.33 | 0.21 | (f) | (0.04 | ) | 0.17 | (0.22 | ) | (0.05 | ) | — | (g) | (0.27 | ) | |||||||||||||||||||||
| November 1, 2001 through August 31, 2002 (e) | 10.37 | 0.23 | 0.06 | 0.29 | (0.22 | ) | (0.11 | ) | — | (0.33 | ) | ||||||||||||||||||||||||
| (a) | Annualized for periods less than one year. |
| (b) | Not annualized for periods less than one year. |
| (c) | Includes adjustments in accordance with accounting principles generally accepted in the United States of America and as such, the net asset value for financial reporting purposes and the returns based upon those net asset values may differ from the net asset value and returns for shareholder transactions. |
| (d) | The Fund changed its fiscal year end from August 31 to the last day in February. |
| (e) | The Fund changed its fiscal year end from October 31 to August 31. |
| (f) | Calculated based on average shares outstanding. |
| (g) | Amount rounds to less than $0.01. |
| | | Ratios/Supplemental data | | ||||||||||||||||||||||||
|---|---|---|---|---|---|---|---|---|---|---|---|---|---|---|---|---|---|---|---|---|---|---|---|---|---|---|---|
| Ratios to average net assets (a) | |||||||||||||||||||||||||||
| Net asset value, end of period | | Total return (excludes sales charge) (b)(c) | | Net assets end of period (000’s) | | Net expenses | | Net investment income (loss) | | Expenses without waivers, reimbursements and earnings credits | | Portfolio turnover rate (b) | |||||||||||||||
| $9.77 | 1.35 | % | $ | 153,898 | 1.00 | % | 4.25 | % | 1.09 | % | 208 | % | |||||||||||||||
| 9.85 | 2.39 | 175,836 | 1.00 | 4.29 | 1.08 | 246 | |||||||||||||||||||||
| 9.84 | 2.30 | 209,284 | 1.00 | 4.19 | 1.05 | 479 | |||||||||||||||||||||
| 10.02 | 0.83 | 371,756 | 1.00 | 2.67 | 1.03 | 201 | |||||||||||||||||||||
| 10.21 | 1.58 | 643,278 | 1.00 | 1.75 | 1.04 | 253 | |||||||||||||||||||||
| 10.23 | 1.64 | 1,168,000 | 1.00 | 2.07 | 1.04 | 319 | |||||||||||||||||||||
| 10.33 | 2.92 | 1,127,000 | 1.00 | 2.41 | 1.03 | 192 | |||||||||||||||||||||
FOR THE PERIODS INDICATED (continued)
| | | | | Per share operating performance | | ||||||||||||||||||||||||||
|---|---|---|---|---|---|---|---|---|---|---|---|---|---|---|---|---|---|---|---|---|---|---|---|---|---|---|---|---|---|---|---|
| Investment operations | Distributions | ||||||||||||||||||||||||||||||
| | Net asset value, beginning of period | | Net investment income (loss) | | Net realized and unrealized gains (losses) on investments | | Total from investment operations | | Net investment income | | Net realized gains | | Total distributions | ||||||||||||||||||
Emerging Markets Debt Fund | |||||||||||||||||||||||||||||||
| Six Months Ended August 31, 2007 (Unaudited) | $ | 8.73 | $ | 0.25 | $ | (0.38 | ) | $ | (0.13 | ) | $ | (0.22 | ) | $ | — | $ | (0.22 | ) | |||||||||||||
| September 1, 2006 through February 28, 2007 (d) | 8.39 | 0.24 | 0.36 | 0.60 | (0.23 | ) | (0.03 | ) | (0.26 | ) | |||||||||||||||||||||
| May 15, 2006 (e) through August 31, 2006 | 8.07 | 0.14 | 0.33 | 0.47 | (0.15 | ) | — | (0.15 | ) | ||||||||||||||||||||||
| (a) | Annualized for periods less than one year. |
| (b) | Not annualized for periods less than one year. |
| (c) | Includes adjustments in accordance with accounting principles generally accepted in the United States of America and as such, the net asset value for financial reporting purposes and the returns based upon those net asset values may differ from the net asset value and returns for shareholder transactions. |
| (d) | The Fund changed its fiscal year end from August 31 to the last day in February. |
| (e) | Commencement of offering of class of shares. |
| (f) | Amount rounds to less than $0.01. |
| | Ratios/Supplemental data | | ||||||||||||||||||||||||||||||
|---|---|---|---|---|---|---|---|---|---|---|---|---|---|---|---|---|---|---|---|---|---|---|---|---|---|---|---|---|---|---|---|---|
| Ratios to average net assets (a) | ||||||||||||||||||||||||||||||||
| Redemption fees | | Net asset value, end of period | | Total return (b)(c) | | Net assets end of period (000’s) | | Net expenses | | Net investment income (loss) | | Expenses without waivers, reimbursements and earnings credits | | Portfolio turnover rate (b) | ||||||||||||||||||
| —(f) | $ | 8.38 | (1.56 | )% | $ | 19,772 | 1.03 | % | 5.94 | % | 1.04 | % | 44 | % | ||||||||||||||||||
| —(f) | 8.73 | 7.15 | 8,571 | 1.05 | 5.42 | 1.14 | 68 | |||||||||||||||||||||||||
| —(f) | 8.39 | 5.88 | 2,426 | 1.05 | 7.23 | 1.23 | 270 | |||||||||||||||||||||||||
FOR THE PERIODS INDICATED (continued)
| | | | | Per share operating performance | | |||||||||||||||||||||||||||||
|---|---|---|---|---|---|---|---|---|---|---|---|---|---|---|---|---|---|---|---|---|---|---|---|---|---|---|---|---|---|---|---|---|---|---|
| Investment operations | Distributions | |||||||||||||||||||||||||||||||||
| | Net asset value, beginning of period | | Net investment income (loss) | | Net realized and unrealized gains (losses) on investments | | Total from investment operations | | Net investment income | | Net realized gains | | Total distributions | | ||||||||||||||||||||
Bond Fund | ||||||||||||||||||||||||||||||||||
| Six Months Ended August 31, 2007 (Unaudited) | $ | 9.31 | $ | 0.24 | $ | (0.35 | ) | $ | (0.11 | ) | $ | (0.24 | ) | $ | — | $ | (0.24 | ) | ||||||||||||||||
| September 1, 2006 through February 28, 2007 (d) | 9.20 | 0.23 | 0.12 | 0.35 | (0.24 | ) | — | (0.24 | ) | |||||||||||||||||||||||||
| Year Ended August 31, 2006 | 9.76 | 0.42 | (0.28 | ) | 0.14 | (0.43 | ) | (0.27 | ) | (0.70 | ) | |||||||||||||||||||||||
| Year Ended August 31, 2005 | 9.97 | 0.36 | 0.13 | 0.49 | (0.40 | ) | (0.30 | ) | (0.70 | ) | ||||||||||||||||||||||||
| Year Ended August 31, 2004 | 9.94 | 0.33 | 0.33 | 0.66 | (0.33 | ) | (0.30 | ) | (0.63 | ) | ||||||||||||||||||||||||
| Year Ended August 31, 2003 | 10.04 | 0.40 | (0.01 | ) | 0.39 | (0.41 | ) | (0.08 | ) | (0.49 | ) | |||||||||||||||||||||||
| November 1, 2001 through August 31, 2002 (e) | 10.08 | 0.32 | 0.02 | 0.34 | (0.32 | ) | (0.06 | ) | (0.38 | ) | ||||||||||||||||||||||||
| �� | ||||||||||||||||||||||||||||||||||
Emerging Markets Debt Fund | ||||||||||||||||||||||||||||||||||
| Six Months Ended August 31, 2007 (Unaudited) | 8.74 | 0.23 | (0.38 | ) | (0.15 | ) | (0.21 | ) | — | (0.21 | ) | |||||||||||||||||||||||
| September 1, 2006 through February 28, 2007 (d) | 8.39 | 0.21 | 0.39 | 0.60 | (0.22 | ) | (0.03 | ) | (0.25 | ) | ||||||||||||||||||||||||
| Year Ended August 31, 2006 | 9.29 | 0.45 | 0.42 | 0.87 | (0.46 | ) | (1.35 | ) | (1.81 | ) | ||||||||||||||||||||||||
| Year Ended August 31, 2005 | 9.58 | 0.61 | 1.08 | 1.69 | (0.67 | ) | (1.31 | ) | (1.98 | ) | ||||||||||||||||||||||||
| Year Ended August 31, 2004 | 9.02 | 0.67 | 0.60 | 1.27 | (0.71 | ) | — | (0.71 | ) | |||||||||||||||||||||||||
| Year Ended August 31, 2003 | 7.53 | 0.68 | 1.53 | 2.21 | (0.72 | ) | — | (0.72 | ) | |||||||||||||||||||||||||
| August 1, 2002 through August 31, 2002 (f) | 7.05 | 0.05 | 0.49 | 0.54 | (0.06 | ) | — | (0.06 | ) | |||||||||||||||||||||||||
| Year Ended July 31, 2002 | 7.82 | 0.77 | (0.77 | ) | — | (0.77 | ) | — | (0.77 | ) | ||||||||||||||||||||||||
Real Return Fund | ||||||||||||||||||||||||||||||||||
| Six Months Ended August 31, 2007 (Unaudited) | 9.54 | 0.35 | (0.20 | ) | 0.15 | (0.36 | ) | — | (0.36 | ) | ||||||||||||||||||||||||
| September 1, 2006 through February 28, 2007 (d) | 9.53 | 0.06 | 0.02 | 0.08 | (0.07 | ) | — | (0.07 | ) | |||||||||||||||||||||||||
| Year ended August 31, 2006 (g) | 10.00 | 0.48 | (0.49 | ) | (0.01 | ) | (0.46 | ) | — | (0.46 | ) | |||||||||||||||||||||||
Short Term Bond Fund | ||||||||||||||||||||||||||||||||||
| Six Months Ended August 31, 2007 (Unaudited) | 9.53 | 0.24 | (0.22 | ) | 0.02 | (0.23 | ) | — | (0.23 | ) | ||||||||||||||||||||||||
| September 1, 2006 through February 28, 2007 (d) | 9.51 | 0.23 | 0.03 | 0.26 | (0.24 | ) | — | (0.24 | ) | |||||||||||||||||||||||||
| Year Ended August 31, 2006 | 9.64 | 0.44 | (0.14 | ) | 0.30 | (0.43 | ) | — | (0.43 | ) | ||||||||||||||||||||||||
| Year Ended August 31, 2005 | 9.84 | 0.32 | (0.17 | ) | 0.15 | (0.35 | ) | — | (0.35 | ) | ||||||||||||||||||||||||
| Year Ended August 31, 2004 | 9.86 | 0.22 | (0.02 | ) | 0.20 | (0.22 | ) | — | (0.22 | ) | ||||||||||||||||||||||||
| Year Ended August 31, 2003 | 10.04 | 0.26 | (0.03 | ) | 0.23 | (0.27 | ) | (0.14 | ) | (0.41 | ) | |||||||||||||||||||||||
| November 1, 2001 to August 31, 2002 (e) | 10.03 | 0.28 | 0.04 | 0.32 | (0.27 | ) | (0.04 | ) | (0.31 | ) | ||||||||||||||||||||||||
| (a) | Annualized for periods less than one year. |
| (b) | Not annualized for periods less than one year. |
| (c) | Includes adjustments in accordance with accounting principles generally accepted in the United States of America and as such, the net asset value for financial reporting purposes and the returns based upon those net asset values may differ from the net asset value and returns for shareholder transactions. |
| (d) | The Fund changed its fiscal year end from August 31 to the last day in February. |
| (e) | The Fund changed its fiscal year end from October 31 to August 31. |
| (f) | The Fund changed its fiscal year end from July 31 to August 31. |
| (g) | Commencement of operations was September 1, 2005. |
| (h) | Voluntary contribution from Advisor. The total return without the voluntary contribution would have been 10.46%. |
| (i) | Amount rounds to less than $0.01. |
| (j) | Includes interest expense of 0.01%. |
| (k) | Percentages prior to September 10, 2001 reflect the portfolio turnover of The Emerging Markets Debt Portfolio, in which the Fund invested all of its investable assets. |
| | | | | Ratios/Supplemental data | | |||||||||||||||||||||||||||||||||
|---|---|---|---|---|---|---|---|---|---|---|---|---|---|---|---|---|---|---|---|---|---|---|---|---|---|---|---|---|---|---|---|---|---|---|---|---|---|---|
| Ratios to average net assets (a) | ||||||||||||||||||||||||||||||||||||||
| Contribution from affiliate | | Redemption fees | | Net asset value, end of period | | Total return (b)(c) | | Net assets end of period (000’s) | | Net expenses | | Net investment income (loss) | | Expenses without waivers, reimbursements and earnings credits | | Portfolio turnover rate (b) | | |||||||||||||||||||||
| $— | $ | — | $ | 8.96 | (1.22 | )% | $ | 1,716,159 | 0.65 | % | 5.20 | % | 0.70 | % | 379 | % | ||||||||||||||||||||||
| — | — | 9.31 | 3.81 | 1,459,959 | 0.65 | 4.97 | 0.70 | 357 | ||||||||||||||||||||||||||||||
| — | — | 9.20 | 1.55 | 1,310,157 | 0.65 | 4.69 | 0.71 | 711 | ||||||||||||||||||||||||||||||
| — | — | 9.76 | 5.12 | 202,659 | 0.66 | 3.72 | 0.74 | 559 | ||||||||||||||||||||||||||||||
| — | — | 9.97 | 6.88 | 188,775 | 0.66 | 3.33 | 0.78 | 571 | ||||||||||||||||||||||||||||||
| — | — | 9.94 | 3.82 | 308,000 | 0.66 | 3.97 | 0.76 | 679 | ||||||||||||||||||||||||||||||
| — | — | 10.04 | 3.57 | 312,000 | 0.66 | 3.95 | 0.74 | 572 | ||||||||||||||||||||||||||||||
| — | — | (i) | 8.38 | (1.76 | ) | 212,466 | 1.23 | 5.71 | 1.24 | 44 | ||||||||||||||||||||||||||||
| — | — | (i) | 8.74 | 7.17 | 125,421 | 1.25 | 4.98 | 1.35 | 68 | |||||||||||||||||||||||||||||
| 0.04(h) | — | (i) | 8.39 | 10.99 | (h) | 117,423 | 1.26 | (j) | 5.77 | 1.42 | 270 | |||||||||||||||||||||||||||
| — | — | (i) | 9.29 | 19.87 | 34,448 | 1.25 | 6.56 | 1.72 | 337 | |||||||||||||||||||||||||||||
| — | — | 9.58 | 14.56 | 36,145 | 1.26 | (j) | 7.01 | 1.65 | 166 | |||||||||||||||||||||||||||||
| — | — | 9.02 | 30.49 | 60,000 | 1.25 | 8.11 | 1.52 | 157 | ||||||||||||||||||||||||||||||
| — | — | 7.53 | 7.69 | 41,000 | 1.25 | 9.86 | 1.30 | 12 | ||||||||||||||||||||||||||||||
| — | — | 7.05 | (0.67 | ) | 35,000 | 1.25 | 9.59 | 1.54 | 110 | (k) | ||||||||||||||||||||||||||||
| — | — | 9.33 | 1.63 | 63,782 | 0.65 | 7.51 | 1.13 | 173 | ||||||||||||||||||||||||||||||
| — | — | 9.54 | 0.83 | 61,757 | 0.65 | 1.18 | 1.09 | 154 | ||||||||||||||||||||||||||||||
| — | — | 9.53 | 0.01 | 58,882 | 0.65 | 5.20 | 1.21 | 223 | ||||||||||||||||||||||||||||||
| — | — | 9.32 | 0.24 | 1,495,105 | 0.55 | 5.03 | 0.64 | 217 | ||||||||||||||||||||||||||||||
| — | — | 9.53 | 2.72 | 1,190,100 | 0.55 | 4.96 | 0.64 | 143 | ||||||||||||||||||||||||||||||
| — | — | 9.51 | 3.22 | 640,217 | 0.55 | 4.73 | 0.65 | 540 | ||||||||||||||||||||||||||||||
| — | — | 9.64 | 1.52 | 159,035 | 0.56 | 3.48 | 0.68 | 194 | ||||||||||||||||||||||||||||||
| — | — | 9.84 | 1.99 | 94,681 | 0.58 | 2.22 | 0.73 | 261 | ||||||||||||||||||||||||||||||
| — | — | 9.86 | 2.28 | 122,000 | 0.56 | 2.59 | 0.71 | 386 | ||||||||||||||||||||||||||||||
| — | — | 10.04 | 3.21 | 122,000 | 0.57 | 3.22 | 0.72 | 215 | ||||||||||||||||||||||||||||||
FOR THE PERIODS INDICATED (continued)
| | | | | Per share operating performance | | ||||||||||||||||||||||||||||||
|---|---|---|---|---|---|---|---|---|---|---|---|---|---|---|---|---|---|---|---|---|---|---|---|---|---|---|---|---|---|---|---|---|---|---|---|
| Investment operations | Distributions | ||||||||||||||||||||||||||||||||||
| | Net asset value, beginning of period | | Net investment income (loss) | | Net realized and unrealized gains (losses) on investments | | Total from investment operations | | Net investment income | | Net realized gains | | Tax return of capital | | Total distributions | ||||||||||||||||||||
Short Term Bond Fund II | |||||||||||||||||||||||||||||||||||
| Six Months Ended August 31, 2007 (Unaudited) | $ | 9.86 | $ | 0.24 | $ | (0.07 | ) | $ | 0.17 | $ | (0.24 | ) | $ | — | $ | — | $ | (0.24 | ) | ||||||||||||||||
| September 1, 2006 through February 28, 2007 (d) | 9.86 | 0.23 | (f) | 0.02 | 0.25 | (0.25 | ) | — | — | (0.25 | ) | ||||||||||||||||||||||||
| Year Ended August 31, 2006 | 10.03 | 0.47 | (0.19 | ) | 0.28 | (0.45 | ) | — | — | (0.45 | ) | ||||||||||||||||||||||||
| Year Ended August 31, 2005 | 10.22 | 0.32 | (0.18 | ) | 0.14 | (0.33 | ) | — | — | (0.33 | ) | ||||||||||||||||||||||||
| Year Ended August 31, 2004 | 10.25 | 0.23 | (f) | (0.03 | ) | 0.20 | (0.23 | ) | — | — | (g) | (0.23 | ) | ||||||||||||||||||||||
| Year Ended August 31, 2003 | 10.35 | 0.27 | (f) | (0.05 | ) | 0.22 | (0.27 | ) | (0.05 | ) | — | (g) | (0.32 | ) | |||||||||||||||||||||
| November 1, 2001 to August 31, 2002 (e) | 10.40 | 0.26 | 0.07 | 0.33 | (0.27 | ) | (0.11 | ) | — | (0.38 | ) | ||||||||||||||||||||||||
Strategic Income Fund | �� | ||||||||||||||||||||||||||||||||||
| Six Months Ended August 31, 2007 (Unaudited) | 9.24 | 0.25 | (f) | (0.53 | ) | (0.28 | ) | (0.24 | ) | — | — | (0.24 | ) | ||||||||||||||||||||||
| September 1, 2006 through February 28, 2007 (d) | 9.12 | 0.23 | (f) | 0.14 | 0.37 | (0.25 | ) | — | — | (0.25 | ) | ||||||||||||||||||||||||
| Year Ended August 31, 2006 | 9.33 | 0.45 | (f) | (0.13 | ) | 0.32 | (0.53 | ) | — | — | (0.53 | ) | |||||||||||||||||||||||
| Year Ended August 31, 2005 | 9.08 | 0.46 | 0.19 | 0.65 | (0.40 | ) | — | — | (0.40 | ) | |||||||||||||||||||||||||
| Year Ended August 31, 2004 | 8.92 | 0.49 | (f) | 0.16 | 0.65 | (0.49 | ) | — | — | (0.49 | ) | ||||||||||||||||||||||||
| Year Ended August 31, 2003 | 8.65 | 0.45 | (f) | 0.27 | 0.72 | (0.45 | ) | — | — | (0.45 | ) | ||||||||||||||||||||||||
| November 1, 2001 through August 31, 2002 (e) | 8.95 | 0.45 | (0.31 | ) | 0.14 | (0.42 | ) | — | (0.02 | ) | (0.44 | ) | |||||||||||||||||||||||
| (a) | Annualized for periods less than one year. |
| (b) | Not annualized for periods less than one year. |
| (c) | Includes adjustments in accordance with accounting principles generally accepted in the United States of America and as such, the net asset value for financial reporting purposes and the returns based upon those net asset values may differ from the net asset value and returns for shareholder transactions. |
| (d) | The Fund changed its fiscal year end from August 31 to the last day in February. |
| (e) | The Fund changed its fiscal year end from October 31 to August 31. |
| (f) | Calculated based upon average shares outstanding. |
| (g) | Amount rounds to less than $0.01. |
| (h) | Includes interest expense of 0.01%. |
| | Ratios/Supplemental data | | |||||||||||||||||||||||||||||||||
|---|---|---|---|---|---|---|---|---|---|---|---|---|---|---|---|---|---|---|---|---|---|---|---|---|---|---|---|---|---|---|---|---|---|---|---|
| Ratios to average net assets (a) | |||||||||||||||||||||||||||||||||||
| Redemption fees | | Net asset value, end of period | | Total return (b)(c) | | Net assets end of period (000’s) | | Net expenses | | Net investment income (loss) | | Expenses without waivers, reimbursements and earnings credits | | Portfolio turnover rate (b) | |||||||||||||||||||||
| $— | $ | 9.79 | 1.71 | % | $ | 138,506 | 0.50 | % | 4.75 | % | 0.74 | % | 208 | % | |||||||||||||||||||||
| — | 9.86 | 2.54 | 151,633 | 0.50 | 4.75 | 0.72 | 246 | ||||||||||||||||||||||||||||
| — | 9.86 | 2.91 | 375,097 | 0.50 | 4.71 | 0.70 | 479 | ||||||||||||||||||||||||||||
| — | 10.03 | 1.35 | 432,056 | 0.50 | 3.21 | 0.68 | 201 | ||||||||||||||||||||||||||||
| — | 10.22 | 2.01 | 492,178 | 0.50 | 2.26 | 0.70 | 253 | ||||||||||||||||||||||||||||
| — | 10.25 | 2.15 | 342,000 | 0.50 | 2.58 | 0.70 | 319 | ||||||||||||||||||||||||||||
| — | 10.35 | 3.30 | 144,000 | 0.50 | 2.91 | 0.70 | 192 | ||||||||||||||||||||||||||||
| — | 8.72 | (3.12 | ) | 1,659 | 0.90 | 5.52 | 2.21 | 322 | |||||||||||||||||||||||||||
| — | 9.24 | 4.07 | 1,627 | 0.90 | 5.03 | 3.46 | 223 | ||||||||||||||||||||||||||||
| —(g) | 9.12 | 3.58 | 1,796 | 0.90 | 4.94 | 3.32 | 299 | ||||||||||||||||||||||||||||
| — | 9.33 | 7.30 | 1,892 | 0.95 | 4.30 | 1.86 | 461 | ||||||||||||||||||||||||||||
| — | 9.08 | 7.48 | 2,364 | 1.01 | (h) | 5.44 | 1.95 | 152 | |||||||||||||||||||||||||||
| — | 8.92 | 8.48 | 3,000 | 1.00 | 5.10 | 1.48 | 248 | ||||||||||||||||||||||||||||
| — | 8.65 | 1.61 | 5,000 | 1.00 | 6.08 | 1.48 | 178 | ||||||||||||||||||||||||||||
FOR THE PERIODS INDICATED (continued)
| | | | | Per share operating performance | | ||||||||||||||||||||||||||||||
|---|---|---|---|---|---|---|---|---|---|---|---|---|---|---|---|---|---|---|---|---|---|---|---|---|---|---|---|---|---|---|---|---|---|---|---|
| Investment operations | Distributions | ||||||||||||||||||||||||||||||||||
| | Net asset value, beginning of period | | Net investment income (loss) | | Net realized and unrealized gains (losses) on investments | | Total from investment operations | | Net investment income | | Net realized gains | | Tax return of capital | | Total distributions | ||||||||||||||||||||
Bond Fund | |||||||||||||||||||||||||||||||||||
| Six Months Ended August 31, 2007 (Unaudited) | $ | 9.31 | $ | 0.25 | $ | (0.36 | ) | $ | (0.11 | ) | $ | (0.25 | ) | $ | — | $ | — | $ | (0.25 | ) | |||||||||||||||
| September 1, 2006 through February 28, 2007 (d) | 9.19 | 0.22 | 0.14 | 0.36 | (0.24 | ) | — | — | (0.24 | ) | |||||||||||||||||||||||||
| Year Ended August 31, 2006 | 9.75 | 0.46 | (0.31 | ) | 0.15 | (0.44 | ) | (0.27 | ) | — | (0.71 | ) | |||||||||||||||||||||||
| Year Ended August 31, 2005 | 9.96 | 0.38 | 0.13 | 0.51 | (0.42 | ) | (0.30 | ) | — | (0.72 | ) | ||||||||||||||||||||||||
| Year Ended August 31, 2004 | 9.94 | 0.35 | 0.32 | 0.67 | (0.35 | ) | (0.30 | ) | — | (0.65 | ) | ||||||||||||||||||||||||
| Year Ended August 31, 2003 | 10.04 | 0.42 | (0.02 | ) | 0.40 | (0.42 | ) | (0.08 | ) | — | (0.50 | ) | |||||||||||||||||||||||
| November 1, 2001 through August 31, 2002 (e) | 10.08 | 0.34 | 0.02 | 0.36 | (0.34 | ) | (0.06 | ) | — | (0.40 | ) | ||||||||||||||||||||||||
Enhanced Income Fund | |||||||||||||||||||||||||||||||||||
| Six Months Ended August 31, 2007 (Unaudited) | 9.75 | 0.27 | (0.23 | ) | 0.04 | (0.27 | ) | — | — | (0.27 | ) | ||||||||||||||||||||||||
| September 1, 2006 through February 28, 2007 (d) | 9.76 | 0.27 | (0.01 | ) | 0.26 | (0.27 | ) | — | — | (0.27 | ) | ||||||||||||||||||||||||
| Year Ended August 31, 2006 | 9.82 | 0.50 | (0.06 | ) | 0.44 | (0.50 | ) | — | — | (0.50 | ) | ||||||||||||||||||||||||
| Year Ended August 31, 2005 | 9.84 | 0.28 | (0.02 | ) | 0.26 | (0.28 | ) | — | — | (0.28 | ) | ||||||||||||||||||||||||
| Year Ended August 31, 2004 | 9.86 | 0.14 | (0.02 | ) | 0.12 | (0.14 | ) | — | — | (0.14 | ) | ||||||||||||||||||||||||
| Year Ended August 31, 2003 | 9.98 | 0.23 | (0.12 | ) | 0.11 | (0.23 | ) | — | — | (0.23 | ) | ||||||||||||||||||||||||
| November 30, 2001 (f) through August 31, 2002 | 10.00 | 0.18 | (0.02 | ) | 0.16 | (0.18 | ) | — | — | (0.18 | ) | ||||||||||||||||||||||||
Real Return Fund | |||||||||||||||||||||||||||||||||||
| Six Months Ended August 31, 2007 (Unaudited) | 9.55 | 0.36 | (0.20 | ) | 0.16 | (0.37 | ) | — | — | (0.37 | ) | ||||||||||||||||||||||||
| September 1, 2006 through February 28, 2007 (d) | 9.53 | 0.06 | 0.03 | 0.09 | (0.07 | ) | — | — | (0.07 | ) | |||||||||||||||||||||||||
| Year ended August 31, 2006 (g) | 10.00 | 0.49 | (0.49 | ) | — | (0.47 | ) | — | — | (0.47 | ) | ||||||||||||||||||||||||
Short Term Bond Fund | |||||||||||||||||||||||||||||||||||
| Six Months Ended August 31, 2007 (Unaudited) | 9.53 | 0.25 | (0.21 | ) | 0.04 | (0.25 | ) | — | — | (0.25 | ) | ||||||||||||||||||||||||
| September 1, 2006 through February 28, 2007 (d) | 9.51 | 0.24 | 0.03 | 0.27 | (0.25 | ) | — | — | (0.25 | ) | |||||||||||||||||||||||||
| Year Ended August 31, 2006 | 9.64 | 0.48 | (0.15 | ) | 0.33 | (0.46 | ) | — | — | (0.46 | ) | ||||||||||||||||||||||||
| Year Ended August 31, 2005 | 9.85 | 0.36 | (0.19 | ) | 0.17 | (0.38 | ) | — | — | (0.38 | ) | ||||||||||||||||||||||||
| Year Ended August 31, 2004 | 9.86 | 0.25 | (0.02 | ) | 0.23 | (0.24 | ) | — | — | (0.24 | ) | ||||||||||||||||||||||||
| Year Ended August 31, 2003 | 10.05 | 0.28 | (0.04 | ) | 0.24 | (0.29 | ) | (0.14 | ) | — | (0.43 | ) | |||||||||||||||||||||||
| November 1, 2001 through August 31, 2002 (e) | 10.03 | 0.29 | 0.06 | 0.35 | (0.29 | ) | (0.04 | ) | — | (0.33 | ) | ||||||||||||||||||||||||
Strategic Income Fund | |||||||||||||||||||||||||||||||||||
| Six Months Ended August 31, 2007 (Unaudited) | 9.25 | 0.26 | (h) | (0.54 | ) | (0.28 | ) | (0.25 | ) | — | — | (0.25 | ) | ||||||||||||||||||||||
| September 1, 2006 through February 28, 2007 (d) | 9.12 | 0.24 | (h) | 0.15 | 0.39 | (0.26 | ) | — | — | (0.26 | ) | ||||||||||||||||||||||||
| Year Ended August 31, 2006 | 9.33 | 0.48 | (h) | (0.14 | ) | 0.34 | (0.55 | ) | — | — | (0.55 | ) | |||||||||||||||||||||||
| Year Ended August 31, 2005 | 9.08 | (0.12 | ) | 0.80 | 0.68 | (0.43 | ) | — | — | (0.43 | ) | ||||||||||||||||||||||||
| Year Ended August 31, 2004 | 8.92 | 0.51 | (h) | 0.17 | 0.68 | (0.52 | ) | — | — | (0.52 | ) | ||||||||||||||||||||||||
| Year Ended August 31, 2003 | 8.65 | 0.48 | (h) | 0.27 | 0.75 | (0.48 | ) | — | — | (0.48 | ) | ||||||||||||||||||||||||
| November 1, 2001 through August 31, 2002 (e) | 8.95 | 0.47 | (0.30 | ) | 0.17 | (0.45 | ) | — | (0.02 | ) | (0.47 | ) | |||||||||||||||||||||||
| (a) | Annualized for periods less than one year. |
| (b) | Not annualized for periods less than one year. |
| (c) | Includes adjustments in accordance with accounting principles generally accepted in the United States of America and as such, the net asset value for financial reporting purposes and the returns based upon those net asset values may differ from the net asset value and returns for shareholder transactions. |
| (d) | The Fund changed its fiscal year end from August 31 to the last day in February. |
| (e) | The Fund changed its fiscal year end from October 31 to August 31. |
| (f) | Commencement of operations of class of shares. |
| (g) | Commencement of operations was September 1, 2005. |
| (h) | Calculated based upon average shares outstanding. |
| (i) | Amount rounds to less than $0.01. |
| (j) | Includes interest expense of 0.01%. |
| | Ratios/Supplemental data | | ||||||||||||||||||||||||||||||
|---|---|---|---|---|---|---|---|---|---|---|---|---|---|---|---|---|---|---|---|---|---|---|---|---|---|---|---|---|---|---|---|---|
| Ratios to average net assets (a) | ||||||||||||||||||||||||||||||||
| Redemption fees | | Net asset value, end of period | | Total return (b)(c) | | Net assets end of period (000’s) | | Net expenses | | Net investment income (loss) | | Expenses without waivers, reimbursements and earnings credits | | Portfolio turnover rate (b) | ||||||||||||||||||
| $— | $ | 8.95 | (1.25 | )% | $ | 430,382 | 0.49 | % | 5.37 | % | 0.55 | % | 379 | % | ||||||||||||||||||
| — | 9.31 | 3.99 | 398,771 | 0.49 | 5.15 | 0.55 | 357 | |||||||||||||||||||||||||
| — | 9.19 | 1.70 | 265,279 | 0.49 | 4.91 | 0.58 | 711 | |||||||||||||||||||||||||
| — | 9.75 | 5.33 | 259,697 | 0.49 | 3.85 | 0.59 | 559 | |||||||||||||||||||||||||
| — | 9.96 | 6.96 | 318,100 | 0.49 | 3.51 | 0.62 | 571 | |||||||||||||||||||||||||
| — | 9.94 | 3.99 | 478,000 | 0.49 | 4.10 | 0.60 | 679 | |||||||||||||||||||||||||
| — | 10.04 | 3.71 | 747,000 | 0.49 | 4.14 | 0.58 | 572 | |||||||||||||||||||||||||
| — | 9.52 | 0.37 | 189,621 | 0.20 | 5.46 | 0.53 | 109 | |||||||||||||||||||||||||
| — | 9.75 | 2.66 | 183,102 | 0.20 | 5.53 | 0.55 | 44 | |||||||||||||||||||||||||
| — | 9.76 | 4.61 | 131,238 | 0.20 | 5.04 | 0.57 | 264 | |||||||||||||||||||||||||
| — | 9.82 | 2.69 | 163,344 | 0.20 | 2.66 | 0.56 | 128 | |||||||||||||||||||||||||
| — | 9.84 | 1.28 | 293,752 | 0.20 | 1.47 | 0.56 | 156 | |||||||||||||||||||||||||
| — | 9.86 | 1.14 | 354,000 | 0.20 | 2.33 | 0.56 | 328 | |||||||||||||||||||||||||
| — | 9.98 | 1.58 | 300,000 | 0.20 | 2.40 | 0.68 | 120 | |||||||||||||||||||||||||
| — | 9.34 | 1.73 | 6,210 | 0.50 | 7.66 | 0.98 | 173 | |||||||||||||||||||||||||
| — | 9.55 | 0.96 | 6,109 | 0.50 | 1.22 | 0.94 | 154 | |||||||||||||||||||||||||
| — | 9.53 | 0.12 | 944 | 0.50 | 7.35 | 0.98 | 223 | |||||||||||||||||||||||||
| — | 9.32 | 0.37 | 493,507 | 0.30 | 5.28 | 0.49 | 217 | |||||||||||||||||||||||||
| — | 9.53 | 2.84 | 454,688 | 0.30 | 5.19 | 0.49 | 143 | |||||||||||||||||||||||||
| — | 9.51 | 3.47 | 380,233 | 0.30 | 4.87 | 0.51 | 540 | |||||||||||||||||||||||||
| — | 9.64 | 1.75 | 471,460 | 0.30 | 3.60 | 0.53 | 194 | |||||||||||||||||||||||||
| — | 9.85 | 2.38 | 641,869 | 0.30 | 2.49 | 0.55 | 261 | |||||||||||||||||||||||||
| — | 9.86 | 2.44 | 806,000 | 0.30 | 2.85 | 0.55 | 386 | |||||||||||||||||||||||||
| — | 10.05 | 3.55 | 618,000 | 0.30 | 3.53 | 0.54 | 215 | |||||||||||||||||||||||||
| — | 8.72 | (3.10 | ) | 3,099 | 0.65 | 5.76 | 2.06 | 322 | ||||||||||||||||||||||||
| — | 9.25 | 4.30 | 3,684 | 0.65 | 5.28 | 3.34 | 223 | |||||||||||||||||||||||||
| —(i) | 9.12 | 3.81 | 3,851 | 0.65 | 5.20 | 3.20 | 299 | |||||||||||||||||||||||||
| — | 9.33 | 7.63 | 2,042 | 0.65 | 4.45 | 1.36 | 461 | |||||||||||||||||||||||||
| — | 9.08 | 7.85 | 40,000 | 0.66 | (j) | 5.63 | 1.22 | 152 | ||||||||||||||||||||||||
| — | 8.92 | 8.86 | 108,000 | 0.65 | 5.42 | 0.97 | 248 | |||||||||||||||||||||||||
| — | 8.65 | 1.92 | 135,000 | 0.65 | 6.44 | 0.98 | 178 | |||||||||||||||||||||||||
FOR THE PERIODS INDICATED (continued)
| | | | | Per share operating performance | | ||||||||||||||||||||||||||
|---|---|---|---|---|---|---|---|---|---|---|---|---|---|---|---|---|---|---|---|---|---|---|---|---|---|---|---|---|---|---|---|
| Investment operations | Distributions | ||||||||||||||||||||||||||||||
| | Net asset value, beginning of period | | Net investment income (loss) | | Net realized and unrealized gains (losses) on investments | | Total from investment operations | | Net investment income | | Net realized gains | | Total distributions | ||||||||||||||||||
Bond Fund | |||||||||||||||||||||||||||||||
| Six Months Ended August 31, 2007 (Unaudited) | $ | 9.31 | $ | 0.25 | $ | (0.36 | ) | $ | (0.11 | ) | $ | (0.25 | ) | $ | — | $ | (0.25 | ) | |||||||||||||
| September 1, 2006 through February 28, 2007 (d) | 9.20 | 0.24 | 0.12 | 0.36 | (0.25 | ) | — | (0.25 | ) | ||||||||||||||||||||||
| Year Ended August 31, 2006 | 9.76 | 0.48 | (0.32 | ) | 0.16 | (0.45 | ) | (0.27 | ) | (0.72 | ) | ||||||||||||||||||||
| Year Ended August 31, 2005 | 9.97 | 0.32 | 0.20 | 0.52 | (0.43 | ) | (0.30 | ) | (0.73 | ) | |||||||||||||||||||||
| Year Ended August 31, 2004 | 9.95 | 0.36 | 0.32 | 0.68 | (0.36 | ) | (0.30 | ) | (0.66 | ) | |||||||||||||||||||||
| Year Ended August 31, 2003 | 10.05 | 0.43 | (0.02 | ) | 0.41 | (0.43 | ) | (0.08 | ) | (0.51 | ) | ||||||||||||||||||||
| November 1, 2001 through August 31, 2002 (e) | 10.09 | 0.34 | 0.02 | 0.36 | (0.34 | ) | (0.06 | ) | (0.40 | ) | |||||||||||||||||||||
| (a) | Annualized for periods less than one year. |
| (b) | Not annualized for periods less than one year. |
| (c) | Includes adjustments in accordance with accounting principles generally accepted in the United States of America and as such, the net asset value for financial reporting purposes and the returns based upon those net asset values may differ from the net asset value and returns for shareholder transactions. |
| (d) | The Fund changed its fiscal year end from August 31 to the last day in February. |
| (e) | The Fund changed its fiscal year from October 31 to August 31. |
| | | Ratios/Supplemental data | | ||||||||||||||||||||||||
|---|---|---|---|---|---|---|---|---|---|---|---|---|---|---|---|---|---|---|---|---|---|---|---|---|---|---|---|
| Ratios to average net assets (a) | |||||||||||||||||||||||||||
Net asset value, end of period | | Total return (b)(c) | | Net assets end of period (000’s) | | Net expenses | | Net investment income (loss) | | Expenses without waivers, reimbursements and earnings credits | | Portfolio turnover rate (b) | |||||||||||||||
| $8.95 | (1.20 | )% | $ | 158,931 | 0.40 | % | 5.45 | % | 0.45 | % | 379 | % | |||||||||||||||
| 9.31 | 3.95 | 162,248 | 0.40 | 5.23 | 0.45 | 357 | |||||||||||||||||||||
| 9.20 | 1.80 | 145,624 | 0.40 | 5.00 | 0.48 | 711 | |||||||||||||||||||||
| 9.76 | 5.45 | 126,272 | 0.40 | 3.90 | 0.51 | 559 | |||||||||||||||||||||
| 9.97 | 7.05 | 380,794 | 0.40 | 3.59 | 0.56 | 571 | |||||||||||||||||||||
| 9.95 | 4.08 | 444,000 | 0.40 | 4.19 | 0.55 | 679 | |||||||||||||||||||||
| 10.05 | 3.80 | 609,000 | 0.40 | 4.20 | 0.53 | 572 | |||||||||||||||||||||
AS OF AUGUST 31, 2007 (Unaudited)
| | Classes Offered | Trust | | |||||||
|---|---|---|---|---|---|---|---|---|---|---|
| Bond Fund | Class A, Class B, Class C, Select Class, Institutional Class and Ultra | JPM I | ||||||||
| Emerging Markets Debt | Class A, Class C, R Class and Select Class | JPM I | ||||||||
| Enhanced Income Fund | Institutional Class | JPM I | ||||||||
| Real Return Fund | Class A, Class C, Select Class and Institutional Class | JPM I | ||||||||
| Short Term Bond Fund | Class A, Select Class and Institutional Class | JPM I | ||||||||
| Short Term Bond Fund II | Class A, Class M and Select Class | MFG | ||||||||
| Strategic Income Fund | Class A, Class B, Class C, Select Class and Institutional Class | JPM I | ||||||||
| | Market Value | | Percentage | |||||||
|---|---|---|---|---|---|---|---|---|---|---|
| Bond Fund | $ | 61,367 | 2.6 | % | ||||||
| Emerging Markets Debt Fund | 5,323 | 2.2 | ||||||||
| Enhanced Income Fund | 13,210 | 7.0 | ||||||||
| Short Term Bond Fund | 64,505 | 3.2 | ||||||||
| Short Term Bond Fund II | 15,122 | 4.7 | ||||||||
| Strategic Income Fund | 1,782 | 9.7 | ||||||||
AS OF AUGUST 31, 2007 (Unaudited) (continued)
whether the cost of the closing transaction exceeds the premium received when the option was written. If a call option is exercised, the premium is added to the proceeds from the sale of underlying security in determining whether there has been a realized gain or loss. If a put option is exercised, the premium reduces the cost basis of the security.
| Bond Fund | |||||||||||||||||||
|---|---|---|---|---|---|---|---|---|---|---|---|---|---|---|---|---|---|---|---|
| | Number of contracts | | Premiums Received | | Notional Value | | Premiums Received | ||||||||||||
| Options outstanding at February 28, 2007 | 4,197 | $ | 753 | $ | 5,217,450 | $ | 38,405 | ||||||||||||
| Options written | 20,799 | 5,669 | 6,628,473 | 41,533 | |||||||||||||||
| Options expired | — | — | — | — | |||||||||||||||
| Options exercised or terminated in closing purchase transactions | (16,155 | ) | (3,281 | ) | (8,631,213 | ) | (59,570 | ) | |||||||||||
| Options outstanding at August 31, 2007 | 8,841 | $ | 3,141 | $ | 3,214,710 | $ | 20,368 | ||||||||||||
| Real Return Fund | ||||||||||||||||||||||||
|---|---|---|---|---|---|---|---|---|---|---|---|---|---|---|---|---|---|---|---|---|---|---|---|---|
| | Number of contracts | | Premiums Received | | Notional Value | | Notional Value | | Premiums Received | |||||||||||||||
| Options outstanding at February 28, 2007 | 106,181 | $ | 34 | $ | 122,819 | EUR 1,000 | $ | 1,464 | ||||||||||||||||
| Options written | 368,270 | 198 | 215,769 | — | 1,345 | |||||||||||||||||||
| Options expired | (44 | ) | (2 | ) | — | — | — | |||||||||||||||||
| Options exercised or terminated in closing purchase transactions | (262,158 | ) | (111 | ) | (230,872 | ) | (1,000 | ) | (2,076 | ) | ||||||||||||||
| Options outstanding at August 31, 2007 | 212,249 | $ | 119 | $ | 107,716 | EUR — | $ | 733 | ||||||||||||||||
| Short Term Bond Fund | |||||||||||||||||||
|---|---|---|---|---|---|---|---|---|---|---|---|---|---|---|---|---|---|---|---|
| | Number of contracts | | Premiums Received | | Notional Value | | Premiums Received | ||||||||||||
| Options outstanding at February 28, 2007 | 533 | $ | 101 | $ | 1,612,870 | $ | 13,046 | ||||||||||||
| Options written | 5,430 | 1,938 | 2,641,054 | 17,178 | |||||||||||||||
| Options expired | — | — | — | — | |||||||||||||||
| Options exercised or terminated in closing purchase transactions | (3,241 | ) | (902 | ) | (2,923,682 | ) | (22,673 | ) | |||||||||||
| Options outstanding at August 31, 2007 | 2,722 | $ | 1,137 | $ | 1,330,242 | $ | 7,551 | ||||||||||||
| Short Term Bond Fund II | |||||||||||||||||||
|---|---|---|---|---|---|---|---|---|---|---|---|---|---|---|---|---|---|---|---|
| | Number of contracts | | Premiums Received | | Notional Value | | Premiums Received | ||||||||||||
| Options outstanding at February 28, 2007 | 164 | $ | 32 | $ | 319,031 | $ | 3,477 | ||||||||||||
| Options written | 968 | 327 | 313,592 | 2,820 | |||||||||||||||
| Options expired | — | — | — | — | |||||||||||||||
| Options exercised or terminated in closing purchase transactions | (636 | ) | (164 | ) | (416,837 | ) | (4,646 | ) | |||||||||||
| Options outstanding at August 31, 2007 | 496 | $ | 195 | $ | 215,786 | $ | 1,651 | ||||||||||||
| Strategic Income Fund | |||||||||||||||||||
|---|---|---|---|---|---|---|---|---|---|---|---|---|---|---|---|---|---|---|---|
| | Number of contracts | | Premiums Received | | Notional Value | | Premiums Received | ||||||||||||
| Options outstanding at February 28, 2007 | 114 | $ | 23 | $ | 158,040 | $ | 1,495 | ||||||||||||
| Options written | 545 | 150 | 140,315 | 1,289 | |||||||||||||||
| Options expired | — | — | — | — | |||||||||||||||
| Options exercised or terminated in closing purchase transactions | (423 | ) | (85 | ) | (214,626 | ) | (2,082 | ) | |||||||||||
| Options outstanding at August 31, 2007 | 236 | $ | 88 | $ | 83,729 | $ | 702 | ||||||||||||
AS OF AUGUST 31, 2007 (Unaudited) (continued)
AS OF AUGUST 31, 2007 (Unaudited) (continued)
services is paid a fee. The fee is accrued daily and paid monthly based on each Fund’s respective average daily net assets. The annual fee rate for each Fund is as follows:
| | ||||||
|---|---|---|---|---|---|---|
| Bond Fund | 0.30 | % | ||||
| Emerging Markets Debt Fund | 0.70 | |||||
| Enhanced Income Fund | 0.25 | |||||
| Real Return Fund | 0.35 | |||||
| Short Term Bond Fund | 0.25 | |||||
| Short Term Bond Fund II | 0.25 | |||||
| Strategic Income Fund | 0.45 | |||||
| | Six Months Ended 8/31/07 | |||||
|---|---|---|---|---|---|---|
| Bond Fund | $ | 78 | ||||
| Emerging Markets Debt Fund | 8 | |||||
| Enhanced Income Fund | 13 | |||||
| Real Return Fund | 4 | |||||
| Short Term Bond Fund | 210 | |||||
| Short Term Bond Fund II | 11 | |||||
| Strategic Income Fund | — | (a) | ||||
| (a) | Amount rounds to less than $1,000. |
| | Class A | | Class B | | Class C | | Class M | |||||||||||
|---|---|---|---|---|---|---|---|---|---|---|---|---|---|---|---|---|---|---|
| Bond Fund | 0.25 | % | 0.75 | % | 0.75 | % | n/a | |||||||||||
| Emerging Markets Debt Fund | 0.25 | n/a | 0.75 | n/a | ||||||||||||||
| Real Return Fund | 0.25 | n/a | 0.75 | n/a | ||||||||||||||
| Short Term Bond Fund | 0.25 | n/a | n/a | n/a | ||||||||||||||
| Short Term Bond Fund II | 0.25 | n/a | n/a | 0.35 | % | |||||||||||||
| Strategic Income Fund | 0.25 | 0.75 | 0.75 | 0.50 | * | |||||||||||||
| * | Class M Shares of the Strategic Income Fund were liquidated on July 2, 2007. |
AS OF AUGUST 31, 2007 (Unaudited) (continued)
| | Front-End Sales Charge | | CDSC | |||||||
|---|---|---|---|---|---|---|---|---|---|---|
| Bond Fund | $ | 16 | $ | 10 | ||||||
| Emerging Markets Debt Fund | 5 | — | (a) | |||||||
| Real Return Fund | — | (a) | — | |||||||
| Short Term Bond Fund | 1 | — | ||||||||
| Short Term Bond Fund II | — | (a) | — | |||||||
| Strategic Income Fund | 1 | 5 | ||||||||
| (a) | Amount rounds to less than $1,000. |
| | Class A | | Class B | | Class C | | Class M | | R Class | | Select Class | | Institutional Class | |||||||||||||||||
|---|---|---|---|---|---|---|---|---|---|---|---|---|---|---|---|---|---|---|---|---|---|---|---|---|---|---|---|---|---|---|
| Bond Fund | 0.25 | % | 0.25 | % | 0.25 | % | n/a | n/a | 0.25 | % | 0.10 | % | ||||||||||||||||||
| Emerging Markets Debt Fund | 0.25 | n/a | 0.25 | n/a | 0.05 | % | 0.25 | n/a | ||||||||||||||||||||||
| Enhanced Income Fund | n/a | n/a | n/a | n/a | n/a | n/a | 0.10 | |||||||||||||||||||||||
| Real Return Fund | 0.25 | n/a | 0.25 | n/a | n/a | 0.25 | 0.10 | |||||||||||||||||||||||
| Short Term Bond Fund | 0.25 | n/a | n/a | n/a | n/a | 0.25 | 0.10 | |||||||||||||||||||||||
| Short Term Bond Fund II | 0.25 | n/a | n/a | 0.25 | % | n/a | 0.25 | n/a | ||||||||||||||||||||||
| Strategic Income Fund | 0.25 | 0.25 | 0.25 | 0.30 | * | n/a | 0.25 | 0.10 | ||||||||||||||||||||||
| * | Class M Shares of the Strategic Income Fund were liquidated on July 2, 2007. |
| | Class A | | Class B | | Class C | | Class M | | R Class | | Select Class | | Institutional Class | | Ultra | |||||||||||||||||||
|---|---|---|---|---|---|---|---|---|---|---|---|---|---|---|---|---|---|---|---|---|---|---|---|---|---|---|---|---|---|---|---|---|---|---|
| Bond Fund | 0.75 | % | 1.50 | % | 1.50 | % | n/a | n/a | 0.69 | % | 0.49 | % | 0.40 | % | ||||||||||||||||||||
| Emerging Markets Debt Fund | 1.50 | n/a | 2.00 | n/a | 1.05 | % | 1.25 | n/a | n/a | |||||||||||||||||||||||||
| Enhanced Income Fund | n/a | n/a | n/a | n/a | n/a | n/a | 0.25 | n/a | ||||||||||||||||||||||||||
| Real Return Fund | 0.90 | n/a | 1.40 | n/a | n/a | 0.65 | 0.50 | n/a | ||||||||||||||||||||||||||
| Short Term Bond Fund | 0.75 | n/a | n/a | n/a | n/a | 0.60 | 0.30 | n/a | ||||||||||||||||||||||||||
| Short Term Bond Fund II | 0.75 | n/a | n/a | 1.00 | % | n/a | 0.50 | n/a | n/a | |||||||||||||||||||||||||
| Strategic Income Fund | 1.15 | 1.65 | 1.65 | 1.45 | * | n/a | 0.90 | 0.65 | n/a | |||||||||||||||||||||||||
| * | Class M Shares of the Strategic Income Fund were liquidated on July 2, 2007. |
| Contractual Waivers | ||||||||||||||||||||||
|---|---|---|---|---|---|---|---|---|---|---|---|---|---|---|---|---|---|---|---|---|---|---|
| | Investment Advisory | | Administration | | Shareholder Servicing | | Total | | Contractual Reimbursements | |||||||||||||
| Bond Fund | $ | 138 | $ | 45 | $ | 40 | $ | 223 | $ | — | ||||||||||||
| Emerging Markets Debt Fund | 7 | 6 | — | 13 | — | |||||||||||||||||
| Enhanced Income Fund | 144 | 28 | 96 | 268 | — | |||||||||||||||||
| Real Return Fund | 109 | 22 | 35 | 166 | — | (a) | ||||||||||||||||
| Short Term Bond Fund | 280 | 153 | 244 | 677 | — | |||||||||||||||||
| Short Term Bond Fund II | 122 | 23 | 131 | 276 | — | |||||||||||||||||
| Strategic Income Fund | 51 | 11 | 2 | 64 | 88 | |||||||||||||||||
| Voluntary Waivers | |||||||||||||||
|---|---|---|---|---|---|---|---|---|---|---|---|---|---|---|---|
| | Investment Advisory | | Administration | | Total | ||||||||||
| Bond Fund | $ | 212 | $ | 126 | $ | 338 | |||||||||
| Enhanced Income Fund | — | 48 | 48 | ||||||||||||
| Short Term Bond Fund | — | 344 | 344 | ||||||||||||
| (a) | Amount rounds to less than $1,000. |
| Contractual Waivers | ||||||||||||||||||||||
|---|---|---|---|---|---|---|---|---|---|---|---|---|---|---|---|---|---|---|---|---|---|---|
| | Investment Advisory | | Administration | | Shareholder Servicing | | Total | | Contractual Reimbursements | |||||||||||||
| Bond Fund | $ | 130 | $ | 89 | $ | 29 | $ | 248 | $ | — | ||||||||||||
| Emerging Markets Debt Fund | 37 | 24 | — | 61 | — | |||||||||||||||||
| Enhanced Income Fund | 149 | 31 | 86 | 266 | — | |||||||||||||||||
| Real Return Fund | 89 | 22 | 33 | 144 | — | |||||||||||||||||
| Short Term Bond Fund | 191 | 240 | 203 | 634 | — | |||||||||||||||||
| Short Term Bond Fund II | 140 | 22 | 201 | 363 | — | |||||||||||||||||
| Strategic Income Fund | 56 | 12 | 2 | 70 | 249 | |||||||||||||||||
| Voluntary Waivers | |||||||||||||||
|---|---|---|---|---|---|---|---|---|---|---|---|---|---|---|---|
| | Investment Advisory | | Administration | | Total | ||||||||||
| Bond Fund | $ | 156 | $ | 70 | $ | 226 | |||||||||
| Enhanced Income Fund | — | 33 | 33 | ||||||||||||
| Short Term Bond Fund | 4 | 109 | 113 | ||||||||||||
| Contractual Waivers | ||||||||||||||||||||||
|---|---|---|---|---|---|---|---|---|---|---|---|---|---|---|---|---|---|---|---|---|---|---|
| | Investment Advisory | | Administration | | Shareholder Servicing | | Total | | Contractual Reimbursements | |||||||||||||
| Bond Fund | $ | 331 | $ | 86 | $ | 40 | $ | 457 | $ | — | ||||||||||||
| Emerging Markets Debt Fund | 46 | 15 | 59 | 120 | — | |||||||||||||||||
| Enhanced Income Fund | 253 | 52 | 140 | 445 | — | |||||||||||||||||
| Real Return Fund | 180 | 54 | 56 | 290 | 20 | |||||||||||||||||
| Short Term Bond Fund | 171 | 412 | 416 | 999 | — | |||||||||||||||||
| Short Term Bond Fund II | 129 | 183 | 670 | 982 | — | |||||||||||||||||
| Strategic Income Fund | 99 | 23 | 2 | 124 | 419 | |||||||||||||||||
AS OF AUGUST 31, 2007 (Unaudited) (continued)
| Voluntary Waivers | |||||||||||||||
|---|---|---|---|---|---|---|---|---|---|---|---|---|---|---|---|
| | Investment Advisory | | Administration | | Total | ||||||||||
| Bond Fund | $ | 171 | $ | 121 | $ | 292 | |||||||||
| Enhanced Income Fund | — | 70 | 70 | ||||||||||||
| Short Term Bond Fund | — | 140 | 140 | ||||||||||||
| Government | | Purchases (excluding U.S. Government) | | Sales (excluding U.S. Government) | | Purchases of U.S. Government | | Sales of U.S. Government | ||||||||||
|---|---|---|---|---|---|---|---|---|---|---|---|---|---|---|---|---|---|---|
| Bond Fund | $ | 18,612,708 | $ | 17,473,874 | $ | 311,864 | $ | 308,101 | ||||||||||
| Emerging Markets Debt Fund | 184,201 | 68,390 | 13,779 | 14,664 | ||||||||||||||
| Enhanced Income Fund | 203,263 | 217,997 | 1,243 | 1,827 | ||||||||||||||
| Real Return Fund | 151,832 | 130,571 | 17,920 | 17,222 | ||||||||||||||
| Short Term Bond Fund | 5,504,438 | 4,642,457 | 28,501 | 40,649 | ||||||||||||||
| Short Term Bond Fund II | 935,536 | 1,028,167 | 5,841 | 8,182 | ||||||||||||||
| Strategic Income Fund | 111,094 | 104,057 | 7,055 | 7,181 | ||||||||||||||
| | Gross Aggregate Costs | | Gross Unrealized Appreciation | | Gross Unrealized Depreciation | | Net Unrealized Appreciation (Depreciation) | |||||||||||
|---|---|---|---|---|---|---|---|---|---|---|---|---|---|---|---|---|---|---|
| Bond Fund | $ | 3,503,793 | $ | 24,349 | $ | 63,339 | $ | (38,990 | ) | |||||||||
| Emerging Markets Debt | 247,057 | 4,111 | 9,306 | (5,195 | ) | |||||||||||||
| Enhanced Income Fund | 218,707 | 136 | 3,586 | (3,450 | ) | |||||||||||||
| Real Return Fund | 82,259 | 345 | 1,178 | (833 | ) | |||||||||||||
| Short Term Bond Fund | 2,497,442 | 11,291 | 29,325 | (18,034 | ) | |||||||||||||
| Short Term Bond Fund II | 368,959 | 1,602 | 7,180 | (5,578 | ) | |||||||||||||
| Strategic Income Fund | 29,800 | 326 | 992 | (666 | ) | |||||||||||||
redemption requests that otherwise might require the untimely disposition of securities, and are subject to each Fund’s borrowing restrictions. The Interfund Loan Rate is determined, as specified in the Order, by averaging the current repurchase agreement rate and the current bank loan rate. The Order was granted to JPMorgan Trust II and may be relied upon by the Funds because they are investment companies in the same “group of investment companies” (as defined in Section 12(d)(1)(G) of the 1940 Act).
| Date | | Average Borrowings | | Number of Days Used | | Interest Paid | ||||||||
|---|---|---|---|---|---|---|---|---|---|---|---|---|---|---|
| Bond Fund | $ | 20,727 | 2 | $ | 6 | |||||||||
| Strategic Income Fund | 640 | 1 | — | (a) | ||||||||||
| (a) | Amount rounds to less than $1,000. |
| | Market Value of Securities Transferred to the Bond Fund (amounts in thousands) | | Number of Select Class Shares Issued (amounts in thousands) | |||||||
|---|---|---|---|---|---|---|---|---|---|---|
| JPMorgan Chase Bank Fixed Income Fund | $ | 164,784 | 17,738 | |||||||
| JPMorgan Chase Bank Intermediate Fixed Income Fund | 361,940 | 38,960 | ||||||||
| JPMorgan Chase Bank Intermediate Term Bond Trust | 186,712 | 20,098 | ||||||||
| JPMorgan Chase Bank Fixed Income Trust | 30,829 | 3,318 | ||||||||
| $ | 744,265 | 80,114 | ||||||||
AS OF AUGUST 31, 2007 (Unaudited) (continued)
(Unaudited)
| Name (Year of Birth); Positions With the Funds | | Principal Occupations During Past 5 Years | | Number of Portfolios in Fund Complex Overseen by Trustee (1) | | Other Directorships Held Outside Fund Complex | |||||||||
|---|---|---|---|---|---|---|---|---|---|---|---|---|---|---|---|
Independent Trustees | |||||||||||||||
| William J. Armstrong (1941); Trustee of Trust since 2005; Trustee of heritage JPMorgan Funds since 1987. | Retired; CFO and Consultant, EduNeering, Inc. (internet business education supplier) (2000–2001); Vice President and Treasurer, Ingersoll–Rand Company (manufacturer of industrial equipment) (1972–2000). | 143 | None. | ||||||||||||
| Roland R. Eppley, Jr. (1932); Trustee of Trust since 2005; Trustee of heritage JPMorgan Funds since 1989. | Retired; President and Chief Executive Officer, Eastern States Bankcard (1971–1988). | 143 | None. | ||||||||||||
| John F. Finn (1947); Trustee of Trust since 2005; Trustee of heritage One Group Mutual Funds since 1998. | President and Chief Executive Officer, Gardner, Inc. (wholesale distributor to outdoor power equipment industry) (1979–present). | 143 | Director, Cardinal Health, Inc. (CAH) (1994–present); Chairman, The Columbus Association of the Performing Arts (CAPA) (2003–present). | ||||||||||||
| Dr. Matthew Goldstein (1941); Trustee of Trust since 2005; Trustee of heritage JPMorgan Funds since 2003. | Chancellor, City University of New York (1999–present); President, Adelphi University (New York) (1998–1999). | 143 | Director, Albert Einstein School of Medicine (1998–present); Director, New Plan Excel Realty Trust, Inc. (real estate investment trust) (2000–present); Director, Lincoln Center Institute for the Arts in Education (1999–present). | ||||||||||||
| Robert J. Higgins (1945); Trustee of Trust since 2005; Trustee of heritage JPMorgan Funds since 2002. | Retired; Director of Administration of the State of Rhode Island (2003–2004); President — Consumer Banking and Investment Services, Fleet Boston Financial (1971–2001). | 143 | None. | ||||||||||||
| Peter C. Marshall (1942); Trustee of Trust since 2005; Trustee of heritage One Group Mutual Funds since 1994. | Self-employed business consultant (2001–present); Senior Vice President, W.D. Hoard, Inc. (corporate parent of DCI Marketing, Inc.) (2000–2002); President, DCI Marketing, Inc. (1992–2000). | 143 | None. | ||||||||||||
| Marilyn McCoy (1948); Trustee of Trust since 2005; Trustee of heritage One Group Mutual Funds since 1999. | Vice President of Administration and Planning, Northwestern University (1985–present). | 143 | Trustee, Carleton College (2003–present). | ||||||||||||
| William G. Morton, Jr. (1937); Trustee of Trust since 2005; Trustee of heritage JPMorgan Funds since 2003. | Retired; Chairman Emeritus (2001–2002), and Chairman and Chief Executive Officer, Boston Stock Exchange (1985–2001). | 143 | Director, Radio Shack Corporation (electronics) (1987–present); Director, The National Football Foundation and College Hall of Fame (1994–present); Trustee, Stratton Mountain School (2001–present). | ||||||||||||
| Robert A. Oden, Jr. (1946); Trustee of Trust since 2005; Trustee of heritage One Group Mutual Funds since 1997. | President, Carleton College (2002–present); President, Kenyon College (1995–2002). | 143 | Director, American University in Cairo. | ||||||||||||
(Unaudited) (continued)
| Name (Year of Birth); Positions With the Funds | | Principal Occupations During Past 5 Years | | Number of Portfolios in Fund Complex Overseen by Trustee (1) | | Other Directorships Held Outside Fund Complex | |||||||||
|---|---|---|---|---|---|---|---|---|---|---|---|---|---|---|---|
Independent Trustees | |||||||||||||||
| Fergus Reid, III (1932); Trustee of Trust (Chairman) since 2005; Trustee (Chairman) of heritage JPMorgan Funds since 1987. | Chairman, Lumelite Corporation (plastics manufacturing) (2003–present); Chairman and Chief Executive Officer, Lumelite Corporation (1985–2002). | 143 | Trustee, Morgan Stanley Funds (196 portfolios) (1995–present). | ||||||||||||
| Frederick W. Ruebeck (1939); Trustee of Trust since 2005; Trustee of heritage One Group Mutual Funds since 1994. | Advisor, Jerome P. Green & Associates, LLC (broker-dealer) (2000–present); Chief Investment Officer, Wabash College (2004–present); self-employed consultant (2000–present); Director of Investments, Eli Lilly and Company (1988–1999). | 143 | Trustee, Wabash College (1988–present); Chairman, Indianapolis Symphony Orchestra Foundation (1994–present). | ||||||||||||
| James J. Schonbachler (1943); Trustee of Trust since 2005; Trustee of heritage JPMorgan Funds since 2001. | Retired; Managing Director of Bankers Trust Company (financial services) (1968–1998). | 143 | None. | ||||||||||||
Interested Trustee | |||||||||||||||
| Leonard M. Spalding, Jr.* (1935); Trustee of Trust since 2005; Trustee of heritage JPMorgan Funds since 1998. | Retired; Chief Executive Officer, Chase Mutual Funds (investment company) (1989–1998); President and Chief Executive Officer, Vista Capital Management (investment management) (1990–1998); Chief Investment Executive, Chase Manhattan Private Bank (investment management) (1990–1998). | 143 | Director, Glenview Trust Company, LLC (2001–present); Trustee, St. Catherine College (1998–present); Trustee, Bellarmine University (2000–present); Director, Springfield-Washington County Economic Development Authority (1997–present); Trustee, Marion and Washington County, Kentucky Airport Board (1998–present); Trustee, Catholic Education Foundation (2005–present). | ||||||||||||
| (1) | A Fund Complex means two or more registered investment companies that hold themselves out to investors as related companies for purposes of investment and investor services or have a common investment adviser or have an investment adviser that is an affiliated person of the investment adviser of any of the other registered investment companies. The JPMorgan Funds Complex for which the Board of Trustees serves currently includes eight registered investment companies (143 funds). |
| * | Mr. Spalding is deemed to be an “interested person” due to his ownership of JPMorgan Chase stock. |
(Unaudited)
| Name (Year of Birth), Positions Held with the Trust (Since) | | Principal Occupations During Past 5 Years | ||||
|---|---|---|---|---|---|---|
| George C.W. Gatch (1962), President (2005) | Managing Director, J.P. Morgan Investment Management Inc.; Director and President, JPMorgan Distribution Services, Inc. and JPMorgan Funds Management, Inc. since 2005. Mr. Gatch is CEO and President of the JPMorgan Funds. Mr. Gatch has been an employee of JPMorgan since 1986 and has held positions such as President and CEO of DKB Morgan, a Japanese mutual fund company, which was a joint venture between J.P. Morgan and Dai-Ichi Kangyo Bank, as well as positions in business management, marketing, and sales. | |||||
| Robert L. Young (1963), Senior Vice President (2005)* | Director and Vice President, JPMorgan Distribution Services, Inc. and JPMorgan Funds Management, Inc.; Chief Operating Officer, JPMorgan Funds since 2005, and One Group Mutual Funds from 2001 until 2005. Mr. Young was Vice President and Treasurer, JPMorgan Funds Management, Inc. (formerly One Group Administrative Services), and Vice President and Treasurer, JPMorgan Distribution Services, Inc. (formerly One Group Dealer Services, Inc.) from 1999 to 2005. | |||||
| Patricia A. Maleski (1960), Vice President and Chief Administrative Officer (2005) | Managing Director, JPMorgan Funds Management, Inc.; Head of Funds Administration and Board Liaison, previously, Treasurer, JPMorgan Funds. Ms. Maleski has been with JPMorgan Chase & Co. since 2001. | |||||
| Stephen M. Benham (1959), Secretary (2005) | Vice President and Assistant General Counsel, JPMorgan Chase & Co. since 2004; Vice President (Legal Advisory) of Merrill Lynch Investment Managers, L.P. from 2000 to 2004. | |||||
| Stephanie J. Dorsey (1969), Treasurer (2005)* | Vice President, JPMorgan Funds Management, Inc.; Director of Mutual Fund Administration, JPMorgan Funds Management, Inc. (formerly One Group Administrative Services), from 2004 to 2005; Ms. Dorsey worked for JPMorgan Chase & Co. (formerly Bank One Corporation) from 2003 to 2004; prior to joining Bank One Corporation, she was a Senior Manager specializing in Financial Services audits at PricewaterhouseCoopers LLP from 1992 through 2002. | |||||
| Stephen M. Ungerman (1953), Chief Compliance Officer (2005) | Vice President, JPMorgan Chase & Co.; Mr. Ungerman was head of Fund Administration — Pooled Vehicles from 2000 to 2004. Mr. Ungerman has been with JPMorgan Chase & Co. since 2000. | |||||
| Paul L. Gulinello (1950), AML Compliance Officer (2005) | Vice President and Anti Money Laundering Compliance Officer for JPMorgan Asset Management Americas, additionally responsible for personal trading and compliance testing since 2004; Treasury Services Operating Risk Management and Compliance Executive supporting all JPMorgan Treasury Services business units from July 2000 to 2004. | |||||
| Susan M. Canning (1969), Assistant Secretary (2007)* | Vice President and Assistant General Counsel, JPMorgan Chase & Co.; Ms. Canning has served as an attorney with various titles for JPMorgan Chase & Co. since 1997. | |||||
| Elizabeth A. Davin (1964), Assistant Secretary (2005)* | Vice President and Assistant General Counsel, JPMorgan Chase & Co. since 2005; Senior Counsel, JPMorgan Chase & Co. (formerly Bank One Corporation) from 2004 to 2005; Assistant General Counsel and Associate General Counsel and Vice President, Gartmore Global Investments, Inc. from 1999 to 2004. | |||||
| Jessica K. Ditullio (1962), Assistant Secretary (2005)* | Vice President and Assistant General Counsel, JPMorgan Chase & Co. since 2005; Ms. Ditullio has served as an attorney with various titles for JPMorgan Chase & Co. (formerly Bank One Corporation) since 1990. | |||||
| Nancy E. Fields (1949), Assistant Secretary (2005)* | Vice President, JPMorgan Funds Management, Inc. and JPMorgan Distribution Services, Inc.; from 1999 to 2005, Director, Mutual Fund Administration, JPMorgan Funds Management, Inc. (formerly One Group Administrative Services) and Senior Project Manager, Mutual Funds, JPMorgan Distribution Services, Inc. (formerly One Group Dealer Services, Inc.). | |||||
| Ellen W. O’Brien (1957), Assistant Secretary (2005)** | Assistant Vice President, JPMorgan Investor Services, Co., responsible for Blue Sky registration. Ms. O’Brien has served in this capacity since joining the firm in 1991. | |||||
| Jeffrey D. House (1972), Assistant Treasurer (2006)* | Vice President, JPMorgan Funds Management, Inc. since July 2006; formerly, Senior Manager of Financial Services of BISYS Fund Services, Inc. from December 1995 until July 2006. | |||||
| Arthur A. Jensen (1966), Assistant Treasurer (2005)* | Vice President, JPMorgan Funds Management, Inc. since April 2005; formerly, Vice President of Financial Services of BISYS Fund Services, Inc. from 2001 until 2005. | |||||
| Laura S. Melman (1966), Assistant Treasurer (2006) | Vice President, JPMorgan Funds Management, Inc. since August, 2006, responsible for Taxation; Vice President of Structured Products at The Bank of New York Co., Inc. from 2001 until 2006. | |||||
| Francesco Tango (1971) Assistant Treasurer (2007) | Vice President, JPMorgan Funds Management, Inc. since January 2003: Associate, JPMorgan Funds Management, Inc. since 1999. | |||||
| * | The contact address for the officer is 1111 Polaris Parkway, Columbus, OH 43271. |
| ** | The contact address for the officer is 73 Tremont Street, Floor 1, Boston, MA 02108. |
(Unaudited)
| | Beginning Account Value, March 1, 2007 | | Ending Account Value, August 31, 2007 | | Expenses Paid During March 1, 2007 to August 31, 2007* | | Annualized Expense Ratio | |||||||||||
|---|---|---|---|---|---|---|---|---|---|---|---|---|---|---|---|---|---|---|
Bond Fund | ||||||||||||||||||
Class A | ||||||||||||||||||
| Actual | $ | 1,000.00 | $ | 987.40 | $ | 3.76 | 0.75 | % | ||||||||||
| Hypothetical | 1,000.00 | 1,021.42 | 3.82 | 0.75 | ||||||||||||||
Class B | ||||||||||||||||||
| Actual | 1,000.00 | 983.00 | 7.00 | 1.40 | ||||||||||||||
| Hypothetical | 1,000.00 | 1,018.15 | 7.12 | 1.40 | ||||||||||||||
Class C | ||||||||||||||||||
| Actual | 1,000.00 | 983.20 | 7.00 | 1.40 | ||||||||||||||
| Hypothetical | 1,000.00 | 1,018.15 | 7.12 | 1.40 | ||||||||||||||
Select Class | ||||||||||||||||||
| Actual | 1,000.00 | 987.80 | 3.26 | 0.65 | ||||||||||||||
| Hypothetical | 1,000.00 | 1,021.93 | 3.31 | 0.65 | ||||||||||||||
Institutional Class | ||||||||||||||||||
| Actual | 1,000.00 | 987.50 | 2.45 | 0.49 | ||||||||||||||
| Hypothetical | 1,000.00 | 1,022.74 | 2.50 | 0.49 | ||||||||||||||
Ultra | ||||||||||||||||||
| Actual | 1,000.00 | 988.00 | 2.00 | 0.40 | ||||||||||||||
| Hypothetical | 1,000.00 | 1,023.19 | 2.04 | 0.40 | ||||||||||||||
Emerging Markets Debt Fund | ||||||||||||||||||
Class A | ||||||||||||||||||
| Actual | 1,000.00 | 981.10 | 7.34 | 1.47 | ||||||||||||||
| Hypothetical | 1,000.00 | 1,017.80 | 7.48 | 1.47 | ||||||||||||||
| | Beginning Account Value, March 1, 2007 | | Ending Account Value, August 31, 2007 | | Expenses Paid During March 1, 2007 to August 31, 2007* | | Annualized Expense Ratio | |||||||||||
|---|---|---|---|---|---|---|---|---|---|---|---|---|---|---|---|---|---|---|
Class C | ||||||||||||||||||
| Actual | $ | 1,000.00 | $ | 979.10 | $ | 9.83 | 1.97 | % | ||||||||||
| Hypothetical | 1,000.00 | 1,015.27 | 10.01 | 1.97 | ||||||||||||||
R Class | ||||||||||||||||||
| Actual | 1,000.00 | 984.40 | 5.15 | 1.03 | ||||||||||||||
| Hypothetical | 1,000.00 | 1,020.01 | 5.24 | 1.03 | ||||||||||||||
Select Class | ||||||||||||||||||
| Actual | 1,000.00 | 982.40 | 6.15 | 1.23 | ||||||||||||||
| Hypothetical | 1,000.00 | 1,019.00 | 6.26 | 1.23 | ||||||||||||||
Enhanced Income Fund | ||||||||||||||||||
Institutional Class | ||||||||||||||||||
| Actual | 1,000.00 | 1,003.70 | 1.01 | 0.20 | ||||||||||||||
| Hypothetical | 1,000.00 | 1,024.20 | 1.02 | 0.20 | ||||||||||||||
Real Return Fund | ||||||||||||||||||
Class A | ||||||||||||||||||
| Actual | 1,000.00 | 1,014.00 | 4.57 | 0.90 | ||||||||||||||
| Hypothetical | 1,000.00 | 1,020.67 | 4.58 | 0.90 | ||||||||||||||
Class C | ||||||||||||||||||
| Actual | 1,000.00 | 1,012.00 | 7.10 | 1.40 | ||||||||||||||
| Hypothetical | 1,000.00 | 1,018.15 | 7.12 | 1.40 | ||||||||||||||
Select Class | ||||||||||||||||||
| Actual | 1,000.00 | 1,016.30 | 3.30 | 0.65 | ||||||||||||||
| Hypothetical | 1,000.00 | 1,021.93 | 3.31 | 0.65 | ||||||||||||||
Institutional Class | ||||||||||||||||||
| Actual | 1,000.00 | 1,017.30 | 2.54 | 0.50 | ||||||||||||||
| Hypothetical | 1,000.00 | 1,022.68 | 2.55 | 0.50 | ||||||||||||||
Short Term Bond Fund | ||||||||||||||||||
Class A | ||||||||||||||||||
| Actual | 1,000.00 | 1,002.50 | 3.79 | 0.75 | ||||||||||||||
| Hypothetical | 1,000.00 | 1,021.42 | 3.82 | 0.75 | ||||||||||||||
Select Class | ||||||||||||||||||
| Actual | 1,000.00 | 1,002.40 | 2.78 | 0.55 | ||||||||||||||
| Hypothetical | 1,000.00 | 1,022.43 | 2.80 | 0.55 | ||||||||||||||
Institutional Class | ||||||||||||||||||
| Actual | 1,000.00 | 1,003.70 | 1.52 | 0.30 | ||||||||||||||
| Hypothetical | 1,000.00 | 1,023.69 | 1.53 | 0.30 | ||||||||||||||
Short Term Bond Fund II | ||||||||||||||||||
Class A | ||||||||||||||||||
| Actual | 1,000.00 | 1,014.80 | 3.81 | 0.75 | ||||||||||||||
| Hypothetical | 1,000.00 | 1,021.42 | 3.82 | 0.75 | ||||||||||||||
Class M | ||||||||||||||||||
| Actual | 1,000.00 | 1,013.50 | 5.08 | 1.00 | ||||||||||||||
| Hypothetical | 1,000.00 | 1,020.16 | 5.09 | 1.00 | ||||||||||||||
Select Class | ||||||||||||||||||
| Actual | 1,000.00 | 1,017.10 | 2.54 | 0.50 | ||||||||||||||
| Hypothetical | 1,000.00 | 1,022.68 | 2.55 | 0.50 | ||||||||||||||
(Unaudited) (continued)
| | Beginning Account Value, March 1, 2007 | | Ending Account Value, August 31, 2007 | | Expenses Paid During March 1, 2007 to August 31, 2007* | | Annualized Expense Ratio | |||||||||||
|---|---|---|---|---|---|---|---|---|---|---|---|---|---|---|---|---|---|---|
Strategic Income Fund | ||||||||||||||||||
Class A | ||||||||||||||||||
| Actual | $ | 1,000.00 | $ | 967.60 | $ | 5.70 | 1.15 | % | ||||||||||
| Hypothetical | 1,000.00 | 1,019.41 | 5.85 | 1.15 | ||||||||||||||
Class B | ||||||||||||||||||
| Actual | 1,000.00 | 964.90 | 8.17 | 1.65 | ||||||||||||||
| Hypothetical | 1,000.00 | 1,016.89 | 8.39 | 1.65 | ||||||||||||||
Class C | ||||||||||||||||||
| Actual | 1,000.00 | 964.90 | 8.17 | 1.65 | ||||||||||||||
| Hypothetical | 1,000.00 | 1,016.89 | 8.39 | 1.65 | ||||||||||||||
Select Class | ||||||||||||||||||
| Actual | 1,000.00 | 968.80 | 4.47 | 0.90 | ||||||||||||||
| Hypothetical | 1,000.00 | 1,020.67 | 4.58 | 0.90 | ||||||||||||||
Institutional Class | ||||||||||||||||||
| Actual | 1,000.00 | 969.00 | 3.23 | 0.65 | ||||||||||||||
| Hypothetical | 1,000.00 | 1,021.93 | 3.31 | 0.65 | ||||||||||||||
| * | Expenses are equal to the Funds’ annualized expense ratio, multiplied by the average account value over the period, multiplied by 184/365 (to reflect the one-half year period). |
(Unaudited)
(Unaudited) (continued)
contractual services provided to the Funds, less expenses of providing such services. Expenses include direct and indirect costs and are calculated using an allocation methodology developed by the Adviser. The Trustees also recognized that it is difficult to make comparisons of profitability from fund investment advisory contracts because comparative information is not generally publicly available and is affected by numerous factors, including the structure of the particular adviser, the types of funds it manages, its business mix, numerous assumptions regarding allocations and the fact that publicly-traded fund managers’ operating profits and net income are net of distribution and marketing expenses. Based on their review, the Trustees concluded that the profitability to the Adviser of each of the Investment Advisory Agreements was not unreasonable in light of the services and benefits provided to each Fund.
Compliance Officer
Lipper rankings noted by the Trustees, as part of their review and the determinations made by the Trustees with respect to each Fund’s performance is summarized below:
(Unaudited) (continued)
Universe Group. The Trustees also considered information provided by JPMF and JPMDS related to the structure and distribution strategy of the Fund and, in light of this information, considered the fees to be reasonable.
© JPMorgan Chase & Co., 2007 All rights reserved. August 2007. | SAN-INC-807 |
ITEM 2. CODE OF ETHICS.
Disclose whether, as of the end of the period covered by the report, the registrant has adopted a code of ethics that applies to the registrant’s principal executive officer, principal financial officer, principal accounting officer or controller, or persons performing similar functions, regardless of whether these individuals are employed by the registrant or a third party. If the registrant has not adopted such a code of ethics, explain why it has not done so.
The registrant must briefly describe the nature of any amendment, during the period covered by the report, to a provision of its code of ethics that applies to the registrant’s principal executive officer, principal financial officer, principal accounting officer or controller, or persons performing similar functions, regardless of whether these individuals are employed by the registrant or a third party, and that relates to any element of the code of ethics definition enumerated in paragraph (b) of this Item. The registrant must file a copy of any such amendment as an exhibit pursuant to Item 12(a)(1), unless the registrant has elected to satisfy paragraph (f) of this Item by positing its code of ethics on its website pursuant to paragraph (f)(2) of this Item, or by undertaking to provide its code of ethics to any person without charge, upon request, pursuant to paragraph (f)(3) of this Item.
If the registrant has, during the period covered by the report, granted a waiver, including an implicit waiver, from a provision of the code of ethics that applies to the registrant’s principal executive officer, principal financial officer, principal accounting officer or controller, or persons performing similar functions, regardless of whether these individuals are employed by the registrant or third party, that relates to one or more items set forth in paragraph (b) of this Item, the registrant must briefly describe the nature of the waiver, the name of the person to whom the waiver was granted, and the date of the waiver.
Not applicable to a semi-annual report.
ITEM 3. AUDIT COMMITTEE FINANCIAL EXPERT.
(a) (1) Disclose that the registrant’s board of directors has determined that the registrant either:
| (i) Has at least one audit committee financial expert serving on its audit committee; or |
(ii) Does not have an audit committee financial expert serving on its audit committee.
(2) If the registrant provides the disclosure required by paragraph (a)(1)(i) of this Item, it must disclose the name of the audit committee financial expert and whether that person is “independent.” In order to be considered “independent” for purposes of this Item, a member of an audit committee may not, other than in his or her capacity as a member of the audit committee, the board of directors, or any other board committee:
(i) Accept directly or indirectly any consulting, advisory, or other compensatory fee from the issuer; or
(ii) Be an “interested person” of the investment company as defined in Section 2(a)(19) of the Act (15 U.S.C. 80a-2(a)(19)).
(3) If the registrant provides the disclosure required by paragraph (a)(1)(ii) of this Item, it must explain why it does not have an audit committee financial expert.
Not applicable to a semi-annual report.
ITEM 4. PRINCIPAL ACCOUNTANT FEES AND SERVICES.
(a) Disclose, under the caption Audit Fees, the aggregate fees billed for each of the last two fiscal years for professional services rendered by the principal accountant for the audit of the registrant’s annual financial statements or services that are normally provided by the accountant in connection with statutory and regulatory filings or engagements for those fiscal years.
(b) Disclose, under the caption Audit-Related Fees, the aggregate fees billed in each of the last two fiscal years for assurance and related services by the principal accountant that are reasonably related to the performance of the audit of the registrant’s financial statements and are not reported under paragraph (a) of this Item. Registrants shall describe the nature of the services comprising the fees disclosed under this category.
(c) Disclose, under the caption Tax Fees, the aggregate fees billed in each of the last two fiscal years for professional services rendered by the principal accountant for tax compliance, tax advice, and tax planning. Registrants shall describe the nature of the services comprising the fees disclosed under this category.
(d) Disclose, under the caption All Other Fees, the aggregate fees billed in each of the last two fiscal years for products and services provided by the principal accountant, other than the services reported in paragraphs (a) through (c) of this Item. Registrants shall describe the nature of the services comprising the fees disclosed under this category.
(e) (1) Disclose the audit committee’s pre-approval policies and procedures described in paragraph (c)(7) of Rule 2-01 of Regulation S-X.
(2) Disclose the percentage of services described in each of paragraphs (b) through (d) of this Item that were approved by the audit committee pursuant to paragraph (c)(7)(i)(C) of Rule 2-01 of Regulation S-X.
(f) If greater than 50 percent, disclose the percentage of hours expended on the principal accountant’s engagement to audit the registrant’s financial statements for the most recent fiscal year that were attributed to work performed by persons other than the principal accountant’s full-time, permanent employees.
(g) Disclose the aggregate non-audit fees billed by the registrant’s accountant for services rendered to the registrant, and rendered to the registrant’s investment adviser (not including any sub-adviser whose role is primarily portfolio management and is subcontracted with or overseen by another investment adviser), and any entity controlling, controlled by, or under common control with the adviser that provides ongoing services to the registrant for each of the last two fiscal years of the registrant.
(h) Disclose whether the registrant’s audit committee of the board of directors has considered whether the provision of non-audit services that were rendered to the registrant’s investment adviser (not including any subadviser whose role is primarily portfolio management and is subcontracted with or overseen by another investment adviser), and any entity controlling, controlled by, or under common control with the investment adviser that provides ongoing services to the registrant that were not pre-approved pursuant to paragraph (c)(7)(ii) of Rule 2-01 of Regulation S-X is compatible with maintaining the principal accountant’s independence.
Not applicable to a semi-annual report.
ITEM 5. AUDIT COMMITTEE OF LISTED REGISTRANTS.
(a) If the registrant is a listed issuer as defined in Rule 10A-3 under the Exchange Act (17CFR 240.10A-3), state whether or not the registrant has a separately-designated standing audit committee established in accordance with Section 3(a)(58)(A) of the Exchange Act (15 U.S.C. 78c(a)(58)(A)). If the registrant has such a committee, however designated, identify each committee member. If the entire board of directors is acting as the registrant’s audit committee as specified in Section 3(a)(58)(B) of the Exchange Act (15 U.S.C. 78c(a)(58)(B)), so state.
(b) If applicable, provide the disclosure required by Rule 10A-3(d) under the Exchange Act (17CFR 240.10A-3(d)) regarding an exemption from the listing standards for all audit committees.
Not applicable to a semi-annual report.
ITEM 6. SCHEDULE OF INVESTMENTS
File Schedule I – Investments in securities of unaffiliated issuers as of the close of the reporting period as set forth in Section 210.12-12 of Regulation S-X, unless the schedule is included as part of the report to shareholders filed under Item 1 of this Form.
Included in Item 1.
ITEM 7. DISCLOSURE OF PROXY VOTING POLICIES AND PROCEDURES FOR CLOSED-END MANAGEMENT INVESTMENT COMPANIES.
A closed-end management investment company that is filing an annual report on this Form N-CSR must, unless it invests exclusively in non-voting securities, describe the policies and procedures that it uses to determine how to vote proxies relating to portfolio securities, including the procedures that the company uses when a vote presents a conflict between the interests of its shareholders, on the one hand, and those of the company’s investment adviser; principal underwriter; or any affiliated person (as defined in Section 2(a)(3) of the Investment Company Act of 1940 (15 U.S.C. 80a-2(a)(3)) and the rules thereunder) of the company, its investment adviser, or its principal underwriter, on the other. Include any policies and procedures of the company’s investment adviser, or any other third party, that the company uses, or that are used on the company’s behalf, to determine how to vote proxies relating to portfolio securities.
Not applicable.
ITEM 8. PORTFOLIO MANAGERS OF CLOSED-END MANAGEMENT INVESTMENT COMPANIES.
Not applicable.
ITEM 9. PURCHASE OF EQUITY SECURITIES BY CLOSED-END MANAGEMENT INVESTMENT COMPANY AND AFFILIATED PURCHASERS.
(a) If the registrant is a closed-end management investment company, provide the information specified in paragraph (b) of this Item with respect to any purchase made by or on behalf of the registrant or any "affiliated purchaser," as defined in Rule 10b-18(a)(3) under the Exchange Act (17 CFR 240.10b-18(a)(3)), of shares or other units of any class of the registrant's equity securities that is registered by the registrant pursuant to Section 12 of the Exchange Act (15 U.S.C. 781).
Not applicable.
ITEM 10. SUBMISSION OF MATTERS TO A VOTE OF SECURITY HOLDERS.
Describe any material changes to the procedures by which shareholders may recommend nominees to the registrant's board of directors, where those changes were implemented after the registrant last provided disclosure in response to the requirements of Item 7(d)(2)(ii)(G) of Schedule 14A (17 CFR 240.14a-101), or this Item.
No material changes to report.
ITEM 11. CONTROLS AND PROCEDURES.
(a) Disclose the conclusions of the registrant’s principal executive and principal financial officers, or persons performing similar functions, regarding the effectiveness of the registrant’s disclosure controls and procedures (as defined in Rule 30a-3(c) under the
Act (17 CFR 270.30a-3(c))) as of a date within 90 days of the filing date of the report that includes the disclosure required by this paragraph, based on the evaluation of these controls and procedures required by Rule 30a-3(b) under the Act (17 CFR 270.30a-3(b)) and Rules 13a-15(b) or 15d-15(b) under the Exchange Act (17 CFR 240.13a-15(b) or 240.15d-15(b)).
The Registrant's principal executive and principal financial officers have concluded, based on their evaluation of the Registrant's disclosure controls and procedures as of a date within 90 days of the filing date of this report, that the Registrant's disclosure controls and procedures are reasonably designed to ensure that information required to be disclosed by the Registrant on Form N-CSR is recorded, processed, summarized and reported within the required time periods and that information required to be disclosed by the Registrant in the reports that it files or submits on Form N-CSR is accumulated and communicated to the Registrant's management, including its principal executive and principal financial officers, as appropriate to allow timely decisions regarding required disclosure.
(b) Disclose any change in the registrant’s internal control over financial reporting (as defined in Rule 30a-3(d) under the Act (17 CFR 270.30a-3(d)) that occurred during the registrant's second fiscal quarter of the period covered by this report that has materially affected, or is reasonably likely to materially affect, the registrant's internal control over financial reporting.
There were no changes in the Registrant's internal control over financial reporting that occurred during the last fiscal quarter covered by this report that have materially affected, or are reasonably likely to materially affect, the Registrant's internal control over financial reporting.
ITEM 12. EXHIBITS.
(a) File the exhibits listed below as part of this Form. Letter or number the exhibits in the sequence indicated.
(a)(1) Any code of ethics, or amendment thereto, that is the subject of the disclosure required by Item 2, to the extent that the registrant intends to satisfy the Item 2 requirements through filing of an exhibit.
Not applicable.
(a)(2) A separate certification for each principal executive officer and principal financial officer of the registrant as required by Rule 30a-2(a) under the Act (17 CFR 270.30a-2).
Certifications pursuant to Rule 30a-2(a) under the Investment Company Act of 1940 are attached hereto.
(a)(3) Any written solicitation to purchase securities under Rule 23c-1 under the Act (17 CFR 270.23c-1) sent or given during the period covered by the report by or on behalf of the registrant to 10 or more persons.
Not applicable.
(b) A separate or combined certification for each principal executive officer and principal officer of the registrant as required by Rule 30a-2(b) under the Act of 1940.
Certifications pursuant to Rule 30a-2(b) under the Investment Company Act of 1940 are attached hereto.
SIGNATURES
Pursuant to the requirements of the Securities Exchange Act of 1934 and the Investment Company Act of 1940, the registrant has duly caused this report to be signed on its behalf by the undersigned, thereunto duly authorized.
J.P. Morgan Mutual Fund Group
By: | /s/_____________________________ |
George C.W. Gatch
President and Principal Executive Officer
November 7, 2007
Pursuant to the requirements of the Securities Exchange Act of 1934 and the Investment Company Act of 1940, this report has been signed below by the following persons on behalf of the registrant and in the capacities and on the dates indicated.
By: | /s/_____________________________ |
George C.W. Gatch
President and Principal Executive Officer
November 7, 2007
By: | /s/_____________________________ |
Stephanie J. Dorsey
Treasurer and Principal Financial Officer
November 7, 2007