2015 Investor Day August 31, 2015 Exhibit 99.1

CAUTIONARY STATEMENTS FOR PURPOSES OF THE SAFE HARBOR PROVISIONS OF THE SECURITIES LITIGATION REFORM ACT Any statements contained in this investor presentation regarding the outlook for the Company’s businesses and their respective markets, such as projections of future performance, guidance, statements of the Company’s plans and objectives, forecasts of market trends and other matters, are forward-looking statements based on the Company’s assumptions and beliefs. Such statements may be identified by such words or phrases as “will likely result,” “are expected to,” “will continue,” “outlook,” “will benefit,” “is anticipated,” “estimate,” “project,” “management believes” or similar expressions. These forward-looking statements are subject to certain risks and uncertainties that could cause actual results to differ materially from those discussed in such statements and no assurance can be given that the results in any forward-looking statement will be achieved. For these statements, TCF claims the protection of the safe harbor for forward-looking statements contained in the Private Securities Litigation Reform Act of 1995. Any forward-looking statement speaks only as of the date on which it is made, and we disclaim any obligation to subsequently revise any forward-looking statement to reflect events or circumstances after such date or to reflect the occurrence of anticipated or unanticipated events. Certain factors could cause the Company’s future results to differ materially from those expressed or implied in any forward-looking statements contained herein. These factors include the factors discussed in Part I, Item 1A of the Company’s Annual Report on Form 10-K for the year ended December 31, 2014, the factors discussed below and any other cautionary statements, written or oral, which may be made or referred to in connection with any such forward-looking statements. Since it is not possible to foresee all such factors, these factors should not be considered as complete or exhaustive. Adverse Economic or Business Conditions; Competitive Conditions; Credit and Other Risks. Deterioration in general economic and banking industry conditions, including those arising from government shutdowns, defaults, anticipated defaults or rating agency downgrades of sovereign debt (including debt of the U.S.), or increases in unemployment; adverse economic, business and competitive developments such as shrinking interest margins, reduced demand for financial services and loan and lease products, deposit outflows, increased deposit costs due to competition for deposit growth and evolving payment system developments, deposit account attrition or an inability to increase the number of deposit accounts; customers completing financial transactions without using a bank; adverse changes in credit quality and other risks posed by TCF’s loan, lease, investment, securities held to maturity and securities available for sale portfolios, including declines in commercial or residential real estate values, changes in the allowance for loan and lease losses dictated by new market conditions or regulatory requirements, or the inability of home equity line borrowers to make increased payments caused by increased interest rates or amortization of principal; deviations from estimates of prepayment rates and fluctuations in interest rates that result in decreases in the value of assets such as interest-only strips that arise in connection with TCF’s loan sales activity; interest rate risks resulting from fluctuations in prevailing interest rates or other factors that result in a mismatch between yields earned on TCF’s interest-earning assets and the rates paid on its deposits and borrowings; foreign currency exchange risks; counterparty risk, including the risk of defaults by our counterparties or diminished availability of counterparties who satisfy our credit quality requirements; decreases in demand for the types of equipment that TCF leases or finances; the effect of any negative publicity. Legislative and Regulatory Requirements. New consumer protection and supervisory requirements and regulations, including those resulting from action by the Consumer Financial Protection Bureau and changes in the scope of Federal preemption of state laws that could be applied to national banks and their subsidiaries; the imposition of requirements that adversely impact TCF’s deposit, lending, loan collection and other business activities such as mortgage foreclosure moratorium laws, further regulation of financial institution campus banking programs, use by municipalities of eminent (continued) 2
CAUTIONARY STATEMENTS FOR PURPOSES OF THE SAFE HARBOR PROVISIONS OF THE SECURITIES LITIGATION REFORM ACT (cont.) 3 domain on property securing troubled residential mortgage loans, or imposition of underwriting or other limitations that impact the ability to offer certain variable-rate products; changes affecting customer account charges and fee income, including changes to interchange rates; regulatory actions or changes in customer opt-in preferences with respect to overdrafts, which may have an adverse impact on TCF’s fee revenue; changes to bankruptcy laws which would result in the loss of all or part of TCF’s security interest due to collateral value declines; deficiencies in TCF’s compliance under the Bank Secrecy Act in past or future periods, which may result in regulatory enforcement action including monetary penalties; increased health care costs resulting from Federal health care reform; regulatory criticism and resulting enforcement actions or other adverse consequences such as increased capital requirements, higher deposit insurance assessments or monetary damages or penalties; heightened regulatory practices, requirements or expectations, including, but not limited to, requirements related to enterprise risk management, the Bank Secrecy Act and anti-money laundering compliance activity. Earnings/Capital Risks and Constraints, Liquidity Risks. Limitations on TCF’s ability to pay dividends or to increase dividends because of financial performance deterioration, regulatory restrictions or limitations; increased deposit insurance premiums, special assessments or other costs related to adverse conditions in the banking industry; the impact on banks of regulatory reform, including additional capital, leverage, liquidity and risk management requirements or changes in the composition of qualifying regulatory capital; adverse changes in securities markets directly or indirectly affecting TCF’s ability to sell assets or to fund its operations; diminished unsecured borrowing capacity resulting from TCF credit rating downgrades or unfavorable conditions in the credit markets that restrict or limit various funding sources; costs associated with new regulatory requirements or interpretive guidance relating to liquidity; uncertainties relating to future retail deposit account changes, including limitations on TCF’s ability to predict customer behavior and the impact on TCF’s fee revenues. Branching Risk; Growth Risks. Adverse developments affecting TCF’s supermarket banking relationships or any of the supermarket chains in which TCF maintains supermarket branches; costs related to closing underperforming branches; slower than anticipated growth in existing or acquired businesses; inability to successfully execute on TCF’s growth strategy through acquisitions or cross-selling opportunities; failure to expand or diversify TCF’s balance sheet through new or expanded programs or opportunities; failure to successfully attract and retain new customers, including the failure to attract and retain manufacturers and dealers to expand the inventory finance business; failure to effectuate, and risks of claims related to, sales and securitizations of loans; risks related to new product additions and addition of distribution channels (or entry into new markets) for existing products. Technological and Operational Matters. Technological or operational difficulties, loss or theft of information, cyber-attacks and other security breaches, counterparty failures and the possibility that deposit account losses (fraudulent checks, etc.) may increase; failure to keep pace with technological change, including the failure to develop and maintain technology necessary to satisfy customer demands. Ability to attract and retain employees given competitive conditions and the impact of consolidating facilities. Litigation Risks. Results of litigation or government enforcement actions, including class action litigation or enforcement actions concerning TCF’s lending or deposit activities, including account servicing processes or fees or charges, or employment practices; and possible increases in indemnification obligations for certain litigation against Visa U.S.A. and potential reductions in card revenues resulting from such litigation or other litigation against Visa. Accounting, Audit, Tax and Insurance Matters. Changes in accounting standards or interpretations of existing standards; federal or state monetary, fiscal or tax policies, including adoption of state legislation that would increase state taxes; ineffective internal controls; adverse federal, state or foreign tax assessments or findings in tax audits; lack of or inadequate insurance coverage for claims against TCF; potential for claims and legal action related to TCF’s fiduciary responsibilities.

8:30am Welcome Mike Jones, Chief Financial Officer 8:35am A Look Back William Cooper, Chairman & Chief Executive Officer 8:45am A Look Ahead Craig Dahl, Vice Chairman & President 9:15am Enterprise Risk Management & Credit Jim Costa, Chief Risk Officer Mark Bagley, Chief Credit Officer 9:35am Questions & Answers 10:00am Break 10:15am Auto Finance Brian MacInnis, Chief Executive Officer, Gateway One Lending & Finance 10:40am Leasing and Equipment Finance Bill Henak, President & Chief Executive Officer, TCF Equipment Finance 11:05am Inventory Finance Ross Perrelli, President & Chief Executive Officer, TCF Inventory Finance 11:30am Retail Banking Tom Jasper, Vice Chairman & Executive Vice President 12:00pm Conclusion / Questions & Answers Craig Dahl, Vice Chairman & President 12:30pm Lunch 4 Agenda
• Vance Opperman, Lead Director • Tom Butterfield, Chief Information Officer • Gloria Charley, Director of Talent Management • Paul Gendler, President, Winthrop Resources Corporation • Mark Goldman, Director of Corporate Communications • Joe Green, General Counsel and Secretary • Andy Jackson, Chief Audit Executive Officer • Mark Jeter, Managing Director of Branch Banking • Jason Korstange, Director of Investor Relations • Brian Maass, Treasurer • Mark Rohde, Managing Director Retail Lending • Tammy Schuette, Corporate Controller • Barbara Shaw, Corporate Human Resources Director • Geoff Thomas, Managing Director of Customer Segments and Alternative Channels Other TCF Executives in Attendance 5
A LOOK BACK WILLIAM COOPER CHAIRMAN & CHIEF EXECUTIVE OFFICER
Challenges at TCF THE DURBIN AMENDMENT AND REGULATION E • Reduced TCF’s total banking fees by approximately $100 million annually • No related reduction in expenses 7 REGULATORY COSTS • 2014 risk management costs increased 41% compared to 2011 • 2014 average risk management FTEs increased 16% compared to 2011 ECONOMIC CHALLENGES • Extended low interest rate environment • Slow economic recovery
TCF’s Response • National Loan and Lease Growth and Diversification • Increased investment in leasing and equipment finance with corresponding earnings growth • Accelerated TCF Inventory Finance growth • Acquired an auto finance platform • Added a national second lien mortgage program • Added TCF Capital Funding • Established a strong loan and lease origination engine • Revenue Diversification • Developed a core loan sale and securitization capability as well as growth in loan servicing revenue • Repositioned the balance sheet • Maintained one of the highest net interest margins in the industry • Developed a strong enterprise risk management program 8 EARLY RECOGNITION THAT BUSINESS MODEL NEEDED TO CHANGE

NET INCOME $2.1 $35.3 $64.8 $100.2 0 20 40 60 80 100 120 2011 2012 2013 2014 Gains on Sales of Loans Servicing Fee Income REPLACING LOST REVENUE ($ millions) NET CHARGE-OFFS 4-Year Performance Metrics 9 $109 $83 $152 $174 0.61% 0.46% 0.87% 0.96% 0.00% 0.20% 0.40% 0.60% 0.80% 1.00% 1.20% 1.40% 0 50 100 150 200 2011 2012 2013 2014 Net Income Return on Average Assets ($ millions) LOAN AND LEASE ORIGINATIONS $5.5 $10.8 $12.0 $13.5 0 3 6 9 12 15 2011 2012 2013 2014 ($ billions) 1.72% 1.23% 0.78% 0.56% 1.45% 1.54% 0.81% 0.49% 0.00% 0.20% 0.40% 0.60% 0.80% 1.00% 1.20% 1.40% 1.60% 1.80% 2.00% 2011 2012 2013 2014 FDIC-Insured Institutions with Greater than $10 Billion in Total Assets TCF Financial Corporation 2 1 1 Excludes a net, after-tax charge of $295.8 million related to repositioning TCF’s balance sheet in the first quarter of 2012 2 Source: FDIC Quarterly Banking Profile

A LOOK AHEAD CRAIG DAHL VICE CHAIRMAN & PRESIDENT

$2,678 $2,888 $1,118 $3,112 $2,106 $2,302 $3,791 2Q15 Earning Asset Yield of 4.81% • $19.8 billion national bank holding company headquartered in Minnesota • 45th largest publicly-traded U.S. based bank holding company by asset size1 • 376 bank branches in eight states • Over 146,000 small business banking relationships: • 73,500 checking accounts • 72,600 lending relationships • 85% of total assets are loans & leases • Tangible common equity to tangible assets of 8.72%2 • Tangible book value (TBV) per common share of $10.112 • Return on average tangible common equity (ROATCE) of 11.34%3 11 ($ millions) 1 Source: SNL Financial (3/31/15) 2 See “Reconciliation of GAAP to Non-GAAP Financial Measures – Tangible Common Equity and Tangible Book Value Per Common Share” slide 3 QTD annualized; see “Reconciliation of GAAP to Non-GAAP Financial Measures – Return on Average Tangible Common Equity” slide Leasing & Equipment Finance 21% Inventory Finance 12% Consumer Real Estate & Other (first mortgages) 16% Commercial 17% Auto Finance 13% $4,968 $2,287 $5,376 $3,196 2Q15 Rate of 0.28% Savings 31% Money Market 15% CDs 20% Checking 34% Securities & Other 6% ($ millions) Consumer Real Estate (junior liens) 15% Current Corporate Profile At June 30, 2015 A WELL-DIVERSIFIED EARNING ASSET PORTFOLIO… …FUNDED BY A LOW COST DEPOSIT BASE
Strong Individually. Stronger Together. One TCF. Taking an Enterprise View of TCF 12
Unified by a Common Mission, Vision and Values 13 Vision Mission We will be a sound, well-capitalized, principled bank that gathers core deposits and lends under the fundamental concept of diversification that enables us to consistently achieve superior returns for our employees, customers and shareholders. TCF strives to consistently deliver superior performance by providing the essential means to enhance the rhythm of customers’ lives and help them achieve their goals. Unified by the passion to act as an ally of our customers, we lend prudently in diverse, niche segments and fund these assets through core deposits, both generated through a great customer experience within our communities. Values Lead with INTEGRITY Be NIMBLE Build RELATIONSHIPS Be PRUDENT Create OPPORTUNITIES Win as a PASSIONATE team
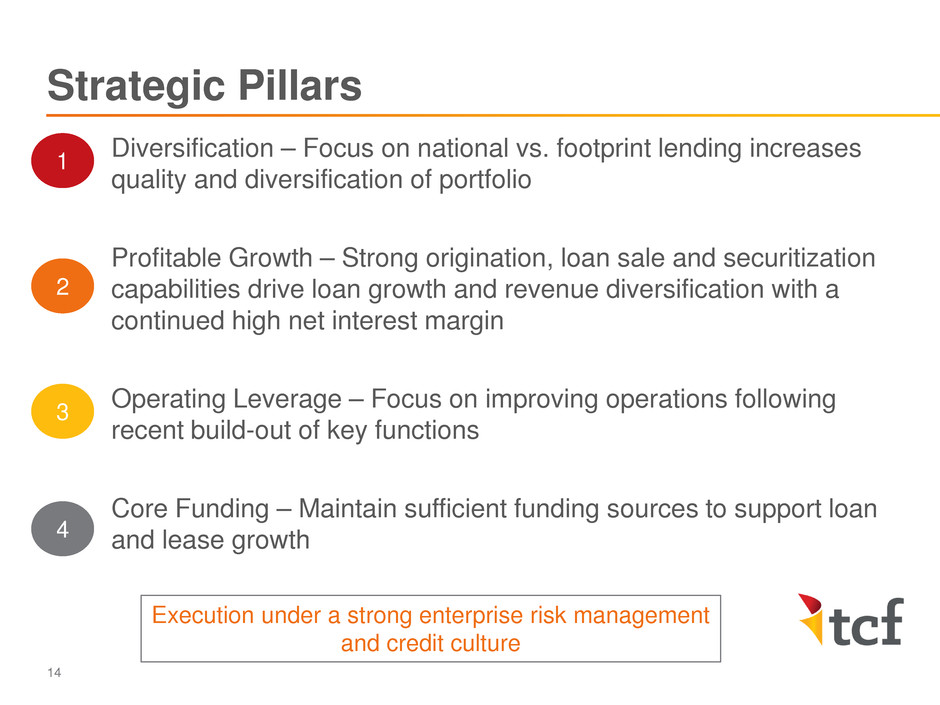
Diversification – Focus on national vs. footprint lending increases quality and diversification of portfolio Profitable Growth – Strong origination, loan sale and securitization capabilities drive loan growth and revenue diversification with a continued high net interest margin Operating Leverage – Focus on improving operations following recent build-out of key functions Core Funding – Maintain sufficient funding sources to support loan and lease growth Strategic Pillars 14 1 2 3 4 Execution under a strong enterprise risk management and credit culture
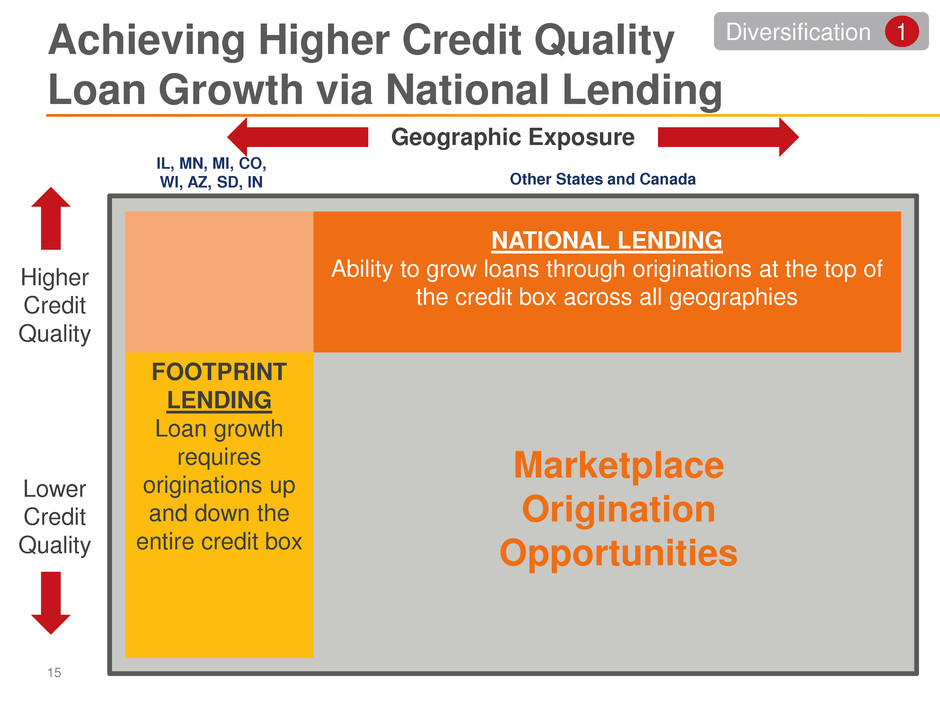
Achieving Higher Credit Quality Loan Growth via National Lending 15 FOOTPRINT LENDING Loan growth requires originations up and down the entire credit box NATIONAL LENDING Ability to grow loans through originations at the top of the credit box across all geographies Higher Credit Quality Lower Credit Quality Geographic Exposure Marketplace Origination Opportunities IL, MN, MI, CO, WI, AZ, SD, IN Other States and Canada Diversification 1

$14,150 $15,426 $15,847 12/11 12/12 12/13 12/14 6/15 Inventory Finance Leasing & Equipment Finance Commercial Auto Finance Consumer Real Estate- Junior Lien Consumer Real Estate & Other- First Mortgage $16,402 1 • Year-over-year loan and lease growth of 5.2% • Auto Finance and Inventory Finance portfolios make up 27% of total loans and leases vs. 5% at year end 2011 • Consumer real estate first mortgages make up 17% of total loans and leases vs. 34% at year end 2011 • No single asset class greater than 25% of the total portfolio at June 30, 2015 • Flexibility to strategically invest growing capital base in response to competitive environments ($ millions) 22% 20% 24% 10% 8% 53% Wholesale 47% Retail 4% 10% 27% 21% 22% 5% 22% 24% 34% 11% 23% 19% 12% 19% Diverse Loan and Lease Portfolio 16 1 Auto Finance loan and lease portfolio totaled $3.6 million at 12/11 17% 22% 18% 14% 13% $16,877 16% 15% 16% 16% 16% Diversification 1

Loan and Lease Portfolio Business Unit Consumer Commercial Leasing and Equipment Finance Inventory Finance Auto Finance Type / Segment Consumer Real Estate Multi-family housing Retail services Office buildings Warehouse / Industrial buildings Specialty vehicles Manufacturing Medical Construction Powersports Lawn & Garden Electronics & Appliances Primarily used autos Geography Local1 National Local1 National National Canada National Rate Fixed-rate Variable-rate Fixed-rate Variable/adjustable- rate Fixed-rate Variable-rate Fixed-rate Average Loan & Lease Size First Mortgages: $104,000 Junior Liens: $44,000 $2.3 million $74,000 $214,000 $17,000 Estimated Weighted Average Life2 72 months 30 months 19 months 4 months 23 months Collateral Real estate Real estate All assets Equipment Inventory Vehicle 17 Granularity in all aspects of our business model 1 TCF’s branch footprint (IL, MN, MI, CO, WI, AZ, SD, IN) 2 As of June 30, 2015; estimated weighted average life represents how many months it is expected to take to pay half of the outstanding principal Diversification 1
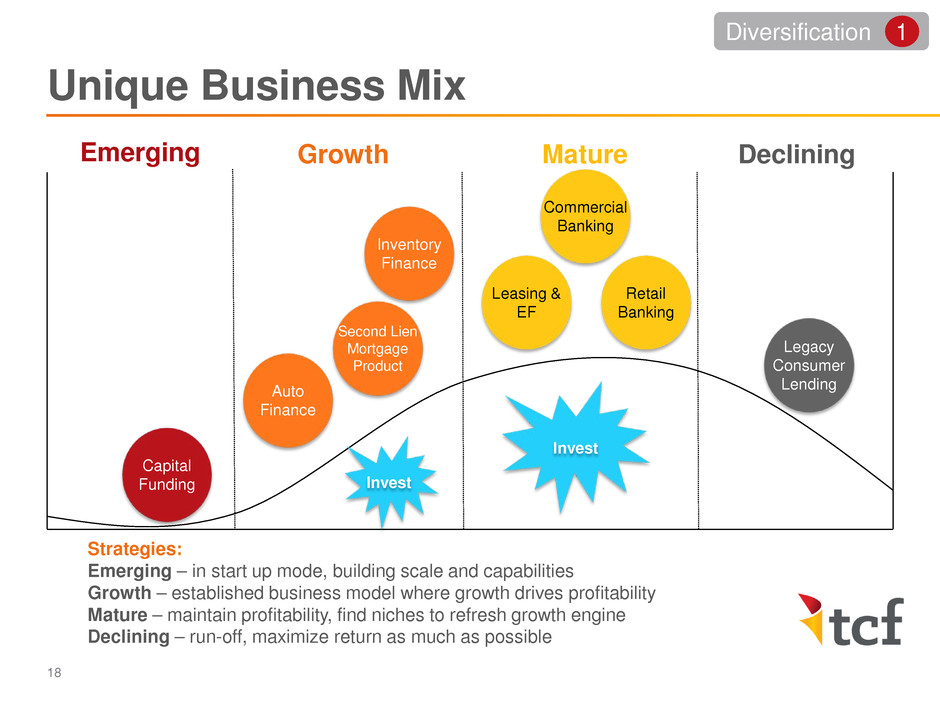
Unique Business Mix 18 Auto Finance Inventory Finance Leasing & EF Commercial Banking Legacy Consumer Lending Second Lien Mortgage Product Strategies: Emerging – in start up mode, building scale and capabilities Growth – established business model where growth drives profitability Mature – maintain profitability, find niches to refresh growth engine Declining – run-off, maximize return as much as possible Capital Funding Retail Banking Invest Emerging Growth Mature Declining Invest Diversification 1
A Company Built for Growth • Strong origination capabilities • Investments in technology across the businesses • Product and service launches and enhancements • TDR portfolio loan sale in 4Q14 reduced credit overhang of legacy consumer portfolio • Strong and experienced management teams in place • Enhanced enterprise risk management = disciplined growth 19 Profitable Growth 2

($ millions) 2012 2013 2014 2015 YTD Period Beginning Balance $14,165 $15,436 $15,927 $16,534 New Originations 10,752 12,025 13,490 7,510 Less Run-off2 8,678 9,828 10,062 5,666 Subtotal 2,074 2,197 3,428 1,844 Growth Rate3 15% 14% 22% 22%4 Less Loan & Lease Sales 803 1,706 2,821 1,301 Period Ending Balance $15,436 $15,927 $16,534 $17,077 1 Includes portfolio loans and leases and loans and leases held for sale 2 Includes activity from payments, pre-payments and charge-offs 3 Excludes loan and lease sales 4 Annualized • Continued strong origination capabilities • Diversity across asset classes reduces concentration risk • Originate to sell capability a core competency LOAN AND LEASE BALANCE ROLLFORWARD1 20 Strong Originations Create Growth Opportunities Profitable Growth 2
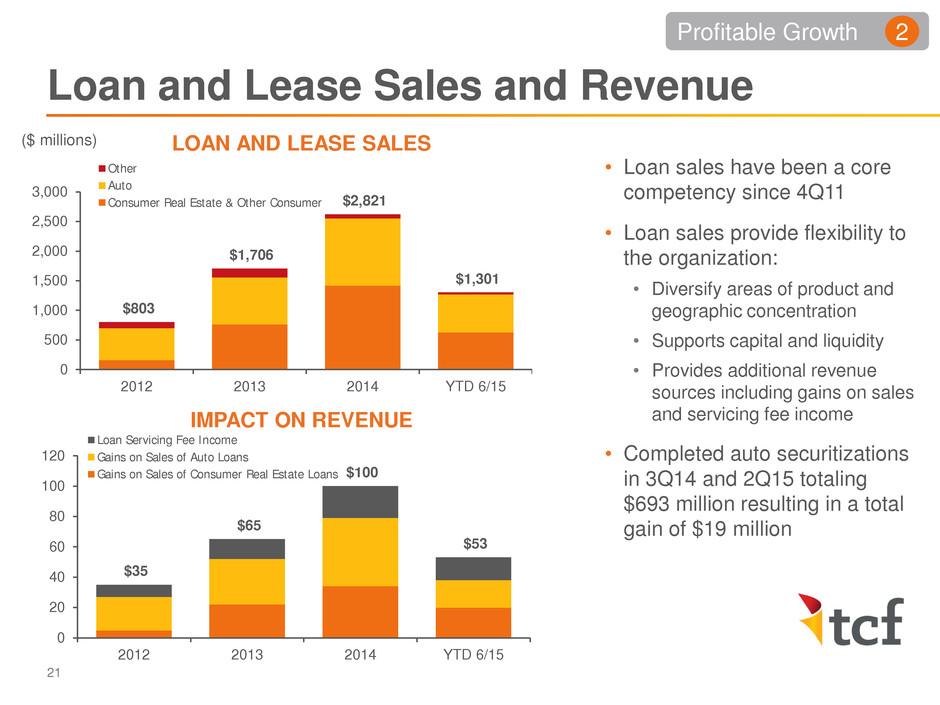
$803 $1,706 $2,821 $1,301 0 500 1,000 1,500 2,000 2,500 3,000 2012 2013 2014 YTD 6/15 Other Auto Consumer Real Estate & Other Consumer $35 $65 $100 $53 0 20 40 60 80 100 120 2012 2013 2014 YTD 6/15 Loan Servicing Fee Income Gains on Sales of Auto Loans Gains on Sales of Consumer Real Estate Loans Loan and Lease Sales and Revenue Profitable Growth 2 LOAN AND LEASE SALES ($ millions) IMPACT ON REVENUE • Loan sales have been a core competency since 4Q11 • Loan sales provide flexibility to the organization: • Diversify areas of product and geographic concentration • Supports capital and liquidity • Provides additional revenue sources including gains on sales and servicing fee income • Completed auto securitizations in 3Q14 and 2Q15 totaling $693 million resulting in a total gain of $19 million 21
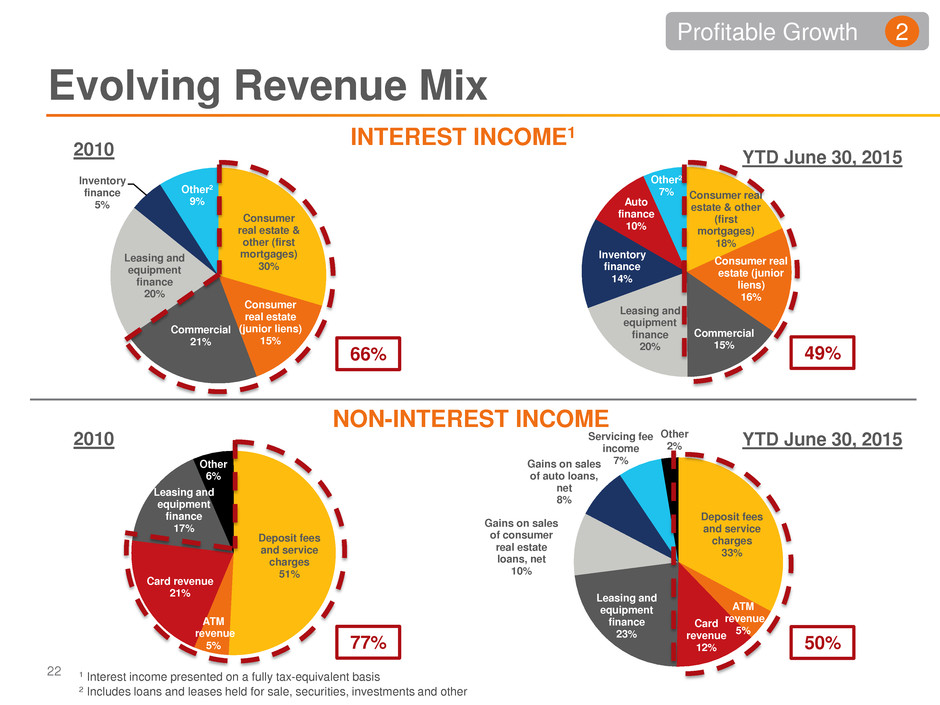
Consumer real estate & other (first mortgages) 30% Consumer real estate (junior liens) 15% Leasing and equipment finance 20% Commercial 21% Inventory finance 5% Other2 9% 22 1 Interest income presented on a fully tax-equivalent basis 2 Includes loans and leases held for sale, securities, investments and other NON-INTEREST INCOME Deposit fees and service charges 33% ATM revenue 5% Card revenue 12% Leasing and equipment finance 23% Gains on sales of consumer real estate loans, net 10% Gains on sales of auto loans, net 8% Servicing fee income 7% Other 2% Evolving Revenue Mix INTEREST INCOME1 Consumer real estate & other (first mortgages) 18% Consumer real estate (junior liens) 16% Auto finance 10% Leasing and equipment finance 20% Commercial 15% Inventory finance 14% Other2 7% Profitable Growth 2 YTD June 30, 2015 2010 Deposit fees and service charges 51% ATM revenue 5% Card revenue 21% Leasing and equipment finance 17% Other 6% 2010 YTD June 30, 2015 66% 49% 77% 50%
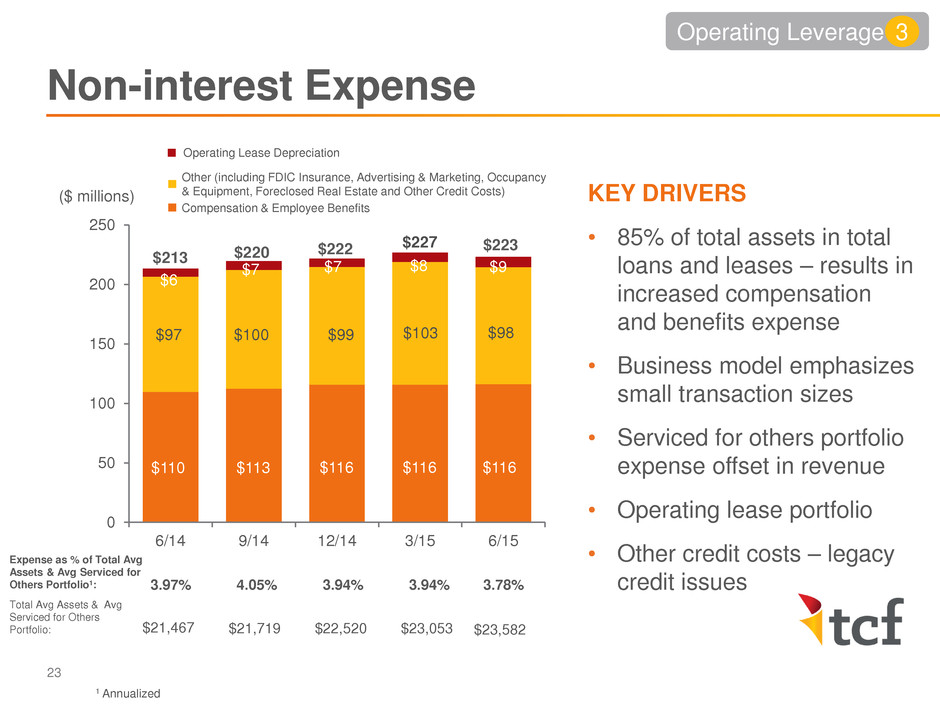
$222 $213 $220 $223 0 50 100 150 200 250 6/14 9/14 12/14 3/15 6/15 23 Operating Lease Depreciation KEY DRIVERS • 85% of total assets in total loans and leases – results in increased compensation and benefits expense • Business model emphasizes small transaction sizes • Serviced for others portfolio expense offset in revenue • Operating lease portfolio • Other credit costs – legacy credit issues ($ millions) Other (including FDIC Insurance, Advertising & Marketing, Occupancy & Equipment, Foreclosed Real Estate and Other Credit Costs) Compensation & Employee Benefits Expense as % of Total Avg Assets & Avg Serviced for Others Portfolio1: 3.97% 4.05% 1 Annualized Total Avg Assets & Avg Serviced for Others Portfolio: $21,467 $21,719 $22,520 3.94% $23,053 3.94% $227 $103 $110 $113 $116 $116 $8 $6 $7 $7 $9 $116 $97 $100 $99 Non-interest Expense $23,582 3.78% $98 Operating Leverage 3

Total Net Burden to Avg. Assets2 2.28% 2.71% Net Burden View 24 Operating Leverage 3 $109 $114 $2231 Le nd in g Fu nd in g Objective: Lower Net Burden (Net Cost to Raise Deposits) 2Q 2015 1Q 2015 Non-interest Expense $109 $113 Less: Banking Fees 53 50 Net Burden $56 $63 Avg. Deposits $15,220 $15,018 Net Burden – Funding2 1.45% 1.69% 2Q 2015 1Q 2015 Non-interest Expense $114 $114 Less: Non-interest Inc.3 56 45 Net Burden $58 $69 Avg. Loans & Leases $17,343 $16,992 Net Burden – Lending2 1.34% 1.63% Objective: Lower Net Burden (Net Cost to Originate/Service Assets) ($ millions) 1 Support Services allocated to Funding and Lending segments 2 Annualized 3 Includes gains on sales of auto loans, net; gains on sales of consumer real estate loans, net; servicing fee income and leasing and equipment finance NON-INTEREST EXPENSE (2Q15)

Expense Initiatives 25 Retail Banking Lending Control Functions Support PHASE 1 • Disciplined marketing spend in retail banking • Hold corporate and support services headcount stable • Strategic sourcing initiative to review all vendor spend • Utilize technology to drive automation across the platforms PHASE 2 • Review for physical distribution and operational changes in the branches • Setting targeted efficiency gains • Leverage the asset growth – expenses up 2%, asset growth 5-10% PHASE 3 • Leverage Control Functions as overall business grows Operating Leverage 3
• Addition of Tom Butterfield as Chief Information Officer • Improve IT collaboration across platforms to enhance the businesses • Full hardware and software assessment across the platforms • Online and digital technology development • Enhancing our architecture discipline • Data center optimization Technology Initiatives 26 Operating Leverage 3

The TCF Funding Strategy 27 Core Funding 4 $4,968 $2,287 $5,376 $3,196 YTD 2Q15 Rate of 0.28% Savings 31% Money Market 15% CDs 20% Checking 34% • A low-cost core deposit base that is granular (over 90% FDIC insured) • Focused on customer retention and account quality • New products and service enhancements Customer Attrition Current Products per Household Target Products per Household 2 - 3 4 - 6 Account Quality RETAIL BANKING CHECKING QTD 2Q15 VS 2Q14

• Online and mobile enhancements – investing in technology that customers demand • More lending products available to retail banking distribution networks • Mortgages • Credit Cards • Products targeting millennials that are also available to customers preferring non-traditional banking products – cross sell into other products New Products Expanding Wallet Share 28 Core Funding 4
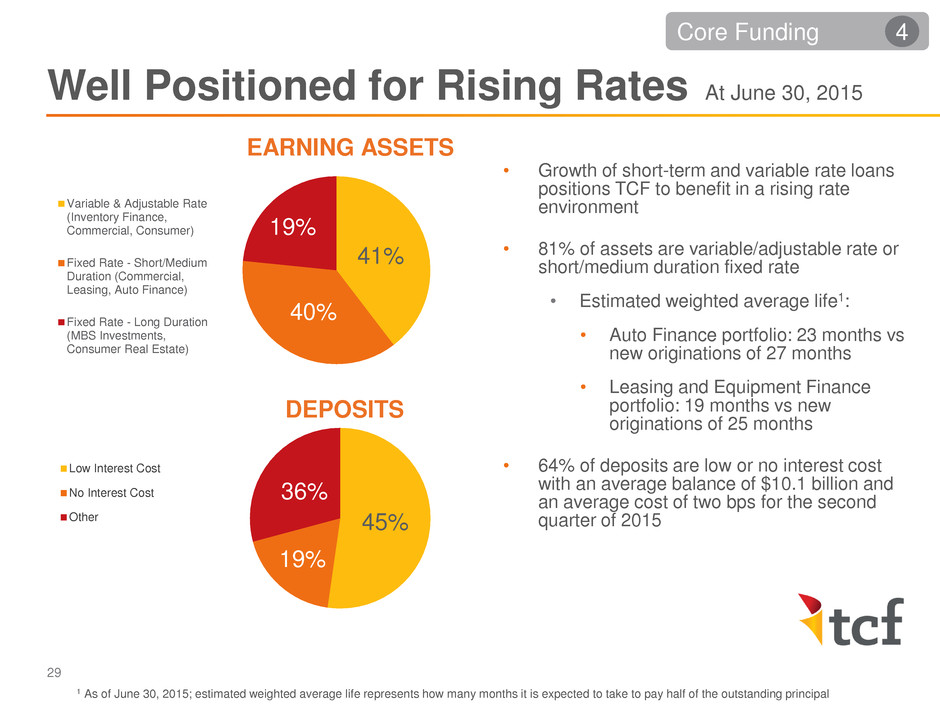
41% 40% 19% EARNING ASSETS Variable & Adjustable Rate (Inventory Finance, Commercial, Consumer) Fixed Rate - Short/Medium Duration (Commercial, Leasing, Auto Finance) Fixed Rate - Long Duration (MBS Investments, Consumer Real Estate) 45% 19% 36% DEPOSITS Low Interest Cost No Interest Cost Other • Growth of short-term and variable rate loans positions TCF to benefit in a rising rate environment • 81% of assets are variable/adjustable rate or short/medium duration fixed rate • Estimated weighted average life1: • Auto Finance portfolio: 23 months vs new originations of 27 months • Leasing and Equipment Finance portfolio: 19 months vs new originations of 25 months • 64% of deposits are low or no interest cost with an average balance of $10.1 billion and an average cost of two bps for the second quarter of 2015 1 As of June 30, 2015; estimated weighted average life represents how many months it is expected to take to pay half of the outstanding principal 29 Well Positioned for Rising Rates At June 30, 2015 Core Funding 4
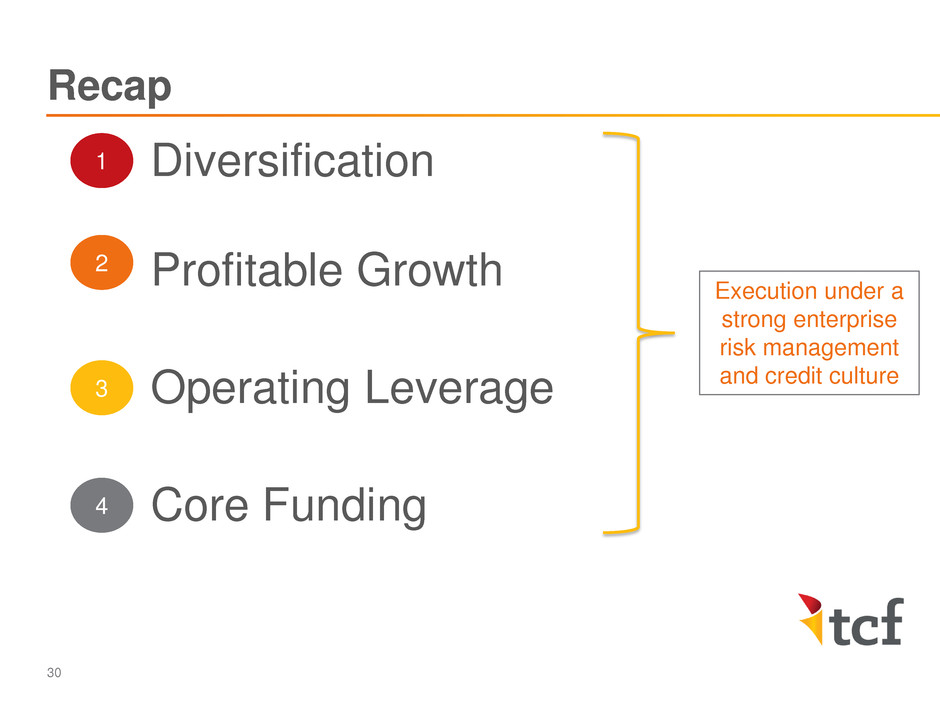
Recap 30 1 2 3 4 Diversification Profitable Growth Operating Leverage Core Funding Execution under a strong enterprise risk management and credit culture
Enterprise Risk Management & Credit JIM COSTA CHIEF RISK OFFICER MARK BAGLEY CHIEF CREDIT OFFICER
Enhanced Enterprise Risk Management • Redesigned a comprehensive framework to identify, manage and monitor all risks • Structured around classic three lines of defense principle 1. Business 2. Risk 3. Audit • Objective: seamless second line of defense 32
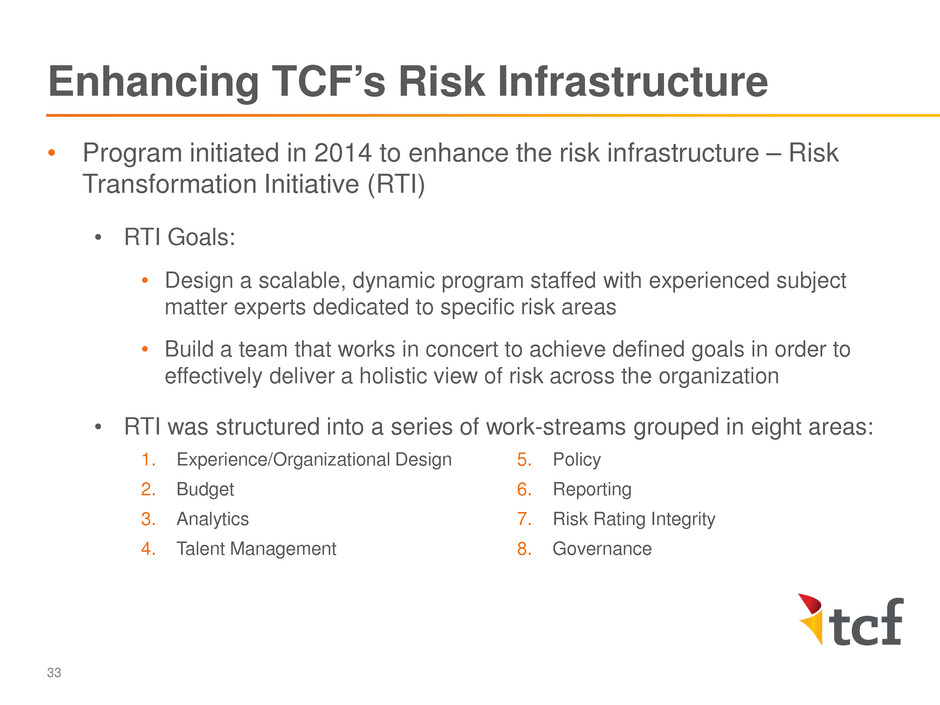
• Program initiated in 2014 to enhance the risk infrastructure – Risk Transformation Initiative (RTI) • RTI Goals: • Design a scalable, dynamic program staffed with experienced subject matter experts dedicated to specific risk areas • Build a team that works in concert to achieve defined goals in order to effectively deliver a holistic view of risk across the organization • RTI was structured into a series of work-streams grouped in eight areas: 1. Experience/Organizational Design 5. Policy 2. Budget 6. Reporting 3. Analytics 7. Risk Rating Integrity 4. Talent Management 8. Governance 33 Enhancing TCF’s Risk Infrastructure
New Organizational Design • New centralized model • Improved risk reporting lines to codify independence • 18 specialized risk teams address specific risks • Experience: • Members of leadership team average 24 years • Key industry certifications • New leadership team infused with outside talent • Mix of large bank and regional bank experience 34
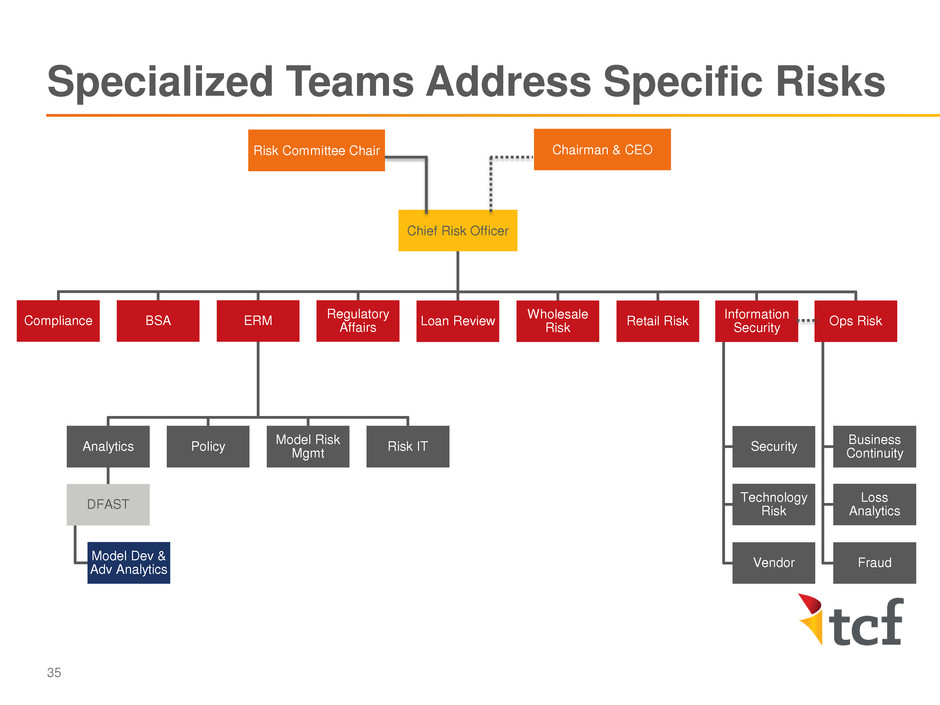
Risk Committee Chair Chairman & CEO Chief Risk Officer Compliance BSA ERM Analytics DFAST Model Dev & Adv Analytics Policy Model Risk Mgmt Risk IT Regulatory Affairs Loan Review Wholesale Risk Retail Risk Information Security Security Technology Risk Vendor Ops Risk Business Continuity Loss Analytics Fraud 35 Specialized Teams Address Specific Risks
Investments for the Long Term • Material investments made in people, processes and architecture • Provides sustainability of controls • Enables resiliency to respond to ever evolving risk and regulatory landscape • Aligns TCF to industry best practice 36
Talent Management • Investing in TCF’s most valuable resource: people • Annual talent assessment and peer reviews • Required industry certifications • Specific requirements for ongoing outside professional training • Common performance objectives: • Maintain highest level of integrity and professionalism with all applicable constituencies, TCF management and regulators • Demonstrate independence in professional points of view as a TCF second line of defense member • Communicate to the CRO new and emerging risks without delay • Effectively lead and manage high performing teams by being committed to talent management disciplines 37
Analytics • Consolidated analytics resources into a center of excellence • Principle: • Better risk measurement allows for stronger risk management • Results: • New models, deeper data, enhanced data controls, and new governance over model risk • Formalized and structured stress testing program • Stronger scenario analyses • More crisp views of forward portfolio performance • Smarter decision making about risk / reward 38

Policy • Established enterprise governance over policy administration • Designed consistency in policy design and review • Conducted comprehensive assessment of policy compliance with regulation • Adopted new technology to facilitate more efficient policy management 39

Reporting • Redesigned reporting of risk profile to ensure improved visibility of enterprise risks to TCF Board and Management • Leveraged new risk analytics to add higher value content into risk reporting: • New metrics on leading indicators of risks • Stress testing • Capital Markets Intelligence • Redesigned TCF’s Risk Appetite statement • Implemented new framework for concentration management to effectively balance risk / reward decisions with new Risk Appetite 40
Risk Rating Integrity • Conducted enterprise review of fundamental measures of credit risk across all TCF Lines of Business • Benchmarked to industry best practice • Leveraged best practice findings to enhance: • Risk quantification • Risk reporting • Capital adequacy assessment • Stress testing 41

Governance • Conducted enterprise review of TCF governance structure • Clarified roles and responsibilities of key committees • Optimized efficiency of committee design to provide: • Timely design making • Clear accountability • Improved communication to Board and regulators • More effective utilization of key talent 42
• TCF Risk Program meets and exceeds industry standards for design, talent, measurement, management and reporting of risks • New design enables management to smartly allocate capital to proactively embrace risk taking • New design ensures risks are prudently managed in a fashion that balances risk reward, all in concert with TCF’s Risk Appetite, mission, vision and values Balancing Risk Reward Equation 43
• Balance sheet risks: • Pricing: thinner – challenges risk reward • Issuance / market liquidity: volumes in certain asset classes exceed historical peaks • Structure: competition impacting terms reflects longer point in credit cycle • Non-balance sheet risks: • Cyber threats – top of mind • Non-bank entrants elicit heightened standards for regulated entities • Regulatory focus on: • Stress testing, governance, consumer compliance, BSA / AML On the Horizon – Emerging Risks 44
• Disciplined credit culture and organizational alignment • Experienced credit leadership with tenured Credit Administration staff (members of leadership average 28 years of experience) • Defined origination strategies by line of business with demonstrated execution • Front-end guidance • Dedicated credit teams • Leverage underwriting, decisioning, portfolio management process, protocols and workflows • Larger exposures require committee approval system A Disciplined Credit Culture 45
• Asset growth within the footprint requires originations up and down the entire credit box • National lending platforms allow for asset growth through originations concentrated at the top of the credit box • Credit quality of national lending businesses continues to exceed expectations, even through the recession Credit Quality Through National Lending 46

60+ DAY DELINQUENCIES1 1 Excludes acquired portfolios and non-accrual loans and leases 2 Annualized 0.18% 0.17% 0.14% 0.14% 0.10% 0.00% 0.10% 0.20% 0.30% 6/14 9/14 12/14 3/15 6/15 $10 $16 $56 $13 $13 0 10 20 30 40 50 60 6/14 9/14 12/14 3/15 6/15 Normal Provision Added Reserve TDR Sale $18 $22 $16 NON-PERFORMING ASSETS PROVISION FOR CREDIT LOSSES ($ millions) 0.45% 0.66% 0.40% 0.28% 0.41% 0.00% 0.20% 0.40% 0.60% 0.80% 1.00% 6/14 9/14 12/14 3/15 6/15 NET CHARGE-OFF RATIO2 Stabilizing Credit Performance 47 $325 $343 $282 $285 $264 2.02% 2.08% 1.71% 1.66% 1.56% 0.00% 1.00% 2.00% 3.00% 4.00% 5.00% 6.00% 0 100 200 300 400 6/14 9/14 12/14 3/15 6/15 Other Real Estate Owned Non-accrual Loans & Leases NPAs / Loans & Leases and Other Real Estate Owned($ millions)
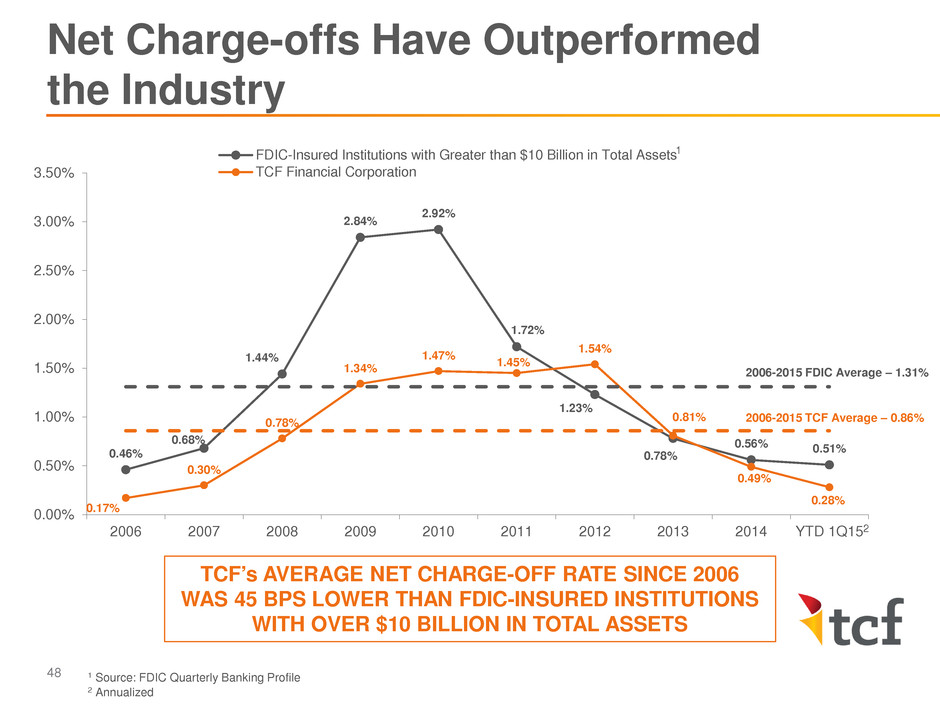
0.46% 0.68% 1.44% 2.84% 2.92% 1.72% 1.23% 0.78% 0.56% 0.51% 0.17% 0.30% 0.78% 1.34% 1.47% 1.45% 1.54% 0.81% 0.49% 0.28% 0.00% 0.50% 1.00% 1.50% 2.00% 2.50% 3.00% 3.50% 2006 2007 2008 2009 2010 2011 2012 2013 2014 YTD 1Q15 FDIC-Insured Institutions with Greater than $10 Billion in Total Assets TCF Financial Corporation 2 TCF’s AVERAGE NET CHARGE-OFF RATE SINCE 2006 WAS 45 BPS LOWER THAN FDIC-INSURED INSTITUTIONS WITH OVER $10 BILLION IN TOTAL ASSETS 1 Source: FDIC Quarterly Banking Profile 2 Annualized 1 Net Charge-offs Have Outperformed the Industry 48 2006-2015 FDIC Average – 1.31% 2006-2015 TCF Average – 0.86%

($ millions) Strong Credit Performance Across the Businesses Auto Finance 2Q14 1Q15 2Q15 Net Charge-offs $1.8 $3.4 $3.7 Net Charge-offs (%) 0.48 % 0.66 % 0.66 % ALLL/Loans 0.92 % 0.95 % 0.96 % Non-Performing Assets $1.5 $4.6 $6.4 Over 60 Day Delinquencies $2.2 $3.4 $2.5 49
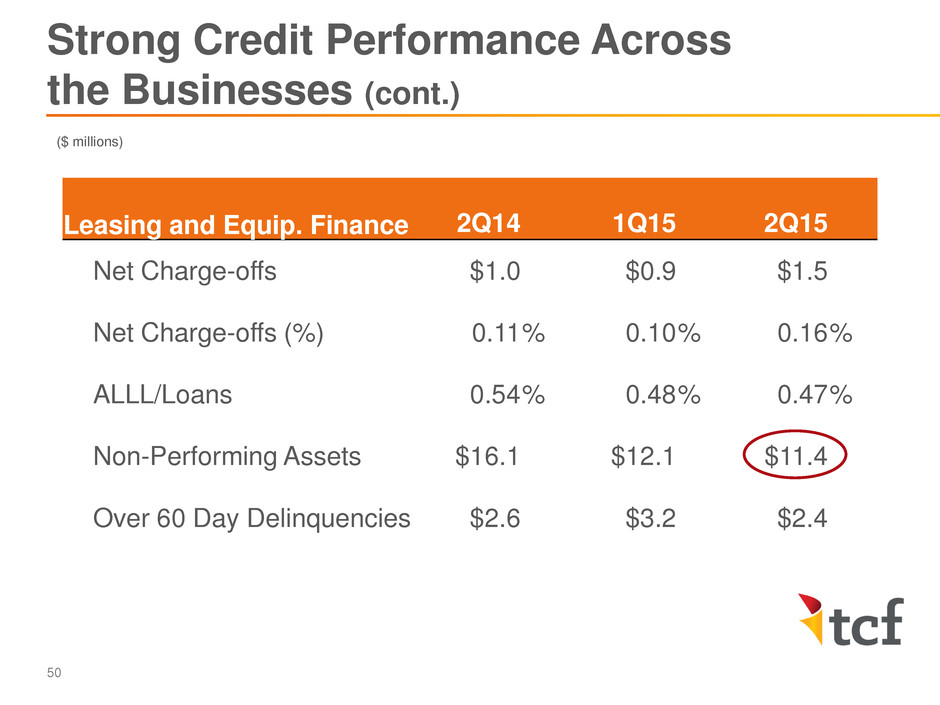
($ millions) Strong Credit Performance Across the Businesses (cont.) Leasing and Equip. Finance 2Q14 1Q15 2Q15 Net Charge-offs $1.0 $0.9 $1.5 Net Charge-offs (%) 0.11 % 0.10 % 0.16 % ALLL/Loans 0.54 % 0.48 % 0.47 % Non-Performing Assets $16.1 $12.1 $11.4 Over 60 Day Delinquencies $2.6 $3.2 $2.4 50

($ millions) Strong Credit Performance Across the Businesses (cont.) Inventory Finance 2Q14 1Q15 2Q15 Net Charge-offs $0.1 $0.4 $0.6 Net Charge-offs (%) 0.02 % 0.08 % 0.11 % ALLL/Loans 0.51 % 0.53 % 0.52 % Non-Performing Assets $2.0 $9.5 $2.9 Over 60 Day Delinquencies $0.2 $0.1 $0.1 51
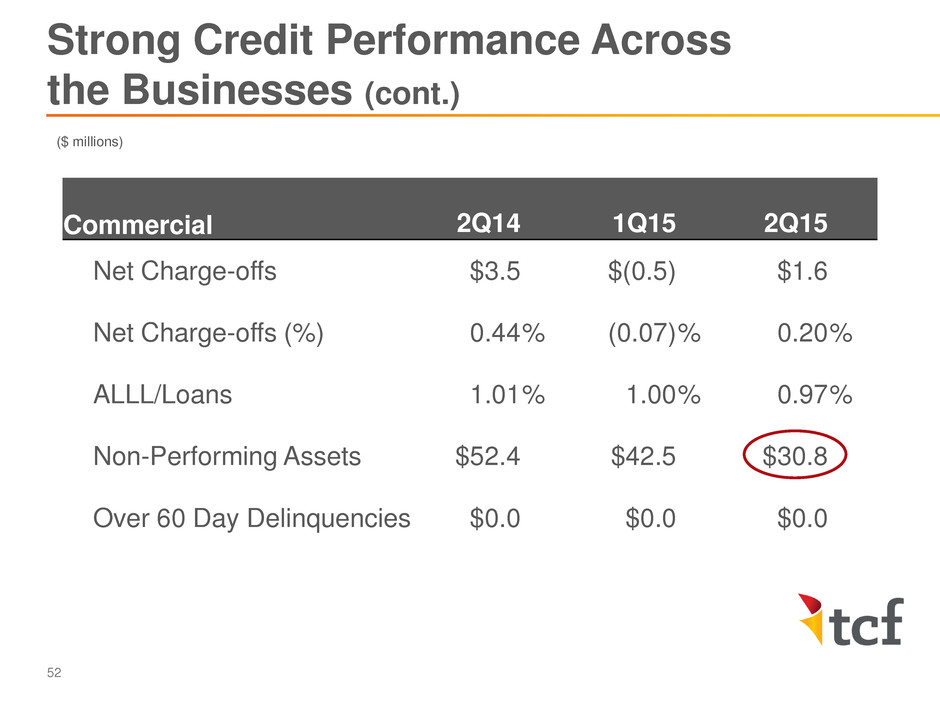
($ millions) Strong Credit Performance Across the Businesses (cont.) Commercial 2Q14 1Q15 2Q15 Net Charge-offs $3.5 $(0.5) $1.6 Net Charge-offs (%) 0.44 % (0.07) % 0.20 % ALLL/Loans 1.01 % 1.00 % 0.97 % Non-Performing Assets $52.4 $42.5 $30.8 Over 60 Day Delinquencies $0.0 $0.0 $0.0 52

($ millions) Strong Credit Performance Across the Businesses (cont.) Consumer Real Estate 2Q14 1Q15 2Q15 Net Charge-offs $11.5 $7.3 $9.7 Net Charge-offs (%) 0.75 % 0.51 % 0.69 % ALLL/Loans 2.68 % 1.43 % 1.35 % Non-Performing Assets $253.1 $215.9 $212.2 Over 60 Day Delinquencies $23.1 $16.7 $11.5 53
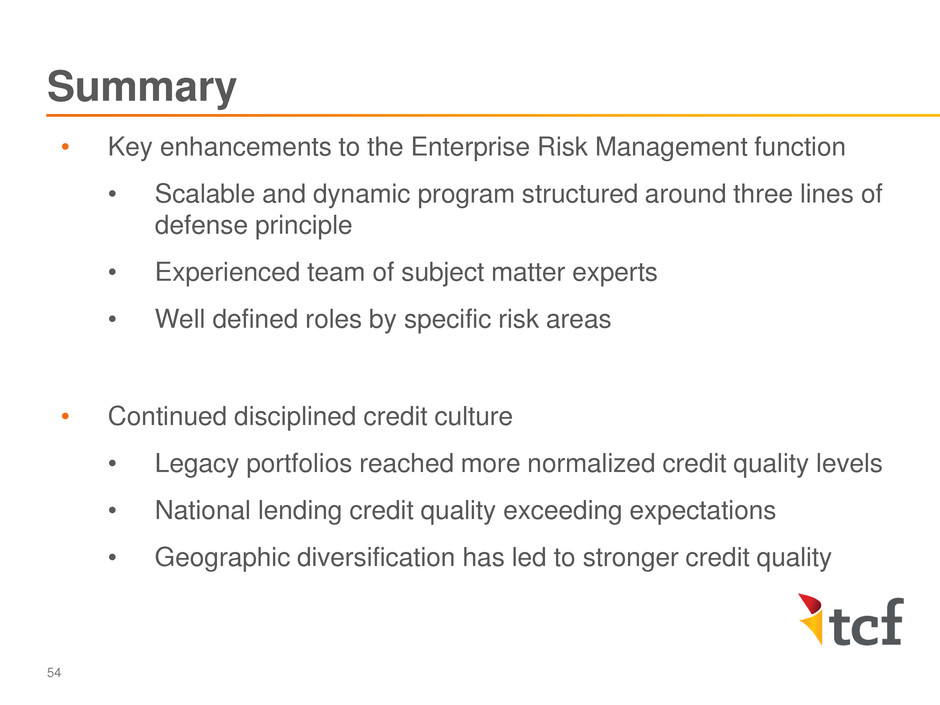
• Key enhancements to the Enterprise Risk Management function • Scalable and dynamic program structured around three lines of defense principle • Experienced team of subject matter experts • Well defined roles by specific risk areas • Continued disciplined credit culture • Legacy portfolios reached more normalized credit quality levels • National lending credit quality exceeding expectations • Geographic diversification has led to stronger credit quality Summary 54

Questions & Answers

Break

Auto Finance BRIAN MACINNIS CHIEF EXECUTIVE OFFICER GATEWAY ONE LENDING & FINANCE

• Industry risk segment distribution has remained unchanged over the past year: • Super Prime – 21% • Prime – 41% • Nonprime – 18% • Subprime – 16% • Deep subprime – 4% GATEWAY FOCUS • Continued growth opportunities in the market • Originations in a stable credit environment • Consistent underwriting standards A Stable Industry with Growth Opportunities 58 $811 $839 $870 $886 $906 0 200 400 600 800 1,000 3/14 6/14 9/14 12/14 3/15 OPEN INDUSTRY AUTO BALANCES BY LENDER TYPE Banks Captive Credit Unions Finance ($ billions) Source: Experian, State of the Market, March 2015 1.89% 2.09% 2.40% 2.38% 1.93% 0.00% 1.00% 2.00% 3.00% 4.00% 5.00% 6.00% 7.00% 3/14 6/14 9/14 12/14 3/15 STABLE 30+ DAY DELINQUENCIES YEAR-OVER-YEAR Banks Captives Credit Unions Finance Industry STABLE DISTRIBUTION BY RISK SEGMENT
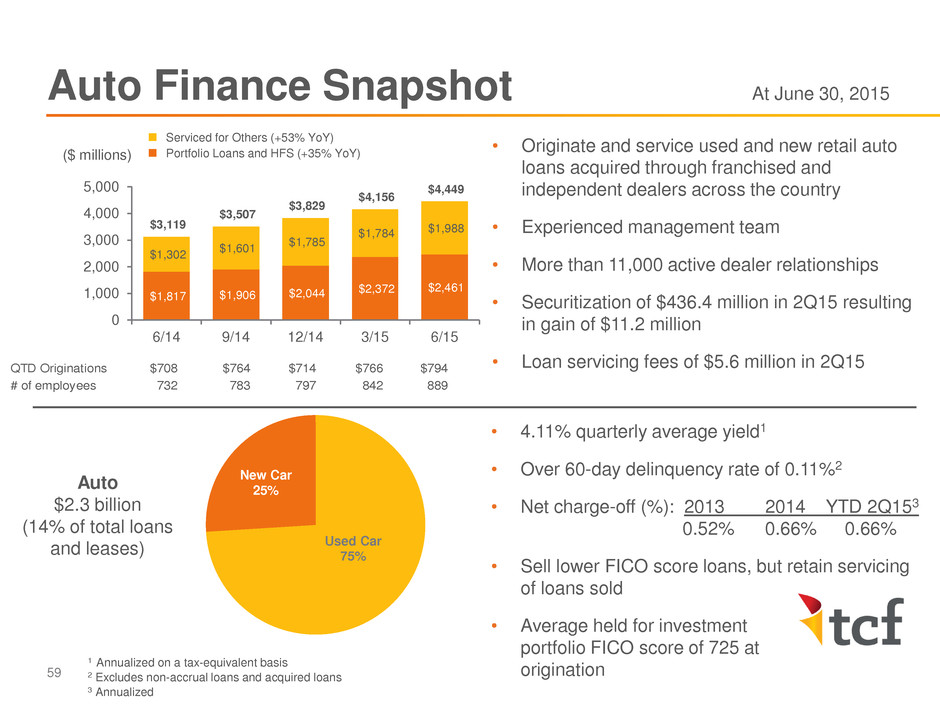
Auto Finance Snapshot At June 30, 2015 59 QTD Originations $708 $764 $714 $766 $794 # of employees 732 783 797 842 889 • Originate and service used and new retail auto loans acquired through franchised and independent dealers across the country • Experienced management team • More than 11,000 active dealer relationships • Securitization of $436.4 million in 2Q15 resulting in gain of $11.2 million • Loan servicing fees of $5.6 million in 2Q15 Used Car 75% New Car 25% Auto $2.3 billion (14% of total loans and leases) • 4.11% quarterly average yield1 • Over 60-day delinquency rate of 0.11%2 • Net charge-off (%): 2013 2014 YTD 2Q153 0.52% 0.66% 0.66% • Sell lower FICO score loans, but retain servicing of loans sold • Average held for investment portfolio FICO score of 725 at origination 1 Annualized on a tax-equivalent basis 2 Excludes non-accrual loans and acquired loans 3 Annualized $1,817 $1,906 $2,044 $2,372 $2,461 $1,302 $1,601 $1,785 $1,784 $1,988 $3,119 $3,507 $3,829 $4,156 $4,449 0 1,000 2,000 3,000 4,000 5,000 6/14 9/14 12/14 3/15 6/15 ($ millions) Serviced for Others (+53% YoY) Portfolio Loans and HFS (+35% YoY)
WHO IS GATEWAY? • One of the largest indirect auto finance companies in the U.S. • Finance auto loans with a weighted average life of 23 months1 • Created by a management team with over 100 years of combined industry experience, exceptional leadership and outstanding demonstrated results WHAT MAKES GATEWAY DIFFERENT? • Leverages a high-tech, high-touch business model for underwriting and servicing • Relies on experienced underwriters to make common sense credit decisions • Underwriting based on the totality of a customer’s ability, stability, and credit • Consistent servicing methodology by credit tier, driving superior results across the portfolio HOW DOES GATEWAY MITIGATE RISK? • Utilize extensive analytics to monitor portfolio performance • Maintain consistent underwriting policies – while other lenders are stretching guidelines in response to increased competition Unique Auto Lender with a Focus on Risk Mitigation 60 1 As of June 30, 2015; estimated weighted average life represents how many months it is expected to take to pay half of the outstanding principal
OPPORTUNITIES FOR GROWTH • Dealer Relationships • Breadth – continue to sign new dealers and expand national footprint • Depth – leverage existing dealer relationships to increase penetration • Loan Sale Strategy • Leverage multiple funding sources – both private sales and securitizations • Maintain flexibility by spreading risk across owned & sold portfolios • Direct Lending Initiative • Originate direct auto loans via the TCF retail banking network – with Gateway underwriting and servicing these loans AREAS OF RISK • Regulatory Environment • Economic Uncertainty Auto Outlook Focused on Disciplined Growth 61

• Experienced management with over 100 years of combined industry experience • Unique high-tech, high-touch business model drives operations • Auto assets perform consistently, maintaining stability throughout an economic downturn, with a short average life • Focus on risk mitigation Summary 62

Questions & Answers
Leasing and Equipment Finance BILL HENAK PRESIDENT & CHIEF EXECUTIVE OFFICER TCF EQUIPMENT FINANCE

65 • Banks looking to purchase leasing companies • US GDP increased 0.2% in 1Q15 and 3.7% in 2Q15 • Market liquidity remains strong • Strong competition and pressuring margins • Top leasing talent in the marketplace • Sale is large enough to pull liquidity out of the market • Potential for niche vendor programs to change financing sources as overall GE businesses are sold • Top 50 leasing companies held $491 billion in assets as of 2014, up 4.04% from prior year1 • Top 50 leasing companies originated $214 billion in assets in 2014 up 3.17% from prior year1 • Continue to target niche market growth strategies • Focused discipline around expense management and scaling the expense base • Targeted pricing strategies aimed specifically at price sensitive markets 1 Source: The Monitor, 2015 Monitor100 Leasing and Equipment Finance – Industry Overview INDUSTRY HEADLINES INDUSTRY SIZE & GROWTH TCF LEASING & EQUIPMENT FINANCE FOCUS GE CAPITAL’S DECISION CREATES OPPORTUNITIES

($ millions) 1 Includes operating leases of $97.9 million at June 30, 2015 2 Source: The Monitor, 2015 Monitor Bank 50 3 Source: The Monitor, 2015 Monitor 100 • 14th largest bank-affiliated leasing company2 and 27th largest equipment finance/leasing company3 in the U.S. • Experienced management team • Uninstalled backlog of $526.4 million, up from $418.0 million at December 31, 2014 Specialty Vehicles 27% Manufact. 9% Medical 9% Const. 12% Other 43% Leasing & Equipment Finance $3.8 billion (22% of total loans and leases) • 4.66% quarterly average yield4 • Over 60-day delinquency rate of 0.06%5 • Net charge-off (%): 2013 2014 YTD 2Q156 0.10% 0.10% 0.13% • 2Q15 fee revenue of $26.7 million, 23.5% of TCF total fees and other revenue 4 Annualized on a tax-equivalent basis 5 Excludes non-accrual loans and leases and acquired loans and leases 6 Annualized 66 Leasing and Equipment Finance Snapshot At June 30, 2015 $3,355 $3,484 $3,679 $3,994 $4,036 1,000 2,000 3,000 4,000 5,000 12/11 12/12 12/13 12/14 6/15 Portfolio Loans and Leases Serviced for Others 1 YTD Originations $1,484 $1,696 $1,730 $1,874 $858

67 1 Source: Thomson Reuters/PayNet SBLI Index 2 Source: Equipment Leasing and Finance Association TCF’s Strong Liquidity Drove Growth When the Market was Shrinking 0% 50% 100% 150% 200% 250% 2006 2007 2008 2009 2010 2011 2012 2013 2014 TCF Leasing & Equipment Finance SBLI Index1 Outperforming the Industry GROWTH VS. PAYNET SMALL BUSINESS LENDING INDEX 0.00% 0.25% 0.50% 0.75% 1.00% 1.25% 1.50% 1.75% 2.00% 2.25% 2.50% 2.75% 3.00% OVER 30-DAY DELINQUENCY PERFORMANCE VS MONTHLY LEASING AND FINANCE INDEX TCF Leasing & Equipment Finance MLFI Index2 Strong industry and equipment knowledge drives underwriting that allows TCF’s portfolio to consistently outperform the industry
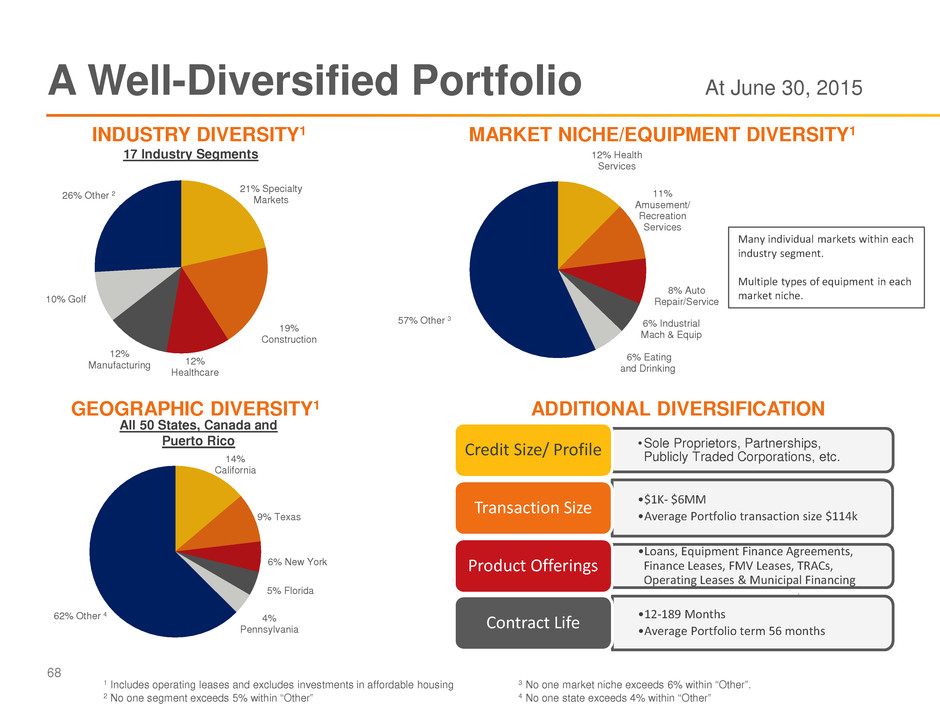
21% Specialty Markets 19% Construction 12% Healthcare 12% Manufacturing 10% Golf 26% Other 2 17 Industry Segments Many individual markets within each industry segment. Multiple types of equipment in each market niche. •Sole Proprietors, Partnerships, Publicly Traded Corporations, etc. Credit Size/ Profile •$1K- $6MM •Average Portfolio transaction size $114k Transaction Size •Loans, Equipment Finance Agreements, Finance Leases, FMV Leases, TRACs, Operating Leases & Municipal Financing Product Offerings •12-189 Months •Average Portfolio term 56 months Contract Life A Well-Diversified Portfolio At June 30, 2015 INDUSTRY DIVERSITY1 MARKET NICHE/EQUIPMENT DIVERSITY1 GEOGRAPHIC DIVERSITY1 ADDITIONAL DIVERSIFICATION 12% Health Services 11% Amusement/ Recreation Services 8% Auto Repair/Service 6% Industrial Mach & Equip 6% Eating and Drinking 57% Other 3 3 No one market niche exceeds 6% within “Other”. 4 No one state exceeds 4% within “Other” 14% California 9% Texas 6% New York 5% Florida 4% Pennsylvania 62% Other 4 1 Includes operating leases and excludes investments in affordable housing 2 No one segment exceeds 5% within “Other” All 50 States, Canada and Puerto Rico 68
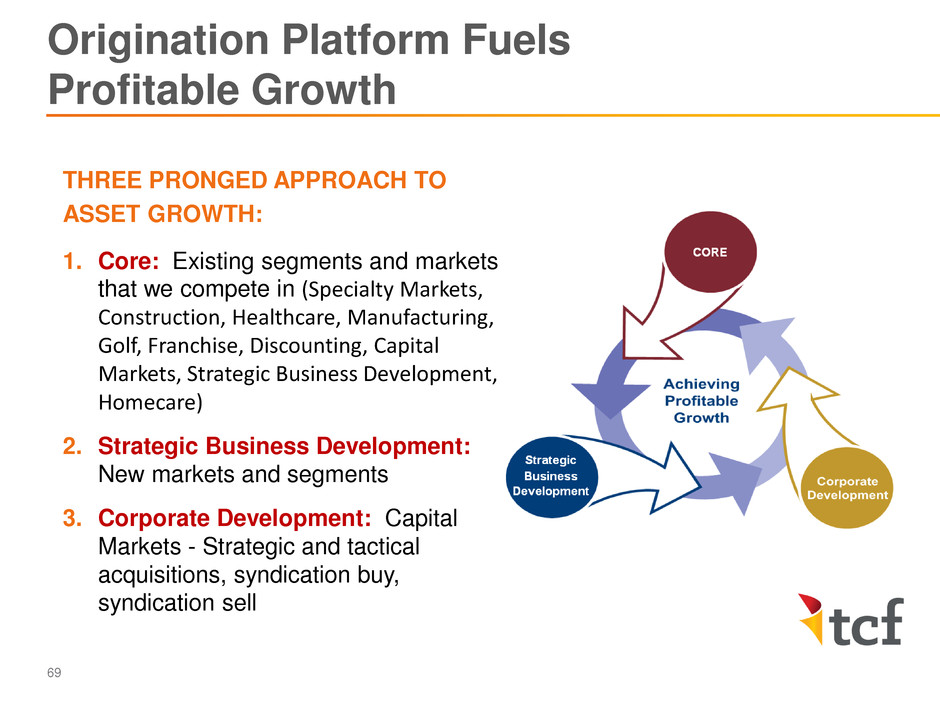
THREE PRONGED APPROACH TO ASSET GROWTH: 1. Core: Existing segments and markets that we compete in (Specialty Markets, Construction, Healthcare, Manufacturing, Golf, Franchise, Discounting, Capital Markets, Strategic Business Development, Homecare) 2. Strategic Business Development: New markets and segments 3. Corporate Development: Capital Markets - Strategic and tactical acquisitions, syndication buy, syndication sell Origination Platform Fuels Profitable Growth 69
• Continue to focus on niche market strategy • Seek adjacent segments to drive profitable growth • Take advantage of GE divestiture primarily through talent and program opportunities • Focus on expense management Summary 70

Questions & Answers
Inventory Finance ROSS PERRELLI PRESIDENT & CHIEF EXECUTIVE OFFICER TCF INVENTORY FINANCE
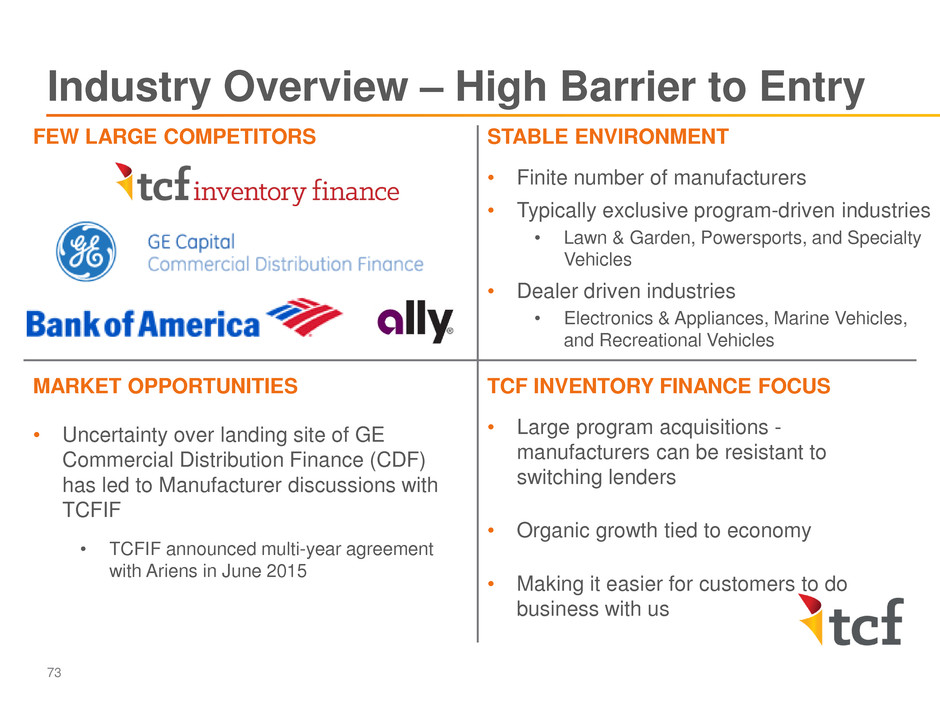
Industry Overview – High Barrier to Entry 73 FEW LARGE COMPETITORS STABLE ENVIRONMENT • Finite number of manufacturers • Typically exclusive program-driven industries • Lawn & Garden, Powersports, and Specialty Vehicles • Dealer driven industries • Electronics & Appliances, Marine Vehicles, and Recreational Vehicles TCF INVENTORY FINANCE FOCUS • Large program acquisitions - manufacturers can be resistant to switching lenders • Organic growth tied to economy • Making it easier for customers to do business with us MARKET OPPORTUNITIES • Uncertainty over landing site of GE Commercial Distribution Finance (CDF) has led to Manufacturer discussions with TCFIF • TCFIF announced multi-year agreement with Ariens in June 2015
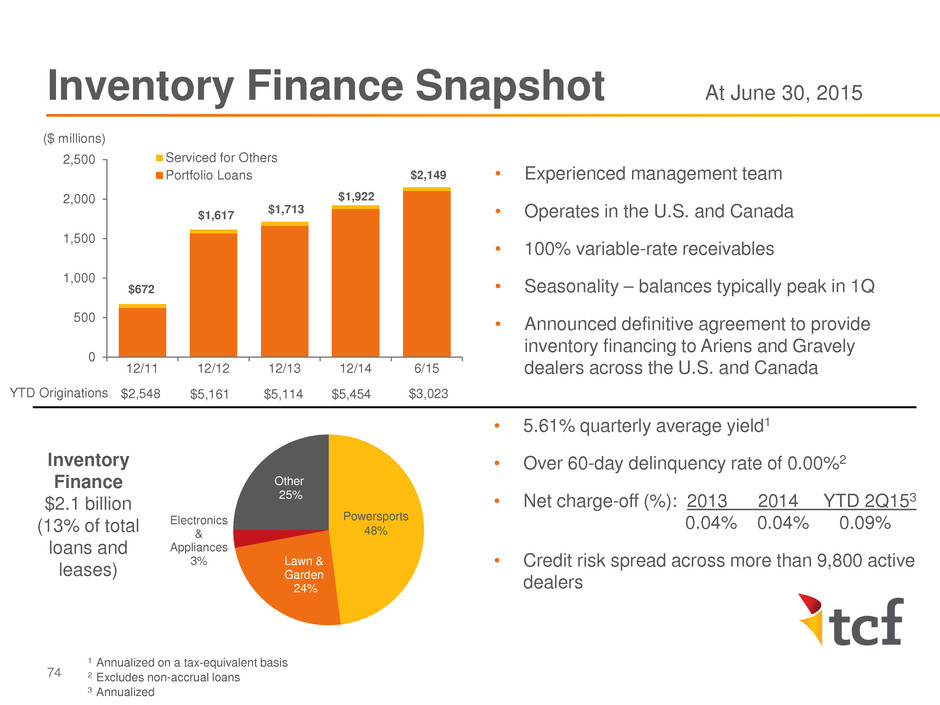
74 ($ millions) Lawn & Garden 24% Electronics & Appliances 3% Other 25% Powersports 48% Inventory Finance $2.1 billion (13% of total loans and leases) • 5.61% quarterly average yield1 • Over 60-day delinquency rate of 0.00%2 • Net charge-off (%): 2013 2014 YTD 2Q153 0.04% 0.04% 0.09% • Credit risk spread across more than 9,800 active dealers 1 Annualized on a tax-equivalent basis 2 Excludes non-accrual loans 3 Annualized • Experienced management team • Operates in the U.S. and Canada • 100% variable-rate receivables • Seasonality – balances typically peak in 1Q • Announced definitive agreement to provide inventory financing to Ariens and Gravely dealers across the U.S. and Canada Inventory Finance Snapshot At June 30, 2015 $672 $1,617 $1,713 $1,922 $2,149 0 500 1,000 1,500 2,000 2,500 12/11 12/12 12/13 12/14 6/15 Serviced for Others Portfolio Loans YTD Originations $2,548 $5,161 $5,114 $5,454 $3,023
• Extends credit to distributors and dealers to purchase inventory from our manufacturers • Generates revenue through high yielding loans • Differentiators include superior customer service, long-term relationships and state-of- the-art systems • Dedicated account management by manufacturer/dealer • Dedicated credit lines • Develop multiple touch points with manufacturers • Inventory platform provides manufacturer insight into their dealer network A High Yielding, Service-Based Business 75
• Risk mitigation channels: • Discretionary loans to dealers secured by inventory • Manufacturer repurchase on repossessed inventory • Exclusive program features such as loss recourse and favorable loss rebates • Spread of risk through more than 9,800 dealers across six industries • Personal guarantees and irrevocable letters of credit from some dealers • Underwriting and risk models • Collateral inspections • Collection calls on delinquent payments Program Structure Supports Effective Risk Mitigation 76
• Signed deal with Ariens within 30 days of GE Capital announcement • TCF Inventory Finance has seen an increase in inquiries from GE customers • Open to all manufacturers and able to commit to a program by the end of 2016 • Several manufacturers in exclusive programs have notice periods in 2016 with a 6 to 12 month notice of termination required • Manufacturers are weighing options Market Opportunities Present 77
GROWTH STRATEGY • Re-engineered sales processes • Sales force focused on dealer driven industries • Strategy team focused on exclusive programs • More effective customer experience through new inventory platform • Engage major manufacturers prior to their contractual end dates BUSINESS OUTLOOK • High focus on improving operating leverage through new inventory platform • High cost/high touch regulatory environment THREE YEAR VIEW • Appetite for additional programs • Focus on the customer experience • Lean and data driven operating environment Future Focus on Service, Leverage and Technology 78

• Unique high yielding, high return business with a high barrier to entry and strong credit performance • Experienced management team • Emphasis on technology to lead enhancements in service and operating leverage • Low risk based on highly effective risk structures • GE Capital breakup presents additional growth opportunities Summary 79

Questions & Answers

Retail Banking TOM JASPER VICE CHAIRMAN & EXECUTIVE VICE PRESIDENT

Evolution of Industry Distribution Channels 82 • Low interest rate environment impairs the value of deposits • Basel III / LCR has increased the competition for consumer deposits, driving rates higher • Economy post-recession recovery is modest in terms of economic growth and employment / wages • CFPB oversight expected to continue to impact revenue and costs of retail banking • Gathering low cost core deposits • Reduction of customer attrition through improved service levels • Increase wallet share of households already on the books • Mobile app usage up significantly across all demographics2 • Most consumers are now omnichannel using three to four alternative channels3 • ATM • Online bill pay • Mobile deposits • Branch AN EVOLUTION OF DISTRIBUTION INDUSTRY CHALLENGES INCREASING USAGE OF ALTERNATIVE CHANNELS TCF RETAIL BANKING FOCUS 1 Source:: American Bankers Association Survey: More Consumers Turning to Mobile Banking (August 11, 2015) 2 Source: Chase Survey (June 2015) 3 Gallup (April 27, 2015) Internet 32% Branches 17% ATM 13% Mobile 12% Mail 7% Telephone 5% Don't Know 13% 2015 ABA Survey – Preferred Banking Methods1 • Online banking continues to be the preferred banking method • Branches remain second most popular way to bank • Mobile banking popularity increasing

83 99 24 53 35 7 155 1 2 IL MN MI CO WI AZ SD IN TCF Branches 155 99 53 35 24 7 2 1 376 ATMs 265 223 66 36 26 7 2 1 626 Total 420 322 119 71 50 14 4 2 1,002 BRANCH FOOTPRINT PHYSICAL DISTRIBUTION • Physical distribution in branches and ATMs remain important to consumers, but is evolving • Manage physical distribution to increase profitability, access funding, and deliver on meeting the needs of customers today and tomorrow STRATEGIES • Increase market presence by positioning physical distribution in high volume, high visibility areas with focus on an expanded ATM network • Effectively roll-out of new branch designs that will: • Reflect the way consumers use branches today • Be designed around capturing new relationships, distributing more products, and providing a higher level of service • Migrate transactions away from teller line to alternative channels • Improve the cost and effectiveness of the branch • Consolidate underperforming locations and re- invest in alternative distribution channels Physical Distribution Remains Key Distribution Channel At June 30, 2015

• Consistent recent success with 19 consecutive quarters of deposit growth • Strategy shift from a focus on gross checking accounts to quality relationships • Leverage physical distribution and digital assets • Improve cross-sell and penetration of additional products • Remain focused on meeting customer needs in transacting, saving, and borrowing An Evolving Strategy with a Continued Focus on Retail Deposit Funding 84

CUSTOMER NEEDS Every customer has 5 basic financial needs. Priority and timing vary by segment and life stage. Checking Credit Card General Purpose Re-loadable Card Money Order Money Transfer Bill Payment Check Cashing Savings Money Market CD IRA Mortgage Home Equity Auto Credit Card Overdraft Line Investments & Insurance - Not current strategy TRANSACT INVEST PROTECT SAVE BORROW TCF focuses on meeting 3 of these needs and is expanding product line distribution to do so. Customer Need Continuum 85 Products in development
• Instant issue of cards in the branch • Website and mobile enhancements • Enhanced overdraft protection (ODP) products • Mortgage lending in branch • Suite of services targeting millennials that are also available to customers preferring non-traditional banking products • Credit card • Investing in technology that customers demand • Enhancing both the digital and in-person customer experience Robust Product and Service Opportunities 86 Each initiative largely leverages the existing franchise with modest investments – reducing net burden while improving customer experience

• In a competitive market, organic growth has a higher cost • Expand segments in markets where premiums to acquire may be lower, effectively increasing funding capacity while managing interest costs • M&A opportunities could augment the equation • Alignment on quality relationships and superior service are beginning to be evidenced in the market • Expect less elasticity than industry as rates rise based on our portfolios and customer base • Focusing on digital strategy has dual benefit of improving efficiency and appeal to customers Summary 87

Questions & Answers
Conclusion CRAIG DAHL VICE CHAIRMAN & PRESIDENT
Why TCF? 90 • Focus on national vs. footprint lending increases quality and diversification of portfolio • Strong origination, loan sale and securitization capabilities drive loan growth and revenue diversification • Focus on improving operating leverage following recent build-out of key functions • Maintain sufficient funding sources to support loan and lease growth

Questions & Answers
Appendix

1 When evaluating capital adequacy and utilization, management considers financial measures such as Tangible Common Equity and Tangible Book Value Per Common Share. These measures are non-GAAP financial measures and are viewed by management as useful indicators of capital levels available to withstand unexpected market or economic conditions, and also provide investors, regulators and other users with information to be viewed in relation to other banking institutions. RECONCILIATION OF GAAP TO NON-GAAP FINANCIAL MEASURES – TANGIBLE COMMON EQUITY AND TANGIBLE BOOK VALUE PER COMMON SHARE1 93 Jun. 30, 2014 Mar. 31, 2015 Jun. 30, 2015 Computation of tangible common equity to tangible assets Total equity $ 2,071,711 $ 2,181,682 $ 2,222,022 Less: Non-controlling interest in subsidiaries 16,805 21,890 19,511 Total TCF Financial Corporation stockholders' equity 2,054,906 2,159,792 2,202,511 Less: Preferred stock 263,240 263,240 263,240 Goodwill 225,640 225,640 225,640 Other intangibles 5,483 4,252 3,909 Tangible common equity $ 1,560,543 $ 1,666,660 $ 1,709,722 Total assets $ 18,837,777 $ 19,984,573 $ 19,826,350 Less: Goodwill 225,640 225,640 225,640 Other intangibles 5,483 4,252 3,909 Tangible assets $ 18,606,654 $ 19,754,681 $ 19,596,801 Tangible common equity ratio 8.39 % 8.44 % 8.72 % Common stock shares outstanding (thousands) 166,881 168,099 169,102 Tangible book value per common share $ 9.35 $ 9.91 $ 10.11 ($ thousands, except per share data)

1 When evaluating capital adequacy and utilization, management considers financial measures such as return on average tangible common equity. This measure is a non-GAAP financial measure and is viewed by management as a useful indicator of capital levels available to withstand unexpected market or economic conditions, and also provide investors, regulators and other users with information to be viewed in relation to other banking institutions. RECONCILIATION OF GAAP TO NON-GAAP FINANCIAL MEASURES – RETURN ON AVERAGE TANGIBLE COMMON EQUITY1 94 QTD QTD QTD YTD Jun. 30, 2014 Mar. 31, 2015 Jun. 30, 2015 Jun. 30, 2015 Computation of return on average tangible common equity: Net income available to common stockholders $ 48,278 $ 34,954 $ 47,408 $ 82,362 Other intangibles amortization, net of tax 264 245 246 491 Adjusted net income available to common stockholders $ 48,542 $ 35,199 $ 47,654 $ 82,853 Average balances: Total equity $ 2,041,925 $ 2,150,858 $ 2,196,213 $ 2,173,661 Less: Non-controlling interest in subsidiaries 21,110 17,077 22,514 19,810 Total TCF Financial Corporation stockholders’ equity 2,020,815 2,133,781 2,173,699 2,153,851 Less: Preferred stock 263,240 263,240 263,240 263,240 Goodwill 225,640 225,640 225,640 225,640 Other intangibles 5,711 4,474 4,110 4,291 Average tangible common equity $ 1,526,224 $ 1,640,427 $ 1,680,709 $ 1,660,680 Annualized return on average tangible common equity 12.72 % 8.58 % 11.34 % 9.98 % ($ thousands)


