UNITED STATES SECURITIES AND EXCHANGE COMMISSION
Washington, D.C. 20549
FORM N-CSR
CERTIFIED SHAREHOLDER REPORT OF REGISTERED MANAGEMENT
INVESTMENT COMPANIES
Investment Company Act file number: 811-05162
Exact name of registrant as specified in charter: Delaware VIP® Trust
Address of principal executive offices:
2005 Market Street
Philadelphia, PA 19103
Name and address of agent for service:
David F. Connor, Esq.
2005 Market Street
Philadelphia, PA 19103
Registrant’s telephone number, including area code: (800) 523-1918
Date of fiscal year end: December 31
Date of reporting period: December 31, 2009
Item 1. Reports to Stockholders
| Delaware VIP® Trust |
| Delaware VIP Cash Reserve Series |
| |
| |
| |
| |
| |
| |
| Annual Report |
| |
| |
| December 31, 2009 |
| |
| |
| |
| |
| |
| |
| |
| |
| |
| |
| |
| |
| |
| |
| |
|
Table of contents
| > Portfolio management review | 1 |
| | |
| > Performance summary | 1 |
| | |
| > Disclosure of Series expenses | 3 |
| | |
| > Sector allocation | 4 |
| | |
| > Statement of net assets | 5 |
| | |
| > Statement of operations | 7 |
| | |
| > Statements of changes in net assets | 7 |
| | |
| > Financial highlights | 8 |
| | |
| > Notes to financial statements | 10 |
| | |
| > Report of independent registered public accounting firm | 14 |
| | |
| > Other Series information | 15 |
| | |
| > Board of trustees/directors and officers addendum | 19 |
On January 4, 2010, Delaware Management Holdings, Inc., and its subsidiaries (collectively known by the marketing name of Delaware Investments) were sold by a subsidiary of Lincoln National Corporation to Macquarie Group Limited, a global provider of banking, financial, advisory, investment and funds management services. Please see your Series’ prospectus and any supplements thereto for more complete information.
Investments in Delaware VIP® Cash Reserve Series are not and will not be deposits with or liabilities of Macquarie Bank Limited ABN 46 008 583 542 and its holding companies, including subsidiaries or related companies, and are subject to investment risk, including possible delays in repayment and loss of income and capital invested. No Macquarie Group company guarantees or will guarantee the performance of the Series, the repayment of capital from the Series, or any particular rate of return.
Unless otherwise noted, views expressed herein are current as of Dec. 31, 2009, and are subject to change.
Funds are not FDIC insured and are not guaranteed. It is possible to lose the principal amount invested.
Mutual fund advisory services provided by Delaware Management Company, a series of Delaware Management Business Trust, which is a registered investment advisor. Delaware Investments is the marketing name of Delaware Management Holdings, Inc. and its subsidiaries. Macquarie Group refers to Macquarie Group Limited and its subsidiaries and affiliates worldwide.
© 2010 Delaware Management Holdings, Inc.
All third-party trademarks cited are the property of their respective owners.
| Delaware VIP® Trust — Delaware VIP Cash Reserve Series | |
| Portfolio management review | Jan. 12, 2010 |
For the 12-month period ended Dec. 31, 2009, the Delaware VIP Cash Reserve Series Standard Class shares returned +0.26%, while Service Class shares gained 0.25% (both with distributions reinvested). By comparison, the U.S. Consumer Price Index gained 2.70% (source: Bureau of Labor Statistics).
The year 2009 presented challenges for investors holding short-term and other money market instruments that are considered to be conservative investments. The difficult conditions for short-term investments stood in stark contrast to the returns generated by riskier asset classes during the year. Performance among high yield bonds, for example, exceeded 40% as it appeared investors generally sought risky securities with the same level of enthusiasm that they avoided them in 2008 (source: Bloomberg).
This appetite for risk, combined with a fed funds rate that remained at a floating rate between zero and 0.25% through the entire annual period, dampened returns for money market vehicles. (Money market funds are highly sensitive to movements in the fed funds rate.) Additionally, yields on 2-year Treasurys hovered below 1.0% for much of the annual period, and even dropped below 0.70% late in the year. (Source: Bloomberg.)
The direction of any future movements continues to be dependent on the economy’s performance and the potential threat of inflation in 2010. Though the U.S. economy began to grow in late 2009, the Federal Open Market Committee in December stated its commitment to maintain the fed funds rate at its present range for “an extended period” (source: Federal Reserve).
| Unless otherwise noted, the views expressed are current as of Dec. 31, 2009, and are subject to change. |
Performance summary
The performance data quoted represent past performance; past performance does not guarantee future results. Please obtain the performance data for the most recent month end by calling the number noted in the introductory section of this report on the page related to this Series. Current performance may be lower or higher than the performance data quoted.
You should consider the investment objectives, risks, charges, and expenses of the Series carefully before investing. The Delaware VIP Cash Reserve Series prospectus contains this and other important information about the Series. To obtain a prospectus, contact the company noted on the page related to this Series in the introductory section of this report, either by phone or through the company’s Web site. We advise you to read the prospectus carefully before you invest or send money.
| Delaware VIP Cash Reserve Series | | | | | | | | | | |
| Average annual total returns | | | | | | | | | | |
| For periods ended Dec. 31, 2009 | | 1 year | | 3 years | | 5 years | | 10 years | | Lifetime |
Standard Class shares (commenced
operations on July 28, 1988) | | +0.26% | | +2.37% | | +2.85% | | +2.68% | | +4.03% |
Service Class shares (commenced operations on May 1, 2000) | | +0.25% | | +2.73% | | +2.96% | | n/a | | +2.55% |
Returns reflect the reinvestment of all distributions.
As described in the Series’ most recent prospectus, the net expense ratio for Service Class shares of the Series was 0.97%, while total operating expenses for Standard Class and Service Class shares were 0.72% and 1.02%, respectively. The management fee for Standard Class and Service Class shares was 0.45%. Management had voluntarily agreed to reimburse expenses and/or waive its management fees to ensure expenses did not exceed 0.39% of average daily net assets, excluding 12b-1 fees, until such time as the voluntary cap was discontinued. Effective Jan. 19, 2010, management has voluntarily agreed to change the expense limitation to 0.29% of average daily net assets of the Series, excluding 12b-1 fees, until such time as the voluntary cap is discontinued, with such exceptions as described in the most recent prospectus.
The Series’ distributor has contracted to limit the 12b-1 fees for Service Class shares to no more than 0.25% of average daily net assets through April 30, 2010.
Earnings from a variable annuity or variable life investment compound tax-free until withdrawal, and as a result, no adjustments were made for income taxes.
Expense limitations were in effect for both classes during the periods shown in the Series performance chart above.
Performance data do not reflect insurance fees related to a variable annuity or variable life investment or the deferred sales charge that would apply to certain withdrawals of investments. Performance shown here would have been reduced if such fees were included or the expense limitation removed. For more information about fees, consult your variable annuity or variable life prospectus.
Investments in variable products involve risk. An investment in the Series is not insured or guaranteed by the Federal Deposit Insurance Corporation or any other government agency.
Although the Series seeks to preserve the value of a share at $1.00 per share, it is possible to lose money by investing in the Series. Adverse conditions may affect the issuer’s ability to pay interest and principal on these securities.
Cash Reserve Series-1
Delaware VIP® Cash Reserve Series (continued)
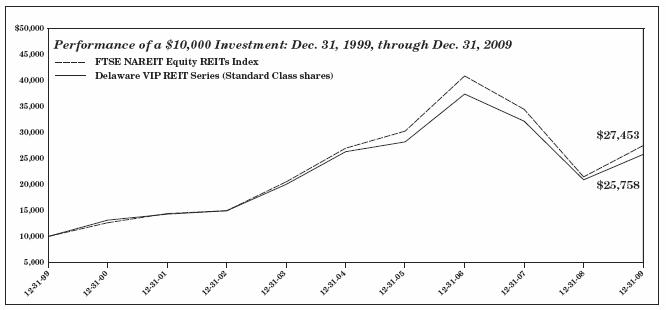
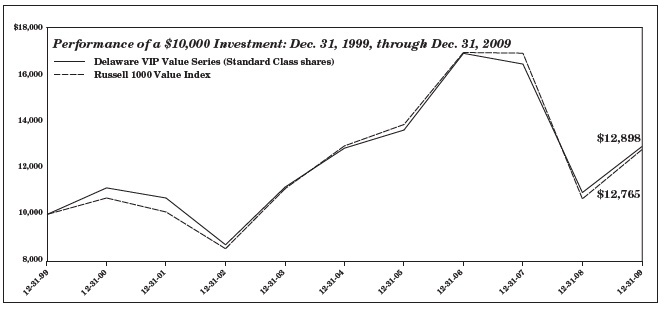
The chart shows a $10,000 investment in the Delaware VIP Cash Reserve Series Standard Class shares for the period from Dec. 31, 1999, through Dec. 31, 2009.
The chart also shows $10,000 invested in the U.S. Consumer Price Index for the period from Dec. 31, 1999, through Dec. 31, 2009. The U.S. Consumer Price Index is a measure of inflation that is calculated by the U.S. Department of Labor, representing changes in prices of all goods and services purchased for consumption by urban households. An index is unmanaged and does not reflect the costs of operating a mutual fund, such as the costs of buying, selling, and holding securities.
Index performance returns do not reflect any management fees, transaction costs or expenses. Indices are unmanaged and one cannot invest directly in an index.
Performance of Service Class shares will vary due to different charges and expenses.
Past performance is not a guarantee of future results.
Cash Reserve Series-2
Delaware VIP® Trust — Delaware VIP Cash Reserve Series
Disclosure of Series Expenses
For the Period July 1, 2009 to December 31, 2009
As a shareholder of the Series, you incur ongoing costs, including management fees; distribution and/or service (12b-1) fees; and other Series expenses. This Example is intended to help you understand your ongoing costs (in dollars) of investing in the Series and to compare these costs with the ongoing costs of investing in other mutual funds.
The Example is based on an investment of $1,000 invested at the beginning of the period and held for the entire period from July 1, 2009 to December 31, 2009.
Actual Expenses
The first section of the table shown, “Actual Series Return,” provides information about actual account values and actual expenses. You may use the information in this section of the table, together with the amount you invested, to estimate the expenses that you paid over the period. Simply divide your account value by $1,000 (for example, an $8,600 account value divided by $1,000 = 8.6), then multiply the result by the number in the first section under the heading entitled “Expenses Paid During Period” to estimate the expenses you paid on your account during the period.
Hypothetical Example for Comparison Purposes
The second section of the table shown, “Hypothetical 5% Return,” provides information about hypothetical account values and hypothetical expenses based on the Series’ actual expense ratio and an assumed rate of return of 5% per year before expenses, which is not the Series’ actual return. The hypothetical account values and expenses may not be used to estimate the actual ending account balance or expenses you paid for the period. You may use this information to compare the ongoing costs of investing in the Series and other funds. To do so, compare the 5% hypothetical example with the 5% hypothetical examples that appear in the shareholder reports of other funds.
Please note that the expenses shown in the table are meant to highlight your ongoing costs only. As a shareholder of the Series, you do not incur any transaction costs, such as sales charges (loads), redemption fees or exchange fees, but shareholders of other funds may incur such costs. Also, the fees related to the variable annuity investment or the deferred sales charge that could apply have not been included. Therefore, the second section of the table is useful in comparing ongoing costs only, and will not help you determine the relative total costs of owning different funds. The Series’ actual expenses shown in the table reflect fee waivers in effect. The expenses shown in the table assume reinvestment of all dividends and distributions.
Expense Analysis of an Investment of $1,000
| | | | | | | | | | | Expenses |
| | Beginning | | Ending | | | | | Paid During |
| | Account | | Account | | Annualized | | Period |
| | Value | | Value | | Expense | | 7/1/09 to |
| | 7/1/09 | | 12/31/09 | | Ratios | | 12/31/09* |
| Actual Series Return | | | | | | | | | | | | | |
| Standard Class | | $ | 1,000.00 | | $ | 1,001.00 | | 0.41 | % | | $ | 2.07 | |
| Service Class | | | 1,000.00 | | | 1,001.00 | | 0.41 | % | | | 2.07 | |
| Hypothetical 5% Return (5% return before expenses) | | | | | |
| Standard Class | | $ | 1,000.00 | | $ | 1,023.14 | | 0.41 | % | | $ | 2.09 | |
| Service Class | | | 1,000.00 | | | 1,023.14 | | 0.41 | % | | | 2.09 | |
Effective 1/19/10, Delaware Management Company (DMC) has voluntarily agreed to waive that portion, if any, of its management fee and/or pay/reimburse the Series to the extent necessary to ensure that total annual operating expenses (excluding any 12b-1 plan expenses, taxes, interest, inverse floater program expenses, brokerage fees, certain insurance costs, and nonroutine expenses or costs including, but not limited to, those relating to reorganizations, litigation, conducting shareholder meetings, and liquidations (collectively, “nonroutine expenses”)), do not exceed 0.29% of average daily net assets of the Series until such time as the voluntary expense cap is discontinued. The Series’ expense analysis would be as follows if this new limit was in effect for the entire period:
Expense Analysis of an Investment of $1,000
| | | | | | | | | | | Expenses |
| | Beginning | | Ending | | | | | Paid During |
| | Account | | Account | | Annualized | | Period |
| | Value | | Value | | Expense | | 7/1/09 to |
| | 7/1/09 | | 12/31/09 | | Ratios | | 12/31/09* |
| Actual Series Return | | | | | | | | | | | | | |
| Standard Class | | $ | 1,000.00 | | $ | 1,001.00 | | 0.29 | % | | $ | 1.46 | |
| Service Class | | | 1,000.00 | | | 1,001.00 | | 0.29 | % | | | 1.46 | |
| Hypothetical 5% Return (5% return before expenses) | | | | | |
| Standard Class | | $ | 1,000.00 | | $ | 1,023.74 | | 0.29 | % | | $ | 1.48 | |
| Service Class | | | 1,000.00 | | | 1,023.74 | | 0.29 | % | | | 1.48 | |
*“Expenses Paid During Period” are equal to the Series’ annualized expense ratio, multiplied by the average account value over the period, multiplied by 184/365 (to reflect the one-half year period).
Cash Reserve Series-3
Delaware VIP® Trust — Delaware VIP Cash Reserve Series
Sector Allocation
As of December 31, 2009
Sector designations may be different than the sector designations presented in other Series materials. The sector designations may represent the investment manager’s internal sector classifications, which may result in the sector designations for one series being different than another series’ sector designations.
| Percentage |
| Sector | of Net Assets |
| Agency Obligations | 4.20 | % |
| Certificates of Deposit | 6.99 | % |
| Commercial Paper | 69.06 | % |
| Colleges & Universities | 21.81 | % |
| Financial Services | 15.63 | % |
| Industrial | 11.69 | % |
| Mortgage Bankers & Brokers | 18.53 | % |
| Pharmaceuticals | 1.40 | % |
| Corporate Bonds | 14.03 | % |
| Banking | 9.81 | % |
| Consumer Products | 2.82 | % |
| Financial Services | 1.40 | % |
| Municipal Bonds | 5.88 | % |
| Total Value of Securities | 100.16 | % |
| Liabilities Net of Receivables and Other Assets | (0.16 | %) |
| Total Net Assets | 100.00 | % |
Cash Reserve Series-4
Delaware VIP® Trust — Delaware VIP Cash Reserve Series
Statement of Net Assets
December 31, 2009
| | | Principal | | | |
| | | | Amount | | Value |
| AGENCY OBLIGATIONS–4.20% | | | | | | |
| Federal Home Loan Bank | | | | | | |
| ≠ | 0.516% 10/19/10 | | $ | 500,000 | | $ | 499,937 |
| | 1.15% 4/16/10 | | | 250,000 | | | 250,000 |
| Total Agency Obligations | | | | | | |
| (cost $749,937) | | | | | | 749,937 |
| |
| CERTIFICATES OF DEPOSIT–6.99% | | | | | | |
| Bank of Nova Scotia Housing 0.18% 2/17/10 | | | 250,000 | | | 250,000 |
| BNP Paribas New York 0.11% 1/12/10 | | | 250,000 | | | 250,000 |
| Nordea Finland New York 0.20% 3/3/10 | | | 250,000 | | | 250,000 |
| Rabobank Nederland New York 0.39% 2/16/10 | | | 250,000 | | | 250,000 |
| Societe Generale New York 0.18% 1/15/10 | | | 250,000 | | | 250,000 |
| Total Certificates of Deposit | | | | | | |
| (cost $1,250,000) | | | | | | 1,250,000 |
| |
| COMMERCIAL PAPER–69.06% | | | | | | |
| Colleges & Universities–21.81% | | | | | | |
| ≠Cornell University | | | | | | |
| 0.25% 2/9/10 | | | 250,000 | | | 249,932 |
| 0.25% 3/16/10 | | | 250,000 | | | 249,872 |
| ≠Dartmouth College 0.25% 1/14/10 | | | 250,000 | | | 249,977 |
| Emory University | | | | | | |
| 0.25% 2/10/10 | | | 250,000 | | | 250,000 |
| 0.25% 3/18/10 | | | 250,000 | | | 250,000 |
| ≠Leland Stanford Junior University | | | | | | |
| 0.25% 4/1/10 | | | 250,000 | | | 249,844 |
| 0.29% 4/7/10 | | | 250,000 | | | 249,807 |
| Massachusetts Health & Education Facilities | | | | | | |
| Authority 0.20% 1/21/10 | | | 250,000 | | | 250,000 |
| ≠University of California | | | | | | |
| 0.24% 2/18/10 | | | 250,000 | | | 249,920 |
| 0.25% 2/24/10 | | | 250,000 | | | 249,906 |
| ≠University of Chicago | | | | | | |
| 0.28% 1/6/10 | | | 250,000 | | | 249,990 |
| 0.29% 3/3/10 | | | 250,000 | | | 249,877 |
| ≠Vanderbilt University 0.22% 1/7/10 | | | 250,000 | | | 249,991 |
| ≠Yale University | | | | | | |
| 0.330% 2/3/10 | | | 250,000 | | | 249,924 |
| 0.351% 1/12/10 | | | 400,000 | | | 399,958 |
| | | | | | | 3,898,998 |
| Financial Services–15.63% | | | | | | |
| Abbey National Treasury Services | | | | | | |
| 0.20% 3/8/10 | | | 250,000 | | | 250,000 |
| ≠Allianz Finance 0.16% 2/4/10 | | | 500,000 | | | 499,924 |
| ≠Calyon North America 0.16% 2/11/10 | | | 250,000 | | | 249,954 |
| ≠CME Group 0.19% 2/3/10 | | | 400,000 | | | 399,930 |
| ≠General Electric Capital Services | | | | | | |
| 0.15% 1/19/10 | | | 500,000 | | | 499,963 |
| ≠Rabobank USA Financial 0.18% 1/7/10 | | | 645,000 | | | 644,981 |
| Societe Generale North America 0.02% 1/4/10 | | | 250,000 | | | 250,000 |
| | | | | | | 2,794,752 |
| Industrial–11.69% | | | | | | |
| ≠Danaher 0.15% 1/4/10 | | | 250,000 | | | 249,997 |
| ≠Koch Resources | | | | | | |
| 0.16% 1/11/10 | | | 300,000 | | | 299,987 |
| 0.18% 1/22/10 | | | 250,000 | | | 249,974 |
| ≠Medtronic 0.13% 1/28/10 | | | 250,000 | | | 249,976 |
| ≠Northern Illinois Gas 0.05% 1/4/10 | | | 540,000 | | | 539,997 |
| ≠Total Capital | | | | | | |
| 0.19% 2/17/10 | | | 250,000 | | | 249,938 |
| 0.19% 3/4/10 | | | 250,000 | | | 249,918 |
| | | | | | | 2,089,787 |
| Mortgage Bankers & Brokers–18.53% | | | | | | |
| ≠Australia & New Zealand Banking Group | | | | | | |
| 0.11% 1/8/10 | | | 400,000 | | | 399,991 |
| ≠Danske | | | | | | |
| 0.15% 1/22/10 | | | 250,000 | | | 249,978 |
| 0.155% 1/8/10 | | | 250,000 | | | 249,992 |
| ≠Goldman Sachs Group 0.12% 1/22/10 | | | 250,000 | | | 249,983 |
| ≠ING US Funding 0.401% 1/6/10 | | | 250,000 | | | 249,986 |
| ≠JPMorgan Chase Bank | | | | | | |
| 0.20% 1/28/10 | | | 149,000 | | | 148,978 |
| 0.25% 3/15/10 | | | 365,000 | | | 364,815 |
| ≠Lloyds TSB Bank 0.15% 1/13/10 | | | 250,000 | | | 249,988 |
| ≠National Australian Funding 0.195% 1/25/10 | | | 400,000 | | | 399,948 |
| ≠Nordea North America 0.15% 1/15/10 | | | 250,000 | | | 249,985 |
| ≠Westpac Securities New Zealand | | | | | | |
| 0.15% 1/15/10 | | | 250,000 | | | 249,985 |
| 0.23% 1/25/10 | | | 250,000 | | | 249,962 |
| | | | | | | 3,313,591 |
| Pharmaceuticals–1.40% | | | | | | |
| Pfizer 0.512% 2/1/10 | | | 250,000 | | | 249,890 |
| | | | | | | 249,890 |
| Total Commercial Paper | | | | | | |
| (cost $12,347,018) | | | | | | 12,347,018 |
| |
| CORPORATE BONDS–14.03% | | | | | | |
| Banking–9.81% | | | | | | |
| •Barclays Bank New York 1.434% 1/13/10 | | | 250,000 | | | 249,996 |
| Citigroup 4.625% 8/3/10 | | | 250,000 | | | 254,814 |
| •Goldman Sachs Group 0.457% 3/2/10 | | | 250,000 | | | 249,314 |
| •Morgan Stanley 0.564% 1/15/10 | | | 250,000 | | | 249,631 |
| PNC Funding 4.50% 3/10/10 | | | 250,000 | | | 249,942 |
| Wells Fargo | | | | | | |
| • | 0.711% 1/29/10 | | | 250,000 | | | 250,000 |
| 4.20% 1/15/10 | | | 250,000 | | | 250,175 |
| | | | | | | 1,753,872 |
| Consumer Products–2.82% | | | | | | |
| •Proctor & Gamble International Funding | | | | | | |
| 0.525% 2/8/10 | | | 250,000 | | | 250,000 |
| Wal-Mart Stores 4.125% 7/1/10 | | | 250,000 | | | 254,585 |
| | | | | | | 504,585 |
| Financial Services–1.40% | | | | | | |
| Credit Suisse USA 4.125% 1/15/10 | | | 250,000 | | | 250,094 |
| | | | | | | 250,094 |
| Total Corporate Bonds | | | | | | |
| (cost $2,508,551) | | | | | | 2,508,551 |
Cash Reserve Series-5
Delaware VIP® Cash Reserve Series
Statement of Net Assets (continued)
| | | Principal | | | |
| | Amount | | Value |
| MUNICIPAL BONDS–5.88% | | | | | |
| California State Revenue Anticipation Notes | | | | | |
| Subordinate Series A-1 3.00% 5/25/10 | $ | 250,000 | | $ | 251,711 |
| District of Columbia Series C 0.20% 6/1/26 | | 270,000 | | | 270,000 |
| •Metropolitan Government Nashville & Davidson | | | | | |
| County, Tennessee Health & Education | | | | | |
| | Facilities Board Revenue Refunding | | | | | |
| (Vanderbilt University) | | | | | |
| Series A 0.17% 7/1/18 | | 280,000 | | | 280,000 |
| •Washington State Health Care Facilities | | | | | |
| Authority Revenue (Catholic Health Care) | | | | | |
| | Series A-4 0.17% 12/1/36 | | 250,000 | | | 250,000 |
| Total Municipal Bonds | | | | | |
| (cost $1,051,711) | | | | | 1,051,711 |
| TOTAL VALUE OF SECURITIES–100.16% (cost $17,907,217)© | | 17,907,217 | |
| LIABILITIES NET OF RECEIVABLES AND OTHER ASSETS–(0.16%) | | (27,983 | ) |
| NET ASSETS APPLICABLE TO 17,878,363 SHARES OUTSTANDING–100.00% | $ | 17,879,234 | |
NET ASSET VALUE–DELAWARE VIP CASH RESERVE SERIES STANDARD
CLASS ($17,878,190 / 17,877,320 Shares) | | | $1.00 | |
| NET ASSET VALUE–DELAWARE VIP CASH RESERVE SERIES SERVICE CLASS ($1,044 / 1,043 Shares) | | | $1.00 | |
| COMPONENTS OF NET ASSETS AT DECEMBER 31, 2009: | | | |
| Shares of beneficial interest (unlimited authorization–no par) | $ | 17,931,442 | |
| Undistributed net investment income | | 268 | |
| Accumulated net realized loss on investments | | (52,476 | ) |
| Total net assets | $ | 17,879,234 | |
____________________ | | | |
| ≠ | The rate shown is the effective yield at the time of purchase. |
| • | Variable rate security. The rate shown is the rate as of December 31, 2009. |
| © | Also the cost for federal income tax purposes. |
See accompanying notes
Cash Reserve Series-6
Delaware VIP® Trust —
Delaware VIP Cash Reserve Series
Statement of Operations
Year Ended December 31, 2009
| INVESTMENT INCOME: | | | |
| Interest | $ | 126,559 | |
| |
| EXPENSES: | | | |
| Management fees | | 78,791 | |
| Audit and tax | | 11,617 | |
| Dividend disbursing and transfer agent fees and expenses | | 9,899 | |
| Reports and statements to shareholders | | 7,299 | |
| Accounting and administration expenses | | 7,004 | |
| Treasury insurance expense | | 5,169 | |
| Legal fees | | 2,901 | |
| Custodian fees | | 2,780 | |
| Pricing fees | | 2,549 | |
| Trustees’ fees | | 1,186 | |
| Insurance fees | | 561 | |
| Consulting fees | | 270 | |
| Registration fees | | 253 | |
| Dues and services | | 93 | |
| Trustees’ expenses | | 85 | |
| Distribution expenses – Service Class | | 3 | |
| | | 130,460 | |
| Less fees waived | | (48,624 | ) |
| Less waived distribution expenses Service Class | | (3 | ) |
| Total operating expenses | | 81,833 | |
| |
| NET INVESTMENT INCOME | | 44,726 | |
| |
| NET REALIZED GAIN ON INVESTMENTS | | 75 | |
| |
| NET INCREASE IN NET ASSETS RESULTING | | | |
| FROM OPERATIONS | $ | 44,801 | |
See accompanying notes
Delaware VIP Trust —
Delaware VIP Cash Reserve Series
Statements of Changes in Net Assets
| Year Ended |
| 12/31/09 | | 12/31/08 |
| INCREASE IN NET ASSETS FROM | | | | | | | |
| OPERATIONS: | | | | | | | |
| Net investment income | $ | 44,726 | | | $ | 401,153 | |
| Net realized gain on investments | | 75 | | | | 313 | |
| Net increase in net assets resulting | | | | | | | |
| from operations | | 44,801 | | | | 401,466 | |
| |
| DIVIDENDS AND DISTRIBUTIONS | | | | | | | |
| TO SHAREHOLDERS FROM: | | | | | | | |
| Net investment income: | | | | | | | |
| Standard Class | | (44,774 | ) | | | (400,796 | ) |
| Service Class | | (3 | ) | | | (38 | ) |
| | | (44,777 | ) | | | (400,834 | ) |
| |
| CAPITAL SHARE TRANSACTIONS | | | | | | | |
| (at $1.00 per share): | | | | | | | |
| Proceeds from shares sold: | | | | | | | |
| Standard Class | | 6,828,473 | | | | 7,310,117 | |
| Net asset value of shares issued upon | | | | | | | |
| reinvestment of dividends and distributions: | | | | | | | |
| Standard Class | | 47,641 | | | | 427,820 | |
| Service Class | | 4 | | | | 63 | |
| | | 6,876,118 | | | | 7,738,000 | |
| Cost of shares repurchased: | | | | | | | |
| Standard Class | | (6,359,904 | ) | | | (10,802,266 | ) |
| Service Class | | – | | | | (5,159 | ) |
| | | (6,359,904 | ) | | | (10,807,425 | ) |
| Increase (Decrease) in net assets derived from | | | | | | | |
| capital share transactions | | 516,214 | | | | (3,069,425 | ) |
| |
| NET INCREASE (DECREASE) | | | | | | | |
| IN NET ASSETS | | 516,238 | | | | (3,068,793 | ) |
| |
| NET ASSETS: | | | | | | | |
| Beginning of year | | 17,362,996 | | | | 20,431,789 | |
| End of year (including undistributed | | | | | | | |
| net investment income of $268 | | | | | | | |
| and $319, respectively) | $ | 17,879,234 | | | $ | 17,362,996 | |
| |
See accompanying notes
Cash Reserve Series-7
Delaware VIP® Trust — Delaware VIP Cash Reserve Series
Financial Highlights
Selected data for each share of the Series outstanding throughout each period were as follows:
| | Delaware VIP Cash Reserve Series Standard Class | |
| | Year Ended | |
| | 12/31/09 | | 12/31/08 | | 12/31/07 | | 12/31/06 | | 12/31/05 | |
| Net asset value, beginning of period | | $1.000 | | $1.000 | | $1.000 | | $1.000 | | $1.000 | |
| |
| Income from investment operations: | | | | | | | | | | | |
| Net investment income | | 0.003 | | 0.021 | | 0.047 | | 0.044 | | 0.027 | |
| Total from investment operations | | 0.003 | | 0.021 | | 0.047 | | 0.044 | | 0.027 | |
| |
| Less dividends and distributions from: | | | | | | | | | | | |
| Net investment income | | (0.003 | ) | (0.021 | ) | (0.047 | ) | (0.044 | ) | (0.027 | ) |
| Total dividends and distributions | | (0.003 | ) | (0.021 | ) | (0.047 | ) | (0.044 | ) | (0.027 | ) |
| |
| Net asset value, end of period | | $1.000 | | $1.000 | | $1.000 | | $1.000 | | $1.000 | |
| |
| Total return1 | | 0.26% | | 2.12% | | 4.76% | | 4.49% | | 2.69% | |
| |
| Ratios and supplemental data: | | | | | | | | | | | |
| Net assets, end of period (000 omitted) | | $17,878 | | $17,362 | | $20,426 | | $20,971 | | $23,430 | |
| Ratio of expenses to average net assets | | 0.47% | | 0.72% | | 0.64% | | 0.67% | | 0.61% | |
| Ratio of expenses to average net assets | | | | | | | | | | | |
| prior to fees waived and expense paid indirectly | | 0.75% | | 0.72% | | 0.64% | | 0.67% | | 0.61% | |
| Ratio of net investment income to average net assets | | 0.26% | | 2.14% | | 4.66% | | 4.39% | | 2.62% | |
| Ratio of net investment income (loss) to average net assets | | | | | | | | | | | |
| prior to fees waived and expense paid indirectly | | (0.02% | ) | 2.14% | | 4.66% | | 4.39% | | 2.62% | |
____________________
| 1Total investment return is based on the change in net asset value of a share during the period and assumes reinvestment of dividends and distributions at net asset value. Total investment return during some of the periods shown reflects a waiver by the manager. Performance would have been lower had the waiver not been in effect. |
See accompanying notes
Cash Reserve Series-8
Delaware VIP® Cash Reserve Series
Financial Highlights (continued)
Selected data for each share of the Series outstanding throughout each period were as follows:
| | Delaware VIP Cash Reserve Series Service Class | |
| | Year Ended | |
| | 12/31/09 | | 12/31/08 | | 12/31/07 | | 12/31/06 | | 12/31/05 | |
| Net asset value, beginning of period | | $1.000 | | $1.000 | | $1.000 | | $1.000 | | $1.000 | |
| |
| Income from investment operations: | | | | | | | | | | | |
| Net investment income | | 0.003 | | 0.019 | | 0.044 | | 0.041 | | 0.024 | |
| Total from investment operations | | 0.003 | | 0.019 | | 0.044 | | 0.041 | | 0.024 | |
| |
| Less dividends and distributions from: | | | | | | | | | | | |
| Net investment income | | (0.003 | ) | (0.019 | ) | (0.044 | ) | (0.041 | ) | (0.024 | ) |
| Total dividends and distributions | | (0.003 | ) | (0.019 | ) | (0.044 | ) | (0.041 | ) | (0.024 | ) |
| |
| Net asset value, end of period | | $1.000 | | $1.000 | | $1.000 | | $1.000 | | $1.000 | |
| |
| Total return1 | | 0.25% | | 1.89% | | 4.50% | | 4.23% | | 2.43% | |
| |
| Ratios and supplemental data: | | | | | | | | | | | |
| Net assets, end of period (000 omitted) | | $1 | | $1 | | $6 | | $6 | | $6 | |
| Ratio of expenses to average net assets | | 0.50% | | 0.97% | | 0.89% | | 0.92% | | 0.86% | |
| Ratio of expenses to average net assets | | | | | | | | | | | |
| prior to fees waived and expense paid indirectly | | 1.05% | | 1.02% | | 0.94% | | 0.97% | | 0.91% | |
| Ratio of net investment income to average net assets | | 0.23% | | 1.89% | | 4.41% | | 4.14% | | 2.37% | |
| Ratio of net investment income (loss) to average net assets | | | | | | | | | | | |
| prior to fees waived and expense paid indirectly | | (0.32% | ) | 1.84% | | 4.36% | | 4.09% | | 2.32% | |
____________________
| 1Total investment return is based on the change in net asset value of a share during the period and assumes reinvestment of dividends and distributions at net asset value. Total investment return during some of the periods shown reflects waivers by the manager and/or distributor. Performance would have been lower had the waivers not been in effect. |
See accompanying notes
Cash Reserve Series-9
Delaware VIP® Trust — Delaware VIP Cash Reserve Series
Notes to Financial Statements
December 31, 2009
Delaware VIP Trust (Trust) is organized as a Delaware statutory trust and offers 12 series: Delaware VIP Cash Reserve Series, Delaware VIP Diversified Income Series, Delaware VIP Emerging Markets Series, Delaware VIP Growth Opportunities Series, Delaware VIP High Yield Series, Delaware VIP International Value Equity Series, Delaware VIP Limited-Term Diversified Income Series (formerly, Delaware VIP Capital Reserves Series), Delaware VIP REIT Series, Delaware VIP Small Cap Value Series, Delaware VIP Trend Series, Delaware VIP U.S. Growth Series and Delaware VIP Value Series. These financial statements and the related notes pertain to Delaware VIP Cash Reserve Series (Series). The Trust is an open-end investment company. The Series is considered diversified under the Investment Company Act of 1940, as amended, and offers Standard Class and Service Class shares. The Standard Class shares do not carry a 12b-1 fee and the Service Class shares carry a 12b-1 fee. The shares of the Series are sold only to separate accounts of life insurance companies.
The investment objective of the Series is to seek to provide maximum current income, while preserving principal and maintaining liquidity, by investing its assets in a diversified portfolio of money market securities and managing the portfolio to maintain a constant net asset value of $1 per share.
1. Significant Accounting Policies
The following accounting policies are in accordance with U.S. generally accepted accounting principles (U.S. GAAP) and are consistently followed by the Series.
Security Valuation—Securities are valued at amortized cost, which approximates market value.
Federal Income Taxes—No provision for federal income taxes has been made as the Series intends to continue to qualify for federal income tax purposes as a regulated investment company under Subchapter M of the Internal Revenue Code of 1986, as amended, and make the requisite distributions to shareholders. The Series evaluates tax positions taken or expected to be taken in the course of preparing the Series’ tax returns to determine whether the tax positions are “more-likely-than-not” of being sustained by the applicable tax authority. Tax positions not deemed to meet the more-likely-than-not threshold are recorded as a tax benefit or expense in the current year. Management has analyzed the Series’ tax positions taken on federal income tax returns for all open tax years (tax years ended December 31, 2006 – December 31, 2009), and has concluded that no provision for federal income tax is required in the Series’ financial statements.
Class Accounting—Investment income and common expenses are allocated to the classes of the Series on the basis of “settled shares” of each class in relation to the net assets of the Series. Realized and unrealized gain (loss) on investments is allocated to the classes of the Series on the basis of daily net assets of each class. Distribution expenses relating to a specific class are charged directly to that class.
Repurchase Agreements—The Series may invest in a pooled cash account along with other members of the Delaware Investments® Family of Funds pursuant to an exemptive order issued by the Securities and Exchange Commission. The aggregate daily balance of the pooled cash account is invested in repurchase agreements secured by obligations of the U.S. government. The respective collateral is held by the Series’ custodian bank until the maturity of the respective repurchase agreements. Each repurchase agreement is at least 102% collateralized. However, in the event of default or bankruptcy by the counterparty to the agreement, realization of the collateral may be subject to legal proceedings. At December 31, 2009, the Series held no investments in repurchase agreements.
Use of Estimates—The preparation of financial statements in conformity with U.S. GAAP requires management to make estimates and assumptions that affect the reported amounts of assets and liabilities at the date of the financial statements and the reported amounts of revenues and expenses during the reporting period. Actual results could differ from those estimates.
Other—Expenses directly attributable to the Series are charged directly to the Series. Other expenses common to various funds within the Delaware Investments Family of Funds are generally allocated amongst such funds on the basis of average net assets. Management fees and some other expenses are paid monthly. Security transactions are recorded on the date the securities are purchased or sold (trade date) for financial reporting purposes. Costs used in calculating realized gains and losses on the sale of investment securities are those of the specific securities sold. Interest income is recorded on the accrual basis. Discounts and premiums are amortized to interest income over the lives of the respective securities. The Series declares dividends daily from net investment income and pays such dividends monthly and declares and pays distributions from net realized gain on investments, if any, following the close of the fiscal year.
The Series may receive earnings credits from its custodian when positive cash balances are maintained, which are used to offset custody fees. There were no earnings credits for the year ended December 31, 2009.
On July 1, 2009, the Financial Accounting Standards Board (FASB) issued the FASB Accounting Standards Codification (Codification). The Codification became the single source of authoritative nongovernmental U.S. GAAP, superseding existing literature of the FASB, American Institute of Certified Public Accountants, Emerging Issues Task Force and other sources. The Codification is effective for interim and annual periods ending after September 15, 2009. The Series adopted the Codification for the year ended December 31, 2009. There was no impact to financial statements as the Codification requirements are disclosure-only in nature.
Management has evaluated whether any events or transactions occurred subsequent to December 31, 2009 through February 17, 2010, the date of issuance of the Series’ financial statements, and determined that there were no material events or transactions that would require recognition or disclosure in the Series’ financial statements.
2. Investment Management, Administration Agreements and Other Transactions with Affiliates
In accordance with the terms of its investment management agreement, the Series pays Delaware Management Company (DMC), a series of Delaware Management Business Trust and the investment manager, an annual fee which is calculated daily at the rate of 0.45% on the first $500 million of average daily net assets of the Series, 0.40% on the next $500 million, 0.35% on the next $1.5 billion, and 0.30% on average daily net assets in excess of $2.5 billion.
Cash Reserve Series-10
Delaware VIP® Cash Reserve Series
Notes to Financial Statements (continued)
2. Investment Management, Administration Agreements and Other Transactions with Affiliates (continued)
Effective February 19, 2009, DMC has voluntarily agreed to waive that portion, if any, of its management fee and/or pay/reimburse the Series to the extent necessary to ensure that total annual operating expenses (excluding any 12b-1 plan expenses, taxes, interest, inverse floater program expenses, brokerage fees, certain insurance costs, and nonroutine expenses or costs including, but not limited to, those relating to reorganizations, litigation, conducting shareholder meetings, and liquidations (collectively, “nonroutine expenses”)), do not exceed 0.39% of average daily net assets of the Series until such time as the voluntary expense cap is discontinued. For purposes of this waiver and reimbursement, nonroutine expenses may also include such additional costs and expenses, as may be agreed upon from time to time by the Series’ Board of Trustees (Board) and DMC. This expense waiver and reimbursement applies only to expenses paid directly by the Series, and may be discontinued at any time because it is voluntary.
Delaware Service Company, Inc. (DSC), an affiliate of DMC, provides fund accounting and financial administration oversight services to the Series. For these services, the Series pays DSC fees based on the aggregate daily net assets of the Delaware Investments Family of Funds at the following annual rate: 0.0050% of the first $30 billion; 0.0045% of the next $10 billion; 0.0040% of the next $10 billion; and 0.0025% of aggregate average daily net assets in excess of $50 billion. The fees payable to DSC under the service agreement described above are allocated among all funds in the Delaware Investments Family of Funds on a relative net asset value basis. For the year ended December 31, 2009, the Series was charged $875 for these services.
DSC also provides dividend disbursing and transfer agency services. The Series pays DSC a monthly fee based on the number of shareholder accounts for dividend disbursing and transfer agent services.
Pursuant to a distribution agreement and distribution plan, the Series pays Delaware Distributors, L.P. (DDLP), the distributor and an affiliate of DMC, an annual distribution and service fee not to exceed 0.30% of the average daily net assets of the Service Class shares. DDLP has contracted to waive distribution and service fees through April 30, 2010 in order to prevent distribution and service fees of the Service Class shares from exceeding 0.25% of average daily net assets. Effective February 19, 2009, DDLP has voluntarily agreed to waive distribution and service fees in order to prevent distribution and service fees of the Service Class shares from exceeding 0.00% of average daily net assets. This voluntary expense waiver may be discontinued at any time because it is voluntary. Standard Class shares pay no distribution and service expenses.
At December 31, 2009, the Series had liabilities payable to affiliates as follows:
| | | | Dividend Disbursing, | | | | Other |
| | Investment | | Transfer Agent and Fund | | | | Expenses |
| | Management | | Accounting Oversight | | Distribution | | Payable |
| | Fee Payable to | | Fees and Other Expenses | | Fee Payable | | to DMC |
| | DMC | | Payable to DSC | | to DDLP | | and Affiliates* |
| | $4,848 | | $193 | | $— | | $783 |
____________________
*DMC, as part of its administrative services, pays operating expenses on behalf of the Series and is reimbursed on a periodic basis. Such expenses include items such as printing of shareholder reports, fees for audit, legal and tax services, custodian fees and trustees’ fees.
As provided in the investment management agreement, the Series bears the cost of certain legal and tax services, including internal legal and tax services provided to the Series by DMC and/or its affiliates’ employees. For the year ended December 31, 2009, the Series was charged $1,467 for internal legal and tax services provided by DMC and/or its affiliates’ employees.
Trustees’ fees include expenses accrued by the Series for each Trustee’s retainer and meeting fees. Certain officers of DMC, DSC and DDLP are officers and/or Trustees of the Trust. These officers and Trustees are paid no compensation by the Series.
3. Investments
U.S. GAAP defines fair value as the price that the Series would receive to sell an asset or pay to transfer a liability in an orderly transaction between market participants at the measurement date under current market conditions. A framework for measuring fair value and a three level hierarchy for fair value measurements has been established based upon the transparency of inputs to the valuation of an asset or liability. Inputs may be observable or unobservable and refer broadly to the assumptions that market participants would use in pricing the asset or liability. Observable inputs reflect the assumptions market participants would use in pricing the asset or liability based on market data obtained from sources independent of the reporting entity. Unobservable inputs reflect the reporting entity’s own assumptions about the assumptions that market participants would use in pricing the asset or liability developed based on the best information available under the circumstances. The Series’ investment in its entirety is assigned a level based upon the observability of the inputs which are significant to the overall valuation. The three-tier hierarchy of inputs is summarized below.
Level 1 – inputs are quoted prices in active markets
Level 2 – inputs are observable, directly or indirectly
Level 3 – inputs are unobservable and reflect assumptions on the part of the reporting entity
Cash Reserve Series-11
Delaware VIP® Cash Reserve Series
Notes to Financial Statements (continued)
3. Investments (continued)
The following table summarizes the valuation of the Series’ investments by the fair value hierarchy levels as of December 31, 2009:
| Level 2 |
| Agency, Asset-Backed and Mortgage-Backed Securities | $ | 749,937 |
| Corporate Debt | | 2,508,551 |
| Municipal Bonds | | 1,051,711 |
| Short-Term | | 13,597,018 |
| Total | $ | 17,907,217 |
| |
There were no Level 3 securities at the beginning or end of the year.
In January 2010, the Financial Accounting Standards Board issued an Accounting Standards Update, Improving Disclosures about Fair Value Measurements, which introduces new disclosure requirements and clarifies certain existing disclosure requirements around fair value measurements currently presented above. The new disclosures and clarifications of existing disclosures are generally effective for the Series’ year ending December 31, 2010 and interim periods therein. Management is evaluating the impact of this update on its current disclosures.
4. Dividend and Distribution Information
Income and long-term capital gain distributions are determined in accordance with federal income tax regulations, which may differ from U.S. GAAP. Additionally, distributions from net short-term gains on sales of investment securities are treated as ordinary income for federal income tax purposes. The tax character of dividends and distributions paid during the years ended December 31, 2009 and 2008 was as follows:
| | Year | | Year |
| | Ended | | Ended |
| | 12/31/09 | | 12/31/08 |
| Ordinary income | | $44,777 | | $400,834 |
5. Components of Net Assets on a Tax Basis
As of December 31, 2009, the components of net assets on a tax basis were as follows:
| Shares of beneficial interest | $ | 17,931,442 | |
| Undistributed ordinary income | | 268 | |
| Capital loss carryforwards | | (52,476 | ) |
| Net assets | $ | 17,879,234 | |
| |
For federal income tax purposes, capital loss carryforwards may be carried forward and applied against future capital gains. $75 was utilized in 2009. Capital loss carryforwards of $52,476 remaining at December 31, 2009 will expire in 2010.
6. Line of Credit
The Series, along with certain other funds in the Delaware Investments® Family of Funds (Participants), participates in a $35,000,000 revolving line of credit with The Bank of New York Mellon (BNY Mellon) to be used for temporary or emergency purposes as an additional source of liquidity to fund redemptions of investor shares. Under the agreement, Participants are charged an annual commitment fee, which is allocated across the Participants on the basis of each Participant’s allocation of the entire facility. The Participants may borrow up to a maximum of one third of their net assets under the agreement. The agreement expires on November 16, 2010. The Series had no amounts outstanding as of December 31, 2009, or at any time during the year then ended.
7. Credit and Market Risk
An investment in the Series is not insured or guaranteed by the Federal Deposit Insurance Corporation or any other government agency. Although the Series seeks to preserve the value of your investment at $1.00 per share, it is possible to lose money by investing in the Series.
The Series may invest up to 10% of its net assets in illiquid securities, which may include securities with contractual restrictions on resale, securities exempt from registration under Rule 144A of the Securities Act of 1933, as amended (Act), and other securities which may not be readily marketable. The relative illiquidity of these securities may impair the Series from disposing of them in a timely manner and at a fair price when it is necessary or desirable to do so. While maintaining oversight, the Series’ Board of Trustees has delegated to DMC the day-to-day functions of determining whether individual securities are liquid for purposes of the Series’ limitation on investments in illiquid assets. The Series may also invest in securities exempt from registration under Section 4(2) of the Act, which exempts from registration transactions by an issuer not involving any public offering. Securities eligible for resale pursuant to Rule 144A, which are determined to be liquid, are not subject to the Series’ 10% limit on investments in illiquid securities. As of December 31, 2009, there were no Section 4(2) and/or Rule 144A securities and no securities have been determined to be illiquid under the Series’ Liquidity Procedures.
Cash Reserve Series-12
Delaware VIP® Cash Reserve Series
Notes to Financial Statements (continued)
8. Guaranty Program
The Series participated in the U.S. Treasury’s Temporary Guaranty Program for Money Market Funds (Program) which expired on September 18, 2009.
The Program was designed to guarantee the share price of any publicly offered eligible money market mutual fund — whether retail or institutional — that applied for and paid a fee to participate in the Program.
The Program provided coverage to shareholders of record for amounts that they held in participating money market funds as of the close of business on September 19, 2008. The coverage for these shareholders under the Program was reduced by amounts redeemed from their accounts after September 19, 2008 that were not later reinvested. Investments of shareholders in a participating money market fund who were not shareholders of record as of September 19, 2008 and amounts initially invested after September 19, 2008 were not covered by the Program. If a shareholder who owned shares covered by the Program closed his or her account or transfers the shares to a new account, the shares were not covered by the Program.
9. Contractual Obligations
The Series enters into contracts in the normal course of business that contain a variety of indemnifications. The Series’ maximum exposure under these arrangements is unknown. However, the Series has not had prior claims or losses pursuant to these contracts. Management has reviewed the Series’ existing contracts and expects the risk of loss to be remote.
10. Sale of Delaware Investments to Macquarie Group
On August 18, 2009, Lincoln National Corporation (parent company of Delaware Investments) and Macquarie Group (Macquarie) entered into an agreement pursuant to which Delaware Investments, including DMC, DDLP and DSC, would be acquired by Macquarie, an Australia-based global provider of banking, financial, advisory, investment and funds management services (Transaction). The Transaction was completed on January 4, 2010. DMC, DDLP and DSC are now wholly-owned subsidiaries of Macquarie.
The Transaction resulted in a change of control of DMC which, in turn, caused the termination of the investment advisory agreement between DMC and the Series. On January 4, 2010, the new investment advisory agreement between DMC and the Series that was approved by the shareholders became effective.
11. Subsequent Event
Effective January 19, 2010, DMC has voluntarily agreed to change the expense limitation to 0.29% of average daily net assets of the Series.
12. Tax Information (Unaudited)
For the fiscal year ended December 31, 2009, the Series designates distributions paid during the year as follows:
| | (A) | | (B) | | |
| | Long-Term | | Ordinary | | |
| | Capital Gain | | Income | | Total |
| | Distributions | | Distributions | | Distributions |
| | (Tax Basis) | | (Tax Basis) | | (Tax Basis) |
| | –% | | 100% | | 100% |
____________________
(A) and (B) are based on a percentage of the Series’ total distributions.
Cash Reserve Series-13
Delaware VIP® Trust — Delaware VIP Cash Reserve Series
Report of Independent Registered Public Accounting Firm
To the Shareholders and Board of Trustees
Delaware VIP Trust–Delaware VIP Cash Reserve Series
We have audited the accompanying statement of net assets of the Delaware VIP Cash Reserve Series (one of the series constituting Delaware VIP Trust) (the “Series”) as of December 31, 2009, and the related statement of operations for the year then ended, the statements of changes in net assets for each of the two years in the period then ended, and the financial highlights for each of the five years in the period then ended. These financial statements and financial highlights are the responsibility of the Series’ management. Our responsibility is to express an opinion on these financial statements and financial highlights based on our audits.
We conducted our audits in accordance with the standards of the Public Company Accounting Oversight Board (United States). Those standards require that we plan and perform the audit to obtain reasonable assurance about whether the financial statements and financial highlights are free of material misstatement. We were not engaged to perform an audit of the Series’ internal control over financial reporting. Our audits included consideration of internal control over financial reporting as a basis for designing audit procedures that are appropriate in the circumstances, but not for the purpose of expressing an opinion on the effectiveness of the Series’ internal control over financial reporting. Accordingly, we express no such opinion. An audit also includes examining, on a test basis, evidence supporting the amounts and disclosures in the financial statements and financial highlights, assessing the accounting principles used and significant estimates made by management, and evaluating the overall financial statement presentation. Our procedures included confirmation of securities owned as of December 31, 2009, by correspondence with the custodian. We believe that our audits provide a reasonable basis for our opinion.
In our opinion, the financial statements and financial highlights referred to above present fairly, in all material respects, the financial position of the Delaware VIP Cash Reserve Series of Delaware VIP Trust at December 31, 2009, the results of its operations for the year then ended, the changes in its net assets for each of the two years in the period then ended, and its financial highlights for each of the five years in the period then ended, in conformity with U.S. generally accepted accounting principles.
Philadelphia, Pennsylvania
February 17, 2010
The Series files its complete schedule of portfolio holdings with the Securities and Exchange Commission (Commission) for the first and third quarters of each fiscal year on Form N-Q. The Series’ Forms N-Q, as well as a description of the policies and procedures that the Series uses to determine how to vote proxies (if any) relating to portfolio securities is available without charge (i) upon request, by calling 800 523-1918; and (ii) on the Commission’s website at http://www.sec.gov. In addition, a description of the policies and procedures that the Series uses to determine how to vote proxies (if any) relating to portfolio securities is available without charge on the Delaware Investments® Funds’ Web site at http://www.delawareinvestments.com. The Series’ Forms N-Q may be reviewed and copied at the Commission’s Public Reference Room in Washington, DC; information on the operation of the Public Reference Room may be obtained by calling 800 SEC-0330.
Information (if any) regarding how the Series voted proxies relating to portfolio securities during the most recently disclosed 12-month period ended June 30 is available without charge (i) through the Delaware Investments Funds’ Web site at http://www.delawareinvestments.com; and (ii) on the Commission’s website at http://www.sec.gov. |
Cash Reserve Series-14
Delaware VIP® Trust — Delaware VIP Cash Reserve Series
Other Series Information
Board Consideration of New Investment Advisory Agreement
At a meeting held on September 3, 2009 (the “Meeting”), the Board of Trustees of the Delaware Investments Family of Funds (the “Board”), including the independent Trustees, unanimously approved a new investment advisory agreement between each registrant on behalf of each series (each, a “Fund” and together, the “Funds”) and Delaware Management Company (“DMC”) in connection with the sale of Delaware Investments’ advisory business to Macquarie Bank Limited (the “Macquarie Group”) (the “Transaction”). In making its decision, the Board considered information furnished specifically in connection with the approval of the new investment advisory agreements with DMC (the “New Investment Advisory Agreements”) which included extensive materials about the Transaction and matters related to the proposed approvals. To assist the Board in considering the New Investment Advisory Agreements, Macquarie Group provided materials and information about Macquarie Group, including detailed written responses to the questions posed by the independent Trustees. DMC also provided materials and information about the Transaction, including detailed written responses to the questions posed by the independent Trustees.
At the Meeting, the Trustees discussed the Transaction with DMC management and with key Macquarie Group representatives. The Meeting included discussions of the strategic rationale for the Transaction and Macquarie Group’s general plans and intentions regarding the Funds and DMC. The Board members also inquired about the plans for, and anticipated roles and responsibilities of, key employees and officers of Delaware Management Holdings Inc. and DMC in connection with the Transaction.
In connection with the Trustees’ review of the New Investment Advisory Agreements for the Funds, DMC and/or Macquarie Group emphasized that:
- They expected that there would be no adverse changes as a result of the Transaction, in the nature, quality, or extent of services currently provided to the Funds and their shareholders, including investment management, distribution, or other shareholder services.
- No material changes in personnel or operations were contemplated in the operation of DMC under Macquarie Group as a result of the Transaction and no material changes were currently contemplated in connection with third party service providers to the Funds.
- Macquarie Group had no intention to cause DMC to alter the voluntary expense waivers and reimbursements currently in effect for the Funds.
- Under the agreement between Macquarie Group and Lincoln National Corporation (“LNC”) (the “Transaction Agreement”), Macquarie Group has agreed to conduct, and to cause its affiliates to conduct, their respective businesses in compliance with the conditions of Section 15(f) of the Investment Company Act of 1940 (the “1940 Act”) with respect to the Funds, to the extent within its control, including maintaining Board composition of at least 75% of the Board members qualifying as independent Trustees and not imposing any “unfair burden” on the Funds for at least two years from the closing of the Transaction (the “Closing”).
In addition to the information provided by DMC and Macquarie Group as described above, the Trustees also considered all other factors they believed to be relevant to evaluating the New Investment Advisory Agreements, including the specific matters discussed below. In their deliberations, the Trustees did not identify any particular information that was controlling, and different Trustees may have attributed different weights to the various factors. However, for each Fund, the Trustees determined that the overall arrangements between the Fund and DMC, as provided in the respective New Investment Advisory Agreement, including the proposed advisory fee and the related administration arrangements between the Fund and DMC, were fair and reasonable in light of the services to be performed, expenses incurred, and such other matters as the Trustees considered relevant. Factors evaluated included:
- The potential for expanding distribution of Fund shares through access to Macquarie Group’s existing distribution channels;
- Delaware Investments’ acquisition of an exclusive wholesaling sales force from a subsidiary of LNC;
- The reputation, financial strength, and resources of Macquarie Group as well as its historic and ongoing commitment to the asset management business in Australia as well as other parts of the world;
- The terms and conditions of the New Investment Advisory Agreements, including that each Fund’s total contractual fee rate under the New Investment Advisory Agreement will remain the same;
- The Board’s full annual review (or initial approval) of the current investment advisory agreements at their in-person meeting in May 2009 as required by the 1940 Act and its determination that (i) DMC had the capabilities, resources, and personnel necessary to provide the satisfactory advisory and administrative services currently provided to each Fund and (ii) the advisory and/or management fees paid by each Fund, taking into account any applicable fee waivers and breakpoints, represented reasonable compensation to DMC in light of the services provided, the costs to DMC of providing those services, economies of scale, and the fees and other expenses paid by similar funds and such other matters that the Board considered relevant in the exercise of its reasonable judgment;
- The portfolio management teams for the Funds are not currently expected to change as a result of the Transaction;
- LNC and Macquarie Group were expected to execute a reimbursement agreement pursuant to which LNC and Macquarie Group would agree to pay (or reimburse) all reasonable out-of-pocket costs and expenses of the Funds in connection with the Board’s consideration of the Transaction, the New Investment Advisory Agreements and related agreements, and all costs related to the proxy solicitation (the “Expense Agreement”);
Cash Reserve Series-15
Delaware VIP® Cash Reserve Series
Other Series Information (continued)
- The likelihood that Macquarie Group would invest additional amounts in Delaware Investments, including DMC, which could result in increased assets under management, which in turn would allow some Funds the potential opportunity to achieve economies of scale and lower fees payable by Fund shareholders; and
- The compliance and regulatory history of Macquarie Group and its affiliates.
In making their decision relating to the approval of each Fund’s New Investment Advisory Agreement, the independent Trustees gave attention to all information furnished. The following discussion, however, identifies the primary factors taken into account by the Trustees and the conclusions reached in approving the New Investment Advisory Agreements.
NATURE, EXTENT, AND QUALITY OF SERVICE. The Trustees considered the services historically provided by DMC to the Funds and their shareholders. In reviewing the nature, extent, and quality of services, the Board considered that the New Investment Advisory Agreements would be substantially similar to the current investment advisory agreements between the Funds and DMC (the “Current Investment Advisory Agreements”), and they therefore, considered the many reports furnished to them throughout 2008 and 2009 at regular Board meetings covering matters such as: the relative performance of the Funds; the compliance of portfolio managers with the investment policies, strategies, and restrictions for the Funds; the compliance of management personnel with the code of ethics adopted throughout the Delaware Investments Family of Funds complex; and the adherence to fair value pricing procedures as established by the Board. The Trustees were pleased with the current staffing of DMC and the emphasis placed on research and risk management in the investment process. Favorable consideration was given to DMC’s efforts to maintain expenditures and, in some instances, increase financial and human resources committed to Fund matters.
The Board also considered the transfer agent and shareholder services that would continue to be provided to Fund shareholders by DMC’s affiliate, Delaware Service company, Inc. (“DSC”). The Trustees noted, in particular, DSC’s commitment to maintain a high level of service as well as DMC’s expenditures to improve the delivery of shareholder services. The Board was assured that shareholders would continue to receive the benefits provided to Fund shareholders by being part of the Delaware Investments Family of Funds, including each shareholder’s ability to exchange an investment in one Fund for the same class of shares in another Fund without a sales charge, to reinvest Fund dividends into additional shares of any of the Funds, and the privilege to combine holdings in other Funds to obtain a reduced sales charge.
Based on the information provided by DMC and Macquarie Group, including that Macquarie Group and DMC currently expected no material changes as a result of the Transaction in (i) personnel or operations of DMC or (ii) third party service providers to the Funds, the Board concluded that the satisfactory nature, extent, and quality of services currently provided to the Funds and their shareholders were very likely to continue under the New Investment Advisory Agreements. Moreover, the Board concluded that the Funds would probably benefit from the expanded distribution resources that would become available to Delaware Investments following the Transaction. The Board also concluded that it was very unlikely that any “unfair burden” would be imposed on any of the Funds for the first two years following the Closing as a result of the Transaction. Consequently, the Board concluded that it did not expect the Transaction to result in any adverse changes in the nature, quality, or extent of services (including investment management, distribution or other shareholder services) currently provided to the Funds and their shareholders.
INVESTMENT PERFORMANCE. The Board considered the overall investment performance of DMC and the Funds. The Trustees placed significant emphasis on the investment performance of the Funds in view of its importance to shareholders. Although the Trustees gave appropriate consideration to performance reports and discussions with portfolio managers at Board meetings throughout the year, the Trustees gave particular weight to their review of investment performance in connection with the approval of the Current Investment Advisory agreements at the Board meeting held in May 2009. At that meeting, the Trustees reviewed reports prepared by Lipper, Inc., an independent statistical compilation organization (“Lipper”), which showed each Fund’s investment performance as of December 31, 2008 in comparison to a group of funds selected by Lipper as being similar to the Fund (the “Performance Universe”). During the May 2009 agreement review process, the Trustees observed the significant improvements to relative investment performance of the Funds compared to the Funds’ performance as of December 31, 2007.
At their meeting on September 3, 2009, the Trustees, including the independent Trustees in consultation with their independent counsel, reviewed the investment performance of each Fund. The Trustees compared the performance of each Fund relative to that of its respective Performance Universe for the 1-, 3-, 5-, and 10-year periods ended June 30, 2009 and compared its relative investment performance against the corresponding relative investment performance of each Fund for such time periods ended December 31, 2008, to the extent applicable. As of June 30, 2009, 30 of the Funds had investment performance relative to that of the respective Performance Universe that was better than the corresponding relative investment performance at December 31, 2008 for all applicable time periods. At June 30, 2009, an additional 6 Funds had investment performance relative to that of their respective Performance Universe that was better than the corresponding relative investment performance at December 31, 2008 for a majority of the applicable time periods. At June 30, 2009, 15 additional Funds had investment performance relative to that of their respective Performance Universe that was better than the corresponding relative performance at December 31, 2008 and only 29 Funds had poorer relative investment performance at June 30, 2009 compared to that at December 31, 2008.
The Board therefore concluded that the investment performance of the Funds, on an aggregate basis, had continued to improve relative to their respective Performance Universe since the data reviewed at the May 2009 meeting. Based on information provided by DMC and Macquarie Group, the Board concluded that neither the Transaction nor the New Investment Advisory Agreement would likely have an adverse effect on the investment performance of any Fund because (i) DMC and Macquarie Group did not currently expect the Transaction to cause any material change to the Funds’ portfolio management teams responsible for investment performance, which the Board found to be satisfactory and improving; and (ii) as discussed in more detail below, the Funds’ expenses were not expected to increase as a result of the Transaction.
Cash Reserve Series-16
Delaware VIP® Cash Reserve Series
Other Series Information (continued)
COMPARATIVE EXPENSES. The Trustees also evaluated expense comparison data for the Funds previously provided in May 2009. At that meeting, DMC had provided the Board with information on pricing levels and fee structures for the Funds and comparative funds. The Trustees focused on the comparative analysis of the effective management fees and total expense ratios of each Fund versus the effective management fees and expense ratios of a group of funds selected by Lipper as being similar to each Fund (the “Expense Group”). In reviewing comparative costs, each Fund’s contractual management fee and the actual management fee incurred by the Fund were compared with the contractual management fees (assuming all funds in the Expense Group were similar in size to the Fund) and actual management fees (as reported by each fund) of other funds within the Expense Group, taking into account any applicable breakpoints and fee limitations. Each Fund’s total expenses were also compared with those of its Expense Group. The Trustees also considered fees paid to Delaware Investments for nonmanagement services. At the September 3, 2009 meeting, DMC advised the Board that the more recent comparative expenses for the Funds remained consistent with the previous review in May 2009 and, consequently, the Trustees concluded that expenses of the Funds were satisfactory.
The Board also considered the Expense Agreement under negotiation in evaluating Fund expenses. The Trustees expected that the Expense Agreement would provide that LNC and Macquarie Group would pay or reimburse the Trusts for all reasonable out-of-pocket costs and expenses in connection with the Transaction and the consideration of the New Investment Advisory Agreements (subject to certain limited exceptions).
Based on information provided by DMC and Macquarie Group, the Board concluded that neither the Transaction nor the New Investment Advisory Agreements likely would have an adverse effect on the Funds’ expenses because (i) each Fund’s contractual fee rates under the New Investment Advisory Agreement would remain the same; (ii) under the Expense Agreement, the Funds would be reimbursed for all reasonable out-of-pocket costs and expenses in connection with the Transaction and the related proxy solicitation (subject to certain limited exceptions); and (iii) the expense ratios of certain Funds might decline as a result of the possible increased investment in Delaware Investments by Macquarie Group, as discussed below under “Economies of Scale.”
MANAGEMENT PROFITABILITY. At their meeting on September 3, 2009, the Board evaluated DMC’s profitability in connection with the operation of the Funds. The Board had previously considered DMC’s profitability in connection with the operation of the Funds at its May 2009 meeting. At that meeting, the Board reviewed an analysis that addressed the overall profitability of Delaware Investments’ business in providing management and other services to each of the Funds and the Delaware Investments Family of Funds as a whole. Specific attention was given to the methodology followed in allocating costs for the purpose of determining profitability.
At the May 2009 meeting, representatives of DMC had stated that the level of profits of DMC, to a certain extent, reflect operational cost savings and efficiencies initiated by Delaware Investments (including DMC and its affiliates that provide services to the Funds). The Board considered Delaware Investments’ efforts to improve services provided to Fund shareholders and to meet additional regulatory and compliance requirements resulting from recent industry-wide U.S. Securities and Exchange Commission initiatives. At that meeting, the Board found that the management fees were reasonable in light of the services rendered and the level of profitability of DMC. At the September 3, 2009 meeting, DMC advised the Board that DMC did not expect the Transaction to affect materially the profitability of Delaware Investments compared to the level of profitability considered during the May 2009 review. Moreover, the Trustees reviewed pro forma balance sheets of certain key companies in Delaware Investments as of June 30, 2009 (which were provided by Macquarie Group and DMC in response to the Trustees’ requests) and evaluated the projections of Delaware Investments’ capitalization following the Transaction for purposes of evaluating the financial ability of Delaware Investments to continue to provide the nature, extent, and quality of services as it had under the Current Investment Advisory Agreement.
Based on information provided by DMC and Macquarie Group, the Board concluded that DMC and Delaware Investments would be sufficiently capitalized following the Transaction to continue the same level and quality of services to the Funds under the New Investment Advisory Agreements as was the case under the Current Investment Advisory Agreements. The Board also concluded that Macquarie Group had sufficient financial strength and resources, as well as an ongoing commitment to a global asset management business, to continue investing in Delaware Investments, including DMC, to the extent that Macquarie Group determined it was appropriate. Finally, because services and costs were expected to be substantially the same (and DMC had represented that, correspondingly, profitability would be about the same), under the New Investment Advisory Agreements as under the Current Investment Advisory Agreements, the Trustees concluded that the profitability of Delaware Investments would not result in an inequitable charge on the Funds or their shareholders. Accordingly, the Board concluded that the fees charged under the New Investment Advisory Agreements would be reasonable in light of the services to be provided and the expected profitability of DMC.
ECONOMIES OF SCALE. The Trustees considered whether economies of scale would be realized by Delaware Investments as each Fund’s assets increase and the extent to which any economies of scale would be reflected in the management fees charged. The Trustees took into account DMC’s practice of maintaining the competitive nature of management fees based on its analysis of fees charged by comparable funds. DMC management believed, and the Board agreed, that the Funds were priced with breakpoints and relatively low management fees to reflect potential economies of scale to Fund shareholders.
The Board also acknowledged Macquarie Group’s statement that the Transaction would not by itself immediately provide additional economies of scale given Macquarie Group’s limited presence in the U.S. mutual fund market. Nonetheless, the Trustees concluded that additional economies of scale could potentially be achieved in the future if DMC were owned by Macquarie Group as a result of Macquarie Group’s willingness to invest further in Delaware Investments if appropriate opportunities arise. The Board further concluded that potential economies of scale could be achieved as a result of Delaware Investments’ expanded distribution capabilities arising from the Transaction, as well as opportunities that might arise from Macquarie Group’s global asset management business.
Cash Reserve Series-17
Delaware VIP® Cash Reserve Series
Other Series Information (continued)
FALL-OUT BENEFITS. The Board acknowledged that DMC would continue to benefit from soft dollar arrangements using portfolio brokerage of each Fund that invests in equity securities and that DMC’s profitability would likely be somewhat lower without the benefit of practices with respect to allocating Fund portfolio brokerage for brokerage and research services. The Board also considered that Macquarie Group and Delaware Investments may derive reputational, strategic, and other benefits from their association with the Delaware Investments Family of Funds, including service relationships with DMC, DSC, and Delaware Distributors, L.P., and evaluated the extent to which Delaware Investments might derive ancillary benefits from Fund operations, including the potential for procuring additional business as a result of the prestige and visibility associated with its role as service provider to the Delaware Investments Family of Funds and the benefits from allocation of Fund brokerage to improve trading efficiencies. However, the Board concluded that (i) any such benefits under the New Investment Advisory Agreements would not be dissimilar from those existing under the Current Investment Advisory Agreements, (ii) such benefits did not impose a cost or burden on the Funds or their shareholders, and (iii) such benefits would probably have an indirectly beneficial effect on the Funds and their shareholders because of the added importance that DMC and Macquarie Group might attach to the Funds as a result of the fall-out benefits that the Funds conveyed.
BOARD REVIEW OF MACQUARIE GROUP. The Trustees reviewed detailed information supplied by Macquarie Group about its operations as well as other information regarding Macquarie Group provided by independent legal counsel to the independent Trustees. Based on this review, the Trustees concluded that Delaware Investments would continue to have the financial ability to maintain the high quality of services required by the Funds. The Trustees noted that there would be a limited transition period during which some services previously provided by LNC to Delaware Investments would continue to be provided by LNC after the Closing, and concluded that this arrangement would help minimize disruption in Delaware Investments’ provision of services to the Funds following the Transaction.
The Board considered Macquarie Group’s support for Delaware Investments’ plans for Fund distribution by transferring wholesalers from Lincoln Financial Distributors, Inc., LNC’s retail distributor, to Delaware Investments, and Macquarie Group’s current intention to leave the Funds’ other service providers in place. The Board also considered Macquarie Group’s current strategic plans to increase its asset management activities, one of its core businesses, particularly in North America, and its statement that its acquisition of DMC is an important component of this strategic growth and the establishment of a significant presence in the United States. Based in part on the information provided by DMC and Macquarie Group, the Board concluded that Macquarie Group’s acquisition of Delaware Investments could potentially enhance the nature, quality, and extent of services provided to the Funds and their shareholders.
CONCLUSION. The Board concluded that the advisory fee rate under each New Investment Advisory Agreement was reasonable in relation to the services provided and that execution of the New Investment Advisory Agreement would be in the best interests of the shareholders. For each Fund, the Trustees noted that they had concluded in their most recent advisory agreement continuance considerations in May 2009 that the management fees and total expense ratios were at acceptable levels in light of the quality of services provided to the Funds and in comparison to those of the Funds’ respective peer groups; that the advisory fee schedule would not be increased and would stay the same for all of the Funds; that the total expense ratio had not changed materially since that determination; and that DMC had represented that the overall expenses for each Fund were not expected to be adversely affected by the Transaction. The Trustees also noted, with respect to the Funds that currently had the benefit of voluntary fee limitations, that Macquarie Group had no present intention to cause DMC to alter any voluntary expense limitations or reimbursements currently in effect. On that basis, the Trustees concluded that the total expense ratios and proposed advisory fees for the Funds anticipated to result from the Transaction were acceptable. In approving each New Investment Advisory Agreement, the Board stated that it anticipated reviewing the continuance of the New Investment Advisory Agreement in advance of the expiration of the initial two-year period.
Cash Reserve Series-18
Delaware Investments® Family of Funds
BOARD OF TRUSTEES/DIRECTORS AND OFFICERS ADDENDUM
A mutual fund is governed by a Board of Trustees/Directors (“Trustees”), which has oversight responsibility for the management of a fund’s business affairs. Trustees establish procedures and oversee and review the performance of the investment manager, the distributor, and others who perform services for the fund. The independent fund trustees, in particular, are advocates for shareholder interests. Each trustee has served in that capacity since he or she was elected to or appointed to the Board of Trustees, and will continue to serve until his or her retirement or the election of a new trustee in his or her place. The following is a list of the Trustees and Officers with certain background and related information.
| | | | Number of | Other |
| | | Principal | Portfolios in Fund | Directorships |
| Name, | Position(s) | | Occupation(s) | Complex Overseen | Held by |
| Address, | Held with | Length of Time | During | by Trustee | Trustee |
| and Birth Date | Fund(s) | Served | Past 5 Years | or Officer | or Officer |
| INTERESTED TRUSTEES | | | | |
| Patrick P. Coyne1 | Chairman, | Chairman and Trustee | Patrick P. Coyne has served in | 81 | Director — |
| 2005 Market Street | President, | since August 16, 2006 | various executive capacities | | Kaydon Corp. |
| Philadelphia, PA | Chief Executive | | at different times at | | |
| 19103 | Officer, and | President and | Delaware Investments.2 | | |
| Trustee | Chief Executive Officer | | | |
| April 1963 | | since August 1, 2006 | | | |
| |
| INDEPENDENT TRUSTEES | | | | |
| Thomas L. Bennett | Trustee | Since | Private Investor — | 81 | Director — |
| 2005 Market Street | | March 2005 | (March 2004–Present) | | Bryn Mawr |
| Philadelphia, PA | | | | | Bank Corp. (BMTC) |
| 19103 | | | Investment Manager — | | (April 2007–Present) |
| | | | Morgan Stanley & Co. | | |
| October 1947 | | | (January 1984–March 2004) | | |
| John A. Fry | Trustee | Since | President — | 81 | Director — |
| 2005 Market Street | | January 2001 | Franklin & Marshall College | | Community Health |
| Philadelphia, PA | | | (June 2002–Present) | | Systems |
| 19103 | | | | | |
| | | | Executive Vice President — | | |
| May 1960 | | | University of Pennsylvania | | |
| | | (April 1995–June 2002) | | |
| Anthony D. Knerr | Trustee | Since | Founder and Managing Director — | 81 | None |
| 2005 Market Street | | April 1990 | Anthony Knerr & Associates | | |
| Philadelphia, PA | | | (Strategic Consulting) | | |
| 19103 | | | (1990–Present) | | |
| |
| December 1938 | | | | | |
| Lucinda S. Landreth | Trustee | Since | Chief Investment Officer — | 81 | None |
| 2005 Market Street | | March 2005 | Assurant, Inc. | | |
| Philadelphia, PA | | | (Insurance) | | |
| 19103 | | | (2002–2004) | | |
| |
| June 1947 | | | | | |
| Ann R. Leven | Trustee | Since | Consultant — | 81 | None |
| 2005 Market Street | | October 1989 | ARL Associates | | |
| Philadelphia, PA | | | (Financial Planning) | | |
| 19103 | | | (1983–Present) | | |
| |
| November 1940 | | | | | |
Cash Reserve Series-19
| | | | Number of | Other |
| | | Principal | Portfolios in Fund | Directorships |
| Name, | Position(s) | | Occupation(s) | Complex Overseen | Held by |
| Address, | Held with | Length of Time | During | by Trustee | Trustee |
| and Birth Date | Fund(s) | Served | Past 5 Years | or Officer | or Officer |
| INDEPENDENT TRUSTEES (CONTINUED) |
| Thomas F. Madison | Trustee | Since | President and Chief | 81 | Director and Chair of |
| 2005 Market Street | | May 19973 | Executive Officer — | | Compensation |
| Philadelphia, PA | | | MLM Partners, Inc. | | Committee, |
| 19103 | | | (Small Business Investing | | Governance Committee |
| | | and Consulting) | | Member |
| February 1936 | | | (January 1993–Present) | | — CenterPoint Energy |
| |
| | | | | Lead Director and Chair |
| | | | | of Audit |
| | | | | and Governance |
| | | | | Committees, |
| | | | | Member of |
| | | | | Compensation |
| | | | | Committee — Digital |
| | | | | River, Inc. |
| |
| | | | | Director and Chair of |
| | | | | Governance |
| | | | | Committee, Audit |
| | | | | Committee Member — |
| | | | | Rimage Corporation |
| |
| | | | | Director and Chair of |
| | | | | Compensation |
| | | | | Committee — Spanlink |
| | | | | Communications |
| |
| | | | | Lead Director and Chair |
| | | | | of Compensation and |
| | | | | Governance |
| | | | | Committees — |
| | | | | Valmont Industries, Inc. |
| Janet L. Yeomans | Trustee | Since | Vice President and Treasurer | 81 | None |
| 2005 Market Street | | April 1999 | (January 2006–Present) | | |
| Philadelphia, PA | | | Vice President — Mergers & Acquisitions | | |
| 19103 | | | (January 2003–January 2006), and | | |
| | | Vice President | | |
| July 1948 | | | (July 1995–January 2003) | | |
| | | 3M Corporation | | |
| J. Richard Zecher | Trustee | Since | Founder — | 81 | Director and Audit |
| 2005 Market Street | | March 2005 | Investor Analytics | | Committee Member — |
| Philadelphia, PA | | | (Risk Management) | | Investor Analytics |
| 19103 | | | (May 1999–Present) | | |
| |
| July 1940 | | | Founder — | | |
| | | Sutton Asset Management | | |
| | | (Hedge Fund) | | |
| | | (September 1996–Present) | | |
Cash Reserve Series-20
| | | | Number of | Other |
| | | Principal | Portfolios in Fund | Directorships |
| Name, | Position(s) | | Occupation(s) | Complex Overseen | Held by |
| Address, | Held with | Length of Time | During | by Trustee | Trustee |
| and Birth Date | Fund(s) | Served | Past 5 Years | or Officer | or Officer |
| OFFICERS |
| David F. Connor | Vice President, | Vice President since | David F. Connor has served as | 81 | None4 |
| 2005 Market Street | Deputy General | September 2000 | Vice President and Deputy | | |
| Philadelphia, PA | Counsel, and Secretary | and Secretary | General Counsel of | | |
| 19103 | | since | Delaware Investments | | |
| | October 2005 | since 2000. | | |
| December 1963 | | | | | |
| Daniel V. Geatens | Vice President | Treasurer | Daniel V. Geatens has served | 81 | None4 |
| 2005 Market Street | and Treasurer | since | in various capacities at | | |
| Philadelphia, PA | | October 25, 2007 | different times at | | |
| 19103 | | | Delaware Investments. | | |
|
| October 1972 | | | | | |
| David P. O’Connor | Senior Vice | Senior Vice President, | David P. O’Connor has served in | 81 | None4 |
| 2005 Market Street | President, | General Counsel, and | various executive and legal | | |
| Philadelphia, PA | General Counsel, | Chief Legal Officer | capacities at different times | | |
| 19103 | and Chief | since | at Delaware Investments. | | |
| Legal Officer | October 2005 | | | |
| February 1966 | | | | | |
| Richard Salus | Senior | Chief Financial | Richard Salus has served in | 81 | None4 |
| 2005 Market Street | Vice President | Officer since | various executive capacities | | |
| Philadelphia, PA | and | November 2006 | at different times at | | |
| 19103 | Chief Financial | | Delaware Investments. | | |
| Officer | | | | |
| October 1963 | | | | | |
1 Patrick P. Coyne is considered to be an “Interested Trustee” because he is an executive officer of the Fund’s(s’) investment advisor. |
2 Delaware Investments is the marketing name for Delaware Management Holdings, Inc. and its subsidiaries, including the Fund’s(s’) investment advisor, principal underwriter, and its transfer agent. |
3 In 1997, several funds managed by Voyageur Fund Managers, Inc. (the “Voyageur Funds”) were incorporated into the Delaware Investments Family of Funds. Mr. Madison served as a director of the Voyageur Funds from 1993 until 1997. |
4 David F. Connor, Daniel V. Geatens, David P. O’Connor, and Richard Salus serve in similar capacities for the six portfolios of the Optimum Fund Trust, which have the same investment advisor, principal underwriter, and transfer agent as the registrant. |
The Statement of Additional Information for the Fund(s) includes additional information about the Trustees and Officers and is available, without charge, upon request by calling 800 523-1918.
| PO14857 AR-VIPCAS [12/09] DG3 2/10 (5427) | Cash Reserve Series-21 |
| Delaware VIP® Trust |
| Delaware VIP Diversified Income Series |
| |
| |
| |
| |
| |
| |
| Annual Report |
| |
| |
| December 31, 2009 |
| |
| |
| |
| |
| |
| |
| |
| |
| |
| |
| |
| |
| |
| |
| |
|
Table of contents
| > Portfolio management review | 1 |
| | |
| > Performance summary | 1 |
| | |
| > Disclosure of Series expenses | 3 |
| | |
| > Security types and credit quality breakdown | 4 |
| | |
| > Statement of net assets | 5 |
| | |
| > Statement of operations | 24 |
| | |
| > Statements of changes in net assets | 24 |
| | |
| > Financial highlights | 25 |
| | |
| > Notes to financial statements | 27 |
| | |
| > Report of independent registered public accounting firm | 36 |
| | |
| > Other Series information | 37 |
| | |
| > Board of trustees/directors and officers addendum | 41 |
On January 4, 2010, Delaware Management Holdings, Inc., and its subsidiaries (collectively known by the marketing name of Delaware Investments) were sold by a subsidiary of Lincoln National Corporation to Macquarie Group Limited, a global provider of banking, financial, advisory, investment and funds management services. Please see your Series’ prospectus and any supplements thereto for more complete information.
Investments in Delaware VIP® Diversified Income Series are not and will not be deposits with or liabilities of Macquarie Bank Limited ABN 46 008 583 542 and its holding companies, including subsidiaries or related companies, and are subject to investment risk, including possible delays in repayment and loss of income and capital invested. No Macquarie Group company guarantees or will guarantee the performance of the Series, the repayment of capital from the Series, or any particular rate of return.
Unless otherwise noted, views expressed herein are current as of Dec. 31, 2009, and are subject to change.
Funds are not FDIC insured and are not guaranteed. It is possible to lose the principal amount invested.
Mutual fund advisory services provided by Delaware Management Company, a series of Delaware Management Business Trust, which is a registered investment advisor. Delaware Investments is the marketing name of Delaware Management Holdings, Inc. and its subsidiaries. Macquarie Group refers to Macquarie Group Limited and its subsidiaries and affiliates worldwide.
© 2010 Delaware Management Holdings, Inc.
All third-party trademarks cited are the property of their respective owners.
| Delaware VIP® Trust — Delaware VIP Diversified Income Series | |
| Portfolio management review | Jan. 12, 2010 |
For the 12-month period ended Dec. 31, 2009, Delaware VIP Diversified Income Series Standard Class shares returned +26.96%, and Service Class shares returned +26.66% (both figures reflect returns with dividends reinvested). The Series’ benchmark, the Barclays Capital U.S. Aggregate Index, returned +5.93%.
The period began amid the worst economic and financial markets that the portfolio management team has ever witnessed. Beginning in March 2009, however, a considerable recovery took shape that featured what were in our view some of the most attractive fixed income opportunities in decades.
The Federal Reserve and federal government took a series of steps to loosen tight credit markets and improve economic conditions, including passing the American Recovery and Reinvestment Act of 2009, a nearly $800 billion economic stimulus package enacted in February 2009. Starting late in the first quarter of 2009, the fixed income and equity markets began a substantial bounce-back, recovering much of their earlier losses as conditions in the credit markets began to normalize once again. And by later in the year, many economic indicators in the United States showed signs of recovery, and even growth, while other indicators showed at least a slowing decline.
At the start of the period, we maintained the defensive positioning that we had adopted within the Series prior to the beginning of the fiscal year. This decision helped to mitigate losses through the worst conditions of the credit crisis, though the Series generally faced significant challenges during that difficult time.
The Series’ commitment to broad diversification, for example, meant that it continued to hold positions in riskier asset types. Although we had markedly reduced such allocations, the Series’ riskier holdings made it a challenge to keep pace with benchmark performance during the darkest days of market performance.
Though the Series began the period with up to 10% of its assets invested in Treasurys, its underweight position there versus its benchmark (Treasurys represented 35% of the Series’ benchmark at the beginning of the fiscal period) hurt its relative performance, as investors continued fleeing almost uniformly to the relative safety of government securities. For similar reasons, exposure to nonagency mortgage-backed securities (MBS) — those not backed by the government — also detracted from returns relative to the benchmark as investors remained risk averse.
As market conditions improved, investors seemed to quickly rediscover their appetite for risk. In contrast to the opening months of the period, the Series’ diversified strategy, combined with our decision to quickly add risk back into the Series by adding to its positions in investment grade and high yield corporate bonds, among other areas, contributed significantly to its strong performance for the year.
Our overweight allocation to investment grade corporate bonds — which we started to build in late 2008 and which grew to as high as 38% in June 2009 — was a key contributor to the Series’ relative return during the annual period.
Additionally, exposure to high yield and emerging markets debt, which are not included in the benchmark index, also greatly benefited performance. Within high yield, we viewed the most attractive part of the market (on a risk-return basis) to be in medium- to lower-quality B-rated bonds, as well as higher-quality CCC-rated bonds. The Series increased its allocation in these riskier asset classes primarily by shifting out of traditionally conservative asset classes such as Treasurys and agency MBS, which generally lagged riskier asset classes when the markets began their recovery.
| Unless otherwise noted, the views expressed are current as of Dec. 31, 2009, and are subject to change. |
Performance summary
The performance data quoted represent past performance; past performance does not guarantee future results. Investment return and principal value will fluctuate so your shares, when redeemed, may be worth more or less than their original cost. Please obtain the performance data for the most recent month end by calling the number noted in the introductory section of this report on the page related to this Series. Current performance may be lower or higher than the performance data quoted.
You should consider the investment objectives, risks, charges, and expenses of the Series carefully before investing. The Delaware VIP Diversified Income Series prospectus contains this and other important information about the Series. To obtain a prospectus, contact the company noted on the page related to this Series in the introductory section of this report, either by phone or through the company’s Web site. We advise you to read the prospectus carefully before you invest or send money.
| Delaware VIP Diversified Income Series | | | | | | | | |
| Average annual total returns | | | | | | | | |
| For periods ended Dec. 31, 2009 | | 1 year | | 3 years | | 5 years | | Lifetime |
| Standard Class shares (commenced operations on May 16, 2003) | | +26.96% | | +9.26% | | +6.98% | | +7.33% |
| Service Class shares (commenced operations on May 16, 2003) | | +26.66% | | +8.97% | | +6.71% | | +7.03% |
Returns reflect the reinvestment of all distributions.
Diversified Income Series-1
Delaware VIP® Diversified Income Series (continued)
As described in the Series’ most recent prospectus, the net expense ratio for Service Class shares of the Series was 0.98%, while total operating expenses for Standard Class and Service Class shares were 0.73% and 1.03%, respectively. The management fee for Standard Class and Service Class shares was 0.62%.
The Series’ distributor has contracted to limit the 12b-1 fees for Service Class shares to no more than 0.25% of average daily net assets through April 30, 2010.
Earnings from a variable annuity or variable life investment compound tax-free until withdrawal, and as a result, no adjustments were made for income taxes.
Expense limitations were in effect for both classes during certain periods shown in the Series performance chart on the previous page and in the Performance of a $10,000 Investment chart below.
Performance data do not reflect insurance fees related to a variable annuity or variable life investment or the deferred sales charge that would apply to certain withdrawals of investments. Performance shown here would have been reduced if such fees were included or the expense limitation removed. For more information about fees, consult your variable annuity or variable life prospectus.
The letter ratings are provided by S&P and describe the credit-worthiness of the underlying bonds in the Series and generally range from AAA (highest quality) to CCC (lowest quality, highly speculative).
Investments in variable products involve risk. Fixed income securities and bond funds can lose value, and investors can lose principal, as interest rates rise. They also may be affected by economic conditions that hinder an issuer’s ability to make interest and principal payments on its debt.
The Series may also be subject to prepayment risk, the risk that the principal of a fixed income security that is held by the Series may be prepaid prior to maturity, potentially forcing the Series to reinvest that money at a lower interest rate.
High yielding, noninvestment grade bonds (junk bonds) involve higher risk than investment grade bonds.
The Series may invest in derivatives, which may involve additional expenses and are subject to risk, including the risk that an underlying security or securities index moves in the opposite direction from what the portfolio manager anticipated. A derivative transaction depends upon the counterparties’ ability to fulfill their contractual obligations.
International investments entail risks not ordinarily associated with U.S. investments including fluctuation in currency values, differences in accounting principles, or economic or political instability in other nations. Investing in emerging markets can be riskier than investing in established foreign markets due to increased volatility and lower trading volume.
The Series may experience portfolio turnover in excess of 100%, which could result in higher transaction costs and tax liability.
Instances of high double-digit returns are unusual, cannot be sustained, and were primarily achieved during favorable market conditions.
Please read both the contract and underlying prospectus for specific details regarding the product’s risk profile.
The chart shows a $10,000 investment in the Delaware VIP Diversified Income Series Standard Class shares for the period from May 16, 2003, through Dec. 31, 2009.
The chart also shows $10,000 invested in the Barclays Capital U.S. Aggregate Index for the period from May 16, 2003, through Dec. 31, 2009. The Barclays Capital U.S. Aggregate Index is a broad composite of more than 8,500 securities that tracks the investment grade domestic bond market.
Index performance returns do not reflect any management fees, transaction costs or expenses. Indices are unmanaged and one cannot invest directly in an index.
Performance of Service Class shares will vary due to different charges and expenses.
Past performance is not a guarantee of future results.
Diversified Income Series-2
Delaware VIP® Trust — Delaware VIP Diversified Income Series
Disclosure of Series Expenses
For the Period July 1, 2009 to December 31, 2009
As a shareholder of the Series, you incur ongoing costs, including management fees; distribution and/or service (12b-1) fees; and other Series expenses. This Example is intended to help you understand your ongoing costs (in dollars) of investing in the Series and to compare these costs with the ongoing costs of investing in other mutual funds.
The Example is based on an investment of $1,000 invested at the beginning of the period and held for the entire period from July 1, 2009 to December 31, 2009.
Actual Expenses
The first section of the table shown, “Actual Series Return,” provides information about actual account values and actual expenses. You may use the information in this section of the table, together with the amount you invested, to estimate the expenses that you paid over the period. Simply divide your account value by $1,000 (for example, an $8,600 account value divided by $1,000 = 8.6), then multiply the result by the number in the first section under the heading entitled “Expenses Paid During Period” to estimate the expenses you paid on your account during the period.
Hypothetical Example for Comparison Purposes
The second section of the table shown, “Hypothetical 5% Return,” provides information about hypothetical account values and hypothetical expenses based on the Series’ actual expense ratio and an assumed rate of return of 5% per year before expenses, which is not the Series’ actual return. The hypothetical account values and expenses may not be used to estimate the actual ending account balance or expenses you paid for the period. You may use this information to compare the ongoing costs of investing in the Series and other funds. To do so, compare the 5% hypothetical example with the 5% hypothetical examples that appear in the shareholder reports of other funds.
Please note that the expenses shown in the table are meant to highlight your ongoing costs only. As a shareholder of the Series, you do not incur any transaction costs, such as sales charges (loads), redemption fees or exchange fees, but shareholders of other funds may incur such costs. Also, the fees related to the variable annuity investment or the deferred sales charge that could apply have not been included. Therefore, the second section of the table is useful in comparing ongoing costs only, and will not help you determine the relative total costs of owning different funds. The Series’ actual expenses shown in the table reflect fee waivers in effect for Service Class shares. The expenses shown in the table assume reinvestment of all dividends and distributions.
Expense Analysis of an Investment of $1,000
| | | | | | | | | Expenses |
| | Beginning | | Ending | | | | | Paid During |
| | Account | | Account | | Annualized | | Period |
| | Value | | Value | | Expense | | 7/1/09 to |
| | 7/1/09 | | 12/31/09 | | Ratios | | 12/31/09* |
| Actual Series Return | | | | | | | | | | |
| Standard Class | | $1,000.00 | | $1,139.00 | | 0.71 | % | | $3.83 | |
| Service Class | | 1,000.00 | | 1,136.30 | | 0.96 | % | | 5.17 | |
| Hypothetical 5% Return (5% return before expenses) | | | | |
| Standard Class | | $1,000.00 | | $1,021.62 | | 0.71 | % | | $3.62 | |
| Service Class | | 1,000.00 | | 1,020.36 | | 0.96 | % | | 4.89 | |
*“Expenses Paid During Period” are equal to the Series’ annualized expense ratio, multiplied by the average account value over the period, multiplied by 184/365 (to reflect the one-half year period).
Diversified Income Series-3
Delaware VIP® Trust — Delaware VIP Diversified Income Series
Security Types and Credit Quality Breakdown
As of December 31, 2009
Sector designations may be different than the sector designations presented in other Series materials. The sector designations may represent the investment manager’s internal sector classifications, which may result in the sector designations for one series being different than another series’ sector designations.
| Percentage |
| Security types | of Net Assets |
| Agency Asset-Backed Securities | 0.02 | % |
| Agency Collateralized Mortgage Obligations | 1.85 | % |
| Agency Mortgage-Backed Securities | 3.53 | % |
| Commercial Mortgage-Backed Securities | 4.78 | % |
| Convertible Bonds | 3.85 | % |
| Corporate Bonds | 62.35 | % |
| Banking | 7.83 | % |
| Basic Industry | 4.61 | % |
| Brokerage | 2.93 | % |
| Capital Goods | 3.21 | % |
| Communications | 11.86 | % |
| Consumer Cyclical | 6.96 | % |
| Consumer Non-Cyclical | 6.57 | % |
| Electric & Gas | 4.23 | % |
| Energy | 6.86 | % |
| Finance Companies | 3.28 | % |
| Industrials | 0.09 | % |
| Insurance | 1.01 | % |
| Natural Gas | 0.27 | % |
| Real Estate | 0.66 | % |
| Technology | 1.35 | % |
| Transportation | 0.63 | % |
| Municipal Bonds | 0.83 | % |
| Non-Agency-Asset Backed Securities | 3.79 | % |
| Non-Agency Collateralized Mortgage Obligations | 2.90 | % |
| Regional Authorities | 0.29 | % |
| Senior Secured Loans | 4.70 | % |
| Sovereign Debt | 2.52 | % |
| Supranational Banks | 1.85 | % |
| U.S. Treasury Obligations | 2.34 | % |
| Common Stock | 0.14 | % |
| Convertible Preferred Stock | 0.24 | % |
| Preferred Stock | 0.28 | % |
| Warrant | 0.00 | % |
| Discount Note | 0.26 | % |
| Securities Lending Collateral | 5.43 | % |
| Total Value of Securities | 101.95 | % |
| Obligation to Return Securities Lending Collateral | (5.57 | %) |
| Receivables and Other Assets Net of Liabilities | 3.62 | % |
| Total Net Assets | 100.00 | % |
| | | |
| Credit Quality Breakdown | | |
| (as a % of fixed income investments)* | | |
| AAA | 23.10 | % |
| AA | 3.31 | % |
| A | 13.14 | % |
| BBB | 22.34 | % |
| BB | 13.45 | % |
| B | 16.97 | % |
| CCC | 7.22 | % |
| C | 0.02 | % |
| Not Rated | 0.45 | % |
| Total | 100.00 | % |
*Bond ratings are determined by independent, nationally recognized statistical rating organizations.
Diversified Income Series-4
Delaware VIP® Trust — Delaware VIP Diversified Income Series
Statement of Net Assets
December 31, 2009
| | | Principal | | Value |
| | Amount° | | (U.S. $) |
| AGENCY ASSET-BACKED | | | | | | |
| SECURITIES–0.02% | | | | | | |
| Fannie Mae Grantor Trust Series | | | | | | |
| 2003-T4 2A5 5.407% 9/26/33 | USD | | 290,701 | | $ | 254,090 |
| •Fannie Mae Whole Loan Series | | | | | | |
| 2002-W11 AV1 0.571% 11/25/32 | | | 8,058 | | | 7,983 |
| Total Agency Asset-Backed | | | | | | |
| Securities (cost $297,488) | | | | | | 262,073 |
| |
| AGENCY COLLATERALIZED MORTGAGE | | | |
| OBLIGATIONS–1.85% | | | | | | |
| Fannie Mae Grantor Trust | | | | | | |
| Series 1999-T2 A1 7.50% 1/19/39 | | | 1,184 | | | 1,327 |
| Series 2001-T8 A2 9.50% 7/25/41 | | | 10,900 | | | 11,797 |
| Series 2002-T4 A3 7.50% 12/25/41 | | | 23,188 | | | 26,144 |
| Series 2004-T1 1A2 6.50% 1/25/44 | | | 26,873 | | | 29,091 |
| Fannie Mae REMICS | | | | | | |
| Series 1996-46 ZA 7.50% 11/25/26 | | | 110,690 | | | 120,926 |
| Series 2001-50 BA 7.00% 10/25/41 | | | 148,655 | | | 163,637 |
| Series 2002-90 A1 6.50% 6/25/42 | | | 13,590 | | | 14,712 |
| Series 2002-90 A2 6.50% 11/25/42 | | | 46,718 | | | 50,574 |
| Series 2003-38 MP 5.50% 5/25/23 | | | 2,100,000 | | | 2,230,759 |
| Series 2003-122 AJ 4.50% 2/25/28 | | | 83,595 | | | 86,233 |
| Series 2005-110 MB 5.50% 9/25/35 | | | 529,005 | | | 550,323 |
| Series 2006-M2 A2F 5.259% 5/25/20 | | | 320,000 | | | 335,674 |
| Series 2009-94 AC 5.00% 11/25/39 | | | 1,400,000 | | | 1,411,858 |
| Fannie Mae Whole Loan | | | | | | |
| Series 2002-W6 2A1 7.00% 6/25/42 | | | 41,050 | | | 45,188 |
| Series 2004-W9 2A1 6.50% 2/25/44 | | | 7,329 | | | 7,934 |
| Series 2004-W11 1A2 6.50% 5/25/44 | | | 77,094 | | | 83,458 |
| Freddie Mac REMICS | | | | | | |
| Series 1730 Z 7.00% 5/15/24 | | | 96,910 | | | 101,507 |
| Series 2326 ZQ 6.50% 6/15/31 | | | 104,356 | | | 112,887 |
| Series 2541 JB 5.00% 2/15/16 | | | 48,596 | | | 49,025 |
| Series 2557 WE 5.00% 1/15/18 | | | 1,365,000 | | | 1,447,169 |
| Series 2622 PE 4.50% 5/15/18 | | | 3,510,000 | | | 3,655,676 |
| Series 2662 MA 4.50% 10/15/31 | | | 222,824 | | | 230,682 |
| Series 2687 PG 5.50% 3/15/32 | | | 1,250,000 | | | 1,320,373 |
| Series 2694 QG 4.50% 1/15/29 | | | 965,000 | | | 1,006,604 |
| Series 2762 LG 5.00% 9/15/32 | | | 3,895,000 | | | 4,022,528 |
| Series 2809 DC 4.50% 6/15/19 | | | 1,000,000 | | | 1,039,395 |
| Series 2872 GC 5.00% 11/15/29 | | | 625,000 | | | 653,126 |
| Series 2890 PC 5.00% 7/15/30 | | | 1,520,000 | | | 1,592,277 |
| Series 3022 MB 5.00% 12/15/28 | | | 165,000 | | | 173,331 |
| Series 3128 BC 5.00% 10/15/27 | | | 3,895,000 | | | 4,104,710 |
| Series 3131 MC 5.50% 4/15/33 | | | 930,000 | | | 985,649 |
| Series 3337 PB 5.50% 7/15/30 | | | 1,015,000 | | | 1,066,679 |
| tFreddie Mac Structured Pass | | | | | | |
| Through Securities | | | | | | |
| Series T-54 2A 6.50% 2/25/43 | | | 23,243 | | | 25,136 |
| Series T-58 2A 6.50% 9/25/43 | | | 9,675 | | | 10,481 |
| Total Agency Collateralized | | | | | | |
| Mortgage Obligations | | | | | | |
| (cost $25,550,278) | | | | | | 26,766,870 |
| | | | | | | |
| AGENCY MORTGAGE-BACKED | | | | | | |
| SECURITIES–3.53% | | | | | | |
| Fannie Mae | | | | | | |
| 5.50% 1/1/13 | | | 73,290 | | | 74,458 |
| 6.50% 8/1/17 | | | 36,109 | | | 38,719 |
| •Fannie Mae ARM | | | | | | |
| 3.044% 10/1/33 | | | 39,335 | | | 40,138 |
| 5.007% 8/1/35 | | | 278,592 | | | 293,711 |
| 5.144% 11/1/35 | | | 773,391 | | | 812,952 |
| 5.534% 6/1/37 | | | 22,933 | | | 24,276 |
| 5.899% 8/1/37 | | | 854,634 | | | 909,648 |
| Fannie Mae Relocation 15 yr | | | | | | |
| 4.00% 9/1/20 | | | 715,298 | | | 704,567 |
| Fannie Mae Relocation 30 yr | | | | | | |
| 5.00% 11/1/33 | | | 32,550 | | | 33,193 |
| 5.00% 8/1/34 | | | 50,445 | | | 51,441 |
| 5.00% 11/1/34 | | | 51,888 | | | 52,913 |
| 5.00% 4/1/35 | | | 152,440 | | | 155,449 |
| 5.00% 10/1/35 | | | 255,691 | | | 260,739 |
| 5.00% 1/1/36 | | | 357,898 | | | 364,963 |
| Fannie Mae S.F. 15 yr | | | | | | |
| 5.00% 5/1/21 | | | 636,004 | | | 669,273 |
| 6.00% 12/1/22 | | | 3,359,432 | | | 3,593,973 |
| Fannie Mae S.F. 20 yr 5.00% 8/1/28 | | | 3,168,870 | | | 3,279,264 |
| Fannie Mae S.F. 30 yr | | | | | | |
| 4.50% 3/1/39 | | | 1,277,160 | | | 1,276,223 |
| 5.00% 9/1/35 | | | 563,278 | | | 579,149 |
| 5.00% 12/1/36 | | | 6,090,113 | | | 6,261,715 |
| 5.00% 12/1/37 | | | 866,932 | | | 890,682 |
| 5.00% 1/1/38 | | | 1,333,322 | | | 1,369,850 |
| 5.00% 2/1/38 | | | 583,620 | | | 599,576 |
| 6.50% 2/1/36 | | | 1,594,042 | | | 1,717,989 |
| 6.50% 3/1/36 | | | 1,483,356 | | | 1,591,826 |
| 7.50% 3/1/32 | | | 826 | | | 932 |
| 7.50% 4/1/32 | | | 2,966 | | | 3,347 |
| Fannie Mae S.F. 30 yr TBA | | | | | | |
| 4.50% 1/1/40 | | | 5,325,000 | | | 5,315,016 |
| •Freddie Mac ARM | | | | | | |
| 4.29% 12/1/33 | | | 56,552 | | | 58,527 |
| 4.352% 4/1/34 | | | 3,654 | | | 3,780 |
| 5.684% 7/1/36 | | | 407,103 | | | 429,600 |
| 5.733% 8/1/37 | | | 19,262 | | | 20,312 |
| 5.909% 6/1/37 | | | 1,461,143 | | | 1,551,693 |
| 6.082% 10/1/37 | | | 746,052 | | | 794,371 |
| 6.115% 10/1/37 | | | 37,154 | | | 39,585 |
| 6.332% 2/1/37 | | | 1,222,957 | | | 1,304,694 |
| Freddie Mac Relocation 30 yr | | | | | | |
| 5.00% 9/1/33 | | | 74,232 | | | 75,639 |
| Freddie Mac S.F. 15 yr | | | | | | |
| 4.50% 5/1/20 | | | 1,462,907 | | | 1,519,761 |
| 5.00% 6/1/18 | | | 480,834 | | | 506,860 |
| Freddie Mac S.F. 30 yr | | | | | | |
| 4.50% 10/1/35 | | | 1,299,376 | | | 1,301,136 |
| 6.00% 2/1/36 | | | 2,521,495 | | | 2,680,665 |
| 6.50% 8/1/38 | | | 1,179,081 | | | 1,263,208 |
Diversified Income Series-5
Delaware VIP® Diversified Income Series
Statement of Net Assets (continued)
| | Principal | | Value |
| | Amount° | | (U.S. $) |
| AGENCY MORTGAGE-BACKED | | | | | | |
| SECURITIES (continued) | | | | | | |
| Freddie Mac S.F. 30 yr TBA | | | | | | |
| 4.00% 1/1/40 | USD | | 1,000,000 | | $ | 964,219 |
| 5.00% 1/1/40 | | | 6,860,000 | | | 7,033,639 |
| *GNMA I S.F. 30 yr 7.00% 12/15/34 | | | 426,131 | | | 469,961 |
| Total Agency Mortgage-Backed | | | | | | |
| Securities (cost $49,789,509) | | | | | | 50,983,632 |
| | |
| COMMERCIAL MORTGAGE- | | | | | | |
| BACKED SECURITIES–4.78% | | | | | | |
| #American Tower Trust 144A | | | | | | |
| Series 2007-1A AFX 5.42% 4/15/37 | | | 1,890,000 | | | 1,941,975 |
| Series 2007-1A D 5.957% 4/15/37 | | | 315,000 | | | 321,300 |
| Bank of America Commercial | | | | | | |
| Mortgage Securities | | | | | | |
| Series 2004-2 A3 4.05% 11/10/38 | | | 1,732,817 | | | 1,738,105 |
| • | Series 2004-3 A5 5.398% 6/10/39 | | | 1,310,000 | | | 1,319,596 |
| • | Series 2005-1 A5 5.082% 11/10/42 | | | 4,615,000 | | | 4,578,037 |
| • | Series 2005-6 A4 5.179% 9/10/47 | | | 1,200,000 | | | 1,178,498 |
| Series 2005-6 AM 5.179% 9/10/47 | | | 485,000 | | | 413,755 |
| Series 2006-4 A4 5.634% 7/10/46 | | | 1,780,000 | | | 1,667,526 |
| • | Series 2007-4 AM 5.811% 2/10/51 | | | 1,010,000 | | | 728,991 |
| Bear Stearns Commercial | | | | | | |
| Mortgage Securities | | | | | | |
| • | Series 2005-PW10 A4 5.405% 12/11/40 | | | 2,999,000 | | | 2,939,010 |
| • | Series 2005-T20 A4A 5.15% 10/12/42 | | | 3,780,000 | | | 3,709,692 |
| • | Series 2006-PW12 A4 5.719% 9/11/38 | | | 1,185,000 | | | 1,203,291 |
| Series 2006-PW14 A4 5.201% 12/11/38 | | | 3,360,000 | | | 3,228,604 |
| Series 2007-PW15 A4 5.331% 2/11/44 | | | 2,085,000 | | | 1,799,301 |
| • | Series 2007-PW16 A4 5.719% 6/11/40 | | | 502,000 | | | 456,303 |
| tCommercial Mortgage Pass | | | | | | |
| Through Certificates | | | | | | |
| •# | Series 2001-J1A A2 144A | | | | | | |
| 6.457% 2/16/34 | | | 162,534 | | | 167,053 |
| • | Series 2005-C6 A5A 5.116% 6/10/44 | | | 2,490,000 | | | 2,417,665 |
| Series 2006-C7 A2 5.69% 6/10/46 | | | 230,000 | | | 235,131 |
| •Credit Suisse Mortgage Capital | | | | | | |
| Certificates Series 2006-C1 AAB | | | | | | |
| 5.548% 2/15/39 | | | 115,000 | | | 115,308 |
| #Crown Castle Towers 144A | | | | | | |
| Series 2005-1A C 5.074% 6/15/35 | | | 90,000 | | | 90,900 |
| Series 2006-1A B 5.362% 11/15/36 | | | 1,830,000 | | | 1,875,750 |
| General Electric Capital Commercial | | | | | | |
| Mortgage Series 2002-1A A3 | | | | | | |
| 6.269% 12/10/35 | | | 900,000 | | | 948,369 |
| Goldman Sachs Mortgage Securities II | | | | | | |
| Series 2004-GG2 A6 5.396% 8/10/38 | | | 1,815,000 | | | 1,783,558 |
| Series 2005-GG4 A4 4.761% 7/10/39 | | | 1,020,000 | | | 923,697 |
| Series 2005-GG4 A4A 4.751% 7/10/39 | | | 4,585,000 | | | 4,439,042 |
| Series 2006-GG6 A4 5.553% 4/10/38 | | | 1,500,000 | | | 1,368,020 |
| @•# | Series 2006-RR3 A1S 144A | | | | | | |
| 5.661% 7/18/56 | | | 695,000 | | | 201,550 |
| • | Series 2007-GG10 A4 5.805% 8/10/45 | | | 2,045,000 | | | 1,755,929 |
| Greenwich Capital Commercial Funding | | | | | | |
| Series 2004-GG1 A7 5.317% 6/10/36 | | | 1,295,000 | | | 1,314,428 |
| Series 2005-GG5 A5 5.224% 4/1/37 | | | 2,860,000 | | | 2,709,021 |
| JP Morgan Chase Commercial | | | | | | |
| Mortgage Securities | | | | | | |
| Series 2002-C1 A3 5.376% 7/12/37 | | | 605,000 | | | 628,897 |
| Series 2002-C2 A2 5.05% 12/12/34 | | | 345,000 | | | 355,474 |
| Series 2003-C1 A2 4.985% 1/12/37 | | | 788,000 | | | 802,222 |
| Series 2005-LDP3 A4A | | | | | | |
| 4.936% 8/15/42 | | | 880,000 | | | 835,040 |
| Series 2005-LDP4 A4 | | | | | | |
| 4.918% 10/15/42 | | | 940,000 | | | 903,746 |
| • | Series 2005-LDP5 A4 | | | | | | |
| 5.179% 12/15/44 | | | 2,100,000 | | | 2,078,940 |
| Series 2006-LDP9 A2 | | | | | | |
| 5.134% 5/15/47 | | | 1,850,000 | | | 1,769,043 |
| Lehman Brothers-UBS Commercial | | | | | | |
| Mortgage Trust | | | | | | |
| Series 2002-C1 A4 6.462% 3/15/31 | | | 110,000 | | | 116,394 |
| Series 2003-C8 A2 4.207% 11/15/27 | | | 29,890 | | | 30,064 |
| Series 2004-C1 A4 4.568% 1/15/31 | | | 2,710,000 | | | 2,650,827 |
| •Merrill Lynch Mortgage Trust Series | | | | | | |
| 2005-CKI1 A6 5.233% 11/12/37 | | | 900,000 | | | 890,909 |
| Merrill Lynch/Countrywide Commercial | | | | | | |
| Mortgage Trust Series 2007-5 A1 | | | | | | |
| 4.275% 8/12/48 | | | 117,034 | | | 118,455 |
| Morgan Stanley Capital I | | | | | | |
| #Series 1999-FNV1 G 144A | | | | | | |
| 6.12% 3/15/31 | | | 104,053 | | | 101,626 |
| | Series 2004-T15 A4 5.27% 6/11/41 | | | 1,200,000 | | | 1,201,955 |
| Series 2005-IQ9 A4 4.66% 7/15/56 | | | 400,000 | | | 392,293 |
| Series 2006-IQ12 A4 | | | | | | |
| 5.332% 12/15/43 | | | 2,045,000 | | | 1,897,663 |
| Series 2007-IQ14 A4 5.692% 4/15/49 | | | 570,000 | | | 480,302 |
| • | Series 2007-T27 A4 5.65% 6/13/42 | | | 5,430,000 | | | 5,242,528 |
| •#Morgan Stanley Dean Witter Capital I | | | | | | |
| Series 2001-TOP1 E 144A | | | | | | |
| 7.366% 2/15/33 | | | 100,000 | | | 92,992 |
| #SBA Commercial Mortgage Securities | | | | | | |
| Trust Series 2006-1A B 144A | | | | | | |
| 5.451% 11/15/36 | | | 260,000 | | | 265,200 |
| Wachovia Bank Commercial | | | | | | |
| Mortgage Trust Series 2006-C28 A2 | | | | | | |
| 5.50% 10/15/48 | | | 655,000 | | | 667,898 |
| Total Commercial Mortgage-Backed | | | | | | |
| Securities (cost $65,347,989) | | | | | | 69,091,873 |
| |
| CONVERTIBLE BONDS–3.85% | | | | | | |
| Advanced Micro Devices 6.00% exercise | | | | | | |
| price $28.08, expiration date 5/1/15 | | | 2,655,000 | | | 2,402,774 |
| Alaska Communications System Group | | | | | | |
| 5.75% exercise price $12.90, | | | | | | |
| expiration date 3/1/13 | | | 1,151,000 | | | 1,057,481 |
Diversified Income Series-6
Delaware VIP® Diversified Income Series
Statement of Net Assets (continued)
| | | Principal | | Value |
| | Amount° | | (U.S. $) |
| CONVERTIBLE BONDS (continued) | | | | | | |
| Alcatel-Lucent USA | | | | | | |
| 2.75% exercise price $16.75, | | | | | | |
| expiration date 3/1/13 | USD | | 56,000 | | $ | 55,790 |
| 2.875% exercise price $15.35, | | | | | | |
| expiration date 6/15/25 | | | 1,675,000 | | | 1,436,313 |
| *Amgen 0.375% exercise price $79.48, | | | | | | |
| expiration date 2/1/13 | | | 2,080,000 | | | 2,103,400 |
| ArvinMeritor 4.00% exercise price $26.73, | | | | | | |
| expiration date 2/15/27 | | | 1,830,000 | | | 1,367,925 |
| Beazer Homes USA 4.625% exercise | | | | | | |
| price $49.64, expiration date 6/15/24 | | | 568,000 | | | 529,660 |
| Bristow Group 3.00% exercise | | | | | | |
| price $77.34, expiration date 6/14/38 | | | 1,374,000 | | | 1,238,318 |
| Century Aluminum 1.75% exercise | | | | | | |
| price $30.54, expiration date 8/1/24 | | | 220,000 | | | 211,475 |
| Chesapeake Energy 2.25% exercise | | | | | | |
| price $85.89, expiration date 12/15/38 | | | 1,721,000 | | | 1,310,111 |
| #Corporate Office Properties 144A | | | | | | |
| 3.50% exercise price $53.12, | | | | | | |
| expiration date 9/15/26 | | | 1,852,000 | | | 1,801,070 |
| #Digital Realty Trust 144A 5.50% exercise | | | | | | |
| price $43.00, expiration date 4/15/29 | | | 1,340,000 | | | 1,750,375 |
| Flextronics International 1.00% exercise | | | | | | |
| price $15.53, expiration date 8/1/10 | | | 29,000 | | | 28,638 |
| Ford Motor 4.25% exercise price $9.30, | | | | | | |
| expiration date 11/15/16 | | | 565,000 | | | 711,194 |
| Freeport-McMoRan Copper & Gold | | | | | | |
| 6.75% exercise price $72.91, | | | | | | |
| expiration date 5/1/10 | | | 8,719 | | | 1,004,865 |
| #Gaylord Entertainment 144A | | | | | | |
| 3.75% exercise price $27.25, | | | | | | |
| expiration date 9/29/14 | | | 2,505,000 | | | 2,564,493 |
| Health Care REIT 4.75% exercise | | | | | | |
| price $50.00, expiration date 7/15/27 | | | 1,391,000 | | | 1,559,659 |
| ΦHologic 2.00% exercise price $38.59, | | | | | | |
| expiration date 12/15/37 | | | 4,138,000 | | | 3,553,507 |
| *#Intel 144A 3.25% exercise price $22.68, | | | | | | |
| expiration date 8/1/39 | | | 1,448,000 | | | 1,670,630 |
| #International Game Technology 144A | | | | | | |
| 3.25% exercise price $19.96, | | | | | | |
| expiration date 5/1/14 | | | 1,433,000 | | | 1,753,634 |
| Interpublic Group 4.25% exercise | | | | | | |
| price $12.42, expiration date 3/15/23 | | | 1,620,000 | | | 1,617,975 |
| Inverness Medical Innovations | | | | | | |
| 3.00% exercise price $43.98, | | | | | | |
| expiration date 5/15/16 | | | 1,434,000 | | | 1,652,685 |
| Jefferies Group 3.875% exercise | | | | | | |
| | price $39.20, expiration date 11/1/29 | | | 1,668,000 | | | 1,655,490 |
| L-3 Communications 3.00% exercise | | | | | | |
| price $100.14, expiration date 8/1/35 | | | 20,000 | | | 21,100 |
| Leap Wireless International | | | | | | |
| 4.50% exercise price $93.21, | | | | | | |
| expiration date 7/15/14 | | | 1,000,000 | | | 832,500 |
| Level 3 Communications 5.25% exercise | | | | | | |
| price $3.98, expiration date 12/15/11 | | | 614,000 | | | 585,603 |
| Linear Technology 3.00% exercise | | | | | | |
| price $46.12, expiration date 5/1/27 | | | 1,840,000 | | | 1,853,800 |
| Medtronic 1.625% exercise | | | | | | |
| price $55.41, expiration date 4/15/13 | | | 1,078,000 | | | 1,130,553 |
| †Mirant (Escrow) 2.50% exercise | | | | | | |
| price $67.95, expiration date 6/15/21 | | | 110,000 | | | 0 |
| National City 4.00% exercise | | | | | | |
| price $482.51, expiration date 2/1/11 | | | 2,140,000 | | | 2,190,825 |
| National Retail Properties | | | | | | |
| 5.125% exercise price $25.42, | | | | | | |
| expiration date 6/15/28 | | | 885,000 | | | 944,738 |
| NII Holdings 3.125% exercise price | | | | | | |
| | $118.32, expiration date 6/15/12 | | | 1,068,000 | | | 985,230 |
| Peabody Energy 4.75% exercise | | | | | | |
| price $58.44, expiration date 12/15/41 | | | 2,547,000 | | | 2,585,204 |
| Qwest Communications International | | | | | | |
| 3.50% exercise price $5.01, | | | | | | |
| expiration date 11/15/25 | | | 35,000 | | | 36,488 |
| Rayonier TRS Holdings 3.75% exercise | | | | | | |
| price $54.82, expiration date 10/15/12 | | | 32,000 | | | 34,160 |
| SanDisk 1.00% exercise price $82.35, | | | | | | |
| expiration date 5/15/13 | | | 1,640,000 | | | 1,375,550 |
| #SBA Communications 144A | | | | | | |
| 4.00% exercise price $30.38 | | | | | | |
| expiration date 10/1/14 | | | 1,783,000 | | | 2,349,102 |
| #Sino-Forest 144A 5.00% exercise | | | | | | |
| price $20.29, expiration date 8/1/13 | | | 1,258,000 | | | 1,492,303 |
| Transocean | | | | | | |
| 1.50% exercise price $168.61, | | | | | | |
| expiration date 12/15/37 | | | 1,462,000 | | | 1,418,140 |
| * | 1.625% exercise price $168.61, | | | | | | |
| expiration date 12/15/37 | | | 920,000 | | | 915,400 |
| VeriSign 3.25% exercise price $34.37, | | | | | | |
| expiration date 8/15/37 | | | 2,670,000 | | | 2,386,312 |
| #Virgin Media 144A 6.50% exercise | | | | | | |
| price $19.22, expiration date 11/15/16 | | | 1,175,000 | | | 1,398,250 |
| Total Convertible Bonds | | | | | | |
| (cost $52,262,202) | | | | | | 55,572,720 |
| |
| CORPORATE BONDS–62.35% | | | | | | |
| Banking–7.83% | | | | | | |
| #AgriBank 9.125% 7/15/19 | | | 2,600,000 | | | 2,861,898 |
| •BAC Capital Trust XIV 5.63% 12/31/49 | | | 2,288,000 | | | 1,595,880 |
| Bank of America | | | | | | |
| 5.125% 11/15/14 | | | 510,000 | | | 529,328 |
| 5.30% 3/15/17 | | | 4,375,000 | | | 4,294,216 |
| 6.10% 6/15/17 | | | 4,455,000 | | | 4,534,718 |
| Bank of New York Mellon | | | | | | |
| 4.95% 3/15/15 | | | 980,000 | | | 1,030,536 |
| Barclays Bank | | | | | | |
| 5.20% 7/10/14 | | | 440,000 | | | 466,873 |
| 6.75% 5/22/19 | | | 3,390,000 | | | 3,787,993 |
Diversified Income Series-7
Delaware VIP® Diversified Income Series
Statement of Net Assets (continued)
| | | Principal | | Value |
| | Amount° | | (U.S. $) |
| CORPORATE BONDS (continued) | | | | | | |
| Banking (continued) | | | | | | |
| #Barclays Bank 144A 6.05% 12/4/17 | USD | | 6,850,000 | | $ | 6,982,142 |
| BB&T 5.25% 11/1/19 | | | 647,000 | | | 624,727 |
| BB&T Capital Trust II 6.75% 6/7/36 | | | 3,895,000 | | | 3,773,258 |
| •BB&T Capital Trust IV 6.82% 6/12/57 | | | 1,600,000 | | | 1,464,000 |
| @#CoBank ACB 144A 7.875% 4/16/18 | | | 2,634,000 | | | 2,858,388 |
| Credit Suisse/New York | | | | | | |
| | 5.30% 8/13/19 | | | 1,030,000 | | | 1,059,768 |
| 6.00% 2/15/18 | | | 1,665,000 | | | 1,744,948 |
| Export-Import Bank of Korea | | | | | | |
| 5.875% 1/14/15 | | | 3,440,000 | | | 3,699,551 |
| #Industrial Bank of Korea 144A | | | | | | |
| 7.125% 4/23/14 | | | 714,000 | | | 799,949 |
| JPMorgan Chase Capital XVIII | | | | | | |
| 6.95% 8/17/36 | | | 1,855,000 | | | 1,807,549 |
| JPMorgan Chase Capital XXII | | | | | | |
| 6.45% 2/2/37 | | | 1,430,000 | | | 1,316,351 |
| JPMorgan Chase Capital XXV | | | | | | |
| 6.80% 10/1/37 | | | 8,453,000 | | | 8,424,605 |
| KeyBank 6.95% 2/1/28 | | | 4,255,000 | | | 3,655,458 |
| KFW 5.50% 6/5/14 | AUD | | 2,815,000 | | | 2,483,057 |
| *Korea Development Bank | | | | | | |
| 5.30% 1/17/13 | USD | | 1,600,000 | | | 1,682,440 |
| Landwirtschaftliche Rentenbank | | | | | | |
| 6.00% 7/15/14 | AUD | | 1,842,000 | | | 1,647,700 |
| #National Agricultural Cooperative | | | | | | |
| Federation 144A 5.00% 9/30/14 | USD | | 1,304,000 | | | 1,354,345 |
| •National City Bank 0.625% 6/7/17 | | | 435,000 | | | 386,695 |
| PNC Bank 6.875% 4/1/18 | | | 3,385,000 | | | 3,598,580 |
| PNC Funding | | | | | | |
| 5.25% 11/15/15 | | | 235,000 | | | 241,969 |
| 5.625% 2/1/17 | | | 1,250,000 | | | 1,240,440 |
| @*Popular North America Capital Trust I | | | | | | |
| 6.564% 9/15/34 | | | 1,034,000 | | | 606,418 |
| •#Rabobank Nederland 144A | | | | | | |
| 11.00% 12/29/49 | | | 5,045,000 | | | 6,168,219 |
| Regions Financial 7.75% 11/10/14 | | | 3,865,000 | | | 3,815,532 |
| #Russian Agricultural Bank 144A | | | | | | |
| 6.299% 5/15/17 | | | 1,599,000 | | | 1,618,188 |
| Silicon Valley Bank | | | | | | |
| 5.70% 6/1/12 | | | 2,285,000 | | | 2,322,111 |
| 6.05% 6/1/17 | | | 935,000 | | | 847,365 |
| U.S. Bank North America | | | | | | |
| 4.95% 10/30/14 | | | 525,000 | | | 557,418 |
| •USB Capital IX 6.189% 4/15/49 | | | 6,460,000 | | | 5,256,825 |
| VTB Capital 6.875% 5/29/18 | | | 310,000 | | | 313,100 |
| #VTB Capital 144A 6.875% 5/29/18 | | | 2,060,000 | | | 2,060,000 |
| Wachovia | | | | | | |
| 5.25% 8/1/14 | | | 1,415,000 | | | 1,466,376 |
| 5.625% 10/15/16 | | | 4,580,000 | | | 4,689,572 |
| •Wells Fargo Capital XIII | | | | | | |
| 7.70% 12/29/49 | | | 7,995,000 | | | 7,795,124 |
| Westpac Banking 4.875% 11/19/19 | | | 2,660,000 | | | 2,630,522 |
| Zions Bancorporation | | | | | | |
| 5.50% 11/16/15 | | | 997,000 | | | 705,680 |
| 5.65% 5/15/14 | | | 655,000 | | | 477,591 |
| 6.00% 9/15/15 | | | 433,000 | | | 306,600 |
| 7.75% 9/23/14 | | | 1,760,000 | | | 1,554,670 |
| | | | | | | 113,138,673 |
| Basic Industry–4.61% | | | | | | |
| #Algoma Acqusition 144A | | | | | | |
| 9.875% 6/15/15 | | | 1,380,000 | | | 1,181,625 |
| ArcelorMittal | | | | | | |
| * | 6.125% 6/1/18 | | | 2,215,000 | | | 2,289,258 |
| 9.00% 2/15/15 | | | 965,000 | | | 1,140,951 |
| 9.85% 6/1/19 | | | 2,445,000 | | | 3,167,555 |
| California Steel Industries | | | | | | |
| 6.125% 3/15/14 | | | 507,000 | | | 477,848 |
| Century Aluminum 8.00% 5/15/14 | | | 1,105,950 | | | 1,083,831 |
| #Compass Minerals International 144A | | | | | | |
| 8.00% 6/1/19 | | | 904,000 | | | 935,640 |
| Cytec Industries 6.00% 10/1/15 | | | 2,308,000 | | | 2,436,089 |
| Domtar 7.125% 8/15/15 | | | 272,000 | | | 274,720 |
| Dow Chemical | | | | | | |
| 5.70% 5/15/18 | | | 1,695,000 | | | 1,724,722 |
| 8.55% 5/15/19 | | | 3,390,000 | | | 4,051,534 |
| #Essar Steel Algoma 144A | | | | | | |
| 9.375% 3/15/15 | | | 1,455,000 | | | 1,442,269 |
| #Evraz Group 144A | | | | | | |
| 8.875% 4/24/13 | | | 1,358,000 | | | 1,364,790 |
| 9.50% 4/24/18 | | | 1,215,000 | | | 1,215,000 |
| #FMG Finance 144A 10.625% 9/1/16 | | | 2,095,000 | | | 2,328,069 |
| Freeport-McMoRan Copper & Gold | | | | | | |
| 8.375% 4/1/17 | | | 2,285,000 | | | 2,505,505 |
| #Georgia-Pacific 144A 8.25% 5/1/16 | | | 875,000 | | | 931,875 |
| *#Gerdau Holdings 144A 7.00% 1/20/20 | | | 760,000 | | | 784,700 |
| Huntsman International | | | | | | |
| * | 7.375% 1/1/15 | | | 1,511,000 | | | 1,458,115 |
| 7.875% 11/15/14 | | | 1,130,000 | | | 1,110,225 |
| Innophos 8.875% 8/15/14 | | | 809,000 | | | 825,180 |
| #Innophos Holdings 144A | | | | | | |
| 9.50% 4/15/12 | | | 362,000 | | | 369,240 |
| International Paper 7.30% 11/15/39 | | | 1,180,000 | | | 1,255,750 |
| Lubrizol 8.875% 2/1/19 | | | 3,655,000 | | | 4,551,644 |
| #MacDermid 144A 9.50% 4/15/17 | | | 1,286,000 | | | 1,292,430 |
| Massey Energy 6.875% 12/15/13 | | | 2,761,000 | | | 2,771,354 |
| #Nalco 144A 8.25% 5/15/17 | | | 695,000 | | | 741,913 |
| #Newpage 144A 11.375% 12/31/14 | | | 1,710,000 | | | 1,735,650 |
| •Noranda Aluminum Acquisition PIK | | | | | | |
| 5.274% 5/15/15 | | | 1,115,517 | | | 871,498 |
| @#Norske Skogindustrier 144A | | | | | | |
| 7.125% 10/15/33 | | | 565,000 | | | 305,100 |
| Novelis 7.25% 2/15/15 | | | 975,000 | | | 933,563 |
| *#Novelis 144A 11.50% 2/15/15 | | | 1,048,000 | | | 1,127,910 |
| #PE Paper Escrow 144A | | | | | | |
| 12.00% 8/1/14 | | | 270,000 | | | 298,879 |
| @=Port Townsend 7.32% 8/27/12 | | | 200,788 | | | 145,571 |
Diversified Income Series-8
Delaware VIP® Diversified Income Series
Statement of Net Assets (continued)
| | | Principal | | Value |
| | Amount° | | (U.S. $) |
| CORPORATE BONDS (continued) | | | | | | |
| Basic Industry (continued) | | | | | | |
| Reliance Steel & Aluminum | | | | | | |
| 6.85% 11/15/36 | USD | | 1,881,000 | | $ | 1,586,486 |
| Ryerson | | | | | | |
| • | 7.656% 11/1/14 | | | 447,000 | | | 414,034 |
| 12.25% 11/1/15 | | | 335,000 | | | 351,750 |
| #Sappi Papier Holding 144A | | | | | | |
| 6.75% 6/15/12 | | | 1,381,000 | | | 1,323,759 |
| #Severstal 144A 9.75% 7/29/13 | | | 440,000 | | | 445,500 |
| Southern Copper 7.50% 7/27/35 | | | 2,446,000 | | | 2,429,705 |
| Steel Dynamics 7.75% 4/15/16 | | | 2,030,000 | | | 2,123,888 |
| Teck Resources 10.25% 5/15/16 | | | 426,000 | | | 498,420 |
| #Teck Resources 144A 10.75% 5/15/19 | | | 1,781,000 | | | 2,137,200 |
| United States Steel 7.00% 2/1/18 | | | 778,000 | | | 763,202 |
| Vale Overseas | | | | | | |
| 6.875% 11/21/36 | | | 2,271,000 | | | 2,274,772 |
| 6.875% 11/10/39 | | | 1,520,000 | | | 1,537,820 |
| #Vale Overseas 144A 6.625% 9/25/19 | | | 1,508,000 | | | 1,519,310 |
| | | | | | | 66,535,849 |
| Brokerage–2.93% | | | | | | |
| #Cemex Finance 144A 9.50% 12/14/16 | | | 1,100,000 | | | 1,157,750 |
| Citigroup | | | | | | |
| 6.01% 1/15/15 | | | 2,180,000 | | | 2,228,387 |
| 6.375% 8/12/14 | | | 5,365,000 | | | 5,622,235 |
| 6.50% 8/19/13 | | | 2,560,000 | | | 2,729,093 |
| •Citigroup Capital XXI 8.30% 12/21/57 | | | 695,000 | | | 672,413 |
| E*Trade Financial PIK | | | | | | |
| 12.50% 11/30/17 | | | 1,657,000 | | | 1,891,051 |
| Goldman Sachs Group | | | | | | |
| 5.125% 1/15/15 | | | 865,000 | | | 909,906 |
| 5.25% 10/15/13 | | | 1,340,000 | | | 1,424,317 |
| 5.95% 1/18/18 | | | 1,120,000 | | | 1,184,580 |
| 6.25% 9/1/17 | | | 1,883,000 | | | 2,022,440 |
| Jefferies Group | | | | | | |
| 6.25% 1/15/36 | | | 1,390,000 | | | 1,110,809 |
| 6.45% 6/8/27 | | | 3,988,000 | | | 3,407,020 |
| *JPMorgan Chase 6.00% 10/1/17 | | | 1,185,000 | | | 1,270,721 |
| LaBranche 11.00% 5/15/12 | | | 3,118,000 | | | 3,012,768 |
| Lazard Group | | | | | | |
| 6.85% 6/15/17 | | | 1,441,000 | | | 1,452,293 |
| 7.125% 5/15/15 | | | 440,000 | | | 457,290 |
| Morgan Stanley | | | | | | |
| 5.375% 10/15/15 | | | 3,515,000 | | | 3,636,384 |
| 5.55% 4/27/17 | | | 1,750,000 | | | 1,760,364 |
| 6.00% 4/28/15 | | | 5,020,000 | | | 5,353,498 |
| 6.25% 8/28/17 | | | 1,010,000 | | | 1,055,618 |
| | | | | | | 42,358,937 |
| Capital Goods–3.21% | | | | | | |
| Allied Waste North America | | | | | | |
| 6.875% 6/1/17 | | | 3,380,000 | | | 3,592,236 |
| 7.125% 5/15/16 | | | 3,820,000 | | | 4,073,506 |
| AMH Holdings 11.25% 3/1/14 | | | 565,000 | | | 548,050 |
| Anixter 10.00% 3/15/14 | | | 1,004,000 | | | 1,114,440 |
| #BAE Systems Holdings 144A | | | | | | |
| 4.95% 6/1/14 | | | 385,000 | | | 401,274 |
| 5.20% 8/15/15 | | | 1,240,000 | | | 1,278,981 |
| Building Materials 7.75% 8/1/14 | | | 765,000 | | | 761,175 |
| #BWAY 144A 10.00% 4/15/14 | | | 1,447,000 | | | 1,537,438 |
| *•#C8 Capital 144A 6.64% 12/31/49 | | | 1,420,000 | | | 987,792 |
| #Case New Holland 144A 7.75% 9/1/13 | | | 1,000,000 | | | 1,027,500 |
| Casella Waste Systems 9.75% 2/1/13 | | | 1,071,000 | | | 1,062,968 |
| #Casella Waste Systems 144A | | | | | | |
| 11.00% 7/15/14 | | | 470,000 | | | 511,125 |
| #CPM Holdings 144A 10.625% 9/1/14 | | | 320,000 | | | 339,200 |
| *Crown Americas 7.625% 11/15/13 | | | 539,000 | | | 559,213 |
| #Crown Americas 144A 7.625% 5/15/17 | | | 515,000 | | | 536,888 |
| Eastman Kodak 7.25% 11/15/13 | | | 569,000 | | | 472,270 |
| *Graham Packaging 9.875% 10/15/14 | | | 1,903,000 | | | 1,950,574 |
| #Graham Packaging 144A 8.25% 1/1/17 | | | 775,000 | | | 769,188 |
| Graphic Packaging International | | | | | | |
| 9.50% 8/15/13 | | | 2,043,000 | | | 2,119,612 |
| #Graphic Packaging International 144A | | | | | | |
| 9.50% 6/15/17 | | | 498,000 | | | 530,370 |
| #Greif 144A 7.75% 8/1/19 | | | 590,000 | | | 604,750 |
| Intertape Polymer 8.50% 8/1/14 | | | 690,000 | | | 594,263 |
| Jabil Circuit 7.75% 7/15/16 | | | 798,000 | | | 841,890 |
| L-3 Communications 6.125% 7/15/13 | | | 586,000 | | | 594,790 |
| #Owens-Brockway Glass Container 144A | | | | | | |
| 7.375% 5/15/16 | | | 347,000 | | | 360,013 |
| #Plastipak Holdings 144A | | | | | | |
| 8.50% 12/15/15 | | | 857,000 | | | 883,781 |
| 10.625% 8/15/19 | | | 873,000 | | | 966,848 |
| Pregis 12.375% 10/15/13 | | | 2,173,000 | | | 2,115,958 |
| RBS Global/Rexnord | | | | | | |
| 9.50% 8/1/14 | | | 755,000 | | | 760,663 |
| * | 11.75% 8/1/16 | | | 928,000 | | | 923,360 |
| *Sanmina-SCI 8.125% 3/1/16 | | | 1,864,000 | | | 1,868,660 |
| #Sealed Air 144A 7.875% 6/15/17 | | | 340,000 | | | 362,666 |
| Smurfit Kappa Funding 7.75% 4/1/15 | | | 910,000 | | | 879,288 |
| *Solo Cup 8.50% 2/15/14 | | | 1,432,000 | | | 1,406,940 |
| Terex 8.00% 11/15/17 | | | 995,000 | | | 962,663 |
| Thermadyne Holdings 10.50% 2/1/14 | | | 808,000 | | | 768,610 |
| #Trimas 144A 9.75% 12/15/17 | | | 795,000 | | | 784,069 |
| Tyco International Finance | | | | | | |
| 8.50% 1/15/19 | | | 4,050,000 | | | 4,899,401 |
| USG 6.30% 11/15/16 | | | 1,588,000 | | | 1,429,200 |
| #USG 144A 9.75% 8/1/14 | | | 230,000 | | | 246,675 |
| | | | | | | 46,428,288 |
| Communications–11.86% | | | | | | |
| Affinion Group 11.50% 10/15/15 | | | 810,000 | | | 852,525 |
| Alcatel-Lucent USA 6.45% 3/15/29 | | | 902,000 | | | 650,568 |
| America Movil SAB de CV | | | | | | |
| 5.625% 11/15/17 | | | 1,774,000 | | | 1,845,561 |
| American Tower 7.00% 10/15/17 | | | 2,685,000 | | | 2,987,063 |
| AT&T 6.50% 9/1/37 | | | 5,075,000 | | | 5,277,395 |
| Belo | | | | | | |
| 6.75% 5/30/13 | | | 495,000 | | | 489,431 |
| 8.00% 11/15/16 | | | 650,000 | | | 671,125 |
| #Cablevision Systems 144A | | | | | | |
| 8.625% 9/15/17 | | | 785,000 | | | 821,306 |
Diversified Income Series-9
Delaware VIP® Diversified Income Series
Statement of Net Assets (continued)
| | | Principal | | Value |
| | | | Amount° | | (U.S. $) |
| CORPORATE BONDS (continued) | | | | | | | |
| Communications (continued) | | | | | | | |
| *CCH II 13.50% 11/30/16 | | USD | | 1,770,000 | | $ | 2,093,025 |
| #Cengage Learning Acquisitions 144A | | | | | | | |
| 10.50% 1/15/15 | | | | 1,180,000 | | | 1,134,275 |
| #Cequel Communications I Holdings I | | | | | | | |
| 144A 8.625% 11/15/17 | | | | 585,000 | | | 593,775 |
| #Charter Communications Operating | | | | | | | |
| 144A 10.875% 9/15/14 | | | | 1,888,000 | | | 2,124,000 |
| Cincinnati Bell | | | | | | | |
| 7.00% 2/15/15 | | | | 1,183,000 | | | 1,174,128 |
| 8.25% 10/15/17 | | | | 1,480,000 | | | 1,509,600 |
| Citizens Communications | | | | | | | |
| 6.25% 1/15/13 | | | | 336,000 | | | 338,520 |
| 7.125% 3/15/19 | | | | 1,017,000 | | | 966,150 |
| #Clearwire Communications/Finance | | | | | | | |
| 144A 12.00% 12/1/15 | | | | 4,785,000 | | | 4,880,700 |
| *#Columbus International 144A | | | | | | | |
| 11.50% 11/20/14 | | | | 1,925,000 | | | 2,030,875 |
| Comcast | | | | | | | |
| 4.95% 6/15/16 | | | | 2,250,000 | | | 2,313,871 |
| 6.50% 1/15/15 | | | | 3,615,000 | | | 4,054,464 |
| #Cox Communications 144A | | | | | | | |
| 5.875% 12/1/16 | | | | 1,410,000 | | | 1,494,562 |
| 6.95% 6/1/38 | | | | 1,580,000 | | | 1,678,941 |
| 8.375% 3/1/39 | | | | 1,770,000 | | | 2,210,852 |
| *Cricket Communications | | | | | | | |
| 9.375% 11/1/14 | | | | 3,526,000 | | | 3,561,260 |
| #*Cricket Communications 144A | | | | | | | |
| 7.75% 5/15/16 | | | | 560,000 | | | 561,400 |
| Crown Castle International | | | | | | | |
| 9.00% 1/15/15 | | | | 1,537,000 | | | 1,644,590 |
| #CSC Holdings 144A | | | | | | | |
| 8.50% 4/15/14 | | | | 483,000 | | | 516,810 |
| 8.50% 6/15/15 | | | | 197,000 | | | 210,790 |
| Deutsche Telekom International Finance | | | | | | | |
| 5.25% 7/22/13 | | | | 2,055,000 | | | 2,183,166 |
| #Digicel Group 144A | | | | | | | |
| 8.25% 9/1/17 | | | | 1,105,000 | | | 1,082,900 |
| 8.875% 1/15/15 | | | | 1,445,000 | | | 1,408,875 |
| * | 9.125% 1/15/15 | | | | 620,000 | | | 613,800 |
| 12.00% 4/1/14 | | | | 1,385,000 | | | 1,544,275 |
| #DigitalGlobe 144A 10.50% 5/1/14 | | | | 521,000 | | | 560,075 |
| DirecTV Holdings 7.625% 5/15/16 | | | | 5,845,000 | | | 6,393,815 |
| #DirecTVHoldings 144A 4.75% 10/1/14 | | | | 1,080,000 | | | 1,103,583 |
| DISH DBS 7.125% 2/1/16 | | | | 1,426,000 | | | 1,463,433 |
| #DISH DBS 144A 7.875% 9/1/19 | | | | 4,605,000 | | | 4,852,518 |
| #GCI 144A 8.625% 11/15/19 | | | | 540,000 | | | 547,425 |
| #Global Crossing 144A 12.00% 9/15/15 | | | | 1,865,000 | | | 2,056,163 |
| @Grupo Televisa 8.49% 5/11/37 | | MXN | | 19,000,000 | | | 1,192,449 |
| #GXS Worldwide 144A 9.75% 6/15/15 | | USD | | 2,150,000 | | | 2,123,125 |
| Hughes Network Systems/Finance | | | | | | | |
| 9.50% 4/15/14 | | | | 1,456,000 | | | 1,510,600 |
| #Intelsat Bermuda 144A 11.25% 2/4/17 | | | | 3,388,000 | | | 3,413,410 |
| Intelsat Jackson Holdings | | | | | | | |
| 11.25% 6/15/16 | | | | 3,668,000 | | | 3,988,949 |
| Intelsat Subsidiary Holding | | | | | | | |
| 8.875% 1/15/15 | | | | 678,000 | | | 705,120 |
| Interpublic Group 6.25% 11/15/14 | | | | 1,573,000 | | | 1,517,945 |
| #Interpublic Group 144A | | | | | | | |
| 10.00% 7/15/17 | | | | 179,000 | | | 199,585 |
| Lamar Media | | | | | | | |
| 6.625% 8/15/15 | | | | 627,000 | | | 605,055 |
| * | 6.625% 8/15/15 | | | | 829,000 | | | 808,275 |
| Level 3 Financing | | | | | | | |
| 9.25% 11/1/14 | | | | 982,000 | | | 932,900 |
| 12.25% 3/15/13 | | | | 737,000 | | | 784,905 |
| LIN Television 6.50% 5/15/13 | | | | 245,000 | | | 233,975 |
| #Mediacom Capital 144A | | | | | | | |
| 9.125% 8/15/19 | | | | 1,070,000 | | | 1,096,750 |
| *MetroPCS Wireless 9.25% 11/1/14 | | | | 2,871,000 | | | 2,921,243 |
| *#NET Servicos de Comunicacao 144A | | | | | | | |
| 7.50% 1/27/20 | | | | 1,241,000 | | | 1,272,025 |
| Nielsen Finance | | | | | | | |
| 10.00% 8/1/14 | | | | 623,000 | | | 652,593 |
| 11.50% 5/1/16 | | | | 491,000 | | | 551,148 |
| 11.625% 2/1/14 | | | | 562,000 | | | 634,358 |
| Ω | 12.50% 8/1/16 | | | | 737,000 | | | 676,198 |
| #NII Capital 144A | | | | | | | |
| 8.875% 12/15/19 | | | | 1,045,000 | | | 1,022,794 |
| 10.00% 8/15/16 | | | | 1,610,000 | | | 1,694,525 |
| #Nordic Telephone Holdings 144A | | | | | | | |
| 8.875% 5/1/16 | | | | 1,421,000 | | | 1,509,813 |
| PAETEC Holding 8.875% 6/30/17 | | | | 1,033,000 | | | 1,051,078 |
| #Qwest 144A 8.375% 5/1/16 | | | | 1,030,000 | | | 1,109,825 |
| Qwest Communications International | | | | | | | |
| 7.50% 2/15/14 | | | | 788,000 | | | 794,895 |
| #Rainbow National Services 144A | | | | | | | |
| 10.375% 9/1/14 | | | | 433,000 | | | 458,980 |
| Shaw Communications 6.75% 11/9/39 | | CAD | | 2,779,000 | | | 2,617,177 |
| #Sinclair Television Group 144A | | | | | | | |
| 9.25% 11/1/17 | | USD | | 775,000 | | | 809,875 |
| Sirius Satellite 9.625% 8/1/13 | | | | 525,000 | | | 525,000 |
| #Sirius XM Radio 144A 9.75% 9/1/15 | | | | 180,000 | | | 190,350 |
| Sprint Capital | | | | | | | |
| 6.875% 11/15/28 | | | | 2,705,000 | | | 2,262,056 |
| 8.75% 3/15/32 | | | | 3,935,000 | | | 3,728,412 |
| Sprint Nextel 6.00% 12/1/16 | | | | 3,196,000 | | | 2,932,330 |
| *#Telcordia Technologies 144A | | | | | | | |
| 10.00% 3/15/13 | | | | 2,180,000 | | | 1,951,100 |
| Telecom Italia Capital | | | | | | | |
| 5.25% 10/1/15 | | | | 4,305,000 | | | 4,506,645 |
| 7.175% 6/18/19 | | | | 2,495,000 | | | 2,786,436 |
| Telesat Canada | | | | | | | |
| 11.00% 11/1/15 | | | | 1,789,000 | | | 1,950,010 |
| 12.50% 11/1/17 | | | | 691,000 | | | 763,555 |
| #Terremark Worldwide 144A | | | | | | | |
| 12.00% 6/15/17 | | | | 832,000 | | | 923,520 |
| Time Warner Cable 8.25% 4/1/19 | | | | 3,920,000 | | | 4,676,916 |
Diversified Income Series-10
Delaware VIP® Diversified Income Series
Statement of Net Assets (continued)
| | | Principal | | Value |
| | Amount° | | (U.S. $) |
| CORPORATE BONDS (continued) | | | | | | |
| Communications (continued) | | | | | | |
| Time Warner Telecom Holdings | | | | | | |
| 9.25% 2/15/14 | USD | | 1,018,000 | | $ | 1,054,903 |
| *#Univision Communications 144A | | | | | | |
| 12.00% 7/1/14 | | | 795,000 | | | 879,469 |
| #UPC Holding 144A 9.875% 4/15/18 | | | 590,000 | | | 625,400 |
| Verizon Communications | | | | | | |
| 6.40% 2/15/38 | | | 1,890,000 | | | 1,982,400 |
| Videotron Ltee | | | | | | |
| 6.375% 12/15/15 | | | 32,000 | | | 31,440 |
| 9.125% 4/15/18 | | | 630,000 | | | 696,150 |
| #Videotron Ltee 144A 9.125% 4/15/18 | | | 287,000 | | | 317,135 |
| #Vimpelcom 144A 9.125% 4/30/18 | | | 2,926,000 | | | 3,138,135 |
| Virgin Media Finance | | | | | | |
| 8.375% 10/15/19 | | | 850,000 | | | 878,688 |
| 8.75% 4/15/14 | | | 135,000 | | | 140,063 |
| Visant Holding 8.75% 12/1/13 | | | 928,000 | | | 958,160 |
| #Vivendi 144A | | | | | | |
| 5.75% 4/4/13 | | | 4,875,000 | | | 5,129,104 |
| 6.625% 4/4/18 | | | 2,285,000 | | | 2,480,422 |
| Vodafone Group | | | | | | |
| 5.00% 12/16/13 | | | 480,000 | | | 508,699 |
| 5.00% 9/15/15 | | | 1,775,000 | | | 1,862,795 |
| 5.375% 1/30/15 | | | 3,200,000 | | | 3,442,730 |
| #Wind Acquisition Finance 144A | | | | | | |
| 11.75% 7/15/17 | | | 1,455,000 | | | 1,596,863 |
| 12.00% 12/1/15 | | | 570,000 | | | 612,750 |
| Windstream 8.125% 8/1/13 | | | 735,000 | | | 766,238 |
| #Windstream 144A 7.875% 11/1/17 | | | 235,000 | | | 233,238 |
| WPP Finance UK 8.00% 9/15/14 | | | 5,580,000 | | | 6,352,215 |
| #XM Satellite Radio 144A 13.00% 8/1/13 | | | 350,000 | | | 381,938 |
| XM Satellite Radio Holdings PIK | | | | | | |
| 10.00% 6/1/11 | | | 730,000 | | | 733,650 |
| | | | | | | 171,386,075 |
| Consumer Cyclical–6.96% | | | | | | |
| *#Allison Transmission 144A | | | | | | |
| 11.00% 11/1/15 | | | 2,675,000 | | | 2,822,125 |
| America Axle & Manufacturing | | | | | | |
| * | 5.25% 2/11/14 | | | 1,395,000 | | | 1,217,138 |
| 7.875% 3/1/17 | | | 685,000 | | | 582,250 |
| *ArvinMeritor 8.125% 9/15/15 | | | 1,990,000 | | | 1,910,400 |
| Beazer Homes USA 8.625% 5/15/11 | | | 1,057,000 | | | 1,035,860 |
| Burlington Coat Factory Investment | | | | | | |
| Holdings 14.50% 10/15/14 | | | 3,460,000 | | | 3,477,299 |
| *Burlington Coat Factory Warehouse | | | | | | |
| 11.125% 4/15/14 | | | 860,000 | | | 892,250 |
| Carrols 9.00% 1/15/13 | | | 361,000 | | | 368,220 |
| Corrections Corporation of America | | | | | | |
| 7.75% 6/1/17 | | | 1,220,000 | | | 1,262,700 |
| CVS Caremark 6.60% 3/15/19 | | | 730,000 | | | 800,223 |
| t#CVS Pass Through Trust 144A | | | | | | |
| 8.353% 7/10/31 | | | 6,495,531 | | | 7,165,349 |
| Darden Restaurants 6.80% 10/15/37 | | | 2,630,000 | | | 2,735,692 |
| Duane Reade 11.75% 8/1/15 | | | 25,000 | | | 27,250 |
| Ford Motor 7.45% 7/16/31 | | | 3,200,000 | | | 2,844,000 |
| Ford Motor Credit | | | | | | |
| 7.50% 8/1/12 | | | 2,805,000 | | | 2,830,354 |
| 7.80% 6/1/12 | | | 1,530,000 | | | 1,547,287 |
| 8.00% 6/1/14 | | | 1,253,000 | | | 1,287,747 |
| 9.875% 8/10/11 | | | 375,000 | | | 392,777 |
| 12.00% 5/15/15 | | | 1,360,000 | | | 1,578,688 |
| #Galaxy Entertainment Finance 144A | | | | | | |
| 9.875% 12/15/12 | | | 1,475,000 | | | 1,482,375 |
| Gaylord Entertainment | | | | | | |
| 6.75% 11/15/14 | | | 900,000 | | | 841,500 |
| Global Cash Access/Finance | | | | | | |
| 8.75% 3/15/12 | | | 754,000 | | | 754,943 |
| GMAC | | | | | | |
| 6.00% 12/15/11 | | | 468,000 | | | 463,320 |
| 6.625% 5/15/12 | | | 1,240,000 | | | 1,227,600 |
| 6.875% 9/15/11 | | | 4,096,000 | | | 4,075,519 |
| 6.875% 8/28/12 | | | 2,083,000 | | | 2,062,170 |
| Goodyear Tire & Rubber | | | | | | |
| * | 9.00% 7/1/15 | | | 954,000 | | | 996,930 |
| 10.50% 5/15/16 | | | 1,153,000 | | | 1,279,830 |
| #Harrah’s Operating 144A | | | | | | |
| 10.00% 12/15/18 | | | 2,887,000 | | | 2,331,253 |
| #Harrah’s Operating Escrow 144A | | | | | | |
| 11.25% 6/1/17 | | | 2,172,000 | | | 2,283,315 |
| Interface 9.50% 2/1/14 | | | 223,000 | | | 220,491 |
| #Interface 144A 11.375% 11/1/13 | | | 650,000 | | | 729,625 |
| #Invista 144A 9.25% 5/1/12 | | | 1,047,000 | | | 1,067,940 |
| K Hovnanian Enterprises | | | | | | |
| 6.25% 1/15/15 | | | 585,000 | | | 421,200 |
| 7.50% 5/15/16 | | | 910,000 | | | 655,200 |
| #K Hovnanian Enterprises 144A | | | | | | |
| 10.625% 10/15/16 | | | 990,000 | | | 1,039,500 |
| #Landry’s Restaurants 144A | | | | | | |
| 11.625% 12/1/15 | | | 485,000 | | | 516,525 |
| M/I Homes 6.875% 4/1/12 | | | 359,000 | | | 340,153 |
| Macy’s Retail Holdings | | | | | | |
| 6.65% 7/15/24 | | | 2,746,000 | | | 2,512,590 |
| 8.875% 7/15/15 | | | 968,000 | | | 1,072,060 |
| Meritage Homes | | | | | | |
| 6.25% 3/15/15 | | | 159,000 | | | 147,075 |
| 7.00% 5/1/14 | | | 985,000 | | | 945,600 |
| MGM MIRAGE | | | | | | |
| * | 6.625% 7/15/15 | | | 415,000 | | | 324,738 |
| 7.50% 6/1/16 | | | 1,273,000 | | | 999,305 |
| * | 7.625% 1/15/17 | | | 1,441,000 | | | 1,127,583 |
| 13.00% 11/15/13 | | | 842,000 | | | 970,405 |
| #MGM MIRAGE 144A | | | | | | |
| 11.125% 11/15/17 | | | 607,000 | | | 675,288 |
| 11.375% 3/1/18 | | | 1,225,000 | | | 1,102,500 |
| Mobile Mini | | | | | | |
| 6.875% 5/1/15 | | | 629,000 | | | 597,550 |
| 9.75% 8/1/14 | | | 225,000 | | | 235,125 |
| Mohawk Industries 6.875% 1/15/16 | | | 621,000 | | | 621,000 |
Diversified Income Series-11
Delaware VIP® Diversified Income Series
Statement of Net Assets (continued)
| | | Principal | | Value |
| | Amount° | | (U.S. $) |
| CORPORATE BONDS (continued) | | | | | | |
| Consumer Cyclical (continued) | | | | | | |
| Mohegan Tribal Gaming Authority | | | | | | |
| 6.875% 2/15/15 | USD | | 800,000 | | $ | 524,000 |
| *#NCL 144A 11.75% 11/15/16 | | | 695,000 | | | 689,788 |
| New Albertsons 7.25% 5/1/13 | | | 294,000 | | | 299,145 |
| #Norcraft 144A 10.50% 12/15/15 | | | 710,000 | | | 731,300 |
| Nordstrom | | | | | | |
| 6.75% 6/1/14 | | | 2,585,000 | | | 2,889,701 |
| 7.00% 1/15/38 | | | 1,615,000 | | | 1,793,803 |
| *OSI Restaurant Partners | | | | | | |
| 10.00% 6/15/15 | | | 1,166,000 | | | 1,034,825 |
| Pinnacle Entertainment | | | | | | |
| 7.50% 6/15/15 | | | 1,981,000 | | | 1,832,425 |
| #Pinnacle Entertainment 144A | | | | | | |
| 8.625% 8/1/17 | | | 745,000 | | | 763,625 |
| @#Pokagon Gaming Authority 144A | | | | | | |
| 10.375% 6/15/14 | | | 796,000 | | | 831,820 |
| Quiksilver 6.875% 4/15/15 | | | 2,140,000 | | | 1,765,500 |
| Rite Aid 9.375% 12/15/15 | | | 2,241,000 | | | 1,983,285 |
| Royal Caribbean Cruises | | | | | | |
| 6.875% 12/1/13 | | | 15,000 | | | 14,813 |
| * | 7.00% 6/15/13 | | | 1,130,000 | | | 1,132,825 |
| Ryland Group 8.40% 5/15/17 | | | 1,088,000 | | | 1,169,600 |
| #Sealy Mattress 144A | | | | | | |
| 10.875% 4/15/16 | | | 349,000 | | | 390,008 |
| #Shingle Springs Tribal Gaming | | | | | | |
| Authority 144A 9.375% 6/15/15 | | | 1,671,000 | | | 1,278,315 |
| Speedway Motorsports 8.75% 6/1/16 | | | 728,000 | | | 771,680 |
| #Standard Pacific Escrow 144A | | | | | | |
| 10.75% 9/15/16 | | | 1,080,000 | | | 1,107,000 |
| *Tenneco 8.625% 11/15/14 | | | 1,772,000 | | | 1,796,365 |
| Toys R US | | | | | | |
| 7.625% 8/1/11 | | | 404,000 | | | 412,585 |
| 7.875% 4/15/13 | | | 562,000 | | | 567,620 |
| #Toys R US Property 144A | | | | | | |
| 10.75% 7/15/17 | | | 702,000 | | | 772,200 |
| #TRW Automotive 144A | | | | | | |
| 7.00% 3/15/14 | | | 1,385,000 | | | 1,364,225 |
| * | 7.25% 3/15/17 | | | 810,000 | | | 789,750 |
| #Volvo Treasury 144A 5.95% 4/1/15 | | | 3,460,000 | | | 3,574,414 |
| *Wynn Las Vegas 6.625% 12/1/14 | | | 1,425,000 | | | 1,384,031 |
| | | | | | | 100,562,465 |
| Consumer Non-Cyclical–6.57% | | | | | | |
| Accellent 10.50% 12/1/13 | | | 1,520,000 | | | 1,470,600 |
| #Alliance HealthCare Services 144A | | | | | | |
| 8.00% 12/1/16 | | | 1,010,000 | | | 989,800 |
| #Alliance One International 144A | | | | | | |
| 10.00% 7/15/16 | | | 2,365,000 | | | 2,495,075 |
| #Anheuser-Busch InBev Worldwide 144A | | | | | | |
| 7.20% 1/15/14 | | | 2,135,000 | | | 2,423,575 |
| *Aramark 8.50% 2/1/15 | | | 2,286,000 | | | 2,366,010 |
| Bausch & Lomb 9.875% 11/1/15 | | | 2,615,000 | | | 2,771,900 |
| Beckman Coulter | | | | | | |
| 6.00% 6/1/15 | | | 2,600,000 | | | 2,837,931 |
| 7.00% 6/1/19 | | | 1,850,000 | | | 2,100,222 |
| Biomet 11.625% 10/15/17 | | | 761,000 | | | 844,710 |
| Biomet PIK 10.375% 10/15/17 | | | 698,000 | | | 760,820 |
| #Bio-Rad Laboratories 144A | | | | | | |
| 8.00% 9/15/16 | | | 515,000 | | | 544,613 |
| #CareFusion 144A 6.375% 8/1/19 | | | 5,730,000 | | | 6,145,138 |
| Community Health Systems | | | | | | |
| 8.875% 7/15/15 | | | 2,066,000 | | | 2,143,475 |
| Cornell 10.75% 7/1/12 | | | 239,000 | | | 245,274 |
| *Delhaize Group 5.875% 2/1/14 | | | 1,505,000 | | | 1,617,855 |
| DJO Finance 10.875% 11/15/14 | | | 1,190,000 | | | 1,261,400 |
| #Dole Food 144A | | | | | | |
| 8.00% 10/1/16 | | | 705,000 | | | 719,100 |
| 13.875% 3/15/14 | | | 610,000 | | | 736,575 |
| HCA | | | | | | |
| 6.50% 2/15/16 | | | 1,201,000 | | | 1,146,955 |
| 9.25% 11/15/16 | | | 3,806,000 | | | 4,096,207 |
| #HCA 144A 9.875% 2/15/17 | | | 120,000 | | | 133,200 |
| HCA PIK 9.625% 11/15/16 | | | 416,000 | | | 451,360 |
| Hospira 6.40% 5/15/15 | | | 3,010,000 | | | 3,335,342 |
| Ingles Markets 8.875% 5/15/17 | | | 851,000 | | | 889,295 |
| Inverness Medical Innovations | | | | | | |
| 9.00% 5/15/16 | | | 1,167,000 | | | 1,199,093 |
| Iron Mountain | | | | | | |
| 6.625% 1/1/16 | | | 322,000 | | | 317,170 |
| 8.00% 6/15/20 | | | 1,769,000 | | | 1,804,380 |
| * | 8.75% 7/15/18 | | | 243,000 | | | 253,328 |
| Jarden 8.00% 5/1/16 | | | 1,273,000 | | | 1,320,738 |
| #JBS USA Finance 144A | | | | | | |
| 11.625% 5/1/14 | | | 1,502,000 | | | 1,708,525 |
| Medco Health Solutions | | | | | | |
| 7.125% 3/15/18 | | | 4,805,000 | | | 5,410,006 |
| #M-Foods Holdings 144A | | | | | | |
| 9.75% 10/1/13 | | | 406,000 | | | 423,763 |
| #National Money Mart 144A | | | | | | |
| 10.375% 12/15/16 | | | 1,355,000 | | | 1,392,263 |
| #Novasep Holding 144A | | | | | | |
| 9.75% 12/15/16 | | | 2,120,000 | | | 2,077,600 |
| Psychiatric Solutions 7.75% 7/15/15 | | | 978,000 | | | 951,105 |
| #Psychiatric Solutions 144A | | | | | | |
| 7.75% 7/15/15 | | | 1,047,000 | | | 992,033 |
| Quest Diagnostics | | | | | | |
| 5.45% 11/1/15 | | | 5,673,000 | | | 6,140,749 |
| 6.40% 7/1/17 | | | 1,970,000 | | | 2,165,008 |
| RSC Equipment Rental 9.50% 12/1/14 | | | 2,104,000 | | | 2,117,150 |
| *#RSC Equipment Rental III 144A | | | | | | |
| 10.25% 11/15/19 | | | 975,000 | | | 983,531 |
| Select Medical 7.625% 2/1/15 | | | 2,194,000 | | | 2,139,150 |
| #ServiceMaster PIK 144A | | | | | | |
| 10.75% 7/15/15 | | | 1,070,000 | | | 1,118,150 |
| Smithfield Foods 7.75% 5/15/13 | | | 1,688,000 | | | 1,645,800 |
| #Smithfield Foods 144A | | | | | | |
| 10.00% 7/15/14 | | | 495,000 | | | 539,550 |
Diversified Income Series-12
Delaware VIP® Diversified Income Series
Statement of Net Assets (continued)
| | | Principal | | Value |
| | Amount° | | (U.S. $) |
| CORPORATE BONDS (continued) | | | | | | |
| Consumer Non-Cyclical (continued) | | | | | | |
| Supervalu | | | | | | |
| | 7.50% 11/15/14 | USD | | 850,000 | | $ | 864,875 |
| 8.00% 5/1/16 | | | 1,062,000 | | | 1,083,240 |
| Tenet Healthcare 7.375% 2/1/13 | | | 1,987,000 | | | 2,001,903 |
| #Tops Markets 144A 10.125% 10/15/15 | | | 550,000 | | | 569,250 |
| #Tyson Foods 144A 10.50% 3/1/14 | | | 840,000 | | | 963,900 |
| UnitedHealth Group 6.00% 2/15/18 | | | 3,425,000 | | | 3,543,505 |
| Universal Hospital Services PIK | | | | | | |
| 8.50% 6/1/15 | | | 543,000 | | | 537,570 |
| •US Oncology Holdings PIK | | | | | | |
| 6.428% 3/15/12 | | | 2,324,000 | | | 2,184,560 |
| Yale University 2.90% 10/15/14 | | | 4,070,000 | | | 4,059,451 |
| *Yankee Acquisition 9.75% 2/15/17 | | | 1,965,000 | | | 1,945,350 |
| | | | | | | 94,979,128 |
| Electric & Gas–4.23% | | | | | | |
| AES | | | | | | |
| 7.75% 3/1/14 | | | 150,000 | | | 153,000 |
| 8.00% 10/15/17 | | | 529,000 | | | 545,531 |
| 8.00% 6/1/20 | | | 5,771,000 | | | 5,900,847 |
| #AES 144A 8.75% 5/15/13 | | | 72,000 | | | 74,160 |
| Ameren 8.875% 5/15/14 | | | 1,015,000 | | | 1,141,113 |
| #American Transmission Systems 144A | | | | | | |
| 5.25% 1/15/22 | | | 1,780,000 | | | 1,761,536 |
| #Calpine Construction Finance 144A | | | | | | |
| 8.00% 6/1/16 | | | 1,598,000 | | | 1,653,930 |
| #Centrais Eletricas Brasileiras 144A | | | | | | |
| 6.875% 7/30/19 | | | 3,165,000 | | | 3,445,894 |
| Duquense Light Holdings | | | | | | |
| 5.50% 8/15/15 | | | 1,076,000 | | | 1,020,313 |
| Edison Mission Energy | | | | | | |
| 7.00% 5/15/17 | | | 255,000 | | | 202,725 |
| 7.20% 5/15/19 | | | 723,000 | | | 551,288 |
| * | 7.50% 6/15/13 | | | 445,000 | | | 420,525 |
| Elwood Energy 8.159% 7/5/26 | | | 993,642 | | | 918,671 |
| #Enel Finance International 144A | | | | | | |
| 3.875% 10/7/14 | | | 425,000 | | | 430,640 |
| 5.125% 10/7/19 | | | 3,925,000 | | | 3,956,769 |
| Energy Future Holdings | | | | | | |
| 5.55% 11/15/14 | | | 1,500,000 | | | 1,071,297 |
| 10.875% 11/1/17 | | | 789,000 | | | 648,953 |
| Illinois Power 9.75% 11/15/18 | | | 7,220,000 | | | 8,991,895 |
| #Majapahit Holding 144A | | | | | | |
| 7.75% 1/20/20 | | | 924,000 | | | 972,510 |
| 8.00% 8/7/19 | | | 1,505,000 | | | 1,595,300 |
| Midamerican Funding 6.75% 3/1/11 | | | 20,000 | | | 20,895 |
| Mirant North America | | | | | | |
| 7.375% 12/31/13 | | | 206,000 | | | 204,713 |
| *Mirant North Americas Generation | | | | | | |
| 8.50% 10/1/21 | | | 1,541,000 | | | 1,471,655 |
| NRG Energy | | | | | | |
| 7.25% 2/1/14 | | | 889,000 | | | 902,335 |
| 7.375% 2/1/16 | | | 3,871,000 | | | 3,885,516 |
| 7.375% 1/15/17 | | | 579,000 | | | 581,895 |
| Orion Power Holdings 12.00% 5/1/10 | | | 771,000 | | | 794,130 |
| Pennsylvania Electric 5.20% 4/1/20 | | | 4,510,000 | | | 4,450,536 |
| PPL Electric Utilities 7.125% 11/30/13 | | | 1,130,000 | | | 1,292,783 |
| Progress Energy 4.875% 12/1/19 | | | 2,400,000 | | | 2,336,846 |
| Public Service Company of Oklahoma | | | | | | |
| 5.15% 12/1/19 | | | 4,385,000 | | | 4,361,939 |
| •Puget Sound Energy 6.974% 6/1/67 | | | 1,279,000 | | | 1,130,086 |
| *RRI Energy 7.625% 6/15/14 | | | 428,000 | | | 425,860 |
| Sempra Energy 6.00% 10/15/39 | | | 2,175,000 | | | 2,155,088 |
| *Texas Competitive Electric Holdings | | | | | | |
| 10.25% 11/1/15 | | | 1,981,000 | | | 1,614,515 |
| | | | | | | 61,085,689 |
| Energy–6.86% | | | | | | |
| #Adaro Indonesia 144A | | | | | | |
| 7.625% 10/22/19 | | | 1,688,000 | | | 1,677,450 |
| #Arch Coal 144A 8.75% 8/1/16 | | | 635,000 | | | 674,688 |
| Berry Petroleum 10.25% 6/1/14 | | | 1,025,000 | | | 1,119,813 |
| Chesapeake Energy | | | | | | |
| 6.50% 8/15/17 | | | 1,390,000 | | | 1,369,150 |
| 6.625% 1/15/16 | | | 948,000 | | | 943,260 |
| 7.00% 8/15/14 | | | 17,000 | | | 17,298 |
| 7.25% 12/15/18 | | | 141,000 | | | 142,763 |
| 9.50% 2/15/15 | | | 2,547,000 | | | 2,808,068 |
| CITIC Resources 6.75% 5/15/14 | | | 1,270,000 | | | 1,247,775 |
| Complete Production Services | | | | | | |
| 8.00% 12/15/16 | | | 1,381,000 | | | 1,368,916 |
| Copano Energy 7.75% 6/1/18 | | | 810,000 | | | 816,075 |
| Denbury Resources | | | | | | |
| 7.50% 4/1/13 | | | 232,000 | | | 234,320 |
| 9.75% 3/1/16 | | | 599,000 | | | 642,428 |
| *Dynergy Holdings | | | | | | |
| 7.75% 6/1/19 | | | 1,818,000 | | | 1,586,205 |
| 8.375% 5/1/16 | | | 205,000 | | | 195,775 |
| Enbridge Energy Partners | | | | | | |
| 9.875% 3/1/19 | | | 3,730,000 | | | 4,730,642 |
| Energy Transfer Partners | | | | | | |
| 9.70% 3/15/19 | | | 2,810,000 | | | 3,476,202 |
| Enterprise Products Operating | | | | | | |
| 5.00% 3/1/15 | | | 1,185,000 | | | 1,219,282 |
| 6.125% 10/15/39 | | | 130,000 | | | 126,010 |
| • | 8.375% 8/1/66 | | | 2,260,000 | | | 2,206,228 |
| * | 9.75% 1/31/14 | | | 1,960,000 | | | 2,341,228 |
| Forest Oil 7.25% 6/15/19 | | | 957,000 | | | 949,823 |
| #Gaz Capital 144A | | | | | | |
| 7.288% 8/16/37 | | | 669,000 | | | 620,498 |
| * | 9.25% 4/23/19 | | | 1,506,000 | | | 1,686,720 |
| Geophysique-Veritas 7.75% 5/15/17 | | | 997,000 | | | 994,508 |
| *#Headwaters 144A 11.375% 11/1/14 | | | 335,000 | | | 350,913 |
| #Helix Energy Solutions Group 144A | | | | | | |
| 9.50% 1/15/16 | | | 1,664,000 | | | 1,713,920 |
| #Hercules Offshore 144A | | | | | | |
| 10.50% 10/15/17 | | | 1,585,000 | | | 1,680,100 |
Diversified Income Series-13
Delaware VIP® Diversified Income Series
Statement of Net Assets (continued)
| | | Principal | | Value |
| | Amount° | | (U.S. $) |
| CORPORATE BONDS (continued) | | | | | | |
| Energy (continued) | | | | | | |
| #Hilcorp Energy I 144A | | | | | | |
| 7.75% 11/1/15 | USD | | 545,000 | | $ | 536,825 |
| | 9.00% 6/1/16 | | | 692,000 | | | 705,840 |
| #Holly 144A 9.875% 6/15/17 | | | 965,000 | | | 1,020,488 |
| International Coal Group | | | | | | |
| 10.25% 7/15/14 | | | 1,926,000 | | | 1,860,998 |
| KCS Energy 7.125% 4/1/12 | | | 19,000 | | | 19,143 |
| *Key Energy Services 8.375% 12/1/14 | | | 1,318,000 | | | 1,327,885 |
| Kinder Morgan Energy Partners | | | | | | |
| 6.85% 2/15/20 | | | 140,000 | | | 155,587 |
| 9.00% 2/1/19 | | | 2,490,000 | | | 3,068,926 |
| Mariner Energy 8.00% 5/15/17 | | | 1,032,000 | | | 995,880 |
| MarkWest Energy Partners | | | | | | |
| 8.75% 4/15/18 | | | 587,000 | | | 607,545 |
| #Midcontinent Express Pipeline 144A | | | | | | |
| 6.70% 9/15/19 | | | 3,190,000 | | | 3,277,635 |
| #Murray Energy 144A | | | | | | |
| 10.25% 10/15/15 | | | 845,000 | | | 845,000 |
| Nexen 7.50% 7/30/39 | | | 3,800,000 | | | 4,370,520 |
| Noble Energy 8.25% 3/1/19 | | | 2,725,000 | | | 3,265,576 |
| OPTI Canada | | | | | | |
| 7.875% 12/15/14 | | | 736,000 | | | 607,200 |
| 8.25% 12/15/14 | | | 1,400,000 | | | 1,160,250 |
| Petrobras International Finance | | | | | | |
| 5.75% 1/20/20 | | | 2,345,000 | | | 2,397,263 |
| Petrohawk Energy | | | | | | |
| 7.875% 6/1/15 | | | 480,000 | | | 487,200 |
| 9.125% 7/15/13 | | | 1,378,000 | | | 1,446,900 |
| #Petrohawk Energy 144A | | | | | | |
| 10.50% 8/1/14 | | | 332,000 | | | 364,370 |
| Petroleum Development | | | | | | |
| 12.00% 2/15/18 | | | 1,022,000 | | | 1,059,048 |
| #Petronas Capital 144A | | | | | | |
| 5.25% 8/12/19 | | | 1,483,000 | | | 1,489,246 |
| Plains All American Pipeline | | | | | | |
| 5.75% 1/15/20 | | | 6,360,000 | | | 6,376,758 |
| Plains Exploration & Production | | | | | | |
| 8.625% 10/15/19 | | | 500,000 | | | 516,250 |
| *#Power Sector Assets & Liabilities | | | | | | |
| Management 144A 7.39% 12/2/24 | | | 1,113,000 | | | 1,151,955 |
| Pride International 8.50% 6/15/19 | | | 3,635,000 | | | 4,216,599 |
| Quicksilver Resources | | | | | | |
| 7.125% 4/1/16 | | | 1,085,000 | | | 1,017,188 |
| 11.75% 1/1/16 | | | 477,000 | | | 543,780 |
| Range Resources 8.00% 5/15/19 | | | 1,027,000 | | | 1,104,025 |
| #Ras Laffan Liquefied Natural Gas III | | | | | | |
| 144A 5.832% 9/30/16 | | | 425,000 | | | 445,683 |
| Regency Energy Partners | | | | | | |
| 8.375% 12/15/13 | | | 405,000 | | | 421,200 |
| #Regency Energy Partners 144A | | | | | | |
| 9.375% 6/1/16 | | | 593,000 | | | 634,510 |
| #SandRidge Energy 144A | | | | | | |
| 8.75% 1/15/20 | | | 1,395,000 | | | 1,401,975 |
| 9.875% 5/15/16 | | | 1,679,000 | | | 1,775,543 |
| •TransCanada Pipelines | | | | | | |
| 6.35% 5/15/67 | | | 2,470,000 | | | 2,320,837 |
| Weatherford International | | | | | | |
| 4.95% 10/15/13 | | | 270,000 | | | 281,812 |
| 5.95% 6/15/12 | | | 1,615,000 | | | 1,729,400 |
| 9.625% 3/1/19 | | | 2,205,000 | | | 2,753,397 |
| Williams 7.50% 1/15/31 | | | 415,000 | | | 448,896 |
| #Woodside Finance 144A | | | | | | |
| 4.50% 11/10/14 | | | 2,985,000 | | | 3,014,867 |
| 5.00% 11/15/13 | | | 1,000,000 | | | 1,023,947 |
| | | | | | | 99,188,005 |
| Finance Companies–3.28% | | | | | | |
| Capital One Bank USA | | | | | | |
| 8.80% 7/15/19 | | | 5,280,000 | | | 6,249,646 |
| Capital One Capital V | | | | | | |
| 10.25% 8/15/39 | | | 3,205,000 | | | 3,735,476 |
| Capital One Capital VI | | | | | | |
| 8.875% 5/15/40 | | | 1,560,000 | | | 1,673,100 |
| Cardtronics 9.25% 8/15/13 | | | 1,759,000 | | | 1,818,367 |
| #CDP Financial 144A | | | | | | |
| 4.40% 11/25/19 | | | 4,590,000 | | | 4,405,390 |
| 5.60% 11/25/39 | | | 3,200,000 | | | 3,102,352 |
| FTI Consulting | | | | | | |
| 7.625% 6/15/13 | | | 647,000 | | | 659,131 |
| 7.75% 10/1/16 | | | 340,000 | | | 345,950 |
| General Electric Capital | | | | | | |
| • | 2.07% 2/2/11 | NOK | | 7,500,000 | | | 1,271,964 |
| @ | 5.125% 1/28/14 | SEK | | 7,400,000 | | | 1,060,689 |
| * | 6.00% 8/7/19 | USD | | 8,810,000 | | | 9,161,616 |
| 6.75% 3/15/32 | | | 190,000 | | | 194,277 |
| @General Electric Capital UK Funding | | | | | | |
| 4.625% 1/18/16 | GBP | | 509,000 | | | 801,283 |
| •#ILFC E-Capital Trust II 144A | | | | | | |
| 6.25% 12/21/65 | USD | | 660,000 | | | 349,800 |
| International Lease Finance | | | | | | |
| 5.25% 1/10/13 | | | 695,000 | | | 567,243 |
| 5.35% 3/1/12 | | | 933,000 | | | 810,327 |
| 5.55% 9/5/12 | | | 1,487,000 | | | 1,238,940 |
| 5.625% 9/20/13 | | | 2,910,000 | | | 2,284,431 |
| 5.875% 5/1/13 | | | 455,000 | | | 361,921 |
| * | 6.375% 3/25/13 | | | 1,235,000 | | | 1,016,090 |
| 6.625% 11/15/13 | | | 2,165,000 | | | 1,744,191 |
| Nuveen Investments | | | | | | |
| 10.50% 11/15/15 | | | 3,863,000 | | | 3,524,988 |
| TNB Capital 5.25% 5/5/15 | | | 895,000 | | | 940,855 |
| | | | | | | 47,318,027 |
| Industrials–0.09% | | | | | | |
| *Sally Holdings 10.50% 11/15/16 | | | 1,168,000 | | | 1,261,440 |
| | | | | | | 1,261,440 |
| Insurance–1.01% | | | | | | |
| •Chubb 6.375% 3/29/67 | | | 1,865,000 | | | 1,753,100 |
| MetLife 6.817% 8/15/18 | | | 655,000 | | | 730,716 |
| •#MetLife Capital Trust X 144A | | | | | | |
| 9.25% 4/8/38 | | | 4,420,000 | | | 5,038,799 |
Diversified Income Series-14
Delaware VIP® Diversified Income Series
Statement of Net Assets (continued)
| | | Principal | | Value |
| | Amount° | | (U.S. $) |
| CORPORATE BONDS (continued) | | | | | | |
| Insurance (continued) | | | | | | |
| @=‡t#Twin Reefs Pass Through Trust 144A | | | | | | |
| 1.386% 12/31/49 | USD | | 600,000 | | $ | 0 |
| UnitedHealth Group | | | | | | |
| 5.50% 11/15/12 | | | 1,561,000 | | | 1,667,743 |
| 5.80% 3/15/36 | | | 1,197,000 | | | 1,076,210 |
| WellPoint | | | | | | |
| 5.00% 12/15/14 | | | 244,000 | | | 254,115 |
| 6.00% 2/15/14 | | | 2,646,000 | | | 2,872,185 |
| 7.00% 2/15/19 | | | 1,040,000 | | | 1,165,157 |
| | | | | | | 14,558,025 |
| Natural Gas–0.27% | | | | | | |
| AmeriGas Partners 7.125% 5/20/16 | | | 512,000 | | | 514,560 |
| El Paso | | | | | | |
| 6.875% 6/15/14 | | | 192,000 | | | 192,818 |
| * | 7.00% 6/15/17 | | | 1,273,000 | | | 1,268,916 |
| 7.25% 6/1/18 | | | 126,000 | | | 125,118 |
| 8.25% 2/15/16 | | | 210,000 | | | 225,225 |
| #El Paso Performance-Linked Trust 144A | | | | | | |
| 7.75% 7/15/11 | | | 354,000 | | | 364,677 |
| Inergy Finance | | | | | | |
| * | 6.875% 12/15/14 | | | 475,000 | | | 471,438 |
| 8.25% 3/1/16 | | | 376,000 | | | 383,520 |
| #Inergy Finance 144A 8.75% 3/1/15 | | | 308,000 | | | 318,010 |
| | | | | | | 3,864,282 |
| Real Estate–0.66% | | | | | | |
| Developers Diversified Realty | | | | | | |
| 5.375% 10/15/12 | | | 1,195,000 | | | 1,123,832 |
| * | 9.625% 3/15/16 | | | 865,000 | | | 904,082 |
| *#Host Hotels & Resorts 144A | | | | | | |
| 9.00% 5/15/17 | | | 1,084,000 | | | 1,177,495 |
| ProLogis 7.375% 10/30/19 | | | 3,465,000 | | | 3,423,773 |
| Regency Centers 5.875% 6/15/17 | | | 550,000 | | | 509,716 |
| •#USB Realty 144A 6.091% 12/22/49 | | | 2,700,000 | | | 1,991,250 |
| Ventas Realty 6.50% 6/1/16 | | | 490,000 | | | 475,300 |
| | | | | | | 9,605,448 |
| Technology–1.35% | | | | | | |
| *First Data 9.875% 9/24/15 | | | 5,941,000 | | | 5,569,688 |
| *Freescale Semiconductor | | | | | | |
| 8.875% 12/15/14 | | | 6,750,000 | | | 6,226,875 |
| Sungard Data Systems | | | | | | |
| 9.125% 8/15/13 | | | 930,000 | | | 957,900 |
| * | 10.25% 8/15/15 | | | 1,553,000 | | | 1,661,710 |
| #Unisys 144A 12.75% 10/15/14 | | | 828,000 | | | 960,480 |
| Xerox | | | | | | |
| * | 4.25% 2/15/15 | | | 2,315,000 | | | 2,301,476 |
| 8.25% 5/15/14 | | | 1,615,000 | | | 1,854,325 |
| | | | | | | 19,532,454 |
| Transportation–0.63% | | | | | | |
| #Ashtead Capital 144A 9.00% 8/15/16 | | | 832,000 | | | 837,200 |
| #Ashtead Holdings 144A 8.625% 8/1/15 | | | 75,000 | | | 75,750 |
| Avis Budget Car Rental | | | | | | |
| 7.625% 5/15/14 | | | 1,535,000 | | | 1,465,925 |
| * | 7.75% 5/15/16 | | | 950,000 | | | 893,000 |
| Delta Air Lines 7.92% 11/18/10 | | | 623,000 | | | 626,115 |
| Hertz | | | | | | |
| 8.875% 1/1/14 | | | 1,244,000 | | | 1,278,210 |
| * | 10.50% 1/1/16 | | | 836,000 | | | 896,610 |
| Kansas City Southern de Mexico | | | | | | |
| 9.375% 5/1/12 | | | 2,180,000 | | | 2,272,650 |
| #Kansas City Southern de Mexico 144A | | | | | | |
| 12.50% 4/1/16 | | | 595,000 | | | 687,225 |
| ‡@Northwest Airlines 10.00% 2/1/10 | | | 145,000 | | | 1,102 |
| | | | | | | 9,033,787 |
| Total Corporate Bonds | | | | | | |
| (cost $838,300,215) | | | | | | 900,836,572 |
| |
| MUNICIPAL BONDS–0.83% | | | | | | |
| California State | | | | | | |
| 7.30% 10/1/39 | | | 5,000,000 | | | 4,747,350 |
| 7.55% 4/1/39 | | | 4,895,000 | | | 4,826,030 |
| North Texas Tollway Authority Series A | | | | | | |
| 6.00% 1/1/20 | | | 385,000 | | | 426,711 |
| Oregon State Taxable Pension | | | | | | |
| (1st Subordinate) 5.892% 6/1/27 | | | 5,000 | | | 5,043 |
| •Puerto Rico Sales Tax Financing | | | | | | |
| | Revenue (1st Subordinate) Class B | | | | | | |
| 5.00% 8/1/39 | | | 1,875,000 | | | 1,967,081 |
| Total Municipal Bonds | | | | | | |
| (cost $12,332,462) | | | | | | 11,972,215 |
| |
| NON-AGENCY ASSET-BACKED | | | | | | |
| SECURITIES–3.79% | | | | | | |
| •#AH Mortgage Advance Trust Series | | | | | | |
| 2009-ADV3 A1 144A | | | | | | |
| 2.186% 10/6/21 | | | 2,150,000 | | | 2,158,170 |
| #Bank of America Auto Trust Series | | | | | | |
| 2009-3A A4 144A 2.67% 12/15/16 | | | 4,220,000 | | | 4,189,036 |
| •Bank of America Credit Card Trust | | | | | | |
| Series 2008-A5 A5 1.433% 12/16/13 | | | 2,460,000 | | | 2,471,332 |
| #Cabela’s Master Credit Card Trust | | | | | | |
| Series 2008-1A A1 144A | | | | | | |
| 4.31% 12/16/13 | | | 1,220,000 | | | 1,247,394 |
| Capital Auto Receivables Asset Trust | | | | | | |
| Series 2007-3 A3A 5.02% 9/15/11 | | | 1,303,788 | | | 1,322,369 |
| Series 2008-1 A3A 3.86% 8/15/12 | | | 892,497 | | | 909,740 |
| Capital One Multi-Asset Execution Trust | | | | | | |
| Series 2007-A7 A7 5.75% 7/15/20 | | | 750,000 | | | 810,510 |
| Series 2008-A3 A3 5.05% 2/15/16 | | | 1,000,000 | | | 1,073,202 |
| Series 2009-A2 A2 3.20% 4/15/14 | | | 1,845,000 | | | 1,893,894 |
| Caterpillar Financial Asset Trust | | | | | | |
| Series 2007-A A3A 5.34% 6/25/12 | | | 133,356 | | | 135,743 |
| Series 2008-A A3 4.94% 4/25/14 | | | 2,010,000 | | | 2,057,104 |
| @Chase Funding Mortgage Loan | | | | | | |
| Asset-Backed Certificates | | | | | | |
| Series 2002-3 1A6 4.707% 9/25/13 | | | 544,858 | | | 503,682 |
Diversified Income Series-15
Delaware VIP® Diversified Income Series
Statement of Net Assets (continued)
| | | Principal | | Value |
| | Amount° | | (U.S. $) |
| NON-AGENCY ASSET-BACKED | | | | | | |
| SECURITIES (continued) | | | | | | |
| Chase Issuance Trust | | | | | | |
| | Series 2005-A7 A7 4.55% 3/15/13 | USD | | 1,255,000 | | $ | 1,300,723 |
| Series 2005-A10 A10 4.65% 12/17/12 | | | 1,270,000 | | | 1,308,900 |
| • | Series 2008-A6 A 1.433% 5/15/15 | | | 3,000,000 | | | 3,051,739 |
| Series 2008-A9 A9 4.26% 5/15/13 | | | 840,000 | | | 873,293 |
| Citibank Credit Card Issuance Trust | | | | | | |
| Series 2000-A3 A3 5.45% 5/10/13 | | | 1,210,000 | | | 1,273,533 |
| Series 2007-A3 A3 6.15% 6/15/39 | | | 1,797,000 | | | 1,951,684 |
| • | Series 2007-A7 A7 0.583% 8/20/14 | | | 750,000 | | | 741,810 |
| • | Series 2009-A1 A1 1.983% 3/17/14 | | | 1,540,000 | | | 1,572,327 |
| • | Series 2009-A2 A2 1.783% 5/15/14 | | | 2,300,000 | | | 2,338,214 |
| Citicorp Residential Mortgage Securities | | | | | | |
| Series 2006-3 A4 5.703% 11/25/36 | | | 1,910,000 | | | 1,636,485 |
| Series 2006-3 A5 5.948% 11/25/36 | | | 1,800,000 | | | 1,120,449 |
| CNH Equipment Trust | | | | | | |
| • | Series 2007-B A3B 0.833% 10/17/11 | | | 70,264 | | | 70,269 |
| Series 2008-A A4A 4.93% 8/15/14 | | | 755,000 | | | 782,043 |
| Series 2008-A3 4.12% 5/15/12 | | | 264,001 | | | 267,518 |
| Series 2008-B A3A 4.78% 7/16/12 | | | 659,125 | | | 670,014 |
| Series 2009-C A3 1.85% 12/16/13 | | | 950,000 | | | 946,294 |
| @Countrywide Asset-Backed Certificates | | | | | | |
| Series 2006-13 1AF3 5.944% 1/25/37 | | | 20,000 | | | 10,357 |
| Daimler Chrysler Auto Trust Series | | | | | | |
| 2008-B A3A 4.71% 9/10/12 | | | 1,025,000 | | | 1,052,567 |
| Discover Card Master Trust | | | | | | |
| Series 2007-A1 A1 5.65% 3/16/20 | | | 1,800,000 | | | 1,934,456 |
| Series 2008-A4 A4 5.65% 12/15/15 | | | 530,000 | | | 576,189 |
| #Dunkin Securitization Series 2006-1 A2 | | | | | | |
| 144A 5.779% 6/20/31 | | | 2,415,000 | | | 2,329,231 |
| •Ford Credit Floorplan Master Owner | | | | | | |
| Trust Series 2009-2 A | | | | | | |
| 1.783% 9/15/14 | | | 1,355,000 | | | 1,357,340 |
| General Electric Capital Credit Card | | | | | | |
| Master Note Trust Series 2009-3 A | | | | | | |
| 2.54% 9/15/14 | | | 2,035,000 | | | 2,036,627 |
| •#Golden Credit Card Trust | | | | | | |
| Series 2008-3 A 144A 1.233% 7/15/17 | | | 1,200,000 | | | 1,186,359 |
| #Harley-Davidson Motorcycle Trust | | | | | | |
| Series 2006-1 A2 144A 5.04% 10/15/12 | | | 278,797 | | | 286,137 |
| Hyundai Auto Receivables Trust | | | | | | |
| Series 2007-A A3A 5.04% 1/17/12 | | | 137,751 | | | 140,187 |
| Series 2008-A A3 4.93% 12/17/12 | | | 900,000 | | | 937,680 |
| Series 2009-4 A3 1.00% 2/15/14 | | | 735,000 | | | 732,236 |
| John Deere Owner Trust Series 2008-A A3 | | | | | | |
| 4.18% 6/15/12 | | | 811,916 | | | 822,388 |
| •MBNA Credit Card Master Note Trust | | | | | | |
| Series 2005-A4 0.273% 11/15/12 | | | 720,000 | | | 717,645 |
| •Merrill Auto Trust Securitization Series | | | | | | |
| 2007-1 A4 0.293% 12/15/13 | | | 645,000 | | | 637,942 |
| Mid-State Trust | | | | | | |
| Series 11 A1 4.864% 7/15/38 | | | 15,179 | | | 13,568 |
| Series 2005-1 A 5.745% 1/15/40 | | | 165,682 | | | 155,678 |
| # | Series 2006-1 A 144A 5.787% 10/15/40 | | | 198,604 | | | 198,243 |
| •Residential Asset Securities | | | | | | |
| Series 2006-KS3 AI3 0.401% 4/25/36 | | | 77,157 | | | 71,169 |
| PStructured Asset Securities | | | | | | |
| Series 2001-SB1 A2 3.375% 8/25/31 | | | 31,823 | | | 25,335 |
| World Omni Auto Receivables Trust | | | | | | |
| Series 2008-A A3A 3.94% 10/15/12 | | | 830,000 | | | 847,870 |
| Total Non-Agency Asset-Backed | | | | | | |
| Securities (cost $54,281,012) | | | | | | 54,746,675 |
| |
| NON-AGENCY COLLATERALIZED | | | | | | |
| MORTGAGE OBLIGATIONS–2.90% | | | | | | |
| @American Home Mortgage | | | | | | |
| Investment Trust Series 2005-2 5A1 | | | | | | |
| 5.064% 9/25/35 | | | 69,114 | | | 55,538 |
| •ARM Trust Series 2005-10 3A11 | | | | | | |
| 5.401% 1/25/36 | | | 900,566 | | | 748,073 |
| Bank of America Alternative Loan Trust | | | | | | |
| Series 2003-10 2A1 6.00% 12/25/33 | | | 809,406 | | | 806,624 |
| Series 2004-2 1A1 6.00% 3/25/34 | | | 109,516 | | | 106,128 |
| Series 2004-10 1CB1 6.00% 11/25/34 | | | 62,549 | | | 50,606 |
| Series 2004-11 1CB1 6.00% 12/25/34 | | | 3,872 | | | 3,094 |
| Series 2005-1 2A1 5.50% 2/25/20 | | | 495,870 | | | 445,043 |
| Series 2005-3 2A1 5.50% 4/25/20 | | | 64,804 | | | 57,837 |
| Series 2005-5 2CB1 6.00% 6/25/35 | | | 231,628 | | | 154,974 |
| Series 2005-6 7A1 5.50% 7/25/20 | | | 403,264 | | | 369,995 |
| Series 2005-9 5A1 5.50% 10/25/20 | | | 713,697 | | | 654,817 |
| Bank of America Funding Securities | | | | | | |
| Series 2005-8 1A1 5.50% 1/25/36 | | | 2,104,922 | | | 1,929,622 |
| Series 2006-5 2A10 5.75% 9/25/36 | | | 1,850,000 | | | 1,384,923 |
| •Bank of America Mortgage Securities | | | | | | |
| Series 2003-D 1A2 3.718% 5/25/33 | | | 33 | | | 21 |
| Series 2005-I 4A1 5.233% 10/25/35 | | | 176,489 | | | 145,134 |
| Chase Mortgage Finance | | | | | | |
| Series 2003-S8 A2 5.00% 9/25/18 | | | 363,987 | | | 365,807 |
| •Chaseflex Trust Series 2006-1 A4 | | | | | | |
| 6.30% 6/25/36 | | | 1,490,000 | | | 948,745 |
| Citicorp Mortgage Securities | | | | | | |
| Series 2006-3 1A9 5.75% 6/25/36 | | | 200,000 | | | 160,705 |
| Series 2006-4 3A1 5.50% 8/25/21 | | | 975,035 | | | 933,596 |
| •Citigroup Mortgage Loan Trust | | | | | | |
| Series 2004-UST1 A6 5.073% 8/25/34 | | | 711,727 | | | 706,292 |
| Series 2007-AR8 1A3A | | | | | | |
| 5.817% 8/25/37 | | | 1,669,538 | | | 1,191,472 |
| tCountrywide Home Loan Mortgage Pass | | | | | | |
| Through Trust | | | | | | |
| • | Series 2003-21 A1 4.066% 5/25/33 | | | 386 | | | 301 |
| Series 2005-23 A1 5.50% 11/25/35 | | | 2,218,227 | | | 2,033,490 |
| Series 2006-1 A2 6.00% 3/25/36 | | | 584,577 | | | 449,576 |
| @ | Series 2006-17 A5 6.00% 12/25/36 | | | 238,530 | | | 211,844 |
| • | Series 2006-HYB1 3A1 5.19% 3/20/36 | | | 847,298 | | | 503,628 |
| Credit Suisse First Boston | | | | | | |
| Mortgage Securities | | | | | | |
| Series 2003-29 5A1 7.00% 12/25/33 | | | 77,153 | | | 76,056 |
| Series 2004-1 3A1 7.00% 2/25/34 | | | 34,849 | | | 31,217 |
Diversified Income Series-16
Delaware VIP® Diversified Income Series
Statement of Net Assets (continued)
| | | Principal | | Value |
| | Amount° | | (U.S. $) |
| NON-AGENCY COLLATERALIZED |
| MORTGAGE OBLIGATIONS (continued) | | | | | |
| First Horizon Asset Securities | | | | | | |
| Series 2003-5 1A17 8.00% 7/25/33 | USD | | 973 | | $ | 968 |
| • | Series 2004-AR5 4A1 5.663% 10/25/34 | | | 57,061 | | | 46,358 |
| • | Series 2007-AR2 1A1 5.83% 8/25/37 | | | 1,082,847 | | | 738,780 |
| • | Series 2007-AR3 2A2 6.281% 11/25/37 | | | 2,431,910 | | | 1,646,554 |
| •GMAC Mortgage Loan Trust | | | | | | |
| Series 2005-AR2 4A 5.167% 5/25/35 | | | 1,530,068 | | | 1,244,585 |
| GSMPS Mortgage Loan Trust | | | | | | |
| # | 144A Series 2005-RP1 1A3 | | | | | | |
| 8.00% 1/25/35 | | | 220,172 | | | 202,971 |
| # | 144A Series 2005-RP1 1A4 | | | | | | |
| 8.50% 1/25/35 | | | 170,100 | | | 156,971 |
| Series 2006-RP1 1A2 7.50% 1/25/36 | | | 268,915 | | | 235,182 |
| •GSR Mortgage Loan Trust | | | | | | |
| Series 2005-AR6 2A1 3.336% 9/25/35 | | | 106,859 | | | 92,658 |
| Series 2006-AR1 3A1 5.343% 1/25/36 | | | 474,715 | | | 347,287 |
| •JPMorgan Mortgage Trust | | | | | | |
| @ | Series 2004-A6 1A2 4.839% 12/25/34 | | | 715,152 | | | 599,953 |
| Series 2005-A1 4A1 4.771% 2/25/35 | | | 120,437 | | | 110,684 |
| Series 2005-A2 5A1 4.312% 4/25/35 | | | 72,389 | | | 65,460 |
| Series 2005-A4 1A1 5.38% 7/25/35 | | | 743,985 | | | 648,215 |
| Series 2005-A8 2A1 4.954% 11/25/35 | | | 1,452,985 | | | 1,320,875 |
| Series 2006-A2 3A3 5.673% 4/25/36 | | | 495,000 | | | 315,856 |
| Lehman Mortgage Trust Series 2005-2 | | | | | | |
| 2A3 5.50% 12/25/35 | | | 323,489 | | | 282,325 |
| MASTR Alternative Loans Trust | | | | | | |
| Series 2003-9 1A1 5.50% 12/25/18 | | | 36,686 | | | 36,227 |
| •MASTR ARM Trust | | | | | | |
| Series 2003-6 1A2 3.825% 12/25/33 | | | 1,106 | | | 982 |
| Series 2005-6 7A1 5.331% 6/25/35 | | | 493,424 | | | 378,844 |
| #MASTR Reperforming Loan Trust 144A | | | | | | |
| Series 2005-1 1A5 8.00% 8/25/34 | | | 326,498 | | | 309,765 |
| Series 2005-2 1A4 8.00% 5/25/35 | | | 200,530 | | | 188,874 |
| Series 2005-2 A2 5.006% 7/25/35 | | | 138,493 | | | 121,290 |
| Prime Mortgage Trust Series 2004-CL1 | | | | | | |
| 1A1 6.00% 2/25/34 | | | 5,490 | | | 5,594 |
| •Residential Accredit Loans | | | | | | |
| Series 2004-QA6 NB1 4.68% 12/26/34 | | | 3,086 | | | 1,994 |
| Residential Asset Mortgage Products | | | | | | |
| Series 2004-SL1 A3 7.00% 11/25/31 | | | 13,718 | | | 13,737 |
| Series 2004-SL4 A3 6.50% 7/25/32 | | | 98,690 | | | 96,809 |
| •Structured ARM Loan Trust | | | | | | |
| Series 2006-5 5A4 5.489% 6/25/36 | | | 95,947 | | | 16,001 |
| Structured Asset Securities | | | | | | |
| • | Series 2002-22H 1A 6.943% 11/25/32 | | | 1,035 | | | 999 |
| Series 2004-12H 1A 6.00% 5/25/34 | | | 275,007 | | | 249,000 |
| tWashington Mutual Alternative | | | | | | |
| Mortgage Pass Through Certificates | | | | | | |
| Series 2005-1 5A2 6.00% 3/25/35 | | | 159,508 | | | 105,125 |
| tWashington Mutual Mortgage Pass | | | | | | |
| Through Certificates | | | | | | |
| Series 2004-CB3 1A 6.00% 10/25/34 | | | 194,942 | | | 186,962 |
| | Series 2004-CB3 4A 6.00% 10/25/19 | | | 181,542 | | | 180,765 |
| • | Series 2006-AR10 1A1 5.92% 9/25/36 | | | 842,815 | | | 639,279 |
| • | Series 2006-AR14 2A1 5.754% 11/25/36 | | | 2,587,032 | | | 1,924,093 |
| • | Series 2007-HY1 1A1 5.673% 2/25/37 | | | 1,816,148 | | | 1,155,654 |
| • | Series 2007-HY3 4A1 5.314% 3/25/37 | | | 2,640,525 | | | 2,101,821 |
| Wells Fargo Mortgage-Backed | | | | | | |
| Securities Trust | | | | | | |
| Series 2004-E A2 4.50% 5/25/34 | | | 24,765 | | | 23,814 |
| • | Series 2004-O A1 4.863% 8/25/34 | | | 2,735,591 | | | 2,673,787 |
| • | Series 2004-T A1 3.242% 9/25/34 | | | 48,899 | | | 46,805 |
| • | Series 2005-AR2 2A1 4.317% 3/25/35 | | | 74,574 | | | 65,829 |
| • | Series 2005-AR16 2A1 3.363% 10/25/35 | | | 8,341 | | | 7,055 |
| • | Series 2005-AR16 6A4 5.00% 10/25/35 | | | 1,310,519 | | | 497,120 |
| Series 2006-1 A3 5.00% 3/25/21 | | | 504,289 | | | 476,554 |
| Series 2006-2 3A1 5.75% 3/25/36 | | | 1,165,385 | | | 989,485 |
| Series 2006-3 A11 5.50% 3/25/36 | | | 2,555,000 | | | 2,162,801 |
| Series 2006-4 2A3 5.75% 4/25/36 | | | 387,300 | | | 139,065 |
| Series 2006-7 2A1 6.00% 6/25/36 | | | 167,299 | | | 138,702 |
| Series 2006-AR5 2A1 5.541% 4/25/36 | | | 912,146 | | | 710,922 |
| • | Series 2006-AR6 7A1 5.112% 3/25/36 | | | 952,108 | | | 848,799 |
| • | Series 2006-AR10 5A1 5.589% 7/25/36 | | | 932,619 | | | 726,036 |
| • | Series 2006-AR18 2A2 5.713% 11/25/36 | | | 765,291 | | | 218,128 |
| • | Series 2006-AR19 A1 5.622% 12/25/36 | | | 1,012,416 | | | 814,180 |
| Series 2007-8 2A6 6.00% 7/25/37 | | | 400,000 | | | 285,455 |
| Series 2007-13 A7 6.00% 9/25/37 | | | 899,844 | | | 773,022 |
| Total Non-Agency Collateralized | | | | | | |
| Mortgage Obligations | | | | | | |
| (cost $48,557,486) | | | | | | 41,892,214 |
| |
| REGIONAL AUTHORITIES–0.29%Δ | | | | | | |
| Canada–0.29% | | | | | | |
| Province of Ontario Canada | | | | | | |
| 4.00% 10/7/19 | | | 2,135,000 | | | 2,048,421 |
| 4.40% 6/2/19 | CAD | | 1,890,000 | | | 1,821,265 |
| Quebec Province 4.50% 12/1/19 | CAD | | 365,000 | | | 350,816 |
| Total Regional Authorities | | | | | | |
| (cost $4,283,373) | | | | | | 4,220,502 |
| |
| «SENIOR SECURED LOANS–4.70% | | | | | | |
| Advanced Disposal Services | | | | | | |
| 6.00% 1/2/15 | USD | | 735,000 | | | 727,650 |
| Affiliated Computer Services | | | | | | |
| Term Tranche Loan A 2.231% 3/20/13 | | | 740,000 | | | 734,827 |
| Term Tranche Loan B 2.236% 3/20/13 | | | 325,000 | | | 322,728 |
| AIQ 3.75% 6/1/16 | | | 760,000 | | | 753,031 |
| Allen System Term Tranche Loan | | | | | | |
| 8.50% 10/18/13 | | | 495,000 | | | 495,619 |
| Allied Security Holdings 6.75% 2/23/15 | | | 724,927 | | | 727,645 |
| Alltran Term Tranche Loan | | | | | | |
| 3.009% 8/7/14 | | | 373,368 | | | 344,666 |
Diversified Income Series-17
Delaware VIP® Diversified Income Series
Statement of Net Assets (continued)
| | | Principal | | Value |
| | | Amount° | | (U.S. $) |
| «SENIOR SECURED LOANS (continued) | | | | | | |
| Anchor Glass Term Tranche Loan B | | | | | | |
| 6.75% 6/20/14 | USD | | 925,372 | | $ | 929,226 |
| Aramark | | | | | | |
| 1.995% 1/26/14 | | | 35,556 | | | 33,729 |
| Term Tranche Loan B 2.155% 1/26/14 | | | 540,650 | | | 512,866 |
| Ashland Term Tranche Loan | | | | | | |
| 7.65% 5/20/14 | | | 722,504 | | | 733,944 |
| Avis Car Rental 4.04% 4/19/12 | | | 1,106,888 | | | 1,079,675 |
| Bausch & Lomb | | | | | | |
| Term Tranche Loan B | | | | | | |
| 3.533% 4/11/15 | | | 880,023 | | | 838,495 |
| Term Tranche Loan DD | | | | | | |
| 3.519% 4/11/15 | | | 213,706 | | | 203,622 |
| BE Aerospace 5.75% 7/28/14 | | | 785,904 | | | 792,128 |
| Biomet Term Tranche Loan B | | | | | | |
| 3.281% 3/25/15 | | | 297,411 | | | 286,093 |
| Building Materials 6.063% 9/15/14 | | | 495,000 | | | 451,688 |
| Burlington Coat Factory Term | | | | | | |
| Tranche Loan 2.51% 5/28/13 | | | 1,040,000 | | | 968,178 |
| Butler Term Tranche Loan | | | | | | |
| 5.50% 12/30/16 | | | 365,000 | | | 366,369 |
| Calpine 1st Lien 3.165% 3/29/14 | | | 1,150,742 | | | 1,093,325 |
| Cengage Learning Term Tranche Loan | | | | | | |
| 2.73% 7/7/14 | | | 493,737 | | | 493,325 |
| Charter Communications 2.26% 3/6/14 | | | 1,549,496 | | | 1,455,450 |
| Community Health Systems | | | | | | |
| Term Tranche Loan B | | | | | | |
| 2.504% 7/25/14 | | | 916,454 | | | 870,201 |
| Term Tranche Loan DD | | | | | | |
| 2.506% 7/25/14 | | | 46,842 | | | 44,083 |
| Dana Holdings Term Tranch Loan B | | | | | | |
| 7.231% 1/30/15 | | | 3,266,158 | | | 3,133,470 |
| Delta Air Lines 8.75% 9/16/13 | | | 865,000 | | | 865,541 |
| DirectTV Term Tranche Loan C | | | | | | |
| 5.25% 4/13/13 | | | 685,445 | | | 686,922 |
| Discovery Communications | | | | | | |
| 5.25% 5/14/14 | | | 871,560 | | | 880,929 |
| Energy Futures Holdings Term Tranche | | | | | | |
| Loan B 3.735% 10/10/14 | | | 3,868,232 | | | 3,151,410 |
| First Data Corporation Term Tranche | | | | | | |
| Loan B2 3.001% 9/24/14 | | | 985,574 | | | 878,255 |
| Flextronics International Term Tranche | | | | | | |
| Loan B 2.54% 10/1/12 | | | 806,481 | | | 764,480 |
| Ford Motor Term Tranche Loan B | | | | | | |
| 3.287% 12/15/13 | | | 7,826,478 | | | 7,253,463 |
| Freescale Semiconductor 1.985% 12/1/13 | | | 786,440 | | | 690,175 |
| General Nutrition Center Term Tranche | | | | | | |
| Loan B 2.529% 9/16/13 | | | 659,953 | | | 615,821 |
| Goodyear Tire & Rubber 2nd Lien | | | | | | |
| 2.34% 4/30/14 | | | 540,000 | | | 504,114 |
| Graham Packaging International | | | | | | |
| Term Tranche Loan C 3.088% 5/16/14 | | | 1,588,615 | | | 1,550,321 |
| Term Tranche Loan C 6.75% 4/5/14 | | | 1,361,574 | | | 1,373,910 |
| Hanesbrands 5.25% 12/10/15 | | | 735,000 | | | 742,401 |
| Harrahs 12.375% 12/31/16 | | | 1,485,000 | | | 1,497,994 |
| Harrahs Operating 9.50% 10/31/16 | | | 505,000 | | | 506,263 |
| HCA 2.533% 11/18/13 | | | 1,165,187 | | | 1,117,420 |
| HealthSouth 4.011% 3/14/14 | | | 841,735 | | | 819,429 |
| Huntsman Term Tranch | | | | | | |
| Loan C 2.484% 6/23/16 | | | 515,000 | | | 492,682 |
| Intelsat | | | | | | |
| Term Tranche Loan A3 2.735% 7/3/12 | | | 396,552 | | | 379,103 |
| Term Tranche Loan BA 2.735% 1/3/14 | | | 296,709 | | | 281,715 |
| Term Tranche Loan BB 2.735% 1/3/14 | | | 296,715 | | | 281,720 |
| Term Tranche Loan BC 2.735% 1/3/14 | | | 296,709 | | | 281,715 |
| Johnsondiversey Term Tranche | | | | | | |
| Loan B 5.50% 11/24/15 | | | 710,000 | | | 713,255 |
| Knology 5.75% 6/30/14 | | | 532,305 | | | 511,012 |
| Language Line Holdings | | | | | | |
| 5.75% 10/14/15 | | | 740,000 | | | 738,187 |
| Level 3 Communications | | | | | | |
| Term Tranche Loan A 2.53% 3/13/14 | | | 415,000 | | | 377,997 |
| Term Tranche Loan B 11.50% 3/13/14 | | | 400,000 | | | 428,200 |
| Levi Strauss Term Tranche | | | | | | |
| Loan B 2.482% 3/27/14 | | | 240,000 | | | 218,800 |
| MacDermid Term Tranche | | | | | | |
| Loan B 2.234% 4/12/14 | | | 1,023,220 | | | 900,434 |
| MCC Georgia Term Tranche | | | | | | |
| Loan D 5.50% 3/31/17 | | | 535,000 | | | 537,453 |
| MGM MIRAGE 6.00% 10/3/11 | | | 495,000 | | | 463,355 |
| Nalco Holding Term Tranche | | | | | | |
| Loan 1.985% 5/6/16 | | | 1,240,625 | | | 1,256,133 |
| Nielsen Finance Term Tranche | | | | | | |
| Loan B 3.985% 5/9/16 | | | 489,373 | | | 462,703 |
| NTELOS Holdings 5.75% 7/31/15 | | | 250,000 | | | 252,266 |
| Nuveen Investment | | | | | | |
| 2nd Lien 12.50% 7/9/15 | | | 620,000 | | | 642,630 |
| Term Tranche | | | | | | |
| Loan B 3.281% 11/13/14 | | | 372,041 | | | 327,571 |
| Pilot Travel Centers Term Tranche | | | | | | |
| Loan A 5.25% 11/12/13 | | | 735,000 | | | 736,378 |
| Pinnacle Foods Finance 2.985% 4/2/14 | | | 248,728 | | | 232,560 |
| PQ Term Tranche Loan 6.74% 7/30/15 | | | 2,476,000 | | | 2,147,930 |
| Rehabcare Group Term Tranche | | | | | | |
| Loan B 6.00% 11/3/15 | | | 980,000 | | | 972,346 |
| Rental Service 2nd Lien | | | | | | |
| 3.817% 11/30/13 | | | 396,202 | | | 371,317 |
| Reynolds Consumer Products US | | | | | | |
| 6.25% 11/5/15 | | | 990,000 | | | 997,633 |
| Rite Aid 9.50% 6/5/15 | | | 1,100,000 | | | 1,141,366 |
| Rockwood Specialties Term Tranche | | | | | | |
| Loan H 6.00% 5/15/14 | | | 620,000 | | | 627,750 |
| Select Medical Term Tranch | | | | | | |
| Loan B 4.02% 8/22/14 | | | 944,506 | | | 917,947 |
| Sinclair Television Group Term Tranche | | | | | | |
| Loan B 6.50% 10/16/15 | | | 495,000 | | | 497,784 |
| Solutia 7.25% 2/28/14 | | | 557,270 | | | 567,165 |
| Sungard Data Systems 6.75% 2/28/14 | | | 1,169,203 | | | 1,181,872 |
| Targa Resources Term Tranche | | | | | | |
| Loan 6.00% 6/5/16 | | | 810,000 | | | 815,403 |
Diversified Income Series-18
Delaware VIP® Diversified Income Series
Statement of Net Assets (continued)
| | | Principal | | Value |
| | Amount° | | (U.S. $) |
| SENIOR SECURED LOANS (continued) | | | | | |
| TASC | | | | | | |
| Term Tranch Loan A 5.50% 12/19/14 | USD | | 70,000 | | $ | 70,292 |
| Term Tranch Loan B 5.50% 12/19/14 | | | 160,000 | | | 160,975 |
| Telesat Canada | | | | | | |
| 3.24% 10/31/14 | | | 813,398 | | | 782,553 |
| 3.24% 10/31/14 | | | 69,863 | | | 67,213 |
| Toys R US 4.486% 7/19/12 | | | 470,000 | | | 460,527 |
| Univision Communications | | | | | | |
| 2.533% 9/29/14 | | | 2,735,000 | | | 2,382,869 |
| Visant Holdings Term Tranche Loan C | | | | | | |
| 2.235% 1/21/11 | | | 250,000 | | | 244,750 |
| Warner Chilcott | | | | | | |
| 5.75% 4/30/15 | | | 76,250 | | | 76,425 |
| Term Tranche Loan A 5.50% 10/30/14 | | | 206,780 | | | 207,328 |
| Term Tranche Loan B 5.75% 4/30/15 | | | 103,390 | | | 103,664 |
| Term Tranche Loan B2 5.75% 4/30/15 | | | 227,458 | | | 228,060 |
| Total Senior Secured Loans | | | | | | |
| (cost $61,647,090) | | | | | | 67,829,919 |
| |
| SOVEREIGN DEBT–2.52%Δ | | | | | | |
| Brazil–0.68% | | | | | | |
| Federal Republic of Brazil | | | | | | |
| * | 12.50% 1/5/16 | BRL | | 6,934,000 | | | 4,515,255 |
| 12.50% 1/5/22 | BRL | | 8,130,000 | | | 5,294,063 |
| | | | | | | 9,809,318 |
| Colombia–0.22% | | | | | | |
| Republic of Colombia 7.375% 9/18/37 | USD | | 2,894,000 | | | 3,168,930 |
| | | | | | | 3,168,930 |
| Indonesia–0.60% | | | | | | |
| Indonesia Treasury Bond | | | | | | |
| 10.75% 5/15/16 | IDR | | 36,531,000,000 | | | 4,174,817 |
| 12.80% 6/15/21 | IDR | | 36,200,000,000 | | | 4,531,998 |
| | | | | | | 8,706,815 |
| Mexico–0.55% | | | | | | |
| Mexican Government 10.00% 11/20/36 | MXN | | 90,587,300 | | | 7,900,196 |
| | | | | | | 7,900,196 |
| Norway–0.13% | | | | | | |
| Eksportfinans 3.00% 11/17/14 | USD | | 1,920,000 | | | 1,892,736 |
| | | | | | | 1,892,736 |
| Poland–0.16% | | | | | | |
| Poland Government Bond | | | | | | |
| 5.50% 10/25/19 | PLN | | 7,090,000 | | | 2,338,586 |
| | | | | | | 2,338,586 |
| Republic of Korea–0.18% | | | | | | |
| Government of South Korea | | | | | | |
| 4.25% 12/7/21 | EUR | | 969,000 | | | 1,291,311 |
| #Korea Expressway 144A 4.50% 3/23/15 | USD | | 1,220,000 | | | 1,245,908 |
| | | | | | | 2,537,219 |
| Total Sovereign Debt | | | | | | |
| (cost $34,394,404) | | | | | | 36,353,800 |
| SUPRANATIONAL BANKS–1.85% | | | | | | |
| European Investment Bank | | | | | | |
| 6.125% 1/23/17 | AUD | | 470,000 | | | 417,224 |
| 9.00% 12/21/18 | ZAR | | 29,400,000 | | | 3,804,753 |
| ^ | 10.902% 3/30/16 | TRY | | 3,940,000 | | | 1,396,327 |
| 11.25% 2/14/13 | BRL | | 4,800,000 | | | 2,848,978 |
| #European Investment Bank 144A | | | | | | |
| 4.00% 5/15/14 | NOK | | 5,480,000 | | | 966,755 |
| Inter-American Development Bank | | | | | | |
| 7.25% 5/24/12 | NZD | | 1,343,000 | | | 1,027,613 |
| International Bank for Reconstruction | | | | | | |
| & Development | | | | | | |
| 5.375% 12/15/14 | NZD | | 7,603,000 | | | 5,440,118 |
| 5.75% 8/20/12 | MXN | | 48,800,000 | | | 3,683,052 |
| 5.75% 10/21/19 | AUD | | 2,316,000 | | | 1,975,576 |
| 8.75% 6/15/12 | BRL | | 2,380,000 | | | 1,342,543 |
| International Finance 5.75% 6/24/14 | AUD | | 4,262,000 | | | 3,810,915 |
| Total Supranational Banks | | | | | | |
| (cost $25,338,676) | | | | | | 26,713,854 |
| |
| U.S. TREASURY | | | | | | |
| OBLIGATIONS–2.34% | | | | | | |
| U.S. Treasury Bond 4.50% 8/15/39 | USD | | 4,375,000 | | | 4,277,249 |
| U.S. Treasury Inflation Index Notes | | | | | | |
| 1.625% 1/15/15 | | | 12,963,003 | | | 13,497,728 |
| ∞ | 2.00% 1/15/14 | | | 6,423,026 | | | 6,800,378 |
| * | 2.375% 1/15/17 | | | 6,163,770 | | | 6,665,057 |
| *U.S. Treasury Notes | | | | | | |
| 2.125% 11/30/14 | | | 1,975,000 | | | 1,928,870 |
| 3.375% 11/15/19 | | | 700,000 | | | 673,535 |
| Total U.S. Treasury Obligations | | | | | | |
| (cost $34,221,703) | | | | | | 33,842,817 |
| | | | | |
| | Number of | | | |
| | Shares | | | |
| COMMON STOCK–0.14% | | | | | | |
| =*†Adelphia Recovery Trust Series Arahova | | | 1 | | | 0 |
| †Alliance Imaging | | | 88,066 | | | 502,857 |
| Blackstone Group | | | 25,000 | | | 328,000 |
| =†Century Communications | | | 2,500,000 | | | 0 |
| †Delta Air Lines | | | 12 | | | 137 |
| †DirecTV | | | 15,850 | | | 528,597 |
| †Flextronics International | | | 29,800 | | | 217,838 |
| †Geoeye | | | 7,600 | | | 211,888 |
| Merck | | | 298 | | | 10,889 |
| †Mirant | | | 116 | | | 1,771 |
| †Mobile Mini | | | 18,836 | | | 265,399 |
| P=†Port Townsend | | | 685 | | | 7 |
| Total Common Stock | | | | | | |
| (cost $2,417,237) | | | | | | 2,067,383 |
Diversified Income Series-19
Delaware VIP® Diversified Income Series
Statement of Net Assets (continued)
| | | Number of | | Value |
| | Shares | | (U.S. $) |
| CONVERTIBLE PREFERRED | | | | | | |
| STOCK–0.24% | | | | | | |
| Mylan 6.50% exercise price $17.08, | | | | | | |
| expiration date 11/15/10 | | | 2,096 | | $ | 2,387,344 |
| Whiting Petroleum 6.25% exercise price | | | | | | |
| $43.42, expiration date 12/31/49 | | | 5,931 | | | 1,065,563 |
| Total Convertible Preferred Stock | | | | | | |
| (cost $3,166,898) | | | | | | 3,452,907 |
| |
| PREFERRED STOCK–0.28% | | | | | | |
| •Bank of America 8.125% | | | 1,570,000 | | | 1,513,464 |
| •PNC Financial Services Group 8.25% | | | 2,420,000 | | | 2,469,559 |
| =Port Townsend | | | 137 | | | 0 |
| Total Preferred Stock | | | | | | |
| (cost $3,803,532) | | | | | | 3,983,023 |
| |
| WARRANT–0.00% | | | | | | |
| =†Port Townsend | | | 137 | | | 1 |
| Total Warrant (cost $3,288) | | | | | | 1 |
| | | | |
| | Principal | | |
| | Amount° | | |
| ≠DISCOUNT NOTE–0.26% | | | | | | |
| Federal Home Loan Bank 0.001% 1/4/10 | USD | | 3,820,000 | | | 3,820,000 |
| Total Discount Note | | | | | | |
| (cost $3,820,000) | | | | | | 3,820,000 |
| |
| Total Value of Securities | | | | | | |
| Before Securities Lending | | | | | | |
| Collateral–96.52% | | | | | | |
| (cost $1,319,814,842) | | | | | | 1,394,409,050 |
| |
| | Number of | | | |
| | Shares | | | |
| SECURITIES LENDING | | | | | | |
| COLLATERAL**–5.43% | | | | | | |
| Investment Companies | | | | | | |
| Mellon GSL DBT II Collateral Fund | | | 58,665,646 | | | 58,665,646 |
| BNY Mellon SL DBT II | | | | | | |
| Liquidating Fund | | | 19,968,680 | | | 19,739,041 |
| †@ | Mellon GSL Reinvestment Trust II | | | 1,852,892 | | | 78,748 |
| Total Securities Lending Collateral | | | | | | |
| (cost $80,487,218) | | | | | | 78,483,435 |
| | | | | | | |
| TOTAL VALUE OF SECURITIES–101.95% (cost $1,400,302,060) | | 1,472,892,485 | © |
| OBLIGATION TO RETURN SECURITIES LENDING COLLATERAL**–(5.57%) | | (80,487,218 | ) |
| RECEIVABLES AND OTHER ASSETS NET OF LIABILITIES–3.62% | | 52,371,294 | |
| NET ASSETS APPLICABLE TO 131,973,162 SHARES OUTSTANDING–100.00% | $ | 1,444,776,561 | |
| NET ASSET VALUE–DELAWARE VIP DIVERSIFIED INCOME SERIES | | | |
| STANDARD CLASS ($652,803,379 / 59,472,172 Shares) | | | $10.98 | |
| NET ASSET VALUE–DELAWARE VIP DIVERSIFIED INCOME SERIES | | | |
| SERVICE CLASS ($791,973,182 / 72,500,990 Shares) | | | $10.92 | |
| COMPONENTS OF NET ASSETS AT DECEMBER 31, 2009: | | | |
| Shares of beneficial interest (unlimited authorization–no par) | $ | 1,300,601,443 | |
| Undistributed net investment income | | 71,249,350 | |
| Accumulated net realized loss on investments | | (334,091 | ) |
| Net unrealized appreciation of investments and foreign currencies | | 73,259,859 | |
| Total net assets | $ | 1,444,776,561 | |
| | | | |
Diversified Income Series-20
Delaware VIP® Diversified Income Series
Statement of Net Assets (continued)
____________________
°Principal amount shown is stated in the currency in which each security is denominated.
AUD – Australian Dollar
BRL – Brazilian Real
CAD – Canadian Dollar
EUR – European Monetary Unit
GBP – British Pound Sterling
IDR – Indonesian Rupiah
ILS – Israeli Shekel
INR – Indian Rupee
KRW – South Korean Won
MXN – Mexican Peso
MYR – Malaysia Ringgit
NOK – Norwegian Kroner
NZD – New Zealand Dollar
PLN – Polish Zloty
SEK – Swedish Krona
SGD – Singapore Dollar
TRY – Turkish Lira
TWD – Taiwan Dollar
USD – United States Dollar
ZAR – South African Rand
| • | Variable rate security. The rate shown is the rate as of December 31, 2009. |
| t | Pass Through Agreement. Security represents the contractual right to receive a proportionate amount of underlying payments due to the counterparty pursuant to various agreements related to the rescheduling of obligations and the exchange of certain notes. |
| * | Fully or partially on loan. |
| # | Security exempt from registration under Rule 144A of the Securities Act of 1933, as amended. At December 31, 2009, the aggregate amount of Rule 144A securities was $277,048,856, which represented 19.18% of the Series’ net assets. See Note 10 in “Notes to Financial Statements.” |
| Φ | Step coupon bond. Coupon decreases periodically based on a predetermined schedule. Stated rate in effect at December 31, 2009. |
| † | Non income producing security. |
| @ | Illiquid security. At December 31, 2009, the aggregate amount of illiquid securities was $9,464,492, which represented 0.66% of the Series’ net assets. See Note 10 in “Notes to Financial Statements.” |
| = | Security is being fair valued in accordance with the Series’ fair valuation policy. At December 31, 2009, the aggregate amount of fair valued securities was $145,579, which represented 0.01% of the Series’ net assets. See Note 1 in “Notes to Financial Statements.” |
| Ω | Step coupon bond. Indicates security that has a zero coupon that remains in effect until a predetermined date at which time the stated interest rate becomes effective. |
| ‡ | Non income producing security; security is currently in default. |
| P | Restricted Security. Investment in a security not registered under the Securities Act of 1933, as amended. This security has certain restrictions on resale which may limit its liquidity. At December 31, 2009, the aggregate amount of the restricted securities was $25,342, or 0.00% of the Series’ net assets. See Note 10 in “Notes to Financial Statements.” |
| Δ | Securities have been classified by country of origin. |
| « | Senior Secured Loans generally pay interest at rates which are periodically redetermined by reference to a base lending rate plus a premium. These base lending rates are generally: (i) the prime rate offered by one or more United States banks, (ii) the lending rate offered by one or more European banks such as the London Inter-Bank Offered Rate (LIBOR), and (iii) the certificate of deposit rate. Senior Secured Loans may be subject to restrictions on resale. Stated rate in effect at December 31, 2009. |
| ^ | Zero coupon security. The rate shown is the yield at the time of purchase. |
| ∞ | Fully or partially pledged as collateral for financial futures contracts. |
| ≠ | The rate shown is the effective yield at the time of purchase. |
| ** | See Note 9 in “Notes to Financial Statements.” |
| © | Includes $79,408,442 of securities loaned. |
Diversified Income Series-21
Delaware VIP® Diversified Income Series
Statement of Net Assets (continued)
Summary of Abbreviations:
ARM – Adjustable Rate Mortgage
CDS – Credit Default Swap
GNMA – Government National Mortgage Association
GSMPS – Goldman Sachs Reperforming Mortgage Securities
MASTR – Mortgage Asset Securitization Transactions, Inc.
PIK – Pay-in-kind
REIT – Real Estate Investment Trust
REMIC – Real Estate Mortgage Investment Conduit
S.F. – Single Family
TBA – To be announced
yr – Year
1The following foreign currency exchange contracts, financial futures contracts and swap contracts were outstanding at December 31, 2009:
Foreign Currency Exchange Contracts
| | | | | | | | | | | Unrealized |
| | | | | | | | | | | Appreciation |
| Contracts to Receive (Deliver) | | In Exchange For | | Settlement Date | | (Depreciation) |
| AUD | 522,314 | | | USD | (473,634 | ) | | 1/8/10 | | | | $ | (4,861 | ) |
| BRL | (4,116,600 | ) | | USD | 2,287,000 | | | 1/8/10 | | | | | (70,587 | ) |
| CAD | 5,320,251 | | | USD | (4,967,787 | ) | | 1/8/10 | | | | | 95,989 | |
| CAD | 7,061,868 | | | USD | (6,594,022 | ) | | 1/8/10 | | | | | 127,412 | |
| EUR | (1,015,070 | ) | | USD | 1,478,005 | | | 1/8/10 | | | | | 24,798 | |
| IDR | 20,737,285,000 | | | USD | (2,173,036 | ) | | 1/8/10 | | | | | 23,632 | |
| ILS | 10,675,267 | | | USD | (2,830,960 | ) | | 1/29/10 | | | | | (16,411 | ) |
| INR | 181,926,400 | | | USD | (3,904,000 | ) | | 10/20/10 | | | | | (74,409 | ) |
| GBP | (502,369 | ) | | USD | 828,689 | | | 1/8/10 | | | | | 16,823 | |
| KRW | 18,117,781,883 | | | USD | (15,608,013 | ) | | 1/8/10 | | | | | (74,869 | ) |
| MYR | 26,400,279 | | | USD | (7,799,196 | ) | | 1/8/10 | | | | | (91,536 | ) |
| NOK | 14,713,939 | | | USD | (2,586,657 | ) | | 1/8/10 | | | | | (48,842 | ) |
| NOK | 45,087,611 | | | USD | (7,936,143 | ) | | 1/8/10 | | | | | (159,571 | ) |
| NZD | (9,065,114 | ) | | USD | 6,460,278 | | | 1/8/10 | | | | | (112,775 | ) |
| PLN | (8,833,391 | ) | | USD | 3,043,034 | | | 1/8/10 | | | | | (35,085 | ) |
| PLN | (2,348,545 | ) | | USD | 825,673 | | | 1/8/10 | | | | | 7,290 | |
| SGD | 10,904,349 | | | USD | (7,848,808 | ) | | 1/8/10 | | | | | (88,992 | ) |
| TRY | (2,067,908 | ) | | USD | 1,364,512 | | | 1/8/10 | | | | | (15,811 | ) |
| TWD | 252,279,375 | | | USD | (7,820,191 | ) | | 1/8/10 | | | | | 66,431 | |
| ZAR | (40,607,979 | ) | | USD | 5,346,623 | | | 1/6/10 | | | | | (127,153 | ) |
| | | | | | | | | | | | $ | (558,527 | ) |
| | | | | | | | | | | | | | |
Diversified Income Series-22
Delaware VIP® Diversified Income Series
Statement of Net Assets (continued)
| Financial Futures Contract | | | | | | | | | | | | |
| Notional | | Notional | | Expiration | | Unrealized |
| Contract to Sell | | Proceeds | | Value | | Date | | Appreciation |
| 773 U.S. Treasury 5 yr notes | $ | 90,225,117 | | $88,417,914 | | 3/31/10 | | | | $ | 1,807,203 | |
| |
| Swap Contracts | | | | | | | | | | | | |
| CDS Contracts | | | | | | | | | | | | |
| | | | Annual | | | | | Unrealized |
| Swap Counterparty & | Notional | | Protection | | Termination | | Appreciation |
| Referenced Obligation | | Value | | Payments | | Date | | (Depreciation) |
| Protection Purchased: | | | | | | | | | | | | |
| JPMorgan Securities | | | | | | | | | | | | |
| J.C. Penny | | | | | | | | | | | | |
| 5 yr CDS | $ | 1,350,000 | | 1.00% | | 3/20/15 | | | | $ | (2,295 | ) |
| 5 yr CDS | | 3,370,000 | | 1.00% | | 3/20/15 | | | | | (836 | ) |
| Donnelly (R.R.) & Son CDS | | 5,100,000 | | 5.00% | | 6/20/14 | | | | | (963,588 | ) |
| $ | 9,820,000 | | | | | | | | $ | (966,719 | ) |
| Protection Sold: | | | | | | | | | | | | |
| CitiGroup | | | | | | | | | | | | |
| MetLife 5 yr CDS | $ | 1,215,000 | | 5.00% | | 9/20/14 | | | | $ | 82,694 | |
| JPMorgan Securities | | | | | | | | | | | | |
| Macy’s | | | | | | | | | | | | |
| 5 yr CDS | | 1,350,000 | | 1.00% | | 3/20/15 | | | | | 6,503 | |
| 5 yr CDS | | 3,370,000 | | 1.00% | | 3/20/15 | | | | | 12,779 | |
| MetLife 5 yr CDS | | 1,185,000 | | 1.00% | | 12/20/14 | | | | | 40,328 | |
| UnitedHealth Group | | | | | | | | | | | | |
| 5 yr CDS | | 530,000 | | 1.00% | | 12/20/14 | | | | | 13,910 | |
| 5 yr CDS | | 1,720,000 | | 1.00% | | 12/20/14 | | | | | 32,649 | |
| $ | 9,370,000 | | | | | | | | | 188,863 | |
| Total | | | | | | | | | | $ | (777,856 | ) |
| | | | | | | | | | | | | |
The use of foreign currency exchange contracts, financial futures contracts and swap contracts involves elements of market risk and risks in excess of the amounts recognized in the financial statements. The notional values presented above represent the Series’ total exposure in such contracts, whereas only the net unrealized appreciation (depreciation) is reflected in the Series’ net assets.
____________________
1See Note 8 in “Notes to financial statements.”
See accompanying notes
Diversified Income Series-23
Delaware VIP® Trust —
Delaware VIP Diversified Income Series
Statement of Operations
Year Ended December 31, 2009
| INVESTMENT INCOME: | | | |
| Interest | $ | 79,621,350 | |
| Dividends | | 782,304 | |
| Securities lending income | | 342,499 | |
| | | 80,746,153 | |
| |
| EXPENSES: | | | |
| Management fees | | 7,037,745 | |
| Distribution expenses – Service Class | | 1,723,947 | |
| Accounting and administration expenses | | 457,395 | |
| Reports and statements to shareholders | | 249,107 | |
| Legal fees | | 169,467 | |
| Dividend disbursing and transfer agent fees and expenses | | 114,338 | |
| Custodian fees | | 84,152 | |
| Audit and tax | | 77,036 | |
| Trustees’ fees | | 74,757 | |
| Pricing fees | | 47,889 | |
| Insurance fees | | 32,677 | |
| Consulting fees | | 15,446 | |
| Registration fees | | 10,933 | |
| Dues and services | | 7,839 | |
| Trustees’ expenses | | 5,381 | |
| | | 10,108,109 | |
| Less waiver of distribution expenses – Service Class | | (286,555 | ) |
| Total operating expenses | | 9,821,554 | |
| |
| NET INVESTMENT INCOME | | 70,924,599 | |
| |
| NET REALIZED AND UNREALIZED GAIN (LOSS) | | | |
| ON INVESTMENTS AND FOREIGN CURRENCIES: | | | |
| Net realized gain (loss) on: | | | |
| Investments | | 38,488,841 | |
| Futures contracts | | 561,118 | |
| Swap contracts | | (2,511,774 | ) |
| Options written | | 505 | |
| Foreign currencies | | 2,723,949 | |
| Net realized gain | | 39,262,639 | |
| Net change in unrealized appreciation/depreciation | | | |
| of investments and foreign currencies | | 158,471,926 | |
| |
| NET REALIZED AND UNREALIZED GAIN ON | | | |
| INVESTMENTS AND FOREIGN CURRENCIES | | 197,734,565 | |
| |
| NET INCREASE IN NET ASSETS RESULTING | | | |
| FROM OPERATIONS | $ | 268,659,164 | |
| | | | |
See accompanying notes
Delaware VIP Trust —
Delaware VIP Diversified Income Series
Statements of Changes in Net Assets
| Year Ended |
| 12/31/09 | | 12/31/08 |
| INCREASE (DECREASE) IN NET | | | | | | | |
| ASSETS FROM OPERATIONS: | | | | | | | |
| Net investment income | $ | 70,924,599 | | | $ | 53,219,795 | |
| Net realized gain (loss) on investments and | | | | | | | |
| foreign currencies | | 39,262,639 | | | | (23,449,436 | ) |
| Net change in unrealized appreciation/ | | | | | | | |
| depreciation of investments and | | | | | | | |
| foreign currencies | | 158,471,926 | | | | (91,427,207 | ) |
| Net increase (decrease) in net assets | | | | | | | |
| resulting from operations | | 268,659,164 | | | | (61,656,848 | ) |
| |
| DIVIDENDS AND DISTRIBUTIONS | | | | | | | |
| TO SHAREHOLDERS FROM: | | | | | | | |
| Net investment income: | | | | | | | |
| Standard Class | | (36,367,242 | ) | | | (23,559,654 | ) |
| Service Class | | (29,650,665 | ) | | | (15,920,819 | ) |
| Net realized gain on investments: | | | | | | | |
| Standard Class | | – | | | | (8,085,906 | ) |
| Service Class | | – | | | | (5,823,668 | ) |
| | | (66,017,907 | ) | | | (53,390,047 | ) |
| |
| CAPITAL SHARE TRANSACTIONS: | | | | | | | |
| Proceeds from shares sold: | | | | | | | |
| Standard Class | | 157,177,306 | | | | 250,752,557 | |
| Service Class | | 328,338,614 | | | | 243,982,623 | |
| Net asset value of shares issued upon | | | | | | | |
| reinvestment of dividends and distributions: | | | | | | | |
| Standard Class | | 36,367,242 | | | | 31,645,560 | |
| Service Class | | 29,650,665 | | | | 21,744,487 | |
| | | 551,533,827 | | | | 548,125,227 | |
| |
| Cost of shares repurchased: | | | | | | | |
| Standard Class | | (180,106,108 | ) | | | (194,049,242 | ) |
| Service Class | | (102,428,722 | ) | | | (144,518,523 | ) |
| | | (282,534,830 | ) | | | (338,567,765 | ) |
| Increase in net assets derived from capital | | | | | | | |
| share transactions | | 268,998,997 | | | | 209,557,462 | |
| |
| NET INCREASE IN NET ASSETS | | 471,640,254 | | | | 94,510,567 | |
| |
| NET ASSETS: | | | | | | | |
| Beginning of year | | 973,136,307 | | | | 878,625,740 | |
| End of year (including undistributed | | | | | | | |
| net investment income of $71,249,350 | | | | | | | |
| and $63,048,966, respectively) | $ | 1,444,776,561 | | | $ | 973,136,307 | |
See accompanying notes
Diversified Income Series-24
Delaware VIP® Trust — Delaware VIP Diversified Income Series
Financial Highlights
Selected data for each share of the Series outstanding throughout each period were as follows:
| | Delaware VIP Diversified Income Series Standard Class | |
| | Year Ended | |
| | 12/31/09 | | | 12/31/08 | | | 12/31/07 | | | 12/31/06 | | | 12/31/05 | |
| Net asset value, beginning of period | | $ 9.250 | | | $ 10.220 | | | $ 9.830 | | | $ 9.260 | | | $ 9.450 | |
| | |
| Income (loss) from investment operations: | | | | | | | | | | | | | | | |
| Net investment income1 | | 0.628 | | | 0.500 | | | 0.527 | | | 0.496 | | | 0.373 | |
Net realized and unrealized gain (loss) on investments and foreign currencies | | 1.721 | | | (0.926 | ) | | 0.207 | | | 0.227 | | | (0.416 | ) |
| Total from investment operations | | 2.349 | | | (0.426 | ) | | 0.734 | | | 0.723 | | | (0.043 | ) |
| | |
| Less dividends and distributions from: | | | | | | | | | | | | | | | |
| Net investment income | | (0.619 | ) | | (0.405 | ) | | (0.318 | ) | | (0.153 | ) | | (0.099 | ) |
| Net realized gain on investments | | – | | | (0.139 | ) | | (0.026 | ) | | – | | | (0.048 | ) |
| Total dividends and distributions | | (0.619 | ) | | (0.544 | ) | | (0.344 | ) | | (0.153 | ) | | (0.147 | ) |
| | |
| Net asset value, end of period | | $10.980 | | | $9.250 | | | $10.220 | | | $9.830 | | | $9.260 | |
| | |
| Total return2 | | 26.96% | | | (4.54% | ) | | 7.63% | | | 7.92% | | | (0.45% | ) |
| | |
| Ratios and supplemental data: | | | | | | | | | | | | | | | |
| Net assets, end of period (000 omitted) | | $652,804 | | | $542,074 | | | $521,511 | | | $294,248 | | | $90,811 | |
| Ratio of expenses to average net assets | | 0.73% | | | 0.73% | | | 0.73% | | | 0.79% | | | 0.79% | |
| Ratio of expenses to average net assets | | | | | | | | | | | | | | | |
| prior to fees waived and expenses paid indirectly | | 0.73% | | | 0.73% | | | 0.73% | | | 0.79% | | | 0.86% | |
| Ratio of net investment income to average net assets | | 6.33% | | | 5.16% | | | 5.30% | | | 5.26% | | | 4.02% | |
| Ratio of net investment income to average net assets | | | | | | | | | | | | | | | |
| prior to fees waived and expenses paid indirectly | | 6.33% | | | 5.16% | | | 5.30% | | | 5.26% | | | 3.95% | |
| Portfolio turnover | | 202% | | | 244% | | | 299% | | | 311% | | | 400% | |
____________________
1The average shares outstanding method has been applied for per share information. |
2Total investment return is based on the change in net asset value of a share during the period and assumes reinvestment of dividends and distributions at net asset value. Total investment return during some of the periods shown reflects a waiver by the manager. Performance would have been lower had the waiver not been in effect. |
See accompanying notes
Diversified Income Series-25
Delaware VIP® Diversified Income Series
Financial Highlights (continued)
Selected data for each share of the Series outstanding throughout each period were as follows:
| | Delaware VIP Diversified Income Series Service Class | |
| | Year Ended | |
| | 12/31/09 | | | 12/31/08 | | | 12/31/07 | | | 12/31/06 | | | 12/31/05 | |
| Net asset value, beginning of period | | $ 9.200 | | | $ 10.180 | | | $ 9.790 | | | $ 9.230 | | | $ 9.410 | |
| | |
| Income (loss) from investment operations: | | | | | | | | | | | | | | | |
| Net investment income1 | | 0.603 | | | 0.476 | | | 0.502 | | | 0.472 | | | 0.350 | |
Net realized and unrealized gain (loss) on investments and foreign currencies | | 1.712 | | | (0.937 | ) | | 0.209 | | | 0.218 | | | (0.406 | ) |
| Total from investment operations | | 2.315 | | | (0.461 | ) | | 0.711 | | | 0.690 | | | (0.056 | ) |
| | |
| Less dividends and distributions from: | | | | | | | | | | | | | | | |
| Net investment income | | (0.595 | ) | | (0.380 | ) | | (0.295 | ) | | (0.130 | ) | | (0.076 | ) |
| Net realized gain on investments | | – | | | (0.139 | ) | | (0.026 | ) | | – | | | (0.048 | ) |
| Total dividends and distributions | | (0.595 | ) | | (0.519 | ) | | (0.321 | ) | | (0.130 | ) | | (0.124 | ) |
| | |
| Net asset value, end of period | | $10.920 | | | $9.200 | | | $10.180 | | | $9.790 | | | $9.230 | |
| | |
| Total return2 | | 26.66% | | | (4.90% | ) | | 7.41% | | | 7.57% | | | (0.59% | ) |
| | |
| Ratios and supplemental data: | | | | | | | | | | | | | | | |
| Net assets, end of period (000 omitted) | | $791,973 | | | $431,062 | | | $357,115 | | | $208,724 | | | $130,870 | |
| Ratio of expenses to average net assets | | 0.98% | | | 0.98% | | | 0.98% | | | 1.04% | | | 1.04% | |
| Ratio of expenses to average net assets | | | | | | | | | | | | | | | |
| prior to fees waived and expenses paid indirectly | | 1.03% | | | 1.03% | | | 1.03% | | | 1.09% | | | 1.16% | |
| Ratio of net investment income to average net assets | | 6.08% | | | 4.91% | | | 5.05% | | | 5.01% | | | 3.77% | |
| Ratio of net investment income to average net assets | | | | | | | | | | | | | | | |
| prior to fees waived and expenses paid indirectly | | 6.03% | | | 4.86% | | | 5.00% | | | 4.96% | | | 3.65% | |
| Portfolio turnover | | 202% | | | 244% | | | 299% | | | 311% | | | 400% | |
____________________
1The average shares outstanding method has been applied for per share information. |
2Total investment return is based on the change in net asset value of a share during the period and assumes reinvestment of dividends and distributions at net asset value. Total investment return during some of the periods shown reflects waivers by the manager and/or distributor. Performance would have been lower had the waivers not been in effect. |
See accompanying notes
Diversified Income Series-26
Delaware VIP® Trust — Delaware VIP Diversified Income Series
Notes to Financial Statements
December 31, 2009
Delaware VIP Trust (Trust) is organized as a Delaware statutory trust and offers 12 series: Delaware VIP Cash Reserve Series, Delaware VIP Diversified Income Series, Delaware VIP Emerging Markets Series, Delaware VIP Growth Opportunities Series, Delaware VIP High Yield Series, Delaware VIP International Value Equity Series, Delaware VIP Limited-Term Diversified Income Series (formerly, Delaware VIP Capital Reserves Series), Delaware VIP REIT Series, Delaware VIP Small Cap Value Series, Delaware VIP Trend Series, Delaware VIP U.S. Growth Series and Delaware VIP Value Series. These financial statements and the related notes pertain to Delaware VIP Diversified Income Series (Series). The Trust is an open-end investment company. The Series is considered diversified under the Investment Company Act of 1940, as amended, and offers Standard Class and Service Class shares. The Standard Class shares do not carry a 12b-1 fee and the Service Class shares carry a 12b-1 fee. The shares of the Series are sold only to separate accounts of life insurance companies.
The investment objective of the Series is to seek maximum long-term total return consistent with reasonable risk.
1. Significant Accounting Policies
The following accounting policies are in accordance with U.S. generally accepted accounting principles (U.S. GAAP) and are consistently followed by the Series.
Security Valuation—Equity securities, except those traded on the Nasdaq Stock Market, Inc. (Nasdaq), are valued at the last quoted sales price as of the time of the regular close of the New York Stock Exchange (NYSE) on the valuation date. Securities traded on the Nasdaq are valued in accordance with the Nasdaq Official Closing Price, which may not be the last sales price. If on a particular day an equity security does not trade, then the mean between the bid and ask prices will be used. Securities listed on a foreign exchange are valued at the last quoted sales price on the valuation date. U.S. government and agency securities are valued at the mean between the bid and ask prices. Short-term debt securities are valued at market value. Other debt securities, credit default swap (CDS) contracts and interest rate swap contracts are valued by an independent pricing service or broker. To the extent current market prices are not available, the pricing service may take into account developments related to the specific security, as well as transactions in comparable securities. Investment companies are valued at net asset value per share. Foreign currency exchange contracts and foreign cross currency exchange contracts are valued at the mean between the bid and ask prices of the contracts. Interpolated values are derived when the settlement date of the contract is an interim date for which quotations are not available. Financial futures contracts are valued at the daily quoted settlement prices. Exchange-traded options are valued at the last reported sale price or, if no sales are reported, at the mean between the last reported bid and ask prices. Generally, index swap contracts and other securities and assets for which market quotations are not readily available are valued at fair value as determined in good faith under the direction of the Series’ Board of Trustees (Board). In determining whether market quotations are readily available or fair valuation will be used, various factors will be taken into consideration, such as market closures or suspension of trading in a security. The Series may use fair value pricing more frequently for securities traded primarily in non-U.S. markets because, among other things, most foreign markets close well before the Series values its securities at 4:00 p.m. Eastern time. The earlier close of these foreign markets gives rise to the possibility that significant events, including broad market moves, government actions or pronouncements, aftermarket trading, or news events may have occurred in the interim. To account for this, the Series may frequently value foreign securities using fair value prices based on third-party vendor modeling tools (international fair value pricing).
Federal Income Taxes—No provision for federal income taxes has been made as the Series intends to continue to qualify for federal income tax purposes as a regulated investment company under Subchapter M of the Internal Revenue Code of 1986, as amended, and make the requisite distributions to shareholders. The Series evaluates tax positions taken or expected to be taken in the course of preparing the Series’ tax returns to determine whether the tax positions are “more-likely-than-not” of being sustained by the applicable tax authority. Tax positions not deemed to meet the more-likely-than-not threshold are recorded as a tax benefit or expense in the current year. Management has analyzed the Series’ tax positions taken on federal income tax returns for all open tax years (tax years ended December 31, 2006 – December 31, 2009), and has concluded that no provision for federal income tax is required in the Series’ financial statements.
Class Accounting—Investment income, common expenses and realized and unrealized gain (loss) on investments are allocated to the classes of the Series on the basis of daily net assets of each class. Distribution expenses relating to a specific class are charged directly to that class.
Repurchase Agreements—The Series may invest in a pooled cash account along with other members of the Delaware Investments® Family of Funds pursuant to an exemptive order issued by the Securities and Exchange Commission. The aggregate daily balance of the pooled cash account is invested in repurchase agreements secured by obligations of the U.S. government. The respective collateral is held by the Series’ custodian bank until the maturity of the respective repurchase agreements. Each repurchase agreement is at least 102% collateralized. However, in the event of default or bankruptcy by the counterparty to the agreement, realization of the collateral may be subject to legal proceedings. At December 31, 2009, the Series held no investments in repurchase agreements.
Foreign Currency Transactions—Transactions denominated in foreign currencies are recorded at the prevailing exchange rates on the valuation date. The value of all assets and liabilities denominated in foreign currencies is translated into U.S. dollars at the exchange rate of such currencies against the U.S. dollar daily. Transaction gains or losses resulting from changes in exchange rates during the reporting period or upon settlement of the foreign currency transaction are reported in operations for the current period. The Series isolates that portion of realized gains and losses on investments in debt securities, which are due to changes in the foreign exchange rates from that which are due to changes in market prices of debt securities. The Series reports certain foreign currency related transactions as components of realized gains (losses) for financial reporting purposes, whereas such components are treated as ordinary income (loss) for federal income tax purposes.
Use of Estimates—The preparation of financial statements in conformity with U.S. GAAP requires management to make estimates and assumptions that affect the reported amounts of assets and liabilities at the date of the financial statements and the reported amounts of revenues and expenses during the reporting period. Actual results could differ from those estimates.
Diversified Income Series-27
Delaware VIP® Diversified Income Series
Notes to Financial Statements (continued)
1. Significant Accounting Policies (continued)
Other—Expenses directly attributable to the Series are charged directly to the Series. Other expenses common to various funds within the Delaware Investments® Family of Funds are generally allocated amongst such funds on the basis of average net assets. Management fees and some other expenses are paid monthly. Security transactions are recorded on the date the securities are purchased or sold (trade date) for financial reporting purposes. Costs used in calculating realized gains and losses on the sale of investment securities are those of the specific securities sold. Dividend income is recorded on the ex-dividend date and interest income is recorded on the accrual basis. Withholding taxes have been provided for in accordance with the Series’ understanding of the applicable country’s tax rules and rates. Discounts and premiums on non-convertible bonds are amortized to interest income over the lives of the respective securities. Realized gains (losses) on paydowns of mortgage- and asset-backed securities are classified as interest income. The Series declares and pays dividends from net investment income and distributions from net realized gain on investments, if any, following the close of the fiscal year.
The Series may receive earnings credits from its custodian when positive cash balances are maintained, which are used to offset custody fees. There were no earnings credits for the year ended December 31, 2009.
On July 1, 2009, the Financial Accounting Standards Board (FASB) issued the FASB Accounting Standards Codification (Codification). The Codification became the single source of authoritative nongovernmental U.S. GAAP, superseding existing literature of the FASB, American Institute of Certified Public Accountants, Emerging Issues Task Force and other sources. The Codification is effective for interim and annual periods ending after September 15, 2009. The Series adopted the Codification for the year ended December 31, 2009. There was no impact to financial statements as the Codification requirements are disclosure-only in nature.
Management has evaluated whether any events or transactions occurred subsequent to December 31, 2009 through February 17, 2010, the date of issuance of the Series’ financial statements, and determined that there were no material events or transactions that would require recognition or disclosure in the Series’ financial statements.
2. Investment Management, Administration Agreements and Other Transactions with Affiliates
In accordance with the terms of its investment management agreement, the Series pays Delaware Management Company (DMC), a series of Delaware Management Business Trust and the investment manager, an annual fee which is calculated daily at the rate of 0.65% on the first $500 million of average daily net assets of the Series, 0.60% on the next $500 million, 0.55% on the next $1.5 billion, and 0.50% on the average daily net assets in excess of $2.5 billion.
Delaware Service Company, Inc. (DSC), an affiliate of DMC, provides fund accounting and financial administration oversight services to the Series. For these services, the Series pays DSC fees based on the aggregate daily net assets of the Delaware Investments Family of Funds at the following annual rate: 0.0050% of the first $30 billion; 0.0045% of the next $10 billion; 0.0040% of the next $10 billion; and 0.0025% of aggregate average daily net assets in excess of $50 billion. The fees payable to DSC under the service agreement described above are allocated among all funds in the Delaware Investments Family of Funds on a relative net asset value basis. For the year ended December 31, 2009, the Series was charged $57,174 for these services.
DSC also provides dividend disbursing and transfer agency services. The Series pays DSC a monthly fee based on the number of shareholder accounts for dividend disbursing and transfer agent services.
Pursuant to a distribution agreement and distribution plan, the Series pays Delaware Distributors, L.P. (DDLP), the distributor and an affiliate of DMC, an annual distribution and service fee not to exceed 0.30% of the average daily net assets of the Service Class shares. DDLP has contracted to waive distribution and service fees through April 30, 2010 in order to prevent distribution and service fees of the Service Class shares from exceeding 0.25% of average daily net assets. Standard Class shares pay no distribution and service expenses.
At December 31, 2009, the Series had liabilities payable to affiliates as follows:
| | | Dividend Disbursing, | | | | Other |
| Investment | | Transfer Agent and Fund | | | | Expenses |
| Management | | Accounting Oversight | | Distribution | | Payable |
| Fee Payable to | | Fees and Other Expenses | | Fee Payable | | to DMC |
| DMC | | Payable to DSC | | to DDLP | | and Affiliates* |
| | $729,168 | | $15,149 | | $165,268 | | $89,850 |
____________________
*DMC, as part of its administrative services, pays operating expenses on behalf of the Series and is reimbursed on a periodic basis. Such expenses include items such as printing of shareholder reports, fees for audit, legal and tax services, custodian fees and trustees’ fees.
As provided in the investment management agreement, the Series bears the cost of certain legal and tax services, including internal legal and tax services provided to the Series by DMC and/or its affiliates’ employees. For the year ended December 31, 2009, the Series was charged $96,089 for internal legal and tax services provided by DMC and/or its affiliates’ employees.
Trustees’ fees include expenses accrued by the Series for each Trustee’s retainer and meeting fees. Certain officers of DMC, DSC and DDLP are officers and/or Trustees of the Trust. These officers and Trustees are paid no compensation by the Series.
Diversified Income Series-28
Delaware VIP® Diversified Income Series
Notes to Financial Statements (continued)
3. Investments
For the year ended December 31, 2009, the Series made purchases and sales of investment securities other than short-term investments as follows:
| Purchases other than U.S. government securities | $ | 2,149,376,081 |
| Purchases of U.S. government securities | | 337,198,111 |
| Sales other than U.S. government securities | | 1,880,948,469 |
| Sales of U.S. government securities | | 326,310,775 |
At December 31, 2009, the cost of investments and unrealized appreciation (depreciation) for federal income tax purposes for the Series were as follows:
| | | Aggregate | | Aggregate | | Net |
| Cost of | | Unrealized | | Unrealized | | Unrealized |
| | Investments | | Appreciation | | Depreciation | | Appreciation |
| $1,402,722,093 | | $87,125,495 | | $(16,955,103) | | $70,170,392 |
U.S. GAAP defines fair value as the price that the Series would receive to sell an asset or pay to transfer a liability in an orderly transaction between market participants at the measurement date under current market conditions. A framework for measuring fair value and a three level hierarchy for fair value measurements has been established based upon the transparency of inputs to the valuation of an asset or liability. Inputs may be observable or unobservable and refer broadly to the assumptions that market participants would use in pricing the asset or liability. Observable inputs reflect the assumptions market participants would use in pricing the asset or liability based on market data obtained from sources independent of the reporting entity. Unobservable inputs reflect the reporting entity’s own assumptions about the assumptions that market participants would use in pricing the asset or liability developed based on the best information available under the circumstances. The Series’ investment in its entirety is assigned a level based upon the observability of the inputs which are significant to the overall valuation. The three-tier hierarchy of inputs is summarized below.
Level 1 – inputs are quoted prices in active markets
Level 2 – inputs are observable, directly or indirectly
Level 3 – inputs are unobservable and reflect assumptions on the part of the reporting entity
The following table summarizes the valuation of the Series’ investments by the fair value hierarchy levels as of December 31, 2009:
| | | Level 1 | | Level 2 | | Level 3 | | Total |
| Agency, Asset-Backed & Mortgage-Backed Securities | | $ | – | | $ | 240,197,258 | | $ | 3,546,079 | | $ | 243,743,337 |
| Corporate Debt | | | 1,065,563 | | | 1,024,842,363 | | | 1,784,192 | | | 1,027,692,118 |
| Foreign Debt | | | – | | | 53,973,464 | | | 13,314,692 | | | 67,288,156 |
| Municipal Bonds | | | – | | | 11,972,215 | | | – | | | 11,972,215 |
| U.S. Treasury Obligations | | | 33,842,817 | | | – | | | – | | | 33,842,817 |
| Common Stock | | | 2,067,376 | | | – | | | 7 | | | 2,067,383 |
| Short Term | | | – | | | 3,820,000 | | | – | | | 3,820,000 |
| Other | | | – | | | 3,983,023 | | | 1 | | | 3,983,024 |
| Securities Lending Collateral | | | 58,665,646 | | | 19,739,041 | | | 78,748 | | | 78,483,435 |
| Total | | $ | 95,641,402 | | $ | 1,358,527,364 | | $ | 18,723,719 | | $ | 1,472,892,485 |
| |
| Derivatives | | $ | – | | $ | 470,820 | | $ | – | | $ | 470,820 |
Diversified Income Series-29
Delaware VIP® Diversified Income Series
Notes to Financial Statements (continued)
3. Investments (continued)
The following is a reconciliation of investments in which significant unobservable inputs (Level 3) were used in determining fair value:
| Agency, Asset- | | | | | | | | |
| Backed and | | | | | | | | |
| Mortgage- | | | | | | | | |
| Backed | | Corporate | | Foreign |
| Securities | | Debt | | Debt |
| Balance as of 12/31/08 | | $ | 4,102,837 | | | | $ | 5,744,156 | | | $ | 5,935,901 | |
| Net realized loss | | | (3,537 | ) | | | | (1,108,952 | ) | | | (663,198 | ) |
| Net change in unrealized appreciation/depreciation | | | 326,330 | | | | | 911,309 | | | | 1,264,326 | |
| Purchases | | | 2,322,188 | | | | | 1,304,529 | | | | 11,004,628 | |
| Sales | | | (541,677 | ) | | | | (1,413,755 | ) | | | (3,430,718 | ) |
| Transfer into Level 3 | | | – | | | | | 932,832 | | | | – | |
| Transfers out of Level 3 | | | (2,660,062 | ) | | | | (4,585,927 | ) | | | (796,247 | ) |
| Balance as of 12/31/09 | | $ | 3,546,079 | | | | $ | 1,784,192 | | | $ | 13,314,692 | |
| | | | | | | | | | | | | | |
| Net change in unrealized | | | | | | | | | | | | | |
| appreciation/depreciation from | | | | | | | | | | | | | |
| investments still held as of 12/31/09 | | $ | 250,979 | | | | $ | (543,368 | ) | | $ | 1,008,701 | |
| | | | | | | | | | | | Securities | | | | |
| | Common | | | | Lending | | Total |
| | Stock | | Other | | Collateral | | Series |
| Balance as of 12/31/08 | | | $ | 7 | | | | $ | 1 | | | | $ | 61,145 | | | $ | 15,844,047 | |
| Net realized loss | | | | – | | | | | – | | | | | – | | | | (1,775,687 | ) |
| Net change in unrealized appreciation/depreciation | | | | – | | | | | – | | | | | 17,603 | | | | 2,519,568 | |
| Purchases | | | | – | | | | | – | | | | | – | | | | 14,631,345 | |
| Sales | | | | – | | | | | – | | | | | – | | | | (5,386,150 | ) |
| Transfers into Level 3 | | | | – | | | | | – | | | | | – | | | | 932,832 | |
| Transfers out of Level 3 | | | | – | | | | | – | | | | | – | | | | (8,042,236 | ) |
| Balance as of 12/31/09 | | | $ | 7 | | | | $ | 1 | | | | $ | 78,748 | | | $ | 18,723,719 | |
| | | | | | | | | | | | | | | | | | | | |
| Net change in unrealized | | | | | | | | | | | | | | | | | | | |
| appreciation/depreciation from | | | | | | | | | | | | | | | | | | | |
| investments still held as of 12/31/09 | | | $ | – | | | | $ | – | | | | $ | 17,603 | | | $ | 733,915 | |
In January 2010, the Financial Accounting Standards Board issued an Accounting Standards Update, Improving Disclosures about Fair Value Measurements, which introduces new disclosure requirements and clarifies certain existing disclosure requirements around fair value measurements currently presented above. The new disclosures and clarifications of existing disclosures are generally effective for the Series’ year ending December 31, 2010 and interim periods therein. Management is evaluating the impact of this update on its current disclosures.
4. Dividend and Distribution Information
Income and long-term capital gain distributions are determined in accordance with federal income tax regulations, which may differ from U.S. GAAP. Additionally, distributions from net gains on foreign currency transactions and net short-term gains on sales of investment securities are treated as ordinary income for federal income tax purposes. The tax character of dividends and distributions paid during the years ended December 31, 2009 and 2008 was as follows:
| Year | | Year |
| Ended | | Ended |
| 12/31/09 | | 12/31/08 |
| Ordinary income | $ | 66,017,907 | | $ | 50,138,696 |
| Long-term capital gain | | – | | | 3,251,351 |
| Total | $ | 66,017,907 | | $ | 53,390,047 |
| |
5. Components of Net Assets on a Tax Basis
As of December 31, 2009, the components of net assets on a tax basis were as follows:
| Shares of beneficial interest | $ | 1,300,601,443 | |
| Undistributed ordinary income | | 75,631,778 | |
| Post-October currency losses | | (937,403 | ) |
| Other temporary differences | | (717,542 | ) |
| Unrealized appreciation of investments, | | | |
| swap contracts and foreign currencies | | 70,198,285 | |
| Net assets | $ | 1,444,776,561 | |
| |
Diversified Income Series-30
Delaware VIP® Diversified Income Series
Notes to Financial Statements (continued)
5. Components of Net Assets on a Tax Basis (continued)
The differences between book basis and tax basis components of net assets are primarily attributable to tax deferral of losses on wash sales, tax deferral of losses straddles, mark-to-market on foreign currency contracts, mark-to-market on futures contracts and tax treatment of contingent payment debt instruments and CDS contracts.
Post-October currency losses represent losses realized on foreign currency transactions from November 1, 2009 through December 31, 2009, that, in accordance with federal income tax regulations, the Series has elected to defer and treat as having arisen in the following fiscal year.
For financial reporting purposes, capital accounts are adjusted to reflect the tax character of permanent book/tax differences. Reclassifications are primarily due to tax treatment of paydown gains (losses) of mortgage- and asset-backed securities, dividends and distributions, CDS contracts, gain (loss) on foreign currency transactions and foreign future contracts. Results of operations and net assets were not affected by these reclassifications. For the year ended December 31, 2009, the Series recorded the following reclassifications:
| Undistributed | | Accumulated |
| Net Investment | | Net Realized |
| Income | | Loss |
| $3,293,692 | | $(3,293,692) |
For federal income tax purposes, capital loss carryforwards may be carried forward and applied against future capital gains. $21,350,848 was utilized in 2009.
6. Capital Shares
Transactions in capital shares were as follows:
| Year | | Year |
| Ended | | Ended |
| 12/31/09 | | 12/31/08 |
| Shares sold: | | | | | |
| Standard Class | 16,003,816 | | | 25,435,606 | |
| Service Class | 32,789,932 | | | 24,801,536 | |
| |
| Shares issued upon reinvestment of dividends and distributions: | | | | | |
| Standard Class | 4,086,207 | | | 3,180,458 | |
| Service Class | 3,342,803 | | | 2,191,984 | |
| | 56,222,758 | | | 55,609,584 | |
| Shares repurchased: | | | | | |
| Standard Class | (19,235,858 | ) | | (21,016,183 | ) |
| Service Class | (10,466,803 | ) | | (15,250,066 | ) |
| (29,702,661 | ) | | (36,266,249 | ) |
| Net increase | 26,520,097 | | | 19,343,335 | |
| |
7. Line of Credit
The Series, along with certain other funds in the Delaware Investments® Family of Funds (Participants), participates in a $35,000,000 revolving line of credit with The Bank of New York Mellon (BNY Mellon) to be used for temporary or emergency purposes as an additional source of liquidity to fund redemptions of investor shares. Under the agreement, Participants are charged an annual commitment fee, which is allocated across the Participants on the basis of each Participant’s allocation of the entire facility. The Participants may borrow up to a maximum of one third of their net assets under the agreement. The agreement expires on November 16, 2010. The Series had no amounts outstanding as of December 31, 2009, or at any time during the year then ended.
8. Derivatives
U.S. GAAP requires enhanced disclosures that enable investors to understand: 1) how and why an entity uses derivatives, 2) how they are accounted for, and 3) how they affect an entity’s results of operations and financial position.
Foreign Currency Exchange Contracts
The Series may enter into foreign currency exchange contracts and foreign cross currency exchange contracts as a way of managing foreign exchange rate risk. The Series may enter into these contracts to fix the U.S. dollar value of a security that it has agreed to buy or sell for the period between the date the trade was entered into and the date the security is delivered and paid for. The Series may also use these contracts to hedge the U.S. dollar value of securities it already owns that are denominated in foreign currencies. The change in value is recorded as an unrealized gain or loss. When the contract is closed, a realized gain or loss is recorded equal to the difference between the value of the contract at the time it was opened and the value at the time it was closed.
Diversified Income Series-31
Delaware VIP® Diversified Income Series
Notes to Financial Statements (continued)
8. Derivatives (continued)
The use of foreign currency exchange contracts and foreign cross currency exchange contracts does not eliminate fluctuations in the underlying prices of the securities, but does establish a rate of exchange that can be achieved in the future. Although foreign currency exchange contracts limit the risk of loss due to a decline in the value of the hedged currency, they also limit any potential gain that might result should the value of the currency increase. In addition, the Series could be exposed to risks if the counterparties to the contracts are unable to meet the terms of their contracts. The Series’ maximum risk of loss from counterparty credit risk is the value of its currency exchanged with the counterparty. The risk is generally mitigated by having a netting arrangement between the Series and the counterparty and by the posting of collateral by the counterparty to the Series to cover the Series’ exposure to the counterparty.
Futures Contracts
A futures contract is an agreement in which the writer (or seller) of the contract agrees to deliver to the buyer an amount of cash or securities equal to a specific dollar amount times the difference between the value of a specific security or index at the close of the last trading day of the contract and the price at which the agreement is made. The Series may use futures in the normal course of pursuing its investment objective. The Series may invest in financial futures contracts to hedge its existing portfolio securities against fluctuations in fair value caused by changes in prevailing market interest rates. Upon entering into a financial futures contract, the Series deposits cash or pledges U.S. government securities to a broker, equal to the minimum “initial margin” requirements of the exchange on which the contract is traded. Subsequent payments are received from the broker or paid to the broker each day, based on the daily fluctuation in the market value of the contract. These receipts or payments are known as “variation margin” and are recorded daily by the Series as unrealized gains or losses until the contracts are closed. When the contracts are closed, the Series records a realized gain or loss equal to the difference between the value of the contract at the time it was opened and the value at the time it was closed. Risks of entering into financial futures contracts include potential imperfect correlation between the financial futures contracts and the underlying securities and the possibility of an illiquid secondary market for these instruments. When investing in futures, there is minimal counterparty credit risk to the Series because futures are exchange traded and the exchange’s clearinghouse, as counterparty to all exchange traded futures, guarantees against default.
Written Options
During the year ended December 31, 2009, the Series entered into options contracts in the normal course of pursuing its investment objective. The Series may buy or write options contracts for any number of reasons, including: to manage the Series’ exposure to changes in securities prices and foreign currencies; as an efficient means of adjusting the Series’ overall exposure to certain markets; to protect the value of portfolio securities; and as a cash management tool. The Series may buy or write call or put options on securities, financial indices, and foreign currencies. When the Series buys an option, a premium is paid and an asset is recorded and adjusted on a daily basis to reflect the current market value of the options purchased. When the Series writes an option, a premium is received and a liability is recorded and adjusted on a daily basis to reflect the current market value of the options written. Premiums received from writing options that expire unexercised are treated by the Series on the expiration date as realized gains. The difference between the premium received and the amount paid on effecting a closing purchase transaction, including brokerage commissions, is treated as realized gain or loss. If a call option is exercised, the premium is added to the proceeds from the sale of the underlying security in determining whether the Series has a realized gain or loss. If a put option is exercised, the premium reduces the cost basis of the securities purchased by the Series. The Series, as writer of an option, bears the market risk of an unfavorable change in the price of the security underlying the written option. When writing options, the Series is subject to minimal counterparty credit risk because the counterparty is only obligated to pay premiums and does not bear the market risk of an unfavorable market change.
Transactions in written options during the year ended December 31, 2009 for the Series were as follows:
| | Number of | | | | |
| | contracts | | Premiums |
| Options outstanding at December 31, 2008 | | – | | | $ | – | |
| Options written | | 2,832,219 | | | | 57,102 | |
| Options expired | | (2,088,800 | ) | | | (20,478 | ) |
| Options terminated in closing purchase transactions | | (743,419 | ) | | | (36,624 | ) |
| Options outstanding at December 31, 2009 | | – | | | $ | – | |
| |
Swap Contracts
The Series may enter into interest rate swap contracts, index swap contracts and CDS contracts in the normal course of pursuing its investment objective. The Series may use interest rate swaps to adjust the Series’ sensitivity to interest rates or to hedge against changes in interest rates. Index swaps may be used to gain exposure to markets that the Series invests in, such as the corporate bond market. The Series may also use index swaps as a substitute for futures or options contracts if such contracts are not directly available to the Series on favorable terms. The Series may enter into CDS contracts in order to hedge against a credit event, to enhance total return or to gain exposure to certain securities or markets.
Interest Rate Swaps. An interest rate swap contract is an exchange of interest rates between counterparties. In one instance, an interest rate swap involves payments received by the Series from another party based on a variable or floating interest rate, in return for making payments based on a fixed interest rate. An interest rate swap can also work in reverse with the Series receiving payments based on a fixed interest rate and making payments based on a variable or floating interest rate. Interest rate swaps may be used to adjust the Series’ sensitivity to interest rates or to hedge against changes in interest rates. Periodic payments on such contracts are accrued daily and recorded as unrealized appreciation/depreciation on swap contracts. Upon periodic payment/receipt or termination of the contract, such amounts are recorded as realized gains or losses on swap contracts. The Series’ maximum risk of loss from counterparty credit risk is the discounted net value of the cash flows to be received from/paid to the counterparty over the interest rate swap contract’s remaining life, to the extent that the amount is positive. This risk is mitigated by having a netting arrangement between the Series and the counterparty and by the posting of collateral by the counterparty to the Series to cover the Series’ exposure to the counterparty.
Diversified Income Series-32
Delaware VIP® Diversified Income Series
Notes to Financial Statements (continued)
8. Derivatives (continued)
Index Swaps. Index swaps involve commitments to pay interest in exchange for a market linked return based on a notional amount. To the extent the total return of the security, instrument or basket of instruments underlying the transaction exceeds the offsetting interest obligation, the Series will receive a payment from the counterparty. To the extent the total return of the security, instrument or basket of instruments underlying the transaction falls short of the offsetting interest obligation, the Series will make a payment to the counterparty. The change in value of swap contracts outstanding, if any, is recorded as unrealized appreciation or depreciation daily. A realized gain or loss is recorded on maturity or termination of the swap contract. The Series’ maximum risk of loss from counterparty credit risk is the discounted net value of the cash flows to be received from/paid to the counterparty over the index swap contract’s remaining life, to the extent that the amount is positive. This risk is mitigated by having a netting arrangement between the Series and the counterparty and by the posting of collateral by the counterparty to the Series to cover the Series’ exposure to the counterparty.
Credit Default Swaps. A CDS contract is a risk-transfer instrument through which one party (purchaser of protection) transfers to another party (seller of protection) the financial risk of a credit event (as defined in the CDS agreement), as it relates to a particular reference security or basket of securities (such as an index). In exchange for the protection offered by the seller of protection, the purchaser of protection agrees to pay the seller of protection a periodic amount at a stated rate that is applied to the notional amount of the CDS contract. In addition, an upfront payment may be made or received by the Series in connection with an unwinding or assignment of a CDS contract. Upon the occurrence of a credit event, the seller of protection would pay the par (or other agreed-upon) value of the reference security (or basket of securities) to the counterparty. Credit events generally include, among others, bankruptcy, failure to pay, and obligation default.
During the year ended December 31, 2009, the Series entered into CDS contracts as a purchaser and seller of protection. Periodic payments (receipts) on such contracts are accrued daily and recorded as unrealized losses (gains) on swap contracts. Upon payment, such amounts are recorded as realized losses (gains) on swap contracts. Upfront payments made or received in connection with CDS contracts are amortized over the expected life of the CDS contracts as unrealized losses (gains) on swap contracts. The change in value of CDS contracts is recorded as unrealized appreciation or depreciation daily. A realized gain or loss is recorded upon a credit event (as defined in the CDS agreement) or the maturity or termination of the agreement. At December 31 2009, the aggregate unrealized depreciation of credit default swaps was $966,719. The Series has posted $2,800,000 as collateral for all open derivatives. If a credit event has occurred as of December 31, 2009, the swaps’ credit-risk-related contingent features would have been triggered and the Series would have received $450,000 less the value of the contracts’ related reference obligations.
As disclosed in the footnotes to the Statement of Net Assets, at December 31, 2009, the notional value of the protection sold was $9,370,000, which reflects the maximum potential amount the Series could be required to make as a seller of credit protection if a credit event occurs. The quoted market prices and resulting market values for credit default swap agreements on securities and credit indices serve as an indicator of the current status of the payment/performance risk and represent the likelihood of an expected liability (or profit) for the credit derivative if the swap agreement has been closed/sold as of the period end. Increasing market values, in absolute terms when compared to the notional amount of the swap, represent a deterioration of the reference entity’s credit soundness and a greater likelihood of risk of default or other credit event occurring as defined under the terms of the agreement. At December 31, 2009, the net unrealized appreciation of the protection sold was $188,863.
Credit default swaps may involve greater risks than if the Series had invested in the reference obligation directly. Credit default swaps are subject to general market risk, liquidity risk, counterparty risk and credit risk. The Series’ maximum risk of loss from counterparty credit risk, either as the seller of protection or the buyer of protection, is the fair value of the contract. This risk is mitigated by having a netting arrangement between the Series and the counterparty and by the posting of collateral by the counterparty to the Series to cover the Series’ exposure to the counterparty.
Swaps Generally. Because there is no organized market for swap contracts, the value of open swaps may differ from that which would be realized in the event the Series terminated its position in the agreement. Risks of entering into these contracts include the potential inability of the counterparty to meet the terms of the contracts. This type of risk is generally limited to the amount of favorable movement in the value of the underlying security, instrument or basket of instruments, if any, at the day of default. Risks also arise from potential losses from adverse market movements and such losses could exceed the unrealized amounts shown on the Statement of Net Assets.
Fair values of derivative instruments as of December 31, 2009 was as follows:
| Asset Derivatives | | | Liability Derivatives | |
| Statement of | | | | | | | Statement of | | | | | |
| Net Assets | | | | | | | Net Assets | | | | | |
| Location | | Fair Value | | Location | | Fair Value |
| Foreign exchange contracts (Currency) | Receivables and other assets net | | | | | | | Receivables and other assets net | | | | | |
| of liabilities | | | $ | 79,578 | | | of liabilities | | | $ | 638,105 | |
| | |
| Interest rate contracts (Futures) | Receivables and other assets net | | | | | | | Receivables and other assets net | | | | | |
| of liabilities | | | | 1,807,203 | | | of liabilities | | | | – | |
| | |
| Credit contracts (Swaps) | Receivables and other assets net | | | | | | | Receivables and other assets net | | | | | |
| of liabilities | | | | 82,694 | | | of liabilities | | | | 860,550 | |
| Total | | | | $ | 1,969,475 | | | | | | $ | 1,498,655 | |
Diversified Income Series-33
Delaware VIP® Diversified Income Series
Notes to Financial Statements (continued)
8. Derivatives (continued)
Statement of Operations
The effect of derivative instruments on the statement of operations for the year ended December 31, 2009 was as follows:
| | | | | | | | | Change in Unrealized |
| | Location of Gain or | | Realized Gain or | | Appreciation or Depreciation |
| Loss on Derivatives | | Loss on Derivatives | | on Derivatives Recognized |
| Recognized in Income | | Recognized in Income | | in Income |
| Foreign exchange contracts (Currency) | Net realized gain on foreign | | | | | | | | | | | | |
| currencies and net change | | | | | | | | | | | | |
| in unrealized appreciation/ | | | | | | | | | | | | |
| depreciation of investments | | | | | | | | | | | | |
| and foreign currencies | | | $ | 2,723,949 | | | | | $ | 589,216 | | |
| | |
| Foreign exchange contracts (Options) | Net realized gain on written | | | | | | | | | | | | |
| options and net change in | | | | | | | | | | | | |
| unrealized appreciation/ | | | | | | | | | | | | |
| depreciation of investments | | | | | | | | | | | | |
| and foreign currencies | | | $ | 505 | | | | | $ | – | | |
| | |
| Interest rate contracts (Futures) | Net realized gain on futures | | | | | | | | | | | | |
| contracts and net change | | | | | | | | | | | | |
| in unrealized appreciation/ | | | | | | | | | | | | |
| depreciation of investments | | | | | | | | | | | | |
| and foreign currencies | | | $ | 561,118 | | | | | $ | 958,698 | | |
| | |
| Credit contracts (Swaps) | Net realized loss on swap | | | | | | | | | | | | |
| contracts and net change | | | | | | | | | | | | |
| in unrealized appreciation/ | | | | | | | | | | | | |
| depreciation of investments | | | | | | | | | | | | |
| and foreign currencies | | | $ | (2,511,774 | ) | | | | $ | (963,441 | ) | |
| Total | | | | $ | 773,798 | | | | | $ | 584,473 | | |
9. Securities Lending
The Series, along with other funds in the Delaware Investments® Family of Funds, may lend its securities pursuant to a security lending agreement (Lending Agreement) with BNY Mellon. With respect to each loan, if the aggregate market value of securities collateral held plus cash collateral received on any business day is less than the aggregate market value of the securities which are the subject of such loan, the borrower will be notified to provide additional collateral not less than the applicable collateral requirements. Cash collateral received is generally invested in the Mellon GSL DBT II Collateral Fund (Collective Trust) established by BNY Mellon for the purpose of investment on behalf of clients participating in its securities lending programs. The Collective Trust may invest in fixed income securities, with a weighted average maturity not to exceed 90 days, rated in one of the top three tiers by Standard & Poor’s Ratings Group (S&P) or Moody’s Investors Service, Inc. (Moody’s) or repurchase agreements collateralized by such securities. The Collective Trust seeks to maintain a net asset value per unit of $1.00, but there can be no assurance that it will always be able to do so. At December 31, 2009, the Collective Trust held only cash and assets with a maturity of one business day or less (Cash/Overnight Assets). The Series may incur investment losses as a result of investing securities lending collateral in the Collective Trust. This could occur if an investment in the Collective Trust defaulted or if it were necessary to liquidate assets in the Collective Trust to meet returns on outstanding security loans at a time when the Collective Trust’s net asset value per unit was less than $1.00. Under those circumstances, the Series may not receive an amount from the Collective Trust that is equal in amount to the collateral the Series would be required to return to the borrower of the securities and the Series would be required to make up for this shortfall. Effective April 20, 2009, BNY Mellon transferred the assets of the Collective Trust other than the Cash/Overnight Assets to the BNY Mellon SL DBT II Liquidating Fund (Liquidating Fund), effectively bifurcating the collateral investment pool. The Series’ exposure to the Liquidating Fund is expected to decrease as the Liquidating Fund’s assets mature or are sold. In October 2008, BNY Mellon transferred certain distressed securities from the Collective Trust into the Mellon GSL Reinvestment Trust II. The Series can also accept U.S. government securities and letters of credit (non-cash collateral) in connection with securities loans. In the event of default or bankruptcy by the lending agent, realization and/or retention of the collateral may be subject to legal proceedings. In the event the borrower fails to return loaned securities and the collateral received is insufficient to cover the value of the loaned securities and provided such collateral shortfall is not the result of investment losses, the lending agent has agreed to pay the amount of the shortfall to the Series, or at the discretion of the lending agent, replace the loaned securities. The Series continues to record dividends or interest, as applicable, on the securities loaned and is subject to change in value of the securities loaned that may occur during the term of the loan. The Series has the right under the Lending Agreement to recover the securities from the borrower on demand. With respect to security loans collateralized by non-cash collateral, the Series receives loan premiums paid by the borrower. With respect to security loans collateralized by cash collateral, the earnings from the collateral investments are shared among the Series, the security lending agent and the borrower. The Series records security lending income net of allocations to the security lending agent and the borrower.
At December 31, 2009, the value of the securities on loan was $79,408,442, for which the Series received collateral, comprised of securities collateral valued at $990,473, and cash collateral of $80,487,218. At December 31, 2009, the value of invested collateral was $78,483,435. Investments purchased with cash collateral are presented on the Statement of Net Assets under the caption “Securities Lending Collateral.”
Diversified Income Series-34
Delaware VIP® Diversified Income Series
Notes to Financial Statements (continued)
10. Credit and Market Risk
Some countries in which the Series may invest require governmental approval for the repatriation of investment income, capital or the proceeds of sales of securities by foreign investors. In addition, if there is deterioration in a country’s balance of payments or for other reasons, a country may impose temporary restrictions on foreign capital remittances abroad.
The securities exchanges of certain foreign markets are substantially smaller, less liquid and more volatile than the major securities markets in the United States. Consequently, acquisition and disposition of securities by the Series may be inhibited. In addition, a significant portion of the aggregate market value of securities listed on the major securities exchanges in emerging markets are held by a smaller number of investors. This may limit the number of shares available for acquisition or disposition by the Series.
The Series invests in fixed income securities whose value is derived from underlying mortgages or consumer loans. The value of these securities is sensitive to changes in economic conditions, including delinquencies and/or defaults, and may be adversely affected by shifts in the market’s perception of the issuers and changes in interest rates. Investors receive principal and interest payments as the underlying mortgages or consumer loans are paid back. Some of these securities are collateralized mortgage obligations (CMOs). CMOs are debt securities issued by U.S. government agencies or by financial institutions and other mortgage lenders, which are collateralized by a pool of mortgages held under an indenture. Prepayment of mortgages may shorten the stated maturity of the obligations and can result in a loss of premium, if any has been paid. Certain of these securities may be stripped (securities which provide only the principal or interest feature of the underlying security). The yield to maturity on an interest-only CMO is extremely sensitive not only to changes in prevailing interest rates, but also to the rate of principal payments (including prepayments) on the related underlying mortgage assets. A rapid rate of principal payments may have a material adverse affect on the Series’ yield to maturity. If the underlying mortgage assets experience greater than anticipated prepayments of principal, the Series may fail to fully recoup its initial investment in these securities even if the securities are rated in the highest rating categories.
The Series invests a portion of its assets in high yield fixed income securities, which carry ratings of BB or lower by S&P and/or Ba or lower by Moody’s. Investments in these higher yielding securities are generally accompanied by a greater degree of credit risk than higher rated securities. Additionally, lower rated securities may be more susceptible to adverse economic and competitive industry conditions than investment-grade securities.
The Series may invest up to 15% of its net assets in illiquid securities, which may include securities with contractual restrictions on resale, securities exempt from registration under Rule 144A of the Securities Act of 1933, as amended, and other securities which may not be readily marketable. The relative illiquidity of these securities may impair the Series from disposing of them in a timely manner and at a fair price when it is necessary or desirable to do so. While maintaining oversight, the Series’ Board has delegated to DMC the day-to-day functions of determining whether individual securities are liquid for purposes of the Series’ limitation on investments in illiquid assets. Securities eligible for resale pursuant to Rule 144A, which are determined to be liquid, are not subject to the Series’ 15% limit on investments in illiquid securities. Rule 144A and illiquid securities have been identified on the Statement of Net Assets.
11. Contractual Obligations
The Series enters into contracts in the normal course of business that contain a variety of indemnifications. The Series’ maximum exposure under these arrangements is unknown. However, the Series has not had prior claims or losses pursuant to these contracts. Management has reviewed the Series’ existing contracts and expects the risk of loss to be remote.
12. Sale of Delaware Investments to Macquarie Group
On August 18, 2009, Lincoln National Corporation (parent company of Delaware Investments) and Macquarie Group (Macquarie) entered into an agreement pursuant to which Delaware Investments, including DMC, DDLP and DSC, would be acquired by Macquarie, an Australia-based global provider of banking, financial, advisory, investment and funds management services (Transaction). The Transaction was completed on January 4, 2010. DMC, DDLP and DSC are now wholly-owned subsidiaries of Macquarie.
The Transaction resulted in a change of control of DMC which, in turn, caused the termination of the investment advisory agreement between DMC and the Series. On January 4, 2010, the new investment advisory agreement between DMC and the Series that was approved by the shareholders became effective.
13. Tax Information (Unaudited)
For the fiscal year ended December 31, 2009, the Series designates distributions paid during the year as follows:
| (A) | | (B) | | |
| Long-Term | | Ordinary | | |
| Capital Gain | | Income | | Total |
| Distributions | | Distributions | | Distributions |
| (Tax Basis) | | (Tax Basis) | | (Tax Basis) |
| –% | | 100% | | 100% |
____________________
(A) and (B) are based on a percentage of the Series’ total distributions.
Diversified Income Series-35
Delaware VIP® Trust — Delaware VIP Diversified Income Series
Report of Independent Registered Public Accounting Firm
To the Shareholders and Board of Trustees
Delaware VIP Trust–Delaware VIP Diversified Income Series
We have audited the accompanying statement of net assets of the Delaware VIP Diversified Income Series (one of the series constituting Delaware VIP Trust) (the “Series”) as of December 31, 2009, and the related statement of operations for the year then ended, the statements of changes in net assets for each of the two years in the period then ended, and the financial highlights for each of the five years in the period then ended. These financial statements and financial highlights are the responsibility of the Series’ management. Our responsibility is to express an opinion on these financial statements and financial highlights based on our audits.
We conducted our audits in accordance with the standards of the Public Company Accounting Oversight Board (United States). Those standards require that we plan and perform the audit to obtain reasonable assurance about whether the financial statements and financial highlights are free of material misstatement. We were not engaged to perform an audit of the Series’ internal control over financial reporting. Our audits included consideration of internal control over financial reporting as a basis for designing audit procedures that are appropriate in the circumstances, but not for the purpose of expressing an opinion on the effectiveness of the Series’ internal control over financial reporting. Accordingly, we express no such opinion. An audit also includes examining, on a test basis, evidence supporting the amounts and disclosures in the financial statements and financial highlights, assessing the accounting principles used and significant estimates made by management, and evaluating the overall financial statement presentation. Our procedures included confirmation of securities owned as of December 31, 2009, by correspondence with the custodian and brokers or by other appropriate auditing procedures where replies from brokers were not received. We believe that our audits provide a reasonable basis for our opinion.
In our opinion, the financial statements and financial highlights referred to above present fairly, in all material respects, the financial position of the Delaware VIP Diversified Income Series of Delaware VIP Trust at December 31, 2009, the results of its operations for the year then ended, the changes in its net assets for each of the two years in the period then ended, and its financial highlights for each of the five years in the period then ended, in conformity with U.S. generally accepted accounting principles.
Philadelphia, Pennsylvania
February 17, 2010
The Series files its complete schedule of portfolio holdings with the Securities and Exchange Commission (Commission) for the first and third quarters of each fiscal year on Form N-Q. The Series’ Forms N-Q, as well as a description of the policies and procedures that the Series uses to determine how to vote proxies (if any) relating to portfolio securities is available without charge (i) upon request, by calling 800 523-1918; and (ii) on the Commission’s website at http://www.sec.gov. In addition, a description of the policies and procedures that the Series uses to determine how to vote proxies (if any) relating to portfolio securities is available without charge on the Delaware Investments® Funds’ Web site at http://www.delawareinvestments.com. The Series’ Forms N-Q may be reviewed and copied at the Commission’s Public Reference Room in Washington, DC; information on the operation of the Public Reference Room may be obtained by calling 800 SEC-0330.
Information (if any) regarding how the Series voted proxies relating to portfolio securities during the most recently disclosed 12-month period ended June 30 is available without charge (i) through the Delaware Investments Funds’ Web site at http://www.delawareinvestments.com; and (ii) on the Commission’s website at http://www.sec.gov. |
Diversified Income Series-36
Delaware VIP® Trust — Delaware VIP Diversified Income Series
Other Series Information
Board Consideration of New Investment Advisory Agreement
At a meeting held on September 3, 2009 (the “Meeting”), the Board of Trustees of the Delaware Investments Family of Funds (the “Board”), including the independent Trustees, unanimously approved a new investment advisory agreement between each registrant on behalf of each series (each, a “Fund” and together, the “Funds”) and Delaware Management Company (“DMC”) in connection with the sale of Delaware Investments’ advisory business to Macquarie Bank Limited (the “Macquarie Group”) (the “Transaction”). In making its decision, the Board considered information furnished specifically in connection with the approval of the new investment advisory agreements with DMC (the “New Investment Advisory Agreements”) which included extensive materials about the Transaction and matters related to the proposed approvals. To assist the Board in considering the New Investment Advisory Agreements, Macquarie Group provided materials and information about Macquarie Group, including detailed written responses to the questions posed by the independent Trustees. DMC also provided materials and information about the Transaction, including detailed written responses to the questions posed by the independent Trustees.
At the Meeting, the Trustees discussed the Transaction with DMC management and with key Macquarie Group representatives. The Meeting included discussions of the strategic rationale for the Transaction and Macquarie Group’s general plans and intentions regarding the Funds and DMC. The Board members also inquired about the plans for, and anticipated roles and responsibilities of, key employees and officers of Delaware Management Holdings Inc. and DMC in connection with the Transaction.
In connection with the Trustees’ review of the New Investment Advisory Agreements for the Funds, DMC and/or Macquarie Group emphasized that:
- They expected that there would be no adverse changes as a result of the Transaction, in the nature, quality, or extent of services currently provided to the Funds and their shareholders, including investment management, distribution, or other shareholder services.
- No material changes in personnel or operations were contemplated in the operation of DMC under Macquarie Group as a result of the Transaction and no material changes were currently contemplated in connection with third party service providers to the Funds.
- Macquarie Group had no intention to cause DMC to alter the voluntary expense waivers and reimbursements currently in effect for the Funds.
- Under the agreement between Macquarie Group and Lincoln National Corporation (“LNC”) (the “Transaction Agreement”), Macquarie Group has agreed to conduct, and to cause its affiliates to conduct, their respective businesses in compliance with the conditions of Section 15(f) of the Investment Company Act of 1940 (the “1940 Act”) with respect to the Funds, to the extent within its control, including maintaining Board composition of at least 75% of the Board members qualifying as independent Trustees and not imposing any “unfair burden” on the Funds for at least two years from the closing of the Transaction (the “Closing”).
In addition to the information provided by DMC and Macquarie Group as described above, the Trustees also considered all other factors they believed to be relevant to evaluating the New Investment Advisory Agreements, including the specific matters discussed below. In their deliberations, the Trustees did not identify any particular information that was controlling, and different Trustees may have attributed different weights to the various factors. However, for each Fund, the Trustees determined that the overall arrangements between the Fund and DMC, as provided in the respective New Investment Advisory Agreement, including the proposed advisory fee and the related administration arrangements between the Fund and DMC, were fair and reasonable in light of the services to be performed, expenses incurred, and such other matters as the Trustees considered relevant. Factors evaluated included:
- The potential for expanding distribution of Fund shares through access to Macquarie Group’s existing distribution channels;
- Delaware Investments’ acquisition of an exclusive wholesaling sales force from a subsidiary of LNC;
- The reputation, financial strength, and resources of Macquarie Group as well as its historic and ongoing commitment to the asset management business in Australia as well as other parts of the world;
- The terms and conditions of the New Investment Advisory Agreements, including that each Fund’s total contractual fee rate under the New Investment Advisory Agreement will remain the same;
- The Board’s full annual review (or initial approval) of the current investment advisory agreements at their in-person meeting in May 2009 as required by the 1940 Act and its determination that (i) DMC had the capabilities, resources, and personnel necessary to provide the satisfactory advisory and administrative services currently provided to each Fund and (ii) the advisory and/or management fees paid by each Fund, taking into account any applicable fee waivers and breakpoints, represented reasonable compensation to DMC in light of the services provided, the costs to DMC of providing those services, economies of scale, and the fees and other expenses paid by similar funds and such other matters that the Board considered relevant in the exercise of its reasonable judgment;
- The portfolio management teams for the Funds are not currently expected to change as a result of the Transaction;
- LNC and Macquarie Group were expected to execute a reimbursement agreement pursuant to which LNC and Macquarie Group would agree to pay (or reimburse) all reasonable out-of-pocket costs and expenses of the Funds in connection with the Board’s consideration of the Transaction, the New Investment Advisory Agreements and related agreements, and all costs related to the proxy solicitation (the “Expense Agreement”);
Diversified Income Series-37
Delaware VIP® Diversified Income Series
Other Series Information (continued)
- The likelihood that Macquarie Group would invest additional amounts in Delaware Investments, including DMC, which could result in increased assets under management, which in turn would allow some Funds the potential opportunity to achieve economies of scale and lower fees payable by Fund shareholders; and
- The compliance and regulatory history of Macquarie Group and its affiliates.
In making their decision relating to the approval of each Fund’s New Investment Advisory Agreement, the independent Trustees gave attention to all information furnished. The following discussion, however, identifies the primary factors taken into account by the Trustees and the conclusions reached in approving the New Investment Advisory Agreements.
NATURE, EXTENT, AND QUALITY OF SERVICE. The Trustees considered the services historically provided by DMC to the Funds and their shareholders. In reviewing the nature, extent, and quality of services, the Board considered that the New Investment Advisory Agreements would be substantially similar to the current investment advisory agreements between the Funds and DMC (the “Current Investment Advisory Agreements”), and they therefore, considered the many reports furnished to them throughout 2008 and 2009 at regular Board meetings covering matters such as: the relative performance of the Funds; the compliance of portfolio managers with the investment policies, strategies, and restrictions for the Funds; the compliance of management personnel with the code of ethics adopted throughout the Delaware Investments Family of Funds complex; and the adherence to fair value pricing procedures as established by the Board. The Trustees were pleased with the current staffing of DMC and the emphasis placed on research and risk management in the investment process. Favorable consideration was given to DMC’s efforts to maintain expenditures and, in some instances, increase financial and human resources committed to Fund matters.
The Board also considered the transfer agent and shareholder services that would continue to be provided to Fund shareholders by DMC’s affiliate, Delaware Service company, Inc. (“DSC”). The Trustees noted, in particular, DSC’s commitment to maintain a high level of service as well as DMC’s expenditures to improve the delivery of shareholder services. The Board was assured that shareholders would continue to receive the benefits provided to Fund shareholders by being part of the Delaware Investments Family of Funds, including each shareholder’s ability to exchange an investment in one Fund for the same class of shares in another Fund without a sales charge, to reinvest Fund dividends into additional shares of any of the Funds, and the privilege to combine holdings in other Funds to obtain a reduced sales charge.
Based on the information provided by DMC and Macquarie Group, including that Macquarie Group and DMC currently expected no material changes as a result of the Transaction in (i) personnel or operations of DMC or (ii) third party service providers to the Funds, the Board concluded that the satisfactory nature, extent, and quality of services currently provided to the Funds and their shareholders were very likely to continue under the New Investment Advisory Agreements. Moreover, the Board concluded that the Funds would probably benefit from the expanded distribution resources that would become available to Delaware Investments following the Transaction. The Board also concluded that it was very unlikely that any “unfair burden” would be imposed on any of the Funds for the first two years following the Closing as a result of the Transaction. Consequently, the Board concluded that it did not expect the Transaction to result in any adverse changes in the nature, quality, or extent of services (including investment management, distribution or other shareholder services) currently provided to the Funds and their shareholders.
INVESTMENT PERFORMANCE. The Board considered the overall investment performance of DMC and the Funds. The Trustees placed significant emphasis on the investment performance of the Funds in view of its importance to shareholders. Although the Trustees gave appropriate consideration to performance reports and discussions with portfolio managers at Board meetings throughout the year, the Trustees gave particular weight to their review of investment performance in connection with the approval of the Current Investment Advisory agreements at the Board meeting held in May 2009. At that meeting, the Trustees reviewed reports prepared by Lipper, Inc., an independent statistical compilation organization (“Lipper”), which showed each Fund’s investment performance as of December 31, 2008 in comparison to a group of funds selected by Lipper as being similar to the Fund (the “Performance Universe”). During the May 2009 agreement review process, the Trustees observed the significant improvements to relative investment performance of the Funds compared to the Funds’ performance as of December 31, 2007.
At their meeting on September 3, 2009, the Trustees, including the independent Trustees in consultation with their independent counsel, reviewed the investment performance of each Fund. The Trustees compared the performance of each Fund relative to that of its respective Performance Universe for the 1-, 3-, 5-, and 10-year periods ended June 30, 2009 and compared its relative investment performance against the corresponding relative investment performance of each Fund for such time periods ended December 31, 2008, to the extent applicable. As of June 30, 2009, 30 of the Funds had investment performance relative to that of the respective Performance Universe that was better than the corresponding relative investment performance at December 31, 2008 for all applicable time periods. At June 30, 2009, an additional 6 Funds had investment performance relative to that of their respective Performance Universe that was better than the corresponding relative investment performance at December 31, 2008 for a majority of the applicable time periods. At June 30, 2009, 15 additional Funds had investment performance relative to that of their respective Performance Universe that was better than the corresponding relative performance at December 31, 2008 and only 29 Funds had poorer relative investment performance at June 30, 2009 compared to that at December 31, 2008.
The Board therefore concluded that the investment performance of the Funds, on an aggregate basis, had continued to improve relative to their respective Performance Universe since the data reviewed at the May 2009 meeting. Based on information provided by DMC and Macquarie Group, the Board concluded that neither the Transaction nor the New Investment Advisory Agreement would likely have an adverse effect on the investment performance of any Fund because (i) DMC and Macquarie Group did not currently expect the Transaction to cause any material change to the Funds’ portfolio management teams responsible for investment performance, which the Board found to be satisfactory and improving; and (ii) as discussed in more detail below, the Funds’ expenses were not expected to increase as a result of the Transaction.
Diversified Income Series-38
Delaware VIP® Diversified Income Series
Other Series Information (continued)
COMPARATIVE EXPENSES. The Trustees also evaluated expense comparison data for the Funds previously provided in May 2009. At that meeting, DMC had provided the Board with information on pricing levels and fee structures for the Funds and comparative funds. The Trustees focused on the comparative analysis of the effective management fees and total expense ratios of each Fund versus the effective management fees and expense ratios of a group of funds selected by Lipper as being similar to each Fund (the “Expense Group”). In reviewing comparative costs, each Fund’s contractual management fee and the actual management fee incurred by the Fund were compared with the contractual management fees (assuming all funds in the Expense Group were similar in size to the Fund) and actual management fees (as reported by each fund) of other funds within the Expense Group, taking into account any applicable breakpoints and fee limitations. Each Fund’s total expenses were also compared with those of its Expense Group. The Trustees also considered fees paid to Delaware Investments for nonmanagement services. At the September 3, 2009 meeting, DMC advised the Board that the more recent comparative expenses for the Funds remained consistent with the previous review in May 2009 and, consequently, the Trustees concluded that expenses of the Funds were satisfactory.
The Board also considered the Expense Agreement under negotiation in evaluating Fund expenses. The Trustees expected that the Expense Agreement would provide that LNC and Macquarie Group would pay or reimburse the Trusts for all reasonable out-of-pocket costs and expenses in connection with the Transaction and the consideration of the New Investment Advisory Agreements (subject to certain limited exceptions).
Based on information provided by DMC and Macquarie Group, the Board concluded that neither the Transaction nor the New Investment Advisory Agreements likely would have an adverse effect on the Funds’ expenses because (i) each Fund’s contractual fee rates under the New Investment Advisory Agreement would remain the same; (ii) under the Expense Agreement, the Funds would be reimbursed for all reasonable out-of-pocket costs and expenses in connection with the Transaction and the related proxy solicitation (subject to certain limited exceptions); and (iii) the expense ratios of certain Funds might decline as a result of the possible increased investment in Delaware Investments by Macquarie Group, as discussed below under “Economies of Scale.”
MANAGEMENT PROFITABILITY. At their meeting on September 3, 2009, the Board evaluated DMC’s profitability in connection with the operation of the Funds. The Board had previously considered DMC’s profitability in connection with the operation of the Funds at its May 2009 meeting. At that meeting, the Board reviewed an analysis that addressed the overall profitability of Delaware Investments’ business in providing management and other services to each of the Funds and the Delaware Investments Family of Funds as a whole. Specific attention was given to the methodology followed in allocating costs for the purpose of determining profitability.
At the May 2009 meeting, representatives of DMC had stated that the level of profits of DMC, to a certain extent, reflect operational cost savings and efficiencies initiated by Delaware Investments (including DMC and its affiliates that provide services to the Funds). The Board considered Delaware Investments’ efforts to improve services provided to Fund shareholders and to meet additional regulatory and compliance requirements resulting from recent industry-wide U.S. Securities and Exchange Commission initiatives. At that meeting, the Board found that the management fees were reasonable in light of the services rendered and the level of profitability of DMC. At the September 3, 2009 meeting, DMC advised the Board that DMC did not expect the Transaction to affect materially the profitability of Delaware Investments compared to the level of profitability considered during the May 2009 review. Moreover, the Trustees reviewed pro forma balance sheets of certain key companies in Delaware Investments as of June 30, 2009 (which were provided by Macquarie Group and DMC in response to the Trustees’ requests) and evaluated the projections of Delaware Investments’ capitalization following the Transaction for purposes of evaluating the financial ability of Delaware Investments to continue to provide the nature, extent, and quality of services as it had under the Current Investment Advisory Agreement.
Based on information provided by DMC and Macquarie Group, the Board concluded that DMC and Delaware Investments would be sufficiently capitalized following the Transaction to continue the same level and quality of services to the Funds under the New Investment Advisory Agreements as was the case under the Current Investment Advisory Agreements. The Board also concluded that Macquarie Group had sufficient financial strength and resources, as well as an ongoing commitment to a global asset management business, to continue investing in Delaware Investments, including DMC, to the extent that Macquarie Group determined it was appropriate. Finally, because services and costs were expected to be substantially the same (and DMC had represented that, correspondingly, profitability would be about the same), under the New Investment Advisory Agreements as under the Current Investment Advisory Agreements, the Trustees concluded that the profitability of Delaware Investments would not result in an inequitable charge on the Funds or their shareholders. Accordingly, the Board concluded that the fees charged under the New Investment Advisory Agreements would be reasonable in light of the services to be provided and the expected profitability of DMC.
ECONOMIES OF SCALE. The Trustees considered whether economies of scale would be realized by Delaware Investments as each Fund’s assets increase and the extent to which any economies of scale would be reflected in the management fees charged. The Trustees took into account DMC’s practice of maintaining the competitive nature of management fees based on its analysis of fees charged by comparable funds. DMC management believed, and the Board agreed, that the Funds were priced with breakpoints and relatively low management fees to reflect potential economies of scale to Fund shareholders.
The Board also acknowledged Macquarie Group’s statement that the Transaction would not by itself immediately provide additional economies of scale given Macquarie Group’s limited presence in the U.S. mutual fund market. Nonetheless, the Trustees concluded that additional economies of scale could potentially be achieved in the future if DMC were owned by Macquarie Group as a result of Macquarie Group’s willingness to invest further in Delaware Investments if appropriate opportunities arise. The Board further concluded that potential economies of scale could be achieved as a result of Delaware Investments’ expanded distribution capabilities arising from the Transaction, as well as opportunities that might arise from Macquarie Group’s global asset management business.
Diversified Income Series-39
Delaware VIP® Diversified Income Series
Other Series Information (continued)
FALL-OUT BENEFITS. The Board acknowledged that DMC would continue to benefit from soft dollar arrangements using portfolio brokerage of each Fund that invests in equity securities and that DMC’s profitability would likely be somewhat lower without the benefit of practices with respect to allocating Fund portfolio brokerage for brokerage and research services. The Board also considered that Macquarie Group and Delaware Investments may derive reputational, strategic, and other benefits from their association with the Delaware Investments Family of Funds, including service relationships with DMC, DSC, and Delaware Distributors, L.P., and evaluated the extent to which Delaware Investments might derive ancillary benefits from Fund operations, including the potential for procuring additional business as a result of the prestige and visibility associated with its role as service provider to the Delaware Investments Family of Funds and the benefits from allocation of Fund brokerage to improve trading efficiencies. However, the Board concluded that (i) any such benefits under the New Investment Advisory Agreements would not be dissimilar from those existing under the Current Investment Advisory Agreements, (ii) such benefits did not impose a cost or burden on the Funds or their shareholders, and (iii) such benefits would probably have an indirectly beneficial effect on the Funds and their shareholders because of the added importance that DMC and Macquarie Group might attach to the Funds as a result of the fall-out benefits that the Funds conveyed.
BOARD REVIEW OF MACQUARIE GROUP. The Trustees reviewed detailed information supplied by Macquarie Group about its operations as well as other information regarding Macquarie Group provided by independent legal counsel to the independent Trustees. Based on this review, the Trustees concluded that Delaware Investments would continue to have the financial ability to maintain the high quality of services required by the Funds. The Trustees noted that there would be a limited transition period during which some services previously provided by LNC to Delaware Investments would continue to be provided by LNC after the Closing, and concluded that this arrangement would help minimize disruption in Delaware Investments’ provision of services to the Funds following the Transaction.
The Board considered Macquarie Group’s support for Delaware Investments’ plans for Fund distribution by transferring wholesalers from Lincoln Financial Distributors, Inc., LNC’s retail distributor, to Delaware Investments, and Macquarie Group’s current intention to leave the Funds’ other service providers in place. The Board also considered Macquarie Group’s current strategic plans to increase its asset management activities, one of its core businesses, particularly in North America, and its statement that its acquisition of DMC is an important component of this strategic growth and the establishment of a significant presence in the United States. Based in part on the information provided by DMC and Macquarie Group, the Board concluded that Macquarie Group’s acquisition of Delaware Investments could potentially enhance the nature, quality, and extent of services provided to the Funds and their shareholders.
CONCLUSION. The Board concluded that the advisory fee rate under each New Investment Advisory Agreement was reasonable in relation to the services provided and that execution of the New Investment Advisory Agreement would be in the best interests of the shareholders. For each Fund, the Trustees noted that they had concluded in their most recent advisory agreement continuance considerations in May 2009 that the management fees and total expense ratios were at acceptable levels in light of the quality of services provided to the Funds and in comparison to those of the Funds’ respective peer groups; that the advisory fee schedule would not be increased and would stay the same for all of the Funds; that the total expense ratio had not changed materially since that determination; and that DMC had represented that the overall expenses for each Fund were not expected to be adversely affected by the Transaction. The Trustees also noted, with respect to the Funds that currently had the benefit of voluntary fee limitations, that Macquarie Group had no present intention to cause DMC to alter any voluntary expense limitations or reimbursements currently in effect. On that basis, the Trustees concluded that the total expense ratios and proposed advisory fees for the Funds anticipated to result from the Transaction were acceptable. In approving each New Investment Advisory Agreement, the Board stated that it anticipated reviewing the continuance of the New Investment Advisory Agreement in advance of the expiration of the initial two-year period.
Diversified Income Series-40
Delaware Investments® Family of Funds
BOARD OF TRUSTEES/DIRECTORS AND OFFICERS ADDENDUM
A mutual fund is governed by a Board of Trustees/Directors (“Trustees”), which has oversight responsibility for the management of a fund’s business affairs. Trustees establish procedures and oversee and review the performance of the investment manager, the distributor, and others who perform services for the fund. The independent fund trustees, in particular, are advocates for shareholder interests. Each trustee has served in that capacity since he or she was elected to or appointed to the Board of Trustees, and will continue to serve until his or her retirement or the election of a new trustee in his or her place. The following is a list of the Trustees and Officers with certain background and related information.
| | | | Number of | Other |
| | | Principal | Portfolios in Fund | Directorships |
| Name, | Position(s) | | Occupation(s) | Complex Overseen | Held by |
| Address, | Held with | Length of Time | During | by Trustee | Trustee |
| and Birth Date | Fund(s) | Served | Past 5 Years | or Officer | or Officer |
| INTERESTED TRUSTEES | | | | | |
| Patrick P. Coyne1 | Chairman, | Chairman and Trustee | Patrick P. Coyne has served in | 81 | Director — |
| 2005 Market Street | President, | since August 16, 2006 | various executive capacities | | Kaydon Corp. |
| Philadelphia, PA | Chief Executive | | at different times at | | |
| 19103 | Officer, and | President and | Delaware Investments.2 | | |
| | Trustee | Chief Executive Officer | | | |
| April 1963 | | since August 1, 2006 | | | |
| | | | | | |
| INDEPENDENT TRUSTEES | | | | | |
| Thomas L. Bennett | Trustee | Since | Private Investor — | 81 | Director — |
| 2005 Market Street | | March 2005 | (March 2004–Present) | | Bryn Mawr |
| Philadelphia, PA | | | | | Bank Corp. (BMTC) |
| 19103 | | | Investment Manager — | | (April 2007–Present) |
| | | | Morgan Stanley & Co. | | |
| October 1947 | | | (January 1984–March 2004) | | |
| John A. Fry | Trustee | Since | President — | 81 | Director — |
| 2005 Market Street | | January 2001 | Franklin & Marshall College | | Community Health |
| Philadelphia, PA | | | (June 2002–Present) | | Systems |
| 19103 | | | | | |
| | | | Executive Vice President — | | |
| May 1960 | | | University of Pennsylvania | | |
| | | | (April 1995–June 2002) | | |
| Anthony D. Knerr | Trustee | Since | Founder and Managing Director — | 81 | None |
| 2005 Market Street | | April 1990 | Anthony Knerr & Associates | | |
| Philadelphia, PA | | | (Strategic Consulting) | | |
| 19103 | | | (1990–Present) | | |
| |
| December 1938 | | | | | |
| Lucinda S. Landreth | Trustee | Since | Chief Investment Officer — | 81 | None |
| 2005 Market Street | | March 2005 | Assurant, Inc. | | |
| Philadelphia, PA | | | (Insurance) | | |
| 19103 | | | (2002–2004) | | |
| |
| June 1947 | | | | | |
| Ann R. Leven | Trustee | Since | Consultant — | 81 | None |
| 2005 Market Street | | October 1989 | ARL Associates | | |
| Philadelphia, PA | | | (Financial Planning) | | |
| 19103 | | | (1983–Present) | | |
| |
| November 1940 | | | | | |
Diversified Income Series-41
| | | | Number of | Other |
| | | Principal | Portfolios in Fund | Directorships |
| Name, | Position(s) | | Occupation(s) | Complex Overseen | Held by |
| Address, | Held with | Length of Time | During | by Trustee | Trustee |
| and Birth Date | Fund(s) | Served | Past 5 Years | or Officer | or Officer |
| INDEPENDENT TRUSTEES (CONTINUED) | | | | |
| Thomas F. Madison | Trustee | Since | President and Chief | 81 | Director and Chair of |
| 2005 Market Street | | May 19973 | Executive Officer — | | Compensation |
| Philadelphia, PA | | | MLM Partners, Inc. | | Committee, |
| 19103 | | | (Small Business Investing | | Governance Committee |
| | | | and Consulting) | | Member |
| February 1936 | | | (January 1993–Present) | | — CenterPoint Energy |
| |
| | | | | | Lead Director and Chair |
| | | | | | of Audit |
| | | | | | and Governance |
| | | | | | Committees, |
| | | | | | Member of |
| | | | | | Compensation |
| | | | | | Committee — Digital |
| | | | | | River, Inc. |
| |
| | | | | | Director and Chair of |
| | | | | | Governance |
| | | | | | Committee, Audit |
| | | | | | Committee Member — |
| | | | | | Rimage Corporation |
| |
| | | | | | Director and Chair of |
| | | | | | Compensation |
| | | | | | Committee — Spanlink |
| | | | | | Communications |
| |
| | | | | | Lead Director and Chair |
| | | | | | of Compensation and |
| | | | | | Governance |
| | | | | | Committees — |
| | | | | | Valmont Industries, Inc. |
| Janet L. Yeomans | Trustee | Since | Vice President and Treasurer | 81 | None |
| 2005 Market Street | | April 1999 | (January 2006–Present) | | |
| Philadelphia, PA | | | Vice President — Mergers & Acquisitions | | |
| 19103 | | | (January 2003–January 2006), and | | |
| | | | Vice President | | |
| July 1948 | | | (July 1995–January 2003) | | |
| | | | 3M Corporation | | |
| J. Richard Zecher | Trustee | Since | Founder — | 81 | Director and Audit |
| 2005 Market Street | | March 2005 | Investor Analytics | | Committee Member — |
| Philadelphia, PA | | | (Risk Management) | | Investor Analytics |
| 19103 | | | (May 1999–Present) | | |
| |
| July 1940 | | | Founder — | | |
| | | | Sutton Asset Management | | |
| | | | (Hedge Fund) | | |
| | | | (September 1996–Present) | | |
Diversified Income Series-42
| | | | Number of | Other |
| | | Principal | Portfolios in Fund | Directorships |
| Name, | Position(s) | | Occupation(s) | Complex Overseen | Held by |
| Address, | Held with | Length of Time | During | by Trustee | Trustee |
| and Birth Date | Fund(s) | Served | Past 5 Years | or Officer | or Officer |
| OFFICERS | | | | | |
| David F. Connor | Vice President, | Vice President since | David F. Connor has served as | 81 | None4 |
| 2005 Market Street | Deputy General | September 2000 | Vice President and Deputy | | |
| Philadelphia, PA | Counsel, and Secretary | and Secretary | General Counsel of | | |
| 19103 | | since | Delaware Investments | | |
| | | October 2005 | since 2000. | | |
| December 1963 | | | | | |
| Daniel V. Geatens | Vice President | Treasurer | Daniel V. Geatens has served | 81 | None4 |
| 2005 Market Street | and Treasurer | since | in various capacities at | | |
| Philadelphia, PA | | October 25, 2007 | different times at | | |
| 19103 | | | Delaware Investments. | | |
| |
| October 1972 | | | | | |
| David P. O’Connor | Senior Vice | Senior Vice President, | David P. O’Connor has served in | 81 | None4 |
| 2005 Market Street | President, | General Counsel, and | various executive and legal | | |
| Philadelphia, PA | General Counsel, | Chief Legal Officer | capacities at different times | | |
| 19103 | and Chief | since | at Delaware Investments. | | |
| | Legal Officer | October 2005 | | | |
| February 1966 | | | | | |
| Richard Salus | Senior | Chief Financial | Richard Salus has served in | 81 | None4 |
| 2005 Market Street | Vice President | Officer since | various executive capacities | | |
| Philadelphia, PA | and | November 2006 | at different times at | | |
| 19103 | Chief Financial | | Delaware Investments. | | |
| | Officer | | | | |
| October 1963 | | | | | |
1 Patrick P. Coyne is considered to be an “Interested Trustee” because he is an executive officer of the Fund’s(s’) investment advisor. |
2 Delaware Investments is the marketing name for Delaware Management Holdings, Inc. and its subsidiaries, including the Fund’s(s’) investment advisor, principal underwriter, and its transfer agent. |
3 In 1997, several funds managed by Voyageur Fund Managers, Inc. (the “Voyageur Funds”) were incorporated into the Delaware Investments Family of Funds. Mr. Madison served as a director of the Voyageur Funds from 1993 until 1997. |
4 David F. Connor, Daniel V. Geatens, David P. O’Connor, and Richard Salus serve in similar capacities for the six portfolios of the Optimum Fund Trust, which have the same investment advisor, principal underwriter, and transfer agent as the registrant. |
The Statement of Additional Information for the Fund(s) includes additional information about the Trustees and Officers and is available, without charge, upon request by calling 800 523-1918.
| PO14857 AR-VIPDIVINC [12/09] DG3 2/10 (5427) | Diversified Income Series-43 |
| Delaware VIP® Trust |
| Delaware VIP Emerging Markets Series |
| |
| |
| |
| |
| |
| |
| Annual Report |
| |
| |
| December 31, 2009 |
| |
| |
| |
| |
| |
| |
| |
| |
| |
| |
| |
| |
| |
| |
| |
|
Table of contents
| > Portfolio management review | 1 |
| | |
| > Performance summary | 1 |
| | |
| > Disclosure of Series expenses | 3 |
| | |
| > Country and sector allocations | 4 |
| | |
| > Statement of net assets | 5 |
| | |
| > Statement of operations | 9 |
| | |
| > Statements of changes in net assets | 9 |
| | |
| > Financial highlights | 10 |
| | |
| > Notes to financial statements | 12 |
| | |
| > Report of independent registered public accounting firm | 18 |
| | |
| > Other Series information | 19 |
| | |
| > Board of trustees/directors and officers addendum | 23 |
On January 4, 2010, Delaware Management Holdings, Inc., and its subsidiaries (collectively known by the marketing name of Delaware Investments) were sold by a subsidiary of Lincoln National Corporation to Macquarie Group Limited, a global provider of banking, financial, advisory, investment and funds management services. Please see your Series’ prospectus and any supplements thereto for more complete information.
Investments in Delaware VIP® Emerging Markets Series are not and will not be deposits with or liabilities of Macquarie Bank Limited ABN 46 008 583 542 and its holding companies, including subsidiaries or related companies, and are subject to investment risk, including possible delays in repayment and loss of income and capital invested. No Macquarie Group company guarantees or will guarantee the performance of the Series, the repayment of capital from the Series, or any particular rate of return.
Unless otherwise noted, views expressed herein are current as of Dec. 31, 2009, and are subject to change.
Funds are not FDIC insured and are not guaranteed. It is possible to lose the principal amount invested.
Mutual fund advisory services provided by Delaware Management Company, a series of Delaware Management Business Trust, which is a registered investment advisor. Delaware Investments is the marketing name of Delaware Management Holdings, Inc. and its subsidiaries. Macquarie Group refers to Macquarie Group Limited and its subsidiaries and affiliates worldwide.
© 2010 Delaware Management Holdings, Inc.
All third-party trademarks cited are the property of their respective owners.
| Delaware VIP® Trust — Delaware VIP Emerging Markets Series | |
| Portfolio management review | Jan. 12, 2010 |
For the 12-month period ended Dec. 31, 2009, the Delaware VIP Emerging Markets Series returned +78.11% for Standard Class shares and +77.67% for Service Class shares, both with all distributions reinvested. The Series’ benchmark index, the MSCI Emerging Markets Index, returned +78.51% (source for index data: MSCI).
Indonesia was among the strongest-performing markets in the Series’ universe. Elsewhere in Asia, China advanced rather strongly, and Indian markets were buoyed by favorable election results in mid-May. Markets in Europe, Middle East, and Africa region posted strong gains, with Russia and Hungary among the strongest. In South America, Brazil and Colombia posted impressive gains.
Prior to discussing specific performance drivers, we would like to highlight that the Series’ country and sector allocations are primarily the result of our bottom-up stock selection process.
With the Indian market up for the period, our underweight in India was a significant detractor from Series performance. This underweight was primarily the result of the high valuations we saw for many Indian stocks. Additionally, the Series was hindered by holdings in participation notes in two Indian companies. The notes were underwritten by Lehman Brothers and were appropriately used as a way to gain access to the Indian market prior to the Series’ approval as a qualified investor by Indian regulatory authorities. In light of Lehman’s bankruptcy, these notes have been written down to mere cents on the dollar.
The Series’ holdings in the Republic of Korea also detracted from performance. Despite the fact that the Korean market advanced by nearly 70% within the index, some of the Series’ largest positions were in names that trailed the index. Examples of such positions include telecommunications companies SK Telecom and KT, as well as Korea Electric Power, an integrated utility company. Relative to the index, the Series was considerably overweight in all three stocks. Generally speaking, telecommunications and utilities have underperformed throughout the market rally, as investors seemed to have shifted away from these traditionally defensive sectors.
Additionally, the Series’ holdings in Taiwan detracted from performance. The most significant detractor from performance was the Series’ overweight position in President Chain Store, a company that operates a chain of convenience stores throughout the country. The company’s shares advanced by nearly 16% for the period, trailing the broader gains posted by the index. The Series’ overweight versus the index thereby had negative effects on the Series’ relative performance.
Within Brazil, some of the Series’ significant positions, including Petrobras and Eletrobras, Brazil’s largest utility, significantly outperformed the broad emerging markets index during the period; in both cases, the positive effects of these overweights resulted in positive contributions to Series performance relative to the index.
The Series’ holdings in Indonesia and Russia contributed positively to Series performance versus the index, including Gudang Garam, an Indonesian tobacco producer, and Russian commercial bank Sberbank. We added to the Series’ Sberbank shares as we believe they were undervalued.
As always, we look to remain disciplined in making investment decisions for the Series. Our process remains focused on seeking to maintain, in our view, an attractive balance between risk and reward, as we continue to look to invest in companies that we believe are trading at significant discounts to our estimates of their intrinsic value.
Unless otherwise noted, the views expressed are current as of Dec. 31, 2009, and are subject to change. |
Performance Summary
The performance data quoted below represent past performance; past performance does not guarantee future results. Investment return and principal value will fluctuate so your shares, when redeemed, may be worth more or less than their original cost. Please obtain the performance data for the most recent month end by calling the number noted in the introductory section of this report on the page related to this Series.
You should consider the investment objectives, risks, charges, and expenses of the Series carefully before investing. The Delaware VIP Emerging Markets Series prospectus contains this and other important information about the Series. To obtain a prospectus, contact the company noted on the page related to this Series in the introductory section of this report, either by phone or through the company Web site. We advise you to read the prospectus carefully before you invest or send money.
Delaware VIP Emerging Markets Series
Average annual total returns
For periods ended Dec. 31, 2009 | | 1 year | | 3 years | | 5 years | | 10 years | | Lifetime |
Standard Class shares (commenced
operations on May 1, 1997) | | +78.11% | | +6.21% | | +14.19% | | +14.10% | | +9.94% |
Service Class shares (commenced
operations on May 1, 2000) | | +77.67% | | +5.94% | | +13.90% | | n/a | | +15.46% |
Returns reflect the reinvestment of all distributions.
Emerging Markets Series-1
Delaware VIP® Emerging Markets Series (continued)
As described in the Series’ most recent prospectus, the net expense ratio for Service Class shares of the Series was 1.66%, while total operating expenses for Standard Class and Service Class shares were 1.41% and 1.71%, respectively. The management fee for Standard Class and Service Class shares was 1.24%.
The Series’ distributor has contracted to limit the 12b-1 fees for Service Class shares to no more than 0.25% of average daily net assets through April 30, 2010.
Earnings from a variable annuity or variable life investment compound tax-free until withdrawal, and as a result, no adjustments were made for income taxes.
Expense limitations were in effect for both classes during certain periods shown in the Series performance chart on the previous page and in the Performance of a $10,000 Investment chart below.
Performance data do not reflect insurance fees related to a variable annuity or variable life investment or the deferred sales charge that would apply to certain withdrawals of investments. Performance shown here would have been reduced if such fees were included or the expense limitation removed. For more information about fees, consult your variable annuity or variable life prospectus.
Investments in variable products involve risk.
International investments entail risks not ordinarily associated with U.S. investments including fluctuation in currency values, differences in accounting principles, or economic or political instability in other nations. Investing in emerging markets can be riskier than investing in established foreign markets due to increased volatility and lower trading volume.
If and when we invest in forward foreign currency contracts or use other investments to hedge against currency risks, the Series will be subject to special risks, including counterparty risk.
Instances of high double-digit returns are unusual, cannot be sustained, and were primarily achieved during favorable market conditions.
Please read both the contract and underlying prospectus for specific details regarding the product’s risk profile.
The chart shows a $10,000 investment in the Delaware VIP Emerging Markets Series Standard Class shares for the period from Dec. 31, 1999, through Dec. 31, 2009.
The chart also shows $10,000 invested in the MSCI Emerging Markets Index for the period from Dec. 31, 1999, through Dec. 31, 2009. The MSCI Emerging Markets Index measures equity market performance across emerging market countries world-wide. Index “gross” return reflects the maximum possible dividend reinvestment. Index “net” return approximates the minimum possible dividend reinvestment, after deduction of withholding tax at the highest possible rate.
Index performance returns do not reflect any management fees, transaction costs or expenses. Indices are unmanaged and one cannot invest directly in an index.
Performance of Service Class shares will vary due to different charges and expenses.
Past performance is not a guarantee of future results.
Emerging Markets Series-2
Delaware VIP® Trust — Delaware VIP Emerging Markets Series
Disclosure of Series Expenses
For the Period July 1, 2009 to December 31, 2009
As a shareholder of the Series, you incur ongoing costs, including management fees; distribution and/or service (12b-1) fees; and other Series expenses. This Example is intended to help you understand your ongoing costs (in dollars) of investing in the Series and to compare these costs with the ongoing costs of investing in other mutual funds.
The Example is based on an investment of $1,000 invested at the beginning of the period and held for the entire period from July 1, 2009 to December 31, 2009.
Actual Expenses
The first section of the table shown, “Actual Series Return,” provides information about actual account values and actual expenses. You may use the information in this section of the table, together with the amount you invested, to estimate the expenses that you paid over the period. Simply divide your account value by $1,000 (for example, an $8,600 account value divided by $1,000 = 8.6), then multiply the result by the number in the first section under the heading entitled “Expenses Paid During Period” to estimate the expenses you paid on your account during the period.
Hypothetical Example for Comparison Purposes
The second section of the table shown, “Hypothetical 5% Return,” provides information about hypothetical account values and hypothetical expenses based on the Series’ actual expense ratio and an assumed rate of return of 5% per year before expenses, which is not the Series’ actual return. The hypothetical account values and expenses may not be used to estimate the actual ending account balance or expenses you paid for the period. You may use this information to compare the ongoing costs of investing in the Series and other funds. To do so, compare the 5% hypothetical example with the 5% hypothetical examples that appear in the shareholder reports of other funds.
Please note that the expenses shown in the table are meant to highlight your ongoing costs only. As a shareholder of the Series, you do not incur any transaction costs, such as sales charges (loads), redemption fees or exchange fees, but shareholders of other funds may incur such costs. Also, the fees related to the variable annuity investment or the deferred sales charge that could apply have not been included. Therefore, the second section of the table is useful in comparing ongoing costs only, and will not help you determine the relative total costs of owning different funds. The Series’ actual expenses shown in the table reflect fee waivers in effect. The expenses shown in the table assume reinvestment of all dividends and distributions.
Expense Analysis of an Investment of $1,000
| | Beginning
Account
Value
7/1/09 | | Ending
Account
Value
12/31/09 | | Annualized
Expense
Ratios | | Expenses
Paid During
Period
7/1/09 to
12/31/09* |
| Actual Series Return |
| Standard Class | | | $1,000.00 | | | | $1,352.70 | | | | 1.38% | | | | $8.18 | |
| Service Class | | | 1,000.00 | | | | 1,350.80 | | | | 1.63% | | | | 9.66 | |
| Hypothetical 5% Return (5% return before expenses) |
| Standard Class | | | $1,000.00 | | | | $1,018.25 | | | | 1.38% | | | | $7.02 | |
| Service Class | | | 1,000.00 | | | | 1,016.99 | | | | 1.63% | | | | 8.29 | |
*“Expenses Paid During Period” are equal to the Series’ annualized expense ratio, multiplied by the average account value over the period, multiplied by 184/365 (to reflect the one-half year period).
Emerging Markets Series-3
Delaware VIP® Trust — Delaware VIP Emerging Markets Series
Country and Sector Allocations
As of December 31, 2009
Sector designations may be different than the sector designations presented in other Series materials. The sector designations may represent the investment manager’s internal sector classifications, which may result in the sector designations for one series being different than another series’ sector designations.
| | Percentage |
| Country | | of Net Assets |
| Common Stock | | 94.10 | % |
| Argentina | | 3.80 | % |
| Australia | | 0.12 | % |
| Brazil | | 14.52 | % |
| China | | 8.45 | % |
| France | | 0.43 | % |
| Hong Kong | | 3.91 | % |
| Hungary | | 0.38 | % |
| India | | 1.50 | % |
| Indonesia | | 2.70 | % |
| Israel | | 0.85 | % |
| Malaysia | | 2.28 | % |
| Mexico | | 6.03 | % |
| Pakistan | | 0.12 | % |
| Peru | | 0.92 | % |
| Philippines | | 0.29 | % |
| Poland | | 1.38 | % |
| Republic of Korea | | 12.88 | % |
| Russia | | 9.49 | % |
| South Africa | | 9.15 | % |
| Taiwan | | 6.17 | % |
| Thailand | | 2.49 | % |
| Turkey | | 3.28 | % |
| United Kingdom | | 1.41 | % |
| United States | | 1.55 | % |
| Preferred Stock | | 5.50 | % |
| Brazil | | 2.83 | % |
| Malaysia | | 0.12 | % |
| Republic of Korea | | 1.83 | % |
| Russia | | 0.72 | % |
| Participation Notes | | 0.05 | % |
| Discount Note | | 0.06 | % |
| Securities Lending Collateral | | 4.79 | % |
| Total Value of Securities | | 104.50 | % |
| Obligation to Return Securities Lending Collateral | | (4.90 | %) |
| Receivables and Other Assets Net of Liabilities | | 0.40 | % |
| Total Net Assets | | 100.00 | % |
| | | | |
| Common Stock, Preferred Stock and | | |
| Participation Notes by Sector | | |
| Consumer Discretionary | | 6.17 | % |
| Consumer Staples | | 7.48 | % |
| Energy | | 17.24 | % |
| Financials | | 15.17 | % |
| Industrials | | 7.07 | % |
| Information Technology | | 11.32 | % |
| Materials | | 14.67 | % |
| Telecommunication Services | | 11.74 | % |
| Utilities | | 8.79 | % |
| Total | | 99.65 | % |
Emerging Markets Series-4
Delaware VIP® Trust — Delaware VIP Emerging Markets Series
Statement of Net Assets
December 31, 2009
| | Number of | | Value |
| | Shares | | (U.S. $) |
| COMMON STOCK–94.10%Δ | | | | | |
| Argentina–3.80% | | | | | |
| *@Cresud ADR | | 725,539 | | $ | 10,433,248 |
| *†Empresa Distribuidora Y | | | | | |
| | Comercializadora Norte ADR | | 200,000 | | | 1,580,000 |
| †#Grupo Clarin Class B 144A GDR | | 209,100 | | | 1,027,622 |
| *@IRSA Inversiones y | | | | | |
| | Representaciones GDR | | 315,012 | | | 2,992,614 |
| *Pampa Energia ADR | | 66,800 | | | 781,560 |
| Petrobras Energia | | | | | |
| Participaciones ADR | | 72,592 | | | 1,134,613 |
| †Telecom Argentina ADR | | 90,400 | | | 1,520,528 |
| | | | | 19,470,185 |
| Australia–0.12% | | | | | |
| †Alara Resources | | 119,472 | | | 19,317 |
| ±†@Strike Resources | | 907,648 | | | 571,164 |
| | | | | 590,481 |
| Brazil–14.52% | | | | | |
| AES Tiete | | 359,636 | | | 3,548,904 |
| Banco Santander Brasil ADR | | 350,400 | | | 4,884,576 |
| *†Braskem ADR | | 88,199 | | | 1,447,346 |
| Centrais Eletricas Brasileiras | | 1,216,923 | | | 25,371,762 |
| Cyrela Brazil Realty | | 114,015 | | | 1,602,620 |
| *†Fibria Celulose ADR | | 272,283 | | | 6,218,944 |
| Itau Unibanco Holding ADR | | 240,477 | | | 5,492,483 |
| Petroleo Brasileiro ADR | | 484,000 | | | 20,516,760 |
| Tim Participacoes ADR | | 103,528 | | | 3,075,817 |
| †Triunfo Participacoes e Investmentos | | 61,000 | | | 199,484 |
| Vale ADR | | 78,502 | | | 1,948,420 |
| | | | | 74,307,116 |
| oChina–8.45% | | | | | |
| *†51job ADR | | 67,300 | | | 1,192,556 |
| China Life Insurance ADR | | 80,000 | | | 5,868,000 |
| *China Petroleum & Chemical ADR | | 27,088 | | | 2,385,640 |
| ±*China Telecom | | 6,857,637 | | | 2,835,639 |
| †Focus Media Holding ADR | | 204,781 | | | 3,245,779 |
| ±Fosun International | | 652,598 | | | 452,401 |
| ±*†Foxconn International Holdings | | 1,766,000 | | | 2,032,950 |
| †Hollysys Automation Technologies | | 145,100 | | | 1,742,651 |
| ±†Huadian Power International | | 5,494,000 | | | 1,451,407 |
| ±†Metallurgical | | 1,554,000 | | | 919,930 |
| ±*PetroChina | | 2,128,000 | | | 2,529,774 |
| PetroChina ADR | | 40,000 | | | 4,758,400 |
| *†Shanda Games ADR | | 284,625 | | | 2,900,329 |
| *†Sina | | 98,107 | | | 4,432,474 |
| ±†Sinopec Shanghai Petrochemical | | 3,754,377 | | | 1,474,563 |
| ±Sinotrans | | 4,326,332 | | | 1,128,825 |
| *†Sohu.com | | 6,100 | | | 349,408 |
| *†Spreadtrum Communications ADR | | 138,300 | | | 755,118 |
| ±Travelsky Technology | | 2,772,961 | | | 2,794,827 |
| | | | | 43,250,671 |
| France–0.43% | | | | | |
| ±Vallourec | | 12,042 | | | 2,175,736 |
| | | | | 2,175,736 |
| nHong Kong–3.91% | | | | | |
| ±China Unicom | | 3,327,021 | | | 4,365,764 |
| *China Unicom ADR | | 568,192 | | | 7,448,996 |
| ±China Water Affairs Group | | 984,866 | | | 390,116 |
| ±*First Pacific | | 3,183,285 | | | 1,934,640 |
| ±Franshion Properties China | | 9,558,000 | | | 3,344,676 |
| ±†Tom Group | | 26,212,004 | | | 2,530,378 |
| | | | | | 20,014,570 |
| Hungary–0.38% | | | | | |
| ±*OTP Bank | | 68,336 | | | 1,950,135 |
| | | | | 1,950,135 |
| India–1.50% | | | | | |
| ±†@Indiabulls Real Estate GDR | | 44,628 | | | 217,784 |
| ±†Oil India | | 19,385 | | | 518,729 |
| *#Reliance Industries 144A GDR | | 143,410 | | | 6,790,464 |
| *†Sify Technologies ADR | | 102,500 | | | 176,300 |
| | | | | 7,703,277 |
| Indonesia–2.70% | | | | | |
| ±Gudang Garam | | 3,733,227 | | | 8,500,019 |
| ±Tambang Batubara Bukit Asam | | 2,919,097 | | | 5,298,429 |
| | | | | 13,798,448 |
| Israel–0.85% | | | | | |
| ±Israel Chemicals | | 333,516 | | | 4,373,364 |
| | | | | 4,373,364 |
| Malaysia–2.28% | | | | | |
| ±†Eastern & Oriental | | 4,015,375 | | | 1,217,651 |
| ±Hong Leong Bank | | 1,800,000 | | | 4,264,833 |
| ±KLCC Property Holdings | | 1,766,200 | | | 1,769,752 |
| ±Media Prima | | 1,055,500 | | | 514,803 |
| ±Oriental Holdings | | 1,436,600 | | | 2,383,998 |
| ±†UEM Land Holdings | | 3,557,688 | | | 1,536,448 |
| | | | | 11,687,485 |
| Mexico–6.03% | | | | | |
| America Movil Series L ADR | | 136,221 | | | 6,399,662 |
| †Cemex ADR | | 540,760 | | | 6,391,782 |
| *†Consorcio ARA | | 2,224,100 | | | 1,547,644 |
| *†Empresas ICA | | 1,242,768 | | | 2,898,446 |
| Fomento Economico Mexicano ADR | | 151,629 | | | 7,259,996 |
| Grupo Televisa ADR | | 306,600 | | | 6,365,016 |
| | | | | 30,862,546 |
| Pakistan–0.12% | | | | | |
| @Oil & Gas Development GDR | | 48,282 | | | 633,320 |
| | | | | 633,320 |
| Peru–0.92% | | | | | |
| Cia de Minas Buenaventura ADR | | 140,940 | | | 4,717,262 |
| | | | | 4,717,262 |
| Philippines–0.29% | | | | | |
| Philippine Long Distance | | | | | |
| | Telephone ADR | | 25,926 | | | 1,469,226 |
| | | | | 1,469,226 |
| Poland–1.38% | | | | | |
| ±†Polska Grupa Energetyczna | | 142,017 | | | 1,213,122 |
| ±Polski Koncern Naftowy Orlen | | 293,760 | | | 3,460,132 |
| ±Telekomunikacja Polska | | 434,628 | | | 2,399,237 |
| | | | | 7,072,491 |
Emerging Markets Series-5
Delaware VIP® Emerging Markets Series
Statement of Net Assets (continued)
| | Number of | | Value |
| | Shares | | (U.S. $) |
| COMMON STOCK (continued) | | | | | |
| Republic of Korea–12.88% | | | | | |
| ±CJ | | 51,355 | | $ | 2,760,514 |
| ±D&Shop | | 279,500 | | | 480,028 |
| ±Daelim Industrial | | 11,659 | | | 827,262 |
| ±GS Holdings | | 50,000 | | | 1,446,593 |
| ±Hyundai Elevator | | 20,899 | | | 1,039,878 |
| KB Financial Group ADR | | 186,596 | | | 9,488,429 |
| ±Korea Electric Power | | 127,730 | | | 3,723,241 |
| Korea Electric Power ADR | | 478,151 | | | 6,952,316 |
| ±KT | | 112,200 | | | 3,771,116 |
| *LG Display ADR | | 208,709 | | | 3,533,443 |
| ±Lotte Chilsung Beverage | | 9 | | | 6,507 |
| ±Lotte Confectionery | | 3,008 | | | 3,334,197 |
| ±Samsung Electronics | | 22,930 | | | 15,702,214 |
| ±†SK Communications | | 107,325 | | | 1,432,595 |
| ±SK Energy | | 44,113 | | | 4,425,906 |
| ±SK Holdings | | 9,171 | | | 698,875 |
| ±SK Telecom | | 13,785 | | | 2,009,396 |
| SK Telecom ADR | | 265,965 | | | 4,324,591 |
| | | | | 65,957,101 |
| Russia–9.49% | | | | | |
| †Chelyabinsk Zink Plant GDR | | 77,800 | | | 287,860 |
| =†Enel OGK-5 GDR | | 15,100 | | | 53,449 |
| Gazprom ADR | | 605,610 | | | 15,443,054 |
| LUKOIL ADR | | 26,333 | | | 1,485,181 |
| LUKOIL ADR | | | | | |
| | (London International Exchange) | | 150,000 | | | 8,595,000 |
| †MMC Norilsk Nickel ADR | | 97,975 | | | 1,403,982 |
| Mobile TeleSystems ADR | | 69,401 | | | 3,393,015 |
| @Sberbank | | 4,008,801 | | | 11,260,722 |
| ±Surgutneftegaz ADR | | 336,052 | | | 2,971,192 |
| =†@TGK-5 GDR | | 6,230 | | | 9,701 |
| VTB Bank GDR | | 774,991 | | | 3,657,958 |
| | | | | 48,561,114 |
| South Africa–9.15% | | | | | |
| ±ArcelorMittal Steel South Africa | | 245,552 | | | 3,388,653 |
| ±†Blue Label Telecoms | | 462,103 | | | 320,224 |
| Gold Fields ADR | | 340,348 | | | 4,461,962 |
| ±Impala Platinum Holdings | | 152,575 | | | 4,153,638 |
| ±JD Group | | 545,025 | | | 3,607,668 |
| ±JSE | | 162,430 | | | 1,318,704 |
| ±*Sasol | | 121,822 | | | 4,862,132 |
| Sasol ADR | | 73,227 | | | 2,924,686 |
| ±Standard Bank Group | | 317,616 | | | 4,344,843 |
| ±*†Steinhoff International Holdings | | 418,714 | | | 1,168,288 |
| ±Sun International | | 188,959 | | | 2,415,322 |
| ±Telkom | | 148,490 | | | 747,784 |
| ±Tongaat Hulett | | 240,987 | | | 3,208,376 |
| ±Vodacom Group | | 1,306,050 | | | 9,933,880 |
| | | | | 46,856,160 |
| Taiwan–6.17% | | | | | |
| ±†Cathay Financial Holding | | 2,027,747 | | | 3,774,594 |
| ±†Evergreen Marine | | 5,532,000 | | | 3,081,346 |
| ±Formosa Chemicals & Fibre | | 2,322,990 | | | 5,035,664 |
| ±MediaTek | | 678 | | | 11,773 |
| ±President Chain Store | | 1,660,320 | | | 3,943,354 |
| *Siliconware Precision Industries ADR | | 101,000 | | | 708,010 |
| ±Taiwan Semiconductor Manufacturing | | 2,335,864 | | | 4,707,138 |
| ±United Microelectronics | | 7,517,461 | | | 4,060,613 |
| *United Microelectronics ADR | | 628,254 | | | 2,437,626 |
| ±Walsin Lihwa | | 10,268,100 | | | 3,846,879 |
| | | | | 31,606,997 |
| Thailand–2.49% | | | | | |
| ±Bangkok Bank-Foreign | | 717,191 | | | 2,510,711 |
| @PTT Exploration & Production -Foreign | | 580,023 | | | 2,557,390 |
| ±Siam Cement NVDR | | 1,088,634 | | | 7,666,809 |
| | | | | 12,734,910 |
| Turkey–3.28% | | | | | |
| ±†Alarko Gayrimenkul Yatirim Ortakligi | | 56,976 | | | 531,222 |
| ±Alarko Holding | | 1,133,310 | | | 3,024,442 |
| ±†Turk Sise ve Cam Fabrikalari | | 1,855,224 | | | 2,322,879 |
| ±Turkcell Iletisim Hizmet | | 414,125 | | | 2,930,588 |
| Turkcell Iletisim Hizmet ADR | | 134,190 | | | 2,346,983 |
| ±Turkiye Is Bankasi Class C | | 800,000 | | | 3,370,456 |
| ±Yazicilar Holding Class A | | 347,478 | | | 2,244,097 |
| | | | | 16,770,667 |
| United Kingdom–1.41% | | | | | |
| ±†Anglo American | | 85,826 | | | 3,717,731 |
| †Anglo American ADR | | 104,315 | | | 2,283,393 |
| ±†@Griffin Mining | | 1,846,472 | | | 1,112,357 |
| ±Mwana Africa | | 470,093 | | | 94,968 |
| | | | | 7,208,449 |
| United States–1.55% | | | | | |
| †Google Class A | | 6,000 | | | 3,719,880 |
| †MEMC Electronic Materials | | 310,000 | | | 4,222,200 |
| | | | | 7,942,080 |
| Total Common Stock | | | | | |
| | (cost $484,893,019) | | | | | 481,713,791 |
| | | | | | |
| PREFERRED STOCK–5.50%Δ | | | | | |
| Brazil–2.83% | | | | | |
| †Braskem Class A | | 324,568 | | | 2,621,869 |
| @Jereissati Participacoes 3.52% | | 1,228,595 | | | 726,020 |
| *Vale Class A 2.38% | | 461,280 | | | 11,168,110 |
| | | | | 14,515,999 |
| Malaysia–0.12% | | | | | |
| ±†Eastern & Oriental | | 2,007,687 | | | 621,539 |
| | | | | 621,539 |
| Republic of Korea–1.83% | | | | | |
| ±CJ 6.81% | | 31,500 | | | 615,119 |
| ±CJ Cheiljedang 1.72% | | 17,300 | | | 898,464 |
| ±Hyundai Motor 2.33% | | 76,342 | | | 2,799,136 |
| ±Samsung Electronics 1.05% | | 11,195 | | | 5,039,148 |
| | | | | 9,351,867 |
| Russia–0.72% | | | | | |
| @AK Transneft 0.91% | | 4,387 | | | 3,685,080 |
| | | | | 3,685,080 |
| Total Preferred Stock | | | | | |
| | (cost $23,979,831) | | | | | 28,174,485 |
Emerging Markets Series-6
Delaware VIP® Emerging Markets Series
Statement of Net Assets (continued)
| | Number of | | Value |
| | Shares | | (U.S. $) |
| PARTICIPATION NOTES–0.05% | | | | | | |
| =†#@Lehman Indian Oil CW-12 LEPO 144A | | | 100,339 | | $ | 39,479 |
| =†#Lehman Oil & Natural Gas | | | | | | |
| | CW-12 LEPO 144A | | | 146,971 | | | 223,087 |
| Total Participation Notes | | | | | | |
| | (cost $4,952,197) | | | | | | 262,566 |
| | | | | | | |
| | Principal | | | |
| | Amount | | | |
| | (U.S $) | | | |
| ≠DISCOUNT NOTE–0.06% | | | | | | |
| Federal Home Loan Bank 0.001% 1/4/10 | | $ | 293,000 | | | 293,000 |
| Total Discount Note | | | | | | |
| | (cost $293,000) | | | | | | 293,000 |
| | | | | | | |
| Total Value of Securities | | | | | | |
| Before Securities Lending | | | | | | |
| Collateral–99.71% | | | | | | |
| | (cost $514,118,047) | | | | | | 510,443,842 |
| | | | | | | |
| | Number of | | |
| | Shares | | |
| SECURITIES LENDING | | | | | | |
| COLLATERAL**–4.79% | | | | | | |
| Investment Companies | | | | | | |
| | Mellon GSL DBT II Collateral Fund | | | 16,658,841 | | | 16,658,841 |
| | BNY Mellon SL DBT II | | | | | | |
| | Liquidating Fund | | | 7,932,769 | | | 7,841,542 |
| †@ | Mellon GSL Reinvestment Trust II | | | 521,138 | | | 22,148 |
| Total Securities Lending Collateral | | | | | | |
| | (cost $25,112,748) | | | | | | 24,522,531 |
| TOTAL VALUE OF SECURITIES–104.50% (cost $539,230,795) | | 534,966,373 | © |
| OBLIGATION TO RETURN SECURITIES LENDING COLLATERAL**–(4.90%) | | (25,112,748 | ) |
| RECEIVABLES AND OTHER ASSETS NET OF LIABILITIES–0.40% | | 2,063,446 | |
| NET ASSETS APPLICABLE TO 27,159,876 SHARES OUTSTANDING–100.00% | | $511,917,071 | |
| NET ASSET VALUE–DELAWARE VIP EMERGING MARKETS SERIES | | | |
| STANDARD CLASS ($245,148,861 / 12,992,931 Shares) | | | $18.87 | |
| NET ASSET VALUE–DELAWARE VIP EMERGING MARKETS SERIES | | | |
| SERVICE CLASS ($266,768,210 / 14,166,945 Shares) | | | $18.83 | |
| COMPONENTS OF NET ASSETS AT DECEMBER 31, 2009: | | | |
| Shares of beneficial interest (unlimited authorization–no par) | | $529,670,489 | |
| Undistributed net investment income | | 3,127,687 | |
| Accumulated net realized loss on investments | | (16,650,812 | ) |
| Net unrealized depreciation of investments and foreign currencies | | (4,230,293 | ) |
| Total net assets | | $511,917,071 | |
| | | | |
Emerging Markets Series-7
Delaware VIP® Emerging Markets Series
Statement of Net Assets (continued)
____________________
| Δ | Securities have been classified by country of origin. Classification by type of business has been presented on page 4 in “Country and Sector Allocations.” |
| * | Fully or partially on loan. |
| † | Non income producing security. |
| = | Security is being fair valued in accordance with the Series’ fair valuation policy. At December 31, 2009, the aggregate amount of fair valued securities was $325,716, which represented 0.06% of the Series’ net assets. See Note 1 in “Notes to Financial Statements.” |
| ± | Security is being valued based on international fair value pricing. At December 31, 2009, the aggregate amount of international fair value priced securities was $222,611,279, which represented 43.49% of the Series’ net assets. See Note 1 in “Notes to Financial Statements.” |
| @ | Illiquid security. At December 31, 2009, the aggregate amount of illiquid securities was $34,261,027 which represented 6.69% of the Series’ net assets. See Note 10 in “Notes to Financial Statements.” |
| # | Security exempt from registration under Rule 144A of the Securities Act of 1933, as amended. At December 31, 2009, the aggregate amount of Rule 144A securities was $8,080,652, which represented 1.58% of the Series’ net assets. See Note 10 in “Notes to Financial Statements.” |
| o | Securities listed and traded on the Hong Kong Stock Exchange. |
| n | Securities listed and traded on the Hong Kong Stock Exchange. These securities have significant business operations in China. |
| ≠ | The rate shown is the effective yield at the time of purchase. |
| © | Includes $24,217,041 of securities loaned. |
| ** | See Note 9 in “Notes to Financial Statements.” |
Summary of Abbreviations:
ADR – American Depositary Receipts
GDR – Global Depositary Receipts
LEPO – Low Exercise Price Option
NVDR – Non-Voting Depositary Receipts
See accompanying notes
Emerging Markets Series-8
Delaware VIP® Trust —
Delaware VIP Emerging Markets Series
Statement of Operations
Year Ended December 31, 2009
| INVESTMENT INCOME: | | | | |
| Dividends | | $ | 10,672,578 | |
| Interest | | | 7,475 | |
| Securities lending income | | | 250,226 | |
| Foreign tax withheld | | | (946,982 | ) |
| | | | 9,983,297 | |
| | | | | |
| EXPENSES: | | | | |
| Management fees | | | 5,067,898 | |
| Distribution expenses – Service Class | | | 632,154 | |
| Custodian fees | | | 207,438 | |
| Accounting and administration expenses | | | 162,173 | |
| Reports and statements to shareholders | | | 62,918 | |
| Dividend disbursing and transfer agent fees and expenses | | | 59,732 | |
| Legal fees | | | 54,303 | |
| Audit and tax | | | 32,512 | |
| Trustees’ fees | | | 25,822 | |
| Insurance fees | | | 9,301 | |
| Pricing fees | | | 8,600 | |
| Consulting fees | | | 5,016 | |
| Dues and services | | | 4,395 | |
| Trustees’ expenses | | | 1,837 | |
| Registration fees | | | 190 | |
| | | 6,334,289 | |
| Less fees waived | | | (48,060 | ) |
| Less waiver of distribution expenses – Service Class | | | (105,211 | ) |
| Total operating expenses | | | 6,181,018 | |
| | | | | |
| NET INVESTMENT INCOME | | | 3,802,279 | |
| | | | | |
| NET REALIZED AND UNREALIZED GAIN (LOSS) | | | | |
| | ON INVESTMENTS AND FOREIGN CURRENCIES: | | | | |
| Net realized loss on: | | | | |
| | Investments (net of foreign capital gains tax of $274,965) | | | (16,189,226 | ) |
| | Foreign currencies | | | (390,191 | ) |
| Net realized loss | | | (16,579,417 | ) |
| Net change in unrealized appreciation/depreciation | | | | |
| | of investments and foreign currencies (net of | | | | |
| | foreign capital gains tax of $14,231) | | | 247,029,440 | |
| | | | | |
| NET REALIZED AND UNREALIZED GAIN ON | | | | |
| | INVESTMENTS AND FOREIGN CURRENCIES | | | 230,450,023 | |
| | | | | |
| NET INCREASE IN NET ASSETS RESULTING | | | | |
| | FROM OPERATIONS | | $ | 234,252,302 | |
| | | | | |
See accompanying notes
Delaware VIP Trust —
Delaware VIP Emerging Markets Series
Statements of Changes in Net Assets
| | | Year Ended |
| | | 12/31/09 | | 12/31/08 |
| INCREASE (DECREASE) IN NET | | | | | | | | |
| | ASSETS FROM OPERATIONS: | | | | | | | | |
| Net investment income | | $ | 3,802,279 | | | $ | 7,172,467 | |
| Net realized gain (loss) on investments and | | | | | | | | |
| foreign currencies | | | (16,579,417 | ) | | | 15,591,572 | |
| Net change in unrealized appreciation/ | | | | | | | | |
| depreciation of investments and | | | | | | | | |
| foreign currencies | | | 247,029,440 | | | | (372,065,894 | ) |
| Net increase (decrease) in net assets | | | | | | | | |
| resulting from operations | | | 234,252,302 | | | | (349,301,855 | ) |
| | | | | | | | | |
| DIVIDENDS AND DISTRIBUTIONS | | | | | | | | |
| TO SHAREHOLDERS FROM: | | | | | | | | |
| Net investment income: | | | | | | | | |
| Standard Class | | | (2,625,767 | ) | | | (4,335,219 | ) |
| Service Class | | | (1,951,606 | ) | | | (3,380,039 | ) |
| Net realized gain on investments: | | | | | | | | |
| Standard Class | | | (8,181,947 | ) | | | (44,109,323 | ) |
| Service Class | | | (8,275,986 | ) | | | (41,526,196 | ) |
| | | | (21,035,306 | ) | | | (93,350,777 | ) |
| | | | | | | | | |
| CAPITAL SHARE TRANSACTIONS: | | | | | | | | |
| Proceeds from shares sold: | | | | | | | | |
| Standard Class | | | 64,207,874 | | | | 77,544,753 | |
| Service Class | | | 72,781,872 | | | | 126,961,564 | |
| Net asset value of shares issued upon | | | | | | | | |
| reinvestment of dividends and distributions: | | | | | | | | |
| Standard Class | | | 10,807,714 | | | | 48,444,542 | |
| Service Class | | | 10,227,592 | | | | 44,906,235 | |
| | | | 158,025,052 | | | | 297,857,094 | |
| Cost of shares repurchased: | | | | | | | | |
| Standard Class | | | (90,754,718 | ) | | | (91,543,778 | ) |
| Service Class | | | (93,602,954 | ) | | | (98,916,962 | ) |
| | | | (184,357,672 | ) | | | (190,460,740 | ) |
| Increase (decrease) in net assets derived | | | | | | | | |
| from capital share transactions | | | (26,332,620 | ) | | | 107,396,354 | |
| | | | | | | | | |
| NET INCREASE (DECREASE) | | | | | | | | |
| IN NET ASSETS | | | 186,884,376 | | | | (335,256,278 | ) |
| | | | | | | | | |
| NET ASSETS: | | | | | | | | |
| Beginning of year | | | 325,032,695 | | | | 660,288,973 | |
| End of year (including undistributed | | | | | | | | |
| net investment income of $3,127,687 | | | | | | | | |
| and $4,534,371, respectively) | | $ | 511,917,071 | | | $ | 325,032,695 | |
| | | | | | | | | |
See accompanying notes
Emerging Markets Series-9
Delaware VIP® Trust — Delaware VIP Emerging Markets Series
Financial Highlights
Selected data for each share of the Series outstanding throughout each period were as follows:
| Delaware VIP Emerging Markets Series Standard Class |
| Year Ended |
| | 12/31/09 | | 12/31/08 | | 12/31/07 | | 12/31/06 | | 12/31/05 | |
| Net asset value, beginning of period | | $11.290 | | $27.840 | | $22.240 | | $18.200 | | $14.500 | |
| | | | | | | | | | | | |
| Income (loss) from investment operations: | | | | | | | | | | | |
| Net investment income1 | | 0.152 | | 0.282 | | 0.267 | | 0.457 | | 0.412 | |
| Net realized and unrealized gain (loss) on investments | | | | | | | | | | | |
| and foreign currencies | | 8.173 | | (12.865 | ) | 7.564 | | 4.340 | | 3.519 | |
| Total from investment operations | | 8.325 | | (12.583 | ) | 7.831 | | 4.797 | | 3.931 | |
| | | | | | | | | | | | |
| Less dividends and distributions from: | | | | | | | | | | | |
| Net investment income | | (0.181 | ) | (0.355 | ) | (0.419 | ) | (0.243 | ) | (0.051 | ) |
| Net realized gain on investments | | (0.564 | ) | (3.612 | ) | (1.812 | ) | (0.514 | ) | (0.180 | ) |
| Total dividends and distributions | | (0.745 | ) | (3.967 | ) | (2.231 | ) | (0.757 | ) | (0.231 | ) |
| | | | | | | | | | | | |
| Net asset value, end of period | | $18.870 | | $11.290 | | $27.840 | | $22.240 | | $18.200 | |
| | | | | | | | | | | | |
| Total return2 | | 78.11% | | (51.56% | ) | 38.86% | | 27.13% | | 27.49% | |
| | | | | | | | | | | | |
| Ratios and supplemental data: | | | | | | | | | | | |
| Net assets, end of period (000 omitted) | | $245,149 | | $159,025 | | $346,779 | | $189,572 | | $120,292 | |
| Ratio of expenses to average net assets | | 1.39% | | 1.41% | | 1.47% | | 1.51% | | 1.47% | |
| Ratio of expenses to average net assets | | | | | | | | | | | |
| prior to fees waived and expense paid indirectly | | 1.41% | | 1.41% | | 1.48% | | 1.56% | | 1.57% | |
| Ratio of net investment income to average net assets | | 1.07% | | 1.48% | | 1.09% | | 2.37% | | 2.55% | |
| Ratio of net investment income to average net assets | | | | | | | | | | | |
| prior to fees waived and expense paid indirectly | | 1.05% | | 1.48% | | 1.08% | | 2.32% | | 2.45% | |
| Portfolio turnover | | 28% | | 42% | | 92% | | 67% | | 18% | |
____________________
| 1The average shares outstanding method has been applied for per share information. |
| 2Total investment return is based on the change in net asset value of a share during the period and assumes reinvestment of dividends and distributions at net asset value. Total investment return during some of the periods shown reflects a waiver by the manager. Performance would have been lower had the waiver not been in effect. |
See accompanying notes
Emerging Markets Series-10
Delaware VIP® Emerging Markets Series
Financial Highlights (continued)
Selected data for each share of the Series outstanding throughout each period were as follows:
| | Delaware VIP Emerging Markets Series Service Class |
| | Year Ended |
| | 12/31/09 | | 12/31/08 | | 12/31/07 | | 12/31/06 | | 12/31/05 | |
| Net asset value, beginning of period | | $11.250 | | $27.750 | | $22.180 | | $18.160 | | $14.480 | |
| | | | | | | | | | | | |
| Income (loss) from investment operations: | | | | | | | | | | | |
| Net investment income1 | | 0.117 | | 0.235 | | 0.205 | | 0.409 | | 0.372 | |
| Net realized and unrealized gain (loss) on investments | | | | | | | | | | | |
| and foreign currencies | | 8.160 | | (12.829 | ) | 7.548 | | 4.328 | | 3.507 | |
| Total from investment operations | | 8.277 | | (12.594 | ) | 7.753 | | 4.737 | | 3.879 | |
| | | | | | | | | | | | |
| Less dividends and distributions from: | | | | | | | | | | | |
| Net investment income | | (0.133 | ) | (0.294 | ) | (0.371 | ) | (0.203 | ) | (0.019 | ) |
| Net realized gain on investments | | (0.564 | ) | (3.612 | ) | (1.812 | ) | (0.514 | ) | (0.180 | ) |
| Total dividends and distributions | | (0.697 | ) | (3.906 | ) | (2.183 | ) | (0.717 | ) | (0.199 | ) |
| | | | | | | | | | | | |
| Net asset value, end of period | | $18.830 | | $11.250 | | $27.750 | | $22.180 | | $18.160 | |
| | | | | | | | | | | | |
| Total return2 | | 77.67% | | (51.68% | ) | 38.51% | | 26.81% | | 27.11% | |
| | | | | | | | | | | | |
| Ratios and supplemental data: | | | | | | | | | | | |
| Net assets, end of period (000 omitted) | | $266,768 | | $166,008 | | $313,510 | | $157,737 | | $78,576 | |
| Ratio of expenses to average net assets | | 1.64% | | 1.66% | | 1.72% | | 1.76% | | 1.72% | |
| Ratio of expenses to average net assets | | | | | | | | | | | |
| prior to fees waived and expense paid indirectly | | 1.71% | | 1.71% | | 1.78% | | 1.86% | | 1.87% | |
| Ratio of net investment income to average net assets | | 0.82% | | 1.23% | | 0.84% | | 2.12% | | 2.30% | |
| Ratio of net investment income to average net assets | | | | | | | | | | | |
| prior to fees waived and expense paid indirectly | | 0.75% | | 1.18% | | 0.78% | | 2.02% | | 2.15% | |
| Portfolio turnover | | 28% | | 42% | | 92% | | 67% | | 18% | |
____________________
| 1The average shares outstanding method has been applied for per share information. |
| 2Total investment return is based on the change in net asset value of a share during the period and assumes reinvestment of dividends and distributions at net asset value. Total investment return during some of the periods shown reflects waivers by the manager and distributor. Performance would have been lower had the waivers not been in effect. |
See accompanying notes
Emerging Markets Series-11
Delaware VIP® Trust — Delaware VIP Emerging Markets Series
Notes to Financial Statements
December 31, 2009
Delaware VIP Trust (Trust) is organized as a Delaware statutory trust and offers 12 series: Delaware VIP Cash Reserve Series, Delaware VIP Diversified Income Series, Delaware VIP Emerging Markets Series, Delaware VIP Growth Opportunities Series, Delaware VIP High Yield Series, Delaware VIP International Value Equity Series, Delaware VIP Limited-Term Diversified Income Series (formerly, Delaware VIP Capital Reserves Series), Delaware VIP REIT Series, Delaware VIP Small Cap Value Series, Delaware VIP Trend Series, Delaware VIP U.S. Growth Series and Delaware VIP Value Series. These financial statements and the related notes pertain to Delaware VIP Emerging Markets Series (Series). The Trust is an open-end investment company. The Series is considered diversified under the Investment Company Act of 1940, as amended, and offers Standard Class and Service Class shares. The Standard Class shares do not carry a 12b-1 fee and the Service Class shares carry a 12b-1 fee. The shares of the Series are sold only to separate accounts of life insurance companies.
The investment objective of the Series is to seek long-term capital appreciation.
1. Significant Accounting Policies
The following accounting policies are in accordance with U.S. generally accepted accounting principles (U.S. GAAP) and are consistently followed by the Series.
Security Valuation—Equity securities, except those traded on the Nasdaq Stock Market, Inc. (Nasdaq), are valued at the last quoted sales price as of the time of the regular close of the New York Stock Exchange (NYSE) on the valuation date. Securities traded on the Nasdaq are valued in accordance with the Nasdaq Official Closing Price, which may not be the last sales price. If on a particular day an equity security does not trade, then the mean between the bid and ask prices will be used. Securities listed on a foreign exchange are valued at the last quoted sales price on the valuation date. Short-term debt securities are valued at market value. Investment companies are valued at net asset value per share. Foreign currency exchange contracts are valued at the mean between the bid and asked prices of the contracts. Interpolated values are derived when the settlement date of the contract is an interim date for which quotations are not available. Generally, other securities and assets for which market quotations are not readily available are valued at fair value as determined in good faith under the direction of the Series’ Board of Trustees (Board). In determining whether market quotations are readily available or fair valuation will be used, various factors will be taken into consideration, such as market closures or suspension of trading in a security. The Series may use fair value pricing more frequently for securities traded primarily in non-U.S. markets because, among other things, most foreign markets close well before the Series values its securities at 4:00 p.m. Eastern time. The earlier close of these foreign markets gives rise to the possibility that significant events, including broad market moves, government actions or pronouncements, aftermarket trading, or news events may have occurred in the interim. To account for this, the Series may frequently value foreign securities using fair value prices based on third-party vendor modeling tools (international fair value pricing).
Federal Income Taxes—No provision for federal income taxes has been made as the Series intends to continue to qualify for federal income tax purposes as a regulated investment company under Subchapter M of the Internal Revenue Code of 1986, as amended, and make the requisite distributions to shareholders. The Series evaluates tax positions taken or expected to be taken in the course of preparing the Series’ tax returns to determine whether the tax positions are “more-likely-than-not” of being sustained by the applicable tax authority. Tax positions not deemed to meet the more-likely-than-not threshold are recorded as a tax benefit or expense in the current year. Management has analyzed the Series’ tax positions taken on federal income tax returns for all open tax years (tax years ended December 31, 2006 – December 31, 2009), and has concluded that no provision for federal income tax is required in the Series’ financial statements.
Class Accounting—Investment income, common expenses and realized and unrealized gain (loss) on investments are allocated to the classes of the Series on the basis of daily net assets of each class. Distribution expenses relating to a specific class are charged directly to that class.
Repurchase Agreements—The Series may invest in a pooled cash account along with other members of the Delaware Investments® Family of Funds pursuant to an exemptive order issued by the Securities and Exchange Commission. The aggregate daily balance of the pooled cash account is invested in repurchase agreements secured by obligations of the U.S. government. The respective collateral is held by the Series’ custodian bank until the maturity of the respective repurchase agreements. Each repurchase agreement is at least 102% collateralized. However, in the event of default or bankruptcy by the counterparty to the agreement, realization of the collateral may be subject to legal proceedings. At December 31, 2009, the Series held no investments in repurchase agreements.
Foreign Currency Transactions—Transactions denominated in foreign currencies are recorded at the prevailing exchange rates on the valuation date. The value of all assets and liabilities denominated in foreign currencies is translated into U.S. dollars at the exchange rate of such currencies against the U.S. dollar daily. Transaction gains or losses resulting from changes in exchange rates during the reporting period or upon settlement of the foreign currency transaction are reported in operations for the current period. The Series does not isolate that portion of realized gains and losses on investments which are due to changes in foreign exchange rates from that which are due to changes in market prices. The Series reports certain foreign currency related transactions as components of realized gains (losses) for financial reporting purposes, whereas such components are treated as ordinary income (loss) for federal income tax purposes.
Use of Estimates—The preparation of financial statements in conformity with U.S. GAAP requires management to make estimates and assumptions that affect the reported amounts of assets and liabilities at the date of the financial statements and the reported amounts of revenues and expenses during the reporting period. Actual results could differ from those estimates.
Other—Expenses directly attributable to the Series are charged directly to the Series. Other expenses common to various funds within the Delaware Investments Family of Funds are generally allocated amongst such funds on the basis of average net assets. Management fees and some other expenses are paid monthly. Security transactions are recorded on the date the securities are purchased or sold (trade date) for financial reporting purposes. Costs used in calculating realized gains and losses on the sale of investment securities are those of the specific securities sold. Dividend income is recorded on the ex-dividend date and interest income is recorded on the accrual basis.
Emerging Markets Series-12
Delaware VIP® Emerging Markets Series
Notes to Financial Statements (continued)
1. Significant Accounting Policies (continued)
Foreign dividends are also recorded on the ex-dividend date or as soon after the ex-dividend date that the Series is aware of such dividends, net of all non-rebatable tax withholdings. Withholding taxes on foreign dividends have been recorded in accordance with the Series’ understanding of the applicable country’s tax rules and rates. The Series declares and pays dividends from net investment income and distributions from net realized gain on investments, if any, following the close of the fiscal year.
The Series may receive earnings credits from its custodian when positive cash balances are maintained, which are used to offset custody fees. There were no earnings credits for the year ended December 31, 2009.
On July 1, 2009, the Financial Accounting Standards Board (FASB) issued the FASB Accounting Standards Codification (Codification). The Codification became the single source of authoritative nongovernmental U.S. GAAP, superseding existing literature of the FASB, American Institute of Certified Public Accountants, Emerging Issues Task Force and other sources. The Codification is effective for interim and annual periods ending after September 15, 2009. The Series adopted the Codification for the year ended December 31, 2009. There was no impact to financial statements as the Codification requirements are disclosure-only in nature.
Management has evaluated whether any events or transactions occurred subsequent to December 31, 2009 through February 17, 2010, the date of issuance of the Series’ financial statements, and determined that there were no material events or transactions that would require recognition or disclosure in the Series’ financial statements.
2. Investment Management, Administration Agreements and Other Transactions with Affiliates
In accordance with the terms of its investment management agreement, the Series pays Delaware Management Company (DMC), a series of Delaware Management Business Trust and the investment manager, an annual fee which is calculated daily at the rate of 1.25% on the first $500 million of average daily net assets of the Series, 1.20% on the next $500 million, 1.15% on the next $1.5 billion, and 1.10% on average daily net assets in excess of $2.5 billion.
Effective May 1, 2009, DMC voluntarily agreed to waive that portion, if any, of its management fee and/or pay/reimburse the Series to the extent necessary to ensure that total annual operating expenses (excluding any 12b-1 plan expenses, taxes, interest, inverse floater program expenses, brokerage fees, certain insurance costs, and nonroutine expenses or costs including, but not limited to, those relating to reorganizations, litigation, conducting shareholder meetings, and liquidations (collectively, “nonroutine expenses”)) do not exceed 1.36% of average daily net assets of the Series until such time as the voluntary expense cap is discontinued. For purposes of this waiver and reimbursement, nonroutine expenses may also include such additional costs and expenses, as may be agreed upon from time to time by the Series’ Board and DMC. This expense waiver and reimbursement applies only to expenses paid directly by the Series, and may be discontinued at any time because they are voluntary. Effective August 17, 2009, the waiver was discontinued.
Delaware Service Company, Inc. (DSC), an affiliate of DMC, provides fund accounting and financial administration oversight services to the Series. For these services, the Series pays DSC fees based on the aggregate daily net assets of the Delaware Investments® Family of Funds at the following annual rate: 0.0050% of the first $30 billion; 0.0045% of the next $10 billion; 0.0040% of the next $10 billion; and 0.0025% of aggregate average daily net assets in excess of $50 billion. The fees payable to DSC under the service agreement described above are allocated among all funds in the Delaware Investments Family of Funds on a relative net asset value basis. For the year ended December 31, 2008, the Series was charged $20,272 for these services.
DSC also provides dividend disbursing and transfer agency services. The Series pays DSC a monthly fee based on the number of shareholder accounts for dividend disbursing and transfer agent services.
Pursuant to a distribution agreement and distribution plan, the Series pays Delaware Distributors, L.P. (DDLP), the distributor and an affiliate of DMC, an annual distribution and service fee not to exceed 0.30% of the average daily net assets of the Service Class shares. DDLP has contracted to waive distribution and service fees through April 30, 2010 in order to prevent distribution and service fees of the Service Class shares from exceeding 0.25% of average daily net assets. Standard Class shares pay no distribution and service expenses.
At December 31, 2009, the Series had liabilities payable to affiliates as follows:
| | | Dividend Disbursing, | | | | Other |
| Investment | | Transfer Agent and Fund | | | | Expenses |
| Management | | Accounting Oversight | | Distribution | | Payable |
| Fee Payable to | | Fees and Other Expenses | | Fee Payable | | to DMC |
| DMC | | Payable to DSC | | to DDLP | | and Affiliates* |
| | $530,431 | | $5,316 | | $55,226 | | $22,956 |
____________________
*DMC as part of its administrative services, pays operating expenses on behalf of the Series and is reimbursed on a periodic basis. Such expenses include items such as printing of shareholder reports, fees for audit, legal and tax services, custodian fees and trustees’ fees.
As provided in the investment management agreement, the Series bears the cost of certain legal and tax services, including internal legal and tax services provided to the Series by DMC and/or its affiliates’ employees. For the year ended December 31, 2009, the Series was charged $33,615 for internal legal and tax services provided by DMC and/or its affiliates’ employees.
Emerging Markets Series-13
Delaware VIP® Emerging Markets Series
Notes to Financial Statements (continued)
2. Investment Management, Administration Agreements and Other Transactions with Affiliates (continued)
Trustees’ fees include expenses accrued by the Series for each Trustee’s retainer and meeting fees. Certain officers of DMC, DSC and DDLP are officers and/or Trustees of the Trust. These officers and Trustees are paid no compensation by the Series.
3. Investments
For the year ended December 31, 2009, the Series made purchases and sales of investment securities other than short-term investments as follows:
| Purchases | $111,239,788 |
| Sales | $153,533,420 |
At December 31, 2009, the cost of investments and unrealized appreciation (depreciation) for federal income tax purposes for the Series were as follows:
| | | Aggregate | | Aggregate | | Net |
| Cost of | | Unrealized | | Unrealized | | Unrealized |
| Investments | | Appreciation | | Depreciation | | Depreciation |
| $540,450,608 | | $83,686,601 | | $(89,170,836) | | $(5,484,235) |
U.S. GAAP defines fair value as the price that the Series would receive to sell an asset or pay to transfer a liability in an orderly transaction between market participants at the measurement date under current market conditions. A framework for measuring fair value and a three level hierarchy for fair value measurements has established based upon the transparency of inputs to the valuation of an asset or liability. Inputs may be observable or unobservable and refer broadly to the assumptions that market participants would use in pricing the asset or liability. Observable inputs reflect the assumptions market participants would use in pricing the asset liability based on market data obtained from sources independent of the reporting entity. Unobservable inputs reflect the reporting entity’s own assumptions about assumptions that market participants would use in pricing the asset or liability developed based on the best information available under the circumstances. The investment in its entirety is assigned a level based upon the observability of the inputs which are significant to the overall valuation. The three-tier hierarchy of is summarized below.
Level 1 – inputs are quoted prices in active markets
Level 2 – inputs are observable, directly or indirectly
Level 3 – inputs are unobservable and reflect assumptions on the part of the reporting entity
The following table summarizes the valuation of the Series’ investments by the fair value hierarchy levels as of December 31, 2009:
| | Level 1 | | Level 2 | | Level 3 | | Total |
| Common Stock | | $ | 265,068,434 | | $ | 216,582,207 | | $ | 63,150 | | $ | 481,713,791 |
| Other | | | 18,201,079 | | | 9,973,406 | | | 262,566 | | | 28,437,051 |
| Securities Lending Collateral | | | 16,658,841 | | | 7,841,542 | | | 22,148 | | | 24,522,531 |
| Short-Term | | | – | | | 293,000 | | | – | | | 293,000 |
| Total | | $ | 299,928,354 | | $ | 234,690,155 | | $ | 347,864 | | $ | 534,966,373 |
| | | | | | | | | | | | | |
The following is a reconciliation of investments in which significant unobservable inputs (Level 3) were used in determining fair value:
| | | | | | Securities | | |
| | Common | | | | Lending | | Total |
| | Stock | | Other | | Collateral | | Series |
| Balance as of 12/31/08 | | | $ | 28,830 | | | | $ | 1,940,711 | | | | $ | 17,198 | | | | $ | 1,986,739 | |
| Net change in unrealized appreciation/depreciation | | | | 34,320 | | | | | (1,678,145 | ) | | | | 4,950 | | | | | (1,638,875 | ) |
| Balance as of 12/31/09 | | | $ | 63,150 | | | | $ | 262,566 | | | | $ | 22,148 | | | | $ | 347,864 | |
| | | | | | | | | | | | | | | | | | | | | |
| Net change in unrealized | | | | | | | | | | | | | | | | | | | | |
| appreciation/depreciation from | | | | | | | | | | | | | | | | | | | | |
| investments still held as of 12/31/09 | | | $ | 34,320 | | | | $ | (1,678,145 | ) | | | $ | 4,950 | | | | $ | (1,638,875 | ) |
In January 2010, the Financial Accounting Standards Board issued an Accounting Standards Update, Improving Disclosures about Fair Value Measurements, which introduces new disclosure requirements and clarifies certain existing disclosure requirements around fair value measurements currently presented above. The new disclosures and clarifications of existing disclosures are generally effective for the Series’ year ending December 31, 2010 and interim periods therein. Management is evaluating the impact of this update on its current disclosures.
Emerging Markets Series-14
Delaware VIP® Emerging Markets Series
Notes to Financial Statements (continued)
4. Dividend and Distribution Information
Income and long-term capital gain distributions are determined in accordance with federal income tax regulations, which may differ from U.S. GAAP. Additionally, distributions from net gains on foreign currency transactions and net short-term gains on sales of investment securities are treated as ordinary income for federal income tax purposes. The tax character of dividends and distributions paid during the years ended December 31, 2009 and 2008 was as follows:
| | Year | | Year |
| | Ended | | Ended |
| | 12/31/09 | | 12/31/08 |
| Ordinary income | | $ | 9,069,133 | | $ | 68,391,102 |
| Long-term capital gain | | | 11,966,173 | | | 24,959,675 |
| | $ | 21,035,306 | | $ | 93,350,777 |
| | | | | | | |
5. Components of Net Assets on a Tax Basis
As of December 31, 2009, the components of net assets on a tax basis were as follows:
| Shares of beneficial interest | $ | 529,670,489 | |
| Undistributed ordinary income | | 3,477,961 | |
| Capital loss carryforwards | | (15,706,655 | ) |
| Post-October currency losses | | (74,618 | ) |
| Unrealized depreciation of investments | | | |
| and foreign currencies | | (5,450,106 | ) |
| Net assets | $ | 511,917,071 | |
| | | | |
The differences between book basis and tax basis components of net assets are primarily attributable to tax deferral of losses on wash sales, tax treatment of foreign capital gains taxes and tax treatment of unrealized gain on investments in passive foreign investment companies.
Post-October currency losses represent losses realized on foreign currency transactions from November 1, 2009 through December 31, 2009 that, in accordance with federal income tax regulations, the Series has elected to defer and treat as having arisen in the following fiscal year.
For financial reporting purposes, capital accounts are adjusted to reflect the tax character of permanent book/tax differences. Reclassifications are primarily due to tax treatment of gain (loss) on foreign currency transactions, tax treatment of foreign capital gains taxes and dividends and distributions. Results of operations and net assets were not affected by these reclassifications. For the year ended December 31, 2009, the Series recorded the following reclassifications:
| Undistributed | | Accumulated |
| Net Investment | | Net Realized |
| Income | | Loss |
| $(631,590) | | $631,590 |
For federal income tax purposes, capital loss carryforwards may be carried forward and applied against future capital gains. Capital loss carryforwards remaining at December 31, 2009 will expire as follows: $15,706,655 expires in 2017.
Emerging Markets Series-15
Delaware VIP® Emerging Markets Series
Notes to Financial Statements (continued)
6. Capital Shares
Transactions in capital shares were as follows:
| | Year | | Year |
| | Ended | | Ended |
| | 12/31/09 | | 12/31/08 |
| Shares sold: | | | | | | |
| Standard Class | | 4,590,499 | | | 4,167,059 | |
| Service Class | | 5,077,451 | | | 6,514,036 | |
| | | | | | | |
| Shares issued upon reinvestment of dividends and distributions: | | | | | | |
| Standard Class | | 938,985 | | | 2,388,784 | |
| Service Class | | 888,583 | | | 2,217,592 | |
| | 11,495,518 | | | 15,287,471 | |
| Shares repurchased: | | | | | | |
| Standard Class | | (6,623,444 | ) | | (4,925,390 | ) |
| Service Class | | (6,553,969 | ) | | (5,273,657 | ) |
| | (13,177,413 | ) | | (10,199,047 | ) |
| Net increase (decrease) | | (1,681,895 | ) | | 5,088,424 | |
| | | | | | | |
7. Line of Credit
The Series, along with certain other funds in the Delaware Investments® Family of Funds (Participants), participates in a $35,000,000 revolving line of credit with The Bank of New York Mellon (BNY Mellon) to be used for temporary or emergency purposes as an additional source of liquidity to fund redemptions of investor shares. Under the agreement, Participants are charged an annual commitment fee, which is allocated across the Participants on the basis of each Participant’s allocation of the entire facility. The Participants may borrow up to a maximum of one third of their net assets under the agreement. The agreement expires on November 16, 2010. The Series had no amounts outstanding as of December 31, 2009, or at any time during the year then ended.
8. Derivatives
U.S. GAAP requires enhanced disclosures that enable investors to understand: 1) how and why an entity uses derivatives, 2) how they are accounted for, and 3) how they affect an entity’s results of operations and financial position.
Foreign Currency Exchange Contracts
The Series may enter into foreign currency exchange contracts as a way of managing foreign exchange rate risk. The Series may enter into these contracts to fix the U.S. dollar value of a security that it has agreed to buy or sell for the period between the date the trade was entered into and the date the security is delivered and paid for. The Series may also use these contracts to hedge the U.S. dollar value of securities it already owns that are denominated in foreign currencies. The change in value is recorded as an unrealized gain or loss. When the contract is closed, a realized gain or loss is recorded equal to the difference between the value of the contract at the time it was opened and the value at the time it was closed.
The use of foreign currency exchange contracts does not eliminate fluctuations in the underlying prices of the securities, but does establish a rate of exchange that can be achieved in the future. Although foreign currency exchange contracts limit the risk of loss due to a decline in the value of the hedged currency, they also limit any potential gain that might result should the value of the currency increase. In addition, the Series could be exposed to risks if the counterparties to the contracts are unable to meet the terms of their contracts. The Series’ maximum risk of loss from counterparty credit risk is the value of its currency exchanged with the counterparty. The risk is generally mitigated by having a netting arrangement between the Series and the counterparty and by the posting of collateral by the counterparty to the Series to cover the Series’ exposure to the counterparty. No foreign currency exchange contracts were outstanding at December 31, 2009.
9. Securities Lending
The Series, along with other funds in the Delaware Investments Family of Funds, may lend its securities pursuant to a security lending agreement (Lending Agreement) with BNY Mellon. With respect to each loan, if the aggregate market value of securities collateral held plus cash collateral received on any business day is less than the aggregate market value of the securities which are the subject of such loan, the borrower will be notified to provide additional collateral not less than the applicable collateral requirements. Cash collateral received is generally invested in the Mellon GSL DBT II Collateral Fund (Collective Trust) established by BNY Mellon for the purpose of investment on behalf of clients participating in its securities lending programs. The Collective Trust may invest in fixed income securities, with a weighted average maturity not to exceed 90 days, rated in one of the top three tiers by Standard & Poor’s Ratings Group or Moody’s Investors Service, Inc. or repurchase agreements collateralized by such securities. The Collective Trust seeks to maintain a net asset value per unit of $1.00, but there can be no assurance that it will always be able to do so. At December 31, 2009, the Collective Trust held only cash and assets with a maturity of one business day or less (Cash/Overnight Assets). The Series may incur investment losses as a result of investing securities lending collateral in the Collective Trust. This could occur if an investment in the Collective Trust defaulted or if it were necessary to liquidate assets in the Collective Trust to meet returns on outstanding security loans at a time when the Collective Trust’s net asset value per unit was less than $1.00. Under those circumstances, the Series may not receive an amount from the Collective Trust that is equal in amount to the collateral the Series would be required to return to the borrower of the securities and the Series would be required to make up for this shortfall. Effective April 20, 2009, BNY Mellon transferred the assets of the Collective Trust other than the Cash/Overnight Assets to the BNY Mellon SL DBT II Liquidating Fund (Liquidating Fund), effectively bifurcating the collateral investment pool. The Series’ exposure to the Liquidating Fund is expected to decrease as the Liquidating Fund’s assets mature or are sold. In October 2008,
Emerging Markets Series-16
Delaware VIP® Emerging Markets Series
Notes to Financial Statements (continued)
9. Securities Lending (continued)
BNY Mellon transferred certain distressed securities from the Collective Trust into the Mellon GSL Reinvestment Trust II. The Series can also accept U.S. government securities and letters of credit (non-cash collateral) in connection with securities loans. In the event of default or bankruptcy by the lending agent, realization and/or retention of the collateral may be subject to legal proceedings. In the event the borrower fails to return loaned securities and the collateral received is insufficient to cover the value of the loaned securities and provided such collateral shortfall is not the result of investment losses, the lending agent has agreed to pay the amount of the shortfall to the Series, or at the discretion of the lending agent, replace the loaned securities. The Series continues to record dividends or interest, as applicable, on the securities loaned and is subject to change in value of the securities loaned that may occur during the term of the loan. The Series has the right under the Lending Agreement to recover the securities from the borrower on demand. With respect to security loans collateralized by non-cash collateral, the Series receives loan premiums paid by the borrower. With respect to security loans collateralized by cash collateral, the earnings from the collateral investments are shared among the Series, the security lending agent and the borrower. The Series records security lending income net of allocations to the security lending agent and the borrower.
At December 31, 2009, the value of the securities on loan was $24,217,041, for which cash collateral was received and invested in accordance with the Lending Agreement. At December 31, 2009, the value of invested collateral was $24,522,531. Such investments are presented on the Statement of Net Assets under the caption “Securities Lending Collateral.”
10. Credit and Market Risk
Some countries in which the Series may invest require governmental approval for the repatriation of investment income, capital or the proceeds of sales of securities by foreign investors. In addition, if there is deterioration in a country’s balance of payments or for other reasons, a country may impose temporary restrictions on foreign capital remittances abroad.
The securities exchanges of certain foreign markets are substantially smaller, less liquid and more volatile than the major securities markets in the United States. Consequently, acquisition and disposition of securities by the Series may be inhibited. In addition, a significant portion of the aggregate market value of equity securities listed on the major securities exchanges in emerging markets are held by a smaller number of investors. This may limit the number of shares available for acquisition or disposition by the Series.
The Series may invest up to 10% of its net assets in illiquid securities, which may include securities with contractual restrictions on resale, securities exempt from registration under Rule 144A of the Securities Act of 1933, as amended, and other securities which may not be readily marketable. The relative illiquidity of these securities may impair the Series from disposing of them in a timely manner and at a fair price when it is necessary or desirable to do so. While maintaining oversight, the Series’ Board has delegated to DMC the day-to-day functions of determining whether individual Rule 144A securities are liquid for purposes of the Series’ limitation on investments in illiquid assets. Securities eligible for resale pursuant to Rule 144A, which are determined to be liquid, are not subject to the Series’ 10% limit on investments in illiquid securities. Rule 144A and illiquid securities have been identified on the Statement of Net Assets.
11. Contractual Obligations
The Series enters into contracts in the normal course of business that contain a variety of indemnifications. The Series’ maximum exposure under these arrangements is unknown. However, the Series has not had prior claims or losses pursuant to these contracts. Management has reviewed the Series’ existing contracts and expects the risk of loss to be remote.
12. Sale of Delaware Investments to Macquarie Group
On August 18, 2009, Lincoln National Corporation (parent company of Delaware Investments) and Macquarie Group (Macquarie) entered into an agreement pursuant to which Delaware Investments, including DMC, DDLP and DSC, would be acquired by Macquarie, an Australia-based global provider of banking, financial, advisory, investment and funds management services (Transaction). The Transaction was completed on January 4, 2010. DMC, DDLP and DSC are now wholly-owned subsidiaries of Macquarie.
The Transaction resulted in a change of control of DMC which, in turn, caused the termination of the investment advisory agreement between DMC and the Series. On January 4, 2010, the new investment advisory agreement between DMC and the Series that was approved by the shareholders became effective.
13. Tax Information (Unaudited)
For the fiscal year ended December 31, 2009, the Series designates distributions paid during the year as follows:
| (A) | | (B) | | |
| Long-Term | | Ordinary | | |
| Capital Gain | | Income | | Total |
| Distributions | | Distributions | | Distributions |
| (Tax Basis) | | (Tax Basis) | | (Tax Basis) |
| 57% | | 43% | | 100% |
____________________
(A) and (B) are based on a percentage of the Series’ total distributions.
The Series intends to pass through foreign tax credits in the maximum amount of $550,970. The gross foreign source income earned during the fiscal year 2009 by the Series was $10,526,864.
Emerging Markets Series-17
Delaware VIP® Trust — Delaware VIP Emerging Markets Series
Report of Independent Registered Public Accounting Firm
To the Shareholders and Board of Trustees
Delaware VIP Trust–Delaware VIP Emerging Markets Series
We have audited the accompanying statement of net assets of the Delaware VIP Emerging Markets Series (one of the series constituting Delaware VIP Trust) (the “Series”) as of December 31, 2009, and the related statement of operations for the year then ended, the statements of changes in net assets for each of the two years in the period then ended, and the financial highlights for each of the five years in the period then ended. These financial statements and financial highlights are the responsibility of the Series’ management. Our responsibility is to express an opinion on these financial statements and financial highlights based on our audits.
We conducted our audits in accordance with the standards of the Public Company Accounting Oversight Board (United States). Those standards require that we plan and perform the audit to obtain reasonable assurance about whether the financial statements and financial highlights are free of material misstatement. We were not engaged to perform an audit of the Series’ internal control over financial reporting. Our audits included consideration of internal control over financial reporting as a basis for designing audit procedures that are appropriate in the circumstances, but not for the purpose of expressing an opinion on the effectiveness of the Series’ internal control over financial reporting. Accordingly, we express no such opinion. An audit also includes examining, on a test basis, evidence supporting the amounts and disclosures in the financial statements and financial highlights, assessing the accounting principles used and significant estimates made by management, and evaluating the overall financial statement presentation. Our procedures included confirmation of securities owned as of December 31, 2009, by correspondence with the custodian and brokers. We believe that our audits provide a reasonable basis for our opinion.
In our opinion, the financial statements and financial highlights referred to above present fairly, in all material respects, the financial position of the Delaware VIP Emerging Markets Series of Delaware VIP Trust at December 31, 2009, the results of its operations for the year then ended, the changes in its net assets for each of the two years in the period then ended, and its financial highlights for each of the five years in the period then ended, in conformity with U.S. generally accepted accounting principles.
Philadelphia, Pennsylvania
February 17, 2010
The Series files its complete schedule of portfolio holdings with the Securities and Exchange Commission (Commission) for the first and third quarters of each fiscal year on Form N-Q. The Series’ Forms N-Q, as well as a description of the policies and procedures that the Series uses to determine how to vote proxies (if any) relating to portfolio securities is available without charge (i) upon request, by calling 800 523-1918; and (ii) on the Commission’s website at http://www.sec.gov. In addition, a description of the policies and procedures that the Series uses to determine how to vote proxies (if any) relating to portfolio securities is available without charge on the Delaware Investments® Funds’ Web site at http://www.delawareinvestments.com. The Series’ Forms N-Q may be reviewed and copied at the Commission’s Public Reference Room in Washington, DC; information on the operation of the Public Reference Room may be obtained by calling 800 SEC-0330.
Information (if any) regarding how the Series voted proxies relating to portfolio securities during the most recently disclosed 12-month period ended June 30 is available without charge (i) through the Delaware Investments Funds’ Web site at http://www.delawareinvestments.com; and (ii) on the Commission’s website at http://www.sec.gov. |
Emerging Markets Series-18
Delaware VIP® Trust — Delaware VIP Emerging Markets Series
Other Series Information
Board Consideration of New Investment Advisory Agreement
At a meeting held on September 3, 2009 (the “Meeting”), the Board of Trustees of the Delaware Investments Family of Funds (the “Board”), including the independent Trustees, unanimously approved a new investment advisory agreement between each registrant on behalf of each series (each, a “Fund” and together, the “Funds”) and Delaware Management Company (“DMC”) in connection with the sale of Delaware Investments’ advisory business to Macquarie Bank Limited (the “Macquarie Group”) (the “Transaction”). In making its decision, the Board considered information furnished specifically in connection with the approval of the new investment advisory agreements with DMC (the “New Investment Advisory Agreements”) which included extensive materials about the Transaction and matters related to the proposed approvals. To assist the Board in considering the New Investment Advisory Agreements, Macquarie Group provided materials and information about Macquarie Group, including detailed written responses to the questions posed by the independent Trustees. DMC also provided materials and information about the Transaction, including detailed written responses to the questions posed by the independent Trustees.
At the Meeting, the Trustees discussed the Transaction with DMC management and with key Macquarie Group representatives. The Meeting included discussions of the strategic rationale for the Transaction and Macquarie Group’s general plans and intentions regarding the Funds and DMC. The Board members also inquired about the plans for, and anticipated roles and responsibilities of, key employees and officers of Delaware Management Holdings Inc. and DMC in connection with the Transaction.
In connection with the Trustees’ review of the New Investment Advisory Agreements for the Funds, DMC and/or Macquarie Group emphasized that:
- They expected that there would be no adverse changes as a result of the Transaction, in the nature, quality, or extent of services currently provided to the Funds and their shareholders, including investment management, distribution, or other shareholder services.
- No material changes in personnel or operations were contemplated in the operation of DMC under Macquarie Group as a result of the Transaction and no material changes were currently contemplated in connection with third party service providers to the Funds.
- Macquarie Group had no intention to cause DMC to alter the voluntary expense waivers and reimbursements currently in effect for the Funds.
- Under the agreement between Macquarie Group and Lincoln National Corporation (“LNC”) (the “Transaction Agreement”), Macquarie Group has agreed to conduct, and to cause its affiliates to conduct, their respective businesses in compliance with the conditions of Section 15(f) of the Investment Company Act of 1940 (the “1940 Act”) with respect to the Funds, to the extent within its control, including maintaining Board composition of at least 75% of the Board members qualifying as independent Trustees and not imposing any “unfair burden” on the Funds for at least two years from the closing of the Transaction (the “Closing”).
In addition to the information provided by DMC and Macquarie Group as described above, the Trustees also considered all other factors they believed to be relevant to evaluating the New Investment Advisory Agreements, including the specific matters discussed below. In their deliberations, the Trustees did not identify any particular information that was controlling, and different Trustees may have attributed different weights to the various factors. However, for each Fund, the Trustees determined that the overall arrangements between the Fund and DMC, as provided in the respective New Investment Advisory Agreement, including the proposed advisory fee and the related administration arrangements between the Fund and DMC, were fair and reasonable in light of the services to be performed, expenses incurred, and such other matters as the Trustees considered relevant. Factors evaluated included:
- The potential for expanding distribution of Fund shares through access to Macquarie Group’s existing distribution channels;
- Delaware Investments’ acquisition of an exclusive wholesaling sales force from a subsidiary of LNC;
- The reputation, financial strength, and resources of Macquarie Group as well as its historic and ongoing commitment to the asset management business in Australia as well as other parts of the world;
- The terms and conditions of the New Investment Advisory Agreements, including that each Fund’s total contractual fee rate under the New Investment Advisory Agreement will remain the same;
- The Board’s full annual review (or initial approval) of the current investment advisory agreements at their in-person meeting in May 2009 as required by the 1940 Act and its determination that (i) DMC had the capabilities, resources, and personnel necessary to provide the satisfactory advisory and administrative services currently provided to each Fund and (ii) the advisory and/or management fees paid by each Fund, taking into account any applicable fee waivers and breakpoints, represented reasonable compensation to DMC in light of the services provided, the costs to DMC of providing those services, economies of scale, and the fees and other expenses paid by similar funds and such other matters that the Board considered relevant in the exercise of its reasonable judgment;
- The portfolio management teams for the Funds are not currently expected to change as a result of the Transaction;
- LNC and Macquarie Group were expected to execute a reimbursement agreement pursuant to which LNC and Macquarie Group would agree to pay (or reimburse) all reasonable out-of-pocket costs and expenses of the Funds in connection with the Board’s consideration of the Transaction, the New Investment Advisory Agreements and related agreements, and all costs related to the proxy solicitation (the “Expense Agreement”);
Emerging Markets Series-19
Delaware VIP® Emerging Markets Series
Other Series Information (continued)
- The likelihood that Macquarie Group would invest additional amounts in Delaware Investments, including DMC, which could result in increased assets under management, which in turn would allow some Funds the potential opportunity to achieve economies of scale and lower fees payable by Fund shareholders; and
- The compliance and regulatory history of Macquarie Group and its affiliates.
In making their decision relating to the approval of each Fund’s New Investment Advisory Agreement, the independent Trustees gave attention to all information furnished. The following discussion, however, identifies the primary factors taken into account by the Trustees and the conclusions reached in approving the New Investment Advisory Agreements.
NATURE, EXTENT, AND QUALITY OF SERVICE. The Trustees considered the services historically provided by DMC to the Funds and their shareholders. In reviewing the nature, extent, and quality of services, the Board considered that the New Investment Advisory Agreements would be substantially similar to the current investment advisory agreements between the Funds and DMC (the “Current Investment Advisory Agreements”), and they therefore, considered the many reports furnished to them throughout 2008 and 2009 at regular Board meetings covering matters such as: the relative performance of the Funds; the compliance of portfolio managers with the investment policies, strategies, and restrictions for the Funds; the compliance of management personnel with the code of ethics adopted throughout the Delaware Investments Family of Funds complex; and the adherence to fair value pricing procedures as established by the Board. The Trustees were pleased with the current staffing of DMC and the emphasis placed on research and risk management in the investment process. Favorable consideration was given to DMC’s efforts to maintain expenditures and, in some instances, increase financial and human resources committed to Fund matters.
The Board also considered the transfer agent and shareholder services that would continue to be provided to Fund shareholders by DMC’s affiliate, Delaware Service company, Inc. (“DSC”). The Trustees noted, in particular, DSC’s commitment to maintain a high level of service as well as DMC’s expenditures to improve the delivery of shareholder services. The Board was assured that shareholders would continue to receive the benefits provided to Fund shareholders by being part of the Delaware Investments Family of Funds, including each shareholder’s ability to exchange an investment in one Fund for the same class of shares in another Fund without a sales charge, to reinvest Fund dividends into additional shares of any of the Funds, and the privilege to combine holdings in other Funds to obtain a reduced sales charge.
Based on the information provided by DMC and Macquarie Group, including that Macquarie Group and DMC currently expected no material changes as a result of the Transaction in (i) personnel or operations of DMC or (ii) third party service providers to the Funds, the Board concluded that the satisfactory nature, extent, and quality of services currently provided to the Funds and their shareholders were very likely to continue under the New Investment Advisory Agreements. Moreover, the Board concluded that the Funds would probably benefit from the expanded distribution resources that would become available to Delaware Investments following the Transaction. The Board also concluded that it was very unlikely that any “unfair burden” would be imposed on any of the Funds for the first two years following the Closing as a result of the Transaction. Consequently, the Board concluded that it did not expect the Transaction to result in any adverse changes in the nature, quality, or extent of services (including investment management, distribution or other shareholder services) currently provided to the Funds and their shareholders.
INVESTMENT PERFORMANCE. The Board considered the overall investment performance of DMC and the Funds. The Trustees placed significant emphasis on the investment performance of the Funds in view of its importance to shareholders. Although the Trustees gave appropriate consideration to performance reports and discussions with portfolio managers at Board meetings throughout the year, the Trustees gave particular weight to their review of investment performance in connection with the approval of the Current Investment Advisory agreements at the Board meeting held in May 2009. At that meeting, the Trustees reviewed reports prepared by Lipper, Inc., an independent statistical compilation organization (“Lipper”), which showed each Fund’s investment performance as of December 31, 2008 in comparison to a group of funds selected by Lipper as being similar to the Fund (the “Performance Universe”). During the May 2009 agreement review process, the Trustees observed the significant improvements to relative investment performance of the Funds compared to the Funds’ performance as of December 31, 2007.
At their meeting on September 3, 2009, the Trustees, including the independent Trustees in consultation with their independent counsel, reviewed the investment performance of each Fund. The Trustees compared the performance of each Fund relative to that of its respective Performance Universe for the 1-, 3-, 5-, and 10-year periods ended June 30, 2009 and compared its relative investment performance against the corresponding relative investment performance of each Fund for such time periods ended December 31, 2008, to the extent applicable. As of June 30, 2009, 30 of the Funds had investment performance relative to that of the respective Performance Universe that was better than the corresponding relative investment performance at December 31, 2008 for all applicable time periods. At June 30, 2009, an additional 6 Funds had investment performance relative to that of their respective Performance Universe that was better than the corresponding relative investment performance at December 31, 2008 for a majority of the applicable time periods. At June 30, 2009, 15 additional Funds had investment performance relative to that of their respective Performance Universe that was better than the corresponding relative performance at December 31, 2008 and only 29 Funds had poorer relative investment performance at June 30, 2009 compared to that at December 31, 2008.
The Board therefore concluded that the investment performance of the Funds, on an aggregate basis, had continued to improve relative to their respective Performance Universe since the data reviewed at the May 2009 meeting. Based on information provided by DMC and Macquarie Group, the Board concluded that neither the Transaction nor the New Investment Advisory Agreement would likely have an adverse effect on the investment performance of any Fund because (i) DMC and Macquarie Group did not currently expect the Transaction to cause any material change to the Funds’ portfolio management teams responsible for investment performance, which the Board found to be satisfactory and improving; and (ii) as discussed in more detail below, the Funds’ expenses were not expected to increase as a result of the Transaction.
Emerging Markets Series-20
Delaware VIP® Emerging Markets Series
Other Series Information (continued)
COMPARATIVE EXPENSES. The Trustees also evaluated expense comparison data for the Funds previously provided in May 2009. At that meeting, DMC had provided the Board with information on pricing levels and fee structures for the Funds and comparative funds. The Trustees focused on the comparative analysis of the effective management fees and total expense ratios of each Fund versus the effective management fees and expense ratios of a group of funds selected by Lipper as being similar to each Fund (the “Expense Group”). In reviewing comparative costs, each Fund’s contractual management fee and the actual management fee incurred by the Fund were compared with the contractual management fees (assuming all funds in the Expense Group were similar in size to the Fund) and actual management fees (as reported by each fund) of other funds within the Expense Group, taking into account any applicable breakpoints and fee limitations. Each Fund’s total expenses were also compared with those of its Expense Group. The Trustees also considered fees paid to Delaware Investments for nonmanagement services. At the September 3, 2009 meeting, DMC advised the Board that the more recent comparative expenses for the Funds remained consistent with the previous review in May 2009 and, consequently, the Trustees concluded that expenses of the Funds were satisfactory.
The Board also considered the Expense Agreement under negotiation in evaluating Fund expenses. The Trustees expected that the Expense Agreement would provide that LNC and Macquarie Group would pay or reimburse the Trusts for all reasonable out-of-pocket costs and expenses in connection with the Transaction and the consideration of the New Investment Advisory Agreements (subject to certain limited exceptions).
Based on information provided by DMC and Macquarie Group, the Board concluded that neither the Transaction nor the New Investment Advisory Agreements likely would have an adverse effect on the Funds’ expenses because (i) each Fund’s contractual fee rates under the New Investment Advisory Agreement would remain the same; (ii) under the Expense Agreement, the Funds would be reimbursed for all reasonable out-of-pocket costs and expenses in connection with the Transaction and the related proxy solicitation (subject to certain limited exceptions); and (iii) the expense ratios of certain Funds might decline as a result of the possible increased investment in Delaware Investments by Macquarie Group, as discussed below under “Economies of Scale.”
MANAGEMENT PROFITABILITY. At their meeting on September 3, 2009, the Board evaluated DMC’s profitability in connection with the operation of the Funds. The Board had previously considered DMC’s profitability in connection with the operation of the Funds at its May 2009 meeting. At that meeting, the Board reviewed an analysis that addressed the overall profitability of Delaware Investments’ business in providing management and other services to each of the Funds and the Delaware Investments Family of Funds as a whole. Specific attention was given to the methodology followed in allocating costs for the purpose of determining profitability.
At the May 2009 meeting, representatives of DMC had stated that the level of profits of DMC, to a certain extent, reflect operational cost savings and efficiencies initiated by Delaware Investments (including DMC and its affiliates that provide services to the Funds). The Board considered Delaware Investments’ efforts to improve services provided to Fund shareholders and to meet additional regulatory and compliance requirements resulting from recent industry-wide U.S. Securities and Exchange Commission initiatives. At that meeting, the Board found that the management fees were reasonable in light of the services rendered and the level of profitability of DMC. At the September 3, 2009 meeting, DMC advised the Board that DMC did not expect the Transaction to affect materially the profitability of Delaware Investments compared to the level of profitability considered during the May 2009 review. Moreover, the Trustees reviewed pro forma balance sheets of certain key companies in Delaware Investments as of June 30, 2009 (which were provided by Macquarie Group and DMC in response to the Trustees’ requests) and evaluated the projections of Delaware Investments’ capitalization following the Transaction for purposes of evaluating the financial ability of Delaware Investments to continue to provide the nature, extent, and quality of services as it had under the Current Investment Advisory Agreement.
Based on information provided by DMC and Macquarie Group, the Board concluded that DMC and Delaware Investments would be sufficiently capitalized following the Transaction to continue the same level and quality of services to the Funds under the New Investment Advisory Agreements as was the case under the Current Investment Advisory Agreements. The Board also concluded that Macquarie Group had sufficient financial strength and resources, as well as an ongoing commitment to a global asset management business, to continue investing in Delaware Investments, including DMC, to the extent that Macquarie Group determined it was appropriate. Finally, because services and costs were expected to be substantially the same (and DMC had represented that, correspondingly, profitability would be about the same), under the New Investment Advisory Agreements as under the Current Investment Advisory Agreements, the Trustees concluded that the profitability of Delaware Investments would not result in an inequitable charge on the Funds or their shareholders. Accordingly, the Board concluded that the fees charged under the New Investment Advisory Agreements would be reasonable in light of the services to be provided and the expected profitability of DMC.
ECONOMIES OF SCALE. The Trustees considered whether economies of scale would be realized by Delaware Investments as each Fund’s assets increase and the extent to which any economies of scale would be reflected in the management fees charged. The Trustees took into account DMC’s practice of maintaining the competitive nature of management fees based on its analysis of fees charged by comparable funds. DMC management believed, and the Board agreed, that the Funds were priced with breakpoints and relatively low management fees to reflect potential economies of scale to Fund shareholders.
The Board also acknowledged Macquarie Group’s statement that the Transaction would not by itself immediately provide additional economies of scale given Macquarie Group’s limited presence in the U.S. mutual fund market. Nonetheless, the Trustees concluded that additional economies of scale could potentially be achieved in the future if DMC were owned by Macquarie Group as a result of Macquarie Group’s willingness to invest further in Delaware Investments if appropriate opportunities arise. The Board further concluded that potential economies of scale could be achieved as a result of Delaware Investments’ expanded distribution capabilities arising from the Transaction, as well as opportunities that might arise from Macquarie Group’s global asset management business.
Emerging Markets Series-21
Delaware VIP® Emerging Markets Series
Other Series Information (continued)
FALL-OUT BENEFITS. The Board acknowledged that DMC would continue to benefit from soft dollar arrangements using portfolio brokerage of each Fund that invests in equity securities and that DMC’s profitability would likely be somewhat lower without the benefit of practices with respect to allocating Fund portfolio brokerage for brokerage and research services. The Board also considered that Macquarie Group and Delaware Investments may derive reputational, strategic, and other benefits from their association with the Delaware Investments Family of Funds, including service relationships with DMC, DSC, and Delaware Distributors, L.P., and evaluated the extent to which Delaware Investments might derive ancillary benefits from Fund operations, including the potential for procuring additional business as a result of the prestige and visibility associated with its role as service provider to the Delaware Investments Family of Funds and the benefits from allocation of Fund brokerage to improve trading efficiencies. However, the Board concluded that (i) any such benefits under the New Investment Advisory Agreements would not be dissimilar from those existing under the Current Investment Advisory Agreements, (ii) such benefits did not impose a cost or burden on the Funds or their shareholders, and (iii) such benefits would probably have an indirectly beneficial effect on the Funds and their shareholders because of the added importance that DMC and Macquarie Group might attach to the Funds as a result of the fall-out benefits that the Funds conveyed.
BOARD REVIEW OF MACQUARIE GROUP. The Trustees reviewed detailed information supplied by Macquarie Group about its operations as well as other information regarding Macquarie Group provided by independent legal counsel to the independent Trustees. Based on this review, the Trustees concluded that Delaware Investments would continue to have the financial ability to maintain the high quality of services required by the Funds. The Trustees noted that there would be a limited transition period during which some services previously provided by LNC to Delaware Investments would continue to be provided by LNC after the Closing, and concluded that this arrangement would help minimize disruption in Delaware Investments’ provision of services to the Funds following the Transaction.
The Board considered Macquarie Group’s support for Delaware Investments’ plans for Fund distribution by transferring wholesalers from Lincoln Financial Distributors, Inc., LNC’s retail distributor, to Delaware Investments, and Macquarie Group’s current intention to leave the Funds’ other service providers in place. The Board also considered Macquarie Group’s current strategic plans to increase its asset management activities, one of its core businesses, particularly in North America, and its statement that its acquisition of DMC is an important component of this strategic growth and the establishment of a significant presence in the United States. Based in part on the information provided by DMC and Macquarie Group, the Board concluded that Macquarie Group’s acquisition of Delaware Investments could potentially enhance the nature, quality, and extent of services provided to the Funds and their shareholders.
CONCLUSION. The Board concluded that the advisory fee rate under each New Investment Advisory Agreement was reasonable in relation to the services provided and that execution of the New Investment Advisory Agreement would be in the best interests of the shareholders. For each Fund, the Trustees noted that they had concluded in their most recent advisory agreement continuance considerations in May 2009 that the management fees and total expense ratios were at acceptable levels in light of the quality of services provided to the Funds and in comparison to those of the Funds’ respective peer groups; that the advisory fee schedule would not be increased and would stay the same for all of the Funds; that the total expense ratio had not changed materially since that determination; and that DMC had represented that the overall expenses for each Fund were not expected to be adversely affected by the Transaction. The Trustees also noted, with respect to the Funds that currently had the benefit of voluntary fee limitations, that Macquarie Group had no present intention to cause DMC to alter any voluntary expense limitations or reimbursements currently in effect. On that basis, the Trustees concluded that the total expense ratios and proposed advisory fees for the Funds anticipated to result from the Transaction were acceptable. In approving each New Investment Advisory Agreement, the Board stated that it anticipated reviewing the continuance of the New Investment Advisory Agreement in advance of the expiration of the initial two-year period.
Emerging Markets Series-22
Delaware Investments® Family of Funds
BOARD OF TRUSTEES/DIRECTORS AND OFFICERS ADDENDUM
A mutual fund is governed by a Board of Trustees/Directors (“Trustees”), which has oversight responsibility for the management of a fund’s business affairs. Trustees establish procedures and oversee and review the performance of the investment manager, the distributor, and others who perform services for the fund. The independent fund trustees, in particular, are advocates for shareholder interests. Each trustee has served in that capacity since he or she was elected to or appointed to the Board of Trustees, and will continue to serve until his or her retirement or the election of a new trustee in his or her place. The following is a list of the Trustees and Officers with certain background and related information.
| | | | Number of | Other |
| | | Principal | Portfolios in Fund | Directorships |
| Name, | Position(s) | | Occupation(s) | Complex Overseen | Held by |
| Address, | Held with | Length of Time | During | by Trustee | Trustee |
| and Birth Date | Fund(s) | Served | Past 5 Years | or Officer | or Officer |
| INTERESTED TRUSTEES | | | | | |
| Patrick P. Coyne1 | Chairman, | Chairman and Trustee | Patrick P. Coyne has served in | 81 | Director — |
| 2005 Market Street | President, | since August 16, 2006 | various executive capacities | | Kaydon Corp. |
| Philadelphia, PA | Chief Executive | | at different times at | | |
| 19103 | Officer, and | President and | Delaware Investments.2 | | |
| Trustee | Chief Executive Officer | | | |
| April 1963 | | since August 1, 2006 | | | |
| | | | | | |
| INDEPENDENT TRUSTEES | | | | | |
| Thomas L. Bennett | Trustee | Since | Private Investor — | 81 | Director — |
| 2005 Market Street | | March 2005 | (March 2004–Present) | | Bryn Mawr |
| Philadelphia, PA | | | | | Bank Corp. (BMTC) |
| 19103 | | | Investment Manager — | | (April 2007–Present) |
| | | | Morgan Stanley & Co. | | |
| October 1947 | | | (January 1984–March 2004) | | |
| John A. Fry | Trustee | Since | President — | 81 | Director — |
| 2005 Market Street | | January 2001 | Franklin & Marshall College | | Community Health |
| Philadelphia, PA | | | (June 2002–Present) | | Systems |
| 19103 | | | | | |
| | | | Executive Vice President — | | |
| May 1960 | | | University of Pennsylvania | | |
| | | | (April 1995–June 2002) | | |
| Anthony D. Knerr | Trustee | Since | Founder and Managing Director — | 81 | None |
| 2005 Market Street | | April 1990 | Anthony Knerr & Associates | | |
| Philadelphia, PA | | | (Strategic Consulting) | | |
| 19103 | | | (1990–Present) | | |
| |
| December 1938 | | | | | |
| Lucinda S. Landreth | Trustee | Since | Chief Investment Officer — | 81 | None |
| 2005 Market Street | | March 2005 | Assurant, Inc. | | |
| Philadelphia, PA | | | (Insurance) | | |
| 19103 | | | (2002–2004) | | |
| |
| June 1947 | | | | | |
| Ann R. Leven | Trustee | Since | Consultant — | 81 | None |
| 2005 Market Street | | October 1989 | ARL Associates | | |
| Philadelphia, PA | | | (Financial Planning) | | |
| 19103 | | | (1983–Present) | | |
| |
| November 1940 | | | | | |
Emerging Markets Series-23
| | | | Number of | Other |
| | | Principal | Portfolios in Fund | Directorships |
| Name, | Position(s) | | Occupation(s) | Complex Overseen | Held by |
| Address, | Held with | Length of Time | During | by Trustee | Trustee |
| and Birth Date | Fund(s) | Served | Past 5 Years | or Officer | or Officer |
| INDEPENDENT TRUSTEES (CONTINUED) | | | | |
| Thomas F. Madison | Trustee | Since | President and Chief | 81 | Director and Chair of |
| 2005 Market Street | | May 19973 | Executive Officer — | | Compensation |
| Philadelphia, PA | | | MLM Partners, Inc. | | Committee, |
| 19103 | | | (Small Business Investing | | Governance Committee |
| | | and Consulting) | | Member |
| February 1936 | | | (January 1993–Present) | | — CenterPoint Energy |
| |
| | | | | Lead Director and Chair |
| | | | | of Audit |
| | | | | and Governance |
| | | | | Committees, |
| | | | | Member of |
| | | | | Compensation |
| | | | | Committee — Digital |
| | | | | River, Inc. |
| |
| | | | | Director and Chair of |
| | | | | Governance |
| | | | | Committee, Audit |
| | | | | Committee Member — |
| | | | | Rimage Corporation |
| |
| | | | | Director and Chair of |
| | | | | Compensation |
| | | | | Committee — Spanlink |
| | | | | Communications |
| |
| | | | | Lead Director and Chair |
| | | | | of Compensation and |
| | | | | Governance |
| | | | | Committees — |
| | | | | Valmont Industries, Inc. |
| Janet L. Yeomans | Trustee | Since | Vice President and Treasurer | 81 | None |
| 2005 Market Street | | April 1999 | (January 2006–Present) | | |
| Philadelphia, PA | | | Vice President — Mergers & Acquisitions | | |
| 19103 | | | (January 2003–January 2006), and | | |
| | | Vice President | | |
| July 1948 | | | (July 1995–January 2003) | | |
| | | 3M Corporation | | |
| J. Richard Zecher | Trustee | Since | Founder — | 81 | Director and Audit |
| 2005 Market Street | | March 2005 | Investor Analytics | | Committee Member — |
| Philadelphia, PA | | | (Risk Management) | | Investor Analytics |
| 19103 | | | (May 1999–Present) | | |
| |
| July 1940 | | | Founder — | | |
| | | Sutton Asset Management | | |
| | | (Hedge Fund) | | |
| | | (September 1996–Present) | | |
Emerging Markets Series-24
| | | | | Number of | Other |
| | | Principal | Portfolios in Fund | Directorships |
| Name, | Position(s) | | Occupation(s) | Complex Overseen | Held by |
| Address, | Held with | Length of Time | During | by Trustee | Trustee |
| and Birth Date | Fund(s) | Served | Past 5 Years | or Officer | or Officer |
| OFFICERS | | | | | |
| David F. Connor | Vice President, | Vice President since | David F. Connor has served as | 81 | None4 |
| 2005 Market Street | Deputy General | September 2000 | Vice President and Deputy | | |
| Philadelphia, PA | Counsel, and Secretary | and Secretary | General Counsel of | | |
| 19103 | | since | Delaware Investments | | |
| | October 2005 | since 2000. | | |
| December 1963 | | | | | |
| Daniel V. Geatens | Vice President | Treasurer | Daniel V. Geatens has served | 81 | None4 |
| 2005 Market Street | and Treasurer | since | in various capacities at | | |
| Philadelphia, PA | | October 25, 2007 | different times at | | |
| 19103 | | | Delaware Investments. | | |
| |
| October 1972 | | | | | |
| David P. O’Connor | Senior Vice | Senior Vice President, | David P. O’Connor has served in | 81 | None4 |
| 2005 Market Street | President, | General Counsel, and | various executive and legal | | |
| Philadelphia, PA | General Counsel, | Chief Legal Officer | capacities at different times | | |
| 19103 | and Chief | since | at Delaware Investments. | | |
| Legal Officer | October 2005 | | | |
| February 1966 | | | | | |
| Richard Salus | Senior | Chief Financial | Richard Salus has served in | 81 | None4 |
| 2005 Market Street | Vice President | Officer since | various executive capacities | | |
| Philadelphia, PA | and | November 2006 | at different times at | | |
| 19103 | Chief Financial | | Delaware Investments. | | |
| Officer | | | | |
| October 1963 | | | | | |
1 Patrick P. Coyne is considered to be an “Interested Trustee” because he is an executive officer of the Fund’s(s’) investment advisor.
2 Delaware Investments is the marketing name for Delaware Management Holdings, Inc. and its subsidiaries, including the Fund’s(s’) investment advisor, principal underwriter, and its transfer agent.
3 In 1997, several funds managed by Voyageur Fund Managers, Inc. (the “Voyageur Funds”) were incorporated into the Delaware Investments Family of Funds. Mr. Madison served as a director of the Voyageur Funds from 1993 until 1997.
4 David F. Connor, Daniel V. Geatens, David P. O’Connor, and Richard Salus serve in similar capacities for the six portfolios of the Optimum Fund Trust, which have the same investment advisor, principal underwriter, and transfer agent as the registrant.
The Statement of Additional Information for the Fund(s) includes additional information about the Trustees and Officers and is available, without charge, upon request by calling 800 523-1918.
| PO14857 AR-VIPEM [12/09] DG3 2/10 (5427) | Emerging Markets Series-25 |
| Delaware VIP® Trust |
| Delaware VIP Growth Opportunities Series |
| |
| |
| |
| |
| |
| |
| Annual Report |
| |
| |
| December 31, 2009 |
| |
| |
| |
| |
| |
| |
| |
| |
| |
| |
| |
| |
| |
| |
| |
|
Table of contents
| > Portfolio management review | 1 |
| | |
| > Performance summary | 1 |
| | |
| > Disclosure of Series expenses | 3 |
| | |
| > Sector allocation and top 10 holdings | 4 |
| | |
| > Statement of net assets | 5 |
| | |
| > Statement of operations | 7 |
| | |
| > Statements of changes in net assets | 7 |
| | |
| > Financial highlights | 8 |
| | |
| > Notes to financial statements | 10 |
| | |
| > Report of independent registered public accounting firm | 15 |
| | |
| > Other Series information | 16 |
| | |
| > Board of trustees/directors and officers addendum | 20 |
On January 4, 2010, Delaware Management Holdings, Inc., and its subsidiaries (collectively known by the marketing name of Delaware Investments) were sold by a subsidiary of Lincoln National Corporation to Macquarie Group Limited, a global provider of banking, financial, advisory, investment and funds management services. Please see your Series’ prospectus and any supplements thereto for more complete information.
Investments in Delaware VIP® Growth Opportunities Series are not and will not be deposits with or liabilities of Macquarie Bank Limited ABN 46 008 583 542 and its holding companies, including subsidiaries or related companies, and are subject to investment risk, including possible delays in repayment and loss of income and capital invested. No Macquarie Group company guarantees or will guarantee the performance of the Series, the repayment of capital from the Series, or any particular rate of return.
Unless otherwise noted, views expressed herein are current as of Dec. 31, 2009, and are subject to change.
Funds are not FDIC insured and are not guaranteed. It is possible to lose the principal amount invested.
Mutual fund advisory services provided by Delaware Management Company, a series of Delaware Management Business Trust, which is a registered investment advisor. Delaware Investments is the marketing name of Delaware Management Holdings, Inc. and its subsidiaries. Macquarie Group refers to Macquarie Group Limited and its subsidiaries and affiliates worldwide.
© 2010 Delaware Management Holdings, Inc.
All third-party trademarks cited are the property of their respective owners.
| Delaware VIP® Trust — Delaware VIP Growth Opportunities Series | |
| Portfolio management review | Jan. 12, 2010 |
For the 12-month period ended Dec. 31, 2009, the Delaware VIP Growth Opportunities Series Standard Class shares returned +45.41%, while Service Class shares returned +45.12% (both figures reflect returns with dividends reinvested). The Series’ benchmark, the Russell Midcap® Growth Index, returned +46.29%.
From December 2008 until early March 2009, the financial crisis continued to worsen, pushing the U.S. economy deeper into recession. The U.S. Congress and the Federal Reserve undertook an extraordinary set of actions to shore up the economy. Congress passed a monumental fiscal stimulus package while the Federal Reserve launched a range of unconventional programs, alongside its employment of more traditional means of monetary stimulus, such as dropping the target for the fed funds rate down to virtually zero.
During this time, investors’ risk aversion grew. Many investors fled the equity market for the relative comfort of U.S. government securities. The S&P 500 Index, a measure of the broad stock market, dropped to its lowest level in more than a decade. (Source: Bloomberg.)
The stock market hit its low point for the year in early March. From this point, stocks (as measured by the S&P 500 Index) recorded several consecutive months of gains, as investors grew increasingly confident that the financial crisis had been successfully contained. At first, the rally focused on what we viewed as riskier segments of the equity market, such as the financial and industrials sectors, as investors sought securities with higher potential returns. But by the end of the fiscal year, the rally had reached almost every corner of the market.
The Series was conservatively positioned throughout the fiscal year. We believe this stance added value, especially during the first half when equity prices declined. Although strong stock selection in the basic industry/capital goods and consumer services sectors aided performance compared to the benchmark, it could not offset the negative effect of poor stock selection in the financials and technology sectors.
During the fiscal period, we maintained our focus on companies that we believed had the potential to deliver comparatively strong results. Urban Outfitters, one of the Series’ top contributors, was the type of company our investment process favored during the period. The stock rose after the company reported better-than-expected earnings and sales trends. We retained this position because of the company’s long-term growth potential.
Unfortunately, a position in IMS Health detracted from performance. IMS collects prescription data in the United States and Europe on behalf of clients in the pharmaceutical and insurance industries. The company experienced a drop in sales primarily because of regulatory changes in Europe. Cost-cutting measures by pharmaceutical companies also slowed business. For these reasons we sold our position during the fiscal period.
At period end, the market’s general assessment seemed to be that the economy was on the mend, as evidenced by tightening credit spreads and improving housing and industrial production data. An accommodative Fed and high cash balances generally make for favorable investment conditions, in our opinion, although there was also the potential for this to be offset by renewed fears of inflation, a reversal of recent economic gains, and possible legislative actions thought to be detrimental to business. In this environment, we remained committed to seeking out those companies we believed had the potential to generate strong relative growth in earnings and revenues.
| Unless otherwise noted, the views expressed are current as of Dec. 31, 2009, and are subject to change. |
Performance summary
The performance data quoted below represent past performance; past performance does not guarantee future results. Investment return and principal value will fluctuate so your shares, when redeemed, may be worth more or less than their original cost. Please obtain the performance data for the most recent month end by calling the number noted in the introductory section of this report on the page related to this Series.
You should consider the investment objectives, risks, charges, and expenses of the Series carefully before investing. The Delaware VIP Growth Opportunities Series prospectus contains this and other important information about the Series. To obtain a prospectus, contact the company noted on the page related to this Series in the introductory section of this report, either by phone or through the company Web site. We advise you to read the prospectus carefully before you invest or send money.
| Delaware VIP Growth Opportunities Series | | | | | | | | | | |
| Average annual total returns | | | | | | | | | | |
| For periods ended Dec. 31, 2009 | | 1 year | | 3 years | | 5 years | | 10 years | | Lifetime |
Standard Class shares (commenced
operations on July 12, 1991) | | +45.41% | | -0.79% | | +2.96% | | +0.60% | | +8.13% |
Service Class shares (commenced operations on May 1, 2000) | | +45.12% | | -1.02% | | +2.72% | | n/a | | -0.28% |
Returns reflect the reinvestment of all distributions.
Growth Opportunities Series-1
Delaware VIP® Growth Opportunities Series (continued)
As described in the Series’ most recent prospectus, the net expense ratio for Service Class shares of the Series was 1.22%, while total operating expenses for Standard Class and Service Class shares were 0.97% and 1.27%, respectively. The management fee for Standard Class and Service Class shares was 0.75%.
The Series’ distributor has contracted to limit the 12b-1 fees for Service Class shares to no more than 0.25% of average daily net assets through April 30, 2010.
Earnings from a variable annuity or variable life investment compound tax-free until withdrawal, and as a result, no adjustments were made for income taxes.
Expense limitations were in effect for both classes during certain periods shown in the Series performance chart on the previous page and in the Performance of a $10,000 Investment chart below.
Performance of Service Class shares will vary due to different charges and expenses.
Performance data do not reflect insurance fees related to a variable annuity or variable life investment or the deferred sales charge that would apply to certain withdrawals of investments. Performance shown here would have been reduced if such fees were included or the expense limitation removed. For more information about fees, consult your variable annuity or variable life prospectus.
Investments in variable products involve risk. Prices of growth companies’ securities may be more volatile than any other securities, particular over the short term. The Series will be affected primarily by changes in stock prices. Investments in small and/or medium-sized companies typically exhibit greater risk and higher volatility than larger, more established companies.
Instances of high double-digit returns are unusual, cannot be sustained, and were primarily achieved during favorable market conditions.
Please read both the contract and underlying prospectus for specific details regarding the product’s risk profile.
The chart shows a $10,000 investment in the Delaware VIP Growth Opportunities Series Standard Class shares for the period from Dec. 31, 1999, through Dec. 31, 2009.
The chart also shows $10,000 invested in the Russell Midcap Growth Index for the period from Dec. 31, 1999, through Dec. 31, 2009. The Russell Midcap Growth Index measures the performance of the mid-cap growth segment of the U.S. equity universe. It includes those Russell Midcap Index companies with higher price-to-book ratios and higher forecasted growth values.
Index performance returns do not reflect any management fees, transaction costs or expenses. Indices are unmanaged and one cannot invest directly in an index.
Performance of Service Class shares will vary due to different charges and expenses.
Past performance is not a guarantee of future results.
Growth Opportunities Series-2
Delaware VIP® Trust — Delaware VIP Growth Opportunities Series
Disclosure of Series Expenses
For the Period July 1, 2009 to December 31, 2009
As a shareholder of the Series, you incur ongoing costs, including management fees; distribution and/or service (12b-1) fees; and other Series expenses. This Example is intended to help you understand your ongoing costs (in dollars) of investing in the Series and to compare these costs with the ongoing costs of investing in other mutual funds.
The Example is based on an investment of $1,000 invested at the beginning of the period and held for the entire period from July 1, 2009 to December 31, 2009.
Actual Expenses
The first section of the table shown, “Actual Series Return,” provides information about actual account values and actual expenses. You may use the information in this section of the table, together with the amount you invested, to estimate the expenses that you paid over the period. Simply divide your account value by $1,000 (for example, an $8,600 account value divided by $1,000 = 8.6), then multiply the result by the number in the first section under the heading entitled “Expenses Paid During Period” to estimate the expenses you paid on your account during the period.
Hypothetical Example for Comparison Purposes
The second section of the table shown, “Hypothetical 5% Return,” provides information about hypothetical account values and hypothetical expenses based on the Series’ actual expense ratio and an assumed rate of return of 5% per year before expenses, which is not the Series’ actual return. The hypothetical account values and expenses may not be used to estimate the actual ending account balance or expenses you paid for the period. You may use this information to compare the ongoing costs of investing in the Series and other funds. To do so, compare the 5% hypothetical example with the 5% hypothetical examples that appear in the shareholder reports of other funds.
Please note that the expenses shown in the table are meant to highlight your ongoing costs only. As a shareholder of the Series, you do not incur any transaction costs, such as sales charges (loads), redemption fees or exchange fees, but shareholders of other funds may incur such costs. Also, the fees related to the variable annuity investment or the deferred sales charge that could apply have not been included. Therefore, the second section of the table is useful in comparing ongoing costs only, and will not help you determine the relative total costs of owning different funds. The Series’ actual expenses shown in the table reflect fee waivers in effect for Service Class shares. The expenses shown in the table assume reinvestment of all dividends and distributions.
Expense Analysis of an Investment of $1,000
| | | | | | | | Expenses |
| | Beginning | | Ending | | | | Paid During |
| | Account | | Account | | Annualized | | Period |
| | Value | | Value | | Expense | | 7/1/09 to |
| | 7/1/09 | | 12/31/09 | | Ratios | | 12/31/09* |
| Actual Series Return | | | | | | | | | | | | |
| Standard Class | | $ | 1,000.00 | | $ | 1,255.80 | | 1.11% | | $ | 6.31 | |
| Service Class | | | 1,000.00 | | | 1,254.50 | | 1.36% | | | 7.73 | |
| Hypothetical 5% Return (5% return before expenses) | | | | |
| Standard Class | | $ | 1,000.00 | | $ | 1,019.61 | | 1.11% | | $ | 5.65 | |
| Service Class | | | 1,000.00 | | | 1,018.40 | | 1.36% | | | 6.92 | |
| | | | | | | | | | | | | |
*“Expenses Paid During Period” are equal to the Series’ annualized expense ratio, multiplied by the average account value over the period, multiplied by 184/365 (to reflect the one-half year period).
Growth Opportunities Series-3
Delaware VIP® Trust — Delaware VIP Growth Opportunities Series
Sector Allocation and Top 10 Holdings
As of December 31, 2009
Sector designations may be different than the sector designations presented in other Series materials. The sector designations may represent the investment manager’s internal sector classifications, which may result in the sector designations for one series being different than another series’ sector designations.
| Percentage |
| Sector | of Net Assets |
| Common Stock | 98.49 | % |
| Basic Industry/Capital Goods | 8.96 | % |
| Business Services | 8.39 | % |
| Consumer Durables | 1.53 | % |
| Consumer Non-Durables | 16.56 | % |
| Consumer Services | 2.32 | % |
| Energy | 7.88 | % |
| Financials | 6.82 | % |
| Health Care | 20.55 | % |
| Technology | 21.83 | % |
| Transportation | 1.86 | % |
| Utilities | 1.79 | % |
| Securities Lending Collateral | 10.21 | % |
| Total Value of Securities | 108.70 | % |
| Obligation to Return Securities Lending Collateral | (10.54 | %) |
| Receivables and Other Assets Net of Liabilities | 1.84 | % |
| Total Net Assets | 100.00 | % |
| | | |
Holdings are for informational purposes only and are subject to change at any time. They are not a recommendation to buy, sell, or hold any security.
| Percentage |
| Top 10 Holdings | of Net Assets |
| Urban Outfitters | 3.17 | % |
| Cardinal Health | 3.07 | % |
| Dollar Tree | 2.68 | % |
| Aetna | 2.35 | % |
| Cephalon | 2.26 | % |
| CareFusion | 2.12 | % |
| Boston Scientific | 2.10 | % |
| Stryker | 2.09 | % |
| Amazon.com | 2.01 | % |
| Akamai Technologies | 1.90 | % |
| | | |
Growth Opportunities Series-4
Delaware VIP® Trust — Delaware VIP Growth Opportunities Series
Statement of Net Assets
December 31, 2009
| Number of | | |
| Shares | | Value |
| COMMON STOCK–98.49% | | | | | |
| Basic Industry/Capital Goods–8.96% | | | | | |
| †Agrium | | 7,700 | | $ | 473,550 |
| Cliffs Natural Resources | | 5,400 | | | 248,886 |
| Flowserve | | 4,200 | | | 397,026 |
| Joy Global | | 9,000 | | | 464,310 |
| †Mettler-Toledo International | | 1,500 | | | 157,485 |
| †Quanta Services | | 14,600 | | | 304,264 |
| Roper Industries | | 9,100 | | | 476,567 |
| | | | | | 2,522,088 |
| Business Services–8.39% | | | | | |
| †Corrections Corporation of America | | 17,700 | | | 434,535 |
| Dun & Bradstreet | | 4,300 | | | 362,791 |
| †Fiserv | | 5,600 | | | 271,488 |
| Global Payments | | 9,400 | | | 506,284 |
| †Hewitt Associates Class A | | 11,700 | | | 494,442 |
| †Iron Mountain | | 12,900 | | | 293,604 |
| | | | | | 2,363,144 |
| Consumer Durables–1.53% | | | | | |
| †LKQ | | 22,000 | | | 430,980 |
| | | | | | 430,980 |
| Consumer Non-Durables–16.56% | | | | | |
| †Amazon.com | | 4,200 | | | 564,984 |
| American Eagle Outfitters | | 24,100 | | | 409,218 |
| †Chico’s FAS | | 27,900 | | | 391,995 |
| Coach | | 13,800 | | | 504,114 |
| †Dollar Tree | | 15,600 | | | 753,480 |
| †GameStop Class A | | 12,500 | | | 274,250 |
| Gap | | 21,700 | | | 454,615 |
| *†Rue21 | | 5,300 | | | 148,877 |
| †Urban Outfitters | | 25,500 | | | 892,245 |
| Williams-Sonoma | | 13,000 | | | 270,140 |
| | | | | | 4,663,918 |
| Consumer Services–2.32% | | | | | |
| †Bally Technologies | | 6,800 | | | 280,772 |
| *Host Hotels & Resorts | | 18,891 | | | 220,459 |
| *†Wynn Resorts | | 2,600 | | | 151,398 |
| | | | | | 652,629 |
| Energy–7.88% | | | | | |
| Chesapeake Energy | | 13,400 | | | 346,792 |
| Core Laboratories | | 3,697 | | | 436,690 |
| *Diamond Offshore Drilling | | 3,500 | | | 344,470 |
| *†First Solar | | 1,800 | | | 243,720 |
| National Oilwell Varco | | 7,600 | | | 335,084 |
| Noble Energy | | 7,200 | | | 512,784 |
| | | | | | 2,219,540 |
| Financials–6.82% | | | | | |
| †Affiliated Managers Group | | 4,100 | | | 276,135 |
| Aon | | 6,000 | | | 230,040 |
| †Artio Global Investors | | 10,300 | | | 262,547 |
| Federated Investors Class B | | 9,300 | | | 255,750 |
| Hanover Insurance Group | | 6,200 | | | 275,466 |
| †IntercontinentalExchange | | 2,900 | | | 325,670 |
| People’s United Financial | | 17,600 | | | 293,920 |
| | | | | | 1,919,528 |
| Health Care–20.55% | | | | | |
| *†@Abraxis BioScience | | 2,600 | | | 105,430 |
| Aetna | | 20,900 | | | 662,530 |
| †Affymax | | 10,000 | | | 247,400 |
| †Biogen Idec | | 8,900 | | | 476,150 |
| †Boston Scientific | | 65,800 | | | 592,200 |
| Cardinal Health | | 26,800 | | | 864,032 |
| †CareFusion | | 23,900 | | | 597,739 |
| †Cephalon | | 10,200 | | | 636,582 |
| †Charles River Laboratories International | | 13,800 | | | 464,922 |
| *†Savient Pharmaceuticals | | 23,500 | | | 319,835 |
| †Stericycle | | 4,200 | | | 231,714 |
| Stryker | | 11,700 | | | 589,329 |
| | | | | | 5,787,863 |
| Technology–21.83% | | | | | |
| †Activision Blizzard | | 30,100 | | | 334,411 |
| *†Akamai Technologies | | 21,100 | | | 534,462 |
| †American Tower Class A | | 9,100 | | | 393,211 |
| ASML Holding | | 12,221 | | | 416,614 |
| †Avago Technologies | | 15,600 | | | 285,324 |
| †Citrix Systems | | 12,200 | | | 507,642 |
| †CommScope | | 18,700 | | | 496,111 |
| †F5 Networks | | 7,000 | | | 370,860 |
| †Lam Research | | 11,300 | | | 443,073 |
| †LSI | | 82,400 | | | 495,224 |
| †Nuance Communications | | 32,000 | | | 497,280 |
| †Red Hat | | 9,400 | | | 290,460 |
| †Riverbed Technology | | 17,600 | | | 404,272 |
| *†Sybase | | 10,700 | | | 464,380 |
| †Teradyne | | 20,000 | | | 214,600 |
| | | | | | 6,147,924 |
| Transportation–1.86% | | | | | |
| *Hunt (J.B.) Transport Services | | 16,200 | | | 522,774 |
| | | | | | 522,774 |
| Utilities–1.79% | | | | | |
| ITC Holdings | | 9,700 | | | 505,273 |
| | | | | | 505,273 |
| Total Common Stock | | | | | |
| (cost $21,337,068) | | | | | 27,735,661 |
| |
| Total Value of Securities Before | | | | | |
| Securities Lending Collateral–98.49% | | | | | |
| (cost $21,337,068) | | | | | 27,735,661 |
| |
| SECURITIES LENDING | | | | | |
| COLLATERAL**–10.21% | | | | | |
| Investment Companies | | | | | |
| Mellon GSL DBT II | | | | | |
| Collateral Fund | | 1,723,635 | | | 1,723,635 |
| BNY Mellon SL DBT II | | | | | |
| Liquidating Fund | | 1,159,895 | | | 1,146,556 |
| †@Mellon GSL Reinvestment Trust II | | 83,589 | | | 3,553 |
| Total Securities Lending Collateral | | | | | |
| (cost $2,967,119) | | | | | 2,873,744 |
| | | | | | |
Growth Opportunities Series-5
Delaware VIP® Growth Opportunities Series
Statement of Net Assets (continued)
| TOTAL VALUE OF SECURITIES–108.70% (cost $24,304,187) | $ | 30,609,405 | © |
| OBLIGATION TO RETURN SECURITIES LENDING COLLATERAL**– (10.54%) | | (2,967,119 | ) |
| RECEIVABLES AND OTHER ASSETS NET OF LIABILITIES–1.84% | | 518,400 | |
| NET ASSETS APPLICABLE TO 1,739,093 SHARES OUTSTANDING–100.00% | $ | 28,160,686 | |
NET ASSET VALUE–DELAWARE VIP GROWTH OPPORTUNITIES SERIES
STANDARD CLASS ($20,207,698 / 1,239,521 Shares) | | | $16.30 | |
NET ASSET VALUE–DELAWARE VIP GROWTH OPPORTUNITIES SERIES
SERVICE CLASS ($7,952,988 / 499,572 Shares) | | | $15.92 | |
| COMPONENTS OF NET ASSETS AT DECEMBER 31, 2009: | | | | |
| Shares of beneficial interest (unlimited authorization–no par) | $ | 26,839,946 | |
| Accumulated net realized loss on investments | | (4,984,478 | ) |
| Net unrealized appreciation of investments | | 6,305,218 | |
| Total net assets | $ | 28,160,686 | |
| ____________________ | | | |
| † | Non income producing security. |
| * | Fully or partially on loan. |
| ** | See Note 8 in “Notes to financial statements.” |
| @ | Illiquid security. At December 31, 2009, the aggregate amount of illiquid securities was $108,983 which represented 0.39% of the Series’ net assets. See Note 9 in “Notes to Financial Statements.” |
| © | Includes $2,881,031 of securities loaned. |
See accompanying notes
Growth Opportunities Series-6
Delaware VIP® Trust —
Delaware VIP Growth Opportunities Series
Statement of Operations
Year Ended December 31, 2009
| INVESTMENT INCOME: | | | |
| Dividends | $ | 192,205 | |
| Interest | | 373 | |
| Securities lending income | | 20,920 | |
| Foreign tax withheld | | (1,141 | ) |
| | | 212,357 | |
| |
| EXPENSES: | | | |
| Management fees | | 178,332 | |
| Legal fees | | 22,283 | |
| Distribution expenses – Service Class | | 20,200 | |
| Reports and statements to shareholders | | 13,524 | |
| Dividend disbursing and transfer agent fees and expenses | | 13,064 | |
| Audit and tax | | 11,695 | |
| Accounting and administration expenses | | 9,511 | |
| Dues and services | | 1,791 | |
| Trustees’ fees | | 1,532 | |
| Custodian fees | | 698 | |
| Insurance fees | | 641 | |
| Pricing fees | | 439 | |
| Consulting fees | | 323 | |
| Trustees’ expenses | | 111 | |
| Registration fees | | 54 | |
| | | 274,198 | |
| Less waiver of distribution expenses – Service Class | | (3,369 | ) |
| Total operating expenses | | 270,829 | |
| |
| NET INVESTMENT LOSS | | (58,472 | ) |
| |
| NET REALIZED AND UNREALIZED GAIN (LOSS) | | | |
| ON INVESTMENTS: | | | |
| Net realized loss on investments | | (1,570,591 | ) |
| Net change in unrealized appreciation/depreciation | | | |
| of investments | | 10,567,944 | |
| |
| NET REALIZED AND UNREALIZED GAIN | | | |
| ON INVESTMENTS | | 8,997,353 | |
| |
| NET INCREASE IN NET ASSETS RESULTING | | | |
| FROM OPERATIONS | $ | 8,938,881 | |
| | | | |
See accompanying notes
Delaware VIP Trust —
Delaware VIP Growth Opportunities Series
Statements of Changes in Net Assets
| | | Year Ended |
| | | 12/31/09 | | 12/31/08 |
| INCREASE (DECREASE) IN NET | | | | | | | | |
| ASSETS FROM OPERATIONS: | | | | | | | | |
| Net investment loss | | $ | (58,472 | ) | | $ | (120,469 | ) |
| Net realized loss on investments | | | (1,570,591 | ) | | | (3,286,557 | ) |
| Net change in unrealized appreciation/ | | | | | | | | |
| depreciation of investments | | | 10,567,944 | | | | (12,581,485 | ) |
| Net increase (decrease) in net assets | | | | | | | | |
| resulting from operations | | | 8,938,881 | | | | (15,988,511 | ) |
| |
| DIVIDENDS AND DISTRIBUTIONS | | | | | | | | |
| TO SHAREHOLDERS FROM: | | | | | | | | |
| Net realized gain on investments: | | | | | | | | |
| Standard Class | | | – | | | | (3,036,756 | ) |
| Service Class | | | – | | | | (1,194,551 | ) |
| | | | – | | | | (4,231,307 | ) |
| |
| CAPITAL SHARE TRANSACTIONS: | | | | | | | | |
| Proceeds from shares sold: | | | | | | | | |
| Standard Class | | | 2,089,940 | | | | 1,098,723 | |
| Service Class | | | 1,155,903 | | | | 1,374,874 | |
| Net asset value of shares issued upon | | | | | | | | |
| reinvestment of dividends and distributions: | | | | | | | | |
| Standard Class | | | – | | | | 3,036,756 | |
| Service Class | | | – | | | | 1,194,551 | |
| | | | 3,245,843 | | | | 6,704,904 | |
| Cost of shares repurchased: | | | | | | | | |
| Standard Class | | | (3,452,812 | ) | | | (6,341,841 | ) |
| Service Class | | | (1,846,366 | ) | | | (2,884,740 | ) |
| | | | (5,299,178 | ) | | | (9,226,581 | ) |
| Decrease in net assets derived from capital | | | | | | | | |
| share transactions | | | (2,053,335 | ) | | | (2,521,677 | ) |
| |
| NET INCREASE (DECREASE) | | | | | | | | |
| IN NET ASSETS | | | 6,885,546 | | | | (22,741,495 | ) |
| |
| NET ASSETS: | | | | | | | | |
| Beginning of year | | | 21,275,140 | | | | 44,016,635 | |
| End of year (there was no undistributed | | | | | | | | |
| net investment income at either year end) | | $ | 28,160,686 | | | $ | 21,275,140 | |
| | | | | | | | | |
See accompanying notes
Growth Opportunities Series-7
Delaware VIP® Trust — Delaware VIP Growth Opportunities Series
Financial Highlights
Selected data for each share of the Series outstanding throughout each period were as follows:
| Delaware VIP Growth Opportunities Series Standard Class |
| Year Ended |
| | 12/31/09 | | 12/31/08 | | 12/31/07 | | 12/31/06 | | 12/31/05 | |
| Net asset value, beginning of period | | $11.210 | | $21.360 | | $18.910 | | $17.780 | | $15.960 | |
| |
| Income (loss) from investment operations: | | | | | | | | | | | |
| Net investment loss1 | | (0.023 | ) | (0.047 | ) | (0.050 | ) | (0.021 | ) | (0.056 | ) |
| Net realized and unrealized gain (loss) on investments | | 5.113 | | (7.975 | ) | 2.500 | | 1.151 | | 1.876 | |
| Total from investment operations | | 5.090 | | (8.022 | ) | 2.450 | | 1.130 | | 1.820 | |
| |
| Less dividends and distributions from: | | | | | | | | | | | |
| Net realized gain on investments | | – | | (2.128 | ) | – | | – | | – | |
| Total dividends and distributions | | – | | (2.128 | ) | – | | – | | – | |
| |
| Net asset value, end of period | | $16.300 | | $11.210 | | $21.360 | | $18.910 | | $17.780 | |
| |
| Total return2 | | 45.41% | | (40.55% | ) | 12.96% | | 6.36% | | 11.40% | |
| |
| Ratios and supplemental data: | | | | | | | | | | | |
| Net assets, end of period (000 omitted) | | $20,208 | | $15,173 | | $31,945 | | $38,859 | | $46,000 | |
| Ratio of expenses to average net assets | | 1.07% | | 0.97% | | 0.90% | | 0.91% | | 0.90% | |
| Ratio of net investment loss to average net assets | | (0.18% | ) | (0.29% | ) | (0.24% | ) | (0.11% | ) | (0.35% | ) |
| Portfolio turnover | | 95% | | 101% | | 91% | | 67% | | 75% | |
| 1The average shares outstanding method has been applied for per share information. |
| 2Total investment return is based on the change in net asset value of a share during the period and assumes reinvestment of dividends and distributions at net asset value. |
See accompanying notes
Growth Opportunities Series-8
Delaware VIP® Growth Opportunities Series
Financial Highlights (continued)
Selected data for each share of the Series outstanding throughout each period were as follows:
| Delaware VIP Growth Opportunities Series Service Class |
| Year Ended |
| | 12/31/09 | | 12/31/08 | | 12/31/07 | | 12/31/06 | | 12/31/05 | |
| Net asset value, beginning of period | | $10.970 | | $21.010 | | $18.640 | | $17.580 | | $15.810 | |
| |
| Income (loss) from investment operations: | | | | | | | | | | | |
| Net investment loss1 | | (0.056 | ) | (0.087 | ) | (0.101 | ) | (0.066 | ) | (0.096 | ) |
| Net realized and unrealized gain (loss) on investments | | 5.006 | | (7.825 | ) | 2.471 | | 1.126 | | 1.866 | |
| Total from investment operations | | 4.950 | | (7.912 | ) | 2.370 | | 1.060 | | 1.770 | |
| |
| Less dividends and distributions from: | | | | | | | | | | | |
| Net realized gain on investments | | – | | (2.128 | ) | – | | – | | – | |
| Total dividends and distributions | | – | | (2.128 | ) | – | | – | | – | |
| |
| Net asset value, end of period | | $15.920 | | $10.970 | | $21.010 | | $18.640 | | $17.580 | |
| |
| Total return2 | | 45.12% | | (40.71% | ) | 12.71% | | 6.03% | | 11.20% | |
| |
| Ratios and supplemental data: | | | | | | | | | | | |
| Net assets, end of period (000 omitted) | | $7,953 | | $6,102 | | $12,072 | | $12,196 | | $14,048 | |
| Ratio of expenses to average net assets | | 1.32% | | 1.22% | | 1.15% | | 1.16% | | 1.15% | |
| Ratio of expenses to average net assets | | | | | | | | | | | |
| prior to fees waived and expenses paid indirectly | | 1.37% | | 1.27% | | 1.20% | | 1.21% | | 1.20% | |
| Ratio of net investment loss to average net assets | | (0.43% | ) | (0.54% | ) | (0.49% | ) | (0.36% | ) | (0.60% | ) |
| Ratio of net investment loss to average net assets | | | | | | | | | | | |
| prior to fees waived and expenses paid indirectly | | (0.48% | ) | (0.59% | ) | (0.54% | ) | (0.41% | ) | (0.65% | ) |
| Portfolio turnover | | 95% | | 101% | | 91% | | 67% | | 75% | |
____________________
| 1The average shares outstanding method has been applied for per share information. |
| 2Total investment return is based on the change in net asset value of a share during the period and assumes reinvestment of dividends and distributions at net asset value. Total investment return during all of the periods shown reflects a waiver by the distributor. Performance would have been lower had the waiver not been in effect. |
See accompanying notes
Growth Opportunities Series-9
Delaware VIP® Trust — Delaware VIP Growth Opportunities Series
Notes to Financial Statements
December 31, 2009
Delaware VIP Trust (Trust) is organized as a Delaware statutory trust and offers 12 series: Delaware VIP Cash Reserve Series, Delaware VIP Diversified Income Series, Delaware VIP Emerging Markets Series, Delaware VIP Growth Opportunities Series, Delaware VIP High Yield Series, Delaware VIP International Value Equity Series, Delaware VIP Limited-Term Diversified Income Series (formerly, Delaware VIP Capital Reserves Series), Delaware VIP REIT Series, Delaware VIP Small Cap Value Series, Delaware VIP Trend Series, Delaware VIP U.S. Growth Series and Delaware VIP Value Series. These financial statements and the related notes pertain to Delaware VIP Growth Opportunities Series (Series). The Trust is an open-end investment company. The Series is considered diversified under the Investment Company Act of 1940, as amended, and offers Standard Class and Service Class shares. The Standard Class shares do not carry a 12b-1 fee and the Service Class shares carry a 12b-1 fee. The shares of the Series are sold only to separate accounts of life insurance companies.
The investment objective of the Series is to seek long-term capital appreciation.
1. Significant Accounting Policies
The following accounting policies are in accordance with U.S. generally accepted accounting principles (U.S. GAAP) and are consistently followed by the Series.
Security Valuation—Equity securities, except those traded on the Nasdaq Stock Market, Inc. (Nasdaq), are valued at the last quoted sales price as of the time of the regular close of the New York Stock Exchange (NYSE) on the valuation date. Securities traded on the Nasdaq are valued in accordance with the Nasdaq Official Closing Price, which may not be the last sales price. If on a particular day an equity security does not trade, then the mean between the bid and ask prices will be used. Short-term debt securities are valued at market value. Investment companies are valued at net asset value per share. Generally, other securities and assets for which market quotations are not readily available are valued at fair value as determined in good faith under the direction of the Series’ Board of Trustees (Board). In determining whether market quotations are readily available or fair valuation will be used, various factors will be taken into consideration, such as market closures or suspension of trading in a security. The Series may use fair value pricing more frequently for securities traded primarily in non-U.S. markets because, among other things, most foreign markets close well before the Series values its securities at 4:00 p.m. Eastern time. The earlier close of these foreign markets gives rise to the possibility that significant events, including broad market moves, government actions or pronouncements, aftermarket trading, or news events may have occurred in the interim. To account for this, the Series may frequently value foreign securities using fair value prices based on third-party vendor modeling tools (international fair value pricing).
Federal Income Taxes—No provision for federal income taxes has been made as the Series intends to continue to qualify for federal income tax purposes as a regulated investment company under Subchapter M of the Internal Revenue Code of 1986, as amended, and make the requisite distributions to shareholders. The Series evaluates tax positions taken or expected to be taken in the course of preparing the Series’ tax returns to determine whether the tax positions are “more-likely-than-not” of being sustained by the applicable tax authority. Tax positions not deemed to meet the more-likely-than-not threshold are recorded as a tax benefit or expense in the current year. Management has analyzed the Series’ tax positions taken on federal income tax returns for all open tax years (tax years ended December 31, 2006 – December 31, 2009), and has concluded that no provision for federal income tax is required in the Series’ financial statements.
Class Accounting—Investment income, common expenses and realized and unrealized gain (loss) on investments are allocated to the classes of the Series on the basis of daily net assets of each class. Distribution expenses relating to a specific class are charged directly to that class.
Repurchase Agreements—The Series may invest in a pooled cash account along with other members of the Delaware Investments® Family of Funds pursuant to an exemptive order issued by the Securities and Exchange Commission. The aggregate daily balance of the pooled cash account is invested in repurchase agreements secured by obligations of the U.S. government. The respective collateral is held by the Series’ custodian bank until the maturity of the respective repurchase agreements. Each repurchase agreement is at least 102% collateralized. However, in the event of default or bankruptcy by the counterparty to the agreement, realization of the collateral may be subject to legal proceedings. At December 31, 2009, the Series held no investments in repurchase agreements.
Use of Estimates—The preparation of financial statements in conformity with U.S. GAAP requires management to make estimates and assumptions that affect the reported amounts of assets and liabilities at the date of the financial statements and the reported amounts of revenues and expenses during the reporting period. Actual results could differ from those estimates.
Other—Expenses directly attributable to the Series are charged directly to the Series. Other expenses common to various funds within the Delaware Investments Family of Funds are generally allocated amongst such funds on the basis of average net assets. Management fees and some other expenses are paid monthly. Security transactions are recorded on the date the securities are purchased or sold (trade date) for financial reporting purposes. Costs used in calculating realized gains and losses on the sale of investment securities are those of the specific securities sold. Dividend income is recorded on the ex-dividend date and interest income is recorded on the accrual basis. The Series declares and pays dividends from net investment income and distributions from net realized gain on investments, if any, following the close of the fiscal year.
Subject to seeking best execution, the Series may direct certain security trades to brokers who have agreed to rebate a portion of the related brokerage commission to the Series in cash. In general, best execution refers to many factors, including the price paid or received for a security, the commission charged, the promptness and reliability of execution, the confidentiality and placement accorded the order, and other factors affecting the overall benefit obtained by the Series on the transaction. There were no commission rebates during the year ended December 31, 2009.
The Series may receive earnings credits from its custodian when positive cash balances are maintained, which are used to offset custody fees. There were no earnings credits for the year ended December 31, 2009.
Growth Opportunities Series-10
Delaware VIP® Growth Opportunities Series
Notes to Financial Statements (continued)
1. Significant Accounting Policies (continued)
On July 1, 2009, the Financial Accounting Standards Board (FASB) issued the FASB Accounting Standards Codification (Codification). The Codification became the single source of authoritative nongovernmental U.S. GAAP, superseding existing literature of the FASB, American Institute of Certified Public Accountants, Emerging Issues Task Force and other sources. The Codification is effective for interim and annual periods ending after September 15, 2009. The Series adopted the Codification for the year ended December 31, 2009. There was no impact to financial statements as the Codification requirements are disclosure-only in nature.
Management has evaluated whether any events or transactions occurred subsequent to December 31, 2009 through February 17, 2010, the date of issuance of the Series’ financial statements, and determined that there were no material events or transactions that would require recognition or disclosure in the Series’ financial statements.
2. Investment Management, Administration Agreements and Other Transactions with Affiliates
In accordance with the terms of its investment management agreement, the Series pays Delaware Management Company (DMC), a series of Delaware Management Business Trust and the investment manager, an annual fee which is calculated daily at the rate of 0.75% on the first $500 million of average daily net assets of the Series, 0.70% on the next $500 million, 0.65% on the next $1.5 billion, and 0.60% on average daily net assets in excess of $2.5 billion.
Delaware Service Company, Inc. (DSC), an affiliate of DMC, provides fund accounting and financial administration oversight services to the Series. For these services, the Series pays DSC fees based on the aggregate daily net assets of the Delaware Investments® Family of Funds at the following annual rate: 0.0050% of the first $30 billion; 0.0045% of the next $10 billion; 0.0040% of the next $10 billion; and 0.0025% of aggregate average daily net assets in excess of $50 billion. The fees payable to DSC under the service agreement described above are allocated among all funds in the Delaware Investments Family of Funds on a relative net asset value basis. For the year ended December 31, 2009, the Series was charged $1,189 for these services.
DSC also provides dividend disbursing and transfer agency services. The Series pays DSC a monthly fee based on the number of shareholder accounts for dividend disbursing and transfer agent services.
Pursuant to a distribution agreement and distribution plan, the Series pays Delaware Distributors, L.P. (DDLP), the distributor and an affiliate of DMC, an annual distribution and service fee not to exceed 0.30% of the average daily net assets of the Service Class shares. DDLP has contracted to waive distribution and service fees through April 30, 2010 in order to prevent distribution and service fees of the Service Class shares from exceeding 0.25% of average daily net assets. Standard Class shares pay no distribution and service expenses.
At December 31, 2009, the Series had liabilities payable to affiliates as follows:
| | | | Dividend Disbursing, | | | | Other |
| | Investment | | Transfer Agent and Fund | | | | Expenses |
| | Management | | Accounting Oversight | | Distribution | | Payable |
| | Fee Payable to | | Fees and Other Expenses | | Fee Payable | | to DMC |
| | DMC | | Payable to DSC | | to DDLP | | and Affiliates* |
| | $17,599 | | $297 | | $1,640 | | $557 |
____________________
*DMC, as part of its administrative services, pays operating expenses on behalf of the Series and is reimbursed on a periodic basis. Such expenses include items such as printing of shareholder reports, fees for audit, legal and tax services, custodian fees and trustees’ fees.
As provided in the investment management agreement, the Series bears the cost of certain legal and tax services, including internal legal and tax services provided to the Series by DMC and/or its affiliates’ employees. For the year ended December 31, 2009, the Series was charged $1,990 for internal legal and tax services provided by DMC and/or its affiliates’ employees.
Trustees’ fees include expenses accrued by the Series for each Trustee’s retainer and meeting fees. Certain officers of DMC, DSC and DDLP are officers and/or Trustees of the Trust. These officers and Trustees are paid no compensation by the Series.
3. Investments
For the year ended December 31, 2009, the Series made purchases and sales of investment securities other than short-term investments as follows:
| Purchases | $22,107,249 |
| Sales | 24,181,156 |
Growth Opportunities Series-11
Delaware VIP® Growth Opportunities Series
Notes to Financial Statements (continued)
3. Investments (continued)
At December 31, 2009, the cost of investments and unrealized appreciation (depreciation) for federal income tax purposes for the Series were as follows:
| | | | Aggregate | | Aggregate | | Net |
| Cost of | | Unrealized | | Unrealized | | Unrealized |
| Investments | | Appreciation | | Depreciation | | Appreciation |
| $24,499,252 | | $6,492,802 | | $(382,649) | | $6,110,153 |
U.S. GAAP defines fair value as the price that the Series would receive to sell an asset or pay to transfer a liability in an orderly transaction between market participants at the measurement date under current market conditions. A framework for measuring fair value and a three level hierarchy for fair value measurements has been established based upon the transparency of inputs to the valuation of an asset or liability. Inputs may be observable or unobservable and refer broadly to the assumptions that market participants would use in pricing the asset or liability. Observable inputs reflect the assumptions market participants would use in pricing the asset or liability based on market data obtained from sources independent of the reporting entity. Unobservable inputs reflect the reporting entity’s own assumptions about the assumptions that market participants would use in pricing the asset or liability developed based on the best information available under the circumstances. The Series’ investment in its entirety is assigned a level based upon the observability of the inputs which are significant to the overall valuation. The three-tier hierarchy of inputs is summarized below.
Level 1 – inputs are quoted prices in active markets
Level 2 – inputs are observable, directly or indirectly
Level 3 – inputs are unobservable and reflect assumptions on the part of the reporting entity
The following table summarizes the valuation of the Series’ investments by the fair value hierarchy levels as of December 31, 2009:
| Level 1 | | Level 2 | | Level 3 | | Total |
| Common Stock | $ | 27,735,661 | | $ | – | | $ | – | | $ | 27,735,661 |
| Securities Lending Collateral | | 1,723,635 | | | 1,146,556 | | | 3,553 | | | 2,873,744 |
| Total | $ | 29,459,296 | | $ | 1,146,556 | | $ | 3,553 | | $ | 30,609,405 |
| | | | | | | | | | | | |
The following is a reconciliation of investments in which significant unobservable inputs (Level 3) were used in determining fair value:
| Securities |
| Lending |
| Collateral |
| Balance as of 12/31/08 | | $ | 2,758 | |
| Net change in unrealized appreciation/depreciation | | | 795 | |
| Balance as of 12/31/09 | | $ | 3,553 | |
| | | | | |
| Net change in unrealized | | | | |
| appreciation/depreciation from | | | | |
| investments still held as of 12/31/09 | | $ | 795 | |
In January 2010, the Financial Accounting Standards Board issued an Accounting Standards Update, Improving Disclosures about Fair Value Measurements, which introduces new disclosure requirements and clarifies certain existing disclosure requirements around fair value measurements currently presented above. The new disclosures and clarifications of existing disclosures are generally effective for the Series’ year ending December 31, 2010 and interim periods therein. Management is evaluating the impact of this update on its current disclosures.
4. Dividend and Distribution Information
Income and long-term capital gain distributions are determined in accordance with federal income tax regulations, which may differ from U.S. GAAP. Additionally, distributions from net short-term gains on sales of investment securities are treated as ordinary income for federal income tax purposes. There were no dividends and distributions paid during the year ended December 31, 2009. The tax character of dividends and distributions paid during the year ended December 31, 2008 was as follows:
| | Year |
| | Ended |
| | 12/31/08 |
| Long-term capital gain | | $4,231,307 |
Growth Opportunities Series-12
Delaware VIP® Growth Opportunities Series
Notes to Financial Statements (continued)
5. Components of Net Assets on a Tax Basis
As of December 31, 2009, the components of net assets on a tax basis were as follows:
| Shares of beneficial interest | $ | 26,839,946 | |
| Capital loss carryforwards | | (4,789,413 | ) |
| Unrealized appreciation of investments | | 6,110,153 | |
| Net assets | $ | 28,160,686 | |
| | | | |
The differences between book basis and tax basis components of net assets are primarily attributable to tax deferral of losses on wash sales.
For financial reporting purposes, capital accounts are adjusted to reflect the tax character of permanent book/tax differences. Reclassifications are primarily due to tax treatment of net operating losses. Results of operations and net assets were not affected by these reclassifications. For the year ended December 31, 2009, the Series recorded the following reclassifications:
| Accumulated | | |
| Net Investment | | Paid-in |
| | Loss | | Capital |
| | $58,472 | | $(58,472) |
For federal income tax purposes, capital loss carryforwards may be carried forward and applied against future capital gains. Capital loss carryforwards remaining at December 31, 2009 will expire as follows: $1,717,628 expires in 2016 and $3,071,785 expires in 2017.
6. Capital Shares
Transactions in capital shares were as follows:
| | Year | | Year |
| | Ended | | Ended |
| | 12/31/09 | | 12/31/08 |
| Shares sold: | | | | | | |
| Standard Class | | 162,556 | | | 70,431 | |
| Service Class | | 88,648 | | | 90,473 | |
| |
| Shares issued upon reinvestment of dividends and distributions: | | | | | | |
| Standard Class | | – | | | 189,560 | |
| Service Class | | – | | | 76,038 | |
| | | 251,204 | | | 426,502 | |
| Shares repurchased: | | | | | | |
| Standard Class | | (276,681 | ) | | (402,049 | ) |
| Service Class | | (145,177 | ) | | (184,994 | ) |
| | | (421,858 | ) | | (587,043 | ) |
| Net decrease | | (170,654 | ) | | (160,541 | ) |
| | | | | | | |
7. Line of Credit
The Series, along with certain other funds in the Delaware Investments® Family of Funds (Participants), participates in a $35,000,000 revolving line of credit with The Bank of New York Mellon (BNY Mellon) to be used for temporary or emergency purposes as an additional source of liquidity to fund redemptions of investor shares. Under the agreement, Participants are charged an annual commitment fee, which is allocated across the Participants on the basis of each Participant’s allocation of the entire facility. The Participants may borrow up to a maximum of one third of their net assets under the agreement. The agreement expires on November 16, 2010. The Series had no amounts outstanding as of December 31, 2009, or at any time during the year then ended.
8. Securities Lending
The Series, along with other funds in the Delaware Investments Family of Funds, may lend its securities pursuant to a security lending agreement (Lending Agreement) with BNY Mellon. With respect to each loan, if the aggregate market value of securities collateral held plus cash collateral received on any business day is less than the aggregate market value of the securities which are the subject of such loan, the borrower will be notified to provide additional collateral not less than the applicable collateral requirements. Cash collateral received is generally invested in the Mellon GSL DBT II Collateral Fund (Collective Trust) established by BNY Mellon for the purpose of investment on behalf of clients participating in its securities lending programs. The Collective Trust may invest in fixed income securities, with a weighted average maturity not to exceed 90 days, rated in one of the top three tiers by Standard & Poor’s Ratings Group or Moody’s Investors Service, Inc. or repurchase agreements collateralized by such securities. The Collective Trust seeks to maintain a net asset value per unit of $1.00, but there can be no assurance that it will always be able to do so. At December 31, 2009, the Collective Trust held only cash and assets with a maturity of one business day or less (Cash/Overnight Assets). The Series may incur investment losses as a result of
Growth Opportunities Series-13
Delaware VIP® Growth Opportunities Series
Notes to Financial Statements (continued)
8. Securities Lending (continued)
investing securities lending collateral in the Collective Trust. This could occur if an investment in the Collective Trust defaulted or if it were necessary to liquidate assets in the Collective Trust to meet returns on outstanding security loans at a time when the Collective Trust’s net asset value per unit was less than $1.00. Under those circumstances, the Series may not receive an amount from the Collective Trust that is equal in amount to the collateral the Series would be required to return to the borrower of the securities and the Series would be required to make up for this shortfall. Effective April 20, 2009, BNY Mellon transferred the assets of the Collective Trust other than the Cash/Overnight Assets to the BNY Mellon SL DBT II Liquidating Fund (Liquidating Fund), effectively bifurcating the collateral investment pool. The Series’ exposure to the Liquidating Fund is expected to decrease as the Liquidating Fund’s assets mature or are sold. In October 2008, BNY Mellon transferred certain distressed securities from the Collective Trust into the Mellon GSL Reinvestment Trust II. The Series can also accept U.S. government securities and letters of credit (non-cash collateral) in connection with securities loans. In the event of default or bankruptcy by the lending agent, realization and/or retention of the collateral may be subject to legal proceedings. In the event the borrower fails to return loaned securities and the collateral received is insufficient to cover the value of the loaned securities and provided such collateral shortfall is not the result of investment losses, the lending agent has agreed to pay the amount of the shortfall to the Series, or at the discretion of the lending agent, replace the loaned securities. The Series continues to record dividends or interest, as applicable, on the securities loaned and is subject to change in value of the securities loaned that may occur during the term of the loan. The Series has the right under the Lending Agreement to recover the securities from the borrower on demand. With respect to security loans collateralized by non-cash collateral, the Series receives loan premiums paid by the borrower. With respect to security loans collateralized by cash collateral, the earnings from the collateral investments are shared among the Series, the security lending agent and the borrower. The Series records security lending income net of allocations to the security lending agent and the borrower.
At December 31, 2009, the value of the securities on loan was $2,881,031 for which cash collateral was received and invested in accordance with the Lending Agreement. At December 31, 2009, the value of invested collateral was $2,873,744. Such investments are presented on the Statement of Net Assets under the caption “Securities Lending Collateral.”
9. Credit and Market Risk
The Series invests a significant portion of its assets in small- and mid-sized companies and may be subject to certain risks associated with ownership of securities of such companies. Investments in small- or mid-sized companies may be more volatile than investments in larger companies for a number of reasons, which include more limited financial resources or a dependence on narrow product lines.
The Series may invest up to 10% of its net assets in illiquid securities, which may include securities with contractual restrictions on resale, securities exempt from registration under Rule 144A of the Securities Act of 1933, as amended, and other securities which may not be readily marketable. The relative illiquidity of these securities may impair the Series from disposing of them in a timely manner and at a fair price when it is necessary or desirable to do so. While maintaining oversight, the Series’ Board has delegated to DMC the day-to-day functions of determining whether individual securities are liquid for purposes of the Series’ limitation on investments in illiquid assets. Securities eligible for resale pursuant to Rule 144A, which are determined to be liquid, are not subject to the Series’ 10% limit on investments in illiquid securities. As of December 31, 2009, there were no Rule 144A securities. Illiquid securities have been identified on the Statement of Net Assets.
10. Contractual Obligations
The Series enters into contracts in the normal course of business that contain a variety of indemnifications. The Series’ maximum exposure under these arrangements is unknown. However, the Series has not had prior claims or losses pursuant to these contracts. Management has reviewed the Series’ existing contracts and expects the risk of loss to be remote.
11. Sale of Delaware Investments to Macquarie Group
On August 18, 2009, Lincoln National Corporation (parent company of Delaware Investments) and Macquarie Group (Macquarie) entered into an agreement pursuant to which Delaware Investments, including DMC, DDLP and DSC, would be acquired by Macquarie, an Australia-based global provider of banking, financial, advisory, investment and funds management services (Transaction). The Transaction was completed on January 4, 2010. DMC, DDLP and DSC are now wholly-owned subsidiaries of Macquarie.
The Transaction resulted in a change of control of DMC which, in turn, caused the termination of the investment advisory agreement between DMC and the Series. On January 4, 2010, the new investment advisory agreement between DMC and the Series that was approved by the shareholders became effective.
Growth Opportunities Series-14
Delaware VIP® Trust — Delaware VIP Growth Opportunities Series
Report of Independent Registered Public Accounting Firm
To the Shareholders and Board of Trustees
Delaware VIP Trust–Delaware VIP Growth Opportunities Series
We have audited the accompanying statement of net assets of the Delaware VIP Growth Opportunities Series (one of the series constituting Delaware VIP Trust) (the “Series”) as of December 31, 2009, and the related statement of operations for the year then ended, the statements of changes in net assets for each of the two years in the period then ended, and the financial highlights for each of the five years in the period then ended. These financial statements and financial highlights are the responsibility of the Series’ management. Our responsibility is to express an opinion on these financial statements and financial highlights based on our audits.
We conducted our audits in accordance with the standards of the Public Company Accounting Oversight Board (United States). Those standards require that we plan and perform the audit to obtain reasonable assurance about whether the financial statements and financial highlights are free of material misstatement. We were not engaged to perform an audit of the Series’ internal control over financial reporting. Our audits included consideration of internal control over financial reporting as a basis for designing audit procedures that are appropriate in the circumstances, but not for the purpose of expressing an opinion on the effectiveness of the Series’ internal control over financial reporting. Accordingly, we express no such opinion. An audit also includes examining, on a test basis, evidence supporting the amounts and disclosures in the financial statements and financial highlights, assessing the accounting principles used and significant estimates made by management, and evaluating the overall financial statement presentation. Our procedures included confirmation of securities owned as of December 31, 2009, by correspondence with the custodian and brokers or by other appropriate auditing procedures where replies from brokers were not received. We believe that our audits provide a reasonable basis for our opinion.
In our opinion, the financial statements and financial highlights referred to above present fairly, in all material respects, the financial position of the Delaware VIP Growth Opportunities Series of Delaware VIP Trust at December 31, 2009, the results of its operations for the year then ended, the changes in its net assets for each of the two years in the period then ended, and its financial highlights for each of the five years in the period then ended, in conformity with U.S. generally accepted accounting principles.
Philadelphia, Pennsylvania
February 17, 2010
The Series files its complete schedule of portfolio holdings with the Securities and Exchange Commission (Commission) for the first and third quarters of each fiscal year on Form N-Q. The Series’ Forms N-Q, as well as a description of the policies and procedures that the Series uses to determine how to vote proxies (if any) relating to portfolio securities is available without charge (i) upon request, by calling 800 523-1918; and (ii) on the Commission’s website at http://www.sec.gov. In addition, a description of the policies and procedures that the Series uses to determine how to vote proxies (if any) relating to portfolio securities is available without charge on the Delaware Investments® Funds’ Web site at http://www.delawareinvestments.com. The Series’ Forms N-Q may be reviewed and copied at the Commission’s Public Reference Room in Washington, DC; information on the operation of the Public Reference Room may be obtained by calling 800 SEC-0330.
Information (if any) regarding how the Series voted proxies relating to portfolio securities during the most recently disclosed 12-month period ended June 30 is available without charge (i) through the Delaware Investments Funds’ Web site at http://www.delawareinvestments.com; and (ii) on the Commission’s website at http://www.sec.gov. |
Growth Opportunities Series-15
Delaware VIP® Trust — Delaware VIP Growth Opportunities Series
Other Series Information
Board Consideration of New Investment Advisory Agreement
At a meeting held on September 3, 2009 (the “Meeting”), the Board of Trustees of the Delaware Investments Family of Funds (the “Board”), including the independent Trustees, unanimously approved a new investment advisory agreement between each registrant on behalf of each series (each, a “Fund” and together, the “Funds”) and Delaware Management Company (“DMC”) in connection with the sale of Delaware Investments’ advisory business to Macquarie Bank Limited (the “Macquarie Group”) (the “Transaction”). In making its decision, the Board considered information furnished specifically in connection with the approval of the new investment advisory agreements with DMC (the “New Investment Advisory Agreements”) which included extensive materials about the Transaction and matters related to the proposed approvals. To assist the Board in considering the New Investment Advisory Agreements, Macquarie Group provided materials and information about Macquarie Group, including detailed written responses to the questions posed by the independent Trustees. DMC also provided materials and information about the Transaction, including detailed written responses to the questions posed by the independent Trustees.
At the Meeting, the Trustees discussed the Transaction with DMC management and with key Macquarie Group representatives. The Meeting included discussions of the strategic rationale for the Transaction and Macquarie Group’s general plans and intentions regarding the Funds and DMC. The Board members also inquired about the plans for, and anticipated roles and responsibilities of, key employees and officers of Delaware Management Holdings Inc. and DMC in connection with the Transaction.
In connection with the Trustees’ review of the New Investment Advisory Agreements for the Funds, DMC and/or Macquarie Group emphasized that:
They expected that there would be no adverse changes as a result of the Transaction, in the nature, quality, or extent of services currently provided to the Funds and their shareholders, including investment management, distribution, or other shareholder services.
No material changes in personnel or operations were contemplated in the operation of DMC under Macquarie Group as a result of the Transaction and no material changes were currently contemplated in connection with third party service providers to the Funds.
Macquarie Group had no intention to cause DMC to alter the voluntary expense waivers and reimbursements currently in effect for the Funds.
Under the agreement between Macquarie Group and Lincoln National Corporation (“LNC”) (the “Transaction Agreement”), Macquarie Group has agreed to conduct, and to cause its affiliates to conduct, their respective businesses in compliance with the conditions of Section 15(f) of the Investment Company Act of 1940 (the “1940 Act”) with respect to the Funds, to the extent within its control, including maintaining Board composition of at least 75% of the Board members qualifying as independent Trustees and not imposing any “unfair burden” on the Funds for at least two years from the closing of the Transaction (the “Closing”).
In addition to the information provided by DMC and Macquarie Group as described above, the Trustees also considered all other factors they believed to be relevant to evaluating the New Investment Advisory Agreements, including the specific matters discussed below. In their deliberations, the Trustees did not identify any particular information that was controlling, and different Trustees may have attributed different weights to the various factors. However, for each Fund, the Trustees determined that the overall arrangements between the Fund and DMC, as provided in the respective New Investment Advisory Agreement, including the proposed advisory fee and the related administration arrangements between the Fund and DMC, were fair and reasonable in light of the services to be performed, expenses incurred, and such other matters as the Trustees considered relevant. Factors evaluated included:
The potential for expanding distribution of Fund shares through access to Macquarie Group’s existing distribution channels;
Delaware Investments’ acquisition of an exclusive wholesaling sales force from a subsidiary of LNC;
The reputation, financial strength, and resources of Macquarie Group as well as its historic and ongoing commitment to the asset management business in Australia as well as other parts of the world;
The terms and conditions of the New Investment Advisory Agreements, including that each Fund’s total contractual fee rate under the New Investment Advisory Agreement will remain the same;
The Board’s full annual review (or initial approval) of the current investment advisory agreements at their in-person meeting in May 2009 as required by the 1940 Act and its determination that (i) DMC had the capabilities, resources, and personnel necessary to provide the satisfactory advisory and administrative services currently provided to each Fund and (ii) the advisory and/or management fees paid by each Fund, taking into account any applicable fee waivers and breakpoints,represented reasonable compensation to DMC in light of the services provided, the costs to DMC of providing those services, economies of scale, and the fees and other expenses paid by similar funds and such other matters that the Board considered relevant in the exercise of its reasonable judgment;
The portfolio management teams for the Funds are not currently expected to change as a result of the Transaction;
LNC and Macquarie Group were expected to execute a reimbursement agreement pursuant to which LNC and Macquarie Group would agree to pay (or reimburse) all reasonable out-of-pocket costs and expenses of the Funds in connection with the Board’s consideration of the Transaction, the New Investment Advisory Agreements and related agreements, and all costs related to the proxy solicitation (the “Expense Agreement”);
Growth Opportunities Series-16
Delaware VIP® Growth Opportunities Series
Other Series Information (continued)
The likelihood that Macquarie Group would invest additional amounts in Delaware Investments, including DMC, which could result in increased assets under management, which in turn would allow some Funds the potential opportunity to achieve economies of scale and lower fees payable by Fund shareholders; and
The compliance and regulatory history of Macquarie Group and its affiliates.
In making their decision relating to the approval of each Fund’s New Investment Advisory Agreement, the independent Trustees gave attention to all information furnished. The following discussion, however, identifies the primary factors taken into account by the Trustees and the conclusions reached in approving the New Investment Advisory Agreements.
NATURE, EXTENT, AND QUALITY OF SERVICE. The Trustees considered the services historically provided by DMC to the Funds and their shareholders. In reviewing the nature, extent, and quality of services, the Board considered that the New Investment Advisory Agreements would be substantially similar to the current investment advisory agreements between the Funds and DMC (the “Current Investment Advisory Agreements”), and they therefore, considered the many reports furnished to them throughout 2008 and 2009 at regular Board meetings covering matters such as: the relative performance of the Funds; the compliance of portfolio managers with the investment policies, strategies, and restrictions for the Funds; the compliance of management personnel with the code of ethics adopted throughout the Delaware Investments Family of Funds complex; and the adherence to fair value pricing procedures as established by the Board. The Trustees were pleased with the current staffing of DMC and the emphasis placed on research and risk management in the investment process. Favorable consideration was given to DMC’s efforts to maintain expenditures and, in some instances, increase financial and human resources committed to Fund matters.
The Board also considered the transfer agent and shareholder services that would continue to be provided to Fund shareholders by DMC’s affiliate, Delaware Service company, Inc. (“DSC”). The Trustees noted, in particular, DSC’s commitment to maintain a high level of service as well as DMC’s expenditures to improve the delivery of shareholder services. The Board was assured that shareholders would continue to receive the benefits provided to Fund shareholders by being part of the Delaware Investments Family of Funds, including each shareholder’s ability to exchange an investment in one Fund for the same class of shares in another Fund without a sales charge, to reinvest Fund dividends into additional shares of any of the Funds, and the privilege to combine holdings in other Funds to obtain a reduced sales charge.
Based on the information provided by DMC and Macquarie Group, including that Macquarie Group and DMC currently expected no material changes as a result of the Transaction in (i) personnel or operations of DMC or (ii) third party service providers to the Funds, the Board concluded that the satisfactory nature, extent, and quality of services currently provided to the Funds and their shareholders were very likely to continue under the New Investment Advisory Agreements. Moreover, the Board concluded that the Funds would probably benefit from the expanded distribution resources that would become available to Delaware Investments following the Transaction. The Board also concluded that it was very unlikely that any “unfair burden” would be imposed on any of the Funds for the first two years following the Closing as a result of the Transaction. Consequently, the Board concluded that it did not expect the Transaction to result in any adverse changes in the nature, quality, or extent of services (including investment management, distribution or other shareholder services) currently provided to the Funds and their shareholders.
INVESTMENT PERFORMANCE. The Board considered the overall investment performance of DMC and the Funds. The Trustees placed significant emphasis on the investment performance of the Funds in view of its importance to shareholders. Although the Trustees gave appropriate consideration to performance reports and discussions with portfolio managers at Board meetings throughout the year, the Trustees gave particular weight to their review of investment performance in connection with the approval of the Current Investment Advisory agreements at the Board meeting held in May 2009. At that meeting, the Trustees reviewed reports prepared by Lipper, Inc., an independent statistical compilation organization (“Lipper”), which showed each Fund’s investment performance as of December 31, 2008 in comparison to a group of funds selected by Lipper as being similar to the Fund (the “Performance Universe”). During the May 2009 agreement review process, the Trustees observed the significant improvements to relative investment performance of the Funds compared to the Funds’ performance as of December 31, 2007.
At their meeting on September 3, 2009, the Trustees, including the independent Trustees in consultation with their independent counsel, reviewed the investment performance of each Fund. The Trustees compared the performance of each Fund relative to that of its respective Performance Universe for the 1-, 3-, 5-, and 10-year periods ended June 30, 2009 and compared its relative investment performance against the corresponding relative investment performance of each Fund for such time periods ended December 31, 2008, to the extent applicable. As of June 30, 2009, 30 of the Funds had investment performance relative to that of the respective Performance Universe that was better than the corresponding relative investment performance at December 31, 2008 for all applicable time periods. At June 30, 2009, an additional 6 Funds had investment performance relative to that of their respective Performance Universe that was better than the corresponding relative investment performance at December 31, 2008 for a majority of the applicable time periods. At June 30, 2009, 15 additional Funds had investment performance relative to that of their respective Performance Universe that was better than the corresponding relative performance at December 31, 2008 and only 29 Funds had poorer relative investment performance at June 30, 2009 compared to that at December 31, 2008.
The Board therefore concluded that the investment performance of the Funds, on an aggregate basis, had continued to improve relative to their respective Performance Universe since the data reviewed at the May 2009 meeting. Based on information provided by DMC and Macquarie Group, the Board concluded that neither the Transaction nor the New Investment Advisory Agreement would likely have an adverse effect on the investment performance of any Fund because (i) DMC and Macquarie Group did not currently expect the Transaction to cause any material change to the Funds’ portfolio management teams responsible for investment performance, which the Board found to be satisfactory and improving; and (ii) as discussed in more detail below, the Funds’ expenses were not expected to increase as a result of the Transaction.
Growth Opportunities Series-17
Delaware VIP® Growth Opportunities Series
Other Series Information (continued)
COMPARATIVE EXPENSES. The Trustees also evaluated expense comparison data for the Funds previously provided in May 2009. At that meeting, DMC had provided the Board with information on pricing levels and fee structures for the Funds and comparative funds. The Trustees focused on the comparative analysis of the effective management fees and total expense ratios of each Fund versus the effective management fees and expense ratios of a group of funds selected by Lipper as being similar to each Fund (the “Expense Group”). In reviewing comparative costs, each Fund’s contractual management fee and the actual management fee incurred by the Fund were compared with the contractual management fees (assuming all funds in the Expense Group were similar in size to the Fund) and actual management fees (as reported by each fund) of other funds within the Expense Group, taking into account any applicable breakpoints and fee limitations. Each Fund’s total expenses were also compared with those of its Expense Group. The Trustees also considered fees paid to Delaware Investments for nonmanagement services. At the September 3, 2009 meeting, DMC advised the Board that the more recent comparative expenses for the Funds remained consistent with the previous review in May 2009 and, consequently, the Trustees concluded that expenses of the Funds were satisfactory.
The Board also considered the Expense Agreement under negotiation in evaluating Fund expenses. The Trustees expected that the Expense Agreement would provide that LNC and Macquarie Group would pay or reimburse the Trusts for all reasonable out-of-pocket costs and expenses in connection with the Transaction and the consideration of the New Investment Advisory Agreements (subject to certain limited exceptions).
Based on information provided by DMC and Macquarie Group, the Board concluded that neither the Transaction nor the New Investment Advisory Agreements likely would have an adverse effect on the Funds’ expenses because (i) each Fund’s contractual fee rates under the New Investment Advisory Agreement would remain the same; (ii) under the Expense Agreement, the Funds would be reimbursed for all reasonable out-of-pocket costs and expenses in connection with the Transaction and the related proxy solicitation (subject to certain limited exceptions); and (iii) the expense ratios of certain Funds might decline as a result of the possible increased investment in Delaware Investments by Macquarie Group, as discussed below under “Economies of Scale.”
MANAGEMENT PROFITABILITY. At their meeting on September 3, 2009, the Board evaluated DMC’s profitability in connection with the operation of the Funds. The Board had previously considered DMC’s profitability in connection with the operation of the Funds at its May 2009 meeting. At that meeting, the Board reviewed an analysis that addressed the overall profitability of Delaware Investments’ business in providing management and other services to each of the Funds and the Delaware Investments Family of Funds as a whole. Specific attention was given to the methodology followed in allocating costs for the purpose of determining profitability.
At the May 2009 meeting, representatives of DMC had stated that the level of profits of DMC, to a certain extent, reflect operational cost savings and efficiencies initiated by Delaware Investments (including DMC and its affiliates that provide services to the Funds). The Board considered Delaware Investments’ efforts to improve services provided to Fund shareholders and to meet additional regulatory and compliance requirements resulting from recent industry-wide U.S. Securities and Exchange Commission initiatives. At that meeting, the Board found that the management fees were reasonable in light of the services rendered and the level of profitability of DMC. At the September 3, 2009 meeting, DMC advised the Board that DMC did not expect the Transaction to affect materially the profitability of Delaware Investments compared to the level of profitability considered during the May 2009 review. Moreover, the Trustees reviewed pro forma balance sheets of certain key companies in Delaware Investments as of June 30, 2009 (which were provided by Macquarie Group and DMC in response to the Trustees’ requests) and evaluated the projections of Delaware Investments’ capitalization following the Transaction for purposes of evaluating the financial ability of Delaware Investments to continue to provide the nature, extent, and quality of services as it had under the Current Investment Advisory Agreement.
Based on information provided by DMC and Macquarie Group, the Board concluded that DMC and Delaware Investments would be sufficiently capitalized following the Transaction to continue the same level and quality of services to the Funds under the New Investment Advisory Agreements as was the case under the Current Investment Advisory Agreements. The Board also concluded that Macquarie Group had sufficient financial strength and resources, as well as an ongoing commitment to a global asset management business, to continue investing in Delaware Investments, including DMC, to the extent that Macquarie Group determined it was appropriate. Finally, because services and costs were expected to be substantially the same (and DMC had represented that, correspondingly, profitability would be about the same), under the New Investment Advisory Agreements as under the Current Investment Advisory Agreements, the Trustees concluded that the profitability of Delaware Investments would not result in an inequitable charge on the Funds or their shareholders. Accordingly, the Board concluded that the fees charged under the New Investment Advisory Agreements would be reasonable in light of the services to be provided and the expected profitability of DMC.
ECONOMIES OF SCALE. The Trustees considered whether economies of scale would be realized by Delaware Investments as each Fund’s assets increase and the extent to which any economies of scale would be reflected in the management fees charged. The Trustees took into account DMC’s practice of maintaining the competitive nature of management fees based on its analysis of fees charged by comparable funds. DMC management believed, and the Board agreed, that the Funds were priced with breakpoints and relatively low management fees to reflect potential economies of scale to Fund shareholders.
The Board also acknowledged Macquarie Group’s statement that the Transaction would not by itself immediately provide additional economies of scale given Macquarie Group’s limited presence in the U.S. mutual fund market. Nonetheless, the Trustees concluded that additional economies of scale could potentially be achieved in the future if DMC were owned by Macquarie Group as a result of Macquarie Group’s willingness to invest further in Delaware Investments if appropriate opportunities arise. The Board further concluded that potential economies of scale could be achieved as a result of Delaware Investments’ expanded distribution capabilities arising from the Transaction, as well as opportunities that might arise from Macquarie Group’s global asset management business.
Growth Opportunities Series-18
Delaware VIP® Growth Opportunities Series
Other Series Information (continued)
FALL-OUT BENEFITS. The Board acknowledged that DMC would continue to benefit from soft dollar arrangements using portfolio brokerage of each Fund that invests in equity securities and that DMC’s profitability would likely be somewhat lower without the benefit of practices with respect to allocating Fund portfolio brokerage for brokerage and research services. The Board also considered that Macquarie Group and Delaware Investments may derive reputational, strategic, and other benefits from their association with the Delaware Investments Family of Funds, including service relationships with DMC, DSC, and Delaware Distributors, L.P., and evaluated the extent to which Delaware Investments might derive ancillary benefits from Fund operations, including the potential for procuring additional business as a result of the prestige and visibility associated with its role as service provider to the Delaware Investments Family of Funds and the benefits from allocation of Fund brokerage to improve trading efficiencies. However, the Board concluded that (i) any such benefits under the New Investment Advisory Agreements would not be dissimilar from those existing under the Current Investment Advisory Agreements, (ii) such benefits did not impose a cost or burden on the Funds or their shareholders, and (iii) such benefits would probably have an indirectly beneficial effect on the Funds and their shareholders because of the added importance that DMC and Macquarie Group might attach to the Funds as a result of the fall-out benefits that the Funds conveyed.
BOARD REVIEW OF MACQUARIE GROUP. The Trustees reviewed detailed information supplied by Macquarie Group about its operations as well as other information regarding Macquarie Group provided by independent legal counsel to the independent Trustees. Based on this review, the Trustees concluded that Delaware Investments would continue to have the financial ability to maintain the high quality of services required by the Funds. The Trustees noted that there would be a limited transition period during which some services previously provided by LNC to Delaware Investments would continue to be provided by LNC after the Closing, and concluded that this arrangement would help minimize disruption in Delaware Investments’ provision of services to the Funds following the Transaction.
The Board considered Macquarie Group’s support for Delaware Investments’ plans for Fund distribution by transferring wholesalers from Lincoln Financial Distributors, Inc., LNC’s retail distributor, to Delaware Investments, and Macquarie Group’s current intention to leave the Funds’ other service providers in place. The Board also considered Macquarie Group’s current strategic plans to increase its asset management activities, one of its core businesses, particularly in North America, and its statement that its acquisition of DMC is an important component of this strategic growth and the establishment of a significant presence in the United States. Based in part on the information provided by DMC and Macquarie Group, the Board concluded that Macquarie Group’s acquisition of Delaware Investments could potentially enhance the nature, quality, and extent of services provided to the Funds and their shareholders.
CONCLUSION. The Board concluded that the advisory fee rate under each New Investment Advisory Agreement was reasonable in relation to the services provided and that execution of the New Investment Advisory Agreement would be in the best interests of the shareholders. For each Fund, the Trustees noted that they had concluded in their most recent advisory agreement continuance considerations in May 2009 that the management fees and total expense ratios were at acceptable levels in light of the quality of services provided to the Funds and in comparison to those of the Funds’ respective peer groups; that the advisory fee schedule would not be increased and would stay the same for all of the Funds; that the total expense ratio had not changed materially since that determination; and that DMC had represented that the overall expenses for each Fund were not expected to be adversely affected by the Transaction. The Trustees also noted, with respect to the Funds that currently had the benefit of voluntary fee limitations, that Macquarie Group had no present intention to cause DMC to alter any voluntary expense limitations or reimbursements currently in effect. On that basis, the Trustees concluded that the total expense ratios and proposed advisory fees for the Funds anticipated to result from the Transaction were acceptable. In approving each New Investment Advisory Agreement, the Board stated that it anticipated reviewing the continuance of the New Investment Advisory Agreement in advance of the expiration of the initial two-year period.
Growth Opportunities Series-19
Delaware Investments® Family of Funds
BOARD OF TRUSTEES/DIRECTORS AND OFFICERS ADDENDUM
A mutual fund is governed by a Board of Trustees/Directors (“Trustees”), which has oversight responsibility for the management of a fund’s business affairs. Trustees establish procedures and oversee and review the performance of the investment manager, the distributor, and others who perform services for the fund. The independent fund trustees, in particular, are advocates for shareholder interests. Each trustee has served in that capacity since he or she was elected to or appointed to the Board of Trustees, and will continue to serve until his or her retirement or the election of a new trustee in his or her place. The following is a list of the Trustees and Officers with certain background and related information.
| | | | Number of | Other |
| | | Principal | Portfolios in Fund | Directorships |
| Name, | Position(s) | | Occupation(s) | Complex Overseen | Held by |
| Address, | Held with | Length of Time | During | by Trustee | Trustee |
| and Birth Date | Fund(s) | Served | Past 5 Years | or Officer | or Officer |
| INTERESTED TRUSTEES | | | | | |
| Patrick P. Coyne1 | Chairman, | Chairman and Trustee | Patrick P. Coyne has served in | 81 | Director — |
| 2005 Market Street | President, | since August 16, 2006 | various executive capacities | | Kaydon Corp. |
| Philadelphia, PA | Chief Executive | | at different times at | | |
| 19103 | Officer, and | President and | Delaware Investments.2 | | |
| | Trustee | Chief Executive Officer | | | |
| April 1963 | | since August 1, 2006 | | | |
| | | | | | |
| INDEPENDENT TRUSTEES | | | | | |
| Thomas L. Bennett | Trustee | Since | Private Investor — | 81 | Director — |
| 2005 Market Street | | March 2005 | (March 2004–Present) | | Bryn Mawr |
| Philadelphia, PA | | | | | Bank Corp. (BMTC) |
| 19103 | | | Investment Manager — | | (April 2007–Present) |
| | | | Morgan Stanley & Co. | | |
| October 1947 | | | (January 1984–March 2004) | | |
| John A. Fry | Trustee | Since | President — | 81 | Director — |
| 2005 Market Street | | January 2001 | Franklin & Marshall College | | Community Health |
| Philadelphia, PA | | | (June 2002–Present) | | Systems |
| 19103 | | | | | |
| | | | Executive Vice President — | | |
| May 1960 | | | University of Pennsylvania | | |
| | | | (April 1995–June 2002) | | |
| Anthony D. Knerr | Trustee | Since | Founder and Managing Director — | 81 | None |
| 2005 Market Street | | April 1990 | Anthony Knerr & Associates | | |
| Philadelphia, PA | | | (Strategic Consulting) | | |
| 19103 | | | (1990–Present) | | |
| |
| December 1938 | | | | | |
| Lucinda S. Landreth | Trustee | Since | Chief Investment Officer — | 81 | None |
| 2005 Market Street | | March 2005 | Assurant, Inc. | | |
| Philadelphia, PA | | | (Insurance) | | |
| 19103 | | | (2002–2004) | | |
| |
| June 1947 | | | | | |
| Ann R. Leven | Trustee | Since | Consultant — | 81 | None |
| 2005 Market Street | | October 1989 | ARL Associates | | |
| Philadelphia, PA | | | (Financial Planning) | | |
| 19103 | | | (1983–Present) | | |
| |
| November 1940 | | | | | |
Growth Opportunities Series-20
| | | | Number of | Other |
| | | Principal | Portfolios in Fund | Directorships |
| Name, | Position(s) | | Occupation(s) | Complex Overseen | Held by |
| Address, | Held with | Length of Time | During | by Trustee | Trustee |
| and Birth Date | Fund(s) | Served | Past 5 Years | or Officer | or Officer |
| INDEPENDENT TRUSTEES (CONTINUED) | | | | |
| Thomas F. Madison | Trustee | Since | President and Chief | 81 | Director and Chair of |
| 2005 Market Street | | May 19973 | Executive Officer — | | Compensation |
| Philadelphia, PA | | | MLM Partners, Inc. | | Committee, |
| 19103 | | | (Small Business Investing | | Governance Committee |
| | | | and Consulting) | | Member |
| February 1936 | | | (January 1993–Present) | | — CenterPoint Energy |
| |
| | | | | | Lead Director and Chair |
| | | | | | of Audit |
| | | | | | and Governance |
| | | | | | Committees, |
| | | | | | Member of |
| | | | | | Compensation |
| | | | | | Committee — Digital |
| | | | | | River, Inc. |
| |
| | | | | | Director and Chair of |
| | | | | | Governance |
| | | | | | Committee, Audit |
| | | | | | Committee Member — |
| | | | | | Rimage Corporation |
| |
| | | | | | Director and Chair of |
| | | | | | Compensation |
| | | | | | Committee — Spanlink |
| | | | | | Communications |
| |
| | | | | | Lead Director and Chair |
| | | | | | of Compensation and |
| | | | | | Governance |
| | | | | | Committees — |
| | | | | | Valmont Industries, Inc. |
| Janet L. Yeomans | Trustee | Since | Vice President and Treasurer | 81 | None |
| 2005 Market Street | | April 1999 | (January 2006–Present) | | |
| Philadelphia, PA | | | Vice President — Mergers & Acquisitions | | |
| 19103 | | | (January 2003–January 2006), and | | |
| | | | Vice President | | |
| July 1948 | | | (July 1995–January 2003) | | |
| | | | 3M Corporation | | |
| J. Richard Zecher | Trustee | Since | Founder — | 81 | Director and Audit |
| 2005 Market Street | | March 2005 | Investor Analytics | | Committee Member — |
| Philadelphia, PA | | | (Risk Management) | | Investor Analytics |
| 19103 | | | (May 1999–Present) | | |
| |
| July 1940 | | | Founder — | | |
| | | | Sutton Asset Management | | |
| | | | (Hedge Fund) | | |
| | | | (September 1996–Present) | | |
Growth Opportunities Series-21
| | | | Number of | Other |
| | | Principal | Portfolios in Fund | Directorships |
| Name, | Position(s) | | Occupation(s) | Complex Overseen | Held by |
| Address, | Held with | Length of Time | During | by Trustee | Trustee |
| and Birth Date | Fund(s) | Served | Past 5 Years | or Officer | or Officer |
| OFFICERS | | | | | |
| David F. Connor | Vice President, | Vice President since | David F. Connor has served as | 81 | None4 |
| 2005 Market Street | Deputy General | September 2000 | Vice President and Deputy | | |
| Philadelphia, PA | Counsel, and Secretary | and Secretary | General Counsel of | | |
| 19103 | | since | Delaware Investments | | |
| | | October 2005 | since 2000. | | |
| December 1963 | | | | | |
| Daniel V. Geatens | Vice President | Treasurer | Daniel V. Geatens has served | 81 | None4 |
| 2005 Market Street | and Treasurer | since | in various capacities at | | |
| Philadelphia, PA | | October 25, 2007 | different times at | | |
| 19103 | | | Delaware Investments. | | |
| |
| October 1972 | | | | | |
| David P. O’Connor | Senior Vice | Senior Vice President, | David P. O’Connor has served in | 81 | None4 |
| 2005 Market Street | President, | General Counsel, and | various executive and legal | | |
| Philadelphia, PA | General Counsel, | Chief Legal Officer | capacities at different times | | |
| 19103 | and Chief | since | at Delaware Investments. | | |
| | Legal Officer | October 2005 | | | |
| February 1966 | | | | | |
| Richard Salus | Senior | Chief Financial | Richard Salus has served in | 81 | None4 |
| 2005 Market Street | Vice President | Officer since | various executive capacities | | |
| Philadelphia, PA | and | November 2006 | at different times at | | |
| 19103 | Chief Financial | | Delaware Investments. | | |
| | Officer | | | | |
| October 1963 | | | | | |
1 Patrick P. Coyne is considered to be an “Interested Trustee” because he is an executive officer of the Fund’s(s’) investment advisor. |
2 Delaware Investments is the marketing name for Delaware Management Holdings, Inc. and its subsidiaries, including the Fund’s(s’) investment advisor, principal underwriter, and its transfer agent. |
3 In 1997, several funds managed by Voyageur Fund Managers, Inc. (the “Voyageur Funds”) were incorporated into the Delaware Investments Family of Funds. Mr. Madison served as a director of the Voyageur Funds from 1993 until 1997. |
4 David F. Connor, Daniel V. Geatens, David P. O’Connor, and Richard Salus serve in similar capacities for the six portfolios of the Optimum Fund Trust, which have the same investment advisor, principal underwriter, and transfer agent as the registrant. |
The Statement of Additional Information for the Fund(s) includes additional information about the Trustees and Officers and is available, without charge, upon request by calling 800 523-1918.
| PO14857 AR-VIPGO [12/09] DG3 2/10 (5427) | Growth Opportunities Series-22 |
| Delaware VIP® Trust |
| Delaware VIP High Yield Series |
| |
| |
| |
| |
| |
| |
| Annual Report |
| |
| |
| December 31, 2009 |
| |
| |
| |
| |
| |
| |
| |
| |
| |
| |
| |
| |
| |
| |
| |
|
Table of contents
| > Portfolio management review | 1 |
| | |
| > Performance summary | 1 |
| | |
| > Disclosure of Series expenses | 3 |
| | |
| > Security types and credit quality breakdown | 4 |
| | |
| > Statement of net assets | 5 |
| | |
| > Statement of operations | 11 |
| | |
| > Statements of changes in net assets | 11 |
| | |
| > Financial highlights | 12 |
| | |
| > Notes to financial statements | 14 |
| | |
| > Report of independent registered public accounting firm | 20 |
| | |
| > Other Series information | 21 |
| | |
| > Board of trustees/directors and officers addendum | 25 |
On January 4, 2010, Delaware Management Holdings, Inc., and its subsidiaries (collectively known by the marketing name of Delaware Investments) were sold by a subsidiary of Lincoln National Corporation to Macquarie Group Limited, a global provider of banking, financial, advisory, investment and funds management services. Please see your Series’ prospectus and any supplements thereto for more complete information.
Investments in Delaware VIP® High Yield Series are not and will not be deposits with or liabilities of Macquarie Bank Limited ABN 46 008 583 542 and its holding companies, including subsidiaries or related companies, and are subject to investment risk, including possible delays in repayment and loss of income and capital invested. No Macquarie Group company guarantees or will guarantee the performance of the Series, the repayment of capital from the Series, or any particular rate of return.
Unless otherwise noted, views expressed herein are current as of Dec. 31, 2009, and are subject to change.
Funds are not FDIC insured and are not guaranteed. It is possible to lose the principal amount invested.
Mutual fund advisory services provided by Delaware Management Company, a series of Delaware Management Business Trust, which is a registered investment advisor. Delaware Investments is the marketing name of Delaware Management Holdings, Inc. and its subsidiaries. Macquarie Group refers to Macquarie Group Limited and its subsidiaries and affiliates worldwide.
© 2010 Delaware Management Holdings, Inc.
All third-party trademarks cited are the property of their respective owners.
| Delaware VIP® Trust — Delaware VIP High Yield Series | |
| Portfolio management review | Jan. 12, 2010 |
For the 12-month fiscal period ended Dec. 31, 2009, the Delaware VIP High Yield Series Standard Class shares returned +48.97%, and the Service Class shares returned +48.65% (both figures reflect returns with dividends reinvested). The Series’ benchmark, the Merrill Lynch U.S. High Yield Master II Constrained Index, returned +58.09%.
The period began amid the worst economic and financial markets that the portfolio management team has ever witnessed. Early in the new year, however, the environment for high yield securities took a 180-degree turn and the market began experiencing significant inflows of investment capital, leading to annual total return performance among high yield bonds that was well above average.
Investors seemed increasingly willing to accept risk around the time that a monumental fiscal stimulus program was signed into law by president Obama in February 2009. This nearly $800 billion economic stimulus package — the American Recovery and Reinvestment Act of 2009 — was coupled with the Federal Reserve’s commitment to keeping short-term interest rates near zero, as well as a variety of other government initiatives designed to restore liquidity and boost confidence in the financial markets. Credit spreads among high yield bonds began to narrow substantially beginning in March, as investors’ confidence in corporate balance sheets and earnings prospects rebounded.
As markets bounced back, they often recovered much of their earlier losses. In the credit market, in particular, conditions began to normalize once again. And by later in the year, many economic indicators in the United States showed signs of recovery, and even growth, while other indicators showed at least a slowing decline.
As market conditions improved, investors seemed to quickly rediscover their appetite for risk, and for high yield bonds. For the year, lower-rated CCC-rated bonds returned more than 110%, compared to 41% for BB-rated bonds (data: J.P. Morgan). In addition, the best-performing industries (financials, broadcasting, retailing, and homebuilding) included companies with some of the weakest credit in the high yield bond market. Notably, these were the worst-performing industries in 2008 — a year when investors generally fled from risky securities — but were the best performers in 2009, when investors tended to take the opposite approach. (Source: J.P. Morgan.)
At the start of the period, we maintained the defensive positioning that we had adopted within the Series prior to the beginning of the fiscal year. This decision helped mitigate losses through the worst conditions of the credit crisis, though as managers we generally faced significant challenges during that difficult time.
As the year progressed and conditions improved, we came to view the most attractive part of the high yield market (on a risk-return basis) to be in medium- to lower-quality B-rated bonds, as well as in higher-quality CCC-rated bonds. Our general concerns for the ongoing threat of bond defaults throughout the year led us away from the riskiest parts of the market at times, and was a primary reason the Series performance did not replicate the full advance of the benchmark index.
| Unless otherwise noted, the views expressed are current as of Dec. 31, 2009, and are subject to change. |
Performance summary
The performance data quoted represent past performance; past performance does not guarantee future results. Investment return and principal value will fluctuate so your shares, when redeemed, may be worth more or less than their original cost. Please obtain the performance data for the most recent month end by calling the number noted in the introductory section of this report on the page related to this Series. Current performance may be lower or higher than the performance data quoted.
You should consider the investment objectives, risks, charges, and expenses of the Series carefully before investing. The Delaware VIP High Yield Series prospectus contains this and other important information about the Series. To obtain a prospectus, contact the company noted on the page related to this Series in the introductory section of this report, either by phone or through the company’s Web site. We advise you to read the prospectus carefully before you invest or send money.
| Delaware VIP High Yield Series | | | | | | | | | | |
| Average annual total returns | | | | | | | | | | |
| For periods ended Dec. 31, 2009 | | 1 year | | 3 years | | 5 years | | 10 years | | Lifetime |
Standard Class shares (commenced
operations on July 28, 1988) | | +48.97% | | +5.11% | | +6.23% | | +4.99% | | +6.78% |
Service Class shares (commenced operations on May 1, 2000) | | +48.65% | | +4.83% | | +5.96% | | n/a | | +5.69% |
Returns reflect the reinvestment of all distributions.
High Yield Series-1
Delaware VIP® High Yield Series (continued)
As described in the Series’ most recent prospectus, the net expense ratio for Service Class shares of the Series was 1.02%. Total operating expenses for Standard Class and Service Class shares were 0.77% and 1.07%, respectively. The management fee for Standard Class and Service Class shares was 0.65%.
The Series’ distributor has contracted to limit the 12b-1 fees for Service Class shares to no more than 0.25% of average daily net assets through April 30, 2010.
Earnings from a variable annuity or variable life investment compound tax-free until withdrawal, and as a result, no adjustments were made for income taxes.
Expense limitations were in effect for both classes during the periods shown in the Series performance chart on the previous page.
Performance data do not reflect insurance fees related to a variable annuity or variable life investment or the deferred sales charge that would apply to certain withdrawals of investments. Performance shown here would have been reduced if such fees were included or the expense limitation removed. For more information about fees, consult your variable annuity or variable life prospectus.
Investments in variable products involve risk. Fixed income securities and bond funds can lose value, and investors can lose principal, as interest rates rise. They also may be affected by economic conditions that hinder an issuer’s ability to make interest and principal payments on its debt.
The letter ratings are provided by S&P and describe the credit-worthiness of the underlying bonds in the Series and generally range from AAA (highest quality) to CCC (lowest; highly speculative).
The Series may also be subject to prepayment risk, the risk that the principal of a fixed income security that is held by the Series may be prepaid prior to maturity, potentially forcing the Series to reinvest that money at a lower interest rate.
High yielding, noninvestment grade bonds (junk bonds) involve higher risk than investment grade bonds.
The Series may invest in derivatives, which may involve additional expenses and are subject to risk, including the risk that an underlying security or securities index moves in the opposite direction from what the portfolio manager anticipated. A derivative transaction depends upon the counterparties’ ability to fulfill their contractual obligations.
International investments entail risks not ordinarily associated with U.S. investments including fluctuation in currency values, differences in accounting principles, or economic or political instability in other nations. Investing in emerging markets can be riskier than investing in established foreign markets due to increased volatility and lower trading volume.
Instances of high double-digit returns are unusual, cannot be sustained, and were primarily achieved during favorable market conditions.
The chart shows a $10,000 investment in the Delaware VIP High Yield Series Standard Class shares for the period from Dec. 31, 1999, through Dec. 31, 2009.
The chart also shows $10,000 invested in the Merrill Lynch U.S. High Yield Master II Constrained Index for the period from Dec. 31, 1999, through Dec. 31, 2009. The Merrill Lynch U.S. High Yield Master II Constrained Index is a market value–weighted index that tracks the public high yield debt market.
Index performance returns do not reflect any management fees, transaction costs or expenses. Indices are unmanaged and one cannot invest directly in an index.
Performance of Service Class shares will vary due to different charges and expenses.
Past performance is not a guarantee of future results.
High Yield Series-2
Delaware VIP® Trust — Delaware VIP High Yield Series
Disclosure of Series Expenses
For the Period July 1, 2009 to December 31, 2009
As a shareholder of the Series, you incur ongoing costs, including management fees; distribution and/or service (12b-1) fees; and other Series expenses. This Example is intended to help you understand your ongoing costs (in dollars) of investing in the Series and to compare these costs with the ongoing costs of investing in other mutual funds.
The Example is based on an investment of $1,000 invested at the beginning of the period and held for the entire period from July 1, 2009 to December 31, 2009.
Actual Expenses
The first section of the table shown, “Actual Series Return,” provides information about actual account values and actual expenses. You may use the information in this section of the table, together with the amount you invested, to estimate the expenses that you paid over the period. Simply divide your account value by $1,000 (for example, an $8,600 account value divided by $1,000 = 8.6), then multiply the result by the number in the first section under the heading entitled “Expenses Paid During Period” to estimate the expenses you paid on your account during the period.
Hypothetical Example for Comparison Purposes
The second section of the table shown, “Hypothetical 5% Return,” provides information about hypothetical account values and hypothetical expenses based on the Series’ actual expense ratio and an assumed rate of return of 5% per year before expenses, which is not the Series’ actual return. The hypothetical account values and expenses may not be used to estimate the actual ending account balance or expenses you paid for the period. You may use this information to compare the ongoing costs of investing in the Series and other funds. To do so, compare the 5% hypothetical example with the 5% hypothetical examples that appear in the shareholder reports of other funds.
Please note that the expenses shown in the table are meant to highlight your ongoing costs only. As a shareholder of the Series, you do not incur any transaction costs, such as sales charges (loads), redemption fees or exchange fees, but shareholders of other funds may incur such costs. Also, the fees related to the variable annuity investment or the deferred sales charge that could apply have not been included. Therefore, the second section of the table is useful in comparing ongoing costs only, and will not help you determine the relative total costs of owning different funds. The Series’ actual expenses shown in the table reflect fee waivers in effect. The expenses shown in the table assume reinvestment of all dividends and distributions.
Expense Analysis of an Investment of $1,000
| | | | | | | | Expenses |
| | Beginning | | Ending | | | | Paid During |
| | Account | | Account | | Annualized | | Period |
| | Value | | Value | | Expense | | 7/1/09 to |
| | 7/1/09 | | 12/31/09 | | Ratios | | 12/31/09* |
| Actual Series Return | | | | | | | | | | |
| Standard Class | | $1,000.00 | | $1,193.70 | | 0.77% | | $ | 4.26 | |
| Service Class | | 1,000.00 | | 1,191.60 | | 1.02% | | | 5.63 | |
| Hypothetical 5% Return (5% return before expenses) | | | | |
| Standard Class | | $1,000.00 | | $1,021.32 | | 0.77% | | $ | 3.92 | |
| Service Class | | 1,000.00 | | 1,020.06 | | 1.02% | | | 5.19 | |
*“Expenses Paid During Period” are equal to the Series’ annualized expense ratio, multiplied by the average account value over the period, multiplied by 184/365 (to reflect the one-half year period).
High Yield Series-3
Delaware VIP® Trust — Delaware VIP High Yield Series
Security Types and Credit Quality Breakdown
As of December 31, 2009
Sector designations may be different than the sector designations presented in other Series materials. The sector designations may represent the investment manager’s internal sector classifications, which may result in the sector designations for one series being different than another series’ sector designations.
| Percentage |
| Security Types | of Net Assets |
| Convertible Bonds | 1.17 | % |
| Corporate Bonds | 92.43 | % |
| Basic Industry | 7.18 | % |
| Brokerage | 1.63 | % |
| Capital Goods | 5.01 | % |
| Consumer Cyclical | 10.59 | % |
| Consumer Non-Cyclical | 6.45 | % |
| Energy | 10.82 | % |
| Finance & Investments | 6.54 | % |
| Media | 5.82 | % |
| Real Estate | 0.57 | % |
| Services Cyclical | 10.32 | % |
| Services Non-Cyclical | 6.01 | % |
| Technology & Electronics | 3.24 | % |
| Telecommunications | 14.60 | % |
| Utilities | 3.65 | % |
| Senior Secured Loans | 1.30 | % |
| Common Stock | 0.63 | % |
| Preferred Stocks | 0.53 | % |
| Discount Note | 0.14 | % |
| Securities Lending Collateral | 5.37 | % |
| Total Value of Securities | 101.57 | % |
| Obligation to Return Securities Lending Collateral | (5.49 | %) |
| Receivables and Other Assets Net of Liabilities | 3.92 | % |
| Total Net Assets | 100.00 | % |
| |
| Credit Quality Breakdown | | |
| (as a % of fixed income investments)* | | |
| AAA | 3.94 | % |
| AA | 0.53 | % |
| A | 1.35 | % |
| BBB | 3.82 | % |
| BB | 20.49 | % |
| B | 54.18 | % |
| CCC | 14.97 | % |
| Not Rated | 0.72 | % |
| Total | 100.00 | % |
*Bond ratings are determined by independent, nationally recognized statistical rating organizations.
High Yield Series-4
Delaware VIP® Trust — Delaware VIP High Yield Series
Statement of Net Assets
December 31, 2009
| | | Principal | | | |
| | | Amount | | Value |
| | | | (U.S. $) | | (U.S. $) |
| CONVERTIBLE BONDS–1.17% | | | | | |
| *Advanced Micro Devices 6.00% exercise price | | | | | |
| | $28.08, expiration date 5/1/15 | | $1,035,000 | | $ | 936,675 |
| Beazer Homes USA 4.625% exercise price | | | | | |
| | $49.64, expiration date 6/15/24 | | 800,000 | | | 746,000 |
| Century Aluminum 1.75% exercise price | | | | | |
| | $30.54, expiration date 8/1/24 | | 295,000 | | | 283,569 |
| #Corporate Office Properties | | | | | |
| 144A 3.50% exercise price $53.12, | | | | | |
| expiration date 9/15/26 | | 440,000 | | | 427,900 |
| ΦHologic 2.00% exercise price $38.59, | | | | | |
| expiration date 12/15/37 | | 1,230,000 | | | 1,056,263 |
| Leap Wireless International 4.50% exercise | | | | | |
| price $93.21, expiration date 7/15/14 | | 1,390,000 | | | 1,157,174 |
| Level 3 Communications 5.25% exercise price | | | | | |
| | $3.98, expiration date 12/15/11 | | 605,000 | | | 577,019 |
| ≠†Mirant (Escrow) 2.50% exercise price $67.95, | | | | | |
| expiration date 6/15/21 | | 785,000 | | | 0 |
| Total Convertible Bonds | | | | | |
| (cost $4,647,732) | | | | | 5,184,600 |
| |
| CORPORATE BONDS–92.43% | | | | | |
| Basic Industry–7.18% | | | | | |
| #Algoma Acquisition 144A 9.875% 6/15/15 | | 2,485,000 | | | 2,127,781 |
| California Steel Industries 6.125% 3/15/14 | | 1,120,000 | | | 1,055,600 |
| Century Aluminum 8.00% 5/15/14 | | 1,616,000 | | | 1,583,680 |
| *#Evraz Group 144A 9.50% 4/24/18 | | 2,465,000 | | | 2,465,000 |
| #FMG Finance 144A 10.625% 9/1/16 | | 1,945,000 | | | 2,161,381 |
| Freeport McMoRan Copper & Gold | | | | | |
| 8.375% 4/1/17 | | 1,865,000 | | | 2,044,974 |
| *Hexion US Finance 9.75% 11/15/14 | | 1,080,000 | | | 1,063,800 |
| #Innophos Holdings 144A 9.50% 4/15/12 | | 400,000 | | | 408,000 |
| #MacDermid 144A 9.50% 4/15/17 | | 2,837,000 | | | 2,851,186 |
| *#Momentive Performance Material 144A | | | | | |
| 12.50% 6/15/14 | | 990,000 | | | 1,093,950 |
| #NewPage 144A 11.375% 12/31/14 | | 2,125,000 | | | 2,156,875 |
| •Noranda Aluminium Acquisition PIK | | | | | |
| 5.274% 5/15/15 | | 1,512,167 | | | 1,181,380 |
| Novelis | | | | | |
| 7.25% 2/15/15 | | 1,565,000 | | | 1,498,488 |
| # | 144A 11.50% 2/15/15 | | 670,000 | | | 721,088 |
| #PE Paper Escrow 144A 12.00% 8/1/14 | | 335,000 | | | 370,831 |
| @=Port Townsend 7.32% 8/27/12 | | 558,395 | | | 404,836 |
| Ryerson | | | | | |
| • | 7.656% 11/1/14 | | 990,000 | | | 916,988 |
| 12.00% 11/1/15 | | 1,045,000 | | | 1,097,250 |
| #Sappi Papier Holding 144A 6.75% 6/15/12 | | 1,460,000 | | | 1,399,484 |
| #Severstal 144A 9.75% 7/29/13 | | 995,000 | | | 1,007,438 |
| Steel Dynamics 7.75% 4/15/16 | | 1,845,000 | | | 1,930,331 |
| Teck Resources | | | | | |
| 10.25% 5/15/16 | | 605,000 | | | 707,850 |
| # | 144A 10.75% 5/15/19 | | 1,210,000 | | | 1,452,000 |
| | | | | | 31,700,191 |
| Brokerage–1.63% | | | | | |
| #Cemex Finance 144A 9.50% 12/14/16 | | 2,380,000 | | | 2,504,950 |
| E Trade Financial PIK 12.50% 11/30/17 | | 1,009,000 | | | 1,151,521 |
| LaBranche 11.00% 5/15/12 | | 3,650,000 | | | 3,526,813 |
| | | | | | 7,183,284 |
| Capital Goods–5.01% | | | | | |
| #BWAY 144A 10.00% 4/15/14 | | 1,930,000 | | | 2,050,625 |
| *•#C8 Capital 144A 6.64% 12/31/49 | | 1,445,000 | | | 1,005,182 |
| #CPM Holdings 144A 10.625% 9/1/14 | | 400,000 | | | 424,000 |
| *Eastman Kodak 7.25% 11/15/13 | | 575,000 | | | 477,250 |
| #Graphic Packaging International | | | | | |
| 144A 9.50% 6/15/17 | | 2,335,000 | | | 2,486,775 |
| Intertape Polymer 8.50% 8/1/14 | | 957,000 | | | 824,216 |
| #Plastipak Holdings 144A | | | | | |
| 8.50% 12/15/15 | | 1,050,000 | | | 1,082,813 |
| 10.625% 8/15/19 | | 1,050,000 | | | 1,162,875 |
| Pregis 12.375% 10/15/13 | | 1,568,000 | | | 1,526,840 |
| RBS Global/Rexnord | | | | | |
| 9.50% 8/1/14 | | 485,000 | | | 488,638 |
| * | 11.75% 8/1/16 | | 1,410,000 | | | 1,402,950 |
| Smurfit Kappa Funding 7.75% 4/1/15 | | 3,075,000 | | | 2,971,218 |
| *Solo Cup 8.50% 2/15/14 | | 425,000 | | | 417,563 |
| Thermadyne Holdings 10.50% 2/1/14 | | 1,840,000 | | | 1,750,300 |
| #Trimas 144A 9.75% 12/15/17 | | 1,775,000 | | | 1,750,594 |
| USG | | | | | |
| 6.30% 11/15/16 | | 2,020,000 | | | 1,818,000 |
| # | 144A 9.75% 8/1/14 | | 450,000 | | | 482,625 |
| | | | | | 22,122,464 |
| Consumer Cyclical–10.59% | | | | | |
| *#Allison Transmission 144A 11.00% 11/1/15 | | 2,520,000 | | | 2,658,600 |
| American Axle & Manufacturing | | | | | |
| 7.875% 3/1/17 | | 1,315,000 | | | 1,117,750 |
| # | 144A 9.25% 1/15/17 | | 750,000 | | | 765,000 |
| *ArvinMeritor 8.125% 9/15/15 | | 1,630,000 | | | 1,564,800 |
| #Associated Materials 144A 9.875% 11/15/16 | | 235,000 | | | 249,100 |
| Beazer Homes USA 8.625% 5/15/11 | | 1,750,000 | | | 1,715,000 |
| Building Materials 7.75% 8/1/14 | | 1,360,000 | | | 1,353,200 |
| Burlington Coat Factory Investment | | | | | |
| Holdings 14.50% 10/15/14 | | 1,075,000 | | | 1,080,375 |
| *Burlington Coat Factory Warehouse | | | | | |
| 11.125% 4/15/14 | | 1,025,000 | | | 1,063,438 |
| Carrols 9.00% 1/15/13 | | 520,000 | | | 530,400 |
| Duane Reade 11.75% 8/1/15 | | 990,000 | | | 1,079,100 |
| Ford Motor 7.45% 7/16/31 | | 1,240,000 | | | 1,102,050 |
| Ford Motor Credit 12.00% 5/15/15 | | 3,790,000 | | | 4,399,431 |
| Interface | | | | | |
| 9.50% 2/1/14 | | 270,000 | | | 266,963 |
| # | 144A 11.375% 11/1/13 | | 710,000 | | | 796,975 |
| K Hovnanian Enterprises | | | | | |
| 7.50% 5/15/16 | | 675,000 | | | 486,000 |
| # | 144A 10.625% 10/15/16 | | 1,020,000 | | | 1,071,000 |
| *#Landry’s Restaurants 144A | | | | | |
| 11.625% 12/1/15 | | 3,200,000 | | | 3,407,999 |
| M/I Homes 6.875% 4/1/12 | | 1,025,000 | | | 971,188 |
High Yield Series-5
Delaware VIP® High Yield Series
Statement of Net Assets (continued)
| | | Principal | | | |
| | | Amount | | Value |
| | | | (U.S. $) | | (U.S. $) |
| CORPORATE BONDS (continued) | | | | | |
| Consumer Cyclical (continued) | | | | | |
| Macy’s Retail Holdings | | | | | |
| * | 6.375% 3/15/37 | | $1,605,000 | | $ | 1,364,250 |
| 6.70% 7/15/34 | | 245,000 | | | 214,375 |
| 7.875% 8/15/36 | | 700,000 | | | 623,000 |
| Meritage Homes | | | | | |
| 6.25% 3/15/15 | | 331,000 | | | 306,175 |
| 7.00% 5/1/14 | | 1,595,000 | | | 1,531,200 |
| Mobile Mini | | | | | |
| 6.875% 5/1/15 | | 1,215,000 | | | 1,154,250 |
| 9.75% 8/1/14 | | 215,000 | | | 224,675 |
| *Navistar International 8.25% 11/1/21 | | 2,140,000 | | | 2,204,200 |
| #Norcraft Finance 144A 10.50% 12/15/15 | | 1,585,000 | | | 1,632,550 |
| Norcraft Holdings/Capital 9.75% 9/1/12 | | 887,000 | | | 855,955 |
| *OSI Restaurant Partners 10.00% 6/15/15 | | 1,261,000 | | | 1,119,138 |
| Quiksilver 6.875% 4/15/15 | | 2,560,000 | | | 2,112,000 |
| Rite Aid 9.375% 12/15/15 | | 2,515,000 | | | 2,225,775 |
| *Sally Holdings 10.50% 11/15/16 | | 1,750,000 | | | 1,890,000 |
| #Standard Pacific Escrow 144A | | | | | |
| 10.75% 9/15/16 | | 520,000 | | | 533,000 |
| #Toys R Us 144A 10.75% 7/15/17 | | 995,000 | | | 1,094,500 |
| #TRW Automotive 144A 8.875% 12/1/17 | | 1,860,000 | | | 1,943,700 |
| | | | | | | 46,707,112 |
| Consumer Non-Cyclical–6.45% | | | | | |
| #Alliance One International 144A | | | | | |
| 10.00% 7/15/16 | | 2,010,000 | | | 2,120,550 |
| Cornell 10.75% 7/1/12 | | 590,000 | | | 605,488 |
| #Cott Beverages 144A 8.375% 11/15/17 | | 1,300,000 | | | 1,345,500 |
| #Dole Food 144A 13.875% 3/15/14 | | 924,000 | | | 1,115,730 |
| Ingles Markets 8.875% 5/15/17 | | 1,105,000 | | | 1,154,725 |
| #JBS USA Finance 144A 11.625% 5/1/14 | | 1,645,000 | | | 1,871,188 |
| #JohnsonDiversey Holdings 144A | | | | | |
| 10.50% 5/15/20 | | 4,710,000 | | | 4,757,099 |
| #M-Foods Holdings 144A 9.75% 10/1/13 | | 655,000 | | | 683,656 |
| #Novasep Holding 144A 9.75% 12/15/16 | | 2,150,000 | | | 2,107,000 |
| #Quintiles Transnational PIK 144A | | | | | |
| 9.50% 12/30/14 | | 1,025,000 | | | 1,032,688 |
| *#ServiceMaster PIK 144A 10.75% 7/15/15 | | 2,135,000 | | | 2,231,074 |
| Smithfield Foods | | | | | |
| * | 7.75% 5/15/13 | | 1,330,000 | | | 1,296,750 |
| 7.75% 7/1/17 | | 260,000 | | | 241,150 |
| # | 144A 10.00% 7/15/14 | | 1,635,000 | | | 1,782,150 |
| #Tops Markets 144A 10.125% 10/15/15 | | 2,090,000 | | | 2,163,150 |
| #Viskase 144A 9.875% 1/15/18 | | 2,140,000 | | | 2,166,750 |
| Yankee Acquisition | | | | | |
| * | 8.50% 2/15/15 | | 335,000 | | | 334,163 |
| 9.75% 2/15/17 | | 1,455,000 | | | 1,440,450 |
| | | | | | 28,449,261 |
| Energy–10.82% | | | | | |
| #Antero Resources Finance 144A | | | | | |
| 9.375% 12/1/17 | | 1,695,000 | | | 1,737,375 |
| #Aquilex Holdings/Finance 144A | | | | | |
| 11.125% 12/15/16 | | 1,600,000 | | | 1,604,000 |
| Berry Petroleum 10.25% 6/1/14 | | 985,000 | | | 1,076,113 |
| Chesapeake Energy | | | | | |
| 6.625% 1/15/16 | | 497,000 | | | 494,515 |
| 7.25% 12/15/18 | | 355,000 | | | 359,438 |
| 9.50% 2/15/15 | | 820,000 | | | 904,050 |
| Complete Production Service | | | | | |
| 8.00% 12/15/16 | | 1,145,000 | | | 1,134,981 |
| Copano Energy 7.75% 6/1/18 | | 955,000 | | | 962,163 |
| Denbury Resources | | | | | |
| * | 7.50% 4/1/13 | | 215,000 | | | 217,150 |
| 9.75% 3/1/16 | | 965,000 | | | 1,034,963 |
| #Drummond 144A 9.00% 10/15/14 | | 2,115,000 | | | 2,228,680 |
| Dynergy Holdings 7.75% 6/1/19 | | 2,390,000 | | | 2,085,275 |
| El Paso | | | | | |
| 6.875% 6/15/14 | | 836,000 | | | 839,562 |
| * | 7.00% 6/15/17 | | 795,000 | | | 792,450 |
| •Enterprise Products Operating | | | | | |
| 8.375% 8/1/66 | | 430,000 | | | 419,769 |
| *#Headwaters 144A 11.375% 11/1/14 | | 2,145,000 | | | 2,246,887 |
| #Helix Energy Solutions Group 144A | | | | | |
| 9.50% 1/15/16 | | 2,020,000 | | | 2,080,600 |
| #Hercules Offshore 144A 10.50% 10/15/17 | | 2,120,000 | | | 2,247,199 |
| #Hilcorp Energy I 144A | | | | | |
| 7.75% 11/1/15 | | 1,339,000 | | | 1,318,915 |
| 9.00% 6/1/16 | | 760,000 | | | 775,200 |
| #Holly 144A 9.875% 6/15/17 | | 1,785,000 | | | 1,887,638 |
| International Coal Group 10.25% 7/15/14 | | 2,180,000 | | | 2,106,425 |
| *Key Energy Services 8.375% 12/1/14 | | 2,195,000 | | | 2,211,462 |
| Mariner Energy 8.00% 5/15/17 | | 1,928,000 | | | 1,860,520 |
| *MarkWest Energy Partners 8.75% 4/15/18 | | 1,540,000 | | | 1,593,900 |
| #Murray Energy 144A 10.25% 10/15/15 | | 1,930,000 | | | 1,930,000 |
| OPTI Canada | | | | | |
| 7.875% 12/15/14 | | 2,070,000 | | | 1,707,750 |
| 8.25% 12/15/14 | | 639,000 | | | 529,571 |
| PetroHawk Energy | | | | | |
| 7.875% 6/1/15 | | 925,000 | | | 938,875 |
| * | 9.125% 7/15/13 | | 758,000 | | | 795,900 |
| # | 144A 10.50% 8/1/14 | | 240,000 | | | 263,400 |
| Petroleum Development 12.00% 2/15/18 | | 1,155,000 | | | 1,196,869 |
| Quicksilver Resources | | | | | |
| * | 7.125% 4/1/16 | | 1,690,000 | | | 1,584,375 |
| 11.75% 1/1/16 | | 495,000 | | | 564,300 |
| Regency Energy Partners 8.375% 12/15/13 | | 758,000 | | | 788,320 |
| #SandRidge Energy 144A | | | | | |
| 8.75% 1/15/20 | | 1,235,000 | | | 1,241,175 |
| 9.875% 5/15/16 | | 1,855,000 | | | 1,961,663 |
| | | | | | 47,721,428 |
| Finance & Investments–6.54% | | | | | |
| •BAC Capital Trust XIV 5.63% 12/31/49 | | 3,195,000 | | | 2,228,513 |
| •#C5 Capital 144A 6.196% 12/31/49 | | 1,650,000 | | | 1,132,761 |
| Capital One Capital V 10.25% 8/15/39 | | 1,985,000 | | | 2,313,547 |
| •Citigroup Capital XXI 8.30% 12/21/57 | | 975,000 | | | 943,313 |
| City National Capital Trust I 9.625% 2/1/40 | | 2,155,000 | | | 2,294,709 |
High Yield Series-6
Delaware VIP® High Yield Series
Statement of Net Assets (continued)
| | | Principal | | | |
| | | Amount | | Value |
| | | | (U.S. $) | | (U.S. $) |
| CORPORATE BONDS (continued) | | | | | |
| Finance & Investments (continued) | | | | | |
| International Lease Finance | | | | | |
| 5.25% 1/10/13 | | $1,175,000 | | $ | 959,008 |
| 5.35% 3/1/12 | | 205,000 | | | 178,046 |
| 5.55% 9/5/12 | | 680,000 | | | 566,563 |
| 5.625% 9/20/13 | | 1,045,000 | | | 820,354 |
| * | 6.375% 3/25/13 | | 1,750,000 | | | 1,439,804 |
| 6.625% 11/15/13 | | 985,000 | | | 793,547 |
| JPMorgan Chase Capital XXV 6.80% 10/1/37 | | 175,000 | | | 174,412 |
| LVB Acquisition 11.625% 10/15/17 | | 1,950,000 | | | 2,164,500 |
| •#MetLife Capital Trust X 144A 9.25% 4/8/38 | | 1,930,000 | | | 2,200,200 |
| Nuveen Investments 10.50% 11/15/15 | | 3,895,000 | | | 3,554,187 |
| @Popular North America Capital Trust I | | | | | |
| 6.564% 9/15/34 | | 985,000 | | | 577,681 |
| •#Rabobank Nederland 144A 11.00% 12/29/49 | | 1,895,000 | | | 2,316,902 |
| •USB Capital IX 6.189% 4/15/49 | | 1,600,000 | | | 1,302,000 |
| Zions Bancorporation | | | | | |
| 5.50% 11/16/15 | | 1,215,000 | | | 859,981 |
| * | 5.65% 5/15/14 | | 280,000 | | | 204,161 |
| 6.00% 9/15/15 | | 1,590,000 | | | 1,125,854 |
| 7.75% 9/23/14 | | 795,000 | | | 702,251 |
| | | | | | 28,852,294 |
| Media–5.82% | | | | | |
| Affinion Group 11.50% 10/15/15 | | 840,000 | | | 884,100 |
| #Cablevision Systems 144A 8.625% 9/15/17 | | 1,185,000 | | | 1,239,806 |
| CCH II 13.50% 11/30/16 | | 1,805,000 | | | 2,134,413 |
| #Cengage Learning Acquisitions 144A | | | | | |
| 10.50% 1/15/15 | | 500,000 | | | 480,625 |
| #Cequel Communications Holdings I 144A | | | | | |
| 8.625% 11/15/17 | | 1,065,000 | | | 1,080,975 |
| #Charter Communications Operating 144A | | | | | |
| 10.875% 9/15/14 | | 1,920,000 | | | 2,159,999 |
| Clear Channel Communications | | | | | |
| 10.75% 8/1/16 | | 1,015,000 | | | 801,850 |
| #Columbus International 144A | | | | | |
| 11.50% 11/20/14 | | 1,985,000 | | | 2,094,175 |
| DISH DBS | | | | | |
| 7.875% 9/1/19 | | 1,050,000 | | | 1,106,438 |
| # | 144A 7.875% 9/1/19 | | 1,035,000 | | | 1,090,631 |
| #MDC Partners 144A 11.00% 11/1/16 | | 1,110,000 | | | 1,159,950 |
| #Mediacom Capital 144A 9.125% 8/15/19 | | 1,030,000 | | | 1,055,750 |
| Nielsen Finance | | | | | |
| 10.00% 8/1/14 | | 1,610,000 | | | 1,686,475 |
| 11.50% 5/1/16 | | 385,000 | | | 432,163 |
| 11.625% 2/1/14 | | 365,000 | | | 411,994 |
| Ω | 12.50% 8/1/16 | | 970,000 | | | 889,975 |
| #Sinclair Television Group 144A | | | | | |
| 9.25% 11/1/17 | | 1,580,000 | | | 1,651,100 |
| #Univision Communications 144A | | | | | |
| 12.00% 7/1/14 | | 1,465,000 | | | 1,620,656 |
| #UPC Holding 144A 9.875% 4/15/18 | | 940,000 | | | 996,400 |
| #XM Satellite Radio 144A 13.00% 8/1/13 | | 620,000 | | | 676,575 |
| XM Satellite Radio Holdings PIK | | | | | |
| 10.00% 6/1/11 | | 2,025,000 | | | 2,035,125 |
| | | | | | 25,689,175 |
| Real Estate–0.57% | | | | | |
| Developers Diversified Realty | | | | | |
| 9.625% 3/15/16 | | 470,000 | | | 491,235 |
| #Felcor Lodging Trust 144A 10.00% 10/1/14 | | 1,990,000 | | | 2,017,363 |
| | | | | | 2,508,598 |
| Services Cyclical–10.32% | | | | | |
| AMH Holdings 11.25% 3/1/14 | | 1,303,000 | | | 1,263,910 |
| *Aramark Services 8.50% 2/1/15 | | 1,249,000 | | | 1,292,715 |
| #Ashtead Capital 144A 9.00% 8/15/16 | | 2,044,000 | | | 2,056,775 |
| Avis Budget Car Rental | | | | | |
| * | 7.625% 5/15/14 | | 1,025,000 | | | 978,875 |
| 7.75% 5/15/16 | | 1,185,000 | | | 1,113,900 |
| Cardtronics 9.25% 8/15/13 | | 1,913,000 | | | 1,977,564 |
| Delta Air Lines | | | | | |
| 7.92% 11/18/10 | | 920,000 | | | 924,600 |
| # | 144A 9.50% 9/15/14 | | 975,000 | | | 1,017,656 |
| #Galaxy Entertainment Finance 144A | | | | | |
| 9.875% 12/15/12 | | 3,070,000 | | | 3,085,349 |
| *Gaylord Entertainment 6.75% 11/15/14 | | 840,000 | | | 785,400 |
| #General Maritime 144A 12.00% 11/15/17 | | 1,205,000 | | | 1,260,731 |
| Global Cash Access 8.75% 3/15/12 | | 1,733,000 | | | 1,735,166 |
| #Harrah’s Operating Escrow 144A | | | | | |
| 11.25% 6/1/17 | | 3,220,000 | | | 3,385,024 |
| *Hertz 10.50% 1/1/16 | | 1,480,000 | | | 1,587,300 |
| Kansas City Southern de Mexico | | | | | |
| 9.375% 5/1/12 | | 1,517,000 | | | 1,581,473 |
| # | 144A 12.50% 4/1/16 | | 405,000 | | | 467,775 |
| MGM MIRAGE | | | | | |
| * | 6.625% 7/15/15 | | 610,000 | | | 477,325 |
| * | 7.50% 6/1/16 | | 795,000 | | | 624,075 |
| 7.625% 1/15/17 | | 1,310,000 | | | 1,025,075 |
| 13.00% 11/15/13 | | 1,878,000 | | | 2,164,395 |
| # | 144A 11.125% 11/15/17 | | 890,000 | | | 990,125 |
| Mohegan Tribal Gaming Authority | | | | | |
| 6.875% 2/15/15 | | 1,175,000 | | | 769,625 |
| * | 7.125% 8/15/14 | | 875,000 | | | 600,469 |
| #National Money Mart 144A | | | | | |
| 10.375% 12/15/16 | | 1,085,000 | | | 1,114,838 |
| #NCL 144A 11.75% 11/15/16 | | 1,055,000 | | | 1,047,088 |
| PHH 7.125% 3/1/13 | | 2,070,000 | | | 1,925,100 |
| *Pinnacle Entertainment 7.50% 6/15/15 | | 2,870,000 | | | 2,654,750 |
| @#Pokagon Gaming Authority 144A | | | | | |
| 10.375% 6/15/14 | | 1,816,000 | | | 1,897,720 |
| Royal Caribbean Cruises 6.875% 12/1/13 | | 1,230,000 | | | 1,214,625 |
| *RSC Equipment Rental 9.50% 12/1/14 | | 2,895,000 | | | 2,913,094 |
| *#RSC Equipment Rental/Holdings III 144A | | | | | |
| 10.25% 11/15/19 | | 285,000 | | | 287,494 |
| #Shingle Springs Tribal Gaming Authority | | | | | |
| 144A 9.375% 6/15/15 | | 1,705,000 | | | 1,304,325 |
| | | | | | 45,524,336 |
| Services Non-Cyclical–6.01% | | | | | |
| Accellent 10.50% 12/1/13 | | 685,000 | | | 662,738 |
| #Alliance HealthCare Services 144A | | | | | |
| 8.00% 12/1/16 | | 1,040,000 | | | 1,019,200 |
| *Bausch & Lomb 9.875% 11/1/15 | | 1,920,000 | | | 2,035,200 |
High Yield Series-7
Delaware VIP® High Yield Series
Statement of Net Assets (continued)
| | | Principal | | | |
| | | Amount | | Value |
| | | | (U.S. $) | | (U.S. $) |
| CORPORATE BONDS (continued) | | | | | |
| Services Non-Cyclical (continued) | | | | | |
| Casella Waste Systems 9.75% 2/1/13 | | $2,499,000 | | $ | 2,480,258 |
| Community Health Systems | | | | | |
| 8.875% 7/15/15 | | 2,015,000 | | | 2,090,563 |
| DJO Finance 10.875% 11/15/14 | | 2,030,000 | | | 2,151,800 |
| HCA | | | | | |
| 9.25% 11/15/16 | | 3,335,000 | | | 3,589,293 |
| PIK 9.625% 11/15/16 | | 613,143 | | | 665,260 |
| Inverness Medical Innovations | | | | | |
| 9.00% 5/15/16 | | 1,600,000 | | | 1,644,000 |
| Psychiatric Solutions | | | | | |
| * | 7.75% 7/15/15 | | 1,740,000 | | | 1,692,150 |
| # | 144A 7.75% 7/15/15 | | 205,000 | | | 194,238 |
| Select Medical 7.625% 2/1/15 | | 2,695,000 | | | 2,627,624 |
| Tenet Healthcare 7.375% 2/1/13 | | 2,065,000 | | | 2,080,488 |
| Universal Hospital Services PIK | | | | | |
| 8.50% 6/1/15 | | 1,015,000 | | | 1,004,850 |
| •US Oncology PIK 6.428% 3/15/12 | | 2,747,000 | | | 2,582,179 |
| | | | | | 26,519,841 |
| Technology & Electronics–3.24% | | | | | |
| *#Advanced Micro Devices 144A | | | | | |
| 8.125% 12/15/17 | | 450,000 | | | 450,563 |
| Anixter 10.00% 3/15/14 | | 1,070,000 | | | 1,187,700 |
| *First Data 9.875% 9/24/15 | | 4,835,000 | | | 4,532,812 |
| Freescale Semiconductor 8.875% 12/15/14 | | 2,510,000 | | | 2,315,475 |
| Sanmina-SCI 8.125% 3/1/16 | | 2,265,000 | | | 2,270,663 |
| Sungard Data Systems 10.25% 8/15/15 | | 2,103,000 | | | 2,250,210 |
| #Unisys 144A 12.75% 10/15/14 | | 1,095,000 | | | 1,270,200 |
| | | | | | 14,277,623 |
| Telecommunications–14.60% | | | | | |
| @=‡Allegiance Telecom 11.75% 2/15/10 | | 565,000 | | | 0 |
| Cincinnati Bell 8.25% 10/15/17 | | 1,540,000 | | | 1,570,800 |
| Citizens Communications 7.125% 3/15/19 | | 470,000 | | | 446,500 |
| #Clearwire Communications/Finance 144A | | | | | |
| * | 12.00% 12/1/15 | | 2,115,000 | | | 2,157,300 |
| 12.00% 12/1/15 | | 2,185,000 | | | 2,228,700 |
| Cricket Communications | | | | | |
| * | 9.375% 11/1/14 | | 3,257,000 | | | 3,289,569 |
| *# | 144A 7.75% 5/15/16 | | 1,225,000 | | | 1,228,063 |
| #Digicel Group 144A | | | | | |
| 8.25% 9/1/17 | | 1,730,000 | | | 1,695,400 |
| 8.875% 1/15/15 | | 1,430,000 | | | 1,394,250 |
| * | 9.125% 1/15/15 | | 850,000 | | | 841,500 |
| #GCI 144A 8.625% 11/15/19 | | 2,115,000 | | | 2,144,081 |
| #GeoEye 144A 9.625% 10/1/15 | | 1,245,000 | | | 1,287,019 |
| #Global Crossing 144A 12.00% 9/15/15 | | 1,980,000 | | | 2,182,950 |
| #GXS Worldwide 144A 9.75% 6/15/15 | | 2,185,000 | | | 2,157,688 |
| Hughes Network Systems/Finance | | | | | |
| 9.50% 4/15/14 | | 1,963,000 | | | 2,036,613 |
| #Intelsat Bermuda 144A 11.25% 2/4/17 | | 3,185,000 | | | 3,208,887 |
| Level 3 Financing | | | | | |
| 9.25% 11/1/14 | | 1,040,000 | | | 988,000 |
| * | 12.25% 3/15/13 | | 1,025,000 | | | 1,091,625 |
| Lucent Technologies 6.45% 3/15/29 | | 919,000 | | | 662,829 |
| MetroPCS Wireless | | | | | |
| * | 9.25% 11/1/14 | | 2,955,000 | | | 3,006,712 |
| # | 144A 9.25% 11/1/14 | | 175,000 | | | 178,063 |
| #NII Capital 144A | | | | | |
| 8.875% 12/15/19 | | 720,000 | | | 704,700 |
| 10.00% 8/15/16 | | 1,955,000 | | | 2,057,638 |
| #Nordic Telephone Holdings 144A | | | | | |
| 8.875% 5/1/16 | | 2,358,000 | | | 2,505,374 |
| PAETEC Holding 8.875% 6/30/17 | | 1,055,000 | | | 1,073,463 |
| Qwest 7.25% 9/15/25 | | 1,300,000 | | | 1,209,000 |
| Qwest Capital Funding 7.75% 2/15/31 | | 1,200,000 | | | 1,026,000 |
| Sprint Capital | | | | | |
| * | 6.875% 11/15/28 | | 930,000 | | | 777,713 |
| 8.75% 3/15/32 | | 6,995,000 | | | 6,627,762 |
| *#Telcordia Technologies 144A 10.00% 3/15/13 | | 1,295,000 | | | 1,159,025 |
| Telesat Canada/Telesat | | | | | |
| 11.00% 11/1/15 | | 1,320,000 | | | 1,438,800 |
| 12.50% 11/1/17 | | 1,195,000 | | | 1,320,475 |
| #Terremark Worldwide 144A 12.00% 6/15/17 | | 1,945,000 | | | 2,158,950 |
| #Viasat 144A 8.875% 9/15/16 | | 1,070,000 | | | 1,107,450 |
| #VimpelCom 144A 9.125% 4/30/18 | | 1,140,000 | | | 1,222,650 |
| *Virgin Media Finance 8.375% 10/15/19 | | 1,275,000 | | | 1,318,031 |
| West 11.00% 10/15/16 | | 1,625,000 | | | 1,706,250 |
| #Wind Acquisition Finance 144A | | | | | |
| 11.75% 7/15/17 | | 1,855,000 | | | 2,035,863 |
| 12.00% 12/1/15 | | 1,065,000 | | | 1,144,875 |
| | | | | | 64,390,568 |
| Utilities–3.65% | | | | | |
| AES | | | | | |
| * | 8.00% 10/15/17 | | 1,457,000 | | | 1,502,531 |
| 8.00% 6/1/20 | | 715,000 | | | 731,088 |
| Edison Mission Energy | | | | | |
| * | 7.00% 5/15/17 | | 870,000 | | | 691,650 |
| 7.20% 5/15/19 | | 600,000 | | | 457,500 |
| Elwood Energy 8.159% 7/5/26 | | 1,699,263 | | | 1,571,052 |
| Energy Future Holdings | | | | | |
| 5.55% 11/15/14 | | 990,000 | | | 707,056 |
| 10.875% 11/1/17 | | 990,000 | | | 814,275 |
| *Mirant Americas Generation 8.50% 10/1/21 | | 2,325,000 | | | 2,220,374 |
| NRG Energy | | | | | |
| 7.375% 2/1/16 | | 2,105,000 | | | 2,112,894 |
| 7.375% 1/15/17 | | 400,000 | | | 402,000 |
| Orion Power Holdings 12.00% 5/1/10 | | 1,606,000 | | | 1,654,180 |
| •Puget Sound Energy 6.974% 6/1/67 | | 1,615,000 | | | 1,426,966 |
| *Texas Competitive Electric Holdings | | | | | |
| 10.25% 11/1/15 | | 2,220,000 | | | 1,809,300 |
| | | | | | 16,100,866 |
| Total Corporate Bonds | | | | | |
| (cost $376,736,882) | | | | | 407,747,041 |
High Yield Series-8
Delaware VIP® High Yield Series
Statement of Net Assets (continued)
| | | Principal | | | |
| | | Amount | | Value |
| | | | (U.S. $) | | (U.S. $) |
| «SENIOR SECURED LOANS–1.30% | | | | | |
| Chester Downs & Marina 12.375% 12/31/16 | | $1,040,000 | | $ | 1,049,100 |
| PQ Term Tranche Loan 6.74% 7/30/15 | | 2,524,000 | | | 2,189,570 |
| Texas Competitive Electric Holdings Term | | | | | |
| Tranche Loan B2 3.735% 10/10/14 | | 1,668,569 | | | 1,359,366 |
| Univision Communications Term Tranche | | | | | |
| | Loan B 2.533% 9/29/14 | | 1,295,000 | | | 1,128,269 |
| Total Senior Secured Loans | | | | | |
| (cost $4,999,407) | | | | | 5,726,305 |
| |
| | | Number of | | | |
| | | Shares | | | |
| COMMON STOCK–0.63% | | | | | |
| †Alliance Imaging | | 92,144 | | | 526,142 |
| P=†Avado Brands | | 1,813 | | | 0 |
| Blackstone Group | | 39,000 | | | 511,680 |
| =†Calpine | | 1,204,800 | | | 0 |
| =†Century Communications | | 2,820,000 | | | 0 |
| †DIRECTV Class A | | 21,500 | | | 717,025 |
| †Flextronics International | | 61,050 | | | 446,276 |
| †GeoEye | | 8,000 | | | 223,040 |
| †Mirant | | 827 | | | 12,628 |
| *†Mobile Mini | | 23,557 | | | 331,918 |
| P=†PT Holdings | | 1,905 | | | 19 |
| †USGen | | 475,000 | | | 0 |
| Total Common Stock | | | | | |
| (cost $3,878,847) | | | | | 2,768,728 |
| |
| PREFERRED STOCKS–0.53% | | | | | |
| •Bank of America | | | | | |
| 8.00% | | 2,190,000 | | | 2,111,462 |
| 8.125% | | 265,000 | | | 255,457 |
| =†Port Townsend | | 381 | | | 0 |
| Total Preferred Stocks | | | | | |
| (cost $2,604,131) | | | | | 2,366,919 |
| | | | | | |
| WARRANT–0.00% | | | | | |
| =†Port Townsend | | 381 | | | 4 |
| Total Warrant (cost $9,144) | | | | | 4 |
| |
| | | Principal | | | |
| | | Amount | | | |
| | | (U.S. $) | | | |
| ≠DISCOUNT NOTE–0.14% | | | | | |
| Federal Home Loan Bank | | | | | |
| 0.001% 1/4/10 | | $612,000 | | 612,000 |
| Total Discount Note | | | | | |
| (cost $612,000) | | | | 612,000 |
| |
| Total Value of Securities | | | | | |
| Before Securities Lending | | | | | |
| Collateral–96.20% | | | | | |
| (cost $393,488,143) | | | | 424,405,597 |
| |
| | | Number of | | | |
| | | Shares | | | |
| SECURITIES LENDING | | | | | |
| COLLATERAL**–5.37% | | | | | |
| Investment Companies | | | | | |
| Mellon GSL DBT II Collateral Fund | | 16,883,261 | | 16,883,261 |
| BNY Mellon SL DBT II Liquidating Fund | | 6,838,781 | | 6,756,831 |
| †@ | Mellon GSL Reinvestment Trust II | | 491,181 | | | 20,875 |
| Total Securities Lending Collateral | | | | | |
| (cost $24,213,223) | | | | 23,660,967 |
| TOTAL VALUE OF SECURITIES–101.57% (cost $417,701,366) | | 448,066,564 | © |
| OBLIGATION TO RETURN SECURITIES LENDING COLLATERAL**–(5.49%) | | (24,213,223 | ) |
| RECEIVABLES AND OTHER ASSETS NET OF LIABILITIES–3.92% | | 17,303,114 | |
| NET ASSETS APPLICABLE TO 77,847,909 SHARES OUTSTANDING–100.00% | $ | 441,156,455 | |
| NET ASSET VALUE–DELAWARE VIP HIGH YIELD SERIES | | | |
| STANDARD CLASS ($154,761,203 / 27,272,700 Shares) | | | $5.67 | |
| NET ASSET VALUE–DELAWARE VIP HIGH YIELD SERIES | | | |
| SERVICE CLASS ($286,395,252 / 50,575,209 Shares) | | | $5.66 | |
| COMPONENTS OF NET ASSETS AT DECEMBER 31, 2009: | | | |
| Shares of beneficial interest (unlimited authorization–no par) | $ | 426,834,755 | |
| Undistributed net investment income | | 34,483,825 | |
| Accumulated net realized loss on investments | | (50,527,323 | ) |
| Net unrealized appreciation of investments | | 30,365,198 | |
| Total net assets | $ | 441,156,455 | |
| | | | |
High Yield Series-9
Delaware VIP® High Yield Series
Statement of Net Assets (continued)
____________________
| # | Security exempt from registration under Rule 144A of the Securities Act of 1933, as amended. At December 31, 2009, the aggregate amount of Rule 144A securities was $169,268,439, which represented 38.37% of the Series’ net assets. See Note 10 in “Notes to Financial Statements.” |
| P | Restricted Security. Investment in a security not registered under the Securities Act of 1933, as amended. This security has certain restrictions on resale which may limit its liquidity. At December 31, 2009, the aggregate amount of the restricted securities was $19, or 0.00% of the Series’ net assets. See Note 10 in “Notes to Financial Statements.” |
| † | Non income producing security. |
| ‡ | Non income producing security; security is currently in default. |
| • | Variable rate security. The rate shown is the rate as of December 31, 2009. |
| = | Security is being fair valued in accordance with the Series’ fair valuation policy. At December 31, 2009, the aggregate amount of fair valued securities was $404,859, which represented 0.09% of the Series’ net assets. See Note 1 in “Notes to Financial Statements.” |
| @ | Illiquid security. At December 31, 2009, the aggregate amount of illiquid securities was $2,901,112, which represented 0.66% of the Series’ net assets. See Note 10 in “Notes to Financial Statements.” |
| Φ | Step coupon bond. Coupon increases/decreases periodically based on a predetermined schedule. Stated rate in effect at December 31, 2009. |
| Ω | Step coupon bond. Indicates security that has a zero coupon that remains in effect until a predetermined date at which time the stated interest rate becomes effective. |
| « | Senior Secured Loans generally pay interest at rates which are periodically redetermined by reference to a base lending rate plus a premium. These base lending rates are generally: (i) the prime rate offered by one or more United States banks, (ii) the lending rate offered by one or more European banks such as the London Inter-Bank Offered Rate (LIBOR), and (iii) the certificate of deposit rate. Senior Secured Loans may be subject to restrictions on resale. Stated rate in effect at December 31, 2009. |
| ≠ | The rate shown is the effective yield at the time of purchase. |
| * | Fully or partially on loan. |
| ** | See Note 9 in “Notes to Financial Statements.” |
| © | Includes $23,634,063 of securities loaned. |
PIK – Pay-in-kind
See accompanying notes
High Yield Series-10
Delaware VIP® Trust —
Delaware VIP High Yield Series
Statement of Operations
Year Ended December 31, 2009
| INVESTMENT INCOME: | | | | |
| Interest | | $ | 39,256,606 | |
| Securities lending income | | | 151,711 | |
| Dividends | | | 447,818 | |
| | | 39,856,135 | |
| |
| EXPENSES: | | | | |
| Management fees | | | 2,403,484 | |
| Distribution expenses – Service Class | | | 729,992 | |
| Accounting and administration expenses | | | 148,297 | |
| Reports and statements to shareholders | | | 96,849 | |
| Legal fees | | | 56,222 | |
| Dividend disbursing and transfer agent fees and expenses | | | 44,385 | |
| Audit and tax | | | 35,996 | |
| Trustees’ fees | | | 24,022 | |
| Pricing fees | | | 14,548 | |
| Custodian fees | | | 11,566 | |
| Insurance fees | | | 9,906 | |
| Consulting fees | | | 4,639 | |
| Dues and services | | | 3,405 | |
| Registration fees | | | 2,192 | |
| Trustees’ expenses | | | 1,733 | |
| | | 3,587,236 | |
| Less fees waived | | | (29,988 | ) |
| Less waiver of distribution expenses – Service Class | | | (121,552 | ) |
| Total operating expenses | | | 3,435,696 | |
| |
| NET INVESTMENT INCOME | | | 36,420,439 | |
| |
| NET REALIZED AND UNREALIZED GAIN (LOSS) | | | | |
| ON INVESTMENTS: | | | | |
| Net realized gain (loss) on: | | | | |
| Investments | | | 2,281,455 | |
| Swap contracts | | | (113,448 | ) |
| Net realized gain | | | 2,168,007 | |
| Net change in unrealized appreciation/depreciation | | | | |
| of investments and swap contracts | | | 107,530,365 | |
| |
| NET REALIZED AND UNREALIZED GAIN | | | | |
| ON INVESTMENTS | | | 109,698,372 | |
| |
| NET INCREASE IN NET ASSETS RESULTING | | | | |
| FROM OPERATIONS | | $ | 146,118,811 | |
| | | | | |
See accompanying notes
Delaware VIP Trust —
Delaware VIP High Yield Series
Statements of Changes in Net Assets
| | Year Ended |
| | 12/31/09 | | 12/31/08 |
| INCREASE (DECREASE) IN NET | | | | | | | | |
| ASSETS FROM OPERATIONS: | | | | | | | | |
| Net investment income | | $ | 36,420,439 | | | $ | 26,584,383 | |
| Net realized gain (loss) on investments | | | 2,168,007 | | | | (43,447,588 | ) |
| Net change in unrealized appreciation/ | | | | | | | | |
| depreciation of investments and | | | | | | | | |
| swap contracts | | | 107,530,365 | | | | (70,119,098 | ) |
| Net increase (decrease) in net assets | | | | | | | | |
| resulting from operations | | | 146,118,811 | | | | (86,982,303 | ) |
| |
| DIVIDENDS AND DISTRIBUTIONS | | | | | | | | |
| TO SHAREHOLDERS FROM: | | | | | | | | |
| Net investment income: | | | | | | | | |
| Standard Class | | | (9,272,175 | ) | | | (10,325,738 | ) |
| Service Class | | | (17,460,896 | ) | | | (16,189,243 | ) |
| | | (26,733,071 | ) | | | (26,514,981 | ) |
| |
| CAPITAL SHARE TRANSACTIONS: | | | | | | | | |
| Proceeds from shares sold: | | | | | | | | |
| Standard Class | | | 50,357,353 | | | | 41,371,907 | |
| Service Class | | | 127,446,968 | | | | 80,977,060 | |
| Net asset value of shares issued upon | | | | | | | | |
| reinvestment of dividends and distributions: | | | | | | | | |
| Standard Class | | | 9,272,175 | | | | 10,325,738 | |
| Service Class | | | 17,460,896 | | | | 16,189,243 | |
| | | | 204,537,392 | | | | 148,863,948 | |
| Cost of shares repurchased: | | | | | | | | |
| Standard Class | | | (38,662,229 | ) | | | (47,611,036 | ) |
| Service Class | | | (115,694,169 | ) | | | (67,694,861 | ) |
| | | | (154,356,398 | ) | | | (115,305,897 | ) |
| Increase in net assets derived from | | | | | | | | |
| capital share transactions | | | 50,180,994 | | | | 33,558,051 | |
| |
| NET INCREASE (DECREASE) | | | | | | | | |
| IN NET ASSETS | | | 169,566,734 | | | | (79,939,233 | ) |
| |
| NET ASSETS: | | | | | | | | |
| Beginning of year | | | 271,589,721 | | | | 351,528,954 | |
| End of year (including undistributed | | | | | | | | |
| net investment income of $34,483,825, | | | | | | | | |
| and $26,271,758, respectively) | | $ | 441,156,455 | | | $ | 271,589,721 | |
| | | | | | | | | |
See accompanying notes
High Yield Series-11
Delaware VIP® Trust — Delaware VIP High Yield Series
Financial Highlights
Selected data for each share of the Series outstanding throughout each period were as follows:
| | Delaware VIP High Yield Series Standard Class | |
| | Year Ended | |
| | 12/31/09 | | | 12/31/08 | | | 12/31/07 | | | 12/31/06 | | | 12/31/05 | |
| Net asset value, beginning of period | | $4.140 | | | $5.950 | | | $6.200 | | | $5.910 | | | $6.110 | |
| |
| Income (loss) from investment operations: | | | | | | | | | | | | | | | |
| Net investment income1 | | 0.488 | | | 0.430 | | | 0.464 | | | 0.473 | | | 0.434 | |
| Net realized and unrealized gain (loss) on investments | | | | | | | | | | | | | | | |
| and foreign currencies | | 1.414 | | | (1.766 | ) | | (0.290 | ) | | 0.226 | | | (0.227 | ) |
| Total from investment operations | | 1.902 | | | (1.336 | ) | | 0.174 | | | 0.699 | | | 0.207 | |
| |
| Less dividends and distributions from: | | | | | | | | | | | | | | | |
| Net investment income | | (0.372 | ) | | (0.474 | ) | | (0.424 | ) | | (0.409 | ) | | (0.407 | ) |
| Total dividends and distributions | | (0.372 | ) | | (0.474 | ) | | (0.424 | ) | | (0.409 | ) | | (0.407 | ) |
| |
| Net asset value, end of period | | $5.670 | | | $4.140 | | | $5.950 | | | $6.200 | | | $5.910 | |
| |
| Total return2 | | 48.97% | | | (24.17% | ) | | 2.79% | | | 12.45% | | | 3.59% | |
| |
| Ratios and supplemental data: | | | | | | | | | | | | | | | |
| Net assets, end of period (000 omitted) | | $154,761 | | | $93,011 | | | $132,667 | | | $105,576 | | | $70,139 | |
| Ratio of expenses to average net assets | | 0.76% | | | 0.74% | | | 0.75% | | | 0.78% | | | 0.78% | |
| Ratio of expenses to average net assets | | | | | | | | | | | | | | | |
| prior to fees waived and expense paid indirectly | | 0.77% | | | 0.77% | | | 0.75% | | | 0.78% | | | 0.78% | |
| Ratio of net investment income to average net assets | | 10.01% | | | 8.35% | | | 7.66% | | | 8.01% | | | 7.39% | |
| Ratio of net investment income to average net assets | | | | | | | | | | | | | | | |
| prior to fees waived and expense paid indirectly | | 10.00% | | | 8.32% | | | 7.66% | | | 8.01% | | | 7.39% | |
| Portfolio turnover | | 123% | | | 109% | | | 143% | | | 132% | | | 162% | |
____________________
1The average shares outstanding method has been applied for per share information.
2Total investment return is based on the change in net asset value of a share during the period and assumes reinvestment of dividends and distributions at net asset value. Total investment return during some of the periods shown reflects a waiver by the manager. Performance would have been lower had the waiver not been in effect.
See accompanying notes
High Yield Series-12
Delaware VIP® High Yield Series
Financial Highlights (continued)
Selected data for each share of the Series outstanding throughout each period were as follows:
| | Delaware VIP High Yield Series Service Class | |
| | Year Ended | |
| | 12/31/09 | | | 12/31/08 | | | 12/31/07 | | | 12/31/06 | | | 12/31/05 | |
| Net asset value, beginning of period | | $4.130 | | | $5.930 | | | $6.190 | | | $5.900 | | | $6.100 | |
| |
| Income (loss) from investment operations: | | | | | | | | | | | | | | | |
| Net investment income1 | | 0.475 | | | 0.418 | | | 0.448 | | | 0.458 | | | 0.419 | |
| Net realized and unrealized gain (loss) on investments | | | | | | | | | | | | | | | |
| and foreign currencies | | 1.414 | | | (1.759 | ) | | (0.299 | ) | | 0.226 | | | (0.226 | ) |
| Total from investment operations | | 1.889 | | | (1.341 | ) | | 0.149 | | | 0.684 | | | 0.193 | |
| |
| Less dividends and distributions from: | | | | | | | | | | | | | | | |
| Net investment income | | (0.359 | ) | | (0.459 | ) | | (0.409 | ) | | (0.394 | ) | | (0.393 | ) |
| Total dividends and distributions | | (0.359 | ) | | (0.459 | ) | | (0.409 | ) | | (0.394 | ) | | (0.393 | ) |
| |
| Net asset value, end of period | | $5.660 | | | $4.130 | | | $5.930 | | | $6.190 | | | $5.900 | |
| |
| Total return2 | | 48.65% | | | (24.43% | ) | | 2.55% | | | 12.19% | | | 3.34% | |
| |
| Ratios and supplemental data: | | | | | | | | | | | | | | | |
| Net assets, end of period (000 omitted) | | $286,395 | | | $178,579 | | | $218,862 | | | $200,768 | | | $162,384 | |
| Ratio of expenses to average net assets | | 1.01% | | | 0.99% | | | 1.00% | | | 1.03% | | | 1.03% | |
| Ratio of expenses to average net assets | | | | | | | | | | | | | | | |
| prior to fees waived and expense paid indirectly | | 1.07% | | | 1.07% | | | 1.05% | | | 1.08% | | | 1.08% | |
| Ratio of net investment income to average net assets | | 9.76% | | | 8.10% | | | 7.41% | | | 7.76% | | | 7.14% | |
| Ratio of net investment income to average net assets | | | | | | | | | | | | | | | |
| prior to fees waived and expense paid indirectly | | 9.70% | | | 8.02% | | | 7.36 | | | 7.71% | | | 7.09% | |
| Portfolio turnover | | 123% | | | 109% | | | 143% | | | 132% | | | 162% | |
____________________
1The average shares outstanding method has been applied for per share information.
2Total investment return is based on the change in net asset value of a share during the period and assumes reinvestment of dividends and distributions at net asset value. Total investment return during some of the periods shown reflects waivers by the manager and distributor. Performance would have been lower had the waivers not been in effect.
See accompanying notes
High Yield Series-13
Delaware VIP® Trust — Delaware VIP High Yield Series
Notes to Financial Statements
December 31, 2009
Delaware VIP Trust (Trust) is organized as a Delaware statutory trust and offers 12 series: Delaware VIP Cash Reserve Series, Delaware VIP Diversified Income Series, Delaware VIP Emerging Markets Series, Delaware VIP Growth Opportunities Series, Delaware VIP High Yield Series, Delaware VIP International Value Equity Series, Delaware VIP Limited-Term Diversified Income Series (formerly, Delaware VIP Capital Reserves Series), Delaware VIP REIT Series, Delaware VIP Small Cap Value Series, Delaware VIP Trend Series, Delaware VIP U.S. Growth Series and Delaware VIP Value Series. These financial statements and the related notes pertain to Delaware VIP High Yield Series (Series). The Trust is an open-end investment company. The Series is considered diversified under the Investment Company Act of 1940, as amended, and offers Standard Class and Service Class shares. The Standard Class shares do not carry a 12b-1 fee and the Service Class shares carry a 12b-1 fee. The shares of the Series are sold only to separate accounts of life insurance companies.
The investment objective of the Series is to seek total return and, as a secondary objective, high current income.
1. Significant Accounting Policies
The following accounting policies are in accordance with U.S. generally accepted accounting principles (U.S. GAAP) and are consistently followed by the Series.
Security Valuation—Equity securities, except those traded on the Nasdaq Stock Market, Inc. (Nasdaq), are valued at the last quoted sales price as of the time of the regular close of the New York Stock Exchange (NYSE) on the valuation date. Securities traded on the Nasdaq are valued in accordance with the Nasdaq Official Closing Price, which may not be the last sales price. If on a particular day an equity security does not trade, then the mean between the bid and ask prices will be used. Short-term debt securities are valued at market value. Other debt securities, credit default swap (CDS) contracts and interest rate swap contracts are valued by an independent pricing service or broker. To the extent current market prices are not available, the pricing service may take into account developments related to the specific security, as well as transactions in comparable securities. Investment companies are valued at net asset value per share. Generally, other securities and assets for which market quotations are not readily available are valued at fair value as determined in good faith under the direction of the Series’ Board of Trustees (Board). In determining whether market quotations are readily available or fair valuation will be used, various factors will be taken into consideration, such as market closures or suspension of trading in a security. The Series may use fair value pricing more frequently for securities traded primarily in non-U.S. markets because, among other things, most foreign markets close well before the Series values its securities at 4:00 p.m. Eastern time. The earlier close of these foreign markets gives rise to the possibility that significant events, including broad market moves, government actions or pronouncements, aftermarket trading, or news events may have occurred in the interim. To account for this, the Series may frequently value foreign securities using fair value prices based on third-party vendor modeling tools (international fair value pricing).
Federal Income Taxes—No provision for federal income taxes has been made as the Series intends to continue to qualify for federal income tax purposes as a regulated investment company under Subchapter M of the Internal Revenue Code of 1986, as amended, and make the requisite distributions to shareholders. The Series evaluates tax positions taken or expected to be taken in the course of preparing the Series’ tax returns to determine whether the tax positions are “more-likely-than-not” of being sustained by the applicable tax authority. Tax positions not deemed to meet the more-likely-than-not threshold are recorded as a tax benefit or expense in the current year. Management has analyzed the Series’ tax positions taken on federal income tax returns for all open tax years (tax years ended December 31, 2006 – December 31, 2009), and has concluded that no provision for federal income tax is required in the Series’ financial statements.
Class Accounting—Investment income, common expenses and realized and unrealized gain (loss) on investments are allocated to the classes of the Series on the basis of daily net assets of each class. Distribution expenses relating to a specific class are charged directly to that class.
Repurchase Agreements—The Series may invest in a pooled cash account along with other members of the Delaware Investments® Family of Funds pursuant to an exemptive order issued by the Securities and Exchange Commission. The aggregate daily balance of the pooled cash account is invested in repurchase agreements secured by obligations of the U.S. government. The respective collateral is held by the Series’ custodian bank until the maturity of the respective repurchase agreements. Each repurchase agreement is at least 102% collateralized. However, in the event of default or bankruptcy by the counterparty to the agreement, realization of the collateral may be subject to legal proceedings. At December 31, 2009, the Series held no investments in repurchase agreements.
Use of Estimates—The preparation of financial statements in conformity with U.S. GAAP requires management to make estimates and assumptions that affect the reported amounts of assets and liabilities at the date of the financial statements and the reported amounts of revenues and expenses during the reporting period. Actual results could differ from those estimates.
Other—Expenses directly attributable to the Series are charged directly to the Series. Other expenses common to various funds within the Delaware Investments Family of Funds are generally allocated amongst such funds on the basis of average net assets. Management fees and some other expenses are paid monthly. Security transactions are recorded on the date the securities are purchased or sold (trade date) for financial reporting purposes. Costs used in calculating realized gains and losses on the sale of investment securities are those of the specific securities sold. Dividend income is recorded on the ex-dividend date and interest income is recorded on the accrual basis. Discounts and premiums on non-convertible bonds are amortized to interest income over the lives of the respective securities. Realized gains (losses) on paydowns of mortgage- and asset-backed securities are classified as interest income. The Series declares and pays dividends from net investment income and distributions from net realized gain on investments, if any, following the close of the fiscal year.
The Series may receive earnings credits from its custodian when positive cash balances are maintained, which are used to offset custody fees. There were no earnings credits for the year ended December 31, 2009.
High Yield Series-14
Delaware VIP® High Yield Series
Notes to Financial Statements (continued)
1. Significant Accounting Policies (continued)
On July 1, 2009, the Financial Accounting Standards Board (FASB) issued the FASB Accounting Standards Codification (Codification). The Codification became the single source of authoritative nongovernmental U.S. GAAP, superseding existing literature of the FASB, American Institute of Certified Public Accountants, Emerging Issues Task Force and other sources. The Codification is effective for interim and annual periods ending after September 15, 2009. The Series adopted the Codification for the year ended December 31, 2009. There was no impact to financial statements as the Codification requirements are disclosure-only in nature.
Management has evaluated whether any events or transactions occurred subsequent to December 31, 2009 through February 17, 2010, the date of issuance of the Series’ financial statements, and determined that there were no material events or transactions that would require recognition or disclosure in the Series’ financial statements.
2. Investment Management, Administration Agreements and Other Transactions with Affiliates
In accordance with the terms of its investment management agreement, the Series pays Delaware Management Company (DMC), a series of Delaware Management Business Trust and the investment manager, an annual fee which is calculated daily at the rate of 0.65% on the first $500 million of average daily net assets of the Series, 0.60% on the next $500 million, 0.55% on the next $1.5 billion, and 0.50% on average daily net assets in excess of $2.5 billion.
Effective May 1, 2009, DMC has voluntarily agreed to waive that portion, if any, of its management fee and/or pay/reimburse the Series to the extent necessary to ensure that total annual operating expenses (excluding any 12b-1 plan expenses, taxes, interest, inverse floater program expenses, brokerage fees, certain insurance costs and nonroutine expenses or costs including, but not limited to, those relating to reorganizations, litigation, conducting shareholder meetings, and liquidations (collectively, “nonroutine expenses”)) do not exceed 0.77% of average daily net assets of the Series until such time as the voluntary expense cap is discontinued. Prior to May 1, 2009, DMC had contractually agreed to waive that portion, if any, of its management fee and reimburse the Series to the extent necessary to ensure that the total annual operating expenses (excluding any 12b-1 plan expenses, taxes, interest, inverse floater program expenses, brokerage fees, certain insurance costs, and nonroutine expenses did not exceed 0.74% of average daily net assets of the Series through April 30, 2009. For purposes of this waiver and reimbursement, nonroutine expenses may also include such additional costs and expenses, as may be agreed upon from time to time by the Series’ Board and DMC. This expense waiver and reimbursement applies only to expenses paid directly by the Series, and may be discontinued at any time because they are voluntary. Effective August 17, 2009, the expense waiver was discontinued.
Delaware Service Company, Inc. (DSC), an affiliate of DMC, provides fund accounting and financial administration oversight services to the Series. For these services, the Series pays DSC fees based on the aggregate daily net assets of the Delaware Investments® Family of Funds at the following annual rate: 0.0050% of the first $30 billion; 0.0045% of the next $10 billion; 0.0040% of the next $10 billion; and 0.0025% of aggregate average daily net assets in excess of $50 billion. The fees payable to DSC under the service agreement described above are allocated among all funds in the Delaware Investments Family of Funds on a relative net asset value basis. For the year ended December 31, 2009, the Series was charged $18,537 for these services.
DSC also provides dividend disbursing and transfer agency services. The Series pays DSC a monthly fee based on the number of shareholder accounts for dividend disbursing and transfer agent services.
Pursuant to a distribution agreement and distribution plan, the Series pays Delaware Distributors, L.P. (DDLP), the distributor and an affiliate of DMC, an annual distribution and service fee not to exceed 0.30% of the average daily net assets of the Service Class shares. DDLP has contracted to waive distribution and service fees through April 30, 2010 in order to prevent distribution and service fees of the Service Class shares from exceeding 0.25% of average daily net assets. Standard Class shares pay no distribution and service expenses.
At December 31, 2009, the Series had liabilities payable to affiliates as follows:
| | | Dividend Disbursing, | | | | Other |
| Investment | | Transfer Agent and Fund | | | | Expenses |
| Management | | Accounting Oversight | | Distribution | | Payable |
| Fee Payable to | | Fees and Other Expenses | | Fee Payable | | to DMC |
| DMC | | Payable to DSC | | to DDLP | | and Affiliates* |
| | $239,894 | | $4,625 | | $60,002 | | $32,566 |
____________________
*DMC, as part of its administrative services, pays operating expenses on behalf of the Series and is reimbursed on a periodic basis. Such expenses include items such as printing of shareholder reports, fees for audit, legal and tax services, custodian fees and trustees’ fees.
As provided in the investment management agreement, the Series bears the cost of certain legal and tax services, including internal legal and tax services provided to the Series by DMC and/or its affiliates’ employees. For the year ended December 31, 2009, the Series was charged $31,496 for internal legal and tax services provided by DMC and/or its affiliates’ employees.
Trustees’ fees include expenses accrued by the Series for each Trustee’s retainer and meeting fees. Certain officers of DMC, DSC and DDLP are officers and/or Trustees of the Trust. These officers and Trustees are paid no compensation by the Series.
High Yield Series-15
Delaware VIP® High Yield Series
Notes to Financial Statements (continued)
3. Investments
For the year ended December 31, 2009, the Series made purchases and sales of investment securities other than short-term investments as follows:
| Purchases | | $ | 505,195,764 |
| Sales | | $ | 429,982,740 |
At December 31, 2009, the cost of investments and unrealized appreciation (depreciation) for federal income tax purposes for the Series were as follows:
| | | Aggregate | | Aggregate | | |
| Cost of | | Unrealized | | Unrealized | | Net Unrealized |
| Investments | | Appreciation | | Depreciation | | Appreciation |
| | $416,371,013 | | $35,913,206 | | $(4,217,655) | �� | $31,695,551 |
U.S. GAAP defines fair value as the price that the Series would receive to sell an asset or pay to transfer a liability in an orderly transaction between market participants at the measurement date under current market conditions. A framework for measuring fair value and a three level hierarchy for fair value measurements has been established based upon the transparency of inputs to the valuation of an asset or liability. Inputs may be observable or unobservable and refer broadly to the assumptions that market participants would use in pricing the asset or liability. Observable inputs reflect the assumptions market participants would use in pricing the asset or liability based on market data obtained from sources independent of the reporting entity. Unobservable inputs reflect the reporting entity’s own assumptions about the assumptions that market participants would use in pricing the asset or liability developed based on the best information available under the circumstances. The Series’ investment in its entirety is assigned a level based upon the observability of the inputs which are significant to the overall valuation. The three-tier hierarchy of inputs is summarized below.
Level 1 – inputs are quoted prices in active markets
Level 2 – inputs are observable, directly or indirectly
Level 3 – inputs are unobservable and reflect assumptions on the part of the reporting entity
The following table summarizes the valuation of the Series’ investments by the fair value hierarchy levels as of December 31, 2009:
| | Level 1 | | Level 2 | | Level 3 | | Total |
| Corporate Debt | | $ | – | | $ | 418,253,110 | | $ | 404,836 | | $ | 418 ,657,946 |
| Common Stock | | | 2,768,709 | | | – | | | 19 | | | 2,768,728 |
| Short Term | | | – | | | 612,000 | | | – | | | 612,000 |
| Other | | | – | | | 2,366,919 | | | 4 | | | 2,366,923 |
| Securities Lending Collateral | | | 16,883,261 | | | 6,756,831 | | | 20,875 | | | 23,660,967 |
| Total | | $ | 19,651,970 | | $ | 427,988,860 | | $ | 425,734 | | $ | 448,066,564 |
| | | | | | | | | | | | | |
The following is a reconciliation of investments in which significant unobservable inputs (Level 3) were used in determining fair value:
| | | | | | | | | | | | | | | | Securities | | | | |
| | Corporate | | Common | | | | | | Lending | | Total |
| | Debt | | Stock | | Other | | Collateral | | Series |
| Balance as of 12/31/08 | | | $ | 386,715 | | | | $ | 19 | | | $ | 4 | | | | $ | 16,209 | | | $ | 402,947 | |
| Net realized loss | | | | – | | | | | – | | | | (72,431 | ) | | | | – | | | | (72,431 | ) |
| Net change in unrealized appreciation/depreciation | | | | – | | | | | – | | | | 72,431 | | | | | 4,666 | | | | 77,097 | |
| Purchases | | | | 18,121 | | | | | – | | | | – | | | | | – | | | | 18,121 | |
| Balance as of 12/31/09 | | | $ | 404,836 | | | | $ | 19 | | | $ | 4 | | | | $ | 20,875 | | | $ | 425,734 | |
| |
| Net change in unrealized appreciation/depreciation | | | | | | | | | | | | | | | | | | | | | | | |
| from investments still held as of 12/31/09 | | | $ | – | | | | $ | – | | | $ | – | | | | $ | 4,666 | | | $ | 4,666 | |
In January 2010, the Financial Accounting Standards Board issued an Accounting Standards Update, Improving Disclosures about Fair Value Measurements, which introduces new disclosure requirements and clarifies certain existing disclosure requirements around fair value measurements currently presented above. The new disclosures and clarifications of existing disclosures are generally effective for the Series’ year ending December 31, 2010 and interim periods therein. Management is evaluating the impact of this update on its current disclosures.
High Yield Series-16
Delaware VIP® High Yield Series
Notes to Financial Statements (continued)
4. Dividend and Distribution Information
Income and long-term capital gain distributions are determined in accordance with federal income tax regulations, which may differ from U.S. GAAP. Additionally, distributions from net short-term gains on sales of investment securities are treated as ordinary income for federal income tax purposes. The tax character of dividends and distributions paid during the years ended December 31, 2009 and 2008 was as follows:
| | Year | | Year |
| | Ended | | Ended |
| | 12/31/09 | | 12/31/08 |
| Ordinary income | | $26,733,071 | | $26,514,981 |
5. Components of Net Assets on a Tax Basis
As of December 31, 2009, the components of net assets on a tax basis were as follows:
| Shares of beneficial interest | $ | 426,834,755 | |
| Undistributed ordinary income | | 34,561,792 | |
| Capital loss carryforwards | | (51,857,676 | ) |
| Other temporary differences | | (77,967 | ) |
| Unrealized appreciation of investments | | 31,695,551 | |
| Net assets | $ | 441,156,455 | |
| | | | |
The differences between book basis and tax basis components of net assets are primarily attributable to tax deferral of losses on wash sales, contingent payment debt instruments and tax treatment of market discount and premium on debt instruments.
For financial reporting purposes, capital accounts are adjusted to reflect the tax character of permanent book/tax differences. Reclassifications are primarily due to tax treatment of market discount and premium on certain debt instruments, expiration of capital loss carryforwards and tax treatment of CDS contracts. Results of operations and net assets were not affected by these reclassifications. For the year ended December 31, 2009, the Series recorded the following reclassifications:
| | Undistributed | | Accumulated | | |
| | Net Investment | | Net Realized | | Paid in |
| | Income | | Loss | | Capital |
| | $(1,475,301) | | $19,558,091 | | $(18,082,790) |
For federal income tax purposes, capital loss carryforwards may be carried forward and applied against future capital gains. $18,082,790 expired in 2009. Capital loss carryforwards remaining at December 31, 2009 will expire as follows: $4,569,135 expires in 2010; $561,008 expires in 2015; $36,349,246 expires in 2016 and $10,378,287 expires in 2017.
6. Capital Shares
Transactions in capital shares were as follows:
| Year | | Year |
| Ended | | Ended |
| 12/31/09 | | 12/31/08 |
| Shares sold: | | | | | |
| Standard Class | 10,615,179 | | | 8,048,858 | |
| Service Class | 27,589,302 | | | 16,546,987 | |
| |
| Shares issued upon reinvestment of dividends and distributions: | | | | | |
| Standard Class | 2,186,834 | | | 1,955,632 | |
| Service Class | 4,118,136 | | | 3,066,144 | |
| | 44,509,451 | | | 29,617,621 | |
| Shares repurchased: | | | | | |
| Standard Class | (8,011,315 | ) | | (9,830,584 | ) |
| Service Class | (24,407,080 | ) | | (13,234,600 | ) |
| | (32,418,395 | ) | | (23,065,184 | ) |
| Net increase | 12,091,056 | | | 6,552,437 | |
| | | | | | |
High Yield Series-17
Delaware VIP® High Yield Series
Notes to Financial Statements (continued)
7. Line of Credit
The Series, along with certain other funds in the Delaware Investments® Family of Funds (Participants), participates in a $35,000,000 revolving line of credit with The Bank of New York Mellon (BNY Mellon) to be used for temporary or emergency purposes as an additional source of liquidity to fund redemptions of investor shares. Under the agreement, Participants are charged an annual commitment fee, which is allocated across the Participants on the basis of each Participant’s allocation of the entire facility. The Participants may borrow up to a maximum of one third of their net assets under the agreement. The agreement expires on November 16, 2010. The Series had no amounts outstanding as of December 31, 2009, or at any time during the year then ended.
8. Derivatives
U.S. GAAP requires enhanced disclosures that enable investors to understand: 1) how and why an entity uses derivatives, 2) how they are accounted for, and 3) how they affect an entity’s results of operations and financial position.
Swap Contracts
The Series may enter into CDS contracts in the normal course of pursuing its investment objectives. The Series may enter into CDS contracts in order to hedge against a credit event, to enhance total return or to gain exposure to certain securities or markets.
Credit Default Swaps. A CDS contract is a risk-transfer instrument through which one party (purchaser of protection) transfers to another party (seller of protection) the financial risk of a credit event (as defined in the CDS agreement), as it relates to a particular reference security or basket of securities (such as an index). In exchange for the protection offered by the seller of protection, the purchaser of protection agrees to pay the seller of protection a periodic amount at a stated rate that is applied to the notional amount of the CDS contract. In addition, an upfront payment may be made or received by the Series in connection with an unwinding or assignment of a CDS contract. Upon the occurrence of a credit event, the seller of protection would pay the par (or other agreed-upon) value of the reference security (or basket of securities) to the counterparty. Credit events generally include, among others, bankruptcy, failure to pay, and obligation default.
During the year ended December 31, 2009, the Series entered into CDS contracts as a purchaser of protection. Periodic payments on such contracts are accrued daily and recorded as unrealized losses on swap contracts. Upon payment, such amounts are recorded as realized losses on swap contracts. Upfront payments made or received in connection with CDS contracts are amortized over the expected life of the CDS contracts as unrealized losses (gains) on swap contracts. The change in value of CDS contracts is recorded as unrealized appreciation or depreciation daily. A realized gain or loss is recorded upon a credit event (as defined in the CDS agreement) or the maturity or termination of the agreement. For the year ended December 31, 2009, the Series did not enter into any CDS contracts as a seller of protection. There were no outstanding swap contracts at December 31, 2009.
Credit default swaps may involve greater risks than if the Series had invested in the reference obligation directly. Credit default swaps are subject to general market risk, liquidity risk, counterparty risk and credit risk. The Series’ maximum risk of loss from counterparty credit risk, either as the seller of protection or the buyer of protection, is the fair value of the contract. This risk is mitigated by having a netting arrangement between the Series and the counterparty and by the posting of collateral by the counterparty to the Series to cover the Series’ exposure to the counterparty.
Swaps Generally. Because there is no organized market for swap contracts, the value of open swaps may differ from that which would be realized in the event the Series terminated its position in the agreement. Risks of entering into these contracts include the potential inability of the counterparty to meet the terms of the contracts. This type of risk is generally limited to the amount of favorable movement in the value of the underlying security, instrument or basket of instruments, if any, at the day of default. Risks also arise from potential losses from adverse market movements and such losses could exceed the unrealized amounts shown on the statements of net assets.
9. Securities Lending
The Series, along with other funds in the Delaware Investments® Family of Funds, may lend its securities pursuant to a security lending agreement (Lending Agreement) with BNY Mellon. With respect to each loan, if the aggregate market value of securities collateral held plus cash collateral received on any business day is less than the aggregate market value of the securities which are the subject of such loan, the borrower will be notified to provide additional collateral not less than the applicable collateral requirements. Cash collateral received is generally invested in the Mellon GSL DBT II Collateral Fund (Collective Trust) established by BNY Mellon for the purpose of investment on behalf of clients participating in its securities lending programs. The Collective Trust may invest in fixed income securities, with a weighted average maturity not to exceed 90 days, rated in one of the top three tiers by Standard & Poor’s Ratings Group (S&P) or Moody’s Investors Service, Inc. (Moody’s) or repurchase agreements collateralized by such securities. The Collective Trust seeks to maintain a net asset value per unit of $1.00, but there can be no assurance that it will always be able to do so. At December 31, 2009, the Collective Trust held only cash and assets with a maturity of one business day or less (Cash/Overnight Assets). The Series may incur investment losses as a result of investing securities lending collateral in the Collective Trust. This could occur if an investment in the Collective Trust defaulted or if it were necessary to liquidate assets in the Collective Trust to meet returns on outstanding security loans at a time when the Collective Trust’s net asset value per unit was less than $1.00. Under those circumstances, the Series may not receive an amount from the Collective Trust that is equal in amount to the collateral the Series would be required to return to the borrower of the securities and the Series would be required to make up for this shortfall. Effective April 20, 2009, BNY Mellon transferred the assets of the Collective Trust other than the Cash/Overnight Assets to the BNY Mellon SL DBT II Liquidating Fund (Liquidating Fund), effectively bifurcating the collateral investment pool. The Series’ exposure to the Liquidating Fund is expected to decrease as the Liquidating Fund’s assets mature or are sold. In October 2008, BNY Mellon transferred certain distressed securities from the Collective Trust into the Mellon GSL Reinvestment Trust II. The Series can also accept U.S. government securities and letters of credit (non-cash collateral) in connection with securities loans. In the event of default or bankruptcy by the lending agent, realization and/or retention of the collateral may be subject to legal proceedings. In the event the borrower fails to return loaned securities and the collateral received is insufficient to cover the value of the loaned securities and provided such collateral shortfall is not the result of investment losses, the lending agent has agreed to pay the amount of the shortfall to the Series, or at the discretion of the lending agent, replace the loaned securities. The Series continues to record dividends or interest, as applicable, on the securities loaned and is subject to change in value of the securities loaned that may occur during the term of the loan. The Series has the right under the Lending Agreement
High Yield Series-18
Delaware VIP® High Yield Series
Notes to Financial Statements (continued)
9. Securities Lending (continued)
to recover the securities from the borrower on demand. With respect to security loans collateralized by non-cash collateral, the Series receives loan premiums paid by the borrower. With respect to security loans collateralized by cash collateral, the earnings from the collateral investments are shared among the Series, the security lending agent and the borrower. The Series records security lending income net of allocations to the security lending agent and the borrower.
At December 31, 2009, the value of the securities on loan was $23,634,063, for which cash collateral was received and invested in accordance with the Lending Agreement. At December 31, 2009, the value of invested collateral was $23,660,967. Such investments are presented on the Statement of Net Assets under the caption “Securities Lending Collateral.”
10. Credit and Market Risk
The Series invests in high yield fixed income securities, which carry ratings of BB or lower by S&P and/or Ba or lower by Moody’s. Investments in these higher yielding securities are generally accompanied by a greater degree of credit risk than higher rated securities. Additionally, lower rated securities may be more susceptible to adverse economic and competitive industry conditions than investment grade securities.
The Series may invest up to 15% of its net assets in illiquid securities, which may include securities with contractual restrictions on resale, securities exempt from registration under Rule 144A of the Securities Act of 1933, as amended, and other securities which may not be readily marketable. The relative illiquidity of these securities may impair the Series from disposing of them in a timely manner and at a fair price when it is necessary or desirable to do so. While maintaining oversight, the Series’ Board has delegated to DMC the day-to-day functions of determining whether individual securities are liquid for purposes of the Series’ limitation on investments in illiquid assets. Securities eligible for resale pursuant to Rule 144A, which are determined to be liquid, are not subject to the Series’ 15% limit on investments in illiquid securities. Rule 144A and illiquid securities have been identified on the Statement of Net Assets.
11. Contractual Obligations
The Series enters into contracts in the normal course of business that contain a variety of indemnifications. The Series’ maximum exposure under these arrangements is unknown. However, the Series has not had prior claims or losses pursuant to these contracts. Management has reviewed the Series’ existing contracts and expects the risk of loss to be remote.
12. Sale of Delaware Investments to Macquarie Group
On August 18, 2009, Lincoln National Corporation (parent company of Delaware Investments) and Macquarie Group (Macquarie) entered into an agreement pursuant to which Delaware Investments, including DMC, DDLP and DSC, would be acquired by Macquarie, an Australia-based global provider of banking, financial, advisory, investment and funds management services (Transaction). The Transaction was completed on January 4, 2010. DMC, DDLP and DSC are now wholly-owned subsidiaries of Macquarie.
The Transaction resulted in a change of control of DMC which, in turn, caused the termination of the investment advisory agreement between DMC and the Series. On January 4, 2010, the new investment advisory agreement between DMC and the Series that was approved by the shareholders became effective.
13. Tax Information (Unaudited)
For the fiscal year ended December 31, 2009, the Series designates distributions paid during the year as follows:
| | (A) | | (B) | | |
| | Long-Term | | Ordinary | | |
| | Capital Gain | | Income | | Total |
| | Distributions | | Distributions | | Distributions |
| | (Tax Basis) | | (Tax Basis) | | (Tax Basis) |
| | – | | 100% | | 100% |
____________________
(A) and (B) are based on a percentage of the Series’ total distributions.
High Yield Series-19
Delaware VIP® Trust — Delaware VIP High Yield Series
Report of Independent Registered Public Accounting Firm
To the Shareholders and Board of Trustees
Delaware VIP Trust–Delaware VIP High Yield Series
We have audited the accompanying statement of net assets of the Delaware VIP High Yield Series (one of the series constituting Delaware VIP Trust) (the “Series”) as of December 31, 2009, and the related statement of operations for the year then ended, the statements of changes in net assets for each of the two years in the period then ended, and the financial highlights for each of the five years in the period then ended. These financial statements and financial highlights are the responsibility of the Series’ management. Our responsibility is to express an opinion on these financial statements and financial highlights based on our audits.
We conducted our audits in accordance with the standards of the Public Company Accounting Oversight Board (United States). Those standards require that we plan and perform the audit to obtain reasonable assurance about whether the financial statements and financial highlights are free of material misstatement. We were not engaged to perform an audit of the Series’ internal control over financial reporting. Our audits included consideration of internal control over financial reporting as a basis for designing audit procedures that are appropriate in the circumstances, but not for the purpose of expressing an opinion on the effectiveness of the Series’ internal control over financial reporting. Accordingly, we express no such opinion. An audit also includes examining, on a test basis, evidence supporting the amounts and disclosures in the financial statements and financial highlights, assessing the accounting principles used and significant estimates made by management, and evaluating the overall financial statement presentation. Our procedures included confirmation of securities owned as of December 31, 2009, by correspondence with the custodian and brokers. We believe that our audits provide a reasonable basis for our opinion.
In our opinion, the financial statements and financial highlights referred to above present fairly, in all material respects, the financial position of the Delaware VIP High Yield Series of Delaware VIP Trust at December 31, 2009, the results of its operations for the year then ended, the changes in its net assets for each of the two years in the period then ended, and its financial highlights for each of the five years in the period then ended, in conformity with U.S. generally accepted accounting principles.
Philadelphia, Pennsylvania
February 17, 2010
The Series files its complete schedule of portfolio holdings with the Securities and Exchange Commission (Commission) for the first and third quarters of each fiscal year on Form N-Q. The Series’ Forms N-Q, as well as a description of the policies and procedures that the Series uses to determine how to vote proxies (if any) relating to portfolio securities is available without charge (i) upon request, by calling 800 523-1918; and (ii) on the Commission’s website at http://www.sec.gov. In addition, a description of the policies and procedures that the Series uses to determine how to vote proxies (if any) relating to portfolio securities is available without charge on the Delaware Investments® Funds’ Web site at http://www.delawareinvestments.com. The Series’ Forms N-Q may be reviewed and copied at the Commission’s Public Reference Room in Washington, DC; information on the operation of the Public Reference Room may be obtained by calling 800 SEC-0330.
Information (if any) regarding how the Series voted proxies relating to portfolio securities during the most recently disclosed 12-month period ended June 30 is available without charge (i) through the Delaware Investments Funds’ Web site at http://www.delawareinvestments.com; and (ii) on the Commission’s website at http://www.sec.gov. |
High Yield Series-20
Delaware VIP® Trust — Delaware VIP High Yield Series
Other Series Information
Board Consideration of New Investment Advisory Agreement
At a meeting held on September 3, 2009 (the “Meeting”), the Board of Trustees of the Delaware Investments Family of Funds (the “Board”), including the independent Trustees, unanimously approved a new investment advisory agreement between each registrant on behalf of each series (each, a “Fund” and together, the “Funds”) and Delaware Management Company (“DMC”) in connection with the sale of Delaware Investments’ advisory business to Macquarie Bank Limited (the “Macquarie Group”) (the “Transaction”). In making its decision, the Board considered information furnished specifically in connection with the approval of the new investment advisory agreements with DMC (the “New Investment Advisory Agreements”) which included extensive materials about the Transaction and matters related to the proposed approvals. To assist the Board in considering the New Investment Advisory Agreements, Macquarie Group provided materials and information about Macquarie Group, including detailed written responses to the questions posed by the independent Trustees. DMC also provided materials and information about the Transaction, including detailed written responses to the questions posed by the independent Trustees.
At the Meeting, the Trustees discussed the Transaction with DMC management and with key Macquarie Group representatives. The Meeting included discussions of the strategic rationale for the Transaction and Macquarie Group’s general plans and intentions regarding the Funds and DMC. The Board members also inquired about the plans for, and anticipated roles and responsibilities of, key employees and officers of Delaware Management Holdings Inc. and DMC in connection with the Transaction.
In connection with the Trustees’ review of the New Investment Advisory Agreements for the Funds, DMC and/or Macquarie Group emphasized that:
- They expected that there would be no adverse changes as a result of the Transaction, in the nature, quality, or extent of services currently provided to the Funds and their shareholders, including investment management, distribution, or other shareholder services.
- No material changes in personnel or operations were contemplated in the operation of DMC under Macquarie Group as a result of the Transaction and no material changes were currently contemplated in connection with third party service providers to the Funds.
- Macquarie Group had no intention to cause DMC to alter the voluntary expense waivers and reimbursements currently in effect for the Funds.
- Under the agreement between Macquarie Group and Lincoln National Corporation (“LNC”) (the “Transaction Agreement”), Macquarie Group has agreed to conduct, and to cause its affiliates to conduct, their respective businesses in compliance with the conditions of Section 15(f) of the Investment Company Act of 1940 (the “1940 Act”) with respect to the Funds, to the extent within its control, including maintaining Board composition of at least 75% of the Board members qualifying as independent Trustees and not imposing any “unfair burden” on the Funds for at least two years from the closing of the Transaction (the “Closing”).
In addition to the information provided by DMC and Macquarie Group as described above, the Trustees also considered all other factors they believed to be relevant to evaluating the New Investment Advisory Agreements, including the specific matters discussed below. In their deliberations, the Trustees did not identify any particular information that was controlling, and different Trustees may have attributed different weights to the various factors. However, for each Fund, the Trustees determined that the overall arrangements between the Fund and DMC, as provided in the respective New Investment Advisory Agreement, including the proposed advisory fee and the related administration arrangements between the Fund and DMC, were fair and reasonable in light of the services to be performed, expenses incurred, and such other matters as the Trustees considered relevant. Factors evaluated included:
- The potential for expanding distribution of Fund shares through access to Macquarie Group’s existing distribution channels;
- Delaware Investments’ acquisition of an exclusive wholesaling sales force from a subsidiary of LNC;
- The reputation, financial strength, and resources of Macquarie Group as well as its historic and ongoing commitment to the asset management business in Australia as well as other parts of the world;
- The terms and conditions of the New Investment Advisory Agreements, including that each Fund’s total contractual fee rate under the New Investment Advisory Agreement will remain the same;
- The Board’s full annual review (or initial approval) of the current investment advisory agreements at their in-person meeting in May 2009 as required by the 1940 Act and its determination that (i) DMC had the capabilities, resources, and personnel necessary to provide the satisfactory advisory and administrative services currently provided to each Fund and (ii) the advisory and/or management fees paid by each Fund, taking into account any applicable fee waivers and breakpoints, represented reasonable compensation to DMC in light of the services provided, the costs to DMC of providing those services, economies of scale, and the fees and other expenses paid by similar funds and such other matters that the Board considered relevant in the exercise of its reasonable judgment;
- The portfolio management teams for the Funds are not currently expected to change as a result of the Transaction;
- LNC and Macquarie Group were expected to execute a reimbursement agreement pursuant to which LNC and Macquarie Group would agree to pay (or reimburse) all reasonable out-of-pocket costs and expenses of the Funds in connection with the Board’s consideration of the Transaction, the New Investment Advisory Agreements and related agreements, and all costs related to the proxy solicitation (the “Expense Agreement”);
High Yield Series-21
Delaware VIP® High Yield Series
Other Series Information (continued)
- The likelihood that Macquarie Group would invest additional amounts in Delaware Investments, including DMC, which could result in increased assets under management, which in turn would allow some Funds the potential opportunity to achieve economies of scale and lower fees payable by Fund shareholders; and
- The compliance and regulatory history of Macquarie Group and its affiliates.
In making their decision relating to the approval of each Fund’s New Investment Advisory Agreement, the independent Trustees gave attention to all information furnished. The following discussion, however, identifies the primary factors taken into account by the Trustees and the conclusions reached in approving the New Investment Advisory Agreements.
NATURE, EXTENT, AND QUALITY OF SERVICE. The Trustees considered the services historically provided by DMC to the Funds and their shareholders. In reviewing the nature, extent, and quality of services, the Board considered that the New Investment Advisory Agreements would be substantially similar to the current investment advisory agreements between the Funds and DMC (the “Current Investment Advisory Agreements”), and they therefore, considered the many reports furnished to them throughout 2008 and 2009 at regular Board meetings covering matters such as: the relative performance of the Funds; the compliance of portfolio managers with the investment policies, strategies, and restrictions for the Funds; the compliance of management personnel with the code of ethics adopted throughout the Delaware Investments Family of Funds complex; and the adherence to fair value pricing procedures as established by the Board. The Trustees were pleased with the current staffing of DMC and the emphasis placed on research and risk management in the investment process. Favorable consideration was given to DMC’s efforts to maintain expenditures and, in some instances, increase financial and human resources committed to Fund matters.
The Board also considered the transfer agent and shareholder services that would continue to be provided to Fund shareholders by DMC’s affiliate, Delaware Service company, Inc. (“DSC”). The Trustees noted, in particular, DSC’s commitment to maintain a high level of service as well as DMC’s expenditures to improve the delivery of shareholder services. The Board was assured that shareholders would continue to receive the benefits provided to Fund shareholders by being part of the Delaware Investments Family of Funds, including each shareholder’s ability to exchange an investment in one Fund for the same class of shares in another Fund without a sales charge, to reinvest Fund dividends into additional shares of any of the Funds, and the privilege to combine holdings in other Funds to obtain a reduced sales charge.
Based on the information provided by DMC and Macquarie Group, including that Macquarie Group and DMC currently expected no material changes as a result of the Transaction in (i) personnel or operations of DMC or (ii) third party service providers to the Funds, the Board concluded that the satisfactory nature, extent, and quality of services currently provided to the Funds and their shareholders were very likely to continue under the New Investment Advisory Agreements. Moreover, the Board concluded that the Funds would probably benefit from the expanded distribution resources that would become available to Delaware Investments following the Transaction. The Board also concluded that it was very unlikely that any “unfair burden” would be imposed on any of the Funds for the first two years following the Closing as a result of the Transaction. Consequently, the Board concluded that it did not expect the Transaction to result in any adverse changes in the nature, quality, or extent of services (including investment management, distribution or other shareholder services) currently provided to the Funds and their shareholders.
INVESTMENT PERFORMANCE. The Board considered the overall investment performance of DMC and the Funds. The Trustees placed significant emphasis on the investment performance of the Funds in view of its importance to shareholders. Although the Trustees gave appropriate consideration to performance reports and discussions with portfolio managers at Board meetings throughout the year, the Trustees gave particular weight to their review of investment performance in connection with the approval of the Current Investment Advisory agreements at the Board meeting held in May 2009. At that meeting, the Trustees reviewed reports prepared by Lipper, Inc., an independent statistical compilation organization (“Lipper”), which showed each Fund’s investment performance as of December 31, 2008 in comparison to a group of funds selected by Lipper as being similar to the Fund (the “Performance Universe”). During the May 2009 agreement review process, the Trustees observed the significant improvements to relative investment performance of the Funds compared to the Funds’ performance as of December 31, 2007.
At their meeting on September 3, 2009, the Trustees, including the independent Trustees in consultation with their independent counsel, reviewed the investment performance of each Fund. The Trustees compared the performance of each Fund relative to that of its respective Performance Universe for the 1-, 3-, 5-, and 10-year periods ended June 30, 2009 and compared its relative investment performance against the corresponding relative investment performance of each Fund for such time periods ended December 31, 2008, to the extent applicable. As of June 30, 2009, 30 of the Funds had investment performance relative to that of the respective Performance Universe that was better than the corresponding relative investment performance at December 31, 2008 for all applicable time periods. At June 30, 2009, an additional 6 Funds had investment performance relative to that of their respective Performance Universe that was better than the corresponding relative investment performance at December 31, 2008 for a majority of the applicable time periods. At June 30, 2009, 15 additional Funds had investment performance relative to that of their respective Performance Universe that was better than the corresponding relative performance at December 31, 2008 and only 29 Funds had poorer relative investment performance at June 30, 2009 compared to that at December 31, 2008.
The Board therefore concluded that the investment performance of the Funds, on an aggregate basis, had continued to improve relative to their respective Performance Universe since the data reviewed at the May 2009 meeting. Based on information provided by DMC and Macquarie Group, the Board concluded that neither the Transaction nor the New Investment Advisory Agreement would likely have an adverse effect on the investment performance of any Fund because (i) DMC and Macquarie Group did not currently expect the Transaction to cause any material change to the Funds’ portfolio management teams responsible for investment performance, which the Board found to be satisfactory and improving; and (ii) as discussed in more detail below, the Funds’ expenses were not expected to increase as a result of the Transaction.
High Yield Series-22
Delaware VIP® High Yield Series
Other Series Information (continued)
COMPARATIVE EXPENSES. The Trustees also evaluated expense comparison data for the Funds previously provided in May 2009. At that meeting, DMC had provided the Board with information on pricing levels and fee structures for the Funds and comparative funds. The Trustees focused on the comparative analysis of the effective management fees and total expense ratios of each Fund versus the effective management fees and expense ratios of a group of funds selected by Lipper as being similar to each Fund (the “Expense Group”). In reviewing comparative costs, each Fund’s contractual management fee and the actual management fee incurred by the Fund were compared with the contractual management fees (assuming all funds in the Expense Group were similar in size to the Fund) and actual management fees (as reported by each fund) of other funds within the Expense Group, taking into account any applicable breakpoints and fee limitations. Each Fund’s total expenses were also compared with those of its Expense Group. The Trustees also considered fees paid to Delaware Investments for nonmanagement services. At the September 3, 2009 meeting, DMC advised the Board that the more recent comparative expenses for the Funds remained consistent with the previous review in May 2009 and, consequently, the Trustees concluded that expenses of the Funds were satisfactory.
The Board also considered the Expense Agreement under negotiation in evaluating Fund expenses. The Trustees expected that the Expense Agreement would provide that LNC and Macquarie Group would pay or reimburse the Trusts for all reasonable out-of-pocket costs and expenses in connection with the Transaction and the consideration of the New Investment Advisory Agreements (subject to certain limited exceptions).
Based on information provided by DMC and Macquarie Group, the Board concluded that neither the Transaction nor the New Investment Advisory Agreements likely would have an adverse effect on the Funds’ expenses because (i) each Fund’s contractual fee rates under the New Investment Advisory Agreement would remain the same; (ii) under the Expense Agreement, the Funds would be reimbursed for all reasonable out-of-pocket costs and expenses in connection with the Transaction and the related proxy solicitation (subject to certain limited exceptions); and (iii) the expense ratios of certain Funds might decline as a result of the possible increased investment in Delaware Investments by Macquarie Group, as discussed below under “Economies of Scale.”
MANAGEMENT PROFITABILITY. At their meeting on September 3, 2009, the Board evaluated DMC’s profitability in connection with the operation of the Funds. The Board had previously considered DMC’s profitability in connection with the operation of the Funds at its May 2009 meeting. At that meeting, the Board reviewed an analysis that addressed the overall profitability of Delaware Investments’ business in providing management and other services to each of the Funds and the Delaware Investments Family of Funds as a whole. Specific attention was given to the methodology followed in allocating costs for the purpose of determining profitability.
At the May 2009 meeting, representatives of DMC had stated that the level of profits of DMC, to a certain extent, reflect operational cost savings and efficiencies initiated by Delaware Investments (including DMC and its affiliates that provide services to the Funds). The Board considered Delaware Investments’ efforts to improve services provided to Fund shareholders and to meet additional regulatory and compliance requirements resulting from recent industry-wide U.S. Securities and Exchange Commission initiatives. At that meeting, the Board found that the management fees were reasonable in light of the services rendered and the level of profitability of DMC. At the September 3, 2009 meeting, DMC advised the Board that DMC did not expect the Transaction to affect materially the profitability of Delaware Investments compared to the level of profitability considered during the May 2009 review. Moreover, the Trustees reviewed pro forma balance sheets of certain key companies in Delaware Investments as of June 30, 2009 (which were provided by Macquarie Group and DMC in response to the Trustees’ requests) and evaluated the projections of Delaware Investments’ capitalization following the Transaction for purposes of evaluating the financial ability of Delaware Investments to continue to provide the nature, extent, and quality of services as it had under the Current Investment Advisory Agreement.
Based on information provided by DMC and Macquarie Group, the Board concluded that DMC and Delaware Investments would be sufficiently capitalized following the Transaction to continue the same level and quality of services to the Funds under the New Investment Advisory Agreements as was the case under the Current Investment Advisory Agreements. The Board also concluded that Macquarie Group had sufficient financial strength and resources, as well as an ongoing commitment to a global asset management business, to continue investing in Delaware Investments, including DMC, to the extent that Macquarie Group determined it was appropriate. Finally, because services and costs were expected to be substantially the same (and DMC had represented that, correspondingly, profitability would be about the same), under the New Investment Advisory Agreements as under the Current Investment Advisory Agreements, the Trustees concluded that the profitability of Delaware Investments would not result in an inequitable charge on the Funds or their shareholders. Accordingly, the Board concluded that the fees charged under the New Investment Advisory Agreements would be reasonable in light of the services to be provided and the expected profitability of DMC.
ECONOMIES OF SCALE. The Trustees considered whether economies of scale would be realized by Delaware Investments as each Fund’s assets increase and the extent to which any economies of scale would be reflected in the management fees charged. The Trustees took into account DMC’s practice of maintaining the competitive nature of management fees based on its analysis of fees charged by comparable funds. DMC management believed, and the Board agreed, that the Funds were priced with breakpoints and relatively low management fees to reflect potential economies of scale to Fund shareholders.
The Board also acknowledged Macquarie Group’s statement that the Transaction would not by itself immediately provide additional economies of scale given Macquarie Group’s limited presence in the U.S. mutual fund market. Nonetheless, the Trustees concluded that additional economies of scale could potentially be achieved in the future if DMC were owned by Macquarie Group as a result of Macquarie Group’s willingness to invest further in Delaware Investments if appropriate opportunities arise. The Board further concluded that potential economies of scale could be achieved as a result of Delaware Investments’ expanded distribution capabilities arising from the Transaction, as well as opportunities that might arise from Macquarie Group’s global asset management business.
High Yield Series-23
Delaware VIP® High Yield Series
Other Series Information (continued)
FALL-OUT BENEFITS. The Board acknowledged that DMC would continue to benefit from soft dollar arrangements using portfolio brokerage of each Fund that invests in equity securities and that DMC’s profitability would likely be somewhat lower without the benefit of practices with respect to allocating Fund portfolio brokerage for brokerage and research services. The Board also considered that Macquarie Group and Delaware Investments may derive reputational, strategic, and other benefits from their association with the Delaware Investments Family of Funds, including service relationships with DMC, DSC, and Delaware Distributors, L.P., and evaluated the extent to which Delaware Investments might derive ancillary benefits from Fund operations, including the potential for procuring additional business as a result of the prestige and visibility associated with its role as service provider to the Delaware Investments Family of Funds and the benefits from allocation of Fund brokerage to improve trading efficiencies. However, the Board concluded that (i) any such benefits under the New Investment Advisory Agreements would not be dissimilar from those existing under the Current Investment Advisory Agreements, (ii) such benefits did not impose a cost or burden on the Funds or their shareholders, and (iii) such benefits would probably have an indirectly beneficial effect on the Funds and their shareholders because of the added importance that DMC and Macquarie Group might attach to the Funds as a result of the fall-out benefits that the Funds conveyed.
BOARD REVIEW OF MACQUARIE GROUP. The Trustees reviewed detailed information supplied by Macquarie Group about its operations as well as other information regarding Macquarie Group provided by independent legal counsel to the independent Trustees. Based on this review, the Trustees concluded that Delaware Investments would continue to have the financial ability to maintain the high quality of services required by the Funds. The Trustees noted that there would be a limited transition period during which some services previously provided by LNC to Delaware Investments would continue to be provided by LNC after the Closing, and concluded that this arrangement would help minimize disruption in Delaware Investments’ provision of services to the Funds following the Transaction.
The Board considered Macquarie Group’s support for Delaware Investments’ plans for Fund distribution by transferring wholesalers from Lincoln Financial Distributors, Inc., LNC’s retail distributor, to Delaware Investments, and Macquarie Group’s current intention to leave the Funds’ other service providers in place. The Board also considered Macquarie Group’s current strategic plans to increase its asset management activities, one of its core businesses, particularly in North America, and its statement that its acquisition of DMC is an important component of this strategic growth and the establishment of a significant presence in the United States. Based in part on the information provided by DMC and Macquarie Group, the Board concluded that Macquarie Group’s acquisition of Delaware Investments could potentially enhance the nature, quality, and extent of services provided to the Funds and their shareholders.
CONCLUSION. The Board concluded that the advisory fee rate under each New Investment Advisory Agreement was reasonable in relation to the services provided and that execution of the New Investment Advisory Agreement would be in the best interests of the shareholders. For each Fund, the Trustees noted that they had concluded in their most recent advisory agreement continuance considerations in May 2009 that the management fees and total expense ratios were at acceptable levels in light of the quality of services provided to the Funds and in comparison to those of the Funds’ respective peer groups; that the advisory fee schedule would not be increased and would stay the same for all of the Funds; that the total expense ratio had not changed materially since that determination; and that DMC had represented that the overall expenses for each Fund were not expected to be adversely affected by the Transaction. The Trustees also noted, with respect to the Funds that currently had the benefit of voluntary fee limitations, that Macquarie Group had no present intention to cause DMC to alter any voluntary expense limitations or reimbursements currently in effect. On that basis, the Trustees concluded that the total expense ratios and proposed advisory fees for the Funds anticipated to result from the Transaction were acceptable. In approving each New Investment Advisory Agreement, the Board stated that it anticipated reviewing the continuance of the New Investment Advisory Agreement in advance of the expiration of the initial two-year period.
High Yield Series-24
Delaware Investments® Family of Funds
BOARD OF TRUSTEES/DIRECTORS AND OFFICERS ADDENDUM
A mutual fund is governed by a Board of Trustees/Directors (“Trustees”), which has oversight responsibility for the management of a fund’s business affairs. Trustees establish procedures and oversee and review the performance of the investment manager, the distributor, and others who perform services for the fund. The independent fund trustees, in particular, are advocates for shareholder interests. Each trustee has served in that capacity since he or she was elected to or appointed to the Board of Trustees, and will continue to serve until his or her retirement or the election of a new trustee in his or her place. The following is a list of the Trustees and Officers with certain background and related information.
| | | | Number of | Other |
| | | Principal | Portfolios in Fund | Directorships |
| Name, | Position(s) | | Occupation(s) | Complex Overseen | Held by |
| Address, | Held with | Length of Time | During | by Trustee | Trustee |
| and Birth Date | Fund(s) | Served | Past 5 Years | or Officer | or Officer |
| INTERESTED TRUSTEES | | | | | |
| Patrick P. Coyne1 | Chairman, | Chairman and Trustee | Patrick P. Coyne has served in | 81 | Director — |
| 2005 Market Street | President, | since August 16, 2006 | various executive capacities | | Kaydon Corp. |
| Philadelphia, PA | Chief Executive | | at different times at | | |
| 19103 | Officer, and | President and | Delaware Investments.2 | | |
| Trustee | Chief Executive Officer | | | |
| April 1963 | | since August 1, 2006 | | | |
| | | | | | |
| INDEPENDENT TRUSTEES | | | | | |
| Thomas L. Bennett | Trustee | Since | Private Investor — | 81 | Director — |
| 2005 Market Street | | March 2005 | (March 2004–Present) | | Bryn Mawr |
| Philadelphia, PA | | | | | Bank Corp. (BMTC) |
| 19103 | | | Investment Manager — | | (April 2007–Present) |
| | | | Morgan Stanley & Co. | | |
| October 1947 | | | (January 1984–March 2004) | | |
| John A. Fry | Trustee | Since | President — | 81 | Director — |
| 2005 Market Street | | January 2001 | Franklin & Marshall College | | Community Health |
| Philadelphia, PA | | | (June 2002–Present) | | Systems |
| 19103 | | | | | |
| | | | Executive Vice President — | | |
| May 1960 | | | University of Pennsylvania | | |
| | | | (April 1995–June 2002) | | |
| Anthony D. Knerr | Trustee | Since | Founder and Managing Director — | 81 | None |
| 2005 Market Street | | April 1990 | Anthony Knerr & Associates | | |
| Philadelphia, PA | | | (Strategic Consulting) | | |
| 19103 | | | (1990–Present) | | |
| |
| December 1938 | | | | | |
| Lucinda S. Landreth | Trustee | Since | Chief Investment Officer — | 81 | None |
| 2005 Market Street | | March 2005 | Assurant, Inc. | | |
| Philadelphia, PA | | | (Insurance) | | |
| 19103 | | | (2002–2004) | | |
| |
| June 1947 | | | | | |
| Ann R. Leven | Trustee | Since | Consultant — | 81 | None |
| 2005 Market Street | | October 1989 | ARL Associates | | |
| Philadelphia, PA | | | (Financial Planning) | | |
| 19103 | | | (1983–Present) | | |
| |
| November 1940 | | | | | |
High Yield Series-25
| | | | Number of | Other |
| | | Principal | Portfolios in Fund | Directorships |
| Name, | Position(s) | | Occupation(s) | Complex Overseen | Held by |
| Address, | Held with | Length of Time | During | by Trustee | Trustee |
| and Birth Date | Fund(s) | Served | Past 5 Years | or Officer | or Officer |
| INDEPENDENT TRUSTEES (CONTINUED) | | | | |
| Thomas F. Madison | Trustee | Since | President and Chief | 81 | Director and Chair of |
| 2005 Market Street | | May 19973 | Executive Officer — | | Compensation |
| Philadelphia, PA | | | MLM Partners, Inc. | | Committee, |
| 19103 | | | (Small Business Investing | | Governance Committee |
| | | and Consulting) | | Member |
| February 1936 | | | (January 1993–Present) | | — CenterPoint Energy |
| |
| | | | | Lead Director and Chair |
| | | | | of Audit |
| | | | | and Governance |
| | | | | Committees, |
| | | | | Member of |
| | | | | Compensation |
| | | | | Committee — Digital |
| | | | | River, Inc. |
| |
| | | | | Director and Chair of |
| | | | | Governance |
| | | | | Committee, Audit |
| | | | | Committee Member — |
| | | | | Rimage Corporation |
| |
| | | | | Director and Chair of |
| | | | | Compensation |
| | | | | Committee — Spanlink |
| | | | | Communications |
| |
| | | | | Lead Director and Chair |
| | | | | of Compensation and |
| | | | | Governance |
| | | | | Committees — |
| | | | | Valmont Industries, Inc. |
| Janet L. Yeomans | Trustee | Since | Vice President and Treasurer | 81 | None |
| 2005 Market Street | | April 1999 | (January 2006–Present) | | |
| Philadelphia, PA | | | Vice President — Mergers & Acquisitions | | |
| 19103 | | | (January 2003–January 2006), and | | |
| | | Vice President | | |
| July 1948 | | | (July 1995–January 2003) | | |
| | | 3M Corporation | | |
| J. Richard Zecher | Trustee | Since | Founder — | 81 | Director and Audit |
| 2005 Market Street | | March 2005 | Investor Analytics | | Committee Member — |
| Philadelphia, PA | | | (Risk Management) | | Investor Analytics |
| 19103 | | | (May 1999–Present) | | |
| |
| July 1940 | | | Founder — | | |
| | | Sutton Asset Management | | |
| | | (Hedge Fund) | | |
| | | (September 1996–Present) | | |
High Yield Series-26
| | | | Number of | Other |
| | | Principal | Portfolios in Fund | Directorships |
| Name, | Position(s) | | Occupation(s) | Complex Overseen | Held by |
| Address, | Held with | Length of Time | During | by Trustee | Trustee |
| and Birth Date | Fund(s) | Served | Past 5 Years | or Officer | or Officer |
| OFFICERS | | | | | |
| David F. Connor | Vice President, | Vice President since | David F. Connor has served as | 81 | None4 |
| 2005 Market Street | Deputy General | September 2000 | Vice President and Deputy | | |
| Philadelphia, PA | Counsel, and Secretary | and Secretary | General Counsel of | | |
| 19103 | | since | Delaware Investments | | |
| | October 2005 | since 2000. | | |
| December 1963 | | | | | |
| Daniel V. Geatens | Vice President | Treasurer | Daniel V. Geatens has served | 81 | None4 |
| 2005 Market Street | and Treasurer | since | in various capacities at | | |
| Philadelphia, PA | | October 25, 2007 | different times at | | |
| 19103 | | | Delaware Investments. | | |
| |
| October 1972 | | | | | |
| David P. O’Connor | Senior Vice | Senior Vice President, | David P. O’Connor has served in | 81 | None4 |
| 2005 Market Street | President, | General Counsel, and | various executive and legal | | |
| Philadelphia, PA | General Counsel, | Chief Legal Officer | capacities at different times | | |
| 19103 | and Chief | since | at Delaware Investments. | | |
| Legal Officer | October 2005 | | | |
| February 1966 | | | | | |
| Richard Salus | Senior | Chief Financial | Richard Salus has served in | 81 | None4 |
| 2005 Market Street | Vice President | Officer since | various executive capacities | | |
| Philadelphia, PA | and | November 2006 | at different times at | | |
| 19103 | Chief Financial | | Delaware Investments. | | |
| Officer | | | | |
| October 1963 | | | | | |
1 Patrick P. Coyne is considered to be an “Interested Trustee” because he is an executive officer of the Fund’s(s’) investment advisor.
2 Delaware Investments is the marketing name for Delaware Management Holdings, Inc. and its subsidiaries, including the Fund’s(s’) investment advisor, principal underwriter, and its transfer agent.
3 In 1997, several funds managed by Voyageur Fund Managers, Inc. (the “Voyageur Funds”) were incorporated into the Delaware Investments Family of Funds. Mr. Madison served as a director of the Voyageur Funds from 1993 until 1997.
4 David F. Connor, Daniel V. Geatens, David P. O’Connor, and Richard Salus serve in similar capacities for the six portfolios of the Optimum Fund Trust, which have the same investment advisor, principal underwriter, and transfer agent as the registrant.
The Statement of Additional Information for the Fund(s) includes additional information about the Trustees and Officers and is available, without charge, upon request by calling 800 523-1918.
| PO14857 AR-VIPHY [12/09] DG3 2/10 (5427) | High Yield Series-27 |
| Delaware VIP® Trust |
| Delaware VIP International Value Equity Series |
| |
| |
| |
| |
| |
| |
| Annual Report |
| |
| |
| December 31, 2009 |
| |
| |
| |
| |
| |
| |
| |
| |
| |
| |
| |
| |
| |
| |
| |
|
Table of contents
| > Portfolio management review | 1 |
| | |
| > Performance summary | 2 |
| | |
| > Disclosure of Series expenses | 4 |
| | |
| > Country and sector allocations | 5 |
| | |
| > Statement of net assets | 6 |
| | |
| > Statement of operations | 8 |
| | |
| > Statements of changes in net assets | 8 |
| | |
| > Financial highlights | 9 |
| | |
| > Notes to financial statements | 11 |
| | |
| > Report of independent registered public accounting firm | 17 |
| | |
| > Other Series information | 18 |
| | |
| > Board of trustees/directors and officers addendum | 22 |
On January 4, 2010, Delaware Management Holdings, Inc., and its subsidiaries (collectively known by the marketing name of Delaware Investments) were sold by a subsidiary of Lincoln National Corporation to Macquarie Group Limited, a global provider of banking, financial, advisory, investment and funds management services. Please see your Series’ prospectus and any supplements thereto for more complete information.
Investments in Delaware VIP® International Value Equity Series are not and will not be deposits with or liabilities of Macquarie Bank Limited ABN 46 008 583 542 and its holding companies, including subsidiaries or related companies, and are subject to investment risk, including possible delays in repayment and loss of income and capital invested. No Macquarie Group company guarantees or will guarantee the performance of the Series, the repayment of capital from the Series, or any particular rate of return.
Unless otherwise noted, views expressed herein are current as of Dec. 31, 2009, and are subject to change.
Funds are not FDIC insured and are not guaranteed. It is possible to lose the principal amount invested.
Mutual fund advisory services provided by Delaware Management Company, a series of Delaware Management Business Trust, which is a registered investment advisor. Delaware Investments is the marketing name of Delaware Management Holdings, Inc. and its subsidiaries. Macquarie Group refers to Macquarie Group Limited and its subsidiaries and affiliates worldwide.
© 2010 Delaware Management Holdings, Inc.
All third-party trademarks cited are the property of their respective owners.
| Delaware VIP® Trust — Delaware VIP International Value Equity Series | |
| Portfolio management review | Jan. 12, 2010 |
When the fiscal year began in January 2009, global financial markets were already in the midst of a protracted downturn accompanied by a global credit crisis. Investors have experienced weak economic cycles and significant market declines before, but the situation at the start of the fiscal year was worse than anything many had seen in decades.
Both the global economy and investor sentiment in general seemed to reach low points during the winter months, eventually setting the stage for the start of a recovery. Given the crisis atmosphere and investors’ tremendous risk aversion, international equities were trading at, in our view, relatively cheap prices by early March 2009. Additionally, dramatic steps had been taken by the central banks and fiscal authorities around the world to boost global economic growth.
Over time, investors seemed to conclude that the worst-case scenario of a market collapse was unlikely, despite continued economic weakness. Stock market performance was very strong beginning in the second quarter of 2009, with the subsequent “snap-back” rally led overwhelmingly by the market’s most volatile stocks, as buyers took advantage of extremely low valuations.
By the third calendar quarter of 2009 and continuing into the fourth quarter, the stock market rally became broader, as the deepest stock-price discounts vanished. By autumn, investors were beginning to favor individual companies with what we view as having more solid business fundamentals and the prospect of sustainable earnings growth at a reasonable valuation.
Delaware VIP International Value Equity Series Standard Class shares returned +34.73%, and the Service Class shares returned +34.61% (both figures reflect returns with dividends reinvested). This performance was above that of its benchmark, the MSCI EAFE Index (net), which returned +31.78% during the same time frame. For complete, annualized performance of Delaware VIP International Value Equity Series, please see the table on the next page. Strong stock selection was the primary driver of the Series’ relative outperformance for the fiscal year.
Before the start of the Series’ fiscal year, we positioned the Series relatively defensively. Like many investors, we failed to anticipate the depths of the market’s collapse, but we did conclude that economic conditions were rapidly deteriorating. This led us to take a number of proactive steps:
- We substantially cut the Series’ allocation to the more economically sensitive financial stocks, moving from an underweighted exposure (relative to our MSCI EAFE benchmark) to an even more underweighted one.
- We increasingly avoided companies with significant debt levels, which we believed would suffer if capital became less readily available.
- When we did invest in these and other cyclical (more economically sensitive) sectors, we favored individual securities that we believed offered less volatility as well as other relatively conservative characteristics.
Given the gathering economic risks, we felt this defensive approach was prudent. In retrospect, it proved to be helpful for performance in the very challenging market environment we encountered through the early part of 2009. While the defensive positioning of the Series’ holdings was not generally helpful during the year’s second quarter — when riskier securities fared the best overall — it was effective during the first quarter, during which the Series outperformed its benchmark, the MSCI EAFE Index. Overall, stock selection drove performance during the second half.
We maintained the Series’ defensive stance through roughly the end of the second quarter of 2009. During the third quarter, we preserved our basic defensive positioning but sought to adapt to changing market conditions. As evidence mounted that the market’s progress was sustainable and the economy was slowly improving, we felt more comfortable adding to the Series’ beta (its risk exposure relative to its benchmark).
By the end of the year, the market appeared to be assessing stocks on a company-by-company basis, and because of our regular emphasis on careful research of individual stocks, we felt we were in a favorable environment for our style of value investing.
Unless otherwise noted, the views expressed are current as of Dec. 31, 2009, and are subject to change.
International Value Equity Series-1
Delaware VIP® International Value Equity Series (continued)
Performance summary
The performance data quoted below represent past performance; past performance does not guarantee future results. Investment return and principal value will fluctuate so your shares, when redeemed, may be worth more or less than their original cost. Please obtain the performance data for the most recent month end by calling the number noted in the introductory section of this report on the page related to this Series.
You should consider the investment objectives, risks, charges, and expenses of the Series carefully before investing. The Delaware VIP International Value Equity Series prospectus contains this and other important information about the Series. To obtain a prospectus, contact the company noted on the page related to this Series in the introductory section of this report, either by phone or through the company Web site. We advise you to read the prospectus carefully before you invest or send money.
| Delaware VIP International Value Equity Series | | | | | | | | | | |
| Average annual total returns | | | | | | | | | | |
| For periods ended Dec. 31, 2009 | | 1 year | | 3 years | | 5 years | | 10 years | | Lifetime |
| Standard Class shares (commenced operations on Oct. 29, 1992) | | +34.73% | | -6.54% | | +2.63% | | +4.56% | | +7.51% |
| Service Class shares (commenced operations on May 1, 2000) | | +34.61% | | -6.78% | | +2.38% | | n/a | | +5.17% |
Returns reflect the reinvestment of all distributions.
As described in the Series’ most recent prospectus, expenses for Standard Class and Service Class shares were as follows: the net expense ratio for Service Class shares of the Series was 1.30%. Total operating expenses for Standard Class and Service Class shares were 1.05% and 1.35%, respectively. The management fee for Standard Class and Service Class shares was 0.85%.
The Series’ distributor has contracted to limit the 12b-1 fees for Service Class shares to no more than 0.25% of average daily net assets through April 30, 2010.
Earnings from a variable annuity or variable life investment compound tax-free until withdrawal, and as a result, no adjustments were made for income taxes.
Expense limitations were in effect for both classes during certain periods shown in the Series performance chart above and in the Performance of a $10,000 Investment chart on the next page.
Performance data do not reflect insurance fees related to a variable annuity or variable life investment or the deferred sales charge that would apply to certain withdrawals of investments. Performance shown here would have been reduced if such fees were included or the expense limitation removed. For more information about fees, consult your variable annuity or variable life prospectus.
Investments in variable products involve risk. International investments entail risks not ordinarily associated with U.S. investments including fluctuation in currency values, differences in accounting principles, or economic or political instability in other nations. The Series will be affected primarily by changes in stock prices.
Instances of high double-digit returns are unusual, cannot be sustained, and were primarily achieved during favorable market conditions.
Please read both the contract and underlying prospectus for specific details regarding the product’s risk profile.
International Value Equity Series-2
Delaware VIP® International Value Equity Series (continued)
The chart shows a $10,000 investment in the Delaware VIP International Value Equity Series Standard Class shares for the period from Dec. 31, 1999, through Dec. 31, 2009.
The chart also shows $10,000 invested in the MSCI EAFE Index for the period from Dec. 31, 1999, through Dec. 31, 2009. The MSCI EAFE Index measures equity market performance across developed market countries in Europe, Australasia, and the Far East. Index “gross” return reflects the maximum possible dividend reinvestment. Index “net” return approximates the minimum possible dividend reinvestment, after deduction of withholding tax at the highest possible rate.
Index performance returns do not reflect any management fees, transaction costs or expenses. Indices are unmanaged and one cannot invest directly in an index.
Performance of Service Class shares will vary due to different charges and expenses.
Past performance is not a guarantee of future results.
International Value Equity Series-3
Delaware VIP® Trust — Delaware VIP International Value Equity Series
Disclosure of Series Expenses
For the Period July 1, 2009 to December 31, 2009
As a shareholder of the Series, you incur ongoing costs, including management fees; distribution and/or service (12b-1) fees; and other Series expenses. This Example is intended to help you understand your ongoing costs (in dollars) of investing in the Series and to compare these costs with the ongoing costs of investing in other mutual funds.
The Example is based on an investment of $1,000 invested at the beginning of the period and held for the entire period from July 1, 2009 to December 31, 2009.
Actual Expenses
The first section of the table shown, “Actual Series Return,” provides information about actual account values and actual expenses. You may use the information in this section of the table, together with the amount you invested, to estimate the expenses that you paid over the period. Simply divide your account value by $1,000 (for example, an $8,600 account value divided by $1,000 = 8.6), then multiply the result by the number in the first section under the heading entitled “Expenses Paid During Period” to estimate the expenses you paid on your account during the period.
Hypothetical Example for Comparison Purposes
The second section of the table shown, “Hypothetical 5% Return,” provides information about hypothetical account values and hypothetical expenses based on the Series’ actual expense ratio and an assumed rate of return of 5% per year before expenses, which is not the Series’ actual return. The hypothetical account values and expenses may not be used to estimate the actual ending account balance or expenses you paid for the period. You may use this information to compare the ongoing costs of investing in the Series and other funds. To do so, compare the 5% hypothetical example with the 5% hypothetical examples that appear in the shareholder reports of other funds.
Please note that the expenses shown in the table are meant to highlight your ongoing costs only. As a shareholder of the Series, you do not incur any transaction costs, such as sales charges (loads), redemption fees or exchange fees, but shareholders of other funds may incur such costs. Also, the fees related to the variable annuity investment or the deferred sales charge that could apply have not been included. Therefore, the second section of the table is useful in comparing ongoing costs only, and will not help you determine the relative total costs of owning different funds. The Series’ actual expenses shown in the table reflect fee waivers in effect. The expenses shown in the table assume reinvestment of all dividends and distributions.
Expense Analysis of an Investment of $1,000
| | | | | | | | | Expenses |
| Beginning | | Ending | | | | Paid During |
| Account | | Account | | Annualized | | Period |
| Value | | Value | | Expense | | 7/1/09 to |
| 7/1/09 | | 12/31/09 | | Ratios | | 12/31/09* |
| Actual Series Return | | | | | | | | | | | |
| Standard Class | $1,000.00 | | $1,257.30 | | 0.99% | | $ | 5.63 | |
| Service Class | 1,000.00 | | 1,256.00 | | 1.24% | | | 7.05 | |
| Hypothetical 5% Return (5% return before expenses) | | | | |
| Standard Class | $1,000.00 | | $1,020.21 | | 0.99% | | $ | 5.04 | |
| Service Class | 1,000.00 | | 1,018.95 | | 1.24% | | | 6.31 | |
*“Expenses Paid During Period” are equal to the Series’ annualized expense ratio, multiplied by the average account value over the period, multiplied by 184/365 (to reflect the one-half year period).
International Value Equity Series-4
Delaware VIP® Trust — Delaware VIP International Value Equity Series
Country and Sector Allocations
As of December 31, 2009
Sector designations may be different than the sector designations presented in other Series materials. The sector designations may represent the investment manager’s internal sector classifications, which may result in the sector designations for one series being different than another series’ sector designations.
| Percentage |
| Country | of Net Assets |
| Common Stock | 100.02 | % |
| Australia | 3.26 | % |
| Brazil | 3.23 | % |
| Canada | 8.92 | % |
| Denmark | 1.44 | % |
| Finland | 2.03 | % |
| France | 18.53 | % |
| Germany | 8.26 | % |
| Hong Kong | 7.32 | % |
| Italy | 5.80 | % |
| Japan | 9.94 | % |
| Luxembourg | 1.24 | % |
| Netherlands | 2.62 | % |
| Singapore | 2.11 | % |
| Spain | 2.15 | % |
| Sweden | 4.38 | % |
| Switzerland | 3.97 | % |
| Taiwan | 1.72 | % |
| United Kingdom | 13.10 | % |
| Securities Lending Collateral | 10.75 | % |
| Total Value of Securities | 110.77 | % |
| Obligation to Return Securities Lending Collateral | (11.09 | %) |
| Receivables and Other Assets Net of Liabilities | 0.32 | % |
| Total Net Assets | 100.00 | % |
| |
| Percentage |
| Sector | of Net Assets |
| Consumer Discretionary | 21.33 | % |
| Consumer Staples | 8.04 | % |
| Energy | 9.21 | % |
| Financials | 11.54 | % |
| Health Care | 7.39 | % |
| Industrials | 18.78 | % |
| Information Technology | 6.47 | % |
| Materials | 8.42 | % |
| Telecommunication Services | 6.74 | % |
| Utilities | 2.10 | % |
| Total | 100.02 | % |
International Value Equity Series-5
Delaware VIP® Trust — Delaware VIP International Value Equity Series
Statement of Net Assets
December 31, 2009
| Number of | | Value |
| Shares | | (U.S. $) |
| COMMON STOCK–100.02%Δ | | | | |
| Australia–3.26% | | | | |
| ±Coca-Cola Amatil | 237,735 | | $ | 2,451,177 |
| ±Telstra | 328,446 | | | 1,009,768 |
| | | | | 3,460,945 |
| Brazil–3.23% | | | | |
| Petroleo Brasileiro ADR | 54,800 | | | 2,322,972 |
| *Vale ADR | 37,900 | | | 1,100,237 |
| | | | | 3,423,209 |
| Canada–8.92% | | | | |
| †Agrium | 40,600 | | | 2,496,900 |
| †CGI Group Class A | 349,391 | | | 4,735,476 |
| *TELUS | 68,510 | | | 2,224,219 |
| | | | | 9,456,595 |
| Denmark–1.44% | | | | |
| ±Novo Nordisk Class B | 23,864 | | | 1,521,364 |
| | | | | 1,521,364 |
| Finland–2.03% | | | | |
| ±*Nokia | 166,469 | | | 2,149,591 |
| | | | | 2,149,591 |
| France–18.53% | | | | |
| ±*AXA | 76,354 | | | 1,790,339 |
| ±*Compagnie de Saint-Gobain | 46,975 | | | 2,544,845 |
| ±*Lafarge | 24,707 | | | 2,032,029 |
| ±PPR | 17,072 | | | 2,046,524 |
| ±Publicis Groupe | 45,852 | | | 1,861,879 |
| ±Sanofi-Aventis | 14,307 | | | 1,123,652 |
| ±Teleperformance | 72,679 | | | 2,355,081 |
| ±*Total | 25,525 | | | 1,637,297 |
| ±Vallourec | 8,517 | | | 1,538,842 |
| ±Vivendi | 91,543 | | | 2,713,373 |
| | | | | 19,643,861 |
| Germany–8.26% | | | | |
| ±Bayerische Motoren Werke | 48,881 | | | 2,236,203 |
| ±Deutsche Post | 120,180 | | | 2,330,799 |
| ±Linde | 16,385 | | | 1,964,225 |
| ±Metro | 36,220 | | | 2,226,251 |
| | | | | 8,757,478 |
| Hong Kong–7.32% | | | | |
| ±CNOOC | 1,468,000 | | | 2,286,971 |
| ±Esprit Holdings | 308,797 | | | 2,048,689 |
| ±*Techtronic Industries | 2,250,859 | | | 1,865,819 |
| ±Yue Yuen Industrial Holdings | 539,500 | | | 1,561,924 |
| | | | | 7,763,403 |
| Italy–5.80% | | | | |
| ±Finmeccanica | 122,811 | | | 1,963,707 |
| ±Parmalat | 819,550 | | | 2,288,193 |
| ±UniCredit | 568,491 | | | 1,898,379 |
| | | | | 6,150,279 |
| Japan–9.94% | | | | |
| ±*Asahi Glass | 222,000 | | | 2,113,042 |
| ±Astellas Pharma | 50,800 | | | 1,896,512 |
| ±*Don Quijote | 74,700 | | | 1,813,829 |
| ±Mitsubishi UFJ Financial Group | 419,835 | | | 2,069,350 |
| ±Round One | 134,835 | | | 800,224 |
| ±Toyota Motor | 43,743 | | | 1,845,436 |
| | | | | 10,538,393 |
| Luxembourg–1.24% | | | | |
| ±ArcelorMittal | 28,711 | | | 1,310,534 |
| | | | | 1,310,534 |
| Netherlands–2.62% | | | | |
| ±*Koninklijke Philips Electronics | 94,149 | | | 2,779,294 |
| | | | | 2,779,294 |
| Singapore–2.11% | | | | |
| ±Singapore Airlines | 211,000 | | | 2,234,298 |
| | | | | 2,234,298 |
| Spain–2.15% | | | | |
| ±Banco Santander | 137,854 | | | 2,274,973 |
| | | | | 2,274,973 |
| Sweden–4.38% | | | | |
| Autoliv | 60,200 | | | 2,610,272 |
| ±*Nordea Bank | 200,713 | | | 2,032,475 |
| | | | | 4,642,747 |
| Switzerland–3.97% | | | | |
| ±Novartis | 43,439 | | | 2,369,880 |
| †Transocean | 22,200 | | | 1,838,160 |
| | | | | 4,208,040 |
| Taiwan–1.72% | | | | |
| Chunghwa Telecom ADR | 98,435 | | | 1,827,938 |
| | | | | 1,827,938 |
| United Kingdom–13.10% | | | | |
| ±AstraZeneca | 19,845 | | | 932,568 |
| ±BP | 172,724 | | | 1,670,783 |
| ±Greggs | 223,499 | | | 1,567,473 |
| ±National Grid | 203,184 | | | 2,217,410 |
| ±Standard Chartered | 85,205 | | | 2,142,094 |
| ±Tomkins | 657,666 | | | 2,054,444 |
| ±Vodafone Group | 903,294 | | | 2,090,814 |
| ±WPP Group | 124,072 | | | 1,212,183 |
| | | | | 13,887,769 |
| Total Common Stock | | | | |
| (cost $100,609,403) | | | | 106,030,711 |
| |
| Total Value of Securities | | | | |
| Before Securities Lending | | | | |
| Collateral–100.02% | | | | |
| (cost $100,609,403) | | | | 106,030,711 |
| |
| SECURITIES LENDING | | | | |
| COLLATERAL**–10.75% | | | | |
| Investment Companies | | | | |
| Mellon GSL DBT II Collateral Fund | 7,390,832 | | | 7,390,832 |
| BNY Mellon SL DB II Liquidating Fund | 4,041,180 | | | 3,994,706 |
| †@Mellon GSL Reinvestment Trust II | 322,640 | | | 13,712 |
| Total Securities Lending Collateral | | | | |
| (cost $11,754,652) | | | | 11,399,250 |
International Value Equity Series-6
Delaware VIP® International Value Equity Series
Statement of Net Assets (continued)
| TOTAL VALUE OF SECURITIES–110.77% (cost $112,364,055) | $ | 117,429,961 | © |
| OBLIGATION TO RETURN SECURITIES LENDING COLLATERAL**–(11.09%) | | (11,754,652 | ) |
| RECEIVABLES AND OTHER ASSETS NET OF LIABILITIES–0.32% | | 333,284 | |
| NET ASSETS APPLICABLE TO 10,689,320 SHARES OUTSTANDING–100.00% | $ | 106,008,593 | |
| NET ASSET VALUE–DELAWARE VIP INTERNATIONAL VALUE EQUITY SERIES STANDARD CLASS | | | | |
| ($105,998,386 / 10,688,290 Shares) | | | $9.92 | |
| NET ASSET VALUE–DELAWARE VIP INTERNATIONAL VALUE EQUITY SERIES SERVICE CLASS | | | | |
| ($10,207 / 1,030 Shares) | | | $9.91 | |
| COMPONENTS OF NET ASSETS AT DECEMBER 31, 2009: | | | |
| Shares of beneficial interest (unlimited authorization–no par) | $ | 125,256,379 | |
| Undistributed net investment income | | 1,992,721 | |
| Accumulated net realized loss on investments | | (26,303,886 | ) |
| Net unrealized appreciation of investments and foreign currencies | | 5,063,379 | |
| Total net assets | $ | 106,008,593 | |
| | | | |
____________________
| Δ | Securities have been classified by country of origin. Classification by type of business has been presented on page 4 in “Country and Sector Allocations.” |
| † | Non income producing security. |
| ± | Security is being valued based on international fair value pricing. At December 31, 2009, the aggregate amount of international fair value priced securities was $86,874,537, which represented 81.95% of the Series’ net assets. See Note 1 in “Notes to Financial Statements.” |
| @ | Illiquid security. At December 31, 2009, the aggregate amount of illiquid securities was $13,712, which represented 0.01% of the Series’ net assets. See Note 10 in “Notes to Financial Statements” |
| * | Fully or partially on loan. |
| ** | See Note 9 in “Notes to Financial Statements.” |
| © | Includes $11,139,616 of securities loaned. |
ADR – American Depositary Receipts
See accompanying notes
International Value Equity Series-7
Delaware VIP® Trust —
Delaware VIP International Value Equity Series
Statement of Operations
Year Ended December 31, 2009
| INVESTMENT INCOME: | | | |
| Dividends | $ | 3,347,091 | |
| Securities lending income | | 184,783 | |
| Interest | | 3,164 | |
| Foreign tax withheld | | (303,331 | ) |
| | | 3,231,707 | |
| |
| EXPENSES: | | | |
| Management fees | | 762,355 | |
| Custodian fees | | 37,586 | |
| Accounting and administration expenses | | 35,876 | |
| Reports and statements to shareholders | | 23,283 | |
| Dividend disbursing and transfer agent fees and expenses | | 19,890 | |
| Audit and tax | | 16,614 | |
| Legal fees | | 12,607 | |
| Trustees’ fees | | 5,762 | |
| Pricing fees | | 3,742 | |
| Insurance fees | | 2,303 | |
| Dues and services | | 2,048 | |
| Consulting fees | | 1,157 | |
| Trustees’ expenses | | 417 | |
| Registration fees | | 341 | |
| Distribution expenses – Service Class | | 31 | |
| | 924,012 | |
| Less fees waived | | (29,230 | ) |
| Less waiver of distribution expenses – Service Class | | (5 | ) |
| Total operating expenses | | 894,777 | |
| |
| NET INVESTMENT INCOME | | 2,336,930 | |
| |
| NET REALIZED AND UNREALIZED GAIN (LOSS) | | | |
| ON INVESTMENTS AND FOREIGN CURRENCIES: | | | |
| Net realized loss on: | | | |
| Investments | | (6,484,572 | ) |
| Foreign currencies | | (270,417 | ) |
| Net realized loss | | (6,754,989 | ) |
| Net change in unrealized appreciation/depreciation | | | |
| of investments and foreign currencies | | 33,248,636 | |
| |
| NET REALIZED AND UNREALIZED GAIN | | | |
| ON INVESTMENTS AND FOREIGN CURRENCIES | | 26,493,647 | |
| |
| NET INCREASE IN NET ASSETS RESULTING | | | |
| FROM OPERATIONS | $ | 28,830,577 | |
| |
| See accompanying notes |
Delaware VIP Trust —
Delaware VIP International Value Equity Series
Statements of Changes in Net Assets
| Year Ended |
| 12/31/09 | | 12/31/08 |
| INCREASE (DECREASE) IN NET | | | | | | | |
| ASSETS FROM OPERATIONS: | | | | | | | |
| Net investment income | $ | 2,336,930 | | | $ | 3,187,459 | |
| Net realized loss on investments and | | | | | | | |
| foreign currencies | | (6,754,989 | ) | | | (19,787,228 | ) |
| Net change in unrealized appreciation/ | | | | | | | |
| depreciation of investments and | | | | | | | |
| foreign currencies | | 33,248,636 | | | | (43,258,358 | ) |
| Net increase (decrease) in net assets | | | | | | | |
| resulting from operations | | 28,830,577 | | | | (59,858,127 | ) |
| |
| DIVIDENDS AND DISTRIBUTIONS | | | | | | | |
| TO SHAREHOLDERS FROM: | | | | | | | |
| Net investment income: | | | | | | | |
| Standard Class | | (2,825,544 | ) | | | (2,740,721 | ) |
| Service Class | | (249 | ) | | | (2,558 | ) |
| Net realized gain on investments: | | | | | | | |
| Standard Class | | – | | | | (10,032,456 | ) |
| Service Class | | – | | | | (10,984 | ) |
| | | (2,825,793 | ) | | | (12,786,719 | ) |
| |
| CAPITAL SHARE TRANSACTIONS: | | | | | | | |
| Proceeds from shares sold: | | | | | | | |
| Standard Class | | 13,634,332 | | | | 3,040,855 | |
| Service Class | | 581 | | | | 8,082 | |
| Net asset value of shares issued upon | | | | | | | |
| reinvestment of dividends and distributions: | | | | | | | |
| Standard Class | | 2,825,544 | | | | 12,773,177 | |
| Service Class | | 249 | | | | 13,542 | |
| | | 16,460,706 | | | | 15,835,656 | |
| Cost of shares repurchased: | | | | | | | |
| Standard Class | | (10,177,492 | ) | | | (23,233,738 | ) |
| Service Class | | (9,441 | ) | | | (98,506 | ) |
| | | (10,186,933 | ) | | | (23,332,244 | ) |
| Increase (decrease) in net assets derived | | | | | | | |
| from capital share transactions | | 6,273,773 | | | | (7,496,588 | ) |
| |
| NET INCREASE (DECREASE) | | | | | | | |
| IN NET ASSETS | | 32,278,557 | | | | (80,141,434 | ) |
| |
| NET ASSETS: | | | | | | | |
| Beginning of year | | 73,730,036 | | | | 153,871,470 | |
| End of year (including undistributed | | | | | | | |
| net investment income of $1,992,721 | | | | | | | |
| and $2,752,001, respectively) | $ | 106,008,593 | | | $ | 73,730,036 | |
| | | | | | | | |
| See accompanying notes |
International Value Equity Series-8
Delaware VIP® Trust — Delaware VIP International Value Equity Series
Financial Highlights
Selected data for each share of the Series outstanding throughout each period were as follows:
| | Delaware VIP International Value Equity Series Standard Class |
| | Year Ended |
| | 12/31/09 | | 12/31/08 | | 12/31/07 | | 12/31/06 | | 12/31/05 | |
| Net asset value, beginning of period | | $7.640 | | $14.700 | | $23.100 | | $20.380 | | $18.550 | |
| |
| Income (loss) from investment operations: | | | | | | | | | | | |
| Net investment income1 | | 0.216 | | 0.306 | | 0.273 | | 0.512 | | 0.496 | |
| Net realized and unrealized gain (loss) on | | | | | | | | | | | |
| investments and foreign currencies | | 2.324 | | (6.103 | ) | 0.858 | | 4.043 | | 1.838 | |
| Total from investment operations | | 2.540 | | (5.797 | ) | 1.131 | | 4.555 | | 2.334 | |
| |
| Less dividends and distributions from: | | | | | | | | | | | |
| Net investment income | | (0.260 | ) | (0.271 | ) | (0.508 | ) | (0.616 | ) | (0.291 | ) |
| Net realized gain on investments | | – | | (0.992 | ) | (9.023 | ) | (1.219 | ) | (0.213 | ) |
| Total dividends and distributions | | (0.260 | ) | (1.263 | ) | (9.531 | ) | (1.835 | ) | (0.504 | ) |
| |
| Net asset value, end of period | | $9.920 | | $7.640 | | $14.700 | | $23.100 | | $20.380 | |
| |
| Total return2 | | 34.73% | | (42.42% | ) | 5.24% | | 23.59% | | 12.87% | |
| |
| Ratios and supplemental data: | | | | | | | | | | | |
| Net assets, end of period (000 omitted) | | $105,999 | | $73,712 | | $153,691 | | $173,017 | | $161,293 | |
| Ratio of expenses to average net assets | | 1.00% | | 1.04% | | 0.99% | | 1.01% | | 1.00% | |
| Ratio of expenses to average net assets | | | | | | | | | | | |
| prior to fees waived and expense paid indirectly | | 1.03% | | 1.05% | | 0.99% | | 1.01% | | 1.02% | |
| Ratio of net investment income to average net assets | | 2.60% | | 2.79% | | 1.66% | | 2.44% | | 2.63% | |
| Ratio of net investment income to average net assets | | | | | | | | | | | |
| prior to fees waived and expense paid indirectly | | 2.57% | | 2.78% | | 1.66% | | 2.44% | | 2.61% | |
| Portfolio turnover | | 37% | | 35% | | 21% | | 114% | | 8% | |
| 1The average shares outstanding method has been applied for per share information. |
| 2Total investment return is based on the change in net asset value of a share during the period and assumes reinvestment of dividends and distributions at net asset value. Total investment return during some of the periods shown reflects a waiver by the manager. Performance would have been lower had the waiver not been in effect. |
See accompanying notes
International Value Equity Series-9
Delaware VIP® International Value Equity Series
Financial Highlights (continued)
Selected data for each share of the Series outstanding throughout each period were as follows:
| | Delaware VIP International Value Equity Series Service Class |
| | Year Ended |
| | 12/31/09 | | 12/31/08 | | 12/31/07 | | 12/31/06 | | 12/31/05 | |
| Net asset value, beginning of period | | $7.620 | | $14.660 | | $23.050 | | $20.350 | | $18.520 | |
| |
| Income (loss) from investment operations: | | | | | | | | | | | |
| Net investment income1 | | 0.196 | | 0.279 | | 0.233 | | 0.459 | | 0.449 | |
| Net realized and unrealized gain (loss) on | | | | | | | | | | | |
| investments and foreign currencies | | 2.327 | | (6.096 | ) | 0.856 | | 4.029 | | 1.845 | |
| Total from investment operations | | 2.523 | | (5.817 | ) | 1.089 | | 4.488 | | 2.294 | |
| |
| Less dividends and distributions from: | | | | | | | | | | | |
| Net investment income | | (0.233 | ) | (0.231 | ) | (0.456 | ) | (0.569 | ) | (0.251 | ) |
| Net realized gain on investments | | – | | (0.992 | ) | (9.023 | ) | (1.219 | ) | (0.213 | ) |
| Total dividends and distributions | | (0.233 | ) | (1.223 | ) | (9.479 | ) | (1.788 | ) | (0.464 | ) |
| |
| Net asset value, end of period | | $9.910 | | $7.620 | | $14.660 | | $23.050 | | $20.350 | |
| |
| Total return2 | | 34.61% | | (42.67% | ) | 4.98% | | 23.24% | | 12.65% | |
| |
| Ratios and supplemental data: | | | | | | | | | | | |
| Net assets, end of period (000 omitted) | | $10 | | $18 | | $180 | | $60 | | $62 | |
| Ratio of expenses to average net assets | | 1.25% | | 1.29% | | 1.24% | | 1.26% | | 1.25% | |
| Ratio of expenses to average net assets | | | | | | | | | | | |
| prior to fees waived and expense paid indirectly | | 1.33% | | 1.35% | | 1.29% | | 1.31% | | 1.32% | |
| Ratio of net investment income to average net assets | | 2.35% | | 2.54% | | 1.41% | | 2.19% | | 2.38% | |
| Ratio of net investment income to average net assets | | | | | | | | | | | |
| prior to fees waived and expense paid indirectly | | 2.27% | | 2.48% | | 1.36% | | 2.14% | | 2.31% | |
| Portfolio turnover | | 37% | | 35% | | 21% | | 114% | | 8% | |
____________________
| 1The average shares outstanding method has been applied for per share information. |
| 2Total investment return is based on the change in net asset value of a share during the period and assumes reinvestment of dividends and distributions at net asset value. Total investment return during some of the periods shown reflects waivers by the manager and/or distributor. Performance would have been lower had the waivers not been in effect. |
See accompanying notes
International Value Equity Series-10
Delaware VIP® Trust — Delaware VIP International Value Equity Series
Notes to Financial Statements
December 31, 2009
Delaware VIP Trust (Trust) is organized as a Delaware statutory trust and offers 12 series: Delaware VIP Cash Reserve Series, Delaware VIP Diversified Income Series, Delaware VIP Emerging Markets Series, Delaware VIP Growth Opportunities Series, Delaware VIP High Yield Series, Delaware VIP International Value Equity Series, Delaware VIP Limited-Term Diversified Income Series (formerly Delaware VIP Capital Reserves Series), Delaware VIP REIT Series, Delaware VIP Small Cap Value Series, Delaware VIP Trend Series, Delaware VIP U.S. Growth Series and Delaware VIP Value Series. These financial statements and the related notes pertain to Delaware VIP International Value Equity Series (Series). The Trust is an open-end investment company. The Series is considered diversified under the Investment Company Act of 1940, as amended, and offers Standard Class and Service Class shares. The Standard Class shares do not carry a 12b-1 fee and the Service Class shares carry a 12b-1 fee. The shares of the Series are sold only to separate accounts of life insurance companies.
The investment objective of the Series is to seek long-term growth without undue risk to principal.
1. Significant Accounting Policies
The following accounting policies are in accordance with U.S. generally accepted accounting principles (U.S. GAAP) and are consistently followed by the Series.
Security Valuation—Equity securities, except those traded on the Nasdaq Stock Market, Inc. (Nasdaq), are valued at the last quoted sales price as of the time of the regular close of the New York Stock Exchange (NYSE) on the valuation date. Securities traded on the Nasdaq are valued in accordance with the Nasdaq Official Closing Price, which may not be the last sales price. If on a particular day an equity security does not trade, then the mean between the bid and ask prices will be used. Securities listed on a foreign exchange are valued at the last quoted sales price on the valuation date. Short-term debt securities are valued at market value. Investment companies are valued at net asset value per share. Foreign currency exchange contracts are valued at the mean between the bid and ask prices. Interpolated values are derived when the settlement date of the contract is an interim date for which quotations are not available. Generally, other securities and assets for which market quotations are not readily available are valued at fair value as determined in good faith under the direction of the Series’ Board of Trustees (Board). In determining whether market quotations are readily available or fair valuation will be used, various factors will be taken into consideration, such as market closures or suspension of trading in a security. The Series may use fair value pricing more frequently for securities traded primarily in non-U.S. markets because, among other things, most foreign markets close well before the Series values its securities at 4:00 p.m. Eastern time. The earlier close of these foreign markets gives rise to the possibility that significant events, including broad market moves, government actions or pronouncements, aftermarket trading, or news events may have occurred in the interim. To account for this, the Series may frequently value foreign securities using fair value prices based on third-party vendor modeling tools (international fair value pricing).
Federal Income Taxes—No provision for federal income taxes has been made as the Series intends to continue to qualify for federal income tax purposes as a regulated investment company under Subchapter M of the Internal Revenue Code of 1986, as amended, and make the requisite distributions to shareholders. The Series evaluates tax positions taken or expected to be taken in the course of preparing the Series’ tax returns to determine whether the tax positions are “more-likely-than-not” of being sustained by the applicable tax authority. Tax positions not deemed to meet the more-likely-than-not threshold are recorded as a tax benefit or expense in the current year. Management has analyzed the Series’ tax positions taken on federal income tax returns for all open tax years (tax years ended December 31, 2006 – December 31, 2009), and has concluded that no provision for federal income tax is required in the Series’ financial statements.
Class Accounting—Investment income, common expenses and realized and unrealized gain (loss) on investments are allocated to the classes of the Series on the basis of daily net assets of each class. Distribution expenses relating to a specific class are charged directly to that class.
Repurchase Agreements—The Series may invest in a pooled cash account along with other members of the Delaware Investments® Family of Funds pursuant to an exemptive order issued by the Securities and Exchange Commission. The aggregate daily balance of the pooled cash account is invested in repurchase agreements secured by obligations of the U.S. government. The respective collateral is held by the Series’ custodian bank until the maturity of the respective repurchase agreements. Each repurchase agreement is at least 102% collateralized. However, in the event of default or bankruptcy by the counterparty to the agreement, realization of the collateral may be subject to legal proceedings. At December 31, 2009, the Series held no investments in repurchase agreements.
Foreign Currency Transactions—Transactions denominated in foreign currencies are recorded at the prevailing exchange rates on the valuation date. The value of all assets and liabilities denominated in foreign currencies is translated into U.S. dollars at the exchange rate of such currencies against the U.S. dollar daily. Transaction gains or losses resulting from changes in exchange rates during the reporting period or upon settlement of the foreign currency transaction are reported in operations for the current period. The Series does not isolate that portion of realized gains and losses on investments which are due to changes in foreign exchange rates from that which are due to changes in market prices. The Series reports certain foreign currency related transactions as components of realized gains (losses) for financial reporting purposes, whereas such components are treated as ordinary income (loss) for federal income tax purposes.
Use of Estimates—The preparation of financial statements in conformity with U.S. GAAP requires management to make estimates and assumptions that affect the reported amounts of assets and liabilities at the date of the financial statements and the reported amounts of revenues and expenses during the reporting period. Actual results could differ from those estimates.
Other—Expenses directly attributable to the Series are charged directly to the Series. Other expenses common to various funds within the Delaware Investments Family of Funds are generally allocated amongst such funds on the basis of average net assets. Management fees and some other expenses are paid monthly. Security transactions are recorded on the date the securities are purchased or sold (trade date) for financial reporting purposes. Costs used in calculating realized gains and losses on the sale of investment securities are those of the specific securities sold. Dividend income is recorded on the ex-dividend date and interest income is recorded on the accrual basis. Foreign dividends are also recorded on the ex-dividend date or as soon after the ex-dividend date that the Series is aware of such dividends, net of all non-rebatable tax withholdings. Withholding taxes on foreign dividends have been recorded in accordance with the Series’ understanding of the applicable country’s tax rules and rates. The Series declares and pays dividends from net investment income and distributions from net realized gain on investments, if any, following the close of the fiscal year.
International Value Equity Series-11
Delaware VIP® International Value Equity Series
Notes to Financial Statements (continued)
1. Significant Accounting Policies (continued)
The Series may receive earnings credits from its custodian when positive cash balances are maintained, which are used to offset custody fees. There were no earnings credits for the year ended December 31, 2009.
On July 1, 2009, the Financial Accounting Standards Board (FASB) issued the FASB Accounting Standards Codification (Codification). The Codification became the single source of authoritative nongovernmental U.S. GAAP, superseding existing literature of the FASB, American Institute of Certified Public Accountants, Emerging Issues Task Force and other sources. The Codification is effective for interim and annual periods ending after September 15, 2009. The Series adopted the Codification for the year ended December 31, 2009. There was no impact to financial statements as the Codification requirements are disclosure-only in nature.
Management has evaluated whether any events or transactions occurred subsequent to December 31, 2009 through February 17, 2010, the date of issuance of the Series’ financial statements, and determined that there were no material events or transactions that would require recognition or disclosure in the Series’ financial statements.
2. Investment Management, Administration Agreements and Other Transactions with Affiliates
In accordance with the terms of its investment management agreement, the Series pays Delaware Management Company (DMC), a series of Delaware Management Business Trust and the investment manager, an annual fee which is calculated daily at the rate of 0.85% on the first $500 million of average daily net assets of the Series, 0.80% on the next $500 million, 0.75% on the next $1.5 billion, and 0.70% on average daily net assets in excess of $2.5 billion.
Effective May 1, 2009, DMC has voluntarily agreed to waive that portion, if any, of its management fee and/or pay/reimburse the Series to the extent necessary to ensure that total annual operating expenses (excluding any 12b-1 plan expenses, taxes, interest, inverse floater program expenses, brokerage fees, certain insurance costs, and nonroutine expenses or costs including, but not limited to, those relating to reorganizations, litigation, conducting shareholder meetings, and liquidations (collectively, “nonroutine expenses”)) do not exceed 1.00% of average daily net assets of the Series until such time as the voluntary expense cap is discontinued. Prior to May 1, 2009, DMC had contractually agreed to waive that portion, if any, of its management fee and reimburse the Series to the extent necessary to ensure that the total annual operating expenses (excluding any 12b-1 plan expenses, taxes, interest, inverse floater program expenses, brokerage fees, certain insurance costs, and nonroutine expenses did not exceed 1.01% of average daily net assets of the Series through April 30, 2009. For purposes of this waiver and reimbursement, nonroutine expenses may also include such additional costs and expenses, as may be agreed upon from time to time by the Series’ Board and DMC. This expense waiver and reimbursement applies only to expenses paid directly by the Series, and may be discontinued at any time because they are voluntary. Effective August 17, 2009, the expense waiver was discontinued.
Delaware Service Company, Inc. (DSC), an affiliate of DMC, provides fund accounting and financial administration oversight services to the Series. For these services, the Series pays DSC fees based on the aggregate daily net assets of the Delaware Investments® Family of Funds at the following annual rate: 0.0050% of the first $30 billion; 0.0045% of the next $10 billion; 0.0040% of the next $10 billion; and 0.0025% of aggregate average daily net assets in excess of $50 billion. The fees payable to DSC under the service agreement described above are allocated among all funds in the Delaware Investments Family of Funds on a relative net asset value basis. For the year ended December 31, 2009, the Series was charged $4,484 for these services.
DSC also provides dividend disbursing and transfer agency services. The Series pays DSC a monthly fee based on the number of shareholder accounts for dividend disbursing and transfer agent services.
Pursuant to a distribution agreement and distribution plan, the Series pays Delaware Distributors, L.P. (DDLP), the distributor and an affiliate of DMC, an annual distribution and service fee not to exceed 0.30% of the average daily net assets of the Service Class shares. DDLP has contracted to waive distribution and service fees through April 30, 2010 in order to prevent distribution and service fees of the Service Class shares from exceeding 0.25% of average daily net assets. Standard Class shares pay no distribution and service expenses.
At December 31, 2009, the Series had liabilities payable to affiliates as follows:
| | | | Dividend Disbursing, | | | | Other |
| | Investment | | Transfer Agent and Fund | | | | Expenses |
| | Management | | Accounting Oversight | | Distribution | | Payable |
| | Fee Payable to | | Fees and Other Expenses | | Fee Payable | | to DMC |
| | DMC | | Payable to DSC | | to DDLP | | and Affiliates* |
| | $76,362 | | $1,128 | | $2 | | $2,603 |
____________________
*DMC, as part of its administrative services, pays operating expenses on behalf of the Series and is reimbursed on a periodic basis. Such expenses include items such as printing of shareholder reports, fees for audit, legal and tax services, custodian fees and trustees’ fees.
As provided in the investment management agreement, the Series bears the cost of certain legal and tax services, including internal legal and tax services provided to the Series by DMC and/or its affiliates’ employees. For the year ended December 31, 2009, the Series was charged $7,409 for internal legal and tax services provided by DMC and/or its affiliates’ employees.
Trustees’ fees include expenses accrued by the Series for each Trustee’s retainer and meeting fees. Certain officers of DMC, DSC and DDLP are officers and/or Trustees of the Trust. These officers and Trustees are paid no compensation by the Series.
International Value Equity Series-12
Delaware VIP® International Value Equity Series
Notes to Financial Statements (continued)
3. Investments
For the year ended December 31, 2009, the Series made purchases and sales of investment securities other than short-term investments as follows:
| Purchases | $ | 39,329,353 |
| Sales | | 32,630,851 |
At December 31, 2009, the cost of investments and unrealized appreciation (depreciation) for federal income tax purposes for the Series were as follows:
| | | | Aggregate | | Aggregate | | Net |
| | Cost of | | Unrealized | | Unrealized | | Unrealized |
| | Investments | | Appreciation | | Depreciation | | Depreciation |
| | $113,190,406 | | $14,849,396 | | $(10,609,841) | | $4,239,555 |
U.S. GAAP defines fair value as the price that the Series would receive to sell an asset or pay to transfer a liability in an orderly transaction between market participants at the measurement date under current market conditions. A framework for measuring fair value and a three level hierarchy for fair value measurements has been established based upon the transparency of inputs to the valuation of an asset or liability. Inputs may be observable or unobservable and refer broadly to the assumptions that market participants would use in pricing the asset or liability. Observable inputs reflect the assumptions market participants would use in pricing the asset or liability based on market data obtained from sources independent of the reporting entity. Unobservable inputs reflect the reporting entity’s own assumptions about the assumptions that market participants would use in pricing the asset or liability developed based on the best information available under the circumstances. The Series’ investment in its entirety is assigned a level based upon the observability of the inputs which are significant to the overall valuation. The three-tier hierarchy of inputs is summarized below.
Level 1 – inputs are quoted prices in active markets
Level 2 – inputs are observable, directly or indirectly
Level 3 – inputs are unobservable and reflect assumptions on the part of the reporting entity
The following table summarizes the valuation of the Series’ investments by the fair value hierarchy levels as of December 31, 2009:
| Level 1 | | Level 2 | | Level 3 | | Total |
| Common Stock | $ | 19,156,174 | | $ | 86,874,537 | | $ | – | | $ | 106,030,711 |
| Securities Lending Collateral | | 7,390,832 | | | 3,994,706 | | | 13,712 | | | 11,399,250 |
| Total | $ | 26,547,006 | | $ | 90,869,243 | | $ | 13,712 | | $ | 117,429,961 |
| |
As a result of utilizing international fair value pricing at December 31, 2009, the majority of the portfolio was categorized as level 2 in the hierarchy.
The following is a reconciliation of investments in which significant unobservable inputs (Level 3) were used in determining fair value:
| | | | | | Securities | | | | |
| | Common | | Lending | | Total |
| Stock | | Collateral | | Series |
| Balance as of 12/31/08 | $ | 1,048,831 | | | | | $10,647 | | | $ | 1,059,478 | |
| Net realized loss | | (569,868 | ) | | | | – | | | | (569,868 | ) |
| Net change in unrealized appreciation/depreciation | | 569,868 | | | | | 3,065 | | | | 572,933 | |
| Purchases | | 174,608 | | | | | – | | | | 174,608 | |
| Sales | | (274,780 | ) | | | | – | | | | (274,780 | ) |
| Transfers out | | (948,659 | ) | | | | – | | | | (948,659 | ) |
| Balance as of 12/31/09 | $ | – | | | | | $13,712 | | | $ | 13,712 | |
| |
| Net change in unrealized | | | | | | | | | | | | |
| appreciation/depreciation from | | | | | | | | | | | | |
| investments still held as of 12/31/09 | $ | – | | | | | $ 3,065 | | | $ | 3,065 | |
In January 2010, the Financial Accounting Standards Board issued an Accounting Standards Update, Improving Disclosures about Fair Value Measurements, which introduces new disclosure requirements and clarifies certain existing disclosure requirements around fair value measurements currently presented above. The new disclosures and clarifications of existing disclosures are generally effective for the Series’ year ending December 31, 2010 and interim periods therein. Management is evaluating the impact of this update on its current disclosures.
International Value Equity Series-13
Delaware VIP® International Value Equity Series
Notes to Financial Statements (continued)
4. Dividend and Distribution Information
Income and long-term capital gain distributions are determined in accordance with federal income tax regulations, which may differ from U.S. GAAP. Additionally, distributions from net gains on foreign currency transactions and net short-term gains on sales of investment securities are treated as ordinary income for federal income tax purposes. The tax character of dividends and distributions paid during years ended December 31, 2009 and 2008 was as follows:
| Year | | Year |
| Ended | | Ended |
| 12/31/09 | | 12/31/08 |
| Ordinary income | $ | 2,825,793 | | $ | 5,279,879 |
| Long-term capital gain | | – | | | 7,506,840 |
| Total | $ | 2,825,793 | | $ | 12,786,719 |
| |
5. Components of Net Assets on a Tax Basis
As of December 31, 2009, the components of net assets on a tax basis were as follows:
| Shares of beneficial interest | $ | 125,256,379 | |
| Undistributed ordinary income | | 2,015,551 | |
| Post-October currency losses | | (22,830 | ) |
| Capital loss carryforwards | | (25,477,535 | ) |
| Unrealized appreciation of investments | | | |
| and foreign currencies | | 4,237,028 | |
| Net assets | $ | 106,008,593 | |
| |
The differences between book basis and tax basis components of net assets are primarily attributable to tax deferral of losses on wash sales.
Post-October currency losses represent losses realized on foreign currency transactions from November 1, 2009 through December 31, 2009 that, in accordance with federal income tax regulations, the Series has elected to defer and treat as having arisen in the following year.
For financial reporting purposes, capital accounts are adjusted to reflect the tax character of permanent book/tax differences. Reclassifications are primarily due to tax treatment of gain (loss) on foreign currency transactions. Results of operations and net assets were not affected by these reclassifications. For the year ended December 31, 2009, the Series recorded the following reclassifications:
| Undistributed | | Accumulated |
| Net Investment | | Net Realized |
| Income | | Loss |
| $(270,417) | | $270,417 |
For federal income tax purposes, capital loss carryforwards may be carried forward and applied against future capital gains. Capital loss carryforwards remaining at December 31, 2009 will expire as follows: $ 12,753,714 expires in 2016 and $12,723,821 expires in 2017.
6. Capital Shares
Transactions in capital shares were as follows:
| Year | | Year |
| Ended | | Ended |
| 12/31/09 | | 12/31/08 |
| Shares sold: | | | | | |
| Standard Class | 1,888,616 | | | 268,376 | |
| Service Class | 69 | | | 744 | |
| |
| Shares issued upon reinvestment of dividends and distributions: | | | | | |
| Standard Class | 408,907 | | | 1,090,792 | |
| Service Class | 36 | | | 1,157 | |
| | 2,297,628 | | | 1,361,069 | |
| Shares repurchased: | | | | | |
| Standard Class | (1,261,776 | ) | | (2,161,739 | ) |
| Service Class | (1,387 | ) | | (11,916 | ) |
| | (1,263,163 | ) | | (2,173,655 | ) |
| Net increase (decrease) | 1,034,465 | | | (812,586 | ) |
| |
International Value Equity Series-14
Delaware VIP® International Value Equity Series
Notes to Financial Statements (continued)
7. Line of Credit
The Series, along with certain other funds in the Delaware Investments® Family of Funds (Participants), participates in a $35,000,000 revolving line of credit with The Bank of New York Mellon (BNY Mellon) to be used for temporary or emergency purposes as an additional source of liquidity to fund redemptions of investor shares. Under the agreement, Participants are charged an annual commitment fee, which is allocated across the Participants on the basis of each Participant’s allocation of the entire facility. The Participants may borrow up to a maximum of one third of their net assets under the agreement. The agreement expires on November 16, 2010. The Series had no amounts outstanding as of December 31, 2009, or at any time during the year then ended.
8. Derivatives
U.S. GAAP requires enhanced disclosures that enable investors to understand: 1) how and why an entity uses derivatives, 2) how they are accounted for, and 3) how they affect an entity’s results of operations and financial position.
Foreign Currency Exchange Contracts
The Series may enter into foreign currency exchange contracts and foreign cross currency exchange contracts as a way of managing foreign exchange rate risk. The Series may enter into these contracts to fix the U.S. dollar value of a security that it has agreed to buy or sell for the period between the date the trade was entered into and the date the security is delivered and paid for. The Series may also use these contracts to hedge the U.S. dollar value of securities it already owns that are denominated in foreign currencies. The change in value is recorded as an unrealized gain or loss. When the contract is closed, a realized gain or loss is recorded equal to the difference between the value of the contract at the time it was opened and the value at the time it was closed.
The use of foreign currency exchange contracts and foreign cross currency exchange contracts does not eliminate fluctuations in the underlying prices of the securities, but does establish a rate of exchange that can be achieved in the future. Although foreign currency exchange contracts limit the risk of loss due to a decline in the value of the hedged currency, they also limit any potential gain that might result should the value of the currency increase. In addition, the Series could be exposed to risks if the counterparties to the contracts are unable to meet the terms of their contracts. The Series’ maximum risk of loss from counterparty credit risk is the value of its currency exchanged with the counterparty. The risk is generally mitigated by having a netting arrangement between the Series and the counterparty and by the posting of collateral by the counterparty to the Series to cover the Series’ exposure to the counterparty. There were no foreign currency exchange contracts outstanding at December 31, 2009.
9. Securities Lending
The Series, along with other funds in the Delaware Investments Family of Funds, may lend its securities pursuant to a security lending agreement (Lending Agreement) with BNY Mellon. With respect to each loan, if the aggregate market value of securities collateral held plus cash collateral received on any business day is less than the aggregate market value of the securities which are the subject of such loan, the borrower will be notified to provide additional collateral not less than the applicable collateral requirements. Cash collateral received is generally invested in the Mellon GSL DBT II Collateral Fund (Collective Trust) established by BNY Mellon for the purpose of investment on behalf of clients participating in its securities lending programs. The Collective Trust may invest in fixed income securities, with a weighted average maturity not to exceed 90 days, rated in one of the top three tiers by Standard & Poor’s Ratings Group or Moody’s Investors Service, Inc. or repurchase agreements collateralized by such securities. The Collective Trust seeks to maintain a net asset value per unit of $1.00, but there can be no assurance that it will always be able to do so. At December 31, 2009, the Collective Trust held only cash and assets with a maturity of one business day or less (Cash/Overnight Assets). The Series may incur investment losses as a result of investing securities lending collateral in the Collective Trust. This could occur if an investment in the Collective Trust defaulted or if it were necessary to liquidate assets in the Collective Trust to meet returns on outstanding security loans at a time when the Collective Trust’s net asset value per unit was less than $1.00. Under those circumstances, the Series may not receive an amount from the Collective Trust that is equal in amount to the collateral the Series would be required to return to the borrower of the securities and the Series would be required to make up for this shortfall. Effective April 20, 2009, BNY Mellon transferred the assets of the Collective Trust other than the Cash/Overnight Assets to the BNY Mellon SL DBT II Liquidating Fund (Liquidating Fund), effectively bifurcating the collateral investment pool. The Series’ exposure to the Liquidating Fund is expected to decrease as the Liquidating Fund’s assets mature or are sold. In October 2008, BNY Mellon transferred certain distressed securities from the Collective Trust into the Mellon GSL Reinvestment Trust II. The Series can also accept U.S. government securities and letters of credit (non-cash collateral) in connection with securities loans. In the event of default or bankruptcy by the lending agent, realization and/or retention of the collateral may be subject to legal proceedings. In the event the borrower fails to return loaned securities and the collateral received is insufficient to cover the value of the loaned securities and provided such collateral shortfall is not the result of investment losses, the lending agent has agreed to pay the amount of the shortfall to the Series, or at the discretion of the lending agent, replace the loaned securities. The Series continues to record dividends or interest, as applicable, on the securities loaned and is subject to change in value of the securities loaned that may occur during the term of the loan. The Series has the right under the Lending Agreement to recover the securities from the borrower on demand. With respect to security loans collateralized by non-cash collateral, the Series receives loan premiums paid by the borrower. With respect to security loans collateralized by cash collateral, the earnings from the collateral investments are shared among the Series, the security lending agent and the borrower. The Series records security lending income net of allocations to the security lending agent and the borrower.
At December 31, 2009, the value of the securities on loan was $11,139,616, for which cash collateral was received and invested in accordance with the lending agreement. At December 31, 2009, the value of invested collateral was $11,399,250. Such investments are presented on the Statement of Net Assets under the caption “Securities Lending Collateral.”
10. Credit and Market Risk
Some countries in which the Series may invest require governmental approval for the repatriation of investment income, capital or the proceeds of sales of securities by foreign investors. In addition, if there is deterioration in a country’s balance of payments or for other reasons, a country may impose temporary restrictions on foreign capital remittances abroad.
International Value Equity Series-15
Delaware VIP® International Value Equity Series
Notes to Financial Statements (continued)
10. Credit and Market Risk (continued)
The securities exchanges of certain foreign markets are substantially smaller, less liquid, and more volatile than the major securities markets in the United States. Consequently, acquisition and disposition of securities by the Series may be inhibited. In addition, a significant portion of the aggregate market value of equity securities listed on the major securities exchanges in emerging markets are held by a smaller number of investors. This may limit the number of shares available for acquisition or disposition by the Series.
The Series may invest up to 10% of its net assets in illiquid securities, which may include securities with contractual restrictions on resale, securities exempt from registration under Rule 144A of the Securities Act of 1933, as amended, and other securities which may not be readily marketable. The relative illiquidity of these securities may impair the Series from disposing of them in a timely manner and at a fair price when it is necessary or desirable to do so. While maintaining oversight, the Series’ Board has delegated to DMC the day-to-day functions of determining whether individual securities are liquid for purposes of the Series’ limitation on investments in illiquid assets. Securities eligible for resale pursuant to Rule 144A, which are determined to be liquid, are not subject to the Series’ limit on investments in illiquid securities. As of December 31, 2009, there were no Rule 144A securities. Illiquid securities have been identified on the Statement of Net Assets.
11. Contractual Obligations
The Series enters into contracts in the normal course of business that contain a variety of indemnifications. The Series’ maximum exposure under these arrangements is unknown. However, the Series has not had prior claims or losses pursuant to these contracts. Management has reviewed the Series’ existing contracts and expects the risk of loss to be remote.
12. Sale of Delaware Investments to Macquarie Group
On August 18, 2009, Lincoln National Corporation (parent company of Delaware Investments) and Macquarie Group (Macquarie) entered into an agreement pursuant to which Delaware Investments, including DMC, DDLP and DSC, would be acquired by Macquarie, an Australia-based global provider of banking, financial, advisory, investment and funds management services (Transaction). The Transaction was completed on January 4, 2010. DMC, DDLP and DSC are now wholly-owned subsidiaries of Macquarie.
The Transaction resulted in a change of control of DMC which, in turn, caused the termination of the investment advisory agreement between DMC and the Series. On January 4, 2010, the new investment advisory agreement between DMC and the Series that was approved by the shareholders became effective.
13. Tax Information (Unaudited)
For the fiscal year ended December 31, 2009, the Series designates distributions paid during the year as follows:
| | (A) | | (B) | | | | |
| | Long-Term | | Ordinary | | | | |
| | Capital Gain | | Income | | Total | | (C) |
| | Distributions | | Distributions | | Distributions | | Qualifying |
| | (Tax Basis) | | (Tax Basis) | | (Tax Basis) | | Dividends1 |
| | – | | 100% | | 100% | | 10% |
____________________
(A) and (B) are based on a percentage of the Series’ total distributions.
(C) is based on a percentage of the Series’ ordinary income distributions.
1Qualifying dividends represent dividends which qualify for the corporate dividends received deduction.
The Series intends to pass through foreign tax credits in the maximum amount of $145,750. The gross foreign source income earned during the fiscal year 2009 by the Series was $3,172,113.
International Value Equity Series-16
Delaware VIP® Trust — Delaware VIP International Value Equity Series
Report of Independent Registered Public Accounting Firm
To the Shareholders and Board of Trustees
Delaware VIP Trust–Delaware VIP International Value Equity Series
We have audited the accompanying statement of net assets of the Delaware VIP International Value Equity Series (one of the series constituting Delaware VIP Trust) (the “Series”) as of December 31, 2009, and the related statement of operations for the year then ended, the statements of changes in net assets for each of the two years in the period then ended, and the financial highlights for each of the five years in the period then ended. These financial statements and financial highlights are the responsibility of the Series’ management. Our responsibility is to express an opinion on these financial statements and financial highlights based on our audits.
We conducted our audits in accordance with the standards of the Public Company Accounting Oversight Board (United States). Those standards require that we plan and perform the audit to obtain reasonable assurance about whether the financial statements and financial highlights are free of material misstatement. We were not engaged to perform an audit of the Series’ internal control over financial reporting. Our audits included consideration of internal control over financial reporting as a basis for designing audit procedures that are appropriate in the circumstances, but not for the purpose of expressing an opinion on the effectiveness of the Series’ internal control over financial reporting. Accordingly, we express no such opinion. An audit also includes examining, on a test basis, evidence supporting the amounts and disclosures in the financial statements and financial highlights, assessing the accounting principles used and significant estimates made by management, and evaluating the overall financial statement presentation. Our procedures included confirmation of securities owned as of December 31, 2009, by correspondence with the custodian and brokers. We believe that our audits provide a reasonable basis for our opinion.
In our opinion, the financial statements and financial highlights referred to above present fairly, in all material respects, the financial position of the Delaware VIP International Value Equity Series of Delaware VIP Trust at December 31, 2009, the results of its operations for the year then ended, the changes in its net assets for each of the two years in the period then ended, and its financial highlights for each of the five years in the period then ended, in conformity with U.S. generally accepted accounting principles.
Philadelphia, Pennsylvania
February 17, 2010
The Series files its complete schedule of portfolio holdings with the Securities and Exchange Commission (Commission) for the first and third quarters of each fiscal year on Form N-Q. The Series’ Forms N-Q, as well as a description of the policies and procedures that the Series uses to determine how to vote proxies (if any) relating to portfolio securities is available without charge (i) upon request, by calling 800 523-1918; and (ii) on the Commission’s website at http://www.sec.gov. In addition, a description of the policies and procedures that the Series uses to determine how to vote proxies (if any) relating to portfolio securities is available without charge on the Delaware Investments® Funds’ Web site at http://www.delawareinvestments.com. The Series’ Forms N-Q may be reviewed and copied at the Commission’s Public Reference Room in Washington, DC; information on the operation of the Public Reference Room may be obtained by calling 800 SEC-0330.
Information (if any) regarding how the Series voted proxies relating to portfolio securities during the most recently disclosed 12-month period ended June 30 is available without charge (i) through the Delaware Investments Funds’ Web site at http://www.delawareinvestments.com; and (ii) on the Commission’s website at http://www.sec.gov. |
International Value Equity Series-17
Delaware VIP® Trust — Delaware VIP International Value Equity Series
Other Series Information
Board Consideration of New Investment Advisory Agreement
At a meeting held on September 3, 2009 (the “Meeting”), the Board of Trustees of the Delaware Investments Family of Funds (the “Board”), including the independent Trustees, unanimously approved a new investment advisory agreement between each registrant on behalf of each series (each, a “Fund” and together, the “Funds”) and Delaware Management Company (“DMC”) in connection with the sale of Delaware Investments’ advisory business to Macquarie Bank Limited (the “Macquarie Group”) (the “Transaction”). In making its decision, the Board considered information furnished specifically in connection with the approval of the new investment advisory agreements with DMC (the “New Investment Advisory Agreements”) which included extensive materials about the Transaction and matters related to the proposed approvals. To assist the Board in considering the New Investment Advisory Agreements, Macquarie Group provided materials and information about Macquarie Group, including detailed written responses to the questions posed by the independent Trustees. DMC also provided materials and information about the Transaction, including detailed written responses to the questions posed by the independent Trustees.
At the Meeting, the Trustees discussed the Transaction with DMC management and with key Macquarie Group representatives. The Meeting included discussions of the strategic rationale for the Transaction and Macquarie Group’s general plans and intentions regarding the Funds and DMC. The Board members also inquired about the plans for, and anticipated roles and responsibilities of, key employees and officers of Delaware Management Holdings Inc. and DMC in connection with the Transaction.
In connection with the Trustees’ review of the New Investment Advisory Agreements for the Funds, DMC and/or Macquarie Group emphasized that:
- They expected that there would be no adverse changes as a result of the Transaction, in the nature, quality, or extent of services currently provided to the Funds and their shareholders, including investment management, distribution, or other shareholder services.
- No material changes in personnel or operations were contemplated in the operation of DMC under Macquarie Group as a result of the Transaction and no material changes were currently contemplated in connection with third party service providers to the Funds.
- Macquarie Group had no intention to cause DMC to alter the voluntary expense waivers and reimbursements currently in effect for the Funds.
- Under the agreement between Macquarie Group and Lincoln National Corporation (“LNC”) (the “Transaction Agreement”), Macquarie Group has agreed to conduct, and to cause its affiliates to conduct, their respective businesses in compliance with the conditions of Section 15(f) of the Investment Company Act of 1940 (the “1940 Act”) with respect to the Funds, to the extent within its control, including maintaining Board composition of at least 75% of the Board members qualifying as independent Trustees and not imposing any “unfair burden” on the Funds for at least two years from the closing of the Transaction (the “Closing”).
In addition to the information provided by DMC and Macquarie Group as described above, the Trustees also considered all other factors they believed to be relevant to evaluating the New Investment Advisory Agreements, including the specific matters discussed below. In their deliberations, the Trustees did not identify any particular information that was controlling, and different Trustees may have attributed different weights to the various factors. However, for each Fund, the Trustees determined that the overall arrangements between the Fund and DMC, as provided in the respective New Investment Advisory Agreement, including the proposed advisory fee and the related administration arrangements between the Fund and DMC, were fair and reasonable in light of the services to be performed, expenses incurred, and such other matters as the Trustees considered relevant. Factors evaluated included:
- The potential for expanding distribution of Fund shares through access to Macquarie Group’s existing distribution channels;
- Delaware Investments’ acquisition of an exclusive wholesaling sales force from a subsidiary of LNC;
- The reputation, financial strength, and resources of Macquarie Group as well as its historic and ongoing commitment to the asset management business in Australia as well as other parts of the world;
- The terms and conditions of the New Investment Advisory Agreements, including that each Fund’s total contractual fee rate under the New Investment Advisory Agreement will remain the same;
- The Board’s full annual review (or initial approval) of the current investment advisory agreements at their in-person meeting in May 2009 as required by the 1940 Act and its determination that (i) DMC had the capabilities, resources, and personnel necessary to provide the satisfactory advisory and administrative services currently provided to each Fund and (ii) the advisory and/or management fees paid by each Fund, taking into account any applicable fee waivers and breakpoints, represented reasonable compensation to DMC in light of the services provided, the costs to DMC of providing those services, economies of scale, and the fees and other expenses paid by similar funds and such other matters that the Board considered relevant in the exercise of its reasonable judgment;
- The portfolio management teams for the Funds are not currently expected to change as a result of the Transaction;
- LNC and Macquarie Group were expected to execute a reimbursement agreement pursuant to which LNC and Macquarie Group would agree to pay (or reimburse) all reasonable out-of-pocket costs and expenses of the Funds in connection with the Board’s consideration of the Transaction, the New Investment Advisory Agreements and related agreements, and all costs related to the proxy solicitation (the “Expense Agreement”);
International Value Equity Series-18
Delaware VIP® International Value Equity Series
Other Series Information (continued)
- The likelihood that Macquarie Group would invest additional amounts in Delaware Investments, including DMC, which could result in increased assets under management, which in turn would allow some Funds the potential opportunity to achieve economies of scale and lower fees payable by Fund shareholders; and
- The compliance and regulatory history of Macquarie Group and its affiliates.
In making their decision relating to the approval of each Fund’s New Investment Advisory Agreement, the independent Trustees gave attention to all information furnished. The following discussion, however, identifies the primary factors taken into account by the Trustees and the conclusions reached in approving the New Investment Advisory Agreements.
NATURE, EXTENT, AND QUALITY OF SERVICE. The Trustees considered the services historically provided by DMC to the Funds and their shareholders. In reviewing the nature, extent, and quality of services, the Board considered that the New Investment Advisory Agreements would be substantially similar to the current investment advisory agreements between the Funds and DMC (the “Current Investment Advisory Agreements”), and they therefore, considered the many reports furnished to them throughout 2008 and 2009 at regular Board meetings covering matters such as: the relative performance of the Funds; the compliance of portfolio managers with the investment policies, strategies, and restrictions for the Funds; the compliance of management personnel with the code of ethics adopted throughout the Delaware Investments Family of Funds complex; and the adherence to fair value pricing procedures as established by the Board. The Trustees were pleased with the current staffing of DMC and the emphasis placed on research and risk management in the investment process. Favorable consideration was given to DMC’s efforts to maintain expenditures and, in some instances, increase financial and human resources committed to Fund matters.
The Board also considered the transfer agent and shareholder services that would continue to be provided to Fund shareholders by DMC’s affiliate, Delaware Service company, Inc. (“DSC”). The Trustees noted, in particular, DSC’s commitment to maintain a high level of service as well as DMC’s expenditures to improve the delivery of shareholder services. The Board was assured that shareholders would continue to receive the benefits provided to Fund shareholders by being part of the Delaware Investments Family of Funds, including each shareholder’s ability to exchange an investment in one Fund for the same class of shares in another Fund without a sales charge, to reinvest Fund dividends into additional shares of any of the Funds, and the privilege to combine holdings in other Funds to obtain a reduced sales charge.
Based on the information provided by DMC and Macquarie Group, including that Macquarie Group and DMC currently expected no material changes as a result of the Transaction in (i) personnel or operations of DMC or (ii) third party service providers to the Funds, the Board concluded that the satisfactory nature, extent, and quality of services currently provided to the Funds and their shareholders were very likely to continue under the New Investment Advisory Agreements. Moreover, the Board concluded that the Funds would probably benefit from the expanded distribution resources that would become available to Delaware Investments following the Transaction. The Board also concluded that it was very unlikely that any “unfair burden” would be imposed on any of the Funds for the first two years following the Closing as a result of the Transaction. Consequently, the Board concluded that it did not expect the Transaction to result in any adverse changes in the nature, quality, or extent of services (including investment management, distribution or other shareholder services) currently provided to the Funds and their shareholders.
INVESTMENT PERFORMANCE. The Board considered the overall investment performance of DMC and the Funds. The Trustees placed significant emphasis on the investment performance of the Funds in view of its importance to shareholders. Although the Trustees gave appropriate consideration to performance reports and discussions with portfolio managers at Board meetings throughout the year, the Trustees gave particular weight to their review of investment performance in connection with the approval of the Current Investment Advisory agreements at the Board meeting held in May 2009. At that meeting, the Trustees reviewed reports prepared by Lipper, Inc., an independent statistical compilation organization (“Lipper”), which showed each Fund’s investment performance as of December 31, 2008 in comparison to a group of funds selected by Lipper as being similar to the Fund (the “Performance Universe”). During the May 2009 agreement review process, the Trustees observed the significant improvements to relative investment performance of the Funds compared to the Funds’ performance as of December 31, 2007.
At their meeting on September 3, 2009, the Trustees, including the independent Trustees in consultation with their independent counsel, reviewed the investment performance of each Fund. The Trustees compared the performance of each Fund relative to that of its respective Performance Universe for the 1-, 3-, 5-, and 10-year periods ended June 30, 2009 and compared its relative investment performance against the corresponding relative investment performance of each Fund for such time periods ended December 31, 2008, to the extent applicable. As of June 30, 2009, 30 of the Funds had investment performance relative to that of the respective Performance Universe that was better than the corresponding relative investment performance at December 31, 2008 for all applicable time periods. At June 30, 2009, an additional 6 Funds had investment performance relative to that of their respective Performance Universe that was better than the corresponding relative investment performance at December 31, 2008 for a majority of the applicable time periods. At June 30, 2009, 15 additional Funds had investment performance relative to that of their respective Performance Universe that was better than the corresponding relative performance at December 31, 2008 and only 29 Funds had poorer relative investment performance at June 30, 2009 compared to that at December 31, 2008.
The Board therefore concluded that the investment performance of the Funds, on an aggregate basis, had continued to improve relative to their respective Performance Universe since the data reviewed at the May 2009 meeting. Based on information provided by DMC and Macquarie Group, the Board concluded that neither the Transaction nor the New Investment Advisory Agreement would likely have an adverse effect on the investment performance of any Fund because (i) DMC and Macquarie Group did not currently expect the Transaction to cause any material change to the Funds’ portfolio management teams responsible for investment performance, which the Board found to be satisfactory and improving; and (ii) as discussed in more detail below, the Funds’ expenses were not expected to increase as a result of the Transaction.
International Value Equity Series-19
Delaware VIP® International Value Equity Series
Other Series Information (continued)
COMPARATIVE EXPENSES. The Trustees also evaluated expense comparison data for the Funds previously provided in May 2009. At that meeting, DMC had provided the Board with information on pricing levels and fee structures for the Funds and comparative funds. The Trustees focused on the comparative analysis of the effective management fees and total expense ratios of each Fund versus the effective management fees and expense ratios of a group of funds selected by Lipper as being similar to each Fund (the “Expense Group”). In reviewing comparative costs, each Fund’s contractual management fee and the actual management fee incurred by the Fund were compared with the contractual management fees (assuming all funds in the Expense Group were similar in size to the Fund) and actual management fees (as reported by each fund) of other funds within the Expense Group, taking into account any applicable breakpoints and fee limitations. Each Fund’s total expenses were also compared with those of its Expense Group. The Trustees also considered fees paid to Delaware Investments for nonmanagement services. At the September 3, 2009 meeting, DMC advised the Board that the more recent comparative expenses for the Funds remained consistent with the previous review in May 2009 and, consequently, the Trustees concluded that expenses of the Funds were satisfactory.
The Board also considered the Expense Agreement under negotiation in evaluating Fund expenses. The Trustees expected that the Expense Agreement would provide that LNC and Macquarie Group would pay or reimburse the Trusts for all reasonable out-of-pocket costs and expenses in connection with the Transaction and the consideration of the New Investment Advisory Agreements (subject to certain limited exceptions).
Based on information provided by DMC and Macquarie Group, the Board concluded that neither the Transaction nor the New Investment Advisory Agreements likely would have an adverse effect on the Funds’ expenses because (i) each Fund’s contractual fee rates under the New Investment Advisory Agreement would remain the same; (ii) under the Expense Agreement, the Funds would be reimbursed for all reasonable out-of-pocket costs and expenses in connection with the Transaction and the related proxy solicitation (subject to certain limited exceptions); and (iii) the expense ratios of certain Funds might decline as a result of the possible increased investment in Delaware Investments by Macquarie Group, as discussed below under “Economies of Scale.”
MANAGEMENT PROFITABILITY. At their meeting on September 3, 2009, the Board evaluated DMC’s profitability in connection with the operation of the Funds. The Board had previously considered DMC’s profitability in connection with the operation of the Funds at its May 2009 meeting. At that meeting, the Board reviewed an analysis that addressed the overall profitability of Delaware Investments’ business in providing management and other services to each of the Funds and the Delaware Investments Family of Funds as a whole. Specific attention was given to the methodology followed in allocating costs for the purpose of determining profitability.
At the May 2009 meeting, representatives of DMC had stated that the level of profits of DMC, to a certain extent, reflect operational cost savings and efficiencies initiated by Delaware Investments (including DMC and its affiliates that provide services to the Funds). The Board considered Delaware Investments’ efforts to improve services provided to Fund shareholders and to meet additional regulatory and compliance requirements resulting from recent industry-wide U.S. Securities and Exchange Commission initiatives. At that meeting, the Board found that the management fees were reasonable in light of the services rendered and the level of profitability of DMC. At the September 3, 2009 meeting, DMC advised the Board that DMC did not expect the Transaction to affect materially the profitability of Delaware Investments compared to the level of profitability considered during the May 2009 review. Moreover, the Trustees reviewed pro forma balance sheets of certain key companies in Delaware Investments as of June 30, 2009 (which were provided by Macquarie Group and DMC in response to the Trustees’ requests) and evaluated the projections of Delaware Investments’ capitalization following the Transaction for purposes of evaluating the financial ability of Delaware Investments to continue to provide the nature, extent, and quality of services as it had under the Current Investment Advisory Agreement.
Based on information provided by DMC and Macquarie Group, the Board concluded that DMC and Delaware Investments would be sufficiently capitalized following the Transaction to continue the same level and quality of services to the Funds under the New Investment Advisory Agreements as was the case under the Current Investment Advisory Agreements. The Board also concluded that Macquarie Group had sufficient financial strength and resources, as well as an ongoing commitment to a global asset management business, to continue investing in Delaware Investments, including DMC, to the extent that Macquarie Group determined it was appropriate. Finally, because services and costs were expected to be substantially the same (and DMC had represented that, correspondingly, profitability would be about the same), under the New Investment Advisory Agreements as under the Current Investment Advisory Agreements, the Trustees concluded that the profitability of Delaware Investments would not result in an inequitable charge on the Funds or their shareholders. Accordingly, the Board concluded that the fees charged under the New Investment Advisory Agreements would be reasonable in light of the services to be provided and the expected profitability of DMC.
ECONOMIES OF SCALE. The Trustees considered whether economies of scale would be realized by Delaware Investments as each Fund’s assets increase and the extent to which any economies of scale would be reflected in the management fees charged. The Trustees took into account DMC’s practice of maintaining the competitive nature of management fees based on its analysis of fees charged by comparable funds. DMC management believed, and the Board agreed, that the Funds were priced with breakpoints and relatively low management fees to reflect potential economies of scale to Fund shareholders.
The Board also acknowledged Macquarie Group’s statement that the Transaction would not by itself immediately provide additional economies of scale given Macquarie Group’s limited presence in the U.S. mutual fund market. Nonetheless, the Trustees concluded that additional economies of scale could potentially be achieved in the future if DMC were owned by Macquarie Group as a result of Macquarie Group’s willingness to invest further in Delaware Investments if appropriate opportunities arise. The Board further concluded that potential economies of scale could be achieved as a result of Delaware Investments’ expanded distribution capabilities arising from the Transaction, as well as opportunities that might arise from Macquarie Group’s global asset management business.
International Value Equity Series-20
Delaware VIP® International Value Equity Series
Other Series Information (continued)
FALL-OUT BENEFITS. The Board acknowledged that DMC would continue to benefit from soft dollar arrangements using portfolio brokerage of each Fund that invests in equity securities and that DMC’s profitability would likely be somewhat lower without the benefit of practices with respect to allocating Fund portfolio brokerage for brokerage and research services. The Board also considered that Macquarie Group and Delaware Investments may derive reputational, strategic, and other benefits from their association with the Delaware Investments Family of Funds, including service relationships with DMC, DSC, and Delaware Distributors, L.P., and evaluated the extent to which Delaware Investments might derive ancillary benefits from Fund operations, including the potential for procuring additional business as a result of the prestige and visibility associated with its role as service provider to the Delaware Investments Family of Funds and the benefits from allocation of Fund brokerage to improve trading efficiencies. However, the Board concluded that (i) any such benefits under the New Investment Advisory Agreements would not be dissimilar from those existing under the Current Investment Advisory Agreements, (ii) such benefits did not impose a cost or burden on the Funds or their shareholders, and (iii) such benefits would probably have an indirectly beneficial effect on the Funds and their shareholders because of the added importance that DMC and Macquarie Group might attach to the Funds as a result of the fall-out benefits that the Funds conveyed.
BOARD REVIEW OF MACQUARIE GROUP. The Trustees reviewed detailed information supplied by Macquarie Group about its operations as well as other information regarding Macquarie Group provided by independent legal counsel to the independent Trustees. Based on this review, the Trustees concluded that Delaware Investments would continue to have the financial ability to maintain the high quality of services required by the Funds. The Trustees noted that there would be a limited transition period during which some services previously provided by LNC to Delaware Investments would continue to be provided by LNC after the Closing, and concluded that this arrangement would help minimize disruption in Delaware Investments’ provision of services to the Funds following the Transaction.
The Board considered Macquarie Group’s support for Delaware Investments’ plans for Fund distribution by transferring wholesalers from Lincoln Financial Distributors, Inc., LNC’s retail distributor, to Delaware Investments, and Macquarie Group’s current intention to leave the Funds’ other service providers in place. The Board also considered Macquarie Group’s current strategic plans to increase its asset management activities, one of its core businesses, particularly in North America, and its statement that its acquisition of DMC is an important component of this strategic growth and the establishment of a significant presence in the United States. Based in part on the information provided by DMC and Macquarie Group, the Board concluded that Macquarie Group’s acquisition of Delaware Investments could potentially enhance the nature, quality, and extent of services provided to the Funds and their shareholders.
CONCLUSION. The Board concluded that the advisory fee rate under each New Investment Advisory Agreement was reasonable in relation to the services provided and that execution of the New Investment Advisory Agreement would be in the best interests of the shareholders. For each Fund, the Trustees noted that they had concluded in their most recent advisory agreement continuance considerations in May 2009 that the management fees and total expense ratios were at acceptable levels in light of the quality of services provided to the Funds and in comparison to those of the Funds’ respective peer groups; that the advisory fee schedule would not be increased and would stay the same for all of the Funds; that the total expense ratio had not changed materially since that determination; and that DMC had represented that the overall expenses for each Fund were not expected to be adversely affected by the Transaction. The Trustees also noted, with respect to the Funds that currently had the benefit of voluntary fee limitations, that Macquarie Group had no present intention to cause DMC to alter any voluntary expense limitations or reimbursements currently in effect. On that basis, the Trustees concluded that the total expense ratios and proposed advisory fees for the Funds anticipated to result from the Transaction were acceptable. In approving each New Investment Advisory Agreement, the Board stated that it anticipated reviewing the continuance of the New Investment Advisory Agreement in advance of the expiration of the initial two-year period.
International Value Equity Series-21
Delaware Investments® Family of Funds
BOARD OF TRUSTEES/DIRECTORS AND OFFICERS ADDENDUM
A mutual fund is governed by a Board of Trustees/Directors (“Trustees”), which has oversight responsibility for the management of a fund’s business affairs. Trustees establish procedures and oversee and review the performance of the investment manager, the distributor, and others who perform services for the fund. The independent fund trustees, in particular, are advocates for shareholder interests. Each trustee has served in that capacity since he or she was elected to or appointed to the Board of Trustees, and will continue to serve until his or her retirement or the election of a new trustee in his or her place. The following is a list of the Trustees and Officers with certain background and related information.
| | | | Number of | Other |
| | | Principal | Portfolios in Fund | Directorships |
| Name, | Position(s) | | Occupation(s) | Complex Overseen | Held by |
| Address, | Held with | Length of Time | During | by Trustee | Trustee |
| and Birth Date | Fund(s) | Served | Past 5 Years | or Officer | or Officer |
| INTERESTED TRUSTEES | | | | | |
| Patrick P. Coyne1 | Chairman, | Chairman and Trustee | Patrick P. Coyne has served in | 81 | Director — |
| 2005 Market Street | President, | since August 16, 2006 | various executive capacities | | Kaydon Corp. |
| Philadelphia, PA | Chief Executive | | at different times at | | |
| 19103 | Officer, and | President and | Delaware Investments.2 | | |
| | Trustee | Chief Executive Officer | | | |
| April 1963 | | since August 1, 2006 | | | |
| | | | | | |
| INDEPENDENT TRUSTEES | | | | | |
| Thomas L. Bennett | Trustee | Since | Private Investor — | 81 | Director — |
| 2005 Market Street | | March 2005 | (March 2004–Present) | | Bryn Mawr |
| Philadelphia, PA | | | | | Bank Corp. (BMTC) |
| 19103 | | | Investment Manager — | | (April 2007–Present) |
| | | | Morgan Stanley & Co. | | |
| October 1947 | | | (January 1984–March 2004) | | |
| John A. Fry | Trustee | Since | President — | 81 | Director — |
| 2005 Market Street | | January 2001 | Franklin & Marshall College | | Community Health |
| Philadelphia, PA | | | (June 2002–Present) | | Systems |
| 19103 | | | | | |
| | | | Executive Vice President — | | |
| May 1960 | | | University of Pennsylvania | | |
| | | | (April 1995–June 2002) | | |
| Anthony D. Knerr | Trustee | Since | Founder and Managing Director — | 81 | None |
| 2005 Market Street | | April 1990 | Anthony Knerr & Associates | | |
| Philadelphia, PA | | | (Strategic Consulting) | | |
| 19103 | | | (1990–Present) | | |
| |
| December 1938 | | | | | |
| Lucinda S. Landreth | Trustee | Since | Chief Investment Officer — | 81 | None |
| 2005 Market Street | | March 2005 | Assurant, Inc. | | |
| Philadelphia, PA | | | (Insurance) | | |
| 19103 | | | (2002–2004) | | |
| |
| June 1947 | | | | | |
| Ann R. Leven | Trustee | Since | Consultant — | 81 | None |
| 2005 Market Street | | October 1989 | ARL Associates | | |
| Philadelphia, PA | | | (Financial Planning) | | |
| 19103 | | | (1983–Present) | | |
| |
| November 1940 | | | | | |
International Value Equity Series-22
| | | | Number of | Other |
| | | Principal | Portfolios in Fund | Directorships |
| Name, | Position(s) | | Occupation(s) | Complex Overseen | Held by |
| Address, | Held with | Length of Time | During | by Trustee | Trustee |
| and Birth Date | Fund(s) | Served | Past 5 Years | or Officer | or Officer |
| INDEPENDENT TRUSTEES (CONTINUED) | | | | |
| Thomas F. Madison | Trustee | Since | President and Chief | 81 | Director and Chair of |
| 2005 Market Street | | May 19973 | Executive Officer — | | Compensation |
| Philadelphia, PA | | | MLM Partners, Inc. | | Committee, |
| 19103 | | | (Small Business Investing | | Governance Committee |
| | | | and Consulting) | | Member |
| February 1936 | | | (January 1993–Present) | | — CenterPoint Energy |
| |
| | | | | | Lead Director and Chair |
| | | | | | of Audit |
| | | | | | and Governance |
| | | | | | Committees, |
| | | | | | Member of |
| | | | | | Compensation |
| | | | | | Committee — Digital |
| | | | | | River, Inc. |
| |
| | | | | | Director and Chair of |
| | | | | | Governance |
| | | | | | Committee, Audit |
| | | | | | Committee Member — |
| | | | | | Rimage Corporation |
| |
| | | | | | Director and Chair of |
| | | | | | Compensation |
| | | | | | Committee — Spanlink |
| | | | | | Communications |
| |
| | | | | | Lead Director and Chair |
| | | | | | of Compensation and |
| | | | | | Governance |
| | | | | | Committees — |
| | | | | | Valmont Industries, Inc. |
| Janet L. Yeomans | Trustee | Since | Vice President and Treasurer | 81 | None |
| 2005 Market Street | | April 1999 | (January 2006–Present) | | |
| Philadelphia, PA | | | Vice President — Mergers & Acquisitions | | |
| 19103 | | | (January 2003–January 2006), and | | |
| | | | Vice President | | |
| July 1948 | | | (July 1995–January 2003) | | |
| | | | 3M Corporation | | |
| J. Richard Zecher | Trustee | Since | Founder — | 81 | Director and Audit |
| 2005 Market Street | | March 2005 | Investor Analytics | | Committee Member — |
| Philadelphia, PA | | | (Risk Management) | | Investor Analytics |
| 19103 | | | (May 1999–Present) | | |
| |
| July 1940 | | | Founder — | | |
| | | | Sutton Asset Management | | |
| | | | (Hedge Fund) | | |
| | | | (September 1996–Present) | | |
International Value Equity Series-23
| | | | Number of | Other |
| | | Principal | Portfolios in Fund | Directorships |
| Name, | Position(s) | | Occupation(s) | Complex Overseen | Held by |
| Address, | Held with | Length of Time | During | by Trustee | Trustee |
| and Birth Date | Fund(s) | Served | Past 5 Years | or Officer | or Officer |
| OFFICERS | | | | | |
| David F. Connor | Vice President, | Vice President since | David F. Connor has served as | 81 | None4 |
| 2005 Market Street | Deputy General | September 2000 | Vice President and Deputy | | |
| Philadelphia, PA | Counsel, and Secretary | and Secretary | General Counsel of | | |
| 19103 | | since | Delaware Investments | | |
| | | October 2005 | since 2000. | | |
| December 1963 | | | | | |
| Daniel V. Geatens | Vice President | Treasurer | Daniel V. Geatens has served | 81 | None4 |
| 2005 Market Street | and Treasurer | since | in various capacities at | | |
| Philadelphia, PA | | October 25, 2007 | different times at | | |
| 19103 | | | Delaware Investments. | | |
| |
| October 1972 | | | | | |
| David P. O’Connor | Senior Vice | Senior Vice President, | David P. O’Connor has served in | 81 | None4 |
| 2005 Market Street | President, | General Counsel, and | various executive and legal | | |
| Philadelphia, PA | General Counsel, | Chief Legal Officer | capacities at different times | | |
| 19103 | and Chief | since | at Delaware Investments. | | |
| | Legal Officer | October 2005 | | | |
| February 1966 | | | | | |
| Richard Salus | Senior | Chief Financial | Richard Salus has served in | 81 | None4 |
| 2005 Market Street | Vice President | Officer since | various executive capacities | | |
| Philadelphia, PA | and | November 2006 | at different times at | | |
| 19103 | Chief Financial | | Delaware Investments. | | |
| | Officer | | | | |
| October 1963 | | | | | |
1 Patrick P. Coyne is considered to be an “Interested Trustee” because he is an executive officer of the Fund’s(s’) investment advisor. |
2 Delaware Investments is the marketing name for Delaware Management Holdings, Inc. and its subsidiaries, including the Fund’s(s’) investment advisor, principal underwriter, and its transfer agent. |
3 In 1997, several funds managed by Voyageur Fund Managers, Inc. (the “Voyageur Funds”) were incorporated into the Delaware Investments Family of Funds. Mr. Madison served as a director of the Voyageur Funds from 1993 until 1997. |
4 David F. Connor, Daniel V. Geatens, David P. O’Connor, and Richard Salus serve in similar capacities for the six portfolios of the Optimum Fund Trust, which have the same investment advisor, principal underwriter, and transfer agent as the registrant. |
The Statement of Additional Information for the Fund(s) includes additional information about the Trustees and Officers and is available, without charge, upon request by calling 800 523-1918.
| PO14857 AR-VIPIVE [12/09] DG3 2/10 (5427) | International Value Equity Series-24 |
| Delaware VIP® Trust |
Delaware VIP Limited-Term Diversified Income Series
(formerly, Delaware VIP Capital Reserve Series) |
| |
| |
| |
| |
| |
| |
| Annual Report |
| |
| |
December 31, 2009 |
| |
| |
| |
| |
| |
| |
| |
| |
| |
| |
| |
| |
| |
| |
| |
|
Table of contents
| > Portfolio management review | 1 |
| | |
| > Performance summary | 2 |
| | |
| > Disclosure of Series expenses | 4 |
| | |
| > Security types and credit quality breakdown | 5 |
| | |
| > Statement of net assets | 6 |
| | |
| > Statement of assets and liabilities | 15 |
| | |
| > Statement of operations | 16 |
| | |
| > Statements of changes in net assets | 16 |
| | |
| > Financial highlights | 17 |
| | |
| > Notes to financial statements | 19 |
| | |
| > Report of independent registered public accounting firm | 27 |
| | |
| > Other Series information | 28 |
| | |
| > Board of trustees/directors and officers addendum | 32 |
On January 4, 2010, Delaware Management Holdings, Inc., and its subsidiaries (collectively known by the marketing name of Delaware Investments) were sold by a subsidiary of Lincoln National Corporation to Macquarie Group Limited, a global provider of banking, financial, advisory, investment and funds management services. Please see your Series’ prospectus and any supplements thereto for more complete information.
Investments in Delaware VIP® Limited-Term Diversified Income Series are not and will not be deposits with or liabilities of Macquarie Bank Limited ABN 46 008 583 542 and its holding companies, including subsidiaries or related companies, and are subject to investment risk, including possible delays in repayment and loss of income and capital invested. No Macquarie Group company guarantees or will guarantee the performance of the Series, the repayment of capital from the Series, or any particular rate of return.
Unless otherwise noted, views expressed herein are current as of Dec. 31, 2009, and are subject to change.
Funds are not FDIC insured and are not guaranteed. It is possible to lose the principal amount invested.
Mutual fund advisory services provided by Delaware Management Company, a series of Delaware Management Business Trust, which is a registered investment advisor. Delaware Investments is the marketing name of Delaware Management Holdings, Inc. and its subsidiaries. Macquarie Group refers to Macquarie Group Limited and its subsidiaries and affiliates worldwide.
© 2010 Delaware Management Holdings, Inc.
All third-party trademarks cited are the property of their respective owners.
| Delaware VIP® Trust — Delaware VIP Limited-Term Diversified Income Series | |
| Portfolio management review | Jan. 12, 2010 |
For the 12-month period ended Dec. 31, 2009, Delaware VIP Limited-Term Diversified Income Series Standard Class shares returned +12.77%, and Service Class shares returned +12.57% (both figures reflect returns with dividends reinvested). The Series’ benchmark, the Barclays Capital 1-3 Year Government/Credit Index, returned +3.83%.
The period began amid the worst economic and financial markets that the portfolio management team has ever witnessed. Beginning in March 2009, however, a considerable recovery took shape that featured what were in our view some of the most attractive fixed income opportunities in decades.
The Federal Reserve and federal government took a series of steps to loosen tight credit markets and improve economic conditions, including passing the American Recovery and Reinvestment Act of 2009, a nearly $800 billion economic stimulus package enacted in February 2009. Starting late in the first quarter of 2009, the fixed income and equity markets began a substantial bounce-back, recovering much of their earlier losses as conditions in the credit markets began to normalize once again. And by later in the year, many economic indicators in the United States showed signs of recovery, and even growth, while other indicators showed at least a slowing decline.
At the beginning of the fiscal period, we began to put greater weight on the arguments for optimism (within both the economy and the financial markets), while continuing to recognize the serious downside risks that accompanied many opportunities. As a result, we primarily focused on adding high-quality bonds, including agency mortgage-backed securities (MBS) and solid investment grade credits into the Series; we also selectively increased the Series’ high yield credits. Our overweight allocation to investment grade corporate bonds — built in response to the historic risk-reward characteristics and valuations we believed remained in place within the asset class — was perhaps the greatest contributor to the Series’ relative return during the fiscal period.
Additionally, the Series’ exposure to high yield and emerging markets debt, which are not included in its benchmark index, also greatly benefited performance. We increased the Series’ allocation to the high yield sector at approximately the same time that we began to ramp up its exposure to investment grade credit because we believed that excellent value opportunities existed in both areas. Within emerging markets, we focused on countries that we believed had good fiscal policies in place prior to the downturn, less-distressed economies, or a sufficient level of flexibility in their economic stimulus programs. These countries tended to experience more vigorous economic recoveries. Examples include Indonesia and Brazil, among others.
We increased the Series’ allocation in riskier asset classes, as outlined above, primarily by shifting out of traditionally conservative asset classes such as Treasurys and agency MBS. In addition to putting the Series in a position to benefit from the advance within those riskier asset classes, this shift also proved beneficial because Treasury and agency securities generally lagged riskier asset classes for much of calendar year 2009.
At the end of the fiscal year, we maintained an overweight position in investment grade corporate bonds and emphasized BBB- and A-rated issues, as well as financials. Our meaningful exposure to the high yield sector at year end helped overall performance. However, we believe the Series didn’t capture the full extent of the high yield market’s appreciation because we tended to emphasize higher-quality credits when returns were progressively stronger within the lower-quality categories.
We continued to underweight government securities, both Treasurys and agencies. Our reduction of exposure to what we view as overpriced agency bonds and an emphasis on intermediate issues seemed well positioned at year end in light of a steepening yield curve.
| Unless otherwise noted, the views expressed are current as of Dec. 31, 2009, and are subject to change. |
Limited-Term Diversified Income Series-1
Delaware VIP® Limited-Term Diversified Income Series (continued)
Performance summary
The performance data quoted represent past performance; past performance does not guarantee future results. Investment return and principal value will fluctuate so your shares, when redeemed, may be worth more or less than original cost. Please obtain the performance data for the most recent month end by calling the number noted in the introductory section of this report on the page related to this Series. Current performance may be lower or higher than the performance data quoted.
You should consider the investment objectives, risks, charges, and expenses of the Series carefully before investing. The Delaware VIP Limited-Term Diversified Income Series prospectus contains this and other important information about the Series. To obtain a prospectus, contact the company noted on the page related to this Series in the introductory section of this report, either by phone or through the company’s Web site. We advise you to read the prospectus carefully before you invest. Read the prospectus carefully before you invest or send money.
| Delaware VIP Limited-Term Diversified Income Series | | | | | | | | | | |
| Average annual total returns | | | | | | | | | | |
| For periods ended Dec. 31, 2009 | | 1 year | | 3 years | | 5 years | | 10 years | | Lifetime |
| Standard Class shares (commenced operations on July 28, 1988) | | +12.77% | | +5.51% | | +4.57% | | +5.48% | | +5.97% |
| Service Class shares (commenced operations on May 1, 2000) | | +12.57% | | +5.25% | | +4.27% | | n/a | | +5.34% |
Returns reflect the reinvestment of all distributions.
As described in the Series’ most recent prospectus, the net expense ratio for Service Class shares of the Series was 0.92%. Total operating expenses for Standard Class and Service Class shares were 0.67% and 0.97%, respectively. The management fee for Standard Class and Service Class shares was 0.50%.
The Series’ distributor has contracted to limit the 12b-1 fees for Service Class shares to no more than 0.25% of average daily net assets through April 30, 2010.
Earnings from a variable annuity or variable life investment compound tax-free until withdrawal, and as a result, no adjustments were made for income taxes.
Expense limitations were in effect for both classes during certain periods shown in the Series performance chart above and in the Performance of a $10,000 Investment chart on the next page.
Prior to April 15, 2009 Delaware VIP Limited-Term Diversified Income Series was named Delaware VIP Capital Reserve Series. At the close of business on April 14, 2009, the Series’ investment objective, strategies, and policies changed; and the Series became a limited-term fixed income Series. It is no longer a Series that invests primarily in short-term securities. These changes are significant and present additional investment risks. Also, these changes may affect future performance and a shareholders’ tax liability. For more information about the Series, please obtain a copy of the Series’ prospectus by calling 800 523-1918.
Performance data do not reflect insurance fees related to a variable annuity or variable life investment or the deferred sales charge that would apply to certain withdrawals of investments. Performance shown here would have been reduced if such fees were included or the expense limitation removed. For more information about fees, consult your variable annuity or variable life prospectus.
The letter ratings are provided by S&P and describe the credit-worthiness of the underlying bonds in the Series and generally range from AAA (highest quality) to CCC (lowest; highly speculative).
Investments in variable products involve risk. Fixed income securities and bond funds can lose value, and investors can lose principal, as interest rates rise. They also may be affected by economic conditions that hinder an issuer’s ability to make interest and principal payments on its debt.
The Series may also be subject to prepayment risk, the risk that the principal of a fixed income security that is held by the Series may be prepaid prior to maturity, potentially forcing the Series to reinvest that money at a lower interest rate.
The Series may invest in derivatives, which may involve additional expenses and are subject to risk, including the risk that an underlying security or securities index moves in the opposite direction from what the portfolio manager anticipated. A derivative transaction depends upon the counterparties’ ability to fulfill their contractual obligations.
The Series may experience portfolio turnover in excess of 100%, which could result in higher transaction costs and tax liability.
Please read both the contract and underlying prospectus for specific details regarding the product’s risk profile.
Limited-Term Diversified Income Series-2
Delaware VIP® Limited-Term Diversified Income Series (continued)
The chart shows a $10,000 investment in the Delaware VIP Limited-Term Diversified Income Series Standard Class shares for the period from Dec. 31, 1999, through Dec. 31, 2009.
The chart also shows $10,000 invested in the Barclays Capital 1-3 Year Government/Credit Index and the Merrill Lynch 1–3 Year Treasury Index for the period from Dec. 31, 1999, through Dec. 31, 2009. The Barclays Capital 1-3 Year Government/Credit Index is a market value-weighted index of government fixed-rate debt securities and investment grade U.S. and foreign fixed-rate debt securities with average maturities of one to three years. The Merrill Lynch 1–3 Year Treasury Index generally tracks the market for U.S. Treasury securities with maturities of one to three years.
Effective April 14, 2009, the Barclays Capital 1-3 Year Government/Credit Index replaced the Merrill Lynch 1-3 Year Treasury Index as the Series’ benchmark. The Merrill Lynch 1-3 Year Treasury Index may be excluded from this comparison in the future.
Index performance returns do not reflect any management fees, transaction costs or expenses. Indices are unmanaged and one cannot invest directly in an index.
Performance of Service Class shares will vary due to different charges and expenses.
Past performance is not a guarantee of future results.
Limited-Term Diversified Income Series-3
Delaware VIP® Trust — Delaware VIP Limited-Term Diversified Income Series
Disclosure of Series Expenses
For the Period July 1, 2009 to December 31, 2009
As a shareholder of the Series, you incur ongoing costs, including management fees; distribution and/or service (12b-1) fees; and other Series expenses. This Example is intended to help you understand your ongoing costs (in dollars) of investing in the Series and to compare these costs with the ongoing costs of investing in other mutual funds.
The Example is based on an investment of $1,000 invested at the beginning of the period and held for the entire period from July 1, 2009 to December 31, 2009.
Actual Expenses
The first section of the table shown, “Actual Series Return,” provides information about actual account values and actual expenses. You may use the information in this section of the table, together with the amount you invested, to estimate the expenses that you paid over the period. Simply divide your account value by $1,000 (for example, an $8,600 account value divided by $1,000 = 8.6), then multiply the result by the number in the first section under the heading entitled “Expenses Paid During Period” to estimate the expenses you paid on your account during the period.
Hypothetical Example for Comparison Purposes
The second section of the table shown, “Hypothetical 5% Return,” provides information about hypothetical account values and hypothetical expenses based on the Series’ actual expense ratio and an assumed rate of return of 5% per year before expenses, which is not the Series’ actual return. The hypothetical account values and expenses may not be used to estimate the actual ending account balance or expenses you paid for the period. You may use this information to compare the ongoing costs of investing in the Series and other funds. To do so, compare the 5% hypothetical example with the 5% hypothetical examples that appear in the shareholder reports of other funds.
Please note that the expenses shown in the table are meant to highlight your ongoing costs only. As a shareholder of the Series, you do not incur any transaction costs, such as sales charges (loads), redemption fees or exchange fees, but shareholders of other funds may incur such costs. Also, the fees related to the variable annuity investment or the deferred sales charge that could apply have not been included. Therefore, the second section of the table is useful in comparing ongoing costs only, and will not help you determine the relative total costs of owning different funds. The Series’ actual expenses shown in the table reflect fee waivers in effect for Service Class shares. The expenses shown in the table assume reinvestment of all dividends and distributions.
Expense Analysis of an Investment of $1,000
| | | | | | | | | | | | | | | Expenses |
| | Beginning | | Ending | | | | | Paid During |
| | Account | | Account | | Annualized | | Period |
| | Value | | Value | | Expense | | 7/1/09 to |
| | 7/1/09 | | 12/31/09 | | Ratios | | 12/31/09* |
| Actual Series Return | | | | | | | | | | | | | | | | | |
| Standard Class | | | $ | 1,000.00 | | | | $ | 1,054.10 | | | 0.64 | % | | $ | 3.31 | |
| Service Class | | | | 1,000.00 | | | | | 1,053.10 | | | 0.89 | % | | | 4.61 | |
| Hypothetical 5% Return (5% return before expenses) | | | | | |
| Standard Class | | | $ | 1,000.00 | | | | $ | 1,021.98 | | | 0.64 | % | | $ | 3.26 | |
| Service Class | | | | 1,000.00 | | | | | 1,020.72 | | | 0.89 | % | | | 4.53 | |
*“Expenses Paid During Period” are equal to the Series’ annualized expense ratio, multiplied by the average account value over the period, multiplied by 184/365 (to reflect the one-half year period).
Limited-Term Diversified Income Series-4
Delaware VIP® Trust — Delaware VIP Limited-Term Diversified Income Series
Security Types and Credit Quality Breakdown
As of December 31, 2009
Sector designations may be different than the sector designations presented in other Series materials. The sector designations may represent the investment manager’s internal sector classifications, which may result in the sector designations for one series being different than another series’ sector designations.
| | Percentage |
| Security Types | | of Net Assets |
| Agency Asset-Backed Securities | | 0.01 | % |
| Agency Collateralized Mortgage Obligations | | 1.47 | % |
| Agency Mortgage-Backed Securities | | 17.04 | % |
| Agency Obligations | | 1.81 | % |
| Commercial Mortgage-Backed Securities | | 4.71 | % |
| Convertible Bonds | | 0.42 | % |
| Corporate Bonds | | 40.60 | % |
| Banking | | 9.70 | % |
| Basic Industry | | 1.24 | % |
| Brokerage | | 2.71 | % |
| Capital Goods | | 2.24 | % |
| Communications | | 8.59 | % |
| Consumer Cyclical | | 0.88 | % |
| Consumer Non-Cyclical | | 3.86 | % |
| Electric | | 1.54 | % |
| Energy | | 3.40 | % |
| Finance Companies | | 2.26 | % |
| Insurance | | 0.87 | % |
| Natural Gas | | 2.26 | % |
| Real Estate | | 0.18 | % |
| Technology | | 0.54 | % |
| Transportation | | 0.33 | % |
| Municipal Bond | | 0.52 | % |
| Non-Agency Asset-Backed Securities | | 8.81 | % |
| Non-Agency Collateralized Mortgage Obligations | | 0.87 | % |
| Regional Authority | | 0.46 | % |
| Senior Secured Loans | | 1.56 | % |
| Sovereign Agencies | | 1.34 | % |
| Sovereign Debt | | 0.13 | % |
| Supranational Banks | | 1.49 | % |
| U.S. Treasury Obligations | | 13.31 | % |
| Preferred Stock | | 0.70 | % |
| Discount Note | | 0.89 | % |
| Securities Lending Collateral | | 0.84 | % |
| Total Value of Securities | | 96.98 | % |
| Obligation to Return Securities Lending Collateral | | (0.86 | %) |
| Receivables and Other Assets Net of Liabilities | | 3.88 | % |
| Total Net Assets | | 100.00 | % |
| | | | |
| Credit Quality Breakdown | | | |
| (as a % of fixed income investments)* | | | |
| AAA | | 58.70 | % |
| AA | | 4.33 | % |
| A | | 11.37 | % |
| BBB | | 18.30 | % |
| BB | | 3.83 | % |
| B | | 3.15 | % |
| CCC | | 0.32 | % |
| Total | | 100.00 | % |
*Bond ratings are determined by independent, nationally recognized statistical rating organizations.
Limited-Term Diversified Income Series-5
Delaware VIP® Trust — Delaware VIP Limited-Term Diversified Income Series
Statement of Net Assets
December 31, 2009
| | | Principal | | | |
| | | Amount | | Value |
| | | (U.S. $) | | (U.S. $) |
| AGENCY ASSET-BACKED | | | | | | |
| | SECURITIES–0.01% | | | | | | |
| Fannie Mae Grantor Trust | | | | | | |
| Series 2003-T4 2A5 5.407% 9/26/33 | | $ | 23,256 | | $ | 20,327 |
| Total Agency Asset-Backed Securities | | | | | | |
| (cost $23,068) | | | | | | 20,327 |
| | |
| AGENCY COLLATERALIZED | | | | | | |
| MORTGAGE OBLIGATIONS–1.47% | | | | | | |
| Fannie Mae Grantor Trust | | | | | | |
| Series 2001-T5 A2 7.00% 2/19/30 | | | 27,850 | | | 30,379 |
| Series 2001-T8 A2 9.50% 7/25/41 | | | 16,846 | | | 18,232 |
| Fannie Mae REMIC | | | | | | |
| Series 2003-32 PH 5.50% 3/25/32 | | | 611,996 | | | 645,024 |
| Series 2003-91 BE 4.00% 11/25/16 | | | 521,854 | | | 531,482 |
| Series 2006-69 PB 6.00% 10/25/32 | | | 2,536,374 | | | 2,664,628 |
| Fannie Mae Whole Loan | | | | | | |
| Series 2004-W9 2A1 6.50% 2/25/44 | | | 39,578 | | | 42,844 |
| Freddie Mac REMIC | | | | | | |
| Series 2326 ZQ 6.50% 6/15/31 | | | 75,568 | | | 81,746 |
| Series 2644 AW 4.00% 1/15/26 | | | 101,426 | | | 102,172 |
| Series 2694 QG 4.50% 1/15/29 | | | 60,000 | | | 62,587 |
| Series 2706 UG 4.50% 8/15/16 | | | 1,065,000 | | | 1,109,275 |
| Series 2890 PC 5.00% 7/15/30 | | | 140,000 | | | 146,657 |
| Series 3094 US 6.75% 9/15/34 | | | 132,472 | | | 118,360 |
| Series 3337 PB 5.50% 7/15/30 | | | 40,000 | | | 42,037 |
| Series 3416 GK 4.00% 7/15/22 | | | 170,646 | | | 176,229 |
| •Freddie Mac Strip | | | | | | |
| Series 19 F 1.918% 6/1/28 | | | 13,210 | | | 12,752 |
| tFreddie Mac Structured Pass | | | | | | |
| Through Securities | | | | | | |
| Series T-54 2A 6.50% 2/25/43 | | | 1,660 | | | 1,795 |
| Series T-58 2A 6.50% 9/25/43 | | | 41,119 | | | 44,545 |
| GNMA | | | | | | |
| Series 2002-28 B 5.779% 7/16/24 | | | 12,280 | | | 12,604 |
| • | Series 2003-78 B 5.11% 10/16/27 | | | 55,000 | | | 57,860 |
| Total Agency Collateralized Mortgage | | | | | | |
| Obligations (cost $5,858,043) | | | | | | 5,901,208 |
| | |
| AGENCY MORTGAGE-BACKED | | | | | | |
| SECURITIES–17.04% | | | | | | |
| Fannie Mae | | | | | | |
| 6.50% 8/1/17 | | | 16,550 | | | 17,746 |
| 7.00% 11/15/16 | | | 21,741 | | | 23,180 |
| 8.50% 9/20/10 | | | 409 | | | 425 |
| •Fannie Mae ARM | | | | | | |
| 3.044% 10/1/33 | | | 18,874 | | | 19,259 |
| 3.19% 12/1/33 | | | 21,862 | | | 22,640 |
| 3.423% 8/1/34 | | | 31,112 | | | 31,973 |
| 3.869% 6/1/34 | | | 30,037 | | | 31,050 |
| 4.169% 1/1/35 | | | 1,438,974 | | | 1,495,483 |
| 4.32% 9/1/39 | | | 1,182,656 | | | 1,218,139 |
| 4.442% 10/1/39 | | | 2,443,159 | | | 2,513,478 |
| 4.802% 11/1/35 | | | 282,928 | | | 294,497 |
| 4.831% 9/1/35 | | | 949,745 | | | 992,453 |
| 5.007% 8/1/35 | | | 39,055 | | | 41,174 |
| 5.133% 9/1/38 | | | 1,904,495 | | | 2,003,344 |
| 5.144% 11/1/35 | | | 11,088 | | | 11,655 |
| 5.146% 3/1/38 | | | 28,550 | | | 30,075 |
| 5.373% 4/1/36 | | | 838,405 | | | 878,680 |
| 5.55% 8/1/37 | | | 644,095 | | | 681,731 |
| 5.899% 8/1/37 | | | 414,523 | | | 441,207 |
| 6.138% 6/1/36 | | | 163,983 | | | 172,670 |
| 6.15% 8/1/37 | | | 869,249 | | | 930,097 |
| 6.161% 7/1/36 | | | 129,591 | | | 136,609 |
| 6.299% 4/1/36 | | | 51,420 | | | 54,393 |
| 6.324% 8/1/36 | | | 149,785 | | | 158,628 |
| 6.332% 7/1/36 | | | 139,515 | | | 147,297 |
| Fannie Mae Relocation 30 yr | | | | | | |
| Pool #763656 5.00% 1/1/34 | | | 70,392 | | | 71,782 |
| Pool #763742 5.00% 1/1/34 | | | 102,725 | | | 104,752 |
| Fannie Mae S.F. 15 yr | | | | | | |
| 4.50% 9/1/20 | | | 3,088,351 | | | 3,218,992 |
| 5.00% 9/1/18 | | | 257,867 | | | 271,679 |
| 5.00% 10/1/18 | | | 4,116 | | | 4,337 |
| 5.00% 2/1/19 | | | 6,523 | | | 6,865 |
| 5.00% 5/1/21 | | | 47,009 | | | 49,468 |
| 5.50% 4/1/21 | | | 3,088 | | | 3,276 |
| 5.50% 1/1/23 | | | 31,074 | | | 32,928 |
| 6.00% 3/1/18 | | | 1,427,742 | | | 1,530,097 |
| 6.00% 8/1/22 | | | 85,342 | | | 91,300 |
| 7.00% 11/1/14 | | | 748 | | | 806 |
| 7.50% 3/1/15 | | | 4,156 | | | 4,431 |
| 8.00% 10/1/14 | | | 1,002 | | | 1,049 |
| 8.00% 10/1/16 | | | 17,962 | | | 19,630 |
| Fannie Mae S.F. 15 yr TBA | | | | | | |
| 4.00% 1/1/23 | | | 5,300,000 | | | 5,330,639 |
| 4.50% 1/1/23 | | | 3,000,000 | | | 3,085,314 |
| 5.00% 1/1/23 | | | 6,435,000 | | | 6,724,575 |
| Fannie Mae S.F. 30 yr | | | | | | |
| 5.00% 3/1/34 | | | 12,091 | | | 12,459 |
| 5.00% 12/1/37 | | | 95,363 | | | 97,975 |
| 5.00% 1/1/38 | | | 150,234 | | | 154,349 |
| 5.00% 2/1/38 | | | 71,541 | | | 73,496 |
| 6.00% 11/1/34 | | | 6,177 | | | 6,589 |
| 6.00% 4/1/36 | | | 23,007 | | | 24,438 |
| 6.00% 10/1/36 | | | 2,794,109 | | | 2,967,868 |
| 6.00% 1/1/38 | | | 855,686 | | | 908,899 |
| 6.50% 6/1/29 | | | 2,702 | | | 2,929 |
| 6.50% 1/1/34 | | | 2,932 | | | 3,163 |
| 6.50% 4/1/36 | | | 10,206 | | | 10,952 |
| 6.50% 6/1/36 | | | 22,324 | | | 23,956 |
| 6.50% 10/1/36 | | | 17,014 | | | 18,258 |
| 6.50% 8/1/37 | | | 5,990 | | | 6,422 |
| 6.50% 12/1/37 | | | 23,710 | | | 25,418 |
| 7.00% 12/1/34 | | | 1,343 | | | 1,479 |
Limited-Term Diversified Income Series-6
Delaware VIP® Limited-Term Diversified Income Series
Statement of Net Assets (continued)
| | | Principal | | | |
| | | Amount | | Value |
| | | (U.S. $) | | (U.S. $) |
| AGENCY MORTGAGE-BACKED | | | | | | |
| | SECURITIES (continued) | | | | | | |
| Fannie Mae S.F. 30 yr (continued) | | | | | | |
| 7.00% 12/1/35 | | $ | 1,342 | | $ | 1,473 |
| 7.00% 4/1/37 | | | 2,458,299 | | | 2,697,288 |
| 7.00% 12/1/37 | | | 39,928 | | | 43,810 |
| 7.50% 6/1/31 | | | 17,458 | | | 19,700 |
| 7.50% 4/1/32 | | | 786 | | | 887 |
| 7.50% 5/1/33 | | | 2,486 | | | 2,811 |
| 7.50% 6/1/34 | | | 1,859 | | | 2,083 |
| 9.00% 7/1/20 | | | 28,688 | | | 31,603 |
| 10.00% 8/1/19 | | | 23,662 | | | 25,846 |
| Fannie Mae S.F. 30 yr TBA 6.50% 1/1/40 | | | 11,950,000 | | | 12,797,709 |
| •Freddie Mac ARM | | | | | | |
| 3.326% 4/1/33 | | | 11,130 | | | 11,500 |
| | 4.352% 4/1/34 | | | 5,622 | | | 5,815 |
| 5.029% 7/1/38 | | | 4,731,315 | | | 4,967,464 |
| 5.684% 7/1/36 | | | 243,238 | | | 256,679 |
| 5.722% 6/1/37 | | | 1,982,057 | | | 2,098,714 |
| 5.819% 10/1/36 | | | 29,655 | | | 31,315 |
| 6.082% 10/1/37 | | | 2,238,157 | | | 2,383,113 |
| Freddie Mac Balloon 7 yr | | | | | | |
| 5.00% 6/1/11 | | | 89,976 | | | 91,450 |
| 5.00% 11/1/11 | | | 103,677 | | | 107,151 |
| Freddie Mac S.F. 15 yr | | | | | | |
| 4.00% 11/1/13 | | | 65,517 | | | 67,146 |
| 5.00% 4/1/20 | | | 245,715 | | | 258,646 |
| 8.00% 5/1/15 | | | 23,531 | | | 25,647 |
| 8.50% 10/1/15 | | | 85 | | | 90 |
| Freddie Mac S.F. 15 yr 4.00% 3/1/14 | | | 83,034 | | | 85,155 |
| Freddie Mac S.F. 30 yr | | | | | | |
| 6.00% 2/1/36 | | | 4,830,451 | | | 5,135,373 |
| 7.00% 11/1/33 | | | 17,466 | | | 19,229 |
| 9.00% 4/1/17 | | | 1,763 | | | 1,952 |
| GNMA I S.F. 15 yr 8.50% 8/15/10 | | | 272 | | | 274 |
| GNMA I S.F. 30 yr | | | | | | |
| 7.00% 12/15/34 | | | 53,266 | | | 58,745 |
| 7.50% 1/15/32 | | | 1,688 | | | 1,903 |
| 11.00% 11/15/10 | | | 6,760 | | | 6,813 |
| GNMA II S.F. 30 yr | | | | | | |
| 12.00% 6/20/14 | | | 3,367 | | | 3,762 |
| 12.00% 2/20/16 | | | 545 | | | 605 |
| Total Agency Mortgage-Backed | | | | | | |
| Securities (cost $68,165,806) | | | | | | 68,480,204 |
| |
| AGENCY OBLIGATIONS–1.81% | | | | | | |
| ΦFederal Home Loan Banks 1.00% 9/2/11 | | | 3,615,000 | | | 3,614,443 |
| Freddie Mac 2.05% 3/9/11 | | | 3,635,000 | | | 3,644,677 |
| Total Agency Obligations | | | | | | |
| (cost $7,279,653) | | | | | | 7,259,120 |
| |
| COMMERCIAL MORTGAGE-BACKED | | | | | | |
| SECURITIES–4.71% | | | | | | |
| #American Tower Trust Series | | | | | | |
| 2007-1A AFX 144A 5.42% 4/15/37 | | | 95,000 | | | 97,613 |
| Bank of America Commercial | | | | | | |
| Mortgage Securities | | | | | | |
| Series 2004-2 A3 4.05% 11/10/38 | | | 909,253 | | | 912,028 |
| • | Series 2004-3 A5 5.398% 6/10/39 | | | 90,000 | | | 90,659 |
| • | Series 2005-1 A5 5.082% 11/10/42 | | | 330,000 | | | 327,357 |
| • | Series 2007-4 AM 5.811% 2/10/51 | | | 315,000 | | | 227,359 |
| Bear Stearns Commercial | | | | | | |
| Mortgage Securities | | | | | | |
| Series 2005-PW10 A1 5.085% 12/11/40 | | | 335,309 | | | 339,376 |
| Series 2005-PW10 A4 5.405% 12/11/40 | | | 245,000 | | | 240,099 |
| Series 2005-PWR9 A4A 4.871% 9/11/42 | | | 1,395,000 | | | 1,337,365 |
| • | Series 2005-T20 A4A 5.15% 10/12/42 | | | 2,025,000 | | | 1,987,335 |
| • | Series 2006-PW12 A4 5.719% 9/11/38 | | | 135,000 | | | 137,084 |
| Series 2007-PW15 A4 5.331% 2/11/44 | | | 595,000 | | | 513,470 |
| tCommercial Mortgage Pass | | | | | | |
| Through Certificates | | | | | | |
| # | Series 2001-J1A A2 144A | | | | | | |
| 6.457% 2/16/34 | | | 41,675 | | | 42,834 |
| Series 2005-C6 A5A 5.116% 6/10/44 | | | 3,165,000 | | | 3,073,056 |
| #Crown Castle Towers 144A | | | | | | |
| • | Series 2005-1A AFL 0.613% 6/15/35 | | | 110,000 | | | 107,800 |
| Series 2006-1A B 5.362% 11/15/36 | | | 250,000 | | | 256,250 |
| First Union National Bank-Bank of America | | | | | | |
| Commercial Mortgage Trust | | | | | | |
| Series 2001-C1 C 6.403% 3/15/33 | | | 45,000 | | | 46,132 |
| General Electric Capital Commercial | | | | | | |
| Mortgage Series 2002-1A A3 | | | | | | |
| 6.269% 12/10/35 | | | 100,000 | | | 105,374 |
| Goldman Sachs Mortgage Securities II | | | | | | |
| Series 2004-GG2 A3 4.602% 8/10/38 | | | 58,777 | | | 58,733 |
| Series 2004-GG2 A6 5.396% 8/10/38 | | | 470,000 | | | 461,858 |
| Series 2005-GG4 A4 4.761% 7/10/39 | | | 1,370,000 | | | 1,240,651 |
| Series 2005-GG4 A4A 4.751% 7/10/39 | | | 1,405,000 | | | 1,360,274 |
| • | Series 2006-GG6 A4 5.553% 4/10/38 | | | 915,000 | | | 834,492 |
| • | Series 2007-GG10 A4 5.805% 8/10/45 | | | 545,000 | | | 467,961 |
| Greenwich Capital Commercial Funding | | | | | | |
| Series 2004-GG1 A7 5.317% 6/10/36 | | | 215,000 | | | 218,225 |
| JPMorgan Chase Commercial | | | | | | |
| Mortgage Securities | | | | | | |
| Series 2002-C1 A3 5.376% 7/12/37 | | | 500,000 | | | 519,749 |
| • | Series 2005-LDP5 A4 5.179% 12/15/44 | | | 1,990,000 | | | 1,970,043 |
| Lehman Brothers-UBS Commercial | | | | | | |
| Mortgage Trust | | | | | | |
| Series 2001-C2 A1 6.27% 6/15/20 | | | 1,369 | | | 1,373 |
| Series 2003-C8 A2 4.207% 11/15/27 | | | 23,597 | | | 23,734 |
| Merrill Lynch-Countrywide Commercial | | | | | | |
| Mortgage Trust Series 2007-5 A1 | | | | | | |
| 4.275% 8/12/48 | | | 109,720 | | | 111,051 |
| •Morgan Stanley Capital I | | | | | | |
| Series 2007-T27 A4 5.65% 6/13/42 | | | 1,645,000 | | | 1,588,206 |
| #SBA Commercial Mortgage Securities | | | | | | |
| Trust Series 2006-1A B 144A | | | | | | |
| 5.451% 11/15/36 | | | 150,000 | | | 153,000 |
Limited-Term Diversified Income Series-7
Delaware VIP® Limited-Term Diversified Income Series
Statement of Net Assets (continued)
| | | Principal | | | |
| | | Amount | | Value |
| | | (U.S. $) | | (U.S. $) |
| COMMERCIAL MORTGAGE-BACKED | | | | | | |
| | SECURITIES (continued) | | | | | | |
| •Wachovia Bank Commercial Mortgage | | | | | | |
| Trust Series 2005-C20 A5 | | | | | | |
| 5.087% 7/15/42 | | $ | 80,000 | | $ | 80,091 |
| Total Commercial Mortgage-Backed | | | | | | |
| Securities (cost $17,737,498) | | | | | | 18,930,632 |
| |
| CONVERTIBLE BONDS–0.42% | | | | | | |
| Amgen 0.375% exercise price $79.48, | | | | | | |
| expiration date 2/1/13 | | | 375,000 | | | 379,219 |
| Medtronic 1.625% exercise price $55.41, | | | | | | |
| expiration date 4/15/13 | | | 1,250,000 | | | 1,310,937 |
| Total Convertible Bonds | | | | | | |
| (cost $1,473,506) | | | | | | 1,690,156 |
| |
| CORPORATE BONDS–40.60% | | | | | | |
| Banking – 9.70% | | | | | | |
| #Achmea Hypotheekbank 144A | | | | | | |
| 3.20% 11/3/14 | | | 1,910,000 | | | 1,908,419 |
| #ANZ National International 144A | | | | | | |
| 3.25% 4/2/12 | | | 1,640,000 | | | 1,690,218 |
| Bank of America | | | | | | |
| • | 0.554% 6/15/17 | | | 605,000 | | | 514,982 |
| * | 4.375% 12/1/10 | | | 370,000 | | | 382,058 |
| 4.90% 5/1/13 | | | 465,000 | | | 482,439 |
| 5.125% 11/15/14 | | | 6,000 | | | 6,227 |
| 7.375% 5/15/14 | | | 2,365,000 | | | 2,686,131 |
| Bank of New York Mellon 4.95% 1/14/11 | | | 730,000 | | | 759,948 |
| Barclays Bank | | | | | | |
| 5.20% 7/10/14 | | | 1,555,000 | | | 1,649,970 |
| # | 144A 2.70% 3/5/12 | | | 480,000 | | | 490,697 |
| BB&T | | | | | | |
| 5.70% 4/30/14 | | | 1,440,000 | | | 1,560,223 |
| 6.50% 8/1/11 | | | 555,000 | | | 589,689 |
| Capital One Financial 7.375% 5/23/14 | | | 1,120,000 | | | 1,269,302 |
| Export-Import Bank of Korea | | | | | | |
| 5.875% 1/14/15 | | | 1,375,000 | | | 1,478,745 |
| JPMorgan Chase | | | | | | |
| • | 0.584% 6/13/16 | | | 605,000 | | | 552,405 |
| 5.75% 1/2/13 | | | 1,960,000 | | | 2,091,752 |
| Key Bank 5.80% 7/1/14 | | | 1,305,000 | | | 1,271,409 |
| KFW | | | | | | |
| 2.75% 10/21/14 | | | 1,750,000 | | | 1,732,262 |
| 3.50% 3/10/14 | | | 1,925,000 | | | 1,980,180 |
| Korea Development Bank 5.30% 1/17/13 | | | 660,000 | | | 694,007 |
| #National Australia Bank 144A 3.375% 7/8/14 | | | 585,000 | | | 590,537 |
| #NIBC Bank 2.80% 144A 12/2/14 | | | 2,140,000 | | | 2,084,758 |
| #•Rabobank 144A 11.00% 12/29/49 | | | 1,240,000 | | | 1,516,074 |
| *Regions Financial 7.75% 11/10/14 | | | 1,330,000 | | | 1,312,977 |
| Rentenbank | | | | | | |
| 1.875% 9/24/12 | | | 620,000 | | | 618,606 |
| 3.25% 3/15/13 | | | 850,000 | | | 874,430 |
| 4.125% 7/15/13 | | | 1,155,000 | | | 1,218,746 |
| Silicon Valley Bank 5.70% 6/1/12 | | | 380,000 | | | 386,172 |
| U.S. Bank North America 6.375% 8/1/11 | | | 784,000 | | | 843,106 |
| •USB Capital IX 6.189% 4/15/49 | | | 1,105,000 | | | 899,194 |
| Wachovia 5.25% 8/1/14 | | | 1,540,000 | | | 1,595,914 |
| Wells Fargo Bank | | | | | | |
| • | 0.483% 5/16/16 | | | 545,000 | | | 483,335 |
| 6.45% 2/1/11 | | | 605,000 | | | 639,075 |
| •Wells Fargo Capital XIII 7.70% 12/29/49 | | | 1,045,000 | | | 1,018,875 |
| Western Corporate Federal Credit Union | | | | | | |
| 1.75% 11/2/12 | | | 1,125,000 | | | 1,120,716 |
| | | | | | | 38,993,578 |
| Basic Industry–1.24% | | | | | | |
| ArcelorMittal | | | | | | |
| 5.375% 6/1/13 | | | 550,000 | | | 580,839 |
| * | 9.00% 2/15/15 | | | 425,000 | | | 502,492 |
| Dow Chemical 7.60% 5/15/14 | | | 1,700,000 | | | 1,936,235 |
| #Evraz Group 144A 9.50% 4/24/18 | | | 100,000 | | | 100,000 |
| Freeport McMoRan Copper & Gold | | | | | | |
| 8.375% 4/1/17 | | | 700,000 | | | 767,551 |
| #NewPage 11.375% 144A 12/31/14 | | | 600,000 | | | 609,000 |
| #Severstal 144A 9.75% 7/29/13 | | | 100,000 | | | 101,250 |
| Teck Resources | | | | | | |
| 10.25% 5/15/16 | | | 125,000 | | | 146,250 |
| # | 144A 10.75% 5/15/19 | | | 210,000 | | | 252,000 |
| | | | | | | 4,995,617 |
| Brokerage–2.71% | | | | | | |
| Citigroup | | | | | | |
| 6.375% 8/12/14 | | | 1,290,000 | | | 1,351,852 |
| 6.50% 8/19/13 | | | 1,710,000 | | | 1,822,948 |
| Goldman Sachs Group 5.25% 10/15/13 | | | 1,900,000 | | | 2,019,553 |
| Jefferies Group 5.875% 6/8/14 | | | 380,000 | | | 390,613 |
| LaBranche 11.00% 5/15/12 | | | 635,000 | | | 613,569 |
| Lazard Group | | | | | | |
| 6.85% 6/15/17 | | | 608,000 | | | 612,765 |
| 7.125% 5/15/15 | | | 114,000 | | | 118,480 |
| Morgan Stanley | | | | | | |
| • | 0.764% 10/15/15 | | | 420,000 | | | 394,421 |
| * | 4.00% 1/15/10 | | | 280,000 | | | 280,206 |
| 5.30% 3/1/13 | | | 1,329,000 | | | 1,401,776 |
| 6.00% 4/28/15 | | | 1,780,000 | | | 1,898,252 |
| | | | | | | 10,904,435 |
| Capital Goods–2.24% | | | | | | |
| Allied Waste North America | | | | | | |
| 6.50% 11/15/10 | | | 725,000 | | | 754,051 |
| 7.125% 5/15/16 | | | 1,370,000 | | | 1,460,917 |
| 7.25% 3/15/15 | | | 1,254,000 | | | 1,311,842 |
| #BAE Systems Holdings 144A 4.95% 6/1/14 | | | 760,000 | | | 792,126 |
| #BWAY 144A 10.00% 4/15/14 | | | 535,000 | | | 568,438 |
| Graphic Packaging International | | | | | | |
| 9.50% 8/15/13 | | | 670,000 | | | 695,125 |
| L-3 Communications Holdings | | | | | | |
| 6.125% 7/15/13 | | | 200,000 | | | 203,000 |
Limited-Term Diversified Income Series-8
Delaware VIP® Limited-Term Diversified Income Series
Statement of Net Assets (continued)
| | | Principal | | | |
| | | Amount | | Value |
| | | (U.S. $) | | (U.S. $) |
| CORPORATE BONDS (continued) | | | | | | |
| Capital Goods (continued) | | | | | | |
| Tyco International Finance | | | | | | |
| | 4.125% 10/15/14 | | $ | 345,000 | | $ | 353,048 |
| 6.375% 10/15/11 | | | 815,000 | | | 874,295 |
| 8.50% 1/15/19 | | | 615,000 | | | 743,983 |
| Waste Management 7.375% 8/1/10 | | | 1,183,000 | | | 1,225,601 |
| | | | | | | | 8,982,426 |
| Communications–8.59% | | | | | | |
| #American Tower 144A 4.625% 4/1/15 | | | 1,375,000 | | | 1,392,355 |
| AT&T 6.70% 11/15/13 | | | 190,000 | | | 214,551 |
| AT&T Wireless 8.125% 5/1/12 | | | 1,344,000 | | | 1,519,446 |
| #Cablevision Systems 144A 8.625% 9/15/17 | | | 300,000 | | | 313,875 |
| Cellco Partnership/Verizon Wireless | | | | | | |
| Capital 7.375% 11/15/13 | | | 325,000 | | | 373,635 |
| #Charter Communications Operating | | | | | | |
| Capital 144A 10.875% 9/15/14 | | | 95,000 | | | 106,875 |
| Cincinnati Bell 7.00% 2/15/15 | | | 265,000 | | | 263,013 |
| Citizens Communications 7.125% 3/15/19 | | | 659,000 | | | 626,050 |
| Comcast | | | | | | |
| 4.95% 6/15/16 | | | 905,000 | | | 930,690 |
| 5.45% 11/15/10 | | | 700,000 | | | 723,589 |
| 5.50% 3/15/11 | | | 600,000 | | | 628,066 |
| 6.50% 1/15/15 | | | 710,000 | | | 796,313 |
| COX Communications | | | | | | |
| 5.45% 12/15/14 | | | 2,350,000 | | | 2,520,408 |
| # | 144A 5.875% 12/1/16 | | | 335,000 | | | 355,091 |
| *Cricket Communications 9.375% 11/1/14 | | | 860,000 | | | 868,600 |
| CSC Holdings 6.75% 4/15/12 | | | 42,000 | | | 43,575 |
| Deutsche Telekom International Finance | | | | | | |
| 8.50% 6/15/10 | | | 935,000 | | | 966,360 |
| DirecTV Holdings/Financing | | | | | | |
| 7.625% 5/15/16 | | | 3,095,000 | | | 3,385,604 |
| # | 144A 4.75% 10/1/14 | | | 495,000 | | | 505,809 |
| #DISH DBS 144A 7.875% 9/1/19 | | | 350,000 | | | 368,813 |
| EchoStar DBS 7.125% 2/1/16 | | | 480,000 | | | 492,600 |
| #Inmarsat Finance 144A 7.375% 12/1/17 | | | 290,000 | | | 297,975 |
| Intelsat Jackson Holdings 11.25% 6/15/16 | | | 35,000 | | | 38,063 |
| *MetroPCS Wireless 9.25% 11/1/14 | | | 405,000 | | | 412,088 |
| Rogers Wireless 9.625% 5/1/11 | | | 675,000 | | | 740,889 |
| Sprint Nextel 6.00% 12/1/16 | | | 1,460,000 | | | 1,339,550 |
| Telecom Italia Capital | | | | | | |
| * | 4.95% 9/30/14 | | | 1,500,000 | | | 1,556,351 |
| 5.25% 11/15/13 | | | 300,000 | | | 315,812 |
| 5.25% 10/1/15 | | | 480,000 | | | 502,483 |
| 6.20% 7/18/11 | | | 691,000 | | | 731,667 |
| Time Warner Cable | | | | | | |
| 5.40% 7/2/12 | | | 580,000 | | | 620,051 |
| 7.50% 4/1/14 | | | 1,420,000 | | | 1,637,602 |
| 8.25% 2/14/14 | | | 495,000 | | | 579,042 |
| Verizon Global Funding 6.875% 6/15/12 | | | 580,000 | | | 642,497 |
| #Vivendi 144A 5.75% 4/4/13 | | | 3,075,000 | | | 3,235,280 |
| Vodafone Group 5.00% 12/16/13 | | | 1,020,000 | | | 1,080,986 |
| #Wind Acquisition Finance 144A | | | | | | |
| 11.75% 7/15/17 | | | 850,000 | | | 932,875 |
| Windstream 8.125% 8/1/13 | | | 570,000 | | | 594,225 |
| WPP Finance 8.00% 9/15/14 | | | 1,625,000 | | | 1,849,884 |
| | | | | | | 34,502,638 |
| Consumer Cyclical–0.88% | | | | | | |
| Goodyear Tire & Rubber 10.50% 5/15/16 | | | 610,000 | | | 677,100 |
| #Harrah’s Operating Escrow 144A | | | | | | |
| 11.25% 6/1/17 | | | 950,000 | | | 998,687 |
| MGM Mirage 13.00% 11/15/13 | | | 445,000 | | | 512,863 |
| Nordstrom 6.75% 6/1/14 | | | 705,000 | | | 788,100 |
| Target 6.35% 1/15/11 | | | 540,000 | | | 570,361 |
| | | | | | | 3,547,111 |
| Consumer Non-Cyclical–3.86% | | | | | | |
| #Anheuser-Busch InBev Worldwide 144A | | | | | | |
| 7.20% 1/15/14 | | | 1,425,000 | | | 1,617,609 |
| *Aramark 8.50% 2/1/15 | | | 495,000 | | | 512,325 |
| #CareFusion 144A 5.125% 8/1/14 | | | 2,125,000 | | | 2,236,103 |
| Community Health Systems 8.875% 7/15/15 | | | 830,000 | | | 861,125 |
| Corrections Corporation of America | | | | | | |
| 7.75% 6/1/17 | | | 280,000 | | | 289,800 |
| Delhaize Group 5.875% 2/1/14 | | | 1,932,000 | | | 2,076,875 |
| HCA 9.25% 11/15/16 | | | 825,000 | | | 887,906 |
| HCA PIK 9.625% 11/15/16 | | | 73,000 | | | 79,205 |
| Hospira 6.40% 5/15/15 | | | 1,030,000 | | | 1,141,330 |
| Iron Mountain 8.00% 6/15/20 | | | 760,000 | | | 775,200 |
| #JBS USA Finance 144A 11.625% 5/1/14 | | | 36,000 | | | 40,950 |
| McKesson 6.50% 2/15/14 | | | 1,425,000 | | | 1,577,716 |
| Medco Health Solutions 7.25% 8/15/13 | | | 1,000,000 | | | 1,111,845 |
| #RSC Equipment Rental/Holdings III 144A | | | | | | |
| 10.25% 11/15/19 | | | 655,000 | | | 660,731 |
| Supervalu 7.50% 11/15/14 | | | 520,000 | | | 529,100 |
| Yale University 2.90% 10/15/14 | | | 1,105,000 | | | 1,102,136 |
| | | | | | | 15,499,956 |
| Electric–1.54% | | | | | | |
| #AES 144A 8.75% 5/15/13 | | | 290,000 | | | 298,700 |
| Ameren 8.875% 5/15/14 | | | 445,000 | | | 500,291 |
| #Enel Finance International 144A | | | | | | |
| 3.875% 10/7/14 | | | 185,000 | | | 187,455 |
| NRG Energy 7.375% 2/1/16 | | | 850,000 | | | 853,188 |
| Pacific Gas & Electric 4.20% 3/1/11 | | | 272,000 | | | 280,764 |
| PacifiCorp 6.90% 11/15/11 | | | 1,100,000 | | | 1,204,763 |
| @#Power Receivables Finance 144A 6.29% 1/1/12 | | | 35,219 | | | 35,922 |
| PPL Electric Utilities 7.125% 11/30/13 | | | 1,080,000 | | | 1,235,580 |
| *Virginia Electric & Power 5.10% 11/30/12 | | | 1,470,000 | | | 1,588,668 |
| | | | | | | 6,185,331 |
| Energy–3.40% | | | | | | |
| Anadarko Finance 6.75% 5/1/11 | | | 615,000 | | | 650,097 |
| Chesapeake Energy | | | | | | |
| 7.25% 12/15/18 | | | 550,000 | | | 556,875 |
| * | 9.50% 2/15/15 | | | 760,000 | | | 837,900 |
| Forest Oil Corp 7.25% 6/15/19 | | | 340,000 | | | 337,450 |
| Massey Energy 6.875% 12/15/13 | | | 895,000 | | | 898,356 |
| Nexen 5.05% 11/20/13 | | | 1,600,000 | | | 1,670,261 |
| Plains All American Pipeline 4.25% 9/1/12 | | | 2,460,000 | | | 2,540,270 |
Limited-Term Diversified Income Series-9
Delaware VIP® Limited-Term Diversified Income Series
Statement of Net Assets (continued)
| | | Principal | | | |
| | | Amount | | Value |
| | | | (U.S. $) | | (U.S. $) |
| CORPORATE BONDS (continued) | | | | | | |
| Energy (continued) | | | | | | |
| Pride International 7.375% 7/15/14 | | $ | 830,000 | | $ | 861,125 |
| Weatherford International | | | | | | |
| | 5.15% 3/15/13 | | | 785,000 | | | 822,678 |
| 5.95% 6/15/12 | | | 1,225,000 | | | 1,311,774 |
| #Woodside Petroleum 144A | | | | | | |
| 4.50% 11/10/14 | | | 2,300,000 | | | 2,323,014 |
| 5.00% 11/15/13 | | | 830,000 | | | 849,876 |
| | | | | | | 13,659,676 |
| Finance Companies–2.26% | | | | | | |
| #CDP Financial 144A 3.00% 11/25/14 | | | 2,065,000 | | | 2,017,315 |
| #FIH Erhvervsbank 144A 1.75% 12/6/12 | | | 1,755,000 | | | 1,723,038 |
| FTI Consulting 7.625% 6/15/13 | | | 559,000 | | | 569,481 |
| General Electric Capital | | | | | | |
| • | 0.514% 9/15/14 | | | 1,390,000 | | | 1,312,907 |
| 6.00% 6/15/12 | | | 700,000 | | | 754,966 |
| International Lease Finance | | | | | | |
| 5.35% 3/1/12 | | | 11,000 | | | 9,554 |
| 5.75% 6/15/11 | | | 970,000 | | | 891,531 |
| 5.875% 5/1/13 | | | 182,000 | | | 144,768 |
| 6.375% 3/25/13 | | | 100,000 | | | 82,275 |
| 6.625% 11/15/13 | | | 1,330,000 | | | 1,071,489 |
| USAA Capital 2.24% 3/30/12 | | | 500,000 | | | 506,741 |
| | | | | | | 9,084,065 |
| Insurance–0.87% | | | | | | |
| #Metropolitan Life Global Funding I 144A | | | | | | |
| 4.625% 8/19/10 | | | 310,000 | | | 315,760 |
| UnitedHealth Group | | | | | | |
| 5.25% 3/15/11 | | | 230,000 | | | 238,397 |
| 5.50% 11/15/12 | | | 412,000 | | | 440,173 |
| WellPoint 6.80% 8/1/12 | | | 2,275,000 | | | 2,511,548 |
| | | | | | | 3,505,878 |
| Natural Gas–2.26% | | | | | | |
| El Paso | | | | | | |
| 7.00% 6/15/17 | | | 150,000 | | | 149,519 |
| 8.25% 2/15/16 | | | 220,000 | | | 235,950 |
| Energy Transfer Partners 5.65% 8/1/12 | | | 1,375,000 | | | 1,462,296 |
| Enterprise Products Operating | | | | | | |
| 4.95% 6/1/10 | | | 480,000 | | | 486,588 |
| 5.00% 3/1/15 | | | 520,000 | | | 535,044 |
| 6.375% 2/1/13 | | | 312,000 | | | 337,845 |
| 7.50% 2/1/11 | | | 665,000 | | | 704,798 |
| • | 8.375% 8/1/66 | | | 465,000 | | | 453,936 |
| * | 9.75% 1/31/14 | | | 750,000 | | | 895,878 |
| Kinder Morgan Energy Partners | | | | | | |
| 5.625% 2/15/15 | | | 665,000 | | | 715,920 |
| 6.75% 3/15/11 | | | 455,000 | | | 481,318 |
| 7.50% 11/1/10 | | | 525,000 | | | 549,758 |
| 9.00% 2/1/19 | | | 470,000 | | | 579,275 |
| TransCanada Pipelines 4.00% 6/15/13 | | | 1,470,000 | | | 1,507,145 |
| | | | | | | 9,095,270 |
| Real Estate–0.18% | | | | | | |
| #•USB Realty 144A 6.091% 12/22/49 | | | 1,000,000 | | | 737,500 |
| | | | | | | 737,500 |
| Technology–0.54% | | | | | | |
| *Freescale Semiconductor 8.875% 12/15/14 | | | 615,000 | | | 567,338 |
| Xerox | | | | | | |
| * | 4.25% 2/15/15 | | | 545,000 | | | 541,816 |
| 8.25% 5/15/14 | | | 930,000 | | | 1,067,815 |
| | | | | | | 2,176,969 |
| Transportation–0.33% | | | | | | |
| CSX | | | | | | |
| 6.25% 4/1/15 | | | 900,000 | | | 992,420 |
| 6.75% 3/15/11 | | | 300,000 | | | 318,715 |
| | | | | | | 1,311,135 |
| Total Corporate Bonds | | | | | | |
| (cost $155,502,553) | | | | | | 163,181,585 |
| |
| MUNICIPAL BOND–0.52% | | | | | | |
| Puerto Rico Sales Tax Financing Class B | | | | | | |
| 5.00% 8/1/39 | | | 2,000,000 | | | 2,098,220 |
| Total Municipal Bond (cost $2,000,000) | | | | | | 2,098,220 |
| |
| NON-AGENCY ASSET-BACKED | | | | | | |
| SECURITIES–8.81% | | | | | | |
| #•AH Mortgage Advance Trust | | | | | | |
| Series 2009-ADV3 A1 144A | | | | | | |
| 2.186% 10/6/21 | | | 580,000 | | | 582,204 |
| •@Ameriquest Mortgage Securities | | | | | | |
| Series 2003-11 AF6 5.14% 1/25/34 | | | 53,302 | | | 49,590 |
| #Bank of America Auto Trust | | | | | | |
| Series 2009-3A A4 144A 2.67% 12/15/16 | | | 1,160,000 | | | 1,151,489 |
| •Bank of America Credit Card Trust | | | | | | |
| Series 2008-A5 A5 1.433% 12/16/13 | | | 6,990,000 | | | 7,022,199 |
| Capital Auto Receivables Asset Trust | | | | | | |
| Series 2007-3 A3A 5.02% 9/15/11 | | | 263,168 | | | 266,919 |
| •Capital One Multi-Asset Execution Trust | | | | | | |
| Series 2006-A11 A11 0.323% 6/17/19 | | | 4,000,000 | | | 3,726,674 |
| Caterpillar Financial Asset Trust | | | | | | |
| Series 2007-A A3A 5.34% 6/25/12 | | | 155,924 | | | 158,715 |
| Series 2008-A A3 4.94% 4/25/14 | | | 740,000 | | | 757,342 |
| @Centex Home Equity Series 2005-D AF4 | | | | | | |
| 5.27% 10/25/35 | | | 92,341 | | | 91,431 |
| @Chase Funding Mortgage Loan Asset- | | | | | | |
| Backed Certificates Series 2002-3 1A6 | | | | | | |
| 4.707% 9/25/13 | | | 112,639 | | | 104,127 |
| Chase Issuance Trust | | | | | | |
| • | Series 2005-A2 A2 0.303% 12/15/14 | | | 2,300,000 | | | 2,273,026 |
| • | Series 2005-A6 A6 0.303% 7/15/14 | | | 2,015,000 | | | 1,987,550 |
| Series 2005-A7 A7 4.55% 3/15/13 | | | 270,000 | | | 279,837 |
| Series 2005-A10 A10 4.65% 12/17/12 | | | 1,050,000 | | | 1,082,162 |
| Series 2008-A9 A9 4.26% 5/15/13 | | | 670,000 | | | 696,555 |
| • | Series 2009-A2 A2 1.783% 4/15/14 | | | 3,460,000 | | | 3,539,695 |
| Citibank Credit Card Issuance Trust | | | | | | |
| Series 2006-A4 A4 5.45% 5/10/13 | | | 775,000 | | | 815,692 |
| • | Series 2007-A6 A6 0.274% 7/12/12 | | | 300,000 | | | 299,461 |
| • | Series 2009-A1 A1 1.983% 3/17/14 | | | 810,000 | | | 827,003 |
| CitiFinancial Mortgage Securities | | | | | | |
| Series 2004-1 AF2 2.645% 4/25/34 | | | 13,199 | | | 13,115 |
Limited-Term Diversified Income Series-10
Delaware VIP® Limited-Term Diversified Income Series
Statement of Net Assets (continued)
| | | Principal | | | |
| | | Amount | | Value |
| | | (U.S. $) | | (U.S. $) |
| NON-AGENCY ASSET-BACKED | | | | | | |
| | SECURITIES (continued) | | | | | | |
| CNH Equipment Trust | | | | | | |
| • | Series 2007-A A4 0.273% 9/17/12 | | $ | 139,678 | | $ | 138,965 |
| • | Series 2007-B A3B 0.833% 10/17/11 | | | 160,967 | | | 160,979 |
| Series 2007-C A3A 5.21% 12/15/11 | | | 76,454 | | | 77,021 |
| Series 2008-A A3 4.12% 5/15/12 | | | 101,750 | | | 103,106 |
| Series 2008-A A4A 4.93% 8/15/14 | | | 150,000 | | | 155,373 |
| Series 2008-B A3A 4.78% 7/16/12 | | | 51,029 | | | 51,872 |
| Series 2009-C A3 1.85% 12/16/13 | | | 260,000 | | | 258,986 |
| #Countrywide Asset-Backed NIM | | | | | | |
| Certificates Series 2004-BC1 Note 144A | | | | | | |
| 5.50% 4/25/35 | | | 26 | | | 0 |
| Discover Card Master Trust | | | | | | |
| • | Series 2005-4 A2 0.323% 6/16/15 | | | 3,600,000 | | | 3,504,142 |
| Series 2007-A1 A1 5.65% 3/16/20 | | | 340,000 | | | 365,397 |
| Series 2008-A4 A4 5.65% 12/15/15 | | | 80,000 | | | 86,972 |
| #Dunkin Securitization | | | | | | |
| Series 2006-1 A2 144A 5.779% 6/20/31 | | | 100,000 | | | 96,449 |
| •Ford Credit Auto Owner Trust | | | | | | |
| Series 2008-C A4B 1.983% 4/15/13 | | | 1,100,000 | | | 1,118,240 |
| •Ford Credit Floorplan Master Owner Trust | | | | | | |
| Series 2009-2 A 1.783% 9/15/14 | | | 360,000 | | | 360,622 |
| General Electric Capital Credit Card | | | | | | |
| Master Note Trust Series 2009-3 A | | | | | | |
| 2.54% 9/15/14 | | | 520,000 | | | 520,416 |
| #•Golden Credit Card Trust | | | | | | |
| Series 2008-3 A 144A 1.233% 7/15/17 | | | 125,000 | | | 123,579 |
| Harley-Davidson Motorcycle Trust | | | | | | |
| #Series 2006-1 A2 144A 5.04% 10/15/12 | | | 37,173 | | | 38,152 |
| Series 2009-4 A3 1.00% 2/17/14 | | | 205,000 | | | 204,229 |
| Hyundai Auto Receivables Trust | | | | | | |
| Series 2007-A A3A 5.04% 1/17/12 | | | 12,715 | | | 12,940 |
| Series 2008-A A3 4.93% 12/17/12 | | | 50,000 | | | 52,093 |
| •Morgan Stanley Mortgage Loan Trust | | | | | | |
| Series 2006-12XS A1 0.351% 10/25/36 | | | 21,955 | | | 21,968 |
| New Century Home Equity Loan Trust | | | | | | |
| Series 2003-5 AI4 4.76% 11/25/33 | | | 30,457 | | | 29,581 |
| Nissan Auto Receivables Owner Trust | | | | | | |
| Series 2008-B A2 3.80% 10/15/10 | | | 19,968 | | | 19,994 |
| Residential Asset Securities | | | | | | |
| Series 2002-KS2 AI5 6.779% 4/25/32 | | | 23,145 | | | 12,524 |
| • | Series 2006-KS3 AI3 0.401% 4/25/36 | | | 198,403 | | | 183,007 |
| Residential Funding Mortgage Securities II | | | | | | |
| Series 2001-HS2 A5 7.42% 4/25/31 | | | 9,074 | | | 8,847 |
| Structured Asset Securities | | | | | | |
| ∏ | Series 2001-SB1 A2 3.375% 8/25/31 | | | 28,792 | | | 22,922 |
| ∏ | Series 2005-4XS 1A2B 4.67% 3/25/35 | | | 28,554 | | | 25,034 |
| Volkswagen Auto Lease Trust | | | | | | |
| Series 2009-A A2 2.87% 7/15/11 | | | 1,510,966 | | | 1,524,292 |
| World Omni Auto Receivables Trust | | | | | | |
| • | Series 2007-B A3B 0.623% 1/17/12 | | | 331,595 | | | 331,649 |
| Series 2008-A A3A 3.94% 10/15/12 | | | 65,000 | | | 66,399 |
| Total Non-Agency Asset-Backed | | | | | | |
| Securities (cost $35,091,419) | | | | | | 35,400,536 |
| | | | | | | | |
| NON-AGENCY COLLATERALIZED | | | | | | |
| MORTGAGE OBLIGATIONS–0.87% | | | | | | |
| @American Home Mortgage Investment | | | | | | |
| Trust Series 2005-2 5A1 5.064% 9/25/35 | | | 23,038 | | | 18,513 |
| Bank of America Alternative Loan Trust | | | | | | |
| Series 2003-10 2A1 6.00% 12/25/33 | | | 59,055 | | | 58,852 |
| Series 2004-2 1A1 6.00% 3/25/34 | | | 55,923 | | | 54,193 |
| Series 2004-10 1CB1 6.00% 11/25/34 | | | 65,156 | | | 52,715 |
| Series 2004-11 1CB1 6.00% 12/25/34 | | | 30,421 | | | 24,309 |
| Series 2005-3 2A1 5.50% 4/25/20 | | | 91,205 | | | 81,400 |
| Series 2005-6 7A1 5.50% 7/25/20 | | | 75,909 | | | 69,646 |
| Series 2005-9 5A1 5.50% 10/25/20 | | | 70,845 | | | 65,000 |
| •Bank of America Mortgage Securities | | | | | | |
| Series 2003-D 1A2 3.718% 5/25/33 | | | 300 | | | 192 |
| Citicorp Mortgage Securities Series | | | | | | |
| 2006-4 3A1 5.50% 8/25/21 | | | 174,113 | | | 166,714 |
| Countrywide Alternative Loan Trust | | | | | | |
| Series 2005-1CB 2A2 5.50% 3/25/35 | | | 104,279 | | | 85,611 |
| tCountrywide Home Loan Mortgage | | | | | | |
| Pass Through Trust | | | | | | |
| • | Series 2003-21 A1 4.066% 5/25/33 | | | 15,426 | | | 12,037 |
| • | Series 2003-46 1A1 3.444% 1/19/34 | | | 14,995 | | | 12,641 |
| @ | Series 2006-17 A5 6.00% 12/25/36 | | | 15,670 | | | 13,917 |
| Deutsche Alternative Securities Loan Trust | | | | | | |
| Series 2003-4XS A6A 4.82% 10/25/33 | | | 50,371 | | | 45,913 |
| •First Horizon Asset Securities | | | | | | |
| Series 2004-AR5 4A1 5.663% 10/25/34 | | | 31,248 | | | 25,387 |
| Series 2007-AR3 2A2 6.281% 11/25/37 | | | 57,580 | | | 38,985 |
| •GMAC Mortgage Loan Trust | | | | | | |
| Series 2005-AR2 4A 5.167% 5/25/35 | | | 64,734 | | | 52,656 |
| #GSMPS Mortgage Loan Trust 144A | | | | | | |
| Series 1998-3 A 7.75% 9/19/27 | | | 20,201 | | | 19,261 |
| Series 2005-RP1 1A3 8.00% 1/25/35 | | | 23,590 | | | 21,747 |
| Series 2005-RP1 1A4 8.50% 1/25/35 | | | 10,309 | | | 9,513 |
| Series 2006-RP1 1A2 7.50% 1/25/36 | | | 30,733 | | | 26,878 |
| •JPMorgan Mortgage Trust | | | | | | |
| Series 2005-A1 4A1 4.771% 2/25/35 | | | 68,484 | | | 62,938 |
| Series 2005-A4 1A1 5.38% 7/25/35 | | | 88,922 | | | 77,476 |
| Lehman Mortgage Trust | | | | | | |
| Series 2005-2 2A3 5.50% 12/25/35 | | | 86,264 | | | 75,287 |
| •MASTR Adjustable Rate Mortgages Trust | | | | | | |
| Series 2003-6 1A2 3.825% 12/25/33 | | | 8,851 | | | 7,857 |
| | Series 2005-6 7A1 5.331% 6/25/35 | | | 60,917 | | | 46,771 |
| #MASTR Reperforming Loan Trust | | | | | | |
| Series 2005-1 1A5 144A 8.00% 8/25/34 | | | 45,512 | | | 43,179 |
| #MASTR Specialized Loan Trust | | | | | | |
| Series 2005-2 A2 144A 5.006% 7/25/35 | | | 19,359 | | | 16,955 |
| •MLCC Mortgage Investors | | | | | | |
| Series 2004-HB1 A1 0.591% 4/25/29 | | | 1,718,886 | | | 1,218,989 |
| Residential Asset Mortgage Products | | | | | | |
| Series 2004-SL4 A3 6.50% 7/25/32 | | | 17,416 | | | 17,084 |
| •Structured Adjustable Rate Mortgage Loan | | | | | | |
| Trust Series 2006-5 5A4 | | | | | | |
| 5.489% 6/25/36 | | | 36,903 | | | 6,154 |
Limited-Term Diversified Income Series-11
Delaware VIP® Limited-Term Diversified Income Series
Statement of Net Assets (continued)
| | | Principal | | | |
| | | Amount | | Value |
| | | (U.S. $) | | (U.S. $) |
| NON-AGENCY COLLATERALIZED | | | | | | |
| | MORTGAGE OBLIGATIONS (continued) | | | | | | |
| Structured Asset Securities | | | | | | |
| Series 2004-12H 1A 6.00% 5/25/34 | | $ | 19,098 | | $ | 17,292 |
| tWashington Mutual Mortgage | | | | | | |
| Pass Through Certificates | | | | | | |
| Series 2003-S10 A2 5.00% 10/25/18 | | | 102,070 | | | 102,581 |
| • | Series 2006-AR10 1A1 5.92% 9/25/36 | | | 309,316 | | | 234,617 |
| • | Series 2007-HY3 4A1 5.314% 3/25/37 | | | 313,861 | | | 249,829 |
| Wells Fargo Mortgage Backed | | | | | | |
| Securities Trust | | | | | | |
| • | Series 2004-T A1 3.242% 9/25/34 | | | 9,265 | | | 8,868 |
| • | Series 2005-AR16 2A1 3.363% 10/25/35 | | | 8,341 | | | 7,055 |
| • | Series 2006-AR6 7A1 5.112% 3/25/36 | | | 207,602 | | | 185,076 |
| • | Series 2006-AR10 5A1 5.589% 7/25/36 | | | 175,797 | | | 136,857 |
| Series 2007-8 2A6 6.00% 7/25/37 | | | 60,000 | | | 42,818 |
| Total Non-Agency Collateralized | | | | | | |
| Mortgage Obligations | | | | | | |
| (cost $3,317,720) | | | | | | 3,513,763 |
| | |
| REGIONAL AUTHORITY–0.46% | | | | | | |
| Province of Ontario Canada | | | | | | |
| 1.875% 11/19/12 | | | 1,855,000 | | | 1,837,795 |
| Total Regional Authority | | | | | | |
| (cost $1,851,605) | | | | | | 1,837,795 |
| | |
| «SENIOR SECURED LOANS–1.56% | | | | | | |
| AIQ Term Loan 5.50% 6/1/16 | | | 250,000 | | | 247,708 |
| Bausch & Lomb | | | | | | |
| Term Tranche Loan B 3.533% 4/11/15 | | | 89,442 | | | 85,221 |
| Term Tranche Loan DD 3.519% 4/11/15 | | | 21,720 | | | 20,695 |
| BE Aerospace 5.75% 7/28/14 | | | 240,309 | | | 242,212 |
| Biomet Term Tranche Loan B | | | | | | |
| 3.281% 3/25/15 | | | 251,718 | | | 242,139 |
| Calpine Term Tranche Loan T1 | | | | | | |
| 3.165% 3/29/14 | | | 346,238 | | | 328,962 |
| First Data Term Tranche Loan B2 | | | | | | |
| 3.00% 9/24/14 | | | 249,362 | | | 222,209 |
| Flextronics International Term Tranche | | | | | | |
| Loan B 2.54% 10/1/12 | | | 347,342 | | | 329,252 |
| Ford Motor Term Tranche Loan B | | | | | | |
| 3.287% 12/15/13 | | | 595,409 | | | 551,816 |
| Harrah’s Chester Downs Term Loan | | | | | | |
| 12.375% 12/31/16 | | | 200,000 | | | 201,750 |
| HCA Term Tranche Loan B 2.533% 11/18/13 | | | 366,399 | | | 351,378 |
| Huntsman Term Tranche Loan C | | | | | | |
| 2.484% 6/30/16 | | | 825,000 | | | 789,249 |
| Intelsat | | | | | | |
| Term Loan B-2-A 2.735% 1/3/14 | | | 79,402 | | | 75,390 |
| Term Loan B-2-B 2.735% 1/3/14 | | | 79,378 | | | 75,367 |
| Term Loan B-2-C 2.735% 1/3/14 | | | 79,378 | | | 75,367 |
| MCC Georgia Term Tranche Loan D | | | | | | |
| 5.50% 3/31/17 | | | 750,000 | | | 753,438 |
| MetroPCS Wireless Term Tranche Loan B | | | | | | |
| 2.54% 11/4/13 | | | 247,442 | | | 237,297 |
| Nuveen Investments | | | | | | |
| Term Tranche Loan B 3.281% 11/13/14 | | | 275,983 | | | 242,994 |
| 2nd Lien Term Loan 12.50% 7/9/15 | | | 284,000 | | | 294,366 |
| Rental Services 2nd Lien 3.817% 11/30/13 | | | 124,929 | | | 117,082 |
| Telesat Canada | | | | | | |
| Term Tranche Loan B 3.24% 10/31/14 | | | 274,179 | | | 263,782 |
| Term Tranche Loan II 3.24% 10/31/14 | | | 23,549 | | | 22,656 |
| Texas Competitive Electric Holdings Term | | | | | | |
| Tranche Loan B2 3.735% 10/10/14 | | | 371,154 | | | 302,376 |
| Univision Communications Term Tranche | | | | | | |
| Loan B 2.533% 9/29/14 | | | 250,000 | | | 217,813 |
| Total Senior Secured Loans | | | | | | |
| (cost $5,763,726) | | | | | | 6,290,519 |
| |
| SOVEREIGN AGENCIES–1.34%Δ | | | | | | |
| Canada – 0.13% | | | | | | |
| Export Development Canada 3.125% 4/24/14 | | | 515,000 | | | 522,183 |
| | | | | | | 522,183 |
| France–0.31% | | | | | | |
| #Societe Financement de l’Economie | | | | | | |
| Francaise 144A 2.125% 1/30/12 | | | 1,240,000 | | | 1,256,418 |
| | | | | | | 1,256,418 |
| Japan–0.45% | | | | | | |
| Japan Bank for International Cooperation | | | | | | |
| 2.125% 11/5/12 | | | 1,800,000 | | | 1,793,140 |
| | | | | | | 1,793,140 |
| Norway–0.45% | | | | | | |
| Eksportfinans ASA 3.00% 11/17/14 | | | 1,850,000 | | | 1,823,730 |
| | | | | | | 1,823,730 |
| Total Sovereign Agencies | | | | | | |
| (cost $5,421,958) | | | | | | 5,395,471 |
| |
| SOVEREIGN DEBT–0.13%Δ | | | | | | |
| Republic of Korea–0.13% | | | | | | |
| #Korea Expressway 144A 4.50% 3/23/15 | | | 530,000 | | | 541,255 |
| Total Sovereign Debt (cost $528,814) | | | | | | 541,255 |
| |
| SUPRANATIONAL BANKS–1.49% | | | | | | |
| *European Investment Bank 2.375% 3/14/14 | | | 3,880,000 | | | 3,820,007 |
| International Finance 3.00% 4/22/14 | | | 2,185,000 | | | 2,192,119 |
| Total Supranational Banks | | | | | | |
| (cost $6,156,827) | | | | | | 6,012,126 |
| |
| U.S. TREASURY OBLIGATIONS–13.31% | | | | | | |
| U.S. Treasury Notes | | | | | | |
| 1.125% 12/15/12 | | | 34,260,000 | | | 33,721,878 |
| * | 2.125% 11/30/14 | | | 19,630,000 | | | 19,171,502 |
| ∞ | 3.375% 11/15/19 | | | 620,000 | | | 596,560 |
| Total U.S. Treasury Obligations | | | | | | |
| (cost $54,361,844) | | | | | | 53,489,940 |
Limited-Term Diversified Income Series-12
Delaware VIP® Limited-Term Diversified Income Series
Statement of Net Assets (continued)
| | | Number of | | Value |
| | | | Shares | | (U.S. $) |
| PREFERRED STOCK–0.70% | | | | | | |
| •PNC Financial Services Group 8.25% | | | 2,765,000 | | $ | 2,821,624 |
| Total Preferred Stock (cost $2,587,573) | | | | | | 2,821,624 |
| |
| | | Principal | | | |
| | | Amount | | | |
| | | (U.S. $) | | | |
| ≠DISCOUNT NOTE–0.89% | | | | | | |
| Federal Home Loan Bank 0.001% 1/4/10 | | $ | 3,567,000 | | | 3,567,000 |
| Total Discount Note (cost $3,567,000) | | | | | | 3,567,000 |
| | |
| Total Value of Securities Before | | | | | | |
| Securities Lending Collateral–96.14% | | | | | | |
| (cost $376,688,613) | | | | | | 386,431,481 |
| | | | | | | |
| | | Number of | | |
| | | Shares | | |
| SECURITIES LENDING | | | | | | |
| COLLATERAL**–0.84% | | | | | | |
| Investment Companies | | | | | | |
| Mellon GSL DBT II Collateral Fund | | | 2,307,400 | | | 2,307,400 |
| BNY Mellon SL DB II Liquidating Fund | | | 1,076,468 | | | 1,063,219 |
| †@ | Mellon GSL Reinvestment Trust II | | | 70,018 | | | 2,976 |
| Total Securities Lending Collateral | | | | | | |
| (cost $3,453,886) | | | | | | 3,373,595 |
| TOTAL VALUE OF SECURITIES–96.98% (cost $380,142,499) | | | 389,805,076 | © |
| OBLIGATION TO RETURN SECURITIES LENDING COLLATERAL**–(0.86%) | | | (3,453,886 | ) |
| RECEIVABLES AND OTHER ASSETS NET OF LIABILITIES–3.88% | | | 15,591,279 | |
| NET ASSETS APPLICABLE TO 40,399,856 SHARES OUTSTANDING–100.00% | | $ | 401,942,469 | |
| NET ASSET VALUE–DELAWARE VIP LIMITED-TERM DIVERSIFIED INCOME SERIES | | | | |
| STANDARD CLASS ($30,513,571 / 3,048,439 Shares) | | | | $10.01 | |
| NET ASSET VALUE–DELAWARE VIP LIMITED-TERM DIVERSIFIED INCOME SERIES | | | | |
| SERVICE CLASS ($371,428,898 / 37,351,417 Shares) | | | | $9.94 | |
| COMPONENTS OF NET ASSETS AT DECEMBER 31, 2009: | | | | |
| Shares of beneficial interest (unlimited authorization–no par) | | $ | 388,666,287 | |
| Undistributed net investment income | | | 248,127 | |
| Accumulated net realized gain on investments | | | 3,401,323 | |
| Net unrealized appreciation of investments | | | 9,626,732 | |
| Total net assets | | $ | 401,942,469 | |
| |
____________________
| t | Pass Through Agreement. Security represents the contractual right to receive a proportionate amount of underlying payments due to the counterparty pursuant to various agreements related to the rescheduling of obligations and the exchange of certain notes. |
| • | Variable rate security. The rate shown is the rate as of December 31, 2009. |
| « | Senior Secured Loans generally pay interest at rates which are periodically redetermined by reference to a base lending rate plus a premium. These base lending rates are generally: (i) the prime rate offered by one or more United States banks, (ii) the lending rate offered by one or more European banks such as the London Inter-Bank Offered Rate (LIBOR), and (iii) the certificate of deposit rate. Senior Secured Loans may be subject to restrictions on resale. Stated rate in effect at December 31, 2009. |
| Φ | Step coupon bond. Coupon increases periodically based on a predetermined schedule. Stated rate in effect at December 31, 2009. |
| Δ | Securities have been classified by country of origin. |
| # | Security exempt from registration under Rule 144A of the Securities Act of 1933, as amended. At December 31, 2009, the aggregate amount of Rule 144A securities was $36,839,701, which represented 9.17% of the Series’ net assets. See Note 10 in “Notes to Financial Statements.” |
| † | Non income producing security. |
| * | Fully or partially on loan. |
| ** | See Note 9 in “Notes to Financial Statements.” |
| © | Includes $3,379,120 of securities loaned. |
| @ | Illiquid security. At December 31, 2009, the aggregate amount of illiquid securities was $316,476, which represented 0.08% of the Series’ net assets. See Note 10 in “Notes to Financial Statements.” |
| Õ | Restricted Security. Investment in a security not registered under the Securities Act of 1933, as amended. This security has certain restrictions on resale which may limit its liquidity. At December 31, 2009, the aggregate amount of the restricted securities was $47,956, or 0.01% of the Series’ net assets. See Note 10 in “Notes to Financial Statements.” |
| ∞ | Fully or partially pledged as collateral for financial futures contracts. |
| ≠ | The rate shown is the effective yield at the time of purchase. |
Limited-Term Diversified Income Series-13
Delaware VIP® Limited-Term Diversified Income Series
Statement of Net Assets (continued)
Summary of Abbreviations:
ARM – Adjustable Rate Mortgage
CDS – Credit Default Swap
GNMA – Government National Mortgage Association
GSMPS – Goldman Sachs Reperforming Mortgage Securities
MASTR – Mortgage Asset Securitization Transactions, Inc.
NIM – Net Interest Margin
PIK– Pay-in-kind
REMIC – Real Estate Mortgage Investment Conduit
S.F. – Single Family
TBA – To be announced
yr – Year
1The following financial futures contracts and swap contracts were outstanding at December 31, 2009:
Financial Futures Contracts
| | Notional | | Notional | | Expiration | | Unrealized |
| Contracts to Buy | | | Cost | | Value | | Date | | Depreciation |
| 38 U.S. Treasury 5 yr Notes | | $ | 4,436,608 | | $4,346,547 | | | 3/31/10 | | | $(90,061) |
| | |
| Swap Contracts | | | | | | | | | | | | | | | |
| CDS Contracts | | | | | | | | | | | | | | | |
| | | | | Annual | | | | | | Unrealized |
| Swap Counterparty & | | Notional | | Protection | | Termination | | Appreciation |
| Referenced Obligation | | | Value | | Payments | | Date | | (Depreciation) |
| Protection Purchased: | | | | | | | | | | | | | | | |
| JPMorgan Securities | | | | | | | | | | | | | | | |
| Penny (J.C.) | | | | | | | | | | | | | | | |
| 5 yr CDS | | $ | 935,000 | | 1.00% | | | 3/20/15 | | | | $ | (232 | ) | |
| 5 yr CDS | | | 375,000 | | 1.00% | | | 3/20/15 | | | | | (637 | ) | |
| | $ | 1,310,000 | | | | | | | | | $ | (869 | ) | |
| Protection Sold: | | | | | | | | | | | | | | | |
| JPMorgan Securities | | | | | | | | | | | | | | | |
| Macy’s | | | | | | | | | | | | | | | |
| 5 yr CDS | | $ | 935,000 | | 1.00% | | | 3/20/15 | | | | $ | 3,545 | | |
| 5 yr CDS | | | 375,000 | | 1.00% | | | 3/20/15 | | | | | 1,806 | | |
| MetLife 5 yr CDS | | | 395,000 | | 1.00% | | | 12/20/14 | | | | | 13,443 | | |
| UnitedHealth Group | | | | | | | | | | | | | | | |
| 5 yr CDS | | | 485,000 | | 1.00% | | | 12/20/14 | | | | | 9,206 | | |
| 5 yr CDS | | | 1,010,000 | | 1.00% | | | 12/20/14 | | | | | 26,508 | | |
| | $ | 3,200,000 | | | | | | | | | | 54,508 | | |
| Total | | | | | | | | | | | | $ | 53,639 | | |
| |
The use of financial futures contracts and swap contracts involves elements of market risk and risks in excess of the amounts recognized in the financial statements. The notional values presented above represent the Series’ total exposure in such contracts, whereas only the net unrealized appreciation (depreciation) is reflected in the Series’ net assets.
____________________
1See Note 8 in “Notes to Financial Statements.”
See accompanying notes
Limited-Term Diversified Income Series-14
Delaware VIP® Trust —
Delaware VIP Limited-Term Diversified Income Series
Statement of Assets and Liabilities
December 31, 2009
| ASSETS: | | | |
| Investments, at value (including $3,379,120 of | | | |
| securities loaned) | | $ | 382,864,481 |
| Short-term investments, at value | | | 3,567,000 |
| Short-term investments held as collateral | | | |
| for loaned securities, at value | | | 3,373,595 |
| Cash | | | 43,268,519 |
| Restricted cash | | | 110,000 |
| Receivables for securities sold | | | 2,410,058 |
| Dividends and interest receivable | | | 2,930,979 |
| Receivable for fund shares sold | | | 365,647 |
| Annual protection payments on credit default swaps | | | 578 |
| Securities lending income receivable | | | 769 |
| Total assets | | | 438,891,626 |
| |
| LIABILITIES: | | | |
| Payables for securities purchased | | | 32,259,239 |
| Credit default swap, at value (including up | | | |
| front payment received $106,197) | | | 52,557 |
| Distributions payable | | | 282,224 |
| Payable for fund shares redeemed | | | 553,052 |
| Variation margin payable | | | 10,984 |
| Obligation to return securities lending collateral | | | 3,453,886 |
| Due to manager and affiliates | | | 266,374 |
| Other accrued expenses | | | 70,841 |
| Total liabilities | | | 36,949,157 |
| |
| Total Net Assets | | $ | 401,942,469 |
| |
| Investments, at cost | | $ | 373,121,613 |
| Short-term investments, at cost | | | 3,567,000 |
| Short-term investments held as collateral | | | |
| for loaned securities, at cost | | | 3,453,886 |
See accompanying notes
Limited-Term Diversified Income Series-15
Delaware VIP® Trust —
Delaware VIP Limited-Term Diversified Income Series
Statement of Operations
Year Ended December 31, 2009
| INVESTMENT INCOME: | | | | |
| Interest | | $ | 10,261,281 | |
| Dividend | | | 185,394 | |
| Securities lending income | | | 36,462 | |
| | | 10,483,137 | |
| |
| EXPENSES: | | | | |
| Management fees | | | 1,217,426 | |
| Distribution expenses – Service Class | | | 639,175 | |
| Accounting and administration expenses | | | 96,880 | |
| Reports and statements to shareholders | | | 35,683 | |
| Legal fees | | | 32,626 | |
| Dividend disbursing and transfer agent fees and expenses | | | 30,891 | |
| Audit and tax | | | 25,099 | |
| Pricing fees | | | 20,386 | |
| Trustees’ fees | | | 14,924 | |
| Registration fees | | | 11,157 | |
| Custodian fees | | | 8,934 | |
| Insurance fees | | | 4,601 | |
| Consulting fees | | | 2,422 | |
| Dues and services | | | 1,366 | |
| Trustees’ expenses | | | 1,107 | |
| | | 2,142,677 | |
| Less waiver of distribution expenses – Service Class | | | (106,529 | ) |
| Total operating expenses | | | 2,036,148 | |
| |
| NET INVESTMENT INCOME | | | 8,446,989 | |
| |
| NET REALIZED AND UNREALIZED GAIN | | | | |
| ON INVESTMENTS: | | | | |
| Net realized gain on: | | | | |
| Investments | | | 6,660,689 | |
| Futures contracts | | | 163,759 | |
| Swap contracts | | | 16,403 | |
| Net realized gain | | | 6,840,851 | |
| Net change in unrealized appreciation/depreciation | | | | |
| of investments | | | 10,629,203 | |
| |
| NET REALIZED AND UNREALIZED GAIN | | | | |
| ON INVESTMENTS | | | 17,470,054 | |
| |
| NET INCREASE IN NET ASSETS RESULTING | | | | |
| FROM OPERATIONS | | $ | 25,917,043 | |
See accompanying notes
Delaware VIP Trust —
Delaware VIP Limited-Term Diversified Income Series
Statements of Changes in Net Assets
| | Year Ended |
| | 12/31/09 | | 12/31/08 |
| INCREASE (DECREASE) IN NET | | | | | | | | |
| ASSETS FROM OPERATIONS: | | | | | | | | |
| Net investment income | | $ | 8,446,989 | | | $ | 2,840,789 | |
| Net realized gain (loss) on investments | | | 6,840,851 | | | | (2,615,199 | ) |
| Net change in unrealized appreciation/ | | | | | | | | |
| depreciation of investments | | | 10,629,203 | | | | (1,053,576 | ) |
| Net increase (decrease) in net assets | | | | | | | | |
| resulting from operations | | | 25,917,043 | | | | (827,986 | ) |
| |
| DIVIDENDS AND DISTRIBUTIONS | | | | | | | | |
| TO SHAREHOLDERS FROM: | | | | | | | | |
| Net investment income: | | | | | | | | |
| Standard Class | | | (1,100,043 | ) | | | (1,161,244 | ) |
| Service Class | | | (7,028,974 | ) | | | (1,689,644 | ) |
| | | | (8,129,017 | ) | | | (2,850,888 | ) |
| |
| CAPITAL SHARE TRANSACTIONS: | | | | | | | | |
| Proceeds from shares sold: | | | | | | | | |
| Standard Class | | | 17,000,880 | | | | 17,234,452 | |
| Service Class | | | 354,034,529 | | | | 94,218,468 | |
| Net asset value of shares issued upon | | | | | | | | |
| reinvestment of dividends and distributions: | | | | | | | | |
| Standard Class | | | 958,052 | | | | 1,169,222 | |
| Service Class | | | 6,394,746 | | | | 1,662,621 | |
| | | | 378,388,207 | | | | 114,284,763 | |
| Cost of shares repurchased: | | | | | | | | |
| Standard Class | | | (15,368,263 | ) | | | (12,599,525 | ) |
| Service Class | | | (88,634,583 | ) | | | (28,378,950 | ) |
| | | | (104,002,846 | ) | | | (40,978,475 | ) |
| Increase in net assets derived from capital | | | | | | | | |
| share transactions | | | 274,385,361 | | | | 73,306,288 | |
| |
| NET INCREASE IN NET ASSETS | | | 292,173,387 | | | | 69,627,414 | |
| |
| NET ASSETS: | | | | | | | | |
| Beginning of year | | | 109,769,082 | | | | 40,141,668 | |
| End of year (including undistributed | | | | | | | | |
| net investment income of $248,127 | | | | | | | | |
| and $79,592, respectively) | | $ | 401,942,469 | | | $ | 109,769,082 | |
| |
See accompanying notes
Limited-Term Diversified Income Series-16
Delaware VIP® Trust — Delaware VIP Limited-Term Diversified Income Series
Financial Highlights
Selected data for each share of the Series outstanding throughout each period were as follows:
| | Delaware VIP Limited-Term Diversified Income Series Standard Class | |
| | Year Ended | |
| | 12/31/09 | | 12/31/08 | | 12/31/07 | | 12/31/06 | | 12/31/05 | |
| Net asset value, beginning of period | | $9.190 | | $9.670 | | $9.710 | | $9.710 | | $9.940 | |
| | |
| Income (loss) from investment operations: | | | | | | | | | | | |
| Net investment income1 | | 0.358 | | 0.418 | | 0.324 | | 0.396 | | 0.355 | |
| Net realized and unrealized gain (loss) on investments | | | | | | | | | | | |
| and foreign currencies | | 0.809 | | (0.451 | ) | 0.099 | | 0.038 | | (0.180 | ) |
| Total from investment operations | | 1.167 | | (0.033 | ) | 0.423 | | 0.434 | | 0.175 | |
| | |
| Less dividends and distributions from: | | | | | | | | | | | |
| Net investment income | | (0.347 | ) | (0.447 | ) | (0.463 | ) | (0.434 | ) | (0.405 | ) |
| Total dividends and distributions | | (0.347 | ) | (0.447 | ) | (0.463 | ) | (0.434 | ) | (0.405 | ) |
| | |
| Net asset value, end of period | | $10.010 | | $9.190 | | $9.670 | | $9.710 | | $9.710 | |
| | |
| Total return2 | | 12.77% | | (0.28% | ) | 4.46% | | 4.57% | | 1.79% | |
| | |
| Ratios and supplemental data: | | | | | | | | | | | |
| Net assets, end of period (000 omitted) | | $30,513 | | $25,357 | | $20,880 | | $22,626 | | $23,895 | |
| Ratio of expenses to average net assets | | 0.62% | | 0.63% | | 0.68% | | 0.71% | | 0.71% | |
| Ratio of expenses to average net assets | | | | | | | | | | | |
| prior to fees waived and expense paid indirectly | | 0.62% | | 0.67% | | 0.68% | | 0.71% | | 0.71% | |
| Ratio of net investment income to average net assets | | 3.69% | | 4.46% | | 3.36% | | 4.10% | | 3.61% | |
| Ratio of net investment income to average net assets | | | | | | | | | | | |
| prior to fees waived and expense paid indirectly | | 3.69% | | 4.42% | | 3.36% | | 4.10% | | 3.61% | |
| Portfolio turnover | | 358% | | 339% | | 170% | | 318% | | 259% | |
____________________
1The average shares outstanding method has been applied for per share information. |
2Total investment return is based on the change in net asset value of a share during the period and assumes reinvestment of dividends and distributions at net asset value. Total investment return during some of the periods shown reflects a waiver by the manager. Performance would have been lower had the waiver not been in effect. |
See accompanying notes
Limited-Term Diversified Income Series-17
Delaware VIP® Limited-Term Diversified Income Series
Financial Highlights (continued)
Selected data for each share of the Series outstanding throughout each period were as follows:
| | Delaware VIP Limited-Term Diversified Income Series Service Class | |
| | Year Ended | |
| | 12/31/09 | | 12/31/08 | | 12/31/07 | | 12/31/06 | | 12/31/05 | |
| Net asset value, beginning of period | | $9.130 | | $9.610 | | $9.650 | | $9.650 | | $9.900 | |
| | |
| Income (loss) from investment operations: | | | | | | | | | | | |
| Net investment income1 | | 0.334 | | 0.395 | | 0.300 | | 0.372 | | 0.331 | |
| Net realized and unrealized gain (loss) on investments | | | | | | | | | | | |
| and foreign currencies | | 0.798 | | (0.452 | ) | 0.099 | | 0.037 | | (0.200 | ) |
| Total from investment operations | | 1.132 | | (0.057 | ) | 0.399 | | 0.409 | | 0.131 | |
| | |
| Less dividends and distributions from: | | | | | | | | | | | |
| Net investment income | | (0.322 | ) | (0.423 | ) | (0.439 | ) | (0.409 | ) | (0.381 | ) |
| Total dividends and distributions | | (0.322 | ) | (0.423 | ) | (0.439 | ) | (0.409 | ) | (0.381 | ) |
| | |
| Net asset value, end of period | | $9.940 | | $9.130 | | $9.610 | | $9.650 | | $9.650 | |
| | |
| Total return2 | | 12.57% | | (0.64% | ) | 4.23% | | 4.34% | | 1.35% | |
| | |
| Ratios and supplemental data: | | | | | | | | | | | |
| Net assets, end of period (000 omitted) | | $371,429 | | $84,412 | | $19,262 | | $11,706 | | $ 4,493 | |
| Ratio of expenses to average net assets | | 0.87% | | 0.88% | | 0.93% | | 0.96% | | 0.96% | |
| Ratio of expenses to average net assets | | | | | | | | | | | |
| prior to fees waived and expense paid indirectly | | 0.92% | | 0.97% | | 0.98% | | 1.01% | | 1.01% | |
| Ratio of net investment income to average net assets | | 3.44% | | 4.21% | | 3.11% | | 3.85% | | 3.36% | |
| Ratio of net investment income to average net assets | | | | | | | | | | | |
| prior to fees waived and expense paid indirectly | | 3.39% | | 4.12% | | 3.06% | | 3.78% | | 3.31% | |
| Portfolio turnover | | 358% | | 339% | | 170% | | 318% | | 259% | |
____________________
1The average shares outstanding method has been applied for per share information. |
2Total investment return is based on the change in net asset value of a share during the period and assumes reinvestment of dividends and distributions at net asset value. Total investment return during some of the periods shown reflects waivers by the manager and/or distributor. Performance would have been lower had the waivers not been in effect. |
See accompanying notes
Limited-Term Diversified Income Series-18
Delaware VIP® Trust — Delaware VIP Limited-Term Diversified Income Series
Notes to Financial Statements
December 31, 2009
Delaware VIP Trust (Trust) is organized as a Delaware statutory trust and offers 12 series: Delaware VIP Cash Reserve Series, Delaware VIP Diversified Income Series, Delaware VIP Emerging Markets Series, Delaware VIP Growth Opportunities Series, Delaware VIP High Yield Series, Delaware VIP International Value Equity Series, Delaware VIP Limited-Term Diversified Income Series (formerly, Delaware VIP Capital Reserves Series), Delaware VIP REIT Series, Delaware VIP Small Cap Value Series, Delaware VIP Trend Series, Delaware VIP U.S. Growth Series and Delaware VIP Value Series. These financial statements and the related notes pertain to Delaware VIP Limited-Term Diversified Income Series (Series). The Trust is an open-end investment company. The Series is considered diversified under the Investment Company Act of 1940, as amended, and offers Standard Class and Service Class shares. The Standard Class shares do not carry a 12b-1 fee and the Service Class shares carry a 12b-1 fee. The shares of the Series are sold only to separate accounts of life insurance companies.
The investment objective of the Series is to seek maximum total return, consistent with reasonable risk.
1. Significant Accounting Policies
The following accounting policies are in accordance with U.S. generally accepted accounting principles (U.S. GAAP) and are consistently followed by the Series.
Security Valuation—Equity securities, except those traded on the Nasdaq Stock Market, Inc. (Nasdaq), are valued at the last quoted sales price as of the time of the regular close of the New York Stock Exchange (NYSE) on the valuation date. Securities traded on the Nasdaq are valued in accordance with the Nasdaq Official Closing Price, which may not be the last sales price. If on a particular day an equity security does not trade, then the mean between the bid and ask prices will be used. Short-term debt securities are valued at market value. U.S. government and agency securities are valued at the mean between the bid and ask prices. Other debt securities, credit default swap (CDS) contracts and interest rate swap contracts are valued by an independent pricing service or broker. To the extent current market prices are not available, the pricing service may take into account developments related to the specific security, as well as transactions in comparable securities. Investment companies are valued at net asset value per share. Foreign currency exchange contracts are valued at the mean between the bid and ask prices of the contracts. Interpolated values are derived when the settlement date of the contract is an interim date for which quotations are not available. Financial futures contracts and options on futures contracts are valued at the daily quoted settlement prices. Generally, other securities and assets for which market quotations are not readily available are valued at fair value as determined in good faith under the direction of the Series’ Board of Trustees (Board). In determining whether market quotations are readily available or fair valuation will be used, various factors will be taken into consideration, such as market closures or suspension of trading in a security. The Series may use fair value pricing more frequently for securities traded primarily in non-U.S. markets because, among other things, most foreign markets close well before the Series values its securities at 4:00 p.m. Eastern time. The earlier close of these foreign markets gives rise to the possibility that significant events, including broad market moves, government actions or pronouncements, aftermarket trading, or news events may have occurred in the interim. To account for this, the Series may frequently value foreign securities using fair value prices based on third-party vendor modeling tools (international fair value pricing).
Federal Income Taxes—No provision for federal income taxes has been made as the Series intends to continue to qualify for federal income tax purposes as a regulated investment company under Subchapter M of the Internal Revenue Code of 1986, as amended, and make the requisite distributions to shareholders. The Series evaluates tax positions taken or expected to be taken in the course of preparing the Series’ tax returns to determine whether the tax positions are “more-likely-than-not” of being sustained by the applicable tax authority. Tax positions not deemed to meet the more-likely-than-not threshold are recorded as a tax benefit or expense in the current year. Management has analyzed the Series’ tax positions taken on federal income tax returns for all open tax years (tax years ended December 31, 2006 – December 31, 2009), and has concluded that no provision for federal income tax is required in the Series’ financial statements.
Class Accounting—Investment income and common expenses are allocated to the classes of the Series on the basis of “settled shares” of each class in relation to the net assets of the Series. Realized and unrealized gain (loss) on investments is allocated to the classes of the Series on the basis of daily net assets of each class. Distribution expenses relating to a specific class are charged directly to that class.
Repurchase Agreements—The Series may invest in a pooled cash account along with other members of the Delaware Investments® Family of Funds pursuant to an exemptive order issued by the Securities and Exchange Commission. The aggregate daily balance of the pooled cash account is invested in repurchase agreements secured by obligations of the U.S. government. The respective collateral is held by the Series’ custodian bank until the maturity of the respective repurchase agreements. Each repurchase agreement is at least 102% collateralized. However, in the event of default or bankruptcy by the counterparty to the agreement, realization of the collateral may be subject to legal proceedings. At December 31, 2009, the Series held no investments in repurchase agreements.
Use of Estimates—The preparation of financial statements in conformity with U.S. GAAP requires management to make estimates and assumptions that affect the reported amounts of assets and liabilities at the date of the financial statements and the reported amounts of revenues and expenses during the reporting period. Actual results could differ from those estimates.
Other—Expenses directly attributable to the Series are charged directly to the Series. Other expenses common to various funds within the Delaware Investments Family of Funds are generally allocated amongst such funds on the basis of average net assets. Management fees and some other expenses are paid monthly. Security transactions are recorded on the date the securities are purchased or sold (trade date) for financial reporting purposes. Costs used in calculating realized gains and losses on the sale of investment securities are those of the specific securities sold. Interest income is recorded on the accrual basis. Discounts and premiums are amortized to interest income over the lives of the respective securities. Realized gains (losses) on paydowns of mortgage- and asset-backed securities are classified as interest income. The Series declares dividends daily from net investment income and pays such dividends monthly and declares and pays distributions from net realized gain on investments, if any, following the close of the fiscal year.
The Series may receive earnings credits from its custodian when positive cash balances are maintained, which are used to offset custody fees. There were no earnings credits for the year ended December 31, 2009.
Limited-Term Diversified Income Series-19
Delaware VIP® Limited-Term Diversified Income Series
Notes to Financial Statements (continued)
1. Significant Accounting Policies (continued)
On July 1, 2009, the Financial Accounting Standards Board (FASB) issued the FASB Accounting Standards Codification (Codification). The Codification became the single source of authoritative nongovernmental U.S. GAAP, superseding existing literature of the FASB, American Institute of Certified Public Accountants, Emerging Issues Task Force and other sources. The Codification is effective for interim and annual periods ending after September 15, 2009. The Series adopted the Codification for the year ended December 31, 2009. There was no impact to financial statements as the Codification requirements are disclosure-only in nature.
Management has evaluated whether any events or transactions occurred subsequent to December 31, 2009 through February 17, 2010, the date of issuance of the Series’ financial statements, and determined that there were no material events or transactions that would require recognition or disclosure in the Series’ financial statements.
2. Investment Management, Administration Agreements and Other Transactions with Affiliates
In accordance with the terms of its investment management agreement, the Series pays Delaware Management Company (DMC), a series of Delaware Management Business Trust and the investment manager, an annual fee which is calculated daily at the rate of 0.50% on the first $500 million of average daily net assets of the Series, 0.475% on the next $500 million, 0.45% on the next $1.5 billion, and 0.425% on average daily net assets in excess of $2.5 billion.
DMC had contractually agreed to waive that portion, if any, of its management fee and reimburse the Series to the extent necessary to ensure that annual operating expenses (excluding any 12b-1 plan expenses, taxes, interest, inverse floater program expenses, brokerage fees, certain insurance costs, and nonroutine expenses or costs including, but not limited to, those relating to reorganizations, litigation, conducting shareholder meetings, and liquidations (collectively, “nonroutine expenses”)) did not exceed 0.62% of average daily net assets of the Series through April 30, 2009. For purposes of this waiver and reimbursement, nonroutine expenses may also include such additional costs and expenses, as may be agreed upon from time to time by the Series’ Board and DMC. This expense waiver and reimbursement applied only to expenses paid directly by the Series.
Delaware Service Company, Inc. (DSC), an affiliate of DMC, provides fund accounting and financial administration oversight services to the Series. For these services, the Series pays DSC fees based on the aggregate daily net assets of the Delaware Investments® Family of Funds at the following annual rate: 0.0050% of the first $30 billion; 0.0045% of the next $10 billion; 0.0040% of the next $10 billion; and 0.0025% of aggregate average daily net assets in excess of $50 billion. The fees payable to DSC under the service agreement described above are allocated among all funds in the Delaware Investments Family of Funds on a relative net asset value basis. For the year ended December 31, 2009, the Series was charged $12,174 for these services.
DSC also provides dividend disbursing and transfer agency services. The Series pays DSC a monthly fee based on the number of shareholder accounts for dividend disbursing and transfer agent services.
Pursuant to a distribution agreement and distribution plan, the Series pays Delaware Distributors, L.P. (DDLP), the distributor and an affiliate of DMC, an annual distribution and service fee not to exceed 0.30% of the average daily net assets of the Service Class shares. DDLP has contracted to waive distribution and service fees through April 30, 2010 in order to prevent distribution and service fees of the Service Class shares from exceeding 0.25% of average daily net assets. Standard Class shares pay no distribution and service expenses.
At December 31, 2009, the Series had liabilities payable to affiliates as follows:
| | | | Dividend Disbursing, | | | | Other |
| | Investment | | Transfer Agent and Fund | | | | Expenses |
| | Management | | Accounting Oversight | | Distribution | | Payable |
| | Fee Payable to | | Fees and Other Expenses | | Fee Payable | | to DMC |
| | DMC | | Payable to DSC | | to DDLP | | and Affiliates* |
| | $167,834 | | $4,205 | | $77,589 | | $16,746 |
____________________
*DMC, as part of its administrative services, pays operating expenses on behalf of the Series and is reimbursed on a periodic basis. Such expenses include items such as printing of shareholder reports, fees for audit, legal and tax services, custodian fees and trustees’ fees.
As provided in the investment management agreement, the Series bears the cost of certain legal and tax services, including internal legal and tax services provided to the Series by DMC and/or its affiliates’ employees. For the year ended December 31, 2009, the Series was charged $19,781 for internal legal and tax services provided by DMC and/or its affiliates’ employees.
Trustees’ fees include expenses accrued by the Series for each Trustee’s retainer and meeting fees. Certain officers of DMC, DSC and DDLP are officers and/or Trustees of the Trust. These officers and Trustees are paid no compensation by the Series.
Limited-Term Diversified Income Series-20
Delaware VIP® Limited-Term Diversified Income Series
Notes to Financial Statements (continued)
3. Investments
For the year ended December 31, 2009, the Series made purchases and sales of investment securities other than short-term investments as follows:
| Purchases other than U.S. government securities | $ | 490,509,172 |
| Purchases of U.S. government securities | | 588,769,995 |
| Sales other than U.S. government securities | | 268,921,846 |
| Sales of U.S. government securities | | 554,131,439 |
At December 31, 2009, the cost of investments and unrealized appreciation (depreciation) for federal income tax purposes for the Series were as follows:
| | | | Aggregate | | Aggregate | | Net |
| | Cost of | | Unrealized | | Unrealized | | Unrealized |
| | Investments | | Appreciation | | Depreciation | | Appreciation |
| | $379,774,513 | | $12,182,366 | | $(2,151,803) | | $10,030,563 |
U.S. GAAP defines fair value as the price that the Series would receive to sell an asset or pay to transfer a liability in an orderly transaction between market participants at the measurement date under current market conditions. A framework for measuring fair value and a three level hierarchy for fair value measurements has been established based upon the transparency of inputs to the valuation of an asset or liability. Inputs may be observable or unobservable and refer broadly to the assumptions that market participants would use in pricing the asset or liability. Observable inputs reflect the assumptions market participants would use in pricing the asset or liability based on market data obtained from sources independent of the reporting entity. Unobservable inputs reflect the reporting entity’s own assumptions about the assumptions that market participants would use in pricing the asset or liability developed based on the best information available under the circumstances. The Series’ investment in its entirety is assigned a level based upon the observability of the inputs which are significant to the overall valuation. The three-tier hierarchy of inputs is summarized below.
Level 1 – inputs are quoted prices in active markets
Level 2 – inputs are observable, directly or indirectly
Level 3 – inputs are unobservable and reflect assumptions on the part of the reporting entity
The following table summarizes the valuation of the Series’ investments by the fair value hierarchy levels as of December 31, 2009:
| | Level 1 | | Level 2 | | Level 3 | | Total |
| Agency, Asset-Backed and Mortgage-Backed Securities | | $ | – | | $ | 138,800,007 | | | $ | 705,783 | | $ | 139,505,790 | |
| Corporate Debt | | | – | | | 171,162,260 | | | | – | | | 171,162,260 | |
| Foreign Debt | | | – | | | 13,786,647 | | | | – | | | 13,786,647 | |
| Municipal Bonds | | | – | | | 2,098,220 | | | | – | | | 2,098,220 | |
| Short Term | | | – | | | 3,567,000 | | | | – | | | 3,567,000 | |
| U.S. Treasury Obligations | | | 53,489,940 | | | – | | | | – | | | 53,489,940 | |
| Other | | | – | | | 2,821,624 | | | | – | | | 2,821,624 | |
| Securities Lending Collateral | | | 2,307,400 | | | 1,063,219 | | | | 2,976 | | | 3,373,595 | |
| Total | | $ | 55,797,340 | | $ | 333,298,977 | | | $ | 708,759 | | $ | 389,805,076 | |
| |
| Derivatives | | $ | – | | $ | (36,422 | ) | | $ | – | | $ | (36,422 | ) |
The following is a reconciliation of investments in which significant unobservable inputs (Level 3) were used in determining fair value:
| | Agency, Asset- | | | | | | | | | |
| | Backed and | | | | | | | | | |
| | Mortgage- | | Securities | | | | |
| | Backed | | Lending | | Total |
| | Securities | | Collateral | | Series |
| Balance as of 12/31/08 | | | $ | 546,320 | | | | | $ | 2,311 | | | $ | 548,631 | |
| Net change in unrealized appreciation/depreciation | | | | 23,111 | | | | | | 665 | | | | 23,776 | |
| Purchases | | | | 580,026 | | | | | | – | | | | 580,026 | |
| Sales | | | | (1,802 | ) | | | | | – | | | | (1,802 | ) |
| Transfers out of Level 3 | | | | (441,872 | ) | | | | | – | | | | (441,872 | ) |
| Balance as of 12/31/09 | | | $ | 705,783 | | | | | $ | 2,976 | | | $ | 708,759 | |
| |
| Net change in unrealized | | | | | | | | | | | | | | | |
| appreciation/depreciation from | | | | | | | | | | | | | | | |
| investments still held as of 12/31/09 | | | $ | 19,507 | | | | | $ | 665 | | | $ | 20,172 | |
Limited-Term Diversified Income Series-21
Delaware VIP® Limited-Term Diversified Income Series
Notes to Financial Statements (continued)
3. Investments (continued)
In January 2010, the Financial Accounting Standards Board issued an Accounting Standards Update, Improving Disclosures about Fair Value Measurements, which introduces new disclosure requirements and clarifies certain existing disclosure requirements around fair value measurements currently presented above. The new disclosures and clarifications of existing disclosures are generally effective for the Series’ year ending December 31, 2010 and interim periods therein. Management is evaluating the impact of this update on its current disclosures.
4. Dividend and Distribution Information
Income and long-term capital gain distributions are determined in accordance with federal income tax regulations, which may differ from U.S. GAAP. Additionally, distributions from net gains on foreign currency transactions and net short-term gains on sales of investment securities are treated as ordinary income for federal income tax purposes. The tax character of dividends and distributions paid during the years ended December 31, 2009 and 2008 was as follows:
| | Year | | Year |
| | Ended | | Ended |
| | 12/31/09 | | 12/31/08 |
| Ordinary income | | $ | 8,129,017 | | $ | 2,850,888 |
5. Components of Net Assets on a Tax Basis
As of December 31, 2009, the components of net assets on a tax basis were as follows:
| Shares of beneficial interest | | $ | 388,666,287 | |
| Undistributed ordinary income | | | 3,297,444 | |
| Post-October losses | | | (51,825 | ) |
| Unrealized appreciation of investments | | | | |
| and swap contracts | | | 10,030,563 | |
| Net assets | | $ | 401,942,469 | |
| |
The differences between book basis and tax basis components of net assets are primarily attributable to tax deferral of losses on wash sales, tax treatment of CDS contracts, mark-to-market of futures contracts, and market discount and premium on debt instruments.
Post-October losses represent losses realized on investment transactions from November 1, 2009 through December 31, 2009, that, in accordance with federal income tax regulations, the Series has elected to defer and treat as having arisen in the following fiscal year.
For financial reporting purposes, capital accounts are adjusted to reflect the tax character of permanent book/tax differences. Reclassifications are primarily due to tax treatment of CDS contracts, paydown gains (losses) on mortgage- and asset-backed securities and market discount and premium on certain debt instruments. Results of operations and net assets were not affected by these reclassifications. For the year ended December 31, 2009, the Series recorded the following reclassifications:
| | Undistributed | | Accumulated |
| | Net Investment | | Net Realized |
| | Income | | Gain |
| | $(149,437) | | $149,437 |
For federal income tax purposes, capital loss carryforwards may be carried forward and applied against future capital gains. $1,793,037 was utilized in 2009.
6. Capital Shares
Transactions in capital shares were as follows:
| | Year | | Year |
| | Ended | | Ended |
| | 12/31/09 | | 12/31/08 |
| Shares sold: | | | | | | |
| Standard Class | | 1,783,855 | | | 1,813,150 | |
| Service Class | | 36,604,195 | | | 10,080,743 | |
| |
| Shares issued upon reinvestment of dividends and distributions: | | | | | | |
| Standard Class | | 98,411 | | | 123,483 | |
| Service Class | | 655,367 | | | 177,908 | |
| | 39,141,828 | | | 12,195,284 | |
| Shares repurchased: | | | | | | |
| Standard Class | | (1,591,938 | ) | | (1,338,478 | ) |
| Service Class | | (9,150,731 | ) | | (3,021,387 | ) |
| | (10,742,669 | ) | | (4,359,865 | ) |
| Net increase | | 28,399,159 | | | 7,835,419 | |
| |
Limited-Term Diversified Income Series-22
Delaware VIP® Limited-Term Diversified Income Series
Notes to Financial Statements (continued)
7. Line of Credit
The Series, along with certain other funds in the Delaware Investments® Family of Funds (Participants), participates in a $35,000,000 revolving line of credit with The Bank of New York Mellon (BNY Mellon) to be used for temporary or emergency purposes as an additional source of liquidity to fund redemptions of investor shares. Under the agreement, Participants are charged an annual commitment fee, which is allocated across the Participants on the basis of each Participant’s allocation of the entire facility. The Participants may borrow up to a maximum of one third of their net assets under the agreement. The agreement expires on November 16, 2010. The Series had no amounts outstanding as of December 31, 2009, or at any time during the year then ended.
8. Derivatives
U.S. GAAP requires enhanced disclosures that enable investors to understand: 1) how and why an entity uses derivatives, 2) how they are accounted for, and 3) how they affect an entity’s results of operations and financial position.
Foreign Currency Exchange Contracts
The Series may enter into foreign currency exchange contracts and foreign cross currency exchange contracts as a way of managing foreign exchange rate risk. The Series may enter into these contracts to fix the U.S. dollar value of a security that it has agreed to buy or sell for the period between the date the trade was entered into and the date the security is delivered and paid for. The Series may also use these contracts to hedge the U.S. dollar value of securities it already owns that are denominated in foreign currencies. The change in value is recorded as an unrealized gain or loss. When the contract is closed, a realized gain or loss is recorded equal to the difference between the value of the contract at the time it was opened and the value at the time it was closed.
The use of foreign currency exchange contracts and foreign cross currency exchange contracts does not eliminate fluctuations in the underlying prices of the securities, but does establish a rate of exchange that can be achieved in the future. Although foreign currency exchange contracts limit the risk of loss due to a decline in the value of the hedged currency, they also limit any potential gain that might result should the value of the currency increase. In addition, the Series could be exposed to risks if the counterparties to the contracts are unable to meet the terms of their contracts. The Series’ maximum risk of loss from counterparty credit risk is the value of its currency exchanged with the counterparty. The risk is generally mitigated by having a netting arrangement between the Series and the counterparty and by the posting of collateral by the counterparty to the Series to cover the Series’ exposure to the counterparty. There were no foreign currency exchange contracts outstanding at December 31, 2009.
Futures Contracts
A futures contract is an agreement in which the writer (or seller) of the contract agrees to deliver to the buyer an amount of cash or securities equal to a specific dollar amount times the difference between the value of a specific security or index at the close of the last trading day of the contract and the price at which the agreement is made. The Series may use futures in the normal course of pursuing its investment objective. The Series may invest in financial futures contracts to hedge its existing portfolio securities against fluctuations in fair value caused by changes in prevailing market interest rates. Upon entering into a financial futures contract, the Series deposits cash or pledges U.S. government securities to a broker, equal to the minimum “initial margin” requirements of the exchange on which the contract is traded. Subsequent payments are received from the broker or paid to the broker each day, based on the daily fluctuation in the market value of the contract. These receipts or payments are known as “variation margin” and are recorded daily by the Series as unrealized gains or losses until the contracts are closed. When the contracts are closed, the Series records a realized gain or loss equal to the difference between the value of the contract at the time it was opened and the value at the time it was closed. Risks of entering into financial futures contracts include potential imperfect correlation between the financial futures contracts and the underlying securities and the possibility of an illiquid secondary market for these instruments. When investing in futures, there is minimal counterparty credit risk to a Series because futures are exchange traded and the exchange’s clearinghouse, as counterparty to all exchange traded futures, guarantees against default.
Written Options
The Series may buy or write options contracts for any number of reasons, including: to manage the Series’ exposure to changes in securities prices and foreign currencies; as an efficient means of adjusting the Series’ overall exposure to certain markets; to protect the value of portfolio securities; and as a cash management tool. The Series may buy or write call or put options on securities, financial indices, and foreign currencies. When the Series buys an option, a premium is paid and an asset is recorded and adjusted on a daily basis to reflect the current market value of the options purchased. When the Series writes an option, a premium is received and a liability is recorded and adjusted on a daily basis to reflect the current market value of the options written. Premiums received from writing options that expire unexercised are treated by the Series on the expiration date as realized gains. The difference between the premium received and the amount paid on effecting a closing purchase transaction, including brokerage commissions, is treated as realized gain or loss. If a call option is exercised, the premium is added to the proceeds from the sale of the underlying security in determining whether the Series has a realized gain or loss. If a put option is exercised, the premium reduces the cost basis of the securities purchased by the Series. The Series, as writer of an option, bears the market risk of an unfavorable change in the price of the security underlying the written option. When writing options, the Series is subject to minimal counterparty credit risk because the counterparty is only obligated to pay premiums and does not bear the market risk of an unfavorable change. There were no written options during the year ended December 31, 2009.
Swap Contracts
The Series may enter into interest rate swap contracts, index swap contracts and CDS contracts in the normal course of pursuing its investment objective. The Series may use interest rate swaps to adjust the Series’ sensitivity to interest rates or to hedge against changes in interest rates. Index swaps may be used to gain exposure to markets that the Series invests in, such as the corporate bond market. The Series may also use index swaps as a substitute for futures or options contracts if such contracts are not directly available to the Series on favorable terms. The Series may enter into CDS contracts in order to hedge against a credit event, to enhance total return or to gain exposure to certain securities or markets.
Interest Rate Swaps. An interest rate swap contract is an exchange of interest rates between counterparties. In one instance, an interest rate swap involves payments received by the Series from another party based on a variable or floating interest rate, in return for making payments based on a fixed interest rate. An interest rate swap can also work in reverse with the Series receiving payments based on a fixed interest rate and making payments based on a variable or floating interest rate. Interest rate
Limited-Term Diversified Income Series-23
Delaware VIP® Limited-Term Diversified Income Series
Notes to Financial Statements (continued)
8. Derivatives (continued)
swaps may be used to adjust the Series’ sensitivity to interest rates or to hedge against changes in interest rates. Periodic payments on such contracts are accrued daily and recorded as unrealized appreciation/depreciation on swap contracts. Upon periodic payment/receipt or termination of the contract, such amounts are recorded as realized gains or losses on swap contracts. A Series’ maximum risk of loss from counterparty credit risk is the discounted net value of the cash flows to be received from/paid to the counterparty over the interest rate swap contract’s remaining life, to the extent that the amount is positive. This risk is mitigated by having a netting arrangement between the Series and the counterparty and by the posting of collateral by the counterparty to the Series to cover the Series’ exposure to the counterparty.
Index Swaps. Index swaps involve commitments to pay interest in exchange for a market linked return based on a notional amount. To the extent the total return of the security, instrument or basket of instruments underlying the transaction exceeds the offsetting interest obligation, the Series will receive a payment from the counterparty. To the extent the total return of the security, instrument or basket of instruments underlying the transaction falls short of the offsetting interest obligation, the Series will make a payment to the counterparty. The change in value of swap contracts outstanding, if any, is recorded as unrealized appreciation or depreciation daily. A realized gain or loss is recorded on maturity or termination of the swap contract. The Series’ maximum risk of loss from counterparty credit risk is the discounted net value of the cash flows to be received from/paid to the counterparty over the index swap contract’s remaining life, to the extent that the amount is positive. This risk is mitigated by having a netting arrangement between the Series and the counterparty and by the posting of collateral by the counterparty to the Series to cover the Series’ exposure to the counterparty.
Credit Default Swaps. A CDS contract is a risk-transfer instrument through which one party (purchaser of protection) transfers to another party (seller of protection) the financial risk of a credit event (as defined in the CDS agreement), as it relates to a particular reference security or basket of securities (such as an index). In exchange for the protection offered by the seller of protection, the purchaser of protection agrees to pay the seller of protection a periodic amount at a stated rate that is applied to the notional amount of the CDS contract. In addition, an upfront payment may be made or received by the Series in connection with an unwinding or assignment of a CDS contract. Upon the occurrence of a credit event, the seller of protection would pay the par (or other agreed-upon) value of the reference security (or basket of securities) to the counterparty. Credit events generally include, among others, bankruptcy, failure to pay, and obligation default.
During the year ended December 31, 2009, the Series entered into CDS contracts as a purchaser and seller of protection. Periodic payments (receipts) on such contracts are accrued daily and recorded as unrealized losses (gains) on swap contracts. Upon payment (receipt), such amounts are recorded as realized losses (gains) on swap contracts. Upfront payments made or received in connection with CDS contracts are amortized over the expected life of the CDS contracts as unrealized losses (gains) on swap contracts. The change in value of CDS contracts is recorded as unrealized appreciation or depreciation daily. A realized gain or loss is recorded upon a credit event (as defined in the CDS agreement) or the maturity or termination of the agreement. At December 31 2009, the aggregate unrealized depreciation of credit default swaps was $869. The Series has posted $110,000 as collateral for all open derivatives, which is presented as restricted cash on the Statement of Assets and Liabilities. If a credit event has occurred as of December 31, 2009, the swaps’ credit-risk-related contingent features would have been triggered and the Series would have been required to pay $1,890,000 less the value of the contracts’ related reference obligations.
As disclosed in the footnotes to the Statement of Net Assets, at December 31, 2009, the notional value of the protection sold was $3,200,000, which reflects the maximum potential amount the Series could be required to make as a seller of credit protection if a credit event occurs. The quoted market prices and resulting market values for credit default swap agreements on securities and credit indices serve as an indicator of the current status of the payment/performance risk and represent the likelihood of an expected liability (or profit) for the credit derivative if the swap agreement has been closed/sold as of the period end. Increasing market values, in absolute terms when compared to the notional amount of the swap, represent a deterioration of the reference entity’s credit soundness and a greater likelihood of risk of default or other credit event occurring as defined under the terms of the agreement. At December 31, 2009, the net unrealized appreciation of the protection sold was $54,508.
Credit default swaps may involve greater risks than if the Series had invested in the reference obligation directly. Credit default swaps are subject to general market risk, liquidity risk, counterparty risk and credit risk. The Series’ maximum risk of loss from counterparty credit risk, either as the seller of protection or the buyer of protection, is the fair value of the contract. This risk is mitigated by having a netting arrangement between the Series and the counterparty and by the posting of collateral by the counterparty to the Series to cover the Series’ exposure to the counterparty.
Swaps Generally. Because there is no organized market for swap contracts, the value of open swaps may differ from that which would be realized in the event the Series terminated its position in the agreement. Risks of entering into these contracts include the potential inability of the counterparty to meet the terms of the contracts. This type of risk is generally limited to the amount of favorable movement in the value of the underlying security, instrument or basket of instruments, if any, at the day of default. Risks also arise from potential losses from adverse market movements and such losses could exceed the unrealized amounts shown on the statements of net assets.
Limited-Term Diversified Income Series-24
Delaware VIP® Limited-Term Diversified Income Series
Notes to Financial Statements (continued)
8. Derivatives (continued)
Fair values of derivative instruments as of December 31, 2009 was as follows:
| | Asset Derivatives | | Liability Derivatives |
| | Statement of | | | | | | | Statement of | | | | |
| | Assets and Liabilities | | | | | | | Assets and Liabilities | | | | |
| | Location | | Fair Value | | Location | | Fair Value |
| Interest rate contracts (Futures) | | Receivables | | | $ | – | | | Payables/Net assets- | | $ | (90,061 | )* |
| | | | | | | | | unrealized depreciation | | | | |
| |
| Credit contracts (Swaps) | | Receivables | | | | 54,508 | | | Payables | | | (869 | ) |
| Total | | | | | $ | 54,508 | | | | | $ | (90,930 | ) |
____________________
*Includes cumulative depreciation of futures contracts as reported in the notes to the Statement of Net Assets. Only current days variation margin is reported with the Series’ assets and liabilities.
Statement of Operations
The effect of derivative instruments on the statement of operations for the year ended December 31, 2009 was as follows:
| | | | | | | | | Change in Unrealized |
| | Location of Gain or | | Realized Gain or | | Appreciation or Depreciation |
| | Loss on Derivatives Recognized | | Loss on Derivatives | | on Derivatives Recognized |
| | in Income | | Recognized in Income | | in Income |
| Interest rate contracts (Futures) | | Net realized gain on futures | | | | | | | | | | | |
| | contracts and net change in | | | | | | | | | | | |
| | unrealized appreciation/depreciation | | | | | | | | | | | |
| | of investments | | | $ | 163,759 | | | | $ | (134,343 | ) | |
| | |
| Credit contracts (Swaps) | | Net realized gain on swap contracts | | | | | | | | | | | |
| | and net change in unrealized | | | | | | | | | | | |
| | appreciation/depreciation of | | | | | | | | | | | |
| | investments | | | | 16,403 | | | | | 55,341 | | |
| Total | | | | | $ | 180,162 | | | | $ | (79,002 | ) | |
9. Securities Lending
The Series, along with other funds in the Delaware Investments® Family of Funds, may lend its securities pursuant to a security lending agreement (Lending Agreement) with BNY Mellon. With respect to each loan, if the aggregate market value of securities collateral held plus cash collateral received on any business day is less than the aggregate market value of the securities which are the subject of such loan, the borrower will be notified to provide additional collateral not less than the applicable collateral requirements. Cash collateral received is generally invested in the Mellon GSL DBT II Collateral Fund (Collective Trust) established by BNY Mellon for the purpose of investment on behalf of clients participating in its securities lending programs. The Collective Trust may invest in fixed income securities, with a weighted average maturity not to exceed 90 days, rated in one of the top three tiers by Standard & Poor’s Ratings Group (S&P) or Moody’s Investors Service, Inc. (Moody’s) or repurchase agreements collateralized by such securities. The Collective Trust seeks to maintain a net asset value per unit of $1.00, but there can be no assurance that it will always be able to do so. At December 31, 2009, the Collective Trust held only cash and assets with a maturity of one business day or less (Cash/Overnight Assets). The Series may incur investment losses as a result of investing securities lending collateral in the Collective Trust. This could occur if an investment in the Collective Trust defaulted or if it were necessary to liquidate assets in the Collective Trust to meet returns on outstanding security loans at a time when the Collective Trust’s net asset value per unit was less than $1.00. Under those circumstances, the Series may not receive an amount from the Collective Trust that is equal in amount to the collateral the Series would be required to return to the borrower of the securities and the Series would be required to make up for this shortfall. Effective April 20, 2009, BNY Mellon transferred the assets of the Collective Trust other than the Cash/Overnight Assets to the BNY Mellon SL DBT II Liquidating Fund (Liquidating Fund), effectively bifurcating the collateral investment pool. The Series’ exposure to the Liquidating Fund is expected to decrease as the Liquidating Fund’s assets mature or are sold. In October 2008, BNY Mellon transferred certain distressed securities from the Collective Trust into the Mellon GSL Reinvestment Trust II. The Series can also accept U.S. government securities and letters of credit (non-cash collateral) in connection with securities loans. In the event of default or bankruptcy by the lending agent, realization and/or retention of the collateral may be subject to legal proceedings. In the event the borrower fails to return loaned securities and the collateral received is insufficient to cover the value of the loaned securities and provided such collateral shortfall is not the result of investment losses, the lending agent has agreed to pay the amount of the shortfall to the Series, or at the discretion of the lending agent, replace the loaned securities. The Series continues to record dividends or interest, as applicable, on the securities loaned and is subject to change in value of the securities loaned that may occur during the term of the loan. The Series has the right under the Lending Agreement to recover the securities from the borrower
Limited-Term Diversified Income Series-25
Delaware VIP® Limited-Term Diversified Income Series
Notes to Financial Statements (continued)
9. Securities Lending (continued)
on demand. With respect to security loans collateralized by non-cash collateral, the Series receives loan premiums paid by the borrower. With respect to security loans collateralized by cash collateral, the earnings from the collateral investments are shared among the Series, the security lending agent and the borrower. The Series records security lending income net of allocations to the security lending agent and the borrower.
At December 31, 2009, the value of the securities on loan was $3,379,120, for which cash collateral was received and invested in accordance with the Lending Agreement. At December 31, 2009, the value of invested collateral was $3,373,595. Such investments are presented on the Statement of Net Assets under the caption “Securities Lending Collateral.”
10. Credit and Market Risk
The Series invests in fixed income securities whose value is derived from an underlying pool of mortgages or consumer loans. The value of these securities is sensitive to changes in economic conditions, including delinquencies and/or defaults, and may be adversely affected by shifts in the market’s perception of the issuers and changes in interest rates. Investors receive principal and interest payments as the underlying mortgages and consumer loans are paid back. Some of these securities are collateralized mortgage obligations (CMOs). CMOs are debt securities issued by U.S. government agencies or by financial institutions and other mortgage lenders, which are collateralized by a pool of mortgages held under an indenture. Prepayment of mortgages may shorten the stated maturity of the obligations and can result in a loss of premium, if any has been paid. Certain of these securities may be stripped (securities which provide only the principal or interest feature of the underlying security). The yield to maturity on an interest-only CMO is extremely sensitive not only to changes in prevailing interest rates, but also to the rate of principal payments (including prepayments) on the related underlying mortgage assets. A rapid rate of principal payments may have a material adverse affect on the Series’ yield to maturity. If the underlying mortgage assets experience greater than anticipated prepayments of principal, the Series may fail to recoup its initial investment in these securities even if the securities are rated in the highest rating categories.
The Series invests in high yield fixed income securities, which carry ratings of BB or lower by S&P and/or Ba or lower by Moody’s. Investments in these higher yielding securities are generally accompanied by a greater degree of credit risk than higher rated securities. Additionally, lower rated securities may be more susceptible to adverse economic and competitive industry conditions than investment grade securities.
The Series may invest up to 15% of its net assets in illiquid securities, which may include securities with contractual restrictions on resale, securities exempt from registration under Rule 144A of the Securities Act of 1933, as amended, and other securities which may not be readily marketable. The relative illiquidity of these securities may impair the Series from disposing of them in a timely manner and at a fair price when it is necessary or desirable to do so. While maintaining oversight, the Series’ Board has delegated to DMC the day-to-day functions of determining whether individual securities are liquid for purposes of the Series’ limitation on investments in illiquid assets. Securities eligible for resale pursuant to Rule 144A, which are determined to be liquid, are not subject to the Series’ 15% limit on investments in illiquid securities. Rule 144A and illiquid securities have been identified on the Statement of Net Assets.
11. Contractual Obligations
The Series enters into contracts in the normal course of business that contain a variety of indemnifications. The Series’ maximum exposure under these arrangements is unknown. However, the Series has not had prior claims or losses pursuant to these contracts. Management has reviewed the Series’ existing contracts and expects the risk of loss to be remote.
12. Sale of Delaware Investments to Macquarie Group
On August 18, 2009, Lincoln National Corporation (parent company of Delaware Investments) and Macquarie Group (Macquarie) entered into an agreement pursuant to which Delaware Investments, including DMC, DDLP and DSC, would be acquired by Macquarie, an Australia-based global provider of banking, financial, advisory, investment and funds management services (Transaction). The Transaction was completed on January 4, 2010. DMC, DDLP and DSC are now wholly-owned subsidiaries of Macquarie.
The Transaction resulted in a change of control of DMC which, in turn, caused the termination of the investment advisory agreement between DMC and the Series. On January 4, 2010, the new investment advisory agreement between DMC and the Series that was approved by the shareholders became effective.
13. Tax Information (Unaudited)
For the fiscal year ended December 31, 2009, the Series designates distributions paid during the year as follows:
| | (A) | | (B) | | | | |
| | Long-Term | | Ordinary | | | | |
| | Capital Gain | | Income | | Total | | (C) |
| | Distributions | | Distributions | | Distributions | | Qualifying |
| | (Tax Basis) | | (Tax Basis) | | (Tax Basis) | | Dividends1 |
| | – | | 100% | | 100% | | 1% |
____________________
(A) and (B) are based on a percentage of the Series’ total distributions.
(C) is based on a percentage of the Series’ ordinary income distributions.
1Qualifying dividends represent dividends which qualify for the corporate dividends received deduction.
Limited-Term Diversified Income Series-26
Delaware VIP® Trust — Delaware VIP Limited-Term Diversified Income Series
Report of Independent Registered Public Accounting Firm
To the Shareholders and Board of Trustees
Delaware VIP Trust–Delaware VIP Limited-Term Diversified Income Series
We have audited the accompanying statement of net assets and statement of assets and liabilities of the Delaware VIP Limited-Term Diversified Income Series (one of the series constituting Delaware VIP Trust) (the “Series”) as of December 31, 2009, and the related statement of operations for the year then ended, the statements of changes in net assets for each of the two years in the period then ended, and the financial highlights for each of the five years in the period then ended. These financial statements and financial highlights are the responsibility of the Series’ management. Our responsibility is to express an opinion on these financial statements and financial highlights based on our audits.
We conducted our audits in accordance with the standards of the Public Company Accounting Oversight Board (United States). Those standards require that we plan and perform the audit to obtain reasonable assurance about whether the financial statements and financial highlights are free of material misstatement. We were not engaged to perform an audit of the Series’ internal control over financial reporting. Our audits included consideration of internal control over financial reporting as a basis for designing audit procedures that are appropriate in the circumstances, but not for the purpose of expressing an opinion on the effectiveness of the Series’ internal control over financial reporting. Accordingly, we express no such opinion. An audit also includes examining, on a test basis, evidence supporting the amounts and disclosures in the financial statements and financial highlights, assessing the accounting principles used and significant estimates made by management, and evaluating the overall financial statement presentation. Our procedures included confirmation of securities owned as of December 31, 2009, by correspondence with the custodian and brokers or by other appropriate auditing procedures where replies from brokers were not received. We believe that our audits provide a reasonable basis for our opinion.
In our opinion, the financial statements and financial highlights referred to above present fairly, in all material respects, the financial position of the Delaware VIP Limited-Term Diversified Income Series of Delaware VIP Trust at December 31, 2009, the results of its operations for the year then ended, the changes in its net assets for each of the two years in the period then ended, and its financial highlights for each of the five years in the period then ended, in conformity with U.S. generally accepted accounting principles.
Philadelphia, Pennsylvania
February 17, 2010
The Series files its complete schedule of portfolio holdings with the Securities and Exchange Commission (Commission) for the first and third quarters of each fiscal year on Form N-Q. The Series’ Forms N-Q, as well as a description of the policies and procedures that the Series uses to determine how to vote proxies (if any) relating to portfolio securities is available without charge (i) upon request, by calling 800 523-1918; and (ii) on the Commission’s website at http://www.sec.gov. In addition, a description of the policies and procedures that the Series uses to determine how to vote proxies (if any) relating to portfolio securities is available without charge on the Delaware Investments® Funds’ Web site at http://www.delawareinvestments.com. The Series’ Forms N-Q may be reviewed and copied at the Commission’s Public Reference Room in Washington, DC; information on the operation of the Public Reference Room may be obtained by calling 800 SEC-0330.
Information (if any) regarding how the Series voted proxies relating to portfolio securities during the most recently disclosed 12-month period ended June 30 is available without charge (i) through the Delaware Investments Funds’ Web site at http://www.delawareinvestments.com; and (ii) on the Commission’s website at http://www.sec.gov. |
Limited-Term Diversified Income Series-27
Delaware VIP® Trust — Delaware VIP Limited-Term Diversified Income Series
Other Series Information
Board Consideration of New Investment Advisory Agreement
At a meeting held on September 3, 2009 (the “Meeting”), the Board of Trustees of the Delaware Investments Family of Funds (the “Board”), including the independent Trustees, unanimously approved a new investment advisory agreement between each registrant on behalf of each series (each, a “Fund” and together, the “Funds”) and Delaware Management Company (“DMC”) in connection with the sale of Delaware Investments’ advisory business to Macquarie Bank Limited (the “Macquarie Group”) (the “Transaction”). In making its decision, the Board considered information furnished specifically in connection with the approval of the new investment advisory agreements with DMC (the “New Investment Advisory Agreements”) which included extensive materials about the Transaction and matters related to the proposed approvals. To assist the Board in considering the New Investment Advisory Agreements, Macquarie Group provided materials and information about Macquarie Group, including detailed written responses to the questions posed by the independent Trustees. DMC also provided materials and information about the Transaction, including detailed written responses to the questions posed by the independent Trustees.
At the Meeting, the Trustees discussed the Transaction with DMC management and with key Macquarie Group representatives. The Meeting included discussions of the strategic rationale for the Transaction and Macquarie Group’s general plans and intentions regarding the Funds and DMC. The Board members also inquired about the plans for, and anticipated roles and responsibilities of, key employees and officers of Delaware Management Holdings Inc. and DMC in connection with the Transaction.
In connection with the Trustees’ review of the New Investment Advisory Agreements for the Funds, DMC and/or Macquarie Group emphasized that:
- They expected that there would be no adverse changes as a result of the Transaction, in the nature, quality, or extent of services currently provided to the Funds and their shareholders, including investment management, distribution, or other shareholder services.
- No material changes in personnel or operations were contemplated in the operation of DMC under Macquarie Group as a result of the Transaction and no material changes were currently contemplated in connection with third party service providers to the Funds.
- Macquarie Group had no intention to cause DMC to alter the voluntary expense waivers and reimbursements currently in effect for the Funds.
- Under the agreement between Macquarie Group and Lincoln National Corporation (“LNC”) (the “Transaction Agreement”), Macquarie Group has agreed to conduct, and to cause its affiliates to conduct, their respective businesses in compliance with the conditions of Section 15(f) of the Investment Company Act of 1940 (the “1940 Act”) with respect to the Funds, to the extent within its control, including maintaining Board composition of at least 75% of the Board members qualifying as independent Trustees and not imposing any “unfair burden” on the Funds for at least two years from the closing of the Transaction (the “Closing”).
In addition to the information provided by DMC and Macquarie Group as described above, the Trustees also considered all other factors they believed to be relevant to evaluating the New Investment Advisory Agreements, including the specific matters discussed below. In their deliberations, the Trustees did not identify any particular information that was controlling, and different Trustees may have attributed different weights to the various factors. However, for each Fund, the Trustees determined that the overall arrangements between the Fund and DMC, as provided in the respective New Investment Advisory Agreement, including the proposed advisory fee and the related administration arrangements between the Fund and DMC, were fair and reasonable in light of the services to be performed, expenses incurred, and such other matters as the Trustees considered relevant. Factors evaluated included:
- The potential for expanding distribution of Fund shares through access to Macquarie Group’s existing distribution channels;
- Delaware Investments’ acquisition of an exclusive wholesaling sales force from a subsidiary of LNC;
- The reputation, financial strength, and resources of Macquarie Group as well as its historic and ongoing commitment to the asset management business in Australia as well as other parts of the world;
- The terms and conditions of the New Investment Advisory Agreements, including that each Fund’s total contractual fee rate under the New Investment Advisory Agreement will remain the same;
- The Board’s full annual review (or initial approval) of the current investment advisory agreements at their in-person meeting in May 2009 as required by the 1940 Act and its determination that (i) DMC had the capabilities, resources, and personnel necessary to provide the satisfactory advisory and administrative services currently provided to each Fund and (ii) the advisory and/or management fees paid by each Fund, taking into account any applicable fee waivers and breakpoints, represented reasonable compensation to DMC in light of the services provided, the costs to DMC of providing those services, economies of scale, and the fees and other expenses paid by similar funds and such other matters that the Board considered relevant in the exercise of its reasonable judgment;
- The portfolio management teams for the Funds are not currently expected to change as a result of the Transaction;
- LNC and Macquarie Group were expected to execute a reimbursement agreement pursuant to which LNC and Macquarie Group would agree to pay (or reimburse) all reasonable out-of-pocket costs and expenses of the Funds in connection with the Board’s consideration of the Transaction, the New Investment Advisory Agreements and related agreements, and all costs related to the proxy solicitation (the “Expense Agreement”);
Limited-Term Diversified Income Series-28
Delaware VIP® Limited-Term Diversified Income Series
Other Series Information (continued)
- The likelihood that Macquarie Group would invest additional amounts in Delaware Investments, including DMC, which could result in increased assets under management, which in turn would allow some Funds the potential opportunity to achieve economies of scale and lower fees payable by Fund shareholders; and
- The compliance and regulatory history of Macquarie Group and its affiliates.
In making their decision relating to the approval of each Fund’s New Investment Advisory Agreement, the independent Trustees gave attention to all information furnished. The following discussion, however, identifies the primary factors taken into account by the Trustees and the conclusions reached in approving the New Investment Advisory Agreements.
NATURE, EXTENT, AND QUALITY OF SERVICE. The Trustees considered the services historically provided by DMC to the Funds and their shareholders. In reviewing the nature, extent, and quality of services, the Board considered that the New Investment Advisory Agreements would be substantially similar to the current investment advisory agreements between the Funds and DMC (the “Current Investment Advisory Agreements”), and they therefore, considered the many reports furnished to them throughout 2008 and 2009 at regular Board meetings covering matters such as: the relative performance of the Funds; the compliance of portfolio managers with the investment policies, strategies, and restrictions for the Funds; the compliance of management personnel with the code of ethics adopted throughout the Delaware Investments Family of Funds complex; and the adherence to fair value pricing procedures as established by the Board. The Trustees were pleased with the current staffing of DMC and the emphasis placed on research and risk management in the investment process. Favorable consideration was given to DMC’s efforts to maintain expenditures and, in some instances, increase financial and human resources committed to Fund matters.
The Board also considered the transfer agent and shareholder services that would continue to be provided to Fund shareholders by DMC’s affiliate, Delaware Service company, Inc. (“DSC”). The Trustees noted, in particular, DSC’s commitment to maintain a high level of service as well as DMC’s expenditures to improve the delivery of shareholder services. The Board was assured that shareholders would continue to receive the benefits provided to Fund shareholders by being part of the Delaware Investments Family of Funds, including each shareholder’s ability to exchange an investment in one Fund for the same class of shares in another Fund without a sales charge, to reinvest Fund dividends into additional shares of any of the Funds, and the privilege to combine holdings in other Funds to obtain a reduced sales charge.
Based on the information provided by DMC and Macquarie Group, including that Macquarie Group and DMC currently expected no material changes as a result of the Transaction in (i) personnel or operations of DMC or (ii) third party service providers to the Funds, the Board concluded that the satisfactory nature, extent, and quality of services currently provided to the Funds and their shareholders were very likely to continue under the New Investment Advisory Agreements. Moreover, the Board concluded that the Funds would probably benefit from the expanded distribution resources that would become available to Delaware Investments following the Transaction. The Board also concluded that it was very unlikely that any “unfair burden” would be imposed on any of the Funds for the first two years following the Closing as a result of the Transaction. Consequently, the Board concluded that it did not expect the Transaction to result in any adverse changes in the nature, quality, or extent of services (including investment management, distribution or other shareholder services) currently provided to the Funds and their shareholders.
INVESTMENT PERFORMANCE. The Board considered the overall investment performance of DMC and the Funds. The Trustees placed significant emphasis on the investment performance of the Funds in view of its importance to shareholders. Although the Trustees gave appropriate consideration to performance reports and discussions with portfolio managers at Board meetings throughout the year, the Trustees gave particular weight to their review of investment performance in connection with the approval of the Current Investment Advisory agreements at the Board meeting held in May 2009. At that meeting, the Trustees reviewed reports prepared by Lipper, Inc., an independent statistical compilation organization (“Lipper”), which showed each Fund’s investment performance as of December 31, 2008 in comparison to a group of funds selected by Lipper as being similar to the Fund (the “Performance Universe”). During the May 2009 agreement review process, the Trustees observed the significant improvements to relative investment performance of the Funds compared to the Funds’ performance as of December 31, 2007.
At their meeting on September 3, 2009, the Trustees, including the independent Trustees in consultation with their independent counsel, reviewed the investment performance of each Fund. The Trustees compared the performance of each Fund relative to that of its respective Performance Universe for the 1-, 3-, 5-, and 10-year periods ended June 30, 2009 and compared its relative investment performance against the corresponding relative investment performance of each Fund for such time periods ended December 31, 2008, to the extent applicable. As of June 30, 2009, 30 of the Funds had investment performance relative to that of the respective Performance Universe that was better than the corresponding relative investment performance at December 31, 2008 for all applicable time periods. At June 30, 2009, an additional 6 Funds had investment performance relative to that of their respective Performance Universe that was better than the corresponding relative investment performance at December 31, 2008 for a majority of the applicable time periods. At June 30, 2009, 15 additional Funds had investment performance relative to that of their respective Performance Universe that was better than the corresponding relative performance at December 31, 2008 and only 29 Funds had poorer relative investment performance at June 30, 2009 compared to that at December 31, 2008.
The Board therefore concluded that the investment performance of the Funds, on an aggregate basis, had continued to improve relative to their respective Performance Universe since the data reviewed at the May 2009 meeting. Based on information provided by DMC and Macquarie Group, the Board concluded that neither the Transaction nor the New Investment Advisory Agreement would likely have an adverse effect on the investment performance of any Fund because (i) DMC and Macquarie Group did not currently expect the Transaction to cause any material change to the Funds’ portfolio management teams responsible for investment performance, which the Board found to be satisfactory and improving; and (ii) as discussed in more detail below, the Funds’ expenses were not expected to increase as a result of the Transaction.
Limited-Term Diversified Income Series-29
Delaware VIP® Limited-Term Diversified Income Series
Other Series Information (continued)
COMPARATIVE EXPENSES. The Trustees also evaluated expense comparison data for the Funds previously provided in May 2009. At that meeting, DMC had provided the Board with information on pricing levels and fee structures for the Funds and comparative funds. The Trustees focused on the comparative analysis of the effective management fees and total expense ratios of each Fund versus the effective management fees and expense ratios of a group of funds selected by Lipper as being similar to each Fund (the “Expense Group”). In reviewing comparative costs, each Fund’s contractual management fee and the actual management fee incurred by the Fund were compared with the contractual management fees (assuming all funds in the Expense Group were similar in size to the Fund) and actual management fees (as reported by each fund) of other funds within the Expense Group, taking into account any applicable breakpoints and fee limitations. Each Fund’s total expenses were also compared with those of its Expense Group. The Trustees also considered fees paid to Delaware Investments for nonmanagement services. At the September 3, 2009 meeting, DMC advised the Board that the more recent comparative expenses for the Funds remained consistent with the previous review in May 2009 and, consequently, the Trustees concluded that expenses of the Funds were satisfactory.
The Board also considered the Expense Agreement under negotiation in evaluating Fund expenses. The Trustees expected that the Expense Agreement would provide that LNC and Macquarie Group would pay or reimburse the Trusts for all reasonable out-of-pocket costs and expenses in connection with the Transaction and the consideration of the New Investment Advisory Agreements (subject to certain limited exceptions).
Based on information provided by DMC and Macquarie Group, the Board concluded that neither the Transaction nor the New Investment Advisory Agreements likely would have an adverse effect on the Funds’ expenses because (i) each Fund’s contractual fee rates under the New Investment Advisory Agreement would remain the same; (ii) under the Expense Agreement, the Funds would be reimbursed for all reasonable out-of-pocket costs and expenses in connection with the Transaction and the related proxy solicitation (subject to certain limited exceptions); and (iii) the expense ratios of certain Funds might decline as a result of the possible increased investment in Delaware Investments by Macquarie Group, as discussed below under “Economies of Scale.”
MANAGEMENT PROFITABILITY. At their meeting on September 3, 2009, the Board evaluated DMC’s profitability in connection with the operation of the Funds. The Board had previously considered DMC’s profitability in connection with the operation of the Funds at its May 2009 meeting. At that meeting, the Board reviewed an analysis that addressed the overall profitability of Delaware Investments’ business in providing management and other services to each of the Funds and the Delaware Investments Family of Funds as a whole. Specific attention was given to the methodology followed in allocating costs for the purpose of determining profitability.
At the May 2009 meeting, representatives of DMC had stated that the level of profits of DMC, to a certain extent, reflect operational cost savings and efficiencies initiated by Delaware Investments (including DMC and its affiliates that provide services to the Funds). The Board considered Delaware Investments’ efforts to improve services provided to Fund shareholders and to meet additional regulatory and compliance requirements resulting from recent industry-wide U.S. Securities and Exchange Commission initiatives. At that meeting, the Board found that the management fees were reasonable in light of the services rendered and the level of profitability of DMC. At the September 3, 2009 meeting, DMC advised the Board that DMC did not expect the Transaction to affect materially the profitability of Delaware Investments compared to the level of profitability considered during the May 2009 review. Moreover, the Trustees reviewed pro forma balance sheets of certain key companies in Delaware Investments as of June 30, 2009 (which were provided by Macquarie Group and DMC in response to the Trustees’ requests) and evaluated the projections of Delaware Investments’ capitalization following the Transaction for purposes of evaluating the financial ability of Delaware Investments to continue to provide the nature, extent, and quality of services as it had under the Current Investment Advisory Agreement.
Based on information provided by DMC and Macquarie Group, the Board concluded that DMC and Delaware Investments would be sufficiently capitalized following the Transaction to continue the same level and quality of services to the Funds under the New Investment Advisory Agreements as was the case under the Current Investment Advisory Agreements. The Board also concluded that Macquarie Group had sufficient financial strength and resources, as well as an ongoing commitment to a global asset management business, to continue investing in Delaware Investments, including DMC, to the extent that Macquarie Group determined it was appropriate. Finally, because services and costs were expected to be substantially the same (and DMC had represented that, correspondingly, profitability would be about the same), under the New Investment Advisory Agreements as under the Current Investment Advisory Agreements, the Trustees concluded that the profitability of Delaware Investments would not result in an inequitable charge on the Funds or their shareholders. Accordingly, the Board concluded that the fees charged under the New Investment Advisory Agreements would be reasonable in light of the services to be provided and the expected profitability of DMC.
ECONOMIES OF SCALE. The Trustees considered whether economies of scale would be realized by Delaware Investments as each Fund’s assets increase and the extent to which any economies of scale would be reflected in the management fees charged. The Trustees took into account DMC’s practice of maintaining the competitive nature of management fees based on its analysis of fees charged by comparable funds. DMC management believed, and the Board agreed, that the Funds were priced with breakpoints and relatively low management fees to reflect potential economies of scale to Fund shareholders.
The Board also acknowledged Macquarie Group’s statement that the Transaction would not by itself immediately provide additional economies of scale given Macquarie Group’s limited presence in the U.S. mutual fund market. Nonetheless, the Trustees concluded that additional economies of scale could potentially be achieved in the future if DMC were owned by Macquarie Group as a result of Macquarie Group’s willingness to invest further in Delaware Investments if appropriate opportunities arise. The Board further concluded that potential economies of scale could be achieved as a result of Delaware Investments’ expanded distribution capabilities arising from the Transaction, as well as opportunities that might arise from Macquarie Group’s global asset management business.
Limited-Term Diversified Income Series-30
Delaware VIP® Limited-Term Diversified Income Series
Other Series Information (continued)
FALL-OUT BENEFITS. The Board acknowledged that DMC would continue to benefit from soft dollar arrangements using portfolio brokerage of each Fund that invests in equity securities and that DMC’s profitability would likely be somewhat lower without the benefit of practices with respect to allocating Fund portfolio brokerage for brokerage and research services. The Board also considered that Macquarie Group and Delaware Investments may derive reputational, strategic, and other benefits from their association with the Delaware Investments Family of Funds, including service relationships with DMC, DSC, and Delaware Distributors, L.P., and evaluated the extent to which Delaware Investments might derive ancillary benefits from Fund operations, including the potential for procuring additional business as a result of the prestige and visibility associated with its role as service provider to the Delaware Investments Family of Funds and the benefits from allocation of Fund brokerage to improve trading efficiencies. However, the Board concluded that (i) any such benefits under the New Investment Advisory Agreements would not be dissimilar from those existing under the Current Investment Advisory Agreements, (ii) such benefits did not impose a cost or burden on the Funds or their shareholders, and (iii) such benefits would probably have an indirectly beneficial effect on the Funds and their shareholders because of the added importance that DMC and Macquarie Group might attach to the Funds as a result of the fall-out benefits that the Funds conveyed.
BOARD REVIEW OF MACQUARIE GROUP. The Trustees reviewed detailed information supplied by Macquarie Group about its operations as well as other information regarding Macquarie Group provided by independent legal counsel to the independent Trustees. Based on this review, the Trustees concluded that Delaware Investments would continue to have the financial ability to maintain the high quality of services required by the Funds. The Trustees noted that there would be a limited transition period during which some services previously provided by LNC to Delaware Investments would continue to be provided by LNC after the Closing, and concluded that this arrangement would help minimize disruption in Delaware Investments’ provision of services to the Funds following the Transaction.
The Board considered Macquarie Group’s support for Delaware Investments’ plans for Fund distribution by transferring wholesalers from Lincoln Financial Distributors, Inc., LNC’s retail distributor, to Delaware Investments, and Macquarie Group’s current intention to leave the Funds’ other service providers in place. The Board also considered Macquarie Group’s current strategic plans to increase its asset management activities, one of its core businesses, particularly in North America, and its statement that its acquisition of DMC is an important component of this strategic growth and the establishment of a significant presence in the United States. Based in part on the information provided by DMC and Macquarie Group, the Board concluded that Macquarie Group’s acquisition of Delaware Investments could potentially enhance the nature, quality, and extent of services provided to the Funds and their shareholders.
CONCLUSION. The Board concluded that the advisory fee rate under each New Investment Advisory Agreement was reasonable in relation to the services provided and that execution of the New Investment Advisory Agreement would be in the best interests of the shareholders. For each Fund, the Trustees noted that they had concluded in their most recent advisory agreement continuance considerations in May 2009 that the management fees and total expense ratios were at acceptable levels in light of the quality of services provided to the Funds and in comparison to those of the Funds’ respective peer groups; that the advisory fee schedule would not be increased and would stay the same for all of the Funds; that the total expense ratio had not changed materially since that determination; and that DMC had represented that the overall expenses for each Fund were not expected to be adversely affected by the Transaction. The Trustees also noted, with respect to the Funds that currently had the benefit of voluntary fee limitations, that Macquarie Group had no present intention to cause DMC to alter any voluntary expense limitations or reimbursements currently in effect. On that basis, the Trustees concluded that the total expense ratios and proposed advisory fees for the Funds anticipated to result from the Transaction were acceptable. In approving each New Investment Advisory Agreement, the Board stated that it anticipated reviewing the continuance of the New Investment Advisory Agreement in advance of the expiration of the initial two-year period.
Limited-Term Diversified Income Series-31
Delaware Investments® Family of Funds
BOARD OF TRUSTEES/DIRECTORS AND OFFICERS ADDENDUM
A mutual fund is governed by a Board of Trustees/Directors (“Trustees”), which has oversight responsibility for the management of a fund’s business affairs. Trustees establish procedures and oversee and review the performance of the investment manager, the distributor, and others who perform services for the fund. The independent fund trustees, in particular, are advocates for shareholder interests. Each trustee has served in that capacity since he or she was elected to or appointed to the Board of Trustees, and will continue to serve until his or her retirement or the election of a new trustee in his or her place. The following is a list of the Trustees and Officers with certain background and related information.
| | | | Number of | Other |
| | | Principal | Portfolios in Fund | Directorships |
| Name, | Position(s) | | Occupation(s) | Complex Overseen | Held by |
| Address, | Held with | Length of Time | During | by Trustee | Trustee |
| and Birth Date | Fund(s) | Served | Past 5 Years | or Officer | or Officer |
| INTERESTED TRUSTEES | | | | |
| Patrick P. Coyne1 | Chairman, | Chairman and Trustee | Patrick P. Coyne has served in | 81 | Director — |
| 2005 Market Street | President, | since August 16, 2006 | various executive capacities | | Kaydon Corp. |
| Philadelphia, PA | Chief Executive | | at different times at | | |
| 19103 | Officer, and | President and | Delaware Investments.2 | | |
| Trustee | Chief Executive Officer | | | |
| April 1963 | | since August 1, 2006 | | | |
| |
| INDEPENDENT TRUSTEES | | | | |
| Thomas L. Bennett | Trustee | Since | Private Investor — | 81 | Director — |
| 2005 Market Street | | March 2005 | (March 2004–Present) | | Bryn Mawr |
| Philadelphia, PA | | | | | Bank Corp. (BMTC) |
| 19103 | | | Investment Manager — | | (April 2007–Present) |
| | | | Morgan Stanley & Co. | | |
| October 1947 | | | (January 1984–March 2004) | | |
| John A. Fry | Trustee | Since | President — | 81 | Director — |
| 2005 Market Street | | January 2001 | Franklin & Marshall College | | Community Health |
| Philadelphia, PA | | | (June 2002–Present) | | Systems |
| 19103 | | | | | |
| | | | Executive Vice President — | | |
| May 1960 | | | University of Pennsylvania | | |
| | | (April 1995–June 2002) | | |
| Anthony D. Knerr | Trustee | Since | Founder and Managing Director — | 81 | None |
| 2005 Market Street | | April 1990 | Anthony Knerr & Associates | | |
| Philadelphia, PA | | | (Strategic Consulting) | | |
| 19103 | | | (1990–Present) | | |
| |
| December 1938 | | | | | |
| Lucinda S. Landreth | Trustee | Since | Chief Investment Officer — | 81 | None |
| 2005 Market Street | | March 2005 | Assurant, Inc. | | |
| Philadelphia, PA | | | (Insurance) | | |
| 19103 | | | (2002–2004) | | |
| |
| June 1947 | | | | | |
| Ann R. Leven | Trustee | Since | Consultant — | 81 | None |
| 2005 Market Street | | October 1989 | ARL Associates | | |
| Philadelphia, PA | | | (Financial Planning) | | |
| 19103 | | | (1983–Present) | | |
| |
| November 1940 | | | | | |
Limited-Term Diversified Income Series-32
| | | | Number of | Other |
| | | Principal | Portfolios in Fund | Directorships |
| Name, | Position(s) | | Occupation(s) | Complex Overseen | Held by |
| Address, | Held with | Length of Time | During | by Trustee | Trustee |
| and Birth Date | Fund(s) | Served | Past 5 Years | or Officer | or Officer |
| INDEPENDENT TRUSTEES (CONTINUED) |
| Thomas F. Madison | Trustee | Since | President and Chief | 81 | Director and Chair of |
| 2005 Market Street | | May 19973 | Executive Officer — | | Compensation |
| Philadelphia, PA | | | MLM Partners, Inc. | | Committee, |
| 19103 | | | (Small Business Investing | | Governance Committee |
| | | and Consulting) | | Member |
| February 1936 | | | (January 1993–Present) | | — CenterPoint Energy |
| |
| | | | | Lead Director and Chair |
| | | | | of Audit |
| | | | | and Governance |
| | | | | Committees, |
| | | | | Member of |
| | | | | Compensation |
| | | | | Committee — Digital |
| | | | | River, Inc. |
| |
| | | | | Director and Chair of |
| | | | | Governance |
| | | | | Committee, Audit |
| | | | | Committee Member — |
| | | | | Rimage Corporation |
| |
| | | | | Director and Chair of |
| | | | | Compensation |
| | | | | Committee — Spanlink |
| | | | | Communications |
| |
| | | | | Lead Director and Chair |
| | | | | of Compensation and |
| | | | | Governance |
| | | | | Committees — |
| | | | | Valmont Industries, Inc. |
| Janet L. Yeomans | Trustee | Since | Vice President and Treasurer | 81 | None |
| 2005 Market Street | | April 1999 | (January 2006–Present) | | |
| Philadelphia, PA | | | Vice President — Mergers & Acquisitions | | |
| 19103 | | | (January 2003–January 2006), and | | |
| | | Vice President | | |
| July 1948 | | | (July 1995–January 2003) | | |
| | | 3M Corporation | | |
| J. Richard Zecher | Trustee | Since | Founder — | 81 | Director and Audit |
| 2005 Market Street | | March 2005 | Investor Analytics | | Committee Member — |
| Philadelphia, PA | | | (Risk Management) | | Investor Analytics |
| 19103 | | | (May 1999–Present) | | |
| |
| July 1940 | | | Founder — | | |
| | | Sutton Asset Management | | |
| | | (Hedge Fund) | | |
| | | | (September 1996–Present) | | |
Limited-Term Diversified Income Series-33
| | | | Number of | Other |
| | | Principal | Portfolios in Fund | Directorships |
| Name, | Position(s) | | Occupation(s) | Complex Overseen | Held by |
| Address, | Held with | Length of Time | During | by Trustee | Trustee |
| and Birth Date | Fund(s) | Served | Past 5 Years | or Officer | or Officer |
| OFFICERS |
| David F. Connor | Vice President, | Vice President since | David F. Connor has served as | 81 | None4 |
| 2005 Market Street | Deputy General | September 2000 | Vice President and Deputy | | |
| Philadelphia, PA | Counsel, and Secretary | and Secretary | General Counsel of | | |
| 19103 | | since | Delaware Investments | | |
| | October 2005 | since 2000. | | |
| December 1963 | | | | | |
| Daniel V. Geatens | Vice President | Treasurer | Daniel V. Geatens has served | 81 | None4 |
| 2005 Market Street | and Treasurer | since | in various capacities at | | |
| Philadelphia, PA | | October 25, 2007 | different times at | | |
| 19103 | | | Delaware Investments. | | |
|
| October 1972 | | | | | |
| David P. O’Connor | Senior Vice | Senior Vice President, | David P. O’Connor has served in | 81 | None4 |
| 2005 Market Street | President, | General Counsel, and | various executive and legal | | |
| Philadelphia, PA | General Counsel, | Chief Legal Officer | capacities at different times | | |
| 19103 | and Chief | since | at Delaware Investments. | | |
| Legal Officer | October 2005 | | | |
| February 1966 | | | | | |
| Richard Salus | Senior | Chief Financial | Richard Salus has served in | 81 | None4 |
| 2005 Market Street | Vice President | Officer since | various executive capacities | | |
| Philadelphia, PA | and | November 2006 | at different times at | | |
| 19103 | Chief Financial | | Delaware Investments. | | |
| Officer | | | | |
| October 1963 | | | | | |
1 Patrick P. Coyne is considered to be an “Interested Trustee” because he is an executive officer of the Fund’s(s’) investment advisor. |
2 Delaware Investments is the marketing name for Delaware Management Holdings, Inc. and its subsidiaries, including the Fund’s(s’) investment advisor, principal underwriter, and its transfer agent. |
3 In 1997, several funds managed by Voyageur Fund Managers, Inc. (the “Voyageur Funds”) were incorporated into the Delaware Investments Family of Funds. Mr. Madison served as a director of the Voyageur Funds from 1993 until 1997. |
4 David F. Connor, Daniel V. Geatens, David P. O’Connor, and Richard Salus serve in similar capacities for the six portfolios of the Optimum Fund Trust, which have the same investment advisor, principal underwriter, and transfer agent as the registrant. |
The Statement of Additional Information for the Fund(s) includes additional information about the Trustees and Officers and is available, without charge, upon request by calling 800 523-1918.
| PO14857 AR-VIPLTD [12/09] DG3 2/10 (5427) | Limited-Term Diversified Income Series-34 |
| Delaware VIP® Trust |
| Delaware VIP REIT Series |
| |
| |
| |
| |
| |
| |
| Annual Report |
| |
| |
| December 31, 2009 |
| |
| |
| |
| |
| |
| |
| |
| |
| |
| |
| |
| |
| |
| |
| |
|
Table of contents
| > Portfolio management review | 1 |
| | |
| > Performance summary | 1 |
| | |
| > Disclosure of Series expenses | 3 |
| | |
| > Sector allocation and top 10 holdings | 4 |
| | |
| > Statement of net assets | 5 |
| | |
| > Statement of operations | 7 |
| | |
| > Statements of changes in net assets | 7 |
| | |
| > Financial highlights | 8 |
| | |
| > Notes to financial statements | 10 |
| | |
| > Report of independent registered public accounting firm | 15 |
| | |
| > Other Series information | 16 |
| | |
| > Board of trustees/directors and officers addendum | 20 |
On January 4, 2010, Delaware Management Holdings, Inc., and its subsidiaries (collectively known by the marketing name of Delaware Investments) were sold by a subsidiary of Lincoln National Corporation to Macquarie Group Limited, a global provider of banking, financial, advisory, investment and funds management services. Please see your Series’ prospectus and any supplements thereto for more complete information.
Investments in Delaware VIP® REIT Series are not and will not be deposits with or liabilities of Macquarie Bank Limited ABN 46 008 583 542 and its holding companies, including subsidiaries or related companies, and are subject to investment risk, including possible delays in repayment and loss of income and capital invested. No Macquarie Group company guarantees or will guarantee the performance of the Series, the repayment of capital from the Series, or any particular rate of return.
Unless otherwise noted, views expressed herein are current as of Dec. 31, 2009, and are subject to change.
Funds are not FDIC insured and are not guaranteed. It is possible to lose the principal amount invested.
Mutual fund advisory services provided by Delaware Management Company, a series of Delaware Management Business Trust, which is a registered investment advisor. Delaware Investments is the marketing name of Delaware Management Holdings, Inc. and its subsidiaries. Macquarie Group refers to Macquarie Group Limited and its subsidiaries and affiliates worldwide.
© 2010 Delaware Management Holdings, Inc.
All third-party trademarks cited are the property of their respective owners.
| Delaware VIP® Trust — Delaware VIP REIT Series | |
| Portfolio management review | Jan. 12, 2010 |
For its fiscal year ended Dec. 31, 2009, Delaware VIP REIT Series Standard Class shares returned +23.31% and Service Class shares returned +23.24% (both figures include reinvestment of dividends). By comparison, the Series’ benchmark, the FTSE NAREIT Equity REITs Index, advanced by 27.99% during the same period.
Investors in U.S. real estate securities saw tremendous market volatility during the past year. As measured by the FTSE NAREIT Equity REITs Index, real estate investment trusts (REITs) were down sharply for much of the first two months of 2009. Beginning in March, however, REIT investors seemed increasingly comfortable owning companies with higher debt levels and weaker balance sheets. In this environment, the real estate securities market turned in much-improved performance for the remainder of the period. In fact, as investors’ pessimism turned to optimism, many of the same REITs that had fared the worst during the downturn ended up doing best when markets turned positive. (Source: Bloomberg.)
As we do across all types of market conditions, we continued employing our “bottom up” security selection strategy, in which we evaluate potential investments based on our assessment of each company’s growth prospects, relative valuation, and balance-sheet quality (among other factors). Given the volatile conditions of the past year, however, our approach was more opportunistic than usual, as we sought to take advantage of shifting conditions in the marketplace.
Within the Series, our holdings in the lodging sector contributed negatively to performance when measured against the index. The lodging group had been one of the real estate market’s worst performers during the downturn, but it bounced back strongly during the rebound. For much of the period, we were underweight versus the benchmark index in this sector — this intentional lack of exposure in the sector hampered results relative to the index.
A second source of relative underperformance came within the industrials sector, where our group of stocks posted a collective decline of more than 1% for the period. The sector advanced by more than 5% within the benchmark index.
The Series also lost ground against the benchmark within industry groups that included healthcare, regional malls, and specialty REITs.
On the positive side, the Series’ investments in the so-called mixed sector — which consists of companies that own multiple property types or that focus on niches within the real estate market — contributed to performance measured relative to the benchmark index. In the manufactured homes sector, a position in Equity Lifestyle Properties performed well. The Series’ position within diversified REITs also contributed positively to relative performance, with a notable contribution from our lone holding, Vornado Realty Trust.
| Unless otherwise noted, the views expressed are current as of Dec. 31, 2009, and are subject to change. |
Performance summary
The performance data quoted below represent past performance; past performance does not guarantee future results. Investment return and principal value will fluctuate so your shares, when redeemed, may be worth more or less than their original cost. Please obtain the performance data for the most recent month end by calling the number noted in the introductory section of this report on the page related to this Series.
You should consider the investment objectives, risks, charges, and expenses of the Series carefully before investing. The Delaware VIP REIT Series prospectus contains this and other important information about the Series. To obtain a prospectus, contact the company noted on the page related to this Series in the introductory section of this report, either by phone or through the company Web site. We advise you to read the prospectus carefully before you invest or send money.
| Delaware VIP REIT Series | | | | | | | | | | | | | |
| Average annual total returns | | | | | | | | | | | | | |
| For periods ended Dec. 31, 2009 | 1 year | | 3 years | | 5 years | | 10 years | | Lifetime |
Standard Class shares (commenced
operations on May 4, 1998) | +23.31% | | -11.67% | | -0.41% | | +9.92 | | +7.33% |
Service Class shares (commenced operations on May 1, 2000) | +23.24% | | -11.87% | | -0.65% | | n/a | | +9.05% |
Returns reflect the reinvestment of all distributions.
As described in the Series’ most recent prospectus, the net expense ratio for Service Class shares of the Series was 1.12%, while total operating expenses for Standard Class and Service Class shares were 0.87% and 1.17%, respectively. The management fee for Standard Class and Service Class shares was 0.75%.
The Series’ distributor has contracted to limit the 12b-1 fees for Service Class shares to no more than 0.25% of average daily net assets through April 30, 2010.
REIT Series-1
Delaware VIP® REIT Series (continued)
Earnings from a variable annuity or variable life investment compound tax-free until withdrawal, and as a result, no adjustments were made for income taxes.
Expense limitations were in effect for both classes during certain periods shown in the Series performance chart on the previous page and in the Performance of a $10,000 Investment chart below.
Performance data do not reflect insurance fees related to a variable annuity or variable life investment or the deferred sales charge that would apply to certain withdrawals of investments. Performance shown here would have been reduced if such fees were included or the expense limitation removed. For more information about fees, consult your variable annuity or variable life prospectus.
Investments in variable products involve risk. REIT investments are subject to many of the risks associated with direct real estate ownership, including changes in economic conditions, credit risk, and interest rate fluctuations.
Because the Series expects to hold a concentrated portfolio of a limited number of securities, the Series’ risk is increased because each investment has a greater effect on the Series’ overall performance.
The Series may experience portfolio turnover in excess of 100%, which could result in higher transaction costs and tax liability.
The Series is also affected by interest rate changes, particularly if the REITs held in the portfolio use floating rate debt to finance their ongoing obligations. Some portfolios offer more risk than others.
Instances of high double-digit returns are unusual, cannot be sustained, and were primarily achieved during favorable market conditions.
Please read both the contract and underlying prospectus for specific details regarding the product’s risk profile.
The chart shows a $10,000 investment in the Delaware VIP REIT Series Standard Class shares for the period from Dec. 31, 1999, through Dec. 31, 2009.
The chart also shows $10,000 invested in the FTSE NAREIT Equity REITs Index for the period from Dec. 31, 1999, through Dec. 31, 2009. The FTSE NAREIT Equity REITs Index measures the performance of all publicly traded equity real estate investment trusts traded on U.S. exchanges.
Index performance returns do not reflect any management fees, transaction costs or expenses. Indices are unmanaged and one cannot invest directly in an index.
Performance of Service Class shares will vary due to different charges and expenses.
Past performance is not a guarantee of future results.
REIT Series-2
Delaware VIP® Trust — Delaware VIP REIT Series
Disclosure of Series Expenses
For the Period July 1, 2009 to December 31, 2009
As a shareholder of the Series, you incur ongoing costs, including management fees; distribution and/or service (12b-1) fees; and other Series expenses. This Example is intended to help you understand your ongoing costs (in dollars) of investing in the Series and to compare these costs with the ongoing costs of investing in other mutual funds.
The Example is based on an investment of $1,000 invested at the beginning of the period and held for the entire period from July 1, 2009 to December 31, 2009.
Actual Expenses
The first section of the table shown, “Actual Series Return,” provides information about actual account values and actual expenses. You may use the information in this section of the table, together with the amount you invested, to estimate the expenses that you paid over the period. Simply divide your account value by $1,000 (for example, an $8,600 account value divided by $1,000 = 8.6), then multiply the result by the number in the first section under the heading entitled “Expenses Paid During Period” to estimate the expenses you paid on your account during the period.
Hypothetical Example for Comparison Purposes
The second section of the table shown, “Hypothetical 5% Return,” provides information about hypothetical account values and hypothetical expenses based on the Series’ actual expense ratio and an assumed rate of return of 5% per year before expenses, which is not the Series’ actual return. The hypothetical account values and expenses may not be used to estimate the actual ending account balance or expenses you paid for the period. You may use this information to compare the ongoing costs of investing in the Series and other funds. To do so, compare the 5% hypothetical example with the 5% hypothetical examples that appear in the shareholder reports of other funds.
Please note that the expenses shown in the table are meant to highlight your ongoing costs only. As a shareholder of the Series, you do not incur any transaction costs, such as sales charges (loads), redemption fees or exchange fees, but shareholders of other funds may incur such costs. Also, the fees related to the variable annuity investment or the deferred sales charge that could apply have not been included. Therefore, the second section of the table is useful in comparing ongoing costs only, and will not help you determine the relative total costs of owning different funds. The Series’ actual expenses shown in the table reflect fee waivers in effect. The expenses shown in the table assume reinvestment of all dividends and distributions.
Expense Analysis of an Investment of $1,000
| | | | | | | Expenses |
| Beginning | | Ending | | | | Paid During |
| Account | | Account | | Annualized | | Period |
| Value | | Value | | Expense | | 7/1/09 to |
| 7/1/09 | | 12/31/09 | | Ratios | | 12/31/09* |
| Actual Series Return | | | | | | | | | | | | | |
| Standard Class | | $ | 1,000.00 | | | | $ | 1,414.20 | | | 0.86% | | $5.23 |
| Service Class | | | 1,000.00 | | | | | 1,413.50 | | | 1.11% | | 6.75 |
| Hypothetical 5% Return (5% return before expenses) |
| Standard Class | | $ | 1,000.00 | | | | $ | 1,020.87 | | | 0.86% | | $4.38 |
| Service Class | | | 1,000.00 | | | | | 1,019.61 | | | 1.11% | | 5.65 |
*“Expenses Paid During Period” are equal to the Series’ annualized expense ratio, multiplied by the average account value over the period, multiplied by 184/365 (to reflect the one-half year period).
REIT Series-3
Delaware VIP® Trust — Delaware VIP REIT Series
Sector Allocation and Top 10 Holdings
As of December 31, 2009
Sector designations may be different than the sector designations presented in other Series materials. The sector designations may represent the investment manager’s internal sector classifications, which may result in the sector designations for one series being different than another series’ sector designations.
| Percentage |
| Sector | of Net Assets |
| Common Stock | 97.68 | % |
| Diversified REITs | 4.91 | % |
| Health Care REITs | 13.68 | % |
| Hotel REITs | 3.84 | % |
| Industrial REITs | 3.99 | % |
| Mall REITs | 13.46 | % |
| Manufactured Housing REITs | 1.55 | % |
| Multifamily REITs | 15.18 | % |
| Office REITs | 15.15 | % |
| Office/Industrial REITs | 5.81 | % |
| Real Estate Operating Companies | 1.32 | % |
| Self-Storage REITs | 4.92 | % |
| Shopping Center REITs | 8.64 | % |
| Single Tenant REITs | 1.19 | % |
| Specialty REITs | 4.04 | % |
| Discount Note | 0.15 | % |
| Securities Lending Collateral | 24.36 | % |
| Total Value of Securities | 122.19 | % |
| Obligation to Return Securities Lending Collateral | (24.89 | %) |
| Receivables and Other Assets Net of Liabilities | 2.70 | % |
| Total Net Assets | 100.00 | % |
Holdings are for informational purposes only and are subject to change at any time. They are not a recommendation to buy, sell, or hold any security.
| Percentage |
| Top 10 Holdings | of Net Assets |
| Simon Property Group | 11.11 | % |
| Equity Residential | 5.24 | % |
| Vornado Realty Trust | 4.91 | % |
| Public Storage | 4.82 | % |
| Boston Properties | 4.76 | % |
| Host Hotels & Resorts | 3.85 | % |
| HCP | 3.44 | % |
| Health Care REIT | 3.07 | % |
| Ventas | 2.79 | % |
| Macerich | 2.35 | % |
REIT Series-4
Delaware VIP® Trust — Delaware VIP REIT Series
Statement of Net Assets
December 31, 2009
| Number of | | | |
| Shares | | Value |
| COMMON STOCK–97.68% | | | | | |
| Diversified REITs–4.91% | | | | | |
| *Vornado Realty Trust | | 192,183 | | $ | 13,441,282 |
| | | | | 13,441,282 |
| Health Care REITs–13.68% | | | | | |
| *HCP | | 308,050 | | | 9,407,846 |
| *Health Care REIT | | 189,425 | | | 8,395,316 |
| *Healthcare Realty Trust | | 160,200 | | | 3,437,892 |
| LTC Properties | | 82,025 | | | 2,194,169 |
| *Nationwide Health Properties | | 181,125 | | | 6,371,978 |
| *Ventas | | 174,400 | | | 7,628,256 |
| | | | | 37,435,457 |
| Hotel REITs–3.84% | | | | | |
| *Host Hotels & Resorts | | 901,849 | | | 10,524,577 |
| | | | | 10,524,577 |
| Industrial REITs–3.99% | | | | | |
| AMB Property | | 176,030 | | | 4,497,567 |
| ProLogis | | 469,626 | | | 6,429,179 |
| | | | | 10,926,746 |
| Mall REITs–13.46% | | | | | |
| *Macerich | | 179,046 | | | 6,436,712 |
| *Simon Property Group | | 380,880 | | | 30,394,205 |
| | | | | 36,830,917 |
| Manufactured Housing REITs–1.55% | | | | | |
| Equity Lifestyle Properties | | 84,059 | | | 4,242,458 |
| | | | | 4,242,458 |
| Multifamily REITs–15.18% | | | | | |
| Apartment Investment & Management | | 336,298 | | | 5,353,864 |
| *AvalonBay Communities | | 69,340 | | | 5,693,507 |
| *Camden Property Trust | | 112,975 | | | 4,786,751 |
| *Equity Residential | | 424,850 | | | 14,351,434 |
| *Essex Property Trust | | 51,466 | | | 4,305,131 |
| *Mid-America Apartment Communities | | 57,125 | | | 2,757,995 |
| UDR | | 260,931 | | | 4,289,706 |
| | | | | 41,538,388 |
| Office REITs–15.15% | | | | | |
| *Alexandria Real Estate Equities | | 90,625 | | | 5,826,281 |
| *BioMed Realty Trust | | 157,775 | | | 2,489,690 |
| *Boston Properties | | 194,125 | | | 13,019,963 |
| *Brandywine Realty Trust | | 321,690 | | | 3,667,266 |
| Government Properties Income Trust | | 95,170 | | | 2,187,007 |
| HRPT Properties Trust | | 148,475 | | | 960,633 |
| *Kilroy Realty | | 85,375 | | | 2,618,451 |
| *Mack-Cali Realty | | 151,550 | | | 5,239,084 |
| SL Green Realty | | 108,568 | | | 5,454,456 |
| | | | | 41,462,831 |
| Office/Industrial REITs–5.81% | | | | | |
| *Digital Realty Trust | | 122,350 | | | 6,151,758 |
| *Duke Realty | | 347,620 | | | 4,230,535 |
| *Liberty Property Trust | | 172,000 | | | 5,505,720 |
| | | | | 15,888,013 |
| Real Estate Operating Companies–1.32% | | | | | |
| †Pebblebrook Hotel Trust | | 57,550 | | | 1,266,676 |
| *Starwood Hotels & Resorts Worldwide | | 64,141 | | | 2,345,636 |
| | | | | 3,612,312 |
| Self-Storage REITs–4.92% | | | | | |
| *Extra Space Storage | | 23,400 | | | 270,270 |
| *Public Storage | | 161,982 | | | 13,193,434 |
| | | | | 13,463,704 |
| Shopping Center REITs–8.64% | | | | | |
| *Cedar Shopping Centers | | 108,739 | | | 739,425 |
| *Federal Realty Investment Trust | | 77,614 | | | 5,256,020 |
| *Kimco Realty | | 277,075 | | | 3,748,825 |
| Ramco-Gershenson Properties Trust | | 118,125 | | | 1,126,913 |
| *Regency Centers | | 113,369 | | | 3,974,717 |
| *Tanger Factory Outlet Centers | | 96,075 | | | 3,745,964 |
| *Weingarten Realty Investors | | 255,475 | | | 5,055,850 |
| | | | | 23,647,714 |
| Single Tenant REITs–1.19% | | | | | |
| *National Retail Properties | | 153,275 | | | 3,252,496 |
| | | | | 3,252,496 |
| Specialty REITs–4.04% | | | | | |
| *Entertainment Properties Trust | | 120,675 | | | 4,256,207 |
| *Plum Creek Timber | | 138,400 | | | 5,225,984 |
| *Rayonier | | 37,061 | | | 1,562,492 |
| | | | | 11,044,683 |
| Total Common Stock | | | | | |
| (cost $221,961,688) | | | | | 267,311,578 |
| | | | |
| Principal | | | |
| Amount | | | |
| ≠DISCOUNT NOTE–0.15% | | | | | |
| Federal Home Loan Bank 0.001% 1/4/10 | | $407,000 | | | 407,000 |
| Total Discount Note | | | | | |
| (cost $407,000) | | | | | 407,000 |
| |
| Total Value of Securities | | | | | |
| Before Securities Lending | | | | | |
| Collateral–97.83% | | | | | |
| (cost $222,368,688) | | | | | 267,718,578 |
| | | | |
| Number of | | | |
| Shares | | | |
| SECURITIES LENDING | | | | | |
| COLLATERAL**–24.36% | | | | | |
| Investment Companies | | | | | |
| Mellon GSL DBT II Collateral Fund | | 56,089,536 | | | 56,089,536 |
| BNY Mellon SL DB II Liquidating Fund | | 10,640,702 | | | 10,518,334 |
| @†Mellon GSL Reinvestment Trust II | | 1,389,278 | | | 59,044 |
| Total Securities Lending Collateral | | | | | |
| (cost $68,119,516) | | | | | 66,666,914 |
REIT Series-5
Delaware VIP® REIT Series
Statement of Net Assets (continued)
| TOTAL VALUE OF SECURITIES–122.19% (cost $290,488,204) | $ 334,385,492 | © |
| OBLIGATION TO RETURN SECURITIES LENDING COLLATERAL**–(24.89%) | (68,119,516 | ) |
| RECEIVABLES AND OTHER ASSETS NET OF LIABILITIES–2.70% | 7,382,236 | |
| NET ASSETS APPLICABLE TO 35,287,635 SHARES OUTSTANDING–100.00% | $ 273,648,212 | |
NET ASSET VALUE–DELAWARE VIP REIT SERIES STANDARD CLASS ($148,975,157 / 19,214,162 Shares) | | $7.75 | |
NET ASSET VALUE–DELAWARE VIP REIT SERIES SERVICE CLASS ($124,673,055 / 16,073,473 Shares) | | $7.76 | |
| COMPONENTS OF NET ASSETS AT DECEMBER 31, 2009: | | |
| Shares of beneficial interest (unlimited authorization–no par) | $ 466,092,736 | |
| Undistributed net investment income | 7,361,515 | |
| Accumulated net realized loss on investments | (243,703,327 | ) |
| Net unrealized appreciation of investments | 43,897,288 | |
| Total net assets | $ 273,648,212 | |
| ____________________ | | |
| † | Non income producing security. |
| * | Fully or partially on loan. |
| ** | See Note 8 in “Notes to Financial Statements.” |
| © | Includes $66,498,986 of securities loaned. |
| ≠ | The rate shown is the effective yield at the time of purchase. |
| @ | Illiquid security. At December 31, 2009, the aggregate amount of illiquid securities was $59,044, which represented 0.02% of the Series’ net assets. See Note 9 in “Notes to Financial Statements.” |
REIT – Real Estate Investment Trust
See accompanying notes
REIT Series-6
Delaware VIP® Trust —
Delaware VIP REIT Series
Statement of Operations
Year Ended December 31, 2009
| INVESTMENT INCOME: | | | |
| Dividends | $ | 9,014,022 | |
| Interest | | 11,741 | |
| Securities lending income | | 177,565 | |
| Foreign tax withheld | | (4 | ) |
| | | 9,203,324 | |
| |
| EXPENSES: | | | |
| Management fees | | 1,716,488 | |
| Distribution expenses – Service Class | | 322,699 | |
| Reports and statements to shareholders | | 112,986 | |
| Accounting and administration expenses | | 91,546 | |
| Dividend disbursing and transfer agent fees and expenses | | 41,701 | |
| Legal fees | | 32,222 | |
| Trustees’ fees | | 14,574 | |
| Audit and tax | | 13,060 | |
| Custodian fees | | 8,131 | |
| Insurance fees | | 5,653 | |
| Dues and services | | 3,525 | |
| Consulting fees | | 2,900 | |
| Registration fees | | 2,393 | |
| Trustees’ expenses | | 1,062 | |
| Pricing fees | | 363 | |
| | | 2,369,303 | |
| Less fees waived | | (13,855 | ) |
| Less waiver of distribution expenses – Service Class | | (53,996 | ) |
| Total operating expenses | | 2,301,452 | |
| |
| NET INVESTMENT INCOME | | 6,901,872 | |
| |
| NET REALIZED AND UNREALIZED GAIN (LOSS) | | | |
| ON INVESTMENTS: | | | |
| Net realized loss on investments | | (117,818,254 | ) |
| Net change in unrealized appreciation/depreciation | | | |
| of investments | | 160,544,349 | |
| |
| NET REALIZED AND UNREALIZED GAIN | | | |
| ON INVESTMENTS | | 42,726,095 | |
| |
| NET INCREASE IN NET ASSETS RESULTING | | | |
| FROM OPERATIONS | $ | 49,627,967 | |
| | | | |
See accompanying notes
Delaware VIP Trust —
Delaware VIP REIT Series
Statements of Changes in Net Assets
| Year Ended |
| 12/31/09 | | 12/31/08 |
| INCREASE (DECREASE) IN NET | | | | | | | |
| ASSETS FROM OPERATIONS: | | | | | | | |
| Net investment income | $ | 6,901,872 | | | $ | 8,961,691 | |
| Net realized loss on investments | | (117,818,254 | ) | | | (117,494,372 | ) |
| Net change in unrealized appreciation/ | | | | | | | |
| depreciation of investments | | 160,544,349 | | | | (42,310,886 | ) |
| Net increase (decrease) in net assets | | | | | | | |
| resulting from operations | | 49,627,967 | | | | (150,843,567 | ) |
| |
| DIVIDENDS AND DISTRIBUTIONS | | | | | | | |
| TO SHAREHOLDERS FROM: | | | | | | | |
| Net investment income: | | | | | | | |
| Standard Class | | (5,646,592 | ) | | | (4,888,716 | ) |
| Service Class | | (4,865,041 | ) | | | (4,122,163 | ) |
| Net realized gain on investments: | | | | | | | |
| Standard Class | | – | | | | (75,971,767 | ) |
| Service Class | | – | | | | (74,308,853 | ) |
| | | (10,511,633 | ) | | | (159,291,499 | ) |
| |
| CAPITAL SHARE TRANSACTIONS: | | | | | | | |
| Proceeds from shares sold: | | | | | | | |
| Standard Class | | 17,883,933 | | | | 27,792,892 | |
| Service Class | | 13,774,766 | | | | 26,395,289 | |
| Net asset value of shares issued upon | | | | | | | |
| reinvestment of dividends and distributions: | | | | | |
| Standard Class | | 5,646,592 | | | | 80,860,483 | |
| Service Class | | 4,865,040 | | | | 78,431,016 | |
| | | 42,170,331 | | | | 213,479,680 | |
| Cost of shares repurchased: | | | | | | | |
| Standard Class | | (32,255,131 | ) | | | (61,947,148 | ) |
| Service Class | | (38,016,417 | ) | | | (66,198,679 | ) |
| | | (70,271,548 | ) | | | (128,145,827 | ) |
| Increase (decrease) in net assets derived | | | | | | | |
| from capital share transactions | | (28,101,217 | ) | | | 85,333,853 | |
| |
| NET INCREASE (DECREASE) IN | | | | | | | |
| NET ASSETS | | 11,015,117 | | | | (224,801,213 | ) |
| |
| NET ASSETS: | | | | | | | |
| Beginning of year | | 262,633,095 | | | | 487,434,308 | |
| End of year (including undistributed | | | | | | | |
| net investment income of $7,361,515 | | | | | | | |
| and $10,952,004, respectively) | $ | 273,648,212 | | | $ | 262,633,095 | |
| | | | | | | | |
See accompanying notes
REIT Series-7
Delaware VIP® Trust — Delaware VIP REIT Series
Financial Highlights
Selected data for each share of the Series outstanding throughout each period were as follows:
| Delaware VIP REIT Series Standard Class |
| Year Ended |
| | 12/31/09 | | 12/31/08 | | 12/31/07 | | 12/31/06 | | 12/31/05 | |
| Net asset value, beginning of period | | $6.640 | | $15.830 | | $22.860 | | $18.770 | | $19.080 | |
| |
| Income (loss) from investment operations: | | | | | | | | | | | |
| Net investment income1 | | 0.189 | | 0.244 | | 0.253 | | 0.378 | | 0.523 | |
| Net realized and unrealized gain (loss) on investments | | 1.211 | | (3.678 | ) | (2.541 | ) | 5.424 | | 0.618 | |
| Total from investment operations | | 1.400 | | (3.434 | ) | (2.288 | ) | 5.802 | | 1.141 | |
| |
| Less dividends and distributions from: | | | | | | | | | | | |
| Net investment income | | (0.290 | ) | (0.348 | ) | (0.297 | ) | (0.395 | ) | (0.360 | ) |
| Net realized gain on investments | | – | | (5.408 | ) | (4.445 | ) | (1.317 | ) | (1.091 | ) |
| Total dividends and distributions | | (0.290 | ) | (5.756 | ) | (4.742 | ) | (1.712 | ) | (1.451 | ) |
| |
| Net asset value, end of period | | $7.750 | | $6.640 | | $15.830 | | $22.860 | | $18.770 | |
| |
| Total return2 | | 23.31% | | (35.06% | ) | (13.94% | ) | 32.63% | | 7.17% | |
| |
| Ratios and supplemental data: | | | | | | | | | | | |
| Net assets, end of period (000 omitted) | | $148,975 | | $136,561 | | $250,072 | | $672,738 | | $637,889 | |
| Ratio of expenses to average net assets | | 0.89% | | 0.87% | | 0.83% | | 0.84% | | 0.85% | |
| Ratio of expenses to average net assets | | | | | | | | | | | |
| prior to fees waived and expense paid indirectly | | 0.89% | | 0.87% | | 0.83% | | 0.84% | | 0.85% | |
| Ratio of net investment income to average net assets | | 3.13% | | 2.37% | | 1.30% | | 1.87% | | 2.89% | |
| Ratio of net investment income to average net assets | | | | | | | | | | | |
| prior to fees waived and expense paid indirectly | | 3.13% | | 2.37% | | 1.30% | | 1.87% | | 2.89% | |
| Portfolio turnover | | 183% | | 106% | | 72% | | 100% | | 42% | |
____________________
| 1The average shares outstanding method has been applied for per share information. |
| 2Total investment return is based on the change in net asset value of a share during the period and assumes reinvestment of dividends and distributions at net asset value. Total investment return during some of the periods shown reflects a waiver by the manager. Performance would have been lower had the waiver not been in effect. |
See accompanying notes
REIT Series-8
Delaware VIP® REIT Series
Financial Highlights (continued)
Selected data for each share of the Series outstanding throughout each period were as follows:
| Delaware VIP REIT Series Service Class |
| Year Ended |
| | 12/31/09 | | 12/31/08 | | 12/31/07 | | 12/31/06 | | 12/31/05 | |
| Net asset value, beginning of period | | $6.620 | | $15.790 | | $22.820 | | $18.740 | | $19.050 | |
| |
| Income (loss) from investment operations: | | | | | | | | | | | |
| Net investment income1 | | 0.174 | | 0.218 | | 0.205 | | 0.327 | | 0.478 | |
| Net realized and unrealized gain (loss) on investments | | 1.230 | | (3.680 | ) | (2.544 | ) | 5.420 | | 0.622 | |
| Total from investment operations | | 1.404 | | (3.462 | ) | (2.339 | ) | 5.747 | | 1.100 | |
| |
| Less dividends and distributions from: | | | | | | | | | | | |
| Net investment income | | (0.264 | ) | (0.300 | ) | (0.246 | ) | (0.350 | ) | (0.319 | ) |
| Net realized gain on investments | | – | | (5.408 | ) | (4.445 | ) | (1.317 | ) | (1.091 | ) |
| Total dividends and distributions | | (0.264 | ) | (5.708 | ) | (4.691 | ) | (1.667 | ) | (1.410 | ) |
| |
| Net asset value, end of period | | $7.760 | | $6.620 | | $15.790 | | $22.820 | | $18.740 | |
| |
| Total return2 | | 23.24% | | (35.28% | ) | (14.18% | ) | 32.32% | | 6.86% | |
| |
| Ratios and supplemental data: | | | | | | | | | | | |
| Net assets, end of period (000 omitted) | | $124,673 | | $126,072 | | $237,362 | | $314,551 | | $201,883 | |
| Ratio of expenses to average net assets | | 1.14% | | 1.12% | | 1.08% | | 1.09% | | 1.10% | |
| Ratio of expenses to average net assets | | | | | | | | | | | |
| prior to fees waived and expense paid indirectly | | 1.19% | | 1.17% | | 1.13% | | 1.14% | | 1.15% | |
| Ratio of net investment income to average net assets | | 2.88% | | 2.12% | | 1.05% | | 1.62% | | 2.64% | |
| Ratio of net investment income to average net assets | | | | | | | | | | | |
| prior to fees waived and expense paid indirectly | | 2.83% | | 2.07% | | 1.00% | | 1.57% | | 2.59% | |
| Portfolio turnover | | 183% | | 106% | | 72% | | 100% | | 42% | |
____________________
| 1The average shares outstanding method has been applied for per share information. |
| 2Total investment return is based on the change in net asset value of a share during the period and assumes reinvestment of dividends and distributions at net asset value. Total investment return during some of the periods shown reflects waivers by the manager and/or the distributor. Performance would have been lower had the waivers not been in effect. |
See accompanying notes
REIT Series-9
Delaware VIP® Trust — Delaware VIP REIT Series
Notes to Financial Statements
December 31, 2009
Delaware VIP Trust (Trust) is organized as a Delaware statutory trust and offers 12 series: Delaware VIP Cash Reserve Series, Delaware VIP Diversified Income Series, Delaware VIP Emerging Markets Series, Delaware VIP Growth Opportunities Series, Delaware VIP High Yield Series, Delaware VIP International Value Equity Series, Delaware VIP Limited-Term Diversified Income Series (formerly, Delaware VIP Capital Reserves Series), Delaware VIP REIT Series, Delaware VIP Small Cap Value Series, Delaware VIP Trend Series, Delaware VIP U.S. Growth Series and Delaware VIP Value Series. These financial statements and the related notes pertain to Delaware VIP REIT Series (Series). The Trust is an open-end investment company. The Series is considered diversified under the Investment Company Act of 1940, as amended, and offers Standard Class and Service Class shares. The Standard Class shares do not carry a 12b-1 fee and the Service Class shares carry a 12b-1 fee. The shares of the Series are sold only to separate accounts of life insurance companies.
The investment objective of the Series is to seek maximum long-term total return, with capital appreciation as a secondary objective.
1. Significant Accounting Policies
The following accounting policies are in accordance with U.S. generally accepted accounting principles (U.S. GAAP) and are consistently followed by the Series.
Security Valuation—Equity securities, except those traded on the Nasdaq Stock Market, Inc. (Nasdaq), are valued at the last quoted sales price as of the time of the regular close of the New York Stock Exchange (NYSE) on the valuation date. Securities traded on the Nasdaq are valued in accordance with the Nasdaq Official Closing Price, which may not be the last sales price. If on a particular day an equity security does not trade, then the mean between the bid and ask prices will be used. Short-term debt securities are valued at market value. Investment companies are valued at net asset value per share. Generally, other securities and assets for which market quotations are not readily available are valued at fair value as determined in good faith under the direction of the Series’ Board of Trustees (Board). In determining whether market quotations are readily available or fair valuation will be used, various factors will be taken into consideration, such as market closures or suspension of trading in a security. The Series may use fair value pricing more frequently for securities traded primarily in non-U.S. markets because, among other things, most foreign markets close well before the Series values its securities at 4:00 p.m. Eastern time. The earlier close of these foreign markets gives rise to the possibility that significant events, including broad market moves, government actions or pronouncements, aftermarket trading, or news events may have occurred in the interim. To account for this, the Series may frequently value foreign securities using fair value prices based on third-party vendor modeling tools (international fair value pricing).
Federal Income Taxes—No provision for federal income taxes has been made as the Series intends to continue to qualify for federal income tax purposes as a regulated investment company under Subchapter M of the Internal Revenue Code of 1986, as amended, and make the requisite distributions to shareholders. The Series evaluates tax positions taken or expected to be taken in the course of preparing the Series’ tax returns to determine whether the tax positions are “more-likely-than-not” of being sustained by the applicable tax authority. Tax positions not deemed to meet the more-likely-than-not threshold are recorded as a tax benefit or expense in the current year. Management has analyzed the Series’ tax positions taken on federal income tax returns for all open tax years (tax years ended December 31, 2006 – December 31, 2009), and has concluded that no provision for federal income tax is required in the Series’ financial statements.
Class Accounting—Investment income, common expenses and realized and unrealized gain (loss) on investments are allocated to the classes of the Series on the basis of daily net assets of each class. Distribution expenses relating to a specific class are charged directly to that class.
Repurchase Agreements—The Series may invest in a pooled cash account along with other members of the Delaware Investments® Family of Funds pursuant to an exemptive order issued by the Securities and Exchange Commission. The aggregate daily balance of the pooled cash account is invested in repurchase agreements secured by obligations of the U.S. government. The respective collateral is held by the Series’ custodian bank until the maturity of the respective repurchase agreements. Each repurchase agreement is at least 102% collateralized. However, in the event of default or bankruptcy by the counterparty to the agreement, realization of the collateral may be subject to legal proceedings. At December 31, 2009, the Series held no investments in repurchase agreements.
Use of Estimates—The preparation of financial statements in conformity with U.S. GAAP requires management to make estimates and assumptions that affect the reported amounts of assets and liabilities at the date of the financial statements and the reported amounts of revenues and expenses during the reporting period. Actual results could differ from those estimates.
Other—Expenses directly attributable to the Series are charged directly to the Series. Other expenses common to various funds within the Delaware Investments Family of Funds are generally allocated amongst such funds on the basis of average net assets. Management fees and some other expenses are paid monthly. Security transactions are recorded on the date the securities are purchased or sold (trade date) for financial reporting purposes. Costs used in calculating realized gains and losses on the sale of investment securities are those of the specific securities sold. Dividend income is recorded on the ex-dividend date and interest income is recorded on the accrual basis. Distributions received from investments in real estate investment trusts (REITs) are recorded as dividend income on ex-dividend date, subject to reclassification upon notice of the character of such distributions by the issuer. The financial statements reflect an estimate of the reclassification of the distribution character. The Series declares and pays dividends from net investment income and distributions from net realized gain on investments, if any, following the close of the fiscal year.
Subject to seeking best execution, the Series may direct certain security trades to brokers who have agreed to rebate a portion of the related brokerage commission to the Series in cash. Such commission rebates are included in realized gain on investments in the accompanying financial statements and totaled $701 for the year ended December 31, 2009. In general, best execution refers to many factors, including the price paid or received for a security, the commission charged, the promptness and reliability of execution, the confidentiality and placement accorded the order, and other factors affecting the overall benefit obtained by the Series on the transaction.
The Series may receive earnings credits from its custodian when positive cash balances are maintained, which are used to offset custody fees. There were no earnings credits for the year ended December 31, 2009.
REIT Series-10
Delaware VIP® REIT Series
Notes to Financial Statements (continued)
1. Significant Accounting Policies (continued)
On July 1, 2009, the Financial Accounting Standards Board (FASB) issued the FASB Accounting Standards Codification (Codification). The Codification became the single source of authoritative nongovernmental U.S. GAAP, superseding existing literature of the FASB, American Institute of Certified Public Accountants, Emerging Issues Task Force and other sources. The Codification is effective for interim and annual periods ending after September 15, 2009. The Series adopted the Codification for the year ended December 31, 2009. There was no impact to financial statements as the Codification requirements are disclosure-only in nature.
Management has evaluated whether any events or transactions occurred subsequent to December 31, 2009 through February 17, 2010, the date of issuance of the Series’ financial statements, and determined that there were no material events or transactions that would require recognition or disclosure in the Series’ financial statements.
2. Investment Management, Administration Agreements and Other Transactions with Affiliates
In accordance with the terms of its investment management agreement, the Series pays Delaware Management Company (DMC), a series of Delaware Management Business Trust and the investment manager, an annual fee which is calculated daily at the rate of 0.75% on the first $500 million of average daily net assets of the Series, 0.70% on the next $500 million, 0.65% on the next $1.5 billion, and 0.60% on average daily net assets in excess of $2.5 billion.
Effective May 1, 2009, DMC has voluntarily agreed to waive that portion, if any, of its management fee and/or pay/reimburse the Series to the extent necessary to ensure that total annual operating expenses (excluding any 12b-1 plan expenses, taxes, interest, inverse floater program expenses, brokerage fees, certain insurance costs, and nonroutine expenses or costs including, but not limited to, those relating to reorganizations, litigation, conducting shareholder meetings, and liquidations (collectively, “nonroutine expenses”)) do not exceed 0.86% of average daily net assets of the Series until such time as the voluntary expense cap is discontinued. For purposes of this waiver and reimbursement, nonroutine expenses may also include such additional costs and expenses, as may be agreed upon from time to time by the Series’ Board and DMC. This expense waiver and reimbursement applies only to expenses paid directly by the Series, and may be discontinued at any time because they are voluntary. Effective August 17, 2009, the expense waiver was discontinued.
Delaware Service Company, Inc. (DSC), an affiliate of DMC, provides fund accounting and financial administration oversight services to the Series. For these services, the Series pays DSC fees based on the aggregate daily net assets of the Delaware Investments® Family of Funds at the following annual rate: 0.0050% of the first $30 billion; 0.0045% of the next $10 billion; 0.0040% of the next $10 billion; and 0.0025% of aggregate average daily net assets in excess of $50 billion. The fees payable to DSC under the service agreement described above are allocated among all funds in the Delaware Investments Family of Funds on a relative net asset value basis. For the year ended December 31, 2009, the Series was charged $11,443 for these services.
DSC also provides dividend disbursing and transfer agency services. The Series pays DSC a monthly fee based on the number of shareholder accounts for dividend disbursing and transfer agent services.
Pursuant to a distribution agreement and distribution plan, the Series pays Delaware Distributors, L.P. (DDLP), the distributor and an affiliate of DMC, an annual distribution and service fee not to exceed 0.30% of the average daily net assets of the Service Class shares. DDLP has contracted to waive distribution and service fees through April 30, 2010 in order to prevent distribution and service fees of the Service Class shares from exceeding 0.25% of average daily net assets. Standard Class shares pay no distribution and service expenses.
At December 31, 2009, the Series had liabilities payable to affiliates as follows:
| | | Dividend Disbursing, | | | | Other |
| Investment | | Transfer Agent and Fund | | | | Expenses |
| Management | | Accounting Oversight | | Distribution | | Payable |
| Fee Payable to | | Fees and Other Expenses | | Fee Payable | | to DMC |
| DMC | | Payable to DSC | | to DDLP | | and Affiliates* |
| $172,643 | | $2,887 | | $26,298 | | $31,820 |
____________________
*DMC, as part of its administrative services, pays operating expenses on behalf of the Series and is reimbursed on a periodic basis. Such expenses include items such as printing of shareholder reports, fees for audit, legal and tax services, custodian fees and trustees’ fees.
As provided in the investment management agreement, the Series bears the cost of certain legal and tax services, including internal legal and tax services provided to the Series by DMC and/or its affiliates’ employees. For the year ended December 31, 2009, the Series was charged $19,138 for internal legal and tax services provided by DMC and/or its affiliates’ employees.
Trustees’ fees include expenses accrued by the Series for each Trustee’s retainer and meeting fees. Certain officers of DMC, DSC and DDLP are officers and/or Trustees of the Trust. These officers and Trustees are paid no compensation by the Series.
3. Investments
For the year ended December 31, 2009, the Series made purchases and sales of investment securities other than short-term investments as follows:
| Purchases | $ | 406,914,185 |
| Sales | | 426,248,492 |
REIT Series-11
Delaware VIP® REIT Series
Notes to Financial Statements (continued)
3. Investments (continued)
At December 31, 2009, the cost of investments and unrealized appreciation (depreciation) for federal income tax purposes for the Series were as follows:
| | | Aggregate | | Aggregate | | |
| Cost of | | Unrealized | | Unrealized | | Net Unrealized |
| Investments | | Appreciation | | Depreciation | | Depreciation |
| | $380,224,488 | | $10,481,995 | | $(56,320,991) | | $(45,838,996) |
U.S. GAAP defines fair value as the price that the Series would receive to sell an asset or pay to transfer a liability in an orderly transaction between market participants at the measurement date under current market conditions. A framework for measuring fair value and a three level hierarchy for fair value measurements has been established based upon the transparency of inputs to the valuation of an asset or liability. Inputs may be observable or unobservable and refer broadly to the assumptions that market participants would use in pricing the asset or liability. Observable inputs reflect the assumptions market participants would use in pricing the asset or liability based on market data obtained from sources independent of the reporting entity. Unobservable inputs reflect the reporting entity’s own assumptions about the assumptions that market participants would use in pricing the asset or liability developed based on the best information available under the circumstances. The Series’ investment in its entirety is assigned a level based upon the observability of the inputs which are significant to the overall valuation. The three-tier hierarchy of inputs is summarized below.
Level 1 – inputs are quoted prices in active markets
Level 2 – inputs are observable, directly or indirectly
Level 3 – inputs are unobservable and reflect assumptions on the part of the reporting entity
The following table summarizes the valuation of the Series’ investments by the fair value hierarchy levels as of December 31, 2009:
| Level 1 | | Level 2 | | Level 3 | | Total |
| Common Stock | $ | 267,311,578 | | $ | – | | $ | – | | $ | 267,311,578 |
| Short-Term | | – | | | 407,000 | | | – | | | 407,000 |
| Securities Lending Collateral | | 56,089,536 | | | 10,518,334 | | | 59,044 | | | 66,666,914 |
| Total | $ | 323,401,114 | | $ | 10,925,334 | | $ | 59,044 | | $ | 334,385,492 |
| | | | | | | | | | | | |
The following is a reconciliation of investments in which significant unobservable inputs (Level 3) were used in determining fair value:
| Securities |
| Lending |
| Collateral |
| Balance as of 12/31/08 | | $45,846 | |
| Net change in unrealized | | | |
| appreciation/depreciation | | 13,198 | |
| Balance as of 12/31/09 | | $59,044 | |
| | |
| Net change in unrealized | | | |
| appreciation/depreciation from | | | |
| investments still held as of 12/31/09 | | $13,198 | |
In January 2010, the Financial Accounting Standards Board issued an Accounting Standards Update, Improving Disclosures about Fair Value Measurements, which introduces new disclosure requirements and clarifies certain existing disclosure requirements around fair value measurements currently presented above. The new disclosures and clarifications of existing disclosures are generally effective for the Series’ year ending December 31, 2010 and interim periods therein. Management is evaluating the impact of this update on its current disclosures.
4. Dividend and Distribution Information
Income and long-term capital gain distributions are determined in accordance with federal income tax regulations, which may differ from U.S. GAAP. Additionally, distributions from net short-term gains on sales of investment securities are treated as ordinary income for federal income tax purposes. The tax character of dividends and distributions paid during the years ended December 31, 2009 and 2008 was as follows:
| Year | | Year |
| Ended | | Ended |
| 12/31/09 | | 12/31/08 |
| Ordinary income | $ | 10,511,633 | | $ | 39,881,561 |
| Long-term capital gain | | – | | | 119,409,938 |
| Total | $ | 10,511,633 | | $ | 159,291,499 |
| | | | | | |
REIT Series-12
Delaware VIP® REIT Series
Notes to Financial Statements (continued)
5. Components of Net Assets on a Tax Basis
As of December 31, 2009, the components of net assets on a tax basis were as follows:
| Shares of beneficial interest | $ | 466,092,736 | |
| Undistributed ordinary income | | 7,361,515 | |
| Post-October losses | | (2,438,787 | ) |
| Capital loss carryforwards | | (151,528,256 | ) |
| Unrealized depreciation of investments | | (45,838,996 | ) |
| Net assets | $ | 273,648,212 | |
| | | | |
The differences between book basis and tax basis components of net assets are primarily attributable to tax deferral of losses on wash sales.
The undistributed earnings for the Series may be subject to reclassification upon notice of the tax character of distributions received from investments in REITs.
Post-October losses represent losses realized on investment transactions from November 1, 2009 through December 31, 2009 that, in accordance with federal income tax regulations, the Series has elected to defer and treat as having arisen in the following fiscal year.
For financial reporting purposes, capital accounts are adjusted to reflect the tax character of permanent book/tax differences. Reclassifications are primarily due to tax treatment of return of capital from investments. Results of operations and net assets were not affected by these reclassifications. For the year ended December 31, 2009, the Series recorded the following reclassifications:
| Undistributed Net | | Accumulated |
| Investment Income | | Net Realized Loss |
| | $19,272 | | $(19,272) |
For federal income tax purposes, capital loss carryforwards may be carried forward and applied against future capital gains. Capital loss carryforwards remaining at December 31, 2009 will expire as follows: $59,739,771 expires in 2016 and $91,788,485 expires in 2017.
6. Capital Shares
Transactions in capital shares were as follows:
| Year | | Year |
| Ended | | Ended |
| 12/31/09 | | 12/31/08 |
| Shares sold: | | | | | |
| Standard Class | 2,993,469 | | | 2,742,925 | |
| Service Class | 2,381,821 | | | 2,656,786 | |
| |
| Shares issued upon reinvestment of dividends and distributions: | | | | | |
| Standard Class | 1,100,700 | | | 7,700,998 | |
| Service Class | 946,506 | | | 7,469,621 | |
| | 7,422,496 | | | 20,570,330 | |
| Shares repurchased: | | | | | |
| Standard Class | (5,458,860 | ) | | (5,662,973 | ) |
| Service Class | (6,291,707 | ) | | (6,121,105 | ) |
| | (11,750,567 | ) | | (11,784,078 | ) |
| Net increase (decrease) | (4,328,071 | ) | | 8,786,252 | |
| | | | | | |
7. Line of Credit
The Series, along with certain other funds in the Delaware Investments® Family of Funds (Participants), participates in a $35,000,000 revolving line of credit with The Bank of New York Mellon (BNY Mellon) to be used for temporary or emergency purposes as an additional source of liquidity to fund redemptions of investor shares. Under the agreement, Participants are charged an annual commitment fee, which is allocated across the Participants on the basis of each Participant’s allocation of the entire facility. The Participants may borrow up to a maximum of one third of their net assets under the agreement. The agreement expires on November 16, 2010. The Series had no amounts outstanding as of December 31, 2009, or at any time during the year then ended.
8. Securities Lending
The Series, along with other funds in the Delaware Investments® Family of Funds, may lend its securities pursuant to a security lending agreement (Lending Agreement) with BNY Mellon. With respect to each loan, if the aggregate market value of securities collateral held plus cash collateral received on any business day is less than the aggregate market value of the securities which are the subject of such loan, the borrower will be notified to provide additional collateral not less than the applicable collateral requirements. Cash collateral received is generally invested in the Mellon GSL DBT II Collateral Fund (Collective Trust) established by BNY Mellon for the purpose of
REIT Series-13
Delaware VIP® REIT Series
Notes to Financial Statements (continued)
8. Securities Lending (continued)
investment on behalf of clients participating in its securities lending programs. The Collective Trust may invest in fixed income securities, with a weighted average maturity not to exceed 90 days, rated in one of the top three tiers by Standard & Poor’s Ratings Group or Moody’s Investors Service, Inc. or repurchase agreements collateralized by such securities. The Collective Trust seeks to maintain a net asset value per unit of $1.00, but there can be no assurance that it will always be able to do so. At December 31, 2009, the Collective Trust held only cash and assets with a maturity of one business day or less (Cash/Overnight Assets). The Series may incur investment losses as a result of investing securities lending collateral in the Collective Trust. This could occur if an investment in the Collective Trust defaulted or if it were necessary to liquidate assets in the Collective Trust to meet returns on outstanding security loans at a time when the Collective Trust’s net asset value per unit was less than $1.00. Under those circumstances, the Series may not receive an amount from the Collective Trust that is equal in amount to the collateral the Series would be required to return to the borrower of the securities and the Series would be required to make up for this shortfall. Effective April 20, 2009, BNY Mellon transferred the assets of the Collective Trust other than the Cash/Overnight Assets to the BNY Mellon SL DBT II Liquidating Fund (Liquidating Fund), effectively bifurcating the collateral investment pool. The Series’ exposure to the Liquidating Fund is expected to decrease as the Liquidating Fund’s assets mature or are sold. In October 2008, BNY Mellon transferred certain distressed securities from the Collective Trust into the Mellon GSL Reinvestment Trust II. The Series can also accept U.S. government securities and letters of credit (non-cash collateral) in connection with securities loans. In the event of default or bankruptcy by the lending agent, realization and/or retention of the collateral may be subject to legal proceedings. In the event the borrower fails to return loaned securities and the collateral received is insufficient to cover the value of the loaned securities and provided such collateral shortfall is not the result of investment losses, the lending agent has agreed to pay the amount of the shortfall to the Series, or at the discretion of the lending agent, replace the loaned securities. The Series continues to record dividends or interest, as applicable, on the securities loaned and is subject to change in value of the securities loaned that may occur during the term of the loan. The Series has the right under the Lending Agreement to recover the securities from the borrower on demand. With respect to security loans collateralized by non-cash collateral, the Series receives loan premiums paid by the borrower. With respect to security loans collateralized by cash collateral, the earnings from the collateral investments are shared among the Series, the security lending agent and the borrower. The Series records security lending income net of allocations to the security lending agent and the borrower.
At December 31, 2009, the value of the securities on loan was $66,498,986, for which cash collateral was received and invested in accordance with the Lending Agreement. At December 31, 2009, the value of invested collateral was $66,666,914. Such investments are presented on the Statement of Net Assets under the caption “Securities Lending Collateral.”
9. Credit and Market Risk
The Series concentrates its investments in the real estate industry and is subject to the risks associated with that industry. If the Series holds real estate directly as a result of defaults or receives rental income directly from real estate holdings, its tax status as a regulated investment company may be jeopardized. The Series is also affected by interest rate changes, particularly if the REITs it holds use floating rate debt to finance their ongoing operations. Its investments may also tend to fluctuate more in value than a portfolio that invests in a broader range of industries.
The Series may invest up to 10% of its net assets in illiquid securities, which may include securities with contractual restrictions on resale, securities exempt from registration under Rule 144A of the Securities Act of 1933, as amended, and other securities which may not be readily marketable. The relative illiquidity of these securities may impair the Series from disposing of them in a timely manner and at a fair price when it is necessary or desirable to do so. While maintaining oversight, the Series’ Board has delegated to DMC the day-to-day functions of determining whether individual securities are liquid for purposes of the Series’ limitation on investments in illiquid assets. Securities eligible for resale pursuant to Rule 144A, which are determined to be liquid, are not subject to the Series’ 10% limit on investments in illiquid securities. As of December 31, 2009, there were no Rule 144A securities. Illiquid securities have been identified on the Statement of Net Assets.
10. Contractual Obligations
The Series enters into contracts in the normal course of business that contain a variety of indemnifications. The Series’ maximum exposure under these arrangements is unknown. However, the Series has not had prior claims or losses pursuant to these contracts. Management has reviewed the Series’ existing contracts and expects the risk of loss to be remote.
11. Sale of Delaware Investments to Macquarie Group
On August 18, 2009, Lincoln National Corporation (parent company of Delaware Investments) and Macquarie Group (Macquarie) entered into an agreement pursuant to which Delaware Investments, including DMC, DDLP and DSC, would be acquired by Macquarie, an Australia-based global provider of banking, financial, advisory, investment and funds management services (Transaction). The Transaction was completed on January 4, 2010. DMC, DDLP and DSC are now wholly-owned subsidiaries of Macquarie.
The Transaction resulted in a change of control of DMC which, in turn, caused the termination of the investment advisory agreement between DMC and the Series. On January 4, 2010, the new investment advisory agreement between DMC and the Series that was approved by the shareholders became effective.
12. Tax Information (Unaudited)
For the fiscal year ended December 31, 2009, the Series designates distributions paid during the year as follows:
| (A) | | (B) | | |
| Long-Term | | Ordinary | | |
| Capital Gain | | Income | | Total |
| Distributions | | Distributions | | Distributions |
| (Tax Basis) | | (Tax Basis) | | (Tax Basis) |
| – | | 100% | | 100% |
____________________
(A) and (B) are based on a percentage of the Series’ total distributions.
REIT Series-14
Delaware VIP® Trust — Delaware VIP REIT Series
Report of Independent Registered Public Accounting Firm
To the Shareholders and Board of Trustees
Delaware VIP Trust–Delaware VIP REIT Series
We have audited the accompanying statement of net assets of the Delaware VIP REIT Series (one of the series constituting Delaware VIP Trust) (the “Series”) as of December 31, 2009, and the related statement of operations for the year then ended, the statements of changes in net assets for each of the two years in the period then ended, and the financial highlights for each of the five years in the period then ended. These financial statements and financial highlights are the responsibility of the Series’ management. Our responsibility is to express an opinion on these financial statements and financial highlights based on our audits.
We conducted our audits in accordance with the standards of the Public Company Accounting Oversight Board (United States). Those standards require that we plan and perform the audit to obtain reasonable assurance about whether the financial statements and financial highlights are free of material misstatement. We were not engaged to perform an audit of the Series’ internal control over financial reporting. Our audits included consideration of internal control over financial reporting as a basis for designing audit procedures that are appropriate in the circumstances, but not for the purpose of expressing an opinion on the effectiveness of the Series’ internal control over financial reporting. Accordingly, we express no such opinion. An audit also includes examining, on a test basis, evidence supporting the amounts and disclosures in the financial statements and financial highlights, assessing the accounting principles used and significant estimates made by management, and evaluating the overall financial statement presentation. Our procedures included confirmation of securities owned as of December 31, 2009, by correspondence with the custodian and brokers or by other appropriate auditing procedures where replies from brokers were not received. We believe that our audits provide a reasonable basis for our opinion.
In our opinion, the financial statements and financial highlights referred to above present fairly, in all material respects, the financial position of the Delaware VIP REIT Series of Delaware VIP Trust at December 31, 2009, the results of its operations for the year then ended, the changes in its net assets for each of the two years in the period then ended, and its financial highlights for each of the five years in the period then ended, in conformity with U.S. generally accepted accounting principles.

Philadelphia, Pennsylvania
February 17, 2010
The Series files its complete schedule of portfolio holdings with the Securities and Exchange Commission (Commission) for the first and third quarters of each fiscal year on Form N-Q. The Series’ Forms N-Q, as well as a description of the policies and procedures that the Series uses to determine how to vote proxies (if any) relating to portfolio securities is available without charge (i) upon request, by calling 800 523-1918; and (ii) on the Commission’s website at http://www.sec.gov. In addition, a description of the policies and procedures that the Series uses to determine how to vote proxies (if any) relating to portfolio securities is available without charge on the Delaware Investments® Funds’ Web site at http://www.delawareinvestments.com. The Series’ Forms N-Q may be reviewed and copied at the Commission’s Public Reference Room in Washington, DC; information on the operation of the Public Reference Room may be obtained by calling 800 SEC-0330.
Information (if any) regarding how the Series voted proxies relating to portfolio securities during the most recently disclosed 12-month period ended June 30 is available without charge (i) through the Delaware Investments Funds’ Web site at http://www.delawareinvestments.com; and (ii) on the Commission’s website at http://www.sec.gov. |
REIT Series-15
Delaware VIP® Trust — Delaware VIP REIT Series
Other Series Information
Board Consideration of New Investment Advisory Agreement
At a meeting held on September 3, 2009 (the “Meeting”), the Board of Trustees of the Delaware Investments Family of Funds (the “Board”), including the independent Trustees, unanimously approved a new investment advisory agreement between each registrant on behalf of each series (each, a “Fund” and together, the “Funds”) and Delaware Management Company (“DMC”) in connection with the sale of Delaware Investments’ advisory business to Macquarie Bank Limited (the “Macquarie Group”) (the “Transaction”). In making its decision, the Board considered information furnished specifically in connection with the approval of the new investment advisory agreements with DMC (the “New Investment Advisory Agreements”) which included extensive materials about the Transaction and matters related to the proposed approvals. To assist the Board in considering the New Investment Advisory Agreements, Macquarie Group provided materials and information about Macquarie Group, including detailed written responses to the questions posed by the independent Trustees. DMC also provided materials and information about the Transaction, including detailed written responses to the questions posed by the independent Trustees.
At the Meeting, the Trustees discussed the Transaction with DMC management and with key Macquarie Group representatives. The Meeting included discussions of the strategic rationale for the Transaction and Macquarie Group’s general plans and intentions regarding the Funds and DMC. The Board members also inquired about the plans for, and anticipated roles and responsibilities of, key employees and officers of Delaware Management Holdings Inc. and DMC in connection with the Transaction.
In connection with the Trustees’ review of the New Investment Advisory Agreements for the Funds, DMC and/or Macquarie Group emphasized that:
- They expected that there would be no adverse changes as a result of the Transaction, in the nature, quality, or extent of services currently provided to the Funds and their shareholders, including investment management, distribution, or other shareholder services.
- No material changes in personnel or operations were contemplated in the operation of DMC under Macquarie Group as a result of the Transaction and no material changes were currently contemplated in connection with third party service providers to the Funds.
- Macquarie Group had no intention to cause DMC to alter the voluntary expense waivers and reimbursements currently in effect for the Funds.
- Under the agreement between Macquarie Group and Lincoln National Corporation (“LNC”) (the “Transaction Agreement”), Macquarie Group has agreed to conduct, and to cause its affiliates to conduct, their respective businesses in compliance with the conditions of Section 15(f) of the Investment Company Act of 1940 (the “1940 Act”) with respect to the Funds, to the extent within its control, including maintaining Board composition of at least 75% of the Board members qualifying as independent Trustees and not imposing any “unfair burden” on the Funds for at least two years from the closing of the Transaction (the “Closing”).
In addition to the information provided by DMC and Macquarie Group as described above, the Trustees also considered all other factors they believed to be relevant to evaluating the New Investment Advisory Agreements, including the specific matters discussed below. In their deliberations, the Trustees did not identify any particular information that was controlling, and different Trustees may have attributed different weights to the various factors. However, for each Fund, the Trustees determined that the overall arrangements between the Fund and DMC, as provided in the respective New Investment Advisory Agreement, including the proposed advisory fee and the related administration arrangements between the Fund and DMC, were fair and reasonable in light of the services to be performed, expenses incurred, and such other matters as the Trustees considered relevant. Factors evaluated included:
- The potential for expanding distribution of Fund shares through access to Macquarie Group’s existing distribution channels;
- Delaware Investments’ acquisition of an exclusive wholesaling sales force from a subsidiary of LNC;
- The reputation, financial strength, and resources of Macquarie Group as well as its historic and ongoing commitment to the asset management business in Australia as well as other parts of the world;
- The terms and conditions of the New Investment Advisory Agreements, including that each Fund’s total contractual fee rate under the New Investment Advisory Agreement will remain the same;
- The Board’s full annual review (or initial approval) of the current investment advisory agreements at their in-person meeting in May 2009 as required by the 1940 Act and its determination that (i) DMC had the capabilities, resources, and personnel necessary to provide the satisfactory advisory and administrative services currently provided to each Fund and (ii) the advisory and/or management fees paid by each Fund, taking into account any applicable fee waivers and breakpoints, represented reasonable compensation to DMC in light of the services provided, the costs to DMC of providing those services, economies of scale, and the fees and other expenses paid by similar funds and such other matters that the Board considered relevant in the exercise of its reasonable judgment;
- The portfolio management teams for the Funds are not currently expected to change as a result of the Transaction;
- LNC and Macquarie Group were expected to execute a reimbursement agreement pursuant to which LNC and Macquarie Group would agree to pay (or reimburse) all reasonable out-of-pocket costs and expenses of the Funds in connection with the Board’s consideration of the Transaction, the New Investment Advisory Agreements and related agreements, and all costs related to the proxy solicitation (the “Expense Agreement”);
REIT Series-16
Delaware VIP® REIT Series
Other Series Information (continued)
- The likelihood that Macquarie Group would invest additional amounts in Delaware Investments, including DMC, which could result in increased assets under management, which in turn would allow some Funds the potential opportunity to achieve economies of scale and lower fees payable by Fund shareholders; and
- The compliance and regulatory history of Macquarie Group and its affiliates.
In making their decision relating to the approval of each Fund’s New Investment Advisory Agreement, the independent Trustees gave attention to all information furnished. The following discussion, however, identifies the primary factors taken into account by the Trustees and the conclusions reached in approving the New Investment Advisory Agreements.
NATURE, EXTENT, AND QUALITY OF SERVICE. The Trustees considered the services historically provided by DMC to the Funds and their shareholders. In reviewing the nature, extent, and quality of services, the Board considered that the New Investment Advisory Agreements would be substantially similar to the current investment advisory agreements between the Funds and DMC (the “Current Investment Advisory Agreements”), and they therefore, considered the many reports furnished to them throughout 2008 and 2009 at regular Board meetings covering matters such as: the relative performance of the Funds; the compliance of portfolio managers with the investment policies, strategies, and restrictions for the Funds; the compliance of management personnel with the code of ethics adopted throughout the Delaware Investments Family of Funds complex; and the adherence to fair value pricing procedures as established by the Board. The Trustees were pleased with the current staffing of DMC and the emphasis placed on research and risk management in the investment process. Favorable consideration was given to DMC’s efforts to maintain expenditures and, in some instances, increase financial and human resources committed to Fund matters.
The Board also considered the transfer agent and shareholder services that would continue to be provided to Fund shareholders by DMC’s affiliate, Delaware Service company, Inc. (“DSC”). The Trustees noted, in particular, DSC’s commitment to maintain a high level of service as well as DMC’s expenditures to improve the delivery of shareholder services. The Board was assured that shareholders would continue to receive the benefits provided to Fund shareholders by being part of the Delaware Investments Family of Funds, including each shareholder’s ability to exchange an investment in one Fund for the same class of shares in another Fund without a sales charge, to reinvest Fund dividends into additional shares of any of the Funds, and the privilege to combine holdings in other Funds to obtain a reduced sales charge.
Based on the information provided by DMC and Macquarie Group, including that Macquarie Group and DMC currently expected no material changes as a result of the Transaction in (i) personnel or operations of DMC or (ii) third party service providers to the Funds, the Board concluded that the satisfactory nature, extent, and quality of services currently provided to the Funds and their shareholders were very likely to continue under the New Investment Advisory Agreements. Moreover, the Board concluded that the Funds would probably benefit from the expanded distribution resources that would become available to Delaware Investments following the Transaction. The Board also concluded that it was very unlikely that any “unfair burden” would be imposed on any of the Funds for the first two years following the Closing as a result of the Transaction. Consequently, the Board concluded that it did not expect the Transaction to result in any adverse changes in the nature, quality, or extent of services (including investment management, distribution or other shareholder services) currently provided to the Funds and their shareholders.
INVESTMENT PERFORMANCE. The Board considered the overall investment performance of DMC and the Funds. The Trustees placed significant emphasis on the investment performance of the Funds in view of its importance to shareholders. Although the Trustees gave appropriate consideration to performance reports and discussions with portfolio managers at Board meetings throughout the year, the Trustees gave particular weight to their review of investment performance in connection with the approval of the Current Investment Advisory agreements at the Board meeting held in May 2009. At that meeting, the Trustees reviewed reports prepared by Lipper, Inc., an independent statistical compilation organization (“Lipper”), which showed each Fund’s investment performance as of December 31, 2008 in comparison to a group of funds selected by Lipper as being similar to the Fund (the “Performance Universe”). During the May 2009 agreement review process, the Trustees observed the significant improvements to relative investment performance of the Funds compared to the Funds’ performance as of December 31, 2007.
At their meeting on September 3, 2009, the Trustees, including the independent Trustees in consultation with their independent counsel, reviewed the investment performance of each Fund. The Trustees compared the performance of each Fund relative to that of its respective Performance Universe for the 1-, 3-, 5-, and 10-year periods ended June 30, 2009 and compared its relative investment performance against the corresponding relative investment performance of each Fund for such time periods ended December 31, 2008, to the extent applicable. As of June 30, 2009, 30 of the Funds had investment performance relative to that of the respective Performance Universe that was better than the corresponding relative investment performance at December 31, 2008 for all applicable time periods. At June 30, 2009, an additional 6 Funds had investment performance relative to that of their respective Performance Universe that was better than the corresponding relative investment performance at December 31, 2008 for a majority of the applicable time periods. At June 30, 2009, 15 additional Funds had investment performance relative to that of their respective Performance Universe that was better than the corresponding relative performance at December 31, 2008 and only 29 Funds had poorer relative investment performance at June 30, 2009 compared to that at December 31, 2008.
The Board therefore concluded that the investment performance of the Funds, on an aggregate basis, had continued to improve relative to their respective Performance Universe since the data reviewed at the May 2009 meeting. Based on information provided by DMC and Macquarie Group, the Board concluded that neither the Transaction nor the New Investment Advisory Agreement would likely have an adverse effect on the investment performance of any Fund because (i) DMC and Macquarie Group did not currently expect the Transaction to cause any material change to the Funds’ portfolio management teams responsible for investment performance, which the Board found to be satisfactory and improving; and (ii) as discussed in more detail below, the Funds’ expenses were not expected to increase as a result of the Transaction.
REIT Series-17
Delaware VIP® REIT Series
Other Series Information (continued)
COMPARATIVE EXPENSES. The Trustees also evaluated expense comparison data for the Funds previously provided in May 2009. At that meeting, DMC had provided the Board with information on pricing levels and fee structures for the Funds and comparative funds. The Trustees focused on the comparative analysis of the effective management fees and total expense ratios of each Fund versus the effective management fees and expense ratios of a group of funds selected by Lipper as being similar to each Fund (the “Expense Group”). In reviewing comparative costs, each Fund’s contractual management fee and the actual management fee incurred by the Fund were compared with the contractual management fees (assuming all funds in the Expense Group were similar in size to the Fund) and actual management fees (as reported by each fund) of other funds within the Expense Group, taking into account any applicable breakpoints and fee limitations. Each Fund’s total expenses were also compared with those of its Expense Group. The Trustees also considered fees paid to Delaware Investments for nonmanagement services. At the September 3, 2009 meeting, DMC advised the Board that the more recent comparative expenses for the Funds remained consistent with the previous review in May 2009 and, consequently, the Trustees concluded that expenses of the Funds were satisfactory.
The Board also considered the Expense Agreement under negotiation in evaluating Fund expenses. The Trustees expected that the Expense Agreement would provide that LNC and Macquarie Group would pay or reimburse the Trusts for all reasonable out-of-pocket costs and expenses in connection with the Transaction and the consideration of the New Investment Advisory Agreements (subject to certain limited exceptions).
Based on information provided by DMC and Macquarie Group, the Board concluded that neither the Transaction nor the New Investment Advisory Agreements likely would have an adverse effect on the Funds’ expenses because (i) each Fund’s contractual fee rates under the New Investment Advisory Agreement would remain the same; (ii) under the Expense Agreement, the Funds would be reimbursed for all reasonable out-of-pocket costs and expenses in connection with the Transaction and the related proxy solicitation (subject to certain limited exceptions); and (iii) the expense ratios of certain Funds might decline as a result of the possible increased investment in Delaware Investments by Macquarie Group, as discussed below under “Economies of Scale.”
MANAGEMENT PROFITABILITY. At their meeting on September 3, 2009, the Board evaluated DMC’s profitability in connection with the operation of the Funds. The Board had previously considered DMC’s profitability in connection with the operation of the Funds at its May 2009 meeting. At that meeting, the Board reviewed an analysis that addressed the overall profitability of Delaware Investments’ business in providing management and other services to each of the Funds and the Delaware Investments Family of Funds as a whole. Specific attention was given to the methodology followed in allocating costs for the purpose of determining profitability.
At the May 2009 meeting, representatives of DMC had stated that the level of profits of DMC, to a certain extent, reflect operational cost savings and efficiencies initiated by Delaware Investments (including DMC and its affiliates that provide services to the Funds). The Board considered Delaware Investments’ efforts to improve services provided to Fund shareholders and to meet additional regulatory and compliance requirements resulting from recent industry-wide U.S. Securities and Exchange Commission initiatives. At that meeting, the Board found that the management fees were reasonable in light of the services rendered and the level of profitability of DMC. At the September 3, 2009 meeting, DMC advised the Board that DMC did not expect the Transaction to affect materially the profitability of Delaware Investments compared to the level of profitability considered during the May 2009 review. Moreover, the Trustees reviewed pro forma balance sheets of certain key companies in Delaware Investments as of June 30, 2009 (which were provided by Macquarie Group and DMC in response to the Trustees’ requests) and evaluated the projections of Delaware Investments’ capitalization following the Transaction for purposes of evaluating the financial ability of Delaware Investments to continue to provide the nature, extent, and quality of services as it had under the Current Investment Advisory Agreement.
Based on information provided by DMC and Macquarie Group, the Board concluded that DMC and Delaware Investments would be sufficiently capitalized following the Transaction to continue the same level and quality of services to the Funds under the New Investment Advisory Agreements as was the case under the Current Investment Advisory Agreements. The Board also concluded that Macquarie Group had sufficient financial strength and resources, as well as an ongoing commitment to a global asset management business, to continue investing in Delaware Investments, including DMC, to the extent that Macquarie Group determined it was appropriate. Finally, because services and costs were expected to be substantially the same (and DMC had represented that, correspondingly, profitability would be about the same), under the New Investment Advisory Agreements as under the Current Investment Advisory Agreements, the Trustees concluded that the profitability of Delaware Investments would not result in an inequitable charge on the Funds or their shareholders. Accordingly, the Board concluded that the fees charged under the New Investment Advisory Agreements would be reasonable in light of the services to be provided and the expected profitability of DMC.
ECONOMIES OF SCALE. The Trustees considered whether economies of scale would be realized by Delaware Investments as each Fund’s assets increase and the extent to which any economies of scale would be reflected in the management fees charged. The Trustees took into account DMC’s practice of maintaining the competitive nature of management fees based on its analysis of fees charged by comparable funds. DMC management believed, and the Board agreed, that the Funds were priced with breakpoints and relatively low management fees to reflect potential economies of scale to Fund shareholders.
The Board also acknowledged Macquarie Group’s statement that the Transaction would not by itself immediately provide additional economies of scale given Macquarie Group’s limited presence in the U.S. mutual fund market. Nonetheless, the Trustees concluded that additional economies of scale could potentially be achieved in the future if DMC were owned by Macquarie Group as a result of Macquarie Group’s willingness to invest further in Delaware Investments if appropriate opportunities arise. The Board further concluded that potential economies of scale could be achieved as a result of Delaware Investments’ expanded distribution capabilities arising from the Transaction, as well as opportunities that might arise from Macquarie Group’s global asset management business.
REIT Series-18
Delaware VIP® REIT Series
Other Series Information (continued)
FALL-OUT BENEFITS. The Board acknowledged that DMC would continue to benefit from soft dollar arrangements using portfolio brokerage of each Fund that invests in equity securities and that DMC’s profitability would likely be somewhat lower without the benefit of practices with respect to allocating Fund portfolio brokerage for brokerage and research services. The Board also considered that Macquarie Group and Delaware Investments may derive reputational, strategic, and other benefits from their association with the Delaware Investments Family of Funds, including service relationships with DMC, DSC, and Delaware Distributors, L.P., and evaluated the extent to which Delaware Investments might derive ancillary benefits from Fund operations, including the potential for procuring additional business as a result of the prestige and visibility associated with its role as service provider to the Delaware Investments Family of Funds and the benefits from allocation of Fund brokerage to improve trading efficiencies. However, the Board concluded that (i) any such benefits under the New Investment Advisory Agreements would not be dissimilar from those existing under the Current Investment Advisory Agreements, (ii) such benefits did not impose a cost or burden on the Funds or their shareholders, and (iii) such benefits would probably have an indirectly beneficial effect on the Funds and their shareholders because of the added importance that DMC and Macquarie Group might attach to the Funds as a result of the fall-out benefits that the Funds conveyed.
BOARD REVIEW OF MACQUARIE GROUP. The Trustees reviewed detailed information supplied by Macquarie Group about its operations as well as other information regarding Macquarie Group provided by independent legal counsel to the independent Trustees. Based on this review, the Trustees concluded that Delaware Investments would continue to have the financial ability to maintain the high quality of services required by the Funds. The Trustees noted that there would be a limited transition period during which some services previously provided by LNC to Delaware Investments would continue to be provided by LNC after the Closing, and concluded that this arrangement would help minimize disruption in Delaware Investments’ provision of services to the Funds following the Transaction.
The Board considered Macquarie Group’s support for Delaware Investments’ plans for Fund distribution by transferring wholesalers from Lincoln Financial Distributors, Inc., LNC’s retail distributor, to Delaware Investments, and Macquarie Group’s current intention to leave the Funds’ other service providers in place. The Board also considered Macquarie Group’s current strategic plans to increase its asset management activities, one of its core businesses, particularly in North America, and its statement that its acquisition of DMC is an important component of this strategic growth and the establishment of a significant presence in the United States. Based in part on the information provided by DMC and Macquarie Group, the Board concluded that Macquarie Group’s acquisition of Delaware Investments could potentially enhance the nature, quality, and extent of services provided to the Funds and their shareholders.
CONCLUSION. The Board concluded that the advisory fee rate under each New Investment Advisory Agreement was reasonable in relation to the services provided and that execution of the New Investment Advisory Agreement would be in the best interests of the shareholders. For each Fund, the Trustees noted that they had concluded in their most recent advisory agreement continuance considerations in May 2009 that the management fees and total expense ratios were at acceptable levels in light of the quality of services provided to the Funds and in comparison to those of the Funds’ respective peer groups; that the advisory fee schedule would not be increased and would stay the same for all of the Funds; that the total expense ratio had not changed materially since that determination; and that DMC had represented that the overall expenses for each Fund were not expected to be adversely affected by the Transaction. The Trustees also noted, with respect to the Funds that currently had the benefit of voluntary fee limitations, that Macquarie Group had no present intention to cause DMC to alter any voluntary expense limitations or reimbursements currently in effect. On that basis, the Trustees concluded that the total expense ratios and proposed advisory fees for the Funds anticipated to result from the Transaction were acceptable. In approving each New Investment Advisory Agreement, the Board stated that it anticipated reviewing the continuance of the New Investment Advisory Agreement in advance of the expiration of the initial two-year period.
REIT Series-19
Delaware Investments® Family of Funds
BOARD OF TRUSTEES/DIRECTORS AND OFFICERS ADDENDUM
A mutual fund is governed by a Board of Trustees/Directors (“Trustees”), which has oversight responsibility for the management of a fund’s business affairs. Trustees establish procedures and oversee and review the performance of the investment manager, the distributor, and others who perform services for the fund. The independent fund trustees, in particular, are advocates for shareholder interests. Each trustee has served in that capacity since he or she was elected to or appointed to the Board of Trustees, and will continue to serve until his or her retirement or the election of a new trustee in his or her place. The following is a list of the Trustees and Officers with certain background and related information.
| | | | Number of | Other |
| | | Principal | Portfolios in Fund | Directorships |
| Name, | Position(s) | | Occupation(s) | Complex Overseen | Held by |
| Address, | Held with | Length of Time | During | by Trustee | Trustee |
| and Birth Date | Fund(s) | Served | Past 5 Years | or Officer | or Officer |
| INTERESTED TRUSTEES | | | | | |
| Patrick P. Coyne1 | Chairman, | Chairman and Trustee | Patrick P. Coyne has served in | 81 | Director — |
| 2005 Market Street | President, | since August 16, 2006 | various executive capacities | | Kaydon Corp. |
| Philadelphia, PA | Chief Executive | | at different times at | | |
| 19103 | Officer, and | President and | Delaware Investments.2 | | |
| Trustee | Chief Executive Officer | | | |
| April 1963 | | since August 1, 2006 | | | |
| | | | | | |
| INDEPENDENT TRUSTEES | | | | | |
| Thomas L. Bennett | Trustee | Since | Private Investor — | 81 | Director — |
| 2005 Market Street | | March 2005 | (March 2004–Present) | | Bryn Mawr |
| Philadelphia, PA | | | | | Bank Corp. (BMTC) |
| 19103 | | | Investment Manager — | | (April 2007–Present) |
| | | | Morgan Stanley & Co. | | |
| October 1947 | | | (January 1984–March 2004) | | |
| John A. Fry | Trustee | Since | President — | 81 | Director — |
| 2005 Market Street | | January 2001 | Franklin & Marshall College | | Community Health |
| Philadelphia, PA | | | (June 2002–Present) | | Systems |
| 19103 | | | | | |
| | | | Executive Vice President — | | |
| May 1960 | | | University of Pennsylvania | | |
| | | | (April 1995–June 2002) | | |
| Anthony D. Knerr | Trustee | Since | Founder and Managing Director — | 81 | None |
| 2005 Market Street | | April 1990 | Anthony Knerr & Associates | | |
| Philadelphia, PA | | | (Strategic Consulting) | | |
| 19103 | | | (1990–Present) | | |
| |
| December 1938 | | | | | |
| Lucinda S. Landreth | Trustee | Since | Chief Investment Officer — | 81 | None |
| 2005 Market Street | | March 2005 | Assurant, Inc. | | |
| Philadelphia, PA | | | (Insurance) | | |
| 19103 | | | (2002–2004) | | |
| |
| June 1947 | | | | | |
| Ann R. Leven | Trustee | Since | Consultant — | 81 | None |
| 2005 Market Street | | October 1989 | ARL Associates | | |
| Philadelphia, PA | | | (Financial Planning) | | |
| 19103 | | | (1983–Present) | | |
| |
| November 1940 | | | | | |
REIT Series-20
| | | | Number of | Other |
| | | Principal | Portfolios in Fund | Directorships |
| Name, | Position(s) | | Occupation(s) | Complex Overseen | Held by |
| Address, | Held with | Length of Time | During | by Trustee | Trustee |
| and Birth Date | Fund(s) | Served | Past 5 Years | or Officer | or Officer |
| INDEPENDENT TRUSTEES (CONTINUED) | | | | |
| Thomas F. Madison | Trustee | Since | President and Chief | 81 | Director and Chair of |
| 2005 Market Street | | May 19973 | Executive Officer — | | Compensation |
| Philadelphia, PA | | | MLM Partners, Inc. | | Committee, |
| 19103 | | | (Small Business Investing | | Governance Committee |
| | | and Consulting) | | Member |
| February 1936 | | | (January 1993–Present) | | — CenterPoint Energy |
| |
| | | | | Lead Director and Chair |
| | | | | of Audit |
| | | | | and Governance |
| | | | | Committees, |
| | | | | Member of |
| | | | | Compensation |
| | | | | Committee — Digital |
| | | | | River, Inc. |
| |
| | | | | Director and Chair of |
| | | | | Governance |
| | | | | Committee, Audit |
| | | | | Committee Member — |
| | | | | Rimage Corporation |
| |
| | | | | Director and Chair of |
| | | | | Compensation |
| | | | | Committee — Spanlink |
| | | | | Communications |
| |
| | | | | Lead Director and Chair |
| | | | | of Compensation and |
| | | | | Governance |
| | | | | Committees — |
| | | | | Valmont Industries, Inc. |
| Janet L. Yeomans | Trustee | Since | Vice President and Treasurer | 81 | None |
| 2005 Market Street | | April 1999 | (January 2006–Present) | | |
| Philadelphia, PA | | | Vice President — Mergers & Acquisitions | | |
| 19103 | | | (January 2003–January 2006), and | | |
| | | Vice President | | |
| July 1948 | | | (July 1995–January 2003) | | |
| | | 3M Corporation | | |
| J. Richard Zecher | Trustee | Since | Founder — | 81 | Director and Audit |
| 2005 Market Street | | March 2005 | Investor Analytics | | Committee Member — |
| Philadelphia, PA | | | (Risk Management) | | Investor Analytics |
| 19103 | | | (May 1999–Present) | | |
| |
| July 1940 | | | Founder — | | |
| | | Sutton Asset Management | | |
| | | (Hedge Fund) | | |
| | | (September 1996–Present) | | |
REIT Series-21
| | | | Number of | Other |
| | | Principal | Portfolios in Fund | Directorships |
| Name, | Position(s) | | Occupation(s) | Complex Overseen | Held by |
| Address, | Held with | Length of Time | During | by Trustee | Trustee |
| and Birth Date | Fund(s) | Served | Past 5 Years | or Officer | or Officer |
| OFFICERS | | | | | |
| David F. Connor | Vice President, | Vice President since | David F. Connor has served as | 81 | None4 |
| 2005 Market Street | Deputy General | September 2000 | Vice President and Deputy | | |
| Philadelphia, PA | Counsel, and Secretary | and Secretary | General Counsel of | | |
| 19103 | | since | Delaware Investments | | |
| | October 2005 | since 2000. | | |
| December 1963 | | | | | |
| Daniel V. Geatens | Vice President | Treasurer | Daniel V. Geatens has served | 81 | None4 |
| 2005 Market Street | and Treasurer | since | in various capacities at | | |
| Philadelphia, PA | | October 25, 2007 | different times at | | |
| 19103 | | | Delaware Investments. | | |
| |
| October 1972 | | | | | |
| David P. O’Connor | Senior Vice | Senior Vice President, | David P. O’Connor has served in | 81 | None4 |
| 2005 Market Street | President, | General Counsel, and | various executive and legal | | |
| Philadelphia, PA | General Counsel, | Chief Legal Officer | capacities at different times | | |
| 19103 | and Chief | since | at Delaware Investments. | | |
| Legal Officer | October 2005 | | | |
| February 1966 | | | | | |
| Richard Salus | Senior | Chief Financial | Richard Salus has served in | 81 | None4 |
| 2005 Market Street | Vice President | Officer since | various executive capacities | | |
| Philadelphia, PA | and | November 2006 | at different times at | | |
| 19103 | Chief Financial | | Delaware Investments. | | |
| Officer | | | | |
| October 1963 | | | | | |
1 Patrick P. Coyne is considered to be an “Interested Trustee” because he is an executive officer of the Fund’s(s’) investment advisor.
2 Delaware Investments is the marketing name for Delaware Management Holdings, Inc. and its subsidiaries, including the Fund’s(s’) investment advisor, principal underwriter, and its transfer agent.
3 In 1997, several funds managed by Voyageur Fund Managers, Inc. (the “Voyageur Funds”) were incorporated into the Delaware Investments Family of Funds. Mr. Madison served as a director of the Voyageur Funds from 1993 until 1997.
4 David F. Connor, Daniel V. Geatens, David P. O’Connor, and Richard Salus serve in similar capacities for the six portfolios of the Optimum Fund Trust, which have the same investment advisor, principal underwriter, and transfer agent as the registrant.
The Statement of Additional Information for the Fund(s) includes additional information about the Trustees and Officers and is available, without charge, upon request by calling 800 523-1918.
| PO14857 AR-VIPREIT [12/09] DG3 2/10 (5427) | REIT Series-22 |
| Delaware VIP® Trust |
| Delaware VIP Small Cap Value Series |
| |
| |
| |
| |
| |
| |
| Annual Report |
| |
| |
| December 31, 2009 |
| |
| |
| |
| |
| |
| |
| |
| |
| |
| |
| |
| |
| |
| |
| |
|
Table of contents
| > Portfolio management review | 1 |
| | |
| > Performance summary | 1 |
| | |
| > Disclosure of Series expenses | 3 |
| | |
| > Sector allocation and top 10 holdings | 4 |
| | |
| > Statement of net assets | 5 |
| | |
| > Statement of operations | 7 |
| | |
| > Statements of changes in net assets | 7 |
| | |
| > Financial highlights | 8 |
| | |
| > Notes to financial statements | 10 |
| | |
| > Report of independent registered public accounting firm | 16 |
| | |
| > Other Series information | 17 |
| | |
| > Board of trustees/directors and officers addendum | 21 |
On January 4, 2010, Delaware Management Holdings, Inc., and its subsidiaries (collectively known by the marketing name of Delaware Investments) were sold by a subsidiary of Lincoln National Corporation to Macquarie Group Limited, a global provider of banking, financial, advisory, investment and funds management services. Please see your Series’ prospectus and any supplements thereto for more complete information.
Investments in Delaware VIP® Small Cap Value Series are not and will not be deposits with or liabilities of Macquarie Bank Limited ABN 46 008 583 542 and its holding companies, including subsidiaries or related companies, and are subject to investment risk, including possible delays in repayment and loss of income and capital invested. No Macquarie Group company guarantees or will guarantee the performance of the Series, the repayment of capital from the Series, or any particular rate of return.
Unless otherwise noted, views expressed herein are current as of Dec. 31, 2009, and are subject to change.
Funds are not FDIC insured and are not guaranteed. It is possible to lose the principal amount invested.
Mutual fund advisory services provided by Delaware Management Company, a series of Delaware Management Business Trust, which is a registered investment advisor. Delaware Investments is the marketing name of Delaware Management Holdings, Inc. and its subsidiaries. Macquarie Group refers to Macquarie Group Limited and its subsidiaries and affiliates worldwide.
© 2010 Delaware Management Holdings, Inc.
All third-party trademarks cited are the property of their respective owners.
| Delaware VIP® Trust — Delaware VIP Small Cap Value Series | |
| Portfolio management review | Jan. 12, 2010 |
For its fiscal period ended Dec. 31, 2009, Delaware VIP Small Cap Value Series returned +31.83% for Standard Class shares and +31.56% for Service Class shares, both with all distributions reinvested. The Series’ benchmark index, the Russell 2000® Value Index, returned +20.55%.
The economy was in a deep recession during the first three months of the fiscal period, and the market reacted to the plethora of dire news. In March 2009, however, a stock market turnaround began, as investors seemed to begin believing that the worst was over. We believe this change in outlook was primarily driven by the government’s actions earlier in the year, particularly those meant to encourage consumer spending, including the cash-for-clunkers program, which took effect in August 2009, and the implementation of a housing tax credit. Both proved popular with consumers. Despite the stock market turnaround and signs that the economy was slowly healing, many businesses remained cautious about spending. (Source: Bloomberg.)
In January 2009, when the Fed began taking aggressive measures to encourage consumer spending, we implemented a two-pronged investment strategy. We sought stocks that we believed would benefit from improving business conditions, and we increased our positions in more economically sensitive areas of the economy in anticipation of increased consumer spending. We continued this two-pronged approach during the majority of the year.
During the second half of the fiscal year, we gradually reduced the Series’ position in the consumer services sector, which represented a significant overweight earlier in the year. The sector was one of the strongest performers in the benchmark index and several consumer services stocks within the Series achieved or exceeded our target prices.
One of the Series’ top contributors was coal producer Walter Energy. The stock’s performance was driven primarily by the price of metallurgical coal, which defied our expectations by remaining strong during the majority of the fiscal year. We trimmed the Series’ position in November, to realize some gain and create an opportunity to pursue other investment opportunities.
One of the largest detractors from performance during the fiscal period was Hercules Offshore, a provider of oil and gas drilling services. The stock price suffered as both day rates (the amount of money drillers such as Hercules are paid per day) and natural gas prices declined during the fiscal year. Because these trends seemed likely to continue, we sold the position.
At the close of the fiscal year, we believe the Series was generally positioned to benefit from the stimulus being added to the financial system. As such, it was overweight compared to the Russell 2000 Value Index in the more-cyclical sectors of the equity market.
| Unless otherwise noted, the views expressed are current as of Dec. 31, 2009, and are subject to change. |
Performance summary
The performance data quoted below represent past performance; past performance does not guarantee future results. Investment return and principal value will fluctuate so your shares, when redeemed, may be worth more or less than their original cost. Please obtain the performance data for the most recent month end by calling the number noted in the introductory section of this report on the page related to this Series.
You should consider the investment objectives, risks, charges, and expenses of the Series carefully before investing. The Delaware VIP Small Cap Value Series prospectus contains this and other important information about the Series. To obtain a prospectus, contact the company noted on the page related to this Series in the introductory section of this report, either by phone or through the company Web site. We advise you to read the prospectus carefully before you invest or send money.
Delaware VIP Small Cap Value Series
| Average annual total returns | | | | | | | | | | | | | |
| For periods ended Dec. 31, 2009 | 1 year | | 3 years | | 5 years | | 10 years | | Lifetime |
Standard Class shares (commenced
operations on Dec. 27, 1993) | +31.83 | % | | -4.78 | % | | +1.88 | % | | +8.97 | % | | +9.76% |
Service Class shares (commenced
operations on May 1, 2000) | +31.56 | % | | -5.01 | % | | +1.63 | % | | n/a | | +9.13% |
Returns reflect the reinvestment of all distributions.
Small Cap Value Series-1
Delaware VIP® Small Cap Value Series (continued)
As described in the Series’ most recent prospectus, the net expense ratio for Service Class shares of the Series was 1.10%, while total operating expenses for Standard Class and Service Class shares were 0.85% and 1.15%, respectively. The management fee for Standard Class and Service Class shares was 0.73%.
The Series’ distributor has contracted to limit the 12b-1 fees for Service Class shares to no more than 0.25% of average daily net assets through April 30, 2010.
Earnings from a variable annuity or variable life investment compound tax-free until withdrawal, and as a result, no adjustments were made for income taxes.
Expense limitations were in effect for both classes during certain periods shown in the Series performance chart on the previous page and in the Performance of a $10,000 Investment chart below.
Performance data do not reflect insurance fees related to a variable annuity or variable life investment or the deferred sales charge that would apply to certain withdrawals of investments. Performance shown here would have been reduced if such fees were included or the expense limitation removed. For more information about fees, consult your variable annuity or variable life prospectus.
Investments in variable products involve risk. The Series will be affected primarily by changes in stock prices.
Investments in small and/or medium-sized companies typically exhibit greater risk and higher volatility than larger, more established companies.
Instances of high double-digit returns are unusual, cannot be sustained, and were primarily achieved during favorable market conditions.
Please read both the contract and underlying prospectus for specific details regarding the product’s risk profile.
The chart shows a $10,000 investment in the Delaware VIP Small Cap Value Series Standard Class shares for the period from Dec. 31, 1999, through Dec. 31, 2009.
The chart also shows $10,000 invested in the Russell 2000 Value Index for the period from Dec. 31, 1999, through Dec. 31, 2009. The Russell 2000 Value Index measures the performance of the small-cap value segment of the U.S. equity universe. It includes those Russell 2000 companies with lower price-to-book ratios and lower forecasted growth values.
Index performance returns do not reflect any management fees, transaction costs or expenses. Indices are unmanaged and one cannot invest directly in an index.
Performance of Service Class shares will vary due to different charges and expenses.
Past performance is not a guarantee of future results.
Small Cap Value Series-2
Delaware VIP® Trust — Delaware VIP Small Cap Value Series
Disclosure of Series Expenses
For the Period July 1, 2009 to December 31, 2009
As a shareholder of the Series, you incur ongoing costs, including management fees; distribution and/or service (12b-1) fees; and other Series expenses. This Example is intended to help you understand your ongoing costs (in dollars) of investing in the Series and to compare these costs with the ongoing costs of investing in other mutual funds.
The Example is based on an investment of $1,000 invested at the beginning of the period and held for the entire period from July 1, 2009 to December 31, 2009.
Actual Expenses
The first section of the table shown, “Actual Series Return,” provides information about actual account values and actual expenses. You may use the information in this section of the table, together with the amount you invested, to estimate the expenses that you paid over the period. Simply divide your account value by $1,000 (for example, an $8,600 account value divided by $1,000 = 8.6), then multiply the result by the number in the first section under the heading entitled “Expenses Paid During Period” to estimate the expenses you paid on your account during the period.
Hypothetical Example for Comparison Purposes
The second section of the table shown, “Hypothetical 5% Return,” provides information about hypothetical account values and hypothetical expenses based on the Series’ actual expense ratio and an assumed rate of return of 5% per year before expenses, which is not the Series’ actual return. The hypothetical account values and expenses may not be used to estimate the actual ending account balance or expenses you paid for the period. You may use this information to compare the ongoing costs of investing in the Series and other funds. To do so, compare the 5% hypothetical example with the 5% hypothetical examples that appear in the shareholder reports of other funds.
Please note that the expenses shown in the table are meant to highlight your ongoing costs only. As a shareholder of the Series, you do not incur any transaction costs, such as sales charges (loads), redemption fees or exchange fees, but shareholders of other funds may incur such costs. Also, the fees related to the variable annuity investment or the deferred sales charge that could apply have not been included. Therefore, the second section of the table is useful in comparing ongoing costs only, and will not help you determine the relative total costs of owning different funds. The Series’ actual expenses shown in the table reflect fee waivers in effect. The expenses shown in the table assume reinvestment of all dividends and distributions.
Expense Analysis of an Investment of $1,000
| | | | | | | Expenses |
| Beginning | | Ending | | | | Paid During |
| Account | | Account | | Annualized | | Period |
| Value | | Value | | Expense | | 7/1/09 to |
| 7/1/09 | | 12/31/09 | | Ratios | | 12/31/09* |
| Actual Series Return | | | | | | | | | | | | | |
| Standard Class | | $ | 1,000.00 | | | | $ | 1,311.20 | | | 0.82% | | $4.78 |
| Service Class | | | 1,000.00 | | | | | 1,309.60 | | | 1.07% | | 6.23 |
| Hypothetical 5% Return (5% return before expenses) |
| Standard Class | | $ | 1,000.00 | | | | $ | 1,021.07 | | | 0.82% | | $4.18 |
| Service Class | | | 1,000.00 | | | | | 1,019.81 | | | 1.07% | | 5.45 |
*“Expenses Paid During Period” are equal to the Series’ annualized expense ratio, multiplied by the average account value over the period, multiplied by 184/365 (to reflect the one-half year period).
Small Cap Value Series-3
Delaware VIP® Trust — Delaware VIP Small Cap Values Series
Sector Allocation and Top 10 Holdings
As of December 31, 2009
Sector designations may be different than the sector designations presented in other Series materials. The sector designations may represent the investment manager’s internal sector classifications, which may result in the sector designations for one series being different than another series’ sector designations.
| | Percentage |
| Sector | | of Net Assets |
| Common Stock | | 97.49 | % |
| Basic Industry | | 10.52 | % |
| Business Services | | 3.02 | % |
| Capital Spending | | 9.42 | % |
| Consumer Cyclical | | 1.88 | % |
| Consumer Services | | 12.57 | % |
| Consumer Staples | | 3.82 | % |
| Energy | | 8.02 | % |
| Financial Services | | 20.74 | % |
| Health Care | | 3.68 | % |
| Real Estate | | 4.19 | % |
| Technology | | 13.91 | % |
| Transportation | | 3.14 | % |
| Utilities | | 2.58 | % |
| Convertible Preferred Stock | | 0.94 | % |
| Discount Note | | 0.15 | % |
| Securities Lending Collateral | | 8.48 | % |
| Total Value of Securities | | 107.06 | % |
| Obligation to Return Securities Lending Collateral | | (8.67 | %) |
| Receivables and Other Assets Net of Liabilities | | 1.61 | % |
| Total Net Assets | | 100.00 | % |
Holdings are for informational purposes only and are subject to change at any time. They are not a recommendation to buy, sell, or hold any security.
| | Percentage |
| Top 10 Holdings | | of Net Assets |
| Platinum Underwriters Holdings | | 2.43 | % |
| Whiting Petroleum | | 2.39 | % |
| Newfield Exploration | | 2.31 | % |
| Walter Energy | | 2.15 | % |
| FMC | | 2.03 | % |
| Crown Holdings | | 1.89 | % |
| Albemarle | | 1.88 | % |
| Synopsys | | 1.85 | % |
| Del Monte Foods | | 1.77 | % |
| Cytec Industries | | 1.77 | % |
Small Cap Value Series-4
Delaware VIP® Trust — Delaware VIP Small Cap Value Series
Statement of Net Assets
December 31, 2009
| | Number of | | |
| | Shares | | Value |
| COMMON STOCK–97.49% | | | | | |
| Basic Industry–10.52% | | | | | |
| *Albemarle | | 387,500 | | $ | 14,093,375 |
| †Crown Holdings | | 553,000 | | | 14,145,740 |
| Cytec Industries | | 363,800 | | | 13,249,596 |
| FMC | | 272,900 | | | 15,216,904 |
| Kaiser Aluminum | | 117,400 | | | 4,886,188 |
| †Thompson Creek Metals | | 605,900 | | | 7,101,148 |
| Valspar | | 373,100 | | | 10,125,934 |
| | | | | 78,818,885 |
| Business Services–3.02% | | | | | |
| Brink’s | | 218,200 | | | 5,310,988 |
| †Brink’s Home Security Holdings | | 221,300 | | | 7,223,232 |
| †United Stationers | | 113,300 | | | 6,441,105 |
| Viad | | 178,200 | | | 3,676,266 |
| | | | | 22,651,591 |
| Capital Spending–9.42% | | | | | |
| *Actuant Class A | | 478,800 | | | 8,872,164 |
| †Altra Holdings | | 259,200 | | | 3,201,120 |
| Chicago Bridge & Iron | | 388,100 | | | 7,847,382 |
| Gardner Denver | | 269,400 | | | 11,462,970 |
| Insteel Industries | | 330,400 | | | 4,295,200 |
| Mueller Water Products Class A | | 806,584 | | | 4,194,237 |
| *Regal Beloit | | 188,100 | | | 9,769,914 |
| *Wabtec | | 119,000 | | | 4,859,960 |
| *Walter Energy | | 213,500 | | | 16,078,685 |
| | | | | 70,581,632 |
| Consumer Cyclical–1.88% | | | | | |
| *Autoliv | | 100,000 | | | 4,336,000 |
| MDC Holdings | | 314,000 | | | 9,746,560 |
| | | | | 14,082,560 |
| Consumer Services–12.57% | | | | | |
| bebe Stores | | 332,200 | | | 2,082,894 |
| Brinker International | | 265,000 | | | 3,953,800 |
| Cato Class A | | 375,000 | | | 7,522,500 |
| *†CEC Entertainment | | 219,200 | | | 6,996,864 |
| †Children’s Place Retail Stores | | 171,700 | | | 5,667,817 |
| †Collective Brands | | 212,200 | | | 4,831,794 |
| Finish Line Class A | | 470,600 | | | 5,906,030 |
| †Genesco | | 263,500 | | | 7,235,710 |
| *†Jack in the Box | | 312,900 | | | 6,154,743 |
| Men’s Wearhouse | | 248,800 | | | 5,239,728 |
| *Meredith | | 259,500 | | | 8,005,575 |
| *Movado Group | | 370,100 | | | 3,597,372 |
| PETsMART | | 272,300 | | | 7,267,687 |
| Phillips-Van Heusen | | 121,000 | | | 4,922,280 |
| Stage Stores | | 426,325 | | | 5,269,377 |
| †Warnaco Group | | 184,100 | | | 7,767,179 |
| Wolverine World Wide | | 63,650 | | | 1,732,553 |
| | | | | 94,153,903 |
| Consumer Staples–3.82% | | | | | |
| Del Monte Foods | | 1,171,100 | | | 13,280,274 |
| Herbalife | | 226,300 | | | 9,180,991 |
| Schweitzer-Mauduit International | | 87,600 | | | 6,162,660 |
| | | | | 28,623,925 |
| Energy–8.02% | | | | | |
| *†Encore Acquisition | | 151,500 | | | 7,275,030 |
| *†Forest Oil | | 280,000 | | | 6,230,000 |
| †Newfield Exploration | | 359,400 | | | 17,333,862 |
| Southwest Gas | | 397,000 | | | 11,326,410 |
| †Whiting Petroleum | | 250,400 | | | 17,896,088 |
| | | | | 60,061,390 |
| Financial Services–20.74% | | | | | |
| Bank of Hawaii | | 268,500 | | | 12,635,610 |
| Berkley (W.R.) | | 267,243 | | | 6,584,868 |
| Boston Private Financial Holdings | | 666,200 | | | 3,843,974 |
| Community Bank System | | 299,800 | | | 5,789,138 |
| CVB Financial | | 296,500 | | | 2,561,760 |
| East West Bancorp | | 198,600 | | | 3,137,880 |
| †=@East West Bancorp | | 233,446 | | | 3,688,447 |
| First Financial Bancorp | | 359,000 | | | 5,227,040 |
| First Midwest Bancorp | | 355,000 | | | 3,865,950 |
| Hancock Holding | | 289,000 | | | 12,655,310 |
| Harleysville Group | | 340,300 | | | 10,818,137 |
| Independent Bank | | 364,800 | | | 7,620,672 |
| Infinity Property & Casualty | | 280,500 | | | 11,399,520 |
| NBT Bancorp | | 500,500 | | | 10,195,185 |
| Platinum Underwriters Holdings | | 475,800 | | | 18,218,381 |
| S&T Bancorp | | 168,900 | | | 2,872,989 |
| Selective Insurance Group | | 734,500 | | | 12,082,525 |
| *StanCorp Financial Group | | 119,600 | | | 4,786,392 |
| Sterling Bancshares | | 1,218,600 | | | 6,251,418 |
| Univest Corporation of Pennsylvania | | 65,800 | | | 1,153,474 |
| Validus Holdings | | 280,721 | | | 7,562,624 |
| Wesbanco | | 195,700 | | | 2,414,938 |
| | | | | 155,366,232 |
| Health Care–3.68% | | | | | |
| †Alliance HealtCare Services | | 392,800 | | | 2,242,888 |
| *Cooper | | 168,200 | | | 6,411,784 |
| Service Corporation International | | 1,225,800 | | | 10,039,302 |
| Universal Health Services Class B | | 291,800 | | | 8,899,900 |
| | | | | 27,593,874 |
| Real Estate–4.19% | | | | | |
| Brandywine Realty Trust | | 538,933 | | | 6,143,836 |
| *Education Realty Trust | | 408,700 | | | 1,978,108 |
| Government Properties Income Trust | | 197,500 | | | 4,538,550 |
| Highwoods Properties | | 297,500 | | | 9,921,625 |
| Washington Real Estate | | | | | |
| Investment Trust | | 318,000 | | | 8,760,900 |
| | | | | 31,343,019 |
| Technology–13.91% | | | | | |
| *†Amkor Technologies | | 1,020,500 | | | 7,306,780 |
| †Brocade Communications Systems | | 613,200 | | | 4,678,716 |
| *†Checkpoint Systems | | 364,200 | | | 5,554,050 |
| †Cirrus Logic | | 1,414,000 | | | 9,643,480 |
| †Compuware | | 829,000 | | | 5,993,670 |
| *†Electronics for Imaging | | 330,000 | | | 4,293,300 |
| *†ON Semiconductor | | 613,000 | | | 5,400,530 |
| †Parametric Technology | | 647,700 | | | 10,583,418 |
Small Cap Value Series-5
Delaware VIP® Small Cap Value Series
Statement of Net Assets (continued)
| | Number of | | | |
| | Shares | | Value |
| COMMON STOCK (continued) | | | | | | |
| Technology (continued) | | | | | | |
| †Premiere Global Services | | | 621,950 | | $ | 5,131,088 |
| QAD | | | 358,500 | | | 2,190,435 |
| *†Sybase | | | 295,700 | | | 12,833,380 |
| †Synopsys | | | 621,100 | | | 13,838,108 |
| *†Tech Data | | | 172,500 | | | 8,048,850 |
| *†Vishay Intertechnology | | | 1,040,200 | | | 8,685,670 |
| | | | | | 104,181,475 |
| Transportation–3.14% | | | | | | |
| *Alexander & Baldwin | | | 359,400 | | | 12,302,262 |
| *†Kirby | | | 215,500 | | | 7,505,865 |
| †Saia | | | 247,800 | | | 3,672,396 |
| | | | | | 23,480,523 |
| Utilities–2.58% | | | | | | |
| *Black Hills | | | 162,600 | | | 4,330,038 |
| †El Paso Electric | | | 551,700 | | | 11,188,476 |
| *Otter Tail | | | 152,700 | | | 3,786,960 |
| | | | | | 19,305,474 |
| Total Common Stock | | | | | | |
| | (cost $642,215,986) | | | | | | 730,244,483 |
| | | | | | | |
| CONVERTIBLE PREFERRED | | | | | | |
| | STOCK–0.94% | | | | | | |
| =@East West Bancorp Series A 8.00% exercise | | | | | | |
| | price $15.54, expiration date 12/31/49 | | | 4,030 | | | 7,043,586 |
| Total Convertible Preferred Stock | | | | | | |
| | (cost $4,030,000) | | | | | | 7,043,586 |
| | | | | | | |
| | Principal | | | |
| | Amount | | |
| ≠DISCOUNT NOTE–0.15% | | | | | | |
| Federal Home Loan Bank 0.001% 1/4/10 | | | $1,101,000 | | | 1,101,000 |
| Total Discount Note | | | | | | |
| | (cost $1,101,000) | | | | | | 1,101,000 |
| | | | | | | |
| Total Value of Securities | | | | | | |
| | Before Securities | | | | | | |
| | Lending Collateral–98.58% | | | | | | |
| | (cost $647,346,986) | | | | | | 738,389,069 |
| | | | | | | |
| | Number of | | | |
| | Shares | | | |
| SECURITIES LENDING | | | | | | |
| | COLLATERAL**–8.48% | | | | | | |
| Investment Companies | | | | | | |
| | Mellon GSL DBT II Collateral Fund | | | 38,581,315 | | | 38,581,315 |
| | BNY Mellon SL DB II Liquidating Fund | | | 25,190,939 | | | 24,901,243 |
| †@ | Mellon GSL Reinvestment Trust II | | | 1,155,865 | | | 49,124 |
| Total Securities Lending Collateral | | | | | | |
| | (cost $64,928,119) | | | | | | 63,531,682 |
| TOTAL VALUE OF SECURITIES–107.06% (cost $712,275,105) | | | 801,920,751 | © |
| OBLIGATION TO RETURN SECURITIES LENDING COLLATERAL**–(8.67%) | | | (64,928,119 | ) |
| RECEIVABLES AND OTHER ASSETS NET OF LIABILITIES–1.61% | | | 12,037,939 | |
| NET ASSETS APPLICABLE TO 30,833,718 SHARES OUTSTANDING–100.00% | | $ | 749,030,571 | |
| NET ASSET VALUE–DELAWARE VIP SMALL CAP VALUE STANDARD CLASS | | | | |
| ($279,722,449 / 11,504,204 Shares) | | | | $24.31 | |
| NET ASSET VALUE–DELAWARE VIP SMALL CAP VALUE SERIES SERVICE CLASS | | | | |
| ($469,308,122 / 19,329,514 Shares) | | | | $24.28 | |
| COMPONENTS OF NET ASSETS AT DECEMBER 31, 2009: | | | | |
| Shares of beneficial interest (unlimited authorization–no par) | | $ | 736,389,092 | |
| Undistributed net investment income | | | 4,880,811 | |
| Accumulated net realized loss on investments | | | (81,884,978 | ) |
| Net unrealized appreciation of investments | | | 89,645,646 | |
| Total net assets | | $ | 749,030,571 | |
| ____________________ | | | | |
| * | Fully or partially on loan. |
| † | Non income producing security. |
| = | Security is being fair valued in accordance with the Series’ fair valuation policy. At December 31, 2009, the aggregate amount of fair valued securities was $10,732,033, which represented 1.43% of the Series’ net assets. See Note 1 in “Notes to Financial Statements.” |
| @ | Illiquid security. At December 31, 2009, the aggregate amount of illiquid securities was $10,781,157, which represented 1.44% of the Series’ net assets. See Note 9 in “Notes to Financial Statements.” |
| ≠ | The rate shown is the effective yield at the time of purchase. |
| ** | See Note 8 in “Notes to Financial Statements.” |
| © | Includes $63,255,886 of securities loaned. |
See accompanying notes
Small Cap Value Series-6
Delaware VIP® Trust —
Delaware VIP Small Cap Value Series
Statement of Operations
Year Ended December 31, 2009
| INVESTMENT INCOME: | | | | |
| Dividends | | $ | 10,661,096 | |
| Interest | | | 25,009 | |
| Securities lending income | | | 200,718 | |
| Foreign tax withheld | | | (5,235 | ) |
| | | | 10,881,588 | |
| | | | | |
| EXPENSES: | | | | |
| Management fees | | | 4,812,743 | |
| Distribution expenses – Service Class | | | 1,228,648 | |
| Accounting and administration expenses | | | 260,728 | |
| Reports and statements to shareholders | | | 157,306 | |
| Dividend disbursing and transfer agent fees and expenses | | | 98,309 | |
| Legal fees | | | 92,336 | |
| Audit and tax | | | 48,184 | |
| Trustees’ fees | | | 42,060 | |
| Insurance fees | | | 16,811 | |
| Custodian fees | | | 11,657 | |
| Consulting fees | | | 8,948 | |
| Dues and services | | | 6,185 | |
| Trustees’ expenses | | | 3,057 | |
| Pricing fees | | | 766 | |
| | | 6,787,738 | |
| Less waiver of distribution expenses – Service Class | | | (204,727 | ) |
| Total operating expenses | | | 6,583,011 | |
| | | | | |
| NET INVESTMENT INCOME | | | 4,298,577 | |
| | | | | |
NET REALIZED AND UNREALIZED GAIN (LOSS)
ON INVESTMENTS AND FOREIGN CURRENCIES: | | | | |
| Net realized loss on: | | | | |
| Investments | | | (49,241,116 | ) |
| Foreign currencies | | | (496 | ) |
| Net realized loss | | | (49,241,612 | ) |
Net change in unrealized appreciation/depreciation of
investments and foreign currencies | | | 231,671,851 | |
| | | | | |
NET REALIZED AND UNREALIZED GAIN
ON INVESTMENTS AND FOREIGN CURRENCIES | | | 182,430,239 | |
| | | | | |
NET INCREASE IN NET ASSETS RESULTING
FROM OPERATIONS | | $ | 186,728,816 | |
| | | | | |
See accompanying notes
Delaware VIP Trust —
Delaware VIP Small Cap Value Series
Statements of Changes in Net Assets
| | Year Ended |
| | 12/31/09 | | 12/31/08 |
| INCREASE (DECREASE) IN NET | | | | | | | | |
| | ASSETS FROM OPERATIONS: | | | | | | | | |
| Net investment income | | $ | 4,298,577 | | | $ | 5,168,450 | |
| Net realized loss on investments and | | | | | | | | |
| | foreign currencies | | | (49,241,612 | ) | | | (29,423,642 | ) |
| Net change in unrealized appreciation/ | | | | | | | | |
| | depreciation of investments and | | | | | | | | |
| | foreign currencies | | | 231,671,851 | | | | (253,727,101 | ) |
| Net increase (decrease) in net assets | | | | | | | | |
| | resulting from operations | | | 186,728,816 | | | | (277,982,293 | ) |
| | | | | | | | | |
| DIVIDENDS AND DISTRIBUTIONS | | | | | | | | |
| | TO SHAREHOLDERS FROM: | | | | | | | | |
| Net investment income: | | | | | | | | |
| Standard Class | | | (2,410,975 | ) | | | (2,314,150 | ) |
| | Service Class | | | (2,827,391 | ) | | | (2,528,148 | ) |
| Net realized gain on investments: | | | | | | | | |
| Standard Class | | | – | | | | (20,274,716 | ) |
| | Service Class | | | – | | | | (36,492,362 | ) |
| | | (5,238,366 | ) | | | (61,609,376 | ) |
| | | | | | | | | |
| CAPITAL SHARE TRANSACTIONS: | | | | | | | | |
| Proceeds from shares sold: | | | | | | | | |
| | Standard Class | | | 35,346,942 | | | | 67,819,194 | |
| | Service Class | | | 40,983,538 | | | | 85,050,259 | |
| Net asset value of shares issued upon | | | | | | | | |
| reinvestment of dividends and distributions: | | | | | | | | |
| | Standard Class | | | 2,410,975 | | | | 22,588,865 | |
| Service Class | | | 2,827,391 | | | | 39,020,510 | |
| | | 81,568,846 | | | | 214,478,828 | |
| Cost of shares repurchased: | | | | | | | | |
| | Standard Class | | | (66,943,338 | ) | | | (82,634,357 | ) |
| | Service Class | | | (101,954,279 | ) | | | (116,855,931 | ) |
| | | (168,897,617 | ) | | | (199,490,288 | ) |
| Increase (decrease) in net assets derived | | | | | | | | |
| | from capital share transactions | | | (87,328,771 | ) | | | 14,988,540 | |
| | | | | | | | | |
| NET INCREASE (DECREASE) | | | | | | | | |
| | IN NET ASSETS | | | 94,161,679 | | | | (324,603,129 | ) |
| | | | | | | | | |
| NET ASSETS: | | | | | | | | |
| Beginning of year | | | 654,868,892 | | | | 979,472,021 | |
| End of year (including undistributed | | | | | | | | |
| | net investment income of $4,880,811 | | | | | | | | |
| | and $5,821,096, respectively) | | $ | 749,030,571 | | | $ | 654,868,892 | |
| | | | | | | | | |
See accompanying notes
Small Cap Value Series-7
Delaware VIP® Trust — Delaware VIP Small Cap Value Series
Financial Highlights
Selected data for each share of the Series outstanding throughout each period were as follows:
| | Delaware VIP Small Cap Value Series Standard Class |
| | Year Ended |
| | 12/31/09 | | | 12/31/08 | | | 12/31/07 | | | 12/31/06 | | | 12/31/05 | |
| Net asset value, beginning of period | | $18.630 | | | $28.650 | | | $33.420 | | | $30.830 | | | $30.450 | |
| | | | | | | | | | | | | | | | |
| Income (loss) from investment operations: | | | | | | | | | | | | | | | |
| Net investment income1 | | 0.160 | | | 0.190 | | | 0.194 | | | 0.146 | | | 0.121 | |
Net realized and unrealized gain (loss) on
investments and foreign currencies | | 5.712 | | | (8.248 | ) | | (2.127 | ) | | 4.703 | | | 2.539 | |
| Total from investment operations | | 5.872 | | | (8.058 | ) | | (1.933 | ) | | 4.849 | | | 2.660 | |
| | | | | | | | | | | | | | | | |
| Less dividends and distributions from: | | | | | | | | | | | | | | | |
| Net investment income | | (0.192 | ) | | (0.201 | ) | | (0.168 | ) | | (0.082 | ) | | (0.114 | ) |
| Net realized gain on investments | | – | | | (1.761 | ) | | (2.669 | ) | | (2.177 | ) | | (2.166 | ) |
| Total dividends and distributions | | (0.192 | ) | | (1.962 | ) | | (2.837 | ) | | (2.259 | ) | | (2.280 | ) |
| | | | | | | | | | | | | | | | |
| Net asset value, end of period | | $24.310 | | | $18.630 | | | $28.650 | | | $33.420 | | | $30.830 | |
| | | | | | | | | | | | | | | | |
| Total return2 | | 31.83% | | | (29.88% | ) | | (6.62% | ) | | 16.19% | | | 9.42% | |
| | | | | | | | | | | | | | | | |
| Ratios and supplemental data: | | | | | | | | | | | | | | | |
| Net assets, end of period (000 omitted) | | $279,723 | | | $241,427 | | | $353,412 | | | $502,801 | | | $413,633 | |
| Ratio of expenses to average net assets | | 0.85% | | | 0.85% | | | 0.81% | | | 0.84% | | | 0.85% | |
| Ratio of net investment income to average net assets | | 0.82% | | | 0.78% | | | 0.61% | | | 0.46% | | | 0.41% | |
| Portfolio turnover | | 19% | | | 29% | | | 27% | | | 36% | | | 32% | |
____________________
1The average shares outstanding method has been applied for per share information. |
2Total investment return is based on the change in net asset value of a share during the period and assumes reinvestment of dividends and distributions at net asset value. |
See accompanying notes
Small Cap Value Series-8
Delaware VIP® Small Cap Value Series
Financial Highlights (continued)
Selected data for each share of the Series outstanding throughout each period were as follows:
| | Delaware VIP Small Cap Value Series Service Class |
| | Year Ended |
| | 12/31/09 | | | 12/31/08 | | | 12/31/07 | | | 12/31/06 | | | 12/31/05 | |
| Net asset value, beginning of period | | $18.590 | | | $28.570 | | | $33.330 | | | $30.760 | | | $30.390 | |
| | | | | | | | | | | | | | | | |
| Income (loss) from investment operations: | | | | | | | | | | | | | | | |
| Net investment income1 | | 0.111 | | | 0.129 | | | 0.115 | | | 0.066 | | | 0.048 | |
Net realized and unrealized gain (loss) on
investments and foreign currencies | | 5.709 | | | (8.226 | ) | | (2.117 | ) | | 4.689 | | | 2.536 | |
| Total from investment operations | | 5.820 | | | (8.097 | ) | | (2.002 | ) | | 4.755 | | | 2.584 | |
| | | | | | | | | | | | | | | | |
| Less dividends and distributions from: | | | | | | | | | | | | | | | |
| Net investment income | | (0.130 | ) | | (0.122 | ) | | (0.089 | ) | | (0.008 | ) | | (0.048 | ) |
| Net realized gain on investments | | – | | | (1.761 | ) | | (2.669 | ) | | (2.177 | ) | | (2.166 | ) |
| Total dividends and distributions | | (0.130 | ) | | (1.883 | ) | | (2.758 | ) | | (2.185 | ) | | (2.214 | ) |
| | | | | | | | | | | | | | | | |
| Net asset value, end of period | | $24.280 | | | $18.590 | | | $28.570 | | | $33.330 | | | $30.760 | |
| | | | | | | | | | | | | | | | |
| Total return2 | | 31.56% | | | (30.07% | ) | | (6.84% | ) | | 15.89% | | | 9.15% | |
| | | | | | | | | | | | | | | | |
| Ratios and supplemental data: | | | | | | | | | | | | | | | |
| Net assets, end of period (000 omitted) | | $469,308 | | | $413,442 | | | $626,060 | | | $682,181 | | | $511,723 | |
| Ratio of expenses to average net assets | | 1.10% | | | 1.10% | | | 1.06% | | | 1.09% | | | 1.10% | |
| Ratio of expenses to average net assets | | | | | | | | | | | | | | | |
| prior to fees waived and expenses paid indirectly | | 1.15% | | | 1.15% | | | 1.11% | | | 1.14% | | | 1.15% | |
| Ratio of net investment income to average net assets | | 0.57% | | | 0.53% | | | 0.36% | | | 0.21% | | | 0.16% | |
| Ratio of net investment income to average net assets | | | | | | | | | | | | | | | |
| prior to fees waived and expenses paid indirectly | | 0.52% | | | 0.48% | | | 0.31% | | | 0.16% | | | 0.11% | |
| Portfolio turnover | | 19% | | | 29% | | | 27% | | | 36% | | | 32% | |
____________________
1The average shares outstanding method has been applied for per share information. |
2Total investment return is based on the change in net asset value of a share during the period and assumes reinvestment of dividends and distributions at net asset value. Total investment return during all of the periods shown reflects a waiver by the distributor. Performance would have been lower had the waiver not been in effect. |
See accompanying notes
Small Cap Value Series-9
Delaware VIP® Trust — Delaware VIP Small Cap Value Series
Notes to Financial Statements
December 31, 2009
Delaware VIP Trust (Trust) is organized as a Delaware statutory trust and offers 12 series: Delaware VIP Cash Reserve Series, Delaware VIP Diversified Income Series, Delaware VIP Emerging Markets Series, Delaware VIP Growth Opportunities Series, Delaware VIP High Yield Series, Delaware VIP International Value Equity Series, Delaware VIP Limited-Term Diversified Income Series (formerly, Delaware VIP Capital Reserves Series), Delaware VIP REIT Series, Delaware VIP Small Cap Value Series, Delaware VIP Trend Series, Delaware VIP U.S. Growth Series and Delaware VIP Value Series. These financial statements and the related notes pertain to Delaware VIP Small Cap Value Series (Series). The Trust is an open-end investment company. The Series is considered diversified under the Investment Company Act of 1940, as amended, and offers Standard Class and Service Class shares. The Standard Class shares do not carry a 12b-1 fee and the Service Class shares carry a 12b-1 fee. The shares of the Series are sold only to separate accounts of life insurance companies.
The investment objective of the Series is to seek capital appreciation.
1. Significant Accounting Policies
The following accounting policies are in accordance with U.S. generally accepted accounting principles (U.S. GAAP) and are consistently followed by the Series.
Security Valuation—Equity securities, except those traded on the Nasdaq Stock Market, Inc. (Nasdaq) are valued at the last quoted sales price as of the time of the regular close of the New York Stock Exchange (NYSE) on the valuation date. Securities traded on the Nasdaq are valued in accordance with the Nasdaq Official Closing Price, which may not be the last sales price. If on a particular day an equity security does not trade, then the mean between the bid and ask prices will be used. Short-term debt securities are valued at market value. Investment companies are valued at net asset value per share. Generally, other securities and assets for which market quotations are not readily available are valued at fair value as determined in good faith under the direction of the Series’ Board of Trustees (Board). In determining whether market quotations are readily available or fair valuation will be used, various factors will be taken into consideration, such as market closures or suspension of trading in a security. The Series may use fair value pricing more frequently for securities traded primarily in non-U.S. markets because, among other things, most foreign markets close well before the Series values its securities at 4:00 p.m. Eastern time. The earlier close of these foreign markets gives rise to the possibility that significant events, including broad market moves, government actions or pronouncements, aftermarket trading, or news events may have occurred in the interim. To account for this, the Series may frequently value foreign securities using fair value prices based on third-party vendor modeling tools (international fair value pricing).
Federal Income Taxes—No provision for federal income taxes has been made as the Series intends to continue to qualify for federal income tax purposes as a regulated investment company under Subchapter M of the Internal Revenue Code of 1986, as amended, and make the requisite distributions to shareholders. The Series evaluates tax positions taken or expected to be taken in the course of preparing the Series’ tax returns to determine whether the tax positions are “more-likely-than-not” of being sustained by the applicable tax authority. Tax positions not deemed to meet the more-likely-than-not threshold are recorded as a tax benefit or expense in the current year. Management has analyzed the Series’ tax positions taken on federal income tax returns for all open tax years (tax years ended December 31, 2006 – December 31, 2009), and has concluded that no provision for federal income tax is required in the Series’ financial statements.
Class Accounting—Investment income, common expenses and realized and unrealized gain (loss) on investments are allocated to the classes of the Series on the basis of daily net assets of each class. Distribution expenses relating to a specific class are charged directly to that class.
Repurchase Agreements—The Series may invest in a pooled cash account along with other members of the Delaware Investments® Family of Funds pursuant to an exemptive order issued by the Securities and Exchange Commission. The aggregate daily balance of the pooled cash account is invested in repurchase agreements secured by obligations of the U.S. government. The respective collateral is held by the Series’ custodian bank until the maturity of the respective repurchase agreements. Each repurchase agreement is at least 102% collateralized. However, in the event of default or bankruptcy by the counterparty to the agreement, realization of the collateral may be subject to legal proceedings. At December 31, 2009, the Series held no investments in repurchase agreements.
Use of Estimates—The preparation of financial statements in conformity with U.S. GAAP requires management to make estimates and assumptions that affect the reported amounts of assets and liabilities at the date of the financial statements and the reported amounts of revenues and expenses during the reporting period. Actual results could differ from those estimates.
Other—Expenses directly attributable to the Series are charged directly to the Series. Other expenses common to various funds within the Delaware Investments Family of Funds are generally allocated amongst such funds on the basis of average net assets. Management fees and some other expenses are paid monthly. Security transactions are recorded on the date the securities are purchased or sold (trade date) for financial reporting purposes. Costs used in calculating realized gains and losses on the sale of investment securities are those of the specific securities sold. Dividend income is recorded on the ex-dividend date and interest income is recorded on the accrual basis. Distributions received from investments in real estate investment trusts are recorded as dividend income on ex-dividend date, subject to reclassification upon notice of the character of such distribution by the issuer. Foreign dividends are also recorded on the ex-dividend date or as soon after the ex-dividend date that the Series is aware of such dividends, net of all non-rebatable tax withholdings. Withholding taxes on foreign dividends have been recorded in accordance with the Series’ understanding of the applicable country’s tax rules and rates. The Series declares and pays dividends from net investment income and distributions from net realized gain on investments, if any, following the close of the fiscal year.
Subject to seeking best execution, the Series may direct certain security trades to brokers who have agreed to rebate a portion of the related brokerage commission to the Series in cash. In general, best execution refers to many factors, including the price paid or received for a security, the commission charged, the promptness and reliability of execution, the confidentiality and placement accorded the order, and other factors affecting the overall benefit obtained by the Series on the transaction. There were no commission rebates during the year ended December 31, 2009.
Small Cap Value Series-10
Delaware VIP® Small Cap Value Series
Notes to Financial Statements (continued)
1. Significant Accounting Policies (continued)
The Series may receive earnings credits from its custodian when positive cash balances are maintained, which are used to offset custody fees. There were no earnings credits for the year ended December 31, 2009.
On July 1, 2009, the Financial Accounting Standards Board (FASB) issued the FASB Accounting Standards Codification (Codification). The Codification became the single source of authoritative nongovernmental U.S. GAAP, superseding existing literature of the FASB, American Institute of Certified Public Accountants, Emerging Issues Task Force and other sources. The Codification is effective for interim and annual periods ending after September 15, 2009. The Series adopted the Codification for the year ended December 31, 2009. There was no impact to financial statements as the Codification requirements are disclosure-only in nature.
Management has evaluated whether any events or transactions occurred subsequent to December 31, 2009 through February 17, 2010, the date of issuance of the Series’ financial statements, and determined that there were no material events or transactions that would require recognition or disclosure in the Series’ financial statements.
2. Investment Management, Administration Agreements and Other Transactions with Affiliates
In accordance with the terms of its investment management agreement, the Series pays Delaware Management Company (DMC), a series of Delaware Management Business Trust and the investment manager, an annual fee which is calculated daily at the rate of 0.75% on the first $500 million of average daily net assets of the Series, 0.70% on the next $500 million, 0.65% on the next $1.5 billion, and 0.60% on average daily net assets in excess of $2.5 billion.
Effective May 1, 2009, DMC has voluntarily agreed to waive that portion, if any, of its management fee and/or pay/reimburse the Series to the extent necessary to ensure that total annual operating expenses (excluding any 12b-1 plan expenses, taxes, interest, inverse floater program expenses, brokerage fees, certain insurance costs, and nonroutine expenses or costs including, but not limited to, those relating to reorganizations, litigation, conducting shareholder meetings, and liquidations (collectively, “nonroutine expenses”)) do not exceed 0.87% of average daily net assets of the Series until such time as the voluntary expense cap is discontinued. For purposes of this waiver and reimbursement, nonroutine expenses may also include such additional costs and expenses, as may be agreed upon from time to time by the Series’ Board and DMC. This expense waiver and reimbursement applies only to expenses paid directly by the Series, and may be discontinued at any time because they are voluntary. Effective August 17, 2009, the expense waiver was discontinued.
Delaware Service Company, Inc. (DSC), an affiliate of DMC, provides fund accounting and financial administration oversight services to the Series. For these services, the Series pays DSC fees based on the aggregate daily net assets of the Delaware Investments® Family of Funds at the following annual rate: 0.0050% of the first $30 billion; 0.0045% of the next $10 billion; 0.0040% of the next $10 billion; and 0.0025% of aggregate average daily net assets in excess of $50 billion. The fees payable to DSC under the service agreement described above are allocated among all funds in the Delaware Investments Family of Funds on a relative net asset value basis. For the year ended December 31, 2009, the Series was charged $32,591 for these services.
DSC also provides dividend disbursing and transfer agency services. The Series pays DSC a monthly fee based on the number of shareholder accounts for dividend disbursing and transfer agent services.
Pursuant to a distribution agreement and distribution plan, the Series pays Delaware Distributors, L.P. (DDLP), the distributor and an affiliate of DMC, an annual distribution and service fee not to exceed 0.30% of the average daily net assets of the Service Class shares. DDLP has contracted to waive distribution and service fees through April 30, 2010 in order to prevent distribution and service fees of the Service Class shares from exceeding 0.25% of average daily net assets. Standard Class shares pay no distribution and service expenses.
At December 31, 2009, the Series had liabilities payable to affiliates as follows:
| | Dividend Disbursing, | | | | Other |
| Investment | | Transfer Agent and Fund | | | | Expenses |
| Management | | Accounting Oversight | | Distribution | | Payable |
| Fee Payable to | | Fees and Other Expenses | | Fee Payable | | to DMC |
| DMC | | Payable to DSC | | to DDLP | | and Affiliates* |
| $459,536 | | $7,845 | | $97,934 | | $55,637 |
____________________
*DMC, as part of its administrative services, pays operating expenses on behalf of the Series and is reimbursed on a periodic basis. Such expenses include items such as printing of shareholder reports, fees for audit, legal and tax services, custodian fees and trustees’ fees.
As provided in the investment management agreement, the Series bears the cost of certain legal and tax services, including internal legal and tax services provided to the Series by DMC and/or its affiliates’ employees. For the year ended December 31, 2009, the Series was charged $54,276 for internal legal and tax services provided by DMC and/or its affiliates’ employees.
Trustees’ fees include expenses accrued by the Series for each Trustee’s retainer and meeting fees. Certain officers of DMC, DSC and DDLP are officers and/or Trustees of the Trust. These officers and Trustees are paid no compensation by the Series.
Small Cap Value Series-11
Delaware VIP® Small Cap Value Series
Notes to Financial Statements (continued)
3. Investments
For the year ended December 31, 2009, the Series made purchases and sales of investment securities other than short-term investments as follows:
| Purchases | | $ | 121,046,721 |
| Sales | | | 186,451,071 |
At December 31, 2009, the cost of investments and unrealized appreciation (depreciation) for federal income tax purposes for the Series were as follows:
| | | Aggregate | | Aggregate | | Net |
| | Cost of | | Unrealized | | Unrealized | | Unrealized |
| Investments | | Appreciation | | Depreciation | | Appreciation |
| $712,850,005 | | $169,574,549 | | $(80,503,803) | | $89,070,746 |
U.S. GAAP defines fair value as the price that the Series would receive to sell an asset or pay to transfer a liability in an orderly transaction between market participants at the measurement date under current market conditions. A framework for measuring fair value and a three level hierarchy for fair value measurements has been established based upon the transparency of inputs to the valuation of an asset or liability. Inputs may be observable or unobservable and refer broadly to the assumptions that market participants would use in pricing the asset or liability. Observable inputs reflect the assumptions market participants would use in pricing the asset or liability based on market data obtained from sources independent of the reporting entity. Unobservable inputs reflect the reporting entity’s own assumptions about the assumptions that market participants would use in pricing the asset or liability developed based on the best information available under the circumstances. The Series’ investment in its entirety is assigned a level based upon the observability of the inputs which are significant to the overall valuation. The three-tier hierarchy of inputs is summarized below.
Level 1 – inputs are quoted prices in active markets
Level 2 – inputs are observable, directly or indirectly
Level 3 – inputs are unobservable and reflect assumptions on the part of the reporting entity
The following table summarizes the valuation of the Series’ investments by the fair value hierarchy levels as of December 31, 2009:
| | Level 1 | | Level 2 | | Level 3 | | Total |
| Common Stock | | $ | 726,556,036 | | $ | – | | $ | 3,688,447 | | $ | 730,244,483 |
| Convertible Preferred Stock | | | – | | | – | | | 7,043,586 | | | 7,043,586 |
| Short-Term | | | – | | | 1,101,000 | | | – | | | 1,101,000 |
| Securities Lending Collateral | | | 38,581,315 | | | 24,901,243 | | | 49,124 | | | 63,531,682 |
| Total | | $ | 765,137,351 | | $ | 26,002,243 | | $ | 10,781,157 | | $ | 801,920,751 |
| | | | | | | | | | | | | |
The following is a reconciliation of investments in which significant unobservable inputs (Level 3) were used in determining fair value:
| | | | | Convertible | | Securities | | | |
| | Common | | Preferred | | Lending | | Total |
| | Stock | | Stock | | Collateral | | Series |
| Balance as of 12/31/08 | | $ | – | | | $ | – | | | | $ | 38,144 | | | $ | 38,144 |
| Net change in unrealized appreciation/depreciation | | | 1,578,095 | | | | 3,013,586 | | | | | 10,980 | | | | 4,602,661 |
| Purchases | | | 2,110,352 | | | | 4,030,000 | | | | | – | | | | 6,140,352 |
| Balance as of 12/31/09 | | $ | 3,688,447 | | | $ | 7,043,586 | | | | $ | 49,124 | | | $ | 10,781,157 |
| | | | | | | | | | | | | | | | | |
| Net change in unrealized | | | | | | | | | | | | | | | | |
| appreciation/depreciation from | | | | | | | | | | | | | | | | |
| investments still held as of 12/31/09 | | $ | 1,578,095 | | | $ | 3,013,586 | | | | $ | 10,980 | | | $ | 4,602,661 |
In January 2010, the Financial Accounting Standards Board issued an Accounting Standards Update, Improving Disclosures about Fair Value Measurements, which introduces new disclosure requirements and clarifies certain existing disclosure requirements around fair value measurements currently presented above. The new disclosures and clarifications of existing disclosures are generally effective for the Series’ year ending December 31, 2010 and interim periods therein. Management is evaluating the impact of this update on its current disclosures.
Small Cap Value Series-12
Delaware VIP® Small Cap Value Series
Notes to Financial Statements (continued)
4. Dividend and Distribution Information
Income and long-term capital gain distributions are determined in accordance with federal income tax regulations, which may differ from U.S. GAAP. Additionally, distributions from net gains on foreign currency transactions and net short-term gains on sales of investment securities are treated as ordinary income for federal income tax purposes. The tax character of dividends and distributions paid during the years ended December 31, 2009 and 2008 was as follows:
| | Year | | Year |
| | Ended | | Ended |
| | 12/31/09 | | 12/31/08 |
| Ordinary income | | $ | 5,238,366 | | $ | 7,766,562 |
| Long-term capital gain | | | – | | | 53,842,814 |
| Total | | $ | 5,238,366 | | $ | 61,609,376 |
| | | | | | | |
5. Components of Net Assets on a Tax Basis
As of December 31, 2009, the components of net assets on a tax basis were as follows:
| Shares of beneficial interest | | $ | 736,389,092 | |
| Undistributed ordinary income | | | 4,880,811 | |
| Post-October losses | | | (7,114,034 | ) |
| Capital loss carryforwards | | | (74,196,044 | ) |
| Unrealized appreciation of investments | | | 89,070,746 | |
| Net assets | | $ | 749,030,571 | |
| | | | | |
The differences between book basis and tax basis components of net assets are primarily attributable to tax deferral of losses on wash sales.
Post-October losses represent losses realized on investment transactions from November 1, 2009 through December 31, 2009 that, in accordance with federal income tax regulations, the Series has elected to defer and treat as having arisen in the following fiscal year.
For financial reporting purposes, capital accounts are adjusted to reflect the tax character of permanent book/tax differences. Reclassifications are primarily due to tax treatment of gain (loss) on foreign currency transactions. Results of operations and net assets were not affected by these reclassifications. For the year ended December 31, 2009, the Series recorded the following reclassifications:
| Undistributed | | Accumulated |
| Net Investment | | Net Realized |
| | Income | | Loss |
| $(496) | | $496 |
For federal income tax purposes, capital loss carryforwards may be carried forward and applied against future capital gains. Capital loss carryforwards remaining at December 31, 2009 will expire as follows: $8,993,730 expires in 2016 and $65,202,314 expires in 2017.
6. Capital Shares
Transactions in capital shares were as follows:
| | Year | | Year |
| | Ended | | Ended |
| | 12/31/09 | | 12/31/08 |
| Shares sold: | | | | | | |
| Standard Class | | 1,855,882 | | | 3,108,369 | |
| Service Class | | 2,137,247 | | | 3,512,245 | |
| | | | | | | |
| Shares issued upon reinvestment of dividends and distributions: | | | | | | |
| Standard Class | | 135,753 | | | 896,028 | |
| Service Class | | 159,200 | | | 1,549,047 | |
| | 4,288,082 | | | 9,065,689 | |
| Shares repurchased: | | | | | | |
| Standard Class | | (3,443,312 | ) | | (3,385,869 | ) |
| Service Class | | (5,207,620 | ) | | (4,736,423 | ) |
| | (8,650,932 | ) | | (8,122,292 | ) |
| Net increase (decrease) | | (4,362,850 | ) | | 943,397 | |
| | | | | | | |
Small Cap Value Series-13
Delaware VIP® Small Cap Value Series
Notes to Financial Statements (continued)
7. Line of Credit
The Series, along with certain other funds in the Delaware Investments® Family of Funds (Participants), participates in a $35,000,000 revolving line of credit with The Bank of New York Mellon (BNY Mellon) to be used for temporary or emergency purposes as an additional source of liquidity to fund redemptions of investor shares. Under the agreement, Participants are charged an annual commitment fee, which is allocated across the Participants on the basis of each Participant’s allocation of the entire facility. The Participants may borrow up to a maximum of one third of their net assets under the agreement. The agreement expires on November 16, 2010. The Series had no amounts outstanding as of December 31, 2009, or at any time during the year then ended.
8. Securities Lending
The Series, along with other funds in the Delaware Investments Family of Funds, may lend its securities pursuant to a security lending agreement (Lending Agreement) with BNY Mellon. With respect to each loan, if the aggregate market value of securities collateral held plus cash collateral received on any business day is less than the aggregate market value of the securities which are the subject of such loan, the borrower will be notified to provide additional collateral not less than the applicable collateral requirements. Cash collateral received is generally invested in the Mellon GSL DBT II Collateral Fund (Collective Trust) established by BNY Mellon for the purpose of investment on behalf of clients participating in its securities lending programs. The Collective Trust may invest in fixed income securities, with a weighted average maturity not to exceed 90 days, rated in one of the top three tiers by Standard & Poor’s Ratings Group or Moody’s Investors Service, Inc. or repurchase agreements collateralized by such securities. The Collective Trust seeks to maintain a net asset value per unit of $1.00, but there can be no assurance that it will always be able to do so. At December 31, 2009, the Collective Trust held only cash and assets with a maturity of one business day or less (Cash/Overnight Assets). The Series may incur investment losses as a result of investing securities lending collateral in the Collective Trust. This could occur if an investment in the Collective Trust defaulted or if it were necessary to liquidate assets in the Collective Trust to meet returns on outstanding security loans at a time when the Collective Trust’s net asset value per unit was less than $1.00. Under those circumstances, the Series may not receive an amount from the Collective Trust that is equal in amount to the collateral the Series would be required to return to the borrower of the securities and the Series would be required to make up for this shortfall. Effective April 20, 2009, BNY Mellon transferred the assets of the Collective Trust other than the Cash/Overnight Assets to the BNY Mellon SL DBT II Liquidating Fund (Liquidating Fund), effectively bifurcating the collateral investment pool. The Series’ exposure to the Liquidating Fund is expected to decrease as the Liquidating Fund’s assets mature or are sold. In October 2008, BNY Mellon transferred certain distressed securities from the Collective Trust into the Mellon GSL Reinvestment Trust II. The Series can also accept U.S. government securities and letters of credit (non-cash collateral) in connection with securities loans. In the event of default or bankruptcy by the lending agent, realization and/or retention of the collateral may be subject to legal proceedings. In the event the borrower fails to return loaned securities and the collateral received is insufficient to cover the value of the loaned securities and provided such collateral shortfall is not the result of investment losses, the lending agent has agreed to pay the amount of the shortfall to the Series, or at the discretion of the lending agent, replace the loaned securities. The Series continues to record dividends or interest, as applicable, on the securities loaned and is subject to change in value of the securities loaned that may occur during the term of the loan. The Series has the right under the Lending Agreement to recover the securities from the borrower on demand. With respect to security loans collateralized by non-cash collateral, the Series receives loan premiums paid by the borrower. With respect to security loans collateralized by cash collateral, the earnings from the collateral investments are shared among the Series, the security lending agent and the borrower. The Series records security lending income net of allocations to the security lending agent and the borrower.
At December 31, 2009, the value of the securities on loan was $63,255,886, for which cash collateral was received and invested in accordance with the Lending Agreement. At December 31, 2009, the value of invested collateral was $63,531,682. Such investments are presented on the Statement of Net Assets under the caption “Securities Lending Collateral.”
9. Credit and Market Risk
The Series invests a significant portion of its assets in small companies and may be subject to certain risks associated with ownership of securities of such companies. Investments in small-sized companies may be more volatile than investments in larger companies for a number of reasons, which include limited financial resources or a dependence on narrow product lines.
The Series may invest up to 10% of its net assets in illiquid securities, which may include securities with contractual restrictions on resale, securities exempt from registration under Rule 144A of the Securities Act of 1933, as amended, and other securities which may not be readily marketable. The relative illiquidity of these securities may impair the Series from disposing of them in a timely manner and at a fair price when it is necessary or desirable to do so. While maintaining oversight, the Series’ Board has delegated to DMC the day-to-day functions of determining whether individual securities are liquid for purposes of the Series’ limitation on investments in illiquid assets. Securities eligible for resale pursuant to Rule 144A, which are determined to be liquid, are not subject to the Series’ 10% limit on investments in illiquid securities. As of December 31, 2009, there were no Rule 144A securities. Illiquid securities have been identified on the Statement of Net Assets.
10. Contractual Obligations
The Series enters into contracts in the normal course of business that contain a variety of indemnifications. The Series’ maximum exposure under these arrangements is unknown. However, the Series has not had prior claims or losses pursuant to these contracts. Management has reviewed the Series’ existing contracts and expects the risk of loss to be remote.
11. Sale of Delaware Investments to Macquarie Group
On August 18, 2009, Lincoln National Corporation (parent company of Delaware Investments) and Macquarie Group (Macquarie) entered into an agreement pursuant to which Delaware Investments, including DMC, DDLP and DSC, would be acquired by Macquarie, an Australia-based global provider of banking, financial, advisory, investment and funds management services (Transaction). The Transaction was completed on January 4, 2010. DMC, DDLP and DSC are now wholly-owned subsidiaries of Macquarie.
Small Cap Value Series-14
Delaware VIP® Small Cap Value Series
Notes to Financial Statements (continued)
11. Sale of Delaware Investments to Macquarie Group (continued)
The Transaction resulted in a change of control of DMC which, in turn, caused the termination of the investment advisory agreement between DMC and the Series. On January 4, 2010, the new investment advisory agreement between DMC and the Series that was approved by the shareholders became effective.
12. Tax Information (Unaudited)
For the fiscal year ended December 31, 2009, the Series designates distributions paid during the year as follows:
| (A) | | (B) | | | | |
| Long-Term | | Ordinary | | | | |
| Capital Gain | | Income | | Total | | (C) |
| Distributions | | Distributions | | Distributions | | Qualifying |
| (Tax Basis) | | (Tax Basis) | | (Tax Basis) | | Dividends1 |
| 0% | | 100% | | 100% | | 100% |
____________________
(A) and (B) are based on a percentage of the Series’ total distributions.
(C) is based on a percentage of the Series’ ordinary income distributions.
1Qualifying dividends represent dividends which qualify for the corporate dividends received deduction.
Small Cap Value Series-15
Delaware VIP® Trust — Delaware VIP Small Cap Value Series
Report of Independent Registered Public Accounting Firm
To the Shareholders and Board of Trustees
Delaware VIP Trust–Delaware VIP Small Cap Value Series
We have audited the accompanying statement of net assets of the Delaware VIP Small Cap Value Series (one of the series constituting Delaware VIP Trust) (the “Series”) as of December 31, 2009, and the related statement of operations for the year then ended, the statements of changes in net assets for each of the two years in the period then ended, and the financial highlights for each of the five years in the period then ended. These financial statements and financial highlights are the responsibility of the Series’ management. Our responsibility is to express an opinion on these financial statements and financial highlights based on our audits.
We conducted our audits in accordance with the standards of the Public Company Accounting Oversight Board (United States). Those standards require that we plan and perform the audit to obtain reasonable assurance about whether the financial statements and financial highlights are free of material misstatement. We were not engaged to perform an audit of the Series’ internal control over financial reporting. Our audits included consideration of internal control over financial reporting as a basis for designing audit procedures that are appropriate in the circumstances, but not for the purpose of expressing an opinion on the effectiveness of the Series’ internal control over financial reporting. Accordingly, we express no such opinion. An audit also includes examining, on a test basis, evidence supporting the amounts and disclosures in the financial statements and financial highlights, assessing the accounting principles used and significant estimates made by management, and evaluating the overall financial statement presentation. Our procedures included confirmation of securities owned as of December 31, 2009, by correspondence with the custodian and brokers. We believe that our audits provide a reasonable basis for our opinion.
In our opinion, the financial statements and financial highlights referred to above present fairly, in all material respects, the financial position of the Delaware VIP Small Cap Value Series of Delaware VIP Trust at December 31, 2009, the results of its operations for the year then ended, the changes in its net assets for each of the two years in the period then ended, and its financial highlights for each of the five years in the period then ended, in conformity with U.S. generally accepted accounting principles.
Philadelphia, Pennsylvania
February 17, 2010
The Series files its complete schedule of portfolio holdings with the Securities and Exchange Commission (Commission) for the first and third quarters of each fiscal year on Form N-Q. The Series’ Forms N-Q, as well as a description of the policies and procedures that the Series uses to determine how to vote proxies (if any) relating to portfolio securities is available without charge (i) upon request, by calling 800 523-1918; and (ii) on the Commission’s website at http://www.sec.gov. In addition, a description of the policies and procedures that the Series uses to determine how to vote proxies (if any) relating to portfolio securities is available without charge on the Delaware Investments® Funds’ Web site at http://www.delawareinvestments.com. The Series’ Forms N-Q may be reviewed and copied at the Commission’s Public Reference Room in Washington, DC; information on the operation of the Public Reference Room may be obtained by calling 800 SEC-0330. Information (if any) regarding how the Series voted proxies relating to portfolio securities during the most recently disclosed 12-month period ended June 30 is available without charge (i) through the Delaware Investments Funds’ Web site at http://www.delawareinvestments.com; and (ii) on the Commission’s website at http://www.sec.gov. |
Small Cap Value Series-16
Delaware VIP® Trust — Delaware VIP Small Cap Value Series
Other Series Information
Board Consideration of New Investment Advisory Agreement
At a meeting held on September 3, 2009 (the “Meeting”), the Board of Trustees of the Delaware Investments Family of Funds (the “Board”), including the independent Trustees, unanimously approved a new investment advisory agreement between each registrant on behalf of each series (each, a “Fund” and together, the “Funds”) and Delaware Management Company (“DMC”) in connection with the sale of Delaware Investments’ advisory business to Macquarie Bank Limited (the “Macquarie Group”) (the “Transaction”). In making its decision, the Board considered information furnished specifically in connection with the approval of the new investment advisory agreements with DMC (the “New Investment Advisory Agreements”) which included extensive materials about the Transaction and matters related to the proposed approvals. To assist the Board in considering the New Investment Advisory Agreements, Macquarie Group provided materials and information about Macquarie Group, including detailed written responses to the questions posed by the independent Trustees. DMC also provided materials and information about the Transaction, including detailed written responses to the questions posed by the independent Trustees.
At the Meeting, the Trustees discussed the Transaction with DMC management and with key Macquarie Group representatives. The Meeting included discussions of the strategic rationale for the Transaction and Macquarie Group’s general plans and intentions regarding the Funds and DMC. The Board members also inquired about the plans for, and anticipated roles and responsibilities of, key employees and officers of Delaware Management Holdings Inc. and DMC in connection with the Transaction.
In connection with the Trustees’ review of the New Investment Advisory Agreements for the Funds, DMC and/or Macquarie Group emphasized that:
- They expected that there would be no adverse changes as a result of the Transaction, in the nature, quality, or extent of services currently provided to the Funds and their shareholders, including investment management, distribution, or other shareholder services.
- No material changes in personnel or operations were contemplated in the operation of DMC under Macquarie Group as a result of the Transaction and no material changes were currently contemplated in connection with third party service providers to the Funds.
- Macquarie Group had no intention to cause DMC to alter the voluntary expense waivers and reimbursements currently in effect for the Funds.
- Under the agreement between Macquarie Group and Lincoln National Corporation (“LNC”) (the “Transaction Agreement”), Macquarie Group has agreed to conduct, and to cause its affiliates to conduct, their respective businesses in compliance with the conditions of Section 15(f) of the Investment Company Act of 1940 (the “1940 Act”) with respect to the Funds, to the extent within its control, including maintaining Board composition of at least 75% of the Board members qualifying as independent Trustees and not imposing any “unfair burden” on the Funds for at least two years from the closing of the Transaction (the “Closing”).
In addition to the information provided by DMC and Macquarie Group as described above, the Trustees also considered all other factors they believed to be relevant to evaluating the New Investment Advisory Agreements, including the specific matters discussed below. In their deliberations, the Trustees did not identify any particular information that was controlling, and different Trustees may have attributed different weights to the various factors. However, for each Fund, the Trustees determined that the overall arrangements between the Fund and DMC, as provided in the respective New Investment Advisory Agreement, including the proposed advisory fee and the related administration arrangements between the Fund and DMC, were fair and reasonable in light of the services to be performed, expenses incurred, and such other matters as the Trustees considered relevant. Factors evaluated included:
- The potential for expanding distribution of Fund shares through access to Macquarie Group’s existing distribution channels;
- Delaware Investments’ acquisition of an exclusive wholesaling sales force from a subsidiary of LNC;
- The reputation, financial strength, and resources of Macquarie Group as well as its historic and ongoing commitment to the asset management business in Australia as well as other parts of the world;
- The terms and conditions of the New Investment Advisory Agreements, including that each Fund’s total contractual fee rate under the New Investment Advisory Agreement will remain the same;
- The Board’s full annual review (or initial approval) of the current investment advisory agreements at their in-person meeting in May 2009 as required by the 1940 Act and its determination that (i) DMC had the capabilities, resources, and personnel necessary to provide the satisfactory advisory and administrative services currently provided to each Fund and (ii) the advisory and/or management fees paid by each Fund, taking into account any applicable fee waivers and breakpoints, represented reasonable compensation to DMC in light of the services provided, the costs to DMC of providing those services, economies of scale, and the fees and other expenses paid by similar funds and such other matters that the Board considered relevant in the exercise of its reasonable judgment;
- The portfolio management teams for the Funds are not currently expected to change as a result of the Transaction;
- LNC and Macquarie Group were expected to execute a reimbursement agreement pursuant to which LNC and Macquarie Group would agree to pay (or reimburse) all reasonable out-of-pocket costs and expenses of the Funds in connection with the Board’s consideration of the Transaction, the New Investment Advisory Agreements and related agreements, and all costs related to the proxy solicitation (the “Expense Agreement”);
Small Cap Value Series-17
Delaware VIP® Small Cap Value Series
Other Series Information (continued)
- The likelihood that Macquarie Group would invest additional amounts in Delaware Investments, including DMC, which could result in increased assets under management, which in turn would allow some Funds the potential opportunity to achieve economies of scale and lower fees payable by Fund shareholders; and
- The compliance and regulatory history of Macquarie Group and its affiliates.
In making their decision relating to the approval of each Fund’s New Investment Advisory Agreement, the independent Trustees gave attention to all information furnished. The following discussion, however, identifies the primary factors taken into account by the Trustees and the conclusions reached in approving the New Investment Advisory Agreements.
NATURE, EXTENT, AND QUALITY OF SERVICE. The Trustees considered the services historically provided by DMC to the Funds and their shareholders. In reviewing the nature, extent, and quality of services, the Board considered that the New Investment Advisory Agreements would be substantially similar to the current investment advisory agreements between the Funds and DMC (the “Current Investment Advisory Agreements”), and they therefore, considered the many reports furnished to them throughout 2008 and 2009 at regular Board meetings covering matters such as: the relative performance of the Funds; the compliance of portfolio managers with the investment policies, strategies, and restrictions for the Funds; the compliance of management personnel with the code of ethics adopted throughout the Delaware Investments Family of Funds complex; and the adherence to fair value pricing procedures as established by the Board. The Trustees were pleased with the current staffing of DMC and the emphasis placed on research and risk management in the investment process. Favorable consideration was given to DMC’s efforts to maintain expenditures and, in some instances, increase financial and human resources committed to Fund matters.
The Board also considered the transfer agent and shareholder services that would continue to be provided to Fund shareholders by DMC’s affiliate, Delaware Service company, Inc. (“DSC”). The Trustees noted, in particular, DSC’s commitment to maintain a high level of service as well as DMC’s expenditures to improve the delivery of shareholder services. The Board was assured that shareholders would continue to receive the benefits provided to Fund shareholders by being part of the Delaware Investments Family of Funds, including each shareholder’s ability to exchange an investment in one Fund for the same class of shares in another Fund without a sales charge, to reinvest Fund dividends into additional shares of any of the Funds, and the privilege to combine holdings in other Funds to obtain a reduced sales charge.
Based on the information provided by DMC and Macquarie Group, including that Macquarie Group and DMC currently expected no material changes as a result of the Transaction in (i) personnel or operations of DMC or (ii) third party service providers to the Funds, the Board concluded that the satisfactory nature, extent, and quality of services currently provided to the Funds and their shareholders were very likely to continue under the New Investment Advisory Agreements. Moreover, the Board concluded that the Funds would probably benefit from the expanded distribution resources that would become available to Delaware Investments following the Transaction. The Board also concluded that it was very unlikely that any “unfair burden” would be imposed on any of the Funds for the first two years following the Closing as a result of the Transaction. Consequently, the Board concluded that it did not expect the Transaction to result in any adverse changes in the nature, quality, or extent of services (including investment management, distribution or other shareholder services) currently provided to the Funds and their shareholders.
INVESTMENT PERFORMANCE. The Board considered the overall investment performance of DMC and the Funds. The Trustees placed significant emphasis on the investment performance of the Funds in view of its importance to shareholders. Although the Trustees gave appropriate consideration to performance reports and discussions with portfolio managers at Board meetings throughout the year, the Trustees gave particular weight to their review of investment performance in connection with the approval of the Current Investment Advisory agreements at the Board meeting held in May 2009. At that meeting, the Trustees reviewed reports prepared by Lipper, Inc., an independent statistical compilation organization (“Lipper”), which showed each Fund’s investment performance as of December 31, 2008 in comparison to a group of funds selected by Lipper as being similar to the Fund (the “Performance Universe”). During the May 2009 agreement review process, the Trustees observed the significant improvements to relative investment performance of the Funds compared to the Funds’ performance as of December 31, 2007.
At their meeting on September 3, 2009, the Trustees, including the independent Trustees in consultation with their independent counsel, reviewed the investment performance of each Fund. The Trustees compared the performance of each Fund relative to that of its respective Performance Universe for the 1-, 3-, 5-, and 10-year periods ended June 30, 2009 and compared its relative investment performance against the corresponding relative investment performance of each Fund for such time periods ended December 31, 2008, to the extent applicable. As of June 30, 2009, 30 of the Funds had investment performance relative to that of the respective Performance Universe that was better than the corresponding relative investment performance at December 31, 2008 for all applicable time periods. At June 30, 2009, an additional 6 Funds had investment performance relative to that of their respective Performance Universe that was better than the corresponding relative investment performance at December 31, 2008 for a majority of the applicable time periods. At June 30, 2009, 15 additional Funds had investment performance relative to that of their respective Performance Universe that was better than the corresponding relative performance at December 31, 2008 and only 29 Funds had poorer relative investment performance at June 30, 2009 compared to that at December 31, 2008.
The Board therefore concluded that the investment performance of the Funds, on an aggregate basis, had continued to improve relative to their respective Performance Universe since the data reviewed at the May 2009 meeting. Based on information provided by DMC and Macquarie Group, the Board concluded that neither the Transaction nor the New Investment Advisory Agreement would likely have an adverse effect on the investment performance of any Fund because (i) DMC and Macquarie Group did not currently expect the Transaction to cause any material change to the Funds’ portfolio management teams responsible for investment performance, which the Board found to be satisfactory and improving; and (ii) as discussed in more detail below, the Funds’ expenses were not expected to increase as a result of the Transaction.
Small Cap Value Series-18
Delaware VIP® Small Cap Value Series
Other Series Information (continued)
COMPARATIVE EXPENSES. The Trustees also evaluated expense comparison data for the Funds previously provided in May 2009. At that meeting, DMC had provided the Board with information on pricing levels and fee structures for the Funds and comparative funds. The Trustees focused on the comparative analysis of the effective management fees and total expense ratios of each Fund versus the effective management fees and expense ratios of a group of funds selected by Lipper as being similar to each Fund (the “Expense Group”). In reviewing comparative costs, each Fund’s contractual management fee and the actual management fee incurred by the Fund were compared with the contractual management fees (assuming all funds in the Expense Group were similar in size to the Fund) and actual management fees (as reported by each fund) of other funds within the Expense Group, taking into account any applicable breakpoints and fee limitations. Each Fund’s total expenses were also compared with those of its Expense Group. The Trustees also considered fees paid to Delaware Investments for nonmanagement services. At the September 3, 2009 meeting, DMC advised the Board that the more recent comparative expenses for the Funds remained consistent with the previous review in May 2009 and, consequently, the Trustees concluded that expenses of the Funds were satisfactory.
The Board also considered the Expense Agreement under negotiation in evaluating Fund expenses. The Trustees expected that the Expense Agreement would provide that LNC and Macquarie Group would pay or reimburse the Trusts for all reasonable out-of-pocket costs and expenses in connection with the Transaction and the consideration of the New Investment Advisory Agreements (subject to certain limited exceptions).
Based on information provided by DMC and Macquarie Group, the Board concluded that neither the Transaction nor the New Investment Advisory Agreements likely would have an adverse effect on the Funds’ expenses because (i) each Fund’s contractual fee rates under the New Investment Advisory Agreement would remain the same; (ii) under the Expense Agreement, the Funds would be reimbursed for all reasonable out-of-pocket costs and expenses in connection with the Transaction and the related proxy solicitation (subject to certain limited exceptions); and (iii) the expense ratios of certain Funds might decline as a result of the possible increased investment in Delaware Investments by Macquarie Group, as discussed below under “Economies of Scale.”
MANAGEMENT PROFITABILITY. At their meeting on September 3, 2009, the Board evaluated DMC’s profitability in connection with the operation of the Funds. The Board had previously considered DMC’s profitability in connection with the operation of the Funds at its May 2009 meeting. At that meeting, the Board reviewed an analysis that addressed the overall profitability of Delaware Investments’ business in providing management and other services to each of the Funds and the Delaware Investments Family of Funds as a whole. Specific attention was given to the methodology followed in allocating costs for the purpose of determining profitability.
At the May 2009 meeting, representatives of DMC had stated that the level of profits of DMC, to a certain extent, reflect operational cost savings and efficiencies initiated by Delaware Investments (including DMC and its affiliates that provide services to the Funds). The Board considered Delaware Investments’ efforts to improve services provided to Fund shareholders and to meet additional regulatory and compliance requirements resulting from recent industry-wide U.S. Securities and Exchange Commission initiatives. At that meeting, the Board found that the management fees were reasonable in light of the services rendered and the level of profitability of DMC. At the September 3, 2009 meeting, DMC advised the Board that DMC did not expect the Transaction to affect materially the profitability of Delaware Investments compared to the level of profitability considered during the May 2009 review. Moreover, the Trustees reviewed pro forma balance sheets of certain key companies in Delaware Investments as of June 30, 2009 (which were provided by Macquarie Group and DMC in response to the Trustees’ requests) and evaluated the projections of Delaware Investments’ capitalization following the Transaction for purposes of evaluating the financial ability of Delaware Investments to continue to provide the nature, extent, and quality of services as it had under the Current Investment Advisory Agreement.
Based on information provided by DMC and Macquarie Group, the Board concluded that DMC and Delaware Investments would be sufficiently capitalized following the Transaction to continue the same level and quality of services to the Funds under the New Investment Advisory Agreements as was the case under the Current Investment Advisory Agreements. The Board also concluded that Macquarie Group had sufficient financial strength and resources, as well as an ongoing commitment to a global asset management business, to continue investing in Delaware Investments, including DMC, to the extent that Macquarie Group determined it was appropriate. Finally, because services and costs were expected to be substantially the same (and DMC had represented that, correspondingly, profitability would be about the same), under the New Investment Advisory Agreements as under the Current Investment Advisory Agreements, the Trustees concluded that the profitability of Delaware Investments would not result in an inequitable charge on the Funds or their shareholders. Accordingly, the Board concluded that the fees charged under the New Investment Advisory Agreements would be reasonable in light of the services to be provided and the expected profitability of DMC.
ECONOMIES OF SCALE. The Trustees considered whether economies of scale would be realized by Delaware Investments as each Fund’s assets increase and the extent to which any economies of scale would be reflected in the management fees charged. The Trustees took into account DMC’s practice of maintaining the competitive nature of management fees based on its analysis of fees charged by comparable funds. DMC management believed, and the Board agreed, that the Funds were priced with breakpoints and relatively low management fees to reflect potential economies of scale to Fund shareholders.
The Board also acknowledged Macquarie Group’s statement that the Transaction would not by itself immediately provide additional economies of scale given Macquarie Group’s limited presence in the U.S. mutual fund market. Nonetheless, the Trustees concluded that additional economies of scale could potentially be achieved in the future if DMC were owned by Macquarie Group as a result of Macquarie Group’s willingness to invest further in Delaware Investments if appropriate opportunities arise. The Board further concluded that potential economies of scale could be achieved as a result of Delaware Investments’ expanded distribution capabilities arising from the Transaction, as well as opportunities that might arise from Macquarie Group’s global asset management business.
Small Cap Value Series-19
Delaware VIP® Small Cap Value Series
Other Series Information (continued)
FALL-OUT BENEFITS. The Board acknowledged that DMC would continue to benefit from soft dollar arrangements using portfolio brokerage of each Fund that invests in equity securities and that DMC’s profitability would likely be somewhat lower without the benefit of practices with respect to allocating Fund portfolio brokerage for brokerage and research services. The Board also considered that Macquarie Group and Delaware Investments may derive reputational, strategic, and other benefits from their association with the Delaware Investments Family of Funds, including service relationships with DMC, DSC, and Delaware Distributors, L.P., and evaluated the extent to which Delaware Investments might derive ancillary benefits from Fund operations, including the potential for procuring additional business as a result of the prestige and visibility associated with its role as service provider to the Delaware Investments Family of Funds and the benefits from allocation of Fund brokerage to improve trading efficiencies. However, the Board concluded that (i) any such benefits under the New Investment Advisory Agreements would not be dissimilar from those existing under the Current Investment Advisory Agreements, (ii) such benefits did not impose a cost or burden on the Funds or their shareholders, and (iii) such benefits would probably have an indirectly beneficial effect on the Funds and their shareholders because of the added importance that DMC and Macquarie Group might attach to the Funds as a result of the fall-out benefits that the Funds conveyed.
BOARD REVIEW OF MACQUARIE GROUP. The Trustees reviewed detailed information supplied by Macquarie Group about its operations as well as other information regarding Macquarie Group provided by independent legal counsel to the independent Trustees. Based on this review, the Trustees concluded that Delaware Investments would continue to have the financial ability to maintain the high quality of services required by the Funds. The Trustees noted that there would be a limited transition period during which some services previously provided by LNC to Delaware Investments would continue to be provided by LNC after the Closing, and concluded that this arrangement would help minimize disruption in Delaware Investments’ provision of services to the Funds following the Transaction.
The Board considered Macquarie Group’s support for Delaware Investments’ plans for Fund distribution by transferring wholesalers from Lincoln Financial Distributors, Inc., LNC’s retail distributor, to Delaware Investments, and Macquarie Group’s current intention to leave the Funds’ other service providers in place. The Board also considered Macquarie Group’s current strategic plans to increase its asset management activities, one of its core businesses, particularly in North America, and its statement that its acquisition of DMC is an important component of this strategic growth and the establishment of a significant presence in the United States. Based in part on the information provided by DMC and Macquarie Group, the Board concluded that Macquarie Group’s acquisition of Delaware Investments could potentially enhance the nature, quality, and extent of services provided to the Funds and their shareholders.
CONCLUSION. The Board concluded that the advisory fee rate under each New Investment Advisory Agreement was reasonable in relation to the services provided and that execution of the New Investment Advisory Agreement would be in the best interests of the shareholders. For each Fund, the Trustees noted that they had concluded in their most recent advisory agreement continuance considerations in May 2009 that the management fees and total expense ratios were at acceptable levels in light of the quality of services provided to the Funds and in comparison to those of the Funds’ respective peer groups; that the advisory fee schedule would not be increased and would stay the same for all of the Funds; that the total expense ratio had not changed materially since that determination; and that DMC had represented that the overall expenses for each Fund were not expected to be adversely affected by the Transaction. The Trustees also noted, with respect to the Funds that currently had the benefit of voluntary fee limitations, that Macquarie Group had no present intention to cause DMC to alter any voluntary expense limitations or reimbursements currently in effect. On that basis, the Trustees concluded that the total expense ratios and proposed advisory fees for the Funds anticipated to result from the Transaction were acceptable. In approving each New Investment Advisory Agreement, the Board stated that it anticipated reviewing the continuance of the New Investment Advisory Agreement in advance of the expiration of the initial two-year period.
Small Cap Value Series-20
Delaware Investments® Family of Funds
BOARD OF TRUSTEES/DIRECTORS AND OFFICERS ADDENDUM
A mutual fund is governed by a Board of Trustees/Directors (“Trustees”), which has oversight responsibility for the management of a fund’s business affairs. Trustees establish procedures and oversee and review the performance of the investment manager, the distributor, and others who perform services for the fund. The independent fund trustees, in particular, are advocates for shareholder interests. Each trustee has served in that capacity since he or she was elected to or appointed to the Board of Trustees, and will continue to serve until his or her retirement or the election of a new trustee in his or her place. The following is a list of the Trustees and Officers with certain background and related information.
| | | | Number of | Other |
| | | Principal | Portfolios in Fund | Directorships |
| Name, | Position(s) | | Occupation(s) | Complex Overseen | Held by |
| Address, | Held with | Length of Time | During | by Trustee | Trustee |
| and Birth Date | Fund(s) | Served | Past 5 Years | or Officer | or Officer |
| INTERESTED TRUSTEES | | | | | |
| Patrick P. Coyne1 | Chairman, | Chairman and Trustee | Patrick P. Coyne has served in | 81 | Director — |
| 2005 Market Street | President, | since August 16, 2006 | various executive capacities | | Kaydon Corp. |
| Philadelphia, PA | Chief Executive | | at different times at | | |
| 19103 | Officer, and | President and | Delaware Investments.2 | | |
| | Trustee | Chief Executive Officer | | | |
| April 1963 | | since August 1, 2006 | | | |
| | | | | | |
| INDEPENDENT TRUSTEES | | | | | |
| Thomas L. Bennett | Trustee | Since | Private Investor — | 81 | Director — |
| 2005 Market Street | | March 2005 | (March 2004–Present) | | Bryn Mawr |
| Philadelphia, PA | | | | | Bank Corp. (BMTC) |
| 19103 | | | Investment Manager — | | (April 2007–Present) |
| | | | Morgan Stanley & Co. | | |
| October 1947 | | | (January 1984–March 2004) | | |
| John A. Fry | Trustee | Since | President — | 81 | Director — |
| 2005 Market Street | | January 2001 | Franklin & Marshall College | | Community Health |
| Philadelphia, PA | | | (June 2002–Present) | | Systems |
| 19103 | | | | | |
| | | | Executive Vice President — | | |
| May 1960 | | | University of Pennsylvania | | |
| | | | (April 1995–June 2002) | | |
| Anthony D. Knerr | Trustee | Since | Founder and Managing Director — | 81 | None |
| 2005 Market Street | | April 1990 | Anthony Knerr & Associates | | |
| Philadelphia, PA | | | (Strategic Consulting) | | |
| 19103 | | | (1990–Present) | | |
| |
| December 1938 | | | | | |
| Lucinda S. Landreth | Trustee | Since | Chief Investment Officer — | 81 | None |
| 2005 Market Street | | March 2005 | Assurant, Inc. | | |
| Philadelphia, PA | | | (Insurance) | | |
| 19103 | | | (2002–2004) | | |
| |
| June 1947 | | | | | |
| Ann R. Leven | Trustee | Since | Consultant — | 81 | None |
| 2005 Market Street | | October 1989 | ARL Associates | | |
| Philadelphia, PA | | | (Financial Planning) | | |
| 19103 | | | (1983–Present) | | |
| |
| November 1940 | | | | | |
Small Cap Value Series-21
| | | | Number of | Other |
| | | Principal | Portfolios in Fund | Directorships |
| Name, | Position(s) | | Occupation(s) | Complex Overseen | Held by |
| Address, | Held with | Length of Time | During | by Trustee | Trustee |
| and Birth Date | Fund(s) | Served | Past 5 Years | or Officer | or Officer |
| INDEPENDENT TRUSTEES (CONTINUED) | | | | |
| Thomas F. Madison | Trustee | Since | President and Chief | 81 | Director and Chair of |
| 2005 Market Street | | May 19973 | Executive Officer — | | Compensation |
| Philadelphia, PA | | | MLM Partners, Inc. | | Committee, |
| 19103 | | | (Small Business Investing | | Governance Committee |
| | | | and Consulting) | | Member |
| February 1936 | | | (January 1993–Present) | | — CenterPoint Energy |
| |
| | | | | | Lead Director and Chair |
| | | | | | of Audit |
| | | | | | and Governance |
| | | | | | Committees, |
| | | | | | Member of |
| | | | | | Compensation |
| | | | | | Committee — Digital |
| | | | | | River, Inc. |
| |
| | | | | | Director and Chair of |
| | | | | | Governance |
| | | | | | Committee, Audit |
| | | | | | Committee Member — |
| | | | | | Rimage Corporation |
| |
| | | | | | Director and Chair of |
| | | | | | Compensation |
| | | | | | Committee — Spanlink |
| | | | | | Communications |
| |
| | | | | | Lead Director and Chair |
| | | | | | of Compensation and |
| | | | | | Governance |
| | | | | | Committees — |
| | | | | | Valmont Industries, Inc. |
| Janet L. Yeomans | Trustee | Since | Vice President and Treasurer | 81 | None |
| 2005 Market Street | | April 1999 | (January 2006–Present) | | |
| Philadelphia, PA | | | Vice President — Mergers & Acquisitions | | |
| 19103 | | | (January 2003–January 2006), and | | |
| | | | Vice President | | |
| July 1948 | | | (July 1995–January 2003) | | |
| | | | 3M Corporation | | |
| J. Richard Zecher | Trustee | Since | Founder — | 81 | Director and Audit |
| 2005 Market Street | | March 2005 | Investor Analytics | | Committee Member — |
| Philadelphia, PA | | | (Risk Management) | | Investor Analytics |
| 19103 | | | (May 1999–Present) | | |
| |
| July 1940 | | | Founder — | | |
| | | | Sutton Asset Management | | |
| | | | (Hedge Fund) | | |
| | | | (September 1996–Present) | | |
Small Cap Value Series-22
| | | | Number of | Other |
| | | Principal | Portfolios in Fund | Directorships |
| Name, | Position(s) | | Occupation(s) | Complex Overseen | Held by |
| Address, | Held with | Length of Time | During | by Trustee | Trustee |
| and Birth Date | Fund(s) | Served | Past 5 Years | or Officer | or Officer |
| OFFICERS | | | | | |
| David F. Connor | Vice President, | Vice President since | David F. Connor has served as | 81 | None4 |
| 2005 Market Street | Deputy General | September 2000 | Vice President and Deputy | | |
| Philadelphia, PA | Counsel, and Secretary | and Secretary | General Counsel of | | |
| 19103 | | since | Delaware Investments | | |
| | | October 2005 | since 2000. | | |
| December 1963 | | | | | |
| Daniel V. Geatens | Vice President | Treasurer | Daniel V. Geatens has served | 81 | None4 |
| 2005 Market Street | and Treasurer | since | in various capacities at | | |
| Philadelphia, PA | | October 25, 2007 | different times at | | |
| 19103 | | | Delaware Investments. | | |
| |
| October 1972 | | | | | |
| David P. O’Connor | Senior Vice | Senior Vice President, | David P. O’Connor has served in | 81 | None4 |
| 2005 Market Street | President, | General Counsel, and | various executive and legal | | |
| Philadelphia, PA | General Counsel, | Chief Legal Officer | capacities at different times | | |
| 19103 | and Chief | since | at Delaware Investments. | | |
| | Legal Officer | October 2005 | | | |
| February 1966 | | | | | |
| Richard Salus | Senior | Chief Financial | Richard Salus has served in | 81 | None4 |
| 2005 Market Street | Vice President | Officer since | various executive capacities | | |
| Philadelphia, PA | and | November 2006 | at different times at | | |
| 19103 | Chief Financial | | Delaware Investments. | | |
| | Officer | | | | |
| October 1963 | | | | | |
1 Patrick P. Coyne is considered to be an “Interested Trustee” because he is an executive officer of the Fund’s(s’) investment advisor. |
2 Delaware Investments is the marketing name for Delaware Management Holdings, Inc. and its subsidiaries, including the Fund’s(s’) investment advisor, principal underwriter, and its transfer agent. |
3 In 1997, several funds managed by Voyageur Fund Managers, Inc. (the “Voyageur Funds”) were incorporated into the Delaware Investments Family of Funds. Mr. Madison served as a director of the Voyageur Funds from 1993 until 1997. |
4 David F. Connor, Daniel V. Geatens, David P. O’Connor, and Richard Salus serve in similar capacities for the six portfolios of the Optimum Fund Trust, which have the same investment advisor, principal underwriter, and transfer agent as the registrant. |
The Statement of Additional Information for the Fund(s) includes additional information about the Trustees and Officers and is available, without charge, upon request by calling 800 523-1918.
| PO14857 AR-VIPSCV [12/09] DG3 2/10 (5427) | Small Cap Value Series-23 |
| Delaware VIP® Trust |
| Delaware VIP Trend Series |
| |
| |
| |
| |
| |
| |
| Annual Report |
| |
| |
| December 31, 2009 |
| |
| |
| |
| |
| |
| |
| |
| |
| |
| |
| |
| |
| |
| |
| |
|
Table of contents
| > Portfolio management review | 1 |
| | |
| > Performance summary | 1 |
| | |
| > Disclosure of Series expenses | 3 |
| | |
| > Sector allocation and top 10 holdings | 4 |
| | |
| > Statement of net assets | 5 |
| | |
| > Statement of operations | 7 |
| | |
| > Statements of changes in net assets | 7 |
| | |
| > Financial highlights | 8 |
| | |
| > Notes to financial statements | 10 |
| | |
| > Report of independent registered public accounting firm | 15 |
| | |
| > Other Series information | 16 |
| | |
| > Board of trustees/directors and officers addendum | 20 |
On January 4, 2010, Delaware Management Holdings, Inc., and its subsidiaries (collectively known by the marketing name of Delaware Investments) were sold by a subsidiary of Lincoln National Corporation to Macquarie Group Limited, a global provider of banking, financial, advisory, investment and funds management services. Please see your Series’ prospectus and any supplements thereto for more complete information.
Investments in Delaware VIP® Trend Series are not and will not be deposits with or liabilities of Macquarie Bank Limited ABN 46 008 583 542 and its holding companies, including subsidiaries or related companies, and are subject to investment risk, including possible delays in repayment and loss of income and capital invested. No Macquarie Group company guarantees or will guarantee the performance of the Series, the repayment of capital from the Series, or any particular rate of return.
Unless otherwise noted, views expressed herein are current as of Dec. 31, 2009, and are subject to change.
Funds are not FDIC insured and are not guaranteed. It is possible to lose the principal amount invested.
Mutual fund advisory services provided by Delaware Management Company, a series of Delaware Management Business Trust, which is a registered investment advisor. Delaware Investments is the marketing name of Delaware Management Holdings, Inc. and its subsidiaries. Macquarie Group refers to Macquarie Group Limited and its subsidiaries and affiliates worldwide.
© 2010 Delaware Management Holdings, Inc.
All third-party trademarks cited are the property of their respective owners.
Delaware VIP® Trust — Delaware VIP Trend Series| Portfolio management review | Jan. 12, 2010 |
For the 12-month fiscal period ended Dec. 31, 2009, the Delaware VIP Trend Series Standard Class shares returned +54.73%, and the Service Class shares returned +54.37% (both figures reflect returns with dividends reinvested). The Series’ benchmark, the Russell 2000® Growth Index, returned +34.47%.
The year 2009 was a time of tremendous volatility for stock investors. Between the start of the period in January 2009 and the market’s low in early March 2009, equities remained severely depressed as the recession deepened. The economy’s 5.4% drop in the fourth quarter of 2008 and 6.4% decline in the first quarter of 2009 constituted the worst consecutive quarterly drop in gross domestic product in more than 50 years. (Source: Bloomberg.)
Starting in the second week of March, however, conditions gradually began to improve. From this point, stocks (as measured by the S&P 500 Index) recorded seven consecutive months of gains, as investors grew increasingly confident that the financial crisis had been successfully contained. At first, the rally focused on what we viewed as riskier segments of the equity market, such as the financial and industrials sectors, as investors sought securities with higher potential returns. But by the end of the fiscal year, the rally had reached almost every corner of the market.
We believe this change in outlook among investors was primarily driven by the government’s actions, particularly those meant to encourage consumer spending. Two notable programs that helped the market rally continue through the summer were the cash-for-clunkers program, which took effect in August 2009, and the implementation of a housing tax credit, both of which proved popular with consumers. Despite the renewed economic optimism that prevailed, it is important to note that unemployment remained a prominent, ongoing concern that could continue to cloud the economic picture in the future.
With the exception of transportation, the Series outperformed the benchmark in every sector. Positions in healthcare and basic industry stocks accounted for much of the Series’ outperformance versus its benchmark index. Within the broader market environment, we maintained our bottom-up investment process during the year. This process is designed to seek market-leading companies that demonstrate strong product cycles and innovative concepts. We look to invest in small companies that, in our opinion, have strong growth rates within industries that are growing faster than the economy as a whole. Before investing in a company, we attempt to decipher its attractiveness relative to its peers. We analyze a company’s price-to-earnings ratio, estimated growth rate, market capitalization, and cash flows.
| Unless otherwise noted, the views expressed are current as of Dec. 31, 2009, and are subject to change. |
Performance summary
The performance data quoted below represent past performance; past performance does not guarantee future results. Investment return and principal value will fluctuate so your shares, when redeemed, may be worth more or less than their original cost. Please obtain the performance data for the most recent month end by calling the number noted in the introductory section of this report on the page related to this Series.
You should consider the investment objectives, risks, charges, and expenses of the Series carefully before investing. The Delaware VIP Trend Series prospectus contains this and other important information about the Series. To obtain a prospectus, contact the company noted on the page related to this Series in the introductory section of this report, either by phone or through the company Web site. We advise you to read the prospectus carefully before you invest or send money.
| Delaware VIP Trend Series | | | | | | | | | | |
| Average annual total returns | | | | | | | | | | |
| For periods ended Dec. 31, 2009 | | 1 year | | 3 years | | 5 years | | 10 years | | Lifetime |
Standard Class shares (commenced operations on Dec. 27, 1993) | | +54.73% | | -3.00% | | +0.78% | | -0.02% | | +8.63% |
Service Class shares (commenced operations on May 1, 2000) | | +54.37% | | -3.23% | | +0.54% | | n/a | | -1.23% |
| | | | | | | | | | | |
| Returns reflect the reinvestment of all distributions. | | | | | | | | | | |
Trend Series-1
Delaware VIP® Trend Series (continued)
As described in the Series’ most recent prospectus, the net expense ratio for Service Class shares of the Series was 1.12%, while total operating expenses for Standard Class and Service Class shares were 0.87% and 1.17%, respectively. The management fee for Standard Class and Service Class shares was 0.75%.
The Series’ distributor has contracted to limit the 12b-1 fees for Service Class shares to no more than 0.25% of average daily net assets through April 30, 2010.
Earnings from a variable annuity or variable life investment compound tax-free until withdrawal, and as a result, no adjustments were made for income taxes.
Expense limitations were in effect for both classes during certain periods shown in the Series performance chart on the previous page and in the Performance of a $10,000 Investment chart below.
Performance data do not reflect insurance fees related to a variable annuity or variable life investment or the deferred sales charge that would apply to certain withdrawals of investments. Performance shown here would have been reduced if such fees were included or the expense limitation removed. For more information about fees, consult your variable annuity or variable life prospectus.
Investments in variable products involve risk. The Series will be affected primarily by changes in stock prices.
Investments in small and/or medium-sized companies typically exhibit greater risk and higher volatility than larger, more established companies.
Instances of high double-digit returns are unusual, cannot be sustained, and were primarily achieved during favorable market conditions.
Please read both the contract and underlying prospectus for specific details regarding the product’s risk profile.
The chart shows a $10,000 investment in the Delaware VIP Trend Series Standard Class shares for the period from Dec. 31, 1999, through Dec. 31, 2009.
The chart also shows $10,000 invested in the Russell 2000 Growth Index for the period from Dec. 31, 1999, through Dec. 31, 2009. The Russell 2000 Growth Index measures the performance of the small-cap growth segment of the U.S. equity universe. It includes those Russell 2000 companies with higher price-to-book ratios and higher forecasted growth values.
Index performance returns do not reflect any management fees, transaction costs or expenses. Indices are unmanaged and one cannot invest directly in an index.
Performance of Service Class shares will vary due to different charges and expenses.
Past performance is not a guarantee of future results.
Trend Series-2
Delaware VIP® Trust — Delaware VIP Trend Series
Disclosure of Series Expenses
For the Period July 1, 2009 to December 31, 2009
As a shareholder of the Series, you incur ongoing costs, including management fees; distribution and/or service (12b-1) fees; and other Series expenses. This Example is intended to help you understand your ongoing costs (in dollars) of investing in the Series and to compare these costs with the ongoing costs of investing in other mutual funds.
The Example is based on an investment of $1,000 invested at the beginning of the period and held for the entire period from July 1, 2009 to December 31, 2009.
Actual Expenses
The first section of the table shown, “Actual Series Return,” provides information about actual account values and actual expenses. You may use the information in this section of the table, together with the amount you invested, to estimate the expenses that you paid over the period. Simply divide your account value by $1,000 (for example, an $8,600 account value divided by $1,000 = 8.6), then multiply the result by the number in the first section under the heading entitled “Expenses Paid During Period” to estimate the expenses you paid on your account during the period.
Hypothetical Example for Comparison Purposes
The second section of the table shown, “Hypothetical 5% Return,” provides information about hypothetical account values and hypothetical expenses based on the Series’ actual expense ratio and an assumed rate of return of 5% per year before expenses, which is not the Series’ actual return. The hypothetical account values and expenses may not be used to estimate the actual ending account balance or expenses you paid for the period. You may use this information to compare the ongoing costs of investing in the Series and other funds. To do so, compare the 5% hypothetical example with the 5% hypothetical examples that appear in the shareholder reports of other funds.
Please note that the expenses shown in the table are meant to highlight your ongoing costs only. As a shareholder of the Series, you do not incur any transaction costs, such as sales charges (loads), redemption fees or exchange fees, but shareholders of other funds may incur such costs. Also, the fees related to the variable annuity investment or the deferred sales charge that could apply have not been included. Therefore, the second section of the table is useful in comparing ongoing costs only, and will not help you determine the relative total costs of owning different funds. The Series’ actual expenses shown in the table reflect fee waivers in effect for Service Class shares. The expenses shown in the table assume reinvestment of all dividends and distributions.
Expense Analysis of an Investment of $1,000
| | | | | | | Expenses |
| Beginning | | Ending | | | | Paid During |
| Account | | Account | | Annualized | | Period |
| Value | | Value | | Expense | | 7/1/09 to |
| 7/1/09 | | 12/31/09 | | Ratios | | 12/31/09* |
| Actual Series Return | | | | | | | | | | | | | | | |
| Standard Class | | $ | 1,000.00 | | | | $ | 1,297.30 | | | 0.87% | | | $5.04 | |
| Service Class | | | 1,000.00 | | | | | 1,296.30 | | | 1.12% | | | 6.48 | |
| Hypothetical 5% Return (5% return before expenses) | | | | |
| Standard Class | | $ | 1,000.00 | | | | $ | 1,020.82 | | | 0.87% | | | $4.43 | |
| Service Class | | | 1,000.00 | | | | | 1,019.56 | | | 1.12% | | | 5.70 | |
*“Expenses Paid During Period” are equal to the Series’ annualized expense ratio, multiplied by the average account value over the period, multiplied by 184/365 (to reflect the one-half year period).
Trend Series-3
Delaware VIP® Trust — Delaware VIP Trend Series
Sector Allocation and Top 10 Holdings
As of December 31, 2009
Sector designations may be different than the sector designations presented in other Series materials. The sector designations may represent the investment manager’s internal sector classifications, which may result in the sector designations for one series being different than another series’ sector designations.
| Percentage |
| Sector | of Net Assets |
| Common Stock² | 99.61 | % |
| Basic Industry/Capital Goods | 8.28 | % |
| Business Services | 9.13 | % |
| Consumer Non-Durables | 9.34 | % |
| Consumer Services | 8.18 | % |
| Energy | 3.90 | % |
| Financials | 3.87 | % |
| Health Care | 25.03 | % |
| Technology | 27.94 | % |
| Transportation | 3.94 | % |
| Securities Lending Collateral | 11.42 | % |
| Total Value of Securities | 111.03 | % |
| Obligation to Return Securities Lending Collateral | (11.59 | %) |
| Receivables and Other Assets Net of Liabilities | 0.56 | % |
| Total Net Assets | 100.00 | % |
²Narrow industries are utilized for compliance purposes for diversification whereas broad sectors are used for financial reporting.
Holdings are for informational purposes only and are subject to change at any time. They are not a recommendation to buy, sell, or hold any security.
| Percentage |
| Top 10 Holdings | of Net Assets |
| Abraxis BioScience | 3.02 | % |
| Ultra Salon Cosmetics & Fragrance | 2.51 | % |
| Cardtronics | 2.50 | % |
| Perrigo | 2.35 | % |
| Veeco Instruments | 2.26 | % |
| OSI Pharmaceuticals | 2.02 | % |
| TriQuint Semiconductor | 2.01 | % |
| Teradyne | 1.86 | % |
| Sybase | 1.85 | % |
| Human Genome Sciences | 1.83 | % |
Trend Series-4
Delaware VIP® Trust — Delaware VIP Trend Series
Statement of Net Assets
December 31, 2009
| Number of | | | |
| Shares | | Value |
| COMMON STOCK–99.61%² | | | | |
| Basic Industry/Capital Goods–8.28% | | | | |
| *Bucyrus International Class A | 85,400 | | $ | 4,813,998 |
| *Dynamic Materials | 181,200 | | | 3,633,060 |
| †*Itron | 62,000 | | | 4,189,340 |
| †*Mettler-Toledo International | 16,900 | | | 1,774,331 |
| †Middleby | 90,700 | | | 4,446,114 |
| †Mistras Group | 209,800 | | | 3,159,588 |
| †Tetra Tech | 171,150 | | | 4,650,146 |
| | | | 26,666,577 |
| Business Services–9.13% | | | | |
| †*Clean Harbors | 44,300 | | | 2,640,723 |
| †Emergency Medical Services Class A | 84,600 | | | 4,581,090 |
| †*FTI Consulting | 71,700 | | | 3,381,372 |
| †*Geo Group | 231,700 | | | 5,069,596 |
| †Net 1 UEPS Technologies | 211,600 | | | 4,109,272 |
| Solera Holdings | 123,300 | | | 4,440,033 |
| †*SuccessFactors | 313,400 | | | 5,196,172 |
| | | | 29,418,258 |
| Consumer Non-Durables–9.34% | | | | |
| †*Deer Consumer Products | 229,500 | | | 2,597,940 |
| †LKQ | 224,800 | | | 4,403,832 |
| †*lululemon athletica | 175,452 | | | 5,281,105 |
| †*Penske Auto Group | 140,000 | | | 2,125,200 |
| †*Tractor Supply | 81,900 | | | 4,337,424 |
| †Ulta Salon Cosmetics & Fragrance | 444,600 | | | 8,073,936 |
| Williams-Sonoma | 157,300 | | | 3,268,694 |
| | | | 30,088,131 |
| Consumer Services–8.18% | | | | |
| †*BJ’s Restaurants | 198,000 | | | 3,726,360 |
| †*Cardtronics | 726,600 | | | 8,043,462 |
| †First Cash Financial Services | 184,800 | | | 4,100,712 |
| †*Gaylord Entertainment | 168,700 | | | 3,331,825 |
| †*P.F. Chang’s China Bistro | 69,200 | | | 2,623,372 |
| †*Texas Roadhouse Class A | 279,200 | | | 3,135,416 |
| †WMS Industries | 34,900 | | | 1,396,000 |
| | | | 26,357,147 |
| Energy–3.90% | | | | |
| *Carbo Ceramics | 63,350 | | | 4,318,570 |
| *Core Laboratories | 43,189 | | | 5,101,484 |
| †*Goodrich Petroleum | 129,400 | | | 3,150,890 |
| | | | 12,570,944 |
| Financials–3.87% | | | | |
| Hanover Insurance Group | 89,900 | | | 3,994,257 |
| Lazard Class A | 38,600 | | | 1,465,642 |
| †ProAssurance | 69,200 | | | 3,716,732 |
| †Stifel Financial | 55,700 | | | 3,299,668 |
| | | | 12,476,299 |
| Health Care–25.03% | | | | |
| †@Abraxis BioScience | 240,168 | | | 9,738,812 |
| †Acorda Therapeutics | 125,200 | | | 3,157,544 |
| †*CardioNet | 829,000 | | | 4,924,260 |
| †Celera | 607,800 | | | 4,199,898 |
| †*Charles River Laboratories International | 157,800 | | | 5,316,282 |
| †*China Nuokang Bio-Pharmaceutical ADR | 136,000 | | | 1,067,600 |
| †Cypress Bioscience | 230,305 | | | 1,326,557 |
| Healthcare Services Group | 222,400 | | | 4,772,704 |
| †*Human Genome Sciences | 193,000 | | | 5,905,800 |
| †Ligand Pharmaceuticals Class B | 661,900 | | | 1,436,323 |
| †*Martek Biosciences | 170,600 | | | 3,231,164 |
| †*Masimo | 123,500 | | | 3,756,870 |
| †*OSI Pharmaceuticals | 209,300 | | | 6,494,579 |
| *Perrigo | 190,000 | | | 7,569,600 |
| †*Savient Pharmaceuticals | 418,800 | | | 5,699,868 |
| STERIS | 39,300 | | | 1,099,221 |
| †Syneron Medical | 256,800 | | | 2,683,560 |
| †Talecris Biotherapeutics Holdings | 160,500 | | | 3,574,335 |
| †*Wright Medical Group | 247,100 | | | 4,682,545 |
| | | | 80,637,522 |
| Technology–27.94% | | | | |
| Applied Signal Technology | 148,600 | | | 2,866,494 |
| †*Arris Group | 348,900 | | | 3,987,927 |
| †*Aruba Networks | 551,800 | | | 5,882,188 |
| †BigBand Networks | 711,100 | | | 2,446,184 |
| †Cogent | 299,300 | | | 3,109,727 |
| †*CommScope | 210,700 | | | 5,589,871 |
| †F5 Networks | 77,800 | | | 4,121,844 |
| *Harte-Hanks | 296,300 | | | 3,194,114 |
| Henry (Jack) & Associates | 126,400 | | | 2,922,368 |
| †*Nuance Communications | 360,900 | | | 5,608,386 |
| †*Riverbed Technology | 199,900 | | | 4,591,703 |
| †Sanmina-SCI | 484,300 | | | 5,341,829 |
| †*STEC | 190,300 | | | 3,109,502 |
| †*Sybase | 137,300 | | | 5,958,820 |
| †*Teradyne | 559,300 | | | 6,001,289 |
| †*TriQuint Semiconductor | 1,077,900 | | | 6,467,400 |
| †*Varian Semiconductor Equipment Associates | 161,600 | | | 5,798,208 |
| †*Veeco Instruments | 220,500 | | | 7,285,320 |
| †Volterra Semiconductor | 300,000 | | | 5,736,000 |
| | | | 90,019,174 |
| Transportation–3.94% | | | | |
| †Echo Global Logistics | 38,200 | | | 484,758 |
| *†Genco Shipping & Trading | 65,900 | | | 1,474,842 |
| *Hunt (J.B.) Transport Services | 145,300 | | | 4,688,831 |
| *Knight Transportation | 184,800 | | | 3,564,792 |
| †Marten Transport | 137,800 | | | 2,473,510 |
| | | | 12,686,733 |
| Total Common Stock | | | | |
| (cost $259,859,619) | | | | 320,920,785 |
| | | | | |
| Total Value of Securities | | | | |
| Before Securities Lending | | | | |
| Collateral–99.61% (cost $259,859,619) | | | | 320,920,785 |
| | | | | |
| SECURITIES LENDING | | | | |
| COLLATERAL**–11.42% | | | | |
| Investment Companies | | | | |
| Mellon GSL DBT II Collateral Fund | 28,058,236 | | | 28,058,236 |
| BNY Mellon SL DB II Liquidating Fund | 8,805,547 | | | 8,704,283 |
| †@Mellon GSL Reinvestment Trust II | 462,002 | | | 19,635 |
| Total Securities Lending Collateral | | | | |
| (cost $37,325,785) | | | | 36,782,154 |
Trend Series-5
Delaware VIP® Trend Series
Statement of Net Assets (continued)
| TOTAL VALUE OF SECURITIES–111.03% (cost $297,185,404) | | $357,702,939 | © |
| OBLIGATION TO RETURN SECURITIES LENDING COLLATERAL**–(11.59%) | | (37,325,785 | ) |
| RECEIVABLES AND OTHER ASSETS NET OF LIABILITIES–0.56% | | 1,800,486 | |
| NET ASSETS APPLICABLE TO 12,614,023 SHARES OUTSTANDING–100.00% | | $322,177,640 | |
NET ASSET VALUE–DELAWARE VIP TREND SERIES STANDARD CLASS ($241,328,141 / 9,388,746 Shares) | | | $25.70 | |
NET ASSET VALUE–DELAWARE VIP TREND SERIES SERVICE CLASS ($80,849,499 / 3,225,277 Shares) | | | $25.07 | |
| COMPONENTS OF NET ASSETS AT DECEMBER 31, 2009: | | | |
| Shares of beneficial interest (unlimited authorization–no par) | | $324,492,206 | |
| Accumulated net investment loss | | (8,200 | ) |
| Accumulated net realized loss on investments | | (62,832,344 | ) |
| Net unrealized appreciation of investments and foreign currencies | | 60,525,978 | |
| Total net assets | | $322,177,640 | |
| ____________________ |
| ² | Narrow industries are utilized for compliance purposes for diversification whereas broad sectors are used for financial reporting. |
| † | Non income producing security. |
| @ | Illiquid security. At December 31, 2009, the aggregate amount of illiquid securities was $9,758,447 which represented 3.03% of the Series’ net assets. See Note 9 in “Notes to Financial Statements.” |
| * | Fully or partially on loan. |
| ** | See Note 8 in “Notes to Financial Statements.” |
| © | Includes $36,461,484 of securities loaned. |
ADR – American Depositary Receipts
See accompanying notes
Trend Series-6
Delaware VIP® Trust —
Delaware VIP Trend Series
Statement of Operations
Year Ended December 31, 2009
| INVESTMENT INCOME: | | | |
| Dividends | $ | 980,204 | |
| Securities lending income | | 345,768 | |
| Interest income | | 9,603 | |
| Foreign tax withheld | | (4,468 | ) |
| | 1,331,107 | |
| | | | |
| EXPENSES: | | | |
| Management fees | | 1,969,273 | |
| Distribution expenses – Service Class | | 202,691 | |
| Reports and statements to shareholders | | 114,518 | |
| Accounting and administration expenses | | 105,028 | |
| Legal fees | | 57,986 | |
| Dividend disbursing and transfer agent fees and expenses | | 38,055 | |
| Audit and tax | | 20,946 | |
| Trustees’ fees | | 16,777 | |
| Custodian fees | | 6,896 | |
| Insurance fees | | 6,518 | |
| Dues and services | | 3,403 | |
| Consulting fees | | 3,337 | |
| Trustees’ expenses | | 1,201 | |
| Pricing fees | | 614 | |
| Registration fees | | 51 | |
| | 2,547,294 | |
| Less waiver of distribution expenses – Service Class | | (33,846 | ) |
| Total operating expenses | | 2,513,448 | |
| | | | |
| NET INVESTMENT LOSS | | (1,182,341 | ) |
| | | | |
| NET REALIZED AND UNREALIZED GAIN (LOSS) | | | |
| ON INVESTMENTS AND FOREIGN CURRENCIES: | | | |
| Net realized loss on: | | | |
| Investments | | (13,119,369 | ) |
| Foreign currencies | | (27,829 | ) |
| Net realized loss | | (13,147,198 | ) |
| Net change in unrealized appreciation/depreciation | | | |
| of investments | | 131,642,200 | |
| | | | |
| NET REALIZED AND UNREALIZED GAIN | | | |
| ON INVESTMENTS AND FOREIGN CURRENCIES | | 118,495,002 | |
| | | | |
| NET INCREASE IN NET ASSETS RESULTING | | | |
| FROM OPERATIONS | $ | 117,312,661 | |
| | | | |
See accompanying notes
Delaware VIP Trust —
Delaware VIP Trend Series
Statements of Changes in Net Assets
| Year Ended |
| 12/31/09 | | 12/31/08 |
| INCREASE (DECREASE) IN NET | | | | | | | |
| ASSETS FROM OPERATIONS: | | | | | | | |
| Net investment loss | $ | (1,182,341 | ) | | $ | (1,235,926 | ) |
| Net realized loss on investments and | | | | | | | |
| foreign currencies | | (13,147,198 | ) | | | (49,057,624 | ) |
| Net change in unrealized appreciation/ | | | | | | | |
| depreciation of investments | | 131,642,200 | | | | (166,809,876 | ) |
| Net increase (decrease) in net assets | | | | | | | |
| resulting from operations | | 117,312,661 | | | | (217,103,426 | ) |
| | | | | | | | |
| DIVIDENDS AND DISTRIBUTIONS | | | | | | | |
| TO SHAREHOLDERS FROM: | | | | | | | |
| Net realized gain on investments: | | | | | | | |
| Standard Class | | – | | | | (57,555,485 | ) |
| Service Class | | – | | | | (20,580,629 | ) |
| | – | | | | (78,136,114 | ) |
| | | | | | | | |
| CAPITAL SHARE TRANSACTIONS: | | | | | | | |
| Proceeds from shares sold: | | | | | | | |
| Standard Class | | 11,834,949 | | | | 7,884,284 | |
| Service Class | | 11,164,913 | | | | 18,679,554 | |
| Net asset value of shares issued upon | | | | | | | |
| reinvestment of dividends and distributions: | | | | | | | |
| Standard Class | | – | | | | 57,555,485 | |
| Service Class | | – | | | | 20,580,629 | |
| | 22,999,862 | | | | 104,699,952 | |
| Cost of shares repurchased: | | | | | | | |
| Standard Class | | (28,595,604 | ) | | | (52,450,665 | ) |
| Service Class | | (21,394,652 | ) | | | (33,343,678 | ) |
| | (49,990,256 | ) | | | (85,794,343 | ) |
| Increase (decrease) in net assets derived | | | | | | | |
| from capital share transactions | | (26,990,394 | ) | | | 18,905,609 | |
| | | | | | | | |
| NET INCREASE (DECREASE) | | | | | | | |
| IN NET ASSETS | | 90,322,267 | | | | (276,333,931 | ) |
| | | | | | | | |
| NET ASSETS: | | | | | | | |
| Beginning of year | | 231,855,373 | | | | 508,189,304 | |
| End of year (including accumulated | | | | | | | |
| net investment loss of $8,200 | | | | | | | |
| and $–, respectively) | $ | 322,177,640 | | | $ | 231,855,373 | |
| | | | | | | | |
See accompanying notes
Trend Series-7
Delaware VIP® Trust — Delaware VIP Trend Series
Financial Highlights
Selected data for each share of the Series outstanding throughout each period were as follows:
| | Delaware VIP Trend Series Standard Class |
| | Year Ended |
| | 12/31/09 | | 12/31/08 | | 12/31/07 | | 12/31/06 | | 12/31/05 | |
| Net asset value, beginning of period | | $16.610 | | $38.500 | | $35.000 | | $32.530 | | $30.730 | |
| | | | | | | | | | | | |
| Income (loss) from investment operations: | | | | | | | | | | | |
| Net investment loss1 | | (0.076 | ) | (0.069 | ) | (0.090 | ) | (0.088 | ) | (0.108 | ) |
| Net realized and unrealized gain (loss) on investments | | | | | | | | | | | |
| and foreign currencies | | 9.166 | | (15.699 | ) | 3.836 | | 2.558 | | 1.908 | |
| Total from investment operations | | 9.090 | | (15.768 | ) | 3.746 | | 2.470 | | 1.800 | |
| | | | | | | | | | | | |
| Less dividends and distributions from: | | | | | | | | | | | |
| Net realized gain on investments | | – | | (6.122 | ) | (0.246 | ) | – | | – | |
| Total dividends and distributions | | – | | (6.122 | ) | (0.246 | ) | – | | – | |
| | | | | | | | | | | | |
| Net asset value, end of period | | $25.700 | | $16.610 | | $38.500 | | $35.000 | | $32.530 | |
| | | | | | | | | | | | |
| Total return2 | | 54.73% | | (46.74% | ) | 10.75% | | 7.59% | | 5.86% | |
| | | | | | | | | | | | |
| Ratios and supplemental data: | | | | | | | | | | | |
| Net assets, end of period (000 omitted) | | $241,328 | | $170,993 | | $376,101 | | $410,167 | | $450,525 | |
| Ratio of expenses to average net assets | | 0.89% | | 0.87% | | 0.86% | | 0.87% | | 0.87% | |
| Ratio of net investment loss to average net assets | | (0.39% | ) | (0.26% | ) | (0.24% | ) | (0.26% | ) | (0.36% | ) |
| Portfolio turnover | | 103% | | 93% | | 78% | | 64% | | 63% | |
____________________
| 1The average shares outstanding method has been applied for per share information. |
| 2Total investment return is based on the change in net asset value of a share during the period and assumes reinvestment of dividends and distributions at net asset value. |
See accompanying notes
Trend Series-8
Delaware VIP® Trend Series
Financial Highlights (continued)
Selected data for each share of the Series outstanding throughout each period were as follows:
| | Delaware VIP Trend Series Service Class |
| | Year Ended |
| | 12/31/09 | | 12/31/08 | | 12/31/07 | | 12/31/06 | | 12/31/05 | |
| Net asset value, beginning of period | | $16.240 | | $37.880 | | $34.530 | | $32.170 | | $30.460 | |
| | | | | | | | | | | | |
| Income (loss) from investment operations: | | | | | | | | | | | |
| Net investment loss1 | | (0.125 | ) | (0.133 | ) | (0.184 | ) | (0.171 | ) | (0.182 | ) |
| Net realized and unrealized gain (loss) on investments | | | | | | | | | | | |
| and foreign currencies | | 8.955 | | (15.385 | ) | 3.780 | | 2.531 | | 1.892 | |
| Total from investment operations | | 8.830 | | (15.518 | ) | 3.596 | | 2.360 | | 1.710 | |
| | | | | | | | | | | | |
| Less dividends and distributions from: | | | | | | | | | | | |
| Net realized gain on investments | | – | | (6.122 | ) | (0.246 | ) | – | | – | |
| Total dividends and distributions | | – | | (6.122 | ) | (0.246 | ) | – | | – | |
| | | | | | | | | | | | |
| Net asset value, end of period | | $25.070 | | $16.240 | | $37.880 | | $34.530 | | $32.170 | |
| | | | | | | | | | | | |
| Total return2 | | 54.37% | | (46.86% | ) | 10.46% | | 7.34% | | 5.61% | |
| | | | | | | | | | | | |
| Ratios and supplemental data: | | | | | | | | | | | |
| Net assets, end of period (000 omitted) | | $80,850 | | $60,862 | | $132,088 | | $128,909 | | $119,361 | |
| Ratio of expenses to average net assets | | 1.14% | | 1.12% | | 1.11% | | 1.12% | | 1.12% | |
| Ratio of expenses to average net assets | | | | | | | | | | | |
| prior to fees waived and expense paid indirectly | | 1.19% | | 1.17% | | 1.16% | | 1.17% | | 1.17% | |
| Ratio of net investment loss to average net assets | | (0.64% | ) | (0.51% | ) | (0.49% | ) | (0.51% | ) | (0.61% | ) |
| Ratio of net investment loss to average net assets | | | | | | | | | | | |
| prior to fees waived and expense paid indirectly | | (0.69% | ) | (0.56% | ) | (0.54% | ) | (0.56% | ) | (0.66% | ) |
| Portfolio turnover | | 103% | | 93% | | 78% | | 64% | | 63% | |
____________________
| 1The average shares outstanding method has been applied for per share information. |
| 2Total investment return is based on the change in net asset value of a share during the period and assumes reinvestment of dividends and distributions at net asset value. Total investment return during all of the periods shown reflects a waiver by the distributor. Performance would have been lower had the waiver not been in effect. |
See accompanying notes
Trend Series-9
Delaware VIP® Trust — Delaware VIP Trend Series
Notes to Financial Statements
December 31, 2009
Delaware VIP Trust (Trust) is organized as a Delaware statutory trust and offers 12 series: Delaware VIP Cash Reserve Series, Delaware VIP Diversified Income Series, Delaware VIP Emerging Markets Series, Delaware VIP Growth Opportunities Series, Delaware VIP High Yield Series, Delaware VIP International Value Equity Series, Delaware VIP Limited-Term Diversified Income Series, (formerly, Delaware VIP Capital Reserves Series), Delaware VIP REIT Series, Delaware VIP Small Cap Value Series, Delaware VIP Trend Series, Delaware VIP U.S. Growth Series and Delaware VIP Value Series. These financial statements and the related notes pertain to Delaware VIP Trend Series (Series). The Trust is an open-end investment company. The Series is considered diversified under the Investment Company Act of 1940, as amended, and offers Standard Class and Service Class shares. The Standard Class shares do not carry a 12b-1 fee and the Service Class shares carry a 12b-1 fee. The shares of the Series are sold only to separate accounts of life insurance companies.
The investment objective of the Series is to seek long-term capital appreciation.
1. Significant Accounting Policies
The following accounting policies are in accordance with U.S. generally accepted accounting principles (U.S. GAAP) and are consistently followed by the Series.
Security Valuation—Equity securities, except those traded on the Nasdaq Stock Market, Inc. (Nasdaq), are valued at the last quoted sales price as of the time of the regular close of the New York Stock Exchange (NYSE) on the valuation date. Securities traded on the Nasdaq are valued in accordance with the Nasdaq Official Closing Price, which may not be the last sales price. If on a particular day an equity security does not trade, then the mean between the bid and ask prices will be used. Short-term debt securities are valued at market value. Investment companies are valued at net asset value per share. Generally, other securities and assets for which market quotations are not readily available are valued at fair value as determined in good faith under the direction of the Series’ Board of Trustees (Board). In determining whether market quotations are readily available or fair valuation will be used, various factors will be taken into consideration, such as market closures or suspension of trading in a security. The Series may use fair value pricing more frequently for securities traded primarily in non-U.S. markets because, among other things, most foreign markets close well before the Series values its securities at 4:00 p.m. Eastern time. The earlier close of these foreign markets gives rise to the possibility that significant events, including broad market moves, government actions or pronouncements, aftermarket trading, or news events may have occurred in the interim. To account for this, the Series may frequently value foreign securities using fair value prices based on third-party vendor modeling tools (international fair value pricing).
Federal Income Taxes—No provision for federal income taxes has been made as the Series intends to continue to qualify for federal income tax purposes as a regulated investment company under Subchapter M of the Internal Revenue Code of 1986, as amended, and make the requisite distributions to shareholders. The Series evaluates tax positions taken or expected to be taken in the course of preparing the Series’ tax returns to determine whether the tax positions are “more-likely-than-not” of being sustained by the applicable tax authority. Tax positions not deemed to meet the more-likely-than-not threshold are recorded as a tax benefit or expense in the current year. Management has analyzed the Series’ tax positions taken on federal income tax returns for all open tax years (tax years ended December 31, 2006 – December 31, 2009), and has concluded that no provision for federal income tax is required in the Series’ financial statements.
Class Accounting—Investment income, common expenses and realized and unrealized gain (loss) on investments are allocated to the classes of the Series on the basis of daily net assets of each class. Distribution expenses relating to a specific class are charged directly to that class.
Repurchase Agreements—The Series may invest in a pooled cash account along with other members of the Delaware Investments® Family of Funds pursuant to an exemptive order issued by the Securities and Exchange Commission. The aggregate daily balance of the pooled cash account is invested in repurchase agreements secured by obligations of the U.S. government. The respective collateral is held by the Series’ custodian bank until the maturity of the respective repurchase agreements. Each repurchase agreement is at least 102% collateralized. However, in the event of default or bankruptcy by the counterparty to the agreement, realization of the collateral may be subject to legal proceedings. At December 31, 2009, the Series held no investments in repurchase agreements.
Use of Estimates—The preparation of financial statements in conformity with U.S. GAAP requires management to make estimates and assumptions that affect the reported amounts of assets and liabilities at the date of the financial statements and the reported amounts of revenues and expenses during the reporting period. Actual results could differ from those estimates.
Other—Expenses directly attributable to the Series are charged directly to the Series. Other expenses common to various funds within the Delaware Investments Family of Funds are generally allocated amongst such funds on the basis of average net assets. Management fees and some other expenses are paid monthly. Security transactions are recorded on the date the securities are purchased or sold (trade date) for financial reporting purposes. Costs used in calculating realized gains and losses on the sale of investment securities are those of the specific securities sold. Dividend income is recorded on the ex-dividend date and interest income is recorded on the accrual basis. The Series declares and pays dividends from net investment income and distributions from net realized gain on investments, if any, following the close of the fiscal year.
Subject to seeking best execution, the Series may direct certain security trades to brokers who have agreed to rebate a portion of the related brokerage commission to the Series in cash. In general, best execution refers to many factors, including the price paid or received for a security, the commission charged, the promptness and reliability of execution, the confidentiality and placement accorded the order, and other factors affecting the overall benefit obtained by the Series on the transaction. There were no commission rebates during the year ended December 31, 2009.
The Series may receive earnings credits from its custodian when positive cash balances are maintained, which are used to offset custody fees. There were no earnings credits for the year ended December 31, 2009.
Trend Series-10
Delaware VIP® Trend Series
Notes to Financial Statements (continued)
1. Significant Accounting Policies (continued)
On July 1, 2009, the Financial Accounting Standards Board (FASB) issued the FASB Accounting Standards Codification (Codification). The Codification became the single source of authoritative nongovernmental U.S. GAAP, superseding existing literature of the FASB, American Institute of Certified Public Accountants, Emerging Issues Task Force and other sources. The Codification is effective for interim and annual periods ending after September 15, 2009. The Series adopted the Codification for the year ended December 31, 2009. There was no impact to financial statements as the Codification requirements are disclosure-only in nature.
Management has evaluated whether any events or transactions occurred subsequent to December 31, 2009 through February 17, 2010, the date of issuance of the Series’ financial statements, and determined that there were no material events or transactions that would require recognition or disclosure in the Series’ financial statements.
2. Investment Management, Administration Agreements and Other Transactions with Affiliates
In accordance with the terms of its investment management agreement, the Series pays Delaware Management Company (DMC), a series of Delaware Management Business Trust and the investment manager, an annual fee which is calculated daily at the rate of 0.75% on the first $500 million of average daily net assets of the Series, 0.70% on the next $500 million, 0.65% on the next $1.5 billion, and 0.60% on average daily net assets in excess of $2.5 billion.
Delaware Service Company, Inc. (DSC), an affiliate of DMC, provides fund accounting and financial administration oversight services to the Series. For these services, the Series pays DSC fees based on the aggregate daily net assets of the Delaware Investments® Family of Funds at the following annual rate: 0.0050% of the first $30 billion; 0.0045% of the next $10 billion; 0.0040% of the next $10 billion; and 0.0025% of aggregate average daily net assets in excess of $50 billion. The fees payable to DSC under the service agreement described above are allocated among all funds in the Delaware Investments Family of Funds on a relative net asset value basis. For the year ended December 31, 2009, the Series was charged $13,128 for these services.
DSC also provides dividend disbursing and transfer agency services. The Series pays DSC a monthly fee based on the number of shareholder accounts for dividend disbursing and transfer agent services.
Pursuant to a distribution agreement and distribution plan, the Series pays Delaware Distributors, L.P. (DDLP), the distributor and an affiliate of DMC, an annual distribution and service fee not to exceed 0.30% of the average daily net assets of the Service Class shares. DDLP has contracted to waive distribution and service fees through April 30, 2010 in order to prevent distribution and service fees of the Service Class shares from exceeding 0.25% of average daily net assets. Standard Class shares pay no distribution and service expenses.
At December 31, 2009, the Series had liabilities payable to affiliates as follows:
| | | | Dividend Disbursing, | | | | Other |
| | Investment | | Transfer Agent and Fund | | | | Expenses |
| | Management | | Accounting Oversight | | Distribution | | Payable |
| | Fee Payable to | | Fees and Other Expenses | | Fee Payable | | to DMC |
| | DMC | | Payable to DSC | | to DDLP | | and Affiliates* |
| | $199,829 | | $3,341 | | $16,682 | | $34,712 |
____________________
*DMC, as part of its administrative services, pays operating expenses on behalf of the Series and is reimbursed on a periodic basis. Such expenses include items such as printing of shareholder reports, fees for audit, legal and tax services, custodian fees and trustees’ fees.
As provided in the investment management agreement, the Series bears the cost of certain legal and tax services, including internal legal and tax services provided to the Series by DMC and/or its affiliates’ employees. For the year ended December 31, 2009, the Series was charged $21,756 for internal legal and tax services provided by DMC and/or its affiliates’ employees.
Trustees’ fees include expenses accrued by the Series for each Trustee’s retainer and meeting fees. Certain officers of DMC, DSC and DDLP are officers and/or Trustees of the Trust. These officers and Trustees are paid no compensation by the Series.
3. Investments
For the year ended December 31, 2009, the Series made purchases and sales of investment securities other than short-term investments as follows:
| Purchases | $261,468,682 |
| Sales | 276,947,380 |
Trend Series-11
Delaware VIP® Trend Series
Notes to Financial Statements (continued)
3. Investments (continued)
At December 31, 2009, the cost of investments and unrealized appreciation (depreciation) for federal income tax purposes for the Series were as follows:
| | | | Aggregate | | Aggregate | | Net |
| | Cost of | | Unrealized | | Unrealized | | Unrealized |
| | Investments | | Appreciation | | Depreciation | | Appreciation |
| | $299,899,001 | | $68,903,520 | | $(11,099,582) | | $57,803,938 |
U.S. GAAP defines fair value as the price that the Series would receive to sell an asset or pay to transfer a liability in an orderly transaction between market participants at the measurement date under current market conditions. A framework for measuring fair value and a three level hierarchy for fair value measurements has been established based upon the transparency of inputs to the valuation of an asset or liability. Inputs may be observable or unobservable and refer broadly to the assumptions that market participants would use in pricing the asset or liability. Observable inputs reflect the assumptions market participants would use in pricing the asset or liability based on market data obtained from sources independent of the reporting entity. Unobservable inputs reflect the reporting entity’s own assumptions about the assumptions that market participants would use in pricing the asset or liability developed based on the best information available under the circumstances. The Series’ investment in its entirety is assigned a level based upon the observability of the inputs which are significant to the overall valuation. The three-tier hierarchy of inputs is summarized below.
Level 1 – inputs are quoted prices in active markets
Level 2 – inputs are observable, directly or indirectly
Level 3 – inputs are unobservable and reflect assumptions on the part of the reporting entity
The following table summarizes the valuation of the Series’ investments by the fair value hierarchy levels as of December 31, 2009:
| | Level 1 | | Level 2 | | Level 3 | | Total |
| Common Stock | | $ | 320,920,785 | | $ | – | | $ | – | | $ | 320,920,785 |
| Securities Lending Collateral | | | 28,058,236 | | | 8,704,283 | | | 19,635 | | | 36,782,154 |
| Total | | $ | 348,979,021 | | $ | 8,704,283 | | $ | 19,635 | | $ | 357,702,939 |
| | | | | | | | | | | | | |
The following is a reconciliation of investments in which significant unobservable inputs (Level 3) were used in determining fair value:
| Securities |
| Lending |
| Collateral |
| Balance as of 12/31/08 | | $ | 15,246 | |
| Net change in unrealized appreciation/depreciation | | | 4,389 | |
| Balance as of 12/31/09 | | $ | 19,635 | |
| | | | | |
| Net change in unrealized | | | | |
| appreciation/depreciation from | | | | |
| investments still held as of 12/31/09 | | $ | 4,389 | |
In January 2010, the Financial Accounting Standards Board issued an Accounting Standards Update, Improving Disclosures about Fair Value Measurements, which introduces new disclosure requirements and clarifies certain existing disclosure requirements around fair value measurements currently presented above. The new disclosures and clarifications of existing disclosures are generally effective for the Series’ year ending December 31, 2010 and interim periods therein. Management is evaluating the impact of this update on its current disclosures.
4. Dividend and Distribution Information
Income and long-term capital gain distributions are determined in accordance with federal income tax regulations, which may differ from U.S. GAAP. Additionally, distributions from net short-term gains on sales of investment securities are treated as ordinary income for federal income tax purposes. There were no dividends and distributions paid during the year ended December 31, 2009. The tax character of dividends and distributions paid during the year ended December 31, 2008 was as follows:
| Year |
| Ended |
| 12/31/08 |
| Ordinary income | $ | 742,584 |
| Long-term capital gain | | 77,390,754 |
| Return of capital | | 2,776 |
| Total | $ | 78,136,114 |
| | | |
Trend Series-12
Delaware VIP® Trend Series
Notes to Financial Statements (continued)
5. Components of Net Assets on a Tax Basis
As of December 31, 2009, the components of net assets on a tax basis were as follows:
| Shares of beneficial interest | $ | 324,492,206 | |
| Post-October losses | | (882,189 | ) |
| Post-October currency losses | | (8,200 | ) |
| Capital loss carryforwards | | (59,236,558 | ) |
| Unrealized appreciation of investments and | | | |
| foreign currencies | | 57,812,381 | |
| Net assets | $ | 322,177,640 | |
The differences between book basis and tax basis components of net assets are primarily attributable to tax deferral of losses on wash sales.
Post-October losses represent losses realized on foreign currency and investment transactions from November 1, 2009 through December 31, 2009, that, in accordance with federal income tax regulations, the Series has elected to defer and treat as having arisen in the following fiscal year.
For financial reporting purposes, capital accounts are adjusted to reflect the tax character of permanent book/tax differences. Reclassifications are primarily due to tax treatment of net operating losses and gain (loss) on foreign currency transactions. Results of operations and net assets were not affected by these reclassifications. For the year ended December 31, 2009, the Series recorded the following reclassifications:
| Accumulated | | Accumulated | | |
| Net Investment | | Net Realized | | Paid-in |
| Loss | | Loss | | Capital |
| $1,174,141 | | $27,829 | | $(1,201,970) |
For federal income tax purposes, capital loss carryforwards may be carried forward and applied against future capital gains. Capital loss carryforwards remaining at December 31, 2009 will expire as follows: $22,165,948 expires in 2016 and $37,070,610 expires in 2017.
6. Capital Shares
Transactions in capital shares were as follows:
| Year | | Year |
| Ended | | Ended |
| 12/31/09 | | 12/31/08 |
| Shares sold: | | | | | |
| Standard Class | 565,927 | | | 326,899 | |
| Service Class | 560,678 | | | 726,090 | |
| | | | | | |
| Shares issued upon reinvestment of dividends and distributions: | | | | | |
| Standard Class | – | | | 2,205,191 | |
| Service Class | – | | | 805,189 | |
| 1,126,605 | | | 4,063,369 | |
| Shares repurchased: | | | | | |
| Standard Class | (1,473,995 | ) | | (2,005,114 | ) |
| Service Class | (1,084,101 | ) | | (1,269,512 | ) |
| (2,558,096 | ) | | (3,274,626 | ) |
| Net increase (decrease) | (1,431,491 | ) | | 788,743 | |
7. Line of Credit
The Series, along with certain other funds in the Delaware Investments® Family of Funds (Participants), participates in a $35,000,000 revolving line of credit with The Bank of New York Mellon (BNY Mellon) to be used for temporary or emergency purposes as an additional source of liquidity to fund redemptions of investor shares. Under the agreement, Participants are charged an annual commitment fee, which is allocated across the Participants on the basis of each Participant’s allocation of the entire facility. The Participants may borrow up to a maximum of one third of their net assets under the agreement. The agreement expires on November 16, 2010. The Series had no amounts outstanding as of December 31, 2009, or at any time during the year then ended.
Trend Series-13
Delaware VIP® Trend Series
Notes to Financial Statements (continued)
8. Securities Lending
The Series, along with other funds in the Delaware Investments Family of Funds, may lend its securities pursuant to a security lending agreement (Lending Agreement) with BNY Mellon. With respect to each loan, if the aggregate market value of securities collateral held plus cash collateral received on any business day is less than the aggregate market value of the securities which are the subject of such loan, the borrower will be notified to provide additional collateral not less than the applicable collateral requirements. Cash collateral received is generally invested in the Mellon GSL DBT II Collateral Fund (Collective Trust) established by BNY Mellon for the purpose of investment on behalf of clients participating in its securities lending programs. The Collective Trust may invest in fixed income securities, with a weighted average maturity not to exceed 90 days, rated in one of the top three tiers by Standard & Poor’s Ratings Group or Moody’s Investors Service, Inc. or repurchase agreements collateralized by such securities. The Collective Trust seeks to maintain a net asset value per unit of $1.00, but there can be no assurance that it will always be able to do so. At December 31, 2009, the Collective Trust held only cash and assets with a maturity of one business day or less (Cash/Overnight Assets). The Series may incur investment losses as a result of investing securities lending collateral in the Collective Trust. This could occur if an investment in the Collective Trust defaulted or if it were necessary to liquidate assets in the Collective Trust to meet returns on outstanding security loans at a time when the Collective Trust’s net asset value per unit was less than $1.00. Under those circumstances, the Series may not receive an amount from the Collective Trust that is equal in amount to the collateral the Series would be required to return to the borrower of the securities and the Series would be required to make up for this shortfall. Effective April 20, 2009, BNY Mellon transferred the assets of the Collective Trust other than the Cash/Overnight Assets to the BNY Mellon SL DBT II Liquidating Fund (Liquidating Fund), effectively bifurcating the collateral investment pool. The Series’ exposure to the Liquidating Fund is expected to decrease as the Liquidating Fund’s assets mature or are sold. In October 2008, BNY Mellon transferred certain distressed securities from the Collective Trust into the Mellon GSL Reinvestment Trust II. The Series can also accept U.S. government securities and letters of credit (non-cash collateral) in connection with securities loans. In the event of default or bankruptcy by the lending agent, realization and/or retention of the collateral may be subject to legal proceedings. In the event the borrower fails to return loaned securities and the collateral received is insufficient to cover the value of the loaned securities and provided such collateral shortfall is not the result of investment losses, the lending agent has agreed to pay the amount of the shortfall to the Series, or at the discretion of the lending agent, replace the loaned securities. The Series continues to record dividends or interest, as applicable, on the securities loaned and is subject to change in value of the securities loaned that may occur during the term of the loan. The Series has the right under the Lending Agreement to recover the securities from the borrower on demand. With respect to security loans collateralized by non-cash collateral, the Series receives loan premiums paid by the borrower. With respect to security loans collateralized by cash collateral, the earnings from the collateral investments are shared among the Series, the security lending agent and the borrower. The Series records security lending income net of allocations to the security lending agent and the borrower.
At December 31, 2009, the value of the securities on loan was $36,461,484, for which the Series received collateral, comprised of non-cash collateral valued at $145,314, and cash collateral of $37,325,785. At December 31, 2009, the value of invested collateral was $36,782,154. Investments purchased with cash collateral are presented on the Statement of Net Assets under the caption “Securities Lending Collateral.”
9. Credit and Market Risk
The Series invests a significant portion of its assets in small companies and may be subject to certain risks associated with ownership of securities of such companies. Investments in small-sized companies may be more volatile than investments in larger companies for a number of reasons, which include limited financial resources or a dependence on narrow product lines.
The Series may invest up to 10% of its net assets in illiquid securities, which may include securities with contractual restrictions on resale, securities exempt from registration under Rule 144A of the Securities Act of 1933, as amended, and other securities which may not be readily marketable. The relative illiquidity of these securities may impair the Series from disposing of them in a timely manner and at a fair price when it is necessary or desirable to do so. While maintaining oversight, the Series’ Board has delegated to DMC the day-to-day functions of determining whether individual securities are liquid for purposes of the Series’ limitation on investments in illiquid assets. Securities eligible for resale pursuant to Rule 144A, which are determined to be liquid, are not subject to the Series’ 10% limit on investments in illiquid assets. As of December 31, 2009, there were no Rule 144A securities. Illiquid securities have been identified on the Statement of Net Assets.
10. Contractual Obligations
The Series enters into contracts in the normal course of business that contain a variety of indemnifications. The Series’ maximum exposure under these arrangements is unknown. However, the Series has not had prior claims or losses pursuant to these contracts. Management has reviewed the Series’ existing contracts and expects the risk of loss to be remote.
11. Sale of Delaware Investments to Macquarie Group
On August 18, 2009, Lincoln National Corporation (parent company of Delaware Investments) and Macquarie Group (Macquarie) entered into an agreement pursuant to which Delaware Investments, including DMC, DDLP and DSC, would be acquired by Macquarie, an Australia-based global provider of banking, financial, advisory, investment and funds management services (Transaction). The Transaction was completed on January 4, 2010. DMC, DDLP and DSC are now wholly-owned subsidiaries of Macquarie.
The Transaction resulted in a change of control of DMC which, in turn, caused the termination of the investment advisory agreement between DMC and the Series. On January 4, 2010, the new investment advisory agreement between DMC and the Series that was approved by the shareholders became effective.
Trend Series-14
Delaware VIP® Trust — Delaware VIP Trend Series
Report of Independent Registered Public Accounting Firm
To the Shareholders and Board of Trustees
Delaware VIP Trust–Delaware VIP Trend Series
We have audited the accompanying statement of net assets of the Delaware VIP Trend Series (one of the series constituting Delaware VIP Trust) (the “Series”) as of December 31, 2009, and the related statement of operations for the year then ended, the statements of changes in net assets for each of the two years in the period then ended, and the financial highlights for each of the five years in the period then ended. These financial statements and financial highlights are the responsibility of the Series’ management. Our responsibility is to express an opinion on these financial statements and financial highlights based on our audits.
We conducted our audits in accordance with the standards of the Public Company Accounting Oversight Board (United States). Those standards require that we plan and perform the audit to obtain reasonable assurance about whether the financial statements and financial highlights are free of material misstatement. We were not engaged to perform an audit of the Series’ internal control over financial reporting. Our audits included consideration of internal control over financial reporting as a basis for designing audit procedures that are appropriate in the circumstances, but not for the purpose of expressing an opinion on the effectiveness of the Series’ internal control over financial reporting. Accordingly, we express no such opinion. An audit also includes examining, on a test basis, evidence supporting the amounts and disclosures in the financial statements and financial highlights, assessing the accounting principles used and significant estimates made by management, and evaluating the overall financial statement presentation. Our procedures included confirmation of securities owned as of December 31, 2009, by correspondence with the custodian and brokers or by other appropriate auditing procedures where replies from brokers were not received. We believe that our audits provide a reasonable basis for our opinion.
In our opinion, the financial statements and financial highlights referred to above present fairly, in all material respects, the financial position of the Delaware VIP Trend Series of Delaware VIP Trust at December 31, 2009, the results of its operations for the year then ended, the changes in its net assets for each of the two years in the period then ended, and its financial highlights for each of the five years in the period then ended, in conformity with U.S. generally accepted accounting principles.
Philadelphia, Pennsylvania
February 17, 2010
The Series files its complete schedule of portfolio holdings with the Securities and Exchange Commission (Commission) for the first and third quarters of each fiscal year on Form N-Q. The Series’ Forms N-Q, as well as a description of the policies and procedures that the Series uses to determine how to vote proxies (if any) relating to portfolio securities is available without charge (i) upon request, by calling 800 523-1918; and (ii) on the Commission’s website at http://www.sec.gov. In addition, a description of the policies and procedures that the Series uses to determine how to vote proxies (if any) relating to portfolio securities is available without charge on the Delaware Investments® Funds’ Web site at http://www.delawareinvestments.com. The Series’ Forms N-Q may be reviewed and copied at the Commission’s Public Reference Room in Washington, DC; information on the operation of the Public Reference Room may be obtained by calling 800 SEC-0330. Information (if any) regarding how the Series voted proxies relating to portfolio securities during the most recently disclosed 12-month period ended June 30 is available without charge (i) through the Delaware Investments Funds’ Web site at http://www.delawareinvestments.com; and (ii) on the Commission’s website at http://www.sec.gov. |
Trend Series-15
Delaware VIP® Trust — Delaware VIP Trend Series
Other Series Information
Board Consideration of New Investment Advisory Agreement
At a meeting held on September 3, 2009 (the “Meeting”), the Board of Trustees of the Delaware Investments Family of Funds (the “Board”), including the independent Trustees, unanimously approved a new investment advisory agreement between each registrant on behalf of each series (each, a “Fund” and together, the “Funds”) and Delaware Management Company (“DMC”) in connection with the sale of Delaware Investments’ advisory business to Macquarie Bank Limited (the “Macquarie Group”) (the “Transaction”). In making its decision, the Board considered information furnished specifically in connection with the approval of the new investment advisory agreements with DMC (the “New Investment Advisory Agreements”) which included extensive materials about the Transaction and matters related to the proposed approvals. To assist the Board in considering the New Investment Advisory Agreements, Macquarie Group provided materials and information about Macquarie Group, including detailed written responses to the questions posed by the independent Trustees. DMC also provided materials and information about the Transaction, including detailed written responses to the questions posed by the independent Trustees.
At the Meeting, the Trustees discussed the Transaction with DMC management and with key Macquarie Group representatives. The Meeting included discussions of the strategic rationale for the Transaction and Macquarie Group’s general plans and intentions regarding the Funds and DMC. The Board members also inquired about the plans for, and anticipated roles and responsibilities of, key employees and officers of Delaware Management Holdings Inc. and DMC in connection with the Transaction.
In connection with the Trustees’ review of the New Investment Advisory Agreements for the Funds, DMC and/or Macquarie Group emphasized that:
- They expected that there would be no adverse changes as a result of the Transaction, in the nature, quality, or extent of services currently provided to the Funds and their shareholders, including investment management, distribution, or other shareholder services.
- No material changes in personnel or operations were contemplated in the operation of DMC under Macquarie Group as a result of the Transaction and no material changes were currently contemplated in connection with third party service providers to the Funds.
- Macquarie Group had no intention to cause DMC to alter the voluntary expense waivers and reimbursements currently in effect for the Funds.
- Under the agreement between Macquarie Group and Lincoln National Corporation (“LNC”) (the “Transaction Agreement”), Macquarie Group has agreed to conduct, and to cause its affiliates to conduct, their respective businesses in compliance with the conditions of Section 15(f) of the Investment Company Act of 1940 (the “1940 Act”) with respect to the Funds, to the extent within its control, including maintaining Board composition of at least 75% of the Board members qualifying as independent Trustees and not imposing any “unfair burden” on the Funds for at least two years from the closing of the Transaction (the “Closing”).
In addition to the information provided by DMC and Macquarie Group as described above, the Trustees also considered all other factors they believed to be relevant to evaluating the New Investment Advisory Agreements, including the specific matters discussed below. In their deliberations, the Trustees did not identify any particular information that was controlling, and different Trustees may have attributed different weights to the various factors. However, for each Fund, the Trustees determined that the overall arrangements between the Fund and DMC, as provided in the respective New Investment Advisory Agreement, including the proposed advisory fee and the related administration arrangements between the Fund and DMC, were fair and reasonable in light of the services to be performed, expenses incurred, and such other matters as the Trustees considered relevant. Factors evaluated included:
- The potential for expanding distribution of Fund shares through access to Macquarie Group’s existing distribution channels;
- Delaware Investments’ acquisition of an exclusive wholesaling sales force from a subsidiary of LNC;
- The reputation, financial strength, and resources of Macquarie Group as well as its historic and ongoing commitment to the asset management business in Australia as well as other parts of the world;
- The terms and conditions of the New Investment Advisory Agreements, including that each Fund’s total contractual fee rate under the New Investment Advisory Agreement will remain the same;
- The Board’s full annual review (or initial approval) of the current investment advisory agreements at their in-person meeting in May 2009 as required by the 1940 Act and its determination that (i) DMC had the capabilities, resources, and personnel necessary to provide the satisfactory advisory and administrative services currently provided to each Fund and (ii) the advisory and/or management fees paid by each Fund, taking into account any applicable fee waivers and breakpoints, represented reasonable compensation to DMC in light of the services provided, the costs to DMC of providing those services, economies of scale, and the fees and other expenses paid by similar funds and such other matters that the Board considered relevant in the exercise of its reasonable judgment;
- The portfolio management teams for the Funds are not currently expected to change as a result of the Transaction;
- LNC and Macquarie Group were expected to execute a reimbursement agreement pursuant to which LNC and Macquarie Group would agree to pay (or reimburse) all reasonable out-of-pocket costs and expenses of the Funds in connection with the Board’s consideration of the Transaction, the New Investment Advisory Agreements and related agreements, and all costs related to the proxy solicitation (the “Expense Agreement”);
Trend Series-16
Delaware VIP® Trend Series
Other Series Information (continued)
- The likelihood that Macquarie Group would invest additional amounts in Delaware Investments, including DMC, which could result in increased assets under management, which in turn would allow some Funds the potential opportunity to achieve economies of scale and lower fees payable by Fund shareholders; and
- The compliance and regulatory history of Macquarie Group and its affiliates.
In making their decision relating to the approval of each Fund’s New Investment Advisory Agreement, the independent Trustees gave attention to all information furnished. The following discussion, however, identifies the primary factors taken into account by the Trustees and the conclusions reached in approving the New Investment Advisory Agreements.
NATURE, EXTENT, AND QUALITY OF SERVICE. The Trustees considered the services historically provided by DMC to the Funds and their shareholders. In reviewing the nature, extent, and quality of services, the Board considered that the New Investment Advisory Agreements would be substantially similar to the current investment advisory agreements between the Funds and DMC (the “Current Investment Advisory Agreements”), and they therefore, considered the many reports furnished to them throughout 2008 and 2009 at regular Board meetings covering matters such as: the relative performance of the Funds; the compliance of portfolio managers with the investment policies, strategies, and restrictions for the Funds; the compliance of management personnel with the code of ethics adopted throughout the Delaware Investments Family of Funds complex; and the adherence to fair value pricing procedures as established by the Board. The Trustees were pleased with the current staffing of DMC and the emphasis placed on research and risk management in the investment process. Favorable consideration was given to DMC’s efforts to maintain expenditures and, in some instances, increase financial and human resources committed to Fund matters.
The Board also considered the transfer agent and shareholder services that would continue to be provided to Fund shareholders by DMC’s affiliate, Delaware Service company, Inc. (“DSC”). The Trustees noted, in particular, DSC’s commitment to maintain a high level of service as well as DMC’s expenditures to improve the delivery of shareholder services. The Board was assured that shareholders would continue to receive the benefits provided to Fund shareholders by being part of the Delaware Investments Family of Funds, including each shareholder’s ability to exchange an investment in one Fund for the same class of shares in another Fund without a sales charge, to reinvest Fund dividends into additional shares of any of the Funds, and the privilege to combine holdings in other Funds to obtain a reduced sales charge.
Based on the information provided by DMC and Macquarie Group, including that Macquarie Group and DMC currently expected no material changes as a result of the Transaction in (i) personnel or operations of DMC or (ii) third party service providers to the Funds, the Board concluded that the satisfactory nature, extent, and quality of services currently provided to the Funds and their shareholders were very likely to continue under the New Investment Advisory Agreements. Moreover, the Board concluded that the Funds would probably benefit from the expanded distribution resources that would become available to Delaware Investments following the Transaction. The Board also concluded that it was very unlikely that any “unfair burden” would be imposed on any of the Funds for the first two years following the Closing as a result of the Transaction. Consequently, the Board concluded that it did not expect the Transaction to result in any adverse changes in the nature, quality, or extent of services (including investment management, distribution or other shareholder services) currently provided to the Funds and their shareholders.
INVESTMENT PERFORMANCE. The Board considered the overall investment performance of DMC and the Funds. The Trustees placed significant emphasis on the investment performance of the Funds in view of its importance to shareholders. Although the Trustees gave appropriate consideration to performance reports and discussions with portfolio managers at Board meetings throughout the year, the Trustees gave particular weight to their review of investment performance in connection with the approval of the Current Investment Advisory agreements at the Board meeting held in May 2009. At that meeting, the Trustees reviewed reports prepared by Lipper, Inc., an independent statistical compilation organization (“Lipper”), which showed each Fund’s investment performance as of December 31, 2008 in comparison to a group of funds selected by Lipper as being similar to the Fund (the “Performance Universe”). During the May 2009 agreement review process, the Trustees observed the significant improvements to relative investment performance of the Funds compared to the Funds’ performance as of December 31, 2007.
At their meeting on September 3, 2009, the Trustees, including the independent Trustees in consultation with their independent counsel, reviewed the investment performance of each Fund. The Trustees compared the performance of each Fund relative to that of its respective Performance Universe for the 1-, 3-, 5-, and 10-year periods ended June 30, 2009 and compared its relative investment performance against the corresponding relative investment performance of each Fund for such time periods ended December 31, 2008, to the extent applicable. As of June 30, 2009, 30 of the Funds had investment performance relative to that of the respective Performance Universe that was better than the corresponding relative investment performance at December 31, 2008 for all applicable time periods. At June 30, 2009, an additional 6 Funds had investment performance relative to that of their respective Performance Universe that was better than the corresponding relative investment performance at December 31, 2008 for a majority of the applicable time periods. At June 30, 2009, 15 additional Funds had investment performance relative to that of their respective Performance Universe that was better than the corresponding relative performance at December 31, 2008 and only 29 Funds had poorer relative investment performance at June 30, 2009 compared to that at December 31, 2008.
The Board therefore concluded that the investment performance of the Funds, on an aggregate basis, had continued to improve relative to their respective Performance Universe since the data reviewed at the May 2009 meeting. Based on information provided by DMC and Macquarie Group, the Board concluded that neither the Transaction nor the New Investment Advisory Agreement would likely have an adverse effect on the investment performance of any Fund because (i) DMC and Macquarie Group did not currently expect the Transaction to cause any material change to the Funds’ portfolio management teams responsible for investment performance, which the Board found to be satisfactory and improving; and (ii) as discussed in more detail below, the Funds’ expenses were not expected to increase as a result of the Transaction.
Trend Series-17
Delaware VIP® Trend Series
Other Series Information (continued)
COMPARATIVE EXPENSES. The Trustees also evaluated expense comparison data for the Funds previously provided in May 2009. At that meeting, DMC had provided the Board with information on pricing levels and fee structures for the Funds and comparative funds. The Trustees focused on the comparative analysis of the effective management fees and total expense ratios of each Fund versus the effective management fees and expense ratios of a group of funds selected by Lipper as being similar to each Fund (the “Expense Group”). In reviewing comparative costs, each Fund’s contractual management fee and the actual management fee incurred by the Fund were compared with the contractual management fees (assuming all funds in the Expense Group were similar in size to the Fund) and actual management fees (as reported by each fund) of other funds within the Expense Group, taking into account any applicable breakpoints and fee limitations. Each Fund’s total expenses were also compared with those of its Expense Group. The Trustees also considered fees paid to Delaware Investments for nonmanagement services. At the September 3, 2009 meeting, DMC advised the Board that the more recent comparative expenses for the Funds remained consistent with the previous review in May 2009 and, consequently, the Trustees concluded that expenses of the Funds were satisfactory.
The Board also considered the Expense Agreement under negotiation in evaluating Fund expenses. The Trustees expected that the Expense Agreement would provide that LNC and Macquarie Group would pay or reimburse the Trusts for all reasonable out-of-pocket costs and expenses in connection with the Transaction and the consideration of the New Investment Advisory Agreements (subject to certain limited exceptions).
Based on information provided by DMC and Macquarie Group, the Board concluded that neither the Transaction nor the New Investment Advisory Agreements likely would have an adverse effect on the Funds’ expenses because (i) each Fund’s contractual fee rates under the New Investment Advisory Agreement would remain the same; (ii) under the Expense Agreement, the Funds would be reimbursed for all reasonable out-of-pocket costs and expenses in connection with the Transaction and the related proxy solicitation (subject to certain limited exceptions); and (iii) the expense ratios of certain Funds might decline as a result of the possible increased investment in Delaware Investments by Macquarie Group, as discussed below under “Economies of Scale.”
MANAGEMENT PROFITABILITY. At their meeting on September 3, 2009, the Board evaluated DMC’s profitability in connection with the operation of the Funds. The Board had previously considered DMC’s profitability in connection with the operation of the Funds at its May 2009 meeting. At that meeting, the Board reviewed an analysis that addressed the overall profitability of Delaware Investments’ business in providing management and other services to each of the Funds and the Delaware Investments Family of Funds as a whole. Specific attention was given to the methodology followed in allocating costs for the purpose of determining profitability.
At the May 2009 meeting, representatives of DMC had stated that the level of profits of DMC, to a certain extent, reflect operational cost savings and efficiencies initiated by Delaware Investments (including DMC and its affiliates that provide services to the Funds). The Board considered Delaware Investments’ efforts to improve services provided to Fund shareholders and to meet additional regulatory and compliance requirements resulting from recent industry-wide U.S. Securities and Exchange Commission initiatives. At that meeting, the Board found that the management fees were reasonable in light of the services rendered and the level of profitability of DMC. At the September 3, 2009 meeting, DMC advised the Board that DMC did not expect the Transaction to affect materially the profitability of Delaware Investments compared to the level of profitability considered during the May 2009 review. Moreover, the Trustees reviewed pro forma balance sheets of certain key companies in Delaware Investments as of June 30, 2009 (which were provided by Macquarie Group and DMC in response to the Trustees’ requests) and evaluated the projections of Delaware Investments’ capitalization following the Transaction for purposes of evaluating the financial ability of Delaware Investments to continue to provide the nature, extent, and quality of services as it had under the Current Investment Advisory Agreement.
Based on information provided by DMC and Macquarie Group, the Board concluded that DMC and Delaware Investments would be sufficiently capitalized following the Transaction to continue the same level and quality of services to the Funds under the New Investment Advisory Agreements as was the case under the Current Investment Advisory Agreements. The Board also concluded that Macquarie Group had sufficient financial strength and resources, as well as an ongoing commitment to a global asset management business, to continue investing in Delaware Investments, including DMC, to the extent that Macquarie Group determined it was appropriate. Finally, because services and costs were expected to be substantially the same (and DMC had represented that, correspondingly, profitability would be about the same), under the New Investment Advisory Agreements as under the Current Investment Advisory Agreements, the Trustees concluded that the profitability of Delaware Investments would not result in an inequitable charge on the Funds or their shareholders. Accordingly, the Board concluded that the fees charged under the New Investment Advisory Agreements would be reasonable in light of the services to be provided and the expected profitability of DMC.
ECONOMIES OF SCALE. The Trustees considered whether economies of scale would be realized by Delaware Investments as each Fund’s assets increase and the extent to which any economies of scale would be reflected in the management fees charged. The Trustees took into account DMC’s practice of maintaining the competitive nature of management fees based on its analysis of fees charged by comparable funds. DMC management believed, and the Board agreed, that the Funds were priced with breakpoints and relatively low management fees to reflect potential economies of scale to Fund shareholders.
The Board also acknowledged Macquarie Group’s statement that the Transaction would not by itself immediately provide additional economies of scale given Macquarie Group’s limited presence in the U.S. mutual fund market. Nonetheless, the Trustees concluded that additional economies of scale could potentially be achieved in the future if DMC were owned by Macquarie Group as a result of Macquarie Group’s willingness to invest further in Delaware Investments if appropriate opportunities arise. The Board further concluded that potential economies of scale could be achieved as a result of Delaware Investments’ expanded distribution capabilities arising from the Transaction, as well as opportunities that might arise from Macquarie Group’s global asset management business.
Trend Series-18
Delaware VIP® Trend Series
Other Series Information (continued)
FALL-OUT BENEFITS. The Board acknowledged that DMC would continue to benefit from soft dollar arrangements using portfolio brokerage of each Fund that invests in equity securities and that DMC’s profitability would likely be somewhat lower without the benefit of practices with respect to allocating Fund portfolio brokerage for brokerage and research services. The Board also considered that Macquarie Group and Delaware Investments may derive reputational, strategic, and other benefits from their association with the Delaware Investments Family of Funds, including service relationships with DMC, DSC, and Delaware Distributors, L.P., and evaluated the extent to which Delaware Investments might derive ancillary benefits from Fund operations, including the potential for procuring additional business as a result of the prestige and visibility associated with its role as service provider to the Delaware Investments Family of Funds and the benefits from allocation of Fund brokerage to improve trading efficiencies. However, the Board concluded that (i) any such benefits under the New Investment Advisory Agreements would not be dissimilar from those existing under the Current Investment Advisory Agreements, (ii) such benefits did not impose a cost or burden on the Funds or their shareholders, and (iii) such benefits would probably have an indirectly beneficial effect on the Funds and their shareholders because of the added importance that DMC and Macquarie Group might attach to the Funds as a result of the fall-out benefits that the Funds conveyed.
BOARD REVIEW OF MACQUARIE GROUP. The Trustees reviewed detailed information supplied by Macquarie Group about its operations as well as other information regarding Macquarie Group provided by independent legal counsel to the independent Trustees. Based on this review, the Trustees concluded that Delaware Investments would continue to have the financial ability to maintain the high quality of services required by the Funds. The Trustees noted that there would be a limited transition period during which some services previously provided by LNC to Delaware Investments would continue to be provided by LNC after the Closing, and concluded that this arrangement would help minimize disruption in Delaware Investments’ provision of services to the Funds following the Transaction.
The Board considered Macquarie Group’s support for Delaware Investments’ plans for Fund distribution by transferring wholesalers from Lincoln Financial Distributors, Inc., LNC’s retail distributor, to Delaware Investments, and Macquarie Group’s current intention to leave the Funds’ other service providers in place. The Board also considered Macquarie Group’s current strategic plans to increase its asset management activities, one of its core businesses, particularly in North America, and its statement that its acquisition of DMC is an important component of this strategic growth and the establishment of a significant presence in the United States. Based in part on the information provided by DMC and Macquarie Group, the Board concluded that Macquarie Group’s acquisition of Delaware Investments could potentially enhance the nature, quality, and extent of services provided to the Funds and their shareholders.
CONCLUSION. The Board concluded that the advisory fee rate under each New Investment Advisory Agreement was reasonable in relation to the services provided and that execution of the New Investment Advisory Agreement would be in the best interests of the shareholders. For each Fund, the Trustees noted that they had concluded in their most recent advisory agreement continuance considerations in May 2009 that the management fees and total expense ratios were at acceptable levels in light of the quality of services provided to the Funds and in comparison to those of the Funds’ respective peer groups; that the advisory fee schedule would not be increased and would stay the same for all of the Funds; that the total expense ratio had not changed materially since that determination; and that DMC had represented that the overall expenses for each Fund were not expected to be adversely affected by the Transaction. The Trustees also noted, with respect to the Funds that currently had the benefit of voluntary fee limitations, that Macquarie Group had no present intention to cause DMC to alter any voluntary expense limitations or reimbursements currently in effect. On that basis, the Trustees concluded that the total expense ratios and proposed advisory fees for the Funds anticipated to result from the Transaction were acceptable. In approving each New Investment Advisory Agreement, the Board stated that it anticipated reviewing the continuance of the New Investment Advisory Agreement in advance of the expiration of the initial two-year period.
Trend Series-19
Delaware Investments® Family of Funds
BOARD OF TRUSTEES/DIRECTORS AND OFFICERS ADDENDUM
A mutual fund is governed by a Board of Trustees/Directors (“Trustees”), which has oversight responsibility for the management of a fund’s business affairs. Trustees establish procedures and oversee and review the performance of the investment manager, the distributor, and others who perform services for the fund. The independent fund trustees, in particular, are advocates for shareholder interests. Each trustee has served in that capacity since he or she was elected to or appointed to the Board of Trustees, and will continue to serve until his or her retirement or the election of a new trustee in his or her place. The following is a list of the Trustees and Officers with certain background and related information.
| | | | Number of | Other |
| | | Principal | Portfolios in Fund | Directorships |
| Name, | Position(s) | | Occupation(s) | Complex Overseen | Held by |
| Address, | Held with | Length of Time | During | by Trustee | Trustee |
| and Birth Date | Fund(s) | Served | Past 5 Years | or Officer | or Officer |
| INTERESTED TRUSTEES | | | | | |
| Patrick P. Coyne1 | Chairman, | Chairman and Trustee | Patrick P. Coyne has served in | 81 | Director — |
| 2005 Market Street | President, | since August 16, 2006 | various executive capacities | | Kaydon Corp. |
| Philadelphia, PA | Chief Executive | | at different times at | | |
| 19103 | Officer, and | President and | Delaware Investments.2 | | |
| Trustee | Chief Executive Officer | | | |
| April 1963 | | since August 1, 2006 | | | |
| | | | | | |
| INDEPENDENT TRUSTEES | | | | | |
| Thomas L. Bennett | Trustee | Since | Private Investor — | 81 | Director — |
| 2005 Market Street | | March 2005 | (March 2004–Present) | | Bryn Mawr |
| Philadelphia, PA | | | | | Bank Corp. (BMTC) |
| 19103 | | | Investment Manager — | | (April 2007–Present) |
| | | Morgan Stanley & Co. | | |
| October 1947 | | | (January 1984–March 2004) | | |
| John A. Fry | Trustee | Since | President — | 81 | Director — |
| 2005 Market Street | | January 2001 | Franklin & Marshall College | | Community Health |
| Philadelphia, PA | | | (June 2002–Present) | | Systems |
| 19103 | | | | | |
| | | Executive Vice President — | | |
| May 1960 | | | University of Pennsylvania | | |
| | | (April 1995–June 2002) | | |
| Anthony D. Knerr | Trustee | Since | Founder and Managing Director — | 81 | None |
| 2005 Market Street | | April 1990 | Anthony Knerr & Associates | | |
| Philadelphia, PA | | | (Strategic Consulting) | | |
| 19103 | | | (1990–Present) | | |
| | | | | | |
| December 1938 | | | | | |
| Lucinda S. Landreth | Trustee | Since | Chief Investment Officer — | 81 | None |
| 2005 Market Street | | March 2005 | Assurant, Inc. | | |
| Philadelphia, PA | | | (Insurance) | | |
| 19103 | | | (2002–2004) | | |
| | | | | | |
| June 1947 | | | | | |
| Ann R. Leven | Trustee | Since | Consultant — | 81 | None |
| 2005 Market Street | | October 1989 | ARL Associates | | |
| Philadelphia, PA | | | (Financial Planning) | | |
| 19103 | | | (1983–Present) | | |
| | | | | | |
| November 1940 | | | | | |
Trend Series-20
| | | | Number of | Other |
| | | Principal | Portfolios in Fund | Directorships |
| Name, | Position(s) | | Occupation(s) | Complex Overseen | Held by |
| Address, | Held with | Length of Time | During | by Trustee | Trustee |
| and Birth Date | Fund(s) | Served | Past 5 Years | or Officer | or Officer |
| INDEPENDENT TRUSTEES ( CONTINUED) |
| Thomas F. Madison | Trustee | Since | President and Chief | 81 | Director and Chair of |
| 2005 Market Street | | May 19973 | Executive Officer — | | Compensation |
| Philadelphia, PA | | | MLM Partners, Inc. | | Committee, |
| 19103 | | | (Small Business Investing | | Governance Committee |
| | | and Consulting) | | Member |
| February 1936 | | | (January 1993–Present) | | — CenterPoint Energy |
| | | | | |
| | | | | Lead Director and Chair |
| | | | | of Audit |
| | | | | and Governance |
| | | | | Committees, |
| | | | | Member of |
| | | | | Compensation |
| | | | | Committee — Digital |
| | | | | River, Inc. |
| | | | | |
| | | | | Director and Chair of |
| | | | | Governance |
| | | | | Committee, Audit |
| | | | | Committee Member — |
| | | | | Rimage Corporation |
| | | | | |
| | | | | Director and Chair of |
| | | | | Compensation |
| | | | | Committee — Spanlink |
| | | | | Communications |
| | | | | |
| | | | | Lead Director and Chair |
| | | | | of Compensation and |
| | | | | Governance |
| | | | | Committees — |
| | | | | Valmont Industries, Inc. |
| Janet L. Yeomans | Trustee | Since | Vice President and Treasurer | 81 | None |
| 2005 Market Street | | April 1999 | (January 2006–Present) | | |
| Philadelphia, PA | | | Vice President — Mergers & Acquisitions | | |
| 19103 | | | (January 2003–January 2006), and | | |
| | | Vice President | | |
| July 1948 | | | (July 1995–January 2003) | | |
| | | 3M Corporation | | |
| J. Richard Zecher | Trustee | Since | Founder — | 81 | Director and Audit |
| 2005 Market Street | | March 2005 | Investor Analytics | | Committee Member — |
| Philadelphia, PA | | | (Risk Management) | | Investor Analytics |
| 19103 | | | (May 1999–Present) | | |
| | | | | | |
| July 1940 | | | Founder — | | |
| | | Sutton Asset Management | | |
| | | (Hedge Fund) | | |
| | | (September 1996–Present) | | |
Trend Series-21
| | | | Number of | Other |
| | | Principal | Portfolios in Fund | Directorships |
| Name, | Position(s) | | Occupation(s) | Complex Overseen | Held by |
| Address, | Held with | Length of Time | During | by Trustee | Trustee |
| and Birth Date | Fund(s) | Served | Past 5 Years | or Officer | or Officer |
| OFFICERS | | | | | |
| David F. Connor | Vice President, | Vice President since | David F. Connor has served as | 81 | None4 |
| 2005 Market Street | Deputy General | September 2000 | Vice President and Deputy | | |
| Philadelphia, PA | Counsel, and Secretary | and Secretary | General Counsel of | | |
| 19103 | | since | Delaware Investments | | |
| | October 2005 | since 2000. | | |
| December 1963 | | | | | |
| Daniel V. Geatens | Vice President | Treasurer | Daniel V. Geatens has served | 81 | None4 |
| 2005 Market Street | and Treasurer | since | in various capacities at | | |
| Philadelphia, PA | | October 25, 2007 | different times at | | |
| 19103 | | | Delaware Investments. | | |
| | | | | | |
| October 1972 | | | | | |
| David P. O’Connor | Senior Vice | Senior Vice President, | David P. O’Connor has served in | 81 | None4 |
| 2005 Market Street | President, | General Counsel, and | various executive and legal | | |
| Philadelphia, PA | General Counsel, | Chief Legal Officer | capacities at different times | | |
| 19103 | and Chief | since | at Delaware Investments. | | |
| Legal Officer | October 2005 | | | |
| February 1966 | | | | | |
| Richard Salus | Senior | Chief Financial | Richard Salus has served in | 81 | None4 |
| 2005 Market Street | Vice President | Officer since | various executive capacities | | |
| Philadelphia, PA | and | November 2006 | at different times at | | |
| 19103 | Chief Financial | | Delaware Investments. | | |
| Officer | | | | |
| October 1963 | | | | | |
1 Patrick P. Coyne is considered to be an “Interested Trustee” because he is an executive officer of the Fund’s(s’) investment advisor. |
2 Delaware Investments is the marketing name for Delaware Management Holdings, Inc. and its subsidiaries, including the Fund’s(s’) investment advisor, principal underwriter, and its transfer agent. |
3 In 1997, several funds managed by Voyageur Fund Managers, Inc. (the “Voyageur Funds”) were incorporated into the Delaware Investments Family of Funds. Mr. Madison served as a director of the Voyageur Funds from 1993 until 1997. |
4 David F. Connor, Daniel V. Geatens, David P. O’Connor, and Richard Salus serve in similar capacities for the six portfolios of the Optimum Fund Trust, which have the same investment advisor, principal underwriter, and transfer agent as the registrant. |
The Statement of Additional Information for the Fund(s) includes additional information about the Trustees and Officers and is available, without charge, upon request by calling 800 523-1918.
| PO14857 AR-VIPT [12/09] DG3 2/10 (5427) | Trend Series-22 |
| Delaware VIP® Trust |
| Delaware VIP U.S. Growth Series |
| |
| |
| |
| |
| |
| |
| Annual Report |
| |
| |
December 31, 2009 |
| |
| |
| |
| |
| |
| |
| |
| |
| |
| |
| |
| |
| |
| |
| |
|
Table of contents
| > Portfolio management review | 1 |
| | |
| > Performance summary | 2 |
| | |
| > Disclosure of Series expenses | 4 |
| | |
| > Sector allocation and top 10 holdings | 5 |
| | |
| > Statement of net assets | 6 |
| | |
| > Statement of operations | 8 |
| | |
| > Statements of changes in net assets | 8 |
| | |
| > Financial highlights | 9 |
| | |
| > Notes to financial statements | 11 |
| | |
| > Report of independent registered public accounting firm | 16 |
| | |
| > Other Series information | 17 |
| | |
| > Board of trustees/directors and officers addendum | 21 |
On January 4, 2010, Delaware Management Holdings, Inc., and its subsidiaries (collectively known by the marketing name of Delaware Investments) were sold by a subsidiary of Lincoln National Corporation to Macquarie Group Limited, a global provider of banking, financial, advisory, investment and funds management services. Please see your Series’ prospectus and any supplements thereto for more complete information.
Investments in Delaware VIP® U.S. Growth Series are not and will not be deposits with or liabilities of Macquarie Bank Limited ABN 46 008 583 542 and its holding companies, including subsidiaries or related companies, and are subject to investment risk, including possible delays in repayment and loss of income and capital invested. No Macquarie Group company guarantees or will guarantee the performance of the Series, the repayment of capital from the Series, or any particular rate of return.
Unless otherwise noted, views expressed herein are current as of Dec. 31, 2009, and are subject to change.
Funds are not FDIC insured and are not guaranteed. It is possible to lose the principal amount invested.
Mutual fund advisory services provided by Delaware Management Company, a series of Delaware Management Business Trust, which is a registered investment advisor. Delaware Investments is the marketing name of Delaware Management Holdings, Inc. and its subsidiaries. Macquarie Group refers to Macquarie Group Limited and its subsidiaries and affiliates worldwide.
© 2010 Delaware Management Holdings, Inc.
All third-party trademarks cited are the property of their respective owners.
| Delaware VIP® Trust — Delaware VIP U.S. Growth Series | |
| Portfolio management review | Jan. 12, 2010 |
For the 12-month period ended Dec. 31, 2009, the Delaware VIP U.S. Growth Series Standard Class shares returned +43.30%, and the Service Class shares returned +42.94% (both figures reflect returns with dividends reinvested). The Series’ benchmark, the Russell 1000® Growth Index, returned +37.21%.
From December 2008 until early March 2009, the financial crisis continued to worsen, pushing the U.S. economy deeper into recession. The U.S. Congress and the Federal Reserve undertook an extraordinary set of actions to shore up the economy. Congress passed a monumental fiscal stimulus package while the Federal Reserve launched a range of unconventional programs, alongside its employment of more traditional means of monetary stimulus, such as dropping the target for the fed funds rate down to virtually zero.
The stage for the markets’ rebound was set in early March, following dramatic steps to boost economic growth taken by the Federal Reserve and other central banks around the world, as well as by the U.S. Treasury Department. Given the crisis atmosphere and investors’ tremendous risk aversion, global equities were trading at depressed prices when they began to rise after March 9. The market recovery started slowly, but gradually it became evident to investors that the economy’s decline was easing and possibly even starting to reverse.
Over time, investors seemed to conclude that the worst-case scenario of economic collapse was unlikely, despite continued weakness. This led to strong stock market performance in the second quarter of 2009. The subsequent “snap-back” rally was led overwhelmingly by the market’s most volatile stocks, as buyers took advantage of what we viewed as extremely low valuations. In fact, many of the strongest performers during this time were those that we viewed as highly speculative companies with weak business fundamentals, many of which were hit the hardest in the market decline. By the third calendar quarter of 2009 and continuing into the fourth, the market rally became broader, as the deepest stock-price discounts vanished.
Throughout the fiscal year we stayed true to our stock selection philosophy, seeking only higher-quality companies with business models that we believed could withstand the type of adverse market cycles we have experienced of late. This was in keeping with our goal of aiming to own stocks over a three- to five-year time horizon, and our consideration of each company’s competitive position in both strong and adverse market conditions.
We believe that “cash flow is king,” and thus looked for companies (and management teams) that could generate real cash economic returns to their shareholders, regardless of whether that comes in the form of dividends, share buybacks, or reinvestment. We believe our approach to valuation was generally beneficial in an environment where many companies had great difficulties raising cash through the equity or capital (debt) markets.
Apple was one of top performers in the Series. The company overcame a period of lackluster consumer activity by producing and marketing stellar products. iPhone sales have exceeded expectations and the device remained highly profitable as a stand-alone product. However, the story does not end there — the iPhone’s success attracted more consumers to the company’s Mac and iPod lines, which generated even greater platform benefits.
Another strong contributor was Crown Castle International. The popularity of iPhone, BlackBerry, and other smart-phone devices has forced telecommunications carriers to add bandwidth capacity to their wireless networks. We believed Crown Castle was well positioned to benefit from this trend because it is the largest owner and operator of cell phone towers.
Unfortunately, the Series held some stocks that could not escape the harsh economic realities of the fiscal year, which at times included fallout from management missteps. Hard-drive manufacturer Seagate Technology, for instance, struggled because of a lack of technology spending, as many businesses held off on major systems upgrades. The company also suffered from poor managerial execution, which sparked a board fight and eventually led to the creation of a new management team.
Likewise, MGM Mirage struggled with a weak economy that dramatically depressed leisure travel to Las Vegas (and other tourist destinations). To make matters worse, the company struggled to raise much-needed financing for its high-profile City Center, a major project for the company in Las Vegas. We chose to sell both Seagate and MGM Mirage during the period.
We believe the massive deleveraging of businesses and consumers over the near-to-intermediate term may continue to threaten a meaningful market recovery. Regardless of the specific macroeconomic outcome, we remain consistent in our long-term investment philosophy: We want to own strong secular-growth companies with solid business models and competitive positions that have the potential to grow market share and deliver shareholder value in a variety of market environments.
Unless otherwise noted, the views expressed are current as of Dec. 31, 2009, and are subject to change.
U.S. Growth Series-1
Delaware VIP® U.S. Growth Series (continued)
Performance summary
The performance data quoted below represent past performance; past performance does not guarantee future results. Investment return and principal value will fluctuate so your shares, when redeemed, may be worth more or less than their original cost. Please obtain the performance data for the most recent month end by calling the number noted in the introductory section of this report on the page related to this Series.
You should consider the investment objectives, risks, charges, and expenses of the Series carefully before investing. The Delaware VIP U.S. Growth Series prospectus contains this and other important information about the Series. To obtain a prospectus, contact the company noted on the page related to this Series in the introductory section of this report, either by phone or through the company Web site. We advise you to read the prospectus carefully before you invest or send money.
| Delaware VIP U.S. Growth Series | | | | | | | | | | |
| Average annual total returns | | | | | | | | | | |
| For periods ended Dec. 31, 2009 | | 1 year | | 3 years | | 5 years | | 10 years | | Lifetime |
| Standard Class shares (commenced operations on Nov. 15, 1999) | | +43.30% | | -2.57% | | +1.64% | | -3.36% | | -2.77% |
| Service Class shares (commenced operations on May 1, 2000) | | +42.94% | | -2.81% | | +1.40% | | n/a | | -3.99% |
Returns reflect the reinvestment of all distributions.
As described in the Series’ most recent prospectus, the net expense ratio for Service Class shares of the Series was 1.01%, while total operating expenses for Standard Class and Service Class shares were 0.76% and 1.06%, respectively. The management fee for Standard Class and Service Class shares was 0.65%.
The Series’ distributor has contracted to limit the 12b-1 fees for Service Class shares to no more than 0.25% of average daily net assets through April 30, 2010.
Earnings from a variable annuity or variable life investment compound tax-free until withdrawal, and as a result, no adjustments were made for income taxes.
Expense limitations were in effect for both classes during certain periods shown in the Series performance chart above and in the Performance of a $10,000 Investment chart on the next page.
Performance data do not reflect insurance fees related to a variable annuity or variable life investment or the deferred sales charge that would apply to certain withdrawals of investments. Performance shown here would have been reduced if such fees were included or the expense limitation removed. For more information about fees, consult your variable annuity or variable life prospectus.
Investments in variable products involve risk. The Series will be affected primarily by changes in stock prices. Investments in small and/or medium-sized companies typically exhibit greater risk and higher volatility than larger, more established companies.
Instances of high double-digit returns are unusual, cannot be sustained, and were primarily achieved during favorable market conditions.
Please read both the contract and underlying prospectus for specific details regarding the product’s risk profile.
U.S. Growth Series-2
Delaware VIP® U.S. Growth Series (continued)
The chart shows a $10,000 investment in the Delaware VIP U.S. Growth Series Standard Class shares for the period from Dec. 31, 1999, through Dec. 31, 2009.
The chart also shows $10,000 invested in the Russell 1000 Growth Index for the period from Dec. 31, 1999, through Dec. 31, 2009. The Russell 1000 Growth Index measures the performance of the large-cap growth segment of the U.S. equity universe. It includes those Russell 1000 companies with higher price-to-book ratios and higher forecasted growth values.
Index performance returns do not reflect any management fees, transaction costs or expenses. Indices are unmanaged and one cannot invest directly in an index.
Performance of Service Class shares will vary due to different charges and expenses.
Past performance is not a guarantee of future results.
U.S. Growth Series-3
Delaware VIP® Trust — Delaware VIP U.S. Growth Series
Disclosure of Series Expenses
For the Period July 1, 2009 to December 31, 2009
As a shareholder of the Series, you incur ongoing costs, including management fees; distribution and/or service (12b-1) fees; and other Series expenses. This Example is intended to help you understand your ongoing costs (in dollars) of investing in the Series and to compare these costs with the ongoing costs of investing in other mutual funds.
The Example is based on an investment of $1,000 invested at the beginning of the period and held for the entire period from July 1, 2009 to December 31, 2009.
Actual Expenses
The first section of the table shown, “Actual Series Return,” provides information about actual account values and actual expenses. You may use the information in this section of the table, together with the amount you invested, to estimate the expenses that you paid over the period. Simply divide your account value by $1,000 (for example, an $8,600 account value divided by $1,000 = 8.6), then multiply the result by the number in the first section under the heading entitled “Expenses Paid During Period” to estimate the expenses you paid on your account during the period.
Hypothetical Example for Comparison Purposes
The second section of the table shown, “Hypothetical 5% Return,” provides information about hypothetical account values and hypothetical expenses based on the Series’ actual expense ratio and an assumed rate of return of 5% per year before expenses, which is not the Series’ actual return. The hypothetical account values and expenses may not be used to estimate the actual ending account balance or expenses you paid for the period. You may use this information to compare the ongoing costs of investing in the Series and other funds. To do so, compare the 5% hypothetical example with the 5% hypothetical examples that appear in the shareholder reports of other funds.
Please note that the expenses shown in the table are meant to highlight your ongoing costs only. As a shareholder of the Series, you do not incur any transaction costs, such as sales charges (loads), redemption fees or exchange fees, but shareholders of other funds may incur such costs. Also, the fees related to the variable annuity investment or the deferred sales charge that could apply have not been included. Therefore, the second section of the table is useful in comparing ongoing costs only, and will not help you determine the relative total costs of owning different funds. The Series’ actual expenses shown in the table reflect fee waivers in effect for Service Class shares. The expenses shown in the table assume reinvestment of all dividends and distributions.
Expense Analysis of an Investment of $1,000
| | | | | | | | | | | | | | Expenses |
| | Beginning | | Ending | | | | | | | Paid During |
| | Account | | Account | | Annualized | | Period |
| | Value | | Value | | Expense | | 7/1/09 to |
| | 7/1/09 | | 12/31/09 | | Ratios | | 12/31/09* |
| Actual Series Return | | | | | | | | | | | | | | | | |
| Standard Class | | $ | 1,000.00 | | | $ | 1,243.10 | | | 0.73 | % | | | | $4.13 | |
| Service Class | | | 1,000.00 | | | | 1,239.50 | | | 0.98 | % | | | | 5.53 | |
| Hypothetical 5% Return (5% return before expenses) | | | | | | |
| Standard Class | | $ | 1,000.00 | | | $ | 1,021.52 | | | 0.73 | % | | | | $3.72 | |
| Service Class | | | 1,000.00 | | | | 1,020.26 | | | 0.98 | % | | | | 4.99 | |
*“Expenses Paid During Period” are equal to the Series’ annualized expense ratio, multiplied by the average account value over the period, multiplied by 184/365 (to reflect the one-half year period).
U.S. Growth Series-4
Delaware VIP® Trust — Delaware VIP U.S. Growth Series
Sector Allocation and Top 10 Holdings
As of December 31, 2009
Sector designations may be different than the sector designations presented in other Series materials. The sector designations may represent the investment manager’s internal sector classifications, which may result in the sector designations for one series being different than another series' sector designations.
| | Percentage |
| Sector | | of Net Assets |
| Common Stock² | | 97.95 | % |
| Basic Industry/Capital Goods | | 5.09 | % |
| Business Services | | 18.75 | % |
| Consumer Non-Durables | | 11.04 | % |
| Consumer Services | | 0.50 | % |
| Energy | | 3.60 | % |
| Financials | | 9.06 | % |
| Health Care | | 18.95 | % |
| Technology | | 30.96 | % |
| Discount Note | | 0.17 | % |
| Securities Lending Collateral | | 5.65 | % |
| Total Value of Securities | | 103.77 | % |
| Obligation to Return Securities Lending Collateral | | (5.81 | %) |
| Receivables and Other Assets Net of Liabilities | | 2.04 | % |
| Total Net Assets | | 100.00 | % |
²Narrow industries are utilized for compliance purposes for diversification whereas broad sectors are used for financial reporting.
Holdings are for informational purposes only and are subject to change at any time. They are not a recommendation to buy, sell, or hold any security.
| | Percentage |
| Top 10 Holdings | | of Net Assets |
| Apple | | 5.07 | % |
| Google Class A | | 5.02 | % |
| Visa Class A | | 4.85 | % |
| Allergan | | 4.37 | % |
| QUALCOMM | | 4.28 | % |
| Crown Castle International | | 4.24 | % |
| Medco Health Solutions | | 3.69 | % |
| EOG Resources | | 3.60 | % |
| Intuit | | 3.41 | % |
| IntercontinentalExchange | | 3.37 | % |
U.S. Growth Series-5
Delaware VIP® Trust — Delaware VIP U.S. Growth Series
Statement of Net Assets
December 31, 2009
| | | Number of | | | |
| | | | Shares | | Value |
| COMMON STOCK–97.95%² | | | | | | |
| Basic Industry/Capital Goods–5.09% | | | | | | |
| Praxair | | | 60,000 | | $ | 4,818,600 |
| Syngenta ADR | | | 110,000 | | | 6,189,700 |
| | | | | | | 11,008,300 |
| Business Services–18.75% | | | | | | |
| *Expeditors International of Washington | | | 165,000 | | | 5,730,450 |
| †Google Class A | | | 17,500 | | | 10,849,650 |
| *MasterCard Class A | | | 28,000 | | | 7,167,440 |
| United Parcel Service Class B | | | 110,000 | | | 6,310,700 |
| *Visa Class A | | | 120,000 | | | 10,495,200 |
| | | | | | | 40,553,440 |
| Consumer Non-Durables–11.04% | | | | | | |
| Lowe’s | | | 210,000 | | | 4,911,900 |
| NIKE Class B | | | 105,000 | | | 6,937,350 |
| Procter & Gamble | | | 85,000 | | | 5,153,550 |
| *Staples | | | 280,000 | | | 6,885,200 |
| | | | | | | 23,888,000 |
| Consumer Services–0.50% | | | | | | |
| *Weight Watchers International | | | 37,100 | | | 1,081,836 |
| | | | | | | 1,081,836 |
| Energy–3.60% | | | | | | |
| EOG Resources | | | 80,000 | | | 7,784,000 |
| | | | | | | 7,784,000 |
| Financials–9.06% | | | | | | |
| Bank of New York Mellon | | | 205,000 | | | 5,733,850 |
| CME Group | | | 19,500 | | | 6,551,025 |
| †IntercontinentalExchange | | | 65,000 | | | 7,299,500 |
| | | | | | | 19,584,375 |
| Health Care–18.95% | | | | | | |
| Allergan | | | 150,000 | | | 9,451,500 |
| †Gilead Sciences | | | 135,000 | | | 5,842,800 |
| †Medco Health Solutions | | | 125,000 | | | 7,988,750 |
| Novo-Nordisk ADR | | | 95,000 | | | 6,065,750 |
| UnitedHealth Group | | | 165,000 | | | 5,029,200 |
| Walgreen | | | 180,000 | | | 6,609,600 |
| | | | | | | 40,987,600 |
| Technology–30.96% | | | | | | |
| *†Adobe Systems | | | 150,000 | | | 5,517,000 |
| †Apple | | | 52,000 | | | 10,964,720 |
| †Crown Castle International | | | 235,000 | | | 9,174,400 |
| †Intuit | | | 240,000 | | | 7,370,400 |
| *†priceline.com | | | 26,500 | | | 5,790,250 |
| QUALCOMM | | | 200,000 | | | 9,252,000 |
| †Symantec | | | 310,000 | | | 5,545,900 |
| †Teradata | | | 205,000 | | | 6,443,150 |
| *†VeriSign | | | 285,000 | | | 6,908,400 |
| | | | | | | 66,966,220 |
| Total Common Stock | | | | | | |
| (cost $185,838,084) | | | | | | 211,853,771 |
| |
| | | Principal | | | |
| | | Amount | | | |
| ≠DISCOUNT NOTE–0.17% | | | | | | |
| Federal Home Loan Bank 0.001% 1/4/10 | | $ | 361,000 | | | 361,000 |
| Total Discount Note | | | | | | |
| (cost $361,000) | | | | | | 361,000 |
| |
| Total Value of Securities | | | | | | |
| Before Securities Lending | | | | | | |
| Collateral–98.12% | | | | | | |
| (cost $186,199,084) | | | | | | 212,214,771 |
| |
| | | Number of | | | |
| | | | Shares | | | |
| SECURITIES LENDING | | | | | | |
| COLLATERAL**–5.65% | | | | | | |
| Investment Companies | | | | | | |
| Mellon GSL DBT II Collateral Fund | | | 7,898,822 | | | 7,898,822 |
| BNY Mellon SL DB II Liquidating Fund | | | 4,365,896 | | | 4,315,688 |
| †@ | Mellon GSL Reinvestment Trust II | | | 289,789 | | | 12,316 |
| Total Securities Lending Collateral | | | | | | |
| (cost $12,554,507) | | | | | | 12,226,826 |
U.S. Growth Series-6
Delaware VIP® U.S. Growth Series
Statement of Net Assets (continued)
| TOTAL VALUE OF SECURITIES–103.77% (cost $198,753,591) | | $ | 224,441,597 | © |
| OBLIGATION TO RETURN SECURITIES LENDING COLLATERAL**–(5.81%) | | | (12,554,507 | ) |
| RECEIVABLES AND OTHER ASSETS NET OF LIABILITIES–2.04% | | | 4,406,617 | |
| NET ASSETS APPLICABLE TO 30,303,391 SHARES OUTSTANDING–100.00% | | $ | 216,293,707 | |
NET ASSET VALUE–DELAWARE VIP U.S. GROWTH SERIES
STANDARD CLASS ($151,610,687 / 21,179,464 Shares) | | | | $7.16 | |
NET ASSET VALUE–DELAWARE VIP U.S. GROWTH SERIES SERVICE CLASS ($64,683,020 / 9,123,927 Shares) | | | | $7.09 | |
| COMPONENTS OF NET ASSETS AT DECEMBER 31, 2009: | | | | |
| Shares of beneficial interest (unlimited authorization–no par) | | $ | 235,797,207 | |
| Undistributed net investment income | | | 89,342 | |
| Accumulated net realized loss on investments | | | (45,280,848 | ) |
| Net unrealized appreciation of investments | | | 25,688,006 | |
| Total net assets | | $ | 216,293,707 | |
| |
____________________
| ² | Narrow industries are utilized for compliance purposes for diversification whereas broad sectors are used for financial reporting. |
| * | Fully or partially on loan. |
| † | Non income producing security. |
| @ | Illiquid security. At December 31, 2009, the aggregate amount of illiquid securities was $12,316, which represented 0.01% of the Series’ net assets. See Note 9 in “Notes to Financial Statements.” |
| ≠ | The rate shown is the effective yield at the time of purchase. |
| ** | See Note 8 in “Notes to Financial Statements.” |
| © | Includes $12,295,250 of securities loaned. |
ADR – American Depositary Receipts
See accompanying notes
U.S. Growth Series-7
Delaware VIP® Trust —
Delaware VIP U.S. Growth Series
Statement of Operations
Year Ended December 31, 2009
| INVESTMENT INCOME: | | | | |
| Dividends | | $ | 1,447,178 | |
| Interest | | | 9,936 | |
| Securities lending income | | | 52,296 | |
| Foreign tax withheld | | | (24,219 | ) |
| | | 1,485,191 | |
| |
| EXPENSES: | | | | |
| Management fees | | | 1,101,006 | |
| Distribution expenses – Service Class | | | 113,236 | |
| Accounting and administration expenses | | | 67,754 | |
| Legal fees | | | 23,691 | |
| Dividend disbursing and transfer agent fees and expenses | | | 21,883 | |
| Audit and tax | | | 19,702 | |
| Reports and statements to shareholders | | | 18,727 | |
| Trustees’ fees | | | 10,973 | |
| Insurance fees | | | 4,656 | |
| Custodian fees | | | 3,613 | |
| Dues and services | | | 2,415 | |
| Consulting fees | | | 2,397 | |
| Trustees’ expenses | | | 793 | |
| Registration fees | | | 244 | |
| Pricing fees | | | 232 | |
| | | 1,391,322 | |
| Less waiver of distribution expenses – Service Class | | | (18,835 | ) |
| Total operating expenses | | | 1,372,487 | |
| |
| NET INVESTMENT INCOME | | | 112,704 | |
| |
| NET REALIZED AND UNREALIZED GAIN (LOSS) | | | | |
| ON INVESTMENTS: | | | | |
| Net realized loss on investments | | | (37,125,105 | ) |
| Net change in unrealized appreciation/depreciation | | | | |
| of investments | | | 98,992,576 | |
| |
| NET REALIZED AND UNREALIZED GAIN | | | | |
| ON INVESTMENTS | | | 61,867,471 | |
| |
| NET INCREASE IN NET ASSETS RESULTING | | | | |
| FROM OPERATIONS | | $ | 61,980,175 | |
| |
See accompanying notes
Delaware VIP Trust —
Delaware VIP U.S. Growth Series
Statements of Changes in Net Assets
| | Year Ended |
| | 12/31/09 | | 12/31/08 |
| INCREASE (DECREASE) IN NET | | | | | | | | |
| ASSETS FROM OPERATIONS: | | | | | | | | |
| Net investment income | | $ | 112,704 | | | $ | 333,379 | |
| Net realized loss on investments | | | | | | | | |
| and foreign currencies | | | (37,125,105 | ) | | | (7,378,733 | ) |
| Net change in unrealized appreciation/ | | | | | | | | |
| depreciation of investments | | | 98,992,576 | | | | (96,205,240 | ) |
| Net increase (decrease) in net assets | | | | | | | | |
| resulting from operations | | | 61,980,175 | | | | (103,250,594 | ) |
| |
| DIVIDENDS AND DISTRIBUTIONS | | | | | | | | |
| TO SHAREHOLDERS FROM: | | | | | | | | |
| Net investment income: | | | | | | | | |
| Standard Class | | | (348,065 | ) | | | (56,897 | ) |
| Net realized gain on investments: | | | | | | | | |
| Standard Class | | | – | | | | (3,698,278 | ) |
| Service Class | | | – | | | | (884,275 | ) |
| | | (348,065 | ) | | | (4,639,450 | ) |
| |
| CAPITAL SHARE TRANSACTIONS: | | | | | | | | |
| Proceeds from shares sold: | | | | | | | | |
| Standard Class | | | 26,399,773 | | | | 76,187,409 | |
| Service Class | | | 36,155,403 | | | | 8,400,728 | |
| Net asset value of shares issued upon | | | | | | | | |
| reinvestment of dividends and distributions: | | | | | | | | |
| Standard Class | | | 348,065 | | | | 3,755,174 | |
| Service Class | | | – | | | | 884,275 | |
| | | | 62,903,241 | | | | 89,227,586 | |
| Cost of shares repurchased: | | | | | | | | |
| Standard Class | | | (49,780,577 | ) | | | (16,255,762 | ) |
| Service Class | | | (8,837,043 | ) | | | (10,295,194 | ) |
| | | | (58,617,620 | ) | | | (26,550,956 | ) |
| Increase in net assets derived | | | | | | | | |
| from capital share transactions | | | 4,285,621 | | | | 62,676,630 | |
| |
| NET INCREASE (DECREASE) | | | | | | | | |
| IN NET ASSETS | | | 65,917,731 | | | | (45,213,414 | ) |
| |
| NET ASSETS: | | | | | | | | |
| Beginning of year | | | 150,375,976 | | | | 195,589,390 | |
| End of year (including undistributed | | | | | | | | |
| net investment income of $89,342 | | | | | | | | |
| and $324,703, respectively) | | $ | 216,293,707 | | | $ | 150,375,976 | |
| | | | | | | | | |
See accompanying notes
U.S. Growth Series-8
Delaware VIP® Trust — Delaware VIP U.S. Growth Series
Financial Highlights
Selected data for each share of the Series outstanding throughout each period were as follows:
| | Delaware VIP U.S. Growth Series Standard Class | |
| | Year Ended | |
| | 12/31/09 | | 12/31/08 | | 12/31/07 | | 12/31/06 | | 12/31/05 | |
| Net asset value, beginning of period | | $5.010 | | $8.960 | | $7.960 | | $7.780 | | $6.830 | | |
| | |
| Income (loss) from investment operations: | | | | | | | | | | | | |
| Net investment income (loss)1 | | 0.007 | | 0.016 | | 0.007 | | (0.003 | ) | (0.005 | ) | |
| Net realized and unrealized gain (loss) on investments | | | | | | | | | | | | |
| and foreign currencies | | 2.157 | | (3.768 | ) | 0.993 | | 0.183 | | 0.997 | | |
| Total from investment operations | | 2.164 | | (3.752 | ) | 1.000 | | 0.180 | | 0.992 | | |
| | |
| Less dividends and distributions from: | | | | | | | | | | | | |
| Net investment income | | (0.014 | ) | (0.003 | ) | – | | – | | (0.042 | ) | |
| Net realized gain on investments | | – | | (0.195 | ) | – | | – | | – | | |
| Total dividends and distributions | | (0.014 | ) | (0.198 | ) | – | | – | | (0.042 | ) | |
| | |
| Net asset value, end of period | | $7.160 | | $5.010 | | $8.960 | | $7.960 | | $7.780 | | |
| | |
| Total return2 | | 43.30% | | (42.66% | ) | 12.56% | | 2.31% | | 14.65% | | |
| | |
| Ratios and supplemental data: | | | | | | | | | | | | |
| Net assets, end of period (000 omitted) | | $151,611 | | $127,338 | | $153,839 | | $138,548 | | $45,653 | | |
| Ratio of expenses to average net assets | | 0.75% | | 0.76% | | 0.74% | | 0.77% | | 0.81% | | |
| Ratio of net investment income (loss) to average net assets | | 0.12% | | 0.22% | | 0.08% | | (0.04% | ) | (0.07% | ) | |
| Portfolio turnover | | 43% | | 28% | | 52% | | 21% | | 91% | | |
____________________
| 1The average shares outstanding method has been applied for per share information. |
| 2Total investment return is based on the change in net asset value of a share during the period and assumes reinvestment of dividends and distributions at net asset value. |
See accompanying notes
U.S. Growth Series-9
Delaware VIP® U.S. Growth Series
Financial Highlights (continued)
Selected data for each share of the Series outstanding throughout each period were as follows:
| | Delaware VIP U.S. Growth Series Service Class | |
| | Year Ended | |
| | 12/31/09 | | 12/31/08 | | 12/31/07 | | 12/31/06 | | 12/31/05 | | |
| Net asset value, beginning of period | | $4.960 | | $8.900 | | $7.920 | | $7.760 | | $6.810 | | |
| | |
| Income (loss) from investment operations: | | | | | | | | | | | | |
| Net investment loss1 | | (0.008 | ) | (0.002 | ) | (0.014 | ) | (0.022 | ) | (0.023 | ) | |
| Net realized and unrealized gain (loss) on investments | | | | | | | | | | | | |
| and foreign currencies | | 2.138 | | (3.743 | ) | 0.994 | | 0.182 | | 0.999 | | |
| Total from investment operations | | 2.130 | | (3.745 | ) | 0.980 | | 0.160 | | 0.976 | | |
| | |
| Less dividends and distributions from: | | | | | | | | | | | | |
| Net investment income | | – | | – | | – | | – | | (0.026 | ) | |
| Net realized gain on investments | | – | | (0.195 | ) | – | | – | | – | | |
| Total dividends and distributions | | – | | (0.195 | ) | – | | – | | (0.026 | ) | |
| | |
| Net asset value, end of period | | $7.090 | | $4.960 | | $8.900 | | $7.920 | | $7.760 | | |
| | |
| Total return2 | | 42.94% | | (42.86% | ) | 12.37% | | 2.06% | | 14.41% | | |
| | |
| Ratios and supplemental data: | | | | | | | | | | | | |
| Net assets, end of period (000 omitted) | | $64,683 | | $23,038 | | $41,750 | | $38,596 | | $42,062 | | |
| Ratio of expenses to average net assets | | 1.00% | | 1.01% | | 0.99% | | 1.02% | | 1.06% | | |
| Ratio of expenses to average net assets | | | | | | | | | | | | |
| prior to fees waived and expenses paid indirectly | | 1.05% | | 1.06% | | 1.04% | | 1.07% | | 1.11% | | |
| Ratio of net investment loss to average net assets | | (0.13% | ) | (0.03% | ) | (0.17% | ) | (0.29% | ) | (0.32% | ) | |
| Ratio of net investment loss to average net assets | | | | | | | | | | | | |
| prior to fees waived and expenses paid indirectly | | (0.18% | ) | (0.08% | ) | (0.22% | ) | (0.34% | ) | (0.37% | ) | |
| Portfolio turnover | | 43% | | 28% | | 52% | | 21% | | 91% | | |
____________________
| 1The average shares outstanding method has been applied for per share information. |
| 2Total investment return is based on the change in net asset value of a share during the period and assumes reinvestment of dividends and distributions at net asset value. Total investment return during all of the periods shown reflects a waiver by the distributor. Performance would have been lower had the waiver not been in effect. |
See accompanying notes
U.S. Growth Series-10
Delaware VIP® Trust — Delaware VIP U.S. Growth Series
Notes to Financial Statements
December 31, 2009
Delaware VIP Trust (Trust) is organized as a Delaware statutory trust and offers 12 series: Delaware VIP Cash Reserve Series, Delaware VIP Diversified Income Series, Delaware VIP Emerging Markets Series, Delaware VIP Growth Opportunities Series, Delaware VIP High Yield Series, Delaware VIP International Value Equity Series, Delaware VIP Limited-Term Diversified Income Series (formerly, Delaware VIP Capital Reserves Series), Delaware VIP REIT Series, Delaware VIP Small Cap Value Series, Delaware VIP Trend Series, Delaware VIP U.S. Growth Series and Delaware VIP Value Series. These financial statements and the related notes pertain to Delaware VIP U.S. Growth Series (Series). The Trust is an open-end investment company. The Series is considered diversified under the Investment Company Act of 1940, as amended, and offers Standard Class and Service Class shares. The Standard Class shares do not carry a 12b-1 fee and the Service Class shares carry a 12b-1 fee. The shares of the Series are sold only to separate accounts of life insurance companies.
The investment objective of the Series is to seek long-term capital appreciation.
1. Significant Accounting Policies
The following accounting policies are in accordance with U.S. generally accepted accounting principles (U.S. GAAP) and are consistently followed by the Series.
Security Valuation—Equity securities, except those traded on the Nasdaq Stock Market, Inc. (Nasdaq), are valued at the last quoted sales price as of the time of the regular close of the New York Stock Exchange (NYSE) on the valuation date. Securities traded on the Nasdaq are valued in accordance with the Nasdaq Official Closing Price, which may not be the last sales price. If on a particular day an equity security does not trade, then the mean between the bid and ask prices will be used. Short-term debt securities are valued at market value. Investment companies are valued at net asset value per share. Generally, other securities and assets for which market quotations are not readily available are valued at fair value as determined in good faith under the direction of the Series’ Board of Trustees (Board). In determining whether market quotations are readily available or fair valuation will be used, various factors will be taken into consideration, such as market closures or suspension of trading in a security. The Series may use fair value pricing more frequently for securities traded primarily in non-U.S. markets because, among other things, most foreign markets close well before the Series values its securities at 4:00 p.m. Eastern time. The earlier close of these foreign markets gives rise to the possibility that significant events, including broad market moves, government actions or pronouncements, aftermarket trading, or news events may have occurred in the interim. To account for this, the Series may frequently value foreign securities using fair value prices based on third-party vendor modeling tools (international fair value pricing).
Federal Income Taxes—No provision for federal income taxes has been made as the Series intends to continue to qualify for federal income tax purposes as a regulated investment company under Subchapter M of the Internal Revenue Code of 1986, as amended, and make the requisite distributions to shareholders. The Series evaluates tax positions taken or expected to be taken in the course of preparing the Series’ tax returns to determine whether the tax positions are “more-likely-than-not” of being sustained by the applicable tax authority. Tax positions not deemed to meet the more-likely-than-not threshold are recorded as a tax benefit or expense in the current year. Management has analyzed the Series’ tax positions taken on federal income tax returns for all open tax years (tax years ended December 31, 2006 – December 31, 2009), and has concluded that no provision for federal income tax is required in the Series’ financial statements.
Class Accounting—Investment income, common expenses and realized and unrealized gain (loss) on investments are allocated to the classes of the Series on the basis of daily net assets of each class. Distribution expenses relating to a specific class are charged directly to that class.
Repurchase Agreements—The Series may invest in a pooled cash account along with other members of the Delaware Investments® Family of Funds pursuant to an exemptive order issued by the Securities and Exchange Commission. The aggregate daily balance of the pooled cash account is invested in repurchase agreements secured by obligations of the U.S. government. The respective collateral is held by the Series’ custodian bank until the maturity of the respective repurchase agreements. Each repurchase agreement is at least 102% collateralized. However, in the event of default or bankruptcy by the counterparty to the agreement, realization of the collateral may be subject to legal proceedings. At December 31, 2009, the Series held no investments in repurchase agreements.
Use of Estimates—The preparation of financial statements in conformity with U.S. GAAP requires management to make estimates and assumptions that affect the reported amounts of assets and liabilities at the date of the financial statements and the reported amounts of revenues and expenses during the reporting period. Actual results could differ from those estimates.
Other—Expenses directly attributable to the Series are charged directly to the Series. Other expenses common to various funds within the Delaware Investments Family of Funds are generally allocated amongst such funds on the basis of average net assets. Management fees and some other expenses are paid monthly. Security transactions are recorded on the date the securities are purchased or sold (trade date) for financial reporting purposes. Costs used in calculating realized gains and losses on the sale of investment securities are those of the specific securities sold. Dividend income is recorded on the ex-dividend date and interest income is recorded on the accrual basis. The Series declares and pays dividends from net investment income and distributions from net realized gain on investments, if any, following the close of the fiscal year.
Subject to seeking best execution, the Series may direct certain security trades to brokers who have agreed to rebate a portion of the related brokerage commission to the Series in cash. Such commission rebates are included in realized gain on investments in the accompanying financial statements and totaled $7,388 for the year ended December 31, 2009. In general, best execution refers to many factors, including the price paid or received for a security, the commission charged, the promptness and reliability of execution, the confidentiality and placement accorded the order, and other factors affecting the overall benefit obtained by the Series on the transaction.
The Series may receive earnings credits from its custodian when positive cash balances are maintained, which are used to offset custody fees. There were no earnings credits for the year ended December 31, 2009.
U.S. Growth Series-11
Delaware VIP® U.S. Growth Series
Notes to Financial Statements (continued)
1. Significant Accounting Policies (continued)
On July 1, 2009, the Financial Accounting Standards Board (FASB) issued the FASB Accounting Standards Codification (Codification). The Codification became the single source of authoritative nongovernmental U.S. GAAP, superseding existing literature of the FASB, American Institute of Certified Public Accountants, Emerging Issues Task Force and other sources. The Codification is effective for interim and annual periods ending after September 15, 2009. The Series adopted the Codification for the year ended December 31, 2009. There was no impact to financial statements as the Codification requirements are disclosure-only in nature.
Management has evaluated whether any events or transactions occurred subsequent to December 31, 2009 through February 17, 2010, the date of issuance of the Series’ financial statements, and determined that there were no material events or transactions that would require recognition or disclosure in the Series’ financial statements.
2. Investment Management, Administration Agreements and Other Transactions with Affiliates
In accordance with the terms of its investment management agreement, the Series pays Delaware Management Company (DMC), a series of Delaware Management Business Trust and the investment manager, an annual fee which is calculated daily at the rate of 0.65% on the first $500 million of average daily net assets of the Series, 0.60% on the next $500 million, 0.55% on the next $1.5 billion and 0.50% on average daily net assets in excess of $2.5 billion.
Delaware Service Company, Inc. (DSC), an affiliate of DMC, provides fund accounting and financial administration oversight services to the Series. For these services, the Series pays DSC fees based on the aggregate daily net assets of the Delaware Investments® Family of Funds at the following annual rate: 0.0050% of the first $30 billion; 0.0045% of the next $10 billion; 0.0040% of the next $10 billion; and 0.0025% of aggregate average daily net assets in excess of $50 billion. The fees payable to DSC under the service agreement described above are allocated among all funds in the Delaware Investments Family of Funds on a relative net asset value basis. For the year ended December 31, 2009, the Series was charged $8,469 for these services.
DSC also provides dividend disbursing and transfer agency services. The Series pays DSC a monthly fee based on the number of shareholder accounts for dividend disbursing and transfer agent services.
Pursuant to a distribution agreement and distribution plan, the Series pays Delaware Distributors, L.P. (DDLP), the distributor and an affiliate of DMC, an annual distribution and service fee not to exceed 0.30% of the average daily net assets of the Service Class shares. DDLP has contracted to waive distribution and service fees through April 30, 2010 in order to prevent distribution and service fees of the Service Class shares from exceeding 0.25% of average daily net assets. Standard Class shares pay no distribution and service expenses.
At December 31, 2009, the Series had liabilities payable to affiliates as follows:
| | | Dividend Disbursing, | | | | Other |
| Investment | | Transfer Agent and Fund | | | | Expenses |
| Management | | Accounting Oversight | | Distribution | | Payable |
| Fee Payable to | | Fees and Other Expenses | | Fee Payable | | to DMC |
| DMC | | Payable to DSC | | to DDLP | | and Affiliates* |
| $115,982 | | $2,237 | | $13,057 | | $6,593 |
____________________
*DMC, as part of its administrative services, pays operating expenses on behalf of the Series and is reimbursed on a periodic basis. Such expenses include items such as printing of shareholder reports, fees for audit, legal and tax services, custodian fees and trustees’ fees.
As provided in the investment management agreement, the Series bears the cost of certain legal and tax services, including internal legal and tax services provided to the Series by DMC and/or its affiliates’ employees. For the year ended December 31, 2009, the Series was charged $14,284 for internal legal and tax services provided by DMC and/or its affiliates’ employees.
Trustees’ fees include expenses accrued by the Series for each Trustee’s retainer and meeting fees. Certain officers of DMC, DSC and DDLP are officers and/or Trustees of the Trust. These officers and Trustees are paid no compensation by the Series.
3. Investments
For the year ended December 31, 2009, the Series made purchases and sales of investment securities other than short-term investments as follows:
| Purchases | | $75,218,580 |
| Sales | | 71,218,356 |
At December 31, 2009, the cost of investments and unrealized appreciation (depreciation) for federal income tax purposes for the Series were as follows:
| | | Aggregate | | Aggregate | | Net |
| Cost of | | Unrealized | | Unrealized | | Unrealized |
| Investments | | Appreciation | | Depreciation | | Appreciation |
| | $200,420,747 | | $30,759,499 | | $(6,738,649) | | $24,020,850 |
U.S. Growth Series-12
Delaware VIP® U.S. Growth Series
Notes to Financial Statements (continued)
3. Investments (continued)
U.S. GAAP defines fair value as the price that the Series would receive to sell an asset or pay to transfer a liability in an orderly transaction between market participants at the measurement date under current market conditions. A framework for measuring fair value and a three level hierarchy for fair value measurements has been established based upon the transparency of inputs to the valuation of an asset or liability. Inputs may be observable or unobservable and refer broadly to the assumptions that market participants would use in pricing the asset or liability. Observable inputs reflect the assumptions market participants would use in pricing the asset or liability based on market data obtained from sources independent of the reporting entity. Unobservable inputs reflect the reporting entity’s own assumptions about the assumptions that market participants would use in pricing the asset or liability developed based on the best information available under the circumstances. The Series’ investment in its entirety is assigned a level based upon the observability of the inputs which are significant to the overall valuation. The three-tier hierarchy of inputs is summarized below.
Level 1 – inputs are quoted prices in active markets
Level 2 – inputs are observable, directly or indirectly
Level 3 – inputs are unobservable and reflect assumptions on the part of the reporting entity
The following table summarizes the valuation of the Series’ investments by the fair value hierarchy levels as of December 31, 2009:
| Level 1 | | Level 2 | | Level 3 | | Total |
| Common Stock | $ | 211,853,771 | | $ | – | | $ | – | | $ | 211,853,771 |
| Short-Term | | – | | | 361,000 | | | – | | | 361,000 |
| Securities Lending Collateral | | 7,898,822 | | | 4,315,688 | | | 12,316 | | | 12,226,826 |
| Total | $ | 219,752,593 | | $ | 4,676,688 | | $ | 12,316 | | $ | 224,441,597 |
| | | | | | | | | | | | |
The following is a reconciliation of investments in which significant unobservable inputs (Level 3) were used in determining fair value:
| Securities |
| Lending |
| Collateral |
| Balance as of 12/31/2008 | | $ 9,563 | |
| Net change in unrealized appreciation/depreciation | | 2,753 | |
| Balance as of 12/31/09 | | $12,316 | |
| Net change in unrealized | | | |
| appreciation/depreciation from | | | |
| investments still held as of 12/31/09 | | $ 2,753 | |
In January 2010, the Financial Accounting Standards Board issued an Accounting Standards Update, Improving Disclosures about Fair Value Measurements, which introduces new disclosure requirements and clarifies certain existing disclosure requirements around fair value measurements currently presented above. The new disclosures and clarifications of existing disclosures are generally effective for the Series’ year ending December 31, 2010 and interim periods therein. Management is evaluating the impact of this update on its current disclosures.
4. Dividend and Distribution Information
Income and long-term capital gain distributions are determined in accordance with federal income tax regulations, which may differ from U.S. GAAP. Additionally, distributions from net gains on foreign currency transactions and net short-term gains on sales of investment securities are treated as ordinary income for federal income tax purposes. The tax character of dividends and distributions paid during the years ended December 31, 2009 and 2008 was as follows:
| Year | | Year |
| Ended | | Ended |
| 12/31/09 | | 12/31/08 |
| Ordinary income | $ | 348,065 | | $ | 260,076 |
| Long-term capital gain | | – | | | 4,379,374 |
| Total | $ | 348,065 | | $ | 4,639,450 |
| | | | | | |
5. Components of Net Assets on a Tax Basis
As of December 31, 2009, the components of net assets on a tax basis were as follows:
| Shares of beneficial interest | $ | 235,797,207 | |
| Undistributed ordinary income | | 89,342 | |
| Post-October losses | | (551,389 | ) |
| Capital loss carryforwards | | (43,062,303 | ) |
| Unrealized appreciation of investments | | 24,020,850 | |
| Net assets | $ | 216,293,707 | |
| | | | |
The differences between book basis and tax basis components of net assets are primarily attributable to tax deferral of losses on wash sales.
U.S. Growth Series-13
Delaware VIP® U.S. Growth Series
Notes to Financial Statements (continued)
5. Components of Net Assets on a Tax Basis (continued)
Post-October losses represent losses realized on investment transactions from November 1, 2009 through December 31, 2009 that, in accordance with federal income tax regulations, the Series has elected to defer and treat as having arisen in the following fiscal year.
For federal income tax purposes, capital loss carryforwards may be carried forward and applied against future capital gains. Capital loss carryforwards remaining at December 31, 2009 will expire as follows: $7,434,024 expires in 2016 and $35,628,279 expires in 2017.
6. Capital Shares
Transactions in capital shares were as follows:
| Year | | Year |
| Ended | | Ended |
| 12/31/09 | | 12/31/08 |
| Shares sold: | | | | | |
| Standard Class | 4,638,803 | | | 10,444,266 | |
| Service Class | 5,993,815 | | | 1,299,985 | |
| |
| Shares issued upon reinvestment of dividends and distributions: | | | | | |
| Standard Class | 66,298 | | | 484,539 | |
| Service Class | – | | | 114,990 | |
| | 10,698,916 | | | 12,343,780 | |
| Shares repurchased: | | | | | |
| Standard Class | (8,954,959 | ) | | (2,664,066 | ) |
| Service Class | (1,515,468 | ) | | (1,462,521 | ) |
| | (10,470,427 | ) | | (4,126,587 | ) |
| Net increase | 228,489 | | | 8,217,193 | |
| | | | | | |
7. Line of Credit
The Series, along with certain other funds in the Delaware Investments® Family of Funds (Participants), participates in a $35,000,000 revolving line of credit with The Bank of New York Mellon (BNY Mellon) to be used for temporary or emergency purposes as an additional source of liquidity to fund redemptions of investor shares. Under the agreement, Participants are charged an annual commitment fee, which is allocated across the Participants on the basis of each Participant’s allocation of the entire facility. The Participants may borrow up to a maximum of one third of their net assets under the agreement. The agreement expires on November 16, 2010. The Series had no amounts outstanding as of December 31, 2009, or at any time during the year then ended.
8. Securities Lending
The Series, along with other funds in the Delaware Investments Family of Funds, may lend its securities pursuant to a security lending agreement (Lending Agreement) with BNY Mellon. With respect to each loan, if the aggregate market value of securities collateral held plus cash collateral received on any business day is less than the aggregate market value of the securities which are the subject of such loan, the borrower will be notified to provide additional collateral not less than the applicable collateral requirements. Cash collateral received is generally invested in the Mellon GSL DBT II Collateral Fund (Collective Trust) established by BNY Mellon for the purpose of investment on behalf of clients participating in its securities lending programs. The Collective Trust may invest in fixed income securities, with a weighted average maturity not to exceed 90 days, rated in one of the top three tiers by Standard & Poor’s Ratings Group or Moody’s Investors Service, Inc. or repurchase agreements collateralized by such securities. The Collective Trust seeks to maintain a net asset value per unit of $1.00, but there can be no assurance that it will always be able to do so. At December 31, 2009, the Collective Trust held only cash and assets with a maturity of one business day or less (Cash/Overnight Assets). The Series may incur investment losses as a result of investing securities lending collateral in the Collective Trust. This could occur if an investment in the Collective Trust defaulted or if it were necessary to liquidate assets in the Collective Trust to meet returns on outstanding security loans at a time when the Collective Trust’s net asset value per unit was less than $1.00. Under those circumstances, the Series may not receive an amount from the Collective Trust that is equal in amount to the collateral the Series would be required to return to the borrower of the securities and the Series would be required to make up for this shortfall. Effective April 20, 2009, BNY Mellon transferred the assets of the Collective Trust other than the Cash/Overnight Assets to the BNY Mellon SL DBT II Liquidating Fund (Liquidating Fund), effectively bifurcating the collateral investment pool. The Series’ exposure to the Liquidating Fund is expected to decrease as the Liquidating Fund’s assets mature or are sold. In October 2008, BNY Mellon transferred certain distressed securities from the Collective Trust into the Mellon GSL Reinvestment Trust II. The Series can also accept U.S. government securities and letters of credit (non-cash collateral) in connection with securities loans. In the event of default or bankruptcy by the lending agent, realization and/or retention of the collateral may be subject to legal proceedings. In the event the borrower fails to return loaned securities and the collateral received is insufficient to cover the value of the loaned securities and provided such collateral shortfall is not the result of investment losses, the lending agent has agreed to pay the amount of the shortfall to the Series, or at the discretion of the lending agent, replace the loaned securities. The Series continues to record dividends or interest, as applicable, on the securities loaned and is subject to change in value of the securities loaned that may occur during the term of the loan. The Series has the right under the Lending Agreement to recover the securities from the borrower on demand. With respect to security loans collateralized by non-cash collateral, the Series receives loan premiums paid by the borrower. With respect to security loans collateralized by cash collateral, the earnings from the collateral investments are shared among the Series, the security lending agent and the borrower. The Series records security lending income net of allocations to the security lending agent and the borrower.
U.S. Growth Series-14
Delaware VIP® U.S. Growth Series
Notes to Financial Statements (continued)
8. Securities Lending (continued)
At December 31, 2009, the value of the securities on loan was $12,295,250, for which cash collateral was received and invested in accordance with the Lending Agreement. At December 31, 2009, the value of invested collateral was $12,226,826. Such investments are presented on the Statement of Net Assets under the caption “Securities Lending Collateral.”
9. Credit and Market Risk
The Series may invest up to 15% of its total assets in illiquid securities, which may include securities with contractual restrictions on resale, securities exempt from registration under Rule 144A of the Securities Act of 1933, as amended, and other securities which may not be readily marketable. The relative illiquidity of these securities may impair the Series from disposing of them in a timely manner and at a fair price when it is necessary or desirable to do so. While maintaining oversight, the Series’ Board has delegated to DMC the day-to-day functions of determining whether individual securities are liquid for purposes of the Series’ limitation on investments in illiquid assets. Securities eligible for resale pursuant to Rule 144A, which are determined to be liquid, are not subject to the Series’ 15% limit on investments in illiquid securities. As of December 31, 2009, there were no Rule 144A securities. Illiquid securities have been identified on the Statement of Net Assets.
10. Contractual Obligations
The Series enters into contracts in the normal course of business that contain a variety of indemnifications. The Series’ maximum exposure under these arrangements is unknown. However, the Series has not had prior claims or losses pursuant to these contracts. Management has reviewed the Series’ existing contracts and expects the risk of loss to be remote.
11. Sale of Delaware Investments to Macquarie Group
On August 18, 2009, Lincoln National Corporation (parent company of Delaware Investments) and Macquarie Group (Macquarie) entered into an agreement pursuant to which Delaware Investments, including DMC, DDLP and DSC, would be acquired by Macquarie, an Australia-based global provider of banking, financial, advisory, investment and funds management services (Transaction). The Transaction was completed on January 4, 2010. DMC, DDLP and DSC are now wholly-owned subsidiaries of Macquarie.
The Transaction resulted in a change of control of DMC which, in turn, caused the termination of the investment advisory agreement between DMC and the Series. On January 4, 2010, the new investment advisory agreement between DMC and the Series that was approved by the shareholders became effective.
12. Tax Information (Unaudited)
For the fiscal year ended December 31, 2009, the Series designates distributions paid during the year as follows:
| (A) | | (B) | | | | |
| Long-Term | | Ordinary | | | | |
| Capital Gain | | Income | | Total | | (C) |
| Distributions | | Distributions | | Distributions | | Qualifying |
| (Tax Basis) | | (Tax Basis) | | (Tax Basis) | | Dividends1 |
| 0% | | 100% | | 100% | | 100% |
____________________
(A) and (B) are based on a percentage of the Series’ total distributions.
(C) is based on a percentage of the Series’ ordinary income distributions.
1Qualifying dividends represent dividends which qualify for the corporate dividends received deduction.
U.S. Growth Series-15
Delaware VIP® Trust — Delaware VIP U.S. Growth Series
Report of Independent Registered Public Accounting Firm
To the Shareholders and Board of Trustees
Delaware VIP Trust–Delaware VIP U.S. Growth Series
We have audited the accompanying statement of net assets of the Delaware VIP U.S. Growth Series (one of the series constituting Delaware VIP Trust) (the “Series”) as of December 31, 2009, and the related statement of operations for the year then ended, the statements of changes in net assets for each of the two years in the period then ended, and the financial highlights for each of the five years in the period then ended. These financial statements and financial highlights are the responsibility of the Series’ management. Our responsibility is to express an opinion on these financial statements and financial highlights based on our audits.
We conducted our audits in accordance with the standards of the Public Company Accounting Oversight Board (United States). Those standards require that we plan and perform the audit to obtain reasonable assurance about whether the financial statements and financial highlights are free of material misstatement. We were not engaged to perform an audit of the Series’ internal control over financial reporting. Our audits included consideration of internal control over financial reporting as a basis for designing audit procedures that are appropriate in the circumstances, but not for the purpose of expressing an opinion on the effectiveness of the Series’ internal control over financial reporting. Accordingly, we express no such opinion. An audit also includes examining, on a test basis, evidence supporting the amounts and disclosures in the financial statements and financial highlights, assessing the accounting principles used and significant estimates made by management, and evaluating the overall financial statement presentation. Our procedures included confirmation of securities owned as of December 31, 2009, by correspondence with the custodian and brokers. We believe that our audits provide a reasonable basis for our opinion.
In our opinion, the financial statements and financial highlights referred to above present fairly, in all material respects, the financial position of the Delaware VIP U.S. Growth Series of Delaware VIP Trust at December 31, 2009, the results of its operations for the year then ended, the changes in its net assets for each of the two years in the period then ended, and its financial highlights for each of the five years in the period then ended, in conformity with U.S. generally accepted accounting principles.

Philadelphia, Pennsylvania
February 17, 2010
The Series files its complete schedule of portfolio holdings with the Securities and Exchange Commission (Commission) for the first and third quarters of each fiscal year on Form N-Q. The Series’ Forms N-Q, as well as a description of the policies and procedures that the Series uses to determine how to vote proxies (if any) relating to portfolio securities is available without charge (i) upon request, by calling 800 523-1918; and (ii) on the Commission’s website at http://www.sec.gov. In addition, a description of the policies and procedures that the Series uses to determine how to vote proxies (if any) relating to portfolio securities is available without charge on the Delaware Investments® Funds’ Web site at http://www.delawareinvestments.com. The Series’ Forms N-Q may be reviewed and copied at the Commission’s Public Reference Room in Washington, DC; information on the operation of the Public Reference Room may be obtained by calling 800 SEC-0330.
Information (if any) regarding how the Series voted proxies relating to portfolio securities during the most recently disclosed 12-month period ended June 30 is available without charge (i) through the Delaware Investments Funds’ Web site at http://www.delawareinvestments.com; and (ii) on the Commission’s website at http://www.sec.gov. |
U.S. Growth Series-16
Delaware VIP® Trust — Delaware VIP U.S. Growth Series
Other Series Information
Board Consideration of New Investment Advisory Agreement
At a meeting held on September 3, 2009 (the “Meeting”), the Board of Trustees of the Delaware Investments Family of Funds (the “Board”), including the independent Trustees, unanimously approved a new investment advisory agreement between each registrant on behalf of each series (each, a “Fund” and together, the “Funds”) and Delaware Management Company (“DMC”) in connection with the sale of Delaware Investments’ advisory business to Macquarie Bank Limited (the “Macquarie Group”) (the “Transaction”). In making its decision, the Board considered information furnished specifically in connection with the approval of the new investment advisory agreements with DMC (the “New Investment Advisory Agreements”) which included extensive materials about the Transaction and matters related to the proposed approvals. To assist the Board in considering the New Investment Advisory Agreements, Macquarie Group provided materials and information about Macquarie Group, including detailed written responses to the questions posed by the independent Trustees. DMC also provided materials and information about the Transaction, including detailed written responses to the questions posed by the independent Trustees.
At the Meeting, the Trustees discussed the Transaction with DMC management and with key Macquarie Group representatives. The Meeting included discussions of the strategic rationale for the Transaction and Macquarie Group’s general plans and intentions regarding the Funds and DMC. The Board members also inquired about the plans for, and anticipated roles and responsibilities of, key employees and officers of Delaware Management Holdings Inc. and DMC in connection with the Transaction.
In connection with the Trustees’ review of the New Investment Advisory Agreements for the Funds, DMC and/or Macquarie Group emphasized that:
- They expected that there would be no adverse changes as a result of the Transaction, in the nature, quality, or extent of services currently provided to the Funds and their shareholders, including investment management, distribution, or other shareholder services.
- No material changes in personnel or operations were contemplated in the operation of DMC under Macquarie Group as a result of the Transaction and no material changes were currently contemplated in connection with third party service providers to the Funds.
- Macquarie Group had no intention to cause DMC to alter the voluntary expense waivers and reimbursements currently in effect for the Funds.
- Under the agreement between Macquarie Group and Lincoln National Corporation (“LNC”) (the “Transaction Agreement”), Macquarie Group has agreed to conduct, and to cause its affiliates to conduct, their respective businesses in compliance with the conditions of Section 15(f) of the Investment Company Act of 1940 (the “1940 Act”) with respect to the Funds, to the extent within its control, including maintaining Board composition of at least 75% of the Board members qualifying as independent Trustees and not imposing any “unfair burden” on the Funds for at least two years from the closing of the Transaction (the “Closing”).
In addition to the information provided by DMC and Macquarie Group as described above, the Trustees also considered all other factors they believed to be relevant to evaluating the New Investment Advisory Agreements, including the specific matters discussed below. In their deliberations, the Trustees did not identify any particular information that was controlling, and different Trustees may have attributed different weights to the various factors. However, for each Fund, the Trustees determined that the overall arrangements between the Fund and DMC, as provided in the respective New Investment Advisory Agreement, including the proposed advisory fee and the related administration arrangements between the Fund and DMC, were fair and reasonable in light of the services to be performed, expenses incurred, and such other matters as the Trustees considered relevant. Factors evaluated included:
- The potential for expanding distribution of Fund shares through access to Macquarie Group’s existing distribution channels;
- Delaware Investments’ acquisition of an exclusive wholesaling sales force from a subsidiary of LNC;
- The reputation, financial strength, and resources of Macquarie Group as well as its historic and ongoing commitment to the asset management business in Australia as well as other parts of the world;
- The terms and conditions of the New Investment Advisory Agreements, including that each Fund’s total contractual fee rate under the New Investment Advisory Agreement will remain the same;
- The Board’s full annual review (or initial approval) of the current investment advisory agreements at their in-person meeting in May 2009 as required by the 1940 Act and its determination that (i) DMC had the capabilities, resources, and personnel necessary to provide the satisfactory advisory and administrative services currently provided to each Fund and (ii) the advisory and/or management fees paid by each Fund, taking into account any applicable fee waivers and breakpoints, represented reasonable compensation to DMC in light of the services provided, the costs to DMC of providing those services, economies of scale, and the fees and other expenses paid by similar funds and such other matters that the Board considered relevant in the exercise of its reasonable judgment;
- The portfolio management teams for the Funds are not currently expected to change as a result of the Transaction;
- LNC and Macquarie Group were expected to execute a reimbursement agreement pursuant to which LNC and Macquarie Group would agree to pay (or reimburse) all reasonable out-of-pocket costs and expenses of the Funds in connection with the Board’s consideration of the Transaction, the New Investment Advisory Agreements and related agreements, and all costs related to the proxy solicitation (the “Expense Agreement”);
U.S. Growth Series-17
Delaware VIP® U.S. Growth Series
Other Series Information (continued)
- The likelihood that Macquarie Group would invest additional amounts in Delaware Investments, including DMC, which could result in increased assets under management, which in turn would allow some Funds the potential opportunity to achieve economies of scale and lower fees payable by Fund shareholders; and
- The compliance and regulatory history of Macquarie Group and its affiliates.
In making their decision relating to the approval of each Fund’s New Investment Advisory Agreement, the independent Trustees gave attention to all information furnished. The following discussion, however, identifies the primary factors taken into account by the Trustees and the conclusions reached in approving the New Investment Advisory Agreements.
NATURE, EXTENT, AND QUALITY OF SERVICE. The Trustees considered the services historically provided by DMC to the Funds and their shareholders. In reviewing the nature, extent, and quality of services, the Board considered that the New Investment Advisory Agreements would be substantially similar to the current investment advisory agreements between the Funds and DMC (the “Current Investment Advisory Agreements”), and they therefore, considered the many reports furnished to them throughout 2008 and 2009 at regular Board meetings covering matters such as: the relative performance of the Funds; the compliance of portfolio managers with the investment policies, strategies, and restrictions for the Funds; the compliance of management personnel with the code of ethics adopted throughout the Delaware Investments Family of Funds complex; and the adherence to fair value pricing procedures as established by the Board. The Trustees were pleased with the current staffing of DMC and the emphasis placed on research and risk management in the investment process. Favorable consideration was given to DMC’s efforts to maintain expenditures and, in some instances, increase financial and human resources committed to Fund matters.
The Board also considered the transfer agent and shareholder services that would continue to be provided to Fund shareholders by DMC’s affiliate, Delaware Service company, Inc. (“DSC”). The Trustees noted, in particular, DSC’s commitment to maintain a high level of service as well as DMC’s expenditures to improve the delivery of shareholder services. The Board was assured that shareholders would continue to receive the benefits provided to Fund shareholders by being part of the Delaware Investments Family of Funds, including each shareholder’s ability to exchange an investment in one Fund for the same class of shares in another Fund without a sales charge, to reinvest Fund dividends into additional shares of any of the Funds, and the privilege to combine holdings in other Funds to obtain a reduced sales charge.
Based on the information provided by DMC and Macquarie Group, including that Macquarie Group and DMC currently expected no material changes as a result of the Transaction in (i) personnel or operations of DMC or (ii) third party service providers to the Funds, the Board concluded that the satisfactory nature, extent, and quality of services currently provided to the Funds and their shareholders were very likely to continue under the New Investment Advisory Agreements. Moreover, the Board concluded that the Funds would probably benefit from the expanded distribution resources that would become available to Delaware Investments following the Transaction. The Board also concluded that it was very unlikely that any “unfair burden” would be imposed on any of the Funds for the first two years following the Closing as a result of the Transaction. Consequently, the Board concluded that it did not expect the Transaction to result in any adverse changes in the nature, quality, or extent of services (including investment management, distribution or other shareholder services) currently provided to the Funds and their shareholders.
INVESTMENT PERFORMANCE. The Board considered the overall investment performance of DMC and the Funds. The Trustees placed significant emphasis on the investment performance of the Funds in view of its importance to shareholders. Although the Trustees gave appropriate consideration to performance reports and discussions with portfolio managers at Board meetings throughout the year, the Trustees gave particular weight to their review of investment performance in connection with the approval of the Current Investment Advisory agreements at the Board meeting held in May 2009. At that meeting, the Trustees reviewed reports prepared by Lipper, Inc., an independent statistical compilation organization (“Lipper”), which showed each Fund’s investment performance as of December 31, 2008 in comparison to a group of funds selected by Lipper as being similar to the Fund (the “Performance Universe”). During the May 2009 agreement review process, the Trustees observed the significant improvements to relative investment performance of the Funds compared to the Funds’ performance as of December 31, 2007.
At their meeting on September 3, 2009, the Trustees, including the independent Trustees in consultation with their independent counsel, reviewed the investment performance of each Fund. The Trustees compared the performance of each Fund relative to that of its respective Performance Universe for the 1-, 3-, 5-, and 10-year periods ended June 30, 2009 and compared its relative investment performance against the corresponding relative investment performance of each Fund for such time periods ended December 31, 2008, to the extent applicable. As of June 30, 2009, 30 of the Funds had investment performance relative to that of the respective Performance Universe that was better than the corresponding relative investment performance at December 31, 2008 for all applicable time periods. At June 30, 2009, an additional 6 Funds had investment performance relative to that of their respective Performance Universe that was better than the corresponding relative investment performance at December 31, 2008 for a majority of the applicable time periods. At June 30, 2009, 15 additional Funds had investment performance relative to that of their respective Performance Universe that was better than the corresponding relative performance at December 31, 2008 and only 29 Funds had poorer relative investment performance at June 30, 2009 compared to that at December 31, 2008.
The Board therefore concluded that the investment performance of the Funds, on an aggregate basis, had continued to improve relative to their respective Performance Universe since the data reviewed at the May 2009 meeting. Based on information provided by DMC and Macquarie Group, the Board concluded that neither the Transaction nor the New Investment Advisory Agreement would likely have an adverse effect on the investment performance of any Fund because (i) DMC and Macquarie Group did not currently expect the Transaction to cause any material change to the Funds’ portfolio management teams responsible for investment performance, which the Board found to be satisfactory and improving; and (ii) as discussed in more detail below, the Funds’ expenses were not expected to increase as a result of the Transaction.
U.S. Growth Series-18
Delaware VIP® U.S. Growth Series
Other Series Information (continued)
COMPARATIVE EXPENSES. The Trustees also evaluated expense comparison data for the Funds previously provided in May 2009. At that meeting, DMC had provided the Board with information on pricing levels and fee structures for the Funds and comparative funds. The Trustees focused on the comparative analysis of the effective management fees and total expense ratios of each Fund versus the effective management fees and expense ratios of a group of funds selected by Lipper as being similar to each Fund (the “Expense Group”). In reviewing comparative costs, each Fund’s contractual management fee and the actual management fee incurred by the Fund were compared with the contractual management fees (assuming all funds in the Expense Group were similar in size to the Fund) and actual management fees (as reported by each fund) of other funds within the Expense Group, taking into account any applicable breakpoints and fee limitations. Each Fund’s total expenses were also compared with those of its Expense Group. The Trustees also considered fees paid to Delaware Investments for nonmanagement services. At the September 3, 2009 meeting, DMC advised the Board that the more recent comparative expenses for the Funds remained consistent with the previous review in May 2009 and, consequently, the Trustees concluded that expenses of the Funds were satisfactory.
The Board also considered the Expense Agreement under negotiation in evaluating Fund expenses. The Trustees expected that the Expense Agreement would provide that LNC and Macquarie Group would pay or reimburse the Trusts for all reasonable out-of-pocket costs and expenses in connection with the Transaction and the consideration of the New Investment Advisory Agreements (subject to certain limited exceptions).
Based on information provided by DMC and Macquarie Group, the Board concluded that neither the Transaction nor the New Investment Advisory Agreements likely would have an adverse effect on the Funds’ expenses because (i) each Fund’s contractual fee rates under the New Investment Advisory Agreement would remain the same; (ii) under the Expense Agreement, the Funds would be reimbursed for all reasonable out-of-pocket costs and expenses in connection with the Transaction and the related proxy solicitation (subject to certain limited exceptions); and (iii) the expense ratios of certain Funds might decline as a result of the possible increased investment in Delaware Investments by Macquarie Group, as discussed below under “Economies of Scale.”
MANAGEMENT PROFITABILITY. At their meeting on September 3, 2009, the Board evaluated DMC’s profitability in connection with the operation of the Funds. The Board had previously considered DMC’s profitability in connection with the operation of the Funds at its May 2009 meeting. At that meeting, the Board reviewed an analysis that addressed the overall profitability of Delaware Investments’ business in providing management and other services to each of the Funds and the Delaware Investments Family of Funds as a whole. Specific attention was given to the methodology followed in allocating costs for the purpose of determining profitability.
At the May 2009 meeting, representatives of DMC had stated that the level of profits of DMC, to a certain extent, reflect operational cost savings and efficiencies initiated by Delaware Investments (including DMC and its affiliates that provide services to the Funds). The Board considered Delaware Investments’ efforts to improve services provided to Fund shareholders and to meet additional regulatory and compliance requirements resulting from recent industry-wide U.S. Securities and Exchange Commission initiatives. At that meeting, the Board found that the management fees were reasonable in light of the services rendered and the level of profitability of DMC. At the September 3, 2009 meeting, DMC advised the Board that DMC did not expect the Transaction to affect materially the profitability of Delaware Investments compared to the level of profitability considered during the May 2009 review. Moreover, the Trustees reviewed pro forma balance sheets of certain key companies in Delaware Investments as of June 30, 2009 (which were provided by Macquarie Group and DMC in response to the Trustees’ requests) and evaluated the projections of Delaware Investments’ capitalization following the Transaction for purposes of evaluating the financial ability of Delaware Investments to continue to provide the nature, extent, and quality of services as it had under the Current Investment Advisory Agreement.
Based on information provided by DMC and Macquarie Group, the Board concluded that DMC and Delaware Investments would be sufficiently capitalized following the Transaction to continue the same level and quality of services to the Funds under the New Investment Advisory Agreements as was the case under the Current Investment Advisory Agreements. The Board also concluded that Macquarie Group had sufficient financial strength and resources, as well as an ongoing commitment to a global asset management business, to continue investing in Delaware Investments, including DMC, to the extent that Macquarie Group determined it was appropriate. Finally, because services and costs were expected to be substantially the same (and DMC had represented that, correspondingly, profitability would be about the same), under the New Investment Advisory Agreements as under the Current Investment Advisory Agreements, the Trustees concluded that the profitability of Delaware Investments would not result in an inequitable charge on the Funds or their shareholders. Accordingly, the Board concluded that the fees charged under the New Investment Advisory Agreements would be reasonable in light of the services to be provided and the expected profitability of DMC.
ECONOMIES OF SCALE. The Trustees considered whether economies of scale would be realized by Delaware Investments as each Fund’s assets increase and the extent to which any economies of scale would be reflected in the management fees charged. The Trustees took into account DMC’s practice of maintaining the competitive nature of management fees based on its analysis of fees charged by comparable funds. DMC management believed, and the Board agreed, that the Funds were priced with breakpoints and relatively low management fees to reflect potential economies of scale to Fund shareholders.
The Board also acknowledged Macquarie Group’s statement that the Transaction would not by itself immediately provide additional economies of scale given Macquarie Group’s limited presence in the U.S. mutual fund market. Nonetheless, the Trustees concluded that additional economies of scale could potentially be achieved in the future if DMC were owned by Macquarie Group as a result of Macquarie Group’s willingness to invest further in Delaware Investments if appropriate opportunities arise. The Board further concluded that potential economies of scale could be achieved as a result of Delaware Investments’ expanded distribution capabilities arising from the Transaction, as well as opportunities that might arise from Macquarie Group’s global asset management business.
U.S. Growth Series-19
Delaware VIP® U.S. Growth Series
Other Series Information (continued)
FALL-OUT BENEFITS. The Board acknowledged that DMC would continue to benefit from soft dollar arrangements using portfolio brokerage of each Fund that invests in equity securities and that DMC’s profitability would likely be somewhat lower without the benefit of practices with respect to allocating Fund portfolio brokerage for brokerage and research services. The Board also considered that Macquarie Group and Delaware Investments may derive reputational, strategic, and other benefits from their association with the Delaware Investments Family of Funds, including service relationships with DMC, DSC, and Delaware Distributors, L.P., and evaluated the extent to which Delaware Investments might derive ancillary benefits from Fund operations, including the potential for procuring additional business as a result of the prestige and visibility associated with its role as service provider to the Delaware Investments Family of Funds and the benefits from allocation of Fund brokerage to improve trading efficiencies. However, the Board concluded that (i) any such benefits under the New Investment Advisory Agreements would not be dissimilar from those existing under the Current Investment Advisory Agreements, (ii) such benefits did not impose a cost or burden on the Funds or their shareholders, and (iii) such benefits would probably have an indirectly beneficial effect on the Funds and their shareholders because of the added importance that DMC and Macquarie Group might attach to the Funds as a result of the fall-out benefits that the Funds conveyed.
BOARD REVIEW OF MACQUARIE GROUP. The Trustees reviewed detailed information supplied by Macquarie Group about its operations as well as other information regarding Macquarie Group provided by independent legal counsel to the independent Trustees. Based on this review, the Trustees concluded that Delaware Investments would continue to have the financial ability to maintain the high quality of services required by the Funds. The Trustees noted that there would be a limited transition period during which some services previously provided by LNC to Delaware Investments would continue to be provided by LNC after the Closing, and concluded that this arrangement would help minimize disruption in Delaware Investments’ provision of services to the Funds following the Transaction.
The Board considered Macquarie Group’s support for Delaware Investments’ plans for Fund distribution by transferring wholesalers from Lincoln Financial Distributors, Inc., LNC’s retail distributor, to Delaware Investments, and Macquarie Group’s current intention to leave the Funds’ other service providers in place. The Board also considered Macquarie Group’s current strategic plans to increase its asset management activities, one of its core businesses, particularly in North America, and its statement that its acquisition of DMC is an important component of this strategic growth and the establishment of a significant presence in the United States. Based in part on the information provided by DMC and Macquarie Group, the Board concluded that Macquarie Group’s acquisition of Delaware Investments could potentially enhance the nature, quality, and extent of services provided to the Funds and their shareholders.
CONCLUSION. The Board concluded that the advisory fee rate under each New Investment Advisory Agreement was reasonable in relation to the services provided and that execution of the New Investment Advisory Agreement would be in the best interests of the shareholders. For each Fund, the Trustees noted that they had concluded in their most recent advisory agreement continuance considerations in May 2009 that the management fees and total expense ratios were at acceptable levels in light of the quality of services provided to the Funds and in comparison to those of the Funds’ respective peer groups; that the advisory fee schedule would not be increased and would stay the same for all of the Funds; that the total expense ratio had not changed materially since that determination; and that DMC had represented that the overall expenses for each Fund were not expected to be adversely affected by the Transaction. The Trustees also noted, with respect to the Funds that currently had the benefit of voluntary fee limitations, that Macquarie Group had no present intention to cause DMC to alter any voluntary expense limitations or reimbursements currently in effect. On that basis, the Trustees concluded that the total expense ratios and proposed advisory fees for the Funds anticipated to result from the Transaction were acceptable. In approving each New Investment Advisory Agreement, the Board stated that it anticipated reviewing the continuance of the New Investment Advisory Agreement in advance of the expiration of the initial two-year period.
U.S. Growth Series-20
Delaware Investments® Family of Funds
BOARD OF TRUSTEES/DIRECTORS AND OFFICERS ADDENDUM
A mutual fund is governed by a Board of Trustees/Directors (“Trustees”), which has oversight responsibility for the management of a fund’s business affairs. Trustees establish procedures and oversee and review the performance of the investment manager, the distributor, and others who perform services for the fund. The independent fund trustees, in particular, are advocates for shareholder interests. Each trustee has served in that capacity since he or she was elected to or appointed to the Board of Trustees, and will continue to serve until his or her retirement or the election of a new trustee in his or her place. The following is a list of the Trustees and Officers with certain background and related information.
| | | | Number of | Other |
| | | Principal | Portfolios in Fund | Directorships |
| Name, | Position(s) | | Occupation(s) | Complex Overseen | Held by |
| Address, | Held with | Length of Time | During | by Trustee | Trustee |
| and Birth Date | Fund(s) | Served | Past 5 Years | or Officer | or Officer |
| INTERESTED TRUSTEES | | | | | |
| Patrick P. Coyne1 | Chairman, | Chairman and Trustee | Patrick P. Coyne has served in | 81 | Director — |
| 2005 Market Street | President, | since August 16, 2006 | various executive capacities | | Kaydon Corp. |
| Philadelphia, PA | Chief Executive | | at different times at | | |
| 19103 | Officer, and | President and | Delaware Investments.2 | | |
| Trustee | Chief Executive Officer | | | |
| April 1963 | | since August 1, 2006 | | | |
| | | | | | |
| INDEPENDENT TRUSTEES | | | | | |
| Thomas L. Bennett | Trustee | Since | Private Investor — | 81 | Director — |
| 2005 Market Street | | March 2005 | (March 2004–Present) | | Bryn Mawr |
| Philadelphia, PA | | | | | Bank Corp. (BMTC) |
| 19103 | | | Investment Manager — | | (April 2007–Present) |
| | | | Morgan Stanley & Co. | | |
| October 1947 | | | (January 1984–March 2004) | | |
| John A. Fry | Trustee | Since | President — | 81 | Director — |
| 2005 Market Street | | January 2001 | Franklin & Marshall College | | Community Health |
| Philadelphia, PA | | | (June 2002–Present) | | Systems |
| 19103 | | | | | |
| | | | Executive Vice President — | | |
| May 1960 | | | University of Pennsylvania | | |
| | | | (April 1995–June 2002) | | |
| Anthony D. Knerr | Trustee | Since | Founder and Managing Director — | 81 | None |
| 2005 Market Street | | April 1990 | Anthony Knerr & Associates | | |
| Philadelphia, PA | | | (Strategic Consulting) | | |
| 19103 | | | (1990–Present) | | |
| |
| December 1938 | | | | | |
| Lucinda S. Landreth | Trustee | Since | Chief Investment Officer — | 81 | None |
| 2005 Market Street | | March 2005 | Assurant, Inc. | | |
| Philadelphia, PA | | | (Insurance) | | |
| 19103 | | | (2002–2004) | | |
| |
| June 1947 | | | | | |
| Ann R. Leven | Trustee | Since | Consultant — | 81 | None |
| 2005 Market Street | | October 1989 | ARL Associates | | |
| Philadelphia, PA | | | (Financial Planning) | | |
| 19103 | | | (1983–Present) | | |
| |
| November 1940 | | | | | |
U.S. Growth Series-21
| | | | Number of | Other |
| | | Principal | Portfolios in Fund | Directorships |
| Name, | Position(s) | | Occupation(s) | Complex Overseen | Held by |
| Address, | Held with | Length of Time | During | by Trustee | Trustee |
| and Birth Date | Fund(s) | Served | Past 5 Years | or Officer | or Officer |
| INDEPENDENT TRUSTEES (CONTINUED) | | | | |
| Thomas F. Madison | Trustee | Since | President and Chief | 81 | Director and Chair of |
| 2005 Market Street | | May 19973 | Executive Officer — | | Compensation |
| Philadelphia, PA | | | MLM Partners, Inc. | | Committee, |
| 19103 | | | (Small Business Investing | | Governance Committee |
| | | and Consulting) | | Member |
| February 1936 | | | (January 1993–Present) | | — CenterPoint Energy |
| |
| | | | | Lead Director and Chair |
| | | | | of Audit |
| | | | | and Governance |
| | | | | Committees, |
| | | | | Member of |
| | | | | Compensation |
| | | | | Committee — Digital |
| | | | | River, Inc. |
| |
| | | | | Director and Chair of |
| | | | | Governance |
| | | | | Committee, Audit |
| | | | | Committee Member — |
| | | | | Rimage Corporation |
| |
| | | | | Director and Chair of |
| | | | | Compensation |
| | | | | Committee — Spanlink |
| | | | | Communications |
| |
| | | | | Lead Director and Chair |
| | | | | of Compensation and |
| | | | | Governance |
| | | | | Committees — |
| | | | | Valmont Industries, Inc. |
| Janet L. Yeomans | Trustee | Since | Vice President and Treasurer | 81 | None |
| 2005 Market Street | | April 1999 | (January 2006–Present) | | |
| Philadelphia, PA | | | Vice President — Mergers & Acquisitions | | |
| 19103 | | | (January 2003–January 2006), and | | |
| | | Vice President | | |
| July 1948 | | | (July 1995–January 2003) | | |
| | | 3M Corporation | | |
| J. Richard Zecher | Trustee | Since | Founder — | 81 | Director and Audit |
| 2005 Market Street | | March 2005 | Investor Analytics | | Committee Member — |
| Philadelphia, PA | | | (Risk Management) | | Investor Analytics |
| 19103 | | | (May 1999–Present) | | |
| |
| July 1940 | | | Founder — | | |
| | | Sutton Asset Management | | |
| | | (Hedge Fund) | | |
| | | (September 1996–Present) | | |
U.S. Growth Series-22
| | | | Number of | Other |
| | | Principal | Portfolios in Fund | Directorships |
| Name, | Position(s) | | Occupation(s) | Complex Overseen | Held by |
| Address, | Held with | Length of Time | During | by Trustee | Trustee |
| and Birth Date | Fund(s) | Served | Past 5 Years | or Officer | or Officer |
| OFFICERS | | | | | |
| David F. Connor | Vice President, | Vice President since | David F. Connor has served as | 81 | None4 |
| 2005 Market Street | Deputy General | September 2000 | Vice President and Deputy | | |
| Philadelphia, PA | Counsel, and Secretary | and Secretary | General Counsel of | | |
| 19103 | | since | Delaware Investments | | |
| | October 2005 | since 2000. | | |
| December 1963 | | | | | |
| Daniel V. Geatens | Vice President | Treasurer | Daniel V. Geatens has served | 81 | None4 |
| 2005 Market Street | and Treasurer | since | in various capacities at | | |
| Philadelphia, PA | | October 25, 2007 | different times at | | |
| 19103 | | | Delaware Investments. | | |
| |
| October 1972 | | | | | |
| David P. O’Connor | Senior Vice | Senior Vice President, | David P. O’Connor has served in | 81 | None4 |
| 2005 Market Street | President, | General Counsel, and | various executive and legal | | |
| Philadelphia, PA | General Counsel, | Chief Legal Officer | capacities at different times | | |
| 19103 | and Chief | since | at Delaware Investments. | | |
| Legal Officer | October 2005 | | | |
| February 1966 | | | | | |
| Richard Salus | Senior | Chief Financial | Richard Salus has served in | 81 | None4 |
| 2005 Market Street | Vice President | Officer since | various executive capacities | | |
| Philadelphia, PA | and | November 2006 | at different times at | | |
| 19103 | Chief Financial | | Delaware Investments. | | |
| Officer | | | | |
| October 1963 | | | | | |
1 Patrick P. Coyne is considered to be an “Interested Trustee” because he is an executive officer of the Fund’s(s’) investment advisor.
2 Delaware Investments is the marketing name for Delaware Management Holdings, Inc. and its subsidiaries, including the Fund’s(s’) investment advisor, principal underwriter, and its transfer agent.
3 In 1997, several funds managed by Voyageur Fund Managers, Inc. (the “Voyageur Funds”) were incorporated into the Delaware Investments Family of Funds. Mr. Madison served as a director of the Voyageur Funds from 1993 until 1997.
4 David F. Connor, Daniel V. Geatens, David P. O’Connor, and Richard Salus serve in similar capacities for the six portfolios of the Optimum Fund Trust, which have the same investment advisor, principal underwriter, and transfer agent as the registrant.
The Statement of Additional Information for the Fund(s) includes additional information about the Trustees and Officers and is available, without charge, upon request by calling 800 523-1918.
| PO14857 AR-VIPUSG [12/09] DG3 2/10 (5427) | U.S. Growth Series-23 |
| Delaware VIP® Trust |
| Delaware VIP Value Series |
| |
| |
| |
| |
| |
| |
| Annual Report |
| |
| |
| December 31, 2009 |
| |
| |
| |
| |
| |
| |
| |
| |
| |
| |
| |
| |
| |
| |
| |
|
Table of contents
| > Portfolio management review | 1 |
| | |
| > Performance summary | 2 |
| | |
| > Disclosure of Series expenses | 4 |
| | |
| > Sector allocation and top 10 holdings | 5 |
| | |
| > Statement of net assets | 6 |
| | |
| > Statement of operations | 8 |
| | |
| > Statements of changes in net assets | 8 |
| | |
| > Financial highlights | 9 |
| | |
| > Notes to financial statements | 11 |
| | |
| > Report of independent registered public accounting firm | 17 |
| | |
| > Other Series information | 18 |
| | |
| > Board of trustees/directors and officers addendum | 22 |
On January 4, 2010, Delaware Management Holdings, Inc., and its subsidiaries (collectively known by the marketing name of Delaware Investments) were sold by a subsidiary of Lincoln National Corporation to Macquarie Group Limited, a global provider of banking, financial, advisory, investment and funds management services. Please see your Series’ prospectus and any supplements thereto for more complete information.
Investments in Delaware VIP® Value Series are not and will not be deposits with or liabilities of Macquarie Bank Limited ABN 46 008 583 542 and its holding companies, including subsidiaries or related companies, and are subject to investment risk, including possible delays in repayment and loss of income and capital invested. No Macquarie Group company guarantees or will guarantee the performance of the Series, the repayment of capital from the Series, or any particular rate of return.
Unless otherwise noted, views expressed herein are current as of Dec. 31, 2009, and are subject to change.
Funds are not FDIC insured and are not guaranteed. It is possible to lose the principal amount invested.
Mutual fund advisory services provided by Delaware Management Company, a series of Delaware Management Business Trust, which is a registered investment advisor. Delaware Investments is the marketing name of Delaware Management Holdings, Inc. and its subsidiaries. Macquarie Group refers to Macquarie Group Limited and its subsidiaries and affiliates worldwide.
© 2010 Delaware Management Holdings, Inc.
All third-party trademarks cited are the property of their respective owners.
| Delaware VIP® Trust — Delaware VIP Value Series | |
| Portfolio management review | Jan. 12, 2010 |
For the 12-month period ended Dec. 31, 2009, the Delaware VIP Value Series returned +17.96% for Standard Class shares and +17.65% for Service Class shares, both with all distributions reinvested. The Series’ benchmark index, the Russell 1000® Value Index, returned +19.69%.
The past 12 months was a time of tremendous volatility for stock investors. For the first three months of the fiscal period, equities remained severely depressed as the recession deepened. Starting in the second week of March 2009, however, conditions gradually began to improve. Credit markets began to function more normally and investor confidence gradually increased; evidence of economic growth also mounted. Investors seemed to conclude that the market climate was less dire than they had feared. We believe this change in outlook among investors was primarily driven by the government’s actions, particularly those meant to encourage consumer spending. Two notable programs that helped the market rally continue through the summer were the cash-for-clunkers program and the implementation of a housing tax credit, both of which proved popular with consumers.
During this fiscal period, the Series generated strong results but trailed its benchmark. The largest boost to performance came during the period’s first three months, and then again in the fourth quarter of 2009, when the Series held up well during what was a less-speculative market environment. This trend has been fairly typical of our management approach; through our value-oriented, defensive style, we seek to do well in relative terms in lower-return markets by trying to minimize losses.
The biggest contributor to relative performance for the Series was an overweight position in information technology stocks as compared to the benchmark. Despite the recent slowdown in technology spending, we continue to like this sector. Debt levels tend to be lower than in most other sectors, and many of the companies are global in nature and offer exposure to emerging markets. One of the top-performing stocks within this group was Motorola, whose shares rose due to widespread sentiment that the mobile telephone maker might be in the early stages of a turnaround.
The biggest detractor from relative performance during the fiscal year came from the Series’ investments in financials. Performance was negatively affected by our significant underweight and less credit-sensitive exposure, which caused the Series to lag the share price gains that occurred among financials more broadly. Our stance on financials remains somewhat cautious despite the market’s embrace of this sector. In our view, asset quality and loss reserve adequacy are still questionable, lending activity remains weak, and regulatory pressures are likely to increase.
At the individual stock level, the biggest detractor was R.R. Donnelley & Sons, whose commercial printing business has suffered along with consumer spending trends. We sold our position prior to the market recovery because we believed R.R. Donnelley could continue to face significant challenges for some time.
We continue to see economic risks ahead and believe that an overall defensive posture remains warranted. The recent surge in equity prices pushed market valuation levels above their long-run averages. Overall, the market appears to be a bit overvalued, in our view, especially given the potential for weaker-than-expected consumer spending and economic growth. In this environment, we find ourselves putting even more emphasis on bottom-up, company-level fundamentals. We continue to seek stocks selling at large discounts to our estimates of long-term intrinsic value, targeting companies whose shares have lagged during the recent bull phase. We’re seeing more opportunity in some of the more cyclical sectors and are considering ways to mitigate the effects of a potential rise in longer-term inflation on the Series.
Unless otherwise noted, the views expressed are current as of Dec. 31, 2009, and are subject to change.
Value Series-1
Delaware VIP® Value Series (continued)
Performance summary
The performance data quoted below represent past performance; past performance does not guarantee future results. Investment return and principal value will fluctuate so your shares, when redeemed, may be worth more or less than their original cost. Please obtain the performance data for the most recent month end by calling the number noted in the introductory section of this report on the page related to this Series.
You should consider the investment objectives, risks, charges, and expenses of the Series carefully before investing. The Delaware VIP Value Series prospectus contains this and other important information about the Series. To obtain a prospectus, contact the company noted on the page related to this Series in the introductory section of this report, either by phone or through the company Web site. We advise you to read the prospectus carefully before you invest or send money.
| Delaware VIP Value Series | | | | | | | | | |
| Average annual total returns | | | | | | | | | |
| For periods ended Dec. 31, 2009 | 1 year | | 3 years | | 5 years | | 10 years | | Lifetime |
Standard Class shares (commenced
operations on July 28, 1988) | +17.96% | | -8.58% | | +0.10% | | +2.58% | | +7.36% |
Service Class shares (commenced
operations on May 1, 2000) | +17.65% | | -8.82% | | -0.14% | | n/a | | +3.01% |
Returns reflect the reinvestment of all distributions.
As described in the Series’ most recent prospectus, the net expense ratio for Service Class shares of the Series was 1.01%, while total operating expenses for Standard Class and Service Class shares were 0.76% and 1.06%, respectively. The management fee for Standard Class and Service Class shares was 0.65%.
The Series’ distributor has contracted to limit the 12b-1 fees for Service Class shares to no more than 0.25% of average daily net assets through April 30, 2010.
Earnings from a variable annuity or variable life investment compound tax-free until withdrawal, and as a result, no adjustments were made for income taxes.
Expense limitations were in effect for both classes during certain periods shown in the Series performance chart above and in the Performance of a $10,000 Investment chart on the next page.
Performance data do not reflect insurance fees related to a variable annuity or variable life investment or the deferred sales charge that would apply to certain withdrawals of investments. Performance shown here would have been reduced if such fees were included or the expense limitation removed. For more information about fees, consult your variable annuity or variable life prospectus.
Investments in variable products involve risk. The Series will be affected primarily by changes in stock prices.
Please read both the contract and underlying prospectus for specific details regarding the product’s risk profile.
Value Series-2
Delaware VIP® Value Series (continued)
The chart shows a $10,000 investment in the Delaware VIP Value Series Standard Class shares for the period from Dec. 31, 1999, through Dec. 31, 2009.
The chart also shows $10,000 invested in the Russell 1000 Value Index for the period from Dec. 31, 1999, through Dec. 31, 2009. The Russell 1000 Value Index measures the performance of the large-cap value segment of the U.S. equity universe. It includes those Russell 1000 companies with lower price-to-book ratios and lower forecasted growth values.
Index performance returns do not reflect any management fees, transaction costs or expenses. Indices are unmanaged and one cannot invest directly in an index.
Performance of the Service Class shares will vary due to different charges and expenses.
Past performance is not a guarantee of future results.
Value Series-3
Delaware VIP® Trust — Delaware VIP Value Series
Disclosure of Series Expenses
For the Period July 1, 2009 to December 31, 2009
As a shareholder of the Series, you incur ongoing costs, including management fees; distribution and/or service (12b-1) fees; and other Series expenses. This Example is intended to help you understand your ongoing costs (in dollars) of investing in the Series and to compare these costs with the ongoing costs of investing in other mutual funds.
The Example is based on an investment of $1,000 invested at the beginning of the period and held for the entire period from July 1, 2009 to December 31, 2009.
Actual Expenses
The first section of the table shown, “Actual Series Return,” provides information about actual account values and actual expenses. You may use the information in this section of the table, together with the amount you invested, to estimate the expenses that you paid over the period. Simply divide your account value by $1,000 (for example, an $8,600 account value divided by $1,000 = 8.6), then multiply the result by the number in the first section under the heading entitled “Expenses Paid During Period” to estimate the expenses you paid on your account during the period.
Hypothetical Example for Comparison Purposes
The second section of the table shown, “Hypothetical 5% Return,” provides information about hypothetical account values and hypothetical expenses based on the Series’ actual expense ratio and an assumed rate of return of 5% per year before expenses, which is not the Series’ actual return. The hypothetical account values and expenses may not be used to estimate the actual ending account balance or expenses you paid for the period. You may use this information to compare the ongoing costs of investing in the Series and other funds. To do so, compare the 5% hypothetical example with the 5% hypothetical examples that appear in the shareholder reports of other funds.
Please note that the expenses shown in the table are meant to highlight your ongoing costs only. As a shareholder of the Series, you do not incur any transaction costs, such as sales charges (loads), redemption fees or exchange fees, but shareholders of other funds may incur such costs. Also, the fees related to the variable annuity investment or the deferred sales charge that could apply have not been included. Therefore, the second section of the table is useful in comparing ongoing costs only, and will not help you determine the relative total costs of owning different funds. The Series’ actual expenses shown in the table reflect fee waivers in effect for Service Class shares. The expenses shown in the table assume reinvestment of all dividends and distributions.
Expense Analysis of an Investment of $1,000
| | | | | | | | | | | Expenses |
| Beginning | | Ending | | | | Paid During |
| Account | | Account | | Annualized | | Period |
| Value | | Value | | Expense | | 7/1/09 to |
| 7/1/09 | | 12/31/09 | | Ratios | | 12/31/09* |
| Actual Series Return | | | | | | | | | | | |
| Standard Class | $ | 1,000.00 | | | $ | 1,194.80 | | | 0.74% | | $ | 4.09 | |
| Service Class | | 1,000.00 | | | | 1,193.00 | | | 0.99% | | | 5.47 | |
| Hypothetical 5% Return (5% return before expenses) | | | | |
| Standard Class | $ | 1,000.00 | | | $ | 1,021.48 | | | 0.74% | | $ | 3.77 | |
| Service Class | | 1,000.00 | | | | 1,020.21 | | | 0.99% | | | 5.04 | |
*“Expenses Paid During Period” are equal to the Series’ annualized expense ratio, multiplied by the average account value over the period, multiplied by 184/365 (to reflect the one-half year period).
Value Series-4
Delaware VIP® Trust — Delaware VIP Value Series
Sector Allocation and Top 10 Holdings
As of December 31, 2009
Sector designations may be different than the sector designations presented in other Series materials. The sector designations may represent the investment manager’s internal sector classifications, which may result in the sector designations for one series being different than another series’ sector designations.
| Percentage |
| Sector | of Net Assets |
| Common Stock | 96.92 | % |
| Consumer Discretionary | 6.36 | % |
| Consumer Staples | 17.86 | % |
| Energy | 11.55 | % |
| Financials | 8.55 | % |
| Health Care | 19.83 | % |
| Industrials | 5.94 | % |
| Information Technology | 12.06 | % |
| Materials | 3.12 | % |
| Telecommunications | 6.05 | % |
| Utilities | 5.60 | % |
| Discount Note | 0.22 | % |
| Securities Lending Collateral | 2.99 | % |
| Total Value of Securities | 100.13 | % |
| Obligation to Return Securities Lending Collateral | (3.05 | %) |
| Receivables and Other Assets Net of Liabilities | 2.92 | % |
| Total Net Assets | 100.00 | % |
Holdings are for informational purposes only and are subject to change at any time. They are not a recommendation to buy, sell, or hold any security.
| Percentage |
| Top 10 Holdings | of Net Assets |
| Merck | 3.68 | % |
| Pfizer | 3.51 | % |
| Cardinal Health | 3.45 | % |
| Intel | 3.37 | % |
| Archer-Daniels-Midland | 3.28 | % |
| Lowe’s | 3.25 | % |
| Bristol-Myers Squibb | 3.22 | % |
| Kimberly-Clark | 3.14 | % |
| CVS Caremark | 3.14 | % |
| Waste Management | 3.12 | % |
Value Series-5
Delaware VIP® Trust — Delaware VIP Value Series
Statement of Net Assets
December 31, 2009
| Number of | | | |
| Shares | | Value |
| COMMON STOCK–96.92% | | | | |
| Consumer Discretionary–6.36% | | | | |
| Lowe’s | 700,300 | | $ | 16,380,017 |
| Mattel | 782,800 | | | 15,640,344 |
| | | | 32,020,361 |
| Consumer Staples–17.86% | | | | |
| Archer-Daniels-Midland | 527,500 | | | 16,516,025 |
| CVS Caremark | 490,200 | | | 15,789,342 |
| Heinz (H.J.) | 354,900 | | | 15,175,524 |
| Kimberly-Clark | 247,900 | | | 15,793,709 |
| Kraft Foods Class A | 495,200 | | | 13,459,536 |
| Safeway | 619,700 | | | 13,193,413 |
| | | | 89,927,549 |
| Energy–11.55% | | | | |
| Chevron | 187,200 | | | 14,412,528 |
| ConocoPhillips | 288,300 | | | 14,723,481 |
| Marathon Oil | 462,100 | | | 14,426,762 |
| National Oilwell Varco | 331,100 | | | 14,598,199 |
| | | | 58,160,970 |
| Financials–8.55% | | | | |
| Allstate | 461,300 | | | 13,857,452 |
| Bank of New York Mellon | 487,200 | | | 13,626,984 |
| Travelers | 312,500 | | | 15,581,250 |
| | | | 43,065,686 |
| Health Care–19.83% | | | | |
| Bristol-Myers Squibb | 642,000 | | | 16,210,500 |
| Cardinal Health | 539,500 | | | 17,393,480 |
| Johnson & Johnson | 226,600 | | | 14,595,306 |
| Merck | 506,700 | | | 18,514,818 |
| Pfizer | 972,641 | | | 17,692,340 |
| *Quest Diagnostics | 256,400 | | | 15,481,432 |
| | | | 99,887,876 |
| Industrials–5.94% | | | | |
| Northrop Grumman | 253,900 | | | 14,180,315 |
| *Waste Management | 465,000 | | | 15,721,650 |
| | | | 29,901,965 |
| Information Technology–12.06% | | | | |
| Intel | 830,900 | | | 16,950,360 |
| International Business Machines | 118,800 | | | 15,550,920 |
| Motorola | 1,691,700 | | | 13,127,592 |
| Xerox | 1,783,900 | | | 15,091,794 |
| | | | 60,720,666 |
| Materials–3.12% | | | | |
| duPont (E.I.) deNemours | 466,300 | | | 15,700,321 |
| | | | 15,700,321 |
| Telecommunications–6.05% | | | | |
| AT&T | 538,124 | | | 15,083,616 |
| Verizon Communications | 464,900 | | | 15,402,137 |
| | | | 30,485,753 |
| Utilities–5.60% | | | | |
| Edison International | 409,700 | | | 14,249,366 |
| Progress Energy | 340,400 | | | 13,959,804 |
| | | | 28,209,170 |
| Total Common Stock | | | | |
| (cost $452,609,355) | | | | 488,080,317 |
| | | | | |
| Principal | | | |
| Amount | | | |
| ≠DISCOUNT NOTE–0.22% | | | | |
| Federal Home Loan Bank 0.001% 1/4/10 | $1,137,000 | | | 1,137,000 |
| Total Discount Note | | | | |
| (cost $1,137,000) | | | | 1,137,000 |
| |
| Total Value of Securities | | | | |
| Before Securities Lending | | | | |
| Collateral–97.14% (cost $453,746,355) | | | | 489,217,317 |
| |
| Number of | | | |
| Shares | | | |
| SECURITIES LENDING | | | | |
| COLLATERAL**–2.99% | | | | |
| Investment Companies | | | | |
| Mellon GSL DBT II Collateral Fund | 14,976,965 | | | 14,976,965 |
| BNY Mellon SL DB II Liquidating Fund | 75,831 | | | 74,959 |
| †@Mellon GSL Reinvestment Trust II | 302,595 | | | 12,860 |
| Total Securities Lending Collateral | | | | |
| (cost $15,355,391) | | | | 15,064,784 |
Value Series-6
Delaware VIP® Value Series
Statement of Net Assets (continued)
| TOTAL VALUE OF SECURITIES–100.13% (cost $469,101,746) | $ | 504,282,101 | © |
| OBLIGATION TO RETURN SECURITIES LENDING COLLATERAL**–(3.05%) | | (15,355,391 | ) |
| RECEIVABLES AND OTHER ASSETS NET OF LIABILITIES–2.92% | | 14,684,886 | |
| NET ASSETS APPLICABLE TO 34,489,732 SHARES OUTSTANDING–100.00% | $ | 503,611,596 | |
| NET ASSET VALUE–DELAWARE VIP VALUE SERIES STANDARD CLASS | | | | |
| ($369,858,855 / 25,324,876 Shares) | | | $14.60 | |
| NET ASSET VALUE–DELAWARE VIP VALUE SERIES SERVICE CLASS | | | | |
| ($133,752,741 / 9,164,856 Shares) | | | $14.59 | |
| COMPONENTS OF NET ASSETS AT DECEMBER 31, 2009: | | | |
| Shares of beneficial interest (unlimited authorization–no par) | $ | 604,785,099 | |
| Undistributed net investment income | | 11,780,027 | |
| Accumulated net realized loss on investments | | (148,133,885 | ) |
| Net unrealized appreciation of investments | | 35,180,355 | |
| Total net assets | $ | 503,611,596 | |
| | | | |
____________________
| * | Fully or partially on loan. |
| † | Non income producing security. |
| @ | Illiquid security. At December 31, 2009, the aggregate amount of illiquid securities was $12,860, which represented 0.00% of the Series’ net assets. See Note 9 in “Notes to Financial Statements.” |
| ≠ | The rate shown is the effective yield at the time of purchase. |
| ** | See Note 8 in “Notes to Financial Statements.” |
| © | Includes $14,912,284 of securities loaned. |
See accompanying notes
Value Series-7
Delaware VIP® Trust —
Delaware VIP Value Series
Statement of Operations
Year Ended December 31, 2009
| INVESTMENT INCOME: | | | |
| Dividends | $ | 15,311,436 | |
| Interest | | 14,347 | |
| Securities lending income | | 32,967 | |
| | 15,358,750 | |
| |
| EXPENSES: | | | |
| Management fees | | 2,855,146 | |
| Distribution expenses - Service Class | | 334,472 | |
| Accounting and administration expenses | | 175,709 | |
| Reports and statements to shareholders | | 94,317 | |
| Legal fees | | 62,455 | |
| Dividend disbursing and transfer agent fees and expenses | | 53,055 | |
| Audit and tax | | 32,862 | |
| Trustees’ fees | | 28,491 | |
| Insurance fees | | 11,840 | |
| Custodian fees | | 8,688 | |
| Consulting fees | | 6,126 | |
| Dues and services | | 4,609 | |
| Trustees’ expenses | | 2,072 | |
| Pricing fees | | 287 | |
| Registration fees | | 210 | |
| | 3,670,339 | |
| Less management fees waived | | (64,287 | ) |
| Less waiver of distribution expenses – Service Class | | (55,687 | ) |
| Total operating expenses | | 3,550,365 | |
| |
| NET INVESTMENT INCOME | | 11,808,385 | |
| |
| NET REALIZED AND UNREALIZED GAIN (LOSS) | | | |
| ON INVESTMENTS: | | | |
| Net realized loss on investments | | (40,152,185 | ) |
| Net change in unrealized appreciation/depreciation | | | |
| of investments | | 104,293,959 | |
| |
| NET REALIZED AND UNREALIZED GAIN | | | |
| ON INVESTMENTS | | 64,141,774 | |
| |
| NET INCREASE IN NET ASSETS RESULTING | | | |
| FROM OPERATIONS | $ | 75,950,159 | |
| | | | |
See accompanying notes
Delaware VIP Trust —
Delaware VIP Value Series
Statements of Changes in Net Assets
| Year Ended |
| 12/31/09 | | 12/31/08 |
| INCREASE (DECREASE) IN NET | | | | | | | |
| ASSETS FROM OPERATIONS: | | | | | | | |
| Net investment income | $ | 11,808,385 | | | $ | 13,467,008 | |
| Net realized loss on investments | | (40,152,185 | ) | | | (105,103,524 | ) |
| Net change in unrealized appreciation/ | | | | | | | |
| depreciation of investments | | 104,293,959 | | | | (117,233,839 | ) |
| Net increase (decrease) in net assets | | | | | | | |
| resulting from operations | | 75,950,159 | | | | (208,870,355 | ) |
| |
| DIVIDENDS AND DISTRIBUTIONS | | | | | | | |
| TO SHAREHOLDERS FROM: | | | | | | | |
| Net investment income: | | | | | | | |
| Standard Class | | (10,376,155 | ) | | | (9,996,705 | ) |
| Service Class | | (3,114,029 | ) | | | (3,566,223 | ) |
| Net realized gain on investments: | | | | | | | |
| Standard Class | | – | | | | (28,701,479 | ) |
| Service Class | | – | | | | (11,521,643 | ) |
| | (13,490,184 | ) | | | (53,786,050 | ) |
| |
| CAPITAL SHARE TRANSACTIONS: | | | | | | | |
| Proceeds from shares sold: | | | | | | | |
| Standard Class | | 56,073,093 | | | | 157,490,543 | |
| Service Class | | 31,469,468 | | | | 31,719,084 | |
| Net asset value of shares issued upon | | | | | | | |
| reinvestment of dividends and distributions: | | | | | | | |
| Standard Class | | 10,376,155 | | | | 38,698,184 | |
| Service Class | | 3,114,029 | | | | 15,087,866 | |
| | 101,032,745 | | | | 242,995,677 | |
| Cost of shares repurchased: | | | | | | | |
| Standard Class | | (73,040,031 | ) | | | (101,483,937 | ) |
| Service Class | | (23,550,520 | ) | | | (47,039,106 | ) |
| | (96,590,551 | ) | | | (148,523,043 | ) |
| Increase in net assets derived | | | | | | | |
| from capital share transactions | | 4,442,194 | | | | 94,472,634 | |
| |
| NET INCREASE (DECREASE) | | | | | | | |
| IN NET ASSETS | | 66,902,169 | | | | (168,183,771 | ) |
| |
| NET ASSETS: | | | | | | | |
| Beginning of year | | 436,709,427 | | | | 604,893,198 | |
| End of year (including undistributed | | | | | | | |
| net investment income of $11,780,027 | | | | | | | |
| and $13,461,826, respectively) | $ | 503,611,596 | | | $ | 436,709,427 | |
| | | | | | | | |
See accompanying notes
Value Series-8
Delaware VIP® Trust — Delaware VIP Value Series
Financial Highlights
Selected data for each share of the Series outstanding throughout each period were as follows:
| | Delaware VIP Value Series Standard Class | |
| | Year Ended | |
| | 12/31/09 | | | 12/31/08 | | | 12/31/07 | | | 12/31/06 | | | 12/31/05 | | |
| Net asset value, beginning of period | | $12.830 | | | $21.440 | | | $22.980 | | | $19.230 | | | $18.460 | | |
| | |
| Income (loss) from investment operations: | | | | | | | | | | | | | | | | |
| Net investment income1 | | 0.351 | | | 0.438 | | | 0.472 | | | 0.437 | | | 0.369 | | |
| Net realized and unrealized gain (loss) | | | | | | | | | | | | | | | | |
| on investments and foreign currencies | | 1.838 | | | (7.066 | ) | | (1.058 | ) | | 4.075 | | | 0.722 | | |
| Total from investment operations | | 2.189 | | | (6.628 | ) | | (0.586 | ) | | 4.512 | | | 1.091 | | |
| | |
| Less dividends and distributions from: | | | | | | | | | | | | | | | | |
| Net investment income | | (0.419 | ) | | (0.512 | ) | | (0.370 | ) | | (0.328 | ) | | (0.321 | ) | |
| Net realized gain on investments | | – | | | (1.470 | ) | | (0.584 | ) | | (0.434 | ) | | – | | |
| Total dividends and distributions | | (0.419 | ) | | (1.982 | ) | | (0.954 | ) | | (0.762 | ) | | (0.321 | ) | |
| | |
| Net asset value, end of period | | $14.600 | | | $12.830 | | | $21.440 | | | $22.980 | | | $19.230 | | |
| | |
| Total return2 | | 17.96% | | | (33.42% | ) | | (2.72% | ) | | 24.10% | | | 6.03% | | |
| | |
| Ratios and supplemental data: | | | | | | | | | | | | | | | | |
| Net assets, end of period (000 omitted) | | $369,859 | | | $330,717 | | | $427,011 | | | $497,525 | | | $349,443 | | |
| Ratio of expenses to average net assets | | 0.74% | | | 0.71% | | | 0.69% | | | 0.72% | | | 0.73% | | |
| Ratio of expenses to average net assets | | | | | | | | | | | | | | | | |
| prior to fees waived and expenses paid indirectly | | 0.76% | | | 0.76% | | | 0.73% | | | 0.77% | | | 0.78% | | |
| Ratio of net investment income to average net assets | | 2.75% | | | 2.69% | | | 2.07% | | | 2.12% | | | 1.98% | | |
| Ratio of net investment income to average net assets | | | | | | | | | | | | | | | | |
| prior to fees waived and expenses paid indirectly | | 2.73% | | | 2.65% | | | 2.03% | | | 2.07% | | | 1.93% | | |
| Portfolio turnover | | 22% | | | 38% | | | 29% | | | 14% | | | 23% | | |
____________________
1The average shares outstanding method has been applied for per share information. |
2Total investment return is based on the change in net asset value of a share during the period and assumes reinvestment of dividends and distributions at net asset value. Total investment return during all of the periods shown reflects a waiver by the manager. Performance would have been lower had the waiver not been in effect. |
See accompanying notes
Value Series-9
Delaware VIP® Value Series
Financial Highlights (continued)
Selected data for each share of the Series outstanding throughout each period were as follows:
| | Delaware VIP Value Series Service Class |
| | Year Ended |
| | 12/31/09 | | | 12/31/08 | | | 12/31/07 | | | 12/31/06 | | | 12/31/05 | |
| Net asset value, beginning of period | | $12.810 | | | $21.390 | | | $22.940 | | | $19.200 | | | $18.430 | |
| |
| Income (loss) from investment operations: | | | | | | | | | | | | | | | |
| Net investment income1 | | 0.319 | | | 0.397 | | | 0.415 | | | 0.385 | | | 0.323 | |
| Net realized and unrealized gain (loss) | | | | | | | | | | | | | | | |
| on investments and foreign currencies | | 1.839 | | | (7.052 | ) | | (1.063 | ) | | 4.070 | | | 0.726 | |
| Total from investment operations | | 2.158 | | | (6.655 | ) | | (0.648 | ) | | 4.455 | | | 1.049 | |
| |
| Less dividends and distributions from: | | | | | | | | | | | | | | | |
| Net investment income | | (0.378 | ) | | (0.455 | ) | | (0.318 | ) | | (0.281 | ) | | (0.279 | ) |
| Net realized gain on investments | | – | | | (1.470 | ) | | (0.584 | ) | | (0.434 | ) | | – | |
| Total dividends and distributions | | (0.378 | ) | | (1.925 | ) | | (0.902 | ) | | (0.715 | ) | | (0.279 | ) |
| |
| Net asset value, end of period | | $14.590 | | | $12.810 | | | $21.390 | | | $22.940 | | | $19.200 | |
| |
| Total return2 | | 17.65% | | | (33.57% | ) | | (3.00% | ) | | 23.79% | | | 5.79% | |
| |
| Ratios and supplemental data: | | | | | | | | | | | | | | | |
| Net assets, end of period (000 omitted) | | $133,753 | | | $105,992 | | | $177,882 | | | $143,405 | | | $75,778 | |
| Ratio of expenses to average net assets | | 0.99% | | | 0.96% | | | 0.94% | | | 0.97% | | | 0.98% | |
| Ratio of expenses to average net assets | | | | | | | | | | | | | | | |
| prior to fees waived and expenses paid indirectly | | 1.06% | | | 1.06% | | | 1.03% | | | 1.07% | | | 1.08% | |
| Ratio of net investment income to average net assets | | 2.50% | | | 2.44% | | | 1.82% | | | 1.87% | | | 1.73% | |
| Ratio of net investment income to average net assets | | | | | | | | | | | | | | | |
| prior to fees waived and expenses paid indirectly | | 2.43% | | | 2.35% | | | 1.73% | | | 1.77% | | | 1.63% | |
| Portfolio turnover | | 22% | | | 38% | | | 29% | | | 14% | | | 23% | |
____________________
1The average shares outstanding method has been applied for per share information. |
2Total investment return is based on the change in net asset value of a share during the period and assumes reinvestment of dividends and distributions at net asset value. Total investment return during all of the periods shown reflects waivers by the manager and/or distributor. Performance would have been lower had the waivers not been in effect. |
See accompanying notes
Value Series-10
Delaware VIP® Trust — Delaware VIP Value Series
Notes to Financial Statements
December 31, 2009
Delaware VIP Trust (Trust) is organized as a Delaware statutory trust and offers 12 series: Delaware VIP Cash Reserve Series, Delaware VIP Diversified Income Series, Delaware VIP Emerging Markets Series, Delaware VIP Growth Opportunities Series, Delaware VIP High Yield Series, Delaware VIP International Value Equity Series, Delaware VIP Limited-Term Diversified Income Series (formerly, Delaware VIP Capital Reserves Series), Delaware VIP REIT Series, Delaware VIP Small Cap Value Series, Delaware VIP Trend Series, Delaware VIP U.S. Growth Series and Delaware VIP Value Series. These financial statements and the related notes pertain to Delaware VIP Value Series (Series). The Trust is an open-end investment company. The Series is considered diversified under the Investment Company Act of 1940, as amended, and offers Standard Class and Service Class shares. The Standard Class shares do not carry a 12b-1 fee and the Service Class shares carry a 12b-1 fee. The shares of the Series are sold only to separate accounts of life insurance companies.
The investment objective of the Series is to seek long-term capital appreciation.
1. Significant Accounting Policies
The following accounting policies are in accordance with U.S. generally accepted accounting principles (U.S. GAAP) and are consistently followed by the Series.
Security Valuation—Equity securities, except those traded on the Nasdaq Stock Market, Inc. (Nasdaq), are valued at the last quoted sales price as of the time of the regular close of the New York Stock Exchange (NYSE) on the valuation date. Securities traded on the Nasdaq are valued in accordance with the Nasdaq Official Closing Price, which may not be the last sales price. If on a particular day an equity security does not trade, then the mean between the bid and ask prices will be used. Short-term debt securities are valued at market value. Investment companies are valued at net asset value per share. Generally, other securities and assets for which market quotations are not readily available are valued at fair value as determined in good faith under the direction of the Series’ Board of Trustees (Board). In determining whether market quotations are readily available or fair valuation will be used, various factors will be taken into consideration, such as market closures or suspension of trading in a security. The Series may use fair value pricing more frequently for securities traded primarily in non-U.S. markets because, among other things, most foreign markets close well before the Series values its securities at 4:00 p.m. Eastern time. The earlier close of these foreign markets gives rise to the possibility that significant events, including broad market moves, government actions or pronouncements, aftermarket trading, or news events may have occurred in the interim. To account for this, the Series may frequently value foreign securities using fair value prices based on third-party vendor modeling tools (international fair value pricing).
Federal Income Taxes—No provision for federal income taxes has been made as the Series intends to continue to qualify for federal income tax purposes as a regulated investment company under Subchapter M of the Internal Revenue Code of 1986, as amended, and make the requisite distributions to shareholders. The Series evaluates tax positions taken or expected to be taken in the course of preparing the Series’ tax returns to determine whether the tax positions are “more-likely-than-not” of being sustained by the applicable tax authority. Tax positions not deemed to meet the more-likely-than-not threshold are recorded as a tax benefit or expense in the current year. Management has analyzed the Series’ tax positions taken on federal income tax returns for all open tax years (tax years ended December 31, 2006 – December 31, 2009), and has concluded that no provision for federal income tax is required in the Series’ financial statements.
Class Accounting—Investment income, common expenses and realized and unrealized gain (loss) on investments are allocated to the classes of the Series on the basis of daily net assets of each class. Distribution expenses relating to a specific class are charged directly to that class.
Repurchase Agreements—The Series may invest in a pooled cash account along with other members of the Delaware Investments® Family of Funds pursuant to an exemptive order issued by the Securities and Exchange Commission. The aggregate daily balance of the pooled cash account is invested in repurchase agreements secured by obligations of the U.S. government. The respective collateral is held by the Series’ custodian bank until the maturity of the respective repurchase agreements. Each repurchase agreement is at least 102% collateralized. However, in the event of default or bankruptcy by the counterparty to the agreement, realization of the collateral may be subject to legal proceedings. At December 31, 2009, the Series held no investments in repurchase agreements.
Use of Estimates—The preparation of financial statements in conformity with U.S. GAAP requires management to make estimates and assumptions that affect the reported amounts of assets and liabilities at the date of the financial statements and the reported amounts of revenues and expenses during the reporting period. Actual results could differ from those estimates.
Other—Expenses directly attributable to the Series are charged directly to the Series. Other expenses common to various funds within the Delaware Investments Family of Funds are generally allocated amongst such funds on the basis of average net assets. Management fees and some other expenses are paid monthly. Security transactions are recorded on the date the securities are purchased or sold (trade date) for financial reporting purposes. Costs used in calculating realized gains and losses on the sale of investment securities are those of the specific securities sold. Dividend income is recorded on the ex-dividend date and interest income is recorded on the accrual basis. The Series declares and pays dividends from net investment income and distributions from net realized gain on investments, if any, following the close of the fiscal year.
Subject to seeking best execution, the Series may direct certain security trades to brokers who have agreed to rebate a portion of the related brokerage commission to the Series in cash. In general, best execution refers to many factors, including the price paid or received for a security, the commission charged, the promptness and reliability of execution, the confidentiality and placement accorded the order, and other factors affecting the overall benefit obtained by the Series on the transaction. There were no commission rebates during the year ended December 31, 2009.
The Series may receive earnings credits from its custodian when positive cash balances are maintained, which are used to offset custody fees. There were no earnings credits for the year ended December 31, 2009.
Value Series-11
Delaware VIP® Value Series
Notes to Financial Statements (continued)
1. Significant Accounting Policies (continued)
On July 1, 2009, the Financial Accounting Standards Board (FASB) issued the FASB Accounting Standards Codification (Codification). The Codification became the single source of authoritative nongovernmental U.S. GAAP, superseding existing literature of the FASB, American Institute of Certified Public Accountants, Emerging Issues Task Force and other sources. The Codification is effective for interim and annual periods ending after September 15, 2009. The Series adopted the Codification for the year ended December 31, 2009. There was no impact to financial statements as the Codification requirements are disclosure-only in nature.
Management has evaluated whether any events or transactions occurred subsequent to December 31, 2009 through February 17, 2010, the date of issuance of the Series’ financial statements, and determined that there were no material events or transactions that would require recognition or disclosure in the Series’ financial statements.
2. Investment Management, Administration Agreements and Other Transactions with Affiliates
In accordance with the terms of its investment management agreement, the Series pays Delaware Management Company (DMC), a series of Delaware Management Business Trust and the investment manager, an annual fee which is calculated daily at the rate of 0.65% on the first $500 million of average daily net assets of the Series, 0.60% on the next $500 million, 0.55% on the next $1.5 billion, and 0.50% on average daily net assets in excess of $2.5 billion.
DMC had voluntarily agreed to waive management fees in the amount of 0.05% on the first $500 million of average daily net assets until such time as the waiver was discontinued. DMC’s voluntary waiver prevented its management fees from exceeding 0.60% of the Series’ average daily net assets until such time as the waiver was discontinued. The waiver was discontinued effective close of business April 30, 2009.
Delaware Service Company, Inc. (DSC), an affiliate of DMC, provides fund accounting and financial administration oversight services to the Series. For these services, the Series pays DSC fees based on the aggregate daily net assets of the Delaware Investments® Family of Funds at the following annual rate: 0.0050% of the first $30 billion; 0.0045% of the next $10 billion; 0.0040% of the next $10 billion; and 0.0025% of aggregate average daily net assets in excess of $50 billion. The fees payable to DSC under the service agreement described above are allocated among all funds in the Delaware Investments Family of Funds on a relative net asset value basis. For the year ended December 31, 2009, the Series was charged $21,964 for these services.
DSC also provides dividend disbursing and transfer agency services. The Series pays DSC a monthly fee based on the number of shareholder accounts for dividend disbursing and transfer agent services.
Pursuant to a distribution agreement and distribution plan, the Series pays Delaware Distributors, L.P. (DDLP), the distributor and an affiliate of DMC, an annual distribution and service fee not to exceed 0.30% of the average daily net assets of the Service Class shares. DDLP has contracted to waive distribution and service fees through April 30, 2010 in order to prevent distribution and service fees of the Service Class shares from exceeding 0.25% of average daily net assets. Standard Class shares pay no distribution and service expenses.
At December 31, 2009, the Series had liabilities payable to affiliates as follows:
| | Dividend Disbursing, | | | | Other |
| Investment | | Transfer Agent and Fund | | | | Expenses |
| Management | | Accounting Oversight | | Distribution | | Payable |
| Fee Payable to | | Fees and Other Expenses | | Fee Payable | | to DMC |
| DMC | | Payable to DSC | | to DDLP | | and Affiliates* |
| $277,435 | | $5,350 | | $28,368 | | $26,194 |
____________________
*DMC, as part of its administrative services, pays operating expenses on behalf of the Series and is reimbursed on a periodic basis. Such expenses include items such as printing of shareholder reports, fees for audit, legal and tax services, custodian fees and trustees’ fees.
As provided in the investment management agreement, the Series bears the cost of certain legal and tax services, including internal legal and tax services provided to the Series by DMC and/or its affiliates’ employees. For the year ended December 31, 2009, the Series was charged $36,506 for internal legal and tax services provided by DMC and/or its affiliates’ employees.
Trustees’ fees include expenses accrued by the Series for each Trustee’s retainer and meeting fees. Certain officers of DMC, DSC and DDLP are officers and/or Trustees of the Trust. These officers and Trustees are paid no compensation by the Series.
Value Series-12
Delaware VIP® Value Series
Notes to Financial Statements (continued)
3. Investments
For the year ended December 31, 2009, the Series made purchases and sales of investment securities other than short-term investments as follows:
| Purchases | | $91,634,318 |
| Sales | | 94,031,575 |
At December 31, 2009, the cost of investments and unrealized appreciation (depreciation) for federal income tax purposes for the Series were as follows:
| | | | Aggregate | | Aggregate | | Net |
| Cost of | | Unrealized | | Unrealized | | Unrealized |
| Investments | | Appreciation | | Depreciation | | Appreciation |
| $470,684,265 | | $57,961,020 | | $(24,363,184) | | $33,597,836 |
U.S. GAAP defines fair value as the price that the Series would receive to sell an asset or pay to transfer a liability in an orderly transaction between market participants at the measurement date under current market conditions. A framework for measuring fair value and a three level hierarchy for fair value measurements has been established based upon the transparency of inputs to the valuation of an asset or liability. Inputs may be observable or unobservable and refer broadly to the assumptions that market participants would use in pricing the asset or liability. Observable inputs reflect the assumptions market participants would use in pricing the asset or liability based on market data obtained from sources independent of the reporting entity. Unobservable inputs reflect the reporting entity’s own assumptions about the assumptions that market participants would use in pricing the asset or liability developed based on the best information available under the circumstances. The Series’ investment in its entirety is assigned a level based upon the observability of the inputs which are significant to the overall valuation. The three-tier hierarchy of inputs is summarized below.
Level 1 – inputs are quoted prices in active markets
Level 2 – inputs are observable, directly or indirectly
Level 3 – inputs are unobservable and reflect assumptions on the part of the reporting entity
The following table summarizes the valuation of the Series’ investments by the fair value hierarchy levels as of December 31, 2009:
| Level 1 | | Level 2 | | Level 3 | | Total |
| Common Stock | $ | 488,080,317 | | $ | – | | $ | – | | $ | 488,080,317 |
| Short-Term | | – | | | 1,137,000 | | | – | | | 1,137,000 |
| Securities Lending Collateral | | 14,976,965 | | | 74,959 | | | 12,860 | | | 15,064,784 |
| Total | $ | 503,057,282 | | $ | 1,211,959 | | $ | 12,860 | | $ | 504,282,101 |
| | | | | | | | | | | |
The following is a reconciliation of investments in which significant unobservable inputs (Level 3) were used in determining fair value:
| Securities |
| Lending |
| Collateral |
| Balance as of 12/31/08 | | $ | 9,986 | |
| Net change in unrealized appreciation/depreciation | | | 2,874 | |
| Balance as of 12/31/09 | | $ | 12,860 | |
| | | | | |
Net change in unrealized
appreciation/depreciation from | | | | |
| investments still held as of 12/31/09 | | $ | 2,874 | |
In January 2010, the Financial Accounting Standards Board issued an Accounting Standards Update, Improving Disclosures about Fair Value Measurements, which introduces new disclosure requirements and clarifies certain existing disclosure requirements around fair value measurements currently presented above. The new disclosures and clarifications of existing disclosures are generally effective for the Series’ year ending December 31, 2010 and interim periods therein. Management is evaluating the impact of this update on its current disclosures.
Value Series-13
Delaware VIP® Value Series
Notes to Financial Statements (continued)
4. Dividend and Distribution Information
Income and long-term capital gain distributions are determined in accordance with federal income tax regulations, which may differ from U.S. GAAP. Additionally, distributions from net short-term gains on sales of investment securities are treated as ordinary income for federal income tax purposes. The tax character of dividends and distributions paid during the years ended December 31, 2009 and 2008 was as follows:
| Year | | Year |
| Ended | | Ended |
| 12/31/09 | | 12/31/08 |
| Ordinary income | $ | 13,490,184 | | $ | 22,204,211 |
| Long-term capital gain | | – | | | 31,581,839 |
| Total | $ | 13,490,184 | | $ | 53,786,050 |
| | | | | |
5. Components of Net Assets on a Tax Basis
As of December 31, 2009, the components of net assets on a tax basis were as follows:
| Shares of beneficial interest | $ | 604,785,099 | |
| Undistributed ordinary income | | 11,780,027 | |
| *Capital loss carryforwards | | (146,551,366 | ) |
| Unrealized appreciation of investments | | 33,597,836 | |
| Net assets | $ | 503,611,596 | |
| | | |
The differences between book basis and tax basis components of net assets are primarily attributable to tax deferral of losses on wash sales.
For financial reporting purposes, capital accounts are adjusted to reflect the tax character of permanent book/tax differences. Reclassifications are primarily due to expiration of capital loss carryforwards. Results of operations and net assets were not affected by these reclassifications. For the year ended December 31, 2009, the Series recorded the following reclassifications:
| Accumulated Net | | Paid-in |
| Realized Loss | | Capital |
| | $1,097,656 | | $(1,097,656) |
For federal income tax purposes, capital loss carryforwards may be carried forward and applied against future capital gains. $1,097,656 expired in 2009. Capital loss carryforwards remaining at December 31, 2009 will expire as follows: $1,479,986 expires in 2010, $102,136,575 expires in 2016, and $42,934,805 expires in 2017.
____________________
*The amount of this loss which can be utilized in subsequent years is subject to an annual limitation in accordance with the Internal Revenue Code due to the fund merger with Delaware VIP Devon Series in 2003.
Value Series-14
Delaware VIP® Value Series
Notes to Financial Statements (continued)
6. Capital Shares
Transactions in capital shares were as follows:
| Year | | Year |
| Ended | | Ended |
| 12/31/09 | | 12/31/08 |
| Shares sold: | | | | | |
| Standard Class | 4,543,090 | | | 10,050,871 | |
| Service Class | 2,473,419 | | | 1,912,509 | |
| |
| Shares issued upon reinvestment of dividends and distributions: | | | | | |
| Standard Class | 907,007 | | | 2,197,512 | |
| Service Class | 271,730 | | | 856,292 | |
| | 8,195,246 | | | 15,017,184 | |
| |
| Shares repurchased: | | | | | |
| Standard Class | (5,900,683 | ) | | (6,391,399 | ) |
| Service Class | (1,855,327 | ) | | (2,809,337 | ) |
| | (7,756,010 | ) | | (9,200,736 | ) |
| Net increase | 439,236 | | | 5,816,448 | |
| | | | | | |
7. Line of Credit
The Series, along with certain other funds in the Delaware Investments® Family of Funds (Participants), participates in a $35,000,000 revolving line of credit with The Bank of New York Mellon (BNY Mellon) to be used for temporary or emergency purposes as an additional source of liquidity to fund redemptions of investor shares. Under the agreement, Participants are charged an annual commitment fee, which is allocated across the Participants on the basis of each Participant’s allocation of the entire facility. The Participants may borrow up to a maximum of one third of their net assets under the agreement. The agreement expires on November 16, 2010. The Series had no amounts outstanding as of December 31, 2009, or at any time during the year then ended.
8. Securities Lending
The Series, along with other funds in the Delaware Investments Family of Funds, may lend its securities pursuant to a security lending agreement (Lending Agreement) with BNY Mellon. With respect to each loan, if the aggregate market value of securities collateral held plus cash collateral received on any business day is less than the aggregate market value of the securities which are the subject of such loan, the borrower will be notified to provide additional collateral not less than the applicable collateral requirements. Cash collateral received is generally invested in the Mellon GSL DBT II Collateral Fund (Collective Trust) established by BNY Mellon for the purpose of investment on behalf of clients participating in its securities lending programs. The Collective Trust may invest in fixed income securities, with a weighted average maturity not to exceed 90 days, rated in one of the top three tiers by Standard & Poor’s Ratings Group or Moody’s Investors Service, Inc. or repurchase agreements collateralized by such securities. The Collective Trust seeks to maintain a net asset value per unit of $1.00, but there can be no assurance that it will always be able to do so. At December 31, 2009, the Collective Trust held only cash and assets with a maturity of one business day or less (Cash/Overnight Assets). The Series may incur investment losses as a result of investing securities lending collateral in the Collective Trust. This could occur if an investment in the Collective Trust defaulted or if it were necessary to liquidate assets in the Collective Trust to meet returns on outstanding security loans at a time when the Collective Trust’s net asset value per unit was less than $1.00. Under those circumstances, the Series may not receive an amount from the Collective Trust that is equal in amount to the collateral the Series would be required to return to the borrower of the securities and the Series would be required to make up for this shortfall. Effective April 20, 2009, BNY Mellon transferred the assets of the Collective Trust other than the Cash/Overnight Assets to the BNY Mellon SL DBT II Liquidating Fund (Liquidating Fund), effectively bifurcating the collateral investment pool. The Series’ exposure to the Liquidating Fund is expected to decrease as the Liquidating Fund’s assets mature or are sold. In October 2008, BNY Mellon transferred certain distressed securities from the Collective Trust into the Mellon GSL Reinvestment Trust II. The Series can also accept U.S. government securities and letters of credit (non-cash collateral) in connection with securities loans. In the event of default or bankruptcy by the lending agent, realization and/or retention of the collateral may be subject to legal proceedings. In the event the borrower fails to return loaned securities and the collateral received is insufficient to cover the value of the loaned securities and provided such collateral shortfall is not the result of investment losses, the lending agent has agreed to pay the amount of the shortfall to the Series, or at the discretion of the lending agent, replace the loaned securities. The Series continues to record dividends or interest, as applicable, on the securities loaned and is subject to change in value of the securities loaned that may occur during the term of the loan. The Series has the right under the Lending Agreement to recover the securities from the borrower on demand. With respect to security loans collateralized by non-cash collateral, the Series receives loan premiums paid by the borrower. With respect to security loans collateralized by cash collateral, the earnings from the collateral investments are shared among the Series, the security lending agent and the borrower. The Series records security lending income net of allocations to the security lending agent and the borrower.
At December 31, 2009, the value of the securities on loan was $14,912,284, for which cash collateral was received and invested in accordance with the Lending Agreement. At December 31, 2009, the value of invested collateral was $15,064,784. Such investments are presented on the Statement of Net Assets under the caption “Securities Lending Collateral.”
Value Series-15
Delaware VIP® Value Series
Notes to Financial Statements (continued)
9. Credit and Market Risk
The Series may invest up to 10% of its net assets in illiquid securities, which may include securities with contractual restrictions on resale, securities exempt from registration under Rule 144A of the Securities Act of 1933, as amended, and other securities which may not be readily marketable. The relative illiquidity of these securities may impair the Series from disposing of them in a timely manner and at a fair price when it is necessary or desirable to do so. While maintaining oversight, the Series’ Board has delegated to DMC the day-to-day functions of determining whether individual securities are liquid for purposes of the Series’ limitation on investments in illiquid assets. Securities eligible for resale pursuant to Rule 144A, which are determined to be liquid, are not subject to the Series’ 10% limit on investments in illiquid securities. As of December 31, 2009, there were no Rule 144A securities. Illiquid securities have been identified on the Statement of Net Assets.
10. Contractual Obligations
The Series enters into contracts in the normal course of business that contain a variety of indemnifications. The Series’ maximum exposure under these arrangements is unknown. However, the Series has not had prior claims or losses pursuant to these contracts. Management has reviewed the Series’ existing contracts and expects the risk of loss to be remote.
11. Sale of Delaware Investments to Macquarie Group
On August 18, 2009, Lincoln National Corporation (parent company of Delaware Investments) and Macquarie Group (Macquarie) entered into an agreement pursuant to which Delaware Investments, including DMC, DDLP and DSC, would be acquired by Macquarie, an Australia-based global provider of banking, financial, advisory, investment and funds management services (Transaction). The Transaction was completed on January 4, 2010. DMC, DDLP and DSC are now wholly-owned subsidiaries of Macquarie.
The Transaction resulted in a change of control of DMC which, in turn, caused the termination of the investment advisory agreement between DMC and the Series. On January 4, 2010, the new investment advisory agreement between DMC and the Series that was approved by the shareholders became effective.
12. Tax Information (Unaudited)
For the fiscal year ended December 31, 2009, the Series designates distributions paid during the year as follows:
| (A) | | (B) | | | | |
| Long-Term | | Ordinary | | | | |
| Capital Gain | | Income | | Total | | (C) |
| Distributions | | Distributions | | Distributions | | Qualifying |
| (Tax Basis) | | (Tax Basis) | | (Tax Basis) | | Dividends1 |
| 0% | | 100% | | 100% | | 100% |
____________________
(A) and (B) are based on a percentage of the Series’ total distributions.
(C) is based on a percentage of the Series’ ordinary income distributions.
1Qualifying dividends represent dividends which qualify for the corporate dividends received deduction.
Value Series-16
Delaware VIP® Trust — Delaware VIP Value Series
Report of Independent Registered Public Accounting Firm
To the Shareholders and Board of Trustees
Delaware VIP Trust–Delaware VIP Value Series
We have audited the accompanying statement of net assets of the Delaware VIP Value Series (one of the series constituting Delaware VIP Trust) (the “Series”) as of December 31, 2009, and the related statement of operations for the year then ended, the statements of changes in net assets for each of the two years in the period then ended, and the financial highlights for each of the five years in the period then ended. These financial statements and financial highlights are the responsibility of the Series’ management. Our responsibility is to express an opinion on these financial statements and financial highlights based on our audits.
We conducted our audits in accordance with the standards of the Public Company Accounting Oversight Board (United States). Those standards require that we plan and perform the audit to obtain reasonable assurance about whether the financial statements and financial highlights are free of material misstatement. We were not engaged to perform an audit of the Series’ internal control over financial reporting. Our audits included consideration of internal control over financial reporting as a basis for designing audit procedures that are appropriate in the circumstances, but not for the purpose of expressing an opinion on the effectiveness of the Series’ internal control over financial reporting. Accordingly, we express no such opinion. An audit also includes examining, on a test basis, evidence supporting the amounts and disclosures in the financial statements and financial highlights, assessing the accounting principles used and significant estimates made by management, and evaluating the overall financial statement presentation. Our procedures included confirmation of securities owned as of December 31, 2009, by correspondence with the custodian and brokers. We believe that our audits provide a reasonable basis for our opinion.
In our opinion, the financial statements and financial highlights referred to above present fairly, in all material respects, the financial position of the Delaware VIP Value Series of Delaware VIP Trust at December 31, 2009, the results of its operations for the year then ended, the changes in its net assets for each of the two years in the period then ended, and its financial highlights for each of the five years in the period then ended, in conformity with U.S. generally accepted accounting principles.
Philadelphia, Pennsylvania
February 17, 2010
The Series files its complete schedule of portfolio holdings with the Securities and Exchange Commission (Commission) for the first and third quarters of each fiscal year on Form N-Q. The Series’ Forms N-Q, as well as a description of the policies and procedures that the Series uses to determine how to vote proxies (if any) relating to portfolio securities is available without charge (i) upon request, by calling 800 523-1918; and (ii) on the Commission’s website at http://www.sec.gov. In addition, a description of the policies and procedures that the Series uses to determine how to vote proxies (if any) relating to portfolio securities is available without charge on the Delaware Investments® Funds’ Web site at http://www.delawareinvestments.com. The Series’ Forms N-Q may be reviewed and copied at the Commission’s Public Reference Room in Washington, DC; information on the operation of the Public Reference Room may be obtained by calling 800 SEC-0330. Information (if any) regarding how the Series voted proxies relating to portfolio securities during the most recently disclosed 12-month period ended June 30 is available without charge (i) through the Delaware Investments Funds’ Web site at http://www.delawareinvestments.com; and (ii) on the Commission’s website at http://www.sec.gov. |
Value Series-17
Delaware VIP® Trust — Delaware VIP Value Series
Other Series Information
Board Consideration of New Investment Advisory Agreement
At a meeting held on September 3, 2009 (the “Meeting”), the Board of Trustees of the Delaware Investments Family of Funds (the “Board”), including the independent Trustees, unanimously approved a new investment advisory agreement between each registrant on behalf of each series (each, a “Fund” and together, the “Funds”) and Delaware Management Company (“DMC”) in connection with the sale of Delaware Investments’ advisory business to Macquarie Bank Limited (the “Macquarie Group”) (the “Transaction”). In making its decision, the Board considered information furnished specifically in connection with the approval of the new investment advisory agreements with DMC (the “New Investment Advisory Agreements”) which included extensive materials about the Transaction and matters related to the proposed approvals. To assist the Board in considering the New Investment Advisory Agreements, Macquarie Group provided materials and information about Macquarie Group, including detailed written responses to the questions posed by the independent Trustees. DMC also provided materials and information about the Transaction, including detailed written responses to the questions posed by the independent Trustees.
At the Meeting, the Trustees discussed the Transaction with DMC management and with key Macquarie Group representatives. The Meeting included discussions of the strategic rationale for the Transaction and Macquarie Group’s general plans and intentions regarding the Funds and DMC. The Board members also inquired about the plans for, and anticipated roles and responsibilities of, key employees and officers of Delaware Management Holdings Inc. and DMC in connection with the Transaction.
In connection with the Trustees’ review of the New Investment Advisory Agreements for the Funds, DMC and/or Macquarie Group emphasized that:
- They expected that there would be no adverse changes as a result of the Transaction, in the nature, quality, or extent of services currently provided to the Funds and their shareholders, including investment management, distribution, or other shareholder services.
- No material changes in personnel or operations were contemplated in the operation of DMC under Macquarie Group as a result of the Transaction and no material changes were currently contemplated in connection with third party service providers to the Funds.
- Macquarie Group had no intention to cause DMC to alter the voluntary expense waivers and reimbursements currently in effect for the Funds.
- Under the agreement between Macquarie Group and Lincoln National Corporation (“LNC”) (the “Transaction Agreement”), Macquarie Group has agreed to conduct, and to cause its affiliates to conduct, their respective businesses in compliance with the conditions of Section 15(f) of the Investment Company Act of 1940 (the “1940 Act”) with respect to the Funds, to the extent within its control, including maintaining Board composition of at least 75% of the Board members qualifying as independent Trustees and not imposing any “unfair burden” on the Funds for at least two years from the closing of the Transaction (the “Closing”).
In addition to the information provided by DMC and Macquarie Group as described above, the Trustees also considered all other factors they believed to be relevant to evaluating the New Investment Advisory Agreements, including the specific matters discussed below. In their deliberations, the Trustees did not identify any particular information that was controlling, and different Trustees may have attributed different weights to the various factors. However, for each Fund, the Trustees determined that the overall arrangements between the Fund and DMC, as provided in the respective New Investment Advisory Agreement, including the proposed advisory fee and the related administration arrangements between the Fund and DMC, were fair and reasonable in light of the services to be performed, expenses incurred, and such other matters as the Trustees considered relevant. Factors evaluated included:
- The potential for expanding distribution of Fund shares through access to Macquarie Group’s existing distribution channels;
- Delaware Investments’ acquisition of an exclusive wholesaling sales force from a subsidiary of LNC;
- The reputation, financial strength, and resources of Macquarie Group as well as its historic and ongoing commitment to the asset management business in Australia as well as other parts of the world;
- The terms and conditions of the New Investment Advisory Agreements, including that each Fund’s total contractual fee rate under the New Investment Advisory Agreement will remain the same;
- The Board’s full annual review (or initial approval) of the current investment advisory agreements at their in-person meeting in May 2009 as required by the 1940 Act and its determination that (i) DMC had the capabilities, resources, and personnel necessary to provide the satisfactory advisory and administrative services currently provided to each Fund and (ii) the advisory and/or management fees paid by each Fund, taking into account any applicable fee waivers and breakpoints, represented reasonable compensation to DMC in light of the services provided, the costs to DMC of providing those services, economies of scale, and the fees and other expenses paid by similar funds and such other matters that the Board considered relevant in the exercise of its reasonable judgment;
- The portfolio management teams for the Funds are not currently expected to change as a result of the Transaction;
- LNC and Macquarie Group were expected to execute a reimbursement agreement pursuant to which LNC and Macquarie Group would agree to pay (or reimburse) all reasonable out-of-pocket costs and expenses of the Funds in connection with the Board’s consideration of the Transaction, the New Investment Advisory Agreements and related agreements, and all costs related to the proxy solicitation (the “Expense Agreement”);
Value Series-18
Delaware VIP® Delaware VIP Value Series
Other Series Information (continued)
- The likelihood that Macquarie Group would invest additional amounts in Delaware Investments, including DMC, which could result in increased assets under management, which in turn would allow some Funds the potential opportunity to achieve economies of scale and lower fees payable by Fund shareholders; and
- The compliance and regulatory history of Macquarie Group and its affiliates.
In making their decision relating to the approval of each Fund’s New Investment Advisory Agreement, the independent Trustees gave attention to all information furnished. The following discussion, however, identifies the primary factors taken into account by the Trustees and the conclusions reached in approving the New Investment Advisory Agreements.
NATURE, EXTENT, AND QUALITY OF SERVICE. The Trustees considered the services historically provided by DMC to the Funds and their shareholders. In reviewing the nature, extent, and quality of services, the Board considered that the New Investment Advisory Agreements would be substantially similar to the current investment advisory agreements between the Funds and DMC (the “Current Investment Advisory Agreements”), and they therefore, considered the many reports furnished to them throughout 2008 and 2009 at regular Board meetings covering matters such as: the relative performance of the Funds; the compliance of portfolio managers with the investment policies, strategies, and restrictions for the Funds; the compliance of management personnel with the code of ethics adopted throughout the Delaware Investments Family of Funds complex; and the adherence to fair value pricing procedures as established by the Board. The Trustees were pleased with the current staffing of DMC and the emphasis placed on research and risk management in the investment process. Favorable consideration was given to DMC’s efforts to maintain expenditures and, in some instances, increase financial and human resources committed to Fund matters.
The Board also considered the transfer agent and shareholder services that would continue to be provided to Fund shareholders by DMC’s affiliate, Delaware Service company, Inc. (“DSC”). The Trustees noted, in particular, DSC’s commitment to maintain a high level of service as well as DMC’s expenditures to improve the delivery of shareholder services. The Board was assured that shareholders would continue to receive the benefits provided to Fund shareholders by being part of the Delaware Investments Family of Funds, including each shareholder’s ability to exchange an investment in one Fund for the same class of shares in another Fund without a sales charge, to reinvest Fund dividends into additional shares of any of the Funds, and the privilege to combine holdings in other Funds to obtain a reduced sales charge.
Based on the information provided by DMC and Macquarie Group, including that Macquarie Group and DMC currently expected no material changes as a result of the Transaction in (i) personnel or operations of DMC or (ii) third party service providers to the Funds, the Board concluded that the satisfactory nature, extent, and quality of services currently provided to the Funds and their shareholders were very likely to continue under the New Investment Advisory Agreements. Moreover, the Board concluded that the Funds would probably benefit from the expanded distribution resources that would become available to Delaware Investments following the Transaction. The Board also concluded that it was very unlikely that any “unfair burden” would be imposed on any of the Funds for the first two years following the Closing as a result of the Transaction. Consequently, the Board concluded that it did not expect the Transaction to result in any adverse changes in the nature, quality, or extent of services (including investment management, distribution or other shareholder services) currently provided to the Funds and their shareholders.
INVESTMENT PERFORMANCE. The Board considered the overall investment performance of DMC and the Funds. The Trustees placed significant emphasis on the investment performance of the Funds in view of its importance to shareholders. Although the Trustees gave appropriate consideration to performance reports and discussions with portfolio managers at Board meetings throughout the year, the Trustees gave particular weight to their review of investment performance in connection with the approval of the Current Investment Advisory agreements at the Board meeting held in May 2009. At that meeting, the Trustees reviewed reports prepared by Lipper, Inc., an independent statistical compilation organization (“Lipper”), which showed each Fund’s investment performance as of December 31, 2008 in comparison to a group of funds selected by Lipper as being similar to the Fund (the “Performance Universe”). During the May 2009 agreement review process, the Trustees observed the significant improvements to relative investment performance of the Funds compared to the Funds’ performance as of December 31, 2007.
At their meeting on September 3, 2009, the Trustees, including the independent Trustees in consultation with their independent counsel, reviewed the investment performance of each Fund. The Trustees compared the performance of each Fund relative to that of its respective Performance Universe for the 1-, 3-, 5-, and 10-year periods ended June 30, 2009 and compared its relative investment performance against the corresponding relative investment performance of each Fund for such time periods ended December 31, 2008, to the extent applicable. As of June 30, 2009, 30 of the Funds had investment performance relative to that of the respective Performance Universe that was better than the corresponding relative investment performance at December 31, 2008 for all applicable time periods. At June 30, 2009, an additional 6 Funds had investment performance relative to that of their respective Performance Universe that was better than the corresponding relative investment performance at December 31, 2008 for a majority of the applicable time periods. At June 30, 2009, 15 additional Funds had investment performance relative to that of their respective Performance Universe that was better than the corresponding relative performance at December 31, 2008 and only 29 Funds had poorer relative investment performance at June 30, 2009 compared to that at December 31, 2008.
The Board therefore concluded that the investment performance of the Funds, on an aggregate basis, had continued to improve relative to their respective Performance Universe since the data reviewed at the May 2009 meeting. Based on information provided by DMC and Macquarie Group, the Board concluded that neither the Transaction nor the New Investment Advisory Agreement would likely have an adverse effect on the investment performance of any Fund because (i) DMC and Macquarie Group did not currently expect the Transaction to cause any material change to the Funds’ portfolio management teams responsible for investment performance, which the Board found to be satisfactory and improving; and (ii) as discussed in more detail below, the Funds’ expenses were not expected to increase as a result of the Transaction.
Value Series-19
Delaware VIP® Delaware VIP Value Series
Other Series Information (continued)
COMPARATIVE EXPENSES. The Trustees also evaluated expense comparison data for the Funds previously provided in May 2009. At that meeting, DMC had provided the Board with information on pricing levels and fee structures for the Funds and comparative funds. The Trustees focused on the comparative analysis of the effective management fees and total expense ratios of each Fund versus the effective management fees and expense ratios of a group of funds selected by Lipper as being similar to each Fund (the “Expense Group”). In reviewing comparative costs, each Fund’s contractual management fee and the actual management fee incurred by the Fund were compared with the contractual management fees (assuming all funds in the Expense Group were similar in size to the Fund) and actual management fees (as reported by each fund) of other funds within the Expense Group, taking into account any applicable breakpoints and fee limitations. Each Fund’s total expenses were also compared with those of its Expense Group. The Trustees also considered fees paid to Delaware Investments for nonmanagement services. At the September 3, 2009 meeting, DMC advised the Board that the more recent comparative expenses for the Funds remained consistent with the previous review in May 2009 and, consequently, the Trustees concluded that expenses of the Funds were satisfactory.
The Board also considered the Expense Agreement under negotiation in evaluating Fund expenses. The Trustees expected that the Expense Agreement would provide that LNC and Macquarie Group would pay or reimburse the Trusts for all reasonable out-of-pocket costs and expenses in connection with the Transaction and the consideration of the New Investment Advisory Agreements (subject to certain limited exceptions).
Based on information provided by DMC and Macquarie Group, the Board concluded that neither the Transaction nor the New Investment Advisory Agreements likely would have an adverse effect on the Funds’ expenses because (i) each Fund’s contractual fee rates under the New Investment Advisory Agreement would remain the same; (ii) under the Expense Agreement, the Funds would be reimbursed for all reasonable out-of-pocket costs and expenses in connection with the Transaction and the related proxy solicitation (subject to certain limited exceptions); and (iii) the expense ratios of certain Funds might decline as a result of the possible increased investment in Delaware Investments by Macquarie Group, as discussed below under “Economies of Scale.”
MANAGEMENT PROFITABILITY. At their meeting on September 3, 2009, the Board evaluated DMC’s profitability in connection with the operation of the Funds. The Board had previously considered DMC’s profitability in connection with the operation of the Funds at its May 2009 meeting. At that meeting, the Board reviewed an analysis that addressed the overall profitability of Delaware Investments’ business in providing management and other services to each of the Funds and the Delaware Investments Family of Funds as a whole. Specific attention was given to the methodology followed in allocating costs for the purpose of determining profitability.
At the May 2009 meeting, representatives of DMC had stated that the level of profits of DMC, to a certain extent, reflect operational cost savings and efficiencies initiated by Delaware Investments (including DMC and its affiliates that provide services to the Funds). The Board considered Delaware Investments’ efforts to improve services provided to Fund shareholders and to meet additional regulatory and compliance requirements resulting from recent industry-wide U.S. Securities and Exchange Commission initiatives. At that meeting, the Board found that the management fees were reasonable in light of the services rendered and the level of profitability of DMC. At the September 3, 2009 meeting, DMC advised the Board that DMC did not expect the Transaction to affect materially the profitability of Delaware Investments compared to the level of profitability considered during the May 2009 review. Moreover, the Trustees reviewed pro forma balance sheets of certain key companies in Delaware Investments as of June 30, 2009 (which were provided by Macquarie Group and DMC in response to the Trustees’ requests) and evaluated the projections of Delaware Investments’ capitalization following the Transaction for purposes of evaluating the financial ability of Delaware Investments to continue to provide the nature, extent, and quality of services as it had under the Current Investment Advisory Agreement.
Based on information provided by DMC and Macquarie Group, the Board concluded that DMC and Delaware Investments would be sufficiently capitalized following the Transaction to continue the same level and quality of services to the Funds under the New Investment Advisory Agreements as was the case under the Current Investment Advisory Agreements. The Board also concluded that Macquarie Group had sufficient financial strength and resources, as well as an ongoing commitment to a global asset management business, to continue investing in Delaware Investments, including DMC, to the extent that Macquarie Group determined it was appropriate. Finally, because services and costs were expected to be substantially the same (and DMC had represented that, correspondingly, profitability would be about the same), under the New Investment Advisory Agreements as under the Current Investment Advisory Agreements, the Trustees concluded that the profitability of Delaware Investments would not result in an inequitable charge on the Funds or their shareholders. Accordingly, the Board concluded that the fees charged under the New Investment Advisory Agreements would be reasonable in light of the services to be provided and the expected profitability of DMC.
ECONOMIES OF SCALE. The Trustees considered whether economies of scale would be realized by Delaware Investments as each Fund’s assets increase and the extent to which any economies of scale would be reflected in the management fees charged. The Trustees took into account DMC’s practice of maintaining the competitive nature of management fees based on its analysis of fees charged by comparable funds. DMC management believed, and the Board agreed, that the Funds were priced with breakpoints and relatively low management fees to reflect potential economies of scale to Fund shareholders.
The Board also acknowledged Macquarie Group’s statement that the Transaction would not by itself immediately provide additional economies of scale given Macquarie Group’s limited presence in the U.S. mutual fund market. Nonetheless, the Trustees concluded that additional economies of scale could potentially be achieved in the future if DMC were owned by Macquarie Group as a result of Macquarie Group’s willingness to invest further in Delaware Investments if appropriate opportunities arise. The Board further concluded that potential economies of scale could be achieved as a result of Delaware Investments’ expanded distribution capabilities arising from the Transaction, as well as opportunities that might arise from Macquarie Group’s global asset management business.
Value Series-20
Delaware VIP® Delaware VIP Value Series
Other Series Information (continued)
FALL-OUT BENEFITS. The Board acknowledged that DMC would continue to benefit from soft dollar arrangements using portfolio brokerage of each Fund that invests in equity securities and that DMC’s profitability would likely be somewhat lower without the benefit of practices with respect to allocating Fund portfolio brokerage for brokerage and research services. The Board also considered that Macquarie Group and Delaware Investments may derive reputational, strategic, and other benefits from their association with the Delaware Investments Family of Funds, including service relationships with DMC, DSC, and Delaware Distributors, L.P., and evaluated the extent to which Delaware Investments might derive ancillary benefits from Fund operations, including the potential for procuring additional business as a result of the prestige and visibility associated with its role as service provider to the Delaware Investments Family of Funds and the benefits from allocation of Fund brokerage to improve trading efficiencies. However, the Board concluded that (i) any such benefits under the New Investment Advisory Agreements would not be dissimilar from those existing under the Current Investment Advisory Agreements, (ii) such benefits did not impose a cost or burden on the Funds or their shareholders, and (iii) such benefits would probably have an indirectly beneficial effect on the Funds and their shareholders because of the added importance that DMC and Macquarie Group might attach to the Funds as a result of the fall-out benefits that the Funds conveyed.
BOARD REVIEW OF MACQUARIE GROUP. The Trustees reviewed detailed information supplied by Macquarie Group about its operations as well as other information regarding Macquarie Group provided by independent legal counsel to the independent Trustees. Based on this review, the Trustees concluded that Delaware Investments would continue to have the financial ability to maintain the high quality of services required by the Funds. The Trustees noted that there would be a limited transition period during which some services previously provided by LNC to Delaware Investments would continue to be provided by LNC after the Closing, and concluded that this arrangement would help minimize disruption in Delaware Investments’ provision of services to the Funds following the Transaction.
The Board considered Macquarie Group’s support for Delaware Investments’ plans for Fund distribution by transferring wholesalers from Lincoln Financial Distributors, Inc., LNC’s retail distributor, to Delaware Investments, and Macquarie Group’s current intention to leave the Funds’ other service providers in place. The Board also considered Macquarie Group’s current strategic plans to increase its asset management activities, one of its core businesses, particularly in North America, and its statement that its acquisition of DMC is an important component of this strategic growth and the establishment of a significant presence in the United States. Based in part on the information provided by DMC and Macquarie Group, the Board concluded that Macquarie Group’s acquisition of Delaware Investments could potentially enhance the nature, quality, and extent of services provided to the Funds and their shareholders.
CONCLUSION. The Board concluded that the advisory fee rate under each New Investment Advisory Agreement was reasonable in relation to the services provided and that execution of the New Investment Advisory Agreement would be in the best interests of the shareholders. For each Fund, the Trustees noted that they had concluded in their most recent advisory agreement continuance considerations in May 2009 that the management fees and total expense ratios were at acceptable levels in light of the quality of services provided to the Funds and in comparison to those of the Funds’ respective peer groups; that the advisory fee schedule would not be increased and would stay the same for all of the Funds; that the total expense ratio had not changed materially since that determination; and that DMC had represented that the overall expenses for each Fund were not expected to be adversely affected by the Transaction. The Trustees also noted, with respect to the Funds that currently had the benefit of voluntary fee limitations, that Macquarie Group had no present intention to cause DMC to alter any voluntary expense limitations or reimbursements currently in effect. On that basis, the Trustees concluded that the total expense ratios and proposed advisory fees for the Funds anticipated to result from the Transaction were acceptable. In approving each New Investment Advisory Agreement, the Board stated that it anticipated reviewing the continuance of the New Investment Advisory Agreement in advance of the expiration of the initial two-year period.
Value Series-21
Delaware Investments® Family of Funds
BOARD OF TRUSTEES/DIRECTORS AND OFFICERS ADDENDUM
A mutual fund is governed by a Board of Trustees/Directors (“Trustees”), which has oversight responsibility for the management of a fund’s business affairs. Trustees establish procedures and oversee and review the performance of the investment manager, the distributor, and others who perform services for the fund. The independent fund trustees, in particular, are advocates for shareholder interests. Each trustee has served in that capacity since he or she was elected to or appointed to the Board of Trustees, and will continue to serve until his or her retirement or the election of a new trustee in his or her place. The following is a list of the Trustees and Officers with certain background and related information.
| | | | Number of | Other |
| | | Principal | Portfolios in Fund | Directorships |
| Name, | Position(s) | | Occupation(s) | Complex Overseen | Held by |
| Address, | Held with | Length of Time | During | by Trustee | Trustee |
| and Birth Date | Fund(s) | Served | Past 5 Years | or Officer | or Officer |
| INTERESTED TRUSTEES | | | | | |
| Patrick P. Coyne1 | Chairman, | Chairman and Trustee | Patrick P. Coyne has served in | 81 | Director — |
| 2005 Market Street | President, | since August 16, 2006 | various executive capacities | | Kaydon Corp. |
| Philadelphia, PA | Chief Executive | | at different times at | | |
| 19103 | Officer, and | President and | Delaware Investments.2 | | |
| Trustee | Chief Executive Officer | | | |
| April 1963 | | since August 1, 2006 | | | |
| | | | | | |
| INDEPENDENT TRUSTEES | | | | | |
| Thomas L. Bennett | Trustee | Since | Private Investor — | 81 | Director — |
| 2005 Market Street | | March 2005 | (March 2004–Present) | | Bryn Mawr |
| Philadelphia, PA | | | | | Bank Corp. (BMTC) |
| 19103 | | | Investment Manager — | | (April 2007–Present) |
| | | | Morgan Stanley & Co. | | |
| October 1947 | | | (January 1984–March 2004) | | |
| John A. Fry | Trustee | Since | President — | 81 | Director — |
| 2005 Market Street | | January 2001 | Franklin & Marshall College | | Community Health |
| Philadelphia, PA | | | (June 2002–Present) | | Systems |
| 19103 | | | | | |
| | | | Executive Vice President — | | |
| May 1960 | | | University of Pennsylvania | | |
| | | | (April 1995–June 2002) | | |
| Anthony D. Knerr | Trustee | Since | Founder and Managing Director — | 81 | None |
| 2005 Market Street | | April 1990 | Anthony Knerr & Associates | | |
| Philadelphia, PA | | | (Strategic Consulting) | | |
| 19103 | | | (1990–Present) | | |
| |
| December 1938 | | | | | |
| Lucinda S. Landreth | Trustee | Since | Chief Investment Officer — | 81 | None |
| 2005 Market Street | | March 2005 | Assurant, Inc. | | |
| Philadelphia, PA | | | (Insurance) | | |
| 19103 | | | (2002–2004) | | |
| |
| June 1947 | | | | | |
| Ann R. Leven | Trustee | Since | Consultant — | 81 | None |
| 2005 Market Street | | October 1989 | ARL Associates | | |
| Philadelphia, PA | | | (Financial Planning) | | |
| 19103 | | | (1983–Present) | | |
| |
| November 1940 | | | | | |
Value Series-22
| | | | Number of | Other |
| | | Principal | Portfolios in Fund | Directorships |
| Name, | Position(s) | | Occupation(s) | Complex Overseen | Held by |
| Address, | Held with | Length of Time | During | by Trustee | Trustee |
| and Birth Date | Fund(s) | Served | Past 5 Years | or Officer | or Officer |
| INDEPENDENT TRUSTEES (CONTINUED) | | | | |
| Thomas F. Madison | Trustee | Since | President and Chief | 81 | Director and Chair of |
| 2005 Market Street | | May 19973 | Executive Officer — | | Compensation |
| Philadelphia, PA | | | MLM Partners, Inc. | | Committee, |
| 19103 | | | (Small Business Investing | | Governance Committee |
| | | and Consulting) | | Member |
| February 1936 | | | (January 1993–Present) | | — CenterPoint Energy |
| |
| | | | | Lead Director and Chair |
| | | | | of Audit |
| | | | | and Governance |
| | | | | Committees, |
| | | | | Member of |
| | | | | Compensation |
| | | | | Committee — Digital |
| | | | | River, Inc. |
| |
| | | | | Director and Chair of |
| | | | | Governance |
| | | | | Committee, Audit |
| | | | | Committee Member — |
| | | | | Rimage Corporation |
| |
| | | | | Director and Chair of |
| | | | | Compensation |
| | | | | Committee — Spanlink |
| | | | | Communications |
| |
| | | | | Lead Director and Chair |
| | | | | of Compensation and |
| | | | | Governance |
| | | | | Committees — |
| | | | | Valmont Industries, Inc. |
| Janet L. Yeomans | Trustee | Since | Vice President and Treasurer | 81 | None |
| 2005 Market Street | | April 1999 | (January 2006–Present) | | |
| Philadelphia, PA | | | Vice President — Mergers & Acquisitions | | |
| 19103 | | | (January 2003–January 2006), and | | |
| | | Vice President | | |
| July 1948 | | | (July 1995–January 2003) | | |
| | | 3M Corporation | | |
| J. Richard Zecher | Trustee | Since | Founder — | 81 | Director and Audit |
| 2005 Market Street | | March 2005 | Investor Analytics | | Committee Member — |
| Philadelphia, PA | | | (Risk Management) | | Investor Analytics |
| 19103 | | | (May 1999–Present) | | |
| |
| July 1940 | | | Founder — | | |
| | | Sutton Asset Management | | |
| | | (Hedge Fund) | | |
| | | (September 1996–Present) | | |
Value Series-23
| | | | Number of | Other |
| | | Principal | Portfolios in Fund | Directorships |
| Name, | Position(s) | | Occupation(s) | Complex Overseen | Held by |
| Address, | Held with | Length of Time | During | by Trustee | Trustee |
| and Birth Date | Fund(s) | Served | Past 5 Years | or Officer | or Officer |
| OFFICERS | | | | | |
| David F. Connor | Vice President, | Vice President since | David F. Connor has served as | 81 | None4 |
| 2005 Market Street | Deputy General | September 2000 | Vice President and Deputy | | |
| Philadelphia, PA | Counsel, and Secretary | and Secretary | General Counsel of | | |
| 19103 | | since | Delaware Investments | | |
| | October 2005 | since 2000. | | |
| December 1963 | | | | | |
| Daniel V. Geatens | Vice President | Treasurer | Daniel V. Geatens has served | 81 | None4 |
| 2005 Market Street | and Treasurer | since | in various capacities at | | |
| Philadelphia, PA | | October 25, 2007 | different times at | | |
| 19103 | | | Delaware Investments. | | |
| |
| October 1972 | | | | | |
| David P. O’Connor | Senior Vice | Senior Vice President, | David P. O’Connor has served in | 81 | None4 |
| 2005 Market Street | President, | General Counsel, and | various executive and legal | | |
| Philadelphia, PA | General Counsel, | Chief Legal Officer | capacities at different times | | |
| 19103 | and Chief | since | at Delaware Investments. | | |
| Legal Officer | October 2005 | | | |
| February 1966 | | | | | |
| Richard Salus | Senior | Chief Financial | Richard Salus has served in | 81 | None4 |
| 2005 Market Street | Vice President | Officer since | various executive capacities | | |
| Philadelphia, PA | and | November 2006 | at different times at | | |
| 19103 | Chief Financial | | Delaware Investments. | | |
| Officer | | | | |
| October 1963 | | | | | |
1 Patrick P. Coyne is considered to be an “Interested Trustee” because he is an executive officer of the Fund’s(s’) investment advisor.
2 Delaware Investments is the marketing name for Delaware Management Holdings, Inc. and its subsidiaries, including the Fund’s(s’) investment advisor, principal underwriter, and its transfer agent.
3 In 1997, several funds managed by Voyageur Fund Managers, Inc. (the “Voyageur Funds”) were incorporated into the Delaware Investments Family of Funds. Mr. Madison served as a director of the Voyageur Funds from 1993 until 1997.
4 David F. Connor, Daniel V. Geatens, David P. O’Connor, and Richard Salus serve in similar capacities for the six portfolios of the Optimum Fund Trust, which have the same investment advisor, principal underwriter, and transfer agent as the registrant.
The Statement of Additional Information for the Fund(s) includes additional information about the Trustees and Officers and is available, without charge, upon request by calling 800 523-1918.
| PO14857 AR-VIPV [12/09] DG3 2/10 (5427) | Value Series-24 |
Item 2. Code of Ethics
The registrant has adopted a code of ethics that applies to the registrant’s principal executive officer, principal financial officer, principal accounting officer or controller, or persons performing similar functions, regardless of whether these individuals are employed by the registrant or a third party. A copy of the registrant’s Code of Business Ethics has been posted on the Delaware Investments Internet Web site at www.delawareinvestments.com. Any amendments to the Code of Business Ethics, and information on any waiver from its provisions granted by the registrant, will also be posted on this Web site within five business days of such amendment or waiver and will remain on the Web site for at least 12 months.
Item 3. Audit Committee Financial Expert
The registrant’s Board of Trustees/Directors has determined that each member of the registrant’s Audit Committee is an audit committee financial expert, as defined below. For purposes of this item, an “audit committee financial expert” is a person who has the following attributes:
a. An understanding of generally accepted accounting principles and financial statements;
b. The ability to assess the general application of such principles in connection with the accounting for estimates, accruals, and reserves;
c. Experience preparing, auditing, analyzing, or evaluating financial statements that present a breadth and level of complexity of accounting issues that are generally comparable to the breadth and complexity of issues that can reasonably be expected to be raised by the registrant’s financial statements, or experience actively supervising one or more persons engaged in such activities;
d. An understanding of internal controls and procedures for financial reporting; and
e. An understanding of audit committee functions.
An “audit committee financial expert” shall have acquired such attributes through:
a. Education and experience as a principal financial officer, principal accounting officer, controller, public accountant, or auditor or experience in one or more positions that involve the performance of similar functions;
b. Experience actively supervising a principal financial officer, principal accounting officer, controller, public accountant, auditor, or person performing similar functions;
c. Experience overseeing or assessing the performance of companies or public accountants with respect to the preparation, auditing, or evaluation of financial statements; or
d. Other relevant experience.
The registrant’s Board of Trustees/Directors has also determined that each member of the registrant’s Audit Committee is independent. In order to be “independent” for purposes of this item, the Audit Committee member may not: (i) other than in his or her capacity as a member of the Board of Trustees/Directors or any committee thereof, accept directly or indirectly any consulting, advisory or other compensatory fee from the issuer; or (ii) be an “interested person” of the registrant as defined in Section 2(a)(19) of the Investment Company Act of 1940.
The names of the audit committee financial experts on the registrant’s Audit Committee are set forth below:
Thomas L. Bennett 1
John A. Fry
Thomas F. Madison
J. Richard Zecher
Item 4. Principal Accountant Fees and Services
(a) Audit fees.
The aggregate fees billed for services provided to the registrant by its independent auditors for the audit of the registrant’s annual financial statements and for services normally provided by the independent auditors in connection with statutory and regulatory filings or engagements were $281,656 for the fiscal year ended December 31, 2009.
____________________
1 The instructions to Form N-CSR require disclosure on the relevant experience of persons who qualify as audit committee financial experts based on “other relevant experience.” The Board of Trustees/Directors has determined that Mr. Bennett qualifies as an audit committee financial expert by virtue of his education, Chartered Financial Analyst designation, and his experience as a credit analyst, portfolio manager and the manager of other credit analysts and portfolio managers.
The aggregate fees billed for services provided to the registrant by its independent auditors for the audit of the registrant’s annual financial statements and for services normally provided by the independent auditors in connection with statutory and regulatory filings or engagements were $380,200 for the fiscal year ended December 31, 2008.
(b) Audit-related fees.
The aggregate fees billed by the registrant’s independent auditors for services relating to the performance of the audit of the registrant’s financial statements and not reported under paragraph (a) of this Item were $0 for the fiscal year ended December 31, 2009.
The aggregate fees billed by the registrant’s independent auditors for services relating to the performance of the audit of the financial statements of the registrant’s investment adviser and other service providers under common control with the adviser and that relate directly to the operations or financial reporting of the registrant were $19,074 for the registrant’s fiscal year ended December 31, 2009. The percentage of these fees relating to services approved by the registrant’s Audit Committee pursuant to the de minimis exception from the pre-approval requirement in Rule 2-01(c)(7)(i)(C) of Regulation S-X was 0%. These audit-related services were as follows: issuance of report concerning transfer agent's system of internal accounting control pursuant to Rule 17Ad-13 of the Securities Exchange Act.
The aggregate fees billed by the registrant’s independent auditors for services relating to the performance of the audit of the registrant’s financial statements and not reported under paragraph (a) of this Item were $0 for the fiscal year ended December 31, 2008.
The aggregate fees billed by the registrant’s independent auditors for services relating to the performance of the audit of the financial statements of the registrant’s investment adviser and other service providers under common control with the adviser and that relate directly to the operations or financial reporting of the registrant were $19,074 for the registrant’s fiscal year ended December 31, 2008. The percentage of these fees relating to services approved by the registrant’s Audit Committee pursuant to the de minimis exception from the pre-approval requirement in Rule 2-01(c)(7)(i)(C) of Regulation S-X was 0%. These audit-related services were as follows: issuance of report concerning transfer agent's system of internal accounting control pursuant to Rule 17Ad-13 of the Securities Exchange Act.
(c) Tax fees.
The aggregate fees billed by the registrant’s independent auditors for tax-related services provided to the registrant were $105,324 for the fiscal year ended December 31, 2009. The percentage of these fees relating to services approved by the registrant’s Audit Committee pursuant to the de minimis exception from the pre-approval requirement in Rule 2-01(c)(7)(i)(C) of Regulation S-X was 0%. These tax-related services were as follows: review of income tax returns and review of annual excise distribution calculations.
The aggregate fees billed by the registrant’s independent auditors for tax-related services provided to the registrant’s investment adviser and other service providers under common control with the adviser and that relate directly to the operations or financial reporting of the registrant were $0 for the registrant’s fiscal year ended December 31, 2009.
The aggregate fees billed by the registrant’s independent auditors for tax-related services provided to the registrant were $132,306 for the fiscal year ended December 31, 2008. The percentage of these fees relating to services approved by the registrant’s Audit Committee pursuant to the de minimis exception from the pre-approval requirement in Rule 2-01(c)(7)(i)(C) of Regulation S-X was 0%. These tax-related services were as follows: review of income tax returns and review of annual excise distribution calculations.
The aggregate fees billed by the registrant’s independent auditors for tax-related services provided to the registrant’s adviser and other service providers under common control with the adviser and that relate directly to the operations or financial reporting of the registrant were $0 for the registrant’s fiscal year ended December 31, 2008.
(d) All other fees.
The aggregate fees billed for all services provided by the independent auditors to the registrant other than those set forth in paragraphs (a), (b) and (c) of this Item were $0 for the fiscal year ended December 31, 2009.
The aggregate fees billed for all services other than those set forth in paragraphs (b) and (c) of this Item provided by the registrant’s independent auditors to the registrant’s adviser and other service providers under common control with the adviser and that relate directly to the operations or financial reporting of the registrant were $0 for the registrant’s fiscal year ended December 31, 2009.
The aggregate fees billed for all services provided by the independent auditors to the registrant other than those set forth in paragraphs (a), (b) and (c) of this Item were $0 for the fiscal year ended December 31, 2008.
The aggregate fees billed for all services other than those set forth in paragraphs (b) and (c) of this Item provided by the registrant’s independent auditors to the registrant’s adviser and other service providers under common control with the adviser and that relate directly to the operations or financial reporting of the registrant were $0 for the registrant’s fiscal year ended December 31, 2008.
(e) The registrant’s Audit Committee has established pre-approval policies and procedures as permitted by Rule 2-01(c)(7)(i)(B) of Regulation S-X (the “Pre-Approval Policy”) with respect to services provided by the registrant’s independent auditors. Pursuant to the Pre-Approval Policy, the Audit Committee has pre-approved the services set forth in the table below with respect to the registrant up to the specified fee limits. Certain fee limits are based on aggregate fees to the registrant and other registrants within the Delaware Investments Family of Funds.
| Service | Range of Fees |
| Audit Services | |
| Statutory audits or financial audits for new Funds | up to $25,000 per Fund |
| Services associated with SEC registration statements (e.g., Form N-1A, Form N-14, etc.), periodic reports and other documents filed with the SEC or other documents issued in connection with securities offerings (e.g., comfort letters for closed-end Fund offerings, consents), and assistance in responding to SEC comment letters | up to $10,000 per Fund |
| Consultations by Fund management as to the accounting or disclosure treatment of transactions or events and/or the actual or potential impact of final or proposed rules, standards or interpretations by the SEC, FASB, or other regulatory or standard-setting bodies (Note: Under SEC rules, some consultations may be considered “audit-related services” rather than “audit services”) | up to $25,000 in the aggregate |
| Audit-Related Services | |
| Consultations by Fund management as to the accounting or disclosure treatment of transactions or events and/or the actual or potential impact of final or proposed rules, standards or interpretations by the SEC, FASB, or other regulatory or standard-setting bodies (Note: Under SEC rules, some consultations may be considered “audit services” rather than “audit-related services”) | up to $25,000 in the aggregate |
| Tax Services | |
| U.S. federal, state and local and international tax planning and advice (e.g., consulting on statutory, regulatory or administrative developments, evaluation of Funds’ tax compliance function, etc.) | up to $25,000 in the aggregate |
| U.S. federal, state and local tax compliance (e.g., excise distribution reviews, etc.) | up to $5,000 per Fund |
| Review of federal, state, local and international income, franchise and other tax returns | up to $5,000 per Fund |
Under the Pre-Approval Policy, the Audit Committee has also pre-approved the services set forth in the table below with respect to the registrant’s investment adviser and other entities controlling, controlled by or under common control with the investment adviser that provide ongoing services to the registrant (the “Control Affiliates”) up to the specified fee limit. This fee limit is based on aggregate fees to the investment adviser and its Control Affiliates.
| Service | Range of Fees |
| Non-Audit Services | |
| Services associated with periodic reports and other documents filed with the SEC and assistance in responding to SEC comment letters | up to $10,000 in the aggregate |
The Pre-Approval Policy requires the registrant’s independent auditors to report to the Audit Committee at each of its regular meetings regarding all services initiated since the last such report was rendered, including those services authorized by the Pre-Approval Policy.
(f) Not applicable.
(g) The aggregate non-audit fees billed by the registrant’s independent auditors for services rendered to the registrant and to its investment adviser and other service providers under common control with the adviser were $305,038 and $386,308 for the registrant’s fiscal years ended December 31, 2009 and December 31, 2008, respectively.
(h) In connection with its selection of the independent auditors, the registrant’s Audit Committee has considered the independent auditors’ provision of non-audit services to the registrant’s investment adviser and other service providers under common control with the adviser that were not required to be pre-approved pursuant to Rule 2-01(c)(7)(ii) of Regulation S-X. The Audit Committee has determined that the independent auditors’ provision of these services is compatible with maintaining the auditors’ independence.
Item 5. Audit Committee of Listed Registrants
Not applicable.
Item 6. Investments
(a) Included as part of report to shareholders filed under Item 1 of this Form N-CSR.
(b) Divestment of securities in accordance with Section 13(c) of the Investment Company Act of 1940.
Not applicable.
Item 7. Disclosure of Proxy Voting Policies and Procedures for Closed-End Management Investment Companies
Not applicable.
Item 8. Portfolio Managers of Closed-End Management Investment Companies
Not applicable.
Item 9. Purchases of Equity Securities by Closed-End Management Investment Company and Affiliated Purchasers
Not applicable.
Item 10. Submission of Matters to a Vote of Security Holders
Not applicable.
Item 11. Controls and Procedures
The registrant’s principal executive officer and principal financial officer have evaluated the registrant’s disclosure controls and procedures within 90 days of the filing of this report and have concluded that they are effective in providing reasonable assurance that the information required to be disclosed by the registrant in its reports or statements filed under the Securities Exchange Act of 1934 is recorded, processed, summarized and reported within the time periods specified in the rules and forms of the Securities and Exchange Commission.
There were no significant changes in the registrant’s internal control over financial reporting that occurred during the second fiscal quarter of the period covered by the report to stockholders included herein (i.e., the registrant’s fourth fiscal quarter) that have materially affected, or are reasonably likely to materially affect, the registrant’s internal control over financial reporting.
Item 12. Exhibits
| (a) | | (1) Code of Ethics |
| | |
| | Not applicable. |
| | |
| | (2) Certifications of Principal Executive Officer and Principal Financial Officer pursuant to Rule 30a-2 under the Investment Company Act of 1940 are attached hereto as Exhibit 99.CERT. |
| | |
| | (3) Written solicitations to purchase securities pursuant to Rule 23c-1 under the Securities Exchange Act of 1934. |
| | |
| | Not applicable. |
| | |
| (b) | | Certifications pursuant to Section 906 of the Sarbanes-Oxley Act of 2002 are furnished herewith as Exhibit 99.906CERT. |
SIGNATURES
Pursuant to the requirements of the Securities Exchange Act of 1934 and the Investment Company Act of 1940, the registrant has duly caused this report to be signed on its behalf, by the undersigned, thereunto duly authorized.
Name of Registrant: Delaware VIP® Trust
| PATRICK P. COYNE |
| By: | Patrick P. Coyne |
| Title: | Chief Executive Officer |
| Date: | February 25, 2010 |
Pursuant to the requirements of the Securities Exchange Act of 1934 and the Investment Company Act of 1940, this report has been signed below by the following persons on behalf of the registrant and in the capacities and on the dates indicated.
| PATRICK P. COYNE |
| By: | Patrick P. Coyne |
| Title: | Chief Executive Officer |
| Date: | February 25, 2010 |
| |
| |
| RICHARD SALUS |
| By: | Richard Salus |
| Title: | Chief Financial Officer |
| Date: | February 25, 2010 |