UNITED STATES
SECURITIES AND EXCHANGE COMMISSION
WASHINGTON, D.C. 20549
FORM N-CSR
CERTIFIED SHAREHOLDER REPORT OF REGISTERED
MANAGEMENT INVESTMENT COMPANIES
Investment Company Act file number: 811-01716
AB CAP FUND, INC.
(Exact name of registrant as specified in charter)
1345 Avenue of the Americas, New York, New York 10105
(Address of principal executive offices) (Zip code)
Joseph J. Mantineo
AllianceBernstein L.P.
1345 Avenue of the Americas
New York, New York 10105
(Name and address of agent for service)
Registrant’s telephone number, including area code: (800) 221-5672
Date of fiscal year end: December 31, 2017
Date of reporting period: June 30, 2017
| ITEM 1. | REPORTS TO STOCKHOLDERS. |
JUN 06.30.17

SEMI-ANNUAL REPORT
AB FLEXFEETM CORE OPPORTUNITIES PORTFOLIO


A discussion of the Fund’s investment performance is not included in this report. AllianceBernstein L.P. would like to thank you for your interest in the Fund.
| Investment Products Offered | • Are Not FDIC Insured • May Lose Value • Are Not Bank Guaranteed | |
Investors should consider the investment objectives, risks, charges and expenses of the Fund carefully before investing. For copies of our prospectus or summary prospectus, which contain this and other information, visit us online at www.abfunds.com or contact your AB representative. Please read the prospectus and/or summary prospectus carefully before investing.
This shareholder report must be preceded or accompanied by the Fund’s prospectus for individuals who are not current shareholders of the Fund.
You may obtain a description of the Fund’s proxy voting policies and procedures, and information regarding how the Fund voted proxies relating to portfolio securities during the most recent 12-month period ended June 30, without charge. Simply visit AB’s website at www.abfunds.com, or go to the Securities and Exchange Commission’s (the “Commission”) website at www.sec.gov, or call AB at (800) 227 4618.
The Fund files its complete schedule of portfolio holdings with the Commission for the first and third quarters of each fiscal year on Form N-Q. The Fund’s Forms N-Q are available on the Commission’s website at www.sec.gov. The Fund’s Forms N-Q may also be reviewed and copied at the Commission’s Public Reference Room in Washington, DC; information on the operation of the Public Reference Room may be obtained by calling (800) SEC 0330. AB publishes full portfolio holdings for the Fund monthly at www.abfunds.com.
AllianceBernstein Investments, Inc. (ABI) is the distributor of the AB family of mutual funds. ABI is a member of FINRA and is an affiliate of AllianceBernstein L.P., the Adviser of the funds.
The [A/B] logo is a registered service mark of AllianceBernstein and AllianceBernstein® is a registered service mark used by permission of the owner, AllianceBernstein L.P.
EXPENSE EXAMPLE
(unaudited)
As a shareholder of the Fund, you incur two types of costs: (1) transaction costs, including sales charges (loads) on purchase payments, contingent deferred sales charges on redemptions and (2) ongoing costs, including management fees; distribution (12b-1) fees; and other Fund expenses. This example is intended to help you understand your ongoing costs (in dollars) of investing in the Fund and to compare these costs with the ongoing costs of investing in other mutual funds.
This Example is based on an investment of $1,000 invested at the beginning of the period and held for the entire period as indicated below.
Actual Expenses
The table below provides information about actual account values and actual expenses. You may use the information, together with the amount you invested, to estimate the expenses that you paid over the period. Simply divide your account value by $1,000 (for example, an $8,600 account value divided by $1,000 = 8.6), then multiply the result by the number under the heading entitled “Expenses Paid During Period” to estimate the expenses you paid on your account during this period.
Hypothetical Example for Comparison Purposes
The table below also provides information about hypothetical account values and hypothetical expenses based on the Fund’s actual expense ratio and an assumed annual rate of return of 5% before expenses, which is not the Fund’s actual return. The hypothetical account values and expenses may not be used to estimate the actual ending account balance or expenses you paid for the period. You may use this information to compare the ongoing costs of investing in the Fund and other funds by comparing this 5% hypothetical example with the 5% hypothetical examples that appear in the shareholder reports of other funds.
Please note that the expenses shown in the table are meant to highlight your ongoing costs only and do not reflect any transactional costs, such as sales charges (loads), or contingent deferred sales charges on redemptions. Therefore, the hypothetical example is useful in comparing ongoing costs only, and will not help you determine the relative total costs of owning different funds. In addition, if these transactional costs were included, your costs would have been higher.
| Beginning Account Value 6/28/2017^ | Ending Account Value 6/30/2017 | Expenses Paid During Period* | Annualized Expense Ratio* | Total Expenses Paid During Period+ | Total Annualized Expense Ratio+ | |||||||||||||||||||
| Advisor Class | ||||||||||||||||||||||||
Actual | $ | 1,000 | $ | 996.00 | $ | 0.01 | 0.11 | % | $ | 0.02 | 0.22 | % | ||||||||||||
Hypothetical** | $ | 1,000 | $ | 1,000.40 | $ | 0.00 | 0.11 | % | $ | 0.02 | 0.22 | % | ||||||||||||
| abfunds.com | AB FLEXFEE CORE OPPORTUNITIES PORTFOLIO | 1 |
EXPENSE EXAMPLE (continued)
| ^ | Commencement of operations. |
| * | Expenses are equal to each classes’ annualized expense ratios multiplied by the average account value over the period, multiplied by 3/365 (to reflect the since inception period). |
| + | In connection with the Fund’s investments in affiliated/unaffiliated underlying portfolios, the Fund incurs no direct expenses, but bears proportionate shares of the fees and expenses (i.e., operating, administrative and investment advisory fees) of the affiliated/unaffiliated underlying portfolios. The Adviser has contractually agreed to waive its fees from the Fund in an amount equal to the Fund’s pro rata share of certain acquired fund fees and expenses of the affiliated underlying portfolios. The Fund’s total expenses are equal to the classes’ annualized expense ratio plus the Fund’s pro rata share of the weighted average expense ratio of the affiliated/unaffiliated underlying portfolios in which it invests, multiplied by the average account value over the period, multiplied by 3/365 (to reflect the since inception period). |
| ** | Assumes 5% annual return before expenses. |
| 2 | AB FLEXFEE CORE OPPORTUNITIES PORTFOLIO | abfunds.com |
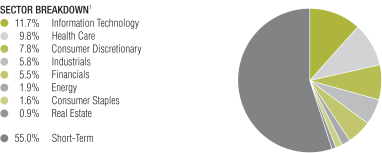
PORTFOLIO SUMMARY
June 30, 2017 (unaudited)
PORTFOLIO STATISTICS
Net Assets ($mil): $1.0
TEN LARGEST HOLDINGS2
| Company | U.S. $ Value | Percent of Net Assets | ||||||
| Time Warner, Inc. | $ | 42,273 | 4.3 | % | ||||
| Facebook, Inc. – Class A | 40,915 | 4.1 | ||||||
| JPMorgan Chase & Co. | 39,302 | 4.0 | ||||||
| Alphabet, Inc. – Class C | 37,258 | 3.7 | ||||||
| Raytheon Co. | 35,849 | 3.6 | ||||||
| Gilead Sciences, Inc. | 25,764 | 2.6 | ||||||
| Biogen, Inc. | 23,337 | 2.3 | ||||||
| Wal-Mart Stores, Inc. | 22,704 | 2.3 | ||||||
| Eli Lilly & Co. | 22,303 | 2.2 | ||||||
| Edwards Lifesciences Corp. | 21,874 | 2.2 | ||||||
| $ | 311,579 | 31.3 | % | |||||
| 1 | All data are as of June 30, 2017. The Fund’s sector breakdown is expressed as a percentage of total investments and may vary over time. |
| 2 | Long-term investments. |
Please note: The sector classifications presented herein are based on the Global Industry Classification Standard (GICS) which was developed by Morgan Stanley Capital International and Standard & Poor’s. The components are divided into sector, industry group, and industry sub-indices as classified by the GICS for each of the market capitalization indices in the broad market. These sector classifications are broadly defined. The “Portfolio of Investments” section of the report reflects more specific industry information and is consistent with the investment restrictions discussed in the Fund’s prospectus.
| abfunds.com | AB FLEXFEE CORE OPPORTUNITIES PORTFOLIO | 3 |
PORTFOLIO OF INVESTMENTS
June 30, 2017 (unaudited)
| Company | Shares | U.S. $ Value | ||||||
| ||||||||
COMMON STOCKS – 82.3% | ||||||||
Information Technology – 21.3% | ||||||||
Communications Equipment – 0.6% | ||||||||
Arista Networks, Inc.(a) | 38 | $ | 5,692 | |||||
|
| |||||||
Electronic Equipment, Instruments & Components – 1.5% | ||||||||
Dolby Laboratories, Inc. – Class A | 216 | 10,575 | ||||||
IPG Photonics Corp.(a) | 27 | 3,918 | ||||||
|
| |||||||
| 14,493 | ||||||||
|
| |||||||
Internet Software & Services – 7.8% | ||||||||
Alphabet, Inc. – Class C(a) | 41 | 37,258 | ||||||
Facebook, Inc. – Class A(a) | 271 | 40,915 | ||||||
|
| |||||||
| 78,173 | ||||||||
|
| |||||||
IT Services – 5.3% | ||||||||
Cognizant Technology Solutions Corp. – Class A | 97 | 6,441 | ||||||
International Business Machines Corp. | 104 | 15,998 | ||||||
Mastercard, Inc. – Class A | 135 | 16,396 | ||||||
Visa, Inc. – Class A | 151 | 14,161 | ||||||
|
| |||||||
| 52,996 | ||||||||
|
| |||||||
Semiconductors & Semiconductor Equipment – 2.8% | ||||||||
Intel Corp. | 206 | 6,950 | ||||||
Xilinx, Inc. | 319 | 20,518 | ||||||
|
| |||||||
| 27,468 | ||||||||
|
| |||||||
Software – 1.3% | ||||||||
Electronic Arts, Inc.(a) | 50 | 5,286 | ||||||
VMware, Inc. – Class A(a) | 93 | 8,131 | ||||||
|
| |||||||
| 13,417 | ||||||||
|
| |||||||
Technology Hardware, Storage & Peripherals – 2.0% | ||||||||
Apple, Inc. | 140 | 20,163 | ||||||
|
| |||||||
| 212,402 | ||||||||
|
| |||||||
Health Care – 17.8% | ||||||||
Biotechnology – 6.6% | ||||||||
Alexion Pharmaceuticals, Inc.(a) | 137 | 16,669 | ||||||
Biogen, Inc.(a) | 86 | 23,337 | ||||||
Gilead Sciences, Inc. | 364 | 25,764 | ||||||
|
| |||||||
| 65,770 | ||||||||
|
| |||||||
Health Care Equipment & Supplies – 5.2% | ||||||||
Danaher Corp. | 184 | 15,528 | ||||||
Edwards Lifesciences Corp.(a) | 185 | 21,874 | ||||||
Hologic, Inc.(a) | 312 | 14,159 | ||||||
|
| |||||||
| 51,561 | ||||||||
|
| |||||||
| 4 | AB FLEXFEE CORE OPPORTUNITIES PORTFOLIO | abfunds.com |
PORTFOLIO OF INVESTMENTS (continued)
| Company | Shares | U.S. $ Value | ||||||
| ||||||||
Health Care Providers & Services – 3.8% | ||||||||
Cigna Corp. | 123 | $ | 20,589 | |||||
UnitedHealth Group, Inc. | 94 | 17,429 | ||||||
|
| |||||||
| 38,018 | ||||||||
|
| |||||||
Pharmaceuticals – 2.2% | ||||||||
Eli Lilly & Co. | 271 | 22,303 | ||||||
|
| |||||||
| 177,652 | ||||||||
|
| |||||||
Consumer Discretionary – 14.3% | ||||||||
Household Durables – 2.5% | ||||||||
DR Horton, Inc. | 406 | 14,035 | ||||||
Garmin Ltd. | 222 | 11,329 | ||||||
|
| |||||||
| 25,364 | ||||||||
|
| |||||||
Media – 7.4% | ||||||||
Comcast Corp. – Class A | 469 | 18,253 | ||||||
Discovery Communications, Inc. – Class A(a) | 490 | 12,657 | ||||||
Time Warner, Inc. | 421 | 42,273 | ||||||
|
| |||||||
| 73,183 | ||||||||
|
| |||||||
Specialty Retail – 2.8% | ||||||||
Home Depot, Inc. (The) | 56 | 8,591 | ||||||
Ross Stores, Inc. | 332 | 19,166 | ||||||
|
| |||||||
| 27,757 | ||||||||
|
| |||||||
Textiles, Apparel & Luxury Goods – 1.6% | ||||||||
NIKE, Inc. – Class B | 264 | 15,576 | ||||||
|
| |||||||
| 141,880 | ||||||||
|
| |||||||
Industrials – 10.6% | ||||||||
Aerospace & Defense – 3.9% | ||||||||
Hexcel Corp. | 67 | 3,537 | ||||||
Raytheon Co. | 222 | 35,849 | ||||||
|
| |||||||
| 39,386 | ||||||||
|
| |||||||
Electrical Equipment – 0.6% | ||||||||
AMETEK, Inc. | 94 | 5,694 | ||||||
|
| |||||||
Industrial Conglomerates – 2.0% | ||||||||
Carlisle Cos., Inc. | 83 | 7,918 | ||||||
Roper Technologies, Inc. | 51 | 11,808 | ||||||
|
| |||||||
| 19,726 | ||||||||
|
| |||||||
Machinery – 2.0% | ||||||||
Caterpillar, Inc. | 56 | 6,018 | ||||||
Fortive Corp. | 90 | 5,701 | ||||||
Parker-Hannifin Corp. | 49 | 7,831 | ||||||
|
| |||||||
| 19,550 | ||||||||
|
| |||||||
Road & Rail – 1.2% | ||||||||
Landstar System, Inc. | 44 | 3,766 | ||||||
Union Pacific Corp. | 78 | 8,495 | ||||||
|
| |||||||
| 12,261 | ||||||||
|
| |||||||
| abfunds.com | AB FLEXFEE CORE OPPORTUNITIES PORTFOLIO | 5 |
PORTFOLIO OF INVESTMENTS (continued)
| Company | Shares | U.S. $ Value | ||||||
| ||||||||
Trading Companies & Distributors – 0.9% | ||||||||
MSC Industrial Direct Co., Inc. – Class A | 105 | $ | 9,026 | |||||
|
| |||||||
| 105,643 | ||||||||
|
| |||||||
Financials – 10.2% | ||||||||
Banks – 3.9% | ||||||||
JPMorgan Chase & Co. | 430 | 39,302 | ||||||
|
| |||||||
Capital Markets – 2.7% | ||||||||
Goldman Sachs Group, Inc. (The) | 62 | 13,758 | ||||||
State Street Corp. | 143 | 12,831 | ||||||
|
| |||||||
| 26,589 | ||||||||
|
| |||||||
Diversified Financial Services – 1.3% | ||||||||
Berkshire Hathaway, Inc. – Class B(a) | 76 | 12,872 | ||||||
|
| |||||||
Insurance – 2.3% | ||||||||
Allstate Corp. (The) | 78 | 6,898 | ||||||
Chubb Ltd. | 107 | 15,556 | ||||||
|
| |||||||
| 22,454 | ||||||||
|
| |||||||
| 101,217 | ||||||||
|
| |||||||
Energy – 3.5% | ||||||||
Energy Equipment & Services – 1.8% | ||||||||
Dril-Quip, Inc.(a) | 63 | 3,075 | ||||||
National Oilwell Varco, Inc. | 98 | 3,228 | ||||||
Oceaneering International, Inc. | 71 | 1,622 | ||||||
Oil States International, Inc.(a) | 115 | 3,122 | ||||||
TechnipFMC PLC(a) | 256 | 6,963 | ||||||
|
| |||||||
| 18,010 | ||||||||
|
| |||||||
Oil, Gas & Consumable Fuels – 1.7% | ||||||||
Noble Energy, Inc. | 595 | 16,838 | ||||||
|
| |||||||
| 34,848 | ||||||||
|
| |||||||
Consumer Staples – 2.9% | ||||||||
Beverages – 0.6% | ||||||||
Constellation Brands, Inc. – Class A | 31 | 6,006 | ||||||
|
| |||||||
Food & Staples Retailing – 2.3% | ||||||||
Wal-Mart Stores, Inc. | 300 | 22,704 | ||||||
|
| |||||||
| 28,710 | ||||||||
|
| |||||||
Real Estate – 1.7% | ||||||||
Real Estate Management & Development – 1.7% | ||||||||
CBRE Group, Inc. – Class A(a) | 464 | 16,890 | ||||||
|
| |||||||
Total Common Stocks | 819,242 | |||||||
|
| |||||||
| 6 | AB FLEXFEE CORE OPPORTUNITIES PORTFOLIO | abfunds.com |
PORTFOLIO OF INVESTMENTS (continued)
| Company | Shares | U.S. $ Value | ||||||
| ||||||||
SHORT-TERM INVESTMENTS – 100.4% | ||||||||
Investment Companies – 100.4% | ||||||||
AB Fixed Income Shares, Inc. – Government Money Market Portfolio – Class AB, 0.79%(b)(c) | 1,000,003 | $ | 1,000,003 | |||||
|
| |||||||
Total Investments – 182.7% | 1,819,245 | |||||||
Other assets less liabilities – (82.7)% | (823,669 | ) | ||||||
|
| |||||||
Net Assets – 100.0% | $ | 995,576 | ||||||
|
| |||||||
| (a) | Non-income producing security. |
| (b) | To obtain a copy of the fund’s shareholder report, please go to the Securities and Exchange Commission’s website at www.sec.gov, or call AB at (800) 227-4618. |
| (c) | Investment in affiliated money market mutual fund. The rate shown represents the 7-day yield as of period end. |
See notes to financial statements.
| abfunds.com | AB FLEXFEE CORE OPPORTUNITIES PORTFOLIO | 7 |
STATEMENT OF ASSETS & LIABILITIES
June 30, 2017 (unaudited)
| Assets | ||||
Investments in securities, at value | ||||
Unaffiliated issuers (cost $823,952) | $ | 819,242 | ||
Affiliated issuers (cost $1,000,003) | 1,000,003 | |||
Prepaid expenses | 45,496 | |||
Receivable from Adviser | 2,879 | |||
Dividends receivable | 296 | |||
|
| |||
Total assets | 1,867,916 | |||
|
| |||
| Liabilities | ||||
Payable for investment securities purchased | 823,952 | |||
Offering expenses payable | 46,000 | |||
Transfer Agent fee payable | 7 | |||
Accrued expenses and other liabilities | 2,381 | |||
|
| |||
Total liabilities | 872,340 | |||
|
| |||
Net Assets | $ | 995,576 | ||
|
| |||
| Composition of Net Assets | ||||
Capital stock, at par | $ | 10 | ||
Additional paid-in capital | 999,993 | |||
Undistributed net investment income | 283 | |||
Net unrealized depreciation on investments | (4,710 | ) | ||
|
| |||
| $ | 995,576 | |||
|
|
Net Asset Value Per Share—11 billion shares of capital stock authorized, $.0001 par value
| Class | Net Assets | Shares Outstanding | Net Asset Value | |||||||||
| ||||||||||||
| Advisor | $ | 995,576 | 100,000 | $ | 9.96 | |||||||
| ||||||||||||
See notes to financial statements.
| 8 | AB FLEXFEE CORE OPPORTUNITIES PORTFOLIO | abfunds.com |
STATEMENT OF OPERATIONS
Period from June 28, 2017(a) to June 30, 2017 (unaudited)
| Investment Income | ||||||||
Dividends | ||||||||
Unaffiliated issuers | $ | 295 | $ | 295 | ||||
|
| |||||||
| Expenses | ||||||||
Management fee (see Note B) | 17 | |||||||
Transfer agency-Advisor Class | 7 | |||||||
Audit and tax | 1,041 | |||||||
Administrative | 554 | |||||||
Amortization of offering expenses | 504 | |||||||
Legal | 458 | |||||||
Custodian | 413 | |||||||
Directors’ fees | 241 | |||||||
Printing | 172 | |||||||
Miscellaneous | 56 | |||||||
|
| |||||||
Total expenses | 3,463 | |||||||
Less: expenses waived and reimbursed by the Adviser | (3,451 | ) | ||||||
|
| |||||||
Net expenses | 12 | |||||||
|
| |||||||
Net investment income | 283 | |||||||
|
| |||||||
| Unrealized Gain (Loss) on Investment | ||||||||
Net change in unrealized appreciation/depreciation on: | ||||||||
Investments | (4,710 | ) | ||||||
|
| |||||||
Net loss on investments | (4,710 | ) | ||||||
|
| |||||||
Net Decrease in Net Assets from Operations | $ | (4,427 | ) | |||||
|
|
| (a) | Commencement of operations. |
See notes to financial statements.
| abfunds.com | AB FLEXFEE CORE OPPORTUNITIES PORTFOLIO | 9 |
STATEMENT OF CHANGES IN NET ASSETS
| June 28, 2017(a) to June 30, 2017 (unaudited) | ||||
| Increase in Net Assets from Operations | ||||
Net investment income | $ | 283 | ||
Net change in unrealized appreciation/depreciation on investments | (4,710 | ) | ||
|
| |||
Net decrease in net assets from operations | (4,427 | ) | ||
| Capital Stock Transactions | ||||
Net increase | 1,000,003 | |||
|
| |||
Total increase | 995,576 | |||
| Net Assets | ||||
Beginning of period | – 0 | – | ||
|
| |||
End of period (including undistributed net investment income of $283) | $ | 995,576 | ||
|
| |||
| (a) | Commencement of operations. |
See notes to financial statements.
| 10 | AB FLEXFEE CORE OPPORTUNITIES PORTFOLIO | abfunds.com |
NOTES TO FINANCIAL STATEMENTS
June 30, 2017 (unaudited)
NOTE A
Significant Accounting Policies
AB Cap Fund, Inc. (the “Company”), which is a Maryland corporation, is registered under the Investment Company Act of 1940 as an open-end management investment company. The Company operates as a series company currently comprised of 31 portfolios. Each portfolio is considered to be a separate entity for financial reporting and tax purposes. This report relates only to the AB FlexFee Core Opportunities Portfolio (the “Fund”), a diversified portfolio. The Fund commenced operations on June 28, 2017. The Fund has authorized issuance of Class A, Class B, Class C, Advisor Class, Class R, Class K, Class I, Class Z, Class T, Class 1, and Class 2 shares. No classes are being publicly offered. Class A, Class B, Class C, Class R, Class K, Class I, Class Z, Class T, Class 1, and Class 2 shares have not been issued. As of June 30, 2017, AllianceBernstein L.P. (the “Adviser”) was the sole shareholder of Advisor Class shares. Advisor Class shares are sold without an initial or contingent deferred sales charge and are not subject to ongoing distribution expenses. All eleven classes of shares have identical voting, dividend, liquidation and other rights, except that the classes bear different distribution and transfer agency expenses. Each class has exclusive voting rights with respect to its distribution plan. The financial statements have been prepared in conformity with U.S. generally accepted accounting principles (“U.S. GAAP”), which require management to make certain estimates and assumptions that affect the reported amounts of assets and liabilities in the financial statements and amounts of income and expenses during the reporting period. Actual results could differ from those estimates. The Fund is an investment company under U.S. GAAP and follows the accounting and reporting guidance applicable to investment companies. The following is a summary of significant accounting policies followed by the Fund.
1. Security Valuation
Portfolio securities are valued at their current market value determined on the basis of market quotations or, if market quotations are not readily available or are deemed unreliable, at “fair value” as determined in accordance with procedures established by and under the general supervision of the Fund’s Board of Directors (the “Board”).
In general, the market values of securities which are readily available and deemed reliable are determined as follows: securities listed on a national securities exchange (other than securities listed on the NASDAQ Stock Market, Inc. (“NASDAQ”)) or on a foreign securities exchange are valued at the last sale price at the close of the exchange or foreign securities exchange. If there has been no sale on such day, the securities are valued at the last traded price from the previous day. Securities listed on more
| abfunds.com | AB FLEXFEE CORE OPPORTUNITIES PORTFOLIO | 11 |
NOTES TO FINANCIAL STATEMENTS (continued)
than one exchange are valued by reference to the principal exchange on which the securities are traded; securities listed only on NASDAQ are valued in accordance with the NASDAQ Official Closing Price; listed or over the counter (“OTC”) market put or call options are valued at the mid level between the current bid and ask prices. If either a current bid or current ask price is unavailable, AllianceBernstein L.P. (the “Adviser”) will have discretion to determine the best valuation (e.g. last trade price in the case of listed options); open futures contracts are valued using the closing settlement price or, in the absence of such a price, the most recent quoted bid price. If there are no quotations available for the day of valuation, the last available closing settlement price is used; U.S. Government securities and any other debt instruments having 60 days or less remaining until maturity are generally valued at market by an independent pricing vendor, if a market price is available. If a market price is not available, the securities are valued at amortized cost. This methodology is commonly used for short-term securities that have an original maturity of 60 days or less, as well as short-term securities that had an original term to maturity that exceeded 60 days. In instances when amortized cost is utilized, the Valuation Committee (the “Committee”) must reasonably conclude that the utilization of amortized cost is approximately the same as the fair value of the security. Such factors the Committee will consider include, but are not limited to, an impairment of the creditworthiness of the issuer or material changes in interest rates. Fixed-income securities, including mortgage-backed and asset-backed securities, may be valued on the basis of prices provided by a pricing service or at a price obtained from one or more of the major broker-dealers. In cases where broker-dealer quotes are obtained, the Adviser may establish procedures whereby changes in market yields or spreads are used to adjust, on a daily basis, a recently obtained quoted price on a security. Swaps and other derivatives are valued daily, primarily using independent pricing services, independent pricing models using market inputs, as well as third party broker-dealers or counterparties. Open end mutual funds are valued at the closing net asset value per share, while exchange traded funds are valued at the closing market price per share.
Securities for which market quotations are not readily available (including restricted securities) or are deemed unreliable are valued at fair value as deemed appropriate by the Adviser. Factors considered in making this determination may include, but are not limited to, information obtained by contacting the issuer, analysts, analysis of the issuer’s financial statements or other available documents. In addition, the Fund may use fair value pricing for securities primarily traded in non-U.S. markets because most foreign markets close well before the Fund values its securities at 4:00 p.m., Eastern Time. The earlier close of these foreign markets gives rise to the possibility that significant events, including broad market moves, may have
| 12 | AB FLEXFEE CORE OPPORTUNITIES PORTFOLIO | abfunds.com |
NOTES TO FINANCIAL STATEMENTS (continued)
occurred in the interim and may materially affect the value of those securities. To account for this, the Fund may frequently value many of its foreign equity securities using fair value prices based on third party vendor modeling tools to the extent available.
2. Fair Value Measurements
In accordance with U.S. GAAP regarding fair value measurements, fair value is defined as the price that the Fund would receive to sell an asset or pay to transfer a liability in an orderly transaction between market participants at the measurement date. U.S. GAAP establishes a framework for measuring fair value, and a three-level hierarchy for fair value measurements based upon the transparency of inputs to the valuation of an asset or liability (including those valued based on their market values as described in Note A.1 above). Inputs may be observable or unobservable and refer broadly to the assumptions that market participants would use in pricing the asset or liability. Observable inputs reflect the assumptions market participants would use in pricing the asset or liability based on market data obtained from sources independent of the Fund. Unobservable inputs reflect the Fund’s own assumptions about the assumptions that market participants would use in pricing the asset or liability based on the best information available in the circumstances. Each investment is assigned a level based upon the observability of the inputs which are significant to the overall valuation. The three-tier hierarchy of inputs is summarized below.
| • | Level 1—quoted prices in active markets for identical investments |
| • | Level 2—other significant observable inputs (including quoted prices for similar investments, interest rates, prepayment speeds, credit risk, etc.) |
| • | Level 3—significant unobservable inputs (including the Fund’s own assumptions in determining the fair value of investments) |
Where readily available market prices or relevant bid prices are not available for certain equity investments, such investments may be valued based on similar publicly traded investments, movements in relevant indices since last available prices or based upon underlying company fundamentals and comparable company data (such as multiples to earnings or other multiples to equity). Where an investment is valued using an observable input, such as another publicly traded security, the investment will be classified as Level 2. If management determines that an adjustment is appropriate based on restrictions on resale, illiquidity or uncertainty, and such adjustment is a significant component of the valuation, the investment will be classified as Level 3. An investment will also be classified as Level 3 where management uses company fundamentals and other significant inputs to determine the valuation.
| abfunds.com | AB FLEXFEE CORE OPPORTUNITIES PORTFOLIO | 13 |
NOTES TO FINANCIAL STATEMENTS (continued)
The following table summarizes the valuation of the Fund’s investments by the above fair value hierarchy levels as of June 30, 2017:
Investments in | Level 1 | Level 2 | Level 3 | Total | ||||||||||||
Assets: | ||||||||||||||||
Common Stocks^ | $ | 819,242 | $ | – 0 | – | $ | – 0 | – | $ | 819,242 | ||||||
Short-Term Investments: | ||||||||||||||||
Investment Companies | 1,000,003 | – 0 | – | – 0 | – | 1,000,003 | ||||||||||
|
|
|
|
|
|
|
| |||||||||
Total Investments in Securities | 1,819,245 | – 0 | – | – 0 | – | 1,819,245 | ||||||||||
Other Financial Instruments*: | – 0 | – | – 0 | – | – 0 | – | – 0 | – | ||||||||
|
|
|
|
|
|
|
| |||||||||
Total | $ | 1,819,245 | $ | – 0 | – | $ | – 0 | – | $ | 1,819,245 | ||||||
|
|
|
|
|
|
|
| |||||||||
| ^ | See Portfolio of Investments for sector classifications. |
| * | Other financial instruments are derivative instruments, such as futures, forwards and swaps, which are valued at the unrealized appreciation/depreciation on the instrument. |
The Fund recognizes all transfers between levels of the fair value hierarchy assuming the financial instrument was transferred at the beginning of the reporting period.
The Adviser established the Committee to oversee the pricing and valuation of all securities held in the Fund. The Committee operates under pricing and valuation policies and procedures established by the Adviser and approved by the Board, including pricing policies which set forth the mechanisms and processes to be employed on a daily basis to implement these policies and procedures. In particular, the pricing policies describe how to determine market quotations for securities and other instruments. The Committee’s responsibilities include: 1) fair value and liquidity determinations (and oversight of any third parties to whom any responsibility for fair value and liquidity determinations is delegated), and 2) regular monitoring of the Adviser’s pricing and valuation policies and procedures and modification or enhancement of these policies and procedures (or recommendation of the modification of these policies and procedures) as the Committee believes appropriate.
The Committee is also responsible for monitoring the implementation of the pricing policies by the Adviser’s Pricing Group (the “Pricing Group”) and any third party which performs certain pricing functions in accordance with the pricing policies. The Pricing Group is responsible for the oversight of the third party on a day-to-day basis. The Committee and the Pricing Group perform a series of activities to provide reasonable assurance of the accuracy of prices including: 1) periodic vendor due diligence meetings, review of methodologies, new developments and process at vendors, 2) daily comparison of security valuation versus prior day for all securities that exceeded established thresholds, and 3) daily review of unpriced, stale, and variance reports with exceptions reviewed by senior management and the Committee.
| 14 | AB FLEXFEE CORE OPPORTUNITIES PORTFOLIO | abfunds.com |
NOTES TO FINANCIAL STATEMENTS (continued)
In addition, several processes outside of the pricing process are used to monitor valuation issues including: 1) performance and performance attribution reports are monitored for anomalous impacts based upon benchmark performance, and 2) portfolio managers review all portfolios for performance and analytics (which are generated using the Adviser’s prices).
3. Currency Translation
Assets and liabilities denominated in foreign currencies and commitments under forward currency exchange contracts are translated into U.S. dollars at the mean of the quoted bid and ask prices of such currencies against the U.S. dollar. Purchases and sales of portfolio securities are translated into U.S. dollars at the rates of exchange prevailing when such securities were acquired or sold. Income and expenses are translated into U.S. dollars at the rates of exchange prevailing when accrued.
Net realized gain or loss on foreign currency transactions represents foreign exchange gains and losses from sales and maturities of foreign fixed income investments, foreign currency exchange contracts, holding of foreign currencies, currency gains or losses realized between the trade and settlement dates on foreign investment transactions, and the difference between the amounts of dividends, interest and foreign withholding taxes recorded on the Fund’s books and the U.S. dollar equivalent amounts actually received or paid. Net unrealized currency gains and losses from valuing foreign currency denominated assets and liabilities at period end exchange rates are reflected as a component of net unrealized appreciation and depreciation of foreign currency denominated assets and liabilities.
4. Taxes
It is the Fund’s policy to meet the requirements of the Internal Revenue Code applicable to regulated investment companies and to distribute all of its investment company taxable income and net realized gains, if any, to shareholders. Therefore, no provisions for federal income or excise taxes are required. The Fund may be subject to taxes imposed by countries in which it invests. Such taxes are generally based on income and/or capital gains earned or repatriated. Taxes are accrued and applied to net investment income, net realized gains and net unrealized appreciation/depreciation as such income and/or gains are earned.
In accordance with U.S. GAAP requirements regarding accounting for uncertainties in income taxes, management has analyzed the Fund’s tax positions taken or expected to be taken on federal and state income tax returns for the current initial tax year, and has concluded that no provision for income tax is required in the Fund’s financial statements.
| abfunds.com | AB FLEXFEE CORE OPPORTUNITIES PORTFOLIO | 15 |
NOTES TO FINANCIAL STATEMENTS (continued)
5. Investment Income and Investment Transactions
Dividend income is recorded on the ex-dividend date or as soon as the Fund is informed of the dividend. Interest income is accrued daily. Investment transactions are accounted for on the date securities are purchased or sold. Investment gains or losses are determined on the identified cost basis. The Fund amortizes premiums and accretes discounts as adjustments to interest income.
6. Class Allocations
All income earned and expenses incurred by the Fund are borne on a pro-rata basis by each settled class of shares, based on the proportionate interest in the Fund represented by the net assets of such class, except for class specific expenses which are allocated to the respective class. Expenses of the Company are charged proportionately to each portfolio or based on other appropriate methods. Realized and unrealized gains and losses are allocated among the various share classes based on their respective net assets.
7. Dividends and Distributions
Dividends and distributions to shareholders, if any, are recorded on the ex-dividend date. Income dividends and capital gains distributions are determined in accordance with federal tax regulations and may differ from those determined in accordance with U.S. GAAP. To the extent these differences are permanent, such amounts are reclassified within the capital accounts based on their federal tax basis treatment; temporary differences do not require such reclassification.
8. Offering Expenses
Offering expenses of $46,000 were deferred and amortized on a straight line basis over a one year period starting from June 28, 2017 (commencement of operations).
NOTE B
Management Fee and Other Transactions with Affiliates
Under the terms of the investment advisory agreement, the Fund pays the Adviser a management fee at an annual rate of .55% of the Fund’s average daily net assets (“Base Fee”). The management fee is increased or decreased from the Base Fee by a performance adjustment (“Performance Adjustment”) that depends on whether, and to what extent, the investment performance of the Advisor Class shares of the Fund (“Measuring Class”) exceeds, or is exceeded by, the performance of the S&P 500 Index (“Index”) plus 1.40% (“Index Hurdle”) over the Performance Period (as defined below). The Performance Adjustment is calculated and accrued daily, according to a schedule that adds or subtracts .00357% of the Fund’s average daily net assets for each .01% of absolute performance by
| 16 | AB FLEXFEE CORE OPPORTUNITIES PORTFOLIO | abfunds.com |
NOTES TO FINANCIAL STATEMENTS (continued)
which the performance of the Measuring Class exceeds or lags the performance of the Index Hurdle for the period from the beginning of the Performance Period through the current business day. The maximum Performance Adjustment (positive or negative) will not exceed an annualized rate of +/- .50% (“Maximum Performance Adjustment”) of the Fund’s average daily net assets, which would occur when the performance of the Measuring Class exceeds, or is exceeded by, the Index Hurdle by 1.40% for the Performance Period. On a monthly basis, the Fund will pay the Adviser the minimum fee rate of ..05% on an annualized basis (Base Fee minus the Maximum Performance Adjustment) applied to the average daily net assets for the month. At the end of the Performance Period, the Fund will pay to the Adviser the total management fee, less the amount of any minimum fees paid during the Performance Period and any waivers described below. The period over which performance is measured (“Performance Period”) is initially from the commencement of operations to December 31, 2018 and thereafter each 12-month period beginning on the first business day in the month of January through December 31 of the same year. In addition, the Adviser has agreed to waive its management fee by limiting the Fund’s accrual of the management fee (base fee plus performance adjustment) on any day to the amount corresponding to the maximum fee rate multiplied by the Fund’s current net assets as of the preceding day if such amount is less than the amount that would have been accrued based on the Fund’s average daily net assets for the performance period. The minimum fee is paid monthly while the performance fee is paid at the end of the Performance Period. For the reporting period ended June 30, 2017, the Fund accrued management fees of $17, as reflected in the Statement of Operations, at an annual effective rate (excluding the impact from any expense waivers in effect) of .16% of the Fund’s average net assets, which included a (.39)% performance adjustment of $(43). The Adviser has agreed to waive its fees and bear certain expenses to the extent necessary to limit total expenses (other than the management fee, acquired fund fees and expenses other than the advisory fees of any AB Mutual Funds in which the Fund may invest, interest expense, taxes, extraordinary expenses, and brokerage commissions and other transaction costs) on an annual basis from exceeding .05% of average daily net assets. Any fees waived and expenses borne by the Adviser are subject to repayment by the Fund until the end of the third fiscal year after the fiscal period in which the fee was waived or the expense was borne; such waivers that are subject to repayment amount to $2,886 for the fiscal period ended June 30, 2017. In any case, no repayment will be made that would cause the Fund’s total annual expenses (subject to the exclusions set forth above) to exceed .05%.
Pursuant to the investment advisory agreement, the Fund may reimburse the Adviser for certain legal and accounting services provided to the Fund by the Adviser. For the period ended June 30, 2017, the Adviser voluntarily agreed to waive such fees that amounted to $554.
| abfunds.com | AB FLEXFEE CORE OPPORTUNITIES PORTFOLIO | 17 |
NOTES TO FINANCIAL STATEMENTS (continued)
The Fund compensates AllianceBernstein Investor Services, Inc. (“ABIS”), a wholly-owned subsidiary of the Adviser, under a Transfer Agency Agreement for providing personnel and facilities to perform transfer agency services for the Fund. ABIS may make payments to intermediaries that provide omnibus account services, sub-accounting services and/or networking services. The compensation retained by ABIS amounted to $83 for the period ended June 30, 2017.
The Fund may invest in AB Government Money Market Portfolio (the “Government Money Market Portfolio”) which has a contractual annual advisory fee rate of .20% of the portfolio’s average daily net assets and bears its own expenses. In connection with the investment by the Fund in the Government Money Market Portfolio, the Adviser has agreed to waive its investment advisory fee from the Fund in an amount equal to the Fund’s pro rata share of the effective advisory fee of Government Money Market Portfolio, as borne indirectly by the Fund as an acquired fund fee and expense. For the period ended June 30, 2017, such waiver amounted to $11. A summary of the Fund’s transactions in shares of the Government Money Market Portfolio for the period ended June 30, 2017 is as follows:
Market Value | Purchases at Cost (000) | Sales Proceeds (000) | Market Value June 30, 2017 (000) | Dividend Income (000) | ||||||||||||||
| $ | – 0 | – | $ | 1,000 | $ | – 0 | – | $ | 1,000 | $ | – 0 | – | ||||||
| * | Commencement of operations. |
Brokerage commissions paid on investment transactions for the period ended June 30, 2017 amounted to $151, of which $0 and $0, respectively, was paid to Sanford C. Bernstein & Co. LLC and Sanford C. Bernstein Limited, affiliates of the Adviser.
NOTE C
Investment Transactions
Purchases and sales of investment securities (excluding short-term investments) for the period ended June 30, 2017, were as follows:
| Purchases | Sales | |||||||
Investment securities (excluding | $ | 823,952 | $ | – 0 | – | |||
U.S. government securities | – 0 | – | – 0 | – | ||||
The cost of investments for federal income tax purposes was substantially the same as cost for financial reporting purposes. Accordingly, gross
| 18 | AB FLEXFEE CORE OPPORTUNITIES PORTFOLIO | abfunds.com |
NOTES TO FINANCIAL STATEMENTS (continued)
unrealized appreciation and unrealized depreciation (excluding foreign currency contracts and futures contracts) are as follows:
Gross unrealized appreciation | $ | 3,596 | ||
Gross unrealized depreciation | (8,306 | ) | ||
|
| |||
Net unrealized depreciation | $ | (4,710 | ) | |
|
|
1. Derivative Financial Instruments
The Fund may use derivatives in an effort to earn income and enhance returns, to replace more traditional direct investments, to obtain exposure to otherwise inaccessible markets (collectively, “investment purposes”), or to hedge or adjust the risk profile of its portfolio.
The Fund did not engage in derivative transactions for the period ended June 30, 2017.
2. Currency Transactions
The Fund may invest in non-U.S. Dollar-denominated securities on a currency hedged or unhedged basis. The Fund may seek investment opportunities by taking long or short positions in currencies through the use of currency-related derivatives, including forward currency exchange contracts, futures and options on futures, swaps, and other options. The Fund may enter into transactions for investment opportunities when it anticipates that a foreign currency will appreciate or depreciate in value but securities denominated in that currency are not held by the Fund and do not present attractive investment opportunities. Such transactions may also be used when the Adviser believes that it may be more efficient than a direct investment in a foreign currency-denominated security. The Fund may also conduct currency exchange contracts on a spot basis (i.e., for cash at the spot rate prevailing in the currency exchange market for buying or selling currencies).
NOTE D
Capital Stock
Each class consists of 1,000,000,000 authorized shares. Transactions in capital shares for each class were as follows:
| Shares | Amount | |||||||||||||||
| June 28, 2017* to June 30, 2017 (unaudited) | June 28, 2017* to June 30, 2017 (unaudited) | |||||||||||||||
|
|
|
| |||||||||||||
| Advisor Class | ||||||||||||||||
Shares sold | 100,000 | $ | 1,000,003 | |||||||||||||
| ||||||||||||||||
Net increase | 100,000 | $ | 1,000,003 | |||||||||||||
| ||||||||||||||||
| * | Commencement of operations. |
| abfunds.com | AB FLEXFEE CORE OPPORTUNITIES PORTFOLIO | 19 |
NOTES TO FINANCIAL STATEMENTS (continued)
NOTE E
Risks Involved in Investing in the Fund
Capitalization Risk—Investments in small- and mid-capitalization companies may be more volatile than investments in large-capitalization companies. Investments in small- and mid-capitalization companies may have additional risks because these companies may have limited product lines, markets or financial resources.
Derivatives Risk—The Fund may enter into derivative transactions such as forwards, options, futures and swaps. Derivatives may be illiquid, difficult to price, and leveraged so that small changes may produce disproportionate losses for the Fund, and subject to counterparty risk to a greater degree than more traditional investments. Derivatives may result in significant losses, including losses that are far greater than the value of the derivatives reflected on the statement of assets and liabilities.
Indemnification Risk—In the ordinary course of business, the Fund enters into contracts that contain a variety of indemnifications. The Fund’s maximum exposure under these arrangements is unknown. However, the Fund has not had prior claims or losses pursuant to these indemnification provisions and expects the risk of loss thereunder to be remote. Therefore, the Fund has not accrued any liability in connection with these indemnification provisions.
NOTE F
Tax Information
For tax purposes, net capital losses may be carried over to offset future capital gains, if any. Under the Regulated Investment Company Modernization Act of 2010, funds are permitted to carry forward capital losses incurred in taxable years beginning after December 22, 2010 for an indefinite period. These capital loss carryforwards will retain their character as either short-term or long-term capital losses.
NOTE G
Other
In October 2016, the U.S. Securities and Exchange Commission adopted new rules and amended existing rules (together, “final rules”) intended to modernize the reporting and disclosure of information by registered investment companies. In part, the final rules amend Regulation S-X and require standardized, enhanced disclosure about derivatives in investment company financial statements, as well as other amendments. The compliance date for the amendments to Regulation S-X is August 1, 2017 (for reporting period end dates of August 31, 2017 or after). Management has evaluated the impact of the amendments and expects the effect of the adoption of the final rules on financial statements will be limited to additional disclosures.
| 20 | AB FLEXFEE CORE OPPORTUNITIES PORTFOLIO | abfunds.com |
NOTES TO FINANCIAL STATEMENTS (continued)
NOTE H
Subsequent Events
Management has evaluated subsequent events for possible recognition or disclosure in the financial statements through the date the financial statements are issued. Management has determined that there are no material events that would require disclosure in the Fund’s financial statements through this date.
| abfunds.com | AB FLEXFEE CORE OPPORTUNITIES PORTFOLIO | 21 |
FINANCIAL HIGHLIGHTS
Selected Data For A Shares Of Capital Stock Outstanding Throughout Each Period
| Advisor Class | ||||
June 28, 2017(a) to 2017 | ||||
|
| |||
Net asset value, beginning of period | $ 10.00 | |||
|
| |||
Income From Investment Operations | ||||
Net investment income(b)(c)(d) | .00 | |||
Net realized and unrealized loss on investment and foreign currency transactions | (.04 | ) | ||
|
| |||
Net decrease in net asset value from operations | (.04 | ) | ||
|
| |||
Net asset value, end of period | $ 9.96 | |||
|
| |||
Total Return | ||||
Total investment return based on net asset value(e) | (0.40 | )% | ||
Ratios/Supplemental Data | ||||
Net assets, end of period (000’s omitted) | $996 | |||
Ratio to average net assets of: | ||||
Expenses, net of waivers/reimbursements(f)(g) | .11 | % | ||
Expenses, before waivers/reimbursements(f)(g) | 31.77 | % | ||
Net investment income(d)(g) | 2.60 | % | ||
Portfolio turnover rate | .00 | % | ||
| (a) | Commencement of operations. |
| (b) | Based on average shares outstanding. |
| (c) | Amount is less than $0.005. |
| (d) | Net of expenses waived/reimbursed by the Adviser. |
| (e) | Total investment return is calculated assuming an initial investment made at the net asset value at the beginning of the period, reinvestment of all dividends and distributions at net asset value during the period, and redemption on the last day of the period. Initial sales charge or contingent deferred sales charge is not reflected in the calculation of total investment return. Total investment return does not reflect the deduction of taxes that a shareholder would pay on fund distributions or the redemption of fund shares. Total investment return for a period of less than one year is not annualized. |
| (f) | In connection with the Fund’s investments in affiliated underlying portfolios, the Fund incurs no direct expenses but bears proportionate shares of the fees and expenses (i.e. operating, administrative and investment advisory fees) of the affiliated underlying portfolios. The Adviser has contractually agreed to waive its fees from the Fund in an amount equal to the Fund’s pro rata share of certain acquired fund fees and expenses, and for the period ended June 30, 2017, such waiver amounted to 0.10% annualized for the Fund. |
| (g) | Annualized. |
See notes to financial statements.
| 22 | AB FLEXFEE CORE OPPORTUNITIES PORTFOLIO | abfunds.com |
BOARD OF DIRECTORS
Marshall C. Turner, Jr(1) , Chairman
John H. Dobkin(1)
Michael J. Downey(1)
William H. Foulk, Jr.(1)
D. James Guzy(1)
Nancy P. Jacklin(1)
Robert M. Keith, President and Chief Executive Officer
Carol C. McMullen(1)
Garry L. Moody(1)
Earl D. Weiner(1)
OFFICERS
Philip L. Kirstein,
Senior Vice President and Independent Compliance Officer
Frank V. Caruso(2), Senior Vice President
Emilie D. Wrapp, Secretary
Joseph J. Mantineo, Treasurer and Chief Financial Officer
Phyllis J. Clarke, Controller
Vincent S. Noto, Chief Compliance Officer
Custodian and Accounting Agent Brown Brothers Harriman & Co. 50 Post Office Square Boston, MA 02110
Principal Underwriter AllianceBernstein Investments, Inc. 1345 Avenue of the Americas New York, NY 10105
Transfer Agent AllianceBernstein Investor Services, Inc. P.O. Box 786003 San Antonio, TX 78278-6003 Toll-Free (800) 221-6003 | Independent Registered Public Accounting Firm Ernst & Young LLP 5 Times Square New York, NY 10036
Legal Counsel Seward & Kissel LLP One Battery Park Plaza New York, NY 10004 |
| 1 | Member of the Audit Committee, the Governance and Nominating Committee and the Independent Directors Committee. |
| 2 | The management of, and investment decisions for, the Fund’s portfolio are made by the Adviser’s Relative Value Investment Team. While the members of the team work jointly to determine the investment strategy, including security selection, for the Fund, Mr. Frank Caruso, CFA, who is team leader of U.S. Growth Equities, is primarily responsible for the day-to-day management of the Fund. |
| abfunds.com | AB FLEXFEE CORE OPPORTUNITIES PORTFOLIO | 23 |
Information Regarding the Review and Approval of the Fund’s Advisory Agreement
The disinterested directors (the “directors”) of AB Cap Fund, Inc. (the “Company”) unanimously approved the Company’s Advisory Agreement with the Adviser in respect of AB FlexFeeTM Core Opportunities Portfolio (the “Fund”) for an initial two-year period at a meeting held on January 31-February 1, 2017 (the “Meeting”). (At the time of the approval of the Advisory Agreement, the Fund was known as AB Performance Fee Series – Core Opportunities Portfolio.)
Prior to approval of the Advisory Agreement, the directors had requested from the Adviser, and received and evaluated, extensive materials. They reviewed the proposed Advisory Agreement with the Adviser and with experienced counsel who are independent of the Adviser, who advised on the relevant legal standards. The directors also reviewed an independent evaluation prepared by the Company’s Senior Officer (who is also the Company’s Independent Compliance Officer), who acted as their independent fee consultant, of the reasonableness of the proposed performance-based advisory fee (which consists of a base fee plus or minus a performance adjustment), in which the Senior Officer concluded that the proposed contractual fee for the Fund was reasonable. The directors also discussed the proposed approval in private sessions with counsel and the Company’s Senior Officer.
The directors considered their knowledge of the nature and quality of the services to be provided by the Adviser to the Fund gained from their experience as directors or trustees of most of the registered investment companies advised by the Adviser, their overall confidence in the Adviser’s integrity and competence they have gained from that experience, the Adviser’s initiative in identifying and raising potential issues with the directors and its responsiveness, frankness and attention to concerns raised by the directors in the past, including the Adviser’s willingness to consider and implement organizational and operational changes designed to improve investment results and the services provided to the AB Funds. The directors noted that they have four regular meetings each year, at each of which they receive presentations from the Adviser on the investment results of the AB Funds and review extensive materials and information presented by the Adviser.
The directors also considered all factors they believed relevant, including the specific matters discussed below. During the course of their deliberations, the directors evaluated, among other things, the reasonableness of the proposed advisory fee. The directors did not identify any particular information that was all-important or controlling, and different directors may have attributed different weights to the various factors. The directors determined that the selection of the Adviser to manage the Fund and the overall arrangements between the Fund and the Adviser, as provided in
| 24 | AB FLEXFEE CORE OPPORTUNITIES PORTFOLIO | abfunds.com |
the Advisory Agreement, including the proposed advisory fee, were fair and reasonable in light of the services to be performed, expenses to be incurred and such other matters as the directors considered relevant in the exercise of their business judgment. The material factors and conclusions that formed the basis for the directors’ determinations included the following:
Nature, Extent and Quality of Services to be Provided
The directors considered the scope and quality of services to be provided by the Adviser under the Advisory Agreement, including the quality of the investment research capabilities of the Adviser and the other resources it has dedicated to performing services for the AB Funds. They also noted the professional experience and qualifications of the Fund’s portfolio management team and other senior personnel of the Adviser. The directors also considered that the Advisory Agreement provides that the Fund will reimburse the Adviser for the cost to it of providing certain clerical, accounting, administrative and other services to the Fund by employees of the Adviser or its affiliates. Requests for these reimbursements will be subject to the directors’ approval on a quarterly basis and, to the extent requested and paid, result in a higher rate of total compensation from the Fund to the Adviser than the fee rate stated in the Advisory Agreement. The directors noted that the methodology to be used to determine the reimbursement amounts had been reviewed by an independent consultant retained by the Company’s Senior Officer. The quality of administrative and other services, including the Adviser’s role in coordinating the activities of the Fund’s other service providers, also was considered. The directors concluded that, overall, they were satisfied with the nature, extent and quality of services to be provided to the Fund under the Advisory Agreement.
Costs of Services to be Provided and Profitability
Because the Fund had not yet commenced operations, the directors were unable to consider historical information about the profitability of the Fund. However, the Adviser agreed to provide the directors with profitability information in connection with future proposed continuances of the Advisory Agreement. They also considered the costs to be borne by the Adviser in providing services to the Fund and that the Fund was unlikely to be profitable to the Adviser unless it achieves a material level of net assets. The directors also noted that, due to the performance fee component of the advisory fee, profitability would tend to be higher with better performance relative to the Fund’s benchmark, which they considered to create an appropriate alignment of incentives.
Fall-Out Benefits
The directors considered the other benefits to the Adviser and its affiliates from their proposed relationships with the Fund, including, but not limited to, benefits relating to 12b-1 fees and sales charges to be received by the Fund’s principal underwriter (which is a wholly owned subsidiary of the Adviser) in respect of certain classes of the Fund’s shares; and transfer
| abfunds.com | AB FLEXFEE CORE OPPORTUNITIES PORTFOLIO | 25 |
agency fees to be paid by the Fund to a wholly owned subsidiary of the Adviser. The directors recognized that the Adviser’s future profitability would be somewhat lower without these benefits. The directors understood that the Adviser also might derive reputational and other benefits from its association with the Fund.
Investment Results
Since the Fund had not yet commenced operations, no performance or other historical information for the Fund was available. The Adviser manages another AB Fund with a similar investment style, and, at the Meeting, the directors reviewed performance information for that AB Fund. Based on this information, together with the Adviser’s written and oral presentations regarding the management of the Fund and their general knowledge and confidence in the Adviser’s expertise in managing mutual funds, the directors concluded that they were satisfied that the Adviser was capable of providing high quality Fund management services to the Fund.
Advisory Fees and Other Expenses
The directors considered the proposed advisory fee rate payable by the Fund to the Adviser and information prepared by three analytical services that are not affiliated with the Adviser (the “15(c) service providers”), concerning advisory fee rates paid by other funds in the same category as the Fund at a hypothetical common asset level of $250 million. The directors recognized that it is difficult to make comparisons of advisory fees because there are variations in the services that are included in the fees paid by other funds. The directors considered the Fund’s proposed contractual effective advisory fee rate against a peer group median.
The directors recognized that the Adviser’s total compensation from the Fund pursuant to the Advisory Agreement would be increased by amounts paid pursuant to the expense reimbursement provision in the Advisory Agreement, and that the impact of such expense reimbursement would depend on the size of the Fund and the extent to which the Adviser requests reimbursements pursuant to this provision.
The directors also considered the Adviser’s fee schedule for institutional clients pursuing a similar investment style. For this purpose, they reviewed the relevant advisory fee information from the Adviser’s Form ADV and the evaluation from the Company’s Senior Officer and noted the differences between the Fund’s proposed fee schedule, on the one hand, and the institutional fee schedule and the schedule of fees charged to any offshore funds and any sub-advised funds, on the other. The directors noted that the Adviser may, in some cases, agree to fee rates with large institutional clients that are lower than those reviewed by the directors and that they had previously discussed with the Adviser its policies in respect of such arrangements. The directors also compared the proposed advisory fee for the Fund with that for another AB Fund with a similar investment style.
| 26 | AB FLEXFEE CORE OPPORTUNITIES PORTFOLIO | abfunds.com |
The Adviser reviewed with the directors the significantly greater scope of the services it provides to the Fund relative to institutional, offshore fund and sub-advised fund clients. In light of the substantial differences in services rendered by the Adviser to institutional, offshore fund and sub-advised fund clients as compared to funds such as the Fund, the directors considered these fee comparisons inapt and did not place significant weight on them in their deliberations.
The directors noted that the Fund may invest in shares of exchange-traded funds (“ETFs”), subject to the restrictions and limitations of the Investment Company Act of 1940 as these may be varied as a result of exemptive orders issued by the SEC. The directors also noted that ETFs pay advisory fees pursuant to their advisory contracts. The directors concluded, based on the Adviser’s explanation of how it may use ETFs when they are the most cost-effective way to obtain desired exposures or to “equitize” cash inflows pending purchases of underlying securities, that the proposed advisory fee would be for services in addition to, rather than duplicative of, the services provided under the advisory contracts of the ETFs in which the Fund may invest.
The directors also considered the projected total expense ratio of the Advisor Class shares of the Fund in comparison to a peer group and a peer universe selected by each 15(c) service provider. The directors also considered the Adviser’s proposed expense cap for the “other expenses” of the Fund (expenses excluding the advisory fee, Rule 12b-1 fees, and certain other expenses typically excluded from the Adviser’s expense caps) for the period ending December 31, 2018. The directors noted that it was likely that the expense ratios of some of the other funds in the Fund’s category were lowered by waivers or reimbursements by those funds’ investment advisers, which in some cases might be voluntary or temporary. The directors view the projected expense ratio information as relevant to their evaluation of the Adviser’s services because the Adviser is responsible for coordinating services provided to the Fund by acceptable.
Economies of Scale
The directors noted that the proposed advisory fee schedule for the Fund does not contain breakpoints and that they had previously discussed their strong preference for breakpoints in advisory contracts with the Adviser. The directors took into consideration prior presentations by an independent consultant on economies of scale in the mutual fund industry and for the AB Funds, and by the Adviser concerning certain of its views on economies of scale. The directors also had requested and received from the Adviser certain updates on economies of scale in advance of the Meeting. The directors believe that economies of scale may be realized (if at all) by the Adviser across a variety of products and services, and not only in respect of a single fund. The directors noted that there is no established methodology for setting breakpoints that give effect to the
| abfunds.com | AB FLEXFEE CORE OPPORTUNITIES PORTFOLIO | 27 |
fund-specific services provided by a fund’s adviser and to the economies of scale that an adviser may realize in its overall mutual fund business or those components of it which directly or indirectly affect a fund’s operations. The directors observed that in the mutual fund industry as a whole, as well as among funds similar to the Fund, there is no uniformity or pattern in the fees and asset levels at which breakpoints (if any) apply. The directors also noted that the advisory agreements for many funds do not have breakpoints at all. The directors informed the Adviser that they would monitor the Fund’s assets and its profitability to the Adviser and anticipated revisiting the question of breakpoints in the future if circumstances warranted doing so.
| 28 | AB FLEXFEE CORE OPPORTUNITIES PORTFOLIO | abfunds.com |
This page is not part of the Shareholder Report or the Financial Statements.
AB FAMILY OF FUNDS
US EQUITY
US CORE
Core Opportunities Fund
Select US Equity Portfolio
US GROWTH
Concentrated Growth Fund
Discovery Growth Fund
Growth Fund
Large Cap Growth Fund
Small Cap Growth Portfolio
US VALUE
Discovery Value Fund
Equity Income Fund
Relative Value Fund1
Small Cap Value Portfolio
Value Fund
INTERNATIONAL/ GLOBAL EQUITY
INTERNATIONAL/ GLOBAL CORE
Global Core Equity Portfolio
International Portfolio
International Strategic Core Portfolio
Sustainable Global Thematic Fund1
Tax-Managed International Portfolio
Tax-Managed Wealth Appreciation Strategy
Wealth Appreciation Strategy
INTERNATIONAL/ GLOBAL GROWTH
Concentrated International Growth Portfolio
International Growth Fund
INTERNATIONAL/ GLOBAL EQUITY (continued)
INTERNATIONAL/ GLOBAL VALUE
Asia ex-Japan Equity Portfolio
International Value Fund
FIXED INCOME
MUNICIPAL
High Income Municipal Portfolio
Intermediate California Municipal Portfolio
Intermediate Diversified Municipal Portfolio
Intermediate New York Municipal Portfolio
Municipal Bond Inflation Strategy
Tax-Aware Fixed Income Portfolio
National Portfolio
Arizona Portfolio
California Portfolio
Massachusetts Portfolio
Minnesota Portfolio
New Jersey Portfolio
New York Portfolio
Ohio Portfolio
Pennsylvania Portfolio
Virginia Portfolio
TAXABLE
Bond Inflation Strategy
Global Bond Fund
High Income Fund
High Yield Portfolio
Income Fund
Intermediate Bond Portfolio
Limited Duration High Income Portfolio
Short Duration Portfolio
ALTERNATIVES
All Market Real Return Portfolio
Credit Long/Short Portfolio
Global Real Estate Investment Fund
Select US Long/Short Portfolio
Unconstrained Bond Fund
MULTI-ASSET
All Market Income Portfolio
All Market Total Return Portfolio1
Conservative Wealth Strategy
Emerging Markets Multi-Asset Portfolio
Global Risk Allocation Fund
Tax-Managed All Market Income Portfolio1
TARGET-DATE
Multi-Manager Select Retirement Allocation Fund
Multi-Manager Select 2010 Fund
Multi-Manager Select 2015 Fund
Multi-Manager Select 2020 Fund
Multi-Manager Select 2025 Fund
Multi-Manager Select 2030 Fund
Multi-Manager Select 2035 Fund
Multi-Manager Select 2040 Fund
Multi-Manager Select 2045 Fund
Multi-Manager Select 2050 Fund
Multi-Manager Select 2055 Fund
CLOSED-END FUNDS
Alliance California Municipal Income Fund
AllianceBernstein Global High Income Fund
AllianceBernstein National Municipal Income Fund
We also offer Government Exchange Reserves, which serves as the money market fund exchange vehicle for the AB mutual funds. An investment in Government Exchange Reserves is not a deposit in a bank and is not insured or guaranteed by the Federal Deposit Insurance Corporation or any other government agency. Although the Fund seeks to preserve the value of your investment at $1.00 per share, it is possible to lose money by investing in the Fund.
Investors should consider the investment objectives, risks, charges and expenses of the Fund carefully before investing. For copies of our prospectus or summary prospectus, which contain this and other information, visit us online at www.abfunds.com or contact your AB representative. Please read the prospectus and/or summary prospectus carefully before investing.
| 1 | Prior to November 1, 2016, Sustainable Global Thematic Fund was named Global Thematic Growth Fund; prior to January 9, 2017, Relative Value Fund was named Growth & Income Fund; prior to April 17, 2017, Tax-Managed All Market Income Portfolio was named Tax-Managed Balanced Wealth Strategy; prior to April 24, 2017, All Market Total Return Portfolio was named Balanced Wealth Strategy. |
| abfunds.com | AB FLEXFEE CORE OPPORTUNITIES PORTFOLIO | 29 |
NOTES
| 30 | AB FLEXFEE CORE OPPORTUNITIES PORTFOLIO | abfunds.com |
NOTES
| abfunds.com | AB FLEXFEE CORE OPPORTUNITIES PORTFOLIO | 31 |
NOTES
| 32 | AB FLEXFEE CORE OPPORTUNITIES PORTFOLIO | abfunds.com |
AB FLEXFEE CORE OPPORTUNITIES PORTFOLIO
1345 Avenue of the Americas
New York, NY 10105
800 221 5672
FFCO-0152-0617 
JUN 06.30.17

SEMI-ANNUAL REPORT
AB FLEXFEETM INTERNATIONAL STRATEGIC CORE PORTFOLIO


A discussion of the Fund’s investment performance is not included in this report. AllianceBernstein L.P. would like to thank you for your interest in the Fund.
| Investment Products Offered | • Are Not FDIC Insured • May Lose Value • Are Not Bank Guaranteed | |
Investors should consider the investment objectives, risks, charges and expenses of the Fund carefully before investing. For copies of our prospectus or summary prospectus, which contain this and other information, visit us online at www.abfunds.com or contact your AB representative. Please read the prospectus and/or summary prospectus carefully before investing.
This shareholder report must be preceded or accompanied by the Fund’s prospectus for individuals who are not current shareholders of the Fund.
You may obtain a description of the Fund’s proxy voting policies and procedures, and information regarding how the Fund voted proxies relating to portfolio securities during the most recent 12-month period ended June 30, without charge. Simply visit AB’s website at www.abfunds.com, or go to the Securities and Exchange Commission’s (the “Commission”) website at www.sec.gov, or call AB at (800) 227 4618.
The Fund files its complete schedule of portfolio holdings with the Commission for the first and third quarters of each fiscal year on Form N-Q. The Fund’s Forms N-Q are available on the Commission’s website at www.sec.gov. The Fund’s Forms N-Q may also be reviewed and copied at the Commission’s Public Reference Room in Washington, DC; information on the operation of the Public Reference Room may be obtained by calling (800) SEC 0330. AB publishes full portfolio holdings for the Fund monthly at www.abfunds.com.
AllianceBernstein Investments, Inc. (ABI) is the distributor of the AB family of mutual funds. ABI is a member of FINRA and is an affiliate of AllianceBernstein L.P., the Adviser of the funds.
The [A/B] logo is a registered service mark of AllianceBernstein and AllianceBernstein® is a registered service mark used by permission of the owner, AllianceBernstein L.P.
EXPENSE EXAMPLE
(unaudited)
As a shareholder of the Fund, you incur two types of costs: (1) transaction costs, including sales charges (loads) on purchase payments, contingent deferred sales charges on redemptions and (2) ongoing costs, including management fees; distribution (12b-1) fees; and other Fund expenses. This example is intended to help you understand your ongoing costs (in dollars) of investing in the Fund and to compare these costs with the ongoing costs of investing in other mutual funds.
The Example is based on an investment of $1,000 invested at the beginning of the period and held for the entire period as indicated below.
Actual Expenses
The table below provides information about actual account values and actual expenses. You may use the information, together with the amount you invested, to estimate the expenses that you paid over the period. Simply divide your account value by $1,000 (for example, an $8,600 account value divided by $1,000 = 8.6), then multiply the result by the number under the heading entitled “Expenses Paid During Period” to estimate the expenses you paid on your account during this period.
Hypothetical Example for Comparison Purposes
The table below also provides information about hypothetical account values and hypothetical expenses based on the Fund’s actual expense ratio and an assumed annual rate of return of 5% before expenses, which is not the Fund’s actual return. The hypothetical account values and expenses may not be used to estimate the actual ending account balance or expenses you paid for the period. You may use this information to compare the ongoing costs of investing in the Fund and other funds by comparing this 5% hypothetical example with the 5% hypothetical examples that appear in the shareholder reports of other funds.
Please note that the expenses shown in the table are meant to highlight your ongoing costs only and do not reflect any transactional costs, such as sales charges (loads), or contingent deferred sales charges on redemptions. Therefore, the hypothetical example is useful in comparing ongoing costs only, and will not help you determine the relative total costs of owning different funds. In addition, if these transactional costs were included, your costs would have been higher.
| abfunds.com | AB FLEXFEE INTERNATIONAL STRATEGIC CORE PORTFOLIO | 1 |
EXPENSE EXAMPLE (continued)
| Beginning Account Value June 28, 2017^ | Ending Account Value June 30, 2017 | Expenses Paid During Period* | Annualized Expense Ratio* | Total Expenses Paid During Period+ | Total Annualized Expense Ratio+ | |||||||||||||||||||
| Advisor Class | ||||||||||||||||||||||||
Actual | $ | 1,000 | $ | 994.00 | $ | 0.02 | 0.23 | % | $ | 0.02 | 0.28 | % | ||||||||||||
Hypothetical** | $ | 1,000 | $ | 1,000.39 | $ | 0.02 | 0.23 | % | $ | 0.02 | 0.28 | % | ||||||||||||
| ^ | Commencement of operations. |
| * | Expenses are equal to each classes’ annualized expense ratio, multiplied by the average account value over the period, multiplied by 3/365 (to reflect the since inception period). |
| + | In connection with the Fund’s investments in affiliated/unaffiliated underlying portfolios, the Fund incurs no direct expenses, but bears proportionate shares of the fees and expenses (i.e., operating, administrative and investment advisory fees) of the affiliated/unaffiliated underlying portfolios. The Adviser has contractually agreed to waive its fees from the Fund in an amount equal to the Fund’s pro rata share of certain acquired fund fees and expenses of the affiliated underlying portfolios. The Fund’s total expenses are equal to the classes’ annualized expense ratio plus the Fund’s pro rata share of the weighted average expense ratio of the affiliated/unaffiliated underlying portfolios in which it invests, multiplied by the average account value over the period, multiplied by 3/365 (to reflect the since inception period). |
| ** | Assumes 5% annual return before expenses. |
| 2 | AB FLEXFEE INTERNATIONAL STRATEGIC CORE PORTFOLIO | abfunds.com |
PORTFOLIO SUMMARY
June 30, 2017 (unaudited)
PORTFOLIO STATISTICS
Net Assets ($mil): $3.0
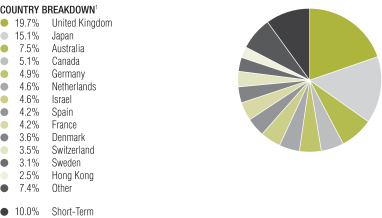
| 1 | All data are as of June 30, 2017. The Fund’s sector and country breakdowns are expressed as a percentage of total investments and may vary over time. The Fund also enters into derivative transactions, which may be used for hedging or investment purposes (see “Portfolio of Investments” section of the report for additional details). “Other” country weightings represent 2.4% or less in the following countries: Finland, Italy, Norway, Portugal, Singapore and South Korea. |
Please note: The sector classifications presented herein are based on the Global Industry Classification Standard (GICS) which was developed by Morgan Stanley Capital International and Standard & Poor’s. The components are divided into sector, industry group, and industry sub-indices as classified by the GICS for each of the market capitalization indices in the broad market. These sector classifications are broadly defined. The “Portfolio of Investments” section of the report reflects more specific industry information and is consistent with the investment restrictions discussed in the Fund’s prospectus.
| abfunds.com | AB FLEXFEE INTERNATIONAL STRATEGIC CORE PORTFOLIO | 3 |
PORTFOLIO SUMMARY (continued)
June 30, 2017 (unaudited)
TEN LARGEST HOLDINGS1
| Company | U.S. $ Value | Percent of Net Assets | ||||||
| Amadeus IT Group SA – Class A | $ | 71,731 | 2.4 | % | ||||
| Aristocrat Leisure Ltd. | 70,041 | 2.4 | ||||||
| Check Point Software Technologies Ltd. | 65,448 | 2.2 | ||||||
| Oracle Corp. Japan | 65,048 | 2.2 | ||||||
| RELX PLC | 64,851 | 2.2 | ||||||
| British American Tobacco PLC | 64,054 | 2.1 | ||||||
| Logitech International SA | 60,715 | 2.0 | ||||||
| SAP SE | 55,476 | 1.9 | ||||||
| Bandai Namco Holdings, Inc. | 54,668 | 1.8 | ||||||
| Reckitt Benckiser Group PLC | 53,728 | 1.8 | ||||||
| $ | 625,760 | 21.0 | % | |||||
| 1 | Long-term investments. |
| 4 | AB FLEXFEE INTERNATIONAL STRATEGIC CORE PORTFOLIO | abfunds.com |
PORTFOLIO OF INVESTMENTS
June 30, 2017 (unaudited)
| Company | Shares | U.S. $ Value | ||||||
| ||||||||
COMMON STOCKS – 95.1% | ||||||||
Financials – 25.3% | ||||||||
Banks – 16.5% | ||||||||
Bank Hapoalim BM | 3,960 | $ | 26,703 | |||||
Bank of Queensland Ltd. | 2,360 | 20,764 | ||||||
BOC Hong Kong Holdings Ltd. | 8,000 | 38,286 | ||||||
Danske Bank A/S | 430 | 16,543 | ||||||
DBS Group Holdings Ltd. | 3,300 | 49,668 | ||||||
DNB ASA | 1,860 | 31,666 | ||||||
Mitsubishi UFJ Financial Group, Inc. | 7,600 | 51,262 | ||||||
National Australia Bank Ltd. | 1,680 | 38,217 | ||||||
Nordea Bank AB | 2,540 | 32,351 | ||||||
Oversea-Chinese Banking Corp., Ltd. | 3,100 | 24,283 | ||||||
Royal Bank of Canada | 630 | 45,744 | ||||||
Seven Bank Ltd. | 4,700 | 16,852 | ||||||
Sumitomo Mitsui Financial Group, Inc. | 900 | 35,140 | ||||||
Swedbank AB – Class A | 1,310 | 31,972 | ||||||
Toronto-Dominion Bank (The) | 670 | 33,763 | ||||||
|
| |||||||
| 493,214 | ||||||||
|
| |||||||
Capital Markets – 3.4% | ||||||||
Euronext NV(a) | 820 | 42,587 | ||||||
IG Group Holdings PLC | 3,200 | 23,688 | ||||||
Thomson Reuters Corp. | 750 | 34,724 | ||||||
|
| |||||||
| 100,999 | ||||||||
|
| |||||||
Diversified Financial Services – 0.9% | ||||||||
ORIX Corp. | 1,800 | 28,008 | ||||||
|
| |||||||
Insurance – 4.5% | ||||||||
Admiral Group PLC | 560 | 14,613 | ||||||
Direct Line Insurance Group PLC | 7,470 | 34,590 | ||||||
Euler Hermes Group | 240 | 28,508 | ||||||
NN Group NV | 420 | 14,903 | ||||||
Talanx AG | 380 | 14,214 | ||||||
Tryg A/S | 1,190 | 26,024 | ||||||
|
| |||||||
| 132,852 | ||||||||
|
| |||||||
| 755,073 | ||||||||
|
| |||||||
Information Technology – 20.0% | ||||||||
Internet Software & Services – 1.6% | ||||||||
Moneysupermarket.com Group PLC | 10,470 | 48,224 | ||||||
|
| |||||||
IT Services – 4.0% | ||||||||
Amadeus IT Group SA – Class A | 1,200 | 71,731 | ||||||
Capgemini SE | 210 | 21,694 | ||||||
CGI Group, Inc. – Class A(b) | 500 | 25,547 | ||||||
|
| |||||||
| 118,972 | ||||||||
|
| |||||||
Semiconductors & Semiconductor Equipment – 1.1% | ||||||||
SCREEN Holdings Co., Ltd. | 500 | 33,446 | ||||||
|
| |||||||
| abfunds.com | AB FLEXFEE INTERNATIONAL STRATEGIC CORE PORTFOLIO | 5 |
PORTFOLIO OF INVESTMENTS (continued)
| Company | Shares | U.S. $ Value | ||||||
| ||||||||
Software – 10.4% | ||||||||
Check Point Software Technologies Ltd.(b) | 600 | $ | 65,448 | |||||
Constellation Software, Inc./Canada | 42 | 21,972 | ||||||
Nice Ltd. | 660 | 51,999 | ||||||
Oracle Corp. Japan | 1,000 | 65,048 | ||||||
Playtech PLC | 1,720 | 21,306 | ||||||
Sage Group PLC (The) | 3,030 | 27,152 | ||||||
SAP SE | 530 | 55,476 | ||||||
|
| |||||||
| 308,401 | ||||||||
|
| |||||||
Technology Hardware, Storage & Peripherals – 2.9% | ||||||||
Logitech International SA | 1,650 | 60,715 | ||||||
Samsung Electronics Co., Ltd. (GDR)(a) | 25 | 25,875 | ||||||
|
| |||||||
| 86,590 | ||||||||
|
| |||||||
| 595,633 | ||||||||
|
| |||||||
Industrials – 12.7% | ||||||||
Aerospace & Defense – 1.4% | ||||||||
BAE Systems PLC | 2,500 | 20,638 | ||||||
QinetiQ Group PLC | 6,020 | 21,207 | ||||||
|
| |||||||
| 41,845 | ||||||||
|
| |||||||
Airlines – 2.2% | ||||||||
Japan Airlines Co., Ltd. | 1,000 | 30,975 | ||||||
Qantas Airways Ltd. | 7,920 | 34,813 | ||||||
|
| |||||||
| 65,788 | ||||||||
|
| |||||||
Commercial Services & Supplies – 1.3% | ||||||||
G4S PLC | 8,860 | 37,681 | ||||||
|
| |||||||
Machinery – 0.5% | ||||||||
Kone Oyj – Class B | 300 | 15,263 | ||||||
|
| |||||||
Professional Services – 5.2% | ||||||||
Experian PLC | 2,510 | 51,512 | ||||||
RELX PLC | 3,000 | 64,851 | ||||||
Wolters Kluwer NV | 930 | 39,333 | ||||||
|
| |||||||
| 155,696 | ||||||||
|
| |||||||
Road & Rail – 0.6% | ||||||||
Central Japan Railway Co. | 100 | 16,332 | ||||||
|
| |||||||
Transportation Infrastructure – 1.5% | ||||||||
Aena SA(a) | 230 | 44,913 | ||||||
|
| |||||||
| 377,518 | ||||||||
|
| |||||||
Consumer Discretionary – 10.1% | ||||||||
Distributors – 1.4% | ||||||||
PALTAC Corp. | 1,200 | 40,440 | ||||||
|
| |||||||
Hotels, Restaurants & Leisure – 2.3% | ||||||||
Aristocrat Leisure Ltd. | 4,040 | 70,041 | ||||||
|
| |||||||
| 6 | AB FLEXFEE INTERNATIONAL STRATEGIC CORE PORTFOLIO | abfunds.com |
PORTFOLIO OF INVESTMENTS (continued)
| Company | Shares | U.S. $ Value | ||||||
| ||||||||
Household Durables – 0.9% | ||||||||
Fujitsu General Ltd. | 1,100 | $ | 25,509 | |||||
|
| |||||||
Leisure Products – 1.8% | ||||||||
Bandai Namco Holdings, Inc. | 1,600 | 54,668 | ||||||
|
| |||||||
Media – 2.1% | ||||||||
Informa PLC | 1,850 | 16,136 | ||||||
UBM PLC | 2,210 | 19,861 | ||||||
WPP PLC | 1,270 | 26,742 | ||||||
|
| |||||||
| 62,739 | ||||||||
|
| |||||||
Textiles, Apparel & Luxury Goods – 1.6% | ||||||||
HUGO BOSS AG | 680 | 47,670 | ||||||
|
| |||||||
| 301,067 | ||||||||
|
| |||||||
Consumer Staples – 7.4% | ||||||||
Beverages – 1.6% | ||||||||
Diageo PLC | 960 | 28,370 | ||||||
Royal Unibrew A/S | 430 | 20,627 | ||||||
|
| |||||||
| 48,997 | ||||||||
|
| |||||||
Food Products – 1.8% | ||||||||
Nestle SA (REG) | 205 | 17,880 | ||||||
Salmar ASA | 1,450 | 35,941 | ||||||
|
| |||||||
| 53,821 | ||||||||
|
| |||||||
Household Products – 1.8% | ||||||||
Reckitt Benckiser Group PLC | 530 | 53,728 | ||||||
|
| |||||||
Tobacco – 2.2% | ||||||||
British American Tobacco PLC | 940 | 64,054 | ||||||
|
| |||||||
| 220,600 | ||||||||
|
| |||||||
Health Care – 5.9% | ||||||||
Pharmaceuticals – 5.9% | ||||||||
Indivior PLC(b) | 3,160 | 12,867 | ||||||
Novo Nordisk A/S – Class B | 510 | 21,913 | ||||||
Recordati SpA | 920 | 37,324 | ||||||
Roche Holding AG | 130 | 33,217 | ||||||
Sanofi | 520 | 49,826 | ||||||
Shionogi & Co., Ltd. | 400 | 22,303 | ||||||
|
| |||||||
| 177,450 | ||||||||
|
| |||||||
Telecommunication Services – 4.7% | ||||||||
Diversified Telecommunication Services – 4.7% | ||||||||
Com Hem Holding AB | 2,420 | 33,609 | ||||||
HKT Trust & HKT Ltd. – Class SS | 31,000 | 40,738 | ||||||
Nippon Telegraph & Telephone Corp. | 800 | 37,763 | ||||||
TDC A/S | 4,620 | 26,867 | ||||||
|
| |||||||
| 138,977 | ||||||||
|
| |||||||
| abfunds.com | AB FLEXFEE INTERNATIONAL STRATEGIC CORE PORTFOLIO | 7 |
PORTFOLIO OF INVESTMENTS (continued)
| Company | Shares | U.S. $ Value | ||||||
| ||||||||
Materials – 4.6% | ||||||||
Chemicals – 2.9% | ||||||||
Covestro AG(a) | 500 | $ | 36,247 | |||||
Croda International PLC | 635 | 32,158 | ||||||
Nippon Shokubai Co., Ltd. | 300 | 19,378 | ||||||
|
| |||||||
| 87,783 | ||||||||
|
| |||||||
Containers & Packaging – 1.7% | ||||||||
Amcor Ltd./Australia | 4,080 | 50,827 | ||||||
|
| |||||||
| 138,610 | ||||||||
|
| |||||||
Energy – 3.4% |
| |||||||
Oil, Gas & Consumable Fuels – 3.4% |
| |||||||
Caltex Australia Ltd. | 870 | 21,126 | ||||||
Royal Dutch Shell PLC – Class B | 1,780 | 47,787 | ||||||
TOTAL SA | 630 | 31,278 | ||||||
|
| |||||||
| 100,191 | ||||||||
|
| |||||||
Utilities – 1.0% |
| |||||||
Electric Utilities – 1.0% |
| |||||||
EDP – Energias de Portugal SA | 4,500 | 14,720 | ||||||
Endesa SA | 640 | 14,764 | ||||||
|
| |||||||
| 29,484 | ||||||||
|
| |||||||
Total Common Stocks | 2,834,603 | |||||||
|
| |||||||
SHORT-TERM INVESTMENTS – 10.5% |
| |||||||
Investment Companies – 10.5% |
| |||||||
AB Fixed Income Shares, Inc. – Government Money Market Portfolio – Class AB, 0.79%(c)(d) | 314,394 | 314,394 | ||||||
|
| |||||||
Total Investments – 105.6% | 3,148,997 | |||||||
Other assets less liabilities – (5.6)% | (168,252 | ) | ||||||
|
| |||||||
Net Assets – 100.0% | $ | 2,980,745 | ||||||
|
| |||||||
FORWARD CURRENCY EXCHANGE CONTRACTS (see Note C)
| Counterparty | Contracts to Deliver (000) | In Exchange For (000) | Settlement Date | Unrealized Appreciation/ (Depreciation) | ||||||||||||
Brown Brothers Harriman & Co. | AUD 4 | USD 6 | 9/15/17 | $ | 3 | |||||||||||
Brown Brothers Harriman & Co. | AUD 34 | USD 26 | 9/15/17 | (160 | ) | |||||||||||
Brown Brothers Harriman & Co. | CAD 210 | USD 161 | 9/15/17 | (717 | ) | |||||||||||
Brown Brothers Harriman & Co. | GBP 65 | USD 84 | 9/15/17 | (557 | ) | |||||||||||
Brown Brothers Harriman & Co. | ILS 447 | USD 128 | 9/15/17 | (546 | ) | |||||||||||
Brown Brothers Harriman & Co. | JPY 1,950 | USD 17 | 9/15/17 | 77 | ||||||||||||
Brown Brothers Harriman & Co. | NOK 393 | USD 47 | 9/15/17 | (520 | ) | |||||||||||
Brown Brothers Harriman & Co. | SEK 77 | USD 9 | 9/15/17 | (129 | ) | |||||||||||
Brown Brothers Harriman & Co. | SGD 46 | USD 33 | 9/15/17 | (113 | ) | |||||||||||
| 8 | AB FLEXFEE INTERNATIONAL STRATEGIC CORE PORTFOLIO | abfunds.com |
PORTFOLIO OF INVESTMENTS (continued)
| Counterparty | Contracts to Deliver (000) | In Exchange For (000) | Settlement Date | Unrealized Appreciation/ (Depreciation) | ||||||||||
Brown Brothers Harriman & Co. | USD 139 | CHF 133 | 9/15/17 | $ | (7 | ) | ||||||||
Brown Brothers Harriman & Co. | USD 245 | EUR 214 | 9/15/17 | 808 | ||||||||||
Brown Brothers Harriman & Co. | USD 237 | JPY 26,582 | 9/15/17 | (333 | ) | |||||||||
|
| |||||||||||||
| $ | (2,194 | ) | ||||||||||||
|
| |||||||||||||
| (a) | Security is exempt from registration under Rule 144A of the Securities Act of 1933. These securities are considered restricted, but liquid and may be resold in transactions exempt from registration, normally to qualified institutional buyers. At June 30, 2017, the aggregate market value of these securities amounted to $149,622 or 5.0% of net assets. |
| (b) | Non-income producing security. |
| (c) | To obtain a copy of the fund’s shareholder report, please go to the Securities and Exchange Commission’s website at www.sec.gov, or call AB at (800) 227-4618. |
| (d) | Investment in affiliated money market mutual fund. The rate shown represents the 7-day yield as of period end. |
Currency Abbreviations:
AUD – Australian Dollar
CAD – Canadian Dollar
CHF – Swiss Franc
EUR – Euro
GBP – Great British Pound
ILS – Israeli Shekel
JPY – Japanese Yen
NOK – Norwegian Krone
SEK – Swedish Krona
SGD – Singapore Dollar
USD – United States Dollar
Glossary:
GDR – Global Depositary Receipt
REG – Registered Shares
See notes to financial statements.
| abfunds.com | AB FLEXFEE INTERNATIONAL STRATEGIC CORE PORTFOLIO | 9 |
STATEMENT OF ASSETS & LIABILITIES
June 30, 2017 (unaudited)
| Assets | ||||
Investments in securities, at value | ||||
Unaffiliated issuers (cost $2,853,667) | $ | 2,834,603 | ||
Affiliated issuers (cost $314,394) | 314,394 | |||
Foreign currencies, at value (cost $658,563) | 658,508 | |||
Prepaid expenses | 45,496 | |||
Receivable for investment securities sold | 15,919 | |||
Receivable from Adviser | 3,112 | |||
Dividends receivable | 1,034 | |||
Unrealized appreciation on forward currency exchange contracts | 888 | |||
|
| |||
Total assets | 3,873,954 | |||
|
| |||
| Liabilities | ||||
Payable for investment securities purchased | 841,445 | |||
Offering expenses payable | 46,000 | |||
Unrealized depreciation on forward currency exchange contracts | 3,082 | |||
Transfer Agent fee payable | 21 | |||
Accrued expenses and other liabilities | 2,661 | |||
|
| |||
Total liabilities | 893,209 | |||
|
| |||
Net Assets | $ | 2,980,745 | ||
|
| |||
| Composition of Net Assets | ||||
Capital stock, at par | $ | 30 | ||
Additional paid-in capital | 2,999,973 | |||
Undistributed net investment income | 960 | |||
Accumulated net realized gain on investment | 1,556 | |||
Net unrealized depreciation on investments | (21,774 | ) | ||
|
| |||
| $ | 2,980,745 | |||
|
|
Net Asset Value Per Share—11 billion shares of capital stock authorized, $.0001 par value
| Class | Net Assets | Shares Outstanding | Net Asset Value | |||||||||
| ||||||||||||
| Advisor | $ | 2,980,745 | 300,000 | $ | 9.94 | |||||||
| ||||||||||||
See notes to financial statements.
| 10 | AB FLEXFEE INTERNATIONAL STRATEGIC CORE PORTFOLIO | abfunds.com |
STATEMENT OF OPERATIONS
Period from June 28, 2017(a) to June 30, 2017 (unaudited)
| Investment Income | ||||||||
Dividends | ||||||||
Unaffiliated issuers (net of foreign taxes withheld of $69) | $ | 1,034 | $ | 1,034 | ||||
|
| |||||||
| Expenses | ||||||||
Management fee (see Note B) | 60 | |||||||
Transfer agency-Advisor Class | 21 | |||||||
Audit and tax | 973 | |||||||
Administrative | 711 | |||||||
Custodian | 570 | |||||||
Amortization of offering expenses | 504 | |||||||
Legal | 422 | |||||||
Printing | 269 | |||||||
Directors’ fees | 241 | |||||||
Miscellaneous | 186 | |||||||
|
| |||||||
Total expenses | 3,957 | |||||||
Less: expenses waived and reimbursed by the Adviser | (3,883 | ) | ||||||
|
| |||||||
Net expenses | 74 | |||||||
|
| |||||||
Net investment income | 960 | |||||||
|
| |||||||
| Realized and Unrealized Gain (Loss) on Investment and Foreign Currency Transactions | ||||||||
Net realized gain (loss) on: | ||||||||
Investment transactions | 17 | |||||||
Foreign currency transactions | 1,539 | |||||||
Net change in unrealized appreciation/depreciation on: | ||||||||
Investments | (19,064 | ) | ||||||
Foreign currency denominated assets and liabilities | (2,710 | ) | ||||||
|
| |||||||
Net loss on investment and foreign currency transactions | (20,218 | ) | ||||||
|
| |||||||
Net Decrease in Net Assets from Operations | $ | (19,258 | ) | |||||
|
|
| (a) | Commencement of operations. |
See notes to financial statements.
| abfunds.com | AB FLEXFEE INTERNATIONAL STRATEGIC CORE PORTFOLIO | 11 |
STATEMENT OF CHANGES IN NET ASSETS
| June 28, 2017(a) to June 30, 2017 (unaudited) | ||||
| Increase (Decrease) in Net Assets from Operations | ||||
Net investment income | $ | 960 | ||
Net realized gain on investment and foreign currency transactions | 1,556 | |||
Net change in unrealized appreciation/depreciation on investments and foreign currency denominated assets and liabilities | (21,774 | ) | ||
|
| |||
Net decrease in net assets from operations | (19,258 | ) | ||
| Capital Stock Transactions | ||||
Net increase | 3,000,003 | |||
|
| |||
Total increase | 2,980,745 | |||
| Net Assets | ||||
Beginning of period | – 0 | – | ||
|
| |||
End of period (including undistributed net investment income of $960) | $ | 2,980,745 | ||
|
| |||
| (a) | Commencement of operations. |
See notes to financial statements.
| 12 | AB FLEXFEE INTERNATIONAL STRATEGIC CORE PORTFOLIO | abfunds.com |
NOTES TO FINANCIAL STATEMENTS
June 30, 2017 (unaudited)
NOTE A
Significant Accounting Policies
AB Cap Fund, Inc. (the “Company”), which is a Maryland corporation, is registered under the Investment Company Act of 1940 as an open-end management investment company. The Company operates as a series company currently comprised of 31 portfolios. Each portfolio is considered to be a separate entity for financial reporting and tax purposes. This report relates only to the AB FlexFee International Strategic Core Portfolio (the “Fund”), a diversified portfolio. The Fund commenced operations on June 28, 2017. The Fund has authorized issuance of Class A, Class B, Class C, Advisor Class, Class R, Class K, Class I, Class Z, Class T, Class 1, and Class 2 shares. No classes are being publicly offered. Class A, Class B, Class C, Class R, Class K, Class I, Class Z, Class T, Class 1, and Class 2 shares have not been issued. As of June 30, 2017, AllianceBernstein L.P. (the “Adviser”) was the sole shareholder of Advisor Class shares. Advisor Class shares are sold without an initial or contingent deferred sales charge and are not subject to ongoing distribution expenses. All eleven classes of shares have identical voting, dividend, liquidation and other rights, except that the classes bear different distribution and transfer agency expenses. Each class has exclusive voting rights with respect to its distribution plan. The financial statements have been prepared in conformity with U.S. generally accepted accounting principles (“U.S. GAAP”), which require management to make certain estimates and assumptions that affect the reported amounts of assets and liabilities in the financial statements and amounts of income and expenses during the reporting period. Actual results could differ from those estimates. The Fund is an investment company under U.S. GAAP and follows the accounting and reporting guidance applicable to investment companies. The following is a summary of significant accounting policies followed by the Fund.
1. Security Valuation
Portfolio securities are valued at their current market value determined on the basis of market quotations or, if market quotations are not readily available or are deemed unreliable, at “fair value” as determined in accordance with procedures established by and under the general supervision of the Fund’s Board of Directors (the “Board”).
In general, the market values of securities which are readily available and deemed reliable are determined as follows: securities listed on a national securities exchange (other than securities listed on the NASDAQ Stock Market, Inc. (“NASDAQ”)) or on a foreign securities exchange are valued at the last sale price at the close of the exchange or foreign securities exchange. If there has been no sale on such day, the securities are valued at the last traded price from the previous day. Securities listed on more
| abfunds.com | AB FLEXFEE INTERNATIONAL STRATEGIC CORE PORTFOLIO | 13 |
NOTES TO FINANCIAL STATEMENTS (continued)
than one exchange are valued by reference to the principal exchange on which the securities are traded; securities listed only on NASDAQ are valued in accordance with the NASDAQ Official Closing Price; listed or over the counter (“OTC”) market put or call options are valued at the mid level between the current bid and ask prices. If either a current bid or current ask price is unavailable, AllianceBernstein L.P. (the “Adviser”) will have discretion to determine the best valuation (e.g. last trade price in the case of listed options); open futures contracts are valued using the closing settlement price or, in the absence of such a price, the most recent quoted bid price. If there are no quotations available for the day of valuation, the last available closing settlement price is used; U.S. Government securities and any other debt instruments having 60 days or less remaining until maturity are generally valued at market by an independent pricing vendor, if a market price is available. If a market price is not available, the securities are valued at amortized cost. This methodology is commonly used for short-term securities that have an original maturity of 60 days or less, as well as short-term securities that had an original term to maturity that exceeded 60 days. In instances when amortized cost is utilized, the Valuation Committee (the “Committee”) must reasonably conclude that the utilization of amortized cost is approximately the same as the fair value of the security. Such factors the Committee will consider include, but are not limited to, an impairment of the creditworthiness of the issuer or material changes in interest rates. Fixed-income securities, including mortgage-backed and asset-backed securities, may be valued on the basis of prices provided by a pricing service or at a price obtained from one or more of the major broker-dealers. In cases where broker-dealer quotes are obtained, the Adviser may establish procedures whereby changes in market yields or spreads are used to adjust, on a daily basis, a recently obtained quoted price on a security. Swaps and other derivatives are valued daily, primarily using independent pricing services, independent pricing models using market inputs, as well as third party broker-dealers or counterparties. Open end mutual funds are valued at the closing net asset value per share, while exchange traded funds are valued at the closing market price per share.
Securities for which market quotations are not readily available (including restricted securities) or are deemed unreliable are valued at fair value as deemed appropriate by the Adviser. Factors considered in making this determination may include, but are not limited to, information obtained by contacting the issuer, analysts, analysis of the issuer’s financial statements or other available documents. In addition, the Fund may use fair value pricing for securities primarily traded in non-U.S. markets because most foreign markets close well before the Fund values its securities at 4:00 p.m., Eastern Time. The earlier close of these foreign markets gives rise to the possibility that significant events, including broad market moves, may have
| 14 | AB FLEXFEE INTERNATIONAL STRATEGIC CORE PORTFOLIO | abfunds.com |
NOTES TO FINANCIAL STATEMENTS (continued)
occurred in the interim and may materially affect the value of those securities. To account for this, the Fund may frequently value many of its foreign equity securities using fair value prices based on third party vendor modeling tools to the extent available.
2. Fair Value Measurements
In accordance with U.S. GAAP regarding fair value measurements, fair value is defined as the price that the Fund would receive to sell an asset or pay to transfer a liability in an orderly transaction between market participants at the measurement date. U.S. GAAP establishes a framework for measuring fair value, and a three-level hierarchy for fair value measurements based upon the transparency of inputs to the valuation of an asset or liability (including those valued based on their market values as described in Note A.1 above). Inputs may be observable or unobservable and refer broadly to the assumptions that market participants would use in pricing the asset or liability. Observable inputs reflect the assumptions market participants would use in pricing the asset or liability based on market data obtained from sources independent of the Fund. Unobservable inputs reflect the Fund’s own assumptions about the assumptions that market participants would use in pricing the asset or liability based on the best information available in the circumstances. Each investment is assigned a level based upon the observability of the inputs which are significant to the overall valuation. The three-tier hierarchy of inputs is summarized below.
| • | Level 1—quoted prices in active markets for identical investments |
| • | Level 2—other significant observable inputs (including quoted prices for similar investments, interest rates, prepayment speeds, credit risk, etc.) |
| • | Level 3—significant unobservable inputs (including the Fund’s own assumptions in determining the fair value of investments) |
Where readily available market prices or relevant bid prices are not available for certain equity investments, such investments may be valued based on similar publicly traded investments, movements in relevant indices since last available prices or based upon underlying company fundamentals and comparable company data (such as multiples to earnings or other multiples to equity). Where an investment is valued using an observable input, such as another publicly traded security, the investment will be classified as Level 2. If management determines that an adjustment is appropriate based on restrictions on resale, illiquidity or uncertainty, and such adjustment is a significant component of the valuation, the investment will be classified as Level 3. An investment will also be classified as Level 3 where management uses company fundamentals and other significant inputs to determine the valuation.
| abfunds.com | AB FLEXFEE INTERNATIONAL STRATEGIC CORE PORTFOLIO | 15 |
NOTES TO FINANCIAL STATEMENTS (continued)
The following table summarizes the valuation of the Fund’s investments by the above fair value hierarchy levels as of June 30, 2017:
Investments in Securities | Level 1 | Level 2 | Level 3 | Total | ||||||||||||
Assets: | ||||||||||||||||
Common Stocks: | ||||||||||||||||
Financials | $ | 142,739 | $ | 612,334 | $ | – 0 | – | $ | 755,073 | |||||||
Information Technology | 138,842 | 456,791 | – 0 | – | 595,633 | |||||||||||
Industrials | – 0 | – | 377,518 | – 0 | – | 377,518 | ||||||||||
Consumer Discretionary | – 0 | – | 301,067 | – 0 | – | 301,067 | ||||||||||
Consumer Staples | 20,627 | 199,973 | – 0 | – | 220,600 | |||||||||||
Health Care | 37,324 | 140,126 | – 0 | – | 177,450 | |||||||||||
Telecommunication Services | 74,347 | 64,630 | – 0 | – | 138,977 | |||||||||||
Materials | – 0 | – | 138,610 | – 0 | – | 138,610 | ||||||||||
Energy | – 0 | – | 100,191 | – 0 | – | 100,191 | ||||||||||
Utilities | – 0 | – | 29,484 | – 0 | – | 29,484 | ||||||||||
Short-Term Investments: | ||||||||||||||||
Investment Companies | 314,394 | – 0 | – | – 0 | – | 314,394 | ||||||||||
|
|
|
|
|
|
|
| |||||||||
Total Investments in Securities | 728,273 | 2,420,724 | † | – 0 | – | 3,148,997 | ||||||||||
Other Financial Instruments*: | ||||||||||||||||
Assets | ||||||||||||||||
Forward Currency Exchange Contracts | – 0 | – | 888 | – 0 | – | 888 | ||||||||||
Liabilities | ||||||||||||||||
Forward Currency Exchange Contracts | – 0 | – | (3,082 | ) | – 0 | – | (3,082 | ) | ||||||||
|
|
|
|
|
|
|
| |||||||||
Total | $ | 728,273 | $ | 2,418,530 | $ | – 0 | – | $ | 3,146,803 | |||||||
|
|
|
|
|
|
|
| |||||||||
| † | A significant portion of the Fund’s foreign equity investments are categorized as Level 2 investments since they are valued using fair value prices based on third party vendor modeling tools to the extent available, see note A.1. |
| * | Other financial instruments are derivative instruments, such as futures, forwards and swaps, which are valued at the unrealized appreciation/depreciation on the instrument. |
The Fund recognizes all transfers between levels of the fair value hierarchy assuming the financial instrument was transferred at the beginning of the reporting period.
The Adviser established the Committee to oversee the pricing and valuation of all securities held in the Fund. The Committee operates under pricing and valuation policies and procedures established by the Adviser and approved by the Board, including pricing policies which set forth the mechanisms and processes to be employed on a daily basis to implement these policies and procedures. In particular, the pricing policies describe how to determine market quotations for securities and other instruments. The Committee’s responsibilities include: 1) fair value and liquidity determinations (and oversight of any third parties to whom any responsibility for fair value and liquidity determinations is delegated), and 2) regular monitoring of the Adviser’s pricing and valuation policies and procedures and modification or enhancement of these policies and procedures (or recommendation of the modification of these policies and procedures) as the Committee believes appropriate.
| 16 | AB FLEXFEE INTERNATIONAL STRATEGIC CORE PORTFOLIO | abfunds.com |
NOTES TO FINANCIAL STATEMENTS (continued)
The Committee is also responsible for monitoring the implementation of the pricing policies by the Adviser’s Pricing Group (the “Pricing Group”) and any third party which performs certain pricing functions in accordance with the pricing policies. The Pricing Group is responsible for the oversight of the third party on a day-to-day basis. The Committee and the Pricing Group perform a series of activities to provide reasonable assurance of the accuracy of prices including: 1) periodic vendor due diligence meetings, review of methodologies, new developments and process at vendors, 2) daily comparison of security valuation versus prior day for all securities that exceeded established thresholds, and 3) daily review of unpriced, stale, and variance reports with exceptions reviewed by senior management and the Committee.
In addition, several processes outside of the pricing process are used to monitor valuation issues including: 1) performance and performance attribution reports are monitored for anomalous impacts based upon benchmark performance, and 2) portfolio managers review all portfolios for performance and analytics (which are generated using the Adviser’s prices).
3. Currency Translation
Assets and liabilities denominated in foreign currencies and commitments under forward currency exchange contracts are translated into U.S. dollars at the mean of the quoted bid and ask prices of such currencies against the U.S. dollar. Purchases and sales of portfolio securities are translated into U.S. dollars at the rates of exchange prevailing when such securities were acquired or sold. Income and expenses are translated into U.S. dollars at the rates of exchange prevailing when accrued.
Net realized gain or loss on foreign currency transactions represents foreign exchange gains and losses from sales and maturities of foreign fixed income investments, foreign currency exchange contracts, holding of foreign currencies, currency gains or losses realized between the trade and settlement dates on foreign investment transactions, and the difference between the amounts of dividends, interest and foreign withholding taxes recorded on the Fund’s books and the U.S. dollar equivalent amounts actually received or paid. Net unrealized currency gains and losses from valuing foreign currency denominated assets and liabilities at period end exchange rates are reflected as a component of net unrealized appreciation and depreciation of foreign currency denominated assets and liabilities.
4. Taxes
It is the Fund’s policy to meet the requirements of the Internal Revenue Code applicable to regulated investment companies and to distribute all of
| abfunds.com | AB FLEXFEE INTERNATIONAL STRATEGIC CORE PORTFOLIO | 17 |
NOTES TO FINANCIAL STATEMENTS (continued)
its investment company taxable income and net realized gains, if any, to shareholders. Therefore, no provisions for federal income or excise taxes are required. The Fund may be subject to taxes imposed by countries in which it invests. Such taxes are generally based on income and/or capital gains earned or repatriated. Taxes are accrued and applied to net investment income, net realized gains and net unrealized appreciation/depreciation as such income and/or gains are earned.
In accordance with U.S. GAAP requirements regarding accounting for uncertainties in income taxes, management has analyzed the Fund’s tax positions taken or expected to be taken on federal and state income tax returns for the current initial tax year, and has concluded that no provision for income tax is required in the Fund’s financial statements.
5. Investment Income and Investment Transactions
Dividend income is recorded on the ex-dividend date or as soon as the Fund is informed of the dividend. Interest income is accrued daily. Investment transactions are accounted for on the date securities are purchased or sold. Investment gains or losses are determined on the identified cost basis. The Fund amortizes premiums and accretes discounts as adjustments to interest income.
6. Class Allocations
All income earned and expenses incurred by the Fund are borne on a pro-rata basis by each settled class of shares, based on the proportionate interest in the Fund represented by the net assets of such class, except for class specific expenses which are allocated to the respective class. Expenses of the Company are charged proportionately to each portfolio or based on other appropriate methods. Realized and unrealized gains and losses are allocated among the various share classes based on their respective net assets.
7. Dividends and Distributions
Dividends and distributions to shareholders, if any, are recorded on the ex-dividend date. Income dividends and capital gains distributions are determined in accordance with federal tax regulations and may differ from those determined in accordance with U.S. GAAP. To the extent these differences are permanent, such amounts are reclassified within the capital accounts based on their federal tax basis treatment; temporary differences do not require such reclassification.
8. Offering Expenses
Offering expenses of $46,000 were deferred and amortized on a straight line basis over a one year period starting from June 28, 2017 (commencement of operations).
| 18 | AB FLEXFEE INTERNATIONAL STRATEGIC CORE PORTFOLIO | abfunds.com |
NOTES TO FINANCIAL STATEMENTS (continued)
NOTE B
Management Fee and Other Transactions with Affiliates
Under the terms of the investment advisory agreement, the Fund pays the Adviser a management fee at an annual rate of .55% of the Fund’s average daily net assets (“Base Fee”). The management fee is increased or decreased from the Base Fee by a performance adjustment (“Performance Adjustment”) that depends on whether, and to what extent, the investment performance of the Advisor Class shares of the Fund (“Measuring Class”) exceeds, or is exceeded by, the performance of the MSCI EAFE Index with IDCo Fair Value Pricing (net) (“Index”) plus 1.40% (“Index Hurdle”) over the Performance Period (as defined below). The Performance Adjustment is calculated and accrued daily, according to a schedule that adds or subtracts .00357% of the Fund’s average daily net assets for each .01% of absolute performance by which the performance of the Measuring Class exceeds or lags the performance of the Index Hurdle for the period from the beginning of the Performance Period through the current business day. The maximum Performance Adjustment (positive or negative) will not exceed an annualized rate of +/- .50% (“Maximum Performance Adjustment”) of the Fund’s average daily net assets, which would occur when the performance of the Measuring Class exceeds, or is exceeded by, the Index Hurdle by 1.40% for the Performance Period. On a monthly basis, the Fund will pay the Adviser the minimum fee rate of .05% on an annualized basis (Base Fee minus the Maximum Performance Adjustment) applied to the average daily net assets for the month. At the end of the Performance Period, the Fund will pay to the Adviser the total management fee, less the amount of any minimum fees paid during the Performance Period and any waivers described below. The period over which performance is measured (“Performance Period”) is initially from the commencement of operations to December 31, 2018 and thereafter each 12-month period beginning on the first business day in the month of January through December 31 of the same year. In addition, the Adviser has agreed to waive its management fee by limiting the Fund’s accrual of the management fee (base fee plus performance adjustment) on any day to the amount corresponding to the maximum fee rate multiplied by the Fund’s current net assets as of the preceding day if such amount is less than the amount that would have been accrued based on the Fund’s average daily net assets for the performance period. The minimum fee is paid monthly while the performance fee is paid at the end of the Performance Period. For the reporting period ended June 30, 2017, the Fund accrued management fees of $60, as reflected in the Statement of Operations, at an annual effective rate (excluding the impact from any expense waivers in effect) of .18% of the Fund’s average net assets, which included a (.37)% performance adjustment of $(120). The Adviser has agreed to waive its fees and bear certain expenses through December 31, 2018 to the extent necessary to limit total expenses (other than the management
| abfunds.com | AB FLEXFEE INTERNATIONAL STRATEGIC CORE PORTFOLIO | 19 |
NOTES TO FINANCIAL STATEMENTS (continued)
fee, acquired fund fees and expenses other than the advisory fees of any AB Mutual Funds in which the Fund may invest, interest expense, taxes, extraordinary expenses, and brokerage commissions and other transaction costs) on an annual basis from exceeding .10% of average daily net assets. Any fees waived and expenses borne by the Adviser are subject to repayment by the Fund until the end of the third fiscal year after the fiscal period in which the fees were waived or the expenses were borne; such waivers that are subject to repayment amount to $3,154 for the fiscal period ended June 30, 2017. In any case, no repayment will be made that would cause the Fund’s total annual expenses (subject to the exclusions set forth above) to exceed .10%.
Pursuant to the investment advisory agreement, the Fund may reimburse the Adviser for certain legal and accounting services provided to the Fund by the Adviser. For the period ended June 30, 2017, the Adviser voluntarily agreed to waive such fees that amounted to $711.
The Fund compensates AllianceBernstein Investor Services, Inc. (“ABIS”), a wholly-owned subsidiary of the Adviser, under a Transfer Agency Agreement for providing personnel and facilities to perform transfer agency services for the Fund. ABIS may make payments to intermediaries that provide omnibus account services, sub-accounting services and/or networking services. The compensation retained by ABIS amounted to $248 for the period ended June 30, 2017.
The Fund may invest in AB Government Money Market Portfolio (the “Government Money Market Portfolio”) which has a contractual annual advisory fee rate of .20% of the portfolio’s average daily net assets and bears its own expenses. In connection with the investment by the Fund in the Government Money Market Portfolio, the Adviser has agreed to waive its advisory fee from the Fund in an amount equal to the Fund’s pro rata share of the effective advisory fee of Government Money Market Portfolio, as borne indirectly by the Fund as an acquired fund fee and expense. For the period ended June 30, 2017, such waiver amounted to $18. A summary of the Fund’s transactions in shares of the Government Money Market Portfolio for the period ended June 30, 2017 is as follows:
Market Value | Purchases at Cost (000) | Sales Proceeds (000) | Market Value June 30, 2017 (000) | Dividend Income (000) | ||||||||||||||
| $ | – 0 | – | $ | 3,000 | $ | 2,686 | $ | 314 | $ | – 0 | – | |||||||
| * | Commencement of operations. |
Brokerage commissions paid on investment transactions for the period ended June 30, 2017 amounted to $824, of which $0 and $0, respectively, was paid to Sanford C. Bernstein & Co. LLC or Sanford C. Bernstein Limited, affiliates of the Adviser.
| 20 | AB FLEXFEE INTERNATIONAL STRATEGIC CORE PORTFOLIO | abfunds.com |
NOTES TO FINANCIAL STATEMENTS (continued)
NOTE C
Investment Transactions
Purchases and sales of investment securities (excluding short-term investments) for the period ended June 30, 2017, were as follows:
| Purchases | Sales | |||||||
Investment securities (excluding | $ | 2,869,755 | $ | 16,104 | ||||
U.S. government securities | – 0 | – | – 0 | – | ||||
The cost of investments for federal income tax purposes was substantially the same as cost for financial reporting purposes. Accordingly, gross unrealized appreciation and unrealized depreciation (excluding foreign currency contracts) are as follows:
Gross unrealized appreciation | $ | 10,729 | ||
Gross unrealized depreciation | (29,793 | ) | ||
|
| |||
Net unrealized depreciation | $ | (19,064 | ) | |
|
|
1. Derivative Financial Instruments
The Fund may use derivatives in an effort to earn income and enhance returns, to replace more traditional direct investments, to obtain exposure to otherwise inaccessible markets (collectively, “investment purposes”), or to hedge or adjust the risk profile of its portfolio.
The principal types of derivatives utilized by the Fund, as well as the methods in which they may be used are:
| • | Forward Currency Exchange Contracts |
The Fund may enter into forward currency exchange contracts in order to hedge its exposure to changes in foreign currency exchange rates on its foreign portfolio holdings, to hedge certain firm purchase and sales commitments denominated in foreign currencies and for non-hedging purposes as a means of making direct investments in foreign currencies, as described below under “Currency Transactions”.
A forward currency exchange contract is a commitment to purchase or sell a foreign currency at a future date at a negotiated forward rate. The gain or loss arising from the difference between the original contract and the closing of such contract would be included in net realized gain or loss on foreign currency transactions. Fluctuations in the value of open forward currency exchange contracts are recorded for financial reporting purposes as unrealized appreciation and/or depreciation by the Fund. Risks may arise from the potential inability of a counterparty to meet the terms of a contract and from unanticipated movements in the value of a foreign currency relative to the U.S. dollar.
During the period ended June 30, 2017, the Fund held forward currency exchange contracts for hedging purposes.
| abfunds.com | AB FLEXFEE INTERNATIONAL STRATEGIC CORE PORTFOLIO | 21 |
NOTES TO FINANCIAL STATEMENTS (continued)
The Fund typically enters into International Swaps and Derivatives Association, Inc. Master Agreements (“ISDA Master Agreement”) or similar master agreements (collectively, “Master Agreements”) with its derivative contract counterparties in order to, among other things, reduce its credit risk to counterparties. ISDA Master Agreements include provisions for general obligations, representations, collateral and events of default or termination. Under an ISDA Master Agreement, the Fund typically may offset with the counterparty certain derivative financial instruments’ payables and/or receivables with collateral held and/or posted and create one single net payment (close-out netting) in the event of default or termination.
Various master agreements govern the terms of certain transactions with counterparties, including transactions such as derivative transactions, repurchase and reverse repurchase agreements. These Master Agreements typically attempt to reduce the counterparty risk associated with such transactions by specifying credit protection mechanisms and providing standardization that improves legal certainty. Cross-termination provisions under Master Agreements typically provide that a default in connection with one transaction between the Fund and a counterparty gives the non-defaulting party the right to terminate any other transactions in place with the defaulting party to create one single net payment due to/due from the defaulting party. In the event of a default by a Master Agreements counterparty, the return of collateral with market value in excess of the Fund’s net liability, held by the defaulting party, may be delayed or denied.
The Fund’s Master Agreements may contain provisions for early termination of OTC derivative transactions in the event the net assets of the Fund decline below specific levels (“net asset contingent features”). If these levels are triggered, the Fund’s counterparty has the right to terminate such transaction and require the Fund to pay or receive a settlement amount in connection with the terminated transaction. For additional details, please refer to netting arrangements by counterparty tables below.
During the period ended June 30, 2017, the Fund had entered into the following derivatives:
Asset Derivatives | Liability Derivatives | |||||||||||
Derivative Type | Statement of | Fair Value | Statement of | Fair Value | ||||||||
Foreign exchange | Unrealized appreciation on forward currency exchange contracts | $ | 888 | Unrealized depreciation on forward currency exchange contracts | $ | 3,082 | ||||||
|
|
|
| |||||||||
Total | $ | 888 | $ | 3,082 | ||||||||
|
|
|
| |||||||||
| 22 | AB FLEXFEE INTERNATIONAL STRATEGIC CORE PORTFOLIO | abfunds.com |
NOTES TO FINANCIAL STATEMENTS (continued)
Derivative Type | Location of | Realized Gain or (Loss) on Derivatives | Change in Unrealized Appreciation or (Depreciation) | |||||||
Foreign exchange contracts | Net realized gain/(loss) on foreigncurrency transactions; Net change in unrealized appreciation/depreciation on foreign currency denominated assets and liabilities | $ | – 0 | – | $ | (2,194 | ) | |||
|
|
|
| |||||||
Total | $ | – 0 | – | $ | (2,194 | ) | ||||
|
|
|
| |||||||
The following table represents the average monthly volume of the Fund’s derivative transactions during the period ended June 30, 2017.
Forward Currency Exchange Contracts: | ||||
Average principal amount on buy contracts | $ | 625,555 | ||
Average principal amount on sale contracts | $ | 506,096 |
For financial reporting purposes, the Fund does not offset derivative assets and derivative liabilities that are subject to netting arrangements in the statement of assets and liabilities.
All derivatives held at period end were subject to netting arrangements. The following tables present the Fund’s derivative assets and liabilities by counterparty net of amounts available for offset under Master Agreements (“MA”) and net of the related collateral received/pledged by the Fund as of June 30, 2017:
Counterparty | Derivative Assets Subject to a MA | Derivatives Available for Offset | Cash Collateral Received | Security Collateral Received | Net Amount of Derivatives Assets | |||||||||||||||
OTC Derivatives: | ||||||||||||||||||||
Brown Brothers Harriman & Co. | $ | 888 | $ | (888 | ) | $ | – 0 | – | $ | – 0 | – | $ | – 0 | – | ||||||
|
|
|
|
|
|
|
|
|
| |||||||||||
Total | $ | 888 | $ | (888 | ) | $ | – 0 | – | $ | – 0 | – | $ | – 0 | – | ||||||
|
|
|
|
|
|
|
|
|
| |||||||||||
| abfunds.com | AB FLEXFEE INTERNATIONAL STRATEGIC CORE PORTFOLIO | 23 |
NOTES TO FINANCIAL STATEMENTS (continued)
Counterparty | Derivative Liabilities Subject to a MA | Derivatives Available for Offset | Cash Collateral Pledged | Security Collateral Pledged | Net Amount of Derivatives Liabilities | |||||||||||||||
OTC Derivatives: | ||||||||||||||||||||
Brown Brothers Harriman & Co. | $ | 3,082 | $ | (888 | ) | $ | – 0 | – | $ | – 0 | – | $ | 2,194 | |||||||
|
|
|
|
|
|
|
|
|
| |||||||||||
Total | $ | 3,082 | $ | (888 | ) | $ | – 0 | – | $ | – 0 | – | $ | 2,194 | ^ | ||||||
|
|
|
|
|
|
|
|
|
| |||||||||||
| ^ | Net amount represents the net receivable/payable that would be due from/to the counterparty in the event of default or termination. The net amount from OTC financial derivative instruments can only be netted across transactions governed under the same master agreement with the same counterparty. |
2. Currency Transactions
The Fund may invest in non-U.S. Dollar-denominated securities on a currency hedged or unhedged basis. The Fund may seek investment opportunities by taking long or short positions in currencies through the use of currency-related derivatives, including forward currency exchange contracts, futures and options on futures, swaps, and other options. The Fund may enter into transactions for investment opportunities when it anticipates that a foreign currency will appreciate or depreciate in value but securities denominated in that currency are not held by the Fund and do not present attractive investment opportunities. Such transactions may also be used when the Adviser believes that it may be more efficient than a direct investment in a foreign currency-denominated security. The Fund may also conduct currency exchange contracts on a spot basis (i.e., for cash at the spot rate prevailing in the currency exchange market for buying or selling currencies).
NOTE D
Capital Stock
Each class consists of 1,000,000,000 authorized shares. Transactions in capital shares for each class were as follows:
| Shares | Amount | |||||||||||||||
June 28, 2017* to June 30, 2017 (unaudited) | June 28, 2017* to June 30, 2017 (unaudited) | |||||||||||||||
|
| |||||||||||||||
| Advisor Class | ||||||||||||||||
Shares sold | 300,000 | $ | 3,000,003 | |||||||||||||
| ||||||||||||||||
Net increase | 300,000 | $ | 3,000,003 | |||||||||||||
| ||||||||||||||||
| * | Commencement of operations. |
| 24 | AB FLEXFEE INTERNATIONAL STRATEGIC CORE PORTFOLIO | abfunds.com |
NOTES TO FINANCIAL STATEMENTS (continued)
NOTE E
Risks Involved in Investing in the Fund
Foreign (Non-U.S.) Risk—Investments in securities of non-U.S. issuers may involve more risk than those of U.S. issuers. These securities may fluctuate more widely in price and may be less liquid due to adverse market, economic, political, regulatory or other factors.
Currency Risk—Fluctuations in currency exchange rates may negatively affect the value of the Fund’s investments or reduce its returns.
Capitalization Risk—Investments in mid-capitalization companies may be more volatile than investments in large-capitalization companies. Investments in mid-capitalization companies may have additional risks because these companies have limited product lines, markets or financial resources.
Derivatives Risk—The Fund may enter into derivative transactions such as forwards, options, futures and swaps. Derivatives may be illiquid, difficult to price, and leveraged so that small changes may produce disproportionate losses for the Fund, and subject to counterparty risk to a greater degree than more traditional investments. Derivatives may result in significant losses, including losses that are far greater than the value of the derivatives reflected on the statement of assets and liabilities.
Indemnification Risk—In the ordinary course of business, the Fund enters into contracts that contain a variety of indemnifications. The Fund’s maximum exposure under these arrangements is unknown. However, the Fund has not had prior claims or losses pursuant to these indemnification provisions and expects the risk of loss thereunder to be remote. Therefore, the Fund has not accrued any liability in connection with these indemnification provisions.
NOTE F
Tax Information
For tax purposes, net capital losses may be carried over to offset future capital gains, if any. Under the Regulated Investment Company Modernization Act of 2010, funds are permitted to carry forward capital losses incurred in taxable years beginning after December 22, 2010 for an indefinite period. These capital loss carryforwards will retain their character as either short-term or long-term capital losses.
NOTE G
Other
In October 2016, the U.S. Securities and Exchange Commission adopted new rules and amended existing rules (together, “final rules”) intended to modernize the reporting and disclosure of information by registered
| abfunds.com | AB FLEXFEE INTERNATIONAL STRATEGIC CORE PORTFOLIO | 25 |
NOTES TO FINANCIAL STATEMENTS (continued)
investment companies. In part, the final rules amend Regulation S-X and require standardized, enhanced disclosure about derivatives in investment company financial statements, as well as other amendments. The compliance date for the amendments to Regulation S-X is August 1, 2017 (for reporting period end dates of August 31, 2017 or after). Management has evaluated the impact of the amendments and expects the effect of the adoption of the final rules on financial statements will be limited to additional disclosures.
NOTE H
Subsequent Events
Management has evaluated subsequent events for possible recognition or disclosure in the financial statements through the date the financial statements are issued. Management has determined that there are no material events that would require disclosure in the Fund’s financial statements through this date.
| 26 | AB FLEXFEE INTERNATIONAL STRATEGIC CORE PORTFOLIO | abfunds.com |
FINANCIAL HIGHLIGHTS
Selected Data For A Share Of Capital Stock Outstanding Throughout Each Period
| Advisor Class | ||||
June 28, (unaudited) | ||||
|
| |||
Net asset value, beginning of period | $ 10.00 | |||
|
| |||
Income From Investment Operations | ||||
Net investment income(b)(c)(d) | .00 | |||
Net realized and unrealized loss on investment and foreign currency transactions | (.06 | ) | ||
|
| |||
Net decrease in net asset value from operations | (.06 | ) | ||
|
| |||
Net asset value, end of period | $ 9.94 | |||
|
| |||
Total Return | ||||
Total investment return based on net asset value(e) | (.60 | )% | ||
Ratios/Supplemental Data | ||||
Net assets, end of period (000’s omitted) | $2,981 | |||
Ratio to average net assets of: | ||||
Expenses, net of waivers/reimbursements(f)(g) | .23 | % | ||
Expenses, before waivers/reimbursements(f)(g) | 12.08 | % | ||
Net investment income(d)(f) | 2.93 | % | ||
Portfolio turnover rate | 1 | % | ||
| (a) | Commencement of operations. |
| (b) | Based on average shares outstanding. |
| (c) | Amount is less than $0.005 |
| (d) | Net of expenses waived/reimbursed by the Adviser. |
| (e) | Total investment return is calculated assuming an initial investment made at the net asset value at the beginning of the period, reinvestment of all dividends and distributions at net asset value during the period, and redemption on the last day of the period. Initial sales charge or contingent deferred sales charge is not reflected in the calculation of total investment return. Total investment return does not reflect the deduction of taxes that a shareholder would pay on fund distributions or the redemption of fund shares. Total investment return for a period of less than one year is not annualized. |
| (f) | Annualized. |
| (g) | In connection with the Fund’s investments in affiliated underlying portfolios, the Fund incurs no direct expenses but bears proportionate shares of the fees and expenses (i.e. operating, administrative and investment advisory fees) of the affiliated underlying portfolios. The Adviser has contractually agreed to waive its fees from the Fund in an amount equal to the Fund’s pro rata share of certain acquired fund fees and expenses, and for period ended June 30, 2017, such waiver amounted to 0.06%, annualized for the Fund. |
See notes to financial statements.
| abfunds.com | AB FLEXFEE INTERNATIONAL STRATEGIC CORE PORTFOLIO | 27 |
BOARD OF DIRECTORS
Marshall C. Turner, Jr(1), Chairman John H. Dobkin(1) Michael J. Downey(1) William H. Foulk, Jr.(1) D. James Guzy(1) | Nancy P. Jacklin(1) Robert M. Keith, President and Chief Executive Officer Carol C. McMullen(1) Garry L. Moody(1) Earl D. Weiner(1) | |
OFFICERS
Philip L. Kirstein, Senior Vice President and Independent Compliance Officer Kent W. Hargis(2), Vice President Sammy Suzuki(2), Vice President Emilie D. Wrapp, Secretary | Joseph J. Mantineo, Treasurer and Chief Financial Officer Phyllis J. Clarke, Controller Vincent S. Noto, Chief Compliance Officer |
Custodian and Accounting Agent Brown Brothers Harriman & Co. 50 Post Office Square Boston, MA 02110
Principal Underwriter AllianceBernstein Investments, Inc. 1345 Avenue of the Americas New York, NY 10105
Transfer Agent AllianceBernstein Investor Services, P.O. Box 786003 San Antonio, TX 78278-6003 Toll-Free (800) 221-6003 | Independent Registered Public Accounting Firm Ernst & Young LLP 5 Times Square New York, NY 10036
Legal Counsel Seward & Kissel LLP One Battery Park Plaza New York, NY 10004 | |
| 1 | Member of the Audit Committee, the Governance and Nominating Committee and the Independent Directors Committee. |
| 2 | The day-to-day management of, and investment decisions for, the portfolio is made by the Adviser. Messrs. Hargis and Suzuki are the investment professionals with the most significant responsibility for the day-to-day management of the Fund’s portfolio. |
| 28 | AB FLEXFEE INTERNATIONAL STRATEGIC CORE PORTFOLIO | abfunds.com |
Information Regarding the Review and Approval of the Fund’s Advisory Agreement
The disinterested directors (the “directors”) of AB Cap Fund, Inc. (the “Company”) unanimously approved the Company’s Advisory Agreement with the Adviser in respect of AB FlexFeeTM International Strategic Core Portfolio (the “Fund”) for an initial two-year period at a meeting held on January 31-February 1, 2017 (the “Meeting”). (At the time of the approval of the Advisory Agreement, the Fund was known as AB Performance Fee Series – International Strategic Core Portfolio.)
Prior to approval of the Advisory Agreement, the directors had requested from the Adviser, and received and evaluated, extensive materials. They reviewed the proposed Advisory Agreement with the Adviser and with experienced counsel who are independent of the Adviser, who advised on the relevant legal standards. The directors also reviewed an independent evaluation prepared by the Company’s Senior Officer (who is also the Company’s Independent Compliance Officer), who acted as their independent fee consultant, of the reasonableness of the proposed performance-based advisory fee (which consists of a base fee plus or minus a performance adjustment), in which the Senior Officer concluded that the proposed contractual fee for the Fund was reasonable. The directors also discussed the proposed approval in private sessions with counsel and the Company’s Senior Officer.
The directors considered their knowledge of the nature and quality of the services to be provided by the Adviser to the Fund gained from their experience as directors or trustees of most of the registered investment companies advised by the Adviser, their overall confidence in the Adviser’s integrity and competence they have gained from that experience, the Adviser’s initiative in identifying and raising potential issues with the directors and its responsiveness, frankness and attention to concerns raised by the directors in the past, including the Adviser’s willingness to consider and implement organizational and operational changes designed to improve investment results and the services provided to the AB Funds. The directors noted that they have four regular meetings each year, at each of which they receive presentations from the Adviser on the investment results of the AB Funds and review extensive materials and information presented by the Adviser.
The directors also considered all factors they believed relevant, including the specific matters discussed below. During the course of their deliberations, the directors evaluated, among other things, the reasonableness of the proposed advisory fee. The directors did not identify any particular information that was all-important or controlling, and different directors may have attributed different weights to the various factors. The directors determined that the selection of the Adviser to manage the Fund and the overall arrangements between the Fund and the Adviser, as provided in the Advisory Agreement, including the proposed advisory fee, were fair
| abfunds.com | AB FLEXFEE INTERNATIONAL STRATEGIC CORE PORTFOLIO | 29 |
and reasonable in light of the services to be performed, expenses to be incurred and such other matters as the directors considered relevant in the exercise of their business judgment. The material factors and conclusions that formed the basis for the directors’ determinations included the following:
Nature, Extent and Quality of Services to be Provided
The directors considered the scope and quality of services to be provided by the Adviser under the Advisory Agreement, including the quality of the investment research capabilities of the Adviser and the other resources it has dedicated to performing services for the AB Funds. They also noted the professional experience and qualifications of the Fund’s portfolio management team and other senior personnel of the Adviser. The directors also considered that the Advisory Agreement provides that the Fund will reimburse the Adviser for the cost to it of providing certain clerical, accounting, administrative and other services to the Fund by employees of the Adviser or its affiliates. Requests for these reimbursements will be subject to the directors’ approval on a quarterly basis and, to the extent requested and paid, result in a higher rate of total compensation from the Fund to the Adviser than the fee rate stated in the Advisory Agreement. The directors noted that the methodology to be used to determine the reimbursement amounts had been reviewed by an independent consultant retained by the Company’s Senior Officer. The quality of administrative and other services, including the Adviser’s role in coordinating the activities of the Fund’s other service providers, also was considered. The directors concluded that, overall, they were satisfied with the nature, extent and quality of services to be provided to the Fund under the Advisory Agreement.
Costs of Services to be Provided and Profitability
Because the Fund had not yet commenced operations, the directors were unable to consider historical information about the profitability of the Fund. However, the Adviser agreed to provide the directors with profitability information in connection with future proposed continuances of the Advisory Agreement. They also considered the costs to be borne by the Adviser in providing services to the Fund and that the Fund was unlikely to be profitable to the Adviser unless it achieves a material level of net assets. The directors also noted that, due to the performance fee component of the advisory fee, profitability would tend to be higher with better performance relative to the Fund’s benchmark, which they considered to create an appropriate alignment of incentives.
Fall-Out Benefits
The directors considered the other benefits to the Adviser and its affiliates from their proposed relationships with the Fund, including, but not limited to, benefits relating to 12b-1 fees and sales charges to be received by the Fund’s principal underwriter (which is a wholly owned subsidiary of the Adviser) in respect of certain classes of the Fund’s shares; and transfer agency fees to be paid by the Fund to a wholly owned subsidiary of the
| 30 | AB FLEXFEE INTERNATIONAL STRATEGIC CORE PORTFOLIO | abfunds.com |
Adviser. The directors recognized that the Adviser’s future profitability would be somewhat lower without these benefits. The directors understood that the Adviser also might derive reputational and other benefits from its association with the Fund.
Investment Results
Since the Fund had not yet commenced operations, no performance or other historical information for the Fund was available. The Adviser manages another AB Fund with a similar investment style, and, at the Meeting, the directors reviewed performance information for that AB Fund. Based on this information, together with the Adviser’s written and oral presentations regarding the management of the Fund and their general knowledge and confidence in the Adviser’s expertise in managing mutual funds, the directors concluded that they were satisfied that the Adviser was capable of providing high quality Fund management services to the Fund.
Advisory Fees and Other Expenses
The directors considered the proposed advisory fee rate payable by the Fund to the Adviser and information prepared by three analytical services that are not affiliated with the Adviser (the “15(c) service providers”), concerning advisory fee rates paid by other funds in the same category as the Fund at a hypothetical common asset level of $250 million. The directors recognized that it is difficult to make comparisons of advisory fees because there are variations in the services that are included in the fees paid by other funds. The directors considered the Fund’s proposed contractual effective advisory fee rate against a peer group median.
The directors recognized that the Adviser’s total compensation from the Fund pursuant to the Advisory Agreement would be increased by amounts paid pursuant to the expense reimbursement provision in the Advisory Agreement, and that the impact of such expense reimbursement would depend on the size of the Fund and the extent to which the Adviser requests reimbursements pursuant to this provision.
The directors also considered the Adviser’s fee schedule for institutional clients pursuing a similar investment style. For this purpose, they reviewed the relevant advisory fee information from the Adviser’s Form ADV and the evaluation from the Company’s Senior Officer and noted the differences between the Fund’s proposed fee schedule, on the one hand, and the institutional fee schedule and the schedule of fees charged to any offshore funds and any sub-advised funds, on the other. The directors noted that the Adviser may, in some cases, agree to fee rates with large institutional clients that are lower than those reviewed by the directors and that they had previously discussed with the Adviser its policies in respect of such arrangements. The directors also compared the proposed advisory fee for the Fund with that for another AB Fund with a similar investment style.
| abfunds.com | AB FLEXFEE INTERNATIONAL STRATEGIC CORE PORTFOLIO | 31 |
The Adviser reviewed with the directors the significantly greater scope of the services it provides to the Fund relative to institutional, offshore fund and sub-advised fund clients. In light of the substantial differences in services rendered by the Adviser to institutional, offshore fund and sub-advised fund clients as compared to funds such as the Fund, the directors considered these fee comparisons inapt and did not place significant weight on them in their deliberations.
The directors noted that the Fund may invest in shares of exchange-traded funds (“ETFs”), subject to the restrictions and limitations of the Investment Company Act of 1940 as these may be varied as a result of exemptive orders issued by the SEC. The directors also noted that ETFs pay advisory fees pursuant to their advisory contracts. The directors concluded, based on the Adviser’s explanation of how it may use ETFs when they are the most cost-effective way to obtain desired exposures or to “equitize” cash inflows pending purchases of underlying securities, that the proposed advisory fee would be for services in addition to, rather than duplicative of, the services provided under the advisory contracts of the ETFs in which the Fund may invest.
The directors also considered the projected total expense ratio of the Advisor Class shares of the Fund in comparison to a peer group and a peer universe selected by each 15(c) service provider. The directors also considered the Adviser’s proposed expense cap for the “other expenses” of the Fund (expenses excluding the advisory fee, Rule 12b-1 fees, and certain other expenses typically excluded from the Adviser’s expense caps) for the period ending December 31, 2018. The directors noted that it was likely that the expense ratios of some of the other funds in the Fund’s category were lowered by waivers or reimbursements by those funds’ investment advisers, which in some cases might be voluntary or temporary. The directors view the projected expense ratio information as relevant to their evaluation of the Adviser’s services because the Adviser is responsible for coordinating services provided to the Fund by others. Based on their review, the directors concluded that the Fund’s projected expense ratio was acceptable.
Economies of Scale
The directors noted that the proposed advisory fee schedule for the Fund does not contain breakpoints and that they had previously discussed their strong preference for breakpoints in advisory contracts with the Adviser. The directors took into consideration prior presentations by an independent consultant on economies of scale in the mutual fund industry and for the AB Funds, and by the Adviser concerning certain of its views on economies of scale. The directors also had requested and received from the Adviser certain updates on economies of scale in advance of the Meeting. The directors believe that economies of scale may be realized (if at all) by the Adviser across a variety of products and services, and not only in respect of
| 32 | AB FLEXFEE INTERNATIONAL STRATEGIC CORE PORTFOLIO | abfunds.com |
a single fund. The directors noted that there is no established methodology for setting breakpoints that give effect to the fund-specific services provided by a fund’s adviser and to the economies of scale that an adviser may realize in its overall mutual fund business or those components of it which directly or indirectly affect a fund’s operations. The directors observed that in the mutual fund industry as a whole, as well as among funds similar to the Fund, there is no uniformity or pattern in the fees and asset levels at which breakpoints (if any) apply. The directors also noted that the advisory agreements for many funds do not have breakpoints at all. The directors informed the Adviser that they would monitor the Fund’s assets and its profitability to the Adviser and anticipated revisiting the question of breakpoints in the future if circumstances warranted doing so.
| abfunds.com | AB FLEXFEE INTERNATIONAL STRATEGIC CORE PORTFOLIO | 33 |
This page is not part of the Shareholder Report or the Financial Statements.
AB FAMILY OF FUNDS
US EQUITY
US CORE
Core Opportunities Fund
Select US Equity Portfolio
US GROWTH
Concentrated Growth Fund
Discovery Growth Fund
Growth Fund
Large Cap Growth Fund
Small Cap Growth Portfolio
US VALUE
Discovery Value Fund
Equity Income Fund
Relative Value Fund1
Small Cap Value Portfolio
Value Fund
INTERNATIONAL/ GLOBAL EQUITY
INTERNATIONAL/ GLOBAL CORE
Global Core Equity Portfolio
International Portfolio
International Strategic Core Portfolio
Sustainable Global Thematic Fund1
Tax-Managed International Portfolio
Tax-Managed Wealth Appreciation Strategy
Wealth Appreciation Strategy
INTERNATIONAL/ GLOBAL GROWTH
Concentrated International Growth Portfolio
International Growth Fund
INTERNATIONAL/ GLOBAL EQUITY (continued)
INTERNATIONAL/ GLOBAL VALUE
Asia ex-Japan Equity Portfolio
International Value Fund
FIXED INCOME
MUNICIPAL
High Income Municipal Portfolio
Intermediate California Municipal Portfolio
Intermediate Diversified Municipal Portfolio
Intermediate New York Municipal Portfolio
Municipal Bond Inflation Strategy
Tax-Aware Fixed Income Portfolio
National Portfolio
Arizona Portfolio
California Portfolio
Massachusetts Portfolio
Minnesota Portfolio
New Jersey Portfolio
New York Portfolio
Ohio Portfolio
Pennsylvania Portfolio
Virginia Portfolio
TAXABLE
Bond Inflation Strategy
Global Bond Fund
High Income Fund
High Yield Portfolio
Income Fund
Intermediate Bond Portfolio
Limited Duration High Income Portfolio
Short Duration Portfolio
ALTERNATIVES
All Market Real Return Portfolio
Credit Long/Short Portfolio
Global Real Estate Investment Fund
Select US Long/Short Portfolio
Unconstrained Bond Fund
MULTI-ASSET
All Market Income Portfolio
All Market Total Return Portfolio1
Conservative Wealth Strategy
Emerging Markets Multi-Asset Portfolio
Global Risk Allocation Fund
Tax-Managed All Market Income Portfolio1
TARGET-DATE
Multi-Manager Select Retirement Allocation Fund
Multi-Manager Select 2010 Fund
Multi-Manager Select 2015 Fund
Multi-Manager Select 2020 Fund
Multi-Manager Select 2025 Fund
Multi-Manager Select 2030 Fund
Multi-Manager Select 2035 Fund
Multi-Manager Select 2040 Fund
Multi-Manager Select 2045 Fund
Multi-Manager Select 2050 Fund
Multi-Manager Select 2055 Fund
CLOSED-END FUNDS
Alliance California Municipal Income Fund
AllianceBernstein Global High Income Fund
AllianceBernstein National Municipal Income Fund
We also offer Government Exchange Reserves, which serves as the money market fund exchange vehicle for the AB mutual funds. An investment in Government Exchange Reserves is not a deposit in a bank and is not insured or guaranteed by the Federal Deposit Insurance Corporation or any other government agency. Although the Fund seeks to preserve the value of your investment at $1.00 per share, it is possible to lose money by investing in the Fund.
Investors should consider the investment objectives, risks, charges and expenses of the Fund carefully before investing. For copies of our prospectus or summary prospectus, which contain this and other information, visit us online at www.abfunds.com or contact your AB representative. Please read the prospectus and/or summary prospectus carefully before investing.
| 1 | Prior to November 1, 2016, Sustainable Global Thematic Fund was named Global Thematic Growth Fund; prior to January 9, 2017, Relative Value Fund was named Growth & Income Fund; prior to April 17, 2017, Tax-Managed All Market Income Portfolio was named Tax-Managed Balanced Wealth Strategy; prior to April 24, 2017, All Market Total Return Portfolio was named Balanced Wealth Strategy. |
| 34 | AB FLEXFEE INTERNATIONAL STRATEGIC CORE PORTFOLIO | abfunds.com |
NOTES
| abfunds.com | AB FLEXFEE INTERNATIONAL STRATEGIC CORE PORTFOLIO | 35 |
NOTES
| 36 | AB FLEXFEE INTERNATIONAL STRATEGIC CORE PORTFOLIO | abfunds.com |
AB FLEXFEE INTERNATIONAL STRATEGIC CORE PORTFOLIO
1345 Avenue of the Americas
New York, NY 10105
800 221 5672
FFISCP-0152-0617 
JUN 06.30.17

SEMI-ANNUAL REPORT
AB FLEXFEETM LARGE CAP GROWTH PORTFOLIO


A discussion of the Fund’s investment performance is not included in this report. AllianceBernstein L.P. would like to thank you for your interest in the Fund.
| Investment Products Offered | • Are Not FDIC Insured • May Lose Value • Are Not Bank Guaranteed | |
Investors should consider the investment objectives, risks, charges and expenses of the Fund carefully before investing. For copies of our prospectus or summary prospectus, which contain this and other information, visit us online at www.abfunds.com or contact your AB representative. Please read the prospectus and/or summary prospectus carefully before investing.
This shareholder report must be preceded or accompanied by the Fund’s prospectus for individuals who are not current shareholders of the Fund.
You may obtain a description of the Fund’s proxy voting policies and procedures, and information regarding how the Fund voted proxies relating to portfolio securities during the most recent 12-month period ended June 30, without charge. Simply visit AB’s website at www.abfunds.com, or go to the Securities and Exchange Commission’s (the “Commission”) website at www.sec.gov, or call AB at (800) 227 4618.
The Fund files its complete schedule of portfolio holdings with the Commission for the first and third quarters of each fiscal year on Form N-Q. The Fund’s Forms N-Q are available on the Commission’s website at www.sec.gov. The Fund’s Forms N-Q may also be reviewed and copied at the Commission’s Public Reference Room in Washington, DC; information on the operation of the Public Reference Room may be obtained by calling (800) SEC 0330. AB publishes full portfolio holdings for the Fund monthly at www.abfunds.com.
AllianceBernstein Investments, Inc. (ABI) is the distributor of the AB family of mutual funds. ABI is a member of FINRA and is an affiliate of AllianceBernstein L.P., the Adviser of the funds.
The [A/B] logo is a registered service mark of AllianceBernstein and AllianceBernstein® is a registered service mark used by permission of the owner, AllianceBernstein L.P.
EXPENSE EXAMPLE
(unaudited)
As a shareholder of the Fund, you incur two types of costs: (1) transaction costs, including sales charges (loads) on purchase payments, contingent deferred sales charges on redemptions and (2) ongoing costs, including management fees; distribution (12b-1) fees; and other Fund expenses. This example is intended to help you understand your ongoing costs (in dollars) of investing in the Fund and to compare these costs with the ongoing costs of investing in other mutual funds.
This Example is based on an investment of $1,000 invested at the beginning of the period and held for the entire period as indicated below.
Actual Expenses
The table below provides information about actual account values and actual expenses. You may use the information, together with the amount you invested, to estimate the expenses that you paid over the period. Simply divide your account value by $1,000 (for example, an $8,600 account value divided by $1,000 = 8.6), then multiply the result by the number under the heading entitled “Expenses Paid During Period” to estimate the expenses you paid on your account during this period.
Hypothetical Example for Comparison Purposes
The table below also provides information about hypothetical account values and hypothetical expenses based on the Fund’s actual expense ratio and an assumed annual rate of return of 5% before expenses, which is not the Fund’s actual return. The hypothetical account values and expenses may not be used to estimate the actual ending account balance or expenses you paid for the period. You may use this information to compare the ongoing costs of investing in the Fund and other funds by comparing this 5% hypothetical example with the 5% hypothetical examples that appear in the shareholder reports of other funds.
Please note that the expenses shown in the table are meant to highlight your ongoing costs only and do not reflect any transactional costs, such as sales charges (loads), or contingent deferred sales charges on redemptions. Therefore, the hypothetical example is useful in comparing ongoing costs only, and will not help you determine the relative total costs of owning different funds. In addition, if these transactional costs were included, your costs would have been higher.
| Beginning Account Value 6/28/2017^ | Ending Account Value 6/30/2017 | Expenses Paid During Period* | Annualized Expense Ratio* | Total Expenses Paid During Period+ | Total Annualized Expense Ratio+ | |||||||||||||||||||
Advisor Class |
| |||||||||||||||||||||||
Actual | $ | 1,000 | $ | 993.00 | $ | 0.01 | 0.15 | % | $ | 0.02 | 0.26 | % | ||||||||||||
Hypothetical** | $ | 1,000 | $ | 1,000.40 | $ | 0.01 | 0.15 | % | $ | 0.02 | 0.26 | % | ||||||||||||
| abfunds.com | AB FLEXFEE LARGE CAP GROWTH PORTFOLIO | 1 |
EXPENSE EXAMPLE (continued)
| ^ | Commencement of operations. |
| * | Expenses are equal to each classes’ annualized expense ratio, multiplied by the average account value over the period, multiplied by 3/365 (to reflect the since inception period). |
| + | In connection with the Fund’s investments in affiliated/unaffiliated underlying portfolios, the Fund incurs no direct expenses, but bears proportionate shares of the fees and expenses (i.e., operating, administrative and investment advisory fees) of the affiliated/unaffiliated underlying portfolios. The Adviser has contractually agreed to waive its fees from the Fund in an amount equal to the Fund’s pro rata share of certain acquired fund fees and expenses of the affiliated underlying portfolios. The Fund’s total expenses are equal to the classes’ annualized expense ratio plus the Fund’s pro rata share of the weighted average expense ratio of the affiliated/unaffiliated underlying portfolios in which it invests, multiplied by the average account value over the period, multiplied by 3/365 (to reflect the since inception period). |
| ** | Assumes 5% annual return before expenses. |
| 2 | AB FLEXFEE LARGE CAP GROWTH PORTFOLIO | abfunds.com |
PORTFOLIO SUMMARY
June 30, 2017 (unaudited)
PORTFOLIO STATISTICS
Net Assets ($thousand): $993.0
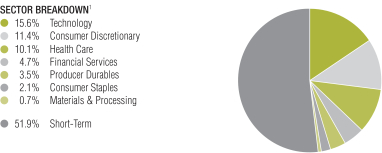
TEN LARGEST HOLDINGS2
| Company | U.S. $ Value | Percent of Net Assets | ||||||
| Alphabet, Inc. – Class C | $ | 75,425 | 7.6 | % | ||||
| Facebook, Inc. – Class A | 64,166 | 6.5 | ||||||
| Visa, Inc. – Class A | 49,141 | 4.9 | ||||||
| UnitedHealth Group, Inc. | 41,720 | 4.2 | ||||||
| Apple, Inc. | 39,173 | 3.9 | ||||||
| Home Depot, Inc. (The) | 38,657 | 3.9 | ||||||
| Edwards Lifesciences Corp. | 36,536 | 3.7 | ||||||
| NIKE, Inc. – Class B | 35,046 | 3.5 | ||||||
| Intuitive Surgical, Inc. | 33,673 | 3.4 | ||||||
| Xilinx, Inc. | 28,558 | 2.9 | ||||||
| $ | 442,095 | 44.5 | % | |||||
| 1 | All data are as of June 30, 2017. The Fund’s sector breakdown is expressed as a percentage of total investments and may vary over time. |
| 2 | Long-term investments. |
Please note: The Fund’s sector breakdown is classified in the above pie chart and throughout this report according to the Russell sector classification scheme. The Russell Sector scheme was developed by Russell Investments. Russell classifies index members into industries that most closely describe the nature of its business and its primary economic orientation. Multiple resources are used to obtain overall information about the company. Additional Russell sector scheme information can be found within Russell Index methodology documents available on Russell.com. The “Portfolio of Investments” section of the report reflects more specific industry information and is consistent with the investment restrictions discussed in the Fund’s prospectus.
| abfunds.com | AB FLEXFEE LARGE CAP GROWTH PORTFOLIO | 3 |
PORTFOLIO OF INVESTMENTS
June 30, 2017 (unaudited)
| Company | Shares | U.S. $ Value | ||||||
| ||||||||
COMMON STOCKS – 93.5% | ||||||||
Technology – 30.4% | ||||||||
Computer Services, Software & Systems – 18.9% | ||||||||
Adobe Systems, Inc.(a) | 197 | $ | 27,864 | |||||
Alphabet, Inc. – Class C(a) | 83 | 75,425 | ||||||
Cognizant Technology Solutions Corp. – Class A | 120 | 7,968 | ||||||
Facebook, Inc. – Class A(a) | 425 | 64,166 | ||||||
Palo Alto Networks, Inc.(a) | 43 | 5,754 | ||||||
ServiceNow, Inc.(a) | 56 | 5,936 | ||||||
|
| |||||||
| 187,113 | ||||||||
|
| |||||||
Computer Technology – 3.9% | ||||||||
Apple, Inc. | 272 | 39,173 | ||||||
|
| |||||||
Electronic Components – 0.6% | ||||||||
Amphenol Corp. – Class A | 77 | 5,684 | ||||||
|
| |||||||
Electronic Entertainment – 1.7% | ||||||||
Electronic Arts, Inc.(a) | 159 | 16,810 | ||||||
|
| |||||||
Semiconductors & Component – 4.7% | ||||||||
NVIDIA Corp. | 60 | 8,674 | ||||||
Texas Instruments, Inc. | 124 | 9,539 | ||||||
Xilinx, Inc. | 444 | 28,558 | ||||||
|
| |||||||
| 46,771 | ||||||||
|
| |||||||
Telecommunications Equipment – 0.6% | ||||||||
Arista Networks, Inc.(a) | 38 | 5,692 | ||||||
|
| |||||||
| 301,243 | ||||||||
|
| |||||||
Consumer Discretionary – 22.1% | ||||||||
Auto Parts – 0.4% | ||||||||
WABCO Holdings, Inc.(a) | 31 | 3,953 | ||||||
|
| |||||||
Cable Television Services – 2.4% | ||||||||
Comcast Corp. – Class A | 620 | 24,130 | ||||||
|
| |||||||
Diversified Retail – 3.9% | ||||||||
Costco Wholesale Corp. | 150 | 23,989 | ||||||
Dollar Tree, Inc.(a) | 206 | 14,404 | ||||||
|
| |||||||
| 38,393 | ||||||||
|
| |||||||
Entertainment – 1.9% | ||||||||
Walt Disney Co. (The) | 180 | 19,125 | ||||||
|
| |||||||
Leisure Time – 0.9% | ||||||||
Priceline Group, Inc. (The)(a) | 5 | 9,353 | ||||||
|
| |||||||
Restaurants – 1.9% | ||||||||
Starbucks Corp. | 314 | 18,309 | ||||||
|
| |||||||
| 4 | AB FLEXFEE LARGE CAP GROWTH PORTFOLIO | abfunds.com |
PORTFOLIO OF INVESTMENTS (continued)
| Company | Shares | U.S. $ Value | ||||||
| ||||||||
Specialty Retail – 7.2% | ||||||||
Home Depot, Inc. (The) | 252 | $ | 38,657 | |||||
O’Reilly Automotive, Inc.(a) | 18 | 3,937 | ||||||
TJX Cos., Inc. (The) | 275 | 19,847 | ||||||
Ulta Salon Cosmetics & Fragrance, Inc.(a) | 31 | 8,908 | ||||||
|
| |||||||
| 71,349 | ||||||||
|
| |||||||
Textiles, Apparel & Shoes – 3.5% | ||||||||
NIKE, Inc. – Class B | 594 | 35,046 | ||||||
|
| |||||||
| 219,658 | ||||||||
|
| |||||||
Health Care – 19.7% | ||||||||
Biotechnology – 2.2% | ||||||||
Biogen, Inc.(a) | 80 | 21,709 | ||||||
|
| |||||||
Health Care Facilities – 0.4% | ||||||||
VCA, Inc.(a) | 49 | 4,523 | ||||||
|
| |||||||
Health Care Management Services – 4.2% | ||||||||
UnitedHealth Group, Inc. | 225 | 41,720 | ||||||
|
| |||||||
Health Care Services – 1.4% | ||||||||
Cerner Corp.(a) | 217 | 14,424 | ||||||
|
| |||||||
Medical & Dental Instruments & Supplies – 4.4% | ||||||||
Align Technology, Inc.(a) | 47 | 7,056 | ||||||
Edwards Lifesciences Corp.(a) | 309 | 36,536 | ||||||
|
| |||||||
| 43,592 | ||||||||
|
| |||||||
Medical Equipment – 5.0% | ||||||||
Danaher Corp. | 184 | 15,528 | ||||||
Intuitive Surgical, Inc.(a) | 36 | 33,673 | ||||||
|
| |||||||
| 49,201 | ||||||||
|
| |||||||
Pharmaceuticals – 2.1% | ||||||||
Zoetis, Inc. | 332 | 20,710 | ||||||
|
| |||||||
| 195,879 | ||||||||
|
| |||||||
Financial Services – 9.1% | ||||||||
Financial Data & Systems – 8.6% | ||||||||
Fiserv, Inc.(a) | 146 | 17,861 | ||||||
S&P Global, Inc. | 82 | 11,971 | ||||||
Vantiv, Inc. – Class A(a) | 99 | 6,271 | ||||||
Visa, Inc. – Class A | 524 | 49,141 | ||||||
|
| |||||||
| 85,244 | ||||||||
|
| |||||||
Securities Brokerage & Services – 0.5% | ||||||||
MarketAxess Holdings, Inc. | 25 | 5,028 | ||||||
|
| |||||||
| 90,272 | ||||||||
|
| |||||||
Producer Durables – 6.8% | ||||||||
Back Office Support, HR & Consulting – 0.7% | ||||||||
Automatic Data Processing, Inc. | 70 | 7,172 | ||||||
|
| |||||||
| abfunds.com | AB FLEXFEE LARGE CAP GROWTH PORTFOLIO | 5 |
PORTFOLIO OF INVESTMENTS (continued)
| Company | Shares | U.S. $ Value | ||||||
| ||||||||
Railroads – 0.9% | ||||||||
Union Pacific Corp. | 82 | $ | 8,931 | |||||
|
| |||||||
Scientific Instruments: Control & Filter – 3.5% | ||||||||
Allegion PLC | 130 | 10,546 | ||||||
IDEX Corp. | 54 | 6,102 | ||||||
Roper Technologies, Inc. | 76 | 17,596 | ||||||
|
| |||||||
| 34,244 | ||||||||
|
| |||||||
Scientific Instruments: Electrical – 0.9% | ||||||||
AO Smith Corp. | 164 | 9,238 | ||||||
|
| |||||||
Scientific Instruments: Gauges & Meters – 0.8% | ||||||||
Mettler-Toledo International, Inc.(a) | 13 | 7,651 | ||||||
|
| |||||||
| 67,236 | ||||||||
|
| |||||||
Consumer Staples – 4.1% | ||||||||
Beverage: Brewers & Distillers – 1.7% | ||||||||
Constellation Brands, Inc. – Class A | 89 | 17,242 | ||||||
|
| |||||||
Beverage: Soft Drinks – 2.4% | ||||||||
Monster Beverage Corp.(a) | 480 | 23,846 | ||||||
|
| |||||||
| 41,088 | ||||||||
|
| |||||||
Materials & Processing – 1.3% | ||||||||
Chemicals: Diversified – 0.9% | ||||||||
Ecolab, Inc. | 68 | 9,027 | ||||||
|
| |||||||
Diversified Materials & Processing – 0.4% | ||||||||
Hexcel Corp. | 74 | 3,906 | ||||||
|
| |||||||
| 12,933 | ||||||||
|
| |||||||
Total Common Stocks | 928,309 | |||||||
|
| |||||||
SHORT-TERM INVESTMENTS – 100.8% | ||||||||
Investment Companies – 100.8% | ||||||||
AB Fixed Income Shares, Inc. – Government Money Market Portfolio – Class AB, 0.79%(b)(c) | 1,000,003 | 1,000,003 | ||||||
|
| |||||||
Total Investments – 194.3% | 1,928,312 | |||||||
Other assets less liabilities – (94.3)% | (935,732 | ) | ||||||
|
| |||||||
Net Assets – 100.0% | $ | 992,580 | ||||||
|
| |||||||
| (a) | Non-income producing security. |
| (b) | To obtain a copy of the fund’s shareholder report, please go to the Securities and Exchange Commission’s website at www.sec.gov, or call AB at (800) 227-4618. |
| (c) | Investment in affiliated money market mutual fund. The rate shown represents the 7-day yield as of period end. |
See notes to financial statements.
| 6 | AB FLEXFEE LARGE CAP GROWTH PORTFOLIO | abfunds.com |
STATEMENT OF ASSETS & LIABILITIES
June 30, 2017 (unaudited)
| Assets | ||||
Investments in securities, at value | ||||
Unaffiliated issuers (cost $935,813) | $ | 928,309 | ||
Affiliated issuers (cost $1,000,003) | 1,000,003 | |||
Prepaid expenses | 45,496 | |||
Receivable from Adviser | 2,810 | |||
Dividends receivable | 98 | |||
|
| |||
Total assets | 1,976,716 | |||
|
| |||
| Liabilities | ||||
Payable for investment securities purchased | 935,813 | |||
Offering expenses payable | 46,000 | |||
Transfer Agent fee payable | 7 | |||
Accrued expenses and other liabilities | 2,316 | |||
|
| |||
Total liabilities | 984,136 | |||
|
| |||
Net Assets | $ | 992,580 | ||
|
| |||
| Composition of Net Assets | ||||
Capital stock, at par | $ | 10 | ||
Additional paid-in capital | 999,993 | |||
Undistributed net investment income | 81 | |||
Net unrealized depreciation on investments | (7,504 | ) | ||
|
| |||
| $ | 992,580 | |||
|
|
Net Asset Value Per Share—11 billion shares of capital stock authorized, $.0001 par value
| Class | Net Assets | Shares Outstanding | Net Asset Value | |||||||||
| ||||||||||||
| Advisor | $ | 992,580 | 100,000 | $ | 9.93 | |||||||
| ||||||||||||
See notes to financial statements.
| abfunds.com | AB FLEXFEE LARGE CAP GROWTH PORTFOLIO | 7 |
STATEMENT OF OPERATIONS
Period from June 28, 2017(a) to June 30, 2017 (unaudited)
| Investment Income | ||||||||
Dividends | ||||||||
Unaffiliated issuers | $ | 98 | $ | 98 | ||||
|
| |||||||
| Expenses | ||||||||
Management fee (see Note B) | 22 | |||||||
Transfer agency—Advisor Class | 7 | |||||||
Audit and tax | 964 | |||||||
Administrative | 802 | |||||||
Amortization of offering expenses | 504 | |||||||
Legal | 449 | |||||||
Custodian | 413 | |||||||
Directors’ fees | 241 | |||||||
Printing | 194 | |||||||
Miscellaneous | 55 | |||||||
|
| |||||||
Total expenses | 3,651 | |||||||
Less: expenses waived and reimbursed by the Adviser (see Note B) | (3,634 | ) | ||||||
|
| |||||||
Net expenses | 17 | |||||||
|
| |||||||
Net investment income | 81 | |||||||
|
| |||||||
| Unrealized (Loss) on Investments | ||||||||
Net change in unrealized appreciation/depreciation on: | ||||||||
Investments | (7,504 | ) | ||||||
|
| |||||||
Net loss on investments | (7,504 | ) | ||||||
|
| |||||||
Net Decrease in Net Assets from Operations | $ | (7,423 | ) | |||||
|
|
| (a) | Commencement of operations. |
See notes to financial statements.
| 8 | AB FLEXFEE LARGE CAP GROWTH PORTFOLIO | abfunds.com |
STATEMENT OF CHANGES IN NET ASSETS
| June 28, 2017(a) to June 30, 2017 (unaudited) | ||||
| Increase (Decrease) in Net Assets from Operations | ||||
Net investment income | $ | 81 | ||
Net change in unrealized appreciation/depreciation on investments | (7,504 | ) | ||
|
| |||
Net decrease in net assets from operations | (7,423 | ) | ||
| Capital Stock Transactions | ||||
Net increase | 1,000,003 | |||
|
| |||
Total increase | 992,580 | |||
| Net Assets | ||||
Beginning of period | – 0 | – | ||
|
| |||
End of period (including undistributed net investment income of $81) | $ | 992,580 | ||
|
| |||
| (a) | Commencement of operations. |
See notes to financial statements.
| abfunds.com | AB FLEXFEE LARGE CAP GROWTH PORTFOLIO | 9 |
NOTES TO FINANCIAL STATEMENTS
June 30, 2017 (unaudited)
NOTE A
Significant Accounting Policies
AB Cap Fund, Inc. (the “Company”), which is a Maryland corporation, is registered under the Investment Company Act of 1940 as an open-end management investment company. The Company operates as a series company currently comprised of 31 portfolios. Each portfolio is considered to be a separate entity for financial reporting and tax purposes. This report relates only to the AB FlexFee Large Cap Growth Portfolio (the “Fund”), a diversified portfolio. The Fund commenced operations on June 28, 2017. The Fund has authorized issuance of Class A, Class B, Class C, Advisor Class, Class R, Class K, Class I, Class Z, Class T, Class 1, and Class 2 shares. No classes are being publicly offered. Class A, Class B, Class C, Class R, Class K, Class I, Class Z, Class T, Class 1, and Class 2 shares have not been issued. As of June 30, 2017, AllianceBernstein L.P. (the “Adviser”) was the sole shareholder of Advisor Class shares. Advisor Class shares are sold without an initial or contingent deferred sales charge and are not subject to ongoing distribution expenses. All eleven classes of shares have identical voting, dividend, liquidation and other rights, except that the classes bear different distribution and transfer agency expenses. Each class has exclusive voting rights with respect to its distribution plan. The financial statements have been prepared in conformity with U.S. generally accepted accounting principles (“U.S. GAAP”), which require management to make certain estimates and assumptions that affect the reported amounts of assets and liabilities in the financial statements and amounts of income and expenses during the reporting period. Actual results could differ from those estimates. The Fund is an investment company under U.S. GAAP and follows the accounting and reporting guidance applicable to investment companies. The following is a summary of significant accounting policies followed by the Fund.
1. Security Valuation
Portfolio securities are valued at their current market value determined on the basis of market quotations or, if market quotations are not readily available or are deemed unreliable, at “fair value” as determined in accordance with procedures established by and under the general supervision of the Fund’s Board of Directors (the “Board”).
In general, the market values of securities which are readily available and deemed reliable are determined as follows: securities listed on a national securities exchange (other than securities listed on the NASDAQ Stock Market, Inc. (“NASDAQ”)) or on a foreign securities exchange are valued at the last sale price at the close of the exchange or foreign securities exchange. If there has been no sale on such day, the securities are valued at the last traded price from the previous day. Securities listed on more
| 10 | AB FLEXFEE LARGE CAP GROWTH PORTFOLIO | abfunds.com |
NOTES TO FINANCIAL STATEMENTS (continued)
than one exchange are valued by reference to the principal exchange on which the securities are traded; securities listed only on NASDAQ are valued in accordance with the NASDAQ Official Closing Price; listed or over the counter (“OTC”) market put or call options are valued at the mid level between the current bid and ask prices. If either a current bid or current ask price is unavailable, AllianceBernstein L.P. (the “Adviser”) will have discretion to determine the best valuation (e.g. last trade price in the case of listed options); open futures contracts are valued using the closing settlement price or, in the absence of such a price, the most recent quoted bid price. If there are no quotations available for the day of valuation, the last available closing settlement price is used; U.S. Government securities and any other debt instruments having 60 days or less remaining until maturity are generally valued at market by an independent pricing vendor, if a market price is available. If a market price is not available, the securities are valued at amortized cost. This methodology is commonly used for short-term securities that have an original maturity of 60 days or less, as well as short-term securities that had an original term to maturity that exceeded 60 days. In instances when amortized cost is utilized, the Valuation Committee (the “Committee”) must reasonably conclude that the utilization of amortized cost is approximately the same as the fair value of the security. Such factors the Committee will consider include, but are not limited to, an impairment of the creditworthiness of the issuer or material changes in interest rates. Fixed-income securities, including mortgage-backed and asset-backed securities, may be valued on the basis of prices provided by a pricing service or at a price obtained from one or more of the major broker-dealers. In cases where broker-dealer quotes are obtained, the Adviser may establish procedures whereby changes in market yields or spreads are used to adjust, on a daily basis, a recently obtained quoted price on a security. Swaps and other derivatives are valued daily, primarily using independent pricing services, independent pricing models using market inputs, as well as third party broker-dealers or counterparties. Open end mutual funds are valued at the closing net asset value per share, while exchange traded funds are valued at the closing market price per share.
Securities for which market quotations are not readily available (including restricted securities) or are deemed unreliable are valued at fair value as deemed appropriate by the Adviser. Factors considered in making this determination may include, but are not limited to, information obtained by contacting the issuer, analysts, analysis of the issuer’s financial statements or other available documents. In addition, the Fund may use fair value pricing for securities primarily traded in non-U.S. markets because most foreign markets close well before the Fund values its securities at 4:00 p.m., Eastern Time. The earlier close of these foreign markets gives rise to the possibility that significant events, including broad market moves, may have
| abfunds.com | AB FLEXFEE LARGE CAP GROWTH PORTFOLIO | 11 |
NOTES TO FINANCIAL STATEMENTS (continued)
occurred in the interim and may materially affect the value of those securities. To account for this, the Fund may frequently value many of its foreign equity securities using fair value prices based on third party vendor modeling tools to the extent available.
2. Fair Value Measurements
In accordance with U.S. GAAP regarding fair value measurements, fair value is defined as the price that the Fund would receive to sell an asset or pay to transfer a liability in an orderly transaction between market participants at the measurement date. U.S. GAAP establishes a framework for measuring fair value, and a three-level hierarchy for fair value measurements based upon the transparency of inputs to the valuation of an asset or liability (including those valued based on their market values as described in Note A.1 above). Inputs may be observable or unobservable and refer broadly to the assumptions that market participants would use in pricing the asset or liability. Observable inputs reflect the assumptions market participants would use in pricing the asset or liability based on market data obtained from sources independent of the Fund. Unobservable inputs reflect the Fund’s own assumptions about the assumptions that market participants would use in pricing the asset or liability based on the best information available in the circumstances. Each investment is assigned a level based upon the observability of the inputs which are significant to the overall valuation. The three-tier hierarchy of inputs is summarized below.
| • | Level 1—quoted prices in active markets for identical investments |
| • | Level 2—other significant observable inputs (including quoted prices for similar investments, interest rates, prepayment speeds, credit risk, etc.) |
| • | Level 3—significant unobservable inputs (including the Fund’s own assumptions in determining the fair value of investments) |
Where readily available market prices or relevant bid prices are not available for certain equity investments, such investments may be valued based on similar publicly traded investments, movements in relevant indices since last available prices or based upon underlying company fundamentals and comparable company data (such as multiples to earnings or other multiples to equity). Where an investment is valued using an observable input, such as another publicly traded security, the investment will be classified as Level 2. If management determines that an adjustment is appropriate based on restrictions on resale, illiquidity or uncertainty, and such adjustment is a significant component of the valuation, the investment will be classified as Level 3. An investment will also be classified as Level 3 where management uses company fundamentals and other significant inputs to determine the valuation.
| 12 | AB FLEXFEE LARGE CAP GROWTH PORTFOLIO | abfunds.com |
NOTES TO FINANCIAL STATEMENTS (continued)
The following table summarizes the valuation of the Fund’s investments by the above fair value hierarchy levels as of June 30, 2017:
Investments in | Level 1 | Level 2 | Level 3 | Total | ||||||||||||
Assets: | ||||||||||||||||
Common Stocks^ | $ | 928,309 | $ | – 0 | – | $ | – 0 | – | $ | 928,309 | ||||||
Short-Term Investments: | ||||||||||||||||
Investment Companies | 1,000,003 | – 0 | – | – 0 | – | 1,000,003 | ||||||||||
|
|
|
|
|
|
|
| |||||||||
Total Investments in Securities | 1,928,312 | – 0 | – | – 0 | – | 1,928,312 | ||||||||||
Other Financial Instruments* | – 0 | – | – 0 | – | – 0 | – | – 0 | – | ||||||||
|
|
|
|
|
|
|
| |||||||||
Total | $ | 1,928,312 | $ | – 0 | – | $ | – 0 | – | $ | 1,928,312 | ||||||
|
|
|
|
|
|
|
| |||||||||
| ^ | See Portfolio of Investments for sector classifications. |
| * | Other financial instruments are derivative instruments, such as futures, forwards and swaps which are valued at the unrealized appreciation/depreciation on the instrument. |
The Fund recognizes all transfers between levels of the fair value hierarchy assuming the financial instrument was transferred at the beginning of the reporting period.
The Adviser established the Committee to oversee the pricing and valuation of all securities held in the Fund. The Committee operates under pricing and valuation policies and procedures established by the Adviser and approved by the Board, including pricing policies which set forth the mechanisms and processes to be employed on a daily basis to implement these policies and procedures. In particular, the pricing policies describe how to determine market quotations for securities and other instruments. The Committee’s responsibilities include: 1) fair value and liquidity determinations (and oversight of any third parties to whom any responsibility for fair value and liquidity determinations is delegated), and 2) regular monitoring of the Adviser’s pricing and valuation policies and procedures and modification or enhancement of these policies and procedures (or recommendation of the modification of these policies and procedures) as the Committee believes appropriate.
The Committee is also responsible for monitoring the implementation of the pricing policies by the Adviser’s Pricing Group (the “Pricing Group”) and any third party which performs certain pricing functions in accordance with the pricing policies. The Pricing Group is responsible for the oversight of the third party on a day-to-day basis. The Committee and the Pricing Group perform a series of activities to provide reasonable assurance of the accuracy of prices including: 1) periodic vendor due diligence meetings, review of methodologies, new developments and process at vendors, 2) daily comparison of security valuation versus prior day for all securities that exceeded established thresholds, and 3) daily review of unpriced, stale, and variance reports with exceptions reviewed by senior management and the Committee.
| abfunds.com | AB FLEXFEE LARGE CAP GROWTH PORTFOLIO | 13 |
NOTES TO FINANCIAL STATEMENTS (continued)
In addition, several processes outside of the pricing process are used to monitor valuation issues including: 1) performance and performance attribution reports are monitored for anomalous impacts based upon benchmark performance, and 2) portfolio managers review all portfolios for performance and analytics (which are generated using the Adviser’s prices).
3. Currency Translation
Assets and liabilities denominated in foreign currencies and commitments under forward currency exchange contracts are translated into U.S. dollars at the mean of the quoted bid and ask prices of such currencies against the U.S. dollar. Purchases and sales of portfolio securities are translated into U.S. dollars at the rates of exchange prevailing when such securities were acquired or sold. Income and expenses are translated into U.S. dollars at the rates of exchange prevailing when accrued.
Net realized gain or loss on foreign currency transactions represents foreign exchange gains and losses from sales and maturities of foreign fixed income investments, foreign currency exchange contracts, holding of foreign currencies, currency gains or losses realized between the trade and settlement dates on foreign investment transactions, and the difference between the amounts of dividends, interest and foreign withholding taxes recorded on the Fund’s books and the U.S. dollar equivalent amounts actually received or paid. Net unrealized currency gains and losses from valuing foreign currency denominated assets and liabilities at period end exchange rates are reflected as a component of net unrealized appreciation and depreciation of foreign currency denominated assets and liabilities.
4. Taxes
It is the Fund’s policy to meet the requirements of the Internal Revenue Code applicable to regulated investment companies and to distribute all of its investment company taxable income and net realized gains, if any, to shareholders. Therefore, no provisions for federal income or excise taxes are required. The Fund may be subject to taxes imposed by countries in which it invests. Such taxes are generally based on income and/or capital gains earned or repatriated. Taxes are accrued and applied to net investment income, net realized gains and net unrealized appreciation/depreciation as such income and/or gains are earned.
In accordance with U.S. GAAP requirements regarding accounting for uncertainties in income taxes, management has analyzed the Fund’s tax positions taken or expected to be taken on federal and state income tax returns for the current initial tax year, and has concluded that no provision for income tax is required in the Fund’s financial statements.
| 14 | AB FLEXFEE LARGE CAP GROWTH PORTFOLIO | abfunds.com |
NOTES TO FINANCIAL STATEMENTS (continued)
5. Investment Income and Investment Transactions
Dividend income is recorded on the ex-dividend date or as soon as the Fund is informed of the dividend. Interest income is accrued daily. Investment transactions are accounted for on the date securities are purchased or sold. Investment gains or losses are determined on the identified cost basis. The Fund amortizes premiums and accretes discounts as adjustments to interest income.
6. Class Allocations
All income earned and expenses incurred by the Fund are borne on a pro-rata basis by each settled class of shares, based on the proportionate interest in the Fund represented by the net assets of such class, except for class specific expenses which are allocated to the respective class. Expenses of the Company are charged proportionately to each portfolio or based on other appropriate methods. Realized and unrealized gains and losses are allocated among the various share classes based on their respective net assets.
7. Dividends and Distributions
Dividends and distributions to shareholders, if any, are recorded on the ex-dividend date. Income dividends and capital gains distributions are determined in accordance with federal tax regulations and may differ from those determined in accordance with U.S. GAAP. To the extent these differences are permanent, such amounts are reclassified within the capital accounts based on their federal tax basis treatment; temporary differences do not require such reclassification.
8. Offering Expenses
Offering expenses of $46,000 were deferred and amortized on a straight line basis over a one year period starting from June 28, 2017 (commencement of operations).
NOTE B
Management Fee and Other Transactions with Affiliates
Under the terms of the investment advisory agreement, the Fund pays the Adviser a management fee at an annual rate of .55% of the Fund’s average daily net assets (“Base Fee”). The management fee is increased or decreased from the Base Fee by a performance adjustment (“Performance Adjustment”) that depends on whether, and to what extent, the investment performance of the Advisor Class shares of the Fund (“Measuring Class”) exceeds, or is exceeded by, the performance of the Russell 1000 Growth Index (“Index”) plus 1.40% (“Index Hurdle”) over the Performance Period (as defined below). The Performance Adjustment is calculated and accrued daily, according to a schedule that adds or subtracts .00357% of the Fund’s average daily net assets for each .01% of absolute performance by
| abfunds.com | AB FLEXFEE LARGE CAP GROWTH PORTFOLIO | 15 |
NOTES TO FINANCIAL STATEMENTS (continued)
which the performance of the Measuring Class exceeds or lags the performance of the Index Hurdle for the period from the beginning of the Performance Period through the current business day. The maximum Performance Adjustment (positive or negative) will not exceed an annualized rate of +/-.50% (“Maximum Performance Adjustment”) of the Fund’s average daily net assets, which would occur when the performance of the Measuring Class exceeds, or is exceeded by, the Index Hurdle by 1.40% for the Performance Period. On a monthly basis, the Fund will pay the Adviser the minimum fee rate of .05% on an annualized basis (Base Fee minus the Maximum Performance Adjustment) applied to the average daily net assets for the month. At the end of the Performance Period, the Fund will pay to the Adviser the total management fee, less the amount of any minimum fees paid during the Performance Period and any waivers described below. The period over which performance is measured (“Performance Period”) is initially from the commencement of operations to December 31, 2018 and thereafter each 12-month period beginning on the first business day in the month of January through December 31 of the same year. In addition, the Adviser has agreed to waive its management fee by limiting the Fund’s accrual of the management fee (base fee plus performance adjustment) on any day to the amount corresponding to the maximum fee rate multiplied by the Fund’s current net assets as of the preceding day if such amount is less than the amount that would have been accrued based on the Fund’s average daily net assets for the performance period. The minimum fee is paid monthly while the performance fee is paid at the end of the Performance Period. For the reporting period ended June 30, 2017, the Fund accrued management fees of $22, as reflected in the Statement of Operations, at an annual effective rate (excluding the impact from any expense waivers in effect) of .20% of the Fund’s average net assets, which included a (.35)% performance adjustment of $(38). The Adviser has agreed to waive its fees and bear certain expenses through December 31, 2018 to the extent necessary to limit total expenses (other than the management fee, acquired fund fees and expenses other than the advisory fees of any AB Mutual Funds in which the Fund may invest, interest expense, taxes, extraordinary expenses, and brokerage commissions and other transaction costs) on an annual basis from exceeding .05% of average daily net assets. Any fees waived and expenses borne by the Adviser are subject to repayment by the Fund until the end of the third fiscal year after the fiscal period in which the fees were waived or the expenses were borne; such waivers that are subject to repayment amount to $2,821 for the fiscal period ended June 30, 2017. In any case, no repayment will be made that would cause the Fund’s total annual expenses (subject to the exclusions set forth above) to exceed .05%.
Pursuant to the investment advisory agreement, the Fund may reimburse the Adviser for certain legal and accounting services provided to the Fund by the Adviser. For the period ended June 30, 2017, the Adviser voluntarily agreed to waive such fees that amounted to $802.
| 16 | AB FLEXFEE LARGE CAP GROWTH PORTFOLIO | abfunds.com |
NOTES TO FINANCIAL STATEMENTS (continued)
The Fund compensates AllianceBernstein Investor Services, Inc. (“ABIS”), a wholly-owned subsidiary of the Adviser, under a Transfer Agency Agreement for providing personnel and facilities to perform transfer agency services for the Fund. ABIS may make payments to intermediaries that provide omnibus account services, sub-accounting services and/or networking services. The compensation retained by ABIS amounted to $83 for the period ended June 30, 2017.
The Fund may invest in AB Government Money Market Portfolio (the “Government Money Market Portfolio”) which has a contractual annual advisory fee rate of .20% of the portfolio’s average daily net assets and bears its own expenses. In connection with the investment by the Fund in the Government Money Market Portfolio, the Adviser has agreed to waive its advisory fee from the Fund in an amount equal to the Fund’s pro rata share of the effective advisory fee of Government Money Market Portfolio, as borne indirectly by the Fund as an acquired fund fee and expense. For the period ended June 30, 2017, such waiver amounted to $11. A summary of the Fund’s transactions in shares of the Government Money Market Portfolio for the period ended June 30, 2017 is as follows:
Market Value | Purchases at Cost (000) | Sales Proceeds (000) | Market Value June 30, 2017 (000) | Dividend Income (000) | ||||||||||||||
| $ – 0 | – | $ | 1,000 | $ | – 0 | – | $ | 1,000 | $ | – 0 | – | |||||||
| * | Commencement of operations. |
Brokerage commissions paid on investment transactions for the period ended June 30, 2017 amounted to $126, of which $0 and $0, respectively, was paid to Sanford C. Bernstein & Co. LLC or Sanford C. Bernstein Limited, affiliates of the Adviser.
NOTE C
Investment Transactions
Purchases and sales of investment securities (excluding short-term investments) for the period ended June 30, 2017, were as follows:
| Purchases | Sales | |||||||
Investment securities (excluding | $ | 935,812 | $ | – 0 | – | |||
U.S. government securities | – 0 | – | – 0 | – | ||||
The cost of investments for federal income tax purposes was substantially the same as cost for financial reporting purposes. Accordingly, gross unrealized appreciation and unrealized depreciation are as follows:
Gross unrealized appreciation | $ | 4,639 | ||
Gross unrealized depreciation | (12,143 | ) | ||
|
| |||
Net unrealized depreciation | $ | (7,504 | ) | |
|
|
| abfunds.com | AB FLEXFEE LARGE CAP GROWTH PORTFOLIO | 17 |
NOTES TO FINANCIAL STATEMENTS (continued)
1. Derivative Financial Instruments
The Fund may use derivatives in an effort to earn income and enhance returns, to replace more traditional direct investments, to obtain exposure to otherwise inaccessible markets (collectively, “investment purposes”), or to hedge or adjust the risk profile of its portfolio.
The Fund did not engage in derivative transactions for the period ended June 30, 2017.
2. Currency Transactions
The Fund may invest in non-U.S. Dollar-denominated securities on a currency hedged or unhedged basis. The Fund may seek investment opportunities by taking long or short positions in currencies through the use of currency-related derivatives, including forward currency exchange contracts, futures and options on futures, swaps, and other options. The Fund may enter into transactions for investment opportunities when it anticipates that a foreign currency will appreciate or depreciate in value but securities denominated in that currency are not held by the Fund and do not present attractive investment opportunities. Such transactions may also be used when the Adviser believes that it may be more efficient than a direct investment in a foreign currency-denominated security. The Fund may also conduct currency exchange contracts on a spot basis (i.e., for cash at the spot rate prevailing in the currency exchange market for buying or selling currencies).
NOTE D
Capital Stock
Each class consists of 1,000,000,000 authorized shares. Transactions in capital shares for each class were as follows:
| Shares | Amount | |||||||||||||||
| June 28, 2017* to June 30, 2017 (unaudited) | June 28, 2017* to June 30, 2017 (unaudited) | |||||||||||||||
|
| |||||||||||||||
| Advisor Class | ||||||||||||||||
Shares sold | 100,000 | $ | 1,000,003 | |||||||||||||
| ||||||||||||||||
Net increase | 100,000 | $ | 1,000,003 | |||||||||||||
| ||||||||||||||||
| * | Commencement of operations. |
NOTE E
Risks Involved in Investing in the Fund
Foreign (Non-U.S.) Risk—Investments in securities of non-U.S. issuers may involve more risk than those of U.S. issuers. These securities may fluctuate more widely in price and may be less liquid due to adverse market, economic, political, regulatory or other factors.
| 18 | AB FLEXFEE LARGE CAP GROWTH PORTFOLIO | abfunds.com |
NOTES TO FINANCIAL STATEMENTS (continued)
Derivatives Risk—The Fund may enter into derivative transactions such as forwards, options, futures and swaps. Derivatives may be illiquid, difficult to price, and leveraged so that small changes may produce disproportionate losses for the Fund, and subject to counterparty risk to a greater degree than more traditional investments. Derivatives may result in significant losses, including losses that are far greater than the value of the derivatives reflected on the statement of assets and liabilities.
Indemnification Risk—In the ordinary course of business, the Fund enters into contracts that contain a variety of indemnifications. The Fund’s maximum exposure under these arrangements is unknown. However, the Fund has not had prior claims or losses pursuant to these indemnification provisions and expects the risk of loss thereunder to be remote. Therefore, the Fund has not accrued any liability in connection with these indemnification provisions.
NOTE F
Tax Information
For tax purposes, net capital losses may be carried over to offset future capital gains, if any. Under the Regulated Investment Company Modernization Act of 2010, funds are permitted to carry forward capital losses incurred in taxable years beginning after December 22, 2010 for an indefinite period. These capital loss carryforwards will retain their character as either short-term or long-term capital losses.
NOTE G
Other
In October 2016, the U.S. Securities and Exchange Commission adopted new rules and amended existing rules (together, “final rules”) intended to modernize the reporting and disclosure of information by registered investment companies. In part, the final rules amend Regulation S-X and require standardized, enhanced disclosure about derivatives in investment company financial statements, as well as other amendments. The compliance date for the amendments to Regulation S-X is August 1, 2017 (for reporting period end dates of August 31, 2017 or after). Management has evaluated the impact of the amendments and expects the effect of the adoption of the final rules on financial statements will be limited to additional disclosures.
NOTE H
Subsequent Events
Management has evaluated subsequent events for possible recognition or disclosure in the financial statements through the date the financial statements are issued. Management has determined that there are no material events that would require disclosure in the Fund’s financial statements through this date.
| abfunds.com | AB FLEXFEE LARGE CAP GROWTH PORTFOLIO | 19 |
FINANCIAL HIGHLIGHTS
Selected Data For A Share Of Capital Stock Outstanding Throughout Each Period
| Advisor Class | ||||
June 28, (unaudited) | ||||
|
| |||
Net asset value, beginning of period | $ 10.00 | |||
|
| |||
Income From Investment Operations | ||||
Net investment income(b)(c)(d) | .00 | |||
Net unrealized loss on investment | (.07 | ) | ||
|
| |||
Net decrease in net asset value from operations | (.07 | ) | ||
|
| |||
Net asset value, end of period | $ 9.93 | |||
|
| |||
Total Return | ||||
Total investment return based on net asset value(e) | (0.70 | )% | ||
Ratios/Supplemental Data | ||||
Net assets, end of period (000’s omitted) | $993 | |||
Ratio to average net assets of: | ||||
Expenses, net of waivers/reimbursements(f)(g) | .15 | % | ||
Expenses, before waivers/reimbursements(f)(g) | 33.62 | % | ||
Net investment income(d)(g) | .74 | % | ||
Portfolio turnover rate | .00 | % | ||
| (a) | Commencement of operations. |
| (b) | Based on average shares outstanding. |
| (c) | Amount is less than $0.005. |
| (d) | Net of expenses waived/reimbursed by the Adviser. |
| (e) | Total investment return is calculated assuming an initial investment made at the net asset value at the beginning of the period, reinvestment of all dividends and distributions at net asset value during the period, and redemption on the last day of the period. Initial sales charge or contingent deferred sales charge is not reflected in the calculation of total investment return. Total investment return does not reflect the deduction of taxes that a shareholder would pay on fund distributions or the redemption of fund shares. Total investment return for a period of less than one year is not annualized. |
| (f) | In connection with the Fund’s investments in affiliated underlying portfolios, the Fund incurs no direct expenses but bears proportionate shares of the fees and expenses (i.e. operating, administrative and investment advisory fees) of the affiliated underlying portfolios. The Adviser has contractually agreed to waive its fees from the Fund in an amount equal to the Fund’s pro rata share of certain acquired fund fees and expenses, and for the six months ended, such waiver amounted to 0.10% annualized for the Fund. |
| (g) | Annualized. |
See notes to financial statements.
| 20 | AB FLEXFEE LARGE CAP GROWTH PORTFOLIO | abfunds.com |
BOARD OF DIRECTORS
Marshall C. Turner, Jr(1), Chairman John H. Dobkin(1) Michael J. Downey(1) William H. Foulk, Jr. (1) D. James Guzy(1) | Nancy P. Jacklin(1) Robert M. Keith, President and Chief Executive Officer Carol C. McMullen(1) Garry L. Moody(1) Earl D. Weiner(1) |
OFFICERS
Philip L. Kirstein, Senior Vice President and Independent Compliance Officer Frank V. Caruso(2), Vice President Vincent C. Dupont(2), Vice President John H. Fogarty(2), Vice President | Karen Sesin(2), Vice President Emilie D. Wrapp, Secretary Joseph J. Mantineo, Treasurer and Chief Financial Officer Phyllis J. Clarke, Controller Vincent S. Noto, Chief Compliance Officer |
Custodian and Accounting Agent Brown Brothers Harriman & Co. 50 Post Office Square Boston, MA 02110
Principal Underwriter AllianceBernstein Investments, Inc. 1345 Avenue of the Americas New York, NY 10105
Transfer Agent AllianceBernstein Investor Services, Inc. P.O. Box 786003 San Antonio, TX 78278-6003 Toll-Free (800) 221-6003 | Independent Registered Public Accounting Firm Ernst & Young LLP 5 Times Square New York, NY 10036
Legal Counsel Seward & Kissel LLP One Battery Park Plaza New York, NY 10004 |
| 1 | Member of the Audit Committee, the Governance and Nominating Committee and the Independent Directors Committee. |
| 2 | The day-to-day management of, and investment decisions for, the Fund’s portfolio are made by the Adviser’s U.S. Large Cap Growth Investment Team. Messrs. Caruso, Dupont and Fogarty and Ms. Sesin are the investment professionals with the most significant responsibility for the day-to-day management of the Fund’s portfolio. |
| abfunds.com | AB FLEXFEE LARGE CAP GROWTH PORTFOLIO | 21 |
Information Regarding the Review and Approval of the Fund’s Advisory Agreement
The disinterested directors (the “directors”) of AB Cap Fund, Inc. (the “Company”) unanimously approved the Company’s Advisory Agreement with the Adviser in respect of AB FlexFeeTM Large Cap Growth Portfolio (the “Fund”) for an initial two-year period at a meeting held on January 31-February 1, 2017 (the “Meeting”). (At the time of the approval of the Advisory Agreement, the Fund was known as AB Performance Fee Series—Large Cap Growth Portfolio.)
Prior to approval of the Advisory Agreement, the directors had requested from the Adviser, and received and evaluated, extensive materials. They reviewed the proposed Advisory Agreement with the Adviser and with experienced counsel who are independent of the Adviser, who advised on the relevant legal standards. The directors also reviewed an independent evaluation prepared by the Company’s Senior Officer (who is also the Company’s Independent Compliance Officer), who acted as their independent fee consultant, of the reasonableness of the proposed performance-based advisory fee (which consists of a base fee plus or minus a performance adjustment), in which the Senior Officer concluded that the proposed contractual fee for the Fund was reasonable. The directors also discussed the proposed approval in private sessions with counsel and the Company’s Senior Officer.
The directors considered their knowledge of the nature and quality of the services to be provided by the Adviser to the Fund gained from their experience as directors or trustees of most of the registered investment companies advised by the Adviser, their overall confidence in the Adviser’s integrity and competence they have gained from that experience, the Adviser’s initiative in identifying and raising potential issues with the directors and its responsiveness, frankness and attention to concerns raised by the directors in the past, including the Adviser’s willingness to consider and implement organizational and operational changes designed to improve investment results and the services provided to the AB Funds. The directors noted that they have four regular meetings each year, at each of which they receive presentations from the Adviser on the investment results of the AB Funds and review extensive materials and information presented by the Adviser.
The directors also considered all factors they believed relevant, including the specific matters discussed below. During the course of their deliberations, the directors evaluated, among other things, the reasonableness of the proposed advisory fee. The directors did not identify any particular information that was all-important or controlling, and different directors may have attributed different weights to the various factors. The directors determined that the selection of the Adviser to manage the Fund and the overall arrangements between the Fund and the Adviser, as provided in the
| 22 | AB FLEXFEE LARGE CAP GROWTH PORTFOLIO | abfunds.com |
Advisory Agreement, including the proposed advisory fee, were fair and reasonable in light of the services to be performed, expenses to be incurred and such other matters as the directors considered relevant in the exercise of their business judgment. The material factors and conclusions that formed the basis for the directors’ determinations included the following:
Nature, Extent and Quality of Services to be Provided
The directors considered the scope and quality of services to be provided by the Adviser under the Advisory Agreement, including the quality of the investment research capabilities of the Adviser and the other resources it has dedicated to performing services for the AB Funds. They also noted the professional experience and qualifications of the Fund’s portfolio management team and other senior personnel of the Adviser. The directors also considered that the Advisory Agreement provides that the Fund will reimburse the Adviser for the cost to it of providing certain clerical, accounting, administrative and other services to the Fund by employees of the Adviser or its affiliates. Requests for these reimbursements will be subject to the directors’ approval on a quarterly basis and, to the extent requested and paid, result in a higher rate of total compensation from the Fund to the Adviser than the fee rate stated in the Advisory Agreement. The directors noted that the methodology to be used to determine the reimbursement amounts had been reviewed by an independent consultant retained by the Company’s Senior Officer. The quality of administrative and other services, including the Adviser’s role in coordinating the activities of the Fund’s other service providers, also was considered. The directors concluded that, overall, they were satisfied with the nature, extent and quality of services to be provided to the Fund under the Advisory Agreement.
Costs of Services to be Provided and Profitability
Because the Fund had not yet commenced operations, the directors were unable to consider historical information about the profitability of the Fund. However, the Adviser agreed to provide the directors with profitability information in connection with future proposed continuances of the Advisory Agreement. They also considered the costs to be borne by the Adviser in providing services to the Fund and that the Fund was unlikely to be profitable to the Adviser unless it achieves a material level of net assets. The directors also noted that, due to the performance fee component of the advisory fee, profitability would tend to be higher with better performance relative to the Fund’s benchmark, which they considered to create an appropriate alignment of incentives.
Fall-Out Benefits
The directors considered the other benefits to the Adviser and its affiliates from their proposed relationships with the Fund, including, but not limited to, benefits relating to 12b-1 fees and sales charges to be received by the Fund’s principal underwriter (which is a wholly owned subsidiary of the
| abfunds.com | AB FLEXFEE LARGE CAP GROWTH PORTFOLIO | 23 |
Adviser) in respect of certain classes of the Fund’s shares; and transfer agency fees to be paid by the Fund to a wholly owned subsidiary of the Adviser. The directors recognized that the Adviser’s future profitability would be somewhat lower without these benefits. The directors understood that the Adviser also might derive reputational and other benefits from its association with the Fund.
Investment Results
Since the Fund had not yet commenced operations, no performance or other historical information for the Fund was available. The Adviser manages another AB Fund with a similar investment style, and, at the Meeting, the directors reviewed performance information for that AB Fund. Based on this information, together with the Adviser’s written and oral presentations regarding the management of the Fund and their general knowledge and confidence in the Adviser’s expertise in managing mutual funds, the directors concluded that they were satisfied that the Adviser was capable of providing high quality Fund management services to the Fund.
Advisory Fees and Other Expenses
The directors considered the proposed advisory fee rate payable by the Fund to the Adviser and information prepared by three analytical services that are not affiliated with the Adviser (the “15(c) service providers”), concerning advisory fee rates paid by other funds in the same category as the Fund at a hypothetical common asset level of $250 million. The directors recognized that it is difficult to make comparisons of advisory fees because there are variations in the services that are included in the fees paid by other funds. The directors considered the Fund’s proposed contractual effective advisory fee rate against a peer group median.
The directors recognized that the Adviser’s total compensation from the Fund pursuant to the Advisory Agreement would be increased by amounts paid pursuant to the expense reimbursement provision in the Advisory Agreement, and that the impact of such expense reimbursement would depend on the size of the Fund and the extent to which the Adviser requests reimbursements pursuant to this provision.
The directors also considered the Adviser’s fee schedule for institutional clients pursuing a similar investment style. For this purpose, they reviewed the relevant advisory fee information from the Adviser’s Form ADV and the evaluation from the Company’s Senior Officer and noted the differences between the Fund’s proposed fee schedule, on the one hand, and the institutional fee schedule and the schedule of fees charged to any offshore funds and any sub-advised funds, on the other. The directors noted that the Adviser may, in some cases, agree to fee rates with large institutional clients that are lower than those reviewed by the directors and that they had previously discussed with the Adviser its policies in respect of such
| 24 | AB FLEXFEE LARGE CAP GROWTH PORTFOLIO | abfunds.com |
arrangements. The directors also compared the proposed advisory fee for the Fund with that for another AB Fund with a similar investment style.
The Adviser reviewed with the directors the significantly greater scope of the services it provides to the Fund relative to institutional, offshore fund and sub-advised fund clients. In light of the substantial differences in services rendered by the Adviser to institutional, offshore fund and sub-advised fund clients as compared to funds such as the Fund, the directors considered these fee comparisons inapt and did not place significant weight on them in their deliberations.
The directors noted that the Fund may invest in shares of exchange-traded funds (“ETFs”), subject to the restrictions and limitations of the Investment Company Act of 1940 as these may be varied as a result of exemptive orders issued by the SEC. The directors also noted that ETFs pay advisory fees pursuant to their advisory contracts. The directors concluded, based on the Adviser’s explanation of how it may use ETFs when they are the most cost-effective way to obtain desired exposures or to “equitize” cash inflows pending purchases of underlying securities, that the proposed advisory fee would be for services in addition to, rather than duplicative of, the services provided under the advisory contracts of the ETFs in which the Fund may invest.
The directors also considered the projected total expense ratio of the Advisor Class shares of the Fund in comparison to a peer group and a peer universe selected by each 15(c) service provider. The directors also considered the Adviser’s proposed expense cap for the “other expenses” of the Fund (expenses excluding the advisory fee, Rule 12b-1 fees, and certain other expenses typically excluded from the Adviser’s expense caps) for the period ending December 31, 2018. The directors noted that it was likely that the expense ratios of some of the other funds in the Fund’s category were lowered by waivers or reimbursements by those funds’ investment advisers, which in some cases might be voluntary or temporary. The directors view the projected expense ratio information as relevant to their evaluation of the Adviser’s services because the Adviser is responsible for coordinating services provided to the Fund by others. Based on their review, the directors concluded that the Fund’s projected expense ratio was acceptable.
Economies of Scale
The directors noted that the proposed advisory fee schedule for the Fund does not contain breakpoints and that they had previously discussed their strong preference for breakpoints in advisory contracts with the Adviser. The directors took into consideration prior presentations by an independent consultant on economies of scale in the mutual fund industry and for the AB Funds, and by the Adviser concerning certain of its views on economies of scale. The directors also had requested and received
| abfunds.com | AB FLEXFEE LARGE CAP GROWTH PORTFOLIO | 25 |
from the Adviser certain updates on economies of scale in advance of the Meeting. The directors believe that economies of scale may be realized (if at all) by the Adviser across a variety of products and services, and not only in respect of a single fund. The directors noted that there is no established methodology for setting breakpoints that give effect to the fund-specific services provided by a fund’s adviser and to the economies of scale that an adviser may realize in its overall mutual fund business or those components of it which directly or indirectly affect a fund’s operations. The directors observed that in the mutual fund industry as a whole, as well as among funds similar to the Fund, there is no uniformity or pattern in the fees and asset levels at which breakpoints (if any) apply. The directors also noted that the advisory agreements for many funds do not have breakpoints at all. The directors informed the Adviser that they would monitor the Fund’s assets and its profitability to the Adviser and anticipated revisiting the question of breakpoints in the future if circumstances warranted doing so.
| 26 | AB FLEXFEE LARGE CAP GROWTH PORTFOLIO | abfunds.com |
This page is not part of the Shareholder Report or the Financial Statements.
AB FAMILY OF FUNDS
US EQUITY
US CORE
Core Opportunities Fund
Select US Equity Portfolio
US GROWTH
Concentrated Growth Fund
Discovery Growth Fund
Growth Fund
Large Cap Growth Fund
Small Cap Growth Portfolio
US VALUE
Discovery Value Fund
Equity Income Fund
Relative Value Fund1
Small Cap Value Portfolio
Value Fund
INTERNATIONAL/ GLOBAL EQUITY
INTERNATIONAL/ GLOBAL CORE
Global Core Equity Portfolio
International Portfolio
International Strategic Core Portfolio
Sustainable Global Thematic Fund1
Tax-Managed International Portfolio
Tax-Managed Wealth Appreciation Strategy
Wealth Appreciation Strategy
INTERNATIONAL/ GLOBAL GROWTH
Concentrated International Growth Portfolio
International Growth Fund
INTERNATIONAL/ GLOBAL EQUITY (continued)
INTERNATIONAL/ GLOBAL VALUE
Asia ex-Japan Equity Portfolio
International Value Fund
FIXED INCOME
MUNICIPAL
High Income Municipal Portfolio
Intermediate California Municipal Portfolio
Intermediate Diversified Municipal Portfolio
Intermediate New York Municipal Portfolio
Municipal Bond Inflation Strategy
Tax-Aware Fixed Income Portfolio
National Portfolio
Arizona Portfolio
California Portfolio
Massachusetts Portfolio
Minnesota Portfolio
New Jersey Portfolio
New York Portfolio
Ohio Portfolio
Pennsylvania Portfolio
Virginia Portfolio
TAXABLE
Bond Inflation Strategy
Global Bond Fund
High Income Fund
High Yield Portfolio
Income Fund
Intermediate Bond Portfolio
Limited Duration High Income Portfolio
Short Duration Portfolio
ALTERNATIVES
All Market Real Return Portfolio
Credit Long/Short Portfolio
Global Real Estate Investment Fund
Select US Long/Short Portfolio
Unconstrained Bond Fund
MULTI-ASSET
All Market Income Portfolio
All Market Total Return Portfolio1
Conservative Wealth Strategy
Emerging Markets Multi-Asset Portfolio
Global Risk Allocation Fund
Tax-Managed All Market Income Portfolio1
TARGET-DATE
Multi-Manager Select Retirement Allocation Fund
Multi-Manager Select 2010 Fund
Multi-Manager Select 2015 Fund
Multi-Manager Select 2020 Fund
Multi-Manager Select 2025 Fund
Multi-Manager Select 2030 Fund
Multi-Manager Select 2035 Fund
Multi-Manager Select 2040 Fund
Multi-Manager Select 2045 Fund
Multi-Manager Select 2050 Fund
Multi-Manager Select 2055 Fund
CLOSED-END FUNDS
Alliance California Municipal Income Fund
AllianceBernstein Global High Income Fund
AllianceBernstein National Municipal Income Fund
We also offer Government Exchange Reserves, which serves as the money market fund exchange vehicle for the AB mutual funds. An investment in Government Exchange Reserves is not a deposit in a bank and is not insured or guaranteed by the Federal Deposit Insurance Corporation or any other government agency. Although the Fund seeks to preserve the value of your investment at $1.00 per share, it is possible to lose money by investing in the Fund.
Investors should consider the investment objectives, risks, charges and expenses of the Fund carefully before investing. For copies of our prospectus or summary prospectus, which contain this and other information, visit us online at www.abfunds.com or contact your AB representative. Please read the prospectus and/or summary prospectus carefully before investing.
| 1 | Prior to November 1, 2016, Sustainable Global Thematic Fund was named Global Thematic Growth Fund; prior to January 9, 2017, Relative Value Fund was named Growth & Income Fund; prior to April 17, 2017, Tax-Managed All Market Income Portfolio was named Tax-Managed Balanced Wealth Strategy; prior to April 24, 2017, All Market Total Return Portfolio was named Balanced Wealth Strategy. |
| abfunds.com | AB FLEXFEE LARGE CAP GROWTH PORTFOLIO | 27 |
NOTES
| 28 | AB FLEXFEE LARGE CAP GROWTH PORTFOLIO | abfunds.com |
AB FLEXFEE LARGE CAP GROWTH PORTFOLIO
1345 Avenue of the Americas
New York, NY 10105
800 221 5672
FFLCG-0152-0617 
JUN 06.30.17

SEMI-ANNUAL REPORT
AB FLEXFEETM US THEMATIC PORTFOLIO


A discussion of the Fund’s investment performance is not included in this report. AllianceBernstein L.P. would like to thank you for your interest in the Fund.
| Investment Products Offered | • Are Not FDIC Insured • May Lose Value • Are Not Bank Guaranteed | |
Investors should consider the investment objectives, risks, charges and expenses of the Fund carefully before investing. For copies of our prospectus or summary prospectus, which contain this and other information, visit us online at www.abfunds.com or contact your AB representative. Please read the prospectus and/or summary prospectus carefully before investing.
This shareholder report must be preceded or accompanied by the Fund’s prospectus for individuals who are not current shareholders of the Fund.
You may obtain a description of the Fund’s proxy voting policies and procedures, and information regarding how the Fund voted proxies relating to portfolio securities during the most recent 12-month period ended June 30, without charge. Simply visit AB’s website at www.abfunds.com, or go to the Securities and Exchange Commission’s (the “Commission”) website at www.sec.gov, or call AB at (800) 227 4618.
The Fund files its complete schedule of portfolio holdings with the Commission for the first and third quarters of each fiscal year on Form N-Q. The Fund’s Forms N-Q are available on the Commission’s website at www.sec.gov. The Fund’s Forms N-Q may also be reviewed and copied at the Commission’s Public Reference Room in Washington, DC; information on the operation of the Public Reference Room may be obtained by calling (800) SEC 0330. AB publishes full portfolio holdings for the Fund monthly at www.abfunds.com.
AllianceBernstein Investments, Inc. (ABI) is the distributor of the AB family of mutual funds. ABI is a member of FINRA and is an affiliate of AllianceBernstein L.P., the Adviser of the funds.
The [A/B] logo is a registered service mark of AllianceBernstein and AllianceBernstein® is a registered service mark used by permission of the owner, AllianceBernstein L.P.
EXPENSE EXAMPLE
(unaudited)
As a shareholder of the Fund, you incur two types of costs: (1) transaction costs, including sales charges (loads) on purchase payments, contingent deferred sales charges on redemptions and (2) ongoing costs, including management fees; distribution (12b-1) fees; and other Fund expenses. This example is intended to help you understand your ongoing costs (in dollars) of investing in the Fund and to compare these costs with the ongoing costs of investing in other mutual funds.
The Example is based on an investment of $1,000 invested at the beginning of the period and held for the entire period as indicated below.
Actual Expenses
The table below provides information about actual account values and actual expenses. You may use the information, together with the amount you invested, to estimate the expenses that you paid over the period. Simply divide your account value by $1,000 (for example, an $8,600 account value divided by $1,000 = 8.6), then multiply the result by the number under the heading entitled “Expenses Paid During Period” to estimate the expenses you paid on your account during this period.
Hypothetical Example for Comparison Purposes
The table below also provides information about hypothetical account values and hypothetical expenses based on the Fund’s actual expense ratio and an assumed annual rate of return of 5% before expenses, which is not the Fund’s actual return. The hypothetical account values and expenses may not be used to estimate the actual ending account balance or expenses you paid for the period. You may use this information to compare the ongoing costs of investing in the Fund and other funds by comparing this 5% hypothetical example with the 5% hypothetical examples that appear in the shareholder reports of other funds.
Please note that the expenses shown in the table are meant to highlight your ongoing costs only and do not reflect any transactional costs, such as sales charges (loads), or contingent deferred sales charges on redemptions. Therefore, the hypothetical example is useful in comparing ongoing costs only, and will not help you determine the relative total costs of owning different funds. In addition, if these transactional costs were included, your costs would have been higher.
| abfunds.com | AB FLEXFEE US THEMATIC PORTFOLIO | 1 |
EXPENSE EXAMPLE (continued)
| Beginning Account Value 6/28/2017^ | Ending Account Value 6/30/2017 | Expenses Paid During Period* | Annualized Expense Ratio* | Total Expenses Paid During Period+ | Total Annualized Expense Ratio+ | |||||||||||||||||||
| Advisor Class | ||||||||||||||||||||||||
Actual | $ | 1,000 | $ | 991.00 | $ | 0.00 | 0.00 | % | $ | 0.01 | 0.10 | % | ||||||||||||
Hypothetical** | $ | 1,000 | $ | 1,000.41 | $ | 0.00 | 0.00 | % | $ | 0.01 | 0.10 | % | ||||||||||||
| ^ | Commencement of operations. |
| * | Expenses are equal to each classes’ annualized expense ratio, multiplied by the average account value over the period, multiplied by 3/365 (to reflect the since inception period). |
| + | In connection with the Fund’s investments in affiliated/unaffiliated underlying portfolios, the Fund incurs no direct expenses, but bears proportionate shares of the fees and expenses (i.e., operating, administrative and investment advisory fees) of the affiliated/unaffiliated underlying portfolios. The Adviser has contractually agreed to waive its fees from the Fund in an amount equal to the Fund’s pro rata share of certain acquired fund fees and expenses of the affiliated underlying portfolios. The Fund’s total expenses are equal to the classes’ annualized expense ratio plus the Fund’s pro rata share of the weighted average expense ratio of the affiliated/unaffiliated underlying portfolios in which it invests, multiplied by the average account value over the period, multiplied by 3/365 (to reflect the since inception period). |
| ** | Assumes 5% annual return before expenses. |
| 2 | AB FLEXFEE US THEMATIC PORTFOLIO | abfunds.com |
PORTFOLIO SUMMARY
June 30, 2017 (unaudited)
PORTFOLIO STATISTICS
Net Assets ($mil): $1.0
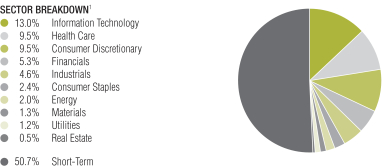
TEN LARGEST HOLDINGS2
| Company | U.S. $ Value | Percent of Net Assets | ||||||
| UnitedHealth Group, Inc. | $ | 28,740 | �� | 2.9 | % | |||
| Xylem, Inc./NY | 28,380 | 2.9 | ||||||
| Visa, Inc. – Class A | 26,915 | 2.7 | ||||||
| Walt Disney Co. (The) | 26,138 | 2.6 | ||||||
| Home Depot, Inc. (The) | 25,464 | 2.6 | ||||||
| Ecolab, Inc. | 24,691 | 2.5 | ||||||
| American Water Works Co., Inc. | 23,619 | 2.4 | ||||||
| Abbott Laboratories | 23,284 | 2.3 | ||||||
| Broadcom Ltd. | 23,072 | 2.3 | ||||||
| Vestas Wind Systems A/S (ADR) | 22,862 | 2.3 | ||||||
| $ | 253,165 | 25.5 | % | |||||
| 1 | All data are as of June 30, 2017. The Fund’s sector breakdown is expressed as a percentage of total investments and may vary over time. |
| 2 | Long-term investments. |
Please note: The sector classifications presented herein are based on the Global Industry Classification Standard (GICS) which was developed by Morgan Stanley Capital International and Standard & Poor’s. The components are divided into sector, industry group, and industry sub-indices as classified by the GICS for each of the market capitalization indices in the broad market. These sector classifications are broadly defined. The “Portfolio of Investments” section of the report reflects more specific industry information and is consistent with the investment restrictions discussed in the Fund’s prospectus.
| abfunds.com | AB FLEXFEE US THEMATIC PORTFOLIO | 3 |
PORTFOLIO OF INVESTMENTS
June 30, 2017 (unaudited)
| Company | Shares | U.S. $ Value | ||||||
| ||||||||
COMMON STOCKS – 98.1% | ||||||||
| Information Technology – 25.9% | ||||||||
Communications Equipment – 1.0% | ||||||||
Lumentum Holdings, Inc.(a) | 169 | $ | 9,642 | |||||
|
| |||||||
Electronic Equipment, Instruments & Components – 1.3% | ||||||||
Flex Ltd.(a) | 784 | 12,787 | ||||||
|
| |||||||
Internet Software & Services – 6.1% | ||||||||
Alibaba Group Holding Ltd. (Sponsored ADR)(a) | 125 | 17,612 | ||||||
Alphabet, Inc. – Class C(a) | 24 | 21,810 | ||||||
Facebook, Inc. – Class A(a) | 140 | 21,137 | ||||||
|
| |||||||
| 60,559 | ||||||||
|
| |||||||
IT Services – 2.7% | ||||||||
Visa, Inc. – Class A | 287 | 26,915 | ||||||
|
| |||||||
Semiconductors & Semiconductor Equipment – 7.8% | ||||||||
Broadcom Ltd. | 99 | 23,072 | ||||||
KLA-Tencor Corp. | 158 | 14,459 | ||||||
Monolithic Power Systems, Inc. | 112 | 10,797 | ||||||
NVIDIA Corp. | 101 | 14,600 | ||||||
NXP Semiconductors NV(a) | 130 | 14,228 | ||||||
|
| |||||||
| 77,156 | ||||||||
|
| |||||||
Software – 4.7% | ||||||||
Fortinet, Inc.(a) | 302 | 11,307 | ||||||
Microsoft Corp. | 289 | 19,921 | ||||||
salesforce.com, Inc.(a) | 182 | 15,761 | ||||||
|
| |||||||
| 46,989 | ||||||||
|
| |||||||
Technology Hardware, Storage & Peripherals – 2.3% | ||||||||
Apple, Inc. | 158 | 22,755 | ||||||
|
| |||||||
| 256,803 | ||||||||
|
| |||||||
| Health Care – 18.9% | ||||||||
Biotechnology – 1.6% | ||||||||
Regeneron Pharmaceuticals, Inc.(a) | 32 | 15,716 | ||||||
|
| |||||||
Health Care Equipment & Supplies – 5.8% | ||||||||
Abbott Laboratories | 479 | 23,284 | ||||||
Danaher Corp. | 225 | 18,988 | ||||||
West Pharmaceutical Services, Inc. | 161 | 15,218 | ||||||
|
| |||||||
| 57,490 | ||||||||
|
| |||||||
Health Care Providers & Services – 2.9% | ||||||||
UnitedHealth Group, Inc. | 155 | 28,740 | ||||||
|
| |||||||
Life Sciences Tools & Services – 5.5% | ||||||||
Bio-Rad Laboratories, Inc. – Class A(a) | 99 | 22,405 | ||||||
Bruker Corp. | 651 | 18,775 | ||||||
ICON PLC(a) | 140 | 13,690 | ||||||
|
| |||||||
| 54,870 | ||||||||
|
| |||||||
| 4 | AB FLEXFEE US THEMATIC PORTFOLIO | abfunds.com |
PORTFOLIO OF INVESTMENTS (continued)
| Company | Shares | U.S. $ Value | ||||||
| ||||||||
Pharmaceuticals – 3.1% | ||||||||
Johnson & Johnson | 138 | $ | 18,256 | |||||
Roche Holding AG (Sponsored ADR) | 396 | 12,593 | ||||||
|
| |||||||
| 30,849 | ||||||||
|
| |||||||
| 187,665 | ||||||||
|
| |||||||
| Consumer Discretionary – 18.9% | ||||||||
Auto Components – 1.9% | ||||||||
Delphi Automotive PLC | 220 | 19,283 | ||||||
|
| |||||||
Diversified Consumer Services – 1.0% | ||||||||
Bright Horizons Family Solutions, Inc.(a) | 133 | 10,269 | ||||||
|
| |||||||
Hotels, Restaurants & Leisure – 1.9% | ||||||||
Starbucks Corp. | 316 | 18,426 | ||||||
|
| |||||||
Internet & Direct Marketing Retail – 5.0% | ||||||||
Amazon.com, Inc.(a) | 21 | 20,328 | ||||||
Ctrip.com International Ltd. (ADR)(a) | 248 | 13,357 | ||||||
Netflix, Inc.(a) | 104 | 15,539 | ||||||
|
| |||||||
| 49,224 | ||||||||
|
| |||||||
Media – 4.9% | ||||||||
Comcast Corp. – Class A | 574 | 22,340 | ||||||
Walt Disney Co. (The) | 246 | 26,138 | ||||||
|
| |||||||
| 48,478 | ||||||||
|
| |||||||
Specialty Retail – 2.6% | ||||||||
Home Depot, Inc. (The) | 166 | 25,464 | ||||||
|
| |||||||
Textiles, Apparel & Luxury Goods – 1.6% | ||||||||
NIKE, Inc. – Class B | 276 | 16,284 | ||||||
|
| |||||||
| 187,428 | ||||||||
|
| |||||||
| Financials – 10.5% | ||||||||
Capital Markets – 8.4% | ||||||||
Affiliated Managers Group, Inc. | 93 | 15,425 | ||||||
Charles Schwab Corp. (The) | 341 | 14,650 | ||||||
Goldman Sachs Group, Inc. (The) | 37 | 8,210 | ||||||
Intercontinental Exchange, Inc. | 346 | 22,808 | ||||||
MSCI, Inc. – Class A | 213 | 21,937 | ||||||
|
| |||||||
| 83,030 | ||||||||
|
| |||||||
Insurance – 2.1% | ||||||||
AIA Group Ltd. (Sponsored ADR) | 725 | 21,297 | ||||||
|
| |||||||
| 104,327 | ||||||||
|
| |||||||
| Industrials – 9.1% | ||||||||
Aerospace & Defense – 2.2% | ||||||||
Hexcel Corp. | 414 | 21,855 | ||||||
|
| |||||||
| abfunds.com | AB FLEXFEE US THEMATIC PORTFOLIO | 5 |
PORTFOLIO OF INVESTMENTS (continued)
| Company | Shares | U.S. $ Value | ||||||
| ||||||||
Electrical Equipment – 4.1% | ||||||||
Rockwell Automation, Inc. | 109 | $ | 17,654 | |||||
Vestas Wind Systems A/S (ADR) | 743 | 22,862 | ||||||
|
| |||||||
| 40,516 | ||||||||
|
| |||||||
Machinery – 2.8% | ||||||||
Xylem, Inc./NY | 512 | 28,380 | ||||||
|
| |||||||
| 90,751 | ||||||||
|
| |||||||
| Consumer Staples – 4.8% | ||||||||
Beverages – 1.8% | ||||||||
Monster Beverage Corp.(a) | 356 | 17,686 | ||||||
|
| |||||||
Food & Staples Retailing – 1.6% | ||||||||
CVS Health Corp. | 194 | 15,609 | ||||||
|
| |||||||
Household Products – 1.4% | ||||||||
Colgate-Palmolive Co. | 192 | 14,233 | ||||||
|
| |||||||
| 47,528 | ||||||||
|
| |||||||
| Energy – 4.0% | ||||||||
Oil, Gas & Consumable Fuels – 4.0% | ||||||||
Concho Resources, Inc.(a) | 114 | 13,854 | ||||||
EOG Resources, Inc. | 148 | 13,397 | ||||||
Range Resources Corp. | 521 | 12,072 | ||||||
|
| |||||||
| 39,323 | ||||||||
|
| |||||||
| Materials – 2.5% | ||||||||
Chemicals – 2.5% | ||||||||
Ecolab, Inc. | 186 | 24,691 | ||||||
|
| |||||||
| Utilities – 2.4% | ||||||||
Water Utilities – 2.4% | ||||||||
American Water Works Co., Inc. | 303 | 23,619 | ||||||
|
| |||||||
| Real Estate – 1.1% | ||||||||
Equity Real Estate Investment Trusts (REITs) – 1.1% | ||||||||
SBA Communications Corp.(a) | 78 | 10,522 | ||||||
|
| |||||||
Total Common Stocks | 972,657 | |||||||
|
| |||||||
SHORT-TERM INVESTMENTS – 100.9% | ||||||||
Investment Companies – 100.9% | ||||||||
AB Fixed Income Shares, Inc. – Government Money Market Portfolio – Class AB, 0.79%(b)(c) | 1,000,003 | 1,000,003 | ||||||
|
| |||||||
Total Investments – 199.0% | 1,972,660 | |||||||
Other assets less liabilities – (99.0)% | (981,416 | ) | ||||||
|
| |||||||
Net Assets – 100.0% | $ | 991,244 | ||||||
|
| |||||||
| 6 | AB FLEXFEE US THEMATIC PORTFOLIO | abfunds.com |
PORTFOLIO OF INVESTMENTS (continued)
| (a) | Non-income producing security. |
| (b) | To obtain a copy of the fund’s shareholder report, please go to the Securities and Exchange Commission’s website at www.sec.gov, or call AB at (800) 227-4618. |
| (c) | Investment in affiliated money market mutual fund. The rate shown represents the 7-day yield as of period end. |
Glossary:
ADR – American Depositary Receipt
See notes to financial statements.
| abfunds.com | AB FLEXFEE US THEMATIC PORTFOLIO | 7 |
STATEMENT OF ASSETS & LIABILITIES
June 30, 2017 (unaudited)
| Assets | ||||
Investments in securities, at value | ||||
Unaffiliated issuers (cost $981,507) | $ | 972,657 | ||
Affiliated issuers (cost $1,000,003) | 1,000,003 | |||
Prepaid expenses | 45,496 | |||
Receivable from Adviser | 2,726 | |||
Dividends receivable | 90 | |||
|
| |||
Total assets | 2,020,972 | |||
|
| |||
| Liabilities | ||||
Payable for investment securities purchased | 981,507 | |||
Offering expenses payable | 46,000 | |||
Transfer Agent fee payable | 7 | |||
Accrued expenses and other liabilities | 2,214 | |||
|
| |||
Total liabilities | 1,029,728 | |||
|
| |||
Net Assets | $ | 991,244 | ||
|
| |||
| Composition of Net Assets | ||||
Capital stock, at par | $ | 10 | ||
Additional paid-in capital | 999,993 | |||
Undistributed net investment income | 91 | |||
Net unrealized depreciation on investments | (8,850 | ) | ||
|
| |||
| $ | 991,244 | |||
|
|
Net Asset Value Per Share—11 billion shares of capital stock authorized, $.0001 par value
| Class | Net Assets | Shares Outstanding | Net Asset Value | |||||||||
| ||||||||||||
| Advisor | $ | 991,244 | 100,000 | $ | 9.91 | |||||||
| ||||||||||||
See notes to financial statements.
| 8 | AB FLEXFEE US THEMATIC PORTFOLIO | abfunds.com |
STATEMENT OF OPERATIONS
Period from June 28, 2017(a) to June 30, 2017 (unaudited)
| Investment Income | ||||||||
Dividends | ||||||||
Unaffiliated issuers | $ | 91 | $ | 91 | ||||
|
| |||||||
| Expenses | ||||||||
Management fee (see Note B) | 5 | |||||||
Transfer agency—Advisor Class | 7 | |||||||
Audit and tax | 826 | |||||||
Administrative | 554 | |||||||
Amortization of offering expenses | 504 | |||||||
Legal | 458 | |||||||
Custodian | 419 | |||||||
Directors’ fees | 241 | |||||||
Printing | 215 | |||||||
Miscellaneous | 56 | |||||||
|
| |||||||
Total expenses | 3,285 | |||||||
Less: expenses waived and reimbursed by the Adviser | (3,285 | ) | ||||||
|
| |||||||
Net expenses | – 0 | – | ||||||
|
| |||||||
Net investment income | 91 | |||||||
|
| |||||||
| Unrealized (Loss) on Investments | ||||||||
Net change in unrealized appreciation/depreciation on: | ||||||||
Investments | (8,850 | ) | ||||||
|
| |||||||
Net loss on investments | (8,850 | ) | ||||||
|
| |||||||
Net Decrease in Net Assets from Operations | $ | (8,759 | ) | |||||
|
|
| (a) | Commencement of operations. |
See notes to financial statements.
| abfunds.com | AB FLEXFEE US THEMATIC PORTFOLIO | 9 |
STATEMENT OF CHANGES IN NET ASSETS
| June 28, 2017(a) to June 30, 2017 (unaudited) | ||||
| Increase (Decrease) in Net Assets from Operations | ||||
Net investment income | $ | 91 | ||
Net change in unrealized appreciation/depreciation on investments | (8,850 | ) | ||
|
| |||
Net decrease in net assets from operations | (8,759 | ) | ||
| Capital Stock Transactions | ||||
Net increase | 1,000,003 | |||
|
| |||
Total increase | 991,244 | |||
| Net Assets | ||||
Beginning of period | – 0 | – | ||
|
| |||
End of period (including undistributed net investment income of $91) | $ | 991,244 | ||
|
| |||
| (a) | Commencement of operations. |
See notes to financial statements.
| 10 | AB FLEXFEE US THEMATIC PORTFOLIO | abfunds.com |
NOTES TO FINANCIAL STATEMENTS
June 30, 2017 (unaudited)
NOTE A
Significant Accounting Policies
AB Cap Fund, Inc. (the “Company”), which is a Maryland corporation, is registered under the Investment Company Act of 1940 as an open-end management investment company. The Company operates as a series company currently comprised of 31 portfolios. Each portfolio is considered to be a separate entity for financial reporting and tax purposes. This report relates only to the AB FlexFee US Thematic Portfolio (the “Fund”), a diversified portfolio. The Fund commenced operations on June 28, 2017. The Fund has authorized issuance of Class A, Class B, Class C, Advisor Class, Class R, Class K, Class I, Class Z, Class T, Class 1, and Class 2 shares. No classes are being publicly offered. Class A, Class B, Class C, Class R, Class K, Class I, Class Z, Class T, Class 1, and Class 2 shares have not been issued. As of June 30, 2017, AllianceBernstein L.P. (the “Adviser”) was the sole shareholder of Advisor Class shares. Advisor Class shares are sold without an initial or contingent deferred sales charge and are not subject to ongoing distribution expenses. All eleven classes of shares have identical voting, dividend, liquidation and other rights, except that the classes bear different distribution and transfer agency expenses. Each class has exclusive voting rights with respect to its distribution plan. The financial statements have been prepared in conformity with U.S. generally accepted accounting principles (“U.S. GAAP”), which require management to make certain estimates and assumptions that affect the reported amounts of assets and liabilities in the financial statements and amounts of income and expenses during the reporting period. Actual results could differ from those estimates. The Fund is an investment company under U.S. GAAP and follows the accounting and reporting guidance applicable to investment companies. The following is a summary of significant accounting policies followed by the Fund.
1. Security Valuation
Portfolio securities are valued at their current market value determined on the basis of market quotations or, if market quotations are not readily available or are deemed unreliable, at “fair value” as determined in accordance with procedures established by and under the general supervision of the Fund’s Board of Directors (the “Board”).
In general, the market values of securities which are readily available and deemed reliable are determined as follows: securities listed on a national securities exchange (other than securities listed on the NASDAQ Stock Market, Inc. (“NASDAQ”)) or on a foreign securities exchange are valued at the last sale price at the close of the exchange or foreign securities exchange. If there has been no sale on such day, the securities are valued at the last traded price from the previous day. Securities listed on more
| abfunds.com | AB FLEXFEE US THEMATIC PORTFOLIO | 11 |
NOTES TO FINANCIAL STATEMENTS (continued)
than one exchange are valued by reference to the principal exchange on which the securities are traded; securities listed only on NASDAQ are valued in accordance with the NASDAQ Official Closing Price; listed or over the counter (“OTC”) market put or call options are valued at the mid level between the current bid and ask prices. If either a current bid or current ask price is unavailable, AllianceBernstein L.P. (the “Adviser”) will have discretion to determine the best valuation (e.g. last trade price in the case of listed options); open futures contracts are valued using the closing settlement price or, in the absence of such a price, the most recent quoted bid price. If there are no quotations available for the day of valuation, the last available closing settlement price is used; U.S. Government securities and any other debt instruments having 60 days or less remaining until maturity are generally valued at market by an independent pricing vendor, if a market price is available. If a market price is not available, the securities are valued at amortized cost. This methodology is commonly used for short-term securities that have an original maturity of 60 days or less, as well as short-term securities that had an original term to maturity that exceeded 60 days. In instances when amortized cost is utilized, the Valuation Committee (the “Committee”) must reasonably conclude that the utilization of amortized cost is approximately the same as the fair value of the security. Such factors the Committee will consider include, but are not limited to, an impairment of the creditworthiness of the issuer or material changes in interest rates. Fixed-income securities, including mortgage-backed and asset-backed securities, may be valued on the basis of prices provided by a pricing service or at a price obtained from one or more of the major broker-dealers. In cases where broker-dealer quotes are obtained, the Adviser may establish procedures whereby changes in market yields or spreads are used to adjust, on a daily basis, a recently obtained quoted price on a security. Swaps and other derivatives are valued daily, primarily using independent pricing services, independent pricing models using market inputs, as well as third party broker-dealers or counterparties. Open end mutual funds are valued at the closing net asset value per share, while exchange traded funds are valued at the closing market price per share.
Securities for which market quotations are not readily available (including restricted securities) or are deemed unreliable are valued at fair value as deemed appropriate by the Adviser. Factors considered in making this determination may include, but are not limited to, information obtained by contacting the issuer, analysts, analysis of the issuer’s financial statements or other available documents. In addition, the Fund may use fair value pricing for securities primarily traded in non-U.S. markets because most foreign markets close well before the Fund values its securities at 4:00 p.m., Eastern Time. The earlier close of these foreign markets gives rise to the possibility that significant events, including broad market moves, may have
| 12 | AB FLEXFEE US THEMATIC PORTFOLIO | abfunds.com |
NOTES TO FINANCIAL STATEMENTS (continued)
occurred in the interim and may materially affect the value of those securities. To account for this, the Fund may frequently value many of its foreign equity securities using fair value prices based on third party vendor modeling tools to the extent available.
2. Fair Value Measurements
In accordance with U.S. GAAP regarding fair value measurements, fair value is defined as the price that the Fund would receive to sell an asset or pay to transfer a liability in an orderly transaction between market participants at the measurement date. U.S. GAAP establishes a framework for measuring fair value, and a three-level hierarchy for fair value measurements based upon the transparency of inputs to the valuation of an asset or liability (including those valued based on their market values as described in Note A.1 above). Inputs may be observable or unobservable and refer broadly to the assumptions that market participants would use in pricing the asset or liability. Observable inputs reflect the assumptions market participants would use in pricing the asset or liability based on market data obtained from sources independent of the Fund. Unobservable inputs reflect the Fund’s own assumptions about the assumptions that market participants would use in pricing the asset or liability based on the best information available in the circumstances. Each investment is assigned a level based upon the observability of the inputs which are significant to the overall valuation. The three-tier hierarchy of inputs is summarized below.
| • | Level 1—quoted prices in active markets for identical investments |
| • | Level 2—other significant observable inputs (including quoted prices for similar investments, interest rates, prepayment speeds, credit risk, etc.) |
| • | Level 3—significant unobservable inputs (including the Fund’s own assumptions in determining the fair value of investments) |
Where readily available market prices or relevant bid prices are not available for certain equity investments, such investments may be valued based on similar publicly traded investments, movements in relevant indices since last available prices or based upon underlying company fundamentals and comparable company data (such as multiples to earnings or other multiples to equity). Where an investment is valued using an observable input, such as another publicly traded security, the investment will be classified as Level 2. If management determines that an adjustment is appropriate based on restrictions on resale, illiquidity or uncertainty, and such adjustment is a significant component of the valuation, the investment will be classified as Level 3. An investment will also be classified as Level 3 where management uses company fundamentals and other significant inputs to determine the valuation.
| abfunds.com | AB FLEXFEE US THEMATIC PORTFOLIO | 13 |
NOTES TO FINANCIAL STATEMENTS (continued)
The following table summarizes the valuation of the Fund’s investments by the above fair value hierarchy levels as of June 30, 2017:
Investments in | Level 1 | Level 2 | Level 3 | Total | ||||||||||||
Assets: | ||||||||||||||||
Common Stocks^ | $ | 972,657 | $ | – 0 | – | $ | – 0 | – | $ | 972,657 | ||||||
Short-Term Investments: | ||||||||||||||||
Investment Companies | 1,000,003 | – 0 | – | – 0 | – | 1,000,003 | ||||||||||
|
|
|
|
|
|
|
| |||||||||
Total Investments in Securities | 1,972,660 | – 0 | – | – 0 | – | 1,972,660 | ||||||||||
Other Financial Instruments*: | – 0 | – | – 0 | – | – 0 | – | – 0 | – | ||||||||
|
|
|
|
|
|
|
| |||||||||
Total | $ | 1,972,660 | $ | – 0 | – | $ | – 0 | – | $ | 1,972,660 | ||||||
|
|
|
|
|
|
|
| |||||||||
| ^ | See Portfolio of Investments for sector classifications. |
| * | Other financial instruments are derivative instruments, such as futures, forwards and swaps, which are valued at the unrealized appreciation/depreciation on the instrument. |
The Fund recognizes all transfers between levels of the fair value hierarchy assuming the financial instrument was transferred at the beginning of the reporting period.
The Adviser established the Committee to oversee the pricing and valuation of all securities held in the Fund. The Committee operates under pricing and valuation policies and procedures established by the Adviser and approved by the Board, including pricing policies which set forth the mechanisms and processes to be employed on a daily basis to implement these policies and procedures. In particular, the pricing policies describe how to determine market quotations for securities and other instruments. The Committee’s responsibilities include: 1) fair value and liquidity determinations (and oversight of any third parties to whom any responsibility for fair value and liquidity determinations is delegated), and 2) regular monitoring of the Adviser’s pricing and valuation policies and procedures and modification or enhancement of these policies and procedures (or recommendation of the modification of these policies and procedures) as the Committee believes appropriate.
The Committee is also responsible for monitoring the implementation of the pricing policies by the Adviser’s Pricing Group (the “Pricing Group”) and any third party which performs certain pricing functions in accordance with the pricing policies. The Pricing Group is responsible for the oversight of the third party on a day-to-day basis. The Committee and the Pricing Group perform a series of activities to provide reasonable assurance of the accuracy of prices including: 1) periodic vendor due diligence meetings, review of methodologies, new developments and process at vendors, 2) daily comparison of security valuation versus prior day for all securities that exceeded established thresholds, and 3) daily review of unpriced, stale, and variance reports with exceptions reviewed by senior management and the Committee.
| 14 | AB FLEXFEE US THEMATIC PORTFOLIO | abfunds.com |
NOTES TO FINANCIAL STATEMENTS (continued)
In addition, several processes outside of the pricing process are used to monitor valuation issues including: 1) performance and performance attribution reports are monitored for anomalous impacts based upon benchmark performance, and 2) portfolio managers review all portfolios for performance and analytics (which are generated using the Adviser’s prices).
3. Currency Translation
Assets and liabilities denominated in foreign currencies and commitments under forward currency exchange contracts are translated into U.S. dollars at the mean of the quoted bid and ask prices of such currencies against the U.S. dollar. Purchases and sales of portfolio securities are translated into U.S. dollars at the rates of exchange prevailing when such securities were acquired or sold. Income and expenses are translated into U.S. dollars at the rates of exchange prevailing when accrued.
Net realized gain or loss on foreign currency transactions represents foreign exchange gains and losses from sales and maturities of foreign fixed income investments, foreign currency exchange contracts, holding of foreign currencies, currency gains or losses realized between the trade and settlement dates on foreign investment transactions, and the difference between the amounts of dividends, interest and foreign withholding taxes recorded on the Fund’s books and the U.S. dollar equivalent amounts actually received or paid. Net unrealized currency gains and losses from valuing foreign currency denominated assets and liabilities at period end exchange rates are reflected as a component of net unrealized appreciation and depreciation of foreign currency denominated assets and liabilities.
4. Taxes
It is the Fund’s policy to meet the requirements of the Internal Revenue Code applicable to regulated investment companies and to distribute all of its investment company taxable income and net realized gains, if any, to shareholders. Therefore, no provisions for federal income or excise taxes are required. The Fund may be subject to taxes imposed by countries in which it invests. Such taxes are generally based on income and/or capital gains earned or repatriated. Taxes are accrued and applied to net investment income, net realized gains and net unrealized appreciation/depreciation as such income and/or gains are earned.
In accordance with U.S. GAAP requirements regarding accounting for uncertainties in income taxes, management has analyzed the Fund’s tax positions taken or expected to be taken on federal and state income tax returns for the current initial year, and has concluded that no provision for income tax is required in the Fund’s financial statements.
| abfunds.com | AB FLEXFEE US THEMATIC PORTFOLIO | 15 |
NOTES TO FINANCIAL STATEMENTS (continued)
5. Investment Income and Investment Transactions
Dividend income is recorded on the ex-dividend date or as soon as the Fund is informed of the dividend. Interest income is accrued daily. Investment transactions are accounted for on the date securities are purchased or sold. Investment gains or losses are determined on the identified cost basis. The Fund amortizes premiums and accretes discounts as adjustments to interest income.
6. Class Allocations
All income earned and expenses incurred by the Fund are borne on a pro-rata basis by each settled class of shares, based on the proportionate interest in the Fund represented by the net assets of such class, except for class specific expenses which are allocated to the respective class. Expenses of the Company are charged proportionately to each portfolio or based on other appropriate methods. Realized and unrealized gains and losses are allocated among the various share classes based on their respective net assets.
7. Dividends and Distributions
Dividends and distributions to shareholders, if any, are recorded on the ex-dividend date. Income dividends and capital gains distributions are determined in accordance with federal tax regulations and may differ from those determined in accordance with U.S. GAAP. To the extent these differences are permanent, such amounts are reclassified within the capital accounts based on their federal tax basis treatment; temporary differences do not require such reclassification.
8. Offering Expenses
Offering expenses of $46,000 were deferred and amortized on a straight line basis over a one year period starting from June 28, 2017 (commencement of operations).
NOTE B
Management Fee and Other Transactions with Affiliates
Under the terms of the investment advisory agreement, the Fund pays the Adviser a management fee at an annual rate of .55% of the Fund’s average daily net assets (“Base Fee”). The management fee is increased or decreased from the Base Fee by a performance adjustment (“Performance Adjustment”) that depends on whether, and to what extent, the investment performance of the Advisor Class shares of the Fund (“Measuring Class”) exceeds, or is exceeded by, the performance of the Russell 1000 Growth Index (“Index”) plus 1.40% (“Index Hurdle”) over the Performance Period (as defined below). The Performance Adjustment is calculated and accrued daily, according to a schedule that adds or subtracts .00357% of the Fund’s average daily net assets for each .01% of absolute performance by which
| 16 | AB FLEXFEE US THEMATIC PORTFOLIO | abfunds.com |
NOTES TO FINANCIAL STATEMENTS (continued)
the performance of the Measuring Class exceeds or lags the performance of the Index Hurdle for the period from the beginning of the Performance Period through the current business day. The maximum Performance Adjustment (positive or negative) will not exceed an annualized rate of +/-.50% (“Maximum Performance Adjustment”) of the Fund’s average daily net assets, which would occur when the performance of the Measuring Class exceeds, or is exceeded by, the Index Hurdle by 1.40% for the Performance Period. On a monthly basis, the Fund will pay the Adviser the minimum fee rate of .05% on an annualized basis (Base Fee minus the Maximum Performance Adjustment) applied to the average daily net assets for the month. At the end of the Performance Period, the Fund will pay to the Adviser the total management fee, less the amount of any minimum fees paid during the Performance Period and any waivers described below. The period over which performance is measured (“Performance Period”) is initially from the commencement of operations to December 31, 2018 and thereafter each 12-month period beginning on the first business day in the month of January through December 31 of the same year. In addition, the Adviser has agreed to waive its management fee by limiting the Fund’s accrual of the management fee (base fee plus performance adjustment) on any day to the amount corresponding to the maximum fee rate multiplied by the Fund’s current net assets as of the preceding day if such amount is less than the amount that would have been accrued based on the Fund’s average daily net assets for the performance period. The minimum fee is paid monthly while the performance fee is paid at the end of the Performance Period. For the reporting period ended June 30, 2017, the Fund accrued management fees of $5, as reflected in the Statement of Operations, at an annual effective rate (excluding the impact from any expense waivers in effect) of .05% of the Fund’s average net assets, which included a (.50)% performance adjustment of $(54). The Adviser has agreed to waive its fees and bear certain expenses through December 31, 2018 to the extent necessary to limit total expenses (other than the management fee, acquired fund fees and expenses other than the advisory fees of any AB Mutual Funds in which the Fund may invest, interest expense, taxes, extraordinary expenses, and brokerage commissions and other transaction costs) on an annual basis from exceeding .05% of average daily net assets. Any fees waived and expenses borne by the Adviser are subject to repayment by the Fund until the end of the third fiscal year after the fiscal period in which the fees were waived or the expenses were borne; such waivers that are subject to repayment amount to $2,720 for the fiscal period ended June 30, 2017. In any case, no repayment will be made that would cause the Fund’s total annual expenses (subject to the exclusions set forth above) to exceed .05%.
Pursuant to the investment advisory agreement, the Fund may reimburse the Adviser for certain legal and accounting services provided to the Fund by the Adviser. For the period ended June 30, 2017, the Adviser voluntarily agreed to waive such fees in the amount of $554.
| abfunds.com | AB FLEXFEE US THEMATIC PORTFOLIO | 17 |
NOTES TO FINANCIAL STATEMENTS (continued)
The Fund compensates AllianceBernstein Investor Services, Inc. (“ABIS”), a wholly-owned subsidiary of the Adviser, under a Transfer Agency Agreement for providing personnel and facilities to perform transfer agency services for the Fund. ABIS may make payments to intermediaries that provide omnibus account services, sub-accounting services and/or networking services. The compensation retained by ABIS amounted to $83 for the period ended June 30, 2017.
The Fund may invest in AB Government Money Market Portfolio (the “Government Money Market Portfolio”) which has a contractual annual advisory fee rate of .20% of the portfolio’s average daily net assets and bears its own expenses. In connection with the investment by the Fund in the Government Money Market Portfolio, the Adviser has agreed to waive its advisory fee from the Fund in an amount equal to the Fund’s pro rata share of the effective advisory fees of Government Money Market Portfolio, as borne indirectly by the Fund as an acquired fund fee and expense. For the period ended June 30, 2017, such waiver amounted to $11. A summary of the Fund’s transactions in shares of the Government Money Market Portfolio for the period ended June 30, 2017 is as follows:
Market Value | Purchases at Cost (000) | Sales Proceeds (000) | Market Value June 30, 2017 (000) | Dividend Income (000) | ||||||||||||||
| $ – 0 | – | $ | 1,000 | $ | – 0 | – | $ | 1,000 | $ | – 0 | – | |||||||
| * | Commencement of operations. |
Brokerage commissions paid on investment transactions for the period ended June 30, 2017 amounted to $185, of which $0 and $0, respectively, was paid to Sanford C. Bernstein & Co. LLC or Sanford C. Bernstein Limited, affiliates of the Adviser.
NOTE C
Investment Transactions
Purchases and sales of investment securities (excluding short-term investments) for the period ended June 30, 2017, were as follows:
| Purchases | Sales | |||||||
Investment securities (excluding | $ | 981,507 | $ | – 0 | – | |||
U.S. government securities | – 0 | – | – 0 | – | ||||
The cost of investments for federal income tax purposes was substantially the same as cost for financial reporting purposes. Accordingly, gross unrealized appreciation and unrealized depreciation are as follows:
Gross unrealized appreciation | $ | 3,854 | ||
Gross unrealized depreciation | (12,704 | ) | ||
|
| |||
Net unrealized depreciation | $ | (8,850 | ) | |
|
|
| 18 | AB FLEXFEE US THEMATIC PORTFOLIO | abfunds.com |
NOTES TO FINANCIAL STATEMENTS (continued)
1. Derivative Financial Instruments
The Fund may use derivatives in an effort to earn income and enhance returns, to replace more traditional direct investments, to obtain exposure to otherwise inaccessible markets (collectively, “investment purposes”), or to hedge or adjust the risk profile of its portfolio.
The Fund did not engage in derivative transactions during the period ended June 30, 2017.
2. Currency Transactions
The Fund may invest in non-U.S. Dollar-denominated securities on a currency hedged or unhedged basis. The Fund may seek investment opportunities by taking long or short positions in currencies through the use of currency-related derivatives, including forward currency exchange contracts, futures and options on futures, swaps, and other options. The Fund may enter into transactions for investment opportunities when it anticipates that a foreign currency will appreciate or depreciate in value but securities denominated in that currency are not held by the Fund and do not present attractive investment opportunities. Such transactions may also be used when the Adviser believes that it may be more efficient than a direct investment in a foreign currency-denominated security. The Fund may also conduct currency exchange contracts on a spot basis (i.e., for cash at the spot rate prevailing in the currency exchange market for buying or selling currencies).
NOTE D
Capital Stock
Each class consists of 1,000,000,000 authorized shares. Transactions in capital shares for each class were as follows:
| Shares | Amount | |||||||||||||||
| June 28, 2017* to June 30, 2017 (unaudited) | June 28, 2017* to June 30, 2017 (unaudited) | |||||||||||||||
|
| |||||||||||||||
| Advisor Class | ||||||||||||||||
Shares sold | 100,000 | $ | 1,000,003 | |||||||||||||
| ||||||||||||||||
Net increase | 100,000 | $ | 1,000,003 | |||||||||||||
| ||||||||||||||||
| * | Commencement of operations. |
NOTE E
Risks Involved in Investing in the Fund
Foreign (Non-U.S.) Risk—Investments in securities of non-U.S. issuers may involve more risk than those of U.S. issuers. These securities may fluctuate more widely in price and may be less liquid due to adverse market, economic, political, regulatory or other factors.
| abfunds.com | AB FLEXFEE US THEMATIC PORTFOLIO | 19 |
NOTES TO FINANCIAL STATEMENTS (continued)
Capitalization Risk—Investments in mid-capitalization companies may be more volatile than investments in large-capitalization companies. Investments in mid-capitalization companies may have additional risks because these companies have limited product lines, markets or financial resources.
Indemnification Risk—In the ordinary course of business, the Fund enters into contracts that contain a variety of indemnifications. The Fund’s maximum exposure under these arrangements is unknown. However, the Fund has not had prior claims or losses pursuant to these indemnification provisions and expects the risk of loss thereunder to be remote. Therefore, the Fund has not accrued any liability in connection with these indemnification provisions.
NOTE F
Tax Information
For tax purposes, net capital losses may be carried over to offset future capital gains, if any. Under the Regulated Investment Company Modernization Act of 2010, funds are permitted to carry forward capital losses incurred in taxable years beginning after December 22, 2010 for an indefinite period. These capital loss carryforwards will retain their character as either short-term or long-term capital losses.
NOTE G
Other
In October 2016, the U.S. Securities and Exchange Commission adopted new rules and amended existing rules (together, “final rules”) intended to modernize the reporting and disclosure of information by registered investment companies. In part, the final rules amend Regulation S-X and require standardized, enhanced disclosure about derivatives in investment company financial statements, as well as other amendments. The compliance date for the amendments to Regulation S-X is August 1, 2017 (for reporting period end dates of August 31, 2017 or after). Management has evaluated the impact of the amendments and expects the effect of the adoption of the final rules on financial statements will be limited to additional disclosures.
NOTE H
Subsequent Events
Management has evaluated subsequent events for possible recognition or disclosure in the financial statements through the date the financial statements are issued. Management has determined that there are no material events that would require disclosure in the Fund’s financial statements through this date.
| 20 | AB FLEXFEE US THEMATIC PORTFOLIO | abfunds.com |
FINANCIAL HIGHLIGHTS
Selected Data For A Share Of Capital Stock Outstanding Throughout Each Period
| Advisor Class | ||||
June 28, (unaudited) | ||||
|
| |||
Net asset value, beginning of period | $ 10.00 | |||
|
| |||
Income From Investment Operations | ||||
Net investment income(b)(c)(d) | .00 | |||
Net realized and unrealized loss on investment | (.09 | ) | ||
|
| |||
Net decrease in net asset value from operations | (.09 | ) | ||
|
| |||
Net asset value, end of period | $ 9.91 | |||
|
| |||
Total Return | ||||
Total investment return based on net asset value(e) | (.90 | )% | ||
Ratios/Supplemental Data | ||||
Net assets, end of period (000’s omitted) | $991 | |||
Ratio to average net assets of: | ||||
Expenses, net of waivers/reimbursements(f)(g) | .00 | %(h) | ||
Expenses, before waivers/reimbursements(f)(g) | 30.22 | % | ||
Net investment income(d)(f) | .83 | % | ||
Portfolio turnover rate | .00 | % | ||
| (a) | Commencement of operations. |
| (b) | Based on average shares outstanding. |
| (c) | Amount is less than $0.005. |
| (d) | Net of expenses waived/reimbursed by the Adviser. |
| (e) | Total investment return is calculated assuming an initial investment made at the net asset value at the beginning of the period, reinvestment of all dividends and distributions at net asset value during the period, and redemption on the last day of the period. Initial sales charge or contingent deferred sales charge is not reflected in the calculation of total investment return. Total investment return does not reflect the deduction of taxes that a shareholder would pay on fund distributions or the redemption of fund shares. Total investment return for a period of less than one year is not annualized. |
| (f) | Annualized. |
| (g) | In connection with the Fund’s investments in affiliated underlying portfolios, the Fund incurs no direct expenses but bears proportionate shares of the fees and expenses (i.e. operating, administrative and investment advisory fees) of the affiliated underlying portfolios. The Adviser has contractually agreed to waive its fees from the Fund in an amount equal to the Fund’s pro rata share of certain acquired fund fees and expenses, and for the period ended June 30,2017, such waiver amounted to 0.10% annualized for the Fund. |
| (h) | Amount is less than 0.005%. |
See notes to financial statements.
| abfunds.com | AB FLEXFEE US THEMATIC PORTFOLIO | 21 |
BOARD OF DIRECTORS
Marshall C. Turner, Jr(1) , Chairman John H. Dobkin(1) Michael J. Downey(1) William H. Foulk, Jr.(1) D. James Guzy(1) | Nancy P. Jacklin(1) Robert M. Keith, President and Chief Executive Officer Carol C. McMullen(1) Garry L. Moody(1) Earl D. Weiner(1) |
OFFICERS
Philip L. Kirstein, Senior Vice President and Independent Compliance Officer Daniel C. Roarty(2), Vice President Emilie D. Wrapp, Secretary | Joseph J. Mantineo, Treasurer and Chief Financial Officer Phyllis J. Clarke, Controller Vincent S. Noto, Chief Compliance Officer |
Custodian and Accounting Agent Brown Brothers Harriman & Co. 50 Post Office Square Boston, MA 02110
Principal Underwriter AllianceBernstein Investments, Inc. 1345 Avenue of the Americas New York, NY 10105 | Independent Registered Public Accounting Firm Ernst & Young LLP 5 Times Square New York, NY 10036
Legal Counsel Seward & Kissel LLP One Battery Park Plaza New York, NY 10004 |
Transfer Agent
AllianceBernstein Investor Services,
Inc.
P.O. Box 786003
San Antonio, TX 78278-6003
Toll-Free (800) 221-6003
| 1 | Member of the Audit Committee, the Governance and Nominating Committee and the Independent Directors Committee. |
| 2 | The day-to-day management of, and investment decisions for, the Fund are made by the Adviser’s Global Growth and Thematic Investment Team. Mr. Daniel C. Roarty is the investment professional with the most significant responsibility for the day-to-day management of the Fund on the Team. |
| 22 | AB FLEXFEE US THEMATIC PORTFOLIO | abfunds.com |
Information Regarding the Review and Approval of the Fund’s Advisory Agreement
The disinterested directors (the “directors”) of AB Cap Fund, Inc. (the “Company”) unanimously approved the Company’s Advisory Agreement with the Adviser in respect of AB FlexFeeTM US Thematic Portfolio (the “Fund”) for an initial two-year period at a meeting held on January 31-February 1, 2017 (the “Meeting”). (At the time of the approval of the Advisory Agreement, the Fund was known as AB Performance Fee Series – US Thematic Portfolio.)
Prior to approval of the Advisory Agreement, the directors had requested from the Adviser, and received and evaluated, extensive materials. They reviewed the proposed Advisory Agreement with the Adviser and with experienced counsel who are independent of the Adviser, who advised on the relevant legal standards. The directors also reviewed an independent evaluation prepared by the Company’s Senior Officer (who is also the Company’s Independent Compliance Officer), who acted as their independent fee consultant, of the reasonableness of the proposed performance-based advisory fee (which consists of a base fee plus or minus a performance adjustment), in which the Senior Officer concluded that the proposed contractual fee for the Fund was reasonable. The directors also discussed the proposed approval in private sessions with counsel and the Company’s Senior Officer.
The directors considered their knowledge of the nature and quality of the services to be provided by the Adviser to the Fund gained from their experience as directors or trustees of most of the registered investment companies advised by the Adviser, their overall confidence in the Adviser’s integrity and competence they have gained from that experience, the Adviser’s initiative in identifying and raising potential issues with the directors and its responsiveness, frankness and attention to concerns raised by the directors in the past, including the Adviser’s willingness to consider and implement organizational and operational changes designed to improve investment results and the services provided to the AB Funds. The directors noted that they have four regular meetings each year, at each of which they receive presentations from the Adviser on the investment results of the AB Funds and review extensive materials and information presented by the Adviser.
The directors also considered all factors they believed relevant, including the specific matters discussed below. During the course of their deliberations, the directors evaluated, among other things, the reasonableness of the proposed advisory fee. The directors did not identify any particular information that was all-important or controlling, and different directors may have attributed different weights to the various factors. The directors determined that the selection of the Adviser to manage the Fund and the overall arrangements between the Fund and the Adviser, as provided in the Advisory Agreement, including the proposed advisory fee, were fair
| abfunds.com | AB FLEXFEE US THEMATIC PORTFOLIO | 23 |
and reasonable in light of the services to be performed, expenses to be incurred and such other matters as the directors considered relevant in the exercise of their business judgment. The material factors and conclusions that formed the basis for the directors’ determinations included the following:
Nature, Extent and Quality of Services to be Provided
The directors considered the scope and quality of services to be provided by the Adviser under the Advisory Agreement, including the quality of the investment research capabilities of the Adviser and the other resources it has dedicated to performing services for the AB Funds. They also noted the professional experience and qualifications of the Fund’s portfolio management team and other senior personnel of the Adviser. The directors also considered that the Advisory Agreement provides that the Fund will reimburse the Adviser for the cost to it of providing certain clerical, accounting, administrative and other services to the Fund by employees of the Adviser or its affiliates. Requests for these reimbursements will be subject to the directors’ approval on a quarterly basis and, to the extent requested and paid, result in a higher rate of total compensation from the Fund to the Adviser than the fee rate stated in the Advisory Agreement. The directors noted that the methodology to be used to determine the reimbursement amounts had been reviewed by an independent consultant retained by the Company’s Senior Officer. The quality of administrative and other services, including the Adviser’s role in coordinating the activities of the Fund’s other service providers, also was considered. The directors concluded that, overall, they were satisfied with the nature, extent and quality of services to be provided to the Fund under the Advisory Agreement.
Costs of Services to be Provided and Profitability
Because the Fund had not yet commenced operations, the directors were unable to consider historical information about the profitability of the Fund. However, the Adviser agreed to provide the directors with profitability information in connection with future proposed continuances of the Advisory Agreement. They also considered the costs to be borne by the Adviser in providing services to the Fund and that the Fund was unlikely to be profitable to the Adviser unless it achieves a material level of net assets. The directors also noted that, due to the performance fee component of the advisory fee, profitability would tend to be higher with better performance relative to the Fund’s benchmark, which they considered to create an appropriate alignment of incentives.
Fall-Out Benefits
The directors considered the other benefits to the Adviser and its affiliates from their proposed relationships with the Fund, including, but not limited to, benefits relating to 12b-1 fees and sales charges to be received by the Fund’s principal underwriter (which is a wholly owned subsidiary of the Adviser) in respect of certain classes of the Fund’s shares; and transfer agency fees to be paid by the Fund to a wholly owned subsidiary of the
| 24 | AB FLEXFEE US THEMATIC PORTFOLIO | abfunds.com |
Adviser. The directors recognized that the Adviser’s future profitability would be somewhat lower without these benefits. The directors understood that the Adviser also might derive reputational and other benefits from its association with the Fund.
Investment Results
Since the Fund had not yet commenced operations, no performance or other historical information for the Fund was available. The Adviser manages another AB Fund with a somewhat similar investment style, and, at the Meeting, the directors reviewed performance information for that AB Fund. Based on this information, together with the Adviser’s written and oral presentations regarding the management of the Fund and their general knowledge and confidence in the Adviser’s expertise in managing mutual funds, the directors concluded that they were satisfied that the Adviser was capable of providing high quality Fund management services to the Fund.
Advisory Fees and Other Expenses
The directors considered the proposed advisory fee rate payable by the Fund to the Adviser and information prepared by three analytical services that are not affiliated with the Adviser (the “15(c) service providers”), concerning advisory fee rates paid by other funds in the same category as the Fund at a hypothetical common asset level of $250 million. The directors recognized that it is difficult to make comparisons of advisory fees because there are variations in the services that are included in the fees paid by other funds. The directors considered the Fund’s proposed contractual effective advisory fee rate against a peer group median.
The directors recognized that the Adviser’s total compensation from the Fund pursuant to the Advisory Agreement would be increased by amounts paid pursuant to the expense reimbursement provision in the Advisory Agreement, and that the impact of such expense reimbursement would depend on the size of the Fund and the extent to which the Adviser requests reimbursements pursuant to this provision.
The directors also considered the Adviser’s fee schedule for institutional clients pursuing a similar investment style. For this purpose, they reviewed the relevant advisory fee information from the Adviser’s Form ADV and the evaluation from the Company’s Senior Officer and noted the differences between the Fund’s proposed fee schedule, on the one hand, and the institutional fee schedule and the schedule of fees charged to any offshore funds and any sub-advised funds, on the other. The directors noted that the Adviser may, in some cases, agree to fee rates with large institutional clients that are lower than those reviewed by the directors and that they had previously discussed with the Adviser its policies in respect of such arrangements.
| abfunds.com | AB FLEXFEE US THEMATIC PORTFOLIO | 25 |
The Adviser reviewed with the directors the significantly greater scope of the services it provides to the Fund relative to institutional, offshore fund and sub-advised fund clients. In light of the substantial differences in services rendered by the Adviser to institutional, offshore fund and sub-advised fund clients as compared to funds such as the Fund, the directors considered these fee comparisons inapt and did not place significant weight on them in their deliberations.
The directors noted that the Fund may invest in shares of exchange-traded funds (“ETFs”), subject to the restrictions and limitations of the Investment Company Act of 1940 as these may be varied as a result of exemptive orders issued by the SEC. The directors also noted that ETFs pay advisory fees pursuant to their advisory contracts. The directors concluded, based on the Adviser’s explanation of how it may use ETFs when they are the most cost-effective way to obtain desired exposures or to “equitize” cash inflows pending purchases of underlying securities, that the proposed advisory fee would be for services in addition to, rather than duplicative of, the services provided under the advisory contracts of the ETFs in which the Fund may invest.
The directors also considered the projected total expense ratio of the Advisor Class shares of the Fund in comparison to a peer group and a peer universe selected by each 15(c) service provider. The directors also considered the Adviser’s proposed expense cap for the “other expenses” of the Fund (expenses excluding the advisory fee, Rule 12b-1 fees, and certain other expenses typically excluded from the Adviser’s expense caps) for the period ending December 31, 2018. The directors noted that it was likely that the expense ratios of some of the other funds in the Fund’s category were lowered by waivers or reimbursements by those funds’ investment advisers, which in some cases might be voluntary or temporary. The directors view the projected expense ratio information as relevant to their evaluation of the Adviser’s services because the Adviser is responsible for coordinating services provided to the Fund by others. Based on their review, the directors concluded that the Fund’s projected expense ratio was acceptable.
Economies of Scale
The directors noted that the proposed advisory fee schedule for the Fund does not contain breakpoints and that they had previously discussed their strong preference for breakpoints in advisory contracts with the Adviser. The directors took into consideration prior presentations by an independent consultant on economies of scale in the mutual fund industry and for the AB Funds, and by the Adviser concerning certain of its views on economies of scale. The directors also had requested and received from the Adviser certain updates on economies of scale in advance of the Meeting. The directors believe that economies of scale may be realized (if at all) by the Adviser across a variety of products and services, and not
| 26 | AB FLEXFEE US THEMATIC PORTFOLIO | abfunds.com |
only in respect of a single fund. The directors noted that there is no established methodology for setting breakpoints that give effect to the fund-specific services provided by a fund’s adviser and to the economies of scale that an adviser may realize in its overall mutual fund business or those components of it which directly or indirectly affect a fund’s operations. The directors observed that in the mutual fund industry as a whole, as well as among funds similar to the Fund, there is no uniformity or pattern in the fees and asset levels at which breakpoints (if any) apply. The directors also noted that the advisory agreements for many funds do not have breakpoints at all. The directors informed the Adviser that they would monitor the Fund’s assets and its profitability to the Adviser and anticipated revisiting the question of breakpoints in the future if circumstances warranted doing so.
| abfunds.com | AB FLEXFEE US THEMATIC PORTFOLIO | 27 |
This page is not part of the Shareholder Report or the Financial Statements.
AB FAMILY OF FUNDS
US EQUITY
US CORE
Core Opportunities Fund
Select US Equity Portfolio
US GROWTH
Concentrated Growth Fund
Discovery Growth Fund
Growth Fund
Large Cap Growth Fund
Small Cap Growth Portfolio
US VALUE
Discovery Value Fund
Equity Income Fund
Relative Value Fund1
Small Cap Value Portfolio
Value Fund
INTERNATIONAL/ GLOBAL EQUITY
INTERNATIONAL/ GLOBAL CORE
Global Core Equity Portfolio
International Portfolio
International Strategic Core Portfolio
Sustainable Global Thematic Fund1
Tax-Managed International Portfolio
Tax-Managed Wealth Appreciation Strategy
Wealth Appreciation Strategy
INTERNATIONAL/ GLOBAL GROWTH
Concentrated International Growth Portfolio
International Growth Fund
INTERNATIONAL/ GLOBAL EQUITY (continued)
INTERNATIONAL/ GLOBAL VALUE
Asia ex-Japan Equity Portfolio
International Value Fund
FIXED INCOME
MUNICIPAL
High Income Municipal Portfolio
Intermediate California Municipal Portfolio
Intermediate Diversified Municipal Portfolio
Intermediate New York Municipal Portfolio
Municipal Bond Inflation Strategy
Tax-Aware Fixed Income Portfolio
National Portfolio
Arizona Portfolio
California Portfolio
Massachusetts Portfolio
Minnesota Portfolio
New Jersey Portfolio
New York Portfolio
Ohio Portfolio
Pennsylvania Portfolio
Virginia Portfolio
TAXABLE
Bond Inflation Strategy
Global Bond Fund
High Income Fund
High Yield Portfolio
Income Fund
Intermediate Bond Portfolio
Limited Duration High Income Portfolio
Short Duration Portfolio
ALTERNATIVES
All Market Real Return Portfolio
Credit Long/Short Portfolio
Global Real Estate Investment Fund
Select US Long/Short Portfolio
Unconstrained Bond Fund
MULTI-ASSET
All Market Income Portfolio
All Market Total Return Portfolio1
Conservative Wealth Strategy
Emerging Markets Multi-Asset Portfolio
Global Risk Allocation Fund
Tax-Managed All Market Income Portfolio1
TARGET-DATE
Multi-Manager Select Retirement Allocation Fund
Multi-Manager Select 2010 Fund
Multi-Manager Select 2015 Fund
Multi-Manager Select 2020 Fund
Multi-Manager Select 2025 Fund
Multi-Manager Select 2030 Fund
Multi-Manager Select 2035 Fund
Multi-Manager Select 2040 Fund
Multi-Manager Select 2045 Fund
Multi-Manager Select 2050 Fund
Multi-Manager Select 2055 Fund
CLOSED-END FUNDS
Alliance California Municipal Income Fund
AllianceBernstein Global High Income Fund
AllianceBernstein National Municipal Income Fund
We also offer Government Exchange Reserves, which serves as the money market fund exchange vehicle for the AB mutual funds. An investment in Government Exchange Reserves is not a deposit in a bank and is not insured or guaranteed by the Federal Deposit Insurance Corporation or any other government agency. Although the Fund seeks to preserve the value of your investment at $1.00 per share, it is possible to lose money by investing in the Fund.
Investors should consider the investment objectives, risks, charges and expenses of the Fund carefully before investing. For copies of our prospectus or summary prospectus, which contain this and other information, visit us online at www.abfunds.com or contact your AB representative. Please read the prospectus and/or summary prospectus carefully before investing.
| 1 | Prior to November 1, 2016, Sustainable Global Thematic Fund was named Global Thematic Growth Fund; prior to January 9, 2017, Relative Value Fund was named Growth & Income Fund; prior to April 17, 2017, Tax-Managed All Market Income Portfolio was named Tax-Managed Balanced Wealth Strategy; prior to April 24, 2017, All Market Total Return Portfolio was named Balanced Wealth Strategy. |
| 28 | AB FLEXFEE US THEMATIC PORTFOLIO | abfunds.com |
AB FLEXFEE US THEMATIC PORTFOLIO
1345 Avenue of the Americas
New York, NY 10105
800 221 5672
FFUT-0152-0617 
| ITEM 2. | CODE OF ETHICS. |
Not applicable when filing a semi-annual report to shareholders.
| ITEM 3. | AUDIT COMMITTEE FINANCIAL EXPERT. |
Not applicable when filing a semi-annual report to shareholders.
| ITEM 4. | PRINCIPAL ACCOUNTANT FEES AND SERVICES. |
Not applicable when filing a semi-annual report to shareholders.
| ITEM 5. | AUDIT COMMITTEE OF LISTED REGISTRANTS. |
Not applicable to the registrant.
| ITEM 6. | SCHEDULE OF INVESTMENTS. |
Please see Schedule of Investments contained in the Report to Shareholders included under Item 1 of this Form N-CSR.
| ITEM 7. | DISCLOSURE OF PROXY VOTING POLICIES AND PROCEDURES FOR CLOSED-END MANAGEMENT INVESTMENT COMPANIES. |
Not applicable to the registrant.
| ITEM 8. | PORTFOLIO MANAGERS OF CLOSED-END MANAGEMENT INVESTMENT COMPANIES. |
Not applicable to the registrant.
| ITEM 9. | PURCHASES OF EQUITY SECURITIES BY CLOSED-END MANAGEMENT INVESTMENT COMPANY AND AFFILIATED PURCHASERS. |
Not applicable to the registrant.
| ITEM 10. | SUBMISSION OF MATTERS TO A VOTE OF SECURITY HOLDERS. |
There have been no material changes to the procedures by which shareholders may recommend nominees to the Fund’s Board of Directors since the Fund last provided disclosure in response to this item.
| ITEM 11. | CONTROLS AND PROCEDURES. |
(a) The registrant’s principal executive officer and principal financial officer have concluded that the registrant’s disclosure controls and procedures (as defined in Rule 30a-2(c) under the Investment Company Act of 1940, as amended) are effective at the reasonable assurance level based on their evaluation of these controls and procedures as of a date within 90 days of the filing date of this document.
(b) There were no changes in the registrant’s internal controls over financial reporting that occurred during the second fiscal quarter of the period that has materially affected, or is reasonably likely to materially affect, the registrant’s internal control over financial reporting.
| ITEM 12. | EXHIBITS. |
The following exhibits are attached to this Form N-CSR:
EXHIBIT NO. | DESCRIPTION OF EXHIBIT | |
| 12 (b) (1) | Certification of Principal Executive Officer Pursuant to Section 302 of the Sarbanes-Oxley Act of 2002 | |
| 12 (b) (2) | Certification of Principal Financial Officer Pursuant to Section 302 of the Sarbanes-Oxley Act of 2002 | |
| 12 (c) | Certification of Principal Executive Officer and Principal Financial Officer Pursuant to Section 906 of the Sarbanes-Oxley Act of 2002 | |
SIGNATURES
Pursuant to the requirements of the Securities Exchange Act of 1934 and the Investment Company Act of 1940, the registrant has duly caused this report to be signed on its behalf by the undersigned, thereunto duly authorized.
(Registrant): AB Cap Fund, Inc.
| By: | /s/ Robert M. Keith | |
| Robert M. Keith | ||
| President |
Date: August 25, 2017
Pursuant to the requirements of the Securities Exchange Act of 1934 and the Investment Company Act of 1940, this report has been signed below by the following persons on behalf of the registrant and in the capacities and on the dates indicated.
| By: | /s/ Robert M. Keith | |
| Robert M. Keith | ||
| President |
Date: August 25, 2017
| By: | /s/ Joseph J. Mantineo | |
| Joseph J. Mantineo | ||
| Treasurer and Chief Financial Officer |
Date: August 25, 2017