UNITED STATES
SECURITIES AND EXCHANGE COMMISSION
WASHINGTON, D.C. 20549
FORMN-CSR
CERTIFIED SHAREHOLDER REPORT OF REGISTERED
MANAGEMENT INVESTMENT COMPANIES
Investment Company Act file number:811-01716
AB CAP FUND, INC.
(Exact name of registrant as specified in charter)
1345 Avenue of the Americas, New York, New York 10105
(Address of principal executive offices) (Zip code)
Joseph J. Mantineo
AllianceBernstein L.P.
1345 Avenue of the Americas
New York, New York 10105
(Name and address of agent for service)
Registrant’s telephone number, including area code: (800)221-5672
Date of fiscal year end: June 30, 2019
Date of reporting period: December 31, 2018
| ITEM 1. | REPORTS TO STOCKHOLDERS. |
DEC 12.31.18

SEMI-ANNUAL REPORT
AB CONCENTRATED GROWTH FUND

Beginning January 1, 2021, as permitted by new regulations adopted by the Securities and Exchange Commission, the Fund’s annual and semi-annual shareholder reports will no longer be sent by mail, unless you specifically request paper copies of the reports. Instead, the reports will be made available on a website, and you will be notified by mail each time a report is posted and provided with a website address to access the report.
If you already elected to receive shareholder reports electronically, you will not be affected by this change and you need not take any action. You may elect to receive shareholder reports and other communications from the Fund electronically at any time by contacting your financial intermediary (such as a broker-dealer or bank) or, if you are a direct investor, by calling the Fund at (800) 221 5672.
You may elect to receive all future reports in paper form free of charge. If you invest through a financial intermediary, you can contact your financial intermediary to request that you continue to receive paper copies of your shareholder reports; if you invest directly with the Fund, you can call the Fund at (800) 221 5672. Your election to receive reports in paper form will apply to all funds held in your account with your financial intermediary or, if you invest directly, to all AB Mutual Funds you hold.
| Investment Products Offered | • Are Not FDIC Insured• May Lose Value• Are Not Bank Guaranteed | |
Investors should consider the investment objectives, risks, charges and expenses of the Fund carefully before investing. For copies of our prospectus or summary prospectus, which contain this and other information, visit us online at www.abfunds.com or contact your AB representative. Please read the prospectus and/or summary prospectus carefully before investing.
This shareholder report must be preceded or accompanied by the Fund’s prospectus for individuals who are not current shareholders of the Fund.
You may obtain a description of the Fund’s proxy voting policies and procedures, and information regarding how the Fund voted proxies relating to portfolio securities during the most recent12-month period ended June 30, without charge. Simply visit AB’s website at www.abfunds.com, or go to the Securities and Exchange Commission’s (the “Commission”) website at www.sec.gov, or call AB at (800) 227 4618.
The Fund files its complete schedule of portfolio holdings with the Commission for the first and third quarters of each fiscal year. The Fund’s portfolio holdings reports are available on the Commission’s website at www.sec.gov. The Fund’s portfolio holdings reports may also be reviewed and copied at the Commission’s Public Reference Room in Washington, DC; information on the operation of the Public Reference Room may be obtained by calling (800) SEC 0330. AB publishes full portfolio holdings for the Fund monthly at www.abfunds.com.
AllianceBernstein Investments, Inc. (ABI) is the distributor of the AB family of mutual funds. ABI is a member of FINRA and is an affiliate of AllianceBernstein L.P., the Adviser of the funds.
The [A/B] logo is a registered service mark of AllianceBernstein and AllianceBernstein® is a registered service mark used by permission of the owner, AllianceBernstein L.P.
| FROM THE PRESIDENT |  |
Dear Shareholder,
We are pleased to provide this report for AB Concentrated Growth Fund (the “Fund”). Please review the discussion of Fund performance, the market conditions during the reporting period and the Fund’s investment strategy.
As always, AB strives to keep clients ahead of what’s next by:
| + | Transforming uncommon insights into uncommon knowledge with a global research scope |
| + | Navigating markets with seasoned investment experience and sophisticated solutions |
| + | Providing thoughtful investment insights and actionable ideas |
Whether you’re an individual investor or a multi-billion-dollar institution, we put knowledge and experience to work for you.
AB’s global research organization connects and collaborates across platforms and teams to deliver impactful insights and innovative products. Better insights lead to better opportunities—anywhere in the world.
For additional information about AB’s range of products and shareholder resources, please log on to www.abfunds.com.
Thank you for your investment in the AB Mutual Funds.
Sincerely,

Robert M. Keith
President and Chief Executive Officer, AB Mutual Funds
| abfunds.com | AB CONCENTRATED GROWTH FUND | 1 | |
SEMI-ANNUAL REPORT
February 7, 2019
This report provides management’s discussion of fund performance for AB Concentrated Growth Fund for the semi-annual reporting period ended December 31, 2018.
The Fund’s investment objective is long-term growth of capital.
NAV RETURNS AS OF DECEMBER 31, 2018(unaudited)
| 6 Months | 12 Months | |||||||
| AB CONCENTRATED GROWTH FUND | ||||||||
| Class A Shares | -3.60% | 1.23% | ||||||
| Class C Shares | -4.02% | 0.44% | ||||||
| Advisor Class Shares1 | -3.50% | 1.48% | ||||||
| Class R Shares1 | -3.75% | 0.94% | ||||||
| Class K Shares1 | -3.62% | 1.23% | ||||||
| Class I Shares1 | -3.50% | 1.51% | ||||||
| Class Z Shares1 | -3.50% | 1.48% | ||||||
| S&P 500 Index | -6.85% | -4.38% | ||||||
| 1 | Please note that these share classes are for investors purchasing shares through accounts established under certainfee-based programs sponsored and maintained by certain broker-dealers and financial intermediaries, institutional pension plans and/or investment advisory clients of, and certain other persons associated with, the Adviser and its affiliates or the Fund. |
INVESTMENT RESULTS
The table above shows the Fund’s performance compared to its benchmark, the Standard & Poor’s (“S&P”) 500 Index, for thesix- and12-month periods ended December 31, 2018.
For thesix-month period, all share classes outperformed the benchmark, before sales charges. An overweight to the health care sector contributed, relative to the benchmark, while an underweight to utilities detracted. Security selection in the industrials sector contributed, but detracted within financials. Top absolute contributors to performance included Abbott Laboratories, Starbucks and IQVIA. Top absolute detractors included Aptiv, Charles Schwab and Booking Holdings.
During the12-month period, all share classes outperformed the benchmark, before sales charges. An underweight to the energy sector contributed, while an underweight to utilities detracted from returns. Security selection in the industrials sector contributed, but detracted within consumer discretionary. Top absolute contributors included Abbott, MasterCard and Zoetis. Top absolute detractors included Celgene, Charles Schwab and Aptiv.
| 2 | AB CONCENTRATED GROWTH FUND | abfunds.com | |
The Fund did not utilize derivatives during thesix- or12-month periods.
MARKET REVIEW AND INVESTMENT STRATEGY
US equity markets posted negative performance during both periods, despite the US equity market providing strong earnings growth. Health care and utilities were the strongest performing sectors over thesix-month period, while energy and materials lagged. Health care and utilities were also strong performers during the 12-month period, while the energy and communication-services sectors lagged. US equities ended the12-month period lower as the S&P 500 Index returned-4.38%.
Market volatility has increased as investors experienced a number of concerns, including the global trade war. Earnings growth in 2018 was very strong but investor anxiety caused a decline in the market for the year. In this environment, the Fund’s Senior Investment Management Team remains focused on sustainably growing the underlying earnings power of the Fund and believes the Fund is well positioned for the current environment.
INVESTMENT POLICIES
The Adviser seeks to achieve the Fund’s investment objective of long-term growth of capital by investing primarily in common stocks of listed US companies. The Adviser employs an appraisal method that attempts to measure each prospective company’s quality and growth rate by numerous factors. Such factors include: a company’s record and projections of profit and earnings growth, accuracy and availability of information with respect to the company, success and experience of management, accessibility of management to the Fund’s Adviser, product lines and competitive position both in the United States and abroad, lack of cyclicality, large market capitalization and liquidity of the company’s securities. The Adviser compares these results to the general stock markets to determine the relative attractiveness of each company at a given time. The Adviser weighs economic, political and market factors in making investment decisions; this appraisal technique attempts to measure each investment candidate not only against other stocks of the same industry group, but also against a broad spectrum of investments. While the Fund primarily invests in companies that have market capitalizations of $5 billion or more, it may invest in companies that have market capitalizations of $3 billion to $5 billion.
The Fund invests in a relatively small number of individual stocks. The Fund is considered to be“non-diversified”, which means that the securities laws do not limit the percentage of its assets that it may invest in any one company (subject to certain limitations under the Internal Revenue Code of 1986, as amended).
| abfunds.com | AB CONCENTRATED GROWTH FUND | 3 | |
DISCLOSURES AND RISKS
Benchmark Disclosure
The S&P 500® Index is unmanaged and does not reflect fees and expenses associated with the active management of a mutual fund portfolio. The S&P 500 Index includes 500 US stocks and is a common representation of the performance of the overall US stock market. An investor cannot invest directly in an index or average, and its results are not indicative of the performance for any specific investment, including the Fund.
A Word About Risk
Market Risk: The value of the Fund’s assets will fluctuate as the equity markets fluctuate. The value of the Fund’s investments may decline, sometimes rapidly and unpredictably, simply because of economic changes or other events that affect large portions of the market.
Focused Portfolio Risk: Investments in a limited number of companies may have more risk because changes in the value of a single security may have a more significant effect, either negative or positive, on the Fund’s net asset value (“NAV”).
Sector Risk: The Fund may have more risk because of concentrated investments in a particular market sector, such as the technology or health care sector. Market or economic factors affecting that sector could have a major effect on the value of the Fund’s investments.
Capitalization Risk: Investments inmid-capitalization companies may be more volatile and less liquid than investments in large-capitalization companies.
Non-Diversification Risk: The Fund may have more risk because it is“non-diversified”, meaning that it can invest more of its assets in a smaller number of issuers. Accordingly, changes in the value of a single security may have a more significant effect, either negative or positive, on the Fund’s NAV.
Management Risk: The Fund is subject to management risk because it is an actively managed investment fund. The Adviser will apply its investment techniques and risk analyses in making investment decisions for the Fund, but there is no guarantee that its techniques will produce the intended results.
These risks are fully discussed in the Fund’s prospectus. As with all investments, you may lose money by investing in the Fund.
| 4 | AB CONCENTRATED GROWTH FUND | abfunds.com | |
DISCLOSURES AND RISKS(continued)
An Important Note About Historical Performance
The investment return and principal value of an investment in the Fund will fluctuate, so that shares, when redeemed, may be worth more or less than their original cost. Performance shown in this report represents past performance and does not guarantee future results. Current performance may be lower or higher than the performance information shown. You may obtain performance information current to the most recentmonth-end by visiting www.abfunds.com.
Effective as of the close of business on February 28, 2014, the W.P. Stewart Growth Fund, Inc. (the “Predecessor Fund”) was converted into the Fund and the Predecessor Fund’s shares were converted into Advisor Class shares of the Fund. The inception date for Class A, C, R, K, I and Z shares is February 28, 2014. The inception date of the Predecessor Fund is February 28, 1994.
All fees and expenses related to the operation of the Fund have been deducted. NAV returns do not reflect sales charges; if sales charges were reflected, the Fund’s quoted performance would be lower. SEC returns reflect the applicable sales charges for each share class: a 4.25% maximumfront-end sales charge for Class A shares and a 1%1-year contingent deferred sales charge for Class C shares. Returns for the different share classes will vary due to different expenses associated with each class. Performance assumes reinvestment of distributions and does not account for taxes.
Please note: References to specific securities are presented to illustrate the Fund’s investment philosophy and are not to be considered advice or recommendations. This information reflects prevailing market conditions and the Adviser’s judgments as of the date indicated, which are subject to change. In preparing this report, the Adviser has relied upon and assumed without independent verification, the accuracy and completeness of all information available from third-party sources. It should not be assumed that any investments made in the future will be profitable or will equal the performance of the selected investments referenced herein.
| abfunds.com | AB CONCENTRATED GROWTH FUND | 5 | |
HISTORICAL PERFORMANCE
AVERAGE ANNUAL RETURNS AS OF DECEMBER 31, 2018(unaudited)
| NAV Returns | SEC Returns (reflects applicable | |||||||
| CLASS A SHARES | ||||||||
| 1 Year | 1.23% | -3.08% | ||||||
| Since Inception1 | 8.94% | 7.97% | ||||||
| CLASS C SHARES | ||||||||
| 1 Year | 0.44% | -0.49% | ||||||
| Since Inception1 | 8.13% | 8.13% | ||||||
| ADVISOR CLASS SHARES2 | ||||||||
| 1 Year | 1.48% | 1.48% | ||||||
| 5 Years | 8.55% | 8.55% | ||||||
| 10 Years | 13.63% | 13.63% | ||||||
| CLASS R SHARES2 | ||||||||
| 1 Year | 0.94% | 0.94% | ||||||
| Since Inception1 | 8.66% | 8.66% | ||||||
| CLASS K SHARES2 | ||||||||
| 1 Year | 1.23% | 1.23% | ||||||
| Since Inception1 | 8.94% | 8.94% | ||||||
| CLASS I SHARES2 | ||||||||
| 1 Year | 1.51% | 1.51% | ||||||
| Since Inception1 | 9.23% | 9.23% | ||||||
| CLASS Z SHARES2 | ||||||||
| 1 Year | 1.48% | 1.48% | ||||||
| Since Inception1 | 9.22% | 9.22% | ||||||
The Fund’s prospectus fee table shows the Fund’s total annual operating expense ratios as 1.22%, 1.97%, 0.96%, 1.45%, 1.22%, 0.97% and 0.93% for Class A, Class C, Advisor Class, Class R, Class K, Class I and Class Z shares, respectively, gross of any fee waivers or expense reimbursements. The Financial Highlights section of this report sets forth expense ratio data for the current reporting period; the expense ratios shown above may differ from the expense ratios in the Financial Highlights section since they are based on different time periods.
| 1 | Inception date: 2/28/2014. |
| 2 | These share classes are offered at NAV to eligible investors and their SEC returns are the same as their NAV returns. Please note that these share classes are for investors purchasing shares through accounts established under certainfee-based programs sponsored and maintained by certain broker-dealers and financial intermediaries, institutional pension plans and/or investment advisory clients of, and certain other persons associated with, the Adviser and its affiliates or the Fund. |
| 6 | AB CONCENTRATED GROWTH FUND | abfunds.com | |
HISTORICAL PERFORMANCE(continued)
SEC AVERAGE ANNUAL RETURNS
AS OF THE MOST RECENT CALENDARQUARTER-END
DECEMBER 31, 2018(unaudited)
SEC Returns (reflects applicable | ||||
| CLASS A SHARES | ||||
| 1 Year | -3.08% | |||
| Since Inception1 | 7.97% | |||
| CLASS C SHARES | ||||
| 1 Year | -0.49% | |||
| Since Inception1 | 8.13% | |||
| ADVISOR CLASS SHARES2 | ||||
| 1 Year | 1.48% | |||
| 5 Years | 8.55% | |||
| 10 Years | 13.63% | |||
| CLASS R SHARES2 | ||||
| 1 Year | 0.94% | |||
| Since Inception1 | 8.66% | |||
| CLASS K SHARES2 | ||||
| 1 Year | 1.23% | |||
| Since Inception1 | 8.94% | |||
| CLASS I SHARES2 | ||||
| 1 Year | 1.51% | |||
| Since Inception1 | 9.23% | |||
| CLASS Z SHARES2 | ||||
| 1 Year | 1.48% | |||
| Since Inception1 | 9.22% | |||
| 1 | Inception date: 2/28/2014. |
| 2 | Please note that these share classes are for investors purchasing shares through accounts established under certainfee-based programs sponsored and maintained by certain broker-dealers and financial intermediaries, institutional pension plans and/or investment advisory clients of, and certain other persons associated with, the Adviser and its affiliates or the Fund. |
| abfunds.com | AB CONCENTRATED GROWTH FUND | 7 | |
EXPENSE EXAMPLE
(unaudited)
As a shareholder of the Fund, you incur two types of costs: (1) transaction costs, including sales charges (loads) on purchase payments, contingent deferred sales charges on redemptions and (2) ongoing costs, including management fees; distribution(12b-1) fees; and other Fund expenses. This example is intended to help you understand your ongoing costs (in dollars) of investing in the Fund and to compare these costs with the ongoing costs of investing in other mutual funds.
This Example is based on an investment of $1,000 invested at the beginning of the period and held for the entire period as indicated below.
Actual Expenses
The table below provides information about actual account values and actual expenses. You may use the information, together with the amount you invested, to estimate the expenses that you paid over the period. Simply divide your account value by $1,000 (for example, an $8,600 account value divided by $1,000 = 8.6), then multiply the result by the number under the heading entitled “Expenses Paid During Period” to estimate the expenses you paid on your account during this period.
Hypothetical Example for Comparison Purposes
The table below also provides information about hypothetical account values and hypothetical expenses based on the Fund’s actual expense ratio and an assumed annual rate of return of 5% before expenses, which is not the Fund’s actual return. The hypothetical account values and expenses may not be used to estimate the actual ending account balance or expenses you paid for the period. You may use this information to compare the ongoing costs of investing in the Fund and other funds by comparing this 5% hypothetical example with the 5% hypothetical examples that appear in the shareholder reports of other funds.
Please note that the expenses shown in the table are meant to highlight your ongoing costs only and do not reflect any transactional costs, such as sales charges (loads), or contingent deferred sales charges on redemptions. Therefore, the hypothetical example is useful in comparing ongoing costs only, and will not help you determine the relative total costs of owning different funds. In addition, if these transactional costs were included, your costs would have been higher.
| Beginning Account Value July 1, 2018 | Ending Account Value December 31, 2018 | Expenses Paid During Period* | Annualized Expense Ratio* | Total Expenses Paid During Period+ | Total Annualized Expense Ratio+ | |||||||||||||||||||
| Class A | ||||||||||||||||||||||||
Actual | $ | 1,000 | $ | 964.00 | $ | 5.89 | 1.19 | % | $ | 5.89 | 1.19 | % | ||||||||||||
Hypothetical** | $ | 1,000 | $ | 1,019.21 | $ | 6.06 | 1.19 | % | $ | 6.06 | 1.19 | % | ||||||||||||
| 8 | AB CONCENTRATED GROWTH FUND | abfunds.com | |
EXPENSE EXAMPLE(continued)
| Beginning Account Value July 1, 2018 | Ending Account Value December 31, 2018 | Expenses Paid During Period* | Annualized Expense Ratio* | Total Expenses Paid During Period+ | Total Annualized Expense Ratio+ | |||||||||||||||||||
| Class C | ||||||||||||||||||||||||
Actual | $ | 1,000 | $ | 959.80 | $ | 9.58 | 1.94 | % | $ | 9.58 | 1.94 | % | ||||||||||||
Hypothetical** | $ | 1,000 | $ | 1,015.43 | $ | 9.86 | 1.94 | % | $ | 9.86 | 1.94 | % | ||||||||||||
| Advisor Class | ||||||||||||||||||||||||
Actual | $ | 1,000 | $ | 965.00 | $ | 4.66 | 0.94 | % | $ | 4.66 | 0.94 | % | ||||||||||||
Hypothetical** | $ | 1,000 | $ | 1,020.47 | $ | 4.79 | 0.94 | % | $ | 4.79 | 0.94 | % | ||||||||||||
| Class R | ||||||||||||||||||||||||
Actual | $ | 1,000 | $ | 962.50 | $ | 7.12 | 1.44 | % | $ | 7.12 | 1.44 | % | ||||||||||||
Hypothetical** | $ | 1,000 | $ | 1,017.95 | $ | 7.32 | 1.44 | % | $ | 7.32 | 1.44 | % | ||||||||||||
| Class K | ||||||||||||||||||||||||
Actual | $ | 1,000 | $ | 963.80 | $ | 5.94 | 1.20 | % | $ | 5.94 | 1.20 | % | ||||||||||||
Hypothetical** | $ | 1,000 | $ | 1,019.16 | $ | 6.11 | 1.20 | % | $ | 6.11 | 1.20 | % | ||||||||||||
| Class I | ||||||||||||||||||||||||
Actual | $ | 1,000 | $ | 965.00 | $ | 4.56 | 0.92 | % | $ | 4.61 | 0.93 | % | ||||||||||||
Hypothetical** | $ | 1,000 | $ | 1,020.57 | $ | 4.69 | 0.92 | % | $ | 4.74 | 0.93 | % | ||||||||||||
| Class Z | ||||||||||||||||||||||||
Actual | $ | 1,000 | $ | 965.00 | $ | 4.51 | 0.91 | % | $ | 4.56 | 0.92 | % | ||||||||||||
Hypothetical** | $ | 1,000 | $ | 1,020.62 | $ | 4.63 | 0.91 | % | $ | 4.69 | 0.92 | % | ||||||||||||
| * | Expenses are equal to the classes’ annualized expense ratios, multiplied by the average account value over the period, multiplied by 184/365 (to reflect theone-half year period). |
| ** | Assumes 5% annual return before expenses. |
| + | In connection with the Fund’s investments in affiliated/unaffiliated underlying portfolios, the Fund incurs no direct expenses, but bears proportionate shares of the fees and expenses (i.e., operating, administrative and investment advisory fees) of the affiliated/unaffiliated underlying portfolios. The Adviser has contractually agreed to waive its fees from the Fund in an amount equal to the Fund’s pro rata share of certain acquired fund fees and expenses of the affiliated underlying portfolios. The Fund’s total expenses are equal to the classes’ annualized expense ratio plus the Fund’s pro rata share of the weighted average expense ratio of the affiliated/unaffiliated underlying portfolios in which it invests, multiplied by the average account value over the period, multiplied by 184/365 (to reflect theone-half year period). |
| abfunds.com | AB CONCENTRATED GROWTH FUND | 9 | |
PORTFOLIO SUMMARY
December 31, 2018(unaudited)
PORTFOLIO STATISTICS
Net Assets ($mil): $403.8
TEN LARGEST HOLDINGS2
| Company | U.S. $ Value | Percent of Net Assets | ||||||
| Abbott Laboratories | $ | 34,918,537 | 8.6 | % | ||||
| Mastercard, Inc. – Class A | 33,151,276 | 8.2 | ||||||
| Microsoft Corp. | 25,467,763 | 6.3 | ||||||
| Amphenol Corp. – Class A | 25,305,706 | 6.3 | ||||||
| IQVIA Holdings, Inc. | 23,238,763 | 5.8 | ||||||
| Ulta Salon Cosmetics & Fragrance, Inc. | 21,991,529 | 5.4 | ||||||
| Facebook, Inc. – Class A | 20,608,659 | 5.1 | ||||||
| Booking Holdings, Inc. | 19,735,488 | 4.9 | ||||||
| Charles Schwab Corp. (The) | 19,397,625 | 4.8 | ||||||
| Allegion PLC | 18,998,719 | 4.7 | ||||||
| $ | 242,814,065 | 60.1 | % | |||||
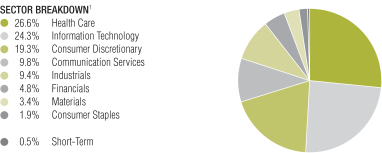
| 1 | All data are as of December 31, 2018. The Fund’s sector breakdown is expressed as a percentage of total investments and may vary over time. |
| 2 | Long-term investments. |
Please note: The sector classifications presented herein are based on the Global Industry Classification Standard (GICS) which was developed by Morgan Stanley Capital International and Standard & Poor’s. The components are divided into sector, industry group, and industrysub-indices as classified by the GICS for each of the market capitalization indices in the broad market. These sector classifications are broadly defined. The “Portfolio of Investments” section of the report reflects more specific industry information and is consistent with the investment restrictions discussed in the Fund’s prospectus.
| 10 | AB CONCENTRATED GROWTH FUND | abfunds.com | |
PORTFOLIO OF INVESTMENTS
December 31, 2018(unaudited)
| Company | Shares | U.S. $ Value | ||||||
| ||||||||
COMMON STOCKS – 99.2% | ||||||||
Health Care – 26.5% | ||||||||
Biotechnology – 4.0% | ||||||||
Celgene Corp.(a) | 251,770 | $ | 16,135,939 | |||||
|
| |||||||
Health Care Equipment & Supplies – 12.4% | ||||||||
Abbott Laboratories | 482,767 | 34,918,537 | ||||||
West Pharmaceutical Services, Inc. | 156,782 | 15,369,340 | ||||||
|
| |||||||
| 50,287,877 | ||||||||
|
| |||||||
Life Sciences Tools & Services – 5.8% | ||||||||
IQVIA Holdings, Inc.(a) | 200,041 | 23,238,763 | ||||||
|
| |||||||
Pharmaceuticals – 4.3% | ||||||||
Zoetis, Inc. | 204,765 | 17,515,598 | ||||||
|
| |||||||
| 107,178,177 | ||||||||
|
| |||||||
Information Technology – 24.2% | ||||||||
Electronic Equipment, Instruments & Components – 6.3% | ||||||||
Amphenol Corp. – Class A | 312,339 | 25,305,706 | ||||||
|
| |||||||
IT Services – 8.2% | ||||||||
Mastercard, Inc. – Class A | 175,729 | 33,151,276 | ||||||
|
| |||||||
Software – 6.3% | ||||||||
Microsoft Corp. | 250,741 | 25,467,763 | ||||||
|
| |||||||
Technology Hardware, Storage & | ||||||||
Apple, Inc. | 87,692 | 13,832,536 | ||||||
|
| |||||||
| 97,757,281 | ||||||||
|
| |||||||
Consumer Discretionary – 19.2% | ||||||||
Auto Components – 4.2% | ||||||||
Aptiv PLC | 278,150 | 17,125,696 | ||||||
|
| |||||||
Hotels, Restaurants & Leisure – 4.6% | ||||||||
Starbucks Corp. | 289,273 | 18,629,181 | ||||||
|
| |||||||
Internet & Direct Marketing Retail – 4.9% | ||||||||
Booking Holdings, Inc.(a) | 11,458 | 19,735,488 | ||||||
|
| |||||||
Specialty Retail – 5.5% | ||||||||
Ulta Salon Cosmetics & Fragrance, Inc.(a) | 89,820 | 21,991,529 | ||||||
|
| |||||||
| 77,481,894 | ||||||||
|
| |||||||
Communication Services – 9.8% | ||||||||
Interactive Media & Services – 9.8% | ||||||||
Alphabet, Inc. – Class C(a) | 18,255 | 18,905,060 | ||||||
Facebook, Inc. – Class A(a) | 157,210 | 20,608,659 | ||||||
|
| |||||||
| 39,513,719 | ||||||||
|
| |||||||
| abfunds.com | AB CONCENTRATED GROWTH FUND | 11 | |
PORTFOLIO OF INVESTMENTS(continued)
| Company | Shares | U.S. $ Value | ||||||
| ||||||||
Industrials – 9.4% | ||||||||
Building Products – 4.7% | ||||||||
Allegion PLC | 238,348 | $ | 18,998,719 | |||||
|
| |||||||
Professional Services – 4.7% | ||||||||
Verisk Analytics, Inc. – Class A(a) | 174,012 | 18,974,269 | ||||||
|
| |||||||
| 37,972,988 | ||||||||
|
| |||||||
Financials – 4.8% | ||||||||
Capital Markets – 4.8% | ||||||||
Charles Schwab Corp. (The) | 467,075 | 19,397,625 | ||||||
|
| |||||||
Materials – 3.4% | ||||||||
Chemicals – 3.4% | ||||||||
Ecolab, Inc. | 92,846 | 13,680,859 | ||||||
|
| |||||||
Consumer Staples – 1.9% | ||||||||
Food Products – 1.9% | ||||||||
Hershey Co. (The) | 69,880 | 7,489,738 | ||||||
|
| |||||||
Total Common Stocks | 400,472,281 | |||||||
|
| |||||||
SHORT-TERM INVESTMENTS – 0.4% | ||||||||
Investment Companies – 0.4% | ||||||||
AB Fixed Income Shares, Inc. – Government Money Market Portfolio – Class AB, 2.31%(b)(c)(d) | 1,797,463 | 1,797,463 | ||||||
|
| |||||||
Total Investments – 99.6% | 402,269,744 | |||||||
Other assets less liabilities – 0.4% | 1,524,209 | |||||||
|
| |||||||
Net Assets – 100.0% | $ | 403,793,953 | ||||||
|
| |||||||
| (a) | Non-income producing security. |
| (b) | Affiliated investments. |
| (c) | The rate shown represents the7-day yield as of period end. |
| (d) | To obtain a copy of the fund’s shareholder report, please go to the Securities and Exchange Commission’s website at www.sec.gov, or call AB at(800) 227-4618. |
See notes to financial statements.
| 12 | AB CONCENTRATED GROWTH FUND | abfunds.com | |
STATEMENT OF ASSETS & LIABILITIES
December 31, 2018(unaudited)
| Assets |
| |||
Investments in securities, at value | ||||
Unaffiliated issuers (cost $338,958,111) | $ | 400,472,281 | ||
Affiliated issuers (cost $1,797,463) | 1,797,463 | |||
Receivable for investment securities sold | 2,520,168 | |||
Receivable for capital stock sold | 1,941,305 | |||
Unaffiliated dividends receivable | 114,547 | |||
Affiliated dividends receivable | 5,317 | |||
|
| |||
Total assets | 406,851,081 | |||
|
| |||
| Liabilities |
| |||
Payable for capital stock redeemed | 2,661,213 | |||
Advisory fee payable | 264,932 | |||
Administrative fee payable | 20,695 | |||
Distribution fee payable | 18,246 | |||
Transfer Agent fee payable | 4,338 | |||
Directors’ fees payable | 81 | |||
Accrued expenses and other liabilities | 87,623 | |||
|
| |||
Total liabilities | 3,057,128 | |||
|
| |||
Net Assets | $ | 403,793,953 | ||
|
| |||
| Composition of Net Assets |
| |||
Capital stock, at par | $ | 1,261 | ||
Additionalpaid-in capital | 337,962,678 | |||
Distributable earnings | 65,830,014 | |||
|
| |||
| $ | 403,793,953 | |||
|
| |||
Net Asset Value Per Share—33 billion shares of capital stock authorized, $.0001 par value
| Class | Net Assets | Shares Outstanding | Net Asset Value | |||||||||
| ||||||||||||
| A | $ | 21,503,780 | 678,243 | $ | 31.71 | * | ||||||
| ||||||||||||
| C | $ | 17,619,429 | 578,733 | $ | 30.44 | |||||||
| ||||||||||||
| Advisor | $ | 363,385,373 | 11,313,798 | $ | 32.12 | |||||||
| ||||||||||||
| R | $ | 12,593 | 402.68 | $ | 31.27 | |||||||
| ||||||||||||
| K | $ | 560,878 | 17,689 | $ | 31.71 | |||||||
| ||||||||||||
| I | $ | 121,826 | 3,787 | $ | 32.17 | |||||||
| ||||||||||||
| Z | $ | 590,074 | 18,351 | $ | 32.15 | |||||||
| ||||||||||||
| * | The maximum offering price per share for Class A shares was $33.12 which reflects a sales charge of 4.25%. |
See notes to financial statements.
| abfunds.com | AB CONCENTRATED GROWTH FUND | 13 | |
STATEMENT OF OPERATIONS
Six Months Ended December 31, 2018(unaudited)
| Investment Income | ||||||||
Dividends | ||||||||
Unaffiliated issuers | $ | 1,652,870 | ||||||
Affiliated issuers | 126,936 | $ | 1,779,806 | |||||
|
| |||||||
| Expenses | ||||||||
Advisory fee (see Note B) | 1,766,876 | |||||||
Distribution fee—Class A | 30,155 | |||||||
Distribution fee—Class C | 93,802 | |||||||
Distribution fee—Class R | 37 | |||||||
Distribution fee—Class K | 750 | |||||||
Transfer agency—Class A | 5,189 | |||||||
Transfer agency—Class C | 4,082 | |||||||
Transfer agency—Advisor Class | 85,567 | |||||||
Transfer agency—Class R | 4 | |||||||
Transfer agency—Class K | 150 | |||||||
Transfer agency—Class I | 10 | |||||||
Transfer agency—Class Z | 75 | |||||||
Custodian | 56,368 | |||||||
Registration fees | 52,203 | |||||||
Administrative | 36,785 | |||||||
Legal | 20,689 | |||||||
Audit and tax | 18,383 | |||||||
Printing | 14,905 | |||||||
Directors’ fees | 12,501 | |||||||
Miscellaneous | 8,978 | |||||||
|
| |||||||
Total expenses | 2,207,509 | |||||||
Less: expenses waived and reimbursed by the Adviser (see Note B) | (8,937 | ) | ||||||
|
| |||||||
Net expenses | 2,198,572 | |||||||
|
| |||||||
Net investment loss | (418,766 | ) | ||||||
|
| |||||||
| Realized and Unrealized Gain (Loss) on Investment Transactions | ||||||||
Net realized gain on investment transactions | 15,567,091 | |||||||
Net change in unrealized appreciation/depreciation of investments | (30,436,264 | ) | ||||||
|
| |||||||
Net loss on investment transactions | (14,869,173 | ) | ||||||
|
| |||||||
Net Decrease in Net Assets from Operations | $ | (15,287,939 | ) | |||||
|
|
See notes to financial statements.
| 14 | AB CONCENTRATED GROWTH FUND | abfunds.com | |
STATEMENT OF CHANGES IN NET ASSETS
| Six Months Ended December 31, 2018 (unaudited) | Year Ended June 30, 2018 | |||||||
| Increase (Decrease) in Net Assets from Operations | ||||||||
Net investment loss | $ | (418,766 | ) | $ | (1,087,717 | ) | ||
Net realized gain on investment transactions | 15,567,091 | 31,405,783 | ||||||
Net change in unrealized appreciation/depreciation of investments | (30,436,264 | ) | 20,471,090 | |||||
|
|
|
| |||||
Net increase (decrease) in net assets from operations | (15,287,939 | ) | 50,789,156 | |||||
| Distributions to Shareholders* | ||||||||
Class A | (1,607,170 | ) | (777,915 | ) | ||||
Class C | (1,347,233 | ) | (660,109 | ) | ||||
Advisor Class | (27,894,149 | ) | (11,330,515 | ) | ||||
Class R | (1,045 | ) | (481 | ) | ||||
Class K | (42,507 | ) | (16,379 | ) | ||||
Class I | (8,711 | ) | (486 | ) | ||||
Class Z | (48,301 | ) | (1,412,119 | ) | ||||
| Capital Stock Transactions |
| |||||||
Net increase (decrease) | 34,532,480 | (28,981,967 | ) | |||||
|
|
|
| |||||
Total increase (decrease) | (11,704,575 | ) | 7,609,185 | |||||
| Net Assets |
| |||||||
Beginning of period | 415,498,528 | 407,889,343 | ||||||
|
|
|
| |||||
End of period | $ | 403,793,953 | $ | 415,498,528 | ||||
|
|
|
| |||||
| * | The prior year’s amounts have been reclassified to conform with the current year’s presentation. See Note I, Recent Accounting Pronouncements, in the Notes to Financial Statements for more information. |
See notes to financial statements.
| abfunds.com | AB CONCENTRATED GROWTH FUND | 15 | |
NOTES TO FINANCIAL STATEMENTS
December 31, 2018(unaudited)
NOTE A
Significant Accounting Policies
AB Cap Fund, Inc. (the “Company”), which is a Maryland corporation, is registered under the Investment Company Act of 1940 as anopen-end management investment company. The Company operates as a series company currently comprised of 29 portfolios. Each portfolio is considered to be a separate entity for financial reporting and tax purposes. This report relates only to the AB Concentrated Growth Fund (the “Fund”), anon-diversified portfolio. The Fund has authorized the issuance of Class A, Class B, Class C, Advisor Class, Class R, Class K, Class I, Class Z, Class T, Class 1 and Class 2 shares. Class B, Class T, Class 1 and Class 2 shares have not been issued. Class A shares are sold with afront-end sales charge of up to 4.25% for purchases not exceeding $1,000,000. With respect to purchases of $1,000,000 or more, Class A shares redeemed within one year of purchase may be subject to a contingent deferred sales charge of 1%. Class C shares are subject to a contingent deferred sales charge of 1% on redemptions made within the first year after purchase, and 0% after the first year of purchase. Class C shares will automatically convert to Class A shares ten years after the end of the calendar month of purchase. Class R and Class K shares are sold without an initial or contingent deferred sales charge. Advisor Class, Class I and Class Z shares are sold without an initial or contingent deferred sales charge and are not subject to ongoing distribution expenses. All eleven classes of shares have identical voting, dividend, liquidation and other rights, except that the classes bear different distribution and transfer agency expenses. Each class has exclusive voting rights with respect to its distribution plan. The financial statements have been prepared in conformity with U.S. generally accepted accounting principles (“U.S. GAAP”) which require management to make certain estimates and assumptions that affect the reported amounts of assets and liabilities in the financial statements and amounts of income and expenses during the reporting period. Actual results could differ from those estimates. The Fund is an investment company under U.S. GAAP and follows the accounting and reporting guidance applicable to investment companies. The following is a summary of significant accounting policies followed by the Fund.
1. Security Valuation
Portfolio securities are valued at their current market value determined on the basis of market quotations or, if market quotations are not readily available or are deemed unreliable, at “fair value” as determined in accordance with procedures established by and under the general supervision of the Company’s Board of Directors (the “Board”).
| 16 | AB CONCENTRATED GROWTH FUND | abfunds.com | |
NOTES TO FINANCIAL STATEMENTS(continued)
In general, the market values of securities which are readily available and deemed reliable are determined as follows: securities listed on a national securities exchange (other than securities listed on the NASDAQ Stock Market, Inc. (“NASDAQ”)) or on a foreign securities exchange are valued at the last sale price at the close of the exchange or foreign securities exchange. If there has been no sale on such day, the securities are valued at the last traded price from the previous day. Securities listed on more than one exchange are valued by reference to the principal exchange on which the securities are traded; securities listed only on NASDAQ are valued in accordance with the NASDAQ Official Closing Price; listed or over the counter (“OTC”) market put or call options are valued at the mid level between the current bid and ask prices. If either a current bid or current ask price is unavailable, the Adviser will have discretion to determine the best valuation (e.g., last trade price in the case of listed options); open futures are valued using the closing settlement price or, in the absence of such a price, the most recent quoted bid price. If there are no quotations available for the day of valuation, the last available closing settlement price is used; U.S. Government securities and any other debt instruments having 60 days or less remaining until maturity are generally valued at market by an independent pricing vendor, if a market price is available. If a market price is not available, the securities are valued at amortized cost. This methodology is commonly used for short term securities that have an original maturity of 60 days or less, as well as short term securities that had an original term to maturity that exceeded 60 days. In instances when amortized cost is utilized, the Valuation Committee (the “Committee”) must reasonably conclude that the utilization of amortized cost is approximately the same as the fair value of the security. Such factors the Committee will consider include, but are not limited to, an impairment of the creditworthiness of the issuer or material changes in interest rates. Fixed-income securities, including mortgage-backed and asset-backed securities, may be valued on the basis of prices provided by a pricing service or at a price obtained from one or more of the major broker-dealers. In cases where broker-dealer quotes are obtained, the Adviser may establish procedures whereby changes in market yields or spreads are used to adjust, on a daily basis, a recently obtained quoted price on a security. Swaps and other derivatives are valued daily, primarily using independent pricing services, independent pricing models using market inputs, as well as third party broker-dealers or counterparties. Open end mutual funds are valued at the closing net asset value per share, while exchange traded funds are valued at the closing market price per share.
Securities for which market quotations are not readily available (including restricted securities) or are deemed unreliable are valued at fair value as deemed appropriate by the Adviser. Factors considered in making this determination may include, but are not limited to, information obtained by
| abfunds.com | AB CONCENTRATED GROWTH FUND | 17 | |
NOTES TO FINANCIAL STATEMENTS(continued)
contacting the issuer, analysts, analysis of the issuer’s financial statements or other available documents. In addition, the Fund may use fair value pricing for securities primarily traded innon-U.S. markets because most foreign markets close well before the Fund values its securities at 4:00 p.m., Eastern Time. The earlier close of these foreign markets gives rise to the possibility that significant events, including broad market moves, may have occurred in the interim and may materially affect the value of those securities. To account for this, the Fund generally values many of its foreign equity securities using fair value prices based on third party vendor modeling tools to the extent available.
2. Fair Value Measurements
In accordance with U.S. GAAP regarding fair value measurements, fair value is defined as the price that the Fund would receive to sell an asset or pay to transfer a liability in an orderly transaction between market participants at the measurement date. U.S. GAAP establishes a framework for measuring fair value, and a three-level hierarchy for fair value measurements based upon the transparency of inputs to the valuation of an asset or liability (including those valued based on their market values as described in Note A.1 above). Inputs may be observable or unobservable and refer broadly to the assumptions that market participants would use in pricing the asset or liability. Observable inputs reflect the assumptions market participants would use in pricing the asset or liability based on market data obtained from sources independent of the Fund. Unobservable inputs reflect the Fund’s own assumptions about the assumptions that market participants would use in pricing the asset or liability based on the best information available in the circumstances. Each investment is assigned a level based upon the observability of the inputs which are significant to the overall valuation. The three-tier hierarchy of inputs is summarized below.
| • | Level 1—quoted prices in active markets for identical investments |
| • | Level 2—other significant observable inputs (including quoted prices for similar investments, interest rates, prepayment speeds, credit risk, etc.) |
| • | Level 3—significant unobservable inputs (including the Fund’s own assumptions in determining the fair value of investments) |
Where readily available market prices or relevant bid prices are not available for certain equity investments, such investments may be valued based on similar publicly traded investments, movements in relevant indices since last available prices or based upon underlying company fundamentals and comparable company data (such as multiples to earnings or other multiples to equity). Where an investment is valued using an observable input, such as another publicly traded security, the investment will be classified
| 18 | AB CONCENTRATED GROWTH FUND | abfunds.com | |
NOTES TO FINANCIAL STATEMENTS(continued)
as Level 2. If management determines that an adjustment is appropriate based on restrictions on resale, illiquidity or uncertainty, and such adjustment is a significant component of the valuation, the investment will be classified as Level 3. An investment will also be classified as Level 3 where management uses company fundamentals and other significant inputs to determine the valuation.
The following table summarizes the valuation of the Fund’s investments by the above fair value hierarchy levels as of December 31, 2018:
Investments in | Level 1 | Level 2 | Level 3 | Total | ||||||||||||
Assets: | ||||||||||||||||
Common Stocks(a) | $ | 400,472,281 | $ | – 0 | – | $ | – 0 | – | $ | 400,472,281 | ||||||
Short-Term Investments | 1,797,463 | – 0 | – | – 0 | – | 1,797,463 | ||||||||||
|
|
|
|
|
|
|
| |||||||||
Total Investments in Securities | 402,269,744 | – 0 | – | – 0 | – | 402,269,744 | ||||||||||
Other Financial Instruments(b) | – 0 | – | – 0 | – | – 0 | – | – 0 | – | ||||||||
|
|
|
|
|
|
|
| |||||||||
Total(c) | $ | 402,269,744 | $ | – 0 | – | $ | – 0 | – | $ | 402,269,744 | ||||||
|
|
|
|
|
|
|
| |||||||||
| (a) | See Portfolio of Investments for sector classifications. |
| (b) | Other financial instruments are derivative instruments, such as futures, forwards and swaps, which are valued at the unrealized appreciation/(depreciation) on the instrument. Other financial instruments may also include swaps with upfront premiums, options written and swaptions written which are valued at market value. |
| (c) | There were no transfers between any levels during the reporting period. |
The Fund recognizes all transfers between levels of the fair value hierarchy assuming the financial instruments were transferred at the beginning of the reporting period.
The Adviser established the Committee to oversee the pricing and valuation of all securities held in the Fund. The Committee operates under pricing and valuation policies and procedures established by the Adviser and approved by the Board, including pricing policies which set forth the mechanisms and processes to be employed on a daily basis to implement these policies and procedures. In particular, the pricing policies describe how to determine market quotations for securities and other instruments. The Committee’s responsibilities include: 1) fair value and liquidity determinations (and oversight of any third parties to whom any responsibility for fair value and liquidity determinations is delegated), and 2) regular monitoring of the Adviser’s pricing and valuation policies and procedures and modification or enhancement of these policies and procedures (or recommendation of the modification of these policies and procedures) as the Committee believes appropriate.
| abfunds.com | AB CONCENTRATED GROWTH FUND | 19 | |
NOTES TO FINANCIAL STATEMENTS(continued)
The Committee is also responsible for monitoring the implementation of the pricing policies by the Adviser’s Pricing Group (the “Pricing Group”) and any third party which performs certain pricing functions in accordance with the pricing policies. The Pricing Group is responsible for the oversight of the third party on aday-to-day basis. The Committee and the Pricing Group perform a series of activities to provide reasonable assurance of the accuracy of prices including: 1) periodic vendor due diligence meetings, review of methodologies, new developments and processes at vendors, 2) daily comparison of security valuation versus prior day for all securities that exceeded established thresholds, and 3) daily review of unpriced, stale, and variance reports with exceptions reviewed by senior management and the Committee.
In addition, several processes outside of the pricing process are used to monitor valuation issues including: 1) performance and performance attribution reports are monitored for anomalous impacts based upon benchmark performance, and 2) portfolio managers review all portfolios for performance and analytics (which are generated using the Adviser’s prices).
3. Currency Translation
Assets and liabilities denominated in foreign currencies and commitments under forward currency exchange contracts are translated into U.S. dollars at the mean of the quoted bid and ask prices of such currencies against the U.S. dollar. Purchases and sales of portfolio securities are translated into U.S. dollars at the rates of exchange prevailing when such securities were acquired or sold. Income and expenses are translated into U.S. dollars at rates of exchange prevailing when accrued.
Net realized gain or loss on foreign currency transactions represents foreign exchange gains and losses from sales and maturities of foreign fixed income investments, holding of foreign currencies, currency gains or losses realized between the trade and settlement dates on foreign investment transactions, and the difference between the amounts of dividends, interest and foreign withholding taxes recorded on the Fund’s books and the U.S. dollar equivalent amounts actually received or paid. Net unrealized currency gains and losses from valuing foreign currency denominated assets and liabilities at period end exchange rates are reflected as a component of net unrealized appreciation or depreciation of foreign currency denominated assets and liabilities.
4. Taxes
It is the Fund’s policy to meet the requirements of the Internal Revenue Code applicable to regulated investment companies and to distribute all of its investment company taxable income and net realized gains, if any, to
| 20 | AB CONCENTRATED GROWTH FUND | abfunds.com | |
NOTES TO FINANCIAL STATEMENTS(continued)
shareholders. Therefore, no provisions for federal income or excise taxes are required. The Fund may be subject to taxes imposed by countries in which it invests. Such taxes are generally based on income and/or capital gains earned or repatriated. Taxes are accrued and applied to net investment income, net realized gains and net unrealized appreciation/depreciation as such income and/or gains are earned.
In accordance with U.S. GAAP requirements regarding accounting for uncertainties in income taxes, management has analyzed the Fund’s tax positions taken or expected to be taken on federal and state income tax returns for all open tax years (the current and the prior three tax years) and has concluded that no provision for income tax is required in the Fund’s financial statements.
5. Investment Income and Investment Transactions
Dividend income is recorded on theex-dividend date or as soon as the Fund is informed of the dividend. Interest income is accrued daily and includes amortization of premiums and accretions of discounts as adjustments to interest income. Investment transactions are accounted for on the date the securities are purchased or sold. Investment gains or losses are determined on the identified cost basis. The Fund amortizes premiums and accretes discounts as adjustments to interest income.
6. Class Allocations
All income earned and expenses incurred by the Fund are borne on apro-rata basis by each outstanding class of shares, based on the proportionate interest in the Fund represented by the net assets of such class, except for class specific expenses which are allocated to the respective class. Expenses of the Company are charged proportionately to each portfolio or based on other appropriate methods. Realized and unrealized gains and losses are allocated among the various share classes based on respective net assets.
7. Dividends and Distributions
Dividends and distributions to shareholders, if any, are recorded on theex-dividend date. Income dividends and capital gains distributions are determined in accordance with federal tax regulations and may differ from those determined in accordance with U.S. GAAP. To the extent these differences are permanent, such amounts are reclassified within the capital accounts based on their federal tax basis treatment; temporary differences do not require such reclassification.
NOTE B
Advisory Fee and Other Transactions with Affiliates
Under the terms of the investment advisory agreement, the Fund pays the Adviser an advisory fee at an annual rate of .80% of the Fund’s average
| abfunds.com | AB CONCENTRATED GROWTH FUND | 21 | |
NOTES TO FINANCIAL STATEMENTS(continued)
daily net assets. The fee is accrued daily and paid monthly. The Adviser has agreed to waive its fees and bear certain expenses to the extent necessary to limit total operating expenses (excluding expenses associated with acquired fund fees and expenses other than the advisory fees of any AB Mutual Funds in which the Fund may invest, interest expense, taxes, extraordinary expenses, and brokerage commissions and other transaction costs) on an annual basis (the “Expense Caps”) to 1.24%, 1.99%, .99%, 1.49%, 1.24%, .99% and .99% of daily average net assets for Class A, Class C, Advisor Class, Class R, Class K, Class I and Class Z shares, respectively. For the six months ended December 31, 2018, there was no such waiver/reimbursement. The Expense Caps may not be terminated by the Adviser prior to October 31, 2019.
During 2017, AXA S.A. (“AXA”), a French holding company for the AXA Group, a worldwide leader in life, property and casualty and health insurance and asset management, announced its intention to pursue the sale of a minority stake in its subsidiary, AXA Equitable Holdings, Inc. (“AXA Equitable”), the holding company for a diversified financial services organization, through an initial public offering (“IPO”). AXA Equitable is the holding company for a diverse group of financial services companies, including AllianceBernstein L.P., the investment adviser to the Funds (“the Adviser”). During the second quarter of 2018, AXA Equitable completed the IPO, and, as a result, AXA held approximately 72.2% of the outstanding common stock of AXA Equitable as of September 30, 2018. Contemporaneously with the IPO, AXA sold $862.5 million aggregate principal amount of its 7.25% mandatorily exchangeable notes (the “MxB Notes”) due May 15, 2021 and exchangeable into up to 43,125,000 shares of common stock (or approximately 7% of the outstanding shares of common stock of AXA Equitable). AXA retains ownership (including voting rights) of such shares of common stock until the MxB Notes are exchanged, which may be on a date that is earlier than the maturity date at AXA’s option upon the occurrence of certain events.
In March 2018, AXA announced its intention to sell its entire interest in AXA Equitable over time, subject to market conditions and other factors (the “Plan”). It is anticipated that one or more of the transactions contemplated by the Plan may ultimately result in the indirect transfer of a “controlling block” of voting securities of the Adviser (a “Change of Control Event”) and therefore may be deemed an “assignment” causing a termination of each Fund’s current investment advisory agreement. In order to ensure that the existing investment advisory services could continue uninterrupted, at meetings held in late July through early August 2018, the Boards of Directors/Trustees (each a “Board” and collectively, the “Boards”) approved new investment advisory agreements with the Adviser, in connection with the Plan. The Boards also agreed to call and hold a joint meeting of shareholders on October 11, 2018
| 22 | AB CONCENTRATED GROWTH FUND | abfunds.com | |
NOTES TO FINANCIAL STATEMENTS(continued)
for shareholders of each Fund to (1) approve the new investment advisory agreement with the Adviser that would be effective after the first Change of Control Event and (2) approve any future advisory agreement approved by the Board and that has terms not materially different from the current agreement, in the event there are subsequent Change of Control Events arising from completion of the Plan that terminate the advisory agreement after the first Change of Control Event. Approval of a future advisory agreement means that shareholders may not have another opportunity to vote on a new agreement with the Adviser even upon a change of control, as long as no single person or group of persons acting together gains “control” (as defined in the 1940 Act) of AXA Equitable.
At the November 14, 2018 adjourned shareholder meeting, shareholders approved the new and future investment advisory agreements.
On November 20, 2018 AXA completed a public offering of 60,000,000 shares of AXA Equitable’s common stock and simultaneously sold 30,000,000 of such shares to AXA Equitable pursuant to a separate agreement with it. As a result AXA currently owns approximately 59.2% of the shares of common stock of AXA Equitable.
Pursuant to the Advisory Agreement, the Fund may reimburse the Adviser for certain legal and accounting services provided to the Fund by the Adviser. For the six months ended December 31, 2018, the reimbursement for such services amounted to $36,785.
The Fund compensates AllianceBernstein Investor Services, Inc. (“ABIS”), a wholly-owned subsidiary of the Adviser, under a Transfer Agency Agreement for providing personnel and facilities to perform transfer agency services for the Fund. ABIS may make payments to intermediaries that provide omnibus account services,sub-accounting services and/or networking services. Such compensation retained by ABIS amounted to $44,641 for the six months ended December 31, 2018.
AllianceBernstein Investments, Inc. (the “Distributor”), a wholly-owned subsidiary of the Adviser, serves as the distributor of the Fund’s shares. The Distributor has advised the Fund that it has retainedfront-end sales charges of $1,995 from the sale of Class A shares and received $23 and $132 in contingent deferred sales charges imposed upon redemptions by shareholders of Class A and Class C shares, respectively, for the six months ended December 31, 2018.
The Fund may invest in AB Government Money Market Portfolio (the “Government Money Market Portfolio”) which has a contractual annual advisory fee rate of ..20% of the portfolio’s average daily net assets and
| abfunds.com | AB CONCENTRATED GROWTH FUND | 23 | |
NOTES TO FINANCIAL STATEMENTS(continued)
bears its own expenses. Effective August 1, 2018, the Adviser has contractually agreed to waive .10% of the advisory fee of Government Money Market Portfolio until August 31, 2019. In connection with the investment by the Fund in Government Money Market Portfolio, the Adviser has contractually agreed to waive its advisory fee from the Fund in an amount equal to the Fund’s pro rata share of the effective advisory fee of Government Money Market Portfolio, as borne indirectly by the Fund as an acquired fund fee and expense. For the six months ended December 31, 2018, such waiver amounted to $8,937. A summary of the Fund’s transactions in AB mutual funds for the six months ended December 31, 2018 is as follows:
Fund | Market Value 6/30/18 (000) | Purchases at Cost (000) | Sales Proceeds (000) | Market Value 12/31/18 (000) | Dividend Income (000) | |||||||||||||||
Government Money Market Portfolio | $ | 23,239 | $ | 56,235 | $ | 77,677 | $ | 1,797 | $ | 127 | ||||||||||
Brokerage commissions paid on investment transactions for the six months ended December 31, 2018 amounted to $19,557, of which $0 and $0, respectively, was paid to Sanford C. Bernstein & Co. LLC and Sanford C. Bernstein Limited, affiliates of the Adviser.
NOTE C
Distribution Services Agreement
The Fund has adopted a Distribution Services Agreement (“the Agreement”) pursuant to Rule12b-1 under the Investment Company Act of 1940 for Class A, Class C, Class R and Class K. Under the Agreement, the Fund pays distribution and servicing fees to the Distributor at an annual rate of up to .25% of the Fund’s average daily net assets attributable to Class A shares, 1% of the Fund’s average daily net assets attributable to Class C shares. .50% of the Fund’s average daily net assets attributable to Class R shares, and .25% of the Fund’s average daily net assets attributable to Class K shares. There are no distribution and servicing fees on the Advisor Class, Class I and Class Z shares. The fees are accrued daily and paid monthly. Since the commencement of the Fund’s operations, the Distributor has incurred expenses in excess of the distribution costs reimbursed by the Fund in the amounts of $177,966,$-0- and$-0- for Class C, Class R and Class K shares, respectively. The Agreement provides that the Distributor will use such payments in their entirety for distribution assistance and promotional activities. While such costs may be recovered from the Fund in future periods so long as the Agreement is in effect, the rate of the distribution and servicing fees payable under the Agreement may not be increased without a shareholder vote. In accordance with the Agreement,
| 24 | AB CONCENTRATED GROWTH FUND | abfunds.com | |
NOTES TO FINANCIAL STATEMENTS(continued)
there is no provision for recovery of unreimbursed distribution costs incurred by the Distributor beyond the current fiscal year for Class A shares. The Agreement also provides that the Adviser may use its own resources to finance the distribution of the Fund’s shares.
NOTE D
Investment Transactions
Purchases and sales of investment securities (excluding short-term investments) for the six months ended December 31, 2018 were as follows:
| Purchases | Sales | |||||||
Investment securities (excluding | $ | 89,502,009 | $ | 63,075,923 | ||||
U.S. government securities | – 0 | – | – 0 | – | ||||
The cost of investments for federal income tax purposes was substantially the same as the cost for financial reporting purposes. Accordingly, gross unrealized appreciation and unrealized depreciation are as follows:
Gross unrealized appreciation | $ | 77,346,314 | ||
Gross unrealized depreciation | (15,832,144 | ) | ||
|
| |||
Net unrealized appreciation | $ | 61,514,170 | ||
|
|
1. Derivative Financial Instruments
The Fund may use derivatives in an effort to earn income and enhance returns, to replace more traditional direct investments, to obtain exposure to otherwise inaccessible markets (collectively, “investment purposes”), or to hedge or adjust the risk profile of its portfolio.
The Fund did not engage in derivatives transactions for the six months ended December 31, 2018.
2. Currency Transactions
The Fund may invest innon-U.S. Dollar-denominated securities on a currency hedged or unhedged basis. The Fund may seek investment opportunities by taking long or short positions in currencies through the use of currency-related derivatives, including forward currency exchange contracts, futures and options on futures, swaps, and other options. The Fund may enter into transactions for investment opportunities when it anticipates that a foreign currency will appreciate or depreciate in value but securities denominated in that currency are not held by the Fund and do not present attractive investment opportunities. Such transactions may also be used when the Adviser believes that it may be more efficient than a direct investment in a foreign currency-denominated security. The Fund may also conduct currency exchange contracts on a spot basis (i.e., for cash at the spot rate prevailing in the currency exchange market for buying or selling currencies).
| abfunds.com | AB CONCENTRATED GROWTH FUND | 25 | |
NOTES TO FINANCIAL STATEMENTS(continued)
NOTE E
Capital Stock
Each class consists of 3,000,000,000 authorized shares. Transactions in capital shares for each class were as follows:
| Shares | Amount | |||||||||||||||||||||||
| Six Months Ended December 31, 2018 (unaudited) | Year Ended June 30, 2018 | Six Months Ended December 31, 2018 (unaudited) | Year Ended June 30, 2018 | |||||||||||||||||||||
|
| |||||||||||||||||||||||
| Class A | ||||||||||||||||||||||||
Shares sold | 90,695 | 269,544 | $ | 3,185,293 | $ | 9,329,240 | ||||||||||||||||||
| ||||||||||||||||||||||||
Shares issued in reinvestment of distributions | 43,192 | 20,846 | 1,447,354 | 702,718 | ||||||||||||||||||||
| ||||||||||||||||||||||||
Shares converted from Class C | 342 | 12,890 | 13,110 | 436,390 | ||||||||||||||||||||
| ||||||||||||||||||||||||
Shares redeemed | (215,470 | ) | (357,838 | ) | (7,978,700 | ) | (12,201,788 | ) | ||||||||||||||||
| ||||||||||||||||||||||||
Net decrease | (81,241 | ) | (54,558 | ) | $ | (3,332,943 | ) | $ | (1,733,440 | ) | ||||||||||||||
| ||||||||||||||||||||||||
| Class C | ||||||||||||||||||||||||
Shares sold | 63,737 | 55,935 | $ | 2,137,722 | $ | 1,875,273 | ||||||||||||||||||
| ||||||||||||||||||||||||
Shares issued in reinvestment of distributions | 36,915 | 18,143 | 1,188,284 | 593,815 | ||||||||||||||||||||
| ||||||||||||||||||||||||
Shares converted to Class A | (354 | ) | (13,254 | ) | (13,110 | ) | (436,390 | ) | ||||||||||||||||
| ||||||||||||||||||||||||
Shares redeemed | (51,773 | ) | (118,835 | ) | (1,850,245 | ) | (3,955,350 | ) | ||||||||||||||||
| ||||||||||||||||||||||||
Net increase (decrease) | 48,525 | (58,011 | ) | $ | 1,462,651 | $ | (1,922,652 | ) | ||||||||||||||||
| ||||||||||||||||||||||||
| Advisor Class | ||||||||||||||||||||||||
Shares sold | 1,821,863 | 2,820,160 | $ | 67,288,863 | $ | 98,242,352 | ||||||||||||||||||
| ||||||||||||||||||||||||
Shares issued in reinvestment of distributions | 655,960 | 282,855 | 22,269,839 | 9,625,552 | ||||||||||||||||||||
| ||||||||||||||||||||||||
Shares redeemed | (1,463,192 | ) | (1,861,200 | ) | (53,184,139 | ) | (64,877,292 | ) | ||||||||||||||||
| ||||||||||||||||||||||||
Net increase | 1,014,631 | 1,241,815 | $ | 36,374,563 | $ | 42,990,612 | ||||||||||||||||||
| ||||||||||||||||||||||||
| Class R | ||||||||||||||||||||||||
Shares sold | – 0 | – | 0 | (a) | $ | 5 | $ | 0 | (b) | |||||||||||||||
| ||||||||||||||||||||||||
Net increase | – 0 | – | 0 | (a) | $ | 5 | $ | 0 | (b) | |||||||||||||||
| ||||||||||||||||||||||||
| Class K | ||||||||||||||||||||||||
Shares sold | 706 | 3,624 | $ | 26,261 | $ | 122,804 | ||||||||||||||||||
| ||||||||||||||||||||||||
Shares issued in reinvestment of distributions | 1,237 | 471 | 41,462 | 15,898 | ||||||||||||||||||||
| ||||||||||||||||||||||||
Shares redeemed | (4 | ) | (524 | ) | (147 | ) | (17,743 | ) | ||||||||||||||||
| ||||||||||||||||||||||||
Net increase | 1,939 | 3,571 | $ | 67,576 | $ | 120,959 | ||||||||||||||||||
| ||||||||||||||||||||||||
| 26 | AB CONCENTRATED GROWTH FUND | abfunds.com | |
NOTES TO FINANCIAL STATEMENTS(continued)
| Shares | Amount | |||||||||||||||||||||||
| Six Months Ended December 31, 2018 (unaudited) | Year Ended June 30, 2018 | Six Months Ended December 31, 2018 (unaudited) | Year Ended June 30, 2018 | |||||||||||||||||||||
|
| |||||||||||||||||||||||
| Class I | ||||||||||||||||||||||||
Shares sold | 3,115 | 174 | $ | 116,258 | $ | 6,365 | ||||||||||||||||||
| ||||||||||||||||||||||||
Shares issued in reinvestment of distributions | 225 | 0 | (a) | 7,657 | 0 | (b) | ||||||||||||||||||
| ||||||||||||||||||||||||
Shares redeemed | (134 | ) | 0 | (a) | (5,015 | ) | (11 | ) | ||||||||||||||||
| ||||||||||||||||||||||||
Net increase | 3,206 | 174 | $ | 118,900 | $ | 6,354 | ||||||||||||||||||
| ||||||||||||||||||||||||
| Class Z | ||||||||||||||||||||||||
Shares sold | 3,107 | 91,429 | $ | 100,188 | $ | 3,029,493 | ||||||||||||||||||
| ||||||||||||||||||||||||
Shares issues in reinvestment of distributions | 1,208 | 41,460 | 41,059 | 1,412,118 | ||||||||||||||||||||
| ||||||||||||||||||||||||
Shares redeemed | (8,610 | ) | (2,055,443 | ) | (299,519 | ) | (72,885,411 | ) | ||||||||||||||||
| ||||||||||||||||||||||||
Net decrease | (4,295 | ) | (1,922,554 | ) | $ | (158,272 | ) | $ | (68,443,800 | ) | ||||||||||||||
| ||||||||||||||||||||||||
| (a) | Amount is less than one share. |
| (b) | Amount is less than $.50. |
NOTE F
Risks Involved in Investing in the Fund
Focused Portfolio Risk—Investments in a limited number of companies may have more risk because changes in the value of a single security may have a more significant effect, either negative or positive, on the Fund’s net asset value, or NAV.
Sector Risk—The Fund may have more risk because of concentrated investments in a particular market sector, such as the technology or health care sector. Market or economic factors affecting that sector could have a major effect on the value of the Fund’s investments.
Capitalization Risk—Investments inmid-capitalization companies may be more volatile and less liquid than investments in large-capitalization companies.
Non-Diversification Risk—The Fund may have more risk because it is“non-diversified”, meaning that it can invest more of its assets in a smaller number of issuers. Accordingly, changes in the value of a single security may have a more significant effect, either negative or positive, on the Fund’s NAV.
Indemnification Risk—In the ordinary course of business, the Fund enters into contracts that contain a variety of indemnifications. The Fund’s maximum exposure under these arrangements is unknown. However, the
| abfunds.com | AB CONCENTRATED GROWTH FUND | 27 | |
NOTES TO FINANCIAL STATEMENTS(continued)
Fund has not had prior claims or losses pursuant to these indemnification provisions and expects the risk of loss thereunder to be remote. Therefore, the Fund has not accrued any liability in connection with these indemnification provisions.
NOTE G
Joint Credit Facility
A number ofopen-end mutual funds managed by the Adviser, including the Fund, participate in a $325 million revolving credit facility (the “Facility”) intended to provide short-term financing, if necessary, subject to certain restrictions in connection with abnormal redemption activity. Commitment fees related to the Facility are paid by the participating funds and are included in miscellaneous expenses in the statement of operations. The Fund did not utilize the Facility during the six months ended December 31, 2018.
NOTE H
Distributions to Shareholders
The tax character of distributions to be paid for the year ending June 30, 2019 will be determined at the end of the current fiscal year. The tax character of distributions paid during the fiscal years ended June 30, 2018 and June 30, 2017 were as follows:
| 2018 | 2017 | |||||||
Distributions paid from: | ||||||||
Long-term capital gains | $ | 14,198,004 | $ | 1,524,262 | ||||
|
|
|
| |||||
Total taxable distributions paid | $ | 14,198,004 | $ | 1,524,262 | ||||
|
|
|
| |||||
As of June 30, 2018, the components of accumulated earnings/(deficit) on a tax basis were as follows:
Undistributed capital gains | $ | 22,253,427 | ||
Other losses | (544,061 | )(a) | ||
Unrealized appreciation/(depreciation) | 90,357,703 | (b) | ||
|
| |||
Total accumulated earnings/(deficit) | $ | 112,067,069 | ||
|
|
| (a) | At June 30, 2018, the Fund had a qualified late-year ordinary loss deferral of $544,061. This loss is deemed to arise on July 1, 2018. |
| (b) | The difference between book-basis andtax-basis unrealized appreciation/(depreciation) is attributable primarily to the tax deferral of losses on wash sales. |
For tax purposes, net realized capital losses may be carried over to offset future capital gains, if any. Funds are permitted to carry forward capital losses for an indefinite period, and such losses will retain their character as either short-term or long-term capital losses. As of June 30, 2018, the Fund did not have any capital loss carryforwards.
| 28 | AB CONCENTRATED GROWTH FUND | abfunds.com | |
NOTES TO FINANCIAL STATEMENTS(continued)
NOTE I
Recent Accounting Pronouncements
In August 2018, the Financial Accounting Standards Board issued an Accounting Standards Update, ASU2018-13, Fair Value Measurement (Topic 820), Disclosure Framework—Changes to the Disclosure Requirements for Fair Value Measurement which removes, modifies and adds disclosures to Topic 820. The amendments in this ASU2018-13 apply to all entities that are required, under existing U.S. GAAP, to make disclosures about recurring or nonrecurring fair value measurements. The amendments in this ASU2018-13 are effective for all entities for fiscal years, and interim periods within those fiscal years, beginning after December 15, 2019. At this time, management is evaluating the implications of these changes on the financial statements.
In October 2018, the U.S. Securities and Exchange Commission adopted amendments to certain disclosure requirements included in RegulationS-X that had become “redundant, duplicative, overlapping, outdated or superseded, in light of the other Commission disclosure requirements, GAAP or changes in the information environment.” The compliance date for the amendments to RegulationS-X was November 5, 2018 (for reporting period end dates of September 30, 2018 or after). Management has adopted the amendments which simplified certain disclosure requirements on the financial statements.
NOTE J
Subsequent Events
Management has evaluated subsequent events for possible recognition or disclosure in the financial statements through the date the financial statements are issued. Management has determined that there are no material events that would require disclosure in the Fund’s financial statements through this date.
| abfunds.com | AB CONCENTRATED GROWTH FUND | 29 | |
FINANCIAL HIGHLIGHTS
Selected Data For A Share Of Capital Stock Outstanding Throughout Each Period
| Class A | ||||||||||||||||||||||||
Six Months (unaudited) | Year Ended June 30, | February 28, 2014(a)to June 30, 2014 | ||||||||||||||||||||||
| 2018 | 2017 | 2016 | 2015 | |||||||||||||||||||||
|
|
|
|
|
|
|
|
|
|
|
| |||||||||||||
Net asset value, beginning of period | $ 35.44 | $ 32.65 | $ 26.04 | $ 28.61 | $ 26.26 | $ 24.85 | ||||||||||||||||||
|
| |||||||||||||||||||||||
Income From Investment Operations | ||||||||||||||||||||||||
Net investment income (loss)(b)(c) | (.07 | ) | (.15 | ) | (.08 | ) | (.05 | ) | (.10 | ) | (.01 | ) | ||||||||||||
Net realized and unrealized gain (loss) on investment transactions | (1.07 | ) | 4.13 | 6.82 | (1.73 | ) | 3.24 | 1.42 | ||||||||||||||||
|
| |||||||||||||||||||||||
Net increase (decrease) in net asset value from operations | (1.14 | ) | 3.98 | 6.74 | (1.78 | ) | 3.14 | 1.41 | ||||||||||||||||
|
| |||||||||||||||||||||||
Less: Distributions | ||||||||||||||||||||||||
Distributions from net realized gain on investment transactions | (2.59 | ) | (1.19 | ) | (.13 | ) | (.79 | ) | (.79 | ) | – 0 | – | ||||||||||||
|
| |||||||||||||||||||||||
Net asset value, end of period | $ 31.71 | $ 35.44 | $ 32.65 | $ 26.04 | $ 28.61 | $ 26.26 | ||||||||||||||||||
|
| |||||||||||||||||||||||
Total Return |
| |||||||||||||||||||||||
Total investment return based on net asset value(d) | (3.60 | )% | 12.39 | % | 25.93 | % | (6.38 | )% | 12.12 | % | 5.67 | % | ||||||||||||
Ratios/Supplemental Data | ||||||||||||||||||||||||
Net assets, end of period (000’s omitted) | $21,504 | $26,920 | $26,579 | $30,438 | $13,785 | $56 | ||||||||||||||||||
Ratio to average net assets of: | ||||||||||||||||||||||||
Expenses, net of waivers/reimbursements(e)‡ | 1.19 | %^ | 1.21 | % | 1.22 | % | 1.24 | % | 1.24 | % | 1.24 | %^ | ||||||||||||
Expenses, before waivers/reimbursements(e)‡ | 1.19 | %^ | 1.21 | % | 1.22 | % | 1.27 | % | 1.39 | % | 2.58 | %^ | ||||||||||||
Net investment income (loss)(c) | (.37 | )%^ | (.45 | )% | (.27 | )% | (.19 | )% | (.37 | )% | (.20 | )%^ | ||||||||||||
Portfolio turnover rate | 15 | % | 27 | % | 29 | % | 44 | % | 23 | % | 17 | % | ||||||||||||
| �� | ||||||||||||||||||||||||
‡ Expense ratios exclude the estimated acquired fund fees of the affiliated/unaffiliated underlying |
| |||||||||||||||||||||||
portfolios | 0 | % | .01 | % | .01 | % | – 0 | – | – 0 | – | – 0 | – | ||||||||||||
See footnote summary on page 37.
| 30 | AB CONCENTRATED GROWTH FUND | abfunds.com | |
FINANCIAL HIGHLIGHTS(continued)
Selected Data For A Share Of Capital Stock Outstanding Throughout Each Period
| Class C | ||||||||||||||||||||||||
Six Months (unaudited) | Year Ended June 30, | February 28, 2014(a)to June 30, 2014(f) | ||||||||||||||||||||||
| 2018 | 2017 | 2016 | 2015 | |||||||||||||||||||||
|
|
|
|
|
|
|
|
|
|
|
| |||||||||||||
Net asset value, beginning of period | $ 34.27 | $ 31.84 | $ 25.58 | $ 28.33 | $ 26.20 | $ 24.85 | ||||||||||||||||||
|
| |||||||||||||||||||||||
Income From Investment Operations | ||||||||||||||||||||||||
Net investment income (loss)(b)(c) | (.20 | ) | (.40 | ) | (.29 | ) | (.25 | ) | (.32 | ) | (.05 | ) | ||||||||||||
Net realized and unrealized gain (loss) on investment transactions | (1.04 | ) | 4.02 | 6.68 | (1.71 | ) | 3.24 | 1.40 | ||||||||||||||||
|
| |||||||||||||||||||||||
Net increase (decrease) in net asset value from operations | (1.24 | ) | 3.62 | 6.39 | (1.96 | ) | 2.92 | 1.35 | ||||||||||||||||
|
| |||||||||||||||||||||||
Less: Distributions |
| |||||||||||||||||||||||
Distributions from net realized gain on investment transactions | (2.59 | ) | (1.19 | ) | (.13 | ) | (.79 | ) | (.79 | ) | – 0 | – | ||||||||||||
|
| |||||||||||||||||||||||
Net asset value, end of period | $ 30.44 | $ 34.27 | $ 31.84 | $ 25.58 | $ 28.33 | $ 26.20 | ||||||||||||||||||
|
| |||||||||||||||||||||||
Total Return |
| |||||||||||||||||||||||
Total investment return based on net asset value(d) | (4.02 | )% | 11.56 | % | 25.03 | % | (7.10 | )% | 11.29 | % | 5.43 | % | ||||||||||||
Ratios/Supplemental Data | ||||||||||||||||||||||||
Net assets, end of period (000’s omitted) | $17,619 | $18,168 | $18,727 | $19,617 | $10,652 | $47 | ||||||||||||||||||
Ratio to average net assets of: | ||||||||||||||||||||||||
Expenses, net of waivers/reimbursements(e)‡ | 1.94 | %^ | 1.96 | % | 1.97 | % | 1.99 | % | 1.99 | % | 1.99 | %^ | ||||||||||||
Expenses, before waivers/reimbursements(e)‡ | 1.94 | %^ | 1.96 | % | 1.97 | % | 2.01 | % | 2.14 | % | 3.54 | %^ | ||||||||||||
Net investment income (loss)(c) | (1.13 | )%^ | (1.20 | )% | (1.02 | )% | (.94 | )% | (1.15 | )% | (.93 | )%^ | ||||||||||||
Portfolio turnover rate | 15 | % | 27 | % | 29 | % | 44 | % | 23 | % | 17 | % | ||||||||||||
‡ Expense ratios exclude the estimated acquired fund fees of the affiliated/unaffiliated underlying |
| |||||||||||||||||||||||
portfolios | 0 | % | .01 | % | .01 | % | – 0 | – | – 0 | – | – 0 | – | ||||||||||||
See footnote summary on page 37.
| abfunds.com | AB CONCENTRATED GROWTH FUND | 31 | |
FINANCIAL HIGHLIGHTS(continued)
Selected Data For A Share Of Capital Stock Outstanding Throughout Each Period
| Advisor Class | ||||||||||||||||||||||||||||
Six Months (unaudited) | Year Ended June 30, | January 1, June 30, 2014 | Year Ended 2013 | |||||||||||||||||||||||||
| 2018 | 2017 | 2016 | 2015 | |||||||||||||||||||||||||
|
| |||||||||||||||||||||||||||
Net asset value, beginning of period | $ 35.83 | $ 32.91 | $ 26.18 | $ 28.69 | $ 26.28 | $ 25.80 | $ 18.91 | |||||||||||||||||||||
|
| |||||||||||||||||||||||||||
Income From Investment Operations | ||||||||||||||||||||||||||||
Net investment income (loss)(b)(c) | (.02 | ) | (.07 | ) | (.01 | ) | .01 | (.04 | ) | (.01 | ) | (.03 | ) | |||||||||||||||
Net realized and unrealized gain (loss) on investment transactions | (1.10 | ) | 4.18 | 6.87 | (1.73 | ) | 3.24 | 1.04 | 6.92 | |||||||||||||||||||
|
| |||||||||||||||||||||||||||
Net increase (decrease) in net asset value from operations | (1.12 | ) | 4.11 | 6.86 | (1.72 | ) | 3.20 | 1.03 | 6.89 | |||||||||||||||||||
|
| |||||||||||||||||||||||||||
Less: Distributions | ||||||||||||||||||||||||||||
Distributions from net realized gain on investment transactions | (2.59 | ) | (1.19 | ) | (.13 | ) | (.79 | ) | (.79 | ) | (.55 | ) | – 0 | – | ||||||||||||||
Redemption fee | – 0 | – | – 0 | – | – 0 | – | – 0 | – | – 0 | – | – 0 | – | .00 | (g) | ||||||||||||||
|
| |||||||||||||||||||||||||||
Net asset value, end of period | $ 32.12 | $ 35.83 | $ 32.91 | $ 26.18 | $ 28.69 | $ 26.28 | $ 25.80 | |||||||||||||||||||||
|
| |||||||||||||||||||||||||||
Total Return |
| |||||||||||||||||||||||||||
Total investment return based on net asset value(d) | (3.50 | )% | 12.69 | % | 26.26 | % | (6.16 | )% | 12.34 | % | 4.11 | % | 36.44 | % | ||||||||||||||
Ratios/Supplemental Data | ||||||||||||||||||||||||||||
Net assets, end of period (000’s omitted) | $363,385 | $369,006 | $298,099 | $227,787 | $192,909 | $36,630 | $25,170 | |||||||||||||||||||||
Ratio to average net assets of: | ||||||||||||||||||||||||||||
Expenses, net of waivers/reimbursements(e)‡ | .94 | %^ | .96 | % | .96 | % | .99 | % | .99 | % | 1.06 | %^ | 1.23 | % | ||||||||||||||
Expenses, before waivers/reimbursements(e)‡ | .94 | %^ | .96 | % | .97 | % | 1.01 | % | 1.12 | % | 2.26 | %^ | 1.90 | % | ||||||||||||||
Net investment income (loss)(c) | (.13 | )%^ | (.21 | )% | (.03 | )% | .05 | % | (.13 | )% | (.06 | )%^ | (.14 | )% | ||||||||||||||
Portfolio turnover rate | 15 | % | 27 | % | 29 | % | 44 | % | 23 | % | 17 | % | 42 | % | ||||||||||||||
‡ Expense ratios exclude the estimated acquired fund fees of the affiliated/unaffiliated underlying |
| |||||||||||||||||||||||||||
portfolios | 0 | % | .01 | % | .01 | % | 0 | % | 0 | % | 0 | % | 0 | % | ||||||||||||||
See footnote summary on page 37.
| 32 | AB CONCENTRATED GROWTH FUND | abfunds.com | |
FINANCIAL HIGHLIGHTS(continued)
Selected Data For A Share Of Capital Stock Outstanding Throughout Each Period
| Class R | ||||||||||||||||||||||||
Six Months (unaudited) | Year Ended June 30, | February 28, 2014(a)to June 30, 2014 | ||||||||||||||||||||||
| 2018 | 2017 | 2016 | 2015 | |||||||||||||||||||||
|
| |||||||||||||||||||||||
Net asset value, beginning of period | $ 35.04 | $ 32.37 | $ 25.88 | $ 28.51 | $ 26.24 | $ 24.85 | ||||||||||||||||||
|
| |||||||||||||||||||||||
Income From Investment Operations | ||||||||||||||||||||||||
Net investment income (loss)(b)(c) | (.12 | ) | (.24 | ) | (.15 | ) | (.12 | ) | (.17 | ) | (.03 | ) | ||||||||||||
Net realized and unrealized gain (loss) on investment transactions | (1.06 | ) | 4.10 | 6.77 | (1.72 | ) | 3.23 | 1.42 | ||||||||||||||||
|
| |||||||||||||||||||||||
Net increase (decrease) in net asset value from operations | (1.18 | ) | 3.86 | 6.62 | (1.84 | ) | 3.06 | 1.39 | ||||||||||||||||
|
| |||||||||||||||||||||||
Less: Distributions | ||||||||||||||||||||||||
Distributions from net realized gain on investment transactions | (2.59 | ) | (1.19 | ) | (.13 | ) | (.79 | ) | (.79 | ) | – 0 | – | ||||||||||||
|
| |||||||||||||||||||||||
Net asset value, end of period | $ 31.27 | $ 35.04 | $ 32.37 | $ 25.88 | $ 28.51 | $ 26.24 | ||||||||||||||||||
|
| |||||||||||||||||||||||
Total Return | ||||||||||||||||||||||||
Total investment return based on net asset value(d) | (3.75 | )% | 12.12 | % | 25.63 | % | (6.62 | )% | 11.82 | % | 5.59 | % | ||||||||||||
Ratios/Supplemental Data | ||||||||||||||||||||||||
Net assets, end of period (000’s omitted) | $13 | $14 | $13 | $33 | $11 | $10 | ||||||||||||||||||
Ratio to average net assets of: | ||||||||||||||||||||||||
Expenses, net of waivers/reimbursements(e)‡ | 1.44 | %^ | 1.45 | % | 1.46 | % | 1.49 | % | 1.49 | % | 1.49 | %^ | ||||||||||||
Expenses, before waivers/reimbursements(e)‡ | 1.44 | %^ | 1.45 | % | 1.47 | % | 1.50 | % | 1.60 | % | 2.79 | %^ | ||||||||||||
Net investment income (loss)(c) | (.64 | )%^ | (.70 | )% | (.53 | )% | (.45 | )% | (.62 | )% | (.41 | )%^ | ||||||||||||
Portfolio turnover rate | 15 | % | 27 | % | 29 | % | 44 | % | 23 | % | 17 | % | ||||||||||||
‡ Expense ratios exclude the estimated acquired fund fees of the affiliated/unaffiliated underlying |
| |||||||||||||||||||||||
portfolios | 0 | % | .01 | % | .01 | % | – 0 | – | – 0 | – | – 0 | – | ||||||||||||
See footnote summary on page 37.
| abfunds.com | AB CONCENTRATED GROWTH FUND | 33 | |
FINANCIAL HIGHLIGHTS(continued)
Selected Data For A Share Of Capital Stock Outstanding Throughout Each Period
| Class K | ||||||||||||||||||||||||
Six Months (unaudited) | Year Ended June 30, | February 28, 2014(a)to June 30, 2014 | ||||||||||||||||||||||
| 2018 | 2017 | 2016 | 2015 | |||||||||||||||||||||
|
| |||||||||||||||||||||||
Net asset value, beginning of period | $ 35.45 | $ 32.66 | $ 26.04 | $ 28.61 | $ 26.26 | $ 24.85 | ||||||||||||||||||
|
|
|
| |||||||||||||||||||||
Income From Investment Operations | ||||||||||||||||||||||||
Net investment income (loss)(b)(c) | (.07 | ) | (.16 | ) | (.09 | ) | (.05 | ) | (.10 | ) | (.01 | ) | ||||||||||||
Net realized and unrealized gain (loss) on investment transactions | (1.08 | ) | 4.14 | 6.84 | (1.73 | ) | 3.24 | 1.42 | ||||||||||||||||
|
| |||||||||||||||||||||||
Net increase (decrease) in net asset value from operations | (1.15 | ) | 3.98 | 6.75 | (1.78 | ) | 3.14 | 1.41 | ||||||||||||||||
|
| |||||||||||||||||||||||
Less: Distributions | ||||||||||||||||||||||||
Distributions from net realized gain on investment transactions | (2.59 | ) | (1.19 | ) | (.13 | ) | (.79 | ) | (.79 | ) | – 0 | – | ||||||||||||
|
| |||||||||||||||||||||||
Net asset value, end of period | $ 31.71 | $ 35.45 | $ 32.66 | $ 26.04 | $ 28.61 | $ 26.26 | ||||||||||||||||||
|
| |||||||||||||||||||||||
Total Return | ||||||||||||||||||||||||
Total investment return based on net asset value(d) | (3.62 | )% | 12.38 | % | 25.97 | % | (6.38 | )% | 12.12 | % | 5.67 | % | ||||||||||||
Ratios/Supplemental Data | ||||||||||||||||||||||||
Net assets, end of period (000’s omitted) | $561 | $558 | $398 | $99 | $12 | $10 | ||||||||||||||||||
Ratio to average net assets of: | ||||||||||||||||||||||||
Expenses, net of waivers/reimbursements(e)‡ | 1.20 | %^ | 1.21 | % | 1.21 | % | 1.24 | % | 1.24 | % | 1.24 | %^ | ||||||||||||
Expenses, before waivers/reimbursements(e)‡ | 1.20 | %^ | 1.22 | % | 1.22 | % | 1.24 | % | 1.35 | % | 2.58 | %^ | ||||||||||||
Net investment income (loss)(c) | (.39 | )%^ | (.46 | )% | (.31 | )% | (.18 | )% | (.38 | )% | (.15 | )%^ | ||||||||||||
Portfolio turnover rate | 15 | % | 27 | % | 29 | % | 44 | % | 23 | % | 17 | % | ||||||||||||
‡ Expense ratios exclude the estimated acquired fund fees of the affiliated/unaffiliated underlying |
| |||||||||||||||||||||||
portfolios | 0 | % | .01 | % | .01 | % | – 0 | – | – 0 | – | – 0 | – | ||||||||||||
See footnote summary on page 37.
| 34 | AB CONCENTRATED GROWTH FUND | abfunds.com | |
FINANCIAL HIGHLIGHTS(continued)
Selected Data For A Share Of Capital Stock Outstanding Throughout Each Period
| Class I | ||||||||||||||||||||||||
Six Months (unaudited) | Year Ended June 30, | February 28, 2014(a)to June 30, 2014 | ||||||||||||||||||||||
| 2018 | 2017 | 2016 | 2015 | |||||||||||||||||||||
|
| |||||||||||||||||||||||
Net asset value, beginning of period | $ 35.88 | $ 32.95 | $ 26.21 | $ 28.71 | $ 26.28 | $ 24.85 | ||||||||||||||||||
|
|
|
| |||||||||||||||||||||
Income From Investment Operations | ||||||||||||||||||||||||
Net investment income (loss)(b)(c) | (.04 | ) | (.07 | ) | .00 | (g) | .02 | (.02 | ) | (.02 | ) | |||||||||||||
Net realized and unrealized gain (loss) on investment transactions | (1.08 | ) | 4.19 | 6.87 | (1.73 | ) | 3.24 | 1.45 | ||||||||||||||||
|
| |||||||||||||||||||||||
Net increase (decrease) in net asset value from operations | (1.12 | ) | 4.12 | 6.87 | (1.71 | ) | 3.22 | 1.43 | ||||||||||||||||
|
| |||||||||||||||||||||||
Less: Distributions | ||||||||||||||||||||||||
Distributions from net realized gain on investment transactions | (2.59 | ) | (1.19 | ) | (.13 | ) | (.79 | ) | (.79 | ) | – 0 | – | ||||||||||||
|
| |||||||||||||||||||||||
Net asset value, end of period | $ 32.17 | $ 35.88 | $ 32.95 | $ 26.21 | $ 28.71 | $ 26.28 | ||||||||||||||||||
|
| |||||||||||||||||||||||
Total Return | ||||||||||||||||||||||||
Total investment return based on net asset value(d) | (3.50 | )% | 12.71 | % | 26.26 | % | (6.12 | )% | 12.42 | % | 5.75 | % | ||||||||||||
Ratios/Supplemental Data | ||||||||||||||||||||||||
Net assets, end of period (000’s omitted) | $122 | $21 | $13 | $25 | $12 | $26,344 | ||||||||||||||||||
Ratio to average net assets of: | ||||||||||||||||||||||||
Expenses, net of waivers/reimbursements(e)‡ | .92 | %^ | .95 | % | .95 | % | .98 | % | .99 | % | .99 | %^ | ||||||||||||
Expenses, before waivers/reimbursements(e)‡ | .93 | %^ | .96 | % | .96 | % | .98 | % | 1.09 | % | 1.95 | %^ | ||||||||||||
Net investment income (loss)(b) | (.20 | )%^ | (.21 | )% | .01 | % | .07 | % | (.07 | )% | (.27 | )%^ | ||||||||||||
Portfolio turnover rate | 15 | % | 27 | % | 29 | % | 44 | % | 23 | % | 17 | % | ||||||||||||
‡ Expense ratios exclude the estimated acquired fund fees of the affiliated/unaffiliated underlying |
| |||||||||||||||||||||||
portfolios | 0 | % | .01 | % | .01 | % | – 0 | – | – 0 | – | – 0 | – | ||||||||||||
See footnote summary on page 37.
| abfunds.com | AB CONCENTRATED GROWTH FUND | 35 | |
FINANCIAL HIGHLIGHTS(continued)
Selected Data For A Share Of Capital Stock Outstanding Throughout Each Period
| Class Z | ||||||||||||||||||||||||
Six Months (unaudited) | Year Ended June 30, | February 28, 2014(a)to June 30, 2014 | ||||||||||||||||||||||
| 2018 | 2017 | 2016 | 2015 | |||||||||||||||||||||
|
| |||||||||||||||||||||||
Net asset value, beginning of period | $ 35.86 | $ 32.93 | $ 26.19 | $ 28.69 | $ 26.28 | $ 24.85 | ||||||||||||||||||
|
|
|
| |||||||||||||||||||||
Income From Investment Operations | ||||||||||||||||||||||||
Net investment income (loss)(b)(c) | (.02 | ) | (.05 | ) | .00 | (g) | .02 | (.04 | ) | .01 | ||||||||||||||
Net realized and unrealized gain (loss) on investment transactions | (1.10 | ) | 4.17 | 6.87 | (1.73 | ) | 3.24 | 1.42 | ||||||||||||||||
|
| |||||||||||||||||||||||
Net increase (decrease) in net asset value from operations | (1.12 | ) | 4.12 | 6.87 | (1.71 | ) | 3.20 | 1.43 | ||||||||||||||||
|
| |||||||||||||||||||||||
Less: Distributions | ||||||||||||||||||||||||
Distributions from net realized gain on investment transactions | (2.59 | ) | (1.19 | ) | (.13 | ) | (.79 | ) | (.79 | ) | – 0 | – | ||||||||||||
|
| |||||||||||||||||||||||
Net asset value, end of period | $ 32.15 | $ 35.86 | $ 32.93 | $ 26.19 | $ 28.69 | $ 26.28 | ||||||||||||||||||
|
| |||||||||||||||||||||||
Total Return | ||||||||||||||||||||||||
Total investment return based on net asset value(d) | (3.50 | )% | 12.72 | % | 26.29 | % | (6.12 | )% | 12.34 | % | 5.75 | % | ||||||||||||
Ratios/Supplemental Data | ||||||||||||||||||||||||
Net assets, end of period (000’s omitted) | $590 | $812 | $64,060 | $44,764 | $34,464 | $11 | ||||||||||||||||||
Ratio to average net assets of: | ||||||||||||||||||||||||
Expenses, net of waivers/reimbursements(e)‡ | .91 | %^ | .91 | % | .93 | % | .96 | % | .99 | % | .99 | %^ | ||||||||||||
Expenses, before waivers/reimbursements(e)‡ | .92 | %^ | .92 | % | .94 | % | .96 | % | 1.08 | % | 2.25 | %^ | ||||||||||||
Net investment income (loss)(c) | (.09 | )%^ | (.13 | )% | 0 | % | .07 | % | (.15 | )% | .09 | %^ | ||||||||||||
Portfolio turnover rate | 15 | % | 27 | % | 29 | % | 44 | % | 23 | % | 17 | % | ||||||||||||
‡ Expense ratios exclude the estimated acquired fund fees of the affiliated/unaffiliated underlying |
| |||||||||||||||||||||||
portfolios | 0 | % | .01 | % | .01 | % | – 0 | – | – 0 | – | – 0 | – | ||||||||||||
See footnote summary on page 37.
| 36 | AB CONCENTRATED GROWTH FUND | abfunds.com | |
FINANCIAL HIGHLIGHTS(continued)
Selected Data For A Share Of Capital Stock Outstanding Throughout Each Period
| (a) | Commencement of operations. |
| (b) | Based on average shares outstanding. |
| (c) | Net of fees and expenses waived/reimbursed by the Adviser. |
| (d) | Total investment return is calculated assuming an initial investment made at the net asset value at the beginning of the period, reinvestment of all dividends and distributions at net asset value during the period, and redemption on the last day of the period. Initial sales charges or contingent deferred sales charges are not reflected in the calculation of total investment return. Total return does not reflect the deduction of taxes that a shareholder would pay on fund distributions or the redemption of fund shares. Total investment return calculated for a period of less than one year is not annualized. |
| (e) | In connection with the Fund’s investments in affiliated underlying portfolios, the Fund incurs no direct expenses, but bears proportionate shares of the fees and expenses (i.e., operating, administrative and investment advisory fees) of the affiliated underlying portfolios. The Adviser has contractually agreed to waive its fees from the Fund in an amount equal to the Fund’s pro rata share of certain acquired fund fees and expenses, and for the years ended June 30, 2018 and June 30, 2017, such waiver amounted to .01% and .01%, respectively. |
| (f) | The Predecessor Fund changed its fiscal year end from December 31 to June 30. |
| (g) | Amount is less than $.005. |
| ^ | Annualized. |
See notes to financial statements.
| abfunds.com | AB CONCENTRATED GROWTH FUND | 37 | |
RESULTS OF STOCKHOLDER MEETING
(unaudited)
A Special Meeting of Stockholders of the AB Cap Fund, Inc. (the “Company”)—AB Concentrated Growth Fund (the “Fund”) was held on October 11, 2018 and adjourned until November 14, 2018. A description of the proposals and number of shares voted at the Meeting are as follows (the proposal number shown below corresponds to the proposal number in the Fund’s proxy statement):
| 1. | To approve and vote upon the election of Directors for the Company, each such Director to serve for a term of indefinite duration and until his or her successor is duly elected and qualifies. |
Director: | Voted For: | Authority Withheld: | ||||||
Michael J. Downey | 177,670,106 | 1,341,274 | ||||||
William H. Foulk, Jr.*. | 177,513,147 | 1,498,234 | ||||||
Nancy P. Jacklin | 177,735,792 | 1,275,589 | ||||||
Robert M. Keith | 177,684,440 | 1,326,940 | ||||||
Carol C. McMullen | 177,776,007 | 1,235,373 | ||||||
Gary L. Moody | 177,685,142 | 1,326,239 | ||||||
Marshall C. Turner, Jr. | 177,657,263 | 1,354,118 | ||||||
Earl D. Weiner | 177,655,684 | 1,355,696 | ||||||
| 2. | To vote upon the approval of new advisory agreements for the Fund with AllianceBernstein L.P. |
| Voted For: | Voted Against: | Abstain: | Broker Non-Votes: | |||
| 5,148,883 | 15,782 | 95,920 | 1,621,657 |
| * | Mr. Foulk retired on December 31, 2018. |
| 38 | AB CONCENTRATED GROWTH FUND | abfunds.com | |
BOARD OF DIRECTORS
Marshall C. Turner, Jr.(1),Chairman Michael J. Downey(1) Nancy P. Jacklin(1) | Robert M. Keith,President and Chief Executive Officer Carol C. McMullen(1) Garry L. Moody(1) Earl D. Weiner(1) |
OFFICERS
James T. Tierney(2),Vice President Emilie D. Wrapp,Secretary Michael B. Reyes,Senior Analyst | Joseph J. Mantineo,Treasurer and Chief Financial Officer Phyllis J. Clarke,Controller Vincent S. Noto,Chief Compliance Officer |
Custodian and Accounting Agent State Street Bank and Trust Company State Street Corporation CCB/5 1 Iron Street Boston, MA 02210
Principal Underwriter AllianceBernstein Investments, Inc. 1345 Avenue of the Americas New York, NY 10105
Transfer Agent AllianceBernstein Investor Services, Inc. P.O. Box 786003 San Antonio, TX 78278-6003 Toll-Free (800) 221-5672 | Independent Registered Public Accounting Firm Ernst & Young LLP 5 Times Square New York, NY 10036
Legal Counsel Seward & Kissel LLP One Battery Park Plaza New York, NY 10004 |
| 1 | Member of the Audit Committee, the Governance and Nominating Committee and the Independent Directors Committee. |
| 2 | The day-to-day management of, and investment decisions for, the Fund’s Portfolio are made by Mr. James T. Tierney. |
| abfunds.com | AB CONCENTRATED GROWTH FUND | 39 | |
Information Regarding the Review and Approval of the Fund’s Advisory Agreement
As described in more detail in the Proxy Statement for the AB Funds dated August 20, 2018, the Boards of the AB Funds, at a meeting held onJuly 31-August 2, 2018, approved new advisory agreements with the Adviser (the “Proposed Agreements”) for the AB Funds, including AB Cap Fund, Inc. in respect of AB Concentrated Growth Fund (the “Fund”), in connection with the planned disposition by AXA S.A. of its remaining shares of AXA Equitable Holdings, Inc. (the indirect holder of a majority of the partnership interests in the Adviser and the indirect parent of AllianceBernstein Corporation, the general partner of the Adviser) in one or more transactions and the related potential for one or more “assignments” (within the meaning of section 2(a)(4) of the Investment Company Act) of the advisory agreements for the AB Funds, including the Fund’s Advisory Agreement, resulting in the automatic termination of such advisory agreements.
At the same meeting, the AB Boards also considered and approved interim advisory agreements with the Adviser (the “Interim Advisory Agreements”) for the AB Funds, including the Fund, to be effective only in the event that stockholder approval of a Proposed Agreement had not been obtained as of the date of one or more transactions resulting in an “assignment” of the Adviser’s advisory agreements, resulting in the automatic termination of such advisory agreements.
The shareholders of the Fund subsequently approved the Proposed Agreements at an annual meeting of shareholders called for the purpose of electing Directors and voting on the Proposed Agreements.
A discussion regarding the basis for the Boards’ approvals at a meeting held onJuly 31-August 2, 2018 is set forth below.
Information Regarding the Review and Approval of the Fund’s Proposed New Advisory Agreement and Interim Advisory Agreement in the Context of Potential Assignments
At a meeting of the AB Boards held on July31-August 2, 2018, the Adviser presented its recommendation that the Boards consider and approve the Proposed Agreements. Section 15(c) of the 1940 Act provides that, after an initial period, a Fund’s Current Agreement and currentsub-advisory agreement, as applicable, will remain in effect only if the Board, including a majority of the Independent Directors, annually reviews and approves them. Each of the Current Agreements had been approved by a Board within theone-year period prior to approval of its related Proposed Agreement, except that the Current Agreements for certain FlexFee funds were approved in February 2017. In connection with their approval of the Proposed Agreements, the Boards considered their conclusions in connection with their most recent approvals of the Current Agreements, in particular in cases where the last approval of a Current Agreement was relatively recent, including the Boards’ general satisfaction with the nature
| 40 | AB CONCENTRATED GROWTH FUND | abfunds.com | |
and quality of services being provided and, as applicable, in the case of certain Funds, actions taken or to be taken in an effort to improve investment performance or reduce expense ratios. The Directors also reviewed updated information provided by the Adviser in respect of each Fund. Also in connection with their approval of the Proposed Agreements, the Boards considered a representation made to them at that time by the Adviser that there were no additional developments not already disclosed to the Boards since their most recent approvals of the Current Agreements that would be a material consideration to the Boards in connection with their consideration of the Proposed Agreements, except for matters disclosed to the Boards by the Adviser. The Directors considered the fact that each Proposed Agreement would have corresponding terms and conditions identical to those of the corresponding Current Agreement with the exception of the effective date and initial term under the Proposed Agreement.
The Directors considered their knowledge of the nature and quality of the services provided by the Adviser to each Fund gained from their experience as directors or trustees of registered investment companies advised by the Adviser, their overall confidence in the Adviser’s integrity and competence they have gained from that experience, the Adviser’s initiative in identifying and raising potential issues with the Directors and its responsiveness, frankness and attention to concerns raised by the Directors in the past, including the Adviser’s willingness to consider and implement organizational and operational changes designed to improve investment results and the services provided to the Funds. The Directors noted that they have four regular meetings each year, at each of which they review extensive materials and information from the Adviser, including information on the investment performance of each Fund.
The Directors also considered all factors they believed relevant, including the specific matters discussed below. During the course of their deliberations, the Directors evaluated, among other things, the reasonableness of the management fees of the Funds they oversee. The Directors did not identify any particular information that was all-important or controlling, and different Directors may have attributed different weights to the various factors. The Directors determined that the selection of the Adviser to manage the Funds, and the overall arrangements between the Funds and the Adviser, as provided in the Proposed Agreements, including the management fees, were fair and reasonable in light of the services performed under the Current Agreements and to be performed under the Proposed Agreements, expenses incurred and to be incurred and such other matters as the Directors considered relevant in the exercise of their business judgment. The material factors and conclusions that formed the basis for the Directors’ determinations included the following:
Nature, Extent and Quality of Services Provided
The Directors considered the scope and quality of services to be provided by the Adviser under the Proposed Agreements, including the quality of
| abfunds.com | AB CONCENTRATED GROWTH FUND | 41 | |
the investment research capabilities of the Adviser and the other resources it has dedicated to performing services for the Funds. They also considered the information that had been provided to them by the Adviser concerning the anticipated implementation of the Plan and the Adviser’s representation that it did not anticipate that such implementation would affect the management or structure of the Adviser, have a material adverse effect on the Adviser, or adversely affect the quality of the services provided to the Funds by the Adviser and its affiliates. The Directors noted that the Adviser from time to time reviews each Fund’s investment strategies and from time to time proposes changes intended to improve the Fund’s relative or absolute performance for the Directors’ consideration. They also noted the professional experience and qualifications of each Fund’s portfolio management team and other senior personnel of the Adviser. The Directors also considered that certain Proposed Agreements, similar to the corresponding Current Agreements, provide that the Funds will reimburse the Adviser for the cost to it of providing certain clerical, accounting, administrative and other services to the Funds by employees of the Adviser or its affiliates. Requests for these reimbursements are made on a quarterly basis and subject to approval by the Directors. The Directors noted that the Adviser did not request any reimbursements from certain Funds in the Fund’s latest fiscal year reviewed. The Directors noted that the methodology to be used to determine the reimbursement amounts had been reviewed by an independent consultant retained by the Funds’ former Senior Officer/Independent Compliance Officer. The quality of administrative and other services, including the Adviser’s role in coordinating the activities of the Funds’ other service providers, also was considered. The Directors of each Fund concluded that, overall, they were satisfied with the nature, extent and quality of services to be provided to the Funds under the Proposed Agreement for the Fund.
Costs of Services to be Provided and Profitability
The Directors reviewed a schedule of the revenues and expenses and related notes indicating the profitability of each Fund to the Adviser for calendar years 2016 and 2017, as applicable, that had been prepared with an expense allocation methodology arrived at in consultation with an independent consultant retained by the Funds’ former Senior Officer/Independent Compliance Officer. The Directors noted the assumptions and methods of allocation used by the Adviser in preparing fund-specific profitability data and understood that there are a number of potentially acceptable allocation methodologies for information of this type. The Directors noted that the profitability information reflected all revenues and expenses of the Adviser’s relationship with a Fund, including those relating to its subsidiaries that provide transfer agency, distribution and brokerage services to the Fund, as applicable. The Directors recognized that it is difficult to make comparisons of the profitability of the Proposed Agreements with the profitability of fund advisory contracts for unaffiliated funds because comparative information is not generally publicly available and is
| 42 | AB CONCENTRATED GROWTH FUND | abfunds.com | |
affected by numerous factors. The Directors focused on the profitability of the Adviser’s relationship with each Fund before taxes and distribution expenses, as applicable. The Directors noted that certain Funds were not profitable to the Adviser in one or more periods reviewed. The Directors concluded that the Adviser’s level of profitability from its relationship with the other Funds was not unreasonable. The Directors were unable to consider historical information about the profitability of certain Funds that had recently commenced operations and for which historical profitability information was not available. The Adviser agreed to provide the Directors with profitability information in connection with future proposed continuances of the Proposed Agreements.
Fall-Out Benefits
The Directors considered the other benefits to the Adviser and its affiliates from their relationships with the Funds, including, but not limited to, as applicable, benefits relating to soft dollar arrangements (whereby investment advisers receive brokerage and research services from brokers that execute agency transactions for their clients) in the case of certain Funds;12b-1 fees and sales charges received by the principal underwriter (which is a wholly owned subsidiary of the Adviser) in respect of certain classes of the shares of most of the Funds; brokerage commissions paid by certain Funds to brokers affiliated with the Adviser; and transfer agency fees paid by most of the Funds to a wholly owned subsidiary of the Adviser. The Directors recognized that the Adviser’s profitability would be somewhat lower, and that a Fund’s unprofitability to the Adviser would be exacerbated, without these benefits. The Directors understood that the Adviser also might derive reputational and other benefits from its association with the Funds.
Investment Results
In addition to the information reviewed by the Directors in connection with the Board meeting at which the Proposed Agreements were approved, the Directors receive detailed performance information for the Funds at each regular Board meeting during the year.
The Boards’ consideration of each Proposed Agreement was informed by their most recent approval of the related Current Agreement, and, in the case of certain Funds, their discussion with the Adviser of the reasons for those Funds’ underperformance in certain periods. The Directors also reviewed updated performance information and, in some cases, discussed with the Adviser the reasons for changes in performance or continued underperformance. On the basis of this review, the Directors concluded that each Fund’s investment performance was acceptable.
Management Fees and Other Expenses
The Directors considered the management fee rate payable by each Fund to the Adviser and information prepared by an independent service provider
| abfunds.com | AB CONCENTRATED GROWTH FUND | 43 | |
(the ‘‘15(c) provider’’) concerning management fee rates payable by other funds in the same category as the Fund. The Directors recognized that it is difficult to make comparisons of management fees because there are variations in the services that are included in the fees paid by other funds. The Directors compared each Fund’s contractual management fee rate with a peer group median, and where applicable, took into account the impact on the management fee rate of the administrative expense reimbursement paid to the Adviser in the latest fiscal year. In the case of the ACS Funds, the Directors noted that the management fee rate is zero but also were cognizant that the Adviser is indirectly compensated by the wrap fee program sponsors that use the ACS Funds as an investment vehicle for their clients.
The Directors also considered the Adviser’s fee schedule for other clients pursuing a similar investment style to each Fund. For this purpose, they reviewed the relevant advisory fee information from the Adviser’s Form ADV and in a report from the Funds’ Senior Analyst and noted the differences between a Fund’s fee schedule, on the one hand, and the Adviser’s institutional fee schedule and the schedule of fees charged by the Adviser to any offshore funds and for services to anysub-advised funds pursuing a similar investment strategy as the Fund, on the other, as applicable. The Directors noted that the Adviser may, in some cases, agree to fee rates with large institutional clients that are lower than those reviewed by the Directors and that they had previously discussed with the Adviser its policies in respect of such arrangements. The Adviser also informed the Directors that, in the case of certain Funds, there were no institutional products managed by the Adviser that have a substantially similar investment style. The Directors also discussed these matters with their independent fee consultant.
The Adviser reviewed with the Directors the significantly greater scope of the services it provides to each Fund relative to institutional, offshore fund andsub-advised fund clients, as applicable. In this regard, the Adviser noted, among other things, that, compared to institutional and offshore orsub-advisory accounts, each Fund, as applicable, (i) demands considerably more portfolio management, research and trading resources due to significantly higher daily cash flows (in the case ofopen-end Funds); (ii) has more tax and regulatory restrictions and compliance obligations; (iii) must prepare and file or distribute regulatory and other communications about fund operations; and (iv) must provide shareholder servicing to retail investors. The Adviser also reviewed the greater legal risks presented by the large and changing population of Fund shareholders who may assert claims against the Adviser in individual or class actions, and the greater entrepreneurial risk in offering new fund products, which require substantial investment to launch, may not succeed, and generally must be priced to compete with larger, more established funds resulting in lack of profitability to the Adviser until a new fund achieves scale. In light of the substantial differences in services rendered by the Adviser to institutional,
| 44 | AB CONCENTRATED GROWTH FUND | abfunds.com | |
offshore fund andsub-advised fund clients as compared to the Funds, and the different risk profile, the Directors considered these fee comparisons inapt and did not place significant weight on them in their deliberations.
The Directors noted that many of the Funds may invest in shares of exchange-traded funds (‘‘ETFs’’), subject to the restrictions and limitations of the 1940 Act as these may be varied as a result of exemptive orders issued by the SEC. The Directors also noted that ETFs pay advisory fees pursuant to their advisory contracts. The Directors concluded, based on the Adviser’s explanation of how it uses ETFs when they are the most cost-effective way to obtain desired exposures, in some cases pending purchases of underlying securities, that each Fund’s management fee would be for services that would be in addition to, rather than duplicative of, the services provided under the advisory contracts of the ETFs.
With respect to each Fund’s management fee, the Directors considered the total expense ratio of the Fund in comparison to a peer group and peer universe selected by the 15(c) service provider. The Directors also considered the Adviser’s expense caps for certain Funds. The Directors view expense ratio information as relevant to their evaluation of the Adviser’s services because the Adviser is responsible for coordinating services provided to a Fund by others.
The Boards’ consideration of each Proposed Agreement was informed by their most recent approval of the related Current Agreement, and, in the case of certain Funds, their discussion with the Adviser of the reasons for those Funds’ expense ratios in certain periods. The Directors also reviewed updated expense ratio information and, in some cases, discussed with the Adviser the reasons for the expense ratios of certain Funds. On the basis of this review, the Directors concluded that each Fund’s expense ratio was acceptable.
The Directors did not consider comparative expense information for the ACS Funds because those Funds do not bear ordinary expenses.
Economies of Scale
The Directors noted that the management fee schedules for certain Funds do not contain breakpoints and that they had discussed their strong preference for breakpoints in advisory contracts with the Adviser. The Directors took into consideration prior presentations by an independent consultant on economies of scale in the mutual fund industry and for the Funds, and by the Adviser concerning certain of its views on economies of scale. The Directors also had requested and received from the Adviser certain updates on economies of scale in advance of the Board meeting. The Directors believe that economies of scale may be realized (if at all) by the Adviser across a variety of products and services, and not only in respect of a single fund. The Directors noted that there is no established methodology for setting breakpoints that give effect to the fund-specific
| abfunds.com | AB CONCENTRATED GROWTH FUND | 45 | |
services provided by a fund’s adviser and to the economies of scale that an adviser may realize in its overall mutual fund business or those components of it which directly or indirectly affect a fund’s operations. The Directors observed that in the mutual fund industry as a whole, as well as among funds similar to each Fund, there is no uniformity or pattern in the fees and asset levels at which breakpoints (if any) apply. The Directors also noted that the advisory agreements for many funds do not have breakpoints at all. The Directors informed the Adviser that they would monitor the asset levels of the Funds without breakpoints and their profitability to the Adviser and anticipated revisiting the question of breakpoints in the future if circumstances warrant doing so.
The Directors did not consider the extent to which fee levels in the Advisory Agreement for the ACS Funds reflect economies of scale because that Advisory Agreement does not provide for any compensation to be paid to the Adviser by the ACS Funds and the expense ratio of each of those Funds is zero.
Interim Advisory Agreements
In approving the Interim Advisory Agreements, the Boards, with the assistance of independent counsel, considered similar factors to those considered in approving the Proposed Agreements. The Interim Advisory Agreements approved by the Boards are identical to the Proposed Agreements, as well as the Current Agreements, in all material respects except for their proposed effective and termination dates and provisions intended to comply with the requirements of the relevant SEC rule, such as provisions requiring escrow of advisory fees. Under the Interim Advisory Agreements, the Adviser would continue to manage a Fund pursuant to an Interim Advisory Agreement until a new advisory agreement was approved by stockholders or until the end of the150-day period, whichever would occur earlier. All fees earned by the Adviser under an Interim Advisory Agreement would be held in escrow pending shareholder approval of the Proposed Agreement. Upon approval of a new advisory agreement by stockholders, the escrowed management fees would be paid to the Adviser, and the Interim Advisory Agreement would terminate.
Information Regarding the Review and Approval of the Fund’s Current Advisory Agreement
The disinterested directors (the “directors”) of AB Cap Fund, Inc. (the “Company”) unanimously approved the continuance of the Company’s Advisory Agreement with the Adviser in respect of AB Concentrated Growth Fund (the “Fund”) at a meeting held onMay 1-3, 2018 (the “Meeting”).
Prior to approval of the continuance of the Advisory Agreement, the directors had requested from the Adviser, and received and evaluated, extensive materials. They reviewed the proposed continuance of the Advisory
| 46 | AB CONCENTRATED GROWTH FUND | abfunds.com | |
Agreement with the Adviser and with experienced counsel who are independent of the Adviser, who advised on the relevant legal standards. The directors also reviewed additional materials, including materials from an outside consultant, who acted as their independent fee consultant, and comparative analytical data prepared by the Senior Analyst for the Fund. The directors also discussed the proposed continuance in private sessions with counsel.
The directors considered their knowledge of the nature and quality of the services provided by the Adviser to the Fund gained from their experience as directors or trustees of most of the registered investment companies advised by the Adviser, their overall confidence in the Adviser’s integrity and competence they have gained from that experience, the Adviser’s initiative in identifying and raising potential issues with the directors and its responsiveness, frankness and attention to concerns raised by the directors in the past, including the Adviser’s willingness to consider and implement organizational and operational changes designed to improve investment results and the services provided to the AB Funds. The directors noted that they have four regular meetings each year, at each of which they review extensive materials and information from the Adviser, including information on the investment performance of the Fund.
The directors also considered all factors they believed relevant, including the specific matters discussed below. During the course of their deliberations, the directors evaluated, among other things, the reasonableness of the advisory fee. The directors did not identify any particular information that wasall-important or controlling, and different directors may have attributed different weights to the various factors. The directors determined that the selection of the Adviser to manage the Fund and the overall arrangements between the Fund and the Adviser, as provided in the Advisory Agreement, including the advisory fee, were fair and reasonable in light of the services performed, expenses incurred and such other matters as the directors considered relevant in the exercise of their business judgment. The material factors and conclusions that formed the basis for the directors’ determinations included the following:
Nature, Extent and Quality of Services Provided
The directors considered the scope and quality of services provided by the Adviser under the Advisory Agreement, including the quality of the investment research capabilities of the Adviser and the other resources it has dedicated to performing services for the Fund. The directors noted that the Adviser from time to time reviews the Fund’s investment strategies and from time to time proposes changes intended to improve the Fund’s relative or absolute performance for the directors’ consideration. They also noted the professional experience and qualifications of the Fund’s portfolio management team and other senior personnel of the Adviser. The directors also considered that the Advisory Agreement provides that the Fund
| abfunds.com | AB CONCENTRATED GROWTH FUND | 47 | |
will reimburse the Adviser for the cost to it of providing certain clerical, accounting, administrative and other services to the Fund by employees of the Adviser or its affiliates. Requests for these reimbursements are made on a quarterly basis and subject to approval by the directors. Reimbursements, to the extent requested and paid, result in a higher rate of total compensation from the Fund to the Adviser than the fee rate stated in the Advisory Agreement. The directors noted that the methodology used to determine the reimbursement amounts had been reviewed by an independent consultant retained by the Company’s former Independent Compliance Officer. The quality of administrative and other services, including the Adviser’s role in coordinating the activities of the Fund’s other service providers, also was considered. The directors concluded that, overall, they were satisfied with the nature, extent and quality of services provided to the Fund under the Advisory Agreement.
Costs of Services Provided and Profitability
The directors reviewed a schedule of the revenues and expenses and related notes indicating the profitability of the Fund to the Adviser for calendar years 2016 and 2017 that had been prepared with an expense allocation methodology arrived at in consultation with an independent consultant retained by the Company’s former Independent Compliance Officer. The directors noted the assumptions and methods of allocation used by the Adviser in preparing fund-specific profitability data and understood that there are a number of potentially acceptable allocation methodologies for information of this type. The directors noted that the profitability information reflected all revenues and expenses of the Adviser’s relationship with the Fund, including those relating to its subsidiaries that provide transfer agency, distribution and brokerage services to the Fund. The directors recognized that it is difficult to make comparisons of the profitability of the Advisory Agreement with the profitability of advisory contracts for unaffiliated funds because comparative information is not generally publicly available and is affected by numerous factors. The directors focused on the profitability of the Adviser’s relationship with the Fund before taxes and distribution expenses. The directors concluded that the Adviser’s level of profitability from its relationship with the Fund was not unreasonable.
Fall-Out Benefits
The directors considered the other benefits to the Adviser and its affiliates from their relationships with the Fund, including, but not limited to, benefits relating to soft dollar arrangements (whereby investment advisers receive brokerage and research services from brokers that execute agency transactions for their clients);12b-1 fees and sales charges received by the Fund’s principal underwriter (which is a wholly owned subsidiary of the Adviser) in respect of certain classes of the Fund’s shares; brokerage commissions paid by the Fund to brokers affiliated with the Adviser; and transfer agency fees paid by the Fund to a wholly owned subsidiary of the
| 48 | AB CONCENTRATED GROWTH FUND | abfunds.com | |
Adviser. The directors recognized that the Adviser’s profitability would be somewhat lower without these benefits. The directors understood that the Adviser also might derive reputational and other benefits from its association with the Fund.
Investment Results
In addition to the information reviewed by the directors in connection with the Meeting, the directors receive detailed performance information for the Fund at each regular Board meeting during the year.
At the Meeting, the directors reviewed performance information prepared by an analytical service that is not affiliated with the Adviser (the “15(c) service provider”), showing the performance of the Class A Shares of the Fund against a group of similar funds (“peer group”) and a larger group of similar funds (“peer universe”), each selected by the 15(c) service provider, and information prepared by the Adviser showing performance of the Class A Shares against a broad-based securities market index, in each case for the1- and3-year periods ended February 28, 2018 and (in the case of comparisons with the broad-based securities market index) for the period from inception. Based on their review, the directors concluded that the Fund’s investment performance was acceptable.
Advisory Fees and Other Expenses
The directors considered the advisory fee rate payable by the Fund to the Adviser and information prepared by the 15(c) service provider concerning advisory fee rates payable by other funds in the same category as the Fund. The directors recognized that it is difficult to make comparisons of advisory fees because there are variations in the services that are included in the fees paid by other funds. The directors compared the Fund’s contractual advisory fee rate with a peer group median and took into account the impact on the advisory fee rate of the administrative expense reimbursement paid to the Adviser in the latest fiscal year.
The directors also considered the Adviser’s fee schedule for other clients pursuing a similar investment style. For this purpose, they reviewed the relevant advisory fee information from the Adviser’s Form ADV and the materials from the Fund’s Senior Analyst and noted the differences between the Fund’s fee schedule, on the one hand, and the Adviser’s institutional fee schedule and the schedule of fees charged by the Adviser to any offshore funds and anysub-advised funds, on the other. The directors noted that the Adviser may, in some cases, agree to fee rates with large institutional clients that are lower than those reviewed by the directors and that they had previously discussed with the Adviser its policies in respect of such arrangements.
The Adviser reviewed with the directors the significantly greater scope of the services it provides to the Fund relative to institutional, offshore fund
| abfunds.com | AB CONCENTRATED GROWTH FUND | 49 | |
andsub-advised fund clients. In this regard, the Adviser noted, among other things, that, compared to institutional and offshore accounts, the Fund (i) demands considerably more portfolio management, research and trading resources due to significantly higher daily cash flows; (ii) has more tax and regulatory restrictions; (iii) must prepare and distribute regulatory and other communications about fund operations; and (iv) must provide shareholder servicing to retail investors. The Adviser also reviewed the greater legal risks presented by the large and changing population of Fund shareholders who may assert claims against the Adviser in individual or class actions, and the greater entrepreneurial risk in offering new fund products, which require substantial investment to launch, may not succeed, and generally must be priced to compete with larger, more established funds resulting in lack of profitability to the Adviser until a new fund achieves scale. In light of the substantial differences in services rendered by the Adviser to institutional, offshore fund andsub-advised fund clients as compared to funds such as the Fund, and the different risk profile, the directors considered these fee comparisons inapt and did not place significant weight on them in their deliberations.
The directors noted that the Fund may invest in shares of exchange-traded funds (“ETFs”), subject to the restrictions and limitations of the Investment Company Act of 1940 as these may be varied as a result of exemptive orders issued by the SEC. The directors also noted that ETFs pay advisory fees pursuant to their advisory contracts. The directors concluded, based on the Adviser’s explanation of how it may use ETFs when they are the most cost-effective way to obtain desired exposures for a fund or to temporarily “equitize” cash inflows pending purchases of underlying securities, that the advisory fee for the Fund would be paid for services that would be in addition to, rather than duplicative of, the services provided under the advisory contracts of the ETFs.
The directors also considered the total expense ratio of the Class A shares of the Fund in comparison to a peer group and a peer universe selected by the 15(c) service provider. The Class A expense ratio of the Fund was based on the Fund’s latest fiscal year and the directors considered the effects of any fee waivers and/or expense reimbursements as a result of the Adviser’s expense cap (although the directors noted that the Fund’s expense ratio was currently below the Adviser’s expense cap). The directors noted that it was likely that the expense ratios of some of the other funds in the Fund’s category were lowered by waivers or reimbursements by those funds’ investment advisers, which in some cases might be voluntary or temporary. The directors view expense ratio information as relevant to their evaluation of the Adviser’s services because the Adviser is responsible for coordinating services provided to the Fund by others. The directors noted that the Fund’s expense ratio was above the medians. After reviewing and discussing the Adviser’s explanations of the reasons for this, the directors concluded that the Fund’s expense ratio was acceptable.
| 50 | AB CONCENTRATED GROWTH FUND | abfunds.com | |
Economies of Scale
The directors noted that the advisory fee schedule for the Fund does not contain breakpoints and that they had discussed their strong preference for breakpoints in advisory contracts with the Adviser. The directors took into consideration prior presentations by an independent consultant on economies of scale in the mutual fund industry and for the AB Funds, and by the Adviser concerning certain of its views on economies of scale. The directors also had requested and received from the Adviser certain updates on economies of scale in advance of the Meeting. The directors believe that economies of scale may be realized (if at all) by the Adviser across a variety of products and services, and not only in respect of a single fund. The directors noted that there is no established methodology for setting breakpoints that give effect to the fund-specific services provided by a fund’s adviser and to the economies of scale that an adviser may realize in its overall mutual fund business or those components of it which directly or indirectly affect a fund’s operations. The directors observed that in the mutual fund industry as a whole, as well as among funds similar to the Fund, there is no uniformity or pattern in the fees and asset levels at which breakpoints (if any) apply. The directors also noted that the advisory agreements for many funds do not have breakpoints at all. The directors informed the Adviser that they would monitor the Fund’s assets (which were well below the level at which they would anticipate adding an initial breakpoint) and its profitability to the Adviser and anticipated revisiting the question of breakpoints in the future if circumstances warranted doing so.
| abfunds.com | AB CONCENTRATED GROWTH FUND | 51 | |
This page is not part of the Shareholder Report or the Financial Statements.
AB FAMILY OF FUNDS
US EQUITY
US CORE
Core Opportunities Fund
FlexFee™ US Thematic Portfolio
Select US Equity Portfolio
US GROWTH
Concentrated Growth Fund
Discovery Growth Fund
FlexFee™ Large Cap Growth Portfolio
Growth Fund
Large Cap Growth Fund
Small Cap Growth Portfolio
US VALUE
Discovery Value Fund
Equity Income Fund
Relative Value Fund
Small Cap Value Portfolio
Value Fund
INTERNATIONAL/ GLOBAL EQUITY
INTERNATIONAL/ GLOBAL CORE
FlexFee™ International Strategic Core Portfolio
Global Core Equity Portfolio
International Portfolio
International Strategic Core Portfolio
Sustainable Global Thematic Fund
Tax-Managed International Portfolio
Tax-Managed Wealth Appreciation Strategy
Wealth Appreciation Strategy
INTERNATIONAL/ GLOBAL GROWTH
Concentrated International Growth Portfolio
FlexFee™ Emerging Markets Growth Portfolio
INTERNATIONAL/ GLOBAL EQUITY(continued)
Sustainable International Thematic Fund
INTERNATIONAL/ GLOBAL VALUE
All China Equity Portfolio
International Value Fund
FIXED INCOME
MUNICIPAL
High Income Municipal Portfolio
Intermediate California Municipal Portfolio
Intermediate Diversified Municipal Portfolio
Intermediate New York Municipal Portfolio
Municipal Bond Inflation Strategy
Tax-Aware Fixed Income Portfolio
National Portfolio
Arizona Portfolio
California Portfolio
Massachusetts Portfolio
Minnesota Portfolio
New Jersey Portfolio
New York Portfolio
Ohio Portfolio
Pennsylvania Portfolio
Virginia Portfolio
TAXABLE
Bond Inflation Strategy
FlexFee™ High Yield Portfolio1
FlexFee™ International Bond Portfolio
Global Bond Fund
High Income Fund
Income Fund
Intermediate Bond Portfolio
Limited Duration High Income Portfolio
Short Duration Portfolio
ALTERNATIVES
All Market Real Return Portfolio
Global Real Estate Investment Fund
Select US Long/Short Portfolio
Unconstrained Bond Fund
MULTI-ASSET
All Market Income Portfolio
All Market Total Return Portfolio
Conservative Wealth Strategy
Emerging Markets Multi-Asset Portfolio
Global Risk Allocation Fund
Tax-Managed All Market Income Portfolio
TARGET-DATE
Multi-Manager Select Retirement Allocation Fund
Multi-Manager Select 2010 Fund
Multi-Manager Select 2015 Fund
Multi-Manager Select 2020 Fund
Multi-Manager Select 2025 Fund
Multi-Manager Select 2030 Fund
Multi-Manager Select 2035 Fund
Multi-Manager Select 2040 Fund
Multi-Manager Select 2045 Fund
Multi-Manager Select 2050 Fund
Multi-Manager Select 2055 Fund
Multi-Manager Select 2060 Fund
CLOSED-END FUNDS
Alliance California Municipal Income Fund
AllianceBernstein Global High Income Fund
AllianceBernstein National Municipal Income Fund
We also offer Government Money Market Portfolio, which serves as the money market fund exchange vehicle for the AB mutual funds. You could lose money by investing in the Fund. Although the Fund seeks to preserve the value of your investment at $1.00 per share, it cannot guarantee it will do so. The Fund may impose a fee upon sale of your shares or may temporarily suspend your ability to sell shares if the Fund’s liquidity falls below required minimums because of market conditions or other factors. An investment in the Fund is not insured or guaranteed by the Federal Deposit Insurance Corporation or any other government agency. The Fund’s sponsor has no legal obligation to provide financial support to the Fund, and you should not expect that the sponsor will provide financial support to the Fund at any time.
Investors should consider the investment objectives, risks, charges and expenses of the Fund carefully before investing. For copies of our prospectus or summary prospectus, which contain this and other information, visit us online at www.abfunds.com or contact your AB representative. Please read the prospectus and/or summary prospectus carefully before investing.
| 1 | Prior to February 23, 2018, FlexFee High Yield Portfolio was named High Yield Portfolio. |
| 52 | AB CONCENTRATED GROWTH FUND | abfunds.com | |
AB CONCENTRATED GROWTH FUND
1345 Avenue of the Americas
New York, NY 10105
800 221 5672
CG-0152-1218 
DEC 12.31.18

SEMI-ANNUAL REPORT
AB CONCENTRATED INTERNATIONAL GROWTH PORTFOLIO

Beginning January 1, 2021, as permitted by new regulations adopted by the Securities and Exchange Commission, the Fund’s annual and semi-annual shareholder reports will no longer be sent by mail, unless you specifically request paper copies of the reports. Instead, the reports will be made available on a website, and you will be notified by mail each time a report is posted and provided with a website address to access the report.
If you already elected to receive shareholder reports electronically, you will not be affected by this change and you need not take any action. You may elect to receive shareholder reports and other communications from the Fund electronically at any time by contacting your financial intermediary (such as a broker-dealer or bank) or, if you are a direct investor, by calling the Fund at (800) 221 5672.
You may elect to receive all future reports in paper form free of charge. If you invest through a financial intermediary, you can contact your financial intermediary to request that you continue to receive paper copies of your shareholder reports; if you invest directly with the Fund, you can call the Fund at (800) 221 5672. Your election to receive reports in paper form will apply to all funds held in your account with your financial intermediary or, if you invest directly, to all AB Mutual Funds you hold.
| Investment Products Offered | • Are Not FDIC Insured• May Lose Value• Are Not Bank Guaranteed | |
Investors should consider the investment objectives, risks, charges and expenses of the Fund carefully before investing. For copies of our prospectus or summary prospectus, which contain this and other information, visit us online at www.abfunds.com or contact your AB representative. Please read the prospectus and/or summary prospectus carefully before investing.
This shareholder report must be preceded or accompanied by the Fund’s prospectus for individuals who are not current shareholders of the Fund.
You may obtain a description of the Fund’s proxy voting policies and procedures, and information regarding how the Fund voted proxies relating to portfolio securities during the most recent12-month period ended June 30, without charge. Simply visit AB’s website at www.abfunds.com, or go to the Securities and Exchange Commission’s (the “Commission”) website at www.sec.gov, or call AB at (800) 227 4618.
The Fund files its complete schedule of portfolio holdings with the Commission for the first and third quarters of each fiscal year. The Fund’s portfolio holdings reports are available on the Commission’s website at www.sec.gov. The Fund’s portfolio holdings reports may also be reviewed and copied at the Commission’s Public Reference Room in Washington, DC; information on the operation of the Public Reference Room may be obtained by calling (800) SEC 0330. AB publishes full portfolio holdings for the Fund monthly at www.abfunds.com.
AllianceBernstein Investments, Inc. (ABI) is the distributor of the AB family of mutual funds. ABI is a member of FINRA and is an affiliate of AllianceBernstein L.P., the Adviser of the funds.
The [A/B] logo is a registered service mark of AllianceBernstein and AllianceBernstein® is a registered service mark used by permission of the owner, AllianceBernstein L.P.
| FROM THE PRESIDENT |  |
Dear Shareholder,
We are pleased to provide this report for AB Concentrated International Growth Portfolio (the “Fund”). Please review the discussion of Fund performance, the market conditions during the reporting period and the Fund’s investment strategy.
As always, AB strives to keep clients ahead of what’s next by:
| + | Transforming uncommon insights into uncommon knowledge with a global research scope |
| + | Navigating markets with seasoned investment experience and sophisticated solutions |
| + | Providing thoughtful investment insights and actionable ideas |
Whether you’re an individual investor or a multi-billion-dollar institution, we put knowledge and experience to work for you.
AB’s global research organization connects and collaborates across platforms and teams to deliver impactful insights and innovative products. Better insights lead to better opportunities—anywhere in the world.
For additional information about AB’s range of products and shareholder resources, please log on to www.abfunds.com.
Thank you for your investment in the AB Mutual Funds.
Sincerely,

Robert M. Keith
President and Chief Executive Officer, AB Mutual Funds
| abfunds.com | AB CONCENTRATED INTERNATIONAL GROWTH PORTFOLIO | 1 | |
SEMI-ANNUAL REPORT
February 8, 2019
This report provides management’s discussion of fund performance for AB Concentrated International Growth Portfolio for the semi-annual reporting period ended December 31, 2018.
The Fund’s investment objective is to seek long-term growth of capital.
NAV RETURNS AS OF DECEMBER 31, 2018(unaudited)
| 6 Months | 12 Months | |||||||
| AB CONCENTRATED INTERNATIONAL GROWTH PORTFOLIO | ||||||||
| Class A Shares | -16.95% | -16.44% | ||||||
| Class C Shares | -17.30% | -17.16% | ||||||
| Advisor Class Shares1 | -16.83% | -16.32% | ||||||
| MSCI EAFE Index (net) | -11.35% | -13.79% | ||||||
| 1 | Please note that this share class is for investors purchasing shares through accounts established under certainfee-based programs sponsored and maintained by certain broker-dealers and financial intermediaries, institutional pension plans and/or investment advisory clients of, and certain other persons associated with, the Adviser and its affiliates or the Fund. |
INVESTMENT RESULTS
The table above shows the Fund’s performance compared to its benchmark, the Morgan Stanley Capital International Europe, Australasia and the Far East (“MSCI EAFE”) Index (net), for thesix- and12-month periods ended December 31, 2018.
All share classes of the Fund underperformed the benchmark for both periods, before sales charges. For both periods, sector selection and security selection detracted, relative to the benchmark. For thesix-month period, an overweight to the technology sector detracted, while an overweight to financials contributed. Security selection within the communication-services sector added to returns, yet detracted within technology. Top absolute contributors to performance included Genmab, Roche and Adecco. Top absolute detractors included Capgemini, Ctrip and Ingenico Group.
During the12-month period, an underweight to the utilities sector detracted, while an underweight to financials contributed. Security selection in the consumer-staples sector was positive, but detracted within consumer discretionary. Top absolute contributors to performance included Kosé, Temenos and HDFC Bank. Top absolute detractors included Ingenico, Eurofins and B&M European Value Retail.
The Fund utilized derivatives in the form of forwards for hedging purposes, which had no material impact on absolute returns for thesix-month period, and detracted for the12-month period.
| 2 | AB CONCENTRATED INTERNATIONAL GROWTH PORTFOLIO | abfunds.com | |
MARKET REVIEW AND INVESTMENT STRATEGY
International markets showed negative performance over both periods. The best performing sectors over both periods were utilities and health care. The worst performing sectors in thesix-month period were information technology and consumer discretionary, and the worst performing sectors in the12-month period included financials and consumer discretionary.
In this environment, the Fund’s Senior Investment Management Team remains focused on sustainably growing the Fund’s underlying earnings power.
INVESTMENT POLICIES
The Adviser seeks to achieve the Fund’s investment objective by investing, under normal circumstances, primarily in common stocks ofnon-US companies, and in companies in at least three countries other than the United States.
The Fund will invest in companies that are determined by the Adviser to offer favorable long-term growth potential and that are trading at attractive valuations. The Adviser will employ an appraisal method which attempts to measure each prospective company’s quality and growth rate by numerous factors. Such factors will include: a company’s record and projections of profit and earnings growth, accuracy and availability of information with respect to the company, success and experience of management, accessibility of management to the Adviser, product lines and competitive position both in the United States and abroad, lack of cyclicality, large market capitalization and liquidity of the company’s securities. The Adviser will compare these results to the characteristics of the general stock markets to determine the relative attractiveness of each company at a given time. The Adviser will weigh economic, political and market factors in making investment decisions; this appraisal technique attempts to measure each investment candidate not only against other stocks of the same industry and region, but also against a broad spectrum of investments.
The Fund will invest in a relatively small number of individual stocks, generally 25 to 35 companies. The Fund will primarily invest inmid- and large-capitalization companies, which are currently defined for the Fund as companies that have market capitalizations of $2.0 billion or more. The Fund’s holdings ofnon-US companies may include some companies located in emerging markets, and at times emerging-market companies may make up a significant portion of the Fund.
Fluctuations in currency exchange rates can have a dramatic impact on the returns of equity securities. While the Adviser may hedge the foreign currency exposure resulting from the Fund’s security positions through the use of currency-related derivatives, it is not required to do so.
| abfunds.com | AB CONCENTRATED INTERNATIONAL GROWTH PORTFOLIO | 3 | |
DISCLOSURES AND RISKS
Benchmark Disclosure
The MSCI EAFE Index is unmanaged and does not reflect fees and expenses associated with the active management of a mutual fund portfolio.The MSCI EAFE Index (net, free float-adjusted, market capitalization weighted) represents the equity market performance of developed markets, excluding the US and Canada. MSCI makes no express or implied warranties or representations, and shall have no liability whatsoever with respect to any MSCI data contained herein. The MSCI data may not be further redistributed or used as a basis for other indices, any securities or financial products. This report is not approved, reviewed or produced by MSCI. Net returns include the reinvestment of dividends after deduction ofnon-US withholding tax. An investor cannot invest directly in an index, and its results are not indicative of the performance for any specific investment, including the Fund.
A Word About Risk
Market Risk: The value of the Fund’s assets will fluctuate as the stock or bond market fluctuates. The value of its investments may decline, sometimes rapidly and unpredictably, simply because of economic changes or other events that affect large portions of the market. It includes the risk that a particular style of investing, such as the Fund’s growth approach, may underperform the market generally.
Focused Portfolio Risk: Investments in a limited number of companies may have more risk because changes in the value of a single security may have a more significant effect, either negative or positive, on the Fund’s net asset value (“NAV”).
Sector Risk: The Fund may have more risk because of concentrated investments in a particular market sector, such as the technology or financial services sector. Market or economic factors affecting that sector could have a major effect on the value of the Fund’s investments.
Foreign(Non-US) Risk: Investments in securities ofnon-US issuers may involve more risk than those of US issuers. These securities may fluctuate more widely in price and may be less liquid due to adverse market, economic, political, regulatory or other factors.
Emerging-Market Risk:Investments in emerging-market countries may have more risk because the markets are less developed and less liquid, and because these investments may be subject to increased economic, political, regulatory or other uncertainties.
Currency Risk: Fluctuations in currency exchange rates may negatively affect the value of the Fund’s investments or reduce its returns.
| 4 | AB CONCENTRATED INTERNATIONAL GROWTH PORTFOLIO | abfunds.com | |
DISCLOSURES AND RISKS(continued)
Capitalization Risk: Investments inmid-capitalization companies may be more volatile than investments in large-capitalization companies. Investments inmid-capitalization companies may have additional risks because these companies have limited product lines, markets or financial resources.
Management Risk: The Fund is subject to management risk because it is an actively managed investment fund. The Adviser will apply its investment techniques and risk analyses in making investment decisions for the Fund, but there is no guarantee that its techniques will produce the intended results.
These risks are fully discussed in the Fund’s prospectus. As with all investments, you may lose money by investing in the Fund.
An Important Note About Historical Performance
The investment return and principal value of an investment in the Fund will fluctuate, so that shares, when redeemed, may be worth more or less than their original cost. Performance shown in this report represents past performance and does not guarantee future results. Current performance may be lower or higher than the performance information shown. You may obtain performance information current to the most recentmonth-end by visiting www.abfunds.com.
All fees and expenses related to the operation of the Fund have been deducted. NAV returns do not reflect sales charges; if sales charges were reflected, the Fund’s quoted performance would be lower. SEC returns reflect the applicable sales charges for each share class: a 4.25% maximumfront-end sales charge for Class A shares and a 1%1-year contingent deferred sales charge for Class C shares. Returns for the different share classes will vary due to different expenses associated with each class. Performance assumes reinvestment of distributions and does not account for taxes.
Please note: References to specific securities are presented to illustrate the Fund’s investment philosophy and are not to be considered advice or recommendations. This information reflects prevailing market conditions and the Adviser’s judgments as of the date indicated, which are subject to change. In preparing this report, the Adviser has relied upon and assumed without independent verification, the accuracy and completeness of all information available from third-party sources. It should not be assumed that any investments made in the future will be profitable or will equal the performance of the selected investments referenced herein.
| abfunds.com | AB CONCENTRATED INTERNATIONAL GROWTH PORTFOLIO | 5 | |
HISTORICAL PERFORMANCE
AVERAGE ANNUAL RETURNS AS OF DECEMBER 31, 2018(unaudited)
| NAV Returns | SEC Returns (reflects applicable | |||||||
| CLASS A SHARES | ||||||||
| 1 Year | -16.44% | -20.00% | ||||||
| Since Inception1 | -0.13% | -1.28% | ||||||
| CLASS C SHARES | ||||||||
| 1 Year | -17.16% | -17.93% | ||||||
| Since Inception1 | -0.89% | -0.89% | ||||||
| ADVISOR CLASS SHARES2 | ||||||||
| 1 Year | -16.32% | -16.32% | ||||||
| Since Inception1 | 0.09% | 0.09% | ||||||
The Fund’s prospectus fee table shows the Fund’s total annual operating expense ratios as 2.09%, 2.90% and 1.81% for Class A, Class C and Advisor Class shares, respectively, gross of any fee waivers or expense reimbursements. Contractual fee waivers and/or expense reimbursements limit the Fund’s annual operating expense ratios exclusive of acquired fund fees and expenses other than the advisory fees of any AB mutual funds in which the Fund may invest, interest expense, and extraordinary expenses to 1.30%, 2.05% and 1.05% for Class A, Class C and Advisor Class shares, respectively. These waivers/reimbursements may not be terminated before October 31, 2019. Any fees waived and expenses borne by the Adviser may be reimbursed by the Fund until the end of the third fiscal year after the fiscal period in which the fee was waived or the expense was borne, provided that no reimbursement payment will be made that would cause the Fund’s total annual operating expenses to exceed the expense limitations. Absent reimbursements or waivers, performance would have been lower. The Financial Highlights section of this report sets forth expense ratio data for the current reporting period; the expense ratios shown above may differ from the expense ratios in the Financial Highlights section since they are based on different time periods.
| 1 | Inception date: 4/15/2015. |
| 2 | This share class is offered at NAV to eligible investors and the SEC returns are the same as the NAV returns. Please note that this share class is for investors purchasing shares through accounts established under certainfee-based programs sponsored and maintained by certain broker-dealers and financial intermediaries, institutional pension plans and/or investment advisory clients of, and certain other persons associated with, the Adviser and its affiliates or the Fund. |
| 6 | AB CONCENTRATED INTERNATIONAL GROWTH PORTFOLIO | abfunds.com | |
HISTORICAL PERFORMANCE(continued)
SEC AVERAGE ANNUAL RETURNS
AS OF THE MOST RECENT CALENDARQUARTER-END
DECEMBER 31, 2018(unaudited)
SEC Returns (reflects applicable | ||||
| CLASS A SHARES | ||||
| 1 Year | -20.00% | |||
| Since Inception1 | -1.28% | |||
| CLASS C SHARES | ||||
| 1 Year | -17.93% | |||
| Since Inception1 | -0.89% | |||
| ADVISOR CLASS SHARES2 | ||||
| 1 Year | -16.32% | |||
| Since Inception1 | 0.09% | |||
| 1 | Inception date: 4/15/2015. |
| 2 | Please note that this share class is for investors purchasing shares through accounts established under certainfee-based programs sponsored and maintained by certain broker-dealers and financial intermediaries, institutional pension plans and/or investment advisory clients of, and certain other persons associated with, the Adviser and its affiliates or the Fund. |
| abfunds.com | AB CONCENTRATED INTERNATIONAL GROWTH PORTFOLIO | 7 | |
EXPENSE EXAMPLE
(unaudited)
As a shareholder of the Fund, you incur two types of costs: (1) transaction costs, including sales charges (loads) on purchase payments, contingent deferred sales charges on redemptions and (2) ongoing costs, including management fees; distribution(12b-1) fees; and other Fund expenses. This example is intended to help you understand your ongoing costs (in dollars) of investing in the Fund and to compare these costs with the ongoing costs of investing in other mutual funds.
This Example is based on an investment of $1,000 invested at the beginning of the period and held for the entire period as indicated below.
Actual Expenses
The table below provides information about actual account values and actual expenses. You may use the information, together with the amount you invested, to estimate the expenses that you paid over the period. Simply divide your account value by $1,000 (for example, an $8,600 account value divided by $1,000 = 8.6), then multiply the result by the number under the heading entitled “Expenses Paid During Period” to estimate the expenses you paid on your account during this period.
Hypothetical Example for Comparison Purposes
The table below also provides information about hypothetical account values and hypothetical expenses based on the Fund’s actual expense ratio and an assumed annual rate of return of 5% before expenses, which is not the Fund’s actual return. The hypothetical account values and expenses may not be used to estimate the actual ending account balance or expenses you paid for the period. You may use this information to compare the ongoing costs of investing in the Fund and other funds by comparing this 5% hypothetical example with the 5% hypothetical examples that appear in the shareholder reports of other funds.
Please note that the expenses shown in the table are meant to highlight your ongoing costs only and do not reflect any transactional costs, such as sales charges (loads), or contingent deferred sales charges on redemptions. Therefore, the hypothetical example is useful in comparing ongoing costs only, and will not help you determine the relative total costs of owning different funds. In addition, if these transactional costs were included, your costs would have been higher.
| 8 | AB CONCENTRATED INTERNATIONAL GROWTH PORTFOLIO | abfunds.com | |
EXPENSE EXAMPLE(continued)
| Beginning Account Value July 1, 2018 | Ending Account Value December 31, 2018 | Expenses Paid During Period* | Annualized Expense Ratio* | Total Expenses Paid During Period+ | Total Annualized Expense Ratio+ | |||||||||||||||||||
| Class A | ||||||||||||||||||||||||
Actual | $ | 1,000 | $ | 830.50 | $ | 5.95 | 1.29 | % | $ | 6.00 | 1.30 | % | ||||||||||||
Hypothetical** | $ | 1,000 | $ | 1,018.70 | $ | 6.56 | 1.29 | % | $ | 6.61 | 1.30 | % | ||||||||||||
| Class C | ||||||||||||||||||||||||
Actual | $ | 1,000 | $ | 827.00 | $ | 9.39 | 2.04 | % | $ | 9.44 | 2.05 | % | ||||||||||||
Hypothetical** | $ | 1,000 | $ | 1,014.92 | $ | 10.36 | 2.04 | % | $ | 10.41 | 2.05 | % | ||||||||||||
| Advisor Class | ||||||||||||||||||||||||
Actual | $ | 1,000 | $ | 831.70 | $ | 4.80 | 1.04 | % | $ | 4.85 | 1.05 | % | ||||||||||||
Hypothetical** | $ | 1,000 | $ | 1,019.96 | $ | 5.30 | 1.04 | % | $ | 5.35 | 1.05 | % | ||||||||||||
| * | Expenses are equal to the classes’ annualized expense ratios, multiplied by the average account value over the period, multiplied by 184/365 (to reflect the one-half year period). |
| ** | Assumes 5% annual return before expenses. |
| + | In connection with the Fund’s investments in affiliated/unaffiliated underlying portfolios, the Fund incurs no direct expenses, but bears proportionate shares of the fees and expenses (i.e., operating, administrative and investment advisory fees) of the affiliated/unaffiliated underlying portfolios. The Adviser has contractually agreed to waive its fees from the Fund in an amount equal to the Fund’s pro rata share of certain acquired fund fees and expenses of the affiliated underlying portfolios. The Fund’s total expenses are equal to the classes’ annualized expense ratio plus the Fund’s pro rata share of the weighted average expense ratio of the affiliated/unaffiliated underlying portfolios in which it invests, multiplied by the average account value over the period, multiplied by 184/365 (to reflect the one-half year period). |
| abfunds.com | AB CONCENTRATED INTERNATIONAL GROWTH PORTFOLIO | 9 | |
PORTFOLIO SUMMARY
December 31, 2018(unaudited)
PORTFOLIO STATISTICS
Net Assets ($mil): $37.6
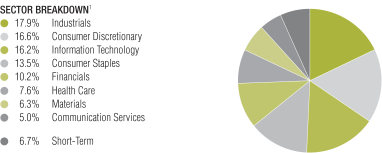
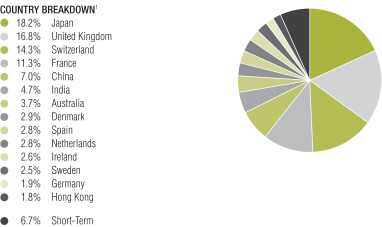
| 1 | All data are as of December 31, 2018. The Fund’s sector and country breakdowns are expressed as a percentage of total investments and may vary over time. The Fund also enters into derivative transactions, which may be used for hedging or investment purposes (see “Portfolio of Investments” section of the report for additional details). |
Please note: The sector classifications presented herein are based on the Global Industry Classification Standard (GICS) which was developed by Morgan Stanley Capital International and Standard & Poor’s. The components are divided into sector, industry group, and industrysub-indices as classified by the GICS for each of the market capitalization indices in the broad market. These sector classifications are broadly defined. The “Portfolio of Investments” section of the report reflects more specific industry information and is consistent with the investment restrictions discussed in the Fund’s prospectus
| 10 | AB CONCENTRATED INTERNATIONAL GROWTH PORTFOLIO | abfunds.com | |
PORTFOLIO SUMMARY(continued)
December 31, 2018(unaudited)
TEN LARGEST HOLDINGS1
| Company | U.S. $ Value | Percent of Net Assets | ||||||
| HDFC Bank Ltd. (ADR) | $ | 1,739,380 | 4.6 | % | ||||
| Sika AG | 1,403,610 | 3.7 | ||||||
| Capgemini SE | 1,389,427 | 3.7 | ||||||
| Treasury Wine Estates Ltd. | 1,387,949 | 3.7 | ||||||
| Reckitt Benckiser Group PLC | 1,336,486 | 3.6 | ||||||
| RELX PLC | 1,333,893 | 3.6 | ||||||
| Recruit Holdings Co., Ltd. | 1,290,076 | 3.4 | ||||||
| Nestle SA | 1,271,415 | 3.4 | ||||||
| LVMH Moet Hennessy Louis Vuitton SE | 1,256,886 | 3.3 | ||||||
| Nidec Corp. | 1,154,099 | 3.1 | ||||||
| $ | 13,563,221 | 36.1 | % | |||||
| 1 | Long-term investments. |
| abfunds.com | AB CONCENTRATED INTERNATIONAL GROWTH PORTFOLIO | 11 | |
PORTFOLIO OF INVESTMENTS
December 31, 2018(unaudited)
| Company | Shares | U.S. $ Value | ||||||
| ||||||||
COMMON STOCKS – 92.8% | ||||||||
Industrials – 17.8% | ||||||||
Building Products – 2.5% | ||||||||
Assa Abloy AB – Class B | 52,742 | $ | 944,440 | |||||
|
| |||||||
Electrical Equipment – 3.1% | ||||||||
Nidec Corp. | 10,200 | 1,154,099 | ||||||
|
| |||||||
Machinery – 5.2% | ||||||||
FANUC Corp. | 4,600 | 698,094 | ||||||
Hoshizaki Corp. | 9,700 | 588,583 | ||||||
KION Group AG | 13,620 | 692,628 | ||||||
|
| |||||||
| 1,979,305 | ||||||||
|
| |||||||
Professional Services – 7.0% | ||||||||
Recruit Holdings Co., Ltd. | 53,400 | 1,290,076 | ||||||
RELX PLC(a) | 64,830 | 1,333,893 | ||||||
|
| |||||||
| 2,623,969 | ||||||||
|
| |||||||
| 6,701,813 | ||||||||
|
| |||||||
Consumer Discretionary – 16.5% | ||||||||
Hotels, Restaurants & Leisure – 4.3% | ||||||||
Compass Group PLC | 40,790 | 858,418 | ||||||
Merlin Entertainments PLC(b) | 191,740 | 776,656 | ||||||
|
| |||||||
| 1,635,074 | ||||||||
|
| |||||||
Internet & Direct Marketing Retail – 4.8% | ||||||||
Alibaba Group Holding Ltd. (Sponsored ADR)(a) | 7,410 | 1,015,689 | ||||||
Ctrip.com International Ltd. (ADR)(a) | 29,000 | 784,740 | ||||||
|
| |||||||
| 1,800,429 | ||||||||
|
| |||||||
Multiline Retail – 2.3% | ||||||||
B&M European Value Retail SA | 235,999 | 846,911 | ||||||
|
| |||||||
Textiles, Apparel & Luxury Goods – 5.1% | ||||||||
LVMH Moet Hennessy Louis Vuitton SE | 4,293 | 1,256,886 | ||||||
Samsonite International SA(a)(b) | 234,300 | 665,607 | ||||||
|
| |||||||
| 1,922,493 | ||||||||
|
| |||||||
| 6,204,907 | ||||||||
|
| |||||||
Information Technology – 16.1% | ||||||||
Electronic Equipment, Instruments & Components – 7.0% | ||||||||
Ingenico Group SA | 10,307 | 584,689 | ||||||
Keyence Corp. | 2,200 | 1,111,981 | ||||||
Murata Manufacturing Co., Ltd. | 6,800 | 916,298 | ||||||
|
| |||||||
| 2,612,968 | ||||||||
|
| |||||||
IT Services – 3.7% | ||||||||
Capgemini SE | 13,969 | 1,389,427 | ||||||
|
| |||||||
| 12 | AB CONCENTRATED INTERNATIONAL GROWTH PORTFOLIO | abfunds.com | |
PORTFOLIO OF INVESTMENTS(continued)
| Company | Shares | U.S. $ Value | ||||||
| ||||||||
Semiconductors & Semiconductor Equipment – 2.8% | ||||||||
ASML Holding NV | 6,665 | $ | 1,044,135 | |||||
|
| |||||||
Software – 2.6% | ||||||||
Temenos AG(a) | 8,240 | 990,141 | ||||||
|
| |||||||
| 6,036,671 | ||||||||
|
| |||||||
Consumer Staples – 13.4% | ||||||||
Beverages – 3.7% | ||||||||
Treasury Wine Estates Ltd. | 133,101 | 1,387,949 | ||||||
|
| |||||||
Food Products – 6.2% | ||||||||
Calbee, Inc. | 33,900 | 1,058,846 | ||||||
Nestle SA | 15,665 | 1,271,415 | ||||||
|
| |||||||
| 2,330,261 | ||||||||
|
| |||||||
Household Products – 3.5% | ||||||||
Reckitt Benckiser Group PLC | 17,453 | 1,336,486 | ||||||
|
| |||||||
| 5,054,696 | ||||||||
|
| |||||||
Financials – 10.1% | ||||||||
Banks – 4.6% | ||||||||
HDFC Bank Ltd. (ADR) | 16,791 | 1,739,380 | ||||||
|
| |||||||
Capital Markets – 2.5% | ||||||||
Partners Group Holding AG(c) | 1,560 | 949,020 | ||||||
|
| |||||||
Insurance – 3.0% | ||||||||
Prudential PLC | 62,401 | 1,114,260 | ||||||
|
| |||||||
| 3,802,660 | ||||||||
|
| |||||||
Health Care – 7.6% | ||||||||
Biotechnology – 2.9% | ||||||||
Genmab A/S(a) | 6,687 | 1,099,479 | ||||||
|
| |||||||
Life Sciences Tools & Services – 4.7% | ||||||||
Eurofins Scientific SE | 2,685 | 1,002,794 | ||||||
Lonza Group AG(a) | 2,840 | 738,271 | ||||||
|
| |||||||
| 1,741,065 | ||||||||
|
| |||||||
| 2,840,544 | ||||||||
|
| |||||||
Materials – 6.3% | ||||||||
Chemicals – 3.7% | ||||||||
Sika AG | 11,050 | 1,403,610 | ||||||
|
| |||||||
Construction Materials – 2.6% | ||||||||
CRH PLC (London) | 36,555 | 967,679 | ||||||
|
| |||||||
| 2,371,289 | ||||||||
|
| |||||||
Communication Services – 5.0% | ||||||||
Diversified Telecommunication Services – 2.8% | ||||||||
Cellnex Telecom SA(a)(b) | 41,020 | 1,049,024 | ||||||
|
| |||||||
| abfunds.com | AB CONCENTRATED INTERNATIONAL GROWTH PORTFOLIO | 13 | |
PORTFOLIO OF INVESTMENTS(continued)
| Company | Shares | U.S. $ Value | ||||||
| ||||||||
Interactive Media & Services – 2.2% | ||||||||
Tencent Holdings Ltd. | 20,700 | $ | 829,663 | |||||
|
| |||||||
| 1,878,687 | ||||||||
|
| |||||||
Total Common Stocks | 34,891,267 | |||||||
|
| |||||||
SHORT-TERM INVESTMENTS – 6.6% | ||||||||
Investment Companies – 6.6% | ||||||||
AB Fixed Income Shares, Inc. – Government Money Market Portfolio – Class AB, 2.31%(d)(e)(f) | 2,490,359 | 2,490,359 | ||||||
|
| |||||||
Total Investments Before Security Lending Collateral for Securities Loaned – 99.4% | 37,381,626 | |||||||
|
| |||||||
INVESTMENTS OF CASH COLLATERAL FOR SECURITIES LOANED – 2.3% | ||||||||
Investment Companies – 2.3% | ||||||||
AB Fixed Income Shares, Inc. – Government Money Market Portfolio – Class AB, 2.31%(d)(e)(f) | 873,622 | 873,622 | ||||||
|
| |||||||
Total Investments – 101.7% | 38,255,248 | |||||||
Other assets less liabilities – (1.7)% | (633,623 | ) | ||||||
|
| |||||||
Net Assets – 100.0% | $ | 37,621,625 | ||||||
|
| |||||||
FORWARD CURRENCY EXCHANGE CONTRACTS (see Note D)
| Counterparty | Contracts to Deliver (000) | In Exchange For (000) | Settlement Date | Unrealized Appreciation/ (Depreciation) | ||||||||||||||||
Bank of America, NA | USD | 109 | CNY | 762 | 1/24/19 | $ | 1,542 | |||||||||||||
Bank of America, NA | USD | 1,185 | AUD | 1,645 | 3/15/19 | (24,525 | ) | |||||||||||||
Bank of America, NA | USD | 1,489 | JPY | 167,106 | 3/15/19 | 44,123 | ||||||||||||||
Bank of America, NA | INR | 87,437 | USD | 1,212 | 3/18/19 | (35,269 | ) | |||||||||||||
Citibank, NA | CNY | 11,863 | USD | 1,705 | 1/24/19 | (23,390 | ) | |||||||||||||
Goldman Sachs Bank USA | USD | 112 | CNY | 775 | 1/24/19 | 566 | ||||||||||||||
Goldman Sachs Bank USA | EUR | 729 | USD | 830 | 3/15/19 | (9,832 | ) | |||||||||||||
HSBC Bank USA | CNY | 908 | USD | 133 | 1/24/19 | 379 | ||||||||||||||
HSBC Bank USA | CNY | 2,303 | USD | 333 | 1/24/19 | (2,596 | ) | |||||||||||||
HSBC Bank USA | USD | 94 | CNY | 648 | 1/24/19 | 490 | ||||||||||||||
Natwest Markets PLC | USD | 138 | CNY | 960 | 1/24/19 | 2,219 | ||||||||||||||
State Street Bank & Trust Co. | CNY | 770 | USD | 111 | 1/24/19 | (1,653 | ) | |||||||||||||
State Street Bank & Trust Co. | USD | 104 | CNY | 713 | 1/24/19 | 342 | ||||||||||||||
State Street Bank & Trust Co. | AUD | 552 | USD | 394 | 3/15/19 | 4,992 | ||||||||||||||
State Street Bank & Trust Co. | CHF | 120 | USD | 123 | 3/15/19 | 331 | ||||||||||||||
State Street Bank & Trust Co. | CHF | 2,588 | USD | 2,631 | 3/15/19 | (19,789 | ) | |||||||||||||
State Street Bank & Trust Co. | EUR | 129 | USD | 148 | 3/15/19 | (212 | ) | |||||||||||||
State Street Bank & Trust Co. | GBP | 111 | USD | 143 | 3/15/19 | 915 | ||||||||||||||
| 14 | AB CONCENTRATED INTERNATIONAL GROWTH PORTFOLIO | abfunds.com | |
PORTFOLIO OF INVESTMENTS(continued)
| Counterparty | Contracts to Deliver (000) | In Exchange For (000) | Settlement Date | Unrealized Appreciation/ (Depreciation) | ||||||||||||||||
State Street Bank & Trust Co. | GBP | 398 | USD | 503 | 3/15/19 | $ | (6,392 | ) | ||||||||||||
State Street Bank & Trust Co. | JPY | 74,642 | USD | 671 | 3/15/19 | (14,051 | ) | |||||||||||||
State Street Bank & Trust Co. | USD | 177 | AUD | 246 | 3/15/19 | (3,468 | ) | |||||||||||||
State Street Bank & Trust Co. | USD | 636 | CHF | 626 | 3/15/19 | 4,651 | ||||||||||||||
State Street Bank & Trust Co. | USD | 4,136 | EUR | 3,609 | 3/15/19 | 23,954 | ||||||||||||||
State Street Bank & Trust Co. | USD | 618 | EUR | 535 | 3/15/19 | (1,081 | ) | |||||||||||||
State Street Bank & Trust Co. | USD | 580 | GBP | 457 | 3/15/19 | 4,930 | ||||||||||||||
State Street Bank & Trust Co. | USD | 35 | GBP | 27 | 3/15/19 | (151 | ) | |||||||||||||
State Street Bank & Trust Co. | USD | 2,101 | JPY | 234,437 | 3/15/19 | 49,864 | ||||||||||||||
UBS AG | JPY | 57,020 | USD | 506 | 3/15/19 | (16,927 | ) | |||||||||||||
|
| |||||||||||||||||||
| $ | (20,038 | ) | ||||||||||||||||||
|
| |||||||||||||||||||
| (a) | Non-income producing security. |
| (b) | Security is exempt from registration under Rule 144A of the Securities Act of 1933. These securities are considered restricted, but liquid and may be resold in transactions exempt from registration, normally to qualified institutional buyers. At December 31, 2018, the aggregate market value of these securities amounted to $2,491,287 or 6.6% of net assets. |
| (c) | Represents entire or partial securities out on loan. See Note E for securities lending information. |
| (d) | Affiliated investments. |
| (e) | The rate shown represents the7-day yield as of period end. |
| (f) | To obtain a copy of the fund’s shareholder report, please go to the Securities and Exchange Commission’s website at www.sec.gov, or call AB at (800)227-4618. |
Currency Abbreviations:
AUD – Australian Dollar
CHF – Swiss Franc
CNY – Chinese Yuan Renminbi
EUR – Euro
GBP – Great British Pound
INR – Indian Rupee
JPY – Japanese Yen
USD – United States Dollar
Glossary:
ADR – American Depositary Receipt
See notes to financial statements.
| abfunds.com | AB CONCENTRATED INTERNATIONAL GROWTH PORTFOLIO | 15 | |
STATEMENT OF ASSETS & LIABILITIES
December 31, 2018(unaudited)
| Assets |
| |||
Investments in securities, at value | ||||
Unaffiliated issuers (cost $38,660,085) | $ | 34,891,267 | (a) | |
Affiliated issuers (cost $3,363,981—including investment of cash collateral for securities loaned of $873,622) | 3,363,981 | |||
Foreign currencies, at value (cost $30,200) | 30,426 | |||
Receivable for capital stock sold | 441,136 | |||
Unrealized appreciation on forward currency exchange contracts | 139,298 | |||
Unaffiliated dividends receivable | 39,967 | |||
Affiliated dividends receivable | 4,749 | |||
|
| |||
Total assets | 38,910,824 | |||
|
| |||
| Liabilities |
| |||
Payable for collateral received on securities loaned | 873,622 | |||
Payable for capital stock redeemed | 167,840 | |||
Unrealized depreciation on forward currency exchange contracts | 159,336 | |||
Administrative fee payable | 23,193 | |||
Directors’ fees payable | 4,664 | |||
Advisory fee payable | 4,289 | |||
Transfer Agent fee payable | 4,105 | |||
Distribution fee payable | 193 | |||
Accrued expenses | 51,957 | |||
|
| |||
Total liabilities | 1,289,199 | |||
|
| |||
Net Assets | $ | 37,621,625 | ||
|
| |||
| Composition of Net Assets |
| |||
Capital stock, at par | $ | 421 | ||
Additionalpaid-in capital | 41,284,666 | |||
Accumulated loss | (3,663,462 | ) | ||
|
| |||
| $ | 37,621,625 | |||
|
| |||
Net Asset Value Per Share—11 billion shares of capital stock authorized, $.0001 par value
| Class | Net Assets | Shares Outstanding | Net Asset Value | |||||||||
| ||||||||||||
| A | $ | 391,374 | 43,930 | $ | 8.91 | * | ||||||
| ||||||||||||
| C | $ | 126,719 | 14,496 | $ | 8.74 | |||||||
| ||||||||||||
| Advisor | $ | 37,103,532 | 4,153,545 | $ | 8.93 | |||||||
| ||||||||||||
| (a) | Includes securities on loan with a value of $837,084 (see Note E). |
| * | The maximum offering price per share for Class A shares was $9.31 which reflects a sales charge of 4.25%. |
See notes to financial statements.
| 16 | AB CONCENTRATED INTERNATIONAL GROWTH PORTFOLIO | abfunds.com | |
STATEMENT OF OPERATIONS
Six Months Ended December 31, 2018(unaudited)
| Investment Income | ||||||||
Dividends | ||||||||
Unaffiliated issuers (net of foreign taxes withheld of $6,983) | $ | 140,424 | ||||||
Affiliated issuers | 34,533 | $ | 174,957 | |||||
|
| |||||||
| Expenses | ||||||||
Advisory fee (see Note B) | 185,826 | |||||||
Distribution fee—Class A | 417 | |||||||
Distribution fee—Class C | 768 | |||||||
Transfer agency—Class A | 82 | |||||||
Transfer agency—Class C | 51 | |||||||
Transfer agency—Advisor Class | 10,121 | |||||||
Custodian | 41,518 | |||||||
Administrative | 40,846 | |||||||
Registration fees | 22,855 | |||||||
Legal | 21,219 | |||||||
Audit and tax | 21,133 | |||||||
Directors’ fees | 9,785 | |||||||
Printing | 4,996 | |||||||
Miscellaneous | 4,625 | |||||||
|
| |||||||
Total expenses | 364,242 | |||||||
Less: expenses waived and reimbursed by the Adviser (see Notes B & E) | (135,291 | ) | ||||||
|
| |||||||
Net expenses | 228,951 | |||||||
|
| |||||||
Net investment loss | (53,994 | ) | ||||||
|
| |||||||
| Realized and Unrealized Gain (Loss) on Investment and Foreign Currency Transactions | ||||||||
Net realized gain (loss) on: | ||||||||
Investment transactions | (79,022 | ) | ||||||
Forward currency exchange contracts | 88,406 | |||||||
Foreign currency transactions | (90,223 | ) | ||||||
Net change in unrealized appreciation/depreciation of: | ||||||||
Investments | (7,553,802 | ) | ||||||
Forward currency exchange contracts | (93,487 | ) | ||||||
Foreign currency denominated assets and liabilities | 1,161 | |||||||
|
| |||||||
Net loss on investment and foreign currency transactions | (7,726,967 | ) | ||||||
|
| |||||||
Net Decrease in Net Assets from Operations | $ | (7,780,961 | ) | |||||
|
|
See notes to financial statements.
| abfunds.com | AB CONCENTRATED INTERNATIONAL GROWTH PORTFOLIO | 17 | |
STATEMENT OF CHANGES IN NET ASSETS
| Six Months Ended December 31, 2018 (unaudited) | Year Ended June 30, 2018 | |||||||
| Increase (Decrease) in Net Assets from Operations | ||||||||
Net investment income (loss) | $ | (53,994 | ) | $ | 212,369 | |||
Net realized gain (loss) on investment transactions and foreign currency | (80,839 | ) | 3,375,905 | |||||
Net change in unrealized appreciation/depreciation of investments and foreign currency denominated assets and liabilities | (7,646,128 | ) | 324,602 | |||||
|
|
|
| |||||
Net increase (decrease) in net assets from operations | (7,780,961 | ) | 3,912,876 | |||||
| Distributions to Shareholders* | ||||||||
Class A | (32,224 | ) | (2,167 | ) | ||||
Class C | (9,241 | ) | (1,537 | ) | ||||
Advisor Class | (2,830,791 | ) | (1,168,296 | ) | ||||
| Capital Stock Transactions | ||||||||
Net increase | 2,393,222 | 10,500,120 | ||||||
|
|
|
| |||||
Total increase (decrease) | (8,259,995 | ) | 13,240,996 | |||||
| Net Assets | ||||||||
Beginning of period | 45,881,620 | 32,640,624 | ||||||
|
|
|
| |||||
End of period | $ | 37,621,625 | $ | 45,881,620 | ||||
|
|
|
| |||||
| * | The prior year’s amounts have been reclassified to conform with the current year’s presentation. See Note I, Recent Accounting Pronouncements, in the Notes to Financial Statements for more information. |
See notes to financial statements.
| 18 | AB CONCENTRATED INTERNATIONAL GROWTH PORTFOLIO | abfunds.com | |
NOTES TO FINANCIAL STATEMENTS
December 31, 2018(unaudited)
NOTE A
Significant Accounting Policies
AB Cap Fund, Inc. (the “Company”), which is a Maryland corporation, is registered under the Investment Company Act of 1940 as anopen-end management investment company. The Company operates as a series company currently comprised of 29 portfolios. Each portfolio is considered to be a separate entity for financial reporting and tax purposes. This report relates only to the AB Concentrated International Growth Portfolio (the “Fund”), a diversified portfolio. The Fund has authorized the issuance of Class A, Class B, Class C, Advisor Class, Class R, Class K, Class I, Class Z, Class T, Class 1 and Class 2 shares. Class B, Class R, Class K, Class I, Class Z, Class T, Class 1 and Class 2 shares have not been issued. Class A shares are sold with afront-end sales charge of up to 4.25% for purchases not exceeding $1,000,000. With respect to purchases of $1,000,000 or more, Class A shares redeemed within one year of purchase may be subject to a contingent deferred sales charge of 1%. Class C shares are subject to a contingent deferred sales charge of 1% on redemptions made within the first year after purchase, and 0% after the first year of purchase. Class C shares will automatically convert to Class A shares ten years after the end of the calendar month of purchase. Advisor Class shares are sold without any initial or contingent deferred sales charge and are not subject to ongoing distribution expenses. All eleven classes of shares have identical voting, dividend, liquidation and other rights, except that the classes bear different distribution and transfer agency expenses. Each class has exclusive voting rights with respect to its distribution plan. The financial statements have been prepared in conformity with U.S. generally accepted accounting principles (“U.S. GAAP”) which require management to make certain estimates and assumptions that affect the reported amounts of assets and liabilities in the financial statements and amounts of income and expenses during the reporting period. Actual results could differ from those estimates. The Fund is an investment company under U.S. GAAP and follows the accounting and reporting guidance applicable to investment companies. The following is a summary of significant accounting policies followed by the Fund.
1. Security Valuation
Portfolio securities are valued at their current market value determined on the basis of market quotations or, if market quotations are not readily available or are deemed unreliable, at “fair value” as determined in accordance with procedures established by and under the general supervision of the Company’s Board of Directors (the “Board”).
In general, the market values of securities which are readily available and deemed reliable are determined as follows: securities listed on a national
| abfunds.com | AB CONCENTRATED INTERNATIONAL GROWTH PORTFOLIO | 19 | |
NOTES TO FINANCIAL STATEMENTS(continued)
securities exchange (other than securities listed on the NASDAQ Stock Market, Inc. (“NASDAQ”)) or on a foreign securities exchange are valued at the last sale price at the close of the exchange or foreign securities exchange. If there has been no sale on such day, the securities are valued at the last traded price from the previous day. Securities listed on more than one exchange are valued by reference to the principal exchange on which the securities are traded; securities listed only on NASDAQ are valued in accordance with the NASDAQ Official Closing Price; listed or over the counter (“OTC”) market put or call options are valued at the mid level between the current bid and ask prices. If either a current bid or current ask price is unavailable, AllianceBernstein L.P. (the “Adviser”) will have discretion to determine the best valuation (e.g., last trade price in the case of listed options); open futures are valued using the closing settlement price or, in the absence of such a price, the most recent quoted bid price. If there are no quotations available for the day of valuation, the last available closing settlement price is used; U.S. Government securities and any other debt instruments having 60 days or less remaining until maturity are generally valued at market by an independent pricing vendor, if a market price is available. If a market price is not available, the securities are valued at amortized cost. This methodology is commonly used for short term securities that have an original maturity of 60 days or less, as well as short term securities that had an original term to maturity that exceeded 60 days. In instances when amortized cost is utilized, the Valuation Committee (the “Committee”) must reasonably conclude that the utilization of amortized cost is approximately the same as the fair value of the security. Such factors the Committee will consider include, but are not limited to, an impairment of the creditworthiness of the issuer or material changes in interest rates. Fixed-income securities, including mortgage-backed and asset-backed securities, may be valued on the basis of prices provided by a pricing service or at a price obtained from one or more of the major broker-dealers. In cases where broker-dealer quotes are obtained, the Adviser may establish procedures whereby changes in market yields or spreads are used to adjust, on a daily basis, a recently obtained quoted price on a security. Swaps and other derivatives are valued daily, primarily using independent pricing services, independent pricing models using market inputs, as well as third party broker-dealers or counterparties. Open end mutual funds are valued at the closing net asset value per share, while exchange traded funds are valued at the closing market price per share.
Securities for which market quotations are not readily available (including restricted securities) or are deemed unreliable are valued at fair value as deemed appropriate by the Adviser. Factors considered in making this determination may include, but are not limited to, information obtained by contacting the issuer, analysts, analysis of the issuer’s financial statements
| 20 | AB CONCENTRATED INTERNATIONAL GROWTH PORTFOLIO | abfunds.com | |
NOTES TO FINANCIAL STATEMENTS(continued)
or other available documents. In addition, the Fund may use fair value pricing for securities primarily traded innon-U.S. markets because most foreign markets close well before the Fund values its securities at 4:00 p.m., Eastern Time. The earlier close of these foreign markets gives rise to the possibility that significant events, including broad market moves, may have occurred in the interim and may materially affect the value of those securities. To account for this, the Fund generally values many of its foreign equity securities using fair value prices based on third party vendor modeling tools to the extent available.
2. Fair Value Measurements
In accordance with U.S. GAAP regarding fair value measurements, fair value is defined as the price that the Fund would receive to sell an asset or pay to transfer a liability in an orderly transaction between market participants at the measurement date. U.S. GAAP establishes a framework for measuring fair value, and a three-level hierarchy for fair value measurements based upon the transparency of inputs to the valuation of an asset or liability (including those valued based on their market values as described in Note A.1 above). Inputs may be observable or unobservable and refer broadly to the assumptions that market participants would use in pricing the asset or liability. Observable inputs reflect the assumptions market participants would use in pricing the asset or liability based on market data obtained from sources independent of the Fund. Unobservable inputs reflect the Fund’s own assumptions about the assumptions that market participants would use in pricing the asset or liability based on the best information available in the circumstances. Each investment is assigned a level based upon the observability of the inputs which are significant to the overall valuation. The three-tier hierarchy of inputs is summarized below.
| • | Level 1—quoted prices in active markets for identical investments |
| • | Level 2—other significant observable inputs (including quoted prices for similar investments, interest rates, prepayment speeds, credit risk, etc.) |
| • | Level 3—significant unobservable inputs (including the Fund’s own assumptions in determining the fair value of investments) |
Where readily available market prices or relevant bid prices are not available for certain equity investments, such investments may be valued based on similar publicly traded investments, movements in relevant indices since last available prices or based upon underlying company fundamentals and comparable company data (such as multiples to earnings or other multiples to equity). Where an investment is valued using an observable input, such as another publicly traded security, the investment will be classified as Level 2. If management determines that an adjustment is appropriate based on restrictions on resale, illiquidity or uncertainty, and such adjustment is a
| abfunds.com | AB CONCENTRATED INTERNATIONAL GROWTH PORTFOLIO | 21 | |
NOTES TO FINANCIAL STATEMENTS(continued)
significant component of the valuation, the investment will be classified as Level 3. An investment will also be classified as Level 3 where management uses company fundamentals and other significant inputs to determine the valuation.
The following table summarizes the valuation of the Fund’s investments by the above fair value hierarchy levels as of December 31, 2018:
Investments in | Level 1 | Level 2 | Level 3 | Total | ||||||||||||
Assets: |
| |||||||||||||||
Common Stocks: | ||||||||||||||||
Industrials | $ | 1,333,893 | $ | 5,367,920 | $ | – 0 | – | $ | 6,701,813 | |||||||
Consumer Discretionary | 1,800,429 | 4,404,478 | – 0 | – | 6,204,907 | |||||||||||
Information Technology | – 0 | – | 6,036,671 | – 0 | – | 6,036,671 | ||||||||||
Consumer Staples | – 0 | – | 5,054,696 | – 0 | – | 5,054,696 | ||||||||||
Financials | 1,739,380 | 2,063,280 | – 0 | – | 3,802,660 | |||||||||||
Health Care | – 0 | – | 2,840,544 | – 0 | – | 2,840,544 | ||||||||||
Materials | – 0 | – | 2,371,289 | – 0 | – | 2,371,289 | ||||||||||
Communication Services | – 0 | – | 1,878,687 | – 0 | – | 1,878,687 | ||||||||||
Short-Term Investments | 2,490,359 | – 0 | – | – 0 | – | 2,490,359 | ||||||||||
Investments of Cash Collateral for Securities Loaned in Affiliated Money Market Fund | 873,622 | – 0 | – | – 0 | – | 873,622 | ||||||||||
|
|
|
|
|
|
|
| |||||||||
Total Investments in Securities | 8,237,683 | 30,017,565 | (a) | – 0 | – | 38,255,248 | ||||||||||
Other Financial Instruments(b): | ||||||||||||||||
Assets: |
| |||||||||||||||
Forward Currency Exchange Contracts | – 0 | – | 139,298 | – 0 | – | 139,298 | ||||||||||
Liabilities: |
| |||||||||||||||
Forward Currency Exchange Contracts | – 0 | – | (159,336 | ) | – 0 | – | (159,336 | ) | ||||||||
|
|
|
|
|
|
|
| |||||||||
Total(c) | $ | 8,237,683 | $ | 29,997,527 | $ | – 0 | – | $ | 38,235,210 | |||||||
|
|
|
|
|
|
|
| |||||||||
| (a) | A significant portion of the Fund’s foreign equity investments are categorized as Level 2 investments since they are valued using fair value prices based on third party vendor modeling tools to the extent available, see Note A.1. |
| (b) | Other financial instruments are derivative instruments, such as futures, forwards and swaps, which are valued at the unrealized appreciation/(depreciation) on the instrument. Other financial instruments may also include swaps with upfront premiums, options written and swaptions written which are valued at market value. |
| (c) | There were no transfers between any levels during the reporting period. |
The Fund recognizes all transfers between levels of the fair value hierarchy assuming the financial instruments were transferred at the beginning of the reporting period.
The Adviser established the Committee to oversee the pricing and valuation of all securities held in the Fund. The Committee operates under pricing and valuation policies and procedures established by the Adviser and approved by the Board, including pricing policies which set forth the mechanisms and processes to be employed on a daily basis to implement these policies and procedures. In particular, the pricing policies describe how to determine market quotations for securities and other instruments.
| 22 | AB CONCENTRATED INTERNATIONAL GROWTH PORTFOLIO | abfunds.com | |
NOTES TO FINANCIAL STATEMENTS(continued)
The Committee’s responsibilities include: 1) fair value and liquidity determinations (and oversight of any third parties to whom any responsibility for fair value and liquidity determinations is delegated), and 2) regular monitoring of the Adviser’s pricing and valuation policies and procedures and modification or enhancement of these policies and procedures (or recommendation of the modification of these policies and procedures) as the Committee believes appropriate.
The Committee is also responsible for monitoring the implementation of the pricing policies by the Adviser’s Pricing Group (the “Pricing Group”) and any third party which performs certain pricing functions in accordance with the pricing policies. The Pricing Group is responsible for the oversight of the third party on aday-to-day basis. The Committee and the Pricing Group perform a series of activities to provide reasonable assurance of the accuracy of prices including: 1) periodic vendor due diligence meetings, review of methodologies, new developments and processes at vendors, 2) daily comparison of security valuation versus prior day for all securities that exceeded established thresholds, and 3) daily review of unpriced, stale, and variance reports with exceptions reviewed by senior management and the Committee.
In addition, several processes outside of the pricing process are used to monitor valuation issues including: 1) performance and performance attribution reports are monitored for anomalous impacts based upon benchmark performance, and 2) portfolio managers review all portfolios for performance and analytics (which are generated using the Adviser’s prices).
3. Currency Translation
Assets and liabilities denominated in foreign currencies and commitments under forward currency exchange contracts are translated into U.S. dollars at the mean of the quoted bid and ask prices of such currencies against the U.S. dollar. Purchases and sales of portfolio securities are translated into U.S. dollars at the rates of exchange prevailing when such securities were acquired or sold. Income and expenses are translated into U.S. dollars at rates of exchange prevailing when accrued.
Net realized gain or loss on foreign currency transactions represents foreign exchange gains and losses from sales and maturities of foreign fixed income investments, holding of foreign currencies, currency gains or losses realized between the trade and settlement dates on foreign investment transactions, and the difference between the amounts of dividends, interest and foreign withholding taxes recorded on the Fund’s books and the U.S. dollar equivalent amounts actually received or paid. Net unrealized currency gains and losses from valuing foreign currency denominated
| abfunds.com | AB CONCENTRATED INTERNATIONAL GROWTH PORTFOLIO | 23 | |
NOTES TO FINANCIAL STATEMENTS(continued)
assets and liabilities at period end exchange rates are reflected as a component of net unrealized appreciation or depreciation of foreign currency denominated assets and liabilities.
4. Taxes
It is the Fund’s policy to meet the requirements of the Internal Revenue Code applicable to regulated investment companies and to distribute all of its investment company taxable income and net realized gains, if any, to shareholders. Therefore, no provisions for federal income or excise taxes are required. The Fund may be subject to taxes imposed by countries in which it invests. Such taxes are generally based on income and/or capital gains earned or repatriated. Taxes are accrued and applied to net investment income, net realized gains and net unrealized appreciation/depreciation as such income and/or gains are earned.
In accordance with U.S. GAAP requirements regarding accounting for uncertainties in income taxes, management has analyzed the Fund’s tax positions taken or expected to be taken on federal and state income tax returns for all open tax years (the current and the prior three tax years) and has concluded that no provision for income tax is required in the Fund’s financial statements.
5. Investment Income and Investment Transactions
Dividend income is recorded on theex-dividend date or as soon as the Fund is informed of the dividend. Interest income is accrued daily. Investment transactions are accounted for on the date the securities are purchased or sold. Investment gains or losses are determined on the identified cost basis. The Fund amortizes premiums and accretes discounts as adjustments to interest income.
6. Class Allocations
All income earned and expenses incurred by the Fund are borne on apro-rata basis by each outstanding class of shares, based on the proportionate interest in the Fund represented by the net assets of such class, except for class specific expenses which are allocated to the respective class. Expenses of the Company are charged proportionately to each portfolio or based on other appropriate methods. Realized and unrealized gains and losses are allocated among the various share classes based on respective net assets.
7. Dividends and Distributions
Dividends and distributions to shareholders, if any, are recorded on theex-dividend date. Income dividends and capital gains distributions are determined in accordance with federal tax regulations and may differ from those determined in accordance with U.S. GAAP. To the extent these
| 24 | AB CONCENTRATED INTERNATIONAL GROWTH PORTFOLIO | abfunds.com | |
NOTES TO FINANCIAL STATEMENTS(continued)
differences are permanent, such amounts are reclassified within the capital accounts based on their federal tax basis treatment; temporary differences do not require such reclassification.
NOTE B
Advisory Fee and Other Transactions with Affiliates
Under the terms of the investment advisory agreement, the Fund pays the Adviser an advisory fee at an annual rate of .85% of the Fund’s average daily net assets. The fee is accrued daily and paid monthly. The Adviser has agreed to waive its fees and bear certain expenses to the extent necessary to limit total operating expenses (excluding acquired fund fees and expenses other than the advisory fees of any AB Mutual Funds in which the Fund may invest, interest expense, taxes, extraordinary expenses, and brokerage commissions and other transaction costs) on an annual basis (the “Expense Caps”) to 1.30%, 2.05% and 1.05% of the daily average net assets for Class A, Class C and Advisor Class shares, respectively. For the six months ended December 31, 2018, the reimbursements/waivers amounted to $133,507. The Expense Caps may not be terminated by the Adviser before October 31, 2019. Any fees waived and expenses borne by the Adviser may be reimbursed by the Fund until the end of the third fiscal year after the fiscal period in which the fee was waived or the expense was borne; such waivers that are subject to repayment amounted to $228,495 for the year ended June 30, 2016, $264,793 for the year ended June 30, 2017 and $300,178 for the period ended June 30, 2018, respectively. In any case, no reimbursement payment will be made that would cause the Fund’s total annual fund operating expenses to exceed the Expense Caps’ net fee percentages set forth above.
During 2017, AXA S.A. (“AXA”), a French holding company for the AXA Group, a worldwide leader in life, property and casualty and health insurance and asset management, announced its intention to pursue the sale of a minority stake in its subsidiary, AXA Equitable Holdings, Inc. (“AXA Equitable”), the holding company for a diversified financial services organization, through an initial public offering (“IPO”). AXA Equitable is the holding company for a diverse group of financial services companies, including AllianceBernstein L.P., the investment adviser to the Funds (“the Adviser”). During the second quarter of 2018, AXA Equitable completed the IPO, and, as a result, AXA held approximately 72.2% of the outstanding common stock of AXA Equitable as of September 30, 2018. Contemporaneously with the IPO, AXA sold $862.5 million aggregate principal amount of its 7.25% mandatorily exchangeable notes (the “MxB Notes”) due May 15, 2021 and exchangeable into up to 43,125,000 shares of common stock (or approximately 7% of the outstanding shares of common stock of AXA Equitable). AXA retains ownership (including voting rights) of such shares of
| abfunds.com | AB CONCENTRATED INTERNATIONAL GROWTH PORTFOLIO | 25 | |
NOTES TO FINANCIAL STATEMENTS(continued)
common stock until the MxB Notes are exchanged, which may be on a date that is earlier than the maturity date at AXA’s option upon the occurrence of certain events.
In March 2018, AXA announced its intention to sell its entire interest in AXA Equitable over time, subject to market conditions and other factors (the “Plan”). It is anticipated that one or more of the transactions contemplated by the Plan may ultimately result in the indirect transfer of a “controlling block” of voting securities of the Adviser (a “Change of Control Event”) and therefore may be deemed an “assignment” causing a termination of each Fund’s current investment advisory agreement. In order to ensure that the existing investment advisory services could continue uninterrupted, at meetings held in late July through early August 2018, the Boards of Directors/Trustees (each a “Board” and collectively, the “Boards”) approved new investment advisory agreements with the Adviser, in connection with the Plan. The Boards also agreed to call and hold a joint meeting of shareholders on October 11, 2018 for shareholders of each Fund to (1) approve the new investment advisory agreement with the Adviser that would be effective after the first Change of Control Event and (2) approve any future advisory agreement approved by the Board and that has terms not materially different from the current agreement, in the event there are subsequent Change of Control Events arising from completion of the Plan that terminate the advisory agreement after the first Change of Control Event. Approval of a future advisory agreement means that shareholders may not have another opportunity to vote on a new agreement with the Adviser even upon a change of control, as long as no single person or group of persons acting together gains “control” (as defined in the 1940 Act) of AXA Equitable.
At the October 11, 2018 meeting, shareholders approved the new and future investment advisory agreements.
On November 20, 2018 AXA completed a public offering of 60,000,000 shares of AXA Equitable’s common stock and simultaneously sold 30,000,000 of such shares to AXA Equitable pursuant to a separate agreement with it. As a result AXA currently owns approximately 59.2% of the shares of common stock of AXA Equitable.
Pursuant to the investment advisory agreement, the Fund may reimburse the Adviser for certain legal and accounting services provided to the Fund by the Adviser. For the six months ended December 31, 2018, the reimbursement for such services amounted to $40,846.
The Fund compensates AllianceBernstein Investor Services, Inc. (“ABIS”), a wholly-owned subsidiary of the Adviser, under a Transfer Agency Agreement for providing personnel and facilities to perform transfer agency
| 26 | AB CONCENTRATED INTERNATIONAL GROWTH PORTFOLIO | abfunds.com | |
NOTES TO FINANCIAL STATEMENTS(continued)
services for the Fund. ABIS may make payments to intermediaries that provide omnibus account services,sub-accounting services and/or networking services. Such compensation retained by ABIS amounted to $9,042 for the six months ended December 31, 2018.
AllianceBernstein Investments, Inc. (the “Distributor”), a wholly-owned subsidiary of the Adviser, serves as the distributor of the Fund’s shares. The Distributor has advised the Fund that it has retainedfront-end sales charges of $578 from the sale of Class A shares and received $0 and $0 in contingent deferred sales charges imposed upon redemptions by shareholders of Class A and Class C shares, respectively, for the six months ended December 31, 2018.
The Fund may invest in AB Government Money Market Portfolio (the “Government Money Market Portfolio”) which has a contractual annual advisory fee rate of .20% of the portfolio’s average daily net assets and bears its own expenses. Effective August 1, 2018, the Adviser has contractually agreed to waive .10% of the advisory fee of Government Money Market Portfolio until August 31, 2019. In connection with the investment by the Fund in Government Money Market Portfolio, the Adviser has contractually agreed to waive its advisory fee from the Fund in an amount equal to the Fund’s pro rata share of the effective advisory fee of Government Money Market Portfolio, as borne indirectly by the Fund as an acquired fund fee and expense. For the six months ended December 31, 2018, such waiver amounted to $1,560.
A summary of the Fund’s transactions in AB mutual funds for the six months ended December 31, 2018 is as follows:
Fund | Market Value 6/30/18 (000) | Purchases at Cost (000) | Sales Proceeds (000) | Market Value 12/31/18 (000) | Dividend Income (000) | |||||||||||||||
Government Money Market Portfolio | $ | 2,005 | $ | 7,751 | $ | 7,266 | $ | 2,490 | $ | 28 | ||||||||||
Government Money Market Portfolio* | 1,160 | 4,369 | 4,655 | 874 | 7 | |||||||||||||||
|
|
|
| |||||||||||||||||
Total | $ | 3,364 | $ | 35 | ||||||||||||||||
|
|
|
| |||||||||||||||||
| * | Investments of cash collateral for securities lending transactions (see Note E). |
Brokerage commissions paid on investment transactions for the six months ended December 31, 2018 amounted to $4,651, of which $0 and $0, respectively, was paid to Sanford C. Bernstein & Co. LLC and Sanford C. Bernstein Limited, affiliates of the Adviser.
| abfunds.com | AB CONCENTRATED INTERNATIONAL GROWTH PORTFOLIO | 27 | |
NOTES TO FINANCIAL STATEMENTS(continued)
NOTE C
Distribution Services Agreement
The Fund has adopted a Distribution Services Agreement (the “Agreement”) pursuant to Rule12b-1 under the Investment Company Act of 1940. Under the Agreement, the Fund pays distribution and servicing fees to the Distributor at an annual rate of up to .25% of the Fund’s average daily net assets attributable to Class A shares and 1% of the Fund’s average daily net assets attributable to Class C shares. There are no distribution and servicing fees on the Advisor Class shares. The fees are accrued daily and paid monthly. The Agreement provides that the Distributor will use such payments in their entirety for distribution assistance and promotional activities. Since the commencement of the Fund’s operations, the Distributor has incurred expenses in excess of the distribution costs reimbursed by the Fund in the amount of $0 for Class C shares. While such costs may be recovered from the Fund in future periods so long as the Agreement is in effect, the rate of the distribution and servicing fees payable under the Agreement may not be increased without a shareholder vote. In accordance with the Agreement, there is no provision for recovery of unreimbursed distribution costs incurred by the Distributor beyond the current fiscal year for Class A shares. The Agreement also provides that the Adviser may use its own resources to finance the distribution of the Fund’s shares.
NOTE D
Investment Transactions
Purchases and sales of investment securities (excluding short-term investments) for the six months ended December 31, 2018 were as follows:
| Purchases | Sales | |||||||
Investment securities (excluding | $ | 7,124,759 | $ | 7,421,380 | ||||
U.S. government securities | – 0 | – | – 0 | – | ||||
The cost of investments for federal income tax purposes was substantially the same as the cost for financial reporting purposes. Accordingly, gross unrealized appreciation and unrealized depreciation are as follows:
Gross unrealized appreciation | $ | 1,167,726 | ||
Gross unrealized depreciation | (4,956,582 | ) | ||
|
| |||
Net unrealized depreciation | $ | (3,788,856 | ) | |
|
|
1. Derivative Financial Instruments
The Fund may use derivatives in an effort to earn income and enhance returns, to replace more traditional direct investments, to obtain exposure to otherwise inaccessible markets (collectively, “investment purposes”), or to hedge or adjust the risk profile of its portfolio.
| 28 | AB CONCENTRATED INTERNATIONAL GROWTH PORTFOLIO | abfunds.com | |
NOTES TO FINANCIAL STATEMENTS(continued)
The principal type of derivative utilized by the Fund, as well as the methods in which they may be used are:
| • | Forward Currency Exchange Contracts |
The Fund may enter into forward currency exchange contracts in order to hedge its exposure to changes in foreign currency exchange rates on its foreign portfolio holdings, to hedge certain firm purchase and sale commitments denominated in foreign currencies and fornon-hedging purposes as a means of making direct investments in foreign currencies, as described below under “Currency Transactions”.
A forward currency exchange contract is a commitment to purchase or sell a foreign currency at a future date at a negotiated forward rate. The gain or loss arising from the difference between the original contract and the closing of such contract would be included in net realized gain or loss on forward currency exchange contracts. Fluctuations in the value of open forward currency exchange contracts are recorded for financial reporting purposes as unrealized appreciation and/or depreciation by the Fund. Risks may arise from the potential inability of a counterparty to meet the terms of a contract and from unanticipated movements in the value of a foreign currency relative to the U.S. dollar.
During the six months ended December 31, 2018, the Fund held forward currency exchange contracts for hedging purposes.
The Fund typically enters into International Swaps and Derivatives Association, Inc. Master Agreements (“ISDA Master Agreement”) with its OTC derivative contract counterparties in order to, among other things, reduce its credit risk to OTC counterparties. ISDA Master Agreements include provisions for general obligations, representations, collateral and events of default or termination. Under an ISDA Master Agreement, the Fund typically may offset with the OTC counterparty certain derivative financial instruments’ payables and/or receivables with collateral held and/or posted and create one single net payment(close-out netting) in the event of default or termination. In the event of a default by an OTC counterparty, the return of collateral with market value in excess of the Fund’s net liability, held by the defaulting party, may be delayed or denied.
The Fund’s ISDA Master Agreements may contain provisions for early termination of OTC derivative transactions in the event the net assets of the Fund decline below specific levels (“net asset contingent features”). If these levels are triggered, the Fund’s OTC counterparty has the right to terminate such transaction and require the Fund to pay or receive a settlement amount in connection with the terminated transaction. If OTC derivatives were held at period end, please refer to netting arrangements by the OTC counterparty tables below for additional details.
| abfunds.com | AB CONCENTRATED INTERNATIONAL GROWTH PORTFOLIO | 29 | |
NOTES TO FINANCIAL STATEMENTS(continued)
During the six months ended December 31, 2018, the Fund had entered into the following derivatives:
Asset Derivatives | Liability Derivatives | |||||||||||
Derivative Type | Statement of | Fair Value | Statement of | Fair Value | ||||||||
Foreign currency contracts | Unrealized appreciation on forward currency exchange contracts | $ | 139,298 |
| Unrealized depreciation on forward currency exchange contracts | $ | 159,336 |
| ||||
|
|
|
| |||||||||
Total | $ | 139,298 | $ | 159,336 | ||||||||
|
|
|
| |||||||||
Derivative Type | Location of Gain or | Realized Gain or (Loss) on Derivatives | Change in Unrealized Appreciation or (Depreciation) | |||||||
Foreign currency contracts | Net realized gain (loss) on forward currency exchange contracts; Net change in unrealized appreciation/depreciation of forward currency exchange contracts | $ | 88,406 |
| $ | (93,487 | ) | |||
|
|
|
| |||||||
Total | $ | 88,406 | $ | (93,487 | ) | |||||
|
|
|
| |||||||
The following table represents the average monthly volume of the Fund’s derivative transactions during the six months ended December 31, 2018:
Forward Currency Exchange Contracts: | ||||
Average principal amount of buy contracts | $ | 8,529,372 | ||
Average principal amount of sale contracts | $ | 7,465,341 |
For financial reporting purposes, the Fund does not offset derivative assets and derivative liabilities that are subject to netting arrangements in the statement of assets and liabilities.
All OTC derivatives held at period end were subject to netting arrangements. The following table presents the Fund’s derivative assets and liabilities by OTC counterparty net of amounts available for offset under ISDA Master Agreements (“MA”) and net of the related collateral received/pledged by the Fund as of December 31, 2018. Exchange-traded derivatives and centrally cleared swaps are not subject to netting arrangements and as such are excluded from the table.
| 30 | AB CONCENTRATED INTERNATIONAL GROWTH PORTFOLIO | abfunds.com | |
NOTES TO FINANCIAL STATEMENTS(continued)
Counterparty | Derivatives Assets Subject to a MA | Derivatives Available for Offset | Cash Collateral Received* | Security Collateral Received* | Net Amount of Derivatives Assets | |||||||||||||||
Bank of America, NA | $ | 45,665 | $ | (45,665 | ) | $ | – 0 | – | $ | – 0 | – | $ | – 0 | – | ||||||
Goldman Sachs Bank USA | 566 | (566 | ) | – 0 | – | – 0 | – | – 0 | – | |||||||||||
HSBC Bank USA | 869 | (869 | ) | – 0 | – | – 0 | – | – 0 | – | |||||||||||
Natwest Markets PLC | 2,219 | – 0 | – | – 0 | – | – 0 | – | 2,219 | ||||||||||||
State Street Bank & Trust Co. | 89,979 | (46,797 | ) | – 0 | – | – 0 | – | 43,182 | ||||||||||||
|
|
|
|
|
|
|
|
|
| |||||||||||
Total | $ | 139,298 | $ | (93,897 | ) | $ | – 0 | – | $ | – 0 | – | $ | 45,401 | ^ | ||||||
|
|
|
|
|
|
|
|
|
| |||||||||||
Counterparty | Derivatives Liabilities Subject to a MA | Derivatives Available for Offset | Cash Collateral Pledged* | Security Collateral Pledged* | Net Amount of Derivatives Liabilities | |||||||||||||||
Bank of America, NA | $ | 59,794 | $ | (45,665 | ) | $ | – 0 | – | $ | – 0 | – | $ | 14,129 | |||||||
Citibank, NA | 23,390 | – 0 | – | – 0 | – | – 0 | – | 23,390 | ||||||||||||
Goldman Sachs Bank USA | 9,832 | (566 | ) | – 0 | – | – 0 | – | 9,266 | ||||||||||||
HSBC Bank USA | 2,596 | (869 | ) | – 0 | – | – 0 | – | 1,727 | ||||||||||||
State Street Bank & Trust Co. | 46,797 | (46,797 | ) | – 0 | – | – 0 | – | – 0 | – | |||||||||||
UBS AG | 16,927 | – 0 | – | – 0 | – | – 0 | – | 16,927 | ||||||||||||
|
|
|
|
|
|
|
|
|
| |||||||||||
Total | $ | 159,336 | $ | (93,897 | ) | $ | – 0 | – | $ | – 0 | – | $ | 65,439 | ^ | ||||||
|
|
|
|
|
|
|
|
|
| |||||||||||
| * | The actual collateral received/pledged may be more than the amount reported due to over-collateralization. |
| ^ | Net amount represents the net receivable/payable that would be due from/to the counterparty in the event of default or termination. The net amount from OTC financial derivative instruments can only be netted across transactions governed under the same master agreement with the same counterparty. |
2. Currency Transactions
The Fund may invest innon-U.S. Dollar-denominated securities on a currency hedged or unhedged basis. The Fund may seek investment opportunities by taking long or short positions in currencies through the use of currency-related derivatives, including forward currency exchange contracts, futures and options on futures, swaps, and other options. The Fund may enter into transactions for investment opportunities when it anticipates that a foreign currency will appreciate or depreciate in value but securities denominated in that currency are not held by the Fund and do not present attractive investment opportunities. Such transactions may also be used when the Adviser believes that it may be more efficient than a direct investment in a foreign currency-denominated security. The Fund may also conduct currency exchange contracts on a spot basis (i.e., for cash at the spot rate prevailing in the currency exchange market for buying or selling currencies).
| abfunds.com | AB CONCENTRATED INTERNATIONAL GROWTH PORTFOLIO | 31 | |
NOTES TO FINANCIAL STATEMENTS(continued)
NOTE E
Securities Lending
The Fund may enter into securities lending transactions. Under the Fund’s securities lending program, all loans of securities will be collateralized continually by cash. The Fund will be compensated for the loan from a portion of the net return from the income earned on cash collateral after a rebate is paid to the borrower (in some cases, this rebate may be a “negative rebate” or fee paid by the borrower to the Fund in connection with the loan), and payments are made for fees of the securities lending agent and for certain other administrative expenses. It is the policy of the Fund to receive collateral consisting of cash in an amount exceeding the value of the securities loaned. The Fund will have the right to call a loan and obtain the securities loaned at any time on notice to the borrower within the normal and customary settlement time for the securities. While the securities are on loan, the borrower is obligated to pay the Fund amounts equal to any income or other distributions from the securities. The Fund will not be able to exercise voting rights with respect to any securities during the existence of a loan, but will have the right to regain ownership of loaned securities in order to exercise voting or other ownership rights. The lending agent has agreed to indemnify the Fund in the case of default of any securities borrower. Collateral received and securities loaned are marked to market daily to ensure that the securities loaned are secured by collateral. The lending agent currently invests the cash collateral received in Government Money Market Portfolio, an eligible money market vehicle, in accordance with the investment restrictions of the Fund, and as approved by the Board. The collateral received on securities loaned is recorded as an asset as well as a corresponding liability in the statement of assets and liabilities. When the Fund lends securities, its investment performance will continue to reflect changes in the value of the securities loaned. At December 31, 2018, the Fund had securities on loan with a value of $837,084 and had received cash collateral which has been invested into Government Money Market Portfolio of $873,622. The cash collateral will be adjusted on the next business day to maintain the required collateral amount. The Fund earned net securities lending income of $6,836 from Government Money Market Portfolio, inclusive of a rebate expense paid to the borrower, for the six months ended December 31, 2018; this amount is reflected in the statement of operations. In connection with the cash collateral investment by the Fund in the Government Money Market Portfolio, the Adviser has agreed to waive a portion of the Fund’s share of the advisory fees of Government Money Market Portfolio, as borne indirectly by the Fund as an acquired fund fee and expense. For the six months ended December 31, 2018, such waiver amounted to $224. A principal risk of lending portfolio securities is that the borrower may fail to return the loaned securities upon termination of the loan and that the collateral will not be sufficient to replace the loaned securities.
| 32 | AB CONCENTRATED INTERNATIONAL GROWTH PORTFOLIO | abfunds.com | |
NOTES TO FINANCIAL STATEMENTS(continued)
NOTE F
Capital Stock
Each class consists of 1,000,000,000 authorized shares. Transactions in capital shares for each class were as follows:
| Shares | Amount | |||||||||||||||||||||||
| Six Months Ended December 31, 2018 (unaudited) | Year Ended June 30, 2018 | Six Months Ended December 31, 2018 (unaudited) | Year Ended June 30, 2018 | |||||||||||||||||||||
|
| |||||||||||||||||||||||
| Class A |
| |||||||||||||||||||||||
Shares sold | 27,450 | 28,536 | $ | 291,694 | $ | 334,644 | ||||||||||||||||||
| ||||||||||||||||||||||||
Shares issued in reinvestment of dividends and distributions | 3,401 | 161 | 30,949 | 1,807 | ||||||||||||||||||||
| ||||||||||||||||||||||||
Shares redeemed | (11,670 | ) | (4,948 | ) | (116,360 | ) | (57,277 | ) | ||||||||||||||||
| ||||||||||||||||||||||||
Net increase | 19,181 | 23,749 | $ | 206,283 | $ | 279,174 | ||||||||||||||||||
| ||||||||||||||||||||||||
| Class C |
| |||||||||||||||||||||||
Shares sold | 273 | 16,522 | $ | 2,809 | $ | 191,433 | ||||||||||||||||||
| ||||||||||||||||||||||||
Shares issued in reinvestment of dividends and distributions | 958 | 111 | 8,556 | 1,229 | ||||||||||||||||||||
| ||||||||||||||||||||||||
Shares redeemed | (1,819 | ) | (4,285 | ) | (19,146 | ) | (49,219 | ) | ||||||||||||||||
| ||||||||||||||||||||||||
Net increase (decrease) | (588 | ) | 12,348 | $ | (7,781 | ) | $ | 143,443 | ||||||||||||||||
| ||||||||||||||||||||||||
| Advisor Class |
| |||||||||||||||||||||||
Shares sold | 590,777 | 1,769,172 | $ | 6,197,070 | $ | 20,899,991 | ||||||||||||||||||
| ||||||||||||||||||||||||
Shares issued in reinvestment of dividends and distributions | 21,308 | 763 | 194,328 | 8,574 | ||||||||||||||||||||
| ||||||||||||||||||||||||
Shares redeemed | (385,934 | ) | (943,979 | ) | (4,196,678 | ) | (10,831,062 | ) | ||||||||||||||||
| ||||||||||||||||||||||||
Net increase | 226,151 | 825,956 | $ | 2,194,720 | $ | 10,077,503 | ||||||||||||||||||
| ||||||||||||||||||||||||
At December 31, 2018, a shareholder of the Fund owned 89% of the Fund’s outstanding shares. Significant transactions by such shareholder, if any, may impact the Fund’s performance.
NOTE G
Risks Involved in Investing in the Fund
Focused Portfolio Risk—Investments in a limited number of companies may have more risk because changes in the value of a single security may have a more significant effect, either negative or positive, on the Fund’s net asset value, or NAV.
| abfunds.com | AB CONCENTRATED INTERNATIONAL GROWTH PORTFOLIO | 33 | |
NOTES TO FINANCIAL STATEMENTS(continued)
Sector Risk—The Fund may have more risk because of concentrated investments in a particular market sector, such as the technology or financial services sector. Market or economic factors affecting that sector could have a major effect on the value of the Fund’s investments.
Foreign(Non-U.S.) Risk—Investments in securities ofnon-U.S. issuers may involve more risk than those of U.S. issuers. These securities may fluctuate more widely in price and may be less liquid due to adverse market, economic, political, regulatory or other factors.
Emerging Market Risk—Investments in emerging market countries may have more risk because the markets are less developed and less liquid, and because these investments may be subject to increased economic, political, regulatory or other uncertainties.
Currency Risk—Fluctuations in currency exchange rates may negatively affect the value of the Fund’s investments or reduce its returns.
Capitalization Risk—Investments inmid-capitalization companies may be more volatile than investments in large-capitalization companies. Investments inmid-capitalization companies may have additional risks because these companies have limited product lines, markets or financial resources.
Indemnification Risk—In the ordinary course of business, the Fund enters into contracts that contain a variety of indemnifications. The Fund’s maximum exposure under these arrangements is unknown. However, the Fund has not had prior claims or losses pursuant to these indemnification provisions and expects the risk of loss thereunder to be remote. Therefore, the Fund has not accrued any liability in connection with these indemnification provisions.
NOTE H
Joint Credit Facility
A number ofopen-end mutual funds managed by the Adviser, including the Fund, participate in a $325 million revolving credit facility (the “Facility”) intended to provide short-term financing, if necessary, subject to certain restrictions in connection with abnormal redemption activity. Commitment fees related to the Facility are paid by the participating funds and are included in miscellaneous expenses in the statement of operations. The Fund did not utilize the Facility during the six months ended December 31, 2018.
| 34 | AB CONCENTRATED INTERNATIONAL GROWTH PORTFOLIO | abfunds.com | |
NOTES TO FINANCIAL STATEMENTS(continued)
NOTE I
Distributions to Shareholders
The tax character of distributions to be paid for the year ending June 30, 2019 will be determined at the end of the current fiscal year. The tax character of distributions paid during the fiscal years ended June 30, 2018 and June 30, 2017 were as follows:
| 2018 | 2017 | |||||||
Distributions paid from: | ||||||||
Ordinary income | $ | 1,132,404 | $ | 14,008 | ||||
Net long-term capital gains | 39,596 | – 0 | – | |||||
|
|
|
| |||||
Total taxable distributions paid | $ | 1,172,000 | $ | 14,008 | ||||
|
|
|
| |||||
As of June 30, 2018, the components of accumulated earnings/(deficit) on a tax basis were as follows:
Undistributed ordinary income | $ | 2,239,053 | ||
Undistributed capital gains | 966,853 | |||
Unrealized appreciation/(depreciation) | 3,783,849 | (a) | ||
|
| |||
Total accumulated earnings/(deficit) | $ | 6,989,755 | ||
|
|
| (a) | The differences between book-basis andtax-basis unrealized appreciation/(depreciation) are attributable primarily to the tax deferral of losses on wash sales and the recognition for tax purposes of unrealized gains/losses on certain derivative instruments. |
For tax purposes, net realized capital losses may be carried over to offset future capital gains, if any. Funds are permitted to carry forward capital losses for an indefinite period, and such losses will retain their character as either short-term or long-term capital losses. As of June 30, 2018, the Fund did not have any capital loss carryforwards.
NOTE J
Recent Accounting Pronouncements
In August 2018, the Financial Accounting Standards Board issued an Accounting Standards Update, ASU2018-13, Fair Value Measurement (Topic 820), Disclosure Framework—Changes to the Disclosure Requirements for Fair Value Measurement which removes, modifies and adds disclosures to Topic 820. The amendments in this ASU2018-13 apply to all entities that are required, under existing U.S. GAAP, to make disclosures about recurring or nonrecurring fair value measurements. The amendments in this ASU2018-13 are effective for all entities for fiscal years, and interim periods within those fiscal years, beginning after December 15, 2019. At this time, management is evaluating the implications of these changes on the financial statements.
In October 2018, the U.S. Securities and Exchange Commission adopted amendments to certain disclosure requirements included in RegulationS-X
| abfunds.com | AB CONCENTRATED INTERNATIONAL GROWTH PORTFOLIO | 35 | |
NOTES TO FINANCIAL STATEMENTS(continued)
that had become “redundant, duplicative, overlapping, outdated or superseded, in light of the other Commission disclosure requirements, GAAP or changes in the information environment.” The compliance date for the amendments toRegulation S-X was November 5, 2018 (for reporting period end dates of September 30, 2018 or after). Management has adopted the amendments which simplified certain disclosure requirements on the financial statements.
NOTE K
Subsequent Events
Management has evaluated subsequent events for possible recognition or disclosure in the financial statements through the date the financial statements are issued. Management has determined that there are no material events that would require disclosure in the Fund’s financial statements through this date.
| 36 | AB CONCENTRATED INTERNATIONAL GROWTH PORTFOLIO | abfunds.com | |
FINANCIAL HIGHLIGHTS
Selected Data For A Share Of Capital Stock Outstanding Throughout Each Period
| Class A | ||||||||||||||||||||
Six Months Ended (unaudited) | Year Ended June 30, | April 15, 2015(a) to June 30, 2015 | ||||||||||||||||||
| 2018 | 2017 | 2016 | ||||||||||||||||||
|
| |||||||||||||||||||
Net asset value, beginning of period | $ 11.54 | $ 10.50 | $ 8.46 | $ 9.77 | $ 10.00 | |||||||||||||||
|
| |||||||||||||||||||
Income From Investment Operations | ||||||||||||||||||||
Net investment income (loss)(b)(c) | (.03 | ) | .08 | .05 | .03 | .03 | ||||||||||||||
Net realized and unrealized gain (loss) on investment transactions and foreign currency | (1.91 | ) | 1.32 | 2.04 | (1.34 | ) | (.26 | ) | ||||||||||||
|
| |||||||||||||||||||
Net increase (decrease) in net asset value from operations | (1.94 | ) | 1.40 | 2.09 | (1.31 | ) | (.23 | ) | ||||||||||||
|
| |||||||||||||||||||
Less: Dividends and Distributions | ||||||||||||||||||||
Dividends from net investment income | (.00 | )(d) | (.08 | ) | (.05 | ) | (.00 | )(d) | – 0 | – | ||||||||||
Distributions from net realized gain on investment transactions | (.69 | ) | (.28 | ) | – 0 | – | (.00 | )(d) | – 0 | – | ||||||||||
|
| |||||||||||||||||||
Total dividends and distributions | (.69 | ) | (.36 | ) | (.05 | ) | – 0 | – | – 0 | – | ||||||||||
|
| |||||||||||||||||||
Net asset value, end of period | $ 8.91 | $ 11.54 | $ 10.50 | $ 8.46 | $ 9.77 | |||||||||||||||
|
| |||||||||||||||||||
Total Return | ||||||||||||||||||||
Total investment return based on net asset value(e) | (16.95 | )% | 13.43 | % | 24.83 | % | (13.39 | )% | (2.30 | )% | ||||||||||
Ratios/Supplemental Data | ||||||||||||||||||||
Net assets, end of period | $391 | $286 | $11 | $9 | $10 | |||||||||||||||
Ratio to average net assets of: | ||||||||||||||||||||
Expenses, net of waivers/reimbursements(f)‡ | 1.29 | %^ | 1.29 | % | 1.29 | % | 1.30 | % | 1.30 | %^ | ||||||||||
Expenses, before waivers/reimbursements(f)‡ | 1.94 | %^ | 2.08 | % | 8.96 | % | 17.79 | % | 18.01 | %^ | ||||||||||
Net investment income (loss)(c) | (.51 | )%^ | .67 | % | .54 | % | .34 | % | 1.58 | %^ | ||||||||||
Portfolio turnover rate | 18 | % | 34 | % | 66 | % | 42 | % | 2 | % | ||||||||||
‡ Expense ratios exclude the estimated acquired fund fees of the affiliated/unaffiliated underlying |
| |||||||||||||||||||
portfolios | .01 | % | .01 | % | .01 | % | .00 | % | .00 | % | ||||||||||
See footnote summary on page 40.
| abfunds.com | AB CONCENTRATED INTERNATIONAL GROWTH PORTFOLIO | 37 | |
FINANCIAL HIGHLIGHTS(continued)
Selected Data For A Share Of Capital Stock Outstanding Throughout Each Period
| Class C | ||||||||||||||||||||
Six Months (unaudited) | Year Ended June 30, | April 15, 2015(a) to June 30, 2015 | ||||||||||||||||||
| 2018 | 2017 | 2016 | ||||||||||||||||||
|
| |||||||||||||||||||
Net asset value, beginning of period | $ 11.38 | $ 10.39 | $ 8.39 | $ 9.75 | $ 10.00 | |||||||||||||||
|
| |||||||||||||||||||
Income From Investment Operations | ||||||||||||||||||||
Net investment income (loss)(b)(c) | (.07 | ) | .00 | (d) | (.02 | ) | (.04 | ) | .02 | |||||||||||
Net realized and unrealized gain (loss) on investment transactions and foreign currency | (1.88 | ) | 1.30 | 2.02 | (1.32 | ) | (.27 | ) | ||||||||||||
|
| |||||||||||||||||||
Net increase (decrease) in net asset value from operations | (1.95 | ) | 1.30 | 2.00 | (1.36 | ) | (.25 | ) | ||||||||||||
|
| |||||||||||||||||||
Less: Dividends and Distributions | ||||||||||||||||||||
Dividends from net investment income | – 0 | – | (.03 | ) | – 0 | – | – 0 | – | – 0 | – | ||||||||||
Distributions from net realized gain on investment transactions | (.69 | ) | (.28 | ) | – 0 | – | (.00 | )(d) | – 0 | – | ||||||||||
|
| |||||||||||||||||||
Total dividends and distributions | (.69 | ) | (.31 | ) | – 0 | – | – 0 | – | – 0 | – | ||||||||||
|
| |||||||||||||||||||
Net asset value, end of period | $ 8.74 | $ 11.38 | $ 10.39 | $ 8.39 | $ 9.75 | |||||||||||||||
|
| |||||||||||||||||||
Total Return | ||||||||||||||||||||
Total investment return based on net asset value(e) | (17.30 | )% | 12.57 | % | 23.84 | % | (13.93 | )% | (2.50 | )% | ||||||||||
Ratios/Supplemental Data | ||||||||||||||||||||
Net assets, end of period | $127 | $172 | $28 | $8 | $9 | |||||||||||||||
Ratio to average net assets of: | ||||||||||||||||||||
Expenses, net of waivers/reimbursements(f)‡ | 2.04 | %^ | 2.04 | % | 2.04 | % | 2.05 | % | 2.05 | %^ | ||||||||||
Expenses, before waivers/reimbursements(f)‡ | 2.68 | %^ | 2.89 | % | 9.39 | % | 18.58 | % | 18.73 | %^ | ||||||||||
Net investment income (loss)(c) | (1.24 | )%^ | .02 | % | (.20 | )% | (.43 | )% | .81 | %^ | ||||||||||
Portfolio turnover rate | 18 | % | 34 | % | 66 | % | 42 | % | 2 | % | ||||||||||
‡ Expense ratios exclude the estimated acquired fund fees of the affiliated/unaffiliated underlying |
| |||||||||||||||||||
portfolios | .01 | % | .01 | % | .01 | % | .00 | % | .00 | % | ||||||||||
See footnote summary on page 40.
| 38 | AB CONCENTRATED INTERNATIONAL GROWTH PORTFOLIO | abfunds.com | |
FINANCIAL HIGHLIGHTS(continued)
Selected Data For A Share Of Capital Stock Outstanding Throughout Each Period
| Advisor Class | ||||||||||||||||||||
Six Months (unaudited) | Year Ended June 30, | April 15, 2015(a) to June 30, 2015 | ||||||||||||||||||
| 2018 | 2017 | 2016 | ||||||||||||||||||
|
| |||||||||||||||||||
Net asset value, beginning of period | $ 11.57 | $ 10.51 | $ 8.47 | $ 9.77 | $ 10.00 | |||||||||||||||
|
| |||||||||||||||||||
Income From Investment Operations | ||||||||||||||||||||
Net investment income (loss)(b)(c) | (.01 | ) | .06 | .20 | .05 | .04 | ||||||||||||||
Net realized and unrealized gain (loss) on investment transactions and foreign currency | (1.93 | ) | 1.37 | 1.91 | (1.33 | ) | (.27 | ) | ||||||||||||
|
| |||||||||||||||||||
Net increase (decrease) in | (1.94 | ) | 1.43 | 2.11 | (1.28 | ) | (.23 | ) | ||||||||||||
|
| |||||||||||||||||||
Less: Dividends and Distributions | ||||||||||||||||||||
Dividends from net | (.01 | ) | (.09 | ) | (.07 | ) | (.02 | ) | – 0 | – | ||||||||||
Distributions from net | (.69 | ) | (.28 | ) | – 0 | – | (.00 | )(d) | – 0 | – | ||||||||||
|
| |||||||||||||||||||
Total dividends and distributions | (.70 | ) | (.37 | ) | (.07 | ) | (.02 | ) | – 0 | – | ||||||||||
|
| |||||||||||||||||||
Net asset value, end of period | $ 8.93 | $ 11.57 | $ 10.51 | $ 8.47 | $ 9.77 | |||||||||||||||
|
| |||||||||||||||||||
Total Return | ||||||||||||||||||||
Total investment return | (16.83 | )% | 13.61 | % | 25.12 | % | (13.13 | )% | (2.30 | )% | ||||||||||
Ratios/Supplemental Data | ||||||||||||||||||||
Net assets, end of period (000’s omitted) | $37,104 | $45,424 | $32,602 | $1,678 | $1,935 | |||||||||||||||
Ratio to average net | ||||||||||||||||||||
Expenses, net of waivers/reimbursements(f)‡ | 1.04 | %^ | 1.04 | % | 1.04 | % | 1.05 | % | 1.05 | %^ | ||||||||||
Expenses, before waivers/reimbursements(f)‡ | 1.66 | %^ | 1.80 | % | 3.75 | % | 17.53 | % | 17.75 | %^ | ||||||||||
Net investment income (loss)(c) | (.24 | )%^ | .53 | % | 2.04 | % | .58 | % | 1.81 | %^ | ||||||||||
Portfolio turnover rate | 18 | % | 34 | % | 66 | % | 42 | % | 2 | % | ||||||||||
‡ Expense ratios exclude the estimated acquired fund fees of the affiliated/unaffiliated underlying |
| |||||||||||||||||||
portfolios | .01 | % | .01 | % | .01 | % | .00 | % | .00 | % | ||||||||||
See footnote summary on page 40.
| abfunds.com | AB CONCENTRATED INTERNATIONAL GROWTH PORTFOLIO | 39 | |
FINANCIAL HIGHLIGHTS(continued)
Selected Data For A Share Of Capital Stock Outstanding Throughout Each Period
| (a) | Commencement of operations. |
| (b) | Based on average shares outstanding. |
| (c) | Net of expenses waived/reimbursed by the Adviser. |
| (d) | Amount is less than $.005. |
| (e) | Total investment return is calculated assuming an initial investment made at the net asset value at the beginning of the period, reinvestment of all dividends and distributions at net asset value during the period, and redemption on the last day of the period. Initial sales charges or contingent deferred sales charges are not reflected in the calculation of total investment return. Total return does not reflect the deduction of taxes that a shareholder would pay on fund distributions or the redemption of fund shares. Total investment return calculated for a period of less than one year is not annualized. |
| (f) | In connection with the Fund’s investments in affiliated underlying portfolios, the Fund incurs no direct expenses, but bears proportionate shares of the fees and expenses (i.e., operating, administrative and investment advisory fees) of the affiliated underlying portfolios. The Adviser has contractually agreed to waive its fees from the Fund in an amount equal to the Fund’s pro rata share of certain acquired fund fees and expenses, and for the six months ended December 31, 2018 and the years ended June 30, 2018 and June 30, 2017, such waiver amounted to .01% (annualized), .01% and .01%, respectively. |
| ^ | Annualized. |
See notes to financial statements.
| 40 | AB CONCENTRATED INTERNATIONAL GROWTH PORTFOLIO | abfunds.com | |
RESULTS OF STOCKHOLDER MEETING
(unaudited)
A Special Meeting of Stockholders of the AB Cap Fund, Inc. (the “Company”)—AB Concentrated International Growth Fund (the “Fund”) was held on October 11, 2018. A description of the proposals and number of shares voted at the Meeting are as follows (the proposal number shown below corresponds to the proposal number in the Fund’s proxy statement):
| 1. | To approve and vote upon the election of Directors for the Company, each such Director to serve for a term of indefinite duration and until his or her successor is duly elected and qualifies. |
Director: | Voted For: | Authority Withheld: | ||||||
Michael J. Downey | 153,531,217 | 1,117,868 | ||||||
William H. Foulk, Jr.* | 153,385,034 | 1,264,050 | ||||||
Nancy P. Jacklin | 153,607,746 | 1,041,339 | ||||||
Robert M. Keith | 153,546,025 | 1,103,060 | ||||||
Carol C. McMullen | 153,649,415 | 999,670 | ||||||
Gary L. Moody | 153,545,113 | 1,103,972 | ||||||
Marshall C. Turner, Jr. | 153,507,495 | 1,141,590 | ||||||
Earl D. Weiner | 153,514,727 | 1,134,358 | ||||||
| 2. | To vote upon the approval of new advisory agreements for the Fund with AllianceBernstein L.P. |
| Voted For: | Voted Against: | Abstain: | Broker Non-Votes: | |||
| 3,892,944 | – 0 – | – 0 – | 37,221 |
| * | Mr. Foulk retired on December 31, 2018. |
| abfunds.com | AB CONCENTRATED INTERNATIONAL GROWTH PORTFOLIO | 41 | |
BOARD OF DIRECTORS
Marshall C. Turner, Jr.(1),Chairman Michael J. Downey(1) Nancy P. Jacklin(1) | Robert M. Keith,President and Chief Executive Officer Carol C. McMullen(1) Garry L. Moody(1) Earl D. Weiner(1) |
OFFICERS
Debasashi (Dev) Chakrabarti(2),Vice President Mark Phelps(2),Vice President Emilie D. Wrapp,Secretary Michael B. Reyes,Senior Analyst | Joseph J. Mantineo,Treasurer and Chief Financial Officer Phyllis J. Clarke,Controller Vincent S. Noto,Chief Compliance Officer |
Custodian and Accounting Agent State Street Bank and Trust Company State Street Corporation CCB/5 1 Iron Street Boston, MA 02210
Principal Underwriter AllianceBernstein Investments, Inc. 1345 Avenue of the Americas New York, NY 10105
Transfer Agent AllianceBernstein Investor Services, Inc. P.O. Box 786003 San Antonio, TX 78278-6003 Toll-Free (800) 221-5672 | Independent Registered Public Accounting Firm Ernst & Young LLP 5 Times Square New York, NY 10036
Legal Counsel Seward & Kissel LLP One Battery Park Plaza New York, NY 10004 |
| 1 | Member of the Audit Committee, the Governance and Nominating Committee and the Independent Directors Committee. |
| 2 | The day-to-day management of, and investment decisions for, the Fund’s Portfolio are made by the Investment Policy Team. Messrs. Phelps and Chakrabarti are the persons with the most significant responsibility for day-to-day management of the Fund’s Portfolio |
| 42 | AB CONCENTRATED INTERNATIONAL GROWTH PORTFOLIO | abfunds.com | |
Information Regarding the Review and Approval of the Fund’s Advisory Agreement
As described in more detail in the Proxy Statement for the AB Funds dated August 20, 2018, the Boards of the AB Funds, at a meeting held onJuly 31-August 2, 2018, approved new advisory agreements with the Adviser (the “Proposed Agreements”) for the AB Funds, including AB Cap Fund, Inc. in respect of AB Concentrated International Growth Portfolio (the “Fund”), in connection with the planned disposition by AXA S.A. of its remaining shares of AXA Equitable Holdings, Inc. (the indirect holder of a majority of the partnership interests in the Adviser and the indirect parent of AllianceBernstein Corporation, the general partner of the Adviser) in one or more transactions and the related potential for one or more “assignments” (within the meaning of section 2(a)(4) of the Investment Company Act) of the advisory agreements for the AB Funds, including the Fund’s Advisory Agreement, resulting in the automatic termination of such advisory agreements.
At the same meeting, the AB Boards also considered and approved interim advisory agreements with the Adviser (the “Interim Advisory Agreements”) for the AB Funds, including the Fund, to be effective only in the event that stockholder approval of a Proposed Agreement had not been obtained as of the date of one or more transactions resulting in an “assignment” of the Adviser’s advisory agreements, resulting in the automatic termination of such advisory agreements.
The shareholders of the Fund subsequently approved the Proposed Agreements at an annual meeting of shareholders called for the purpose of electing Directors and voting on the Proposed Agreements.
A discussion regarding the basis for the Boards’ approvals at a meeting held onJuly 31-August 2, 2018 is set forth below.
Information Regarding the Review and Approval of the Fund’s Proposed New Advisory Agreement and Interim Advisory Agreement in the Context of Potential Assignments
At a meeting of the AB Boards held on July31-August 2, 2018, the Adviser presented its recommendation that the Boards consider and approve the Proposed Agreements. Section 15(c) of the 1940 Act provides that, after an initial period, a Fund’s Current Agreement and currentsub-advisory agreement, as applicable, will remain in effect only if the Board, including a majority of the Independent Directors, annually reviews and approves them. Each of the Current Agreements had been approved by a Board within theone-year period prior to approval of its related Proposed Agreement, except that the Current Agreements for certain FlexFee funds were approved in February 2017. In connection with their approval of the Proposed Agreements, the Boards considered their conclusions in connection with their most recent approvals of the Current Agreements, in particular in cases where the last approval of a Current Agreement was relatively recent, including the Boards’ general satisfaction with the nature
| abfunds.com | AB CONCENTRATED INTERNATIONAL GROWTH PORTFOLIO | 43 | |
and quality of services being provided and, as applicable, in the case of certain Funds, actions taken or to be taken in an effort to improve investment performance or reduce expense ratios. The Directors also reviewed updated information provided by the Adviser in respect of each Fund. Also in connection with their approval of the Proposed Agreements, the Boards considered a representation made to them at that time by the Adviser that there were no additional developments not already disclosed to the Boards since their most recent approvals of the Current Agreements that would be a material consideration to the Boards in connection with their consideration of the Proposed Agreements, except for matters disclosed to the Boards by the Adviser. The Directors considered the fact that each Proposed Agreement would have corresponding terms and conditions identical to those of the corresponding Current Agreement with the exception of the effective date and initial term under the Proposed Agreement.
The Directors considered their knowledge of the nature and quality of the services provided by the Adviser to each Fund gained from their experience as directors or trustees of registered investment companies advised by the Adviser, their overall confidence in the Adviser’s integrity and competence they have gained from that experience, the Adviser’s initiative in identifying and raising potential issues with the Directors and its responsiveness, frankness and attention to concerns raised by the Directors in the past, including the Adviser’s willingness to consider and implement organizational and operational changes designed to improve investment results and the services provided to the Funds. The Directors noted that they have four regular meetings each year, at each of which they review extensive materials and information from the Adviser, including information on the investment performance of each Fund.
The Directors also considered all factors they believed relevant, including the specific matters discussed below. During the course of their deliberations, the Directors evaluated, among other things, the reasonableness of the management fees of the Funds they oversee. The Directors did not identify any particular information that was all-important or controlling, and different Directors may have attributed different weights to the various factors. The Directors determined that the selection of the Adviser to manage the Funds, and the overall arrangements between the Funds and the Adviser, as provided in the Proposed Agreements, including the management fees, were fair and reasonable in light of the services performed under the Current Agreements and to be performed under the Proposed Agreements, expenses incurred and to be incurred and such other matters as the Directors considered relevant in the exercise of their business judgment. The material factors and conclusions that formed the basis for the Directors’ determinations included the following:
Nature, Extent and Quality of Services Provided
The Directors considered the scope and quality of services to be provided by the Adviser under the Proposed Agreements, including the quality of
| 44 | AB CONCENTRATED INTERNATIONAL GROWTH PORTFOLIO | abfunds.com | |
the investment research capabilities of the Adviser and the other resources it has dedicated to performing services for the Funds. They also considered the information that had been provided to them by the Adviser concerning the anticipated implementation of the Plan and the Adviser’s representation that it did not anticipate that such implementation would affect the management or structure of the Adviser, have a material adverse effect on the Adviser, or adversely affect the quality of the services provided to the Funds by the Adviser and its affiliates. The Directors noted that the Adviser from time to time reviews each Fund’s investment strategies and from time to time proposes changes intended to improve the Fund’s relative or absolute performance for the Directors’ consideration. They also noted the professional experience and qualifications of each Fund’s portfolio management team and other senior personnel of the Adviser. The Directors also considered that certain Proposed Agreements, similar to the corresponding Current Agreements, provide that the Funds will reimburse the Adviser for the cost to it of providing certain clerical, accounting, administrative and other services to the Funds by employees of the Adviser or its affiliates. Requests for these reimbursements are made on a quarterly basis and subject to approval by the Directors. The Directors noted that the Adviser did not request any reimbursements from certain Funds in the Fund’s latest fiscal year reviewed. The Directors noted that the methodology to be used to determine the reimbursement amounts had been reviewed by an independent consultant retained by the Funds’ former Senior Officer/Independent Compliance Officer. The quality of administrative and other services, including the Adviser’s role in coordinating the activities of the Funds’ other service providers, also was considered. The Directors of each Fund concluded that, overall, they were satisfied with the nature, extent and quality of services to be provided to the Funds under the Proposed Agreement for the Fund.
Costs of Services to be Provided and Profitability
The Directors reviewed a schedule of the revenues and expenses and related notes indicating the profitability of each Fund to the Adviser for calendar years 2016 and 2017, as applicable, that had been prepared with an expense allocation methodology arrived at in consultation with an independent consultant retained by the Funds’ former Senior Officer/Independent Compliance Officer. The Directors noted the assumptions and methods of allocation used by the Adviser in preparing fund-specific profitability data and understood that there are a number of potentially acceptable allocation methodologies for information of this type. The Directors noted that the profitability information reflected all revenues and expenses of the Adviser’s relationship with a Fund, including those relating to its subsidiaries that provide transfer agency, distribution and brokerage services to the Fund, as applicable. The Directors recognized that it is difficult to make comparisons of the profitability of the Proposed Agreements with the profitability of fund advisory contracts for unaffiliated funds because comparative information is not generally publicly available and is
| abfunds.com | AB CONCENTRATED INTERNATIONAL GROWTH PORTFOLIO | 45 | |
affected by numerous factors. The Directors focused on the profitability of the Adviser’s relationship with each Fund before taxes and distribution expenses, as applicable. The Directors noted that certain Funds were not profitable to the Adviser in one or more periods reviewed. The Directors concluded that the Adviser’s level of profitability from its relationship with the other Funds was not unreasonable. The Directors were unable to consider historical information about the profitability of certain Funds that had recently commenced operations and for which historical profitability information was not available. The Adviser agreed to provide the Directors with profitability information in connection with future proposed continuances of the Proposed Agreements.
Fall-Out Benefits
The Directors considered the other benefits to the Adviser and its affiliates from their relationships with the Funds, including, but not limited to, as applicable, benefits relating to soft dollar arrangements (whereby investment advisers receive brokerage and research services from brokers that execute agency transactions for their clients) in the case of certain Funds;12b-1 fees and sales charges received by the principal underwriter (which is a wholly owned subsidiary of the Adviser) in respect of certain classes of the shares of most of the Funds; brokerage commissions paid by certain Funds to brokers affiliated with the Adviser; and transfer agency fees paid by most of the Funds to a wholly owned subsidiary of the Adviser. The Directors recognized that the Adviser’s profitability would be somewhat lower, and that a Fund’s unprofitability to the Adviser would be exacerbated, without these benefits. The Directors understood that the Adviser also might derive reputational and other benefits from its association with the Funds.
Investment Results
In addition to the information reviewed by the Directors in connection with the Board meeting at which the Proposed Agreements were approved, the Directors receive detailed performance information for the Funds at each regular Board meeting during the year.
The Boards’ consideration of each Proposed Agreement was informed by their most recent approval of the related Current Agreement, and, in the case of certain Funds, their discussion with the Adviser of the reasons for those Funds’ underperformance in certain periods. The Directors also reviewed updated performance information and, in some cases, discussed with the Adviser the reasons for changes in performance or continued underperformance. On the basis of this review, the Directors concluded that each Fund’s investment performance was acceptable.
Management Fees and Other Expenses
The Directors considered the management fee rate payable by each Fund to the Adviser and information prepared by an independent service provider (the ‘‘15(c) provider’’) concerning management fee rates payable by
| 46 | AB CONCENTRATED INTERNATIONAL GROWTH PORTFOLIO | abfunds.com | |
other funds in the same category as the Fund. The Directors recognized that it is difficult to make comparisons of management fees because there are variations in the services that are included in the fees paid by other funds. The Directors compared each Fund’s contractual management fee rate with a peer group median, and where applicable, took into account the impact on the management fee rate of the administrative expense reimbursement paid to the Adviser in the latest fiscal year. In the case of the ACS Funds, the Directors noted that the management fee rate is zero but also were cognizant that the Adviser is indirectly compensated by the wrap fee program sponsors that use the ACS Funds as an investment vehicle for their clients.
The Directors also considered the Adviser’s fee schedule for other clients pursuing a similar investment style to each Fund. For this purpose, they reviewed the relevant advisory fee information from the Adviser’s Form ADV and in a report from the Funds’ Senior Analyst and noted the differences between a Fund’s fee schedule, on the one hand, and the Adviser’s institutional fee schedule and the schedule of fees charged by the Adviser to any offshore funds and for services to anysub-advised funds pursuing a similar investment strategy as the Fund, on the other, as applicable. The Directors noted that the Adviser may, in some cases, agree to fee rates with large institutional clients that are lower than those reviewed by the Directors and that they had previously discussed with the Adviser its policies in respect of such arrangements. The Adviser also informed the Directors that, in the case of certain Funds, there were no institutional products managed by the Adviser that have a substantially similar investment style. The Directors also discussed these matters with their independent fee consultant.
The Adviser reviewed with the Directors the significantly greater scope of the services it provides to each Fund relative to institutional, offshore fund andsub-advised fund clients, as applicable. In this regard, the Adviser noted, among other things, that, compared to institutional and offshore orsub-advisory accounts, each Fund, as applicable, (i) demands considerably more portfolio management, research and trading resources due to significantly higher daily cash flows (in the case ofopen-end Funds); (ii) has more tax and regulatory restrictions and compliance obligations; (iii) must prepare and file or distribute regulatory and other communications about fund operations; and (iv) must provide shareholder servicing to retail investors. The Adviser also reviewed the greater legal risks presented by the large and changing population of Fund shareholders who may assert claims against the Adviser in individual or class actions, and the greater entrepreneurial risk in offering new fund products, which require substantial investment to launch, may not succeed, and generally must be priced to compete with larger, more established funds resulting in lack of profitability to the Adviser until a new fund achieves scale. In light of the substantial differences in services rendered by the Adviser to institutional, offshore fund andsub-advised fund clients as compared to the Funds, and
| abfunds.com | AB CONCENTRATED INTERNATIONAL GROWTH PORTFOLIO | 47 | |
the different risk profile, the Directors considered these fee comparisons inapt and did not place significant weight on them in their deliberations.
The Directors noted that many of the Funds may invest in shares of exchange-traded funds (‘‘ETFs’’), subject to the restrictions and limitations of the 1940 Act as these may be varied as a result of exemptive orders issued by the SEC. The Directors also noted that ETFs pay advisory fees pursuant to their advisory contracts. The Directors concluded, based on the Adviser’s explanation of how it uses ETFs when they are the most cost-effective way to obtain desired exposures, in some cases pending purchases of underlying securities, that each Fund’s management fee would be for services that would be in addition to, rather than duplicative of, the services provided under the advisory contracts of the ETFs.
With respect to each Fund’s management fee, the Directors considered the total expense ratio of the Fund in comparison to a peer group and peer universe selected by the 15(c) service provider. The Directors also considered the Adviser’s expense caps for certain Funds. The Directors view expense ratio information as relevant to their evaluation of the Adviser’s services because the Adviser is responsible for coordinating services provided to a Fund by others.
The Boards’ consideration of each Proposed Agreement was informed by their most recent approval of the related Current Agreement, and, in the case of certain Funds, their discussion with the Adviser of the reasons for those Funds’ expense ratios in certain periods. The Directors also reviewed updated expense ratio information and, in some cases, discussed with the Adviser the reasons for the expense ratios of certain Funds. On the basis of this review, the Directors concluded that each Fund’s expense ratio was acceptable.
The Directors did not consider comparative expense information for the ACS Funds because those Funds do not bear ordinary expenses.
Economies of Scale
The Directors noted that the management fee schedules for certain Funds do not contain breakpoints and that they had discussed their strong preference for breakpoints in advisory contracts with the Adviser. The Directors took into consideration prior presentations by an independent consultant on economies of scale in the mutual fund industry and for the Funds, and by the Adviser concerning certain of its views on economies of scale. The Directors also had requested and received from the Adviser certain updates on economies of scale in advance of the Board meeting. The Directors believe that economies of scale may be realized (if at all) by the Adviser across a variety of products and services, and not only in respect of a single fund. The Directors noted that there is no established methodology for setting breakpoints that give effect to the fund-specific services provided by a fund’s adviser and to the economies of scale that
| 48 | AB CONCENTRATED INTERNATIONAL GROWTH PORTFOLIO | abfunds.com | |
an adviser may realize in its overall mutual fund business or those components of it which directly or indirectly affect a fund’s operations. The Directors observed that in the mutual fund industry as a whole, as well as among funds similar to each Fund, there is no uniformity or pattern in the fees and asset levels at which breakpoints (if any) apply. The Directors also noted that the advisory agreements for many funds do not have breakpoints at all. The Directors informed the Adviser that they would monitor the asset levels of the Funds without breakpoints and their profitability to the Adviser and anticipated revisiting the question of breakpoints in the future if circumstances warrant doing so.
The Directors did not consider the extent to which fee levels in the Advisory Agreement for the ACS Funds reflect economies of scale because that Advisory Agreement does not provide for any compensation to be paid to the Adviser by the ACS Funds and the expense ratio of each of those Funds is zero.
Interim Advisory Agreements
In approving the Interim Advisory Agreements, the Boards, with the assistance of independent counsel, considered similar factors to those considered in approving the Proposed Agreements. The Interim Advisory Agreements approved by the Boards are identical to the Proposed Agreements, as well as the Current Agreements, in all material respects except for their proposed effective and termination dates and provisions intended to comply with the requirements of the relevant SEC rule, such as provisions requiring escrow of advisory fees. Under the Interim Advisory Agreements, the Adviser would continue to manage a Fund pursuant to an Interim Advisory Agreement until a new advisory agreement was approved by stockholders or until the end of the150-day period, whichever would occur earlier. All fees earned by the Adviser under an Interim Advisory Agreement would be held in escrow pending shareholder approval of the Proposed Agreement. Upon approval of a new advisory agreement by stockholders, the escrowed management fees would be paid to the Adviser, and the Interim Advisory Agreement would terminate.
Information Regarding the Review and Approval of the Fund’s Current Advisory Agreement
The disinterested directors (the “directors”) of AB Cap Fund, Inc. (the “Company”) unanimously approved the continuance of the Company’s Advisory Agreement with the Adviser in respect of AB Concentrated International Growth Portfolio (the “Fund”) at a meeting held onMay 1-3, 2018 (the “Meeting”).
Prior to approval of the continuance of the Advisory Agreement, the directors had requested from the Adviser, and received and evaluated, extensive materials. They reviewed the proposed continuance of the Advisory Agreement with the Adviser and with experienced counsel who are
| abfunds.com | AB CONCENTRATED INTERNATIONAL GROWTH PORTFOLIO | 49 | |
independent of the Adviser, who advised on the relevant legal standards. The directors also reviewed additional materials, including materials from an outside consultant, who acted as their independent fee consultant, and comparative analytical data prepared by the Senior Analyst for the Fund. The directors also discussed the proposed continuance in private sessions with counsel.
The directors considered their knowledge of the nature and quality of the services provided by the Adviser to the Fund gained from their experience as directors or trustees of most of the registered investment companies advised by the Adviser, their overall confidence in the Adviser’s integrity and competence they have gained from that experience, the Adviser’s initiative in identifying and raising potential issues with the directors and its responsiveness, frankness and attention to concerns raised by the directors in the past, including the Adviser’s willingness to consider and implement organizational and operational changes designed to improve investment results and the services provided to the AB Funds. The directors noted that they have four regular meetings each year, at each of which they review extensive materials and information from the Adviser, including information on the investment performance of the Fund.
The directors also considered all factors they believed relevant, including the specific matters discussed below. During the course of their deliberations, the directors evaluated, among other things, the reasonableness of the advisory fee. The directors did not identify any particular information that wasall-important or controlling, and different directors may have attributed different weights to the various factors. The directors determined that the selection of the Adviser to manage the Fund and the overall arrangements between the Fund and the Adviser, as provided in the Advisory Agreement, including the advisory fee, were fair and reasonable in light of the services performed, expenses incurred and such other matters as the directors considered relevant in the exercise of their business judgment. The material factors and conclusions that formed the basis for the directors’ determinations included the following:
Nature, Extent and Quality of Services Provided
The directors considered the scope and quality of services provided by the Adviser under the Advisory Agreement, including the quality of the investment research capabilities of the Adviser and the other resources it has dedicated to performing services for the Fund. The directors noted that the Adviser from time to time reviews the Fund’s investment strategies and from time to time proposes changes intended to improve the Fund’s relative or absolute performance for the directors’ consideration. They also noted the professional experience and qualifications of the Fund’s portfolio management team and other senior personnel of the Adviser. The directors also considered that the Advisory Agreement provides that the Fund will reimburse the Adviser for the cost to it of providing certain clerical,
| 50 | AB CONCENTRATED INTERNATIONAL GROWTH PORTFOLIO | abfunds.com | |
accounting, administrative and other services to the Fund by employees of the Adviser or its affiliates. Requests for these reimbursements are made on a quarterly basis and subject to approval by the directors. The Adviser did not request any reimbursements from the Fund in the Fund’s latest fiscal year. The directors noted that the methodology used to determine the reimbursement amounts had been reviewed by an independent consultant retained by the Company’s former Independent Compliance Officer. The quality of administrative and other services, including the Adviser’s role in coordinating the activities of the Fund’s other service providers, also was considered. The directors concluded that, overall, they were satisfied with the nature, extent and quality of services provided to the Fund under the Advisory Agreement.
Costs of Services Provided and Profitability
The directors reviewed a schedule of the revenues and expenses and related notes indicating the profitability of the Fund to the Adviser for calendar years 2016 and 2017 that had been prepared with an expense allocation methodology arrived at in consultation with an independent consultant retained by the Company’s former Independent Compliance Officer. The directors noted the assumptions and methods of allocation used by the Adviser in preparing fund-specific profitability data and understood that there are a number of potentially acceptable allocation methodologies for information of this type. The directors noted that the profitability information reflected all revenues and expenses of the Adviser’s relationship with the Fund, including those relating to its subsidiaries that provide transfer agency, distribution and brokerage services to the Fund. The directors recognized that it is difficult to make comparisons of the profitability of the Advisory Agreement with the profitability of advisory contracts for unaffiliated funds because comparative information is not generally publicly available and is affected by numerous factors. The directors focused on the profitability of the Adviser’s relationship with the Fund before taxes and distribution expenses. The directors noted that the Fund was not profitable to the Adviser in the periods reviewed.
Fall-Out Benefits
The directors considered the other benefits to the Adviser and its affiliates from their relationships with the Fund, including, but not limited to, benefits relating to soft dollar arrangements (whereby investment advisers receive brokerage and research services from brokers that execute agency transactions for their clients);12b-1 fees and sales charges received by the Fund’s principal underwriter (which is a wholly owned subsidiary of the Adviser) in respect of certain classes of the Fund’s shares; brokerage commissions paid by the Fund to brokers affiliated with the Adviser; and transfer agency fees paid by the Fund to a wholly owned subsidiary of the Adviser. The directors recognized that the Fund’s unprofitability to the Adviser would be exacerbated without these benefits. The directors understood that the Adviser also might derive reputational and other benefits from its association with the Fund.
| abfunds.com | AB CONCENTRATED INTERNATIONAL GROWTH PORTFOLIO | 51 | |
Investment Results
In addition to the information reviewed by the directors in connection with the Meeting, the directors receive detailed performance information for the Fund at each regular Board meeting during the year.
At the Meeting, the directors reviewed performance information prepared by an analytical service that is not affiliated with the Adviser (the “15(c) service provider”), showing the performance of the Class A Shares of the Fund against a group of similar funds (“peer group”) and a larger group of similar funds (“peer universe”), each selected by the 15(c) service provider, and information prepared by the Adviser showing performance of the Class A Shares against a broad-based securities market index, in each case for the1-year period ended February 28, 2018 and (in the case of comparisons with the broad-based securities market index) for the period from inception. Based on their review, the directors concluded that the Fund’s investment performance was acceptable.
Advisory Fees and Other Expenses
The directors considered the advisory fee rate payable by the Fund to the Adviser and information prepared by the 15(c) service provider concerning advisory fee rates payable by other funds in the same category as the Fund. The directors recognized that it is difficult to make comparisons of advisory fees because there are variations in the services that are included in the fees paid by other funds. The directors compared the Fund’s contractual advisory fee rate with a peer group median.
The directors also considered the Adviser’s fee schedule for other clients pursuing a similar investment style. For this purpose, they reviewed the relevant advisory fee information from the Adviser’s Form ADV and the materials from the Fund’s Senior Analyst and noted the differences between the Fund’s fee schedule, on the one hand, and the Adviser’s institutional fee schedule and the schedule of fees charged by the Adviser to any offshore funds and anysub-advised funds, on the other. The directors noted that the Adviser may, in some cases, agree to fee rates with large institutional clients that are lower than those reviewed by the directors and that they had previously discussed with the Adviser its policies in respect of such arrangements.
The Adviser reviewed with the directors the significantly greater scope of the services it provides to the Fund relative to institutional, offshore fund andsub-advised fund clients. In this regard, the Adviser noted, among other things, that, compared to institutional and offshore accounts, the Fund (i) demands considerably more portfolio management, research and trading resources due to significantly higher daily cash flows; (ii) has more tax and regulatory restrictions; (iii) must prepare and distribute regulatory and other communications about fund operations; and (iv) must provide shareholder servicing to retail investors. The Adviser also reviewed the greater legal risks presented by the large and changing population of Fund
| 52 | AB CONCENTRATED INTERNATIONAL GROWTH PORTFOLIO | abfunds.com | |
shareholders who may assert claims against the Adviser in individual or class actions, and the greater entrepreneurial risk in offering new fund products, which require substantial investment to launch, may not succeed, and generally must be priced to compete with larger, more established funds resulting in lack of profitability to the Adviser until a new fund achieves scale. In light of the substantial differences in services rendered by the Adviser to institutional, offshore fund andsub-advised fund clients as compared to funds such as the Fund, and the different risk profile, the directors considered these fee comparisons inapt and did not place significant weight on them in their deliberations.
The directors noted that the Fund may invest in shares of exchange-traded funds (“ETFs”), subject to the restrictions and limitations of the Investment Company Act of 1940 as these may be varied as a result of exemptive orders issued by the SEC. The directors also noted that ETFs pay advisory fees pursuant to their advisory contracts, and that the Adviser had provided, and they had reviewed, information about the expense ratios of the relevant ETFs. The directors concluded, based on the Adviser’s explanation of how it may use ETFs when they are the most cost-effective way to obtain desired exposures for a fund or to temporarily “equitize” cash inflows pending purchases of underlying securities, that the advisory fee for the Fund would be paid for services that would be in addition to, rather than duplicative of, the services provided under the advisory contracts of the ETFs.
The directors also considered the total expense ratio of the Class A shares of the Fund in comparison to a peer group and a peer universe selected by the 15(c) service provider. The Class A expense ratio of the Fund was based on the Fund’s latest fiscal year and the directors considered the effects of any fee waivers and/or expense reimbursements as a result of the Adviser’s expense cap. The directors noted that it was likely that the expense ratios of some of the other funds in the Fund’s category were lowered by waivers or reimbursements by those funds’ investment advisers, which in some cases might be voluntary or temporary. The directors view expense ratio information as relevant to their evaluation of the Adviser’s services because the Adviser is responsible for coordinating services provided to the Fund by others. Based on their review, the directors concluded that the Fund’s expense ratio was acceptable.
Economies of Scale
The directors noted that the advisory fee schedule for the Fund does not contain breakpoints and that they had discussed their strong preference for breakpoints in advisory contracts with the Adviser. The directors took into consideration prior presentations by an independent consultant on economies of scale in the mutual fund industry and for the AB Funds, and by the Adviser concerning certain of its views on economies of scale. The directors also had requested and received from the Adviser certain
| abfunds.com | AB CONCENTRATED INTERNATIONAL GROWTH PORTFOLIO | 53 | |
updates on economies of scale in advance of the Meeting. The directors believe that economies of scale may be realized (if at all) by the Adviser across a variety of products and services, and not only in respect of a single fund. The directors noted that there is no established methodology for setting breakpoints that give effect to the fund-specific services provided by a fund’s adviser and to the economies of scale that an adviser may realize in its overall mutual fund business or those components of it which directly or indirectly affect a fund’s operations. The directors observed that in the mutual fund industry as a whole, as well as among funds similar to the Fund, there is no uniformity or pattern in the fees and asset levels at which breakpoints (if any) apply. The directors also noted that the advisory agreements for many funds do not have breakpoints at all. The directors informed the Adviser that they would monitor the Fund’s assets (which were well below the level at which they would anticipate adding an initial breakpoint) and its profitability (currently unprofitable) to the Adviser and anticipated revisiting the question of breakpoints in the future if circumstances warranted doing so.
| 54 | AB CONCENTRATED INTERNATIONAL GROWTH PORTFOLIO | abfunds.com | |
This page is not part of the Shareholder Report or the Financial Statements.
AB FAMILY OF FUNDS
US EQUITY
US CORE
Core Opportunities Fund
FlexFee™ US Thematic Portfolio
Select US Equity Portfolio
US GROWTH
Concentrated Growth Fund
Discovery Growth Fund
FlexFee™ Large Cap Growth Portfolio
Growth Fund
Large Cap Growth Fund
Small Cap Growth Portfolio
US VALUE
Discovery Value Fund
Equity Income Fund
Relative Value Fund
Small Cap Value Portfolio
Value Fund
INTERNATIONAL/ GLOBAL EQUITY
INTERNATIONAL/ GLOBAL CORE
FlexFee™ International Strategic Core Portfolio
Global Core Equity Portfolio
International Portfolio
International Strategic Core Portfolio
Sustainable Global Thematic Fund
Tax-Managed International Portfolio
Tax-Managed Wealth Appreciation Strategy
Wealth Appreciation Strategy
INTERNATIONAL/ GLOBAL GROWTH
Concentrated International Growth Portfolio
FlexFee™ Emerging Markets Growth Portfolio
INTERNATIONAL/ GLOBAL EQUITY(continued)
Sustainable International Thematic Fund
INTERNATIONAL/ GLOBAL VALUE
All China Equity Portfolio
International Value Fund
FIXED INCOME
MUNICIPAL
High Income Municipal Portfolio
Intermediate California Municipal Portfolio
Intermediate Diversified Municipal Portfolio
Intermediate New York Municipal Portfolio
Municipal Bond Inflation Strategy
Tax-Aware Fixed Income Portfolio
National Portfolio
Arizona Portfolio
California Portfolio
Massachusetts Portfolio
Minnesota Portfolio
New Jersey Portfolio
New York Portfolio
Ohio Portfolio
Pennsylvania Portfolio
Virginia Portfolio
TAXABLE
Bond Inflation Strategy
FlexFee™ High Yield Portfolio1
FlexFee™ International Bond Portfolio
Global Bond Fund
High Income Fund
Income Fund
Intermediate Bond Portfolio
Limited Duration High Income Portfolio
Short Duration Portfolio
ALTERNATIVES
All Market Real Return Portfolio
Global Real Estate Investment Fund
Select US Long/Short Portfolio
Unconstrained Bond Fund
MULTI-ASSET
All Market Income Portfolio
All Market Total Return Portfolio
Conservative Wealth Strategy
Emerging Markets Multi-Asset Portfolio
Global Risk Allocation Fund
Tax-Managed All Market Income Portfolio
TARGET-DATE
Multi-Manager Select Retirement Allocation Fund
Multi-Manager Select 2010 Fund
Multi-Manager Select 2015 Fund
Multi-Manager Select 2020 Fund
Multi-Manager Select 2025 Fund
Multi-Manager Select 2030 Fund
Multi-Manager Select 2035 Fund
Multi-Manager Select 2040 Fund
Multi-Manager Select 2045 Fund
Multi-Manager Select 2050 Fund
Multi-Manager Select 2055 Fund
Multi-Manager Select 2060 Fund
CLOSED-END FUNDS
Alliance California Municipal Income Fund
AllianceBernstein Global High Income Fund
AllianceBernstein National Municipal Income Fund
We also offer Government Money Market Portfolio, which serves as the money market fund exchange vehicle for the AB mutual funds. You could lose money by investing in the Fund. Although the Fund seeks to preserve the value of your investment at $1.00 per share, it cannot guarantee it will do so. The Fund may impose a fee upon sale of your shares or may temporarily suspend your ability to sell shares if the Fund’s liquidity falls below required minimums because of market conditions or other factors. An investment in the Fund is not insured or guaranteed by the Federal Deposit Insurance Corporation or any other government agency. The Fund’s sponsor has no legal obligation to provide financial support to the Fund, and you should not expect that the sponsor will provide financial support to the Fund at any time.
Investors should consider the investment objectives, risks, charges and expenses of the Fund carefully before investing. For copies of our prospectus or summary prospectus, which contain this and other information, visit us online at www.abfunds.com or contact your AB representative. Please read the prospectus and/or summary prospectus carefully before investing.
| 1 | Prior to February 23, 2018, FlexFee High Yield Portfolio was named High Yield Portfolio. |
| abfunds.com | AB CONCENTRATED INTERNATIONAL GROWTH PORTFOLIO | 55 | |
NOTES
| 56 | AB CONCENTRATED INTERNATIONAL GROWTH PORTFOLIO | abfunds.com | |
NOTES
| abfunds.com | AB CONCENTRATED INTERNATIONAL GROWTH PORTFOLIO | 57 | |
NOTES
| 58 | AB CONCENTRATED INTERNATIONAL GROWTH PORTFOLIO | abfunds.com | |
NOTES
| abfunds.com | AB CONCENTRATED INTERNATIONAL GROWTH PORTFOLIO | 59 | |
NOTES
| 60 | AB CONCENTRATED INTERNATIONAL GROWTH PORTFOLIO | abfunds.com | |
AB CONCENTRATED INTERNATIONAL GROWTH PORTFOLIO
1345 Avenue of the Americas
New York, NY 10105
800 221 5672
CIG-0152-1218 
DEC 12.31.18

SEMI-ANNUAL REPORT
AB EMERGING MARKETS CORE PORTFOLIO

Beginning January 1, 2021, as permitted by new regulations adopted by the Securities and Exchange Commission, the Fund’s annual and semi-annual shareholder reports will no longer be sent by mail, unless you specifically request paper copies of the reports. Instead, the reports will be made available on a website, and you will be notified by mail each time a report is posted and provided with a website address to access the report.
If you already elected to receive shareholder reports electronically, you will not be affected by this change and you need not take any action. You may elect to receive shareholder reports and other communications from the Fund electronically at any time by contacting your financial intermediary (such as a broker-dealer or bank) or, if you are a direct investor, by calling the Fund at (800) 221 5672.
You may elect to receive all future reports in paper form free of charge. If you invest through a financial intermediary, you can contact your financial intermediary to request that you continue to receive paper copies of your shareholder reports; if you invest directly with the Fund, you can call the Fund at (800) 221 5672. Your election to receive reports in paper form will apply to all funds held in your account with your financial intermediary or, if you invest directly, to all AB Mutual Funds you hold.
A discussion of the Fund’s investment performance is not included in this report. AllianceBernstein L.P. would like to thank you for your interest in the Fund.
| Investment Products Offered | • Are Not FDIC Insured• May Lose Value• Are Not Bank Guaranteed | |
Investors should consider the investment objectives, risks, charges and expenses of the Fund carefully before investing. For copies of our prospectus or summary prospectus, which contain this and other information, visit us online at www.abfunds.com or contact your AB representative. Please read the prospectus and/or summary prospectus carefully before investing.
This shareholder report must be preceded or accompanied by the Fund’s prospectus for individuals who are not current shareholders of the Fund.
You may obtain a description of the Fund’s proxy voting policies and procedures, and information regarding how the Fund voted proxies relating to portfolio securities during the most recent12-month period ended June 30, without charge. Simply visit AB’s website at www.abfunds.com, or go to the Securities and Exchange Commission’s (the “Commission”) website at www.sec.gov, or call AB at (800) 227 4618.
The Fund files its complete schedule of portfolio holdings with the Commission for the first and third quarters of each fiscal year. The Fund’s portfolio holdings reports are available on the Commission’s website at www.sec.gov. The Fund’s portfolio holdings reports may also be reviewed and copied at the Commission’s Public Reference Room in Washington, DC; information on the operation of the Public Reference Room may be obtained by calling (800) SEC 0330. AB publishes full portfolio holdings for the Fund monthly at www.abfunds.com.
AllianceBernstein Investments, Inc. (ABI) is the distributor of the AB family of mutual funds. ABI is a member of FINRA and is an affiliate of AllianceBernstein L.P., the Adviser of the funds.
The [A/B] logo is a registered service mark of AllianceBernstein and AllianceBernstein® is a registered service mark used by permission of the owner, AllianceBernstein L.P.
EXPENSE EXAMPLE
(unaudited)
As a shareholder of the Fund, you incur two types of costs: (1) transaction costs, including sales charges (loads) on purchase payments, contingent deferred sales charges on redemptions and (2) ongoing costs, including management fees; distribution(12b-1) fees; and other Fund expenses. This example is intended to help you understand your ongoing costs (in dollars) of investing in the Fund and to compare these costs with the ongoing costs of investing in other mutual funds.
The Example is based on an investment of $1,000 invested at the beginning of the period and held for the entire period as indicated below.
Actual Expenses
The table below provides information about actual account values and actual expenses. You may use the information, together with the amount you invested, to estimate the expenses that you paid over the period. Simply divide your account value by $1,000 (for example, an $8,600 account value divided by $1,000 = 8.6), then multiply the result by the number under the heading entitled “Expenses Paid During Period” to estimate the expenses you paid on your account during this period.
Hypothetical Example for Comparison Purposes
The table below also provides information about hypothetical account values and hypothetical expenses based on the Fund’s actual expense ratio and an assumed annual rate of return of 5% before expenses, which is not the Fund’s actual return. The hypothetical account values and expenses may not be used to estimate the actual ending account balance or expenses you paid for the period. You may use this information to compare the ongoing costs of investing in the Fund and other funds by comparing this 5% hypothetical example with the 5% hypothetical examples that appear in the shareholder reports of other funds.
Please note that the expenses shown in the table are meant to highlight your ongoing costs only and do not reflect any transactional costs, such as sales charges (loads), or contingent deferred sales charges on redemptions. Therefore, the hypothetical example is useful in comparing ongoing costs only, and will not help you determine the relative total costs of owning different funds. In addition, if these transactional costs were included, your costs would have been higher.
| Beginning Account Value 7/1/2018 | Ending Account Value 12/31/2018 | Expenses Paid During Period* | Annualized Expense Ratio* | |||||||||||||
| Class A | ||||||||||||||||
Actual | $ | 1,000 | $ | 898.20 | $ | 6.46 | 1.35 | % | ||||||||
Hypothetical** | $ | 1,000 | $ | 1,018.40 | $ | 6.87 | 1.35 | % | ||||||||
| abfunds.com | AB EMERGING MARKETS CORE PORTFOLIO | 1 | |
EXPENSE EXAMPLE(continued)
| Beginning Account Value 7/1/2018 | Ending Account Value 12/31/2018 | Expenses Paid During Period* | Annualized Expense Ratio* | |||||||||||||
| Class C | ||||||||||||||||
Actual | $ | 1,000 | $ | 895.50 | $ | 10.03 | 2.10 | % | ||||||||
Hypothetical** | $ | 1,000 | $ | 1,014.62 | $ | 10.66 | 2.10 | % | ||||||||
| Advisor Class | ||||||||||||||||
Actual | $ | 1,000 | $ | 900.00 | $ | 5.27 | 1.10 | % | ||||||||
Hypothetical** | $ | 1,000 | $ | 1,019.66 | $ | 5.60 | 1.10 | % | ||||||||
| * | Expenses are equal to the classes’ annualized expense ratios multiplied by the average account value over the period, multiplied by 184/365 (to reflect theone-half year period). |
| ** | Assumes 5% annual return before expenses. |
| 2 | AB EMERGING MARKETS CORE PORTFOLIO | abfunds.com | |
PORTFOLIO SUMMARY
December 31, 2018 (unaudited)
PORTFOLIO STATISTICS
Net Assets ($mil): $4.0
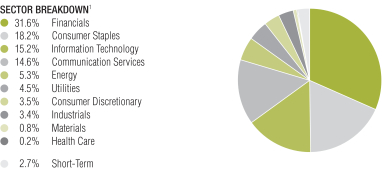
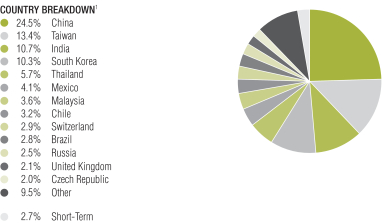
| 1 | All data are as of December 31, 2018. The Fund’s sector and country breakdowns are expressed as a percentage of total investments and may vary over time. The Fund also enters into derivative transactions, which may be used for hedging or investment purposes (see “Portfolio of Investments” section of the report for additional details). “Other” country weightings represent 1.8% or less in the following countries: France, Hong Kong, Hungary, Indonesia, Norway, Peru, South Africa, United Arab Emirates and United States. |
Please note: The sector classifications presented herein are based on the Global Industry Classification Standard (GICS) which was developed by Morgan Stanley Capital International and Standard & Poor’s. The components are divided into sector, industry group, and industrysub-indices as classified by the GICS for each of the market capitalization indices in the broad market. These sector classifications are broadly defined. The “Portfolio of Investments” section of the report reflects more specific industry information and is consistent with the investment restrictions discussed in the Fund’s prospectus.
| abfunds.com | AB EMERGING MARKETS CORE PORTFOLIO | 3 | |
PORTFOLIO SUMMARY(continued)
December 31, 2018 (unaudited)
TEN LARGEST HOLDINGS1
| Company | U.S. $ Value | Percent of Net Assets | ||||||
| Taiwan Semiconductor Manufacturing Co., Ltd. | $ | 188,792 | 4.7 | % | ||||
| Samsung Electronics Co., Ltd. | 161,526 | 4.0 | ||||||
| Tencent Holdings Ltd. | 152,305 | 3.8 | ||||||
| China Mobile Ltd. | 130,634 | 3.3 | ||||||
| Nestle SA (REG) | 117,686 | 3.0 | ||||||
| Infosys Ltd. (Sponsored ADR) | 102,911 | 2.6 | ||||||
| Fubon Financial Holding Co., Ltd. | 101,264 | 2.5 | ||||||
| Alibaba Group Holding Ltd. (Sponsored ADR) | 86,491 | 2.2 | ||||||
| Unilever PLC | 84,005 | 2.1 | ||||||
| Wal-Mart de Mexico SAB de CV | 83,318 | 2.1 | ||||||
| $ | 1,208,932 | 30.3 | % | |||||
| 1 | Long-term investments. |
| 4 | AB EMERGING MARKETS CORE PORTFOLIO | abfunds.com | |
PORTFOLIO OF INVESTMENTS
December 31, 2018 (unaudited)
| Company | Shares | U.S. $ Value | ||||||||||
| ||||||||||||
COMMON STOCKS – 97.9% | ||||||||||||
Financials – 31.7% | ||||||||||||
Banks – 21.7% | ||||||||||||
Agricultural Bank of China Ltd. – Class H | 177,000 | $ | 77,525 | |||||||||
Banco de Chile | 331,828 | 47,379 | ||||||||||
Banco Santander Chile | 364,750 | 27,067 | ||||||||||
Bangkok Bank PCL | 8,500 | 54,039 | ||||||||||
Bank Central Asia Tbk PT | 11,500 | 20,797 | ||||||||||
Bank of China Ltd. – Class H | 88,000 | 37,937 | ||||||||||
China Construction Bank Corp. – Class H | 28,000 | 22,928 | ||||||||||
Credicorp Ltd. | 335 | 74,259 | ||||||||||
CTBC Financial Holding Co., Ltd. | 69,000 | 45,384 | ||||||||||
Industrial & Commercial Bank of China Ltd. – Class H | 26,000 | 18,493 | ||||||||||
Itau Unibanco Holding SA (Preference Shares) | 4,500 | 41,185 | ||||||||||
Kasikornbank PCL (Foreign Shares) | 4,300 | 24,366 | ||||||||||
KB Financial Group, Inc. | 1,040 | 43,386 | ||||||||||
Komercni banka as | 1,300 | 49,086 | ||||||||||
Malayan Banking Bhd | 30,200 | 69,374 | ||||||||||
Moneta Money Bank AS(a) | 10,150 | 32,748 | ||||||||||
OTP Bank Nyrt | 630 | 25,460 | ||||||||||
Public Bank Bhd | 9,100 | 54,479 | ||||||||||
Shinhan Financial Group Co., Ltd. | 1,790 | 63,466 | ||||||||||
Siam Commercial Bank PCL (The) | 9,600 | 39,361 | ||||||||||
|
| |||||||||||
| 868,719 | ||||||||||||
|
| |||||||||||
Consumer Finance – 0.4% | ||||||||||||
Samsung Card Co., Ltd.(b) | 510 | 15,756 | ||||||||||
|
| |||||||||||
Diversified Financial Services – 2.5% | ||||||||||||
Fubon Financial Holding Co., Ltd. | 66,000 | 101,264 | ||||||||||
|
| |||||||||||
Insurance – 5.6% | ||||||||||||
AIA Group Ltd. | 6,400 | 53,164 | ||||||||||
BB Seguridade Participacoes SA | 5,500 | 39,156 | ||||||||||
Cathay Financial Holding Co., Ltd. | 22,000 | 33,678 | ||||||||||
DB Insurance Co., Ltd.(b) | 980 | 61,720 | ||||||||||
PICC Property & Casualty Co., Ltd. – Class H | 18,000 | 18,367 | ||||||||||
Ping An Insurance Group Co. of China Ltd. – Class H | 2,000 | 17,644 | ||||||||||
|
| |||||||||||
| 223,729 | ||||||||||||
|
| |||||||||||
Thrifts & Mortgage Finance – 1.5% | ||||||||||||
Housing Development Finance Corp., Ltd. | 1,780 | 50,065 | ||||||||||
LIC Housing Finance Ltd. | 1,180 | 8,210 | ||||||||||
|
| |||||||||||
| 58,275 | ||||||||||||
|
| |||||||||||
| 1,267,743 | ||||||||||||
|
| |||||||||||
Consumer Staples – 18.3% | ||||||||||||
Beverages – 3.1% | ||||||||||||
Ambev SA | 2,000 | 7,925 | ||||||||||
Cia Cervecerias Unidas SA | 4,240 | 55,102 | ||||||||||
Fomento Economico Mexicano SAB de CV | 4,600 | 39,554 | ||||||||||
| abfunds.com | AB EMERGING MARKETS CORE PORTFOLIO | 5 | |
PORTFOLIO OF INVESTMENTS(continued)
| Company | Shares | U.S. $ Value | ||||||||||
| ||||||||||||
Kweichow Moutai Co., Ltd. – Class A | 220 | $ | 18,996 | |||||||||
|
| |||||||||||
| 121,577 | ||||||||||||
|
| |||||||||||
Food & Staples Retailing – 3.2% | ||||||||||||
CP ALL PCL (NVDR) | 21,200 | 44,766 | ||||||||||
Wal-Mart de Mexico SAB de CV | 32,760 | 83,318 | ||||||||||
|
| |||||||||||
| 128,084 | ||||||||||||
|
| |||||||||||
Food Products – 6.4% | ||||||||||||
AVI Ltd. | 3,040 | 21,482 | ||||||||||
Danone SA | 830 | 58,501 | ||||||||||
Nestle SA (REG) | 1,450 | 117,686 | ||||||||||
Uni-President Enterprises Corp. | 25,000 | 56,717 | ||||||||||
|
| |||||||||||
| 254,386 | ||||||||||||
|
| |||||||||||
Household Products – 0.5% | ||||||||||||
Hindustan Unilever Ltd. | 800 | 20,825 | ||||||||||
|
| |||||||||||
Personal Products – 2.1% | ||||||||||||
Unilever PLC | 1,600 | 84,005 | ||||||||||
|
| |||||||||||
Tobacco – 3.0% | ||||||||||||
ITC Ltd. | 16,280 | 65,630 | ||||||||||
Philip Morris International, Inc. | 830 | 55,411 | ||||||||||
|
| |||||||||||
| 121,041 | ||||||||||||
|
| |||||||||||
| 729,918 | ||||||||||||
|
| |||||||||||
Information Technology – 15.3% | ||||||||||||
IT Services – 5.8% | ||||||||||||
HCL Technologies Ltd. | 4,510 | 62,311 | ||||||||||
Infosys Ltd. (Sponsored ADR) | 10,810 | 102,911 | ||||||||||
Tata Consultancy Services Ltd. | 2,500 | 67,848 | ||||||||||
|
| |||||||||||
| 233,070 | ||||||||||||
|
| |||||||||||
Semiconductors & Semiconductor Equipment – 5.4% | ||||||||||||
Chipbond Technology Corp. | 14,000 | 28,112 | ||||||||||
Taiwan Semiconductor Manufacturing Co., Ltd. | 26,000 | 188,792 | ||||||||||
|
| |||||||||||
| 216,904 | ||||||||||||
|
| |||||||||||
Technology Hardware, Storage & Peripherals – 4.1% | ||||||||||||
Samsung Electronics Co., Ltd. | 4,640 | 161,526 | ||||||||||
|
| |||||||||||
| 611,500 | ||||||||||||
|
| |||||||||||
Communication Services – 14.7% | ||||||||||||
Diversified Telecommunication Services – 5.5% | ||||||||||||
China Telecom Corp., Ltd. – Class H | 140,000 | 71,731 | ||||||||||
Chunghwa Telecom Co., Ltd. | 11,000 | 40,163 | ||||||||||
Emirates Telecommunications Group Co. PJSC | 8,370 | 38,702 | ||||||||||
KT Corp. (Sponsored ADR) | 2,510 | 35,692 | ||||||||||
Telenor ASA | 1,780 | 34,568 | ||||||||||
|
| |||||||||||
| 220,856 | ||||||||||||
|
| |||||||||||
Entertainment – 0.5% | ||||||||||||
NCSoft Corp.(b) | 50 | 20,959 | ||||||||||
|
| |||||||||||
| 6 | AB EMERGING MARKETS CORE PORTFOLIO | abfunds.com | |
PORTFOLIO OF INVESTMENTS(continued)
| Company | Shares | U.S. $ Value | ||||||||||
| ||||||||||||
Interactive Media & Services – 3.8% | ||||||||||||
Tencent Holdings Ltd. | 3,800 | $ | 152,305 | |||||||||
|
| |||||||||||
Media – 0.6% | ||||||||||||
Megacable Holdings SAB de CV | 4,860 | 21,760 | ||||||||||
|
| |||||||||||
Wireless Telecommunication Services – 4.3% | ||||||||||||
Advanced Info Service PCL | 7,900 | 41,854 | ||||||||||
China Mobile Ltd. | 13,500 | 130,634 | ||||||||||
|
| |||||||||||
| 172,488 | ||||||||||||
|
| |||||||||||
| 588,368 | ||||||||||||
|
| |||||||||||
Energy – 5.3% | ||||||||||||
Oil, Gas & Consumable Fuels – 5.3% | ||||||||||||
China Petroleum & Chemical Corp. – Class H | 86,000 | 61,302 | ||||||||||
LUKOIL PJSC (Sponsored ADR) | 1,010 | 72,053 | ||||||||||
PetroChina Co., Ltd. – Class H | 34,000 | 21,097 | ||||||||||
Petronet LNG Ltd. | 8,410 | 26,922 | ||||||||||
Tatneft PJSC (Sponsored ADR) | 478 | 30,114 | ||||||||||
|
| |||||||||||
| 211,488 | ||||||||||||
|
| |||||||||||
Utilities – 4.6% | ||||||||||||
Electric Utilities – 0.6% | ||||||||||||
Transmissora Alianca de Energia Eletrica SA | 3,700 | 22,496 | ||||||||||
|
| |||||||||||
Gas Utilities – 0.6% | ||||||||||||
China Resources Gas Group Ltd. | 6,000 | 23,775 | ||||||||||
|
| |||||||||||
Independent Power and Renewable Electricity Producers – 1.9% | ||||||||||||
China Yangtze Power Co., Ltd. – Class A | 22,600 | 52,301 | ||||||||||
Glow Energy PCL | 9,200 | 25,147 | ||||||||||
|
| |||||||||||
| 77,448 | ||||||||||||
|
| |||||||||||
Water Utilities – 1.5% | ||||||||||||
Guangdong Investment Ltd. | 30,000 | 57,966 | ||||||||||
|
| |||||||||||
| 181,685 | ||||||||||||
|
| |||||||||||
Consumer Discretionary – 3.6% | ||||||||||||
Automobiles – 0.6% | ||||||||||||
Hero MotoCorp Ltd. | 530 | 23,443 | ||||||||||
|
| |||||||||||
Household Durables – 0.2% | ||||||||||||
Coway Co., Ltd. | 150 | 9,961 | ||||||||||
|
| |||||||||||
Internet & Direct Marketing Retail – 2.2% | ||||||||||||
Alibaba Group Holding Ltd. (Sponsored ADR)(b) | 631 | 86,491 | ||||||||||
|
| |||||||||||
Textiles, Apparel & Luxury Goods – 0.6% | ||||||||||||
Shenzhou International Group Holdings Ltd. | 2,000 | 22,732 | ||||||||||
|
| |||||||||||
| 142,627 | ||||||||||||
|
| |||||||||||
Industrials – 3.4% | ||||||||||||
Industrial Conglomerates – 0.3% | ||||||||||||
Far Eastern New Century Corp. | 14,000 | 12,714 | ||||||||||
|
| |||||||||||
| abfunds.com | AB EMERGING MARKETS CORE PORTFOLIO | 7 | |
PORTFOLIO OF INVESTMENTS(continued)
| Company | Shares | U.S. $ Value | ||||||||||
| ||||||||||||
Road & Rail – 1.2% | ||||||||||||
Daqin Railway Co., Ltd. – Class A | 41,300 | $ | 49,548 | |||||||||
|
| |||||||||||
Trading Companies & Distributors – 0.3% | ||||||||||||
BOC Aviation Ltd.(a) | 1,600 | 11,806 | ||||||||||
|
| |||||||||||
Transportation Infrastructure – 1.6% | ||||||||||||
Grupo Aeroportuario del Centro Norte SAB de CV | 4,550 | 21,715 | ||||||||||
Jiangsu Expressway Co., Ltd. – Class H | 14,000 | 19,542 | ||||||||||
Malaysia Airports Holdings Bhd | 10,300 | 20,865 | ||||||||||
|
| |||||||||||
| 62,122 | ||||||||||||
|
| |||||||||||
| 136,190 | ||||||||||||
|
| |||||||||||
Materials – 0.8% | ||||||||||||
Chemicals – 0.8% | ||||||||||||
Formosa Chemicals & Fibre Corp. | 9,000 | 30,789 | ||||||||||
|
| |||||||||||
| Health Care – 0.2% | ||||||||||||
Health Care Providers & Services – 0.2% | ||||||||||||
Shanghai Pharmaceuticals Holding Co., Ltd. – Class H | 4,400 | 8,934 | ||||||||||
|
| |||||||||||
Total Common Stocks | 3,909,242 | |||||||||||
|
| |||||||||||
SHORT-TERM INVESTMENTS – 2.8% | ||||||||||||
Investment Companies – 2.6% | ||||||||||||
AB Fixed Income Shares, Inc. – Government Money Market Portfolio – Class AB, 2.31%(c)(d)(e) | 104,898 | 104,898 | ||||||||||
|
| |||||||||||
| Principal Amount (000) | ||||||||||||
Time Deposits – 0.2% | ||||||||||||
BBH Grand Cayman | CHF | 0 | * | 260 | ||||||||
(0.57)%, 1/02/19 | EUR | 1 | 1,421 | |||||||||
0.24%, 1/02/19 | NOK | 15 | 1,703 | |||||||||
0.37%, 1/02/19 | GBP | 1 | 716 | |||||||||
0.51%, 1/02/19 | SGD | 0 | * | 2 | ||||||||
1.52%, 1/02/19 | HKD | 7 | 874 | |||||||||
4.84%, 1/02/19 | ZAR | 6 | 408 | |||||||||
|
| |||||||||||
Total Time Deposits | 5,384 | |||||||||||
|
| |||||||||||
Total Short-Term Investments | 110,282 | |||||||||||
|
| |||||||||||
Total Investments – 100.7% | 4,019,524 | |||||||||||
Other assets less liabilities – (0.7)% | (26,215 | ) | ||||||||||
|
| |||||||||||
Net Assets – 100.0% | $ | 3,993,309 | ||||||||||
|
| |||||||||||
| 8 | AB EMERGING MARKETS CORE PORTFOLIO | abfunds.com | |
PORTFOLIO OF INVESTMENTS(continued)
FUTURES (see Note D)
| Description | Number of Contracts | Expiration Month | Notional (000) | Original Value | Value at December 31, 2018 | Unrealized Appreciation/ (Depreciation) | ||||||||||||||||||||||
Purchased Contracts |
| |||||||||||||||||||||||||||
MSCI Emerging Market Futures | 1 | March 2019 | USD | 0 | ** | $ | 49,575 | $ | 48,309 | $ | (1,266 | ) | ||||||||||||||||
| * | Principal amount less than 500. |
| ** | Notional amount less than 500. |
| (a) | Security is exempt from registration under Rule 144A of the Securities Act of 1933. These securities are considered restricted, but liquid and may be resold in transactions exempt from registration, normally to qualified institutional buyers. At December 31, 2018, the aggregate market value of these securities amounted to $44,554 or 1.1% of net assets. |
| (b) | Non-income producing security. |
| (c) | Affiliated investments. |
| (d) | To obtain a copy of the fund’s shareholder report, please go to the Securities and Exchange Commission’s website at www.sec.gov, or call AB at (800)227-4618. |
| (e) | The rate shown represents the7-day yield as of period end. |
Currency Abbreviations:
CHF – Swiss Franc
EUR – Euro
GBP – Great British Pound
HKD – Hong Kong Dollar
NOK – Norwegian Krone
SGD – Singapore Dollar
ZAR – South African Rand
Glossary:
ADR – American Depositary Receipt
MSCI – Morgan Stanley Capital International
NVDR – Non Voting Depositary Receipt
PJSC – Public Joint Stock Company
REG – Registered Shares
See notes to financial statements.
| abfunds.com | AB EMERGING MARKETS CORE PORTFOLIO | 9 | |
STATEMENT OF ASSETS & LIABILITIES
December 31, 2018(unaudited)
| Assets | ||||
Investments in securities, at value | ||||
Unaffiliated issuers (cost $3,848,527) | $ | 3,914,626 | ||
Affiliated issuers (cost $104,898) | 104,898 | |||
Cash collateral due from broker | 2,860 | |||
Foreign currencies, at value (cost $14,297) | 14,303 | |||
Receivable for investment securities sold | 49,545 | |||
Receivable from Adviser | 19,308 | |||
Unaffiliated dividends receivable | 10,676 | |||
Affiliated dividends receivable | 273 | |||
|
| |||
Total assets | 4,116,489 | |||
|
| |||
| Liabilities | ||||
Payable for investment securities purchased and foreign currency transactions | 37,445 | |||
Custody fee payable | 28,272 | |||
Audit and tax fee payable | 15,737 | |||
Printing fee payable | 6,356 | |||
Legal fee payable | 6,280 | |||
Transfer Agent fee payable | 899 | |||
Payable for variation margin on futures | 208 | |||
Directors’ fee payable | 73 | |||
Distribution fee payable | 10 | |||
Accrued expenses and other liabilities | 27,900 | |||
|
| |||
Total liabilities | 123,180 | |||
|
| |||
Net Assets | $ | 3,993,309 | ||
|
| |||
| Composition of Net Assets | ||||
Capital stock, at par | $ | 43 | ||
Additionalpaid-in capital | 4,125,396 | |||
Accumulated loss | (132,130 | ) | ||
|
| |||
| $ | 3,993,309 | |||
|
|
Net Asset Value Per Share—30 billion shares of capital stock authorized, $.0001 par value
| Class | Net Assets | Shares Outstanding | Net Asset Value | |||||||||
| ||||||||||||
| A | $ | 9,435 | 1,017.416 | $ | 9.27 | * | ||||||
| ||||||||||||
| C | $ | 9,350 | 1,007.418 | $ | 9.28 | |||||||
| ||||||||||||
| Advisor | $ | 3,974,524 | 428,598 | $ | 9.27 | |||||||
| ||||||||||||
| * | The maximum offering price per share for Class A shares was $9.68 which reflects a sales charge of 4.25%. |
See notes to financial statements.
| 10 | AB EMERGING MARKETS CORE PORTFOLIO | abfunds.com | |
STATEMENT OF OPERATIONS
Six Months Ended December 31, 2018(unaudited)
| Investment Income | ||||||||
Dividends | ||||||||
Unaffiliated issuers (net of foreign taxes withheld of $11,241) | $ | 64,689 | ||||||
Affiliated issuers | 2,080 | |||||||
Interest | 45 | $ | 66,814 | |||||
|
| |||||||
| Expenses | ||||||||
Advisory fee (see Note B) | 22,109 | |||||||
Transfer agency—Class A | 7 | |||||||
Transfer agency—Class C | 8 | |||||||
Transfer agency—Advisor Class | 2,956 | |||||||
Distribution fee—Class A | 14 | |||||||
Distribution fee—Class C | 54 | |||||||
Custodian | 53,476 | |||||||
Audit and tax | 33,991 | |||||||
Administrative | 30,396 | |||||||
Legal | 15,818 | |||||||
Directors’ fees | 12,497 | |||||||
Printing | 2,780 | |||||||
Registration fees | 26 | |||||||
Miscellaneous | 17,443 | |||||||
|
| |||||||
Total expenses | 191,575 | |||||||
Less: expenses waived and reimbursed by the Adviser (see Note B) | (165,982 | ) | ||||||
|
| |||||||
Net expenses | 25,593 | |||||||
|
| |||||||
Net investment income | 41,221 | |||||||
|
| |||||||
| Realized and Unrealized Gain (Loss) on Investment and Foreign Currency Transactions | ||||||||
Net realized gain (loss) on: | ||||||||
Investment transactions | (170,594 | )(a) | ||||||
Forward currency exchange contracts | (891 | ) | ||||||
Futures | (14,914 | ) | ||||||
Foreign currency transactions | 91 | |||||||
Net change in unrealized appreciation/depreciation on: | ||||||||
Investments | (339,607 | )(b) | ||||||
Forward currency exchange contracts | 891 | |||||||
Futures | (1,266 | ) | ||||||
Foreign currency denominated assets and liabilities | 16 | |||||||
|
| |||||||
Net loss on investment and foreign currency transactions | (526,274 | ) | ||||||
|
| |||||||
Net Decrease in Net Assets from Operations | $ | (485,053 | ) | |||||
|
|
| (a) | Net of foreign capital gains taxes of $579. |
| (b) | Net of decrease in accrued foreign capital gains taxes of $350. |
See notes to financial statements.
| abfunds.com | AB EMERGING MARKETS CORE PORTFOLIO | 11 | |
STATEMENT OF CHANGES IN NET ASSETS
| Six Months Ended December 31, 2018 (unaudited) | Year Ended June 30, 2018 | |||||||
| Increase (Decrease) in Net Assets from Operations | ||||||||
Net investment income | $ | 41,221 | $ | 123,890 | ||||
Net realized gain (loss) on investment and foreign currency transactions | (186,308 | ) | 573,978 | |||||
Net change in unrealized appreciation/depreciation on investments and foreign currency denominated assets and liabilities | (339,966 | ) | (539,176 | ) | ||||
|
|
|
| |||||
Net increase (decrease) in net assets from operations | (485,053 | ) | 158,692 | |||||
| Distributions to Shareholders* | ||||||||
Class A | (880 | ) | (1,672 | ) | ||||
Class C | (786 | ) | (1,556 | ) | ||||
Advisor Class | (383,466 | ) | (717,088 | ) | ||||
|
|
|
| |||||
Total decrease | (870,185 | ) | (561,624 | ) | ||||
| Net Assets | ||||||||
Beginning of period | 4,863,494 | 5,425,118 | ||||||
|
|
|
| |||||
End of period | $ | 3,993,309 | $ | 4,863,494 | ||||
|
|
|
| |||||
| * | The prior year’s amounts have been reclassified to conform with the current year’s presentation. See Note I, Recent Accounting Pronouncements, in the Notes to Financial Statements for more information. |
See notes to financial statements.
| 12 | AB EMERGING MARKETS CORE PORTFOLIO | abfunds.com | |
NOTES TO FINANCIAL STATEMENTS
December 31, 2018(unaudited)
NOTE A
Significant Accounting Policies
AB Cap Fund, Inc. (the “Company”), which is a Maryland corporation, is registered under the Investment Company Act of 1940 as anopen-end management investment company. The Company operates as a series company comprised of 29 portfolios currently in operation. Each portfolio is considered to be a separate entity for financial reporting and tax purposes. This report relates only to the AB Emerging Markets Core Portfolio (the “Fund”), a diversified portfolio. AB Emerging Markets Core Portfolio commenced operations on September 9, 2015. The Fund has authorized issuance of Class A, Class C, Advisor Class, Class R, Class K, Class I, Class Z, Class T, Class 1, and Class 2 shares. No classes are being publicly offered. Class R, Class K, Class I, Class Z, Class T, Class 1 or Class 2 shares have not been issued. As of December 31, 2018, AllianceBernstein L.P. (the “Adviser”) was the sole shareholder of Class A, Class C and Advisor Class shares. Class A shares are sold with afront-end sales charge of up to 4.25% for purchases not exceeding $1,000,000. With respect to purchases of $1,000,000 or more, Class A shares redeemed within one year of purchase may be subject to a contingent deferred sales charge of 1%. Class C shares are subject to a contingent deferred sales charge of 1% on redemptions made within the first year after purchase, and 0% after the first year of purchase. Class C shares will automatically convert to Class A shares ten years after the end of the calendar month of purchase. Advisor Class shares are sold without an initial or contingent deferred sales charge and are not subject to ongoing distribution expenses. All ten classes of shares have identical voting, dividend, liquidation and other rights, except that the classes bear different distribution and transfer agency expenses. Each class has exclusive voting rights with respect to its distribution plan. The financial statements have been prepared in conformity with U.S. generally accepted accounting principles (“U.S. GAAP”), which require management to make certain estimates and assumptions that affect the reported amounts of assets and liabilities in the financial statements and amounts of income and expenses during the reporting period. Actual results could differ from those estimates. The Fund is an investment company under U.S. GAAP and follows the accounting and reporting guidance applicable to investment companies. The following is a summary of significant accounting policies followed by the Fund.
1. Security Valuation
Portfolio securities are valued at their current market value determined on the basis of market quotations or, if market quotations are not readily available or are deemed unreliable, at “fair value” as determined in accordance with procedures established by and under the general supervision of the Fund’s Board of Directors (the “Board”).
In general, the market values of securities which are readily available and deemed reliable are determined as follows: securities listed on a national
| abfunds.com | AB EMERGING MARKETS CORE PORTFOLIO | 13 | |
NOTES TO FINANCIAL STATEMENTS(continued)
securities exchange (other than securities listed on the NASDAQ Stock Market, Inc. (“NASDAQ”)) or on a foreign securities exchange are valued at the last sale price at the close of the exchange or foreign securities exchange. If there has been no sale on such day, the securities are valued at the last traded price from the previous day. Securities listed on more than one exchange are valued by reference to the principal exchange on which the securities are traded; securities listed only on NASDAQ are valued in accordance with the NASDAQ Official Closing Price; listed or over the counter (“OTC”) market put or call options are valued at the mid level between the current bid and ask prices. If either a current bid or current ask price is unavailable, the Adviser will have discretion to determine the best valuation (e.g., last trade price in the case of listed options); open futures are valued using the closing settlement price or, in the absence of such a price, the most recent quoted bid price. If there are no quotations available for the day of valuation, the last available closing settlement price is used; U.S. Government securities and any other debt instruments having 60 days or less remaining until maturity are generally valued at market by an independent pricing vendor, if a market price is available. If a market price is not available, the securities are valued at amortized cost. This methodology is commonly used for short term securities that have an original maturity of 60 days or less, as well as short term securities that had an original term to maturity that exceeded 60 days. In instances when amortized cost is utilized, the Valuation Committee (the “Committee”) must reasonably conclude that the utilization of amortized cost is approximately the same as the fair value of the security. Such factors the Committee will consider include, but are not limited to, an impairment of the creditworthiness of the issuer or material changes in interest rates. Fixed-income securities, including mortgage-backed and asset-backed securities, may be valued on the basis of prices provided by a pricing service or at a price obtained from one or more of the major broker-dealers. In cases where broker-dealer quotes are obtained, the Adviser may establish procedures whereby changes in market yields or spreads are used to adjust, on a daily basis, a recently obtained quoted price on a security. Swaps and other derivatives are valued daily, primarily using independent pricing services, independent pricing models using market inputs, as well as third party broker-dealers or counterparties. Open end mutual funds are valued at the closing net asset value per share, while exchange traded funds are valued at the closing market price per share.
Securities for which market quotations are not readily available (including restricted securities) or are deemed unreliable are valued at fair value as deemed appropriate by the Adviser. Factors considered in making this determination may include, but are not limited to, information obtained by contacting the issuer, analysts, analysis of the issuer’s financial statements or other available documents. In addition, the Fund may use fair value pricing for securities primarily traded innon-U.S. markets because most foreign markets close well before the Fund values its securities at 4:00 p.m., Eastern Time. The earlier close of these foreign markets gives rise to the possibility that significant events, including broad market moves, may have
| 14 | AB EMERGING MARKETS CORE PORTFOLIO | abfunds.com | |
NOTES TO FINANCIAL STATEMENTS(continued)
occurred in the interim and may materially affect the value of those securities. To account for this, the Fund generally values many of its foreign equity securities using fair value prices based on third party vendor modeling tools to the extent available.
2. Fair Value Measurements
In accordance with U.S. GAAP regarding fair value measurements, fair value is defined as the price that the Fund would receive to sell an asset or pay to transfer a liability in an orderly transaction between market participants at the measurement date. U.S. GAAP establishes a framework for measuring fair value, and a three-level hierarchy for fair value measurements based upon the transparency of inputs to the valuation of an asset or liability (including those valued based on their market values as described in Note A.1 above). Inputs may be observable or unobservable and refer broadly to the assumptions that market participants would use in pricing the asset or liability. Observable inputs reflect the assumptions market participants would use in pricing the asset or liability based on market data obtained from sources independent of the Fund. Unobservable inputs reflect the Fund’s own assumptions about the assumptions that market participants would use in pricing the asset or liability based on the best information available in the circumstances. Each investment is assigned a level based upon the observability of the inputs which are significant to the overall valuation. The three-tier hierarchy of inputs is summarized below.
| • | Level 1—quoted prices in active markets for identical investments |
| • | Level 2—other significant observable inputs (including quoted prices for similar investments, interest rates, prepayment speeds, credit risk, etc.) |
| • | Level 3—significant unobservable inputs (including the Fund’s own assumptions in determining the fair value of investments) |
The fair value of debt instruments, such as bonds, andover-the-counter derivatives is generally based on market price quotations, recently executed market transactions (where observable) or industry recognized modeling techniques and are generally classified as Level 2. Pricing vendor inputs to Level 2 valuations may include quoted prices for similar investments in active markets, interest rate curves, coupon rates, currency rates, yield curves, option adjusted spreads, default rates, credit spreads and other unique security features in order to estimate the relevant cash flows which is then discounted to calculate fair values. If these inputs are unobservable and significant to the fair value, these investments will be classified as Level 3. In addition,non-agency rated investments are classified as Level 3.
Where readily available market prices or relevant bid prices are not available for certain equity investments, such investments may be valued based on similar publicly traded investments, movements in relevant indices since
| abfunds.com | AB EMERGING MARKETS CORE PORTFOLIO | 15 | |
NOTES TO FINANCIAL STATEMENTS(continued)
last available prices or based upon underlying company fundamentals and comparable company data (such as multiples to earnings or other multiples to equity). Where an investment is valued using an observable input such as another publicly traded security, the investment will be classified as Level 2. If management determines that an adjustment is appropriate based on restrictions on resale, illiquidity or uncertainty, and such adjustment is a significant component of the valuation, the investment will be classified as Level 3. An investment will also be classified as Level 3 where management uses company fundamentals and other significant inputs to determine the valuation.
The following table summarizes the valuation of the Fund’s investments by the above fair value hierarchy levels as of December 31, 2018:
Investments in | Level 1 | Level 2 | Level 3 | Total | ||||||||||||
Assets: | ||||||||||||||||
Common Stocks: | ||||||||||||||||
Financials | $ | 227,110 | $ | 1,040,633 | $ | – 0 | – | $ | 1,267,743 | |||||||
Consumer Staples | 199,765 | 530,153 | – 0 | – | 729,918 | |||||||||||
Information Technology | 102,911 | 508,589 | – 0 | – | 611,500 | |||||||||||
Communication Services | 57,452 | 530,916 | – 0 | – | 588,368 | |||||||||||
Energy | 102,167 | 109,321 | – 0 | – | 211,488 | |||||||||||
Utilities | – 0 | – | 181,685 | – 0 | – | 181,685 | ||||||||||
Consumer Discretionary | 96,452 | 46,175 | – 0 | – | 142,627 | |||||||||||
Industrials | 21,715 | 114,475 | – 0 | – | 136,190 | |||||||||||
Materials | – 0 | – | 30,789 | – 0 | – | 30,789 | ||||||||||
Health Care | – 0 | – | 8,934 | – 0 | – | 8,934 | ||||||||||
Short-Term Investments: | ||||||||||||||||
Investment Companies | 104,898 | – 0 | – | – 0 | – | 104,898 | ||||||||||
Time Deposits | – 0 | – | 5,384 | – 0 | – | 5,384 | ||||||||||
|
|
|
|
|
|
|
| |||||||||
Total Investments in Securities | 912,470 | 3,107,054 | † | – 0 | – | 4,019,524 | ||||||||||
|
|
|
|
|
|
|
| |||||||||
Other Financial Instruments*: | ||||||||||||||||
Liabilities | ||||||||||||||||
Futures | – 0 | – | (1,266 | ) | – 0 | – | (1,266 | )+ | ||||||||
|
|
|
|
|
|
|
| |||||||||
Total^ | $ | 912,470 | $ | 3,105,788 | $ | – 0 | – | $ | 4,018,258 | |||||||
|
|
|
|
|
|
|
| |||||||||
| † | A significant portion of the Fund’s foreign equity investments are categorized as Level 2 investments since they are valued using fair value prices based on third party vendor modeling tools to the extent available, see Note A.1. |
| * | Other financial instruments are derivative instruments, such as futures, forwards and swaps, which are valued at the unrealized appreciation/(depreciation) on the instrument. Other financial instruments may also include swaps with upfront premiums, options written and swaptions written which are valued at market value. |
| + | Only variation margin receivable/payable at period end is reported within the statements of assets and liabilities. This amount reflects cumulative unrealized appreciation/(depreciation) on futures and centrally cleared swaps as reported in the portfolio of investments. Centrally cleared swaps with upfront premiums are presented here at market value. |
| ^ | There were de minimis transfers under 1% of net assets between Level 1 and Level 2 during the reporting period. |
| 16 | AB EMERGING MARKETS CORE PORTFOLIO | abfunds.com | |
NOTES TO FINANCIAL STATEMENTS(continued)
The Fund recognizes all transfers between levels of the fair value hierarchy assuming the financial instrument was transferred at the beginning of the reporting period.
The Adviser established the Committee to oversee the pricing and valuation of all securities held in the Fund. The Committee operates under pricing and valuation policies and procedures established by the Adviser and approved by the Board, including pricing policies which set forth the mechanisms and processes to be employed on a daily basis to implement these policies and procedures. In particular, the pricing policies describe how to determine market quotations for securities and other instruments. The Committee’s responsibilities include: 1) fair value and liquidity determinations (and oversight of any third parties to whom any responsibility for fair value and liquidity determinations is delegated), and 2) regular monitoring of the Adviser’s pricing and valuation policies and procedures and modification or enhancement of these policies and procedures (or recommendation of the modification of these policies and procedures) as the Committee believes appropriate.
The Committee is also responsible for monitoring the implementation of the pricing policies by the Adviser’s Pricing Group (the “Pricing Group”) and any third party which performs certain pricing functions in accordance with the pricing policies. The Pricing Group is responsible for the oversight of the third party on aday-to-day basis. The Committee and the Pricing Group perform a series of activities to provide reasonable assurance of the accuracy of prices including: 1) periodic vendor due diligence meetings, review of methodologies, new developments and process at vendors, 2) daily comparison of security valuation versus prior day for all securities that exceeded established thresholds, and 3) daily review of unpriced, stale, and variance reports with exceptions reviewed by senior management and the Committee.
In addition, several processes outside of the pricing process are used to monitor valuation issues including: 1) performance and performance attribution reports are monitored for anomalous impacts based upon benchmark performance, and 2) portfolio managers review all portfolios for performance and analytics (which are generated using the Adviser’s prices).
3. Currency Translation
Assets and liabilities denominated in foreign currencies and commitments under forward currency exchange contracts are translated into U.S. dollars at the mean of the quoted bid and ask prices of such currencies against the U.S. dollar. Purchases and sales of Fund securities are translated into U.S. dollars at the rates of exchange prevailing when such securities were acquired or sold. Income and expenses are translated into U.S. dollars at rates of exchange prevailing when accrued.
| abfunds.com | AB EMERGING MARKETS CORE PORTFOLIO | 17 | |
NOTES TO FINANCIAL STATEMENTS(continued)
Net realized gain or loss on foreign currency transactions represents foreign exchange gains and losses from sales and maturities of foreign fixed income investments, holding of foreign currencies, currency gains or losses realized between the trade and settlement dates on foreign investment transactions, and the difference between the amounts of dividends, interest and foreign withholding taxes recorded on the Fund’s books and the U.S. dollar equivalent amounts actually received or paid. Net unrealized currency gains and losses from valuing foreign currency denominated assets and liabilities at period end exchange rates are reflected as a component of net unrealized appreciation and depreciation of foreign currency denominated assets and liabilities.
4. Taxes
It is the Fund’s policy to meet the requirements of the Internal Revenue Code applicable to regulated investment companies and to distribute all of its investment company taxable income and net realized gains, if any, to shareholders. Therefore, no provisions for federal income or excise taxes are required. The Fund may be subject to taxes imposed by countries in which it invests. Such taxes are generally based on income and/or capital gains earned or repatriated. Taxes are accrued and applied to net investment income, net realized gains and net unrealized appreciation/depreciation as such income and/or gains are earned.
In accordance with U.S. GAAP requirements regarding accounting for uncertainties in income taxes, management has analyzed the Fund’s tax positions taken or expected to be taken on federal and state income tax returns for all open tax years (all years since inception of the Fund) and has concluded that no provision for income tax is required in the Fund’s financial statements.
5. Investment Income and Investment Transactions
Dividend income is recorded on theex-dividend date or as soon as the Fund is informed of the dividend. Interest income is accrued daily. Investment transactions are accounted for on the date securities are purchased or sold. Investment gains and losses are determined on the identified cost basis. The Fund amortizes premiums and accretes discounts as adjustments to interest income.
6. Class Allocations
All income earned and expenses incurred by the Fund are borne on apro-rata basis by each settled class of shares, based on the proportionate interest in the Fund represented by the net assets of such class, except for class specific expenses which are allocated to the respective class. Expenses of the Company are charged proportionately to each portfolio or based on other appropriate methods. Realized and unrealized gains and losses are allocated among the various share classes based on their respective net assets.
| 18 | AB EMERGING MARKETS CORE PORTFOLIO | abfunds.com | |
NOTES TO FINANCIAL STATEMENTS(continued)
7. Dividends and Distributions
Dividends and distributions to shareholders, if any, are recorded on theex-dividend date. Income dividends and capital gains distributions are determined in accordance with federal tax regulations and may differ from those determined in accordance with U.S. GAAP. To the extent these differences are permanent, such amounts are reclassified within the capital accounts based on their federal tax basis treatment; temporary differences do not require such reclassification.
NOTE B
Advisory Fee and Other Transactions with Affiliates
Under the terms of the investment advisory agreement, the Fund pays the Adviser an advisory fee at an annual rate of 0.95% of the first $2.5 billion of the Fund’s average daily net assets, 0.90% of the next $2.5 billion up to $5 billion, and 0.85% of the excess of $5 billion. Prior to May 5, 2017, the Fund paid the Adviser an advisory fee at an annual rate of 1.175% of the first $1 billion of the Fund’s average daily net assets, 1.05% of the next $1 billion up to $2 billion, 1.00% of the excess of $2 billion up to $3 billion, 0.90% of the excess of $3 billion up to $6 billion, and 0.85% of the excess of $6 billion. The fee is accrued daily and paid monthly. The Adviser has agreed to waive its fees and bear certain expenses to the extent necessary to limit total operating expenses (excluding expenses associated with securities sold short, acquired fund fees and expenses other than advisory fees of any AB mutual funds in which the Fund may invest, except advisory fees borne by the Fund in connection with the investment of securities lending collateral, interest expense, taxes, extraordinary expenses, and brokerage commissions and other transaction costs) on an annual basis (the “Expense Caps”) to 1.35%, 2.10% and 1.10% of the daily average net assets for Class A, Class C and Advisor Class shares, respectively. Effective May 5, 2017, the Expense Cap for Class A was reduced from 1.70% to 1.35% of the daily average net assets, for Class C was reduced from 2.45% to 2.10% of the daily average net assets, for Advisor Class was reduced from 1.45% to 1.10% of the daily average net assets. For the six months ended December 31, 2018 the reimbursements/waivers amounted to $135,465. The Expense Caps may not be terminated by the Adviser prior to one year from the date the Fund’s shares are first offered to the public. Any fees waived and expenses borne by the Adviser are subject to repayment by the Fund until the end of the third fiscal year after the fiscal period in which the fee was waived or the expense was borne; such waivers that are subject to repayment amount to $210,275 for the period ended June 30, 2016, $237,518 and $246,962 for the fiscal years ended June 30, 2017 and June 30, 2018, and $135,465 for the period ended December 31, 2018. In any case, no repayment will be made that would cause the Fund’s total annual operating expenses to exceed the Expense Caps’ net fee percentages specified in the current Expense Caps.
| abfunds.com | AB EMERGING MARKETS CORE PORTFOLIO | 19 | |
NOTES TO FINANCIAL STATEMENTS(continued)
During 2017, AXA S.A. (“AXA”), a French holding company for the AXA Group, a worldwide leader in life, property and casualty and health insurance and asset management, announced its intention to pursue the sale of a minority stake in its subsidiary, AXA Equitable Holdings, Inc. (“AXA Equitable”), the holding company for a diversified financial services organization, through an initial public offering (“IPO”). AXA Equitable is the holding company for a diverse group of financial services companies, including AllianceBernstein L.P., the investment adviser to the Funds (“the Adviser”). During the second quarter of 2018, AXA Equitable completed the IPO, and, as a result, AXA held approximately 72.2% of the outstanding common stock of AXA Equitable as of September 30, 2018. Contemporaneously with the IPO, AXA sold $862.5 million aggregate principal amount of its 7.25% mandatorily exchangeable notes (the “MxB Notes”) due May 15, 2021 and exchangeable into up to 43,125,000 shares of common stock (or approximately 7% of the outstanding shares of common stock of AXA Equitable). AXA retains ownership (including voting rights) of such shares of common stock until the MxB Notes are exchanged, which may be on a date that is earlier than the maturity date at AXA’s option upon the occurrence of certain events.
In March 2018, AXA announced its intention to sell its entire interest in AXA Equitable over time, subject to market conditions and other factors (the “Plan”). It is anticipated that one or more of the transactions contemplated by the Plan may ultimately result in the indirect transfer of a “controlling block” of voting securities of the Adviser (a “Change of Control Event”) and therefore may be deemed an “assignment” causing a termination of each Fund’s current investment advisory agreement. In order to ensure that the existing investment advisory services could continue uninterrupted, at meetings held in late July through early August 2018, the Boards of Directors/Trustees (each a “Board” and collectively, the “Boards”) approved new investment advisory agreements with the Adviser, in connection with the Plan. The Boards also agreed to call and hold a joint meeting of shareholders on October 11, 2018 for shareholders of each Fund to (1) approve the new investment advisory agreement with the Adviser that would be effective after the first Change of Control Event and (2) approve any future advisory agreement approved by the Board and that has terms not materially different from the current agreement, in the event there are subsequent Change of Control Events arising from completion of the Plan that terminate the advisory agreement after the first Change of Control Event. Approval of a future advisory agreement means that shareholders may not have another opportunity to vote on a new agreement with the Adviser even upon a change of control, as long as no single person or group of persons acting together gains “control” (as defined in the 1940 Act) of AXA Equitable.
| 20 | AB EMERGING MARKETS CORE PORTFOLIO | abfunds.com | |
NOTES TO FINANCIAL STATEMENTS(continued)
At the October 11, 2018 meeting, shareholders approved the new and future investment advisory agreements.
On November 20, 2018, AXA completed a public offering of 60,000,000 shares of AXA Equitable’s common stock and simultaneously sold 30,000,000 of such shares to AXA Equitable pursuant to a separate agreement with it. As a result AXA currently owns approximately 59.2% of the shares of common stock of AXA Equitable.
Pursuant to the investment advisory agreement, the Fund may reimburse the Adviser for certain legal and accounting services provided to the Fund by the Adviser. For the six months ended December 31, 2018, the Adviser voluntarily agreed to waive such fees in the amount of $30,396.
The Fund compensates AllianceBernstein Investor Services, Inc. (“ABIS”), a wholly-owned subsidiary of the Adviser, under a Transfer Agency Agreement for providing personnel and facilities to perform transfer agency services for the Fund. ABIS may make payments to intermediaries that provide omnibus account services,sub-accounting services and/or networking services. Such compensation retained by ABIS amounted to $2,293 for the six months ended December 31, 2018.
AllianceBernstein Investments, Inc. (the “Distributor”), a wholly-owned subsidiary of the Adviser, serves as the distributor of the Fund’s shares. The Distributor has advised the Fund that it has retained nofront-end sales charges from the sale of Class A shares nor received any contingent deferred sales charges imposed upon redemptions by shareholders of Class A and Class C shares, respectively, for the six months ended December 31, 2018.
The Fund may invest in AB Government Money Market Portfolio (the “Government Money Market Portfolio”) which has a contractual annual advisory fee rate of .20% of the portfolio’s average daily net assets and bears its own expenses. Effective August 1, 2018, the Adviser has contractually agreed to waive .10% of the advisory fee of Government Money Market Portfolio until August 31, 2019. In connection with the investment by the Fund in Government Money Market Portfolio, the Adviser has contractually agreed to waive its advisory fee from the Fund in an amount equal to the Fund’s pro rata share of the effective advisory fees of Government Money Market Portfolio, as borne indirectly by the Fund as an acquired fund fee and expense. For the six months ended December 31, 2018, such waiver amounted to $121.
| abfunds.com | AB EMERGING MARKETS CORE PORTFOLIO | 21 | |
NOTES TO FINANCIAL STATEMENTS(continued)
A summary of the Fund’s transactions in AB mutual funds for the six months ended December 31, 2018, is as follows:
Fund | Market Value 6/30/18 (000) | Purchases at Cost (000) | Sales Proceeds (000) | Market Value 12/31/18 (000) | Dividend Income (000) | |||||||||||||||
Government Money Market Portfolio | $ | 163 | $ | 1,362 | $ | 1,420 | $ | 105 | $ | 2 | ||||||||||
Brokerage commissions paid on investment transactions for the six months ended December 31, 2018, amounted to $4,197, of which $0 and $0, respectively, was paid to Sanford C. Bernstein & Co. LLC and Sanford C. Bernstein Limited, affiliates of the Adviser.
NOTE C
Distribution Services Agreement
The Fund has adopted a Distribution Services Agreement (the “Agreement”) pursuant to Rule12b-1 under the Investment Company Act of 1940. Under the Agreement, the Fund pays distribution and servicing fees to the Distributor at an annual rate of up to .25% of the Fund’s average daily net assets attributable to Class A shares and 1% of the Fund’s average daily net assets attributable to Class C shares. There are no distribution and servicing fees on Advisor Class shares. The fees are accrued daily and paid monthly. The Agreement provides that the Distributor will use such payments in their entirety for distribution assistance and promotional activities. Since the commencement of the Fund’s operations, the Distributor has incurred no expenses in excess of the distribution costs reimbursed by the Fund for Class C shares. While such costs may be recovered from the Fund in future periods so long as the Agreement is in effect, the rate of the distribution and servicing fees payable under the Agreement may not be increased without a shareholder vote. In accordance with the Agreement, there is no provision for recovery of unreimbursed distribution costs incurred by the Distributor beyond the current fiscal year for Class A shares. The Agreement also provides that the Adviser may use its own resources to finance the distribution of the Fund’s shares.
NOTE D
Investment Transactions
Purchases and sales of investment securities (excluding short-term investments) for the six months ended December 31, 2018 were as follows:
| Purchases | Sales | |||||||
Investment securities (excluding U.S. government securities) | $ | 2,529,445 | $ | 2,767,918 | ||||
U.S. government securities | – 0 | – | – 0 | – | ||||
The cost of investments for federal income tax purposes was substantially the same as cost for financial reporting purposes. Accordingly, gross
| 22 | AB EMERGING MARKETS CORE PORTFOLIO | abfunds.com | |
NOTES TO FINANCIAL STATEMENTS(continued)
unrealized appreciation and unrealized depreciation (excluding foreign currency contracts) are as follows:
Gross unrealized appreciation | $ | 226,683 | ||
Gross unrealized depreciation | (161,850 | ) | ||
|
| |||
Net unrealized appreciation | $ | 64,833 | ||
|
|
1. Derivative Financial Instruments
The Fund may use derivatives in an effort to earn income and enhance returns, to replace more traditional direct investments, to obtain exposure to otherwise inaccessible markets (collectively, “investment purposes”), or to hedge or adjust the risk profile of its fund.
The principal types of derivatives utilized by the Fund, as well as the methods in which they may be used are:
| • | Forward Currency Exchange Contracts |
The Fund may enter into forward currency exchange contracts in order to hedge its exposure to changes in foreign currency exchange rates on its foreign portfolio holdings, to hedge certain firm purchase and sales commitments denominated in foreign currencies and fornon-hedging purposes as a means of making direct investments in foreign currencies, as described below under “Currency Transactions”.
A forward currency exchange contract is a commitment to purchase or sell a foreign currency at a future date at a negotiated forward rate. The gain or loss arising from the difference between the original contract and the closing of such contract would be included in net realized gain or loss on forward currency exchange contracts. Fluctuations in the value of open forward currency exchange contracts are recorded for financial reporting purposes as unrealized appreciation and/or depreciation by the Fund. Risks may arise from the potential inability of a counterparty to meet the terms of a contract and from unanticipated movements in the value of a foreign currency relative to the U.S. dollar.
During the six months ended December 31, 2018, the Fund held forward currency exchange contracts for hedging andnon-hedging purposes.
| • | Futures |
The Fund may buy or sell futures for investment purposes or for the purpose of hedging its fund against adverse effects of potential movements in the market. The Fund bears the market risk that arises from changes in the value of these instruments and the imperfect correlation between movements in the price of the futures and movements in the price of the assets, reference rates or indices which
| abfunds.com | AB EMERGING MARKETS CORE PORTFOLIO | 23 | |
NOTES TO FINANCIAL STATEMENTS(continued)
they are designed to track. Among other things, the Fund may purchase or sell futures for foreign currencies or options thereon fornon-hedging purposes as a means of making direct investment in foreign currencies, as described below under “Currency Transactions”.
At the time the Fund enters into a future, the Fund deposits and maintains as collateral an initial margin with the broker, as required by the exchange on which the transaction is effected. Such amount is shown as cash collateral due from broker on the statement of assets and liabilities. Pursuant to the contract, the Fund agrees to receive from or pay to the broker an amount of cash equal to the daily fluctuation in the value of the contract. Such receipts or payments are known as variation margin and are recorded by the Fund as unrealized gains or losses. Risks may arise from the potential inability of a counterparty to meet the terms of the contract. The credit/counterparty risk for exchange-traded futures is generally less than privately negotiated futures, since the clearinghouse, which is the issuer or counterparty to each exchange-traded future, has robust risk mitigation standards, including the requirement to provide initial and variation margin. When the contract is closed, the Fund records a realized gain or loss equal to the difference between the value of the contract at the time it was opened and the time it was closed.
Use of long futures subjects the Fund to risk of loss in excess of the amounts shown on the statement of assets and liabilities, up to the notional value of the future. Use of short futures subjects the Fund to unlimited risk of loss. Under some circumstances, futures exchanges may establish daily limits on the amount that the price of a future can vary from the previous day’s settlement price, which could effectively prevent liquidation of unfavorable positions.
During the six months ended December 31, 2018, the Fund held futures fornon-hedging purposes.
The Fund typically enters into International Swaps and Derivatives Association, Inc. Master Agreements (“ISDA Master Agreement”) with its OTC derivative contract counterparties in order to, among other things, reduce its credit risk to OTC counterparties. ISDA Master Agreements include provisions for general obligations, representations, collateral and events of default or termination. Under an ISDA Master Agreement, the Fund typically may offset with the OTC counterparty certain derivative financial instruments’ payables and/or receivables with collateral held and/or posted and create one single net payment(close-out netting) in the event of default or termination. In the event of a default by an OTC counterparty, the return of collateral with market value in excess of the Fund’s net liability, held by the defaulting party, may be delayed or denied.
| 24 | AB EMERGING MARKETS CORE PORTFOLIO | abfunds.com | |
NOTES TO FINANCIAL STATEMENTS(continued)
The Fund’s ISDA Master Agreements may contain provisions for early termination of OTC derivative transactions in the event the net assets of the Fund decline below specific levels (“net asset contingent features”). If these levels are triggered, the Fund’s OTC counterparty has the right to terminate such transaction and require the Fund to pay or receive a settlement amount in connection with the terminated transaction. If OTC derivatives were held at period end, please refer to netting arrangements by the OTC counterparty table below for additional details.
During the six months ended December 31, 2018, the Fund had entered into the following derivatives:
Asset Derivatives | Liability Derivatives | |||||||||||
Derivative Type | Statement of | Fair Value | Statement of | Fair Value | ||||||||
Equity contracts | Receivable/Payable for variation margin on futures | $ | – 0 | – | Receivable/Payable for variation margin on futures | $ | 1,266 | * | ||||
|
|
|
| |||||||||
Total | $ | – 0 | – | $ | 1,266 | |||||||
|
|
|
| |||||||||
| * | Only variation margin receivable/payable at period end is reported within the statement of assets and liabilities. This amount reflects cumulative unrealized appreciation/depreciation on futures and centrally cleared swaps as reported in the portfolio of investments. |
Derivative Type | Location of | Realized Gain or (Loss) on Derivatives | Change in Unrealized Appreciation or (Depreciation) | |||||||
Foreign currency contracts | Net realized gain/(loss) on forward currency exchange contracts; Net change in unrealized appreciation/depreciation on forward currency exchange contracts | $ | (891 | ) | $ | 891 | ||||
Equity contracts | Net realized gain/(loss) on futures; Net change in unrealized appreciation/depreciation on futures | (14,914 | ) | (1,266 | ) | |||||
|
|
|
| |||||||
Total | $ | (15,805 | ) | $ | (375 | ) | ||||
|
|
|
| |||||||
| abfunds.com | AB EMERGING MARKETS CORE PORTFOLIO | 25 | |
NOTES TO FINANCIAL STATEMENTS(continued)
The following table represents the average monthly volume of the Fund’s derivative transactions during the six months ended December 31, 2018:
Forward Currency Exchange Contracts: | ||||
Average principal amount of buy contracts | $ | 95,752 | (a) | |
Average principal amount of sale contracts | $ | 94,861 | (a) | |
Futures: | ||||
Average original value of buy contracts | $ | 69,345 | (b) | |
| (a) | Positions were open one month during the reporting period. |
| (b) | Positions were open three months during the reporting period. |
For financial reporting purposes, the Fund does not offset derivative assets and derivative liabilities that are subject to netting arrangements in the statement of assets and liabilities.
2. Currency Transactions
The Fund may invest innon-U.S. Dollar-denominated securities on a currency hedged or unhedged basis. The Fund may seek investment opportunities by taking long or short positions in currencies through the use of currency-related derivatives, including forward currency exchange contracts, futures and options on futures, swaps, and other options. The Fund may enter into transactions for investment opportunities when it anticipates that a foreign currency will appreciate or depreciate in value but securities denominated in that currency are not held by the Fund and do not present attractive investment opportunities. Such transactions may also be used when the Adviser believes that it may be more efficient than a direct investment in a foreign currency-denominated security. The Fund may also conduct currency exchange contracts on a spot basis (i.e., for cash at the spot rate prevailing in the currency exchange market for buying or selling currencies).
NOTE E
Capital Stock
Each class consists of 3,000,000,000 authorized shares. There were no transactions in capital shares for each class for the six months ended December 31, 2018 and for the year ended June 30, 2018.
NOTE F
Risks Involved in Investing in the Fund
Emerging Market Risk—Investments in emerging market countries may have more risk because the markets are less developed and less liquid, and because these investments may be subject to increased economic, political, and regulatory or other uncertainties.
Foreign (Non-U.S.) Risk—Investments in securities ofnon-U.S. issuers may involve more risk than those of U.S. issuers. These securities may fluctuate more widely in price and may be less liquid due to adverse market, economic, political, regulatory or other factors.
| 26 | AB EMERGING MARKETS CORE PORTFOLIO | abfunds.com | |
NOTES TO FINANCIAL STATEMENTS(continued)
Currency Risk—Fluctuations in currency exchange rates may negatively affect the value of the Fund’s investments or reduce its returns. Emerging market currencies may be more volatile and less liquid, and subject to significantly greater risk of currency controls and convertibility restrictions, than currencies of developed countries.
Capitalization Risk—Investments in small- andmid-capitalization companies may be more volatile than investments in large-capitalization companies. Investments in small-capitalization companies may have additional risks because these companies have limited product lines, markets or financial resources.
Derivatives Risk—The Fund may enter into derivative transactions such as forwards, options, futures and swaps. Derivatives may be illiquid, difficult to price, and leveraged so that small changes may produce disproportionate losses for the Fund, and subject to counterparty risk to a greater degree than more traditional investments. Derivatives may result in significant losses, including losses that are far greater than the value of the derivatives reflected in the statement of assets and liabilities.
Sector Risk—The Fund may have more risk because of concentrated investments in a particular market sector, such as the technology or financial services sector. Market or economic factors affecting that sector could have a major effect on the value of the Fund’s investments.
Indemnification Risk—In the ordinary course of business, the Fund enters into contracts that contain a variety of indemnifications. The Fund’s maximum exposure under these arrangements is unknown. However, the Fund has not had prior claims or losses pursuant to these indemnification provisions and expects the risk of loss thereunder to be remote. Therefore, the Fund has not accrued any liability in connection with these indemnification provisions.
NOTE G
Joint Credit Facility
A number ofopen-end mutual funds managed by the Adviser, including the Fund, participate in a $325 million revolving credit facility (the “Facility”) intended to provide short-term financing if necessary, subject to certain restrictions in connection with abnormal redemption activity. Commitment fees related to the Facility are paid by the participating funds and are included in miscellaneous expenses in the statement of operations. The Fund did not utilize the Facility during the six months ended December 31, 2018.
| abfunds.com | AB EMERGING MARKETS CORE PORTFOLIO | 27 | |
NOTES TO FINANCIAL STATEMENTS(continued)
NOTE H
Distributions to Shareholders
The tax character of distributions paid for the year ending June 30, 2019 will be determined at the end of the current fiscal year.
The tax character of distributions paid during the fiscal years end June 30, 2018 and June 30, 2017 were as follows:
| 2018 | 2017 | |||||||
Distributions paid from: | ||||||||
Ordinary income | $ | 231,646 | $ | 80,000 | ||||
Long-term capital gains | 488,670 | – 0 | – | |||||
|
|
|
| |||||
Total taxable distributions paid | $ | 720,316 | $ | 80,000 | ||||
|
|
|
| |||||
As of December 31, 2018, the components of accumulated earnings/(deficit) on a tax basis were as follows:
Undistributed ordinary income | $ | 15,362 | ||
Accumulated capital and other losses | 329,571 | |||
Unrealized appreciation/(depreciation) | 395,368 | (a) | ||
|
| |||
Total accumulated earnings/(deficit) | $ | 740,301 | (b) | |
|
|
| (a) | The differences between book-basis andtax-basis unrealized appreciation/(depreciation) are attributable primarily to the tax deferral of losses on wash sales and the recognition for tax purposes of unrealized gains/losses on certain derivative instruments. |
| (b) | The difference between book-basis andtax-basis components of accumulated earnings/(deficit) is attributable primarily to the tax treatment of accrued Argentinian capital gains tax. |
For tax purposes, net realized capital losses may be carried over to offset future capital gains, if any. Funds are permitted to carry forward capital losses for an indefinite period, and such losses will retain their character as either short-term or long-term capital losses. As of June 30, 2018, the Fund did not have any capital loss carryforwards.
NOTE I
Recent Accounting Pronouncements
In August 2018, the Financial Accounting Standards Board issued an Accounting Standards Update, ASU2018-13, Fair Value Measurement (Topic 820), Disclosure Framework-Changes to the Disclosure Requirements for Fair Value Measurement which removes, modifies and adds disclosures to Topic 820. The amendments in this ASU2018-13 apply to all entities that are required, under existing U.S. GAAP, to make disclosures about recurring or nonrecurring fair value measurements. The amendments in this ASU2018-13 are effective for all entities for fiscal years, and interim periods within those fiscal years, beginning after December 15, 2019. At this time, management is evaluating the implications of these changes on the financial statements. In October 2018, the U.S. Securities
| 28 | AB EMERGING MARKETS CORE PORTFOLIO | abfunds.com | |
NOTES TO FINANCIAL STATEMENTS(continued)
and Exchange Commission adopted amendments to certain disclosure requirements that had become “redundant, duplicative, overlapping, outdated or superseded, in light of the other Commission disclosure requirements, GAAP or changes in the information environment.” The compliance date for the amendments to RegulationS-X was November 5, 2018 (for reporting period end dates of September 30, 2018 or after). Management has adopted the amendments which simplified certain disclosure requirements on the financial statements.
NOTE J
Subsequent Events
Management has evaluated subsequent events for possible recognition or disclosure in the financial statements through the date the financial statements are issued. Management has determined that there are no material events that would require disclosure in the Fund’s financial statements through this date.
| abfunds.com | AB EMERGING MARKETS CORE PORTFOLIO | 29 | |
FINANCIAL HIGHLIGHTS
Selected Data For A Share Of Capital Stock Outstanding Throughout Each Period
| Class A | ||||||||||||||||
| Six Months Ended December 31, 2018 (unaudited) | Year Ended June 30, | September 9, June 30, 2016 | ||||||||||||||
| 2018 | 2017 | |||||||||||||||
|
| |||||||||||||||
Net asset value, beginning of period | $ 11.28 | $ 12.58 | $ 10.80 | $ 10.00 | ||||||||||||
|
| |||||||||||||||
Income From Investment Operations | ||||||||||||||||
Net investment income(b)(c) | .08 | .26 | .12 | .07 | ||||||||||||
Net realized and unrealized gain (loss) on investment and foreign currency transactions | (1.22 | ) | .08 | 1.79 | .78 | |||||||||||
|
| |||||||||||||||
Net increase (decrease) in net asset value from operations | (1.14 | ) | .34 | 1.91 | .85 | |||||||||||
|
| |||||||||||||||
Less: Dividends | ||||||||||||||||
Dividends from net investment income | (.10 | ) | (.18 | ) | (.13 | ) | (.05 | ) | ||||||||
Distributions from net realized gain on investment and foreign currency transactions | (.77 | ) | (1.46 | ) | – 0 | – | – 0 | – | ||||||||
|
| |||||||||||||||
Total dividends and distributions | (.87 | ) | (1.64 | ) | (.13 | ) | (.05 | ) | ||||||||
|
| |||||||||||||||
Net asset value, end of period | $ 9.27 | $ 11.28 | $ 12.58 | $ 10.80 | ||||||||||||
|
| |||||||||||||||
Total Return | ||||||||||||||||
Total investment return based on net asset value(d) | (10.18 | )% | 1.99 | %* | 17.96 | % | 8.50 | % | ||||||||
Ratios/Supplemental Data | ||||||||||||||||
Net assets, end of period (000’s omitted) | $9 | $11 | $13 | $11 | ||||||||||||
Ratio to average net assets of: | ||||||||||||||||
Expenses, net of waivers/reimbursements† | 1.35 | %(e) | 1.35 | % | 1.60 | % | 1.65 | %(e) | ||||||||
Expenses, before waivers/reimbursements† | 8.48 | %(e) | 7.19 | % | 6.88 | % | 8.26 | %(e) | ||||||||
Net investment income(c) | 1.52 | %(e) | 1.99 | % | 1.04 | % | .87 | %(e) | ||||||||
Portfolio turnover rate | 57 | % | 95 | % | 94 | % | 62 | % | ||||||||
† Expense ratios exclude the estimated acquired fund fees of affiliated/unaffiliated underlying |
| |||||||||||||||
portfolios | .01 | % | .01 | % | .01 | % | .00 | % | ||||||||
See footnote summary on page 33.
| 30 | AB EMERGING MARKETS CORE PORTFOLIO | abfunds.com | |
FINANCIAL HIGHLIGHTS(continued)
Selected Data For A Share Of Capital Stock Outstanding Throughout Each Period
| Class C | ||||||||||||||||
| Six Months Ended December 31, 2018 (unaudited) | Year Ended June 30, | September 9, 2015(a) to June 30, 2016 | ||||||||||||||
| 2018 | 2017 | |||||||||||||||
|
| |||||||||||||||
Net asset value, beginning of period | $ 11.23 | $ 12.54 | $ 10.76 | $ 10.00 | ||||||||||||
|
| |||||||||||||||
Income From Investment Operations | ||||||||||||||||
Net investment income(b)(c) | .04 | .16 | .03 | .01 | ||||||||||||
Net realized and unrealized gain (loss) on investment and foreign currency transactions | (1.21 | ) | .08 | 1.80 | .77 | |||||||||||
|
| |||||||||||||||
Net increase (decrease) in net asset value from operations | (1.17 | ) | .24 | 1.83 | .78 | |||||||||||
|
| |||||||||||||||
Less: Dividends | ||||||||||||||||
Dividends from net investment income | (.01 | ) | (.09 | ) | (.05 | ) | (.02 | ) | ||||||||
Distributions from net realized gain on investment and foreign currency transactions | (.77 | ) | (1.46 | ) | – 0 | – | – 0 | – | ||||||||
|
| |||||||||||||||
Total dividends and distributions | (.78 | ) | (1.55 | ) | (.05 | ) | (.02 | ) | ||||||||
|
| |||||||||||||||
Net asset value, end of period | $ 9.28 | $ 11.23 | $ 12.54 | $ 10.76 | ||||||||||||
|
| |||||||||||||||
Total Return | ||||||||||||||||
Total investment return based on net asset value(d) | (10.45 | )% | 1.13 | %* | 17.14 | % | 7.84 | % | ||||||||
Ratios/Supplemental Data | ||||||||||||||||
Net assets, end of period (000’s omitted) | $9 | $11 | $13 | $11 | ||||||||||||
Ratio to average net assets of: | ||||||||||||||||
Expenses, net of waivers/reimbursements† | 2.10 | %(e) | 2.10 | % | 2.35 | % | 2.40 | %(e) | ||||||||
Expenses, before waivers/reimbursements† | 9.25 | %(e) | 7.97 | % | 7.67 | % | 9.01 | %(e) | ||||||||
Net investment income(c) | .77 | %(e) | 1.24 | % | .29 | % | .11 | %(e) | ||||||||
Portfolio turnover rate | 57 | % | 95 | % | 94 | % | 62 | % | ||||||||
† Expense ratios exclude the estimated acquired fund fees of affiliated/unaffiliated underlying |
| |||||||||||||||
portfolios | .01 | % | .01 | % | .01 | % | .00 | % | ||||||||
See footnote summary on page 33.
| abfunds.com | AB EMERGING MARKETS CORE PORTFOLIO | 31 | |
FINANCIAL HIGHLIGHTS(continued)
Selected Data For A Share Of Capital Stock Outstanding Throughout Each Period
| Advisor Class | ||||||||||||||||
| Six Months Ended December 31, 2018 (unaudited) | Year Ended June 30, | September 9, June 30, 2016 | ||||||||||||||
| 2018 | 2017 | |||||||||||||||
|
| |||||||||||||||
Net asset value, beginning of period | $ 11.29 | $ 12.60 | $ 10.81 | $ 10.00 | ||||||||||||
|
| |||||||||||||||
Income From Investment Operations | ||||||||||||||||
Net investment income(b)(c) | .10 | .29 | .14 | .09 | ||||||||||||
Net realized and unrealized gain (loss) on investment and foreign currency transactions | (1.23 | ) | .07 | 1.81 | .77 | |||||||||||
|
| |||||||||||||||
Net increase (decrease) in net asset value from operations | (1.13 | ) | .36 | 1.95 | .86 | |||||||||||
|
| |||||||||||||||
Less: Dividends | ||||||||||||||||
Dividends from net investment income | (.13 | ) | (.21 | ) | (.16 | ) | (.05 | ) | ||||||||
Distributions from net realized gain on investment and foreign currency transactions | (.76 | ) | (1.46 | ) | – 0 | – | – 0 | – | ||||||||
|
| |||||||||||||||
Total dividends and distributions | (.89 | ) | (1.67 | ) | (.16 | ) | (.05 | ) | ||||||||
|
| |||||||||||||||
Net asset value, end of period | $ 9.27 | $ 11.29 | $ 12.60 | $ 10.81 | ||||||||||||
|
| |||||||||||||||
Total Return | ||||||||||||||||
Total investment return based on net asset value(d) | (10.00 | )% | 2.15 | %* | 18.34 | % | 8.69 | % | ||||||||
Ratios/Supplemental Data | ||||||||||||||||
Net assets, end of period (000’s omitted) | $3,975 | $4,841 | $5,399 | $5,413 | ||||||||||||
Ratio to average net assets of: | ||||||||||||||||
Expenses, net of waivers/reimbursements† | 1.10 | %(e) | 1.10 | % | 1.35 | % | 1.40 | %(e) | ||||||||
Expenses, before waivers/reimbursements† | 8.23 | %(e) | 6.94 | % | 6.58 | % | 8.01 | %(e) | ||||||||
Net investment income(c) | 1.77 | %(e) | 2.24 | % | 1.27 | % | 1.12 | %(e) | ||||||||
Portfolio turnover rate | 57 | % | 95 | % | 94 | % | 62 | % | ||||||||
† Expense ratios exclude the estimated acquired fund fees of affiliated/unaffiliated underlying |
| |||||||||||||||
portfolios | .01 | % | .01 | % | .01 | % | .00 | % | ||||||||
See footnote summary on page 33.
| 32 | AB EMERGING MARKETS CORE PORTFOLIO | abfunds.com | |
FINANCIAL HIGHLIGHTS(continued)
Selected Data For A Share Of Capital Stock Outstanding Throughout Each Period
| (a) | Commencement of operations. |
| (b) | Based on average shares outstanding. |
| (c) | Net of expenses waived/reimbursed by the Adviser. |
| (d) | Total investment return is calculated assuming an initial investment made at the net asset value at the beginning of the period, Reinvestment of all dividends and distributions at net asset value during the period, and redemption on the last day of the period. Initial sales charge or contingent deferred sales charge is not reflected in the calculation of total investment return. Total investment return does not reflect the deduction of taxes that a shareholder would pay on fund distributions or the redemption of fund shares. Total investment return for a period of less than one year is not annualized. |
| (e) | Annualized. |
| * | The net asset value and total return include adjustments in accordance with accounting principles generally accepted in the United States of America for financial reporting purposes. As such, the net asset value and total return for shareholder transactions may differ from financial statements. |
See notes to financial statements.
| abfunds.com | AB EMERGING MARKETS CORE PORTFOLIO | 33 | |
RESULTS OF STOCKHOLDER MEETING
(unaudited)
A Special Meeting of Stockholders of the AB Cap Fund, Inc. (the “Company”)—AB Emerging Markets Core Portfolio (the “Fund”) was held on October 11, 2018. A description of the proposals and number of shares voted at the Meeting are as follows (the proposal number shown below corresponds to the proposal number in the Fund’s proxy statement):
| 1. | To approve and vote upon the election of Directors for the Company, each such Director to serve for a term of indefinite duration and until his or her successor is duly elected and qualifies. |
Director: | Voted For: | Authority Withheld: | ||||||
Michael J. Downey | 153,531,217 | 1,117,868 | ||||||
William H. Foulk, Jr.* | 153,385,034 | 1,264,050 | ||||||
Nancy P. Jacklin | 153,607,746 | 1,041,339 | ||||||
Robert M. Keith | 153,546,025 | 1,103,060 | ||||||
Carol C. McMullen | 153,649,415 | 999,670 | ||||||
Gary L. Moody | 153,545,113 | 1,103,972 | ||||||
Marshall C. Turner, Jr. | 153,507,495 | 1,141,590 | ||||||
Earl D. Weiner | 153,514,727 | 1,134,358 | ||||||
| 2. | To vote upon the approval of new advisory agreements for the Fund with AllianceBernstein L.P. |
| Voted For: | Voted Against: | Abstain: | Broker Non-Votes: | |||||||||||
| 430,623 | – 0 | – | – 0 | – | – 0 | – | ||||||||
| * | Mr. Foulk retired on December 31, 2018. |
| 34 | AB EMERGING MARKETS CORE PORTFOLIO | abfunds.com | |
BOARD OF DIRECTORS
Marshall C. Turner, Jr.(1),Chairman Michael J. Downey(1) Nancy P. Jacklin(1) Robert M. Keith,President and Chief Executive Officer | Carol C. McMullen(1) Garry L. Moody(1) Earl D. Weiner(1) |
OFFICERS
Kent W. Hargis(2), Vice President Stuart Rae(2),Vice President Sammy Suzuki(2), Vice President Emilie D. Wrapp,Secretary Michael B. Reyes,Senior Analyst | Joseph J. Mantineo,Treasurer and Chief Financial Officer Phyllis J. Clarke,Controller |
Custodian and Accounting Agent Brown Brothers Harriman & Co. 50 Post Office Square Boston, MA 02110 | Independent Registered Public Accounting Firm Ernst & Young LLP 5 Times Square New York, NY 10036 | |
Principal Underwriter AllianceBernstein Investments, Inc. 1345 Avenue of the Americas New York, NY 10105 |
Legal Counsel Seward & Kissel LLP One Battery Park Plaza New York, NY 10004 | |
Transfer Agent AllianceBernstein Investor Services, P.O. Box 786003 San Antonio, TX 78278-6003 Toll-Free (800) 221-5672 |
| 1 | Member of the Audit Committee, the Governance and Nominating Committee, and the Independent Directors Committee. |
| 2 | The day-to-day management of, and investment decisions for, the Fund’s portfolio are made by the Adviser’s portfolio managers. Messrs. Hargis, Rae and Suzuki are the investment professionals with the most significant responsibility for the day-to-day management of the Fund’s portfolio. |
| abfunds.com | AB EMERGING MARKETS CORE PORTFOLIO | 35 | |
Information Regarding the Review and Approval of the Fund’s Advisory Agreement
As described in more detail in the Proxy Statement for the AB Funds dated August 20, 2018, the Boards of the AB Funds, at a meeting held onJuly 31-August 2, 2018, approved new advisory agreements with the Adviser (the “Proposed Agreements”) for the AB Funds, including AB Cap Fund, Inc. in respect of AB Emerging Markets Core Portfolio (the “Fund”), in connection with the planned disposition by AXA S.A. of its remaining shares of AXA Equitable Holdings, Inc. (the indirect holder of a majority of the partnership interests in the Adviser and the indirect parent of AllianceBernstein Corporation, the general partner of the Adviser) in one or more transactions and the related potential for one or more “assignments” (within the meaning of section 2(a)(4) of the Investment Company Act) of the advisory agreements for the AB Funds, including the Fund’s Advisory Agreement, resulting in the automatic termination of such advisory agreements.
At the same meeting, the AB Boards also considered and approved interim advisory agreements with the Adviser (the “Interim Advisory Agreements”) for the AB Funds, including the Fund, to be effective only in the event that stockholder approval of a Proposed Agreement had not been obtained as of the date of one or more transactions resulting in an “assignment” of the Adviser’s advisory agreements, resulting in the automatic termination of such advisory agreements.
The shareholders of the Fund subsequently approved the Proposed Agreements at an annual meeting of shareholders called for the purpose of electing Directors and voting on the Proposed Agreements.
A discussion regarding the basis for the Boards’ approvals at a meeting held onJuly 31-August 2, 2018 is set forth below.
Information Regarding the Review and Approval of the Fund’s Proposed New Advisory Agreement and Interim Advisory Agreement in the Context of Potential Assignments
At a meeting of the AB Boards held on July31-August 2, 2018, the Adviser presented its recommendation that the Boards consider and approve the Proposed Agreements. Section 15(c) of the 1940 Act provides that, after an initial period, a Fund’s Current Agreement and currentsub-advisory agreement, as applicable, will remain in effect only if the Board, including a majority of the Independent Directors, annually reviews and approves them. Each of the Current Agreements had been approved by a Board within theone-year period prior to approval of its related Proposed Agreement, except that the Current Agreements for certain FlexFee funds were approved in February 2017. In connection with their approval of the Proposed Agreements, the Boards considered their conclusions in connection with their most recent approvals of the Current Agreements, in particular in cases where the last approval of a Current Agreement was
| 36 | AB EMERGING MARKETS CORE PORTFOLIO | abfunds.com | |
relatively recent, including the Boards’ general satisfaction with the nature and quality of services being provided and, as applicable, in the case of certain Funds, actions taken or to be taken in an effort to improve investment performance or reduce expense ratios. The Directors also reviewed updated information provided by the Adviser in respect of each Fund. Also in connection with their approval of the Proposed Agreements, the Boards considered a representation made to them at that time by the Adviser that there were no additional developments not already disclosed to the Boards since their most recent approvals of the Current Agreements that would be a material consideration to the Boards in connection with their consideration of the Proposed Agreements, except for matters disclosed to the Boards by the Adviser. The Directors considered the fact that each Proposed Agreement would have corresponding terms and conditions identical to those of the corresponding Current Agreement with the exception of the effective date and initial term under the Proposed Agreement.
The Directors considered their knowledge of the nature and quality of the services provided by the Adviser to each Fund gained from their experience as directors or trustees of registered investment companies advised by the Adviser, their overall confidence in the Adviser’s integrity and competence they have gained from that experience, the Adviser’s initiative in identifying and raising potential issues with the Directors and its responsiveness, frankness and attention to concerns raised by the Directors in the past, including the Adviser’s willingness to consider and implement organizational and operational changes designed to improve investment results and the services provided to the Funds. The Directors noted that they have four regular meetings each year, at each of which they review extensive materials and information from the Adviser, including information on the investment performance of each Fund.
The Directors also considered all factors they believed relevant, including the specific matters discussed below. During the course of their deliberations, the Directors evaluated, among other things, the reasonableness of the management fees of the Funds they oversee. The Directors did not identify any particular information that wasall-important or controlling, and different Directors may have attributed different weights to the various factors. The Directors determined that the selection of the Adviser to manage the Funds, and the overall arrangements between the Funds and the Adviser, as provided in the Proposed Agreements, including the management fees, were fair and reasonable in light of the services performed under the Current Agreements and to be performed under the Proposed Agreements, expenses incurred and to be incurred and such other matters as the Directors considered relevant in the exercise of their business judgment. The material factors and conclusions that formed the basis for the Directors’ determinations included the following:
Nature, Extent and Quality of Services Provided
The Directors considered the scope and quality of services to be provided by the Adviser under the Proposed Agreements, including the quality of
| abfunds.com | AB EMERGING MARKETS CORE PORTFOLIO | 37 | |
the investment research capabilities of the Adviser and the other resources it has dedicated to performing services for the Funds. They also considered the information that had been provided to them by the Adviser concerning the anticipated implementation of the Plan and the Adviser’s representation that it did not anticipate that such implementation would affect the management or structure of the Adviser, have a material adverse effect on the Adviser, or adversely affect the quality of the services provided to the Funds by the Adviser and its affiliates. The Directors noted that the Adviser from time to time reviews each Fund’s investment strategies and from time to time proposes changes intended to improve the Fund’s relative or absolute performance for the Directors’ consideration. They also noted the professional experience and qualifications of each Fund’s portfolio management team and other senior personnel of the Adviser. The Directors also considered that certain Proposed Agreements, similar to the corresponding Current Agreements, provide that the Funds will reimburse the Adviser for the cost to it of providing certain clerical, accounting, administrative and other services to the Funds by employees of the Adviser or its affiliates. Requests for these reimbursements are made on a quarterly basis and subject to approval by the Directors. The Directors noted that the Adviser did not request any reimbursements from certain Funds in the Fund’s latest fiscal year reviewed. The Directors noted that the methodology to be used to determine the reimbursement amounts had been reviewed by an independent consultant retained by the Funds’ former Senior Officer/Independent Compliance Officer. The quality of administrative and other services, including the Adviser’s role in coordinating the activities of the Funds’ other service providers, also was considered. The Directors of each Fund concluded that, overall, they were satisfied with the nature, extent and quality of services to be provided to the Funds under the Proposed Agreement for the Fund.
Costs of Services to be Provided and Profitability
The Directors reviewed a schedule of the revenues and expenses and related notes indicating the profitability of each Fund to the Adviser for calendar years 2016 and 2017, as applicable, that had been prepared with an expense allocation methodology arrived at in consultation with an independent consultant retained by the Funds’ former Senior Officer/Independent Compliance Officer. The Directors noted the assumptions and methods of allocation used by the Adviser in preparing fund-specific profitability data and understood that there are a number of potentially acceptable allocation methodologies for information of this type. The Directors noted that the profitability information reflected all revenues and expenses of the Adviser’s relationship with a Fund, including those relating to its subsidiaries that provide transfer agency, distribution and brokerage services to the Fund, as applicable. The Directors recognized that it is difficult to make comparisons of the profitability of the Proposed Agreements with the profitability of fund advisory contracts for unaffiliated funds because comparative information is not generally publicly available and is
| 38 | AB EMERGING MARKETS CORE PORTFOLIO | abfunds.com | |
affected by numerous factors. The Directors focused on the profitability of the Adviser’s relationship with each Fund before taxes and distribution expenses, as applicable. The Directors noted that certain Funds were not profitable to the Adviser in one or more periods reviewed. The Directors concluded that the Adviser’s level of profitability from its relationship with the other Funds was not unreasonable. The Directors were unable to consider historical information about the profitability of certain Funds that had recently commenced operations and for which historical profitability information was not available. The Adviser agreed to provide the Directors with profitability information in connection with future proposed continuances of the Proposed Agreements.
Fall-Out Benefits
The Directors considered the other benefits to the Adviser and its affiliates from their relationships with the Funds, including, but not limited to, as applicable, benefits relating to soft dollar arrangements (whereby investment advisers receive brokerage and research services from brokers that execute agency transactions for their clients) in the case of certain Funds;12b-1 fees and sales charges received by the principal underwriter (which is a wholly owned subsidiary of the Adviser) in respect of certain classes of the shares of most of the Funds; brokerage commissions paid by certain Funds to brokers affiliated with the Adviser; and transfer agency fees paid by most of the Funds to a wholly owned subsidiary of the Adviser. The Directors recognized that the Adviser’s profitability would be somewhat lower, and that a Fund’s unprofitability to the Adviser would be exacerbated, without these benefits. The Directors understood that the Adviser also might derive reputational and other benefits from its association with the Funds.
Investment Results
In addition to the information reviewed by the Directors in connection with the Board meeting at which the Proposed Agreements were approved, the Directors receive detailed performance information for the Funds at each regular Board meeting during the year.
The Boards’ consideration of each Proposed Agreement was informed by their most recent approval of the related Current Agreement, and, in the case of certain Funds, their discussion with the Adviser of the reasons for those Funds’ underperformance in certain periods. The Directors also reviewed updated performance information and, in some cases, discussed with the Adviser the reasons for changes in performance or continued underperformance. On the basis of this review, the Directors concluded that each Fund’s investment performance was acceptable.
Management Fees and Other Expenses
The Directors considered the management fee rate payable by each Fund to the Adviser and information prepared by an independent service provider
| abfunds.com | AB EMERGING MARKETS CORE PORTFOLIO | 39 | |
(the “15(c) provider”) concerning management fee rates payable by other funds in the same category as the Fund. The Directors recognized that it is difficult to make comparisons of management fees because there are variations in the services that are included in the fees paid by other funds. The Directors compared each Fund’s contractual management fee rate with a peer group median, and where applicable, took into account the impact on the management fee rate of the administrative expense reimbursement paid to the Adviser in the latest fiscal year. In the case of the ACS Funds, the Directors noted that the management fee rate is zero but also were cognizant that the Adviser is indirectly compensated by the wrap fee program sponsors that use the ACS Funds as an investment vehicle for their clients.
The Directors also considered the Adviser’s fee schedule for other clients pursuing a similar investment style to each Fund. For this purpose, they reviewed the relevant advisory fee information from the Adviser’s Form ADV and in a report from the Funds’ Senior Analyst and noted the differences between a Fund’s fee schedule, on the one hand, and the Adviser’s institutional fee schedule and the schedule of fees charged by the Adviser to any offshore funds and for services to anysub-advised funds pursuing a similar investment strategy as the Fund, on the other, as applicable. The Directors noted that the Adviser may, in some cases, agree to fee rates with large institutional clients that are lower than those reviewed by the Directors and that they had previously discussed with the Adviser its policies in respect of such arrangements. The Adviser also informed the Directors that, in the case of certain Funds, there were no institutional products managed by the Adviser that have a substantially similar investment style. The Directors also discussed these matters with their independent fee consultant.
The Adviser reviewed with the Directors the significantly greater scope of the services it provides to each Fund relative to institutional, offshore fund andsub-advised fund clients, as applicable. In this regard, the Adviser noted, among other things, that, compared to institutional and offshore orsub-advisory accounts, each Fund, as applicable, (i) demands considerably more portfolio management, research and trading resources due to significantly higher daily cash flows (in the case ofopen-end Funds); (ii) has more tax and regulatory restrictions and compliance obligations; (iii) must prepare and file or distribute regulatory and other communications about fund operations; and (iv) must provide shareholder servicing to retail investors. The Adviser also reviewed the greater legal risks presented by the large and changing population of Fund shareholders who may assert claims against the Adviser in individual or class actions, and the greater entrepreneurial risk in offering new fund products, which require substantial investment to launch, may not succeed, and generally must be priced to compete with larger, more established funds resulting in lack of profitability to the Adviser until a new fund achieves scale. In light of the substantial differences in services rendered by the Adviser to institutional, offshore fund andsub-advised fund clients as compared to the Funds, and the different risk profile, the Directors considered these fee comparisons inapt and did not place significant weight on them in their deliberations.
| 40 | AB EMERGING MARKETS CORE PORTFOLIO | abfunds.com | |
The Directors noted that many of the Funds may invest in shares of exchange-traded funds (“ETFs”), subject to the restrictions and limitations of the 1940 Act as these may be varied as a result of exemptive orders issued by the SEC. The Directors also noted that ETFs pay advisory fees pursuant to their advisory contracts. The Directors concluded, based on the Adviser’s explanation of how it uses ETFs when they are the most cost-effective way to obtain desired exposures, in some cases pending purchases of underlying securities, that each Fund’s management fee would be for services that would be in addition to, rather than duplicative of, the services provided under the advisory contracts of the ETFs.
With respect to each Fund’s management fee, the Directors considered the total expense ratio of the Fund in comparison to a peer group and peer universe selected by the 15(c) service provider. The Directors also considered the Adviser’s expense caps for certain Funds. The Directors view expense ratio information as relevant to their evaluation of the Adviser’s services because the Adviser is responsible for coordinating services provided to a Fund by others.
The Boards’ consideration of each Proposed Agreement was informed by their most recent approval of the related Current Agreement, and, in the case of certain Funds, their discussion with the Adviser of the reasons for those Funds’ expense ratios in certain periods. The Directors also reviewed updated expense ratio information and, in some cases, discussed with the Adviser the reasons for the expense ratios of certain Funds. On the basis of this review, the Directors concluded that each Fund’s expense ratio was acceptable.
The Directors did not consider comparative expense information for the ACS Funds because those Funds do not bear ordinary expenses.
Economies of Scale
The Directors noted that the management fee schedules for certain Funds do not contain breakpoints and that they had discussed their strong preference for breakpoints in advisory contracts with the Adviser. The Directors took into consideration prior presentations by an independent consultant on economies of scale in the mutual fund industry and for the Funds, and by the Adviser concerning certain of its views on economies of scale. The Directors also had requested and received from the Adviser certain updates on economies of scale in advance of the Board meeting. The Directors believe that economies of scale may be realized (if at all) by the Adviser across a variety of products and services, and not only in respect of a single fund. The Directors noted that there is no established methodology for setting breakpoints that give effect to the fund-specific services provided by a fund’s adviser and to the economies of scale that an adviser may realize in its overall mutual fund business or those components of it which directly or indirectly affect a fund’s operations. The Directors
| abfunds.com | AB EMERGING MARKETS CORE PORTFOLIO | 41 | |
observed that in the mutual fund industry as a whole, as well as among funds similar to each Fund, there is no uniformity or pattern in the fees and asset levels at which breakpoints (if any) apply. The Directors also noted that the advisory agreements for many funds do not have breakpoints at all. The Directors informed the Adviser that they would monitor the asset levels of the Funds without breakpoints and their profitability to the Adviser and anticipated revisiting the question of breakpoints in the future if circumstances warrant doing so.
The Directors did not consider the extent to which fee levels in the Advisory Agreement for the ACS Funds reflect economies of scale because that Advisory Agreement does not provide for any compensation to be paid to the Adviser by the ACS Funds and the expense ratio of each of those Funds is zero.
Interim Advisory Agreements
In approving the Interim Advisory Agreements, the Boards, with the assistance of independent counsel, considered similar factors to those considered in approving the Proposed Agreements. The Interim Advisory Agreements approved by the Boards are identical to the Proposed Agreements, as well as the Current Agreements, in all material respects except for their proposed effective and termination dates and provisions intended to comply with the requirements of the relevant SEC rule, such as provisions requiring escrow of advisory fees. Under the Interim Advisory Agreements, the Adviser would continue to manage a Fund pursuant to an Interim Advisory Agreement until a new advisory agreement was approved by stockholders or until the end of the150-day period, whichever would occur earlier. All fees earned by the Adviser under an Interim Advisory Agreement would be held in escrow pending shareholder approval of the Proposed Agreement. Upon approval of a new advisory agreement by stockholders, the escrowed management fees would be paid to the Adviser, and the Interim Advisory Agreement would terminate.
Information Regarding the Review and Approval of the Fund’s Current Advisory Agreement
The disinterested directors (the “directors”) of AB Cap Fund, Inc. (the “Company”) unanimously approved the continuance of the Company’s Advisory Agreement with the Adviser in respect of AB Emerging Markets Core Portfolio (the “Fund”) at a meeting held on May1-3, 2018 (the “Meeting”).
Prior to approval of the continuance of the Advisory Agreement, the directors had requested from the Adviser, and received and evaluated, extensive materials. They reviewed the proposed continuance of the Advisory Agreement with the Adviser and with experienced counsel who are independent of the Adviser, who advised on the relevant legal standards. The directors also reviewed additional materials, including materials from
| 42 | AB EMERGING MARKETS CORE PORTFOLIO | abfunds.com | |
an outside consultant, who acted as their independent fee consultant, and comparative analytical data prepared by the Senior Analyst for the Fund. The directors also discussed the proposed continuance in private sessions with counsel.
The directors considered their knowledge of the nature and quality of the services provided by the Adviser to the Fund gained from their experience as directors or trustees of most of the registered investment companies advised by the Adviser, their overall confidence in the Adviser’s integrity and competence they have gained from that experience, the Adviser’s initiative in identifying and raising potential issues with the directors and its responsiveness, frankness and attention to concerns raised by the directors in the past, including the Adviser’s willingness to consider and implement organizational and operational changes designed to improve investment results and the services provided to the AB Funds. The directors noted that they have four regular meetings each year, at each of which they review extensive materials and information from the Adviser, including information on the investment performance of the Fund.
The directors also considered all factors they believed relevant, including the specific matters discussed below. During the course of their deliberations, the directors evaluated, among other things, the reasonableness of the advisory fee. The directors did not identify any particular information that wasall-important or controlling, and different directors may have attributed different weights to the various factors. The directors determined that the selection of the Adviser to manage the Fund and the overall arrangements between the Fund and the Adviser, as provided in the Advisory Agreement, including the advisory fee, were fair and reasonable in light of the services performed, expenses incurred and such other matters as the directors considered relevant in the exercise of their business judgment. The material factors and conclusions that formed the basis for the directors’ determinations included the following:
Nature, Extent and Quality of Services Provided
The directors considered the scope and quality of services provided by the Adviser under the Advisory Agreement, including the quality of the investment research capabilities of the Adviser and the other resources it has dedicated to performing services for the Fund. The directors noted that the Adviser from time to time reviews the Fund’s investment strategies and from time to time proposes changes intended to improve the Fund’s relative or absolute performance for the directors’ consideration. They also noted the professional experience and qualifications of the Fund’s portfolio management team and other senior personnel of the Adviser. The directors also considered that the Advisory Agreement provides that the Fund will reimburse the Adviser for the cost to it of providing certain clerical, accounting, administrative and other services to the Fund by employees of the Adviser or its affiliates. Requests for these reimbursements are made
| abfunds.com | AB EMERGING MARKETS CORE PORTFOLIO | 43 | |
on a quarterly basis and subject to approval by the directors. The Adviser did not request any reimbursements from the Fund in the Fund’s latest fiscal year. The directors noted that the methodology used to determine the reimbursement amounts had been reviewed by an independent consultant retained by the Company’s former Independent Compliance Officer. The quality of administrative and other services, including the Adviser’s role in coordinating the activities of the Fund’s other service providers, also was considered. The directors concluded that, overall, they were satisfied with the nature, extent and quality of services provided to the Fund under the Advisory Agreement.
Costs of Services Provided and Profitability
The directors reviewed a schedule of the revenues and expenses and related notes indicating the profitability of the Fund to the Adviser for calendar years 2016 and 2017 that had been prepared with an expense allocation methodology arrived at in consultation with an independent consultant retained by the Company’s former Independent Compliance Officer. The directors noted the assumptions and methods of allocation used by the Adviser in preparing fund-specific profitability data and understood that there are a number of potentially acceptable allocation methodologies for information of this type. The directors noted that the profitability information reflected all revenues and expenses of the Adviser’s relationship with the Fund, including those relating to its subsidiaries that provide transfer agency, distribution and brokerage services to the Fund, and that the proposed reduction in the advisory fee rate would likely impact the Adviser’s profitability analysis in future years. The directors recognized that it is difficult to make comparisons of the profitability of the Advisory Agreement with the profitability of advisory contracts for unaffiliated funds because comparative information is not generally publicly available and is affected by numerous factors. The directors focused on the profitability of the Adviser’s relationship with the Fund before taxes and distribution expenses. The directors noted that the Fund was not profitable to the Adviser in the periods reviewed. The directors noted that the reduction in the advisory fee rate effective since May 5, 2017 would likely impact the Adviser’s profitability analysis in future years.
Fall-Out Benefits
The directors considered the other benefits to the Adviser and its affiliates from their relationships with the Fund, including, but not limited to, benefits relating to soft dollar arrangements (whereby investment advisers receive brokerage and research services from brokers that execute agency transactions for their clients);12b-1 fees and sales charges received by the Fund’s principal underwriter (which is a wholly owned subsidiary of the Adviser) in respect of certain classes of the Fund’s shares; brokerage commissions paid by the Fund to brokers affiliated with the Adviser; and transfer agency fees paid by the Fund to a wholly owned subsidiary of the Adviser. The directors recognized that the Fund’s
| 44 | AB EMERGING MARKETS CORE PORTFOLIO | abfunds.com | |
unprofitability to the Adviser would be exacerbated without these benefits. The directors understood that the Adviser also might derive reputational and other benefits from its association with the Fund.
Investment Results
In addition to the information reviewed by the directors in connection with the Meeting, the directors receive detailed performance information for the Fund at each regular Board meeting during the year.
At the Meeting, the directors reviewed performance information prepared by an analytical service that is not affiliated with the Adviser (the “15(c) service provider”), showing the performance of the Class A Shares of the Fund against a group of similar funds (“peer group”) and a larger group of similar funds (“peer universe”), each selected by the 15(c) service provider, and information prepared by the Adviser showing performance of the Class A Shares against a broad-based securities market index, in each case for the1-year period ended February 28, 2018 and (in the case of comparisons with the broad-based securities market index) for the period from inception. Based on their review, and their discussion with the Adviser of the reasons for the Fund’s underperformance in certain periods, the directors concluded that the Fund’s investment performance was acceptable.
Advisory Fees and Other Expenses
The directors considered the advisory fee rate payable by the Fund to the Adviser and information prepared by the 15(c) service provider concerning advisory fee rates payable by other funds in the same category as the Fund. The directors recognized that it is difficult to make comparisons of advisory fees because there are variations in the services that are included in the fees paid by other funds. The directors compared the Fund’s contractual effective advisory fee rate (reflecting a reduction in the advisory fee rate effective since May 5, 2017) with a peer group median.
The directors also considered the Adviser’s fee schedule for other clients pursuing a similar investment style. For this purpose, they reviewed the relevant advisory fee information from the Adviser’s Form ADV and the materials from the Fund’s Senior Analyst and noted the differences between the Fund’s fee schedule, on the one hand, and the Adviser’s institutional fee schedule and the schedule of fees charged by the Adviser to any offshore funds and anysub-advised funds, on the other. The directors noted that the Adviser may, in some cases, agree to fee rates with large institutional clients that are lower than those reviewed by the directors and that they had previously discussed with the Adviser its policies in respect of such arrangements.
The Adviser reviewed with the directors the significantly greater scope of the services it provides to the Fund relative to institutional, offshore fund andsub-advised fund clients. In this regard, the Adviser noted, among
| abfunds.com | AB EMERGING MARKETS CORE PORTFOLIO | 45 | |
other things, that, compared to institutional and offshore accounts, the Fund (i) demands considerably more portfolio management, research and trading resources due to significantly higher daily cash flows; (ii) has more tax and regulatory restrictions; (iii) must prepare and distribute regulatory and other communications about fund operations; and (iv) must provide shareholder servicing to retail investors. The Adviser also reviewed the greater legal risks presented by the large and changing population of Fund shareholders who may assert claims against the Adviser in individual or class actions, and the greater entrepreneurial risk in offering new fund products, which require substantial investment to launch, may not succeed, and generally must be priced to compete with larger, more established funds resulting in lack of profitability to the Adviser until a new fund achieves scale. In light of the substantial differences in services rendered by the Adviser to institutional, offshore fund andsub-advised fund clients as compared to funds such as the Fund, and the different risk profile, the directors considered these fee comparisons inapt and did not place significant weight on them in their deliberations.
The directors noted that the Fund may invest in shares of exchange-traded funds (“ETFs”), subject to the restrictions and limitations of the Investment Company Act of 1940 as these may be varied as a result of exemptive orders issued by the SEC. The directors also noted that ETFs pay advisory fees pursuant to their advisory contracts, and that the Adviser had provided, and they had reviewed information about the expense ratios of the relevant ETFs. The directors concluded, based on the Adviser’s explanation of how it may use ETFs when they are the most cost-effective way to obtain desired exposures for a fund or to temporarily “equitize” cash inflows pending purchases of underlying securities, that the advisory fee for the Fund would be paid for services that would be in addition to, rather than duplicative of, the services provided under the advisory contracts of the ETFs.
The directors also considered the total expense ratio of the Class A shares of the Fund in comparison to a peer group and a peer universe selected by the 15(c) service provider. The Class A expense ratio of the Fund was based on the Fund’s latest fiscal year and the information included the pro forma expense ratio to reflect a reduction in the Fund’s expense ratio effective since May 5, 2017, when the advisory fee rate was reduced and the Adviser had set the Fund’s expense cap at a correspondingly lower level. The directors noted that it was likely that the expense ratios of some of the other funds in the Fund’s category were lowered by waivers or reimbursements by those funds’ investment advisers, which in some cases might be voluntary or temporary. The directors view expense ratio information as relevant to their evaluation of the Adviser’s services because the Adviser is responsible for coordinating services provided to the Fund by others. Based on their review, the directors concluded that the Fund’s pro forma expense ratio was acceptable.
| 46 | AB EMERGING MARKETS CORE PORTFOLIO | abfunds.com | |
Economies of Scale
The directors noted that the advisory fee schedule for the Fund contains breakpoints that reduce the fee rates on assets above specified levels. The directors took into consideration prior presentations by an independent consultant on economies of scale in the mutual fund industry and for the AB Funds, and by the Adviser concerning certain of its views on economies of scale. The directors also had requested and received from the Adviser certain updates on economies of scale in advance of the Meeting. The directors believe that economies of scale may be realized (if at all) by the Adviser across a variety of products and services, and not only in respect of a single fund. The directors noted that there is no established methodology for setting breakpoints that give effect to the fund-specific services provided by a fund’s adviser and to the economies of scale that an adviser may realize in its overall mutual fund business or those components of it which directly or indirectly affect a fund’s operations. The directors observed that in the mutual fund industry as a whole, as well as among funds similar to the Fund, there is no uniformity or pattern in the fees and asset levels at which breakpoints (if any) apply. The directors also noted that the advisory agreements for many funds do not have breakpoints at all. Having taken these factors into account, the directors concluded that the Fund’s shareholders would benefit from a sharing of economies of scale in the event the Fund’s net assets exceed a breakpoint in the future.
| abfunds.com | AB EMERGING MARKETS CORE PORTFOLIO | 47 | |
This page is not part of the Shareholder Report or the Financial Statements.
AB FAMILY OF FUNDS
US EQUITY
US CORE
Core Opportunities Fund
FlexFee™ US Thematic Portfolio
Select US Equity Portfolio
US GROWTH
Concentrated Growth Fund
Discovery Growth Fund
FlexFee™ Large Cap Growth Portfolio
Growth Fund
Large Cap Growth Fund
Small Cap Growth Portfolio
US VALUE
Discovery Value Fund
Equity Income Fund
Relative Value Fund
Small Cap Value Portfolio
Value Fund
INTERNATIONAL/ GLOBAL EQUITY
INTERNATIONAL/ GLOBAL CORE
FlexFee™ International Strategic Core Portfolio
Global Core Equity Portfolio
International Portfolio
International Strategic Core Portfolio
Sustainable Global Thematic Fund
Tax-Managed International Portfolio
Tax-Managed Wealth Appreciation Strategy
Wealth Appreciation Strategy
INTERNATIONAL/ GLOBAL GROWTH
Concentrated International Growth Portfolio
FlexFee™ Emerging Markets Growth Portfolio
INTERNATIONAL/ GLOBAL EQUITY(continued)
Sustainable International Thematic Fund
INTERNATIONAL/ GLOBAL VALUE
All China Equity Portfolio
International Value Fund
FIXED INCOME
MUNICIPAL
High Income Municipal Portfolio
Intermediate California Municipal Portfolio
Intermediate Diversified Municipal Portfolio
Intermediate New York Municipal Portfolio
Municipal Bond Inflation Strategy
Tax-Aware Fixed Income Portfolio
National Portfolio
Arizona Portfolio
California Portfolio
Massachusetts Portfolio
Minnesota Portfolio
New Jersey Portfolio
New York Portfolio
Ohio Portfolio
Pennsylvania Portfolio
Virginia Portfolio
TAXABLE
Bond Inflation Strategy
FlexFee™ High Yield Portfolio1
FlexFee™ International Bond Portfolio
Global Bond Fund
High Income Fund
Income Fund
Intermediate Bond Portfolio
Limited Duration High Income Portfolio
Short Duration Portfolio
ALTERNATIVES
All Market Real Return Portfolio
Global Real Estate Investment Fund
Select US Long/Short Portfolio
Unconstrained Bond Fund
MULTI-ASSET
All Market Income Portfolio
All Market Total Return Portfolio
Conservative Wealth Strategy
Emerging Markets Multi-Asset Portfolio
Global Risk Allocation Fund
Tax-Managed All Market Income Portfolio
TARGET-DATE
Multi-Manager Select Retirement Allocation Fund
Multi-Manager Select 2010 Fund
Multi-Manager Select 2015 Fund
Multi-Manager Select 2020 Fund
Multi-Manager Select 2025 Fund
Multi-Manager Select 2030 Fund
Multi-Manager Select 2035 Fund
Multi-Manager Select 2040 Fund
Multi-Manager Select 2045 Fund
Multi-Manager Select 2050 Fund
Multi-Manager Select 2055 Fund
Multi-Manager Select 2060 Fund
CLOSED-END FUNDS
Alliance California Municipal Income Fund
AllianceBernstein Global High Income Fund
AllianceBernstein National Municipal Income Fund
We also offer Government Money Market Portfolio, which serves as the money market fund exchange vehicle for the AB mutual funds. You could lose money by investing in the Fund. Although the Fund seeks to preserve the value of your investment at $1.00 per share, it cannot guarantee it will do so. The Fund may impose a fee upon sale of your shares or may temporarily suspend your ability to sell shares if the Fund’s liquidity falls below required minimums because of market conditions or other factors. An investment in the Fund is not insured or guaranteed by the Federal Deposit Insurance Corporation or any other government agency. The Fund’s sponsor has no legal obligation to provide financial support to the Fund, and you should not expect that the sponsor will provide financial support to the Fund at any time.
Investors should consider the investment objectives, risks, charges and expenses of the Fund carefully before investing. For copies of our prospectus or summary prospectus, which contain this and other information, visit us online at www.abfunds.com or contact your AB representative. Please read the prospectus and/or summary prospectus carefully before investing.
| 1 | Prior to February 23, 2018, FlexFee High Yield Portfolio was named High Yield Portfolio. |
| 48 | AB EMERGING MARKETS CORE PORTFOLIO | abfunds.com | |
AB EMERGING MARKETS CORE PORTFOLIO
1345 Avenue of the Americas
New York, NY 10105
800 221 5672
EMCP-0152-1218 
DEC 12.31.18

SEMI-ANNUAL REPORT
AB GLOBAL CORE EQUITY PORTFOLIO

Beginning January 1, 2021, as permitted by new regulations adopted by the Securities and Exchange Commission, the Fund’s annual and semi-annual shareholder reports will no longer be sent by mail, unless you specifically request paper copies of the reports. Instead, the reports will be made available on a website, and you will be notified by mail each time a report is posted and provided with a website address to access the report.
If you already elected to receive shareholder reports electronically, you will not be affected by this change and you need not take any action. You may elect to receive shareholder reports and other communications from the Fund electronically at any time by contacting your financial intermediary (such as a broker-dealer or bank) or, if you are a direct investor, by calling the Fund at (800) 221 5672.
You may elect to receive all future reports in paper form free of charge. If you invest through a financial intermediary, you can contact your financial intermediary to request that you continue to receive paper copies of your shareholder reports; if you invest directly with the Fund, you can call the Fund at (800) 221 5672. Your election to receive reports in paper form will apply to all funds held in your account with your financial intermediary or, if you invest directly, to all AB Mutual Funds you hold.
| Investment Products Offered | • Are Not FDIC Insured• May Lose Value• Are Not Bank Guaranteed | |
Investors should consider the investment objectives, risks, charges and expenses of the Fund carefully before investing. For copies of our prospectus or summary prospectus, which contain this and other information, visit us online at www.abfunds.com or contact your AB representative. Please read the prospectus and/or summary prospectus carefully before investing.
This shareholder report must be preceded or accompanied by the Fund’s prospectus for individuals who are not current shareholders of the Fund.
You may obtain a description of the Fund’s proxy voting policies and procedures, and information regarding how the Fund voted proxies relating to portfolio securities during the most recent12-month period ended June 30, without charge. Simply visit AB’s website at www.abfunds.com, or go to the Securities and Exchange Commission’s (the “Commission”) website at www.sec.gov, or call AB at (800) 227 4618.
The Fund files its complete schedule of portfolio holdings with the Commission for the first and third quarters of each fiscal year. The Fund’s portfolio holdings reports are available on the Commission’s website at www.sec.gov. The Fund’s portfolio holdings reports may also be reviewed and copied at the Commission’s Public Reference Room in Washington, DC; information on the operation of the Public Reference Room may be obtained by calling (800) SEC 0330. AB publishes full portfolio holdings for the Fund monthly at www.abfunds.com.
AllianceBernstein Investments, Inc. (ABI) is the distributor of the AB family of mutual funds. ABI is a member of FINRA and is an affiliate of AllianceBernstein L.P., the Adviser of the funds.
The [A/B] logo is a registered service mark of AllianceBernstein and AllianceBernstein® is a registered service mark used by permission of the owner, AllianceBernstein L.P.
| FROM THE PRESIDENT |  |
Dear Shareholder,
We are pleased to provide this report for AB Global Core Equity Portfolio (the “Fund”). Please review the discussion of Fund performance, the market conditions during the reporting period and the Fund’s investment strategy.
As always, AB strives to keep clients ahead of what’s next by:
| + | Transforming uncommon insights into uncommon knowledge with a global research scope |
| + | Navigating markets with seasoned investment experience and sophisticated solutions |
| + | Providing thoughtful investment insights and actionable ideas |
Whether you’re an individual investor or a multi-billion-dollar institution, we put knowledge and experience to work for you.
AB’s global research organization connects and collaborates across platforms and teams to deliver impactful insights and innovative products. Better insights lead to better opportunities—anywhere in the world.
For additional information about AB’s range of products and shareholder resources, please log on to www.abfunds.com.
Thank you for your investment in the AB Mutual Funds.
Sincerely,

Robert M. Keith
President and Chief Executive Officer, AB Mutual Funds
| abfunds.com | AB GLOBAL CORE EQUITY PORTFOLIO | 1 | |
SEMI-ANNUAL REPORT
February 12, 2019
This report provides management’s discussion of fund performance for AB Global Core Equity Portfolio for the semi-annual reporting period ended December 31, 2018.
The Fund’s investment objective is to seek long-term growth of capital.
NAV RETURNS AS OF DECEMBER 31, 2018(unaudited)
| 6 Months | 12 Months | |||||||
| AB GLOBAL CORE EQUITY PORTFOLIO | ||||||||
| Class A Shares | -6.32% | -5.33% | ||||||
| Class C Shares | -6.70% | -6.09% | ||||||
| Advisor Class Shares1 | -6.22% | -5.07% | ||||||
| MSCI ACWI (net) | -9.02% | -9.42% | ||||||
| 1 | Please note that this share class is for investors purchasing shares through accounts established under certainfee-based programs sponsored and maintained by certain broker-dealers and financial intermediaries, institutional pension plans and/or investment advisory clients of, and certain other persons associated with, the Adviser and its affiliates or the Fund. |
INVESTMENT RESULTS
The table above shows the Fund’s performance compared with its benchmark, the Morgan Stanley Capital International All Country World Index (“MSCI ACWI”) (net), for thesix- and12-month periods ended December 31, 2018.
All share classes of the Fund outperformed the benchmark for both periods, before sales charges. During both periods, security selection contributed, relative to the benchmark, while sector allocation detracted. Stock selection within the consumer-discretionary sector contributed, while an underweight to health care detracted. Country positioning (a result ofbottom-up security analysis combined with fundamental research) was positive, particularly an overweight to Brazil, which contributed for both periods, while currency selection was negative.
For thesix-month period, stock selection in industrials contributed, while selection in financials and an overweight to consumer discretionary detracted.
For the12-month period, an overweight to Finland contributed. Currency positioning in the South African rand detracted, as did an overweight in communication services.
The Fund did not utilize derivatives during thesix- or12-month periods.
| 2 | AB GLOBAL CORE EQUITY PORTFOLIO | abfunds.com | |
MARKET REVIEW AND INVESTMENT STRATEGY
During thesix-month period ended December 31, 2018, global equities declined. In the US, performance was strong early in the period amid robust corporate earnings and economic data, which sent some US stock indices to record highs. However, concerns about slowing global growth, rising interest rates and worsening trade tensions caused volatility to spike and equities to decline precipitously at the end of the period. Some US indices temporarily entered bear market territory, which is considered a 20% or more decline from their recent highs.Large-cap stocks outperformedsmall-cap stocks, but performance was mixed from a style perspective. In Europe, Italy’s budget disputes with its European Union partners weighed on performance, as did unresolved and ongoing Brexit negotiations. A dramatic decline in the price of oil in the fourth quarter caused a wide dispersion in performance among emerging-market countries, withoil-importing countries benefiting andoil-exporting countries underperforming.
The Fund’s Senior Investment Management Team continues to invest in firms that are attractively valued in a core portfolio setup, and to minimize unintended factor risks.
INVESTMENT POLICIES
The Fund invests primarily in a portfolio of equity securities of issuers from markets around the world. Under normal circumstances, the Fund invests at least 80% of its net assets in equity securities, at least 40% of its net assets in securities ofnon-US companies, and invests in companies in at least three countries (including the United States).
The Fund is principally comprised of companies considered by the Adviser to offer good prospects for attractive returns relative to the general stock market. The Adviser will seek companies that are attractively valued and have the ability to generate high and sustainable returns on invested capital. In addition to returns on invested capital, other criteria that the Adviser will consider include strong business fundamentals, capable management, prudent corporate governance, a strong balance sheet, strong earnings power, high earnings quality, low downside risk and substantial upside potential. In managing the Fund, the Adviser will not seek to have a bias towards any investment style, economic sector, country or company size. The Fund’s holdings ofnon-US companies will frequently include companies located in emerging markets, and at times emerging-market companies will make up a significant portion of the Fund.
Fluctuations in currency exchange rates can have a dramatic impact on the returns of equity securities. While the Adviser may hedge the foreign currency exposure resulting from the Fund’s security positions through the use of currency-related derivatives, it is not required to do so.
| abfunds.com | AB GLOBAL CORE EQUITY PORTFOLIO | 3 | |
DISCLOSURES AND RISKS
Benchmark Disclosure
The MSCI ACWI is unmanaged and does not reflect fees and expenses associated with the active management of a mutual fund portfolio. The MSCI ACWI (net, free float-adjusted, market capitalization weighted) represents the equity market performance of developed and emerging markets. MSCI makes no express or implied warranties or representations, and shall have no liability whatsoever with respect to any MSCI data contained herein. The MSCI data may not be further redistributed or used as a basis for other indices, any securities or financial products. This report is not approved, reviewed or produced by MSCI. Net returns include the reinvestment of dividends after deduction ofnon-US withholding tax. An investor cannot invest directly in an index or average, and their results are not indicative of the performance for any specific investment, including the Fund.
A Word About Risk
Market Risk: The value of the Fund’s assets will fluctuate as the stock or bond market fluctuates. The value of its investments may decline, sometimes rapidly and unpredictably, simply because of economic changes or other events that affect large portions of the market. It includes the risk that a particular style of investing, such as growth, may underperform the market generally.
Foreign(Non-US) Risk: Investments in securities ofnon-US issuers may involve more risk than those of US issuers. These securities may fluctuate more widely in price and may be less liquid due to adverse market, economic, political, regulatory or other factors. These risks may be heightened with respect to investments in emerging-market countries, where there may be an increased amount of economic, political and social instability.
Emerging-Market Risk: Investments in emerging-market countries may have more risk because the markets are less developed and less liquid as well as being subject to increased economic, political, regulatory or other uncertainties.
Currency Risk: Fluctuations in currency exchange rates may negatively affect the value of the Fund’s investments or reduce its returns.
Sector Risk: The Fund may have more risk because of concentrated investments in a particular market sector, such as the technology or financial-services sector. Market or economic factors affecting that sector could have a major effect on the value of the Fund’s investments.
Management Risk: The Fund is subject to management risk because it is an actively managed investment fund. The Adviser will apply its investment techniques and risk analyses in making investment decisions for the Fund, but there is no guarantee that its techniques will produce the intended results.
| 4 | AB GLOBAL CORE EQUITY PORTFOLIO | abfunds.com | |
DISCLOSURES AND RISKS(continued)
These risks are fully discussed in the Fund’s prospectus. As with all investments, you may lose money by investing in the Fund.
An Important Note About Historical Performance
The investment return and principal value of an investment in the Fund will fluctuate, so that shares, when redeemed, may be worth more or less than their original cost. Performance shown in this report represents past performance and does not guarantee future results. Current performance may be lower or higher than the performance information shown. You may obtain performance information current to the most recentmonth-end by visiting www.abfunds.com.
All fees and expenses related to the operation of the Fund have been deducted. Net asset value (“NAV”) returns do not reflect sales charges; if sales charges were reflected, the Fund’s quoted performance would be lower. SEC returns reflect the applicable sales charges for each share class: a 4.25% maximumfront-end sales charge for Class A shares and a 1%1-year contingent deferred sales charge for Class C shares. Returns for the different share classes will vary due to different expenses associated with each class. Performance assumes reinvestment of distributions and does not account for taxes.
| abfunds.com | AB GLOBAL CORE EQUITY PORTFOLIO | 5 | |
HISTORICAL PERFORMANCE
AVERAGE ANNUAL RETURNS AS OF DECEMBER 31, 2018(unaudited)
| NAV Returns | SEC Returns (reflects applicable | |||||||
| CLASS A SHARES | ||||||||
| 1 Year | -5.33% | -9.38% | ||||||
| Since Inception1 | 5.37% | 4.28% | ||||||
| CLASS C SHARES | ||||||||
| 1 Year | -6.09% | -7.01% | ||||||
| Since Inception1 | 4.55% | 4.55% | ||||||
| ADVISOR CLASS SHARES2 | ||||||||
| 1 Year | -5.07% | -5.07% | ||||||
| Since Inception1 | 5.62% | 5.62% | ||||||
The Fund’s current prospectus fee table shows the Fund’s total annual operating expense ratios as 1.15%, 1.90% and 0.90% for Class A, Class C and Advisor Class shares, respectively. The Financial Highlights section of this report sets forth expense ratio data for the current reporting period; the expense ratios shown above may differ from the expense ratios in the Financial Highlights section since they are based on different time periods.
| 1 | Inception date: 11/12/2014. |
| 2 | Please note that this share class is offered at NAV to eligible investors and the SEC returns are the same as the NAV returns. Please note that this share class is for investors purchasing shares through accounts established under certainfee-based programs sponsored and maintained by certain broker-dealers and financial intermediaries, institutional pension plans and/or investment advisory clients of, and certain other persons associated with, the Adviser and its affiliates or the Fund. |
SEC AVERAGE ANNUAL RETURNS
AS OF THE MOST RECENT CALENDARQUARTER-END
DECEMBER 31, 2018(unaudited)
SEC Returns (reflects applicable | ||||
| CLASS A SHARES | ||||
| 1 Year | -9.38% | |||
| Since Inception1 | 4.28% | |||
| CLASS C SHARES | ||||
| 1 Year | -7.01% | |||
| Since Inception1 | 4.55% | |||
| ADVISOR CLASS SHARES2 | ||||
| 1 Year | -5.07% | |||
| Since Inception1 | 5.62% | |||
| 1 | Inception date: 11/12/2014. |
| 2 | Please note that this share class is for investors purchasing shares through accounts established under certainfee-based programs sponsored and maintained by certain broker-dealers and financial intermediaries, institutional pension plans and/or investment advisory clients of, and certain other persons associated with, the Adviser and its affiliates or the Fund. |
| 6 | AB GLOBAL CORE EQUITY PORTFOLIO | abfunds.com | |
EXPENSE EXAMPLE
(unaudited)
As a shareholder of the Fund, you incur two types of costs: (1) transaction costs, including sales charges (loads) on purchase payments, contingent deferred sales charges on redemptions and (2) ongoing costs, including management fees; distribution (12b-1) fees; and other Fund expenses. This example is intended to help you understand your ongoing costs (in dollars) of investing in the Fund and to compare these costs with the ongoing costs of investing in other mutual funds.
The Example is based on an investment of $1,000 invested at the beginning of the period and held for the entire period as indicated below.
Actual Expenses
The table below provides information about actual account values and actual expenses. You may use the information, together with the amount you invested, to estimate the expenses that you paid over the period. Simply divide your account value by $1,000 (for example, an $8,600 account value divided by $1,000 = 8.6), then multiply the result by the number under the heading entitled “Expenses Paid During Period” to estimate the expenses you paid on your account during this period.
Hypothetical Example for Comparison Purposes
The table below also provides information about hypothetical account values and hypothetical expenses based on the Fund’s actual expense ratio and an assumed annual rate of return of 5% before expenses, which is not the Fund’s actual return. The hypothetical account values and expenses may not be used to estimate the actual ending account balance or expenses you paid for the period. You may use this information to compare the ongoing costs of investing in the Fund and other funds by comparing this 5% hypothetical example with the 5% hypothetical examples that appear in the shareholder reports of other funds.
Please note that the expenses shown in the table are meant to highlight your ongoing costs only and do not reflect any transactional costs, such as sales charges (loads), or contingent deferred sales charges on redemptions. Therefore, the hypothetical example is useful in comparing ongoing costs only, and will not help you determine the relative total costs of owning different funds. In addition, if these transactional costs were included, your costs would have been higher.
| Beginning Account Value 7/1/2018 | Ending Account Value 12/31/2018 | Expenses Paid During Period* | Annualized Expense Ratio* | |||||||||||||
| Class A | ||||||||||||||||
Actual | $ | 1,000 | $ | 936.80 | $ | 5.61 | 1.15 | % | ||||||||
Hypothetical** | $ | 1,000 | $ | 1,019.41 | $ | 5.85 | 1.15 | % | ||||||||
| abfunds.com | AB GLOBAL CORE EQUITY PORTFOLIO | 7 | |
EXPENSE EXAMPLE(continued)
| Beginning Account Value 7/1/2018 | Ending Account Value 12/31/2018 | Expenses Paid During Period* | Annualized Expense Ratio* | |||||||||||||
| Class C | ||||||||||||||||
Actual | $ | 1,000 | $ | 933.00 | $ | 9.26 | 1.90 | % | ||||||||
Hypothetical** | $ | 1,000 | $ | 1,015.63 | $ | 9.65 | 1.90 | % | ||||||||
| Advisor Class | ||||||||||||||||
Actual | $ | 1,000 | $ | 937.80 | $ | 4.40 | 0.90 | % | ||||||||
Hypothetical** | $ | 1,000 | $ | 1,020.67 | $ | 4.58 | 0.90 | % | ||||||||
| * | Expenses are equal to the classes’ annualized expense ratios multiplied by the average account value over the period, multiplied by 184/365 (to reflect theone-half year period). |
| ** | Assumes 5% annual return before expenses. |
| 8 | AB GLOBAL CORE EQUITY PORTFOLIO | abfunds.com | |
PORTFOLIO SUMMARY
December 31, 2018(unaudited)
PORTFOLIO STATISTICS
Net Assets ($mil): $517.2
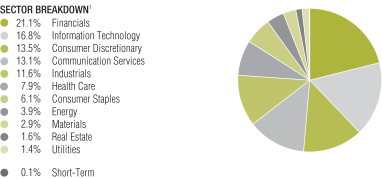
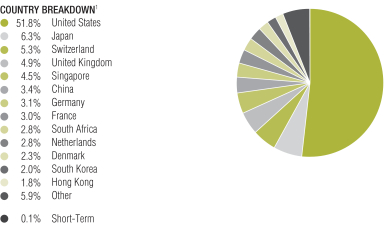
| 1 | All data are as of December 31, 2018. The Fund’s sector and country breakdowns are expressed as a percentage of total investments (excluding security lending collateral) and may vary over time. The Fund also enters into derivative transactions, which may be used for hedging or investment purposes (see “Portfolio of Investments” section of the report for additional details). “Other” country weightings represent 1.5% or less in the following countries: Brazil, Finland, Russia, Spain and Taiwan. |
Please note: The sector classifications presented herein are based on the Global Industry Classification Standard (GICS) which was developed by Morgan Stanley Capital International and Standard & Poor’s. The components are divided into sector, industry group, and industrysub-indices as classified by the GICS for each of the market capitalization indices in the broad market. These sector classifications are broadly defined. The “Portfolio of Investments” section of the report reflects more specific industry information and is consistent with the investment restrictions discussed in the Fund’s prospectus.
| abfunds.com | AB GLOBAL CORE EQUITY PORTFOLIO | 9 | |
PORTFOLIO SUMMARY(continued)
December 31, 2018(unaudited)
TEN LARGEST HOLDINGS1
| Company | U.S. $ Value | Percent of Net Assets | ||||||
| Alphabet, Inc. – Class C | $ | 26,385,272 | 5.1 | % | ||||
| Anthem, Inc. | 25,723,295 | 5.0 | ||||||
| Microsoft Corp. | 23,332,153 | 4.5 | ||||||
| Service Corp. International/US | 19,573,969 | 3.8 | ||||||
| Wells Fargo & Co. | 19,456,497 | 3.8 | ||||||
| Visa, Inc. – Class A | 15,215,321 | 2.9 | ||||||
| Starbucks Corp. | 14,785,467 | 2.8 | ||||||
| Naspers Ltd. – Class N | 14,507,684 | 2.8 | ||||||
| Julius Baer Group Ltd. | 14,457,701 | 2.8 | ||||||
| Dover Corp. | 13,997,016 | 2.7 | ||||||
| $ | 187,434,375 | 36.2 | % | |||||
| 1 | Long-term investments. |
| 10 | AB GLOBAL CORE EQUITY PORTFOLIO | abfunds.com | |
PORTFOLIO OF INVESTMENTS
December 31, 2018(unaudited)
| Company | Shares | U.S. $ Value | ||||||||||
| ||||||||||||
COMMON STOCKS – 99.5% | ||||||||||||
Financials – 21.1% | ||||||||||||
Banks – 9.6% | ||||||||||||
Citigroup, Inc. | 143,540 | $ | 7,472,692 | |||||||||
DBS Group Holdings Ltd. | 592,600 | 10,305,226 | ||||||||||
Jyske Bank A/S | 334,212 | 12,100,047 | ||||||||||
Wells Fargo & Co. | 422,233 | 19,456,497 | ||||||||||
|
| |||||||||||
| 49,334,462 | ||||||||||||
|
| |||||||||||
Capital Markets – 8.7% | ||||||||||||
BlackRock, Inc. – Class A | 11,046 | 4,339,090 | ||||||||||
Julius Baer Group Ltd.(a) | 405,699 | 14,457,701 | ||||||||||
London Stock Exchange Group PLC | 77,576 | 4,024,687 | ||||||||||
Moody’s Corp. | 46,580 | 6,523,063 | ||||||||||
S&P Global, Inc. | 17,690 | 3,006,239 | ||||||||||
Singapore Exchange Ltd. | 2,417,000 | 12,667,043 | ||||||||||
|
| |||||||||||
| 45,017,823 | ||||||||||||
|
| |||||||||||
Diversified Financial Services – 1.4% | ||||||||||||
Cielo SA | 1,804,583 | 4,136,128 | ||||||||||
Pargesa Holding SA | 43,510 | 3,138,033 | ||||||||||
|
| |||||||||||
| 7,274,161 | ||||||||||||
|
| |||||||||||
Insurance – 1.4% | ||||||||||||
Arthur J Gallagher & Co. | 98,890 | 7,288,193 | ||||||||||
|
| |||||||||||
| 108,914,639 | ||||||||||||
|
| |||||||||||
Information Technology – 16.7% | ||||||||||||
Electronic Equipment, Instruments & Components – 0.6% | ||||||||||||
IPG Photonics Corp.(a) | 26,897 | 3,047,161 | ||||||||||
|
| |||||||||||
IT Services – 4.9% | ||||||||||||
Cognizant Technology Solutions Corp. – Class A | 164,369 | 10,434,144 | ||||||||||
Visa, Inc. – Class A | 115,320 | 15,215,321 | ||||||||||
|
| |||||||||||
| 25,649,465 | ||||||||||||
|
| |||||||||||
Semiconductors & Semiconductor Equipment – 3.9% | ||||||||||||
Intel Corp. | 254,732 | 11,954,573 | ||||||||||
NXP Semiconductors NV | 57,000 | 4,176,960 | ||||||||||
Taiwan Semiconductor Manufacturing Co., Ltd. | 545,000 | 3,957,372 | ||||||||||
|
| |||||||||||
| 20,088,905 | ||||||||||||
|
| |||||||||||
Software – 5.3% | ||||||||||||
Microsoft Corp. | 229,715 | 23,332,153 | ||||||||||
SAP SE | 39,786 | 3,948,748 | ||||||||||
|
| |||||||||||
| 27,280,901 | ||||||||||||
|
| |||||||||||
| abfunds.com | AB GLOBAL CORE EQUITY PORTFOLIO | 11 | |
PORTFOLIO OF INVESTMENTS(continued)
| Company | Shares | U.S. $ Value | ||||||||||
| ||||||||||||
Technology Hardware, Storage & Peripherals – 2.0% | ||||||||||||
Samsung Electronics Co., Ltd. | 293,042 | $ | 10,201,295 | |||||||||
|
| |||||||||||
| 86,267,727 | ||||||||||||
|
| |||||||||||
Consumer Discretionary – 13.5% | ||||||||||||
Diversified Consumer Services – 5.0% | ||||||||||||
Service Corp. International/US | 486,189 | 19,573,969 | ||||||||||
Sotheby’s(a) | 155,970 | 6,198,248 | ||||||||||
|
| |||||||||||
| 25,772,217 | ||||||||||||
|
| |||||||||||
Hotels, Restaurants & Leisure – 5.9% | ||||||||||||
Choice Hotels International, Inc. | 7,390 | 528,976 | ||||||||||
Compass Group PLC | 232,739 | 4,897,954 | ||||||||||
Las Vegas Sands Corp. | 154,529 | 8,043,235 | ||||||||||
Starbucks Corp. | 229,588 | 14,785,467 | ||||||||||
Telepizza Group SA(b) | 332,225 | 2,242,010 | ||||||||||
|
| |||||||||||
| 30,497,642 | ||||||||||||
|
| |||||||||||
Specialty Retail – 0.7% | ||||||||||||
AutoZone, Inc.(a) | 4,552 | 3,816,124 | ||||||||||
|
| |||||||||||
Textiles, Apparel & Luxury Goods – 1.9% | ||||||||||||
Samsonite International SA(a)(b) | 3,349,500 | 9,515,367 | ||||||||||
|
| |||||||||||
| 69,601,350 | ||||||||||||
|
| |||||||||||
Communication Services – 13.0% | ||||||||||||
Interactive Media & Services – 5.1% | ||||||||||||
Alphabet, Inc. – Class C(a) | 25,478 | 26,385,272 | ||||||||||
|
| |||||||||||
Media – 2.8% | ||||||||||||
Naspers Ltd. – Class N | 72,460 | 14,507,684 | ||||||||||
|
| |||||||||||
Wireless Telecommunication Services – 5.1% | ||||||||||||
China Mobile Ltd. | 691,000 | 6,686,529 | ||||||||||
KDDI Corp. | 550,300 | 13,149,375 | ||||||||||
SoftBank Group Corp. | 102,500 | 6,713,667 | ||||||||||
|
| |||||||||||
| 26,549,571 | ||||||||||||
|
| |||||||||||
| 67,442,527 | ||||||||||||
|
| |||||||||||
Industrials – 11.6% | ||||||||||||
Air Freight & Logistics – 0.5% | ||||||||||||
CH Robinson Worldwide, Inc. | 32,221 | 2,709,464 | ||||||||||
|
| |||||||||||
Commercial Services & Supplies – 2.9% | ||||||||||||
Secom Co., Ltd. | 151,300 | 12,550,420 | ||||||||||
Taiwan Secom Co., Ltd. | 859,000 | 2,467,808 | ||||||||||
|
| |||||||||||
| 15,018,228 | ||||||||||||
|
| |||||||||||
Machinery – 5.0% | ||||||||||||
Dover Corp. | 197,280 | 13,997,016 | ||||||||||
| 12 | AB GLOBAL CORE EQUITY PORTFOLIO | abfunds.com | |
PORTFOLIO OF INVESTMENTS(continued)
| Company | Shares | U.S. $ Value | ||||||||||
| ||||||||||||
Kone Oyj – Class B | 166,495 | $ | 7,948,703 | |||||||||
Stanley Black & Decker, Inc. | 30,273 | 3,624,889 | ||||||||||
|
| |||||||||||
| 25,570,608 | ||||||||||||
|
| |||||||||||
Professional Services – 1.8% | ||||||||||||
RELX PLC(a) | 460,374 | 9,472,311 | ||||||||||
|
| |||||||||||
Road & Rail – 0.5% | ||||||||||||
ALD SA(b) | 233,170 | 2,776,686 | ||||||||||
|
| |||||||||||
Transportation Infrastructure – 0.9% | ||||||||||||
Flughafen Zurich AG | 26,599 | 4,401,700 | ||||||||||
|
| |||||||||||
| 59,948,997 | ||||||||||||
|
| |||||||||||
Health Care – 7.8% | ||||||||||||
Biotechnology – 1.9% | ||||||||||||
Gilead Sciences, Inc. | 155,223 | 9,709,199 | ||||||||||
|
| |||||||||||
Health Care Providers & Services – 4.9% | ||||||||||||
Anthem, Inc. | 97,945 | 25,723,295 | ||||||||||
|
| |||||||||||
Pharmaceuticals – 1.0% | ||||||||||||
Roche Holding AG | 20,471 | 5,082,107 | ||||||||||
|
| |||||||||||
| 40,514,601 | ||||||||||||
|
| |||||||||||
Consumer Staples – 6.0% | ||||||||||||
Beverages – 2.1% | ||||||||||||
Ambev SA | 750,700 | 2,974,714 | ||||||||||
Diageo PLC | 117,829 | 4,210,550 | ||||||||||
Wuliangye Yibin Co., Ltd. – Class A | 466,165 | 3,465,216 | ||||||||||
|
| |||||||||||
| 10,650,480 | ||||||||||||
|
| |||||||||||
Food Products – 0.7% | ||||||||||||
Danone SA | 51,496 | 3,629,573 | ||||||||||
|
| |||||||||||
Household Products – 1.5% | ||||||||||||
Procter & Gamble Co. (The) | 86,390 | 7,940,969 | ||||||||||
|
| |||||||||||
Personal Products – 1.7% | ||||||||||||
L’Oreal SA | 39,671 | 9,077,693 | ||||||||||
|
| |||||||||||
| 31,298,715 | ||||||||||||
|
| |||||||||||
Energy – 3.9% | ||||||||||||
Oil, Gas & Consumable Fuels – 3.9% | ||||||||||||
Kinder Morgan, Inc./DE | 196,270 | 3,018,633 | ||||||||||
LUKOIL PJSC (Sponsored ADR) | 95,463 | 6,810,330 | ||||||||||
Royal Dutch Shell PLC – Class B | 337,649 | 10,094,860 | ||||||||||
|
| |||||||||||
| 19,923,823 | ||||||||||||
|
| |||||||||||
Materials – 2.9% | ||||||||||||
Chemicals – 2.4% | ||||||||||||
BASF SE | 173,882 | 12,111,519 | ||||||||||
|
| |||||||||||
| abfunds.com | AB GLOBAL CORE EQUITY PORTFOLIO | 13 | |
PORTFOLIO OF INVESTMENTS(continued)
| Company | Shares | U.S. $ Value | ||||||||||
| ||||||||||||
Paper & Forest Products – 0.5% | ||||||||||||
Mondi PLC | 133,818 | $ | 2,787,128 | |||||||||
|
| |||||||||||
| 14,898,647 | ||||||||||||
|
| |||||||||||
Real Estate – 1.6% | ||||||||||||
Real Estate Management & Development – 1.6% | ||||||||||||
CBRE Group, Inc. – Class A(a) | 212,025 | 8,489,481 | ||||||||||
|
| |||||||||||
Utilities – 1.4% | ||||||||||||
Water Utilities – 1.4% | ||||||||||||
Guangdong Investment Ltd. | 3,744,000 | 7,234,084 | ||||||||||
|
| |||||||||||
Total Common Stocks | 514,534,591 | |||||||||||
|
| |||||||||||
| Principal Amount (000) | ||||||||||||
SHORT-TERM INVESTMENTS – 0.1% | ||||||||||||
Time Deposits – 0.1% | ||||||||||||
BBH Grand Cayman | CHF | 306 | 311,244 | |||||||||
(0.57)%, 1/02/19 | EUR | 46 | 52,981 | |||||||||
0.37%, 1/02/19 | GBP | 41 | 51,748 | |||||||||
0.51%, 1/02/19 | SGD | 70 | 51,275 | |||||||||
0.83%, 1/02/19 | AUD | 0 | * | 1 | ||||||||
0.84%, 1/02/19 | CAD | 0 | * | 1 | ||||||||
4.84%, 1/02/19 | ZAR | 772 | 53,665 | |||||||||
Hong Kong & Shanghai Bank, Hong Kong | HKD | 425 | 54,311 | |||||||||
|
| |||||||||||
Total Time Deposits | 575,226 | |||||||||||
|
| |||||||||||
Total Investments – 99.6% | 515,109,817 | |||||||||||
Other assets less liabilities – 0.4% | 2,131,741 | |||||||||||
|
| |||||||||||
Net Assets – 100.0% | $ | 517,241,558 | ||||||||||
|
| |||||||||||
| * | Principal amount less than 500. |
| (a) | Non-income producing security. |
| (b) | Security is exempt from registration under Rule 144A of the Securities Act of 1933. These securities are considered restricted, but liquid and may be resold in transactions exempt from registration, normally to qualified institutional buyers. At December 31, 2018, the aggregate market value of these securities amounted to $14,534,063 or 2.8% of net assets. |
| 14 | AB GLOBAL CORE EQUITY PORTFOLIO | abfunds.com | |
PORTFOLIO OF INVESTMENTS(continued)
Currency Abbreviations:
AUD – Australian Dollar
CAD – Canadian Dollar
CHF – Swiss Franc
EUR – Euro
GBP – Great British Pound
HKD – Hong Kong Dollar
SGD – Singapore Dollar
USD – United States Dollar
ZAR – South African Rand
Glossary:
ADR – American Depositary Receipt
PJSC – Public Joint Stock Company
See notes to financial statements.
| abfunds.com | AB GLOBAL CORE EQUITY PORTFOLIO | 15 | |
STATEMENT OF ASSETS & LIABILITIES
December 31, 2018(unaudited)
| Assets | ||||
Investments in securities, at value | ||||
Unaffiliated issuers (cost $510,929,772) | $ | 515,109,817 | ||
Foreign currencies, at value (cost $696,721) | 701,150 | |||
Receivable for capital stock sold | 2,423,180 | |||
Unaffiliated dividends receivable | 545,053 | |||
Affiliated dividends receivable | 879 | |||
|
| |||
Total assets | 518,780,079 | |||
|
| |||
| Liabilities | ||||
Payable for investment securities purchased and foreign currency transactions | 517,419 | |||
Due to Custodian | 488,558 | |||
Advisory fee payable | 326,259 | |||
Payable for capital stock redeemed | 68,790 | |||
Administrative fee payable | 15,986 | |||
Transfer Agent fee payable | 10,179 | |||
Distribution fee payable | 2,444 | |||
Directors’ fee payable | 62 | |||
Accrued expenses and other liabilities | 108,824 | |||
|
| |||
Total liabilities | 1,538,521 | |||
|
| |||
Net Assets | $ | 517,241,558 | ||
|
| |||
| Composition of Net Assets | ||||
Capital stock, at par | $ | 4,555 | ||
Additionalpaid-in capital | 510,496,197 | |||
Distributable earnings | 6,740,806 | |||
|
| |||
| $ | 517,241,558 | |||
|
|
Net Asset Value Per Share—11 billion shares of capital stock authorized, $.0001 par value
| Class | Net Assets | Shares Outstanding | Net Asset Value | |||||||||
| ||||||||||||
| A | $ | 10,808,566 | 953,555 | $ | 11.34 | * | ||||||
| ||||||||||||
| C | $ | 415,608 | 37,092 | $ | 11.20 | |||||||
| ||||||||||||
| Advisor | $ | 506,017,384 | 44,555,775 | $ | 11.36 | |||||||
| ||||||||||||
| * | The maximum offering price per share for Class A shares was $11.84 which reflects a sales charge of 4.25%. |
See notes to financial statements.
| 16 | AB GLOBAL CORE EQUITY PORTFOLIO | abfunds.com | |
STATEMENT OF OPERATIONS
Six Months Ended December 31, 2018(unaudited)
| Investment Income | ||||||||
Dividends | ||||||||
Unaffiliated issuers (net of foreign taxes withheld of $235,838) | $ | 5,215,441 | ||||||
Affiliated issuers | 14,306 | |||||||
Interest | 1,425 | |||||||
Securities lending income | 2 | $ | 5,231,174 | |||||
|
| |||||||
| Expenses | ||||||||
Advisory fee (see Note B) | 1,958,539 | |||||||
Transfer agency—Class A | 1,234 | |||||||
Transfer agency—Class C | 35 | |||||||
Transfer agency—Advisor Class | 48,050 | |||||||
Distribution fee—Class A | 16,360 | |||||||
Distribution fee—Class C | 1,025 | |||||||
Recoupment of previously reimbursed expenses (see Note B) | 100,011 | |||||||
Custodian | 70,978 | |||||||
Registration fees | 34,836 | |||||||
Administrative | 32,567 | |||||||
Audit and tax | 30,919 | |||||||
Legal | 20,889 | |||||||
Printing | 13,331 | |||||||
Directors’ fees | 12,483 | |||||||
Miscellaneous | 28,119 | |||||||
|
| |||||||
Total expenses | 2,369,376 | |||||||
Less: expenses waived and reimbursed by the Adviser (see Note B and Note E) | (942 | ) | ||||||
|
| |||||||
Net expenses | 2,368,434 | |||||||
|
| |||||||
Net investment income | 2,862,740 | |||||||
|
| |||||||
| Realized and Unrealized Gain (Loss) on Investment and Foreign Currency Transactions | ||||||||
Net realized gain (loss) on: | ||||||||
Investment transactions | 9,914,515 | |||||||
Foreign currency transactions | (78,685 | ) | ||||||
Net change in unrealized appreciation/depreciation on: | ||||||||
Investments | (47,966,425 | ) | ||||||
Foreign currency denominated assets and liabilities | (6,010 | ) | ||||||
|
| |||||||
Net loss on investment and foreign currency transactions | (38,136,605 | ) | ||||||
|
| |||||||
Net Decrease in Net Assets from Operations | $ | (35,273,865 | ) | |||||
|
|
See notes to financial statements.
| abfunds.com | AB GLOBAL CORE EQUITY PORTFOLIO | 17 | |
STATEMENT OF CHANGES IN NET ASSETS
| Six Months Ended December 31, 2018 (unaudited) | Year Ended June 30, 2018 | |||||||
| Increase (Decrease) in Net Assets from Operations | ||||||||
Net investment income | $ | 2,862,740 | $ | 5,653,907 | ||||
Net realized gain on investment and foreign currency transactions | 9,835,830 | 9,917,535 | ||||||
Net change in unrealized appreciation/depreciation on investments and foreign currency denominated assets and liabilities | (47,972,435 | ) | 21,047,293 | |||||
|
|
|
| |||||
Net increase (decrease) in net assets from operations | (35,273,865 | ) | 36,618,735 | |||||
| Distributions to Shareholders* | ||||||||
Class A | (279,015 | ) | (291,551 | ) | ||||
Class C | (7,430 | ) | (3,704 | ) | ||||
Advisor Class | (14,141,980 | ) | (16,928,691 | ) | ||||
| Capital Stock Transactions | ||||||||
Net increase | 88,605,244 | 142,134,008 | ||||||
|
|
|
| |||||
Total increase | 38,902,954 | 161,528,797 | ||||||
| Net Assets | ||||||||
Beginning of period | 478,338,604 | 316,809,807 | ||||||
|
|
|
| |||||
End of period | $ | 517,241,558 | $ | 478,338,604 | ||||
|
|
|
| |||||
| * | The prior year’s amounts have been reclassified to conform with the current year’s presentation. See Note J, Recent Accounting Pronouncements, in the Notes to Financial Statements for more information. |
See notes to financial statements.
| 18 | AB GLOBAL CORE EQUITY PORTFOLIO | abfunds.com | |
NOTES TO FINANCIAL STATEMENTS
December 31, 2018(unaudited)
NOTE A
Significant Accounting Policies
AB Cap Fund, Inc. (the “Company”), which is a Maryland corporation, is registered under the Investment Company Act of 1940 as anopen-end management investment company. The Company operates as a series company comprised of 29 portfolios currently in operation. Each portfolio is considered to be a separate entity for financial reporting and tax purposes. This report relates only to the AB Global Core Equity Portfolio (the “Fund”), a diversified portfolio. The Fund has authorized the issuance of Class A, Class B, Class C, Advisor Class, Class R, Class K, Class I, Class Z, Class T, Class 1, and Class 2 shares. Class B, Class R, Class K, Class I, Class Z, Class T, Class 1, and Class 2 shares are not currently being offered. Class A shares are sold with afront-end sales charge of up to 4.25% for purchases not exceeding $1,000,000. With respect to purchases of $1,000,000 or more, Class A shares redeemed within one year of purchase may be subject to a contingent deferred sales charge of 1%. Class C shares are subject to a contingent deferred sales charge of 1% on redemptions made within the first year after purchase, and 0% after the first year of purchase. Class C shares will automatically convert to Class A shares ten years after the end of the calendar month of purchase. Advisor Class shares are sold without an initial or contingent deferred sales charge and are not subject to ongoing distribution expenses. All eleven classes of shares have identical voting, dividend, liquidation and other rights, except that the classes bear different distribution and transfer agency expenses. Each class has exclusive voting rights with respect to its distribution plan. The financial statements have been prepared in conformity with U.S. generally accepted accounting principles (“U.S. GAAP”), which require management to make certain estimates and assumptions that affect the reported amounts of assets and liabilities in the financial statements and amounts of income and expenses during the reporting period. Actual results could differ from those estimates. The Fund is an investment company under U.S. GAAP and follows the accounting and reporting guidance applicable to investment companies. The following is a summary of significant accounting policies followed by the Fund.
1. Security Valuation
Portfolio securities are valued at their current market value determined on the basis of market quotations or, if market quotations are not readily available or are deemed unreliable, at “fair value” as determined in accordance with procedures established by and under the general supervision of the Company’s Board of Directors (the “Board”).
In general, the market values of securities which are readily available and deemed reliable are determined as follows: securities listed on a national securities exchange (other than securities listed on the NASDAQ Stock
| abfunds.com | AB GLOBAL CORE EQUITY PORTFOLIO | 19 | |
NOTES TO FINANCIAL STATEMENTS(continued)
Market, Inc. (“NASDAQ”)) or on a foreign securities exchange are valued at the last sale price at the close of the exchange or foreign securities exchange. If there has been no sale on such day, the securities are valued at the last traded price from the previous day. Securities listed on more than one exchange are valued by reference to the principal exchange on which the securities are traded; securities listed only on NASDAQ are valued in accordance with the NASDAQ Official Closing Price; listed or over the counter (“OTC”) market put or call options are valued at the mid level between the current bid and ask prices. If either a current bid or current ask price is unavailable, AllianceBernstein L.P. (the “Adviser”) will have discretion to determine the best valuation (e.g., last trade price in the case of listed options); open futures are valued using the closing settlement price or, in the absence of such a price, the most recent quoted bid price. If there are no quotations available for the day of valuation, the last available closing settlement price is used; U.S. Government securities and any other debt instruments having 60 days or less remaining until maturity are generally valued at market by an independent pricing vendor, if a market price is available. If a market price is not available, the securities are valued at amortized cost. This methodology is commonly used for short term securities that have an original maturity of 60 days or less, as well as short term securities that had an original term to maturity that exceeded 60 days. In instances when amortized cost is utilized, the Valuation Committee (the “Committee”) must reasonably conclude that the utilization of amortized cost is approximately the same as the fair value of the security. Such factors the Committee will consider include, but are not limited to, an impairment of the creditworthiness of the issuer or material changes in interest rates. Fixed-income securities, including mortgage-backed and asset-backed securities, may be valued on the basis of prices provided by a pricing service or at a price obtained from one or more of the major broker-dealers. In cases where broker/dealer quotes are obtained, the Adviser may establish procedures whereby changes in market yields or spreads are used to adjust, on a daily basis, a recently obtained quoted price on a security; swaps and other derivatives are valued daily, primarily using independent pricing services, independent pricing models using market inputs, as well as third party broker-dealers or counterparties. Open end mutual funds are valued at the closing net asset value per share, while exchange traded funds are valued at the closing market price per share.
Securities for which market quotations are not readily available (including restricted securities) or are deemed unreliable are valued at fair value as deemed appropriate by the Adviser. Factors considered in making this determination may include, but are not limited to, information obtained by contacting the issuer, analysts, analysis of the issuer’s financial statements or other available documents. In addition, the Fund may use fair value pricing for
| 20 | AB GLOBAL CORE EQUITY PORTFOLIO | abfunds.com | |
NOTES TO FINANCIAL STATEMENTS(continued)
securities primarily traded innon-U.S. markets because most foreign markets close well before the Fund values its securities at 4:00 p.m., Eastern Time. The earlier close of these foreign markets gives rise to the possibility that significant events, including broad market moves, may have occurred in the interim and may materially affect the value of those securities. To account for this, the Fund generally values many of its foreign equity securities using fair value prices based on third party vendor modeling tools to the extent available.
2. Fair Value Measurements
In accordance with U.S. GAAP regarding fair value measurements, fair value is defined as the price that the Fund would receive to sell an asset or pay to transfer a liability in an orderly transaction between market participants at the measurement date. U.S. GAAP establishes a framework for measuring fair value, and a three-level hierarchy for fair value measurements based upon the transparency of inputs to the valuation of an asset or liability (including those valued based on their market values as described in Note A.1 above). Inputs may be observable or unobservable and refer broadly to the assumptions that market participants would use in pricing the asset or liability. Observable inputs reflect the assumptions market participants would use in pricing the asset or liability based on market data obtained from sources independent of the Fund. Unobservable inputs reflect the Fund’s own assumptions about the assumptions that market participants would use in pricing the asset or liability based on the best information available in the circumstances. Each investment is assigned a level based upon the observability of the inputs which are significant to the overall valuation. The three-tier hierarchy of inputs is summarized below.
| • | Level 1—quoted prices in active markets for identical investments |
| • | Level 2—other significant observable inputs (including quoted prices for similar investments, interest rates, prepayment speeds, credit risk, etc.) |
| • | Level 3—significant unobservable inputs (including the Fund’s own assumptions in determining the fair value of investments) |
The fair value of debt instruments, such as bonds, andover-the-counter derivatives is generally based on market price quotations, recently executed market transactions (where observable) or industry recognized modeling techniques and are generally classified as Level 2. Pricing vendor inputs to Level 2 valuations may include quoted prices for similar investments in active markets, interest rate curves, coupon rates, currency rates, yield curves, option adjusted spreads, default rates, credit spreads and other unique security features in order to estimate the relevant cash flows which is then discounted to calculate fair values. If these inputs are unobservable and significant to the fair value, these investments will be classified as Level 3. In addition,non-agency rated investments are classified as Level 3.
| abfunds.com | AB GLOBAL CORE EQUITY PORTFOLIO | 21 | |
NOTES TO FINANCIAL STATEMENTS(continued)
Where readily available market prices or relevant bid prices are not available for certain equity investments, such investments may be valued based on similar publicly traded investments, movements in relevant indices since last available prices or based upon underlying company fundamentals and comparable company data (such as multiples to earnings or other multiples to equity). Where an investment is valued using an observable input such as another publicly traded security, the investment will be classified as Level 2. If management determines that an adjustment is appropriate based on restrictions on resale, illiquidity or uncertainty, and such adjustment is a significant component of the valuation, the investment will be classified as Level 3. An investment will also be classified as Level 3 where management uses company fundamentals and other significant inputs to determine the valuation.
The following table summarizes the valuation of the Fund’s investments by the above fair value hierarchy levels as of December 31, 2018:
Investments in Securities | Level 1 | Level 2 | Level 3 | Total | ||||||||||||
Assets: | ||||||||||||||||
Common Stocks: | ||||||||||||||||
Financials | $ | 48,085,774 | $ | 60,828,865 | $ | – 0 | – | $ | 108,914,639 | |||||||
Information Technology | 68,160,312 | 18,107,415 | – 0 | – | 86,267,727 | |||||||||||
Consumer Discretionary | 55,188,029 | 14,413,321 | – 0 | – | 69,601,350 | |||||||||||
Communication Services | 26,385,272 | 41,057,255 | – 0 | – | 67,442,527 | |||||||||||
Industrials | 20,331,369 | 39,617,628 | – 0 | – | 59,948,997 | |||||||||||
Health Care | 35,432,494 | 5,082,107 | – 0 | – | 40,514,601 | |||||||||||
Consumer Staples | 7,940,969 | 23,357,746 | – 0 | – | 31,298,715 | |||||||||||
Energy | 9,828,963 | 10,094,860 | – 0 | – | 19,923,823 | |||||||||||
Materials | – 0 | – | 14,898,647 | – 0 | – | 14,898,647 | ||||||||||
Real Estate | 8,489,481 | – 0 | – | – 0 | – | 8,489,481 | ||||||||||
Utilities | – 0 | – | 7,234,084 | – 0 | – | 7,234,084 | ||||||||||
Short-Term Investments: | ||||||||||||||||
Time Deposits | – 0 | – | 575,226 | – 0 | – | 575,226 | ||||||||||
|
|
|
|
|
|
|
| |||||||||
Total Investments in Securities | 279,842,663 | 235,267,154 | † | – 0 | – | 515,109,817 | ||||||||||
Other Financial Instruments* | – 0 | – | – 0 | – | – 0 | – | – 0 | – | ||||||||
|
|
|
|
|
|
|
| |||||||||
Total^ | $ | 279,842,663 | $ | 235,267,154 | $ | – 0 | – | $ | 515,109,817 | |||||||
|
|
|
|
|
|
|
| |||||||||
| † | A significant portion of the Fund’s foreign equity investments are categorized as Level 2 investments since they are valued using fair value prices based on third party vendor modeling tools to the extent available, see Note A.1. |
| * | Other financial instruments are derivative instruments, such as futures, forwards and swaps, which are valued at the unrealized appreciation/(depreciation) on the instrument. Other financial instruments may also include swaps with upfront premiums, options written and swaptions written which are valued at market value. |
| ^ | An amount of $6,800,588 was transferred from Level 1 to Level 2 due to the above mentioned foreign equity fair valuation using third party vendor modeling tools during the reporting period. There were no transfers from Level 2 to Level 1 during the reporting period. |
| 22 | AB GLOBAL CORE EQUITY PORTFOLIO | abfunds.com | |
NOTES TO FINANCIAL STATEMENTS(continued)
The Fund recognizes all transfers between levels of the fair value hierarchy assuming the financial instrument was transferred at the beginning of the reporting period.
The Adviser established the Committee to oversee the pricing and valuation of all securities held in the Fund. The Committee operates under pricing and valuation policies and procedures established by the Adviser and approved by the Board, including pricing policies which set forth the mechanisms and processes to be employed on a daily basis to implement these policies and procedures. In particular, the pricing policies describe how to determine market quotations for securities and other instruments. The Committee’s responsibilities include: 1) fair value and liquidity determinations (and oversight of any third parties to whom any responsibility for fair value and liquidity determinations is delegated), and 2) regular monitoring of the Adviser’s pricing and valuation policies and procedures and modification or enhancement of these policies and procedures (or recommendation of the modification of these policies and procedures) as the Committee believes appropriate.
The Committee is also responsible for monitoring the implementation of the pricing policies by the Adviser’s Pricing Group (the “Pricing Group”) and any third party which performs certain pricing functions in accordance with the pricing policies. The Pricing Group is responsible for the oversight of the third party on aday-to-day basis. The Committee and the Pricing Group perform a series of activities to provide reasonable assurance of the accuracy of prices including: 1) periodic vendor due diligence meetings, review of methodologies, new developments and process at vendors, 2) daily comparison of security valuation versus prior day for all securities that exceeded established thresholds, and 3) daily review of unpriced, stale, and variance reports with exceptions reviewed by senior management and the Committee.
In addition, several processes outside of the pricing process are used to monitor valuation issues including: 1) performance and performance attribution reports are monitored for anomalous impacts based upon benchmark performance, and 2) portfolio managers review all portfolios for performance and analytics (which are generated using the Adviser’s prices).
3. Currency Translation
Assets and liabilities denominated in foreign currencies and commitments under forward currency exchange contracts are translated into U.S. dollars at the mean of the quoted bid and ask prices of such currencies against the U.S. dollar. Purchases and sales of portfolio securities are translated into U.S. dollars at the rates of exchange prevailing when such securities were acquired or sold. Income and expenses are translated into U.S. dollars at rates of exchange prevailing when accrued.
| abfunds.com | AB GLOBAL CORE EQUITY PORTFOLIO | 23 | |
NOTES TO FINANCIAL STATEMENTS(continued)
Net realized gain or loss on foreign currency transactions represents foreign exchange gains and losses from sales and maturities of foreign fixed income investments, holding of foreign currencies, currency gains or losses realized between the trade and settlement dates on foreign investment transactions, and the difference between the amounts of dividends, interest and foreign withholding taxes recorded on the Fund’s books and the U.S. dollar equivalent amounts actually received or paid. Net unrealized currency gains and losses from valuing foreign currency denominated assets and liabilities at period end exchange rates are reflected as a component of net unrealized appreciation and depreciation of foreign currency denominated assets and liabilities.
4. Taxes
It is the Fund’s policy to meet the requirements of the Internal Revenue Code applicable to regulated investment companies and to distribute all of its investment company taxable income and net realized gains, if any, to shareholders. Therefore, no provisions for federal income or excise taxes are required. The Fund may be subject to taxes imposed by countries in which it invests. Such taxes are generally based on income and/or capital gains earned or repatriated. Taxes are accrued and applied to net investment income, net realized gains and net unrealized appreciation/depreciation as such income and/or gains are earned.
In accordance with U.S. GAAP requirements regarding accounting for uncertainties in income taxes, management has analyzed the Fund’s tax positions taken or expected to be taken on federal and state income tax returns for all open tax years (all years since inception of the Fund) and has concluded that no provision for income tax is required in the Fund’s financial statements.
5. Investment Income and Investment Transactions
Dividend income is recorded on theex-dividend date or as soon as the Fund is informed of the dividend. Interest income is accrued daily. Investment transactions are accounted for on the date securities are purchased or sold. Investment gains and losses are determined on the identified cost basis. The Fund amortizes premiums and accretes discounts as adjustments to interest income.
6. Class Allocations
All income earned and expenses incurred by the Fund are borne on apro-rata basis by each outstanding class of shares, based on the proportionate interest in the Fund represented by the net assets of such class, except for class specific expenses which are allocated to the respective class. Expenses of the Company are charged proportionately to each portfolio or based on other appropriate methods. Realized and unrealized gains and losses are allocated among the various share classes based on their respective net assets.
| 24 | AB GLOBAL CORE EQUITY PORTFOLIO | abfunds.com | |
NOTES TO FINANCIAL STATEMENTS(continued)
7. Dividends and Distributions
Dividends and distributions to shareholders, if any, are recorded on theex-dividend date. Income dividends and capital gains distributions are determined in accordance with federal tax regulations and may differ from those determined in accordance with U.S. GAAP. To the extent these differences are permanent, such amounts are reclassified within the capital accounts based on their federal tax basis treatment; temporary differences do not require such reclassification.
NOTE B
Advisory Fee and Other Transactions with Affiliates
Under the terms of the investment advisory agreement, the Fund pays the Adviser an advisory fee at an annual rate of .75% of the first $2.5 billion of the Fund’s average daily net assets, .65% of the excess over $2.5 billion up to $5 billion, and .60% of the excess of $5 billion. The fee is accrued daily and paid monthly. The Adviser has agreed to waive its fees and bear certain expenses to the extent necessary to limit total operating expenses (excluding acquired fund fees and expenses other than the advisory fees of any AB mutual funds in which the Fund may invest, interest expense, taxes, extraordinary expenses, and brokerage commissions and other transaction costs) on an annual basis (the “Expense Caps”) to 1.15%, 1.90% and .90% of the daily average net assets for Class A, Class C and Advisor Class shares, respectively. For the six months ended December 31, 2018, the reimbursements/waivers amounted to $0. The expense caps may not be terminated by the Adviser before October 31, 2019. Any fees waived and expenses borne by the Adviser through October 31, 2019 under the expense limitations in effect prior to that date may be reimbursed by the Fund until the end of the third fiscal year after the fiscal period in which the fee was waived or the expense was borne; such waivers that are subject to repayment amount to $117,707 for the fiscal period ended June 30, 2016, $149,385 for the fiscal year ended June 30, 2017, and $30,453 for the fiscal year ended June 30, 2018. For the six months ended December 31, 2018, the Fund made repayments to the Adviser in the amount of $100,011. In any case, no reimbursement payment will be made that would cause the Fund’s total annual operating expenses to exceed the Expense Caps’ net fee percentages set forth above.
During 2017, AXA S.A. (“AXA”), a French holding company for the AXA Group, a worldwide leader in life, property and casualty and health insurance and asset management, announced its intention to pursue the sale of a minority stake in its subsidiary, AXA Equitable Holdings, Inc. (“AXA Equitable”), the holding company for a diversified financial services organization, through an initial public offering (“IPO”). AXA Equitable is the holding company for a diverse group of financial services companies,
| abfunds.com | AB GLOBAL CORE EQUITY PORTFOLIO | 25 | |
NOTES TO FINANCIAL STATEMENTS(continued)
including AllianceBernstein L.P., the investment adviser to the Funds (“the Adviser”). During the second quarter of 2018, AXA Equitable completed the IPO, and, as a result, AXA held approximately 72.2% of the outstanding common stock of AXA Equitable as of September 30, 2018. Contemporaneously with the IPO, AXA sold $862.5 million aggregate principal amount of its 7.25% mandatorily exchangeable notes (the “MxB Notes”) due May 15, 2021 and exchangeable into up to 43,125,000 shares of common stock (or approximately 7% of the outstanding shares of common stock of AXA Equitable). AXA retains ownership (including voting rights) of such shares of common stock until the MxB Notes are exchanged, which may be on a date that is earlier than the maturity date at AXA’s option upon the occurrence of certain events.
In March 2018, AXA announced its intention to sell its entire interest in AXA Equitable over time, subject to market conditions and other factors (the “Plan”). It is anticipated that one or more of the transactions contemplated by the Plan may ultimately result in the indirect transfer of a “controlling block” of voting securities of the Adviser (a “Change of Control Event”) and therefore may be deemed an “assignment” causing a termination of each Fund’s current investment advisory agreement. In order to ensure that the existing investment advisory services could continue uninterrupted, at meetings held in late July through early August 2018, the Boards of Directors/Trustees (each a “Board” and collectively, the “Boards”) approved new investment advisory agreements with the Adviser, in connection with the Plan. The Boards also agreed to call and hold a joint meeting of shareholders on October 11, 2018 for shareholders of each Fund to (1) approve the new investment advisory agreement with the Adviser that would be effective after the first Change of Control Event and (2) approve any future advisory agreement approved by the Board and that has terms not materially different from the current agreement, in the event there are subsequent Change of Control Events arising from completion of the Plan that terminate the advisory agreement after the first Change of Control Event. Approval of a future advisory agreement means that shareholders may not have another opportunity to vote on a new agreement with the Adviser even upon a change of control, as long as no single person or group of persons acting together gains “control” (as defined in the 1940 Act) of AXA Equitable.
At the December 11, 2018 adjourned shareholder meeting, shareholders approved the new and future investment advisory agreements for the Fund.
On November 20, 2018, AXA completed a public offering of 60,000,000 shares of AXA Equitable’s common stock and simultaneously sold 30,000,000 of such shares to AXA Equitable pursuant to a separate agreement with it. As a result AXA currently owns approximately 59.2% of the shares of common stock of AXA Equitable.
| 26 | AB GLOBAL CORE EQUITY PORTFOLIO | abfunds.com | |
NOTES TO FINANCIAL STATEMENTS(continued)
Pursuant to the investment advisory agreement, the Fund may reimburse the Adviser for certain legal and accounting services provided to the Fund by the Adviser. For the six months ended December 31, 2018, the reimbursement for such services amounted to $32,567.
The Fund compensates AllianceBernstein Investor Services, Inc. (“ABIS”), a wholly-owned subsidiary of the Adviser, under a Transfer Agency Agreement for providing personnel and facilities to perform transfer agency services for the Fund. ABIS may make payments to intermediaries that provide omnibus account services,sub-accounting services and/or networking services. Such compensation retained by ABIS amounted to $38,580 for the six months ended December 31, 2018.
AllianceBernstein Investments, Inc. (the “Distributor”), a wholly-owned subsidiary of the Adviser, serves as the distributor of the Fund’s shares. The Distributor has advised the Fund that it has retainedfront-end sales charges of $60 from the sale of Class A shares and received $0 and $75 in contingent deferred sales charges imposed upon redemptions by shareholders of Class A and Class C shares, respectively, for the six months ended December 31, 2018.
The Fund may invest in AB Government Money Market Portfolio (the “Government Money Market Portfolio”) which has a contractual annual advisory fee rate of .20% of the portfolio’s average daily net assets and bears its own expenses. Effective August 1, 2018, the Adviser has contractually agreed to waive .10% of the advisory fee of Government Money Market Portfolio until August 31, 2019. In connection with the investment by the Fund in Government Money Market Portfolio, the Adviser has contractually agreed to waive its advisory fee from the Fund in an amount equal to the Fund’s pro rata share of the effective advisory fees of Government Money Market Portfolio, as borne indirectly by the Fund as an acquired fund fee and expense. For the six months ended December 31, 2018, such waiver amounted to $877.
A summary of the Fund’s transactions in AB mutual funds for the six months ended December 31, 2018 is as follows:
Fund | Market Value 6/30/18 (000) | Purchases at Cost (000) | Sales Proceeds (000) | Market Value 12/31/18 (000) | Dividend Income (000) | |||||||||||||||
Government Money Market Portfolio | $ | 1,444 | $ | 55,754 | $ | 57,198 | $ | – 0 | – | $ | 14 | |||||||||
Government Money Market Portfolio* | 709 | 3,532 | 4,241 | – 0 | – | 0 | ** | |||||||||||||
|
|
|
| |||||||||||||||||
Total | $ | – 0 | – | $ | 14 | |||||||||||||||
|
|
|
| |||||||||||||||||
| * | Investment of cash collateral for securities lending transactions (see Note E). |
| ** | Amount is less than $500. |
| abfunds.com | AB GLOBAL CORE EQUITY PORTFOLIO | 27 | |
NOTES TO FINANCIAL STATEMENTS(continued)
Brokerage commissions paid on investment transactions for the six months ended December 31, 2018 amounted to $106,705, of which $0 and $0, respectively, was paid to Sanford C. Bernstein & Co., LLC and Sanford C. Bernstein Limited, affiliates of the Adviser.
NOTE C
Distribution Services Agreement
The Fund has adopted a Distribution Services Agreement (the “Agreement”) pursuant to Rule12b-1 under the Investment Company Act of 1940. Under the Agreement, the Fund pays distribution and servicing fees to the Distributor at an annual rate of up to .25% of the Fund’s average daily net assets attributable to Class A shares and 1% of the Fund’s average daily net assets attributable to Class C shares. There are no distribution and servicing fees on the Advisor Class. The fees are accrued daily and paid monthly. The Agreement provides that the Distributor will use such payments in their entirety for distribution assistance and promotional activities. Since the commencement of the Fund’s operations, the Distributor has incurred expenses in excess of the distribution costs reimbursed by the Fund in the amounts of $2,521 for Class C shares. While such costs may be recovered from the Fund in future periods so long as the Agreement is in effect, the rate of the distribution and servicing fees payable under the Agreement may not be increased without a shareholder vote. In accordance with the Agreement, there is no provision for recovery of unreimbursed distribution costs incurred by the Distributor beyond the current fiscal year for Class A shares. The Agreement also provides that the Adviser may use its own resources to finance the distribution of the Fund’s shares.
NOTE D
Investment Transactions
Purchases and sales of investment securities (excluding short-term investments) for the six months ended December 31, 2018 were as follows:
| Purchases | Sales | |||||||
Investment securities (excluding U.S. government securities) | $ | 184,861,469 | $ | 108,324,565 | ||||
U.S. government securities | – 0 | – | – 0 | – | ||||
The cost of investments for federal income tax purposes was substantially the same as cost for financial reporting purposes. Accordingly, gross unrealized appreciation and unrealized depreciation are as follows:
Gross unrealized appreciation | $ | 50,273,520 | ||
Gross unrealized depreciation | (46,093,475 | ) | ||
|
| |||
Net unrealized appreciation | $ | 4,180,045 | ||
|
|
| 28 | AB GLOBAL CORE EQUITY PORTFOLIO | abfunds.com | |
NOTES TO FINANCIAL STATEMENTS(continued)
1. Derivative Financial Instruments
The Fund may use derivatives in an effort to earn income and enhance returns, to replace more traditional direct investments, to obtain exposure to otherwise inaccessible markets (collectively, “investment purposes”), or to hedge or adjust the risk profile of its fund.
The Fund did not engage in derivative transactions during the six months ended December 31, 2018.
2. Currency Transactions
The Fund may invest innon-U.S. Dollar-denominated securities on a currency hedged or unhedged basis. The Fund may seek investment opportunities by taking long or short positions in currencies through the use of currency-related derivatives, including forward currency exchange contracts, futures and options on futures, swaps, and other options. The Fund may enter into transactions for investment opportunities when it anticipates that a foreign currency will appreciate or depreciate in value but securities denominated in that currency are not held by the Fund and do not present attractive investment opportunities. Such transactions may also be used when the Adviser believes that it may be more efficient than a direct investment in a foreign currency-denominated security. The Fund may also conduct currency exchange contracts on a spot basis (i.e., for cash at the spot rate prevailing in the currency exchange market for buying or selling currencies).
NOTE E
Securities Lending
The Fund may enter into securities lending transactions. Under the Fund’s securities lending program, all loans of securities will be collateralized continually by cash. The Fund will be compensated for the loan from a portion of the net return from the income earned on cash collateral after a rebate is paid to the borrower (in some cases, this rebate may be a “negative rebate” or fee paid by the borrower to the Fund in connection with the loan), and payments are made for fees of the securities lending agent and for certain other administrative expenses. It is the policy of the Fund to receive collateral consisting of cash in an amount exceeding the value of the securities loaned. A Fund will have the right to call a loan and obtain the securities loaned at any time on notice to the borrower within the normal and customary settlement time for the securities. While the securities are on loan, the borrower is obligated to pay the Fund amounts equal to any income or other distributions from the securities. The Fund will not be able to exercise voting rights with respect to any securities during the existence of a loan, but will have the right to regain ownership of loaned securities in order to exercise voting or other ownership rights. The lending agent has agreed to indemnify the Fund in the case of default of any securities borrower. Collateral received and securities loaned are marked to market daily
| abfunds.com | AB GLOBAL CORE EQUITY PORTFOLIO | 29 | |
NOTES TO FINANCIAL STATEMENTS(continued)
to ensure that the securities loaned are secured by collateral. The lending agent currently invests the cash collateral received in Government Money Market Portfolio, an eligible money market vehicle, in accordance with the investment restrictions of the Fund, and as approved by the Board. The collateral received on securities loaned is recorded as an asset as well as a corresponding liability in the statement of assets and liabilities. When the Fund lends securities, its investment performance will continue to reflect changes in the value of the securities loaned. At December 31, 2018, the Fund had no securities on loan and had received no cash collateral. The Fund earned securities lending income of $2 and $468 from the borrowers and Government Money Market Portfolio, respectively, for the six months ended December 31, 2018; these amounts are reflected in the statement of operations. In connection with the cash collateral investment by the Fund in the Government Money Market Portfolio, the Adviser has agreed to waive a portion of the Fund’s share of the advisory fees of Government Money Market Portfolio, as borne indirectly by the Fund as an acquired fund fee and expense. For the six months ended December 31, 2018, such waiver amounted to $65. A principal risk of lending portfolio securities is that the borrower will fail to return the loaned securities upon termination of the loan and that the collateral will not be sufficient to replace the loaned securities.
NOTE F
Capital Stock
Each class consists of 1,000,000,000 authorized shares. Transactions in capital shares for each class were as follows:
| Shares | Amount | |||||||||||||||||||||||
| Six Months Ended December 31, 2018 (unaudited) | Year Ended June 30, 2018 | Six Months Ended December 31, 2018 (unaudited) | Year Ended June 30, 2018 | |||||||||||||||||||||
|
| |||||||||||||||||||||||
| Class A | ||||||||||||||||||||||||
Shares sold | 242,172 | 542,666 | $ | 3,075,314 | $ | 6,805,669 | ||||||||||||||||||
| ||||||||||||||||||||||||
Shares issued in reinvestment of dividends and distributions | 24,056 | 23,839 | 277,607 | 291,551 | ||||||||||||||||||||
| ||||||||||||||||||||||||
Shares converted from Class C | 750 | – 0 | – | 9,287 | – 0 | – | ||||||||||||||||||
| ||||||||||||||||||||||||
Shares redeemed | (354,229 | ) | (30,235 | ) | (4,308,224 | ) | (373,298 | ) | ||||||||||||||||
| ||||||||||||||||||||||||
Net increase (decrease) | (87,251 | ) | 536,270 | $ | (946,016 | ) | $ | 6,723,922 | ||||||||||||||||
| ||||||||||||||||||||||||
| 30 | AB GLOBAL CORE EQUITY PORTFOLIO | abfunds.com | |
NOTES TO FINANCIAL STATEMENTS(continued)
| Shares | Amount | |||||||||||||||||||||||
| Six Months Ended December 31, 2018 (unaudited) | Year Ended June 30, 2018 | Six Months Ended December 31, 2018 (unaudited) | Year Ended June 30, 2018 | |||||||||||||||||||||
|
| |||||||||||||||||||||||
| Class C | ||||||||||||||||||||||||
Shares sold | 28,736 | 10,406 | $ | 342,296 | $ | 130,717 | ||||||||||||||||||
| ||||||||||||||||||||||||
Shares issued in reinvestment of dividends and distributions | 620 | 265 | 7,073 | 3,221 | ||||||||||||||||||||
| ||||||||||||||||||||||||
Shares converted to Class A | (757 | ) | – 0 | – | (9,287 | ) | – 0 | – | ||||||||||||||||
| ||||||||||||||||||||||||
Shares redeemed | (3,719 | ) | (4,467 | ) | (44,860 | ) | (57,697 | ) | ||||||||||||||||
| ||||||||||||||||||||||||
Net increase | 24,880 | 6,204 | $ | 295,222 | $ | 76,241 | ||||||||||||||||||
| ||||||||||||||||||||||||
| Advisor Class | ||||||||||||||||||||||||
Shares sold | 9,262,769 | 15,208,058 | $ | 115,408,741 | $ | 189,225,280 | ||||||||||||||||||
| ||||||||||||||||||||||||
Shares issued in reinvestment of dividends and distributions | 1,171,379 | 1,349,038 | 13,541,137 | 16,525,713 | ||||||||||||||||||||
| ||||||||||||||||||||||||
Shares redeemed | (3,222,928 | ) | (5,669,924 | ) | (39,693,840 | ) | (70,417,148 | ) | ||||||||||||||||
| ||||||||||||||||||||||||
Net increase | 7,211,220 | 10,887,172 | $ | 89,256,038 | $ | 135,333,845 | ||||||||||||||||||
| ||||||||||||||||||||||||
NOTE G
Risks Involved in Investing in the Fund
Foreign(Non-U.S.) Risk—Investments in securities ofnon-U.S. issuers may involve more risk than those of U.S. issuers. These securities may fluctuate more widely in price and may be less liquid due to adverse market, economic, political, regulatory or other factors. These risks may be heightened with respect to investments in emerging market countries, where there may be an increased amount of economic, political and social instability.
Emerging Market Risk—Investments in emerging market countries may have more risk because the markets are less developed and less liquid as well as being subject to increased economic, political, regulatory or other uncertainties.
Currency Risk—Fluctuations in currency exchange rates may negatively affect the value of the Fund’s investments or reduce its returns.
Sector Risk—The Fund may have more risk because of concentrated investments in a particular market sector, such as the technology or financial services sector. Market or economic factors affecting that sector could have a major effect on the value of the Fund’s investments.
Indemnification Risk—In the ordinary course of business, the Fund enters into contracts that contain a variety of indemnifications. The Fund’s
| abfunds.com | AB GLOBAL CORE EQUITY PORTFOLIO | 31 | |
NOTES TO FINANCIAL STATEMENTS(continued)
maximum exposure under these arrangements is unknown. However, the Fund has not had prior claims or losses pursuant to these indemnification provisions and expects the risk of loss thereunder to be remote. Therefore, the Fund has not accrued any liability in connection with these indemnification provisions.
NOTE H
Joint Credit Facility
A number ofopen-end mutual funds managed by the Adviser, including the Fund, participate in a $325 million revolving credit facility (the “Facility”) intended to provide short-term financing if necessary, subject to certain restrictions in connection with abnormal redemption activity. Commitment fees related to the Facility are paid by the participating funds and are included in miscellaneous expenses in the statement of operations. The Fund did not utilize the Facility during the six months ended December 31, 2018.
NOTE I
Distributions to Shareholders
The tax character of distributions paid for the year ending June 30, 2019 will be determined at the end of the current fiscal year.
The tax character of distributions paid during the fiscal years ended June 30, 2018 and June 30, 2017 were as follows:
| 2018 | 2017 | |||||||
Distributions paid from: | ||||||||
Ordinary income | $ | 8,345,140 | $ | 1,926,994 | ||||
Long-term capital gains | 8,878,806 | – 0 | – | |||||
|
|
|
| |||||
Total taxable distributions paid | $ | 17,223,946 | $ | 1,926,994 | ||||
|
|
|
| |||||
As of June 30, 2018, the components of accumulated earnings/(deficit) on a tax basis were as follows:
Undistributed ordinary income | $ | 3,666,164 | ||
Accumulated capital and other losses | 2,464,961 | |||
Unrealized appreciation/(depreciation) | 50,311,972 | (a) | ||
|
| |||
Total accumulated earnings/(deficit) | $ | 56,443,097 | ||
|
|
| (a) | The difference between book-basis andtax-basis unrealized appreciation/(depreciation) is attributable primarily to the tax deferral of losses on wash sales. |
For tax purposes, net realized capital losses may be carried over to offset future capital gains, if any. Funds are permitted to carry forward capital losses for an indefinite period, and such losses will retain their character as either short-term or long-term capital losses. As of June 30, 2018, the Fund did not have any capital loss carryforwards.
| 32 | AB GLOBAL CORE EQUITY PORTFOLIO | abfunds.com | |
NOTES TO FINANCIAL STATEMENTS(continued)
NOTE J
Recent Accounting Pronouncements
In August 2018, the Financial Accounting Standards Board issued an Accounting Standards Update, ASU2018-13, Fair Value Measurement (Topic 820), Disclosure Framework-Changes to the Disclosure Requirements for Fair Value Measurement which removes, modifies and adds disclosures to Topic 820. The amendments in this ASU2018-13 apply to all entities that are required, under existing U.S. GAAP, to make disclosures about recurring or nonrecurring fair value measurements. The amendments in this ASU2018-13 are effective for all entities for fiscal years, and interim periods within those fiscal years, beginning after December 15, 2019. At this time, management is evaluating the implications of these changes on the financial statements.
In October 2018, the U.S. Securities and Exchange Commission adopted amendments to certain disclosure requirements that had become “redundant, duplicative, overlapping, outdated or superseded, in light of the other Commission disclosure requirements, GAAP or changes in the information environment.” The compliance date for the amendments toRegulation S-X was November 5, 2018 (for reporting period end dates of September 30, 2018 or after). Management has adopted the amendments which simplified certain disclosure requirements on the financial statements.
NOTE K
Subsequent Events
Management has evaluated subsequent events for possible recognition or disclosure in the financial statements through the date the financial statements are issued. Management has determined that there are no material events that would require disclosure in the Fund’s financial statements through this date.
| abfunds.com | AB GLOBAL CORE EQUITY PORTFOLIO | 33 | |
FINANCIAL HIGHLIGHTS
Selected Data For A Share Of Capital Stock Outstanding Throughout Each Period
| Class A | ||||||||||||||||||||
| Six Months Ended December 31, 2018 (unaudited) | Year Ended June 30, | November 12, 2014(a) to June 30, 2015 | ||||||||||||||||||
| 2018 | 2017 | 2016 | ||||||||||||||||||
|
| |||||||||||||||||||
Net asset value, beginning of period | $ 12.42 | $ 11.72 | $ 9.70 | $ 10.15 | $ 10.00 | |||||||||||||||
|
| |||||||||||||||||||
Income From Investment Operations | ||||||||||||||||||||
Net investment income(b)(c) | .05 | .16 | .16 | .16 | .06 | |||||||||||||||
Net realized and unrealized gain (loss) on investment and foreign currency transactions | (.83 | ) | 1.09 | 1.94 | (.51 | ) | .11 | † | ||||||||||||
|
| |||||||||||||||||||
Net increase (decrease) in net asset value from operations | (.78 | ) | 1.25 | 2.10 | (.35 | ) | .17 | |||||||||||||
|
| |||||||||||||||||||
Less: Dividends and Distributions | ||||||||||||||||||||
Dividends from net investment income | (.12 | ) | (.13 | ) | (.08 | ) | (.07 | ) | (.02 | ) | ||||||||||
Distributions from net realized gain on investment and foreign currency transactions | (.18 | ) | (.42 | ) | – 0 | – | (.03 | ) | – 0 | – | ||||||||||
|
| |||||||||||||||||||
Total dividends and distributions | (.30 | ) | (.55 | ) | (.08 | ) | (.10 | ) | (.02 | ) | ||||||||||
|
| |||||||||||||||||||
Net asset value, end of period | $ 11.34 | $ 12.42 | $ 11.72 | $ 9.70 | $ 10.15 | |||||||||||||||
|
| |||||||||||||||||||
Total Return | ||||||||||||||||||||
Total investment return based on net asset value(d) | (6.32 | )% | 10.72 | % | 21.81 | % | (3.40 | )% | 1.72 | % | ||||||||||
Ratios/Supplemental Data | ||||||||||||||||||||
Net assets, end of period (000’s omitted) | $10,809 | �� | $12,925 | $5,911 | $939 | $48 | ||||||||||||||
Ratio to average net assets of: | ||||||||||||||||||||
Expenses, net of waivers/reimbursements | 1.15 | %(e) | 1.15 | % | 1.15 | % | 1.15 | % | 1.15 | %(e) | ||||||||||
Expenses, before waivers/reimbursements | 1.15 | %(e) | 1.15 | % | 1.22 | % | 1.38 | % | 2.84 | %(e) | ||||||||||
Net investment income(c) | .85 | %(e) | 1.31 | % | 1.43 | % | 1.64 | % | .90 | %(e) | ||||||||||
Portfolio turnover rate | 21 | % | 45 | % | 51 | % | 51 | % | 24 | % | ||||||||||
See footnote summary on page 37.
| 34 | AB GLOBAL CORE EQUITY PORTFOLIO | abfunds.com | |
FINANCIAL HIGHLIGHTS(continued)
Selected Data For A Share Of Capital Stock Outstanding Throughout Each Period
| Class C | ||||||||||||||||||||
| Six Months Ended December 31, 2018 (unaudited) | Year Ended June 30, | November 12, 2014(a) to June 30, 2015 | ||||||||||||||||||
| 2018 | 2017 | 2016 | ||||||||||||||||||
|
| |||||||||||||||||||
Net asset value, beginning of period | $ 12.29 | $ 11.63 | $ 9.67 | $ 10.11 | $ 10.00 | |||||||||||||||
|
| |||||||||||||||||||
Income From Investment Operations | ||||||||||||||||||||
Net investment income(b)(c) | .00 | (f) | .06 | .05 | .06 | .05 | ||||||||||||||
Net realized and unrealized gain (loss) on investment and foreign currency transactions | (.82 | ) | 1.08 | 1.96 | (.47 | ) | .07 | † | ||||||||||||
|
| |||||||||||||||||||
Net increase (decrease) in net asset value from operations | (.82 | ) | 1.14 | 2.01 | (.41 | ) | .12 | |||||||||||||
|
| |||||||||||||||||||
Less: Dividends and Distributions | ||||||||||||||||||||
Dividends from net investment income | (.09 | ) | (.06 | ) | (.05 | ) | – 0 | – | (.01 | ) | ||||||||||
Distributions from net realized gain on investment and foreign currency transactions | (.18 | ) | (.42 | ) | – 0 | – | (.03 | ) | – 0 | – | ||||||||||
|
| |||||||||||||||||||
Total dividends and distributions | (.27 | ) | (.48 | ) | (.05 | ) | (.03 | ) | (.01 | ) | ||||||||||
|
| |||||||||||||||||||
Net asset value, end of period | $ 11.20 | $ 12.29 | $ 11.63 | $ 9.67 | $ 10.11 | |||||||||||||||
|
| |||||||||||||||||||
Total Return | ||||||||||||||||||||
Total investment return based on net asset value(d) | (6.70 | )% | 9.87 | % | 20.80 | % | (4.09 | )% | 1.22 | % | ||||||||||
Ratios/Supplemental Data | ||||||||||||||||||||
Net assets, end of period (000’s omitted) | $416 | $150 | $70 | $16 | $11 | |||||||||||||||
Ratio to average net assets of: | ||||||||||||||||||||
Expenses, net of waivers/reimbursements | 1.90 | %(e) | 1.90 | % | 1.90 | % | 1.90 | % | 1.90 | %(e) | ||||||||||
Expenses, before waivers/reimbursements | 1.90 | %(e) | 1.92 | % | 2.06 | % | 2.09 | % | 4.73 | %(e) | ||||||||||
Net investment income(c) | .08 | %(e) | .49 | % | .49 | % | .61 | % | .81 | %(e) | ||||||||||
Portfolio turnover rate | 21 | % | 45 | % | 51 | % | 51 | % | 24 | % | ||||||||||
See footnote summary on page 37.
| abfunds.com | AB GLOBAL CORE EQUITY PORTFOLIO | 35 | |
FINANCIAL HIGHLIGHTS(continued)
Selected Data For A Share Of Capital Stock Outstanding Throughout Each Period
| Advisor Class | ||||||||||||||||||||
| Six Months Ended December 31, 2018 (unaudited) | Year Ended June 30, | November 12, 2014(a) to June 30, 2015 | ||||||||||||||||||
| 2018 | 2017 | 2016 | ||||||||||||||||||
|
| |||||||||||||||||||
Net asset value, beginning of period | $ 12.46 | $ 11.75 | $ 9.72 | $ 10.16 | $ 10.00 | |||||||||||||||
|
| |||||||||||||||||||
Income From Investment Operations | ||||||||||||||||||||
Net investment income(b)(c) | .07 | .18 | .16 | .15 | .18 | |||||||||||||||
Net realized and unrealized gain (loss) on investment and foreign currency transactions | (.84 | ) | 1.10 | 1.97 | (.48 | ) | .01 | † | ||||||||||||
|
| |||||||||||||||||||
Net increase (decrease) in net asset value from operations | (.77 | ) | 1.28 | 2.13 | (.33 | ) | .19 | |||||||||||||
|
| |||||||||||||||||||
Less: Dividends and Distributions | ||||||||||||||||||||
Dividends from net investment income | (.15 | ) | (.15 | ) | (.10 | ) | (.08 | ) | (.03 | ) | ||||||||||
Distributions from net realized gain on investment and foreign currency transactions | (.18 | ) | (.42 | ) | – 0 | – | (.03 | ) | – 0 | – | ||||||||||
|
| |||||||||||||||||||
Total dividends and distributions | (.33 | ) | (.57 | ) | (.10 | ) | (.11 | ) | (.03 | ) | ||||||||||
|
| |||||||||||||||||||
Net asset value, end of period | $ 11.36 | $ 12.46 | $ 11.75 | $ 9.72 | $ 10.16 | |||||||||||||||
|
| |||||||||||||||||||
Total Return | ||||||||||||||||||||
Total investment return based on net asset value(d) | (6.22 | )% | 11.02 | % | 22.09 | % | (3.17 | )% | 1.86 | % | ||||||||||
Ratios/Supplemental Data | ||||||||||||||||||||
Net assets, end of period (000’s omitted) | $506,017 | $465,263 | $310,829 | $156,608 | $101,359 | |||||||||||||||
Ratio to average net assets of: | ||||||||||||||||||||
Expenses, net of waivers/reimbursements | .90 | %(e) | .90 | % | .90 | % | .90 | % | .90 | %(e) | ||||||||||
Expenses, before waivers/reimbursements | .90 | %(e) | .90 | % | .97 | % | 1.08 | % | 2.43 | %(e) | ||||||||||
Net investment income(c) | 1.10 | %(e) | 1.42 | % | 1.52 | % | 1.59 | % | 2.71 | %(e) | ||||||||||
Portfolio turnover rate | 21 | % | 45 | % | 51 | % | 51 | % | 24 | % | ||||||||||
See footnote summary on page 37.
| 36 | AB GLOBAL CORE EQUITY PORTFOLIO | abfunds.com | |
FINANCIAL HIGHLIGHTS(continued)
Selected Data For A Share Of Capital Stock Outstanding Throughout Each Period
| (a) | Commencement of operations. |
| (b) | Based on average shares outstanding. |
| (c) | Net of expenses waived/reimbursed by the Adviser. |
| (d) | Total investment return is calculated assuming an initial investment made at the net asset value at the beginning of the period, reinvestment of all dividends and distributions at net asset value during the period, and redemption on the last day of the period. Initial sales charge or contingent deferred sales charge is not reflected in the calculation of total investment return. Total investment return does not reflect the deduction of taxes that a shareholder would pay on fund distributions or the redemption of fund shares. Total investment return for a period of less than one year is not annualized. |
| (e) | Annualized. |
| (f) | Amount is less than $0.005. |
| † | Due to timing of sales and repurchase of capital shares, the net realized and unrealized gain (loss) per share is not in accord with the Fund’s change in net realized and unrealized gain (loss) on investment transactions for the period. |
See notes to financial statements.
| abfunds.com | AB GLOBAL CORE EQUITY PORTFOLIO | 37 | |
RESULTS OF SHAREHOLDERS MEETING
(unaudited)
A Special Meeting of Shareholders of the AB Cap Fund, Inc. (the “Company”)—AB Global Core Equity Portfolio (the “Fund”) was held on October 11, 2018 and adjourned until December 11, 2018. A description of each proposal and number of shares voted at the Meeting are as follows (the proposal number shown below corresponds to the proposal number in the Fund’s proxy statement):
| 1. | To approve and vote upon the election of Directors for the Fund, each such Director to serve for a term of indefinite duration and until his or her successor is duly elected and qualifies. |
Director: | Voted For | Withheld Authority | ||||||
Michael J. Downey | 215,536,553 | 1,474,295 | ||||||
William H. Foulk, Jr.* | 215,369,140 | 1,641,708 | ||||||
Nancy P. Jacklin | 215,599,334 | 1,411,513 | ||||||
Robert M. Keith | 215,547,510 | 1,463,337 | ||||||
Carol C. McMullen | 215,652,168 | 1,358,679 | ||||||
Garry L. Moody | 215,553,805 | 1,457,043 | ||||||
Marshall C. Turner | 215,527,252 | 1,483,596 | ||||||
Earl D. Weiner | 215,530,515 | 1,480,332 | ||||||
| 2. | To vote upon the approval of new advisory agreements for the Fund with AllianceBernstein L.P. |
Voted For | Voted Against | Abstained | Broker Non-Votes | |||||||||||
| 20,265,640 | 188,589 | 620,828 | 59,762 | |||||||||||
| * | Mr. Foulk retired on December 31, 2018. |
| 38 | AB GLOBAL CORE EQUITY PORTFOLIO | abfunds.com | |
BOARD OF DIRECTORS
Marshall C. Turner, Jr.(1),Chairman Michael J. Downey(1) Nancy P. Jacklin(1) Robert M. Keith,President and Chief Executive Officer | Carol C. McMullen(1) Garry L. Moody(1) Earl D. Weiner(1) |
OFFICERS
David Dalgas(2),Vice President Klaus Ingemann(2),Vice President Emilie D. Wrapp,Secretary Michael B. Reyes, Senior Analyst | Joseph J. Mantineo,Treasurer and Chief Financial Officer Phyllis J. Clarke,Controller Vincent S. Noto,Chief Compliance Officer |
Custodian and Accounting Agent Brown Brothers Harriman & Co. 50 Post Office Square Boston, MA 02110
Principal Underwriter AllianceBernstein Investments, Inc. 1345 Avenue of the Americas New York, NY 10105
Transfer Agent AllianceBernstein Investor Services, Inc. P.O. Box 786003 San Antonio, TX 78278-6003 Toll-Free (800) 221-5672 | Independent Registered Public Accounting Firm Ernst & Young LLP 5 Times Square New York, NY 10036
Legal Counsel Seward & Kissel LLP One Battery Park Plaza New York, NY 10004 |
| 1 | Member of the Audit Committee, the Governance and Nominating Committee, and the Independent Directors Committee. |
| 2 | The day-to-day management of, and investment decisions for, the Investment Policy Team portfolio are made by the Adviser’s Investment Policy Team. Messrs. Dalgas and Ingemann are the investment professionals with the most significant responsibility for the day-to-day management of the Fund’s portfolio. |
| abfunds.com | AB GLOBAL CORE EQUITY PORTFOLIO | 39 | |
Information Regarding the Review and Approval of the Fund’s Advisory Agreement
As described in more detail in the Proxy Statement for the AB Funds dated August 20, 2018, the Boards of the AB Funds, at a meeting held onJuly 31-August 2, 2018, approved new advisory agreements with the Adviser (the “Proposed Agreements”) for the AB Funds, including AB Cap Fund, Inc. in respect of AB Global Core Equity Portfolio (the “Fund”), in connection with the planned disposition by AXA S.A. of its remaining shares of AXA Equitable Holdings, Inc. (the indirect holder of a majority of the partnership interests in the Adviser and the indirect parent of AllianceBernstein Corporation, the general partner of the Adviser) in one or more transactions and the related potential for one or more “assignments” (within the meaning of section 2(a)(4) of the Investment Company Act) of the advisory agreements for the AB Funds, including the Fund’s Advisory Agreement, resulting in the automatic termination of such advisory agreements.
At the same meeting, the AB Boards also considered and approved interim advisory agreements with the Adviser (the “Interim Advisory Agreements”) for the AB Funds, including the Fund, to be effective only in the event that stockholder approval of a Proposed Agreement had not been obtained as of the date of one or more transactions resulting in an “assignment” of the Adviser’s advisory agreements, resulting in the automatic termination of such advisory agreements.
The shareholders of the Fund subsequently approved the Proposed Agreements at an annual meeting of shareholders called for the purpose of electing Directors and voting on the Proposed Agreements.
A discussion regarding the basis for the Boards’ approvals at a meeting held onJuly 31-August 2, 2018 is set forth below.
Information Regarding the Review and Approval of the Fund’s Proposed New Advisory Agreement and Interim Advisory Agreement in the Context of Potential Assignments
At a meeting of the AB Boards held on July31-August 2, 2018, the Adviser presented its recommendation that the Boards consider and approve the Proposed Agreements. Section 15(c) of the 1940 Act provides that, after an initial period, a Fund’s Current Agreement and currentsub-advisory agreement, as applicable, will remain in effect only if the Board, including a majority of the Independent Directors, annually reviews and approves them. Each of the Current Agreements had been approved by a Board within theone-year period prior to approval of its related Proposed Agreement, except that the Current Agreements for certain FlexFee funds were approved in February 2017. In connection with their approval of the Proposed Agreements, the Boards considered their conclusions in connection with their most recent approvals of the Current Agreements, in particular in cases where the last approval of a Current Agreement was relatively recent, including the Boards’ general satisfaction with the nature
| 40 | AB GLOBAL CORE EQUITY PORTFOLIO | abfunds.com | |
and quality of services being provided and, as applicable, in the case of certain Funds, actions taken or to be taken in an effort to improve investment performance or reduce expense ratios. The Directors also reviewed updated information provided by the Adviser in respect of each Fund. Also in connection with their approval of the Proposed Agreements, the Boards considered a representation made to them at that time by the Adviser that there were no additional developments not already disclosed to the Boards since their most recent approvals of the Current Agreements that would be a material consideration to the Boards in connection with their consideration of the Proposed Agreements, except for matters disclosed to the Boards by the Adviser. The Directors considered the fact that each Proposed Agreement would have corresponding terms and conditions identical to those of the corresponding Current Agreement with the exception of the effective date and initial term under the Proposed Agreement.
The Directors considered their knowledge of the nature and quality of the services provided by the Adviser to each Fund gained from their experience as directors or trustees of registered investment companies advised by the Adviser, their overall confidence in the Adviser’s integrity and competence they have gained from that experience, the Adviser’s initiative in identifying and raising potential issues with the Directors and its responsiveness, frankness and attention to concerns raised by the Directors in the past, including the Adviser’s willingness to consider and implement organizational and operational changes designed to improve investment results and the services provided to the Funds. The Directors noted that they have four regular meetings each year, at each of which they review extensive materials and information from the Adviser, including information on the investment performance of each Fund.
The Directors also considered all factors they believed relevant, including the specific matters discussed below. During the course of their deliberations, the Directors evaluated, among other things, the reasonableness of the management fees of the Funds they oversee. The Directors did not identify any particular information that was all-important or controlling, and different Directors may have attributed different weights to the various factors. The Directors determined that the selection of the Adviser to manage the Funds, and the overall arrangements between the Funds and the Adviser, as provided in the Proposed Agreements, including the management fees, were fair and reasonable in light of the services performed under the Current Agreements and to be performed under the Proposed Agreements, expenses incurred and to be incurred and such other matters as the Directors considered relevant in the exercise of their business judgment. The material factors and conclusions that formed the basis for the Directors’ determinations included the following:
Nature, Extent and Quality of Services Provided
The Directors considered the scope and quality of services to be provided by the Adviser under the Proposed Agreements, including the quality of
| abfunds.com | AB GLOBAL CORE EQUITY PORTFOLIO | 41 | |
the investment research capabilities of the Adviser and the other resources it has dedicated to performing services for the Funds. They also considered the information that had been provided to them by the Adviser concerning the anticipated implementation of the Plan and the Adviser’s representation that it did not anticipate that such implementation would affect the management or structure of the Adviser, have a material adverse effect on the Adviser, or adversely affect the quality of the services provided to the Funds by the Adviser and its affiliates. The Directors noted that the Adviser from time to time reviews each Fund’s investment strategies and from time to time proposes changes intended to improve the Fund’s relative or absolute performance for the Directors’ consideration. They also noted the professional experience and qualifications of each Fund’s portfolio management team and other senior personnel of the Adviser. The Directors also considered that certain Proposed Agreements, similar to the corresponding Current Agreements, provide that the Funds will reimburse the Adviser for the cost to it of providing certain clerical, accounting, administrative and other services to the Funds by employees of the Adviser or its affiliates. Requests for these reimbursements are made on a quarterly basis and subject to approval by the Directors. The Directors noted that the Adviser did not request any reimbursements from certain Funds in the Fund’s latest fiscal year reviewed. The Directors noted that the methodology to be used to determine the reimbursement amounts had been reviewed by an independent consultant retained by the Funds’ former Senior Officer/Independent Compliance Officer. The quality of administrative and other services, including the Adviser’s role in coordinating the activities of the Funds’ other service providers, also was considered. The Directors of each Fund concluded that, overall, they were satisfied with the nature, extent and quality of services to be provided to the Funds under the Proposed Agreement for the Fund.
Costs of Services to be Provided and Profitability
The Directors reviewed a schedule of the revenues and expenses and related notes indicating the profitability of each Fund to the Adviser for calendar years 2016 and 2017, as applicable, that had been prepared with an expense allocation methodology arrived at in consultation with an independent consultant retained by the Funds’ former Senior Officer/Independent Compliance Officer. The Directors noted the assumptions and methods of allocation used by the Adviser in preparing fund-specific profitability data and understood that there are a number of potentially acceptable allocation methodologies for information of this type. The Directors noted that the profitability information reflected all revenues and expenses of the Adviser’s relationship with a Fund, including those relating to its subsidiaries that provide transfer agency, distribution and brokerage services to the Fund, as applicable. The Directors recognized that it is difficult to make comparisons of the profitability of the Proposed Agreements with the profitability of fund advisory contracts for unaffiliated funds because comparative information is not generally publicly available and is
| 42 | AB GLOBAL CORE EQUITY PORTFOLIO | abfunds.com | |
affected by numerous factors. The Directors focused on the profitability of the Adviser’s relationship with each Fund before taxes and distribution expenses, as applicable. The Directors noted that certain Funds were not profitable to the Adviser in one or more periods reviewed. The Directors concluded that the Adviser’s level of profitability from its relationship with the other Funds was not unreasonable. The Directors were unable to consider historical information about the profitability of certain Funds that had recently commenced operations and for which historical profitability information was not available. The Adviser agreed to provide the Directors with profitability information in connection with future proposed continuances of the Proposed Agreements.
Fall-Out Benefits
The Directors considered the other benefits to the Adviser and its affiliates from their relationships with the Funds, including, but not limited to, as applicable, benefits relating to soft dollar arrangements (whereby investment advisers receive brokerage and research services from brokers that execute agency transactions for their clients) in the case of certain Funds;12b-1 fees and sales charges received by the principal underwriter (which is a wholly owned subsidiary of the Adviser) in respect of certain classes of the shares of most of the Funds; brokerage commissions paid by certain Funds to brokers affiliated with the Adviser; and transfer agency fees paid by most of the Funds to a wholly owned subsidiary of the Adviser. The Directors recognized that the Adviser’s profitability would be somewhat lower, and that a Fund’s unprofitability to the Adviser would be exacerbated, without these benefits. The Directors understood that the Adviser also might derive reputational and other benefits from its association with the Funds.
Investment Results
In addition to the information reviewed by the Directors in connection with the Board meeting at which the Proposed Agreements were approved, the Directors receive detailed performance information for the Funds at each regular Board meeting during the year.
The Boards’ consideration of each Proposed Agreement was informed by their most recent approval of the related Current Agreement, and, in the case of certain Funds, their discussion with the Adviser of the reasons for those Funds’ underperformance in certain periods. The Directors also reviewed updated performance information and, in some cases, discussed with the Adviser the reasons for changes in performance or continued underperformance. On the basis of this review, the Directors concluded that each Fund’s investment performance was acceptable.
Management Fees and Other Expenses
The Directors considered the management fee rate payable by each Fund to the Adviser and information prepared by an independent service provider
| abfunds.com | AB GLOBAL CORE EQUITY PORTFOLIO | 43 | |
(the “15(c) provider”) concerning management fee rates payable by other funds in the same category as the Fund. The Directors recognized that it is difficult to make comparisons of management fees because there are variations in the services that are included in the fees paid by other funds. The Directors compared each Fund’s contractual management fee rate with a peer group median, and where applicable, took into account the impact on the management fee rate of the administrative expense reimbursement paid to the Adviser in the latest fiscal year. In the case of the ACS Funds, the Directors noted that the management fee rate is zero but also were cognizant that the Adviser is indirectly compensated by the wrap fee program sponsors that use the ACS Funds as an investment vehicle for their clients.
The Directors also considered the Adviser’s fee schedule for other clients pursuing a similar investment style to each Fund. For this purpose, they reviewed the relevant advisory fee information from the Adviser’s Form ADV and in a report from the Funds’ Senior Analyst and noted the differences between a Fund’s fee schedule, on the one hand, and the Adviser’s institutional fee schedule and the schedule of fees charged by the Adviser to any offshore funds and for services to anysub-advised funds pursuing a similar investment strategy as the Fund, on the other, as applicable. The Directors noted that the Adviser may, in some cases, agree to fee rates with large institutional clients that are lower than those reviewed by the Directors and that they had previously discussed with the Adviser its policies in respect of such arrangements. The Adviser also informed the Directors that, in the case of certain Funds, there were no institutional products managed by the Adviser that have a substantially similar investment style. The Directors also discussed these matters with their independent fee consultant.
The Adviser reviewed with the Directors the significantly greater scope of the services it provides to each Fund relative to institutional, offshore fund andsub-advised fund clients, as applicable. In this regard, the Adviser noted, among other things, that, compared to institutional and offshore orsub-advisory accounts, each Fund, as applicable, (i) demands considerably more portfolio management, research and trading resources due to significantly higher daily cash flows (in the case ofopen-end Funds); (ii) has more tax and regulatory restrictions and compliance obligations; (iii) must prepare and file or distribute regulatory and other communications about fund operations; and (iv) must provide shareholder servicing to retail investors. The Adviser also reviewed the greater legal risks presented by the large and changing population of Fund shareholders who may assert claims against the Adviser in individual or class actions, and the greater entrepreneurial risk in offering new fund products, which require substantial investment to launch, may not succeed, and generally must be priced to compete with larger, more established funds resulting in lack of profitability to the Adviser until a new fund achieves scale. In light of the substantial differences in services rendered by the Adviser to institutional, offshore fund andsub-advised fund clients as compared to the Funds, and
| 44 | AB GLOBAL CORE EQUITY PORTFOLIO | abfunds.com | |
the different risk profile, the Directors considered these fee comparisons inapt and did not place significant weight on them in their deliberations.
The Directors noted that many of the Funds may invest in shares of exchange-traded funds (“ETFs”), subject to the restrictions and limitations of the 1940 Act as these may be varied as a result of exemptive orders issued by the SEC. The Directors also noted that ETFs pay advisory fees pursuant to their advisory contracts. The Directors concluded, based on the Adviser’s explanation of how it uses ETFs when they are the most cost-effective way to obtain desired exposures, in some cases pending purchases of underlying securities, that each Fund’s management fee would be for services that would be in addition to, rather than duplicative of, the services provided under the advisory contracts of the ETFs.
With respect to each Fund’s management fee, the Directors considered the total expense ratio of the Fund in comparison to a peer group and peer universe selected by the 15(c) service provider. The Directors also considered the Adviser’s expense caps for certain Funds. The Directors view expense ratio information as relevant to their evaluation of the Adviser’s services because the Adviser is responsible for coordinating services provided to a Fund by others.
The Boards’ consideration of each Proposed Agreement was informed by their most recent approval of the related Current Agreement, and, in the case of certain Funds, their discussion with the Adviser of the reasons for those Funds’ expense ratios in certain periods. The Directors also reviewed updated expense ratio information and, in some cases, discussed with the Adviser the reasons for the expense ratios of certain Funds. On the basis of this review, the Directors concluded that each Fund’s expense ratio was acceptable.
The Directors did not consider comparative expense information for the ACS Funds because those Funds do not bear ordinary expenses.
Economies of Scale
The Directors noted that the management fee schedules for certain Funds do not contain breakpoints and that they had discussed their strong preference for breakpoints in advisory contracts with the Adviser. The Directors took into consideration prior presentations by an independent consultant on economies of scale in the mutual fund industry and for the Funds, and by the Adviser concerning certain of its views on economies of scale. The Directors also had requested and received from the Adviser certain updates on economies of scale in advance of the Board meeting. The Directors believe that economies of scale may be realized (if at all) by the Adviser across a variety of products and services, and not only in respect of a single fund. The Directors noted that there is no established methodology for setting breakpoints that give effect to the fund-specific
| abfunds.com | AB GLOBAL CORE EQUITY PORTFOLIO | 45 | |
services provided by a fund’s adviser and to the economies of scale that an adviser may realize in its overall mutual fund business or those components of it which directly or indirectly affect a fund’s operations. The Directors observed that in the mutual fund industry as a whole, as well as among funds similar to each Fund, there is no uniformity or pattern in the fees and asset levels at which breakpoints (if any) apply. The Directors also noted that the advisory agreements for many funds do not have breakpoints at all. The Directors informed the Adviser that they would monitor the asset levels of the Funds without breakpoints and their profitability to the Adviser and anticipated revisiting the question of breakpoints in the future if circumstances warrant doing so.
The Directors did not consider the extent to which fee levels in the Advisory Agreement for the ACS Funds reflect economies of scale because that Advisory Agreement does not provide for any compensation to be paid to the Adviser by the ACS Funds and the expense ratio of each of those Funds is zero.
Interim Advisory Agreements
In approving the Interim Advisory Agreements, the Boards, with the assistance of independent counsel, considered similar factors to those considered in approving the Proposed Agreements. The Interim Advisory Agreements approved by the Boards are identical to the Proposed Agreements, as well as the Current Agreements, in all material respects except for their proposed effective and termination dates and provisions intended to comply with the requirements of the relevant SEC rule, such as provisions requiring escrow of advisory fees. Under the Interim Advisory Agreements, the Adviser would continue to manage a Fund pursuant to an Interim Advisory Agreement until a new advisory agreement was approved by stockholders or until the end of the150-day period, whichever would occur earlier. All fees earned by the Adviser under an Interim Advisory Agreement would be held in escrow pending shareholder approval of the Proposed Agreement. Upon approval of a new advisory agreement by stockholders, the escrowed management fees would be paid to the Adviser, and the Interim Advisory Agreement would terminate.
Information Regarding the Review and Approval of the Fund’s Current Advisory Agreement
The disinterested directors (the “directors”) of AB Cap Fund, Inc. (the “Company”) unanimously approved the continuance of the Company’s Advisory Agreement with the Adviser in respect of AB Global Core Equity Portfolio (the “Fund”) at a meeting held onMay 1-3, 2018 (the “Meeting”).
Prior to approval of the continuance of the Advisory Agreement, the directors had requested from the Adviser, and received and evaluated, extensive materials. They reviewed the proposed continuance of the Advisory Agreement with the Adviser and with experienced counsel who are
| 46 | AB GLOBAL CORE EQUITY PORTFOLIO | abfunds.com | |
independent of the Adviser, who advised on the relevant legal standards. The directors also reviewed additional materials, including materials from an outside consultant, who acted as their independent fee consultant, and comparative analytical data prepared by the Senior Analyst for the Fund. The directors also discussed the proposed continuance in private sessions with counsel.
The directors considered their knowledge of the nature and quality of the services provided by the Adviser to the Fund gained from their experience as directors or trustees of most of the registered investment companies advised by the Adviser, their overall confidence in the Adviser’s integrity and competence they have gained from that experience, the Adviser’s initiative in identifying and raising potential issues with the directors and its responsiveness, frankness and attention to concerns raised by the directors in the past, including the Adviser’s willingness to consider and implement organizational and operational changes designed to improve investment results and the services provided to the AB Funds. The directors noted that they have four regular meetings each year, at each of which they review extensive materials and information from the Adviser, including information on the investment performance of the Fund.
The directors also considered all factors they believed relevant, including the specific matters discussed below. During the course of their deliberations, the directors evaluated, among other things, the reasonableness of the advisory fee. The directors did not identify any particular information that wasall-important or controlling, and different directors may have attributed different weights to the various factors. The directors determined that the selection of the Adviser to manage the Fund and the overall arrangements between the Fund and the Adviser, as provided in the Advisory Agreement, including the advisory fee, were fair and reasonable in light of the services performed, expenses incurred and such other matters as the directors considered relevant in the exercise of their business judgment. The material factors and conclusions that formed the basis for the directors’ determinations included the following:
Nature, Extent and Quality of Services Provided
The directors considered the scope and quality of services provided by the Adviser under the Advisory Agreement, including the quality of the investment research capabilities of the Adviser and the other resources it has dedicated to performing services for the Fund. The directors noted that the Adviser from time to time reviews the Fund’s investment strategies and from time to time proposes changes intended to improve the Fund’s relative or absolute performance for the directors’ consideration. They also noted the professional experience and qualifications of the Fund’s portfolio management team and other senior personnel of the Adviser. The directors also considered that the Advisory Agreement provides that the Fund will reimburse the Adviser for the cost to it of providing certain clerical,
| abfunds.com | AB GLOBAL CORE EQUITY PORTFOLIO | 47 | |
accounting, administrative and other services to the Fund by employees of the Adviser or its affiliates. Requests for these reimbursements are made on a quarterly basis and subject to approval by the directors. Reimbursements, to the extent requested and paid, result in a higher rate of total compensation from the Fund to the Adviser than the fee rate stated in the Advisory Agreement. The directors noted that the methodology used to determine the reimbursement amounts had been reviewed by an independent consultant retained by the Company’s former Independent Compliance Officer. The quality of administrative and other services, including the Adviser’s role in coordinating the activities of the Fund’s other service providers, also was considered. The directors concluded that, overall, they were satisfied with the nature, extent and quality of services provided to the Fund under the Advisory Agreement.
Costs of Services Provided and Profitability
The directors reviewed a schedule of the revenues and expenses and related notes indicating the profitability of the Fund to the Adviser for calendar years 2016 and 2017 that had been prepared with an expense allocation methodology arrived at in consultation with an independent consultant retained by the Company’s former Independent Compliance Officer. The directors noted the assumptions and methods of allocation used by the Adviser in preparing fund-specific profitability data and understood that there are a number of potentially acceptable allocation methodologies for information of this type. The directors noted that the profitability information reflected all revenues and expenses of the Adviser’s relationship with the Fund, including those relating to its subsidiaries that provide transfer agency, distribution and brokerage services to the Fund. The directors recognized that it is difficult to make comparisons of the profitability of the Advisory Agreement with the profitability of advisory contracts for unaffiliated funds because comparative information is not generally publicly available and is affected by numerous factors. The directors focused on the profitability of the Adviser’s relationship with the Fund before taxes and distribution expenses. The directors noted that the Fund was not profitable to the Adviser in 2016. The directors concluded that the Adviser’s level of profitability from its relationship with the Fund in 2017 was not unreasonable.
Fall-Out Benefits
The directors considered the other benefits to the Adviser and its affiliates from their relationships with the Fund, including, but not limited to, benefits relating to soft dollar arrangements (whereby investment advisers receive brokerage and research services from brokers that execute agency transactions for their clients);12b-1 fees and sales charges received by the Fund’s principal underwriter (which is a wholly owned subsidiary of the Adviser) in respect of certain classes of the Fund’s shares; brokerage commissions paid by the Fund to brokers affiliated with the Adviser; and transfer agency fees paid by the Fund to a wholly owned subsidiary of the
| 48 | AB GLOBAL CORE EQUITY PORTFOLIO | abfunds.com | |
Adviser. The directors recognized that the Adviser’s recent profitability would be somewhat lower without these benefits. The directors understood that the Adviser also might derive reputational and other benefits from its association with the Fund.
Investment Results
In addition to the information reviewed by the directors in connection with the Meeting, the directors receive detailed performance information for the Fund at each regular Board meeting during the year.
At the Meeting, the directors reviewed performance information prepared by an analytical service that is not affiliated with the Adviser (the “15(c) service provider”), showing the performance of the Class A Shares of the Fund against a group of similar funds (���peer group”) and a larger group of similar funds (“peer universe”), each selected by the 15(c) service provider, and information prepared by the Adviser showing performance of the Class A Shares against a broad-based securities market index, in each case for the1- and3-year periods ended February 28, 2018 and (in the case of comparisons with the broad-based securities market index) for the period from inception. Based on their review, the directors concluded that the Fund’s investment performance was acceptable.
Advisory Fees and Other Expenses
The directors considered the advisory fee rate payable by the Fund to the Adviser and information prepared by the 15(c) service provider concerning advisory fee rates payable by other funds in the same category as the Fund. The directors recognized that it is difficult to make comparisons of advisory fees because there are variations in the services that are included in the fees paid by other funds. The directors compared the Fund’s contractual effective advisory fee rate with a peer group median and took into account the impact on the advisory fee rate of the administrative expense reimbursement paid to the Adviser in the latest fiscal year.
The directors also considered the Adviser’s fee schedule for other clients pursuing a similar investment style. For this purpose, they reviewed the relevant advisory fee information from the Adviser’s Form ADV and the materials from the Fund’s Senior Analyst and noted the differences between the Fund’s fee schedule, on the one hand, and the Adviser’s institutional fee schedule and the schedule of fees charged by the Adviser to any offshore funds and anysub-advised funds, on the other. The directors noted that the Adviser may, in some cases, agree to fee rates with large institutional clients that are lower than those reviewed by the directors and that they had previously discussed with the Adviser its policies in respect of such arrangements.
The Adviser reviewed with the directors the significantly greater scope of the services it provides to the Fund relative to institutional, offshore fund
| abfunds.com | AB GLOBAL CORE EQUITY PORTFOLIO | 49 | |
andsub-advised fund clients. In this regard, the Adviser noted, among other things, that, compared to institutional and offshore accounts, the Fund (i) demands considerably more portfolio management, research and trading resources due to significantly higher daily cash flows; (ii) has more tax and regulatory restrictions; (iii) must prepare and distribute regulatory and other communications about fund operations; and (iv) must provide shareholder servicing to retail investors. The Adviser also reviewed the greater legal risks presented by the large and changing population of Fund shareholders who may assert claims against the Adviser in individual or class actions, and the greater entrepreneurial risk in offering new fund products, which require substantial investment to launch, may not succeed, and generally must be priced to compete with larger, more established funds resulting in lack of profitability to the Adviser until a new fund achieves scale. In light of the substantial differences in services rendered by the Adviser to institutional, offshore fund andsub-advised fund clients as compared to funds such as the Fund, and the different risk profile, the directors considered these fee comparisons inapt and did not place significant weight on them in their deliberations.
The directors noted that the Fund may invest in shares of exchange-traded funds (“ETFs”), subject to the restrictions and limitations of the Investment Company Act of 1940 as these may be varied as a result of exemptive orders issued by the SEC. The directors also noted that ETFs pay advisory fees pursuant to their advisory contracts. The directors concluded, based on the Adviser’s explanation of how it may use ETFs when they are the most cost-effective way to obtain desired exposures for a fund or to temporarily “equitize” cash inflows pending purchases of underlying securities, that the advisory fee for the Fund would be paid for services that would be in addition to, rather than duplicative of, the services provided under the advisory contracts of the ETFs.
The directors also considered the total expense ratio of the Class A shares of the Fund in comparison to a peer group and a peer universe selected by the 15(c) service provider. The Class A expense ratio of the Fund was based on the Fund’s latest fiscal year and the directors considered the effects of any fee waivers and/or expense reimbursements as a result of the Adviser’s expense cap. The directors noted that it was likely that the expense ratios of some of the other funds in the Fund’s category were lowered by waivers or reimbursements by those funds’ investment advisers, which in some cases might be voluntary or temporary. The directors view expense ratio information as relevant to their evaluation of the Adviser’s services because the Adviser is responsible for coordinating services provided to the Fund by others. Based on their review, the directors concluded that the Fund’s expense ratio was acceptable.
Economies of Scale
The directors noted that the advisory fee schedule for the Fund contains breakpoints that reduce the fee rates on assets above specified levels. The
| 50 | AB GLOBAL CORE EQUITY PORTFOLIO | abfunds.com | |
directors took into consideration prior presentations by an independent consultant on economies of scale in the mutual fund industry and for the AB Funds, and by the Adviser concerning certain of its views on economies of scale. The directors also had requested and received from the Adviser certain updates on economies of scale in advance of the Meeting. The directors believe that economies of scale may be realized (if at all) by the Adviser across a variety of products and services, and not only in respect of a single fund. The directors noted that there is no established methodology for setting breakpoints that give effect to the fund-specific services provided by a fund’s adviser and to the economies of scale that an adviser may realize in its overall mutual fund business or those components of it which directly or indirectly affect a fund’s operations. The directors observed that in the mutual fund industry as a whole, as well as among funds similar to the Fund, there is no uniformity or pattern in the fees and asset levels at which breakpoints (if any) apply. The directors also noted that the advisory agreements for many funds do not have breakpoints at all. Having taken these factors into account, the directors concluded that the Fund’s shareholders would benefit from a sharing of economies of scale in the event the Fund’s net assets exceed a breakpoint in the future.
| abfunds.com | AB GLOBAL CORE EQUITY PORTFOLIO | 51 | |
This page is not part of the Shareholder Report or the Financial Statements.
AB FAMILY OF FUNDS
US EQUITY
US CORE
Core Opportunities Fund
FlexFee™ US Thematic Portfolio
Select US Equity Portfolio
US GROWTH
Concentrated Growth Fund
Discovery Growth Fund
FlexFee™ Large Cap Growth Portfolio
Growth Fund
Large Cap Growth Fund
Small Cap Growth Portfolio
US VALUE
Discovery Value Fund
Equity Income Fund
Relative Value Fund
Small Cap Value Portfolio
Value Fund
INTERNATIONAL/ GLOBAL EQUITY
INTERNATIONAL/ GLOBAL CORE
FlexFee™ International Strategic Core Portfolio
Global Core Equity Portfolio
International Portfolio
International Strategic Core Portfolio
Sustainable Global Thematic Fund
Tax-Managed International Portfolio
Tax-Managed Wealth Appreciation Strategy
Wealth Appreciation Strategy
INTERNATIONAL/ GLOBAL GROWTH
Concentrated International Growth Portfolio
FlexFee™ Emerging Markets Growth Portfolio
INTERNATIONAL/ GLOBAL EQUITY(continued)
Sustainable International Thematic Fund
INTERNATIONAL/ GLOBAL VALUE
All China Equity Portfolio
International Value Fund
FIXED INCOME
MUNICIPAL
High Income Municipal Portfolio
Intermediate California Municipal Portfolio
Intermediate Diversified Municipal Portfolio
Intermediate New York Municipal Portfolio
Municipal Bond Inflation Strategy
Tax-Aware Fixed Income Portfolio
National Portfolio
Arizona Portfolio
California Portfolio
Massachusetts Portfolio
Minnesota Portfolio
New Jersey Portfolio
New York Portfolio
Ohio Portfolio
Pennsylvania Portfolio
Virginia Portfolio
TAXABLE
Bond Inflation Strategy
FlexFee™ High Yield Portfolio1
FlexFee™ International Bond Portfolio
Global Bond Fund
High Income Fund
Income Fund
Intermediate Bond Portfolio
Limited Duration High Income Portfolio
Short Duration Portfolio
ALTERNATIVES
All Market Real Return Portfolio
Global Real Estate Investment Fund
Select US Long/Short Portfolio
Unconstrained Bond Fund
MULTI-ASSET
All Market Income Portfolio
All Market Total Return Portfolio
Conservative Wealth Strategy
Emerging Markets Multi-Asset Portfolio
Global Risk Allocation Fund
Tax-Managed All Market Income Portfolio
TARGET-DATE
Multi-Manager Select Retirement Allocation Fund
Multi-Manager Select 2010 Fund
Multi-Manager Select 2015 Fund
Multi-Manager Select 2020 Fund
Multi-Manager Select 2025 Fund
Multi-Manager Select 2030 Fund
Multi-Manager Select 2035 Fund
Multi-Manager Select 2040 Fund
Multi-Manager Select 2045 Fund
Multi-Manager Select 2050 Fund
Multi-Manager Select 2055 Fund
Multi-Manager Select 2060 Fund
CLOSED-END FUNDS
Alliance California Municipal Income Fund
AllianceBernstein Global High Income Fund
AllianceBernstein National Municipal Income Fund
We also offer Government Money Market Portfolio, which serves as the money market fund exchange vehicle for the AB mutual funds. You could lose money by investing in the Fund. Although the Fund seeks to preserve the value of your investment at $1.00 per share, it cannot guarantee it will do so. The Fund may impose a fee upon sale of your shares or may temporarily suspend your ability to sell shares if the Fund’s liquidity falls below required minimums because of market conditions or other factors. An investment in the Fund is not insured or guaranteed by the Federal Deposit Insurance Corporation or any other government agency. The Fund’s sponsor has no legal obligation to provide financial support to the Fund, and you should not expect that the sponsor will provide financial support to the Fund at any time.
Investors should consider the investment objectives, risks, charges and expenses of the Fund carefully before investing. For copies of our prospectus or summary prospectus, which contain this and other information, visit us online at www.abfunds.com or contact your AB representative. Please read the prospectus and/or summary prospectus carefully before investing.
| 1 | Prior to February 23, 2018, FlexFee High Yield Portfolio was named High Yield Portfolio. |
| 52 | AB GLOBAL CORE EQUITY PORTFOLIO | abfunds.com | |
AB GLOBAL CORE EQUITY PORTFOLIO
1345 Avenue of the Americas
New York, NY 10105
800 221 5672
GCE-0152-1218 
DEC 12.31.18

SEMI-ANNUAL REPORT
AB INTERNATIONAL STRATEGIC CORE PORTFOLIO

Beginning January 1, 2021, as permitted by new regulations adopted by the Securities and Exchange Commission, the Fund’s annual and semi-annual shareholder reports will no longer be sent by mail, unless you specifically request paper copies of the reports. Instead, the reports will be made available on a website, and you will be notified by mail each time a report is posted and provided with a website address to access the report.
If you already elected to receive shareholder reports electronically, you will not be affected by this change and you need not take any action. You may elect to receive shareholder reports and other communications from the Fund electronically at any time by contacting your financial intermediary (such as a broker-dealer or bank) or, if you are a direct investor, by calling the Fund at (800) 221 5672.
You may elect to receive all future reports in paper form free of charge. If you invest through a financial intermediary, you can contact your financial intermediary to request that you continue to receive paper copies of your shareholder reports; if you invest directly with the Fund, you can call the Fund at (800) 221 5672. Your election to receive reports in paper form will apply to all funds held in your account with your financial intermediary or, if you invest directly, to all AB Mutual Funds you hold.
| Investment Products Offered | • Are Not FDIC Insured• May Lose Value• Are Not Bank Guaranteed | |
Investors should consider the investment objectives, risks, charges and expenses of the Fund carefully before investing. For copies of our prospectus or summary prospectus, which contain this and other information, visit us online at www.abfunds.com or contact your AB representative. Please read the prospectus and/or summary prospectus carefully before investing.
This shareholder report must be preceded or accompanied by the Fund’s prospectus for individuals who are not current shareholders of the Fund.
You may obtain a description of the Fund’s proxy voting policies and procedures, and information regarding how the Fund voted proxies relating to portfolio securities during the most recent12-month period ended June 30, without charge. Simply visit AB’s website at www.abfunds.com, or go to the Securities and Exchange Commission’s (the “Commission”) website at www.sec.gov, or call AB at (800) 227 4618.
The Fund files its complete schedule of portfolio holdings with the Commission for the first and third quarters of each fiscal year. The Fund’s portfolio holdings reports are available on the Commission’s website at www.sec.gov. The Fund’s portfolio holdings reports may also be reviewed and copied at the Commission’s Public Reference Room in Washington, DC; information on the operation of the Public Reference Room may be obtained by calling (800) SEC 0330. AB publishes full portfolio holdings for the Fund monthly at www.abfunds.com.
AllianceBernstein Investments, Inc. (ABI) is the distributor of the AB family of mutual funds. ABI is a member of FINRA and is an affiliate of AllianceBernstein L.P., the Adviser of the funds.
The [A/B] logo is a registered service mark of AllianceBernstein and AllianceBernstein® is a registered service mark used by permission of the owner, AllianceBernstein L.P.
| FROM THE PRESIDENT |  |
Dear Shareholder,
We are pleased to provide this report for AB International Strategic Core Portfolio (the “Fund”). Please review the discussion of Fund performance, the market conditions during the reporting period and the Fund’s investment strategy.
As always, AB strives to keep clients ahead of what’s next by:
| + | Transforming uncommon insights into uncommon knowledge with a global research scope |
| + | Navigating markets with seasoned investment experience and sophisticated solutions |
| + | Providing thoughtful investment insights and actionable ideas |
Whether you’re an individual investor or a multi-billion-dollar institution, we put knowledge and experience to work for you.
AB’s global research organization connects and collaborates across platforms and teams to deliver impactful insights and innovative products. Better insights lead to better opportunities—anywhere in the world.
For additional information about AB’s range of products and shareholder resources, please log on to www.abfunds.com.
Thank you for your investment in the AB Mutual Funds.
Sincerely,

Robert M. Keith
President and Chief Executive Officer, AB Mutual Funds
| abfunds.com | AB INTERNATIONAL STRATEGIC CORE PORTFOLIO | 1 | |
SEMI-ANNUAL REPORT
February 11, 2019
This report provides management’s discussion of fund performance for AB International Strategic Core Portfolio for the semi-annual reporting period ended December 31, 2018.
The Fund’s investment objective is to seek long-term growth of capital.
NAV RETURNS AS OF DECEMBER 31, 2018(unaudited)
| 6 Months | 12 Months | |||||||
| AB INTERNATIONAL STRATEGIC CORE PORTFOLIO | ||||||||
| Class A Shares | -10.85% | -9.03% | ||||||
| Class C Shares | -11.16% | -9.72% | ||||||
| Advisor Class Shares1 | -10.68% | -8.79% | ||||||
| MSCI EAFE Index (net) | -11.35% | -13.79% | ||||||
| 1 | Please note that this share class is for investors purchasing shares through accounts established under certainfee-based programs sponsored and maintained by certain broker-dealers and financial intermediaries, institutional pension plans and/or investment advisory clients of, and certain other persons associated with, the Adviser and its affiliates or the Fund. |
INVESTMENT RESULTS
The table above shows the Fund’s performance compared to its benchmark, the Morgan Stanley Capital International Europe, Australasia and the Far East (“MSCI EAFE”) Index (net), for thesix- and12-month periods ended December 31, 2018.
All share classes of the Fund outperformed the benchmark for both periods, before sales charges. For both periods, security selection within the financials sector contributed, relative to the benchmark. Country allocation (a result ofbottom-up security analysis combined with fundamental research) contributed because of an underweight to Germany, while an underweight to Switzerland detracted. Sector allocation detracted, particularly an underweight in utilities.
For thesix-month period, stock selection in industrials contributed, as did an overweight in technology. Country-wise, an underweight to Japan contributed, while an overweight to Canada detracted. An overweight in technology detracted as well.
During the12-month period, security selection in the consumer-discretionary sector contributed. An underweight in health care detracted. Country-wise, an overweight to Israel contributed, while an underweight to France detracted.
| 2 | AB INTERNATIONAL STRATEGIC CORE PORTFOLIO | abfunds.com | |
The Fund utilized derivatives in the form of currency forwards for hedging purposes, which added to absolute performance for both periods, and futures for investment purposes, which detracted from performance for both periods.
MARKET REVIEW AND INVESTMENT STRATEGY
During thesix-month period ended December 31, 2018, global equities declined. In the US, performance was strong early in the period amid robust corporate earnings and economic data, which sent some US stock indices to record highs. However, concerns about slowing global growth, rising interest rates and worsening trade tensions caused volatility to spike and equities to decline precipitously at the end of the period. Some US indices temporarily entered bear market territory, which is considered a 20% or more decline from their recent highs.Large-cap stocks outperformedsmall-cap stocks, but performance was mixed from a style perspective. In Europe, Italy’s budget disputes with its European Union partners weighed on performance, as did unresolved and ongoing Brexit negotiations. A dramatic decline in the price of oil in the fourth quarter caused a wide dispersion in performance among emerging-market countries, withoil-importing countries benefiting andoil-exporting countries underperforming.
The Fund’s Senior Investment Management Team (the “Team”) continues to be aware of the valuations of the most stable companies in the investable universe. The Fund is positioned in such a way as to avoid the most expensive companies based on price to free cash flow, while at the same time aiming to provide downside protection in case of asell-off. The Team is careful to avoid companies suffering from technological disruptions and changes in consumer preference. The Team continues to uncover what it believes are attractive opportunities with below-market volatility, and looks for a diverse set of opportunities in companies with strong capital stewardship and business models with solid recurring revenues even in cyclical industries, and in companies benefiting from favorable regulations.
INVESTMENT POLICIES
The Adviser seeks to achieve the Fund’s investment objective by investing, under normal circumstances, primarily in common stocks ofnon-US companies, and in companies in at least three countries other than the United States.
The Fund will invest in companies that are determined by the Adviser to offer favorable long-term sustainable profitability, price stability, and attractive valuations. The Adviser will employ an integrated approach that combines both fundamental and quantitative research to identify attractive investment opportunities. Factors that the Adviser will consider
(continued on next page)
| abfunds.com | AB INTERNATIONAL STRATEGIC CORE PORTFOLIO | 3 | |
in this regard will include: a company’s record and projections of profitability, accuracy and availability of information with respect to the company, success and experience of management, competitive advantage, low stock price volatility and liquidity of the company’s securities. The Adviser will compare these results to the characteristics of the general stock markets to determine the relative attractiveness of each company at a given time. The Adviser will weigh economic, political and market factors in making investment decisions. The Adviser will seek to manage the Fund so that it is subject to less share price volatility than many other international mutual funds, although there can be no guarantee that the Adviser will be successful in this regard.
The Fund will primarily invest inmid- and large-capitalization companies, which are currently defined for the Fund as companies that have market capitalizations of $1.5 billion or more. The Fund’s holdings ofnon-US companies will generally include some companies located in emerging markets.
Fluctuations in currency exchange rates can have a dramatic impact on the returns of equity securities. The Adviser may adjust the foreign currency exposure resulting from the Fund’s security positions through the use of currency-related derivatives, primarily in an effort to minimize the currency risk to which the Fund is subject. However, the Adviser is not required to use such derivatives.
| 4 | AB INTERNATIONAL STRATEGIC CORE PORTFOLIO | abfunds.com | |
DISCLOSURES AND RISKS
Benchmark Disclosure
The MSCI EAFE Index is unmanaged and does not reflect fees and expenses associated with the active management of a mutual fund portfolio. The MSCI EAFE Index (net, free float-adjusted market capitalization weighted) represents the equity market performance of developed markets, excluding the US and Canada. MSCI makes no express or implied warranties or representations, and shall have no liability whatsoever with respect to any MSCI data contained herein. The MSCI data may not be further redistributed or used as a basis for other indices, any securities or financial products. This report is not approved, reviewed or produced by MSCI. Net returns include the reinvestment of dividends after deduction ofnon-US withholding tax. An investor cannot invest directly in an index, and its results are not indicative of the performance for any specific investment, including the Fund.
A Word About Risk
Market Risk: The value of the Fund’s assets will fluctuate as the stock or bond market fluctuates. The value of its investments may decline, sometimes rapidly and unpredictably, simply because of economic changes or other events that affect large portions of the market.
Sector Risk: The Fund may have more risk because of concentrated investments in a particular market sector, such as the technology or financial-services sector. Market or economic factors affecting that sector could have a major effect on the value of the Fund’s investments.
Foreign(Non-US) Risk: Investments in securities ofnon-US issuers may involve more risk than those of US issuers. These securities may fluctuate more widely in price and may be less liquid due to adverse market, economic, political, regulatory or other factors. These risks may be heightened with respect to investments in emerging-market countries, where there may be an increased amount of economic, political and social instability.
Currency Risk: Fluctuations in currency exchange rates may negatively affect the value of the Fund’s investments or reduce its returns.
Capitalization Risk: Investments inmid-capitalization companies may be more volatile than investments in large-capitalization companies. Investments inmid-capitalization companies may have additional risks because these companies have limited product lines, markets or financial resources.
Derivatives Risk: Derivatives may be illiquid, difficult to price, and leveraged so that small changes may produce disproportionate losses for the Fund, and may be subject to counterparty risk to a greater degree than more traditional investments.
| abfunds.com | AB INTERNATIONAL STRATEGIC CORE PORTFOLIO | 5 | |
DISCLOSURES AND RISKS(continued)
Management Risk: The Fund is subject to management risk because it is an actively managed investment fund. The Adviser will apply its investment techniques and risk analyses in making investment decisions for the Fund, but there is no guarantee that its techniques will produce the intended results.
These risks are fully discussed in the Fund’s prospectus. As with all investments, you may lose money by investing in the Fund.
An Important Note About Historical Performance
The investment return and principal value of an investment in the Fund will fluctuate, so that shares, when redeemed, may be worth more or less than their original cost. Performance shown in this report represents past performance and does not guarantee future results. Current performance may be lower or higher than the performance information shown. You may obtain performance information current to the most recentmonth-end by visiting www.abfunds.com.
All fees and expenses related to the operation of the Fund have been deducted. Net asset value (“NAV”) returns do not reflect sales charges; if sales charges were reflected, the Fund’s quoted performance would be lower. SEC returns reflect the applicable sales charges for each share class: a 4.25% maximumfront-end sales charge for Class A shares and a 1%1-year contingent deferred sales charge for Class C shares. Returns for the different share classes will vary due to different expenses associated with each class. Performance assumes reinvestment of distributions and does not account for taxes.
| 6 | AB INTERNATIONAL STRATEGIC CORE PORTFOLIO | abfunds.com | |
HISTORICAL PERFORMANCE
AVERAGE ANNUAL RETURNS AS OF DECEMBER 31, 2018(unaudited)
| NAV Returns | SEC Returns (reflects applicable | |||||||
| CLASS A SHARES | ||||||||
| 1 Year | -9.03% | -12.87% | ||||||
| Since Inception1 | 3.05% | 1.76% | ||||||
| CLASS C SHARES | ||||||||
| 1 Year | -9.72% | -10.61% | ||||||
| Since Inception1 | 2.27% | 2.27% | ||||||
| ADVISOR CLASS SHARES2 | ||||||||
| 1 Year | -8.79% | -8.79% | ||||||
| Since Inception1 | 3.29% | 3.29% | ||||||
The Fund’s prospectus fee table shows the Fund’s total annual operating expense ratios as 1.94%, 2.69% and 1.66% for Class A, Class C and Advisor Class shares, respectively, gross of any fee waivers or expense reimbursements. Contractual fee waivers and/or expense reimbursements limit the Fund’s annual operating expense ratios exclusive of acquired fund fees and expenses other than the advisory fees of any AB mutual funds in which the Fund may invest, interest expense, taxes, extraordinary expenses, and brokerage commissions and other transaction costs to 1.20%, 1.95% and 0.95% for Class A, Class C and Advisor Class shares, respectively. These waivers/reimbursements may not be terminated before October 31, 2019. Any fees waived and expenses borne by the Adviser may be reimbursed by the Fund until the end of the third fiscal year after the fiscal period in which the fee was waived or the expense was borne, provided that no reimbursement payment will be made that would cause the Fund’s total annual operating expenses to exceed the expense limitations. Absent reimbursements or waivers, performance would have been lower. The Financial Highlights section of this report sets forth expense ratio data for the current reporting period; the expense ratios shown above may differ from the expense ratios in the Financial Highlights section since they are based on different time periods.
| 1 | Inception date: 7/29/2015. |
| 2 | This share class is offered at NAV to eligible investors and the SEC returns are the same as the NAV returns. Please note that this share class is for investors purchasing shares through accounts established under certainfee-based programs sponsored and maintained by certain broker-dealers and financial intermediaries, institutional pension plans and/or investment advisory clients of, and certain other persons associated with, the Adviser and its affiliates or the Fund. |
| abfunds.com | AB INTERNATIONAL STRATEGIC CORE PORTFOLIO | 7 | |
HISTORICAL PERFORMANCE(continued)
SEC AVERAGE ANNUAL RETURNS
AS OF THE MOST RECENT CALENDARQUARTER-END
DECEMBER 31, 2018(unaudited)
SEC Returns (reflects applicable | ||||
| CLASS A SHARES | ||||
| 1 Year | -12.87% | |||
| Since Inception1 | 1.76% | |||
| CLASS C SHARES | ||||
| 1 Year | -10.61% | |||
| Since Inception1 | 2.27% | |||
| ADVISOR CLASS SHARES2 | ||||
| 1 Year | -8.79% | |||
| Since Inception1 | 3.29% | |||
| 1 | Inception date: 7/29/2015. |
| 2 | Please note that this share class is for investors purchasing shares through accounts established under certainfee-based programs sponsored and maintained by certain broker-dealers and financial intermediaries, institutional pension plans and/or investment advisory clients of, and certain other persons associated with, the Adviser and its affiliates or the Fund. |
| 8 | AB INTERNATIONAL STRATEGIC CORE PORTFOLIO | abfunds.com | |
EXPENSE EXAMPLE
(unaudited)
As a shareholder of the Fund, you incur two types of costs: (1) transaction costs, including sales charges (loads) on purchase payments, contingent deferred sales charges on redemptions and (2) ongoing costs, including management fees; distribution(12b-1) fees; and other Fund expenses. This example is intended to help you understand your ongoing costs (in dollars) of investing in the Fund and to compare these costs with the ongoing costs of investing in other mutual funds.
This Example is based on an investment of $1,000 invested at the beginning of the period and held for the entire period as indicated below.
Actual Expenses
The table below provides information about actual account values and actual expenses. You may use the information, together with the amount you invested, to estimate the expenses that you paid over the period. Simply divide your account value by $1,000 (for example, an $8,600 account value divided by $1,000 = 8.6), then multiply the result by the number under the heading entitled “Expenses Paid During Period” to estimate the expenses you paid on your account during this period.
Hypothetical Example for Comparison Purposes
The table below also provides information about hypothetical account values and hypothetical expenses based on the Fund’s actual expense ratio and an assumed annual rate of return of 5% before expenses, which is not the Fund’s actual return. The hypothetical account values and expenses may not be used to estimate the actual ending account balance or expenses you paid for the period. You may use this information to compare the ongoing costs of investing in the Fund and other funds by comparing this 5% hypothetical example with the 5% hypothetical examples that appear in the shareholder reports of other funds.
Please note that the expenses shown in the table are meant to highlight your ongoing costs only and do not reflect any transactional costs, such as sales charges (loads), or contingent deferred sales charges on redemptions. Therefore, the hypothetical example is useful in comparing ongoing costs only, and will not help you determine the relative total costs of owning different funds. In addition, if these transactional costs were included, your costs would have been higher.
| Beginning Account Value 7/1/2018 | Ending Account Value 12/31/2018 | Expenses Paid During Period* | Annualized Expense Ratio* | |||||||||||||
| Class A | ||||||||||||||||
Actual | $ | 1,000 | $ | 891.50 | $ | 5.72 | 1.20 | % | ||||||||
Hypothetical** | $ | 1,000 | $ | 1,019.16 | $ | 6.11 | 1.20 | % | ||||||||
| abfunds.com | AB INTERNATIONAL STRATEGIC CORE PORTFOLIO | 9 | |
EXPENSE EXAMPLE(continued)
| Beginning Account Value 7/1/2018 | Ending Account Value 12/31/2018 | Expenses Paid During Period* | Annualized Expense Ratio* | |||||||||||||
| Class C | ||||||||||||||||
Actual | $ | 1,000 | $ | 888.40 | $ | 9.28 | 1.95 | % | ||||||||
Hypothetical** | $ | 1,000 | $ | 1,015.38 | $ | 9.91 | 1.95 | % | ||||||||
| Advisor Class | ||||||||||||||||
Actual | $ | 1,000 | $ | 893.20 | $ | 4.53 | 0.95 | % | ||||||||
Hypothetical** | $ | 1,000 | $ | 1,020.42 | $ | 4.84 | 0.95 | % | ||||||||
| * | Expenses are equal to the classes’ annualized expense ratios multiplied by the average account value over the period, multiplied by 184/365 (to reflect the one-half year period). |
| ** | Assumes 5% annual return before expenses. |
| 10 | AB INTERNATIONAL STRATEGIC CORE PORTFOLIO | abfunds.com | |
PORTFOLIO SUMMARY
December 31, 2018(unaudited)
PORTFOLIO STATISTICS
Net Assets ($mil): $91.3
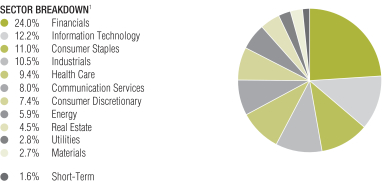
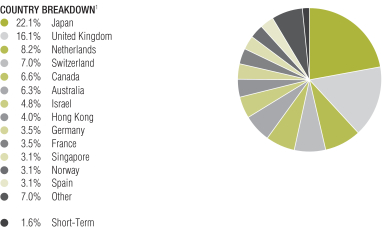
| 1 | All data are as of December 31, 2018. The Fund’s sector and country breakdowns are expressed as a percentage of total investments and may vary over time. The Fund also enters into derivative transactions, which may be used for hedging or investment purposes (see “Portfolio of Investments” section of the report for additional details). “Other” country weightings represent 2.8% or less in the following countries: Denmark, Finland, Portugal, South Korea and United States. |
Please note: The sector classifications presented herein are based on the Global Industry Classification Standard (GICS) which was developed by Morgan Stanley Capital International and Standard & Poor’s. The components are divided into sector, industry group, and industrysub-indices as classified by the GICS for each of the market capitalization indices in the broad market. These sector classifications are broadly defined. The “Portfolio of Investments” section of the report reflects more specific industry information and is consistent with the investment restrictions discussed in the Fund’s prospectus.
| abfunds.com | AB INTERNATIONAL STRATEGIC CORE PORTFOLIO | 11 | |
PORTFOLIO SUMMARY(continued)
December 31, 2018(unaudited)
TEN LARGEST HOLDINGS1
| Company | U.S. $ Value | Percent of Net Assets | ||||||
| Roche Holding AG | $ | 2,774,789 | 3.0 | % | ||||
| Nice Ltd. | 2,134,001 | 2.3 | ||||||
| HKT Trust & HKT Ltd. – Class SS | 2,091,651 | 2.3 | ||||||
| RELX PLC | 2,090,600 | 2.3 | ||||||
| Royal Dutch Shell PLC – Class B | 1,904,800 | 2.1 | ||||||
| Nippon Telegraph & Telephone Corp. | 1,872,689 | 2.1 | ||||||
| Oracle Corp. Japan | 1,663,120 | 1.8 | ||||||
| Novo Nordisk A/S – Class B | 1,630,411 | 1.8 | ||||||
| NN Group NV | 1,615,789 | 1.8 | ||||||
| Royal Bank of Canada | 1,567,303 | 1.7 | ||||||
| $ | 19,345,153 | 21.2 | % | |||||
| 1 | Long-term investments. |
| 12 | AB INTERNATIONAL STRATEGIC CORE PORTFOLIO | abfunds.com | |
PORTFOLIO OF INVESTMENTS
December 31, 2018(unaudited)
| Company | Shares | U.S. $ Value | ||||||
| ||||||||
COMMON STOCKS – 92.7% | ||||||||
Financials – 22.6% | ||||||||
Banks – 12.4% | ||||||||
Bank LeumiLe-Israel BM | 117,940 | $ | 712,949 | |||||
BOC Hong Kong Holdings Ltd. | 86,500 | 321,064 | ||||||
DBS Group Holdings Ltd. | 72,400 | 1,259,025 | ||||||
DNB ASA | 53,900 | 865,185 | ||||||
Hang Seng Bank Ltd. | 46,100 | 1,032,698 | ||||||
Mitsubishi UFJ Financial Group, Inc. | 177,800 | 872,581 | ||||||
Oversea-Chinese Banking Corp., Ltd. | 66,663 | 551,409 | ||||||
Royal Bank of Canada | 22,899 | 1,567,303 | ||||||
Seven Bank Ltd. | 331,700 | 946,887 | ||||||
Sumitomo Mitsui Financial Group, Inc. | 22,600 | 745,011 | ||||||
Toronto-Dominion Bank (The) | 29,290 | 1,455,918 | ||||||
Westpac Banking Corp. | 56,670 | 1,001,353 | ||||||
|
| |||||||
| 11,331,383 | ||||||||
|
| |||||||
Capital Markets – 2.9% | ||||||||
Euronext NV(a) | 12,591 | 725,462 | ||||||
Partners Group Holding AG | 1,713 | 1,042,098 | ||||||
Singapore Exchange Ltd. | 161,600 | 846,915 | ||||||
|
| |||||||
| 2,614,475 | ||||||||
|
| |||||||
Diversified Financial Services – 1.0% | ||||||||
ORIX Corp. | 65,000 | 949,775 | ||||||
|
| |||||||
Insurance – 6.3% | ||||||||
Admiral Group PLC | 40,780 | 1,064,101 | ||||||
Allianz SE (REG) | 3,120 | 626,981 | ||||||
Direct Line Insurance Group PLC | 167,190 | 679,618 | ||||||
NN Group NV | 40,640 | 1,615,789 | ||||||
Sampo Oyj – Class A | 17,160 | 760,525 | ||||||
Swiss Re AG | 10,750 | 989,004 | ||||||
|
| |||||||
| 5,736,018 | ||||||||
|
| |||||||
| 20,631,651 | ||||||||
|
| |||||||
Information Technology – 11.5% | ||||||||
IT Services – 3.4% | ||||||||
Amadeus IT Group SA – Class A | 21,044 | 1,464,191 | ||||||
Capgemini SE | 11,110 | 1,105,057 | ||||||
Otsuka Corp. | 19,600 | 539,420 | ||||||
|
| |||||||
| 3,108,668 | ||||||||
|
| |||||||
Software – 7.5% | ||||||||
Check Point Software Technologies Ltd.(b) | 12,773 | 1,311,148 | ||||||
Constellation Software, Inc./Canada | 2,003 | 1,282,114 | ||||||
Nice Ltd.(b) | 19,697 | 2,134,001 | ||||||
Oracle Corp. Japan | 26,200 | 1,663,120 | ||||||
SAP SE | 4,449 | 441,562 | ||||||
|
| |||||||
| 6,831,945 | ||||||||
|
| |||||||
| abfunds.com | AB INTERNATIONAL STRATEGIC CORE PORTFOLIO | 13 | |
PORTFOLIO OF INVESTMENTS(continued)
| Company | Shares | U.S. $ Value | ||||||
| ||||||||
Technology Hardware, Storage & Peripherals – 0.6% | ||||||||
Samsung Electronics Co., Ltd. | 16,580 | $ | 577,178 | |||||
|
| |||||||
| 10,517,791 | ||||||||
|
| |||||||
Consumer Staples – 10.3% | ||||||||
Beverages – 0.6% | ||||||||
Diageo PLC | 14,670 | 524,224 | ||||||
|
| |||||||
Food & Staples Retailing – 2.0% | ||||||||
Koninklijke Ahold Delhaize NV | 52,100 | 1,316,161 | ||||||
Seven & i Holdings Co., Ltd. | 12,900 | 560,571 | ||||||
|
| |||||||
| 1,876,732 | ||||||||
|
| |||||||
Food Products – 2.6% | ||||||||
Nestle SA (REG) | 15,200 | 1,233,674 | ||||||
Salmar ASA | 23,831 | 1,181,989 | ||||||
|
| |||||||
| 2,415,663 | ||||||||
|
| |||||||
Personal Products – 1.5% | ||||||||
Unilever PLC | 26,120 | 1,371,373 | ||||||
|
| |||||||
Tobacco – 3.6% | ||||||||
British American Tobacco PLC | 37,851 | 1,204,382 | ||||||
Imperial Brands PLC | 27,990 | 849,545 | ||||||
Philip Morris International, Inc. | 17,950 | 1,198,342 | ||||||
|
| |||||||
| 3,252,269 | ||||||||
|
| |||||||
| 9,440,261 | ||||||||
|
| |||||||
Industrials – 9.9% | ||||||||
Aerospace & Defense – 0.8% | ||||||||
BAE Systems PLC | 128,870 | 753,742 | ||||||
|
| |||||||
Airlines – 1.3% | ||||||||
Qantas Airways Ltd. | 301,870 | 1,231,487 | ||||||
|
| |||||||
Construction & Engineering – 1.4% | ||||||||
Taisei Corp. | 28,800 | 1,233,458 | ||||||
|
| |||||||
Professional Services – 5.8% | ||||||||
Experian PLC | 39,170 | 949,556 | ||||||
Intertek Group PLC | 12,020 | 735,659 | ||||||
RELX PLC | 101,385 | 2,090,600 | ||||||
Wolters Kluwer NV | 25,594 | 1,505,111 | ||||||
|
| |||||||
| 5,280,926 | ||||||||
|
| |||||||
Road & Rail – 0.6% | ||||||||
East Japan Railway Co. | 6,300 | 556,354 | ||||||
|
| |||||||
| 9,055,967 | ||||||||
|
| |||||||
| 14 | AB INTERNATIONAL STRATEGIC CORE PORTFOLIO | abfunds.com | |
PORTFOLIO OF INVESTMENTS(continued)
| Company | Shares | U.S. $ Value | ||||||
| ||||||||
Health Care – 8.9% | ||||||||
Pharmaceuticals – 8.9% | ||||||||
Astellas Pharma, Inc. | 91,800 | $ | 1,172,895 | |||||
GlaxoSmithKline PLC | 35,200 | 670,842 | ||||||
H Lundbeck A/S | 16,990 | 747,779 | ||||||
Novo Nordisk A/S – Class B | 35,500 | 1,630,411 | ||||||
Roche Holding AG | 11,177 | 2,774,789 | ||||||
Sanofi | 12,670 | 1,099,122 | ||||||
|
| |||||||
| 8,095,838 | ||||||||
|
| |||||||
Communication Services – 7.6% | ||||||||
Diversified Telecommunication Services – 5.1% | ||||||||
HKT Trust & HKT Ltd. – Class SS | 1,452,000 | 2,091,651 | ||||||
Nippon Telegraph & Telephone Corp. | 45,900 | 1,872,689 | ||||||
TELUS Corp. | 19,020 | 630,424 | ||||||
|
| |||||||
| 4,594,764 | ||||||||
|
| |||||||
Entertainment – 1.0% | ||||||||
CTS Eventim AG & Co. KGaA | 6,214 | 232,054 | ||||||
Daiichikosho Co., Ltd. | 14,700 | 698,717 | ||||||
|
| |||||||
| 930,771 | ||||||||
|
| |||||||
Interactive Media & Services – 0.7% | ||||||||
Kakaku.com, Inc. | 35,400 | 626,182 | ||||||
|
| |||||||
Media – 0.8% | ||||||||
Quebecor, Inc. – Class B | 35,764 | 752,899 | ||||||
|
| |||||||
| 6,904,616 | ||||||||
|
| |||||||
Consumer Discretionary – 6.9% | ||||||||
Hotels, Restaurants & Leisure – 2.3% | ||||||||
Aristocrat Leisure Ltd. | 75,074 | 1,155,674 | ||||||
Compass Group PLC | 42,860 | 901,982 | ||||||
|
| |||||||
| 2,057,656 | ||||||||
|
| |||||||
Household Durables – 2.3% | ||||||||
Auto Trader Group PLC(a) | 177,280 | 1,028,826 | ||||||
Nikon Corp. | 73,100 | 1,088,833 | ||||||
|
| |||||||
| 2,117,659 | ||||||||
|
| |||||||
Internet & Direct Marketing Retail – 0.3% | ||||||||
Moneysupermarket.com Group PLC | 79,492 | 279,094 | ||||||
|
| |||||||
Leisure Products – 1.4% | ||||||||
Bandai Namco Holdings, Inc. | 29,300 | 1,315,548 | ||||||
|
| |||||||
Multiline Retail – 0.6% | ||||||||
Wesfarmers Ltd. | 24,420 | 554,790 | ||||||
|
| |||||||
| 6,324,747 | ||||||||
|
| |||||||
| abfunds.com | AB INTERNATIONAL STRATEGIC CORE PORTFOLIO | 15 | |
PORTFOLIO OF INVESTMENTS(continued)
| Company | Shares | U.S. $ Value | ||||||
| ||||||||
Energy – 5.6% | ||||||||
Oil, Gas & Consumable Fuels – 5.6% | ||||||||
Caltex Australia Ltd. | 29,530 | $ | 529,808 | |||||
Equinor ASA | 27,520 | 583,758 | ||||||
Repsol SA | 25,830 | 415,270 | ||||||
Royal Dutch Shell PLC – Class B | 63,711 | 1,904,800 | ||||||
Showa Shell Sekiyu KK | 60,600 | 839,562 | ||||||
TOTAL SA | 15,282 | 806,051 | ||||||
|
| |||||||
| 5,079,249 | ||||||||
|
| |||||||
Real Estate – 4.3% | ||||||||
Equity Real Estate Investment Trusts (REITs) – 3.0% | ||||||||
Merlin Properties Socimi SA | 59,789 | 738,595 | ||||||
Nippon Building Fund, Inc. | 216 | 1,360,115 | ||||||
Nippon Prologis REIT, Inc. | 311 | 656,357 | ||||||
|
| |||||||
| 2,755,067 | ||||||||
|
| |||||||
Real Estate Management & Development – 1.3% | ||||||||
Vonovia SE | 25,220 | 1,136,891 | ||||||
|
| |||||||
| 3,891,958 | ||||||||
|
| |||||||
Utilities – 2.6% | �� | |||||||
Electric Utilities – 1.8% | ||||||||
EDP – Energias de Portugal SA | 305,350 | 1,068,202 | ||||||
Kansai Electric Power Co., Inc. (The) | 37,800 | 566,876 | ||||||
|
| |||||||
| 1,635,078 | ||||||||
|
| |||||||
Gas Utilities – 0.8% | ||||||||
Tokyo Gas Co., Ltd. | 31,100 | 786,586 | ||||||
|
| |||||||
| 2,421,664 | ||||||||
|
| |||||||
Materials – 2.5% | ||||||||
Chemicals – 1.4% | ||||||||
Covestro AG(a) | 11,815 | 585,132 | ||||||
Victrex PLC | 25,090 | 732,169 | ||||||
|
| |||||||
| 1,317,301 | ||||||||
|
| |||||||
Metals & Mining – 1.1% | ||||||||
Northern Star Resources Ltd. | 146,350 | 955,309 | ||||||
|
| |||||||
| 2,272,610 | ||||||||
|
| |||||||
Total Common Stocks | 84,636,352 | |||||||
|
| |||||||
RIGHTS – 0.0% | ||||||||
Energy – 0.0% | ||||||||
Oil, Gas & Consumable Fuels – 0.0% | ||||||||
Repsol SA, expiring 1/09/19(b) | 25,830 | 11,838 | ||||||
|
| |||||||
| 16 | AB INTERNATIONAL STRATEGIC CORE PORTFOLIO | abfunds.com | |
PORTFOLIO OF INVESTMENTS(continued)
| Company | Shares | U.S. $ Value | ||||||
| ||||||||
SHORT-TERM INVESTMENTS – 1.5% | ||||||||
Investment Companies – 1.5% | ||||||||
AB Fixed Income Shares, Inc. – Government Money Market Portfolio – Class AB, 2.31%(c)(d)(e) | 1,398,404 | $ | 1,398,404 | |||||
|
| |||||||
Total Investments – 94.2% | 86,046,594 | |||||||
Other assets less liabilities – 5.8% | 5,278,164 | |||||||
|
| |||||||
Net Assets – 100.0% | $ | 91,324,758 | ||||||
|
| |||||||
FUTURES (see Note D)
| Description | Number of Contracts | Expiration Month | Notional (000) | Original Value | Value at December 31, 2018 | Unrealized Appreciation/ (Depreciation) | ||||||||||||||||||||||
Purchased Contracts |
| |||||||||||||||||||||||||||
Mini MSCI EAFE Futures | 29 | March 2019 | USD | 1 | $ | 2,553,007 | $ | 2,485,143 | $ | (67,864 | ) | |||||||||||||||||
FORWARD CURRENCY EXCHANGE CONTRACTS (see Note D)
| Counterparty | Contracts to Deliver (000) | In Exchange (000) | Settlement Date | Unrealized Appreciation/ (Depreciation) | ||||||||||||
Bank of America, NA | CAD | 4,681 | USD | 3,599 | 1/17/19 | $ | 168,994 | |||||||||
Bank of America, NA | USD | 1,449 | SEK | 12,866 | 1/17/19 | 4,493 | ||||||||||
Barclays Bank PLC | HKD | 4,219 | USD | 539 | 1/17/19 | 173 | ||||||||||
Barclays Bank PLC | ILS | 10,465 | USD | 2,902 | 1/17/19 | 100,228 | ||||||||||
Barclays Bank PLC | SGD | 1,164 | USD | 846 | 1/17/19 | (8,180 | ) | |||||||||
Barclays Bank PLC | USD | 1,176 | CHF | 1,155 | 1/17/19 | 728 | ||||||||||
Barclays Bank PLC | USD | 3,266 | JPY | 363,726 | 1/17/19 | 56,650 | ||||||||||
Barclays Bank PLC | KRW | 524,987 | USD | 468 | 2/20/19 | (4,391 | ) | |||||||||
Brown Brothers Harriman & Co. | AUD | 673 | USD | 488 | 1/17/19 | 14,023 | ||||||||||
Brown Brothers Harriman & Co. | CAD | 1,287 | USD | 986 | 1/17/19 | 43,293 | ||||||||||
Brown Brothers Harriman & Co. | CHF | 549 | USD | 556 | 1/17/19 | (3,432 | ) | |||||||||
Brown Brothers Harriman & Co. | EUR | 1,128 | USD | 1,301 | 1/17/19 | 7,287 | ||||||||||
Brown Brothers Harriman & Co. | EUR | 1,236 | USD | 1,412 | 1/17/19 | (6,013 | ) | |||||||||
Brown Brothers Harriman & Co. | GBP | 2,329 | USD | 3,040 | 1/17/19 | 68,836 | ||||||||||
Brown Brothers Harriman & Co. | HKD | 4,590 | USD | 587 | 1/17/19 | 776 | ||||||||||
Brown Brothers Harriman & Co. | ILS | 3,332 | USD | 907 | 1/17/19 | 14,629 | ||||||||||
Brown Brothers Harriman & Co. | JPY | 355,199 | USD | 3,179 | 1/17/19 | (65,150 | ) | |||||||||
Brown Brothers Harriman & Co. | NOK | 7,663 | USD | 919 | 1/17/19 | 32,597 | ||||||||||
Brown Brothers Harriman & Co. | SEK | 1,379 | USD | 151 | 1/17/19 | (4,449 | ) | |||||||||
Brown Brothers Harriman & Co. | SGD | 276 | USD | 203 | 1/17/19 | 52 | ||||||||||
Brown Brothers Harriman & Co. | SGD | 517 | USD | 377 | 1/17/19 | (2,359 | ) | |||||||||
Brown Brothers Harriman & Co. | USD | 479 | AUD | 673 | 1/17/19 | (4,739 | ) | |||||||||
Brown Brothers Harriman & Co. | USD | 460 | CAD | 603 | 1/17/19 | (18,056 | ) | |||||||||
Brown Brothers Harriman & Co. | USD | 179 | CHF | 178 | 1/17/19 | 2,676 | ||||||||||
Brown Brothers Harriman & Co. | USD | 3,147 | EUR | 2,753 | 1/17/19 | 10,984 | ||||||||||
| abfunds.com | AB INTERNATIONAL STRATEGIC CORE PORTFOLIO | 17 | |
PORTFOLIO OF INVESTMENTS(continued)
| Counterparty | Contracts to Deliver (000) | In Exchange (000) | Settlement Date | Unrealized Appreciation/ (Depreciation) | ||||||||||||
Brown Brothers Harriman & Co. | USD | 1,242 | EUR | 1,075 | 1/17/19 | $ | (8,903 | ) | ||||||||
Brown Brothers Harriman & Co. | USD | 325 | GBP | 257 | 1/17/19 | 2,410 | ||||||||||
Brown Brothers Harriman & Co. | USD | 1,507 | GBP | 1,158 | 1/17/19 | (29,878 | ) | |||||||||
Brown Brothers Harriman & Co. | USD | 583 | HKD | 4,568 | 1/17/19 | 197 | ||||||||||
Brown Brothers Harriman & Co. | USD | 2,670 | JPY | 299,287 | 1/17/19 | 64,172 | ||||||||||
Brown Brothers Harriman & Co. | USD | 426 | NOK | 3,735 | 1/17/19 | 5,796 | ||||||||||
Brown Brothers Harriman & Co. | USD | 147 | SEK | 1,317 | 1/17/19 | 2,054 | ||||||||||
Brown Brothers Harriman & Co. | USD | 493 | SEK | 4,343 | 1/17/19 | (2,067 | ) | |||||||||
Brown Brothers Harriman & Co. | USD | 235 | SGD | 323 | 1/17/19 | 1,607 | ||||||||||
Brown Brothers Harriman & Co. | AUD | 825 | USD | 582 | 4/16/19 | 206 | ||||||||||
Brown Brothers Harriman & Co. | CAD | 1,119 | USD | 823 | 4/16/19 | 1,794 | ||||||||||
Brown Brothers Harriman & Co. | SGD | 281 | USD | 207 | 4/16/19 | (25 | ) | |||||||||
Brown Brothers Harriman & Co. | USD | 976 | AUD | 1,362 | 4/16/19 | (15,184 | ) | |||||||||
Brown Brothers Harriman & Co. | USD | 652 | EUR | 566 | 4/16/19 | 1,811 | ||||||||||
Brown Brothers Harriman & Co. | USD | 395 | JPY | 43,809 | 4/16/19 | 8,525 | ||||||||||
Brown Brothers Harriman & Co. | USD | 217 | SEK | 1,935 | 4/16/19 | 3,373 | ||||||||||
Deutsche Bank AG | ILS | 2,046 | USD | 551 | 1/17/19 | 3,068 | ||||||||||
Deutsche Bank AG | USD | 576 | GBP | 455 | 1/17/19 | 4,572 | ||||||||||
Goldman Sachs Bank USA | GBP | 519 | USD | 680 | 1/17/19 | 18,069 | ||||||||||
Goldman Sachs Bank USA | USD | 738 | GBP | 582 | 1/17/19 | 4,107 | ||||||||||
Goldman Sachs Bank USA | USD | 565 | NOK | 4,700 | 1/17/19 | (20,580 | ) | |||||||||
JPMorgan Chase Bank, NA | USD | 1,034 | GBP | 817 | 1/17/19 | 7,929 | ||||||||||
JPMorgan Chase Bank, NA | USD | 702 | ILS | 2,587 | 1/17/19 | (9,472 | ) | |||||||||
JPMorgan Chase Bank, NA | USD | 1,072 | JPY | 120,292 | 1/17/19 | 26,760 | ||||||||||
JPMorgan Chase Bank, NA | USD | 520 | EUR | 453 | 4/16/19 | 3,406 | ||||||||||
Royal Bank of Scotland PLC | GBP | 421 | USD | 560 | 1/17/19 | 22,854 | ||||||||||
Royal Bank of Scotland PLC | JPY | 302,999 | USD | 2,727 | 1/17/19 | (40,854 | ) | |||||||||
Royal Bank of Scotland PLC | NOK | 12,407 | USD | 1,523 | 1/17/19 | 86,721 | ||||||||||
Royal Bank of Scotland PLC | USD | 6,350 | EUR | 5,449 | 1/17/19 | (99,604 | ) | |||||||||
Royal Bank of Scotland PLC | CAD | 1,047 | USD | 775 | 4/16/19 | 6,689 | ||||||||||
|
| |||||||||||||||
| $ | 459,203 | |||||||||||||||
|
| |||||||||||||||
| (a) | Security is exempt from registration under Rule 144A of the Securities Act of 1933. These securities are considered restricted, but liquid and may be resold in transactions exempt from registration, normally to qualified institutional buyers. At December 31, 2018, the aggregate market value of these securities amounted to $2,339,420 or 2.6% of net assets. |
| (b) | Non-income producing security. |
| (c) | To obtain a copy of the fund’s shareholder report, please go to the Securities and Exchange Commission’s website at www.sec.gov, or call AB at (800)227-4618. |
| (d) | Affiliated investments. |
| (e) | The rate shown represents the7-day yield as of period end. |
Currency Abbreviations:
AUD – Australian Dollar
CAD – Canadian Dollar
CHF – Swiss Franc
EUR – Euro
GBP – Great British Pound
HKD – Hong Kong Dollar
ILS – Israeli Shekel
JPY – Japanese Yen
KRW – South Korean Won
NOK – Norwegian Krone
SEK – Swedish Krona
SGD – Singapore Dollar
USD – United States Dollar
| 18 | AB INTERNATIONAL STRATEGIC CORE PORTFOLIO | abfunds.com | |
PORTFOLIO OF INVESTMENTS(continued)
Glossary:
EAFE – Europe, Australia, and Far East
MSCI – Morgan Stanley Capital International
REG – Registered Shares
See notes to financial statements.
| abfunds.com | AB INTERNATIONAL STRATEGIC CORE PORTFOLIO | 19 | |
STATEMENT OF ASSETS & LIABILITIES
December 31, 2018(unaudited)
| Assets | ||||
Investments in securities, at value | ||||
Unaffiliated issuers (cost $87,045,487) | $ | 84,648,190 | ||
Affiliated issuers (cost $1,398,404) | 1,398,404 | |||
Cash collateral due from broker | 143,550 | |||
Foreign currencies, at value (cost $838,853) | 842,178 | |||
Receivable for capital stock sold | 4,829,756 | |||
Receivable for investment securities sold and foreign | 1,413,848 | |||
Unrealized appreciation on forward currency exchange contracts | 802,539 | |||
Unaffiliated dividends receivable | 224,059 | |||
Receivable from Adviser | 30,657 | |||
Affiliated dividends receivable | 5,826 | |||
|
| |||
Total assets | 94,339,007 | |||
|
| |||
| Liabilities | ||||
Payable for investment securities purchased | 2,459,492 | |||
Unrealized depreciation on forward currency exchange contracts | 343,336 | |||
Payable for capital stock redeemed | 66,083 | |||
Transfer Agent fee payable | 3,024 | |||
Payable for variation margin on futures | 1,897 | |||
Distribution fee payable | 287 | |||
Directors’ fee payable | 66 | |||
Due to Custodian | 2 | |||
Accrued expenses and other liabilities | 140,062 | |||
|
| |||
Total liabilities | 3,014,249 | |||
|
| |||
Net Assets | $ | 91,324,758 | ||
|
| |||
| Composition of Net Assets | ||||
Capital stock, at par | $ | 871 | ||
Additionalpaid-in capital | 95,857,668 | |||
Accumulated loss | (4,533,781 | ) | ||
|
| |||
| $ | 91,324,758 | |||
|
|
Net Asset Value Per Share—11 billion shares of capital stock authorized, $.0001 par value
| Class | Net Assets | Shares Outstanding | Net Asset Value | |||||||||
| ||||||||||||
| A | $ | 969,092 | 92,630 | $ | 10.46 | * | ||||||
| ||||||||||||
| C | $ | 145,918 | 14,014 | $ | 10.41 | |||||||
| ||||||||||||
| Advisor | $ | 90,209,748 | 8,605,540 | $ | 10.48 | |||||||
| ||||||||||||
| * | The maximum offering price per share for Class A shares was $10.92, which reflects a sales charge of 4.25%. |
See notes to financial statements.
| 20 | AB INTERNATIONAL STRATEGIC CORE PORTFOLIO | abfunds.com | |
STATEMENT OF OPERATIONS
Six Months Ended December 31, 2018(unaudited)
| Investment Income | ||||||||
Dividends | ||||||||
Unaffiliated issuers (net of foreign taxes withheld of $37,986) | $ | 869,211 | ||||||
Affiliated issuers | 24,103 | |||||||
Securities lending income | 2,261 | $ | 895,575 | |||||
|
| |||||||
| Expenses | ||||||||
Advisory fee (see Note B) | 306,054 | |||||||
Transfer agency—Class A | 92 | |||||||
Transfer agency—Class C | 35 | |||||||
Transfer agency—Advisor Class | 11,009 | |||||||
Distribution fee—Class A | 826 | |||||||
Distribution fee—Class C | 732 | |||||||
Custodian | 82,743 | |||||||
Administrative | 34,036 | |||||||
Audit and tax | 32,608 | |||||||
Registration fees | 28,920 | |||||||
Legal | 20,882 | |||||||
Directors’ fees | 12,486 | |||||||
Printing | 5,999 | |||||||
Miscellaneous | 26,368 | |||||||
|
| |||||||
Total expenses | 562,790 | |||||||
Less: expenses waived and reimbursed by the Adviser (see Note B and Note E) | (174,662 | ) | ||||||
|
| |||||||
Net expenses | 388,128 | |||||||
|
| |||||||
Net investment income | 507,447 | |||||||
|
| |||||||
| Realized and Unrealized (Loss) on Investment and Foreign Currency Transactions | ||||||||
Net realized (loss) on: | ||||||||
Investment transactions | (1,964,863 | ) | ||||||
Forward currency exchange contracts | (219,739 | ) | ||||||
Futures | (245,192 | ) | ||||||
Foreign currency transactions | (32,213 | ) | ||||||
Net change in unrealized appreciation/depreciation on: | ||||||||
Investments | (7,522,578 | ) | ||||||
Forward currency exchange contracts | 538,855 | |||||||
Futures | (42,719 | ) | ||||||
Foreign currency denominated assets and liabilities | (588 | ) | ||||||
|
| |||||||
Net loss on investment and foreign currency transactions | (9,489,037 | ) | ||||||
|
| |||||||
Net Decrease in Net Assets from Operations | $ | (8,981,590 | ) | |||||
|
|
See notes to financial statements.
| abfunds.com | AB INTERNATIONAL STRATEGIC CORE PORTFOLIO | 21 | |
STATEMENT OF CHANGES IN NET ASSETS
| Six Months Ended December 31, 2018 (unaudited) | Year Ended June 30, 2018 | |||||||
| Increase (Decrease) in Net Assets from Operations | ||||||||
Net investment income | $ | 507,447 | $ | 1,189,788 | ||||
Net realized gain (loss) on investment and foreign currency transactions | (2,462,007 | ) | 927,779 | |||||
Net change in unrealized appreciation/depreciation on investments and foreign currency denominated assets and liabilities | (7,027,030 | ) | 2,556,685 | |||||
|
|
|
| |||||
Net increase (decrease) in net assets from operations | (8,981,590 | ) | 4,674,252 | |||||
| Distributions to Shareholders* | ||||||||
Class A | (17,655 | ) | (2,938 | ) | ||||
Class C | (3,261 | ) | (893 | ) | ||||
Advisor Class | (2,182,204 | ) | (666,810 | ) | ||||
| Capital Stock Transactions | ||||||||
Net increase | 25,458,021 | 37,476,915 | ||||||
|
|
|
| |||||
Total increase | 14,273,311 | 41,480,526 | ||||||
| Net Assets | ||||||||
Beginning of period | 77,051,447 | 35,570,921 | ||||||
|
|
|
| |||||
End of period | $ | 91,324,758 | $ | 77,051,447 | ||||
|
|
|
| |||||
| * | The prior year’s amounts have been reclassified to conform with the current year’s presentation. See Note J, Recent Accounting Pronouncements, in the Notes to Financial Statements for more information. |
See notes to financial statements.
| 22 | AB INTERNATIONAL STRATEGIC CORE PORTFOLIO | abfunds.com | |
NOTES TO FINANCIAL STATEMENTS
December 31, 2018(unaudited)
NOTE A
Significant Accounting Policies
AB Cap Fund, Inc. (the “Company”), which is a Maryland corporation, is registered under the Investment Company Act of 1940 as anopen-end management investment company. The Company operates as a series company comprised of 29 portfolios currently in operation. Each portfolio is considered to be a separate entity for financial reporting and tax purposes. This report relates only to the AB International Strategic Core Portfolio (the “Fund”), a diversified portfolio. AB International Strategic Core Portfolio commenced operations on July 29, 2015. The Fund has authorized the issuance of Class A, Class B, Class C, Advisor Class, Class R, Class K, Class I, Class Z, Class T, Class 1, and Class 2 shares. Class B, Class R, Class K, Class I, Class Z, Class T, Class 1, and Class 2 shares are not currently being offered. Class A shares are sold with afront-end sales charge of up to 4.25% for purchases not exceeding $1,000,000. With respect to purchases of $1,000,000 or more, Class A shares redeemed within one year of purchase may be subject to a contingent deferred sales charge of 1%. Class C shares are subject to a contingent deferred sales charge of 1% on redemptions made within the first year after purchase, and 0% after the first year of purchase. Class C shares will automatically convert to Class A shares ten years after the end of the calendar month of purchase. Advisor Class shares are sold without an initial or contingent deferred sales charge and are not subject to ongoing distribution expenses. All eleven classes of shares have identical voting, dividend, liquidation and other rights, except that the classes bear different distribution and transfer agency expenses. Each class has exclusive voting rights with respect to its distribution plan. The financial statements have been prepared in conformity with U.S. generally accepted accounting principles (“U.S. GAAP”), which require management to make certain estimates and assumptions that affect the reported amounts of assets and liabilities in the financial statements and amounts of income and expenses during the reporting period. Actual results could differ from those estimates. The Fund is an investment company under U.S. GAAP and follows the accounting and reporting guidance applicable to investment companies. The following is a summary of significant accounting policies followed by the Fund.
1. Security Valuation
Portfolio securities are valued at their current market value determined on the basis of market quotations or, if market quotations are not readily available or are deemed unreliable, at “fair value” as determined in accordance with procedures established by and under the general supervision of the Company’s Board of Directors (the “Board”).
| abfunds.com | AB INTERNATIONAL STRATEGIC CORE PORTFOLIO | 23 | |
NOTES TO FINANCIAL STATEMENTS(continued)
In general, the market values of securities which are readily available and deemed reliable are determined as follows: securities listed on a national securities exchange (other than securities listed on the NASDAQ Stock Market, Inc. (“NASDAQ”)) or on a foreign securities exchange are valued at the last sale price at the close of the exchange or foreign securities exchange. If there has been no sale on such day, the securities are valued at the last traded price from the previous day. Securities listed on more than one exchange are valued by reference to the principal exchange on which the securities are traded; securities listed only on NASDAQ are valued in accordance with the NASDAQ Official Closing Price; listed or over the counter (“OTC”) market put or call options are valued at the mid level between the current bid and ask prices. If either a current bid or current ask price is unavailable, AllianceBernstein L.P. (the “Adviser”) will have discretion to determine the best valuation (e.g., last trade price in the case of listed options); open futures are valued using the closing settlement price or, in the absence of such a price, the most recent quoted bid price. If there are no quotations available for the day of valuation, the last available closing settlement price is used; U.S. Government securities and any other debt instruments having 60 days or less remaining until maturity are generally valued at market by an independent pricing vendor, if a market price is available. If a market price is not available, the securities are valued at amortized cost. This methodology is commonly used for short term securities that have an original maturity of 60 days or less, as well as short term securities that had an original tern to maturity that exceeded 60 days. In instances when amortized cost is utilized, the Valuation Committee (the “Committee”) must reasonably conclude that the utilization of amortized cost is approximately the same as the fair value of the security. Such factors the Committee will consider include, but are not limited to, an impairment of the creditworthiness of the issuer or material changes in interest rates. Fixed-income securities, including mortgage-backed and asset-backed securities, may be valued on the basis of prices provided by a pricing service or at a price obtained from one or more of the major broker-dealers. In cases where broker-dealer quotes are obtained, the Adviser may establish procedures whereby changes in market yields or spreads are used to adjust, on a daily basis, a recently obtained quoted price on a security; swaps and other derivatives are valued daily, primarily using independent pricing services, independent pricing models using market inputs, as well as third party broker-dealers or counterparties. Open end mutual funds are valued at the closing net asset value per share, while exchange traded funds are valued at the closing market price per share.
Securities for which market quotations are not readily available (including restricted securities) or are deemed unreliable are valued at fair value as deemed appropriate by the Adviser. Factors considered in making this determination may include, but are not limited to, information obtained by
| 24 | AB INTERNATIONAL STRATEGIC CORE PORTFOLIO | abfunds.com | |
NOTES TO FINANCIAL STATEMENTS(continued)
contacting the issuer, analysts, analysis of the issuer’s financial statements or other available documents. In addition, the Fund may use fair value pricing for securities primarily traded innon-U.S. markets because most foreign markets close well before the Fund values its securities at 4:00 p.m., Eastern Time. The earlier close of these foreign markets gives rise to the possibility that significant events, including broad market moves, may have occurred in the interim and may materially affect the value of those securities. To account for this, the Fund generally values many of its foreign equity securities using fair value prices based on third party vendor modeling tools to the extent available.
2. Fair Value Measurements
In accordance with U.S. GAAP regarding fair value measurements, fair value is defined as the price that the Fund would receive to sell an asset or pay to transfer a liability in an orderly transaction between market participants at the measurement date. U.S. GAAP establishes a framework for measuring fair value, and a three-level hierarchy for fair value measurements based upon the transparency of inputs to the valuation of an asset or liability (including those valued based on their market values as described in Note A.1 above). Inputs may be observable or unobservable and refer broadly to the assumptions that market participants would use in pricing the asset or liability. Observable inputs reflect the assumptions market participants would use in pricing the asset or liability based on market data obtained from sources independent of the Fund. Unobservable inputs reflect the Fund’s own assumptions about the assumptions that market participants would use in pricing the asset or liability based on the best information available in the circumstances. Each investment is assigned a level based upon the observability of the inputs which are significant to the overall valuation. The three-tier hierarchy of inputs is summarized below.
| • | Level 1—quoted prices in active markets for identical investments |
| • | Level 2—other significant observable inputs (including quoted prices for similar investments, interest rates, prepayment speeds, credit risk, etc.) |
| • | Level 3—significant unobservable inputs (including the Fund’s own assumptions in determining the fair value of investments) |
Where readily available market prices or relevant bid prices are not available for certain equity investments, such investments may be valued based on similar publicly traded investments, movements in relevant indices since last available prices or based upon underlying company fundamentals and comparable company data (such as multiples to earnings or other multiples to equity). Where an investment is valued using an observable input such as another publicly traded security, the investment will be classified
| abfunds.com | AB INTERNATIONAL STRATEGIC CORE PORTFOLIO | 25 | |
NOTES TO FINANCIAL STATEMENTS(continued)
as Level 2. If management determines that an adjustment is appropriate based on restrictions on resale, illiquidity or uncertainty, and such adjustment is a significant component of the valuation, the investment will be classified as Level 3. An investment will also be classified as Level 3 where management uses company fundamentals and other significant inputs to determine the valuation.
The fair value of debt instruments, such as bonds, andover-the-counter derivatives is generally based on market price quotations, recently executed market transactions (where observable) or industry recognized modeling techniques and are generally classified as Level 2. Pricing vendor inputs to Level 2 valuations may include quoted prices for similar investments in active markets, interest rate curves, coupon rates, currency rates, yield curves, option adjusted spreads, default rates, credit spreads and other unique security features in order to estimate the relevant cash flows which is then discounted to calculate fair values. If these inputs are unobservable and significant to the fair value, these investments will be classified as Level 3. In addition,non-agency rated investments are classified as Level 3.
The following table summarizes the valuation of the Fund’s investments by the above fair value hierarchy levels as of December 31, 2018:
Investments in | Level 1 | Level 2 | Level 3 | Total | ||||||||||||
Assets: | ||||||||||||||||
Common Stocks: | ||||||||||||||||
Financials | $ | 3,023,221 | $ | 17,608,430 | $ | – 0 | – | $ | 20,631,651 | |||||||
Information Technology | 2,593,262 | 7,924,529 | – 0 | – | 10,517,791 | |||||||||||
Consumer Staples | 1,198,342 | 8,241,919 | – 0 | – | 9,440,261 | |||||||||||
Industrials | – 0 | – | 9,055,967 | – 0 | – | 9,055,967 | ||||||||||
Health Care | – 0 | – | 8,095,838 | – 0 | – | 8,095,838 | ||||||||||
Communication Services | 1,383,323 | 5,521,293 | – 0 | – | 6,904,616 | |||||||||||
Consumer Discretionary | – 0 | – | 6,324,747 | – 0 | – | 6,324,747 | ||||||||||
Energy | – 0 | – | 5,079,249 | – 0 | – | 5,079,249 | ||||||||||
Real Estate | – 0 | – | 3,891,958 | – 0 | – | 3,891,958 | ||||||||||
Utilities | – 0 | – | 2,421,664 | – 0 | – | 2,421,664 | ||||||||||
Materials | – 0 | – | 2,272,610 | – 0 | – | 2,272,610 | ||||||||||
Rights | 11,838 | – 0 | – | – 0 | – | 11,838 | ||||||||||
Short-Term Investments: | ||||||||||||||||
Investment Companies | 1,398,404 | – 0 | – | – 0 | – | 1,398,404 | ||||||||||
|
|
|
|
|
|
|
| |||||||||
Total Investments in Securities | 9,608,390 | 76,438,204 | † | – 0 | – | 86,046,594 | ||||||||||
Other Financial Instruments*: | ||||||||||||||||
Assets | ||||||||||||||||
Forward Currency Exchange Contracts | – 0 | – | 802,539 | – 0 | – | 802,539 | ||||||||||
| 26 | AB INTERNATIONAL STRATEGIC CORE PORTFOLIO | abfunds.com | |
NOTES TO FINANCIAL STATEMENTS(continued)
Investments in | Level 1 | Level 2 | Level 3 | Total | ||||||||||||
Liabilities | ||||||||||||||||
Futures | $ | – 0 | – | $ | (67,864 | ) | $ | – 0 | – | $ | (67,864 | )** | ||||
Forward Currency Exchange Contracts | – 0 | – | (343,336 | ) | – 0 | – | (343,336 | ) | ||||||||
|
|
|
|
|
|
|
| |||||||||
Total^ | $ | 9,608,390 | $ | 76,829,543 | $ | – 0 | – | $ | 86,437,933 | |||||||
|
|
|
|
|
|
|
| |||||||||
| † | A significant portion of the Fund’s foreign equity investments are categorized as Level 2 investments since they are valued using fair value prices based on third party vendor modeling tools to the extent available, see Note A.1. |
| * | Other financial instruments are derivative instruments, such as futures, forwards and swaps, which are valued at the unrealized appreciation/(depreciation) on the instrument. Other financial instruments may also include swaps with upfront premiums, options written and swaptions written which are valued at market value. |
| ** | Only variation margin receivable/payable at period end is reported within the statements of assets and liabilities. This amount reflects cumulative unrealized appreciation/(depreciation) on futures and centrally cleared swaps as reported in the portfolio of investments. Centrally cleared swaps with upfront premiums are presented here at market value. |
| ^ | An amount of $879,458 was transferred from Level 1 to Level 2 due to the above mentioned foreign equity fair valuation using third party vendor modeling tools during the reporting period. |
The Fund recognizes all transfers between levels of the fair value hierarchy assuming the financial instrument was transferred at the beginning of the reporting period.
The Adviser established the Committee to oversee the pricing and valuation of all securities held in the Fund. The Committee operates under pricing and valuation policies and procedures established by the Adviser and approved by the Board, including pricing policies which set forth the mechanisms and processes to be employed on a daily basis to implement these policies and procedures. In particular, the pricing policies describe how to determine market quotations for securities and other instruments. The Committee’s responsibilities include: 1) fair value and liquidity determinations (and oversight of any third parties to whom any responsibility for fair value and liquidity determinations is delegated), and 2) regular monitoring of the Adviser’s pricing and valuation policies and procedures and modification or enhancement of these policies and procedures (or recommendation of the modification of these policies and procedures) as the Committee believes appropriate.
The Committee is also responsible for monitoring the implementation of the pricing policies by the Adviser’s Pricing Group (the “Pricing Group”) and any third party which performs certain pricing functions in accordance with the pricing policies. The Pricing Group is responsible for the oversight of the third party on aday-to-day basis. The Committee and the Pricing Group perform a series of activities to provide reasonable assurance of the accuracy of prices including: 1) periodic vendor due diligence meetings, review of methodologies, new developments and process at vendors, 2) daily comparison of security valuation versus prior day for all securities that exceeded established thresholds, and 3) daily review of unpriced, stale, and variance reports with exceptions reviewed by senior management and the Committee.
| abfunds.com | AB INTERNATIONAL STRATEGIC CORE PORTFOLIO | 27 | |
NOTES TO FINANCIAL STATEMENTS(continued)
In addition, several processes outside of the pricing process are used to monitor valuation issues including: 1) performance and performance attribution reports are monitored for anomalous impacts based upon benchmark performance, and 2) portfolio managers review all portfolios for performance and analytics (which are generated using the Adviser’s prices).
3. Currency Translation
Assets and liabilities denominated in foreign currencies and commitments under forward currency exchange contracts are translated into U.S. dollars at the mean of the quoted bid and ask prices of such currencies against the U.S. dollar. Purchases and sales of portfolio securities are translated into U.S. dollars at the rates of exchange prevailing when such securities were acquired or sold. Income and expenses are translated into U.S. dollars at rates of exchange prevailing when accrued.
Net realized gain or loss on foreign currency transactions represents foreign exchange gains and losses from sales and maturities of foreign fixed income investments, holding of foreign currencies, currency gains or losses realized between the trade and settlement dates on foreign investment transactions, and the difference between the amounts of dividends, interest and foreign withholding taxes recorded on the Fund’s books and the U.S. dollar equivalent amounts actually received or paid. Net unrealized currency gains and losses from valuing foreign currency denominated assets and liabilities at period end exchange rates are reflected as a component of net unrealized appreciation and depreciation on foreign currency denominated assets and liabilities.
4. Taxes
It is the Fund’s policy to meet the requirements of the Internal Revenue Code applicable to regulated investment companies and to distribute all of its investment company taxable income and net realized gains, if any, to shareholders. Therefore, no provisions for federal income or excise taxes are required. The Fund may be subject to taxes imposed by countries in which it invests. Such taxes are generally based on income and/or capital gains earned or repatriated. Taxes are accrued and applied to net investment income, net realized gains and net unrealized appreciation/depreciation as such income and/or gains are earned.
In accordance with U.S. GAAP requirements regarding accounting for uncertainties in income taxes, management has analyzed the Fund’s tax positions taken or expected to be taken on federal and state income tax returns for all open tax years (all years since inception of the Fund) and has concluded that no provision for income tax is required in the Fund’s financial statements.
| 28 | AB INTERNATIONAL STRATEGIC CORE PORTFOLIO | abfunds.com | |
NOTES TO FINANCIAL STATEMENTS(continued)
5. Investment Income and Investment Transactions
Dividend income is recorded on theex-dividend date or as soon as the Fund is informed of the dividend. Interest income is accrued daily. Investment transactions are accounted for on the date securities are purchased or sold. Investment gains and losses are determined on the identified cost basis. The Fund amortizes premiums and accretes discounts as adjustments to interest income.
6. Class Allocations
All income earned and expenses incurred by the Fund are borne on apro-rata basis by each outstanding class of shares, based on the proportionate interest in the Fund represented by the net assets of such class, except for class specific expenses which are allocated to the respective class. Expenses of the Trust/Fund/Company are charged proportionately to each portfolio or based on other appropriate methods. Realized and unrealized gains and losses are allocated among the various share classes based on their respective net assets.
7. Dividends and Distributions
Dividends and distributions to shareholders, if any, are recorded on theex-dividend date. Income dividends and capital gains distributions are determined in accordance with federal tax regulations and may differ from those determined in accordance with U.S. GAAP. To the extent these differences are permanent, such amounts are reclassified within the capital accounts based on their federal tax basis treatment; temporary differences do not require such reclassification.
NOTE B
Advisory Fee and Other Transactions with Affiliates
Under the terms of the investment advisory agreement, the Fund pays the Adviser an advisory fee at an annual rate of .75% of the first $2.5 billion, .65% of the excess of $2.5 billion up to $5 billion and .60% of the excess over $5 billion of the Fund’s average daily net assets. The fee is accrued daily and paid monthly. The Adviser has agreed to waive its fees and bear certain expenses to the extent necessary to limit total operating expenses (excluding acquired fund fees and expenses other than the advisory fees of any AB mutual funds in which the Fund may invest, interest expense, taxes, extraordinary expenses, and brokerage commissions and other transaction costs) on an annual basis (the “Expense Caps”) to 1.20%, 1.95% and .95% of the daily average net assets for Class A, Class C and Advisor Class shares, respectively. For the six months ended December 31, 2018 the reimbursements/waivers amounted to $139,291. The Expense Caps may not be terminated by the Adviser before October 31, 2019. Any fees waived and expenses borne by the Adviser through February 16, 2017 are subject to repayment by the Fund until the
| abfunds.com | AB INTERNATIONAL STRATEGIC CORE PORTFOLIO | 29 | |
NOTES TO FINANCIAL STATEMENTS(continued)
end of the third fiscal year after the fiscal period in which the fee was waived or the expense was borne; such waivers/expenses borne that are subject to repayment amount to $309,933 for the period ended June 30, 2016 and $194,037 for the period ended June 30, 2017. In any case, no repayment will be made that would cause the Fund’s total annual operating expenses to exceed the Expense Caps’ net fee percentages set forth above.
During 2017, AXA S.A. (“AXA”), a French holding company for the AXA Group, a worldwide leader in life, property and casualty and health insurance and asset management, announced its intention to pursue the sale of a minority stake in its subsidiary, AXA Equitable Holdings, Inc. (“AXA Equitable”), the holding company for a diversified financial services organization, through an initial public offering (“IPO”). AXA Equitable is the holding company for a diverse group of financial services companies, including AllianceBernstein L.P., the investment adviser to the Funds (“the Adviser”). During the second quarter of 2018, AXA Equitable completed the IPO, and, as a result, AXA held approximately 72.2% of the outstanding common stock of AXA Equitable as of September 30, 2018. Contemporaneously with the IPO, AXA sold $862.5 million aggregate principal amount of its 7.25% mandatorily exchangeable notes (the “MxB Notes”) due May 15, 2021 and exchangeable into up to 43,125,000 shares of common stock (or approximately 7% of the outstanding shares of common stock of AXA Equitable). AXA retains ownership (including voting rights) of such shares of common stock until the MxB Notes are exchanged, which may be on a date that is earlier than the maturity date at AXA’s option upon the occurrence of certain events.
In March 2018, AXA announced its intention to sell its entire interest in AXA Equitable over time, subject to market conditions and other factors (the “Plan”). It is anticipated that one or more of the transactions contemplated by the Plan may ultimately result in the indirect transfer of a “controlling block” of voting securities of the Adviser (a “Change of Control Event”) and therefore may be deemed an “assignment” causing a termination of each Fund’s current investment advisory agreement. In order to ensure that the existing investment advisory services could continue uninterrupted, at meetings held in late July through early August 2018, the Boards of Directors/Trustees (each a “Board” and collectively, the “Boards”) approved new investment advisory agreements with the Adviser, in connection with the Plan. The Boards also agreed to call and hold a joint meeting of shareholders on October 11, 2018 for shareholders of each Fund to (1) approve the new investment advisory agreement with the Adviser that would be effective after the first Change of Control Event and (2) approve any future advisory agreement approved by the Board and that has terms not materially different from the current agreement, in the event there are subsequent Change of Control Events arising from completion of the Plan that terminate the advisory agreement after the
| 30 | AB INTERNATIONAL STRATEGIC CORE PORTFOLIO | abfunds.com | |
NOTES TO FINANCIAL STATEMENTS(continued)
first Change of Control Event. Approval of a future advisory agreement means that shareholders may not have another opportunity to vote on a new agreement with the Adviser even upon a change of control, as long as no single person or group of persons acting together gains “control” (as defined in the 1940 Act) of AXA Equitable.
At the December 11, 2018 adjourned shareholder meeting, shareholders approved the new and future investment advisory agreements for the fund.
On November 20, 2018, AXA completed a public offering of 60,000,000 shares of AXA Equitable’s common stock and simultaneously sold 30,000,000 of such shares to AXA Equitable pursuant to a separate agreement with it. As a result AXA currently owns approximately 59.2% of the shares of common stock of AXA Equitable.
Pursuant to the investment advisory agreement, the Fund may reimburse the Adviser for certain legal and accounting services provided to the Fund by the Adviser. For the six months ended December 31, 2018, the Adviser voluntarily agreed to waive such fees in the amount of $34,036.
The Fund compensates AllianceBernstein Investor Services, Inc. (“ABIS”), a wholly-owned subsidiary of the Adviser, under a Transfer Agency Agreement for providing personnel and facilities to perform transfer agency services for the Fund. ABIS may make payments to intermediaries that provide omnibus account services,sub-accounting services and/or networking services. Such compensation retained by ABIS amounted to $8,970 for the six months ended December 31, 2018.
AllianceBernstein Investments, Inc. (the “Distributor”), a wholly-owned subsidiary of the Adviser, serves as the distributor of the Fund’s shares. The Distributor has advised the Fund that it has retainedfront-end sales charges of $173 from the sale of Class A shares and received $0 and $188 in contingent deferred sales charges imposed upon redemptions by shareholders of Class A and Class C shares, respectively, for the six months ended December 31, 2018.
The Fund may invest in AB Government Money Market Portfolio (the “Government Money Market Portfolio”) which has a contractual annual advisory fee rate of .20% of the portfolio’s average daily net assets and bears its own expenses. Effective August 1, 2018, the Adviser has contractually agreed to waive .10% of the advisory fee of Government Money Market Portfolio until August 31, 2019. In connection with the investment by the Fund in Government Money Market Portfolio, the Adviser has contractually agreed to waive its advisory fee from the Fund in an amount equal to the Fund’s pro rata share of the effective advisory fees of Government
| abfunds.com | AB INTERNATIONAL STRATEGIC CORE PORTFOLIO | 31 | |
NOTES TO FINANCIAL STATEMENTS(continued)
Money Market Portfolio, as borne indirectly by the Fund as an acquired fund fee and expense. For the six months ended December 31, 2018, such waiver amounted to $1,290.
A summary of the Fund’s transactions in AB mutual funds for the six months ended December 31, 2018 is as follows:
Fund | Market Value 06/30/18 (000) | Purchases at Cost (000) | Sales Proceeds (000) | Market Value 12/31/18 (000) | Dividend Income (000) | |||||||||||||||
Government Money Market Portfolio | $ | 600 | $ | 26,375 | $ | 25,577 | $ | 1,398 | $ | 23 | ||||||||||
Government Money Market Portfolio* | – 0 | – | 2,591 | 2,591 | – 0 | – | 1 | |||||||||||||
|
|
|
| |||||||||||||||||
Total | $ | 1,398 | $ | 24 | ||||||||||||||||
|
|
|
| |||||||||||||||||
| * | Investment of cash collateral for securities lending transactions (see Note E). |
Brokerage commissions paid on investment transactions for the six months ended December 31, 2018 amounted to $44,321, of which $0 and $0, respectively, was paid to Sanford C. Bernstein & Co., LLC and Sanford C. Bernstein Limited, affiliates of the Adviser.
NOTE C
Distribution Services Agreement
The Fund has adopted a Distribution Services Agreement (the “Agreement”) pursuant to Rule12b-1 under the Investment Company Act of 1940. Under the Agreement, the Fund pays distribution and servicing fees to the Distributor at an annual rate of up to .25% of the Fund’s average daily net assets attributable to Class A shares and 1% of the Fund’s average daily net assets attributable to Class C shares. There are no distribution and servicing fees on the Advisor Class. The fees are accrued daily and paid monthly. The Agreement provides that the Distributor will use such payments in their entirety for distribution assistance and promotional activities. Since the commencement of the Fund’s operations, the Distributor has incurred expenses in excess of the distribution costs reimbursed by the Fund in the amounts of $454 for Class C shares. While such costs may be recovered from the Fund in future periods so long as the Agreement is in effect, the rate of the distribution and servicing fees payable under the Agreement may not be increased without a shareholder vote. In accordance with the Agreement, there is no provision for recovery of unreimbursed distribution costs incurred by the Distributor beyond the current fiscal year for Class A shares. The Agreement also provides that the Adviser may use its own resources to finance the distribution of the Fund’s shares.
| 32 | AB INTERNATIONAL STRATEGIC CORE PORTFOLIO | abfunds.com | |
NOTES TO FINANCIAL STATEMENTS(continued)
NOTE D
Investment Transactions
Purchases and sales of investment securities (excluding short-term investments) for the six months ended December 31, 2018 were as follows:
| Purchases | Sales | |||||||
Investment securities (excluding U.S. government securities) | $ | 51,726,976 | $ | 32,890,979 | ||||
U.S. government securities | – 0 | – | – 0 | – | ||||
The cost of investments for federal income tax purposes was substantially the same as cost for financial reporting purposes. Accordingly, gross unrealized appreciation and unrealized depreciation (excluding foreign currency contracts) are as follows:
Gross unrealized appreciation | $ | 4,183,138 | ||
Gross unrealized depreciation | (6,189,096 | ) | ||
|
| |||
Net unrealized depreciation | $ | (2,005,958 | ) | |
|
|
1. Derivative Financial Instruments
The Fund may use derivatives in an effort to earn income and enhance returns, to replace more traditional direct investments, to obtain exposure to otherwise inaccessible markets (collectively, “investment purposes”), or to hedge or adjust the risk profile of its portfolio.
The principal types of derivatives utilized by the Fund, as well as the methods in which they may be used are:
| • | Forward Currency Exchange Contracts |
The Fund may enter into forward currency exchange contracts in order to hedge its exposure to changes in foreign currency exchange rates on its foreign portfolio holdings, to hedge certain firm purchase and sale commitments denominated in foreign currencies and fornon-hedging purposes as a means of making direct investments in foreign currencies, as described below under “Currency Transactions”.
A forward currency exchange contract is a commitment to purchase or sell a foreign currency at a future date at a negotiated forward rate. The gain or loss arising from the difference between the original contract and the closing of such contract would be included in net realized gain or loss on forward currency exchange contracts. Fluctuations in the value of open forward currency exchange contracts are recorded for financial reporting purposes as unrealized appreciation and/or depreciation by the Fund. Risks may arise from the potential inability of a counterparty to meet the terms of a contract and from unanticipated movements in the value of a foreign currency relative to the U.S. dollar.
| abfunds.com | AB INTERNATIONAL STRATEGIC CORE PORTFOLIO | 33 | |
NOTES TO FINANCIAL STATEMENTS(continued)
During the six months ended December 31, 2018, the Fund held forward currency exchange contracts for hedging purposes.
| • | Futures |
The Fund may buy or sell futures for investment purposes or for the purpose of hedging its fund against adverse effects of potential movements in the market. The Fund bears the market risk that arises from changes in the value of these instruments and the imperfect correlation between movements in the price of the futures and movements in the price of the assets, reference rates or indices which they are designed to track. Among other things, the Fund may purchase or sell futures for foreign currencies or options thereon fornon-hedging purposes as a means of making direct investment in foreign currencies, as described below under “Currency Transactions”.
At the time the Fund enters into a future, the Fund deposits and maintains as collateral an initial margin with the broker, as required by the exchange on which the transaction is effected. Such amount is shown as cash collateral due from broker on the statement of assets and liabilities. Pursuant to the contract, the Fund agrees to receive from or pay to the broker an amount of cash equal to the daily fluctuation in the value of the contract. Such receipts or payments are known as variation margin and are recorded by the Fund as unrealized gains or losses. Risks may arise from the potential inability of a counterparty to meet the terms of the contract. The credit/counterparty risk for exchange-traded futures is generally less than privately negotiated futures, since the clearinghouse, which is the issuer or counterparty to each exchange-traded future, has robust risk mitigation standards, including the requirement to provide initial and variation margin. When the contract is closed, the Fund records a realized gain or loss equal to the difference between the value of the contract at the time it was opened and the time it was closed.
Use of long futures subjects the Fund to risk of loss in excess of the amounts shown on the statement of assets and liabilities, up to the notional value of the future. Use of short futures subjects the Fund to unlimited risk of loss. Under some circumstances, futures exchanges may establish daily limits on the amount that the price of a future can vary from the previous day’s settlement price, which could effectively prevent liquidation of unfavorable positions.
During the six months ended December 31, 2018, the Fund held futures fornon-hedging purposes.
The Fund typically enters into International Swaps and Derivatives Association, Inc. Master Agreements (“ISDA Master Agreement”) with its OTC
| 34 | AB INTERNATIONAL STRATEGIC CORE PORTFOLIO | abfunds.com | |
NOTES TO FINANCIAL STATEMENTS(continued)
derivative contract counterparties in order to, among other things, reduce its credit risk to OTC counterparties. ISDA Master Agreements include provisions for general obligations, representations, collateral and events of default or termination. Under an ISDA Master Agreement, the Fund typically may offset with the OTC counterparty certain derivative financial instruments’ payables and/or receivables with collateral held and/or posted and create one single net payment(close-out netting) in the event of default or termination. In the event of a default by an OTC counterparty, the return of collateral with market value in excess of the Fund’s net liability, held by the defaulting party, may be delayed or denied.
The Fund’s ISDA Master Agreements may contain provisions for early termination of OTC derivative transactions in the event the net assets of the Fund decline below specific levels (“net asset contingent features”). If these levels are triggered, the Fund’s OTC counterparty has the right to terminate such transaction and require the Fund to pay or receive a settlement amount in connection with the terminated transaction. If OTC derivatives were held at period end, please refer to netting arrangements by the OTC counterparty table below for additional details.
During the six months ended December 31, 2018, the Fund had entered into the following derivatives:
| Asset Derivatives | Liability Derivatives | |||||||||||||
Derivative Type | Statement of Assets and Liabilities Location | Fair Value | Statement of Assets and Liabilities Location | Fair Value | ||||||||||
Foreign currency | Unrealized appreciation on forward currency exchange contracts | $ | 802,539 | | Unrealized depreciation on forward currency exchange contracts | $ | 343,336 | |||||||
Equity contracts | | Receivable/ Payable for variation margin on futures | 67,864 | * | ||||||||||
|
|
|
| |||||||||||
Total | $ | 802,539 | $ | 411,200 | ||||||||||
|
|
|
| |||||||||||
| * | Only variation margin receivable/payable at period end is reported within the statement of assets and liabilities. This amount reflects cumulative unrealized appreciation/depreciation on futures and centrally cleared swaps as reported in the portfolio of investments. |
| abfunds.com | AB INTERNATIONAL STRATEGIC CORE PORTFOLIO | 35 | |
NOTES TO FINANCIAL STATEMENTS(continued)
Derivative Type | Location of Gain Derivatives Within Operations | Realized Gain or (Loss) on Derivatives | Change in Unrealized Appreciation or (Depreciation) | |||||||
Foreign currency | Net realized gain/(loss) on forward currency exchange contracts; Net change in unrealized appreciation/depreciation on forward currency exchange contracts | $ | (219,739 | ) | $ | 538,855 | ||||
Equity contracts | Net realized gain/(loss) on futures; Net change in unrealized appreciation/depreciation on futures | (245,192 | ) | (42,719 | ) | |||||
|
|
|
| |||||||
Total | $ | (464,931 | ) | $ | 496,136 | |||||
|
|
|
| |||||||
The following table represents the average monthly volume of the Fund’s derivative transactions during the six months ended December 31, 2018:
Forward Currency Exchange Contracts: | ||||
Average principal amount of buy contracts | $ | 23,572,752 | ||
Average principal amount of sale contracts | $ | 22,927,666 | ||
Futures: | ||||
Average original value of buy contracts | $ | 2,302,766 |
For financial reporting purposes, the Fund does not offset derivative assets and derivative liabilities that are subject to netting arrangements in the statement of assets and liabilities.
All OTC derivatives held at period end were subject to netting arrangements. The following table presents the Fund’s derivative assets and liabilities by OTC counterparty net of amounts available for offset under ISDA Master Agreements (“MA”) and net of the related collateral received/pledged by the Fund as of December 31, 2018. Exchange-traded derivatives and centrally cleared swaps are not subject to netting arrangements and as such are excluded from the table.
Counterparty | Derivative Assets Subject to a MA | Derivatives Available for Offset | Cash Collateral Received* | Security Collateral Received* | Net Amount of Derivatives Assets | |||||||||||||||
Bank of America, NA. | $ | 173,487 | $ | – 0 | – | $ | – 0 | – | $ | – 0 | – | $ | 173,487 | |||||||
Barclays Bank PLC | 157,779 | (12,571 | ) | – 0 | – | – 0 | – | 145,208 | ||||||||||||
Brown Brothers Harriman & Co. | 287,098 | (160,255 | ) | – 0 | – | – 0 | – | 126,843 | ||||||||||||
Deutsche Bank AG | 7,640 | – 0 | – | – 0 | – | – 0 | – | 7,640 | ||||||||||||
| 36 | AB INTERNATIONAL STRATEGIC CORE PORTFOLIO | abfunds.com | |
NOTES TO FINANCIAL STATEMENTS(continued)
Counterparty | Derivative Assets Subject to a MA | Derivatives Available for Offset | Cash Collateral Received* | Security Collateral Received* | Net Amount of Derivatives Assets | |||||||||||||||
Goldman Sachs Bank USA/Goldman Sachs International. | $ | 22,176 | $ | (20,580 | ) | $ | – 0 | – | $ | – 0 | – | $ | 1,596 | |||||||
JPMorgan Chase Bank, NA | 38,095 | (9,472 | ) | – 0 | – | – 0 | – | 28,623 | ||||||||||||
Royal Bank of Scotland PLC | 116,264 | (116,264 | ) | – 0 | – | – 0 | – | – 0 | – | |||||||||||
|
|
|
|
|
|
|
|
|
| |||||||||||
Total | $ | 802,539 | $ | (319,142 | ) | $ | – 0 | – | $ | – 0 | – | $ | 483,397 | ^ | ||||||
|
|
|
|
|
|
|
|
|
| |||||||||||
Counterparty | Derivative Liabilities Subject to a MA | Derivatives Available for Offset | Cash Collateral Pledged* | Security Collateral Pledged* | Net Amount of Derivatives Liabilities | |||||||||||||||
Barclays Bank PLC | $ | 12,571 | $ | (12,571 | ) | $ | – 0 | – | $ | – 0 | – | $ | – 0 | – | ||||||
Brown Brothers Harriman & Co. | 160,255 | (160,255 | ) | – 0 | – | – 0 | – | – 0 | – | |||||||||||
Goldman Sachs Bank USA/Goldman Sachs International. | 20,580 | (20,580 | ) | – 0 | – | – 0 | – | – 0 | – | |||||||||||
JPMorgan Chase Bank, NA | 9,472 | (9,472 | ) | – 0 | – | – 0 | – | – 0 | – | |||||||||||
Royal Bank of Scotland PLC | 140,458 | (116,264 | ) | – 0 | – | – 0 | – | 24,194 | ||||||||||||
|
|
|
|
|
|
|
|
|
| |||||||||||
Total | $ | 343,336 | $ | (319,142 | ) | $ | – 0 | – | $ | – 0 | – | $ | 24,194 | ^ | ||||||
|
|
|
|
|
|
|
|
|
| |||||||||||
| * | The actual collateral received/pledged may be more than the amount reported due to overcollateralization. |
| ^ | Net amount represents the net unrealized receivable/payable that would be due from/to the counterparty in the event of default or termination. The from OTC financial derivative instruments can only be netted across transactions governed under the same master agreement with the same counterparty. |
2. Currency Transactions
The Fund may invest innon-U.S. dollar-denominated securities on a currency hedged or unhedged basis. The Fund may seek investment opportunities by taking long or short positions in currencies through the use of currency-related derivatives, including forward currency exchange contracts, futures and options on futures, swaps, and other options. The Fund may enter into transactions for investment opportunities when it anticipates that a foreign currency will appreciate or depreciate in value but securities denominated in that currency are not held by the Fund and do not present attractive investment opportunities. Such transactions may also be used when the Adviser believes that it may be more efficient than a direct investment in a foreign currency-denominated security. The Fund may also conduct currency exchange contracts on a spot basis (i.e., for cash at the spot rate prevailing in the currency exchange market for buying or selling currencies).
| abfunds.com | AB INTERNATIONAL STRATEGIC CORE PORTFOLIO | 37 | |
NOTES TO FINANCIAL STATEMENTS(continued)
NOTE E
Securities Lending
The Fund may enter into securities lending transactions. Under the Fund’s securities lending program, all loans of securities will be collateralized continually by cash. The Fund will be compensated for the loan from a portion of the net return from the income earned on cash collateral after a rebate is paid to the borrower (in some cases, this rebate may be a “negative rebate” or fee paid by the borrower to the Fund in connection with the loan), and payments are made for fees of the securities lending agent and for certain other administrative expenses. It is the policy of the Fund to receive collateral consisting of cash in an amount exceeding the value of the securities loaned. A Fund will have the right to call a loan and obtain the securities loaned at any time on notice to the borrower within the normal and customary settlement time for the securities. While the securities are on loan, the borrower is obligated to pay the Fund amounts equal to any income or other distributions from the securities. The Fund will not be able to exercise voting rights with respect to any securities during the existence of a loan, but will have the right to regain ownership of loaned securities in order to exercise voting or other ownership rights. The lending agent has agreed to indemnify the Fund in the case of default of any securities borrower. Collateral received and securities loaned are marked to market daily to ensure that the securities loaned are secured by collateral. The lending agent currently invests the cash collateral received in Government Money Market Portfolio, an eligible money market vehicle, in accordance with the investment restrictions of the Fund, and as approved by the Board. The collateral received on securities loaned is recorded as an asset as well as a corresponding liability in the statement of assets and liabilities. When the Fund lends securities, its investment performance will continue to reflect changes in the value of the securities loaned. At December 31, 2018, the Fund had no securities on loan and had received no cash collateral. The Fund earned securities lending income of $2,261 and $750 from the borrowers and Government Money Market Portfolio, respectively, for the six months ended December 31, 2018; these amounts are reflected in the statement of operations. In connection with the cash collateral investment by the Fund in the Government Money Market Portfolio, the Adviser has agreed to waive a portion of the Fund’s share of the advisory fees of Government Money Market Portfolio, as borne indirectly by the Fund as an acquired fund fee and expense. For the six months ended December 31, 2018, such waiver amounted to $45. A principal risk of lending portfolio securities is that the borrower will fail to return the loaned securities upon termination of the loan and that the collateral will not be sufficient to replace the loaned securities.
| 38 | AB INTERNATIONAL STRATEGIC CORE PORTFOLIO | abfunds.com | |
NOTES TO FINANCIAL STATEMENTS(continued)
NOTE F
Capital Stock
Each class consists of 1,000,000,000 authorized shares. Transactions in capital shares for each class were as follows:
| Shares | Amount | |||||||||||||||||||||||
| Six Months Ended December 31, 2018 (unaudited) | Year Ended June 30, 2018 | Six Months Ended December 31, 2018 (unaudited) | Year Ended June 30, 2018 | |||||||||||||||||||||
|
| |||||||||||||||||||||||
| Class A | ||||||||||||||||||||||||
Shares sold | 57,639 | 17,768 | $ | 654,109 | $ | 215,948 | ||||||||||||||||||
| ||||||||||||||||||||||||
Shares issued in reinvestment of dividends | 1,564 | 233 | 16,506 | 2,715 | ||||||||||||||||||||
| ||||||||||||||||||||||||
Shares redeemed | (4,764 | ) | (1,007 | ) | (53,540 | ) | (12,165 | ) | ||||||||||||||||
| ||||||||||||||||||||||||
Net increase | 54,439 | 16,994 | $ | 617,075 | $ | 206,498 | ||||||||||||||||||
| ||||||||||||||||||||||||
| Class C | ||||||||||||||||||||||||
Shares sold | 9,451 | 5,212 | $ | 109,933 | $ | 59,131 | ||||||||||||||||||
| ||||||||||||||||||||||||
Shares issued in reinvestment of dividends | 291 | 69 | 3,052 | 806 | ||||||||||||||||||||
| ||||||||||||||||||||||||
Shares redeemed | (5,637 | ) | (1,004 | ) | (63,385 | ) | (12,000 | ) | ||||||||||||||||
| ||||||||||||||||||||||||
Net increase | 4,105 | 4,277 | $ | 49,600 | $ | 47,937 | ||||||||||||||||||
| ||||||||||||||||||||||||
| Advisor Class | ||||||||||||||||||||||||
Shares sold | 3,484,277 | 3,790,520 | $ | 39,038,860 | $ | 44,811,877 | ||||||||||||||||||
| ||||||||||||||||||||||||
Shares issued in reinvestment of dividends | 194,397 | 50,027 | 2,056,719 | 583,317 | ||||||||||||||||||||
| ||||||||||||||||||||||||
Shares redeemed | (1,411,692 | ) | (690,393 | ) | (16,304,233 | ) | (8,172,714 | ) | ||||||||||||||||
| ||||||||||||||||||||||||
Net increase | 2,266,982 | 3,150,154 | $ | 24,791,346 | $ | 37,222,480 | ||||||||||||||||||
| ||||||||||||||||||||||||
NOTE G
Risks Involved in Investing in the Fund
Sector Risk—The Fund may have more risk because of concentrated investments in a particular market sector, such as the technology or financial services sector. Market or economic factors affecting that sector could have a major effect on the value of the Fund’s investments.
Foreign(Non-U.S.) Risk—Investments in securities ofnon-U.S. issuers may involve more risk than those of U.S. issuers. These securities may fluctuate more widely in price and may be less liquid due to adverse market, economic, political, regulatory or other factors. These risks may be heightened with respect to investments in emerging-market countries, where there may be an increased amount of economic, political and social instability.
| abfunds.com | AB INTERNATIONAL STRATEGIC CORE PORTFOLIO | 39 | |
NOTES TO FINANCIAL STATEMENTS(continued)
Currency Risk—Fluctuations in currency exchange rates may negatively affect the value of the Fund’s investments or reduce its returns.
Capitalization Risk—Investments inmid-capitalization companies may be more volatile than investments in large-capitalization companies. Investments inmid-capitalization companies may have additional risks because these companies have limited product lines, markets or financial resources.
Derivatives Risk—The Fund may enter into derivative transactions such as forwards, options, futures and swaps. Derivatives may be illiquid, difficult to price, and leveraged so that small changes may produce disproportionate losses for the Fund, and subject to counterparty risk to a greater degree than more traditional investments. Derivatives may result in significant losses, including losses that are far greater than the value of the derivatives reflected on the statement of assets and liabilities.
Indemnification Risk—In the ordinary course of business, the Fund enters into contracts that contain a variety of indemnifications. The Fund’s maximum exposure under these arrangements is unknown. However, the Fund has not had prior claims or losses pursuant to these indemnification provisions and expects the risk of loss thereunder to be remote. Therefore, the Fund has not accrued any liability in connection with these indemnification provisions.
NOTE H
Joint Credit Facility
A number ofopen-end mutual funds managed by the Adviser, including the Fund, participate in a $325 million revolving credit facility (the “Facility”) intended to provide short-term financing, if necessary, subject to certain restrictions in connection with abnormal redemption activity. Commitment fees related to the Facility are paid by the participating funds and are included in miscellaneous expenses in the statement of operations. The Fund did not utilize the Facility during the six months ended December 31, 2018.
NOTE I
Tax Information
The tax character of distributions paid for the year ending June 30, 2019 will be determined at the end of the current fiscal year.
| 40 | AB INTERNATIONAL STRATEGIC CORE PORTFOLIO | abfunds.com | |
NOTES TO FINANCIAL STATEMENTS(continued)
The tax character of distributions paid during the fiscal year ended June 30, 2018 and June 30, 2017 were as follows:
| 2018 | 2017 | |||||||
Distributions paid from: | ||||||||
Ordinary income | $ | 593,961 | $ | 107,576 | ||||
Net long-term capital gains | 76,680 | – 0 | – | |||||
|
|
|
| |||||
Total taxable distributions paid | $ | 670,641 | $ | 107,576 | ||||
|
|
|
| |||||
As of June 30, 2018, the components of accumulated earnings/(deficit) on a tax basis were as follows:
Undistributed ordinary income | $ | 1,412,548 | ||
Accumulated capital and other losses | 500,837 | |||
Unrealized appreciation/(depreciation) | 4,737,544 | (a) | ||
|
| |||
Total accumulated earnings/(deficit) | $ | 6,650,929 | ||
|
|
| (a) | The difference between book-basis andtax-basis unrealized appreciation/(depreciation) is attributable primarily to the tax deferral of losses on wash sales, the tax treatment of swaps, and the recognition for tax purposes of unrealized gains/losses on certain derivative instruments. |
For tax purposes, net realized capital losses may be carried over to offset future capital gains, if any. Funds are permitted to carry forward capital losses for an indefinite period, and such losses will retain their character as either short-term or long-term capital losses. As of December 31, 2018 the Fund did not have any capital loss carryforwards.
NOTE J
Recent Accounting Pronouncements
In August 2018, the Financial Accounting Standards Board issued an Accounting Standards Update, ASU2018-13, Fair Value Measurement (Topic 820), Disclosure Framework-Changes to the Disclosure Requirements for Fair Value Measurement which removes, modifies and adds disclosures to Topic 820. The amendments in this ASU2018-13 apply to all entities that are required, under existing U.S. GAAP, to make disclosures about recurring or nonrecurring fair value measurements. The amendments in this ASU2018-13 are effective for all entities for fiscal years, and interim periods within those fiscal years, beginning after December 15, 2019. At this time, management is evaluating the implications of these changes on the financial statements.
In October 2018, the U.S. Securities and Exchange Commission adopted amendments to certain disclosure requirements included in RegulationS-X that had become “redundant, duplicative, overlapping, outdated or superseded, in light of the other Commission disclosure requirements, GAAP or changes in the information environment.” The compliance date for the amendments to RegulationS-X was November 5, 2018 (for reporting
| abfunds.com | AB INTERNATIONAL STRATEGIC CORE PORTFOLIO | 41 | |
NOTES TO FINANCIAL STATEMENTS(continued)
period end dates of September 30, 2018 or after). Management has adopted the amendments which simplified certain disclosure requirements on the financial statements.
NOTE K
Subsequent Events
Management has evaluated subsequent events for possible recognition or disclosure in the financial statements through the date the financial statements are issued. Management has determined that there are no material events that would require disclosure in the Fund’s financial statements through this date.
| 42 | AB INTERNATIONAL STRATEGIC CORE PORTFOLIO | abfunds.com | |
FINANCIAL HIGHLIGHTS
Selected Data For A Share Of Capital Stock Outstanding Throughout Each Period
| Class A | ||||||||||||||||
| Six Months Ended December 31, 2018 (unaudited) | Year Ended June 30, | July 29, 2015(a) to June 30, 2016 | ||||||||||||||
| 2018 | 2017 | |||||||||||||||
|
| |||||||||||||||
Net asset value, beginning of period | $ 12.04 | $ 11.04 | $ 9.79 | $ 10.00 | ||||||||||||
|
| |||||||||||||||
Income From Investment Operations | ||||||||||||||||
Net investment income(b)(c) | .06 | .20 | .22 | .26 | ||||||||||||
Net realized and unrealized gain (loss) on investment and foreign currency transactions | (1.36 | ) | .93 | 1.11 | (.35 | ) | ||||||||||
|
| |||||||||||||||
Net increase (decrease) in net asset value from operations | (1.30 | ) | 1.13 | 1.33 | (.09 | ) | ||||||||||
|
| |||||||||||||||
Less: Dividends and Distributions | ||||||||||||||||
Dividends from net investment income | (.16 | ) | (.07 | ) | (.08 | ) | (.12 | ) | ||||||||
Distributions from net realized gain on investment and foreign currency transactions | (.12 | ) | (.06 | ) | – 0 | – | – 0 | – | ||||||||
|
| |||||||||||||||
Total dividends and distributions | (.28 | ) | (.13 | ) | (.08 | ) | (.12 | ) | ||||||||
|
| |||||||||||||||
Net asset value, end of period | $ 10.46 | $ 12.04 | $ 11.04 | $ 9.79 | ||||||||||||
|
| |||||||||||||||
Total Return | ||||||||||||||||
Total investment return based on net asset value(d) | (10.85 | )% | 10.25 | % | 13.72 | % | (.84 | )% | ||||||||
Ratios/Supplemental Data | ||||||||||||||||
Net assets, end of period | $969 | $460 | $234 | $57 | ||||||||||||
Ratio to average net assets of: | ||||||||||||||||
Expenses, net of waivers/reimbursements(e)† | 1.20 | %(f) | 1.19 | % | 1.19 | % | 1.20 | %(f) | ||||||||
Expenses, before waivers/reimbursements(e)† | 1.63 | %(f) | 1.93 | % | 5.13 | % | 23.67 | %(f) | ||||||||
Net investment income(c) | 1.00 | %(f) | 1.71 | % | 2.15 | % | 2.87 | %(f) | ||||||||
Portfolio turnover rate | 42 | % | 53 | % | 64 | % | 52 | % | ||||||||
† Expense ratios exclude the estimated acquired fund fees of affiliated/unaffiliated underlying |
| |||||||||||||||
portfolios | .00 | %(g) | .01 | % | .01 | % | .00 | % | ||||||||
See footnote summary on page 46.
| abfunds.com | AB INTERNATIONAL STRATEGIC CORE PORTFOLIO | 43 | |
FINANCIAL HIGHLIGHTS(continued)
Selected Data For A Share Of Capital Stock Outstanding Throughout Each Period
| Class C | ||||||||||||||||
| Six Months Ended December 31, 2018 (unaudited) | Year Ended June 30, | July 29, 2015(a) to June 30, 2016 | ||||||||||||||
| 2018 | 2017 | |||||||||||||||
|
| |||||||||||||||
Net asset value, beginning of period | $ 11.95 | $ 11.01 | $ 9.75 | $ 10.00 | ||||||||||||
|
| |||||||||||||||
Income From Investment Operations | ||||||||||||||||
Net investment income(b)(c) | .01 | .10 | .19 | .12 | ||||||||||||
Net realized and unrealized gain (loss) on investment and foreign currency transactions | (1.34 | ) | .93 | 1.07 | (.28 | ) | ||||||||||
|
| |||||||||||||||
Net increase (decrease) in net asset value from operations | (1.33 | ) | 1.03 | 1.26 | (.16 | ) | ||||||||||
|
| |||||||||||||||
Less: Dividends and Distributions | ||||||||||||||||
Dividends from net investment income | (.09 | ) | (.03 | ) | – 0 | – | (.09 | ) | ||||||||
Distributions from net realized gain on investment and foreign currency transactions | (.12 | ) | (.06 | ) | – 0 | – | – 0 | – | ||||||||
|
| |||||||||||||||
Total dividends and distributions | (.21 | ) | (.09 | ) | – 0 | – | (.09 | ) | ||||||||
|
| |||||||||||||||
Net asset value, end of period | $ 10.41 | $ 11.95 | $ 11.01 | $ 9.75 | ||||||||||||
|
| |||||||||||||||
Total Return | ||||||||||||||||
Total investment return based on net asset value(d) | (11.16 | )% | 9.34 | % | 12.92 | % | (1.55 | )% | ||||||||
Ratios/Supplemental Data | ||||||||||||||||
Net assets, end of period | $146 | $118 | $62 | $10 | ||||||||||||
Ratio to average net assets of: | ||||||||||||||||
Expenses, net of waivers/reimbursements(e)† | 1.95 | %(f) | 1.94 | % | 1.94 | % | 1.95 | %(f) | ||||||||
Expenses, before waivers/reimbursements(e)† | 2.40 | %(f) | 2.68 | % | 5.70 | % | 15.57 | %(f) | ||||||||
Net investment income(c) | .22 | %(f) | .88 | % | 1.80 | % | 1.31 | %(f) | ||||||||
Portfolio turnover rate | 42 | % | 53 | % | 64 | % | 52 | % | ||||||||
† Expense ratios exclude the estimated acquired fund fees of affiliated/unaffiliated underlying |
| |||||||||||||||
portfolios | .00 | %(g) | .01 | % | .01 | % | .00 | % | ||||||||
See footnote summary on page 46.
| 44 | AB INTERNATIONAL STRATEGIC CORE PORTFOLIO | abfunds.com | |
FINANCIAL HIGHLIGHTS(continued)
Selected Data For A Share Of Capital Stock Outstanding Throughout Each Period
| Advisor Class | ||||||||||||||||
| Six Months Ended December 31, 2018 (unaudited) | Year Ended June 30, | July 29, 2015(a) to June 30, 2016 | ||||||||||||||
| 2018 | 2017 | |||||||||||||||
|
| |||||||||||||||
Net asset value, beginning of period | $ 12.06 | $ 11.06 | $ 9.80 | $ 10.00 | ||||||||||||
|
| |||||||||||||||
Income From Investment Operations | ||||||||||||||||
Net investment income(b)(c) | .07 | .25 | .27 | .21 | ||||||||||||
Net realized and unrealized gain (loss) on investment and foreign currency transactions | (1.35 | ) | .90 | 1.08 | (.28 | ) | ||||||||||
|
| |||||||||||||||
Net increase (decrease) in net asset value from operations | (1.28 | ) | 1.15 | 1.35 | (.07 | ) | ||||||||||
|
| |||||||||||||||
Less: Dividends and Distributions | ||||||||||||||||
Dividends from net investment income | (.18 | ) | (.09 | ) | (.09 | ) | (.13 | ) | ||||||||
Distributions from net realized gain on investment and foreign currency transactions | (.12 | ) | (.06 | ) | – 0 | – | – 0 | – | ||||||||
|
| |||||||||||||||
Total dividends and distributions | (.30 | ) | (.15 | ) | (.09 | ) | (.13 | ) | ||||||||
|
| |||||||||||||||
Net asset value, end of period | $ 10.48 | $ 12.06 | $ 11.06 | $ 9.80 | ||||||||||||
|
| |||||||||||||||
Total Return | ||||||||||||||||
Total investment return based on net asset value(d) | (10.68 | )% | 10.45 | % | 13.98 | % | (.63 | )% | ||||||||
Ratios/Supplemental Data | ||||||||||||||||
Net assets, end of period | $90,210 | $76,473 | $35,275 | $2,932 | ||||||||||||
Ratio to average net assets of: | ||||||||||||||||
Expenses, net of waivers/reimbursements(e)† | .95 | %(f) | .94 | % | .94 | % | .95 | %(f) | ||||||||
Expenses, before waivers/reimbursements(e)† | 1.38 | %(f) | 1.65 | % | 4.37 | % | 14.60 | %(f) | ||||||||
Net investment income(c) | 1.25 | %(f) | 2.12 | % | 2.60 | % | 2.32 | %(f) | ||||||||
Portfolio turnover rate | 42 | % | 53 | % | 64 | % | 52 | % | ||||||||
† Expense ratios exclude the estimated acquired fund fees of affiliated/unaffiliated underlying |
| |||||||||||||||
portfolios | .00 | %(g) | .01 | % | .01 | % | .00 | % | ||||||||
See footnote summary on page 46.
| abfunds.com | AB INTERNATIONAL STRATEGIC CORE PORTFOLIO | 45 | |
FINANCIAL HIGHLIGHTS(continued)
Selected Data For A Share Of Capital Stock Outstanding Throughout Each Period
| (a) | Commencement of operations. |
| (b) | Based on average shares outstanding. |
| (c) | Net expenses waived/reimbursed by the Adviser |
| (d) | Total investment return is calculated assuming an initial investment made at the net asset value at the beginning of the period, reinvestment of all dividends and distributions at net asset value during the period, and redemption on the last day of the period. Initial sales charge or contingent deferred sales charge is not reflected in the calculation of total investment return. Total investment return does not reflect the deduction of taxes that a shareholder would pay on fund distributions or the redemption of fund shares. Total investment return for a period of less than one year is not annualized. |
| (e) | In connection with the Fund’s investments in affiliated underlying portfolios, the Fund incurs no direct expenses but bears proportionate shares of the acquired fund fees and expenses (i.e. operating, administrative and investment advisory fees) of the affiliated underlying portfolios. The Adviser has contractually agreed to waive its fees from the Fund in an amount equal to the Fund’s pro rata share of certain acquired fund fees and expenses, and for the year ended June 30, 2018 and June 30, 2017 such waiver amounted to 0.01% and 0.01%, respectively. |
| (f) | Annualized. |
| (g) | Amount is less than 0.005%. |
See notes to financial statements.
| 46 | AB INTERNATIONAL STRATEGIC CORE PORTFOLIO | abfunds.com | |
RESULTS OF STOCKHOLDER MEETING
(unaudited)
A Special Meeting of Stockholders of the AB Cap Fund, Inc. (the “Company”)—AB International Strategic Core Portfolio (the “Fund”) was held on October 11, 2018 and adjourned until December 11, 2018. A description of the proposals and number of shares voted at the Meeting are as follows (the proposal number shown below corresponds to the proposal number in the Fund’s proxy statement):
| 1. | To approve and vote upon the election of Directors for the Company, each such Director to serve for a term of indefinite duration and until his or her successor is duly elected and qualifies. |
Director: | Voted For: | Authority Withheld: | ||||||
Michael J. Downey | 215,536,553 | 1,474,295 | ||||||
William H. Foulk, Jr.* | 215,369,140 | 1,641,708 | ||||||
Nancy P. Jacklin | 215,599,334 | 1,411,513 | ||||||
Robert M. Keith | 215,547,510 | 1,463,337 | ||||||
Carol C. McMullen | 215,652,168 | 1,358,679 | ||||||
Gary L. Moody | 215,553,805 | 1,457,043 | ||||||
Marshall C. Turner, Jr. | 215,527,252 | 1,483,596 | ||||||
Earl D. Weiner | 215,530,515 | 1,480,332 | ||||||
| 2. | To vote upon the approval of new advisory agreements for the Fund with AllianceBernstein L.P. |
| Voted For: | Voted Against: | Abstain: | Broker Non-Votes: | |||||||||||
| 4,020,178 | – 0 – | 7,531 | 14,912 | |||||||||||
| * | Mr. Foulk retired on December 31, 2018. |
| abfunds.com | AB INTERNATIONAL STRATEGIC CORE PORTFOLIO | 47 | |
BOARD OF DIRECTORS
Marshall C. Turner, Jr.(1),Chairman Michael J. Downey(1) Nancy P. Jacklin(1) | Robert M. Keith,President and Chief Executive Officer Carol C. McMullen(1) Garry L. Moody(1) Earl D. Weiner(1) |
OFFICERS
Kent W. Hargis(2), Vice President Sammy Suzuki(2),Vice President Emilie D. Wrapp,Secretary Michael B. Reyes,Senior Analyst | Joseph J. Mantineo,Treasurer and Chief Financial Officer Phyllis J. Clarke,Controller Vincent S. Noto,Chief Compliance Officer |
Custodian and Accounting Agent Brown Brothers Harriman & Co. 50 Post Office Square Boston, MA 02110
Principal Underwriter AllianceBernstein Investments, Inc. 1345 Avenue of the Americas New York, NY 10105
Transfer Agent AllianceBernstein Investor Services, Inc. P.O. Box 786003 San Antonio, TX 78278-6003 Toll-Free (800) 221-5672 | Independent Registered Public Accounting Firm Ernst & Young LLP 5 Times Square New York, NY 10036
Legal Counsel Seward & Kissel LLP One Battery Park Plaza New York, NY 10004 |
| 1 | Member of the Audit Committee, the Governance and Nominating Committee and the Independent Directors Committee. |
| 2 | The day-to-day management of, and investment decisions for, the Fund are made by its senior management team. Messrs. Hargis and Suzuki are the investment professionals with the most significant responsibility for the day-to-day management of the Fund’s portfolio. |
| 48 | AB INTERNATIONAL STRATEGIC CORE PORTFOLIO | abfunds.com | |
Information Regarding the Review and Approval of the Fund’s Advisory Agreement
As described in more detail in the Proxy Statement for the AB Funds dated August 20, 2018, the Boards of the AB Funds, at a meeting held onJuly 31-August 2, 2018, approved new advisory agreements with the Adviser (the “Proposed Agreements”) for the AB Funds, including AB Cap Fund, Inc. in respect of AB International Strategic Core Portfolio (the “Fund”), in connection with the planned disposition by AXA S.A. of its remaining shares of AXA Equitable Holdings, Inc. (the indirect holder of a majority of the partnership interests in the Adviser and the indirect parent of AllianceBernstein Corporation, the general partner of the Adviser) in one or more transactions and the related potential for one or more “assignments” (within the meaning of section 2(a)(4) of the Investment Company Act) of the advisory agreements for the AB Funds, including the Fund’s Advisory Agreement, resulting in the automatic termination of such advisory agreements.
At the same meeting, the AB Boards also considered and approved interim advisory agreements with the Adviser (the “Interim Advisory Agreements”) for the AB Funds, including the Fund, to be effective only in the event that stockholder approval of a Proposed Agreement had not been obtained as of the date of one or more transactions resulting in an “assignment” of the Adviser’s advisory agreements, resulting in the automatic termination of such advisory agreements.
The shareholders of the Fund subsequently approved the Proposed Agreements at an annual meeting of shareholders called for the purpose of electing Directors and voting on the Proposed Agreements.
A discussion regarding the basis for the Boards’ approvals at a meeting held onJuly 31-August 2, 2018 is set forth below.
Information Regarding the Review and Approval of the Fund’s Proposed New Advisory Agreement and Interim Advisory Agreement in the Context of Potential Assignments
At a meeting of the AB Boards held on July31-August 2, 2018, the Adviser presented its recommendation that the Boards consider and approve the Proposed Agreements. Section 15(c) of the 1940 Act provides that, after an initial period, a Fund’s Current Agreement and currentsub-advisory agreement, as applicable, will remain in effect only if the Board, including a majority of the Independent Directors, annually reviews and approves them. Each of the Current Agreements had been approved by a Board within theone-year period prior to approval of its related Proposed Agreement, except that the Current Agreements for certain FlexFee funds were approved in February 2017. In connection with their approval of the Proposed Agreements, the Boards considered their conclusions in connection with their most recent approvals of the Current Agreements, in particular in cases where the last approval of a Current Agreement was relatively recent, including the Boards’ general satisfaction with the nature
| abfunds.com | AB INTERNATIONAL STRATEGIC CORE PORTFOLIO | 49 | |
and quality of services being provided and, as applicable, in the case of certain Funds, actions taken or to be taken in an effort to improve investment performance or reduce expense ratios. The Directors also reviewed updated information provided by the Adviser in respect of each Fund. Also in connection with their approval of the Proposed Agreements, the Boards considered a representation made to them at that time by the Adviser that there were no additional developments not already disclosed to the Boards since their most recent approvals of the Current Agreements that would be a material consideration to the Boards in connection with their consideration of the Proposed Agreements, except for matters disclosed to the Boards by the Adviser. The Directors considered the fact that each Proposed Agreement would have corresponding terms and conditions identical to those of the corresponding Current Agreement with the exception of the effective date and initial term under the Proposed Agreement.
The Directors considered their knowledge of the nature and quality of the services provided by the Adviser to each Fund gained from their experience as directors or trustees of registered investment companies advised by the Adviser, their overall confidence in the Adviser’s integrity and competence they have gained from that experience, the Adviser’s initiative in identifying and raising potential issues with the Directors and its responsiveness, frankness and attention to concerns raised by the Directors in the past, including the Adviser’s willingness to consider and implement organizational and operational changes designed to improve investment results and the services provided to the Funds. The Directors noted that they have four regular meetings each year, at each of which they review extensive materials and information from the Adviser, including information on the investment performance of each Fund.
The Directors also considered all factors they believed relevant, including the specific matters discussed below. During the course of their deliberations, the Directors evaluated, among other things, the reasonableness of the management fees of the Funds they oversee. The Directors did not identify any particular information that wasall-important or controlling, and different Directors may have attributed different weights to the various factors. The Directors determined that the selection of the Adviser to manage the Funds, and the overall arrangements between the Funds and the Adviser, as provided in the Proposed Agreements, including the management fees, were fair and reasonable in light of the services performed under the Current Agreements and to be performed under the Proposed Agreements, expenses incurred and to be incurred and such other matters as the Directors considered relevant in the exercise of their business judgment. The material factors and conclusions that formed the basis for the Directors’ determinations included the following:
Nature, Extent and Quality of Services Provided
The Directors considered the scope and quality of services to be provided by the Adviser under the Proposed Agreements, including the quality of
| 50 | AB INTERNATIONAL STRATEGIC CORE PORTFOLIO | abfunds.com | |
the investment research capabilities of the Adviser and the other resources it has dedicated to performing services for the Funds. They also considered the information that had been provided to them by the Adviser concerning the anticipated implementation of the Plan and the Adviser’s representation that it did not anticipate that such implementation would affect the management or structure of the Adviser, have a material adverse effect on the Adviser, or adversely affect the quality of the services provided to the Funds by the Adviser and its affiliates. The Directors noted that the Adviser from time to time reviews each Fund’s investment strategies and from time to time proposes changes intended to improve the Fund’s relative or absolute performance for the Directors’ consideration. They also noted the professional experience and qualifications of each Fund’s portfolio management team and other senior personnel of the Adviser. The Directors also considered that certain Proposed Agreements, similar to the corresponding Current Agreements, provide that the Funds will reimburse the Adviser for the cost to it of providing certain clerical, accounting, administrative and other services to the Funds by employees of the Adviser or its affiliates. Requests for these reimbursements are made on a quarterly basis and subject to approval by the Directors. The Directors noted that the Adviser did not request any reimbursements from certain Funds in the Fund’s latest fiscal year reviewed. The Directors noted that the methodology to be used to determine the reimbursement amounts had been reviewed by an independent consultant retained by the Funds’ former Senior Officer/Independent Compliance Officer. The quality of administrative and other services, including the Adviser’s role in coordinating the activities of the Funds’ other service providers, also was considered. The Directors of each Fund concluded that, overall, they were satisfied with the nature, extent and quality of services to be provided to the Funds under the Proposed Agreement for the Fund.
Costs of Services to be Provided and Profitability
The Directors reviewed a schedule of the revenues and expenses and related notes indicating the profitability of each Fund to the Adviser for calendar years 2016 and 2017, as applicable, that had been prepared with an expense allocation methodology arrived at in consultation with an independent consultant retained by the Funds’ former Senior Officer/Independent Compliance Officer. The Directors noted the assumptions and methods of allocation used by the Adviser in preparing fund-specific profitability data and understood that there are a number of potentially acceptable allocation methodologies for information of this type. The Directors noted that the profitability information reflected all revenues and expenses of the Adviser’s relationship with a Fund, including those relating to its subsidiaries that provide transfer agency, distribution and brokerage services to the Fund, as applicable. The Directors recognized that it is difficult to make comparisons of the profitability of the Proposed Agreements with the profitability of fund advisory contracts for unaffiliated funds because comparative information is not generally publicly available and is
| abfunds.com | AB INTERNATIONAL STRATEGIC CORE PORTFOLIO | 51 | |
affected by numerous factors. The Directors focused on the profitability of the Adviser’s relationship with each Fund before taxes and distribution expenses, as applicable. The Directors noted that certain Funds were not profitable to the Adviser in one or more periods reviewed. The Directors concluded that the Adviser’s level of profitability from its relationship with the other Funds was not unreasonable. The Directors were unable to consider historical information about the profitability of certain Funds that had recently commenced operations and for which historical profitability information was not available. The Adviser agreed to provide the Directors with profitability information in connection with future proposed continuances of the Proposed Agreements.
Fall-Out Benefits
The Directors considered the other benefits to the Adviser and its affiliates from their relationships with the Funds, including, but not limited to, as applicable, benefits relating to soft dollar arrangements (whereby investment advisers receive brokerage and research services from brokers that execute agency transactions for their clients) in the case of certain Funds;12b-1 fees and sales charges received by the principal underwriter (which is a wholly owned subsidiary of the Adviser) in respect of certain classes of the shares of most of the Funds; brokerage commissions paid by certain Funds to brokers affiliated with the Adviser; and transfer agency fees paid by most of the Funds to a wholly owned subsidiary of the Adviser. The Directors recognized that the Adviser’s profitability would be somewhat lower, and that a Fund’s unprofitability to the Adviser would be exacerbated, without these benefits. The Directors understood that the Adviser also might derive reputational and other benefits from its association with the Funds.
Investment Results
In addition to the information reviewed by the Directors in connection with the Board meeting at which the Proposed Agreements were approved, the Directors receive detailed performance information for the Funds at each regular Board meeting during the year.
The Boards’ consideration of each Proposed Agreement was informed by their most recent approval of the related Current Agreement, and, in the case of certain Funds, their discussion with the Adviser of the reasons for those Funds’ underperformance in certain periods. The Directors also reviewed updated performance information and, in some cases, discussed with the Adviser the reasons for changes in performance or continued underperformance. On the basis of this review, the Directors concluded that each Fund’s investment performance was acceptable.
Management Fees and Other Expenses
The Directors considered the management fee rate payable by each Fund to the Adviser and information prepared by an independent service provider
| 52 | AB INTERNATIONAL STRATEGIC CORE PORTFOLIO | abfunds.com | |
(the “15(c) provider”) concerning management fee rates payable by other funds in the same category as the Fund. The Directors recognized that it is difficult to make comparisons of management fees because there are variations in the services that are included in the fees paid by other funds. The Directors compared each Fund’s contractual management fee rate with a peer group median, and where applicable, took into account the impact on the management fee rate of the administrative expense reimbursement paid to the Adviser in the latest fiscal year. In the case of the ACS Funds, the Directors noted that the management fee rate is zero but also were cognizant that the Adviser is indirectly compensated by the wrap fee program sponsors that use the ACS Funds as an investment vehicle for their clients.
The Directors also considered the Adviser’s fee schedule for other clients pursuing a similar investment style to each Fund. For this purpose, they reviewed the relevant advisory fee information from the Adviser’s Form ADV and in a report from the Funds’ Senior Analyst and noted the differences between a Fund’s fee schedule, on the one hand, and the Adviser’s institutional fee schedule and the schedule of fees charged by the Adviser to any offshore funds and for services to anysub-advised funds pursuing a similar investment strategy as the Fund, on the other, as applicable. The Directors noted that the Adviser may, in some cases, agree to fee rates with large institutional clients that are lower than those reviewed by the Directors and that they had previously discussed with the Adviser its policies in respect of such arrangements. The Adviser also informed the Directors that, in the case of certain Funds, there were no institutional products managed by the Adviser that have a substantially similar investment style. The Directors also discussed these matters with their independent fee consultant.
The Adviser reviewed with the Directors the significantly greater scope of the services it provides to each Fund relative to institutional, offshore fund andsub-advised fund clients, as applicable. In this regard, the Adviser noted, among other things, that, compared to institutional and offshore orsub-advisory accounts, each Fund, as applicable, (i) demands considerably more portfolio management, research and trading resources due to significantly higher daily cash flows (in the case ofopen-end Funds); (ii) has more tax and regulatory restrictions and compliance obligations; (iii) must prepare and file or distribute regulatory and other communications about fund operations; and (iv) must provide shareholder servicing to retail investors. The Adviser also reviewed the greater legal risks presented by the large and changing population of Fund shareholders who may assert claims against the Adviser in individual or class actions, and the greater entrepreneurial risk in offering new fund products, which require substantial investment to launch, may not succeed, and generally must be priced to compete with larger, more established funds resulting in lack of profitability to the Adviser until a new fund achieves scale. In light of the substantial differences in services rendered by the Adviser to institutional,
| abfunds.com | AB INTERNATIONAL STRATEGIC CORE PORTFOLIO | 53 | |
offshore fund andsub-advised fund clients as compared to the Funds, and the different risk profile, the Directors considered these fee comparisons inapt and did not place significant weight on them in their deliberations.
The Directors noted that many of the Funds may invest in shares of exchange-traded funds (“ETFs”), subject to the restrictions and limitations of the 1940 Act as these may be varied as a result of exemptive orders issued by the SEC. The Directors also noted that ETFs pay advisory fees pursuant to their advisory contracts. The Directors concluded, based on the Adviser’s explanation of how it uses ETFs when they are the most cost-effective way to obtain desired exposures, in some cases pending purchases of underlying securities, that each Fund’s management fee would be for services that would be in addition to, rather than duplicative of, the services provided under the advisory contracts of the ETFs.
With respect to each Fund’s management fee, the Directors considered the total expense ratio of the Fund in comparison to a peer group and peer universe selected by the 15(c) service provider. The Directors also considered the Adviser’s expense caps for certain Funds. The Directors view expense ratio information as relevant to their evaluation of the Adviser’s services because the Adviser is responsible for coordinating services provided to a Fund by others.
The Boards’ consideration of each Proposed Agreement was informed by their most recent approval of the related Current Agreement, and, in the case of certain Funds, their discussion with the Adviser of the reasons for those Funds’ expense ratios in certain periods. The Directors also reviewed updated expense ratio information and, in some cases, discussed with the Adviser the reasons for the expense ratios of certain Funds. On the basis of this review, the Directors concluded that each Fund’s expense ratio was acceptable.
The Directors did not consider comparative expense information for the ACS Funds because those Funds do not bear ordinary expenses.
Economies of Scale
The Directors noted that the management fee schedules for certain Funds do not contain breakpoints and that they had discussed their strong preference for breakpoints in advisory contracts with the Adviser. The Directors took into consideration prior presentations by an independent consultant on economies of scale in the mutual fund industry and for the Funds, and by the Adviser concerning certain of its views on economies of scale. The Directors also had requested and received from the Adviser certain updates on economies of scale in advance of the Board meeting. The Directors believe that economies of scale may be realized (if at all) by the Adviser across a variety of products and services, and not only in respect of a single fund. The Directors noted that there is no established
| 54 | AB INTERNATIONAL STRATEGIC CORE PORTFOLIO | abfunds.com | |
methodology for setting breakpoints that give effect to the fund-specific services provided by a fund’s adviser and to the economies of scale that an adviser may realize in its overall mutual fund business or those components of it which directly or indirectly affect a fund’s operations. The Directors observed that in the mutual fund industry as a whole, as well as among funds similar to each Fund, there is no uniformity or pattern in the fees and asset levels at which breakpoints (if any) apply. The Directors also noted that the advisory agreements for many funds do not have breakpoints at all. The Directors informed the Adviser that they would monitor the asset levels of the Funds without breakpoints and their profitability to the Adviser and anticipated revisiting the question of breakpoints in the future if circumstances warrant doing so.
The Directors did not consider the extent to which fee levels in the Advisory Agreement for the ACS Funds reflect economies of scale because that Advisory Agreement does not provide for any compensation to be paid to the Adviser by the ACS Funds and the expense ratio of each of those Funds is zero.
Interim Advisory Agreements
In approving the Interim Advisory Agreements, the Boards, with the assistance of independent counsel, considered similar factors to those considered in approving the Proposed Agreements. The Interim Advisory Agreements approved by the Boards are identical to the Proposed Agreements, as well as the Current Agreements, in all material respects except for their proposed effective and termination dates and provisions intended to comply with the requirements of the relevant SEC rule, such as provisions requiring escrow of advisory fees. Under the Interim Advisory Agreements, the Adviser would continue to manage a Fund pursuant to an Interim Advisory Agreement until a new advisory agreement was approved by stockholders or until the end of the150-day period, whichever would occur earlier. All fees earned by the Adviser under an Interim Advisory Agreement would be held in escrow pending shareholder approval of the Proposed Agreement. Upon approval of a new advisory agreement by stockholders, the escrowed management fees would be paid to the Adviser, and the Interim Advisory Agreement would terminate.
Information Regarding the Review and Approval of the Fund’s Current Advisory Agreement
The disinterested directors (the “directors”) of AB Cap Fund, Inc. (the “Company”) unanimously approved the continuance of the Company’s Advisory Agreement with the Adviser in respect of AB International Strategic Core Portfolio (the “Fund”) at a meeting held onMay 1-3, 2018 (the “Meeting”).
Prior to approval of the continuance of the Advisory Agreement, the directors had requested from the Adviser, and received and evaluated, extensive materials. They reviewed the proposed continuance of the Advisory
| abfunds.com | AB INTERNATIONAL STRATEGIC CORE PORTFOLIO | 55 | |
Agreement with the Adviser and with experienced counsel who are independent of the Adviser, who advised on the relevant legal standards. The directors also reviewed additional materials, including materials from an outside consultant, who acted as their independent fee consultant, and comparative analytical data prepared by the Senior Analyst for the Fund. The directors also discussed the proposed continuance in private sessions with counsel.
The directors considered their knowledge of the nature and quality of the services provided by the Adviser to the Fund gained from their experience as directors or trustees of most of the registered investment companies advised by the Adviser, their overall confidence in the Adviser’s integrity and competence they have gained from that experience, the Adviser’s initiative in identifying and raising potential issues with the directors and its responsiveness, frankness and attention to concerns raised by the directors in the past, including the Adviser’s willingness to consider and implement organizational and operational changes designed to improve investment results and the services provided to the AB Funds. The directors noted that they have four regular meetings each year, at each of which they review extensive materials and information from the Adviser, including information on the investment performance of the Fund.
The directors also considered all factors they believed relevant, including the specific matters discussed below. During the course of their deliberations, the directors evaluated, among other things, the reasonableness of the advisory fee. The directors did not identify any particular information that wasall-important or controlling, and different directors may have attributed different weights to the various factors. The directors determined that the selection of the Adviser to manage the Fund and the overall arrangements between the Fund and the Adviser, as provided in the Advisory Agreement, including the advisory fee, were fair and reasonable in light of the services performed, expenses incurred and such other matters as the directors considered relevant in the exercise of their business judgment. The material factors and conclusions that formed the basis for the directors’ determinations included the following:
Nature, Extent and Quality of Services Provided
The directors considered the scope and quality of services provided by the Adviser under the Advisory Agreement, including the quality of the investment research capabilities of the Adviser and the other resources it has dedicated to performing services for the Fund. The directors noted that the Adviser from time to time reviews the Fund’s investment strategies and from time to time proposes changes intended to improve the Fund’s relative or absolute performance for the directors’ consideration. They also noted the professional experience and qualifications of the Fund’s portfolio management team and other senior personnel of the Adviser. The directors also considered that the Advisory Agreement provides that the Fund
| 56 | AB INTERNATIONAL STRATEGIC CORE PORTFOLIO | abfunds.com | |
will reimburse the Adviser for the cost to it of providing certain clerical, accounting, administrative and other services to the Fund by employees of the Adviser or its affiliates. Requests for these reimbursements are made on a quarterly basis and subject to approval by the directors. Reimbursements, to the extent requested and paid, result in a higher rate of total compensation from the Fund to the Adviser than the fee rate stated in the Advisory Agreement. The Adviser did not request any reimbursements from the Fund in the Fund’s latest fiscal year. The directors noted that the methodology used to determine the reimbursement amounts had been reviewed by an independent consultant retained by the Company’s former Independent Compliance Officer. The quality of administrative and other services, including the Adviser’s role in coordinating the activities of the Fund’s other service providers, also was considered. The directors concluded that, overall, they were satisfied with the nature, extent and quality of services provided to the Fund under the Advisory Agreement.
Costs of Services Provided and Profitability
The directors reviewed a schedule of the revenues and expenses and related notes indicating the profitability of the Fund to the Adviser for calendar years 2016 and 2017 that had been prepared with an expense allocation methodology arrived at in consultation with an independent consultant retained by the Company’s former Independent Compliance Officer. The directors noted the assumptions and methods of allocation used by the Adviser in preparing fund-specific profitability data and understood that there are a number of potentially acceptable allocation methodologies for information of this type. The directors noted that the profitability information reflected all revenues and expenses of the Adviser’s relationship with the Fund, including those relating to its subsidiaries that provide transfer agency, distribution and brokerage services to the Fund. The directors recognized that it is difficult to make comparisons of the profitability of the Advisory Agreement with the profitability of advisory contracts for unaffiliated funds because comparative information is not generally publicly available and is affected by numerous factors. The directors focused on the profitability of the Adviser’s relationship with the Fund before taxes and distribution expenses. The directors noted that the Fund was not profitable to the Adviser in the periods reviewed.
Fall-Out Benefits
The directors considered the other benefits to the Adviser and its affiliates from their relationships with the Fund, including, but not limited to, benefits relating to soft dollar arrangements (whereby investment advisers receive brokerage and research services from brokers that execute agency transactions for their clients);12b-1 fees and sales charges received by the Fund’s principal underwriter (which is a wholly owned subsidiary of the Adviser) in respect of certain classes of the Fund’s shares; brokerage commissions paid by the Fund to brokers affiliated with the Adviser; and transfer agency fees paid by the Fund to a wholly owned subsidiary of the
| abfunds.com | AB INTERNATIONAL STRATEGIC CORE PORTFOLIO | 57 | |
Adviser. The directors recognized that the Fund’s unprofitability to the Adviser would be exacerbated without these benefits. The directors understood that the Adviser also might derive reputational and other benefits from its association with the Fund.
Investment Results
In addition to the information reviewed by the directors in connection with the Meeting, the directors receive detailed performance information for the Fund at each regular Board meeting during the year.
At the Meeting, the directors reviewed performance information prepared by an analytical service that is not affiliated with the Adviser (the “15(c) service provider”), showing the performance of the Class A Shares of the Fund against a group of similar funds (“peer group”) and a larger group of similar funds (“peer universe”), each selected by the 15(c) service provider, and information prepared by the Adviser showing performance of the Class A Shares against a broad-based securities market index, in each case for the1-year period ended February 28, 2018 and (in the case of comparisons with the broad-based securities market index) for the period from inception. Based on their review, the directors concluded that the Fund’s investment performance was acceptable.
Advisory Fees and Other Expenses
The directors considered the advisory fee rate payable by the Fund to the Adviser and information prepared by the 15(c) service provider concerning advisory fee rates payable by other funds in the same category as the Fund. The directors recognized that it is difficult to make comparisons of advisory fees because there are variations in the services that are included in the fees paid by other funds. The directors compared the Fund’s contractual effective advisory fee rate with a peer group median.
The directors also considered the Adviser’s fee schedule for other clients pursuing a similar investment style. For this purpose, they reviewed the relevant advisory fee information from the Adviser’s Form ADV and the materials from the Fund’s Senior Analyst and noted the differences between the Fund’s fee schedule, on the one hand, and the Adviser’s institutional fee schedule and the schedule of fees charged by the Adviser to any offshore funds and anysub-advised funds, on the other. The directors noted that the Adviser may, in some cases, agree to fee rates with large institutional clients that are lower than those reviewed by the directors and that they had previously discussed with the Adviser its policies in respect of such arrangements. The directors also compared the advisory fee rate for the Fund with that for another AB Fund with a similar investment style.
The Adviser reviewed with the directors the significantly greater scope of the services it provides to the Fund relative to institutional, offshore fund andsub-advised fund clients. In this regard, the Adviser noted, among
| 58 | AB INTERNATIONAL STRATEGIC CORE PORTFOLIO | abfunds.com | |
other things, that, compared to institutional and offshore accounts, the Fund (i) demands considerably more portfolio management, research and trading resources due to significantly higher daily cash flows; (ii) has more tax and regulatory restrictions; (iii) must prepare and distribute regulatory and other communications about fund operations; and (iv) must provide shareholder servicing to retail investors. The Adviser also reviewed the greater legal risks presented by the large and changing population of Fund shareholders who may assert claims against the Adviser in individual or class actions, and the greater entrepreneurial risk in offering new fund products, which require substantial investment to launch, may not succeed, and generally must be priced to compete with larger, more established funds resulting in lack of profitability to the Adviser until a new fund achieves scale. In light of the substantial differences in services rendered by the Adviser to institutional, offshore fund andsub-advised fund clients as compared to funds such as the Fund, and the different risk profile, the directors considered these fee comparisons inapt and did not place significant weight on them in their deliberations.
The directors noted that the Fund may invest in shares of exchange-traded funds (“ETFs”), subject to the restrictions and limitations of the Investment Company Act of 1940 as these may be varied as a result of exemptive orders issued by the SEC. The directors also noted that ETFs pay advisory fees pursuant to their advisory contracts, and that the Adviser had provided, and they had reviewed information about the expense ratios of the relevant ETFs. The directors concluded, based on the Adviser’s explanation of how it may use ETFs when they are the most cost-effective way to obtain desired exposures for a fund or to temporarily “equitize” cash inflows pending purchases of underlying securities, that the advisory fee for the Fund would be paid for services that would be in addition to, rather than duplicative of, the services provided under the advisory contracts of the ETFs.
The directors also considered the total expense ratio of the Class A shares of the Fund in comparison to a peer group and a peer universe selected by the 15(c) service provider. The Class A expense ratio of the Fund was based on the Fund’s latest fiscal year and the directors considered the effects of any fee waivers and/or expense reimbursements as a result of the Adviser’s expense cap. The directors noted that it was likely that the expense ratios of some of the other funds in the Fund’s category were lowered by waivers or reimbursements by those funds’ investment advisers, which in some cases might be voluntary or temporary. The directors view expense ratio information as relevant to their evaluation of the Adviser’s services because the Adviser is responsible for coordinating services provided to the Fund by others. Based on their review, the directors concluded that the Fund’s expense ratio was acceptable.
| abfunds.com | AB INTERNATIONAL STRATEGIC CORE PORTFOLIO | 59 | |
Economies of Scale
The directors noted that the advisory fee schedule for the Fund contains breakpoints that reduce the fee rates on assets above specified levels. The directors took into consideration prior presentations by an independent consultant on economies of scale in the mutual fund industry and for the AB Funds, and by the Adviser concerning certain of its views on economies of scale. The directors also had requested and received from the Adviser certain updates on economies of scale in advance of the Meeting. The directors believe that economies of scale may be realized (if at all) by the Adviser across a variety of products and services, and not only in respect of a single fund. The directors noted that there is no established methodology for setting breakpoints that give effect to the fund-specific services provided by a fund’s adviser and to the economies of scale that an adviser may realize in its overall mutual fund business or those components of it which directly or indirectly affect a fund’s operations. The directors observed that in the mutual fund industry as a whole, as well as among funds similar to the Fund, there is no uniformity or pattern in the fees and asset levels at which breakpoints (if any) apply. The directors also noted that the advisory agreements for many funds do not have breakpoints at all. Having taken these factors into account, the directors concluded that the Fund’s shareholders would benefit from a sharing of economies of scale in the event the Fund’s net assets exceed a breakpoint in the future.
| 60 | AB INTERNATIONAL STRATEGIC CORE PORTFOLIO | abfunds.com | |
This page is not part of the Shareholder Report or the Financial Statements.
AB FAMILY OF FUNDS
US EQUITY
US CORE
Core Opportunities Fund
FlexFee™ US Thematic Portfolio
Select US Equity Portfolio
US GROWTH
Concentrated Growth Fund
Discovery Growth Fund
FlexFee™ Large Cap Growth Portfolio
Growth Fund
Large Cap Growth Fund
Small Cap Growth Portfolio
US VALUE
Discovery Value Fund
Equity Income Fund
Relative Value Fund
Small Cap Value Portfolio
Value Fund
INTERNATIONAL/ GLOBAL EQUITY
INTERNATIONAL/ GLOBAL CORE
FlexFee™ International Strategic Core Portfolio
Global Core Equity Portfolio
International Portfolio
International Strategic Core Portfolio
Sustainable Global Thematic Fund
Tax-Managed International Portfolio
Tax-Managed Wealth Appreciation Strategy
Wealth Appreciation Strategy
INTERNATIONAL/ GLOBAL GROWTH
Concentrated International Growth Portfolio
FlexFee™ Emerging Markets Growth Portfolio
INTERNATIONAL/ GLOBAL EQUITY(continued)
Sustainable International Thematic Fund
INTERNATIONAL/ GLOBAL VALUE
All China Equity Portfolio
International Value Fund
FIXED INCOME
MUNICIPAL
High Income Municipal Portfolio
Intermediate California Municipal Portfolio
Intermediate Diversified Municipal Portfolio
Intermediate New York Municipal Portfolio
Municipal Bond Inflation Strategy
Tax-Aware Fixed Income Portfolio
National Portfolio
Arizona Portfolio
California Portfolio
Massachusetts Portfolio
Minnesota Portfolio
New Jersey Portfolio
New York Portfolio
Ohio Portfolio
Pennsylvania Portfolio
Virginia Portfolio
TAXABLE
Bond Inflation Strategy
FlexFee™ High Yield Portfolio1
FlexFee™ International Bond Portfolio
Global Bond Fund
High Income Fund
Income Fund
Intermediate Bond Portfolio
Limited Duration High Income Portfolio
Short Duration Portfolio
ALTERNATIVES
All Market Real Return Portfolio
Global Real Estate Investment Fund
Select US Long/Short Portfolio
Unconstrained Bond Fund
MULTI-ASSET
All Market Income Portfolio
All Market Total Return Portfolio
Conservative Wealth Strategy
Emerging Markets Multi-Asset Portfolio
Global Risk Allocation Fund
Tax-Managed All Market Income Portfolio
TARGET-DATE
Multi-Manager Select Retirement Allocation Fund
Multi-Manager Select 2010 Fund
Multi-Manager Select 2015 Fund
Multi-Manager Select 2020 Fund
Multi-Manager Select 2025 Fund
Multi-Manager Select 2030 Fund
Multi-Manager Select 2035 Fund
Multi-Manager Select 2040 Fund
Multi-Manager Select 2045 Fund
Multi-Manager Select 2050 Fund
Multi-Manager Select 2055 Fund
Multi-Manager Select 2060 Fund
CLOSED-END FUNDS
Alliance California Municipal Income Fund
AllianceBernstein Global High Income Fund
AllianceBernstein National Municipal Income Fund
We also offer Government Money Market Portfolio, which serves as the money market fund exchange vehicle for the AB mutual funds. You could lose money by investing in the Fund. Although the Fund seeks to preserve the value of your investment at $1.00 per share, it cannot guarantee it will do so. The Fund may impose a fee upon sale of your shares or may temporarily suspend your ability to sell shares if the Fund’s liquidity falls below required minimums because of market conditions or other factors. An investment in the Fund is not insured or guaranteed by the Federal Deposit Insurance Corporation or any other government agency. The Fund’s sponsor has no legal obligation to provide financial support to the Fund, and you should not expect that the sponsor will provide financial support to the Fund at any time.
Investors should consider the investment objectives, risks, charges and expenses of the Fund carefully before investing. For copies of our prospectus or summary prospectus, which contain this and other information, visit us online at www.abfunds.com or contact your AB representative. Please read the prospectus and/or summary prospectus carefully before investing.
| 1 | Prior to February 23, 2018, FlexFee High Yield Portfolio was named High Yield Portfolio. |
| abfunds.com | AB INTERNATIONAL STRATEGIC CORE PORTFOLIO | 61 | |
NOTES
| 62 | AB INTERNATIONAL STRATEGIC CORE PORTFOLIO | abfunds.com | |
NOTES
| abfunds.com | AB INTERNATIONAL STRATEGIC CORE PORTFOLIO | 63 | |
NOTES
| 64 | AB INTERNATIONAL STRATEGIC CORE PORTFOLIO | abfunds.com | |
NOTES
| abfunds.com | AB INTERNATIONAL STRATEGIC CORE PORTFOLIO | 65 | |
NOTES
| 66 | AB INTERNATIONAL STRATEGIC CORE PORTFOLIO | abfunds.com | |
NOTES
| abfunds.com | AB INTERNATIONAL STRATEGIC CORE PORTFOLIO | 67 | |
NOTES
| 68 | AB INTERNATIONAL STRATEGIC CORE PORTFOLIO | abfunds.com | |
AB INTERNATIONAL STRATEGIC CORE PORTFOLIO
1345 Avenue of the Americas
New York, NY 10105
800 221 5672
ISCP-0152-1218 
DEC 12.31.18

SEMI-ANNUAL REPORT
AB SELECT US EQUITY PORTFOLIO

Beginning January 1, 2021, as permitted by new regulations adopted by the Securities and Exchange Commission, the Fund’s annual and semi-annual shareholder reports will no longer be sent by mail, unless you specifically request paper copies of the reports. Instead, the reports will be made available on a website, and you will be notified by mail each time a report is posted and provided with a website address to access the report.
If you already elected to receive shareholder reports electronically, you will not be affected by this change and you need not take any action. You may elect to receive shareholder reports and other communications from the Fund electronically at any time by contacting your financial intermediary (such as a broker-dealer or bank) or, if you are a direct investor, by calling the Fund at (800) 221 5672.
You may elect to receive all future reports in paper form free of charge. If you invest through a financial intermediary, you can contact your financial intermediary to request that you continue to receive paper copies of your shareholder reports; if you invest directly with the Fund, you can call the Fund at (800) 221 5672. Your election to receive reports in paper form will apply to all funds held in your account with your financial intermediary or, if you invest directly, to all AB Mutual Funds you hold.
| Investment Products Offered | • Are Not FDIC Insured• May Lose Value• Are Not Bank Guaranteed | |
Investors should consider the investment objectives, risks, charges and expenses of the Fund carefully before investing. For copies of our prospectus or summary prospectus, which contain this and other information, visit us online at www.abfunds.com or contact your AB representative. Please read the prospectus and/or summary prospectus carefully before investing.
This shareholder report must be preceded or accompanied by the Fund’s prospectus for individuals who are not current shareholders of the Fund.
You may obtain a description of the Fund’s proxy voting policies and procedures, and information regarding how the Fund voted proxies relating to portfolio securities during the most recent12-month period ended June 30, without charge. Simply visit AB’s website at www.abfunds.com, or go to the Securities and Exchange Commission’s (the “Commission”) website at www.sec.gov, or call AB at (800) 227 4618.
The Fund files its complete schedule of portfolio holdings with the Commission for the first and third quarters of each fiscal year. The Fund’s portfolio holdings reports are available on the Commission’s website at www.sec.gov. The Fund’s portfolio holdings reports may also be reviewed and copied at the Commission’s Public Reference Room in Washington, DC; information on the operation of the Public Reference Room may be obtained by calling (800) SEC 0330. AB publishes full portfolio holdings for the Fund monthly at www.abfunds.com.
AllianceBernstein Investments, Inc. (ABI) is the distributor of the AB family of mutual funds. ABI is a member of FINRA and is an affiliate of AllianceBernstein L.P., the Adviser of the funds.
The [A/B] logo is a registered service mark of AllianceBernstein and AllianceBernstein® is a registered service mark used by permission of the owner, AllianceBernstein L.P.
| FROM THE PRESIDENT |  |
Dear Shareholder,
We are pleased to provide this report for AB Select US Equity Portfolio (the “Fund”). Please review the discussion of Fund performance, the market conditions during the reporting period and the Fund’s investment strategy.
As always, AB strives to keep clients ahead of what’s next by:
| + | Transforming uncommon insights into uncommon knowledge with a global research scope |
| + | Navigating markets with seasoned investment experience and sophisticated solutions |
| + | Providing thoughtful investment insights and actionable ideas |
Whether you’re an individual investor or a multi-billion-dollar institution, we put knowledge and experience to work for you.
AB’s global research organization connects and collaborates across platforms and teams to deliver impactful insights and innovative products. Better insights lead to better opportunities—anywhere in the world.
For additional information about AB’s range of products and shareholder resources, please log on to www.abfunds.com.
Thank you for your investment in the AB Mutual Funds.
Sincerely,

Robert M. Keith
President and Chief Executive Officer, AB Mutual Funds
| abfunds.com | AB SELECT US EQUITY PORTFOLIO | 1 | |
SEMI-ANNUAL REPORT
February 12, 2019
This report provides management’s discussion of fund performance for AB Select US Equity Portfolio for the semi-annual reporting period ended December 31, 2018.
The Fund’s investment objective is long-term growth of capital.
NAV RETURNS AS OF DECEMBER 31, 2018(unaudited)
| 6 Months | 12 Months | |||||||
| AB SELECT US EQUITY PORTFOLIO1 | ||||||||
| Class A Shares | -6.96% | -5.02% | ||||||
| Class C Shares | -7.31% | -5.69% | ||||||
| Advisor Class Shares2 | -6.89% | -4.78% | ||||||
| Class R Shares2 | -7.11% | -5.24% | ||||||
| Class K Shares2 | -7.04% | -5.07% | ||||||
| Class I Shares2 | -6.83% | -4.75% | ||||||
| S&P 500 Index | -6.85% | -4.38% | ||||||
| 1 | Includes the impact of proceeds received and credited to the Fund resulting from class-action settlements, which enhanced the performance of all share classes of the Fund for thesix- and12-month periods ended December 31, 2018, by 0.00% and 0.02%, respectively. |
| 2 | Please note that these share classes are for investors purchasing shares through accounts established under certainfee-based programs sponsored and maintained by certain broker-dealers and financial intermediaries, institutional pension plans and/or investment advisory clients of, and certain other persons associated with, the Adviser and its affiliates or the Fund. |
INVESTMENT RESULTS
The table above shows the Fund’s performance compared to its benchmark, the Standard & Poor’s (“S&P”) 500 Index, for thesix- and12-month periods ended December 31, 2018.
During thesix-month period, all share classes except Class I underperformed the benchmark, before sales charges. Security selection within the energy, consumer-staples and consumer-discretionary sectors detracted, relative to the benchmark, while strong security selection within the financials, utilities and communication-services sectors contributed. From a sector selection perspective, the Fund’s underweight to consumer staples, real estate and overweight to industrials detracted, while the Fund’s underweight to technology and energy, as well as its cash position, contributed.
During the12-month period, all share classes underperformed the benchmark, before sales charges. Security selection within the consumer-discretionary, energy and consumer-staples sectors detracted, while strong
| 2 | AB SELECT US EQUITY PORTFOLIO | abfunds.com | |
security selection within the financials, health care and utilities sectors contributed. From a sector selection perspective, the Fund’s overweight to industrials, real estate and financials detracted, while the Fund’s cash position, overweight to utilities and underweight to technology contributed.
The Fund utilized derivatives in the form of total return swaps for investment purposes, which detracted for thesix-month period, and added for the12-month period, in absolute terms.
MARKET REVIEW AND INVESTMENT STRATEGY
At the beginning of the12-month period ended December 31, 2018, stocks performed strongly, before concerns about higher inflation and interest rates led to a sharp market correction. Throughout the12-month period, other issues were prominent, including tariffs and protectionism, slowing global growth, government regulation of technology companies, a flattening yield curve, a stronger US dollar and a more aggressive US Federal Reserve (the “Fed”). However, investors also saw many positives, including strong earnings, booming dividends and stock buybacks, along with reasonable valuations.
Stocks generated their strongest quarterly returns since 2013 in the first half of thesix-month period, driven by gains in health care, industrials and technology stocks. However, during the fourth quarter of 2018, markets reversed course, falling sharply as investor concerns around slowing economic growth, Fed policy tightening, continuedUS-China trade tensions, and growing political instability in the US led to a sharp market correction. US equities ultimately ended the12-month period lower, as the S&P 500 Index declined 4.38%.
The Fund’s Senior Investment Management Team (the “Team”) continues to seek attractive risk-adjusted returns from a flexible approach unconstrained by investment style, with an intense focus on downside risk. The Team usesbottom-up analysis to find companies with growth potential, adjusting expectations based on the short-term market environment.
INVESTMENT POLICIES
Under normal circumstances, the Fund invests at least 80% of its net assets in equity securities of US companies. For purposes of this requirement, equity securities include common stock, preferred stock and derivatives related to common and preferred stocks.
The Adviser selects investments for the Fund through an intensive“bottom-up” approach that places an emphasis on companies that are engaged in business activities with solid long-term growth potential and operating in industries with high barriers to entry, that have
(continued on next page)
| abfunds.com | AB SELECT US EQUITY PORTFOLIO | 3 | |
strong cash flows and other financial metrics, and that have transparent financial statements and business models. The Adviser also evaluates the quality of company management based on a series of criteria, including: (1) management’s focus on shareholder returns, such as through a demonstrated commitment to dividends and dividend growth, share buybacks or other shareholder-friendly corporate actions; (2) management’s employment of conservative accounting methodologies; (3) management incentives, such as direct equity ownership; and (4) management accessibility. The Adviser seeks to identify companies where events or catalysts may drive the company’s share price higher, such as earnings and/or revenue growth above consensus forecasts, potential market recognition of undervaluation or overstated market-risk discount, or the institution of shareholder-focused changes discussed in the preceding sentence. In light of this catalyst-focused approach, the Adviser expects to engage in active and frequent trading for the Fund. The Adviser may reduce or eliminate the Fund’s holdings in a company’s securities for a number of reasons, including if its evaluation of the above factors changes adversely, if the anticipated events or catalysts do not occur or do not affect the price of the securities as expected, or if the anticipated events or catalysts do occur and cause the securities to be, in the Adviser’s view, overvalued or fully valued. At any given time the Fund may emphasize growth stocks over value stocks, or vice versa.
The Fund’s investments will be focused on securities of companies with large- and medium-market capitalizations, but it may also invest in securities of small-capitalization companies. The Fund may invest innon-US companies, but will limit its investments in such companies to no more than 10% of its net assets. The Fund may purchase securities in initial public offerings and expects to do so on a regular basis.
| 4 | AB SELECT US EQUITY PORTFOLIO | abfunds.com | |
DISCLOSURES AND RISKS
Benchmark Disclosure
The S&P 500® Index is unmanaged and does not reflect fees and expenses associated with the active management of a mutual fund portfolio. The S&P 500 Index includes 500 US stocks and is a common representation of the performance of the overall US stock market. An investor cannot invest directly in an index, and its results are not indicative of the performance for any specific investment, including the Fund.
A Word About Risk
Market Risk: The value of the Fund’s assets will fluctuate as the stock, bond or currency markets fluctuate. The value of the Fund’s investments may decline, sometimes rapidly and unpredictably, simply because of economic changes or other events that affect large portions of the market.
Sector Risk: The Fund may have more risk because of concentrated investments in a particular market sector, such as the technology or financial-services sector. Market or economic factors affecting that sector could have a major effect on the value of the Fund’s investments.
Capitalization Risk: Investments in small- and mid-capitalization companies may be more volatile than investments in large-capitalization companies. Investments in these companies may have additional risks because these companies may have limited product lines, markets or financial resources.
Active Trading Risk: The Fund expects to engage in active and frequent trading of its portfolio securities and its portfolio turnover rate may greatly exceed 100%. A higher rate of portfolio turnover increases transaction costs, which may negatively affect the Fund’s return. In addition, a high rate of portfolio turnover may result in substantial short-term gains, which may have adverse tax consequences for Fund shareholders.
Management Risk: The Fund is subject to management risk because it is an actively managed investment fund. The Adviser will apply its investment techniques and risk analyses in making investment decisions for the Fund, but there is no guarantee that its techniques will produce the intended results.
These risks are fully discussed in the Fund’s prospectus. As with all investments, you may lose money by investing in the Fund.
An Important Note About Historical Performance
The investment return and principal value of an investment in the Fund will fluctuate, so that shares, when redeemed, may be worth more or less than their original cost. Performance shown in this report represents past performance and does not guarantee future
| abfunds.com | AB SELECT US EQUITY PORTFOLIO | 5 | |
DISCLOSURES AND RISKS(continued)
results. Current performance may be lower or higher than the performance information shown. You may obtain performance information current to the most recentmonth-end by visiting www.abfunds.com.
All fees and expenses related to the operation of the Fund have been deducted. Net asset value (“NAV”) returns do not reflect sales charges; if sales charges were reflected, the Fund’s quoted performance would be lower. SEC returns reflect the applicable sales charges for each share class: a 4.25% maximumfront-end sales charge for Class A shares and a 1%1-year contingent deferred sales charge for Class C shares. Returns for the different share classes will vary due to different expenses associated with each class. Performance assumes reinvestment of distributions and does not account for taxes.
| 6 | AB SELECT US EQUITY PORTFOLIO | abfunds.com | |
HISTORICAL PERFORMANCE
AVERAGE ANNUAL RETURNS AS OF DECEMBER 31, 2018(unaudited)
| NAV Returns | SEC Returns (reflects applicable | |||||||
| CLASS A SHARES | ||||||||
| 1 Year | -5.02% | -9.08% | ||||||
| 5 Years | 7.67% | 6.73% | ||||||
| Since Inception1 | 12.18% | 11.50% | ||||||
| CLASS C SHARES | ||||||||
| 1 Year | -5.69% | -6.53% | ||||||
| 5 Years | 6.88% | 6.88% | ||||||
| Since Inception1 | 11.37% | 11.37% | ||||||
| ADVISOR CLASS SHARES2 | ||||||||
| 1 Year | -4.78% | -4.78% | ||||||
| 5 Years | 7.96% | 7.96% | ||||||
| Since Inception1 | 12.48% | 12.48% | ||||||
| CLASS R SHARES2 | ||||||||
| 1 Year | -5.24% | -5.24% | ||||||
| 5 Years | 7.38% | 7.38% | ||||||
| Since Inception1 | 11.89% | 11.89% | ||||||
| CLASS K SHARES2 | ||||||||
| 1 Year | -5.07% | -5.07% | ||||||
| 5 Years | 7.59% | 7.59% | ||||||
| Since Inception1 | 12.11% | 12.11% | ||||||
| CLASS I SHARES2 | ||||||||
| 1 Year | -4.75% | -4.75% | ||||||
| 5 Years | 7.97% | 7.97% | ||||||
| Since Inception1 | 12.48% | 12.48% | ||||||
The Fund’s current prospectus fee table shows the Fund’s total annual operating expense ratios as 1.48%, 2.23%, 1.23%, 1.78%, 1.65% and 1.24% for Class A, Class C, Advisor Class, Class R, Class K and Class I shares, respectively, gross of any fee waivers or expense reimbursements. Contractual fee waivers and/or expense reimbursements limit the Fund’s annual operating expense ratios to 1.47%, 2.23%, 1.22%, 1.78%, 1.56% and 1.23% for Class A, Class C, Advisor Class, Class R, Class K and Class I shares, respectively. These waivers/reimbursements may not be terminated prior to October 31, 2019 and may be extended by the Adviser for additionalone-year terms. Absent reimbursements or waivers, performance would have been lower. The Financial Highlights section of this report sets forth expense ratio data for the current reporting period; the expense ratios shown above may differ from the expense ratios in the Financial Highlights section since they are based on different time periods.
| 1 | Inception date: 12/8/2011. |
| 2 | These share classes are offered at NAV to eligible investors and their SEC returns are the same as their NAV returns. Please note that these share classes are for investors purchasing shares through accounts established under certainfee-based programs sponsored and maintained by certain broker-dealers and financial intermediaries, institutional pension plans and/or investment advisory clients of, and certain other persons associated with, the Adviser and its affiliates or the Fund. |
| abfunds.com | AB SELECT US EQUITY PORTFOLIO | 7 | |
HISTORICAL PERFORMANCE(continued)
SEC AVERAGE ANNUAL RETURNS
AS OF THE MOST RECENT CALENDARQUARTER-END
DECEMBER 31, 2018(unaudited)
SEC Returns (reflects applicable | ||||
| CLASS A SHARES | ||||
| 1 Year | -9.08% | |||
| 5 Years | 6.73% | |||
| Since Inception1 | 11.50% | |||
| CLASS C SHARES | ||||
| 1 Year | -6.53% | |||
| 5 Years | 6.88% | |||
| Since Inception1 | 11.37% | |||
| ADVISOR CLASS SHARES2 | ||||
| 1 Year | -4.78% | |||
| 5 Years | 7.96% | |||
| Since Inception1 | 12.48% | |||
| CLASS R SHARES2 | ||||
| 1 Year | -5.24% | |||
| 5 Years | 7.38% | |||
| Since Inception1 | 11.89% | |||
| CLASS K SHARES2 | ||||
| 1 Year | -5.07% | |||
| 5 Years | 7.59% | |||
| Since Inception1 | 12.11% | |||
| CLASS I SHARES2 | ||||
| 1 Year | -4.75% | |||
| 5 Years | 7.97% | |||
| Since Inception1 | 12.48% | |||
| 1 | Inception date: 12/8/2011. |
| 2 | Please note that these share classes are for investors purchasing shares through accounts established under certainfee-based programs sponsored and maintained by certain broker-dealers and financial intermediaries, institutional pension plans and/or investment advisory clients of, and certain other persons associated with, the Adviser and its affiliates or the Fund. |
| 8 | AB SELECT US EQUITY PORTFOLIO | abfunds.com | |
EXPENSE EXAMPLE
(unaudited)
As a shareholder of the Fund, you incur two types of costs: (1) transaction costs, including sales charges (loads) on purchase payments, contingent deferred sales charges on redemptions and (2) ongoing costs, including management fees; distribution(12b-1) fees; and other Fund expenses. This example is intended to help you understand your ongoing costs (in dollars) of investing in the Fund and to compare these costs with the ongoing costs of investing in other mutual funds.
The Example is based on an investment of $1,000 invested at the beginning of the period and held for the entire period as indicated below.
Actual Expenses
The table below provides information about actual account values and actual expenses. You may use the information, together with the amount you invested, to estimate the expenses that you paid over the period. Simply divide your account value by $1,000 (for example, an $8,600 account value divided by $1,000 = 8.6), then multiply the result by the number under the heading entitled “Expenses Paid During Period” to estimate the expenses you paid on your account during this period.
Hypothetical Example for Comparison Purposes
The table below also provides information about hypothetical account values and hypothetical expenses based on the Fund’s actual expense ratio and an assumed annual rate of return of 5% before expenses, which is not the Fund’s actual return. The hypothetical account values and expenses may not be used to estimate the actual ending account balance or expenses you paid for the period. You may use this information to compare the ongoing costs of investing in the Fund and other funds by comparing this 5% hypothetical example with the 5% hypothetical examples that appear in the shareholder reports of other funds.
Please note that the expenses shown in the table are meant to highlight your ongoing costs only and do not reflect any transactional costs, such as sales charges (loads), or contingent deferred sales charges on redemptions. Therefore, the hypothetical example is useful in comparing ongoing costs only, and will not help you determine the relative total costs of owning different funds. In addition, if these transactional costs were included, your costs would have been higher.
| abfunds.com | AB SELECT US EQUITY PORTFOLIO | 9 | |
EXPENSE EXAMPLE(continued)
| Beginning Account Value 7/1/2018 | Ending Account Value 12/31/2018 | Expenses Paid During Period* | Annualized Expense Ratio* | Total Expenses Paid During Period+ | Total Annualized Expense Ratio+ | |||||||||||||||||||
| Class A | ||||||||||||||||||||||||
Actual | $ | 1,000 | $ | 930.40 | $ | 7.20 | 1.48 | % | $ | 7.25 | 1.49 | % | ||||||||||||
Hypothetical** | $ | 1,000 | $ | 1,017.74 | $ | 7.53 | 1.48 | % | $ | 7.58 | 1.49 | % | ||||||||||||
| Class C | ||||||||||||||||||||||||
Actual | $ | 1,000 | $ | 926.90 | $ | 10.83 | 2.23 | % | $ | 10.88 | 2.24 | % | ||||||||||||
Hypothetical** | $ | 1,000 | $ | 1,013.96 | $ | 11.32 | 2.23 | % | $ | 11.37 | 2.24 | % | ||||||||||||
| Advisor Class | ||||||||||||||||||||||||
Actual | $ | 1,000 | $ | 931.10 | $ | 5.99 | 1.23 | % | $ | 6.04 | 1.24 | % | ||||||||||||
Hypothetical** | $ | 1,000 | $ | 1,019.00 | $ | 6.26 | 1.23 | % | $ | 6.31 | 1.24 | % | ||||||||||||
Class R | ||||||||||||||||||||||||
Actual | $ | 1,000 | $ | 928.90 | $ | 8.56 | 1.76 | % | $ | 8.61 | 1.77 | % | ||||||||||||
Hypothetical** | $ | 1,000 | $ | 1,016.33 | $ | 8.94 | 1.76 | % | $ | 9.00 | 1.77 | % | ||||||||||||
| Class K | ||||||||||||||||||||||||
Actual | $ | 1,000 | $ | 929.60 | $ | 7.54 | 1.55 | % | $ | 7.59 | 1.56 | % | ||||||||||||
Hypothetical** | $ | 1,000 | $ | 1,017.39 | $ | 7.88 | 1.55 | % | $ | 7.93 | 1.56 | % | ||||||||||||
| Class I | ||||||||||||||||||||||||
Actual | $ | 1,000 | $ | 931.70 | $ | 5.94 | 1.22 | % | $ | 5.99 | 1.23 | % | ||||||||||||
Hypothetical** | $ | 1,000 | $ | 1,019.06 | $ | 6.21 | 1.22 | % | $ | 6.26 | 1.23 | % | ||||||||||||
| * | Expenses are equal to the classes’ annualized expense ratios multiplied by the average account value over the period, multiplied by 184/365 (to reflect theone-half year period). |
| + | In connection with the Fund’s investments in affiliated/unaffiliated underlying portfolios, the Fund incurs no direct expenses, but bears proportionate shares of the fees and expenses (i.e., operating, administrative and investment advisory fees) of the affiliated/unaffiliated underlying portfolios. The Adviser has contractually agreed to waive its fees from the Fund in an amount equal to the Fund’s pro rata share of certain acquired fund fees and expenses of the affiliated underlying portfolios. The Fund’s total expenses are equal to the classes’ annualized expense ratio plus the Fund’s pro rata share of the weighted average expense ratio of the affiliated/unaffiliated underlying portfolios in which it invests, multiplied by the average account value over the period, multiplied by 184/365 (to reflect theone-half year period). |
| ** | Assumes 5% annual return before expenses. |
| 10 | AB SELECT US EQUITY PORTFOLIO | abfunds.com | |
PORTFOLIO SUMMARY
December 31, 2018(unaudited)
PORTFOLIO STATISTICS
Net Assets ($mil): $208.3
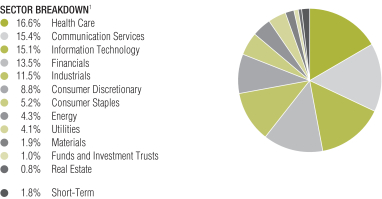
TEN LARGEST HOLDINGS2
| Company | U.S. $ Value | Percent of Net Assets | ||||||
| Berkshire Hathaway, Inc. – Class B | $ | 8,646,411 | 4.2 | % | ||||
| Microsoft Corp. | 8,521,520 | 4.1 | ||||||
| Alphabet, Inc. – Class C | 8,193,746 | 3.9 | ||||||
| Honeywell International, Inc. | 6,715,131 | 3.2 | ||||||
| Northrop Grumman Corp. | 6,640,953 | 3.2 | ||||||
| NextEra Energy, Inc. | 6,125,938 | 3.0 | ||||||
| Home Depot, Inc. (The) | 6,118,510 | 2.9 | ||||||
| Apple, Inc. | 6,096,651 | 2.9 | ||||||
| Johnson & Johnson | 4,983,137 | 2.4 | ||||||
| Cisco Systems, Inc. | 4,801,917 | 2.3 | ||||||
| $ | 66,843,914 | 32.1 | % | |||||
| 1 | All data are as of December 31, 2018. The Fund’s sector breakdown is expressed as a percentage of total investments (excluding security lending collateral) and may vary over time. |
| 2 | Long-term investments. |
Please note: The sector classifications presented herein are based on the Global Industry Classification Standard (GICS) which was developed by Morgan Stanley Capital International and Standard & Poor’s. The components are divided into sector, industry group, and industrysub-indices as classified by the GICS for each of the market capitalization indices in the broad market. These sector classifications are broadly defined. The “Portfolio of Investments” section of the report reflects more specific industry information and is consistent with the investment restrictions discussed in the Fund’s prospectus.
| abfunds.com | AB SELECT US EQUITY PORTFOLIO | 11 | |
PORTFOLIO OF INVESTMENTS
December 31, 2018(unaudited)
| Company | Shares | U.S. $ Value | ||||||
| ||||||||
COMMON STOCKS – 95.3% |
| |||||||
Health Care – 16.4% |
| |||||||
Health Care Equipment & Supplies – 5.3% |
| |||||||
Abbott Laboratories | 55,475 | $ | 4,012,507 | |||||
Boston Scientific Corp.(a) | 95,252 | 3,366,206 | ||||||
Medtronic PLC | 40,713 | 3,703,254 | ||||||
|
| |||||||
| 11,081,967 | ||||||||
|
| |||||||
Health Care Providers & Services – 4.3% |
| |||||||
Cigna Corp. | 17,775 | 3,375,828 | ||||||
Humana, Inc. | 5,997 | 1,718,021 | ||||||
UnitedHealth Group, Inc. | 15,393 | 3,834,704 | ||||||
|
| |||||||
| 8,928,553 | ||||||||
|
| |||||||
Pharmaceuticals – 6.8% |
| |||||||
Allergan PLC | 5,296 | 707,863 | ||||||
Johnson & Johnson | 38,614 | 4,983,137 | ||||||
Merck & Co., Inc. | 52,402 | 4,004,037 | ||||||
Pfizer, Inc. | 48,041 | 2,096,989 | ||||||
Zoetis, Inc. | 27,824 | 2,380,065 | ||||||
|
| |||||||
| 14,172,091 | ||||||||
|
| |||||||
| 34,182,611 | ||||||||
|
| |||||||
Communication Services – 15.3% |
| |||||||
Diversified Telecommunication Services – 3.3% |
| |||||||
AT&T, Inc. | 132,822 | 3,790,740 | ||||||
Verizon Communications, Inc. | 55,134 | 3,099,633 | ||||||
|
| |||||||
| 6,890,373 | ||||||||
|
| |||||||
Entertainment – 4.2% |
| |||||||
Take-Two Interactive Software, Inc.(a) | 17,338 | 1,784,774 | ||||||
Vivendi SA | 143,951 | 3,488,986 | ||||||
Walt Disney Co. (The) | 30,945 | 3,393,119 | ||||||
|
| |||||||
| 8,666,879 | ||||||||
|
| |||||||
Interactive Media & Services – 5.0% |
| |||||||
Alphabet, Inc. – Class C(a) | 7,912 | 8,193,746 | ||||||
Facebook, Inc. – Class A(a) | 16,355 | 2,143,977 | ||||||
|
| |||||||
| 10,337,723 | ||||||||
|
| |||||||
Media – 2.8% |
| |||||||
Comcast Corp. – Class A | 103,827 | 3,535,309 | ||||||
Liberty Media Corp.-Liberty SiriusXM – Class A(a) | 28,827 | 1,060,834 | ||||||
New York Times Co. (The) – Class A | 57,133 | 1,273,495 | ||||||
|
| |||||||
| 5,869,638 | ||||||||
|
| |||||||
| 31,764,613 | ||||||||
|
| |||||||
Information Technology – 14.2% |
| |||||||
Communications Equipment – 2.3% |
| |||||||
Cisco Systems, Inc. | 110,822 | 4,801,917 | ||||||
|
| |||||||
| 12 | AB SELECT US EQUITY PORTFOLIO | abfunds.com | |
PORTFOLIO OF INVESTMENTS(continued)
| Company | Shares | U.S. $ Value | ||||||
| ||||||||
IT Services – 2.3% |
| |||||||
PayPal Holdings, Inc.(a) | 16,219 | $ | 1,363,856 | |||||
Visa, Inc. – Class A | 25,978 | 3,427,537 | ||||||
|
| |||||||
| 4,791,393 | ||||||||
|
| |||||||
Semiconductors & Semiconductor Equipment – 2.0% |
| |||||||
NVIDIA Corp. | 6,544 | 873,624 | ||||||
QUALCOMM, Inc. | 59,346 | 3,377,381 | ||||||
|
| |||||||
| 4,251,005 | ||||||||
|
| |||||||
Software – 4.7% |
| |||||||
Microsoft Corp. | 83,898 | 8,521,520 | ||||||
VMware, Inc. – Class A | 8,421 | 1,154,772 | ||||||
|
| |||||||
| 9,676,292 | ||||||||
|
| |||||||
Technology Hardware, Storage & Peripherals – 2.9% |
| |||||||
Apple, Inc. | 38,650 | 6,096,651 | ||||||
|
| |||||||
| 29,617,258 | ||||||||
|
| |||||||
Financials – 13.3% |
| |||||||
Banks – 8.3% |
| |||||||
Bank of America Corp. | 187,398 | 4,617,487 | ||||||
JPMorgan Chase & Co. | 41,248 | 4,026,630 | ||||||
SunTrust Banks, Inc. | 44,957 | 2,267,631 | ||||||
US Bancorp | 77,970 | 3,563,229 | ||||||
Wells Fargo & Co. | 62,821 | 2,894,791 | ||||||
|
| |||||||
| 17,369,768 | ||||||||
|
| |||||||
Diversified Financial Services – 4.1% |
| |||||||
Berkshire Hathaway, Inc. – Class B(a) | 42,347 | 8,646,411 | ||||||
|
| |||||||
Insurance – 0.9% |
| |||||||
Progressive Corp. (The) | 29,489 | 1,779,071 | ||||||
|
| |||||||
| 27,795,250 | ||||||||
|
| |||||||
Industrials – 11.3% |
| |||||||
Aerospace & Defense – 5.5% |
| |||||||
Boeing Co. (The) | 5,560 | 1,793,100 | ||||||
Northrop Grumman Corp. | 27,117 | 6,640,953 | ||||||
United Technologies Corp. | 29,032 | 3,091,328 | ||||||
|
| |||||||
| 11,525,381 | ||||||||
|
| |||||||
Airlines – 0.8% |
| |||||||
Delta Air Lines, Inc. | 34,298 | 1,711,470 | ||||||
|
| |||||||
Construction & Engineering – 0.9% |
| |||||||
Jacobs Engineering Group, Inc. | 31,874 | 1,863,354 | ||||||
|
| |||||||
Industrial Conglomerates – 3.2% |
| |||||||
Honeywell International, Inc. | 50,826 | 6,715,131 | ||||||
|
| |||||||
| abfunds.com | AB SELECT US EQUITY PORTFOLIO | 13 | |
PORTFOLIO OF INVESTMENTS(continued)
| Company | Shares | U.S. $ Value | ||||||
| ||||||||
Road & Rail – 0.9% |
| |||||||
Norfolk Southern Corp. | 12,039 | $ | 1,800,312 | |||||
|
| |||||||
| 23,615,648 | ||||||||
|
| |||||||
Consumer Discretionary – 8.7% |
| |||||||
Hotels, Restaurants & Leisure – 2.1% |
| |||||||
McDonald’s Corp. | 10,041 | 1,782,981 | ||||||
Starbucks Corp. | 39,088 | 2,517,267 | ||||||
|
| |||||||
| 4,300,248 | ||||||||
|
| |||||||
Household Durables – 0.6% |
| |||||||
Lennar Corp. – Class A | 31,797 | 1,244,852 | ||||||
|
| |||||||
Internet & Direct Marketing Retail – 3.1% |
| |||||||
Amazon.com, Inc.(a) | 2,853 | 4,285,121 | ||||||
Booking Holdings, Inc.(a) | 1,246 | 2,146,135 | ||||||
|
| |||||||
| 6,431,256 | ||||||||
|
| |||||||
Specialty Retail – 2.9% |
| |||||||
Home Depot, Inc. (The) | 35,610 | 6,118,510 | ||||||
|
| |||||||
| 18,094,866 | ||||||||
|
| |||||||
Consumer Staples – 5.2% |
| |||||||
Beverages – 0.5% |
| |||||||
Constellation Brands, Inc. – Class A | 5,791 | 931,309 | ||||||
|
| |||||||
Food & Staples Retailing – 1.6% |
| |||||||
Walmart, Inc. | 35,727 | 3,327,970 | ||||||
|
| |||||||
Household Products – 1.2% |
| |||||||
Procter & Gamble Co. (The) | 27,625 | 2,539,290 | ||||||
|
| |||||||
Personal Products – 1.0% |
| |||||||
Estee Lauder Cos., Inc. (The) – Class A | 16,309 | 2,121,801 | ||||||
|
| |||||||
Tobacco – 0.9% |
| |||||||
Altria Group, Inc. | 36,387 | 1,797,154 | ||||||
|
| |||||||
| 10,717,524 | ||||||||
|
| |||||||
Energy – 4.2% |
| |||||||
Oil, Gas & Consumable Fuels – 4.2% |
| |||||||
Chevron Corp. | 37,006 | 4,025,883 | ||||||
EOG Resources, Inc. | 20,884 | 1,821,293 | ||||||
Occidental Petroleum Corp. | 31,015 | 1,903,701 | ||||||
Valero Energy Corp. | 14,232 | 1,066,973 | ||||||
|
| |||||||
| 8,817,850 | ||||||||
|
| |||||||
Utilities – 4.1% |
| |||||||
Electric Utilities – 2.9% |
| |||||||
NextEra Energy, Inc. | 35,243 | 6,125,938 | ||||||
|
| |||||||
Independent Power and Renewable Electricity Producers – 1.2% |
| |||||||
NRG Energy, Inc. | 61,641 | 2,440,984 | ||||||
|
| |||||||
| 8,566,922 | ||||||||
|
| |||||||
| 14 | AB SELECT US EQUITY PORTFOLIO | abfunds.com | |
PORTFOLIO OF INVESTMENTS(continued)
| Company | Shares | U.S. $ Value | ||||||
| ||||||||
Materials – 1.8% |
| |||||||
Chemicals – 0.4% |
| |||||||
DowDuPont, Inc. | 14,685 | $ | 785,354 | |||||
|
| |||||||
Containers & Packaging – 1.4% |
| |||||||
Berry Global Group, Inc.(a) | 64,244 | 3,053,517 | ||||||
|
| |||||||
| 3,838,871 | ||||||||
|
| |||||||
Real Estate – 0.8% |
| |||||||
Equity Real Estate Investment Trusts (REITs) – 0.8% | ||||||||
Crown Castle International Corp. | 14,792 | 1,606,855 | ||||||
|
| |||||||
Total Common Stocks | 198,618,268 | |||||||
|
| |||||||
INVESTMENT COMPANIES – 1.0% | ||||||||
Funds and Investment Trusts – 1.0% | ||||||||
iShares Nasdaq Biotechnology ETF(b)(c) | 22,520 | 2,171,603 | ||||||
|
| |||||||
PREFERRED STOCKS – 0.8% | ||||||||
Information Technology – 0.7% | ||||||||
Software – 0.7% | ||||||||
Lyft, Inc. | 25,539 | 1,269,799 | ||||||
Lyft, Inc. | 5,253 | 261,179 | ||||||
|
| |||||||
| 1,530,978 | ||||||||
|
| |||||||
Consumer Discretionary – 0.1% | ||||||||
Household Durables – 0.1% | ||||||||
Honest Co., Inc. (The) | 4,005 | 100,355 | ||||||
|
| |||||||
Total Preferred Stocks | 1,631,333 | |||||||
|
| |||||||
SHORT-TERM INVESTMENTS – 1.8% | ||||||||
Investment Companies – 1.7% | ||||||||
AB Fixed Income Shares, Inc. — Government Money Market Portfolio — Class AB, 2.31%(c)(g)(h) | 3,565,583 | 3,565,583 | ||||||
|
| |||||||
| abfunds.com | AB SELECT US EQUITY PORTFOLIO | 15 | |
PORTFOLIO OF INVESTMENTS(continued)
| Principal Amount (000) | U.S. $ Value | |||||||||||
| ||||||||||||
Time Deposits – 0.1% | ||||||||||||
BBH Grand Cayman | EUR | 98 | $ | 112,652 | ||||||||
0.37%, 1/02/19 | GBP | 0 | * | 5 | ||||||||
0.84%, 1/02/19 | CAD | 5 | 3,773 | |||||||||
|
| |||||||||||
Total Time Deposits | 116,430 | |||||||||||
|
| |||||||||||
Total Short-Term Investments | 3,682,013 | |||||||||||
|
| |||||||||||
Total Investments Before Security Lending Collateral for Securities Loaned – 98.9% | 206,103,217 | |||||||||||
|
| |||||||||||
| Shares | ||||||||||||
INVESTMENTS OF CASH COLLATERAL FOR SECURITIES LOANED – 0.1% | ||||||||||||
Investment Companies – 0.1% | ||||||||||||
AB Fixed Income Shares, Inc. — Government Money Market Portfolio — Class AB, 2.31%(c)(g)(h) | 135,450 | 135,450 | ||||||||||
|
| |||||||||||
Total Investments – 99.0% | 206,238,667 | |||||||||||
Other assets less liabilities – 1.0% | 2,094,027 | |||||||||||
|
| |||||||||||
Net Assets – 100.0% | $ | 208,332,694 | ||||||||||
|
| |||||||||||
TOTAL RETURN SWAPS (see Note D)
Counterparty & Referenced Obligation | # of Shares or Units | Rate Paid/ Received | Payment Frequency | Notional Amount (000) | Maturity Date | Unrealized Appreciation/ (Depreciation) | ||||||||||||||||
Receive Total Return on Reference Obligation |
| |||||||||||||||||||||
Morgan Stanley Capital Services, LLC |
| |||||||||||||||||||||
KKR & Co. LP | 10,778 | FedFundEffective Plus 0.95% | Maturity | USD | 314 | 3/06/19 | $ | 4,731.00 | ||||||||||||||
KKR & Co. LP | 549 | FedFundEffective Plus 0.95% | Maturity | USD | 16 | 3/06/19 | (46.00 | ) | ||||||||||||||
KKR & Co. LP | 547 | FedFundEffective Plus 0.95% | Maturity | USD | 17 | 3/06/19 | (700.00 | ) | ||||||||||||||
KKR & Co. LP | 1,596 | FedFundEffective Plus 0.95% | Maturity | USD | 49 | 3/06/19 | (1,478.00 | ) | ||||||||||||||
KKR & Co. LP | 510 | FedFundEffective Plus 0.95% | Maturity | USD | 17 | 3/06/19 | (1,689.00 | ) | ||||||||||||||
KKR & Co. LP | 524 | FedFundEffective Plus 0.95% | Maturity | USD | 18 | 3/06/19 | (2,197.00 | ) | ||||||||||||||
KKR & Co. LP | 468 | FedFundEffective Plus 0.95% | Maturity | USD | 16 | 3/06/19 | (2,211.00 | ) | ||||||||||||||
| 16 | AB SELECT US EQUITY PORTFOLIO | abfunds.com | |
PORTFOLIO OF INVESTMENTS(continued)
Counterparty & Obligation | # of Shares or Units | Rate Paid/ Received | Payment Frequency | Notional Amount (000) | Maturity Date | Unrealized Appreciation/ (Depreciation) | ||||||||||||||||||||
KKR & Co. LP | 473 | | FedFundEffective Plus 0.95% | | Maturity | USD | 17 | 3/06/19 | $ | (2,402.00 | ) | |||||||||||||||
KKR & Co. LP | 1,034 | | FedFundEffective Plus 0.95% | | Maturity | USD | 35 | 3/06/19 | (4,269.00 | ) | ||||||||||||||||
KKR & Co. LP | 1,551 | | FedFundEffective Plus 0.95% | | Maturity | USD | 51 | 3/06/19 | (5,093.00 | ) | ||||||||||||||||
KKR & Co. LP | 960 | | FedFundEffective Plus 0.95% | | Maturity | USD | 34 | 3/06/19 | (5,243.00 | ) | ||||||||||||||||
KKR & Co. LP | 1,626 | | FedFundEffective Plus 0.95% | | Maturity | USD | 55 | 3/06/19 | (7,275.00 | ) | ||||||||||||||||
KKR & Co. LP | 1,968 | | FedFundEffective Plus 0.95% | | Maturity | USD | 70 | 3/06/19 | (10,711.00 | ) | ||||||||||||||||
KKR & Co. LP | 2,644 | | FedFundEffective Plus 0.95% | | Maturity | USD | 93 | 3/06/19 | (13,038.00 | ) | ||||||||||||||||
KKR & Co. LP | 1,935 | | FedFundEffective Plus 0.95% | | Maturity | USD | 75 | 3/06/19 | (16,106.00 | ) | ||||||||||||||||
KKR & Co. LP | 2,508 | | FedFundEffective Plus 0.95% | | Maturity | USD | 97 | 3/06/19 | (21,388.00 | ) | ||||||||||||||||
KKR & Co. LP | 2,865 | | FedFundEffective Plus 0.95% | | Maturity | USD | 111 | 3/06/19 | (24,138.00 | ) | ||||||||||||||||
KKR & Co. LP | 3,170 | | FedFundEffective Plus 0.95% | | Maturity | USD | 122 | 3/06/19 | (26,495.00 | ) | ||||||||||||||||
KKR & Co. LP | 3,631 | | FedFundEffective Minus 0.30% | | Maturity | USD | 138 | 3/06/19 | (27,867.00 | ) | ||||||||||||||||
KKR & Co. LP | 4,585 | | FedFundEffective Plus 0.95% | | Maturity | USD | 180 | 3/06/19 | (41,334.00 | ) | ||||||||||||||||
KKR & Co. LP | 4,932 | | FedFundEffective Plus 0.95% | | Maturity | USD | 194 | 3/06/19 | (44,770.00 | ) | ||||||||||||||||
KKR & Co. LP | 6,557 | | FedFundEffective Plus 0.95% | | Maturity | USD | 253 | 3/06/19 | (54,934.00 | ) | ||||||||||||||||
|
| |||||||||||||||||||||||||
| $ | (308,653 | ) | ||||||||||||||||||||||||
|
| |||||||||||||||||||||||||
| (a) | Non-income producing security. |
| (b) | Represents entire or partial securities out on loan. See Note E for securities lending information. |
| (c) | To obtain a copy of the fund’s shareholder report, please go to the Securities and Exchange Commission’s website at www.sec.gov. Additionally, shareholder reports for AB funds can be obtained by calling AB at (800)227-4618. |
| (d) | Security in which significant unobservable inputs (Level 3) were used in determining fair value. |
| (e) | Fair valued by the Adviser. |
| (f) | Illiquid security. |
| (g) | The rate shown represents the7-day yield as of period end. |
| (h) | Affiliated investments. |
Currency Abbreviations:
AUD – Australian Dollar
CAD – Canadian Dollar
EUR – Euro
GBP – Great British Pound
Glossary:
ETF – Exchange Traded Fund
See notes to financial statements.
| abfunds.com | AB SELECT US EQUITY PORTFOLIO | 17 | |
STATEMENT OF ASSETS & LIABILITIES
December 31, 2018(unaudited)
| Assets | ||||
Investments in securities, at value | $ | 202,537,634 | (a) | |
Affiliated issuers (cost $3,701,033—including investment of cash collateral for securities loaned of $135,450) | 3,701,033 | |||
Cash collateral due from broker | 260,000 | |||
Receivable for investment securities sold | 4,804,859 | |||
| Receivable for capital stock sold | 624,559 | |||
| Unaffiliated dividends receivable | 224,914 | |||
Affiliated dividends receivable | 11,676 | |||
Unrealized appreciation on total return swaps | 4,731 | |||
|
| |||
Total assets | 212,169,406 | |||
|
| |||
| Liabilities | ||||
Payable for investment securities purchased | 1,777,322 | |||
Payable for capital stock redeemed | 1,296,830 | |||
Unrealized depreciation on total return swaps | 313,384 | |||
Advisory fee payable | 172,695 | |||
Payable for collateral received on securities loaned | 135,450 | |||
Administrative fee payable | 20,719 | |||
Distribution fee payable | 11,770 | |||
Transfer Agent fee payable | 5,503 | |||
Due to Custodian | 4,831 | |||
Directors’ fee payable | 74 | |||
Accrued expenses and other liabilities | 98,134 | |||
|
| |||
Total liabilities | 3,836,712 | |||
|
| |||
Net Assets | $ | 208,332,694 | ||
|
| |||
| Composition of Net Assets | ||||
Capital stock, at par | $ | 1,464 | ||
Additionalpaid-in capital | 180,344,787 | |||
Distributable earnings | 27,986,443 | |||
|
| |||
| $ | 208,332,694 | |||
|
|
Net Asset Value Per Share—30 billion shares of capital stock authorized, $.0001 par value
| Class | Net Assets | Shares Outstanding | Net Asset Value | |||||||||
| ||||||||||||
| A | $ | 10,133,060 | 706,919 | $ | 14.33 | * | ||||||
| ||||||||||||
| C | $ | 10,829,519 | 801,651 | $ | 13.51 | |||||||
| ||||||||||||
| Advisor | $ | 158,106,055 | 11,060,746 | $ | 14.29 | |||||||
| ||||||||||||
| R | $ | 14,387 | 1,029 | $ | 13.98 | |||||||
| ||||||||||||
| K | $ | 1,198,456 | 84,669 | $ | 14.15 | |||||||
| ||||||||||||
| I | $ | 28,051,217 | 1,983,971 | $ | 14.14 | |||||||
| ||||||||||||
| * | The maximum offering price per share for Class A shares was $14,97, which reflects a sales charge of 4.25%. |
| (a) | Includes securities on loan with a value of $135,002 (See Note E). |
See notes to financial statements.
| 18 | AB SELECT US EQUITY PORTFOLIO | abfunds.com | |
STATEMENT OF OPERATIONS
Six Months Ended December 31, 2018(unaudited)
| Investment Income | ||||||||
Dividends | $ | 2,196,704 | ||||||
Affiliated issuers | 75,494 | |||||||
Interest | 217 | $ | 2,272,415 | |||||
|
| |||||||
| Expenses | ||||||||
Advisory fee (see Note B) | 1,237,244 | |||||||
Distribution fee—Class A | 14,651 | |||||||
Distribution fee—Class C | 64,872 | |||||||
Distribution fee—Class R | 43 | |||||||
Distribution fee—Class K | 3,199 | |||||||
Transfer agency—Class A | 1,693 | |||||||
Transfer agency—Class C | 2,015 | |||||||
Transfer agency—Advisor Class | 26,746 | |||||||
Transfer agency—Class R | 5 | |||||||
Transfer agency—Class K | 2,559 | |||||||
Transfer agency—Class I | 3,498 | |||||||
Custodian | 71,416 | |||||||
Registration fees | 42,852 | |||||||
Administrative | 37,787 | |||||||
Audit and tax | 25,746 | |||||||
Legal | 20,862 | |||||||
Printing | 12,902 | |||||||
Directors’ fees | 12,494 | |||||||
Miscellaneous | 29,101 | |||||||
|
| |||||||
Total expenses | 1,609,685 | |||||||
Less: expenses waived and reimbursed by the Adviser (see Note B and Note E) | (6,026 | ) | ||||||
|
| |||||||
Net expenses | 1,603,659 | |||||||
|
| |||||||
Net investment income | 668,756 | |||||||
|
| |||||||
| Realized and Unrealized Gain (Loss) on Investment and Foreign Currency Transactions | ||||||||
Net realized gain (loss) on: | ||||||||
Investment transactions | 3,201,436 | |||||||
Swaps | 548,614 | |||||||
Foreign currency transactions | (127 | ) | ||||||
Net change in unrealized appreciation/depreciation on: | ||||||||
Investments | (18,501,094 | ) | ||||||
Swaps | (791,652 | ) | ||||||
|
| |||||||
Net loss on investment and foreign currency transactions | (15,542,823 | ) | ||||||
|
| |||||||
Net Decrease in Net Assets from Operations | $ | (14,874,067 | ) | |||||
|
|
See notes to financial statements.
| abfunds.com | AB SELECT US EQUITY PORTFOLIO | 19 | |
STATEMENT OF CHANGES IN NET ASSETS
| Six Months Ended December 31, 2018 (unaudited) | Year Ended June 30, 2018 | |||||||
| Increase (Decrease) in Net Assets from Operations | ||||||||
Net investment income | $ | 668,756 | $ | 1,362,917 | ||||
Net realized gain on investment and foreign currency transactions | 3,749,923 | 31,753,074 | ||||||
Net change in unrealized appreciation/depreciation on investments and foreign currency denominated assets and liabilities | (19,292,746 | ) | 7,476,294 | |||||
|
|
|
| |||||
Net increase (decrease) in net assets from operations | (14,874,067 | ) | 40,592,285 | |||||
| Distributions to Shareholders* | ||||||||
Class A | (1,107,493 | ) | (1,231,547 | ) | ||||
Class C | (1,286,653 | ) | (1,357,932 | ) | ||||
Advisor Class | (17,849,203 | ) | (25,458,286 | ) | ||||
Class R | (1,703 | ) | (1,810 | ) | ||||
Class K | (119,110 | ) | (299,334 | ) | ||||
Class I | (3,300,315 | ) | (1,454,205 | ) | ||||
| Capital Stock Transactions | ||||||||
Net decrease | (6,511,351 | ) | (37,178,855 | ) | ||||
|
|
|
| |||||
Total decrease | (45,049,895 | ) | (26,389,684 | ) | ||||
| Net Assets | ||||||||
Beginning of period | 253,382,589 | 279,772,273 | ||||||
|
|
|
| |||||
End of period | $ | 208,332,694 | $ | 253,382,589 | ||||
|
|
|
| |||||
| * | The prior year’s amounts have been reclassified to conform with the current year’s presentation. See Note J, Recent Accounting Pronouncements, in the Notes to Financial Statements for more information. |
See notes to financial statements.
| 20 | AB SELECT US EQUITY PORTFOLIO | abfunds.com | |
NOTES TO FINANCIAL STATEMENTS
December 31, 2018(unaudited)
NOTE A
Significant Accounting Policies
AB Cap Fund, Inc. (the “Company”), which is a Maryland corporation, is registered under the Investment Company Act of 1940 as anopen-end management investment company. The Company operates as a series company comprised of 29 portfolios currently in operation. Each portfolio is considered to be a separate entity for financial reporting and tax purposes. This report relates only to the AB Select US Equity Portfolio (the “Fund”), a diversified portfolio. The Fund has authorized the issuance of Class A, Class B, Class C, Advisor Class, Class R, Class K, Class I, Class T, Class 1, and Class 2 shares. Class B, Class T, Class 1, and Class 2 shares are not currently being offered. As of December 31, 2018, AllianceBernstein L.P. (the “Adviser”) was the sole shareholder of Class R shares. Class A shares are sold with afront-end sales charge of up to 4.25% for purchases not exceeding $1,000,000. With respect to purchases of $1,000,000 or more, Class A shares redeemed within one year of purchase may be subject to a contingent deferred sales charge of 1%. Class C shares are subject to a contingent deferred sales charge of 1% on redemptions made within the first year after purchase, and 0% after the first year of purchase. Class C shares will automatically convert to Class A shares ten years after the end of the calendar month of purchase. Class R and Class K shares are sold without an initial or contingent deferred sales charge. Advisor Class and Class I shares are sold without an initial or contingent deferred sales charge and are not subject to ongoing distribution expenses. All ten classes of shares have identical voting, dividend, liquidation and other rights, except that the classes bear different distribution and transfer agency expenses. Each class has exclusive voting rights with respect to its distribution plan. The financial statements have been prepared in conformity with U.S. generally accepted accounting principles (“U.S. GAAP”), which require management to make certain estimates and assumptions that affect the reported amounts of assets and liabilities in the financial statements and amounts of income and expenses during the reporting period. Actual results could differ from those estimates. The Fund is an investment company under U.S. GAAP and follows the accounting and reporting guidance applicable to investment companies. The following is a summary of significant accounting policies followed by the Fund.
1. Security Valuation
Portfolio securities are valued at their current market value determined on the basis of market quotations or, if market quotations are not readily available or are deemed unreliable, at “fair value” as determined in accordance with procedures established by and under the general supervision of the Company’s Board of Directors (the “Board”).
| abfunds.com | AB SELECT US EQUITY PORTFOLIO | 21 | |
NOTES TO FINANCIAL STATEMENTS(continued)
In general, the market values of securities which are readily available and deemed reliable are determined as follows: securities listed on a national securities exchange (other than securities listed on the NASDAQ Stock Market, Inc. (“NASDAQ”) or on a foreign securities exchange are valued at the last sale price at the close of the exchange or foreign securities exchange. If there has been no sale on such day, the securities are valued at the last traded price from the previous day. Securities listed on more than one exchange are valued by reference to the principal exchange on which the securities are traded; securities listed only on NASDAQ are valued in accordance with the NASDAQ Official Closing Price; listed or over the counter (“OTC”) market put or call options are valued at the mid level between the current bid and ask prices. If either a current bid or current ask price is unavailable, the Adviser will have discretion to determine the best valuation (e.g., last trade price in the case of listed options); open futures are valued using the closing settlement price or, in the absence of such a price, the most recent quoted bid price. If there are no quotations available for the day of valuation, the last available closing settlement price is used; U.S. Government securities and any other debt instruments having 60 days or less remaining until maturity are generally valued at market by an independent pricing vendor, if a market price is available. If a market price is not available, the securities are valued at amortized cost. This methodology is commonly used for short- term securities that have an original maturity of 60 days or less, as well as short term securities that had an original term to maturity that exceeded 60 days. In instances when amortized cost is utilized, the Valuation Committee (the “Committee”) must reasonably conclude that the utilization of amortized cost is approximately the same as the fair value of the security. Such factors the Committee will consider include, but are not limited to, an impairment of the creditworthiness of the issuer or material changes in interest rates. Fixed-income securities, including mortgage-backed and asset-backed securities, may be valued on the basis of prices provided by a pricing service or at a price obtained from one or more of the major broker-dealers. In cases where broker/dealer quotes are obtained, the Adviser may establish procedures whereby changes in market yields or spreads are used to adjust, on a daily basis, a recently obtained quoted price on a security; swaps and other derivatives are valued daily, primarily using independent pricing services, independent pricing models using market inputs, as well as third party broker-dealers or counterparties. Open end mutual funds are valued at the closing net asset value per share, while exchange traded funds are valued at the closing market price per share.
Securities for which market quotations are not readily available (including restricted securities) or are deemed unreliable are valued at fair value as deemed appropriate by the Adviser. Factors considered in making this determination may include, but are not limited to, information obtained by
| 22 | AB SELECT US EQUITY PORTFOLIO | abfunds.com | |
NOTES TO FINANCIAL STATEMENTS(continued)
contacting the issuer, analysts, analysis of the issuer’s financial statements or other available documents. In addition, the Fund may use fair value pricing for securities primarily traded innon-U.S. markets because most foreign markets close well before the Fund values its securities at 4:00 p.m., Eastern Time. The earlier close of these foreign markets gives rise to the possibility that significant events, including broad market moves, may have occurred in the interim and may materially affect the value of those securities. To account for this, the Fund generally values many of its foreign equity securities using fair value prices based on third party vendor modeling tools to the extent available.
2. Fair Value Measurements
In accordance with U.S. GAAP regarding fair value measurements, fair value is defined as the price that the Fund would receive to sell an asset or pay to transfer a liability in an orderly transaction between market participants at the measurement date. U.S. GAAP establishes a framework for measuring fair value, and a three-level hierarchy for fair value measurements based upon the transparency of inputs to the valuation of an asset or liability (including those valued based on their market values as described in Note A.1 above). Inputs may be observable or unobservable and refer broadly to the assumptions that market participants would use in pricing the asset or liability. Observable inputs reflect the assumptions market participants would use in pricing the asset or liability based on market data obtained from sources independent of the Fund. Unobservable inputs reflect the Fund’s own assumptions that market participants would use in pricing the asset or liability based on the best information available in the circumstances. Each investment is assigned a level based upon the observability of the inputs which are significant to the overall valuation. The three-tier hierarchy of inputs is summarized below.
| • | Level 1—quoted prices in active markets for identical investments |
| • | Level 2—other significant observable inputs (including quoted prices for similar investments, interest rates, prepayment speeds, credit risk, etc.) |
| • | Level 3—significant unobservable inputs (including the Fund’s own assumptions in determining the fair value of investments) |
The fair value of debt instruments, such as bonds, andover-the-counter derivatives is generally based on market price quotations, recently executed market transactions (where observable) or industry recognized modeling techniques and are generally classified as Level 2. Pricing vendor inputs to Level 2 valuations may include quoted prices for similar investments in active markets, interest rate curves, coupon rates, currency rates, yield curves, option adjusted spreads, default rates, credit spreads and other unique security features in order to estimate the relevant cash flows
| abfunds.com | AB SELECT US EQUITY PORTFOLIO | 23 | |
NOTES TO FINANCIAL STATEMENTS(continued)
which is then discounted to calculate fair values. If these inputs are unobservable and significant to the fair value, these investments will be classified as Level 3. In addition,non-agency rated investments are classified as Level 3.
Where readily available market prices or relevant bid prices are not available for certain equity investments, such investments may be valued based on similar publicly traded investments, movements in relevant indices since last available prices or based upon underlying company fundamentals and comparable company data (such as multiples to earnings or other multiples to equity). Where an investment is valued using an observable input such as another publicly traded security, the investment will be classified as Level 2. If management determines that an adjustment is appropriate based on restrictions on resale, illiquidity or uncertainty, and such adjustment is a significant component of the valuation, the investment will be classified as Level 3. An investment will also be classified as Level 3 where management uses company fundamentals and other significant inputs to determine the valuation.
The following table summarizes the valuation of the Fund’s investments by the above fair value hierarchy levels as of December 31, 2018:
Investments in Securities | Level 1 | Level 2 | Level 3 | Total | ||||||||||||
Assets: | ||||||||||||||||
Common Stocks: | ||||||||||||||||
Health Care | $ | 34,182,611 | $ | – 0 | – | $ | – 0 | – | $ | 34,182,611 | ||||||
Communication Services | 28,275,627 | 3,488,986 | – 0 | – | 31,764,613 | |||||||||||
Information Technology | 29,617,258 | – 0 | – | – 0 | – | 29,617,258 | ||||||||||
Financials | 27,795,250 | – 0 | – | – 0 | – | 27,795,250 | ||||||||||
Industrials | 23,615,648 | – 0 | – | – 0 | – | 23,615,648 | ||||||||||
Consumer Discretionary | 18,094,866 | – 0 | – | – 0 | – | 18,094,866 | ||||||||||
Consumer Staples | 10,717,524 | – 0 | – | – 0 | – | 10,717,524 | ||||||||||
Energy | 8,817,850 | – 0 | – | – 0 | – | 8,817,850 | ||||||||||
Utilities | 8,566,922 | – 0 | – | – 0 | – | 8,566,922 | ||||||||||
Materials | 3,838,871 | – 0 | – | – 0 | – | 3,838,871 | ||||||||||
Real Estate | 1,606,855 | – 0 | – | – 0 | – | 1,606,855 | ||||||||||
Investment Companies | 2,171,603 | – 0 | – | – 0 | – | 2,171,603 | ||||||||||
Preferred Stocks | – 0 | – | – 0 | – | 1,631,333 | 1,631,333 | ||||||||||
Short-Term Investments: | ||||||||||||||||
Investment Companies | 3,565,583 | – 0 | – | – 0 | – | 3,565,583 | ||||||||||
Time Deposits | – 0 | – | 116,430 | – 0 | – | 116,430 | ||||||||||
Investments of Cash Collateral for Securities Loaned in Affiliated Money Market | 135,450 | – 0 | – | – 0 | – | 135,450 | ||||||||||
|
|
|
|
|
|
|
| |||||||||
Total Investments in Securities | 201,001,918 | 3,605,416 | 1,631,333 | 206,238,667 | ||||||||||||
| 24 | AB SELECT US EQUITY PORTFOLIO | abfunds.com | |
NOTES TO FINANCIAL STATEMENTS(continued)
Investments in Securities | Level 1 | Level 2 | Level 3 | Total | ||||||||||||
Other financial instruments*: | ||||||||||||||||
Assets | ||||||||||||||||
Total Return Swaps | $ | – 0 | – | $ | 4,731 | $ | – 0 | – | $ | 4,731 | ||||||
Liabilities | ||||||||||||||||
Total Return Swaps | – 0 | – | (313,384 | ) | – 0 | – | (313,384 | ) | ||||||||
|
|
|
|
|
|
|
| |||||||||
Total^ | $ | 201,001,918 | $ | 3,296,763 | $ | 1,631,333 | $ | 205,930,014 | ||||||||
|
|
|
|
|
|
|
| |||||||||
| * | Other financial instruments are derivative instruments, such as futures, forwards and swaps, which are valued at the unrealized appreciation/(depreciation) on the instrument. Other financial instruments may also include swaps with upfront premiums, options written and swaptions written which are valued at market value. |
| ^ | There were no transfers between any levels during the reporting period. |
The Fund recognizes all transfers between levels of the fair value hierarchy assuming the financial instrument was transferred at the beginning of the reporting period.
The following is a reconciliation of investments in which significant unobservable inputs (Level 3) were used in determining fair value.
| Preferred Stocks | ||||
Balance as of 6/30/18 | $ | 1,507,817 | ||
Accrued discounts/ (premiums) | – 0 | – | ||
Realized gain (loss) | – 0 | – | ||
Change in unrealized appreciation/ depreciation | 123,516 | |||
Purchases | – 0 | – | ||
Transfers into Level 3 | – 0 | – | ||
Transfers out of Level 3 | – 0 | – | ||
|
| |||
Balance as of 12/31/18 | $ | 1,631,333 | ||
|
| |||
Net change in unrealized appreciation/depreciation from investments held as of 12/31/18** | $ | 123,516 | ||
|
| |||
| ** | The unrealized appreciation/depreciation is included in net change in unrealized appreciation/depreciation on investments and other financial instruments in the accompanying statement of operations. |
The Adviser established the Committee to oversee the pricing and valuation of all securities held in the Fund. The Committee operates under pricing and valuation policies and procedures established by the Adviser and approved by the Board, including pricing policies which set forth the mechanisms and processes to be employed on a daily basis to implement these policies and procedures. In particular, the pricing policies describe how to determine market quotations for securities and other instruments. The Committee’s responsibilities include: 1) fair value and liquidity determinations (and oversight of any third parties to whom any responsibility for fair value and liquidity determinations is delegated), and 2) regular monitoring of the Adviser’s pricing and valuation policies and procedures and modification or enhancement of these policies and procedures (or recommendation of the modification of these policies and procedures) as the Committee believes appropriate.
| abfunds.com | AB SELECT US EQUITY PORTFOLIO | 25 | |
NOTES TO FINANCIAL STATEMENTS(continued)
The Committee is also responsible for monitoring the implementation of the pricing policies by the Adviser’s Pricing Group (the “Pricing Group”) and any third party which performs certain pricing functions in accordance with the pricing policies. The Pricing Group is responsible for the oversight of the third party on aday-to-day basis. The Committee and the Pricing Group perform a series of activities to provide reasonable assurance of the accuracy of prices including: 1) periodic vendor due diligence meetings, review methodologies, new developments and process at vendors, 2) daily comparison of security valuation versus prior day for all securities that exceeded established thresholds, and 3) daily review of unpriced, stale, and variance reports with exceptions reviewed by senior management and the Committee.
In addition, several processes outside of the pricing process are used to monitor valuation issues including: 1) performance and performance attribution reports are monitored for anomalous impacts based upon benchmark performance, and 2) portfolio managers review all portfolios for performance and analytics (which are generated using the Adviser’s prices).
3. Currency Translation
Assets and liabilities denominated in foreign currencies and commitments under forward currency exchange contracts are translated into U.S. dollars at the mean of the quoted bid and ask prices of such currencies against the U.S. dollar. Purchases and sales of portfolio securities are translated into U.S. dollars at the rates of exchange prevailing when such securities were acquired or sold. Income and expenses are translated into U.S. dollars at the rates of exchange prevailing when accrued.
Net realized gain or loss on foreign currency transactions represents foreign exchange gains and losses from sales and maturities of foreign fixed income investments, holding of foreign currencies, currency gains or losses realized between the trade and settlement dates on foreign investment transactions, and the difference between the amounts of dividends, interest and foreign withholding taxes recorded on the Fund’s books and the U.S. dollar equivalent amounts actually received or paid. Net unrealized currency gains and losses from valuing foreign currency denominated assets and liabilities at period end exchange rates are reflected as a component of net unrealized appreciation and depreciation of foreign currency denominated assets and liabilities.
4. Taxes
It is the Fund’s policy to meet the requirements of the Internal Revenue Code applicable to regulated investment companies and to distribute all of its investment company taxable income and net realized gains, if any, to shareholders. Therefore, no provisions for federal income or excise taxes
| 26 | AB SELECT US EQUITY PORTFOLIO | abfunds.com | |
NOTES TO FINANCIAL STATEMENTS(continued)
are required. The Fund may be subject to taxes imposed by countries in which it invests. Such taxes are generally based on income and/or capital gains earned or repatriated. Taxes are accrued and applied to net investment income, net realized gains and net unrealized appreciation/depreciation as such income and/or gains are earned.
In accordance with U.S. GAAP requirements regarding accounting for uncertainties in income taxes, management has analyzed the Fund’s tax positions taken or expected to be taken on federal and state income tax returns for all open tax years (all years since inception of the Fund) and has concluded that no provision for income tax is required in the Fund’s financial statements.
5. Investment Income and Investment Transactions
Dividend income is recorded on theex-dividend date or as soon as the Fund is informed of the dividend. Interest income is accrued daily. Investment transactions are accounted for on the date securities are purchased or sold. Investment gains or losses are determined on the identified cost basis. The Fund amortizes premiums and accretes discounts as adjustments to interest income.
6. Class Allocations
All income earned and expenses incurred by the Fund are borne on apro-rata basis by each settled class of shares, based on the proportionate interest in the Fund represented by the net assets of such class, except for class specific expenses which are allocated to the respective class. Expenses of the Company are charged proportionately to each portfolio or based on other appropriate methods. Realized and unrealized gains and losses are allocated among the various share classes based on their respective net assets.
7. Dividends and Distributions
Dividends and distributions to shareholders, if any, are recorded on theex-dividend date. Income dividends and capital gains distributions are determined in accordance with federal tax regulations and may differ from those determined in accordance with U.S. GAAP. To the extent these differences are permanent, such amounts are reclassified within the capital accounts based on their federal tax basis treatment; temporary differences do not require such reclassification.
NOTE B
Advisory Fee and Other Transactions with Affiliates
Under the terms of the investment advisory agreement, the Fund pays the Adviser an advisory fee at an annual rate of 1.00% of the Fund’s average daily net assets. The fee is accrued daily and paid monthly. The Adviser
| abfunds.com | AB SELECT US EQUITY PORTFOLIO | 27 | |
NOTES TO FINANCIAL STATEMENTS(continued)
has agreed to reimburse its fees and bear certain expenses to the extent necessary to limit total operating (excluding acquired fund fees and expenses other than the advisory fees of any AB mutual funds in which the Fund may invest, interest expense, taxes, extraordinary expenses, and brokerage commissions and other transaction costs), on an annual basis (the “Expense Caps”) to 1.55%, 2.30%, 1.30%, 1.80%, 1.55% and 1.30% of the daily average net assets for Class A, Class C, Advisor Class, Class R, Class K and Class I shares, respectively. For the six months ended December 31, 2018, such waiver/reimbursement amounted to $1,255. The Expense Caps may not be terminated before October 31, 2019.
During 2017, AXA S.A. (“AXA”), a French holding company for the AXA Group, a worldwide leader in life, property and casualty and health insurance and asset management, announced its intention to pursue the sale of a minority stake in its subsidiary, AXA Equitable Holdings, Inc. (“AXA Equitable”), the holding company for a diversified financial services organization, through an initial public offering (“IPO”). AXA Equitable is the holding company for a diverse group of financial services companies, including AllianceBernstein L.P., the investment adviser to the Funds (“the Adviser”). During the second quarter of 2018, AXA Equitable completed the IPO, and, as a result, AXA held approximately 72.2% of the outstanding common stock of AXA Equitable as of September 30, 2018. Contemporaneously with the IPO, AXA sold $862.5 million aggregate principal amount of its 7.25% mandatorily exchangeable notes (the “MxB Notes”) due May 15, 2021 and exchangeable into up to 43,125,000 shares of common stock (or approximately 7% of the outstanding shares of common stock of AXA Equitable). AXA retains ownership (including voting rights) of such shares of common stock until the MxB Notes are exchanged, which may be on a date that is earlier than the maturity date at AXA’s option upon the occurrence of certain events.
In March 2018, AXA announced its intention to sell its entire interest in AXA Equitable over time, subject to market conditions and other factors (the “Plan”). It is anticipated that one or more of the transactions contemplated by the Plan may ultimately result in the indirect transfer of a “controlling block” of voting securities of the Adviser (a “Change of Control Event”) and therefore may be deemed an “assignment” causing a termination of each Fund’s current investment advisory agreement. In order to ensure that the existing investment advisory services could continue uninterrupted, at meetings held in late July through early August 2018, the Boards of Directors/Trustees (each a “Board” and collectively, the “Boards”) approved new investment advisory agreements with the Adviser, in connection with the Plan. The Boards also agreed to call and hold a joint meeting of shareholders on October 11, 2018 for shareholders of each Fund to (1) approve the new investment advisory agreement with the Adviser that would be
| 28 | AB SELECT US EQUITY PORTFOLIO | abfunds.com | |
NOTES TO FINANCIAL STATEMENTS(continued)
effective after the first Change of Control Event and (2) approve any future advisory agreement approved by the Board and that has terms not materially different from the current agreement, in the event there are subsequent Change of Control Events arising from completion of the Plan that terminate the advisory agreement after the first Change of Control Event. Approval of a future advisory agreement means that shareholders may not have another opportunity to vote on a new agreement with the Adviser even upon a change of control, as long as no single person or group of persons acting together gains “control” (as defined in the 1940 Act) of AXA Equitable.
At the November 14, 2018 adjourned shareholder meeting, shareholders approved the new and future investment advisory agreements.
On November 20, 2018, AXA completed a public offering of 60,000,000 shares of AXA Equitable’s common stock and simultaneously sold 30,000,000 of such shares to AXA Equitable pursuant to a separate agreement with it. As a result AXA currently owns approximately 59.2% of the shares of common stock of AXA Equitable.
Pursuant to the investment advisory agreement, the Fund may reimburse the Adviser for certain legal and accounting services provided to the Fund by the Adviser. For the six months ended December 31, 2018, the reimbursement for such services amounted to $37,787.
The Fund compensates AllianceBernstein Investor Services, Inc. (“ABIS”), a wholly-owned subsidiary of the Adviser, under a Transfer Agency Agreement for providing personnel and facilities to perform transfer agency services for the Fund. ABIS may make payments to intermediaries that provide omnibus account services,sub-accounting services and/or networking services. The compensation retained by ABIS amounted to $19,833 for the six months ended December 31, 2018.
AllianceBernstein Investments, Inc. (the “Distributor”), a wholly-owned subsidiary of the Adviser, serves as the distributor of the Fund’s shares. The Distributor has advised the Fund that it has retainedfront-end sales charges of $513 from the sale of Class A shares and received $26 and $2,342 in contingent deferred sales charges imposed upon redemption by shareholders of Class A and Class C shares, respectively, for the six months ended December 31, 2018.
The Fund may invest in AB Government Money Market Portfolio (the “Government Money Market Portfolio”) which has a contractual annual advisory fee rate of ..20% of the portfolio’s average daily net assets and bears its own expenses. Effective August 1, 2018, the Adviser has contractually agreed to waive .10% of the advisory fee of Government Money
| abfunds.com | AB SELECT US EQUITY PORTFOLIO | 29 | |
NOTES TO FINANCIAL STATEMENTS(continued)
Market Portfolio until August 31, 2019. In connection with the investment by the Fund in Government Money Market Portfolio, the Adviser has contractually agreed to waive its advisory fee from the Fund in an amount equal to the Fund’s pro rata share of the effective advisory fee of Government Money Market Portfolio, as borne indirectly by the Fund as an acquired fund fee and expense. For the six months ended December 31, 2018, such waiver amounted to $3,832.
A summary of the Fund’s transactions in AB mutual funds for the six months ended December 31, 2018 is as follows:
Fund | Market Value 6/30/18 (000) | Purchases at Cost (000) | Sales Proceeds (000) | Market Value 12/31/18 (000) | Dividend Income (000) | |||||||||||||||
Government Money Market Portfolio | $ | 6,480 | $ | 51,965 | $ | 54,879 | $ | 3,566 | $ | 65 | ||||||||||
Government Money Market Portfolio* | 6,155 | | 45,029 | | | 51,049 | | 135 | 10 | |||||||||||
|
|
|
| |||||||||||||||||
Total | $ | 3,701 | $ | 75 | ||||||||||||||||
|
|
|
| |||||||||||||||||
| * | Investment of cash collateral for securities lending transactions (see Note E). |
Brokerage commissions paid on investment transactions for the six months ended December 31, 2018 amounted to $85,100, of which $0 and $0, respectively, was paid to Sanford C. Bernstein & Co., LLC and Sanford C. Bernstein Limited, affiliates of the Adviser.
NOTE C
Distribution Services Agreement
The Fund has adopted a Distribution Services Agreement (the “Agreement”) pursuant to Rule12b-1 under the Investment Company Act of 1940. Under the Agreement, the Fund pays distribution and servicing fees to the Distributor at an annual rate of up to .30% of the Fund’s average daily net assets attributable to Class A shares, 1% of the Fund’s average daily net assets attributable to Class C shares, .50% of the Fund’s average daily net assets attributable to Class R shares and .25% of the Fund’s average daily net assets attributable to Class K shares. Effective October 31, 2014, payments under the Agreement in respect of Class A shares are limited to an annual rate of .25% of Class A shares’ average daily net assets. There are no distribution and servicing fees on Advisor Class and Class I shares. The fees are accrued daily and paid monthly. The Agreement provides that the Distributor will use such payments in their entirety for distribution assistance and promotional activities. Since the commencement of the Fund’s operation, the Distributor has incurred expenses in excess of the distribution costs reimbursed by the Fund in the
| 30 | AB SELECT US EQUITY PORTFOLIO | abfunds.com | |
NOTES TO FINANCIAL STATEMENTS(continued)
amounts of $92,837, $0 and $1,536 for Class C, Class R and Class K shares, respectively. While such costs may be recovered from the Fund in future periods so long as the Agreement is in effect, the rate of the distribution and servicing fees payable under the Agreement may not be increased without a shareholder vote. In accordance with the Agreement, there is no provision for recovery of unreimbursed distribution costs, incurred by the Distributor, beyond the current fiscal year for Class A shares. The Agreement also provides that the Adviser may use its own resources to finance the distribution of the Fund’s shares.
NOTE D
Investment Transactions
Purchases and sales of investment securities (excluding short-term investments) for the six months ended December 31, 2018 were as follows:
| Purchases | Sales | |||||||
Investment securities (excluding U.S. government securities) | $ | 249,742,036 | $ | 280,650,145 | ||||
U.S. government securities | – 0 | – | – 0 | – | ||||
The cost of investments for federal income tax purposes was substantially the same as cost for financial reporting purposes. Accordingly, gross unrealized appreciation and unrealized depreciation (excluding foreign currency contracts) are as follows:
Gross unrealized appreciation | $ | 35,608,966 | ||
Gross unrealized depreciation | $ | (5,273,236 | ) | |
|
| |||
Net unrealized appreciation | $ | 30,335,730 | ||
|
|
1. Derivative Financial Instruments
The Fund may use derivatives in an effort to earn income and enhance returns, to replace more traditional direct investments, to obtain exposure to otherwise inaccessible markets (collectively, “investment purposes”), or to hedge or adjust the risk profile of its portfolio.
The principal types of derivatives utilized by the Fund, as well as the methods in which they may be used are:
| • | Swaps |
The Fund may enter into swaps to hedge its exposure to interest rates, credit risk, or currencies. The Fund may also enter into swaps fornon-hedging purposes as a means of gaining market exposures including by making direct investments in foreign currencies, as described below under “Currency Transactions” or in order to take a “long” or “short” position with respect to an underlying referenced asset described below under “Total Return Swaps”. A swap is an
| abfunds.com | AB SELECT US EQUITY PORTFOLIO | 31 | |
NOTES TO FINANCIAL STATEMENTS(continued)
agreement that obligates two parties to exchange a series of cash flows at specified intervals based upon or calculated by reference to changes in specified prices or rates for a specified amount of an underlying asset. The payment flows are usually netted against each other, with the difference being paid by one party to the other. In addition, collateral may be pledged or received by the Fund in accordance with the terms of the respective swaps to provide value and recourse to the Fund or its counterparties in the event of default, bankruptcy or insolvency by one of the parties to the swap.
Risks may arise as a result of the failure of the counterparty to the swap to comply with the terms of the swap. The loss incurred by the failure of a counterparty is generally limited to the net interim payment to be received by the Fund, and/or the termination value at the end of the contract. Therefore, the Fund considers the creditworthiness of each counterparty to a swap in evaluating potential counterparty risk. This risk is mitigated by having a netting arrangement between the Fund and the counterparty and by the posting of collateral by the counterparty to the Fund to cover the Fund’s exposure to the counterparty. Additionally, risks may arise from unanticipated movements in interest rates or in the value of the underlying securities. The Fund accrues for the interim payments on swaps on a daily basis, with the net amount recorded within unrealized appreciation/depreciation of swaps on the statement of assets and liabilities, where applicable. Once the interim payments are settled in cash, the net amount is recorded as realized gain/(loss) on swaps on the statement of operations, in addition to any realized gain/(loss) recorded upon the termination of swaps. Upfront premiums paid or received for OTC swaps are recognized as cost or proceeds on the statement of assets and liabilities and are amortized on a straight line basis over the life of the contract. Amortized upfront premiums are included in net realized gain/(loss) from swaps on the statement of operations. Fluctuations in the value of swaps are recorded as a component of net change in unrealized appreciation/depreciation of swaps on the statement of operations.
Total Return Swaps:
The Fund may enter into total return swaps in order to take a “long” or “short” position with respect to an underlying referenced asset. The Fund is subject to market price volatility of the underlying referenced asset. A total return swap involves commitments to pay interest in exchange for a market linked return based on a notional amount. To the extent that the total return of the security, group of securities or index underlying the transaction exceeds or falls short of the offsetting interest obligation, the Fund will receive a payment from or make a payment to the counterparty.
| 32 | AB SELECT US EQUITY PORTFOLIO | abfunds.com | |
NOTES TO FINANCIAL STATEMENTS(continued)
During the six months ended December 31, 2018, the Fund held total return swaps fornon-hedging purposes.
The Fund typically enters into International Swaps and Derivatives Association, Inc. Master Agreements (“ISDA Master Agreement”) with its OTC derivative contract counterparties in order to, among other things, reduce its credit risk to OTC counterparties. ISDA Master Agreements include provisions for general obligations, representations, collateral and events of default or termination. Under an ISDA Master Agreement, the Fund typically may offset with the OTC counterparty certain derivative financial instruments’ payables and/or receivables with collateral held and/or posted and create one single net payment(close-out netting) in the event of default or termination. In the event of a default by an OTC counterparty, the return of collateral with market value in excess of the Fund’s net liability, held by the defaulting party, may be delayed or denied.
The Fund’s ISDA Master Agreements may contain provisions for early termination of OTC derivative transactions in the event the net assets of the Fund decline below specific levels (“net asset contingent features”). If these levels are triggered, the Fund’s OTC counterparty has the right to terminate such transaction and require the Fund to pay or receive a settlement amount in connection with the terminated transaction. If OTC derivatives were held at period end, please refer to netting arrangements by the OTC counterparty table below for additional details.
During the six months ended December 31, 2018 the Fund had entered into the following derivatives:
Asset Derivatives | Liability Derivatives | |||||||||||
Derivative Type | Statement of | Fair Value | Statement of | Fair Value | ||||||||
Interset rate | Unrealized | $ | 4,731 | Unrealized depreciation on total return swaps | $ | 313,384 | ||||||
|
|
|
| |||||||||
Total | $ | 4,731 | $ | 313,384 | ||||||||
|
|
|
| |||||||||
Derivative Type | Location of Gain or | Realized Gain or (Loss) on Derivatives | Change in Unrealized Appreciation or (Depreciation) | |||||||
Equity contracts | Net realized gain/(loss )on swaps; Net change in unrealized appreciation/depreciation on swaps | $ | 548,614 | $ | (791,652 | ) | ||||
|
|
|
| |||||||
Total | $ | 548,614 | $ | (791,652 | ) | |||||
|
|
|
| |||||||
| abfunds.com | AB SELECT US EQUITY PORTFOLIO | 33 | |
NOTES TO FINANCIAL STATEMENTS(continued)
The following table represents the average monthly volume of the Fund’s derivative transactions during the six months ended December 31, 2018.
Total Return Swaps: | ||||
Average notional amount | $ | 1,770,227 | (a) |
| (a) | Positions were open for three months during the reporting period. |
For financial reporting purposes, the Fund does not offset derivative assets and derivative liabilities that are subject to netting arrangements in the statement of assets and liabilities.
All OTC derivatives held at period end were subject to netting arrangements. The following table presents the Fund’s derivative assets and liabilities by OTC counterparty net of amounts available for offset under ISDA Master Agreements (“MA”) and net of the related collateral received/pledged by the Fund as of December 31, 2018. Exchange-traded derivatives and centrally cleared swaps are not subject to netting arrangements and as such are excluded from the table.
Counterparty | Derivative Assets Subject to a MA | Derivatives Available for Offset | Cash Collateral Received* | Security Collateral Received* | Net Amount of Derivatives Assets | |||||||||||||||
Morgan Stanley Capital Services, LLC | $ | 4,731 | $ | (4,731 | ) | $ | – 0 | – | $ | – 0 | – | $ | – 0 | – | ||||||
|
|
|
|
|
|
|
|
|
| |||||||||||
Total | $ | 4,731 | $ | (4,731 | ) | $ | – 0 | – | $ | – 0 | – | $ | – 0 | –^ | ||||||
|
|
|
|
|
|
|
|
|
| |||||||||||
Counterparty | Derivative Liabilities Subject to a MA | Derivatives Available for Offset | Cash Collateral Pledged* | Security Collateral Pledged* | Net Amount of Derivatives Liabilities | |||||||||||||||
Morgan Stanley Capital Services, LLC | $ | 313,384 | $ | (4,731 | ) | $ | (260,000 | ) | $ | – 0 | – | $ | 48,653 | |||||||
|
|
|
|
|
|
|
|
|
| |||||||||||
Total | $ | 313,384 | $ | (4,731 | ) | $ | (260,000 | ) | $ | – 0 | – | $ | 48,653 | ^ | ||||||
|
|
|
|
|
|
|
|
|
| |||||||||||
| * | The actual collateral received/pledged may be more than the amount reported due to overcollateralization. |
| ^ | Net amount represents the net receivable/payable that would be due from/to the counterparty in the event of default or termination. The net from OTC financial derivative instruments can only be netted across transactions governed under the same master agreement with the same counterparty. |
2. Currency Transactions
The Fund may invest innon-U.S. Dollar-denominated securities on a currency hedged or unhedged basis. The Fund may seek investment opportunities by taking long or short positions in currencies through the use of currency-related derivatives, including forward currency exchange contracts, futures and options on futures, swaps, and other options. The Fund
| 34 | AB SELECT US EQUITY PORTFOLIO | abfunds.com | |
NOTES TO FINANCIAL STATEMENTS(continued)
may enter into transactions for investment opportunities when it anticipates that a foreign currency will appreciate or depreciate in value but securities denominated in that currency are not held by the Fund and do not present attractive investment opportunities. Such transactions may also be used when the Adviser believes that it may be more efficient than a direct investment in a foreign currency-denominated security. The Fund may also conduct currency exchange contracts on a spot basis (i.e., for cash at the spot rate prevailing in the currency exchange market for buying or selling currencies).
NOTE E
Securities Lending
The Fund may enter into securities lending transactions. Under the Fund’s securities lending program, all loans of securities will be collateralized continually by cash. The Fund will be compensated for the loan from a portion of the net return from the income earned on cash collateral after a rebate is paid to the borrower (in some cases, this rebate may be a “negative rebate” or fee paid by the borrower to the Fund in connection with the loan), and payments are made for fees of the securities lending agent and for certain other administrative expenses. It is the policy of the Fund to receive collateral consisting of cash in an amount exceeding the value of the securities loaned. A Fund will have the right to call a loan and obtain the securities loaned at any time on notice to the borrower within the normal and customary settlement time for the securities. While the securities are on loan, the borrower is obligated to pay the Fund amounts equal to any income or other distributions from the securities. The Fund will not be able to exercise voting rights with respect to any securities during the existence of a loan, but will have the right to regain ownership of loaned securities in order to exercise voting or other ownership rights. The lending agent has agreed to indemnify the Fund in the case of default of any securities borrower. Collateral received and securities loaned are marked to market daily to ensure that the securities loaned are secured by collateral. The lending agent currently invests the cash collateral received in Government Money Market Portfolio, an eligible money market vehicle, in accordance with the investment restrictions of the Fund, and as approved by the Board. The collateral received on securities loaned is recorded as an asset as well as a corresponding liability in the statement of assets and liabilities. When the Fund lends securities, its investment performance will continue to reflect changes in the value of the securities loaned. At December 31, 2018, the Fund had securities on loan with a value of $135,002 and had received cash collateral which has been invested into Government Money Market Portfolio of $135,450. The cash collateral will be adjusted on the next business day to maintain the required collateral amount. The Fund earned securities lending income of $10,145 from Government Money Market Portfolio, inclusive of rebate expense paid to the borrower, for the
| abfunds.com | AB SELECT US EQUITY PORTFOLIO | 35 | |
NOTES TO FINANCIAL STATEMENTS(continued)
six months ended December 31, 2018; this amount is reflected in the statement of operations. In connection with the cash collateral investment by the Fund in the Government Money Market Portfolio, the Adviser has agreed to waive a portion of the Fund’s share of the advisory fees of Government Money Market Portfolio, as borne indirectly by the Fund as an acquired fund fee and expense. For the six months ended December 31, 2018, such waiver amounted to $939. A principal risk of lending portfolio securities is that the borrower will fail to return the loaned securities upon termination of the loan and that the collateral will not be sufficient to replace the loaned securities.
NOTE F
Capital Stock
Each class consists of 3,000,000,000 authorized shares. Transactions in capital shares for each class were as follows:
| Shares | Amount | |||||||||||||||||||||
| Six Months Ended December 31, 2018 (unaudited) | Year Ended June 30, 2018 | Six Months Ended December 31, 2018 (unaudited) | Year Ended June 30, 2018 | |||||||||||||||||||
|
| |||||||||||||||||||||
| Class A | ||||||||||||||||||||||
Shares sold | 34,729 | 125,883 | $ | 608,709 | $ | 2,157,496 | ||||||||||||||||
| ||||||||||||||||||||||
Shares issued in reinvestment of dividends and distributions | 67,560 | 65,993 | 1,020,155 | 1,100,773 | ||||||||||||||||||
| ||||||||||||||||||||||
Shares converted from Class C | 138 | 1,315 | 2,443 | 22,004 | ||||||||||||||||||
| ||||||||||||||||||||||
Shares redeemed | (98,598 | ) | (196,966 | ) | (1,715,978 | ) | (3,411,620 | ) | ||||||||||||||
| ||||||||||||||||||||||
Net increase (decrease) | 3,829 | (3,775 | ) | $ | (84,671 | ) | $ | (131,347 | ) | |||||||||||||
| ||||||||||||||||||||||
| Class C | ||||||||||||||||||||||
Shares sold | 97,244 | 268,237 | $ | 1,521,033 | $ | 4,418,304 | ||||||||||||||||
| ||||||||||||||||||||||
Shares issued in reinvestment of dividends and distributions | 69,798 | 66,790 | 993,220 | 1,061,957 | ||||||||||||||||||
| ||||||||||||||||||||||
Shares converted to Class A | (146 | ) | (1,382 | ) | (2,443 | ) | (22,004 | ) | ||||||||||||||
| ||||||||||||||||||||||
Shares redeemed | (153,148 | ) | (216,577 | ) | (2,297,837 | ) | (3,571,394 | ) | ||||||||||||||
| ||||||||||||||||||||||
Net increase | 13,748 | 117,068 | $ | 213,973 | $ | 1,886,863 | ||||||||||||||||
| ||||||||||||||||||||||
| 36 | AB SELECT US EQUITY PORTFOLIO | abfunds.com | |
NOTES TO FINANCIAL STATEMENTS(continued)
| Shares | Amount | |||||||||||||||||||||||
| Six Months Ended December 31, 2018 (unaudited) | Year Ended 2018 | Six Months Ended December 31, 2018 (unaudited) | Year Ended 2018 | |||||||||||||||||||||
|
| |||||||||||||||||||||||
| Advisor Class | ||||||||||||||||||||||||
Shares sold | 420,809 | 1,002,386 | $ | 6,811,461 | $ | 17,190,285 | ||||||||||||||||||
| ||||||||||||||||||||||||
Shares issued in reinvestment of dividends and distributions | 1,013,091 | 1,311,990 | 15,247,014 | 21,831,505 | ||||||||||||||||||||
| ||||||||||||||||||||||||
Shares redeemed | (1,261,268 | ) | (5,927,427 | ) | (21,240,233 | ) | (101,368,311 | ) | ||||||||||||||||
| ||||||||||||||||||||||||
Net increase (decrease) | 172,632 | (3,613,051 | ) | $ | 818,242 | $ | (62,346,521 | ) | ||||||||||||||||
| ||||||||||||||||||||||||
| Class R | ||||||||||||||||||||||||
Shares sold | 22 | – 0 | – | $ | 334 | $ | – 0 | – | ||||||||||||||||
| ||||||||||||||||||||||||
Shares issued in reinvestment of dividends and distributions | 1 | 0 | * | 20 | 0 | ** | ||||||||||||||||||
| ||||||||||||||||||||||||
Net increase | 23 | 0 | * | $ | 354 | $ | 0 | ** | ||||||||||||||||
| ||||||||||||||||||||||||
| Class K | ||||||||||||||||||||||||
Shares sold | 12,714 | 16,514 | $ | 198,734 | $ | 281,886 | ||||||||||||||||||
| ||||||||||||||||||||||||
Shares issued in reinvestment of dividends and distributions | 7,989 | 18,185 | 119,110 | 299,334 | ||||||||||||||||||||
| ||||||||||||||||||||||||
Shares redeemed | (101,936 | ) | (30,236 | ) | (1,718,490 | ) | (506,956 | ) | ||||||||||||||||
| ||||||||||||||||||||||||
Net increase (decrease) | (81,233 | ) | 4,463 | $ | (1,400,646 | ) | $ | 74,264 | ||||||||||||||||
| ||||||||||||||||||||||||
| Class I | ||||||||||||||||||||||||
Shares sold | 249,833 | 1,616,150 | $ | 4,147,821 | $ | 27,528,108 | ||||||||||||||||||
| ||||||||||||||||||||||||
Shares issued in reinvestment of dividends and distributions | 221,646 | 88,241 | 3,300,315 | 1,454,205 | ||||||||||||||||||||
| ||||||||||||||||||||||||
Shares redeemed | (791,783 | ) | (323,064 | ) | (13,506,739 | ) | (5,644,427 | ) | ||||||||||||||||
| ||||||||||||||||||||||||
Net increase (decrease) | (320,304 | ) | 1,381,327 | $ | (6,058,603 | ) | $ | 23,337,886 | ||||||||||||||||
| ||||||||||||||||||||||||
| * | Share is less than 0.5. |
| ** | Amount is less than $0.5. |
At December 31, 2018, certain shareholders owned 11% in aggregate of the Fund’s outstanding shares. Significant transactions by such shareholder, if any, may impact the Fund’s performance.
| abfunds.com | AB SELECT US EQUITY PORTFOLIO | 37 | |
NOTES TO FINANCIAL STATEMENTS(continued)
NOTE G
Risks Involved in Investing in the Fund
Sector Risk—The Fund may have more risk because of concentrated investments in a particular market sector, such as the technology or financial services sector. Market or economic factors affecting that sector could have a major effect on the value of the Fund’s investments.
Capitalization Risk—Investments in small- andmid-capitalization companies may be more volatile than investments in large-capitalization companies. Investments in these companies may have additional risks because these companies have limited product lines, markets or financial resources.
Active Trading Risk—The Fund expects to engage in active and frequent trading of its portfolio securities and its portfolio turnover rate may greatly exceed 100%. A higher rate of portfolio turnover increases transaction costs, which may negatively affect the Fund’s return. In addition, a high rate of portfolio turnover may result in substantial short-term gains, which may have adverse tax consequences for Fund shareholders.
Indemnification Risk—In the ordinary course of business, the Fund enters into contracts that contain a variety of indemnifications. The Fund’s maximum exposure under these arrangements is unknown. However, the Fund has not had prior claims or losses pursuant to these indemnification provisions and expects the risk of loss thereunder to be remote. Therefore, the Fund has not accrued any liability in connection with these indemnification provisions.
NOTE H
Joint Credit Facility
A number ofopen-end mutual funds managed by the Adviser, including the Fund, participate in a $325 million revolving credit facility (the “Facility”) intended to provide short-term financing if necessary, subject to certain restrictions in connection with abnormal redemption activity. Commitment fees related to the Facility are paid by the participating funds and are included in miscellaneous expenses in the statement of operations. The Fund did not utilize the Facility during the six months ended December 31, 2018.
NOTE I
Distributions to Shareholders
The tax character of distributions paid for the year ending June 30, 2019 will be determined at the end of the current fiscal year.
| 38 | AB SELECT US EQUITY PORTFOLIO | abfunds.com | |
NOTES TO FINANCIAL STATEMENTS(continued)
The tax character of distributions paid during the fiscal years ended June 30, 2018 and June 30, 2017 were as follows:
| 2018 | 2017 | |||||||
Distributions paid from: | ||||||||
Ordinary income | $ | 18,936,131 | $ | 7,344,823 | ||||
Net long-term capital gains | 10,866,983 | 4,190,777 | ||||||
|
|
|
| |||||
Total taxable distributions paid | $ | 29,803,114 | $ | 11,535,600 | ||||
|
|
|
| |||||
As of June 30, 2018, the components of accumulated earnings/(deficit) on a tax basis were as follows:
Undistributed ordinary income | $ | 12,699,756 | ||
Undistributed capital gains | 9,744,475 | |||
Unrealized appreciation/(depreciation) | 44,080,756 | (a) | ||
|
| |||
Total accumulated earnings/(deficit) | $ | 66,524,987 | ||
|
|
| (a) | The difference between book-basis andtax-basis unrealized appreciation/(depreciation) is attributable primarily to the tax deferral of losses on wash sales. |
For tax purposes, net capital losses may be carried over to offset future capital gains, if any. Funds are permitted to carry forward capital losses for an indefinite period, and such losses will retain their character as either short-term or long-term capital losses. As of June 30, 2018, the Fund did not have any capital loss carryforwards.
NOTE J
Recent Accounting Pronouncements
In August 2018, the Financial Accounting Standards Board issued an Accounting Standards Update, ASU2018-13, Fair Value Measurement (Topic 820), Disclosure Framework-Changes to the Disclosure Requirements for Fair Value Measurement which removes, modifies and adds disclosures to Topic 820. The amendments in this ASU2018-13 apply to all entities that are required, under existing U.S. GAAP, to make disclosures about recurring or nonrecurring fair value measurements. The amendments in this ASU2018-13 are effective for all entities for fiscal years, and interim periods within those fiscal years, beginning after December 15, 2019. At this time, management is evaluating the implications of these changes on the financial statements.
In October 2018, the U.S. Securities and Exchange Commission adopted amendments to certain disclosure requirements included in RegulationS-X that had become “redundant, duplicative, overlapping, outdated or superseded, in light of the other Commission disclosure requirements, GAAP or changes in the information environment.” The compliance date for the amendments to RegulationS-X was November 5, 2018 (for reporting period end dates of September 30, 2018 or after). Management has adopted the amendments which simplified certain disclosure requirements on the financial statements.
| abfunds.com | AB SELECT US EQUITY PORTFOLIO | 39 | |
NOTES TO FINANCIAL STATEMENTS(continued)
NOTE K
Subsequent Events
Management has evaluated subsequent events for possible recognition or disclosure in the financial statements through the date the financial statements are issued. Management has determined that there are no material events that would require disclosure in the Fund’s financial statements through this date.
| 40 | AB SELECT US EQUITY PORTFOLIO | abfunds.com | |
FINANCIAL HIGHLIGHTS
Selected Data For A Share of Capital Stock Outstanding Throughout Each Period
| Class A | ||||||||||||||||||||||||
| Six Months Ended December 31, 2018 (unaudited) | Year Ended June 30, | |||||||||||||||||||||||
| 2018 | 2017 | 2016 | 2015 | 2014 | ||||||||||||||||||||
|
| |||||||||||||||||||||||
Net asset value, beginning of period | $ 17.15 | $ 16.54 | $ 14.70 | $ 15.56 | $ 15.62 | $ 13.26 | ||||||||||||||||||
|
| |||||||||||||||||||||||
Income From Investment Operations | ||||||||||||||||||||||||
Net investment income(a) | .03 | (b) | .05 | (b) | .06 | (b) | .06 | (b) | .01 | .02 | ||||||||||||||
Net realized and unrealized gain (loss) on investment and foreign currency transactions | (1.14 | ) | 2.39 | 2.32 | .21 | 1.20 | 2.68 | |||||||||||||||||
Contributions from Affiliates | – 0 | – | – 0 | – | – 0 | – | – 0 | – | .00 | (c) | – 0 | – | ||||||||||||
|
| |||||||||||||||||||||||
Net increase (decrease) in net asset value from operations | (1.11 | ) | 2.44 | 2.38 | .27 | 1.21 | 2.70 | |||||||||||||||||
|
| |||||||||||||||||||||||
Less: Dividends and Distributions | ||||||||||||||||||||||||
Dividends from net investment income | (.05 | ) | (.03 | ) | – 0 | – | (.02 | ) | (.03 | ) | (.02 | ) | ||||||||||||
Distributions from net realized gain on investment and foreign currency transactions | (1.66 | ) | (1.80 | ) | (.54 | ) | (1.11 | ) | (1.24 | ) | (0.32 | ) | ||||||||||||
|
| |||||||||||||||||||||||
Total dividends and distributions | (1.71 | ) | (1.83 | ) | (.54 | ) | (1.13 | ) | (1.27 | ) | (.34 | ) | ||||||||||||
|
| |||||||||||||||||||||||
Net asset value, end of period | $ 14.33 | $ 17.15 | $ 16.54 | $ 14.70 | $ 15.56 | $ 15.62 | ||||||||||||||||||
|
| |||||||||||||||||||||||
Total Return | ||||||||||||||||||||||||
Total investment return based on net asset value(d)* | (6.96 | )% | 15.03 | % | 16.47 | % | 1.74 | % | 8.02 | % | 20.53 | % | ||||||||||||
Ratios/Supplemental Data | ||||||||||||||||||||||||
Net assets, end of period (000’s omitted) | $10,133 | $12,060 | $11,694 | $42,856 | $18,958 | $17,535 | ||||||||||||||||||
Ratio to average net assets of: | ||||||||||||||||||||||||
Expenses, net of waivers/reimbursements(e)† | 1.48 | %(f) | 1.45 | % | 1.45 | % | 1.45 | % | 1.45 | % | 1.49 | % | ||||||||||||
Expenses, before waivers/reimbursements(e)† | 1.48 | %(f) | 1.46 | % | 1.45 | % | 1.45 | % | 1.45 | % | 1.49 | % | ||||||||||||
Net investment income | .36 | %(b)(f) | .31 | %(b) | .37 | %(b) | .44 | %(b) | .08 | % | .12 | % | ||||||||||||
Portfolio turnover rate | 105 | % | 236 | % | 292 | % | 269 | % | 348 | % | 495 | % | ||||||||||||
† Expense ratios exclude the estimated acquired fund fees of affiliated/unaffiliated underlying |
| |||||||||||||||||||||||
portfolios | .01 | % | .02 | % | .02 | % | .00 | % | .00 | % | .00 | % | ||||||||||||
See footnote summary on page 47.
| abfunds.com | AB SELECT US EQUITY PORTFOLIO | 41 | |
FINANCIAL HIGHLIGHTS(continued)
Selected Data For A Share of Capital Stock Outstanding Throughout Each Period
| Class C | ||||||||||||||||||||||||
| Six Months Ended December 31, 2018 (unaudited) | Year Ended June 30, | |||||||||||||||||||||||
| 2018 | 2017 | 2016 | 2015 | 2014 | ||||||||||||||||||||
|
| |||||||||||||||||||||||
Net asset value, beginning of period | $ 16.28 | $ 15.87 | $ 14.23 | $ 15.19 | $ 15.34 | $ 13.11 | ||||||||||||||||||
|
| |||||||||||||||||||||||
Income From Investment Operations | ||||||||||||||||||||||||
Net investment income(a) | (.03 | )(b) | (.07 | )(b) | (.05 | )(b) | (.06 | )(b) | (.10 | ) | (.08 | ) | ||||||||||||
Net realized and unrealized gain (loss) on investment and foreign currency transactions | (1.08 | ) | 2.28 | 2.23 | .21 | 1.19 | 2.63 | |||||||||||||||||
Contributions from Affiliates | – 0 | – | – 0 | – | – 0 | – | – 0 | – | .00 | (c) | – 0 | – | ||||||||||||
|
| |||||||||||||||||||||||
Net increase (decrease) in net asset value from operations | (1.11 | ) | 2.21 | 2.18 | .15 | 1.09 | 2.55 | |||||||||||||||||
|
| |||||||||||||||||||||||
Less: Distributions | ||||||||||||||||||||||||
Distributions from net realized gain on investment and foreign currency transactions | (1.66 | ) | (1.80 | ) | (.54 | ) | (1.11 | ) | (1.24 | ) | (.32 | ) | ||||||||||||
|
| |||||||||||||||||||||||
Net asset value, end of period | $ 13.51 | $ 16.28 | $ 15.87 | $ 14.23 | $ 15.19 | $ 15.34 | ||||||||||||||||||
|
| |||||||||||||||||||||||
Total Return | ||||||||||||||||||||||||
Total investment return based on net asset value(d)* | (7.31 | )% | 14.19 | % | 15.59 | % | 0.98 | % | 7.31 | % | 19.65 | % | ||||||||||||
Ratios/Supplemental Data | ||||||||||||||||||||||||
Net assets, end of period (000’s omitted) | $10,830 | $12,825 | $10,647 | $12,613 | $16,791 | $10,645 | ||||||||||||||||||
Ratio to average net assets of: | ||||||||||||||||||||||||
Expenses, net of waivers/reimbursements(e)† | 2.23 | %(f) | 2.21 | % | 2.20 | % | 2.20 | % | 2.19 | % | 2.20 | % | ||||||||||||
Expenses, before waivers/reimbursements(e)† | 2.24 | %(f) | 2.21 | % | 2.21 | % | 2.20 | % | 2.19 | % | 2.20 | % | ||||||||||||
Net investment income (loss) | (.39 | )%(b)(f) | (.45 | )%(b) | (.33 | )%(b) | (.41 | )%(b) | (.66 | )% | (.57 | )% | ||||||||||||
Portfolio turnover rate | 105 | % | 236 | % | 292 | % | 269 | % | 348 | % | 495 | % | ||||||||||||
† Expense ratios exclude the estimated acquired fund fees of affiliated/unaffiliated underlying |
| |||||||||||||||||||||||
portfolios | .01 | % | .02 | % | .02 | % | .00 | % | .00 | % | .00 | % | ||||||||||||
See footnote summary on page 47.
| 42 | AB SELECT US EQUITY PORTFOLIO | abfunds.com | |
FINANCIAL HIGHLIGHTS(continued)
Selected Data For A Share of Capital Stock Outstanding Throughout Each Period
| Advisor Class | ||||||||||||||||||||||||
| Six Months Ended December 31, 2018 (unaudited) | Year Ended June 30, | |||||||||||||||||||||||
| 2018 | 2017 | 2016 | 2015 | 2014 | ||||||||||||||||||||
|
| |||||||||||||||||||||||
Net asset value, beginning of period | $ 17.14 | $ 16.53 | $ 14.73 | $ 15.60 | $ 15.64 | $ 13.26 | ||||||||||||||||||
|
| |||||||||||||||||||||||
Income From Investment Operations | ||||||||||||||||||||||||
Net investment income(a) | .05 | (b) | .10 | (b) | .10 | (b) | .09 | (b) | .05 | .06 | ||||||||||||||
Net realized and unrealized gain (loss) on investment and foreign currency transactions | (1.14 | ) | 2.38 | 2.33 | .21 | 1.21 | 2.68 | |||||||||||||||||
Contributions from Affiliates | – 0 | – | – 0 | – | – 0 | – | – 0 | – | .00 | (c) | – 0 | – | ||||||||||||
|
| |||||||||||||||||||||||
Net increase (decrease) in net asset value from operations | (1.09 | ) | 2.48 | 2.43 | .30 | 1.26 | 2.74 | |||||||||||||||||
|
| |||||||||||||||||||||||
Less: Dividends and Distributions | ||||||||||||||||||||||||
Dividends from net investment income | (.10 | ) | (.07 | ) | (.09 | ) | (.06 | ) | (.06 | ) | (.04 | ) | ||||||||||||
Distributions from net realized gain on investment and foreign currency transactions | (1.66 | ) | (1.80 | ) | (.54 | ) | (1.11 | ) | (1.24 | ) | (.32 | ) | ||||||||||||
|
| |||||||||||||||||||||||
Total dividends and distributions | (1.76 | ) | (1.87 | ) | (.63 | ) | (1.17 | ) | (1.30 | ) | (.36 | ) | ||||||||||||
|
| |||||||||||||||||||||||
Net asset value, end of period | $ 14.29 | $ 17.14 | $ 16.53 | $ 14.73 | $ 15.60 | $ 15.64 | ||||||||||||||||||
|
| |||||||||||||||||||||||
Total Return | ||||||||||||||||||||||||
Total investment return based on net asset value(d)* | (6.89 | )% | 15.33 | % | 16.82 | % | 1.91 | % | 8.40 | % | 20.89 | % | ||||||||||||
Ratios/Supplemental Data | ||||||||||||||||||||||||
Net assets, end of period (000’s omitted) | $158,106 | $186,570 | $239,659 | $216,896 | $260,521 | $225,377 | ||||||||||||||||||
Ratio to average net assets of: | ||||||||||||||||||||||||
Expenses, net of waivers/reimbursements(e)† | 1.23 | %(f) | 1.20 | % | 1.20 | % | 1.20 | % | 1.19 | % | 1.19 | % | ||||||||||||
Expenses, before waivers/reimbursements(e)† | 1.23 | %(f) | 1.21 | % | 1.20 | % | 1.20 | % | 1.19 | % | 1.19 | % | ||||||||||||
Net investment income | .61 | %(b)(f) | .56 | %(b) | .67 | %(b) | .60 | %(b) | .34 | % | .42 | % | ||||||||||||
Portfolio turnover rate | 105 | % | 236 | % | 292 | % | 269 | % | 348 | % | 495 | % | ||||||||||||
† Expense ratios exclude the estimated acquired fund fees of affiliated/unaffiliated underlying |
| |||||||||||||||||||||||
portfolios | .01 | % | .02 | % | .02 | % | .00 | % | .00 | % | .00 | % | ||||||||||||
See footnote summary on page 47.
| abfunds.com | AB SELECT US EQUITY PORTFOLIO | 43 | |
FINANCIAL HIGHLIGHTS(continued)
Selected Data For A Share of Capital Stock Outstanding Throughout Each Period
| Class R | ||||||||||||||||||||||||
| Six Months Ended December 31, 2018 (unaudited) | Year Ended June 30, | |||||||||||||||||||||||
| 2018 | 2017 | 2016 | 2015 | 2014 | ||||||||||||||||||||
|
| |||||||||||||||||||||||
Net asset value, beginning of period | $ 16.76 | $ 16.22 | $ 14.48 | $ 15.37 | $ 15.44 | $ 13.13 | ||||||||||||||||||
|
| |||||||||||||||||||||||
Income From Investment Operations | ||||||||||||||||||||||||
Net investment income(a)(b) | .01 | (b) | .00 | (b)(c) | .02 | (b) | .01 | (b) | (.03 | ) | (.01 | ) | ||||||||||||
Net realized and unrealized gain (loss) on investment and foreign currency transactions | (1.12 | ) | 2.34 | 2.28 | .21 | 1.20 | 2.64 | |||||||||||||||||
Contributions from Affiliates | – 0 | – | – 0 | – | – 0 | – | – 0 | – | .00 | (c) | – 0 | – | ||||||||||||
|
| |||||||||||||||||||||||
Net increase (decrease) in net asset value from operations | (1.11 | ) | 2.34 | 2.30 | .22 | 1.17 | 2.63 | |||||||||||||||||
|
| |||||||||||||||||||||||
Less: Dividends and Distributions | ||||||||||||||||||||||||
Dividends from net investment income | (.01 | ) | – 0 | – | (.02 | ) | – 0 | – | – 0 | – | – 0 | – | ||||||||||||
Distributions from net realized gain on investment and foreign currency transactions | (1.66 | ) | (1.80 | ) | (.54 | ) | (1.11 | ) | (1.24 | ) | (.32 | ) | ||||||||||||
|
| |||||||||||||||||||||||
Total dividends and distributions | (1.67 | ) | (1.80 | ) | (.56 | ) | (1.11 | ) | (1.24 | ) | (.32 | ) | ||||||||||||
|
| |||||||||||||||||||||||
Net asset value, end of period | $ 13.98 | $ 16.76 | $ 16.22 | $ 14.48 | $ 15.37 | $ 15.44 | ||||||||||||||||||
|
| |||||||||||||||||||||||
Total Return | ||||||||||||||||||||||||
Total investment return based on net asset value(d)* | (7.11 | )% | 14.71 | % | 16.14 | % | 1.44 | % | 7.80 | % | 20.23 | % | ||||||||||||
Ratios/Supplemental Data | ||||||||||||||||||||||||
Net assets, end of period (000’s omitted) | $14 | $17 | $16 | $15 | $15 | $16 | ||||||||||||||||||
Ratio to average net assets of: | ||||||||||||||||||||||||
Expenses, net of waivers/reimbursements(e)† | 1.76 | %(f) | 1.76 | % | 1.74 | % | 1.72 | % | 1.72 | % | 1.70 | % | ||||||||||||
Expenses, before waivers/reimbursements(e)† | 1.76 | %(f) | 1.76 | % | 1.74 | % | 1.72 | % | 1.72 | % | 1.70 | % | ||||||||||||
Net investment income (loss)(b) | .08 | %(f) | .01 | % | .12 | % | .09 | % | (.18 | )% | (.10 | )% | ||||||||||||
Portfolio turnover rate | 105 | % | 236 | % | 292 | % | 269 | % | 348 | % | 495 | % | ||||||||||||
† Expense ratios exclude the estimated acquired fund fees of affiliated/unaffiliated underlying |
| |||||||||||||||||||||||
portfolios | .01 | % | .02 | % | .02 | % | .00 | % | .00 | % | .00 | % | ||||||||||||
See footnote summary on page 47.
| 44 | AB SELECT US EQUITY PORTFOLIO | abfunds.com | |
FINANCIAL HIGHLIGHTS(continued)
Selected Data For A Share of Capital Stock Outstanding Throughout Each Period
| Class K | ||||||||||||||||||||||||
| Six Months Ended December 31, 2018 (unaudited) | Year Ended June 30, | |||||||||||||||||||||||
| 2018 | 2017 | 2016 | 2015 | 2014 | ||||||||||||||||||||
|
| |||||||||||||||||||||||
Net asset value, beginning of period | $ 16.92 | $ 16.33 | $ 14.56 | $ 15.43 | $ 15.47 | $ 13.14 | ||||||||||||||||||
|
| |||||||||||||||||||||||
Income From Investment Operations | ||||||||||||||||||||||||
Net investment income(a)(b) | .02 | .04 | .05 | .04 | (.00 | )(c) | .01 | |||||||||||||||||
Net realized and unrealized gain (loss) on investment and foreign currency transactions | (1.13 | ) | 2.35 | 2.29 | .21 | 1.20 | 2.64 | |||||||||||||||||
Contributions from Affiliates | – 0 | – | – 0 | – | – 0 | – | – 0 | – | .00 | (c) | – 0 | – | ||||||||||||
|
| |||||||||||||||||||||||
Net increase (decrease) in net asset value from operations | (1.11 | ) | 2.39 | 2.34 | .25 | 1.20 | 2.65 | |||||||||||||||||
|
| |||||||||||||||||||||||
Less: Dividends and Distributions | ||||||||||||||||||||||||
Dividends from net investment income | – 0 | – | – 0 | – | (.03 | ) | (.01 | ) | – 0 | – | – 0 | – | ||||||||||||
Distributions from net realized gain on investment and foreign currency transactions | (1.66 | ) | (1.80 | ) | (.54 | ) | (1.11 | ) | (1.24 | ) | (.32 | ) | ||||||||||||
|
| |||||||||||||||||||||||
Total dividends and distributions | (1.66 | ) | (1.80 | ) | (.57 | ) | (1.12 | ) | (1.24 | ) | (.32 | ) | ||||||||||||
|
| |||||||||||||||||||||||
Net asset value, end of period | $ 14.15 | $ 16.92 | $ 16.33 | $ 14.56 | $ 15.43 | $ 15.47 | ||||||||||||||||||
|
| |||||||||||||||||||||||
Total Return | ||||||||||||||||||||||||
Total investment return based on net asset value(d)* | (7.04 | )% | 14.94 | % | 16.38 | % | 1.58 | % | 8.05 | % | 20.37 | % | ||||||||||||
Ratios/Supplemental Data | ||||||||||||||||||||||||
Net assets, end of period (000’s omitted) | $1,198 | $2,806 | $2,636 | $3,739 | $3,604 | $2,678 | ||||||||||||||||||
Ratio to average net assets of: | ||||||||||||||||||||||||
Expenses, net of waivers/reimbursements(e)† | 1.55 | %(f) | 1.54 | % | 1.55 | % | 1.55 | % | 1.55 | % | 1.55 | % | ||||||||||||
Expenses, before waivers/reimbursements(e)† | 1.65 | %(f) | 1.63 | % | 1.62 | % | 1.60 | % | 1.59 | % | 1.62 | % | ||||||||||||
Net investment income (loss) | .20 | %(b)(f) | .22 | %(b) | .32 | %(b) | .27 | %(b) | (.02 | )% | .07 | % | ||||||||||||
Portfolio turnover rate | 105 | % | 236 | % | 292 | % | 269 | % | 348 | % | 495 | % | ||||||||||||
† Expense ratios exclude the estimated acquired fund fees of affiliated/unaffiliated underlying |
| |||||||||||||||||||||||
portfolios | .01 | % | .02 | % | .02 | % | .00 | % | .00 | % | .00 | % | ||||||||||||
See footnote summary on page 47.
| abfunds.com | AB SELECT US EQUITY PORTFOLIO | 45 | |
FINANCIAL HIGHLIGHTS(continued)
Selected Data For A Share of Capital Stock Outstanding Throughout Each Period
| Class I | ||||||||||||||||||||||||
| Six Months Ended December 31, 2018 (unaudited) | Year Ended June 30, | |||||||||||||||||||||||
| 2018 | 2017 | 2016 | 2015 | 2014 | ||||||||||||||||||||
|
| |||||||||||||||||||||||
Net asset value, beginning of period | $ 16.97 | $ 16.38 | $ 14.61 | $ 15.48 | $ 15.52 | $ 13.17 | ||||||||||||||||||
|
| |||||||||||||||||||||||
Income From Investment Operations | ||||||||||||||||||||||||
Net investment income(a) | .05 | (b) | .10 | (b) | .11 | (b) | .08 | (b) | .05 | .06 | ||||||||||||||
Net realized and unrealized gain (loss) on investment and foreign currency transactions | (1.12 | ) | 2.36 | 2.29 | .22 | 1.20 | 2.65 | |||||||||||||||||
Contributions from Affiliates | – 0 | – | – 0 | – | – 0 | – | – 0 | – | .00 | (c) | – 0 | – | ||||||||||||
|
| |||||||||||||||||||||||
Net increase (decrease) in net asset value from operations | (1.07 | ) | 2.46 | 2.40 | .30 | 1.25 | 2.71 | |||||||||||||||||
|
| |||||||||||||||||||||||
Less: Dividends and Distributions | ||||||||||||||||||||||||
Dividends from net investment income | (.10 | ) | (.07 | ) | (.09 | ) | (.06 | ) | (.05 | ) | (.04 | ) | ||||||||||||
Distributions from net realized gain on investment and foreign currency transactions | (1.66 | ) | (1.80 | ) | (.54 | ) | (1.11 | ) | (1.24 | ) | (.32 | ) | ||||||||||||
|
| |||||||||||||||||||||||
Total dividends and distributions | (1.76 | ) | (1.87 | ) | (.63 | ) | (1.17 | ) | (1.29 | ) | (.36 | ) | ||||||||||||
|
| |||||||||||||||||||||||
Net asset value, end of period | $ 14.14 | $ 16.97 | $ 16.38 | $ 14.61 | $ 15.48 | $ 15.52 | ||||||||||||||||||
|
| |||||||||||||||||||||||
Total Return | ||||||||||||||||||||||||
Total investment return based on net asset value(d)* | (6.83 | )% | 15.35 | % | 16.76 | % | 2.00 | % | 8.34 | % | 20.81 | % | ||||||||||||
Ratios/Supplemental Data | ||||||||||||||||||||||||
Net assets, end of period (000’s omitted) | $28,051 | $39,104 | $15,121 | $21,461 | $38,186 | $30,164 | ||||||||||||||||||
Ratio to average net assets of: | ||||||||||||||||||||||||
Expenses, net of waivers/reimbursements(e)† | 1.22 | %(f) | 1.21 | % | 1.19 | % | 1.18 | % | 1.22 | % | 1.18 | % | ||||||||||||
Expenses, before waivers/reimbursements(e)† | 1.22 | %(f) | 1.22 | % | 1.19 | % | 1.18 | % | 1.22 | % | 1.18 | % | ||||||||||||
Net investment income | .61 | %(b)(f) | .57 | %(b) | .72 | %(b) | .57 | %(b) | .31 | % | .40 | % | ||||||||||||
Portfolio turnover rate | 105 | % | 236 | % | 292 | % | 269 | % | 348 | % | 495 | % | ||||||||||||
† Expense ratios exclude the estimated acquired fund fees of affiliated/unaffiliated underlying |
| |||||||||||||||||||||||
portfolios | .01 | % | .02 | % | .02 | % | .00 | % | .00 | % | .00 | % | ||||||||||||
See footnote summary on page 47.
| 46 | AB SELECT US EQUITY PORTFOLIO | abfunds.com | |
FINANCIAL HIGHLIGHTS(continued)
Selected Data For A Share of Capital Stock Outstanding Throughout Each Period
| (a) | Based on average shares outstanding. |
| (b) | Net of expenses waived/reimbursed by the Adviser. |
| (c) | Amount is less than $0.005. |
| (d) | Total investment return is calculated assuming an initial investment made at the net asset value at the beginning of the period, reinvestment of all dividends and distributions at net asset value during the period, and redemption on the last day of the period. Initial sales charge or contingent deferred sales charge is not reflected in the calculation of total investment return. Total investment return does not reflect the deduction of taxes that a shareholder would pay on fund distributions or the redemption of fund shares. Total investment return for a period of less than one year is not annualized. |
| (e) | In connection with the Fund’s investments in affiliated underlying portfolios, the Fund incurs no direct expenses but bears proportionate shares of the acquired fund fees and expenses (i.e. operating, administrative and investment advisory fees) of the affiliated underlying portfolios. The Adviser has contractually agreed to waive its fees from the Fund in an amount equal to the Fund’s pro rata share of certain acquired fund fees and expenses, and for the six months ended December 31, 2018 and for the years ended June 30, 2018 and June 30, 2017, such waiver amounted to less than 0.005% (annualized), less than 0.005% and 0.01%, respectively. |
| (f) | Annualized. |
| * | Includes the impact of proceeds received , and credited to the Fund resulting from class action settlements, which enhanced the performance of each share class, for the year ended June 30, 2018 by 0.02%. |
See notes to financial statements.
| abfunds.com | AB SELECT US EQUITY PORTFOLIO | 47 | |
RESULTS OF SHAREHOLDERS MEETING
(unaudited)
A Special Meeting of Shareholders of the AB Cap Fund, Inc. (the “Company”)—AB Select US Equity Portfolio (the “Fund”) was held on October 11, 2018 and adjourned until November 14, 2018. A description of each proposal and number of shares voted at the Meeting are as follows (the proposal number shown below corresponds to the proposal number in the Fund’s proxy statement):
| 1. | To approve and vote upon the election of Directors for the Fund, each such Director to serve for a term of indefinite duration and until his or her successor is duly elected and qualifies. |
Director: | Voted For | Withheld Authority | ||||||
Michael J. Downey | 177,670,106 | 1,341,274 | ||||||
William H. Foulk, Jr.* | 177,513,147 | 1,498,234 | ||||||
Nancy P. Jacklin | 177,735,792 | 1,275,589 | ||||||
Robert M. Keith | 177,684,440 | 1,326,940 | ||||||
Carol C. McMullen | 177,776,007 | 1,235,373 | ||||||
Garry L. Moody | 177,685,142 | 1,326,239 | ||||||
Marshall C. Turner | 177,657,263 | 1,354,118 | ||||||
Earl D. Weiner | 177,655,684 | 1,355,696 | ||||||
| 2. | To vote upon the approval of new advisory agreements for the Fund with AllianceBernstein L.P. |
Voted For | Voted Against | Abstained | Broker Non-Votes | |||||||||||
| 5,782,133 | 71,089 | 76,579 | 2,226,582 | |||||||||||
| * | Mr. Foulk retired on December 31, 2018. |
| 48 | AB SELECT US EQUITY PORTFOLIO | abfunds.com | |
BOARD OF DIRECTORS
Marshall C. Turner, Jr.(1), Chairman Michael J. Downey(1) Nancy P. Jacklin(1) Robert M. Keith,President and Chief Executive Officer | Carol C. McMullen(1) Garry L. Moody(1) Earl D. Weiner(1) |
OFFICERS
Kurt A. Feuerman(2), Vice President Anthony Nappo(2), Vice President Emilie D. Wrapp,Secretary Michael B. Reyes,Senior Analyst | Joseph J. Mantineo,Treasurer and Chief Financial Officer Phyllis J. Clarke,Controller Vincent S. Noto,Chief Compliance Officer |
Custodian and Accounting Agent Brown Brothers Harriman & Co. 50 Post Office Square Boston, MA 02110
Principal Underwriter AllianceBernstein Investments, Inc. 1345 Avenue of the Americas New York, NY 10105
Legal Counsel Seward & Kissel LLP One Battery Park Plaza New York, NY 10004 | Independent Registered Public Accounting Firm Ernst & Young LLP 5 Times Square New York, NY 10036
Transfer Agent AllianceBernstein Investor Services, Inc. P.O. Box 786003 San Antonio, TX 78278-6003 Toll-Free(800) 221-5672 |
| 1 | Member of the Audit Committee, the Governance and Nominating Committee, and the Independent Directors Committee. |
| 2 | The day-to-day management of, and investment decisions for, the Fund’s Portfolio are made by the Adviser’s Select Equity Portfolios Investment Team. Messrs. Feuerman and Nappo are the investment professionals with the most significant responsibility for the day-to-day management of the Fund’s Portfolio. |
| abfunds.com | AB SELECT US EQUITY PORTFOLIO | 49 | |
Information Regarding the Review and Approval of the Fund’s Advisory Agreement
As described in more detail in the Proxy Statement for the AB Funds dated August 20, 2018, the Boards of the AB Funds, at a meeting held onJuly 31-August 2, 2018, approved new advisory agreements with the Adviser (the “Proposed Agreements”) for the AB Funds, including AB Cap Fund, Inc. in respect of AB Select US Equity Portfolio (the “Fund”), in connection with the planned disposition by AXA S.A. of its remaining shares of AXA Equitable Holdings, Inc. (the indirect holder of a majority of the partnership interests in the Adviser and the indirect parent of AllianceBernstein Corporation, the general partner of the Adviser) in one or more transactions and the related potential for one or more “assignments” (within the meaning of section 2(a)(4) of the Investment Company Act) of the advisory agreements for the AB Funds, including the Fund’s Advisory Agreement, resulting in the automatic termination of such advisory agreements.
At the same meeting, the AB Boards also considered and approved interim advisory agreements with the Adviser (the “Interim Advisory Agreements”) for the AB Funds, including the Fund, to be effective only in the event that stockholder approval of a Proposed Agreement had not been obtained as of the date of one or more transactions resulting in an “assignment” of the Adviser’s advisory agreements, resulting in the automatic termination of such advisory agreements.
The shareholders of the Fund subsequently approved the Proposed Agreements at an annual meeting of shareholders called for the purpose of electing Directors and voting on the Proposed Agreements.
A discussion regarding the basis for the Boards’ approvals at a meeting held onJuly 31-August 2, 2018 is set forth below.
Information Regarding the Review and Approval of the Fund’s Proposed New Advisory Agreement and Interim Advisory Agreement in the Context of Potential Assignments
At a meeting of the AB Boards held on July31-August 2, 2018, the Adviser presented its recommendation that the Boards consider and approve the Proposed Agreements. Section 15(c) of the 1940 Act provides that, after an initial period, a Fund’s Current Agreement and currentsub-advisory agreement, as applicable, will remain in effect only if the Board, including a majority of the Independent Directors, annually reviews and approves them. Each of the Current Agreements had been approved by a Board within theone-year period prior to approval of its related Proposed Agreement, except that the Current Agreements for certain FlexFee funds were approved in February 2017. In connection with their approval of the Proposed Agreements, the Boards considered their conclusions in connection with their most recent approvals of the Current Agreements, in particular in cases where the last approval of a Current Agreement was relatively recent, including the Boards’ general satisfaction with the nature and quality of
| 50 | AB SELECT US EQUITY PORTFOLIO | abfunds.com | |
services being provided and, as applicable, in the case of certain Funds, actions taken or to be taken in an effort to improve investment performance or reduce expense ratios. The Directors also reviewed updated information provided by the Adviser in respect of each Fund. Also in connection with their approval of the Proposed Agreements, the Boards considered a representation made to them at that time by the Adviser that there were no additional developments not already disclosed to the Boards since their most recent approvals of the Current Agreements that would be a material consideration to the Boards in connection with their consideration of the Proposed Agreements, except for matters disclosed to the Boards by the Adviser. The Directors considered the fact that each Proposed Agreement would have corresponding terms and conditions identical to those of the corresponding Current Agreement with the exception of the effective date and initial term under the Proposed Agreement.
The Directors considered their knowledge of the nature and quality of the services provided by the Adviser to each Fund gained from their experience as directors or trustees of registered investment companies advised by the Adviser, their overall confidence in the Adviser’s integrity and competence they have gained from that experience, the Adviser’s initiative in identifying and raising potential issues with the Directors and its responsiveness, frankness and attention to concerns raised by the Directors in the past, including the Adviser’s willingness to consider and implement organizational and operational changes designed to improve investment results and the services provided to the Funds. The Directors noted that they have four regular meetings each year, at each of which they review extensive materials and information from the Adviser, including information on the investment performance of each Fund.
The Directors also considered all factors they believed relevant, including the specific matters discussed below. During the course of their deliberations, the Directors evaluated, among other things, the reasonableness of the management fees of the Funds they oversee. The Directors did not identify any particular information that was all-important or controlling, and different Directors may have attributed different weights to the various factors. The Directors determined that the selection of the Adviser to manage the Funds, and the overall arrangements between the Funds and the Adviser, as provided in the Proposed Agreements, including the management fees, were fair and reasonable in light of the services performed under the Current Agreements and to be performed under the Proposed Agreements, expenses incurred and to be incurred and such other matters as the Directors considered relevant in the exercise of their business judgment. The material factors and conclusions that formed the basis for the Directors’ determinations included the following:
Nature, Extent and Quality of Services Provided
The Directors considered the scope and quality of services to be provided by the Adviser under the Proposed Agreements, including the quality of
| abfunds.com | AB SELECT US EQUITY PORTFOLIO | 51 | |
the investment research capabilities of the Adviser and the other resources it has dedicated to performing services for the Funds. They also considered the information that had been provided to them by the Adviser concerning the anticipated implementation of the Plan and the Adviser’s representation that it did not anticipate that such implementation would affect the management or structure of the Adviser, have a material adverse effect on the Adviser, or adversely affect the quality of the services provided to the Funds by the Adviser and its affiliates. The Directors noted that the Adviser from time to time reviews each Fund’s investment strategies and from time to time proposes changes intended to improve the Fund’s relative or absolute performance for the Directors’ consideration. They also noted the professional experience and qualifications of each Fund’s portfolio management team and other senior personnel of the Adviser. The Directors also considered that certain Proposed Agreements, similar to the corresponding Current Agreements, provide that the Funds will reimburse the Adviser for the cost to it of providing certain clerical, accounting, administrative and other services to the Funds by employees of the Adviser or its affiliates. Requests for these reimbursements are made on a quarterly basis and subject to approval by the Directors. The Directors noted that the Adviser did not request any reimbursements from certain Funds in the Fund’s latest fiscal year reviewed. The Directors noted that the methodology to be used to determine the reimbursement amounts had been reviewed by an independent consultant retained by the Funds’ former Senior Officer/Independent Compliance Officer. The quality of administrative and other services, including the Adviser’s role in coordinating the activities of the Funds’ other service providers, also was considered. The Directors of each Fund concluded that, overall, they were satisfied with the nature, extent and quality of services to be provided to the Funds under the Proposed Agreement for the Fund.
Costs of Services to be Provided and Profitability
The Directors reviewed a schedule of the revenues and expenses and related notes indicating the profitability of each Fund to the Adviser for calendar years 2016 and 2017, as applicable, that had been prepared with an expense allocation methodology arrived at in consultation with an independent consultant retained by the Funds’ former Senior Officer/Independent Compliance Officer. The Directors noted the assumptions and methods of allocation used by the Adviser in preparing fund-specific profitability data and understood that there are a number of potentially acceptable allocation methodologies for information of this type. The Directors noted that the profitability information reflected all revenues and expenses of the Adviser’s relationship with a Fund, including those relating to its subsidiaries that provide transfer agency, distribution and brokerage services to the Fund, as applicable. The Directors recognized that it is difficult to make comparisons of the profitability of the Proposed Agreements with the profitability of fund advisory contracts for unaffiliated funds because comparative information is not generally publicly available and is
| 52 | AB SELECT US EQUITY PORTFOLIO | abfunds.com | |
affected by numerous factors. The Directors focused on the profitability of the Adviser’s relationship with each Fund before taxes and distribution expenses, as applicable. The Directors noted that certain Funds were not profitable to the Adviser in one or more periods reviewed. The Directors concluded that the Adviser’s level of profitability from its relationship with the other Funds was not unreasonable. The Directors were unable to consider historical information about the profitability of certain Funds that had recently commenced operations and for which historical profitability information was not available. The Adviser agreed to provide the Directors with profitability information in connection with future proposed continuances of the Proposed Agreements.
Fall-Out Benefits
The Directors considered the other benefits to the Adviser and its affiliates from their relationships with the Funds, including, but not limited to, as applicable, benefits relating to soft dollar arrangements (whereby investment advisers receive brokerage and research services from brokers that execute agency transactions for their clients) in the case of certain Funds;12b-1 fees and sales charges received by the principal underwriter (which is a wholly owned subsidiary of the Adviser) in respect of certain classes of the shares of most of the Funds; brokerage commissions paid by certain Funds to brokers affiliated with the Adviser; and transfer agency fees paid by most of the Funds to a wholly owned subsidiary of the Adviser. The Directors recognized that the Adviser’s profitability would be somewhat lower, and that a Fund’s unprofitability to the Adviser would be exacerbated, without these benefits. The Directors understood that the Adviser also might derive reputational and other benefits from its association with the Funds.
Investment Results
In addition to the information reviewed by the Directors in connection with the Board meeting at which the Proposed Agreements were approved, the Directors receive detailed performance information for the Funds at each regular Board meeting during the year.
The Boards’ consideration of each Proposed Agreement was informed by their most recent approval of the related Current Agreement, and, in the case of certain Funds, their discussion with the Adviser of the reasons for those Funds’ underperformance in certain periods. The Directors also reviewed updated performance information and, in some cases, discussed with the Adviser the reasons for changes in performance or continued underperformance. On the basis of this review, the Directors concluded that each Fund’s investment performance was acceptable.
Management Fees and Other Expenses
The Directors considered the management fee rate payable by each Fund to the Adviser and information prepared by an independent service provider
| abfunds.com | AB SELECT US EQUITY PORTFOLIO | 53 | |
(the “15(c) provider”) concerning management fee rates payable by other funds in the same category as the Fund. The Directors recognized that it is difficult to make comparisons of management fees because there are variations in the services that are included in the fees paid by other funds. The Directors compared each Fund’s contractual management fee rate with a peer group median, and where applicable, took into account the impact on the management fee rate of the administrative expense reimbursement paid to the Adviser in the latest fiscal year. In the case of the ACS Funds, the Directors noted that the management fee rate is zero but also were cognizant that the Adviser is indirectly compensated by the wrap fee program sponsors that use the ACS Funds as an investment vehicle for their clients.
The Directors also considered the Adviser’s fee schedule for other clients pursuing a similar investment style to each Fund. For this purpose, they reviewed the relevant advisory fee information from the Adviser’s Form ADV and in a report from the Funds’ Senior Analyst and noted the differences between a Fund’s fee schedule, on the one hand, and the Adviser’s institutional fee schedule and the schedule of fees charged by the Adviser to any offshore funds and for services to anysub-advised funds pursuing a similar investment strategy as the Fund, on the other, as applicable. The Directors noted that the Adviser may, in some cases, agree to fee rates with large institutional clients that are lower than those reviewed by the Directors and that they had previously discussed with the Adviser its policies in respect of such arrangements. The Adviser also informed the Directors that, in the case of certain Funds, there were no institutional products managed by the Adviser that have a substantially similar investment style. The Directors also discussed these matters with their independent fee consultant.
The Adviser reviewed with the Directors the significantly greater scope of the services it provides to each Fund relative to institutional, offshore fund andsub-advised fund clients, as applicable. In this regard, the Adviser noted, among other things, that, compared to institutional and offshore orsub-advisory accounts, each Fund, as applicable, (i) demands considerably more portfolio management, research and trading resources due to significantly higher daily cash flows (in the case ofopen-end Funds); (ii) has more tax and regulatory restrictions and compliance obligations; (iii) must prepare and file or distribute regulatory and other communications about fund operations; and (iv) must provide shareholder servicing to retail investors. The Adviser also reviewed the greater legal risks presented by the large and changing population of Fund shareholders who may assert claims against the Adviser in individual or class actions, and the greater entrepreneurial risk in offering new fund products, which require substantial investment to launch, may not succeed, and generally must be priced to compete with larger, more established funds resulting in lack of profitability to the Adviser until a new fund achieves scale. In light of the substantial differences in services rendered by the Adviser to institutional,
| 54 | AB SELECT US EQUITY PORTFOLIO | abfunds.com | |
offshore fund andsub-advised fund clients as compared to the Funds, and the different risk profile, the Directors considered these fee comparisons inapt and did not place significant weight on them in their deliberations.
The Directors noted that many of the Funds may invest in shares of exchange-traded funds (“ETFs”), subject to the restrictions and limitations of the 1940 Act as these may be varied as a result of exemptive orders issued by the SEC. The Directors also noted that ETFs pay advisory fees pursuant to their advisory contracts. The Directors concluded, based on the Adviser’s explanation of how it uses ETFs when they are the most cost-effective way to obtain desired exposures, in some cases pending purchases of underlying securities, that each Fund’s management fee would be for services that would be in addition to, rather than duplicative of, the services provided under the advisory contracts of the ETFs.
With respect to each Fund’s management fee, the Directors considered the total expense ratio of the Fund in comparison to a peer group and peer universe selected by the 15(c) service provider. The Directors also considered the Adviser’s expense caps for certain Funds. The Directors view expense ratio information as relevant to their evaluation of the Adviser’s services because the Adviser is responsible for coordinating services provided to a Fund by others.
The Boards’ consideration of each Proposed Agreement was informed by their most recent approval of the related Current Agreement, and, in the case of certain Funds, their discussion with the Adviser of the reasons for those Funds’ expense ratios in certain periods. The Directors also reviewed updated expense ratio information and, in some cases, discussed with the Adviser the reasons for the expense ratios of certain Funds. On the basis of this review, the Directors concluded that each Fund’s expense ratio was acceptable.
The Directors did not consider comparative expense information for the ACS Funds because those Funds do not bear ordinary expenses.
Economies of Scale
The Directors noted that the management fee schedules for certain Funds do not contain breakpoints and that they had discussed their strong preference for breakpoints in advisory contracts with the Adviser. The Directors took into consideration prior presentations by an independent consultant on economies of scale in the mutual fund industry and for the Funds, and by the Adviser concerning certain of its views on economies of scale. The Directors also had requested and received from the Adviser certain updates on economies of scale in advance of the Board meeting. The Directors believe that economies of scale may be realized (if at all) by the Adviser across a variety of products and services, and not only in respect of a single fund. The Directors noted that there is no established
| abfunds.com | AB SELECT US EQUITY PORTFOLIO | 55 | |
methodology for setting breakpoints that give effect to the fund-specific services provided by a fund’s adviser and to the economies of scale that an adviser may realize in its overall mutual fund business or those components of it which directly or indirectly affect a fund’s operations. The Directors observed that in the mutual fund industry as a whole, as well as among funds similar to each Fund, there is no uniformity or pattern in the fees and asset levels at which breakpoints (if any) apply. The Directors also noted that the advisory agreements for many funds do not have breakpoints at all. The Directors informed the Adviser that they would monitor the asset levels of the Funds without breakpoints and their profitability to the Adviser and anticipated revisiting the question of breakpoints in the future if circumstances warrant doing so.
The Directors did not consider the extent to which fee levels in the Advisory Agreement for the ACS Funds reflect economies of scale because that Advisory Agreement does not provide for any compensation to be paid to the Adviser by the ACS Funds and the expense ratio of each of those Funds is zero.
Interim Advisory Agreements
In approving the Interim Advisory Agreements, the Boards, with the assistance of independent counsel, considered similar factors to those considered in approving the Proposed Agreements. The Interim Advisory Agreements approved by the Boards are identical to the Proposed Agreements, as well as the Current Agreements, in all material respects except for their proposed effective and termination dates and provisions intended to comply with the requirements of the relevant SEC rule, such as provisions requiring escrow of advisory fees. Under the Interim Advisory Agreements, the Adviser would continue to manage a Fund pursuant to an Interim Advisory Agreement until a new advisory agreement was approved by stockholders or until the end of the150-day period, whichever would occur earlier. All fees earned by the Adviser under an Interim Advisory Agreement would be held in escrow pending shareholder approval of the Proposed Agreement. Upon approval of a new advisory agreement by stockholders, the escrowed management fees would be paid to the Adviser, and the Interim Advisory Agreement would terminate.
Information Regarding the Review and Approval of the Fund’s Current Advisory Agreement
The disinterested directors (the “directors”) of AB Cap Fund, Inc. (the “Company”) unanimously approved the continuance of the Company’s Advisory Agreement with the Adviser in respect of AB Select US Equity Portfolio (the “Fund”) at a meeting held on May1-3, 2018 (the “Meeting”).
Prior to approval of the continuance of the Advisory Agreement, the directors had requested from the Adviser, and received and evaluated, extensive materials. They reviewed the proposed continuance of the Advisory
| 56 | AB SELECT US EQUITY PORTFOLIO | abfunds.com | |
Agreement with the Adviser and with experienced counsel who are independent of the Adviser, who advised on the relevant legal standards. The directors also reviewed additional materials, including materials from an outside consultant, who acted as their independent fee consultant, and comparative analytical data prepared by the Senior Analyst for the Fund. The directors also discussed the proposed continuance in private sessions with counsel.
The directors considered their knowledge of the nature and quality of the services provided by the Adviser to the Fund gained from their experience as directors or trustees of most of the registered investment companies advised by the Adviser, their overall confidence in the Adviser’s integrity and competence they have gained from that experience, the Adviser’s initiative in identifying and raising potential issues with the directors and its responsiveness, frankness and attention to concerns raised by the directors in the past, including the Adviser’s willingness to consider and implement organizational and operational changes designed to improve investment results and the services provided to the AB Funds. The directors noted that they have four regular meetings each year, at each of which they review extensive materials and information from the Adviser, including information on the investment performance of the Fund.
The directors also considered all factors they believed relevant, including the specific matters discussed below. During the course of their deliberations, the directors evaluated, among other things, the reasonableness of the advisory fee. The directors did not identify any particular information that wasall-important or controlling, and different directors may have attributed different weights to the various factors. The directors determined that the selection of the Adviser to manage the Fund and the overall arrangements between the Fund and the Adviser, as provided in the Advisory Agreement, including the advisory fee, were fair and reasonable in light of the services performed, expenses incurred and such other matters as the directors considered relevant in the exercise of their business judgment. The material factors and conclusions that formed the basis for the directors’ determinations included the following:
Nature, Extent and Quality of Services Provided
The directors considered the scope and quality of services provided by the Adviser under the Advisory Agreement, including the quality of the investment research capabilities of the Adviser and the other resources it has dedicated to performing services for the Fund. The directors noted that the Adviser from time to time reviews the Fund’s investment strategies and from time to time proposes changes intended to improve the Fund’s relative or absolute performance for the directors’ consideration. They also noted the professional experience and qualifications of the Fund’s portfolio management team and other senior personnel of the Adviser. The directors also considered that the Advisory Agreement provides that the Fund
| abfunds.com | AB SELECT US EQUITY PORTFOLIO | 57 | |
will reimburse the Adviser for the cost to it of providing certain clerical, accounting, administrative and other services to the Fund by employees of the Adviser or its affiliates. Requests for these reimbursements are made on a quarterly basis and subject to approval by the directors. Reimbursements, to the extent requested and paid, result in a higher rate of total compensation from the Fund to the Adviser than the fee rate stated in the Advisory Agreement. The directors noted that the methodology used to determine the reimbursement amounts had been reviewed by an independent consultant retained by the Company’s former Independent Compliance Officer. The quality of administrative and other services, including the Adviser’s role in coordinating the activities of the Fund’s other service providers, also was considered. The directors concluded that, overall, they were satisfied with the nature, extent and quality of services provided to the Fund under the Advisory Agreement.
Costs of Services Provided and Profitability
The directors reviewed a schedule of the revenues and expenses and related notes indicating the profitability of the Fund to the Adviser for calendar years 2016 and 2017 that had been prepared with an expense allocation methodology arrived at in consultation with an independent consultant retained by the Company’s former Independent Compliance Officer. The directors noted the assumptions and methods of allocation used by the Adviser in preparing fund-specific profitability data and understood that there are a number of potentially acceptable allocation methodologies for information of this type. The directors noted that the profitability information reflected all revenues and expenses of the Adviser’s relationship with the Fund, including those relating to its subsidiaries that provide transfer agency, distribution and brokerage services to the Fund. The directors recognized that it is difficult to make comparisons of the profitability of the Advisory Agreement with the profitability of advisory contracts for unaffiliated funds because comparative information is not generally publicly available and is affected by numerous factors. The directors focused on the profitability of the Adviser’s relationship with the Fund before taxes and distribution expenses. The directors concluded that the Adviser’s level of profitability from its relationship with the Fund was not unreasonable.
Fall-Out Benefits
The directors considered the other benefits to the Adviser and its affiliates from their relationships with the Fund, including, but not limited to, benefits relating to soft dollar arrangements (whereby investment advisers receive brokerage and research services from brokers that execute agency transactions for their clients);12b-1 fees and sales charges received by the Fund’s principal underwriter (which is a wholly owned subsidiary of the Adviser) in respect of certain classes of the Fund’s shares; brokerage commissions paid by the Fund to brokers affiliated with the Adviser; and transfer agency fees paid by the Fund to a wholly owned subsidiary of the
| 58 | AB SELECT US EQUITY PORTFOLIO | abfunds.com | |
Adviser. The directors recognized that the Adviser’s profitability would be somewhat lower without these benefits. The directors understood that the Adviser also might derive reputational and other benefits from its association with the Fund.
Investment Results
In addition to the information reviewed by the directors in connection with the Meeting, the directors receive detailed performance information for the Fund at each regular Board meeting during the year.
At the Meeting, the directors reviewed performance information prepared by an analytical service that is not affiliated with the Adviser (the “15(c) service provider”), showing the performance of the Class A Shares of the Fund against a group of similar funds (“peer group”) and a larger group of similar funds (“peer universe”), each selected by the 15(c) service provider, and information prepared by the Adviser showing performance of the Class A Shares against a broad-based securities market index, in each case for the1-,3- and5-year periods ended February 28, 2018 and (in the case of comparisons with the broad-based securities market index) for the period from inception. Based on their review, the directors concluded that the Fund’s investment performance was acceptable.
Advisory Fees and Other Expenses
The directors considered the advisory fee rate payable by the Fund to the Adviser and information prepared by the 15(c) service provider concerning advisory fee rates payable by other funds in the same category as the Fund. The directors recognized that it is difficult to make comparisons of advisory fees because there are variations in the services that are included in the fees paid by other funds. The directors compared the Fund’s contractual advisory fee rate with a peer group median and took into account the impact on the advisory fee rate of the administrative expense reimbursement paid to the Adviser in the latest fiscal year.
The directors also considered the Adviser’s fee schedule for other clients pursuing a similar investment style. For this purpose, they reviewed the relevant advisory fee information from the Adviser’s Form ADV and the materials from the Fund’s Senior Analyst and noted the differences between the Fund’s fee schedule, on the one hand, and the Adviser’s institutional fee schedule and the schedule of fees charged by the Adviser to any offshore funds and anysub-advised funds, on the other. The directors noted that the Adviser may, in some cases, agree to fee rates with large institutional clients that are lower than those reviewed by the directors and that they had previously discussed with the Adviser its policies in respect of such arrangements.
The Adviser reviewed with the directors the significantly greater scope of the services it provides to the Fund relative to institutional, offshore fund
| abfunds.com | AB SELECT US EQUITY PORTFOLIO | 59 | |
andsub-advised fund clients. In this regard, the Adviser noted, among other things, that, compared to institutional and offshore accounts, the Fund (i) demands considerably more portfolio management, research and trading resources due to significantly higher daily cash flows; (ii) has more tax and regulatory restrictions; (iii) must prepare and distribute regulatory and other communications about fund operations; and (iv) must provide shareholder servicing to retail investors. The Adviser also reviewed the greater legal risks presented by the large and changing population of Fund shareholders who may assert claims against the Adviser in individual or class actions, and the greater entrepreneurial risk in offering new fund products, which require substantial investment to launch, may not succeed, and generally must be priced to compete with larger, more established funds resulting in lack of profitability to the Adviser until a new fund achieves scale. In light of the substantial differences in services rendered by the Adviser to institutional, offshore fund andsub-advised fund clients as compared to funds such as the Fund, and the different risk profile, the directors considered these fee comparisons inapt and did not place significant weight on them in their deliberations.
The directors noted that the Fund invests in shares of exchange-traded funds (“ETFs”), subject to the restrictions and limitations of the Investment Company Act of 1940 as these may be varied as a result of exemptive orders issued by the SEC. The directors also noted that ETFs pay advisory fees pursuant to their advisory contracts, and that the Adviser had provided, and they had reviewed, information about the expense ratios of the relevant ETFs. The directors concluded, based on the Adviser’s explanation of how it uses ETFs when they are the most cost-effective way to obtain desired exposures for a fund or to temporarily “equitize” cash inflows pending purchases of underlying securities, that the advisory fee for the Fund is paid for services that are in addition to, rather than duplicative of, the services provided under the advisory contracts of the ETFs.
The directors also considered the total expense ratio of the Class A shares of the Fund in comparison to a peer group and a peer universe selected by the 15(c) service provider. The Class A expense ratio of the Fund was based on the Fund’s latest fiscal year and the directors considered the effects of any fee waivers and/or expense reimbursements as a result of the Adviser’s expense cap. The directors noted that it was likely that the expense ratios of some of the other funds in the Fund’s category were lowered by waivers or reimbursements by those funds’ investment advisers, which in some cases might be voluntary or temporary. The directors view expense ratio information as relevant to their evaluation of the Adviser’s services because the Adviser is responsible for coordinating services provided to the Fund by others. The directors noted that the Fund’s expense ratio was above the medians. After reviewing and discussing the Adviser’s explanations of the reasons for this, the directors concluded that the Fund’s expense ratio was acceptable.
| 60 | AB SELECT US EQUITY PORTFOLIO | abfunds.com | |
Economies of Scale
The directors noted that the advisory fee schedule for the Fund does not contain breakpoints, and that they had discussed their strong preference for breakpoints in advisory contracts with the Adviser. The directors took into consideration prior presentations by an independent consultant on economies of scale in the mutual fund industry and for the AB Funds, and by the Adviser concerning certain of its views on economies of scale. The directors also had requested and received from the Adviser certain updates on economies of scale in advance of the Meeting. The directors believe that economies of scale may be realized (if at all) by the Adviser across a variety of products and services, and not only in respect of a single fund. The directors noted that there is no established methodology for setting breakpoints that give effect to the fund-specific services provided by a fund’s adviser and to the economies of scale that an adviser may realize in its overall mutual fund business or those components of it which directly or indirectly affect a fund’s operations. The directors observed that in the mutual fund industry as a whole, as well as among funds similar to the Fund, there is no uniformity or pattern in the fees and asset levels at which breakpoints (if any) apply. The directors also noted that the advisory agreements for many funds do not have breakpoints at all. The directors informed the Adviser that they would monitor the Fund’s assets (which were well below the level at which they would anticipate adding an initial breakpoint) and its profitability to the Adviser and anticipated revisiting the question of breakpoints in the future if circumstances warranted doing so.
| abfunds.com | AB SELECT US EQUITY PORTFOLIO | 61 | |
This page is not part of the Shareholder Report or the Financial Statements.
AB FAMILY OF FUNDS
US EQUITY
US CORE
Core Opportunities Fund
FlexFee™ US Thematic Portfolio
Select US Equity Portfolio
US GROWTH
Concentrated Growth Fund
Discovery Growth Fund
FlexFee™ Large Cap Growth Portfolio
Growth Fund
Large Cap Growth Fund
Small Cap Growth Portfolio
US VALUE
Discovery Value Fund
Equity Income Fund
Relative Value Fund
Small Cap Value Portfolio
Value Fund
INTERNATIONAL/ GLOBAL EQUITY
INTERNATIONAL/ GLOBAL CORE
FlexFee™ International Strategic Core Portfolio
Global Core Equity Portfolio
International Portfolio
International Strategic Core Portfolio
Sustainable Global Thematic Fund
Tax-Managed International Portfolio
Tax-Managed Wealth Appreciation Strategy
Wealth Appreciation Strategy
INTERNATIONAL/ GLOBAL GROWTH
Concentrated International Growth Portfolio
FlexFee™ Emerging Markets Growth Portfolio
INTERNATIONAL/ GLOBAL EQUITY(continued)
Sustainable International Thematic Fund
INTERNATIONAL/ GLOBAL VALUE
All China Equity Portfolio
International Value Fund
FIXED INCOME
MUNICIPAL
High Income Municipal Portfolio
Intermediate California Municipal Portfolio
Intermediate Diversified Municipal Portfolio
Intermediate New York Municipal Portfolio
Municipal Bond Inflation Strategy
Tax-Aware Fixed Income Portfolio
National Portfolio
Arizona Portfolio
California Portfolio
Massachusetts Portfolio
Minnesota Portfolio
New Jersey Portfolio
New York Portfolio
Ohio Portfolio
Pennsylvania Portfolio
Virginia Portfolio
TAXABLE
Bond Inflation Strategy
FlexFee™ High Yield Portfolio1
FlexFee™ International Bond Portfolio
Global Bond Fund
High Income Fund
Income Fund
Intermediate Bond Portfolio
Limited Duration High Income Portfolio
Short Duration Portfolio
ALTERNATIVES
All Market Real Return Portfolio
Global Real Estate Investment Fund
Select US Long/Short Portfolio
Unconstrained Bond Fund
MULTI-ASSET
All Market Income Portfolio
All Market Total Return Portfolio
Conservative Wealth Strategy
Emerging Markets Multi-Asset Portfolio
Global Risk Allocation Fund
Tax-Managed All Market Income Portfolio
TARGET-DATE
Multi-Manager Select Retirement Allocation Fund
Multi-Manager Select 2010 Fund
Multi-Manager Select 2015 Fund
Multi-Manager Select 2020 Fund
Multi-Manager Select 2025 Fund
Multi-Manager Select 2030 Fund
Multi-Manager Select 2035 Fund
Multi-Manager Select 2040 Fund
Multi-Manager Select 2045 Fund
Multi-Manager Select 2050 Fund
Multi-Manager Select 2055 Fund
Multi-Manager Select 2060 Fund
CLOSED-END FUNDS
Alliance California Municipal Income Fund
AllianceBernstein Global High Income Fund
AllianceBernstein National Municipal Income Fund
We also offer Government Money Market Portfolio, which serves as the money market fund exchange vehicle for the AB mutual funds. You could lose money by investing in the Fund. Although the Fund seeks to preserve the value of your investment at $1.00 per share, it cannot guarantee it will do so. The Fund may impose a fee upon sale of your shares or may temporarily suspend your ability to sell shares if the Fund’s liquidity falls below required minimums because of market conditions or other factors. An investment in the Fund is not insured or guaranteed by the Federal Deposit Insurance Corporation or any other government agency. The Fund’s sponsor has no legal obligation to provide financial support to the Fund, and you should not expect that the sponsor will provide financial support to the Fund at any time.
Investors should consider the investment objectives, risks, charges and expenses of the Fund carefully before investing. For copies of our prospectus or summary prospectus, which contain this and other information, visit us online at www.abfunds.com or contact your AB representative. Please read the prospectus and/or summary prospectus carefully before investing.
| 1 | Prior to February 23, 2018, FlexFee High Yield Portfolio was named High Yield Portfolio. |
| 62 | AB SELECT US EQUITY PORTFOLIO | abfunds.com | |
NOTES
| abfunds.com | AB SELECT US EQUITY PORTFOLIO | 63 | |
NOTES
| 64 | AB SELECT US EQUITY PORTFOLIO | abfunds.com | |
NOTES
| abfunds.com | AB SELECT US EQUITY PORTFOLIO | 65 | |
NOTES
| 66 | AB SELECT US EQUITY PORTFOLIO | abfunds.com | |
NOTES
| abfunds.com | AB SELECT US EQUITY PORTFOLIO | 67 | |
NOTES
| 68 | AB SELECT US EQUITY PORTFOLIO | abfunds.com | |
AB SELECT US EQUITY PORTFOLIO
1345 Avenue of the Americas
New York, NY 10105
800 221 5672
SUE-0152-1218 
DEC 12.31.18

SEMI-ANNUAL REPORT
AB SELECT US LONG/SHORT PORTFOLIO

Beginning January 1, 2021, as permitted by new regulations adopted by the Securities and Exchange Commission, the Fund’s annual and semi-annual shareholder reports will no longer be sent by mail, unless you specifically request paper copies of the reports. Instead, the reports will be made available on a website, and you will be notified by mail each time a report is posted and provided with a website address to access the report.
If you already elected to receive shareholder reports electronically, you will not be affected by this change and you need not take any action. You may elect to receive shareholder reports and other communications from the Fund electronically at any time by contacting your financial intermediary (such as a broker-dealer or bank) or, if you are a direct investor, by calling the Fund at (800) 221 5672.
You may elect to receive all future reports in paper form free of charge. If you invest through a financial intermediary, you can contact your financial intermediary to request that you continue to receive paper copies of your shareholder reports; if you invest directly with the Fund, you can call the Fund at (800) 221 5672. Your election to receive reports in paper form will apply to all funds held in your account with your financial intermediary or, if you invest directly, to all AB Mutual Funds you hold.
| Investment Products Offered | • Are Not FDIC Insured• May Lose Value• Are Not Bank Guaranteed | |
Investors should consider the investment objectives, risks, charges and expenses of the Fund carefully before investing. For copies of our prospectus or summary prospectus, which contain this and other information, visit us online at www.abfunds.com or contact your AB representative. Please read the prospectus and/or summary prospectus carefully before investing.
This shareholder report must be preceded or accompanied by the Fund’s prospectus for individuals who are not current shareholders of the Fund.
You may obtain a description of the Fund’s proxy voting policies and procedures, and information regarding how the Fund voted proxies relating to portfolio securities during the most recent12-month period ended June 30, without charge. Simply visit AB’s website at www.abfunds.com, or go to the Securities and Exchange Commission’s (the “Commission”) website at www.sec.gov, or call AB at (800) 227 4618.
The Fund files its complete schedule of portfolio holdings with the Commission for the first and third quarters of each fiscal year. The Fund’s portfolio holdings reports are available on the Commission’s website at www.sec.gov. The Fund’s portfolio holdings reports may also be reviewed and copied at the Commission’s Public Reference Room in Washington, DC; information on the operation of the Public Reference Room may be obtained by calling (800) SEC 0330. AB publishes full portfolio holdings for the Fund monthly at www.abfunds.com.
AllianceBernstein Investments, Inc. (ABI) is the distributor of the AB family of mutual funds. ABI is a member of FINRA and is an affiliate of AllianceBernstein L.P., the Adviser of the funds.
The [A/B] logo is a registered service mark of AllianceBernstein and AllianceBernstein® is a registered service mark used by permission of the owner, AllianceBernstein L.P.
| FROM THE PRESIDENT |  |
Dear Shareholder,
We are pleased to provide this report for AB Select US Long/Short Portfolio (the “Fund”). Please review the discussion of Fund performance, the market conditions during the reporting period and the Fund’s investment strategy.
As always, AB strives to keep clients ahead of what’s next by:
| + | Transforming uncommon insights into uncommon knowledge with a global research scope |
| + | Navigating markets with seasoned investment experience and sophisticated solutions |
| + | Providing thoughtful investment insights and actionable ideas |
Whether you’re an individual investor or a multi-billion-dollar institution, we put knowledge and experience to work for you.
AB’s global research organization connects and collaborates across platforms and teams to deliver impactful insights and innovative products. Better insights lead to better opportunities—anywhere in the world.
For additional information about AB’s range of products and shareholder resources, please log on to www.abfunds.com.
Thank you for your investment in the AB Mutual Funds.
Sincerely,

Robert M. Keith
President and Chief Executive Officer, AB Mutual Funds
| abfunds.com | AB SELECT US LONG/SHORT PORTFOLIO | 1 | |
SEMI-ANNUAL REPORT
February 12, 2019
This report provides management’s discussion of fund performance for AB Select US Long/Short Portfolio for the semi-annual reporting period ended December 31, 2018.
The Fund’s investment objective is long-term growth of capital.
NAV RETURNS AS OF DECEMBER 31, 2018(unaudited)
| 6 Months | 12 Months | |||||||
| AB SELECT US LONG/SHORT PORTFOLIO | ||||||||
| Class A Shares | -3.79% | -1.89% | ||||||
| Class C Shares | -4.21% | -2.63% | ||||||
| Advisor Class Shares1 | -3.65% | -1.62% | ||||||
| Class R Shares1 | -3.93% | -2.23% | ||||||
| Class K Shares1 | -3.79% | -1.96% | ||||||
| Class I Shares1 | -3.65% | -1.62% | ||||||
| S&P 500 Index | -6.85% | -4.38% | ||||||
| 1 | Please note that these share classes are for investors purchasing shares through accounts established under certainfee-based programs sponsored and maintained by certain broker-dealers and financial intermediaries, institutional pension plans and/or investment advisory clients of, and certain other persons associated with, the Adviser and its affiliates or the Fund. |
INVESTMENT RESULTS
The table above shows the Fund’s performance compared to its benchmark, the Standard & Poor’s (“S&P”) 500 Index, for thesix- and12-month periods ended December 31, 2018.
All share classes outperformed the benchmark for both periods, before sales charges. During thesix-month period, the Fund’s net market exposure ranged from 48% to 70%, ending the period at 48%. The Fund’s below-market exposure led to outperformance, relative to the fully invested benchmark. Security selection within the Fund’s short holdings also contributed to absolute returns, while security selection within the Fund’s long holdings detracted. Within the Fund’s long holdings, security selection in health care, utilities and communication services contributed, while selection in energy, consumer discretionary and technology detracted. Within the Fund’s short holdings, selection within the industrials and real estate sectors contributed, while selection within the consumer-staples and health care sectors detracted.
During the12-month period, the Fund’s net market exposure ranged from 48% to 71%, ending the period at 48%. The Fund’s below-market exposure
| 2 | AB SELECT US LONG/SHORT PORTFOLIO | abfunds.com | |
led to outperformance, relative to the fully invested benchmark. Security selection within the Fund’s long and short holdings also contributed to absolute returns. Within the Fund’s long holdings, security selection in the health care, technology and utilities sectors contributed, while selection in industrials, consumer staples and financials detracted. Within the Fund’s short holdings, gains from selection within real estate, health care and industrials contributed, while selection within the consumer-staples, consumer-discretionary and materials sectors detracted.
The Fund utilized derivatives in the form of total return swaps for investment purposes, which detracted for thesix-month period and added for the12-month period, while futures for hedging purposes detracted for both periods, in absolute terms.
MARKET REVIEW AND INVESTMENT STRATEGY
At the beginning of the12-month period ended December 31, 2018, stocks performed strongly, before concerns about higher inflation and interest rates led to a sharp market correction. Throughout the12-month period, other issues were prominent, including tariffs and protectionism, slowing global growth, government regulation of technology companies, a flattening yield curve, a stronger US dollar and a more aggressive US Federal Reserve (the “Fed”). However, investors also saw many positives, including strong earnings, booming dividends and stock buybacks, along with reasonable valuations.
Stocks generated their strongest quarterly returns since 2013 in the first half of thesix-month period, driven by gains in health care, industrials and technology stocks. However, during the fourth quarter of 2018, markets reversed course, falling sharply as investor concerns around slowing economic growth, Fed policy tightening, continuedUS-China trade tensions, and growing political instability in the US led to a sharp market correction. US equities ultimately ended the12-month period lower, as the S&P 500 Index declined 4.38%.
The Fund’s Senior Investment Management Team (the “Team”) continues to focus on absolute returns, using a flexible approach to participate in market upside while seeking to protect on the downside. The Team usesbottom-up analysis to find companies with growth potential, adjusting expectations based on the short-term market environment.
INVESTMENT POLICIES
Under normal circumstances, the Fund invests at least 80% of its net assets in equity securities of US companies, short positions in such securities, and cash and US cash equivalents.
(continued on next page)
| abfunds.com | AB SELECT US LONG/SHORT PORTFOLIO | 3 | |
The Adviser selects investments for the Fund’s long positions through an intensive“bottom-up” approach that places an emphasis on companies that are engaged in business activities with solid long-term growth potential and high barriers to entry, that have strong cash flows and other financial metrics, and that have transparent financial statements and business models. The Adviser also evaluates the quality of company management based on a series of criteria, including: (1) management’s focus on shareholder returns, such as through a demonstrated commitment to dividends and dividend growth, share buybacks or other shareholder-friendly corporate actions; (2) management’s employment of conservative accounting methodologies; (3) management incentives, such as direct equity ownership; and (4) management accessibility. The Adviser seeks to identify companies where events or catalysts may drive the company’s share price higher, such as earnings and/or revenue growth above consensus forecasts, potential market recognition of undervaluation or overstated market-risk discount, or the institution of any of the shareholder-friendly practices discussed in the preceding sentence. In light of this catalyst-focused approach, the Adviser expects to engage in active and frequent trading for the Fund.
The Adviser may reduce or eliminate the Fund’s holdings in a company’s securities for a number of reasons, including if its evaluation of the above factors changes adversely, if the anticipated events or catalysts do not occur or do not affect the price of the securities as expected, or if the anticipated events or catalysts do occur and cause the securities to be, in the Adviser’s view, overvalued or fully valued. At any given time the Fund may emphasize growth stocks over value stocks, or vice versa.
In determining securities to be sold short, the Adviser looks for companies facing near-term difficulties such as high valuations, quality of earnings issues, or weakness in demand due to economic factors or long-term issues such as changing technology or competitive concerns in their industries. The Fund may also sell securities of exchange-traded funds (“ETFs”) short, including to hedge its exposure to specific market sectors or if it believes a specific sector or asset will decline in value. When the Fund sells securities short, it sells a stock that it does not own (but has borrowed) at its current market price in anticipation that the price of the stock will decline. To complete, or close out, the short sale transaction, the Fund buys the same stock in the market at a later date and returns it to the lender.
The Adviser derives the ratio between long and short positions for the Fund based on itsbottom-up analysis supplemented with macro-economic and market analyses. Under normal market conditions, the
(continued on next page)
| 4 | AB SELECT US LONG/SHORT PORTFOLIO | abfunds.com | |
net long exposure of the Fund (long exposure minus short exposure) will range between 30% and 70%. The Adviser seeks to minimize the variability of Fund returns through industry diversification as well as by managing long and short exposures and/or by holding a material level of cash and/or cash equivalents. For example, the Fund may hold long positions in equity securities with a value equal to 60% of its net assets and have short sale obligations equal to 15% of its net assets, resulting in 45% net long exposure. Assuming a 60% long exposure, 40% of Fund assets will be held in cash or cash equivalents, including cash and cash equivalents held to cover the Fund’s short sale obligations. During periods of excessive market risk, the Adviser may reduce the net long exposure of the Fund. The Fund may at times hold long and short positions that in the aggregate exceed the value of its net assets (i.e., so that the Fund is effectively leveraged).
The Fund’s investments will be focused on securities of companies with large- and medium-market capitalizations, but it may also take long and short positions in securities of small-capitalization companies. The Fund may invest innon-US companies, but currently intends to limit its investments in such companies to no more than 10% of its net assets. The Fund may purchase securities in initial public offerings and expects to do so on a regular basis.
The Fund may enter into derivatives transactions, such as options, futures contracts, forwards and swaps, as part of its investment strategies or for hedging or other risk management purposes. These transactions may be used, for example, as a means to take a short position in a security or sector without actually selling securities short.
| abfunds.com | AB SELECT US LONG/SHORT PORTFOLIO | 5 | |
DISCLOSURES AND RISKS
Benchmark Disclosure
The S&P 500® Index is unmanaged and does not reflect fees and expenses associated with the active management of a mutual fund portfolio. The S&P 500 Index includes 500 US stocks and is a common representation of the performance of the overall US stock market. An investor cannot invest directly in an index, and its results are not indicative of the performance for any specific investment, including the Fund.
A Word About Risk
Market Risk: The value of the Fund’s assets will fluctuate as the stock, bond or currency markets fluctuate. The value of the Fund’s investments may decline, sometimes rapidly and unpredictably, simply because of economic changes or other events that affect large portions of the market.
Sector Risk: The Fund may have more risk because of concentrated investments in a particular market sector, such as the technology or financial-services sector. Market or economic factors affecting that sector could have a major effect on the value of the Fund’s investments.
Short Sale Risk: Short sales involve the risk that the Fund will incur a loss by subsequently buying a security at a higher price than the price at which it sold the security. The amount of such loss is theoretically unlimited, as it will be based on the increase in value of the security sold short. In contrast, the risk of loss from a long position is limited to the Fund’s investment in the security, because the price of the security cannot fall below zero. The Fund may not always be able to close out a short position on favorable terms.
Derivatives Risk: Derivatives may be illiquid, difficult to price, and leveraged so that small changes may produce disproportionate losses for the Fund, and may be subject to counterparty risk to a greater degree than more traditional investments.
Leverage Risk: To the extent the Fund uses leveraging techniques, the value of its shares may be more volatile because leverage tends to exaggerate the effect of any increase or decrease in the value of the Fund’s investments.
Capitalization Risk: Investments in small- andmid-capitalization companies may be more volatile than investments in large-capitalization companies. Investments in these companies may have additional risks because these companies may have limited product lines, markets or financial resources.
Active Trading Risk: The Fund expects to engage in active and frequent trading of its portfolio securities and its portfolio turnover rate is expected
| 6 | AB SELECT US LONG/SHORT PORTFOLIO | abfunds.com | |
DISCLOSURES AND RISKS(continued)
to greatly exceed 100%. A higher rate of portfolio turnover increases transaction costs, which may negatively affect the Fund’s return. In addition, a high rate of portfolio turnover may result in substantial short-term gains, which may have adverse tax consequences for Fund shareholders.
Management Risk: The Fund is subject to management risk because it is an actively managed investment fund. The Adviser will apply its investment techniques and risk analyses in making investment decisions for the Fund, but there is no guarantee that its techniques will produce the intended results.
These risks are fully discussed in the Fund’s prospectus. As with all investments, you may lose money by investing in the Fund.
An Important Note About Historical Performance
The investment return and principal value of an investment in the Fund will fluctuate, so that shares, when redeemed, may be worth more or less than their original cost. Performance shown in this report represents past performance and does not guarantee future results. Current performance may be lower or higher than the performance information shown. You may obtain performance information current to the most recentmonth-end by visiting www.abfunds.com.
All fees and expenses related to the operation of the Fund have been deducted. Net asset value (“NAV”) returns do not reflect sales charges; if sales charges were reflected, the Fund’s quoted performance would be lower. SEC returns reflect the applicable sales charges for each share class: a 4.25% maximumfront-end sales charge for Class A shares and a 1%1-year contingent deferred sales charge for Class C shares. Returns for the different share classes will vary due to different expenses associated with each class. Performance assumes reinvestment of distributions and does not account for taxes.
| abfunds.com | AB SELECT US LONG/SHORT PORTFOLIO | 7 | |
HISTORICAL PERFORMANCE
AVERAGE RETURNS AS OF DECEMBER 31, 2018(unaudited)
| NAV Returns | SEC Returns (reflects applicable | |||||||
| CLASS A SHARES | ||||||||
| 1 Year | -1.89% | -6.06% | ||||||
| 5 Years | 3.32% | 2.43% | ||||||
| Since Inception1 | 5.98% | 5.23% | ||||||
| CLASS C SHARES | ||||||||
| 1 Year | -2.63% | -3.52% | ||||||
| 5 Years | 2.54% | 2.54% | ||||||
| Since Inception1 | 5.20% | 5.20% | ||||||
| ADVISOR CLASS SHARES2 | ||||||||
| 1 Year | -1.62% | -1.62% | ||||||
| 5 Years | 3.58% | 3.58% | ||||||
| Since Inception1 | 6.25% | 6.25% | ||||||
| CLASS R SHARES2 | ||||||||
| 1 Year | -2.23% | -2.23% | ||||||
| 5 Years | 3.06% | 3.06% | ||||||
| Since Inception1 | 5.71% | 5.71% | ||||||
| CLASS K SHARES2 | ||||||||
| 1 Year | -1.96% | -1.96% | ||||||
| 5 Years | 3.32% | 3.32% | ||||||
| Since Inception1 | 5.98% | 5.98% | ||||||
| CLASS I SHARES2 | ||||||||
| 1 Year | -1.62% | -1.62% | ||||||
| 5 Years | 3.63% | 3.63% | ||||||
| Since Inception1 | 6.29% | 6.29% | ||||||
The Fund’s current prospectus fee table shows the Fund’s total annual operating expense ratios as 2.01%, 2.76%, 1.76%, 2.45%, 2.12% and 1.71% for Class A, Class C, Advisor Class, Class R, Class K and Class I shares, respectively, gross of any fee waivers or expense reimbursements. Contractual fee waivers and/or expense reimbursements limit the Fund’s annual operating expense ratios to 1.95%, 2.70%, 1.71%, 2.22%, 1.97% and 1.65% for Class A, Class C, Advisor Class, Class R, Class K and Class I shares, respectively. These waivers/reimbursements may not be terminated before October 31, 2019. Absent reimbursements or waivers, performance would have been lower. The Financial Highlights section of this report sets forth expense ratio data for the current reporting period; the expense ratios shown above may differ from the expense ratios in the Financial Highlights section since they are based on different time periods.
| 1 | Inception date: 12/12/2012. |
| 2 | These share classes are offered at NAV to eligible investors and their SEC returns are the same as their NAV returns. Please note that these share classes are for investors purchasing shares through accounts established under certainfee-based programs sponsored and maintained by certain broker-dealers and financial intermediaries, institutional pension plans and/or investment advisory clients of, and certain other persons associated with, the Adviser and its affiliates or the Fund. |
| 8 | AB SELECT US LONG/SHORT PORTFOLIO | abfunds.com | |
HISTORICAL PERFORMANCE(continued)
SEC AVERAGE RETURNS
AS OF THE MOST RECENT CALENDARQUARTER-END
DECEMBER 31, 2018(unaudited)
SEC Returns (reflects applicable | ||||
| CLASS A SHARES | ||||
| 1 Year | -6.06% | |||
| 5 Years | 2.43% | |||
| Since Inception1 | 5.23% | |||
| CLASS C SHARES | ||||
| 1 Year | -3.52% | |||
| 5 Years | 2.54% | |||
| Since Inception1 | 5.20% | |||
| ADVISOR CLASS SHARES2 | ||||
| 1 Year | -1.62% | |||
| 5 Years | 3.58% | |||
| Since Inception1 | 6.25% | |||
| CLASS R SHARES2 | ||||
| 1 Year | -2.23% | |||
| 5 Years | 3.06% | |||
| Since Inception1 | 5.71% | |||
| CLASS K SHARES2 | ||||
| 1 Year | -1.96% | |||
| 5 Years | 3.32% | |||
| Since Inception1 | 5.98% | |||
| CLASS I SHARES2 | ||||
| 1 Year | -1.62% | |||
| 5 Years | 3.63% | |||
| Since Inception1 | 6.29% | |||
| 1 | Inception date: 12/12/2012. |
| 2 | Please note that these share classes are for investors purchasing shares through accounts established under certainfee-based programs sponsored and maintained by certain broker-dealers and financial intermediaries, institutional pension plans and/or investment advisory clients of, and certain other persons associated with, the Adviser and its affiliates or the Fund. |
| abfunds.com | AB SELECT US LONG/SHORT PORTFOLIO | 9 | |
EXPENSE EXAMPLE
(unaudited)
As a shareholder of the Fund, you incur two types of costs: (1) transaction costs, including sales charges (loads) on purchase payments, contingent deferred sales charges on redemptions and (2) ongoing costs, including management fees; distribution (12b-1) fees; and other Fund expenses. This example is intended to help you understand your ongoing costs (in dollars) of investing in the Fund and to compare these costs with the ongoing costs of investing in other mutual funds.
The Example is based on an investment of $1,000 invested at the beginning of the period and held for the entire period as indicated below.
Actual Expenses
The table below provides information about actual account values and actual expenses. You may use the information, together with the amount you invested, to estimate the expenses that you paid over the period. Simply divide your account value by $1,000 (for example, an $8,600 account value divided by $1,000 = 8.6), then multiply the result by the number under the heading entitled “Expenses Paid During Period” to estimate the expenses you paid on your account during this period.
Hypothetical Example for Comparison Purposes
The table below also provides information about hypothetical account values and hypothetical expenses based on the Fund’s actual expense ratio and an assumed annual rate of return of 5% before expenses, which is not the Fund’s actual return. The hypothetical account values and expenses may not be used to estimate the actual ending account balance or expenses you paid for the period. You may use this information to compare the ongoing costs of investing in the Fund and other funds by comparing this 5% hypothetical example with the 5% hypothetical examples that appear in the shareholder reports of other funds.
Please note that the expenses shown in the table are meant to highlight your ongoing costs only and do not reflect any transactional costs, such as sales charges (loads), or contingent deferred sales charges on redemptions. Therefore, the hypothetical example is useful in comparing ongoing costs only, and will not help you determine the relative total costs of owning different funds. In addition, if these transactional costs were included, your costs would have been higher.
| Beginning Account Value July 1, 2018 | Ending Account Value December 31, 2018 | Expenses Paid During Period* | Annualized Expense Ratio* | Total Expenses Paid During Period+ | Total Annualized Expense Ratio+ | |||||||||||||||||||
| Class A | ||||||||||||||||||||||||
Actual | $ | 1,000 | $ | 962.10 | $ | 9.30 | 1.88 | % | $ | 9.50 | 1.92 | % | ||||||||||||
Hypothetical** | $ | 1,000 | $ | 1,015.73 | $ | 9.55 | 1.88 | % | $ | 9.75 | 1.92 | % | ||||||||||||
| 10 | AB SELECT US LONG/SHORT PORTFOLIO | abfunds.com | |
EXPENSE EXAMPLE(continued)
| Beginning Account Value July 1, 2018 | Ending Account Value December 31, 2018 | Expenses Paid During Period* | Annualized Expense Ratio* | Total Expenses Paid During Period+ | Total Annualized Expense Ratio+ | |||||||||||||||||||
| Class C | ||||||||||||||||||||||||
Actual | $ | 1,000 | $ | 957.90 | $ | 12.98 | 2.63 | % | $ | 13.18 | 2.67 | % | ||||||||||||
Hypothetical** | $ | 1,000 | $ | 1,011.95 | $ | 13.34 | 2.63 | % | $ | 13.54 | 2.67 | % | ||||||||||||
| Advisor Class | ||||||||||||||||||||||||
Actual | $ | 1,000 | $ | 963.50 | $ | 8.07 | 1.63 | % | $ | 8.26 | 1.67 | % | ||||||||||||
Hypothetical** | $ | 1,000 | $ | 1,016.99 | $ | 8.29 | 1.63 | % | $ | 8.49 | 1.67 | % | ||||||||||||
| Class R | ||||||||||||||||||||||||
Actual | $ | 1,000 | $ | 960.70 | $ | 10.63 | 2.15 | % | $ | 10.82 | 2.19 | % | ||||||||||||
Hypothetical** | $ | 1,000 | $ | 1,014.37 | $ | 10.92 | 2.15 | % | $ | 11.12 | 2.19 | % | ||||||||||||
| Class K | ||||||||||||||||||||||||
Actual | $ | 1,000 | $ | 962.10 | $ | 9.45 | 1.91 | % | $ | 9.64 | 1.95 | % | ||||||||||||
Hypothetical** | $ | 1,000 | $ | 1,015.58 | $ | 9.70 | 1.91 | % | $ | 9.91 | 1.95 | % | ||||||||||||
| Class I | ||||||||||||||||||||||||
Actual | $ | 1,000 | $ | 963.50 | $ | 7.87 | 1.59 | % | $ | 8.07 | 1.63 | % | ||||||||||||
Hypothetical** | $ | 1,000 | $ | 1,017.19 | $ | 8.08 | 1.59 | % | $ | 8.29 | 1.63 | % | ||||||||||||
| * | Expenses are equal to the classes’ annualized expense ratios, multiplied by the average account value over the period, multiplied by 184/365 (to reflect theone-half year period). |
| ** | Assumes 5% annual return before expenses. |
| + | In connection with the Fund’s investments in affiliated/unaffiliated underlying portfolios, the Fund incurs no direct expenses, but bears proportionate shares of the fees and expenses (i.e., operating, administrative and investment advisory fees) of the affiliated/unaffiliated underlying portfolios. The Adviser has contractually agreed to waive its fees from the Fund in an amount equal to the Fund’s pro rata share of certain acquired fund fees and expenses of the affiliated underlying portfolios. The Fund’s total expenses are equal to the classes’ annualized expense ratio plus the Fund’s pro rata share of the weighted average expense ratio of the affiliated/unaffiliated underlying portfolios in which it invests, multiplied by the average account value over the period, multiplied by 184/365 (to reflect theone-half year period). |
| abfunds.com | AB SELECT US LONG/SHORT PORTFOLIO | 11 | |
PORTFOLIO SUMMARY
December 31, 2018(unaudited)
PORTFOLIO STATISTICS
Net Assets ($mil): $946.0
SECTOR BREAKDOWN1
| Long | Short | |||||||
| Communication Services | 7.5 | % | — | % | ||||
| Consumer Discretionary | 4.4 | -0.1 | ||||||
| Consumer Staples | 2.6 | — | ||||||
| Energy | 2.1 | — | ||||||
| Financials | 6.6 | — | ||||||
| Funds and Investment Trusts | 0.5 | — | ||||||
| Health Care | 8.2 | -0.3 | ||||||
| Industrials | 5.6 | -0.1 | ||||||
| Information Technology | 7.6 | — | ||||||
| Materials | 0.9 | — | ||||||
| Real Estate | 0.4 | -0.2 | ||||||
| Utilities | 2.0 | — | ||||||
TEN LARGEST HOLDINGS1
| Long | Short | |||||||||||||
| Company | Company | |||||||||||||
| Berkshire Hathaway, Inc. | 2.1 | % | AbbVie, Inc. | -0.2 | % | |||||||||
| Microsoft Corp. | 2.0 | Empire State Realty Trust, Inc. | -0.1 | |||||||||||
| Alphabet, Inc. | 2.0 | SL Green Realty Corp. | -0.1 | |||||||||||
| Honeywell International, Inc. | 1.6 | Lockheed Martin Corp. | -0.1 | |||||||||||
| Northrop Grumman Corp. | 1.6 | Tesla, Inc. | -0.1 | |||||||||||
| NextEra Energy, Inc. | 1.5 | |||||||||||||
| Home Depot, Inc. (The) | 1.5 | |||||||||||||
| Apple, Inc. | 1.4 | |||||||||||||
| Johnson & Johnson | 1.1 | |||||||||||||
| Cisco Systems, Inc. | 1.1 | |||||||||||||
| 1 | Holdings are expressed as a percentage of total net assets and may vary over time. |
Please note: The sector classifications presented herein are abased on the Global Industry Classification Standard (GICS) which was developed by Morgan Stanley Capital International and Standard & Poor’s. The components are divided into sector, industry group, and industrysub-indices as classified by the GICS for each of the market capitalization indices in the broad market. These sector classifications are broadly defined. The “Portfolio of Investments” section of the report reflects more specific industry information and is consistent with the investment restrictions discussed in the Fund’s prospectus.
| 12 | AB SELECT US LONG/SHORT PORTFOLIO | abfunds.com | |
PORTFOLIO OF INVESTMENTS
December 31, 2018(unaudited)
| Company | Shares | U.S. $ Value | ||||||
| ||||||||
COMMON STOCKS – 47.3% | ||||||||
Health Care – 8.2% | ||||||||
Health Care Equipment & Supplies – 2.7% | ||||||||
Abbott Laboratories | 125,108 | $ | 9,049,061 | |||||
Boston Scientific Corp.(a) | 214,811 | 7,591,421 | ||||||
Medtronic PLC | 91,834 | 8,353,221 | ||||||
|
| |||||||
| 24,993,703 | ||||||||
|
| |||||||
Health Care Providers & Services – 2.1% | ||||||||
Cigna Corp. | 40,735 | 7,736,391 | ||||||
Humana, Inc. | 13,527 | 3,875,215 | ||||||
UnitedHealth Group, Inc. | 34,723 | 8,650,194 | ||||||
|
| |||||||
| 20,261,800 | ||||||||
|
| |||||||
Pharmaceuticals – 3.4% | ||||||||
Allergan PLC | 11,947 | 1,596,836 | ||||||
Johnson & Johnson | 87,093 | 11,239,352 | ||||||
Merck & Co., Inc. | 118,178 | 9,029,981 | ||||||
Pfizer, Inc. | 108,362 | 4,730,001 | ||||||
Zoetis, Inc. | 62,750 | 5,367,635 | ||||||
|
| |||||||
| 31,963,805 | ||||||||
|
| |||||||
| 77,219,308 | ||||||||
|
| |||||||
Communication Services – 7.5% | ||||||||
Diversified Telecommunication Services – 1.6% | ||||||||
AT&T, Inc. | 299,541 | 8,548,900 | ||||||
Verizon Communications, Inc. | 124,340 | 6,990,395 | ||||||
|
| |||||||
| 15,539,295 | ||||||||
|
| |||||||
Entertainment – 2.0% | ||||||||
Take-Two Interactive Software, Inc.(a) | 39,103 | 4,025,263 | ||||||
Vivendi SA | 307,725 | 7,458,426 | ||||||
Walt Disney Co. (The) | 69,809 | 7,654,557 | ||||||
|
| |||||||
| 19,138,246 | ||||||||
|
| |||||||
Interactive Media & Services – 2.5% | ||||||||
Alphabet, Inc. – Class C(a) | 17,849 | 18,484,603 | ||||||
Facebook, Inc. – Class A(a) | 36,884 | 4,835,124 | ||||||
|
| |||||||
| 23,319,727 | ||||||||
|
| |||||||
Media – 1.4% | ||||||||
Comcast Corp. – Class A | 234,152 | 7,972,875 | ||||||
Liberty Media Corp.-Liberty SiriusXM – Class A(a) | 65,012 | 2,392,442 | ||||||
New York Times Co. (The) – Class A | 128,849 | 2,872,044 | ||||||
|
| |||||||
| 13,237,361 | ||||||||
|
| |||||||
| 71,234,629 | ||||||||
|
| |||||||
Information Technology – 7.1% | ||||||||
Communications Equipment – 1.2% | ||||||||
Cisco Systems, Inc. | 249,926 | 10,829,294 | ||||||
|
| |||||||
| abfunds.com | AB SELECT US LONG/SHORT PORTFOLIO | 13 | |
PORTFOLIO OF INVESTMENTS(continued)
| Company | Shares | U.S. $ Value | ||||||
| ||||||||
IT Services – 1.1% | ||||||||
PayPal Holdings, Inc.(a) | 36,580 | $ | 3,076,012 | |||||
Visa, Inc. – Class A | 58,589 | 7,730,233 | ||||||
|
| |||||||
| 10,806,245 | ||||||||
|
| |||||||
Semiconductors & Semiconductor Equipment – 1.0% | ||||||||
NVIDIA Corp. | 14,760 | 1,970,460 | ||||||
QUALCOMM, Inc. | 133,836 | 7,616,607 | ||||||
|
| |||||||
| 9,587,067 | ||||||||
|
| |||||||
Software – 2.3% | ||||||||
Microsoft Corp. | 189,207 | 19,217,755 | ||||||
VMware, Inc. – Class A | 19,095 | 2,618,497 | ||||||
|
| |||||||
| 21,836,252 | ||||||||
|
| |||||||
Technology Hardware, Storage & Peripherals – 1.5% | ||||||||
Apple, Inc. | 87,165 | 13,749,407 | ||||||
|
| |||||||
| 66,808,265 | ||||||||
|
| |||||||
Financials – 6.6% | ||||||||
Banks – 4.1% | ||||||||
Bank of America Corp. | 422,619 | 10,413,332 | ||||||
JPMorgan Chase & Co. | 93,023 | 9,080,905 | ||||||
SunTrust Banks, Inc. | 101,389 | 5,114,061 | ||||||
US Bancorp | 175,839 | 8,035,842 | ||||||
Wells Fargo & Co. | 141,679 | 6,528,569 | ||||||
|
| |||||||
| 39,172,709 | ||||||||
|
| |||||||
Diversified Financial Services – 2.1% | ||||||||
Berkshire Hathaway, Inc. – Class B(a) | 95,502 | 19,499,598 | ||||||
|
| |||||||
Insurance – 0.4% | ||||||||
Progressive Corp. (The) | 66,505 | 4,012,247 | ||||||
|
| |||||||
| 62,684,554 | ||||||||
|
| |||||||
Industrials – 5.6% | ||||||||
Aerospace & Defense – 2.8% | ||||||||
Boeing Co. (The) | 12,541 | 4,044,473 | ||||||
Northrop Grumman Corp. | 61,155 | 14,976,859 | ||||||
United Technologies Corp. | 65,476 | 6,971,884 | ||||||
|
| |||||||
| 25,993,216 | ||||||||
|
| |||||||
Airlines – 0.4% | ||||||||
Delta Air Lines, Inc. | 77,350 | 3,859,765 | ||||||
|
| |||||||
Construction & Engineering – 0.4% | ||||||||
Jacobs Engineering Group, Inc. | 71,884 | 4,202,339 | ||||||
|
| |||||||
Industrial Conglomerates – 1.6% | ||||||||
Honeywell International, Inc. | 114,626 | 15,144,387 | ||||||
|
| |||||||
| 14 | AB SELECT US LONG/SHORT PORTFOLIO | abfunds.com | |
PORTFOLIO OF INVESTMENTS(continued)
| Company | Shares | U.S. $ Value | ||||||
| ||||||||
Road & Rail – 0.4% | ||||||||
Norfolk Southern Corp. | 27,155 | $ | 4,060,759 | |||||
|
| |||||||
| 53,260,466 | ||||||||
|
| |||||||
Consumer Discretionary – 4.3% | ||||||||
Hotels, Restaurants & Leisure – 1.0% | ||||||||
McDonald’s Corp. | 22,647 | 4,021,428 | ||||||
Starbucks Corp. | 88,151 | 5,676,924 | ||||||
|
| |||||||
| 9,698,352 | ||||||||
|
| |||||||
Household Durables – 0.3% | ||||||||
Lennar Corp. – Class A | 71,710 | 2,807,447 | ||||||
|
| |||||||
Internet & Direct Marketing Retail – 1.5% | ||||||||
Amazon.com, Inc.(a) | 6,437 | 9,668,181 | ||||||
Booking Holdings, Inc.(a) | 2,813 | 4,845,167 | ||||||
|
| |||||||
| 14,513,348 | ||||||||
|
| |||||||
Specialty Retail – 1.5% | ||||||||
Home Depot, Inc. (The) | 80,308 | 13,798,521 | ||||||
|
| |||||||
| 40,817,668 | ||||||||
|
| |||||||
Consumer Staples – 2.6% | ||||||||
Beverages – 0.2% | ||||||||
Constellation Brands, Inc. – Class A | 13,063 | 2,100,792 | ||||||
|
| |||||||
Food & Staples Retailing – 0.8% | ||||||||
Walmart, Inc. | 80,569 | 7,505,002 | ||||||
|
| |||||||
Household Products – 0.6% | ||||||||
Procter & Gamble Co. (The) | 62,300 | 5,726,616 | ||||||
|
| |||||||
Personal Products – 0.5% | ||||||||
Estee Lauder Cos., Inc. (The) – Class A | 36,783 | 4,785,468 | ||||||
|
| |||||||
Tobacco – 0.5% | ||||||||
Altria Group, Inc. | 82,062 | 4,053,042 | ||||||
|
| |||||||
| 24,170,920 | ||||||||
|
| |||||||
Energy – 2.1% | ||||||||
Oil, Gas & Consumable Fuels – 2.1% | ||||||||
Chevron Corp. | 83,495 | 9,083,421 | ||||||
EOG Resources, Inc. | 47,119 | 4,109,248 | ||||||
Occidental Petroleum Corp. | 69,985 | 4,295,679 | ||||||
Valero Energy Corp. | 32,100 | 2,406,537 | ||||||
|
| |||||||
| 19,894,885 | ||||||||
|
| |||||||
Utilities – 2.0% | ||||||||
Electric Utilities – 1.4% | ||||||||
NextEra Energy, Inc. | 79,481 | 13,815,388 | ||||||
|
| |||||||
| abfunds.com | AB SELECT US LONG/SHORT PORTFOLIO | 15 | |
PORTFOLIO OF INVESTMENTS(continued)
| Company | Shares | U.S. $ Value | ||||||
| ||||||||
Independent Power and Renewable Electricity Producers – 0.6% | ||||||||
NRG Energy, Inc. | 139,012 | $ | 5,504,875 | |||||
|
| |||||||
| 19,320,263 | ||||||||
|
| |||||||
Materials – 0.9% | ||||||||
Chemicals – 0.2% | ||||||||
DowDuPont, Inc. | 33,143 | 1,772,488 | ||||||
|
| |||||||
Containers & Packaging – 0.7% | ||||||||
Berry Global Group, Inc.(a) | 144,884 | 6,886,336 | ||||||
|
| |||||||
| 8,658,824 | ||||||||
|
| |||||||
Real Estate – 0.4% | ||||||||
Equity Real Estate Investment Trusts (REITs) – 0.4% | ||||||||
Crown Castle International Corp. | 33,361 | 3,624,006 | ||||||
|
| |||||||
Total Common Stocks | 447,693,788 | |||||||
|
| |||||||
PREFERRED STOCKS – 0.6% | ||||||||
Information Technology – 0.5% | ||||||||
Software – 0.5% | ||||||||
Lyft, Inc. | 85,511 | 4,251,607 | ||||||
Lyft, Inc. | 17,100 | 850,212 | ||||||
|
| |||||||
| 5,101,819 | ||||||||
|
| |||||||
Consumer Discretionary – 0.1% | ||||||||
Household Durables – 0.1% | ||||||||
Honest Co., Inc. (The) | 20,767 | 520,366 | ||||||
|
| |||||||
Total Preferred Stocks | 5,622,185 | |||||||
|
| |||||||
INVESTMENT COMPANIES – 0.5% | ||||||||
Funds and Investment Trusts – 0.5% | ||||||||
iShares Nasdaq Biotechnology ETF(e)(f) | 50,789 | 4,897,583 | ||||||
|
| |||||||
| 16 | AB SELECT US LONG/SHORT PORTFOLIO | abfunds.com | |
PORTFOLIO OF INVESTMENTS(continued)
| Company | Shares | U.S. $ Value | ||||||
| ||||||||
SHORT-TERM INVESTMENTS – 50.7% | ||||||||
Investment Companies – 49.9% | ||||||||
AB Fixed Income Shares, Inc. – Government Money Market Portfolio – Class AB, 2.31%(e)(g)(h) | 472,089,539 | $ | 472,089,539 | |||||
|
| |||||||
| Principal Amount (000) | ||||||||
U.S. Treasury Bills – 0.8% | ||||||||
U.S. Treasury Bill | $ | 7,000 | 6,979,933 | |||||
|
| |||||||
Total Short-Term Investments | 479,069,472 | |||||||
|
| |||||||
Total Investments Before Securities Lending Collateral for Securities Loaned – 99.1% | 937,283,028 | |||||||
|
| |||||||
| Shares | ||||||||
INVESTMENTS OF CASH COLLATERAL FOR SECURITIES LOANED – 0.5% | ||||||||
Investment Companies – 0.5% | ||||||||
AB Fixed Income Shares, Inc. – Government Money Market Portfolio – Class AB, 2.31%(e)(g)(h) | 4,888,294 | 4,888,294 | ||||||
|
| |||||||
Total Investments Before Securities Sold | 942,171,322 | |||||||
|
| |||||||
SECURITIES SOLD SHORT – (0.6)% | ||||||||
COMMON STOCKS – (0.6)% | ||||||||
Health Care – (0.2)% | ||||||||
Biotechnology – (0.2)% | ||||||||
AbbVie, Inc. | (26,155 | ) | (2,411,229 | ) | ||||
|
| |||||||
Real Estate – (0.2)% | ||||||||
Equity Real Estate Investment Trusts | ||||||||
Empire State Realty Trust, Inc. – Class A | (86,498 | ) | (1,230,867 | ) | ||||
SL Green Realty Corp. | (11,918 | ) | (942,475 | ) | ||||
|
| |||||||
| (2,173,342 | ) | |||||||
|
| |||||||
Industrials – (0.1)% | ||||||||
Aerospace & Defense – (0.1)% | ||||||||
Lockheed Martin Corp. | (2,450 | ) | (641,508 | ) | ||||
|
| |||||||
| abfunds.com | AB SELECT US LONG/SHORT PORTFOLIO | 17 | |
PORTFOLIO OF INVESTMENTS(continued)
| Company | Shares | U.S. $ Value | ||||||
| ||||||||
Consumer Discretionary – (0.1)% | ||||||||
Automobiles – (0.1)% | ||||||||
Tesla, Inc.(a) | (1,725 | ) | $ | (574,080 | ) | |||
|
| |||||||
Total Securities Sold Short | (5,800,159 | ) | ||||||
|
| |||||||
Total Investments, Net of Securities Sold Short – 99.0% | 936,371,163 | |||||||
Other assets less liabilities – 1.0% | 9,646,865 | |||||||
|
| |||||||
Net Assets – 100.0% | $ | 946,018,028 | ||||||
|
| |||||||
FUTURES (see Note D)
| Description | Number of Contracts | Expiration Month | Notional (000) | Original Value | Value at December 31, 2018 | Unrealized Appreciation/ (Depreciation) | ||||||||||||||||||
Sold Contracts |
| |||||||||||||||||||||||
S&P 500E-Mini Futures | 29 | March 2019 | USD | 1 | $ | 3,599,209 | $ | 3,632,540 | $ | (33,331 | ) | |||||||||||||
TOTAL RETURN SWAPS (see Note D)
| Counterparty & Referenced Obligation | # of Shares or Units | Rate Paid/ Received | Payment Frequency | Notional Amount (000) | Maturity Date | Unrealized Appreciation/ (Depreciation) | ||||||||||||||
Receive Total Return on Reference Obligation |
| |||||||||||||||||||
Morgan Stanley Capital Services LLC |
| |||||||||||||||||||
CTRB Barclays USD Credit Bonds | 3,608 | FedFundEffective Plus 0.95% | Maturity | USD | 139 | 3/06/19 | $ | (31,971 | ) | |||||||||||
CTRB Barclays USD Credit Bonds | 11,257 | FedFundEffective Minus 0.30% | Annual | USD | 427 | 3/06/19 | (93,212 | ) | ||||||||||||
CTRB Barclays USD Credit Bonds | 2,922 | FedFundEffective Plus 0.95% | Maturity | USD | 99 | 3/06/19 | (11,616 | ) | ||||||||||||
CTRB Barclays USD Credit Bonds | 4,977 | FedFundEffective Plus 0.95% | Maturity | USD | 164 | 3/06/19 | (15,863 | ) | ||||||||||||
CTRB Barclays USD Credit Bonds | 5,136 | FedFundEffective Plus 0.95% | Maturity | USD | 175 | 3/06/19 | (22,455 | ) | ||||||||||||
CTRB Barclays USD Credit Bonds | 8,220 | FedFundEffective Plus 0.95% | Maturity | USD | 289 | 3/06/19 | (46,143 | ) | ||||||||||||
CTRB Barclays USD Credit Bonds | 1,443 | FedFundEffective Plus 0.95% | Maturity | USD | 50 | 3/06/19 | (7,790 | ) | ||||||||||||
CTRB Barclays USD Credit Bonds | 1,455 | FedFundEffective Plus 0.95% | Annual | USD | 51 | 3/06/19 | (8,362 | ) | ||||||||||||
| 18 | AB SELECT US LONG/SHORT PORTFOLIO | abfunds.com | |
PORTFOLIO OF INVESTMENTS(continued)
| Counterparty & Referenced Obligation | # of Shares or Units | Rate Paid/ Received | Payment Frequency | Notional Amount (000) | Maturity Date | Unrealized Appreciation/ (Depreciation) | ||||||||||||||||||
CTRB Barclays USD Credit Bonds | 2,961 | | FedFundEffective Plus 0.95% | Maturity | USD | 106 | 3/06/19 | $ | (18,148 | ) | ||||||||||||||
CTRB Barclays USD Credit Bonds | 4,496 | | FedFundEffective Plus 0.95% | | Maturity | USD | 161 | 3/06/19 | (28,467 | ) | ||||||||||||||
CTRB Barclays USD Credit Bonds | 20,571 | | FedFundEffective Plus 0.95% | | Maturity | USD | 797 | 3/06/19 | (190,623 | ) | ||||||||||||||
CTRB Barclays USD Credit Bonds | 9,856 | | FedFundEffective Plus 0.95% | | Maturity | USD | 380 | 3/06/19 | (89,611 | ) | ||||||||||||||
CTRB Barclays USD Credit Bonds | 6,020 | | FedFundEffective Plus 0.95% | | Maturity | USD | 232 | 3/06/19 | (54,524 | ) | ||||||||||||||
CTRB Barclays USD Credit Bonds | 14,274 | | FedFundEffective Plus 0.95% | | Maturity | USD | 560 | 3/06/19 | (139,193 | ) | ||||||||||||||
CTRB Barclays USD Credit Bonds | 6,292 | | FedFundEffective Plus 0.95% | | Maturity | USD | 225 | 3/06/19 | (38,411 | ) | ||||||||||||||
CTRB Barclays USD Credit Bonds | 688 | | FedFundEffective Plus 0.95% | | Maturity | USD | 27 | 3/06/19 | (6,402 | ) | ||||||||||||||
CTRB Barclays USD Credit Bonds | 1,633 | | FedFundEffective Plus 0.95% | | Maturity | USD | 55 | 3/06/19 | (6,444 | ) | ||||||||||||||
CTRB Barclays USD Credit Bonds | 7,506 | | FedFundEffective Plus 0.95% | | Annual | USD | 215 | 3/06/19 | 8,458 | |||||||||||||||
CTRB Barclays USD Credit Bonds | 330 | | FedFundEffective Plus 0.95% | | Monthly | USD | 10 | 3/06/19 | 189 | |||||||||||||||
CTRB Barclays USD Credit Bonds | 3,699 | | FedFundEffective Plus 0.95% | | Monthly | USD | 109 | 3/06/19 | 1,218 | |||||||||||||||
CTRB Barclays USD Credit Bonds | 1,481 | | FedFundEffective Plus 0.95% | | Maturity | USD | 50 | 3/06/19 | (5,979 | ) | ||||||||||||||
CTRB Barclays USD Credit Bonds | 3,733 | | FedFundEffective Plus 0.95% | | Annual | USD | 114 | 3/06/19 | (2,852 | ) | ||||||||||||||
CTRB Barclays USD Credit Bonds | 1,261 | | FedFundEffective Plus 0.95% | | Annual | USD | 39 | 3/06/19 | (1,403 | ) | ||||||||||||||
CTRB Barclays USD Credit Bonds | 1,144 | | FedFundEffective Plus 0.95% | | Annual | USD | 34 | 3/06/19 | 113 | |||||||||||||||
|
| |||||||||||||||||||||||
| $ | (809,491 | ) | ||||||||||||||||||||||
|
| |||||||||||||||||||||||
| (a) | Non-income producing security. |
| (b) | Fair valued by the Adviser. |
| abfunds.com | AB SELECT US LONG/SHORT PORTFOLIO | 19 | |
PORTFOLIO OF INVESTMENTS(continued)
| (c) | Illiquid security. |
| (d) | Security in which significant unobservable inputs (Level 3) were used in determining fair value. |
| (e) | To obtain a copy of the fund’s shareholder report, please go to the Securities and Exchange Commission’s website at www.sec.gov. Additionally, shareholder reports for AB funds can be obtained by calling AB at (800)227-4618. |
| (f) | Represents entire or partial securities out on loan. See Note E for securities lending information. |
| (g) | Affiliated investments. |
| (h) | The rate shown represents the7-day yield as of period end. |
| (i) | Position, or a portion thereof, has been segregated to collateralize OTC derivatives outstanding. |
Glossary:
ETF – Exchange Traded Fund
FedFundEffective – Federal Funds Effective Rate
See notes to financial statements.
| 20 | AB SELECT US LONG/SHORT PORTFOLIO | abfunds.com | |
STATEMENT OF ASSETS & LIABILITIES
December 31, 2018(unaudited)
| Assets | ||||
Investments in securities, at value | ||||
Unaffiliated issuers (cost $494,542,888) | $ | 465,193,489 | (a) | |
Affiliated issuers (cost $476,977,833—including investment of cash collateral for securities loaned of $4,888,294) | 476,977,833 | |||
Cash | 156,207 | |||
Cash collateral due from broker | 522,000 | |||
Foreign currencies, at value (cost $234,405) | 235,117 | |||
Deposit at broker for securities sold short | 12,343,952 | |||
Receivable for capital stock sold | 11,555,028 | |||
Receivable for investment securities sold | 8,365,144 | |||
Affiliated dividends receivable | 821,835 | |||
Unaffiliated dividends and interest receivable | 679,004 | |||
Receivable for variation margin on futures | 465,831 | |||
Unrealized appreciation on total return swaps | 9,978 | |||
|
| |||
Total assets | 977,325,418 | |||
|
| |||
| Liabilities | ||||
Payable for capital stock redeemed | 12,771,972 | |||
Payable for securities sold short, at value (proceeds received $6,242,051) | 5,800,159 | |||
Payable for investment securities purchased | 5,644,107 | |||
Payable for collateral received on securities loaned | 4,888,294 | |||
Advisory fee payable | 1,135,388 | |||
Unrealized depreciation on total return swaps | 819,469 | |||
Distribution fee payable | 88,436 | |||
Administrative fee payable | 17,145 | |||
Transfer Agent fee payable | 13,237 | |||
Dividend expense payable | 10,186 | |||
Payable for terminated total return swaps | 5,989 | |||
Directors’ fees payable | 130 | |||
Accrued expenses | 112,878 | |||
|
| |||
Total liabilities | 31,307,390 | |||
|
| |||
Net Assets | $ | 946,018,028 | ||
|
| |||
| Composition of Net Assets | ||||
Capital stock, at par | $ | 8,232 | ||
Additionalpaid-in capital | 996,687,010 | |||
Accumulated loss | (50,677,214 | ) | ||
|
| |||
| $ | 946,018,028 | |||
|
|
| (a) | Includes securities on loan with a value of $4,872,126 (see Note E). |
See notes to financial statements.
| abfunds.com | AB SELECT US LONG/SHORT PORTFOLIO | 21 | |
STATEMENT OF ASSETS & LIABILITIES(continued)
Net Asset Value Per Share—30 billion shares of capital stock authorized, $.0001 par value
| Class | Net Assets | Shares Outstanding | Net Asset Value | |||||||||
| ||||||||||||
| A | $ | 93,735,519 | 8,237,076 | $ | 11.38 | * | ||||||
| ||||||||||||
| C | $ | 85,501,603 | 7,916,507 | $ | 10.80 | |||||||
| ||||||||||||
| Advisor | $ | 749,967,601 | 64,715,572 | $ | 11.59 | |||||||
| ||||||||||||
| R | $ | 324,052 | 28,981 | $ | 11.18 | |||||||
| ||||||||||||
| K | $ | 11,388 | 1,001 | $ | 11.38 | |||||||
| ||||||||||||
| I | $ | 16,477,865 | 1,418,606 | $ | 11.62 | |||||||
| ||||||||||||
| * | The maximum offering price per share for Class A shares was $11.89 which reflects a sales charge of 4.25%. |
See notes to financial statements.
| 22 | AB SELECT US LONG/SHORT PORTFOLIO | abfunds.com | |
STATEMENT OF OPERATIONS
Six Months Ended December 31, 2018(unaudited)
| Investment Income | ||||||||
Dividends | ||||||||
Unaffiliated issuers | $ | 6,116,658 | ||||||
Affiliated issuers | 3,152,402 | |||||||
Interest | 113,970 | |||||||
Other income | 110,736 | $ | 9,493,766 | |||||
|
| |||||||
| Expenses | ||||||||
Advisory fee (see Note B) | 7,696,723 | |||||||
Distribution fee—Class A | 118,368 | |||||||
Distribution fee—Class C | 486,212 | |||||||
Distribution fee—Class R | 1,012 | |||||||
Distribution fee—Class K | 16 | |||||||
Transfer agency—Class A | 29,663 | |||||||
Transfer agency—Class C | 30,543 | |||||||
Transfer agency—Advisor Class | 256,179 | |||||||
Transfer agency—Class R | 526 | |||||||
Transfer agency—Class K | 13 | |||||||
Transfer agency—Class I | 1,449 | |||||||
Custodian | 138,605 | |||||||
Registration fees | 51,820 | |||||||
Administrative | 36,950 | |||||||
Printing | 32,883 | |||||||
Audit and tax | 26,977 | |||||||
Legal | 21,296 | |||||||
Directors’ fees | 12,548 | |||||||
Miscellaneous | 17,671 | |||||||
|
| |||||||
Total operating expenses (see Note B) | 8,959,454 | |||||||
Dividend expense on securities sold short and interest expense | 191,305 | |||||||
Total expenses | 9,150,759 | |||||||
Less: expenses waived and reimbursed by the Adviser (see Notes B & E) | (173,842 | ) | ||||||
|
| |||||||
Net expenses | 8,976,917 | |||||||
|
| |||||||
Net investment income | 516,849 | |||||||
|
| |||||||
| Realized and Unrealized Gain (Loss) on Investment and Foreign Currency Transactions | ||||||||
Net realized gain (loss) on: | ||||||||
Investment transactions | 2,762,611 | |||||||
Securities sold short | 1,044,587 | |||||||
Futures | (922,660 | ) | ||||||
Swaps | 670,691 | |||||||
Foreign currency transactions | 9,959 | |||||||
Net change in unrealized appreciation/depreciation of: | ||||||||
Investments | (42,888,894 | ) | ||||||
Securities sold short | 711,422 | |||||||
Futures | (555,047 | ) | ||||||
Swaps | (1,696,919 | ) | ||||||
Foreign currency denominated assets and liabilities | 670 | |||||||
|
| |||||||
Net loss on investment and foreign currency transactions | (40,863,580 | ) | ||||||
|
| |||||||
Net Decrease in Net Assets from Operations | $ | (40,346,731 | ) | |||||
|
|
See notes to financial statements.
| abfunds.com | AB SELECT US LONG/SHORT PORTFOLIO | 23 | |
STATEMENT OF CHANGES IN NET ASSETS
| Six Months Ended December 31, 2018 (unaudited) | Year Ended June 30, 2018 | |||||||
| Increase (Decrease) in Net Assets from Operations | ||||||||
Net investment income (loss) | $ | 516,849 | $ | (1,718,062 | ) | |||
Net realized gain on investment and foreign currency transactions | 3,565,188 | 106,813,874 | ||||||
Net change in unrealized appreciation/depreciation of investments and foreign currency denominated assets and liabilities | (44,428,768 | ) | (12,910,908 | ) | ||||
Contributions from Affiliates | – 0 | – | 864 | |||||
|
|
|
| |||||
Net increase (decrease) in net assets from operations | (40,346,731 | ) | 92,185,768 | |||||
| Distributions to Shareholders | ||||||||
Class A | (7,299,089 | ) | (5,268,089 | ) | ||||
Class C | (7,593,841 | ) | (5,436,469 | ) | ||||
Advisor Class | (62,850,348 | ) | (35,550,155 | ) | ||||
Class R | (28,749 | ) | (21,780 | ) | ||||
Class K | (1,013 | ) | (645 | ) | ||||
Class I | (1,330,300 | ) | (609,069 | ) | ||||
| Capital Stock Transactions | ||||||||
Net increase (decrease) | 98,690,833 | (7,684,646 | ) | |||||
|
|
|
| |||||
Total increase (decrease) | (20,759,238 | ) | 37,614,915 | |||||
| Net Assets | ||||||||
Beginning of period | 966,777,266 | 929,162,351 | ||||||
|
|
|
| |||||
End of period | $ | 946,018,028 | $ | 966,777,266 | ||||
|
|
|
| |||||
See notes to financial statements.
| 24 | AB SELECT US LONG/SHORT PORTFOLIO | abfunds.com | |
NOTES TO FINANCIAL STATEMENTS
December 31, 2018(unaudited)
NOTE A
Significant Accounting Policies
AB Cap Fund, Inc. (the “Company”), which is a Maryland corporation, is registered under the Investment Company Act of 1940 as anopen-end management investment company. The Company operates as a series company currently comprised of 29 portfolios. Each portfolio is considered to be a separate entity for financial reporting and tax purposes. This report relates only to the AB Select US Long/Short Portfolio (the “Fund”), a diversified portfolio. The Fund has authorized the issuance of Class A, Class B, Class C, Advisor Class, Class R, Class K, Class I, Class T, Class 1 and Class 2 shares. Class B, Class T, Class 1 and Class 2 shares have not been issued. Class A shares are sold with afront-end sales charge of up to 4.25% for purchases not exceeding $1,000,000. With respect to purchases of $1,000,000 or more, Class A shares redeemed within one year of purchase may be subject to a contingent deferred sales charge of 1%. Class C shares are subject to a contingent deferred sales charge of 1% on redemptions made within the first year after purchase, and 0% after the first year of purchase. Class C shares will automatically convert to Class A shares ten years after the end of the calendar month of purchase. Class R and Class K shares are sold without an initial or contingent deferred sales charge. Advisor Class and Class I shares are sold without an initial or contingent deferred sales charge and are not subject to ongoing distribution expenses. All ten classes of shares have identical voting, dividend, liquidation and other rights, except that the classes bear different distribution and transfer agency expenses. Each class has exclusive voting rights with respect to its distribution plan. The financial statements have been prepared in conformity with U.S. generally accepted accounting principles (“U.S. GAAP”) which require management to make certain estimates and assumptions that affect the reported amounts of assets and liabilities in the financial statements and amounts of income and expenses during the reporting period. Actual results could differ from those estimates. The Fund is an investment company under U.S. GAAP and follows the accounting and reporting guidance applicable to investment companies. The following is a summary of significant accounting policies followed by the Fund.
1. Security Valuation
Portfolio securities are valued at their current market value determined on the basis of market quotations or, if market quotations are not readily available or are deemed unreliable, at “fair value” as determined in accordance with procedures established by and under the general supervision of the Company’s Board of Directors (the “Board”).
| abfunds.com | AB SELECT US LONG/SHORT PORTFOLIO | 25 | |
NOTES TO FINANCIAL STATEMENTS(continued)
In general, the market values of securities which are readily available and deemed reliable are determined as follows: securities listed on a national securities exchange (other than securities listed on the NASDAQ Stock Market, Inc. (“NASDAQ”)) or on a foreign securities exchange are valued at the last sale price at the close of the exchange or foreign securities exchange. If there has been no sale on such day, the securities are valued at the last traded price from the previous day. Securities listed on more than one exchange are valued by reference to the principal exchange on which the securities are traded; securities listed only on NASDAQ are valued in accordance with the NASDAQ Official Closing Price; listed or over the counter (“OTC”) market put or call options are valued at the mid level between the current bid and ask prices. If either a current bid or current ask price is unavailable, AllianceBernstein L.P. (the “Adviser”) will have discretion to determine the best valuation (e.g., last trade price in the case of listed options); open futures are valued using the closing settlement price or, in the absence of such a price, the most recent quoted bid price. If there are no quotations available for the day of valuation, the last available closing settlement price is used; U.S. Government securities and any other debt instruments having 60 days or less remaining until maturity are generally valued at market by an independent pricing vendor, if a market price is available. If a market price is not available, the securities are valued at amortized cost. This methodology is commonly used for short term securities that have an original maturity of 60 days or less, as well as short term securities that had an original term to maturity that exceeded 60 days. In instances when amortized cost is utilized, the Valuation Committee (the “Committee”) must reasonably conclude that the utilization of amortized cost is approximately the same as the fair value of the security. Such factors the Committee will consider include, but are not limited to, an impairment of the creditworthiness of the issuer or material changes in interest rates. Fixed-income securities, including mortgage-backed and asset-backed securities, may be valued on the basis of prices provided by a pricing service or at a price obtained from one or more of the major broker-dealers. In cases where broker-dealer quotes are obtained, the Adviser may establish procedures whereby changes in market yields or spreads are used to adjust, on a daily basis, a recently obtained quoted price on a security. Swaps and other derivatives are valued daily, primarily using independent pricing services, independent pricing models using market inputs, as well as third party broker-dealers or counterparties. Open end mutual funds are valued at the closing net asset value per share, while exchange traded funds are valued at the closing market price per share.
Securities for which market quotations are not readily available (including restricted securities) or are deemed unreliable are valued at fair value as deemed appropriate by the Adviser. Factors considered in making this determination may include, but are not limited to, information obtained by
| 26 | AB SELECT US LONG/SHORT PORTFOLIO | abfunds.com | |
NOTES TO FINANCIAL STATEMENTS(continued)
contacting the issuer, analysts, analysis of the issuer’s financial statements or other available documents. In addition, the Fund may use fair value pricing for securities primarily traded innon-U.S. markets because most foreign markets close well before the Fund values its securities at 4:00 p.m., Eastern Time. The earlier close of these foreign markets gives rise to the possibility that significant events, including broad market moves, may have occurred in the interim and may materially affect the value of those securities. To account for this, the Fund generally values many of its foreign equity securities using fair value prices based on third party vendor modeling tools to the extent available.
2. Fair Value Measurements
In accordance with U.S. GAAP regarding fair value measurements, fair value is defined as the price that the Fund would receive to sell an asset or pay to transfer a liability in an orderly transaction between market participants at the measurement date. U.S. GAAP establishes a framework for measuring fair value, and a three-level hierarchy for fair value measurements based upon the transparency of inputs to the valuation of an asset or liability (including those valued based on their market values as described in Note A.1 above). Inputs may be observable or unobservable and refer broadly to the assumptions that market participants would use in pricing the asset or liability. Observable inputs reflect the assumptions market participants would use in pricing the asset or liability based on market data obtained from sources independent of the Fund. Unobservable inputs reflect the Fund’s own assumptions about the assumptions that market participants would use in pricing the asset or liability based on the best information available in the circumstances. Each investment is assigned a level based upon the observability of the inputs which are significant to the overall valuation. The three-tier hierarchy of inputs is summarized below.
| • | Level 1—quoted prices in active markets for identical investments |
| • | Level 2—other significant observable inputs (including quoted prices for similar investments, interest rates, prepayment speeds, credit risk, etc.) |
| • | Level 3—significant unobservable inputs (including the Fund’s own assumptions in determining the fair value of investments) |
Where readily available market prices or relevant bid prices are not available for certain equity investments, such investments may be valued based on similar publicly traded investments, movements in relevant indices since last available prices or based upon underlying company fundamentals and comparable company data (such as multiples to earnings or other multiples to equity). Where an investment is valued using an observable input, such as another publicly traded security, the investment will be classified as Level 2. If management determines that an adjustment is appropriate
| abfunds.com | AB SELECT US LONG/SHORT PORTFOLIO | 27 | |
NOTES TO FINANCIAL STATEMENTS(continued)
based on restrictions on resale, illiquidity or uncertainty, and such adjustment is a significant component of the valuation, the investment will be classified as Level 3. An investment will also be classified as Level 3 where management uses company fundamentals and other significant inputs to determine the valuation.
Options are valued using market-based inputs to models, broker or dealer quotations, or alternative pricing sources with reasonable levels of price transparency, where such inputs and models are available. Alternatively, the values may be obtained through unobservable management determined inputs and/or management’s proprietary models. Where models are used, the selection of a particular model to value an option depends upon the contractual terms of, and specific risks inherent in, the option as well as the availability of pricing information in the market. Valuation models require a variety of inputs, including contractual terms, market prices, measures of volatility and correlations of such inputs. Exchange traded options generally will be classified as Level 2. For options that do not trade on exchange but trade in liquid markets, inputs can generally be verified and model selection does not involve significant management judgment. Options are classified within Level 2 on the fair value hierarchy when all of the significant inputs can be corroborated to market evidence. Otherwise such instruments are classified as Level 3.
The following table summarizes the valuation of the Fund’s investments by the above fair value hierarchy levels as of December 31, 2018:
Investments in Securities: | Level 1 | Level 2 | Level 3 | Total | ||||||||||||
Assets: | ||||||||||||||||
Common Stocks: | ||||||||||||||||
Health Care | $ | 77,219,308 | $ | – 0 | – | $ | – 0 | – | $ | 77,219,308 | ||||||
Communication Services | 63,776,203 | 7,458,426 | – 0 | – | 71,234,629 | |||||||||||
Information Technology | 66,808,265 | – 0 | – | – 0 | – | 66,808,265 | ||||||||||
Financials | 62,684,554 | – 0 | – | – 0 | – | 62,684,554 | ||||||||||
Industrials | 53,260,466 | – 0 | – | – 0 | – | 53,260,466 | ||||||||||
Consumer Discretionary | 40,817,668 | – 0 | – | – 0 | – | 40,817,668 | ||||||||||
Consumer Staples | 24,170,920 | – 0 | – | – 0 | – | 24,170,920 | ||||||||||
Energy | 19,894,885 | – 0 | – | – 0 | – | 19,894,885 | ||||||||||
Utilities | 19,320,263 | – 0 | – | – 0 | – | 19,320,263 | ||||||||||
Materials | 8,658,824 | – 0 | – | – 0 | – | 8,658,824 | ||||||||||
Real Estate | 3,624,006 | – 0 | – | – 0 | – | 3,624,006 | ||||||||||
Preferred Stocks | – 0 | – | – 0 | – | 5,622,185 | 5,622,185 | ||||||||||
Investment Companies | 4,897,583 | – 0 | – | – 0 | – | 4,897,583 | ||||||||||
Short-Term Investments: | ||||||||||||||||
Investment Companies | 472,089,539 | – 0 | – | – 0 | – | 472,089,539 | ||||||||||
U.S. Treasury Bills | – 0 | – | 6,979,933 | – 0 | – | 6,979,933 | ||||||||||
Investments of Cash Collateral for Securities Loaned in Affiliated Money Market Fund | 4,888,294 | – 0 | – | – 0 | – | 4,888,294 | ||||||||||
| 28 | AB SELECT US LONG/SHORT PORTFOLIO | abfunds.com | |
NOTES TO FINANCIAL STATEMENTS(continued)
Investments in Securities: | Level 1 | Level 2 | Level 3 | Total | ||||||||||||
Liabilities: | ||||||||||||||||
Common Stocks(a) | $ | (5,800,159 | ) | $ | – 0 | – | $ | – 0 | – | $ | (5,800,159 | ) | ||||
|
|
|
|
|
|
|
| |||||||||
Total Investments in Securities | 916,310,619 | 14,438,359 | 5,622,185 | 936,371,163 | ||||||||||||
Other Financial Instruments(b): | ||||||||||||||||
Assets: | ||||||||||||||||
Total Return Swaps | – 0 | – | 9,978 | – 0 | – | 9,978 | ||||||||||
Liabilities: | ||||||||||||||||
Futures | (33,331 | ) | – 0 | – | – 0 | – | (33,331 | )(c) | ||||||||
Total Return Swaps | – 0 | – | (819,469 | ) | – 0 | – | (819,469 | ) | ||||||||
|
|
|
|
|
|
|
| |||||||||
Total(d) | $ | 916,277,288 | $ | 13,628,868 | $ | 5,622,185 | $ | 935,528,341 | ||||||||
|
|
|
|
|
|
|
| |||||||||
| (a) | See Portfolio of Investments for sector classifications. |
| (b) | Other financial instruments are derivative instruments, such as futures, forwards and swaps, which are valued at the unrealized appreciation/(depreciation) on the instrument. Other financial instruments may also include swaps with upfront premiums, options written and swaptions written which are valued at market value. |
| (c) | Only variation margin receivable/(payable) at period end is reported within the statement of assets and liabilities. This amount reflects cumulative unrealized appreciation/(depreciation) of exchange-traded derivatives as reported in the portfolio of investments. |
| (d) | There were no transfers between any levels during the reporting period. |
The Fund recognizes all transfers between levels of the fair value hierarchy assuming the financial instruments were transferred at the beginning of the reporting period.
The following is a reconciliation of investments in which significant unobservable inputs (Level 3) were used in determining fair value.
| Preferred Stocks | Total | |||||||
Balance as of 6/30/18 | $ | 5,210,458 | $ | 5,210,458 | ||||
Accrued discounts/(premiums) | – 0 | – | – 0 | – | ||||
Realized gain (loss) | – 0 | – | – 0 | – | ||||
Change in unrealized appreciation/depreciation | 411,727 | 411,727 | ||||||
Purchases | – 0 | – | – 0 | – | ||||
Sales | – 0 | – | – 0 | – | ||||
Transfers in to Level 3 | – 0 | – | – 0 | – | ||||
Transfers out of Level 3 | – 0 | – | – 0 | – | ||||
|
|
|
| |||||
Balance as of 12/31/18 | $ | 5,622,185 | $ | 5,622,185 | ||||
|
|
|
| |||||
Net change in unrealized appreciation/depreciation from investments held as of 12/31/18(a) | $ | 411,727 | $ | 411,727 | ||||
|
|
|
| |||||
| (a) | The unrealized appreciation/depreciation is included in net change in unrealized appreciation/depreciation on investments and other financial instruments in the accompanying statement of operations. |
The Adviser established the Committee to oversee the pricing and valuation of all securities held in the Fund. The Committee operates under pricing and valuation policies and procedures established by the Adviser and approved by the Board, including pricing policies which set forth the mechanisms and processes to be employed on a daily basis to implement
| abfunds.com | AB SELECT US LONG/SHORT PORTFOLIO | 29 | |
NOTES TO FINANCIAL STATEMENTS(continued)
these policies and procedures. In particular, the pricing policies describe how to determine market quotations for securities and other instruments. The Committee’s responsibilities include: 1) fair value and liquidity determinations (and oversight of any third parties to whom any responsibility for fair value and liquidity determinations is delegated), and 2) regular monitoring of the Adviser’s pricing and valuation policies and procedures and modification or enhancement of these policies and procedures (or recommendation of the modification of these policies and procedures) as the Committee believes appropriate.
The Committee is also responsible for monitoring the implementation of the pricing policies by the Adviser’s Pricing Group (the “Pricing Group”) and any third party which performs certain pricing functions in accordance with the pricing policies. The Pricing Group is responsible for the oversight of the third party on aday-to-day basis. The Committee and the Pricing Group perform a series of activities to provide reasonable assurance of the accuracy of prices including: 1) periodic vendor due diligence meetings, review of methodologies, new developments and processes at vendors, 2) daily comparison of security valuation versus prior day for all securities that exceeded established thresholds, and 3) daily review of unpriced, stale, and variance reports with exceptions reviewed by senior management and the Committee.
In addition, several processes outside of the pricing process are used to monitor valuation issues including: 1) performance and performance attribution reports are monitored for anomalous impacts based upon benchmark performance, and 2) portfolio managers review all portfolios for performance and analytics (which are generated using the Adviser’s prices).
3. Currency Translation
Assets and liabilities denominated in foreign currencies and commitments under forward currency exchange contracts are translated into U.S. dollars at the mean of the quoted bid and ask prices of such currencies against the U.S. dollar. Purchases and sales of portfolio securities are translated into U.S. dollars at the rates of exchange prevailing when such securities were acquired or sold. Income and expenses are translated into U.S. dollars at rates of exchange prevailing when accrued.
Net realized gain or loss on foreign currency transactions represents foreign exchange gains and losses from sales and maturities of foreign fixed income investments, holding of foreign currencies, currency gains or losses realized between the trade and settlement dates on foreign investment transactions, and the difference between the amounts of dividends, interest and foreign withholding taxes recorded on the Fund’s books and
| 30 | AB SELECT US LONG/SHORT PORTFOLIO | abfunds.com | |
NOTES TO FINANCIAL STATEMENTS(continued)
the U.S. dollar equivalent amounts actually received or paid. Net unrealized currency gains and losses from valuing foreign currency denominated assets and liabilities at period end exchange rates are reflected as a component of net unrealized appreciation or depreciation of foreign currency denominated assets and liabilities.
4. Taxes
It is the Fund’s policy to meet the requirements of the Internal Revenue Code applicable to regulated investment companies and to distribute all of its investment company taxable income and net realized gains, if any, to shareholders. Therefore, no provisions for federal income or excise taxes are required. The Fund may be subject to taxes imposed by countries in which it invests. Such taxes are generally based on income and/or capital gains earned or repatriated. Taxes are accrued and applied to net investment income, net realized gains and net unrealized appreciation/depreciation as such income and/or gains are earned.
In accordance with U.S. GAAP requirements regarding accounting for uncertainties in income taxes, management has analyzed the Fund’s tax positions taken or expected to be taken on federal and state income tax returns for all open tax years (the current and the prior three tax years) and has concluded that no provision for income tax is required in the Fund’s financial statements.
5. Investment Income and Investment Transactions
Dividend income is recorded on theex-dividend date or as soon as the Fund is informed of the dividend. Interest income is accrued daily. Investment transactions are accounted for on the date the securities are purchased or sold. Investment gains or losses are determined on the identified cost basis. The Fund amortizes premiums and accretes discounts as adjustments to interest income.
6. Class Allocations
All income earned and expenses incurred by the Fund are borne on apro-rata basis by each outstanding class of shares, based on the proportionate interest in the Fund represented by the net assets of such class, except for class specific expenses which are allocated to the respective class. Expenses of the Company are charged proportionately to each portfolio or based on other appropriate methods. Realized and unrealized gains and losses are allocated among the various share classes based on respective net assets.
7. Dividends and Distributions
Dividends and distributions to shareholders, if any, are recorded on theex-dividend date. Income dividends and capital gains distributions are
| abfunds.com | AB SELECT US LONG/SHORT PORTFOLIO | 31 | |
NOTES TO FINANCIAL STATEMENTS(continued)
determined in accordance with federal tax regulations and may differ from those determined in accordance with U.S. GAAP. To the extent these differences are permanent, such amounts are reclassified within the capital accounts based on their federal tax basis treatment; temporary differences do not require such reclassification.
NOTE B
Advisory Fee and Other Transactions with Affiliates
Under the terms of the investment advisory agreement, the Fund pays the Adviser an advisory fee at an annual rate of 1.50% of the first $2.5 billion and 1.475% thereafter of the Fund’s average daily net assets. Effective February 3, 2017, the advisory fee was reduced from 1.70% to 1.50% of the first $2.5 billion and 1.60% to 1.475% thereafter of the Fund’s average daily net assets. The Adviser has agreed to waive its fees and bear certain expenses to the extent necessary to limit total operating expenses (excluding dividend expense, borrowing costs and brokerage expense on securities sold short) on an annual basis (the “Expense Caps”) to 1.90%, 2.65%, 1.65%, 2.15%, 1.90% and 1.65%, of average daily net assets for Class A, Class C, Advisor Class, Class R, Class K and Class I shares, respectively. Effective February 3, 2017, the Expense Caps were reduced from 2.20% to 1.90%, 2.95% to 2.65%, 1.95% to 1.65%, 2.45% to 2.15%, 2.20% to 1.90% and 1.95% to 1.65%, of average daily net assets for Class A, Class C, Advisor Class, Class R, Class K and Class I shares, respectively. For the six months ended December 31, 2018, such reimbursements/waivers amounted to $353. The Expense Caps may not be terminated by the Adviser before October 31, 2019.
During 2017, AXA S.A. (“AXA”), a French holding company for the AXA Group, a worldwide leader in life, property and casualty and health insurance and asset management, announced its intention to pursue the sale of a minority stake in its subsidiary, AXA Equitable Holdings, Inc. (“AXA Equitable”), the holding company for a diversified financial services organization, through an initial public offering (“IPO”). AXA Equitable is the holding company for a diverse group of financial services companies, including AllianceBernstein L.P., the investment adviser to the Funds (“the Adviser”). During the second quarter of 2018, AXA Equitable completed the IPO, and, as a result, AXA held approximately 72.2% of the outstanding common stock of AXA Equitable as of September 30, 2018. Contemporaneously with the IPO, AXA sold $862.5 million aggregate principal amount of its 7.25% mandatorily exchangeable notes (the “MxB Notes”) due May 15, 2021 and exchangeable into up to 43,125,000 shares of common stock (or approximately 7% of the outstanding shares of common stock of AXA Equitable). AXA retains ownership (including voting rights) of such shares of common stock until the MxB Notes are exchanged, which may be on a date that is earlier than the maturity date at AXA’s option upon the occurrence of certain events.
| 32 | AB SELECT US LONG/SHORT PORTFOLIO | abfunds.com | |
NOTES TO FINANCIAL STATEMENTS(continued)
In March 2018, AXA announced its intention to sell its entire interest in AXA Equitable over time, subject to market conditions and other factors (the “Plan”). It is anticipated that one or more of the transactions contemplated by the Plan may ultimately result in the indirect transfer of a “controlling block” of voting securities of the Adviser (a “Change of Control Event”) and therefore may be deemed an “assignment” causing a termination of each Fund’s current investment advisory agreement. In order to ensure that the existing investment advisory services could continue uninterrupted, at meetings held in late July through early August 2018, the Boards of Directors/Trustees (each a “Board” and collectively, the “Boards”) approved new investment advisory agreements with the Adviser, in connection with the Plan. The Boards also agreed to call and hold a joint meeting of shareholders on October 11, 2018 for shareholders of each Fund to (1) approve the new investment advisory agreement with the Adviser that would be effective after the first Change of Control Event and (2) approve any future advisory agreement approved by the Board and that has terms not materially different from the current agreement, in the event there are subsequent Change of Control Events arising from completion of the Plan that terminate the advisory agreement after the first Change of Control Event. Approval of a future advisory agreement means that shareholders may not have another opportunity to vote on a new agreement with the Adviser even upon a change of control, as long as no single person or group of persons acting together gains “control” (as defined in the 1940 Act) of AXA Equitable.
At the November 14, 2018 adjourned shareholder meeting, shareholders approved the new and future investment advisory agreements.
On November 20, 2018, AXA completed a public offering of 60,000,000 shares of AXA Equitable’s common stock and simultaneously sold 30,000,000 of such shares to AXA Equitable pursuant to a separate agreement with it. As a result AXA currently owns approximately 59.2% of the shares of common stock of AXA Equitable.
Pursuant to the investment advisory agreement, the Fund may reimburse the Adviser for certain legal and accounting services provided to the Fund by the Adviser. For the six months ended December 31, 2018, the reimbursement for such services amounted to $36,950.
The Fund compensates AllianceBernstein Investor Services, Inc. (“ABIS”), a wholly-owned subsidiary of the Adviser, under a Transfer Agency Agreement for providing personnel and facilities to perform transfer agency services for the Fund. ABIS may make payments to intermediaries that provide omnibus account services,sub-accounting services and/or networking services. Such compensation retained by ABIS amounted to $95,253 for the six months ended December 31, 2018.
| abfunds.com | AB SELECT US LONG/SHORT PORTFOLIO | 33 | |
NOTES TO FINANCIAL STATEMENTS(continued)
AllianceBernstein Investments, Inc. (the “Distributor”), a wholly-owned subsidiary of the Adviser, serves as the distributor of the Fund’s shares. The Distributor has advised the Fund that it has retainedfront-end sales charges of $6,579 from the sale of Class A shares and received $22 and $4,165 in contingent deferred sales charges imposed upon redemptions by shareholders of Class A and Class C shares, respectively, for the six months ended December 31, 2018.
The Fund may invest in AB Government Money Market Portfolio (the “Government Money Market Portfolio”) which has a contractual annual advisory fee rate of .20% of the portfolio’s average daily net assets and bears its own expenses. Effective August 1, 2018, the Adviser has contractually agreed to waive .10% of the advisory fee of Government Money Market Portfolio until August 31, 2019. In connection with the investment by the Fund in Government Money Market Portfolio, the Adviser has contractually agreed to waive its advisory fee from the Fund in an amount equal to the Fund’s pro rata share of the effective advisory fee of Government Money Market Portfolio, as borne indirectly by the Fund as an acquired fund fee and expense. For the six months ended December 31, 2018, such waiver amounted to $170,107.
A summary of the Fund’s transactions in AB mutual funds for the six months ended December 31, 2018 is as follows:
Fund | Market Value 6/30/18 (000) | Purchases at Cost (000) | Sales Proceeds (000) | Market Value 12/31/18 (000) | Dividend Income (000) | |||||||||||||||
Government Money Market Portfolio | $ | 269,614 | $ | 429,737 | $ | 227,261 | $ | 472,090 | $ | 3,124 | ||||||||||
Government Money Market Portfolio* | 17,964 | 90,985 | 104,061 | 4,888 | 28 | |||||||||||||||
|
|
|
| |||||||||||||||||
Total | $ | 476,978 | $ | 3,152 | ||||||||||||||||
|
|
|
| |||||||||||||||||
| * | Investments of cash collateral for securities lending transactions (see Note E). |
Brokerage commissions paid on investment transactions for the six months ended December 31, 2018 amounted to $333,385, of which $0 and $0, respectively, was paid to Sanford C. Bernstein & Co. LLC and Sanford C. Bernstein Limited, affiliates of the Adviser.
| 34 | AB SELECT US LONG/SHORT PORTFOLIO | abfunds.com | |
NOTES TO FINANCIAL STATEMENTS(continued)
NOTE C
Distribution Services Agreement
The Fund has adopted a Distribution Services Agreement (the “Agreement”) pursuant to Rule12b-1 under the Investment Company Act of 1940. Under the Agreement, the Fund pays distribution and servicing fees to the Distributor at an annual rate of up to .25% of the Fund’s average daily net assets attributable to Class A shares, 1% of the Fund’s average daily net assets attributable to Class C shares, .50% of the Fund’s average daily net assets attributable to Class R shares, and .25% of the Fund’s average daily net assets attributable to Class K shares. Effective October 31, 2014, payments under the Agreement in respect of Class A shares are limited to an annual rate of .25% of Class A shares average daily net assets. There are no distribution and servicing fees on the Advisor Class and Class I shares. The fees are accrued daily and paid monthly. The Agreement provides that the Distributor will use such payments in their entirety for distribution assistance and promotional activities. Since the commencement of the Fund’s operations, the Distributor has incurred expenses in excess of the distribution costs reimbursed by the Fund in the amounts of $1,435,476, $6,726 and$-0- for Class C, Class R and Class K shares, respectively. While such costs may be recovered from the Fund in future periods so long as the Agreement is in effect, the rate of the distribution and servicing fees payable under the Agreement may not be increased without a shareholder vote. In accordance with the Agreement, there is no provision for recovery of unreimbursed distribution costs incurred by the Distributor beyond the current fiscal year for Class A shares. The Agreement also provides that the Adviser may use its own resources to finance the distribution of the Fund’s shares.
NOTE D
Investment Transactions
Purchases and sales of investment securities (excluding short-term investments) for the six months ended December 31, 2018, were as follows:
| Purchases | Sales | Securities Sold Short | Covers on Securities Sold Short | |||||||||
| $ 828,623,852 | $ | 1,019,674,069 | $ | 100,258,056 | $ | 118,553,008 | ||||||
There were no purchases or sales of U.S. government and government agency obligations for the year ended December 31, 2018.
| abfunds.com | AB SELECT US LONG/SHORT PORTFOLIO | 35 | |
NOTES TO FINANCIAL STATEMENTS(continued)
The cost of investments for federal income tax purposes was substantially the same as the cost for financial reporting purposes. Accordingly, gross unrealized appreciation and unrealized depreciation are as follows:
Gross Unrealized | Net Unrealized Depreciation on Investments | Net Unrealized appreciation on Securities Sold Short | Net Unrealized Depreciation | |||||||||||||
Appreciation | Depreciation on Investments | |||||||||||||||
$ 4,931,858 | $ | (35,124,079 | ) | $ | (30,192,221 | ) | $ | 441,892 | (a) | $ | (29,750,329 | ) | ||||
| (a) | Gross unrealized appreciation was $505,702 and gross unrealized depreciation was $(63,810), resulting in net unrealized appreciation of $441,892. |
1. Derivative Financial Instruments
The Fund may use derivatives in an effort to earn income and enhance returns, to replace more traditional direct investments, to obtain exposure to otherwise inaccessible markets (collectively, “investment purposes”), or to hedge or adjust the risk profile of its portfolio.
The principal types of derivatives utilized by the Fund, as well as the methods in which they may be used are:
| • | Futures |
The Fund may buy or sell futures for investment purposes or for the purpose of hedging its portfolio against adverse effects of potential movements in the market. The Fund bears the market risk that arises from changes in the value of these instruments and the imperfect correlation between movements in the price of the futures and movements in the price of the assets, reference rates or indices which they are designed to track. Among other things, the Fund may purchase or sell futures for foreign currencies or options thereon fornon-hedging purposes as a means of making direct investment in foreign currencies, as described below under “Currency Transactions”.
At the time the Fund enters into futures, the Fund deposits and maintains as collateral an initial margin with the broker, as required by the exchange on which the transaction is effected. Such amount is shown as cash collateral due from broker on the statement of assets and liabilities. Pursuant to the contract, the Fund agrees to receive from or pay to the broker an amount of cash equal to the daily fluctuation in the value of the contract. Such receipts or payments are known as variation margin and are recorded by the Fund as unrealized gains or losses. Risks may arise from the potential inability of a counterparty to meet the terms of the contract. The credit/counterparty risk for exchange-traded futures is generally less than privately negotiated futures, since the clearinghouse, which is the
| 36 | AB SELECT US LONG/SHORT PORTFOLIO | abfunds.com | |
NOTES TO FINANCIAL STATEMENTS(continued)
issuer or counterparty to each exchange-traded future, has robust risk mitigation standards, including the requirement to provide initial and variation margin. When the contract is closed, the Fund records a realized gain or loss equal to the difference between the value of the contract at the time it was opened and the time it was closed.
During the six months ended December 31, 2018, the Fund held futures for hedging purposes.
| • | Swaps |
The Fund may enter into swaps to hedge its exposure to interest rates, credit risk, equity markets or currencies. The Fund may also enter into swaps fornon-hedging purposes as a means of gaining market exposures, making direct investments in foreign currencies, as described below under “Currency Transactions” or in order to take a “long” or “short” position with respect to an underlying referenced asset described below under “Total Return Swaps”. A swap is an agreement that obligates two parties to exchange a series of cash flows at specified intervals based upon or calculated by reference to changes in specified prices or rates for a specified amount of an underlying asset. The payment flows are usually netted against each other, with the difference being paid by one party to the other. In addition, collateral may be pledged or received by the Fund in accordance with the terms of the respective swaps to provide value and recourse to the Fund or its counterparties in the event of default, bankruptcy or insolvency by one of the parties to the swap.
Risks may arise as a result of the failure of the counterparty to the swap to comply with the terms of the swap. The loss incurred by the failure of a counterparty is generally limited to the net interim payment to be received by the Fund, and/or the termination value at the end of the contract. Therefore, the Fund considers the creditworthiness of each counterparty to a swap in evaluating potential counterparty risk. This risk is mitigated by having a netting arrangement between the Fund and the counterparty and by the posting of collateral by the counterparty to the Fund to cover the Fund’s exposure to the counterparty. Additionally, risks may arise from unanticipated movements in interest rates or in the value of the underlying securities. The Fund accrues for the interim payments on swaps on a daily basis, with the net amount recorded within unrealized appreciation/depreciation of swaps on the statement of assets and liabilities, where applicable. Once the interim payments are settled in cash, the net amount is recorded as realized gain/(loss) on swaps on the statement of operations, in addition to any realized gain/(loss) recorded upon the termination of swaps. Upfront premiums paid or received for OTC swaps are recognized as cost or proceeds on the statement of assets
| abfunds.com | AB SELECT US LONG/SHORT PORTFOLIO | 37 | |
NOTES TO FINANCIAL STATEMENTS(continued)
and liabilities and are amortized on a straight line basis over the life of the contract. Amortized upfront premiums are included in net realized gain/(loss) from swaps on the statement of operations. Fluctuations in the value of swaps are recorded as a component of net change in unrealized appreciation/depreciation of swaps on the statement of operations.
Total Return Swaps:
The Fund may enter into total return swaps in order to take a “long” or “short” position with respect to an underlying referenced asset. The Fund is subject to market price volatility of the underlying referenced asset. A total return swap involves commitments to pay interest in exchange for a market linked return based on a notional amount. To the extent that the total return of the security, group of securities or index underlying the transaction exceeds or falls short of the offsetting interest obligation, the Fund will receive a payment from or make a payment to the counterparty.
During the six months ended December 31, 2018, the Fund held total return swaps fornon-hedging purposes.
The Fund typically enters into International Swaps and Derivatives Association, Inc. Master Agreements (“ISDA Master Agreement”) with its OTC derivative contract counterparties in order to, among other things, reduce its credit risk to OTC counterparties. ISDA Master Agreements include provisions for general obligations, representations, collateral and events of default or termination. Under an ISDA Master Agreement, the Fund typically may offset with the OTC counterparty certain derivative financial instruments’ payables and/or receivables with collateral held and/or posted and create one single net payment(close-out netting) in the event of default or termination. In the event of a default by an OTC counterparty, the return of collateral with market value in excess of the Fund’s net liability, held by the defaulting party, may be delayed or denied.
The Fund’s ISDA Master Agreements may contain provisions for early termination of OTC derivative transactions in the event the net assets of the Fund decline below specific levels (“net asset contingent features”). If these levels are triggered, the Fund’s OTC counterparty has the right to terminate such transaction and require the Fund to pay or receive a settlement amount in connection with the terminated transaction. If OTC derivatives were held at period end, please refer to netting arrangements by the OTC counterparty tables below for additional details.
| 38 | AB SELECT US LONG/SHORT PORTFOLIO | abfunds.com | |
NOTES TO FINANCIAL STATEMENTS(continued)
During the six months ended December 31, 2018, the Fund had entered into the following derivatives:
Asset Derivatives | Liability Derivatives | |||||||||||||
Derivative Type | Statement of | Fair Value | Statement of Assets and Liabilities Location | Fair Value | ||||||||||
Equity contracts | | Receivable/ Payable for variation margin on futures | $ | 33,331 | * | |||||||||
Equity contracts | Unrealized appreciation on total return swaps | $ | 9,978 | | Unrealized depreciation on total return swaps | | 819,469 | |||||||
|
|
|
| |||||||||||
Total | $ | 9,978 | $ | 852,800 | ||||||||||
|
|
|
| |||||||||||
| * | Only variation margin receivable/payable at period end is reported within the statement of assets and liabilities. This amount reflects cumulative unrealized appreciation/(depreciation) on futures and centrally cleared swaps as reported in the portfolio of investments. |
Derivative Type | Location of Gain | Realized Gain or (Loss) on Derivatives | Change in Unrealized Appreciation or (Depreciation) | |||||||
Equity contracts | Net realized gain (loss) on futures; Net change in unrealized appreciation/depreciation of futures | $ | (922,660 | ) | $ | (555,047 | ) | |||
Equity contracts | Net realized gain (loss) on swaps; Net change in unrealized appreciation/depreciation of swaps | 670,691 | (1,696,919 | ) | ||||||
|
|
|
| |||||||
Total | $ | (251,969 | ) | $ | (2,251,966 | ) | ||||
|
|
|
| |||||||
The following table represents the average monthly volume of the Fund’s derivative transactions during the six months ended December 31, 2018:
Futures: | ||||
Average original value of sale contracts | $ | 20,932,069 | ||
Total Return Swaps: | ||||
Average notional amount | $ | 4,946,440 | (a) |
| (a) | Positions were open for four months during the period. |
For financial reporting purposes, the Fund does not offset derivative assets and derivative liabilities that are subject to netting arrangements in the statement of assets and liabilities.
| abfunds.com | AB SELECT US LONG/SHORT PORTFOLIO | 39 | |
NOTES TO FINANCIAL STATEMENTS(continued)
All OTC derivatives held at period end were subject to netting arrangements. The following table presents the Fund’s derivative assets and liabilities by OTC counterparty net of amounts available for offset under ISDA Master Agreements (“MA”) and net of the related collateral received/pledged by the Fund as of December 31, 2018. Exchange-traded derivatives and centrally cleared swaps are not subject to netting arrangements and as such are excluded from the table.
Counterparty | Derivatives Assets Subject to a MA | Derivatives Available for Offset | Cash Collateral Received* | Security Collateral Received* | Net Amount of Derivatives Assets | |||||||||||||||
Morgan Stanley Capital Services LLC | $ | 9,978 | $ | (9,978 | ) | $ | – 0 | – | $ | – 0 | – | $ | – 0 | – | ||||||
|
|
|
|
|
|
|
|
|
| |||||||||||
Total | $ | 9,978 | $ | (9,978 | ) | $ | – 0 | – | $ | – 0 | – | $ | – 0 | – | ||||||
|
|
|
|
|
|
|
|
|
| |||||||||||
Counterparty | Derivatives Liabilities Subject to a MA | Derivatives Available for Offset | Cash Collateral Pledged* | Security Collateral Pledged* | Net Amount of Derivatives Liabilities | |||||||||||||||
Morgan Stanley Capital Services LLC | $ | 819,469 | $ | (9,978 | ) | $ | – 0 | – | $ | (724,916 | ) | $ | 84,575 | |||||||
|
|
|
|
|
|
|
|
|
| |||||||||||
Total | $ | 819,469 | $ | (9,978 | ) | $ | – 0 | – | $ | (724,916 | ) | $ | 84,575 | ^ | ||||||
|
|
|
|
|
|
|
|
|
| |||||||||||
| * | The actual collateral received/pledged may be more than the amount reported due to over-collateralization. |
| ^ | Net amount represents the net receivable/payable that would be due from/to the counterparty in the event of default or termination. The net amount from OTC financial derivative instruments can only be netted across transactions governed under the same master agreement with the same counterparty. |
2. Currency Transactions
The Fund may invest innon-U.S. Dollar-denominated securities on a currency hedged or unhedged basis. The Fund may seek investment opportunities by taking long or short positions in currencies through the use of currency-related derivatives, including forward currency exchange contracts, futures and options on futures, swaps, and other options. The Fund may enter into transactions for investment opportunities when it anticipates that a foreign currency will appreciate or depreciate in value but securities denominated in that currency are not held by the Fund and do not present attractive investment opportunities. Such transactions may also be used when the Adviser believes that it may be more efficient than a direct investment in a foreign currency-denominated security. The Fund may also conduct currency exchange contracts on a spot basis (i.e., for cash at the spot rate prevailing in the currency exchange market for buying or selling currencies).
3. Short Sales
The Fund may sell securities short. A short sale is a transaction in which the Fund sells securities it does not own, but has borrowed, in anticipation
| 40 | AB SELECT US LONG/SHORT PORTFOLIO | abfunds.com | |
NOTES TO FINANCIAL STATEMENTS(continued)
of a decline in the market price of the securities. The Fund is obligated to replace the borrowed securities at their market price at the time of settlement. The Fund’s obligation to replace the securities borrowed in connection with a short sale will be fully secured by collateral deposited with the broker. The Fund is liable to the buyer for any dividends/interest payable on securities while those securities are in a short position. These dividends/interest are recorded as an expense of the Fund. Short sales by the Fund involve certain risks and special considerations. Possible losses from short sales differ from losses that could be incurred from a purchase of a security because losses from short sales may be unlimited, whereas losses from purchases cannot exceed the total amount invested.
NOTE E
Securities Lending
The Fund may enter into securities lending transactions. Under the Fund’s securities lending program, all loans of securities will be collateralized continually by cash. The Fund will be compensated for the loan from a portion of the net return from the income earned on cash collateral after a rebate is paid to the borrower (in some cases, this rebate may be a “negative rebate” or fee paid by the borrower to the Fund in connection with the loan), and payments are made for fees of the securities lending agent and for certain other administrative expenses. It is the policy of the Fund to receive collateral consisting of cash in an amount exceeding the value of the securities loaned. The Fund will have the right to call a loan and obtain the securities loaned at any time on notice to the borrower within the normal and customary settlement time for the securities. While the securities are on loan, the borrower is obligated to pay the Fund amounts equal to any income or other distributions from the securities. The Fund will not be able to exercise voting rights with respect to any securities during the existence of a loan, but will have the right to regain ownership of loaned securities in order to exercise voting or other ownership rights. The lending agent has agreed to indemnify the Fund in the case of default of any securities borrower. Collateral received and securities loaned are marked to market daily to ensure that the securities loaned are secured by collateral. The lending agent currently invests the cash collateral received in Government Money Market Portfolio, an eligible money market vehicle, in accordance with the investment restrictions of the Fund, and as approved by the Board. The collateral received on securities loaned is recorded as an asset as well as a corresponding liability in the statement of assets and liabilities. When the Fund lends securities, its investment performance will continue to reflect changes in the value of the securities loaned. At December 31, 2018, the Fund had securities on loan with a value of $4,872,126 and had received cash collateral which has been invested into Government Money Market Portfolio of $4,888,294. The cash collateral will be adjusted on the next business day to maintain the required collateral amount. The Fund
| abfunds.com | AB SELECT US LONG/SHORT PORTFOLIO | 41 | |
NOTES TO FINANCIAL STATEMENTS(continued)
earned net securities lending income of $28,256 from Government Money Market Portfolio, inclusive of a rebate expense paid to the borrower, for the six months ended December 31, 2018; this amount is reflected in the statement of operations. In connection with the cash collateral investment by the Fund in the Government Money Market Portfolio, the Adviser has agreed to waive a portion of the Fund’s share of the advisory fees of Government Money Market Portfolio, as borne indirectly by the Fund as an acquired fund fee and expense. For the six months ended December 31, 2018, such waiver amounted to $3,382. A principal risk of lending portfolio securities is that the borrower may fail to return the loaned securities upon termination of the loan and that the collateral will not be sufficient to replace the loaned securities.
NOTE F
Capital Stock
Each class consists of 3,000,000,000 authorized shares. Transactions in capital shares for each class were as follows:
| Shares | Amount | |||||||||||||||||||||||
| Six Months Ended December 31, 2018 (unaudited) | Year Ended 2018 | Six Months Ended (unaudited) | Year Ended 2018 | |||||||||||||||||||||
|
| |||||||||||||||||||||||
| Class A | ||||||||||||||||||||||||
Shares sold | 1,663,718 | 1,668,946 | $ | 20,548,281 | $ | 21,309,926 | ||||||||||||||||||
| ||||||||||||||||||||||||
Shares issued in reinvestment of distributions | 554,404 | 352,879 | 6,436,624 | 4,428,640 | ||||||||||||||||||||
| ||||||||||||||||||||||||
Shares converted from Class C | 2,801 | 2,063 | 37,556 | 26,126 | ||||||||||||||||||||
| ||||||||||||||||||||||||
Shares redeemed | (1,145,447 | ) | (4,135,136 | ) | (14,657,035 | ) | (52,463,704 | ) | ||||||||||||||||
| ||||||||||||||||||||||||
Net increase (decrease) | 1,075,476 | (2,111,248 | ) | $ | 12,365,426 | $ | (26,699,012 | ) | ||||||||||||||||
| ||||||||||||||||||||||||
| Class C | ||||||||||||||||||||||||
Shares sold | 374,713 | 476,143 | $ | 4,560,882 | $ | 5,856,297 | ||||||||||||||||||
| ||||||||||||||||||||||||
Shares issued in reinvestment of distributions | 618,550 | 403,797 | 6,816,420 | 4,869,795 | ||||||||||||||||||||
| ||||||||||||||||||||||||
Shares converted to Class A | (2,932 | ) | (2,147 | ) | (37,556 | ) | (26,126 | ) | ||||||||||||||||
| ||||||||||||||||||||||||
Shares redeemed | (1,065,316 | ) | (2,249,035 | ) | (12,854,080 | ) | (27,426,851 | ) | ||||||||||||||||
| ||||||||||||||||||||||||
Net decrease | (74,985 | ) | (1,371,242 | ) | $ | (1,514,334 | ) | $ | (16,726,885 | ) | ||||||||||||||
| ||||||||||||||||||||||||
| Advisor Class | ||||||||||||||||||||||||
Shares sold | 14,996,530 | 15,698,890 | $ | 195,497,850 | $ | 202,798,318 | ||||||||||||||||||
| ||||||||||||||||||||||||
Shares issued in reinvestment of distributions | 4,061,044 | 2,194,356 | 48,001,540 | 27,934,150 | ||||||||||||||||||||
| ||||||||||||||||||||||||
Shares redeemed | (12,725,446 | ) | (15,196,275 | ) | (160,691,198 | ) | (195,965,072 | ) | ||||||||||||||||
| ||||||||||||||||||||||||
Net increase | 6,332,128 | 2,696,971 | $ | 82,808,192 | $ | 34,767,396 | ||||||||||||||||||
| ||||||||||||||||||||||||
| 42 | AB SELECT US LONG/SHORT PORTFOLIO | abfunds.com | |
NOTES TO FINANCIAL STATEMENTS(continued)
| Shares | Amount | |||||||||||||||||||||||
| Six Months Ended December 31, 2018 (unaudited) | Year Ended 2018 | Six Months Ended (unaudited) | Year Ended 2018 | |||||||||||||||||||||
|
| |||||||||||||||||||||||
| Class R | ||||||||||||||||||||||||
Shares sold | 1,146 | 5,086 | $ | 14,742 | $ | 63,819 | ||||||||||||||||||
| ||||||||||||||||||||||||
Shares issued in reinvestment of distributions | 2,519 | 1,758 | 28,747 | 21,780 | ||||||||||||||||||||
| ||||||||||||||||||||||||
Shares redeemed | (10,560 | ) | (3,180 | ) | (133,057 | ) | (40,136 | ) | ||||||||||||||||
| ||||||||||||||||||||||||
Net increase (decrease) | (6,895 | ) | 3,664 | $ | (89,568 | ) | $ | 45,463 | ||||||||||||||||
| ||||||||||||||||||||||||
| Class K | ||||||||||||||||||||||||
Shares sold | 1 | – 0 | – | $ | 5 | $ | – 0 | – | ||||||||||||||||
| ||||||||||||||||||||||||
Shares issued in reinvestment of distributions | – 0 | – | 0 | (a) | – 0 | – | 0 | (b) | ||||||||||||||||
| ||||||||||||||||||||||||
Net increase | 1 | – 0 | – | $ | 5 | $ | – 0 | – | ||||||||||||||||
| ||||||||||||||||||||||||
| Class I | ||||||||||||||||||||||||
Shares sold | 303,824 | 30,192 | $ | 3,961,818 | $ | 394,419 | ||||||||||||||||||
| ||||||||||||||||||||||||
Shares issued in reinvestment of distributions | 111,670 | 47,546 | 1,323,290 | 606,208 | ||||||||||||||||||||
| ||||||||||||||||||||||||
Shares redeemed | (13,082 | ) | (5,529 | ) | (163,996 | ) | (72,235 | ) | ||||||||||||||||
| ||||||||||||||||||||||||
Net increase | 402,412 | 72,209 | $ | 5,121,112 | $ | 928,392 | ||||||||||||||||||
| ||||||||||||||||||||||||
| (a) | Amount is less than one share. |
| (b) | Amount is less than $.50. |
NOTE G
Risks Involved in Investing in the Fund
Sector Risk—The Fund may have more risk because of concentrated investments in a particular market sector, such as the technology or financial services sector. Market or economic factors affecting that sector could have a major effect on the value of the Fund’s investments.
Short Sale Risk—Short sales involve the risk that the Fund will incur a loss by subsequently buying a security at a higher price than the price at which it sold the security. The amount of such loss is theoretically unlimited, as it will be based on the increase in value of the security sold short. In contrast, the risk of loss from a long position is limited to the Fund’s investment in the security, because the price of the security cannot fall below zero. The Fund may not always be able to close out a short position on favorable terms.
Derivatives Risk—The Fund may enter into derivative transactions such as forwards, options, futures and swaps. Derivatives may be illiquid, difficult
| abfunds.com | AB SELECT US LONG/SHORT PORTFOLIO | 43 | |
NOTES TO FINANCIAL STATEMENTS(continued)
to price, and leveraged so that small changes may produce disproportionate losses for the Fund, and subject to counterparty risk to a greater degree than more traditional investments. Derivatives may result in significant losses, including losses that are far greater than the value of the derivatives reflected on the statement of assets and liabilities.
Leverage Risk—To the extent the Fund uses leveraging techniques, the value of its shares may be more volatile because leverage tends to exaggerate the effect of any increase or decrease in the value of the Fund’s investments.
Capitalization Risk—Investments in small- andmid-capitalization companies may be more volatile than investments in large-capitalization companies. Investments in these companies may have additional risks because these companies may have limited product lines, markets or financial resources.
Active Trading Risk—The Fund expects to engage in active and frequent trading of its portfolio securities and its portfolio turnover rate is expected to greatly exceed 100%. A higher rate of portfolio turnover increases transaction costs, which may negatively affect the Fund’s return. In addition, a high rate of portfolio turnover may result in substantial short-term gains, which may have adverse tax consequences for Fund shareholders.
Indemnification Risk—In the ordinary course of business, the Fund enters into contracts that contain a variety of indemnifications. The Fund’s maximum exposure under these arrangements is unknown. However, the Fund has not had prior claims or losses pursuant to these indemnification provisions and expects the risk of loss thereunder to be remote. Therefore, the Fund has not accrued any liability in connection with these indemnification provisions.
NOTE H
Joint Credit Facility
A number ofopen-end mutual funds managed by the Adviser, including the Fund, participate in a $325 million revolving credit facility (the “Facility”) intended to provide short-term financing, if necessary, subject to certain restrictions in connection with abnormal redemption activity. Commitment fees related to the Facility are paid by the participating funds and are included in miscellaneous expenses in the statement of operations. The Fund did not utilize the Facility during the six months ended December 31, 2018.
| 44 | AB SELECT US LONG/SHORT PORTFOLIO | abfunds.com | |
NOTES TO FINANCIAL STATEMENTS(continued)
NOTE I
Distributions to Shareholders
The tax character of distributions to be paid for the year ending June 30, 2019 will be determined at the end of the current fiscal year. The tax character of distributions paid during the fiscal years ended June 30, 2018 and December 31, 2017 were as follows:
| 2018 | 2017 | |||||||
Distributions paid from: | ||||||||
Ordinary income | $ | 46,886,207 | $ | – 0 | – | |||
Net long-term capital gains | – 0 | – | – 0 | – | ||||
|
|
|
| |||||
Total taxable distributions paid | $ | 46,886,207 | $ | – 0 | – | |||
|
|
|
| |||||
As of June 30, 2018, the components of accumulated earnings/(deficit) on a tax basis were as follows:
Undistributed ordinary income | $ | 70,923,222 | ||
Unrealized appreciation/(depreciation) | (2,150,364 | )(a) | ||
|
| |||
Total accumulated earnings/(deficit) | $ | 68,772,858 | ||
|
|
| (a) | The differences between book-basis andtax-basis unrealized appreciation/(depreciation) are attributable primarily to the tax deferral of losses on wash sales and the recognition for tax purposes of unrealized gains/losses on certain derivative instruments. |
For tax purposes, net realized capital losses may be carried over to offset future capital gains, if any. Funds are permitted to carry forward capital losses for an indefinite period, and such losses will retain their character as either short-term or long-term capital losses. As of June 30, 2018, the Fund did not have any capital loss carryforwards.
NOTE J
Recent Accounting Pronouncements
In March 2017, the Financial Accounting Standards Board issued an Accounting Standards Update, ASU2017-08, Receivables—Nonrefundable Fees and Other Costs (Subtopic310-20), Premium Amortization on Purchased Callable Debt Securities which amends the amortization period for certain purchased callable debt securities held at a premium, shortening such period to the earliest call date. The ASU2017-08 does not require any accounting change for debt securities held at a discount; the discount continues to be amortized to maturity. The ASU2017-08 is effective for fiscal years, and interim periods within those fiscal years, beginning after December 15, 2018. At this time, management is evaluating the implications of these changes on the financial statements.
In August 2018, the Financial Accounting Standards Board issued an Accounting Standards Update, ASU2018-13, Fair Value Measurement (Topic 820), Disclosure Framework—Changes to the Disclosure
| abfunds.com | AB SELECT US LONG/SHORT PORTFOLIO | 45 | |
NOTES TO FINANCIAL STATEMENTS(continued)
Requirements for Fair Value Measurement which removes, modifies and adds disclosures to Topic 820. The amendments in this ASU2018-13 apply to all entities that are required, under existing U.S. GAAP, to make disclosures about recurring or nonrecurring fair value measurements. The amendments in this ASU2018-13 are effective for all entities for fiscal years, and interim periods within those fiscal years, beginning after December 15, 2019. At this time, management is evaluating the implications of these changes on the financial statements.
In October 2018, the U.S. Securities and Exchange Commission adopted amendments to certain disclosure requirements included in RegulationS-X that had become “redundant, duplicative, overlapping, outdated or superseded, in light of the other Commission disclosure requirements, GAAP or changes in the information environment.” The compliance date for the amendments to RegulationS-X was November 5, 2018 (for reporting period end dates of September 30, 2018 or after). Management has adopted the amendments which simplified certain disclosure requirements on the financial statements.
NOTE K
Subsequent Events
Management has evaluated subsequent events for possible recognition or disclosure in the financial statements through the date the financial statements are issued. Management has determined that there are no material events that would require disclosure in the Fund’s financial statements through this date.
| 46 | AB SELECT US LONG/SHORT PORTFOLIO | abfunds.com | |
FINANCIAL HIGHLIGHTS
Selected Data For A Share Of Capital Stock Outstanding Throughout Each Period
| Class A | ||||||||||||||||||||||||
Six Months (unaudited) | Year Ended June 30, | |||||||||||||||||||||||
| 2018 | 2017 | 2016 | 2015 | 2014 | ||||||||||||||||||||
|
|
|
|
|
|
|
|
|
|
|
| |||||||||||||
Net asset value, beginning of period | $ 12.86 | $ 12.28 | $ 11.40 | $ 11.77 | $ 12.12 | $ 10.92 | ||||||||||||||||||
|
| |||||||||||||||||||||||
Income From Investment Operations | ||||||||||||||||||||||||
Net investment income (loss)(a) | .00 | (b)(d) | (.04 | )(b) | (.09 | )(b) | (.11 | )(b) | (.16 | ) | (.10 | )(c) | ||||||||||||
Net realized and unrealized gain (loss) on investment and foreign currency transactions | (.47 | ) | 1.26 | .97 | .12 | .31 | 1.47 | |||||||||||||||||
Contributions from Affiliates | – 0 | – | .00 | (d) | – 0 | – | – 0 | – | – 0 | – | – 0 | – | ||||||||||||
|
| |||||||||||||||||||||||
Net increase (decrease) in net asset value from operations | (.47 | ) | 1.22 | .88 | .01 | .15 | 1.37 | |||||||||||||||||
|
| |||||||||||||||||||||||
Less: Distributions | ||||||||||||||||||||||||
Distributions from net realized gain on investment transactions | (1.01 | ) | (.64 | ) | – 0 | – | (.38 | ) | (.50 | ) | (.17 | ) | ||||||||||||
|
| |||||||||||||||||||||||
Net asset value, end of period | $ 11.38 | $ 12.86 | $ 12.28 | $ 11.40 | $ 11.77 | $ 12.12 | ||||||||||||||||||
|
| |||||||||||||||||||||||
Total Return | ||||||||||||||||||||||||
Total investment return based on net asset value(e) | (3.79 | )% | 10.10 | % | 7.72 | % | .02 | % | 1.31 | % | 12.55 | % | ||||||||||||
Ratios/Supplemental Data | ||||||||||||||||||||||||
Net assets, end of period (000’s omitted) | $93,735 | $92,102 | $113,847 | $166,015 | $308,235 | $480,571 | ||||||||||||||||||
Ratio to average net assets of: | ||||||||||||||||||||||||
Expenses, net of waivers/reimbursements(f)(g)‡ | 1.88 | %^ | 1.88 | % | 2.11 | % | 2.29 | % | 2.27 | % | 2.31 | % | ||||||||||||
Expenses, before waivers/reimbursements(f)(g)‡ | 1.92 | %^ | 1.94 | % | 2.18 | % | 2.30 | % | 2.27 | % | 2.36 | % | ||||||||||||
Net investment loss | (.03 | )%(b)^ | (.30 | )%(b) | (.77 | )%(b) | (.98 | )%(b) | (1.34 | )% | (.88 | )%(c) | ||||||||||||
Portfolio turnover rate (excluding securities sold short) | 121 | % | 291 | % | 295 | % | 329 | % | 535 | % | 581 | % | ||||||||||||
Portfolio turnover rate (including securities sold short) | 134 | % | 346 | % | 528 | % | 519 | % | 718 | % | 673 | % | ||||||||||||
‡ Expense ratios exclude the estimated acquired fund fees of the affiliated/unaffiliated underlying |
| |||||||||||||||||||||||
portfolios | .04 | % | .07 | % | .08 | % | – 0 | – | – 0 | – | – 0 | – | ||||||||||||
See footnote summary on page 53.
| abfunds.com | AB SELECT US LONG/SHORT PORTFOLIO | 47 | |
FINANCIAL HIGHLIGHTS(continued)
Selected Data For A Share Of Capital Stock Outstanding Throughout Each Period
| Class C | ||||||||||||||||||||||||
Six Months (unaudited) | Year Ended June 30, | |||||||||||||||||||||||
| 2018 | 2017 | 2016 | 2015 | 2014 | ||||||||||||||||||||
|
|
|
|
|
|
|
|
|
|
|
| |||||||||||||
Net asset value, beginning of period | $ 12.30 | $ 11.86 | $ 11.09 | $ 11.55 | $ 11.99 | $ 10.88 | ||||||||||||||||||
|
| |||||||||||||||||||||||
Income From Investment Operations | ||||||||||||||||||||||||
Net investment loss(a) | (.05 | )(b) | (.13 | )(b) | (.18 | )(b) | (.19 | )(b) | (.25 | ) | (.19 | ) | ||||||||||||
Net realized and unrealized gain (loss) on investment and foreign currency transactions | (.44 | ) | 1.21 | .95 | .11 | .31 | 1.47 | |||||||||||||||||
Contributions from Affiliates | – 0 | – | .00 | (d) | – 0 | – | – 0 | – | – 0 | – | – 0 | – | ||||||||||||
|
| |||||||||||||||||||||||
Net increase (decrease) in net asset value from operations | (.49 | ) | 1.08 | .77 | (.08 | ) | .06 | 1.28 | ||||||||||||||||
|
| |||||||||||||||||||||||
Less: Distributions | ||||||||||||||||||||||||
Distributions from net realized gain on investment transactions | (1.01 | ) | (.64 | ) | – 0 | – | (.38 | ) | (.50 | ) | (.17 | ) | ||||||||||||
|
| |||||||||||||||||||||||
Net asset value, end of period | $ 10.80 | $ 12.30 | $ 11.86 | $ 11.09 | $ 11.55 | $ 11.99 | ||||||||||||||||||
|
| |||||||||||||||||||||||
Total Return | ||||||||||||||||||||||||
Total investment return based on net asset value(e) | (4.21 | )% | 9.34 | % | 6.94 | % | (.78 | )% | .56 | % | 11.76 | % | ||||||||||||
Ratios/Supplemental Data | ||||||||||||||||||||||||
Net assets, end of period (000’s omitted) | $85,502 | $98,333 | $111,027 | $159,990 | $232,110 | $182,059 | ||||||||||||||||||
Ratio to average net assets of: | ||||||||||||||||||||||||
Expenses, net of waivers/reimbursements(f)(g)‡ | 2.63 | %^ | 2.63 | % | 2.86 | % | 3.05 | % | 3.04 | % | 3.06 | % | ||||||||||||
Expenses, before waivers/reimbursements(f)(g)‡ | 2.66 | %^ | 2.69 | % | 2.94 | % | 3.06 | % | 3.04 | % | 3.06 | % | ||||||||||||
Net investment loss | (.79 | )%(b)^ | (1.05 | )%(b) | (1.53 | )%(b) | (1.73 | )%(b) | (2.09 | )% | (1.64 | )% | ||||||||||||
Portfolio turnover rate (excluding securities sold short) | 121 | % | 291 | % | 295 | % | 329 | % | 535 | % | 581 | % | ||||||||||||
Portfolio turnover rate (including securities sold short) | 134 | % | 346 | % | 528 | % | 519 | % | 718 | % | 673 | % | ||||||||||||
‡ Expense ratios exclude the estimated acquired fund fees of the affiliated/unaffiliated underlying |
| |||||||||||||||||||||||
portfolios | .04 | % | .07 | % | .08 | % | – 0 | – | – 0 | – | – 0 | – | ||||||||||||
See footnote summary on page 53.
| 48 | AB SELECT US LONG/SHORT PORTFOLIO | abfunds.com | |
FINANCIAL HIGHLIGHTS(continued)
Selected Data For A Share Of Capital Stock Outstanding Throughout Each Period
| Advisor Class | ||||||||||||||||||||||||
Six Months (unaudited) | Year Ended June 30, | |||||||||||||||||||||||
| 2018 | 2017 | 2016 | 2015 | 2014 | ||||||||||||||||||||
|
|
|
|
|
|
|
|
|
|
|
| |||||||||||||
Net asset value, beginning of period | $ 13.06 | $ 12.43 | $ 11.51 | $ 11.86 | $ 12.17 | $ 10.94 | ||||||||||||||||||
|
| |||||||||||||||||||||||
Income From Investment Operations | ||||||||||||||||||||||||
Net investment income (loss)(a) | .01 | (b) | (.01 | )(b) | (.06 | )(b) | (.08 | )(b) | (.13 | ) | (.07 | ) | ||||||||||||
Net realized and unrealized gain (loss) on investment and foreign currency transactions | (.47 | ) | 1.28 | .98 | .11 | .32 | 1.47 | |||||||||||||||||
Contributions from Affiliates | – 0 | – | .00 | (d) | – 0 | – | – 0 | – | – 0 | – | – 0 | – | ||||||||||||
|
| |||||||||||||||||||||||
Net increase (decrease) in net asset value from operations | (.46 | ) | 1.27 | .92 | .03 | .19 | 1.40 | |||||||||||||||||
|
| |||||||||||||||||||||||
Less: Distributions | ||||||||||||||||||||||||
Distributions from net realized gain on investment transactions | (1.01 | ) | (.64 | ) | – 0 | – | (.38 | ) | (.50 | ) | (.17 | ) | ||||||||||||
|
| |||||||||||||||||||||||
Net asset value, end of period | $ 11.59 | $ 13.06 | $ 12.43 | $ 11.51 | $ 11.86 | $ 12.17 | ||||||||||||||||||
|
| |||||||||||||||||||||||
Total Return | ||||||||||||||||||||||||
Total investment return based on net asset value(e) | (3.65 | )% | 10.39 | % | 7.99 | % | .27 | % | 1.56 | % | 12.80 | % | ||||||||||||
Ratios/Supplemental Data | ||||||||||||||||||||||||
Net assets, end of period (000’s omitted) | $749,968 | $762,575 | $692,136 | $816,563 | $1,189,226 | $810,892 | ||||||||||||||||||
Ratio to average net assets of: | ||||||||||||||||||||||||
Expenses, net of waivers/reimbursements(f)(g)‡ | 1.63 | %^ | 1.64 | % | 1.86 | % | 2.05 | % | 2.04 | % | 2.06 | % | ||||||||||||
Expenses, before waivers/reimbursements(f)(g)‡ | 1.67 | %^ | 1.69 | % | 1.94 | % | 2.06 | % | 2.04 | % | 2.06 | % | ||||||||||||
Net investment income (loss) | .22 | %(b)^ | (.04 | )%(b) | (.53 | )%(b) | (.73 | )%(b) | (1.09 | )% | (.63 | )% | ||||||||||||
Portfolio turnover rate (excluding securities sold short) | 121 | % | 291 | % | 295 | % | 329 | % | 535 | % | 581 | % | ||||||||||||
Portfolio turnover rate (including securities sold short) | 134 | % | 346 | % | 528 | % | 519 | % | 718 | % | 673 | % | ||||||||||||
‡ Expense ratios exclude the estimated acquired fund fees of the affiliated/unaffiliated underlying |
| |||||||||||||||||||||||
portfolios | .04 | % | .07 | % | .08 | % | – 0 | – | – 0 | – | – 0 | – | ||||||||||||
See footnote summary on page 53.
| abfunds.com | AB SELECT US LONG/SHORT PORTFOLIO | 49 | |
FINANCIAL HIGHLIGHTS(continued)
Selected Data For A Share Of Capital Stock Outstanding Throughout Each Period
| Class R | ||||||||||||||||||||||||
Six Months (unaudited) | Year Ended June 30, | |||||||||||||||||||||||
| 2018 | 2017 | 2016 | 2015 | 2014 | ||||||||||||||||||||
|
|
|
|
|
|
|
|
|
|
|
| |||||||||||||
Net asset value, beginning of period | $ 12.67 | $ 12.14 | $ 11.30 | $ 11.70 | $ 12.07 | $ 10.91 | ||||||||||||||||||
|
| |||||||||||||||||||||||
Income From Investment Operations | ||||||||||||||||||||||||
Net investment loss(a) | (.02 | )(b) | (.07 | )(b) | (.13 | )(b) | (.14 | )(b) | (.18 | ) | (.13 | ) | ||||||||||||
Net realized and unrealized gain (loss) on investment and foreign currency transactions | (.46 | ) | 1.24 | .97 | .12 | .31 | 1.46 | |||||||||||||||||
Contributions from Affiliates | – 0 | – | .00 | (d) | – 0 | – | – 0 | – | – 0 | – | – 0 | – | ||||||||||||
|
| |||||||||||||||||||||||
Net increase (decrease) in net asset value from operations | (.48 | ) | 1.17 | .84 | (.02 | ) | .13 | 1.33 | ||||||||||||||||
|
| |||||||||||||||||||||||
Less: Distributions | ||||||||||||||||||||||||
Distributions from net realized gain on investment transactions | (1.01 | ) | (.64 | ) | – 0 | – | (.38 | ) | (.50 | ) | (.17 | ) | ||||||||||||
|
| |||||||||||||||||||||||
Net asset value, end of period | $ 11.18 | $ 12.67 | $ 12.14 | $ 11.30 | $ 11.70 | $ 12.07 | ||||||||||||||||||
|
| |||||||||||||||||||||||
Total Return | ||||||||||||||||||||||||
Total investment return based on net asset value(e) | (3.93 | )% | 9.80 | % | 7.43 | % | (.25 | )% | 1.15 | % | 12.19 | % | ||||||||||||
Ratios/Supplemental Data | ||||||||||||||||||||||||
Net assets, end of period (000’s omitted) | $324 | $455 | $391 | $698 | $630 | $121 | ||||||||||||||||||
Ratio to average net assets of: | ||||||||||||||||||||||||
Expenses, net of waivers/reimbursements(f)(g)‡ | 2.15 | %^ | 2.15 | % | 2.44 | % | 2.54 | % | 2.57 | % | 2.56 | % | ||||||||||||
Expenses, before waivers/reimbursements(f)(g)‡ | 2.36 | %^ | 2.38 | % | 2.56 | % | 2.55 | % | 2.57 | % | 2.56 | % | ||||||||||||
Net investment loss | (.33 | )%(b)^ | (.55 | )%(b) | (1.09 | )%(b) | (1.20 | )%(b) | (1.55 | )% | (1.12 | )% | ||||||||||||
Portfolio turnover rate (excluding securities sold short) | 121 | % | 291 | % | 295 | % | 329 | % | 535 | % | 581 | % | ||||||||||||
Portfolio turnover rate (including securities sold short) | 134 | % | 346 | % | 528 | % | 519 | % | 718 | % | 673 | % | ||||||||||||
‡ Expense ratios exclude the estimated acquired fund fees of the affiliated/unaffiliated underlying |
| |||||||||||||||||||||||
portfolios | .04 | % | .07 | % | .08 | % | – 0 | – | – 0 | – | – 0 | – | ||||||||||||
See footnote summary on page 53.
| 50 | AB SELECT US LONG/SHORT PORTFOLIO | abfunds.com | |
FINANCIAL HIGHLIGHTS(continued)
Selected Data For A Share Of Capital Stock Outstanding Throughout Each Period
| Class K | ||||||||||||||||||||||||
Six Months (unaudited) | Year Ended June 30, | |||||||||||||||||||||||
| 2018 | 2017 | 2016 | 2015 | 2014 | ||||||||||||||||||||
|
|
|
|
|
|
|
|
|
|
|
| |||||||||||||
Net asset value, beginning of period | $ 12.86 | $ 12.28 | $ 11.40 | $ 11.78 | $ 12.11 | $ 10.92 | ||||||||||||||||||
|
| |||||||||||||||||||||||
Income From Investment Operations | ||||||||||||||||||||||||
Net investment loss(a) | (.01 | )(b) | (.04 | )(b) | (.10 | )(b) | (.11 | )(b) | (.16 | ) | (.12 | )(b) | ||||||||||||
Net realized and unrealized gain (loss) on investment and foreign currency transactions | (.46 | ) | 1.26 | .98 | .11 | .33 | 1.48 | |||||||||||||||||
Contributions from Affiliates | – 0 | – | .00 | (d) | – 0 | – | – 0 | – | – 0 | – | – 0 | – | ||||||||||||
|
| |||||||||||||||||||||||
Net increase (decrease) in net asset value from operations | (.47 | ) | 1.22 | .88 | – 0 | – | .17 | 1.36 | ||||||||||||||||
|
| |||||||||||||||||||||||
Less: Distributions | ||||||||||||||||||||||||
Distributions from net realized gain on investment transactions | (1.01 | ) | (.64 | ) | – 0 | – | (.38 | ) | (.50 | ) | (.17 | ) | ||||||||||||
|
| |||||||||||||||||||||||
Net asset value, end of period | $ 11.38 | $ 12.86 | $ 12.28 | $ 11.40 | $ 11.78 | $ 12.11 | ||||||||||||||||||
|
| |||||||||||||||||||||||
Total Return | ||||||||||||||||||||||||
Total investment return based on net asset value(e) | (3.79 | )% | 10.10 | % | 7.72 | % | .01 | % | 1.40 | % | 12.46 | % | ||||||||||||
Ratios/Supplemental Data | ||||||||||||||||||||||||
Net assets, end of period (000’s omitted) | $11 | $13 | $12 | $31 | $30 | $12 | ||||||||||||||||||
Ratio to average net assets of: | ||||||||||||||||||||||||
Expenses, net of waivers/reimbursements(f)(g)‡ | 1.91 | %^ | 1.90 | % | 2.14 | % | 2.27 | % | 2.31 | % | 2.31 | % | ||||||||||||
Expenses, before waivers/reimbursements(f)(g)‡ | 2.04 | %^ | 2.05 | % | 2.23 | % | 2.28 | % | 2.31 | % | 2.33 | % | ||||||||||||
Net investment loss | (.08 | )%(b)^ | (.32 | )%(b) | (.83 | )%(b) | (.94 | )%(b) | (1.33 | )% | (.99 | )%(b) | ||||||||||||
Portfolio turnover rate (excluding securities sold short) | 121 | % | 291 | % | 295 | % | 329 | % | 535 | % | 581 | % | ||||||||||||
Portfolio turnover rate (including securities sold short) | 134 | % | 346 | % | 528 | % | 519 | % | 718 | % | 673 | % | ||||||||||||
‡ Expense ratios exclude the estimated acquired fund fees of the affiliated/unaffiliated underlying |
| |||||||||||||||||||||||
portfolios | .04 | % | .07 | % | .08 | % | – 0 | – | – 0 | – | – 0 | – | ||||||||||||
See footnote summary on page 53.
| abfunds.com | AB SELECT US LONG/SHORT PORTFOLIO | 51 | |
FINANCIAL HIGHLIGHTS(continued)
Selected Data For A Share Of Capital Stock Outstanding Throughout Each Period
| Class I | ||||||||||||||||||||||||
Six Months (unaudited) | Year Ended June 30, | |||||||||||||||||||||||
| 2018 | 2017 | 2016 | 2015 | 2014 | ||||||||||||||||||||
|
|
|
|
|
|
|
|
|
|
|
| |||||||||||||
Net asset value, beginning of period | $ 13.09 | $ 12.45 | $ 11.52 | $ 11.86 | $ 12.16 | $ 10.93 | ||||||||||||||||||
|
| |||||||||||||||||||||||
Income From Investment Operations | ||||||||||||||||||||||||
Net investment income (loss)(a) | .02 | (b) | .00 | (b)(d) | (.06 | )(b) | (.08 | )(b) | (.12 | ) | (.08 | )(b) | ||||||||||||
Net realized and unrealized gain (loss) on investment and foreign currency transactions | (.48 | ) | 1.28 | .99 | .12 | .32 | 1.48 | |||||||||||||||||
Contributions from Affiliates | – 0 | – | .00 | (d) | – 0 | – | – 0 | – | – 0 | – | – 0 | – | ||||||||||||
|
| |||||||||||||||||||||||
Net increase (decrease) in net asset value from operations | (.46 | ) | 1.28 | .93 | .04 | .20 | 1.40 | |||||||||||||||||
|
| |||||||||||||||||||||||
Less: Distributions | ||||||||||||||||||||||||
Distributions from net realized gain on investment transactions | (1.01 | ) | (.64 | ) | – 0 | – | (.38 | ) | (.50 | ) | (.17 | ) | ||||||||||||
|
| |||||||||||||||||||||||
Net asset value, end of period | $ 11.62 | $ 13.09 | $ 12.45 | $ 11.52 | $ 11.86 | $ 12.16 | ||||||||||||||||||
|
| |||||||||||||||||||||||
Total Return | ||||||||||||||||||||||||
Total investment return based on net asset value(e) | (3.65 | )% | 10.46 | % | 8.07 | % | .27 | % | 1.73 | % | 12.81 | % | ||||||||||||
Ratios/Supplemental Data | ||||||||||||||||||||||||
Net assets, end of period (000’s omitted) | $16,478 | $13,299 | $11,749 | $12,724 | $23,250 | $34,519 | ||||||||||||||||||
Ratio to average net assets of: | ||||||||||||||||||||||||
Expenses, net of waivers/reimbursements(f)(g)‡ | 1.59 | %^ | 1.58 | % | 1.82 | % | 1.97 | % | 1.97 | % | 2.07 | % | ||||||||||||
Expenses, before waivers/reimbursements(f)(g)‡ | 1.63 | %^ | 1.64 | % | 1.90 | % | 1.98 | % | 1.97 | % | 2.09 | % | ||||||||||||
Net investment income (loss) | .29 | %(b)^ | .01 | %(b) | (.49 | )%(b) | (.67 | )%(b) | (1.03 | )% | (.71 | )%(b) | ||||||||||||
Portfolio turnover rate (excluding securities sold short) | 121 | % | 291 | % | 295 | % | 329 | % | 535 | % | 581 | % | ||||||||||||
Portfolio turnover rate (including securities sold short) | 134 | % | 346 | % | 528 | % | 519 | % | 718 | % | 673 | % | ||||||||||||
‡ Expense ratios exclude the estimated acquired fund fees of the affiliated/unaffiliated underlying |
| |||||||||||||||||||||||
portfolios | .04 | % | .07 | % | .08 | % | – 0 | – | – 0 | – | – 0 | – | ||||||||||||
See footnote summary on page 53.
| 52 | AB SELECT US LONG/SHORT PORTFOLIO | abfunds.com | |
FINANCIAL HIGHLIGHTS(continued)
Selected Data For A Share Of Capital Stock Outstanding Throughout Each Period
| (a) | Based on average shares outstanding. |
| (b) | Net of fees and expenses waived/reimbursed by the Adviser. |
| (c) | Net of fees and expenses waived by the Distributor. |
| (d) | Amount is less than $.005. |
| (e) | Total investment return is calculated assuming an initial investment made at the net asset value at the beginning of the period, reinvestment of all dividends and distributions at net asset value during the period, and redemption on the last day of the period. Initial sales charges or contingent deferred sales charges are not reflected in the calculation of total investment return. Total return does not reflect the deduction of taxes that a shareholder would pay on fund distributions or the redemption of fund shares. Total investment return calculated for a period of less than one year is not annualized. |
| (f) | The expense ratios presented below exclude non-operating expenses: |
Six Months (unaudited) | Year Ended June 30, | |||||||||||||||||||||||
| 2018 | 2017 | 2016 | 2015 | 2014 | ||||||||||||||||||||
|
| |||||||||||||||||||||||
Class A | ||||||||||||||||||||||||
Net of waivers/reimbursements | 1.85 | %^ | 1.83 | % | 1.94 | % | 2.09 | % | 2.09 | % | 2.17 | % | ||||||||||||
Before waivers/reimbursements | 1.88 | %^ | 1.88 | % | 2.01 | % | 2.09 | % | 2.09 | % | 2.22 | % | ||||||||||||
Class C | ||||||||||||||||||||||||
Net of waivers/reimbursements | 2.59 | %^ | 2.58 | % | 2.69 | % | 2.84 | % | 2.85 | % | 2.92 | % | ||||||||||||
Before waivers/reimbursements | 2.63 | %^ | 2.64 | % | 2.76 | % | 2.84 | % | 2.85 | % | 2.92 | % | ||||||||||||
Advisor Class | ||||||||||||||||||||||||
Net of waivers/reimbursements | 1.59 | %^ | 1.58 | % | 1.68 | % | 1.84 | % | 1.85 | % | 1.92 | % | ||||||||||||
Before waivers/reimbursements | 1.63 | %^ | 1.64 | % | 1.76 | % | 1.84 | % | 1.85 | % | 1.92 | % | ||||||||||||
Class R | ||||||||||||||||||||||||
Net of waivers/reimbursements | 2.12 | %^ | 2.09 | % | 2.28 | % | 2.32 | % | 2.34 | % | 2.44 | % | ||||||||||||
Before waivers/reimbursements | 2.32 | %^ | 2.33 | % | 2.40 | % | 2.32 | % | 2.34 | % | 2.44 | % | ||||||||||||
Class K | ||||||||||||||||||||||||
Net of waivers/reimbursements | 1.87 | %^ | 1.84 | % | 1.98 | % | 2.05 | % | 2.07 | % | 2.19 | % | ||||||||||||
Before waivers/reimbursements | 1.99 | %^ | 2.00 | % | 2.08 | % | 2.05 | % | 2.07 | % | 2.22 | % | ||||||||||||
Class I | ||||||||||||||||||||||||
Net of waivers/reimbursements | 1.55 | %^ | 1.53 | % | 1.64 | % | 1.77 | % | 1.78 | % | 1.95 | % | ||||||||||||
Before waivers/reimbursements | 1.59 | %^ | 1.59 | % | 1.72 | % | 1.77 | % | 1.78 | % | 1.97 | % | ||||||||||||
| (g) | In connection with the Fund’s investments in affiliated underlying portfolios, the Fund incurs no direct expenses, but bears proportionate shares of the fees and expenses (i.e., operating, administrative and investment advisory fees) of the affiliated underlying portfolios. The Adviser has contractually agreed to waive its fees from the Fund in an amount equal to the Fund’s pro rata share of certain acquired fund fees and expenses, and for the six months ended December 31, 2018 and the years ended June 30, 2018 and June 30, 2017, such waiver amounted to .03% (annualized), .06% and .07%, respectively. |
| ^ | Annualized. |
See notes to financial statements.
| abfunds.com | AB SELECT US LONG/SHORT PORTFOLIO | 53 | |
RESULTS OF SHAREHOLDERS MEETING
(unaudited)
A Special Meeting of Shareholders of the AB Cap Fund, Inc. (the “Company”)—AB Select US Long/Short Portfolio (the “Fund”) was held on October 11, 2018 and adjourned until November 14, 2018. A description of each proposal and number of shares voted at the Meeting are as follows (the proposal number shown below corresponds to the proposal number in the Fund’s proxy statement):
| 1. | To approve and vote upon the election of Directors for the Fund, each such Director to serve for a term of indefinite duration and until his or her successor is duly elected and qualifies. |
Director: | Voted For | Withheld Authority | ||||||
Michael J. Downey | 177,670,106 | 1,341,274 | ||||||
William H. Foulk, Jr.* | 177,513,147 | 1,498,234 | ||||||
Nancy P. Jacklin | 177,735,792 | 1,275,589 | ||||||
Robert M. Keith | 177,684,440 | 1,326,940 | ||||||
Carol C. McMullen | 177,776,007 | 1,235,373 | ||||||
Garry L. Moody | 177,685,142 | 1,326,239 | ||||||
Marshall C. Turner | 177,657,263 | 1,354,118 | ||||||
Earl D. Weiner | 177,655,684 | 1,355,696 | ||||||
| 2. | To vote upon the approval of new advisory agreements for the Fund with AllianceBernstein L.P. |
Voted For | Voted Against | Abstained | Broker Non-Votes | |||||||||||
| 29,404,046 | 169,840 | 533,211 | 13,599,421 | |||||||||||
| *Mr. | Foulk retired on December 31, 2018. |
| 54 | AB SELECT US LONG/SHORT PORTFOLIO | abfunds.com | |
BOARD OF DIRECTORS
Marshall C. Turner, Jr.(1),Chairman
Michael J. Downey(1)
Nancy P. Jacklin(1)
Robert M. Keith,President and Chief Executive Officer
Carol C. McMullen(1)
Garry L. Moody(1)
Earl D. Weiner(1)
OFFICERS
Kurt A. Feuerman(2),Vice President
Anthony Nappo(2),Vice President
Emilie D. Wrapp,Secretary
Michael B. Reyes,Senior Analyst
Joseph J. Mantineo,Treasurer and Chief Financial Officer
Phyllis J. Clarke,Controller
Vincent S. Noto,Chief Compliance Officer
Custodian and Accounting Agent State Street Bank and Trust Company State Street Corporation CCB/5 1 Iron Street Boston, MA 02210
Principal Underwriter AllianceBernstein Investments, Inc.
Legal Counsel Seward & Kissel LLP | Independent Registered Public Accounting Firm Ernst & Young LLP
Transfer Agent AllianceBernstein Investor Services, Inc. |
| 1 | Member of the Audit Committee, the Governance and Nominating Committee, and the Independent Directors Committee. |
| 2 | The day-to-day management of, and investment decisions for, the Fund’s portfolio are made by the Adviser’s portfolio managers. Messrs. Feuerman and Nappo are the investment professionals with the most significant responsibility for the day-to-day management of the Fund’s portfolio. |
| abfunds.com | AB SELECT US LONG/SHORT PORTFOLIO | 55 | |
Information Regarding the Review and Approval of the Fund’s Advisory Agreement
As described in more detail in the Proxy Statement for the AB Funds dated August 20, 2018, the Boards of the AB Funds, at a meeting held onJuly 31-August 2, 2018, approved new advisory agreements with the Adviser (the “Proposed Agreements”) for the AB Funds, including AB Cap Fund, Inc. in respect of AB Select US Long/Short Portfolio (the “Fund”), in connection with the planned disposition by AXA S.A. of its remaining shares of AXA Equitable Holdings, Inc. (the indirect holder of a majority of the partnership interests in the Adviser and the indirect parent of AllianceBernstein Corporation, the general partner of the Adviser) in one or more transactions and the related potential for one or more “assignments” (within the meaning of section 2(a)(4) of the Investment Company Act) of the advisory agreements for the AB Funds, including the Fund’s Advisory Agreement, resulting in the automatic termination of such advisory agreements.
At the same meeting, the AB Boards also considered and approved interim advisory agreements with the Adviser (the “Interim Advisory Agreements”) for the AB Funds, including the Fund, to be effective only in the event that stockholder approval of a Proposed Agreement had not been obtained as of the date of one or more transactions resulting in an “assignment” of the Adviser’s advisory agreements, resulting in the automatic termination of such advisory agreements.
The shareholders of the Fund subsequently approved the Proposed Agreements at an annual meeting of shareholders called for the purpose of electing Directors and voting on the Proposed Agreements.
A discussion regarding the basis for the Boards’ approvals at a meeting held onJuly 31-August 2, 2018 is set forth below.
Information Regarding the Review and Approval of the Fund’s Proposed New Advisory Agreement and Interim Advisory Agreement in the Context of Potential Assignments
At a meeting of the AB Boards held on July31-August 2, 2018, the Adviser presented its recommendation that the Boards consider and approve the Proposed Agreements. Section 15(c) of the 1940 Act provides that, after an initial period, a Fund’s Current Agreement and currentsub-advisory agreement, as applicable, will remain in effect only if the Board, including a majority of the Independent Directors, annually reviews and approves them. Each of the Current Agreements had been approved by a Board within theone-year period prior to approval of its related Proposed Agreement, except that the Current Agreements for certain FlexFee funds were approved in February 2017. In connection with their approval of the Proposed Agreements, the Boards considered their conclusions in connection with their most recent approvals of the Current Agreements, in particular in cases where the last approval of a Current Agreement was relatively recent, including the Boards’ general satisfaction with the nature
| 56 | AB SELECT US LONG/SHORT PORTFOLIO | abfunds.com | |
and quality of services being provided and, as applicable, in the case of certain Funds, actions taken or to be taken in an effort to improve investment performance or reduce expense ratios. The Directors also reviewed updated information provided by the Adviser in respect of each Fund. Also in connection with their approval of the Proposed Agreements, the Boards considered a representation made to them at that time by the Adviser that there were no additional developments not already disclosed to the Boards since their most recent approvals of the Current Agreements that would be a material consideration to the Boards in connection with their consideration of the Proposed Agreements, except for matters disclosed to the Boards by the Adviser. The Directors considered the fact that each Proposed Agreement would have corresponding terms and conditions identical to those of the corresponding Current Agreement with the exception of the effective date and initial term under the Proposed Agreement.
The Directors considered their knowledge of the nature and quality of the services provided by the Adviser to each Fund gained from their experience as directors or trustees of registered investment companies advised by the Adviser, their overall confidence in the Adviser’s integrity and competence they have gained from that experience, the Adviser’s initiative in identifying and raising potential issues with the Directors and its responsiveness, frankness and attention to concerns raised by the Directors in the past, including the Adviser’s willingness to consider and implement organizational and operational changes designed to improve investment results and the services provided to the Funds. The Directors noted that they have four regular meetings each year, at each of which they review extensive materials and information from the Adviser, including information on the investment performance of each Fund.
The Directors also considered all factors they believed relevant, including the specific matters discussed below. During the course of their deliberations, the Directors evaluated, among other things, the reasonableness of the management fees of the Funds they oversee. The Directors did not identify any particular information that was all-important or controlling, and different Directors may have attributed different weights to the various factors. The Directors determined that the selection of the Adviser to manage the Funds, and the overall arrangements between the Funds and the Adviser, as provided in the Proposed Agreements, including the management fees, were fair and reasonable in light of the services performed under the Current Agreements and to be performed under the Proposed Agreements, expenses incurred and to be incurred and such other matters as the Directors considered relevant in the exercise of their business judgment. The material factors and conclusions that formed the basis for the Directors’ determinations included the following:
Nature, Extent and Quality of Services Provided
The Directors considered the scope and quality of services to be provided by the Adviser under the Proposed Agreements, including the quality of
| abfunds.com | AB SELECT US LONG/SHORT PORTFOLIO | 57 | |
the investment research capabilities of the Adviser and the other resources it has dedicated to performing services for the Funds. They also considered the information that had been provided to them by the Adviser concerning the anticipated implementation of the Plan and the Adviser’s representation that it did not anticipate that such implementation would affect the management or structure of the Adviser, have a material adverse effect on the Adviser, or adversely affect the quality of the services provided to the Funds by the Adviser and its affiliates. The Directors noted that the Adviser from time to time reviews each Fund’s investment strategies and from time to time proposes changes intended to improve the Fund’s relative or absolute performance for the Directors’ consideration. They also noted the professional experience and qualifications of each Fund’s portfolio management team and other senior personnel of the Adviser. The Directors also considered that certain Proposed Agreements, similar to the corresponding Current Agreements, provide that the Funds will reimburse the Adviser for the cost to it of providing certain clerical, accounting, administrative and other services to the Funds by employees of the Adviser or its affiliates. Requests for these reimbursements are made on a quarterly basis and subject to approval by the Directors. The Directors noted that the Adviser did not request any reimbursements from certain Funds in the Fund’s latest fiscal year reviewed. The Directors noted that the methodology to be used to determine the reimbursement amounts had been reviewed by an independent consultant retained by the Funds’ former Senior Officer/Independent Compliance Officer. The quality of administrative and other services, including the Adviser’s role in coordinating the activities of the Funds’ other service providers, also was considered. The Directors of each Fund concluded that, overall, they were satisfied with the nature, extent and quality of services to be provided to the Funds under the Proposed Agreement for the Fund.
Costs of Services to be Provided and Profitability
The Directors reviewed a schedule of the revenues and expenses and related notes indicating the profitability of each Fund to the Adviser for calendar years 2016 and 2017, as applicable, that had been prepared with an expense allocation methodology arrived at in consultation with an independent consultant retained by the Funds’ former Senior Officer/Independent Compliance Officer. The Directors noted the assumptions and methods of allocation used by the Adviser in preparing fund-specific profitability data and understood that there are a number of potentially acceptable allocation methodologies for information of this type. The Directors noted that the profitability information reflected all revenues and expenses of the Adviser’s relationship with a Fund, including those relating to its subsidiaries that provide transfer agency, distribution and brokerage services to the Fund, as applicable. The Directors recognized that it is difficult to make comparisons of the profitability of the Proposed Agreements with the profitability of fund advisory contracts for unaffiliated funds because comparative information is not generally publicly available and is
| 58 | AB SELECT US LONG/SHORT PORTFOLIO | abfunds.com | |
affected by numerous factors. The Directors focused on the profitability of the Adviser’s relationship with each Fund before taxes and distribution expenses, as applicable. The Directors noted that certain Funds were not profitable to the Adviser in one or more periods reviewed. The Directors concluded that the Adviser’s level of profitability from its relationship with the other Funds was not unreasonable. The Directors were unable to consider historical information about the profitability of certain Funds that had recently commenced operations and for which historical profitability information was not available. The Adviser agreed to provide the Directors with profitability information in connection with future proposed continuances of the Proposed Agreements.
Fall-Out Benefits
The Directors considered the other benefits to the Adviser and its affiliates from their relationships with the Funds, including, but not limited to, as applicable, benefits relating to soft dollar arrangements (whereby investment advisers receive brokerage and research services from brokers that execute agency transactions for their clients) in the case of certain Funds;12b-1 fees and sales charges received by the principal underwriter (which is a wholly owned subsidiary of the Adviser) in respect of certain classes of the shares of most of the Funds; brokerage commissions paid by certain Funds to brokers affiliated with the Adviser; and transfer agency fees paid by most of the Funds to a wholly owned subsidiary of the Adviser. The Directors recognized that the Adviser’s profitability would be somewhat lower, and that a Fund’s unprofitability to the Adviser would be exacerbated, without these benefits. The Directors understood that the Adviser also might derive reputational and other benefits from its association with the Funds.
Investment Results
In addition to the information reviewed by the Directors in connection with the Board meeting at which the Proposed Agreements were approved, the Directors receive detailed performance information for the Funds at each regular Board meeting during the year.
The Boards’ consideration of each Proposed Agreement was informed by their most recent approval of the related Current Agreement, and, in the case of certain Funds, their discussion with the Adviser of the reasons for those Funds’ underperformance in certain periods. The Directors also reviewed updated performance information and, in some cases, discussed with the Adviser the reasons for changes in performance or continued underperformance. On the basis of this review, the Directors concluded that each Fund’s investment performance was acceptable.
Management Fees and Other Expenses
The Directors considered the management fee rate payable by each Fund to the Adviser and information prepared by an independent service provider
| abfunds.com | AB SELECT US LONG/SHORT PORTFOLIO | 59 | |
(the “15(c) provider”) concerning management fee rates payable by other funds in the same category as the Fund. The Directors recognized that it is difficult to make comparisons of management fees because there are variations in the services that are included in the fees paid by other funds. The Directors compared each Fund’s contractual management fee rate with a peer group median, and where applicable, took into account the impact on the management fee rate of the administrative expense reimbursement paid to the Adviser in the latest fiscal year. In the case of the ACS Funds, the Directors noted that the management fee rate is zero but also were cognizant that the Adviser is indirectly compensated by the wrap fee program sponsors that use the ACS Funds as an investment vehicle for their clients.
The Directors also considered the Adviser’s fee schedule for other clients pursuing a similar investment style to each Fund. For this purpose, they reviewed the relevant advisory fee information from the Adviser’s Form ADV and in a report from the Funds’ Senior Analyst and noted the differences between a Fund’s fee schedule, on the one hand, and the Adviser’s institutional fee schedule and the schedule of fees charged by the Adviser to any offshore funds and for services to anysub-advised funds pursuing a similar investment strategy as the Fund, on the other, as applicable. The Directors noted that the Adviser may, in some cases, agree to fee rates with large institutional clients that are lower than those reviewed by the Directors and that they had previously discussed with the Adviser its policies in respect of such arrangements. The Adviser also informed the Directors that, in the case of certain Funds, there were no institutional products managed by the Adviser that have a substantially similar investment style. The Directors also discussed these matters with their independent fee consultant.
The Adviser reviewed with the Directors the significantly greater scope of the services it provides to each Fund relative to institutional, offshore fund andsub-advised fund clients, as applicable. In this regard, the Adviser noted, among other things, that, compared to institutional and offshore orsub-advisory accounts, each Fund, as applicable, (i) demands considerably more portfolio management, research and trading resources due to significantly higher daily cash flows (in the case ofopen-end Funds); (ii) has more tax and regulatory restrictions and compliance obligations; (iii) must prepare and file or distribute regulatory and other communications about fund operations; and (iv) must provide shareholder servicing to retail investors. The Adviser also reviewed the greater legal risks presented by the large and changing population of Fund shareholders who may assert claims against the Adviser in individual or class actions, and the greater entrepreneurial risk in offering new fund products, which require substantial investment to launch, may not succeed, and generally must be priced to compete with larger, more established funds resulting in lack of profitability to the Adviser until a new fund achieves scale. In light of the substantial differences in services rendered by the Adviser to institutional,
| 60 | AB SELECT US LONG/SHORT PORTFOLIO | abfunds.com | |
offshore fund andsub-advised fund clients as compared to the Funds, and the different risk profile, the Directors considered these fee comparisons inapt and did not place significant weight on them in their deliberations.
The Directors noted that many of the Funds may invest in shares of exchange-traded funds (“ETFs”), subject to the restrictions and limitations of the 1940 Act as these may be varied as a result of exemptive orders issued by the SEC. The Directors also noted that ETFs pay advisory fees pursuant to their advisory contracts. The Directors concluded, based on the Adviser’s explanation of how it uses ETFs when they are the most cost-effective way to obtain desired exposures, in some cases pending purchases of underlying securities, that each Fund’s management fee would be for services that would be in addition to, rather than duplicative of, the services provided under the advisory contracts of the ETFs.
With respect to each Fund’s management fee, the Directors considered the total expense ratio of the Fund in comparison to a peer group and peer universe selected by the 15(c) service provider. The Directors also considered the Adviser’s expense caps for certain Funds. The Directors view expense ratio information as relevant to their evaluation of the Adviser’s services because the Adviser is responsible for coordinating services provided to a Fund by others.
The Boards’ consideration of each Proposed Agreement was informed by their most recent approval of the related Current Agreement, and, in the case of certain Funds, their discussion with the Adviser of the reasons for those Funds’ expense ratios in certain periods. The Directors also reviewed updated expense ratio information and, in some cases, discussed with the Adviser the reasons for the expense ratios of certain Funds. On the basis of this review, the Directors concluded that each Fund’s expense ratio was acceptable.
The Directors did not consider comparative expense information for the ACS Funds because those Funds do not bear ordinary expenses.
Economies of Scale
The Directors noted that the management fee schedules for certain Funds do not contain breakpoints and that they had discussed their strong preference for breakpoints in advisory contracts with the Adviser. The Directors took into consideration prior presentations by an independent consultant on economies of scale in the mutual fund industry and for the Funds, and by the Adviser concerning certain of its views on economies of scale. The Directors also had requested and received from the Adviser certain updates on economies of scale in advance of the Board meeting. The Directors believe that economies of scale may be realized (if at all) by the Adviser across a variety of products and services, and not only in respect of a single fund. The Directors noted that there is no established methodology for setting breakpoints that give effect to the fund-specific
| abfunds.com | AB SELECT US LONG/SHORT PORTFOLIO | 61 | |
services provided by a fund’s adviser and to the economies of scale that an adviser may realize in its overall mutual fund business or those components of it which directly or indirectly affect a fund’s operations. The Directors observed that in the mutual fund industry as a whole, as well as among funds similar to each Fund, there is no uniformity or pattern in the fees and asset levels at which breakpoints (if any) apply. The Directors also noted that the advisory agreements for many funds do not have breakpoints at all. The Directors informed the Adviser that they would monitor the asset levels of the Funds without breakpoints and their profitability to the Adviser and anticipated revisiting the question of breakpoints in the future if circumstances warrant doing so.
The Directors did not consider the extent to which fee levels in the Advisory Agreement for the ACS Funds reflect economies of scale because that Advisory Agreement does not provide for any compensation to be paid to the Adviser by the ACS Funds and the expense ratio of each of those Funds is zero.
Interim Advisory Agreements
In approving the Interim Advisory Agreements, the Boards, with the assistance of independent counsel, considered similar factors to those considered in approving the Proposed Agreements. The Interim Advisory Agreements approved by the Boards are identical to the Proposed Agreements, as well as the Current Agreements, in all material respects except for their proposed effective and termination dates and provisions intended to comply with the requirements of the relevant SEC rule, such as provisions requiring escrow of advisory fees. Under the Interim Advisory Agreements, the Adviser would continue to manage a Fund pursuant to an Interim Advisory Agreement until a new advisory agreement was approved by stockholders or until the end of the150-day period, whichever would occur earlier. All fees earned by the Adviser under an Interim Advisory Agreement would be held in escrow pending shareholder approval of the Proposed Agreement. Upon approval of a new advisory agreement by stockholders, the escrowed management fees would be paid to the Adviser, and the Interim Advisory Agreement would terminate.
Information Regarding the Review and Approval of the Fund’s Current Advisory Agreement
The disinterested directors (the “directors”) of AB Cap Fund, Inc. (the “Company”) unanimously approved the continuance of the Company’s Advisory Agreement with the Adviser in respect of AB Select US Long/Short Portfolio (the “Fund”) at a meeting held on May1-3, 2018 (the “Meeting”).
Prior to approval of the continuance of the Advisory Agreement, the directors had requested from the Adviser, and received and evaluated, extensive materials. They reviewed the proposed continuance of the Advisory Agreement with the Adviser and with experienced counsel who are
| 62 | AB SELECT US LONG/SHORT PORTFOLIO | abfunds.com | |
independent of the Adviser, who advised on the relevant legal standards. The directors also reviewed additional materials, including materials from an outside consultant, who acted as their independent fee consultant, and comparative analytical data prepared by the Senior Analyst for the Fund. The directors also discussed the proposed continuance in private sessions with counsel.
The directors considered their knowledge of the nature and quality of the services provided by the Adviser to the Fund gained from their experience as directors or trustees of most of the registered investment companies advised by the Adviser, their overall confidence in the Adviser’s integrity and competence they have gained from that experience, the Adviser’s initiative in identifying and raising potential issues with the directors and its responsiveness, frankness and attention to concerns raised by the directors in the past, including the Adviser’s willingness to consider and implement organizational and operational changes designed to improve investment results and the services provided to the AB Funds. The directors noted that they have four regular meetings each year, at each of which they review extensive materials and information from the Adviser, including information on the investment performance of the Fund.
The directors also considered all factors they believed relevant, including the specific matters discussed below. During the course of their deliberations, the directors evaluated, among other things, the reasonableness of the advisory fee. The directors did not identify any particular information that wasall-important or controlling, and different directors may have attributed different weights to the various factors. The directors determined that the selection of the Adviser to manage the Fund and the overall arrangements between the Fund and the Adviser, as provided in the Advisory Agreement, including the advisory fee, were fair and reasonable in light of the services performed, expenses incurred and such other matters as the directors considered relevant in the exercise of their business judgment. The material factors and conclusions that formed the basis for the directors’ determinations included the following:
Nature, Extent and Quality of Services Provided
The directors considered the scope and quality of services provided by the Adviser under the Advisory Agreement, including the quality of the investment research capabilities of the Adviser and the other resources it has dedicated to performing services for the Fund. The directors noted that the Adviser from time to time reviews the Fund’s investment strategies and from time to time proposes changes intended to improve the Fund’s relative or absolute performance for the directors’ consideration. They also noted the professional experience and qualifications of the Fund’s portfolio management team and other senior personnel of the Adviser. The directors also considered that the Advisory Agreement provides that the Fund will reimburse the Adviser for the cost to it of providing certain clerical,
| abfunds.com | AB SELECT US LONG/SHORT PORTFOLIO | 63 | |
accounting, administrative and other services to the Fund by employees of the Adviser or its affiliates. Requests for these reimbursements are made on a quarterly basis and subject to approval by the directors. Reimbursements, to the extent requested and paid, result in a higher rate of total compensation from the Fund to the Adviser than the fee rate stated in the Advisory Agreement. The directors noted that the methodology used to determine the reimbursement amounts had been reviewed by an independent consultant retained by the Company’s former Independent Compliance Officer. The quality of administrative and other services, including the Adviser’s role in coordinating the activities of the Fund’s other service providers, also was considered. The directors concluded that, overall, they were satisfied with the nature, extent and quality of services provided to the Fund under the Advisory Agreement.
Costs of Services Provided and Profitability
The directors reviewed a schedule of the revenues and expenses and related notes indicating the profitability of the Fund to the Adviser for calendar years 2016 and 2017 that had been prepared with an expense allocation methodology arrived at in consultation with an independent consultant retained by the Company’s former Independent Compliance Officer. The directors noted the assumptions and methods of allocation used by the Adviser in preparing fund-specific profitability data and understood that there are a number of potentially acceptable allocation methodologies for information of this type. The directors noted that the profitability information reflected all revenues and expenses of the Adviser’s relationship with the Fund, including those relating to its subsidiaries that provide transfer agency, distribution and brokerage services to the Fund. The directors recognized that it is difficult to make comparisons of the profitability of the Advisory Agreement with the profitability of advisory contracts for unaffiliated funds because comparative information is not generally publicly available and is affected by numerous factors. The directors focused on the profitability of the Adviser’s relationship with the Fund before taxes and distribution expenses. The directors concluded that the Adviser’s level of profitability from its relationship with the Fund was not unreasonable. The directors noted that the reduction in the advisory fee rate effective since February 3, 2017 would likely impact the Adviser’s profitability analysis in future years.
Fall-Out Benefits
The directors considered the other benefits to the Adviser and its affiliates from their relationships with the Fund, including, but not limited to, benefits relating to soft dollar arrangements (whereby investment advisers receive brokerage and research services from brokers that execute agency transactions for their clients);12b-1 fees and sales charges received by the Fund’s principal underwriter (which is a wholly owned subsidiary of the Adviser) in respect of certain classes of the Fund’s shares; brokerage commissions paid by the Fund to brokers affiliated with the Adviser; and
| 64 | AB SELECT US LONG/SHORT PORTFOLIO | abfunds.com | |
transfer agency fees paid by the Fund to a wholly owned subsidiary of the Adviser. The directors recognized that the Adviser’s profitability would be somewhat lower without these benefits. The directors understood that the Adviser also might derive reputational and other benefits from its association with the Fund.
Investment Results
In addition to the information reviewed by the directors in connection with the Meeting, the directors receive detailed performance information for the Fund at each regular Board meeting during the year.
At the Meeting, the directors reviewed performance information prepared by an analytical service that is not affiliated with the Adviser (the “15(c) service provider”), showing the performance of the Class A Shares of the Fund against a group of similar funds (“peer group”) and a larger group of similar funds (“peer universe”), each selected by the 15(c) service provider, and information prepared by the Adviser showing performance of the Class A Shares against a broad-based securities market index, in each case for the1-,3- and5-year periods ended February 28, 2018 and (in the case of comparisons with the broad-based securities market index) for the period from inception. Based on their review, the directors concluded that the Fund’s investment performance was acceptable.
Advisory Fees and Other Expenses
The directors considered the advisory fee rate payable by the Fund to the Adviser and information prepared by the 15(c) service provider concerning advisory fee rates payable by other funds in the same category as the Fund. The directors recognized that it is difficult to make comparisons of advisory fees because there are variations in the services that are included in the fees paid by other funds. The directors compared the Fund’s contractual effective advisory fee rate (reflecting a reduction in the advisory fee rate effective since February 3, 2017) with a peer group median and took into account the impact on the advisory fee rate of the administrative expense reimbursement paid to the Adviser in the latest fiscal year.
The directors also considered the Adviser’s fee schedule for other clients pursuing a similar investment style. For this purpose, they reviewed the relevant advisory fee information from the Adviser’s Form ADV and the materials from the Fund’s Senior Analyst and noted the differences between the Fund’s fee schedule, on the one hand, and the Adviser’s institutional fee schedule and the schedule of fees charged by the Adviser to any offshore funds and anysub-advised funds, on the other. The directors noted that the Adviser may, in some cases, agree to fee rates with large institutional clients that are lower than those reviewed by the directors and that they had previously discussed with the Adviser its policies in respect of such arrangements.
| abfunds.com | AB SELECT US LONG/SHORT PORTFOLIO | 65 | |
The Adviser reviewed with the directors the significantly greater scope of the services it provides to the Fund relative to institutional, offshore fund andsub-advised fund clients. In this regard, the Adviser noted, among other things, that, compared to institutional and offshore accounts, the Fund (i) demands considerably more portfolio management, research and trading resources due to significantly higher daily cash flows; (ii) has more tax and regulatory restrictions; (iii) must prepare and distribute regulatory and other communications about fund operations; and (iv) must provide shareholder servicing to retail investors. The Adviser also reviewed the greater legal risks presented by the large and changing population of Fund shareholders who may assert claims against the Adviser in individual or class actions, and the greater entrepreneurial risk in offering new fund products, which require substantial investment to launch, may not succeed, and generally must be priced to compete with larger, more established funds resulting in lack of profitability to the Adviser until a new fund achieves scale. In light of the substantial differences in services rendered by the Adviser to institutional, offshore fund andsub-advised fund clients as compared to funds such as the Fund, and the different risk profile, the directors considered these fee comparisons inapt and did not place significant weight on them in their deliberations.
The directors noted that the Fund invests in shares of exchange-traded funds (“ETFs”), subject to the restrictions and limitations of the Investment Company Act of 1940 as these may be varied as a result of exemptive orders issued by the SEC. The directors also noted that ETFs pay advisory fees pursuant to their advisory contracts, and that the Adviser had provided, and they had reviewed, information about the expense ratios of the relevant ETFs. The directors concluded, based on the Adviser’s explanation of how it uses ETFs when they are the most cost-effective way to obtain desired exposures for a fund or to temporarily “equitize” cash inflows pending purchases of underlying securities, that the advisory fee for the Fund is paid for services that are in addition to, rather than duplicative of, the services provided under the advisory contracts of the ETFs.
The directors also considered the total expense ratio of the Class A shares of the Fund in comparison to a peer group and a peer universe selected by the 15(c) service provider. The Class A expense ratio of the Fund was based on the Fund’s latest fiscal year and the information included the pro forma expense ratio to reflect the reduction in the Fund’s expense ratio effective since February 3, 2017, when the advisory rate was reduced and the Adviser had set the Fund’s expense cap at a correspondingly lower level. The directors noted that it was likely that the expense ratios of some of the other funds in the Fund’s category were lowered by waivers or reimbursements by those funds’ investment advisers, which in some cases might be voluntary or temporary. The directors view expense ratio information as relevant to their evaluation of the Adviser’s services because the Adviser is responsible for coordinating services provided to the Fund
| 66 | AB SELECT US LONG/SHORT PORTFOLIO | abfunds.com | |
by others. The directors noted that the Fund’s pro forma expense ratio was above the peer group median. After reviewing and discussing the Adviser’s explanations of the reasons for this, the directors concluded that the Fund’s pro forma expense ratio was acceptable.
Economies of Scale
The directors noted that the advisory fee schedule for the Fund contains a breakpoint that reduces the fee rate on assets above a specified level. The directors took into consideration prior presentations by an independent consultant on economies of scale in the mutual fund industry and for the AB Funds, and by the Adviser concerning certain of its views on economies of scale. The directors also had requested and received from the Adviser certain updates on economies of scale in advance of the Meeting. The directors believe that economies of scale may be realized (if at all) by the Adviser across a variety of products and services, and not only in respect of a single fund. The directors noted that there is no established methodology for setting breakpoints that give effect to the fund-specific services provided by a fund’s adviser and to the economies of scale that an adviser may realize in its overall mutual fund business or those components of it which directly or indirectly affect a fund’s operations. The directors observed that in the mutual fund industry as a whole, as well as among funds similar to the Fund, there is no uniformity or pattern in the fees and asset levels at which breakpoints (if any) apply. The directors also noted that the advisory agreements for many funds do not have breakpoints at all. Having taken these factors into account, the directors concluded that the Fund’s shareholders would benefit from a sharing of economies of scale in the event the Fund’s net assets exceed the breakpoint in the future.
| abfunds.com | AB SELECT US LONG/SHORT PORTFOLIO | 67 | |
This page is not part of the Shareholder Report or the Financial Statements.
AB FAMILY OF FUNDS
US EQUITY
US CORE
Core Opportunities Fund
FlexFee™ US Thematic Portfolio
Select US Equity Portfolio
US GROWTH
Concentrated Growth Fund
Discovery Growth Fund
FlexFee™ Large Cap Growth Portfolio
Growth Fund
Large Cap Growth Fund
Small Cap Growth Portfolio
US VALUE
Discovery Value Fund
Equity Income Fund
Relative Value Fund
Small Cap Value Portfolio
Value Fund
INTERNATIONAL/ GLOBAL EQUITY
INTERNATIONAL/ GLOBAL CORE
FlexFee™ International Strategic Core Portfolio
Global Core Equity Portfolio
International Portfolio
International Strategic Core Portfolio
Sustainable Global Thematic Fund
Tax-Managed International Portfolio
Tax-Managed Wealth Appreciation Strategy
Wealth Appreciation Strategy
INTERNATIONAL/ GLOBAL GROWTH
Concentrated International Growth Portfolio
FlexFee™ Emerging Markets Growth Portfolio
INTERNATIONAL/ GLOBAL EQUITY(continued)
Sustainable International Thematic Fund
INTERNATIONAL/ GLOBAL VALUE
All China Equity Portfolio
International Value Fund
FIXED INCOME
MUNICIPAL
High Income Municipal Portfolio
Intermediate California Municipal Portfolio
Intermediate Diversified Municipal Portfolio
Intermediate New York Municipal Portfolio
Municipal Bond Inflation Strategy
Tax-Aware Fixed Income Portfolio
National Portfolio
Arizona Portfolio
California Portfolio
Massachusetts Portfolio
Minnesota Portfolio
New Jersey Portfolio
New York Portfolio
Ohio Portfolio
Pennsylvania Portfolio
Virginia Portfolio
TAXABLE
Bond Inflation Strategy
FlexFee™ High Yield Portfolio1
FlexFee™ International Bond Portfolio
Global Bond Fund
High Income Fund
Income Fund
Intermediate Bond Portfolio
Limited Duration High Income Portfolio
Short Duration Portfolio
ALTERNATIVES
All Market Real Return Portfolio
Global Real Estate Investment Fund
Select US Long/Short Portfolio
Unconstrained Bond Fund
MULTI-ASSET
All Market Income Portfolio
All Market Total Return Portfolio
Conservative Wealth Strategy
Emerging Markets Multi-Asset Portfolio
Global Risk Allocation Fund
Tax-Managed All Market Income Portfolio
TARGET-DATE
Multi-Manager Select Retirement Allocation Fund
Multi-Manager Select 2010 Fund
Multi-Manager Select 2015 Fund
Multi-Manager Select 2020 Fund
Multi-Manager Select 2025 Fund
Multi-Manager Select 2030 Fund
Multi-Manager Select 2035 Fund
Multi-Manager Select 2040 Fund
Multi-Manager Select 2045 Fund
Multi-Manager Select 2050 Fund
Multi-Manager Select 2055 Fund
Multi-Manager Select 2060 Fund
CLOSED-END FUNDS
Alliance California Municipal Income Fund
AllianceBernstein Global High Income Fund
AllianceBernstein National Municipal Income Fund
We also offer Government Money Market Portfolio, which serves as the money market fund exchange vehicle for the AB mutual funds. You could lose money by investing in the Fund. Although the Fund seeks to preserve the value of your investment at $1.00 per share, it cannot guarantee it will do so. The Fund may impose a fee upon sale of your shares or may temporarily suspend your ability to sell shares if the Fund’s liquidity falls below required minimums because of market conditions or other factors. An investment in the Fund is not insured or guaranteed by the Federal Deposit Insurance Corporation or any other government agency. The Fund’s sponsor has no legal obligation to provide financial support to the Fund, and you should not expect that the sponsor will provide financial support to the Fund at any time.
Investors should consider the investment objectives, risks, charges and expenses of the Fund carefully before investing. For copies of our prospectus or summary prospectus, which contain this and other information, visit us online at www.abfunds.com or contact your AB representative. Please read the prospectus and/or summary prospectus carefully before investing.
| 1 | Prior to February 23, 2018, FlexFee High Yield Portfolio was named High Yield Portfolio. |
| 68 | AB SELECT US LONG/SHORT PORTFOLIO | abfunds.com | |
AB SELECT US LONG/SHORT PORTFOLIO
1345 Avenue of the Americas
New York, NY 10105
800 221 5672
SULS-0152-1218 
ITEM 2. CODE OF ETHICS.
Not applicable when filing a semi-annual report to shareholders.
ITEM 3. AUDIT COMMITTEE FINANCIAL EXPERT.
Not applicable when filing a semi-annual report to shareholders.
ITEM 4. PRINCIPAL ACCOUNTANT FEES AND SERVICES.
Not applicable when filing a semi-annual report to shareholders.
ITEM 5. AUDIT COMMITTEE OF LISTED REGISTRANTS.
Not applicable to the registrant.
ITEM 6. SCHEDULE OF INVESTMENTS.
Please see Schedule of Investments contained in the Report to Shareholders included under Item 1 of this FormN-CSR.
ITEM 7. DISCLOSURE OF PROXY VOTING POLICIES AND PROCEDURES FORCLOSED-END MANAGEMENT INVESTMENT COMPANIES.
Not applicable to the registrant.
ITEM 8. PORTFOLIO MANAGERS OFCLOSED-END MANAGEMENT INVESTMENT COMPANIES.
Not applicable to the registrant.
ITEM 9. PURCHASES OF EQUITY SECURITIES BYCLOSED-END MANAGEMENT INVESTMENT COMPANY AND AFFILIATED PURCHASERS.
Not applicable to the registrant.
ITEM 10. SUBMISSION OF MATTERS TO A VOTE OF SECURITY HOLDERS.
There have been no material changes to the procedures by which shareholders may recommend nominees to the Fund’s Board of Directors since the Fund last provided disclosure in response to this item.
ITEM 11. CONTROLS AND PROCEDURES.
(a) The registrant’s principal executive officer and principal financial officer have concluded that the registrant’s disclosure controls and procedures (as defined in Rule30a-3(c) under the Investment Company Act of 1940, as amended) are effective at the reasonable assurance level based on their evaluation of these controls and procedures as of a date within 90 days of the filing date of this document.
(b) There were no changes in the registrant’s internal controls over financial reporting that occurred during the second fiscal quarter of the period that has materially affected, or is reasonably likely to materially affect, the registrant’s internal control over financial reporting.
ITEM 12. EXHIBITS.
The following exhibits are attached to this FormN-CSR:
EXHIBIT NO. | DESCRIPTION OF EXHIBIT | |
| 12 (b) (1) | Certification of Principal Executive Officer Pursuant to Section 302 of the Sarbanes-Oxley Act of 2002 | |
| 12 (b) (2) | Certification of Principal Financial Officer Pursuant to Section 302 of the Sarbanes-Oxley Act of 2002 | |
| 12 (c) | Certification of Principal Executive Officer and Principal Financial Officer Pursuant to Section 906 of theSarbanes-Oxley Act of 2002 | |
SIGNATURES
Pursuant to the requirements of the Securities Exchange Act of 1934 and the Investment Company Act of 1940, the registrant has duly caused this report to be signed on its behalf by the undersigned, thereunto duly authorized.
| (Registrant): AB Cap Fund, Inc. | ||
| By: | /s/ Robert M. Keith | |
Robert M. Keith President | ||
Date: February 26, 2019
Pursuant to the requirements of the Securities Exchange Act of 1934 and the Investment Company Act of 1940, this report has been signed below by the following persons on behalf of the registrant and in the capacities and on the dates indicated.
| By: | /s/ Robert M. Keith | |
Robert M. Keith President |
Date: February 26, 2019
| By: | /s/ Joseph J. Mantineo | |
Joseph J. Mantineo Treasurer and Chief Financial Officer |
Date: February 26, 2019