UNITED STATES
SECURITIES AND EXCHANGE COMMISSION
WASHINGTON, D.C. 20549
FORMN-CSR
CERTIFIED SHAREHOLDER REPORT OF REGISTERED
MANAGEMENT INVESTMENT COMPANIES
Investment Company Act file number:811-01716
AB CAP FUND, INC.
(Exact name of registrant as specified in charter)
1345 Avenue of the Americas, New York, New York 10105
(Address of principal executive offices) (Zip code)
Joseph J. Mantineo
AllianceBernstein L.P.
1345 Avenue of the Americas
New York, New York 10105
(Name and address of agent for service)
Registrant’s telephone number, including area code: (800)221-5672
Date of fiscal year end: March 31, 2020
Date of reporting period: September 30, 2019
ITEM 1. REPORTS TO STOCKHOLDERS.
SEP 09.30.19

SEMI-ANNUAL REPORT
AB EMERGING MARKETS
MULTI-ASSET PORTFOLIO

Beginning January 1, 2021, as permitted by new regulations adopted by the Securities and Exchange Commission, the Fund’s annual and semi-annual shareholder reports will no longer be sent by mail, unless you specifically request paper copies of the reports. Instead, the reports will be made available on a website, and you will be notified by mail each time a report is posted and provided with a website address to access the report.
If you already elected to receive shareholder reports electronically, you will not be affected by this change and you need not take any action. You may elect to receive shareholder reports and other communications from the Fund electronically at any time by contacting your financial intermediary (such as a broker-dealer or bank) or, if you are a direct investor, by calling the Fund at (800) 221 5672.
You may elect to receive all future reports in paper form free of charge. If you invest through a financial intermediary, you can contact your financial intermediary to request that you continue to receive paper copies of your shareholder reports; if you invest directly with the Fund, you can call the Fund at (800) 221 5672. Your election to receive reports in paper form will apply to all funds held in your account with your financial intermediary or, if you invest directly, to all AB Mutual Funds you hold.
| Investment Products Offered | • Are Not FDIC Insured• May Lose Value• Are Not Bank Guaranteed | |
Investors should consider the investment objectives, risks, charges and expenses of the Fund carefully before investing. For copies of our prospectus or summary prospectus, which contain this and other information, visit us online at www.abfunds.com or contact your AB representative. Please read the prospectus and/or summary prospectus carefully before investing.
This shareholder report must be preceded or accompanied by the Fund’s prospectus for individuals who are not current shareholders of the Fund.
You may obtain a description of the Fund’s proxy voting policies and procedures, and information regarding how the Fund voted proxies relating to portfolio securities during the most recent12-month period ended June 30, without charge. Simply visit AB’s website at www.abfunds.com, or go to the Securities and Exchange Commission’s (the “Commission”) website at www.sec.gov, or call AB at (800) 227 4618.
The Fund files its complete schedule of portfolio holdings with the Commission for the first and third quarters of each fiscal year as an exhibit to its reports on Form N-PORT. The Fund’s Form N-PORT reports are available on the Commission’s website at www.sec.gov. The Fund’s Forms N-PORT may also be reviewed and copied at the Commission’s Public Reference Room in Washington, DC; information on the operation of the Public Reference Room may be obtained by calling (800) SEC 0330. AB publishes full portfolio holdings for the Fund monthly at www.abfunds.com.
AllianceBernstein Investments, Inc. (ABI) is the distributor of the AB family of mutual funds. ABI is a member of FINRA and is an affiliate of AllianceBernstein L.P., the Adviser of the funds.
The [A/B] logo is a registered service mark of AllianceBernstein and AllianceBernstein® is a registered service mark used by permission of the owner, AllianceBernstein L.P.
| FROM THE PRESIDENT |  |
Dear Shareholder,
We are pleased to provide this report for AB Emerging Markets Multi-Asset Portfolio (the “Fund”). Please review the discussion of Fund performance, the market conditions during the reporting period and the Fund’s investment strategy.
As always, AB strives to keep clients ahead of what’s next by:
| + | Transforming uncommon insights into uncommon knowledge with a global research scope |
| + | Navigating markets with seasoned investment experience and sophisticated solutions |
| + | Providing thoughtful investment insights and actionable ideas |
Whether you’re an individual investor or a multi-billion-dollar institution, we put knowledge and experience to work for you.
AB’s global research organization connects and collaborates across platforms and teams to deliver impactful insights and innovative products. Better insights lead to better opportunities—anywhere in the world.
For additional information about AB’s range of products and shareholder resources, please log on to www.abfunds.com.
Thank you for your investment in the AB Mutual Funds.
Sincerely,

Robert M. Keith
President and Chief Executive Officer, AB Mutual Funds
| abfunds.com | AB EMERGING MARKETS MULTI-ASSET PORTFOLIO | 1 | |
SEMI-ANNUAL REPORT
November 6, 2019
This report provides management’s discussion of fund performance for AB Emerging Markets Multi-Asset Portfolio for the semi-annual reporting period ended September 30, 2019.
The Fund’s investment objective is to maximize total return. Total return is the sum of capital appreciation and income.
NAV RETURNS AS OF SEPTEMBER 30, 2019(unaudited)
| 6 Months | 12 Months | |||||||
| AB EMERGING MARKETS MULTI-ASSET PORTFOLIO | ||||||||
| Class A Shares | -1.33% | 0.49% | ||||||
| Class C Shares | -1.78% | -0.31% | ||||||
| Advisor Class Shares1 | -1.21% | 0.77% | ||||||
| Class R Shares1 | -1.52% | 0.19% | ||||||
| Class K Shares1 | -1.42% | 0.49% | ||||||
| Class I Shares1 | -1.25% | 0.78% | ||||||
| Class Z Shares1 | -1.22% | 0.76% | ||||||
| MSCI EM Index (net) | -3.66% | -2.02% | ||||||
| 1 | Please note that these share classes are for investors purchasing shares through accounts established under certainfee-based programs sponsored and maintained by certain broker-dealers and financial intermediaries, institutional pension plans and/or investment advisory clients of, and certain other persons associated with, the Adviser and its affiliates or the Fund. |
INVESTMENT RESULTS
The table above shows the Fund’s performance compared to its benchmark, the Morgan Stanley Capital International Emerging Markets (“MSCI EM”) Index (net), for thesix- and12-month periods ended September 30, 2019. The Fund’s benchmark is fully composed of equities, while the Fund invests in both equities and fixed income.
All share classes outperformed the benchmark during thesix- and12-month periods, before sales charges. For both periods, overall asset allocation to fixed-income assets contributed, while equity assets detracted, relative to theall-equity benchmark.
The Fund utilized derivatives for hedging and investment purposes in the form of currency forwards, total return swaps and written options, which added to absolute performance for both periods, while variance swaps, credit default swaps and purchased options detracted for both periods; futures detracted for thesix-month period, but contributed for the12-month period; interest rate swaps contributed for thesix-month period, but detracted for the12-month period.
| 2 | AB EMERGING MARKETS MULTI-ASSET PORTFOLIO | abfunds.com | |
MARKET REVIEW AND INVESTMENT STRATEGY
US and international equity markets rose while emerging markets declined during thesix-month period ended September 30, 2019. After an extended period of heightened volatility driven by tariff escalations between the US and China, a slowdown in global growth due to a downturn in the Chinese economy, and heightened geopolitical pressures, US and international markets turned somewhat calmer. Investors responded positively to news about a possible trade dispute resolution and widespread monetary easing by the world’s central banks. Equity markets rallied at the end of the period after the announcement of a new round of high-levelUS-China trade negotiations scheduled for October. In the US, the rally was accompanied by a sharp style rotation as quality-growth and lower-volatility stocks, which had performed strongly earlier in the year, lagged, and value stocks outperformed.
Fixed-income markets performed strongly during the period. Long-dated developed-market treasury securities and emerging-market sovereign debt were strong performers, given their interest-rate sensitivity. Investment-grade corporate bond returns were also robust, and spreads remained near historical lows, outperforming high-yield bonds. After holding rates steady in early 2019, the US Federal Reserve lowered interest rates in July and September. The European Central Bank followed suit in September by cutting rates to a record low and announcing the resumption of quantitative easing. Central bankers in numerous other developed and emerging markets also lowered interest rates and signaled further monetary easing as well as potential fiscal stimulus measures to boost faltering demand.
The Fund’s Senior Investment Management Team (the “Team”) seeks to maximize total return by dynamically adjusting exposure to emerging markets by investing across asset classes. The Team’s emerging-market strategy searches for long-term growth with lower volatility. To reduce risk and provide downside protection, the Team pursues active stocks and flexible bond allocations. The Team utilizes a disciplined investment process, which draws on a rigorous quantitative research toolset with fundamental expertise across all regions and markets.
INVESTMENT POLICIES
The Fund invests at least 80% of its net assets under normal circumstances in securities of emerging-market issuers and/or the currencies of emerging-market countries. Examples of emerging-market countries include Argentina, Brazil, Chile, Croatia, Egypt, Hong Kong, India, Indonesia, Israel, Kazakhstan, Malaysia, Mexico, the People’s Republic of China, Peru, the Philippines, Poland, Russia, South Africa, South Korea, Taiwan, Thailand, Turkey and Venezuela. The Fund may invest up to 20% of its net assets in the securities of developed-market issuers.
(continued on next page)
| abfunds.com | AB EMERGING MARKETS MULTI-ASSET PORTFOLIO | 3 | |
The Fund invests in equity securities, debt securities and currencies, and does not attempt to maintain a constant or relatively constant allocation among these asset classes. Rather, allocations among asset classes are adjusted based on the Adviser’s view of the relative attractiveness of the asset classes. These allocations are informed by the Adviser’s proprietary asset allocation tools, which are comprised of a series of volatility, correlation and expected return forecasts. The Adviser reviews potential Fund investments in each asset class holistically from a country, currency, sector and security standpoint to optimize overall portfolio construction. Under normal circumstances, the Fund will invest between 30% and 95% of its net assets in equity securities, and between 0% and 65% of its net assets in debt securities, with any remainder held in cash (including foreign currency). The Fund is not constrained based on the country, region, market capitalization, credit quality or duration of its investments and its assets may at times be concentrated in a particular country or region.
The process for selecting equity securities for the Fund is primarilybottom-up. The Adviser seeks to identify stocks that are attractive based on valuation, profitability, earnings quality, business trends, price momentum and other measures. The process for selecting debt securities for the Fund is moretop-down. The Adviser believes that inefficiencies in the global debt markets arise from investor emotion, market complexity and conflicting investment agendas. The Adviser combines quantitative forecasts with fundamental credit and economic research in seeking to exploit these inefficiencies. The Adviser seeks to generate returns from the Fund’s fixed-income investments through a combination of country selection, currency allocation, sector analysis and security selection. Debt securities may include those of both corporate and governmental issuers, and may include below investment-grade debt securities (“junk bonds”). The Fund may invest in debt securities with a range of maturities from short- to long-term.
The Adviser considers both quantitative and fundamental factors in adjusting the Fund’s currency exposures. In addition to the Fund’s currency exposure that results from its investments in equity and debt securities denominated in foreign currencies (and any related hedging), the Fund may hold foreign currency (or related derivatives) independently of any such investments, and may hold a currency even if the Fund does not hold any securities denominated in that currency.
The Fund expects to utilize derivatives, such as futures contracts, forwards and swaps, and invest in exchange-traded funds (“ETFs”) to a significant extent. Derivatives and ETFs may provide more efficient
(continued on next page)
| 4 | AB EMERGING MARKETS MULTI-ASSET PORTFOLIO | abfunds.com | |
and economical exposure to market segments than direct investments, and may also be a quicker and more efficient way to alter the Fund’s exposure than buying and selling direct investments. In determining when and to what extent to enter into derivatives transactions or to invest in ETFs, the Adviser will consider factors such as the relative risks and returns expected of potential investments and the cost of such transactions. Derivatives may also be used for hedging purposes, including to hedge against interest-rate, credit and currency fluctuations. The Adviser also expects to use derivatives frequently to effectively leverage the Fund by creating aggregate exposure somewhat in excess of the Fund’s net assets. The notional value of derivatives and ETFs linked to emerging-market securities or currencies are counted towards meeting the percentage minimums and ranges set forth above, including the requirement that the Fund invest at least 80% of its net assets in the securities of emerging-market issuers and/or the currencies of emerging-market countries.
| abfunds.com | AB EMERGING MARKETS MULTI-ASSET PORTFOLIO | 5 | |
DISCLOSURES AND RISKS
Benchmark Disclosure
The MSCI EM Index is unmanaged and does not reflect fees and expenses associated with the active management of a mutual fund portfolio. The MSCI EM Index (net, free float-adjusted, market capitalization weighted) represents the equity market performance of emerging markets. MSCI makes no express or implied warranties or representations, and shall have no liability whatsoever with respect to any MSCI data contained herein. The MSCI data may not be further redistributed or used as a basis for other indices, any securities or financial products. This report is not approved, reviewed or produced by MSCI. Net returns include the reinvestment of dividends after deduction ofnon-US withholding tax. An investor cannot invest directly in an index or average, and their results are not indicative of the performance for any specific investment, including the Fund.
A Word About Risk
Emerging-Market Risk: Investments in emerging-market countries may involve more risk than investments in other foreign countries because the markets in emerging-market countries are less developed and less liquid, and because these investments may be subject to increased economic, political, regulatory or other uncertainties.
Market Risk: The value of the Fund’s assets will fluctuate as the stock, bond or currency markets fluctuate. The value of the Fund’s investments may decline, sometimes rapidly and unpredictably, simply because of economic changes or other events that affect large portions of the market.
Foreign (Non-US) Risk: Investments in securities ofnon-US issuers may involve more risk than those of US issuers. These securities may fluctuate more widely in price and may be more difficult to trade or dispose of due to adverse market, economic, political, regulatory or other factors.
Currency Risk: Fluctuations in currency exchange rates may negatively affect the value of the Fund’s investments or reduce its returns. Emerging-market currencies may be more volatile and less liquid, and subject to significantly greater risk of currency controls and convertibility restrictions, than currencies of developed countries.
Country Concentration Risk: The Fund may not always be diversified among countries or geographic regions and the effect on the Fund’s net asset value (“NAV”) of the specific risks identified above, such as political, regulatory and currency risks, may be magnified due to concentration of the Fund’s investments in a particular country or region.
Allocation Risk: The allocation of Fund assets among different asset classes, such as equity securities, debt securities and currencies, may have a significant effect on the Fund’s NAV when one of these asset
| 6 | AB EMERGING MARKETS MULTI-ASSET PORTFOLIO | abfunds.com | |
DISCLOSURES AND RISKS(continued)
classes is performing better or worse than others. The diversification benefits typically associated with investing in both equity and debt securities may be limited in the emerging-markets context, as movements in emerging-market equity and emerging-market debt markets may be more correlated than movements in the equity and debt markets of developed countries.
Capitalization Risk: Investments in small- andmid-capitalization companies may be more volatile than investments in large-capitalization companies. Investments in small-capitalization companies may have additional risks because these companies have limited product lines, markets or financial resources.
Interest-Rate Risk: Changes in interest rates will affect the value of investments in fixed-income securities. When interest rates rise, the value of existing investments in fixed-income securities tends to fall and this decrease in value may not be offset by higher income from new investments. Interest-rate risk is generally greater for fixed-income securities with longer maturities or durations.
Credit Risk: An issuer or guarantor of a fixed-income security, or the counterparty to a derivatives or other contract, may be unable or unwilling to make timely payments of interest or principal, or to otherwise honor its obligations. The issuer or guarantor may default, causing a loss of the full principal amount of a security and accrued interest. The degree of risk for a particular security may be reflected in its credit rating. There is the possibility that the credit rating of a fixed-income security may be downgraded after purchase, which may adversely affect the value of the security.
Below Investment-Grade Securities Risk: Investments in fixed-income securities with lower ratings (commonly known as “junk bonds”) tend to have a higher probability that an issuer will default or fail to meet its payment obligations. These securities may be subject to greater price volatility due to factors such as specific corporate developments, interest-rate sensitivity and negative perceptions of the junk bond market generally, and may be more difficult to trade or dispose of than other types of securities.
Derivatives Risk: Derivatives may be difficult to price or unwind and leveraged so that small changes may produce disproportionate losses for the Fund. Derivatives may also be subject to counterparty risk to a greater degree than more traditional investments.
Leverage Risk: To the extent the Fund uses leveraging techniques, its NAV may be more volatile because leverage tends to exaggerate the effect of changes in interest rates and any increase or decrease in the value of the Fund’s investments.
| abfunds.com | AB EMERGING MARKETS MULTI-ASSET PORTFOLIO | 7 | |
DISCLOSURES AND RISKS(continued)
Illiquid Investments Risk: Illiquid investments risk exists when certain investments are or become difficult to purchase or sell. Difficulty in selling such investments may result in sales at disadvantageous prices affecting the value of your investment in the Fund. Causes of illiquid investments risk may include low trading volumes, large positions and heavy redemptions of Fund shares. Illiquid investments risk may be higher in a rising interest-rate environment, when the value and liquidity of fixed-income securities generally decline.
Active Trading Risk: The Fund expects to engage in active and frequent trading of its portfolio securities and its portfolio turnover rate may greatly exceed 100%. A higher rate of portfolio turnover increases transaction costs, which may negatively affect the Fund’s return. In addition, a high rate of portfolio turnover may result in substantial short-term gains, which may have adverse tax consequences for Fund shareholders.
Management Risk: The Fund is subject to management risk because it is an actively managed investment fund. The Adviser will apply its investment techniques and risk analyses in making investment decisions, but there is no guarantee that its techniques will produce the intended results.
These risks are fully discussed in the Fund’s prospectus. As with all investments, you may lose money by investing in the Fund.
An Important Note About Historical Performance
The investment return and principal value of an investment in the Fund will fluctuate, so that shares, when redeemed, may be worth more or less than their original cost. Performance shown in this report represents past performance and does not guarantee future results. Current performance may be lower or higher than the performance information shown. You may obtain performance information current to the most recentmonth-end by visiting www.abfunds.com.
All fees and expenses related to the operation of the Fund have been deducted. NAV returns do not reflect sales charges; if sales charges were reflected, the Fund’s quoted performance would be lower. SEC returns reflect the applicable sales charges for each share class: a 4.25% maximumfront-end sales charge for Class A shares and a 1%1-year contingent deferred sales charge for Class C shares. Returns for the different share classes will vary due to different expenses associated with each class. Performance assumes reinvestment of distributions and does not account for taxes.
| 8 | AB EMERGING MARKETS MULTI-ASSET PORTFOLIO | abfunds.com | |
HISTORICAL PERFORMANCE
AVERAGE ANNUAL RETURNS AS OF SEPTEMBER 30, 2019(unaudited)
| NAV Returns | SEC Returns (reflects applicable | |||||||
| CLASS A SHARES | ||||||||
| 1 Year | 0.49% | -3.77% | ||||||
| 5 Years | 2.60% | 1.72% | ||||||
| Since Inception1 | 1.41% | 0.87% | ||||||
| CLASS C SHARES | ||||||||
| 1 Year | -0.31% | -1.26% | ||||||
| 5 Years | 1.84% | 1.84% | ||||||
| Since Inception1 | 0.67% | 0.67% | ||||||
| ADVISOR CLASS SHARES2 | ||||||||
| 1 Year | 0.77% | 0.77% | ||||||
| 5 Years | 2.87% | 2.87% | ||||||
| Since Inception1 | 1.69% | 1.69% | ||||||
| CLASS R SHARES2 | ||||||||
| 1 Year | 0.19% | 0.19% | ||||||
| 5 Years | 2.35% | 2.35% | ||||||
| Since Inception1 | 1.17% | 1.17% | ||||||
| CLASS K SHARES2 | ||||||||
| 1 Year | 0.49% | 0.49% | ||||||
| 5 Years | 2.60% | 2.60% | ||||||
| Since Inception1 | 1.42% | 1.42% | ||||||
| CLASS I SHARES2 | ||||||||
| 1 Year | 0.78% | 0.78% | ||||||
| 5 Years | 2.86% | 2.86% | ||||||
| Since Inception1 | 1.67% | 1.67% | ||||||
| CLASS Z SHARES2 | ||||||||
| 1 Year | 0.76% | 0.76% | ||||||
| Since Inception1 | -1.26% | -1.26% | ||||||
The Fund’s prospectus fee table shows the Fund’s total annual operating expense ratios as 1.81%, 2.59%, 1.59%, 2.24%, 1.97%, 1.47% and 1.61% for Class A, Class C, Advisor Class, Class R, Class K, Class I and Class Z shares, respectively, gross of any fee waivers or expense reimbursements. Contractual fee waivers and/or expense reimbursements limit the Fund’s annual operating expense ratios exclusive of expenses associated with acquired fund fees and expenses other than the advisory fees of any AB mutual funds in which the Fund may invest, interest expense and extraordinary expenses to 1.24%, 1.99%, 0.99%, 1.49%, 1.24%, 0.99% and 0.99% for Class A, Class C, Advisor Class, Class R, Class K, Class I and Class Z shares, respectively. These waivers/reimbursements may not be terminated before July 31, 2020. Absent reimbursements or waivers, performance would have been lower. The Financial Highlights section of this report sets forth expense ratio data for the current reporting period; the expense ratios shown above may differ from the expense ratios in the Financial Highlights section since they are based on different time periods.
(footnotes continued on next page)
| abfunds.com | AB EMERGING MARKETS MULTI-ASSET PORTFOLIO | 9 | |
HISTORICAL PERFORMANCE(continued)
| 1 | Inception dates: 8/31/2011 for all share classes except Class Z; 7/31/2017 for Class Z shares. |
| 2 | These share classes are offered at NAV to eligible investors and their SEC returns are the same as their NAV returns. Please note that these share classes are for investors purchasing shares through accounts established under certainfee-based programs sponsored and maintained by certain broker-dealers and financial intermediaries, institutional pension plans and/or investment advisory clients of, and certain other persons associated with, the Adviser and its affiliates or the Fund. |
| 10 | AB EMERGING MARKETS MULTI-ASSET PORTFOLIO | abfunds.com | |
HISTORICAL PERFORMANCE(continued)
SEC AVERAGE ANNUAL RETURNS
AS OF THE MOST RECENT CALENDARQUARTER-END
SEPTEMBER 30, 2019(unaudited)
SEC Returns (reflects applicable | ||||
| CLASS A SHARES | ||||
| 1 Year | -3.77% | |||
| 5 Years | 1.72% | |||
| Since Inception1 | 0.87% | |||
| CLASS C SHARES | ||||
| 1 Year | -1.26% | |||
| 5 Years | 1.84% | |||
| Since Inception1 | 0.67% | |||
| ADVISOR CLASS SHARES2 | ||||
| 1 Year | 0.77% | |||
| 5 Years | 2.87% | |||
| Since Inception1 | 1.69% | |||
| CLASS R SHARES2 | ||||
| 1 Year | 0.19% | |||
| 5 Years | 2.35% | |||
| Since Inception1 | 1.17% | |||
| CLASS K SHARES2 | ||||
| 1 Year | 0.49% | |||
| 5 Years | 2.60% | |||
| Since Inception1 | 1.42% | |||
| CLASS I SHARES2 | ||||
| 1 Year | 0.78% | |||
| 5 Years | 2.86% | |||
| Since Inception1 | 1.67% | |||
| CLASS Z SHARES2 | ||||
| 1 Year | 0.76% | |||
| Since Inception1 | -1.26% | |||
| 1 | Inception dates: 8/31/2011 for all share classes except Class Z; 7/31/2017 for Class Z shares. |
| 2 | Please note that these share classes are for investors purchasing shares through accounts established under certainfee-based programs sponsored and maintained by certain broker-dealers and financial intermediaries, institutional pension plans and/or investment advisory clients of, and certain other persons associated with, the Adviser and its affiliates or the Fund. |
| abfunds.com | AB EMERGING MARKETS MULTI-ASSET PORTFOLIO | 11 | |
EXPENSE EXAMPLE
(unaudited)
As a shareholder of the Fund, you incur two types of costs: (1) transaction costs, including sales charges (loads) on purchase payments, contingent deferred sales charges on redemptions and (2) ongoing costs, including management fees; distribution(12b-1) fees; and other Fund expenses. This example is intended to help you understand your ongoing costs (in dollars) of investing in the Fund and to compare these costs with the ongoing costs of investing in other mutual funds.
The Example is based on an investment of $1,000 invested at the beginning of the period and held for the entire period as indicated below.
Actual Expenses
The table below provides information about actual account values and actual expenses. You may use the information, together with the amount you invested, to estimate the expenses that you paid over the period. Simply divide your account value by $1,000 (for example, an $8,600 account value divided by $1,000 = 8.6), then multiply the result by the number under the heading entitled “Expenses Paid During Period” to estimate the expenses you paid on your account during this period.
Hypothetical Example for Comparison Purposes
The table below also provides information about hypothetical account values and hypothetical expenses based on the Fund’s actual expense ratio and an assumed annual rate of return of 5% before expenses, which is not the Fund’s actual return. The hypothetical account values and expenses may not be used to estimate the actual ending account balance or expenses you paid for the period. You may use this information to compare the ongoing costs of investing in the Fund and other funds by comparing this 5% hypothetical example with the 5% hypothetical examples that appear in the shareholder reports of other funds.
Please note that the expenses shown in the table are meant to highlight your ongoing costs only and do not reflect any transactional costs, such as sales charges (loads), or contingent deferred sales charges on redemptions. Therefore, the hypothetical example is useful in comparing ongoing costs only, and will not help you determine the relative total costs of owning different funds. In addition, if these transactional costs were included, your costs would have been higher.
| 12 | AB EMERGING MARKETS MULTI-ASSET PORTFOLIO | abfunds.com | |
EXPENSE EXAMPLE(continued)
| Beginning Account Value 4/1/2019 | Ending Account Value 9/30/2019 | Expenses Paid During Period* | Annualized Expense Ratio* | Total Expenses Paid During Period+ | Total Annualized Expense Ratio+ | |||||||||||||||||||
| Class A | ||||||||||||||||||||||||
Actual | $ | 1,000 | $ | 986.70 | $ | 6.11 | 1.23 | % | $ | 6.16 | 1.24 | % | ||||||||||||
Hypothetical** | $ | 1,000 | $ | 1,018.85 | $ | 6.21 | 1.23 | % | $ | 6.26 | 1.24 | % | ||||||||||||
| Class C | ||||||||||||||||||||||||
Actual | $ | 1,000 | $ | 982.20 | $ | 9.81 | 1.98 | % | $ | 9.86 | 1.99 | % | ||||||||||||
Hypothetical** | $ | 1,000 | $ | 1,015.10 | $ | 9.97 | 1.98 | % | $ | 10.02 | 1.99 | % | ||||||||||||
| Advisor Class | ||||||||||||||||||||||||
Actual | $ | 1,000 | $ | 987.90 | $ | 4.87 | 0.98 | % | $ | 4.92 | 0.99 | % | ||||||||||||
Hypothetical** | $ | 1,000 | $ | 1,020.10 | $ | 4.95 | 0.98 | % | $ | 5.00 | 0.99 | % | ||||||||||||
| Class R | ||||||||||||||||||||||||
Actual | $ | 1,000 | $ | 984.80 | $ | 7.34 | 1.48 | % | $ | 7.39 | 1.49 | % | ||||||||||||
Hypothetical** | $ | 1,000 | $ | 1,017.60 | $ | 7.47 | 1.48 | % | $ | 7.52 | 1.49 | % | ||||||||||||
| Class K | ||||||||||||||||||||||||
Actual | $ | 1,000 | $ | 985.80 | $ | 6.11 | 1.23 | % | $ | 6.16 | 1.24 | % | ||||||||||||
Hypothetical** | $ | 1,000 | $ | 1,018.85 | $ | 6.21 | 1.23 | % | $ | 6.26 | 1.24 | % | ||||||||||||
| Class I | ||||||||||||||||||||||||
Actual | $ | 1,000 | $ | 987.50 | $ | 4.87 | 0.98 | % | $ | 4.92 | 0.99 | % | ||||||||||||
Hypothetical** | $ | 1,000 | $ | 1,020.10 | $ | 4.95 | 0.98 | % | $ | 5.00 | 0.99 | % | ||||||||||||
| Class Z | ||||||||||||||||||||||||
Actual | $ | 1,000 | $ | 987.80 | $ | 4.87 | 0.98 | % | $ | 4.92 | 0.99 | % | ||||||||||||
Hypothetical** | $ | 1,000 | $ | 1,020.10 | $ | 4.95 | 0.98 | % | $ | 5.00 | 0.99 | % | ||||||||||||
| * | Expenses are equal to the classes’ annualized expense ratios multiplied by the average account value over the period, multiplied by 183/366 (to reflect theone-half year period). |
| + | In connection with the Fund’s investments in affiliated/unaffiliated underlying portfolios, the Fund incurs no direct expenses, but bears proportionate shares of the fees and expenses (i.e., operating, administrative and investment advisory fees) of the affiliated/unaffiliated underlying portfolios. The Adviser has contractually agreed to waive its fees from the Fund in an amount equal to the Fund’s pro rata share of certain acquired fund fees and expenses of the affiliated underlying portfolios. The Fund’s total expenses are equal to the classes’ annualized expense ratio plus the Fund’s pro rata share of the weighted average expense ratio of the affiliated/unaffiliated underlying portfolios in which it invests, multiplied by the average account value over the period, multiplied by 183/366 (to reflect theone-half year period). |
| ** | Assumes 5% annual return before expenses. |
| abfunds.com | AB EMERGING MARKETS MULTI-ASSET PORTFOLIO | 13 | |
PORTFOLIO SUMMARY
September 30, 2019(unaudited)
PORTFOLIO STATISTICS
Net Assets ($mil): $146.2
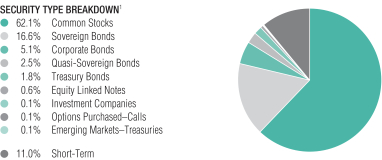
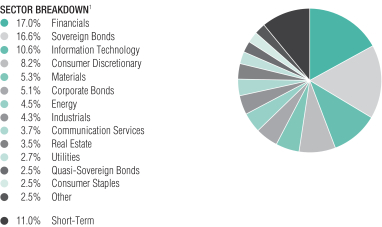
| 1 | All data are as of September 30, 2019. The Fund’s security type and sector breakdowns are expressed as a percentage of total investments (excluding security lending collateral) and may vary over time. The Fund also enters into derivative transactions, which may be used for hedging or investment purposes (see “Portfolio of Investments” section of the report for additional details). “Other” sector weightings represent 1.8% or less in the following sectors: Emerging Markets–Treasuries, Funds and Investment Trusts, Health Care, Options Purchased–Calls, Regional Bonds and Treasury Bonds. |
| 14 | AB EMERGING MARKETS MULTI-ASSET PORTFOLIO | abfunds.com | |
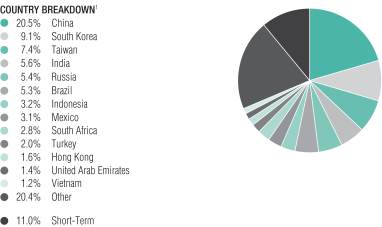
PORTFOLIO SUMMARY(continued)
September 30, 2019(unaudited)
TEN LARGEST HOLDINGS2
| Company | U.S. $ Value | Percent of Net Assets | ||||||
| Samsung Electronics Co., Ltd. | $ | 5,469,882 | 3.7 | % | ||||
| Tencent Holdings Ltd. | 3,061,804 | 2.1 | ||||||
| LUKOIL PJSC (Sponsored ADR) | 2,914,826 | 2.0 | ||||||
| Alibaba Group Holding Ltd. (ADR) | 2,245,230 | 1.5 | ||||||
| Hana Financial Group, Inc. | 1,992,354 | 1.4 | ||||||
| China CITIC Bank Corp., Ltd. – Class H | 1,809,023 | 1.2 | ||||||
| Li Ning Co., Ltd. | 1,780,226 | 1.2 | ||||||
| Fibra Uno Administracion SA de CV | 1,595,198 | 1.1 | ||||||
| HDFC Bank Ltd. (ADR) | 1,581,997 | 1.1 | ||||||
| Anhui Conch Cement Co., Ltd. | 1,421,865 | 1.0 | ||||||
| $ | 23,872,405 | 16.3 | % | |||||
| 1 | All data are as of September 30, 2019. The Fund’s country breakdown is expressed as a percentage of total investments (excluding security lending collateral) and may vary over time. The Fund also enters into derivative transactions, which may be used for hedging or investment purposes (see “Portfolio of Investments” section of the report for additional details). “Other” country weightings represent 1.1% or less in the following countries: Angola, Argentina, Azerbaijan, Bahrain, Bermuda, Canada, Chile, Colombia, Costa Rica, Czech Republic, Dominican Republic, Ecuador, Egypt, El Salvador, Gabon, Ghana, Greece, Guatemala, Honduras, Hungary, Iraq, Ivory Coast, Jamaica, Japan, Kazakhstan, Kenya, Lebanon, Luxembourg, Malaysia, Mongolia, Nigeria, Oman, Pakistan, Panama, Peru, Philippines, Poland, Portugal, Qatar, Saudi Arabia, Senegal, Sri Lanka, Thailand, Trinidad & Tobago, Tunisia, Ukraine, United Kingdom, United Republic of Tanzania, United States, Uruguay, Venezuela and Zambia. |
| 2 | Long-term investments. |
| abfunds.com | AB EMERGING MARKETS MULTI-ASSET PORTFOLIO | 15 | |
PORTFOLIO OF INVESTMENTS
September 30, 2019(unaudited)
| Company | Shares | U.S. $ Value | ||||||||||
| ||||||||||||
COMMON STOCKS – 61.4% | ||||||||||||
Financials – 16.8% | ||||||||||||
Banks – 11.4% | ||||||||||||
Absa Group Ltd. | 9,244 | $ | 93,363 | |||||||||
Abu Dhabi Islamic Bank PJSC | 23,676 | 32,768 | ||||||||||
Agricultural Bank of China Ltd. – Class H | 1,373,000 | 537,662 | ||||||||||
Banco Bradesco SA | 4,400 | 33,093 | ||||||||||
Banco do Brasil SA | 8,500 | 93,061 | ||||||||||
Banco Macro SA (ADR) | 1,805 | 46,966 | ||||||||||
Bancolombia SA (Sponsored ADR) | 3,800 | 187,910 | ||||||||||
Bank Central Asia Tbk PT | 338,500 | 723,703 | ||||||||||
Bank for Foreign Trade of Vietnam JSC | 101,260 | 358,664 | ||||||||||
Bank of China Ltd. – Class A | 150,800 | 75,659 | ||||||||||
Bank of China Ltd. – Class H | 1,586,000 | 621,984 | ||||||||||
Bank of Communications Co., Ltd. – Class A | 109,500 | 83,638 | ||||||||||
Bank of Communications Co., Ltd. – Class H | 830,000 | 541,792 | ||||||||||
China CITIC Bank Corp., Ltd. – Class H | 3,393,000 | 1,809,023 | ||||||||||
China Construction Bank Corp. – Class H | 1,335,000 | 1,017,216 | ||||||||||
China Everbright Bank Co., Ltd. | 170,100 | 93,910 | ||||||||||
China Everbright Bank Co., Ltd. – Class H | 216,000 | 92,014 | ||||||||||
China Minsheng Banking Corp. Ltd. – Class H | 1,573,900 | 1,070,018 | ||||||||||
Chongqing Rural Commercial Bank Co., Ltd. – Class H | 303,000 | 161,319 | ||||||||||
Commercial Bank of Ceylon PLC | 149,360 | 81,178 | ||||||||||
Dubai Islamic Bank PJSC | 67,995 | 97,155 | ||||||||||
Grupo Financiero Banorte SAB de CV – Class O | 16,172 | 87,162 | ||||||||||
Grupo Financiero Galicia SA (ADR) | 4,323 | 56,199 | ||||||||||
Hana Financial Group, Inc. | 67,682 | 1,992,354 | ||||||||||
HDFC Bank Ltd. (ADR) | 27,730 | 1,581,997 | ||||||||||
IndusInd Bank Ltd. | 18,830 | 369,800 | ||||||||||
Industrial Bank Co., Ltd. – Class A | 159,460 | 392,079 | ||||||||||
Industrial Bank of Korea | 51,468 | 567,768 | ||||||||||
Itau Unibanco Holding SA | 14,800 | 107,288 | ||||||||||
KB Financial Group, Inc. | 29,101 | 1,038,658 | ||||||||||
MCB Bank Ltd. | 11,456 | 12,520 | ||||||||||
Moneta Money Bank AS(a) | 68,400 | 210,790 | ||||||||||
Sberbank of Russia PJSC (Sponsored ADR) | 79,918 | 1,130,240 | ||||||||||
Shinhan Financial Group Co., Ltd. | 2,144 | 74,918 | ||||||||||
Standard Bank Group Ltd. | 7,925 | 91,432 | ||||||||||
TCS Group Holding PLC (GDR)(a) | 19,020 | 332,850 | ||||||||||
Turkiye Is Bankasi AS – Class C(b) | 618,360 | 684,951 | ||||||||||
Woori Financial Group, Inc. | 12,180 | 126,609 | ||||||||||
|
| |||||||||||
| 16,709,711 | ||||||||||||
|
| |||||||||||
Capital Markets – 1.2% | ||||||||||||
B3 SA – Brasil Bolsa Balcao | 34,100 | 358,075 | ||||||||||
China Cinda Asset Management Co., Ltd. – Class H | 425,000 | 83,495 | ||||||||||
| 16 | AB EMERGING MARKETS MULTI-ASSET PORTFOLIO | abfunds.com | |
PORTFOLIO OF INVESTMENTS(continued)
| Company | Shares | U.S. $ Value | ||||||||||
| ||||||||||||
China Everbright Ltd. | 766,000 | $ | 896,395 | |||||||||
Korea Investment Holdings Co., Ltd. | 1,450 | 91,096 | ||||||||||
Meritz Securities Co., Ltd. | 21,134 | 89,090 | ||||||||||
NH Investment & Securities Co., Ltd. | 9,089 | 96,389 | ||||||||||
Samsung Securities Co., Ltd. | 3,068 | 90,521 | ||||||||||
Yuanta Financial Holding Co., Ltd. | 164,000 | 97,858 | ||||||||||
|
| |||||||||||
| 1,802,919 | ||||||||||||
|
| |||||||||||
Consumer Finance – 0.5% | ||||||||||||
Manappuram Finance Ltd. | 105,519 | 209,664 | ||||||||||
Muthoot Finance Ltd. | 12,266 | 117,929 | ||||||||||
Samsung Card Co., Ltd. | 10,747 | 315,606 | ||||||||||
|
| |||||||||||
| 643,199 | ||||||||||||
|
| |||||||||||
Diversified Financial Services – 1.6% | ||||||||||||
Far East Horizon Ltd. | 97,000 | 90,087 | ||||||||||
FirstRand Ltd. | 23,643 | 97,139 | ||||||||||
Fubon Financial Holding Co., Ltd. | 459,000 | 658,994 | ||||||||||
Haci Omer Sabanci Holding AS | 410,359 | 694,645 | ||||||||||
Power Finance Corp., Ltd.(b) | 61,390 | 85,991 | ||||||||||
REC Ltd. | 346,166 | 601,573 | ||||||||||
RMB Holdings Ltd. | 23,250 | 115,343 | ||||||||||
|
| |||||||||||
| 2,343,772 | ||||||||||||
|
| |||||||||||
Insurance – 1.7% | ||||||||||||
BB Seguridade Participacoes SA | 26,500 | 223,419 | ||||||||||
Bupa Arabia for Cooperative Insurance Co. | 3,334 | 94,667 | ||||||||||
China Pacific Insurance Group Co., Ltd. – Class H | 23,200 | 85,127 | ||||||||||
IRB Brasil Resseguros S/A | 11,200 | 101,516 | ||||||||||
Liberty Holdings Ltd. | 1,798 | 13,344 | ||||||||||
Orange Life Insurance Ltd.(a) | 9,644 | 217,874 | ||||||||||
PICC Property & Casualty Co., Ltd. – Class H | 184,000 | 214,697 | ||||||||||
Ping An Insurance Group Co. of China Ltd. – Class H | 96,500 | 1,109,144 | ||||||||||
Powszechny Zaklad Ubezpieczen SA | 10,256 | 95,670 | ||||||||||
Ruentex Industries Ltd.(b) | 172,200 | 371,465 | ||||||||||
|
| |||||||||||
| 2,526,923 | ||||||||||||
|
| |||||||||||
Thrifts & Mortgage Finance – 0.4% | ||||||||||||
Housing Development Finance Corp., Ltd. | 12,360 | 344,996 | ||||||||||
Indiabulls Housing Finance Ltd. | 3,865 | 14,015 | ||||||||||
LIC Housing Finance Ltd. | 26,924 | 143,058 | ||||||||||
|
| |||||||||||
| 502,069 | ||||||||||||
|
| |||||||||||
| 24,528,593 | ||||||||||||
|
| |||||||||||
Information Technology – 9.9% | ||||||||||||
Electronic Equipment, Instruments & Components – 1.5% | ||||||||||||
Delta Electronics, Inc. | 19,000 | 81,176 | ||||||||||
Hon Hai Precision Industry Co., Ltd. | 111,000 | 261,918 | ||||||||||
| abfunds.com | AB EMERGING MARKETS MULTI-ASSET PORTFOLIO | 17 | |
PORTFOLIO OF INVESTMENTS(continued)
| Company | Shares | U.S. $ Value | ||||||||||
| ||||||||||||
Samsung SDI Co., Ltd. | 1,730 | $ | 322,072 | |||||||||
Tripod Technology Corp. | 156,000 | 560,852 | ||||||||||
Walsin Technology Corp. | 48,000 | 270,173 | ||||||||||
Yageo Corp. | 25,000 | 198,630 | ||||||||||
Zhen Ding Technology Holding Ltd. | 158,000 | 565,560 | ||||||||||
|
| |||||||||||
| 2,260,381 | ||||||||||||
|
| |||||||||||
IT Services – 0.8% | ||||||||||||
Infosys Ltd. | 19,040 | 215,158 | ||||||||||
Infosys Ltd. (Sponsored ADR) | 86,720 | 986,007 | ||||||||||
|
| |||||||||||
| 1,201,165 | ||||||||||||
|
| |||||||||||
Semiconductors & Semiconductor Equipment – 3.2% | ||||||||||||
Globalwafers Co., Ltd. | 34,000 | 342,900 | ||||||||||
Macronix International | 454,000 | 460,675 | ||||||||||
MediaTek, Inc. | 2,000 | 23,795 | ||||||||||
Nanya Technology Corp. | 371,000 | 963,630 | ||||||||||
Novatek Microelectronics Corp. | 229,000 | 1,314,173 | ||||||||||
Realtek Semiconductor Corp. | 129,000 | 956,418 | ||||||||||
Taiwan Semiconductor Manufacturing Co., Ltd. | 62,000 | 550,655 | ||||||||||
United Microelectronics Corp. | 70,000 | 30,016 | ||||||||||
|
| |||||||||||
| 4,642,262 | ||||||||||||
|
| |||||||||||
Technology Hardware, Storage & Peripherals – 4.4% | ||||||||||||
Asustek Computer, Inc. | 56,000 | 372,671 | ||||||||||
Chicony Electronics Co., Ltd. | 33,000 | 97,207 | ||||||||||
Lenovo Group Ltd. | 120,000 | 80,055 | ||||||||||
Samsung Electronics Co., Ltd. | 95,227 | 3,898,980 | ||||||||||
Samsung Electronics Co., Ltd. (Preference Shares) | 47,590 | 1,570,902 | ||||||||||
Wistron Corp. | 475,000 | 383,338 | ||||||||||
|
| |||||||||||
| 6,403,153 | ||||||||||||
|
| |||||||||||
| 14,506,961 | ||||||||||||
|
| |||||||||||
Consumer Discretionary – 8.0% | ||||||||||||
Automobiles – 0.4% | ||||||||||||
BAIC Motor Corp., Ltd.(a) | 140,500 | 86,798 | ||||||||||
Hyundai Motor Co. | 823 | 92,147 | ||||||||||
Kia Motors Corp. | 10,851 | 413,718 | ||||||||||
|
| |||||||||||
| 592,663 | ||||||||||||
|
| |||||||||||
Diversified Consumer Services – 1.4% | ||||||||||||
Fu Shou Yuan International Group Ltd. | 401,000 | 354,332 | ||||||||||
Kroton Educacional SA | 700 | 1,884 | ||||||||||
New Oriental Education & Technology Group, Inc. (Sponsored ADR)(b) | 10,227 | 1,132,743 | ||||||||||
YDUQS Part | 67,200 | 583,539 | ||||||||||
|
| |||||||||||
| 2,072,498 | ||||||||||||
|
| |||||||||||
| 18 | AB EMERGING MARKETS MULTI-ASSET PORTFOLIO | abfunds.com | |
PORTFOLIO OF INVESTMENTS(continued)
| Company | Shares | U.S. $ Value | ||||||||||
| ||||||||||||
Hotels, Restaurants & Leisure – 0.5% | ||||||||||||
OPAP SA | 66,470 | $ | 683,773 | |||||||||
Yum China Holdings, Inc. | 2,156 | 97,947 | ||||||||||
|
| |||||||||||
| 781,720 | ||||||||||||
|
| |||||||||||
Household Durables – 0.2% | ||||||||||||
Hisense Home Appliances Group Co., Ltd. – Class A | 138,500 | 210,629 | ||||||||||
Woongjin Coway Co., Ltd. | 1,405 | 99,524 | ||||||||||
|
| |||||||||||
| 310,153 | ||||||||||||
|
| |||||||||||
Internet & Direct Marketing Retail – 3.6% | ||||||||||||
Alibaba Group Holding Ltd. (ADR)(b) | 13,426 | 2,245,230 | ||||||||||
Baozun, Inc. (Sponsored ADR)(b)(c) | 9,030 | 385,581 | ||||||||||
Ctrip.com International Ltd. (ADR)(b) | 2,529 | 74,075 | ||||||||||
JD.com, Inc. (ADR)(b) | 3,197 | 90,187 | ||||||||||
MakeMyTrip Ltd.(b) | 34,490 | 782,578 | ||||||||||
Naspers Ltd. – Class N | 7,560 | 1,144,654 | ||||||||||
Prosus NV(b)(c) | 6,910 | 507,250 | ||||||||||
|
| |||||||||||
| 5,229,555 | ||||||||||||
|
| |||||||||||
Specialty Retail – 0.2% | ||||||||||||
Abu Dhabi National Oil Co. for Distribution PJSC | 53,143 | 38,629 | ||||||||||
Home Product Center PCL | 170,900 | 95,550 | ||||||||||
Truworths International Ltd. | 50,100 | 175,350 | ||||||||||
|
| |||||||||||
| 309,529 | ||||||||||||
|
| |||||||||||
Textiles, Apparel & Luxury Goods – 1.7% | ||||||||||||
Feng TAY Enterprise Co., Ltd. | 14,100 | 101,058 | ||||||||||
Fila Korea Ltd. | 463 | 22,400 | ||||||||||
Li Ning Co., Ltd. | 620,500 | 1,780,226 | ||||||||||
Yue Yuen Industrial Holdings Ltd. | 216,500 | 591,496 | ||||||||||
|
| |||||||||||
| 2,495,180 | ||||||||||||
|
| |||||||||||
| 11,791,298 | ||||||||||||
|
| |||||||||||
Materials – 5.2% | ||||||||||||
Chemicals – 1.6% | ||||||||||||
Advanced Petrochemical Co. | 6,922 | 89,560 | ||||||||||
Braskem SA (Preference Shares)(b) | 14,800 | 115,837 | ||||||||||
Formosa Chemicals & Fibre Corp. | 166,000 | 464,105 | ||||||||||
Kumho Petrochemical Co., Ltd. | 2,720 | 162,651 | ||||||||||
Mitsubishi Gas Chemical Co., Inc. | 7,700 | 103,564 | ||||||||||
Nan Ya Plastics Corp. | 74,000 | 166,228 | ||||||||||
PhosAgro PJSC (GDR)(a) | 7,731 | 98,727 | ||||||||||
Saudi Arabian Fertilizer Co. | 4,289 | 91,853 | ||||||||||
Saudi Industrial Investment Group | 4,436 | 27,324 | ||||||||||
Sinopec Shanghai Petrochemical Co., Ltd. | 132,800 | 77,636 | ||||||||||
Tosoh Corp. | 65,900 | 877,910 | ||||||||||
|
| |||||||||||
| 2,275,395 | ||||||||||||
|
| |||||||||||
| abfunds.com | AB EMERGING MARKETS MULTI-ASSET PORTFOLIO | 19 | |
PORTFOLIO OF INVESTMENTS(continued)
| Company | Shares | U.S. $ Value | ||||||||||
| ||||||||||||
Construction Materials – 1.5% | ||||||||||||
Anhui Conch Cement Co., Ltd. – Class A | 148,919 | $ | 863,325 | |||||||||
Anhui Conch Cement Co., Ltd. – Class H | 94,120 | 558,540 | ||||||||||
Asia Cement Corp. | 362,000 | 505,236 | ||||||||||
China Resources Cement Holdings Ltd. | 98,000 | 98,292 | ||||||||||
Taiwan Cement Corp. | 186,198 | 237,906 | ||||||||||
|
| |||||||||||
| 2,263,299 | ||||||||||||
|
| |||||||||||
Metals & Mining – 2.1% | ||||||||||||
Baoshan Iron & Steel Co., Ltd. | 104,800 | 86,833 | ||||||||||
China Zhongwang Holdings Ltd. | 197,600 | 80,423 | ||||||||||
Cia Siderurgica Nacional SA | 27,800 | 88,519 | ||||||||||
Eregli Demir ve Celik Fabrikalari TAS | 76,654 | 92,829 | ||||||||||
Evraz PLC | 8,180 | 47,081 | ||||||||||
Fangda Special Steel Technology Co., Ltd. – Class A | 107,122 | 124,617 | ||||||||||
Glencore PLC(b) | 261,630 | 788,435 | ||||||||||
Grupo Mexico SAB de CV | 42,706 | 100,132 | ||||||||||
Iskenderun Demir ve Celik AS | 27,017 | 29,403 | ||||||||||
Jiangxi Copper Co., Ltd. – Class H | 310,000 | 359,019 | ||||||||||
Korea Zinc Co., Ltd. | 242 | 90,581 | ||||||||||
Kumba Iron Ore Ltd. | 11,493 | 283,967 | ||||||||||
Maanshan Iron & Steel Co., Ltd. – Class H | 252,000 | 94,889 | ||||||||||
NMDC Ltd. | 82,932 | 103,741 | ||||||||||
Polyus PJSC (GDR)(a) | 3,263 | 188,764 | ||||||||||
POSCO | 1,330 | 252,112 | ||||||||||
Vedanta Ltd. | 98,630 | 214,550 | ||||||||||
|
| |||||||||||
| 3,025,895 | ||||||||||||
|
| |||||||||||
Paper & Forest Products – 0.0% | ||||||||||||
Nine Dragons Paper Holdings Ltd. | 13,000 | 10,948 | ||||||||||
|
| |||||||||||
| 7,575,537 | ||||||||||||
|
| |||||||||||
Energy – 4.4% | ||||||||||||
Oil, Gas & Consumable Fuels – 4.4% | ||||||||||||
Adaro Energy Tbk PT | 820,500 | 74,596 | ||||||||||
Bharat Petroleum Corp., Ltd. | 19,372 | 129,687 | ||||||||||
Bukit Asam Tbk PT | 536,000 | 85,368 | ||||||||||
China Petroleum & Chemical Corp. | 126,700 | 89,112 | ||||||||||
China Petroleum & Chemical Corp. – Class H | 744,000 | 440,256 | ||||||||||
Coal India Ltd. | 32,950 | 93,025 | ||||||||||
Exxaro Resources Ltd. | 10,759 | 92,795 | ||||||||||
Hindustan Petroleum Corp., Ltd. | 23,757 | 101,690 | ||||||||||
LUKOIL PJSC (Sponsored ADR) | 35,233 | 2,914,826 | ||||||||||
Oil & Gas Development Co., Ltd. | 100,320 | 79,687 | ||||||||||
Petroleo Brasileiro SA (Preference Shares) | 122,300 | 810,928 | ||||||||||
Polski Koncern Naftowy ORLEN SA | 855 | 21,047 | ||||||||||
PTT Exploration & Production PCL | 25,700 | 101,674 | ||||||||||
Surgutneftegas PJSC (Sponsored ADR)(c) | 112,620 | 614,455 | ||||||||||
| 20 | AB EMERGING MARKETS MULTI-ASSET PORTFOLIO | abfunds.com | |
PORTFOLIO OF INVESTMENTS(continued)
| Company | Shares | U.S. $ Value | ||||||||||
| ||||||||||||
Tatneft PJSC (Sponsored ADR) | 3,380 | $ | 214,630 | |||||||||
Tupras Turkiye Petrol Rafinerileri AS | 7,398 | 187,996 | ||||||||||
Yanzhou Coal Mining Co., Ltd. – Class H | 366,000 | 371,695 | ||||||||||
|
| |||||||||||
| 6,423,467 | ||||||||||||
|
| |||||||||||
Industrials – 4.3% | ||||||||||||
Aerospace & Defense – 0.0% | ||||||||||||
Korea Aerospace Industries Ltd. | 1,534 | 50,143 | ||||||||||
|
| |||||||||||
Air Freight & Logistics – 0.1% | ||||||||||||
Hyundai Glovis Co., Ltd. | 713 | 92,874 | ||||||||||
|
| |||||||||||
Airlines – 0.1% | ||||||||||||
InterGlobe Aviation Ltd.(a) | 4,053 | 107,854 | ||||||||||
|
| |||||||||||
Commercial Services & Supplies – 0.2% | ||||||||||||
Sunny Friend Environmental Technology Co., Ltd. | 42,000 | 367,655 | ||||||||||
|
| |||||||||||
Construction & Engineering – 0.4% | ||||||||||||
China Communications Services Corp., Ltd. – Class H | 294,000 | 166,676 | ||||||||||
Daelim Industrial Co., Ltd. | 5,441 | 472,819 | ||||||||||
|
| |||||||||||
| 639,495 | ||||||||||||
|
| |||||||||||
Electrical Equipment – 0.1% | ||||||||||||
ElSewedy Electric Co. | 103,356 | 84,818 | ||||||||||
|
| |||||||||||
Industrial Conglomerates – 0.7% | ||||||||||||
NWS Holdings Ltd. | 659,000 | 1,020,704 | ||||||||||
|
| |||||||||||
Machinery – 1.5% | ||||||||||||
China Yuchai International Ltd. | 27,440 | 355,348 | ||||||||||
Sinotruk Hong Kong Ltd. | 584,000 | 866,145 | ||||||||||
Weichai Power Co., Ltd. – Class A | 346,704 | 545,700 | ||||||||||
Weichai Power Co., Ltd. – Class H | 120,000 | 173,115 | ||||||||||
Zoomlion Heavy Industry Science and Technology Co., Ltd. – Class A | 372,400 | 297,892 | ||||||||||
|
| |||||||||||
| 2,238,200 | ||||||||||||
|
| |||||||||||
Marine – 0.1% | ||||||||||||
MISC Bhd | 52,300 | 97,587 | ||||||||||
|
| |||||||||||
Road & Rail – 0.2% | ||||||||||||
Daqin Railway Co., Ltd. – Class A | 233,200 | 248,059 | ||||||||||
|
| |||||||||||
Trading Companies & Distributors – 0.3% | ||||||||||||
BOC Aviation Ltd.(a) | 46,900 | 432,842 | ||||||||||
|
| |||||||||||
| abfunds.com | AB EMERGING MARKETS MULTI-ASSET PORTFOLIO | 21 | |
PORTFOLIO OF INVESTMENTS(continued)
| Company | Shares | U.S. $ Value | ||||||||||
| ||||||||||||
Transportation Infrastructure – 0.6% | ||||||||||||
Adani Ports & Special Economic Zone Ltd. | 72,280 | $ | 423,693 | |||||||||
Grupo Aeroportuario del Pacifico SAB de CV – Class B | 9,574 | 92,402 | ||||||||||
International Container Terminal Services, Inc. | 35,620 | 82,890 | ||||||||||
Jiangsu Expressway Co., Ltd. – Class H | 68,000 | 86,348 | ||||||||||
Westports Holdings Bhd | 95,400 | 94,065 | ||||||||||
Zhejiang Expressway Co., Ltd. – Class H | 116,000 | 100,351 | ||||||||||
|
| |||||||||||
| 879,749 | ||||||||||||
|
| |||||||||||
| 6,259,980 | ||||||||||||
|
| |||||||||||
Communication Services – 3.7% | ||||||||||||
Diversified Telecommunication Services – 0.5% | ||||||||||||
Emirates Telecommunications Group Co. PJSC | 20,701 | 92,990 | ||||||||||
KT Corp. (Sponsored ADR) | 52,851 | 597,745 | ||||||||||
MultiChoice Group Ltd.(b) | 3,520 | 27,403 | ||||||||||
Telkom SA SOC Ltd. | 17,884 | 83,371 | ||||||||||
|
| |||||||||||
| 801,509 | ||||||||||||
|
| |||||||||||
Interactive Media & Services – 2.6% | ||||||||||||
Tencent Holdings Ltd. | 73,200 | 3,061,804 | ||||||||||
Yandex NV – Class A(b) | 19,870 | 695,649 | ||||||||||
|
| |||||||||||
| 3,757,453 | ||||||||||||
|
| |||||||||||
Media – 0.1% | ||||||||||||
Cheil Worldwide, Inc. | 4,001 | 82,953 | ||||||||||
|
| |||||||||||
Wireless Telecommunication Services – 0.5% | ||||||||||||
Advanced Info Service PCL | 13,300 | 95,668 | ||||||||||
China Mobile Ltd. | 36,000 | 298,215 | ||||||||||
DiGi.Com Bhd | 80,000 | 90,733 | ||||||||||
Globe Telecom, Inc. | 2,300 | 81,207 | ||||||||||
PLDT, Inc. | 4,015 | 87,998 | ||||||||||
Vodacom Group Ltd. | 12,488 | 98,767 | ||||||||||
|
| |||||||||||
| 752,588 | ||||||||||||
|
| |||||||||||
| 5,394,503 | ||||||||||||
|
| |||||||||||
Real Estate – 3.5% | ||||||||||||
Equity Real Estate Investment Trusts (REITs) – 1.1% | ||||||||||||
Fibra Uno Administracion SA de CV | 1,088,884 | 1,595,198 | ||||||||||
|
| |||||||||||
Real Estate Management & Development – 2.4% | ||||||||||||
Agile Group Holdings Ltd. | 76,000 | 92,322 | ||||||||||
Aldar Properties PJSC | 1,610,140 | 917,349 | ||||||||||
BR Malls Participacoes SA | 29,000 | 100,576 | ||||||||||
China Evergrande Group | 35,000 | 74,577 | ||||||||||
| 22 | AB EMERGING MARKETS MULTI-ASSET PORTFOLIO | abfunds.com | |
PORTFOLIO OF INVESTMENTS(continued)
| Company | Shares | U.S. $ Value | ||||||||||
| ||||||||||||
CK Asset Holdings Ltd. | 35,500 | $ | 240,516 | |||||||||
Country Garden Holdings Co., Ltd. | 70,000 | 88,660 | ||||||||||
Emaar Development PJSC | 64,691 | 72,642 | ||||||||||
Guangzhou R&F Properties Co., Ltd. – Class H | 53,600 | 81,148 | ||||||||||
Highwealth Construction Corp. | 62,000 | 99,706 | ||||||||||
Kerry Properties Ltd. | 53,500 | 164,732 | ||||||||||
KWG Group Holdings Ltd.(b) | 99,000 | 86,799 | ||||||||||
Land & Houses PCL | 277,100 | 86,976 | ||||||||||
New World Development Co., Ltd. | 291,000 | 377,910 | ||||||||||
RiseSun Real Estate Development Co., Ltd. – Class A | 507,448 | 589,255 | ||||||||||
Shenzhen Investment Ltd. | 232,000 | 85,631 | ||||||||||
Vincom Retail JSC | 242,020 | 345,521 | ||||||||||
|
| |||||||||||
| 3,504,320 | ||||||||||||
|
| |||||||||||
| 5,099,518 | ||||||||||||
|
| |||||||||||
Utilities – 2.7% | ||||||||||||
Electric Utilities – 1.4% | ||||||||||||
Centrais Eletricas Brasileiras SA | 18,000 | 173,937 | ||||||||||
Centrais Eletricas Brasileiras SA (Preference Shares) | 95,600 | 966,825 | ||||||||||
Cia Energetica de Minas Gerais | 24,400 | 93,373 | ||||||||||
Cia Energetica de Minas Gerais (Preference Shares) | 5,800 | 20,004 | ||||||||||
EDP – Energias de Portugal SA | 24,032 | 93,264 | ||||||||||
Equatorial Energia SA | 15,600 | 376,545 | ||||||||||
Manila Electric Co. | 8,940 | 63,779 | ||||||||||
Power Grid Corp. of India Ltd. | 73,752 | 207,677 | ||||||||||
|
| |||||||||||
| 1,995,404 | ||||||||||||
|
| |||||||||||
Gas Utilities – 0.3% | ||||||||||||
GAIL India Ltd. | 177,310 | 335,538 | ||||||||||
Petronas Gas Bhd | 27,100 | 106,018 | ||||||||||
|
| |||||||||||
| 441,556 | ||||||||||||
|
| |||||||||||
Independent Power and Renewable Electricity Producers – 0.1% | ||||||||||||
NTPC Ltd. | 53,085 | 88,172 | ||||||||||
|
| |||||||||||
Water Utilities – 0.9% | ||||||||||||
Aguas Andinas SA – Class A | 172,553 | 94,376 | ||||||||||
Cia de Saneamento Basico do Estado de Sao Paulo | 107,500 | 1,283,289 | ||||||||||
|
| |||||||||||
| 1,377,665 | ||||||||||||
|
| |||||||||||
| 3,902,797 | ||||||||||||
|
| |||||||||||
Consumer Staples – 2.5% | ||||||||||||
Beverages – 1.4% | ||||||||||||
Fomento Economico Mexicano SAB de CV | 82,200 | 753,271 | ||||||||||
Tsingtao Brewery Co., Ltd. – Class A | 84,800 | 576,468 | ||||||||||
Wuliangye Yibin Co., Ltd. – Class A | 39,300 | 715,152 | ||||||||||
|
| |||||||||||
| 2,044,891 | ||||||||||||
|
| |||||||||||
| abfunds.com | AB EMERGING MARKETS MULTI-ASSET PORTFOLIO | 23 | |
PORTFOLIO OF INVESTMENTS(continued)
| Company | Shares | U.S. $ Value | ||||||||||
| ||||||||||||
Food & Staples Retailing – 0.5% | ||||||||||||
CP ALL PCL | 175,900 | $ | 467,284 | |||||||||
Jeronimo Martins SGPS SA | 2,404 | 40,540 | ||||||||||
Magnit PJSC (Sponsored GDR)(a) | 6,995 | 91,390 | ||||||||||
President Chain Store Corp. | 10,000 | 93,473 | ||||||||||
|
| |||||||||||
| 692,687 | ||||||||||||
|
| |||||||||||
Food Products – 0.3% | ||||||||||||
Charoen Pokphand Foods PCL | 90,300 | 77,501 | ||||||||||
Indofood Sukses Makmur Tbk PT | 165,000 | 89,468 | ||||||||||
JBS SA | 13,200 | 104,172 | ||||||||||
Nestle Malaysia Bhd | 2,700 | 93,909 | ||||||||||
Uni-President Enterprises Corp. | 50,000 | 120,657 | ||||||||||
|
| |||||||||||
| 485,707 | ||||||||||||
|
| |||||||||||
Household Products – 0.1% | ||||||||||||
Kimberly-Clark de Mexico SAB de CV – Class A(b) | 45,116 | 90,671 | ||||||||||
|
| |||||||||||
Tobacco – 0.2% | ||||||||||||
Eastern Co. SAE | 55,499 | 56,453 | ||||||||||
ITC Ltd. | 27,525 | 100,717 | ||||||||||
KT&G Corp. | 2,120 | 187,038 | ||||||||||
|
| |||||||||||
| 344,208 | ||||||||||||
|
| |||||||||||
| 3,658,164 | ||||||||||||
|
| |||||||||||
Health Care – 0.4% | ||||||||||||
Health Care Providers & Services – 0.3% | ||||||||||||
Jinxin Fertility Group Ltd.(a)(b) | 308,000 | 445,366 | ||||||||||
|
| |||||||||||
Pharmaceuticals – 0.1% | ||||||||||||
Richter Gedeon Nyrt | 10,310 | 166,798 | ||||||||||
|
| |||||||||||
| 612,164 | ||||||||||||
|
| |||||||||||
Total Common Stocks | 89,752,982 | |||||||||||
|
| |||||||||||
| Principal Amount (000) | ||||||||||||
FIXED INCOME SECURITIES – 25.8% | ||||||||||||
Sovereign Bonds – 16.4% | ||||||||||||
Abu Dhabi Government International Bond | U.S.$ | 310 | 308,062 | |||||||||
Angolan Government International Bond | 200 | 224,250 | ||||||||||
Argentine Republic Government International Bond | 13 | 5,606 | ||||||||||
5.875%, 1/11/28 | 219 | 89,790 | ||||||||||
| 24 | AB EMERGING MARKETS MULTI-ASSET PORTFOLIO | abfunds.com | |
PORTFOLIO OF INVESTMENTS(continued)
| Principal Amount (000) | U.S. $ Value | |||||||||
| ||||||||||
6.625%, 7/06/28 | U.S.$ | 150 | $ | 62,475 | ||||||
6.875%,1/26/27-1/11/48 | 2,488 | 1,051,179 | ||||||||
7.125%, 6/28/2117 | 50 | 21,625 | ||||||||
7.82%, 12/31/33 | EUR | 33 | 17,427 | |||||||
Series NY | U.S.$ | 483 | 192,717 | |||||||
Bahrain Government International Bond | 200 | 200,850 | ||||||||
6.00%, 9/19/44(a) | 203 | 199,257 | ||||||||
6.75%, 9/20/29(a) | 244 | 269,925 | ||||||||
Banque Centrale de Tunisie International Bond | 200 | 178,500 | ||||||||
Bermuda Government International Bond | 275 | 314,540 | ||||||||
CBB International Sukuk Programme Co. SPC | 205 | 206,538 | ||||||||
Colombia Government International Bond | 302 | 353,906 | ||||||||
Costa Rica Government International Bond | 470 | 471,028 | ||||||||
Dominican Republic International Bond | 426 | 464,340 | ||||||||
6.40%, 6/05/49(a) | 150 | 159,422 | ||||||||
6.50%, 2/15/48(a) | 298 | 319,791 | ||||||||
6.85%, 1/27/45(a) | 100 | 111,375 | ||||||||
Dubai DOF Sukuk Ltd. | 313 | 358,788 | ||||||||
Ecuador Government International Bond | 366 | 384,872 | ||||||||
10.75%, 3/28/22(a) | 397 | 431,862 | ||||||||
Egypt Government International Bond | 530 | 543,416 | ||||||||
6.125%, 1/31/22(a) | 200 | 206,125 | ||||||||
7.903%, 2/21/48(a) | 300 | 301,687 | ||||||||
8.70%, 3/01/49(a) | 200 | 214,750 | ||||||||
El Salvador Government International Bond | 40 | 41,050 | ||||||||
6.375%, 1/18/27(a) | 86 | 89,333 | ||||||||
7.125%, 1/20/50(a) | 197 | 201,002 | ||||||||
7.75%, 1/24/23(a) | 63 | 68,768 | ||||||||
8.25%, 4/10/32(a) | 100 | 114,250 | ||||||||
Gabon Government International Bond | 365 | 359,183 | ||||||||
Ghana Government International Bond | 200 | 200,563 | ||||||||
Guatemala Government Bond | 200 | 204,125 | ||||||||
4.50%, 5/03/26(a) | 200 | 205,938 | ||||||||
| abfunds.com | AB EMERGING MARKETS MULTI-ASSET PORTFOLIO | 25 | |
PORTFOLIO OF INVESTMENTS(continued)
| Principal Amount (000) | U.S. $ Value | |||||||||
| ||||||||||
Honduras Government International Bond | U.S.$ | 180 | $ | 195,019 | ||||||
7.50%, 3/15/24(a) | 290 | 321,809 | ||||||||
Indonesia Government International Bond | 450 | 461,250 | ||||||||
4.125%, 1/15/25(a) | 380 | 404,221 | ||||||||
5.875%, 1/15/24(a) | 200 | 225,438 | ||||||||
Iraq International Bond | 300 | 306,750 | ||||||||
Ivory Coast Government International Bond | EUR | 164 | 181,042 | |||||||
Jamaica Government International Bond | U.S.$ | 200 | 237,625 | |||||||
7.875%, 7/28/45 | 460 | 602,744 | ||||||||
8.00%, 3/15/39 | 108 | 141,649 | ||||||||
Kazakhstan Government International Bond | 200 | 226,500 | ||||||||
Kenya Government International Bond | 346 | 362,002 | ||||||||
Lebanon Government International Bond | 59 | 40,913 | ||||||||
6.65%, 4/22/24(a) | 57 | 38,368 | ||||||||
6.85%, 3/23/27(a) | 343 | 221,449 | ||||||||
8.25%, 4/12/21(a) | 78 | 66,495 | ||||||||
Series E | 216 | 152,955 | ||||||||
Series G | 206 | 136,926 | ||||||||
6.60%, 11/27/26(a) | 170 | 110,022 | ||||||||
6.65%, 11/03/28(a) | 138 | 89,096 | ||||||||
Mexico Government International Bond | 140 | 151,506 | ||||||||
Mongolia Government International Bond | 200 | 201,750 | ||||||||
Nigeria Government International Bond | 163 | 168,399 | ||||||||
7.625%, 11/28/47(a) | 811 | 800,609 | ||||||||
Oman Government International Bond | 260 | 249,600 | ||||||||
6.75%, 1/17/48(a) | 230 | 217,063 | ||||||||
Pakistan Government International Bond | 200 | 216,188 | ||||||||
Panama Government International Bond | 447 | 461,667 | ||||||||
4.00%, 9/22/24 | 200 | 213,625 | ||||||||
Panama Notas del Tesoro | 113 | 119,130 | ||||||||
| 26 | AB EMERGING MARKETS MULTI-ASSET PORTFOLIO | abfunds.com | |
PORTFOLIO OF INVESTMENTS(continued)
| Principal Amount (000) | U.S. $ Value | |||||||||
| ||||||||||
Perusahaan Penerbit SBSN Indonesia III | U.S.$ | 200 | $ | 214,313 | ||||||
Qatar Government International Bond | 300 | 341,625 | ||||||||
5.103%, 4/23/48(a) | 200 | 255,937 | ||||||||
Republic of Azerbaijan International Bond | 400 | 423,600 | ||||||||
Republic of South Africa Government International Bond | 358 | 335,401 | ||||||||
5.65%, 9/27/47 | 380 | 379,525 | ||||||||
5.75%, 9/30/49 | 230 | 229,253 | ||||||||
Russian Foreign Bond—Eurobond | 600 | 712,312 | ||||||||
Saudi Government International Bond | 200 | 211,800 | ||||||||
5.25%, 1/16/50(a) | 201 | 250,371 | ||||||||
Senegal Government International Bond | EUR | 200 | 226,437 | |||||||
6.25%,7/30/24-5/23/33(a) | U.S.$ | 480 | 505,275 | |||||||
Sri Lanka Government International Bond | 467 | 464,665 | ||||||||
6.20%, 5/11/27(a) | 200 | 187,000 | ||||||||
6.25%, 7/27/21(a) | 433 | 438,818 | ||||||||
7.85%, 3/14/29(a) | 240 | 241,946 | ||||||||
Tanzania Government International Bond | 22 | 22,407 | ||||||||
Turkey Government International Bond | 200 | 175,000 | ||||||||
6.00%, 3/25/27 | 313 | 306,936 | ||||||||
7.00%, 6/05/20 | 95 | 97,316 | ||||||||
Ukraine Government International Bond | EUR | 173 | 203,646 | |||||||
7.75%,9/01/22-9/01/24(a) | U.S.$ | 672 | 706,996 | |||||||
Series GDP | 218 | 203,966 | ||||||||
Uruguay Government International Bond | 98 | 108,259 | ||||||||
4.975%, 4/20/55 | 17 | 20,436 | ||||||||
5.10%, 6/18/50 | 49 | 58,173 | ||||||||
Venezuela Government International Bond | 265 | 25,128 | ||||||||
12.75%, 8/23/22(b)(f)(g) | 564 | 53,590 | ||||||||
| abfunds.com | AB EMERGING MARKETS MULTI-ASSET PORTFOLIO | 27 | |
PORTFOLIO OF INVESTMENTS(continued)
| Principal Amount (000) | U.S. $ Value | |||||||||
| ||||||||||
Zambia Government International Bond | U.S.$ | 200 | $ | 142,250 | ||||||
|
| |||||||||
Total Sovereign Bonds | 24,012,506 | |||||||||
|
| |||||||||
Corporate Bonds – 5.0% | ||||||||||
ABJA Investment Co. Pte Ltd. | 200 | 194,574 | ||||||||
Abu Dhabi National Energy Co. PJSC | 200 | 201,000 | ||||||||
AngloGold Ashanti Holdings PLC | 140 | 147,131 | ||||||||
Bangkok Bank PCL/Hong Kong | 200 | 202,740 | ||||||||
Braskem Netherlands Finance BV | 200 | 200,250 | ||||||||
BRF SA | 208 | 206,336 | ||||||||
Colbun SA | 263 | 273,438 | ||||||||
Cosan Ltd. | 200 | 205,237 | ||||||||
CSN Resources SA | 200 | 208,301 | ||||||||
Digicel Group One Ltd. | 234 | 138,632 | ||||||||
Digicel Group Two Ltd. | 292 | 59,261 | ||||||||
Ecopetrol SA | 56 | 62,356 | ||||||||
Empresas Publicas de Medellin ESP | 200 | 209,400 | ||||||||
8.375%, 11/08/27 | COP | 418,000 | 128,199 | |||||||
Enel Chile SA | U.S.$ | 50 | 55,766 | |||||||
Enel Generacion Chile SA | 40 | 42,188 | ||||||||
Gerdau Trade, Inc. | 200 | 210,375 | ||||||||
GNL Quintero SA | 200 | 214,562 | ||||||||
Gold Fields Orogen Holdings BVI Ltd. | 200 | 211,375 | ||||||||
Gran Tierra Energy International Holdings Ltd. | 400 | 364,010 | ||||||||
| 28 | AB EMERGING MARKETS MULTI-ASSET PORTFOLIO | abfunds.com | |
PORTFOLIO OF INVESTMENTS(continued)
| Principal Amount (000) | U.S. $ Value | |||||||||
| ||||||||||
Indiabulls Housing Finance Ltd. | INR | 10,000 | $ | 139,342 | ||||||
KOC Holding AS | U.S.$ | 200 | 200,480 | |||||||
Lima Metro Line 2 Finance Ltd. | 346 | 368,701 | ||||||||
Medco Oak Tree Pte Ltd. | 200 | 201,750 | ||||||||
Minerva Luxembourg SA | 200 | 207,575 | ||||||||
MV24 Capital BV | 200 | 205,824 | ||||||||
Nexa Resources SA | 200 | 212,291 | ||||||||
Odebrecht Finance Ltd. | 200 | 20,625 | ||||||||
Petkim Petrokimya Holding AS | 200 | 195,500 | ||||||||
Power Finance Corp., Ltd. | 200 | 233,212 | ||||||||
Rede D’or Finance SARL | 200 | 200,722 | ||||||||
Rumo Luxembourg SARL | 200 | 215,000 | ||||||||
SASOL Financing USA LLC | 200 | 215,636 | ||||||||
Tonon Luxembourg SA | 89 | 2,672 | ||||||||
Transportadora de Gas Internacional SA ESP | 200 | 230,437 | ||||||||
Turkiye Sise ve Cam Fabrikalari AS | 200 | 205,812 | ||||||||
Unifin Financiera SAB de CV SOFOM ENR | 200 | 197,400 | ||||||||
Usiminas International Sarl | 200 | 202,007 | ||||||||
Vedanta Resources Ltd. | 200 | 184,000 | ||||||||
Virgolino de Oliveira Finance SA | 202 | 4,980 | ||||||||
Wijaya Karya Persero Tbk PT | IDR | 2,000,000 | 132,917 | |||||||
|
| |||||||||
Total Corporate Bonds | 7,312,014 | |||||||||
|
| |||||||||
| abfunds.com | AB EMERGING MARKETS MULTI-ASSET PORTFOLIO | 29 | |
PORTFOLIO OF INVESTMENTS(continued)
| Principal Amount (000) | U.S. $ Value | |||||||||||
| ||||||||||||
Quasi-Sovereign Bonds – 2.5% | ||||||||||||
Aeropuerto Internacional de Tocumen SA | U.S.$ | 200 | $ | 251,500 | ||||||||
Empresa de Transmision Electrica SA | 200 | 230,062 | ||||||||||
Export-Import Bank of China (The) | 310 | 326,866 | ||||||||||
Kazakhstan Temir Zholy National Co. JSC | 200 | 219,010 | ||||||||||
Oil and Gas Holding Co. BSCC (The) | 200 | 226,937 | ||||||||||
Pertamina Persero PT | 200 | 232,500 | ||||||||||
Perusahaan Listrik Negara PT | 200 | 206,669 | ||||||||||
4.875%, 7/17/49(a) | 200 | 215,000 | ||||||||||
5.45%, 5/21/28(a) | 220 | 253,344 | ||||||||||
Petroleos de Venezuela SA | 226 | 18,056 | ||||||||||
6.00%, 11/15/26(b)(f)(g) | 220 | 17,600 | ||||||||||
9.00%, 11/17/21(b)(f)(g) | 128 | 10,276 | ||||||||||
Petroleos Mexicanos | 154 | 159,982 | ||||||||||
6.75%, 9/21/47 | 255 | 244,545 | ||||||||||
6.84%, 1/23/30(a) | 52 | 53,763 | ||||||||||
6.875%, 8/04/26 | 60 | 64,500 | ||||||||||
7.69%, 1/23/50(a) | 177 | 184,093 | ||||||||||
Sinopec Group Overseas Development Ltd. | 271 | 280,513 | ||||||||||
State Grid Overseas Investment Ltd. | 260 | 266,337 | ||||||||||
Trinidad Generation UnLtd. | 200 | 204,625 | ||||||||||
|
| |||||||||||
Total Quasi-Sovereign Bonds | 3,666,178 | |||||||||||
|
| |||||||||||
Treasury Bonds – 1.8% | ||||||||||||
Indonesia Treasury Bond | IDR | 1,535,000 | 97,972 | |||||||||
Series FR68 | 14,852,000 | 1,102,260 | ||||||||||
Mexican Bonos | MXN | 11,821 | 664,280 | |||||||||
| 30 | AB EMERGING MARKETS MULTI-ASSET PORTFOLIO | abfunds.com | |
PORTFOLIO OF INVESTMENTS(continued)
| Principal Amount (000) | U.S. $ Value | |||||||||||
| ||||||||||||
Russian Federal Bond – OFZ | RUB | 8,298 | $ | 129,682 | ||||||||
Series 6222 | 2,662 | 41,684 | ||||||||||
Series 6227 | 37,543 | 595,258 | ||||||||||
|
| |||||||||||
Total Treasury Bonds | 2,631,136 | |||||||||||
|
| |||||||||||
Emerging Markets - Treasuries – 0.1% | ||||||||||||
Argentine Bonos del Tesoro | ARS | 77 | 411 | |||||||||
Republic of South Africa Government Bond | ZAR | 2,181 | 132,579 | |||||||||
|
| |||||||||||
Total Emerging Markets – Treasuries | 132,990 | |||||||||||
|
| |||||||||||
Regional Bonds – 0.0% | ||||||||||||
Provincia de Neuquen Argentina | U.S.$ | 68 | 37,060 | |||||||||
|
| |||||||||||
Total Fixed Income Securities | 37,791,884 | |||||||||||
|
| |||||||||||
| Shares | ||||||||||||
EQUITY LINKED NOTES – 0.6% | ||||||||||||
Information Technology – 0.6% | ||||||||||||
Electronic Equipment, Instruments & Components – 0.6% | ||||||||||||
FPT Corp., Macquarie Bank Ltd., expiring 3/31/20(b)(j) | 352,463 | 876,562 | ||||||||||
|
| |||||||||||
INVESTMENT COMPANIES – 0.1% | ||||||||||||
Funds and Investment Trusts – 0.1% | ||||||||||||
VFMVN30 ETF Fund(b) | 239,030 | 159,399 | ||||||||||
|
| |||||||||||
| abfunds.com | AB EMERGING MARKETS MULTI-ASSET PORTFOLIO | 31 | |
PORTFOLIO OF INVESTMENTS(continued)
| Notional Amount | U.S. $ Value | |||||||||||
| ||||||||||||
OPTIONS PURCHASED – CALLS – 0.1% | ||||||||||||
Options on Indices – 0.1% | ||||||||||||
MSCI Emerging Markets Index | USD | 7,412,000 | $ | 37,877 | ||||||||
MSCI Emerging Markets Index | 18,639,000 | 95,249 | ||||||||||
|
| |||||||||||
Total Options Purchased – Calls | 133,126 | |||||||||||
|
| |||||||||||
| Shares | ||||||||||||
SHORT-TERM INVESTMENTS – 10.9% | ||||||||||||
Investment Companies – 9.8% | ||||||||||||
AB Fixed Income Shares, Inc. – Government Money Market Portfolio – Class AB, 1.89%(k)(l)(m) | 14,323,587 | 14,323,587 | ||||||||||
|
| |||||||||||
| Principal Amount (000) | ||||||||||||
Treasury Bills – 0.8% | ||||||||||||
Nigeria – 0.3% | ||||||||||||
Nigeria Treasury Bills | NGN | 159,365 | 413,288 | |||||||||
|
| |||||||||||
Egypt – 0.5% | ||||||||||||
Egypt Treasury Bills | EGP | 12,050 | 719,827 | |||||||||
|
| |||||||||||
Total Treasury Bills | 1,133,115 | |||||||||||
|
| |||||||||||
Time Deposits – 0.3% | ||||||||||||
BBH Grand Cayman | EUR | 11 | 12,195 | |||||||||
(0.51)%, 10/01/19 | SEK | 9 | 949 | |||||||||
0.25%, 10/01/19 | AUD | 6 | 4,066 | |||||||||
0.50%, 10/01/19 | NOK | 2 | 190 | |||||||||
0.79%, 10/01/19 | SGD | 8 | 5,709 | |||||||||
0.84%, 10/01/19 | CAD | 1 | 592 | |||||||||
| 32 | AB EMERGING MARKETS MULTI-ASSET PORTFOLIO | abfunds.com | |
PORTFOLIO OF INVESTMENTS(continued)
| Principal Amount (000) | U.S. $ Value | |||||||||||
| ||||||||||||
2.20%, 10/02/19 | HKD | 189 | $ | 24,130 | ||||||||
5.40%, 10/01/19 | ZAR | 315 | 20,814 | |||||||||
Citibank, London | GBP | 24 | 29,286 | |||||||||
Citibank, New York | U.S.$ | 172 | 172,224 | |||||||||
Sumitomo, Tokyo | JPY | 14,382 | 133,013 | |||||||||
|
| |||||||||||
Total Time Deposits | 403,168 | |||||||||||
|
| |||||||||||
Total Short-Term Investments | 15,859,870 | |||||||||||
|
| |||||||||||
Total Investments Before Security Lending Collateral for Securities Loaned – 98.9% | 144,573,823 | |||||||||||
|
| |||||||||||
| Shares | ||||||||||||
INVESTMENTS OF CASH COLLATERAL FOR SECURITIES LOANED – 0.8% | ||||||||||||
Investment Companies – 0.8% | ||||||||||||
AB Fixed Income Shares, Inc. – Government Money Market Portfolio – Class AB, 1.89%(k)(l)(m) | 1,143,528 | 1,143,528 | ||||||||||
|
| |||||||||||
Total Investments – 99.7% | 145,717,351 | |||||||||||
Other assets less liabilities – 0.3% | 462,447 | |||||||||||
|
| |||||||||||
Net Assets – 100.0% | $ | 146,179,798 | ||||||||||
|
| |||||||||||
FUTURES (see Note D)
| Description | Number of Contracts | Expiration Month | Current Notional | Value and Unrealized Appreciation/ (Depreciation) | ||||||||||||
Purchased Contracts |
| |||||||||||||||
FTSE China A50 Index Futures | 346 | October 2019 | $ | 4,706,075 | $ | (55,709 | ) | |||||||||
MSCI Emerging Markets Index Futures | 229 | December 2019 | 11,471,755 | (192,915 | ) | |||||||||||
U.S.T-Note 10 Yr (CBT) Futures | 41 | December 2019 | 5,342,812 | 33,953 | ||||||||||||
|
| |||||||||||||||
| $ | (214,671 | ) | ||||||||||||||
|
| |||||||||||||||
| abfunds.com | AB EMERGING MARKETS MULTI-ASSET PORTFOLIO | 33 | |
PORTFOLIO OF INVESTMENTS(continued)
FORWARD CURRENCY EXCHANGE CONTRACTS (see Note D)
| Counterparty | Contracts to Deliver (000) | In Exchange For (000) | Settlement Date | Unrealized Appreciation/ (Depreciation) | ||||||||||||||||
Australia and New Zealand Banking Group Ltd. | USD | 3,007 | JPY | 322,565 | 11/21/19 | $ | (13,904 | ) | ||||||||||||
Bank of America, NA | KRW | 1,218,862 | USD | 1,017 | 10/30/19 | 54 | ||||||||||||||
Bank of America, NA | RUB | 52,637 | USD | 807 | 11/14/19 | (280 | ) | |||||||||||||
Bank of America, NA | INR | 45,544 | USD | 628 | 10/24/19 | (14,186 | ) | |||||||||||||
Bank of America, NA | BRL | 1,455 | USD | 352 | 10/02/19 | 1,690 | ||||||||||||||
Bank of America, NA | USD | 349 | BRL | 1,455 | 10/02/19 | 795 | ||||||||||||||
Bank of America, NA | USD | 342 | CNH | 2,456 | 10/24/19 | 1,949 | ||||||||||||||
Bank of America, NA | USD | 759 | INR | 54,876 | 10/24/19 | 15,680 | ||||||||||||||
Bank of America, NA | USD | 1,167 | INR | 81,453 | 10/24/19 | (18,202 | ) | |||||||||||||
Bank of America, NA | USD | 1,509 | KRW | 1,818,766 | 10/30/19 | 8,614 | ||||||||||||||
Barclays Bank PLC | IDR | 12,027,208 | USD | 844 | 11/21/19 | 1,362 | ||||||||||||||
Barclays Bank PLC | CNH | 83,304 | USD | 11,735 | 10/24/19 | 75,797 | ||||||||||||||
Barclays Bank PLC | MYR | 2,862 | USD | 685 | 2/13/20 | 3,880 | ||||||||||||||
Barclays Bank PLC | USD | 1,643 | TRY | 9,777 | 12/05/19 | 51,157 | ||||||||||||||
Barclays Bank PLC | USD | 1,855 | MXN | 36,528 | 10/25/19 | (11,853 | ) | |||||||||||||
Barclays Bank PLC | USD | 2,162 | INR | 153,763 | 10/24/19 | 7,018 | ||||||||||||||
BNP Paribas SA | HUF | 269,176 | USD | 935 | 10/11/19 | 58,266 | ||||||||||||||
BNP Paribas SA | TWD | 6,334 | USD | 207 | 11/27/19 | 2,026 | ||||||||||||||
BNP Paribas SA | TRY | 4,746 | USD | 816 | 12/05/19 | (6,627 | ) | |||||||||||||
BNP Paribas SA | PEN | 2,668 | USD | 790 | 11/14/19 | 181 | ||||||||||||||
BNP Paribas SA | PLN | 2,258 | USD | 577 | 10/11/19 | 13,784 | ||||||||||||||
BNP Paribas SA | CNH | 1,546 | USD | 217 | 10/24/19 | 269 | ||||||||||||||
BNP Paribas SA | USD | 396 | PLN | 1,508 | 10/11/19 | (19,480 | ) | |||||||||||||
BNP Paribas SA | USD | 847 | TWD | 26,098 | 11/27/19 | (2,482 | ) | |||||||||||||
BNP Paribas SA | USD | 2,307 | ZAR | 34,054 | 11/21/19 | (73,008 | ) | |||||||||||||
BNP Paribas SA | USD | 1,651 | IDR | 23,842,919 | 11/21/19 | 20,485 | ||||||||||||||
Brown Brothers Harriman & Co. | CZK | 19,640 | USD | 850 | 10/11/19 | 19,780 | ||||||||||||||
Brown Brothers Harriman & Co. | MXN | 8,014 | USD | 412 | 10/25/19 | 7,788 | ||||||||||||||
Brown Brothers Harriman & Co. | THB | 11,728 | USD | 386 | 10/30/19 | 1,983 | ||||||||||||||
Brown Brothers Harriman & Co. | PLN | 888 | USD | 235 | 10/11/19 | 13,030 | ||||||||||||||
Brown Brothers Harriman & Co. | USD | 137 | TRY | 798 | 12/05/19 | 890 | ||||||||||||||
Brown Brothers Harriman & Co. | USD | 303 | CZK | 7,059 | 10/11/19 | (4,225 | ) | |||||||||||||
Brown Brothers Harriman & Co. | USD | 220 | ZAR | 3,270 | 11/21/19 | (5,156 | ) | |||||||||||||
Brown Brothers Harriman & Co. | USD | 309 | MXN | 6,261 | 10/25/19 | 6,794 | ||||||||||||||
Brown Brothers Harriman & Co. | USD | 989 | CNH | 6,995 | 10/24/19 | (10,043 | ) | |||||||||||||
Citibank, NA | IDR | 28,029,017 | USD | 1,938 | 11/21/19 | (27,106 | ) | |||||||||||||
Citibank, NA | COP | 3,059,134 | USD | 909 | 11/14/19 | 31,782 | ||||||||||||||
Citibank, NA | INR | 199,188 | USD | 2,870 | 10/24/19 | 59,525 | ||||||||||||||
Citibank, NA | PHP | 54,321 | USD | 1,043 | 12/06/19 | (3,245 | ) | |||||||||||||
Citibank, NA | INR | 13,816 | USD | 192 | 10/24/19 | (3,072 | ) | |||||||||||||
| 34 | AB EMERGING MARKETS MULTI-ASSET PORTFOLIO | abfunds.com | |
PORTFOLIO OF INVESTMENTS(continued)
| Counterparty | Contracts to Deliver (000) | In Exchange For (000) | Settlement Date | Unrealized Appreciation/ (Depreciation) | ||||||||||||||||
Citibank, NA | BRL | 17,133 | USD | 4,113 | 10/02/19 | $ | (10,140 | ) | ||||||||||||
Citibank, NA | TRY | 3,008 | USD | 514 | 12/05/19 | (7,636 | ) | |||||||||||||
Citibank, NA | EUR | 1,302 | USD | 1,443 | 10/10/19 | 22,850 | ||||||||||||||
Citibank, NA | PLN | 906 | USD | 234 | 10/11/19 | 7,578 | ||||||||||||||
Citibank, NA | USD | 464 | PLN | 1,785 | 10/11/19 | (18,740 | ) | |||||||||||||
Citibank, NA | USD | 4,114 | BRL | 17,133 | 10/02/19 | 9,357 | ||||||||||||||
Goldman Sachs USA | IDR | 25,241,165 | USD | 1,747 | 11/21/19 | (22,775 | ) | |||||||||||||
Goldman Sachs USA | RUB | 69,684 | USD | 1,080 | 11/14/19 | 11,714 | ||||||||||||||
Goldman Sachs USA | INR | 30,047 | USD | 432 | 10/24/19 | 7,766 | ||||||||||||||
Goldman Sachs USA | BRL | 2,419 | USD | 585 | 11/04/19 | 3,929 | ||||||||||||||
Goldman Sachs USA | PLN | 2,102 | USD | 556 | 10/11/19 | 32,012 | ||||||||||||||
Goldman Sachs USA | USD | 2,121 | MYR | 8,935 | 2/13/20 | 5,496 | ||||||||||||||
Goldman Sachs USA | USD | 166 | CZK | 3,856 | 10/11/19 | (2,775 | ) | |||||||||||||
Goldman Sachs USA | USD | 672 | MXN | 13,119 | 10/25/19 | (9,540 | ) | |||||||||||||
Goldman Sachs USA | USD | 862 | MXN | 17,350 | 10/25/19 | 13,944 | ||||||||||||||
Goldman Sachs USA | USD | 2,804 | JPY | 299,694 | 11/21/19 | (22,409 | ) | |||||||||||||
Goldman Sachs USA | USD | 306 | KRW | 365,814 | 10/30/19 | (476 | ) | |||||||||||||
Goldman Sachs USA | USD | 3,104 | IDR | 44,529,928 | 11/21/19 | 17,409 | ||||||||||||||
HSBC Bank USA | IDR | 4,714,949 | USD | 325 | 11/21/19 | (5,715 | ) | |||||||||||||
HSBC Bank USA | CNH | 33,533 | USD | 4,742 | 10/24/19 | 48,548 | ||||||||||||||
HSBC Bank USA | INR | 28,969 | USD | 404 | 10/24/19 | (4,308 | ) | |||||||||||||
HSBC Bank USA | THB | 5,041 | USD | 165 | 10/30/19 | (383 | ) | |||||||||||||
HSBC Bank USA | USD | 1,191 | THB | 36,318 | 10/30/19 | (2,556 | ) | |||||||||||||
HSBC Bank USA | USD | 232 | RUB | 15,027 | 11/14/19 | (1,878 | ) | |||||||||||||
HSBC Bank USA | USD | 466 | KRW | 557,131 | 10/30/19 | (1,465 | ) | |||||||||||||
HSBC Bank USA | USD | 196 | IDR | 2,779,283 | 11/21/19 | (699 | ) | |||||||||||||
JPMorgan Chase Bank, NA | CLP | 574,352 | USD | 809 | 11/14/19 | 20,659 | ||||||||||||||
JPMorgan Chase Bank, NA | THB | 18,147 | USD | 593 | 10/30/19 | (295 | ) | |||||||||||||
JPMorgan Chase Bank, NA | ZAR | 12,331 | USD | 835 | 11/21/19 | 26,097 | ||||||||||||||
JPMorgan Chase Bank, NA | CZK | 12,878 | USD | 550 | 10/11/19 | 5,268 | ||||||||||||||
JPMorgan Chase Bank, NA | USD | 1,779 | CNH | 12,573 | 10/24/19 | (19,592 | ) | |||||||||||||
JPMorgan Chase Bank, NA | USD | 363 | INR | 25,151 | 10/24/19 | (8,616 | ) | |||||||||||||
Morgan Stanley Capital Services LLC | KRW | 10,278,632 | USD | 8,528 | 10/30/19 | (50,873 | ) | |||||||||||||
Morgan Stanley Capital Services LLC | TWD | 19,278 | USD | 620 | 11/27/19 | (3,792 | ) | |||||||||||||
Morgan Stanley Capital Services LLC | BRL | 15,360 | USD | 3,697 | 11/04/19 | 9,712 | ||||||||||||||
Morgan Stanley Capital Services LLC | BRL | 19,405 | USD | 4,660 | 10/02/19 | (10,598 | ) | |||||||||||||
Morgan Stanley Capital Services LLC | TWD | 9,111 | USD | 295 | 11/27/19 | 407 | ||||||||||||||
Morgan Stanley Capital Services LLC | MYR | 5,930 | USD | 1,415 | 2/13/20 | 4,142 | ||||||||||||||
Morgan Stanley Capital Services LLC | BRL | 817 | USD | 201 | 10/02/19 | 4,679 | ||||||||||||||
Morgan Stanley Capital Services LLC | USD | 196 | BRL | 817 | 10/02/19 | 446 | ||||||||||||||
Morgan Stanley Capital Services LLC | USD | 5,295 | MYR | 22,299 | 2/13/20 | 11,429 | ||||||||||||||
| abfunds.com | AB EMERGING MARKETS MULTI-ASSET PORTFOLIO | 35 | |
PORTFOLIO OF INVESTMENTS(continued)
| Counterparty | Contracts to Deliver (000) | In Exchange For (000) | Settlement Date | Unrealized Appreciation/ (Depreciation) | ||||||||||||||||
Morgan Stanley Capital Services LLC | USD | 4,691 | BRL | 19,405 | 10/02/19 | $ | (20,518 | ) | ||||||||||||
Morgan Stanley Capital Services LLC | USD | 1,936 | CZK | 45,434 | 10/11/19 | (16,003 | ) | |||||||||||||
Morgan Stanley Capital Services LLC | USD | 198 | INR | 13,815 | 10/24/19 | (3,428 | ) | |||||||||||||
Morgan Stanley Capital Services LLC | USD | 740 | THB | 22,768 | 10/30/19 | 5,290 | ||||||||||||||
Morgan Stanley Capital Services LLC | USD | 714 | INR | 51,052 | 10/24/19 | 6,147 | ||||||||||||||
Morgan Stanley Capital Services LLC | USD | 1,476 | RUB | 95,404 | 11/14/19 | (13,632 | ) | |||||||||||||
Royal Bank of Canada | USD | 628 | CNH | 4,474 | 10/24/19 | (1,952 | ) | |||||||||||||
Royal Bank of Scotland PLC | KRW | 651,471 | USD | 552 | 10/30/19 | 7,857 | ||||||||||||||
Royal Bank of Scotland PLC | COP | 429,466 | USD | 127 | 11/14/19 | 4,060 | ||||||||||||||
Societe Generale | MXN | 12,245 | USD | 624 | 10/25/19 | 5,913 | ||||||||||||||
Standard Chartered Bank | USD | 578 | CNH | 4,109 | 10/24/19 | (3,161 | ) | |||||||||||||
Standard Chartered Bank | USD | 150 | INR | 10,700 | 10/24/19 | 984 | ||||||||||||||
Standard Chartered Bank | USD | 544 | IDR | 7,776,124 | 11/21/19 | 1,334 | ||||||||||||||
Standard Chartered Bank | USD | 562 | IDR | 7,893,066 | 11/21/19 | (9,148 | ) | |||||||||||||
UBS AG | USD | 1,360 | CNH | 9,650 | 10/24/19 | (9,656 | ) | |||||||||||||
UBS AG | USD | 1,566 | TWD | 48,681 | 11/27/19 | 8,837 | ||||||||||||||
UBS AG | USD | 373 | KRW | 452,555 | 10/30/19 | 4,790 | ||||||||||||||
UBS AG | USD | 480 | IDR | 6,887,090 | 11/21/19 | 2,927 | ||||||||||||||
|
| |||||||||||||||||||
| $ | 220,532 | |||||||||||||||||||
|
| |||||||||||||||||||
CENTRALLY CLEARED CREDIT DEFAULT SWAPS (see Note D)
| Description | Fixed Rate (Pay) Receive | Payment Frequency | Implied | Notional Amount (000) | Market Value | Upfront Premiums Paid (Received) | Unrealized Appreciation/ (Depreciation) | |||||||||||||||||||||
Buy Contracts |
| |||||||||||||||||||||||||||
Argentine Republic Government Bond, 7.500% 4/22/26, 6/20/24* | (5.00 | )% | Quarterly | 83.65 | % | USD 470 | $ | 280,975 | $ | 275,543 | $ | 5,432 | ||||||||||||||||
Argentine Republic Government Bond, 7.500% 4/22/26, 6/20/24* | (5.00 | ) | Quarterly | 83.65 | USD 110 | 65,760 | 14,439 | 51,321 | ||||||||||||||||||||
| 36 | AB EMERGING MARKETS MULTI-ASSET PORTFOLIO | abfunds.com | |
PORTFOLIO OF INVESTMENTS(continued)
| Description | Fixed Rate (Pay) Receive | Payment Frequency | Implied | Notional Amount (000) | Market Value | Upfront Premiums Paid (Received) | Unrealized Appreciation/ (Depreciation) | |||||||||||||||||||||
Republic of Turkey International Bond 11.875% 1/15/30, 6/20/24* | (1.00 | ) % | Quarterly | 3.39 | % | USD 292 | $ | 28,863 | $ | 37,121 | $ | (8,258 | ) | |||||||||||||||
Republic of Turkey International Bond 11.875% 1/15/30, 12/20/24* | (1.00 | ) | Quarterly | 3.53 | USD 292 | 33,778 | 37,388 | (3,610 | ) | |||||||||||||||||||
Argentine Republic Government Bond, 7.500% 4/22/26, 12/20/24* | (5.00 | ) | Quarterly | 82.23 | USD 470 | 281,851 | 286,973 | (5,122 | ) | |||||||||||||||||||
Sale Contracts |
| |||||||||||||||||||||||||||
Republic of Turkey International Bond 11.875% 1/15/30, 6/20/24* | 1.00 | Quarterly | 3.39 | USD 292 | (29,609 | ) | (32,860 | ) | 3,251 | |||||||||||||||||||
Argentine Republic Government Bond, 7.500% 4/22/26, 6/20/24* | 5.00 | Quarterly | 83.65 | USD 580 | (346,735 | ) | (84,445 | ) | (262,290 | ) | ||||||||||||||||||
Argentine Republic Government Bond, 7.500% 4/22/26, 12/20/24* | 5.00 | Quarterly | 82.23 | USD 470 | (281,851 | ) | (276,178 | ) | (5,673 | ) | ||||||||||||||||||
|
|
|
|
|
| |||||||||||||||||||||||
| $ | 33,032 | $ | 257,981 | $ | (224,949 | ) | ||||||||||||||||||||||
|
|
|
|
|
| |||||||||||||||||||||||
| * | Termination date |
| abfunds.com | AB EMERGING MARKETS MULTI-ASSET PORTFOLIO | 37 | |
PORTFOLIO OF INVESTMENTS(continued)
CENTRALLY CLEARED INTEREST RATE SWAPS (see Note D)
| Rate Type | ||||||||||||||||||||||
Notional Amount (000) | Termination Date | Payments made by the Fund | Payments received by the Fund | Payment Frequency Paid/ Received | Market Value | Upfront Premiums Paid (Received) | Unrealized Appreciation/ (Depreciation) | |||||||||||||||
USD 16,700 | 10/02/29 | 3 Month LIBOR | 1.589% | Quarterly/ Semi- Annual | $ | 17,478 | $ | — | $ | 17,478 | ||||||||||||
TOTAL RETURN SWAPS (see Note D)
| Counterparty & Referenced Obligation | Rate Paid/ Received | Payment Frequency | Current (000) | Maturity Date | Unrealized Appreciation/ (Depreciation) | |||||||||||||||||
Pay Total Return on Reference Obligation |
| |||||||||||||||||||||
Citibank, NA iShares Trust JPMorgan USD Emerging Markets Bond Fund | LIBOR Plus 0.20% | Maturity | USD | 4,534 | 10/15/19 | $ | 31,893 | |||||||||||||||
VARIANCE SWAPS (see Note D)
| Swap Counterparty & Referenced Obligation | Volatility Strike Rate | Payment Frequency | �� | Notional Amount (000) | Market Value | Upfront Premiums (Paid) Received | Unrealized Appreciation/ (Depreciation) | |||||||||||||||||||||
Buy Contracts |
| |||||||||||||||||||||||||||
UBS AG | ||||||||||||||||||||||||||||
Hang Seng China Enterprises Index 12/30/19* | 20.89 | % | Maturity | HKD | 108 | $ | (29,897 | ) | $ | — | $ | (29,897 | ) | |||||||||||||||
Sale Contracts |
| |||||||||||||||||||||||||||
JPMorgan Chase Bank, NA | ||||||||||||||||||||||||||||
Hang Seng China Enterprises Index 12/30/19* | 21.65 | % | Maturity | HKD | 104 | 43,727 | — | 43,727 | ||||||||||||||||||||
|
|
|
|
|
| |||||||||||||||||||||||
| $ | 13,830 | $ | — | $ | 13,830 | |||||||||||||||||||||||
|
|
|
|
|
| |||||||||||||||||||||||
| * | Termination date |
| (a) | Security is exempt from registration under Rule 144A of the Securities Act of 1933. These securities are considered restricted, but liquid and may be resold in transactions exempt from registration, normally to qualified institutional buyers. At September 30, 2019, the aggregate market value of these securities amounted to $30,167,287 or 20.6% of net assets. |
| (b) | Non-income producing security. |
| (c) | Represents entire or partial securities out on loan. See Note E for securities lending information. |
| (d) | Coupon rate adjusts periodically based upon a predetermined schedule. Stated interest rate in effect at September 30, 2019. |
| (e) | Floating Rate Security. Stated interest/floor/ceiling rate was in effect at September 30, 2019. |
| (f) | Defaulted. |
| (g) | Security is exempt from registration under Rule 144A of the Securities Act of 1933. These securities, which represent 0.18% of net assets as of September 30, 2019, are considered illiquid and restricted. Additional information regarding such securities follows: |
| 38 | AB EMERGING MARKETS MULTI-ASSET PORTFOLIO | abfunds.com | |
PORTFOLIO OF INVESTMENTS(continued)
144A/Restricted & | Acquisition Date | Cost | Market Value | Percentage of Net Assets | ||||||||||||
Digicel Group One Ltd. | 1/14/19 | $ | 264,427 | $ | 138,632 | 0.09 | % | |||||||||
Petroleos de Venezuela SA | 9/20/17 | 46,505 | 18,056 | 0.01 | % | |||||||||||
Petroleos de Venezuela SA | 5/26/16 | 73,615 | 17,600 | 0.01 | % | |||||||||||
Petroleos de Venezuela SA | 6/14/17 | 65,696 | 10,276 | 0.01 | % | |||||||||||
Tonon Luxembourg SA | 5/03/19 | 244,851 | 2,672 | 0.00 | % | |||||||||||
Venezuela Government International Bond | 9/05/18 | 68,908 | 25,128 | 0.02 | % | |||||||||||
Venezuela Government International Bond | 9/05/18 | 181,114 | 53,590 | 0.04 | % | |||||||||||
Virgolino de Oliveira Finance SA | 7/12/13 | 172,628 | 4,980 | 0.00 | % | |||||||||||
| (h) | Security in which significant unobservable inputs (Level 3) were used in determining fair value. |
| (i) | Fair valued by the Adviser. |
| (j) | Illiquid security. |
| (k) | The rate shown represents the7-day yield as of period end. |
| (l) | To obtain a copy of the fund’s shareholder report, please go to the Securities and Exchange Commission’s website at www.sec.gov, or call AB at (800)227-4618. |
| (m) | Affiliated investments. |
| † | Pay-In-Kind Payments (PIK). The issuer may pay cash interest and/or interest in additional debt securities. Rates shown are the rates in effect at September 30, 2019. |
Currency Abbreviation:
ARS – Argentine Peso AUD – Australian Dollar BRL – Brazilian Real CAD – Canadian Dollar CLP – Chilean Peso CNH – Chinese Yuan Renminbi (Offshore) COP – Colombian Peso CZK – Czech Koruna EGP – Egyptian Pound EUR – Euro GBP – Great British Pound HKD – Hong Kong Dollar HUF – Hungarian Forint IDR – Indonesian Rupiah INR – Indian Rupee JPY – Japanese Yen KRW – South Korean Won | MXN – Mexican Peso MYR – Malaysian Ringgit NGN – Nigerian Naira NOK – Norwegian Krone PEN – Peruvian Sol PHP – Philippine Peso PLN – Polish Zloty RUB – Russian Ruble SEK – Swedish Krona SGD – Singapore Dollar THB – Thailand Baht TRY – Turkish Lira TWD – New Taiwan Dollar USD – United States Dollar ZAR – South African Rand |
| abfunds.com | AB EMERGING MARKETS MULTI-ASSET PORTFOLIO | 39 | |
PORTFOLIO OF INVESTMENTS(continued)
Glossary:
ADR – American Depositary Receipt
CBT – Chicago Board of Trade
ETF – Exchange Traded Fund
FTSE – Financial Times Stock Exchange
GDR – Global Depositary Receipt
JSC – Joint Stock Company
LIBOR – London Interbank Offered Rates
MSCI – Morgan Stanley Capital International
PJSC – Public Joint Stock Company
See notes to financial statements.
| 40 | AB EMERGING MARKETS MULTI-ASSET PORTFOLIO | abfunds.com | |
STATEMENT OF ASSETS & LIABILITIES
September 30, 2019(unaudited)
| Assets | ||||
Investments in securities, at value | ||||
Unaffiliated issuers (cost $129,980,674) | $ | 130,250,236 | (a) | |
Affiliated issuers (cost $15,467,115—including investment of cash collateral for securities loaned of $1,143,528) | 15,467,115 | |||
Cash collateral due from broker | 1,024,348 | |||
Foreign currencies, at value (cost $257,467) | 255,075 | |||
Receivable for capital stock sold | 3,478,460 | |||
Unaffiliated dividends and interest receivable | 774,283 | |||
Unrealized appreciation on forward currency exchange contracts | 716,159 | |||
Receivable for variation margin on futures | 281,556 | |||
Unrealized appreciation on variance swaps | 43,727 | |||
Unrealized appreciation on total return swaps | 31,893 | |||
Affiliated dividends receivable | 23,559 | |||
Receivable for investment securities sold and foreign currency transactions | 22,280 | |||
Receivable for variation margin on centrally cleared swaps | 17,479 | |||
|
| |||
Total assets | 152,386,170 | |||
|
| |||
| Liabilities | ||||
Payable for investment securities purchased and foreign currency transactions | 2,645,450 | |||
Payable for capital stock redeemed | 1,625,075 | |||
Collateral due to Securities Lending Agent | 1,143,528 | |||
Unrealized depreciation on forward currency exchange contracts | 495,627 | |||
Advisory fee payable | 41,552 | |||
Unrealized depreciation on variance swaps | 29,897 | |||
Administrative fee payable | 14,782 | |||
Distribution fee payable | 2,418 | |||
Due to Custodian | 2,259 | |||
Payable for variation margin on centrally cleared swaps | 1,070 | |||
Accrued expenses and other liabilities | 204,714 | |||
|
| |||
Total liabilities | 6,206,372 | |||
|
| |||
Net Assets | $ | 146,179,798 | ||
|
| |||
| Composition of Net Assets | ||||
Capital stock, at par | $ | 1,696 | ||
Additionalpaid-in capital | 161,344,255 | |||
Accumulated loss | (15,166,153 | ) | ||
|
| |||
| $ | 146,179,798 | |||
|
|
See notes to financial statements.
| abfunds.com | AB EMERGING MARKETS MULTI-ASSET PORTFOLIO | 41 | |
STATEMENT OF ASSETS & LIABILITIES(continued)
Net Asset Value Per Share—33 billion shares of capital stock authorized, $.0001 par value
| Class | Net Assets | Shares Outstanding | Net Asset Value | |||||||||
| ||||||||||||
| A | $ | 4,215,218 | 490,010 | $ | 8.60 | * | ||||||
| ||||||||||||
| C | $ | 1,687,480 | 197,194 | $ | 8.56 | |||||||
| ||||||||||||
| Advisor | $ | 139,564,140 | 16,185,131 | $ | 8.62 | |||||||
| ||||||||||||
| R | $ | 293,638 | 34,144 | $ | 8.60 | |||||||
| ||||||||||||
| K | $ | 225,198 | 26,217 | $ | 8.59 | |||||||
| ||||||||||||
| I | $ | 13,902 | �� | 1,627 | $ | 8.54 | ||||||
| ||||||||||||
| Z | $ | 180,222 | 21,041 | $ | 8.57 | |||||||
| ||||||||||||
| (a) | Includes securities on loan with a value of $1,112,531 (see Note E). |
| * | The maximum offering price per share for Class A shares was $8.98, which reflects a sales charge of 4.25%. |
See notes to financial statements.
| 42 | AB EMERGING MARKETS MULTI-ASSET PORTFOLIO | abfunds.com | |
STATEMENT OF OPERATIONS
Six Months Ended September 30, 2019(unaudited)
| Investment Income | ||||||||
Dividends | ||||||||
Unaffiliated issuers (net of foreign taxes withheld of $288,135) | $ | 2,208,835 | ||||||
Affiliated issuers | 197,775 | |||||||
Interest (net of foreign taxes withheld of $2,676) | 1,181,152 | |||||||
Securities lending income | 4,805 | $ | 3,592,567 | |||||
|
| |||||||
| Expenses | ||||||||
Advisory fee (see Note B) | 575,039 | |||||||
Transfer agency—Class A | 1,296 | |||||||
Transfer agency—Class C | 572 | |||||||
Transfer agency—Advisor Class | 33,400 | |||||||
Transfer agency—Class R | 396 | |||||||
Transfer agency—Class K | 289 | |||||||
Transfer agency—Class I | 13 | |||||||
Transfer agency—Class Z | 23 | |||||||
Distribution fee—Class A | 6,100 | |||||||
Distribution fee—Class C | 10,264 | |||||||
Distribution fee—Class R | 761 | |||||||
Distribution fee—Class K | 362 | |||||||
Custodian | 153,329 | |||||||
Registration fees | 54,620 | |||||||
Audit and tax | 48,053 | |||||||
Administrative | 36,547 | |||||||
Printing | 24,482 | |||||||
Legal | 21,031 | |||||||
Directors’ fees | 11,139 | |||||||
Miscellaneous | 48,022 | |||||||
|
| |||||||
Total expenses | 1,025,738 | |||||||
Less: expenses waived and reimbursed by the Adviser (see Note B and Note E) | (346,373 | ) | ||||||
|
| |||||||
Net expenses | 679,365 | |||||||
|
| |||||||
Net investment income | 2,913,202 | |||||||
|
|
See notes to financial statements.
| abfunds.com | AB EMERGING MARKETS MULTI-ASSET PORTFOLIO | 43 | |
STATEMENT OF OPERATIONS(continued)
| Realized and Unrealized Gain (Loss) on Investment and Foreign Currency Transactions | ||||||||
Net realized gain (loss) on: | ||||||||
Investment transactions | $ | (3,167,238 | )(a) | |||||
Forward currency exchange contracts | 1,991,335 | |||||||
Futures | 103,864 | |||||||
Options written | 1,902 | |||||||
Swaps | 59,355 | |||||||
Foreign currency transactions | (235,566 | ) | ||||||
Net change in unrealized appreciation/depreciation on: | ||||||||
Investments | (2,569,986 | )(b) | ||||||
Forward currency exchange contracts | 34,088 | |||||||
Futures | (669,385 | ) | ||||||
Swaps | (82,529 | ) | ||||||
Foreign currency denominated assets and liabilities | (1,874 | ) | ||||||
|
| |||||||
Net loss on investment and foreign currency transactions | (4,536,034 | ) | ||||||
|
| |||||||
Net Decrease in Net Assets from Operations | $ | (1,622,832 | ) | |||||
|
|
| (a) | Includes foreign capital gains taxes of $28,007. |
| (b) | Net of increase in accrued foreign capital gains of $26,569. |
See notes to financial statements.
| 44 | AB EMERGING MARKETS MULTI-ASSET PORTFOLIO | abfunds.com | |
STATEMENT OF CHANGES IN NET ASSETS
| Six Months Ended September 30, 2019 (unaudited) | Year Ended March 31, 2019 | |||||||
| Increase (Decrease) in Net Assets from Operations | ||||||||
Net investment income | $ | 2,913,202 | $ | 4,313,682 | ||||
Net realized gain (loss) on investment and foreign currency transactions | (1,246,348 | ) | (8,417,772 | ) | ||||
Net change in unrealized appreciation/depreciation on investments and foreign currency denominated assets and liabilities | (3,289,686 | ) | (5,538,354 | ) | ||||
|
|
|
| |||||
Net decrease in net assets from operations | (1,622,832 | ) | (9,642,444 | ) | ||||
| Distributions to Shareholders | ||||||||
Class A | (91,489 | ) | (395,036 | ) | ||||
Class C | (33,084 | ) | (105,468 | ) | ||||
Advisor Class | (2,753,050 | ) | (5,672,588 | ) | ||||
Class R | (5,430 | ) | (11,634 | ) | ||||
Class K | (4,984 | ) | (15,613 | ) | ||||
Class I | (1,521 | ) | (8,285 | ) | ||||
Class Z | (2,277 | ) | (491 | ) | ||||
| Capital Stock Transactions | ||||||||
Net increase | 23,683,645 | 510,771 | ||||||
|
|
|
| |||||
Total increase (decrease) | 19,168,978 | (15,340,788 | ) | |||||
| Net Assets | ||||||||
Beginning of period | 127,010,820 | 142,351,608 | ||||||
|
|
|
| |||||
End of period | $ | 146,179,798 | $ | 127,010,820 | ||||
|
|
|
| |||||
See notes to financial statements.
| abfunds.com | AB EMERGING MARKETS MULTI-ASSET PORTFOLIO | 45 | |
NOTES TO FINANCIAL STATEMENTS
September 30, 2019(unaudited)
NOTE A
Significant Accounting Policies
AB Cap Fund, Inc. (the “Company”), which is a Maryland corporation, is registered under the Investment Company Act of 1940 as anopen-end management investment company. The Company operates as a series company currently comprised of 28 portfolios currently in operation. Each portfolio is considered to be a separate entity for financial reporting and tax purposes. This report relates only to the AB Emerging Markets Multi-Asset Portfolio (the “Fund”), a diversified portfolio. The Fund has authorized the issuance of Class A, Class B, Class C, Advisor Class, Class R, Class K, Class I, Class Z, Class T, Class 1 and Class 2 shares. Class B, Class T, Class 1, and Class 2 shares are not currently being offered. As of March 31, 2019, AllianceBernstein L.P. (the “Adviser”) was the sole shareholder of the Class Z shares. Class A shares are sold with afront-end sales charge of up to 4.25% for purchases not exceeding $1,000,000. With respect to purchases of $1,000,000 or more, Class A shares redeemed within one year of purchase may be subject to a contingent deferred sales charge of 1%. Class C shares are subject to a contingent deferred sales charge of 1% on redemptions made within the first year after purchase, and 0% after the first year of purchase. Class C shares will automatically convert to Class A shares ten years after the end of the calendar month of purchase. Class R and Class K shares are sold without an initial or contingent deferred sales charge. Advisor Class and Class I shares are sold without an initial or contingent deferred sales charge and are not subject to ongoing distribution expenses. All eleven classes of shares have identical voting, dividend, liquidation and other rights, except that the classes bear different distribution and transfer agency expenses. Each class has exclusive voting rights with respect to its distribution plan. The financial statements have been prepared in conformity with U.S. generally accepted accounting principles (“U.S. GAAP”), which require management to make certain estimates and assumptions that affect the reported amounts of assets and liabilities in the financial statements and amounts of income and expenses during the reporting period. Actual results could differ from those estimates. The Fund is an investment company under U.S. GAAP and follows the accounting and reporting guidance applicable to investment companies. The following is a summary of significant accounting policies followed by the Fund.
1. Security Valuation
Portfolio securities are valued at their current market value determined on the basis of market quotations or, if market quotations are not readily available or are deemed unreliable, at “fair value” as determined in accordance with procedures established by and under the general supervision of the Company’s Board of Directors (the “Board”).
| 46 | AB EMERGING MARKETS MULTI-ASSET PORTFOLIO | abfunds.com | |
NOTES TO FINANCIAL STATEMENTS(continued)
In general, the market values of securities which are readily available and deemed reliable are determined as follows: securities listed on a national securities exchange (other than securities listed on the NASDAQ Stock Market, Inc. (“NASDAQ”)) or on a foreign securities exchange are valued at the last sale price at the close of the exchange or foreign securities exchange. If there has been no sale on such day, the securities are valued at the last traded price from the previous day. Securities listed on more than one exchange are valued by reference to the principal exchange on which the securities are traded; securities listed only on NASDAQ are valued in accordance with the NASDAQ Official Closing Price; listed or over the counter (“OTC”) market put or call options are valued at the mid level between the current bid and ask prices. If either a current bid or current ask price is unavailable, AllianceBernstein L.P. (the “Adviser”) will have discretion to determine the best valuation (e.g., last trade price in the case of listed options); open futures are valued using the closing settlement price or, in the absence of such a price, the most recent quoted bid price. If there are no quotations available for the day of valuation, the last available closing settlement price is used; U.S. Government securities and any other debt instruments having 60 days or less remaining until maturity are generally valued at market by an independent pricing vendor, if a market price is available. If a market price is not available, the securities are valued at amortized cost. This methodology is commonly used for short term securities that have an original maturity of 60 days or less, as well as short term securities that had an original term to maturity that exceeded 60 days. In instances when amortized cost is utilized, the Valuation Committee (the “Committee”) must reasonably conclude that the utilization of amortized cost is approximately the same as the fair value of the security. Such factors the Committee will consider include, but are not limited to, an impairment of the creditworthiness of the issuer or material changes in interest rates. Fixed-income securities, including mortgage-backed and asset-backed securities, may be valued on the basis of prices provided by a pricing service or at a price obtained from one or more of the major broker-dealers. In cases where broker-dealer quotes are obtained, the Adviser may establish procedures whereby changes in market yields or spreads are used to adjust, on a daily basis, a recently obtained quoted price on a security. Swaps and other derivatives are valued daily, primarily using independent pricing services, independent pricing models using market inputs, as well as third party broker-dealers or counterparties. Open end mutual funds are valued at the closing net asset value per share, while exchange traded funds are valued at the closing market price per share.
Securities for which market quotations are not readily available (including restricted securities) or are deemed unreliable are valued at fair value as deemed appropriate by the Adviser. Factors considered in making this determination may include, but are not limited to, information obtained by
| abfunds.com | AB EMERGING MARKETS MULTI-ASSET PORTFOLIO | 47 | |
NOTES TO FINANCIAL STATEMENTS(continued)
contacting the issuer, analysts, analysis of the issuer’s financial statements or other available documents. In addition, the Fund may use fair value pricing for securities primarily traded innon-U.S. markets because most foreign markets close well before the Fund values its securities at 4:00 p.m., Eastern Time. The earlier close of these foreign markets gives rise to the possibility that significant events, including broad market moves, may have occurred in the interim and may materially affect the value of those securities. To account for this, the Fund generally values many of its foreign equity securities using fair value prices based on third party vendor modeling tools to the extent available.
2. Fair Value Measurements
In accordance with U.S. GAAP regarding fair value measurements, fair value is defined as the price that the Fund would receive to sell an asset or pay to transfer a liability in an orderly transaction between market participants at the measurement date. U.S. GAAP establishes a framework for measuring fair value, and a three-level hierarchy for fair value measurements based upon the transparency of inputs to the valuation of an asset or liability (including those valued based on their market values as described in Note A.1 above). Inputs may be observable or unobservable and refer broadly to the assumptions that market participants would use in pricing the asset or liability. Observable inputs reflect the assumptions market participants would use in pricing the asset or liability based on market data obtained from sources independent of the Fund. Unobservable inputs reflect the Fund’s own assumptions about the assumptions that market participants would use in pricing the asset or liability based on the best information available in the circumstances. Each investment is assigned a level based upon the observability of the inputs which are significant to the overall valuation. The three-tier hierarchy of inputs is summarized below.
| • | Level 1—quoted prices in active markets for identical investments |
| • | Level 2—other significant observable inputs (including quoted prices for similar investments, interest rates, prepayment speeds, credit risk, etc.) |
| • | Level 3—significant unobservable inputs (including the Fund’s own assumptions in determining the fair value of investments) |
The fair value of debt instruments, such as bonds, andover-the-counter derivatives is generally based on market price quotations, recently executed market transactions (where observable) or industry recognized modeling techniques and are generally classified as Level 2. Pricing vendor inputs to Level 2 valuations may include quoted prices for similar investments in active markets, interest rate curves, coupon rates, currency rates, yield curves, option adjusted spreads, default rates, credit spreads and
| 48 | AB EMERGING MARKETS MULTI-ASSET PORTFOLIO | abfunds.com | |
NOTES TO FINANCIAL STATEMENTS(continued)
other unique security features in order to estimate the relevant cash flows which are then discounted to calculate fair values. If these inputs are unobservable and significant to the fair value, these investments will be classified as Level 3.
Where readily available market prices or relevant bid prices are not available for certain equity investments, such investments may be valued based on similar publicly traded investments, movements in relevant indices since last available prices or based upon underlying company fundamentals and comparable company data (such as multiples to earnings or other multiples to equity). Where an investment is valued using an observable input, such as another publicly traded security, the investment will be classified as Level 2. If management determines that an adjustment is appropriate based on restrictions on resale, illiquidity or uncertainty, and such adjustment is a significant component of the valuation, the investment will be classified as Level 3. An investment will also be classified as Level 3 where management uses company fundamentals and other significant inputs to determine the valuation.
Other fixed income investments, includingnon-U.S. government and corporate debt, are generally valued using quoted market prices, if available, which are typically impacted by current interest rates, maturity dates and any perceived credit risk of the issuer. Additionally, in the absence of quoted market prices, these inputs are used by pricing vendors to derive a valuation based upon industry or proprietary models which incorporate issuer specific data with relevant yield/spread comparisons with more widely quoted bonds with similar key characteristics. Those investments for which there are observable inputs are classified as Level 2. Where the inputs are not observable, the investments are classified as Level 3.
The following table summarizes the valuation of the Fund’s investments by the above fair value hierarchy levels as of September 30, 2019:
Investments in Securities | Level 1 | Level 2 | Level 3 | Total | ||||||||||||
Assets: |
| |||||||||||||||
Common Stocks: | ||||||||||||||||
Financials | $ | 4,434,298 | $ | 20,094,295 | $ | – 0 | – | $ | 24,528,593 | |||||||
Information Technology | 986,007 | 13,520,954 | – 0 | – | 14,506,961 | |||||||||||
Consumer Discretionary | 5,939,643 | 5,851,655 | – 0 | – | 11,791,298 | |||||||||||
Materials | 304,488 | 7,271,049 | – 0 | – | 7,575,537 | |||||||||||
Energy | 4,742,835 | 1,680,632 | – 0 | – | 6,423,467 | |||||||||||
Industrials | 532,568 | 5,727,412 | – 0 | – | 6,259,980 | |||||||||||
Communication Services | 1,550,544 | 3,843,959 | – 0 | – | 5,394,503 | |||||||||||
Real Estate | 1,695,774 | 3,403,744 | – 0 | – | 5,099,518 | |||||||||||
Utilities | 3,114,367 | 788,430 | – 0 | – | 3,902,797 | |||||||||||
Consumer Staples | 1,095,957 | 2,562,207 | – 0 | – | 3,658,164 | |||||||||||
| abfunds.com | AB EMERGING MARKETS MULTI-ASSET PORTFOLIO | 49 | |
NOTES TO FINANCIAL STATEMENTS(continued)
Investments in Securities | Level 1 | Level 2 | Level 3 | Total | ||||||||||||
Assets: |
| |||||||||||||||
Common Stocks: | ||||||||||||||||
Health Care | $ | 166,798 | $ | 445,366 | $ | – 0 | – | $ | 612,164 | |||||||
Fixed Income Securities: | ||||||||||||||||
Sovereign Bonds | – 0 | – | 24,012,506 | – 0 | – | 24,012,506 | ||||||||||
Corporate Bonds | – 0 | – | 7,309,342 | 2,672 | 7,312,014 | |||||||||||
Quasi-Sovereign Bonds | – 0 | – | 3,666,178 | – 0 | – | 3,666,178 | ||||||||||
Treasury Bonds | – 0 | – | 2,631,136 | – 0 | – | 2,631,136 | ||||||||||
Emerging Markets – Treasuries | – 0 | – | 132,990 | – 0 | – | 132,990 | ||||||||||
Regional Bonds | – 0 | – | 37,060 | – 0 | – | 37,060 | ||||||||||
Equity Linked Notes | – 0 | – | 876,562 | – 0 | – | 876,562 | ||||||||||
Investment Companies | – 0 | – | 159,399 | – 0 | – | 159,399 | ||||||||||
Options Purchased – Calls | – 0 | – | 133,126 | – 0 | – | 133,126 | ||||||||||
Short-Term Investments: | ||||||||||||||||
Investment Companies | 14,323,587 | – 0 | – | – 0 | – | 14,323,587 | ||||||||||
Treasury Bills | – 0 | – | 1,133,115 | – 0 | – | 1,133,115 | ||||||||||
Time Deposit | – 0 | – | 403,168 | – 0 | – | 403,168 | ||||||||||
Investments of Cash Collateral for Securities Loaned in Affiliated Money Market Fund | 1,143,528 | – 0 | – | – 0 | – | 1,143,528 | ||||||||||
|
|
|
|
|
|
|
| |||||||||
Total Investments in Securities | 40,030,394 | 105,684,285 | + | 2,672 | 145,717,351 | |||||||||||
Other Financial Instruments*: | ||||||||||||||||
Assets |
| |||||||||||||||
Futures | 33,953 | – 0 | – | – 0 | – | 33,953 | † | |||||||||
Forward Currency Exchange Contracts | – 0 | – | 716,159 | – 0 | – | 716,159 | ||||||||||
Centrally Cleared Credit Default Swaps | – 0 | – | 691,227 | – 0 | – | 691,227 | † | |||||||||
Centrally Cleared Interest Rate Swaps | – 0 | – | 17,478 | – 0 | – | 17,478 | † | |||||||||
Total Return Swaps | – 0 | – | 31,893 | – 0 | – | 31,893 | ||||||||||
Variance Swaps | – 0 | – | 43,727 | – 0 | – | 43,727 | ||||||||||
Liabilities |
| |||||||||||||||
Futures | (192,915 | ) | (55,709 | ) | – 0 | – | (248,624 | )† | ||||||||
Forward Currency Exchange Contracts | – 0 | – | (495,627 | ) | – 0 | – | (495,627 | ) | ||||||||
Centrally Cleared Credit Default Swaps | – 0 | – | (658,195 | ) | – 0 | – | (658,195 | )† | ||||||||
Variance Swaps | – 0 | – | (29,897 | ) | – 0 | – | (29,897 | ) | ||||||||
|
|
|
|
|
|
|
| |||||||||
Total | $ | 39,871,432 | $ | 105,945,341 | $ | 2,672 | $ | 145,819,445 | ||||||||
|
|
|
|
|
|
|
| |||||||||
| * | Other financial instruments are derivative instruments, such as futures, forwards and swaps, which are valued at the unrealized appreciation/(depreciation) on the instrument. Other financial instruments may also include swaps with upfront premiums, options written and swaptions written which are valued at market value. |
| + | A significant portion of the Fund’s foreign equity investments are categorized as Level 2 investments since they are valued using fair value prices based on third party vendor modeling tools to the extent available, see Note A.1. |
| † | Only variation margin receivable/payable at period end is reported within the statement of assets and liabilities. This amount reflects cumulative unrealized appreciation/(depreciation) on futures and centrally cleared swaps as reported in the portfolio of investments. Where applicable, centrally cleared swaps with upfront premiums are presented here at market value. |
| 50 | AB EMERGING MARKETS MULTI-ASSET PORTFOLIO | abfunds.com | |
NOTES TO FINANCIAL STATEMENTS(continued)
3. Currency Translation
Assets and liabilities denominated in foreign currencies and commitments under forward currency exchange contracts are translated into U.S. dollars at the mean of the quoted bid and ask prices of such currencies against the U.S. dollar. Purchases and sales of portfolio securities are translated into U.S. dollars at the rates of exchange prevailing when such securities were acquired or sold. Income and expenses are translated into U.S. dollars at the rates of exchange prevailing when accrued.
Net realized gain or loss on foreign currency transactions represents foreign exchange gains and losses from sales and maturities of foreign fixed income investments, holding of foreign currencies, currency gains or losses realized between the trade and settlement dates on foreign investment transactions, and the difference between the amounts of dividends, interest and foreign withholding taxes recorded on the Fund’s books and the U.S. dollar equivalent amounts actually received or paid. Net unrealized currency gains and losses from valuing foreign currency denominated assets and liabilities at period end exchange rates are reflected as a component of net unrealized appreciation or depreciation of foreign currency denominated assets and liabilities.
4. Taxes
It is the Fund’s policy to meet the requirements of the Internal Revenue Code applicable to regulated investment companies and to distribute all of its investment company taxable income and net realized gains, if any, to shareholders. Therefore, no provisions for federal income or excise taxes are required. The Fund may be subject to taxes imposed by countries in which it invests. Such taxes are generally based on income and/or capital gains earned or repatriated. Taxes are accrued and applied to net investment income, net realized gains and net unrealized appreciation/depreciation as such income and/or gains are earned.
In accordance with U.S. GAAP requirements regarding accounting for uncertainties in income taxes, management has analyzed the Fund’s tax positions taken or expected to be taken on federal and state income tax returns for all open tax years (the current and the prior three tax years) and has concluded that no provision for income tax is required in the Fund’s financial statements.
5. Investment Income and Investment Transactions
Dividend income is recorded on theex-dividend date or as soon as the Fund is informed of the dividend. Interest income is accrued daily. Investment transactions are accounted for on the date the securities are purchased or sold. Investment gains or losses are determined on the identified cost basis. The Fund amortizes premiums and accretes discounts as adjustments to interest income.
| abfunds.com | AB EMERGING MARKETS MULTI-ASSET PORTFOLIO | 51 | |
NOTES TO FINANCIAL STATEMENTS(continued)
6. Class Allocations
All income earned and expenses incurred by the Fund are borne on apro-rata basis by each settled class of shares, based on the proportionate interest in the Fund represented by the net assets of such class, except for class specific expenses which are allocated to the respective class. Expenses of the Company are charged proportionately to each portfolio or based on other appropriate methods. Realized and unrealized gains and losses are allocated among the various share classes based on respective net assets.
7. Dividends and Distributions
Dividends and distributions to shareholders, if any, are recorded on theex-dividend date. Income dividends and capital gains distributions are determined in accordance with federal tax regulations and may differ from those determined in accordance with U.S. GAAP. To the extent these differences are permanent, such amounts are reclassified within the capital accounts based on their federal tax basis treatment; temporary differences do not require such reclassification.
NOTE B
Advisory Fee and Other Transactions with Affiliates
Under the terms of the investment advisory agreement, the Fund pays the Adviser an advisory fee at an annual rate of .85% of the first $1 billion, .80% of the next $1 billion, .75% of the next $1 billion and .70% in excess of $3 billion of the Fund’s average daily net assets. Prior to February 3, 2017, the Fund paid the Adviser at an annual rate of 1% of the first $1 billion, .95% of the next $1 billion, .90% of the next $1 billion and .85% in excess of $3 billion of the Fund’s average daily net assets. The fee is accrued daily and paid monthly. The Adviser has agreed to reimburse its fees and bear certain expenses to the extent necessary to limit total operating expenses on an annual basis (“the Expense Caps”) to 1.24%, 1.99%, .99%, 1.49%, 1.24%, .99% and .99% of the daily average net assets for the Class A, Class C, Advisor Class, Class R, Class K, Class I and Class Z shares, respectively. For the six months ended September 30, 2019, such waiver/reimbursement amounted to $337,891. The Expense Caps may not be terminated before July 31, 2020.
Pursuant to the investment advisory agreement, the Fund may reimburse the Adviser for certain legal and accounting services provided to the Fund by the Adviser. For the six months ended September 30, 2019, the reimbursement for such services amounted to $36,547.
The Fund compensates AllianceBernstein Investor Services, Inc. (“ABIS”), a wholly-owned subsidiary of the Adviser, under a Transfer Agency Agreement for providing personnel and facilities to perform transfer agency
| 52 | AB EMERGING MARKETS MULTI-ASSET PORTFOLIO | abfunds.com | |
NOTES TO FINANCIAL STATEMENTS(continued)
services for the Fund. ABIS may make payments to intermediaries that provide omnibus account services,sub-accounting services and/or networking services. The compensation retained by ABIS amounted to $12,434 for the six months ended September 30, 2019.
AllianceBernstein Investments, Inc. (the “Distributor”), a wholly-owned subsidiary of the Adviser, serves as the distributor of the Fund’s shares. The Distributor has advised the Fund that it has retainedfront-end sales charges of $132 from the sale of Class A shares and received $22 and $31 in contingent deferred sales charges imposed upon redemption by shareholders of Class A and Class C shares, respectively, for the six months ended September 30, 2019.
The Fund may invest in AB Government Money Market Portfolio (the “Government Money Market Portfolio”) which has a contractual annual advisory fee rate of .20% of the portfolio’s average daily net assets and bears its own expenses. Effective August 1, 2018, the Adviser has contractually agreed to waive .10% of the advisory fee of Government Money Market Portfolio (resulting in a net advisory fee of .10%) until August 31, 2020. In connection with the investment by the Fund in Government Money Market Portfolio, the Adviser has contractually agreed to waive its advisory fee from the Fund in an amount equal to the Fund’s pro rata share of the effective advisory fee of Government Money Market Portfolio, as borne indirectly by the Fund as an acquired fund fee and expense. For the six months ended September 30, 2019, such waiver amounted to $8,417.
A summary of the Fund’s transactions in AB mutual funds for the six months ended September 30, 2019 is as follows:
| Market Value 3/31/19 (000) | Purchases at Cost (000) | Sales Proceeds (000) | Market Value 9/30/19 (000) | Distributions | ||||||||||||||||
| Fund | Dividend Income (000) | |||||||||||||||||||
Government Money Market Portfolio | $ | 19,689 | $ | 34,793 | $ | 40,159 | $ | 14,323 | $ | 195 | ||||||||||
Government Money Market Portfolio* | 755 | 7,385 | 6,996 | 1,144 | 3 | |||||||||||||||
|
|
|
| |||||||||||||||||
Total | $ | 15,467 | $ | 198 | ||||||||||||||||
|
|
|
| |||||||||||||||||
| * | Investment of cash collateral for securities lending transactions (see Note E). |
During the second quarter of 2018, AXA S.A. (“AXA”), a French holding company for the AXA Group, a worldwide leader in life, property and casualty and health insurance and asset management, completed the sale of a minority stake in its subsidiary, AXA Equitable Holdings, Inc. (“AXA Equitable”), through an initial public offering. AXA Equitable is the holding
| abfunds.com | AB EMERGING MARKETS MULTI-ASSET PORTFOLIO | 53 | |
NOTES TO FINANCIAL STATEMENTS(continued)
company for a diverse group of financial services companies, including an approximately 65.3% economic interest in the Adviser and a 100% interest in AllianceBernstein Corporation, the general partner of the Adviser. Since the initial sale, AXA has completed additional offerings, most recently during the fourth quarter of 2019. As a result, AXA owned 10.1% of the outstanding shares of common stock of AXA Equitable as of November 13, 2019, and no longer owns a controlling interest in AXA Equitable. AXA previously announced its intention to sell its entire interest in AXA Equitable over time, subject to market conditions and other factors (the “Plan”). Most of AXA’s remaining AXA Equitable shares are to be delivered on redemption of AXA bonds mandatorily exchangeable into AXA Equitable shares and maturing in May 2021. AXA retains sole discretion to determine the timing of any future sales of its remaining shares of AXA Equitable common stock.
The latest transaction under the Plan, which occurred on November 13, 2019, resulted in the indirect transfer of a “controlling block” of voting securities of the Adviser (a “Change of Control Event”) and was deemed an “assignment” causing a termination of the Fund’s investment advisory agreement. In order to ensure that investment advisory services could continue uninterrupted in the event of a Change of Control Event, the Board previously approved a new investment advisory agreement with the Adviser. Shareholders of the Fund subsequently approved the new investment advisory agreement, which became effective on November 13, 2019.
NOTE C
Distribution Services Agreement
The Fund has adopted a Distribution Services Agreement (the “Agreement”) pursuant to Rule12b-1 under the Investment Company Act of 1940. Under the Agreement the Fund pays distribution and servicing fees to the Distributor at an annual rate of up to .30% of the Fund’s average daily net assets attributable to Class A shares, 1% of the Fund’s average daily net assets attributable to Class C shares, .50% of the Fund’s average daily net assets attributable to Class R shares and .25% of the Fund’s average daily net assets attributable to Class K shares. Payments under the Agreement in respect of Class A shares are currently limited to an annual rate of .25% of Class A share’s average daily net assets. There are no distribution and servicing fees on Advisor Class and Class I shares. The fees are accrued daily and paid monthly. The Agreement provides that the Distributor will use such payments in their entirety for distribution assistance and promotional activities. Since the commencement of the Fund’s operation, the Distributor has incurred expenses in excess of the distribution costs reimbursed by the Fund in the amounts of $7,651, $395 and $1,576 for Class C, Class K and Class R shares, respectively. While
| 54 | AB EMERGING MARKETS MULTI-ASSET PORTFOLIO | abfunds.com | |
NOTES TO FINANCIAL STATEMENTS(continued)
such costs may be recovered from the Fund in future periods so long as the Agreement is in effect, the rate of the distribution and servicing fees payable under the Agreement may not be increased without a shareholder vote. In accordance with the Agreement, there is no provision for recovery of unreimbursed distribution costs, incurred by the Distributor, beyond the current fiscal period for Class A shares. The Agreement also provides that the Adviser may use its own resources to finance the distribution of the Fund’s shares.
NOTE D
Investment Transactions
Purchases and sales of investment securities (excluding short-term investments) for the six months ended September 30, 2019, were as follows:
| Purchases | Sales | |||||||
Investment securities (excluding | $ | 93,065,604 | $ | 61,180,411 | ||||
U.S. government securities | – 0 | – | – 0 | – | ||||
The cost of investments for federal income tax purposes was substantially the same as the cost for financial reporting purposes. Accordingly, gross unrealized appreciation and unrealized depreciation are as follows:
Gross unrealized appreciation | $ | 8,696,623 | ||
Gross unrealized depreciation | (8,582,948 | ) | ||
|
| |||
Net unrealized appreciation | $ | 113,675 | ||
|
|
1. Derivative Financial Instruments
The Fund may use derivatives in an effort to earn income and enhance returns, to replace more traditional direct investments, to obtain exposure to otherwise inaccessible markets (collectively, “investment purposes”), or to hedge or adjust the risk profile of its portfolio.
The principal types of derivatives utilized by the Fund, as well as the methods in which they may be used are:
| • | Forward Currency Exchange Contracts |
The Fund may enter into forward currency exchange contracts in order to hedge its exposure to changes in foreign currency exchange rates on its foreign portfolio holdings, to hedge certain firm purchase and sale commitments denominated in foreign currencies and fornon-hedging purposes as a means of making direct investments in foreign currencies, as described below under “Currency Transactions”.
A forward currency exchange contract is a commitment to purchase or sell a foreign currency at a future date at a negotiated forward rate.
| abfunds.com | AB EMERGING MARKETS MULTI-ASSET PORTFOLIO | 55 | |
NOTES TO FINANCIAL STATEMENTS(continued)
The gain or loss arising from the difference between the original contract and the closing of such contract would be included in net realized gain or loss on forward currency exchange contracts. Fluctuations in the value of open forward currency exchange contracts are recorded for financial reporting purposes as unrealized appreciation and/or depreciation by the Fund. Risks may arise from the potential inability of a counterparty to meet the terms of a contract and from unanticipated movements in the value of a foreign currency relative to the U.S. dollar.
During the six months ended September 30, 2019, the Fund held forward currency exchange contracts for hedging andnon-hedging purposes.
| • | Futures |
The Fund may buy or sell futures for investment purposes or for the purpose of hedging its portfolio against adverse effects of potential movements in the market. The Fund bears the market risk that arises from changes in the value of these instruments and the imperfect correlation between movements in the price of the futures and movements in the price of the assets, reference rates or indices which they are designed to track. Among other things, the Fund may purchase or sell futures for foreign currencies or options thereon fornon-hedging purposes as a means of making direct investment in foreign currencies, as described below under “Currency Transactions”.
At the time the Fund enters into futures, the Fund deposits and maintains as collateral an initial margin with the broker, as required by the exchange on which the transaction is effected. Such amount is shown as cash collateral due from broker on the statement of assets and liabilities. Pursuant to the contract, the Fund agrees to receive from or pay to the broker an amount of cash equal to the daily fluctuation in the value of the contract. Such receipts or payments are known as variation margin and are recorded by the Fund as unrealized gains or losses. Risks may arise from the potential inability of a counterparty to meet the terms of the contract. The credit/counterparty risk for exchange-traded futures is generally less than privately negotiated futures, since the clearinghouse, which is the issuer or counterparty to each exchange-traded future, has robust risk mitigation standards, including the requirement to provide initial and variation margin. When the contract is closed, the Fund records a realized gain or loss equal to the difference between the value of the contract at the time it was opened and the time it was closed.
Use of long futures subjects the Fund to risk of loss in excess of the amounts shown on the statement of assets and liabilities, up to the notional value of the futures. Use of short futures subjects the Fund to
| 56 | AB EMERGING MARKETS MULTI-ASSET PORTFOLIO | abfunds.com | |
NOTES TO FINANCIAL STATEMENTS(continued)
unlimited risk of loss. Under some circumstances, futures exchanges may establish daily limits on the amount that the price of futures can vary from the previous day’s settlement price, which could effectively prevent liquidation of unfavorable positions.
During the six months ended September 30, 2019, the Fund held futures for hedging andnon-hedging purposes.
| • | Option Transactions |
For hedging and investment purposes, the Fund may purchase and write (sell) put and call options on U.S. and foreign securities, including government securities, and foreign currencies that are traded on U.S. and foreign securities exchanges andover-the-counter markets. Among other things, the Fund may use options transactions fornon-hedging purposes as a means of making direct investments in foreign currencies, as described below under “Currency Transactions” and may use options strategies involving the purchase and/or writing of various combinations of call and/or put options, for hedging and investment purposes.
The risk associated with purchasing an option is that the Fund pays a premium whether or not the option is exercised. Additionally, the Fund bears the risk of loss of the premium and change in market value should the counterparty not perform under the contract. If a put or call option purchased by the Fund were permitted to expire without being sold or exercised, its premium would represent a loss to the Fund. Put and call options purchased are accounted for in the same manner as portfolio securities. The cost of securities acquired through the exercise of call options is increased by premiums paid. The proceeds from securities sold through the exercise of put options are decreased by the premiums paid.
When the Fund writes an option, the premium received by the Fund is recorded as a liability and is subsequently adjusted to the current market value of the option written. The Fund’s maximum payment for written put options equates to the number of shares multiplied by the strike price. In certain circumstances maximum payout amounts may be partially offset by recovery values of the respective referenced assets and upfront premium received upon entering into the contract. Premiums received from written options which expire unexercised are recorded by the Fund on the expiration date as realized gains from options written. The difference between the premium received and the amount paid on effecting a closing purchase transaction, including brokerage commissions, is also treated as a realized gain, or if the premium received is less than the amount paid for the closing purchase transaction, as a realized loss. If a call option is exercised, the premium received is added to the proceeds from the sale of the
| abfunds.com | AB EMERGING MARKETS MULTI-ASSET PORTFOLIO | 57 | |
NOTES TO FINANCIAL STATEMENTS(continued)
underlying security or currency in determining whether the Fund has realized a gain or loss. If a put option is exercised, the premium received reduces the cost basis of the security or currency purchased by the Fund. In writing an option, the Fund bears the market risk of an unfavorable change in the price of the security or currency underlying the written option. Exercise of an option written by the Fund could result in the Fund selling or buying a security or currency at a price different from the current market value.
The Fund may also invest in options on swap agreements, also called “swaptions”. A swaption is an option that gives the buyer the right, but not the obligation, to enter into a swap on a future date in exchange for paying a market-based “premium”. A receiver swaption gives the owner the right to receive the total return of a specified asset, reference rate, or index. A payer swaption gives the owner the right to pay the total return of a specified asset, reference rate, or index. Swaptions also include options that allow an existing swap to be terminated or extended by one of the counterparties. The Fund’s maximum payment for written put swaptions equates to the notional amount of the underlying swap. In certain circumstances maximum payout amounts may be partially offset by recovery values of the respective referenced assets and upfront premium received upon entering into the contract.
During the six months ended September 30, 2019, the Fund held purchased options for hedging andnon-hedging purposes.
During the six months ended September 30, 2019, the Fund held written options for hedging andnon-hedging purposes.
| • | Swaps |
The Fund may enter into swaps to hedge its exposure to interest rates, credit risk, or currencies. The Fund may also enter into swaps fornon-hedging purposes as a means of gaining market exposures including by making direct investments in foreign currencies, as described below under “Currency Transactions” or in order to take a “long” or “short” position with respect to an underlying referenced asset described below under “Total Return Swaps”. A swap is an agreement that obligates two parties to exchange a series of cash flows at specified intervals based upon or calculated by reference to changes in specified prices or rates for a specified amount of an underlying asset. The payment flows are usually netted against each other, with the difference being paid by one party to the other. In addition, collateral may be pledged or received by the Fund in accordance with the terms of the respective swaps to provide value and recourse to the Fund or its counterparties in the event of default, bankruptcy or insolvency by one of the parties to the swap.
| 58 | AB EMERGING MARKETS MULTI-ASSET PORTFOLIO | abfunds.com | |
NOTES TO FINANCIAL STATEMENTS(continued)
Risks may arise as a result of the failure of the counterparty to the swap to comply with the terms of the swap. The loss incurred by the failure of a counterparty is generally limited to the net interim payment to be received by the Fund, and/or the termination value at the end of the contract. Therefore, the Fund considers the creditworthiness of each counterparty to a swap in evaluating potential counterparty risk. This risk is mitigated by having a netting arrangement between the Fund and the counterparty and by the posting of collateral by the counterparty to the Fund to cover the Fund’s exposure to the counterparty. Additionally, risks may arise from unanticipated movements in interest rates or in the value of the underlying securities. The Fund accrues for the interim payments on swaps on a daily basis, with the net amount recorded within unrealized appreciation/depreciation of swaps on the statement of assets and liabilities, where applicable. Once the interim payments are settled in cash, the net amount is recorded as realized gain/(loss) on swaps on the statement of operations, in addition to any realized gain/(loss) recorded upon the termination of swaps. Upfront premiums paid or received for OTC swaps are recognized as cost or proceeds on the statement of assets and liabilities and are amortized on a straight line basis over the life of the contract. Amortized upfront premiums are included in net realized gain/(loss) from swaps on the statement of operations. Fluctuations in the value of swaps are recorded as a component of net change in unrealized appreciation/depreciation of swaps on the statement of operations.
Certain standardized swaps, including certain interest rate swaps and credit default swaps, are (or soon will be) subject to mandatory central clearing. Cleared swaps are transacted through futures commission merchants (“FCMs”) that are members of central clearinghouses, with the clearinghouse serving as central counterparty, similar to transactions in futures contracts. Centralized clearing will be required for additional categories of swaps on aphased-in basis based on requirements published by the Securities and Exchange Commission and Commodity Futures Trading Commission.
At the time the Fund enters into a centrally cleared swap, the Fund deposits and maintains as collateral an initial margin with the broker, as required by the clearinghouse on which the transaction is effected. Such amount is shown as cash collateral due from broker on the statement of assets and liabilities. Pursuant to the contract, the Fund agrees to receive from or pay to the broker an amount of cash equal to the daily fluctuation in the value of the contract. Such receipts or payments are known as variation margin and are recorded by the Fund as unrealized gains or losses. Risks may arise from the potential inability of a counterparty to meet the terms of the contract.
| abfunds.com | AB EMERGING MARKETS MULTI-ASSET PORTFOLIO | 59 | |
NOTES TO FINANCIAL STATEMENTS(continued)
The credit/counterparty risk for centrally cleared swaps is generally less thannon-centrally cleared swaps, since the clearinghouse, which is the issuer or counterparty to each centrally cleared swap, has robust risk mitigation standards, including the requirement to provide initial and variation margin. When the contract is closed, the Fund records a realized gain or loss equal to the difference between the value of the contract at the time it was opened and the time it was closed.
Interest Rate Swaps:
The Fund is subject to interest rate risk exposure in the normal course of pursuing its investment objectives. Because the Fund holds fixed rate bonds, the value of these bonds may decrease if interest rates rise. To help hedge against this risk and to maintain its ability to generate income at prevailing market rates, the Fund may enter into interest rate swaps. Interest rate swaps are agreements between two parties to exchange cash flows based on a notional amount. The Fund may elect to pay a fixed rate and receive a floating rate, or, receive a fixed rate and pay a floating rate on a notional amount.
In addition, the Fund may also enter into interest rate swap transactions to preserve a return or spread on a particular investment or portion of its portfolio, or protecting against an increase in the price of securities the Fund anticipates purchasing at a later date. Interest rate swaps involve the exchange by a Fund with another party of their respective commitments to pay or receive interest (e.g., an exchange of floating rate payments for fixed rate payments) computed based on a contractually-based principal (or “notional”) amount. Interest rate swaps are entered into on a net basis (i.e., the two payment streams are netted out, with the Fund receiving or paying, as the case may be, only the net amount of the two payments).
During the six months ended September 30, 2019, the Fund held interest rate swaps for hedging andnon-hedging purposes.
Credit Default Swaps:
The Fund may enter into credit default swaps, including to manage its exposure to the market or certain sectors of the market, to reduce its risk exposure to defaults by corporate and sovereign issuers held by the Fund, or to create exposure to corporate or sovereign issuers to which it is not otherwise exposed. The Fund may purchase credit protection (“Buy Contract”) or provide credit protection (“Sale Contract”) on the referenced obligation of the credit default swap. During the term of the swap, the Fund receives/(pays) fixed payments from/(to) the respective counterparty, calculated at the agreed upon rate applied to the notional amount. If the Fund is a buyer/(seller) of protection and a credit event occurs, as defined under the terms of
| 60 | AB EMERGING MARKETS MULTI-ASSET PORTFOLIO | abfunds.com | |
NOTES TO FINANCIAL STATEMENTS(continued)
the swap, the Fund will either (i) receive from the seller/(pay to the buyer) of protection an amount equal to the notional amount of the swap (the “Maximum Payout Amount”) and deliver/(take delivery of) the referenced obligation or (ii) receive/(pay) a net settlement amount in the form of cash or securities equal to the notional amount of the swap less the recovery value of the referenced obligation. In certain circumstances Maximum Payout Amounts may be partially offset by recovery values of the respective referenced obligations, upfront premium received upon entering into the agreement, or net amounts received from settlement of buy protection credit default swaps entered into by the Fund for the same referenced obligation with the same counterparty.
Credit default swaps may involve greater risks than if the Fund had invested in the referenced obligation directly. Credit default swaps are subject to general market risk, liquidity risk, counterparty risk and credit risk. If the Fund is a buyer of protection and no credit event occurs, it will lose the payments it made to its counterparty. If the Fund is a seller of protection and a credit event occurs, the value of the referenced obligation received by the Fund coupled with the periodic payments previously received may be less than the Maximum Payout Amount it pays to the buyer, resulting in a net loss to the Fund.
Implied credit spreads over U.S. Treasuries of comparable maturity utilized in determining the market value of credit default swaps on issuers as of period end are disclosed in the portfolio of investments. The implied spreads serve as an indicator of the current status of the payment/performance risk and typically reflect the market’s assessment of the likelihood of default by the issuer of the referenced obligation. The implied credit spread of a particular reference obligation also reflects the cost of buying/selling protection and may reflect upfront payments required to be made to enter into the agreement. Widening credit spreads typically represent a deterioration of the referenced obligation’s credit soundness and greater likelihood of default or other credit event occurring as defined under the terms of the agreement. A credit spread identified as “Defaulted” indicates a credit event has occurred for the referenced obligation.
During the six months ended September 30, 2019, the Fund held credit default swaps for hedging andnon-hedging purposes.
Total Return Swaps:
The Fund may enter into total return swaps in order to take a “long” or “short” position with respect to an underlying referenced asset. The Fund is subject to market price volatility of the underlying referenced
| abfunds.com | AB EMERGING MARKETS MULTI-ASSET PORTFOLIO | 61 | |
NOTES TO FINANCIAL STATEMENTS(continued)
asset. A total return swap involves commitments to pay interest in exchange for a market linked return based on a notional amount. To the extent that the total return of the security, group of securities or index underlying the transaction exceeds or falls short of the offsetting interest obligation, the Fund will receive a payment from or make a payment to the counterparty.
During the six months ended September 30, 2019, the Fund held total return swaps for hedging andnon-hedging purposes.
Variance Swaps:
The Fund may enter into variance swaps to hedge equity market risk or adjust exposure to the equity markets. Variance swaps are contracts in which two parties agree to exchange cash payments based on the difference between the stated level of variance and the actual variance realized on underlying asset(s) or index(es). Actual “variance” as used here is defined as the sum of the square of the returns on the reference asset(s) or index(es) (which in effect is a measure of its “volatility”) over the length of the contract term. So the parties to a variance swap can be said to exchange actual volatility for a contractually stated rate of volatility.
During the six months ended September 30, 2019, the Fund held variance swaps for hedging andnon-hedging purposes.
The Fund typically enters into International Swaps and Derivatives Association, Inc. Master Agreements (“ISDA Master Agreement”) with its OTC derivative contract counterparties in order to, among other things, reduce its credit risk to OTC counterparties. ISDA Master Agreements include provisions for general obligations, representations, collateral and events of default or termination. Under an ISDA Master Agreement, the Fund typically may offset with the OTC counterparty certain derivative financial instruments’ payables and/or receivables with collateral held and/or posted and create one single net payment(close-out netting) in the event of default or termination. In the event of a default by an OTC counterparty, the return of collateral with market value in excess of the Fund’s net liability, held by the defaulting party, may be delayed or denied.
The Fund’s ISDA Master Agreements may contain provisions for early termination of OTC derivative transactions in the event the net assets of the Fund decline below specific levels (“net asset contingent features”). If these levels are triggered, the Fund’s OTC counterparty has the right to terminate such transaction and require the Fund to pay or receive a settlement amount in connection with the terminated transaction. If OTC derivatives were held at period end, please refer to netting arrangements by the OTC counterparty tables below for additional details.
| 62 | AB EMERGING MARKETS MULTI-ASSET PORTFOLIO | abfunds.com | |
NOTES TO FINANCIAL STATEMENTS(continued)
During the six months ended September 30, 2019, the Fund had entered into the following derivatives:
Asset Derivatives | Liability Derivatives | |||||||||||
Derivative Type | Statement of | Fair Value | Statement of | Fair Value | ||||||||
Interest rate | Receivable for variation margin on centrally cleared swaps | $ | 17,478 | * | ||||||||
Interest rate | Receivable/Payable for variation margin on futures | | 33,953 | * | ||||||||
Interest rate | Unrealized appreciation on total return swaps | | 31,893 | |||||||||
Foreign currency | Unrealized appreciation on forward currency exchange contracts | | 716,159 | Unrealized depreciation on forward currency exchange contracts | $ | 495,627 |
| |||||
Credit contracts | Receivable for variation margin on centrally cleared swaps | | 60,004 | * | Payable for variation margin on centrally cleared swaps |
| 284,953 | * | ||||
Equity contracts | Unrealized appreciation on variance swaps | | 43,727 | Unrealized depreciation on variance swaps |
| 29,897 |
| |||||
Equity contracts | Receivable/Payable for variation margin on futures |
| 248,624 | * | ||||||||
Equity contracts | Investment in securities, at value | | 133,126 | |||||||||
|
|
|
| |||||||||
Total | $ | 1,036,340 | $ | 1,059,101 | ||||||||
|
|
|
| |||||||||
| * | Only variation margin receivable/payable at period end is reported within the statement of assets and liabilities. This amount reflects cumulative unrealized appreciation/depreciation on futures and centrally cleared swaps as reported in the portfolio of investments. |
| abfunds.com | AB EMERGING MARKETS MULTI-ASSET PORTFOLIO | 63 | |
NOTES TO FINANCIAL STATEMENTS(continued)
Derivative Type | Location of | Realized Gain or (Loss) on Derivatives | Change in Unrealized Appreciation or (Depreciation) | |||||||
Interest rate contracts | Net realized gain/(loss) on swaps; Net change in unrealized appreciation/depreciation on swaps | $ | 16,187 | $ | 91,396 | |||||
Interest rate contracts | Net realized gain/(loss) on futures; Net change in unrealized appreciation/depreciation on futures | 1,214,300 | (233,602 | ) | ||||||
Foreign currency contracts | Net realized gain/(loss) on forward currency exchange contracts; Net change in unrealized appreciation/depreciation on forward currency exchange contracts | 1,991,335 | 34,088 | |||||||
Foreign currency contracts | Net realized gain/(loss) on investment transactions; Net change in unrealized appreciation/depreciation on investments | 9,505 | – 0 | – | ||||||
Foreign currency contracts | Net realized gain/(loss) on options written; Net change in unrealized appreciation/depreciation on options written | 1,902 | – 0 | – | ||||||
Credit contracts | Net realized gain/(loss) on swaps; Net change in unrealized appreciation/ depreciation on swaps | (13,910 | ) | (224,662 | ) | |||||
Equity contracts | Net realized gain/(loss) on swaps; Net change in unrealized appreciation/ depreciation on swaps | 57,078 | 50,737 | |||||||
Equity contracts | Net realized gain/(loss) on futures; Net change in unrealized appreciation/depreciation on futures | (1,110,436 | ) | (435,783 | ) | |||||
| 64 | AB EMERGING MARKETS MULTI-ASSET PORTFOLIO | abfunds.com | |
NOTES TO FINANCIAL STATEMENTS(continued)
Derivative Type | Location of | Realized Gain or (Loss) on Derivatives | Change in Unrealized Appreciation or (Depreciation) | |||||||
Equity contracts | Net realized gain/(loss) on investment transactions; Net change in unrealized appreciation/depreciation on investments | $ | (18,266 | ) | $ | (161,459 | ) | |||
|
|
|
| |||||||
Total | $ | 2,147,695 | $ | (879,285 | ) | |||||
|
|
|
| |||||||
The following table represents the average monthly volume of the Fund’s derivative transactions during the six months ended September 30, 2019:
Centrally Cleared Credit Default Swaps: | ||||
Average notional amount of buy contracts | $ | 496,286 | ||
Average notional amount of sale contracts | $ | 631,714 | ||
Centrally Cleared Interest Rate Swaps | ||||
Average notional amount | $ | 6,179,189 | (a) | |
Forward Currency Exchange Contracts: | ||||
Average principal amount on buy contracts | $ | 63,768,081 | ||
Average principal amount on sale contracts | $ | 80,043,713 | ||
Futures: | ||||
Average notional amount of buy contracts | $ | 28,769,171 | ||
Average notional amount of sale contracts | $ | 538,688 | (b) | |
Total Return Swaps: | ||||
Average notional amount | $ | 5,344,809 | (c) | |
Variance Swaps: | ||||
Average notional amount | $ | 464,335 | ||
Options Written: | ||||
Average notional amount | $ | 322,668 | (d) | |
Purchased Options: | ||||
Average notional amount | $ | 109,841 | (b) | |
| (a) | Positions were open for two months during the reporting period. |
| (b) | Positions were open for three months during the reporting period. |
| (c) | Positions were open for four months during the reporting period. |
| (d) | Positions were open for one month during the reporting period. |
For financial reporting purposes, the Fund does not offset derivative assets and derivative liabilities that are subject to netting arrangements in the statement of assets and liabilities.
All OTC derivatives held at period end were subject to netting arrangements. The following table presents the Fund’s derivative assets and liabilities by OTC counterparty net of amounts available for offset under
| abfunds.com | AB EMERGING MARKETS MULTI-ASSET PORTFOLIO | 65 | |
NOTES TO FINANCIAL STATEMENTS(continued)
ISDA Master Agreements (“MA”) and net of the related collateral received/pledged by the Fund as of September 30, 2019. Exchange-traded derivatives and centrally cleared swaps are not subject to netting arrangements and as such are excluded from the tables.
Counterparty | Derivative Assets Subject to a MA | Derivatives Available for Offset | Cash Collateral Received* | Security Collateral Received* | Net Amount of Derivative Assets | |||||||||||||||
Bank of America, NA. | $ | 28,782 | $ | (28,782 | ) | $ | – 0 | – | $ | – 0 | – | $ | – 0 | – | ||||||
Barclays Bank PLC | 139,214 | (11,853 | ) | – 0 | – | – 0 | – | 127,361 | ||||||||||||
BNP Paribas | 95,011 | (95,011 | ) | – 0 | – | – 0 | – | – 0 | – | |||||||||||
Brown Brothers Harriman & Co. | 50,265 | (19,424 | ) | – 0 | – | – 0 | – | 30,841 | ||||||||||||
Citibank, NA | 162,985 | (69,939 | ) | – 0 | – | – 0 | – | 93,046 | ||||||||||||
Goldman Sachs Bank USA | 92,270 | (57,975 | ) | – 0 | – | – 0 | – | 34,295 | ||||||||||||
HSBC Bank USA | 48,548 | (17,004 | ) | – 0 | – | – 0 | – | 31,544 | ||||||||||||
JPMorgan Chase Bank, NA | 95,751 | (28,503 | ) | – 0 | – | – 0 | – | 67,248 | ||||||||||||
Morgan Stanley Capital Services LLC/Morgan Stanley & Co. International PLC | 175,378 | (118,844 | ) | – 0 | – | – 0 | – | 56,534 | ||||||||||||
Royal Bank of Scotland PLC | 11,917 | – 0 | – | – 0 | – | – 0 | – | 11,917 | ||||||||||||
Societe Generale | 5,913 | – 0 | – | – 0 | – | – 0 | – | 5,913 | ||||||||||||
Standard Chartered Bank | 2,318 | (2,318 | ) | – 0 | – | – 0 | – | – 0 | – | |||||||||||
UBS AG | 16,554 | (16,554 | ) | – 0 | – | – 0 | – | – 0 | – | |||||||||||
|
|
|
|
|
|
|
|
|
| |||||||||||
Total | $ | 924,906 | $ | (466,207 | ) | $ | – 0 | – | $ | – 0 | – | $ | 458,699 | ^ | ||||||
|
|
|
|
|
|
|
|
|
| |||||||||||
Counterparty | Derivative Liabilities Subject to a MA | Derivatives Available for Offset | Cash Collateral Pledged* | Security Collateral Pledged* | Net Amount of Derivative Liabilities | |||||||||||||||
Australia & New Zealand Banking Group Ltd. | $ | 13,904 | $ | – 0 | – | $ | – 0 | – | $ | – 0 | – | $ | 13,904 | |||||||
Bank of America, NA | 32,668 | (28,782 | ) | – 0 | – | – 0 | – | 3,886 | ||||||||||||
Barclays Bank PLC | 11,853 | (11,853 | ) | – 0 | – | – 0 | – | – 0 | – | |||||||||||
BNP Paribas | 101,597 | (95,011 | ) | – 0 | – | – 0 | – | 6,586 | ||||||||||||
Brown Brothers Harriman & Co. | 19,424 | (19,424 | ) | – 0 | – | – 0 | – | – 0 | – | |||||||||||
Citibank, NA | 69,939 | (69,939 | ) | – 0 | – | – 0 | – | – 0 | – | |||||||||||
Goldman Sachs Bank USA | 57,975 | (57,975 | ) | – 0 | – | – 0 | – | – 0 | – | |||||||||||
HSBC Bank USA | 17,004 | (17,004 | ) | – 0 | – | – 0 | – | – 0 | – | |||||||||||
JPMorgan Chase Bank, NA | 28,503 | (28,503 | ) | – 0 | – | – 0 | – | – 0 | – | |||||||||||
| 66 | AB EMERGING MARKETS MULTI-ASSET PORTFOLIO | abfunds.com | |
NOTES TO FINANCIAL STATEMENTS(continued)
Counterparty | Derivative Liabilities Subject to a MA | Derivatives Available for Offset | Cash Collateral Pledged* | Security Collateral Pledged* | Net Amount of Derivative Liabilities | |||||||||||||||
Morgan Stanley Capital Services LLC/ Morgan Stanley & Co. International PLC | $ | 118,844 | $ | (118,844 | ) | $ | – 0 | – | $ | – 0 | – | $ | – 0 | – | ||||||
Royal Bank of Canada | 1,952 | – 0 | – | – 0 | – | – 0 | – | 1,952 | ||||||||||||
Standard Chartered Bank | 12,309 | (2,318 | ) | – 0 | – | – 0 | – | 9,991 | ||||||||||||
UBS AG | 39,553 | (16,554 | ) | – 0 | – | – 0 | – | 22,999 | ||||||||||||
|
|
|
|
|
|
|
|
|
| |||||||||||
Total | $ | 525,525 | $ | (466,207 | ) | $ | – 0 | – | $ | – 0 | – | $ | 59,318 | ^ | ||||||
|
|
|
|
|
|
|
|
|
| |||||||||||
| * | The actual collateral received/pledged may be more than the amount reported due to overcollateralization. |
| ^ | Net amount represents the net receivable/payable that would be due from/to the counterparty in the event of default or termination. The net amount from OTC financial derivative instruments can only be netted across transactions governed under the same master agreement with the same counterparty. |
2. Currency Transactions
The Fund may invest innon-U.S. Dollar-denominated securities on a currency hedged or unhedged basis. The Fund may seek investment opportunities by taking long or short positions in currencies through the use of currency-related derivatives, including forward currency exchange contracts, futures and options on futures, swaps, and other options. The Fund may enter into transactions for investment opportunities when it anticipates that a foreign currency will appreciate or depreciate in value but securities denominated in that currency are not held by the Fund and do not present attractive investment opportunities. Such transactions may also be used when the Adviser believes that it may be more efficient than a direct investment in a foreign currency-denominated security. The Fund may also conduct currency exchange contracts on a spot basis (i.e., for cash at the spot rate prevailing in the currency exchange market for buying or selling currencies).
NOTE E
Securities Lending
The Fund may enter into securities lending transactions. Under the Fund’s securities lending program, all loans of securities will be collateralized continually by cash collateral and/ornon-cash collateral.Non-cash collateral will include only securities issued or guaranteed by the U.S. government or its agencies or instrumentalities. The Fund cannot sell or repledge anynon-cash collateral, and accordingly will not be reflected in the portfolio of investments. If a loan is collateralized by cash, the Fund will be compensated for the loan from a portion of the net return from the income earned on cash collateral after a rebate is paid to the borrower (in some cases, this rebate may be a “negative rebate” or fee paid by the borrower to the Fund in connection with the loan), and payments are made for fees of the
| abfunds.com | AB EMERGING MARKETS MULTI-ASSET PORTFOLIO | 67 | |
NOTES TO FINANCIAL STATEMENTS(continued)
securities lending agent and for certain other administrative expenses. If the Fund receivesnon-cash collateral, the Fund will receive a fee from the borrower generally equal to a negotiated percentage of the market value of the loaned securities. The Fund will have the right to call a loan and obtain the securities loaned at any time on notice to the borrower within the normal and customary settlement time for the securities. While the securities are on loan, the borrower is obligated to pay the Fund amounts equal to any income or other distributions from the securities. The Fund will not be able to exercise voting rights with respect to any securities during the existence of a loan, but will have the right to regain ownership of loaned securities in order to exercise voting or other ownership rights. Collateral received and securities loaned are marked to market daily to ensure that the securities loaned are secured by collateral. The lending agent currently invests the cash collateral received in Government Money Market Portfolio, an eligible money market vehicle, in accordance with the investment restrictions of the Fund, and as approved by the Board. The collateral received on securities loaned is recorded as an asset as well as a corresponding liability in the statement of assets and liabilities. The collateral will be adjusted the next business day to maintain the required collateral amount. The amounts of securities lending income from the borrowers and Government Money Market Portfolio are reflected in the statement of operations. When the Fund earns net securities lending income from Government Money Market Portfolio, the income is inclusive of a rebate expense paid to the borrower. In connection with the cash collateral investment by the Fund in the Government Money Market Portfolio, the Adviser has agreed to waive a portion of the Fund’s share of the advisory fees of Government Money Market Portfolio, as borne indirectly by the Fund as an acquired fund fee and expense. When the Fund lends securities, its investment performance will continue to reflect changes in the value of the securities loaned. A principal risk of lending portfolio securities is that the borrower may fail to return the loaned securities upon termination of the loan and that the collateral will not be sufficient to replace the loaned securities. The lending agent has agreed to indemnify the Fund in the case of default of any securities borrower.
A summary of the Fund’s transactions surrounding securities lending for the six months ended September 30, 2019 is as follows:
Market Value | Cash Collateral* | Market Value ofNon-Cash Collateral* | Income from Borrowers | Government Money Market Portfolio | ||||||||||||||||||
| Income Earned | Advisory Fee Waived | |||||||||||||||||||||
| $ | 1,112,531 | $ | 1,143,528 | $ | – 0 | – | $ | 4,805 | $ | 2,643 | $ | 65 | ||||||||||
| * | As of September 30, 2019. |
| 68 | AB EMERGING MARKETS MULTI-ASSET PORTFOLIO | abfunds.com | |
NOTES TO FINANCIAL STATEMENTS(continued)
NOTE F
Capital Stock
Each class consists of 3,000,000,000 authorized shares. Transactions in capital shares for each class were as follows:
| Shares | Amount | |||||||||||||||||||||||
| Six Months Ended September 30, 2019 (unaudited) | Year Ended March 31, 2019 | Six Months Ended September 30, 2019 (unaudited) | Year Ended March 31, 2019 | |||||||||||||||||||||
|
| |||||||||||||||||||||||
| Class A | ||||||||||||||||||||||||
Shares sold | 30,913 | 275,968 | $ | 274,232 | $ | 2,527,510 | ||||||||||||||||||
| ||||||||||||||||||||||||
Shares issued in reinvestment of dividends | 8,185 | 39,549 | 71,102 | 337,699 | ||||||||||||||||||||
| ||||||||||||||||||||||||
Shares converted from Class C | 2,106 | 7,865 | 19,021 | 69,150 | ||||||||||||||||||||
| ||||||||||||||||||||||||
Shares redeemed | (170,901 | ) | (789,121 | ) | (1,510,122 | ) | (6,847,556 | ) | ||||||||||||||||
| ||||||||||||||||||||||||
Net decrease | (129,697 | ) | (465,739 | ) | $ | (1,145,767 | ) | $ | (3,913,197 | ) | ||||||||||||||
| ||||||||||||||||||||||||
| Class C | ||||||||||||||||||||||||
Shares sold | 12,562 | 33,811 | $ | 107,181 | $ | 309,472 | ||||||||||||||||||
| ||||||||||||||||||||||||
Shares issued in reinvestment of dividends | 2,444 | 7,855 | 21,127 | 65,999 | ||||||||||||||||||||
| ||||||||||||||||||||||||
Shares converted to Class A | (2,119 | ) | (7,903 | ) | (19,021 | ) | (69,150 | ) | ||||||||||||||||
| ||||||||||||||||||||||||
Shares redeemed | (68,177 | ) | (61,752 | ) | (590,539 | ) | (549,357 | ) | ||||||||||||||||
| ||||||||||||||||||||||||
Net decrease | (55,290 | ) | (27,989 | ) | $ | (481,252 | ) | $ | (243,036 | ) | ||||||||||||||
| ||||||||||||||||||||||||
| Advisor Class | ||||||||||||||||||||||||
Shares sold | 4,451,974 | 6,191,305 | $ | 39,110,207 | $ | 55,398,918 | ||||||||||||||||||
| ||||||||||||||||||||||||
Shares issued in reinvestment of dividends | 253,901 | 575,554 | 2,211,611 | 4,900,267 | ||||||||||||||||||||
| ||||||||||||||||||||||||
Shares redeemed | (1,817,614 | ) | (6,049,179 | ) | (15,980,272 | ) | (53,844,089 | ) | ||||||||||||||||
| ||||||||||||||||||||||||
Net increase | 2,888,261 | 717,680 | $ | 25,341,546 | $ | 6,455,096 | ||||||||||||||||||
| ||||||||||||||||||||||||
| Class R | ||||||||||||||||||||||||
Shares sold | 3,428 | 32,672 | $ | 30,325 | $ | 273,093 | ||||||||||||||||||
| ||||||||||||||||||||||||
Shares issued in reinvestment of dividends | 607 | 1,315 | 5,274 | 11,210 | ||||||||||||||||||||
| ||||||||||||||||||||||||
Shares redeemed | (4,251 | ) | (32,422 | ) | (37,994 | ) | (278,570 | ) | ||||||||||||||||
| ||||||||||||||||||||||||
Net increase (decrease) | (216 | ) | 1,565 | $ | (2,395 | ) | $ | 5,733 | ||||||||||||||||
| ||||||||||||||||||||||||
| abfunds.com | AB EMERGING MARKETS MULTI-ASSET PORTFOLIO | 69 | |
NOTES TO FINANCIAL STATEMENTS(continued)
| Shares | Amount | |||||||||||||||||||||||
| Six Months Ended September 30, 2019 (unaudited) | Year Ended March 31, 2019 | Six Months Ended September 30, 2019 (unaudited) | Year Ended March 31, 2019 | |||||||||||||||||||||
|
| |||||||||||||||||||||||
| Class K | ||||||||||||||||||||||||
Shares sold | 1,871 | 4,398 | $ | 16,416 | $ | 39,791 | ||||||||||||||||||
| ||||||||||||||||||||||||
Shares issued in reinvestment of dividends | 556 | 1,794 | 4,818 | 15,160 | ||||||||||||||||||||
| ||||||||||||||||||||||||
Shares redeemed | (11,461 | ) | (4,365 | ) | (97,671 | ) | (38,112 | ) | ||||||||||||||||
| ||||||||||||||||||||||||
Net increase (decrease) | (9,034 | ) | 1,827 | $ | (76,437 | ) | $ | 16,839 | ||||||||||||||||
| ||||||||||||||||||||||||
| Class I | ||||||||||||||||||||||||
Shares sold | 1,061 | 3,345 | $ | 9,275 | $ | 29,829 | ||||||||||||||||||
| ||||||||||||||||||||||||
Shares issued in reinvestment of dividends | 155 | 924 | 1,334 | 7,782 | ||||||||||||||||||||
| ||||||||||||||||||||||||
Shares redeemed | (16,642 | ) | (189,665 | ) | (141,943 | ) | (1,848,280 | ) | ||||||||||||||||
| ||||||||||||||||||||||||
Net decrease | (15,426 | ) | (185,396 | ) | $ | (131,334 | ) | $ | (1,810,669 | ) | ||||||||||||||
| ||||||||||||||||||||||||
| Class Z | ||||||||||||||||||||||||
Shares sold | 19,786 | 0 | * | $ | 177,242 | $ | 5 | |||||||||||||||||
| ||||||||||||||||||||||||
Shares issued in reinvestment of dividends | 241 | – 0 | – | 2,090 | – 0 | – | ||||||||||||||||||
| ||||||||||||||||||||||||
Shares redeemed | (6 | ) | – 0 | – | (48 | ) | – 0 | – | ||||||||||||||||
| ||||||||||||||||||||||||
Net increase | 20,021 | 0 | * | $ | 179,284 | $ | 5 | |||||||||||||||||
| ||||||||||||||||||||||||
| * | Amount is less than 0.5 shares. |
NOTE G
Risks Involved in Investing in the Fund
Emerging Market Risk—Investments in emerging market countries may involve more risk than investments in other foreign countries because the markets in emerging market countries are less developed and less liquid, and because these investments may be subject to increased economic, political, regulatory, or other uncertainties.
Foreign(Non-U.S.) Risk—Investments in securities ofnon-U.S. issuers may involve more risk than those of U.S. issuers. These securities may fluctuate more widely in price and may be more difficult to trade or dispose of due to adverse market, economic, political, regulatory or other factors.
Currency Risk—Fluctuations in currency exchange rates may negatively affect the value of the Fund’s investments or reduce its returns. Emerging market currencies may be more volatile and less liquid, and subject to significantly greater risk of currency controls and convertibility restrictions, than currencies of developed countries.
��
| 70 | AB EMERGING MARKETS MULTI-ASSET PORTFOLIO | abfunds.com | |
NOTES TO FINANCIAL STATEMENTS(continued)
Country Concentration Risk—The Fund may not always be diversified among countries or geographic regions and the effect on the Fund’s net asset value, or NAV, of the specific risks identified above, such as political, regulatory and currency risks, may be magnified due to concentration of the Fund’s investments in a particular country or region.
Allocation Risk—The allocation of Fund assets among different asset classes, such as equity securities, debt securities and currencies, may have a significant effect on the Fund’s NAV when one of these asset classes is performing better or worse than others. The diversification benefits typically associated with investing in both equity and debt securities may be limited in the emerging markets context, as movements in emerging market equity and emerging market debt markets may be more correlated than movements in the equity and debt markets of developed countries.
Capitalization Risk—Investments in small- andmid-capitalization companies may be more volatile than investments in large-capitalization companies. Investments in small-capitalization companies may have additional risks because these companies have limited product lines, markets or financial resources.
Interest Rate Risk—Changes in interest rates will affect the value of investments in fixed-income securities. When interest rates rise, the value of existing investments in fixed-income securities tends to fall and this decrease in value may not be offset by higher income from new investments. Interest rate risk is generally greater for fixed-income securities with longer maturities or durations.
Credit Risk—An issuer or guarantor of a fixed-income security, or the counterparty to a derivatives or other contract, may be unable or unwilling to make timely payments of interest or principal, or to otherwise honor its obligations. The issuer or guarantor may default, causing a loss of the full principal amount of a security and accrued interest. The degree of risk for a particular security may be reflected in its credit rating. There is the possibility that the credit rating of a fixed-income security may be downgraded after purchase, which may adversely affect the value of the security.
Below Investment Grade Securities Risk—Investments in fixed-income securities with lower ratings (commonly known as “junk bonds”) tend to have a higher probability that an issuer will default or fail to meet its payment obligations. These securities may be subject to greater price volatility due to factors such as specific corporate developments, interest rate sensitivity and negative perceptions of the junk bond market generally, and may be more difficult to trade or dispose of than other types of securities.
Derivatives Risk—The Fund may enter into derivative transactions such as forwards, options, futures and swaps. Derivatives may be illiquid, difficult to price, and leveraged so that small changes may produce disproportionate
| abfunds.com | AB EMERGING MARKETS MULTI-ASSET PORTFOLIO | 71 | |
NOTES TO FINANCIAL STATEMENTS(continued)
losses for the Fund, and subject to counterparty risk to a greater degree than more traditional investments. Derivatives may result in significant losses, including losses that are far greater than the value of the derivatives reflected on the statement of assets and liabilities.
Leverage Risk—When the Fund borrows money or otherwise leverages its investments, its performance may be volatile because leverage tends to exaggerate the effect of any increase or decrease in the value of the Fund’s investments. The Fund may create leverage through the use of reverse repurchase arrangements, forward currency exchange contracts, forward commitments, dollar rolls or futures contracts or by borrowing money. The use of other types of derivative instruments by the Fund, such as options and swaps, may also result in a form of leverage. Leverage may result in higher returns to the Fund than if the Fund were not leveraged, but may also adversely affect returns, particularly if the market is declining.
Illiquid Investments Risk—Illiquid investments risk exists when certain investments are or become difficult to purchase or sell. Difficulty in selling such investments may result in sales at disadvantageous prices affecting the value of your investment in the Fund. Causes of illiquid investments risk may include low trading volumes, large positions and heavy redemptions of Fund shares. Illiquid investments risk may be higher in a rising interest rate environment, when the value and liquidity of fixed income securities generally decline.
Active Trading Risk—The Fund expects to engage in active and frequent trading of its portfolio securities and its portfolio turnover rate may greatly exceed 100%. A higher rate of portfolio turnover increases transaction costs, which may negatively affect the Fund’s return. In addition, a high rate of portfolio turnover may result in substantial short-term gains, which may have adverse tax consequences for Fund shareholders.
LIBOR Risk—A Fund may invest in certain debt securities, derivatives or other financial instruments that utilize the London Interbank Offered Rate, or “LIBOR,” as a “benchmark” or “reference rate” for various interest rate calculations. In July 2017, the United Kingdom Financial Conduct Authority, which regulates LIBOR, announced a desire to phase out the use of LIBOR by the end of 2021. Although financial regulators and industry working groups have suggested alternative reference rates, such as European Interbank Offer Rate (“EURIBOR”), Sterling Overnight Interbank Average Rate (“SONIA”) and Secured Overnight Financing Rate (“SOFR”), global consensus on alternative rates is lacking and the process for amending existing contracts or instruments to transition away from LIBOR remains unclear. The elimination of LIBOR or changes to other reference rates or any other changes or reforms to the determination or supervision of reference rates could have an adverse impact on the market for, or value of, any securities or payments linked to those reference rates, which
| 72 | AB EMERGING MARKETS MULTI-ASSET PORTFOLIO | abfunds.com | |
NOTES TO FINANCIAL STATEMENTS(continued)
may adversely affect a Fund’s performance and/or net asset value. Uncertainty and risk also remain regarding the willingness and ability of issuers and lenders to include revised provisions in new and existing contracts or instruments. Consequently, the transition away from LIBOR to other reference rates may lead to increased volatility and illiquidity in markets that are tied to LIBOR, fluctuations in values of LIBOR-related investments or investments in issuers that utilize LIBOR, increased difficulty in borrowing or refinancing and diminished effectiveness of hedging strategies, adversely affecting a Fund’s performance. Furthermore, the risks associated with the expected discontinuation of LIBOR and transition may be exacerbated if the work necessary to effect an orderly transition to an alternative reference rate is not completed in a timely manner. Because the usefulness of LIBOR as a benchmark could deteriorate during the transition period, these effects could occur prior to the end of 2021.
Indemnification Risk—In the ordinary course of business, the Fund enters into contracts that contain a variety of indemnifications. The Fund’s maximum exposure under these arrangements is unknown. However, the Fund has not had prior claims or losses pursuant to these indemnification provisions and expects the risk of loss thereunder to be remote. Therefore, the Fund has not accrued any liability in connection with these indemnification provisions.
NOTE H
Joint Credit Facility
A number ofopen-end mutual funds managed by the Adviser, including the Fund, participate in a $325 million revolving credit facility (the “Facility”) intended to provide short-term financing, if necessary, subject to certain restrictions in connection with abnormal redemption activity. Commitment fees related to the Facility are paid by the participating funds and are included in miscellaneous expenses in the statement of operations. The Fund did not utilize the Facility during the six months ended September 30, 2019.
NOTE I
Distributions to Shareholders
The tax character of distributions paid for the year ending March 31, 2020 will be determined at the end of the current fiscal year.
The tax character of distributions paid during the fiscal years ended March 31, 2019 and March 31, 2018 were as follows:
| 2019 | 2018 | |||||||
Distributions paid from: | ||||||||
Ordinary income | $ | 6,209,115 | $ | 3,867,831 | ||||
|
|
|
| |||||
Total taxable distributions paid | 6,209,115 | 3,867,831 | ||||||
Return of Capital | – 0 | – | 134,303 | |||||
|
|
|
| |||||
Total distributions paid | $ | 6,209,115 | $ | 4,002,134 | ||||
|
|
|
| |||||
| abfunds.com | AB EMERGING MARKETS MULTI-ASSET PORTFOLIO | 73 | |
NOTES TO FINANCIAL STATEMENTS(continued)
As of March 31, 2019, the components of accumulated earnings/(deficit) on a tax basis were as follows:
Undistributed ordinary income | $ | 227,394 | ||
Accumulated capital and other losses | (11,004,300 | )(a) | ||
Unrealized appreciation/(depreciation) | 453,611 | (b) | ||
|
| |||
Total accumulated earnings/(deficit) | $ | (10,323,295 | )(c) | |
|
|
| (a) | As of March 31, 2019, the Fund had a net capital loss carry forward of $11,004,300. |
| (b) | The differences between book-basis andtax-basis unrealized appreciation/(depreciation) are attributable primarily to the tax deferral of losses on wash sales, the tax treatment of swaps, the tax treatment of passive foreign investment companies (PFICs), and the recognition for tax purposes of unrealized gains/losses on certain derivative instruments. |
| (c) | The difference between book-basis andtax-basis components of accumulated earnings/(deficit) is attributable primarily to the tax treatment of defaulted securities. |
For tax purposes, net realized capital losses may be carried over to offset future capital gains, if any. Funds are permitted to carry forward capital losses for an indefinite period, and such losses will retain their character as either short-term or long-term capital losses. As of March 31, 2019, the Fund had a net short-term capital loss carryforward of $9,668,139 and a net long-term capital loss carryforward of $1,336,161, which may be carried forward for an indefinite period.
NOTE J
Recent Accounting Pronouncements
In March 2017, the Financial Accounting Standards Board issued an Accounting Standards Update, ASU2017-08, Receivables—Nonrefundable Fees and Other Costs (Subtopic310-20), Premium Amortization on Purchased Callable Debt Securities which amends the amortization period for certain purchased callable debt securities held at a premium, shortening such period to the earliest call date. ASU2017-08 does not require any accounting change for debt securities held at a discount; the discount continues to be amortized to maturity. ASU2017-08 is effective for fiscal years, and interim periods within those fiscal years, beginning after December 15, 2018. The Fund has adopted ASU2017-08, which did not have a material impact on the Fund’s financial position or the results of its operations, and had no impact on the Fund’s net assets.
NOTE K
Subsequent Events
Management has evaluated subsequent events for possible recognition or disclosure in the financial statements through the date the financial statements are issued. Management has determined that there are no material events that would require disclosure in the Fund’s financial statements through this date.
| 74 | AB EMERGING MARKETS MULTI-ASSET PORTFOLIO | abfunds.com | |
FINANCIAL HIGHLIGHTS
Selected Data For A Share of Capital Stock Outstanding Throughout Each Period
| Class A | ||||||||||||||||||||||||
| Six Months Ended September 30, 2019 (unaudited) | Year Ended March 31, | |||||||||||||||||||||||
| 2019 | 2018 | 2017 | 2016 | 2015 | ||||||||||||||||||||
|
| |||||||||||||||||||||||
Net asset value, beginning of period | $ 8.89 | $ 10.00 | $ 9.20 | $ 8.59 | $ 8.99 | $ 9.20 | ||||||||||||||||||
|
| |||||||||||||||||||||||
Income From Investment Operations | ||||||||||||||||||||||||
Net investment income(a)(b) | .18 | .30 | .25 | .24 | .27 | .28 | ||||||||||||||||||
Net realized and unrealized gain (loss) on investment and foreign currency transactions | (.30 | ) | (.95 | ) | .89 | .74 | (.37 | ) | (.10 | ) | ||||||||||||||
|
| |||||||||||||||||||||||
Net increase (decrease) in net asset value from operations | (.12 | ) | (.65 | ) | 1.14 | .98 | (.10 | ) | .18 | |||||||||||||||
|
| |||||||||||||||||||||||
Less: Dividends and Distributions | ||||||||||||||||||||||||
Dividends from net investment income | (.17 | ) | (.46 | ) | (.33 | ) | (.30 | ) | (.20 | ) | (.39 | ) | ||||||||||||
Return of capital | – 0 | – | – 0 | – | (.01 | ) | (.07 | ) | (.10 | ) | – 0 | – | ||||||||||||
|
| |||||||||||||||||||||||
Total dividends and distributions | (.17 | ) | (.46 | ) | (.34 | ) | (.37 | ) | (.30 | ) | (.39 | ) | ||||||||||||
|
| |||||||||||||||||||||||
Net asset value, end of period | $ 8.60 | $ 8.89 | $ 10.00 | $ 9.20 | $ 8.59 | $ 8.99 | ||||||||||||||||||
|
| |||||||||||||||||||||||
Total Return | ||||||||||||||||||||||||
Total investment return based on net asset value(c) | (1.33 | )% | (6.20 | )% | 12.56 | % | 11.82 | % | (.98 | )%^ | 1.91 | % | ||||||||||||
Ratios/Supplemental Data | ||||||||||||||||||||||||
Net assets, end of period (000’s omitted) | $4,215 | $5,510 | $10,849 | $4,764 | $1,643 | $634 | ||||||||||||||||||
Ratio to average net assets of: | ||||||||||||||||||||||||
Expenses, net of waivers/reimbursements(d)(e)† | 1.23 | %(f) | 1.24 | % | 1.23 | % | 1.51 | % | 1.62 | % | 1.65 | % | ||||||||||||
Expenses, before waivers/reimbursements(d)(e)† | 1.74 | %(f) | 1.80 | % | 1.92 | % | 2.92 | % | 3.22 | % | 2.96 | % | ||||||||||||
Net investment income(b) | 4.09 | %(f) | 3.36 | % | 2.51 | % | 2.68 | % | 3.15 | % | 2.96 | % | ||||||||||||
Portfolio turnover rate | 53 | % | 110 | % | 74 | % | 118 | % | 108 | % | 114 | % | ||||||||||||
† Expense ratios exclude the estimated acquired fund fees of affiliated/unaffiliated underlying |
| |||||||||||||||||||||||
portfolios | .01 | % | .01 | % | .02 | % | .02 | % | .01 | % | .00 | % | ||||||||||||
See footnote summary on pages 81-82.
| abfunds.com | AB EMERGING MARKETS MULTI-ASSET PORTFOLIO | 75 | |
FINANCIAL HIGHLIGHTS(continued)
Selected Data For A Share of Capital Stock Outstanding Throughout Each Period
| Class C | ||||||||||||||||||||||||
| Six Months Ended September 30, 2019 (unaudited) | Year Ended March 31, | |||||||||||||||||||||||
| 2019 | 2018 | 2017 | 2016 | 2015 | ||||||||||||||||||||
|
| |||||||||||||||||||||||
Net asset value, beginning of period | $ 8.85 | $ 9.95 | $ 9.19 | $ 8.59 | $ 8.97 | $ 9.18 | ||||||||||||||||||
|
| |||||||||||||||||||||||
Income From Investment Operations | ||||||||||||||||||||||||
Net investment income(a)(b) | .15 | .23 | .16 | .17 | .22 | .18 | ||||||||||||||||||
Net realized and unrealized gain (loss) on investment and foreign currency transactions | (.30 | ) | (.93 | ) | .89 | .75 | (.37 | ) | (.08 | ) | ||||||||||||||
|
| |||||||||||||||||||||||
Net increase (decrease) in net asset value from operations | (.15 | ) | (.70 | ) | 1.05 | .92 | (.15 | ) | .10 | |||||||||||||||
|
| |||||||||||||||||||||||
Less: Dividends and Distributions | ||||||||||||||||||||||||
Dividends from net investment income | (.14 | ) | (.40 | ) | (.28 | ) | (.26 | ) | (.16 | ) | (.31 | ) | ||||||||||||
Return of capital | – 0 | – | – 0 | – | (.01 | ) | (.06 | ) | (.07 | ) | – 0 | – | ||||||||||||
|
| |||||||||||||||||||||||
Total dividends and distributions | (.14 | ) | (.40 | ) | (.29 | ) | (.32 | ) | (.23 | ) | (.31 | ) | ||||||||||||
|
| |||||||||||||||||||||||
Net asset value, end of period | $ 8.56 | $ 8.85 | $ 9.95 | $ 9.19 | $ 8.59 | $ 8.97 | ||||||||||||||||||
|
| |||||||||||||||||||||||
Total Return | ||||||||||||||||||||||||
Total investment return based on net asset value(c) | (1.78 | )% | (6.79 | )%^ | 11.63 | %^ | 11.00 | %^ | (1.58 | )%^ | 1.23 | % | ||||||||||||
Ratios/Supplemental Data | ||||||||||||||||||||||||
Net assets, end of period (000’s omitted) | $1,688 | $2,234 | $2,792 | $497 | $95 | $98 | ||||||||||||||||||
Ratio to average net assets of: | ||||||||||||||||||||||||
Expenses, net of waivers/reimbursements(d)(e)† | 1.98 | %(f) | 1.99 | % | 1.98 | % | 2.26 | % | 2.35 | % | 2.35 | % | ||||||||||||
Expenses, before waivers/reimbursements(d)(e)† | 2.49 | %(f) | 2.58 | % | 2.69 | % | 3.69 | % | 3.93 | % | 3.71 | % | ||||||||||||
Net investment income(b) | 3.34 | %(f) | 2.54 | % | 1.57 | % | 1.97 | % | 2.52 | % | 1.97 | % | ||||||||||||
Portfolio turnover rate | 53 | % | 110 | % | 74 | % | 118 | % | 108 | % | 114 | % | ||||||||||||
† Expense ratios exclude the estimated acquired fund fees of affiliated/unaffiliated underlying |
| |||||||||||||||||||||||
portfolios | .01 | % | .01 | % | .02 | % | .02 | % | .01 | % | .00 | % | ||||||||||||
See footnote summary on pages 81-82.
| 76 | AB EMERGING MARKETS MULTI-ASSET PORTFOLIO | abfunds.com | |
FINANCIAL HIGHLIGHTS(continued)
Selected Data For A Share of Capital Stock Outstanding Throughout Each Period
| Advisor Class | ||||||||||||||||||||||||
| Six Months Ended September 30, 2019 (unaudited) | Year Ended March 31, | |||||||||||||||||||||||
| 2019 | 2018 | 2017 | 2016 | 2015 | ||||||||||||||||||||
|
| |||||||||||||||||||||||
Net asset value, beginning of period | $ 8.91 | $ 10.02 | $ 9.22 | $ 8.61 | $ 9.00 | $ 9.22 | ||||||||||||||||||
|
| |||||||||||||||||||||||
Income From Investment Operations | ||||||||||||||||||||||||
Net investment income(a)(b) | .19 | .32 | .27 | .27 | .31 | .31 | ||||||||||||||||||
Net realized and unrealized gain (loss) on investment and foreign currency transactions | (.30 | ) | (.95 | ) | .89 | .74 | (.38 | ) | (.11 | ) | ||||||||||||||
|
| |||||||||||||||||||||||
Net increase (decrease) in net asset value from operations | (.11 | ) | (.63 | ) | 1.16 | 1.01 | (.07 | ) | .20 | |||||||||||||||
|
| |||||||||||||||||||||||
Less: Dividends and Distributions | ||||||||||||||||||||||||
Dividends from net investment income | (.18 | ) | (.48 | ) | (.35 | ) | (.33 | ) | (.22 | ) | (.42 | ) | ||||||||||||
Return of capital | – 0 | – | – 0 | – | (.01 | ) | (.07 | ) | (.10 | ) | – 0 | – | ||||||||||||
|
| |||||||||||||||||||||||
Total dividends and distributions | (.18 | ) | (.48 | ) | (.36 | ) | (.40 | ) | (.32 | ) | (.42 | ) | ||||||||||||
|
| |||||||||||||||||||||||
Net asset value, end of period | $ 8.62 | $ 8.91 | $ 10.02 | $ 9.22 | $ 8.61 | $ 9.00 | ||||||||||||||||||
|
| |||||||||||||||||||||||
Total Return | ||||||||||||||||||||||||
Total investment return based on net asset value(c) | (1.21 | )% | (5.93 | )% | 12.78 | % | 12.07 | % | (.63 | )%^ | 2.17 | % | ||||||||||||
Ratios/Supplemental Data | ||||||||||||||||||||||||
Net assets, end of period (000’s omitted) | $139,564 | $118,492 | $126,029 | $42,000 | $17,572 | $15,805 | ||||||||||||||||||
Ratio to average net assets of: | ||||||||||||||||||||||||
Expenses, net of waivers/reimbursements(d)(e)† | .98 | %(f) | .99 | % | .98 | % | 1.24 | % | 1.35 | % | 1.35 | % | ||||||||||||
Expenses, before waivers/reimbursements(d)(e)† | 1.49 | %(f) | 1.58 | % | 1.67 | % | 2.64 | % | 2.92 | % | 2.65 | % | ||||||||||||
Net investment income(b) | 4.33 | %(f) | 3.53 | % | 2.76 | % | 3.07 | % | 3.60 | % | 3.27 | % | ||||||||||||
Portfolio turnover rate | 53 | % | 110 | % | 74 | % | 118 | % | 108 | % | 114 | % | ||||||||||||
† Expense ratios exclude the estimated acquired fund fees of affiliated/unaffiliated underlying |
| |||||||||||||||||||||||
portfolios | .01 | % | .01 | % | .02 | % | .02 | % | .01 | % | .00 | % | ||||||||||||
See footnote summary on pages 81-82.
| abfunds.com | AB EMERGING MARKETS MULTI-ASSET PORTFOLIO | 77 | |
FINANCIAL HIGHLIGHTS(continued)
Selected Data For A Share of Capital Stock Outstanding Throughout Each Period
| Class R | ||||||||||||||||||||||||
| Six Months Ended September 30, 2019 (unaudited) | Year Ended March 31, | |||||||||||||||||||||||
| 2019 | 2018 | 2017 | 2016 | 2015 | ||||||||||||||||||||
|
| |||||||||||||||||||||||
Net asset value, beginning of period | $ 8.88 | $ 9.97 | $ 9.17 | $ 8.57 | $ 8.96 | $ 9.18 | ||||||||||||||||||
|
| |||||||||||||||||||||||
Income From Investment Operations | ||||||||||||||||||||||||
Net investment income(a)(b) | .17 | .27 | .22 | .18 | .26 | .26 | ||||||||||||||||||
Net realized and unrealized gain (loss) on investment and foreign currency transactions | (.29 | ) | (.94 | ) | .89 | .78 | (.37 | ) | (.11 | ) | ||||||||||||||
|
| |||||||||||||||||||||||
Net increase (decrease) in net asset value from operations | (.12 | ) | (.67 | ) | 1.11 | .96 | (.11 | ) | .15 | |||||||||||||||
|
| |||||||||||||||||||||||
Less: Dividends and Distributions | ||||||||||||||||||||||||
Dividends from net investment income | (.16 | ) | (.42 | ) | (.30 | ) | (.30 | ) | (.19 | ) | (.37 | ) | ||||||||||||
Return of capital | – 0 | – | – 0 | – | (.01 | ) | (.06 | ) | (.09 | ) | – 0 | – | ||||||||||||
|
| |||||||||||||||||||||||
Total dividends and distributions | (.16 | ) | (.42 | ) | (.31 | ) | (.36 | ) | (.28 | ) | (.37 | ) | ||||||||||||
|
| |||||||||||||||||||||||
Net asset value, end of period | $ 8.60 | $ 8.88 | $ 9.97 | $ 9.17 | $ 8.57 | $ 8.96 | ||||||||||||||||||
|
| |||||||||||||||||||||||
Total Return | ||||||||||||||||||||||||
Total investment return based on net asset value(c) | (1.52 | )% | (6.39 | )% | 12.20 | % | 11.51 | % | (1.07 | )% | 1.70 | % | ||||||||||||
Ratios/Supplemental Data | ||||||||||||||||||||||||
Net assets, end of period (000’s omitted) | $294 | $305 | $327 | $184 | $9 | $9 | ||||||||||||||||||
Ratio to average net assets of: | ||||||||||||||||||||||||
Expenses, net of waivers/reimbursements(d)(e)† | 1.48 | %(f) | 1.49 | % | 1.48 | % | 1.72 | % | 1.85 | % | 1.85 | % | ||||||||||||
Expenses, before waivers/reimbursements(d)(e)† | 2.20 | %(f) | 2.23 | % | 2.29 | % | 3.24 | % | 3.39 | % | 3.11 | % | ||||||||||||
Net investment income(b) | 3.84 | %(f) | 3.06 | % | 2.26 | % | 2.08 | % | 3.00 | % | 2.79 | % | ||||||||||||
Portfolio turnover rate | 53 | % | 110 | % | 74 | % | 118 | % | 108 | % | 114 | % | ||||||||||||
† Expense ratios exclude the estimated acquired fund fees of affiliated/unaffiliated underlying |
| |||||||||||||||||||||||
portfolios | .01 | % | .01 | % | .02 | % | .02 | % | .01 | % | .00 | % | ||||||||||||
See footnote summary on pages 81-82.
| 78 | AB EMERGING MARKETS MULTI-ASSET PORTFOLIO | abfunds.com | |
FINANCIAL HIGHLIGHTS(continued)
Selected Data For A Share of Capital Stock Outstanding Throughout Each Period
| Class K | ||||||||||||||||||||||||
| Six Months Ended September 30, 2019 (unaudited) | Year Ended March 31, | |||||||||||||||||||||||
| 2019 | 2018 | 2017 | 2016 | 2015 | ||||||||||||||||||||
|
| |||||||||||||||||||||||
Net asset value, beginning of period | $ 8.87 | $ 9.97 | $ 9.16 | $ 8.56 | $ 8.95 | $ 9.17 | ||||||||||||||||||
|
| |||||||||||||||||||||||
Income From Investment Operations | ||||||||||||||||||||||||
Net investment income(a)(b) | .18 | .29 | .26 | .26 | .24 | .28 | ||||||||||||||||||
Net realized and unrealized gain (loss) on investment and foreign currency transactions | (.29 | ) | (.94 | ) | .88 | .71 | (.33 | ) | (.10 | ) | ||||||||||||||
|
| |||||||||||||||||||||||
Net increase (decrease) in net asset value from operations | (.11 | ) | (.65 | ) | 1.14 | .97 | (.09 | ) | .18 | |||||||||||||||
|
| |||||||||||||||||||||||
Less: Dividends and Distributions | ||||||||||||||||||||||||
Dividends from net investment income | (.17 | ) | (.45 | ) | (.32 | ) | (.30 | ) | (.20 | ) | (.40 | ) | ||||||||||||
Return of capital | – 0 | – | – 0 | – | (.01 | ) | (.07 | ) | (.10 | ) | – 0 | – | ||||||||||||
|
| |||||||||||||||||||||||
Total dividends and distributions | (.17 | ) | (.45 | ) | (.33 | ) | (.37 | ) | (.30 | ) | (.40 | ) | ||||||||||||
|
| |||||||||||||||||||||||
Net asset value, end of period | $ 8.59 | $ 8.87 | $ 9.97 | $ 9.16 | $ 8.56 | $ 8.95 | ||||||||||||||||||
|
| |||||||||||||||||||||||
Total Return | ||||||||||||||||||||||||
Total investment return based on net asset value(c) | (1.42 | )% | (6.19 | )% | 12.56 | % | 11.75 | % | (.86 | )%^ | 1.91 | % | ||||||||||||
Ratios/Supplemental Data | ||||||||||||||||||||||||
Net assets, end of period (000’s omitted) | $225 | $313 | $333 | $298 | $212 | $10 | ||||||||||||||||||
Ratio to average net assets of: | ||||||||||||||||||||||||
Expenses, net of waivers/reimbursements(d)(e)† | 1.23 | %(f) | 1.24 | % | 1.23 | % | 1.53 | % | 1.60 | % | 1.60 | % | ||||||||||||
Expenses, before waivers/reimbursements(d)(e)† | 1.89 | %(f) | 1.96 | % | 2.01 | % | 2.89 | % | 3.34 | % | 2.86 | % | ||||||||||||
Net investment income(b) | 4.20 | %(f) | 3.26 | % | 2.67 | % | 2.94 | % | 2.87 | % | 2.95 | % | ||||||||||||
Portfolio turnover rate | 53 | % | 110 | % | 74 | % | 118 | % | 108 | % | 114 | % | ||||||||||||
† Expense ratios exclude the estimated acquired fund fees of affiliated/unaffiliated underlying |
| |||||||||||||||||||||||
portfolios | .01 | % | .01 | % | .02 | % | .02 | % | .01 | % | .00 | % | ||||||||||||
See footnote summary on pages 81-82.
| abfunds.com | AB EMERGING MARKETS MULTI-ASSET PORTFOLIO | 79 | |
FINANCIAL HIGHLIGHTS(continued)
Selected Data For A Share of Capital Stock Outstanding Throughout Each Period
| Class I | ||||||||||||||||||||||||
| Six Months Ended September 30, 2019 (unaudited) | Year Ended March 31, | |||||||||||||||||||||||
| 2019 | 2018 | 2017 | 2016 | 2015 | ||||||||||||||||||||
|
| |||||||||||||||||||||||
Net asset value, beginning of period | $ 8.83 | $ 9.94 | $ 9.16 | $ 8.56 | $ 8.96 | $ 9.19 | ||||||||||||||||||
|
| |||||||||||||||||||||||
Income From Investment Operations | ||||||||||||||||||||||||
Net investment income(a)(b) | .19 | .28 | .30 | .28 | .30 | .32 | ||||||||||||||||||
Net realized and unrealized gain (loss) on investment and foreign currency transactions | (.30 | ) | (.90 | ) | .85 | .72 | (.37 | ) | (.12 | ) | ||||||||||||||
|
| |||||||||||||||||||||||
Net increase (decrease) in net asset value from operations | (.11 | ) | (.62 | ) | 1.15 | 1.00 | (.07 | ) | .20 | |||||||||||||||
|
| |||||||||||||||||||||||
Less: Dividends and Distributions | ||||||||||||||||||||||||
Dividends from net investment income | (.18 | ) | (.49 | ) | (.36 | ) | (.33 | ) | (.22 | ) | (.43 | ) | ||||||||||||
Return of capital | – 0 | – | – 0 | – | (.01 | ) | (.07 | ) | (.11 | ) | – 0 | – | ||||||||||||
|
| |||||||||||||||||||||||
Total dividends and distributions | (.18 | ) | (.49 | ) | (.37 | ) | (.40 | ) | (.33 | ) | (.43 | ) | ||||||||||||
|
| |||||||||||||||||||||||
Net asset value, end of period | $ 8.54 | $ 8.83 | $ 9.94 | $ 9.16 | $ 8.56 | $ 8.96 | ||||||||||||||||||
|
| |||||||||||||||||||||||
Total Return | ||||||||||||||||||||||||
Total investment return based on net asset value(c) | (1.25 | )% | (5.93 | )% | 12.68 | %^ | 12.15 | %^ | (.66 | )%^ | 2.15 | % | ||||||||||||
Ratios/Supplemental Data | ||||||||||||||||||||||||
Net assets, end of period (000’s omitted) | $14 | $151 | $2,012 | $16,952 | $15,342 | $16,054 | ||||||||||||||||||
Ratio to average net assets of: | ||||||||||||||||||||||||
Expenses, net of waivers/reimbursements(d)(e)† | .98 | %(f) | .99 | % | .98 | % | 1.28 | % | 1.35 | % | 1.35 | % | ||||||||||||
Expenses, before waivers/reimbursements(d)(e)† | 1.45 | %(f) | 1.46 | % | 1.58 | % | 2.51 | % | 2.85 | % | 2.57 | % | ||||||||||||
Net investment income(b) | 4.47 | %(f) | 3.03 | % | 3.12 | % | 3.19 | % | 3.49 | % | 3.37 | % | ||||||||||||
Portfolio turnover rate | 53 | % | 110 | % | 74 | % | 118 | % | 108 | % | 114 | % | ||||||||||||
† Expense ratios exclude the estimated acquired fund fees of affiliated/unaffiliated underlying |
| |||||||||||||||||||||||
portfolios | .01 | % | .01 | % | .02 | % | .02 | % | .01 | % | .00 | % | ||||||||||||
See footnote summary on pages 81-82.
| 80 | AB EMERGING MARKETS MULTI-ASSET PORTFOLIO | abfunds.com | |
FINANCIAL HIGHLIGHTS(continued)
Selected Data For A Share of Capital Stock Outstanding Throughout Each Period
| Class Z | ||||||||||||
| Six Months Ended September 30, 2019 (unaudited) | Year Ended March 31, 2019 | July 31, 2017(g) to March 31, 2018 | ||||||||||
|
| |||||||||||
Net asset value, beginning of period | $ 8.85 | $ 9.95 | $ 9.81 | |||||||||
|
| |||||||||||
Income From Investment Operations | ||||||||||||
Net investment income(a)(b) | .14 | .31 | .15 | |||||||||
Net realized and unrealized gain (loss) on investment and foreign currency transactions | (.24 | ) | (.93 | ) | .30 | |||||||
|
| |||||||||||
Net increase (decrease) in net asset value from operations | (.10 | ) | (.62 | ) | .45 | |||||||
|
| |||||||||||
Less: Dividends and Distributions | ||||||||||||
Dividends from net investment income | (.18 | ) | (.48 | ) | (.30 | ) | ||||||
Return of capital | – 0 | – | – 0 | – | (.01 | ) | ||||||
|
| |||||||||||
Total dividends and distributions | (.18 | ) | (.48 | ) | (.31 | ) | ||||||
|
| |||||||||||
Net asset value, end of period | $ 8.57 | $ 8.85 | $ 9.95 | |||||||||
|
| |||||||||||
Total Return | ||||||||||||
Total investment return based on net asset value(c) | (1.22 | )% | (5.90 | )%^ | 4.66 | %^ | ||||||
Ratios/Supplemental Data | ||||||||||||
Net assets, end of period (000’s omitted) | $180 | $9 | $10 | |||||||||
Ratio to average net assets of: | ||||||||||||
Expenses, net of waivers/reimbursements(d)(e)† | .98 | %(f) | .99 | % | .98 | %(f) | ||||||
Expenses, before waivers/reimbursements(d)(e)† | 1.52 | %(f) | 1.60 | % | 1.71 | %(f) | ||||||
Net investment income(b) | 3.15 | %(f) | 3.49 | % | 2.26 | %(f) | ||||||
Portfolio turnover rate | 53 | % | 110 | % | 74 | % | ||||||
† Expense ratios exclude the estimated acquired fund fees of affiliated/unaffiliated underlying |
| |||||||||||
portfolios | .01 | % | .01 | % | .01 | % | ||||||
| (a) | Based on average shares outstanding. |
| (b) | Net of expenses waived/reimbursed by the Adviser. |
| (c) | Total investment return is calculated assuming an initial investment made at the net asset value at the beginning of the period, reinvestment of all dividends and distributions at net asset value during the period, and redemption on the last day of the period. Initial sales charge or contingent deferred sales charge is not reflected in the calculation of total investment return. Total investment return does not reflect the deduction of taxes that a shareholder would pay on fund distributions or the redemption of fund shares. Total investment return for a period of less than one year is not annualized. |
| (d) | In connection with the Fund’s investments in affiliated underlying portfolios, the Fund incurs no direct expenses but bears proportionate shares of the acquired fund fees and expenses (i.e. operating, administrative and investment advisory fees) of the affiliated underlying portfolios. The Adviser has contractually agreed to waive its fees from the Fund in an amount equal to the Fund’s pro rata share of certain acquired fund fees and expenses, and for the six months ended September 30, 2019, years ended March 31, 2019, March 31, 2018 and March 31, 2017, such waiver amounted to 0.01% (annualized), 0.01%, 0.01% and 0.02%, respectively. |
| abfunds.com | AB EMERGING MARKETS MULTI-ASSET PORTFOLIO | 81 | |
FINANCIAL HIGHLIGHTS(continued)
Selected Data For A Share of Capital Stock Outstanding Throughout Each Period
| (e) | The expense ratios presented below exclude interest expense: |
Six Months Ended September 30, | Year Ended March 31, | |||||||||||||||||||||||
| 2019 | 2018 | 2017 | 2016 | 2015 | ||||||||||||||||||||
|
| |||||||||||||||||||||||
Class A | ||||||||||||||||||||||||
Net of waivers/reimbursements | N/A | 1.24 | % | N/A | N/A | N/A | N/A | |||||||||||||||||
Before waivers/reimbursements | N/A | 1.80 | % | N/A | N/A | N/A | N/A | |||||||||||||||||
Class C | ||||||||||||||||||||||||
Net of waivers/reimbursements | N/A | 1.98 | % | N/A | N/A | N/A | N/A | |||||||||||||||||
Before waivers/reimbursements | N/A | 2.57 | % | N/A | N/A | N/A | N/A | |||||||||||||||||
Advisor Class | ||||||||||||||||||||||||
Net of waivers/reimbursements | N/A | .98 | % | N/A | N/A | N/A | N/A | |||||||||||||||||
Before waivers/reimbursements | N/A | 1.57 | % | N/A | N/A | N/A | N/A | |||||||||||||||||
Class R | ||||||||||||||||||||||||
Net of waivers/reimbursements | N/A | 1.48 | % | N/A | N/A | N/A | N/A | |||||||||||||||||
Before waivers/reimbursements | N/A | 2.22 | % | N/A | N/A | N/A | N/A | |||||||||||||||||
Class K | ||||||||||||||||||||||||
Net of waivers/reimbursements | N/A | 1.24 | % | N/A | N/A | N/A | N/A | |||||||||||||||||
Before waivers/reimbursements | N/A | 1.96 | % | N/A | N/A | N/A | N/A | |||||||||||||||||
Class I | ||||||||||||||||||||||||
Net of waivers/reimbursements | N/A | .98 | % | N/A | N/A | N/A | N/A | |||||||||||||||||
Before waivers/reimbursements | N/A | 1.45 | % | N/A | N/A | N/A | N/A | |||||||||||||||||
| Six Months Ended September 30, 2019 | Year Ended March 31, 2019 | July 31, 2017(g) to March 31, 2018(f) | ||||||||||
|
| |||||||||||
Class Z | ||||||||||||
Net of waivers/reimbursements | N/A | .99 | % | N/A | ||||||||
Before waivers/reimbursements | N/A | 1.60 | % | N/A | ||||||||
| (f) | Annualized. |
| (g) | Commencement of distribution. |
| ^ | The net asset value and total return include adjustments in accordance with accounting principles generally accepted in the United States of America for financial reporting purposes. As such, the net asset value and total return for shareholder transactions may differ from financial statements. |
See notes to financial statements.
| 82 | AB EMERGING MARKETS MULTI-ASSET PORTFOLIO | abfunds.com | |
BOARD OF DIRECTORS
Marshall C. Turner, Jr.(1),Chairman Michael J. Downey(1) Nancy P. Jacklin(1) Robert M. Keith,President and Chief Executive Officer | Carol C. McMullen(1) Garry L. Moody(1) Earl D. Weiner(1) | |
| OFFICERS | ||
Henry S. D’Auria(2),Vice President Paul J. DeNoon(2),*,Vice President Morgan C. Harting(2), Shamaila Khan(2),Vice President Emilie D. Wrapp,Secretary | Michael B. Reyes,Senior Analyst Joseph J. Mantineo,Treasurer and Chief Financial Officer Phyllis J. Clarke,Controller Vincent S. Noto,Chief Compliance Officer | |
Custodian and Accounting Agent Brown Brothers Harriman & Co.
Principal Underwriter AllianceBernstein Investments, Inc.
Legal Counsel Seward & Kissel LLP | Independent Registered Public Accounting Firm Ernst & Young LLP
Transfer Agent AllianceBernstein Investor |
| 1 | Member of the Audit Committee, the Governance and Nominating Committee and the Independent Directors Committee. |
| 2 | Theday-to-day management of, and investment decisions for, the Portfolio are made by the Adviser’s Emerging Markets Multi-Asset Team. Messrs. D’Auria, DeNoon, Harting and Ms. Khan are the investment professionals with the most significant responsibility for theday-to-day management of the Portfolio’s portfolio. |
| * | Mr. DeNoon is expected to retire from the Adviser effective January 1, 2020. |
| abfunds.com | AB EMERGING MARKETS MULTI-ASSET PORTFOLIO | 83 | |
Information Regarding the Review and Approval of the Fund’s Advisory Agreement
The disinterested directors (the “directors”) of AB Cap Fund, Inc. (the “Company”) unanimously approved the continuance of the Company’s Advisory Agreement with the Adviser in respect of AB Emerging Markets Multi-Asset Portfolio (the “Fund”) at a meeting held on May 7-9, 2019 (the “Meeting”).
Prior to approval of the continuance of the Advisory Agreement, the directors had requested from the Adviser, and received and evaluated, extensive materials. They reviewed the proposed continuance of the Advisory Agreement with the Adviser and with experienced counsel who are independent of the Adviser, who advised on the relevant legal standards. The directors also reviewed additional materials, including comparative analytical data prepared by the Senior Analyst for the Fund. The directors also discussed the proposed continuance in private sessions with counsel.
The directors considered their knowledge of the nature and quality of the services provided by the Adviser to the Fund gained from their experience as directors or trustees of most of the registered investment companies advised by the Adviser, their overall confidence in the Adviser’s integrity and competence they have gained from that experience, the Adviser’s initiative in identifying and raising potential issues with the directors and its responsiveness, frankness and attention to concerns raised by the directors in the past, including the Adviser’s willingness to consider and implement organizational and operational changes designed to improve investment results and the services provided to the AB Funds. The directors noted that they have four regular meetings each year, at each of which they review extensive materials and information from the Adviser, including information on the investment performance of the Fund.
The directors also considered all factors they believed relevant, including the specific matters discussed below. During the course of their deliberations, the directors evaluated, among other things, the reasonableness of the advisory fee. The directors did not identify any particular information that was all-important or controlling, and different directors may have attributed different weights to the various factors. The directors determined that the selection of the Adviser to manage the Fund and the overall arrangements between the Fund and the Adviser, as provided in the Advisory Agreement, including the advisory fee, were fair and reasonable in light of the services performed, expenses incurred and such other matters as the directors considered relevant in the exercise of their business judgment. The material factors and conclusions that formed the basis for the directors’ determinations included the following:
Nature, Extent and Quality of Services Provided
The directors considered the scope and quality of services provided by the Adviser under the Advisory Agreement, including the quality of the investment
| 84 | AB EMERGING MARKETS MULTI-ASSET PORTFOLIO | abfunds.com | |
research capabilities of the Adviser and the other resources it has dedicated to performing services for the Fund. The directors noted that the Adviser from time to time reviews the Fund’s investment strategies and from time to time proposes changes intended to improve the Fund’s relative or absolute performance for the directors’ consideration. They also noted the professional experience and qualifications of the Fund’s portfolio management team and other senior personnel of the Adviser. The directors also considered that the Advisory Agreement provides that the Fund will reimburse the Adviser for the cost to it of providing certain clerical, accounting, administrative and other services to the Fund by employees of the Adviser or its affiliates. Requests for these reimbursements are made on a quarterly basis and subject to approval by the directors. The Adviser did not request any reimbursements from the Fund in the Fund’s latest fiscal year. The directors noted that the methodology used to determine the reimbursement amounts had been reviewed by an independent consultant retained by the Fund’s former Senior Officer/Independent Compliance Officer. The quality of administrative and other services, including the Adviser’s role in coordinating the activities of the Fund’s other service providers, also was considered. The directors concluded that, overall, they were satisfied with the nature, extent and quality of services provided to the Fund under the Advisory Agreement.
Costs of Services Provided and Profitability
The directors reviewed a schedule of the revenues and expenses and related notes indicating the profitability of the Fund to the Adviser for calendar years 2017 and 2018 that had been prepared with an expense allocation methodology arrived at in consultation with an independent consultant retained by the Fund’s former Senior Officer/Independent Compliance Officer. The directors noted the assumptions and methods of allocation used by the Adviser in preparing fund-specific profitability data and understood that there are a number of potentially acceptable allocation methodologies for information of this type. The directors noted that the profitability information reflected all revenues and expenses of the Adviser’s relationship with the Fund, including those relating to its subsidiaries that provide transfer agency, distribution and brokerage services to the Fund. The directors recognized that it is difficult to make comparisons of the profitability of the Advisory Agreement with the profitability of advisory contracts for unaffiliated funds because comparative information is not generally publicly available and is affected by numerous factors. The directors focused on the profitability of the Adviser’s relationship with the Fund before taxes and distribution expenses. The directors noted that the Fund was not profitable to the Adviser in the periods reviewed.
Fall-Out Benefits
The directors considered the other benefits to the Adviser and its affiliates from their relationships with the Fund and the underlying fund advised by the Adviser in which the Fund invests, including, but not limited to, benefits relating to soft dollar arrangements (whereby investment advisers receive
| abfunds.com | AB EMERGING MARKETS MULTI-ASSET PORTFOLIO | 85 | |
brokerage and research services from brokers that execute agency transactions for their clients); 12b-1 fees and sales charges received by the Fund’s principal underwriter (which is a wholly owned subsidiary of the Adviser) in respect of certain classes of the Fund’s shares; brokerage commissions paid by the Fund to brokers affiliated with the Adviser; and transfer agency fees paid by the Fund to a wholly owned subsidiary of the Adviser. The directors recognized that the Fund’s unprofitability to the Adviser would be exacerbated without these benefits. The directors understood that the Adviser also might derive reputational and other benefits from its association with the Fund.
Investment Results
In addition to the information reviewed by the directors in connection with the Meeting, the directors receive detailed performance information for the Fund at each regular Board meeting during the year.
At the Meeting, the directors reviewed performance information prepared by an independent service provider (the “15(c) service provider”), showing the performance of the Class A Shares of the Fund against a group of similar funds (“peer group”) and a larger group of similar funds (“peer universe”), each selected by the 15(c) service provider, and information prepared by the Adviser showing performance of the Class A Shares against a broad-based securities market index, in each case for the 1-, 3- and5-year periods ended February 28, 2019 and (in the case of comparisons with the broad-based securities market index) for the period from inception. Based on their review, the directors concluded that the Fund’s investment performance was acceptable.
Advisory Fees and Other Expenses
The directors considered the advisory fee rate payable by the Fund to the Adviser and information prepared by the 15(c) service provider concerning advisory fee rates payable by other funds in the same category as the Fund. The directors recognized that it is difficult to make comparisons of advisory fees because there are variations in the services that are included in the fees paid by other funds. The directors compared the Fund’s contractual effective advisory fee rate with a peer group median and noted that it was above the median.
The directors also considered the Adviser’s fee schedule for other clients pursuing an investment strategy similar to the Fund’s. For this purpose, they reviewed the relevant advisory fee information from the Adviser’s Form ADV and in a report from the Fund’s Senior Analyst and noted the differences between the Fund’s fee schedule, on the one hand, and the Adviser’s institutional fee schedule and the schedule of fees charged by the Adviser to any offshore funds and for services to any sub-advised funds pursuing an investment strategy similar to the Fund’s, on the other. The directors noted that the Adviser may, in some cases, agree to fee
| 86 | AB EMERGING MARKETS MULTI-ASSET PORTFOLIO | abfunds.com | |
rates with large institutional clients that are lower than those reviewed by the directors and that they had previously discussed with the Adviser its policies in respect of such arrangements. The directors previously discussed these matters with an independent fee consultant.
The Adviser reviewed with the directors the significantly greater scope of the services it provides to the Fund relative to institutional, offshore fund and sub-advised fund clients. In this regard, the Adviser noted, among other things, that, compared to institutional and offshore or sub-advisory accounts, the Fund (i) demands considerably more portfolio management, research and trading resources due to significantly higher daily cash flows; (ii) has more tax and regulatory restrictions and compliance obligations; (iii) must prepare and file or distribute regulatory and other communications about fund operations; and (iv) must provide shareholder servicing to retail investors. The Adviser also reviewed the greater legal risks presented by the large and changing population of Fund shareholders who may assert claims against the Adviser in individual or class actions, and the greater entrepreneurial risk in offering new fund products, which require substantial investment to launch, may not succeed, and generally must be priced to compete with larger, more established funds resulting in lack of profitability to the Adviser until a new fund achieves scale. In light of the substantial differences in services rendered by the Adviser to institutional, offshore fund and sub-advised fund clients as compared to the Fund, and the different risk profile, the directors considered these fee comparisons inapt and did not place significant weight on them in their deliberations.
The directors noted that the Fund invests in shares of exchange-traded funds (“ETFs”), subject to the restrictions and limitations of the Investment Company Act of 1940 as these may be varied as a result of exemptive orders issued by the SEC. The directors also noted that ETFs pay advisory fees pursuant to their advisory contracts, and that the Adviser had provided, and they had reviewed, information about the expense ratios of the relevant ETFs. The directors concluded, based on the Adviser’s explanation of how it uses ETFs when they are the most cost-effective way to obtain desired exposures, in some cases pending purchases of underlying securities, that the advisory fee for the Fund is for services that are in addition to, rather than duplicative of, the services provided under the advisory contracts of the ETFs.
In connection with their review of the Fund’s advisory fee, the directors also considered the total expense ratio of the Class A shares of the Fund in comparison to a peer group and a peer universe selected by the 15(c) service provider. The Class A expense ratio of the Fund was based on the Fund’s latest fiscal year and the directors considered the Adviser’s expense cap for the Fund. The directors noted that it was likely that the expense ratios of some of the other funds in the Fund’s category were lowered by waivers or reimbursements by those funds’ investment
| abfunds.com | AB EMERGING MARKETS MULTI-ASSET PORTFOLIO | 87 | |
advisers, which in some cases might be voluntary or temporary. The directors view expense ratio information as relevant to their evaluation of the Adviser’s services because the Adviser is responsible for coordinating services provided to the Fund by others. Based on their review, the directors concluded that the Fund’s expense ratio was acceptable.
Economies of Scale
The directors noted that the advisory fee schedule for the Fund contains breakpoints that reduce the fee rates on assets above specified levels. The directors took into consideration prior presentations by an independent consultant on economies of scale in the mutual fund industry and for the AB Funds, and presentations from time to time by the Adviser concerning certain of its views on economies of scale. The directors also previously discussed economies of scale with an independent fee consultant. The directors also had requested and received from the Adviser certain updates on economies of scale in advance of the Meeting. The directors believe that economies of scale may be realized (if at all) by the Adviser across a variety of products and services, and not only in respect of a single fund. The directors noted that there is no established methodology for setting breakpoints that give effect to the fund-specific services provided by a fund’s adviser and to the economies of scale that an adviser may realize in its overall mutual fund business or those components of it which directly or indirectly affect a fund’s operations. The directors observed that in the mutual fund industry as a whole, as well as among funds similar to the Fund, there is no uniformity or pattern in the fees and asset levels at which breakpoints (if any) apply. The directors also noted that the advisory agreements for many funds do not have breakpoints at all. Having taken these factors into account, the directors concluded that the Fund’s shareholders would benefit from a sharing of economies of scale in the event the Fund’s net assets exceed a breakpoint in the future.
| 88 | AB EMERGING MARKETS MULTI-ASSET PORTFOLIO | abfunds.com | |
This page is not part of the Shareholder Report or the Financial Statements.
AB FAMILY OF FUNDS
US EQUITY
US CORE
Core Opportunities Fund
FlexFee™ US Thematic Portfolio
Select US Equity Portfolio
US GROWTH
Concentrated Growth Fund
Discovery Growth Fund
FlexFee™ Large Cap Growth Portfolio
Growth Fund
Large Cap Growth Fund
Small Cap Growth Portfolio
US VALUE
Discovery Value Fund
Equity Income Fund
Relative Value Fund
Small Cap Value Portfolio
Value Fund
INTERNATIONAL/ GLOBAL EQUITY
INTERNATIONAL/ GLOBAL CORE
FlexFee™ International Strategic Core Portfolio
Global Core Equity Portfolio
International Portfolio
International Strategic Core Portfolio
Sustainable Global Thematic Fund
Tax-Managed International Portfolio
Tax-Managed Wealth Appreciation Strategy
Wealth Appreciation Strategy
INTERNATIONAL/ GLOBAL GROWTH
Concentrated International Growth Portfolio
FlexFee™ Emerging Markets Growth Portfolio
INTERNATIONAL/ GLOBAL EQUITY(continued)
Sustainable International Thematic Fund
INTERNATIONAL/ GLOBAL VALUE
All China Equity Portfolio
International Value Fund
FIXED INCOME
MUNICIPAL
High Income Municipal Portfolio
Intermediate California Municipal Portfolio
Intermediate Diversified Municipal Portfolio
Intermediate New York Municipal Portfolio
Municipal Bond Inflation Strategy
Tax-Aware Fixed Income Portfolio
National Portfolio
Arizona Portfolio
California Portfolio
Massachusetts Portfolio
Minnesota Portfolio
New Jersey Portfolio
New York Portfolio
Ohio Portfolio
Pennsylvania Portfolio
Virginia Portfolio
TAXABLE
Bond Inflation Strategy
FlexFee™ High Yield Portfolio
FlexFee™ International Bond Portfolio
Global Bond Fund
High Income Fund
Income Fund
Intermediate Duration Portfolio
Limited Duration High Income Portfolio
Short Duration Portfolio
Total Return Bond Portfolio1
ALTERNATIVES
All Market Real Return Portfolio
Global Real Estate Investment Fund
Select US Long/Short Portfolio
Unconstrained Bond Fund
MULTI-ASSET
All Market Income Portfolio
All Market Total Return Portfolio
Conservative Wealth Strategy
Emerging Markets Multi-Asset Portfolio
Global Risk Allocation Fund
Tax-Managed All Market Income Portfolio
TARGET-DATE
Multi-Manager Select Retirement Allocation Fund
Multi-Manager Select 2010 Fund
Multi-Manager Select 2015 Fund
Multi-Manager Select 2020 Fund
Multi-Manager Select 2025 Fund
Multi-Manager Select 2030 Fund
Multi-Manager Select 2035 Fund
Multi-Manager Select 2040 Fund
Multi-Manager Select 2045 Fund
Multi-Manager Select 2050 Fund
Multi-Manager Select 2055 Fund
Multi-Manager Select 2060 Fund
CLOSED-END FUNDS
AllianceBernstein Global High Income Fund
AllianceBernstein National Municipal Income Fund
We also offer Government Money Market Portfolio, which serves as the money market fund exchange vehicle for the AB mutual funds. You could lose money by investing in the Fund. Although the Fund seeks to preserve the value of your investment at $1.00 per share, it cannot guarantee it will do so. The Fund may impose a fee upon sale of your shares or may temporarily suspend your ability to sell shares if the Fund’s liquidity falls below required minimums because of market conditions or other factors. An investment in the Fund is not insured or guaranteed by the Federal Deposit Insurance Corporation or any other government agency. The Fund’s sponsor has no legal obligation to provide financial support to the Fund, and you should not expect that the sponsor will provide financial support to the Fund at any time.
Investors should consider the investment objectives, risks, charges and expenses of the Fund carefully before investing. For copies of our prospectus or summary prospectus, which contain this and other information, visit us online at www.abfunds.com or contact your AB representative. Please read the prospectus and/or summary prospectus carefully before investing.
| 1 | Prior to July 12, 2019, Total Return Bond Portfolio was named Intermediate Bond Portfolio. |
| abfunds.com | AB EMERGING MARKETS MULTI-ASSET PORTFOLIO | 89 | |
NOTES
| 90 | AB EMERGING MARKETS MULTI-ASSET PORTFOLIO | abfunds.com | |
NOTES
| abfunds.com | AB EMERGING MARKETS MULTI-ASSET PORTFOLIO | 91 | |
NOTES
| 92 | AB EMERGING MARKETS MULTI-ASSET PORTFOLIO | abfunds.com | |
AB EMERGING MARKETS MULTI-ASSET PORTFOLIO
1345 Avenue of the Americas
New York, NY 10105
800 221 5672
EMMA-0152-0919 
ITEM 2. CODE OF ETHICS.
Not applicable when filing a semi-annual report to shareholders.
ITEM 3. AUDIT COMMITTEE FINANCIAL EXPERT.
Not applicable when filing a semi-annual report to shareholders.
ITEM 4. PRINCIPAL ACCOUNTANT FEES AND SERVICES.
Not applicable when filing a semi-annual report to shareholders.
ITEM 5. AUDIT COMMITTEE OF LISTED REGISTRANTS.
Not applicable to the registrant.
ITEM 6. SCHEDULE OF INVESTMENTS.
Please see Schedule of Investments contained in the Report to Shareholders included under Item 1 of this FormN-CSR.
ITEM 7. DISCLOSURE OF PROXY VOTING POLICIES AND PROCEDURES FORCLOSED-END MANAGEMENT INVESTMENT COMPANIES.
Not applicable to the registrant.
ITEM 8. PORTFOLIO MANAGERS OFCLOSED-END MANAGEMENT INVESTMENT COMPANIES.
Not applicable to the registrant.
ITEM 9. PURCHASES OF EQUITY SECURITIES BYCLOSED-END MANAGEMENT INVESTMENT COMPANY AND AFFILIATED PURCHASERS.
Not applicable to the registrant.
ITEM 10. SUBMISSION OF MATTERS TO A VOTE OF SECURITY HOLDERS.
There have been no material changes to the procedures by which shareholders may recommend nominees to the Fund’s Board of Directors since the Fund last provided disclosure in response to this item.
ITEM 11. CONTROLS AND PROCEDURES.
(a) The registrant’s principal executive officer and principal financial officer have concluded that the registrant’s disclosure controls and procedures (as defined in Rule30a-2(c) under the Investment Company Act of 1940, as amended) are effective at the reasonable assurance level based on their evaluation of these controls and procedures as of a date within 90 days of the filing date of this document.
(b) There were no changes in the registrant’s internal controls over financial reporting that occurred during the second fiscal quarter of the period that has materially affected, or is reasonably likely to materially affect, the registrant’s internal control over financial reporting.
ITEM 12. EXHIBITS.
The following exhibits are attached to this FormN-CSR:
EXHIBIT NO. | DESCRIPTION OF EXHIBIT | |
| 12 (b) (1) | Certification of Principal Executive Officer Pursuant to Section 302 of the Sarbanes-Oxley Act of 2002 | |
| 12 (b) (2) | Certification of Principal Financial Officer Pursuant to Section 302 of the Sarbanes-Oxley Act of 2002 | |
| 12 (c) | Certification of Principal Executive Officer and Principal Financial Officer Pursuant to Section 906 of theSarbanes-Oxley Act of 2002 | |
SIGNATURES
Pursuant to the requirements of the Securities Exchange Act of 1934 and the Investment Company Act of 1940, the registrant has duly caused this report to be signed on its behalf by the undersigned, thereunto duly authorized.
| (Registrant): AB Cap Fund, Inc. | ||
| By: | /s/ Robert M. Keith | |
| Robert M. Keith | ||
| President | ||
| Date: | November 26, 2019 | |
Pursuant to the requirements of the Securities Exchange Act of 1934 and the Investment Company Act of 1940, this report has been signed below by the following persons on behalf of the registrant and in the capacities and on the dates indicated.
| By: | /s/ Robert M. Keith | |
| Robert M. Keith | ||
| President | ||
| Date: | November 26, 2019 | |
| By: | /s/ Joseph J. Mantineo | |
| Joseph J. Mantineo | ||
| Treasurer and Chief Financial Officer | ||
| Date: | November 26, 2019 | |