UNITED STATES
SECURITIES AND EXCHANGE COMMISSION
WASHINGTON, D.C. 20549
FORM N-CSR
CERTIFIED SHAREHOLDER REPORT OF REGISTERED
MANAGEMENT INVESTMENT COMPANIES
Investment Company Act file number: 811-01716
AB CAP FUND, INC.
(Exact name of registrant as specified in charter)
1345 Avenue of the Americas, New York, New York 10105
(Address of principal executive offices) (Zip code)
Joseph J. Mantineo
AllianceBernstein L.P.
1345 Avenue of the Americas
New York, New York 10105
(Name and address of agent for service)
Registrant’s telephone number, including area code: (800) 221-5672
Date of fiscal year end: November 30, 2022
Date of reporting period: November 30, 2022
Enclosed for filing you will find an amended Form N-CSR of the registrant’s original 2022 Form N-CSR filing of the referenced period. The purpose of this amended filing is to update Item 11 (b) and Item 13 (which is addressed in exhibits labeled Exhibit 12 (b)(1) and Exhibit 12 (b)(2) in the original filings). Except as set forth above, no other changes have been made to the Form N-CSR, and this amended filing does not amend, update or change any other items or disclosure found in the Form N-CSR.
ITEM 1. REPORTS TO STOCKHOLDERS.
NOV 11.30.22

ANNUAL REPORT
AB ALL CHINA EQUITY PORTFOLIO

| | |
| |
| Investment Products Offered | | • Are Not FDIC Insured • May Lose Value • Are Not Bank Guaranteed |
Investors should consider the investment objectives, risks, charges and expenses of the Fund carefully before investing. For copies of our prospectus or summary prospectus, which contain this and other information, visit us online at www.abfunds.com or contact your AB representative. Please read the prospectus and/or summary prospectus carefully before investing.
This shareholder report must be preceded or accompanied by the Fund’s prospectus for individuals who are not current shareholders of the Fund.
You may obtain a description of the Fund’s proxy voting policies and procedures, and information regarding how the Fund voted proxies relating to portfolio securities during the most recent 12-month period ended June 30, without charge. Simply visit AB’s website at www.abfunds.com, or go to the Securities and Exchange Commission’s (the “Commission”) website at www.sec.gov, or call AB at (800) 227 4618.
The Fund files its complete schedule of portfolio holdings with the Commission for the first and third quarters of each fiscal year as an exhibit to its reports on Form N-PORT. The Fund’s Form N-PORT reports are available on the Commission’s website at www.sec.gov. AB publishes full portfolio holdings for the Fund monthly at www.abfunds.com.
AllianceBernstein Investments, Inc. (ABI) is the distributor of the AB family of mutual funds. ABI is a member of FINRA and is an affiliate of AllianceBernstein L.P., the Adviser of the funds.
The [A/B] logo is a registered service mark of AllianceBernstein and AllianceBernstein® is a registered service mark used by permission of the owner, AllianceBernstein L.P.
| | |
| FROM THE PRESIDENT | |  |
Dear Shareholder,
We’re pleased to provide this report for the AB All China Equity Portfolio (the “Fund”). Please review the discussion of Fund performance, the market conditions during the reporting period and the Fund’s investment strategy.
At AB, we’re striving to help our clients achieve better outcomes by:
| + | | Fostering diverse perspectives that give us a distinctive approach to navigating global capital markets |
| + | | Applying differentiated investment insights through a connected global research network |
| + | | Embracing innovation to design better ways to invest and leading-edge mutual-fund solutions |
Whether you’re an individual investor or a multibillion-dollar institution, we’re putting our knowledge and experience to work for you every day.
For more information about AB’s comprehensive range of products and shareholder resources, please log on to www.abfunds.com.
Thank you for your investment in AB mutual funds—and for placing your trust in our firm.
Sincerely,

Onur Erzan
President and Chief Executive Officer, AB Mutual Funds
| | |
| |
| abfunds.com | | AB ALL CHINA EQUITY PORTFOLIO | 1 |
ANNUAL REPORT
January 10, 2023
This report provides management’s discussion of fund performance for the AB All China Equity Portfolio for the annual reporting period ended November 30, 2022.
The Fund’s investment objective is to seek long-term growth of capital.
NAV RETURNS AS OF NOVEMBER 30, 2022 (unaudited)
| | | | | | | | |
| | |
| | | 6 Months | | | 12 Months | |
| | |
| AB ALL CHINA EQUITY PORTFOLIO | | | | | | | | |
| | |
| Class A Shares | | | -13.73% | | | | -29.09% | |
| | |
| Advisor Class Shares1 | | | -13.60% | | | | -28.93% | |
| | |
| MSCI China All Shares Index (net) | | | -10.24% | | | | -27.67% | |
| 1 | Please note that this share class is for investors purchasing shares through accounts established under certain fee-based programs sponsored and maintained by certain broker-dealers and financial intermediaries, institutional pension plans and/or investment advisory clients of, and certain other persons associated with, the Adviser and its affiliates or the Fund. |
INVESTMENT RESULTS
The table above shows the Fund’s performance compared to its benchmark, the Morgan Stanley Capital International (“MSCI”) China All Shares Index (net), for the six- and 12-month periods ended November 30, 2022.
During both periods, all share classes of the Fund underperformed the benchmark, before sales charges. The Fund’s renewable energy and electric vehicle names detracted, relative to the benchmark, due to expectations of increased competition in 2023. Real estate holdings remained weak due to macroeconomic concerns. A late rebound, following a sweeping plan by Beijing to boost liquidity in the debt-ridden property market, failed to offset earlier losses. Health care holdings, however, contributed to performance. News that local authorities had approved a new vaccine to fight the coronavirus, as well as the government’s plans to boost vaccination, especially among the elderly, lifted health care companies. Consumption-related holdings also aided performance, buoyed by hopes of economic reopening in China. After years of pursuing strict COVID-19 restrictions, authorities appeared to be turning the corner on pandemic policies, setting up a consumer recovery.
The Fund did not utilize derivatives during either period.
| | |
| |
2 | AB ALL CHINA EQUITY PORTFOLIO | | abfunds.com |
MARKET REVIEW AND INVESTMENT STRATEGY
Chinese equities fell during both the six- and 12-month periods ended November 30, 2022. Investor sentiment was mostly dampened by Beijing’s stance on maintaining its stringent “zero-COVID” policy, although toward the end of the period, a wide range of pandemic restrictions were eased after public discontent at the country’s zero-tolerance policy triggered a wave of protests. Sluggish economic growth further undermined sentiment, as there was little change in China’s economic policy toward a more growth-supportive mode. No large-scale stimulus measures were announced even after the National Congress, where President Xi Jinping secured an unprecedented third term as party leader and replaced economic pragmatists on his leadership team with a cadre of loyalists.
Given the risk of short-term swings in government policy, the Fund’s Senior Investment Management Team (the “Team”) focused on companies aligned with China’s longer-term policies, such as the beneficiaries of domestic decarbonization policy and green energy. The Team also maintained the Fund’s pivot toward consumer-facing companies, as Beijing showed signs of shifting its policy on pandemic control and economic growth, while continuing to look for fundamentally solid companies that the Team believes were oversold.
INVESTMENT POLICIES
The Adviser seeks to achieve the Fund’s investment objective by investing, under normal circumstances, at least 80% of the Fund’s net assets in a portfolio of equity securities of companies economically tied to the People’s Republic of China (“China”) (including Hong Kong). A company is considered to be economically tied to China if: (i) the company is domiciled or organized in China; (ii) the company has securities that are traded principally in China; or (iii) the company conducts a substantial part of its economic activities in China or is a US-listed entity established by a company conducting a substantial part of its economic activities in China, which has been structured to provide investors with exposure to the company. Equity securities may include common stocks, preferred stocks, the equity securities of real estate investment trusts, depositary receipts and derivative instruments related to equity securities. The Adviser expects to invest Fund assets both in shares of companies that trade on the Shanghai Stock Exchange or the Shenzhen Stock Exchange (“China A shares”) and shares of companies economically tied to China that trade in Hong Kong or outside of China.
The Adviser believes that, over time, securities that are undervalued by the market relative to their long-term earnings power can provide high
(continued on next page)
| | |
| |
| abfunds.com | | AB ALL CHINA EQUITY PORTFOLIO | 3 |
returns. The Adviser utilizes fundamental analysis and its quantitative models to attempt to identify these securities for investment by the Fund, attempting to balance factors relating to valuation, company quality and investor sentiment, and will seek to build a portfolio that delivers attractive risk-adjusted returns.
The Adviser may, but frequently will not, hedge the foreign currency exposure resulting from the Fund’s security positions through the use of currency-related derivatives.
| | |
| |
4 | AB ALL CHINA EQUITY PORTFOLIO | | abfunds.com |
DISCLOSURES AND RISKS
Benchmark Disclosure
The MSCI China All Shares Index is unmanaged and does not reflect fees and expenses associated with the active management of a mutual fund portfolio. The MSCI China All Shares Index (net) captures large- and mid-cap representation across China A-shares, B-shares, H-shares, Red-chips, P-chips and foreign listings (e.g., American depositary receipts). The index aims to reflect the opportunity set of China share classes listed in Hong Kong, Shanghai, Shenzhen and outside of China. MSCI makes no express or implied warranties or representations, and shall have no liability whatsoever with respect to any MSCI data contained herein. The MSCI data may not be further redistributed or used as a basis for other indices, any securities or financial products. This report is not approved, reviewed or produced by MSCI. Net returns reflect the reinvestment of dividends after deduction of non-US withholding tax. An investor cannot invest directly in an index, and its results are not indicative for any specific investment, including the Fund.
A Word About Risk
Market Risk: The value of the Fund’s assets will fluctuate as the stock market fluctuates. The value of its investments may decline, sometimes rapidly and unpredictably, simply because of economic changes or other events, including public health crises (including the occurrence of a contagious disease or illness) and regional and global conflicts, that affect large portions of the market. It includes the risk that a particular style of investing, such as the Fund’s value approach, may underperform the market generally.
Foreign (Non-US) Risk: Investments in securities of non-US issuers may involve more risk than those of US issuers. These securities may fluctuate more widely in price and may be more difficult to trade due to adverse market, economic, political, regulatory or other factors. Investments in emerging-market countries such as China may involve more risk than investments in developed countries because the markets in emerging-market countries are less developed and less liquid and are subject to increased economic, political, regulatory or other uncertainties. In addition, the value of the Fund’s investments may decline because of factors such as unfavorable or unsuccessful government actions and reduction in government or central bank support.
China/Single Country Risk: Investments in issuers located in a particular country or geographic region may have more risk because of particular market factors affecting that country or region, including political instability, geopolitical risks or unpredictable economic conditions. Risks of investments in securities of companies economically tied to China may include the volatility of the Chinese stock market; heavy dependence on exports, which may be affected adversely by trade barriers or disputes or may decrease, sometimes significantly, when the world economy weakens; and
| | |
| |
| abfunds.com | | AB ALL CHINA EQUITY PORTFOLIO | 5 |
DISCLOSURES AND RISKS (continued)
the continuing importance of the role of the Chinese government, which may take legal or regulatory actions that affect the contractual arrangements of a company or economic and market practices, and cause the value of the securities of an issuer held by the Fund to decrease significantly. While the Chinese economy has grown at a rapid rate in recent years, the rate of growth has been declining, and there can be no assurance that China’s economy will continue to grow in the future. Investments in China A shares are subject to quotas that may restrict daily trading and to additional risks that could affect liquidity compared to investments in companies in developed markets. Risks of investments in companies based in Hong Kong include heavy reliance on the US economy and regional economies, particularly the Chinese economy, which makes these investments vulnerable to changes in these economies.
Currency Risk: Fluctuations in currency exchange rates may negatively affect the value of the Fund’s investments in equity securities denominated in foreign currencies or reduce the Fund’s returns. Emerging-market currencies may be more volatile and less liquid, and subject to significantly greater risk of currency controls and convertibility restrictions, than currencies of developed countries.
Depositary Receipts Risk: Investing in depositary receipts involves risks that are similar to the risks of direct investments in foreign securities. For example, investing in depositary receipts may involve risks relating to political, economic or regulatory conditions in foreign countries. In addition, the issuers of the securities underlying certain depositary receipts are under no obligation to distribute shareholder communications or pass through any voting rights with respect to the deposited securities to the holders of such receipts.
Illiquid Investments Risk: Illiquid investments risk exists when certain investments are or become difficult to purchase or sell. Difficulty in selling such investments may result in sales at disadvantageous prices affecting the value of your investment in the Fund. Causes of illiquid investments risk may include low trading volumes and large positions. Foreign fixed-income securities may have more illiquid investments risk because secondary trading markets for these securities may be smaller and less well-developed and the securities may trade less frequently. Illiquid investments risk may be higher in a rising interest-rate environment, when the value and liquidity of fixed-income securities generally go down.
Industry/Sector Risk: Investments in a particular industry or group of related industries may have more risk because market or economic factors affecting that industry could have a significant effect on the value of the Fund’s investments.
| | |
| |
6 | AB ALL CHINA EQUITY PORTFOLIO | | abfunds.com |
DISCLOSURES AND RISKS (continued)
Management Risk: The Fund is subject to management risk because it is an actively managed investment fund. The Adviser will apply its investment techniques and risk analyses in making investment decisions, but there is no guarantee that its techniques will produce the intended results. Some of these techniques may incorporate, or rely upon, quantitative models, but there is no guarantee that these models will generate accurate forecasts, reduce risk or otherwise perform as expected.
These risks are fully discussed in the Fund’s prospectus. As with all investments, you may lose money by investing in the Fund.
An Important Note About Historical Performance
The investment return and principal value of an investment in the Fund will fluctuate, so that shares, when redeemed, may be worth more or less than their original cost. Performance shown in this report represents past performance and does not guarantee future results. Current performance may be lower or higher than the performance information shown. You may obtain performance information current to the most recent month-end by visiting www.abfunds.com.
All fees and expenses related to the operation of the Fund have been deducted. Net asset value (“NAV”) returns do not reflect sales charges; if sales charges were reflected, the Fund’s quoted performance would be lower. SEC returns reflect the applicable sales charges for each share class: a 4.25% maximum front-end sales charge for Class A shares. Returns for the different share classes will vary due to different expenses associated with each class. Performance assumes reinvestment of distributions and does not account for taxes.
| | |
| |
| abfunds.com | | AB ALL CHINA EQUITY PORTFOLIO | 7 |
HISTORICAL PERFORMANCE
GROWTH OF A $10,000 INVESTMENT IN THE FUND (unaudited)
7/25/20181 TO 11/30/2022
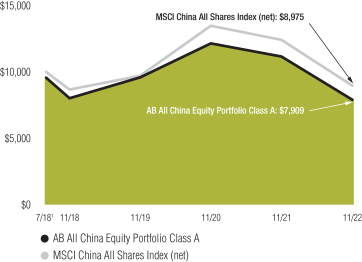
This chart illustrates the total value of an assumed $10,000 investment in AB All China Equity Portfolio Class A shares (from 7/25/20181 to 11/30/2022) as compared to the performance of the Fund’s benchmark. The chart reflects the deduction of the maximum 4.25% sales charge from the initial $10,000 investment in the Fund and assumes the reinvestment of dividends and capital gains distributions.
| 1 | Inception date: 7/25/2018. |
| | |
| |
8 | AB ALL CHINA EQUITY PORTFOLIO | | abfunds.com |
HISTORICAL PERFORMANCE (continued)
AVERAGE ANNUAL RETURNS AS OF NOVEMBER 30, 2022 (unaudited)
| | | | | | | | |
| | |
| | | NAV Returns | | | SEC Returns
(reflects applicable
sales charges) | |
| | |
| CLASS A SHARES | | | | | | | | |
| | |
| 1 Year | | | -29.09% | | | | -32.10% | |
| | |
| Since Inception1 | | | -4.31% | | | | -5.25% | |
| | |
| ADVISOR CLASS SHARES2 | | | | | | | | |
| | |
| 1 Year | | | -28.93% | | | | -28.93% | |
| | |
| Since Inception1 | | | -4.07% | | | | -4.07% | |
The Fund’s current prospectus fee table shows the Fund’s total annual operating expense ratios as 1.45% and 1.20% for Class A and Advisor Class shares, respectively. The Financial Highlights section of this report sets forth expense ratio data for the current reporting period; the expense ratios shown above may differ from the expense ratios in the Financial Highlights section since they are based on different time periods.
| 1 | Inception date: 7/25/2018. |
| 2 | This share class is offered at NAV to eligible investors and the SEC returns are the same as the NAV returns. Please note that this share class is for investors purchasing shares through accounts established under certain fee-based programs sponsored and maintained by certain broker-dealers and financial intermediaries, institutional pension plans and/or investment advisory clients of, and certain other persons associated with, the Adviser and its affiliates or the Fund. |
| | |
| |
| abfunds.com | | AB ALL CHINA EQUITY PORTFOLIO | 9 |
HISTORICAL PERFORMANCE (continued)
SEC AVERAGE ANNUAL RETURNS
AS OF THE MOST RECENT CALENDAR QUARTER-END
DECEMBER 31, 2022 (unaudited)
| | | | |
| |
| | | SEC Returns
(reflects applicable
sales charges) | |
| |
| CLASS A SHARES | | | | |
| |
| 1 Year | | | -30.03% | |
| |
| Since Inception1 | | | -4.84% | |
| |
| ADVISOR CLASS SHARES2 | | | | |
| |
| 1 Year | | | -26.65% | |
| |
| Since Inception1 | | | -3.66% | |
| 1 | Inception date: 7/25/2018. |
| 2 | Please note that this share class is for investors purchasing shares through accounts established under certain fee-based programs sponsored and maintained by certain broker-dealers and financial intermediaries, institutional pension plans and/or investment advisory clients of, and certain other persons associated with, the Adviser and its affiliates or the Fund. |
| | |
| |
10 | AB ALL CHINA EQUITY PORTFOLIO | | abfunds.com |
EXPENSE EXAMPLE
(unaudited)
As a shareholder of the Fund, you incur two types of costs: (1) transaction costs, including sales charges (loads) on purchase payments, contingent deferred sales charges on redemptions and (2) ongoing costs, including management fees; distribution (12b-1) fees; and other Fund expenses. This example is intended to help you understand your ongoing costs (in dollars) of investing in the Fund and to compare these costs with the ongoing costs of investing in other mutual funds.
The Example is based on an investment of $1,000 invested at the beginning of the period and held for the entire period as indicated below.
Actual Expenses
The table below provides information about actual account values and actual expenses. You may use the information, together with the amount you invested, to estimate the expenses that you paid over the period. Simply divide your account value by $1,000 (for example, an $8,600 account value divided by $1,000 = 8.6), then multiply the result by the number under the heading entitled “Expenses Paid During Period” to estimate the expenses you paid on your account during this period.
Hypothetical Example for Comparison Purposes
The table below also provides information about hypothetical account values and hypothetical expenses based on the Fund’s actual expense ratio and an assumed annual rate of return of 5% before expenses, which is not the Fund’s actual return. The hypothetical account values and expenses may not be used to estimate the actual ending account balance or expenses you paid for the period. You may use this information to compare the ongoing costs of investing in the Fund and other funds by comparing this 5% hypothetical example with the 5% hypothetical examples that appear in the shareholder reports of other funds.
Please note that the expenses shown in the table are meant to highlight your ongoing costs only and do not reflect any transactional costs, such as sales charges (loads), or contingent deferred sales charges on redemptions. Therefore, the hypothetical example is useful in comparing ongoing costs only, and will not help you determine the relative total costs of owning different funds. In addition, if these transactional costs were included, your costs would have been higher.
| | |
| |
| abfunds.com | | AB ALL CHINA EQUITY PORTFOLIO | 11 |
EXPENSE EXAMPLE (continued)
| | | | | | | | | | | | | | | | |
| | | Beginning
Account Value
June 1, 2022 | | | Ending
Account Value
November 30, 2022 | | | Expenses Paid
During Period* | | | Annualized
Expense Ratio* | |
| Class A | | | | | | | | | | | | | | | | |
Actual | | $ | 1,000 | | | $ | 862.70 | | | $ | 7.00 | | | | 1.50 | % |
Hypothetical** | | $ | 1,000 | | | $ | 1,017.55 | | | $ | 7.59 | | | | 1.50 | % |
| Advisor Class | | | | | | | | | | | | | | | | |
Actual | | $ | 1,000 | | | $ | 864.00 | | | $ | 5.84 | | | | 1.25 | % |
Hypothetical** | | $ | 1,000 | | | $ | 1,018.80 | | | $ | 6.33 | | | | 1.25 | % |
| * | Expenses are equal to the classes’ annualized expense ratios multiplied by the average account value over the period, multiplied by 183/365 (to reflect the one-half year period). |
| ** | Assumes 5% annual return before expenses. |
| | |
| |
12 | AB ALL CHINA EQUITY PORTFOLIO | | abfunds.com |
PORTFOLIO SUMMARY
November 30, 2022 (unaudited)
PORTFOLIO STATISTICS
Net Assets ($mil): $122.5
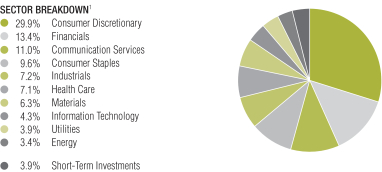
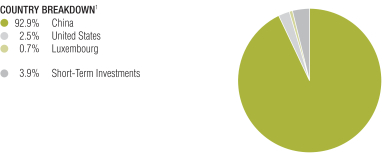
| 1 | The Fund’s sector and country breakdowns are expressed as a percentage of total investments (excluding security lending collateral) and may vary over time. |
Please note: The sector classifications presented herein are based on the Global Industry Classification Standard (GICS) which was developed by Morgan Stanley Capital International and Standard & Poor’s. The components are divided into sector, industry group, and industry sub-indices as classified by the GICS for each of the market capitalization indices in the broad market. These sector classifications are broadly defined. The “Portfolio of Investments” section of the report reflects more specific industry information and is consistent with the investment restrictions discussed in the Fund’s prospectus.
| | |
| |
| abfunds.com | | AB ALL CHINA EQUITY PORTFOLIO | 13 |
PORTFOLIO SUMMARY (continued)
November 30, 2022 (unaudited)
TEN LARGEST HOLDINGS1
| | | | | | | | |
| | |
| Company | | U.S. $ Value | | | Percent of
Net Assets | |
| | |
| Tencent Holdings Ltd. | | $ | 9,497,568 | | | | 7.8 | % |
| | |
| Alibaba Group Holding Ltd. | | | 5,682,752 | | | | 4.6 | |
| | |
| Kweichow Moutai Co., Ltd. – Class A | | | 4,537,591 | | | | 3.7 | |
| | |
| Contemporary Amperex Technology Co., Ltd. – Class A | | | 3,301,413 | | | | 2.7 | |
| | |
| Tongcheng Travel Holdings Ltd. | | | 3,268,589 | | | | 2.7 | |
| | |
| Samsonite International SA | | | 3,057,566 | | | | 2.5 | |
| | |
| China Construction Bank Corp. – Class H | | | 2,735,504 | | | | 2.2 | |
| | |
| Meituan – Class B | | | 2,498,464 | | | | 2.0 | |
| | |
| Ping An Insurance Group Co., of China Ltd. – Class A | | | 2,470,056 | | | | 2.0 | |
| | |
| Jiumaojiu International Holdings Ltd. | | | 2,367,493 | | | | 1.9 | |
| | |
| | $ | 39,416,996 | | | | 32.1 | % |
| | |
| |
14 | AB ALL CHINA EQUITY PORTFOLIO | | abfunds.com |
PORTFOLIO OF INVESTMENTS
November 30, 2022
| | | | | | | | |
| Company | | Shares | | | U.S. $ Value | |
| |
COMMON STOCKS – 96.2% | | | | | | | | |
Consumer Discretionary – 29.9% | | | | | | | | |
Auto Components – 1.6% | | | | | | | | |
Huayu Automotive Systems Co., Ltd. – Class A | | | 388,900 | | | $ | 1,027,443 | |
Zhejiang Shuanghuan Driveline Co., Ltd. | | | 230,000 | | | | 895,156 | |
| | | | | | | | |
| | | | | | | 1,922,599 | |
| | | | | | | | |
Automobiles – 3.5% | | | | | | | | |
Chongqing Changan Automobile Co., Ltd. – Class A | | | 559,575 | | | | 1,082,996 | |
Dongfeng Motor Group Co., Ltd. – Class H | | | 1,688,000 | | | | 950,948 | |
Great Wall Motor Co., Ltd. – Class H | | | 1,240,000 | | | | 1,841,420 | |
XPeng, Inc.(a)(b) | | | 88,400 | | | | 471,581 | |
| | | | | | | | |
| | | | | | | 4,346,945 | |
| | | | | | | | |
Hotels, Restaurants & Leisure – 5.3% | | | | | | | | |
Jiumaojiu International Holdings Ltd.(a)(c) | | | 922,000 | | | | 2,367,493 | |
Shenzhen Overseas Chinese Town Co., Ltd. – Class A | | | 1,032,700 | | | | 863,757 | |
Tongcheng Travel Holdings Ltd.(b) | | | 1,501,200 | | | | 3,268,589 | |
| | | | | | | | |
| | | | | | | 6,499,839 | |
| | | | | | | | |
Household Durables – 0.5% | | | | | | | | |
TCL Technology Group Corp. – Class A | | | 1,089,700 | | | | 627,733 | |
| | | | | | | | |
| | |
Internet & Direct Marketing Retail – 12.4% | | | | | | | | |
Alibaba Group Holding Ltd.(b) | | | 522,160 | | | | 5,682,752 | |
JD.com, Inc. (ADR) | | | 18,540 | | | | 1,060,117 | |
JD.com, Inc. – Class A | | | 79,702 | | | | 2,275,314 | |
Meituan – Class B(b)(c) | | | 115,900 | | | | 2,498,464 | |
Pinduoduo, Inc. (ADR)(b) | | | 27,750 | | | | 2,276,610 | |
Trip.com Group Ltd.(b) | | | 45,500 | | | | 1,439,990 | |
| | | | | | | | |
| | | | | | | 15,233,247 | |
| | | | | | | | |
Specialty Retail – 1.7% | | | | | | | | |
China Tourism Group Duty Free Corp., Ltd. – Class A | | | 35,527 | | | | 1,010,656 | |
Topsports International Holdings Ltd.(c) | | | 1,572,000 | | | | 1,009,445 | |
| | | | | | | | |
| | | | | | | 2,020,101 | |
| | | | | | | | |
Textiles, Apparel & Luxury Goods – 4.9% | | | | | | | | |
Bosideng International Holdings Ltd. | | | 1,782,000 | | | | 887,907 | |
Li Ning Co., Ltd. | | | 256,500 | | | | 2,061,362 | |
Samsonite International SA(b)(c) | | | 1,128,000 | | | | 3,057,566 | |
| | | | | | | | |
| | | | | | | 6,006,835 | |
| | | | | | | | |
| | | | | | | 36,657,299 | |
| | | | | | | | |
Financials – 13.4% | | | | | | | | |
Banks – 6.1% | | | | | | | | |
Bank of Jiangsu Co., Ltd. – Class A | | | 1,425,600 | | | | 1,507,058 | |
Bank of Nanjing Co., Ltd. – Class A | | | 1,216,700 | | | | 1,792,951 | |
China Construction Bank Corp. – Class H | | | 4,520,000 | | | | 2,735,504 | |
| | |
| |
| abfunds.com | | AB ALL CHINA EQUITY PORTFOLIO | 15 |
PORTFOLIO OF INVESTMENTS (continued)
| | | | | | | | |
| Company | | Shares | | | U.S. $ Value | |
| |
China Merchants Bank Co., Ltd. – Class H | | | 291,000 | | | $ | 1,478,004 | |
| | | | | | | | |
| | | | | | | 7,513,517 | |
| | | | | | | | |
Capital Markets – 4.2% | | | | | | | | |
CITIC Securities Co., Ltd. – Class A | | | 534,310 | | | | 1,514,028 | |
GF Securities Co., Ltd. – Class H | | | 1,152,600 | | | | 1,681,573 | |
Guotai Junan Securities Co., Ltd.(c) | | | 1,635,720 | | | | 1,914,565 | |
| | | | | | | | |
| | | | | | | 5,110,166 | |
| | | | | | | | |
Insurance – 3.1% | | | | | | | | |
China Life Insurance Co., Ltd. – Class H | | | 870,000 | | | | 1,333,669 | |
Ping An Insurance Group Co., of China Ltd. – Class A | | | 384,193 | | | | 2,470,056 | |
| | | | | | | | |
| | | | | | | 3,803,725 | |
| | | | | | | | |
| | | | | | | 16,427,408 | |
| | | | | | | | |
Communication Services – 11.0% | | | | | | | | |
Entertainment – 2.2% | | | | | | | | |
NetEase, Inc. | | | 121,200 | | | | 1,752,387 | |
Wuhu Sanqi Interactive Entertainment Network Technology Group Co., Ltd. – Class A | | | 371,000 | | | | 945,073 | |
| | | | | | | | |
| | | | | | | 2,697,460 | |
| | | | | | | | |
Interactive Media & Services – 7.8% | | | | | | | | |
Tencent Holdings Ltd. | | | 251,150 | | | | 9,497,568 | |
| | | | | | | | |
| | |
Media – 1.0% | | | | | | | | |
Chinese Universe Publishing and Media Group Co., Ltd. | | | 914,200 | | | | 1,256,501 | |
| | | | | | | | |
| | | | | | | 13,451,529 | |
| | | | | | | | |
Consumer Staples – 9.6% | | | | | | | | |
Beverages – 8.0% | | | | | | | | |
China Resources Beer Holdings Co., Ltd. | | | 174,000 | | | | 1,205,692 | |
Jiangsu Yanghe Brewery Joint-Stock Co., Ltd. – Class A | | | 43,300 | | | | 878,663 | |
Kweichow Moutai Co., Ltd. – Class A | | | 19,863 | | | | 4,537,591 | |
Luzhou Laojiao Co., Ltd. – Class A | | | 51,691 | | | | 1,384,843 | |
Tsingtao Brewery Co., Ltd. – Class H | | | 194,000 | | | | 1,836,509 | |
| | | | | | | | |
| | | | | | | 9,843,298 | |
| | | | | | | | |
Food Products – 0.9% | | | | | | | | |
Tongwei Co., Ltd. – Class A | | | 169,500 | | | | 1,049,602 | |
| | | | | | | | |
| | |
Personal Products – 0.7% | | | | | | | | |
L’Occitane International SA | | | 303,000 | | | | 851,438 | |
| | | | | | | | |
| | | | | | | 11,744,338 | |
| | | | | | | | |
Industrials – 7.2% | | | | | | | | |
Electrical Equipment – 5.1% | | | | | | | | |
Contemporary Amperex Technology Co., Ltd. – Class A | | | 59,449 | | | | 3,301,413 | |
Jiangsu Zhongtian Technology Co., Ltd. – Class A | | | 191,700 | | | | 459,314 | |
| | |
| |
16 | AB ALL CHINA EQUITY PORTFOLIO | | abfunds.com |
PORTFOLIO OF INVESTMENTS (continued)
| | | | | | | | |
| Company | | Shares | | | U.S. $ Value | |
| |
Ming Yang Smart Energy Group Ltd. – Class A | | | 230,900 | | | $ | 883,395 | |
NARI Technology Co., Ltd. – Class A | | | 414,096 | | | | 1,572,795 | |
| | | | | | | | |
| | | | | | | 6,216,917 | |
| | | | | | | | |
Machinery – 1.4% | | | | | | | | |
Wuxi Lead Intelligent Equipment Co., Ltd. – Class A | | | 273,780 | | | | 1,727,065 | |
| | | | | | | | |
| | |
Road & Rail – 0.7% | | | | | | | | |
Daqin Railway Co., Ltd. – Class A | | | 925,637 | | | | 901,963 | |
| | | | | | | | |
| | | | | | | 8,845,945 | |
| | | | | | | | |
Health Care – 7.1% | | | | | | | | |
Biotechnology – 0.7% | | | | | | | | |
Chongqing Zhifei Biological Products Co., Ltd. – Class A | | | 67,200 | | | | 871,140 | |
| | | | | | | | |
| | |
Health Care Equipment & Supplies – 1.7% | | | | | | | | |
Shenzhen Mindray Bio-Medical Electronics Co., Ltd. – Class A | | | 44,300 | | | | 2,061,509 | |
| | | | | | | | |
| | |
Health Care Providers & Services – 1.3% | | | | | | | | |
Aier Eye Hospital Group Co., Ltd. – Class A | | | 137,296 | | | | 533,554 | |
Shanghai Pharmaceuticals Holding Co., Ltd. – Class H | | | 624,000 | | | | 1,040,515 | |
| | | | | | | | |
| | | | | | | 1,574,069 | |
| | | | | | | | |
Pharmaceuticals – 3.4% | | | | | | | | |
China Resources Sanjiu Medical & Pharmaceutical Co., Ltd. – Class A | | | 181,300 | | | | 1,523,687 | |
Joincare Pharmaceutical Group Industry Co., Ltd. – Class A | | | 642,400 | | | | 1,115,032 | |
Sichuan Kelun Pharmaceutical Co., Ltd. – Class A | | | 451,300 | | | | 1,518,878 | |
| | | | | | | | |
| | | | | | | 4,157,597 | |
| | | | | | | | |
| | | | | | | 8,664,315 | |
| | | | | | | | |
Materials – 6.3% | | | | | | | | |
Chemicals – 3.7% | | | | | | | | |
Hubei Xingfa Chemicals Group Co., Ltd. – Class A | | | 188,500 | | | | 827,049 | |
Shanghai Putailai New Energy Technology Co., Ltd. – Class A | | | 293,100 | | | | 2,333,327 | |
Suzhou TA&A Ultra Clean Technology Co., Ltd. | | | 147,300 | | | | 1,291,098 | |
| | | | | | | | |
| | | | | | | 4,451,474 | |
| | | | | | | | |
Metals & Mining – 2.6% | | | | | | | | |
Ganfeng Lithium Co., Ltd. – Class A | | | 157,220 | | | | 1,840,008 | |
Zijin Mining Group Co., Ltd. – Class A | | | 981,150 | | | | 1,385,148 | |
| | | | | | | | |
| | | | | | | 3,225,156 | |
| | | | | | | | |
| | | | | | | 7,676,630 | |
| | | | | | | | |
| | |
| |
| abfunds.com | | AB ALL CHINA EQUITY PORTFOLIO | 17 |
PORTFOLIO OF INVESTMENTS (continued)
| | | | | | | | |
| Company | | Shares | | | U.S. $ Value | |
| |
Information Technology – 4.3% | | | | | | | | |
Electronic Equipment, Instruments & Components – 2.1% | | | | | | | | |
BOE Technology Group Co., Ltd. – Class A | | | 1,964,300 | | | $ | 1,005,552 | |
Luxshare Precision Industry Co., Ltd. – Class A | | | 349,910 | | | | 1,567,640 | |
| | | | | | | | |
| | | | | | | 2,573,192 | |
| | | | | | | | |
IT Services – 1.0% | | | | | | | | |
Vnet Group, Inc. (ADR)(b) | | | 239,597 | | | | 1,200,381 | |
| | | | | | | | |
| | |
Semiconductors & Semiconductor Equipment – 1.2% | | | | | | | | |
LONGi Green Energy Technology Co., Ltd. – Class A | | | 233,420 | | | | 1,534,930 | |
| | | | | | | | |
| | | | | | | 5,308,503 | |
| | | | | | | | |
Utilities – 4.0% | | | | | | | | |
Gas Utilities – 1.7% | | | | | | | | |
Kunlun Energy Co., Ltd. | | | 2,650,000 | | | | 2,055,990 | |
| | | | | | | | |
| | |
Independent Power and Renewable Electricity Producers – 2.3% | | | | | | | | |
China Datang Corp. Renewable Power Co., Ltd. – Class H | | | 3,629,000 | | | | 1,051,172 | |
China Longyuan Power Group Corp., Ltd. – Class H | | | 614,000 | | | | 757,251 | |
China Yangtze Power Co., Ltd. – Class A | | | 331,500 | | | | 1,000,153 | |
| | | | | | | | |
| | | | | | | 2,808,576 | |
| | | | | | | | |
| | | | | | | 4,864,566 | |
| | | | | | | | |
Energy – 3.4% | | | | | | | | |
Energy Equipment & Services – 1.7% | | | | | | | | |
China Oilfield Services Ltd. – Class H | | | 1,628,000 | | | | 2,058,073 | |
| | | | | | | | |
| | |
Oil, Gas & Consumable Fuels – 1.7% | | | | | | | | |
PetroChina Co., Ltd. – Class H | | | 4,776,000 | | | | 2,173,234 | |
| | | | | | | | |
| | | | | | | 4,231,307 | |
| | | | | | | | |
| | |
Total Common Stocks
(cost $133,863,019) | | | | | | | 117,871,840 | |
| | | | | | | | |
| | | | | | | | |
SHORT-TERM INVESTMENTS – 4.0% | | | | | | | | |
Investment Companies – 4.0% | | | | | | | | |
AB Fixed Income Shares, Inc. – Government Money Market Portfolio – Class AB,
3.50%(d)(e)(f)
(cost $4,844,884) | | | 4,844,884 | | | | 4,844,884 | |
| | | | | | | | |
Total Investments Before Security Lending Collateral for Securities Loaned – 100.2%
(cost $138,707,903) | | | | | | | 122,716,724 | |
| | | | | | | | |
| | |
| |
18 | AB ALL CHINA EQUITY PORTFOLIO | | abfunds.com |
PORTFOLIO OF INVESTMENTS (continued)
| | | | | | | | |
| Company | | Shares | | | U.S. $ Value | |
| |
INVESTMENTS OF CASH COLLATERAL FOR SECURITIES LOANED – 0.2% | | | | | | | | |
Investment Companies – 0.2% | | | | | | | | |
AB Fixed Income Shares, Inc. – Government Money Market Portfolio – Class AB,
3.50%(d)(e)(f)
(cost $320,362) | | | 320,362 | | | $ | 320,362 | |
| | | | | | | | |
| | |
Total Investments – 100.4%
(cost $139,028,265) | | | | | | | 123,037,086 | |
Other assets less liabilities – (0.4)% | | | | | | | (528,788 | ) |
| | | | | | | | |
| | |
Net Assets – 100.0% | | | | | | $ | 122,508,298 | |
| | | | | | | | |
| (a) | Represents entire or partial securities out on loan. See Note E for securities lending information. |
| (b) | Non-income producing security. |
| (c) | Security is exempt from registration under Rule 144A or Regulation S of the Securities Act of 1933. These securities are considered restricted, but liquid and may be resold in transactions exempt from registration. At November 30, 2022, the aggregate market value of these securities amounted to $10,847,533 or 8.9% of net assets. |
| (d) | To obtain a copy of the fund’s shareholder report, please go to the Securities and Exchange Commission’s website at www.sec.gov, or call AB at (800) 227-4618. |
| (e) | The rate shown represents the 7-day yield as of period end. |
| (f) | Affiliated investments. |
Glossary:
ADR – American Depositary Receipt
See notes to financial statements.
| | |
| |
| abfunds.com | | AB ALL CHINA EQUITY PORTFOLIO | 19 |
STATEMENT OF ASSETS & LIABILITIES
November 30, 2022
| | | | |
| Assets | | | | |
Investments in securities, at value | | | | |
Unaffiliated issuers (cost $133,863,019) | | $ | 117,871,840 | (a) |
Affiliated issuers (cost $5,165,246—including investment of cash collateral for securities loaned of $320,362) | | | 5,165,246 | |
Foreign currencies, at value (cost $24,037) | | | 20,178 | |
Receivable for capital stock sold | | | 78,889 | |
Unaffiliated dividends receivable | | | 29,921 | |
| Affiliated dividends receivable | | | 15,459 | |
| | | | |
Total assets | | | 123,181,533 | |
| | | | |
| Liabilities | | | | |
Due to Custodian | | | 11 | |
Payable for collateral received on securities loaned | | | 320,362 | |
Payable for capital stock redeemed | | | 124,999 | |
Advisory fee payable | | | 67,286 | |
Custody and accounting fees payable | | | 64,457 | |
Audit and tax fee payable | | | 40,221 | |
Administrative fee payable | | | 26,331 | |
Transfer Agent fee payable | | | 1,500 | |
Distribution fee payable | | | 315 | |
Accrued expenses | | | 27,753 | |
| | | | |
Total liabilities | | | 673,235 | |
| | | | |
Net Assets | | $ | 122,508,298 | |
| | | | |
| Composition of Net Assets | | | | |
Capital stock, at par | | $ | 1,517 | |
Additional paid-in capital | | | 167,243,510 | |
Accumulated loss | | | (44,736,729 | ) |
| | | | |
| | $ | 122,508,298 | |
| | | | |
Net Asset Value Per Share—11 billion shares of capital stock authorized, $.0001 par value
| | | | | | | | | | | | |
| Class | | Net Assets | | | Shares
Outstanding | | | Net Asset
Value | |
| |
| A | | $ | 1,649,763 | | | | 205,069 | | | $ | 8.04 | * |
| |
| Advisor | | $ | 120,858,535 | | | | 14,968,977 | | | $ | 8.07 | |
| |
| (a) | Includes securities on loan with a value of $2,271,259 (See Note E). |
| * | The maximum offering price per share for Class A shares was $8.40 which reflects a sales charge of 4.25%. |
See notes to financial statements.
| | |
| |
20 | AB ALL CHINA EQUITY PORTFOLIO | | abfunds.com |
STATEMENT OF OPERATIONS
Year Ended November 30, 2022
| | | | | | | | |
| Investment Income | | | | | | | | |
Dividends | | | | | | | | |
Unaffiliated issuers (net of foreign taxes withheld of $284,609) | | $ | 3,483,462 | | | | | |
Affiliated issuers | | | 33,757 | | | | | |
Non-cash dividend income | | | 140,110 | | | | | |
Securities lending income | | | 17,461 | | | $ | 3,674,790 | |
| | | | | | | | |
| Expenses | | | | | | | | |
Advisory fee (see Note B) | | | 1,480,045 | | | | | |
Transfer agency—Class A | | | 309 | | | | | |
Transfer agency—Advisor Class | | | 24,364 | | | | | |
Distribution fee—Class A | | | 4,884 | | | | | |
Custody and accounting | | | 115,741 | | | | | |
Administrative | | | 108,782 | | | | | |
Audit and tax | | | 61,994 | | | | | |
Registration fees | | | 41,201 | | | | | |
Legal | | | 36,173 | | | | | |
Printing | | | 25,541 | | | | | |
Directors’ fees | | | 19,367 | | | | | |
Recoupment of previously reimbursed expenses (see Note B) | | | 13,427 | | | | | |
Miscellaneous | | | 21,410 | | | | | |
| | | | | | | | |
Total expenses | | | 1,953,238 | | | | | |
Less: expenses waived and reimbursed by the Adviser (see Note B and Note E) | | | (3,243 | ) | | | | |
| | | | | | | | |
Net expenses | | | | | | | 1,949,995 | |
| | | | | | | | |
Net investment income | | | | | | | 1,724,795 | |
| | | | | | | | |
| Realized and Unrealized Loss on Investment and Foreign Currency Transactions | | | | | | | | |
Net realized loss on: | | | | | | | | |
Investment transactions | | | | | | | (29,277,840 | ) |
Foreign currency transactions | | | | | | | (28,430 | ) |
Net change in unrealized appreciation (depreciation) on: | | | | | | | | |
Investments | | | | | | | (28,416,261 | ) |
Foreign currency denominated assets and liabilities | | | | | | | (4,048 | ) |
| | | | | | | | |
Net loss on investment and foreign currency transactions | | | | | | | (57,726,579 | ) |
| | | | | | | | |
Net Decrease in Net Assets from Operations | | | | | | $ | (56,001,784 | ) |
| | | | | | | | |
See notes to financial statements.
| | |
| |
| abfunds.com | | AB ALL CHINA EQUITY PORTFOLIO | 21 |
STATEMENT OF CHANGES IN NET ASSETS
| | | | | | | | |
| | | Year Ended
November 30,
2022 | | | Year Ended
November 30,
2021 | |
| Increase (Decrease) in Net Assets from Operations | | | | | | | | |
Net investment income | | $ | 1,724,795 | | | $ | 1,994,821 | |
Net realized gain (loss) on investment and foreign currency transactions | | | (29,306,270 | ) | | | 497,726 | |
Net change in unrealized appreciation (depreciation) on investments and foreign currency denominated assets and liabilities | | | (28,420,309 | ) | | | (24,102,097 | ) |
| | | | | | | | |
Net decrease in net assets from operations | | | (56,001,784 | ) | | | (21,609,550 | ) |
| Distributions to Shareholders | | | | | | | | |
Class A | | | (31,498 | ) | | | (5,466 | ) |
Advisor Class | | | (3,221,789 | ) | | | (645,142 | ) |
| Capital Stock Transactions | | | | | | | | |
Net increase (decrease) | | | (5,492,494 | ) | | | 66,760,490 | |
| | | | | | | | |
Total increase (decrease) | | | (64,747,565 | ) | | | 44,500,332 | |
| Net Assets | | | | | | | | |
Beginning of period | | | 187,255,863 | | | | 142,755,531 | |
| | | | | | | | |
End of period | | $ | 122,508,298 | | | $ | 187,255,863 | |
| | | | | | | | |
See notes to financial statements.
| | |
| |
22 | AB ALL CHINA EQUITY PORTFOLIO | | abfunds.com |
NOTES TO FINANCIAL STATEMENTS
November 30, 2022
NOTE A
Significant Accounting Policies
AB Cap Fund, Inc. (the “Company”) is registered under the Investment Company Act of 1940 as an open-end management investment company. The Company, which is a Maryland corporation, operates as a series company comprised of 12 portfolios currently in operation. Each portfolio is considered to be a separate entity for financial reporting and tax purposes. This report relates only to the AB All China Equity Portfolio (the “Fund”), a diversified portfolio. The Fund has authorized the issuance of Class A, Class B, Class C, Advisor Class, Class R, Class K, Class I, Class Z, Class T, Class 1 and Class 2 shares. Class B, Class C, Class R, Class K, Class I, Class Z, Class T, Class 1 and Class 2 shares are not currently being offered. Class A shares are sold with a front-end sales charge of up to 4.25% for purchases not exceeding $1,000,000. With respect to purchases of $1,000,000 or more, Class A shares redeemed within one year of purchase may be subject to a contingent deferred sales charge of 1%. Advisor Class shares are sold without an initial or contingent deferred sales charge and are not subject to ongoing distribution expenses. All eleven classes of shares have identical voting, dividend, liquidation and other rights, except that the classes bear different distribution and transfer agency expenses. Each class has exclusive voting rights with respect to its distribution plan. The financial statements have been prepared in conformity with U.S. generally accepted accounting principles (“U.S. GAAP”), which require management to make certain estimates and assumptions that affect the reported amounts of assets and liabilities in the financial statements and amounts of income and expenses during the reporting period. Actual results could differ from those estimates. The Fund is an investment company under U.S. GAAP and follows the accounting and reporting guidance applicable to investment companies. The following is a summary of significant accounting policies followed by the Fund.
1. Security Valuation
Portfolio securities are valued at market value determined on the basis of market quotations or, if market quotations are not readily available or are unreliable, at “fair value” as determined in accordance with procedures approved by and under the oversight of the Company’s Board of Directors (the “Board”). Pursuant to these procedures, AllianceBernstein L.P. (the “Adviser”) serves as the Company’s valuation designee pursuant to Rule 2a-5 of the 1940 Act. In this capacity, the Adviser is responsible, among other things, for making all fair value determinations relating to the Company’s portfolio investments, subject to the Board’s oversight.
In general, the market values of securities which are readily available and deemed reliable are determined as follows: securities listed on a national
| | |
| |
| abfunds.com | | AB ALL CHINA EQUITY PORTFOLIO | 23 |
NOTES TO FINANCIAL STATEMENTS (continued)
securities exchange (other than securities listed on the NASDAQ Stock Market, Inc. (“NASDAQ”)) or on a foreign securities exchange are valued at the last sale price at the close of the exchange or foreign securities exchange. If there has been no sale on such day, the securities are valued at the last traded price from the previous day. Securities listed on more than one exchange are valued by reference to the principal exchange on which the securities are traded; securities listed only on NASDAQ are valued in accordance with the NASDAQ Official Closing Price; listed or over the counter (“OTC”) market put or call options are valued at the mid level between the current bid and ask prices. If either a current bid or current ask price is unavailable, the Adviser will have discretion to determine the best valuation (e.g., last trade price in the case of listed options); open futures are valued using the closing settlement price or, in the absence of such a price, the most recent quoted bid price. If there are no quotations available for the day of valuation, the last available closing settlement price is used; U.S. Government securities and any other debt instruments having 60 days or less remaining until maturity are generally valued at market by an independent pricing vendor, if a market price is available. If a market price is not available, the securities are valued at amortized cost. This methodology is commonly used for short term securities that have an original maturity of 60 days or less, as well as short term securities that had an original term to maturity that exceeded 60 days. In instances when amortized cost is utilized, the Valuation Committee (the “Committee”) must reasonably conclude that the utilization of amortized cost is approximately the same as the fair value of the security. Factors the Committee will consider include, but are not limited to, an impairment of the creditworthiness of the issuer or material changes in interest rates. Fixed-income securities, including mortgage-backed and asset-backed securities, may be valued on the basis of prices provided by a pricing service or at a price obtained from one or more of the major broker-dealers. In cases where broker-dealer quotes are obtained, the Adviser may establish procedures whereby changes in market yields or spreads are used to adjust, on a daily basis, a recently obtained quoted price on a security. Swaps and other derivatives are valued daily, primarily using independent pricing services, independent pricing models using market inputs, as well as third party broker-dealers or counterparties. Open-end mutual funds are valued at the closing net asset value per share, while exchange traded funds are valued at the closing market price per share.
Securities for which market quotations are not readily available (including restricted securities) or are deemed unreliable are valued at fair value as deemed appropriate by the Adviser. Factors considered in making this determination may include, but are not limited to, information obtained by contacting the issuer, analysts, analysis of the issuer’s financial statements or other available documents. In addition, the Fund may use fair value pricing for securities primarily traded in non-U.S. markets because most foreign
| | |
| |
24 | AB ALL CHINA EQUITY PORTFOLIO | | abfunds.com |
NOTES TO FINANCIAL STATEMENTS (continued)
markets close well before the Fund values its securities at 4:00 p.m., Eastern Time. The earlier close of these foreign markets gives rise to the possibility that significant events, including broad market moves, may have occurred in the interim and may materially affect the value of those securities. To account for this, the Fund generally values many of its foreign equity securities using fair value prices based on third party vendor modeling tools to the extent available.
2. Fair Value Measurements
In accordance with U.S. GAAP regarding fair value measurements, fair value is defined as the price that the Fund would receive to sell an asset or pay to transfer a liability in an orderly transaction between market participants at the measurement date. U.S. GAAP establishes a framework for measuring fair value, and a three-level hierarchy for fair value measurements based upon the transparency of inputs to the valuation of an asset or liability (including those valued based on their market values as described in Note A.1 above). Inputs may be observable or unobservable and refer broadly to the assumptions that market participants would use in pricing the asset or liability. Observable inputs reflect the assumptions market participants would use in pricing the asset or liability based on market data obtained from sources independent of the Fund. Unobservable inputs reflect the Fund’s own assumptions about the assumptions that market participants would use in pricing the asset or liability based on the best information available in the circumstances. Each investment is assigned a level based upon the observability of the inputs which are significant to the overall valuation. The three-tier hierarchy of inputs is summarized below.
| | • | | Level 1—quoted prices in active markets for identical investments |
| | • | | Level 2—other significant observable inputs (including quoted prices for similar investments, interest rates, prepayment speeds, credit risk, etc.) |
| | • | | Level 3—significant unobservable inputs (including the Fund’s own assumptions in determining the fair value of investments) |
Where readily available market prices or relevant bid prices are not available for certain equity investments, such investments may be valued based on similar publicly traded investments, movements in relevant indices since last available prices or based upon underlying company fundamentals and comparable company data (such as multiples to earnings or other multiples to equity). Where an investment is valued using an observable input, such as another publicly traded security, the investment will be classified as Level 2. If management determines that an adjustment is appropriate based on restrictions on resale, illiquidity or uncertainty, and such adjustment is a significant component of the valuation, the investment will be classified as Level 3. An investment will also
| | |
| |
| abfunds.com | | AB ALL CHINA EQUITY PORTFOLIO | 25 |
NOTES TO FINANCIAL STATEMENTS (continued)
be classified as Level 3 where management uses company fundamentals and other significant inputs to determine the valuation.
The following table summarizes the valuation of the Fund’s investments by the above fair value hierarchy levels as of November 30, 2022:
| | | | | | | | | | | | | | | | |
Investments in
Securities | | Level 1 | | | Level 2 | | | Level 3 | | | Total | |
Assets: | | | | | | | | | | | | | | | | |
Common Stocks: | | | | | | | | | | | | | | | | |
Consumer Discretionary | | $ | 3,336,727 | | | $ | 33,320,572 | | | $ | – 0 | – | | $ | 36,657,299 | |
Financials | | | – 0 | – | | | 16,427,408 | | | | – 0 | – | | | 16,427,408 | |
Communication Services | | | – 0 | – | | | 13,451,529 | | | | – 0 | – | | | 13,451,529 | |
Consumer Staples | | | – 0 | – | | | 11,744,338 | | | | – 0 | – | | | 11,744,338 | |
Industrials | | | – 0 | – | | | 8,845,945 | | | | – 0 | – | | | 8,845,945 | |
Health Care | | | 1,523,687 | | | | 7,140,628 | | | | – 0 | – | | | 8,664,315 | |
Materials | | | – 0 | – | | | 7,676,630 | | | | – 0 | – | | | 7,676,630 | |
Information Technology | | | 1,200,381 | | | | 4,108,122 | | | | – 0 | – | | | 5,308,503 | |
Utilities | | | – 0 | – | | | 4,864,566 | | | | – 0 | – | | | 4,864,566 | |
Energy | | | – 0 | – | | | 4,231,307 | | | | – 0 | – | | | 4,231,307 | |
Short-Term Investments: | | | | | | | | | | | | | | | | |
Investment Companies | | | 4,844,884 | | | | – 0 | – | | | – 0 | – | | | 4,844,884 | |
Investments of Cash Collateral for Securities Loaned in Affiliated Money Market Fund | | | 320,362 | | | | – 0 | – | | | – 0 | – | | | 320,362 | |
| | | | | | | | | | | | | | | | |
Total Investments in Securities | | | 11,226,041 | | | | 111,811,045 | † | | | – 0 | – | | | 123,037,086 | |
Other Financial Instruments* | | | – 0 | – | | | – 0 | – | | | – 0 | – | | | – 0 | – |
| | | | | | | | | | | | | | | | |
Total | | $ | 11,226,041 | | | $ | 111,811,045 | | | $ | – 0 | – | | $ | 123,037,086 | |
| | | | | | | | | | | | | | | | |
| † | A significant portion of the Fund’s foreign equity investments are categorized as Level 2 investments since they are valued using fair value prices based on third party vendor modeling tools to the extent available, see Note A.1. |
| * | Other financial instruments are derivative instruments, such as futures, forwards and swaps, which are valued at the unrealized appreciation (depreciation) on the instrument. Other financial instruments may also include swaps with upfront premiums, written options and written swaptions which are valued at market value. |
3. Currency Translation
Assets and liabilities denominated in foreign currencies and commitments under forward currency exchange contracts are translated into U.S. dollars at the mean of the quoted bid and ask prices of such currencies against the U.S. dollar. Purchases and sales of portfolio securities are translated into U.S. dollars at the rates of exchange prevailing when such securities were acquired or sold. Income and expenses are translated into U.S. dollars at the rates of exchange prevailing when accrued.
Net realized gain or loss on foreign currency transactions represents foreign exchange gains and losses from sales and maturities of foreign fixed income investments, holding of foreign currencies, currency gains or losses realized between the trade and settlement dates on foreign investment transactions, and the difference between the amounts of dividends, interest and foreign withholding taxes recorded on the Fund’s books and
| | |
| |
26 | AB ALL CHINA EQUITY PORTFOLIO | | abfunds.com |
NOTES TO FINANCIAL STATEMENTS (continued)
the U.S. dollar equivalent amounts actually received or paid. Net unrealized currency gains and losses from valuing foreign currency denominated assets and liabilities at period end exchange rates are reflected as a component of net unrealized appreciation or depreciation of foreign currency denominated assets and liabilities.
4. Taxes
It is the Fund’s policy to meet the requirements of the Internal Revenue Code applicable to regulated investment companies and to distribute all of its investment company taxable income and net realized gains, if any, to shareholders. Therefore, no provisions for federal income or excise taxes are required. The Fund may be subject to taxes imposed by countries in which it invests. Such taxes are generally based on income and/or capital gains earned or repatriated. Taxes are accrued and applied to net investment income, net realized gains and net unrealized appreciation/depreciation as such income and/or gains are earned. The Fund’s investments in Chinese securities may be subject to a 10% Chinese Withholding Income Tax (“WIT”) on any dividends, interest or other income from Chinese sources, unless the statutory WIT of 10% is subject to reduction or exemption in accordance with the applicable tax treaty signed with China or domestic regulation.
In accordance with U.S. GAAP requirements regarding accounting for uncertainties in income taxes, management has analyzed the Fund’s tax positions taken or expected to be taken on federal and state income tax returns for all open tax years (the current and the prior three tax years) and has concluded that no provision for income tax is required in the Fund’s financial statements.
5. Investment Income and Investment Transactions
Dividend income is recorded on the ex-dividend date or as soon as the Fund is informed of the dividend. Interest income is accrued daily. Investment transactions are accounted for on the date the securities are purchased or sold. Investment gains or losses are determined on the identified cost basis. Non-cash dividends, if any, are recorded on the ex-dividend date at the fair value of the securities received. The Fund amortizes premiums and accretes discounts as adjustments to interest income. The Fund accounts for distributions received from REIT investments or from regulated investment companies as dividend income, realized gain, or return of capital based on information provided by the REIT or the investment company.
6. Class Allocations
All income earned and expenses incurred by the Fund are borne on a pro-rata basis by each outstanding class of shares, based on the proportionate interest in the Fund represented by the net assets of such class, except for class specific expenses which are allocated to the respective class. Expenses of the Company are charged proportionately to each
| | |
| |
| abfunds.com | | AB ALL CHINA EQUITY PORTFOLIO | 27 |
NOTES TO FINANCIAL STATEMENTS (continued)
portfolio or based on other appropriate methods. Realized and unrealized gains and losses are allocated among the various share classes based on respective net assets.
7. Dividends and Distributions
Dividends and distributions to shareholders, if any, are recorded on the ex-dividend date. Income dividends and capital gains distributions are determined in accordance with federal tax regulations and may differ from those determined in accordance with U.S. GAAP. To the extent these differences are permanent, such amounts are reclassified within the capital accounts based on their federal tax basis treatment; temporary differences do not require such reclassification.
NOTE B
Advisory Fee and Other Transactions with Affiliates
Under the terms of the investment advisory agreement, the Fund pays the Adviser an advisory fee at an annual rate of .95% of Fund’s average daily net assets. The fee is accrued daily and paid monthly. The Adviser has agreed to waive its fees and bear certain expenses to the extent necessary to limit total operating expenses (excluding acquired fund fees and expenses other than the advisory fees of any AB mutual funds in which the Fund may invest, interest expense, taxes, extraordinary expenses, and brokerage commissions and other transaction costs), on an annual basis (the “Expense Caps”) to 1.50% and 1.25% of the daily average net assets for Class A and Advisor Class, respectively. For the year ended November 30, 2022, there was no such reimbursement. The Expense Caps may not be terminated by the Adviser before February 28, 2023. Any fees waived and expenses borne by the Adviser through July 25, 2019 are subject to repayment by the Fund until the end of the third fiscal year after the fiscal period in which the fee was waived or the expense was borne; such waivers that are subject to repayment amount to $202,645 for the year ended November 30, 2019. For the year ended November 30, 2022, the Fund made repayments to the Adviser in the amount of $13,427. In any case, no repayment will be made that would cause the Fund’s total annual operating expenses to exceed the Expense Caps’ net fee percentages set forth above.
Pursuant to the investment advisory agreement, the Fund may reimburse the Adviser for certain legal and accounting services provided to the Fund by the Adviser. For the year ended November 30, 2022, the reimbursement for such services amounted to $108,782.
The Fund compensates AllianceBernstein Investor Services, Inc. (“ABIS”), a wholly-owned subsidiary of the Adviser, under a Transfer Agency Agreement for providing personnel and facilities to perform transfer agency services for the Fund. ABIS may make payments to intermediaries that provide omnibus account services, sub-accounting services and/or
| | |
| |
28 | AB ALL CHINA EQUITY PORTFOLIO | | abfunds.com |
NOTES TO FINANCIAL STATEMENTS (continued)
networking services. Such compensation retained by ABIS amounted to $18,000 for the year ended November 30, 2022.
AllianceBernstein Investments, Inc. (the “Distributor”), a wholly-owned subsidiary of the Adviser, serves as the distributor of the Fund’s shares. The Distributor has advised the Fund that it has retained no front-end sales charges from the sale of Class A shares and received no contingent deferred sales charges imposed upon redemptions by shareholders of Class A for the year ended November 30, 2022.
The Fund may invest in AB Government Money Market Portfolio (the “Government Money Market Portfolio”) which has a contractual annual advisory fee rate of ..20% of the portfolio’s average daily net assets and bears its own expenses. The Adviser has contractually agreed to waive .10% of the advisory fee of Government Money Market Portfolio (resulting in a net advisory fee of .10%) until August 31, 2023. In connection with the investment by the Fund in Government Money Market Portfolio, the Adviser has contractually agreed to waive its advisory fee from the Fund in an amount equal to the Fund’s pro rata share of the effective advisory fee of Government Money Market Portfolio, as borne indirectly by the Fund as an acquired fund fee and expense. For the year ended November 30, 2022, such waiver amounted to $3,136.
A summary of the Fund’s transactions in AB mutual funds for the year ended November 30, 2022 is as follows:
| | | | | | | | | | | | | | | | | | | | |
Fund | | Market Value
11/30/21
(000) | | | Purchases
at Cost
(000) | | | Sales
Proceeds
(000) | | | Market Value
11/30/22
(000) | | | Dividend
Income
(000) | |
Government Money Market Portfolio | | $ | 2,399 | | | $ | 44,848 | | | $ | 42,402 | | | $ | 4,845 | | | $ | 34 | |
Government Money Market Portfolio* | | | 1,205 | | | | 10,707 | | | | 11,592 | | | | 320 | | | | 4 | |
| | | | | | | | | | | | | | | | | | | | |
Total | | | | | | | | | | | | | | $ | 5,165 | | | $ | 38 | |
| | | | | | | | | | | | | | | | | | | | |
| * | Investment of cash collateral for securities lending transactions (see Note E). |
NOTE C
Distribution Services Agreement
The Fund has adopted a Distribution Services Agreement (the “Agreement”) pursuant to Rule 12b-1 under the Investment Company Act of 1940. Under the Agreement, the Fund pays distribution and servicing fees to the Distributor at an annual rate of up to .25% of the Fund’s average daily net assets attributable to Class A shares. There are no distribution and servicing fees
| | |
| |
| abfunds.com | | AB ALL CHINA EQUITY PORTFOLIO | 29 |
NOTES TO FINANCIAL STATEMENTS (continued)
on the Advisor Class. The fees are accrued daily and paid monthly. The Agreement provides that the Distributor will use such payments in their entirety for distribution assistance and promotional activities. In accordance with the Agreement, there is no provision for recovery of unreimbursed distribution costs incurred by the Distributor beyond the current fiscal year for Class A shares. The Agreement also provides that the Adviser may use its own resources to finance the distribution of the Fund’s shares.
NOTE D
Investment Transactions
Purchases and sales of investment securities (excluding short-term investments) for the year ended November 30, 2022, were as follows:
| | | | | | | | |
| | | Purchases | | | Sales | |
Investment securities (excluding U.S. government securities) | | $ | 86,151,226 | | | $ | 95,450,331 | |
U.S. government securities | | | – 0 | – | | | – 0 | – |
The cost of investments for federal income tax purposes, gross unrealized appreciation and unrealized depreciation are as follows:
| | | | |
Cost | | $ | 141,004,981 | |
| | | | |
Gross unrealized appreciation | | $ | 9,541,951 | |
Gross unrealized depreciation | | | (27,509,846 | ) |
| | | | |
Net unrealized depreciation | | $ | (17,967,895 | ) |
| | | | |
1. Derivative Financial Instruments
The Fund may use derivatives in an effort to earn income and enhance returns, to replace more traditional direct investments, to obtain exposure to otherwise inaccessible markets (collectively, “investment purposes”), or to hedge or adjust the risk profile of its portfolio.
The Fund did not engage in derivative transactions for the year ended November 30, 2022.
2. Currency Transactions
The Fund may invest in non-U.S. Dollar-denominated securities on a currency hedged or unhedged basis. The Fund may seek investment opportunities by taking long or short positions in currencies through the use of currency-related derivatives, including forward currency exchange contracts, futures and options on futures, swaps, and other options. The Fund may enter into transactions for investment opportunities when it anticipates that a foreign currency will appreciate or depreciate in value but securities denominated in that currency are not held by the Fund and do not present attractive investment opportunities. Such transactions may also be used when the Adviser believes that it may be more efficient than a direct investment in a foreign currency-denominated security. The Fund may also
| | |
| |
30 | AB ALL CHINA EQUITY PORTFOLIO | | abfunds.com |
NOTES TO FINANCIAL STATEMENTS (continued)
conduct currency exchange contracts on a spot basis (i.e., for cash at the spot rate prevailing in the currency exchange market for buying or selling currencies).
NOTE E
Securities Lending
The Fund may enter into securities lending transactions. Under the Fund’s securities lending program, all loans of securities will be collateralized continually by cash collateral and/or non-cash collateral. Non-cash collateral will include only securities issued or guaranteed by the U.S. government or its agencies or instrumentalities. The Fund cannot sell or repledge any non-cash collateral, such collateral will not be reflected in the portfolio of investments. If a loan is collateralized by cash, the Fund will be compensated for the loan from a portion of the net return from the income earned on cash collateral after a rebate is paid to the borrower (in some cases, this rebate may be a “negative rebate” or fee paid by the borrower to the Fund in connection with the loan), and payments are made for fees of the securities lending agent and for certain other administrative expenses. If the Fund receives non-cash collateral, the Fund will receive a fee from the borrower generally equal to a negotiated percentage of the market value of the loaned securities. The Fund will have the right to call a loan and obtain the securities loaned at any time on notice to the borrower within the normal and customary settlement time for the securities. While the securities are on loan, the borrower is obligated to pay the Fund amounts equal to any dividend income or other distributions from the securities; however, these distributions will not be afforded the same preferential tax treatment as qualified dividends. The Fund will not be able to exercise voting rights with respect to any securities during the existence of a loan, but will have the right to regain ownership of loaned securities in order to exercise voting or other ownership rights. Collateral received and securities loaned are marked to market daily to ensure that the securities loaned are secured by collateral. The lending agent currently invests the cash collateral received in Government Money Market Portfolio, an eligible money market vehicle, in accordance with the investment restrictions of the Fund, and as approved by the Board. The collateral received on securities loaned is recorded as an asset as well as a corresponding liability in the statement of assets and liabilities. The collateral will be adjusted the next business day to maintain the required collateral amount. The amounts of securities lending income from the borrowers and Government Money Market Portfolio are reflected in the statement of operations. When the Fund earns net securities lending income from Government Money Market Portfolio, the income is inclusive of a rebate expense paid to the borrower. In connection with the cash collateral investment by the Fund in the Government Money Market Portfolio, the Adviser has agreed to waive a portion of the Fund’s share of the advisory fees of Government Money Market Portfolio,
| | |
| |
| abfunds.com | | AB ALL CHINA EQUITY PORTFOLIO | 31 |
NOTES TO FINANCIAL STATEMENTS (continued)
as borne indirectly by the Fund as an acquired fund fee and expense. When the Fund lends securities, its investment performance will continue to reflect changes in the value of the securities loaned. A principal risk of lending portfolio securities is that the borrower may fail to return the loaned securities upon termination of the loan and that the collateral will not be sufficient to replace the loaned securities. The lending agent has agreed to indemnify the Fund in the case of default of any securities borrower.
A summary of the Fund’s transactions surrounding securities lending for the year ended November 30, 2022 is as follows:
| | | | | | | | | | | | | | | | | | | | | | |
| | | | | | | | | | | | | Government Money
Market Portfolio | |
Market
Value of
Securities
on Loan* | | | Cash
Collateral* | | | Market
Value of
Non-Cash
Collateral* | | | Income from
Borrowers | | | Income
Earned | | | Advisory Fee
Waived | |
| $ | 2,271,259 | | | $ | 320,362 | | | $ | 1,978,369 | | | $ | 13,891 | | | $ | 3,570 | | | $ | 107 | |
| * | As of November 30, 2022. |
NOTE F
Capital Stock
Each class consists of 1,000,000,000 authorized shares. Transactions in capital shares for each class were as follows:
| | | | | | | | | | | | | | | | | | | | | | | | |
| | | | | | | | | | | | | | | | | | | | | | | | |
| | | Shares | | | | | | Amount | | | | |
| | | Year Ended
November 30, 2022 | | | Year Ended
November 30, 2021 | | | | | | Year Ended
November 30, 2022 | | | Year Ended
November 30, 2021 | | | | |
| | | | | | | | |
| Class A | | | | | | | | | | | | | | | | | | | | | | | | |
Shares sold | | | 22,957 | | | | – 0 | – | | | | | | $ | 250,000 | | | $ | – 0 | – | | | | |
| | | | | |
Shares issued in reinvestment of dividends and distributions | | | 2,820 | | | | 422 | | | | | | | | 31,497 | | | | 5,436 | | | | | |
| | | | | |
Shares redeemed | | | (7,305 | ) | | | (1,000 | ) | | | | | | | (55,004 | ) | | | (11,580 | ) | | | | |
| | | | | |
Net increase (decrease) | | | 18,472 | | | | (578 | ) | | | | | | $ | 226,493 | | | $ | (6,144 | ) | | | | |
| | | | | |
| | | | | | | | | | | | | | | | | | | | | | | | |
| Advisor Class | | | | | | | | | | | | | | | | | | | | | | | | |
Shares sold | | | 3,720,101 | | | | 6,772,322 | | | | | | | $ | 36,797,443 | | | $ | 90,351,067 | | | | | |
| | | | | |
Shares issued in reinvestment of dividends and distributions | | | 274,217 | | | | 47,134 | | | | | | | | 3,065,746 | | | | 608,031 | | | | | |
| | | | | |
Shares redeemed | | | (5,043,966 | ) | | | (1,921,441 | ) | | | | | | | (45,582,176 | ) | | | (24,192,464 | ) | | | | |
| | | | | |
Net increase (decrease) | | | (1,049,648 | ) | | | 4,898,015 | | | | | | | $ | (5,718,987 | ) | | $ | 66,766,634 | | | | | |
| | | | | |
| | |
| |
32 | AB ALL CHINA EQUITY PORTFOLIO | | abfunds.com |
NOTES TO FINANCIAL STATEMENTS (continued)
NOTE G
Risks Involved in Investing in the Fund
Market Risk—The value of the Fund’s assets will fluctuate as the stock market fluctuates. The value of its investments may decline, sometimes rapidly and unpredictably, simply because of economic changes or other events, including public health crises (including the occurrence of a contagious disease or illness) and regional and global conflicts, that affect large portions of the market. It includes the risk that a particular style of investing, such as the Fund’s value approach, may underperform the market generally.
Foreign (Non-U.S.) Risk—Investments in securities of non-U.S. issuers may involve more risk than those of U.S. issuers. These securities may fluctuate more widely in price and may be more difficult to trade due to adverse market, economic, political, regulatory or other factors. Investments in emerging market countries such as China may involve more risk than investments in developed countries because the markets in emerging market countries are less developed and less liquid and are subject to increased economic, political, regulatory, or other uncertainties. In addition, the value of the Fund’s investments may decline because of factors such as unfavorable or unsuccessful government actions and reduction in government or central bank support.
China/Single Country Risk—Investments in issuers located in a particular country or geographic region may have more risk because of particular market factors affecting that country or region, including political instability, geopolitical risks or unpredictable economic conditions. Risks of investments in securities of companies economically tied to China may include the volatility of the Chinese stock market; heavy dependence on exports, which may be affected adversely by trade barriers or disputes or may decrease, sometimes significantly, when the world economy weakens; and the continuing importance of the role of the Chinese Government, which may take legal or regulatory actions that affect the contractual arrangements of a company or economic and market practices, and cause the value of the securities of an issuer held by the Fund to decrease significantly. While the Chinese economy has grown at a rapid rate in recent years, the rate of growth has been declining, and there can be no assurance that China’s economy will continue to grow in the future. Investments in China A shares are subject to quotas that may restrict daily trading and to additional risks that could affect liquidity compared to investments in companies in developed markets. Risks of investments in companies based in Hong Kong include heavy reliance on the U.S. economy and regional economies, particularly the Chinese economy, which makes these investments vulnerable to changes in these economies.
| | |
| |
| abfunds.com | | AB ALL CHINA EQUITY PORTFOLIO | 33 |
NOTES TO FINANCIAL STATEMENTS (continued)
Currency Risk—Fluctuations in currency exchange rates may negatively affect the value of the Fund’s investments in equity securities denominated in foreign currencies or reduce the Fund’s returns. Emerging market currencies may be more volatile and less liquid, and subject to significantly greater risk of currency controls and convertibility restrictions, than currencies of developed countries.
Depositary Receipts Risk—Investing in depositary receipts involves risks that are similar to the risks of direct investments in foreign securities. For example, investing in depositary receipts may involve risks relating to political, economic or regulatory conditions in foreign countries. In addition, the issuers of the securities underlying certain depositary receipts are under no obligation to distribute shareholder communications or pass through any voting rights with respect to the deposited securities to the holders of such receipts.
Illiquid Investments Risk—Illiquid investments risk exists when certain investments are or become difficult to purchase or sell. Difficulty in selling such investments may result in sales at disadvantageous prices affecting the value of your investment in the Fund. Causes of illiquid investments risk may include low trading volumes and large positions. Foreign fixed-income securities may have more illiquid investments risk because secondary trading markets for these securities may be smaller and less well-developed and the securities may trade less frequently. Illiquid investments risk may be higher in a rising interest rate environment, when the value and liquidity of fixed-income securities generally go down.
Industry/Sector Risk—Investments in a particular industry or group of related industries may have more risk because market or economic factors affecting that industry could have a significant effect on the value of the Fund’s investments.
LIBOR Transition and Associated Risk—A Fund may be exposed to debt securities, derivatives or other financial instruments that utilize the London Interbank Offered Rate, or “LIBOR,” as a “benchmark” or “reference rate” for various interest rate calculations. In 2017, the United Kingdom Financial Conduct Authority (“FCA”), which regulates LIBOR, announced a desire to phase out the use of LIBOR by the end of 2021. The FCA and LIBOR’s administrator, ICE Benchmark Administration, have since announced that most LIBOR settings (which reflect LIBOR rates quoted in different currencies over various time periods) will no longer be published after the end of 2021 but that the most widely used U.S. Dollar LIBOR settings will continue to be published until June 30, 2023. However, banks were strongly encouraged to cease entering into agreements with counterparties referencing LIBOR by the end of 2021. It is possible that a
| | |
| |
34 | AB ALL CHINA EQUITY PORTFOLIO | | abfunds.com |
NOTES TO FINANCIAL STATEMENTS (continued)
subset of LIBOR settings will be published after these dates on a “synthetic” basis, but any such publications would be considered non-representative of the underlying market. Since 2018 the Federal Reserve Bank of New York has published the secured overnight funding rate (referred to as SOFR), which is intended to replace U.S. Dollar LIBOR. SOFR is a broad measure of the cost of borrowing cash overnight collateralized by U.S. Treasury securities in the repurchase agreement (repo) market and has been used increasingly on a voluntary basis in new instruments and transactions. In addition, on March 15, 2022, the Adjustable Interest Rate Act was signed into law. This law provides a statutory fallback mechanism to replace LIBOR with a benchmark rate that is selected by the Federal Reserve Board and based on SOFR for certain contracts that reference LIBOR without adequate fallback provisions.
The elimination of LIBOR or changes to other reference rates or any other changes or reforms to the determination or supervision of reference rates could have an adverse impact on the market for, or value of, any securities or payments linked to those reference rates, which may adversely affect a Fund’s performance and/or net asset value. Uncertainty and risk also remain regarding the willingness and ability of issuers and lenders to include revised provisions in new and existing contracts or instruments. Consequently, the transition from LIBOR to other reference rates may lead to increased volatility and illiquidity in markets that are tied to LIBOR, fluctuations in values of LIBOR-related investments or investments in issuers that utilize LIBOR, increased difficulty in borrowing or refinancing and diminished effectiveness of hedging strategies, potentially adversely affecting a Fund’s performance. Furthermore, the risks associated with the expected discontinuation of LIBOR and transition may be exacerbated if the work necessary to effect an orderly transition to an alternative reference rate is not completed in a timely manner. Neither the effect of the LIBOR transition process nor its ultimate success can yet be known.
Indemnification Risk—In the ordinary course of business, the Fund enters into contracts that contain a variety of indemnifications. The Fund’s maximum exposure under these arrangements is unknown. However, the Fund has not had prior claims or losses pursuant to these indemnification provisions and expects the risk of loss thereunder to be remote. Therefore, the Fund has not accrued any liability in connection with these indemnification provisions.
Management Risk—The Fund is subject to management risk because it is an actively-managed investment fund. The Adviser will apply its investment techniques and risk analyses in making investment decisions, but there is no guarantee that its techniques will produce the intended results. Some of these techniques may incorporate, or rely upon, quantitative
| | |
| |
| abfunds.com | | AB ALL CHINA EQUITY PORTFOLIO | 35 |
NOTES TO FINANCIAL STATEMENTS (continued)
models, but there is no guarantee that these models will generate accurate forecasts, reduce risk or otherwise perform as expected.
NOTE H
Joint Credit Facility
A number of open-end mutual funds managed by the Adviser, including the Fund, participate in a $325 million revolving credit facility (the “Facility”) intended to provide short-term financing related to redemptions and other short term liquidity requirements, subject to certain restrictions. Commitment fees related to the Facility are paid by the participating funds and are included in miscellaneous expenses in the statement of operations. The Fund did not utilize the Facility during the year ended November 30, 2022.
NOTE I
Distributions to Shareholders
The tax character of distributions paid during the fiscal years ended November 30, 2022 and November 30, 2021 were as follows:
| | | | | | | | |
| | | 2022 | | | 2021 | |
Distributions paid from: | | | | | | | | |
Ordinary income | | $ | 2,021,848 | | | $ | 650,608 | |
Net long-term capital gains | | | 1,231,439 | | | | – 0 | – |
| | | | | | | | |
Total taxable distributions paid | | $ | 3,253,287 | | | $ | 650,608 | |
| | | | | | | | |
As of November 30, 2022, the components of accumulated earnings (deficit) on a tax basis were as follows:
| | | | |
Undistributed ordinary income | | $ | 1,671,244 | |
Accumulated capital and other losses | | | (28,436,244 | )(a) |
Unrealized appreciation (depreciation) | | | (17,971,729 | )(b) |
| | | | |
Total accumulated earnings (deficit) | | $ | (44,736,729 | ) |
| | | | |
| (a) | As of November 30, 2022, the Fund had a net capital loss carryforward of $28,436,244. |
| (b) | The difference between book-basis and tax-basis unrealized appreciation (depreciation) is attributable primarily to the tax deferral of losses on wash sales. |
For tax purposes, net realized capital losses may be carried over to offset future capital gains, if any. Funds are permitted to carry forward capital losses for an indefinite period, and such losses will retain their character as either short-term or long-term capital losses. As of November 30, 2022, the Fund had a net short-term capital loss carryforward of $13,861,806 and a net long-term capital loss carryforward of $14,574,438, which may be carried forward for an indefinite period.
During the current fiscal year, there were no permanent differences that resulted in adjustments to distributable earnings or additional paid-in capital.
| | |
| |
36 | AB ALL CHINA EQUITY PORTFOLIO | | abfunds.com |
NOTES TO FINANCIAL STATEMENTS (continued)
NOTE J
Recent Accounting Pronouncements
In March 2020, the Financial Accounting Standards Board issued an Accounting Standards Update, ASU 2020-04, “Reference Rate Reform (Topic 848)—Facilitation of the Effects of Reference Rate Reform on Financial Reporting.” ASU 2020-04 provides optional guidance to ease the potential accounting burden due to the discontinuation of the LIBOR and other interbank-offered based reference rates. ASU 2020-04 is effective as of March 12, 2020 through December 31, 2022. Management is currently evaluating the impact, if any, of applying ASU 2020-04.
NOTE K
Subsequent Events
Management has evaluated subsequent events for possible recognition or disclosure in the financial statements through the date the financial statements are issued. Management has determined that there are no material events that would require disclosure in the Fund’s financial statements through this date.
| | |
| |
| abfunds.com | | AB ALL CHINA EQUITY PORTFOLIO | 37 |
FINANCIAL HIGHLIGHTS
Selected Data For A Share Of Capital Stock Outstanding Throughout Each Period
| | | | | | | | | | | | | | | | | | | | |
| | | Class A | |
| | | Year Ended November 30, | | | July 25,
2018(a) to
November 30,
2018 | |
| | 2022 | | | 2021 | | | 2020 | | | 2019 | |
| | | | |
| | | | | | | | | | | | | | | | | | | | |
Net asset value, beginning of period | | | $ 11.51 | | | | $ 12.58 | | | | $ 10.02 | | | | $ 8.37 | | | | $ 10.00 | |
| | | | |
Income From Investment Operations | | | | | | | | | | | | | | | | | | | | |
| | | | | |
Net investment income (loss)(b)(c) | | | .08 | | | | .09 | | | | .04 | | | | .10 | | | | (.01 | ) |
| | | | | |
Net realized and unrealized gain (loss) on investment and foreign currency transactions | | | (3.38 | ) | | | (1.13 | ) | | | 2.62 | | | | 1.55 | | | | (1.62 | ) |
| | | | |
Net increase (decrease) in net asset value from operations | | | (3.30 | ) | | | (1.04 | ) | | | 2.66 | | | | 1.65 | | | | (1.63 | ) |
| | | | |
Less: Dividends and Distributions | | | | | | | | | | | | | | | | | | | | |
| | | | | |
Dividends from net investment income | | | (.09 | ) | | | (.03 | ) | | | (.10 | ) | | | – 0 | – | | | – 0 | – |
| | | | | |
Distributions from net realized gain on investment and foreign currency transactions | | | (.08 | ) | | | – 0 | – | | | – 0 | – | | | – 0 | – | | | – 0 | – |
| | | | |
Total dividends and distributions | | | (.17 | ) | | | (.03 | ) | | | (.10 | ) | | | – 0 | – | | | – 0 | – |
| | | | |
Net asset value, end of period | | | $ 8.04 | | | | $ 11.51 | | | | $ 12.58 | | | | $ 10.02 | | | | $ 8.37 | |
| | | | |
Total Return | | | | | | | | | | | | | | | | | | | | |
| | | | | |
Total investment return based on net asset value(d) | | | (29.09 | )% | | | (8.30 | )% | | | 26.73 | % | | | 19.71 | % | | | (16.30 | )% |
| | | | | |
Ratios/Supplemental Data | | | | | | | | | | | | | | | | | | | | |
| | | | | |
Net assets, end of period (000’s omitted) | | | $1,650 | | | | $2,148 | | | | $2,355 | | | | $1,859 | | | | $685 | |
| | | | | |
Ratio to average net assets of: | | | | | | | | | | | | | | | | | | | | |
| | | | | |
Expenses, net of waivers/reimbursements | | | 1.50 | % | | | 1.44 | % | | | 1.50 | % | | | 1.50 | % | | | 1.50 | %(e) |
| | | | | |
Expenses, before waivers/reimbursements | | | 1.50 | % | | | 1.45 | % | | | 1.56 | % | | | 1.93 | % | | | 4.81 | %(e) |
| | | | | |
Net investment income (loss)(c) | | | .87 | % | | | .70 | % | | | .40 | % | | | 1.00 | % | | | (.33 | )%(e) |
| | | | | |
Portfolio turnover rate | | | 57 | % | | | 75 | % | | | 74 | % | | | 62 | % | | | 38 | % |
See footnote summary on page 40.
| | |
| |
38 | AB ALL CHINA EQUITY PORTFOLIO | | abfunds.com |
FINANCIAL HIGHLIGHTS (continued)
Selected Data For A Share Of Capital Stock Outstanding Throughout Each Period
| | | | | | | | | | | | | | | | | | | | |
| | | Advisor Class | |
| | | Year Ended November 30, | | | July 25,
2018(a) to
November 30,
2018 | |
| | 2022 | | | 2021 | | | 2020 | | | 2019 | |
| | | | |
| | | | | | | | | | | | | | | | | | | | |
Net asset value, beginning of period | | | $ 11.56 | | | | $ 12.63 | | | | $ 10.05 | | | | $ 8.38 | | | | $ 10.00 | |
| | | | |
Income From Investment Operations | | | | | | | | | | | | | | | | | | | | |
| | | | | |
Net investment income (loss)(b)(c) | | | .10 | | | | .14 | | | | .08 | | | | .12 | | | | (.01 | ) |
| | | | | |
Net realized and unrealized gain (loss) on investment and foreign currency transactions | | | (3.39 | ) | | | (1.15 | ) | | | 2.62 | | | | 1.55 | | | | (1.61 | ) |
| | | | |
Net increase (decrease) in net asset value from operations | | | (3.29 | ) | | | (1.01 | ) | | | 2.70 | | | | 1.67 | | | | (1.62 | ) |
| | | | |
Less: Dividends and Distributions | | | | | | | | | | | | | | | | | | | | |
| | | | | |
Dividends from net investment income | | | (.12 | ) | | | (.06 | ) | | | (.12 | ) | | | – 0 | – | | | – 0 | – |
| | | | | |
Distributions from net realized gain on investment and foreign currency transactions | | | (.08 | ) | | | – 0 | – | | | – 0 | – | | | – 0 | – | | | – 0 | – |
| | | | |
Total dividends and distributions | | | (.20 | ) | | | (.06 | ) | | | (.12 | ) | | | – 0 | – | | | – 0 | – |
| | | | |
Net asset value, end of period | | | $ 8.07 | | | | $ 11.56 | | | | $ 12.63 | | | | $ 10.05 | | | | $ 8.38 | |
| | | | |
Total Return | | | | | | | | | | | | | | | | | | | | |
| | | | | |
Total investment return based on net asset value(d) | | | (28.93 | )% | | | (8.07 | )% | | | 27.12 | % | | | 19.93 | % | | | (16.20 | )% |
| | | | | |
Ratios/Supplemental Data | | | | | | | | | | | | | | | | | | | | |
| | | | | |
Net assets, end of period (000’s omitted) | | | $120,858 | | | | $185,108 | | | | $140,401 | | | | $87,498 | | | | $36,145 | |
| | | | | |
Ratio to average net assets of: | | | | | | | | | | | | | | | | | | | | |
| | | | | |
Expenses, net of waivers/reimbursements | | | 1.25 | % | | | 1.20 | % | | | 1.25 | % | | | 1.25 | % | | | 1.25 | %(e) |
| | | | | |
Expenses, before waivers/reimbursements | | | 1.25 | % | | | 1.20 | % | | | 1.31 | % | | | 1.67 | % | | | 5.13 | %(e) |
| | | | | |
Net investment income (loss)(c) | | | 1.11 | % | | | 1.06 | % | | | .69 | % | | | 1.28 | % | | | (.37 | )%(e) |
| | | | | |
Portfolio turnover rate | | | 57 | % | | | 75 | % | | | 74 | % | | | 62 | % | | | 38 | % |
See footnote summary on page 40.
| | |
| |
| abfunds.com | | AB ALL CHINA EQUITY PORTFOLIO | 39 |
FINANCIAL HIGHLIGHTS (continued)
Selected Data For A Share Of Capital Stock Outstanding Throughout Each Period
| (a) | Commencement of operations. |
| (b) | Based on average shares outstanding. |
| (c) | Net of expenses waived/reimbursed by the Adviser. |
| (d) | Total investment return is calculated assuming an initial investment made at the net asset value at the beginning of the period, reinvestment of all dividends and distributions at net asset value during the period, and redemption on the last day of the period. Initial sales charge or contingent deferred sales charge is not reflected in the calculation of total investment return. Total investment return does not reflect the deduction of taxes that a shareholder would pay on fund distributions or the redemption of fund shares. Total investment return for a period of less than one year is not annualized. |
See notes to financial statements.
| | |
| |
40 | AB ALL CHINA EQUITY PORTFOLIO | | abfunds.com |
REPORT OF INDEPENDENT REGISTERED
PUBLIC ACCOUNTING FIRM
To the Shareholders and the Board of Directors of
AB All China Equity Portfolio
Opinion on the Financial Statements
We have audited the accompanying statement of assets and liabilities of AB All China Equity Portfolio (the “Fund”) (one of the portfolios constituting AB Cap Fund, Inc. (the “Company”)), including the portfolio of investments, as of November 30, 2022, and the related statement of operations for the year then ended, the statements of changes in net assets for each of the two years in the period then ended, and the financial highlights for each of the four years in the period then ended and the period from July 25, 2018 (commencement of operations) through November 30, 2018 and the related notes (collectively referred to as the “financial statements”). In our opinion, the financial statements present fairly, in all material respects, the financial position of the Fund (one of the portfolios constituting AB Cap Fund, Inc.) at November 30, 2022, the results of its operations for the year then ended, the changes in its net assets for each of the two years in the period then ended and its financial highlights for each of the four years in the period then ended and the period from July 25, 2018 (commencement of operations) through November 30, 2018, in conformity with U.S. generally accepted accounting principles.
Basis for Opinion
These financial statements are the responsibility of the Company’s management. Our responsibility is to express an opinion on the Fund’s financial statements based on our audits. We are a public accounting firm registered with the Public Company Accounting Oversight Board (United States) (“PCAOB”) and are required to be independent with respect to the Company in accordance with the U.S. federal securities laws and the applicable rules and regulations of the Securities and Exchange Commission and the PCAOB.
We conducted our audits in accordance with the standards of the PCAOB. Those standards require that we plan and perform the audit to obtain reasonable assurance about whether the financial statements are free of material misstatement, whether due to error or fraud. The Company is not required to have, nor were we engaged to perform, an audit of the Company’s internal control over financial reporting. As part of our audits, we are required to obtain an understanding of internal control over financial reporting but not for the purpose of expressing an opinion on the effectiveness of the Company’s internal control over financial reporting. Accordingly, we express no such opinion.
| | |
| |
| abfunds.com | | AB ALL CHINA EQUITY PORTFOLIO | 41 |
REPORT OF INDEPENDENT REGISTERED
PUBLIC ACCOUNTING FIRM (continued)
Our audits included performing procedures to assess the risks of material misstatement of the financial statements, whether due to error or fraud, and performing procedures that respond to those risks. Such procedures included examining, on a test basis, evidence regarding the amounts and disclosures in the financial statements. Our procedures included confirmation of securities owned as of November 30, 2022, by correspondence with the custodian, brokers and others; when replies were not received from brokers or others, we performed other auditing procedures. Our audits also included evaluating the accounting principles used and significant estimates made by management, as well as evaluating the overall presentation of the financial statements. We believe that our audits provide a reasonable basis for our opinion.

We have served as the auditor of one or more of the AB investment companies since 1968.
New York, New York
January 26, 2023
| | |
| |
42 | AB ALL CHINA EQUITY PORTFOLIO | | abfunds.com |
2022 FEDERAL TAX INFORMATION
(unaudited)
For Federal income tax purposes, the following information is furnished with respect to the earnings of the Fund for the taxable year ended November 30, 2022.
For the taxable year ended November 30, 2022, the Fund designates 100% as the maximum amount that may be considered qualified dividend income for individual shareholders.
The fund designates $1,231,439 of dividends as long-term capital gains dividends.
The Fund intends to make an election to pass through foreign taxes to its shareholders. For the taxable year ended November 30, 2022, $284,609 of foreign taxes may be passed through and the associated foreign source income for information reporting purposes is $3,911,198.
Shareholders should not use the above information to prepare their income tax returns. The information necessary to complete your income tax returns will be included with your Form 1099-DIV which will be sent to you separately in January 2023.
| | |
| |
| abfunds.com | | AB ALL CHINA EQUITY PORTFOLIO | 43 |
BOARD OF DIRECTORS
| | |
Garry L. Moody(1), Chairman Jorge A. Bermudez(1) Michael J. Downey(1) Onur Erzan, President and Chief Executive Officer | | Nancy P. Jacklin(1) Jeanette W. Loeb(1) Carol C. McMullen(1) Marshall C. Turner, Jr.(1) |
OFFICERS
| | |
John Lin(2), Vice President Stuart Rae(2), Vice President Nancy E. Hay, Secretary Michael B. Reyes, Senior Vice President | | Joseph J. Mantineo, Treasurer and Chief Financial Officer Jennifer Friedland, Chief Compliance Officer Phyllis J. Clarke, Controller |
| | |
Custodian and Accounting Agent Brown Brothers Harriman & Co. 50 Post Office Square Boston, MA 02110 Principal Underwriter AllianceBernstein Investments, Inc. 501 Commerce Street Nashville, TN 37203 Legal Counsel Seward & Kissel LLP One Battery Park Plaza New York, NY 10004 | | Independent Registered Public Accounting Firm Ernst & Young LLP One Manhattan West New York, NY 10001 Transfer Agent AllianceBernstein Investor Services, Inc. P.O. Box 786003 San Antonio, TX 78278 Toll-Free (800) 221-5672 |
| 1 | Member of the Audit Committee, the Governance and Nominating Committee and the Independent Directors Committee. |
| 2 | The day-to-day management of, and investment decisions for, the Fund’s portfolio are made by the Adviser’s China Equity Team. Messrs. Lin and Rae are the investment professionals with the most significant responsibility for the day-to-day management of the Fund’s portfolio. |
| | |
| |
44 | AB ALL CHINA EQUITY PORTFOLIO | | abfunds.com |
MANAGEMENT OF THE FUND
Board of Directors Information
The business and affairs of the Fund are managed under the direction of the Board of Directors. Certain information concerning the Fund’s Directors is set forth below.
| | | | | | | | |
NAME, ADDRESS* AND AGE (YEAR FIRST ELECTED**) | | PRINCIPAL OCCUPATION(S) DURING PAST FIVE YEARS AND OTHER INFORMATION*** | | PORTFOLIOS IN AB FUND COMPLEX OVERSEEN BY DIRECTOR | | | OTHER PUBLIC COMPANY DIRECTORSHIPS CURRENTLY HELD BY DIRECTOR |
| INTERESTED DIRECTOR | | | | | | | | |
| | | |
Onur Erzan,+ 1345 Avenue of the Americas New York, NY 10105 47 (2021) | | Senior Vice President of AllianceBernstein L.P. (the “Adviser”) and Head of Global Client Group and Head of Private Wealth. He oversees AB’s entire private wealth management business and third-party institutional and retail franchise, where he is responsible for all client services, sales and marketing, as well as product strategy, management and development worldwide. Director, President and Chief Executive Officer of the AB Mutual Funds as of April 1, 2021. He is also a member of the Equitable Holdings Management Committee. Prior to joining the firm in January 2021, he spent 19 years with McKinsey, most recently as a senior partner and co-leader of its Wealth & Asset Management practice. In addition, he co-led McKinsey’s Banking & Securities Solutions (a portfolio of data, analytics, and digital assets and capabilities) globally. | | | 75 | | | None |
| | | | | | | | |
| | |
| |
| abfunds.com | | AB ALL CHINA EQUITY PORTFOLIO | 45 |
MANAGEMENT OF THE FUND (continued)
| | | | | | | | |
NAME, ADDRESS* AND AGE (YEAR FIRST ELECTED**) | | PRINCIPAL OCCUPATION(S) DURING PAST FIVE YEARS AND OTHER INFORMATION*** | | PORTFOLIOS IN AB FUND COMPLEX OVERSEEN BY DIRECTOR | | | OTHER PUBLIC COMPANY DIRECTORSHIPS CURRENTLY HELD BY DIRECTOR |
| DISINTERESTED DIRECTORS | | | | | | |
| | | |
Garry L. Moody,# Chairman of the Board 70 (2018) | | Private Investor since prior to 2018. Formerly, Partner, Deloitte & Touche LLP (1995-2008) where he held a number of senior positions, including Vice Chairman, and U.S. and Global Investment Management Practice Managing Partner; President, Fidelity Accounting and Custody Services Company (1993-1995), where he was responsible for accounting, pricing, custody and reporting for the Fidelity mutual funds; and Partner, Ernst & Young LLP (1975-1993), where he served as the National Director of Mutual Fund Tax Services and Managing Partner of its Chicago Office Tax department. He is a member of the Investment Company Institute’s Board of Governors and the Independent Directors Council’s Governing Council, where he serves as Chairman of its Governance Committee. He is Chairman of the AB Funds and Chairman of the Independent Directors Committees since January 2023 and he has served as a director or trustee, and as Chairman of the Audit Committees, of the AB Funds since 2008. | | | 75 | | | None |
| | | | | | | | |
| | |
| |
46 | AB ALL CHINA EQUITY PORTFOLIO | | abfunds.com |
MANAGEMENT OF THE FUND (continued)
| | | | | | | | |
NAME, ADDRESS* AND AGE (YEAR FIRST ELECTED**) | | PRINCIPAL OCCUPATION(S) DURING PAST FIVE YEARS AND OTHER INFORMATION*** | | PORTFOLIOS IN AB FUND COMPLEX OVERSEEN BY DIRECTOR | | | OTHER PUBLIC COMPANY DIRECTORSHIPS CURRENTLY HELD BY DIRECTOR |
DISINTERESTED DIRECTORS
(continued) | | | | | | |
| | | |
Jorge A. Bermudez,# 71 (2020) | | Private Investor since prior to 2018. Formerly, Chief Risk Officer of Citigroup, Inc., a global financial services company, from November 2007 to March 2008, Chief Executive Officer of Citigroup’s Commercial Business Group in North America and Citibank Texas from 2005 to 2007, and a variety of other executive and leadership roles at various businesses within Citigroup prior to then; Chairman (2018) of the Texas A&M Foundation Board of Trustees (Trustee since 2013) and Chairman of the Smart Grid Center Board at Texas A&M University since 2012; director of, among others, Citibank N.A. from 2005 to 2008, the Federal Reserve Bank of Dallas, Houston Branch from 2009 to 2011, the Federal Reserve Bank of Dallas from 2011 to 2017, and the Electric Reliability Council of Texas from 2010 to 2016. He has served as director or trustee of the AB Funds since January 2020. | | | 75 | | | Moody’s Corporation since April 2011 and Chair of its Audit Commitee since December 2022 |
| | | | | | | | |
| | | |
Michael J. Downey,# 79 (2018) | | Private Investor since prior to 2018. Formerly, Chairman of The Asia Pacific Fund, Inc. (registered investment company) since prior to 2018 until January 2019. From 1987 until 1993, Chairman and CEO of Prudential Mutual Fund Management, director of the Prudential mutual funds, and member of the Executive Committee of Prudential Securities Inc. He has served as a director or trustee of the AB Funds since 2005. | | | 75 | | | None |
| | | | | | | | |
| | |
| |
| abfunds.com | | AB ALL CHINA EQUITY PORTFOLIO | 47 |
MANAGEMENT OF THE FUND (continued)
| | | | | | | | |
NAME, ADDRESS* AND AGE (YEAR FIRST ELECTED**) | | PRINCIPAL OCCUPATION(S) DURING PAST FIVE YEARS AND OTHER INFORMATION*** | | PORTFOLIOS IN AB FUND COMPLEX OVERSEEN BY DIRECTOR | | | OTHER PUBLIC COMPANY DIRECTORSHIPS CURRENTLY HELD BY DIRECTOR |
DISINTERESTED DIRECTORS
(continued) | | | | | | |
| | | |
Nancy P. Jacklin,# 74 (2018) | | Private Investor since prior to 2018. Professorial Lecturer at the Johns Hopkins School of Advanced International Studies (2008-2015). U.S. Executive Director of the International Monetary Fund (which is responsible for ensuring the stability of the international monetary system) (December 2002-May 2006); Partner, Clifford Chance (1992-2002); Sector Counsel, International Banking and Finance, and Associate General Counsel, Citicorp (1985-1992); Assistant General Counsel (International), Federal Reserve Board of Governors (1982-1985); and Attorney Advisor, U.S. Department of the Treasury (1973-1982). Member of the Bar of the District of Columbia and of New York; and member of the Council on Foreign Relations. She has served as a director or trustee of the AB Funds since 2006 and has been Chair of the Governance and Nominating Committees of the AB Funds since August 2014. | | | 75 | | | None |
| | | | | | | | |
| | | |
Jeanette W. Loeb,# 70 (2020) | | Chief Executive Officer of PetCareRx (e-commerce pet pharmacy) from 2002 to 2011 and 2015 to present. Director of New York City Center since 2005. She was a director of AB Multi-Manager Alternative Fund, Inc. (fund of hedge funds) from 2012 to 2018. Formerly, affiliated with Goldman Sachs Group, Inc. (financial services) from 1977 to 1994, including as a partner thereof from 1986 to 1994. She has served as director or trustee of the AB Funds since April 2020. | | | 75 | | | Apollo Investment Corp. (business development company) since August 2011 |
| | |
| |
48 | AB ALL CHINA EQUITY PORTFOLIO | | abfunds.com |
MANAGEMENT OF THE FUND (continued)
| | | | | | | | |
NAME, ADDRESS* AND AGE (YEAR FIRST ELECTED**) | | PRINCIPAL OCCUPATION(S) DURING PAST FIVE YEARS AND OTHER INFORMATION*** | | PORTFOLIOS IN AB FUND COMPLEX OVERSEEN BY DIRECTOR | | | OTHER PUBLIC COMPANY DIRECTORSHIPS CURRENTLY HELD BY DIRECTOR |
DISINTERESTED DIRECTORS
(continued) | | | | | | |
| | | |
Carol C. McMullen,# 67 (2018) | | Managing Director of Slalom Consulting (consulting) since 2014, private investor and a member of the Advisory Board of Butcher Box (since 2018). Formerly, member, Partners Healthcare Investment Committee (2010-2019); Director of Norfolk & Dedham Group (mutual property and casualty insurance) from 2011 until November 2016; Director of Partners Community Physicians Organization (healthcare) from 2014 until December 2016; and Managing Director of The Crossland Group (consulting) from 2012 until 2013. She has held a number of senior positions in the asset and wealth management industries, including at Eastern Bank (where her roles included President of Eastern Wealth Management), Thomson Financial (Global Head of Sales for Investment Management), and Putnam Investments (where her roles included Chief Investment Officer, Core and Growth and Head of Global Investment Research). She has served on a number of private company and non-profit boards, and as a director or trustee of the AB Funds since June 2016. | | | 75 | | | None |
| | |
| |
| abfunds.com | | AB ALL CHINA EQUITY PORTFOLIO | 49 |
MANAGEMENT OF THE FUND (continued)
| | | | | | | | |
NAME, ADDRESS* AND AGE (YEAR FIRST ELECTED**) | | PRINCIPAL OCCUPATION(S) DURING PAST FIVE YEARS AND OTHER INFORMATION*** | | PORTFOLIOS IN AB FUND COMPLEX OVERSEEN BY DIRECTOR | | | OTHER PUBLIC COMPANY DIRECTORSHIPS CURRENTLY HELD BY DIRECTOR |
DISINTERESTED DIRECTORS
(continued) | | | | | | |
| | | |
Marshall C. Turner, Jr.# 81 (2018) | | Private Investor since prior to 2018. Former Chairman and CEO of Dupont Photomasks, Inc. (semi-conductor manufacturing equipment). He was a Director of Xilinx, Inc. (programmable logic semi-conductors and adaptable, intelligent computing) from 2007 through August 2020, and is a former director of 33 other companies and organizations. He has extensive operating leadership and venture capital investing experience, including five interim or full-time CEO roles, and prior service as general partner of institutional venture capital partnerships. He also has extensive non-profit board leadership experience, and currently serves on the board of the George Lucas Educational Foundation. He has served as a director of one AB Fund since 1992, and director or trustee of all AB Funds since 2005. He has served as both Chairman of the AB Funds and Chairman of the Independent Directors Committees from 2014 through December 2022. | | | 75 | | | None |
| | | | | | | | |
| | |
| |
50 | AB ALL CHINA EQUITY PORTFOLIO | | abfunds.com |
MANAGEMENT OF THE FUND (continued)
| * | The address for each of the Fund’s disinterested Directors is c/o AllianceBernstein L.P., Attention: Legal & Compliance Department—Mutual Fund Legal, 1345 Avenue of the Americas, New York, NY 10105. |
| ** | There is no stated term of office for the Fund’s Directors. |
| *** | The information above includes each Director’s principal occupation during the last five years and other information relating to the experience, attributes and skills relevant to each Director’s qualifications to serve as a Director, which led to the conclusion that each Director should serve as a Director for the Fund. |
| + | Mr. Erzan is an “interested person” of the Fund, as defined in the “1940 Act”, due to his position as a Senior Vice President of the Adviser. |
| # | Member of the Audit Committee, the Governance and Nominating Committee and the Independent Directors Committee. |
| | |
| |
| abfunds.com | | AB ALL CHINA EQUITY PORTFOLIO | 51 |
MANAGEMENT OF THE FUND (continued)
Officer Information
Certain information concerning the Fund’s officers is set forth below.
| | | | |
NAME, ADDRESS,*
AND AGE | | POSITION(S)
HELD WITH FUND | | PRINCIPAL OCCUPATION
DURING PAST 5 YEARS |
Onur Erzan
47 | | President and Chief Executive Officer | | See biography above. |
| | | | |
John Lin
45 | | Vice President | | Senior Vice President of the Adviser**, with which he has been associated since prior to 2018. |
| | | | |
Stuart Rae
57 | | Vice President | | Senior Vice President of the Adviser**, with which he has been associated since prior to 2018. He is also Chief Investment Officer of the Asia-Pacific Value Equities. |
| | | | |
Nancy E. Hay
50 | | Secretary | | Vice President and Counsel of the Adviser**, with which she has been associated since prior to 2018 and Assistant Secretary of ABI**. |
| | | | |
Michael B. Reyes
46 | | Senior Vice President | | Vice President of the Adviser**, with which he has been associated since prior to 2018. |
| | | | |
Joseph J. Mantineo
63 | | Treasurer and Chief Financial Officer | | Senior Vice President of AllianceBernstein Investor Services, Inc. (“ABIS**”), with which he has been associated since prior to 2018. |
| | | | |
Phyllis J. Clarke
62 | | Controller | | Vice President of ABIS**, with which she has been associated since prior to 2018. |
| | | | |
Jennifer Friedland
48 | | Chief Compliance Officer | | Vice President of the Adviser** since 2020 and Mutual Fund Chief Compliance Officer (of all Funds since January 2023 and of the ETF Funds since 2022). Before joining the Adviser** in 2020, she was Chief Compliance Officer at WestEnd Advisors, LLC from prior to 2018 until 2019. |
| * | The address for each of the Fund’s Officers is 1345 Avenue of the Americas, New York, NY 10105. |
| ** | The Adviser, ABI and ABIS are affiliates of the Fund. |
The Fund’s Statement of Additional Information (“SAI”) has additional information about the Fund’s Directors and Officers and is available without charge upon request. Contact your financial representative or AB at (800) 227-4618, or visit www.abfunds.com, for a free prospectus or SAI.
| | |
| |
52 | AB ALL CHINA EQUITY PORTFOLIO | | abfunds.com |
Operation and Effectiveness of the Funds’ Liquidity Risk Management Program:
In October 2016, the Securities and Exchange Commission (“SEC”) adopted the open-end fund liquidity rule (the “Liquidity Rule”). In June 2018 the SEC adopted a requirement that funds disclose information about the operation and effectiveness of their Liquidity Risk Management Program (“LRMP”) in their reports to shareholders.
One of the requirements of the Liquidity Rule is for the Fund to designate an Administrator of the Fund’s Liquidity Risk Management Program. The Administrator of the Fund’s LRMP is AllianceBernstein L.P., the Fund’s investment adviser (the “Adviser”). The Adviser has delegated the responsibility to its Liquidity Risk Management Committee (the “Committee”).
Another requirement of the Liquidity Rule is for the Fund’s Board of Directors/Trustees (the “Fund Board”) to receive an annual written report from the Administrator of the LRMP, which addresses the operation of the fund’s LRMP and assesses its adequacy and effectiveness. The Adviser provided the Fund Board with such annual report during the first quarter of 2022, which covered the period January 1, 2021 through December 31, 2021 (the “Program Reporting Period”).
The LRMP’s principal objectives include supporting the Fund’s compliance with limits on investments in illiquid assets and mitigating the risk that the Fund will be unable to meet its redemption obligations in a timely manner.
Pursuant to the LRMP, the Fund classifies the liquidity of its portfolio investments into one of the four categories defined by the SEC: Highly Liquid, Moderately Liquid, Less Liquid, and Illiquid. These classifications are reported to the SEC on Form N-PORT.
During the Program Reporting Period, the Committee reviewed whether the Fund’s strategy is appropriate for an open-end structure, incorporating any holdings of less liquid and illiquid assets. If the Fund participated in derivative transactions, the exposure from such transactions were considered in the LRMP.
The Committee also performed an analysis to determine whether the Fund is required to maintain a Highly Liquid Investment Minimum (“HLIM”). The Committee also incorporated the following information when determining the Fund’s reasonably anticipated trading size for purposes of liquidity monitoring: historical net redemption activity, a Fund’s concentration in an issuer, shareholder concentration, investment performance, total net assets, and distribution channels.
The Adviser informed the Fund Board that the Committee believes the Funds’ LRMP is adequately designed, has been implemented as intended,
| | |
| |
| abfunds.com | | AB ALL CHINA EQUITY PORTFOLIO | 53 |
and has operated effectively since its inception. No material exceptions have been noted since the implementation of the LRMP. During the Program Reporting Period, liquidity in all markets was significantly recovered and improved compared to the prior reporting period which included extreme levels of price volatility and relative illiquidity beginning in March 2020 with COVID-19 impacts. As such, the Program operated in a relatively robust and benign liquidity environment experienced in markets during the Program Reporting Period. There were no liquidity events that impacted the Fund or its ability to timely meet redemptions during the Program Reporting Period.
| | |
| |
54 | AB ALL CHINA EQUITY PORTFOLIO | | abfunds.com |
Information Regarding the Review and Approval of the Fund’s Advisory Agreement
The disinterested directors (the “directors”) of AB Cap Fund, Inc. (the “Company”) unanimously approved the continuance of the Company’s Advisory Agreement with the Adviser in respect of AB All China Equity Portfolio (the “Fund”) at a meeting held in-person on May 3-5, 2022 (the “Meeting”).
Prior to approval of the continuance of the Advisory Agreement, the directors had requested from the Adviser, and received and evaluated, extensive materials. They reviewed the proposed continuance of the Advisory Agreement with the Adviser and with experienced counsel who are independent of the Adviser, who advised on the relevant legal standards. The directors also reviewed additional materials, including comparative analytical data prepared by the Senior Vice President for the Fund. The directors also discussed the proposed continuance in private sessions with counsel.
The directors considered their knowledge of the nature and quality of the services provided by the Adviser to the Fund gained from their experience as directors or trustees of most of the registered investment companies advised by the Adviser, their overall confidence in the Adviser’s integrity and competence they have gained from that experience, the Adviser’s initiative in identifying and raising potential issues with the directors and its responsiveness, frankness and attention to concerns raised by the directors in the past, including the Adviser’s willingness to consider and implement organizational and operational changes designed to improve investment results and the services provided to the AB Funds. The directors noted that they have four regular meetings each year, at each of which they review extensive materials and information from the Adviser, including information on the investment performance of the Fund and the money market fund advised by the Adviser in which the Fund invests a portion of its assets.
The directors also considered all factors they believed relevant, including the specific matters discussed below. During the course of their deliberations, the directors evaluated, among other things, the reasonableness of the advisory fee. The directors did not identify any particular information that was all-important or controlling, and different directors may have attributed different weights to the various factors. The directors determined that the selection of the Adviser to manage the Fund and the overall arrangements between the Fund and the Adviser, as provided in the Advisory Agreement, including the advisory fee, were fair and reasonable in light of the services performed, expenses incurred and such other matters as the directors considered relevant in the exercise of their business
| | |
| |
| abfunds.com | | AB ALL CHINA EQUITY PORTFOLIO | 55 |
judgment. The material factors and conclusions that formed the basis for the directors’ determinations included the following:
Nature, Extent and Quality of Services Provided
The directors considered the scope and quality of services provided by the Adviser under the Advisory Agreement, including the quality of the investment research capabilities of the Adviser and the other resources it has dedicated to performing services for the Fund. The directors noted that the Adviser from time to time reviews the Fund’s investment strategies and from time to time proposes changes intended to improve the Fund’s relative or absolute performance for the directors’ consideration. They also noted the professional experience and qualifications of the Fund’s portfolio management team and other senior personnel of the Adviser. The directors also considered that the Advisory Agreement provides that the Fund will reimburse the Adviser for the cost to it of providing certain clerical, accounting, administrative and other services to the Fund by employees of the Adviser or its affiliates. Requests for these reimbursements are made on a quarterly basis and subject to approval by the directors. Reimbursements, to the extent requested and paid, result in a higher rate of total compensation from the Fund to the Adviser than the fee rate stated in the Advisory Agreement. The directors noted that the methodology used to determine the reimbursement amounts had been reviewed by an independent consultant at the request of the directors. The quality of administrative and other services, including the Adviser’s role in coordinating the activities of the Fund’s other service providers, also was considered. The directors concluded that, overall, they were satisfied with the nature, extent and quality of services provided to the Fund under the Advisory Agreement.
Costs of Services Provided and Profitability
The directors reviewed a schedule of the revenues and expenses and related notes indicating the profitability of the Fund to the Adviser for calendar years 2020 and 2021 that had been prepared with an expense allocation methodology arrived at in consultation with an independent consultant at the request of the directors. The directors noted the assumptions and methods of allocation used by the Adviser in preparing fund-specific profitability data and understood that there are a number of potentially acceptable allocation methodologies for information of this type. The directors noted that the profitability information reflected all revenues and expenses of the Adviser’s relationship with the Fund, including those relating to its subsidiaries that provide transfer agency, distribution and brokerage services to the Fund. The directors recognized that it is difficult to make comparisons of the profitability of the Advisory Agreement with the profitability of fund advisory contracts for unaffiliated funds because comparative information is not generally publicly available and is affected by numerous factors. The directors focused on the profitability of the Adviser’s relationship with the Fund before taxes and distribution
| | |
| |
56 | AB ALL CHINA EQUITY PORTFOLIO | | abfunds.com |
expenses. The directors concluded that the Adviser’s level of profitability from its relationship with the Fund was not unreasonable.
Fall-Out Benefits
The directors considered the other benefits to the Adviser and its affiliates from their relationships with the Fund and the money market fund advised by the Adviser in which the Fund invests, including, but not limited to, benefits relating to soft dollar arrangements (whereby investment advisers receive brokerage and research services from brokers that execute agency transactions for their clients); 12b-1 fees and sales charges received by the Fund’s principal underwriter (which is a wholly owned subsidiary of the Adviser) in respect of certain classes of the Fund’s shares; brokerage commissions paid by the Fund to brokers affiliated with the Adviser; and transfer agency fees paid by the Fund to a wholly owned subsidiary of the Adviser. The directors recognized that the Fund’s profitability to the Adviser would be somewhat lower without these benefits. The directors understood that the Adviser also might derive reputational and other benefits from its association with the Fund.
Investment Results
In addition to the information reviewed by the directors in connection with the Meeting, the directors receive detailed performance information for the Fund at each regular Board meeting during the year.
At the Meeting, the directors reviewed performance information prepared by an independent service provider (the “15(c) service provider”), showing the performance of the Class A Shares of the Fund against a group of similar funds (“peer group”) and a larger group of similar funds (“peer universe”), each selected by the 15(c) service provider, and information prepared by the Adviser showing performance of the Class A Shares against a broad-based securities market index, in each case for the 1- and 3-year periods ended February 28, 2022 and (in the case of comparisons with the broad-based securities market index) for the period from inception. Based on their review, the directors concluded that the Fund’s investment performance was acceptable.
Advisory Fees and Other Expenses
The directors considered the advisory fee rate payable by the Fund to the Adviser and information prepared by the 15(c) service provider concerning advisory fee rates payable by other funds in the same category as the Fund. The directors recognized that it is difficult to make comparisons of advisory fees because there are variations in the services that are included in the fees paid by other funds. The directors compared the Fund’s contractual advisory fee rate with a peer group median and took into account the impact on the advisory fee rate of the administrative expense reimbursement paid to the Adviser in the latest fiscal year.
| | |
| |
| abfunds.com | | AB ALL CHINA EQUITY PORTFOLIO | 57 |
The directors also considered the Adviser’s fee schedule for other clients utilizing investment strategies similar to those of the Fund. For this purpose, they reviewed the relevant advisory fee information from the Adviser’s Form ADV and in a report from the Fund’s Senior Vice President and noted the differences between the Fund’s fee schedule, on the one hand, and the Adviser’s institutional fee schedule and the schedule of fees charged by the Adviser to any offshore funds and for services to any sub-advised funds utilizing investment strategies similar to those of the Fund, on the other. The directors noted that the Adviser may, in some cases, agree to fee rates with large institutional clients that are lower than those reviewed by the directors and that they had previously discussed with the Adviser its policies in respect of such arrangements.
The Adviser reviewed with the directors the significantly greater scope of the services it provides to the Fund relative to institutional, offshore fund and sub-advised fund clients. In this regard, the Adviser noted, among other things, that, compared to institutional and offshore or sub-advisory accounts, the Fund (i) demands considerably more portfolio management, research and trading resources due to significantly higher daily cash flows; (ii) has more tax and regulatory restrictions and compliance obligations; (iii) must prepare and file or distribute regulatory and other communications about fund operations; and (iv) must provide shareholder servicing to retail investors. The Adviser also reviewed the greater legal risks presented by the large and changing population of Fund shareholders who may assert claims against the Adviser in individual or class actions, and the greater entrepreneurial risk in offering new fund products, which require substantial investment to launch, may not succeed, and generally must be priced to compete with larger, more established funds resulting in lack of profitability to the Adviser until a new fund achieves scale. In light of the substantial differences in services rendered by the Adviser to institutional, offshore fund and sub-advised fund clients as compared to the Fund, and the different risk profile, the directors considered these fee comparisons inapt and did not place significant weight on them in their deliberations.
In connection with their review of the Fund’s advisory fee, the directors also considered the total expense ratio of the Class A shares of the Fund in comparison to a peer group and a peer universe selected by the 15(c) service provider. The Class A expense ratio of the Fund was based on the Fund’s latest fiscal year. The Adviser had agreed to cap the Fund’s expenses, but the directors noted that the Fund’s expense ratio was currently below the level of the Adviser’s cap. The directors noted that it was likely that the expense ratios of some of the other funds in the Fund’s category were lowered by waivers or reimbursements by those funds’ investment advisers, which in some cases might be voluntary or temporary. The directors view expense ratio information as relevant to their evaluation of the Adviser’s services because the Adviser is responsible for coordinating services provided to the Fund by others. Based on their review, the directors concluded that the Fund’s expense ratio was acceptable.
| | |
| |
58 | AB ALL CHINA EQUITY PORTFOLIO | | abfunds.com |
Economies of Scale
The directors noted that the advisory fee schedule for the Fund does not contain breakpoints and that they had discussed their strong preference for breakpoints in advisory contracts with the Adviser. The directors took into consideration prior presentations by an independent consultant on economies of scale in the mutual fund industry and for the AB Funds, and presentations from time to time by the Adviser concerning certain of its views on economies of scale. The directors also had requested and received from the Adviser certain updates on economies of scale in advance of the Meeting. The directors believe that economies of scale may be realized (if at all) by the Adviser across a variety of products and services, and not only in respect of a single fund. The directors noted that there is no established methodology for setting breakpoints that give effect to the fund-specific services provided by a fund’s adviser and to the economies of scale that an adviser may realize in its overall mutual fund business or those components of it which directly or indirectly affect a fund’s operations. The directors observed that in the mutual fund industry as a whole, as well as among funds similar to the Fund, there is no uniformity or pattern in the fees and asset levels at which breakpoints (if any) apply. The directors also noted that the advisory agreements for many funds do not have breakpoints at all. The directors informed the Adviser that they would monitor the Fund’s asset level (which was well below the level at which they would anticipate adding an initial breakpoint) and its profitability to the Adviser and anticipated revisiting the question of breakpoints in the future if circumstances warranted doing so.
| | |
| |
| abfunds.com | | AB ALL CHINA EQUITY PORTFOLIO | 59 |
This page is not part of the Shareholder Report or the Financial Statements.
AB FAMILY OF FUNDS
US EQUITY
CORE
Core Opportunities Fund
Select US Equity Portfolio
Sustainable US Thematic Portfolio
GROWTH
Concentrated Growth Fund
Discovery Growth Fund
Growth Fund
Large Cap Growth Fund
Small Cap Growth Portfolio
VALUE
Discovery Value Fund
Equity Income Fund
Relative Value Fund
Small Cap Value Portfolio
Value Fund
INTERNATIONAL/ GLOBAL EQUITY
CORE
Global Core Equity Portfolio
International Strategic Core Portfolio
Sustainable Global Thematic Fund
Sustainable International Thematic Fund
Tax-Managed Wealth Appreciation Strategy
Wealth Appreciation Strategy
GROWTH
Concentrated International Growth Portfolio
VALUE
All China Equity Portfolio
International Value Fund
FIXED INCOME
MUNICIPAL
High Income Municipal Portfolio
Intermediate California Municipal Portfolio
Intermediate Diversified Municipal Portfolio
Intermediate New York Municipal Portfolio
Municipal Bond Inflation Strategy
Tax-Aware Fixed Income Opportunities Portfolio
National Portfolio
Arizona Portfolio
California Portfolio
Massachusetts Portfolio
Minnesota Portfolio
New Jersey Portfolio
New York Portfolio
Ohio Portfolio
Pennsylvania Portfolio
Virginia Portfolio
TAXABLE
Bond Inflation Strategy
Global Bond Fund
High Income Fund
High Yield Portfolio
Income Fund
Intermediate Duration Portfolio
Limited Duration High Income Portfolio
Short Duration Income Portfolio
Short Duration Portfolio
Sustainable Thematic Credit Portfolio
Total Return Bond Portfolio
ALTERNATIVES
All Market Real Return Portfolio
Global Real Estate Investment Fund
Select US Long/Short Portfolio
MULTI-ASSET
All Market Total Return Portfolio
Emerging Markets Multi-Asset Portfolio
Global Risk Allocation Fund
Sustainable Thematic Balanced Portfolio
CLOSED-END FUNDS
AllianceBernstein Global High Income Fund
AllianceBernstein National Municipal Income Fund
EXCHANGE-TRADED FUNDS
Tax-Aware Short Duration Municipal ETF
Ultra Short Income ETF
We also offer Government Money Market Portfolio, which serves as the money market fund exchange vehicle for the AB mutual funds. You could lose money by investing in the Fund. Although the Fund seeks to preserve the value of your investment at $1.00 per share, it cannot guarantee it will do so. The Fund may impose a fee upon sale of your shares or may temporarily suspend your ability to sell shares if the Fund’s liquidity falls below required minimums because of market conditions or other factors. An investment in the Fund is not insured or guaranteed by the Federal Deposit Insurance Corporation or any other government agency. The Fund’s sponsor has no legal obligation to provide financial support to the Fund, and you should not expect that the sponsor will provide financial support to the Fund at any time.
Investors should consider the investment objectives, risks, charges and expenses of the Fund carefully before investing. For copies of our prospectus or summary prospectus, which contain this and other information, visit us online at www.abfunds.com or contact your AB representative. Please read the prospectus and/or summary prospectus carefully before investing.
| | |
| |
60 | AB ALL CHINA EQUITY PORTFOLIO | | abfunds.com |
AB ALL CHINA EQUITY PORTFOLIO
1345 Avenue of the Americas
New York, NY 10105
800 221 5672
ACE-0151-1122 
NOV 11.30.22

ANNUAL REPORT
AB ALL MARKET INCOME PORTFOLIO

| | |
| |
| Investment Products Offered | | • Are Not FDIC Insured • May Lose Value • Are Not Bank Guaranteed |
Investors should consider the investment objectives, risks, charges and expenses of the Fund carefully before investing. For copies of our prospectus or summary prospectus, which contain this and other information, visit us online at www.abfunds.com or contact your AB representative. Please read the prospectus and/or summary prospectus carefully before investing.
This shareholder report must be preceded or accompanied by the Fund’s prospectus for individuals who are not current shareholders of the Fund.
You may obtain a description of the Fund’s proxy voting policies and procedures, and information regarding how the Fund voted proxies relating to portfolio securities during the most recent 12-month period ended June 30, without charge. Simply visit AB’s website at www.abfunds.com, or go to the Securities and Exchange Commission’s (the “Commission”) website at www.sec.gov, or call AB at (800) 227 4618.
The Fund files its complete schedule of portfolio holdings with the Commission for the first and third quarters of each fiscal year as an exhibit to its reports on Form N-PORT. The Fund’s Form N-PORT reports are available on the Commission’s website at www.sec.gov. AB publishes full portfolio holdings for the Fund monthly at www.abfunds.com.
AllianceBernstein Investments, Inc. (ABI) is the distributor of the AB family of mutual funds. ABI is a member of FINRA and is an affiliate of AllianceBernstein L.P., the Adviser of the funds.
The [A/B] logo is a registered service mark of AllianceBernstein and AllianceBernstein® is a registered service mark used by permission of the owner, AllianceBernstein L.P.
| | |
| FROM THE PRESIDENT | |  |
Dear Shareholder,
We’re pleased to provide this report for the AB All Market Income Portfolio (the “Fund”). Please review the discussion of Fund performance, the market conditions during the reporting period and the Fund’s investment strategy.
At AB, we’re striving to help our clients achieve better outcomes by:
| + | | Fostering diverse perspectives that give us a distinctive approach to navigating global capital markets |
| + | | Applying differentiated investment insights through a connected global research network |
| + | | Embracing innovation to design better ways to invest and leading-edge mutual-fund solutions |
Whether you’re an individual investor or a multibillion-dollar institution, we’re putting our knowledge and experience to work for you every day.
For more information about AB’s comprehensive range of products and shareholder resources, please log on to www.abfunds.com.
Thank you for your investment in AB mutual funds—and for placing your trust in our firm.
Sincerely,

Onur Erzan
President and Chief Executive Officer, AB Mutual Funds
| | |
| |
| abfunds.com | | AB ALL MARKET INCOME PORTFOLIO | 1 |
ANNUAL REPORT
January 25, 2023
This report provides management’s discussion of fund performance for the AB All Market Income Portfolio for the annual reporting period ended November 30, 2022.
At a meeting of the Board of Directors of AB Cap Fund, Inc. and The AB Portfolios held on November 1-3, 2022, the Board approved the liquidation and termination of the AB All Market Income Portfolio. Effective as of November 3, 2022, the Fund has suspended sales of its shares to investors who purchase shares directly from the Fund pending the completion of the liquidation and the payment of one or more liquidating distributions to the Fund’s shareholders. In the case of sales to certain retirement plans and sales made through retail omnibus platforms, however, the Fund has continued to offer its shares. The Fund expects to make its liquidating distributions on or shortly after February 3, 2023.
In connection with the liquidation, the imposition of front-end sales charges and distribution and/or service (Rule 12b-1) fees for the Fund have been suspended, effective as of November 3, 2022. In addition, contingent deferred sales charges (“CDSCs”) upon redemption of the Fund’s shares are being waived. This CDSC waiver will also apply to redemptions of shares of other AB mutual funds that are acquired through exchange of the Fund’s shares.
Shareholders may redeem shares of the Fund, and may exchange shares of the Fund for shares of other AB mutual funds, until February 1, 2023. The Fund has converted its assets to cash and/or cash equivalents. Accordingly, the Fund no longer pursues its stated investment objective or engages in any business activities except for the purposes of winding up its business and affairs, preserving the value of its assets, paying its liabilities, and distributing its remaining assets to shareholders.
The Fund’s investment objective is to seek current income with consideration of capital appreciation.
NAV RETURNS AS OF NOVEMBER 30, 2022 (unaudited)
| | | | | | | | |
| | |
| | | 6 Months | | | 12 Months | |
| | |
| AB ALL MARKET INCOME PORTFOLIO | | | | | | | | |
| | |
| Class A Shares | | | -7.02% | | | | -16.11% | |
| | |
| Class C Shares | | | -7.38% | | | | -16.79% | |
| | |
| Advisor Class Shares1 | | | -6.90% | | | | -15.88% | |
| | |
| Primary Benchmark: MSCI ACWI (net) | | | -2.51% | | | | -11.62% | |
| | |
| Bloomberg Global Aggregate Bond Index (USD hedged) | | | -2.71% | | | | -10.52% | |
(footnotes continued on next page)
| | |
| |
2 | AB ALL MARKET INCOME PORTFOLIO | | abfunds.com |
| 1 | Please note that this share class is for investors purchasing shares through accounts established under certain fee-based programs sponsored and maintained by certain broker-dealers and financial intermediaries, institutional pension plans and/or investment advisory clients of, and certain other persons associated with, the Adviser and its affiliates or the Fund. |
INVESTMENT RESULTS
The preceding table shows the Fund’s performance compared to its primary benchmark, the Morgan Stanley Capital International All Country World Index (“MSCI ACWI”) (net), and the Bloomberg Global Aggregate Bond Index (USD hedged) for the six- and 12-month periods ended November 30, 2022.
During both periods, all share classes of the Fund underperformed the primary benchmark, before sales charges. The Fund’s strategic decision to achieve diversification involved holding assets other than equities; over the 12-month period, this diversification detracted from performance, relative to the all-equity benchmark, as bonds underperformed equities. All share classes underperformed the Bloomberg Global Aggregate Bond Index (USD hedged) during both periods, before sales charges.
During the 12-month period, overall security selection within the equity allocation contributed, particularly in income equities. Allocation to US concentrated equity detracted. Overall security selection within fixed income was also positive; allocation to global high yield contributed, while exposure to non-US sovereigns led detractors. Overall security selection within equities was negative during the six-month period. Selection within income equities detracted, while global strategic core equity contributed. Overall security selection within fixed income was also negative. The AB High Income Fund led detractors, while global high yield contributed.
The Fund utilized derivatives for hedging and investment purposes. For both periods, interest rate swaps, credit default swaps, total return swaps and purchased options detracted from absolute returns. Futures and currency forwards detracted for the six-month period and added for the 12-month period.
MARKET REVIEW AND INVESTMENT STRATEGY
US, international and emerging-market stocks declined during the 12-month period ended November 30, 2022. In response to persistently high inflation, central banks—led by the US Federal Reserve (the “Fed”)—took a hawkish pivot, which raised concerns that rapidly rising borrowing costs would slow economic growth significantly and tip global economies into recession. Volatility increased and stocks pulled back after the Fed announced its first interest-rate hike in March 2022, which was followed by five additional rate raises, including four consecutive 0.75% increases. Equity markets began to rebound at the end of the period, after some early evidence of easing inflationary pressures raised hopes that the Fed and other key central banks would soon slow the pace of rate hikes and review the impact of higher rates over a longer time horizon. Against a backdrop of rising rates, growth stocks
| | |
| |
| abfunds.com | | AB ALL MARKET INCOME PORTFOLIO | 3 |
came under pressure throughout most of the period. Within large-cap markets, growth stocks declined, while value stocks rose and outperformed growth stocks significantly. Large-cap stocks outperformed small-cap stocks on a relative basis, but both declined in absolute terms.
Fixed-income government bond market yields increased rapidly, and bond prices fell in all developed markets until November, when markets rallied on lower-than-expected inflation. Most major central banks aggressively tightened monetary policy by raising short-term interest rates and ending bond purchases to combat high and persistent inflation. Developed-market government bonds fell the most in the UK and eurozone, and by the least in Japan. In credit-risk sectors, securitized assets generally outperformed corporate bonds. Investment-grade corporate bonds trailed developed-market treasuries, underperforming in the US against US Treasuries, while outperforming in the eurozone relative to eurozone treasuries. High-yield corporate bonds in the US and eurozone outperformed respective treasury markets. Emerging-market sovereign bonds hedged to the US dollar materially underperformed developed-market treasuries. Emerging-market investment-grade corporate bonds slightly outperformed investment-grade corporates. Emerging-market local-currency bonds lagged as the US dollar advanced against all developed-market currencies and the vast majority of emerging-market currencies. Brent crude oil prices ended higher, even as prices fell later in the period on global growth concerns and reduced demand.
The Fund’s Senior Investment Management Team (the “Team”) continues to focus on generating high, stable income with capital growth by investing in global fixed income, global equities and nontraditional assets. The Team utilizes rigorous quantitative research tools and fundamental expertise across all regions and markets.
INVESTMENT POLICIES
The Adviser allocates the Fund’s investments primarily among a broad range of income-producing securities, including common stock of companies that regularly pay dividends, debt securities (including high-yield debt securities, also known as “junk bonds”), preferred stocks and derivatives related to these types of securities. In addition, the Fund may engage in certain alternative income strategies that generally utilize derivatives to diversify sources of income and manage risk. The Fund pursues a global strategy, typically investing in securities of issuers located in the United States and in other countries throughout the world, including emerging-market countries.
In selecting equity securities for the Fund, the Adviser focuses on securities that have high-dividend yields and are undervalued by the
(continued on next page)
| | |
| |
4 | AB ALL MARKET INCOME PORTFOLIO | | abfunds.com |
market relative to their long-term earnings potential. The Adviser intends to gain exposure to high-yield debt securities through investment in the AB High Income Fund and may, in the future, gain such exposure through direct investments in high-income securities. It is expected that the Fund will pursue a number of generally derivatives-based alternative investment strategies, such as taking long positions in currency derivatives on higher yielding currencies and/or short positions in currency derivatives on lower yielding currencies. These alternative investment strategies may also include buying and writing put and call options, and entering into variance swaps.
The Adviser adjusts the Fund’s investment exposure utilizing the Adviser’s Dynamic Asset Allocation (“DAA”) approach. DAA comprises a series of analytical and forecasting tools employed by the Adviser to gauge fluctuations in the risk/return profile of various asset classes. DAA seeks to adjust the Fund’s investment exposure in changing market conditions and thereby reduce overall portfolio volatility by mitigating the effects of market fluctuations, while preserving consistent long-term return potential. For example, the Adviser may seek to reduce the Fund’s risk exposure to one or more asset classes when DAA suggests that market risks relevant to those asset classes are rising but return opportunities are declining. In addition to directly increasing or decreasing asset class exposure by buying or selling securities in that asset class, the Adviser may pursue DAA implementation for the Fund by investing in derivatives and exchange-traded funds (“ETFs”).
The Adviser intends to utilize a variety of derivatives in its management of the Fund. The Adviser may use derivatives to gain exposure to an asset class, such as using interest-rate derivatives to gain exposure to sovereign bonds. As noted above, the Adviser may separately pursue certain alternative investment strategies that utilize derivatives, and may enter into derivatives in making the adjustments called for by DAA. As a result of the use of derivatives and short sales of securities, the Fund may be leveraged, with net investment exposure in excess of its net assets.
Currency exchange-rate fluctuations can have a dramatic impact on returns. The Fund’s foreign currency exposures will come both from investments in equity and debt securities priced or denominated in foreign currencies and from direct holdings of foreign currencies and currency-related derivatives. The Adviser may seek to hedge all or a portion of the currency exposure resulting from Fund investments or decide not to hedge this exposure. The Adviser may seek investment opportunities by taking long or short positions in currencies through the use of currency-related derivatives.
| | |
| |
| abfunds.com | | AB ALL MARKET INCOME PORTFOLIO | 5 |
DISCLOSURES AND RISKS
Benchmark Disclosure
The MSCI ACWI and the Bloomberg Global Aggregate Bond Index (USD hedged) are unmanaged and do not reflect fees and expenses associated with the active management of a mutual fund portfolio. The MSCI ACWI (net, free float-adjusted, market capitalization weighted) represents the equity market performance of developed and emerging markets. The Bloomberg Global Aggregate Bond Index represents the performance of the global investment-grade developed fixed-income markets, hedged to the US dollar. MSCI makes no express or implied warranties or representations and shall have no liability whatsoever with respect to any MSCI data contained herein. The MSCI data may not be further redistributed or used as a basis for other indices or any securities or financial products. This report is not approved, reviewed or produced by MSCI. Net returns include the reinvestment of dividends after deduction of non-US withholding tax. An investor cannot invest directly in an index or average, and their results are not indicative of the performance for any specific investment, including the Fund.
A Word About Risk
Credit Risk: An issuer or guarantor of a fixed-income security, or the counterparty to a derivatives or other contract, may be unable or unwilling to make timely payments of interest or principal, or to otherwise honor its obligations. The issuer or guarantor may default, causing a loss of the full principal amount of a security and accrued interest. The degree of risk for a particular security may be reflected in its credit rating. There is the possibility that the credit rating of a fixed-income security may be downgraded after purchase, which may adversely affect the value of the security. Investments in fixed-income securities with lower ratings tend to have a higher probability that an issuer will default or fail to meet its payment obligations.
High-Yield Debt Securities Risk: Investments in fixed-income securities with lower ratings (commonly known as “junk bonds”) tend to have a higher probability that an issuer will default or fail to meet its payment obligations. These securities may be subject to greater price volatility due to such factors as specific corporate developments, interest-rate sensitivity, negative perceptions of the junk bond market generally and less secondary market liquidity.
Interest-Rate Risk: Changes in interest rates will affect the value of investments in fixed-income securities. When interest rates rise, the value of existing investments in fixed-income securities tends to fall and this decrease in value may not be offset by higher income from new investments. Interest-rate risk is generally greater for fixed-income securities with longer maturities or durations. The Fund may be subject to greater risk of
| | |
| |
6 | AB ALL MARKET INCOME PORTFOLIO | | abfunds.com |
DISCLOSURES AND RISKS (continued)
rising interest rates than would normally be the case due to the end of a recent period of historically low rates and the effect of potential government fiscal policy initiatives and resulting market reaction to those initiatives.
Inflation Risk: This is the risk that the value of assets or income from investments will be less in the future as inflation decreases the value of money. As inflation increases, the value of the Fund’s assets can decline as can the value of the Fund’s distributions. This risk is significantly greater for fixed-income securities with longer maturities.
Foreign (Non-US) Risk: Investments in securities of non-US issuers may involve more risk than those of US issuers. These securities may fluctuate more widely in price and may be more difficult to trade due to adverse market, economic, political, regulatory or other factors.
Emerging-Market Risk: Investments in emerging-market countries may have more risk because the markets are less developed and less liquid as well as being subject to increased economic, political, regulatory or other uncertainties.
Currency Risk: Fluctuations in currency exchange rates may negatively affect the value of the Fund’s investments or reduce its returns.
Derivatives Risk: Derivatives may be difficult to price or unwind and leveraged so that small changes may produce disproportionate losses for the Fund. Derivatives, especially over-the-counter derivatives, are also subject to counterparty risk, which is the risk that the counterparty (the party on the other side of the transaction) on a derivative transaction will be unable or unwilling to honor its contractual obligations to the Fund.
Short Sale Risk: Short sales involve the risk that the Fund will incur a loss by subsequently buying a security at a higher price than the price at which it sold the security. The amount of such loss is theoretically unlimited, as it will be based on the increase in value of the security sold short. In contrast, the risk of loss from a long position is limited to the Fund’s investment in the security, because the price of the security cannot fall below zero. The Fund may not always be able to close out a short position on favorable terms.
Leverage Risk: To the extent the Fund uses leveraging techniques, its net asset value (“NAV”) may be more volatile because leverage tends to exaggerate the effect of changes in interest rates and any increase or decrease in the value of the Fund’s investments.
Market Risk: The value of the Fund’s assets will fluctuate as the stock or bond market fluctuates. The value of its investments may decline, some-
| | |
| |
| abfunds.com | | AB ALL MARKET INCOME PORTFOLIO | 7 |
DISCLOSURES AND RISKS (continued)
times rapidly and unpredictably, simply because of economic changes or other events, including public health crises (including the occurrence of a contagious disease or illness) and regional and global conflicts, that affect large portions of the market.
Illiquid Investments Risk: Illiquid investments risk exists when certain investments are or become difficult to purchase or sell. Difficulty in selling such investments may result in sales at disadvantageous prices affecting the value of your investment in the Fund. Causes of illiquid investments risk may include low trading volumes and large positions. Foreign fixed-income securities may have more illiquid investments risk because secondary trading markets for these securities may be smaller and less well-developed and the securities may trade less frequently. Illiquid investments risk may be higher in a rising interest-rate environment, when the value and liquidity of fixed-income securities generally go down.
Investment in Other Investment Companies Risk: As with other investments, investments in other investment companies are subject to market and selection risk. In addition, shareholders of the Fund bear both their proportionate share of expenses in the Fund (including management fees) and, indirectly, the expenses of the investment companies in which the Fund invests (to the extent these expenses are not waived or reimbursed by the Adviser).
Management Risk: The Fund is subject to management risk because it is an actively managed investment fund. The Adviser will apply its investment techniques and risk analyses in making investment decisions, but there is no guarantee that its techniques will produce the intended results. Some of these techniques may incorporate, or rely upon, quantitative models, but there is no guarantee that these models will generate accurate forecasts, reduce risk or otherwise perform as expected.
These risks are fully discussed in the Fund’s prospectus. As with all investments, you may lose money by investing in the Fund.
An Important Note About Historical Performance
The investment return and principal value of an investment in the Fund will fluctuate, so that shares, when redeemed, may be worth more or less than their original cost. Performance shown in this report represents past performance and does not guarantee future results. Current performance may be lower or higher than the performance information shown. You may obtain performance information current to the most recent month-end by visiting www.abfunds.com.
| | |
| |
8 | AB ALL MARKET INCOME PORTFOLIO | | abfunds.com |
DISCLOSURES AND RISKS (continued)
All fees and expenses related to the operation of the Fund have been deducted. NAV returns do not reflect sales charges; if sales charges were reflected, the Fund’s quoted performance would be lower. SEC returns reflect the applicable sales charges for each share class: a 4.25% maximum front-end sales charge for Class A shares and a 1% 1-year contingent deferred sales charge for Class C shares. Returns for the different share classes will vary due to different expenses associated with each class. Performance assumes reinvestment of distributions and does not account for taxes.
| | |
| |
| abfunds.com | | AB ALL MARKET INCOME PORTFOLIO | 9 |
HISTORICAL PERFORMANCE
GROWTH OF A $10,000 INVESTMENT IN THE FUND (unaudited)
12/18/20141 TO 11/30/2022
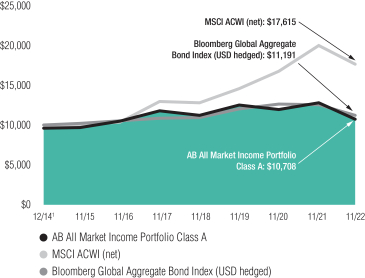
This chart illustrates the total value of an assumed $10,000 investment in AB All Market Income Portfolio Class A shares (from 12/18/20141 to 11/30/2022) as compared to the performance of the Fund’s benchmarks. The chart reflects the deduction of the maximum 4.25% sales charge from the initial $10,000 investment in the Fund and assumes the reinvestment of dividends and capital gains distributions.
| 1 | Inception date: 12/18/2014. |
| | |
| |
10 | AB ALL MARKET INCOME PORTFOLIO | | abfunds.com |
HISTORICAL PERFORMANCE (continued)
AVERAGE ANNUAL RETURNS AS OF NOVEMBER 30, 2022 (unaudited)
| | | | | | | | |
| | |
| | | NAV Returns | | | SEC Returns
(reflects applicable
sales charges) | |
| | |
| CLASS A SHARES | | | | | | | | |
| | |
| 1 Year | | | -16.11% | | | | -19.71% | |
| | |
| 5 Years | | | -1.86% | | | | -2.70% | |
| | |
| Since Inception1 | | | 1.41% | | | | 0.86% | |
| | |
| CLASS C SHARES | | | | | | | | |
| | |
| 1 Year | | | -16.79% | | | | -17.60% | |
| | |
| 5 Years | | | -2.59% | | | | -2.59% | |
| | |
| Since Inception1 | | | 0.65% | | | | 0.65% | |
| | |
| ADVISOR CLASS SHARES2 | | | | | | | | |
| | |
| 1 Year | | | -15.88% | | | | -15.88% | |
| | |
| 5 Years | | | -1.61% | | | | -1.61% | |
| | |
| Since Inception1 | | | 1.66% | | | | 1.66% | |
The Fund’s current prospectus fee table shows the Fund’s total annual operating expense ratios as 1.67%, 2.40% and 1.41% for Class A, Class C and Advisor Class shares, respectively, gross of any fee waivers or expense reimbursements. Contractual fee waivers and/or expense reimbursements limited the Fund’s total annual operating expense ratios (excluding acquired fund fees and expenses, interest expense, taxes, extraordinary expenses, and brokerage commissions and other transaction costs) to 0.99%, 1.74% and 0.74% for Class A, Class C and Advisor Class shares, respectively. These waivers/reimbursements may not be terminated before February 28, 2023, and may be extended by the Adviser for additional one-year terms. Absent reimbursements or waivers, performance would have been lower. The Financial Highlights section of this report sets forth expense ratio data for the current reporting period; the expense ratios shown above may differ from the expense ratios in the Financial Highlights section since they are based on different time periods.
| 1 | Inception date: 12/18/2014. |
| 2 | This share class is offered at NAV to eligible investors and the SEC returns are the same as the NAV returns. Please note that this share class is for investors purchasing shares through accounts established under certain fee-based programs sponsored and maintained by certain broker-dealers and financial intermediaries, institutional pension plans and/or investment advisory clients of, and certain other persons associated with, the Adviser and its affiliates or the Fund. |
| | |
| |
| abfunds.com | | AB ALL MARKET INCOME PORTFOLIO | 11 |
HISTORICAL PERFORMANCE (continued)
SEC AVERAGE ANNUAL RETURNS
AS OF THE MOST RECENT CALENDAR QUARTER-END
DECEMBER 31, 2022 (unaudited)
| | | | |
| |
| | | SEC Returns
(reflects applicable
sales charges) | |
| |
| CLASS A SHARES | | | | |
| |
| 1 Year | | | -22.81% | |
| |
| 5 Years | | | -3.24% | |
| |
| Since Inception1 | | | 0.58% | |
| |
| CLASS C SHARES | | | | |
| |
| 1 Year | | | -20.77% | |
| |
| 5 Years | | | -3.13% | |
| |
| Since Inception1 | | | 0.37% | |
| |
| ADVISOR CLASS SHARES2 | | | | |
| |
| 1 Year | | | -19.07% | |
| |
| 5 Years | | | -2.15% | |
| |
| Since Inception1 | | | 1.39% | |
| 1 | Inception date: 12/18/2014. |
| 2 | Please note that this share class is for investors purchasing shares through accounts established under certain fee-based programs sponsored and maintained by certain broker-dealers and financial intermediaries, institutional pension plans and/or investment advisory clients of, and certain other persons associated with, the Adviser and its affiliates or the Fund. |
| | |
| |
12 | AB ALL MARKET INCOME PORTFOLIO | | abfunds.com |
EXPENSE EXAMPLE
(unaudited)
As a shareholder of the Fund, you incur two types of costs: (1) transaction costs, including sales charges (loads) on purchase payments, contingent deferred sales charges on redemptions and (2) ongoing costs, including management fees; distribution (12b-1) fees; and other Fund expenses. This example is intended to help you understand your ongoing costs (in dollars) of investing in the Fund and to compare these costs with the ongoing costs of investing in other mutual funds.
The Example is based on an investment of $1,000 invested at the beginning of the period and held for the entire period as indicated below.
Actual Expenses
The table below provides information about actual account values and actual expenses. You may use the information, together with the amount you invested, to estimate the expenses that you paid over the period. Simply divide your account value by $1,000 (for example, an $8,600 account value divided by $1,000 = 8.6), then multiply the result by the number under the heading entitled “Expenses Paid During Period” to estimate the expenses you paid on your account during this period.
Hypothetical Example for Comparison Purposes
The table below also provides information about hypothetical account values and hypothetical expenses based on the Fund’s actual expense ratio and an assumed annual rate of return of 5% before expenses, which is not the Fund’s actual return. The hypothetical account values and expenses may not be used to estimate the actual ending account balance or expenses you paid for the period. You may use this information to compare the ongoing costs of investing in the Fund and other funds by comparing this 5% hypothetical example with the 5% hypothetical examples that appear in the shareholder reports of other funds.
Please note that the expenses shown in the table are meant to highlight your ongoing costs only and do not reflect any transactional costs, such as sales charges (loads), or contingent deferred sales charges on redemptions. Therefore, the hypothetical example is useful in comparing ongoing costs only, and will not help you determine the relative total costs of owning different funds. In addition, if these transactional costs were included, your costs would have been higher.
| | | | | | | | | | | | | | | | | | | | | | | | |
| | | Beginning
Account
Value
June 1,
2022 | | | Ending
Account
Value
November 30,
2022 | | | Expenses
Paid
During
Period* | | | Annualized
Expense
Ratio* | | | Total
Expenses
Paid
During
Period+ | | | Total
Annualized
Expense
Ratio+ | |
| Class A | | | | | | | | | | | | | | | | | | | | | | | | |
Actual | | $ | 1,000 | | | $ | 929.80 | | | $ | 3.68 | | | | 0.76 | % | | $ | 4.79 | | | | 0.99 | % |
Hypothetical** | | $ | 1,000 | | | $ | 1,021.26 | | | $ | 3.85 | | | | 0.76 | % | | $ | 5.01 | | | | 0.99 | % |
| | |
| |
| abfunds.com | | AB ALL MARKET INCOME PORTFOLIO | 13 |
EXPENSE EXAMPLE (continued)
| | | | | | | | | | | | | | | | | | | | | | | | |
| | | Beginning
Account
Value
June 1,
2022 | | | Ending
Account
Value
November 30,
2022 | | | Expenses
Paid
During
Period* | | | Annualized
Expense
Ratio* | | | Total
Expenses
Paid
During
Period+ | | | Total
Annualized
Expense
Ratio+ | |
| Class C | | | | | | | | | | | | | | | | | | | | | | | | |
Actual | | $ | 1,000 | | | $ | 926.20 | | | $ | 7.29 | | | | 1.51 | % | | $ | 8.40 | | | | 1.74 | % |
Hypothetical** | | $ | 1,000 | | | $ | 1,017.50 | | | $ | 7.64 | | | | 1.51 | % | | $ | 8.80 | | | | 1.74 | % |
| Advisor Class | | | | | | | | | | | | | | | | | | | | | | | | |
Actual | | $ | 1,000 | | | $ | 931.00 | | | $ | 2.47 | | | | 0.51 | % | | $ | 3.58 | | | | 0.74 | % |
Hypothetical** | | $ | 1,000 | | | $ | 1,022.51 | | | $ | 2.59 | | | | 0.51 | % | | $ | 3.75 | | | | 0.74 | % |
| * | Expenses are equal to the classes’ annualized expense ratios, multiplied by the average account value over the period, multiplied by 183/365 (to reflect the one-half year period), respectively. |
| ** | Assumes 5% annual return before expenses. |
| + | In connection with the Fund’s investments in affiliated/unaffiliated underlying portfolios, the Fund incurs no direct expenses, but bears proportionate shares of the acquired fund fees and expenses (i.e., operating, administrative and investment advisory fees) of the affiliated/unaffiliated underlying portfolios. Currently the Adviser has contractually agreed to waive its fees from the Fund in an amount equal to the Fund’s pro rata share of certain acquired fund fees and expenses of the affiliated underlying portfolios and other expenses of AB High Income Fund. The Fund’s effective expenses are equal to the classes’ annualized expense ratio plus the Fund’s pro rata share of the weighted average expense ratio of the affiliated/unaffiliated underlying portfolios in which it invests, multiplied by the average account value over the period, multiplied by 183/365 (to reflect the one-half year period). |
| | |
| |
14 | AB ALL MARKET INCOME PORTFOLIO | | abfunds.com |
PORTFOLIO SUMMARY
November 30, 2022 (unaudited)
PORTFOLIO STATISTICS
Net Assets ($mil): $48.0
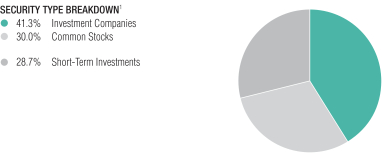
TEN LARGEST HOLDINGS2
| | | | | | | | |
| | |
| Security | | U.S. $ Value | | | Percent of
Net Assets | |
| | |
| AB High Income Fund, Inc. – Class Z | | $ | 18,662,712 | | | | 38.9 | % |
| | |
| Apple, Inc. | | | 472,808 | | | | 1.0 | |
| | |
| Microsoft Corp. | | | 436,034 | | | | 0.9 | |
| | |
| Vanguard Real Estate ETF | | | 384,293 | | | | 0.8 | |
| | |
| Vanguard Global ex-U.S. Real Estate ETF | | | 378,754 | | | | 0.8 | |
| | |
| Novo Nordisk A/S – Class B | | | 230,806 | | | | 0.5 | |
| | |
| Roche Holding AG (Genusschein) | | | 192,055 | | | | 0.4 | |
| | |
| Equinor ASA | | | 191,360 | | | | 0.4 | |
| | |
| Alphabet, Inc. – Class C | | | 182,813 | | | | 0.4 | |
| | |
| AbbVie, Inc. | | | 172,140 | | | | 0.4 | |
| | |
| | $ | 21,303,775 | | | | 44.5 | % |
| 1 | The Fund’s security type breakdown is expressed as a percentage of total investments (excluding security lending collateral) and may vary over time. The Fund also enters into derivative transactions, which may be used for hedging or investment purposes (see “Portfolio of Investments” section of the report for additional details). |
| | |
| |
| abfunds.com | | AB ALL MARKET INCOME PORTFOLIO | 15 |
PORTFOLIO OF INVESTMENTS
November 30, 2022
| | | | | | | | |
| Company | | Shares | | | U.S. $ Value | |
| | | | | | |
INVESTMENT COMPANIES – 40.5% | | | | | | | | |
Funds and Investment Trusts – 40.5%(a) | | | | | | | | |
AB High Income Fund, Inc. – Class Z(b) | | | 2,814,889 | | | $ | 18,662,712 | |
Vanguard Global ex-U.S. Real Estate ETF | | | 8,954 | | | | 378,754 | |
Vanguard Real Estate ETF | | | 4,363 | | | | 384,293 | |
| | | | | | | | |
| | |
Total Investment Companies
(cost $22,120,973) | | | | | | | 19,425,759 | |
| | | | | | | | |
| | | | | | | | |
COMMON STOCKS – 29.4% | | | | | | | | |
Information Technology – 7.2% | | | | | | | | |
Communications Equipment – 0.1% | | | | | | | | |
Juniper Networks, Inc. | | | 2,137 | | | | 71,034 | |
| | | | | | | | |
| | |
IT Services – 1.8% | | | | | | | | |
Amdocs Ltd. | | | 95 | | | | 8,442 | |
Automatic Data Processing, Inc. | | | 447 | | | | 118,071 | |
Capgemini SE | | | 305 | | | | 55,143 | |
Fidelity National Information Services, Inc. | | | 736 | | | | 53,419 | |
FleetCor Technologies, Inc.(c) | | | 42 | | | | 8,240 | |
Gartner, Inc.(c) | | | 120 | | | | 42,044 | |
Genpact Ltd. | | | 1,110 | | | | 51,182 | |
International Business Machines Corp.(d) | | | 621 | | | | 92,467 | |
Mastercard, Inc. – Class A | | | 473 | | | | 168,577 | |
Otsuka Corp. | | | 1,000 | | | | 33,658 | |
Paychex, Inc. | | | 659 | | | | 81,736 | |
VeriSign, Inc.(c) | | | 295 | | | | 58,944 | |
Visa, Inc. – Class A | | | 369 | | | | 80,073 | |
| | | | | | | | |
| | | | | | | 851,996 | |
| | | | | | | | |
Semiconductors & Semiconductor Equipment – 0.9% | | | | | | | | |
Broadcom, Inc. | | | 216 | | | | 119,022 | |
Enphase Energy, Inc.(c) | | | 297 | | | | 95,215 | |
KLA Corp. | | | 255 | | | | 100,253 | |
Micron Technology, Inc. | | | 1,064 | | | | 61,340 | |
QUALCOMM, Inc. | | | 83 | | | | 10,499 | |
Texas Instruments, Inc. | | | 124 | | | | 22,377 | |
| | | | | | | | |
| | | | | | | 408,706 | |
| | | | | | | | |
Software – 3.1% | | | | | | | | |
Adobe, Inc.(c) | | | 110 | | | | 37,942 | |
Autodesk, Inc.(c) | | | 376 | | | | 75,933 | |
Bentley Systems, Inc. – Class B | | | 918 | | | | 36,362 | |
Cadence Design Systems, Inc.(c) | | | 483 | | | | 83,095 | |
Constellation Software, Inc./Canada | | | 45 | | | | 72,545 | |
Crowdstrike Holdings, Inc. – Class A(c) | | | 160 | | | | 18,824 | |
Dropbox, Inc. – Class A(c) | | | 3,392 | | | | 79,916 | |
Fair Isaac Corp.(c) | | | 49 | | | | 30,366 | |
Fortinet, Inc.(c) | | | 1,286 | | | | 68,364 | |
Microsoft Corp.(d) | | | 1,709 | | | | 436,034 | |
| | |
| |
16 | AB ALL MARKET INCOME PORTFOLIO | | abfunds.com |
PORTFOLIO OF INVESTMENTS (continued)
| | | | | | | | |
| Company | | Shares | | | U.S. $ Value | |
| | | | | | |
NortonLifeLock, Inc. | | | 6,142 | | | $ | 141,020 | |
Oracle Corp. | | | 1,150 | | | | 95,485 | |
Palo Alto Networks, Inc.(c) | | | 420 | | | | 71,358 | |
Sage Group PLC (The) | | | 2,425 | | | | 23,521 | |
ServiceNow, Inc.(c) | | | 280 | | | | 116,564 | |
Synopsys, Inc.(c) | | | 139 | | | | 47,196 | |
VMware, Inc. – Class A(c) | | | 456 | | | | 55,400 | |
| | | | | | | | |
| | | | | | | 1,489,925 | |
| | | | | | | | |
Technology Hardware, Storage & Peripherals – 1.3% | | | | | | | | |
Apple, Inc.(d) | | | 3,194 | | | | 472,808 | |
NetApp, Inc. | | | 1,097 | | | | 74,168 | |
Ricoh Co., Ltd. | | | 9,200 | | | | 73,080 | |
| | | | | | | | |
| | | | | | | 620,056 | |
| | | | | | | | |
| | | | | | | 3,441,717 | |
| | | | | | | | |
Health Care – 5.1% | | | | | | | | |
Biotechnology – 0.8% | | | | | | | | |
AbbVie, Inc.(d) | | | 1,068 | | | | 172,140 | |
Alnylam Pharmaceuticals, Inc.(c) | | | 23 | | | | 5,073 | |
Amgen, Inc. | | | 289 | | | | 82,770 | |
Genmab A/S(c) | | | 10 | | | | 4,634 | |
Moderna, Inc.(c) | | | 556 | | | | 97,806 | |
| | | | | | | | |
| | | | | | | 362,423 | |
| | | | | | | | |
Health Care Equipment & Supplies – 0.2% | | | | | | | | |
Coloplast A/S – Class B | | | 108 | | | | 12,767 | |
Hologic, Inc.(c) | | | 824 | | | | 62,756 | |
| | | | | | | | |
| | | | | | | 75,523 | |
| | | | | | | | |
Health Care Providers & Services – 1.6% | | | | | | | | |
AmerisourceBergen Corp. | | | 512 | | | | 87,393 | |
Cardinal Health, Inc. | | | 1,023 | | | | 82,014 | |
Centene Corp.(c) | | | 1,515 | | | | 131,881 | |
CVS Health Corp. | | | 1,005 | | | | 102,390 | |
Elevance Health, Inc. | | | 62 | | | | 33,041 | |
Humana, Inc. | | | 158 | | | | 86,884 | |
McKesson Corp. | | | 177 | | | | 67,557 | |
Molina Healthcare, Inc.(c) | | | 200 | | | | 67,354 | |
UnitedHealth Group, Inc. | | | 224 | | | | 122,698 | |
| | | | | | | | |
| | | | | | | 781,212 | |
| | | | | | | | |
Life Sciences Tools & Services – 0.2% | | | | | | | | |
Mettler-Toledo International, Inc.(c) | | | 63 | | | | 92,582 | |
Sartorius Stedim Biotech | | | 8 | | | | 2,731 | |
Thermo Fisher Scientific, Inc. | | | 24 | | | | 13,445 | |
| | | | | | | | |
| | | | | | | 108,758 | |
| | | | | | | | |
Pharmaceuticals – 2.3% | | | | | | | | |
Bayer AG (REG) | | | 1,306 | | | | 75,796 | |
Chugai Pharmaceutical Co., Ltd.(e) | | | 1,000 | | | | 26,631 | |
Eli Lilly & Co. | | | 460 | | | | 170,697 | |
| | |
| |
| abfunds.com | | AB ALL MARKET INCOME PORTFOLIO | 17 |
PORTFOLIO OF INVESTMENTS (continued)
| | | | | | | | |
| Company | | Shares | | | U.S. $ Value | |
| | | | | | |
Johnson & Johnson | | | 346 | | | $ | 61,588 | |
Merck & Co., Inc. | | | 1,193 | | | | 131,373 | |
Novo Nordisk A/S – Class B | | | 1,840 | | | | 230,806 | |
Pfizer, Inc.(d) | | | 2,336 | | | | 117,104 | |
Roche Holding AG (BR) | | | 70 | | | | 28,120 | |
Roche Holding AG (Genusschein) | | | 588 | | | | 192,055 | |
Takeda Pharmaceutical Co., Ltd. | | | 2,600 | | | | 76,448 | |
| | | | | | | | |
| | | | | | | 1,110,618 | |
| | | | | | | | |
| | | | | | | 2,438,534 | |
| | | | | | | | |
Financials – 4.5% | | | | | | | | |
Banks – 1.7% | | | | | | | | |
Bank Leumi Le-Israel BM | | | 6,673 | | | | 61,172 | |
CaixaBank SA | | | 991 | | | | 3,684 | |
Citizens Financial Group, Inc. | | | 1,031 | | | | 43,694 | |
Commerzbank AG(c) | | | 9,045 | | | | 75,762 | |
DBS Group Holdings Ltd. | | | 1,400 | | | | 36,510 | |
Fifth Third Bancorp | | | 333 | | | | 12,108 | |
JPMorgan Chase & Co. | | | 498 | | | | 68,814 | |
KBC Group NV | | | 222 | | | | 12,298 | |
KeyCorp | | | 2,506 | | | | 47,138 | |
Mitsubishi UFJ Financial Group, Inc. | | | 7,400 | | | | 40,356 | |
NatWest Group PLC | | | 19,290 | | | | 61,348 | |
Nordea Bank Abp | | | 7,040 | | | | 73,983 | |
Oversea-Chinese Banking Corp., Ltd. | | | 7,000 | | | | 64,517 | |
Resona Holdings, Inc. | | | 1,500 | | | | 7,219 | |
Royal Bank of Canada(e) | | | 807 | | | | 80,259 | |
Societe Generale SA | | | 3,197 | | | | 80,465 | |
Toronto-Dominion Bank (The) | | | 721 | | | | 47,988 | |
| | | | | | | | |
| | | | | | | 817,315 | |
| | | | | | | | |
Capital Markets – 0.5% | | | | | | | | |
Ameriprise Financial, Inc. | | | 71 | | | | 23,569 | |
Carlyle Group, Inc. (The) | | | 1,636 | | | | 50,994 | |
Goldman Sachs Group, Inc. (The) | | | 222 | | | | 85,725 | |
Houlihan Lokey, Inc. | | | 521 | | | | 51,240 | |
Partners Group Holding AG | | | 12 | | | | 11,956 | |
Singapore Exchange Ltd. | | | 4,000 | | | | 26,774 | |
| | | | | | | | |
| | | | | | | 250,258 | |
| | | | | | | | |
Insurance – 2.1% | | | | | | | | |
Admiral Group PLC | | | 487 | | | | 11,906 | |
Aon PLC – Class A | | | 63 | | | | 19,422 | |
Aviva PLC | | | 13,317 | | | | 71,902 | |
AXA SA | | | 1,240 | | | | 35,053 | |
Fidelity National Financial, Inc. | | | 1,785 | | | | 72,043 | |
Japan Post Holdings Co., Ltd. | | | 10,300 | | | | 80,733 | |
Japan Post Insurance Co., Ltd. | | | 4,500 | | | | 74,838 | |
Legal & General Group PLC | | | 8,896 | | | | 27,289 | |
Lincoln National Corp. | | | 717 | | | | 27,920 | |
Marsh & McLennan Cos., Inc. | | | 312 | | | | 54,032 | |
| | |
| |
18 | AB ALL MARKET INCOME PORTFOLIO | | abfunds.com |
PORTFOLIO OF INVESTMENTS (continued)
| | | | | | | | |
| Company | | Shares | | | U.S. $ Value | |
| | | | | | |
Medibank Pvt Ltd. | | | 30,407 | | | $ | 60,667 | |
MetLife, Inc. | | | 535 | | | | 41,035 | |
NN Group NV | | | 2,676 | | | | 114,362 | |
Principal Financial Group, Inc. | | | 441 | | | | 39,549 | |
Progressive Corp. (The) | | | 394 | | | | 52,067 | |
Prudential Financial, Inc. | | | 727 | | | | 78,538 | |
Sampo Oyj – Class A | | | 1,268 | | | | 64,216 | |
Willis Towers Watson PLC | | | 254 | | | | 62,525 | |
| | | | | | | | |
| | | | | | | 988,097 | |
| | | | | | | | |
Mortgage Real Estate Investment Trusts (REITs) – 0.2% | | | | | | | | |
Annaly Capital Management, Inc. | | | 4,012 | | | | 86,940 | |
| | | | | | | | |
| | | | | | | 2,142,610 | |
| | | | | | | | |
Energy – 2.1% | | | | | | | | |
Oil, Gas & Consumable Fuels – 2.1% | | | | | | | | |
Cenovus Energy, Inc.(e) | | | 1,574 | | | | 31,301 | |
ConocoPhillips | | | 792 | | | | 97,820 | |
Coterra Energy, Inc. | | | 462 | | | | 12,894 | |
Devon Energy Corp. | | | 415 | | | | 28,436 | |
Eni SpA | | | 6,253 | | | | 93,232 | |
EOG Resources, Inc. | | | 602 | | | | 85,442 | |
Equinor ASA | | | 4,969 | | | | 191,360 | |
Exxon Mobil Corp. | | | 95 | | | | 10,577 | |
Inpex Corp. | | | 700 | | | | 7,714 | |
Keyera Corp.(e) | | | 448 | | | | 10,438 | |
Marathon Petroleum Corp. | | | 726 | | | | 88,434 | |
Repsol SA | | | 3,434 | | | | 53,022 | |
Shell PLC | | | 3,003 | | | | 87,885 | |
Suncor Energy, Inc. | | | 1,187 | | | | 39,030 | |
Texas Pacific Land Corp. | | | 17 | | | | 44,073 | |
Valero Energy Corp. | | | 647 | | | | 86,452 | |
Woodside Energy Group Ltd. | | | 1,471 | | | | 37,150 | |
| | | | | | | | |
| | | | | | | 1,005,260 | |
| | | | | | | | |
Communication Services – 1.8% | | | | | | | | |
Diversified Telecommunication Services – 0.7% | | | | | | | | |
BCE, Inc. | | | 654 | | | | 31,145 | |
Comcast Corp. – Class A | | | 1,479 | | | | 54,191 | |
Deutsche Telekom AG (REG) | | | 1,187 | | | | 24,147 | |
HKT Trust & HKT Ltd. | | | 32,000 | | | | 39,018 | |
Nippon Telegraph & Telephone Corp. | | | 1,600 | | | | 44,366 | |
Orange SA | | | 619 | | | | 6,290 | |
Spark New Zealand Ltd. | | | 23,784 | | | | 77,539 | |
Telefonica SA | | | 5,289 | | | | 19,742 | |
Telstra Corp., Ltd. | | | 13,099 | | | | 35,540 | |
| | | | | | | | |
| | | | | | | 331,978 | |
| | | | | | | | |
Entertainment – 0.2% | | | | | | | | |
Electronic Arts, Inc. | | | 778 | | | | 101,747 | |
| | |
| |
| abfunds.com | | AB ALL MARKET INCOME PORTFOLIO | 19 |
PORTFOLIO OF INVESTMENTS (continued)
| | | | | | | | |
| Company | | Shares | | | U.S. $ Value | |
| | | | | | |
Ubisoft Entertainment SA(c) | | | 413 | | | $ | 11,489 | |
| | | | | | | | |
| | | | | | | 113,236 | |
| | | | | | | | |
Interactive Media & Services – 0.7% | | | | | | | | |
Alphabet, Inc. – Class A(c)(d) | | | 983 | | | | 99,273 | |
Alphabet, Inc. – Class C(c)(d) | | | 1,802 | | | | 182,813 | |
Auto Trader Group PLC(f) | | | 5,170 | | | | 35,690 | |
Kakaku.com, Inc. | | | 1,000 | | | | 17,974 | |
| | | | | | | | |
| | | | | | | 335,750 | |
| | | | | | | | |
Media – 0.1% | | | | | | | | |
Dentsu Group, Inc.(e) | | | 200 | | | | 6,477 | |
Omnicom Group, Inc. | | | 189 | | | | 15,075 | |
Trade Desk, Inc. (The) – Class A(c) | | | 510 | | | | 26,591 | |
| | | | | | | | |
| | | | | | | 48,143 | |
| | | | | | | | |
Wireless Telecommunication Services – 0.1% | | | | | | | | |
SoftBank Corp. | | | 5,200 | | | | 56,574 | |
| | | | | | | | |
| | | | | | | 885,681 | |
| | | | | | | | |
Industrials – 1.8% | | | | | | | | |
Aerospace & Defense – 0.3% | | | | | | | | |
BAE Systems PLC | | | 7,585 | | | | 75,120 | |
Dassault Aviation SA | | | 21 | | | | 3,338 | |
Huntington Ingalls Industries, Inc. | | | 311 | | | | 72,140 | |
| | | | | | | | |
| | | | | | | 150,598 | |
| | | | | | | | |
Building Products – 0.2% | | | | | | | | |
Assa Abloy AB – Class B | | | 1,088 | | | | 24,947 | |
Owens Corning | | | 823 | | | | 73,116 | |
| | | | | | | | |
| | | | | | | 98,063 | |
| | | | | | | | |
Construction & Engineering – 0.1% | | | | | | | | |
AECOM | | | 293 | | | | 24,905 | |
| | | | | | | | |
| | |
Machinery – 0.3% | | | | | | | | |
Caterpillar, Inc. | | | 22 | | | | 5,201 | |
Cummins, Inc. | | | 211 | | | | 52,995 | |
Snap-on, Inc. | | | 326 | | | | 78,435 | |
| | | | | | | | |
| | | | | | | 136,631 | |
| | | | | | | | |
Marine – 0.3% | | | | | | | | |
AP Moller – Maersk A/S – Class A | | | 31 | | | | 65,815 | |
AP Moller – Maersk A/S – Class B | | | 2 | | | | 4,336 | |
SITC International Holdings Co., Ltd. | | | 11,000 | | | | 24,402 | |
ZIM Integrated Shipping Services Ltd.(e) | | | 2,582 | | | | 54,273 | |
| | | | | | | | |
| | | | | | | 148,826 | |
| | | | | | | | |
Professional Services – 0.4% | | | | | | | | |
Booz Allen Hamilton Holding Corp. | | | 444 | | | | 47,242 | |
RELX PLC | | | 2,311 | | | | 65,218 | |
Thomson Reuters Corp. | | | 246 | | | | 28,966 | |
Wolters Kluwer NV | | | 676 | | | | 74,502 | |
| | | | | | | | |
| | | | | | | 215,928 | |
| | | | | | | | |
| | |
| |
20 | AB ALL MARKET INCOME PORTFOLIO | | abfunds.com |
PORTFOLIO OF INVESTMENTS (continued)
| | | | | | | | |
| Company | | Shares | | | U.S. $ Value | |
| | | | | | |
Road & Rail – 0.2% | | | | | | | | |
Canadian National Railway Co. | | | 376 | | | $ | 48,271 | |
Knight-Swift Transportation Holdings, Inc. | | | 647 | | | | 35,863 | |
| | | | | | | | |
| | | | | | | 84,134 | |
| | | | | | | | |
| | | | | | | 859,085 | |
| | | | | | | | |
Consumer Discretionary – 1.7% | | | | | | | | |
Auto Components – 0.1% | | | | | | | | |
Aisin Corp. | | | 200 | | | | 5,512 | |
Lear Corp. | | | 366 | | | | 52,792 | |
| | | | | | | | |
| | | | | | | 58,304 | |
| | | | | | | | |
Automobiles – 0.3% | | | | | | | | |
Tesla, Inc.(c) | | | 712 | | | | 138,627 | |
| | | | | | | | |
| | |
Hotels, Restaurants & Leisure – 0.4% | | | | | | | | |
Booking Holdings, Inc.(c) | | | 35 | | | | 72,781 | |
Domino’s Pizza, Inc. | | | 61 | | | | 23,712 | |
Marriott International, Inc./MD – Class A | | | 134 | | | | 22,157 | |
MGM Resorts International | | | 1,236 | | | | 45,559 | |
Sodexo SA | | | 105 | | | | 10,056 | |
| | | | | | | | |
| | | | | | | 174,265 | |
| | | | | | | | |
Household Durables – 0.1% | | | | | | | | |
Persimmon PLC | | | 754 | | | | 11,679 | |
PulteGroup, Inc. | | | 671 | | | | 30,047 | |
| | | | | | | | |
| | | | | | | 41,726 | |
| | | | | | | | |
Internet & Direct Marketing Retail – 0.3% | | | | | | | | |
Amazon.com, Inc.(c)(d) | | | 1,198 | | | | 115,655 | |
ZOZO, Inc. | | | 1,800 | | | | 45,444 | |
| | | | | | | | |
| | | | | | | 161,099 | |
| | | | | | | | |
Leisure Products – 0.1% | | | | | | | | |
Bandai Namco Holdings, Inc.(e) | | | 500 | | | | 33,130 | |
| | | | | | | | |
| | |
Specialty Retail – 0.4% | | | | | | | | |
AutoZone, Inc.(c) | | | 50 | | | | 128,950 | |
O’Reilly Automotive, Inc.(c) | | | 28 | | | | 24,207 | |
Ulta Beauty, Inc.(c) | | | 125 | | | | 58,105 | |
| | | | | | | | |
| | | | | | | 211,262 | |
| | | | | | | | |
Textiles, Apparel & Luxury Goods – 0.0% | | | | | | | | |
Pandora A/S | | | 140 | | | | 10,658 | |
| | | | | | | | |
| | | | | | | 829,071 | |
| | | | | | | | |
Consumer Staples – 1.6% | | | | | | | | |
Beverages – 0.2% | | | | | | | | |
Coca-Cola Co. (The) | | | 886 | | | | 56,359 | |
Heineken Holding NV(e) | | | 136 | | | | 10,296 | |
Keurig Dr Pepper, Inc. | | | 438 | | | | 16,937 | |
Kirin Holdings Co., Ltd.(e) | | | 1,400 | | | | 22,100 | |
| | | | | | | | |
| | | | | | | 105,692 | |
| | | | | | | | |
| | |
| |
| abfunds.com | | AB ALL MARKET INCOME PORTFOLIO | 21 |
PORTFOLIO OF INVESTMENTS (continued)
| | | | | | | | |
| Company | | Shares | | | U.S. $ Value | |
| | | | | | |
Food & Staples Retailing – 0.5% | | | | | | | | |
George Weston Ltd. | | | 32 | | | $ | 4,007 | |
Jeronimo Martins SGPS SA | | | 1,512 | | | | 33,735 | |
Koninklijke Ahold Delhaize NV(e) | | | 2,790 | | | | 81,306 | |
Kroger Co. (The) | | | 1,524 | | | | 74,966 | |
Loblaw Cos., Ltd. | | | 266 | | | | 24,007 | |
Walmart, Inc. | | | 160 | | | | 24,387 | |
| | | | | | | | |
| | | | | | | 242,408 | |
| | | | | | | | |
Food Products – 0.5% | | | | | | | | |
Archer-Daniels-Midland Co. | | | 887 | | | | 86,483 | |
Bunge Ltd. | | | 741 | | | | 77,686 | |
Nestle SA (REG) | | | 232 | | | | 27,613 | |
Salmar ASA | | | 457 | | | | 16,109 | |
| | | | | | | | |
| | | | | | | 207,891 | |
| | | | | | | | |
Household Products – 0.2% | | | | | | | | |
Colgate-Palmolive Co. | | | 527 | | | | 40,832 | |
Procter & Gamble Co. (The) | | | 350 | | | | 52,206 | |
| | | | | | | | |
| | | | | | | 93,038 | |
| | | | | | | | |
Tobacco – 0.2% | | | | | | | | |
Imperial Brands PLC | | | 3,090 | | | | 79,478 | |
Philip Morris International, Inc. | | | 233 | | | | 23,223 | |
| | | | | | | | |
| | | | | | | 102,701 | |
| | | | | | | | |
| | | | | | | 751,730 | |
| | | | | | | | |
Utilities – 1.3% | | | | | | | | |
Electric Utilities – 0.4% | | | | | | | | |
American Electric Power Co., Inc. | | | 407 | | | | 39,398 | |
Endesa SA | | | 1,890 | | | | 34,974 | |
Enel SpA | | | 3,040 | | | | 16,400 | |
NRG Energy, Inc. | | | 1,640 | | | | 69,618 | |
Xcel Energy, Inc. | | | 479 | | | | 33,635 | |
| | | | | | | | |
| | | | | | | 194,025 | |
| | | | | | | | |
Gas Utilities – 0.3% | | | | | | | | |
AltaGas Ltd. | | | 3,655 | | | | 61,327 | |
Naturgy Energy Group SA(e) | | | 1,312 | | | | 36,888 | |
UGI Corp. | | | 2,069 | | | | 79,967 | |
| | | | | | | | |
| | | | | | | 178,182 | |
| | | | | | | | |
Independent Power and Renewable Electricity Producers – 0.2% | | | | | | | | |
RWE AG | | | 1,874 | | | | 82,495 | |
| | | | | | | | |
| | |
Multi-Utilities – 0.4% | | | | | | | | |
CenterPoint Energy, Inc. | | | 2,667 | | | | 82,971 | |
E.ON SE | | | 1,438 | | | | 13,787 | |
Sempra Energy | | | 522 | | | | 86,751 | |
| | | | | | | | |
| | | | | | | 183,509 | |
| | | | | | | | |
| | | | | | | 638,211 | |
| | | | | | | | |
| | |
| |
22 | AB ALL MARKET INCOME PORTFOLIO | | abfunds.com |
PORTFOLIO OF INVESTMENTS (continued)
| | | | | | | | |
| Company | | Shares | | | U.S. $ Value | |
| | | | | | |
Materials – 1.3% | | | | | | | | |
Chemicals – 0.3% | | | | | | | | |
Mitsubishi Chemical Group Corp. | | | 3,800 | | | $ | 20,291 | |
OCI NV | | | 1,692 | | | | 71,629 | |
Sumitomo Chemical Co., Ltd. | | | 20,100 | | | | 73,281 | |
| | | | | | | | |
| | | | | | | 165,201 | |
| | | | | | | | |
Containers & Packaging – 0.1% | | | | | | | | |
Packaging Corp. of America | | | 163 | | | | 22,150 | |
| | | | | | | | |
| | |
Metals & Mining – 0.9% | | | | | | | | |
Anglo American PLC | | | 1,382 | | | | 57,457 | |
BHP Group Ltd. | | | 1,356 | | | | 42,111 | |
Fortescue Metals Group Ltd.(e) | | | 6,455 | | | | 85,914 | |
Glencore PLC | | | 2,561 | | | | 17,476 | |
Nippon Steel Corp. | | | 4,900 | | | | 78,504 | |
Rio Tinto Ltd. | | | 826 | | | | 61,665 | |
Teck Resources Ltd. – Class B(e) | | | 2,121 | | | | 78,618 | |
| | | | | | | | |
| | | | | | | 421,745 | |
| | | | | | | | |
| | | | | | | 609,096 | |
| | | | | | | | |
Real Estate – 1.0% | | | | | | | | |
Equity Real Estate Investment Trusts (REITs) – 0.9% | | | | | | | | |
Extra Space Storage, Inc. | | | 351 | | | | 56,402 | |
Iron Mountain, Inc. | | | 1,438 | | | | 78,127 | |
Land Securities Group PLC | | | 3,557 | | | | 26,540 | |
Link REIT | | | 2,100 | | | | 14,185 | |
Medical Properties Trust, Inc.(e) | | | 5,047 | | | | 66,217 | |
Nippon Building Fund, Inc. | | | 3 | | | | 13,994 | |
Simon Property Group, Inc. | | | 153 | | | | 18,274 | |
Stockland | | | 27,221 | | | | 71,071 | |
Vornado Realty Trust | | | 101 | | | | 2,554 | |
Weyerhaeuser Co. | | | 2,206 | | | | 72,158 | |
| | | | | | | | |
| | | | | | | 419,522 | |
| | | | | | | | |
Real Estate Management & Development – 0.1% | | | | | | | | |
Nomura Real Estate Holdings, Inc. | | | 2,100 | | | | 50,867 | |
| | | | | | | | |
| | | | | | | 470,389 | |
| | | | | | | | |
Total Common Stocks
(cost $13,973,125) | | | | | | | 14,071,384 | |
| | | | | | | | |
| | |
| |
| abfunds.com | | AB ALL MARKET INCOME PORTFOLIO | 23 |
PORTFOLIO OF INVESTMENTS (continued)
| | | | | | | | |
| Company | | Shares | | | U.S. $ Value | |
| | | | | | |
SHORT-TERM INVESTMENTS – 28.1% | | | | | | | | |
Investment Companies – 28.1% | | | | | | | | |
AB Fixed Income Shares, Inc. – Government Money Market Portfolio – Class AB, 3.50%(a)(b)(g)
(cost $13,485,680) | | | 13,485,680 | | | $ | 13,485,680 | |
| | | | | | | | |
Total Investments Before Security Lending Collateral for Securities Loaned – 98.0%
(cost $49,579,778) | | | | | | | 46,982,823 | |
| | | | | | | | |
INVESTMENTS OF CASH COLLATERAL FOR SECURITIES LOANED – 0.2% | | | | | | | | |
Investment Companies – 0.2% | | | | | | | | |
AB Fixed Income Shares, Inc. – Government Money Market Portfolio – Class AB, 3.50%(a)(b)(g)
(cost $100,446) | | | 100,446 | | | | 100,446 | |
| | | | | | | | |
| | |
Total Investments – 98.2%
(cost $49,680,224) | | | | | | | 47,083,269 | |
Other assets less liabilities – 1.8% | | | | | | | 873,736 | |
| | | | | | | | |
| | |
Net Assets – 100.0% | | | | | | $ | 47,957,005 | |
| | | | | | | | |
FUTURES (see Note D)
| | | | | | | | | | | | | | | | |
| Description | | Number of
Contracts | | | Expiration
Month | | | Current
Notional | | | Value and
Unrealized
Appreciation
(Depreciation) | |
Purchased Contracts | |
S&P 500 E-Mini Futures | | | 2 | | | | December 2022 | | | $ | 408,125 | | | $ | 29,234 | |
| | |
| |
24 | AB ALL MARKET INCOME PORTFOLIO | | abfunds.com |
PORTFOLIO OF INVESTMENTS (continued)
FORWARD CURRENCY EXCHANGE CONTRACTS (see Note D)
| | | | | | | | | | | | | | | | | | | | |
| Counterparty | | Contracts to
Deliver
(000) | | | In Exchange
For
(000) | | | Settlement
Date | | | Unrealized
Appreciation
(Depreciation) | |
Bank of America, NA | | KRW | | | 217,768 | | | USD | | | 152 | | | | 01/30/2023 | | | $ | (14,770 | ) |
Barclays Bank PLC | | MYR | | | 2,828 | | | USD | | | 633 | | | | 12/15/2022 | | | | (6,173 | ) |
Barclays Bank PLC | | USD | | | 177 | | | MYR | | | 809 | | | | 12/15/2022 | | | | 6,115 | |
Barclays Bank PLC | | USD | | | 464 | | | MYR | | | 2,050 | | | | 12/15/2022 | | | | (819 | ) |
Barclays Bank PLC | | INR | | | 45,218 | | | USD | | | 555 | | | | 12/21/2022 | | | | (625 | ) |
Barclays Bank PLC | | TWD | | | 2,852 | | | USD | | | 89 | | | | 12/21/2022 | | | | (4,828 | ) |
Barclays Bank PLC | | USD | | | 74 | | | INR | | | 6,130 | | | | 12/21/2022 | | | | 1,629 | |
Barclays Bank PLC | | USD | | | 348 | | | TWD | | | 10,786 | | | | 12/21/2022 | | | | 4,983 | |
Barclays Bank PLC | | IDR | | | 1,481,343 | | | USD | | | 95 | | | | 01/26/2023 | | | | 576 | |
Barclays Bank PLC | | PHP | | | 15,647 | | | USD | | | 266 | | | | 01/26/2023 | | | | (11,170 | ) |
Barclays Bank PLC | | USD | | | 162 | | | IDR | | | 2,542,901 | | | | 01/26/2023 | | | | 487 | |
Barclays Bank PLC | | USD | | | 158 | | | KRW | | | 217,768 | | | | 01/30/2023 | | | | 9,404 | |
Barclays Bank PLC | | USD | | | 97 | | | CNH | | | 698 | | | | 02/16/2023 | | | | 2,409 | |
BNP Paribas SA | | USD | | | 476 | | | IDR | | | 7,424,529 | | | | 01/26/2023 | | | | (2,088 | ) |
Citibank, NA | | USD | | | 174 | | | PHP | | | 10,405 | | | | 01/26/2023 | | | | 9,902 | |
Deutsche Bank AG | | INR | | | 5,492 | | | USD | | | 66 | | | | 12/21/2022 | | | | (1,272 | ) |
Deutsche Bank AG | | TWD | | | 6,101 | | | USD | | | 195 | | | | 12/21/2022 | | | | (4,519 | ) |
Deutsche Bank AG | | USD | | | 207 | | | TWD | | | 6,659 | | | | 12/21/2022 | | | | 10,656 | |
Deutsche Bank AG | | CNH | | | 3,889 | | | USD | | | 543 | | | | 02/16/2023 | | | | (11,881 | ) |
Goldman Sachs International | | USD | | | 548 | | | INR | | | 44,580 | | | | 12/21/2022 | | | | 85 | |
Goldman Sachs International | | USD | | | 268 | | | PHP | | | 15,865 | | | | 01/26/2023 | | | | 12,817 | |
Goldman Sachs International | | CNH | | | 1,329 | | | USD | | | 183 | | | | 02/16/2023 | | | | (7,205 | ) |
JPMorgan Chase Bank, NA | | TWD | | | 5,476 | | | USD | | | 171 | | | | 12/21/2022 | | | | (7,811 | ) |
JPMorgan Chase Bank, NA | | USD | | | 179 | | | CNH | | | 1,275 | | | | 02/16/2023 | | | | 3,272 | |
Morgan Stanley Capital Services, Inc. | | MYR | | | 1,793 | | | USD | | | 382 | | | | 12/15/2022 | | | | (23,513 | ) |
Morgan Stanley Capital Services, Inc. | | USD | | | 392 | | | MYR | | | 1,763 | | | | 12/15/2022 | | | | 6,836 | |
Morgan Stanley Capital Services, Inc. | | TWD | | | 1,507 | | | USD | | | 47 | | | | 12/21/2022 | | | | (1,986 | ) |
Morgan Stanley Capital Services, Inc. | | USD | | | 194 | | | CLP | | | 173,446 | | | | 01/19/2023 | | | | (958 | ) |
Morgan Stanley Capital Services, Inc. | | IDR | | | 8,486,087 | | | USD | | | 542 | | | | 01/26/2023 | | | | (10 | ) |
Morgan Stanley Capital Services, Inc. | | PHP | | | 10,622 | | | USD | | | 185 | | | | 01/26/2023 | | | | (3,151 | ) |
Morgan Stanley Capital Services, Inc. | | USD | | | 461 | | | CNH | | | 3,244 | | | | 02/16/2023 | | | | 2,473 | |
Standard Chartered Bank | | TWD | | | 1,507 | | | USD | | | 47 | | | | 12/21/2022 | | | | (1,963 | ) |
State Street Bank & Trust Co. | | NOK | | | 1,618 | | | USD | | | 156 | | | | 12/01/2022 | | | | (8,368 | ) |
State Street Bank & Trust Co. | | USD | | | 156 | | | NOK | | | 1,618 | | | | 12/01/2022 | | | | 8,502 | |
State Street Bank & Trust Co. | | USD | | | 274 | | | ZAR | | | 4,741 | | | | 12/15/2022 | | | | (295 | ) |
State Street Bank & Trust Co. | | ZAR | | | 4,741 | | | USD | | | 261 | | | | 12/15/2022 | | | | (12,943 | ) |
State Street Bank & Trust Co. | | THB | | | 23,967 | | | USD | | | 650 | | | | 01/19/2023 | | | | (32,987 | ) |
State Street Bank & Trust Co. | | USD | | | 676 | | | THB | | | 23,967 | | | | 01/19/2023 | | | | 7,426 | |
UBS AG | | CLP | | | 173,446 | | | USD | | | 192 | | | | 01/19/2023 | | | | (847 | ) |
| | | | | | | | | | | | | | | | | | | | |
| | | $ | (72,610 | ) |
| | | | | |
| | |
| |
| abfunds.com | | AB ALL MARKET INCOME PORTFOLIO | 25 |
PORTFOLIO OF INVESTMENTS (continued)
CENTRALLY CLEARED INTEREST RATE SWAPS (see Note D)
| | | | | | | | | | | | | | | | | | | | | | | | | | | | | | |
| | | | Rate Type | | | | |
Notional
Amount
(000) | | | Termination
Date | | | Payments
made
by the
Fund | | Payments
received
by the
Fund | | | Payment
Frequency
Paid/
Received | | | Market
Value | | | Upfront
Premiums
Paid/
(Received) | | | Unrealized
Appreciation
(Depreciation) | |
| CNY | | | 740 | | | | 02/17/2025 | | | China 7-Day Reverse Repo Rate | | | 2.547% | | | | Quarterly | | | $ | 117 | | | $ | – 0 | – | | $ | 117 | |
| CNY | | | 2,204 | | | | 02/20/2025 | | | China 7-Day Reverse Repo Rate | | | 2.598% | | | | Quarterly | | | | 682 | | | | – 0 | – | | | 682 | |
| CNY | | | 2,236 | | | | 02/21/2025 | | | China 7-Day Reverse Repo Rate | | | 2.620% | | | | Quarterly | | | | 833 | | | | – 0 | – | | | 833 | |
| USD | | | 1,050 | | | | 01/10/2027 | | | 1 Day SOFR | | | 1.315% | | | | Annual | | | | (95,635 | ) | | | – 0 | – | | | (95,635 | ) |
| EUR | | | 390 | | | | 08/05/2030 | | | 6 Month EURIBOR | | | (0.232)% | | |
| Semi-
Annual/
Annual |
| | | (80,568 | ) | | | – 0 | – | | | (80,568 | ) |
| EUR | | | 600 | | | | 10/22/2030 | | | 6 Month EURIBOR | | | (0.280)% | | |
| Semi-
Annual/
Annual |
| | | (130,049 | ) | | | – 0 | – | | | (130,049 | ) |
| EUR | | | 190 | | | | 11/12/2030 | | | 6 Month EURIBOR | | | (0.169)% | | |
| Semi-
Annual/
Annual |
| | | (39,768 | ) | | | – 0 | – | | | (39,768 | ) |
| EUR | | | 490 | | | | 05/11/2031 | | | 6 Month EURIBOR | | | 0.115% | | |
| Semi-
Annual/
Annual |
| | | (97,219 | ) | | | 1 | | | | (97,220 | ) |
| GBP | | | 600 | | | | 08/19/2031 | | | 1 Day SONIA | | | 0.539% | | | | Annual | | | | (156,631 | ) | | | – 0 | – | | | (156,631 | ) |
| CAD | | | 160 | | | | 08/19/2031 | | | 3 Month CDOR | | | 1.595% | | |
| Semi-
Annual |
| | | (17,671 | ) | | | – 0 | – | | | (17,671 | ) |
| EUR | | | 150 | | | | 08/19/2031 | | | 6 Month EURIBOR | | | (0.116)% | | |
| Semi-
Annual/
Annual |
| | | (33,296 | ) | | | – 0 | – | | | (33,296 | ) |
| JPY | | | 224,450 | | | | 08/27/2031 | | | 1 Day TONAR | | | (0.015)% | | | | Annual | | | | (79,809 | ) | | | (1,555 | ) | | | (78,254 | ) |
| JPY | | | 55,860 | | | | 08/27/2031 | | | (0.006)% | |
| 1 Day
TONAR |
| |
| Semi-
Annual |
| | | 19,555 | | | | 15,576 | | | | 3,979 | |
| JPY | | | 55,860 | | | | 08/27/2031 | | | 1 Day TONAR | | | (0.006)% | | |
| Semi-
Annual |
| | | (21,597 | ) | | | (2 | ) | | | (21,595 | ) |
| JPY | | | 37,290 | | | | 08/30/2031 | | | 0.000% | |
| 1 Day
TONAR |
| | | Annual | | | | 14,289 | | | | 7,537 | | | | 6,752 | |
| JPY | | | 37,290 | | | | 08/30/2031 | | | 1 Day TONAR | | | 0.000% | | | | Annual | | | | (14,284 | ) | | | (1 | ) | | | (14,283 | ) |
| JPY | | | 24,300 | | | | 11/18/2031 | | | 1 Day TONAR | | | 0.068% | | | | Annual | | | | (7,782 | ) | | | – 0 | – | | | (7,782 | ) |
| EUR | | | 330 | | | | 11/18/2031 | | | 6 Month EURIBOR | | | 0.174% | | |
| Semi-
Annual/
Annual |
| | | (67,647 | ) | | | – 0 | – | | | (67,647 | ) |
| AUD | | | 80 | | | | 02/14/2032 | | | 2.482% | |
| 6 Month
BBSW |
| |
| Semi-
Annual |
| | | 6,978 | | | | – 0 | – | | | 6,978 | |
| USD | | | 1,130 | | | | 05/13/2032 | | | 1 Day SOFR | | | 1.333% | | | | Annual | | | | (190,995 | ) | | | (130,262 | ) | | | (60,733 | ) |
| JPY | | | 18,180 | | | | 08/22/2032 | | | 1 Day TONAR | | | 0.346% | | | | Annual | | | | (3,260 | ) | | | – 0 | – | | | (3,260 | ) |
| EUR | | | 170 | | | | 08/22/2032 | | | 6 Month EURIBOR | | | 1.881% | | |
| Semi-
Annual/
Annual |
| | | (10,287 | ) | | | – 0 | – | | | (10,287 | ) |
| USD | | | 80 | | | | 08/22/2032 | | | 1 Day SOFR | | | 2.620% | | | | Annual | | | | (5,074 | ) | | | – 0 | – | | | (5,074 | ) |
| JPY | | | 13,120 | | | | 09/27/2032 | | | 1 Day TONAR | | | 0.486% | | | | Annual | | | | (1,148 | ) | | | – 0 | – | | | (1,148 | ) |
| USD | | | 290 | | | | 05/13/2052 | | | 1 Day SOFR | | | 1.533% | | | | Annual | | | | (87,131 | ) | | | (56,931 | ) | | | (30,200 | ) |
| | | | | | | | | | | | | |
| | | | | | | | | | | | | | | | | | | | $ | (1,097,397 | ) | | $ | (165,637 | ) | | $ | (931,760 | ) |
| | | | | | | | | | | | | |
| (a) | To obtain a copy of the fund’s shareholder report, please go to the Securities and Exchange Commission’s website at www.sec.gov, or call AB at (800) 227-4618. |
| (b) | Affiliated investments. |
| (c) | Non-income producing security. |
| (d) | Position, or a portion thereof, has been segregated to collateralize margin requirements for open futures contracts. |
| | |
| |
26 | AB ALL MARKET INCOME PORTFOLIO | | abfunds.com |
PORTFOLIO OF INVESTMENTS (continued)
| (e) | Represents entire or partial securities out on loan. See Note E for securities lending information. |
| (f) | Security is exempt from registration under Rule 144A or Regulation S of the Securities Act of 1933. This security is considered restricted, but liquid and may be resold in transactions exempt from registration. At November 30, 2022, the market value of this security amounted to $35,690 or 0.1% of net assets. |
| (g) | The rate shown represents the 7-day yield as of period end. |
| | |
Currency Abbreviations: AUD – Australian Dollar CAD – Canadian Dollar CLP – Chilean Peso CNH – Chinese Yuan Renminbi (Offshore) CNY – Chinese Yuan Renminbi EUR – Euro GBP – Great British Pound IDR – Indonesian Rupiah INR – Indian Rupee JPY – Japanese Yen KRW – South Korean Won MYR – Malaysian Ringgit NOK – Norwegian Krone PHP – Philippine Peso THB – Thailand Baht TWD – New Taiwan Dollar USD – United States Dollar ZAR – South African Rand | | |
Glossary:
BBSW – Bank Bill Swap Reference Rate (Australia)
CDOR – Canadian Dealer Offered Rate
ETF – Exchange Traded Fund
EURIBOR – Euro Interbank Offered Rate
REG – Registered Shares
REIT – Real Estate Investment Trust
SOFR – Secured Overnight Financing Rate
SONIA – Sterling Overnight Index Average
TONAR – Tokyo Overnight Average Rate
TOPIX – Tokyo Price Index
See notes to financial statements.
| | |
| |
| abfunds.com | | AB ALL MARKET INCOME PORTFOLIO | 27 |
STATEMENT OF ASSETS & LIABILITIES
November 30, 2022
| | | | |
| Assets | |
Investments in securities, at value | | | | |
Unaffiliated issuers (cost $14,841,377) | | $ | 14,834,431 | (a) |
Affiliated issuers (cost $34,838,847—including investment of cash collateral for securities loaned of $100,446) | | | 32,248,838 | |
Cash collateral due from broker | | | 332,981 | |
Foreign currencies, at value (cost $753,561) | | | 752,986 | |
Receivable for investment securities sold | | | 340,238 | |
Receivable for terminated total return swaps | | | 288,410 | |
Affiliated dividends receivable | | | 211,878 | |
Unrealized appreciation on forward currency exchange contracts | | | 87,572 | |
Unaffiliated dividends and interest receivable | | | 82,521 | |
Receivable due from Adviser | | | 34,032 | |
Receivable for variation margin on futures | | | 11,984 | |
Receivable for capital stock sold | | | 10,810 | |
| | | | |
Total assets | | | 49,236,681 | |
| | | | |
| Liabilities | |
Due to custodian | | | 229,529 | |
Payable for investment securities purchased and foreign currency transactions | | | 164,340 | |
Custody and accounting fees payable | | | 162,071 | |
Unrealized depreciation on forward currency exchange contracts | | | 160,182 | |
Cash collateral due to broker | | | 136,000 | |
Payable for capital stock redeemed | | | 98,357 | |
Payable for terminated total return swaps | | | 82,884 | |
Audit and tax fee payable | | | 82,680 | |
Payable for collateral received on securities loaned | | | 59,567 | |
Collateral due to securities lending agent | | | 40,879 | |
Payable for variation margin on centrally cleared swaps | | | 16,072 | |
Foreign capital gains tax payable | | | 6,000 | |
Transfer Agent fee payable | | | 1,503 | |
Distribution fee payable | | | 106 | |
Accrued expenses | | | 39,506 | |
| | | | |
Total liabilities | | | 1,279,676 | |
| | | | |
Net Assets | | $ | 47,957,005 | |
| | | | |
| Composition of Net Assets | |
Capital stock, at par | | $ | 630 | |
Additional paid-in capital | | | 73,673,314 | |
Accumulated loss | | | (25,716,939 | ) |
| | | | |
Net Assets | | $ | 47,957,005 | |
| | | | |
See notes to financial statements.
| | |
| |
28 | AB ALL MARKET INCOME PORTFOLIO | | abfunds.com |
STATEMENT OF ASSETS & LIABILITIES (continued)
Net Asset Value Per Share—11 billion shares of capital stock authorized, $.0001 par value
| | | | | | | | | | | | |
| Class | | Net Assets | | | Shares
Outstanding | | | Net Asset
Value | |
| |
| A | | $ | 6,877,455 | | | | 903,871 | | | $ | 7.61 | * |
| |
| C | | $ | 256,621 | | | | 33,686 | | | $ | 7.62 | |
| |
| Advisor | | $ | 40,822,929 | | | | 5,357,679 | | | $ | 7.62 | |
| |
| (a) | Includes securities on loan with a value of $585,762 (see Note E). |
| * | The maximum offering price per share for Class A shares was $7.95 which reflects a sales charge of 4.25%. |
See notes to financial statements.
| | |
| |
| abfunds.com | | AB ALL MARKET INCOME PORTFOLIO | 29 |
STATEMENT OF OPERATIONS
Year Ended November 30, 2022
| | | | | | | | |
| Investment Income | |
Dividends | |
Affiliated issuers | | $ | 1,994,234 | | | | | |
Unaffiliated issuers (net of foreign taxes withheld of $49,065) | | | 861,867 | | | | | |
Interest (net of foreign taxes withheld of $1,012) | | | 132,031 | | | | | |
Securities lending income | | | 17,097 | | | $ | 3,005,229 | |
| | | | | | | | |
| Expenses | |
Advisory fee (see Note B) | | | 430,978 | | | | | |
Distribution fee—Class A | | | 19,891 | | | | | |
Distribution fee—Class C | | | 3,522 | | | | | |
Transfer agency—Class A | | | 4,280 | | | | | |
Transfer agency—Class C | | | 208 | | | | | |
Transfer agency—Advisor Class | | | 37,542 | | | | | |
Custody and accounting | | | 293,167 | | | | | |
Audit and tax | | | 132,082 | | | | | |
Administrative | | | 92,555 | | | | | |
Registration fees | | | 50,172 | | | | | |
Legal | | | 40,065 | | | | | |
Printing | | | 34,782 | | | | | |
Directors’ fees | | | 18,522 | | | | | |
Miscellaneous | | | 34,667 | | | | | |
| | | | | | | | |
Total expenses | | | 1,192,433 | | | | | |
Less: expenses waived and reimbursed by the Adviser (see Notes B & E) | | | (741,626 | ) | | | | |
Less: expenses waived and reimbursed by the Distributor (see Note C) | | | (1,496 | ) | | | | |
| | | | | | | | |
Net expenses | | | | | | | 449,311 | |
| | | | | |
Net investment income | | | | | | | 2,555,918 | |
| | | | | |
| Realized and Unrealized Gain (Loss) on Investment and Foreign Currency Transactions | | | | | | | | |
Net realized gain (loss) on: | |
Affiliated Underlying Portfolios | | | | | | | (2,566,334 | ) |
Investment transactions(a) | | | | | | | (5,223,418 | ) |
Forward currency exchange contracts | | | | | | | 59,005 | |
Futures | | | | | | | (1,294,885 | ) |
Swaps | | | | | | | (2,914,106 | ) |
Foreign currency transactions | | | | | | | (536,599 | ) |
Net change in unrealized appreciation (depreciation) of: | | | | | | | | |
Affiliated Underlying Portfolios | | | | | | | (2,469,160 | ) |
Investments(b) | | | | | | | (1,712,608 | ) |
Forward currency exchange contracts | | | | | | | (186,928 | ) |
Futures | | | | | | | 344,351 | |
Swaps | | | | | | | (289,370 | ) |
Foreign currency denominated assets and liabilities | | | | | | | 23,339 | |
| | | | | |
Net loss on investment and foreign currency transactions | | | | | | | (16,766,713 | ) |
| | | | | |
Net Decrease in Net Assets from Operations | | | | | | $ | (14,210,795 | ) |
| | | | | |
| (a) | Net of foreign realized capital gains taxes of $194. |
| (b) | Net of decrease in accrued foreign capital gains taxes on unrealized gains of $227. |
See notes to financial statements.
| | |
| |
30 | AB ALL MARKET INCOME PORTFOLIO | | abfunds.com |
STATEMENT OF CHANGES IN NET ASSETS
| | | | | | | | |
| | | Year Ended
November 30,
2022 | | | Year Ended
November 30,
2021 | |
| Increase (Decrease) in Net Assets from Operations | | | | | | | | |
Net investment income | | $ | 2,555,918 | | | $ | 2,333,319 | |
Net realized gain (loss) on investment and foreign currency transactions | | | (12,476,337 | ) | | | 5,780,229 | |
Net change in unrealized appreciation (depreciation) of investments and foreign currency denominated assets and liabilities | | | (4,290,376 | ) | | | (1,726,453 | ) |
Contributions from Affiliates (see Note B) | | | – 0 | – | | | 70 | |
| | | | | | | | |
Net increase (decrease) in net assets from operations | | | (14,210,795 | ) | | | 6,387,165 | |
Distributions to Shareholders | |
Class A | | | (166,097 | ) | | | (268,120 | ) |
Class C | | | (5,079 | ) | | | (15,088 | ) |
Advisor Class | | | (1,553,177 | ) | | | (2,855,141 | ) |
Return of capital | |
Class A | | | (76,032 | ) | | | (44,170 | ) |
Class C | | | (2,325 | ) | | | (2,486 | ) |
Advisor Class | | | (710,981 | ) | | | (470,354 | ) |
| Capital Stock Transactions | |
Net decrease | | | (28,199,126 | ) | | | (4,103,075 | ) |
| | | | | | | | |
Total decrease | | | (44,923,612 | ) | | | (1,371,269 | ) |
| Net Assets | |
Beginning of period | | | 92,880,617 | | | | 94,251,886 | |
| | | | | | | | |
End of period | | $ | 47,957,005 | | | $ | 92,880,617 | |
| | | | | | | | |
See notes to financial statements.
| | |
| |
| abfunds.com | | AB ALL MARKET INCOME PORTFOLIO | 31 |
NOTES TO FINANCIAL STATEMENTS
November 30, 2022
NOTE A
Significant Accounting Policies
AB Cap Fund, Inc. (the “Company”) is registered under the Investment Company Act of 1940 as an open-end management investment company. The Company, which is a Maryland corporation, operates as a series company comprised of 12 portfolios currently in operation. Each portfolio is considered to be a separate entity for financial reporting and tax purposes. This report relates only to the AB All Market Income Portfolio (the “Fund”), a diversified portfolio. The Fund has authorized the issuance of Class A, Class B, Class C, Advisor Class, Class R, Class K, Class I, Class Z, Class T, Class 1 and Class 2 shares. Class B, Class R, Class K, Class I, Class Z, Class T, Class 1 and Class 2 shares have not been issued. Class A shares are sold with a front-end sales charge of up to 4.25% for purchases not exceeding $1,000,000. With respect to purchases of $1,000,000 or more, Class A shares redeemed within one year of purchase may be subject to a contingent deferred sales charge of 1%. Class C shares are subject to a contingent deferred sales charge of 1% on redemptions made within the first year after purchase, and 0% after the first year of purchase. Effective May 31, 2021, Class C shares automatically convert to Class A shares eight years after the end of the calendar month of purchase. Prior to May 31, 2021, Class C shares automatically converted to Class A shares 10 years after the end of the calendar month of purchase. Advisor Class shares are sold without any initial or contingent deferred sales charge and are not subject to ongoing distribution expenses. All 11 classes of shares have identical voting, dividend, liquidation and other rights, except that the classes bear different distribution and transfer agency expenses. Each class has exclusive voting rights with respect to its distribution plan. The financial statements have been prepared in conformity with U.S. generally accepted accounting principles (“U.S. GAAP”), which require management to make certain estimates and assumptions that affect the reported amounts of assets and liabilities in the financial statements and amounts of income and expenses during the reporting period. Actual results could differ from those estimates. The Fund is an investment company under U.S. GAAP and follows the accounting and reporting guidance applicable to investment companies. The following is a summary of significant accounting policies followed by the Fund.
At a meeting of the Company’s Board of Directors (the “Board”) held on November 1-3, 2022, the Board approved the liquidation and termination of the Fund. Effective as of November 3, 2022, the Fund has suspended sales of its shares to investors who purchase shares directly from the Fund pending the completion of the liquidation and the payment of one or more liquidating distributions to the Fund’s shareholders. In the case of sales to certain retirement plans and sales made through retail omnibus platforms,
| | |
| |
32 | AB ALL MARKET INCOME PORTFOLIO | | abfunds.com |
NOTES TO FINANCIAL STATEMENTS (continued)
however, the Fund has continued to offer its shares. The Fund expects to make its liquidating distributions on or shortly after February 3, 2023.
In connection with the liquidation, the imposition of front-end sales charges and distribution and/or service (Rule 12b-1) fees for the Fund have been suspended, effective as of November 3, 2022. In addition, contingent deferred sales charges upon redemption of the Fund’s shares are being waived. This contingent deferred sales charges waiver will also apply to redemptions of shares of other AB mutual funds that are acquired through exchange of the Fund’s shares.
Shareholders may redeem shares of the Fund, and may exchange shares of the Fund for shares of other AB mutual funds, until February 1, 2023.
1. Security Valuation
Portfolio securities are valued at market value determined on the basis of market quotations or, if market quotations are not readily available or are unreliable, at “fair value” as determined in accordance with procedures approved by and under the oversight of the Board. Pursuant to these procedures, AllianceBernstein L.P. (the “Adviser”) serves as the Fund’s valuation designee pursuant to Rule 2a-5 of the 1940 Act. In this capacity, the Adviser is responsible, among other things, for making all fair value determinations relating to the Fund’s portfolio investments, subject to the Board’s oversight.
In general, the market values of securities which are readily available and deemed reliable are determined as follows: securities listed on a national securities exchange (other than securities listed on the NASDAQ Stock Market, Inc. (“NASDAQ”)) or on a foreign securities exchange are valued at the last sale price at the close of the exchange or foreign securities exchange. If there has been no sale on such day, the securities are valued at the last traded price from the previous day. Securities listed on more than one exchange are valued by reference to the principal exchange on which the securities are traded; securities listed only on NASDAQ are valued in accordance with the NASDAQ Official Closing Price; listed or over the counter (“OTC”) market put or call options are valued at the mid level between the current bid and ask prices. If either a current bid or current ask price is unavailable, the Adviser will have discretion to determine the best valuation (e.g., last trade price in the case of listed options); open futures are valued using the closing settlement price or, in the absence of such a price, the most recent quoted bid price. If there are no quotations available for the day of valuation, the last available closing settlement price is used; U.S. Government securities and any other debt instruments having 60 days or less remaining until maturity are generally valued at market by an independent pricing vendor, if a market price is available. If a market
| | |
| |
| abfunds.com | | AB ALL MARKET INCOME PORTFOLIO | 33 |
NOTES TO FINANCIAL STATEMENTS (continued)
price is not available, the securities are valued at amortized cost. This methodology is commonly used for short term securities that have an original maturity of 60 days or less, as well as short term securities that had an original term to maturity that exceeded 60 days. In instances when amortized cost is utilized, the Valuation Committee (the “Committee”) must reasonably conclude that the utilization of amortized cost is approximately the same as the fair value of the security. Factors the Committee will consider include, but are not limited to, an impairment of the creditworthiness of the issuer or material changes in interest rates. Fixed-income securities, including mortgage-backed and asset-backed securities, may be valued on the basis of prices provided by a pricing service or at a price obtained from one or more of the major broker-dealers. In cases where broker-dealer quotes are obtained, the Adviser may establish procedures whereby changes in market yields or spreads are used to adjust, on a daily basis, a recently obtained quoted price on a security. Swaps and other derivatives are valued daily, primarily using independent pricing services, independent pricing models using market inputs, as well as third party broker-dealers or counterparties. Open-end mutual funds are valued at the closing net asset value per share, while exchange traded funds are valued at the closing market price per share.
Securities for which market quotations are not readily available (including restricted securities) or are deemed unreliable are valued at fair value as deemed appropriate by the Adviser. Factors considered in making this determination may include, but are not limited to, information obtained by contacting the issuer, analysts, analysis of the issuer’s financial statements or other available documents. In addition, the Fund may use fair value pricing for securities primarily traded in non-U.S. markets because most foreign markets close well before the Fund values its securities at 4:00 p.m., Eastern Time. The earlier close of these foreign markets gives rise to the possibility that significant events, including broad market moves, may have occurred in the interim and may materially affect the value of those securities. To account for this, the Fund generally values many of its foreign equity securities using fair value prices based on third party vendor modeling tools to the extent available.
2. Fair Value Measurements
In accordance with U.S. GAAP regarding fair value measurements, fair value is defined as the price that the Fund would receive to sell an asset or pay to transfer a liability in an orderly transaction between market participants at the measurement date. U.S. GAAP establishes a framework for measuring fair value, and a three-level hierarchy for fair value measurements based upon the transparency of inputs to the valuation of an asset or liability (including those valued based on their market values as described in Note A.1 above). Inputs may be observable or unobservable
| | |
| |
34 | AB ALL MARKET INCOME PORTFOLIO | | abfunds.com |
NOTES TO FINANCIAL STATEMENTS (continued)
and refer broadly to the assumptions that market participants would use in pricing the asset or liability. Observable inputs reflect the assumptions market participants would use in pricing the asset or liability based on market data obtained from sources independent of the Fund. Unobservable inputs reflect the Fund’s own assumptions about the assumptions that market participants would use in pricing the asset or liability based on the best information available in the circumstances. Each investment is assigned a level based upon the observability of the inputs which are significant to the overall valuation. The three-tier hierarchy of inputs is summarized below.
| | • | | Level 1—quoted prices in active markets for identical investments |
| | • | | Level 2—other significant observable inputs (including quoted prices for similar investments, interest rates, prepayment speeds, credit risk, etc.) |
| | • | | Level 3—significant unobservable inputs (including the Fund’s own assumptions in determining the fair value of investments) |
The fair value of debt instruments, such as bonds, and over-the-counter derivatives is generally based on market price quotations, recently executed market transactions (where observable) or industry recognized modeling techniques and are generally classified as Level 2. Pricing vendor inputs to Level 2 valuations may include quoted prices for similar investments in active markets, interest rate curves, coupon rates, currency rates, yield curves, option adjusted spreads, default rates, credit spreads and other unique security features in order to estimate the relevant cash flows which are then discounted to calculate fair values. If these inputs are unobservable and significant to the fair value, these investments will be classified as Level 3.
Where readily available market prices or relevant bid prices are not available for certain equity investments, such investments may be valued based on similar publicly traded investments, movements in relevant indices since last available prices or based upon underlying company fundamentals and comparable company data (such as multiples to earnings or other multiples to equity). Where an investment is valued using an observable input, such as another publicly traded security, the investment will be classified as Level 2. If management determines that an adjustment is appropriate based on restrictions on resale, illiquidity or uncertainty, and such adjustment is a significant component of the valuation, the investment will be classified as Level 3. An investment will also be classified as Level 3 where management uses company fundamentals and other significant inputs to determine the valuation.
| | |
| |
| abfunds.com | | AB ALL MARKET INCOME PORTFOLIO | 35 |
NOTES TO FINANCIAL STATEMENTS (continued)
The following table summarizes the valuation of the Fund’s investments by the above fair value hierarchy levels as of November 30, 2022:
| | | | | | | | | | | | | | | | |
Investments in
Securities: | | Level 1 | | | Level 2 | | | Level 3 | | | Total | |
Assets: | | | | | | | | | | | | | | | | |
Investment Companies | | $ | 19,425,759 | | | $ | – 0 | – | | $ | – 0 | – | | $ | 19,425,759 | |
Common Stocks: | | | | | | | | | | | | | | | | |
Information Technology | | | 3,256,315 | | | | 185,402 | | | | – 0 | – | | | 3,441,717 | |
Health Care | | | 1,788,546 | | | | 649,988 | | | | – 0 | – | | | 2,438,534 | |
Financials | | | 1,045,600 | | | | 1,097,010 | | | | – 0 | – | | | 2,142,610 | |
Energy | | | 534,897 | | | | 470,363 | | | | – 0 | – | | | 1,005,260 | |
Communication Services | | | 510,835 | | | | 374,846 | | | | – 0 | – | | | 885,681 | |
Industrials | | | 521,407 | | | | 337,678 | | | | – 0 | – | | | 859,085 | |
Consumer Discretionary | | | 712,592 | | | | 116,479 | | | | – 0 | – | | | 829,071 | |
Consumer Staples | | | 481,093 | | | | 270,637 | | | | – 0 | – | | | 751,730 | |
Utilities | | | 453,667 | | | | 184,544 | | | | – 0 | – | | | 638,211 | |
Materials | | | 100,768 | | | | 508,328 | | | | – 0 | – | | | 609,096 | |
Real Estate | | | 293,732 | | | | 176,657 | | | | – 0 | – | | | 470,389 | |
Short-Term Investments | | | 13,485,680 | | | | – 0 | – | | | – 0 | – | | | 13,485,680 | |
Investments of Cash Collateral for Securities Loaned in Affiliated Money Market Fund | | | 100,446 | | | | – 0 | – | | | – 0 | – | | | 100,446 | |
| | | | | | | | | | | | | | | | |
Total Investments in Securities | | | 42,711,337 | | | | 4,371,932 | | | | – 0 | – | | | 47,083,269 | |
Other Financial Instruments(a): | | | | | | | | | | | | | | | | |
Assets: | |
Futures | | | 29,234 | | | | – 0 | – | | | – 0 | – | | | 29,234 | (b) |
Forward Currency Exchange Contracts | | | – 0 | – | | | 87,572 | | | | – 0 | – | | | 87,572 | |
Centrally Cleared Interest Rate Swaps | | | – 0 | – | | | 42,454 | | | | – 0 | – | | | 42,454 | (b) |
Liabilities: | |
Forward Currency Exchange Contracts | | | – 0 | – | | | (160,182 | ) | | | – 0 | – | | | (160,182 | ) |
Centrally Cleared Interest Rate Swaps | | | – 0 | – | | | (1,139,851 | ) | | | – 0 | – | | | (1,139,851 | )(b) |
| | | | | | | | | | | | | | | | |
Total | | $ | 42,740,571 | | | $ | 3,201,925 | | | $ | – 0 | – | | $ | 45,942,496 | |
| | | | | | | | | | | | | | | | |
| (a) | Other financial instruments are derivative instruments, such as futures, forwards and swaps, which are valued at the unrealized appreciation (depreciation) on the instrument. Other financial instruments may also include swaps with upfront premiums, written options and written swaptions which are valued at market value. |
| (b) | Only variation margin receivable/(payable) at period end is reported within the statement of assets and liabilities. This amount reflects cumulative unrealized appreciation (depreciation) on futures and centrally cleared swaps as reported in the portfolio of investments. Where applicable, centrally cleared swaps with upfront premiums are presented here at market value. |
3. Currency Translation
Assets and liabilities denominated in foreign currencies and commitments under forward currency exchange contracts are translated into U.S. dollars at the mean of the quoted bid and ask prices of such currencies against the U.S. dollar. Purchases and sales of portfolio securities are translated into U.S. dollars at the rates of exchange prevailing when such securities were acquired or sold. Income and expenses are translated into U.S. dollars at rates of exchange prevailing when accrued.
| | |
| |
36 | AB ALL MARKET INCOME PORTFOLIO | | abfunds.com |
NOTES TO FINANCIAL STATEMENTS (continued)
Net realized gain or loss on foreign currency transactions represents foreign exchange gains and losses from sales and maturities of foreign fixed income investments, holding of foreign currencies, currency gains or losses realized between the trade and settlement dates on foreign investment transactions, and the difference between the amounts of dividends, interest and foreign withholding taxes recorded on the Fund’s books and the U.S. dollar equivalent amounts actually received or paid. Net unrealized currency gains and losses from valuing foreign currency denominated assets and liabilities at period end exchange rates are reflected as a component of net unrealized appreciation or depreciation of foreign currency denominated assets and liabilities.
4. Taxes
It is the Fund’s policy to meet the requirements of the Internal Revenue Code applicable to regulated investment companies and to distribute all of its investment company taxable income and net realized gains, if any, to shareholders. Therefore, no provisions for federal income or excise taxes are required. The Fund may be subject to taxes imposed by countries in which it invests. Such taxes are generally based on income and/or capital gains earned or repatriated. Taxes are accrued and applied to net investment income, net realized gains and net unrealized appreciation/depreciation as such income and/or gains are earned.
In accordance with U.S. GAAP requirements regarding accounting for uncertainties in income taxes, management has analyzed the Fund’s tax positions taken or expected to be taken on federal and state income tax returns for all open tax years (the current and the prior three tax years) and has concluded that no provision for income tax is required in the Fund’s financial statements.
5. Investment Income and Investment Transactions
Dividend income is recorded on the ex-dividend date or as soon as the Fund is informed of the dividend. Interest income is accrued daily. Investment transactions are accounted for on the date the securities are purchased or sold. Investment gains or losses are determined on the identified cost basis. Non-cash dividends, if any, are recorded on the ex-dividend date at the fair value of the securities received. The Fund amortizes premiums and accretes discounts as adjustments to interest income. The Fund accounts for distributions received from REIT investments or from regulated investment companies as dividend income, realized gain, or return of capital based on information provided by the REIT or the investment company.
| | |
| |
| abfunds.com | | AB ALL MARKET INCOME PORTFOLIO | 37 |
NOTES TO FINANCIAL STATEMENTS (continued)
6. Class Allocations
All income earned and expenses incurred by the Fund are borne on a pro-rata basis by each outstanding class of shares, based on the proportionate interest in the Fund represented by the net assets of such class, except for class specific expenses which are allocated to the respective class. Expenses of the Company are charged proportionately to each portfolio or based on other appropriate methods. Realized and unrealized gains and losses are allocated among the various share classes based on respective net assets.
7. Dividends and Distributions
Dividends and distributions to shareholders, if any, are recorded on the ex-dividend date. Income dividends and capital gains distributions are determined in accordance with federal tax regulations and may differ from those determined in accordance with U.S. GAAP. To the extent these differences are permanent, such amounts are reclassified within the capital accounts based on their federal tax basis treatment; temporary differences do not require such reclassification.
NOTE B
Advisory Fee and Other Transactions with Affiliates
Under the terms of the investment advisory agreement, the Fund pays the Adviser an advisory fee at an annual rate of .55% of the first $2.5 billion, .45% for the next $2.5 billion and .40% in excess of $5 billion, of the Fund’s average daily net assets. The Adviser has agreed to waive its fees and bear certain expenses to the extent necessary to limit total operating expenses (excluding acquired fund fees and expenses, interest expense, taxes, extraordinary expenses, and brokerage commissions and other transaction costs) on an annual basis (the “Expense Caps”) to ..99%, 1.74% and .74% of daily average net assets for Class A, Class C, and Advisor Class shares, respectively. For the year ended November 30, 2022, such reimbursements/waivers amounted to $493,578. The Expense Caps may not be terminated by the Adviser before February 28, 2023.
Pursuant to the investment advisory agreement, the Fund may reimburse the Adviser for certain legal and accounting services provided to the Fund by the Adviser. For the year ended November 30, 2022, the Adviser voluntarily agreed to waive such fees in the amount of $92,555.
The Fund compensates AllianceBernstein Investor Services, Inc. (“ABIS”), a wholly-owned subsidiary of the Adviser, under a Transfer Agency Agreement for providing personnel and facilities to perform transfer agency services for the Fund. ABIS may make payments to intermediaries that provide omnibus account services, sub-accounting services and/or
| | |
| |
38 | AB ALL MARKET INCOME PORTFOLIO | | abfunds.com |
NOTES TO FINANCIAL STATEMENTS (continued)
networking services. Such compensation retained by ABIS amounted to $17,927 for the year ended November 30, 2022.
AllianceBernstein Investments, Inc. (the “Distributor”), a wholly-owned subsidiary of the Adviser, serves as the distributor of the Fund’s shares. The Distributor has advised the Fund that it has retained front-end sales charges of $92 from the sale of Class A shares and received $27 and $-0- in contingent deferred sales charges imposed upon redemptions by shareholders of Class A and Class C shares, respectively, for the year ended November 30, 2022.
The Fund may invest in AB Government Money Market Portfolio (the “Government Money Market Portfolio”) which has a contractual annual advisory fee rate of .20% of the portfolio’s average daily net assets and bears its own expenses. The Adviser has contractually agreed to waive .10% of the advisory fee of Government Money Market Portfolio (resulting in a net advisory fee of .10%) until August 31, 2023. In connection with the investment by the Fund in Government Money Market Portfolio, the Adviser has contractually agreed to waive its advisory fee from the Fund in an amount equal to the Fund’s pro rata share of the effective advisory fee of Government Money Market Portfolio, as borne indirectly by the Fund as an acquired fund fee and expense. For the year ended November 30, 2022, such waiver amounted to $7,014.
The Fund may invest in AB High Income Fund, Inc. (“ABHI”), and AB Bond Fund, Inc.—AB All Market Real Return Portfolio (“AMRR”) each an open-end management investment company managed by the Adviser. The Adviser has contractually agreed to waive its management fees and/or bear Fund expenses through February 28, 2023 in an amount equal to the Fund’s proportionate share of all advisory fees and other expenses of ABHI and AMRR that are indirectly borne by the Fund. For the year ended November 30, 2022, such waiver amounted to $148,345.
| | |
| |
| abfunds.com | | AB ALL MARKET INCOME PORTFOLIO | 39 |
NOTES TO FINANCIAL STATEMENTS (continued)
A summary of the Fund’s transactions in AB mutual funds for the year ended November 30, 2022 is as follows:
| | | | | | | | | | | | | | | | | | | | | | | | | | | | | | | | |
| | | | Distributions | |
| Fund | | Market
Value
11/30/21
(000) | | | Purchases
at Cost
(000) | | | Sales
Proceeds
(000) | | | Realized
Gain
(Loss)
(000) | | | Change in
Unrealized
Appr./
(Depr.)
(000) | | | Market
Value
11/30/22
(000) | | | Dividend
Income
(000) | | | Realized
Gains
(000) | |
Government Money Market Portfolio | | $ | 26,525 | | | $ | 65,174 | | | $ | 78,213 | | | $ | – 0 | – | | $ | – 0 | – | | $ | 13,486 | | | $ | 81 | | | $ | – 0 | – |
AB Bond Fund, Inc.—AB All Market Real Return Portfolio | | | – 0 | – | | | 1,596 | | | | 1,458 | | | | (138 | ) | | | – 0 | – | | | – 0 | – | | | – 0 | – | | | – 0 | – |
AB High Income Fund, Inc. | | | 15,120 | | | | 23,204 | | | | 14,764 | | | | (2,428 | ) | | | (2,469 | ) | | | 18,663 | | | | 1,913 | | | | – 0 | – |
Government Money Market Portfolio* | | | 727 | | | | 9,946 | | | | 10,573 | | | | – 0 | – | | | – 0 | – | | | 100 | | | | 3 | | | | – 0 | – |
| | | | | | | | | | | | | | | | | | | | | | | | | | | | | | | | |
Total | | | | | | | | | | | | | | $ | (2,566 | ) | | $ | (2,469 | ) | | $ | 32,249 | | | $ | 1,997 | | | $ | – 0 | – |
| | | | | | | | | | | | | | | | | | | | | | | | | | | | | | | | |
| * | Investments of cash collateral for securities lending transactions (see Note E). |
During the year ended November 30, 2021, the Adviser reimbursed the Fund $70 for trading losses incurred due to a trade entry error.
NOTE C
Distribution Services Agreement
The Fund has adopted a Distribution Services Agreement (the “Agreement”) pursuant to Rule 12b-1 under the Investment Company Act of 1940. Under the Agreement, the Fund pays distribution and servicing fees to the Distributor at an annual rate of up to .25% of the Fund’s average daily net assets attributable to Class A shares, 1% of the Fund’s average daily net assets attributable to Class C shares. There are no distribution and servicing fees on the Advisor Class shares. The fees are accrued daily and paid monthly. As of November 3, 2022, with respect to Class A and Class C shares, payments to the Distributor are voluntarily being limited to 0% of the average daily net assets attributable to Class A and Class C shares. For the year ended November 30, 2022, such waivers amounted to $1,298 and $198, respectively. The Agreement provides that the Distributor will use such payments in their entirety for distribution assistance and promotional activities. Since the commencement of the Fund’s operations, the Distributor has incurred expenses in excess of the
| | |
| |
40 | AB ALL MARKET INCOME PORTFOLIO | | abfunds.com |
NOTES TO FINANCIAL STATEMENTS (continued)
distribution costs reimbursed by the Fund in the amount of $3,331 for Class C shares. While such costs may be recovered from the Fund in future periods so long as the Agreement is in effect, the rate of the distribution and servicing fees payable under the Agreement may not be increased without a shareholder vote. In accordance with the Agreement, there is no provision for recovery of unreimbursed distribution costs incurred by the Distributor beyond the current fiscal year for Class A shares. The Agreement also provides that the Adviser may use its own resources to finance the distribution of the Fund’s shares.
NOTE D
Investment Transactions
Purchases and sales of investment securities (excluding short-term investments) for the year ended November 30, 2022 were as follows:
| | | | | | | | |
| | | Purchases | | | Sales | |
Investment securities (excluding U.S. government securities) | | $ | 62,709,243 | | | $ | 75,002,588 | |
U.S. government securities | | | – 0 | – | | | – 0 | – |
The cost of investments for federal income tax purposes, gross unrealized appreciation and unrealized depreciation are as follows:
| | | | |
Cost | | $ | 50,697,848 | |
| | | | |
Gross unrealized appreciation | | $ | 1,012,181 | |
Gross unrealized depreciation | | | (5,585,727 | ) |
| | | | |
Net unrealized depreciation | | $ | (4,573,546 | ) |
| | | | |
1. Derivative Financial Instruments
The Fund may use derivatives in an effort to earn income and enhance returns, to replace more traditional direct investments, to obtain exposure to otherwise inaccessible markets (collectively, “investment purposes”), or to hedge or adjust the risk profile of its portfolio.
The principal types of derivatives utilized by the Fund, as well as the methods in which they may be used are:
The Fund may buy or sell futures for investment purposes or for the purpose of hedging its portfolio against adverse effects of potential movements in the market. The Fund bears the market risk that arises from changes in the value of these instruments and the imperfect correlation between movements in the price of the futures and movements in the price of the assets, reference rates or indices which they are designed to track. Among other things, the Fund may purchase or sell futures for foreign currencies or options thereon for
| | |
| |
| abfunds.com | | AB ALL MARKET INCOME PORTFOLIO | 41 |
NOTES TO FINANCIAL STATEMENTS (continued)
non-hedging purposes as a means of making direct investment in foreign currencies, as described below under “Currency Transactions”.
At the time the Fund enters into futures, the Fund deposits and maintains as collateral an initial margin with the broker, as required by the exchange on which the transaction is effected. Such amount is shown as cash collateral due from broker on the statement of assets and liabilities. Pursuant to the contract, the Fund agrees to receive from or pay to the broker an amount of cash equal to the daily fluctuation in the value of the contract. Such receipts or payments are known as variation margin and are recorded by the Fund as unrealized gains or losses. Risks may arise from the potential inability of a counterparty to meet the terms of the contract. The credit/counterparty risk for exchange-traded futures is generally less than privately negotiated futures, since the clearinghouse, which is the issuer or counterparty to each exchange-traded future, has robust risk mitigation standards, including the requirement to provide initial and variation margin. When the contract is closed, the Fund records a realized gain or loss equal to the difference between the value of the contract at the time it was opened and the time it was closed.
During the year ended November 30, 2022, the Fund held futures for hedging and non-hedging purposes.
| | • | | Forward Currency Exchange Contracts |
The Fund may enter into forward currency exchange contracts in order to hedge its exposure to changes in foreign currency exchange rates on its foreign portfolio holdings, to hedge certain firm purchase and sale commitments denominated in foreign currencies and for non-hedging purposes as a means of making direct investments in foreign currencies, as described below under “Currency Transactions”.
A forward currency exchange contract is a commitment to purchase or sell a foreign currency at a future date at a negotiated forward rate. The gain or loss arising from the difference between the original contract and the closing of such contract would be included in net realized gain or loss on forward currency exchange contracts. Fluctuations in the value of open forward currency exchange contracts are recorded for financial reporting purposes as unrealized appreciation and/or depreciation by the Fund. Risks may arise from the potential inability of a counterparty to meet the terms of a contract and from unanticipated movements in the value of a foreign currency relative to the U.S. dollar.
During the year ended November 30, 2022, the Fund held forward currency exchange contracts for hedging and non-hedging purposes.
| | |
| |
42 | AB ALL MARKET INCOME PORTFOLIO | | abfunds.com |
NOTES TO FINANCIAL STATEMENTS (continued)
For hedging and investment purposes, the Fund may purchase and write (sell) put and call options on U.S. and foreign securities, including government securities, and foreign currencies that are traded on U.S. and foreign securities exchanges and over-the-counter markets. Among other things, the Fund may use options transactions for non-hedging purposes as a means of making direct investments in foreign currencies, as described below under “Currency Transactions” and may use options strategies involving the purchase and/or writing of various combinations of call and/or put options, for hedging and investment purposes.
The risk associated with purchasing an option is that the Fund pays a premium whether or not the option is exercised. Additionally, the Fund bears the risk of loss of the premium and change in market value should the counterparty not perform under the contract. If a put or call purchased option by the Fund were permitted to expire without being sold or exercised, its premium would represent a loss to the Fund. Put and call purchased options are accounted for in the same manner as portfolio securities. The cost of securities acquired through the exercise of call options is increased by premiums paid. The proceeds from securities sold through the exercise of put options are decreased by the premiums paid.
When the Fund writes an option, the premium received by the Fund is recorded as a liability and is subsequently adjusted to the current market value of the written option. The Fund’s maximum payment for written put options equates to the number of shares multiplied by the strike price. In certain circumstances maximum payout amounts may be partially offset by recovery values of the respective referenced assets and upfront premium received upon entering into the contract. Premiums received from written options which expire unexercised are recorded by the Fund on the expiration date as realized gains from written options. The difference between the premium received and the amount paid on effecting a closing purchase transaction, including brokerage commissions, is also treated as a realized gain, or if the premium received is less than the amount paid for the closing purchase transaction, as a realized loss. If a call option is exercised, the premium received is added to the proceeds from the sale of the underlying security or currency in determining whether the Fund has realized a gain or loss. If a put option is exercised, the premium received reduces the cost basis of the security or currency purchased by the Fund. In writing an option, the Fund bears the market risk of an unfavorable change in the price of the security or currency underlying the written option. Exercise of the written option by the Fund could
| | |
| |
| abfunds.com | | AB ALL MARKET INCOME PORTFOLIO | 43 |
NOTES TO FINANCIAL STATEMENTS (continued)
result in the Fund selling or buying a security or currency at a price different from the current market value.
During the year ended November 30, 2022, the Fund held purchased options for hedging and non-hedging purposes.
The Fund may enter into swaps to hedge its exposure to interest rates, credit risk or currencies. The Fund may also enter into swaps for non-hedging purposes as a means of gaining market exposures, making direct investments in foreign currencies, as described below under “Currency Transactions” or in order to take a “long” or “short” position with respect to an underlying referenced asset described below under “Total Return Swaps”. A swap is an agreement that obligates two parties to exchange a series of cash flows at specified intervals based upon or calculated by reference to changes in specified prices or rates for a specified amount of an underlying asset. The payment flows are usually netted against each other, with the difference being paid by one party to the other. In addition, collateral may be pledged or received by the Fund in accordance with the terms of the respective swaps to provide value and recourse to the Fund or its counterparties in the event of default, bankruptcy or insolvency by one of the parties to the swap.
Risks may arise as a result of the failure of the counterparty to the swap to comply with the terms of the swap. The loss incurred by the failure of a counterparty is generally limited to the net interim payment to be received by the Fund, and/or the termination value at the end of the contract. Therefore, the Fund considers the creditworthiness of each counterparty to a swap in evaluating potential counterparty risk. This risk is mitigated by having a netting arrangement between the Fund and the counterparty and by the posting of collateral by the counterparty to the Fund to cover the Fund’s exposure to the counterparty. Additionally, risks may arise from unanticipated movements in interest rates or in the value of the underlying securities. The Fund accrues for the interim payments on swaps on a daily basis, with the net amount recorded within unrealized appreciation/depreciation of swaps on the statement of assets and liabilities, where applicable. Once the interim payments are settled in cash, the net amount is recorded as realized gain/(loss) on swaps on the statement of operations, in addition to any realized gain/(loss) recorded upon the termination of swaps. Upfront premiums paid or received for swaps are recognized as cost or proceeds on the statement of assets and liabilities and are amortized on a straight line basis over the life of the contract. Amortized upfront premiums are included in net realized gain/(loss) from swaps on the statement of operations. Fluctuations in
| | |
| |
44 | AB ALL MARKET INCOME PORTFOLIO | | abfunds.com |
NOTES TO FINANCIAL STATEMENTS (continued)
the value of swaps are recorded as a component of net change in unrealized appreciation/depreciation of swaps on the statement of operations.
Certain standardized swaps, including certain interest rate swaps and credit default swaps, are (or soon will be) subject to mandatory central clearing. Cleared swaps are transacted through futures commission merchants (“FCMs”) that are members of central clearinghouses, with the clearinghouse serving as central counterparty, similar to transactions in futures contracts. Centralized clearing will be required for additional categories of swaps on a phased-in basis based on requirements published by the Securities and Exchange Commission and Commodity Futures Trading Commission.
At the time the Fund enters into a centrally cleared swap, the Fund deposits and maintains as collateral an initial margin with the broker, as required by the clearinghouse on which the transaction is effected. Such amount is shown as cash collateral due from broker on the statement of assets and liabilities. Pursuant to the contract, the Fund agrees to receive from or pay to the broker an amount of cash equal to the daily fluctuation in the value of the contract. Such receipts or payments are known as variation margin and are recorded by the Fund as unrealized gains or losses. Risks may arise from the potential inability of a counterparty to meet the terms of the contract. The credit/counterparty risk for centrally cleared swaps is generally less than non-centrally cleared swaps, since the clearinghouse, which is the issuer or counterparty to each centrally cleared swap, has robust risk mitigation standards, including the requirement to provide initial and variation margin. When the contract is closed, the Fund records a realized gain or loss equal to the difference between the value of the contract at the time it was opened and the time it was closed.
Interest Rate Swaps:
The Fund is subject to interest rate risk exposure in the normal course of pursuing its investment objectives. Because the Fund holds fixed rate bonds, the value of these bonds may decrease if interest rates rise. To help hedge against this risk and to maintain its ability to generate income at prevailing market rates, the Fund may enter into interest rate swaps. Interest rate swaps are agreements between two parties to exchange cash flows based on a notional amount. The Fund may elect to pay a fixed rate and receive a floating rate, or, receive a fixed rate and pay a floating rate on a notional amount.
In addition, the Fund may also enter into interest rate swap transactions to preserve a return or spread on a particular investment or portion of its portfolio, or protecting against an increase in the price of securities the Fund anticipates purchasing at a later date. Interest
| | |
| |
| abfunds.com | | AB ALL MARKET INCOME PORTFOLIO | 45 |
NOTES TO FINANCIAL STATEMENTS (continued)
rate swaps involve the exchange by a Fund with another party of their respective commitments to pay or receive interest (e.g., an exchange of floating rate payments for fixed rate payments) computed based on a contractually-based principal (or “notional”) amount. Interest rate swaps are entered into on a net basis (i.e., the two payment streams are netted out, with the Fund receiving or paying, as the case may be, only the net amount of the two payments).
During the year ended November 30, 2022, the Fund held interest rate swaps for hedging and non-hedging purposes.
Credit Default Swaps:
The Fund may enter into credit default swaps, including to manage its exposure to the market or certain sectors of the market, to reduce its risk exposure to defaults by corporate and sovereign issuers held by the Fund, or to create exposure to corporate or sovereign issuers to which it is not otherwise exposed. The Fund may purchase credit protection (“Buy Contract”) or provide credit protection (“Sale Contract”) on the referenced obligation of the credit default swap. During the term of the swap, the Fund receives/(pays) fixed payments from/(to) the respective counterparty, calculated at the agreed upon rate applied to the notional amount. If the Fund is a buyer/(seller) of protection and a credit event occurs, as defined under the terms of the swap, the Fund will either (i) receive from the seller/(pay to the buyer) of protection an amount equal to the notional amount of the swap (the “Maximum Payout Amount”) and deliver/(take delivery of) the referenced obligation or (ii) receive/(pay) a net settlement amount in the form of cash or securities equal to the notional amount of the swap less the recovery value of the referenced obligation. In certain circumstances Maximum Payout Amounts may be partially offset by recovery values of the respective referenced obligations, upfront premium received upon entering into the agreement, or net amounts received from settlement of buy protection credit default swaps entered into by the Fund for the same referenced obligations with the same counterparty.
Credit default swaps may involve greater risks than if a Fund had invested in the referenced obligation directly. Credit default swaps are subject to general market risk, liquidity risk, counterparty risk and credit risk. If the Fund is a buyer of protection and no credit event occurs, it will lose the payments it made to its counterparty. If the Fund is a seller of protection and a credit event occurs, the value of the referenced obligation received by the Fund coupled with the periodic payments previously received, may be less than the Maximum Payout Amount it pays to the buyer, resulting in a net loss to the Fund.
| | |
| |
46 | AB ALL MARKET INCOME PORTFOLIO | | abfunds.com |
NOTES TO FINANCIAL STATEMENTS (continued)
Implied credit spreads over U.S. Treasuries of comparable maturity utilized in determining the market value of credit default swaps on issuers as of period end are disclosed in the portfolio of investments. The implied spreads serve as an indicator of the current status of the payment/performance risk and typically reflect the likelihood of default by the issuer of the referenced obligation. The implied credit spread of a particular reference obligation also reflects the cost of buying/selling protection and may reflect upfront payments required to be made to enter into the agreement. Widening credit spreads typically represent a deterioration of the referenced obligation’s credit soundness and greater likelihood of default or other credit event occurring as defined under the terms of the agreement. A credit spread identified as “Defaulted” indicates a credit event has occurred for the referenced obligation.
During the year ended November 30, 2022, the Fund held credit default swaps for hedging and non-hedging purposes.
Total Return Swaps:
The Fund may enter into total return swaps in order to take a “long” or “short” position with respect to an underlying referenced asset. The Fund is subject to market price volatility of the underlying referenced asset. A total return swap involves commitments to pay interest in exchange for a market linked return based on a notional amount. To the extent that the total return of the security, group of securities or index underlying the transaction exceeds or falls short of the offsetting interest obligation, the Fund will receive a payment from or make a payment to the counterparty.
During the year ended November 30, 2022, the Fund held total return swaps for hedging and non-hedging purposes.
The Fund typically enters into International Swaps and Derivatives Association, Inc. Master Agreements (“ISDA Master Agreement”) with its OTC derivative contract counterparties in order to, among other things, reduce its credit risk to OTC counterparties. ISDA Master Agreements include provisions for general obligations, representations, collateral and events of default or termination. Under an ISDA Master Agreement, the Fund typically may offset with the OTC counterparty certain derivative financial instruments’ payables and/or receivables with collateral held and/or posted and create one single net payment (close-out netting) in the event of default or termination. In the event of a default by an OTC counterparty, the return of collateral with market value in excess of the Fund’s net liability, held by the defaulting party, may be delayed or denied.
The Fund’s ISDA Master Agreements may contain provisions for early termination of OTC derivative transactions in the event the net assets of
| | |
| |
| abfunds.com | | AB ALL MARKET INCOME PORTFOLIO | 47 |
NOTES TO FINANCIAL STATEMENTS (continued)
the Fund decline below specific levels (“net asset contingent features”). If these levels are triggered, the Fund’s OTC counterparty has the right to terminate such transaction and require the Fund to pay or receive a settlement amount in connection with the terminated transaction. If OTC derivatives were held at period end, please refer to netting arrangements by the OTC counterparty table below for additional details.
During the year ended November 30, 2022, the Fund had entered into the following derivatives:
| | | | | | | | | | | | |
| | | Asset Derivatives | | | Liability Derivatives | |
Derivative
Type | | Statement of
Assets and
Liabilities
Location | | Fair Value | | | Statement of
Assets and
Liabilities
Location | | Fair Value | |
| | | | |
Equity contracts | | Receivable/Payable for variation margin on futures | | $ | 29,234 | * | | | | | | |
| | | | |
Interest rate contracts | |
Receivable/Payable for variation margin on centrally cleared swaps | |
|
19,341 |
* | |
Receivable/Payable for variation margin on centrally cleared swaps | |
$ |
951,101 |
* |
| | | | |
Foreign currency contracts | |
Unrealized appreciation on forward currency exchange contracts | |
|
87,572 |
| |
Unrealized depreciation on forward currency exchange contracts | |
|
160,182 |
|
| | | | | | | | | | | | |
Total | | | | $ | 136,147 | | | | | $ | 1,111,283 | |
| | | | | | | | | | | | |
| * | Only variation margin receivable/payable at period end is reported within the statement of assets and liabilities. This amount reflects cumulative unrealized appreciation (depreciation) on futures and centrally cleared swaps as reported in the portfolio of investments. |
| | |
| |
48 | AB ALL MARKET INCOME PORTFOLIO | | abfunds.com |
NOTES TO FINANCIAL STATEMENTS (continued)
| | | | | | | | | | |
Derivative Type | | Location of Gain
or (Loss) on
Derivatives Within
Statement of
Operations | | Realized Gain
or (Loss) on
Derivatives | | | Change in
Unrealized
Appreciation or
(Depreciation) | |
Interest rate contracts | | Net realized gain (loss) on futures; Net change in unrealized appreciation (depreciation) of futures | | $ | (298,466 | ) | | $ | (13,201 | ) |
| | | |
Equity contracts | | Net realized gain (loss) on futures; Net change in unrealized appreciation (depreciation) of futures | | | (996,419 | ) | | | 357,552 | |
| | | |
Foreign currency contracts | | Net realized gain (loss) on forward currency exchange contracts; Net change in unrealized appreciation (depreciation) of forward currency exchange contracts | | | 59,005 | | | | (186,928 | ) |
| | | |
Equity contracts | | Net realized gain (loss) on investment transactions; Net change in unrealized appreciation (depreciation) of investments | | | (232,430 | ) | | | (652,173 | ) |
| | | |
Interest rate contracts | | Net realized gain (loss) on swaps; Net change in unrealized appreciation (depreciation) of swaps | | | (1,531,045 | ) | | | (462,140 | ) |
| | | |
Credit contracts | | Net realized gain (loss) on swaps; Net change in unrealized appreciation (depreciation) of swaps | | | (818,737 | ) | | | 46,472 | |
| | | |
Equity contracts | | Net realized gain (loss) on swaps; Net change in unrealized appreciation (depreciation) of swaps | | | (564,324 | ) | | | 126,298 | |
| | | | | | | | | | |
Total | | | | $ | (4,382,416 | ) | | $ | (784,120 | ) |
| | | | | | | | | | |
| | |
| |
| abfunds.com | | AB ALL MARKET INCOME PORTFOLIO | 49 |
NOTES TO FINANCIAL STATEMENTS (continued)
The following table represents the average monthly volume of the Fund’s derivative transactions during the year ended November 30, 2022:
| | | | |
Futures: | | | | |
Average notional amount of buy contracts | | $ | 12,233,198 | |
Average notional amount of sale contracts | | $ | 8,371,474 | (a) |
Forward Currency Exchange Contracts: | | | | |
Average principal amount of buy contracts | | $ | 20,457,531 | |
Average principal amount of sale contracts | | $ | 20,775,061 | |
Purchased Options: | | | | |
Average notional amount | | $ | 47,655,815 | (a) |
Centrally Cleared Interest Rate Swaps: | | | | |
Average notional amount | | $ | 20,077,139 | |
Centrally Cleared Credit Default Swaps: | | | | |
Average notional amount of buy contracts | | $ | 4,516,966 | (b) |
Average notional amount of sale contracts | | $ | 7,701,911 | (a) |
Total Return Swaps: | | | | |
Average notional amount | | $ | 21,265,997 | (a) |
| (a) | Positions were open for eleven months during the year. |
| (b) | Positions were open for eight months during the year. |
For financial reporting purposes, the Fund does not offset derivative assets and derivative liabilities that are subject to netting arrangements in the statement of assets and liabilities.
All OTC derivatives held at period end were subject to netting arrangements. The following table presents the Fund’s derivative assets and liabilities by OTC counterparty net of amounts available for offset under ISDA Master Agreements (“MA”) and net of the related collateral received/pledged by the Fund as of November 30, 2022. Exchange-traded derivatives and centrally cleared swaps are not subject to netting arrangements and as such are excluded from the table.
| | | | | | | | | | | | | | | | | | | | |
Counterparty | | Derivative
Assets
Subject to a
MA | | | Derivatives
Available
for Offset | | | Cash
Collateral
Received* | | | Security
Collateral
Received* | | | Net Amount
of Derivative
Assets | |
Barclays Bank PLC | | $ | 25,603 | | | $ | (23,615 | ) | | $ | – 0 | – | | $ | – 0 | – | | $ | 1,988 | |
Citibank, NA | | | 9,902 | | | | – 0 | – | | | (9,902 | ) | | | – 0 | – | | | – 0 | – |
Deutsche Bank AG | | | 10,656 | | | | (10,656 | ) | | | – 0 | – | | | – 0 | – | | | – 0 | – |
Goldman Sachs International | | | 12,902 | | | | (7,205 | ) | | | – 0 | – | | | – 0 | – | | | 5,697 | |
JPMorgan Chase Bank, NA | | | 3,272 | | | | (3,272 | ) | | | – 0 | – | | | – 0 | – | | | – 0 | – |
Morgan Stanley Capital Services, Inc. | | | 9,309 | | | | (9,309 | ) | | | – 0 | – | | | – 0 | – | | | – 0 | – |
State Street Bank & Trust Co. | | | 15,928 | | | | (15,928 | ) | | | – 0 | – | | | – 0 | – | | | – 0 | – |
| | | | | | | | | | | | | | | �� | | | | | |
Total | | $ | 87,572 | | | $ | (69,985 | ) | | $ | (9,902 | ) | | $ | – 0 | – | | $ | 7,685 | ^ |
| | | | | | | | | | | | | | | | | | | | |
| | |
| |
50 | AB ALL MARKET INCOME PORTFOLIO | | abfunds.com |
NOTES TO FINANCIAL STATEMENTS (continued)
| | | | | | | | | | | | | | | | | | | | |
Counterparty | | Derivative
Liabilities
Subject to a
MA | | | Derivatives
Available
for Offset | | | Cash
Collateral
Pledged* | | | Security
Collateral
Pledged* | | | Net Amount
of Derivative
Liabilities | |
Bank of America, NA | | $ | 14,770 | | | $ | – 0 | – | | $ | – 0 | – | | $ | – 0 | – | | $ | 14,770 | |
Barclays Bank PLC | | | 23,615 | | | | (23,615 | ) | | | – 0 | – | | | – 0 | – | | | – 0 | – |
BNP Paribas SA | | | 2,088 | | | | – 0 | – | | | – 0 | – | | | – 0 | – | | | 2,088 | |
Deutsche Bank AG | | | 17,672 | | | | (10,656 | ) | | | – 0 | – | | | – 0 | – | | | 7,016 | |
Goldman Sachs International | | | 7,205 | | | | (7,205 | ) | | | – 0 | – | | | – 0 | – | | | – 0 | – |
JPMorgan Chase Bank, NA | | | 7,811 | | | | (3,272 | ) | | | – 0 | – | | | – 0 | – | | | 4,539 | |
Morgan Stanley Capital Services, Inc. | | | 29,618 | | | | (9,309 | ) | | | (20,309 | ) | | | – 0 | – | | | – 0 | – |
Standard Chartered Bank | | | 1,963 | | | | – 0 | – | | | – 0 | – | | | – 0 | – | | | 1,963 | |
State Street Bank & Trust Co. | | | 54,593 | | | | (15,928 | ) | | | – 0 | – | | | – 0 | – | | | 38,665 | |
UBS AG | | | 847 | | | | – 0 | – | | | – 0 | – | | | – 0 | – | | | 847 | |
| | | | | | | | | | | | | | | | | | | | |
Total | | $ | 160,182 | | | $ | (69,985 | ) | | $ | (20,309 | ) | | $ | – 0 | – | | $ | 69,888 | ^ |
| | | | | | | | | | | | | | | | | | | | |
| * | The actual collateral received/pledged may be more than the amount reported due to over-collateralization. |
| ^ | Net amount represents the net receivable/payable that would be due from/to the counterparty in the event of default or termination. The net amount from OTC financial derivative instruments can only be netted across transactions governed under the same master agreement with the same counterparty. |
2. Currency Transactions
The Fund may invest in non-U.S. Dollar-denominated securities on a currency hedged or unhedged basis. The Fund may seek investment opportunities by taking long or short positions in currencies through the use of currency-related derivatives, including forward currency exchange contracts, futures and options on futures, swaps, and other options. The Fund may enter into transactions for investment opportunities when it anticipates that a foreign currency will appreciate or depreciate in value but securities denominated in that currency are not held by the Fund and do not present attractive investment opportunities. Such transactions may also be used when the Adviser believes that it may be more efficient than a direct investment in a foreign currency-denominated security. The Fund may also conduct currency exchange contracts on a spot basis (i.e., for cash at the spot rate prevailing in the currency exchange market for buying or selling currencies).
NOTE E
Securities Lending
The Fund may enter into securities lending transactions. Under the Fund’s securities lending program, all loans of securities will be collateralized continually by cash collateral and/or non-cash collateral. Non-cash collateral will include only securities issued or guaranteed by the U.S. government or its agencies or instrumentalities. The Fund cannot sell or repledge any non-cash collateral, such collateral will not be reflected in the portfolio of
| | |
| |
| abfunds.com | | AB ALL MARKET INCOME PORTFOLIO | 51 |
NOTES TO FINANCIAL STATEMENTS (continued)
investments. If a loan is collateralized by cash, the Fund will be compensated for the loan from a portion of the net return from the income earned on cash collateral after a rebate is paid to the borrower (in some cases, this rebate may be a “negative rebate” or fee paid by the borrower to the Fund in connection with the loan), and payments are made for fees of the securities lending agent and for certain other administrative expenses. If the Fund receives non-cash collateral, the Fund will receive a fee from the borrower generally equal to a negotiated percentage of the market value of the loaned securities. The Fund will have the right to call a loan and obtain the securities loaned at any time on notice to the borrower within the normal and customary settlement time for the securities. While the securities are on loan, the borrower is obligated to pay the Fund amounts equal to any dividend income or other distributions from the securities; however, these distributions will not be afforded the same preferential tax treatment as qualified dividends. The Fund will not be able to exercise voting rights with respect to any securities during the existence of a loan, but will have the right to regain ownership of loaned securities in order to exercise voting or other ownership rights. Collateral received and securities loaned are marked to market daily to ensure that the securities loaned are secured by collateral. The lending agent currently invests the cash collateral received in Government Money Market Portfolio, an eligible money market vehicle, in accordance with the investment restrictions of the Fund, and as approved by the Board. The collateral received on securities loaned is recorded as an asset as well as a corresponding liability in the statement of assets and liabilities. The collateral will be adjusted the next business day to maintain the required collateral amount. The amounts of securities lending income from the borrowers and Government Money Market Portfolio are reflected in the statement of operations. When the Fund earns net securities lending income from Government Money Market Portfolio, the income is inclusive of a rebate expense paid to the borrower. In connection with the cash collateral investment by the Fund in Government Money Market Portfolio, the Adviser has agreed to waive a portion of the Fund’s share of the advisory fees of Government Money Market Portfolio, as borne indirectly by the Fund as an acquired fund fee and expense. When the Fund lends securities, its investment performance will continue to reflect changes in the value of the securities loaned. A principal risk of lending portfolio securities is that the borrower may fail to return the loaned securities upon termination of the loan and that the collateral will not be sufficient to replace the loaned securities. The lending agent has agreed to indemnify the Fund in the case of default of any securities borrower.
| | |
| |
52 | AB ALL MARKET INCOME PORTFOLIO | | abfunds.com |
NOTES TO FINANCIAL STATEMENTS (continued)
A summary of the Fund’s transactions surrounding securities lending for the year ended November 30, 2022 is as follows:
| | | | | | | | | | | | | | | | | | | | | | |
| | | | | | | | | | | | | Government Money
Market Portfolio | |
Market
Value of
Securities on Loan* | | | Cash
Collateral* | | | Market
Value of
Non-Cash
Collateral* | | | Income from
Borrowers | | | Income
Earned | | | Advisory Fee
Waived | |
| $ | 585,762 | | | $ | 100,446 | | | $ | 564,266 | | | $ | 14,224 | | | $ | 2,873 | | | $ | 134 | |
| * | As of November 30, 2022. |
NOTE F
Capital Stock
Each class consists of 1,000,000,000 authorized shares. Transactions in capital shares for each class were as follows:
| | | | | | | | | | | | | | | | | | | | | | | | |
| | | | | | | | | | | | | | | | | | | | | | | | |
| | | Shares | | | | | | Amount | | | | |
| | | Year Ended
November 30,
2022 | | | Year Ended
November 30,
2021 | | | | | | Year Ended
November 30,
2022 | | | Year Ended
November 30,
2021 | | | | |
| | | | | | | | |
| Class A | | | | | |
Shares sold | | | 16,506 | | | | 359,195 | | | | | | | $ | 137,604 | | | $ | 3,394,142 | | | | | |
| | | | | |
Shares issued in reinvestment of dividends and distributions | | | 25,151 | | | | 30,345 | | | | | | | | 207,591 | | | | 287,240 | | | | | |
| | | | | |
Shares converted from Class C | | | 705 | | | | 2,833 | | | | | | | | 6,224 | | | | 27,168 | | | | | |
| | | | | |
Shares redeemed | | | (195,898 | ) | | | (63,925 | ) | | | | | | | (1,694,151 | ) | | | (606,436 | ) | | | | |
| | | | | |
Net increase (decrease) | | | (153,536 | ) | | | 328,448 | | | | | | | $ | (1,342,732 | ) | | $ | 3,102,114 | | | | | |
| | | | | |
| | | | | | | | | | | | | | | | | | | | | | | | |
| Class C | | | | | |
Shares sold | | | 2,404 | | | | 729 | | | | | | | $ | 19,965 | | | $ | 6,960 | | | | | |
| | | | | |
Shares issued in reinvestment of dividends and distributions | | | 579 | | | | 1,346 | | | | | | | | 4,780 | | | | 12,729 | | | | | |
| | | | | |
Shares converted to Class A | | | (704 | ) | | | (2,833 | ) | | | | | | | (6,224 | ) | | | (27,168 | ) | | | | |
| | | | | |
Shares redeemed | | | (20,485 | ) | | | (40,330 | ) | | | | | | | (172,923 | ) | | | (377,822 | ) | | | | |
| | | | | |
Net decrease | | | (18,206 | ) | | | (41,088 | ) | | | | | | $ | (154,402 | ) | | $ | (385,301 | ) | | | | |
| | | | | |
| | | | | | | | | | | | | | | | | | | | | | | | |
| Advisor Class | | | | | |
Shares sold | | | 2,234,886 | | | | 2,384,491 | | | | | | | $ | 18,422,377 | | | $ | 22,647,233 | | | | | |
| | | | | |
Shares issued in reinvestment of dividends and distributions | | | 197,055 | | | | 266,566 | | | | | | | | 1,626,027 | | | | 2,524,008 | | | | | |
| | | | | |
Shares redeemed | | | (5,875,302 | ) | | | (3,386,718 | ) | | | | | | | (46,750,396 | ) | | | (31,991,129 | ) | | | | |
| | | | | |
Net decrease | | | (3,443,361 | ) | | | (735,661 | ) | | | | | | $ | (26,701,992 | ) | | $ | (6,819,888 | ) | | | | |
| | | | | |
| | |
| |
| abfunds.com | | AB ALL MARKET INCOME PORTFOLIO | 53 |
NOTES TO FINANCIAL STATEMENTS (continued)
NOTE G
Risks Involved in Investing in the Fund
Market Risk—The value of the Fund’s assets will fluctuate as the stock or bond market fluctuates. The value of its investments may decline, sometimes rapidly and unpredictably, simply because of economic changes or other events, including public health crises (including the occurrence of a contagious disease or illness) and regional and global conflicts, that affect large portions of the market.
Credit Risk—An issuer or guarantor of a fixed-income security, or the counterparty to a derivatives or other contract, may be unable or unwilling to make timely payments of interest or principal, or to otherwise honor its obligations. The issuer or guarantor may default, causing a loss of the full principal amount of a security and accrued interest. The degree of risk for a particular security may be reflected in its credit rating. There is the possibility that the credit rating of a fixed-income security may be downgraded after purchase, which may adversely affect the value of the security. Investments in fixed-income securities with lower ratings tend to have a higher probability that an issuer will default or fail to meet its payment obligations.
High Yield Debt Securities Risk—Investments in fixed-income securities with lower ratings (commonly known as “junk bonds”) tend to have a higher probability that an issuer will default or fail to meet its payment obligations. These securities may be subject to greater price volatility due to such factors as specific corporate developments, interest rate sensitivity, negative perceptions of the junk bond market generally and less secondary market liquidity.
Interest-Rate Risk—Changes in interest rates will affect the value of investments in fixed-income securities. When interest rates rise, the value of existing investments in fixed-income securities tends to fall and this decrease in value may not be offset by higher income from new investments. Interest rate risk is generally greater for fixed-income securities with longer maturities or durations. The Fund may be subject to a greater risk of rising interest rates than would normally be the case due to the end of a recent period of historically low rates and the effect of potential government fiscal policy initiatives and resulting market reaction to those initiatives.
Inflation Risk—This is the risk that the value of assets or income from investments will be less in the future as inflation decreases the value of money. As inflation increases, the value of the Fund’s assets can decline as can the value of the Fund’s distributions. This risk is significantly greater for fixed-income securities with longer maturities.
| | |
| |
54 | AB ALL MARKET INCOME PORTFOLIO | | abfunds.com |
NOTES TO FINANCIAL STATEMENTS (continued)
Foreign (Non-U.S.) Risk—Investments in securities of non-U.S. issuers may involve more risk than those of U.S. issuers. These securities may fluctuate more widely in price and may be more difficult to trade due to adverse market, economic, political, regulatory or other factors.
Emerging Market Risk—Investments in emerging market countries may have more risk because the markets are less developed and less liquid as well as being subject to increased economic, political, regulatory or other uncertainties.
Currency Risk—Fluctuations in currency exchange rates may negatively affect the value of the Fund’s investments or reduce its returns.
Derivatives Risk—Derivatives may be difficult to price or unwind and leveraged so that small changes may produce disproportionate losses for the Fund. A short position in a derivative instrument involves the risk of a theoretically unlimited increase in the value of the underlying instrument, which could cause the Fund to suffer a (potentially unlimited) loss. Derivatives, especially over-the-counter derivatives, are also subject to counterparty risk, which is the risk that the counterparty (the party on the other side of the transaction) on a derivative transaction will be unable or unwilling to honor its contractual obligations to the Fund.
Short Sale Risk—Short sales involve the risk that the Fund will incur a loss by subsequently buying a security at a higher price than the price at which it sold the security. The amount of such loss is theoretically unlimited, as it will be based on the increase in value of the security sold short. In contrast, the risk of loss from a long position is limited to the Fund’s investment in the security, because the price of the security cannot fall below zero. The Fund may not always be able to close out a short position on favorable terms.
Leverage Risk—When the Fund borrows money or otherwise leverages its investments, its performance may be volatile because leverage tends to exaggerate the effect of any increase or decrease in the value of the Fund’s investments. The Fund may create leverage through the use of reverse repurchase arrangements, forward currency exchange contracts, forward commitments, dollar rolls or futures or by borrowing money. The use of other types of derivative instruments by the Fund, such as options and swaps, may also result in a form of leverage. Leverage may result in higher returns to the Fund than if the Fund were not leveraged, but may also adversely affect returns, particularly if the market is declining.
Illiquid Investments Risk—Illiquid investments risk exists when certain investments are or become difficult to purchase or sell. Difficulty in selling
| | |
| |
| abfunds.com | | AB ALL MARKET INCOME PORTFOLIO | 55 |
NOTES TO FINANCIAL STATEMENTS (continued)
such investments may result in sales at disadvantageous prices affecting the value of your investment in the Fund. Causes of illiquid investments risk may include low trading volumes and large positions. Foreign fixed-income securities may have more illiquid investments risk because secondary trading markets for these securities may be smaller and less well developed and the securities may trade less frequently. Illiquid investments risk may be higher in a rising interest rate environment, when the value and liquidity of fixed-income securities generally go down.
Investment in Other Investment Companies Risk—As with other investments, investments in other investment companies are subject to market and selection risk. In addition, shareholders of the Fund bear both their proportionate share of expenses in the Fund (including management fees) and, indirectly, the expenses of the investment companies in which the Fund invests (to the extent these expenses are not waived or reimbursed by the Adviser).
LIBOR Transition and Associated Risk—A Fund may be exposed to debt securities, derivatives or other financial instruments that utilize the London Interbank Offered Rate, or “LIBOR,” as a “benchmark” or “reference rate” for various interest rate calculations. In 2017, the United Kingdom Financial Conduct Authority (“FCA”), which regulates LIBOR, announced a desire to phase out the use of LIBOR by the end of 2021. The FCA and LIBOR’s administrator, ICE Benchmark Administration, have since announced that most LIBOR settings (which reflect LIBOR rates quoted in different currencies over various time periods) will no longer be published after the end of 2021 but that the most widely used U.S. Dollar LIBOR settings will continue to be published until June 30, 2023. However, banks were strongly encouraged to cease entering into agreements with counterparties referencing LIBOR by the end of 2021. It is possible that a subset of LIBOR settings will be published after these dates on a “synthetic” basis, but any such publications would be considered non-representative of the underlying market. Since 2018 the Federal Reserve Bank of New York has published the secured overnight funding rate (referred to as SOFR), which is intended to replace U.S. Dollar LIBOR. SOFR is a broad measure of the cost of borrowing cash overnight collateralized by U.S. Treasury securities in the repurchase agreement (repo) market and has been used increasingly on a voluntary basis in new instruments and transactions. In addition, on March 15, 2022, the Adjustable Interest Rate Act was signed into law. This law provides a statutory fallback mechanism to replace LIBOR with a benchmark rate that is selected by the Federal Reserve Board and based on SOFR for certain contracts that reference LIBOR without adequate fallback provisions.
| | |
| |
56 | AB ALL MARKET INCOME PORTFOLIO | | abfunds.com |
NOTES TO FINANCIAL STATEMENTS (continued)
The elimination of LIBOR or changes to other reference rates or any other changes or reforms to the determination or supervision of reference rates could have an adverse impact on the market for, or value of, any securities or payments linked to those reference rates, which may adversely affect a Fund’s performance and/or net asset value. Uncertainty and risk also remain regarding the willingness and ability of issuers and lenders to include revised provisions in new and existing contracts or instruments. Consequently, the transition from LIBOR to other reference rates may lead to increased volatility and illiquidity in markets that are tied to LIBOR, fluctuations in values of LIBOR-related investments or investments in issuers that utilize LIBOR, increased difficulty in borrowing or refinancing and diminished effectiveness of hedging strategies, potentially adversely affecting a Fund’s performance. Furthermore, the risks associated with the expected discontinuation of LIBOR and transition may be exacerbated if the work necessary to effect an orderly transition to an alternative reference rate is not completed in a timely manner. Neither the effect of the LIBOR transition process nor its ultimate success can yet be known.
Indemnification Risk—In the ordinary course of business, the Fund enters into contracts that contain a variety of indemnifications. The Fund’s maximum exposure under these arrangements is unknown. However, the Fund has not had prior claims or losses pursuant to these indemnification provisions and expects the risk of loss thereunder to be remote. Therefore, the Fund has not accrued any liability in connection with these indemnification provisions.
Management Risk—The Fund is subject to management risk because it is an actively-managed investment fund. The Adviser will apply its investment techniques and risk analyses in making investment decisions, but there is no guarantee that its techniques will produce the intended results. Some of these techniques may incorporate, or rely upon, quantitative models, but there is no guarantee that these models will generate accurate forecasts, reduce risk or otherwise perform as expected.
NOTE H
Joint Credit Facility
A number of open-end mutual funds managed by the Adviser, including the Fund, participate in a $325 million revolving credit facility (the “Facility”) intended to provide short-term financing related to redemptions and other short term liquidity requirements, subject to certain restrictions. Commitment fees related to the Facility are paid by the participating funds and are included in miscellaneous expenses in the statement of operations. The Fund did not utilize the Facility during the year ended November 30, 2022.
| | |
| |
| abfunds.com | | AB ALL MARKET INCOME PORTFOLIO | 57 |
NOTES TO FINANCIAL STATEMENTS (continued)
NOTE I
Distributions to Shareholders
The tax character of distributions paid during the fiscal years ended November 30, 2022 and November 30, 2021 were as follows:
| | | | | | | | |
| | | 2022 | | | 2021 | |
Distributions paid from: | | | | | | | | |
Ordinary income | | $ | 1,724,353 | | | $ | 3,138,349 | |
| | | | | | | | |
Total taxable distributions | | $ | 1,724,353 | | | | 3,138,349 | |
Return of Capital | | | 789,338 | | | | 517,010 | |
| | | | | | | | |
Total distributions paid | | $ | 2,513,691 | | | $ | 3,655,359 | |
| | | | | | | | |
As of November 30, 2022, the components of accumulated earnings (deficit) on a tax basis were as follows:
| | | | |
Accumulated capital and other losses | | $ | (21,143,255 | )(a) |
Unrealized appreciation (depreciation) | | | (4,567,684 | )(b) |
| | | | |
Total accumulated earnings (deficit) | | $ | (25,710,939 | )(c) |
| | | | |
| (a) | As of November 30, 2022, the Fund had a net capital loss carryforward of $21,123,277. As of November 30, 2022, the cumulative deferred loss on straddles was $19,978. |
| (b) | The differences between book-basis and tax-basis unrealized appreciation (depreciation) are attributable primarily to the recognition for tax purposes of unrealized gains/losses on certain derivative instruments, the tax treatment of passive foreign investment companies (PFICs), the tax treatment of swaps, and the tax deferral of losses on wash sales. |
| (c) | The difference between book-basis and tax-basis components of accumulated earnings (deficit) is attributable primarily to the accrual of foreign capital gains tax. |
For tax purposes, net realized capital losses may be carried over to offset future capital gains, if any. Funds are permitted to carry forward capital losses for an indefinite period, and such losses will retain their character as either short-term or long-term capital losses. As of November 30, 2022, the Fund had a net short-term capital loss carryforward of $10,956,396 and a net long-term capital loss carryforward of $10,166,881, which may be carried forward for an indefinite period.
During the current fiscal year, permanent differences primarily due to prior year true-up resulted in a net decrease in accumulated loss and a net decrease in additional paid-in capital. These reclassifications had no effect on net assets.
NOTE J
Recent Accounting Pronouncements
In March 2020, the Financial Accounting Standards Board issued an Accounting Standards Update, ASU 2020-04, “Reference Rate Reform (Topic 848) – Facilitation of the Effects of Reference Rate Reform on Financial Reporting.” ASU 2020-04 provides optional guidance to ease the
| | |
| |
58 | AB ALL MARKET INCOME PORTFOLIO | | abfunds.com |
NOTES TO FINANCIAL STATEMENTS (continued)
potential accounting burden due to the discontinuation of the LIBOR and other interbank-offered based reference rates. ASU 2020-04 is effective as of March 12, 2020 through December 31, 2022. Management is currently evaluating the impact, if any, of applying ASU 2020-04.
NOTE K
Subsequent Events
Management has evaluated subsequent events for possible recognition or disclosure in the financial statements through the date the financial statements are issued. Management has determined that there are no material events that would require disclosure in the Fund’s financial statements through this date.
| | |
| |
| abfunds.com | | AB ALL MARKET INCOME PORTFOLIO | 59 |
FINANCIAL HIGHLIGHTS
Selected Data For A Share Of Capital Stock Outstanding Throughout Each Period
| | | | | | | | | | | | | | | | | | | | |
| | | Class A | |
| | | Year Ended November 30, | |
| | | 2022 | | | 2021 | | | 2020 | | | 2019 | | | 2018 | |
| | | | |
| | | | | | | | | | | | | | | | | | | | |
Net asset value, beginning of period | | | $ 9.36 | | | | $ 9.09 | | | | $ 9.94 | | | | $ 9.30 | | | | $ 10.43 | |
| | | | |
Income From Investment Operations | |
| | | | | |
Net investment income(a)(b) | | | .25 | | | | .21 | | | | .26 | | | | .33 | | | | .48 | |
| | | | | |
Net realized and unrealized gain (loss) on investment and foreign currency transactions | | | (1.74 | ) | | | .42 | | | | (.73 | ) | | | .74 | | | | (.95 | ) |
| | | | | |
Contributions from Affiliates | | | – 0 | – | | | .00 | (c) | | | – 0 | – | | | – 0 | – | | | .00 | (c) |
| | | | |
Net increase (decrease) in net asset value from operations | | | (1.49 | ) | | | .63 | | | | (.47 | ) | | | 1.07 | | | | (.47 | ) |
| | | | |
Less: Dividends and Distributions | |
| | | | | |
Dividends from net investment income | | | (.18 | ) | | | (.31 | ) | | | (.38 | ) | | | (.43 | ) | | | (.45 | ) |
| | | | | |
Distributions from net realized gain on investment transactions | | | – 0 | – | | | – 0 | – | | | – 0 | – | | | – 0 | – | | | (.21 | ) |
| | | | | |
Return of capital | | | (0.08 | ) | | | (.05 | ) | | | – 0 | – | | | – 0 | – | | | – 0 | – |
| | | | |
Total dividends and distributions | | | (.26 | ) | | | (.36 | ) | | | (.38 | ) | | | (.43 | ) | | | (.66 | ) |
| | | | |
Net asset value, end of period | | | $ 7.61 | | | | $ 9.36 | | | | $ 9.09 | | | | $ 9.94 | | | | $ 9.30 | |
| | | | |
|
Total Return | |
| | | | | |
Total investment return based on net asset value(d) | | | (16.11 | )% | | | 6.95 | % | | | (4.51 | )% | | | 11.77 | % | | | (4.80 | )% |
|
Ratios/Supplemental Data | |
| | | | | |
Net assets, end of period (000’s omitted) | | | $6,877 | | | | $9,897 | | | | $6,624 | | | | $7,463 | | | | $5,590 | |
|
Ratio to average net assets of: | |
| | | | | |
Expenses, net of waivers/reimbursements(e)‡ | | | .80 | % | | | .85 | % | | | .76 | % | | | .78 | % | | | .74 | % |
| | | | | |
Expenses, before waivers/reimbursements(e)‡ | | | 1.74 | % | | | 1.52 | % | | | 1.37 | % | | | 1.41 | % | | | 1.37 | % |
| | | | | |
Net investment income(b) | | | 3.03 | % | | | 2.22 | % | | | 2.87 | % | | | 3.43 | % | | | 4.85 | % |
| | | | | |
Portfolio turnover rate | | | 98 | % | | | 86 | % | | | 105 | % | | | 77 | % | | | 74 | % |
| | | | | | | | | | | | | | | | | | | | |
| |
‡ Expense ratios exclude the estimated acquired fund fees of the affiliated/unaffiliated | |
underlying portfolios | | | .20 | % | | | .15 | % | | | .24 | % | | | .24 | % | | | .26 | % |
See footnote summary on page 62.
| | |
| |
60 | AB ALL MARKET INCOME PORTFOLIO | | abfunds.com |
FINANCIAL HIGHLIGHTS (continued)
Selected Data For A Share Of Capital Stock Outstanding Throughout Each Period
| | | | | | | | | | | | | | | | | | | | |
| | | Class C | |
| | | Year Ended November 30, | |
| | | 2022 | | | 2021 | | | 2020 | | | 2019 | | | 2018 | |
| | | | |
| | | | | | | | | | | | | | | | | | | | |
Net asset value, beginning of period | | | $ 9.37 | | | | $ 9.09 | | | | $ 9.94 | | | | $ 9.30 | | | | $ 10.44 | |
| | | | |
Income From Investment Operations | |
| | | | | |
Net investment income(a)(b) | | | .19 | | | | .16 | | | | .19 | | | | .25 | | | | .40 | |
| | | | | |
Net realized and unrealized gain (loss) on investment and foreign currency transactions | | | (1.75 | ) | | | .40 | | | | (.73 | ) | | | .75 | | | | (.95 | ) |
| | | | | |
Contributions from Affiliates | | | – 0 | – | | | .00 | (c) | | | – 0 | – | | | – 0 | – | | | .00 | (c) |
| | | | |
Net increase (decrease) in net asset value from operations | | | (1.56 | ) | | | .56 | | | | (.54 | ) | | | 1.00 | | | | (.55 | ) |
| | | | |
Less: Dividends and Distributions | |
| | | | | |
Dividends from net investment income | | | (0.13 | ) | | | (.24 | ) | | | (.31 | ) | | | (.36 | ) | | | (.38 | ) |
| | | | | |
Distributions from net realized gain on investment transactions | | | – 0 | – | | | – 0 | – | | | – 0 | – | | | – 0 | – | | | (.21 | ) |
| | | | | |
Return of capital | | | (0.06 | ) | | | (.04 | ) | | | – 0 | – | | | – 0 | – | | | – 0 | – |
| | | | |
Total dividends and distributions | | | (.19 | ) | | | (.28 | ) | | | (.31 | ) | | | (.36 | ) | | | (.59 | ) |
| | | | |
Net asset value, end of period | | | $ 7.62 | | | | $ 9.37 | | | | $ 9.09 | | | | $ 9.94 | | | | $ 9.30 | |
| | | | |
|
Total Return | |
| | | | | |
Total investment return based on net asset value(d) | | | (16.79 | )% | | | 6.17 | % | | | (5.25 | )% | | | 10.98 | % | | | (5.57 | )%(f) |
|
Ratios/Supplemental Data | |
| | | | | |
Net assets, end of period (000’s omitted) | | | $257 | | | | $486 | | | | $845 | | | | $1,105 | | | | $704 | |
|
Ratio to average net assets of: | |
| | | | | |
Expenses, net of waivers/reimbursements(e)‡ | | | 1.55 | % | | | 1.59 | % | | | 1.51 | % | | | 1.53 | % | | | 1.49 | % |
| | | | | |
Expenses, before waivers/reimbursements(e)‡ | | | 2.47 | % | | | 2.25 | % | | | 2.12 | % | | | 2.16 | % | | | 2.13 | % |
| | | | | |
Net investment income(b) | | | 2.22 | % | | | 1.68 | % | | | 2.15 | % | | | 2.65 | % | | | 4.11 | % |
| | | | | |
Portfolio turnover rate | | | 98 | % | | | 86 | % | | | 105 | % | | | 77 | % | | | 74 | % |
| | | | | | | | | | | | | | | | | | | | |
| |
�� Expense ratios exclude the estimated acquired fund fees of the affiliated/unaffiliated | |
underlying portfolios | | | .20 | % | | | .15 | % | | | .24 | % | | | .24 | % | | | .26 | % |
See footnote summary on page 62.
| | |
| |
| abfunds.com | | AB ALL MARKET INCOME PORTFOLIO | 61 |
FINANCIAL HIGHLIGHTS (continued)
Selected Data For A Share Of Capital Stock Outstanding Throughout Each Period
| | | | | | | | | | | | | | | | | | | | |
| | | Advisor Class | |
| | | Year Ended November 30, | |
| | | 2022 | | | 2021 | | | 2020 | | | 2019 | | | 2018 | |
| | | | |
| | | | | | | | | | | | | | | | | | | | |
Net asset value, beginning of period | | | $ 9.37 | | | | $ 9.10 | | | | $ 9.96 | | | | $ 9.32 | | | | $ 10.45 | |
| | | | |
Income From Investment Operations | |
| | | | | |
Net investment income(a)(b) | | | .28 | | | | .25 | | | | .28 | | | | .36 | | | | .50 | |
| | | | | |
Net realized and unrealized gain (loss) on investment and foreign currency transactions | | | (1.75 | ) | | | .40 | | | | (.73 | ) | | | .73 | | | | (.95 | ) |
| | | | | |
Contributions from Affiliates | | | – 0 | – | | | .00 | (c) | | | – 0 | – | | | – 0 | – | | | .00 | (c) |
| | | | |
Net increase (decrease) in net asset value from operations | | | (1.47 | ) | | | .65 | | | | (.45 | ) | | | 1.09 | | | | (.45 | ) |
| | | | |
Less: Dividends and Distributions | |
| | | | | |
Dividends from net investment income | | | (0.19 | ) | | | (.33 | ) | | | (.41 | ) | | | (.45 | ) | | | (.47 | ) |
| | | | | |
Distributions from net realized gain on investment transactions | | | – 0 | – | | | – 0 | – | | | – 0 | – | | | – 0 | – | | | (.21 | ) |
| | | | | |
Return of capital | | | (0.09 | ) | | | (.05 | ) | | | – 0 | – | | | – 0 | – | | | – 0 | – |
| | | | |
Total dividends and distributions | | | (.28 | ) | | | (.38 | ) | | | (.41 | ) | | | (.45 | ) | | | (.68 | ) |
| | | | |
Net asset value, end of period | | | $ 7.62 | | | | $ 9.37 | | | | $ 9.10 | | | | $ 9.96 | | | | $ 9.32 | |
| | | | |
|
Total Return | |
| | | | | |
Total investment return based on net asset value(d) | | | (15.88 | )% | | | 7.20 | % | | | (4.35 | )% | | | 12.03 | % | | | (4.56 | )% |
|
Ratios/Supplemental Data | |
| | | | | |
Net assets, end of period (000’s omitted) | | | $40,823 | | | | $82,498 | | | | $86,783 | | | | $99,571 | | | | $97,826 | |
|
Ratio to average net assets of: | |
| | | | | |
Expenses, net of waivers/reimbursements(e)‡ | | | .54 | % | | | .60 | % | | | .51 | % | | | .53 | % | | | .49 | % |
| | | | | |
Expenses, before waivers/reimbursements(e)‡ | | | 1.49 | % | | | 1.26 | % | | | 1.12 | % | | | 1.15 | % | | | 1.12 | % |
| | | | | |
Net investment income(b) | | | 3.29 | % | | | 2.58 | % | | | 3.12 | % | | | 3.77 | % | | | 5.09 | % |
| | | | | |
Portfolio turnover rate | | | 98 | % | | | 86 | % | | | 105 | % | | | 77 | % | | | 74 | % |
| | | | | | | | | | | | | | | | | | | | |
| |
‡ Expense ratios exclude the estimated acquired fund fees of the affiliated/unaffiliated | |
underlying portfolios | | | .20 | % | | | .15 | % | | | .24 | % | | | .24 | % | | | .26 | % |
See footnote summary on page 62.
| | |
| |
62 | AB ALL MARKET INCOME PORTFOLIO | | abfunds.com |
FINANCIAL HIGHLIGHTS (continued)
Selected Data For A Share Of Capital Stock Outstanding Throughout Each Period
| (a) | Based on average shares outstanding. |
| (b) | Net of expenses waived/reimbursed by the Adviser. |
| (c) | Amount is less than $.005. |
| (d) | Total investment return is calculated assuming an initial investment made at the net asset value at the beginning of the period, reinvestment of all dividends and distributions at net asset value during the period, and redemption on the last day of the period. Initial sales charges or contingent deferred sales charges are not reflected in the calculation of total investment return. Total return does not reflect the deduction of taxes that a shareholder would pay on fund distributions or the redemption of fund shares. Total investment return calculated for a period of less than one year is not annualized. |
| (e) | In connection with the Fund’s investments in affiliated underlying portfolios, the Fund incurs no direct expenses, but bears proportionate shares of the fees and expenses (i.e., operating, administrative and investment advisory fees) of the affiliated underlying portfolios. The Adviser has contractually agreed to waive its fees from the Fund in an amount equal to the Fund’s pro rata share of certain acquired fund fees and expenses, and for the period shown below, such waiver amounted to: |
| | | | | | | | | | | | | | | | | | | | |
| | | Year Ended November 30, | |
| | | 2022 | | | 2021 | | | 2020 | | | 2019 | | | 2018 | |
| | | | |
Class A | | | .20 | % | | | .14 | % | | | .23 | % | | | .21 | % | | | .25 | % |
Class C | | | .20 | % | | | .14 | % | | | .23 | % | | | .21 | % | | | .25 | % |
Advisor Class | | | .20 | % | | | .14 | % | | | .23 | % | | | .21 | % | | | .25 | % |
| (f) | The net asset value and total return include adjustments in accordance with accounting principles generally accepted in the United States of America for financial reporting purposes. As such, the net asset value and total return for shareholder transactions may differ from financial statements. |
See notes to financial statements.
| | |
| |
| abfunds.com | | AB ALL MARKET INCOME PORTFOLIO | 63 |
REPORT OF INDEPENDENT REGISTERED
PUBLIC ACCOUNTING FIRM
To the Shareholders and the Board of Directors of AB All Market Income Portfolio
Opinion on the Financial Statements
We have audited the accompanying statement of assets and liabilities of AB All Market Income Portfolio (the “Fund”) (one of the funds constituting AB Cap Fund, Inc. (the “Company”)), including the portfolio of investments, as of November 30, 2022, and the related statement of operations for the year then ended, the statements of changes in net assets for each of the two years in the period then ended, the financial highlights for each of the five years in the period then ended and the related notes (collectively referred to as the “financial statements”). In our opinion, the financial statements present fairly, in all material respects, the financial position of the Fund (one of the funds constituting AB Cap Fund, Inc.) at November 30, 2022, the results of its operations for the year then ended, the changes in its net assets for each of the two years in the period then ended and its financial highlights for each of the five years in the period then ended, in conformity with U.S. generally accepted accounting principles.
Basis for Opinion
These financial statements are the responsibility of the Company’s management. Our responsibility is to express an opinion on the Fund’s financial statements based on our audits. We are a public accounting firm registered with the Public Company Accounting Oversight Board (United States) (“PCAOB”) and are required to be independent with respect to the Company in accordance with the U.S. federal securities laws and the applicable rules and regulations of the Securities and Exchange Commission and the PCAOB.
We conducted our audits in accordance with the standards of the PCAOB. Those standards require that we plan and perform the audit to obtain reasonable assurance about whether the financial statements are free of material misstatement, whether due to error or fraud. The Company is not required to have, nor were we engaged to perform, an audit of the Company’s internal control over financial reporting. As part of our audits, we are required to obtain an understanding of internal control over financial reporting but not for the purpose of expressing an opinion on the effectiveness of the Company’s internal control over financial reporting. Accordingly, we express no such opinion.
Our audits included performing procedures to assess the risks of material misstatement of the financial statements, whether due to error or fraud, and performing procedures that respond to those risks. Such procedures included examining, on a test basis, evidence regarding the amounts and
| | |
| |
64 | AB ALL MARKET INCOME PORTFOLIO | | abfunds.com |
REPORT OF INDEPENDENT REGISTERED
PUBLIC ACCOUNTING FIRM (continued)
disclosures in the financial statements. Our procedures included confirmation of securities owned as of November 30, 2022, by correspondence with the custodian, brokers and others; when replies were not received from brokers or others, we performed other auditing procedures. Our audits also included evaluating the accounting principles used and significant estimates made by management, as well as evaluating the overall presentation of the financial statements. We believe that our audits provide a reasonable basis for our opinion.

We have served as the auditor of one or more of the AB investment companies since 1968.
New York, New York
January 26, 2023
| | |
| |
| abfunds.com | | AB ALL MARKET INCOME PORTFOLIO | 65 |
2022 FEDERAL TAX INFORMATION
(unaudited)
For Federal income tax purposes, the following information is furnished with respect to the distributions paid by the Fund during the taxable year ended November 30, 2022. For individual shareholders, the Fund designates 47.72% of dividends paid as qualified dividend income. For corporate shareholders, 23.82% of dividends paid qualify for the dividends received deduction.
For foreign shareholders, 44.20% of ordinary income dividends paid may be considered to be qualifying to be taxed as interest-related dividends.
Shareholders should not use the above information to prepare their income tax returns. The information necessary to complete your income tax returns will be included with your Form 1099-DIV which will be sent to you separately in January 2023.
| | |
| |
66 | AB ALL MARKET INCOME PORTFOLIO | | abfunds.com |
BOARD OF DIRECTORS
| | |
Garry L. Moody(1) Chairman Jorge A. Bermudez(1) Michael J. Downey(1) Onur Erzan, President and Chief Executive Officer | | Nancy P. Jacklin(1) Jeanette W. Loeb(1) Carol C. McMullen(1) Marshall C. Turner, Jr.(1) |
OFFICERS
| | |
Daniel J. Loewy(2), Vice President Karen Watkin(2), Vice President Nancy E. Hay, Secretary Michael B. Reyes, Senior Vice President | | Joseph J. Mantineo, Treasurer and Chief Financial Officer Phyllis J. Clarke, Controller Jennifer Friedland, Chief Compliance Officer |
| | |
Custodian and Accounting Agent State Street Bank and Trust Company State Street Corporation CCB/5 1 Iron Street Boston, MA 02210 Principal Underwriter AllianceBernstein Investments, Inc. 501 Commerce Street Nashville, TN 37203 Transfer Agent AllianceBernstein Investor Services, Inc. P.O. Box 786003 San Antonio, TX 78278 Toll-Free (800) 221-5672 | | Independent Registered Public Accounting Firm Ernst & Young LLP One Manhattan West New York, NY 10001 Legal Counsel Seward & Kissel LLP One Battery Park Plaza New York, NY 10004 |
| 1 | Member of the Audit Committee, the Governance and Nominating Committee, and the Independent Directors Committee. |
| 2 | The day-to-day management of, and investment decisions for, the Fund’s portfolio are made by the Adviser’s Multi-Asset Solutions Team. Mr. Loewy and Ms. Watkin are the investment professionals with the most significant responsibility for the day-to-day management of the Fund’s portfolio. |
| | |
| |
| abfunds.com | | AB ALL MARKET INCOME PORTFOLIO | 67 |
MANAGEMENT OF THE FUND
Board of Directors Information
The business and affairs of the Fund are managed under the direction of the Board of Directors. Certain information concerning the Fund’s Directors is set forth below.
| | | | | | | | |
NAME,
ADDRESS*, AGE AND
(YEAR FIRST ELECTED**) | | PRINCIPAL
OCCUPATION(S)
DURING PAST FIVE (5) YEARS
AND OTHER INFORMATION*** | | PORTFOLIOS IN AB FUND COMPLEX OVERSEEN BY
DIRECTOR | | | OTHER PUBLIC COMPANY DIRECTORSHIPS CURRENTLY
HELD BY
DIRECTOR |
| INTERESTED DIRECTOR | | | | | | |
| | | |
Onur Erzan,# 1345 Avenue of the Americas New York, NY 10105 47 (2021) | | Senior Vice President of AllianceBernstein L.P. (the “Adviser”), Head of Global Client Group and Head of Private Wealth. He oversees AB’s entire private wealth management business and third-party institutional and retail franchise, where he is responsible for all client services, sales and marketing, as well as product strategy, management and development worldwide. Director, President and Chief Executive Officer of the AB Mutual Funds as of April 1, 2021. He is also a member of the Equitable Holdings Management Committee. Prior to joining the firm in 2021, he spent over 19 years with McKinsey, most recently as a senior partner and co-leader of its Wealth & Asset Management practice. In addition, he co-led McKinsey’s Banking & Securities Solutions (a portfolio of data, analytics and digital assets and capabilities) globally. | | | 75 | | | None |
| | |
| |
68 | AB ALL MARKET INCOME PORTFOLIO | | abfunds.com |
MANAGEMENT OF THE FUND (continued)
| | | | | | | | |
NAME,
ADDRESS*, AGE AND (YEAR FIRST ELECTED**) | | PRINCIPAL OCCUPATION(S) DURING PAST FIVE (5) YEARS AND OTHER INFORMATION*** | | PORTFOLIOS IN AB FUND COMPLEX OVERSEEN BY
DIRECTOR | | | OTHER PUBLIC COMPANY DIRECTORSHIPS CURRENTLY
HELD BY
DIRECTOR |
INDEPENDENT DIRECTORS
| | | | | | |
| | | |
Garry L. Moody,## Chairman of the Board 70 (2014) | | Private Investor since prior to 2018. Formerly, Partner, Deloitte & Touche LLP (1995-2008) where he held a number of senior positions, including Vice Chairman, and U.S. and Global Investment Management Practice Managing Partner; President, Fidelity Accounting and Custody Services Company (1993-1995), where he was responsible for accounting, pricing, custody and reporting for the Fidelity mutual funds; and Partner, Ernst & Young LLP (1975-1993), where he served as the National Director of Mutual Fund Tax Services and Managing Partner of its Chicago Office Tax department. He is a member of the Investment Company Institute’s Board of Governors and the Independent Directors Council’s Governing Council, where he serves as Chairman of its Governance Committee. He is Chairman of the AB Funds and Chairman of the Independent Directors Committees since January 2023 and he has served as a director or trustee, and as Chairman of the Audit Committees, of the AB Funds since 2008. | | | 75 | | | None |
| | |
| |
| abfunds.com | | AB ALL MARKET INCOME PORTFOLIO | 69 |
MANAGEMENT OF THE FUND (continued)
| | | | | | | | |
NAME,
ADDRESS*, AGE AND (YEAR FIRST ELECTED**) | | PRINCIPAL OCCUPATION(S) DURING PAST FIVE (5) YEARS AND OTHER INFORMATION*** | | PORTFOLIOS IN AB FUND COMPLEX OVERSEEN BY
DIRECTOR | | | OTHER PUBLIC COMPANY DIRECTORSHIPS CURRENTLY
HELD BY
DIRECTOR |
INDEPENDENT DIRECTORS
(continued) | | | | | | |
| | | |
Jorge A. Bermudez,## 71 (2020) | | Private Investor since prior to 2018. Formerly, Chief Risk Officer of Citigroup, Inc., a global financial services company, from November 2007 to March 2008, Chief Executive Officer of Citigroup’s Commercial Business Group in North America and Citibank Texas from 2005 to 2007, and a variety of other executive and leadership roles at various businesses within Citigroup prior to then; Chairman (2018) of the Texas A&M Foundation Board of Trustees (Trustee since 2013) and Chairman of the Smart Grid Center Board at Texas A&M University since 2012; director of, among others, Citibank N.A. from 2005 to 2008, the Federal Reserve Bank of Dallas, Houston Branch from 2009 to 2011, the Federal Reserve Bank of Dallas from 2011 to 2017, and the Electric Reliability Council of Texas from 2010 to 2016. He has served as director or trustee of the AB Funds since January 2020. | | | 75 | | | Moody’s Corporation since April 2011 and Chair of its Audit Committee since December 2022 |
| | | | | | | | |
| | | |
Michael J. Downey,## 79 (2014) | | Private Investor since prior to 2018. Formerly, Chairman of The Asia Pacific Fund, Inc. (registered investment company) since prior to 2018 until January 2019. From 1987 until 1993, Chairman and CEO of Prudential Mutual Fund Management, director of the Prudential mutual funds, and member of the Executive Committee of Prudential Securities Inc. He has served as a director or trustee of the AB Funds since 2005. | | | 75 | | | None |
| | |
| |
70 | AB ALL MARKET INCOME PORTFOLIO | | abfunds.com |
MANAGEMENT OF THE FUND (continued)
| | | | | | | | |
NAME,
ADDRESS*, AGE AND (YEAR FIRST ELECTED**) | | PRINCIPAL OCCUPATION(S) DURING PAST FIVE (5) YEARS AND OTHER INFORMATION*** | | PORTFOLIOS IN AB FUND COMPLEX OVERSEEN BY
DIRECTOR | | | OTHER PUBLIC COMPANY DIRECTORSHIPS CURRENTLY
HELD BY
DIRECTOR |
INDEPENDENT DIRECTORS
(continued) | | | | | | |
| | | |
Nancy P. Jacklin,## 74 (2014) | | Private Investor since prior to 2018. Professorial Lecturer at the Johns Hopkins School of Advanced International Studies (2008-2015). U.S. Executive Director of the International Monetary Fund (which is responsible for ensuring the stability of the international monetary system) (December 2002 – May 2006); Partner, Clifford Chance (1992-2002); Sector Counsel, International Banking and Finance, and Associate General Counsel, Citicorp (1985-1992); Assistant General Counsel (International), Federal Reserve Board of Governors (1982-1985); and Attorney Advisor, U.S. Department of the Treasury (1973-1982). Member of the Bar of the District of Columbia and of New York; and member of the Council on Foreign Relations. She has served as a director or trustee of the AB Funds since 2006 and has been Chair of the Governance and Nominating Committees of the AB Funds since August 2014. | | | 75 | | | None |
| | | | | | | | |
| | | |
Jeanette W. Loeb,## 70 (2020) | | Chief Executive Officer of PetCareRx (e-commerce pet pharmacy) from 2002 to 2011 and 2015 to present. Director of New York City Center since 2005. She was a director of AB Multi-Manager Alternative Fund, Inc. (fund of hedge funds) from 2012 to 2018. Formerly, affiliated with Goldman Sachs Group, Inc. (financial services) from 1977 to 1994, including as a partner thereof from 1986 to 1994. She has served as director or trustee of the AB Funds since April 2020. | | | 75 | | | Apollo Investment Corp. (business development company) since August 2011 |
| | |
| |
| abfunds.com | | AB ALL MARKET INCOME PORTFOLIO | 71 |
MANAGEMENT OF THE FUND (continued)
| | | | | | | | |
NAME,
ADDRESS*, AGE AND (YEAR FIRST ELECTED**) | | PRINCIPAL OCCUPATION(S) DURING PAST FIVE (5) YEARS AND OTHER INFORMATION*** | | PORTFOLIOS IN AB FUND COMPLEX OVERSEEN BY
DIRECTOR | | | OTHER PUBLIC COMPANY DIRECTORSHIPS CURRENTLY
HELD BY
DIRECTOR |
INDEPENDENT DIRECTORS
(continued) | | | | | | |
| | | |
Carol C. McMullen,## 67 (2016) | | Managing Director of Slalom Consulting (consulting) since 2014, private investor and a member of the Advisory Board of Butcher Box (since 2018). Formerly, member, Partners Healthcare Investment Committee (2010-2019); Director of Norfolk & Dedham Group (mutual property and casualty insurance) from 2011 until November 2016; Director of Partners Community Physicians Organization (healthcare) from 2014 until December 2016 and Managing Director of The Crossland Group (consulting) from 2012 to 2013. She has held a number of senior positions in the asset and wealth management industries, including at Eastern Bank (where her roles included President of Eastern Wealth Management), Thomson Financial (Global Head of Sales for Investment Management), and Putnam Investments (where her roles included Chief Investment Officer, Core and Growth and Head of Global Investment Research). She has served on a number of private company and non-profit boards, and as a director or trustee of the AB Funds since June 2016. | | | 75 | | | None |
| | |
| |
72 | AB ALL MARKET INCOME PORTFOLIO | | abfunds.com |
MANAGEMENT OF THE FUND (continued)
| | | | | | | | |
NAME,
ADDRESS*, AGE AND (YEAR FIRST ELECTED**) | | PRINCIPAL OCCUPATION(S) DURING PAST FIVE (5) YEARS AND OTHER INFORMATION*** | | PORTFOLIOS IN AB FUND COMPLEX OVERSEEN BY
DIRECTOR | | | OTHER PUBLIC COMPANY DIRECTORSHIPS CURRENTLY
HELD BY
DIRECTOR |
INDEPENDENT DIRECTORS
(continued) | | | | | | |
| | | |
Marshall C. Turner, Jr.,## 81 (2014) | | Private Investor since prior to 2018. Former Chairman and CEO of Dupont Photomasks, Inc. (semi-conductor manufacturing equipment). He was a Director of Xilinx, Inc. (programmable logic semi-conductors and adaptable, intelligent computing) from 2007 through August 2020, and is a former director of 33 other companies and organizations. He has extensive operating leadership and venture capital investing experience, including five interim or full-time CEO roles, and prior service as general partner of institutional venture capital partnerships. He also has extensive non-profit board leadership experience, and currently serves on the board of the George Lucas Educational Foundation. He has served as a director of one AB Fund since 1992, and director or trustee of all AB Funds since 2005. He has served as both Chairman of the AB Funds and Chairman of the Independent Directors Committees from 2014 through December 2022 | | | 75 | | | None |
| | | | | | | | |
| | |
| |
| abfunds.com | | AB ALL MARKET INCOME PORTFOLIO | 73 |
MANAGEMENT OF THE FUND (continued)
| * | The address for each of the Fund’s Directors is c/o AllianceBernstein L.P., Attention: Legal and Compliance Department—Mutual Fund Legal, 1345 Avenue of the Americas, New York, NY 10105. |
| ** | There is no stated term of office for the Fund’s Directors. |
| *** | The information above includes each Director’s principal occupation during the last five years and other information relating to the experience, attributes, and skills relevant to each Director’s qualifications to serve as a Director, which led to the conclusion that each Director should serve as a Director for the Fund. |
| # | Mr. Erzan is an “interested person”, as defined in Section 2(a)(19) of the 1940 Act, of the Fund due to his position as a Senior Vice President of the Adviser. |
| ## | Member of the Audit Committee, the Governance and Nominating Committee, and the Independent Directors Committee. |
| | |
| |
74 | AB ALL MARKET INCOME PORTFOLIO | | abfunds.com |
MANAGEMENT OF THE FUND (continued)
Officer Information
Certain Information concerning the Fund’s Officers is listed below.
| | | | |
NAME, ADDRESS* AND AGE | | POSITION(S)
HELD WITH FUND | | PRINCIPAL OCCUPATION
DURING PAST FIVE (5) YEARS |
Onur Erzan 47 | | President and Chief Executive Officer | | See biography above. |
| | | | |
Daniel J. Loewy 48 | | Vice President | | Senior Vice President of the Adviser**, with which he has been associated since prior to 2018. He is also Chief Investment Officer and Head of Multi-Asset Solutions and Chief Investment Officer for Dynamic Asset Allocation. |
| | | | |
Karen Watkin 45 | | Vice President | | Portfolio Manager for the Multi-Asset Solutions business in EMEA and Senior Vice President of the Adviser, with which she has been associated since prior to 2018. |
| | | | |
Nancy E. Hay 50 | | Secretary | | Vice President and Counsel of the Adviser**, with which she has been associated since prior to 2018 and Assistant Secretary of ABI**. |
| | | | |
Michael B. Reyes 46 | | Senior Vice President | | Vice President of the Adviser**, with which he has been associated since prior to 2018. |
| | | | |
Joseph J. Mantineo 63 | | Treasurer and Chief Financial Officer | | Senior Vice President of AllianceBernstein Investor Services (“ABIS”)**, with which he has been associated since prior to 2018. |
| | | | |
Phyllis J. Clarke 62 | | Controller | | Vice President of ABIS**, with which she has been associated since prior to 2018. |
| | | | |
Jennifer Friedland 48 | | Chief Compliance Officer | | Vice President of the Adviser** since 2020 and Mutual Fund Chief Compliance Officer (of all Funds since January 2023 and of the ETF Funds since 2022). Before joining the Adviser** in 2020, she was Chief Compliance Officer at WestEnd Advisors, LLC from prior to 2018 until 2019. |
| * | The address for each of the Fund’s Officers is 1345 Avenue of the Americas, New York, NY 10105. |
| ** | The Adviser, ABI and ABIS are affiliates of the Fund. |
The Fund’s Statement of Additional Information (“SAI”) has additional information about the Fund’s Directors and Officers and is available without charge upon request. Contact your financial representative or AB at (800) 227-4618, or visit www.abfunds.com, for a free prospectus or SAI.
| | |
| |
| abfunds.com | | AB ALL MARKET INCOME PORTFOLIO | 75 |
Operation and Effectiveness of the Fund’s Liquidity Risk Management Program:
In October 2016, the Securities and Exchange Commission (“SEC”) adopted the open-end fund liquidity rule (the “Liquidity Rule”). In June 2018 the SEC adopted a requirement that funds disclose information about the operation and effectiveness of their Liquidity Risk Management Program (“LRMP”) in their reports to shareholders.
One of the requirements of the Liquidity Rule is for the Fund to designate an Administrator of the Fund’s Liquidity Risk Management Program. The Administrator of the Fund’s LRMP is AllianceBernstein L.P., the Fund’s investment adviser (the “Adviser”). The Adviser has delegated the responsibility to its Liquidity Risk Management Committee (the “Committee”).
Another requirement of the Liquidity Rule is for the Fund’s Board of Directors (the “Fund Board”) to receive an annual written report from the Administrator of the LRMP, which addresses the operation of the Fund’s LRMP and assesses its adequacy and effectiveness. The Adviser provided the Fund Board with such annual report during the first quarter of 2022, which covered the period January 1, 2021 through December 31, 2021 (the “Program Reporting Period”).
The LRMP’s principal objectives include supporting the Fund’s compliance with limits on investments in illiquid assets and mitigating the risk that the Fund will be unable to meet its redemption obligations in a timely manner.
Pursuant to the LRMP, the Fund classifies the liquidity of its portfolio investments into one of the four categories defined by the SEC: Highly Liquid, Moderately Liquid, Less Liquid, and Illiquid. These classifications are reported to the SEC on Form N-PORT.
During the Program Reporting Period, the Committee reviewed whether the Fund’s strategy is appropriate for an open-end structure, incorporating any holdings of less liquid and illiquid assets. If the Fund participated in derivative transactions, the exposure from such transactions were considered in the LRMP.
The Committee also performed an analysis to determine whether the Fund is required to maintain a Highly Liquid Investment Minimum (“HLIM”). The Committee also incorporated the following information when determining the Fund’s reasonably anticipated trading size for purposes of liquidity monitoring: historical net redemption activity, a Fund’s concentration in an issuer, shareholder concentration, investment performance, total net assets, and distribution channels.
The Adviser informed the Fund Board that the Committee believes the Fund’s LRMP is adequately designed, has been implemented as intended,
| | |
| |
76 | AB ALL MARKET INCOME PORTFOLIO | | abfunds.com |
and has operated effectively since its inception. No material exceptions have been noted since the implementation of the LRMP. During the Program Reporting Period, liquidity in all markets was significantly recovered and improved compared to the prior reporting period which included extreme levels of price volatility and relative illiquidity beginning in March 2020 with COVID-19 impacts. As such, the program operated in a relatively robust and benign liquidity environment experienced in markets during the Program Reporting Period. There were no liquidity events that impacted the Fund or its ability to timely meet redemptions during the Program Reporting Period.
| | |
| |
| abfunds.com | | AB ALL MARKET INCOME PORTFOLIO | 77 |
Information Regarding the Review and Approval of the Fund’s Advisory Agreement
The disinterested directors (the “directors”) of AB Cap Fund, Inc. (the “Company”) unanimously approved the continuance of the Company’s Advisory Agreement with the Adviser in respect of AB All Market Income Portfolio (the “Fund”) at a meeting held in-person on August 2-3, 2022 (the “Meeting”).
Prior to approval of the continuance of the Advisory Agreement, the directors had requested from the Adviser, and received and evaluated, extensive materials. They reviewed the proposed continuance of the Advisory Agreement with the Adviser and with experienced counsel who are independent of the Adviser, who advised on the relevant legal standards. The directors also reviewed additional materials, including comparative analytical data prepared by the Senior Vice President for the Fund. The directors also discussed the proposed continuance in private sessions with counsel.
The directors considered their knowledge of the nature and quality of the services provided by the Adviser to the Fund gained from their experience as directors or trustees of most of the registered investment companies advised by the Adviser, their overall confidence in the Adviser’s integrity and competence they have gained from that experience, the Adviser’s initiative in identifying and raising potential issues with the directors and its responsiveness, frankness and attention to concerns raised by the directors in the past, including the Adviser’s willingness to consider and implement organizational and operational changes designed to improve investment results and the services provided to the AB Funds. The directors noted that they have four regular meetings each year, at each of which they review extensive materials and information from the Adviser, including information on the investment performance of the Fund and the underlying funds advised by the Adviser in which the Fund invests a portion of its assets.
The directors also considered all factors they believed relevant, including the specific matters discussed below. During the course of their deliberations, the directors evaluated, among other things, the reasonableness of the advisory fee. The directors did not identify any particular information that was all-important or controlling, and different directors may have attributed different weights to the various factors. The directors determined that the selection of the Adviser to manage the Fund and the overall arrangements between the Fund and the Adviser, as provided in the Advisory Agreement, including the advisory fee, were fair and reasonable in light of the services performed, expenses incurred and such other matters as the directors considered relevant in the exercise of their business
| | |
| |
78 | AB ALL MARKET INCOME PORTFOLIO | | abfunds.com |
judgment. The material factors and conclusions that formed the basis for the directors’ determinations included the following:
Nature, Extent and Quality of Services Provided
The directors considered the scope and quality of services provided by the Adviser under the Advisory Agreement, including the quality of the investment research capabilities of the Adviser and the other resources it has dedicated to performing services for the Fund. The directors noted that the Adviser from time to time reviews the Fund’s investment strategies and from time to time proposes changes intended to improve the Fund’s relative or absolute performance for the directors’ consideration. They also noted the professional experience and qualifications of the Fund’s portfolio management team and other senior personnel of the Adviser. The directors also considered that the Advisory Agreement provides that the Fund will reimburse the Adviser for the cost to it of providing certain clerical, accounting, administrative and other services to the Fund by employees of the Adviser or its affiliates. Requests for these reimbursements are made on a quarterly basis and subject to approval by the directors. The Adviser had not requested any reimbursements from the Fund since its inception in December 2014. The quality of administrative and other services, including the Adviser’s role in coordinating the activities of the Fund’s other service providers, also was considered. The directors concluded that, overall, they were satisfied with the nature, extent and quality of services provided to the Fund under the Advisory Agreement.
Costs of Services Provided and Profitability
The directors reviewed a schedule of the revenues and expenses and related notes indicating the profitability of the Fund to the Adviser for calendar years 2020 and 2021 that had been prepared with an expense allocation methodology arrived at in consultation with an independent consultant at the request of the directors. The directors noted the assumptions and methods of allocation used by the Adviser in preparing fund-specific profitability data and understood that there are a number of potentially acceptable allocation methodologies for information of this type. The directors noted that the profitability information reflected all revenues and expenses of the Adviser’s relationship with the Fund, including those relating to its subsidiaries that provide transfer agency, distribution and brokerage services to the Fund. The directors recognized that it is difficult to make comparisons of the profitability of the Advisory Agreement with the profitability of fund advisory contracts for unaffiliated funds because comparative information is not generally publicly available and is affected by numerous factors. The directors focused on the profitability of the Adviser’s relationship with the Fund before taxes and distribution expenses. The directors noted that the Fund was not profitable to the Adviser in the periods reviewed.
| | |
| |
| abfunds.com | | AB ALL MARKET INCOME PORTFOLIO | 79 |
Fall-Out Benefits
The directors considered the other benefits to the Adviser and its affiliates from their relationships with the Fund and the underlying funds advised by the Adviser in which the Fund invests, including, but not limited to, benefits relating to soft dollar arrangements (whereby investment advisers receive brokerage and research services from brokers that execute agency transactions for their clients); 12b-1 fees and sales charges received by the Fund’s principal underwriter (which is a wholly owned subsidiary of the Adviser) in respect of certain classes of the Fund’s shares; brokerage commissions paid by the Fund to brokers affiliated with the Adviser; and transfer agency fees paid by the Fund to a wholly owned subsidiary of the Adviser. The directors recognized that the Fund’s unprofitability to the Adviser would be exacerbated without these benefits. The directors understood that the Adviser also might derive reputational and other benefits from its association with the Fund.
Investment Results
In addition to the information reviewed by the directors in connection with the Meeting, the directors receive detailed performance information for the Fund at each regular Board meeting during the year.
At the Meeting, the directors reviewed performance information prepared by an independent service provider (the “15(c) service provider”), showing the performance of the Class A Shares of the Fund against a group of similar funds (“peer group”) and a larger group of similar funds (“peer universe”), each selected by the 15(c) service provider, and information prepared by the Adviser showing performance of the Class A Shares against a broad-based securities market index, in each case for the 1-, 3- and 5-year periods ended May 31, 2022 and (in the case of comparisons with the broad-based securities market index) for the period from inception. Based on their review and their discussion with the Adviser of the reasons for the Fund’s underperformance in the periods reviewed, the directors concluded that the Fund’s investment performance was acceptable. The directors determined to continue to monitor the Fund’s performance closely.
Advisory Fees and Other Expenses
The directors considered the advisory fee rate payable by the Fund to the Adviser and information prepared by the 15(c) service provider concerning advisory fee rates payable by other funds in the same category as the Fund. The directors recognized that it is difficult to make comparisons of advisory fees because there are variations in the services that are included in the fees payable by other funds. The directors compared the Fund’s contractual effective advisory fee rate with a peer group median.
The directors also considered the Adviser’s fee schedule for other clients utilizing investment strategies similar to those of the Fund. For this purpose,
| | |
| |
80 | AB ALL MARKET INCOME PORTFOLIO | | abfunds.com |
they reviewed the relevant advisory fee information from the Adviser’s Form ADV and in a report from the Fund’s Senior Vice President and noted the differences between the Fund’s fee schedule, on the one hand, and the Adviser’s institutional fee schedule and the schedule of fees charged by the Adviser to any offshore funds and for services to any sub-advised funds utilizing investment strategies similar to the those of the Fund, on the other. The directors noted that the Adviser may, in some cases, agree to fee rates with large institutional clients that are lower than those reviewed by the directors and that they had previously discussed with the Adviser its policies in respect of such arrangements.
The Adviser reviewed with the directors the significantly greater scope of the services it provides to the Fund relative to institutional, offshore fund and sub-advised fund clients. In this regard, the Adviser noted, among other things, that, compared to institutional and offshore or sub-advisory accounts, the Fund (i) demands considerably more portfolio management, research and trading resources due to significantly higher daily cash flows; (ii) has more tax and regulatory restrictions and compliance obligations; (iii) must prepare and file or distribute regulatory and other communications about fund operations; and (iv) must provide shareholder servicing to retail investors. The Adviser also reviewed the greater legal risks presented by the large and changing population of Fund shareholders who may assert claims against the Adviser in individual or class actions, and the greater entrepreneurial risk in offering new fund products, which require substantial investment to launch, may not succeed, and generally must be priced to compete with larger, more established funds resulting in lack of profitability to the Adviser until a new fund achieves scale. In light of the substantial differences in services rendered by the Adviser to institutional, offshore fund and sub-advised fund clients as compared to the Fund, and the different risk profile, the directors considered these fee comparisons inapt and did not place significant weight on them in their deliberations.
In connection with their review of the Fund’s advisory fee, the directors also considered the total expense ratio of the Class A shares of the Fund in comparison to a peer group and a peer universe selected by the 15(c) service provider. The Class A expense ratio of the Fund was based on the Fund’s latest fiscal year and the directors considered the Adviser’s expense cap for the Fund. The directors noted that it was likely that the expense ratios of some of the other funds in the Fund’s category were lowered by waivers or reimbursements by those funds’ investment advisers, which in some cases might be voluntary or temporary. The directors view expense ratio information as relevant to their evaluation of the Adviser’s services because the Adviser is responsible for coordinating services provided to the Fund by others. Based on their review, the directors concluded that the Fund’s expense ratio was acceptable.
| | |
| |
| abfunds.com | | AB ALL MARKET INCOME PORTFOLIO | 81 |
Economies of Scale
The directors noted that the advisory fee schedule for the Fund contains breakpoints that reduce the fee rates on assets above specified levels. The directors took into consideration prior presentations by an independent consultant on economies of scale in the mutual fund industry and for the AB Funds, and presentations from time to time by the Adviser concerning certain of its views on economies of scale. The directors also had requested and received from the Adviser certain updates on economies of scale in advance of the Meeting. The directors believe that economies of scale may be realized (if at all) by the Adviser across a variety of products and services, and not only in respect of a single fund. The directors noted that there is no established methodology for setting breakpoints that give effect to the fund-specific services provided by a fund’s adviser and to the economies of scale that an adviser may realize in its overall mutual fund business or those components of it which directly or indirectly affect a fund’s operations. The directors observed that in the mutual fund industry as a whole, as well as among funds similar to the Fund, there is no uniformity or pattern in the fees and asset levels at which breakpoints (if any) apply. The directors also noted that the advisory agreements for many funds do not have breakpoints at all. Having taken these factors into account, the directors concluded that the Fund’s shareholders would benefit from a sharing of economies of scale in the event the Fund’s net assets exceed a breakpoint in the future.
| | |
| |
82 | AB ALL MARKET INCOME PORTFOLIO | | abfunds.com |
This page is not part of the Shareholder Report or the Financial Statements.
AB FAMILY OF FUNDS
US EQUITY
CORE
Core Opportunities Fund
Select US Equity Portfolio
Sustainable US Thematic Portfolio
GROWTH
Concentrated Growth Fund
Discovery Growth Fund
Growth Fund
Large Cap Growth Fund
Small Cap Growth Portfolio
VALUE
Discovery Value Fund
Equity Income Fund
Relative Value Fund
Small Cap Value Portfolio
Value Fund
INTERNATIONAL/ GLOBAL EQUITY
CORE
Global Core Equity Portfolio
International Strategic Core Portfolio
Sustainable Global Thematic Fund
Sustainable International Thematic Fund
Tax-Managed Wealth Appreciation Strategy
Wealth Appreciation Strategy
GROWTH
Concentrated International Growth Portfolio
VALUE
All China Equity Portfolio
International Value Fund
FIXED INCOME
MUNICIPAL
High Income Municipal Portfolio
Intermediate California Municipal Portfolio
Intermediate Diversified Municipal Portfolio
Intermediate New York Municipal Portfolio
Municipal Bond Inflation Strategy
Tax-Aware Fixed Income Opportunities Portfolio
National Portfolio
Arizona Portfolio
California Portfolio
Massachusetts Portfolio
Minnesota Portfolio
New Jersey Portfolio
New York Portfolio
Ohio Portfolio
Pennsylvania Portfolio
Virginia Portfolio
TAXABLE
Bond Inflation Strategy
Global Bond Fund
High Income Fund
High Yield Portfolio
Income Fund
Intermediate Duration Portfolio
Limited Duration High Income Portfolio
Short Duration Income Portfolio
Short Duration Portfolio
Sustainable Thematic Credit Portfolio
Total Return Bond Portfolio
ALTERNATIVES
All Market Real Return Portfolio
Global Real Estate Investment Fund
Select US Long/Short Portfolio
MULTI-ASSET
All Market Total Return Portfolio
Emerging Markets Multi-Asset Portfolio
Global Risk Allocation Fund
Sustainable Thematic Balanced Portfolio
CLOSED-END FUNDS
AllianceBernstein Global High Income Fund
AllianceBernstein National Municipal Income Fund
EXCHANGE-TRADED FUNDS
Tax-Aware Short Duration Municipal ETF
Ultra Short Income ETF
We also offer Government Money Market Portfolio, which serves as the money market fund exchange vehicle for the AB mutual funds. You could lose money by investing in the Fund. Although the Fund seeks to preserve the value of your investment at $1.00 per share, it cannot guarantee it will do so. The Fund may impose a fee upon sale of your shares or may temporarily suspend your ability to sell shares if the Fund’s liquidity falls below required minimums because of market conditions or other factors. An investment in the Fund is not insured or guaranteed by the Federal Deposit Insurance Corporation or any other government agency. The Fund’s sponsor has no legal obligation to provide financial support to the Fund, and you should not expect that the sponsor will provide financial support to the Fund at any time.
Investors should consider the investment objectives, risks, charges and expenses of the Fund carefully before investing. For copies of our prospectus or summary prospectus, which contain this and other information, visit us online at www.abfunds.com or contact your AB representative. Please read the prospectus and/or summary prospectus carefully before investing.
| | |
| |
| abfunds.com | | AB ALL MARKET INCOME PORTFOLIO | 83 |
NOTES
| | |
| |
84 | AB ALL MARKET INCOME PORTFOLIO | | abfunds.com |
AB ALL MARKET INCOME PORTFOLIO
1345 Avenue of the Americas
New York, NY 10105
800 221 5672
AMI-0151-1122 
NOV 11.30.22

ANNUAL REPORT
AB SMALL CAP VALUE PORTFOLIO

| | |
| |
| Investment Products Offered | | • Are Not FDIC Insured • May Lose Value • Are Not Bank Guaranteed |
Investors should consider the investment objectives, risks, charges and expenses of the Fund carefully before investing. For copies of our prospectus or summary prospectus, which contain this and other information, visit us online at www.abfunds.com or contact your AB representative. Please read the prospectus and/or summary prospectus carefully before investing.
This shareholder report must be preceded or accompanied by the Fund’s prospectus for individuals who are not current shareholders of the Fund.
You may obtain a description of the Fund’s proxy voting policies and procedures, and information regarding how the Fund voted proxies relating to portfolio securities during the most recent 12-month period ended June 30, without charge. Simply visit AB’s website at www.abfunds.com, or go to the Securities and Exchange Commission’s (the “Commission”) website at www.sec.gov, or call AB at (800) 227 4618.
The Fund files its complete schedule of portfolio holdings with the Commission for the first and third quarters of each fiscal year as an exhibit to its reports on Form N-PORT. The Fund’s Form N-PORT reports are available on the Commission’s website at www.sec.gov. AB publishes full portfolio holdings for the Fund monthly at www.abfunds.com.
AllianceBernstein Investments, Inc. (ABI) is the distributor of the AB family of mutual funds. ABI is a member of FINRA and is an affiliate of AllianceBernstein L.P., the Adviser of the funds.
The [A/B] logo is a registered service mark of AllianceBernstein and AllianceBernstein® is a registered service mark used by permission of the owner, AllianceBernstein L.P.
| | |
| FROM THE PRESIDENT | |  |
Dear Shareholder,
We’re pleased to provide this report for the AB Small Cap Value Portfolio (the “Fund”). Please review the discussion of Fund performance, the market conditions during the reporting period and the Fund’s investment strategy.
At AB, we’re striving to help our clients achieve better outcomes by:
| + | | Fostering diverse perspectives that give us a distinctive approach to navigating global capital markets |
| + | | Applying differentiated investment insights through a connected global research network |
| + | | Embracing innovation to design better ways to invest and leading-edge mutual-fund solutions |
Whether you’re an individual investor or a multibillion-dollar institution, we’re putting our knowledge and experience to work for you every day.
For more information about AB’s comprehensive range of products and shareholder resources, please log on to www.abfunds.com.
Thank you for your investment in AB mutual funds—and for placing your trust in our firm.
Sincerely,

Onur Erzan
President and Chief Executive Officer, AB Mutual Funds
| | |
| |
| abfunds.com | | AB SMALL CAP VALUE PORTFOLIO | 1 |
ANNUAL REPORT
January 9, 2023
This report provides management’s discussion of fund performance for the AB Small Cap Value Portfolio for the annual reporting period ended November 30, 2022.
The Fund’s investment objective is to seek long-term growth of capital.
NAV RETURNS AS OF NOVEMBER 30, 2022 (unaudited)
| | | | | | | | |
| | |
| | | 6 Months | | | 12 Months | |
| | |
| AB SMALL CAP VALUE PORTFOLIO | | | | | | | | |
| | |
| Class A Shares | | | -0.77% | | | | -6.72% | |
| | |
| Class C Shares | | | -1.18% | | | | -7.35% | |
| | |
| Advisor Class Shares1 | | | -0.69% | | | | -6.53% | |
| | |
| Russell 2000 Value Index | | | -0.25% | | | | -4.75% | |
| 1 | Please note that this share class is for investors purchasing shares through accounts established under certain fee-based programs sponsored and maintained by certain broker-dealers and financial intermediaries, institutional pension plans and/or investment advisory clients of, and certain other persons associated with, the Adviser and its affiliates or the Fund. |
INVESTMENT RESULTS
The table above shows the Fund’s performance compared to its benchmark, the Russell 2000 Value Index, for the six- and 12-month periods ended November 30, 2022.
During the 12-month period, all share classes underperformed the benchmark, before sales charges. Overall sector selection drove underperformance, relative to the benchmark. An underweight to energy and an overweight to consumer discretionary detracted most, while underweights to health care and communication services offset some losses. Security selection was positive. Selection within the financials and materials sectors contributed, while selection within industrials and consumer staples detracted.
During the six-month period, all share classes of the Fund underperformed the benchmark, before sales charges. Overall security selection detracted, mainly due to selection within health care and consumer staples, while selection within financials and communication services contributed. Sector selection was positive, as contributions from underweights to energy and real estate helped offset losses from an overweight to technology and an underweight to consumer staples.
The Fund did not utilize derivatives during the six- or 12-month periods.
| | |
| |
2 | AB SMALL CAP VALUE PORTFOLIO | | abfunds.com |
MARKET REVIEW AND INVESTMENT STRATEGY
US, international and emerging-market stocks declined during the 12-month period ended November 30, 2022. In response to persistently high inflation, central banks—led by the US Federal Reserve (the “Fed”)—took a hawkish pivot, which raised concerns that rapidly rising borrowing costs would slow economic growth significantly and tip global economies into recession. Volatility increased and stocks pulled back after the Fed announced its first interest-rate hike in March 2022, which was followed by five additional rate raises, including four consecutive 0.75% increases. Equity markets began to rebound at the end of the period, after some early evidence of easing inflationary pressures raised hopes that the Fed and other key central banks would soon slow the pace of rate hikes and review the impact of higher rates over a longer time horizon. Against a backdrop of rising rates, growth stocks came under pressure throughout most of the period. Within large-cap markets, growth stocks declined, while value stocks rose and outperformed growth stocks significantly. Large-cap stocks outperformed small-cap stocks on a relative basis, but both declined in absolute terms.
The Fund’s Senior Investment Management Team (the “Team”) seeks to invest opportunistically in what it considers to be undervalued companies with solid fundamentals and attractive long-term earnings prospects. The Fund’s emphasis continues to be at the stock-specific level, as the Team looks for companies that offer compelling valuation, strong free cash flow and significant company-level catalysts.
INVESTMENT POLICIES
The Fund invests primarily in a portfolio of equity securities of small-capitalization US companies. Under normal circumstances, the Fund invests at least 80% of its net assets in equity securities of small-capitalization companies. For purposes of this policy, small-capitalization companies are those that, at the time of investment, fall within the capitalization range between the smallest company in the Russell 2000 Value Index and the greater of $2.5 billion or the largest company in the Russell 2000 Value Index.
The Fund invests in companies that are determined by the Adviser to be undervalued, using the Adviser’s fundamental value approach. In selecting securities for the Fund, the Adviser uses its fundamental and quantitative research to identify companies whose long-term earnings power is not reflected in the current market price of the securities.
The Adviser seeks to manage the overall portfolio volatility relative to the Russell 2000 Value Index by favoring promising securities that offer the best balance between return and targeted risk.
| | |
| |
| abfunds.com | | AB SMALL CAP VALUE PORTFOLIO | 3 |
DISCLOSURES AND RISKS
Benchmark Disclosure
The Russell 2000® Value Index is unmanaged and does not reflect fees and expenses associated with the active management of a mutual fund portfolio. The Russell 2000 Value Index represents the performance of small-cap value companies within the US. An investor cannot invest directly in an index or average, and their results are not indicative of the performance for any specific investment, including the Fund.
A Word About Risk
Market Risk: The value of the Fund’s assets will fluctuate as the stock market fluctuates. The value of its investments may decline, sometimes rapidly and unpredictably, simply because of economic changes or other events, including public health crises (including the occurrence of a contagious disease or illness) and regional and global conflicts, that affect large portions of the market. It includes the risk that a particular style of investing, such as the Fund’s value approach, may underperform the market generally.
Capitalization Risk: Investments in small-capitalization companies may be more volatile than investments in large-capitalization companies. Investments in small-capitalization companies may have additional risks because these companies have limited product lines, markets or financial resources.
Industry/Sector Risk: Investments in a particular industry or group of related industries may have more risk because market or economic factors affecting that industry could have a significant effect on the value of the Fund’s investments.
Management Risk: The Fund is subject to management risk because it is an actively managed investment fund. The Adviser will apply its investment techniques and risk analyses in making investment decisions, but there is no guarantee that its techniques will produce the intended results. Some of these techniques may incorporate, or rely upon, quantitative models, but there is no guarantee that these models will generate accurate forecasts, reduce risk or otherwise perform as expected.
These risks are fully discussed in the Fund’s prospectus. As with all investments, you may lose money by investing in the Fund.
An Important Note About Historical Performance
The investment return and principal value of an investment in the Fund will fluctuate, so that shares, when redeemed, may be worth more or less than their original cost. Performance shown in this report represents past performance and does not guarantee future
| | |
| |
4 | AB SMALL CAP VALUE PORTFOLIO | | abfunds.com |
DISCLOSURES AND RISKS (continued)
results. Current performance may be lower or higher than the performance information shown. You may obtain performance information current to the most recent month-end by visiting www.abfunds.com.
All fees and expenses related to the operation of the Fund have been deducted. Net asset value (“NAV”) returns do not reflect sales charges; if sales charges were reflected, the Fund’s quoted performance would be lower. SEC returns reflect the applicable sales charges for each share class: a 4.25% maximum front-end sales charge for Class A shares and a 1% 1-year contingent deferred sales charge for Class C shares. Returns for the different share classes will vary due to different expenses associated with each class. Performance assumes reinvestment of distributions and does not account for taxes.
| | |
| |
| abfunds.com | | AB SMALL CAP VALUE PORTFOLIO | 5 |
HISTORICAL PERFORMANCE
GROWTH OF A $10,000 INVESTMENT IN THE FUND (unaudited)
12/3/20141 TO 11/30/2022
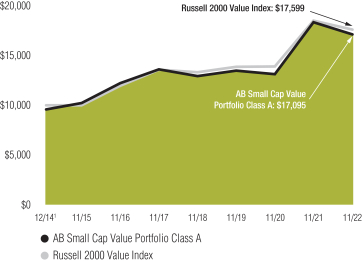
This chart illustrates the total value of an assumed $10,000 investment in AB Small Cap Value Portfolio Class A shares (from 12/3/20141 to 11/30/2022) as compared to the performance of the Fund’s benchmark. The chart reflects the deduction of the maximum 4.25% sales charge from the initial $10,000 investment in the Fund and assumes the reinvestment of dividends and capital gains distributions.
| 1 | Inception date: 12/3/2014. |
| | |
| |
6 | AB SMALL CAP VALUE PORTFOLIO | | abfunds.com |
HISTORICAL PERFORMANCE (continued)
AVERAGE ANNUAL RETURNS AS OF NOVEMBER 30, 2022 (unaudited)
| | | | | | | | |
| | |
| | | NAV Returns | | | SEC Returns (reflects applicable sales charges) | |
| | |
| CLASS A SHARES | | | | | | | | |
| | |
| 1 Year | | | -6.72% | | | | -10.70% | |
| | |
| 5 Years | | | 4.69% | | | | 3.79% | |
| | |
| Since Inception1 | | | 7.52% | | | | 6.94% | |
| | |
| CLASS C SHARES | | | | | | | | |
| | |
| 1 Year | | | -7.35% | | | | -8.21% | |
| | |
| 5 Years | | | 3.93% | | | | 3.93% | |
| | |
| Since Inception1 | | | 6.72% | | | | 6.72% | |
| | |
| ADVISOR CLASS SHARES2 | | | | | | | | |
| | |
| 1 Year | | | -6.53% | | | | -6.53% | |
| | |
| 5 Years | | | 4.94% | | | | 4.94% | |
| | |
| Since Inception1 | | | 7.78% | | | | 7.78% | |
The Fund’s current prospectus fee table shows the Fund’s total annual operating expense ratios as 1.17%, 1.92% and 0.92% for Class A, Class C and Advisor Class shares, respectively, gross of any fee waivers or expense reimbursements. Contractual fee waivers and/or expense reimbursements reduced the Fund’s total annual operating expenses to 1.90% for Class C shares. These waivers/reimbursements may not be terminated prior to February 28, 2023, and may be extended by the Adviser for additional one-year terms. Absent reimbursements or waivers, performance would have been lower. The Financial Highlights section of this report sets forth expense ratio data for the current reporting period; the expense ratios shown above may differ from the expense ratios in the Financial Highlights section since they are based on different time periods.
| 1 | Inception date: 12/3/2014. |
| 2 | This share class is offered at NAV to eligible investors and the SEC returns are the same as the NAV returns. Please note that this share class is for investors purchasing shares through accounts established under certain fee-based programs sponsored and maintained by certain broker-dealers and financial intermediaries, institutional pension plans and/or investment advisory clients of, and certain other persons associated with, the Adviser and its affiliates or the Fund. |
| | |
| |
| abfunds.com | | AB SMALL CAP VALUE PORTFOLIO | 7 |
HISTORICAL PERFORMANCE (continued)
SEC AVERAGE ANNUAL RETURNS
AS OF THE MOST RECENT CALENDAR QUARTER-END
DECEMBER 31, 2022 (unaudited)
| | | | |
| |
| | | SEC Returns (reflects applicable sales charges) | |
| |
| CLASS A SHARES | | | | |
| |
| 1 Year | | | -20.39% | |
| |
| 5 Years | | | 2.49% | |
| |
| Since Inception1 | | | 6.03% | |
| |
| CLASS C SHARES | | | | |
| |
| 1 Year | | | -18.17% | |
| |
| 5 Years | | | 2.65% | |
| |
| Since Inception1 | | | 5.82% | |
| |
| ADVISOR CLASS SHARES2 | | | | |
| |
| 1 Year | | | -16.67% | |
| |
| 5 Years | | | 3.65% | |
| |
| Since Inception1 | | | 6.86% | |
| 1 | Inception date: 12/3/2014. |
| 2 | Please note that this share class is for investors purchasing shares through accounts established under certain fee-based programs sponsored and maintained by certain broker-dealers and financial intermediaries, institutional pension plans and/or investment advisory clients of, and certain other persons associated with, the Adviser and its affiliates or the Fund. |
| | |
| |
8 | AB SMALL CAP VALUE PORTFOLIO | | abfunds.com |
EXPENSE EXAMPLE
(unaudited)
As a shareholder of a mutual fund, you may incur two types of costs: (1) transaction costs, including sales charges (loads) on purchase payments, contingent deferred sales charges on redemptions and (2) ongoing costs, including management fees; distribution (12b-1) fees; and other fund expenses. This example is intended to help you understand your ongoing costs (in dollars) of investing in the Fund and to compare these costs with the ongoing costs of investing in other mutual funds.
The Example is based on an investment of $1,000 invested at the beginning of the period and held for the entire period as indicated below.
Actual Expenses
The table below provides information about actual account values and actual expenses. You may use the information in this line, together with the amount you invested, to estimate the expenses that you paid over the period. Simply divide your account value by $1,000 (for example, an $8,600 account value divided by $1,000 = 8.6), then multiply the result by the number in the first line under the heading entitled “Expenses Paid During Period” to estimate the expenses you paid on your account during this period.
Hypothetical Example for Comparison Purposes
The table below provides information about hypothetical account values and hypothetical expenses based on the Fund’s actual expense ratio and an assumed annual rate of return of 5% before expenses, which is not the Fund’s actual return. The hypothetical account values and expenses may not be used to estimate the actual ending account balance or expenses you paid for the period. You may use this information to compare the ongoing costs of investing in the Fund and other funds by comparing this 5% hypothetical example with the 5% hypothetical examples that appear in the shareholder reports of other funds.
Please note that the expenses shown in the table are meant to highlight your ongoing costs only and do not reflect any transactional costs, such as sales charges (loads), or contingent deferred sales charges on redemptions. Therefore, the hypothetical example is useful in comparing ongoing costs only, and will not help you determine the relative total costs of owning different funds. In addition, if these transactional costs were included, your costs would have been higher.
| | |
| |
| abfunds.com | | AB SMALL CAP VALUE PORTFOLIO | 9 |
EXPENSE EXAMPLE (continued)
| | | | | | | | | | | | | | | | |
| | | Beginning
Account Value
June 1, 2022 | | | Ending
Account Value
November 30, 2022 | | | Expenses Paid
During Period* | | | Annualized
Expense Ratio* | |
| Class A | | | | | | | | | | | | | | | | |
Actual | | $ | 1,000 | | | $ | 992.30 | | | $ | 5.84 | | | | 1.17 | % |
Hypothetical** | | $ | 1,000 | | | $ | 1,019.20 | | | $ | 5.92 | | | | 1.17 | % |
| Class C | | | | | | | | | | | | |
Actual | | $ | 1,000 | | | $ | 988.20 | | | $ | 9.37 | | | | 1.88 | % |
Hypothetical** | | $ | 1,000 | | | $ | 1,015.64 | | | $ | 9.50 | | | | 1.88 | % |
| Advisor Class | | | | | | | | | | | | |
Actual | | $ | 1,000 | | | $ | 993.10 | | | $ | 4.60 | | | | 0.92 | % |
Hypothetical** | | $ | 1,000 | | | $ | 1,020.46 | | | $ | 4.66 | | | | 0.92 | % |
| * | Expenses are equal to the classes’ annualized expense ratios, multiplied by the average account value over the period, multiplied by 183/365 (to reflect the one-half year period), respectively. |
| ** | Assumes 5% annual return before expenses. |
| | |
| |
10 | AB SMALL CAP VALUE PORTFOLIO | | abfunds.com |
PORTFOLIO SUMMARY
November 30, 2022 (unaudited)
PORTFOLIO STATISTICS
Net Assets ($mil): $683.6
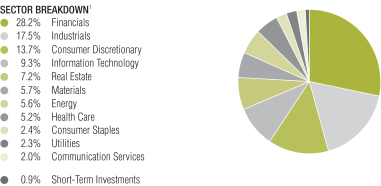
TEN LARGEST HOLDINGS2
| | | | | | | | |
| | |
| Company | | U.S. $ Value | | | Percent of
Net Assets | |
| | |
| Selective Insurance Group, Inc. | | $ | 11,791,233 | | | | 1.7 | % |
| | |
| Associated Banc-Corp. | | | 11,783,154 | | | | 1.7 | |
| | |
| Acadia Healthcare Co., Inc. | | | 11,666,860 | | | | 1.7 | |
| | |
| First BanCorp./Puerto Rico | | | 11,498,088 | | | | 1.7 | |
| | |
| Magnolia Oil & Gas Corp. – Class A | | | 11,389,397 | | | | 1.7 | |
| | |
| Helmerich & Payne, Inc. | | | 11,141,059 | | | | 1.6 | |
| | |
| ArcBest Corp. | | | 11,107,734 | | | | 1.6 | |
| | |
| Heritage Financial Corp./WA | | | 11,006,432 | | | | 1.6 | |
| | |
| Taylor Morrison Home Corp. | | | 10,863,453 | | | | 1.6 | |
| | |
| STAG Industrial, Inc. | | | 10,830,516 | | | | 1.6 | |
| | |
| | $ | 113,077,926 | | | | 16.5 | % |
| 1 | The Fund’s sector breakdown is expressed as a percentage of total investments (excluding security lending collateral) and may vary over time. |
Please note: The sector classifications presented herein are based on the Global Industry Classification Standard (GICS) which was developed by Morgan Stanley Capital International and Standard & Poor’s. The components are divided into sector, industry group, and industry sub-indices as classified by the GICS for each of the market capitalization indices in the broad market. These sector classifications are broadly defined. The “Portfolio of Investments” section of the report reflects more specific industry information and is consistent with the investment restrictions discussed in the Fund’s prospectus.
| | |
| |
| abfunds.com | | AB SMALL CAP VALUE PORTFOLIO | 11 |
PORTFOLIO OF INVESTMENTS
November 30, 2022
| | | | | | | | |
| Company | | Shares | | | U.S. $ Value | |
| |
COMMON STOCKS – 99.3% | |
Financials – 28.3% | |
Banks – 20.6% | |
1st Source Corp. | | | 147,386 | | | $ | 8,415,741 | |
Associated Banc-Corp. | | | 478,990 | | | | 11,783,154 | |
Bank of Marin Bancorp | | | 127,602 | | | | 4,579,636 | |
Berkshire Hills Bancorp, Inc. | | | 329,390 | | | | 10,270,380 | |
Carter Bankshares, Inc.(a) | | | 299,965 | | | | 5,561,351 | |
First BanCorp./Puerto Rico | | | 747,600 | | | | 11,498,088 | |
HarborOne Bancorp, Inc. | | | 545,725 | | | | 7,983,957 | |
Heritage Financial Corp./WA | | | 334,542 | | | | 11,006,432 | |
Independent Bank Group, Inc. | | | 108,530 | | | | 7,156,468 | |
Pacific Premier Bancorp, Inc. | | | 285,594 | | | | 10,552,698 | |
Premier Financial Corp. | | | 289,040 | | | | 8,434,187 | |
Sandy Spring Bancorp, Inc. | | | 162,331 | | | | 5,652,365 | |
Synovus Financial Corp. | | | 191,505 | | | | 8,068,106 | |
Texas Capital Bancshares, Inc.(a) | | | 166,275 | | | | 9,974,837 | |
TriCo Bancshares | | | 191,914 | | | | 10,459,313 | |
Umpqua Holdings Corp. | | | 299,324 | | | | 6,067,297 | |
Webster Financial Corp. | | | 57,223 | | | | 3,109,498 | |
| | | | | | | | |
| | | | | | | 140,573,508 | |
| | | | | | | | |
Capital Markets – 1.9% | |
Moelis & Co. – Class A | | | 201,998 | | | | 8,730,354 | |
Stifel Financial Corp. | | | 69,900 | | | | 4,491,075 | |
| | | | | | | | |
| | | | | | | 13,221,429 | |
| | | | | | | | |
Insurance – 3.0% | |
Hanover Insurance Group, Inc. (The) | | | 58,990 | | | | 8,689,227 | |
Selective Insurance Group, Inc. | | | 122,672 | | | | 11,791,233 | |
| | | | | | | | |
| | | | | | | 20,480,460 | |
| | | | | | | | |
Thrifts & Mortgage Finance – 2.8% | |
BankUnited, Inc. | | | 269,293 | | | | 9,888,439 | |
WSFS Financial Corp. | | | 191,943 | | | | 9,311,155 | |
| | | | | | | | |
| | | | | | | 19,199,594 | |
| | | | | | | | |
| | | | | | | 193,474,991 | |
| | | | | | | | |
Industrials – 17.6% | |
Aerospace & Defense – 0.9% | |
Spirit AeroSystems Holdings, Inc. – Class A | | | 237,180 | | | | 6,216,488 | |
| | | | | | | | |
|
Airlines – 1.1% | |
Alaska Air Group, Inc.(a) | | | 163,470 | | | | 7,755,017 | |
| | | | | | | | |
|
Building Products – 1.2% | |
Masonite International Corp.(a) | | | 106,643 | | | | 8,027,018 | |
| | | | | | | | |
|
Construction & Engineering – 3.9% | |
Arcosa, Inc. | | | 149,920 | | | | 9,160,112 | |
Dycom Industries, Inc.(a) | | | 73,830 | | | | 6,728,866 | |
Fluor Corp.(a) | | | 222,936 | | | | 7,492,879 | |
| | |
| |
12 | AB SMALL CAP VALUE PORTFOLIO | | abfunds.com |
PORTFOLIO OF INVESTMENTS (continued)
| | | | | | | | |
| Company | | Shares | | | U.S. $ Value | |
| |
Great Lakes Dredge & Dock Corp.(a) | | | 468,950 | | | $ | 3,432,714 | |
| | | | | | | | |
| | | | | | | 26,814,571 | |
| | | | | | | | |
Machinery – 4.6% | |
Blue Bird Corp.(a)(b) | | | 363,244 | | | | 4,289,912 | |
REV Group, Inc. | | | 660,620 | | | | 9,176,012 | |
Shyft Group, Inc. (The) | | | 410,586 | | | | 10,071,674 | |
Terex Corp. | | | 169,260 | | | | 7,770,727 | |
| | | | | | | | |
| | | | | | | 31,308,325 | |
| | | | | | | | |
Marine – 1.0% | |
Star Bulk Carriers Corp.(b) | | | 344,340 | | | | 6,628,545 | |
| | | | | | | | |
|
Professional Services – 0.9% | |
Korn Ferry | | | 110,670 | | | | 6,311,510 | |
| | | | | | | | |
|
Road & Rail – 1.6% | |
ArcBest Corp. | | | 134,200 | | | | 11,107,734 | |
| | | | | | | | |
|
Trading Companies & Distributors – 2.4% | |
H&E Equipment Services, Inc. | | | 151,935 | | | | 6,370,635 | |
Herc Holdings, Inc. | | | 74,960 | | | | 9,607,623 | |
| | | | | | | | |
| | | | | | | 15,978,258 | |
| | | | | | | | |
| | | | | | | 120,147,466 | |
| | | | | | | | |
Consumer Discretionary – 13.7% | |
Auto Components – 2.4% | |
Dana, Inc. | | | 557,176 | | | | 9,811,869 | |
Goodyear Tire & Rubber Co. (The)(a) | | | 601,711 | | | | 6,751,198 | |
| | | | | | | | |
| | | | | | | 16,563,067 | |
| | | | | | | | |
Diversified Consumer Services – 1.2% | |
Adtalem Global Education, Inc.(a) | | | 200,490 | | | | 8,340,384 | |
| | | | | | | | |
|
Hotels, Restaurants & Leisure – 4.4% | |
Dine Brands Global, Inc. | | | 114,845 | | | | 8,566,289 | |
Hilton Grand Vacations, Inc.(a) | | | 161,460 | | | | 7,107,469 | |
Papa John’s International, Inc. | | | 86,301 | | | | 7,185,421 | |
Six Flags Entertainment Corp.(a)(b) | | | 286,180 | | | | 6,894,076 | |
| | | | | | | | |
| | | | | | | 29,753,255 | |
| | | | | | | | |
Household Durables – 2.6% | |
KB Home | | | 218,860 | | | | 6,870,015 | |
Taylor Morrison Home Corp.(a) | | | 357,468 | | | | 10,863,453 | |
| | | | | | | | |
| | | | | | | 17,733,468 | |
| | | | | | | | |
Specialty Retail – 3.1% | |
Citi Trends, Inc.(a) | | | 196,320 | | | | 5,932,790 | |
Genesco, Inc.(a) | | | 136,770 | | | | 7,139,394 | |
Sally Beauty Holdings, Inc.(a) | | | 689,820 | | | | 8,112,283 | |
| | | | | | | | |
| | | | | | | 21,184,467 | |
| | | | | | | | |
| | | | | | | 93,574,641 | |
| | | | | | | | |
| | |
| |
| abfunds.com | | AB SMALL CAP VALUE PORTFOLIO | 13 |
PORTFOLIO OF INVESTMENTS (continued)
| | | | | | | | |
| Company | | Shares | | | U.S. $ Value | |
| |
Information Technology – 9.3% | | | | | | | | |
Communications Equipment – 0.4% | | | | | | | | |
Casa Systems, Inc.(a) | | | 938,153 | | | $ | 2,570,539 | |
| | | | | | | | |
| | |
Electronic Equipment, Instruments & Components – 2.6% | | | | | | | | |
Belden, Inc. | | | 95,702 | | | | 7,698,269 | |
TTM Technologies, Inc.(a) | | | 621,790 | | | | 9,992,165 | |
| | | | | | | | |
| | | | | | | 17,690,434 | |
| | | | | | | | |
IT Services – 0.2% | | | | | | | | |
Unisys Corp.(a) | | | 357,156 | | | | 1,535,771 | |
| | | | | | | | |
| | |
Semiconductors & Semiconductor Equipment – 3.0% | | | | | | | | |
Ichor Holdings Ltd.(a) | | | 300,360 | | | | 8,944,721 | |
Kulicke & Soffa Industries, Inc. | | | 99,700 | | | | 4,780,615 | |
MagnaChip Semiconductor Corp.(a) | | | 670,238 | | | | 6,782,809 | |
| | | | | | | | |
| | | | | | | 20,508,145 | |
| | | | | | | | |
Software – 3.1% | | | | | | | | |
A10 Networks, Inc. | | | 431,600 | | | | 8,075,236 | |
ACI Worldwide, Inc.(a) | | | 274,480 | | | | 5,736,632 | |
CommVault Systems, Inc.(a) | | | 111,822 | | | | 7,380,252 | |
| | | | | | | | |
| | | | | | | 21,192,120 | |
| | | | | | | | |
| | | | | | | 63,497,009 | |
| | | | | | | | |
Real Estate – 7.2% | | | | | | | | |
Equity Real Estate Investment Trusts (REITs) – 7.2% | | | | | | | | |
Broadstone Net Lease, Inc. – Class A | | | 372,080 | | | | 6,314,198 | |
Cousins Properties, Inc. | | | 118,113 | | | | 3,115,821 | |
Independence Realty Trust, Inc. | | | 504,859 | | | | 9,148,045 | |
National Storage Affiliates Trust | | | 136,610 | | | | 5,438,444 | |
NETSTREIT Corp. | | | 417,580 | | | | 8,155,337 | |
Physicians Realty Trust | | | 407,676 | | | | 6,086,603 | |
STAG Industrial, Inc. | | | 329,095 | | | | 10,830,516 | |
| | | | | | | | |
| | | | | | | 49,088,964 | |
| | | | | | | | |
Materials – 5.7% | | | | | | | | |
Chemicals – 2.8% | | | | | | | | |
AdvanSix, Inc. | | | 184,650 | | | | 7,600,194 | |
HB Fuller Co. | | | 87,580 | | | | 7,033,550 | |
Innospec, Inc. | | | 41,500 | | | | 4,601,935 | |
| | | | | | | | |
| | | | | | | 19,235,679 | |
| | | | | | | | |
Containers & Packaging – 1.0% | | | | | | | | |
O-I Glass, Inc.(a) | | | 414,030 | | | | 6,794,232 | |
| | | | | | | | |
| | |
Metals & Mining – 1.9% | | | | | | | | |
ATI, Inc.(a) | | | 288,910 | | | | 8,814,644 | |
| | |
| |
14 | AB SMALL CAP VALUE PORTFOLIO | | abfunds.com |
PORTFOLIO OF INVESTMENTS (continued)
| | | | | | | | |
| Company | | Shares | | | U.S. $ Value | |
| |
Haynes International, Inc. | | | 84,723 | | | $ | 4,232,761 | |
| | | | | | | | |
| | | | | | | 13,047,405 | |
| | | | | | | | |
| | | | | | | 39,077,316 | |
| | | | | | | | |
Energy – 5.6% | | | | | | | | |
Energy Equipment & Services – 2.7% | | | | | | | | |
Cactus, Inc. – Class A | | | 132,140 | | | | 7,187,095 | |
Helmerich & Payne, Inc. | | | 218,110 | | | | 11,141,059 | |
| | | | | | | | |
| | | | | | | 18,328,154 | |
| | | | | | | | |
Oil, Gas & Consumable Fuels – 2.9% | |
HF Sinclair Corp. | | | 134,160 | | | | 8,363,534 | |
Magnolia Oil & Gas Corp. – Class A | | | 436,710 | | | | 11,389,397 | |
| | | | | | | | |
| | | | | | | 19,752,931 | |
| | | | | | | | |
| | | | | | | 38,081,085 | |
| | | | | | | | |
Health Care – 5.2% | | | | | | | | |
Health Care Equipment & Supplies – 2.1% | | | | | | | | |
Envista Holdings Corp.(a) | | | 166,310 | | | | 5,674,497 | |
Integra LifeSciences Holdings Corp.(a) | | | 158,930 | | | | 8,731,614 | |
| | | | | | | | |
| | | | | | | 14,406,111 | |
| | | | | | | | |
Health Care Providers & Services – 2.7% | | | | | | | | |
Acadia Healthcare Co., Inc.(a) | | | 131,000 | | | | 11,666,860 | |
Pediatrix Medical Group, Inc.(a) | | | 425,910 | | | | 6,806,042 | |
| | | | | | | | |
| | | | | | | 18,472,902 | |
| | | | | | | | |
Life Sciences Tools & Services – 0.4% | | | | | | | | |
Syneos Health, Inc.(a) | | | 78,370 | | | | 2,764,894 | |
| | | | | | | | |
| | | | | | | 35,643,907 | |
| | | | | | | | |
Consumer Staples – 2.4% | |
Food Products – 2.4% | |
Hain Celestial Group, Inc. (The)(a) | | | 391,572 | | | | 7,338,059 | |
Nomad Foods Ltd.(a) | | | 537,189 | | | | 9,395,436 | |
| | | | | | | | |
| | | | | | | 16,733,495 | |
| | | | | | | | |
Utilities – 2.3% | |
Electric Utilities – 1.5% | |
IDACORP, Inc. | | | 96,120 | | | | 10,624,143 | |
| | | | | | | | |
|
Gas Utilities – 0.8% | |
Southwest Gas Holdings, Inc. | | | 77,810 | | | | 5,326,873 | |
| | | | | | | | |
| | | | | | | 15,951,016 | |
| | | | | | | | |
Communication Services – 2.0% | |
Entertainment – 1.0% | |
IMAX Corp.(a) | | | 391,510 | | | | 6,612,604 | |
| | | | | | | | |
|
Media – 1.0% | |
Criteo SA (Sponsored ADR)(a) | | | 264,587 | | | | 7,159,724 | |
| | | | | | | | |
| | | | | | | 13,772,328 | |
| | | | | | | | |
Total Common Stocks
(cost $655,090,572) | | | | | | | 679,042,218 | |
| | | | | | | | |
| | |
| |
| abfunds.com | | AB SMALL CAP VALUE PORTFOLIO | 15 |
PORTFOLIO OF INVESTMENTS (continued)
| | | | | | | | |
| Company | | Shares | | | U.S. $ Value | |
| |
SHORT-TERM INVESTMENTS – 0.9% | |
Investment Companies – 0.9% | |
AB Fixed Income Shares, Inc. – Government Money Market Portfolio – Class AB,
3.50%(c)(d)(e)
(cost $6,160,765) | | | 6,160,765 | | | $ | 6,160,765 | |
| | | | | | | | |
Total Investments Before Security Lending Collateral for Securities Loaned – 100.2%
(cost $661,251,337) | | | | | | | 685,202,983 | |
| | | | | | | | |
INVESTMENTS OF CASH COLLATERAL FOR SECURITIES LOANED – 0.6% | | | | | | | | |
Investment Companies – 0.6% | |
AB Fixed Income Shares, Inc. – Government Money Market Portfolio – Class AB,
3.50%(c)(d)(e)
(cost $3,939,312) | | | 3,939,312 | | | | 3,939,312 | |
| | | | | | | | |
| | |
Total Investments – 100.8%
(cost $665,190,649) | | | | | | | 689,142,295 | |
Other assets less liabilities – (0.8)% | | | | | | | (5,589,968 | ) |
| | | | | | | | |
Net Assets – 100.0% | | | | | | $ | 683,552,327 | |
| | | | | | | | |
| (a) | Non-income producing security. |
| (b) | Represents entire or partial securities out on loan. See Note E for securities lending information. |
| (c) | Affiliated investments. |
| (d) | The rate shown represents the 7-day yield as of period end. |
| (e) | To obtain a copy of the fund’s shareholder report, please go to the Securities and Exchange Commission’s website at www.sec.gov, or call AB at (800) 227-4618. |
Glossary:
ADR – American Depositary Receipt
REIT – Real Estate Investment Trust
See notes to financial statements.
| | |
| |
16 | AB SMALL CAP VALUE PORTFOLIO | | abfunds.com |
STATEMENT OF ASSETS & LIABILITIES
November 30, 2022
| | | | |
| Assets | |
Investments in securities, at value | | | | |
Unaffiliated issuers (cost $655,090,572) | | $ | 679,042,218 | (a) |
Affiliated issuers (cost $10,100,077—including investment of cash collateral for securities loaned of $3,939,312) | | | 10,100,077 | |
Unaffiliated dividends receivable | | | 1,414,123 | |
Receivable for investment securities sold | | | 417,028 | |
Receivable for capital stock sold | | | 293,626 | |
Affiliated dividends receivable | | | 25,070 | |
| | | | |
Total assets | | | 691,292,142 | |
| | | | |
| Liabilities | |
Payable for collateral received on securities loaned | | | 3,939,312 | |
Payable for capital stock redeemed | | | 1,710,525 | |
Payable for investment securities purchased | | | 1,432,119 | |
Advisory fee payable | | | 440,077 | |
Distribution fee payable | | | 32,752 | |
Administrative fee payable | | | 15,435 | |
Transfer Agent fee payable | | | 11,954 | |
Accrued expenses | | | 157,641 | |
| | | | |
Total liabilities | | | 7,739,815 | |
| | | | |
Net Assets | | $ | 683,552,327 | |
| | | | |
| Composition of Net Assets | |
Capital stock, at par | | $ | 4,755 | |
Additional paid-in capital | | | 632,536,623 | |
Distributable earnings | | | 51,010,949 | |
| | | | |
Net Assets | | $ | 683,552,327 | |
| | | | |
Net Asset Value Per Share—11 billion shares of capital stock authorized, $.0001 par value
| | | | | | | | | | | | |
| Class | | Net Assets | | | Shares
Outstanding | | | Net Asset
Value | |
| |
| A | | $ | 162,521,651 | | | | 11,416,416 | | | $ | 14.24 | * |
| |
| C | | $ | 330,260 | | | | 24,583 | | | $ | 13.43 | |
| |
| Advisor | | $ | 520,700,416 | | | | 36,105,108 | | | $ | 14.42 | |
| |
| (a) | Includes securities on loan with a value of $7,324,635 (see Note E). |
| * | The maximum offering price per share for Class A shares was $14.87 which reflects a sales charge of 4.25%. |
See notes to financial statements.
| | |
| |
| abfunds.com | | AB SMALL CAP VALUE PORTFOLIO | 17 |
STATEMENT OF OPERATIONS
Year Ended November 30, 2022
| | | | | | | | |
| Investment Income | | | | | | | | |
Dividends | | | | | | | | |
Unaffiliated issuers (net of foreign taxes withheld of $25,769) | | $ | 11,078,968 | | | | | |
Affiliated issuers | | | 77,629 | | | | | |
Securities lending income | | | 55,169 | | | $ | 11,211,766 | |
| | | | | | | | |
| Expenses | | | | | | | | |
Advisory fee (see Note B) | | | 5,288,905 | | | | | |
Distribution fee—Class A | | | 412,184 | | | | | |
Distribution fee—Class C | | | 4,059 | | | | | |
Transfer agency—Class A | | | 76,642 | | | | | |
Transfer agency—Class C | | | 217 | | | | | |
Transfer agency—Advisor Class | | | 232,292 | | | | | |
Administrative | | | 92,839 | | | | | |
Custody and accounting | | | 90,581 | | | | | |
Registration fees | | | 83,096 | | | | | |
Audit and tax | | | 56,359 | | | | | |
Legal | | | 39,582 | | | | | |
Printing | | | 37,150 | | | | | |
Directors’ fees | | | 26,236 | | | | | |
Miscellaneous | | | 20,405 | | | | | |
| | | | | | | | |
Total expenses | | | 6,460,547 | | | | | |
Less: expenses waived and reimbursed by the Adviser (see Notes B & E) | | | (7,662 | ) | | | | |
Less: expenses waived and reimbursed by the Distributor (see Note C) | | | (661 | ) | | | | |
| | | | | | | | |
Net expenses | | | | | | | 6,452,224 | |
| | | | | | | | |
Net investment income | | | | | | | 4,759,542 | |
| | | | | | | | |
| Realized and Unrealized Gain (Loss) on Investment Transactions | | | | | | | | |
Net realized gain on investment transactions | | | | | | | 27,324,555 | |
Net change in unrealized appreciation (depreciation) of investments | | | | | | | (81,148,317 | ) |
| | | | | | | | |
Net loss on investment transactions | | | | | | | (53,823,762 | ) |
| | | | | | | | |
Net Decrease in Net Assets from Operations | | | | | | $ | (49,064,220 | ) |
| | | | | | | | |
See notes to financial statements.
| | |
| |
18 | AB SMALL CAP VALUE PORTFOLIO | | abfunds.com |
STATEMENT OF CHANGES IN NET ASSETS
| | | | | | | | |
| | | Year Ended
November 30,
2022 | | | Year Ended
November 30,
2021 | |
| Increase (Decrease) in Net Assets from Operations | | | | | | | | |
Net investment income | | $ | 4,759,542 | | | $ | 1,776,640 | |
Net realized gain on investment transactions | | | 27,324,555 | | | | 74,346,666 | |
Net change in unrealized appreciation (depreciation) of investments | | | (81,148,317 | ) | | | 81,278,604 | |
Contributions from Affiliates (see Note B) | | | – 0 | – | | | 131 | |
| | | | | | | | |
Net increase (decrease) in net assets from operations | | | (49,064,220 | ) | | | 157,402,041 | |
Distributions to Shareholders | | | | | | | | |
Class A | | | (12,622,602 | ) | | | (473,503 | ) |
Class C | | | (34,142 | ) | | | – 0 | – |
Advisor Class | | | (32,957,133 | ) | | | (1,526,842 | ) |
| Capital Stock Transactions | |
Net increase | | | 144,113,685 | | | | 96,528,290 | |
| | | | | | | | |
Total increase | | | 49,435,588 | | | | 251,929,986 | |
| Net Assets | |
Beginning of period | | | 634,116,739 | | | | 382,186,753 | |
| | | | | | | | |
End of period | | $ | 683,552,327 | | | $ | 634,116,739 | |
| | | | | | | | |
See notes to financial statements.
| | |
| |
| abfunds.com | | AB SMALL CAP VALUE PORTFOLIO | 19 |
NOTES TO FINANCIAL STATEMENTS
November 30, 2022
NOTE A
Significant Accounting Policies
AB Cap Fund, Inc. (the “Company”) is registered under the Investment Company Act of 1940 as an open-end management investment company. The Company, which is a Maryland corporation, operates as a series company comprised of 12 portfolios currently in operation. Each portfolio is considered to be a separate entity for financial reporting and tax purposes. This report relates only to the AB Small Cap Value Portfolio (the “Fund”), a diversified portfolio. The Fund has authorized the issuance of Class A, Class B, Class C, Advisor Class, Class R, Class K, Class I, Class Z, Class T, Class 1 and Class 2 shares. Class B, Class R, Class K, Class I, Class Z, Class T, Class 1 and Class 2 shares have not been issued. Class A shares are sold with a front-end sales charge of up to 4.25% for purchases not exceeding $1,000,000. With respect to purchases of $1,000,000 or more, Class A shares redeemed within one year of purchase may be subject to a contingent deferred sales charge of 1%. Class C shares are subject to a contingent deferred sales charge of 1% on redemptions made within the first year after purchase, and 0% after the first year of purchase. Effective May 31, 2021, Class C shares automatically convert to Class A shares eight years after the end of the calendar month of purchase. Prior to May 31, 2021, Class C shares automatically converted to Class A shares 10 years after the end of the calendar month of purchase. Advisor Class shares are sold without any initial or contingent deferred sales charge and are not subject to ongoing distribution expenses. All 11 classes of shares have identical voting, dividend, liquidation and other rights, except that the classes bear different distribution and transfer agency expenses. Each class has exclusive voting rights with respect to its distribution plan. The financial statements have been prepared in conformity with U.S. generally accepted accounting principles (“U.S. GAAP”), which require management to make certain estimates and assumptions that affect the reported amounts of assets and liabilities in the financial statements and amounts of income and expenses during the reporting period. Actual results could differ from those estimates. The Fund is an investment company under U.S. GAAP and follows the accounting and reporting guidance applicable to investment companies. The following is a summary of significant accounting policies followed by the Fund.
1. Security Valuation
Portfolio securities are valued at market value determined on the basis of market quotations or, if market quotations are not readily available or are unreliable, at “fair value” as determined in accordance with procedures approved by and under the oversight of the Company’s Board of Directors (the “Board”). Pursuant to these procedures, AllianceBernstein L.P. (the “Adviser”) serves as the Fund’s valuation designee pursuant to Rule 2a-5
| | |
| |
20 | AB SMALL CAP VALUE PORTFOLIO | | abfunds.com |
NOTES TO FINANCIAL STATEMENTS (continued)
of the 1940 Act. In this capacity, the Adviser is responsible, among other things, for making all fair value determinations relating to the Fund’s portfolio investments, subject to the Board’s oversight.
In general, the market values of securities which are readily available and deemed reliable are determined as follows: securities listed on a national securities exchange (other than securities listed on the NASDAQ Stock Market, Inc. (“NASDAQ”)) or on a foreign securities exchange are valued at the last sale price at the close of the exchange or foreign securities exchange. If there has been no sale on such day, the securities are valued at the last traded price from the previous day. Securities listed on more than one exchange are valued by reference to the principal exchange on which the securities are traded; securities listed only on NASDAQ are valued in accordance with the NASDAQ Official Closing Price; listed or over the counter (“OTC”) market put or call options are valued at the mid level between the current bid and ask prices. If either a current bid or current ask price is unavailable, the Adviser will have discretion to determine the best valuation (e.g., last trade price in the case of listed options); open futures are valued using the closing settlement price or, in the absence of such a price, the most recent quoted bid price. If there are no quotations available for the day of valuation, the last available closing settlement price is used; U.S. Government securities and any other debt instruments having 60 days or less remaining until maturity are generally valued at market by an independent pricing vendor, if a market price is available. If a market price is not available, the securities are valued at amortized cost. This methodology is commonly used for short term securities that have an original maturity of 60 days or less, as well as short term securities that had an original term to maturity that exceeded 60 days. In instances when amortized cost is utilized, the Valuation Committee (the “Committee”) must reasonably conclude that the utilization of amortized cost is approximately the same as the fair value of the security. Factors the Committee will consider include, but are not limited to, an impairment of the creditworthiness of the issuer or material changes in interest rates. Fixed-income securities, including mortgage-backed and asset-backed securities, may be valued on the basis of prices provided by a pricing service or at a price obtained from one or more of the major broker-dealers. In cases where broker-dealer quotes are obtained, the Adviser may establish procedures whereby changes in market yields or spreads are used to adjust, on a daily basis, a recently obtained quoted price on a security. Swaps and other derivatives are valued daily, primarily using independent pricing services, independent pricing models using market inputs, as well as third party broker-dealers or counterparties. Open-end mutual funds are valued at the closing net asset value per share, while exchange traded funds are valued at the closing market price per share.
| | |
| |
| abfunds.com | | AB SMALL CAP VALUE PORTFOLIO | 21 |
NOTES TO FINANCIAL STATEMENTS (continued)
Securities for which market quotations are not readily available (including restricted securities) or are deemed unreliable are valued at fair value as deemed appropriate by the Adviser. Factors considered in making this determination may include, but are not limited to, information obtained by contacting the issuer, analysts, analysis of the issuer’s financial statements or other available documents. In addition, the Fund may use fair value pricing for securities primarily traded in non-U.S. markets because most foreign markets close well before the Fund values its securities at 4:00 p.m., Eastern Time. The earlier close of these foreign markets gives rise to the possibility that significant events, including broad market moves, may have occurred in the interim and may materially affect the value of those securities. To account for this, the Fund generally values many of its foreign equity securities using fair value prices based on third party vendor modeling tools to the extent available.
2. Fair Value Measurements
In accordance with U.S. GAAP regarding fair value measurements, fair value is defined as the price that the Fund would receive to sell an asset or pay to transfer a liability in an orderly transaction between market participants at the measurement date. U.S. GAAP establishes a framework for measuring fair value, and a three-level hierarchy for fair value measurements based upon the transparency of inputs to the valuation of an asset or liability (including those valued based on their market values as described in Note A.1 above). Inputs may be observable or unobservable and refer broadly to the assumptions that market participants would use in pricing the asset or liability. Observable inputs reflect the assumptions market participants would use in pricing the asset or liability based on market data obtained from sources independent of the Fund. Unobservable inputs reflect the Fund’s own assumptions about the assumptions that market participants would use in pricing the asset or liability based on the best information available in the circumstances. Each investment is assigned a level based upon the observability of the inputs which are significant to the overall valuation. The three-tier hierarchy of inputs is summarized below.
| | • | | Level 1—quoted prices in active markets for identical investments |
| | • | | Level 2—other significant observable inputs (including quoted prices for similar investments, interest rates, prepayment speeds, credit risk, etc.) |
| | • | | Level 3—significant unobservable inputs (including the Fund’s own assumptions in determining the fair value of investments) |
Where readily available market prices or relevant bid prices are not available for certain equity investments, such investments may be valued based on similar publicly traded investments, movements in relevant indices since
| | |
| |
22 | AB SMALL CAP VALUE PORTFOLIO | | abfunds.com |
NOTES TO FINANCIAL STATEMENTS (continued)
last available prices or based upon underlying company fundamentals and comparable company data (such as multiples to earnings or other multiples to equity). Where an investment is valued using an observable input, such as another publicly traded security, the investment will be classified as Level 2. If management determines that an adjustment is appropriate based on restrictions on resale, illiquidity or uncertainty, and such adjustment is a significant component of the valuation, the investment will be classified as Level 3. An investment will also be classified as Level 3 where management uses company fundamentals and other significant inputs to determine the valuation.
The following table summarizes the valuation of the Fund’s investments by the above fair value hierarchy levels as of November 30, 2022:
| | | | | | | | | | | | | | | | |
Investments in Securities: | | Level 1 | | | Level 2 | | | Level 3 | | | Total | |
Assets: | | | | | | | | | | | | | | | | |
Common Stocks(a) | | $ | 679,042,218 | | | $ | – 0 | – | | $ | – 0 | – | | $ | 679,042,218 | |
Short-Term Investments | | | 6,160,765 | | | | – 0 | – | | | – 0 | – | | | 6,160,765 | |
Investments of Cash Collateral for Securities Loaned in Affiliated Money Market Fund | | | 3,939,312 | | | | – 0 | – | | | – 0 | – | | | 3,939,312 | |
| | | | | | | | | | | | | | | | |
Total Investments in Securities | | | 689,142,295 | | | | – 0 | – | | | – 0 | – | | | 689,142,295 | |
Other Financial Instruments(b) | | | – 0 | – | | | – 0 | – | | | – 0 | – | | | – 0 | – |
| | | | | | | | | | | | | | | | |
Total | | $ | 689,142,295 | | | $ | – 0 | – | | $ | – 0 | – | | $ | 689,142,295 | |
| | | | | | | | | | | | | | | | |
| (a) | See Portfolio of Investments for sector classifications. |
| (b) | Other financial instruments are derivative instruments, such as futures, forwards and swaps, which are valued at the unrealized appreciation (depreciation) on the instrument. Other financial instruments may also include swaps with upfront premiums, written options and written swaptions which are valued at market value. |
3. Currency Translation
Assets and liabilities denominated in foreign currencies and commitments under forward currency exchange contracts are translated into U.S. dollars at the mean of the quoted bid and ask prices of such currencies against the U.S. dollar. Purchases and sales of portfolio securities are translated into U.S. dollars at the rates of exchange prevailing when such securities were acquired or sold. Income and expenses are translated into U.S. dollars at rates of exchange prevailing when accrued.
Net realized gain or loss on foreign currency transactions represents foreign exchange gains and losses from sales and maturities of foreign fixed income investments, holding of foreign currencies, currency gains or losses
| | |
| |
| abfunds.com | | AB SMALL CAP VALUE PORTFOLIO | 23 |
NOTES TO FINANCIAL STATEMENTS (continued)
realized between the trade and settlement dates on foreign investment transactions, and the difference between the amounts of dividends, interest and foreign withholding taxes recorded on the Fund’s books and the U.S. dollar equivalent amounts actually received or paid. Net unrealized currency gains and losses from valuing foreign currency denominated assets and liabilities at period end exchange rates are reflected as a component of net unrealized appreciation or depreciation of foreign currency denominated assets and liabilities.
4. Taxes
It is the Fund’s policy to meet the requirements of the Internal Revenue Code applicable to regulated investment companies and to distribute all of its investment company taxable income and net realized gains, if any, to shareholders. Therefore, no provisions for federal income or excise taxes are required. The Fund may be subject to taxes imposed by countries in which it invests. Such taxes are generally based on income and/or capital gains earned or repatriated. Taxes are accrued and applied to net investment income, net realized gains and net unrealized appreciation/depreciation as such income and/or gains are earned.
In accordance with U.S. GAAP requirements regarding accounting for uncertainties in income taxes, management has analyzed the Fund’s tax positions taken or expected to be taken on federal and state income tax returns for all open tax years (the current tax year and the prior three tax years) and has concluded that no provision for income tax is required in the Fund’s financial statements.
5. Investment Income and Investment Transactions
Dividend income is recorded on the ex-dividend date or as soon as the Fund is informed of the dividend. Interest income is accrued daily. Investment transactions are accounted for on the date the securities are purchased or sold. Investment gains or losses are determined on the identified cost basis. Non-cash dividends, if any, are recorded on the ex-dividend date at the fair value of the securities received. The Fund amortizes premiums and accretes discounts as adjustments to interest income. The Fund accounts for distributions received from REIT investments or from regulated investment companies as dividend income, realized gain, or return of capital based on information provided by the REIT or the investment company.
6. Class Allocations
All income earned and expenses incurred by the Fund are borne on a pro-rata basis by each outstanding class of shares, based on the proportionate interest in the Fund represented by the net assets of such class, except for class specific expenses which are allocated to the respective
| | |
| |
24 | AB SMALL CAP VALUE PORTFOLIO | | abfunds.com |
NOTES TO FINANCIAL STATEMENTS (continued)
class. Expenses of the Company are charged proportionately to each portfolio or based on other appropriate methods. Realized and unrealized gains and losses are allocated among the various share classes based on respective net assets.
7. Dividends and Distributions
Dividends and distributions to shareholders, if any, are recorded on the ex-dividend date. Income dividends and capital gains distributions are determined in accordance with federal tax regulations and may differ from those determined in accordance with U.S. GAAP. To the extent these differences are permanent, such amounts are reclassified within the capital accounts based on their federal tax basis treatment; temporary differences do not require such reclassification.
NOTE B
Advisory Fee and Other Transactions with Affiliates
Under the terms of the investment advisory agreement, the Fund pays the Adviser an advisory fee at an annual rate of .80% of the Fund’s average daily net assets. The fee is accrued daily and paid monthly. The Adviser has agreed to waive its fees and bear certain expenses to the extent necessary to limit total operating expenses (excluding acquired fund fees and expenses other than the advisory fees of any AB mutual funds in which the Fund may invest, interest expense, taxes, extraordinary expenses, and brokerage commissions and other transactions costs) on an annual basis (the “Expense Caps”) to 1.25%, 2.00%, and 1.00% of daily average net assets for Class A, Class C, and Advisor Class shares, respectively. For the year ended November 30, 2022, there were no such reimbursements. The Expense Caps may not be terminated by the Adviser before February 28, 2023.
Pursuant to the investment advisory agreement, the Fund may reimburse the Adviser for certain legal and accounting services provided to the Fund by the Adviser. For the year ended November 30, 2022, the reimbursement for such services amounted to $92,839.
The Fund compensates AllianceBernstein Investor Services, Inc. (“ABIS”), a wholly-owned subsidiary of the Adviser, under a Transfer Agency Agreement for providing personnel and facilities to perform transfer agency services for the Fund. ABIS may make payments to intermediaries that provide omnibus account services, sub-accounting services and/or networking services. Such compensation retained by ABIS amounted to $93,455 for the year ended November 30, 2022.
AllianceBernstein Investments, Inc. (the “Distributor”), a wholly-owned subsidiary of the Adviser, serves as the distributor of the Fund’s shares.
| | |
| |
| abfunds.com | | AB SMALL CAP VALUE PORTFOLIO | 25 |
NOTES TO FINANCIAL STATEMENTS (continued)
The Distributor has advised the Fund that it has retained front-end sales charges of $144 from the sale of Class A shares and received $4 and $63 in contingent deferred sales charges imposed upon redemptions by shareholders of Class A and Class C shares, respectively, for the year ended November 30, 2022.
The Fund may invest in AB Government Money Market Portfolio (the “Government Money Market Portfolio”) which has a contractual annual advisory fee rate of .20% of the portfolio’s average daily net assets and bears its own expenses. The Adviser has contractually agreed to waive ..10% of the advisory fee of Government Money Market Portfolio (resulting in a net advisory fee of .10%) until August 31, 2023. In connection with the investment by the Fund in Government Money Market Portfolio, the Adviser has contractually agreed to waive its advisory fee from the Fund in an amount equal to the Fund’s pro rata share of the effective advisory fee of Government Money Market Portfolio, as borne indirectly by the Fund as an acquired fund fee and expense. For the year ended November 30, 2022, such waiver amounted to $7,154.
A summary of the Fund’s transactions in AB mutual funds for the year ended November 30, 2022 is as follows:
| | | | | | | | | | | | | | | | | | | | |
Fund | | Market Value
11/30/21
(000) | | | Purchases
at Cost
(000) | | | Sales
Proceeds
(000) | | | Market Value
11/30/22
(000) | | | Dividend
Income
(000) | |
Government Money Market Portfolio | | $ | 10,744 | | | $ | 222,023 | | | $ | 226,606 | | | $ | 6,161 | | | $ | 78 | |
Government Money Market Portfolio* | | | 0 | ** | | | 45,496 | | | | 41,557 | | | | 3,939 | | | | 3 | |
| | | | | | | | | | | | | | | | | | | | |
Total | | | | | | | | | | | | | | $ | 10,100 | | | $ | 81 | |
| | | | | | | | | | | | | | | | | | | | |
| * | Investments of cash collateral for securities lending transactions (see Note E). |
| ** | Amount is less than $500. |
During the year ended November 30, 2021, the Adviser reimbursed the Fund $131 for trading losses incurred due to a trade entry error.
NOTE C
Distribution Services Agreement
The Fund has adopted a Distribution Services Agreement (the “Agreement”) pursuant to Rule 12b-1 under the Investment Company Act of 1940. Under the Agreement, the Fund pays distribution and servicing fees to the Distributor at an annual rate of up to .25% of the Fund’s
| | |
| |
26 | AB SMALL CAP VALUE PORTFOLIO | | abfunds.com |
NOTES TO FINANCIAL STATEMENTS (continued)
average daily net assets attributable to Class A shares and 1% of the Fund’s average daily net assets attributable to Class C shares. There are no distribution and servicing fees on the Advisor Class shares. From November 1, 2021 to June 30, 2022, with respect to Class C shares, payments to the Distributor were voluntarily limited to .75% of the average daily net assets attributable to Class C shares. For the year ended November 30, 2022, such waiver amounted to $661. The fees are accrued daily and paid monthly. The Agreement provides that the Distributor will use such payments in their entirety for distribution assistance and promotional activities. Since the commencement of the Fund’s operations, the Distributor has incurred expenses in excess of the distribution costs reimbursed by the Fund in the amount of $524 for Class C shares. While such costs may be recovered from the Fund in future periods so long as the Agreement is in effect, the rate of the distribution and servicing fees payable under the Agreement may not be increased without a shareholder vote. In accordance with the Agreement, there is no provision for recovery of unreimbursed distribution costs incurred by the Distributor beyond the current fiscal year for Class A shares. The Agreement also provides that the Adviser may use its own resources to finance the distribution of the Fund’s shares.
NOTE D
Investment Transactions
Purchases and sales of investment securities (excluding short-term investments) for the year ended November 30, 2022 were as follows:
| | | | | | | | |
| | | Purchases | | | Sales | |
Investment securities (excluding U.S. government securities)................... | | $ | 415,124,695 | | | $ | 306,508,340 | |
U.S. government securities...................... | | | – 0 | – | | | – 0 | – |
The cost of investments for federal income tax purposes, gross unrealized appreciation and unrealized depreciation are as follows:
| | | | |
Cost | | $ | 667,853,679 | |
| | | | |
Gross unrealized appreciation | | $ | 72,974,908 | |
Gross unrealized depreciation | | | (51,686,292 | ) |
| | | | |
Net unrealized appreciation | | $ | 21,288,616 | |
| | | | |
1. Derivative Financial Instruments
The Fund may use derivatives in an effort to earn income and enhance returns, to replace more traditional direct investments, to obtain exposure to otherwise inaccessible markets (collectively, “investment purposes”), or to hedge or adjust the risk profile of its portfolio.
| | |
| |
| abfunds.com | | AB SMALL CAP VALUE PORTFOLIO | 27 |
NOTES TO FINANCIAL STATEMENTS (continued)
The Fund did not engage in derivatives transactions for the year ended November 30, 2022.
2. Currency Transactions
The Fund may invest in non-U.S. Dollar-denominated securities on a currency hedged or unhedged basis. The Fund may seek investment opportunities by taking long or short positions in currencies through the use of currency-related derivatives, including forward currency exchange contracts, futures and options on futures, swaps, and other options. The Fund may enter into transactions for investment opportunities when it anticipates that a foreign currency will appreciate or depreciate in value but securities denominated in that currency are not held by the Fund and do not present attractive investment opportunities. Such transactions may also be used when the Adviser believes that it may be more efficient than a direct investment in a foreign currency-denominated security. The Fund may also conduct currency exchange contracts on a spot basis (i.e., for cash at the spot rate prevailing in the currency exchange market for buying or selling currencies).
NOTE E
Securities Lending
The Fund may enter into securities lending transactions. Under the Fund’s securities lending program, all loans of securities will be collateralized continually by cash collateral and/or non-cash collateral. Non-cash collateral will include only securities issued or guaranteed by the U.S. government or its agencies or instrumentalities. The Fund cannot sell or repledge any non-cash collateral, such collateral will not be reflected in the portfolio of investments. If a loan is collateralized by cash, the Fund will be compensated for the loan from a portion of the net return from the income earned on cash collateral after a rebate is paid to the borrower (in some cases, this rebate may be a “negative rebate” or fee paid by the borrower to the Fund in connection with the loan), and payments are made for fees of the securities lending agent and for certain other administrative expenses. If the Fund receives non-cash collateral, the Fund will receive a fee from the borrower generally equal to a negotiated percentage of the market value of the loaned securities. The Fund will have the right to call a loan and obtain the securities loaned at any time on notice to the borrower within the normal and customary settlement time for the securities. While the securities are on loan, the borrower is obligated to pay the Fund amounts equal to any dividend income or other distributions from the securities; however, these distributions will not be afforded the same preferential tax treatment as qualified dividends. The Fund will not be able to exercise voting rights with respect to any securities during the existence of a loan, but will have the right to regain ownership of loaned securities in order to exercise
| | |
| |
28 | AB SMALL CAP VALUE PORTFOLIO | | abfunds.com |
NOTES TO FINANCIAL STATEMENTS (continued)
voting or other ownership rights. Collateral received and securities loaned are marked to market daily to ensure that the securities loaned are secured by collateral. The lending agent currently invests the cash collateral received in Government Money Market Portfolio, an eligible money market vehicle, in accordance with the investment restrictions of the Fund, and as approved by the Board. The collateral received on securities loaned is recorded as an asset as well as a corresponding liability in the statement of assets and liabilities. The collateral will be adjusted the next business day to maintain the required collateral amount. The amounts of securities lending income from the borrowers and Government Money Market Portfolio are reflected in the statement of operations. When the Fund earns net securities lending income from Government Money Market Portfolio, the income is inclusive of a rebate expense paid to the borrower. In connection with the cash collateral investment by the Fund in Government Money Market Portfolio, the Adviser has agreed to waive a portion of the Fund’s share of the advisory fees of Government Money Market Portfolio, as borne indirectly by the Fund as an acquired fund fee and expense. When the Fund lends securities, its investment performance will continue to reflect changes in the value of the securities loaned. A principal risk of lending portfolio securities is that the borrower may fail to return the loaned securities upon termination of the loan and that the collateral will not be sufficient to replace the loaned securities. The lending agent has agreed to indemnify the Fund in the case of default of any securities borrower.
A summary of the Fund’s transactions surrounding securities lending for the year ended November 30, 2022 is as follows:
| | | | | | | | | | | | | | | | | | | | | | |
| | | | | | | | | | | | Government Money
Market Portfolio | |
Market
Value of
Securities
on Loan* | | | Cash
Collateral* | | | Market
Value of
Non-Cash
Collateral* | | | Income from
Borrowers | | | Income
Earned | | | Advisory Fee
Waived | |
| $ | 7,324,635 | | | $ | 3,939,312 | | | $ | 3,465,605 | | | $ | 52,472 | | | $ | 2,697 | | | $ | 508 | |
| * | As of November 30, 2022. |
| | |
| |
| abfunds.com | | AB SMALL CAP VALUE PORTFOLIO | 29 |
NOTES TO FINANCIAL STATEMENTS (continued)
NOTE F
Capital Stock
Each class consists of 1,000,000,000 authorized shares. Transactions in capital shares for each class were as follows:
| | | | | | | | | | | | | | | | | | | | | | | | |
| | | | | | | | | | | | | | | | | | | | | | | | |
| | | Shares | | | | | | Amount | | | | |
| | | Year Ended
November 30,
2022 | | | Year Ended
November 30,
2021 | | | | | | Year Ended
November 30,
2022 | | | Year Ended
November 30,
2021 | | | | |
| | | | | | | | |
| Class A | | | | | | | | | | | | | | | | | | | | | | | | |
Shares sold | | | 726,154 | | | | 1,576,338 | | | | | | | $ | 10,581,250 | | | $ | 24,936,636 | | | | | |
| | | | | |
Shares issued in reinvestment of dividends and distributions | | | 764,816 | | | | 37,041 | | | | | | | | 12,259,992 | | | | 464,862 | | | | | |
| | | | | |
Shares converted from Class C | | | 2,016 | | | | – 0 | – | | | | | | | 27,881 | | | | – 0 | – | | | | |
| | | | | |
Shares redeemed | | | (926,722 | ) | | | (1,626,498 | ) | | | | | | | (13,231,989 | ) | | | (25,274,546 | ) | | | | |
| | | | | |
Net increase (decrease) | | | 566,264 | | | | (13,119 | ) | | | | | | $ | 9,637,134 | | | $ | 126,952 | | | | | |
| | | | | |
| | | | | | | | | | | | | | | | | | | | | | | | |
| Class C | | | | | | | | | | | | | | | | | | | | | | | | |
Shares sold | | | 2,900 | | | | 48,083 | | | | | | | $ | 42,240 | | | $ | 718,030 | | | | | |
| | | | | |
Shares issued in reinvestment of distributions | | | 1,867 | | | | – 0 | – | | | | | | | 28,420 | | | | – 0 | – | | | | |
| | | | | |
Shares converted to Class A | | | (2,129 | ) | | | – 0 | – | | | | | | | (27,881 | ) | | | – 0 | – | | | | |
| | | | | |
Shares redeemed | | | (8,655 | ) | | | (42,998 | ) | | | | | | | (110,788 | ) | | | (678,394 | ) | | | | |
| | | | | |
Net increase (decrease) | | | (6,017 | ) | | | 5,085 | | | | | | | $ | (68,009 | ) | | $ | 39,636 | | | | | |
| | | | | |
| | | | | | | | | | | | | | | | | | | | | | | | |
| Advisor Class | | | | | | | | | | | | | | | | | | | | | | | | |
Shares sold | | | 13,729,807 | | | | 10,774,321 | | | | | | | $ | 205,489,237 | | | $ | 171,284,372 | | | | | |
| | | | | |
Shares issued in reinvestment of dividends and distributions | | | 1,726,199 | | | | 74,467 | | | | | | | | 27,964,424 | | | | 943,501 | | | | | |
| | | | | |
Shares redeemed | | | (6,873,085 | ) | | | (4,728,066 | ) | | | | | | | (98,909,101 | ) | | | (75,866,171 | ) | | | | |
| | | | | |
Net increase | | | 8,582,921 | | | | 6,120,722 | | | | | | | $ | 134,544,560 | | | $ | 96,361,702 | | | | | |
| | | | | |
NOTE G
Risks Involved in Investing in the Fund
Market Risk—The value of the Fund’s assets will fluctuate as the stock market fluctuates. The value of its investments may decline, sometimes rapidly and unpredictably, simply because of economic changes or other events, including public health crises (including the occurrence of a
| | |
| |
30 | AB SMALL CAP VALUE PORTFOLIO | | abfunds.com |
NOTES TO FINANCIAL STATEMENTS (continued)
contagious disease or illness) and regional and global conflicts, that affect large portions of the market. It includes the risk that a particular style of investing, such as the Fund’s value approach, may underperform the market generally.
Capitalization Risk—Investments in small-capitalization companies may be more volatile than investments in large-capitalization companies. Investments in small-capitalization companies may have additional risks because these companies have limited product lines, markets or financial resources.
Industry/Sector Risk—Investments in a particular industry or group of related industries may have more risk because market or economic factors affecting that industry could have a significant effect on the value of the Fund’s investments.
LIBOR Transition and Associated Risk—A Fund may be exposed to debt securities, derivatives or other financial instruments that utilize the London Interbank Offered Rate, or “LIBOR,” as a “benchmark” or “reference rate” for various interest rate calculations. In 2017, the United Kingdom Financial Conduct Authority (“FCA”), which regulates LIBOR, announced a desire to phase out the use of LIBOR by the end of 2021. The FCA and LIBOR’s administrator, ICE Benchmark Administration, have since announced that most LIBOR settings (which reflect LIBOR rates quoted in different currencies over various time periods) will no longer be published after the end of 2021 but that the most widely used U.S. Dollar LIBOR settings will continue to be published until June 30, 2023. However, banks were strongly encouraged to cease entering into agreements with counterparties referencing LIBOR by the end of 2021. It is possible that a subset of LIBOR settings will be published after these dates on a “synthetic” basis, but any such publications would be considered non-representative of the underlying market. Since 2018 the Federal Reserve Bank of New York has published the secured overnight funding rate (referred to as SOFR), which is intended to replace U.S. Dollar LIBOR. SOFR is a broad measure of the cost of borrowing cash overnight collateralized by U.S. Treasury securities in the repurchase agreement (repo) market and has been used increasingly on a voluntary basis in new instruments and transactions. In addition, on March 15, 2022, the Adjustable Interest Rate Act was signed into law. This law provides a statutory fallback mechanism to replace LIBOR with a benchmark rate that is selected by the Federal Reserve Board and based on SOFR for certain contracts that reference LIBOR without adequate fallback provisions.
| | |
| |
| abfunds.com | | AB SMALL CAP VALUE PORTFOLIO | 31 |
NOTES TO FINANCIAL STATEMENTS (continued)
The elimination of LIBOR or changes to other reference rates or any other changes or reforms to the determination or supervision of reference rates could have an adverse impact on the market for, or value of, any securities or payments linked to those reference rates, which may adversely affect a Fund’s performance and/or net asset value. Uncertainty and risk also remain regarding the willingness and ability of issuers and lenders to include revised provisions in new and existing contracts or instruments. Consequently, the transition from LIBOR to other reference rates may lead to increased volatility and illiquidity in markets that are tied to LIBOR, fluctuations in values of LIBOR-related investments or investments in issuers that utilize LIBOR, increased difficulty in borrowing or refinancing and diminished effectiveness of hedging strategies, potentially adversely affecting a Fund’s performance. Furthermore, the risks associated with the expected discontinuation of LIBOR and transition may be exacerbated if the work necessary to effect an orderly transition to an alternative reference rate is not completed in a timely manner. Neither the effect of the LIBOR transition process nor its ultimate success can yet be known.
Indemnification Risk—In the ordinary course of business, the Fund enters into contracts that contain a variety of indemnifications. The Fund’s maximum exposure under these arrangements is unknown. However, the Fund has not had prior claims or losses pursuant to these indemnification provisions and expects the risk of loss thereunder to be remote. Therefore, the Fund has not accrued any liability in connection with these indemnification provisions.
Management Risk—The Fund is subject to management risk because it is an actively-managed investment fund. The Adviser will apply its investment techniques and risk analyses in making investment decisions, but there is no guarantee that its techniques will produce the intended results. Some of these techniques may incorporate, or rely upon, quantitative models, but there is no guarantee that these models will generate accurate forecasts, reduce risk or otherwise perform as expected.
NOTE H
Joint Credit Facility
A number of open-end mutual funds managed by the Adviser, including the Fund, participate in a $325 million revolving credit facility (the “Facility”) intended to provide short-term financing related to redemptions and other short term liquidity requirements, subject to certain restrictions. Commitment fees related to the Facility are paid by the participating funds and are included in miscellaneous expenses in the statement of operations. The Fund did not utilize the Facility during the year ended November 30, 2022.
| | |
| |
32 | AB SMALL CAP VALUE PORTFOLIO | | abfunds.com |
NOTES TO FINANCIAL STATEMENTS (continued)
NOTE I
Distributions to Shareholders
The tax character of distributions paid during the fiscal years ended November 30, 2022 and November 30, 2021 were as follows:
| | | | | | | | |
| | | 2022 | | | 2021 | |
Distributions paid from: | | | | | | | | |
Ordinary income | | $ | 40,466,280 | | | $ | 2,000,345 | |
Net long-term capital gains | | | 5,147,597 | | | | – 0 | – |
| | | | | | | | |
Total taxable distributions paid | | $ | 45,613,877 | | | $ | 2,000,345 | |
| | | | | | | | |
As of November 30, 2022, the components of accumulated earnings (deficit) on a tax basis were as follows:
| | | | |
Undistributed ordinary income | | $ | 4,206,394 | |
Undistributed capital gains | | | 25,515,939 | |
Unrealized appreciation (depreciation) | | | 21,288,616 | (a) |
| | | | |
Total accumulated earnings (deficit) | | $ | 51,010,949 | |
| | | | |
| (a) | The differences between book-basis and tax-basis unrealized appreciation (depreciation) are attributable primarily to the tax deferral of losses on wash sales. |
For tax purposes, net realized capital losses may be carried over to offset future capital gains, if any. Funds are permitted to carry forward capital losses for an indefinite period, and such losses will retain their character as either short-term or long-term capital losses. As of November 30, 2022, the Fund did not have any capital loss carryforwards.
During the current fiscal year, permanent differences primarily due to the utilization of earnings and profits distributed to shareholders on redemption of shares and contributions from the Adviser resulted in a net decrease in distributable earnings and a net increase in additional paid-in capital. These reclassifications had no effect on net assets.
NOTE J
Recent Accounting Pronouncements
In March 2020, the Financial Accounting Standards Board issued an Accounting Standards Update, ASU 2020-04, “Reference Rate Reform (Topic 848) – Facilitation of the Effects of Reference Rate Reform on Financial Reporting.” ASU 2020-04 provides optional guidance to ease the potential accounting burden due to the discontinuation of the LIBOR and other interbank-offered based reference rates. ASU 2020-04 is effective as of March 12, 2020 through December 31, 2022. Management is currently evaluating the impact, if any, of applying ASU 2020-04.
| | |
| |
| abfunds.com | | AB SMALL CAP VALUE PORTFOLIO | 33 |
NOTES TO FINANCIAL STATEMENTS (continued)
NOTE K
Subsequent Events
Management has evaluated subsequent events for possible recognition or disclosure in the financial statements through the date the financial statements are issued. Management has determined that there are no material events that would require disclosure in the Fund’s financial statements through this date.
| | |
| |
34 | AB SMALL CAP VALUE PORTFOLIO | | abfunds.com |
FINANCIAL HIGHLIGHTS
Selected Data For A Share Of Capital Stock Outstanding Throughout Each Period
| | | | | | | | | | | | | | | | | | | | |
| | | Class A | |
| | | Year Ended November 30, | |
| | | 2022 | | | 2021 | | | 2020 | | | 2019 | | | 2018 | |
| | | | |
| | | | | | | | | | | | | | | | | | | | |
Net asset value, beginning of period | | | $ 16.37 | | | | $ 11.74 | | | | $ 12.40 | | | | $ 12.59 | | | | $ 14.01 | |
| | | | |
Income From Investment Operations | | | | | | | | | | | | | | | | | | | | |
| | | | | |
Net investment income (loss)(a)(b) | | | .07 | | | | .02 | | | | .04 | | | | .03 | | | | (.01 | ) |
| | | | | |
Net realized and unrealized gain (loss) on investment transactions | | | (1.04 | ) | | | 4.65 | | | | (.37 | ) | | | .43 | | | | (.65 | ) |
| | | | | |
Contributions from Affiliates | | | – 0 | – | | | .00 | (c) | | | – 0 | – | | | – 0 | – | | | – 0 | – |
| | | | |
Net increase (decrease) in net asset value from operations | | | (.97 | ) | | | 4.67 | | | | (.33 | ) | | | .46 | | | | (.66 | ) |
| | | | |
Less: Dividends and Distributions | | | | | | | | | | | | | | | | | | | | |
| | | | | |
Dividends from net investment income | | | (.01 | ) | | | (.04 | ) | | | (.02 | ) | | | – 0 | – | | | – 0 | – |
| | | | | |
Distributions from net realized gain on investment transactions | | | (1.15 | ) | | | – 0 | – | | | (.31 | ) | | | (.65 | ) | | | (.76 | ) |
| | | | |
Total dividends and distributions | | | (1.16 | ) | | | (.04 | ) | | | (.33 | ) | | | (.65 | ) | | | (.76 | ) |
| | | | |
Net asset value, end of period | | | $ 14.24 | | | | $ 16.37 | | | | $ 11.74 | | | | $ 12.40 | | | | $ 12.59 | |
| | | | |
| | | | | |
Total Return | | | | | | | | | | | | | | | | | | | | |
| | | | | |
Total investment return based on net asset value(d) | | | (6.72 | )% | | | 39.92 | % | | | (2.71 | )% | | | 4.22 | % | | | (4.97 | )% |
| | | | | |
Ratios/Supplemental Data | | | | | | | | | | | | | | | | | | | | |
| | | | | |
Net assets, end of period (000’s omitted) | | | $162,522 | | | | $177,607 | | | | $127,581 | | | | $163,493 | | | | $179,874 | |
| | | | | |
Ratio to average net assets of: | | | | | | | | | | | | | | | | | | | | |
| | | | | |
Expenses, net of waivers/reimbursements(e)‡ | | | 1.16 | % | | | 1.17 | % | | | 1.20 | % | | | 1.20 | % | | | 1.24 | % |
| | | | | |
Expenses, before waivers/reimbursements(e)‡ | | | 1.16 | % | | | 1.17 | % | | | 1.21 | % | | | 1.20 | % | | | 1.25 | % |
| | | | | |
Net investment income (loss)(b) | | | .50 | % | | | .13 | % | | | .40 | % | | | .24 | % | | | (.07 | )% |
| | | | | |
Portfolio turnover rate | | | 47 | % | | | 50 | % | | | 48 | % | | | 40 | % | | | 42 | % |
| | | | | | | | | | | | | | | | | | | | |
| |
‡ Expense ratios exclude the estimated acquired fund fees of the affiliated/unaffiliated underlying | |
portfolios | | | .00 | % | | | .00 | % | | | .00 | % | | | .00 | % | | | .01 | % |
See footnote summary on page 38.
| | |
| |
| abfunds.com | | AB SMALL CAP VALUE PORTFOLIO | 35 |
FINANCIAL HIGHLIGHTS (continued)
Selected Data For A Share Of Capital Stock Outstanding Throughout Each Period
| | | | | | | | | | | | | | | | | | | | |
| | | Class C | |
| | | Year Ended November 30, | |
| | | 2022 | | | 2021 | | | 2020 | | | 2019 | | | 2018 | |
| | | | |
| | | | | | | | | | | | | | | | | | | | |
Net asset value, beginning of period | | | $ 15.59 | | | | $ 11.23 | | | | $ 11.93 | | | | $ 12.23 | | | | $ 13.72 | |
| | | | |
Income From Investment Operations | | | | | | | | | | | | | | | | | | | | |
| | | | | |
Net investment loss(a)(b) | | | (.02 | ) | | | (.10 | ) | | | (.04 | ) | | | (.06 | ) | | | (.11 | ) |
| | | | | |
Net realized and unrealized gain (loss) on investment transactions | | | (.99 | ) | | | 4.46 | | | | (.35 | ) | | | .41 | | | | (.62 | ) |
| | | | | |
Contributions from Affiliates | | | – 0 | – | | | .00 | (c) | | | – 0 | – | | | – 0 | – | | | – 0 | – |
| | | | |
Net increase (decrease) in net asset value from operations | | | (1.01 | ) | | | 4.36 | | | | (.39 | ) | | | .35 | | | | (.73 | ) |
| | | | |
Less: Distributions | | | | | | | | | | | | | | | | | | | | |
| | | | | |
Distributions from net realized gain on investment transactions | | | (1.15 | ) | | | – 0 | – | | | (.31 | ) | | | (.65 | ) | | | (.76 | ) |
| | | | |
Net asset value, end of period | | | $13.43 | | | | $15.59 | | | | $11.23 | | | | $11.93 | | | | $12.23 | |
| | | | |
| | | | | |
Total Return | | | | | | | | | | | | | | | | | | | | |
| | | | | |
Total investment return based on net asset value(d) | | | (7.35 | )% | | | 38.82 | % | | | (3.41 | )% | | | 3.40 | % | | | (5.62 | )% |
| | | | | |
Ratios/Supplemental Data | | | | | | | | | | | | | | | | | | | | |
| | | | | |
Net assets, end of period (000’s omitted) | | | $330 | | | | $477 | | | | $287 | | | | $278 | | | | $153 | |
| | | | | |
Ratio to average net assets of: | | | | | | | | | | | | | | | | | | | | |
| | | | | |
Expenses, net of waivers/reimbursements(e)‡ | | | 1.76 | % | | | 1.90 | % | | | 1.97 | % | | | 1.97 | % | | | 1.99 | % |
| | | | | |
Expenses, before waivers/reimbursements(e)‡ | | | 1.92 | % | | | 1.92 | % | | | 1.97 | % | | | 1.97 | % | | | 2.00 | % |
| | | | | |
Net investment loss(b) | | | (.16 | )% | | | (.65 | )% | | | (.37 | )% | | | (.54 | )% | | | (.82 | )% |
| | | | | |
Portfolio turnover rate | | | 47 | % | | | 50 | % | | | 48 | % | | | 40 | % | | | 42 | % |
| | | | | | | | | | | | | | | | | | | | |
| |
‡ Expense ratios exclude the estimated acquired fund fees of the affiliated/unaffiliated underlying | |
portfolios | | | .00 | % | | | .00 | % | | | .00 | % | | | .00 | % | | | .01 | % |
See footnote summary on page 38.
| | |
| |
36 | AB SMALL CAP VALUE PORTFOLIO | | abfunds.com |
FINANCIAL HIGHLIGHTS (continued)
Selected Data For A Share Of Capital Stock Outstanding Throughout Each Period
| | | | | | | | | | | | | | | | | | | | |
| | | Advisor Class | |
| | | Year Ended November 30, | |
| | | 2022 | | | 2021 | | | 2020 | | | 2019 | | | 2018 | |
| | | | |
| | | | | | | | | | | | | | | | | | | | |
Net asset value, beginning of period | | | $ 16.57 | | | | $ 11.88 | | | | $ 12.54 | | | | $ 12.73 | | | | $ 14.12 | |
| | | | |
Income From Investment Operations | | | | | | | | | | | | | | | | | | | | |
| | | | | |
Net investment income(a)(b) | | | .11 | | | | .06 | | | | .07 | | | | .06 | | | | .03 | |
| | | | | |
Net realized and unrealized gain (loss) on investment transactions | | | (1.06 | ) | | | 4.70 | | | | (.36 | ) | | | .43 | | | | (.66 | ) |
| | | | | |
Contributions from Affiliates | | | 0 | | | | .00 | (c) | | | – 0 | – | | | – 0 | – | | | – 0 | – |
| | | | |
Net increase (decrease) in net asset value from operations | | | (.95 | ) | | | 4.76 | | | | (.29 | ) | | | .49 | | | | (.63 | ) |
| | | | |
Less: Dividends and Distributions | | | | | | | | | | | | | | | | | | | | |
| | | | | |
Dividends from net investment income | | | (.05 | ) | | | (.07 | ) | | | (.06 | ) | | | (.03 | ) | | | – 0 | – |
| | | | | |
Distributions from net realized gain on investment transactions | | | (1.15 | ) | | | – 0 | – | | | (.31 | ) | | | (.65 | ) | | | (.76 | ) |
| | | | |
Total dividends and distributions | | | (1.20 | ) | | | (.07 | ) | | | (.37 | ) | | | (.68 | ) | | | (.76 | ) |
| | | | |
Net asset value, end of period | | | $ 14.42 | | | | $ 16.57 | | | | $ 11.88 | | | | $ 12.54 | | | | $ 12.73 | |
| | | | |
| | | | | |
Total Return | | | | | | | | | | | | | | | | | | | | |
| | | | | |
Total investment return based on net asset value(d) | | | (6.53 | )% | | | 40.26 | % | | | (2.42 | )% | | | 4.41 | % | | | (4.70 | )% |
| | | | | |
Ratios/Supplemental Data | | | | | | | | | | | | | | | | | | | | |
| | | | | |
Net assets, end of period (000’s omitted) | | | $520,700 | | | | $456,033 | | | | $254,319 | | | | $214,197 | | | | $144,136 | |
| | | | | |
Ratio to average net assets of: | | | | | | | | | | | | | | | | | | | | |
| | | | | |
Expenses, net of waivers/reimbursements(e)‡ | | | .91 | % | | | .92 | % | | | .96 | % | | | .95 | % | | | .99 | % |
| | | | | |
Expenses, before waivers/reimbursements(e)‡ | | | .91 | % | | | .92 | % | | | .96 | % | | | .96 | % | | | 1.00 | % |
| | | | | |
Net investment income(b) | | | .79 | % | | | .38 | % | | | .67 | % | | | .48 | % | | | .20 | % |
| | | | | |
Portfolio turnover rate | | | 47 | % | | | 50 | % | | | 48 | % | | | 40 | % | | | 42 | % |
| | | | | | | | | | | | | | | | | | | | |
| |
‡ Expense ratios exclude the estimated acquired fund fees of the affiliated/unaffiliated underlying | |
portfolios | | | .00 | % | | | .00 | % | | | .00 | % | | | .00 | % | | | .01 | % |
See footnote summary on page 38.
| | |
| |
| abfunds.com | | AB SMALL CAP VALUE PORTFOLIO | 37 |
FINANCIAL HIGHLIGHTS (continued)
Selected Data For A Share Of Capital Stock Outstanding Throughout Each Period
| (a) | Based on average shares outstanding. |
| (b) | Net of expenses waived/reimbursed by the Adviser. |
| (c) | Amount is less than $.005. |
| (d) | Total investment return is calculated assuming an initial investment made at the net asset value at the beginning of the period, reinvestment of all dividends and distributions at net asset value during the period, and redemption on the last day of the period. Initial sales charges or contingent deferred sales charges are not reflected in the calculation of total investment return. Total return does not reflect the deduction of taxes that a shareholder would pay on fund distributions or the redemption of fund shares. Total investment return calculated for a period of less than one year is not annualized. |
| (e) | In connection with the Fund’s investments in affiliated underlying portfolios, the Fund incurs no direct expenses, but bears proportionate shares of the fees and expenses (i.e., operating, administrative and investment advisory fees) of the affiliated underlying portfolios. The Adviser has contractually agreed to waive its fees from the Fund in an amount equal to the Fund’s pro rata share of certain acquired fund fees and expenses, and for the year ended November 30, 2018, such waiver amounted to .01%. |
See notes to financial statements.
| | |
| |
38 | AB SMALL CAP VALUE PORTFOLIO | | abfunds.com |
REPORT OF INDEPENDENT REGISTERED
PUBLIC ACCOUNTING FIRM
To the Shareholders and the Board of Directors of
AB Small Cap Value Portfolio
Opinion on the Financial Statements
We have audited the accompanying statement of assets and liabilities of AB Small Cap Value Portfolio (the “Fund”) (one of the funds constituting AB Cap Fund, Inc. (the “Company”)), including the portfolio of investments, as of November 30, 2022, and the related statement of operations for the year then ended, the statements of changes in net assets for each of the two years in the period then ended, the financial highlights for each of the five years in the period then ended and the related notes (collectively referred to as the “financial statements”). In our opinion, the financial statements present fairly, in all material respects, the financial position of the Fund (one of the funds constituting AB Cap Fund, Inc.) at November 30, 2022, the results of its operations for the year then ended, the changes in its net assets for each of the two years in the period then ended and its financial highlights for each of the five years in the period then ended, in conformity with U.S. generally accepted accounting principles.
Basis for Opinion
These financial statements are the responsibility of the Company’s management. Our responsibility is to express an opinion on the Fund’s financial statements based on our audits. We are a public accounting firm registered with the Public Company Accounting Oversight Board (United States) (“PCAOB”) and are required to be independent with respect to the Company in accordance with the U.S. federal securities laws and the applicable rules and regulations of the Securities and Exchange Commission and the PCAOB.
We conducted our audits in accordance with the standards of the PCAOB. Those standards require that we plan and perform the audit to obtain reasonable assurance about whether the financial statements are free of material misstatement, whether due to error or fraud. The Company is not required to have, nor were we engaged to perform, an audit of the Company’s internal control over financial reporting. As part of our audits, we are required to obtain an understanding of internal control over financial reporting but not for the purpose of expressing an opinion on the effectiveness of the Company’s internal control over financial reporting. Accordingly, we express no such opinion.
Our audits included performing procedures to assess the risks of material misstatement of the financial statements, whether due to error or fraud, and performing procedures that respond to those risks. Such procedures
| | |
| |
| abfunds.com | | AB SMALL CAP VALUE PORTFOLIO | 39 |
REPORT OF INDEPENDENT REGISTERED
PUBLIC ACCOUNTING FIRM (continued)
included examining, on a test basis, evidence regarding the amounts and disclosures in the financial statements. Our procedures included confirmation of securities owned as of November 30, 2022, by correspondence with the custodian, brokers and others; when replies were not received from brokers or others, we performed other auditing procedures. Our audits also included evaluating the accounting principles used and significant estimates made by management, as well as evaluating the overall presentation of the financial statements. We believe that our audits provide a reasonable basis for our opinion.

We have served as the auditor of one or more of the AB investment companies since 1968.
New York, New York
January 26, 2023
| | |
| |
40 | AB SMALL CAP VALUE PORTFOLIO | | abfunds.com |
2022 FEDERAL TAX INFORMATION
(unaudited)
For Federal income tax purposes, the following information is furnished with respect to the distributions paid by the Fund during the taxable year ended November 30, 2022. For individual shareholders, the Fund designates 17.31% of dividends paid as qualified dividend income. For corporate shareholders, 17.10% of dividends paid qualify for the dividends received deduction. The Fund designates $5,147,597 of dividends paid as long-term capital gain dividends.
Shareholders should not use the above information to prepare their income tax returns. The information necessary to complete your income tax returns will be included with your Form 1099-DIV which will be sent to you separately in January 2023.
| | |
| |
| abfunds.com | | AB SMALL CAP VALUE PORTFOLIO | 41 |
BOARD OF DIRECTORS
| | |
Garry L. Moody(1), Chairman Jorge A. Bermudez(1) Michael J. Downey(1) Onur Erzan, President and Chief Executive Officer | | Nancy P. Jacklin(1) Jeanette W. Loeb(1) Carol J. McMullen(1) Marshall C. Turner, Jr.(1) |
OFFICERS
| | |
James W. MacGregor(2), Vice President Erik A. Turenchalk(2), Vice President Nancy E. Hay, Secretary Michael B. Reyes, Senior Vice President | | Joseph J. Mantineo, Treasurer and Chief Financial Officer Phyllis J. Clarke, Controller Jennifer Friedland, Chief Compliance Officer |
| | |
| Custodian and Accounting Agent | | Legal Counsel |
State Street Bank and Trust Company State Street Corporation CCB/5 1 Iron Street
Boston, MA 02210 Principal Underwriter AllianceBernstein Investments, Inc. 501 Commerce Street Nashville, TN 37203 Transfer Agent AllianceBernstein Investor Services, Inc. P.O. Box 786003 San Antonio, TX 78278 Toll-Free (800) 221-5672 | | Seward & Kissel LLP One Battery Park Plaza New York, NY 10004 Independent Registered Public Accounting Firm Ernst & Young LLP One Manhattan West New York, NY 10001 |
| 1 | Member of the Audit Committee, the Governance and Nominating Committee and the Independent Directors Committee. |
| 2 | The management of, and investment decisions for, the Fund’s portfolio are made by the Adviser’s Small/Mid Cap Value Senior Investment Management Team. Messrs. MacGregor and Turenchalk are the investment professionals with the most significant responsibility for the day-to-day management of the Fund’s portfolio. |
| | |
| |
42 | AB SMALL CAP VALUE PORTFOLIO | | abfunds.com |
MANAGEMENT OF THE FUND
Board of Directors Information
The business and affairs of the Fund are managed under the direction of the Board of Directors. Certain information concerning the Fund’s Directors is set forth below.
| | | | | | | | |
NAME,
ADDRESS*, AGE,
(YEAR FIRST ELECTED**) | | PRINCIPAL
OCCUPATION(S)
DURING PAST FIVE YEARS
AND OTHER INFORMATION*** | | PORTFOLIOS
IN AB FUND
COMPLEX
OVERSEEN BY
DIRECTOR | | | OTHER PUBLIC
COMPANY
DIRECTORSHIPS
CURRENTLY
HELD BY
DIRECTOR |
| INTERESTED DIRECTOR | | | | | | |
| | | |
Onur Erzan,#
1345 Avenue of the Americas
New York, NY 10105
47
(2021) | | Senior Vice President of AllianceBernstein L.P. (the “Adviser”), Head of Global Client Group and Head of Private Wealth. He oversees AB’s entire private wealth management business and third-party institutional and retail franchise, where he is responsible for all client services, sales and marketing, as well as product strategy, management and development worldwide. Director, President and Chief Executive Officer of the AB Mutual Funds as of April 1, 2021. He is also a member of the Equitable Holdings Management Committee. Prior to joining the firm in 2021, he spent over 19 years with McKinsey, most recently as a senior partner and co-leader of its Wealth & Asset Management practice. In addition, he co-led McKinsey’s Banking & Securities Solutions (a portfolio of data, analytics and digital assets and capabilities) globally. | | | 75 | | | None |
| | |
| |
| abfunds.com | | AB SMALL CAP VALUE PORTFOLIO | 43 |
MANAGEMENT OF THE FUND (continued)
| | | | | | | | |
NAME,
ADDRESS*, AGE,
(YEAR FIRST ELECTED**) | | PRINCIPAL
OCCUPATION(S)
DURING PAST FIVE YEARS
AND OTHER INFORMATION*** | | PORTFOLIOS
IN AB FUND
COMPLEX
OVERSEEN BY
DIRECTOR | | | OTHER PUBLIC
COMPANY
DIRECTORSHIPS
CURRENTLY
HELD BY
DIRECTOR |
| DISINTERESTED DIRECTORS | | | | | | |
| | | |
Garry L. Moody,##
Chairman of the Board
70
(2014) | | Private Investor since prior to 2018. Formerly, Partner, Deloitte & Touche LLP (1995-2008) where he held a number of senior positions, including Vice Chairman, and U.S. and Global Investment Management Practice Managing Partner; President, Fidelity Accounting and Custody Services Company (1993-1995), where he was responsible for accounting, pricing, custody and reporting for the Fidelity mutual funds; and Partner, Ernst & Young LLP (1975-1993), where he served as the National Director of Mutual Fund Tax Services and Managing Partner of its Chicago Office Tax department. He is a member of the Investment Company Institute’s Board of Governors and the Independent Directors Council’s Governing Council, where he serves as Chairman of its Governance Committee. He is Chairman of the AB Funds and Chairman of the Independent Directors Committees since January 2023 and he has served as a director or trustee, and as Chairman of the Audit Committees, of the AB Funds since 2008. | | | 75 | | | None |
| | | | | | | | |
| | |
| |
44 | AB SMALL CAP VALUE PORTFOLIO | | abfunds.com |
MANAGEMENT OF THE FUND (continued)
| | | | | | | | |
NAME,
ADDRESS*, AGE,
(YEAR FIRST ELECTED**) | | PRINCIPAL
OCCUPATION(S)
DURING PAST FIVE YEARS
AND OTHER INFORMATION*** | | PORTFOLIOS
IN AB FUND
COMPLEX
OVERSEEN BY
DIRECTOR | | | OTHER PUBLIC
COMPANY
DIRECTORSHIPS
CURRENTLY
HELD BY
DIRECTOR |
DISINTERESTED DIRECTORS
(continued) | | | | | | |
| | | |
Jorge A. Bermudez,## 71
(2020) | | Private Investor since prior to 2018. Formerly, Chief Risk Officer of Citigroup, Inc., a global financial services company, from November 2007 to March 2008, Chief Executive Officer of Citigroup’s Commercial Business Group in North America and Citibank Texas from 2005 to 2007, and a variety of other executive and leadership roles at various businesses within Citigroup prior to then; Chairman (2018) of the Texas A&M Foundation Board of Trustees (Trustee since 2013) and Chairman of the Smart Grid Center Board at Texas A&M University since 2012; director of, among others, Citibank N.A. from 2005 to 2008, the Federal Reserve Bank of Dallas, Houston Branch from 2009 to 2011, the Federal Reserve Bank of Dallas from 2011 to 2017, and the Electric Reliability Council of Texas from 2010 to 2016. He has served as director or trustee of the AB Funds since January 2020. | | | 75 | | | Moody’s Corporation since April 2011 and Chair of its Audit Committee since December 2022 |
| | | | | | | | |
| | | |
Michael J. Downey,##
79
(2014) | | Private Investor since prior to 2018. Formerly, Chairman of The Asia Pacific Fund, Inc. (registered investment company) since prior to 2018 until January 2019. From 1987 until 1993, Chairman and CEO of Prudential Mutual Fund Management, director of the Prudential mutual funds, and member of the Executive Committee of Prudential Securities, Inc. He has served as a director or trustee of the AB Funds since 2005. | | | 75 | | | None |
| | | | | | | | |
| | |
| |
| abfunds.com | | AB SMALL CAP VALUE PORTFOLIO | 45 |
MANAGEMENT OF THE FUND (continued)
| | | | | | | | |
NAME,
ADDRESS*, AGE,
(YEAR FIRST ELECTED**) | | PRINCIPAL
OCCUPATION(S)
DURING PAST FIVE YEARS
AND OTHER INFORMATION*** | | PORTFOLIOS
IN AB FUND
COMPLEX
OVERSEEN BY
DIRECTOR | | | OTHER PUBLIC
COMPANY
DIRECTORSHIPS
CURRENTLY
HELD BY
DIRECTOR |
DISINTERESTED DIRECTORS
(continued) | | | | | | |
| | | |
Nancy P. Jacklin,##
74
(2014) | | Private Investor since prior to 2018. Professorial Lecturer at the Johns Hopkins School of Advanced International Studies (2008-2015). U.S. Executive Director of the International Monetary Fund (which is responsible for ensuring the stability of the international monetary system), (December 2002-May 2006); Partner, Clifford Chance (1992-2002); Sector Counsel, International Banking and Finance, and Associate General Counsel, Citicorp (1985-1992); Assistant General Counsel (International), Federal Reserve Board of Governors (1982-1985); and Attorney Advisor, U.S. Department of the Treasury (1973-1982). Member of the Bar of the District of Columbia and of New York; and member of the Council on Foreign Relations. She has served as a director or trustee of the AB Funds since 2006 and has been Chair of the Governance and Nominating Committees of the AB Funds since August 2014. | | | 75 | | | None |
| | | | | | | | |
| | | |
Jeanette W. Loeb,##
70
(2020) | | Chief Executive Officer of PetCareRx (e-commerce pet pharmacy) from 2002 to 2011 and 2015 to present. Director of New York City Center since 2005. She was a director of AB Multi-Manager Alternative Fund, Inc. (fund of hedge funds) from 2012 to 2018. Formerly, affiliated with Goldman Sachs Group, Inc. (financial services) from 1977 to 1994, including as a partner thereof from 1986 to 1994. She has served as director or trustee of the AB Funds since April 2020. | | | 75 | | | Apollo Investment Corp. (business development company) since August 2011 |
| | |
| |
46 | AB SMALL CAP VALUE PORTFOLIO | | abfunds.com |
MANAGEMENT OF THE FUND (continued)
| | | | | | | | |
NAME,
ADDRESS*, AGE,
(YEAR FIRST ELECTED**) | | PRINCIPAL
OCCUPATION(S)
DURING PAST FIVE YEARS
AND OTHER INFORMATION*** | | PORTFOLIOS
IN AB FUND
COMPLEX
OVERSEEN BY
DIRECTOR | | | OTHER PUBLIC
COMPANY
DIRECTORSHIPS
CURRENTLY
HELD BY
DIRECTOR |
DISINTERESTED DIRECTORS
(continued) | | | | | | |
| | | |
Carol C. McMullen,## 67
(2016) | | Managing Director of Slalom Consulting (consulting) since 2014, private investor and a member of the Advisory Board of Butcher Box (since 2018). Formerly, member, Partners Healthcare Investment Committee (2010-2019); Director of Norfolk & Dedham Group (mutual property and casualty insurance) from 2011 until November 2016; Director of Partners Community Physicians Organization (healthcare) since 2014 until December 2016; and Managing Director of The Crossland Group (consulting) from 2012 until 2013. She has held a number of senior positions in the asset and wealth management industries, including at Eastern Bank (where her roles included President of Eastern Wealth Management), Thomson Financial (Global Head of Sales for Investment Management), and Putnam Investments (where her roles included Chief Investment Officer, Core and Growth and Head of Global Investment Research). She has served on a number of private company and non-profit boards, and as a director or trustee of the AB Funds since June 2016. | | | 75 | | | None |
| | |
| |
| abfunds.com | | AB SMALL CAP VALUE PORTFOLIO | 47 |
MANAGEMENT OF THE FUND (continued)
| | | | | | | | |
NAME,
ADDRESS*, AGE,
(YEAR FIRST ELECTED**) | | PRINCIPAL
OCCUPATION(S)
DURING PAST FIVE YEARS
AND OTHER INFORMATION*** | | PORTFOLIOS
IN AB FUND
COMPLEX
OVERSEEN BY
DIRECTOR | | | OTHER PUBLIC
COMPANY
DIRECTORSHIPS
CURRENTLY
HELD BY
DIRECTOR |
DISINTERESTED DIRECTORS
(continued) | | | | | | |
| | | |
Marshall C. Turner, Jr.,##
81
(2014) | | Private Investor since prior to 2018. Former Chairman and CEO of Dupont Photomasks, Inc. (semi-conductor manufacturing equipment). He was a Director of Xilinx, Inc. (programmable logic semi-conductors and adaptable, intelligent computing) from 2007 through August 2020, and is a former director of 33 other companies and organizations. He has extensive operating leadership and venture capital investing experience, including five interim or full-time CEO roles, and prior service as general partner of institutional venture capital partnerships. He also has extensive non-profit board leadership experience, and currently serves on the board of the George Lucas Educational Foundation. He has served as a director of one AB Fund since 1992, and director or trustee of all AB Funds since 2005. He has served as both Chairman of the AB Funds and Chairman of the Independent Directors Committees from 2014 through December 2022. | | | 75 | | | None |
| | | | | | | | |
| | |
| |
48 | AB SMALL CAP VALUE PORTFOLIO | | abfunds.com |
MANAGEMENT OF THE FUND (continued)
| * | The address for each of the Fund’s disinterested Directors is c/o AllianceBernstein L.P., Attention: Legal and Compliance Department—Mutual Fund Legal, 1345 Avenue of the Americas, New York, NY 10105 |
| ** | There is no stated term of office for the Fund’s Directors. |
| *** | The information above includes each Director’s principal occupation during the last five years and other information relating to the experience, attributes and skills relevant to each Director’s qualifications to serve as a Director, which led to the conclusion that each Director should serve as a Director for the Fund. |
| # | Mr. Erzan is an “interested director” of the Fund, as defined in the 1940 Act, due to his position as a Senior Vice President of the Adviser. |
| ## | Member of the Audit Committee, the Governance and Nominating Committee and the Independent Directors Committee. |
| | |
| |
| abfunds.com | | AB SMALL CAP VALUE PORTFOLIO | 49 |
MANAGEMENT OF THE FUND (continued)
Officers of the Fund
Certain information concerning the Fund’s Officers is listed below.
| | | | |
NAME, ADDRESS*
AND AGE | | PRINCIPAL POSITION(S)
HELD WITH FUND | | PRINCIPAL OCCUPATION
DURING PAST FIVE YEARS |
Onur Erzan 47 | | President and Chief Executive Officer | | See biography above. |
| | | | |
James W. MacGregor 55 | | Vice President | | Senior Vice President and Chief Investment Officer of US Small and Mid-Cap Value Equities. of the Adviser**, with which he has been associated since prior to 2018. He is also Head – US Value Equities since 2019. |
| | | | |
Erik A. Turenchalk 49 | | Vice President | | Senior Vice President of the Adviser**, with which he has been associated since prior to 2018. |
| | | | |
Nancy E. Hay 50 | | Secretary | | Vice President and Counsel of the Adviser, with which she has been associated since prior to 2018 and Assistant Secretary of ABI**. |
| | | | |
Michael B. Reyes 46 | | Senior Vice President | | Vice President of the Adviser**, with which he has been associated since prior to 2018. |
| | | | |
Joseph J. Mantineo 63 | | Treasurer and Chief Financial Officer | | Senior Vice President of AllianceBernstein Investor Services, Inc. (“ABIS”)**, with which he has been associated since prior to 2018. |
| | | | |
Phyllis J. Clarke 62 | | Controller | | Vice President of ABIS**, with which she has been associated since prior to 2018. |
| | | | |
Jennifer Friedland 48 | | Chief Compliance Officer | | Vice President of the Adviser** since 2020 and Mutual Fund Chief Compliance Officer (of all Funds since January 2023 and of the ETF Funds since 2022). Before joining the Adviser** in 2020, she was Chief Compliance Officer at WestEnd Advisors, LLC from prior to 2018 until 2019. |
| * | The address for each of the Fund’s Officers is 1345 Avenue of the Americas, New York, NY 10105. |
| ** | The Adviser, ABI and ABIS are affiliates of the Fund. |
The Fund’s Statement of Additional Information (“SAI”) has additional information about the Fund’s Trustees and Officers and is available without charge upon request. Contact your financial representative or AB at (800) 227-4618, or visit www.abfunds.com, for a free prospectus or SAI.
| | |
| |
50 | AB SMALL CAP VALUE PORTFOLIO | | abfunds.com |
Operation and Effectiveness of the Fund’s Liquidity Risk Management Program:
In October 2016, the Securities and Exchange Commission (“SEC”) adopted the open-end fund liquidity rule (the “Liquidity Rule”). In June 2018 the SEC adopted a requirement that funds disclose information about the operation and effectiveness of their Liquidity Risk Management Program (“LRMP”) in their reports to shareholders.
One of the requirements of the Liquidity Rule is for the Fund to designate an Administrator of the Fund’s Liquidity Risk Management Program. The Administrator of the Fund’s LRMP is AllianceBernstein L.P., the Fund’s investment adviser (the “Adviser”). The Adviser has delegated the responsibility to its Liquidity Risk Management Committee (the “Committee”).
Another requirement of the Liquidity Rule is for the Fund’s Board of Directors (the “Fund Board”) to receive an annual written report from the Administrator of the LRMP, which addresses the operation of the Fund’s LRMP and assesses its adequacy and effectiveness. The Adviser provided the Fund Board with such annual report during the first quarter of 2022, which covered the period January 1, 2021 through December 31, 2021 (the “Program Reporting Period”).
The LRMP’s principal objectives include supporting the Fund’s compliance with limits on investments in illiquid assets and mitigating the risk that the Fund will be unable to meet its redemption obligations in a timely manner.
Pursuant to the LRMP, the Fund classifies the liquidity of its portfolio investments into one of the four categories defined by the SEC: Highly Liquid, Moderately Liquid, Less Liquid, and Illiquid. These classifications are reported to the SEC on Form N-PORT.
During the Program Reporting Period, the Committee reviewed whether the Fund’s strategy is appropriate for an open-end structure, incorporating any holdings of less liquid and illiquid assets. If the Fund participated in derivative transactions, the exposure from such transactions were considered in the LRMP.
The Committee also performed an analysis to determine whether the Fund is required to maintain a Highly Liquid Investment Minimum (“HLIM”). The Committee also incorporated the following information when determining the Fund’s reasonably anticipated trading size for purposes of liquidity monitoring: historical net redemption activity, a Fund’s concentration in an issuer, shareholder concentration, investment performance, total net assets, and distribution channels.
The Adviser informed the Fund Board that the Committee believes the Fund’s LRMP is adequately designed, has been implemented as intended,
| | |
| |
| abfunds.com | | AB SMALL CAP VALUE PORTFOLIO | 51 |
and has operated effectively since its inception. No material exceptions have been noted since the implementation of the LRMP. During the Program Reporting Period, liquidity in all markets was significantly recovered and improved compared to the prior reporting period which included extreme levels of price volatility and relative illiquidity beginning in March 2020 with COVID-19 impacts. As such, the program operated in a relatively robust and benign liquidity environment experienced in markets during the Program Reporting Period. There were no liquidity events that impacted the Fund or its ability to timely meet redemptions during the Program Reporting Period.
| | |
| |
52 | AB SMALL CAP VALUE PORTFOLIO | | abfunds.com |
Information Regarding the Review and Approval of the Fund’s Advisory Agreement
The disinterested directors (the “directors”) of AB Cap Fund, Inc. (the “Company”) unanimously approved the continuance of the Company’s Advisory Agreement with the Adviser in respect of AB Small Cap Value Portfolio (the “Fund”) at a meeting held in-person on May 3-5, 2022 (the “Meeting”).
Prior to approval of the continuance of the Advisory Agreement, the directors had requested from the Adviser, and received and evaluated, extensive materials. They reviewed the proposed continuance of the Advisory Agreement with the Adviser and with experienced counsel who are independent of the Adviser, who advised on the relevant legal standards. The directors also reviewed additional materials, including comparative analytical data prepared by the Senior Vice President for the Fund. The directors also discussed the proposed continuance in private sessions with counsel.
The directors considered their knowledge of the nature and quality of the services provided by the Adviser to the Fund gained from their experience as directors or trustees of most of the registered investment companies advised by the Adviser, their overall confidence in the Adviser’s integrity and competence they have gained from that experience, the Adviser’s initiative in identifying and raising potential issues with the directors and its responsiveness, frankness and attention to concerns raised by the directors in the past, including the Adviser’s willingness to consider and implement organizational and operational changes designed to improve investment results and the services provided to the AB Funds. The directors noted that they have four regular meetings each year, at each of which they review extensive materials and information from the Adviser, including information on the investment performance of the Fund and the money market fund advised by the Adviser in which the Fund invests a portion of its assets.
The directors also considered all factors they believed relevant, including the specific matters discussed below. During the course of their deliberations, the directors evaluated, among other things, the reasonableness of the advisory fee. The directors did not identify any particular information that was all-important or controlling, and different directors may have attributed different weights to the various factors. The directors determined that the selection of the Adviser to manage the Fund and the overall arrangements between the Fund and the Adviser, as provided in the Advisory Agreement, including the advisory fee, were fair and reasonable in light of the services performed, expenses incurred and such other matters as the directors considered relevant in the exercise of their business judgment. The material factors and conclusions that formed the basis for the directors’ determinations included the following:
Nature, Extent and Quality of Services Provided
The directors considered the scope and quality of services provided by the Adviser under the Advisory Agreement, including the quality of the investment
| | |
| |
| abfunds.com | | AB SMALL CAP VALUE PORTFOLIO | 53 |
research capabilities of the Adviser and the other resources it has dedicated to performing services for the Fund. The directors noted that the Adviser from time to time reviews the Fund’s investment strategies and from time to time proposes changes intended to improve the Fund’s relative or absolute performance for the directors’ consideration. They also noted the professional experience and qualifications of the Fund’s portfolio management team and other senior personnel of the Adviser. The directors also considered that the Advisory Agreement provides that the Fund will reimburse the Adviser for the cost to it of providing certain clerical, accounting, administrative and other services to the Fund by employees of the Adviser or its affiliates. Requests for these reimbursements are made on a quarterly basis and subject to approval by the directors. Reimbursements, to the extent requested and paid, result in a higher rate of total compensation from the Fund to the Adviser than the fee rate stated in the Advisory Agreement. The directors noted that the methodology used to determine the reimbursement amounts had been reviewed by an independent consultant at the request of the directors. The quality of administrative and other services, including the Adviser’s role in coordinating the activities of the Fund’s other service providers, also was considered. The directors concluded that, overall, they were satisfied with the nature, extent and quality of services provided to the Fund under the Advisory Agreement.
Costs of Services Provided and Profitability
The directors reviewed a schedule of the revenues and expenses and related notes indicating the profitability of the Fund to the Adviser for calendar years 2020 and 2021 that had been prepared with an expense allocation methodology arrived at in consultation with an independent consultant at the request of the directors. The directors noted the assumptions and methods of allocation used by the Adviser in preparing fund-specific profitability data and understood that there are a number of potentially acceptable allocation methodologies for information of this type. The directors noted that the profitability information reflected all revenues and expenses of the Adviser’s relationship with the Fund, including those relating to its subsidiaries that provide transfer agency, distribution and brokerage services to the Fund. The directors recognized that it is difficult to make comparisons of the profitability of the Advisory Agreement with the profitability of advisory contracts for unaffiliated funds because comparative information is not generally publicly available and is affected by numerous factors. The directors focused on the profitability of the Adviser’s relationship with the Fund before taxes and distribution expenses. The directors concluded that the Adviser’s level of profitability from its relationship with the Fund was not unreasonable.
Fall-Out Benefits
The directors considered the other benefits to the Adviser and its affiliates from their relationships with the Fund and the money market fund advised by the Adviser in which the Fund invests, including, but not limited to, benefits relating to soft dollar arrangements (whereby investment advisers
| | |
| |
54 | AB SMALL CAP VALUE PORTFOLIO | | abfunds.com |
receive brokerage and research services from brokers that execute agency transactions for their clients); 12b-1 fees and sales charges received by the Fund’s principal underwriter (which is a wholly owned subsidiary of the Adviser) in respect of certain classes of the Fund’s shares; brokerage commissions paid by the Fund to brokers affiliated with the Adviser; and transfer agency fees paid by the Fund to a wholly owned subsidiary of the Adviser. The directors recognized that the Adviser’s profitability would be somewhat lower without these benefits. The directors understood that the Adviser also might derive reputational and other benefits from its association with the Fund.
Investment Results
In addition to the information reviewed by the directors in connection with the Meeting, the directors receive detailed performance information for the Fund at each regular Board meeting during the year.
At the Meeting, the directors reviewed performance information prepared by an independent service provider (the “15(c) service provider”), showing the performance of the Class A Shares of the Fund against a group of similar funds (“peer group”) and a larger group of similar funds (“peer universe”), each selected by the 15(c) service provider, and information prepared by the Adviser showing performance of the Class A Shares against a broad-based securities market index, in each case for the 1-, 3- and 5-year periods ended February 28, 2022 and (in the case of comparisons with the broad-based securities market index) for the period from inception. Based on their review, the directors concluded that the Fund’s investment performance was acceptable.
Advisory Fees and Other Expenses
The directors considered the advisory fee rate payable by the Fund to the Adviser and information prepared by the 15(c) service provider concerning advisory fee rates payable by other funds in the same category as the Fund. The directors recognized that it is difficult to make comparisons of advisory fees because there are variations in the services that are included in the fees paid by other funds. The directors compared the Fund’s contractual advisory fee rate with a peer group median. Taking into account the administrative expense reimbursement paid to the Adviser in the latest fiscal year, the directors noted that the Adviser’s total rate of compensation was above the median.
The directors also considered the Adviser’s fee schedule for other clients utilizing investment strategies similar to those of the Fund. For this purpose, they reviewed the relevant advisory fee information from the Adviser’s Form ADV and in a report from the Fund’s Senior Vice President and noted the differences between the Fund’s fee schedule, on the one hand, and the Adviser’s institutional fee schedule and the schedule of fees charged by the Adviser to any offshore funds and for services to any
| | |
| |
| abfunds.com | | AB SMALL CAP VALUE PORTFOLIO | 55 |
sub-advised funds utilizing investment strategies similar to those of the Fund, on the other. The directors noted that the Adviser may, in some cases, agree to fee rates with large institutional clients that are lower than those reviewed by the directors and that they had previously discussed with the Adviser its policies in respect of such arrangements. The directors also compared the advisory fee rate for the Fund with that for another fund advised by the Adviser utilizing similar investment strategies.
The Adviser reviewed with the directors the significantly greater scope of the services it provides to the Fund relative to institutional, offshore fund and sub-advised fund clients. In this regard, the Adviser noted, among other things, that, compared to institutional and offshore or sub-advisory accounts, the Fund (i) demands considerably more portfolio management, research and trading resources due to significantly higher daily cash flows; (ii) has more tax and regulatory restrictions and compliance obligations; (iii) must prepare and file or distribute regulatory and other communications about fund operations; and (iv) must provide shareholder servicing to retail investors. The Adviser also reviewed the greater legal risks presented by the large and changing population of Fund shareholders who may assert claims against the Adviser in individual or class actions, and the greater entrepreneurial risk in offering new fund products, which require substantial investment to launch, may not succeed, and generally must be priced to compete with larger, more established funds resulting in lack of profitability to the Adviser until a new fund achieves scale. In light of the substantial differences in services rendered by the Adviser to institutional, offshore fund and sub-advised fund clients as compared to the Fund, and the different risk profile, the directors considered these fee comparisons inapt and did not place significant weight on them in their deliberations.
In connection with their review of the Fund’s advisory fee, the directors also considered the total expense ratio of the Class A shares of the Fund in comparison to a peer group and a peer universe selected by the 15(c) service provider. The Class A expense ratio of the Fund was based on the Fund’s latest fiscal year. The Adviser had agreed to cap the Fund’s expenses, but the directors noted that the Fund’s expense ratio was currently below the level of the Adviser’s cap. The directors noted that it was likely that the expense ratios of some of the other funds in the Fund’s category were lowered by waivers or reimbursements by those funds’ investment advisers, which in some cases might be voluntary or temporary. The directors view expense ratio information as relevant to their evaluation of the Adviser’s services because the Adviser is responsible for coordinating services provided to the Fund by others. Based on their review, the directors concluded that the Fund’s expense ratio was acceptable.
Economies of Scale
The directors noted that the advisory fee schedule for the Fund does not contain breakpoints and that they had discussed their strong preference
| | |
| |
56 | AB SMALL CAP VALUE PORTFOLIO | | abfunds.com |
for breakpoints in advisory contracts with the Adviser. The directors took into consideration prior presentations by an independent consultant on economies of scale in the mutual fund industry and for the AB Funds, and presentations from time to time by the Adviser concerning certain of its views on economies of scale. The directors also had requested and received from the Adviser certain updates on economies of scale in advance of the Meeting. The directors believe that economies of scale may be realized (if at all) by the Adviser across a variety of products and services, and not only in respect of a single fund. The directors noted that there is no established methodology for setting breakpoints that give effect to the fund-specific services provided by a fund’s adviser and to the economies of scale that an adviser may realize in its overall mutual fund business or those components of it which directly or indirectly affect a fund’s operations. The directors observed that in the mutual fund industry as a whole, as well as among funds similar to the Fund, there is no uniformity or pattern in the fees and asset levels at which breakpoints (if any) apply. The directors also noted that the advisory agreements for many funds do not have breakpoints at all. The directors informed the Adviser that they would monitor the Fund’s asset level (which was well below the level at which they would anticipate adding an initial breakpoint) and its profitability to the Adviser and anticipated revisiting the question of breakpoints in the future if circumstances warranted doing so.
| | |
| |
| abfunds.com | | AB SMALL CAP VALUE PORTFOLIO | 57 |
This page is not part of the Shareholder Report or the Financial Statements.
AB FAMILY OF FUNDS
US EQUITY
CORE
Core Opportunities Fund
Select US Equity Portfolio
Sustainable US Thematic Portfolio
GROWTH
Concentrated Growth Fund
Discovery Growth Fund
Growth Fund
Large Cap Growth Fund
Small Cap Growth Portfolio
VALUE
Discovery Value Fund
Equity Income Fund
Relative Value Fund
Small Cap Value Portfolio
Value Fund
INTERNATIONAL/ GLOBAL EQUITY
CORE
Global Core Equity Portfolio
International Strategic Core Portfolio
Sustainable Global Thematic Fund
Sustainable International Thematic Fund
Tax-Managed Wealth Appreciation Strategy
Wealth Appreciation Strategy
GROWTH
Concentrated International Growth Portfolio
VALUE
All China Equity Portfolio
International Value Fund
FIXED INCOME
MUNICIPAL
High Income Municipal Portfolio
Intermediate California Municipal Portfolio
Intermediate Diversified Municipal Portfolio
Intermediate New York Municipal Portfolio
Municipal Bond Inflation Strategy
Tax-Aware Fixed Income Opportunities Portfolio
National Portfolio
Arizona Portfolio
California Portfolio
Massachusetts Portfolio
Minnesota Portfolio
New Jersey Portfolio
New York Portfolio
Ohio Portfolio
Pennsylvania Portfolio
Virginia Portfolio
TAXABLE
Bond Inflation Strategy
Global Bond Fund
High Income Fund
High Yield Portfolio
Income Fund
Intermediate Duration Portfolio
Limited Duration High Income Portfolio
Short Duration Income Portfolio
Short Duration Portfolio
Sustainable Thematic Credit Portfolio
Total Return Bond Portfolio
ALTERNATIVES
All Market Real Return Portfolio
Global Real Estate Investment Fund
Select US Long/Short Portfolio
MULTI-ASSET
All Market Total Return Portfolio
Emerging Markets Multi-Asset Portfolio
Global Risk Allocation Fund
Sustainable Thematic Balanced Portfolio
CLOSED-END FUNDS
AllianceBernstein Global High Income Fund
AllianceBernstein National Municipal Income Fund
EXCHANGE-TRADED FUNDS
Tax-Aware Short Duration Municipal ETF
Ultra Short Income ETF
We also offer Government Money Market Portfolio, which serves as the money market fund exchange vehicle for the AB mutual funds. You could lose money by investing in the Fund. Although the Fund seeks to preserve the value of your investment at $1.00 per share, it cannot guarantee it will do so. The Fund may impose a fee upon sale of your shares or may temporarily suspend your ability to sell shares if the Fund’s liquidity falls below required minimums because of market conditions or other factors. An investment in the Fund is not insured or guaranteed by the Federal Deposit Insurance Corporation or any other government agency. The Fund’s sponsor has no legal obligation to provide financial support to the Fund, and you should not expect that the sponsor will provide financial support to the Fund at any time.
Investors should consider the investment objectives, risks, charges and expenses of the Fund carefully before investing. For copies of our prospectus or summary prospectus, which contain this and other information, visit us online at www.abfunds.com or contact your AB representative. Please read the prospectus and/or summary prospectus carefully before investing.
| | |
| |
58 | AB SMALL CAP VALUE PORTFOLIO | | abfunds.com |
NOTES
| | |
| |
| abfunds.com | | AB SMALL CAP VALUE PORTFOLIO | 59 |
NOTES
| | |
| |
60 | AB SMALL CAP VALUE PORTFOLIO | | abfunds.com |
AB SMALL CAP VALUE PORTFOLIO
1345 Avenue of the Americas
New York, NY 10105
800 221 5672
SCV-0151-1122 
ITEM 2. CODE OF ETHICS.
(a) The registrant has adopted a code of ethics that applies to its principal executive officer, principal financial officer and principal accounting officer. A copy of the registrant’s code of ethics is filed herewith as Exhibit 12(a)(1).
(b) During the period covered by this report, no material amendments were made to the provisions of the code of ethics adopted in 2(a) above.
(c) During the period covered by this report, no implicit or explicit waivers to the provisions of the code of ethics adopted in 2(a) above were granted.
ITEM 3. AUDIT COMMITTEE FINANCIAL EXPERT.
The registrant’s Board of Directors has determined that independent directors Garry L. Moody, Marshall C. Turner, Jr. and Jorge A. Bermudez qualify as audit committee financial experts.
ITEM 4. PRINCIPAL ACCOUNTANT FEES AND SERVICES.
(a) - (c) The following table sets forth the aggregate fees billed by the independent registered public accounting firm Ernst & Young LLP, for the Fund’s last two fiscal years for professional services rendered for: (i) the audit of the Fund’s annual financial statements included in the Fund’s annual report to stockholders; (ii) assurance and related services that are reasonably related to the performance of the audit of the Fund’s financial statements and are not reported under (i), which include advice and education related to accounting and auditing issues and quarterly press release review (for those Funds which issue press releases), and preferred stock maintenance testing (for those Funds that issue preferred stock); and (iii) tax compliance, tax advice and tax return preparation.
| | | | | | | | | | | | | | | | |
| | | | | | Audit Fees | | | Audit-Related
Fees | | | Tax Fees | |
AB All Market Income | | | 2021 | | | $ | 84,412 | | | $ | — | | | $ | 37,465 | |
| | | 2022 | | | $ | 88,633 | | | $ | — | | | $ | 61,696 | |
AB Small Cap Value | | | 2021 | | | $ | 31,404 | | | $ | — | | | $ | 15,239 | |
| | | 2022 | | | $ | 32,974 | | | $ | — | | | $ | 31,301 | |
AB All China Equity | | | 2021 | | | $ | 33,975 | | | $ | — | | | $ | 11,824 | |
| | | 2022 | | | $ | 35,674 | | | $ | — | | | $ | 31,398 | |
(d) Not applicable.
(e) (1) Beginning with audit and non-audit service contracts entered into on or after May 6, 2003, the Fund’s Audit Committee policies and procedures require the pre-approval of all audit and non-audit services provided to the Fund by the Fund’s independent registered public accounting firm. The Fund’s Audit Committee policies and procedures also require pre-approval of all audit and non-audit services provided to the Adviser and Service Affiliates to the extent that these services are directly related to the operations or financial reporting of the Fund.
(e) (2) All of the amounts for Audit Fees, Audit-Related Fees and Tax Fees in the table under Item 4 (a) – (c) are for services pre-approved by the Fund’s Audit Committee.
(f) Not applicable.
(g) The following table sets forth the aggregate non-audit services provided to the Fund, the Fund’s Adviser and entities that control, are controlled by or under common control with the Adviser that provide ongoing services to the Fund:
| | | | | | | | | | | | |
| | | | | | All Fees for
Non-Audit Services
Provided to the
Portfolio, the Adviser
and Service
Affiliates | | | Total Amount of
Foregoing Column Pre-
approved by the Audit
Committee
(Portion Comprised of
Audit Related Fees)
(Portion Comprised of
Tax Fees) | |
AB All Market Income | | | 2021 | | | $ | 964,705 | | | $ | 37,465 | |
| | | | | | | | | | $ | — | |
| | | | | | | | | | $ | (37,465 | ) |
| | | 2022 | | | $ | 1,994,154 | | | $ | 61,696 | |
| | | | | | | | | | $ | — | |
| | | | | | | | | | $ | (61,696 | ) |
AB Small Cap Value | | | 2021 | | | $ | 942,479 | | | $ | 15,239 | |
| | | | | | | | | | $ | — | |
| | | | | | | | | | $ | (15,239 | ) |
| | | 2022 | | | $ | 1,963,759 | | | $ | 31,301 | |
| | | | | | | | | | $ | — | |
| | | | | | | | | | $ | (31,301 | ) |
AB All China Equity | | | 2021 | | | $ | 939,064 | | | $ | 11,824 | |
| | | | | | | | | | $ | — | |
| | | | | | | | | | $ | (11,824 | ) |
| | | 2022 | | | $ | 1,963,856 | | | $ | 31,398 | |
| | | | | | | | | | $ | — | |
| | | | | | | | | | $ | (31,398 | ) |
(h) The Audit Committee of the Fund has considered whether the provision of any non-audit services not pre-approved by the Audit Committee provided by the Fund’s independent registered public accounting firm to the Adviser and Service Affiliates is compatible with maintaining the auditor’s independence.
ITEM 5. AUDIT COMMITTEE OF LISTED REGISTRANTS.
Not applicable to the registrant.
ITEM 6. INVESTMENTS.
Please see Schedule of Investments contained in the Report to Shareholders included under Item 1 of this Form N-CSR.
ITEM 7. DISCLOSURE OF PROXY VOTING POLICIES AND PROCEDURES FOR CLOSED-END MANAGEMENT INVESTMENT COMPANIES.
Not applicable to the registrant.
ITEM 8. PORTFOLIO MANAGERS OF CLOSED-END MANAGEMENT INVESTMENT COMPANIES.
Not applicable to the registrant.
ITEM 9. PURCHASES OF EQUITY SECURITIES BY CLOSED-END MANAGEMENT INVESTMENT COMPANY AND AFFILIATED PURCHASERS.
Not applicable to the registrant.
ITEM 10. SUBMISSION OF MATTERS TO A VOTE OF SECURITY HOLDERS.
There have been no material changes to the procedures by which shareholders may recommend nominees to the Fund’s Board of Directors since the Fund last provided disclosure in response to this item.
ITEM 11. CONTROLS AND PROCEDURES.
(a) The registrant’s principal executive officer and principal financial officer have concluded that the registrant’s disclosure controls and procedures (as defined in Rule 30a-2(c) under the Investment Company Act of 1940, as amended) are effective at the reasonable assurance level based on their evaluation of these controls and procedures as of a date within 90 days of the filing date of this document.
(b) There were no changes in the registrant’s internal controls over financial reporting that occurred during the period covered by this report that has materially affected, or is reasonably likely to materially affect, the registrant’s internal control over financial reporting.
ITEM 12. DISCLOSURE OF SECURITIES LENDING ACTIVITIES FOR CLOSED-END MANAGEMENT INVESTMENT COMPANIES.
Not applicable to the registrant.
ITEM 13. EXHIBITS.
The following exhibits are attached to this Form N-CSR:
SIGNATURES
Pursuant to the requirements of the Securities Exchange Act of 1934 and the Investment Company Act of 1940, the registrant has duly caused this report to be signed on its behalf by the undersigned, thereunto duly authorized.
(Registrant): AB Cap Fund, Inc.
| | |
| By: | | /s/ Onur Erzan |
| | Onur Erzan |
| | President |
Date: March 3, 2023
Pursuant to the requirements of the Securities Exchange Act of 1934 and the Investment Company Act of 1940, this report has been signed below by the following persons on behalf of the registrant and in the capacities and on the dates indicated.
| | |
| By: | | /s/ Onur Erzan |
| | Onur Erzan |
| | President |
|
| Date: March 3, 2023 |
| |
| By: | | /s/ Joseph J. Mantineo |
| | Joseph J. Mantineo |
| | Treasurer and Chief Financial Officer |
|
| Date: March 3, 2023 |