Exhibit 99.1
| | |
 | | > News Release |
Newell Rubbermaid Reports Third Quarter 2010 Results
» Core Sales Growth of 5.7%
» Normalized EPS of $0.42; a 10.5% Increase Over Prior Year
» Gross Margin Expansion of 70 Basis Points
» Reaffirms Full Year 2010 Guidance
ATLANTA, October 29, 2010– Newell Rubbermaid (NYSE: NWL) today announced third quarter 2010 financial results, including normalized earnings per share of $0.42, a 10.5 percent improvement over prior year results, core sales growth of 5.7 percent and gross margin expansion of 70 basis points.
“I’m very pleased with our third quarter performance,” said Mark Ketchum, President and CEO. “We generated improved results in all key financial metrics. We grew core sales over five percentage points despite lingering economic headwinds, we continued to expand our gross margin and increased normalized earnings per share. I’m confident that these strong financial results provide compelling evidence that our strategy of investing behind consumer driven innovation and brand building is working to create long term value for our shareholders.”
Net sales in the third quarter were $1.49 billion, an increase of 2.6 percent compared with the prior year. Core sales improved 5.7 percent. The year over year impact of last year’s product line exits reduced net sales by 2.0 percent, and foreign currency translation had a negative 1.1 percent impact on sales.
Gross margin for the quarter was 38.1 percent, up 70 basis points from last year as productivity gains and improved product mix more than offset the impact of input cost inflation.
Operating income was $197.6 million, or 13.3 percent of sales, excluding $23.1 million of Project Acceleration restructuring costs and restructuring related costs incurred in connection with the European Transformation Plan. In 2009, operating income was $192.3 million, or 13.3 percent of sales, excluding Project Acceleration restructuring costs of $27.0 million.
Normalized earnings were $0.42 per diluted share compared to prior year normalized results of $0.38 per diluted share, driven primarily by sales growth, improved gross margin, reduced interest expense and a lower tax rate. For the third quarter 2010, normalized diluted earnings per share exclude $0.05 per diluted share for restructuring and restructuring related costs, net of tax; $0.04 per diluted share of dilution related to the conversion feature of the convertible notes issued in March 2009 and the impact of associated hedge transactions; $0.45 per diluted share in charges and other impacts associated with the Capital Structure Optimization Plan; and a benefit of $0.21 per diluted share reflecting the favorable resolution of a tax examination. For the third quarter 2009, normalized earnings per share exclude $0.07 per diluted share for Project Acceleration restructuring costs, net of tax, and $0.02 per diluted share of dilution related to the conversion feature of the convertible notes issued in March 2009 and the impact of associated hedge transactions. (A reconciliation of the “as reported” results to “normalized” results is included below.)
3 Glenlake Parkway | Atlanta, GA 30328 | Phone +1 (770) 418-7000 | www.newellrubbermaid.com | NYSE: NWL

| | |
| | > News Release |
Net income, as reported, was $28.3 million, or $0.09 per diluted share, for the third quarter. This compares to $85.5 million, or $0.28 per diluted share, in the prior year.
The company generated operating cash flow of $194.5 million during the third quarter, compared to $327.7 million in the comparable period last year as the prior year reflected a significant reduction in working capital that did not repeat. Capital expenditures were $38.8 million in the third quarter compared to $37.0 million in the prior year.
Capital Structure Optimization Plan
During the quarter the company successfully initiated a series of transactions designed to optimize its capital structure, reduce interest expense and largely eliminate share dilution associated with its convertible notes. This Capital Structure Optimization Plan included the following components:
| | • | | Issuance of $550 million of new 4.70% senior notes due 2020; |
| | • | | Repurchase of $500 million of common stock through an Accelerated Stock Buyback program (“ASB”) expected to be completed by early 2011 (25,806,452 shares delivered on August 10, 2010); |
| | • | | Cash tender for the company’s outstanding 10.60% notes due 2019 (approximately $279 million of $300 million principal amount of outstanding notes repurchased); |
| | • | | Exchange of common stock (37,728,415 shares) and cash for its 5.50% convertible senior notes due 2014 (approximately $325 million of $345 million principal amount in outstanding notes retired through exchange); |
| | • | | Cash settlement of hedge transactions associated with the convertible notes (approximately $70 million net proceeds received during the quarter); and |
| | • | | As a result of the Capital Optimization Plan transactions, the company recorded a $219 million charge to earnings during the quarter, primarily reflecting the loss on early extinguishment of its notes. |
A reconciliation of the third quarter 2010 and last year’s results is as follows:
| | | | | | | | |
| | | Q3 2010 | | | Q3 2009 | |
| | |
Diluted earnings per share (as reported) | | | $0.09 | | | | $0.28 | |
| | |
Restructuring and restructuring related costs, net of tax | | | $0.05 | | | | $0.07 | |
| | |
Convertible notes dilution | | | $0.04 | | | | $0.02 | |
| | |
Capital structure optimization plan | |
| $0.45
|
| |
| $0.00
|
|
| | |
Benefit from the resolution of a tax examination | | | ($0.21 | ) | | | $0.00 | |
| | | | | | | | |
| | |
“Normalized” EPS | | | $0.42 | | | | $0.38 | |
3 Glenlake Parkway | Atlanta, GA 30328 | Phone +1 (770) 418-7000 | www.newellrubbermaid.com | NYSE: NWL
| | |
| | > News Release |
Nine Months Results
Net sales for the nine months ended September 30, 2010 increased 3.2 percent to $4.29 billion, compared to $4.16 billion in the prior year. Core sales increased 4.6 percent for the nine months. Foreign currency translation increased net sales by 0.3 percent, while the year over year impact of last year’s product line exits lowered net sales by 1.7 percent.
Gross margin was 37.9 percent, a 130 basis point improvement versus the prior year. Productivity gains and improved product mix more than offset the effect of input cost inflation.
Normalized earnings were $1.18 per diluted share compared to $1.04 per diluted share in the prior year. For the nine months ended September 30, 2010, normalized earnings exclude the same items as those in the third quarter 2010 as well as a benefit of $0.01 per diluted share related to the impact of hyperinflationary accounting for the company’s Venezuelan operations. For the nine months ended September 30, 2009, normalized earnings excluded the same items as those in the third quarter 2009, as well as $0.02 per diluted share related to one-time items and other tax adjustments. (A reconciliation of the “as reported” results to “normalized” results is included below.)
Net income, as reported, was $217.1 million, or $0.70 per diluted share. This compares to $224.9 million, or $0.78 per diluted share, in the prior year.
The company generated operating cash flow of $377.9 million during the first nine months of 2010 compared to $415.7 million in the prior year, with the decline driven by the timing of working capital requirements. Capital expenditures were $108.1 million, compared to $107.7 million in the prior year.
A reconciliation of the first nine months 2010 and last year’s results is as follows:
| | | | | | | | |
| | | YTD Q3 2010 | | | YTD Q3 2009 | |
| | |
Diluted earnings per share (as reported) | | | $0.70 | | | | $0.78 | |
| | |
Restructuring and restructuring related costs, net of tax | | | $0.16 | | | | $0.22 | |
| | |
Convertible notes dilution | | | $0.10 | | | | $0.03 | |
| | |
Capital structure optimization plan | | | $0.44 | | | | $0.00 | |
| | |
Benefit from the resolution of a tax examination | | | ($0.21 | ) | | | $0.00 | |
| | |
Other items, net of tax | | | ($0.01 | ) | | | $0.02 | |
| | | | | | | | |
| | |
“Normalized” EPS | | | $1.18 | | | | $1.04 | |
3 Glenlake Parkway | Atlanta, GA 30328 | Phone +1 (770) 418-7000 | www.newellrubbermaid.com | NYSE: NWL
| | |
| | > News Release |
2010 Full Year Outlook
The company reaffirmed its guidance for full year 2010 results, including net sales growth in the low to mid single digit range and core sales growth in the mid single digits. The impact of 2009 product line exits is expected to be a negative one to two percent, and the impact from foreign currency translation is expected to be modestly negative.
Gross margin is expected to improve 75 to 100 basis points with the combination of productivity, mix and pricing more than offsetting the impact of input cost inflation.
The company reaffirmed its guidance for 2010 normalized earnings in the range of $1.40 to $1.50 per diluted share, and stated its belief that results will likely be at the high end of the range.
Operating cash flow is expected to exceed $500 million for the full year, including approximately $70 to $100 million in restructuring cash payments. The company expects capital expenditures of approximately $160 to $170 million.
A reconciliation of the 2010 earnings outlook is as follows:
| | | | |
| | | FY 2010 | |
| |
Diluted earnings per share | | | $0.83 to $0.93 | |
| |
Restructuring and restructuring related costs, net of tax | | | $0.20 to $0.30 | |
| |
Convertible notes dilution | | | $0.10 | |
| |
Capital structure optimization plan* | | | $0.44 | |
| |
Benefit from the resolution of a tax examination | | | ($0.21 | ) |
| |
Other items, net of tax | | | ($0.01 | ) |
| | | | |
| |
“Normalized” EPS | | | $1.40 to $1.50 | |
| * | Reflects impact of capital structure optimization plan transactions as if they were completed on September 30, 2010. |
Conference Call
The company’s third quarter 2010 earnings conference call is scheduled for today, October 29, 2010, at 8:30 am ET. To listen to the webcast, use the link provided under Events & Presentations in the Investor Relations section of Newell Rubbermaid’s Web site atwww.newellrubbermaid.com. The webcast will be available for replay for two weeks. A brief supporting slide presentation will be available prior to the call under Quarterly Earnings in the Investor Relations section on the company’s Web site.
3 Glenlake Parkway | Atlanta, GA 30328 | Phone +1 (770) 418-7000 | www.newellrubbermaid.com | NYSE: NWL
| | |
| | > News Release |
Non-GAAP Financial Measures
This release contains non-GAAP financial measures within the meaning of Regulation G promulgated by the Securities and Exchange Commission. Included in this release is a reconciliation of these non-GAAP financial measures to the most directly comparable financial measures calculated in accordance with GAAP.
About Newell Rubbermaid
Newell Rubbermaid Inc., an S&P 500 company, is a global marketer of consumer and commercial products with 2009 sales of approximately $5.6 billion and a strong portfolio of brands, including Rubbermaid®, Sharpie®, Graco®, Calphalon®, Irwin®, Lenox®, Levolor®, Paper Mate®, Dymo®, Waterman®, Parker®, Goody®, Technical ConceptsTM and Aprica®.
This press release and additional information about Newell Rubbermaid are available on the company’s Web site,www.newellrubbermaid.com.
Contacts:
| | |
Nancy O’Donnell Vice President, Investor Relations +1 (770) 418-7723 | | David Doolittle Vice President, Corporate Communications +1 (770) 418-7519 |
Caution Concerning Forward-Looking Statements
Statements in this press release that are not historical in nature constitute forward-looking statements. These forward-looking statements relate to information or assumptions about the effects of sales, income/(loss), earnings per share, operating income or gross margin improvements or declines, Project Acceleration, the European Transformation Plan, the Capital Structure Optimization Plan, capital and other expenditures, cash flow, dividends, restructuring and restructuring related costs, costs and cost savings, inflation or deflation, particularly with respect to commodities such as oil and resin, debt ratings, and management’s plans, projections and objectives for future operations and performance. These statements are accompanied by words such as “anticipate,” “expect,” “project,” “will,” “believe,” “estimate” and similar expressions. Actual results could differ materially from those expressed or implied in the forward-looking statements. Important factors that could cause actual results to differ materially from those suggested by the forward-looking statements include, but are not limited to, our dependence on the strength of retail, commercial and industrial sectors of the economy in light of the global economic slowdown; currency fluctuations; competition with other manufacturers and distributors of consumer products; major retailers’ strong bargaining power; changes in the prices of raw materials and sourced products and our ability to obtain raw materials and sourced products in a timely manner from suppliers; our ability to develop innovative new products and to develop, maintain and strengthen our end-user brands; our ability to expeditiously close facilities and move operations while managing foreign regulations and other impediments; our ability to implement successfully information technology solutions throughout our organization; our ability to improve productivity and streamline operations; changes to our credit ratings; significant increases in the funding obligations related to our pension plans due to declining asset values or otherwise; the imposition of tax liabilities greater than our provisions for such matters; the risks inherent in our foreign operations and those factors listed in the company’s latest quarterly report
3 Glenlake Parkway | Atlanta, GA 30328 | Phone +1 (770) 418-7000 | www.newellrubbermaid.com | NYSE: NWL
| | |
| | > News Release |
on Form 10-Q, and exhibit 99.1 thereto, filed with the Securities and Exchange Commission. Changes in such assumptions or factors could produce significantly different results. The information contained in this news release is as of the date indicated. The company assumes no obligation to update any forward-looking statements contained in this news release as a result of new information or future events or developments.
3 Glenlake Parkway | Atlanta, GA 30328 | Phone +1 (770) 418-7000 | www.newellrubbermaid.com | NYSE: NWL
Newell Rubbermaid Inc.
CONSOLIDATED STATEMENTS OF OPERATIONS (UNAUDITED)
(in millions, except per share data)
Reconciliation of “As Reported” Results to “Normalized” Results
| | | | | | | | | | | | | | | | | | | | | | | | | | | | |
| | | Three Months Ended September 30, | |
| | | 2010 | | | 2009 | | | YOY
% Change | |
| | | As Reported | | | Excluded
Items (1) | | | Normalized | | | As Reported | | | Excluded
Items (2) | | | Normalized | | |
Net sales | | $ | 1,487.3 | | | $ | — | | | $ | 1,487.3 | | | $ | 1,449.0 | | | $ | — | | | $ | 1,449.0 | | | | 2.6 | % |
Cost of products sold | | | 920.2 | | | | — | | | | 920.2 | | | | 906.4 | | | | — | | | | 906.4 | | | | | |
| | | | | | | | | | | | | | | | | | | | | | | | | | | | |
GROSS MARGIN | | | 567.1 | | | | — | | | | 567.1 | | | | 542.6 | | | | — | | | | 542.6 | | | | 4.5 | % |
% of sales | | | 38.1 | % | | | | | | | 38.1 | % | | | 37.4 | % | | | | | | | 37.4 | % | | | | |
| | | | | | | |
Selling, general & administrative expenses | | | 376.4 | | | | (6.9 | ) | | | 369.5 | | | | 350.3 | | | | — | | | | 350.3 | | | | 5.5 | % |
% of sales | | | 25.3 | % | | | | | | | 24.8 | % | | | 24.2 | % | | | | | | | 24.2 | % | | | | |
| | | | | | | |
Restructuring costs | | | 16.2 | | | | (16.2 | ) | | | — | | | | 27.0 | | | | (27.0 | ) | | | — | | | | | |
| | | | | | | | | | | | | | | | | | | | | | | | | | | | |
OPERATING INCOME | | | 174.5 | | | | 23.1 | | | | 197.6 | | | | 165.3 | | | | 27.0 | | | | 192.3 | | | | 2.8 | % |
% of sales | | | 11.7 | % | | | | | | | 13.3 | % | | | 11.4 | % | | | | | | | 13.3 | % | | | | |
Nonoperating expenses: | | | | | | | | | | | | | | | | | | | | | | | | | | | | |
Interest expense, net | | | 30.3 | | | | — | | | | 30.3 | | | | 35.7 | | | | — | | | | 35.7 | | | | | |
Losses related to extinguishments of debt | | | 218.6 | | | | (218.6 | ) | | | — | | | | — | | | | — | | | | — | | | | | |
Other (income) expense, net | | | (3.5 | ) | | | — | | | | (3.5 | ) | | | 0.6 | | | | — | | | | 0.6 | | | | | |
| | | | | | | | | | | | | | | | | | | | | | | | | | | | |
| | | 245.4 | | | | (218.6 | ) | | | 26.8 | | | | 36.3 | | | | — | | | | 36.3 | | | | (26.2 | )% |
| | | | | | | | | | | | | | | | | | | | | | | | | | | | |
| | | | | | | |
(LOSS) INCOME BEFORE INCOME TAXES | | | (70.9 | ) | | | 241.7 | | | | 170.8 | | | | 129.0 | | | | 27.0 | | | | 156.0 | | | | 9.5 | % |
% of sales | | | (4.8 | )% | | | | | | | 11.5 | % | | | 8.9 | % | | | | | | | 10.8 | % | | | | |
| | | | | | | |
Income taxes | | | (99.2 | ) | | | 151.3 | | | | 52.1 | | | | 43.5 | | | | 6.3 | | | | 49.8 | | | | 4.6 | % |
Effective rate | | | NM | | | | | | | | 30.5 | % | | | 33.7 | % | | | | | | | 31.9 | % | | | | |
| | | | | | | | | | | | | | | | | | | | | | | | | | | | |
| | | | | | | |
NET INCOME (3) | | $ | 28.3 | | | $ | 90.4 | | | $ | 118.7 | | | $ | 85.5 | | | $ | 20.7 | | | $ | 106.2 | | | | 11.8 | % |
| | | | | | | | | | | | | | | | | | | | | | | | | | | | |
% of sales | | | 1.9 | % | | | | | | | 8.0 | % | | | 5.9 | % | | | | | | | 7.3 | % | | | | |
| | | | | | | |
EARNINGS PER SHARE: | | | | | | | | | | | | | | | | | | | | | | | | | | | | |
Basic | | $ | 0.10 | | | $ | 0.32 | | | $ | 0.42 | | | $ | 0.30 | | | $ | 0.08 | | | $ | 0.38 | | | | | |
Diluted | | $ | 0.09 | | | $ | 0.33 | | | $ | 0.42 | | | $ | 0.28 | | | $ | 0.10 | | | $ | 0.38 | | | | | |
AVERAGE SHARES OUTSTANDING: | | | | | | | | | | | | | | | | | | | | | | | | | | | | |
Basic | | | 273.3 | | | | | | | | 281.5 | | | | 280.8 | | | | | | | | 280.8 | | | | | |
Diluted | | | 301.0 | | | | | | | | 284.4 | | | | 301.8 | | | | | | | | 282.5 | | | | | |
| (1) | Items excluded from “normalized” results for 2010 consist of $6.9 million of restructuring related costs incurred in connection with the European Transformation Plan, net of tax effects, $16.2 million of Project Acceleration restructuring costs, including asset impairment charges and employee termination and other costs, net of tax effects, the net of tax impact of $218.6 million in charges incurred to retire outstanding debt under the Capital Structure Optimization Plan, $63.6 million of non-recurring income tax benefits resulting from settlements with tax authorities, share impacts relating to the execution of the Capital Structure Optimization Plan and the dilutive impact of the conversion feature of the convertible notes and the associated hedge transactions for the period outstanding during 2010. |
| (2) | Items excluded from “normalized” results for 2009 consist of $27.0 million of restructuring costs, including asset impairment charges and employee termination and other costs, and the associated tax effects, as well as the dilutive impact of the conversion feature of the convertible notes issued in March 2009 and the associated hedge transactions. |
| (3) | Net income attributable to noncontrolling interests was not material in either of the periods presented. |
Newell Rubbermaid Inc.
CONSOLIDATED STATEMENTS OF OPERATIONS (UNAUDITED)
(in millions, except per share data)
Reconciliation of “As Reported” Results to “Normalized” Results
| | | | | | | | | | | | | | | | | | | | | | | | | | | | |
| | | Nine Months Ended September 30, | |
| | | 2010 | | | 2009 | | | YOY
% Change | |
| | | As Reported | | | Excluded
Items (1) | | | Normalized | | | As Reported | | | Excluded
Items (2) | | | Normalized | | |
Net sales | | $ | 4,289.9 | | | $ | — | | | $ | 4,289.9 | | | $ | 4,157.2 | | | $ | — | | | $ | 4,157.2 | | | | 3.2 | % |
Cost of products sold | | | 2,663.8 | | | | — | | | | 2,663.8 | | | | 2,633.5 | | | | — | | | | 2,633.5 | | | | | |
| | | | | | | | | | | | | | | | | | | | | | | | | | | | |
GROSS MARGIN | | | 1,626.1 | | | | — | | | | 1,626.1 | | | | 1,523.7 | | | | — | | | | 1,523.7 | | | | 6.7 | % |
% of sales | | | 37.9 | % | | | | | | | 37.9 | % | | | 36.7 | % | | | | | | | 36.7 | % | | | | |
| | | | | | | |
Selling, general & administrative expenses | | | 1,064.6 | | | | (8.5 | ) | | | 1,056.1 | | | | 991.1 | | | | — | | | | 991.1 | | | | 6.6 | % |
% of sales | | | 24.8 | % | | | | | | | 24.6 | % | | | 23.8 | % | | | | | | | 23.8 | % | | | | |
| | | | | | | |
Restructuring costs | | | 53.4 | | | | (53.4 | ) | | | — | | | | 87.0 | | | | (87.0 | ) | | | — | | | | | |
| | | | | | | | | | | | | | | | | | | | | | | | | | | | |
OPERATING INCOME | | | 508.1 | | | | 61.9 | | | | 570.0 | | | | 445.6 | | | | 87.0 | | | | 532.6 | | | | 7.0 | % |
% of sales | | | 11.8 | % | | | | | | | 13.3 | % | | | 10.7 | % | | | | | | | 12.8 | % | | | | |
Nonoperating expenses: | | | | | | | | | | | | | | | | | | | | | | | | | | | | |
Interest expense, net | | | 95.5 | | | | — | | | | 95.5 | | | | 106.6 | | | | — | | | | 106.6 | | | | | |
Losses related to extinguishments of debt | | | 218.6 | | | | (218.6 | ) | | | — | | | | 4.7 | | | | (4.7 | ) | | | — | | | | | |
Other (income) expense, net | | | (9.7 | ) | | | 5.6 | | | | (4.1 | ) | | | (2.2 | ) | | | — | | | | (2.2 | ) | | | | |
| | | | | | | | | | | | | | | | | | | | | | | | | | | | |
| | | 304.4 | | | | (213.0 | ) | | | 91.4 | | | | 109.1 | | | | (4.7 | ) | | | 104.4 | | | | (12.5 | )% |
| | | | | | | | | | | | | | | | | | | | | | | | | | | | |
| | | | | | | |
INCOME BEFORE INCOME TAXES | | | 203.7 | | | | 274.9 | | | | 478.6 | | | | 336.5 | | | | 91.7 | | | | 428.2 | | | | 11.8 | % |
% of sales | | | 4.7 | % | | | | | | | 11.2 | % | | | 8.1 | % | | | | | | | 10.3 | % | | | | |
| | | | | | | |
Income taxes | | | (13.4 | ) | | | 156.0 | | | | 142.6 | | | | 111.6 | | | | 23.0 | | | | 134.6 | | | | 5.9 | % |
Effective rate | | | NM | | | | | | | | 29.8 | % | | | 33.2 | % | | | | | | | 31.4 | % | | | | |
| | | | | | | | | | | | | | | | | | | | | | | | | | | | |
| | | | | | | |
NET INCOME (3) | | $ | 217.1 | | | $ | 118.9 | | | $ | 336.0 | | | $ | 224.9 | | | $ | 68.7 | | | $ | 293.6 | | | | 14.4 | % |
| | | | | | | | | | | | | | | | | | | | | | | | | | | | |
% of sales | | | 5.1 | % | | | | | | | 7.8 | % | | | 5.4 | % | | | | | | | 7.1 | % | | | | |
| | | | | | | |
EARNINGS PER SHARE: | | | | | | | | | | | | | | | | | | | | | | | | | | | | |
Basic | | $ | 0.78 | | | $ | 0.41 | | | $ | 1.19 | | | $ | 0.80 | | | $ | 0.25 | | | $ | 1.05 | | | | | |
Diluted | | $ | 0.70 | | | $ | 0.48 | | | $ | 1.18 | | | $ | 0.78 | | | $ | 0.26 | | | $ | 1.04 | | | | | |
AVERAGE SHARES OUTSTANDING: | | | | | | | | | | | | | | | | | | | | | | | | | | | | |
Basic | | | 278.7 | | | | | | | | 281.4 | | | | 280.7 | | | | | | | | 280.7 | | | | | |
Diluted | | | 308.1 | | | | | | | | 283.8 | | | | 289.7 | | | | | | | | 281.6 | | | | | |
| (1) | Items excluded from “normalized” results for 2010 consist of $8.5 million of restructuring related costs incurred in connection with the European Transformation Plan, net of tax effects, $53.4 million of Project Acceleration restructuring costs, including asset impairment charges and employee termination and other costs, net of tax effects, the net of tax impact of $218.6 million in charges incurred to retire outstanding debt under the Capital Structure Optimization Plan, the net of tax impact of a $5.6 million gain resulting from hyperinflationary accounting for the Company’s Venezuelan operations, $63.6 million of non-recurring income tax benefits resulting from settlements with tax authorities, share impacts relating to the execution of the Capital Structure Optimization Plan and the dilutive impact of the conversion feature of the convertible notes and the associated hedge transactions for the period outstanding during 2010. |
| (2) | Items excluded from “normalized” results for 2009 consist of $87.0 million of restructuring costs, including asset impairment charges and employee termination and other costs, and the associated tax effects, $4.7 million of debt extinguishment charges, net of tax effects, as well as the dilutive impact of the conversion feature of the convertible notes issued in March 2009 and the associated hedge transactions. |
| (3) | Net income attributable to noncontrolling interests was not material in either of the periods presented. |
Newell Rubbermaid Inc.
CONSOLIDATED BALANCE SHEETS (UNAUDITED)
(in millions)
| | | | | | | | |
| | | September 30, | | | September 30, | |
| | | 2010 | | | 2009 | |
Assets: | | | | | | | | |
| | |
Cash and cash equivalents | | $ | 153.5 | | | $ | 313.0 | |
Accounts receivable, net | | | 1,004.9 | | | | 943.7 | |
Inventories, net | | | 831.2 | | | | 783.5 | |
Deferred income taxes | | | 208.3 | | | | 128.7 | |
Prepaid expenses and other | | | 127.6 | | | | 93.5 | |
| | | | | | | | |
| | |
Total Current Assets | | | 2,325.5 | | | | 2,262.4 | |
| | |
Property, plant and equipment, net | | | 533.4 | | | | 596.9 | |
Goodwill | | | 2,752.5 | | | | 2,759.4 | |
Other intangible assets, net | | | 645.9 | | | | 647.7 | |
Other assets | | | 312.9 | | | | 356.9 | |
| | | | | | | | |
| | |
Total Assets | | $ | 6,570.2 | | | $ | 6,623.3 | |
| | | | | | | | |
| | |
Liabilities and Stockholders’ Equity: | | | | | | | | |
| | |
Accounts payable | | $ | 553.4 | | | $ | 454.1 | |
Accrued compensation | | | 157.1 | | | | 148.5 | |
Other accrued liabilities | | | 712.9 | | | | 694.5 | |
Short-term debt | | | 191.0 | | | | 74.0 | |
Current portion of long-term debt | | | 269.9 | | | | 560.3 | |
| | | | | | | | |
| | |
Total Current Liabilities | | | 1,884.3 | | | | 1,931.4 | |
| | |
Long-term debt | | | 2,096.5 | | | | 2,032.6 | |
Deferred income taxes | | | 19.6 | | | | — | |
Other non-current liabilities | | | 696.9 | | | | 817.9 | |
| | |
Stockholders’ Equity—Parent | | | 1,869.4 | | | | 1,837.9 | |
Stockholders’ Equity—Noncontrolling Interests | | | 3.5 | | | | 3.5 | |
| | | | | | | | |
| | |
Total Stockholders’ Equity | | | 1,872.9 | | | | 1,841.4 | |
| | | | | | | | |
| | |
Total Liabilities and Stockholders’ Equity | | $ | 6,570.2 | | | $ | 6,623.3 | |
| | | | | | | | |
Newell Rubbermaid Inc.
CONSOLIDATED STATEMENTS OF CASH FLOW (UNAUDITED)
(in millions)
| | | | | | | | |
| | | Nine Months Ended September 30, | |
| | | 2010 | | | 2009 | |
Operating Activities: | | | | | | | | |
Net income | | $ | 217.1 | | | $ | 224.9 | |
Adjustments to reconcile net income to net cash provided by operating activities: | | | | | | | | |
Depreciation and amortization | | | 130.2 | | | | 129.6 | |
Losses related to extinguishments of debt | | | 218.6 | | | | 4.7 | |
Deferred income taxes | | | (3.0 | ) | | | 11.2 | |
Non-cash restructuring costs | | | 5.2 | | | | 24.2 | |
Stock-based compensation expense | | | 27.8 | | | | 25.9 | |
Other | | | 19.7 | | | | 15.3 | |
Changes in operating assets and liabilities: | | | | | | | | |
Accounts receivable | | | (107.5 | ) | | | 49.6 | |
Inventories | | | (141.2 | ) | | | 153.7 | |
Accounts payable | | | 118.7 | | | | (87.6 | ) |
Accrued liabilities and other | | | (107.7 | ) | | | (135.8 | ) |
| | | | | | | | |
Net cash provided by operating activities | | $ | 377.9 | | | $ | 415.7 | |
| | |
Investing Activities: | | | | | | | | |
Acquisition related activity | | $ | (1.5 | ) | | $ | (13.2 | ) |
Capital expenditures | | | (108.1 | ) | | | (107.7 | ) |
Proceeds from sales of non-current assets | | | 9.4 | | | | 6.9 | |
Other | | | (2.0 | ) | | | — | |
| | | | | | | | |
Net cash used in investing activities | | $ | (102.2 | ) | | $ | (114.0 | ) |
| | |
Financing Activities: | | | | | | | | |
Proceeds from issuance of debt, net of debt issuance costs | | $ | 547.3 | | | $ | 634.8 | |
Net proceeds from short-term borrowings | | | 189.6 | | | | 192.5 | |
Proceeds from issuance of warrants | | | — | | | | 32.7 | |
Purchase of call options | | | — | | | | (69.0 | ) |
Payments for settlement of warrants | | | (279.5 | ) | | | — | |
Proceeds from settlement of call options | | | 346.6 | | | | — | |
Payments on and for the settlement of notes payable and debt | | | (610.6 | ) | | | (969.3 | ) |
Cash consideration paid in convertible note exchange | | | (53.0 | ) | | | — | |
Repurchase of common stock | | | (500.1 | ) | | | — | |
Cash dividends | | | (40.8 | ) | | | (57.3 | ) |
Purchase of noncontrolling interests in consolidated subsidiaries | | | — | | | | (29.0 | ) |
Other, net | | | (3.7 | ) | | | (4.4 | ) |
| | | | | | | | |
Net cash used in financing activities | | $ | (404.2 | ) | | $ | (269.0 | ) |
| | |
Currency rate effect on cash and cash equivalents | | $ | 3.7 | | | $ | 4.9 | |
| | | | | | | | |
| | |
(Decrease) increase in cash and cash equivalents | | $ | (124.8 | ) | | $ | 37.6 | |
Cash and cash equivalents at beginning of period | | | 278.3 | | | | 275.4 | |
| | | | | | | | |
Cash and cash equivalents at end of period | | $ | 153.5 | | | $ | 313.0 | |
| | | | | | | | |
Newell Rubbermaid Inc.
Financial Worksheet
(In Millions)
| | | | | | | | | | | | | | | | | | | | | | | | | | | | | | | | | | | | | | | | | | | | | | | | | | | | | | | | |
| | | 2010 | | | 2009 | | | Year-over-year changes | |
| | | | | | Reconciliation (1) | | | | | | | | | Reconciliation (1) | | | | | | Net Sales | | | Normalized OI | |
| | | Net
Sales | | | Reported
OI | | | Excluded
Items | | | Normalized
OI | | | Operating
Margin | | | Net
Sales | | | Reported
OI | | | Excluded
Items | | | Normalized
OI | | | Operating
Margin | | | | | | | |
| | | | | | | | | | | | | $ | | | % | | | $ | | | % | |
Q1: | | | | | | | | | | | | | | | | | | | | | | | | | | | | | | | | | | | | | | | | | | | | | | | | | | | | | | | | |
Home & Family | | $ | 556.9 | | | $ | 68.8 | | | $ | — | | | $ | 68.8 | | | | 12.4 | % | | $ | 557.7 | | | $ | 60.3 | | | $ | — | | | $ | 60.3 | | | | 10.8 | % | | $ | (0.8 | ) | | | (0.1 | )% | | $ | 8.5 | | | | 14.1 | % |
Office Products | | | 351.6 | | | | 47.3 | | | | — | | | | 47.3 | | | | 13.5 | % | | | 318.2 | | | | 31.1 | | | | — | | | | 31.1 | | | | 9.8 | % | | | 33.4 | | | | 10.5 | % | | | 16.2 | | | | 52.1 | % |
Tools, Hardware & Commercial Products | | | 397.9 | | | | 51.6 | | | | — | | | | 51.6 | | | | 13.0 | % | | | 328.0 | | | | 38.0 | | | | — | | | | 38.0 | | | | 11.6 | % | | | 69.9 | | | | 21.3 | % | | | 13.6 | | | | 35.8 | % |
Restructuring Costs | | | — | | | | (16.0 | ) | | | 16.0 | | | | — | | | | | | | | — | | | | (30.5 | ) | | | 30.5 | | | | — | | | | | | | | | | | | | | | | | | | | | |
Corporate | | | — | | | | (21.6 | ) | | | — | | | | (21.6 | ) | | | | | | | — | | | | (18.1 | ) | | | — | | | | (18.1 | ) | | | | | | | | | | | | | | | (3.5 | ) | | | (19.3 | )% |
| | | | | | | | | | | | | | | | | | | | | | | | | | | | | | | | | | | | | | | | | | | | | | | | | | | | | | | | |
Total | | $ | 1,306.4 | | | $ | 130.1 | | | $ | 16.0 | | | $ | 146.1 | | | | 11.2 | % | | $ | 1,203.9 | | | $ | 80.8 | | | $ | 30.5 | | | $ | 111.3 | | | | 9.2 | % | | $ | 102.5 | | | | 8.5 | % | | $ | 34.8 | | | | 31.3 | % |
| | | | | | | | | | | | | | | | | | | | | | | | | | | | | | | | | | | | | | | | | | | | | | | | | | | | | | | | |
| | | |
| | | 2010 | | | 2009 | | | Year-over-year changes | |
| | | | | | Reconciliation (2) | | | | | | | | | Reconciliation (1) | | | | | | Net Sales | | | Normalized OI | |
| | | Net
Sales | | | Reported
OI | | | Excluded
Items | | | Normalized
OI | | | Operating
Margin | | | Net
Sales | | | Reported
OI | | | Excluded
Items | | | Normalized
OI | | | Operating
Margin | | | | | | | | | | |
| | | | | | | | | | | | | $ | | | % | | | $ | | | % | |
Q2: | | | | | | | | | | | | | | | | | | | | | | | | | | | | | | | | | | | | | | | | | | | | | | | | | | | | | | | | |
Home & Family | | $ | 592.0 | | | $ | 75.6 | | | $ | — | | | $ | 75.6 | | | | 12.8 | % | | $ | 617.2 | | | $ | 80.4 | | | $ | — | | | $ | 80.4 | | | | 13.0 | % | | $ | (25.2 | ) | | | (4.1 | )% | | $ | (4.8 | ) | | | (6.0 | )% |
Office Products | | | 483.5 | | | | 99.4 | | | | — | | | | 99.4 | | | | 20.6 | % | | | 496.9 | | | | 99.2 | | | | — | | | | 99.2 | | | | 20.0 | % | | | (13.4 | ) | | | (2.7 | )% | | | 0.2 | | | | 0.2 | % |
Tools, Hardware & Commercial Products | | | 420.7 | | | | 70.1 | | | | — | | | | 70.1 | | | | 16.7 | % | | | 390.2 | | | | 67.6 | | | | — | | | | 67.6 | | | | 17.3 | % | | | 30.5 | | | | 7.8 | % | | | 2.5 | | | | 3.7 | % |
Restructuring Costs | | | — | | | | (21.2 | ) | | | 21.2 | | | | — | | | | | | | | — | | | | (29.5 | ) | | | 29.5 | | | | — | | | | | | | | | | | | | | | | | | | | | |
Corporate | | | — | | | | (20.4 | ) | | | 1.6 | | | | (18.8 | ) | | | | | | | — | | | | (18.2 | ) | | | — | | | | (18.2 | ) | | | | | | | | | | | | | | | (0.6 | ) | | | (3.3 | )% |
| | | | | | | | | | | | | | | | | | | | | | | | | | | | | | | | | | | | | | | | | | | | | | | | | | | | | | | | |
Total | | $ | 1,496.2 | | | $ | 203.5 | | | $ | 22.8 | | | $ | 226.3 | | | | 15.1 | % | | $ | 1,504.3 | | | $ | 199.5 | | | $ | 29.5 | | | $ | 229.0 | | | | 15.2 | % | | $ | (8.1 | ) | | | (0.5 | )% | | $ | (2.7 | ) | | | (1.2 | )% |
| | | | | | | | | | | | | | | | | | | | | | | | | | | | | | | | | | | | | | | | | | | | | | | | | | | | | | | | |
| | | |
| | | 2010 | | | 2009 | | | Year-over-year changes | |
| | | | | | Reconciliation (2) | | | | | | | | | Reconciliation (1) | | | | | | Net Sales | | | Normalized OI | |
| | | Net
Sales | | | Reported
OI | | | Excluded
Items | | | Normalized
OI | | | Operating
Margin | | | Net
Sales | | | Reported
OI | | | Excluded
Items | | | Normalized
OI | | | Operating
Margin | | | $ | | | % | | | $ | | | % | |
| | | | | | | | | | | | | | | |
Q3: | | | | | | | | | | | | | | | | | | | | | | | | | | | | | | | | | | | | | | | | | | | | | | | | | | | | | | | | |
Home & Family | | $ | 608.8 | | | | 76.2 | | | $ | — | | | $ | 76.2 | | | | 12.5 | % | | $ | 596.8 | | | $ | 83.9 | | | $ | — | | | $ | 83.9 | | | | 14.1 | % | | $ | 12.0 | | | | 2.0 | % | | $ | (7.7 | ) | | | (9.2 | )% |
Office Products | | | 450.3 | | | | 70.8 | | | | — | | | | 70.8 | | | | 15.7 | % | | | 448.4 | | | | 53.9 | | | | — | | | | 53.9 | | | | 12.0 | % | | | 1.9 | | | | 0.4 | % | | | 16.9 | | | | 31.4 | % |
Tools, Hardware & Commercial Products | | | 428.2 | | | | 70.5 | | | | — | | | | 70.5 | | | | 16.5 | % | | | 403.8 | | | | 75.3 | | | | — | | | | 75.3 | | | | 18.6 | % | | | 24.4 | | | | 6.0 | % | | | (4.8 | ) | | | (6.4 | )% |
Restructuring Costs | | | — | | | | (16.2 | ) | | | 16.2 | | | | — | | | | | | | | — | | | | (27.0 | ) | | | 27.0 | | | | — | | | | | | | | | | | | | | | | | | | | | |
Corporate | | | — | | | | (26.8 | ) | | | 6.9 | | | | (19.9 | ) | | | | | | | — | | | | (20.8 | ) | | | — | | | | (20.8 | ) | | | | | | | | | | | | | | | 0.9 | | | | 4.3 | % |
| | | | | | | | | | | | | | | | | | | | | | | | | | | | | | | | | | | | | | | | | | | | | | | | | | | | | | | | |
Total | | $ | 1,487.3 | | | $ | 174.5 | | | $ | 23.1 | | | $ | 197.6 | | | | 13.3 | % | | $ | 1,449.0 | | | $ | 165.3 | | | $ | 27.0 | | | $ | 192.3 | | | | 13.3 | % | | $ | 38.3 | | | | 2.6 | % | | $ | 5.3 | | | | 2.8 | % |
| | | | | | | | | | | | | | | | | | | | | | | | | | | | | | | | | | | | | | | | | | | | | | | | | | | | | | | | |
| | | |
| | | 2010 | | | 2009 | | | Year-over-year changes | |
| | | | | | Reconciliation (2) | | | | | | | | | Reconciliation (1) | | | | | | Net Sales | | | Normalized OI | |
| | | Net
Sales | | | Reported
OI | | | Excluded
Items | | | Normalized
OI | | | Operating
Margin | | | Net
Sales | | | Reported
OI | | | Excluded
Items | | | Normalized
OI | | | Operating
Margin | | | $ | | | % | | | $ | | | % | |
YTD: | | | | | | | | | | | | | | | | | | | | | | | | | | | | | | | | | | | | | | | | | | | | | | | | | | | | | | | | |
Home & Family | | $ | 1,757.7 | | | $ | 220.6 | | | $ | — | | | $ | 220.6 | | | | 12.6 | % | | $ | 1,771.7 | | | $ | 224.6 | | | $ | — | | | $ | 224.6 | | | | 12.7 | % | | $ | (14.0 | ) | | | (0.8 | )% | | $ | (4.0 | ) | | | (1.8 | )% |
Office Products | | | 1,285.4 | | | | 217.5 | | | | — | | | | 217.5 | | | | 16.9 | % | | | 1,263.5 | | | | 184.2 | | | | — | | | | 184.2 | | | | 14.6 | % | | | 21.9 | | | | 1.7 | % | | | 33.3 | | | | 18.1 | % |
Tools, Hardware & Commercial Products | | | 1,246.8 | | | | 192.2 | | | | — | | | | 192.2 | | | | 15.4 | % | | | 1,122.0 | | | | 180.9 | | | | — | | | | 180.9 | | | | 16.1 | % | | | 124.8 | | | | 11.1 | % | | | 11.3 | | | | 6.2 | % |
Restructuring Costs | | | — | | | | (53.4 | ) | | | 53.4 | | | | — | | | | | | | | — | | | | (87.0 | ) | | | 87.0 | | | | — | | | | | | | | | | | | | | | | | | | | | |
Corporate | | | — | | | | (68.8 | ) | | | 8.5 | | | | (60.3 | ) | | | | | | | — | | | | (57.1 | ) | | | — | | | | (57.1 | ) | | | | | | | | | | | | | | | (3.2 | ) | | | (5.6 | )% |
| | | | | | | | | | | | | | | | | | | | | | | | | | | | | | | | | | | | | | | | | | | | | | | | | | | | | | | | |
Total | | $ | 4,289.9 | | | $ | 508.1 | | | $ | 61.9 | | | $ | 570.0 | | | | 13.3 | % | | $ | 4,157.2 | | | $ | 445.6 | | | $ | 87.0 | | | $ | 532.6 | | | | 12.8 | % | | $ | 132.7 | | | | 3.2 | % | | $ | 37.4 | | | | 7.0 | % |
| | | | | | | | | | | | | | | | | | | | | | | | | | | | | | | | | | | | | | | | | | | | | | | | | | | | | | | | |
| (1) | Excluded items are related to Project Acceleration costs. |
| (2) | Excluded items are related to Project Acceleration costs and restructuring related costs incurred in connection with the European Transformation Plan. |
Newell Rubbermaid Inc.
Calculation of Free Cash Flow (1)
| | | | | | | | |
| | | Three Months Ended September 30, | |
| | | 2010 | | | 2009 | |
Free Cash Flow (in millions): | | | | | | | | |
Net cash provided by operating activities | | $ | 194.5 | | | $ | 327.7 | |
Capital expenditures | | | (38.8 | ) | | | (37.0 | ) |
| | | | | | | | |
Free Cash Flow | | $ | 155.7 | | | $ | 290.7 | |
| | | | | | | | |
| |
| | | Nine Months Ended September 30, | |
| | | 2010 | | | 2009 | |
Free Cash Flow (in millions): | | | | |
Net cash provided by operating activities | | $ | 377.9 | | | $ | 415.7 | |
Capital expenditures | | | (108.1 | ) | | | (107.7 | ) |
| | | | | | | | |
Free Cash Flow | | $ | 269.8 | | | $ | 308.0 | |
| | | | | | | | |
| (1) | Free Cash Flow is defined as cash flow provided by operating activities less capital expenditures. |
Newell Rubbermaid Inc.
Three Months Ended September 30, 2010
In Millions
Currency Analysis
| | | | | | | | | | | | | | | | | | | | | | | | | | | | |
| | | 2010 | | | 2009 | | | Year-Over-Year Increase (Decrease) | | | | |
| | | Sales as
Reported | | | Currency
Impact | | | Adjusted
Sales | | | Sales as
Reported | | | Excluding
Currency | | | Including
Currency | | | Currency
Impact | |
By Segment | | | | | | | | | | | | | | | | | | | | | | | | | | | | |
Home & Family | | $ | 608.8 | | | $ | (2.8 | ) | | $ | 606.0 | | | $ | 596.8 | | | | 1.5 | % | | | 2.0 | % | | | 0.5 | % |
Office Products | | | 450.3 | | | | 18.5 | | | | 468.8 | | | | 448.4 | | | | 4.5 | % | | | 0.4 | % | | | (4.1 | )% |
Tools, Hardware & Commercial Products | | | 428.2 | | | | (0.1 | ) | | | 428.1 | | | | 403.8 | | | | 6.0 | % | | | 6.0 | % | | | 0.0 | % |
| | | | | | | | | | | | | | | | | | | | | | | | | | | | |
| | | | | | | |
Total Company | | $ | 1,487.3 | | | $ | 15.6 | | | $ | 1,502.9 | | | $ | 1,449.0 | | | | 3.7 | % | | | 2.6 | % | | | (1.1 | )% |
| | | | | | | | | | | | | | | | | | | | | | | | | | | | |
| | | | | | | |
By Geography | | | | | | | | | | | | | | | | | | | | | | | | | | | | |
United States | | $ | 1,023.3 | | | $ | — | | | $ | 1,023.3 | | | $ | 1,008.8 | | | | 1.4 | % | | | 1.4 | % | | | 0.0 | % |
Canada | | | 99.1 | | | | (6.1 | ) | | | 93.0 | | | | 91.8 | | | | 1.3 | % | | | 8.0 | % | | | 6.6 | % |
| | | | | | | | | | | | | | | | | | | | | | | | | | | | |
Total North America | | | 1,122.4 | | | | (6.1 | ) | | | 1,116.3 | | | | 1,100.6 | | | | 1.4 | % | | | 2.0 | % | | | 0.6 | % |
| | | | | | | |
Europe, Middle East and Africa | | | 193.6 | | | | 15.7 | | | | 209.3 | | | | 196.4 | | | | 6.6 | % | | | (1.4 | )% | | | (8.0 | )% |
Latin America | | | 70.2 | | | | 11.5 | | | | 81.7 | | | | 74.0 | | | | 10.4 | % | | | (5.1 | )% | | | (15.5 | )% |
Asia Pacific | | | 101.1 | | | | (5.5 | ) | | | 95.6 | | | | 78.0 | | | | 22.6 | % | | | 29.6 | % | | | 7.1 | % |
| | | | | | | | | | | | | | | | | | | | | | | | | | | | |
Total International | | | 364.9 | | | | 21.7 | | | | 386.6 | | | | 348.4 | | | | 11.0 | % | | | 4.7 | % | | | (6.2 | )% |
| | | | | | | | | | | | | | | | | | | | | | | | | | | | |
Total Company | | $ | 1,487.3 | | | $ | 15.6 | | | $ | 1,502.9 | | | $ | 1,449.0 | | | | 3.7 | % | | | 2.6 | % | | | (1.1 | )% |
| | | | | | | | | | | | | | | | | | | | | | | | | | | | |
Newell Rubbermaid Inc.
Nine Months Ended September 30, 2010
In Millions
Currency Analysis
| | | | | | | | | | | | | | | | | | | | | | | | | | | | |
| | | 2010 | | | 2009 | | | Year-Over-Year (Decrease) Increase | | | | |
| | | Sales as
Reported | | | Currency
Impact | | | Adjusted
Sales | | | Sales as
Reported | | | Excluding
Currency | | | Including
Currency | | | Currency
Impact | |
By Segment | | | | | | | | | | | | | | | | | | | | | | | | | | | | |
Home & Family | | $ | 1,757.7 | | | $ | (18.7 | ) | | $ | 1,739.0 | | | $ | 1,771.7 | | | | (1.8 | )% | | | (0.8 | )% | | | 1.1 | % |
Office Products | | | 1,285.4 | | | | 28.7 | | | | 1,314.1 | | | | 1,263.5 | | | | 4.0 | % | | | 1.7 | % | | | (2.3 | )% |
Tools, Hardware & Commercial Products | | | 1,246.8 | | | | (21.8 | ) | | | 1,225.0 | | | | 1,122.0 | | | | 9.2 | % | | | 11.1 | % | | | 1.9 | % |
| | | | | | | | | | | | | | | | | | | | | | | | | | | | |
| | | | | | | |
Total Company | | $ | 4,289.9 | | | $ | (11.8 | ) | | $ | 4,278.1 | | | $ | 4,157.2 | | | | 2.9 | % | | | 3.2 | % | | | 0.3 | % |
| | | | | | | | | | | | | | | | | | | | | | | | | | | | |
| | | | | | | |
By Geography | | | | | | | | | | | | | | | | | | | | | | | | | | | | |
United States | | $ | 2,969.9 | | | $ | — | | | $ | 2,969.9 | | | $ | 2,941.7 | | | | 1.0 | % | | | 1.0 | % | | | 0.0 | % |
Canada | | | 265.1 | | | | (28.7 | ) | | | 236.4 | | | | 238.8 | | | | (1.0 | )% | | | 11.0 | % | | | 12.0 | % |
| | | | | | | | | | | | | | | | | | | | | | | | | | | | |
Total North America | | | 3,235.0 | | | | (28.7 | ) | | | 3,206.3 | | | | 3,180.5 | | | | 0.8 | % | | | 1.7 | % | | | 0.9 | % |
| | | | | | | |
Europe, Middle East, and Africa | | | 597.6 | | | | 13.4 | | | | 611.0 | | | | 564.8 | | | | 8.2 | % | | | 5.8 | % | | | (2.4 | )% |
Latin America | | | 193.1 | | | | 23.7 | | | | 216.8 | | | | 189.4 | | | | 14.5 | % | | | 2.0 | % | | | (12.5 | )% |
Asia Pacific | | | 264.2 | | | | (20.2 | ) | | | 244.0 | | | | 222.5 | | | | 9.7 | % | | | 18.7 | % | | | 9.1 | % |
| | | | | | | | | | | | | | | | | | | | | | | | | | | | |
Total International | | | 1,054.9 | | | | 16.9 | | | | 1,071.8 | | | | 976.7 | | | | 9.7 | % | | | 8.0 | % | | | (1.7 | )% |
| | | | | | | | | | | | | | | | | | | | | | | | | | | | |
Total Company | | $ | 4,289.9 | | | $ | (11.8 | ) | | $ | 4,278.1 | | | $ | 4,157.2 | | | | 2.9 | % | | | 3.2 | % | | | 0.3 | % |
| | | | | | | | | | | | | | | | | | | | | | | | | | | | |
Newell Rubbermaid Inc.
Impact of Capital Structure Optimization Plan
For the Three and Nine Months Ended September 30, 2010
(In Millions, except EPS amounts)
| | | | | | | | | | | | | | | | | | | | | | | | |
| | | Three Months Ended
September 30, 2010 | | | Nine Months Ended
September 30, 2010 | |
| | | Dollars | | | Shares | | | EPS | | | Dollars | | | Shares | | | EPS | |
Loss related to early extinguishment of $279 million principal amount of 10.6% notes due 2019, net of tax | | $ | 82.8 | | | | | | | $ | 0.28 | | | $ | 82.8 | | | | | | | $ | 0.27 | |
| | | | | | |
Loss related to early extinguishment of $325 million principal amount of 5.50% Convertible Notes, net of tax | | | 54.9 | | | | | | | $ | 0.18 | | | | 54.9 | | | | | | | $ | 0.18 | |
| | | | | | |
Normalize weighted average share count to remove beneficial impact of purchase of 25,806,452 shares in August 2010 under the Accelerated Share Buyback | | | | | | | 14.3 | | | $ | (0.02 | ) | | | | | | | 4.8 | | | $ | (0.02 | ) |
| | | | | | |
Normalize weighted average share count to remove adverse impact of issuance of 37,728,415 shares in September 2010 in the Convertible Notes exchange | | | | | | | (6.1 | ) | | $ | 0.01 | | | | | | | | (2.0 | ) | | $ | 0.01 | |
| | | | | | | | | | | | | | | | | | | | | | | | |
| | | | | | |
Total impact of the Capital Structure Optimization Plan excluded from Normalized Earnings and Earnings per Share | | $ | 137.7 | | | | 8.2 | | | $ | 0.45 | | | $ | 137.7 | | | | 2.8 | | | $ | 0.44 | |
| | | | | | | | | | | | | | | | | | | | | | | | |
|
Q3 2010 Earnings Call Presentation October 29, 2010 |
|
2 Forward-Looking Statement Statements in this presentation that are not historical in nature constitute forward-looking statements. These forward-looking statements relate to information or assumptions about the effects of sales, income/(loss), earnings per share, operating income or gross margin improvements or declines, Project Acceleration, the European Transformation Plan, the Capital Structure Optimization Plan, capital and other expenditures, cash flow, dividends, restructuring and restructuring related costs, costs and cost savings, inflation or deflation, particularly with respect to commodities such as oil and resin, debt ratings, and management's plans, projections and objectives for future operations and performance. These statements are accompanied by words such as "anticipate," "expect," "project," "will," "believe," "estimate" and similar expressions. Actual results could differ materially from those expressed or implied in the forward-looking statements. Important factors that could cause actual results to differ materially from those suggested by the forward-looking statements include, but are not limited to, our dependence on the strength of retail, commercial and industrial sectors of the economy in light of the global economic slowdown; currency fluctuations; competition with other manufacturers and distributors of consumer products; major retailers' strong bargaining power; changes in the prices of raw materials and sourced products and our ability to obtain raw materials and sourced products in a timely manner from suppliers; our ability to develop innovative new products and to develop, maintain and strengthen our end-user brands; our ability to expeditiously close facilities and move operations while managing foreign regulations and other impediments; our ability to implement successfully information technology solutions throughout our organization; our ability to improve productivity and streamline operations; changes to our credit ratings; significant increases in the funding obligations related to our pension plans due to declining asset values or otherwise; the imposition of tax liabilities greater than our provisions for such matters; the risks inherent in our foreign operations and those factors listed in the company’s latest quarterly report on Form 10-Q, and exhibit 99.1 thereto, filed with the Securities and Exchange Commission. Changes in such assumptions or factors could produce significantly different results. The information contained in this presentation is as of the date indicated. The company assumes no obligation to update any forward-looking statements contained in this presentation as a result of new information or future events or developments. |
|
3 Normalized EPS of $0.42; improvement versus prior year quarter normalized EPS of $0.38 primarily driven by expanded gross margins, reduced interest and other expense and a lower tax rate Net Sales of $1.5 billion, a 2.6% increase versus the prior year, included a 5.7% increase in core sales offset by the impact of last year’s product line exits of (2.0%) and foreign currency of (1.1%) Gross Margin expansion of 70 basis points to 38.1% • Year-over-year expansion fueled by productivity gains and improved product mix, which more than offset higher input costs Operating Cash Flow of $194.5 million, compared to $327.7 million last year, as the prior year reflected a significant reduction in working capital that did not repeat Q3 2010 Summary |
|
4 Normalized EPS of $1.18; strong improvement versus prior year’s normalized EPS of $1.04 driven primarily by increases in core sales, expanded gross margins and lower interest expense and tax rate Net Sales of $4.3 billion, a 3.2% increase over the prior year, consisted of a 4.6% increase in core sales offset by the impact of last year’s product line exits of (1.7%); foreign currency benefited the period by 0.3% Gross Margin expansion of 130 basis points to 37.9% • Year-over-year expansion fueled by productivity gains and improved product mix, which more than offset the effect of input cost inflation Operating Cash Flow of $377.9 million, compared to $415.7 million last year, with the decline driven by the timing of working capital requirements; capital expenditures of $108.1 million, compared to $107.7 million in the prior year Q3 YTD 2010 Summary |
|
5 Q3 2010 Sales: Percent Change by Segment Q3 2010 Home & Family Office Products Tools, Hardware & Commercial Products Total Core Sales 4.0 7.5 6.0 5.7 Product Line Exits (2.5) (3.0) 0.0 (2.0) Currency Translation 0.5 (4.1) 0.0 (1.1) Total 2.0 0.4 6.0 2.6 |
|
6 Q3 YTD 2010 Sales: Percent Change by Segment Q3 YTD 2010 Home & Family Office Products Tools, Hardware & Commercial Products Total Core Sales 0.0 7.1 9.2 4.6 Product Line Exits (1.9) (3.1) 0.0 (1.7) Currency Translation 1.1 (2.3) 1.9 0.3 Total (0.8) 1.7 11.1 3.2 |
|
7 Full Year 2010 Outlook Net Sales Growth Core Sales Product Line Exits Currency Translation Gross Margin Expansion "Normalized" EPS** Cash Flow from Operations Capital Expenditures FY 2010 Outlook* $160 to $170 million Mid single digit growth Low to mid single digit growth > $500 million 75 to 100 basis points $1.40 to $1.50 -1% to -2% Modestly negative * Reflects outlook communicated in the Q3 2010 Earnings Release and Earnings Call ** See reconciliation included in the Appendix |
|
8 Innovations Discussed on the Q3 2010 Earnings Call Goody Simple Styles™ Easy-to-use line of hair accessories allows you to achieve the newest hair styles at home with only a few simple steps Helping to drive expanded distribution and shelf space gains in the US and new distribution in several UK retailers |
|
9 Innovations Discussed on the Q3 2010 Earnings Call Rubbermaid Reveal™ Spray Mop Microfiber pad is reusable saving the extra cost of buying disposable pads Picks up 50% more dirt and dust per swipe than traditional mops Refillable spray bottle allows you to use your favorite solution Constructed with durable yet lightweight material |
|
10 Innovations Discussed on the Q3 2010 Earnings Call Levolor® Accordia™ Cellular Shades Features Energy Shield™ – the most energy efficient shading solution available Available in more than 200 fabric choices Custom options allow desired level of light control and privacy |
|
11 Innovations Discussed on the Q3 2010 Earnings Call Graco® “Grow With Me” 4-in-1 Seating System Transforms seamlessly from an extremely functional highchair to an infant feeding booster, a toddler booster and a youth chair |
|
12 Innovations Discussed on the Q3 2010 Earnings Call Paper Mate® Gel, Biodegradable* & Design® Pens Paper Mate Gel Pen Pigmented gel ink delivers smooth writing performance with a burst of color and style Paper Mate Biodegradable* Made with a majority of components that are biodegradable Paper Mate Design Pen Metal barrel pen offering superior writing performance in a variety of fashionable patterns Majority of components biodegrade in soil or home compost in about a year. See disassembly instructions on packaging. * |
|
13 Innovations Discussed on the Q3 2010 Earnings Call Sharpie® Pen Grip & Liquid Pencil Sharpie Pen Grip The everyday writing experience of a Sharpie marker without the ink bleed through; soft grip along the barrel for added writing comfort Sharpie Liquid Pencil Unique liquid graphite technology eliminates the problem of broken leads |
|
14 Innovations Discussed on the Q3 2010 Earnings Call Expo Washable™ Dry Erase Marker Easily washable from skin and most washable fabrics, carpets and car upholstery Available in six bold colors |
|
15 Innovations Discussed on the Q3 2010 Earnings Call MimioClassroom™ Interactive Teaching Technology Affordable, easy-to-use solution for increasing student engagement and enhancing classroom learning Rated #1 interactive whiteboard solution by Scholastic Administrator magazine |
|
16 Innovations Discussed on the Q3 2010 Earnings Call Lenox® Q88™ Bandsaw Blade Designed to meet the sawing needs of the Asian semi- production market Long life in many applications with smooth work piece surface finish, and consistent performance and appearance Winner of the Technology Innovation Award for Metalworking at the 2009 China International Industrial Fair |
|
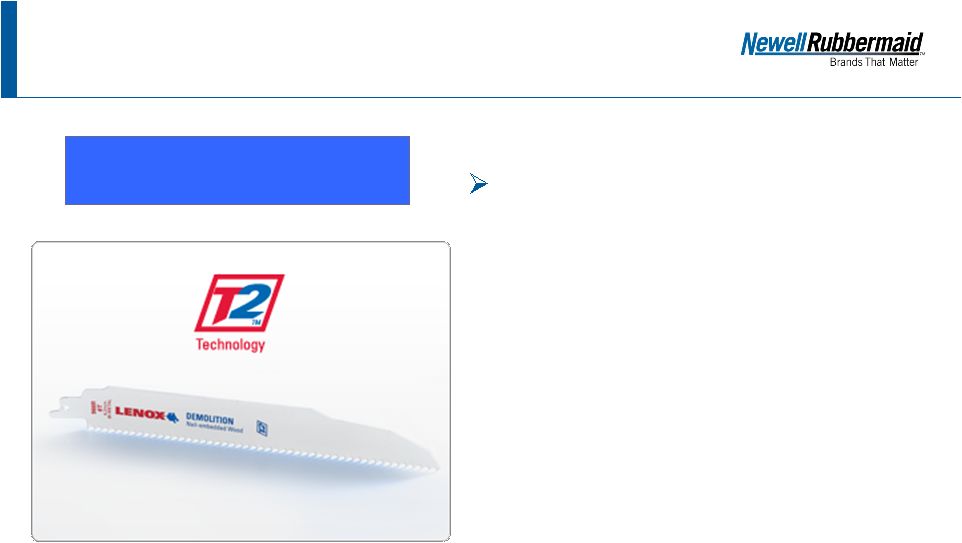
17 Innovations Discussed on the Q3 2010 Earnings Call Lenox® T2™ Reciprocating Saw Blade Offers 100% longer blade life and 25% faster cutting performance |
|
19 Reconciliation: Q3 2010 and Q3 2009 “Normalized” EPS Q3 2010 Q3 2009 Diluted earnings per share (as reported): $0.09 $0.28 Restructuring and restructuring related costs, net of tax [ 1 ] $0.05 $0.07 Convertible notes dilution $0.04 $0.02 Capital Structure Optimization Plan [ 2 ] $0.45 $0.00 Benefit from the resolution of a tax examination [ 3 ] ($0.21) $0.00 "Normalized" EPS: $0.42 $0.38 Totals may not foot due to rounding [ 1 ] Restructuring and restructuring related costs include impairment charges, employee termination benefits and other costs associated with Project Acceleration as well as costs associated with the European Transformation Plan, and the related tax effects. [ 2 ] See subsequent slide for detail of Capital Structure Optimization Plan. [ 3 ] Represents a benefit associated with the favorable resolution of a multi-year tax examination. |
|
20 Reconciliation: Q3 YTD 2010 and Q3 YTD 2009 “Normalized” EPS YTD Q3 2010 YTD Q3 2009 Diluted earnings per share (as reported): $0.70 $0.78 Restructuring and restructuring related costs, net of tax [ 1 ] $0.16 $0.22 Convertible notes dilution $0.10 $0.03 Capital Structure Optimization Plan [ 2 ] $0.44 $0.00 Benefit from the resolution of a tax examination [ 3 ] ($0.21) $0.00 Other items, net of tax ($0.01) $0.02 Normalized EPS: $1.18 $1.04 Totals may not foot due to rounding [ 1 ] Restructuring and restructuring related costs include impairment charges, employee termination benefits and other costs associated with Project Acceleration as well as costs associated with the European Transformation Plan, and the related tax effects. [ 2 ] See subsequent slide for detail of Capital Structure Optimization Plan. [ 3 ] Represents a benefit associated with the favorable resolution of a multi-year tax examination. |
|
21 Reconciliation: Q3 2010 and Q3 YTD 2010 Capital Structure Optimization Plan Q3 2010 YTD Q3 2010 Loss related to early extinguishment of $279 million principal amount of 10.6% notes due 2019, net of tax $0.28 $0.27 Loss related to early extinguishment of $325 million principal amount of 5.50% Convertible Notes, net of tax $0.18 $0.18 Normalize weighted average share count to remove the beneficial impact of the purchase of 25,806,452 shares under the Accelerated Share Buyback in August 2010 ($0.02) ($0.02) Normalize weighted average share count to remove the adverse impact of the issuance of 37,728,415 shares in the Convertible Notes exchange in September 2010 $0.01 $0.01 Total impact of Capital Structure Optimization Plan excluded from Normalized Earnings per Share $0.45 $0.44 |
|
22 Reconciliation: Full Year 2010 Outlook for “Normalized” EPS FY 2010 Diluted earnings per share: $0.83 to $0.93 Restructuring and restructuring related costs, net of tax [ 1 ] $0.20 to $0.30 Capital Structure Optimization Plan [ 2 ] $0.44 Benefit from the resolution of a tax examination [ 3 ] ($0.21) Convertible notes dilution $0.10 Other items, net of tax [ 4 ] ($0.01) "Normalized" EPS: $1.40 to $1.50 [ 1 ] Restructuring and restructuring related costs include impairment charges, employee termination benefits and other costs associated with Project Acceleration as well as costs associated with the European Transformation Plan, and the related tax effects. [ 2 ] See previous slide for the Q3 YTD 2010 impact of the Capital Structure Optimization Plan. Reflects the impact of the Capital Structure Optimization Plan transactions as if they were completed on September 30, 2010. [ 3 ] Represents a benefit associated with the favorable resolution of a multi-year tax examination. [ 4 ] Other items include a benefit related to the impact of hyperinflationary accounting for the Company's Venezuelan operations. |
|
23 Reconciliation: Q3 2010 and Q3 2009 Operating Income to Operating Income Excluding Charges Q3 2010 Q3 2009 Net Sales $1,487.3 $1,449.0 Operating Income (as reported) $174.5 $165.3 Restructuring and Restructuring Related Costs [ 1 ] $23.1 $27.0 Operating Income (excluding charges) $197.6 $192.3 Operating Income (excluding charges), as a Percent of Net Sales 13.3% 13.3% [ 1 ] Restructuring and restructuring related costs include impairment charges, employee termination benefits and other costs associated with Project Acceleration as well as costs associated with the European Transformation Plan, and the related tax effects. $ millions |
|
24 Reconciliation: Q3 YTD 2010 and Q3 YTD 2009 Operating Income to Operating Income Excluding Charges YTD Q3 2010 YTD Q3 2009 Net Sales $4,289.9 $4,157.2 Operating Income (as reported) $508.1 $445.6 Restructuring and Restructuring Related Costs [ 1 ] $61.9 $87.0 Operating Income (excluding charges) $570.0 $532.6 Operating Income (excluding charges), as a Percent of Net Sales 13.3% 12.8% [ 1 ] Restructuring and restructuring related costs include impairment charges, employee termination benefits and other costs associated with Project Acceleration as well as costs associated with the European Transformation Plan, and the related tax effects. $ millions |
|
25 Reconciliation: Q3 2010 and Q3 2009 Free Cash Flow Q3 2010 Q3 2009 Operating Cash Flow $194.5 $327.7 Capital Expenditures (38.8) (37.0) Free Cash Flow $155.7 $290.7 $ millions |
|
26 Reconciliation: Q3 YTD 2010 and Q3 YTD 2009 Free Cash Flow YTD Q3 2010 YTD Q3 2009 Operating Cash Flow $377.9 $415.7 Capital Expenditures (108.1) (107.7) Free Cash Flow $269.8 $308.0 $ millions |