Exhibit 99.1
| | |
 | | > News Release |
Newell Rubbermaid Reports Fourth Quarter 2010 Results
» Core Sales Growth of 4.9%
» Normalized EPS of $0.34; a 26% Increase Compared to Prior Year Quarter
» Provides 2011 Guidance for 10% to 12% Normalized EPS Growth
ATLANTA, January 27, 2011– Newell Rubbermaid (NYSE: NWL) today announced fourth quarter 2010 financial results, including normalized earnings per share of $0.34, a 26 percent improvement over prior year results, core sales growth of 4.9 percent and gross margin of 37.1%.
“I’m pleased to report the conclusion of a successful year for Newell Rubbermaid,” said Mark Ketchum, President and CEO. “We finished out 2010 with very positive fourth quarter results. For both the quarter and the full year, we delivered mid-single digit core sales growth, year-over-year gross margin improvement, strong double-digit normalized EPS growth and robust operating cash flow. As I look back on 2010, I think it’s most notable that we consistently grew cores sales in a sluggish economy and delivered on all of our financial targets, while continuing to advance our long-term growth strategies. By staying focused on the drivers that are in our control, we have created our own momentum to deliver once again a full year of the growth trifecta – sales growth, gross margin expansion and normalized earnings growth. We exit 2010 with positive momentum that provides even greater confidence in our 2011 prospects.”
Net sales in the fourth quarter were $1.47 billion, an increase of 3.4 percent compared with the prior year. Core sales improved 4.9 percent. The year over year impact of last year’s product line exits reduced net sales by 0.8 percent, and foreign currency translation had a negative 0.7 percent impact on sales.
Gross margin for the quarter was 37.1 percent, up 10 basis points from last year as improved product mix and productivity more than offset the impact of input cost inflation.
Fourth quarter operating income, on a normalized basis, was $152.6 million, or 10.4 percent of sales, excluding $30.8 million of Project Acceleration restructuring costs and restructuring related costs incurred in connection with the European Transformation Plan. In 2009, normalized operating income was $142.3 million, or 10.0 percent of sales, excluding Project Acceleration restructuring costs of $13.0 million.
The tax rate for the quarter was 21.2% compared to 29.3% in the prior year. The primary drivers of the decreased tax rate relate to recent U.S. legislation changes and improved profitability outside the United States, which allowed the company to benefit from foreign losses that had not previously been available.
Normalized earnings were $0.34 per diluted share compared to prior year normalized results of $0.27 per diluted share, driven by sales growth, improved gross margin, reduced interest expense and a lower tax rate. For the fourth quarter 2010, normalized diluted earnings per share exclude $0.08 per diluted share for restructuring and restructuring related costs, net of tax. For the fourth quarter 2009, normalized earnings per share excluded $0.04 per diluted share for Project Acceleration restructuring costs, net of tax, $0.02 per diluted share of dilution related to
3 Glenlake Parkway | Atlanta, GA 30328 | Phone +1 (770) 418-7000 | www.newellrubbermaid.com | NYSE: NWL

| | |
| | > News Release |
the conversion feature of the convertible notes issued in March 2009 and the impact of associated hedge transactions, and $0.01 per diluted share associated with the company’s adoption of the parallel rate to translate the results of its Venezuelan operations beginning in the fourth quarter of 2009. (A reconciliation of the “as reported” results to “normalized” results is included below.)
Net income, as reported, was $75.7 million, or $0.25 per diluted share, for the fourth quarter. This compares to net income of $60.6 million, or $0.20 per diluted share, in the prior year.
The company generated operating cash flow of $204.7 million during the fourth quarter, compared to $187.1 million in the comparable period last year. Capital expenditures were $56.6 million in the fourth quarter compared to $45.6 million in the prior year.
A reconciliation of the fourth quarter 2010 and last year’s results is as follows:
| | | | | | | | |
| | | Q4 2010 | | | Q4 2009 | |
| | |
Diluted earnings per share (as reported) | | $ | 0.25 | | | $ | 0.20 | |
| | |
Restructuring and restructuring related costs, net of tax | | $ | 0.08 | | | $ | 0.04 | |
| | |
Convertible notes dilution | | $ | 0.00 | | | $ | 0.02 | |
| | |
Other items, net of tax | | $ | 0.00 | | | $ | 0.01 | |
| | | | | | | | |
| | |
“Normalized” EPS | | $ | 0.34 | | | $ | 0.27 | |
Full Year Results
Net sales for the twelve months ended December 31, 2010 increased 3.3 percent to $5.76 billion, compared to $5.58 billion in the prior year. Core sales increased 4.7 percent for the full year. Foreign currency translation had a negligible impact on net sales, while the year over year impact of last year’s product line exits lowered net sales by 1.4 percent.
Gross margin was 37.7 percent, a 100 basis point improvement versus the prior year. Productivity gains and improved product mix more than offset the effect of input cost inflation.
Normalized earnings were $1.52 per diluted share compared to $1.31 per diluted share in the prior year. For the twelve months ended December 31, 2010, normalized earnings exclude $0.24 per diluted share for restructuring and restructuring related costs, net of tax; $0.10 per diluted share of dilution related to the conversion feature of the convertible notes issued in March 2009 and the impact of associated hedge transactions; $0.44 per diluted share in charges and other impacts associated with the Capital Structure Optimization Plan; a benefit of $0.21 reflecting the favorable resolution of a tax examination and a benefit of $0.01 per diluted per share related to hyperinflationary accounting for the company’s Venezuelan operations. For the twelve months ended December 31, 2009, normalized earnings excluded the same items as those in the fourth quarter 2009, as well as one-time costs of $0.01 per diluted share incurred for the early retirement of $325 million principal amount of medium-term notes. (A reconciliation of the “as reported” results to “normalized” results is included below.)
3 Glenlake Parkway | Atlanta, GA 30328 | Phone +1 (770) 418-7000 | www.newellrubbermaid.com | NYSE: NWL
| | |
| | > News Release |
Net income, as reported, was $292.8 million, or $0.96 per diluted share. This compares to $285.5 million, or $0.97 per diluted share, in the prior year.
“Another notable strategic milestone in 2010 was the completion of Project Acceleration,” said CEO Mark Ketchum. “This multi-year restructuring program was designed to consolidate and streamline our manufacturing and supply chain operations to achieve greater efficiency and best cost. Since the inception of Acceleration, we have reduced our manufacturing footprint by 60% and optimized our distribution and transportation network. By the end of 2011 we will have delivered in excess of $220 million in annualized savings. Project Acceleration required significant effort and resources; and with that hard work behind us, we are now better able to focus on growth.”
Cumulative restructuring costs incurred through the completion of Project Acceleration in 2010 totaled $498 million.
The company generated operating cash flow of $582.6 million during 2010 compared to $602.8 million in the prior year. Capital expenditures were $164.7 million, compared to $153.3 million in the prior year.
A reconciliation of the full year 2010 and last year’s results is as follows:
| | | | | | | | |
| | | FY 2010 | | | FY 2009 | |
| | |
Diluted earnings per share (as reported) | | $ | 0.96 | | | $ | 0.97 | |
| | |
Restructuring and restructuring related costs, net of tax | | $ | 0.24 | | | $ | 0.26 | |
| | |
Convertible notes dilution | | $ | 0.10 | | | $ | 0.06 | |
| | |
Capital structure optimization plan | | $ | 0.44 | | | $ | 0.00 | |
| | |
Benefit from the resolution of a tax examination | | ($ | 0.21 | ) | | $ | 0.00 | |
| | |
Other items, net of tax | | ($ | 0.01 | ) | | $ | 0.02 | |
| | | | | | | | |
| | |
“Normalized” EPS | | $ | 1.52 | | | $ | 1.31 | |
2011 Full Year Outlook
The company expects core sales to increase four to five percent in 2011 and estimates that foreign currency will have a negligible impact on sales. Gross margin is expected to improve 50 to 75 basis points with the combination of productivity, mix and pricing more than offsetting input cost inflation.
3 Glenlake Parkway | Atlanta, GA 30328 | Phone +1 (770) 418-7000 | www.newellrubbermaid.com | NYSE: NWL
| | |
| | > News Release |
The company expects normalized earnings per diluted share to increase 10 to 12 percent in 2011.
The company’s 2011 normalized EPS expectation excludes between $80 and $85 million of restructuring and other Plan-related costs associated with the company’s European Transformation Plan. The company expects to realize annualized net income improvement of $55 to $65 million, upon completion of the European Transformation Plan, and estimates the initiative will result in aggregate restructuring and other Plan-related costs of $110 to $115 million. The costs will be substantially incurred by the end of 2011, and the bulk of the benefits will accrue beginning in the middle of 2012. The Plan’s benefit and cost guidance compares to the previously communicated annualized savings range of $50 to $60 million and a project cost range of $90 to $100 million. (A reconciliation of the “as reported” results to “normalized” results is included below.) Additionally, the implementation of SAP in Europe, previously expected to be substantially complete by the end of 2011, is now estimated to be completed in the first half of 2012.
Operating cash flow is expected to exceed $550 million for the full year, including approximately $90 to $100 million in restructuring and restructuring related cash payments. The company plans to fund capital expenditures of approximately $180 to $200 million during the year.
A reconciliation of the 2011 earnings outlook is as follows:
| | | | |
| | | FY 2011 | |
| |
Diluted earnings per share | | $ | 1.43 to $1.46 | |
| |
Restructuring and restructuring related costs, net of tax | | $ | 0.22 to $0.26 | |
| |
“Normalized” EPS | �� | $ | 1.67 to $1.70 | |
Conference Call
The company’s fourth quarter 2010 earnings conference call is scheduled for today, January 27, 2011, at 10:00 am ET. To listen to the webcast, use the link provided under Events & Presentations in the Investor Relations section of Newell Rubbermaid’s Web site atwww.newellrubbermaid.com. The webcast will be available for replay for two weeks. A brief supporting slide presentation will be available prior to the call under Quarterly Earnings in the Investor Relations section on the company’s Web site.
Non-GAAP Financial Measures
This release contains non-GAAP financial measures within the meaning of Regulation G promulgated by the Securities and Exchange Commission. Included in this release is a reconciliation of these non-GAAP financial measures to the most directly comparable financial measures calculated in accordance with GAAP.
3 Glenlake Parkway | Atlanta, GA 30328 | Phone +1 (770) 418-7000 | www.newellrubbermaid.com | NYSE: NWL
| | |
| | > News Release |
About Newell Rubbermaid
Newell Rubbermaid Inc., an S&P 500 company, is a global marketer of consumer and commercial products with 2010 sales of approximately $5.8 billion and a strong portfolio of brands, including Rubbermaid®, Sharpie®, Graco®, Calphalon®, Irwin®, Lenox®, Levolor®, Paper Mate®, Dymo®, Waterman®, Parker®, Goody®, Technical ConceptsTM and Aprica®.
This press release and additional information about Newell Rubbermaid are available on the company’s Web site,www.newellrubbermaid.com.
Contacts:
| | |
Nancy O’Donnell Vice President, Investor Relations +1 (770) 418-7723 | | David Doolittle Vice President, Corporate Communications +1 (770) 418-7519 |
Caution Concerning Forward-Looking Statements
Statements in this press release that are not historical in nature constitute forward-looking statements. These forward-looking statements relate to information or assumptions about the effects of sales, income/(loss), earnings per share, operating income or gross margin improvements or declines, Project Acceleration, the European Transformation Plan, the Capital Structure Optimization Plan, capital and other expenditures, cash flow, dividends, restructuring and restructuring related costs, costs and cost savings, inflation or deflation, particularly with respect to commodities such as oil and resin, debt ratings, and management’s plans, projections and objectives for future operations and performance. These statements are accompanied by words such as “anticipate,” “expect,” “project,” “will,” “believe,” “estimate” and similar expressions. Actual results could differ materially from those expressed or implied in the forward-looking statements. Important factors that could cause actual results to differ materially from those suggested by the forward-looking statements include, but are not limited to, our dependence on the strength of retail, commercial and industrial sectors of the economy in light of the global economic slowdown; currency fluctuations; competition with other manufacturers and distributors of consumer products; major retailers’ strong bargaining power; changes in the prices of raw materials and sourced products and our ability to obtain raw materials and sourced products in a timely manner from suppliers; our ability to develop innovative new products and to develop, maintain and strengthen our end-user brands; our ability to expeditiously close facilities and move operations while managing foreign regulations and other impediments; our ability to implement successfully information technology solutions throughout our organization; our ability to improve productivity and streamline operations; changes to our credit ratings; significant increases in the funding obligations related to our pension plans due to declining asset values or otherwise; the imposition of tax liabilities greater than our provisions for such matters; the risks inherent in our foreign operations and those factors listed in the company’s latest quarterly report on Form 10-Q, and exhibit 99.1 thereto, filed with the Securities and Exchange Commission. Changes in such assumptions or factors could produce significantly different results. The information contained in this news release is as of the date indicated. The company assumes no obligation to update any forward-looking statements contained in this news release as a result of new information or future events or developments.
3 Glenlake Parkway | Atlanta, GA 30328 | Phone +1 (770) 418-7000 | www.newellrubbermaid.com | NYSE: NWL
Newell Rubbermaid Inc.
CONSOLIDATED STATEMENTS OF OPERATIONS (UNAUDITED)
(in millions, except per share data)
Reconciliation of “As Reported” Results to “Normalized” Results
| | | | | | | | | | | | | | | | | | | | | | | | | | | | |
| | | Three Months Ended December 31, | |
| | | 2010 | | | 2009 | | | YOY
% Change | |
| | | As Reported | | | Excluded
Items (1) | | | Normalized | | | As Reported | | | Excluded
Items (2) | | | Normalized | | |
Net sales | | $ | 1,469.3 | | | $ | — | | | $ | 1,469.3 | | | $ | 1,420.4 | | | $ | — | | | $ | 1,420.4 | | | | 3.4 | % |
Cost of products sold | | | 924.6 | | | | — | | | | 924.6 | | | | 894.6 | | | | — | | | | 894.6 | | | | | |
| | | | | | | | | | | | | | | | | | | | | | | | | | | | |
GROSS MARGIN | | | 544.7 | | | | — | | | | 544.7 | | | | 525.8 | | | | — | | | | 525.8 | | | | 3.6 | % |
% of sales | | | 37.1 | % | | | | | | | 37.1 | % | | | 37.0 | % | | | | | | | 37.0 | % | | | | |
| | | | | | | |
Selling, general & administrative expenses | | | 398.8 | | | | (6.7 | ) | | | 392.1 | | | | 383.5 | | | | — | | | | 383.5 | | | | 2.2 | % |
% of sales | | | 27.1 | % | | | | | | | 26.7 | % | | | 27.0 | % | | | | | | | 27.0 | % | | | | |
| | | | | | | |
Restructuring costs | | | 24.1 | | | | (24.1 | ) | | | — | | | | 13.0 | | | | (13.0 | ) | | | — | | | | | |
| | | | | | | | | | | | | | | | | | | | | | | | | | | | |
OPERATING INCOME | | | 121.8 | | | | 30.8 | | | | 152.6 | | | | 129.3 | | | | 13.0 | | | | 142.3 | | | | 7.2 | % |
% of sales | �� | | 8.3 | % | | | | | | | 10.4 | % | | | 9.1 | % | | | | | | | 10.0 | % | | | | |
Nonoperating expenses: | | | | | | | | | | | | | | | | | | | | | | | | | | | | |
Interest expense, net | | | 22.9 | | | | — | | | | 22.9 | | | | 33.4 | | | | — | | | | 33.4 | | | | | |
Other expense, net | | | 2.3 | | | | — | | | | 2.3 | | | | 4.2 | | | | (2.3 | ) | | | 1.9 | | | | | |
| | | | | | | | | | | | | | | | | | | | | | | | | | | | |
| | | 25.2 | | | | — | | | | 25.2 | | | | 37.6 | | | | (2.3 | ) | | | 35.3 | | | | (28.6 | )% |
| | | | | | | | | | | | | | | | | | | | | | | | | | | | |
| | | | | | | |
INCOME BEFORE INCOME TAXES | | | 96.6 | | | | 30.8 | | | | 127.4 | | | | 91.7 | | | | 15.3 | | | | 107.0 | | | | 19.1 | % |
% of sales | | | 6.6 | % | | | | | | | 8.7 | % | | | 6.5 | % | | | | | | | 7.5 | % | | | | |
| | | | | | | |
Income taxes | | | 20.9 | | | | 6.1 | | | | 27.0 | | | | 31.1 | | | | 0.2 | | | | 31.3 | | | | (13.7 | )% |
Effective rate | | | 21.6 | % | | | | | | | 21.2 | % | | | 33.9 | % | | | | | | | 29.3 | % | | | | |
| | | | | | | | | | | | | | | | | | | | | | | | | | | | |
| | | | | | | |
NET INCOME (3) | | $ | 75.7 | | | $ | 24.7 | | | $ | 100.4 | | | $ | 60.6 | | | $ | 15.1 | | | $ | 75.7 | | | | 32.6 | % |
| | | | | | | | | | | | | | | | | | | | | | | | | | | | |
% of sales | | | 5.2 | % | | | | | | | 6.8 | % | | | 4.3 | % | | | | | | | 5.3 | % | | | | |
| | | | | | | |
EARNINGS PER SHARE: | | | | | | | | | | | | | | | | | | | | | | | | | | | | |
Basic | | $ | 0.26 | | | $ | 0.08 | | | $ | 0.34 | | | $ | 0.22 | | | $ | 0.05 | | | $ | 0.27 | | | | | |
Diluted | | $ | 0.25 | | | $ | 0.09 | | | $ | 0.34 | | | $ | 0.20 | | | $ | 0.07 | | | $ | 0.27 | | | | | |
AVERAGE SHARES OUTSTANDING: | | | | | | | | | | | | | | | | | | | | | | | | | | | | |
Basic | | | 293.5 | | | | | | | | 293.5 | | | | 280.9 | | | | | | | | 280.9 | | | | | |
Diluted | | | 297.6 | | | | | | | | 297.6 | | | | 308.3 | | | | | | | | 282.7 | | | | | |
| (1) | Items excluded from “normalized” results for 2010 consist of $6.7 million of restructuring related costs incurred in connection with the European Transformation Plan, net of tax effects, as well as the net of tax impact of $24.1 million of Project Acceleration restructuring costs, including asset impairment charges and employee termination and other costs. |
| (2) | Items excluded from “normalized” results for 2009 consist of $13.0 million of restructuring costs, including asset impairment charges and employee termination and other costs, and the associated tax effects, the net of tax impact of a $2.3 million loss relating to the Company’s decision to adopt the parallel rate to translate the results of its Venezuelan operations beginning in the fourth quarter of 2009, as well as the dilutive impact of the conversion feature of the convertible notes issued in March 2009 and the associated hedge transactions. |
| (3) | Net income attributable to noncontrolling interests was not material in either of the periods presented. |
Newell Rubbermaid Inc.
CONSOLIDATED STATEMENTS OF OPERATIONS (UNAUDITED)
(in millions, except per share data)
Reconciliation of “As Reported” Results to “Normalized” Results
| | | | | | | | | | | | | | | | | | | | | | | | | | | | |
| | | Twelve Months Ended December 31, | |
| | | 2010 | | | 2009 | | | YOY
% Change | |
| | | As Reported | | | Excluded
Items (1) | | | Normalized | | | As Reported | | | Excluded
Items (2) | | | Normalized | | |
Net sales | | $ | 5,759.2 | | | $ | — | | | $ | 5,759.2 | | | $ | 5,577.6 | | | $ | — | | | $ | 5,577.6 | | | | 3.3 | % |
Cost of products sold | | | 3,588.4 | | | | — | | | | 3,588.4 | | | | 3,528.1 | | | | — | | | | 3,528.1 | | | | | |
| | | | | | | | | | | | | | | | | | | | | | | | | | | | |
GROSS MARGIN | | | 2,170.8 | | | | — | | | | 2,170.8 | | | | 2,049.5 | | | | — | | | | 2,049.5 | | | | 5.9 | % |
% of sales | | | 37.7 | % | | | | | | | 37.7 | % | | | 36.7 | % | | | | | | | 36.7 | % | | | | |
| | | | | | | |
Selling, general & administrative expenses | | | 1,463.4 | | | | (15.2 | ) | | | 1,448.2 | | | | 1,374.6 | | | | — | | | | 1,374.6 | | | | 5.4 | % |
% of sales | | | 25.4 | % | | | | | | | 25.1 | % | | | 24.6 | % | | | | | | | 24.6 | % | | | | |
| | | | | | | |
Restructuring costs | | | 77.5 | | | | (77.5 | ) | | | — | | | | 100.0 | | | | (100.0 | ) | | | — | | | | | |
| | | | | | | | | | | | | | | | | | | | | | | | | | | | |
OPERATING INCOME | | | 629.9 | | | | 92.7 | | | | 722.6 | | | | 574.9 | | | | 100.0 | | | | 674.9 | | | | 7.1 | % |
% of sales | | | 10.9 | % | | | | | | | 12.5 | % | | | 10.3 | % | | | | | | | 12.1 | % | | | | |
Nonoperating expenses: | | | | | | | | | | | | | | | | | | | | | | | | | | | | |
Interest expense, net | | | 118.4 | | | | — | | | | 118.4 | | | | 140.0 | | | | — | | | | 140.0 | | | | | |
Losses related to extinguishments of debt | | | 218.6 | | | | (218.6 | ) | | | — | | | | 4.7 | | | | (4.7 | ) | | | — | | | | | |
Other (income) expense, net | | | (7.4 | ) | | | 5.6 | | | | (1.8 | ) | | | 2.0 | | | | (2.3 | ) | | | (0.3 | ) | | | | |
| | | | | | | | | | | | | | | | | | | | | | | | | | | | |
| | | 329.6 | | | | (213.0 | ) | | | 116.6 | | | | 146.7 | | | | (7.0 | ) | | | 139.7 | | | | (16.5 | )% |
| | | | | | | | | | | | | | | | | | | | | | | | | | | | |
| | | | | | | |
INCOME BEFORE INCOME TAXES | | | 300.3 | | | | 305.7 | | | | 606.0 | | | | 428.2 | | | | 107.0 | | | | 535.2 | | | | 13.2 | % |
% of sales | | | 5.2 | % | | | | | | | 10.5 | % | | | 7.7 | % | | | | | | | 9.6 | % | | | | |
| | | | | | | |
Income taxes | | | 7.5 | | | | 162.1 | | | | 169.6 | | | | 142.7 | | | | 23.2 | | | | 165.9 | | | | 2.2 | % |
Effective rate | | | NM | | | | | | | | 28.0 | % | | | 33.3 | % | | | | | | | 31.0 | % | | | | |
| | | | | | | | | | | | | | | | | | | | | | | | | | | | |
| | | | | | | |
NET INCOME (3) | | $ | 292.8 | | | $ | 143.6 | | | $ | 436.4 | | | $ | 285.5 | | | $ | 83.8 | | | $ | 369.3 | | | | 18.2 | % |
| | | | | | | | | | | | | | | | | | | | | | | | | | | | |
% of sales | | | 5.1 | % | | | | | | | 7.6 | % | | | 5.1 | % | | | | | | | 6.6 | % | | | | |
| | | | | | | |
EARNINGS PER SHARE: | | | | | | | | | | | | | | | | | | | | | | | | | | | | |
Basic | | $ | 1.04 | | | $ | 0.49 | | | $ | 1.53 | | | $ | 1.02 | | | $ | 0.30 | | | $ | 1.32 | | | | | |
Diluted | | $ | 0.96 | | | $ | 0.56 | | | $ | 1.52 | | | $ | 0.97 | | | $ | 0.34 | | | $ | 1.31 | | | | | |
AVERAGE SHARES OUTSTANDING: | | | | | | | | | | | | | | | | | | | | | | | | | | | | |
Basic | | | 282.4 | | | | | | | | 284.4 | | | | 280.8 | | | | | | | | 280.8 | | | | | |
Diluted | | | 305.4 | | | | | | | | 287.3 | | | | 294.4 | | | | | | | | 281.9 | | | | | |
| (1) | Items excluded from “normalized” results for 2010 consist of $15.2 million of restructuring related costs incurred in connection with the European Transformation Plan, net of tax effects, $77.5 million of Project Acceleration restructuring costs, including asset impairment charges and employee termination and other costs, net of tax effects, the net of tax impact of $218.6 million in charges incurred to retire outstanding debt under the Capital Structure Optimization Plan, the net of tax impact of a $5.6 million gain resulting from hyperinflationary accounting for the Company’s Venezuelan operations, $63.6 million of non-recurring income tax benefits resulting from settlements with tax authorities, share impacts relating to the execution of the Capital Structure Optimization Plan and the dilutive impact of the conversion feature of the convertible notes and the associated hedge transactions for the period outstanding during 2010. |
| (2) | Items excluded from “normalized” results for 2009 consist of $100.0 million of restructuring costs, including asset impairment charges and employee termination and other costs, and the associated tax effects, $4.7 million of debt extinguishment charges, net of tax effects, the net of tax impact of a $2.3 million loss relating to the Company’s decision to adopt the parallel rate to translate the results of its Venezuelan operations beginning in the fourth quarter of 2009, as well as the dilutive impact of the conversion feature of the convertible notes issued in March 2009 and the associated hedge transactions. |
| (3) | Net income attributable to noncontrolling interests was not material in either of the periods presented. |
Newell Rubbermaid Inc.
CONSOLIDATED BALANCE SHEETS (UNAUDITED)
(in millions)
| | | | | | | | |
| | | December 31, | | | December 31, | |
| | | 2010 | | | 2009 | |
Assets: | | | | | | | | |
| | |
Cash and cash equivalents | | $ | 139.6 | | | $ | 278.3 | |
Accounts receivable, net | | | 997.9 | | | | 894.1 | |
Inventories, net | | | 701.6 | | | | 688.2 | |
Deferred income taxes | | | 179.2 | | | | 183.8 | |
Prepaid expenses and other | | | 113.7 | | | | 137.7 | |
| | | | | | | | |
| | |
Total Current Assets | | | 2,132.0 | | | | 2,182.1 | |
| | |
Property, plant and equipment, net | | | 529.3 | | | | 578.1 | |
Goodwill | | | 2,749.5 | | | | 2,754.3 | |
Other intangible assets, net | | | 648.3 | | | | 646.2 | |
Other assets | | | 346.2 | | | | 263.2 | |
| | | | | | | | |
| | |
Total Assets | | $ | 6,405.3 | | | $ | 6,423.9 | |
| | | | | | | | |
| | |
Liabilities and Stockholders’ Equity: | | | | | | | | |
| | |
Accounts payable | | $ | 472.5 | | | $ | 433.6 | |
Accrued compensation | | | 190.2 | | | | 176.4 | |
Other accrued liabilities | | | 698.2 | | | | 656.0 | |
Short-term debt | | | 135.0 | | | | 0.6 | |
Current portion of long-term debt | | | 170.0 | | | | 492.9 | |
| | | | | | | | |
| | |
Total Current Liabilities | | | 1,665.9 | | | | 1,759.5 | |
| | |
Long-term debt | | | 2,063.9 | | | | 2,015.3 | |
Other noncurrent liabilities | | | 770.0 | | | | 866.9 | |
| | |
Stockholders’ Equity—Parent | | | 1,902.0 | | | | 1,778.7 | |
Stockholders’ Equity—Noncontrolling Interests | | | 3.5 | | | | 3.5 | |
| | | | | | | | |
| | |
Total Stockholders’ Equity | | | 1,905.5 | | | | 1,782.2 | |
| | | | | | | | |
| | |
Total Liabilities and Stockholders’ Equity | | $ | 6,405.3 | | | $ | 6,423.9 | |
| | | | | | | | |
Newell Rubbermaid Inc.
CONSOLIDATED STATEMENTS OF CASH FLOW (UNAUDITED)
(in millions)
| | | | | | | | |
| | | Twelve Months Ended December 31, | |
| | | 2010 | | | 2009 | |
Operating Activities: | | | | | | | | |
Net income | | $ | 292.8 | | | $ | 285.5 | |
Adjustments to reconcile net income to net cash provided by operating activities: | | | | | | | | |
Depreciation and amortization | | | 172.3 | | | | 175.1 | |
Losses related to extinguishments of debt | | | 218.6 | | | | 4.7 | |
Deferred income taxes | | | (6.1 | ) | | | 14.9 | |
Non-cash restructuring costs | | | 6.3 | | | | 32.4 | |
Stock-based compensation expense | | | 36.5 | | | | 35.1 | |
Other | | | 21.9 | | | | 16.4 | |
Changes in operating assets and liabilities: | | | | | | | | |
Accounts receivable | | | (103.6 | ) | | | 98.0 | |
Inventories | | | (14.5 | ) | | | 243.1 | |
Accounts payable | | | 39.1 | | | | (103.6 | ) |
Accrued liabilities and other | | | (80.7 | ) | | | (198.8 | ) |
| | | | | | | | |
Net cash provided by operating activities | | $ | 582.6 | | | $ | 602.8 | |
| | |
Investing Activities: | | | | | | | | |
Acquisition related activity | | $ | (1.5 | ) | | $ | (13.7 | ) |
Capital expenditures | | | (164.7 | ) | | | (153.3 | ) |
Proceeds from sales of noncurrent assets | | | 16.8 | | | | 17.6 | |
Other | | | (4.0 | ) | | | — | |
| | | | | | | | |
Net cash used in investing activities | | $ | (153.4 | ) | | $ | (149.4 | ) |
| | |
Financing Activities: | | | | | | | | |
Proceeds from issuance of debt, net of debt issuance costs | | $ | 547.3 | | | $ | 634.8 | |
Net proceeds from short-term borrowings | | | 133.6 | | | | 192.5 | |
Proceeds from issuance of warrants | | | — | | | | 32.7 | |
Purchase of call options | | | — | | | | (69.0 | ) |
Payments for settlement of warrants | | | (298.4 | ) | | | — | |
Proceeds from settlement of call options | | | 369.5 | | | | — | |
Payments on and for the settlement of notes payable and debt | | | (710.8 | ) | | | (1,113.0 | ) |
Cash consideration paid in convertible note exchange | | | (53.0 | ) | | | — | |
Repurchase of common stock | | | (500.1 | ) | | | — | |
Cash dividends | | | (55.4 | ) | | | (71.4 | ) |
Purchase of noncontrolling interests in consolidated subsidiaries | | | — | | | | (29.2 | ) |
Other, net | | | (4.6 | ) | | | (4.4 | ) |
| | | | | | | | |
Net cash used in financing activities | | $ | (571.9 | ) | | $ | (427.0 | ) |
| | |
Currency rate effect on cash and cash equivalents | | $ | 4.0 | | | $ | (23.5 | ) |
| | | | | | | | |
| | |
(Decrease) increase in cash and cash equivalents | | $ | (138.7 | ) | | $ | 2.9 | |
Cash and cash equivalents at beginning of year | | | 278.3 | | | | 275.4 | |
| | | | | | | | |
Cash and cash equivalents at end of year | | $ | 139.6 | | | $ | 278.3 | |
| | | | | | | | |
Newell Rubbermaid Inc.
Financial Worksheet
(In Millions)
| | | | | | | | | | | | | | | | | | | | | | | | | | | | | | | | | | | | | | | | | | | | | | | | | | | | | | | | |
| | | 2010 | | | 2009 | | | Year-over-year changes | |
| | | | | | Reconciliation (1) | | | | | | | | | Reconciliation (1) | | | | | | Net Sales | | | Normalized OI | |
| | | Net
Sales | | | Reported
OI | | | Excluded
Items | | | Normalized
OI | | | Operating
Margin | | | Net
Sales | | | Reported
OI | | | Excluded
Items | | | Normalized
OI | | | Operating
Margin | | | | | | | |
| | | | | | | | | | | | | $ | | | % | | | $ | | | % | |
Q1: | | | | | | | | | | | | | | | | | | | | | | | | | | | | | | | | | | | | | | | | | | | | | | | | | | | | | | | | |
Home & Family | | $ | 556.9 | | | $ | 68.8 | | | $ | — | | | $ | 68.8 | | | | 12.4 | % | | $ | 557.7 | | | $ | 60.3 | | | $ | — | | | $ | 60.3 | | | | 10.8 | % | | $ | (0.8 | ) | | | (0.1 | )% | | $ | 8.5 | | | | 14.1 | % |
Office Products | | | 351.6 | | | | 47.3 | | | | — | | | | 47.3 | | | | 13.5 | % | | | 318.2 | | | | 31.1 | | | | — | | | | 31.1 | | | | 9.8 | % | | | 33.4 | | | | 10.5 | % | | | 16.2 | | | | 52.1 | % |
Tools, Hardware & Commercial Products | | | 397.9 | | | | 51.6 | | | | — | | | | 51.6 | | | | 13.0 | % | | | 328.0 | | | | 38.0 | | | | — | | | | 38.0 | | | | 11.6 | % | | | 69.9 | | | | 21.3 | % | | | 13.6 | | | | 35.8 | % |
Restructuring Costs | | | — | | | | (16.0 | ) | | | 16.0 | | | | — | | | | | | | | — | | | | (30.5 | ) | | | 30.5 | | | | — | | | | | | | | | | | | | | | | | | | | | |
Corporate | | | — | | | | (21.6 | ) | | | — | | | | (21.6 | ) | | | | | | | — | | | | (18.1 | ) | | | — | | | | (18.1 | ) | | | | | | | | | | | | | | | (3.5 | ) | | | (19.3 | )% |
| | | | | | | | | | | | | | | | | | | | | | | | | | | | | | | | | | | | | | | | | | | | | | | | | | | | | | | | |
Total | | $ | 1,306.4 | | | $ | 130.1 | | | $ | 16.0 | | | $ | 146.1 | | | | 11.2 | % | | $ | 1,203.9 | | | $ | 80.8 | | | $ | 30.5 | | | $ | 111.3 | | | | 9.2 | % | | $ | 102.5 | | | | 8.5 | % | | $ | 34.8 | | | | 31.3 | % |
| | | | | | | | | | | | | | | | | | | | | | | | | | | | | | | | | | | | | | | | | | | | | | | | | | | | | | | | |
| | | |
| | | 2010 | | | 2009 | | | Year-over-year changes | |
| | | | | | Reconciliation (2) | | | | | | | | | Reconciliation (1) | | | | | | Net Sales | | | Normalized OI | |
| | | Net
Sales | | | Reported
OI | | | Excluded
Items | | | Normalized
OI | | | Operating
Margin | | | Net
Sales | | | Reported
OI | | | Excluded
Items | | | Normalized
OI | | | Operating
Margin | | | | | | | | | | |
| | | | | | | | | | | | | $ | | | % | | | $ | | | % | |
Q2: | | | | | | | | | | | | | | | | | | | | | | | | | | | | | | | | | | | | | | | | | | | | | | | | | | | | | | | | |
Home & Family | | $ | 592.0 | | | $ | 75.6 | | | $ | — | | | $ | 75.6 | | | | 12.8 | % | | $ | 617.2 | | | $ | 80.4 | | | $ | — | | | $ | 80.4 | | | | 13.0 | % | | $ | (25.2 | ) | | | (4.1 | )% | | $ | (4.8 | ) | | | (6.0 | )% |
Office Products | | | 483.5 | | | | 99.4 | | | | — | | | | 99.4 | | | | 20.6 | % | | | 496.9 | | | | 99.2 | | | | — | | | | 99.2 | | | | 20.0 | % | | | (13.4 | ) | | | (2.7 | )% | | | 0.2 | | | | 0.2 | % |
Tools, Hardware & Commercial Products | | | 420.7 | | | | 70.1 | | | | — | | | | 70.1 | | | | 16.7 | % | | | 390.2 | | | | 67.6 | | | | — | | | | 67.6 | | | | 17.3 | % | | | 30.5 | | | | 7.8 | % | | | 2.5 | | | | 3.7 | % |
Restructuring Costs | | | — | | | | (21.2 | ) | | | 21.2 | | | | — | | | | | | | | — | | | | (29.5 | ) | | | 29.5 | | | | — | | | | | | | | | | | | | | | | | | | | | |
Corporate | | | — | | | | (20.4 | ) | | | 1.6 | | | | (18.8 | ) | | | | | | | — | | | | (18.2 | ) | | | — | | | | (18.2 | ) | | | | | | | | | | | | | | | (0.6 | ) | | | (3.3 | )% |
| | | | | | | | | | | | | | | | | | | | | | | | | | | | | | | | | | | | | | | | | | | | | | | | | | | | | | | | |
Total | | $ | 1,496.2 | | | $ | 203.5 | | | $ | 22.8 | | | $ | 226.3 | | | | 15.1 | % | | $ | 1,504.3 | | | $ | 199.5 | | | $ | 29.5 | | | $ | 229.0 | | | | 15.2 | % | | $ | (8.1 | ) | | | (0.5 | )% | | $ | (2.7 | ) | | | (1.2 | )% |
| | | | | | | | | | | | | | | | | | | | | | | | | | | | | | | | | | | | | | | | | | | | | | | | | | | | | | | | |
| | | |
| | | 2010 | | | 2009 | | | Year-over-year changes | |
| | | | | | Reconciliation (2) | | | | | | | | | Reconciliation (1) | | | | | | Net Sales | | | Normalized OI | |
| | | Net
Sales | | | Reported
OI | | | Excluded
Items | | | Normalized
OI | | | Operating
Margin | | | Net
Sales | | | Reported
OI | | | Excluded
Items | | | Normalized
OI | | | Operating
Margin | | | $ | | | % | | | $ | | | % | |
| | | | | | | | | | | | | | |
Q3: | | | | | | | | | | | | | | | | | | | | | | | | | | | | | | | | | | | | | | | | | | | | | | | | | | | | | | | | |
Home & Family | | $ | 608.8 | | | | 76.2 | | | $ | — | | | $ | 76.2 | | | | 12.5 | % | | $ | 596.8 | | | $ | 83.9 | | | $ | — | | | $ | 83.9 | | | | 14.1 | % | | $ | 12.0 | | | | 2.0 | % | | $ | (7.7 | ) | | | (9.2 | )% |
Office Products | | | 450.3 | | | | 70.8 | | | | — | | | | 70.8 | | | | 15.7 | % | | | 448.4 | | | | 53.9 | | | | — | | | | 53.9 | | | | 12.0 | % | | | 1.9 | | | | 0.4 | % | | | 16.9 | | | | 31.4 | % |
Tools, Hardware & Commercial Products | | | 428.2 | | | | 70.5 | | | | — | | | | 70.5 | | | | 16.5 | % | | | 403.8 | | | | 75.3 | | | | — | | | | 75.3 | | | | 18.6 | % | | | 24.4 | | | | 6.0 | % | | | (4.8 | ) | | | (6.4 | )% |
Restructuring Costs | | | — | | | | (16.2 | ) | | | 16.2 | | | | — | | | | | | | | — | | | | (27.0 | ) | | | 27.0 | | | | — | | | | | | | | | | | | | | | | | | | | | |
Corporate | | | — | | | | (26.8 | ) | | | 6.9 | | | | (19.9 | ) | | | | | | | — | | | | (20.8 | ) | | | — | | | | (20.8 | ) | | | | | | | | | | | | | | | 0.9 | | | | 4.3 | % |
| | | | | | | | | | | | | | | | | | | | | | | | | | | | | | | | | | | | | | | | | | | | | | | | | | | | | | | | |
Total | | $ | 1,487.3 | | | $ | 174.5 | | | $ | 23.1 | | | $ | 197.6 | | | | 13.3 | % | | $ | 1,449.0 | | | $ | 165.3 | | | $ | 27.0 | | | $ | 192.3 | | | | 13.3 | % | | $ | 38.3 | | | | 2.6 | % | | $ | 5.3 | | | | 2.8 | % |
| | | | | | | | | | | | | | | | | | | | | | | | | | | | | | | | | | | | | | | | | | | | | | | | | | | | | | | | |
| | | |
| | | 2010 | | | 2009 | | | Year-over-year changes | |
| | | | | | Reconciliation (2) | | | | | | | | | Reconciliation (1) | | | | | | Net Sales | | | Normalized OI | |
| | | Net
Sales | | | Reported
OI | | | Excluded
Items | | | Normalized
OI | | | Operating
Margin | | | Net
Sales | | | Reported
OI | | | Excluded
Items | | | Normalized
OI | | | Operating
Margin | | | $ | | | % | | | $ | | | % | |
| | | | | | | | | | | | | | |
Q4: | | | | | | | | | | | | | | | | | | | | | | | | | | | | | | | | | | | | | | | | | | | | | | | | | | | | | | | | |
Home & Family | | $ | 620.7 | | | $ | 61.2 | | | $ | — | | | $ | 61.2 | | | | 9.9 | % | | $ | 605.5 | | | $ | 50.1 | | | $ | — | | | $ | 50.1 | | | | 8.3 | % | | $ | 15.2 | | | | 2.5 | % | | $ | 11.1 | | | | 22.2 | % |
Office Products | | | 423.5 | | | | 51.9 | | | | — | | | | 51.9 | | | | 12.3 | % | | | 411.2 | | | | 51.0 | | | | — | | | | 51.0 | | | | 12.4 | % | | | 12.3 | | | | 3.0 | % | | | 0.9 | | | | 1.8 | % |
Tools, Hardware & Commercial Products | | | 425.1 | | | | 60.9 | | | | — | | | | 60.9 | | | | 14.3 | % | | | 403.7 | | | | 64.7 | | | | — | | | | 64.7 | | | | 16.0 | % | | | 21.4 | | | | 5.3 | % | | | (3.8 | ) | | | (5.9 | )% |
Restructuring Costs | | | | | | | (24.1 | ) | | | 24.1 | | | | — | | | | | | | | | | | | (13.0 | ) | | | 13.0 | | | | — | | | | | | | | | | | | | | | | | | | | | |
Corporate | | | | | | | (28.1 | ) | | | 6.7 | | | | (21.4 | ) | | | | | | | | | | | (23.5 | ) | | | — | | | | (23.5 | ) | | | | | | | | | | | | | | | 2.1 | | | | 8.9 | % |
| | | | | | | | | | | | | | | | | | | | | | | | | | | | | | | | | | | | | | | | | | | | | | | | | | | | | | | | |
Total | | $ | 1,469.3 | | | $ | 121.8 | | | $ | 30.8 | | | $ | 152.6 | | | | 10.4 | % | | $ | 1,420.4 | | | $ | 129.3 | | | $ | 13.0 | | | $ | 142.3 | | | | 10.0 | % | | $ | 48.9 | | | | 3.4 | % | | $ | 10.3 | | | | 7.2 | % |
| | | | | | | | | | | | | | | | | | | | | | | | | | | | | | | | | | | | | | | | | | | | | | | | | | | | | | | | |
| | | |
| | | 2010 | | | 2009 | | | Year-over-year changes | |
| | | | | | Reconciliation (2) | | | | | | | | | Reconciliation (1) | | | | | | Net Sales | | | Normalized OI | |
| | | Net
Sales | | | Reported
OI | | | Excluded
Items | | | Normalized
OI | | | Operating
Margin | | | Net
Sales | | | Reported
OI | | | Excluded
Items | | | Normalized
OI | | | Operating
Margin | | | | | | | | | | |
| | | | | | | | | | | | | $ | | | % | | | $ | | | % | |
YTD: | | | | | | | | | | | | | | | | | | | | | | | | | | | | | | | | | | | | | | | | | | | | | | | | | | | | | | | | |
Home & Family | | $ | 2,378.4 | | | $ | 281.8 | | | $ | — | | | $ | 281.8 | | | | 11.8 | % | | $ | 2,377.2 | | | $ | 274.7 | | | $ | — | | | $ | 274.7 | | | | 11.6 | % | | $ | 1.2 | | | | 0.1 | % | | $ | 7.1 | | | | 2.6 | % |
Office Products | | | 1,708.9 | | | | 269.4 | | | | — | | | | 269.4 | | | | 15.8 | % | | | 1,674.7 | | | | 235.2 | | | | — | | | | 235.2 | | | | 14.0 | % | | | 34.2 | | | | 2.0 | % | | | 34.2 | | | | 14.5 | % |
Tools, Hardware & Commercial Products | | | 1,671.9 | | | | 253.1 | | | | — | | | | 253.1 | | | | 15.1 | % | | | 1,525.7 | | | | 245.6 | | | | — | | | | 245.6 | | | | 16.1 | % | | | 146.2 | | | | 9.6 | % | | | 7.5 | | | | 3.1 | % |
Restructuring Costs | | | — | | | | (77.5 | ) | | | 77.5 | | | | — | | | | | | | | — | | | | (100.0 | ) | | | 100.0 | | | | — | | | | | | | | | | | | | | | | | | | | | |
Corporate | | | — | | | | (96.9 | ) | | | 15.2 | | | | (81.7 | ) | | | | | | | — | | | | (80.6 | ) | | | — | | | | (80.6 | ) | | | | | | | | | | | | | | | (1.1 | ) | | | (1.4 | )% |
| | | | | | | | | | | | | | | | | | | | | | | | | | | | | | | | | | | | | | | | | | | | | | | | | | | | | | | | |
Total | | $ | 5,759.2 | | | $ | 629.9 | | | $ | 92.7 | | | $ | 722.6 | | | | 12.5 | % | | $ | 5,577.6 | | | $ | 574.9 | | | $ | 100.0 | | | $ | 674.9 | | | | 12.1 | % | | $ | 181.6 | | | | 3.3 | % | | $ | 47.7 | | | | 7.1 | % |
| | | | | | | | | | | | | | | | | | | | | | | | | | | | | | | | | | | | | | | | | | | | | | | | | | | | | | | | |
| (1) | Excluded items are related to Project Acceleration costs. |
| (2) | Excluded items are related to Project Acceleration costs and restructuring related costs incurred in connection with the European Transformation Plan. |
Newell Rubbermaid Inc.
Calculation of Free Cash Flow (1)
| | | | | | | | |
| | | Three Months Ended December 31, | |
| | | 2010 | | | 2009 | |
Free Cash Flow (in millions): | | | | | | | | |
Net cash provided by operating activities | | $ | 204.7 | | | $ | 187.1 | |
Capital expenditures | | | (56.6 | ) | | | (45.6 | ) |
| | | | | | | | |
Free Cash Flow | | $ | 148.1 | | | $ | 141.5 | |
| | | | | | | | |
| |
| | | Twelve Months Ended December 31, | |
| | | 2010 | | | 2009 | |
Free Cash Flow (in millions): | | | | | | | | |
Net cash provided by operating activities | | $ | 582.6 | | | $ | 602.8 | |
Capital expenditures | | | (164.7 | ) | | | (153.3 | ) |
| | | | | | | | |
Free Cash Flow | | $ | 417.9 | | | $ | 449.5 | |
| | | | | | | | |
| (1) | Free Cash Flow is defined as cash flow provided by operating activities less capital expenditures. |
Newell Rubbermaid Inc.
Three Months Ended December 31, 2010
In Millions
Currency Analysis
| | | | | | | | | | | | | | | | | | | | | | | | | | | | |
| | | 2010 | | | 2009 | | | Year-Over-Year Increase (Decrease) | | | | |
| | | Sales as
Reported | | | Currency
Impact | | | Adjusted
Sales | | | Sales as
Reported | | | Excluding
Currency | | | Including
Currency | | | Currency
Impact | |
By Segment | | | | | | | | | | | | | | | | | | | | | | | | | | | | |
Home & Family | | $ | 620.7 | | | $ | (2.2 | ) | | $ | 618.5 | | | $ | 605.5 | | | | 2.1 | % | | | 2.5 | % | | | 0.4 | % |
Office Products | | | 423.5 | | | | 11.6 | | | | 435.1 | | | | 411.2 | | | | 5.8 | % | | | 3.0 | % | | | (2.8 | )% |
Tools, Hardware & Commercial Products | | | 425.1 | | | | 0.3 | | | | 425.4 | | | | 403.7 | | | | 5.4 | % | | | 5.3 | % | | | (0.1 | )% |
| | | | | | | | | | | | | | | | | | | | | | | | | | | | |
| | | | | | | |
Total Company | | $ | 1,469.3 | | | $ | 9.7 | | | $ | 1,479.0 | | | $ | 1,420.4 | | | | 4.1 | % | | | 3.4 | % | | | (0.7 | )% |
| | | | | | | | | | | | | | | | | | | | | | | | | | | | |
| | | | | | | |
By Geography | | | | | | | | | | | | | | | | | | | | | | | | | | | | |
United States | | $ | 980.0 | | | $ | — | | | $ | 980.0 | | | $ | 939.7 | | | | 4.3 | % | | | 4.3 | % | | | 0.0 | % |
Canada | | | 97.2 | | | | (4.6 | ) | | | 92.6 | | | | 87.7 | | | | 5.6 | % | | | 10.8 | % | | | 5.2 | % |
| | | | | | | | | | | | | | | | | | | | | | | | | | | | |
Total North America | | | 1,077.2 | | | | (4.6 | ) | | | 1,072.6 | | | | 1,027.4 | | | | 4.4 | % | | | 4.8 | % | | | 0.4 | % |
| | | | | | | |
Europe, Middle East and Africa | | | 205.9 | | | | 14.8 | | | | 220.7 | | | | 230.3 | | | | (4.2 | )% | | | (10.6 | )% | | | (6.4 | )% |
Latin America | | | 76.7 | | | | 6.2 | | | | 82.9 | | | | 73.5 | | | | 12.8 | % | | | 4.4 | % | | | (8.4 | )% |
Asia Pacific | | | 109.5 | | | | (6.7 | ) | | | 102.8 | | | | 89.2 | | | | 15.2 | % | | | 22.8 | % | | | 7.5 | % |
| | | | | | | | | | | | | | | | | | | | | | | | | | | | |
Total International | | | 392.1 | | | | 14.3 | | | | 406.4 | | | | 393.0 | | | | 3.4 | % | | | (0.2 | )% | | | (3.6 | )% |
| | | | | | | | | | | | | | | | | | | | | | | | | | | | |
Total Company | | $ | 1,469.3 | | | $ | 9.7 | | | $ | 1,479.0 | | | $ | 1,420.4 | | | | 4.1 | % | | | 3.4 | % | | | (0.7 | )% |
| | | | | | | | | | | | | | | | | | | | | | | | | | | | |
Newell Rubbermaid Inc.
Twelve Months Ended December 31, 2010
In Millions
Currency Analysis
| | | | | | | | | | | | | | | | | | | | | | | | | | | | |
| | | 2010 | | | 2009 | | | Year-Over-Year (Decrease) Increase | | | | |
| | | Sales as
Reported | | | Currency
Impact | | | Adjusted
Sales | | | Sales as
Reported | | | Excluding
Currency | | | Including
Currency | | | Currency
Impact | |
By Segment | | | | | | | | | | | | | | | | | | | | | | | | | | | | |
Home & Family | | $ | 2,378.4 | | | $ | (20.9 | ) | | $ | 2,357.5 | | | $ | 2,377.2 | | | | (0.8 | )% | | | 0.1 | % | | | 0.9 | % |
Office Products | | | 1,708.9 | | | | 40.3 | | | | 1,749.2 | | | | 1,674.7 | | | | 4.4 | % | | | 2.0 | % | | | (2.4 | )% |
Tools, Hardware & Commercial Products | | | 1,671.9 | | | | (21.5 | ) | | | 1,650.4 | | | | 1,525.7 | | | | 8.2 | % | | | 9.6 | % | | | 1.4 | % |
| | | | | | | | | | | | | | | | | | | | | | | | | | | | |
| | | | | | | |
Total Company | | $ | 5,759.2 | | | $ | (2.1 | ) | | $ | 5,757.1 | | | $ | 5,577.6 | | | | 3.2 | % | | | 3.3 | % | | | 0.0 | % |
| | | | | | | | | | | | | | | | | | | | | | | | | | | | |
| | | | | | | |
By Geography | | | | | | | | | | | | | | | | | | | | | | | | | | | | |
United States | | $ | 3,949.9 | | | $ | — | | | $ | 3,949.9 | | | $ | 3,881.4 | | | | 1.8 | % | | | 1.8 | % | | | 0.0 | % |
Canada | | | 362.3 | | | | (33.3 | ) | | | 329.0 | | | | 326.5 | | | | 0.8 | % | | | 11.0 | % | | | 10.2 | % |
| | | | | | | | | | | | | | | | | | | | | | | | | | | | |
Total North America | | | 4,312.2 | | | | (33.3 | ) | | | 4,278.9 | | | | 4,207.9 | | | | 1.7 | % | | | 2.5 | % | | | 0.8 | % |
| | | | | | | |
Europe, Middle East, and Africa | | | 803.5 | | | | 28.2 | | | | 831.7 | | | | 795.1 | | | | 4.6 | % | | | 1.1 | % | | | (3.5 | )% |
Latin America | | | 269.8 | | | | 29.9 | | | | 299.7 | | | | 262.9 | | | | 14.0 | % | | | 2.6 | % | | | (11.4 | )% |
Asia Pacific | | | 373.7 | | | | (26.9 | ) | | | 346.8 | | | | 311.7 | | | | 11.3 | % | | | 19.9 | % | | | 8.6 | % |
| | | | | | | | | | | | | | | | | | | | | | | | | | | | |
Total International | | | 1,447.0 | | | | 31.2 | | | | 1,478.2 | | | | 1,369.7 | | | | 7.9 | % | | | 5.6 | % | | | (2.3 | )% |
| | | | | | | | | | | | | | | | | | | | | | | | | | | | |
Total Company | | $ | 5,759.2 | | | $ | (2.1 | ) | | $ | 5,757.1 | | | $ | 5,577.6 | | | | 3.2 | % | | | 3.3 | % | | | 0.0 | % |
| | | | | | | | | | | | | | | | | | | | | | | | | | | | |
Newell Rubbermaid Inc.
Impact of Capital Structure Optimization Plan
For the Twelve Months Ended December 31, 2010
(In Millions, except EPS amounts)
| | | | | | | | | | | | |
| | | Twelve Months Ended
December 31, 2010 | |
| | | Dollars | | | Shares | | | EPS | |
Loss related to early extinguishment of $279 million principal amount of 10.6% notes due 2019, net of tax | | $ | 82.8 | | | | | | | $ | 0.27 | |
| | | |
Loss related to early extinguishment of $325 million principal amount of 5.50% Convertible Notes, net of tax | | | 54.9 | | | | | | | $ | 0.18 | |
| | | |
Normalize third quarter weighted average share count to remove beneficial impact of purchase of 25,806,452 shares in August 2010 under the Accelerated Share Buyback | | | | | | | 3.5 | | | $ | (0.02 | ) |
| | | |
Normalize third quarter weighted average share count to remove adverse impact of issuance of 37,728,415 shares in September 2010 in the Convertible Notes exchange | | | | | | | (1.5 | ) | | $ | 0.01 | |
| | | |
| | | | | | | | | | | | |
| | | |
Total impact of the Capital Structure Optimization Plan excluded from Normalized Earnings and Earnings per Share | | $ | 137.7 | | | | 2.0 | | | $ | 0.44 | |
| | | | | | | | | | | | |
|
Q4 2010 Earnings Call Presentation January 27, 2011 |
|
2 Forward-Looking Statement Statements in this presentation that are not historical in nature constitute forward-looking statements. These forward-looking statements relate to information or assumptions about the effects of sales, income/(loss), earnings per share, operating income or gross margin improvements or declines, Project Acceleration, the European Transformation Plan, the Capital Structure Optimization Plan, capital and other expenditures, cash flow, dividends, restructuring and restructuring related costs, costs and cost savings, inflation or deflation, particularly with respect to commodities such as oil and resin, debt ratings, and management's plans, projections and objectives for future operations and performance. These statements are accompanied by words such as "anticipate," "expect," "project," "will," "believe," "estimate" and similar expressions. Actual results could differ materially from those expressed or implied in the forward-looking statements. Important factors that could cause actual results to differ materially from those suggested by the forward-looking statements include, but are not limited to, our dependence on the strength of retail, commercial and industrial sectors of the economy in light of the global economic slowdown; currency fluctuations; competition with other manufacturers and distributors of consumer products; major retailers' strong bargaining power; changes in the prices of raw materials and sourced products and our ability to obtain raw materials and sourced products in a timely manner from suppliers; our ability to develop innovative new products and to develop, maintain and strengthen our end-user brands; our ability to expeditiously close facilities and move operations while managing foreign regulations and other impediments; our ability to implement successfully information technology solutions throughout our organization; our ability to improve productivity and streamline operations; changes to our credit ratings; significant increases in the funding obligations related to our pension plans due to declining asset values or otherwise; the imposition of tax liabilities greater than our provisions for such matters; the risks inherent in our foreign operations and those factors listed in the company’s latest quarterly report on Form 10-Q, and exhibit 99.1 thereto, filed with the Securities and Exchange Commission. Changes in such assumptions or factors could produce significantly different results. The information contained in this presentation is as of the date indicated. The company assumes no obligation to update any forward-looking statements contained in this presentation as a result of new information or future events or developments. |
|
3 Normalized EPS of $0.34; 26% improvement versus the prior year primarily driven by sales growth, reduced interest and a lower tax rate Net Sales of $1.47 billion, a 3.4% increase versus the prior year, including a 4.9% increase in core sales offset by the impact of last year’s product line exits of (0.8%) and foreign currency of (0.7%) Gross Margin expansion of 10 basis points to 37.1% • Improved product mix and productivity more than offset the impact of input cost inflation Operating Cash Flow of $204.7 million, compared to $187.1 million last year Q4 2010 Summary |
|
4 Normalized EPS of $1.52; 16% improvement versus the prior year driven primarily by higher core sales, expanded gross margins and lower interest expense Net Sales of $5.76 billion, a 3.3% increase over the prior year, consisting of a 4.7% increase in core sales offset by the impact of 2009 product line exits of (1.4%); foreign currency had a negligible impact Gross Margin expansion of 100 basis points to 37.7% • Productivity gains and improved product mix more than offset the effect of input cost inflation Operating Cash Flow of $582.6 million, compared to $602.8 million last year FY 2010 Summary |
|
5 Q4 2010 Sales: Percent Change by Segment Q4 2010 Home & Family Office Products Tools, Hardware & Commercial Products Total Core Sales 2.1 8.2 5.4 4.9 Product Line Exits 0.0 (2.4) 0.0 (0.8) Currency Translation 0.4 (2.8) (0.1) (0.7) Total 2.5 3.0 5.3 3.4 |
|
6 FY 2010 Sales: Percent Change by Segment FY 2010 Home & Family Office Products Tools, Hardware & Commercial Products Total Core Sales 0.5 7.4 8.2 4.7 Product Line Exits (1.3) (3.0) 0.0 (1.4) Currency Translation 0.9 (2.4) 1.4 0.0 Total 0.1 2.0 9.6 3.3 |
|
7 Full Year 2011 Outlook Net Sales Growth Core Sales Growth Currency Translation Gross Margin Expansion "Normalized" EPS** Growth Cash Flow from Operations Capital Expenditures FY 2011 Outlook* $180 to $200 million 4% to 5% 4% to 5% > $550 million 50 to 75 basis points 10% to 12% Negligible impact * Reflects outlook communicated in the Q4 2010 Earnings Release and Earnings Call ** See reconciliation included in the Appendix |
|
8 Innovations Discussed on the Q4 2010 Earnings Call Calphalon Contemporary Nonstick Cookware Refresh Features a hard-anodized exterior and nonstick interior to offer durability, performance and fast clean-up Two loop handles go from stovetop to oven to table Long handles stay cool on the stove and glass lids allow you to view what’s cooking |
|
9 Innovations Discussed on the Q4 2010 Earnings Call Calphalon Tri-Ply Stainless Steel Cookware Refresh Combines the beauty of stainless steel with the superior performance of aluminum Layers of stainless steel surround an inner core of highly-conductive, heavy-gauge aluminum that extends up the sides of each pan to spread heat evenly |
|
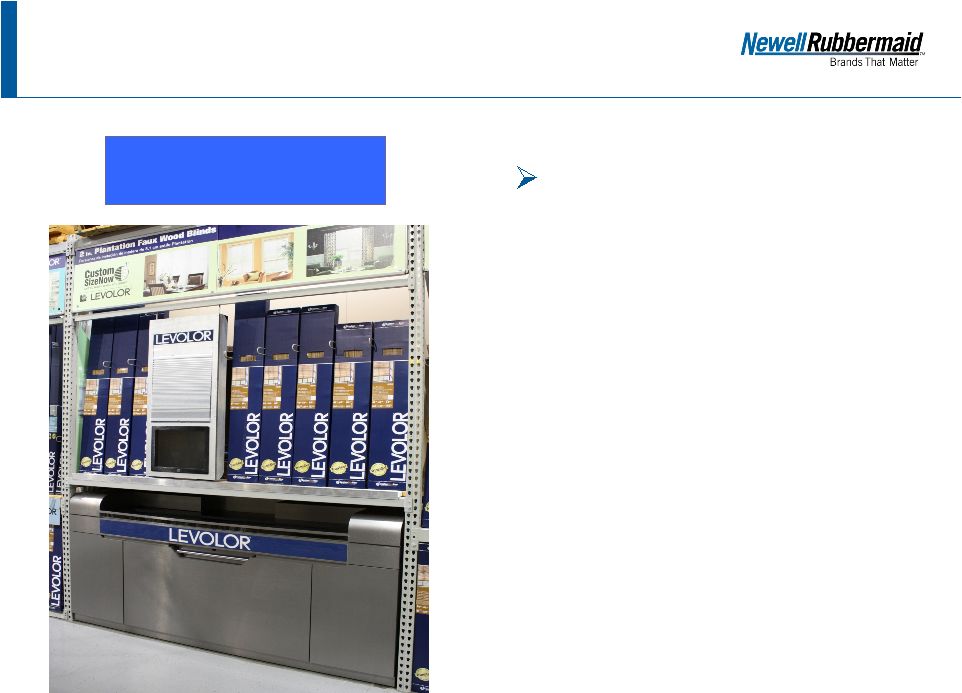
10 Innovations Discussed on the Q4 2010 Earnings Call Levolor® Size-in-Store Blinds and Shades Best-in-class technology makes it easy for consumers to get perfectly sized blinds and shades immediately trimmed to the exact size while in store |
|
11 Innovations Discussed on the Q4 2010 Earnings Call Rubbermaid Reveal™ Spray Mop Microfiber pad is reusable saving the extra cost of buying disposable pads Picks up 50% more dirt and dust per swipe than traditional mops Refillable spray bottle allows you to use your favorite solution Expanding distribution in the mass retail channel |
|
12 Innovations Discussed on the Q4 2010 Earnings Call Sharpie® Gel Highlighter New gel stick technology provides our strongest smear protection across pen and marker inks and ink jet printouts Won’t bleed through paper and works on all paper surfaces Won't dry out if left uncapped Writes as long as a traditional pen-style highlighter |
|
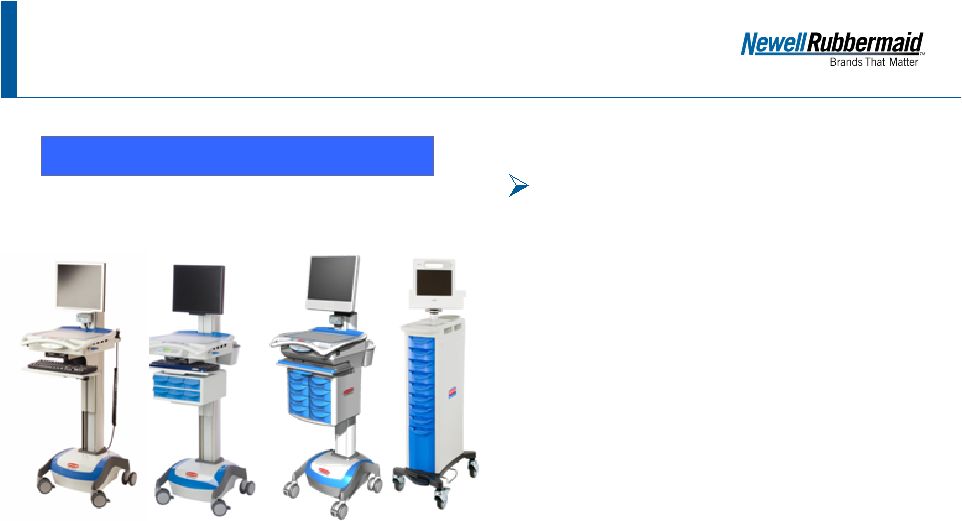
13 Innovations Discussed on the Q4 2010 Earnings Call Rubbermaid® Medical Solutions Product portfolio, including computer carts, medication carts and wall mounted workstations, is designed to reduce user fatigue and improve workflow while adapting to multiple clinical environments |
|
14 Innovations Discussed on the Q4 2010 Earnings Call IRWIN® VISE-GRIP® GrooveLock Pliers Simple push of press-n-slide button adjusts lower jaw 2X faster than traditional groove joint pliers Multi-Groove Ratcheting System has twice the groove positions than any other groove joint pliers, providing precise jaw positioning to grip any type of surface Anti-pinch, non-slip ProTouch™ Grips provide comfort, control, and less hand fatigue |
|
15 Innovations Discussed on the Q4 2010 Earnings Call IRWIN® Universal Handsaw Patent-pending handle-to- blade design and patented universal triple-ground teeth cuts three times faster than traditional handsaws through virtually any material Patented universal tooth grind delivers the speed of a coarse-cutting saw with the fine finish of a fine-cutting saw Lightweight and ergonomic comfort grip handle reduces hand fatigue |
|
17 Reconciliation: Q4 2010 and Q4 2009 “Normalized” EPS Q4 2010 Q4 2009 Diluted earnings per share (as reported): $0.25 $0.20 Restructuring and restructuring related costs, net of tax [ 1 ] $0.08 $0.04 Convertible notes dilution $0.00 $0.02 Other items, net of tax [ 2 ] $0.00 $0.01 "Normalized" EPS: $0.34 $0.27 Totals may not foot due to rounding [ 1 ] Restructuring and restructuring related costs include impairment charges, employee termination benefits and other costs associated with Project Acceleration as well as costs associated with the European Transformation Plan, and the related tax effects. [ 2 ] Other items in Q4 2009 reflect the adoption of the parallel rate to translate the results of the Company's Venezuelan operations beginning in the fourth quarter of 2009. |
|
18 Reconciliation: Full Year 2010 and Full Year 2009 “Normalized” EPS FY 2010 FY 2009 Diluted earnings per share (as reported): $0.96 $0.97 Restructuring and restructuring related costs, net of tax [ 1 ] $0.24 $0.26 Convertible notes dilution $0.10 $0.06 Capital structure optimization plan [ 2 ] $0.44 $0.00 Benefit from the resolution of a tax examination [ 3 ] ($0.21) $0.00 Other items, net of tax [ 4 ] ($0.01) $0.02 "Normalized" EPS: $1.52 $1.31 [ 1 ] Restructuring and restructuring related costs include impairment charges, employee termination benefits and other costs associated with Project Acceleration as well as costs associated with the European Transformation Plan, and the related tax effects. [ 2 ] See subsequent slide for detail of Capital Structure Optimization Plan. [ 3 ] Represents a benefit associated with the favorable resolution of a multi-year tax examination. [ 4 ] Other items in 2010 consist of a benefit associated with hyperinflationary accounting for the Company's Venezuelan operations. Other items in 2009 consist of the impact of the adoption of the parallel rate to translate the results of the Company's Venezuelan operations beginning in the fourth quarter of 2009 and one-time costs for the early retirement of $325 million principal amount of medium-term notes. |
|
19 Reconciliation: Full Year 2010 Capital Structure Optimization Plan, net of tax FY 2010 Loss related to early retirement / extinguishment of $279 million principal amount of 10.6% notes due 2019, net of tax $0.27 Loss related to early retirement / extinguishment of $325 million principal amount of 5.50% Convertible Notes, net of tax $0.18 Normalize third quarter weighted average share count to remove beneficial impact of purchase of 25,806,452 shares in August 2010 under the Accelerated Share Buyback ($0.02) Normalize third quarter weighted average share count to remove adverse impact of issuance of 37,728,415 shares in September 2010 Convertible Notes exchange $0.01 Total impact of the Capital Structure Optimization Plan, net of tax, excluded from "Normalized" Earnings per Share $0.44 |
|
20 Reconciliation: Q4 2010 and Q4 2009 Operating Income to Operating Income Excluding Charges Q4 2010 Q4 2009 Net Sales $1,469.3 $1,420.4 Operating Income (as reported) $121.8 $129.3 Restructuring and Restructuring Related Costs [ 1 ] $30.8 $13.0 Operating Income (excluding charges) $152.6 $142.3 Operating Income (excluding charges), as a Percent of Net Sales 10.4% 10.0% [ 1 ] Restructuring and restructuring related costs include impairment charges, employee termination benefits and other costs associated with Project Acceleration as well as costs associated with the European Transformation Plan. $ millions |
|
21 Reconciliation: Full Year 2010 and Full Year 2009 Operating Income to Operating Income Excluding Charges FY 2010 FY 2009 Net Sales $5,759.2 $5,577.6 Operating Income (as reported) $629.9 $574.9 Restructuring and Restructuring Related Costs [ 1 ] $92.7 $100.0 Operating Income (excluding charges) $722.6 $674.9 Operating Income (excluding charges), as a Percent of Net Sales 12.5% 12.1% [ 1 ] Restructuring and restructuring related costs include impairment charges, employee termination benefits and other costs associated with Project Acceleration as well as costs associated with the European Transformation Plan. |
|
22 Reconciliation: Q4 2010 and Q4 2009 Free Cash Flow Q4 2010 Q4 2009 Operating Cash Flow $204.7 $187.1 Capital Expenditures (56.6) (45.6) Free Cash Flow $148.1 $141.5 $ millions |
|
23 Reconciliation: Full Year 2010 and Full Year 2009 Free Cash Flow FY 2010 FY 2009 Operating Cash Flow $582.6 $602.8 Capital Expenditures (164.7) (153.3) Free Cash Flow $417.9 $449.5 $ millions |
|
24 Reconciliation: Full Year 2011 Outlook for “Normalized” EPS FY 2011 Diluted earnings per share: $1.43 to $1.46 Restructuring and restructuring related costs, net of tax [ 1 ] $0.22 to $0.26 "Normalized" EPS: $1.67 to $1.70 [ 1 ] Restructuring and restructuring related costs include impairment charges, employee termination benefits and other costs associated with the European Transformation Plan, and the related tax effects. |