Exhibit 99.1
 |
Newell Rubbermaid Reports Solid First Quarter 2012 Results and Reaffirms Full Year Guidance
| • Core Sales Growth of 5.2%; Net Sales Growth of 4.6% |  | |
| • Normalized EPS of $0.33, a 13.8% Increase Compared with Prior Year Quarter | ||
ATLANTA, April 27, 2012 – Newell Rubbermaid (NYSE: NWL) today announced first quarter 2012 results and reaffirmed full-year core sales, normalized operating margin, normalized EPS and operating cash flow guidance. | ||
Michael Polk, President and Chief Executive Officer, commented, “We’re encouraged by the solid start to the year. We generated 5.2 percent core sales growth, normalized operating margin expansion, and nearly 14 percent normalized EPS improvement. When adjusted for the timing shift related to our European SAP conversion, core sales growth was 2.9 percent and normalized EPS growth was about in the middle of our full year guidance range of 3 to 6 percent. These results were driven by strong performance in our Professional and Baby segments and continued double digit growth in Latin America and Asia. Our first quarter performance represents a positive step towards our full year guidance as we continue to strengthen our cadence of delivery.” | ||
First Quarter Executive Summary | ||
• First quarter 2012 net sales were $1.33 billion, an increase of 4.6 percent versus prior year results. Core sales, which exclude the impact of changes in foreign currency, grew by 5.2 percent. | ||
• Adjusted for the timing shift from the second quarter to the first quarter related to the company’s European SAP conversion, core sales in the quarter rose 2.9 percent over the year-ago quarter. | ||
• Normalized diluted earnings per share increased 13.8 percent to $0.33 compared with $0.29 in the prior year period; reported earnings per diluted share of $0.27 rose 8.0 percent over the year-ago period. | ||
• Operating cash flow in the quarter was a use of $47.4 million, an improvement of $60.9 million compared with the year-ago period. | ||
• The company paid $16.4 million to repurchase 0.9 million shares under its authorized $300 million share repurchase plan. | ||
• The company reaffirmed its 2012 guidance for core sales growth in a range from 2 to 3 percent, normalized operating margin improvement of up to 20 basis points, normalized diluted earnings per share growth of about 3 to 6 percent, or $1.63 to $1.69, and operating cash flow of $550 to $600 million. |
3 Glenlake Parkway | Atlanta, GA 30328 | Phone +1 (770) 418-7000 | www.newellrubbermaid.com | NYSE: NWL
 |
First Quarter 2012 Operating Results
Net sales in the first quarter were $1.33 billion, an increase of 4.6 percent over the prior year. Excluding 60 basis points of adverse foreign currency translation, core sales grew 5.2 percent. The company estimates the timing shift in customer orders related to its European SAP conversion represents approximately 2.3 percentage points of the reported core sales growth for the quarter. The underlying core sales growth of 2.9 percent was driven by strong performance in the Newell Professional and Baby & Parenting Essentials segments and continued growth in emerging markets.
Operating margin for the quarter, on a normalized basis, was 11.0 percent, up 10 basis points from the prior year. Gross margin expansion and lower structural costs more than offset cost impacts of strategic investments the company has made to support new product launches, sales team expansion and emerging market growth. First quarter gross margin of 38.3 percent expanded 20 basis points versus the prior year as pricing, productivity and mix more than offset the negative impact of input cost inflation.
First quarter operating income on a normalized basis was $146.9 million compared with $139.1 million in the prior year period. First quarter normalized operating income excludes $22.7 million of restructuring and restructuring-related costs incurred primarily in connection with the European Transformation Plan and Project Renewal. In 2011, normalized operating income excluded $11.1 million in restructuring and restructuring-related costs incurred in connection with the European Transformation Plan.
The normalized tax rate for the quarter was 23.5 percent compared with 24.9 percent in the prior year. The year-over-year change in tax rate was primarily driven by the geographical mix in earnings and certain discrete items recorded in the quarter.
Normalized earnings of $0.33 per diluted share compares against prior year normalized results of $0.29 per diluted share. The improvement was driven by sales growth, including the impact of the shift in customer orders related to the European SAP conversion, gross margin expansion, reduced interest expense and a lower effective tax rate.
For the first quarter 2012, normalized diluted earnings per share exclude $0.06 per diluted share for restructuring and restructuring-related costs associated with the European Transformation Plan and Project Renewal. For the first quarter 2011, normalized diluted earnings per share exclude $0.04 per diluted share for restructuring and restructuring-related costs, $0.01 per diluted share for a loss related to the retirement of convertible notes, as well as the impact of net income from discontinued operations of $1.8 million, or $0.01 per diluted share. (A reconciliation of the “as reported” results to “normalized” results is included below.)
Net income, as reported, was $79.3 million, or $0.27 per diluted share, for the first quarter. This compares with net income of $75.7 million, or $0.25 per diluted share, in the prior year.
The company used cash of $47.4 million for operations during the first quarter of 2012, compared with a use of $108.3 million in the comparable period last year. The year-over-year improvement was primarily related to lower incentive compensation and customer program payments, partially offset by increased contributions to the company’s U.S. pension plan. Capital expenditures were $48.3 million in the first quarter compared with $44.9 million in the prior year.
3 Glenlake Parkway | Atlanta, GA 30328 | Phone +1 (770) 418-7000 | www.newellrubbermaid.com | NYSE: NWL
2
|
A reconciliation of the first quarter 2012 and last year’s results is as follows:
| Q1 2012 | Q1 2011 | |||||||
Diluted earnings per share (as reported) | $ | 0.27 | $ | 0.25 | ||||
Restructuring and restructuring-related costs | $ | 0.06 | $ | 0.04 | ||||
Loss related to the retirement of convertible notes | $ | 0.00 | $ | 0.01 | ||||
Discontinued operations | $ | 0.00 | $ | (0.01 | ) | |||
|
|
|
| |||||
“Normalized” EPS | $ | 0.33 | $ | 0.29 | ||||
First Quarter 2012 Operating Segment Results
The Newell Consumer segment’s net sales for the first quarter were $639.6 million, a 2.6 percent decline compared with the prior year quarter. Core sales in the segment decreased 2.0 percent driven by a decline in sales at the Décor business within the Home Organization & Style global business unit. Partially offsetting the decline was the impact of the European SAP pre-buy and strength in the writing businesses. Operating income in the Newell Consumer segment was $75.5 million, or 11.8 percent of sales, compared with $90.8 million, or 13.8 percent of sales, in the prior year. The profitability decline was largely due to gross margin contraction as a result of lower volume and the impact of continuing operational challenges in the Décor business. Structural cost reductions only partially offset gross margin contraction in the segment.
The Newell Professional segment posted first quarter net sales of $510.6 million, a 9.2 percent increase over last year, partially attributable to the European SAP pre-buy in the quarter. All business units within the segment contributed to the core sales growth of 10.1 percent. The segment’s operating income was $70.7 million, or 13.8 percent of sales, as compared with $60.1 million, or 12.9 percent of sales, in the prior year. Volume as well as strong productivity and pricing initiatives drove margin expansion in the quarter. SG&A expense increased over the prior year as the company invested to build selling capabilities and accelerate growth in the faster growing emerging markets.
First quarter net sales in the Baby & Parenting Essentials segment were $182.2 million, a 21.2 percent improvement over the prior year. Core sales increased 21.4 percent driven primarily by year-over-year timing differences of customer shipments in the North American market, improved point of sale performance on Graco, the impact of the European SAP pre-buy and the continued strong performance of the Aprica brand in Japan. First quarter operating income was $22.4 million, or 12.3 percent of sales, compared with $7.4 million, or 4.9 percent of sales, in the prior year, primarily driven by the increase in sales volume.
2012 Full Year Outlook
The company reaffirmed its full year expectation for core sales growth of 2 to 3 percent, which excludes a projected negative impact on net sales of between 1 and 2 percentage points from currency.
3 Glenlake Parkway | Atlanta, GA 30328 | Phone +1 (770) 418-7000 | www.newellrubbermaid.com | NYSE: NWL
3
|
The company continues to expect 2012 normalized operating margin improvement of up to 20 basis points and 2012 normalized earnings per diluted share of between $1.63 and $1.69.
The company’s 2012 normalized EPS expectation excludes between $110 and $130 million of restructuring and restructuring-related costs associated with the company’s European Transformation Plan and Project Renewal. (A reconciliation of the “as reported” results to “normalized” results is included below.)
The company is on track to realize cumulative annualized profitability improvement of $55 to $65 million related to the European Transformation Plan, the majority of which was reflected in the 2011 results. The Project Renewal annualized cost savings of approximately $90 to $100 million are expected to be realized by the first half of 2013 and are intended to fund increased investments to strengthen brand building and selling capabilities in priority markets around the world.
Operating cash flow outlook is unchanged at between $550 and $600 million for the full year, including approximately $110 to $120 million in restructuring and restructuring related cash payments. The company anticipates capital expenditures of $200 to $225 million during the year.
A reconciliation of the 2012 earnings outlook is as follows:
| FY 2012 | ||||
Diluted earnings per share | $ | 1.34 to $1.40 | ||
Restructuring and restructuring-related costs | $ | 0.27 to $0.32 | ||
|
| |||
“Normalized” EPS | $ | 1.63 to $1.69 | ||
Conference Call
The company’s first quarter 2012 earnings conference call is scheduled for today, April 27, 2012, at 10:00 am ET. To listen to the webcast, use the link provided under Events & Presentations in the Investor Relations section of Newell Rubbermaid’s Web site atwww.newellrubbermaid.com. The webcast will be available for replay for 30 days. A brief supporting slide presentation will be available prior to the call under Quarterly Earnings in the Investor Relations section on the company’s Web site.
Analyst Day
The company will host an Analyst Day on May 24, 2012 at the company’s headquarters in Atlanta, Georgia. Members of the investment community who are interested in attending should contact Newell Rubbermaid’s Investor Relations department at (770) 418-7996 or via email atinvestor.relations@newellco.com to obtain registration instructions. The event will be webcast and the link will be located in the Investor Relations section of the company’s Web site atwww.newellrubbermaid.com.
Non-GAAP Financial Measures
This release contains non-GAAP financial measures within the meaning of Regulation G promulgated by the Securities and Exchange Commission. Included in this release is a reconciliation of these non-GAAP financial measures to the most directly comparable financial measures calculated in accordance with GAAP.
3 Glenlake Parkway | Atlanta, GA 30328 | Phone +1 (770) 418-7000 | www.newellrubbermaid.com | NYSE: NWL
4
|
About Newell Rubbermaid
Newell Rubbermaid Inc., an S&P 500 company, is a global marketer of consumer and commercial products with 2011 sales of approximately $5.9 billion and a strong portfolio of leading brands, including Rubbermaid®, Sharpie®, Graco®, Calphalon®, Irwin®, Lenox®, Levolor®, Paper Mate®, Dymo®, Waterman®, Parker®, Goody®, Rubbermaid Commercial Products® and Aprica®.
This press release and additional information about Newell Rubbermaid are available on the company’s Web site,www.newellrubbermaid.com.
| Contacts: | ||
| Nancy O’Donnell | David Doolittle | |
| Vice President, Investor Relations | Vice President, Corporate Communications | |
| +1 (770) 418-7723 | +1 (770) 418-7519 | |
Caution Concerning Forward-Looking Statements
Statements in this press release that are not historical in nature constitute forward-looking statements. These forward-looking statements relate to information or assumptions about the effects of sales, income/(loss), earnings per share, operating income or gross margin improvements or declines, the European Transformation Plan, Project Renewal, capital and other expenditures, cash flow, dividends, restructuring and restructuring-related costs, costs and cost savings, inflation or deflation, particularly with respect to commodities such as oil and resin, debt ratings, and management’s plans, projections and objectives for future operations and performance. These statements are accompanied by words such as “anticipate,” “expect,” “project,” “will,” “believe,” “estimate” and similar expressions. Actual results could differ materially from those expressed or implied in the forward-looking statements. Important factors that could cause actual results to differ materially from those suggested by the forward-looking statements include, but are not limited to, our dependence on the strength of retail, commercial and industrial sectors of the economy in light of the continuation or escalation of the global economic slowdown or regional sovereign debt issues; currency fluctuations; competition with other manufacturers and distributors of consumer products; major retailers’ strong bargaining power; changes in the prices of raw materials and sourced products and our ability to obtain raw materials and sourced products in a timely manner from suppliers; our ability to develop innovative new products and to develop, maintain and strengthen our end-user brands; our ability to expeditiously close facilities and move operations while managing foreign regulations and other impediments; our ability to implement successfully information technology solutions throughout our organization; our ability to improve productivity and streamline operations; changes to our credit ratings; significant increases in the funding obligations related to our pension plans due to declining asset values or otherwise; the imposition of tax liabilities greater than our provisions for such matters; the risks inherent in our foreign operations and those factors listed in the company’s most recently filed Annual Report on Form 10-K, filed with the Securities and Exchange Commission. Changes in such assumptions or factors could produce significantly different results. The information contained in this news release is as of the date indicated. The company assumes no obligation to update any forward-looking statements contained in this news release as a result of new information or future events or developments.
NWL-EA
3 Glenlake Parkway | Atlanta, GA 30328 | Phone +1 (770) 418-7000 | www.newellrubbermaid.com | NYSE: NWL
5
Newell Rubbermaid Inc. CONSOLIDATED STATEMENTS OF OPERATIONS (UNAUDITED) (in millions, except per share data)
| ||||||||||||||||||||
| Reconciliation of "As Reported" Results to "Normalized" Results | ||||||||||||||||||||
| Three Months Ended March 31, | ||||||||||||||||||||||||||||||||||
| 2012 | 2011 (2) | YOY % Change | ||||||||||||||||||||||||||||||||
| As Reported | Excluded Items (1) | Normalized | As Reported | Excluded Items (3) | Normalized | |||||||||||||||||||||||||||||
Net sales | $ | 1,332.4 | $ | - | $ | 1,332.4 | $ | 1,274.2 | $ | - | $ | 1,274.2 | 4.6% | |||||||||||||||||||||
Cost of products sold | 821.8 | - | 821.8 | 789.3 | - | 789.3 | ||||||||||||||||||||||||||||
|
|
|
|
|
|
|
|
|
|
|
| |||||||||||||||||||||||
GROSS MARGIN | 510.6 | - | 510.6 | 484.9 | - | 484.9 | 5.3% | |||||||||||||||||||||||||||
% of sales | 38.3% | 38.3% | 38.1% | 38.1% | ||||||||||||||||||||||||||||||
Selling, general & administrative expenses | 373.7 | (10.0) | 363.7 | 351.1 | (5.3) | 345.8 | 5.2% | |||||||||||||||||||||||||||
% of sales | 28.0% | 27.3% | 27.6% | 27.1% | ||||||||||||||||||||||||||||||
Restructuring costs | 12.7 | (12.7) | - | 5.8 | (5.8) | - | ||||||||||||||||||||||||||||
|
|
|
|
|
|
|
|
|
|
|
| |||||||||||||||||||||||
OPERATING INCOME | 124.2 | 22.7 | 146.9 | 128.0 | 11.1 | 139.1 | 5.6% | |||||||||||||||||||||||||||
% of sales | 9.3% | 11.0% | 10.0% | 10.9% | ||||||||||||||||||||||||||||||
Nonoperating expenses: | ||||||||||||||||||||||||||||||||||
Interest expense, net | 20.2 | - | 20.2 | 21.9 | - | 21.9 | ||||||||||||||||||||||||||||
Loss on extinguishment of debt | - | - | - | 4.8 | (4.8) | - | ||||||||||||||||||||||||||||
Other (income) expense, net | (0.3) | - | (0.3) | 1.5 | - | 1.5 | ||||||||||||||||||||||||||||
|
|
|
|
|
|
|
|
|
|
|
| |||||||||||||||||||||||
| 19.9 | - | 19.9 | 28.2 | (4.8) | 23.4 | (15.0)% | ||||||||||||||||||||||||||||
|
|
|
|
|
|
|
|
|
|
|
| |||||||||||||||||||||||
INCOME BEFORE INCOME TAXES | 104.3 | 22.7 | 127.0 | 99.8 | 15.9 | 115.7 | 9.8% | |||||||||||||||||||||||||||
% of sales | 7.8% | 9.5% | 7.8% | 9.1% | ||||||||||||||||||||||||||||||
Income taxes | 25.0 | 4.9 | 29.9 | 25.9 | 2.9 | 28.8 | 3.8% | |||||||||||||||||||||||||||
Effective rate | 24.0% | 23.5% | 26.0% | 24.9% | ||||||||||||||||||||||||||||||
|
|
|
|
|
|
|
|
|
|
|
| |||||||||||||||||||||||
NET INCOME FROM CONTINUING OPERATIONS | 79.3 | 17.8 | 97.1 | 73.9 | 13.0 | 86.9 | 11.7% | |||||||||||||||||||||||||||
% of sales | 6.0% | 7.3% | 5.8% | 6.8% | ||||||||||||||||||||||||||||||
Income from discontinued operations, net of tax | - | - | - | 1.8 | (1.8) | - | ||||||||||||||||||||||||||||
|
|
|
|
|
|
|
|
|
|
|
| |||||||||||||||||||||||
NET INCOME | $ | 79.3 | $ | 17.8 | $ | 97.1 | $ | 75.7 | $ | 11.2 | $ | 86.9 | 11.7% | |||||||||||||||||||||
|
|
|
|
|
|
|
|
|
|
|
| |||||||||||||||||||||||
| 6.0% | 7.3% | 5.9% | 6.8% | |||||||||||||||||||||||||||||||
EARNINGS PER SHARE: | ||||||||||||||||||||||||||||||||||
Basic | ||||||||||||||||||||||||||||||||||
Income from continuing operations | $ | 0.27 | $ | 0.06 | $ | 0.33 | $ | 0.25 | $ | 0.05 | $ | 0.30 | ||||||||||||||||||||||
Income from discontinued operations | - | - | - | 0.01 | (0.01) | - | ||||||||||||||||||||||||||||
Net income | $ | 0.27 | $ | 0.06 | $ | 0.33 | $ | 0.26 | $ | 0.04 | $ | 0.30 | ||||||||||||||||||||||
Diluted | ||||||||||||||||||||||||||||||||||
Income from continuing operations | $ | 0.27 | $ | 0.06 | $ | 0.33 | $ | 0.25 | $ | 0.04 | $ | 0.29 | ||||||||||||||||||||||
Income from discontinued operations | - | - | - | 0.01 | (0.01) | - | ||||||||||||||||||||||||||||
Net income | $ | 0.27 | $ | 0.06 | $ | 0.33 | $ | 0.25 | $ | 0.04 | $ | 0.29 | ||||||||||||||||||||||
AVERAGE SHARES OUTSTANDING: | ||||||||||||||||||||||||||||||||||
Basic | 292.1 | 292.1 | 294.2 | 294.2 | ||||||||||||||||||||||||||||||
Diluted | 294.7 | 294.7 | 298.2 | 298.2 | ||||||||||||||||||||||||||||||
(1) Items excluded from "normalized" earnings in 2012 consist of the net of tax impact of $10.0 million of restructuring-related costs and $12.7 million of restructuring costs incurred in connection with the European Transformation Plan and Project Renewal.
(2) 2011 results have been adjusted to reclassify the results of operations of the hand torch and solder business to discontinued operations.
(3) Items excluded from "normalized" results for 2011 consist of the net of tax impact of $5.3 million of restructuring-related costs and $5.8 million of restructuring costs incurred in connection with the European Transformation Plan, as well as the net of tax impact of $4.8 million of debt extinguishment costs incurred to exchange substantially all of the remaining convertible notes issued March 2009. "Normalized" results for 2011 also exclude net earnings of $1.8 million relating to operations of the hand torch and solder business, which have been presented as discontinued operations.
Newell Rubbermaid Inc.
CONSOLIDATED BALANCE SHEETS (UNAUDITED)
(in millions)
| Assets: | March 31, 2012 | March 31, 2011 | ||||||
Cash and cash equivalents | $ | 190.1 | $ | 139.7 | ||||
Accounts receivable, net | 942.2 | 967.2 | ||||||
Inventories, net | 858.9 | 844.7 | ||||||
Deferred income taxes | 156.4 | 181.4 | ||||||
Prepaid expenses and other | 144.4 | 171.2 | ||||||
|
|
|
| |||||
Total Current Assets | 2,292.0 | 2,304.2 | ||||||
Property, plant and equipment, net | 561.6 | 535.2 | ||||||
Goodwill | 2,386.8 | 2,791.8 | ||||||
Other intangible assets, net | 673.1 | 662.6 | ||||||
Deferred income taxes | 69.3 | 38.9 | ||||||
Other assets | 306.0 | 304.5 | ||||||
|
|
|
| |||||
Total Assets | $ | 6,288.8 | $ | 6,637.2 | ||||
|
|
|
| |||||
Liabilities and Stockholders' Equity: | ||||||||
Accounts payable | $ | 527.4 | $ | 548.9 | ||||
Accrued compensation | 98.1 | 101.2 | ||||||
Other accrued liabilities | 592.7 | 618.8 | ||||||
Short-term debt | 496.9 | 325.0 | ||||||
Current portion of long-term debt | 12.8 | 411.1 | ||||||
|
|
|
| |||||
Total Current Liabilities | 1,727.9 | 2,005.0 | ||||||
Long-term debt | 1,803.4 | 1,796.3 | ||||||
Other noncurrent liabilities | 806.7 | 797.2 | ||||||
Stockholders' Equity - Parent | 1,947.3 | 2,035.2 | ||||||
Stockholders' Equity - Noncontrolling Interests | 3.5 | 3.5 | ||||||
|
|
|
| |||||
Total Stockholders' Equity | 1,950.8 | 2,038.7 | ||||||
|
|
|
| |||||
Total Liabilities and Stockholders' Equity | $ | 6,288.8 | $ | 6,637.2 | ||||
|
|
|
| |||||
Newell Rubbermaid Inc.
CONSOLIDATED STATEMENTS OF CASH FLOW (UNAUDITED)
(in millions)
| Three Months Ended March 31, | ||||||||
| 2012 | 2011 | |||||||
Operating Activities: | ||||||||
Net income | $ | 79.3 | $ | 75.7 | ||||
| Adjustments to reconcile net income to net cash used in operating activities: | ||||||||
Depreciation and amortization | 39.4 | 40.7 | ||||||
Loss on extinguishment of debt | - | 4.8 | ||||||
Non-cash restructuring costs | - | (0.5) | ||||||
Deferred income taxes | 19.6 | 35.4 | ||||||
Stock-based compensation expense | 9.4 | 8.1 | ||||||
Other | 0.9 | 4.1 | ||||||
| Changes in operating assets and liabilities, excluding the effects of acquisitions and divestitures: | ||||||||
Accounts receivable | 71.8 | 45.1 | ||||||
Inventories | (148.5) | (131.7) | ||||||
Accounts payable | 54.0 | 70.3 | ||||||
Accrued liabilities and other | (173.3) | (260.3) | ||||||
|
|
|
| |||||
Net cash used in operating activities | $ | (47.4) | $ | (108.3) | ||||
Investing Activities: | ||||||||
Acquisitions and acquisition-related activity | $ | (3.7) | $ | (18.9) | ||||
Capital expenditures | (48.3) | (44.9) | ||||||
Proceeds from sales of noncurrent assets | 10.0 | 2.7 | ||||||
|
|
|
| |||||
Net cash used in investing activities | $ | (42.0) | $ | (61.1) | ||||
Financing Activities: | ||||||||
Net short-term borrowings | $ | 392.7 | $ | 190.0 | ||||
Payments on debt | (250.3) | (0.5) | ||||||
Cash consideration paid to exchange convertible notes | - | (3.1) | ||||||
Repurchase and retirement of shares of common stock | (16.4) | - | ||||||
Cash dividends | (24.2) | (14.7) | ||||||
Excess tax benefits related to stock-based compensation | 10.6 | - | ||||||
Other stock-based compensation activity, net | (6.5) | (3.9) | ||||||
|
|
|
| |||||
Net cash provided by financing activities | $ | 105.9 | $ | 167.8 | ||||
Currency rate effect on cash and cash equivalents | $ | 3.4 | $ | 1.7 | ||||
|
|
|
| |||||
Increase in cash and cash equivalents | $ | 19.9 | $ | 0.1 | ||||
Cash and cash equivalents at beginning of year | 170.2 | 139.6 | ||||||
|
|
|
| |||||
Cash and cash equivalents at end of period | $ | 190.1 | $ | 139.7 | ||||
|
|
|
| |||||
Newell Rubbermaid Inc.
Financial Worksheet
(In Millions)
| 2012 | 2011 | |||||||||||||||||||||||||||||||||||||||||||||||||||||||
| Reconciliation (1) | Reconciliation (1) | Year-over-year changes | ||||||||||||||||||||||||||||||||||||||||||||||||||||||
| Net Sales | Reported OI | Excluded Items | Normalized OI | Operating Margin | Net Sales | Reported OI | Excluded Items | Normalized OI | Operating Margin | Net Sales | Normalized OI | |||||||||||||||||||||||||||||||||||||||||||||
| $ | % | $ | % | |||||||||||||||||||||||||||||||||||||||||||||||||||||
Q1: | ||||||||||||||||||||||||||||||||||||||||||||||||||||||||
Newell Consumer | $ | 639.6 | $ | 75.5 | $ | - | $ | 75.5 | 11.8 | % | $ | 656.4 | $ | 90.8 | $ | - | $ | 90.8 | 13.8 | % | $ | (16.8 | ) | (2.6 | )% | $ | (15.3 | ) | (16.9 | )% | ||||||||||||||||||||||||||
Newell Professional | 510.6 | 70.7 | - | 70.7 | 13.8 | % | 467.5 | 60.1 | - | 60.1 | 12.9 | % | 43.1 | 9.2 | % | 10.6 | 17.6 | % | ||||||||||||||||||||||||||||||||||||||
Baby & Parenting | 182.2 | 22.4 | - | 22.4 | 12.3 | % | 150.3 | 7.4 | - | 7.4 | 4.9 | % | 31.9 | 21.2 | % | 15.0 | 202.7 | % | ||||||||||||||||||||||||||||||||||||||
Restructuring Costs | - | (12.7 | ) | 12.7 | - | - | (5.8 | ) | 5.8 | - | ||||||||||||||||||||||||||||||||||||||||||||||
Corporate | - | (31.7 | ) | 10.0 | (21.7 | ) | - | (24.5 | ) | 5.3 | (19.2 | ) | (2.5 | ) | (13.0 | )% | ||||||||||||||||||||||||||||||||||||||||
|
|
|
|
|
|
|
|
|
|
|
|
|
|
|
|
|
|
|
| |||||||||||||||||||||||||||||||||||||
Total | $ | 1,332.4 | $ | 124.2 | $ | 22.7 | $ | 146.9 | 11.0 | % | $ | 1,274.2 | $ | 128.0 | $ | 11.1 | $ | 139.1 | 10.9 | % | $ | 58.2 | 4.6 | % | $ | 7.8 | 5.6 | % | ||||||||||||||||||||||||||||
|
|
|
|
|
|
|
|
|
|
|
|
|
|
|
|
|
|
|
| |||||||||||||||||||||||||||||||||||||
(1) Excluded items consist of restructuring and restructuring-related costs. For 2012, the restructuring and restructuring-related costs of $12.7 million and $10.0 million, respectively, relate to the European Transformation Plan and Project Renewal. For 2011, the restructuring and restructuring-related costs of $5.8 million and $5.3 million, respectively, relate to the European Transformation Plan.
Newell Rubbermaid Inc.
Calculation of Free Cash Flow (1)
Three Months Ended March 31, | ||||||||||
| Free Cash Flow (in millions): | 2012 | 2011 | ||||||||
Net cash used in operating activities | $ | (47.4) | $ | (108.3) | ||||||
Capital expenditures | (48.3) | (44.9) | ||||||||
Free Cash Flow | $ | (95.7) | $ | (153.2) | ||||||
(1) Free Cash Flow is defined as cash flow used in operating activities less capital expenditures.
Newell Rubbermaid Inc.
Three Months Ended March 31, 2012
In Millions
| Currency Analysis | ||||||||||||||||||||||||||||
| By Segment | 2012 | 2011 (1) | Year-Over-Year (Decrease) Increase | |||||||||||||||||||||||||
| Sales as Reported | Currency Impact | Adjusted Sales | Sales as Reported | Excluding Currency | Including Currency | Currency Impact | ||||||||||||||||||||||
Newell Consumer | $ | 639.6 | $ | 3.6 | $ | 643.2 | $ | 656.4 | (2.0)% | (2.6)% | (0.6)% | |||||||||||||||||
Newell Professional | 510.6 | 4.0 | 514.6 | 467.5 | 10.1% | 9.2% | (0.9)% | |||||||||||||||||||||
Baby & Parenting | 182.2 | 0.2 | 182.4 | 150.3 | 21.4% | 21.2% | (0.2)% | |||||||||||||||||||||
|
|
|
|
|
|
|
| |||||||||||||||||||||
Total Company | $ | 1,332.4 | $ | 7.8 | $ | 1,340.2 | $ | 1,274.2 | 5.2% | 4.6% | (0.6)% | |||||||||||||||||
|
|
|
|
|
|
|
| |||||||||||||||||||||
| By Geography | ||||||||||||||||||||||||||||
United States | $ | 860.6 | $ | - | $ | 860.6 | $ | 844.9 | 1.9% | 1.9% | 0.0% | |||||||||||||||||
Canada | 73.4 | 1.4 | 74.8 | 78.5 | (4.7)% | (6.5)% | (1.8)% | |||||||||||||||||||||
|
|
|
|
|
|
|
| |||||||||||||||||||||
Total North America | 934.0 | 1.4 | 935.4 | 923.4 | 1.3% | 1.1% | (0.2)% | |||||||||||||||||||||
Europe, Middle East and Africa | 205.1 | 6.6 | 211.7 | 187.9 | 12.7% | 9.2% | (3.5)% | |||||||||||||||||||||
Latin America | 77.2 | 3.0 | 80.2 | 72.3 | 10.9% | 6.8% | (4.1)% | |||||||||||||||||||||
Asia Pacific | 116.1 | (3.2) | 112.9 | 90.6 | 24.6% | 28.1% | 3.5% | |||||||||||||||||||||
|
|
|
|
|
|
|
| |||||||||||||||||||||
Total International | 398.4 | 6.4 | 404.8 | 350.8 | 15.4% | 13.6% | (1.8)% | |||||||||||||||||||||
|
|
|
|
|
|
|
| |||||||||||||||||||||
Total Company | $ | 1,332.4 | $ | 7.8 | $ | 1,340.2 | $ | 1,274.2 | 5.2% | 4.6% | (0.6)% | |||||||||||||||||
|
|
|
|
|
|
|
| |||||||||||||||||||||
(1)- 2011 results have been adjusted to reclassify the results of operations of the hand torch and solder business to discontinued operations.
 April 27, 2012 Q3 2011 Earnings Call Presentation |
 2 2 Forward-Looking Statement Forward-Looking Statement Nancy O’Donnell VP, Investor Relations (770) 418-7723 nancy.odonnell@newellco.com Alisha Pennix Sr. Manager, Investor Relations (770) 418-7706 alisha.pennix@newellco.com INVESTOR RELATIONS CONTACTS: Statements in this presentation that are not historical in nature constitute forward-looking statements. These forward-looking statements relate to information or assumptions about the effects of sales, income/(loss), earnings per share, operating income or gross margin improvements or declines, the European Transformation Plan, Project Renewal, capital and other expenditures, cash flow, dividends, restructuring and restructuring- related costs, costs and cost savings, inflation or deflation, particularly with respect to commodities such as oil and resin, debt ratings, and management's plans, projections and objectives for future operations and performance. These statements are accompanied by words such as "anticipate," "expect," "project," "will," "believe," "estimate" and similar expressions. Actual results could differ materially from those expressed or implied in the forward-looking statements. Important factors that could cause actual results to differ materially from those suggested by the forward-looking statements include, but are not limited to, our dependence on the strength of retail, commercial and industrial sectors of the economy in light of the continuation or escalation of the global economic slowdown or regional sovereign debt issues; currency fluctuations; competition with other manufacturers and distributors of consumer products; major retailers' strong bargaining power; changes in the prices of raw materials and sourced products and our ability to obtain raw materials and sourced products in a timely manner from suppliers; our ability to develop innovative new products and to develop, maintain and strengthen our end-user brands; our ability to expeditiously close facilities and move operations while managing foreign regulations and other impediments; our ability to implement successfully information technology solutions throughout our organization; our ability to improve productivity and streamline operations; changes to our credit ratings; significant increases in the funding obligations related to our pension plans due to declining asset values or otherwise; the imposition of tax liabilities greater than our provisions for such matters; the risks inherent in our foreign operations and those factors listed in the company’s latest annual report on Form 10-K filed with the Securities and Exchange Commission. Changes in such assumptions or factors could produce significantly different results. The information contained in this presentation is as of the date indicated. The company assumes no obligation to update any forward-looking statements contained in this presentation as a result of new information or future events or developments. |
 3 3 Net Sales of $1.33 billion, a 4.6% increase versus the prior year, reflecting a 5.2% improvement in core sales and a 0.6% unfavorable foreign currency impact Adjusted for the timing shift from Q2 to Q1 related to the company’s European SAP conversion, core sales rose 2.9% Gross Margin of 38.3%, up 20 basis points from the prior year as pricing, productivity and mix more than offset the negative impact of input cost inflation Normalized Operating Margin of 11.0% of sales, up 10 basis points to last year Gross margin expansion and lower structural costs more than offset the impact of strategic investments made to support new product launches, sales team expansion and emerging market growth Normalized EPS of $0.33, as compared with $0.29 in the prior year Cash used for Operations during the quarter was $47.4 million, compared with a use of $108.3 million last year The improvement was primarily due to lower incentive compensation and customer program payments, partially offset by increased contributions to the company’s U.S. pension plan The company paid $24.2 million in cash dividends to shareholders and repurchased 0.9 million shares at a cost of $16.4 million Q1 2012 Summary Q1 2012 Summary |
 4 4 Q1 2012 Sales: Q1 2012 Sales: Percent Change by Segment Percent Change by Segment Q1 2012 Consumer Professional Baby & Parenting Essentials Total Net Sales Core Sales (2.0) 10.1 21.4 5.2 Currency Translation (0.6) (0.9) (0.2) (0.6) Total (2.6) 9.2 21.2 4.6 |
 5 FY 2012 Outlook FY 2012 Outlook * Reflects outlook communicated in the April 27, 2012 Q1 2012 Earnings Release and Earnings Call ** See reconciliation included in the Appendix FY 2012 Outlook* Core Sales 2% to 3% Currency Translation -1% to -2% Total Sales Growth 0% to 2% “Normalized” Operating Margin Up to +20 basis points “Normalized” EPS** $1.63 to $1.69 Cash Flow from Operations $550 to $600 million Capital Expenditures $200 to $225 million 5 |
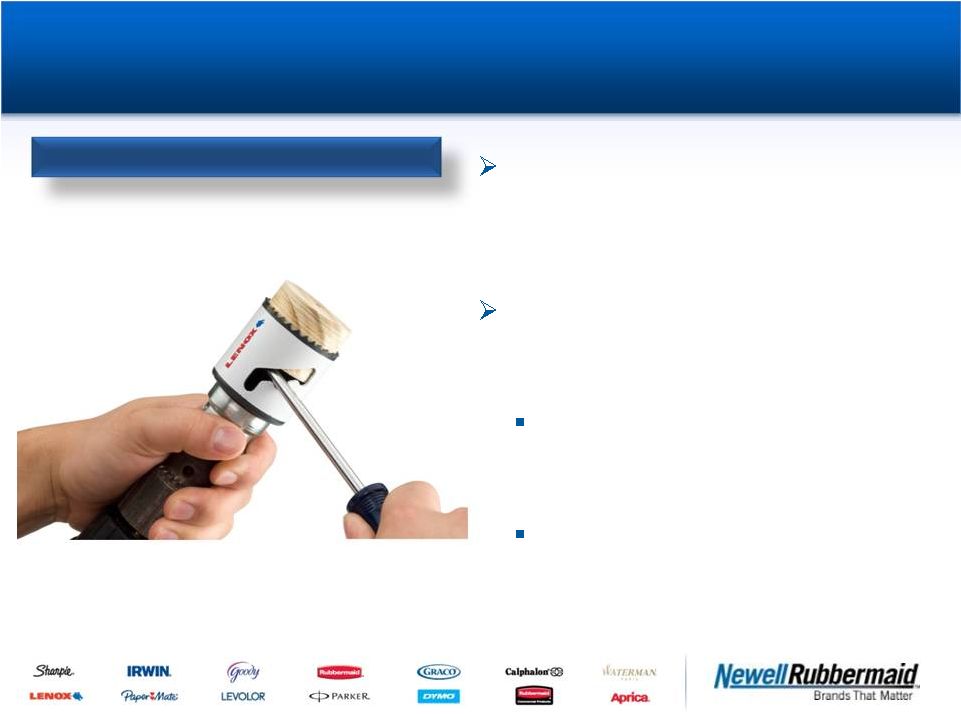 6 Industrial Products & Services achieved its 9 th consecutive quarter of double-digit core sales growth Notable new products include the LENOX® SPEED SLOT™ hole saw Features a patent-pending staircase design for easy plug removal Up to 2X life in metal cutting due to enhanced tooth geometry, thin kerf design and advanced coating Key Growth Initiatives Key Growth Initiatives Industrial Products & Services 6 |
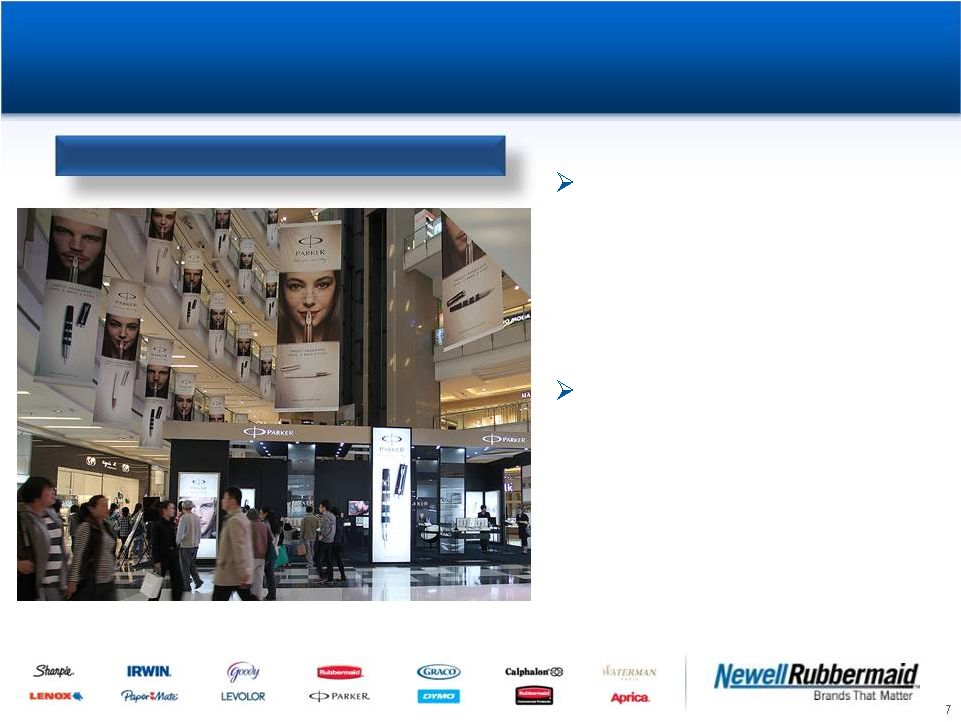 7 7 Key Growth Initiatives Key Growth Initiatives Fine Writing & Luxury Accessories The Parker Ingenuity pen collection featuring exclusive Parker 5 th Technology successfully launched in Japan in Q1 2012 and will launch in China in Q2 2012 Parker 5 th Technology provides an exceptionally smooth and fluid writing experience that adjusts intuitively to the user’s style of writing |
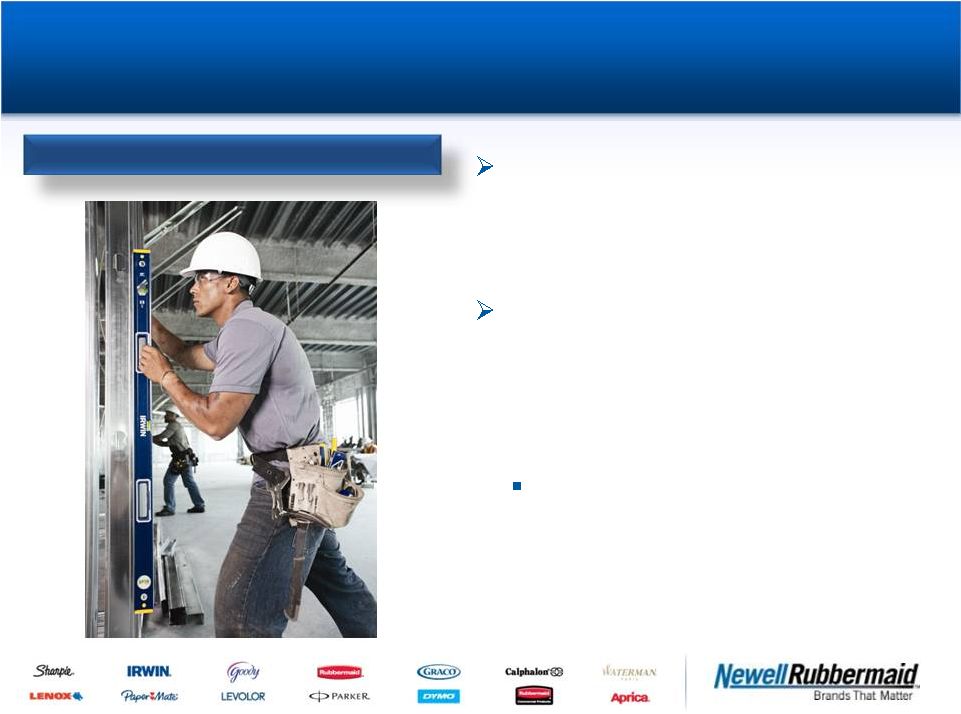 8 IRWIN® grew double-digits driven by new product momentum and “Irwinization” merchandising programs in the Americas New products include box beam levels, I-beam levels, torpedo levels, multiple specialty levels, squares and utility levels for a broad range of needs Tools are packed with features that stand up to the rugged conditions of the jobsite and levels are guaranteed accurate for life* Construction Tools & Accessories Key Growth Initiatives Key Growth Initiatives * Guarantee refers to vial accuracy for the life of the product. See IRWIN.com for product listing. 8 |
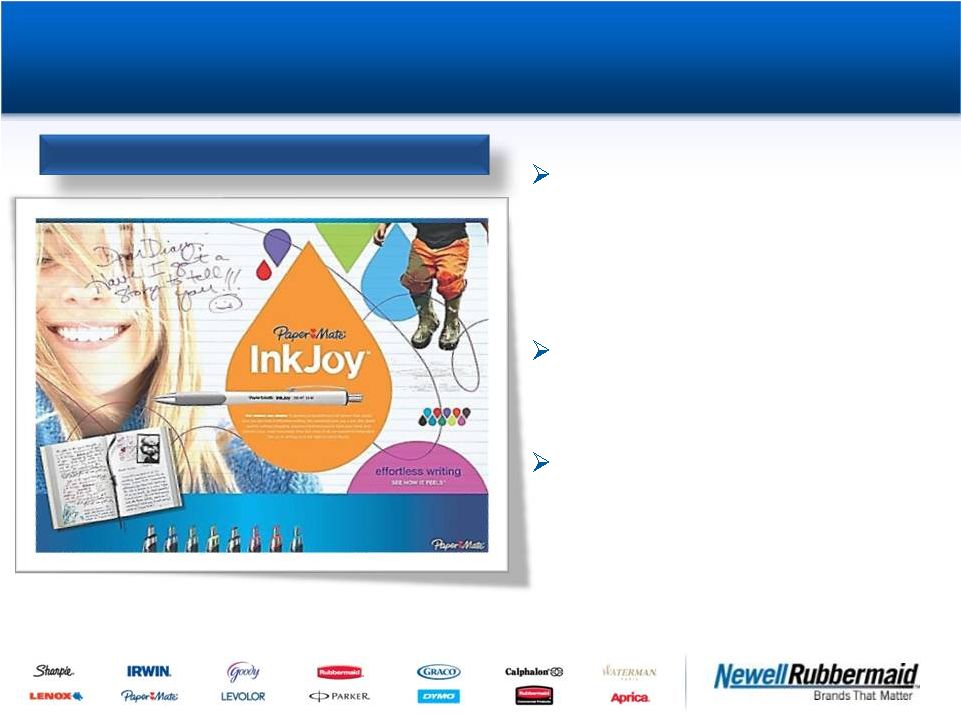 9 9 Paper Mate® is increasing its market share and driving accelerated category growth, primarily on the strength of Paper Mate® InkJoy® Paper Mate® InkJoy® has launched in virtually all countries where Paper Mate® is sold Revolutionary ultra-low viscosity ink technology, combined with an optimized writing tip, creates an unbelievably smooth writing experience Key Growth Initiatives Key Growth Initiatives Writing & Creative Expression |
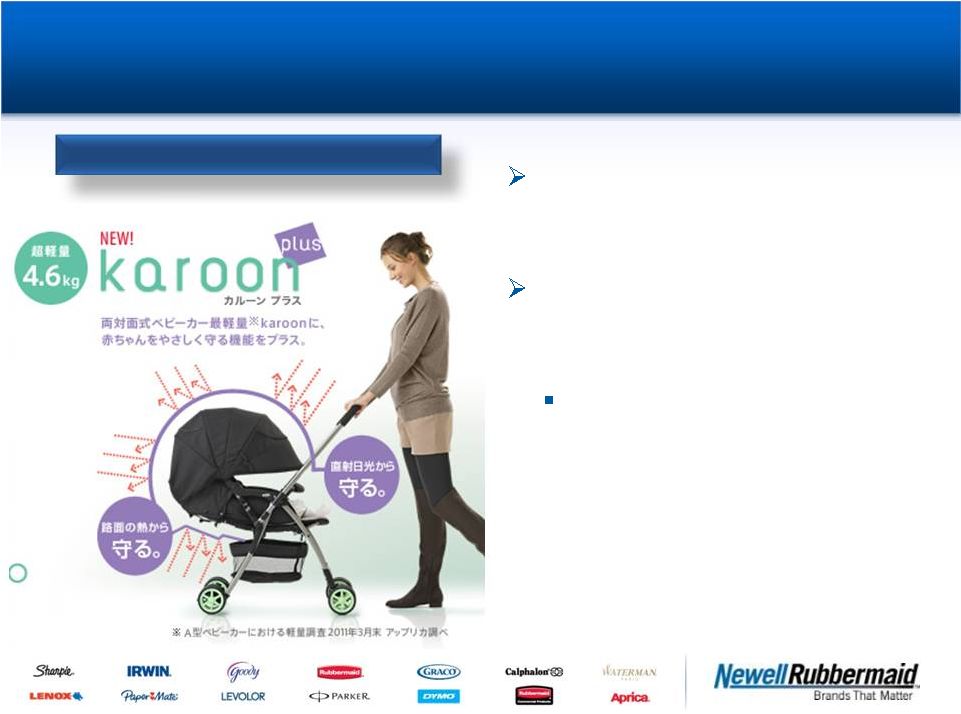 10 10 Key Growth Initiatives Key Growth Initiatives Aprica® Japan’s momentum continued with Q1 2012 growth of over 50% in Asia Notable new products include Karoon™ Plus, the lightest stroller in the category Karoon™ Plus features a reversible handle, 3-D suspension for better steadiness and a 360-degree full canopy Baby & Parenting Essentials |
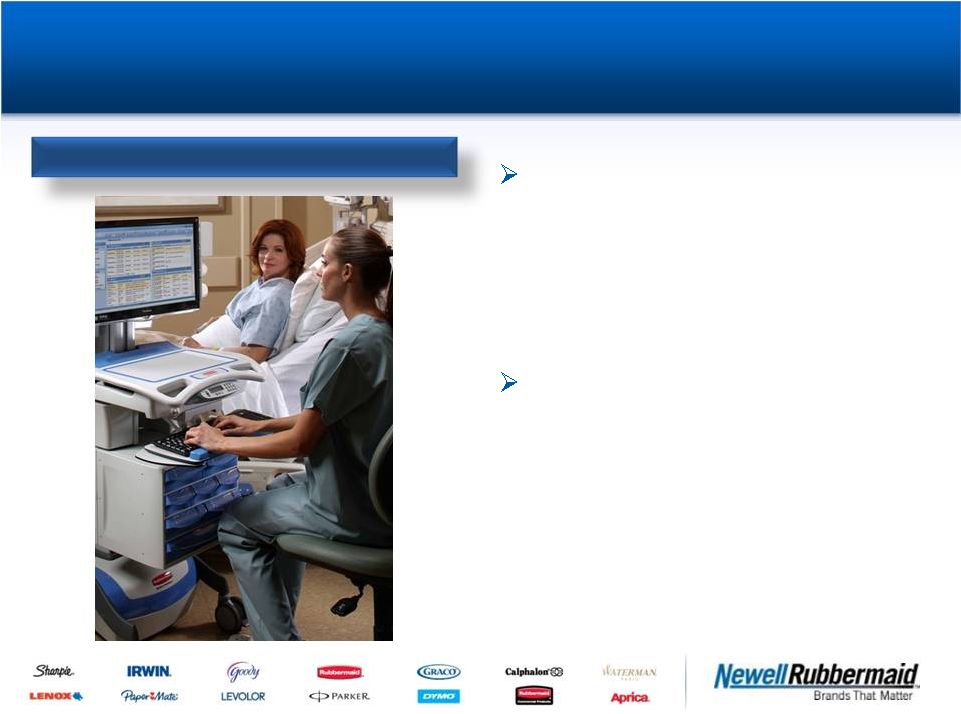 11 11 Key Growth Initiatives Key Growth Initiatives Rubbermaid Medical Solutions Rubbermaid Medical continues to build share as the premier provider of medication carts, wall-mounted workstations and mobile computing solutions for healthcare facilities in the U.S. Rubbermaid Medical increased revenues over 30% in Q1 2012 |
 |
 13 13 Reconciliation: Q1 2012 and Reconciliation: Q1 2012 and Q1 2011 “Normalized” Q1 2011 “Normalized” EPS EPS Q1 2012 Q1 2011 Diluted earnings per share (as reported): $0.27 $0.25 Restructuring and restructuring-related costs $0.06 $0.04 Loss related to the retirement of convertible notes $0.00 $0.01 Discontinued Operations $0.00 ($0.01) "Normalized" EPS $0.33 $0.29 |
 14 14 Reconciliation: Full Year 2012 Reconciliation: Full Year 2012 Outlook for “Normalized” Outlook for “Normalized” EPS EPS FY 2012 Diluted earnings per share $1.34 to $1.40 Restructuring and restructuring-related costs [ 1 ] $0.27 to $0.32 "Normalized" EPS $1.63 to $1.69 [ 1 ] Restructuring and restructuring-related costs include impairment charges, employee termination benefits and other costs associated with the European Transformation Plan and Project Renewal. |
 15 15 Reconciliation: Q1 2012 and Q1 2011 Operating Reconciliation: Q1 2012 and Q1 2011 Operating Income, As Reported, to Operating Income, Normalized Income, As Reported, to Operating Income, Normalized $ millions Q1 2012 Q1 2011 Net sales $1,332.4 $1,274.2 Operating income (as reported) $124.2 $128.0 Restructuring and restructuring-related costs $22.7 $11.1 Operating income (normalized) $146.9 $139.1 Operating margin (normalized) 11.0% 10.9% |
 16 16 Reconciliation: Q1 2012 and Reconciliation: Q1 2012 and Q1 2011 Free Cash Flow Q1 2011 Free Cash Flow $ millions Q1 2012 Q1 2011 Operating Cash Flow ($47.4) ($108.3) Capital Expenditures ($48.3) ($44.9) Free Cash Flow ($95.7) ($153.2) |