UNITED STATES
SECURITIES AND EXCHANGE COMMISSION
Washington, D.C. 20549
FORMN-CSR
CERTIFIED SHAREHOLDER REPORT OF REGISTERED MANAGEMENT
INVESTMENT COMPANIES
Investment Company Act file number: 811-05178
Name of Fund: BlackRock Equity Dividend Fund
Fund Address: 100 Bellevue Parkway, Wilmington, DE 19809
Name and address of agent for service: John M. Perlowski, Chief Executive Officer, BlackRock Equity Dividend Fund, 55 East 52nd Street, New York, NY 10055
Registrant’s telephone number, including area code: (800) 441-7762
Date of fiscal year end: 04/30/2020
Date of reporting period: 04/30/2020
Item 1 – Report to Stockholders
| | |
 | | APRIL 30, 2020 |
BlackRock Equity Dividend Fund
Beginning on January 1, 2021, as permitted by regulations adopted by the Securities and Exchange Commission, paper copies of the Fund’s shareholder reports will no longer be sent by mail, unless you specifically request paper copies of the reports from BlackRock or from your financial intermediary, such as a broker-dealer or bank. Instead, the reports will be made available on a website, and you will be notified by mail each time a report is posted and provided with a website link to access the report.
You may elect to receive all future reports in paper free of charge. If you hold accounts directly with BlackRock, you can call (800) 441-7762 to inform BlackRock that you wish to continue receiving paper copies of your shareholder reports. If you hold accounts through a financial intermediary, you can follow the instructions included with this disclosure, if applicable, or contact your financial intermediary to request that you continue to receive paper copies of your shareholder reports. Please note that not all financial intermediaries may offer this service. Your election to receive reports in paper will apply to all funds advised by BlackRock Advisors, LLC, BlackRock Fund Advisors or their affiliates, or all funds held with your financial intermediary, as applicable.
If you already elected to receive shareholder reports electronically, you will not be affected by this change and you need not take any action. You may elect to receive electronic delivery of shareholder reports and other communications by: (i) accessing the BlackRock website at blackrock.com/edelivery and logging into your accounts, if you hold accounts directly with BlackRock, or (ii) contacting your financial intermediary, if you hold accounts through a financial intermediary. Please note that not all financial intermediaries may offer this service.
|
| Not FDIC Insured • May Lose Value • No Bank Guarantee |
The Markets in Review
Dear Shareholder,
The last 12 months have been a time of sudden change in global financial markets, as a long period of growth and positive returns was interrupted in early 2020 by the emergence and spread of the coronavirus. For much of the reporting period, U.S. equities and bonds both delivered impressive returns, despite fears and doubts about the economy that were ultimately laid to rest with unprecedented monetary stimulus and a sluggish yet resolute performance from the U.S. economy. But as the threat from the coronavirus became more apparent throughout February and March 2020, leading countries around the world took economically disruptive countermeasures, causing equity prices to fall sharply. While markets have since recovered some of these losses as countries around the world begin reopening, there is still significant uncertainty surrounding the long-term impact of the pandemic on the global economy.
Returns for most securities were robust for the first three quarters of the reporting period, as investors began to realize that the U.S. economy was maintaining the modest yet steady growth that had characterized this economic cycle. However, once stay-at-home orders and closures of non-essential businesses became widespread, many workers were laid off and unemployment claims spiked. With large portions of the global economy on hold, all types of international equities ended the reporting period with negative performance, while in the U.S. only large-capitalization stocks delivered a slightly positive return.
The performance of different types of fixed-income securities diverged substantially due to a reduced investor appetite for risk. Treasuries benefited from the risk-off environment, and posted healthy returns, as the 10-year yield (which is inversely related to bond prices) fell to an all-time low. Investment-grade corporate bonds also delivered a positive return, while high-yield corporates were down due to credit concerns.
The U.S. Federal Reserve (the “Fed”) reduced interest rates three times in 2019, to support slowing economic growth. After the coronavirus outbreak, the Fed instituted two emergency rate cuts, pushing short-term interest rates close to zero. To stabilize credit markets, the Fed also announced a new bond-buying program, as did several other central banks around the world, including the European Central Bank and the Bank of Japan.
Looking ahead, while coronavirus-related disruption is certain to hurt worldwide economic growth, the global expansion is likely to continue once the impact of the outbreak subsides. Nonetheless, there are promising signs that a strong coordinated monetary and fiscal response is underway, both in the United States and abroad. With measures being taken to contain the virus and provide support to impacted businesses and individuals, we anticipate a sharp increase in economic activity as life returns to normal.
Overall, we favor a neutral stance toward risk, given the uncertainty surrounding the economic impact of coronavirus countermeasures. Among equities, we see an advantage in U.S. stocks compared to other developed markets, given the diversity of the U.S. economy and the impressive scope of monetary and fiscal stimulus. In bonds, the swift action taken by the world’s central banks means there are attractive opportunities in credit, and we expect credit spreads to narrow as markets stabilize. Both U.S. Treasuries and sustainable investments can help provide portfolio resilience, and the disruption created by the coronavirus appears to be accelerating the shift toward sustainable investments.
In this environment, investors need to think globally, extend their scope across a broad array of asset classes, and be nimble as market conditions change. We encourage you to talk with your financial advisor and visitblackrock.com for further insight about investing in today’s markets.
Sincerely,

Rob Kapito
President, BlackRock Advisors, LLC

Rob Kapito
President, BlackRock Advisors, LLC
| | | | |
| Total Returns as of April 30, 2020 |
| | | 6-month | | 12-month |
U.S. large cap equities
(S&P 500® Index) | | (3.16)% | | 0.86% |
U.S. small cap equities
(Russell 2000® Index) | | (15.47) | | (16.39) |
International equities
(MSCI Europe, Australasia, Far East Index) | | (14.21) | | (11.34) |
Emerging market equities
(MSCI Emerging Markets Index) | | (10.50) | | (12.00) |
3-month Treasury bills
(ICE BofA 3-Month U.S. Treasury Bill Index) | | 0.85 | | 2.07 |
U.S. Treasury securities
(ICE BofA 10-Year U.S. Treasury Index) | | 10.73 | | 19.78 |
U.S. investment grade bonds
(Bloomberg Barclays U.S. Aggregate Bond Index) | | 4.86 | | 10.84 |
Tax-exempt municipal bonds
(S&P Municipal Bond Index) | | (1.26) | | 2.21 |
U.S. high yield bonds
(Bloomberg Barclays U.S. Corporate High Yield 2% Issuer Capped Index) | | (6.60) | | (4.08) |
| Past performance is no guarantee of future results. Index performance is shown for illustrative purposes only. You cannot invest directly in an index. |
| | |
| 2 | | THIS PAGEISNOT PARTOF YOUR FUND REPORT |
Table of Contents

| | |
| Fund Summary as of April 30, 2020 | | BlackRock Equity Dividend Fund |
Investment Objective
BlackRock Equity Dividend Fund’s (the “Fund”) investment objective is to seek long-term total return and current income.
At a meeting held on May 15, 2019, the Board of Directors of FDP Series, Inc. and the Board of Trustees of the Fund approved a reorganization (the “Reorganization”) of FDP BlackRock Equity Dividend Fund (the “Target Fund”) with and into the Fund. Shareholders of the Fund and the Target Fund were not required to approve the Reorganization. The Reorganization closed on September 23, 2019.
On November 13, 2019, the Board of Trustees of the Fund approved a change in the fiscal year-end of the Fund, effective as of April 30, 2020, from July 31 to April 30.
Portfolio Management Commentary
How did the Fund perform?
For the abbreviated annual period from August 1, 2019 through April 30, 2020, the Fund’s Institutional, Service, Investor A, Investor C, Class K and Class R Shares returned (8.98)%, (9.16)%, (9.14)%, (9.62)%, (8.90)% and (9.35)%, respectively, outperforming its benchmark, the Russell 1000® Value Index, which returned (12.00)%. For the same period, all of the Fund’s share classes underperformed the broad-market S&P 500® Index, which returned (0.81)%. The following discussion of relative performance pertains to the Russell 1000® Value Index.
What factors influenced performance?
The largest contribution to relative performance during the period came from stock selection and allocation decisions in the consumer discretionary sector. Notably, selection decisions and overweight exposure to the multi-line retail and household durables industries proved beneficial, as did a lack of exposure to the hotels, restaurants & leisure industry. A combination of stock selection and underweight exposure to industrials also boosted relative performance, primarily due to stock selection among aerospace & defense companies and underweight exposure to airlines. In the information technology (“IT”) sector, overweight exposure to software and selection among technology hardware, storage & peripherals companies benefited relative returns. Lastly, stock selection in communication services, underweight exposure to real estate, and stock selection in the energy sector added to relative performance.
The largest detractor from relative performance was the Fund’s stock selection and allocation decisions within the financials sector. Most prominently, overweight exposure to the banks and insurance industries weighed on relative returns. Underweight exposure in utilities also detracted from relative performance amid the market volatility in the first quarter of 2020. Within consumer staples, an underweight exposure to household products and food & staples retailing firms hurt relative returns. Lastly, stock selection in materials modestly weighed on relative results.
The Fund’s cash balance was elevated during the period. The cash balance was used to control portfolio market risk versus the benchmark, particularly in relation to elevated valuation levels in many traditionally defensive sectors. The Fund’s cash balance contributed to relative performance over the period.
Describe recent portfolio activity.
During the period, a combination of portfolio trading activity and market price changes resulted in increased exposure to the consumer staples and utilities sectors. Conversely, holdings within the financials and energy sectors were reduced.
Describe portfolio positioning at period end.
As of period end, the Fund’s largest allocations were in the financials, health care and consumer staples sectors. Relative to the Russell 1000® Value Index benchmark, the largest overweight positions were in financials, health care and IT. The Fund’s most significant relative underweights were in the real estate, utilities and materials sectors.
The views expressed reflect the opinions of BlackRock as of the date of this report and are subject to change based on changes in market, economic or other conditions. These views are not intended to be a forecast of future events and are no guarantee of future results.
Portfolio Information
TEN LARGEST HOLDINGS
| | | | |
| Security (a) | | Percent of
Net Assets | |
Verizon Communications, Inc. | | | 4 | % |
Bank of America Corp. | | | 3 | |
Citigroup, Inc. | | | 3 | |
Sanofi | | | 2 | |
Medtronic PLC | | | 2 | |
Anthem, Inc. | | | 2 | |
Wells Fargo & Co. | | | 2 | |
Unilever NV - NY Shares | | | 2 | |
Microsoft Corp. | | | 2 | |
Cognizant Technology Solutions Corp. | | | 2 | |
| | (a) | Excludes short-term investments. | |
SECTOR ALLOCATION
| | | | |
| Sector | | Percent of
Net Assets | |
Financials | | | 23 | % |
Health Care | | | 18 | |
Consumer Staples | | | 9 | |
Information Technology | | | 9 | |
Energy | | | 8 | |
Short-Term Securities | | | 8 | |
Communication Services | | | 7 | |
Industrials | | | 7 | |
Consumer Discretionary | | | 5 | |
Utilities | | | 4 | |
Materials | | | 2 | |
For Fund compliance purposes, the Fund’s sector classifications refer to one or more of the sector sub-classifications used by one or more widely recognized market indexes, and/or as defined by the investment adviser. These definitions may not apply for purposes of this report, which may combine such sector sub-classifications for reporting ease.
| | |
| 4 | | 2020 BLACKROCK ANNUAL REPORTTO SHAREHOLDERS |
| | |
| Fund Summary as of April 30, 2020 (continued) | | BlackRock Equity Dividend Fund |
TOTAL RETURN BASED ON A $10,000 INVESTMENT
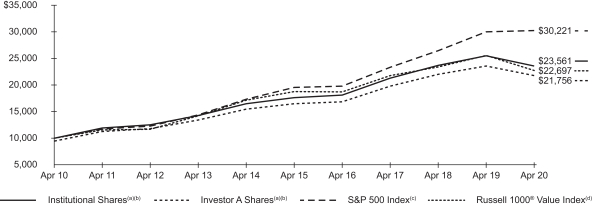
| (a) | Assuming maximum sales charges, if any, transaction costs and other operating expenses, including investment advisory fees. Institutional Shares do not have a sales charge. |
| (b) | Under normal circumstances, the Fund will invest at least 80% of its assets in equity securities and at least 80% of its assets in dividend paying securities. |
| (c) | An unmanaged index that covers 500 leading companies and captures approximately 80% coverage of available market capitalization. |
| (d) | An unmanaged index that is a subset of the Russell 1000® Index and consists of those Russell 1000® securities with lower price-to-book ratios and lower expected growth values. |
Performance Summary for the Period Ended April 30, 2020
| | | | | | | | | | | | | | | | | | | | | | | | | | | | | | | | | | | | | | | | |
| | | | | | | | | Average Annual Total Returns (a) | |
| | | | | | | | | 1 Year | | | | | | 5 Years | | | | | | 10 Years | |
| | | 6-Month
Total Returns | | | | | | w/o sales
charge | | | w/sales
charge | | | | | | w/o sales
charge | | | w/sales
charge | | | | | | w/o sales
charge | | | w/sales
charge | |
Institutional | | | (11.44 | )% | | | | | | | (7.48 | )% | | | N/A | | | | | | | | 6.02 | % | | | N/A | | | | | | | | 8.95 | % | | | N/A | |
Service | | | (11.55 | ) | | | | | | | (7.72 | ) | | | N/A | | | | | | | | 5.73 | | | | N/A | | | | | | | | 8.65 | | | | N/A | |
Investor A | | | (11.54 | ) | | | | | | | (7.69 | ) | | | (12.54 | )% | | | | | | | 5.76 | | | | 4.63 | % | | | | | | | 8.67 | | | | 8.08 | % |
Investor C | | | (11.85 | ) | | | | | | | (8.37 | ) | | | (9.18 | ) | | | | | | | 5.00 | | | | 5.00 | | | | | | | | 7.89 | | | | 7.89 | |
Class K | | | (11.39 | ) | | | | | | | (7.37 | ) | | | N/A | | | | | | | | 6.13 | | | | N/A | | | | | | | | 9.00 | | | | N/A | |
Class R | | | (11.70 | ) | | | | | | | (8.00 | ) | | | N/A | | | | | | | | 5.43 | | | | N/A | | | | | | | | 8.33 | | | | N/A | |
Russell 1000® Value Index | | | (13.66 | ) | | | | | | | (11.01 | ) | | | N/A | | | | | | | | 3.90 | | | | N/A | | | | | | | | 8.54 | | | | N/A | |
S&P 500® Index | | | (3.16 | ) | | | | | | | 0.86 | | | | N/A | | | | | | | | 9.12 | | | | N/A | | | | | | | | 11.69 | | | | N/A | |
| | (a) | Assuming maximum sales charges, if any. Average annual total returns with and without sales charges reflect reductions for distribution and service fees. See “About Fund Performance” on page 6 for a detailed description of share classes, including any related sales charges and fees, and how performance was calculated for certain share classes. | |
N/A — Not applicable as share class and index do not have a sales charge.
Past performance is not indicative of future results.
Performance results may include adjustments made for financial reporting purposes in accordance with U.S. generally accepted accounting principles.
Expense Example
| | | | | | | | | | | | | | | | | | | | | | | | | | | | | | | | |
| | | Actual | | | | | | Hypothetical (b) | | | | |
| | | Beginning
Account Value (11/01/19) | | | Ending
Account Value
(04/30/20) | | | Expenses
Paid During
the Period (a) | | | | | | Beginning
Account Value (11/01/19) | | | Ending
Account Value
(04/30/20) | | | Expenses
Paid During
the Period (a) | | | Annualized
Expense
Ratio | |
Institutional | | $ | 1,000.00 | | | $ | 885.60 | | | $ | 3.33 | | | | | | | $ | 1,000.00 | | | $ | 1,021.33 | | | $ | 3.57 | | | | 0.70 | % |
Service | | | 1,000.00 | | | | 884.50 | | | | 4.69 | | | | | | | | 1,000.00 | | | | 1,019.89 | | | | 5.02 | | | | 1.00 | |
Investor A | | | 1,000.00 | | | | 884.60 | | | | 4.40 | | | | | | | | 1,000.00 | | | | 1,020.19 | | | | 4.72 | | | | 0.95 | |
Investor C | | | 1,000.00 | | | | 881.50 | | | | 7.77 | | | | | | | | 1,000.00 | | | | 1,016.61 | | | | 8.32 | | | | 1.66 | |
Class K | | | 1,000.00 | | | | 886.10 | | | | 2.72 | | | | | | | | 1,000.00 | | | | 1,021.98 | | | | 2.92 | | | | 0.58 | |
Class R | | | 1,000.00 | | | | 883.00 | | | | 5.95 | | | | | | | | 1,000.00 | | | | 1,018.55 | | | | 6.37 | | | | 1.27 | |
| | (a) | For each class of the Fund, expenses are equal to the annualized expense ratio for the class, multiplied by the average account value over the period, multiplied by 182/366 (to reflect the six-month period shown). | |
| | (b) | Hypothetical 5% annual return before expenses is calculated by prorating the number of days in the most recent six-months divided by 366. | |
See “Disclosure of Expenses” on page 6 for further information on how expenses were calculated.
About Fund Performance
Institutional and Class K Shares are not subject to any sales charge. These shares bear no ongoing distribution or service fees and are available only to certain eligible investors. Class K Shares performance shown prior to the Class K Shares inception date of March 28, 2016 is that of Institutional Shares. The performance of the Fund’s Class K Shares would be substantially similar to Institutional Shares because Class K Shares and Institutional Shares invest in the same portfolio of securities and performance would only differ to the extent that Class K Shares and Institutional Shares have different expenses. The actual returns of Class K Shares would have been higher than those of Institutional Shares because Class K Shares have lower expenses than the Institutional Shares.
Service Shares are not subject to any sales charge. These shares are subject to a service fee of 0.25% per year (but no distribution fee) and are only available to certain eligible investors.
Investor A Shares are subject to a maximum initial sales charge (front-end load) of 5.25% and a service fee of 0.25% per year (but no distribution fee). Certain redemptions of these shares may be subject to a contingent deferred sales charge (“CDSC”) where no initial sales charge was paid at the time of purchase. These shares are generally available through financial intermediaries. On February 24, 2020, the Fund’s issued and outstanding Investor C1 Shares converted into Investor A Shares.
Investor C Shares are subject to a 1.00% CDSC if redeemed within one year of purchase. In addition, these shares are subject to a distribution fee of 0.75% per year and a service fee of 0.25% per year. These shares are generally available through financial intermediaries. These shares automatically convert to Investor A Shares after approximately ten years.
Class R Shares are not subject to any sales charge. These shares are subject to a distribution fee of 0.25% per year and a service fee of 0.25% per year. These shares are available only to certain employer-sponsored retirement plans.
Performance information reflects past performance and does not guarantee future results. Current performance may be lower or higher than the performance data quoted. Refer toblackrock.com to obtain performance data current to the most recent month-end. Performance results do not reflect the deduction of taxes that a shareholder would pay on Fund distributions or the redemption of Fund shares. Figures shown in the performance tables on the previous pages assume reinvestment of all distributions, if any, at net asset value (“NAV”) on the ex-dividend date or payable date, as applicable. Investment return and principal value of shares will fluctuate so that shares, when redeemed, may be worth more or less than their original cost. Distributions paid to each class of shares will vary because of the different levels of service, distribution and transfer agency fees applicable to each class, which are deducted from the income available to be paid to shareholders.
BlackRock Advisors, LLC (the “Manager”), the Fund’s investment adviser, has contractually agreed to waive a portion of the Fund’s expenses. Without such waivers, the Fund’s performance would have been lower. With respect to the Fund’s contractual waivers, the Manager is under no obligation to continue waiving its fees after the applicable termination date of such agreement. See Note 6 of the Notes to Financial Statements for additional information on waivers.
Disclosure of Expenses
Shareholders of the Fund may incur the following charges: (a) transactional expenses, such as sales charges; and (b) operating expenses, including investment advisory fees, service and distribution fees, including 12b-1 fees, acquired fund fees and expenses and other fund expenses. The expense example shown on the previous page (which is based on a hypothetical investment of $1,000 invested on November 1, 2019 and held through April 30, 2020) is intended to assist shareholders both in calculating expenses based on an investment in the Fund and in comparing these expenses with similar costs of investing in other mutual funds.
The expense example provides information about actual account values and actual expenses. In order to estimate the expenses a shareholder paid during the period covered by this report, shareholders can divide their account value by $1,000 and then multiply the result by the number corresponding to their Fund and share class under the heading entitled “Expenses Paid During the Period.”
The expense example also provides information about hypothetical account values and hypothetical expenses based on the Fund’s actual expense ratio and an assumed rate of return of 5% per year before expenses. In order to assist shareholders in comparing the ongoing expenses of investing in the Fund and other funds, compare the 5% hypothetical example with the 5% hypothetical examples that appear in shareholder reports of other funds.
The expenses shown in the expense example are intended to highlight shareholders’ ongoing costs only and do not reflect transactional expenses, such as sales charges, if any. Therefore, the hypothetical example is useful in comparing ongoing expenses only, and will not help shareholders determine the relative total expenses of owning different funds. If these transactional expenses were included, shareholder expenses would have been higher.
Derivative Financial Instruments
The Fund may invest in various derivative financial instruments. These instruments are used to obtain exposure to a security, commodity, index, market, and/or other assets without owning or taking physical custody of securities, commodities and/or other referenced assets or to manage market, equity, credit, interest rate, foreign currency exchange rate, commodity and/or other risks. Derivative financial instruments may give rise to a form of economic leverage and involve risks, including the imperfect correlation between the value of a derivative financial instrument and the underlying asset, possible default of the counterparty to the transaction or illiquidity of the instrument. The Fund’s successful use of a derivative financial instrument depends on the investment adviser’s ability to predict pertinent market movements accurately, which cannot be assured. The use of these instruments may result in losses greater than if they had not been used, may limit the amount of appreciation the Fund can realize on an investment and/or may result in lower distributions paid to shareholders. The Fund’s investments in these instruments, if any, are discussed in detail in the Notes to Financial Statements.
| | |
| 6 | | 2020 BLACKROCK ANNUAL REPORTTO SHAREHOLDERS |
| | |
Schedule of Investments April 30, 2020 | | BlackRock Equity Dividend Fund (Percentages shown are based on Net Assets) |
| | | | | | | | |
| Security | | Shares | | | Value | |
| | |
Common Stocks — 91.1% | | | | | | | | |
| | |
| Aerospace & Defense — 2.1% | | | | | | |
BAE Systems PLC | | | 36,709,742 | | | $ | 234,150,586 | |
Lockheed Martin Corp. | | | 294,230 | | | | 114,473,124 | |
| | | | | | | | |
| | | | 348,623,710 | |
| | |
| Air Freight & Logistics — 0.4% | | | | | | |
FedEx Corp. | | | 526,255 | | | | 66,713,346 | |
| | | | | | | | |
| | |
| Auto Components — 0.1% | | | | | | |
Lear Corp. | | | 95,410 | | | | 9,316,787 | |
| | | | | | | | |
| | |
| Automobiles — 1.2% | | | | | | |
General Motors Co. | | | 8,559,710 | | | | 190,795,936 | |
| | | | | | | | |
| | |
| Banks — 10.7% | | | | | | |
Bank of America Corp. | | | 23,276,327 | | | | 559,795,664 | |
Citigroup, Inc. | | | 10,298,429 | | | | 500,091,712 | |
JPMorgan Chase & Co. | | | 2,903,671 | | | | 278,055,535 | |
U.S. Bancorp | | | 1,301,438 | | | | 47,502,487 | |
Wells Fargo & Co. | | | 12,509,676 | | | | 363,406,088 | |
| | | | | | | | |
| | | | 1,748,851,486 | |
| | |
| Beverages — 2.1% | | | | | | |
Constellation Brands, Inc., Class A | | | 1,709,694 | | | | 281,569,505 | |
PepsiCo, Inc. | | | 471,087 | | | | 62,320,099 | |
| | | | | | | | |
| | | | 343,889,604 | |
| | |
| Capital Markets — 4.5% | | | | | | |
Charles Schwab Corp. | | | 5,673,045 | | | | 213,987,257 | |
CME Group, Inc. | | | 448,860 | | | | 79,991,341 | |
Morgan Stanley | | | 6,528,266 | | | | 257,409,528 | |
Raymond James Financial, Inc. | | | 2,824,601 | | | | 186,197,698 | |
| | | | | | | | |
| | | | 737,585,824 | |
| | |
| Chemicals — 1.4% | | | | | | |
Corteva, Inc.(a) | | | 3,349,833 | | | | 87,732,126 | |
DuPont de Nemours, Inc. | | | 3,069,522 | | | | 144,328,925 | |
| | | | | | | | |
| | | | 232,061,051 | |
| | |
| Communications Equipment — 1.8% | | | | | | |
Cisco Systems, Inc. | | | 3,860,131 | | | | 163,592,352 | |
Motorola Solutions, Inc. | | | 879,396 | | | | 126,465,939 | |
| | | | | | | | |
| | | | 290,058,291 | |
| | |
| Construction Materials — 0.2% | | | | | | |
CRH PLC | | | 1,034,887 | | | | 31,202,350 | |
| | | | | | | | |
| | |
| Consumer Finance — 0.3% | | | | | | |
American Express Co. | | | 577,530 | | | | 52,699,613 | |
| | | | | | | | |
| | |
| Diversified Financial Services — 1.8% | | | | | | |
Berkshire Hathaway, Inc., Class B(a) | | | 887,467 | | | | 166,275,817 | |
Equitable Holdings, Inc. | | | 6,841,819 | | | | 125,342,124 | |
| | | | | | | | |
| | | | 291,617,941 | |
| |
| Diversified Telecommunication Services — 4.2% | | | | |
Verizon Communications, Inc. | | | 11,910,544 | | | | 684,260,753 | |
| | | | | | | | |
| | |
| Electric Utilities — 2.9% | | | | | | |
Edison International | | | 2,307,510 | | | | 135,473,912 | |
FirstEnergy Corp. | | | 8,152,605 | | | | 336,458,008 | |
| | | | | | | | |
| | | | 471,931,920 | |
| | |
| Food Products — 1.4% | | | | | | |
Conagra Brands, Inc. | | | 1,682,727 | | | | 56,270,391 | |
Nestle SA, Registered Shares | | | 1,652,833 | | | | 175,051,575 | |
| | | | | | | | |
| | | | 231,321,966 | |
| | |
| Health Care Equipment & Supplies — 5.3% | | | | | | |
Alcon, Inc.(a) | | | 2,668,755 | | | | 140,848,898 | |
Koninklijke Philips NV | | | 7,645,356 | | | | 333,279,994 | |
| | | | | | | | |
| Security | | Shares | | | Value | |
| | |
| Health Care Equipment & Supplies (continued) | | | | | | |
Medtronic PLC | | | 4,009,855 | | | $ | 391,482,144 | |
| | | | | | | | |
| | | | 865,611,036 | |
| | |
| Health Care Providers & Services — 6.1% | | | | | | |
Anthem, Inc. | | | 1,393,463 | | | | 391,186,868 | |
CVS Health Corp. | | | 3,980,400 | | | | 244,993,620 | |
McKesson Corp. | | | 863,536 | | | | 121,974,460 | |
Quest Diagnostics, Inc. | | | 296,283 | | | | 32,623,721 | |
UnitedHealth Group, Inc. | | | 718,400 | | | | 210,110,448 | |
| | | | | | | | |
| | | | 1,000,889,117 | |
| | |
| Household Durables — 1.3% | | | | | | |
Newell Brands, Inc. | | | 6,649,680 | | | | 92,297,558 | |
Sony Corp. | | | 1,983,000 | | | | 127,614,130 | |
| | | | | | | | |
| | | | 219,911,688 | |
| | |
| Industrial Conglomerates — 2.4% | | | | | | |
General Electric Co. | | | 28,085,529 | | | | 190,981,597 | |
Siemens AG, Registered Shares | | | 2,141,131 | | | | 197,590,203 | |
| | | | | | | | |
| | | | 388,571,800 | |
| | |
| Insurance — 6.2% | | | | | | |
Allstate Corp. | | | 909,197 | | | | 92,483,519 | |
American International Group, Inc. | | | 11,149,706 | | | | 283,537,024 | |
Arthur J Gallagher & Co. | | | 2,082,087 | | | | 163,443,829 | |
Fidelity National Financial, Inc. | | | 298,950 | | | | 8,086,598 | |
MetLife, Inc. | | | 4,921,001 | | | | 177,549,716 | |
Prudential Financial, Inc. | | | 591,770 | | | | 36,908,695 | |
Travelers Cos., Inc. | | | 287,611 | | | | 29,109,109 | |
Willis Towers Watson PLC | | | 1,217,425 | | | | 217,054,703 | |
| | | | | | | | |
| | | | 1,008,173,193 | |
| | |
| IT Services — 3.0% | | | | | | |
Cognizant Technology Solutions Corp., Class A | | | 5,852,283 | | | | 339,549,460 | |
Visa, Inc., Class A | | | 841,171 | | | | 150,334,081 | |
| | | | | | | | |
| | | | 489,883,541 | |
| | |
| Machinery — 0.2% | | | | | | |
Pentair PLC | | | 1,130,244 | | | | 39,095,140 | |
| | | | | | | | |
| | |
| Media — 2.8% | | | | | | |
Comcast Corp., Class A | | | 8,053,504 | | | | 303,053,356 | |
Fox Corp., Class A | | | 5,583,950 | | | | 144,456,786 | |
Fox Corp., Class B (a) | | | 295,730 | | | | 7,558,859 | |
| | | | | | | | |
| | | | 455,069,001 | |
| | |
| Multi-Utilities — 1.2% | | | | | | |
NiSource, Inc. | | | 1,278,720 | | | | 32,108,659 | |
Public Service Enterprise Group, Inc. | | | 3,370,129 | | | | 170,899,242 | |
| | | | | | | | |
| | | | 203,007,901 | |
| | |
| Multiline Retail — 1.1% | | | | | | |
Dollar General Corp. | | | 1,056,828 | | | | 185,261,948 | |
| | | | | | | | |
| | |
| Oil, Gas & Consumable Fuels — 8.4% | | | | | | |
Chevron Corp. | | | 2,368,536 | | | | 217,905,312 | |
ConocoPhillips | | | 4,646,484 | | | | 195,616,976 | |
Devon Energy Corp. | | | 5,652,250 | | | | 70,483,558 | |
Enterprise Products Partners LP | | | 10,404,036 | | | | 182,694,872 | |
Equinor ASA | | | 6,553,948 | | | | 90,751,292 | |
Marathon Petroleum Corp. | | | 4,394,115 | | | | 140,963,209 | |
Phillips 66 | | | 867,080 | | | | 63,444,244 | |
Pioneer Natural Resources Co. | | | 1,668,709 | | | | 149,032,401 | |
Williams Cos., Inc. | | | 13,786,682 | | | | 267,048,030 | |
| | | | | | | | |
| | | | 1,377,939,894 | |
| | |
| Personal Products — 2.1% | | | | | | |
Unilever NV — NY Shares | | | 6,900,319 | | | | 341,013,765 | |
| | | | | | | | |
| | | | |
| SCHEDULE OF INVESTMENTS | | | 7 | |
| | |
Schedule of Investments (continued) April 30, 2020 | | BlackRock Equity Dividend Fund (Percentages shown are based on Net Assets) |
| | | | | | | | |
| Security | | Shares | | | Value | |
| | |
| Pharmaceuticals — 6.7% | | | | | | |
AstraZeneca PLC | | | 2,637,230 | | | $ | 275,833,157 | |
Bayer AG, Registered Shares | | | 4,331,031 | | | | 284,849,117 | |
Pfizer, Inc. | | | 3,497,414 | | | | 134,160,801 | |
Sanofi | | | 4,039,507 | | | | 394,553,714 | |
| | | | | | | | |
| | | | 1,089,396,789 | |
| | |
| Road & Rail — 0.8% | | | | | | |
Union Pacific Corp. | | | 769,145 | | | | 122,901,680 | |
| | | | | | | | |
| |
| Semiconductors & Semiconductor Equipment — 0.5% | | | | |
NXP Semiconductors NV | | | 896,808 | | | | 89,295,173 | |
| | | | | | | | |
| | |
| Software — 2.2% | | | | | | |
Constellation Software, Inc. | | | 27,223 | | | | 26,178,241 | |
Microsoft Corp. | | | 1,894,870 | | | | 339,579,652 | |
| | | | | | | | |
| | | | 365,757,893 | |
| | |
| Specialty Retail — 1.3% | | | | | | |
Lowe’s Cos., Inc. | | | 1,989,432 | | | | 208,393,002 | |
| | | | | | | | |
|
| Technology Hardware, Storage & Peripherals — 1.3% | |
Samsung Electronics Co. Ltd. | | | 5,208,720 | | | | 214,169,682 | |
| | | | | | | | |
| | |
| Tobacco — 2.2% | | | | | | |
Altria Group, Inc. | | | 8,089,218 | | | | 317,501,806 | |
British American Tobacco PLC | | | 1,062,660 | | | | 40,959,394 | |
| | | | | | | | |
| | | | 358,461,200 | |
| | |
| Trading Companies & Distributors — 0.9% | | | | | | |
Ferguson PLC | | | 2,087,298 | | | | 150,498,827 | |
| | | | | | | | |
| |
Total Common Stocks — 91.1%
(Cost — $13,083,770,625) | | | | 14,904,232,848 | |
| | | | | | | | |
| | | | | | | | |
| Security | | Shares | | | Value | |
| | |
Preferred Stock — 1.2% | | | | | | | | |
| | |
Household Products — 1.2% | | | | | | | | |
Henkel AG & Co. KGaA, Preference Shares, 0.00%(a) | | | 2,228,282 | | | $ | 197,841,389 | |
| | | | | | | | |
| |
Total Preferred Stock —1.2%
(Cost — $199,509,284) | | | | 197,841,389 | |
| | | | | | | | |
| |
Total Long-Term Investments — 92.3%
(Cost — $13,283,279,909) | | | | 15,102,074,237 | |
| | | | | | | | |
| | |
Short-Term Securities — 7.6% | | | | | | | | |
BlackRock Liquidity Funds, T-Fund, Institutional Class,
0.12%(b)(c) | | | 1,244,064,340 | | | | 1,244,064,340 | |
| | | | | | | | |
| |
Total Short-Term Securities — 7.6%
(Cost — $1,244,064,340) | | | | 1,244,064,340 | |
| | | | | | | | |
| |
Options Purchased — 0.0%
(Cost — $13,440,130) | | | | 4,699,600 | |
| | | | | | | | |
| |
Total Investments — 99.9%
(Cost — $14,540,784,379) | | | | 16,350,838,177 | |
| |
Other Assets Less Liabilities — 0.1% | | | | 16,443,864 | |
| | | | | | | | |
| |
Net Assets — 100.0% | | | $ | 16,367,282,041 | |
| | | | | | | | |
| (a) | Non-income producing security. |
| (b) | Annualized 7-day yield as of period end. |
| (c) | Investments in issuers considered to be an affiliate/affiliates of the Fund during the period ended April 30, 2020 for purposes of Section 2(a)(3) of the Investment Company Act of 1940, as amended, were as follows: |
| | | | | | | | | | | | | | | | | | | | | | | | | | | | | | | | |
| Affiliated Issuer | | Shares
Held at
07/31/19 | | | Shares
Purchased | | | Shares Sold | | | Shares
Held at
04/30/20 | | | Value at
04/30/20 | | | Income | | | Net Realized
Gain (Loss) (a) | | | Change in
Unrealized
Appreciation
(Depreciation) | |
BlackRock Liquidity Funds, T-Fund, Institutional Class | | | 1,551,353,531 | | | | — | | | | (307,289,191 | )(b) | | | 1,244,064,340 | | | $ | 1,244,064,340 | | | $ | 16,119,239 | | | $ | 3,073 | | | $ | — | |
| | | | | | | | | | | | | | | | | | | | | | | | | | | | |
| | (a) | Includes net capital gain distributions, if applicable. | |
| | (b) | Represents net shares purchased (sold). | |
For Fund compliance purposes, the Fund’s industry classifications refer to one or more of the industry sub-classifications used by one or more widely recognized market indexes or rating group indexes, and/or as defined by the investment adviser. These definitions may not apply for purposes of this report, which may combine such industry sub-classifications for reporting ease.
Derivative Financial Instruments Outstanding as of Period End
Exchange-Traded Options Purchased
| | | | | | | | | | | | | | | | | | | | | | | | |
| Description | | Number of
Contracts | | | Expiration
Date | | | Exercise
Price | | | Notional Amount (000) | | | Value | |
| Put | | | | | | | | | | | | | | | | | | | |
Microsoft Corp. | | | 18,950 | | | | 05/15/20 | | | USD | | | 172.50 | | | USD | | | 339,603 | | | $ | 4,699,600 | |
| | | | | | | | | | | | | | | | | | | | | | | | |
| | |
| 8 | | 2020 BLACKROCK ANNUAL REPORTTO SHAREHOLDERS |
| | |
Schedule of Investments (continued) April 30, 2020 | | BlackRock Equity Dividend Fund |
Derivative Financial Instruments Categorized by Risk Exposure
As of period end, the fair values of derivative financial instruments located in the Statement of Assets and Liabilities were as follows:
| | | | | | | | | | | | | | | | | | | | | | | | | | | | |
| | | Commodity
Contracts | | | Credit
Contracts | | | Equity
Contracts | | | Foreign
Currency
Exchange
Contracts | | | Interest
Rate
Contracts | | | Other
Contracts | | | Total | |
Assets — Derivative Financial Instruments | | | | | | | | | | | | | | | | | | | | | | | | | | | | |
Options purchased | | | | | | | | | | | | | | | | | | | | | | | | | | | | |
Investments at value — unaffiliated(a) | | $ | — | | | $ | — | | | $ | 4,699,600 | | | $ | — | | | $ | — | | | $ | — | | | $ | 4,699,600 | |
| | | | | | | | | | | | | | | | | | | | | | | | | | | | |
| | (a) | Includes options purchased at value as reported in the Schedule of Investments. | |
For the period ended April 30, 2020, the effect of derivative financial instruments in the Statements of Operations was as follows:
| | | | | | | | | | | | | | | | | | | | | | | | | | | | |
| | | Commodity
Contracts | | | Credit
Contracts | | | Equity
Contracts | | | Foreign
Currency
Exchange
Contracts | | | Interest
Rate
Contracts | | | Other Contracts | | | Total | |
Net Realized Gain (Loss) from: | | | | | | | | | | | | | | | | | | | | | | | | | | | | |
Options purchased(a) | | $ | — | | | $ | — | | | $ | (3,963,650 | ) | | $ | — | | | $ | — | | | $ | — | | | $ | (3,963,650 | ) |
| | | | | | | | | | | | | | | | | | | | | | | | | | | | |
| | | | | | | |
| Net Change in Unrealized Appreciation (Depreciation) on: | | | | | | | | | | | | | | | | | | | | | |
Options purchased(b) | | $ | — | | | $ | — | | | $ | (8,740,530 | ) | | $ | — | | | $ | — | | | $ | — | | | $ | (8,740,530 | ) |
| | | | | | | | | | | | | | | | | | | | | | | | | | | | |
| | (a) | Options purchased are included in net realized gain (loss) from investments. | |
| | (b) | Options purchased are included in net change in unrealized appreciation (depreciation) on investments. | |
Average Quarterly Balances of Outstanding Derivative Financial Instruments
| | | | |
Options: | |
Average value of option contracts purchased… | | $ | 1,566,533 | |
For more information about the Fund’s investment risks regarding derivative financial instruments, refer to the Notes to Financial Statements.
Fair Value Hierarchy as of Period End
Various inputs are used in determining the fair value of investments. For information about the Fund’s policy regarding valuation of investments, refer to the Notes to Financial Statements.
The following tables summarize the Fund’s investments categorized in the disclosure hierarchy:
| | | | | | | | | | | | | | | | |
| | | Level 1 | | | Level 2 | | | Level 3 | | | Total | |
Assets: | | | | | | | | | | | | | | | | |
Investments: | | | | | | | | | | | | | | | | |
Common Stocks: | | | | | | | | | | | | | | | | |
Aerospace & Defense | | $ | 114,473,124 | | | $ | 234,150,586 | | | $ | — | | | $ | 348,623,710 | |
Air Freight & Logistics | | | 66,713,346 | | | | — | | | | — | | | | 66,713,346 | |
Auto Components | | | 9,316,787 | | | | — | | | | — | | | | 9,316,787 | |
Automobiles | | | 190,795,936 | | | | — | | | | — | | | | 190,795,936 | |
Banks | | | 1,748,851,486 | | | | — | | | | — | | | | 1,748,851,486 | |
Beverages | | | 343,889,604 | | | | — | | | | — | | | | 343,889,604 | |
Capital Markets | | | 737,585,824 | | | | — | | | | — | | | | 737,585,824 | |
Chemicals | | | 232,061,051 | | | | — | | | | — | | | | 232,061,051 | |
Communications Equipment | | | 290,058,291 | | | | — | | | | — | | | | 290,058,291 | |
Construction Materials | | | — | | | | 31,202,350 | | | | — | | | | 31,202,350 | |
Consumer Finance | | | 52,699,613 | | | | — | | | | — | | | | 52,699,613 | |
Diversified Financial Services | | | 291,617,941 | | | | — | | | | — | | | | 291,617,941 | |
Diversified Telecommunication Services | | | 684,260,753 | | | | — | | | | — | | | | 684,260,753 | |
Electric Utilities | | | 471,931,920 | | | | — | | | | — | | | | 471,931,920 | |
Food Products | | | 56,270,391 | | | | 175,051,575 | | | | — | | | | 231,321,966 | |
Health Care Equipment & Supplies | | | 391,482,144 | | | | 474,128,892 | | | | — | | | | 865,611,036 | |
Health Care Providers & Services | | | 1,000,889,117 | | | | — | | | | — | | | | 1,000,889,117 | |
Household Durables | | | 92,297,558 | | | | 127,614,130 | | | | — | | | | 219,911,688 | |
Industrial Conglomerates | | | 190,981,597 | | | | 197,590,203 | | | | — | | | | 388,571,800 | |
Insurance | | | 1,008,173,193 | | | | — | | | | — | | | | 1,008,173,193 | |
| | | | |
| SCHEDULE OF INVESTMENTS | | | 9 | |
| | |
Schedule of Investments (continued) April 30, 2020 | | BlackRock Equity Dividend Fund |
Fair Value Hierarchy as of Period End (continued)
| | | | | | | | | | | | | | | | |
| | | Level 1 | | | Level 2 | | | Level 3 | | | Total | |
IT Services | | $ | 489,883,541 | | | $ | — | | | $ | — | | | $ | 489,883,541 | |
Machinery | | | 39,095,140 | | | | — | | | | — | | | | 39,095,140 | |
Media | | | 455,069,001 | | | | — | | | | — | | | | 455,069,001 | |
Multi-Utilities | | | 203,007,901 | | | | — | | | | — | | | | 203,007,901 | |
Multiline Retail | | | 185,261,948 | | | | — | | | | — | | | | 185,261,948 | |
Oil, Gas & Consumable Fuels | | | 1,287,188,602 | | | | 90,751,292 | | | | — | | | | 1,377,939,894 | |
Personal Products | | | 341,013,765 | | | | — | | | | — | | | | 341,013,765 | |
Pharmaceuticals | | | 134,160,801 | | | | 955,235,988 | | | | — | | | | 1,089,396,789 | |
Road & Rail | | | 122,901,680 | | | | — | | | | — | | | | 122,901,680 | |
Semiconductors & Semiconductor Equipment | | | 89,295,173 | | | | — | | | | — | | | | 89,295,173 | |
Software | | | 365,757,893 | | | | — | | | | — | | | | 365,757,893 | |
Specialty Retail | | | 208,393,002 | | | | — | | | | — | | | | 208,393,002 | |
Technology Hardware, Storage & Peripherals | | | — | | | | 214,169,682 | | | | — | | | | 214,169,682 | |
Tobacco | | | 317,501,806 | | | | 40,959,394 | | | | — | | | | 358,461,200 | |
Trading Companies & Distributors | | | — | | | | 150,498,827 | | | | — | | | | 150,498,827 | |
Preferred Stock | | | — | | | | 197,841,389 | | | | — | | | | 197,841,389 | |
Short-Term Securities | | | 1,244,064,340 | | | | — | | | | — | | | | 1,244,064,340 | |
Options Purchased | | | | | | | | | | | | | | | | |
Equity Contracts | | | 4,699,600 | | | | — | | | | — | | | | 4,699,600 | |
| | | | | | | | | | | | | | | | |
| | $ | 13,461,643,869 | | | $ | 2,889,194,308 | | | $ | — | | | $ | 16,350,838,177 | |
| | | | | | | | | | | | | | | | |
See notes to financial statements.
| | |
| 10 | | 2020 BLACKROCK ANNUAL REPORTTO SHAREHOLDERS |
Statement of Assets and Liabilities
April 30, 2020
| | | | |
| | | BlackRock Equity
Dividend Fund | |
| |
ASSETS | | | | |
Investments at value — unaffiliated(a) | | $ | 15,106,773,837 | |
Investments at value — affiliated(b) | | | 1,244,064,340 | |
Cash | | | 360,710 | |
Foreign currency at value(c) | | | 4,088,352 | |
Receivables: | | | | |
Investments sold | | | 109,517,736 | |
Capital shares sold | | | 23,569,297 | |
Dividends — affiliated | | | 206,086 | |
Dividends — unaffiliated | | | 37,387,955 | |
Prepaid expenses | | | 387,159 | |
| | | | |
Total assets | | | 16,526,355,472 | |
| | | | |
| |
LIABILITIES | | | | |
Payables: | | | | |
Investments purchased | | | 99,894,061 | |
Capital shares redeemed | | | 37,224,817 | |
Investment advisory fees | | | 14,592,162 | |
Trustees’ and Officer’s fees | | | 67,118 | |
Other accrued expenses | | | 5,477,642 | |
Other affiliates | | | 57,488 | |
Service and distribution fees | | | 1,760,143 | |
| | | | |
Total liabilities | | | 159,073,431 | |
| | | | |
| |
NET ASSETS | | $ | 16,367,282,041 | |
| | | | |
| |
NET ASSETS CONSIST OF | | | | |
Paid-in capital | | $ | 14,455,889,167 | |
Accumulated earnings | | | 1,911,392,874 | |
| | | | |
NET ASSETS | | $ | 16,367,282,041 | |
| | | | |
| |
(a) Investments at cost — unaffiliated | | $ | 13,296,720,039 | |
| | | | |
(b) Investments at cost — affiliated | | $ | 1,244,064,340 | |
| | | | |
(c) Foreign currency at cost | | $ | 4,047,587 | |
| | | | |
See notes to financial statements.
Statement of Assets and Liabilities (continued)
April 30, 2020
| | | | |
| | | BlackRock Equity
Dividend Fund | |
|
NET ASSET VALUE | |
| |
| Institutional | | | |
Net assets | | $ | 8,412,640,706 | |
| | | | |
Shares outstanding(d) | | | 486,192,252 | |
| | | | |
Net asset value | | $ | 17.30 | |
| | | | |
| |
| Service | | | |
Net assets | | $ | 89,711,399 | |
| | | | |
Shares outstanding(d) | | | 5,207,560 | |
| | | | |
Net asset value | | $ | 17.23 | |
| | | | |
| |
| Investor A | | | |
Net assets | | $ | 3,954,045,246 | |
| | | | |
Shares outstanding(d) | | | 229,334,242 | |
| | | | |
Net asset value | | $ | 17.24 | |
| | | | |
| |
| Investor C | | | |
Net assets | | $ | 1,033,611,101 | |
| | | | |
Shares outstanding(d) | | | 62,787,808 | |
| | | | |
Net asset value | | $ | 16.46 | |
| | | | |
| |
| Class K | | | |
Net assets | | $ | 2,440,035,237 | |
| | | | |
Shares outstanding(d) | | | 141,085,347 | |
| | | | |
Net asset value | | $ | 17.29 | |
| | | | |
|
| Class R | |
Net assets | | $ | 437,238,352 | |
| | | | |
Shares outstanding(d) | | | 25,099,377 | |
| | | | |
Net asset value | | $ | 17.42 | |
| | | | |
| (d) | Unlimited number of shares authorized, $0.10 par value. |
See notes to financial statements.
| | |
| 12 | | 2020 BLACKROCK ANNUAL REPORTTO SHAREHOLDERS |
Statements of Operations
| | | | | | | | |
| | | BlackRock Equity Dividend Fund | |
| | | Period from
08/01/19 to
04/30/20 | | | Year Ended
July 31, 2019 | |
| | |
INVESTMENT INCOME | | | | | | | | |
Dividends — affiliated | | $ | 16,119,239 | | | $ | 27,720,607 | |
Dividends — unaffiliated | | | 364,105,719 | | | | 512,075,261 | |
Other income | | | 25,246 | | | | — | |
Foreign taxes withheld | | | (7,276,348 | ) | | | (9,493,688 | ) |
| | | | | | | | |
Total investment income | | | 372,973,856 | | | | 530,302,180 | |
| | | | | | | | |
| | |
EXPENSES | | | | | | | | |
Investment advisory | | | 77,795,915 | | | | 109,519,037 | |
Service and distribution — class specific | | | 20,557,405 | | | | 33,556,946 | |
Transfer agent — class specific | | | 15,365,096 | | | | 21,722,746 | |
Accounting services | | | 1,321,105 | | | | 1,560,970 | |
Registration | | | 317,922 | | | | 395,544 | |
Custodian | | | 306,486 | | | | 276,211 | |
Printing | | | 245,557 | | | | 285,657 | |
Trustees and Officer | | | 210,640 | | | | 291,477 | |
Professional | | | 189,284 | | | | 305,264 | |
Reorganization costs | | | 20,250 | | | | — | |
Board realignment and consolidation | | | — | | | | 463,486 | |
Miscellaneous | | | 185,772 | | | | 279,402 | |
| | | | | | | | |
Total expenses | | | 116,515,432 | | | | 168,656,740 | |
Less | | | | | | | | |
Fees waived and/or reimbursed by the Manager | | | (839,554 | ) | | | (902,811 | ) |
| | | | | | | | |
Total expenses after fees waived and/or reimbursed | | | 115,675,878 | | | | 167,753,929 | |
| | | | | | | | |
Net investment income | | | 257,297,978 | | | | 362,548,251 | |
| | | | | | | | |
| | |
REALIZED AND UNREALIZED GAIN (LOSS) | | | | | | | | |
Net realized gain (loss) from: | | | | | | | | |
Capital gain distributions from investment companies — affiliated | | | 3,073 | | | | — | |
Foreign currency transactions | | | (1,235,158 | ) | | | (955,055 | ) |
Investments — unaffiliated | | | 738,055,599 | | | | 2,183,613,138 | |
| | | | | | | | |
| | | 736,823,514 | | | | 2,182,658,083 | |
| | | | | | | | |
Net change in unrealized appreciation (depreciation) on: | | | | | | | | |
Foreign currency translations | | | 276,144 | | | | (39,733 | ) |
Investments — unaffiliated | | | (2,586,628,133 | ) | | | (1,900,256,650 | ) |
| | | | | | | | |
| | | (2,586,351,989 | ) | | | (1,900,296,383 | ) |
| | | | | | | | |
Net realized and unrealized gain (loss) | | | (1,849,528,475 | ) | | | 282,361,700 | |
| | | | | | | | |
NET INCREASE (DECREASE) IN NET ASSETS RESULTING FROM OPERATIONS | | $ | (1,592,230,497 | ) | | $ | 644,909,951 | |
| | | | | | | | |
See notes to financial statements.
Statements of Changes in Net Assets
| | | | | | | | | | | | |
| | | BlackRock Equity Dividend Fund | |
| | | Period from 08/01/19 to
04/30/20 | | | Year Ended July 31, | |
| | | 2019 | | | 2018 | |
| | |
INCREASE (DECREASE) IN NET ASSETS | | | | | | | | |
| | | |
OPERATIONS | | | | | | | | | | | | |
Net investment income | | $ | 257,297,978 | | | $ | 362,548,251 | | | $ | 355,540,653 | |
Net realized gain | | | 736,823,514 | | | | 2,182,658,083 | | | | 2,548,426,937 | |
Net change in unrealized appreciation (depreciation) | | | (2,586,351,989 | ) | | | (1,900,296,383 | ) | | | (439,429,194 | ) |
| | | | | | | | | | | | |
Net increase (decrease) in net assets resulting from operations | | | (1,592,230,497 | ) | | | 644,909,951 | | | | 2,464,538,396 | |
| | | | | | | | | | | | |
| | | |
DISTRIBUTIONS TO SHAREHOLDERS(a) | | | | | | | | | | | | |
Institutional | | | (348,755,055 | ) | | | (2,135,727,228 | ) | | | (711,252,830 | ) |
Service | | | (4,229,257 | ) | | | (24,793,219 | ) | | | (3,335,432 | ) |
Investor A | | | (155,857,910 | ) | | | (949,796,662 | ) | | | (300,058,042 | ) |
Investor B | | | — | | | | — | | | | (24,281 | ) |
Investor C | | | (40,164,167 | ) | | | (367,454,272 | ) | | | (124,146,026 | ) |
Investor C1 | | | (18,013 | ) | | | (147,216 | ) | | | (101,636 | ) |
Class K | | | (92,745,449 | ) | | | (462,295,640 | ) | | | (36,033,423 | ) |
Class R | | | (17,611,553 | ) | | | (130,480,365 | ) | | | (42,580,320 | ) |
| | | | | | | | | | | | |
Decrease in net assets resulting from distributions to shareholders | | | (659,381,404 | ) | | | (4,070,694,602 | ) | | | (1,217,531,990 | ) |
| | | | | | | | | | | | |
| | | |
CAPITAL SHARE TRANSACTIONS | | | | | | | | | | | | |
Net increase (decrease) in net assets derived from capital share transactions | | | (639,568,595 | ) | | | 1,270,698,999 | | | | (1,208,229,169 | ) |
| | | | | | | | | | | | |
| | | |
NET ASSETS | | | | | | | | | | | | |
Total increase (decrease) in net assets | | | (2,891,180,496 | ) | | | (2,155,085,652 | ) | | | 38,777,237 | |
Beginning of period | | | 19,258,462,537 | | | | 21,413,548,189 | | | | 21,374,770,952 | |
| | | | | | | | | | | | |
End of period | | $ | 16,367,282,041 | | | $ | 19,258,462,537 | | | $ | 21,413,548,189 | |
| | | | | | | | | | | | |
| (a) | Distributions for annual periods determined in accordance with U.S. federal income tax regulations. |
See notes to financial statements.
| | |
| 14 | | 2020 BLACKROCK ANNUAL REPORTTO SHAREHOLDERS |
Financial Highlights
(For a share outstanding throughout each period)
| | | | | | | | | | | | | | | | | | | | | | | | | | | | |
| | | BlackRock Equity Dividend Fund | |
| |
| | | Institutional | |
| | | Period from
08/01/19 to
04/30/20 | | | | | | Year Ended July 31, | |
| | | | | | 2019 | | | 2018 | | | 2017 | | | 2016 | | | 2015 | |
| | | | | | | | |
Net asset value, beginning of period | | $ | 19.70 | | | | | | | $ | 23.53 | | | $ | 22.19 | | | $ | 22.33 | | | $ | 24.94 | | | $ | 24.71 | |
| | | | | | | | | | | | | | | | | | | | | | | | | | | | |
Net investment income(a) | | | 0.29 | | | | | | | | 0.43 | | | | 0.42 | | | | 0.43 | | | | 0.44 | | | | 0.47 | |
Net realized and unrealized gain (loss) | | | (1.98 | ) | | | | | | | 0.31 | | | | 2.28 | | | | 3.22 | | | | 0.79 | | | | 1.34 | |
| | | | | | | | | | | | | | | | | | | | | | | | | | | | |
Net increase (decrease) from investment operations | | | (1.69 | ) | | | | | | | 0.74 | | | | 2.70 | | | | 3.65 | | | | 1.23 | | | | 1.81 | |
| | | | | | | | | | | | | | | | | | | | | | | | | | | | |
| | | | | | | |
Distributions(b) | | | | | | | | | | | | | | | | | | | | | | | | | | | | |
From net investment income | | | (0.27 | ) | | | | | | | (0.46 | ) | | | (0.39 | ) | | | (0.44 | ) | | | (0.45 | ) | | | (0.48 | ) |
From net realized gain | | | (0.44 | ) | | | | | | | (4.11 | ) | | | (0.97 | ) | | | (3.35 | ) | | | (3.39 | ) | | | (1.10 | ) |
| | | | | | | | | | | | | | | | | | | | | | | | | | | | |
Total distributions | | | (0.71 | ) | | | | | | | (4.57 | ) | | | (1.36 | ) | | | (3.79 | ) | | | (3.84 | ) | | | (1.58 | ) |
| | | | | | | | | | | | | | | | | | | | | | | | | | | | |
| | | | | | | |
Net asset value, end of period | | $ | 17.30 | | | | | | | $ | 19.70 | | | $ | 23.53 | | | $ | 22.19 | | | $ | 22.33 | | | $ | 24.94 | |
| | | | | | | | | | | | | | | | | | | | | | | | | | | | |
| | | | | | | |
Total Return(c) | | | | | | | | | | | | | | | | | | | | | | | | | | | | |
Based on net asset value | | | (8.98 | )%(d) | | | | | | | 4.02 | % | | | 12.47 | % | | | 17.13 | % | | | 6.29 | % | | | 7.55 | % |
| | | | | | | | | | | | | | | | | | | | | | | | | | | | |
| | | | | | | |
Ratios to Average Net Assets(e) | | | | | | | | | | | | | | | | | | | | | | | | | | | | |
Total expenses | | | 0.71 | %(f) | | | | | | | 0.70 | % | | | 0.72 | % | | | 0.72 | % | | | 0.71 | % | | | 0.70 | % |
| | | | | | | | | | | | | | | | | | | | | | | | | | | | |
Total expenses after fees waived and/or reimbursed and paid indirectly | | | 0.70 | %(f) | | | | | | | 0.69 | % | | | 0.72 | % | | | 0.71 | % | | | 0.69 | % | | | 0.69 | % |
| | | | | | | | | | | | | | | | | | | | | | | | | | | | |
Net investment income | | | 1.98 | %(f) | | | | | | | 2.01 | % | | | 1.86 | % | | | 1.89 | % | | | 2.00 | % | | | 1.86 | % |
| | | | | | | | | | | | | | | | | | | | | | | | | | | | |
| | | | | | | |
Supplemental Data | | | | | | | | | | | | | | | | | | | | | | | | | | | | |
Net assets, end of period (000) | | $ | 8,412,641 | | | | | | | $ | 9,977,737 | | | $ | 11,120,924 | | | $ | 12,305,546 | | | $ | 11,620,763 | | | $ | 13,242,101 | |
| | | | | | | | | | | | | | | | | | | | | | | | | | | | |
Portfolio turnover rate | | | 40 | % | | | | | | | 43 | % | | | 36 | % | | | 29 | % | | | 25 | % | | | 25 | % |
| | | | | | | | | | | | | | | | | | | | | | | | | | | | |
| (a) | Based on average shares outstanding. |
| (b) | Distributions for annual periods determined in accordance with U.S. federal income tax regulations. |
| (c) | Where applicable, assumes the reinvestment of distributions. |
| (d) | Aggregate total return. |
| (e) | Excludes expenses incurred indirectly as a result of investments in underlying funds as follows: |
| | | | | | | | | | | | | | | | | | | | | | | | | | | | |
| | | Period from
08/01/19 to
04/30/20 | | | | | | Year Ended July 31, | |
| | | | | | 2019 | | | 2018 | | | 2017 | | | 2016 | | | 2015 | |
Investments in underlying funds | | | 0.01 | % | | | | | | | 0.01 | % | | | 0.01 | % | | | 0.01 | % | | | 0.01 | % | | | — | % |
| | | | | | | | | | | | | | | | | | | | | | | | | | | | |
See notes to financial statements.
Financial Highlights (continued)
(For a share outstanding throughout each period)
| | | | | | | | | | | | | | | | | | | | | | | | | | | | |
| | | BlackRock Equity Dividend Fund (continued) | |
| |
| | | Service | |
| | | Period from
08/01/19 to
04/30/20 | | | | | | Year Ended July 31, | |
| | | | | | 2019 | | | 2018 | | | 2017 | | | 2016 | | | 2015 | |
| | | | | | | | |
Net asset value, beginning of period | | $ | 19.61 | | | | | | | $ | 23.44 | | | $ | 22.12 | | | $ | 22.26 | | | $ | 24.86 | | | $ | 24.63 | |
| | | | | | | | | | | | | | | | | | | | | | | | | | | | |
Net investment income(a) | | | 0.24 | | | | | | | | 0.36 | | | | 0.36 | | | | 0.39 | | | | 0.37 | | | | 0.39 | |
Net realized and unrealized gain (loss) | | | (1.96 | ) | | | | | | | 0.32 | | | | 2.26 | | | | 3.21 | | | | 0.79 | | | | 1.33 | |
| | | | | | | | | | | | | | | | | | | | | | | | | | | | |
Net increase (decrease) from investment operations | | | (1.72 | ) | | | | | | | 0.68 | | | | 2.62 | | | | 3.60 | | | | 1.16 | | | | 1.72 | |
| | | | | | | | | | | | | | | | | | | | | | | | | | | | |
| | | | | | | |
Distributions(b) | | | | | | | | | | | | | | | | | | | | | | | | | | | | |
From net investment income | | | (0.22 | ) | | | | | | | (0.40 | ) | | | (0.33 | ) | | | (0.39 | ) | | | (0.37 | ) | | | (0.39 | ) |
From net realized gain | | | (0.44 | ) | | | | | | | (4.11 | ) | | | (0.97 | ) | | | (3.35 | ) | | | (3.39 | ) | | | (1.10 | ) |
| | | | | | | | | | | | | | | | | | | | | | | | | | | | |
Total distributions | | | (0.66 | ) | | | | | | | (4.51 | ) | | | (1.30 | ) | | | (3.74 | ) | | | (3.76 | ) | | | (1.49 | ) |
| | | | | | | | | | | | | | | | | | | | | | | | | | | | |
| | | | | | | |
Net asset value, end of period | | $ | 17.23 | | | | | | | $ | 19.61 | | | $ | 23.44 | | | $ | 22.12 | | | $ | 22.26 | | | $ | 24.86 | |
| | | | | | | | | | | | | | | | | | | | | | | | | | | | |
| | | | | | | |
Total Return(c) | | | | | | | | | | | | | | | | | | | | | | | | | | | | |
Based on net asset value | | | (9.16 | )%(d) | | | | | | | 3.74 | % | | | 12.11 | % | | | 16.92 | % | | | 5.95 | % | | | 7.19 | % |
| | | | | | | | | | | | | | | | | | | | | | | | | | | | |
| | | | | | | |
Ratios to Average Net Assets(e) | | | | | | | | | | | | | | | | | | | | | | | | | | | | |
Total expenses | | | 1.01 | %(f) | | | | | | | 1.00 | % | | | 1.01 | % | | | 0.92 | % | | | 1.04 | % | | | 1.02 | % |
| | | | | | | | | | | | | | | | | | | | | | | | | | | | |
Total expenses after fees waived and/or reimbursed and paid indirectly | | | 1.00 | %(f) | | | | | | | 0.99 | % | | | 1.01 | % | | | 0.92 | % | | | 1.01 | % | | | 1.01 | % |
| | | | | | | | | | | | | | | | | | | | | | | | | | | | |
Net investment income | | | 1.68 | %(f) | | | | | | | 1.69 | % | | | 1.59 | % | | | 1.72 | % | | | 1.68 | % | | | 1.58 | % |
| | | | | | | | | | | | | | | | | | | | | | | | | | | | |
| | | | | | | |
Supplemental Data | | | | | | | | | | | | | | | | | | | | | | | | | | | | |
Net assets, end of period (000) | | $ | 89,711 | | | | | | | $ | 130,943 | | | $ | 82,914 | | | $ | 63,273 | | | $ | 86,382 | | | $ | 99,271 | |
| | | | | | | | | | | | | | | | | | | | | | | | | | | | |
Portfolio turnover rate | | | 40 | % | | | | | | | 43 | % | | | 36 | % | | | 29 | % | | | 25 | % | | | 25 | % |
| | | | | | | | | | | | | | | | | | | | | | | | | | | | |
| (a) | Based on average shares outstanding. |
| (b) | Distributions for annual periods determined in accordance with U.S. federal income tax regulations. |
| (c) | Where applicable, assumes the reinvestment of distributions. |
| (d) | Aggregate total return. |
| (e) | Excludes expenses incurred indirectly as a result of investments in underlying funds as follows: |
| | | | | | | | | | | | | | | | | | | | | | | | | | | | |
| | | Period from
08/01/19 to 04/30/20 | | | | | | Year Ended July 31, | |
| | | | | | 2019 | | | 2018 | | | 2017 | | | 2016 | | | 2015 | |
Investments in underlying funds | | | 0.01 | % | | | | | | | 0.01 | % | | | 0.01 | % | | | 0.01 | % | | | 0.01 | % | | | — | % |
| | | | | | | | | | | | | | | | | | | | | | | | | | | | |
See notes to financial statements.
| | |
| 16 | | 2020 BLACKROCK ANNUAL REPORTTO SHAREHOLDERS |
Financial Highlights (continued)
(For a share outstanding throughout each period)
| | | | | | | | | | | | | | | | | | | | | | | | | | | | |
| | | BlackRock Equity Dividend Fund (continued) | |
| |
| | | Investor A | |
| | | Period from
08/01/19 to 04/30/20 | | | | | | Year Ended July 31, | |
| | | | | | 2019 | | | 2018 | | | 2017 | | | 2016 | | | 2015 | |
| | | | | | | | |
Net asset value, beginning of period | | $ | 19.63 | | | | | | | $ | 23.46 | | | $ | 22.13 | | | $ | 22.28 | | | $ | 24.88 | | | $ | 24.65 | |
| | | | | | | | | | | | | | | | | | | | | | | | | | | | |
Net investment income(a) | | | 0.25 | | | | | | | | 0.37 | | | | 0.37 | | | | 0.38 | | | | 0.39 | | | | 0.40 | |
Net realized and unrealized gain (loss) | | | (1.97 | ) | | | | | | | 0.32 | | | | 2.26 | | | | 3.20 | | | | 0.79 | | | | 1.33 | |
| | | | | | | | | | | | | | | | | | | | | | | | | | | | |
Net increase (decrease) from investment operations | | | (1.72 | ) | | | | | | | 0.69 | | | | 2.63 | | | | 3.58 | | | | 1.18 | | | | 1.73 | |
| | | | | | | | | | | | | | | | | | | | | | | | | | | | |
| | | | | | | |
Distributions(b) | | | | | | | | | | | | | | | | | | | | | | | | | | | | |
From net investment income | | | (0.23 | ) | | | | | | | (0.41 | ) | | | (0.33 | ) | | | (0.38 | ) | | | (0.39 | ) | | | (0.40 | ) |
From net realized gain | | | (0.44 | ) | | | | | | | (4.11 | ) | | | (0.97 | ) | | | (3.35 | ) | | | (3.39 | ) | | | (1.10 | ) |
| | | | | | | | | | | | | | | | | | | | | | | | | | | | |
Total distributions | | | (0.67 | ) | | | | | | | (4.52 | ) | | | (1.30 | ) | | | (3.73 | ) | | | (3.78 | ) | | | (1.50 | ) |
| | | | | | | | | | | | | | | | | | | | | | | | | | | | |
| | | | | | | |
Net asset value, end of period | | $ | 17.24 | | | | | | | $ | 19.63 | | | $ | 23.46 | | | $ | 22.13 | | | $ | 22.28 | | | $ | 24.88 | |
| | | | | | | | | | | | | | | | | | | | | | | | | | | | |
| | | | | | | |
Total Return(c) | | | | | | | | | | | | | | | | | | | | | | | | | | | | |
Based on net asset value | | | (9.14 | )%(d) | | | | | | | 3.76 | % | | | 12.18 | % | | | 16.82 | % | | | 6.07 | % | | | 7.25 | % |
| | | | | | | | | | | | | | | | | | | | | | | | | | | | |
| | | | | | | |
Ratios to Average Net Assets(e) | | | | | | | | | | | | | | | | | | | | | | | | | | | | |
Total expenses | | | 0.95 | %(f) | | | | | | | 0.96 | % | | | 0.97 | % | | | 0.97 | % | | | 0.96 | % | | | 0.97 | % |
| | | | | | | | | | | | | | | | | | | | | | | | | | | | |
Total expenses after fees waived and/or reimbursed and paid indirectly | | | 0.95 | %(f) | | | | | | | 0.95 | % | | | 0.96 | % | | | 0.96 | % | | | 0.93 | % | | | 0.96 | % |
| | | | | | | | | | | | | | | | | | | | | | | | | | | | |
Net investment income | | | 1.73 | %(f) | | | | | | | 1.74 | % | | | 1.61 | % | | | 1.66 | % | | | 1.76 | % | | | 1.61 | % |
| | | | | | | | | | | | | | | | | | | | | | | | | | | | |
| | | | | | | |
Supplemental Data | | | | | | | | | | | | | | | | | | | | | | | | | | | | |
Net assets, end of period (000) | | $ | 3,954,045 | | | | | | | $ | 4,504,748 | | | $ | 4,999,366 | | | $ | 5,435,461 | | | $ | 5,951,054 | | | $ | 7,226,833 | |
| | | | | | | | | | | | | | | | | | | | | | | | | | | | |
Portfolio turnover rate | | | 40 | % | | | | | | | 43 | % | | | 36 | % | | | 29 | % | | | 25 | % | | | 25 | % |
| | | | | | | | | | | | | | | | | | | | | | | | | | | | |
| (a) | Based on average shares outstanding. |
| (b) | Distributions for annual periods determined in accordance with U.S. federal income tax regulations. |
| (c) | Where applicable, excludes the effects of any sales charges and assumes the reinvestment of distributions. |
| (d) | Aggregate total return. |
| (e) | Excludes expenses incurred indirectly as a result of investments in underlying funds as follows: |
| | | | | | | | | | | | | | | | | | | | | | | | | | | | |
| | | Period from
08/01/19 to
04/30/20 | | | | | | Year Ended July 31, | |
| | | | | | 2019 | | | 2018 | | | 2017 | | | 2016 | | | 2015 | |
Investments in underlying funds | | | 0.01 | % | | | | | | | 0.01 | % | | | 0.01 | % | | | 0.01 | % | | | 0.01 | % | | | — | % |
| | | | | | | | | | | | | | | | | | | | | | | | | | | | |
See notes to financial statements.
Financial Highlights (continued)
(For a share outstanding throughout each period)
| | | | | | | | | | | | | | | | | | | | | | | | | | | | |
| | | BlackRock Equity Dividend Fund (continued) | |
| |
| | | Investor C | |
| | | Period from
08/01/19 to
04/30/20 | | | | | | Year Ended July 31, | |
| | | | | | 2019 | | | 2018 | | | 2017 | | | 2016 | | | 2015 | |
| | | | | | | | |
Net asset value, beginning of period | | $ | 18.76 | | | | | | | $ | 22.62 | | | $ | 21.37 | | | $ | 21.62 | | | $ | 24.27 | | | $ | 24.08 | |
| | | | | | | | | | | | | | | | | | | | | | | | | | | | |
Net investment income(a) | | | 0.14 | | | | | | | | 0.21 | | | | 0.20 | | | | 0.21 | | | | 0.22 | | | | 0.22 | |
Net realized and unrealized gain (loss) | | | (1.87 | ) | | | | | | | 0.29 | | | | 2.19 | | | | 3.10 | | | | 0.76 | | | | 1.31 | |
| | | | | | | | | | | | | | | | | | | | | | | | | | | | |
Net increase (decrease) from investment operations | | | (1.73 | ) | | | | | | | 0.50 | | | | 2.39 | | | | 3.31 | | | | 0.98 | | | | 1.53 | |
| | | | | | | | | | | | | | | | | | | | | | | | | | | | |
| | | | | | | |
Distributions(b) | | | | | | | | | | | | | | | | | | | | | | | | | | | | |
From net investment income | | | (0.13 | ) | | | | | | | (0.25 | ) | | | (0.17 | ) | | | (0.21 | ) | | | (0.24 | ) | | | (0.24 | ) |
From net realized gain | | | (0.44 | ) | | | | | | | (4.11 | ) | | | (0.97 | ) | | | (3.35 | ) | | | (3.39 | ) | | | (1.10 | ) |
| | | | | | | | | | | | | | | | | | | | | | | | | | | | |
Total distributions | | | (0.57 | ) | | | | | | | (4.36 | ) | | | (1.14 | ) | | | (3.56 | ) | | | (3.63 | ) | | | (1.34 | ) |
| | | | | | | | | | | | | | | | | | | | | | | | | | | | |
| | | | | | | |
Net asset value, end of period | | $ | 16.46 | | | | | | | $ | 18.76 | | | $ | 22.62 | | | $ | 21.37 | | | $ | 21.62 | | | $ | 24.27 | |
| | | | | | | | | | | | | | | | | | | | | | | | | | | | |
| | | | | | | |
Total Return(c) | | | | | | | | | | | | | | | | | | | | | | | | | | | | |
Based on net asset value | | | (9.62 | )%(d) | | | | | | | 3.01 | % | | | 11.44 | % | | | 15.99 | % | | | 5.24 | % | | | 6.51 | % |
| | | | | | | | | | | | | | | | | | | | | | | | | | | | |
| | | | | | | |
Ratios to Average Net Assets(e) | | | | | | | | | | | | | | | | | | | | | | | | | | | | |
Total expenses | | | 1.67 | %(f) | | | | | | | 1.67 | % | | | 1.67 | % | | | 1.69 | % | | | 1.69 | % | | | 1.67 | % |
| | | | | | | | | | | | | | | | | | | | | | | | | | | | |
Total expenses after fees waived and/or reimbursed and paid indirectly | | | 1.66 | %(f) | | | | | | | 1.66 | % | | | 1.67 | % | | | 1.69 | % | | | 1.67 | % | | | 1.66 | % |
| | | | | | | | | | | | | | | | | | | | | | | | | | | | |
Net investment income | | | 1.04 | %(f) | | | | | | | 1.05 | % | | | 0.90 | % | | | 0.94 | % | | | 1.02 | % | | | 0.88 | % |
| | | | | | | | | | | | | | | | | | | | | | | | | | | | |
| | | | | | | |
Supplemental Data | | | | | | | | | | | | | | | | | | | | | | | | | | | | |
Net assets, end of period (000) | | $ | 1,033,611 | | | | | | | $ | 1,615,843 | | | $ | 2,225,355 | | | $ | 2,538,471 | | | $ | 3,043,757 | | | $ | 3,361,651 | |
| | | | | | | | | | | | | | | | | | | | | | | | | | | | |
Portfolio turnover rate | | | 40 | % | | | | | | | 43 | % | | | 36 | % | | | 29 | % | | | 25 | % | | | 25 | % |
| | | | | | | | | | | | | | | | | | | | | | | | | | | | |
| (a) | Based on average shares outstanding. |
| (b) | Distributions for annual periods determined in accordance with U.S. federal income tax regulations. |
| (c) | Where applicable, excludes the effects of any sales charges and assumes the reinvestment of distributions. |
| (d) | Aggregate total return. |
| (e) | Excludes expenses incurred indirectly as a result of investments in underlying funds as follows: |
| | | | | | | | | | | | | | | | | | | | | | | | | | | | |
| | | Period from
08/01/19 to
04/30/20 | | | | | | Year Ended July 31, | |
| | | | | | 2019 | | | 2018 | | | 2017 | | | 2016 | | | 2015 | |
Investments in underlying funds | | | 0.01 | % | | | | | | | 0.01 | % | | | 0.01 | % | | | 0.01 | % | | | 0.01 | % | | | — | % |
| | | | | | | | | | | | | | | | | | | | | | | | | | | | |
See notes to financial statements.
| | |
| 18 | | 2020 BLACKROCK ANNUAL REPORTTO SHAREHOLDERS |
Financial Highlights (continued)
(For a share outstanding throughout each period)
| | | | | | | | | | | | | | | | | | | | | | | | | | | | |
| | | BlackRock Equity Dividend Fund (continued) | |
| |
| | | Class K | |
| | | Period from
08/01/19
to 04/30/20 | | | | | | Year Ended July 31, | |
| | | | | | 2019 | | | 2018 | | | 2017 | | | | | | Period from 03/28/16 (a) to 07/31/16 | |
| | | | | | | | |
Net asset value, beginning of period | | $ | 19.69 | | | | | | | $ | 23.52 | | | $ | 22.18 | | | $ | 22.32 | | | | | | | $ | 20.97 | |
| | | | | | | | | | | | | | | | | | | | | | | | | | | | |
Net investment income(b) | | | 0.30 | | | | | | | | 0.45 | | | | 0.45 | | | | 0.42 | | | | | | | | 0.09 | |
Net realized and unrealized gain (loss) | | | (1.97 | ) | | | | | | | 0.32 | | | | 2.28 | | | | 3.26 | | | | | | | | 1.48 | |
| | | | | | | | | | | | | | | | | | | | | | | | | | | | |
Net increase (decrease) from investment operations | | | (1.67 | ) | | | | | | | 0.77 | | | | 2.73 | | | | 3.68 | | | | | | | | 1.57 | |
| | | | | | | | | | | | | | | | | | | | | | | | | | | | |
| | | | | | | |
Distributions(c) | | | | | | | | | | | | | | | | | | | | | | | | | | | | |
From net investment income | | | (0.29 | ) | | | | | | | (0.49 | ) | | | (0.42 | ) | | | (0.47 | ) | | | | | | | (0.22 | ) |
From net realized gain | | | (0.44 | ) | | | | | | | (4.11 | ) | | | (0.97 | ) | | | (3.35 | ) | | | | | | | — | |
| | | | | | | | | | | | | | | | | | | | | | | | | | | | |
Total distributions | | | (0.73 | ) | | | | | | | (4.60 | ) | | | (1.39 | ) | | | (3.82 | ) | | | | | | | (0.22 | ) |
| | | | | | | | | | | | | | | | | | | | | | | | | | | | |
| | | | | | | |
Net asset value, end of period | | $ | 17.29 | | | | | | | $ | 19.69 | | | $ | 23.52 | | | $ | 22.18 | | | | | | | $ | 22.32 | |
| | | | | | | | | | | | | | | | | | | | | | | | | | | | |
| | | | | | | |
Total Return(d) | | | | | | | | | | | | | | | | | | | | | | | | | | | | |
Based on net asset value | | | (8.90 | )%(e) | | | | | | | 4.14 | % | | | 12.63 | % | | | 17.28 | % | | | | | | | 7.50 | %(e) |
| | | | | | | | | | | | | | | | | | | | | | | | | | | | |
| | | | | | | |
Ratios to Average Net Assets(f) | | | | | | | | | | | | | | | | | | | | | | | | | | | | |
Total expenses | | | 0.59 | %(g) | | | | | | | 0.59 | % | | | 0.59 | % | | | 0.59 | % | | | | | | | 0.58 | %(g)(h) |
| | | | | | | | | | | | | | | | | | | | | | | | | | | | |
Total expenses after fees waived and/or reimbursed and paid indirectly | | | 0.58 | %(g) | | | | | | | 0.58 | % | | | 0.58 | % | | | 0.59 | % | | | | | | | 0.57 | %(g)(h) |
| | | | | | | | | | | | | | | | | | | | | | | | | | | | |
Net investment income | | | 2.10 | %(g) | | | | | | | 2.10 | % | | | 1.99 | % | | | 1.83 | % | | | | | | | 1.22 | %(g) |
| | | | | | | | | | | | | | | | | | | | | | | | | | | | |
| | | | | | | |
Supplemental Data | | | | | | | | | | | | | | | | | | | | | | | | | | | | |
Net assets, end of period (000) | | $ | 2,440,035 | | | | | | | $ | 2,413,725 | | | $ | 2,229,057 | | | $ | 209,323 | | | | | | | $ | 22,861 | |
| | | | | | | | | | | | | | | | | | | | | | | | | | | | |
Portfolio turnover rate | | | 40 | % | | | | | | | 43 | % | | | 36 | % | | | 29 | % | | | | | | | 25 | % |
| | | | | | | | | | | | | | | | | | | | | | | | | | | | |
| (a) | Commencement of operations. |
| (b) | Based on average shares outstanding. |
| (c) | Distributions for annual periods determined in accordance with U.S. federal income tax regulations. |
| (d) | Where applicable, assumes the reinvestment of distributions. |
| (e) | Aggregate total return. |
| (f) | Excludes expenses incurred indirectly as a result of investments in underlying funds as follows: |
| | | | | | | | | | | | | | | | | | | | | | | | | | | | |
| | | Period from
08/01/19 to
04/30/20 | | | | | | Year Ended July 31, | |
| | | 2019 | | | 2018 | | | 2017 | | | | | | Period from 03/28/16 (a) to 07/31/16 | |
Investments in underlying funds | | | 0.01 | % | | | | | | | 0.01 | % | | | 0.01 | % | | | 0.01 | % | | | | | | | 0.01 | % |
| | | | | | | | | | | | | | | | | | | | |
| (h) | Audit and offering costs were not annualized in the calculation of the expense ratios. If these expenses were annualized, the total expenses would have been 0.58%. |
See notes to financial statements.
Financial Highlights (continued)
(For a share outstanding throughout each period)
| | | | | | | | | | | | | | | | | | | | | | | | | | | | |
| | | BlackRock Equity Dividend Fund (continued) | |
| |
| | | Class R | |
| | | Period from
08/01/19
to 04/30/20 | | | | | | Year Ended July 31, | |
| | | | | | 2019 | | | 2018 | | | 2017 | | | 2016 | | | 2015 | |
| | | | | | | | |
Net asset value, beginning of period | | $ | 19.82 | | | | | | | $ | 23.64 | | | $ | 22.28 | | | $ | 22.41 | | | $ | 25.01 | | | $ | 24.76 | |
| | | | | | | | | | | | | | | | | | | | | | | | | | | | |
Net investment income(a) | | | 0.21 | | | | | | | | 0.31 | | | | 0.30 | | | | 0.31 | | | | 0.32 | | | | 0.32 | |
Net realized and unrealized gain (loss) | | | (1.99 | ) | | | | | | | 0.31 | | | | 2.29 | | | | 3.22 | | | | 0.79 | | | | 1.35 | |
| | | | | | | | | | | | | | | | | | | | | | | | | | | | |
Net increase (decrease) from investment operations | | | (1.78 | ) | | | | | | | 0.62 | | | | 2.59 | | | | 3.53 | | | | 1.11 | | | | 1.67 | |
| | | | | | | | | | | | | | | | | | | | | | | | | | | | |
| | | | | | | |
| Distributions(b) | | | | | | | | | | | | | | | | | | | | | |
From net investment income | | | (0.18 | ) | | | | | | | (0.33 | ) | | | (0.26 | ) | | | (0.31 | ) | | | (0.32 | ) | | | (0.32 | ) |
From net realized gain | | | (0.44 | ) | | | | | | | (4.11 | ) | | | (0.97 | ) | | | (3.35 | ) | | | (3.39 | ) | | | (1.10 | ) |
| | | | | | | | | | | | | | | | | | | | | | | | | | | | |
Total distributions | | | (0.62 | ) | | | | | | | (4.44 | ) | | | (1.23 | ) | | | (3.66 | ) | | | (3.71 | ) | | | (1.42 | ) |
| | | | | | | | | | | | | | | | | | | | | | | | | | | | |
| | | | | | | |
Net asset value, end of period | | $ | 17.42 | | | | | | | $ | 19.82 | | | $ | 23.64 | | | $ | 22.28 | | | $ | 22.41 | | | $ | 25.01 | |
| | | | | | | | | | | | | | | | | | | | | | | | | | | | |
| | | | | | | |
Total Return(c) | | | | | | | | | | | | | | | | | | | | | | | | | | | | |
Based on net asset value | | | (9.35 | )%(d) | | | | | | | 3.42 | % | | | 11.86 | % | | | 16.44 | % | | | 5.70 | % | | | 6.96 | % |
| | | | | | | | | | | | | | | | | | | | | | | | | | | | |
| | | | | | | |
Ratios to Average Net Assets(e) | | | | | | | | | | | | | | | | | | | | | | | | | | | | |
Total expenses | | | 1.28 | %(f) | | | | | | | 1.27 | % | | | 1.28 | % | | | 1.29 | % | | | 1.27 | % | | | 1.28 | % |
| | | | | | | | | | | | | | | | | | | | | | | | | | | | |
Total expenses after fees waived and/or reimbursed and paid indirectly | | | 1.27 | %(f) | | | | | | | 1.27 | % | | | 1.28 | % | | | 1.28 | % | | | 1.25 | % | | | 1.28 | % |
| | | | | | | | | | | | | | | | | | | | | | | | | | | | |
Net investment income | | | 1.42 | %(f) | | | | | | | 1.44 | % | | | 1.29 | % | | | 1.33 | % | | | 1.44 | % | | | 1.28 | % |
| | | | | | | | | | | | | | | | | | | | | | | | | | | | |
| | | | | | | |
Supplemental Data | | | | | | | | | | | | | | | | | | | | | | | | | | | | |
Net assets, end of period (000) | | $ | 437,238 | | | | | | | $ | 614,787 | | | $ | 754,259 | | | $ | 819,982 | | | $ | 862,531 | | | $ | 987,928 | |
| | | | | | | | | | | | | | | | | | | | | | | | | | | | |
Portfolio turnover rate | | | 40 | % | | | | | | | 43 | % | | | 36 | % | | | 29 | % | | | 25 | % | | | 25 | % |
| | | | | | | | | | | | | | | | | | | | | | | | | | | | |
| (a) | Based on average shares outstanding. |
| (b) | Distributions for annual periods determined in accordance with U.S. federal income tax regulations. |
| (c) | Where applicable, assumes the reinvestment of distributions. |
| (d) | Aggregate total return. |
| (e) | Excludes expenses incurred indirectly as a result of investments in underlying funds as follows: |
| | | | | | | | | | | | | | | | | | | | | | | | | | | | |
| | | Period from
08/01/19 to
04/30/20 | | | | | | Year Ended July 31, | |
| | | | | | 2019 | | | 2018 | | | 2017 | | | 2016 | | | 2015 | |
Investments in underlying funds | | | 0.01 | % | | | | | | | 0.01 | % | | | 0.01 | % | | | 0.01 | % | | | 0.01 | % | | | — | % |
| | | | | | | | | | | | |
See notes to financial statements.
| | |
| 20 | | 2020 BLACKROCK ANNUAL REPORTTO SHAREHOLDERS |
Notes to Financial Statements
BlackRock Equity Dividend Fund (the “Fund”) is registered under the Investment Company Act of 1940, as amended (the “1940 Act”), as anopen-end management investment company. The Fund is organized as a Massachusetts business trust. The Fund is classified as diversified.
The Fund offers multiple classes of shares. All classes of shares have identical voting, dividend, liquidation and other rights and are subject to the same terms and conditions, except that certain classes bear expenses related to the shareholder servicing and distribution of such shares. Institutional, Service and Class K Shares are sold only to certain eligible investors. Service, Investor A, Investor C and Class R Shares bear certain expenses related to shareholder servicing of such shares, and Investor C and Class R Shares also bear certain expenses related to the distribution of such shares. Investor A and Investor C Shares are generally available through financial intermediaries. Class R Shares are available only to certain employer-sponsored retirement plans. Each class has exclusive voting rights with respect to matters relating to its shareholder servicing and distribution expenditures (except that Investor C shareholders may vote on material changes to the Investor A Shares distribution and service plan).
| | | | | | | | |
| Share Class | | Initial Sales Charge | | CDSC | | | Conversion Privilege |
Institutional, Service, Class K and Class R Shares | | No | | | No | | | None |
Investor A Shares | | Yes | | | No | (a) | | None |
Investor C Shares | | No | | | Yes | (b) | | To Investor A Shares after approximately 10 years |
| | (a) | Investor A Shares may be subject to a contingent deferred sales charge (“CDSC”) for certain redemptions where no initial sales charge was paid at the time of purchase. | |
| | (b) | A CDSC of 1.00% is assessed on certain redemptions of Investor C Shares made within one year after purchase. | |
On February 24, 2020, the Fund’s issued and outstanding Investor C1 Shares converted into Investor A Shares.
The Fund, together with certain other registered investment companies advised by BlackRock Advisors, LLC (the “Manager”) or its affiliates, is included in a complex of equity, multi-asset, index and money market funds referred to as the BlackRock Multi-Asset Complex.
On November 13, 2019, the Board of Trustees of the Fund (the “Board”) approved a change in the fiscalyear-end of the Fund, effective as of April 30, 2020, from July 31 to April 30.
Reorganization: The Board of the Fund and the Board of Directors of FDP BlackRock Equity Dividend Fund (the “Target Fund”) approved the reorganization of the Target Fund into the Fund. As a result, the Fund acquired substantially all of the assets and assumed certain of the liabilities of the Target Fund in exchange for an equal aggregate value of newly-issued shares of the Fund.
Each shareholder of the Target Fund received shares of the Fund in an amount equal to the aggregate net asset value (“NAV”) of such shareholder’s Target Fund shares, as determined at the close of business on September 20, 2019, less the costs of the Target Fund’s reorganization.
The reorganization was accomplished by atax-free exchange of shares of the Fund in the following amounts and at the following conversion ratios:
| | | | | | | | | | | | | | | | |
| Target Fund’s Share Class | | Shares Prior to
Reorganization | | | Conversion
Ratio | | | Fund’s
Share Class | | | Shares of
the Fund | |
Institutional | | | 270,225 | | | | 0.59119094 | | | | Institutional | | | | 159,754 | |
Investor A | | | 3,591,270 | | | | 0.58436499 | | | | Investor A | | | | 2,098,612 | |
Investor C | | | 1,280,273 | | | | 0.59196067 | | | | Investor C | | | | 757,871 | |
The Target Fund’s net assets and composition of net assets on September 20, 2019, the valuation date of the reorganization were as follows:
| | | | |
| | | Target Fund | |
Net assets | | $ | 59,411,744 | |
Paid-in-capital | | | 48,924,157 | |
Accumulated earnings | | | 10,487,587 | |
For financial reporting purposes, assets received and shares issued by the Fund were recorded at fair value. However, the cost basis of the investments received from the Target Fund was carried forward to align ongoing reporting of the Fund’s realized and unrealized gains and losses with amounts distributable to shareholders for tax purposes.
The net assets of the Fund before the reorganization were $19,356,330,228. The aggregate net assets of the Fund immediately after the reorganization amounted to $19,415,741,972. The Target Fund’s fair value and cost of investments prior to the reorganization were as follows:
| | | | | | | | |
| Target Fund | | Fair Value
of Investments | | | Cost of
Investments | |
FDP BlackRock Equity Dividend Fund | | $ | 59,613,327 | | | $ | 48,263,983 | |
The purpose of these transactions was to combine funds managed by the Manager with substantially similar (but not identical) investment objectives, investment policies, strategies, risks and restrictions. The reorganization was atax-free event and was effective on September 23, 2019.
| | | | |
| NOTESTO FINANCIAL STATEMENTS | | | 21 | |
Notes to Financial Statements (continued)
Assuming the reorganization had been completed on August 1, 2019, the beginning of the fiscal reporting period of the Fund, the pro forma results of operations for the period ended April 30, 2020, are as follows:
| | • | | Net investment income: $257,393,501 |
| | • | | Net realized and change in unrealized loss on investments: $(1,848,861,671) |
| | • | | Net decrease in net assets resulting from operations: $(1,591,468,170) |
Because the combined investment portfolios have been managed as a single integrated portfolio since the reorganization was completed, it is not practicable to separate the amounts of revenue and earnings of the Target Fund that have been included in the Fund’s Statements of Operations since September 23, 2019.
Reorganization costs incurred by the Fund in connection with the reorganization were expensed by the Fund. The Manager reimbursed the Fund $20,250, which is included in fees waived and/or reimbursed by the Manager in the Statements of Operations.
| 2. | SIGNIFICANT ACCOUNTING POLICIES |
The financial statements are prepared in conformity with accounting principles generally accepted in the United States of America (“U.S. GAAP”), which may require management to make estimates and assumptions that affect the reported amounts of assets and liabilities in the financial statements, disclosure of contingent assets and liabilities at the date of the financial statements and the reported amounts of increases and decreases in net assets from operations during the reporting period. Actual results could differ from those estimates. The Fund is considered an investment company under U.S. GAAP and follows the accounting and reporting guidance applicable to investment companies. Below is a summary of significant accounting policies:
Investment Transactions and Income Recognition:For financial reporting purposes, investment transactions are recorded on the dates the transactions are executed. Realized gains and losses on investment transactions are determined on the identified cost basis. Dividend income is recorded on theex-dividend date. Dividends from foreign securities where theex-dividend date may have passed are subsequently recorded when the Fund is informed of theex-dividend date. Under the applicable foreign tax laws, a withholding tax at various rates may be imposed on capital gains, dividends and interest. Income, expenses and realized and unrealized gains and losses are allocated daily to each class based on its relative net assets.
Foreign Currency Translation:The Fund’s books and records are maintained in U.S. dollars. Securities and other assets and liabilities denominated in foreign currencies are translated into U.S. dollars using exchange rates determined as of the close of trading on the New York Stock Exchange (“NYSE”). Purchases and sales of investments are recorded at the rates of exchange prevailing on the respective dates of such transactions. Generally, when the U.S. dollar rises in value against a foreign currency, the investments denominated in that currency will lose value; the opposite effect occurs if the U.S. dollar falls in relative value.
The Fund does not isolate the portion of the results of operations arising as a result of changes in the exchange rates from the changes in the market prices of investments held or sold for financial reporting purposes. Accordingly, the effects of changes in exchange rates on investments are not segregated in the Statements of Operations from the effects of changes in market prices of those investments, but are included as a component of net realized and unrealized gain (loss) from investments. The Fund reports realized currency gains (losses) on foreign currency related transactions as components of net realized gain (loss) for financial reporting purposes, whereas such components are generally treated as ordinary income for U.S. federal income tax purposes.
Distributions: Distributions paid by the Fund are recorded on theex-dividend date. The character and timing of distributions are determined in accordance with U.S. federal income tax regulations, which may differ from U.S. GAAP.
Indemnifications:In the normal course of business, the Fund enters into contracts that contain a variety of representations that provide general indemnification. The Fund’s maximum exposure under these arrangements is unknown because it involves future potential claims against the Fund, which cannot be predicted with any certainty.
Other: Expenses directly related to the Fund or its classes are charged to the Fund or the applicable class. Other operating expenses shared by several funds, including other funds managed by the Manager, are prorated among those funds on the basis of relative net assets or other appropriate methods. Expenses directly related to the Fund and other shared expenses prorated to the Fund are allocated daily to each class based on its relative net assets or other appropriate methods.
| 3. | INVESTMENT VALUATION AND FAIR VALUE MEASUREMENTS |
Investment Valuation Policies: The Fund’s investments are valued at fair value (also referred to as “market value” within the financial statements) as of the close of trading on the NYSE (generally 4:00 p.m., Eastern time). U.S. GAAP defines fair value as the price the Fund would receive to sell an asset or pay to transfer a liability in an orderly transaction between market participants at the measurement date. The Fund determines the fair values of its financial instruments using various independent dealers or pricing services under policies approved by the Board. If a security’s market price is not readily available or does not otherwise accurately represent the fair value of the security, the security will be valued in accordance with a policy approved by the Board as reflecting fair value. The BlackRock Global Valuation Methodologies Committee (the “Global Valuation Committee”) is the committee formed by management to develop global pricing policies and procedures and to oversee the pricing function for all financial instruments.
Fair Value Inputs and Methodologies: The following methods and inputs are used to establish the fair value of the Fund’s assets and liabilities:
| | • | | Equity investments traded on a recognized securities exchange are valued at the official closing price each day, if available. For equity investments traded on more than one exchange, the official closing price on the exchange where the stock is primarily traded is used. Equity investments traded on a recognized exchange for which there were no sales on that day may be valued at the last available bid (long positions) or ask (short positions) price. |
| | |
| 22 | | 2020 BLACKROCK ANNUAL REPORTTO SHAREHOLDERS |
Notes to Financial Statements (continued)
Generally, trading in foreign instruments is substantially completed each day at various times prior to the close of trading on the NYSE. Occasionally, events affecting the values of such instruments may occur between the foreign market close and the close of trading on the NYSE that may not be reflected in the computation of the Fund’s net assets. Each business day, the Fund uses a pricing service to assist with the valuation of certain foreign exchange-traded equity securities and foreign exchange-traded andover-the-counter (“OTC”) options (the “Systematic Fair Value Price”). Using current market factors, the Systematic Fair Value Price is designed to value such foreign securities and foreign options at fair value as of the close of trading on the NYSE, which follows the close of the local markets.
| | • | | Investments inopen-end U.S. mutual funds are valued at NAV each business day. |
| | • | | Exchange-traded options are valued at the mean between the last bid and ask prices at the close of the options market in which the options trade. An exchange-traded option for which there is no mean price is valued at the last bid (long positions) or ask (short positions) price. If no bid or ask price is available, the prior day’s price will be used, unless it is determined that the prior day’s price no longer reflects the fair value of the option. OTC options are valued by an independent pricing service using a mathematical model, which incorporates a number of market data factors, such as the trades and prices of the underlying instruments. |
If events (e.g., a company announcement, market volatility or a natural disaster) occur that are expected to materially affect the value of such investments, or in the event that the application of these methods of valuation results in a price for an investment that is deemed not to be representative of the market value of such investment, or if a price is not available, the investment will be valued by the Global Valuation Committee, or its delegate, in accordance with a policy approved by the Board as reflecting fair value (“Fair Valued Investments”). The fair valuation approaches that may be used by the Global Valuation Committee will include market approach, income approach and cost approach. Valuation techniques such as discounted cash flow, use of market comparables and matrix pricing are types of valuation approaches and are typically used in determining fair value. When determining the price for Fair Valued Investments, the Global Valuation Committee, or its delegate, seeks to determine the price that the Fund might reasonably expect to receive or pay from the current sale or purchase of that asset or liability in anarm’s-length transaction. Fair value determinations shall be based upon all available factors that the Global Valuation Committee, or its delegate, deems relevant and consistent with the principles of fair value measurement. The pricing of all Fair Valued Investments is subsequently reported to the Board or a committee thereof on a quarterly basis.
Fair Value Hierarchy: Various inputs are used in determining the fair value of investments. These inputs to valuation techniques are categorized into a fair value hierarchy consisting of three broad levels for financial statement purposes as follows:
| | • | | Level 1 — Unadjusted price quotations in active markets/exchanges for identical assets or liabilities that the Fund has the ability to access |
| | • | | Level 2 — Other observable inputs (including, but not limited to, quoted prices for similar assets or liabilities in markets that are active, quoted prices for identical or similar assets or liabilities in markets that are not active, inputs other than quoted prices that are observable for the assets or liabilities (such as interest rates, yield curves, volatilities, prepayment speeds, loss severities, credit risks and default rates) or other market–corroborated inputs) |
| | • | | Level 3 — Unobservable inputs based on the best information available in the circumstances, to the extent observable inputs are not available (including the Global Valuation Committee’s assumptions used in determining the fair value of investments and derivative financial instruments) |
The hierarchy gives the highest priority to unadjusted quoted prices in active markets for identical assets or liabilities (Level 1 measurements) and the lowest priority to unobservable inputs (Level 3 measurements). Accordingly, the degree of judgment exercised in determining fair value is greatest for instruments categorized in Level 3. The inputs used to measure fair value may fall into different levels of the fair value hierarchy. In such cases, for disclosure purposes, the fair value hierarchy classification is determined based on the lowest level input that is significant to the fair value measurement in its entirety. Investments classified within Level 3 have significant unobservable inputs used by the Global Valuation Committee in determining the price for Fair Valued Investments. Level 3 investments include equity or debt issued by privately held companies or funds. There may not be a secondary market, and/or there are a limited number of investors. The categorization of a value determined for investments and derivative financial instruments is based on the pricing transparency of the investments and derivative financial instruments and is not necessarily an indication of the risks associated with investing in those securities.
| 4. | SECURITIES AND OTHER INVESTMENTS |
Preferred Stocks:Preferred stock has a preference over common stock in liquidation (and generally in receiving dividends as well), but is subordinated to the liabilities of the issuer in all respects. As a general rule, the market value of preferred stock with a fixed dividend rate and no conversion element varies inversely with interest rates and perceived credit risk, while the market price of convertible preferred stock generally also reflects some element of conversion value. Because preferred stock is junior to debt securities and other obligations of the issuer, deterioration in the credit quality of the issuer will cause greater changes in the value of a preferred stock than in a more senior debt security with similar stated yield characteristics. Unlike interest payments on debt securities, preferred stock dividends are payable only if declared by the issuer’s board of directors. Preferred stock also may be subject to optional or mandatory redemption provisions.
| 5. | DERIVATIVE FINANCIAL INSTRUMENTS |
The Fund engages in various portfolio investment strategies using derivative contracts both to increase the returns of the Fund and/or to manage its exposure to certain risks such as credit risk, equity risk, interest rate risk, foreign currency exchange rate risk, commodity price risk or other risks (e.g., inflation risk). Derivative financial instruments categorized by risk exposure are included in the Schedule of Investments. These contracts may be transacted on an exchange or OTC.
Options: The Fund purchases and writes call and put options to increase or decrease its exposure to the risks of underlying instruments, including equity risk, interest rate risk and/or commodity price risk and/or, in the case of options written, to generate gains from options premiums.
A call option gives the purchaser (holder) of the option the right (but not the obligation) to buy, and obligates the seller (writer) to sell (when the option is exercised) the underlying instrument at the exercise or strike price at any time or at a specified time during the option period. A put option gives the holder the right to sell and obligates the writer to buy the underlying instrument at the exercise or strike price at any time or at a specified time during the option period.
| | | | |
| NOTESTO FINANCIAL STATEMENTS | | | 23 | |
Notes to Financial Statements (continued)
Premiums paid on options purchased and premiums received on options written, as well as the daily fluctuation in market value, are included in investments at value —unaffiliated and options written at value, respectively, in the Statement of Assets and Liabilities. When an instrument is purchased or sold through the exercise of an option, the premium is offset against the cost or proceeds of the underlying instrument. When an option expires, a realized gain or loss is recorded in the Statements of Operations to the extent of the premiums received or paid. When an option is closed or sold, a gain or loss is recorded in the Statements of Operations to the extent the cost of the closing transaction exceeds the premiums received or paid. When the Fund writes a call option, such option is typically “covered,” meaning that it holds the underlying instrument subject to being called by the option counterparty. When the Fund writes a put option, cash is segregated in an amount sufficient to cover the obligation. These amounts, which are considered restricted, are included in cash pledged as collateral for options written in the Statement of Assets and Liabilities.
In purchasing and writing options, the Fund bears the risk of an unfavorable change in the value of the underlying instrument or the risk that it may not be able to enter into a closing transaction due to an illiquid market. Exercise of a written option could result in the Fund purchasing or selling a security when it otherwise would not, or at a price different from the current market value.
| 6. | INVESTMENT ADVISORY AGREEMENT AND OTHER TRANSACTIONS WITH AFFILIATES |
Investment Advisory:The Fund entered into an Investment Advisory Agreement with the Manager, the Fund’s investment adviser and an indirect, wholly-owned subsidiary of BlackRock, Inc. (“BlackRock”), to provide investment advisory and administrative services. The Manager is responsible for the management of the Fund’s portfolio and provides the personnel, facilities, equipment and certain other services necessary to the operations of the Fund.
For such services, the Fund pays the Manager a monthly fee at an annual rate equal to the following percentages of the average daily value of the Fund’s net assets.
| | | | |
| Average Daily Net Assets | | Investment Advisory Fee | |
First $8 Billion | | | 0.60 | % |
$8 Billion — $10 Billion | | | 0.56 | |
$10 Billion — $12 Billion | | | 0.54 | |
$12 Billion — $17 Billion | | | 0.52 | |
$17 Billion — $25 Billion | | | 0.51 | |
$25 Billion — $30 Billion | | | 0.50 | |
$30 Billion — $40 Billion | | | 0.47 | |
Greater than $40 Billion | | | 0.45 | |
Service and Distribution Fees:The Fund entered into a Distribution Agreement and a Distribution and Service Plan with BlackRock Investments, LLC (“BRIL”), an affiliate of the Manager. Pursuant to the Distribution and Service Plan and in accordance with Rule12b-1 under the 1940 Act, the Fund pays BRIL ongoing service and distribution fees. The fees are accrued daily and paid monthly at annual rates based upon the average daily net assets of the relevant share class of the Fund as follows:
| | | | | | | | | | | | | | | | | | | | |
| | | Service | | | Investor A | | | Investor C | | | Investor C1 | | | Class R | |
Service Fees | | | 0.25 | % | | | 0.25 | % | | | 0.25 | % | | | 0.25 | % | | | 0.25 | % |
Distribution Fees | | | — | | | | — | | | | 0.75 | | | | 0.55 | | | | 0.25 | |
BRIL and broker-dealers, pursuant tosub-agreements with BRIL, provide shareholder servicing and distribution services to the Fund. The ongoing service and/or distribution fee compensates BRIL and each broker-dealer for providing shareholder servicing and/or distribution related services to shareholders.
The following table shows the class specific service and distribution fees borne directly by each share class of the Fund:
| | | | | | | | |
| | | Period from
08/01/19
to 04/30/20 | | | Year Ended
07/31/19 | |
Service | | $ | 230,302 | | | $ | 282,219 | |
Investor A | | | 8,410,549 | | | | 11,531,387 | |
Investor C | | | 9,842,464 | | | | 18,413,219 | |
Investor C1 | | | 2,822 | | | | 7,399 | |
Class R | | | 2,071,268 | | | | 3,322,722 | |
| | | | | | | | |
Total | | $ | 20,557,405 | | | $ | 33,556,946 | |
| | | | | | | | |
Transfer Agent: Pursuant to written agreements, certain financial intermediaries, some of which may be affiliates, provide the Fund withsub-accounting, recordkeeping,sub-transfer agency and other administrative services with respect to servicing of underlying investor accounts. For these services, these entities receive an asset-based fee or an annual fee per shareholder account, which will vary depending on share class and/or net assets. The Fund paid the following amounts to affiliates of BlackRock in return for these services, which are included in transfer agent — class specific in the Statements of Operations:
| | | | | | | | |
| | | Period from
08/01/19
to 04/30/20 | | | Year Ended
07/31/19 | |
Institutional | | $ | 253,159 | | | $ | 305,370 | |
Investor A | | | — | | | | 15 | |
Investor C | | | — | | | | 5 | |
| | | | | | | | |
Total | | $ | 253,159 | | | $ | 305,390 | |
| | | | | | | | |
| | |
| 24 | | 2020 BLACKROCK ANNUAL REPORTTO SHAREHOLDERS |
Notes to Financial Statements (continued)
The Manager maintains a call center that is responsible for providing certain shareholder services to the Fund. Shareholder services include responding to inquiries and processing purchases and sales based upon instructions from shareholders. The Fund reimbursed the Manager the following amounts for costs incurred in running the call center, which are included in transfer agent — class specific in the Statements of Operations:
| | | | | | | | |
| | | Period from
08/01/19
to 04/30/20 | | | Year Ended
07/31/19 | |
Institutional | | $ | 15,597 | | | $ | 20,441 | |
Service | | | 461 | | | | 385 | |
Investor A | | | 48,254 | | | | 85,000 | |
Investor C | | | 14,870 | | | | 29,905 | |
Investor C1 | | | — | | | | 25 | |
Investor K | | | 3,976 | | | | 5,846 | |
Class R | | | 1,990 | | | | 3,948 | |
| | | | | | | | |
Total | | $ | 85,148 | | | $ | 145,550 | |
| | | | | | | | |
The following table shows the class specific transfer agent fees borne directly by each share class of the Fund:
| | | | | | | | |
| | | Period from
08/01/19
to 04/30/20 | | | Year Ended
07/31/19 | |
Institutional | | $ | 9,284,073 | | | $ | 12,446,025 | |
Service | | | 162,517 | | | | 194,010 | |
Investor A | | | 4,077,248 | | | | 5,972,765 | |
Investor C | | | 880,925 | | | | 1,572,320 | |
Investor C1 | | | 649 | | | | 1,664 | |
Investor K | | | 133,631 | | | | 236,121 | |
Class R | | | 826,053 | | | | 1,299,841 | |
| | | | | | | | |
Total | | $ | 15,365,096 | | | $ | 21,722,746 | |
| | | | | | | | |
Other Fees: Affiliates earned underwriting discounts, direct commissions and dealer concessions on sales of the Fund’s Investor A Shares as follows:
| | | | | | | | |
| | | Period from
08/01/19
to 04/30/20 | | | Year Ended
07/31/19 | |
Investor A | | $ | 148,673 | | | $ | 195,569 | |
Affiliates received CDSCs as follows:
| | | | | | | | |
| | | Period from
08/01/19
to 04/30/20 | | | Year Ended
07/31/19 | |
Investor A | | $ | 26,630 | | | $ | 36,633 | |
Investor C | | | 37,761 | | | | 50,175 | |
Expense Limitations, Waivers and Reimbursements:The Manager contractually agreed to waive its investment advisory fees by the amount of investment advisory fees the Fund pays to the Manager indirectly through its investment in affiliated money market funds (the “affiliated money market fund waiver”) through November 30, 2020. The contractual agreement may be terminated upon 90 days’ notice by a majority of the trustees who are not “interested persons” of the Fund, as defined in the 1940 Act (“Independent Trustees”), or by a vote of a majority of the outstanding voting securities of the Fund. Prior to November 27, 2019, this waiver was voluntary. This amount is included in fees waived and/or reimbursed by the Manager in the Statements of Operations. The amounts waived were as follows:
| | | | | | | | |
| | | Period from
08/01/19 to 04/30/20 | | | Year Ended
07/31/19 | |
Amounts waived | | $ | 819,304 | | | $ | 902,811 | |
The Manager has contractually agreed to waive its investment advisory fee with respect to any portion of the Fund’s assets invested in affiliated equity and fixed-income exchange-traded funds that have a contractual management fee through November 30, 2020. The contractual agreement may be terminated upon 90 days’ notice by a majority of the Independent Trustees, or by a vote of a majority of the outstanding voting securities of the Fund. For the period ended April 30, 2020 and the year ended July 31, 2019, there were no fees waived and/or reimbursed by the Manager pursuant to this arrangement.
| | | | |
| NOTESTO FINANCIAL STATEMENTS | | | 25 | |
Notes to Financial Statements (continued)
For the period ended April 30, 2020, the Manager reimbursed the Fund $20,250 for reorganization costs.
For the period ended April 30, 2020 and year ended July 31, 2019, the Fund reimbursed the Manager for certain accounting services, which is included in accounting services in the Statements of Operations. The reimbursements were as follows:
| | | | | | | | |
| | | Period from
08/01/19 to 04/30/20 | | | Year Ended
07/31/19 | |
Amounts reimbursed | | $ | 189,646 | | | $ | 213,871 | |
Securities Lending:The U.S. Securities and Exchange Commission (“SEC”) has issued an exemptive order which permits BlackRock Investment Management, LLC (“BIM”), an affiliate of the Manager, to serve as securities lending agent for the Fund, subject to applicable conditions. As securities lending agent, BIM bears all operational costs directly related to securities lending. The Fund is responsible for expenses in connection with the investment of cash collateral received for securities on loan (the “collateral investment expenses”). The cash collateral is invested in a private investment company managed by the Manager or its affiliates. However, BIM has agreed to cap the collateral investment expenses of the private investment company to an annual rate of 0.04%. The investment adviser to the private investment company will not charge any advisory fees with respect to shares purchased by the Fund. The private investment company in which the cash collateral has been invested may, under certain circumstances, impose a liquidity fee of up to 2% of the value withdrawn or temporarily restrict withdrawals for up to 10 business days during a 90 day period, in the event that the private investment company’s weekly liquid assets fall below certain thresholds.
Securities lending income is equal to the total of income earned from the reinvestment of cash collateral, net of fees and other payments to and from borrowers of securities, and less the collateral investment expenses. The Fund retains a portion of securities lending income and remits a remaining portion to BIM as compensation for its services as securities lending agent.
Pursuant to the current securities lending agreement, the Fund retains 75% of securities lending income (which excludes collateral investment expenses), and this amount retained can never be less than 70% of the total of securities lending income plus the collateral investment expenses.
In addition, commencing the business day following the date that the aggregate securities lending income earned across the BlackRock Multi-Asset Complex in a calendar year exceeds a specified threshold, the Fund, pursuant to the securities lending agreement, will retain for the remainder of that calendar year securities lending income in an amount equal to 80% of securities lending income (which excludes collateral investment expenses), and this amount retained can never be less than 70% of the total of securities lending income plus the collateral investment expenses.
Prior to January 1, 2020, the Fund retained 73.5% of securities lending income (which excluded collateral investment expenses) and the amount retained could never be less than 70% of the total of securities lending income plus the collateral investment expenses. In addition, commencing the business day following the date that the aggregate securities lending income earned across the BlackRock Multi-Asset Complex in a calendar year exceeded a specified threshold, the Fund would retain for the remainder of that calendar year 80% of securities lending income (which excluded collateral investment expenses), and the amount retained could never be less than 70% of the total of securities lending income plus the collateral investment expenses.
Interfund Lending: In accordance with an exemptive order (the “Order”) from the SEC, the Fund may participate in a joint lending and borrowing facility for temporary purposes (the “Interfund Lending Program”), subject to compliance with the terms and conditions of the Order, and to the extent permitted by the Fund’s investment policies and restrictions. The Fund is currently permitted to borrow under the Interfund Lending Program.
A lending BlackRock fund may lend in aggregate up to 15% of its net assets, but may not lend more than 5% of its net assets to any one borrowing fund through the Interfund Lending Program. A borrowing BlackRock fund may not borrow through the Interfund Lending Program or from any other source more than 33 1/3% of its total assets (or any lower threshold provided for by the fund’s investment restrictions). If a borrowing BlackRock fund’s total outstanding borrowings exceed 10% of its total assets, each of its outstanding interfund loans will be subject to collateralization of at least 102% of the outstanding principal value of the loan. All interfund loans are for temporary or emergency purposes and the interest rate to be charged will be the average of the highest current overnight repurchase agreement rate available to a lending fund and the bank loan rate, as calculated according to a formula established by the Board.
During the period ended April 30, 2020, the Fund did not participate in the Interfund Lending Program.
Trustees and Officers:Certain trustees and/or officers of the Fund are directors and/or officers of BlackRock or its affiliates. The Fund reimburses the Manager for a portion of the compensation paid to the Fund’s Chief Compliance Officer, which is included in Trustees and Officer in the Statements of Operations.
For the period ended April 30, 2020, purchases and sales of investments, excluding short-term securities, were $6,772,740,023 and $7,587,610,852, respectively.
It is the Fund’s policy to comply with the requirements of the Internal Revenue Code of 1986, as amended, applicable to regulated investment companies, and to distribute substantially all of its taxable income to its shareholders. Therefore, no U.S. federal income tax provision is required.
The Fund files U.S. federal and various state and local tax returns. No income tax returns are currently under examination. The statute of limitations on the Fund’s U.S. federal tax returns generally remains open for the period ended April 30, 2020 and each of the four years ended July 31, 2019. The statutes of limitations on the Fund’s state and local tax returns may remain open for an additional year depending upon the jurisdiction.
| | |
| 26 | | 2020 BLACKROCK ANNUAL REPORTTO SHAREHOLDERS |
Notes to Financial Statements (continued)
Management has analyzed tax laws and regulations and their application to the Fund as of April 30, 2020, inclusive of the open tax return years, and does not believe that there are any uncertain tax positions that require recognition of a tax liability in the Fund’s financial statements.
U.S. GAAP requires that certain components of net assets be adjusted to reflect permanent differences between financial and tax reporting. These reclassifications have no effect on net assets or net asset values per share. As of period end, the following permanent differences attributable tonon-deductible expenses and the use of equalization were reclassified to the following accounts:
| | | | |
Paid-in capital | | $ | 65,876,622 | |
Accumulated earnings | | | (65,876,622 | ) |
The tax character of distributions paid was as follows:
| | | | | | | | | | | | |
| | | 04/30/20 | | | 07/31/19 | | | 07/31/18 | |
Ordinary income(a) | | $ | 284,704,279 | | | $ | 618,549,617 | | | $ | 378,965,391 | |
Long-term capital gains(a) | | | 440,606,073 | | | | 3,534,136,275 | | | | 1,008,745,574 | |
| | | | | | | | | | | | |
| | $ | 725,310,352 | | | $ | 4,152,685,892 | | | $ | 1,387,710,965 | |
| | | | | | | | | | | | |
| | (a) | Distribution amounts may include a portion of the proceeds from redeemed shares. | |
As of period end, the tax components of accumulated earnings were as follows:
| | | | |
Undistributed ordinary income | | $ | 13,166,254 | |
Undistributed long term capital gains | | | 348,488,615 | |
Net unrealized gains(a) | | | 1,649,489,303 | |
Qualified late-year losses(b) | | | (99,751,298 | ) |
| | | | |
| | $ | 1,911,392,874 | |
| | | | |
| | (a) | The differences between book-basis andtax-basisnet unrealized gains were attributable primarily to the tax deferral of losses on wash sales and straddles, the realization for tax purposes of unrealized gains/losses on certain foreign currency contracts and the timing and recognition of partnership income. | |
| | (b) | The Fund has elected to defer certain qualified late-year losses and recognize such losses in the next taxable year. | |
As of period end, gross unrealized appreciation and depreciation for investments and derivatives based on cost for U.S. federal income tax purposes were as follows:
| | | | |
Tax cost | | $ | 14,647,407,451 | |
| | | | |
Gross unrealized appreciation | | $ | 2,633,366,556 | |
Gross unrealized depreciation | | | (929,935,830 | ) |
| | | | |
Net unrealized appreciation | | $ | 1,703,430,726 | |
| | | | |
The Fund, along with certain other funds managed by the Manager and its affiliates (“Participating Funds”), is a party to a364-day, $2.25 billion credit agreement with a group of lenders. Under this agreement, the Fund may borrow to fund shareholder redemptions. Excluding commitments designated for certain individual funds, the Participating Funds, including the Fund, can borrow up to an aggregate commitment amount of $1.75 billion at any time outstanding, subject to asset coverage and other limitations as specified in the agreement. The credit agreement has the following terms: a fee of 0.10% per annum on unused commitment amounts and interest at a rate equal to the higher of(a) one-month LIBOR (but, in any event, not less than 0.00%) on the date the loan is made plus 0.80% per annum or (b) the Fed Funds rate (but, in any event, not less than 0.00%) in effect from time to time plus 0.80% per annum on amounts borrowed. The agreement expires in April 2021 unless extended or renewed. These fees were allocated among such funds based upon portions of the aggregate commitment available to them and relative net assets of Participating Funds.
For the period ended April 30, 2020, the amount of bank borrowings and the interest rate for the one-day loan under the credit agreement were $5,000 and 1.61%, respectively. As of April 30, 2020, the Fund did not have any borrowings outstanding under the credit agreement.
In the normal course of business, the Fund invests in securities or other instruments and may enter into certain transactions, and such activities subject the Fund to various risks, including among others, fluctuations in the market (market risk) or failure of an issuer to meet all of its obligations. The value of securities or other instruments may also be affected by various factors, including, without limitation: (i) the general economy; (ii) the overall market as well as local, regional or global political and/or social instability; (iii) regulation, taxation or international tax treaties between various countries; or (iv) currency, interest rate and price fluctuations. Local, regional or global events such as war, acts of terrorism, the spread of infectious illness or other public health issues, recessions, or other events could have a significant impact on the Fund and its investments. The Fund’s prospectus provides details of the risks to which the Fund is subject.
Valuation Risk: The market values of equities, such as common stocks and preferred securities or equity related investments, such as futures and options, may decline due to general market conditions which are not specifically related to a particular company. They may also decline due to factors which affect a particular industry or industries. The Fund may invest in illiquid investments. An illiquid investment is any investment that the Fund reasonably expects cannot be sold or disposed of in current market conditions in seven calendar days or less without the sale or disposition significantly changing the market value of the investment. The Fund may experience
| | | | |
| NOTESTO FINANCIAL STATEMENTS | | | 27 | |
Notes to Financial Statements (continued)
difficulty in selling illiquid investments in a timely manner at the price that it believes the investments are worth. Prices may fluctuate widely over short or extended periods in response to company, market or economic news. Markets also tend to move in cycles, with periods of rising and falling prices. This volatility may cause the Fund’s NAV to experience significant increases or decreases over short periods of time. If there is a general decline in the securities and other markets, the NAV of the Fund may lose value, regardless of the individual results of the securities and other instruments in which the Fund invests.
The price the Fund could receive upon the sale of any particular portfolio investment may differ from the Fund’s valuation of the investment, particularly for securities that trade in thin or volatile markets or that are valued using a fair valuation technique or a price provided by an independent pricing service. Changes to significant unobservable inputs and assumptions (i.e., publicly traded company multiples, growth rate, time to exit) due to the lack of observable inputs may significantly impact the resulting fair value and therefore the Fund’s results of operations. As a result, the price received upon the sale of an investment may be less than the value ascribed by the Fund, and the Fund could realize a greater than expected loss or lesser than expected gain upon the sale of the investment. The Fund’s ability to value its investments may also be impacted by technological issues and/or errors by pricing services or other third party service providers.
An outbreak of respiratory disease caused by a novel coronavirus has developed into a global pandemic and has resulted in closing borders, quarantines, disruptions to supply chains and customer activity, as well as general concern and uncertainty. The impact of this pandemic, and other global health crises that may arise in the future, could affect the economies of many nations, individual companies and the market in general in ways that cannot necessarily be foreseen at the present time. This pandemic may result in substantial market volatility and may adversely impact the prices and liquidity of a fund’s investments. The impact of the pandemic may be short term or may last for an extended period of time.
Counterparty Credit Risk:The Fund may be exposed to counterparty credit risk, or the risk that an entity may fail to or be unable to perform on its commitments related to unsettled or open transactions. The Fund manages counterparty credit risk by entering into transactions only with counterparties that the Manager believes have the financial resources to honor their obligations and by monitoring the financial stability of those counterparties. Financial assets, which potentially expose the Fund to market, issuer and counterparty credit risks, consist principally of financial instruments and receivables due from counterparties. The extent of the Fund’s exposure to market, issuer and counterparty credit risks with respect to these financial assets is approximately their value recorded in the Statement of Assets and Liabilities, less any collateral held by the Fund.
A derivative contract may suffer amark-to-market loss if the value of the contract decreases due to an unfavorable change in the market rates or values of the underlying instrument. Losses can also occur if the counterparty does not perform under the contract.
With exchange-traded options purchased, there is less counterparty credit risk to the Fund since the exchange or clearinghouse, as counterparty to such instruments, guarantees against a possible default. The clearinghouse stands between the buyer and the seller of the contract; therefore, credit risk is limited to failure of the clearinghouse. While offset rights may exist under applicable law, the Fund does not have a contractual right of offset against a clearing broker or clearinghouse in the event of a default (including the bankruptcy or insolvency).
Concentration Risk:As of period end, the Fund invested a significant portion of its assets in securities in the financial sector. Changes in economic conditions affecting such sector would have a greater impact on the Fund and could affect the value, income and/or liquidity of positions in such securities.
| 11. | CAPITAL SHARE TRANSACTIONS |
Transactions in capital shares for each class were as follows:
| | | | | | | | | | | | | | | | | | | | | | | | |
| | | Period from
08/01/19 to 04/30/20 | | | Year Ended
07/31/19 | | | Year Ended
07/31/18 | |
| | | Shares | | | Amount | | | Shares | | | Amount | | | Shares | | | Amount | |
Institutional | | | | | | | | | | | | | | | | | | | | | | | | |
Shares sold | | | 93,069,947 | | | $ | 1,699,543,401 | | | | 106,237,504 | | | $ | 2,189,303,047 | | | | 104,777,183 | | | $ | 2,388,557,346 | |
Shares issued in reinvestment of distributions | | | 14,970,125 | | | | 293,732,362 | | | | 90,420,913 | | | | 1,811,493,936 | | | | 27,999,943 | | | | 634,424,280 | |
Shares issued in reorganization | | | 159,754 | | | | 3,194,717 | | | | — | | | | — | | | | — | | | | — | |
Shares redeemed | | | (128,512,364 | ) | | | (2,416,682,704 | ) | | | (162,804,978 | ) | | | (3,364,027,610 | ) | | | (214,707,419 | ) | | | (4,842,186,118 | ) |
| | | | | | | | | | | | | | | | | | | | | | | | |
Net increase (decrease) | | | (20,312,538 | ) | | $ | (420,212,224 | ) | | | 33,853,439 | | | $ | 636,769,373 | | | | (81,930,293 | ) | | $ | (1,819,204,492 | ) |
| | | | | | | | | | | | | | | | | | | | | | | | |
| | | | | | |
Service | | | | | | | | | | | | | | | | | | | | | | | | |
Shares sold | | | 789,657 | | | $ | 15,052,915 | | | | 3,434,535 | | | $ | 73,634,514 | | | | 1,853,906 | | | $ | 42,385,926 | |
Shares issued in reinvestment of distributions | | | 213,392 | | | | 4,206,785 | | | | 1,244,718 | | | | 24,776,200 | | | | 147,214 | | | | 3,326,098 | |
Shares redeemed | | | (2,473,712 | ) | | | (46,177,252 | ) | | | (1,537,706 | ) | | | (31,967,241 | ) | | | (1,325,309 | ) | | | (29,976,733 | ) |
| | | | | | | | | | | | | | | | | | | | | | | | |
Net increase (decrease) | | | (1,470,663 | ) | | $ | (26,917,552 | ) | | | 3,141,547 | | | $ | 66,443,473 | | | | 675,811 | | | $ | 15,735,291 | |
| | | | | | | | | | | | | | | | | | | | | | | | |
| | | | | | |
Investor A | | | | | | | | | | | | | | | | | | | | | | | | |
Shares sold and automatic conversion of shares | | | 42,924,177 | | | $ | 806,577,191 | | | | 40,986,213 | | | $ | 864,988,400 | | | | 32,214,292 | | | $ | 732,870,504 | |
Shares issued in reinvestment of distributions | | | 7,682,069 | | | | 150,632,495 | | | | 46,024,046 | | | | 918,518,570 | | | | 12,856,169 | | | | 290,495,173 | |
Shares issued in reorganization | | | 2,098,612 | | | | 41,803,110 | | | | — | | | | — | | | | — | | | | — | |
Shares redeemed | | | (52,865,849 | ) | | | (1,001,991,508 | ) | | | (70,611,684 | ) | | | (1,471,360,593 | ) | | | (77,615,202 | ) | | | (1,762,518,685 | ) |
| | | | | | | | | | | | | | | | | | | | | | | | |
Net increase (decrease) | | | (160,991 | ) | | $ | (2,978,712 | ) | | | 16,398,575 | | | $ | 312,146,377 | | | | (32,544,741 | ) | | $ | (739,153,008 | ) |
| | | | | | | | | | | | | | | | | | | | | | | | |
| | |
| 28 | | 2020 BLACKROCK ANNUAL REPORTTO SHAREHOLDERS |
Notes to Financial Statements (continued)
| | | | | | | | | | | | | | | | | | | | | | | | |
| | | Period from
08/01/19 to 04/30/20 | | | Year Ended
07/31/19 | | | Year Ended
07/31/18 | |
| | | Shares | | | Amount | | | Shares | | | Amount | | | Shares | | | Amount | |
| | | | | | |
Investor B(a) | | | | | | | | | | | | | | | | | | | | | | | | |
Shares sold | | | — | | | $ | — | | | | — | | | $ | — | | | | 83 | | | $ | 1,920 | |
Shares issued in reinvestment of distributions | | | — | | | | — | | | | — | | | | — | | | | 964 | | | | 22,359 | |
Shares redeemed | | | — | | | | — | | | | — | | | | — | | | | (26,666 | ) | | | (621,500 | ) |
| | | | | | | | | | | | | | | | | | | | | | | | |
Net decrease | | | — | | | $ | — | | | | — | | | $ | — | | | | (25,619 | ) | | $ | (597,221 | ) |
| | | | | | | | | | | | | | | | | | | | | | | | |
| | | | | | |
Investor C | | | | | | | | | | | | | | | | | | | | | | | | |
Shares sold | | | 3,540,612 | | | $ | 63,510,486 | | | | 6,360,981 | | | $ | 126,380,148 | | | | 4,382,704 | | | $ | 96,205,872 | |
Shares issued in reinvestment of distributions | | | 2,005,916 | | | | 38,052,776 | | | | 18,314,847 | | | | 350,404,665 | | | | 5,430,087 | | | | 118,418,267 | |
Shares issued in reorganization | | | 757,871 | | | | 14,413,917 | | | | — | | | | — | | | | — | | | | — | |
Shares redeemed and automatic conversion of shares | | | (29,648,732 | ) | | | (536,536,668 | ) | | | (36,935,253 | ) | | | (745,964,755 | ) | | | (30,183,579 | ) | | | (660,785,822 | ) |
| | | | | | | | | | | | | | | | | | | | | | | | |
Net decrease | | | (23,344,333 | ) | | $ | (420,559,489 | ) | | | (12,259,425 | ) | | $ | (269,179,942 | ) | | | (20,370,788 | ) | | $ | (446,161,683 | ) |
| | | | | | | | | | | | | | | | | | | | | | | | |
| | | | | | |
Investor C1(b) | | | | | | | | | | | | | | | | | | | | | | | | |
Shares sold | | | 1824 | | | $ | 35,265 | | | | 4,738 | | | $ | 97,155 | | | | 4,865 | | | $ | 106,744 | |
Shares issued in reinvestment of distributions | | | 929 | | | | 17,981 | | | | 7,649 | | | | 146,983 | | | | 4,594 | | | | 100,293 | |
Shares redeemed and conversion of shares | | | (38,888 | ) | | | (748,144 | ) | | | (50,103 | ) | | | (1,092,401 | ) | | | (35,415 | ) | | | (772,414 | ) |
| | | | | | | | | | | | | | | | | | | | | | | | |
Net decrease | | | (36,135 | ) | | $ | (694,898 | ) | | | (37,716 | ) | | $ | (848,263 | ) | | | (25,956 | ) | | $ | (565,377 | ) |
| | | | | | | | | | | | | | | | | | | | | | | | |
| | | | | | |
Class K | | | | | | | | | | | | | | | | | | | | | | | | |
Shares sold | | | 41,792,147 | | | $ | 779,389,476 | | | | 31,790,239 | | | $ | 670,517,510 | | | | 95,113,531 | | | $ | 2,117,838,802 | |
Shares issued in reinvestment of distributions | | | 4,697,413 | | | | 91,709,179 | | | | 22,893,556 | | | | 457,879,751 | | | | 1,537,957 | | | | 34,856,038 | |
Shares redeemed | | | (27,986,846 | ) | | | (525,370,612 | ) | | | (26,867,561 | ) | | | (576,860,778 | ) | | | (11,320,880 | ) | | | (258,826,515 | ) |
| | | | | | | | | | | | | | | | | | | | | | | | |
Net increase | | | 18,502,714 | | | $ | 345,728,043 | | | | 27,816,234 | | | $ | 551,536,483 | | | | 85,330,608 | | | $ | 1,893,868,325 | |
| | | | | | | | | | | | | | | | | | | | | | | | |
| | | | | | |
Class R | | | | | | | | | | | | | | | | | | | | | | | | |
Shares sold | | | 2,059,350 | | | $ | 38,211,624 | | | | 2,805,719 | | | $ | 59,345,868 | | | | 3,345,001 | | | $ | 76,442,612 | |
Shares issued in reinvestment of distributions | | | 882,225 | | | | 17,605,158 | | | | 6,474,213 | | | | 130,417,301 | | | | 1,869,019 | | | | 42,560,604 | |
Shares redeemed | | | (8,862,679 | ) | | | (169,750,545 | ) | | | (10,167,992 | ) | | | (215,931,671 | ) | | | (10,103,007 | ) | | | (231,154,220 | ) |
| | | | | | | | | | | | | | | | | | | | | | | | |
Net decrease | | | (5,921,104 | ) | | $ | (113,933,763 | ) | | | (888,060 | ) | | $ | (26,168,502 | ) | | | (4,888,987 | ) | | $ | (112,151,004 | ) |
| | | | | | | | | | | | | | | | | | | | | | | | |
Total Net Increase (Decrease) | | | (32,743,050 | ) | | $ | (639,568,595 | ) | | | 68,024,594 | | | $ | 1,270,698,999 | | | | (53,779,965 | ) | | $ | (1,208,229,169 | ) |
| | | | | | | | | | | | | | | | | | | | | | | | |
| | (a) | On December 27, 2017, the Fund’s issued and outstanding Investor B Shares converted into Investor A Shares. | |
| | (b) | On February 24, 2020, the Fund’s issued and outstanding Investor C1 Shares converted into Investor A Shares. | |
Management has evaluated the impact of all subsequent events on the Fund through the date the financial statements were issued and has determined that there were no subsequent events requiring adjustment or additional disclosure in the financial statements.
| | | | |
| NOTESTO FINANCIAL STATEMENTS | | | 29 | |
Report of Independent Registered Public Accounting Firm
To the Shareholders and Board of Trustees of BlackRock Equity Dividend Fund:
Opinion on the Financial Statements and Financial Highlights
We have audited the accompanying statement of assets and liabilities of BlackRock Equity Dividend Fund (the “Fund”), including the schedule of investments, as of April 30, 2020, the related statements of operations for the period from August 1, 2019 through April 30, 2020 and for the year ended July 31, 2019, the statements of changes in net assets for the period from August 1, 2019 through April 30, 2020 and for each of the two years in the period ended July 31, 2019, the financial highlights for the period from August 1, 2019 through April 30, 2020 and for each of the five years in the period ended July 31, 2019, and the related notes. In our opinion, the financial statements and financial highlights present fairly, in all material respects, the financial position of the Fund as of April 30, 2020, and the results of its operations for the period from August 1, 2019 through April 30, 2020 and for the year ended July 31, 2019, the changes in its net assets for the period from August 1, 2019 through April 30, 2020 and for each of the two years in the period ended July 31, 2019, and the financial highlights for the period from August 1, 2019 through April 30, 2020 and each of the five years in the period ended July 31, 2019, in conformity with accounting principles generally accepted in the United States of America.
Basis for Opinion
These financial statements and financial highlights are the responsibility of the Fund’s management. Our responsibility is to express an opinion on the Fund’s financial statements and financial highlights based on our audits. We are a public accounting firm registered with the Public Company Accounting Oversight Board (United States) (PCAOB) and are required to be independent with respect to the Fund in accordance with the U.S. federal securities laws and the applicable rules and regulations of the Securities and Exchange Commission and the PCAOB.
We conducted our audits in accordance with the standards of the PCAOB. Those standards require that we plan and perform the audit to obtain reasonable assurance about whether the financial statements and financial highlights are free of material misstatement, whether due to error or fraud. The Fund is not required to have, nor were we engaged to perform, an audit of its internal control over financial reporting. As part of our audits we are required to obtain an understanding of internal control over financial reporting but not for the purpose of expressing an opinion on the effectiveness of the Fund’s internal control over financial reporting. Accordingly, we express no such opinion.
Our audits included performing procedures to assess the risks of material misstatement of the financial statements and financial highlights, whether due to error or fraud, and performing procedures that respond to those risks. Such procedures included examining, on a test basis, evidence regarding the amounts and disclosures in the financial statements and financial highlights. Our audits also included evaluating the accounting principles used and significant estimates made by management, as well as evaluating the overall presentation of the financial statements and financial highlights. Our procedures included confirmation of securities owned as of April 30, 2020, by correspondence with the custodian and brokers; when replies were not received from brokers, we performed other auditing procedures. We believe that our audits provide a reasonable basis for our opinion.
Deloitte & Touche LLP
Boston, Massachusetts
June 22, 2020
We have served as the auditor of one or more BlackRock investment companies since 1992.
| | |
| 30 | | 2020 BLACKROCK ANNUAL REPORTTO SHAREHOLDERS |
| | |
| Important Tax Information (unaudited) | | |
For corporate shareholders, the percentage of ordinary income distributions paid during the period ended April 30, 2020 that qualified for the dividends-received deduction were as follows:
| | | | |
| Fund | | Dividends-Received
Deduction | |
Equity Dividend Fund | | | 83.81 | % |
The following maximum amounts are hereby designated as qualified dividend income for individuals for the period ended April 30, 2020:
| | | | |
| Fund | | Qualified Dividend
Income | |
Equity Dividend Fund | | $ | 347,702,204 | |
For the period ended April 30, 2020, the Fund hereby designates the following maximum amounts allowable as interest-related dividends eligible for exemption from U.S. withholding tax for nonresident aliens and foreign corporations:
| | | | |
| Fund | | Interest-Related
Dividends | |
Equity Dividend Fund | | $ | 11,051,728 | |
The law varies in each state as to whether and what percent of ordinary income dividends attribute to federal obligations is exempt from state income tax. Shareholders are advised to check with their tax advisers to determine if any portion of the dividends received is exempt from state income tax.
The following distribution amounts are hereby designated for the period ended April 30, 2020:
| | | | | | | | |
| Fund | | Short-Term
Capital Gain
Dividends | | | 20% Rate
Long-Term
Capital Gain
Dividends | |
Equity Dividend Fund | | $ | 45,352,646 | | | $ | 374,677,125 | |
Statement Regarding Liquidity Risk Management Program
The Securities and Exchange Commission adopted Rule 22e-4 under the Investment Company Act of 1940, as amended (the “Liquidity Rule”) to promote effective liquidity risk management throughout the open-end investment company industry, thereby reducing the risk that funds will be unable to meet their redemption obligations and mitigating dilution of the interests of fund shareholders.
The Board of Trustees (the “Board”) of BlackRock Equity Dividend Fund met on November 12-13, 2019 (the “Meeting”) to review the liquidity risk management program (the “Program”) applicable to the BlackRock open-end funds, excluding money market funds (each, a “Fund”), pursuant to the Liquidity Rule. The Board has appointed BlackRock Advisors, LLC or BlackRock Fund Advisors (“BlackRock”), each an investment adviser to certain Funds, as the program administrator for each Fund’s Program, as applicable. BlackRock has delegated oversight of the Program to the 40 Act Liquidity Risk Management Committee (the “Committee”). At the Meeting, the Committee, on behalf of BlackRock, provided the Board with a report that addressed the operation of the Program and assessed its adequacy and effectiveness of implementation, including the operation of each Fund’s Highly Liquid Investment Minimum (“HLIM”) where applicable, and any material changes to the Program (the “Report”). The Report covered the period from December 1, 2018 through September 30, 2019 (the “Program Reporting Period”).
The Report described the Program’s liquidity classification methodology for categorizing a Fund’s investments (including derivative transactions) into one of four liquidity buckets. It also described BlackRock’s methodology in establishing a Fund’s HLIM and noted that the Committee reviews and ratifies the HLIM assigned to each Fund no less frequently than annually.
The Report noted that the Program complied with the key factors for consideration under the Liquidity Rule for assessing, managing and periodically reviewing a Fund’s liquidity risk, as follows:
A. The Fund’s investment strategy and liquidity of portfolio investments during both normal and reasonably foreseeable stressed conditions:During the Program Reporting Period, the Committee reviewed whether each Fund’s strategy is appropriate for an open-end fund structure with a focus on Funds with more significant and consistent holdings of less liquid and illiquid assets. The Committee also factored a Fund’s concentration in an issuer into the liquidity classification methodology by taking issuer position sizes into account. Where a Fund participated in borrowings for investment purposes (such as tender option bonds and reverse repurchase agreements), such borrowings were factored into the Program’s calculation of a Fund’s liquidity bucketing. Derivative exposure was also considered in such calculation.
B. Short-term and long-term cash flow projections during both normal and reasonably foreseeable stressed conditions:During the Program Reporting Period, the Committee reviewed historical net redemption activity and used this information as a component to establish each Fund’s reasonably anticipated trading size (“RATS”). Each Fund has adopted an in-kind redemption policy which may be utilized to meet larger redemption requests. The Committee may also take into consideration a Fund’s shareholder ownership concentration (which, depending on product type and distribution channel, may or may not be available), a Fund’s distribution channels, and the degree of certainty associated with a Fund’s short-term and long-term cash flow projections.
C. Holdings of cash and cash equivalents, as well as borrowing arrangements:The Committee considered the terms of the credit facility applicable to the Funds, the financial health of the institution providing the facility and the fact that the credit facility is shared among multiple Funds (including that a portion of the aggregate commitment amount is specifically designated for BlackRock Floating Rate Income Portfolio, a series of BlackRock Funds V). The Committee also considered other types of borrowing available to the Funds, such as the ability to use reverse repurchase agreements and interfund lending, as applicable.
There were no material changes to the Program during the Program Reporting Period. The Report provided to the Board stated that the Committee concluded that based on the operation of the functions, as described in the Report, the Program is operating as intended and is effective in implementing the requirements of the Liquidity Rule.
| | |
| 32 | | 2020 BLACKROCK ANNUAL REPORTTO SHAREHOLDERS |
Trustee and Officer Information
| | | | | | | | |
| Independent Trustees (a) |
| | | | | |
Name
Year of Birth (b) | | Position(s) Held
(Length of Service) (c) | | Principal Occupation(s) During Past Five Years | | Number of BlackRock-Advised
Registered Investment Companies
(“RICs”) Consisting of Investment
Portfolios (“Portfolios”) Overseen | | Public Company and Other
Investment Company
Directorships Held During
Past Five Years |
Mark Stalnecker 1951 | | Chair of the Board and Trustee
(Since 2019) | | Chief Investment Officer, University of Delaware from 1999 to 2013; Trustee and Chair of the Finance and Investment Committees, Winterthur Museum and Country Estate from 2005 to 2016; Member of the Investment Committee, Delaware Public Employees’ Retirement System since 2002; Member of the Investment Committee, Christiana Care Health System from 2009 to 2017; Member of the Investment Committee, Delaware Community Foundation from 2013 to 2014; Director and Chair of the Audit Committee, SEI Private Trust Co. from 2001 to 2014. | | 36 RICs consisting of 150 Portfolios | | None |
Bruce R. Bond 1946 | | Trustee
(Since 2007) | | Board Member, Amsphere Limited (software) since 2018; Trustee and Member of the Governance Committee, State Street Research Mutual Funds from 1997 to 2005; Board Member of Governance, Audit and Finance Committee, Avaya Inc. (computer equipment) from 2003 to 2007. | | 36 RICs consisting of 150 Portfolios | | None |
Susan J. Carter 1956 | | Trustee
(Since 2019) | | Director, Pacific Pension Institute from 2014 to 2018; Advisory Board Member, Center for Private Equity and Entrepreneurship at Tuck School of Business since 1997; Senior Advisor, Commonfund Capital, Inc. (“CCI”) (investment adviser) in 2015; Chief Executive Officer, CCI from 2013 to 2014; President & Chief Executive Officer, CCI from 1997 to 2013; Advisory Board Member, Girls Who Invest from 2015 to 2018 and Board Member thereof since 2018; Advisory Board Member, Bridges Fund Management since 2016; Trustee, Financial Accounting Foundation since 2017; Practitioner Advisory Board Member, Private Capital Research Institute (“PCRI”) since 2017; Lecturer in the Practice of Management, Yale School of Management since 2019. | | 36 RICs consisting of 150 Portfolios | | None |
Collette Chilton 1958 | | Trustee
(Since 2019) | | Chief Investment Officer, Williams College since 2006; Chief Investment Officer, Lucent Asset Management Corporation from 1998 to 2006. | | 36 RICs consisting of 150 Portfolios | | None |
Neil A. Cotty 1954 | | Trustee
(Since 2019) | | Bank of America Corporation from 1996 to 2015, serving in various senior finance leadership roles, including Chief Accounting Officer from 2009 to 2015, Chief Financial Officer of Global Banking, Markets and Wealth Management from 2008 to 2009, Chief Accounting Officer from 2004 to 2008, Chief Financial Officer of Consumer Bank from 2003 to 2004, Chief Financial Officer of Global Corporate Investment Bank from 1999 to 2002. | | 36 RICs consisting of 150 Portfolios | | None |
Lena G. Goldberg 1949 | | Trustee
(Since 2016) | | Senior Lecturer, Harvard Business School, since 2008; Director, Charles Stark Draper Laboratory, Inc. since 2013; FMR LLC/Fidelity Investments (financial services) from 1996 to 2008, serving in various senior roles including Executive Vice President—Strategic Corporate Initiatives and Executive Vice President and General Counsel; Partner, Sullivan & Worcester LLP from 1985 to 1996 and Associate thereof from 1979 to 1985. | | 36 RICs consisting of 150 Portfolios | | None |
| | | | |
| TRUSTEEAND OFFICER INFORMATION | | | 33 | |
Trustee and Officer Information (continued)
| | | | | | | | |
| Independent Trustees (a)(continued) |
| | | | | |
Name
Year of Birth (b) | | Position(s) Held
(Length of Service) (c) | | Principal Occupation(s) During Past Five Years | | Number of BlackRock-Advised
Registered Investment Companies
(“RICs”) Consisting of Investment
Portfolios (“Portfolios”) Overseen | | Public Company and Other
Investment Company
Directorships Held During
Past Five Years |
Henry R. Keizer 1956 | | Trustee
(Since 2016) | | Director, Park Indemnity Ltd. (captive insurer) since 2010; Director, MUFG Americas Holdings Corporation and MUFG Union Bank, N.A. (financial and bank holding company) from 2014 to 2016; Director, American Institute of Certified Public Accountants from 2009 to 2011; Director, KPMG LLP (audit, tax and advisory services) from 2004 to 2005 and 2010 to 2012; Director, KPMG International in 2012, Deputy Chairman and Chief Operating Officer thereof from 2010 to 2012 and U.S. Vice Chairman of Audit thereof from 2005 to 2010; Global Head of Audit, KPMGI (consortium of KPMG firms) from 2006 to 2010; Director, YMCA of Greater New York from 2006 to 2010. | | 36 RICs consisting of 150 Portfolios | | Hertz Global Holdings (car rental); Montpelier Re Holdings, Ltd. (publicly held property and casualty reinsurance) from 2013 until 2015; Sealed Air Corp. (packaging); WABCO (commercial vehicle safety systems) |
Cynthia A. Montgomery 1952 | | Trustee
(Since 2019) | | Professor, Harvard Business School since 1989. | | 36 RICs consisting of 150 Portfolios | | Newell Rubbermaid, Inc. (manufacturing) |
Donald C. Opatrny 1952 | | Trustee
(Since 2015) | | Trustee, Vice Chair, Member of the Executive Committee and Chair of the Investment Committee, Cornell University since 2004; President, Trustee and Member of the Investment Committee, The Aldrich Contemporary Art Museum from 2007 to 2014; Member of the Board and Investment Committee, University School from 2007 to 2018; Member of the Investment Committee, Mellon Foundation from 2009 to 2015; Trustee, Artstor (a Mellon Foundation affiliate) from 2010 to 2015; President and Trustee, the Center for the Arts, Jackson Hole from 2011 to 2018; Director, Athena Capital Advisors LLC (investment management firm) since 2013; Trustee and Chair of the Investment Committee, Community Foundation of Jackson Hole since 2014; Member of Affordable Housing Supply Board of Jackson, Wyoming since 2018; Member, Investment Funds Committee, State of Wyoming since 2017; Trustee, Phoenix Art Museum since 2018; Trustee, Arizona Community Foundation and Member of Investment Committee since 2020. | | 36 RICs consisting of 150 Portfolios | | None |
Joseph P. Platt 1947 | | Trustee
(Since 2019) | | General Partner, Thorn Partners, LP (private investments) since 1998; Director, WQED Multi-Media (public broadcastingnot-for-profit) since 2001; Chair, Basic Health International(non-profit) since 2015. | | 36 RICs consisting of 150 Portfolios | | Greenlight Capital Re, Ltd. (reinsurance company); Consol Energy Inc. |
Kenneth L. Urish 1951 | | Trustee
(Since 2019) | | Managing Partner, Urish Popeck & Co., LLC (certified public accountants and consultants) since 1976; Past-Chairman of the Professional Ethics Committee of the Pennsylvania Institute of Certified Public Accountants and Committee Member thereof since 2007; Member of External Advisory Board, The Pennsylvania State University Accounting Department since founding in 2001; Principal, UP Strategic Wealth Investment Advisors, LLC since 2013; Trustee, The Holy Family Institute from 2001 to 2010; President and Trustee, Pittsburgh Catholic Publishing Associates from 2003 to 2008; Director,Inter-Tel from 2006 to 2007. | | 36 RICs consisting of 150 Portfolios | | None |
Claire A. Walton 1957 | | Trustee
(Since 2019) | | Chief Operating Officer and Chief Financial Officer of Liberty Square Asset Management, LP from 1998 to 2015; General Partner of Neon Liberty Capital Management, LLC since 2003; Director, Boston Hedge Fund Group from 2009 to 2018; Director, Woodstock Ski Runners since 2013; Director, Massachusetts Council on Economic Education from 2013 to 2015. | | 36 RICs consisting of 150 Portfolios | | None |
| | |
| 34 | | 2020 BLACKROCK ANNUAL REPORTTO SHAREHOLDERS |
Trustee and Officer Information (continued)
| | | | | | | | |
| Interested Trustees (a)(d) |
| | | | | |
Name
Year of Birth (b) | | Position(s) Held
(Length of Service) (c) | | Principal Occupation(s) During Past Five Years | | Number of BlackRock-Advised
Registered Investment Companies
(“RICs”) Consisting of Investment
Portfolios (“Portfolios”) Overseen | | Public Company and Other
Investment Company
Directorships Held During
Past Five Years |
Robert Fairbairn 1965 | | Trustee
(Since 2015) | | Vice Chairman of BlackRock, Inc. since 2019; Member of BlackRock’s Global Executive and Global Operating Committees;Co-Chair of BlackRock’s Human Capital Committee; Senior Managing Director of BlackRock, Inc. from 2010 to 2019; oversaw BlackRock’s Strategic Partner Program and Strategic Product Management Group from 2012 to 2019; Member of the Board of Managers of BlackRock Investments, LLC from 2011 to 2018; Global Head of BlackRock’s Retail and iShares® businesses from 2012 to 2016. | | 123 RICs consisting of 261 Portfolios | | None |
John M. Perlowski (e) 1964 | | Trustee
(Since 2015)
President and Chief Executive Officer
(Since 2010) | | Managing Director of BlackRock, Inc. since 2009; Head of BlackRock Global Accounting and Product Services since 2009; Advisory Director of Family Resource Network (charitable foundation) since 2009. | | 124 RICs consisting of 262 Portfolios | | None |
(a) The address of each Trustee is c/o BlackRock, Inc., 55 East 52nd Street, New York, New York 10055. |
(b) Each Independent Trustee holds office until his or her successor is duly elected and qualifies or until his or her earlier death, resignation, retirement or removal as provided by the Fund’sby-laws or charter or statute, or until December 31 of the year in which he or she turns 75. Trustees who are “interested persons,” as defined in the 1940 Act, serve until their successor is duly elected and qualifies or until their earlier death, resignation, retirement or removal as provided by the Fund’sby-laws or statute, or until December 31 of the year in which they turn 72. The Board may determine to extend the terms of Independent Trustees on acase-by-case basis, as appropriate. |
(c) Following the combination of Merrill Lynch Investment Managers, L.P. (“MLIM”) and BlackRock, Inc. in September 2006, the various legacy MLIM and legacy BlackRock fund boards were realigned and consolidated into three new fund boards in 2007. In addition, effective January 1, 2019, three BlackRock Fund Complexes were realigned and consolidated into two BlackRock Fund Complexes. As a result, although the chart shows the year that each Independent Trustee joined the Board, certain Independent Trustees first became members of the boards of other BlackRock-advised Funds, legacy MLIM funds or legacy BlackRock funds as follows: Bruce R. Bond, 2005; Susan J. Carter, 2016; Collette Chilton, 2015; Neil A. Cotty, 2016; Cynthia A. Montgomery, 1994; Joseph P. Platt, 1999; Mark Stalnecker, 2015; Kenneth L. Urish, 1999; Claire A. Walton, 2016. |
(d) Mr. Fairbairn and Mr. Perlowski are both “interested persons,” as defined in the 1940 Act, of the Fund based on their positions with BlackRock, Inc. and its affiliates. Mr. Fairbairn and Mr. Perlowski are also board members of the BlackRock Fixed-Income Complex. |
(e) Mr. Perlowski is also a trustee of the BlackRock Credit Strategies Fund. |
| | | | |
| TRUSTEEAND OFFICER INFORMATION | | | 35 | |
Trustee and Officer Information (continued)
| | | | | | | | |
| Officers Who Are Not Trustees (a) |
| | | |
Name
Year of Birth(b) | | Position(s) Held
(Length of Service) | | Principal Occupation(s) During Past Five Years |
Jennifer McGovern 1977 | | Vice President
(Since 2014) | | Managing Director of BlackRock, Inc. since 2016; Director of BlackRock, Inc. from 2011 to 2015; Head of Product Development and Oversight for BlackRock’s Strategic Product Management Group since 2019; Head of Product Structure and Oversight for BlackRock’s U.S. Wealth Advisory Group from 2013 to 2019. |
Neal J. Andrews 1966 | | Chief Financial Officer
(Since 2007) | | Chief Financial Officer of the iShares® exchange traded funds from 2019 to 2020; Managing Director of BlackRock, Inc. since 2006. |
Jay M. Fife 1970 | | Treasurer
(Since 2007) | | Managing Director of BlackRock, Inc. since 2007. |
Charles Park 1967 | | Chief Compliance Officer
(Since 2014) | | Anti-Money Laundering Compliance Officer for certain BlackRock-advised Funds from 2014 to 2015; Chief Compliance Officer of BlackRock Advisors, LLC and the BlackRock-advised Funds in the BlackRock Multi-Asset Complex and the BlackRock Fixed-Income Complex since 2014; Principal of and Chief Compliance Officer for iShares® Delaware Trust Sponsor LLC since 2012 and BlackRock Fund Advisors (“BFA”) since 2006; Chief Compliance Officer for theBFA-advised iShares® exchange traded funds since 2006; Chief Compliance Officer for BlackRock Asset Management International Inc. since 2012. |
Lisa Belle 1968 | | Anti-Money Laundering Compliance Officer
(Since 2019) | | Managing Director of BlackRock, Inc. since 2019; Global Financial Crime Head for Asset and Wealth Management of JP Morgan from 2013 to 2019; Managing Director of RBS Securities from 2012 to 2013; Head of Financial Crimes for Barclays Wealth Americas from 2010 to 2012. |
Janey Ahn 1975 | | Secretary
(Since 2019) | | Managing Director of BlackRock, Inc. since 2018; Director of BlackRock, Inc. from 2009 to 2017. |
(a) The address of each Officer is c/o BlackRock, Inc., 55 East 52nd Street, New York, New York 10055. |
(b) Officers of the Fund serve at the pleasure of the Board. |
Further information about the Fund’s Trustees and Officers is available in the Fund’s Statement of Additional Information, which can be obtained without charge by calling (800)441-7762.
Effective December 31, 2019, Robert M. Hernandez retired as Trustee of the Fund.
Investment Manager
BlackRock Advisors, LLC
Wilmington, DE 19809
Accounting Services Provider and Custodian
State Street Bank and Trust Company
Boston, MA 02111
Transfer Agent
BNY Mellon Investment Servicing (US) Inc.
Wilmington, DE 19809
Distributor
BlackRock Investments, LLC
New York, NY 10022
Legal Counsel
Sidley Austin LLP
New York, NY 10019
Independent Registered Public Accounting Firm
Deloitte & Touche LLP
Boston, MA 02116
Address of the Fund
100 Bellevue Parkway
Wilmington, DE 19809
| | |
| 36 | | 2020 BLACKROCK ANNUAL REPORTTO SHAREHOLDERS |
Additional Information
General Information
Householding
The Fund will mail only one copy of shareholder documents, including prospectuses, annual and semi-annual reports and proxy statements, to shareholders with multiple accounts at the same address. This practice is commonly called “householding” and is intended to reduce expenses and eliminate duplicate mailings of shareholder documents. Mailings of your shareholder documents may be householded indefinitely unless you instruct us otherwise. If you do not want the mailing of these documents to be combined with those for other members of your household, please call the Fund at(800) 441-7762.
Availability of Quarterly Schedule of Investments
The Fund files its complete schedule of portfolio holdings with the SEC for the first and third quarters of each fiscal year as an exhibit to its reports on Form N-PORT, and for reporting periods ended prior to March 31, 2019, filed such information on Form N-Q. The Fund’s Forms N-PORT and N-Q are available on the SEC’s website at sec.gov. The Fund’s Form N-Q may also be obtained upon request and without charge by calling(800) 441-7762.
Availability of Proxy Voting Policies and Procedures
A description of the policies and procedures that the Fund use to determine how to vote proxies relating to portfolio securities is available upon request and without charge (1) by calling (800) 441-7762; (2) atblackrock.com; and (3) on the SEC’s website at sec.gov.
Availability of Proxy Voting Record
Information about how the Fund voted proxies relating to securities held in the Fund’s portfolios during the most recent 12-month period ended June 30 is available upon request and without charge (1) atblackrock.com; or by calling (800) 441-7762 and (2) on the SEC’s website at sec.gov.
BlackRock’s Mutual Fund Family
BlackRock offers a diverse lineup of open-end mutual funds crossing all investment styles and managed by experts in equity, fixed-income and tax-exempt investing. Visitblackrock.com for more information.
Shareholder Privileges
Account Information
Call us at (800) 441-7762 from 8:00 AM to 6:00 PM ET on any business day to get information about your account balances, recent transactions and share prices. You can also visitblackrock.com for more information.
Automatic Investment Plans
Investor class shareholders who want to invest regularly can arrange to have $50 or more automatically deducted from their checking or savings account and invested in any of the BlackRock funds.
Systematic Withdrawal Plans
Investor class shareholders can establish a systematic withdrawal plan and receive periodic payments of $50 or more from their BlackRock funds, as long as their account balance is at least $10,000.
Retirement Plans
Shareholders may make investments in conjunction with Traditional, Rollover, Roth, Coverdell, Simple IRAs, SEP IRAs and 403(b) Plans.
| | | | |
| ADDITIONAL INFORMATION | | | 37 | |
Additional Information (continued)
BlackRock Privacy Principles
BlackRock is committed to maintaining the privacy of its current and former fund investors and individual clients (collectively, “Clients”) and to safeguarding their non-public personal information. The following information is provided to help you understand what personal information BlackRock collects, how we protect that information and why in certain cases we share such information with select parties.
If you are located in a jurisdiction where specific laws, rules or regulations require BlackRock to provide you with additional or different privacy-related rights beyond what is set forth below, then BlackRock will comply with those specific laws, rules or regulations.
BlackRock obtains or verifies personal non-public information from and about you from different sources, including the following: (i) information we receive from you or, if applicable, your financial intermediary, on applications, forms or other documents; (ii) information about your transactions with us, our affiliates, or others; (iii) information we receive from a consumer reporting agency; and (iv) from visits to our websites.
BlackRock does not sell or disclose to non-affiliated third parties any non-public personal information about its Clients, except as permitted by law or as is necessary to respond to regulatory requests or to service Client accounts. These non-affiliated third parties are required to protect the confidentiality and security of this information and to use it only for its intended purpose.
We may share information with our affiliates to service your account or to provide you with information about other BlackRock products or services that may be of interest to you. In addition, BlackRock restricts access to non-public personal information about its Clients to those BlackRock employees with a legitimate business need for the information. BlackRock maintains physical, electronic and procedural safeguards that are designed to protect the non-public personal information of its Clients, including procedures relating to the proper storage and disposal of such information.
Glossary of Terms Used in this Report
| | |
| Portfolio Abbreviations |
| |
| ADR | | American Depositary Receipts |
| |
| GDR | | Global Depositary Receipt |
| | |
| 38 | | 2020 BLACKROCK ANNUAL REPORTTO SHAREHOLDERS |
Want to know more?
blackrock.com | 800-441-7762
This report is intended for current holders. It is not authorized for use as an offer of sale or a solicitation of an offer to buy shares of the Fund unless preceded or accompanied by the Fund’s current prospectus. Past performance results shown in this report should not be considered a representation of future performance. Investment returns and principal value of shares will fluctuate so that shares, when redeemed, may be worth more or less than their original cost. Statements and other information herein are as dated and are subject to change.
EQDIV-4/20-AR
| Item 2 – | Code of Ethics – The registrant (or the “Fund”) has adopted a code of ethics, as of the end of the period covered by this report, applicable to the registrant’s principal executive officer, principal financial officer, principal accounting officer or controller, or persons performing similar functions. During the period covered by this report, the code of ethics was amended to update certain information and to make othernon-material changes. During the period covered by this report, there have been no waivers granted under the code of ethics. The registrant undertakes to provide a copy of the code of ethics to any person upon request, without charge, who calls1-800-441-7762. |
| Item 3 – | Audit Committee Financial Expert – The registrant’s board of directors (the “board of directors”), has determined that (i) the registrant has the following audit committee financial experts serving on its audit committee and (ii) each audit committee financial expert is independent: |
Neil A. Cotty
Henry R. Keizer
Kenneth L. Urish
Claire A. Walton
Under applicable securities laws, a person determined to be an audit committee financial expert will not be deemed an “expert” for any purpose, including without limitation for the purposes of Section 11 of the Securities Act of 1933, as a result of being designated or identified as an audit committee financial expert. The designation or identification of a person as an audit committee financial expert does not impose on such person any duties, obligations, or liabilities greater than the duties, obligations, and liabilities imposed on such person as a member of the audit committee and board of directors in the absence of such designation or identification. The designation or identification of a person as an audit committee financial expert does not affect the duties, obligations, or liability of any other member of the audit committee or board of directors.
| Item 4 – | Principal Accountant Fees and Services |
The following table presents fees billed by Deloitte & Touche LLP (“D&T”) in each of the last two fiscal years for the services rendered to the Fund:
| | | | | | | | | | | | | | | | |
| | | | | |
| | | (a) Audit Fees | | (b) Audit-Related Fees1 | | (c) Tax Fees2 | | (d) All Other Fees |
| Entity Name | | Current Fiscal Year End | | Previous Fiscal Year End | | Current Fiscal Year End | | Previous Fiscal Year End | | Current Fiscal Year End | | Previous Fiscal Year End | | Current Fiscal Year End | | Previous Fiscal Year End |
| BlackRock Equity Dividend Fund | | $29,682 | | $29,682 | | $6,500 | | $0 | | $14,500 | | $15,800 | | $0 | | $0 |
The following table presents fees billed by D&T that were required to be approved by the registrant’s audit committee (the “Committee”) for services that relate directly to the operations or financial reporting of the Fund and that are rendered on behalf of BlackRock Advisors, LLC (the “Investment Adviser” or “BlackRock”) and entities controlling, controlled by, or under common control with BlackRock (not including anysub-adviser whose role is primarily portfolio management and is subcontracted with or overseen by another investment adviser) that provide ongoing services to the Fund (“Affiliated Service Providers”):
2
| | | | |
| | | Current Fiscal Year End | | Previous Fiscal Year End |
(b) Audit-Related Fees1 | | $0 | | $0 |
(c) Tax Fees2 | | $0 | | $0 |
(d) All Other Fees3 | | $1,984,000 | | $2,050,500 |
1 The nature of the services includes assurance and related services reasonably related to the performance of the audit or review of financial statements not included in Audit Fees, including accounting consultations, agreed-upon procedure reports, attestation reports, comfort letters,out-of-pocket expenses and internal control reviews not required by regulators.
2 The nature of the services includes tax compliance and/or tax preparation, including services relating to the filing or amendment of federal, state or local income tax returns, regulated investment company qualification reviews, taxable income and tax distribution calculations.
3Non-audit fees of $1,984,000 and $2,050,500 for the current fiscal year and previous fiscal year, respectively, were paid to the Fund’s principal accountant in their entirety by BlackRock, in connection with services provided to the Affiliated Service Providers of the Fund and of certain other funds sponsored and advised by BlackRock or its affiliates for a service organization review and an accounting research tool subscription. These amounts represent aggregate fees paid by BlackRock and were not allocated on a per fund basis.
(e)(1) Audit CommitteePre-Approval Policies and Procedures:
The Committee has adopted policies and procedures with regard to thepre-approval of services. Audit, audit-related and tax compliance services provided to the registrant on an annual basis require specificpre-approval by the Committee. The Committee also must approve othernon-audit services provided to the registrant and thosenon-audit services provided to the Investment Adviser and Affiliated Service Providers that relate directly to the operations and the financial reporting of the registrant. Certain of thesenon-audit services that the Committee believes are (a) consistent with the SEC’s auditor independence rules and (b) routine and recurring services that will not impair the independence of the independent accountants may be approved by the Committee without consideration on a specificcase-by-case basis (“generalpre-approval”). The term of any generalpre-approval is 12 months from the date of thepre-approval, unless the Committee provides for a different period. Tax or othernon-audit services provided to the registrant which have a direct impact on the operations or financial reporting of the registrant will only be deemedpre-approved provided that any individual project does not exceed $10,000 attributable to the registrant or $50,000 per project. For this purpose, multiple projects will be aggregated to determine if they exceed the previously mentioned cost levels.
Any proposed services exceeding thepre-approved cost levels will require specificpre-approval by the Committee, as will any other services not subject to generalpre-approval (e.g., unanticipated but permissible services). The Committee is informed of each service approved subject to generalpre-approval at the next regularly scheduledin-person board meeting. At this meeting, an analysis of such services is presented to the Committee for ratification. The Committee may delegate to the Committee Chairman the authority to approve the provision of and fees for any specific engagement of permittednon-audit services, including services exceedingpre-approved cost levels.
(e)(2) None of the services described in each of Items 4(b) through (d) were approved by the Committee pursuant to the de minimis exception in paragraph (c)(7)(i)(C) of Rule2-01 of RegulationS-X.
(f) Not Applicable
3
(g) ) The aggregatenon-audit fees, defined as the sum of the fees shown under “Audit-Related Fees,” “Tax Fees” and “All Other Fees,” paid to the accountant for services rendered by the accountant to the registrant, the Investment Adviser and the Affiliated Service Providers were:
| | | | | | |
| | | Entity Name | | Current Fiscal Year End | | Previous Fiscal Year End |
| | BlackRock Equity Dividend Fund | | $21,000 | | $15,800 |
Additionally, the amounts billed by D&T in connection with services provided to the Affiliated Service Providers of the Fund and of other funds sponsored and advised by BlackRock or its affiliates during the current and previous fiscal years for a service organization review and an accounting research tool subscription were:
| | |
Current Fiscal Year End | | Previous Fiscal Year End |
$1,984,000 | | $2,050,500 |
These amounts represent aggregate fees paid by BlackRock and were not allocated on a per fund basis.
(h) The Committee has considered and determined that the provision ofnon-audit services that were rendered to the Investment Adviser and the Affiliated Service Providers that were notpre-approved pursuant to paragraph (c)(7)(ii) of Rule2-01 of RegulationS-X is compatible with maintaining the principal accountant’s independence.
| Item 5 – | Audit Committee of Listed Registrant – Not Applicable |
(a) The registrant’s Schedule of Investments is included as part of the Report to Stockholders filed under Item 1 of this Form.
(b) Not Applicable due to no such divestments during the semi-annual period covered since the previous FormN-CSR filing.
| Item 7 – | Disclosure of Proxy Voting Policies and Procedures forClosed-End Management Investment Companies – Not Applicable |
| Item 8 – | Portfolio Managers ofClosed-End Management Investment Companies – Not Applicable |
| Item 9 – | Purchases of Equity Securities byClosed-End Management Investment Company and Affiliated Purchasers – Not Applicable |
| Item 10 – | Submission of Matters to a Vote of Security Holders – There have been no material changes to these procedures. |
| Item 11 – | Controls and Procedures |
4
(a) The registrant’s principal executive and principal financial officers, or persons performing similar functions, have concluded that the registrant’s disclosure controls and procedures (as defined in Rule30a-3(c) under the Investment Company Act of 1940, as amended (the “1940 Act”)) are effective as of a date within 90 days of the filing of this report based on the evaluation of these controls and procedures required by Rule30a-3(b) under the 1940 Act and Rule 15d-15(b) under the Securities Exchange Act of 1934, as amended.
(b) There were no changes in the registrant’s internal control over financial reporting (as defined in Rule30a-3(d) under the 1940 Act) that occurred during the period covered by this report that have materially affected, or are reasonably likely to materially affect, the registrant’s internal control over financial reporting.
| Item 12 – | Disclosure of Securities Lending Activities forClosed-End Management Investment Companies –Not Applicable |
| Item 13 – | Exhibits attached hereto |
(a)(1) – Code of Ethics – See Item 2
(a)(2) – Section 302 Certifications are attached
(a)(3) – Not Applicable
(a)(4) – Not Applicable
(b) – Section 906 Certifications are attached
5
Pursuant to the requirements of the Securities Exchange Act of 1934 and the Investment Company Act of 1940, the registrant has duly caused this report to be signed on its behalf by the undersigned, thereunto duly authorized.
BlackRock Equity Dividend Fund
| | | | |
| | By: | | /s/ John M. Perlowski |
| | | | | John M. Perlowski |
| | | | | Chief Executive Officer (principal executive officer) of |
| | | | | BlackRock Equity Dividend Fund |
Date: July 2, 2020
Pursuant to the requirements of the Securities Exchange Act of 1934 and the Investment Company Act of 1940, this report has been signed below by the following persons on behalf of the registrant and in the capacities and on the dates indicated.
| | | | |
| | | By: | | /s/ John M. Perlowski |
| | | | | John M. Perlowski |
| | | | | Chief Executive Officer (principal executive officer) of |
| | | | | BlackRock Equity Dividend Fund |
Date: July 2, 2020
| | | | |
| | | By: | | /s/ Neal J. Andrews |
| | | | | Neal J. Andrews |
| | | | | Chief Financial Officer (principal financial officer) of |
| | | | | BlackRock Equity Dividend Fund |
Date: July 2, 2020
6