UNITED STATES
SECURITIES AND EXCHANGE COMMISSION
Washington, D.C. 20549
FORM N-CSR
CERTIFIED SHAREHOLDER REPORT OF REGISTERED
MANAGEMENT INVESTMENT COMPANIES
Investment Company Act file number | 811-05181 |
|
Morgan Stanley Equally Weighted S&P 500 Fund |
(Exact name of registrant as specified in charter) |
|
522 Fifth Avenue, New York, New York | | 10036 |
(Address of principal executive offices) | | (Zip code) |
|
Ronald E. Robison 522 Fifth Avenue, New York, New York 10036 |
(Name and address of agent for service) |
|
Registrant’s telephone number, including area code: | 212-296-6990 | |
|
Date of fiscal year end: | June 30, 2008 | |
|
Date of reporting period: | June 30, 2008 | |
| | | | | | | | |
Item 1 - Report to Shareholders
INVESTMENT MANAGEMENT

Welcome, Shareholder:
In this report, you'll learn about how your investment in Morgan Stanley Equally-Weighted S&P 500 Fund performed during the annual period. We will provide an overview of the market conditions, and discuss some of the factors that affected performance during the reporting period. In addition, this report includes the Fund's financial statements and a list of Fund investments.
This material must be preceded or accompanied by a prospectus for the fund being offered.
Market forecasts provided in this report may not necessarily come to pass. There is no assurance that the Fund will achieve its investment objective. The Fund is subject to market risk, which is the possibility that market values of securities owned by the Fund will decline and, therefore, the value of the Fund's shares may be less than what you paid for them. Accordingly, you can lose money investing in this Fund. Please see the prospectus for more complete information on investment risks.
Fund Report
For the year ended June 30, 2008
| Total Return for the 12 Months Ended June 30, 2008+ | |
| Class A | | Class B | | Class C | | Class I++ | | S&P
Equal
Weight
Index1 | | Lipper
Multi-Cap
Core Funds
Index2 | |
| | –17.31 | % | | | –17.96 | % | | | –17.89 | % | | | –17.11 | % | | | –16.88 | % | | | –12.67 | % | |
+ Share classes listed above represent classes with the full 12 month period total returns to report. Class R and Class W shares commenced operations on March 31, 2008 and therefore are not listed on the table above.
++ Formerly Class D shares. Renamed Class I shares effective March 31, 2008.
The performance of the Fund's share classes varies because each has different expenses. The Fund's total returns assume the reinvestment of all distributions but do not reflect the deduction of any applicable sales charges. Such costs would lower performance. See Performance Summary for standardized performance and benchmark information.
Market Conditions
The 12-month period ended June 30, 2008 was a period of slow growth for the U.S. economy. The housing market downturn, rising unemployment and tightening in credit conditions have affected all segments of the economy. Consumer expectations also declined, notwithstanding the effect of tax rebates widely considered to be temporary. In this environment, major global stock markets retreated in the last 12 months, with most markets posting double-digit declines.
Complicating the economic picture is the fact that the soft economy is accompanied by rising prices for commodities, particularly food and energy. Concerns about the economy have until recently kept the Federal Reserve (the "Fed") focused on supporting growth. However, as global inflation risk is emerging as a serious threat (inflation is even higher in emerging economies), the Fed has expressed its concern about rising inflation expectations, indicating a shift of stance, while the European Central Bank raised interest rates in an attempt to keep inflation there in check. All said, several economic indicators held up quite well, with U.S. real gross domestic product (GDP) growth estimated to have grown at an annualized rate slightly above one percent in the second quarter of 2008.
Performance Analysis
Class A, B, C and I shares of Morgan Stanley Equally-Weighted S&P 500 Fund underperformed the S&P Equal Weight Index and the Lipper Multi-Cap Core Funds Index for the 12 months ended June 30, 2008, assuming no deduction of applicable sales charges.
Amid market turmoil, energy was the best performing sector for the Fund and the S&P Equal Weight Index during the 12-month period. Energy prices continued to soar, supporting huge profits for many energy companies, which in turn commanded significant investor attention for energy stocks. The worst performing sectors were financials, consumer discretionary and telecommunications services, as well as information technology, all with double-digit negative returns. The credit crunch and continuing downgrade of financial companies continued to impact the financial sector, where the full extent of losses remains unclear. At the same time, higher unemployment and declining consumer confidence with no sign of stabilization in
2
U.S. housing led to the negative performance of consumer-oriented stocks.
Other performance trends within the Fund and the S&P Equal Weight Index during the period included the underperformance of value stocks within the large- and mid-capitalization segments, as investors were looking for the larger, higher-quality companies (many of which are classified as growth stocks) in an environment of slowing economic growth. On an individual stock basis, the highest returning holdings in the overall portfolio were dominated by energy stocks.
There is no guarantee that any sectors mentioned will continue to perform as discussed herein or that securities in such sectors will be held by the Fund in the future.
| TOP 10 HOLDINGS as of 06/30/08 | |
| Sprint Nextel Corp. | | | 0.2 | % | |
| Eastman Kodak Co. | | | 0.2 | | |
| CenturyTel, Inc. | | | 0.2 | | |
| Weatherford International Ltd. (Bermuda) | | | 0.2 | | |
| Jabil Circuit, Inc. | | | 0.2 | | |
| Barr Pharmaceuticals Inc. | | | 0.2 | | |
| Peabody Energy Corp. | | | 0.2 | | |
| Murphy Oil Corp. | | | 0.2 | | |
| Forest Laboratories, Inc. | | | 0.2 | | |
| King Pharmaceuticals, Inc. | | | 0.2 | | |
| TOP FIVE INDUSTRIES as of 06/30/08 | |
| Electric Utilities | | | 5.5 | % | |
| Medical Specialties | | | 3.5 | | |
| Real Estate Investment Trusts | | | 2.6 | | |
| Semiconductors | | | 2.5 | | |
| Major Banks | | | 2.5 | | |
Subject to change daily. Provided for informational purposes only and should not be deemed a recommendation to buy or sell the securities mentioned above. Top 10 holdings and top five industries are as a percentage of net assets. Morgan Stanley is a full-service securities firm engaged in securities trading and brokerage activities, investment banking, research and analysis, financing and financial advisory services.
3
Investment Strategy
The Fund invests in a diversified portfolio of common stocks represented in the Standard & Poor's® 500 Composite Stock Price Index ("S&P 500"). The S&P 500 is a well known stock market index that includes common stocks of 500 companies. The Fund generally invests in each stock included in the S&P 500 in approximately equal proportions. This approach differs from the S&P 500 because stocks in the S&P 500 are represented in proportion to their market value or market-capitalization. For example, the 50 largest companies in the S&P 500 represent approximately 50 percent of the S&P 500's value; however, these same 50 companies represent roughly 10 percent of the Fund's value. The Fund may invest in foreign securities represented in the S&P 500, including depositary receipts.
For More Information About Portfolio Holdings
Each Morgan Stanley fund provides a complete schedule of portfolio holdings in its semiannual and annual reports within 60 days of the end of the fund's second and fourth fiscal quarters. The semiannual reports and the annual reports are filed electronically with the Securities and Exchange Commission (SEC) on Form N-CSRS and Form N-CSR, respectively. Morgan Stanley also delivers the semiannual and annual reports to fund shareholders and makes these reports available on its public web site, www.morganstanley.com. Each Morgan Stanley fund also files a complete schedule of portfolio holdings with the SEC for the fund's first and third fiscal quarters on Form N-Q. Morgan Stanley does not deliver the reports for the first and third fiscal quarters to shareholders, nor are the reports posted to the Morgan Stanley public web site. You may, however, obtain the Form N-Q filings (as well as the Form N-CSR and N-CSRS filings) by access ing the SEC's web site, http://www.sec.gov. You may also review and copy them at the SEC's public reference room in Washington, DC. Information on the operation of the SEC's public reference room may be obtained by calling the SEC at (800) SEC-0330. You can also request copies of these materials, upon payment of a duplicating fee, by electronic request at the SEC's e-mail address (publicinfo@sec.gov) or by writing the public reference section of the SEC, Washington, DC 20549-0102.
Proxy Voting Policy and Procedures and Proxy Voting Record
You may obtain a copy of the Fund's Proxy Voting Policy and Procedures without charge, upon request, by calling toll free (800) 869-NEWS or by visiting the Mutual Fund Center on our Web site at www.morganstanley.com. It is also available on the Securities and Exchange Commission's Web site at http://www.sec.gov.
You may obtain information regarding how the Fund voted proxies relating to portfolio securities during the most recent twelve-month period ended June 30 without charge by visiting the Mutual Fund Center on our Web site at www.morganstanley.com. This information is also available on the Securities and Exchange Commission's Web site at http://www.sec.gov.
4
Householding Notice
To reduce printing and mailing costs, the Fund attempts to eliminate duplicate mailings to the same address. The Fund delivers a single copy of certain shareholder documents, including shareholder reports, prospectuses and proxy materials, to investors with the same last name who reside at the same address. Your participation in this program will continue for an unlimited period of time unless you instruct us otherwise. You can request multiple copies of these documents by calling (800) 869-NEWS, 8:00 a.m. to 8:00 p.m., ET. Once our Customer Service Center has received your instructions, we will begin sending individual copies for each account within 30 days.
5
Performance Summary
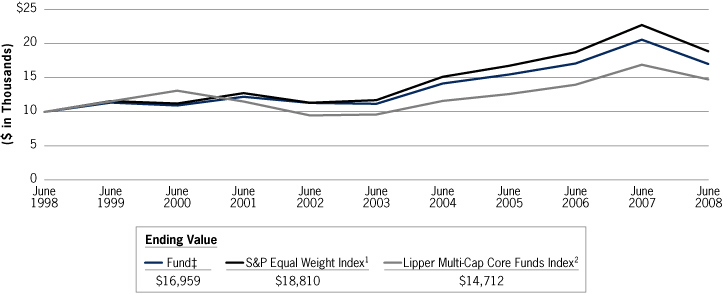
Performance of $10,000 Investment—Class B
Over 10 Years
6
| Average Annual Total Returns—Period Ended June 30, 2008 | |
| Symbol | | Class A Shares*
(Since 07/28/97)
VADAX | | Class B Shares**
(Since 12/01/87)
VADBX | | Class C Shares†
(Since 07/28/97)
VADCX | | Class I Shares††
(Since 07/28/97)
VADDX | | Class R Shares#
(Since 03/31/08)
VADRX | | Class W Shares##
(Since 03/31/08)
VADWX | |
| 1 Year | | (17.31)%3
(21.65)4 | | (17.96)%3
(21.65)4 | | (17.89)%3
(18.62)4 | | (17.11)%3
— | | —
— | | —
— | |
| 5 Years | | 9.183
8.014 | | 8.363
8.074 | | 8.393
8.394 | | 9.453
— | | —
— | | —
— | |
| 10 Years | | 6.043
5.474 | | 5.423
5.424 | | 5.263
5.264 | | 6.293
— | | —
— | | —
— | |
Since Inception
| | 6.963
6.434 | | 10.903
10.904 | | 6.183
6.184 | | 7.213
— | | (2.63)%3
— | | (2.57)%3
— | |
Performance data quoted represents past performance, which is no guarantee of future results and current performance may be lower or higher than the figures shown. For most recent month-end performance figures, please visit www.morganstanley.com/msim or speak with your Financial Advisor. Investment returns and principal value will fluctuate and fund shares, when redeemed, may be worth more or less than their original cost. The graph and table do not reflect the deduction of taxes that a shareholder would pay on fund distributions or the redemption of fund shares. Returns for periods less than one year are not annualized. Performance for Class A, Class B, Class C, Class I, Class R, and Class W shares will vary due to differences in sales charges and expenses. See the Fund's current prospectus for complete details on fees and sales charges.
* The maximum front-end sales charge for Class A is 5.25%.
** The maximum contingent deferred sales charge (CDSC) for Class B is 5.0%. The CDSC declines to 0% after six years. Effective April 2005, Class B shares will generally convert to Class A shares approximately eight years after the end of the calendar month in which the shares were purchased. Performance for periods greater than eight years reflects this conversion (beginning April 2005).
† The maximum contingent deferred sales charge for Class C is 1.0% for shares redeemed within one year of purchase.
†† Class I (formerly Class D) has no sales charge.
# Class R has no sales charge.
## Class W has no sales charge.
(1) The Standard & Poor's Equal Weight Index (S&P EWI) is the equally-weighted version of the widely regarded S&P 500® Index, which measures 500 leading companies in leading U.S. industries. The S&P EWI has the same constituents as the capitalization-weighted S&P 500® Index, but each company in the S&P EWI is allocated a fixed weight, rebalancing quarterly. The Index is unmanaged and its returns do not include any sales charges or fees. Such costs would lower performance. It is not possible to invest directly in an index.
(2) The Lipper Multi-Cap Core Funds Index is an equally weighted performance index of the largest qualifying funds (based on net assets) in the Lipper Multi-Cap Core Funds classification. The Index, which is adjusted for capital gains distributions and income dividends, is unmanaged and should not be considered an investment. There are currently 30 funds represented in this Index. The Fund is in the Lipper Multi-Cap Core Funds classification as of the date of this report.
(3) Figure shown assumes reinvestment of all distributions and does not reflect the deduction of any sales charges.
(4) Figure shown assumes reinvestment of all distributions and the deduction of the maximum applicable sales charge. See the Fund's current prospectus for complete details on fees and sales charges.
‡ Ending value assuming a complete redemption on June 30, 2008.
7
Expense Example
As a shareholder of the Fund, you incur two types of costs: (1) transaction costs, including sales charges (loads) on purchase payments and redemption fees; and (2) ongoing costs, including advisory fees; distribution and service (12b-1) fees; and other Fund expenses. This example is intended to help you understand your ongoing costs (in dollars) of investing in the Fund and to compare these costs with the ongoing costs of investing in other mutual funds.
The example is based on an investment of $1,000 invested at the beginning of the period and held for the entire period 01/01/08 – 06/30/08.
Actual Expenses
The first line of the table below provides information about actual account values and actual expenses. You may use the information in this line, together with the amount you invested, to estimate the expenses that you paid over the period. Simply divide your account value by $1,000 (for example, an $8,600 account value divided by $1,000 = 8.6), then multiply the result by the number in the first line under the heading entitled "Expenses Paid During Period" to estimate the expenses you paid on your account during this period.
Hypothetical Example for Comparison Purposes
The second line of the table below provides information about hypothetical expenses based on the Fund's actual expense ratio and an assumed rate of return of 5% per year before expenses, which is not the Fund's actual return. The hypothetical account values and expenses may not be used to estimate the actual ending account balance or expenses you paid for the period. You may use this information to compare the ongoing cost of investing in the Fund and other funds. To do so, compare this 5% hypothetical example with the 5% hypothetical examples that appear in the shareholder reports of the other funds.
Please note that the expenses shown in the table are meant to highlight your ongoing costs only and do not reflect any transactional costs, such as sales charges (loads) and redemption fees. Therefore, the second line of the table is useful in comparing ongoing costs, and will not help you determine the relative total cost of owning different funds. In addition, if these transactional costs were included, your costs would have been higher.
| | | Beginning
Account Value | | Ending
Account Value | | Expenses Paid
During Period@ | |
| | | 01/01/08 | | 06/30/08 | | 01/01/08 –
06/30/08 | |
| Class A | |
| Actual (–11.27% return) | | $ | 1,000.00 | | | $ | 887.30 | | | $ | 2.86 | | |
| Hypothetical (5% annual return before expenses) | | $ | 1,000.00 | | | $ | 1,021.83 | | | $ | 3.07 | | |
| Class B | |
| Actual (–11.62% return) | | $ | 1,000.00 | | | $ | 883.80 | | | $ | 6.37 | | |
| Hypothetical (5% annual return before expenses) | | $ | 1,000.00 | | | $ | 1,018.10 | | | $ | 6.82 | | |
| Class C | |
| Actual (–11.57% return) | | $ | 1,000.00 | | | $ | 884.30 | | | $ | 6.18 | | |
| Hypothetical (5% annual return before expenses) | | $ | 1,000.00 | | | $ | 1,018.30 | | | $ | 6.62 | | |
| Class I@@ | |
| Actual (–11.15% return) | | $ | 1,000.00 | | | $ | 888.50 | | | $ | 1.69 | | |
| Hypothetical (5% annual return before expenses) | | $ | 1,000.00 | | | $ | 1,023.07 | | | $ | 1.81 | | |
| Class R@@@ | |
| Actual (–2.63% return) | | $ | 1,000.00 | | | $ | 973.70 | | | $ | 3.03 | | |
| Hypothetical (5% annual return before expenses) | | $ | 1,000.00 | | | $ | 1,021.83 | | | $ | 3.07 | | |
| Class W@@@ | |
| Actual (–2.57% return) | | $ | 1,000.00 | | | $ | 974.30 | | | $ | 2.64 | | |
| Hypothetical (5% annual return before expenses) | | $ | 1,000.00 | | | $ | 1,022.23 | | | $ | 2.66 | | |
@ Expenses are equal to the Fund's annualized expense ratios of 0.61%, 1.36%, 1.32%, 0.36%, 0.86% and 0.71% for Class A, Class B, Class C, Class I, Class R and Class W shares, respectively, multiplied by the average account value over the period, multiplied by 182/366 (to reflect the one-half year period) for Class A, B, C and I shares and multiplied by 91/365 (to reflect the actual days in the period for the actual example) for Class R and W shares.
@@ Formerly Class D shares. Renamed Class I shares effective March 31, 2008.
@@@ Shares were first issued on March 31, 2008. Returns listed represent the period from March 31, 2008 through June 30, 2008.
8
Investment Advisory Agreement Approval
Nature, Extent and Quality of Services
The Board reviewed and considered the nature and extent of the investment advisory services provided by the Investment Adviser under the Advisory Agreement, including portfolio management, investment research and equity and fixed income securities trading. The Board also reviewed and considered the nature and extent of the non-advisory, administrative services provided by the Fund's Administrator under the Administration Agreement, including accounting, clerical, bookkeeping, compliance, business management and planning, and the provision of supplies, office space and utilities at the Investment Adviser's expense. (The Investment Adviser and the Administrator together are referred to as the "Adviser" and the Advisory and Administration Agreements together are referred to as the "Management Agreement.") The Board also compared the nature of the services provided by the Adviser with similar services provided by non-affiliated advi sers as reported to the Board by Lipper Inc. ("Lipper").
The Board reviewed and considered the qualifications of the portfolio managers, the senior administrative managers and other key personnel of the Adviser who provide the advisory and administrative services to the Fund. The Board determined that the Adviser's portfolio managers and key personnel are well qualified by education and/or training and experience to perform the services in an efficient and professional manner. The Board concluded that the nature and extent of the advisory and administrative services provided were necessary and appropriate for the conduct of the business and investment activities of the Fund. The Board also concluded that the overall quality of the advisory and administrative services was satisfactory.
Performance Relative to Comparable Funds Managed by Other Advisers
On a regular basis, the Board reviews the performance of all funds in the Morgan Stanley Fund Complex, including the Fund, compared to their peers, paying specific attention to the underperforming funds. In addition, the Board specifically reviewed the Fund's performance for the one-, three- and five-year periods ended December 31, 2007, as shown in a report provided by Lipper (the "Lipper Report"), compared to the performance of comparable funds selected by Lipper (the "performance peer group"). The Board also discussed with the Adviser the performance goals and the actual results achieved in managing the Fund. The Board noted that the Adviser is evaluating various strategic alternatives to improve performance. The Board concluded that it would continue to monitor the Fund's performance.
Fees Relative to Other Proprietary Funds Managed by the Adviser with Comparable Investment Strategies
The Board reviewed the advisory and administrative fee (together, the "management fee") rate paid by the Fund under the Management Agreement. The Board noted that the management fee rate was comparable to the management fee rates charged by the Adviser to other proprietary funds it manages with investment strategies comparable to those of the Fund.
9
Fees and Expenses Relative to Comparable Funds Managed by Other Advisers
The Board reviewed the management fee rate and total expense ratio of the Fund as compared to the average management fee rate and average total expense ratio for funds, selected by Lipper (the "expense peer group"), managed by other advisers with investment strategies comparable to those of the Fund, as shown in the Lipper Report. The Board concluded that the Fund's management fee rate and total expense ratio were competitive with those of its expense peer group.
Breakpoints and Economies of Scale
The Board reviewed the structure of the Fund's management fee schedule under the Management Agreement and noted that it includes a breakpoint. The Board also reviewed the level of the Fund's management fee and noted that the fee, as a percentage of the Fund's net assets, would decrease as net assets increase because the management fee includes a breakpoint. The Board concluded that the Fund's management fee would reflect economies of scale as assets increase.
Profitability of the Adviser and Affiliates
The Board considered information concerning the costs incurred and profits realized by the Adviser and affiliates during the last year from their relationship with the Fund and during the last two years from their relationship with the Morgan Stanley Fund Complex and reviewed with the Adviser the cost allocation methodology used to determine the profitability of the Adviser and affiliates. Based on its review of the information it received, the Board concluded that the profits earned by the Adviser and affiliates were not excessive in light of the advisory, administrative and other services provided to the Fund.
Fall-Out Benefits
The Board considered so-called "fall-out benefits" derived by the Adviser and affiliates from their relationship with the Fund and the Morgan Stanley Fund Complex, such as sales charges on sales of Class A shares and "float" benefits derived from handling of checks for purchases and sales of Fund shares, through a broker-dealer affiliate of the Adviser. The Board also considered that a broker-dealer affiliate of the Adviser receives from the Fund 12b-1 fees for distribution and shareholder services. The Board also considered that, from time to time, the Adviser may, directly or indirectly, effect trades on behalf of certain Morgan Stanley Funds through various electronic communications networks or other alternative trading systems in which the Adviser's affiliates have ownership interests and/or board seats. The Board concluded that the fall-out benefits were relatively small and noted that the sales charges and 12b-1 fees were competitive with those of other broker-dealers.
10
Soft Dollar Benefits
The Board considered whether the Adviser realizes any benefits as a result of brokerage transactions executed through "soft dollar" arrangements. Under such arrangements, brokerage commissions paid by the Fund and/or other funds managed by the Adviser would be used to pay for research that a securities broker obtains from third parties, or to pay for both research and execution services from securities brokers who effect transactions for the Fund. The Board recognized that the receipt of such research from brokers may reduce the Adviser's costs but concluded that the receipt of such research strengthens the investment management resources of the Adviser, which may ultimately benefit the Fund and other funds in the Morgan Stanley Complex.
Adviser Financially Sound and Financially Capable of Meeting the Fund's Needs
The Board considered whether the Adviser is financially sound and has the resources necessary to perform its obligations under the Management Agreement. The Board concluded that the Adviser has the financial resources necessary to fulfill its obligations under the Management Agreement.
Historical Relationship Between the Fund and the Adviser
The Board also reviewed and considered the historical relationship between the Fund and the Adviser, including the organizational structure of the Adviser, the policies and procedures formulated and adopted by the Adviser for managing the Fund's operations and the Board's confidence in the competence and integrity of the senior managers and key personnel of the Adviser. The Board concluded that it is beneficial for the Fund to continue its relationship with the Adviser.
Other Factors and Current Trends
The Board considered the controls and procedures adopted and implemented by the Adviser and monitored by the Fund's Chief Compliance Officer and concluded that the conduct of business by the Adviser indicates a good faith effort on its part to adhere to high ethical standards in the conduct of the Fund's business.
General Conclusion
After considering and weighing all of the above factors, the Board concluded that it would be in the best interest of the Fund and its shareholders to approve renewal of the Management Agreement for another year.
11
Morgan Stanley Equally-Weighted S&P 500 Fund
Portfolio of Investment n June 30, 2008
NUMBER OF
SHARES | |
| | VALUE | |
| | | Common Stocks (99.9%) | |
| | | Advertising/Marketing Services (0.4%) | |
| | 366,342 | | | Interpublic Group of
Companies, Inc. (The) (a) | | $ | 3,150,541 | | |
| | 71,790 | | | Omnicom Group, Inc. | | | 3,221,935 | | |
| | | | 6,372,476 | | |
| | | Aerospace & Defense (1.8%) | |
| | 43,624 | | | Boeing Co. | | | 2,866,969 | | |
| | 38,691 | | | General Dynamics Corp. | | | 3,257,782 | | |
| | 63,433 | | | Goodrich Corp. | | | 3,010,530 | | |
| | 34,887 | | | L-3 Communications
Holdings, Inc. | | | 3,170,182 | | |
| | 32,409 | | | Lockheed Martin Corp. | | | 3,197,472 | | |
| | 47,454 | | | Northrop Grumman Corp. | | | 3,174,673 | | |
| | 29,924 | | | Precision Castparts Corp. | | | 2,883,776 | | |
| | 57,144 | | | Raytheon Co. | | | 3,216,064 | | |
| | 65,766 | | | Rockwell Collins, Inc. | | | 3,154,137 | | |
| | | | 27,931,585 | | |
| | | Agricultural Commodities/
Milling (0.2%) | |
| | 101,257 | | | Archer-Daniels-Midland Co. | | | 3,417,424 | | |
| | | Air Freight/Couriers (0.8%) | |
| | 56,184 | | | C.H. Robinson
Worldwide, Inc. | | | 3,081,130 | | |
| | 77,112 | | | Expeditors International of
Washington, Inc. | | | 3,315,816 | | |
| | 41,073 | | | FedEx Corp. | | | 3,236,142 | | |
| | 49,842 | | | United Parcel Service,
Inc. (Class B) | | | 3,063,787 | | |
| | | | 12,696,875 | | |
| | | Airlines (0.2%) | |
| | 234,449 | | | Southwest Airlines Co. | | | 3,057,215 | | |
| | | Aluminum (0.2%) | |
| | 88,594 | | | Alcoa, Inc. | | | 3,155,718 | | |
| | | Apparel/Footwear (1.2%) | |
| | 106,267 | | | Coach, Inc. (a) | | | 3,068,991 | | |
| | 221,128 | | | Jones Apparel Group, Inc. | | | 3,040,510 | | |
| | 206,883 | | | Liz Claiborne, Inc. | | | 2,927,394 | | |
| | 49,574 | | | Nike, Inc. (Class B) | | | 2,955,106 | | |
NUMBER OF
SHARES | |
| | VALUE | |
| | 51,359 | | | Polo Ralph Lauren Corp. | | $ | 3,224,318 | | |
| | 47,434 | | | V.F. Corp. | | | 3,376,352 | | |
| | | | 18,592,671 | | |
| | | Apparel/Footwear
Retail (1.0%) | |
| | 49,001 | | | Abercrombie & Fitch Co.
(Class A) | | | 3,071,383 | | |
| | 189,574 | | | Gap, Inc. (The) | | | 3,160,198 | | |
| | 181,663 | | | Limited Brands, Inc. | | | 3,061,021 | | |
| | 97,929 | | | Nordstrom, Inc. | | | 2,967,249 | | |
| | 101,880 | | | TJX Companies, Inc. (The) | | | 3,206,164 | | |
| | | | 15,466,015 | | |
| | | Auto Parts: O.E.M. (0.4%) | |
| | 35,404 | | | Eaton Corp. | | | 3,008,278 | | |
| | 107,404 | | | Johnson Controls, Inc. | | | 3,080,347 | | |
| | | | 6,088,625 | | |
| | | Automotive
Aftermarket (0.2%) | |
| | 162,638 | | | Goodyear Tire &
Rubber Co. (The) (a) | | | 2,899,836 | | |
| | | Beverages: Alcoholic (0.8%) | |
| | 54,526 | | | Anheuser-Busch
Companies, Inc. | | | 3,387,155 | | |
| | 43,602 | | | Brown-Forman Corp.
(Class B) | | | 3,295,003 | | |
| | 167,075 | | | Constellation Brands Inc.
(Class A) (a) | | | 3,318,110 | | |
| | 59,994 | | | Molson Coors Brewing Co.
(Class B) | | | 3,259,474 | | |
| | | | 13,259,742 | | |
| | | Beverages:
Non-Alcoholic (0.8%) | |
| | 61,648 | | | Coca-Cola Co. (The) | | | 3,204,463 | | |
| | 180,276 | | | Coca-Cola Enterprises Inc. | | | 3,118,775 | | |
| | 110,637 | | | Pepsi Bottling Group,
Inc. (The) | | | 3,088,985 | | |
| | 50,830 | | | PepsiCo, Inc. | | | 3,232,280 | | |
| | | | 12,644,503 | | |
See Notes to Financial Statements
12
Morgan Stanley Equally-Weighted S&P 500 Fund
Portfolio of Investment n June 30, 2008 continued
NUMBER OF
SHARES | |
| | VALUE | |
| | | Biotechnology (1.3%) | |
| | 73,236 | | | Amgen Inc. (a) | | $ | 3,453,810 | | |
| | 57,026 | | | Biogen Idec Inc. (a) | | | 3,187,183 | | |
| | 55,523 | | | Celgene Corp. (a) | | | 3,546,254 | | |
| | 47,998 | | | Genzyme Corp. (a) | | | 3,456,816 | | |
| | 60,455 | | | Gilead Sciences, Inc. (a) | | | 3,201,092 | | |
| | 46,092 | | | Millipore Corp. (a) | | | 3,127,803 | | |
| | | | 19,972,958 | | |
| | | Broadcasting (0.2%) | |
| | 93,342 | | | Clear Channel
Communications, Inc. | | | 3,285,638 | | |
| | | Building Products (0.2%) | |
| | 198,682 | | | Masco Corp. | | | 3,125,268 | | |
| | | Cable/Satellite TV (0.4%) | |
| | 167,923 | | | Comcast Corp. (Class A) | | | 3,185,499 | | |
| | 121,086 | | | DIRECTV Group,
Inc. (The) (a) | | | 3,137,338 | | |
| | | | 6,322,837 | | |
| | | Casino/Gaming (0.2%) | |
| | 112,826 | | | International
Game Technology | | | 2,818,393 | | |
| | | Chemicals: Agricultural (0.2%) | |
| | 23,638 | | | Monsanto Co. | | | 2,988,789 | | |
| | | Chemicals: Major
Diversified (1.0%) | |
| | 88,028 | | | Dow Chemical Co. (The) | | | 3,073,057 | | |
| | 71,557 | | | Du Pont (E.I.) de
Nemours & Co. | | | 3,069,080 | | |
| | 45,889 | | | Eastman Chemical Co. | | | 3,159,916 | | |
| | 183,475 | | | Hercules Inc. (a) | | | 3,106,232 | | |
| | 67,511 | | | Rohm & Haas Co. | | | 3,135,211 | | |
| | | | 15,543,496 | | |
| | | Chemicals: Specialty (0.8%) | |
| | 32,224 | | | Air Products &
Chemicals, Inc. | | | 3,185,665 | | |
| | 65,442 | | | Ashland Inc. | | | 3,154,304 | | |
| | 34,024 | | | Praxair, Inc. | | | 3,206,422 | | |
| | 58,519 | | | Sigma-Aldrich Corp. | | | 3,151,833 | | |
| | | | 12,698,224 | | |
NUMBER OF
SHARES | |
| | VALUE | |
| | | Coal (0.7%) | |
| | 30,027 | | | CONSOL Energy, Inc. | | $ | 3,374,134 | | |
| | 37,019 | | | Massey Energy Co. | | | 3,470,531 | | |
| | 41,192 | | | Peabody Energy Corp. | | | 3,626,956 | | |
| | | | 10,471,621 | | |
| | | Commercial Printing/
Forms (0.2%) | |
| | 106,987 | | | Donnelley (R.R.) & Sons Co. | | | 3,176,444 | | |
| | | Computer
Communications (0.6%) | |
| | 134,255 | | | Cisco Systems, Inc. (a) | | | 3,122,771 | | |
| | 145,473 | | | Juniper Networks, Inc. (a) | | | 3,226,591 | | |
| | 219,222 | | | QLogic Corp. (a) | | | 3,198,449 | | |
| | | | 9,547,811 | | |
| | | Computer Peripherals (0.6%) | |
| | 205,471 | | | EMC Corp. (a) | | | 3,018,369 | | |
| | 95,914 | | | Lexmark International, Inc.
(Class A) (a) | | | 3,206,405 | | |
| | 141,978 | | | NetApp, Inc. | | | 3,075,243 | | |
| | 42,000 | | | Seagate Technology Inc.
(Escrow) (d) (a) | | | 0 | | |
| | | | 9,300,017 | | |
| | | Computer Processing
Hardware (0.8%) | |
| | 18,875 | | | Apple Inc. (a) | | | 3,160,430 | | |
| | 141,371 | | | Dell Inc. (a) | | | 3,093,197 | | |
| | 72,482 | | | Hewlett-Packard Co. | | | 3,204,429 | | |
| | 295,891 | | | Sun Microsystems (a) | | | 3,219,294 | | |
| | | | 12,677,350 | | |
| | | Construction Materials (0.2%) | |
| | 51,753 | | | Vulcan Materials Co. | | | 3,093,794 | | |
| | | Containers/Packaging (0.8%) | |
| | 63,962 | | | Ball Corp. | | | 3,053,546 | | |
| | 139,515 | | | Bemis Company, Inc. | | | 3,127,926 | | |
| | 146,829 | | | Pactiv Corp. (a) | | | 3,117,180 | | |
| | 159,194 | | | Sealed Air Corp. | | | 3,026,278 | | |
| | | | 12,324,930 | | |
See Notes to Financial Statements
13
Morgan Stanley Equally-Weighted S&P 500 Fund
Portfolio of Investment n June 30, 2008 continued
NUMBER OF
SHARES | |
| | VALUE | |
| | | Contract Drilling (1.1%) | |
| | 41,795 | | | ENSCO International Inc. | | $ | 3,374,528 | | |
| | 70,206 | | | Nabors Industries, Ltd.
(Bermuda) (a) | | | 3,456,241 | | |
| | 51,713 | | | Noble Corp.
(Cayman Islands) | | | 3,359,276 | | |
| | 73,546 | | | Rowan Companies, Inc. | | | 3,438,276 | | |
| | 22,231 | | | Transocean Inc.
(Cayman Islands) | | | 3,387,782 | | |
| | | | 17,016,103 | | |
| | | Data Processing
Services (1.6%) | |
| | 59,713 | | | Affiliated Computer Services,
Inc. (Class A) (a) | | | 3,194,048 | | |
| | 77,655 | | | Automatic Data
Processing, Inc. | | | 3,253,745 | | |
| | 214,950 | | | Convergys Corp. (a) | | | 3,194,157 | | |
| | 85,924 | | | Fidelity National Information
Services, Inc. | | | 3,171,455 | | |
| | 68,704 | | | Fiserv, Inc. (a) | | | 3,117,100 | | |
| | 102,132 | | | Paychex, Inc. | | | 3,194,689 | | |
| | 142,589 | | | Total System Services, Inc. | | | 3,168,328 | | |
| | 131,796 | | | Western Union Co. | | | 3,257,997 | | |
| | | | 25,551,519 | | |
| | | Department Stores (0.8%) | |
| | 252,524 | | | Dillard's, Inc. (Class A) | | | 2,921,703 | | |
| | 76,240 | | | Kohl's Corp. (a) | | | 3,052,650 | | |
| | 158,205 | | | Macy's Inc. | | | 3,072,341 | | |
| | 89,698 | | | Penney (J.C.) Co., Inc. | | | 3,255,140 | | |
| | | | 12,301,834 | | |
| | | Discount Stores (1.2%) | |
| | 100,124 | | | Big Lots, Inc. (a) | | | 3,127,874 | | |
| | 48,132 | | | Costco Wholesale Corp. | | | 3,375,978 | | |
| | 170,518 | | | Family Dollar Stores, Inc. | | | 3,400,129 | | |
| | 44,255 | | | Sears Holdings Corp. (a) | | | 3,259,823 | | |
| | 66,187 | | | Target Corp. | | | 3,077,034 | | |
| | 58,799 | | | Wal-Mart Stores, Inc. | | | 3,304,504 | | |
| | | | 19,545,342 | | |
NUMBER OF
SHARES | |
| | VALUE | |
| | | Drugstore Chains (0.4%) | |
| | 79,982 | | | CVS Caremark Corp. | | $ | 3,164,888 | | |
| | 94,327 | | | Walgreen Co. | | | 3,066,571 | | |
| | | | 6,231,459 | | |
| | | Electric Utilities (5.5%) | |
| | 169,125 | | | AES Corp. (The) (a) | | | 3,248,891 | | |
| | 63,144 | | | Allegheny Energy, Inc. (a) | | | 3,164,146 | | |
| | 77,472 | | | Ameren Corp. | | | 3,271,643 | | |
| | 80,020 | | | American Electric
Power Co., Inc. | | | 3,219,205 | | |
| | 204,834 | | | CenterPoint Energy, Inc. | | | 3,287,586 | | |
| | 215,932 | | | CMS Energy Corp. | | | 3,217,387 | | |
| | 83,347 | | | Consolidated Edison, Inc. | | | 3,258,034 | | |
| | 40,020 | | | Constellation Energy Group | | | 3,285,642 | | |
| | 70,265 | | | Dominion Resources, Inc. | | | 3,336,885 | | |
| | 76,950 | | | DTE Energy Co. | | | 3,265,758 | | |
| | 187,213 | | | Duke Energy Corp. | | | 3,253,762 | | |
| | 64,359 | | | Edison International | | | 3,306,765 | | |
| | 27,344 | | | Entergy Corp. | | | 3,294,405 | | |
| | 36,933 | | | Exelon Corp. | | | 3,322,493 | | |
| | 40,871 | | | FirstEnergy Corp. | | | 3,364,909 | | |
| | 49,813 | | | FPL Group, Inc. | | | 3,266,737 | | |
| | 64,235 | | | Integrys Energy Group, Inc. | | | 3,265,065 | | |
| | 128,170 | | | Pepco Holdings, Inc. | | | 3,287,560 | | |
| | 83,748 | | | PG&E Corp. | | | 3,323,958 | | |
| | 102,990 | | | Pinnacle West Capital Corp. | | | 3,169,002 | | |
| | 64,422 | | | PPL Corp. | | | 3,367,338 | | |
| | 78,113 | | | Progress Energy, Inc. | | | 3,267,467 | | |
| | 72,261 | | | Public Service Enterprise
Group Inc. | | | 3,318,948 | | |
| | 95,913 | | | Southern Co. (The) | | | 3,349,282 | | |
| | 153,578 | | | TECO Energy, Inc. | | | 3,300,391 | | |
| | 161,764 | | | Xcel Energy, Inc. | | | 3,246,603 | | |
| | | | 85,259,862 | | |
| | | Electrical Products (0.6%) | |
| | 78,914 | | | Cooper Industries Ltd.
(Class A) (Bermuda) | | | 3,117,103 | | |
| | 61,363 | | | Emerson Electric Co. | | | 3,034,400 | | |
| | 123,620 | | | Molex Inc. | | | 3,017,564 | | |
| | | | 9,169,067 | | |
See Notes to Financial Statements
14
Morgan Stanley Equally-Weighted S&P 500 Fund
Portfolio of Investment n June 30, 2008 continued
NUMBER OF
SHARES | |
| | VALUE | |
| | | Electronic Components (0.8%) | |
| | 221,276 | | | Jabil Circuit, Inc. | | $ | 3,631,139 | | |
| | 50,791 | | | MEMC Electronic
Materials, Inc. (a) | | | 3,125,678 | | |
| | 156,189 | | | SanDisk Corp. (a) | | | 2,920,734 | | |
| | 89,869 | | | Tyco Electronics Ltd.
(Bermuda) | | | 3,219,108 | | |
| | | | 12,896,659 | | |
| | | Electronic Equipment/
Instruments (0.8%) | |
| | 88,051 | | | Agilent
Technologies, Inc. (a) | | | 3,129,332 | | |
| | 277,988 | | | JDS Uniphase Corp. (a) | | | 3,157,944 | | |
| | 62,807 | | | Rockwell Automation, Inc. | | | 2,746,550 | | |
| | 235,953 | | | Xerox Corp. (a) | | | 3,199,523 | | |
| | | | 12,233,349 | | |
| | | Electronic Production
Equipment (0.8%) | |
| | 164,580 | | | Applied Materials, Inc. | | | 3,141,832 | | |
| | 82,558 | | | KLA-Tencor Corp. | | | 3,360,936 | | |
| | 154,366 | | | Novellus Systems, Inc. (a) | | | 3,271,016 | | |
| | 297,755 | | | Teradyne, Inc. (a) | | | 3,296,148 | | |
| | | | 13,069,932 | | |
| | | Electronics/Appliance
Stores (0.4%) | |
| | 78,632 | | | Best Buy Co., Inc. | | | 3,113,827 | | |
| | 251,372 | | | RadioShack Corp. | | | 3,084,334 | | |
| | | | 6,198,161 | | |
| | | Electronics/Appliances (0.6%) | |
| | 266,564 | | | Eastman Kodak Co. | | | 3,846,518 | | |
| | 73,269 | | | Harman International
Industries, Inc. | | | 3,032,604 | | |
| | 50,122 | | | Whirlpool Corp. | | | 3,094,031 | | |
| | | | 9,973,153 | | |
| | | Engineering &
Construction (0.4%) | |
| | 17,270 | | | Fluor Corp. | | | 3,213,602 | | |
| | 37,872 | | | Jacobs Engineering
Group, Inc. (a) | | | 3,056,270 | | |
| | | | 6,269,872 | | |
NUMBER OF
SHARES | |
| | VALUE | |
| | | Environmental Services (0.4%) | |
| | 243,958 | | | Allied Waste
Industries, Inc. (a) | | $ | 3,078,750 | | |
| | 86,373 | | | Waste Management, Inc. | | | 3,257,126 | | |
| | | | 6,335,876 | | |
| | | Finance/Rental/
Leasing (1.4%) | |
| | 121,844 | | | American Capital
Strategies, Ltd. | | | 2,896,232 | | |
| | 80,881 | | | Capital One Financial Corp. | | | 3,074,287 | | |
| | 360,748 | | | CIT Group, Inc. | | | 2,456,694 | | |
| | 229,567 | | | Discover Financial Services | | | 3,023,397 | | |
| | 138,936 | | | Fannie Mae | | | 2,710,641 | | |
| | 151,607 | | | Freddie Mac | | | 2,486,355 | | |
| | 45,711 | | | Ryder System, Inc. | | | 3,148,574 | | |
| | 144,837 | | | SLM Corp. | | | 2,802,596 | | |
| | | | 22,598,776 | | |
| | | Financial
Conglomerates (1.1%) | |
| | 80,331 | | | American Express Co. | | | 3,026,069 | | |
| | 171,402 | | | Citigroup, Inc. | | | 2,872,697 | | |
| | 87,377 | | | JPMorgan Chase & Co. | | | 2,997,889 | | |
| | 68,307 | | | Leucadia National Corp. (a) | | | 3,206,331 | | |
| | 68,532 | | | Principal Financial
Group, Inc. | | | 2,876,288 | | |
| | 48,841 | | | Prudential Financial, Inc. | | | 2,917,761 | | |
| | | | 17,897,035 | | |
| | | Financial Publishing/
Services (0.6%) | |
| | 95,553 | | | Equifax, Inc. | | | 3,212,492 | | |
| | 76,629 | | | McGraw-Hill Companies,
Inc. (The) | | | 3,074,355 | | |
| | 87,239 | | | Moody's Corp. | | | 3,004,511 | | |
| | | | 9,291,358 | | |
| | | Food Distributors (0.2%) | |
| | 114,426 | | | SYSCO Corp. | | | 3,147,859 | | |
| | | Food Retail (0.8%) | |
| | 122,976 | | | Kroger Co. (The) | | | 3,550,317 | | |
| | 111,159 | | | Safeway Inc. | | | 3,173,589 | | |
See Notes to Financial Statements
15
Morgan Stanley Equally-Weighted S&P 500 Fund
Portfolio of Investment n June 30, 2008 continued
NUMBER OF
SHARES | |
| | VALUE | |
| | 104,356 | | | SUPERVALU, Inc. | | $ | 3,223,557 | | |
| | 125,686 | | | Whole Foods Market, Inc. | | | 2,977,501 | | |
| | | | 12,924,964 | | |
| | | Food: Major Diversified (1.4%) | |
| | 98,985 | | | Campbell Soup Co. | | | 3,312,038 | | |
| | 149,146 | | | ConAgra Foods Inc. | | | 2,875,535 | | |
| | 52,492 | | | General Mills, Inc. | | | 3,189,939 | | |
| | 67,033 | | | Heinz (H.J.) Co. | | | 3,207,529 | | |
| | 64,865 | | | Kellogg Co. | | | 3,114,817 | | |
| | 113,251 | | | Kraft Foods Inc. (Class A) | | | 3,221,991 | | |
| | 261,507 | | | Sara Lee Corp. | | | 3,203,461 | | |
| | | | 22,125,310 | | |
| | | Food: Meat/Fish/Dairy (0.4%) | |
| | 176,430 | | | Dean Foods Co. (a) | | | 3,461,557 | | |
| | 222,316 | | | Tyson Foods, Inc. (Class A) | | | 3,321,401 | | |
| | | | 6,782,958 | | |
| | | Food: Specialty/Candy (0.6%) | |
| | 98,016 | | | Hershey Foods Co. (The) | | | 3,212,964 | | |
| | 89,118 | | | McCormick & Co., Inc.
(Non-Voting) | | | 3,177,948 | | |
| | 42,515 | | | Wrigley (Wm.) Jr. Co. | | | 3,306,817 | | |
| | | | 9,697,729 | | |
| | | Forest Products (0.2%) | |
| | 62,712 | | | Weyerhaeuser Co. | | | 3,207,092 | | |
| | | Gas Distributors (1.3%) | |
| | 363,524 | | | Dynegy, Inc. (Class A) (a) | | | 3,108,130 | | |
| | 77,947 | | | Nicor Inc. | | | 3,319,763 | | |
| | 191,773 | | | NiSource, Inc. | | | 3,436,572 | | |
| | 48,706 | | | Questar Corp. | | | 3,460,074 | | |
| | 59,745 | | | Sempra Energy | | | 3,372,605 | | |
| | 120,645 | | | Spectra Energy Corp. | | | 3,467,337 | | |
| | | | 20,164,481 | | |
| | | Home Building (0.9%) | |
| | 221,127 | | | Centex Corp. | | | 2,956,468 | | |
| | 271,153 | | | D.R. Horton, Inc. | | | 2,942,010 | | |
| | 181,662 | | | KB Home | | | 3,075,538 | | |
NUMBER OF
SHARES | |
| | VALUE | |
| | 217,207 | | | Lennar Corp. (Class A) | | $ | 2,680,334 | | |
| | 295,891 | | | Pulte Homes, Inc. | | | 2,849,430 | | |
| | | | 14,503,780 | | |
| | | Home Furnishings (0.4%) | |
| | 186,161 | | | Leggett & Platt, Inc. | | | 3,121,920 | | |
| | 182,162 | | | Newell Rubbermaid, Inc. | | | 3,058,500 | | |
| | | | 6,180,420 | | |
| | | Home Improvement
Chains (0.6%) | |
| | 126,021 | | | Home Depot, Inc. (The) | | | 2,951,412 | | |
| | 144,900 | | | Lowe's Companies, Inc. | | | 3,006,675 | | |
| | 66,280 | | | Sherwin-Williams Co. | | | 3,044,240 | | |
| | | | 9,002,327 | | |
| | | Hospital/Nursing
Management (0.2%) | |
| | 620,651 | | | Tenet Healthcare Corp. (a) | | | 3,450,820 | | |
| | | Hotels/Resorts/
Cruiselines (0.8%) | |
| | 93,263 | | | Carnival Corp (Panama)
(Units) (c) | | | 3,073,948 | | |
| | 120,512 | | | Marriott International, Inc.
(Class A) | | | 3,162,235 | | |
| | 74,438 | | | Starwood Hotels & Resorts
Worldwide, Inc. | | | 2,982,731 | | |
| | 175,401 | | | Wyndham
Worldwide Corp. (a) | | | 3,141,432 | | |
| | | | 12,360,346 | | |
| | | Household/Personal
Care (1.4%) | |
| | 92,223 | | | Avon Products, Inc. | | | 3,321,872 | | |
| | 61,925 | | | Clorox Co. (The) | | | 3,232,485 | | |
| | 47,522 | | | Colgate-Palmolive Co. | | | 3,283,770 | | |
| | 71,837 | | | Estee Lauder Companies, Inc.
(The) (Class A) | | | 3,336,829 | | |
| | 82,269 | | | International Flavors &
Fragrances, Inc. | | | 3,213,427 | | |
See Notes to Financial Statements
16
Morgan Stanley Equally-Weighted S&P 500 Fund
Portfolio of Investment n June 30, 2008 continued
NUMBER OF
SHARES | |
| | VALUE | |
| | 54,071 | | | Kimberly-Clark Corp. | | $ | 3,232,364 | | |
| | 52,375 | | | Procter &
Gamble Co. (The) | | | 3,184,924 | | |
| | | | 22,805,671 | | |
| | | Industrial
Conglomerates (1.8%) | |
| | 45,303 | | | 3M Co. | | | 3,152,636 | | |
| | 41,310 | | | Danaher Corp. | | | 3,193,263 | | |
| | 120,820 | | | General Electric Co. (b) | | | 3,224,686 | | |
| | 61,034 | | | Honeywell International, Inc. | | | 3,068,790 | | |
| | 84,952 | | | Ingersoll-Rand Co. Ltd.
(Class A) (Bermuda) | | | 3,179,753 | | |
| | 51,633 | | | ITT Corp. | | | 3,269,918 | | |
| | 64,035 | | | Textron, Inc. | | | 3,069,198 | | |
| | 76,612 | | | Tyco International Ltd.
(Bermuda) | | | 3,067,544 | | |
| | 48,083 | | | United Technologies Corp. | | | 2,966,721 | | |
| | | | 28,192,509 | | |
| | | Industrial Machinery (0.4%) | |
| | 68,054 | | | Illinois Tool Works Inc. | | | 3,233,246 | | |
| | 43,533 | | | Parker Hannifin Corp. | | | 3,104,774 | | |
| | | | 6,338,020 | | |
| | | Industrial Specialties (0.4%) | |
| | 74,928 | | | Ecolab Inc. | | | 3,221,155 | | |
| | 55,162 | | | PPG Industries, Inc. | | | 3,164,644 | | |
| | | | 6,385,799 | | |
| | | | | Information Technology
Services (1.4%) | | | | | |
| | 106,987 | | | Citrix Systems, Inc. (a) | | | 3,146,488 | | |
| | 94,598 | | | Cognizant Technology Solutions
Corp. (Class A) (a) | | | 3,075,381 | | |
| | 69,236 | | | Computer
Sciences Corp. (a) | | | 3,243,014 | | |
| | 134,420 | | | Electronic Data
Systems Corp. | | | 3,312,109 | | |
| | 26,951 | | | International Business
Machines Corp. | | | 3,194,502 | | |
NUMBER OF
SHARES | |
| | VALUE | |
| | 142,958 | | | Teradata Corp | | $ | 3,308,048 | | |
| | 778,368 | | | Unisys Corp. (a) | | | 3,074,554 | | |
| | | | 22,354,096 | | |
| | | Insurance Brokers/
Services (0.4%) | |
| | 70,280 | | | AON Corp. | | | 3,228,663 | | |
| | 125,687 | | | Marsh & McLennan
Companies, Inc. | | | 3,336,990 | | |
| | | | 6,565,653 | | |
| | | Integrated Oil (1.3%) | |
| | 34,238 | | | Chevron Corp. | | | 3,394,013 | | |
| | 35,663 | | | ConocoPhillips | | | 3,366,231 | | |
| | 38,959 | | | Exxon Mobil Corp. | | | 3,433,457 | | |
| | 26,994 | | | Hess Corp. | | | 3,406,373 | | |
| | 65,197 | | | Marathon Oil Corp. | | | 3,381,768 | | |
| | 36,798 | | | Murphy Oil Corp. | | | 3,608,044 | | |
| | | | 20,589,886 | | |
| | | Internet Retail (0.5%) | |
| | 40,790 | | | Amazon.com, Inc. (a) | | | 2,991,131 | | |
| | 72,832 | | | Gamestop Corp (Class A) (a) | | | 2,942,413 | | |
| | 160,663 | | | IAC/InterActiveCorp. (a) | | | 3,097,583 | | |
| | | | 9,031,127 | | |
| | | Internet Software/
Services (0.8%) | |
| | 92,405 | | | Akamai
Technologies, Inc. (a) | | | 3,214,770 | | |
| | 6,054 | | | Google Inc. (Class A) (a) | | | 3,186,947 | | |
| | 82,951 | | | VeriSign, Inc. (a) | | | 3,135,548 | | |
| | 149,618 | | | Yahoo! Inc. (a) | | | 3,091,108 | | |
| | | | 12,628,373 | | |
| | | Investment Banks/
Brokers (1.9%) | |
| | 74,205 | | | Ameriprise Financial, Inc. | | | 3,017,917 | | |
| | 154,223 | | | Charles Schwab
Corp. (The) | | | 3,167,740 | | |
| | 7,706 | | | CME Group Inc. | | | 2,952,862 | | |
| | 921,467 | | | E*TRADE Group, Inc. (a) | | | 2,893,406 | | |
See Notes to Financial Statements
17
Morgan Stanley Equally-Weighted S&P 500 Fund
Portfolio of Investment n June 30, 2008 continued
NUMBER OF
SHARES | |
| | VALUE | |
| | 18,002 | | | Goldman Sachs Group,
Inc. (The) | | $ | 3,148,550 | | |
| | 25,510 | | | IntercontinentalExchange Inc. | | | 2,908,140 | | |
| | 136,696 | | | Lehman Brothers
Holdings Inc. | | | 2,707,948 | | |
| | 92,018 | | | Merrill Lynch & Co., Inc. | | | 2,917,891 | | |
| | 85,523 | | | Morgan Stanley (Note 4) | | | 3,084,815 | | |
| | 57,163 | | | NYSE Euronext | | | 2,895,878 | | |
| | | | 29,695,147 | | |
| | | Investment Managers (1.1%) | |
| | 89,990 | | | Federated Investors, Inc.
(Class B) | | | 3,097,456 | | |
| | 32,943 | | | Franklin Resources, Inc. | | | 3,019,226 | | |
| | 110,712 | | | Janus Capital Group, Inc. | | | 2,930,547 | | |
| | 65,312 | | | Legg Mason, Inc. | | | 2,845,644 | | |
| | 55,533 | | | Price (T.) Rowe Group, Inc. | | | 3,135,949 | | |
| | 48,834 | | | State Street Corp. | | | 3,124,888 | | |
| | | | 18,153,710 | | |
| | | Life/Health Insurance (1.2%) | |
| | 50,504 | | | AFLAC, Inc. | | | 3,171,651 | | |
| | 174,108 | | | Genworth Financial Inc.
(Class A) | | | 3,100,863 | | |
| | 68,362 | | | Lincoln National Corp. | | | 3,098,166 | | |
| | 58,138 | | | MetLife, Inc. | | | 3,067,942 | | |
| | 55,080 | | | Torchmark Corp. | | | 3,230,442 | | |
| | 149,687 | | | UnumProvident Corp. | | | 3,061,099 | | |
| | | | 18,730,163 | | |
| | | Major Banks (2.5%) | |
| | 122,068 | | | Bank of America Corp. | | | 2,913,763 | | |
| | 81,620 | | | Bank of New York
Mellon Corp. | | | 3,087,685 | | |
| | 133,929 | | | BB&T Corp. | | | 3,049,563 | | |
| | 112,099 | | | Comerica, Inc. | | | 2,873,097 | | |
| | 495,961 | | | Huntington
Bancshares, Inc. | | | 2,861,695 | | |
| | 286,909 | | | KeyCorp | | | 3,150,261 | | |
| | 655,062 | | | National City Corp. | | | 3,124,646 | | |
| | 57,173 | | | PNC Financial
Services Group | | | 3,264,578 | | |
NUMBER OF
SHARES | |
| | VALUE | |
| | 294,836 | | | Regions Financial Corp. | | $ | 3,216,661 | | |
| | 88,759 | | | SunTrust Banks, Inc. | | | 3,214,851 | | |
| | 111,495 | | | U.S. Bancorp | | | 3,109,596 | | |
| | 189,791 | | | Wachovia Corp. | | | 2,947,454 | | |
| | 135,023 | | | Wells Fargo & Co. | | | 3,206,796 | | |
| | | | 40,020,646 | | |
| | | Major
Telecommunications (0.9%) | |
| | 96,080 | | | AT&T Inc. | | | 3,236,935 | | |
| | 74,222 | | | Embarq Corp. | | | 3,508,474 | | |
| | 418,214 | | | Sprint Nextel Corp. | | | 3,973,033 | | |
| | 93,501 | | | Verizon
Communications, Inc. | | | 3,309,935 | | |
| | | | 14,028,377 | | |
| | | Managed Health Care (1.2%) | |
| | 80,783 | | | Aetna, Inc. | | | 3,274,135 | | |
| | 91,408 | | | CIGNA Corp. | | | 3,234,929 | | |
| | 106,540 | | | Coventry Health
Care, Inc. (a) | | | 3,240,947 | | |
| | 78,819 | | | Humana, Inc. (a) | | | 3,134,632 | | |
| | 121,978 | | | UnitedHealth Group Inc. | | | 3,201,923 | | |
| | 68,491 | | | WellPoint Inc. (a) | | | 3,264,281 | | |
| | | | 19,350,847 | | |
| | | Media Conglomerates (1.0%) | |
| | 165,403 | | | CBS Corp. (Class B) | | | 3,223,704 | | |
| | 103,571 | | | Disney (Walt) Co. (The) | | | 3,231,415 | | |
| | 203,448 | | | News Corp. (Class A) | | | 3,059,858 | | |
| | 226,579 | | | Time Warner, Inc. | | | 3,353,369 | | |
| | 105,017 | | | Viacom Inc. (Class B) (a) | | | 3,207,219 | | |
| | | | 16,075,565 | | |
| | | Medical Distributors (0.8%) | |
| | 83,159 | | | AmerisourceBergen Corp. | | | 3,325,528 | | |
| | 64,035 | | | Cardinal Health, Inc. | | | 3,302,925 | | |
| | 57,945 | | | McKesson Corp. | | | 3,239,705 | | |
| | 107,404 | | | Patterson
Companies, Inc. (a) | | | 3,156,604 | | |
| | | | 13,024,762 | | |
See Notes to Financial Statements
18
Morgan Stanley Equally-Weighted S&P 500 Fund
Portfolio of Investment n June 30, 2008 continued
NUMBER OF
SHARES | |
| | VALUE | |
| | | Medical Specialties (3.5%) | |
| | 98,308 | | | Applera Corp. - Applied
Biosystems Group | | $ | 3,291,352 | | |
| | 37,468 | | | Bard (C.R.), Inc. | | | 3,295,311 | | |
| | 52,810 | | | Baxter International, Inc. | | | 3,376,671 | | |
| | 41,853 | | | Becton, Dickinson & Co. | | | 3,402,649 | | |
| | 260,889 | | | Boston Scientific Corp. (a) | | | 3,206,326 | | |
| | 70,340 | | | Covidien Ltd. | | | 3,368,583 | | |
| | 82,784 | | | Hospira, Inc. (a) | | | 3,320,466 | | |
| | 11,710 | | | Intuitive Surgical, Inc. (a) | | | 3,154,674 | | |
| | 65,029 | | | Medtronic, Inc. | | | 3,365,251 | | |
| | 79,179 | | | Pall Corp. | | | 3,141,823 | | |
| | 116,441 | | | PerkinElmer, Inc. | | | 3,242,882 | | |
| | 82,004 | | | St. Jude Medical, Inc. (a) | | | 3,352,324 | | |
| | 52,861 | | | Stryker Corp. | | | 3,323,900 | | |
| | 57,481 | | | Thermo Fisher
Scientific, Inc. (a) | | | 3,203,416 | | |
| | 64,510 | | | Varian Medical
Systems, Inc. (a) | | | 3,344,844 | | |
| | 52,560 | | | Waters Corp. (a) | | | 3,390,120 | | |
| | 48,314 | | | Zimmer Holdings, Inc. (a) | | | 3,287,768 | | |
| | | | 56,068,360 | | |
| | | Miscellaneous Commercial
Services (0.2%) | |
| | 125,400 | | | Cintas Corp. | | | 3,324,354 | | |
| | | Miscellaneous
Manufacturing (0.2%) | |
| | 64,788 | | | Dover Corp. | | | 3,133,796 | | |
| | | Motor Vehicles (0.5%) | |
| | 569,375 | | | Ford Motor Co. (a) | | | 2,738,694 | | |
| | 239,888 | | | General Motors Corp. | | | 2,758,712 | | |
| | 88,831 | | | Harley-Davidson, Inc. | | | 3,221,012 | | |
| | | | 8,718,418 | | |
| | | Multi-Line Insurance (0.6%) | |
| | 103,055 | | | American International
Group, Inc. | | | 2,726,835 | | |
| | 47,894 | | | Hartford Financial Services
Group, Inc. (The) | | | 3,092,516 | | |
| | 49,242 | | | SAFECO Corp. (a) | | | 3,307,093 | | |
| | | | 9,126,444 | | |
NUMBER OF
SHARES | |
| | VALUE | |
| | | Office Equipment/
Supplies (0.4%) | |
| | 71,498 | | | Avery Dennison Corp. | | $ | 3,140,907 | | |
| | 93,872 | | | Pitney Bowes, Inc. | | | 3,201,035 | | |
| | | | 6,341,942 | | |
| | | Oil & Gas Pipelines (0.4%) | |
| | 157,678 | | | El Paso Corp. | | | 3,427,920 | | |
| | 86,713 | | | Williams Companies,
Inc. (The) | | | 3,495,401 | | |
| | | | 6,923,321 | | |
| | | Oil & Gas Production (2.3%) | |
| | 43,442 | | | Anadarko Petroleum Corp. | | | 3,251,199 | | |
| | 24,159 | | | Apache Corp. | | | 3,358,101 | | |
| | 50,582 | | | Cabot Oil & Gas Corp. | | | 3,425,919 | | |
| | 51,721 | | | Chesapeake Energy Corp. | | | 3,411,517 | | |
| | 27,853 | | | Devon Energy Corp. | | | 3,346,816 | | |
| | 25,367 | | | EOG Resources, Inc. | | | 3,328,150 | | |
| | 34,742 | | | Noble Energy, Inc. | | | 3,493,656 | | |
| | 38,628 | | | Occidental Petroleum Corp. | | | 3,471,112 | | |
| | 52,845 | | | Range Resources Corp. | | | 3,463,461 | | |
| | 72,593 | | | Southwestern Energy Co. (a) | | | 3,456,153 | | |
| | 47,111 | | | XTO Energy, Inc. | | | 3,227,575 | | |
| | | | 37,233,659 | | |
| | | Oil Refining/Marketing (0.6%) | |
| | 85,193 | | | Sunoco, Inc. | | | 3,466,503 | | |
| | 162,558 | | | Tesoro Corp. | | | 3,213,772 | | |
| | 77,818 | | | Valero Energy Corp. | | | 3,204,545 | | |
| | | | 9,884,820 | | |
| | | Oilfield Services/
Equipment (1.7%) | |
| | 39,182 | | | Baker Hughes Inc. | | | 3,422,156 | | |
| | 102,863 | | | BJ Services Co. | | | 3,285,444 | | |
| | 60,632 | | | Cameron
International Corp. (a) | | | 3,355,981 | | |
| | 66,122 | | | Halliburton Co. | | | 3,509,095 | | |
| | 39,154 | | | National-Oilwell
Varco, Inc. (a) | | | 3,473,743 | | |
| | 31,778 | | | Schlumberger Ltd.
(Netherlands Antilles) | | | 3,413,911 | | |
See Notes to Financial Statements
19
Morgan Stanley Equally-Weighted S&P 500 Fund
Portfolio of Investment n June 30, 2008 continued
NUMBER OF
SHARES | |
| | VALUE | |
| | 41,806 | | | Smith International, Inc. | | $ | 3,475,751 | | |
| | 73,973 | | | Weatherford International Ltd.
(Bermuda) (a) | | | 3,668,321 | | |
| | | | 27,604,402 | | |
| | | Other Consumer
Services (0.8%) | |
| | 62,617 | | | Apollo Group, Inc.
(Class A) (a) | | | 2,771,428 | | |
| | 159,501 | | | Block (H&R), Inc. | | | 3,413,321 | | |
| | 117,432 | | | eBay Inc. (a) | | | 3,209,417 | | |
| | 167,074 | | | Expedia, Inc. (a) | | | 3,070,820 | | |
| | | | 12,464,986 | | |
| | | Other Consumer
Specialties (0.2%) | |
| | 51,319 | | | Fortune Brands, Inc. | | | 3,202,819 | | |
| | | Other Metals/Minerals (0.2%) | |
| | 225,652 | | | Titanium Metals Corp. | | | 3,156,871 | | |
| | | Packaged Software (2.0%) | |
| | 81,580 | | | Adobe Systems, Inc. (a) | | | 3,213,436 | | |
| | 89,699 | | | Autodesk, Inc. (a) | | | 3,032,723 | | |
| | 88,546 | | | BMC Software, Inc. (a) | | | 3,187,656 | | |
| | 140,589 | | | CA Inc. | | | 3,246,200 | | |
| | 342,805 | | | Compuware Corp. (a) | | | 3,270,360 | | |
| | 115,788 | | | Intuit Inc. (a) | | | 3,192,275 | | |
| | 117,182 | | | Microsoft Corp. (b) | | | 3,223,677 | | |
| | 535,286 | | | Novell, Inc. (a) | | | 3,152,835 | | |
| | 149,687 | | | Oracle Corp. (a) | | | 3,143,427 | | |
| | 170,784 | | | Symantec Corp. (a) | | | 3,304,670 | | |
| | | | 31,967,259 | | |
| | | Personnel Services (0.4%) | |
| | 156,557 | | | Monster Worldwide Inc. (a) | | | 3,226,640 | | |
| | 131,325 | | | Robert Half
International, Inc. | | | 3,147,860 | | |
| | | | 6,374,500 | | |
| | | Pharmaceuticals: Generic
Drugs (0.6%) | |
| | 80,527 | | | Barr
Pharmaceuticals Inc. (a) | | | 3,630,157 | | |
| | 275,903 | | | Mylan Laboratories, Inc. | | | 3,330,149 | | |
NUMBER OF
SHARES | |
| | VALUE | |
| | 123,897 | | | Watson
Pharmaceuticals, Inc. (a) | | $ | 3,366,281 | | |
| | | | 10,326,587 | | |
| | | Pharmaceuticals: Major (1.7%) | |
| | 62,006 | | | Abbott Laboratories | | | 3,284,458 | | |
| | 169,037 | | | Bristol-Myers Squibb Co. | | | 3,470,330 | | |
| | 51,641 | | | Johnson & Johnson | | | 3,322,582 | | |
| | 70,489 | | | Lilly (Eli) & Co. | | | 3,253,772 | | |
| | 94,166 | | | Merck & Co., Inc. | | | 3,549,117 | | |
| | 190,886 | | | Pfizer, Inc. (b) | | | 3,334,778 | | |
| | 178,140 | | | Schering-Plough Corp. | | | 3,507,577 | | |
| | 69,135 | | | Wyeth | | | 3,315,715 | | |
| | | | 27,038,329 | | |
| | | Pharmaceuticals: Other (0.6%) | |
| | 60,687 | | | Allergan, Inc. | | | 3,158,758 | | |
| | 103,538 | | | Forest Laboratories, Inc. (a) | | | 3,596,910 | | |
| | 342,450 | | | King
Pharmaceuticals, Inc. (a) | | | 3,585,452 | | |
| | | | 10,341,120 | | |
| | | Precious Metals (0.4%) | |
| | 28,267 | | | Freeport-McMoRan Copper &
Gold, Inc. | | | 3,312,610 | | |
| | 67,581 | | | Newmont Mining Corp. | | | 3,525,025 | | |
| | | | 6,837,635 | | |
| | | Property - Casualty
Insurers (1.5%) | |
| | 57,924 | | | ACE Ltd. (Cayman Islands) | | | 3,191,033 | | |
| | 69,076 | | | Allstate Corp. (The) | | | 3,149,175 | | |
| | 64,309 | | | Chubb Corp. (The) | | | 3,151,784 | | |
| | 114,863 | | | Cincinnati Financial Corp. | | | 2,917,520 | | |
| | 66,844 | | | Loews Corp. | | | 3,134,984 | | |
| | 165,404 | | | Progressive Corp. (The) | | | 3,096,363 | | |
| | 72,497 | | | St. Paul Travelers
Companies, Inc. (The) | | | 3,146,370 | | |
| | 116,645 | | | XL Capital Ltd. (Class A)
(Cayman Islands) | | | 2,398,221 | | |
| | | | 24,185,450 | | |
See Notes to Financial Statements
20
Morgan Stanley Equally-Weighted S&P 500 Fund
Portfolio of Investment n June 30, 2008 continued
NUMBER OF
SHARES | |
| | VALUE | |
| | | Publishing: Books/
Magazines (0.2%) | |
| | 114,268 | | | Meredith Corp. | | $ | 3,232,642 | | |
| | | Publishing:
Newspapers (0.8%) | |
| | 144,646 | | | Gannett Co., Inc. | | | 3,134,479 | | |
| | 208,185 | | | New York Times Co.
(The) (Class A) | | | 3,203,967 | | |
| | 74,775 | | | Scripps (E.W.) Co. (Class A) | | | 3,106,154 | | |
| | 5,917 | | | Washington Post Co.
(The) (Class B) | | | 3,472,687 | | |
| | | | 12,917,287 | | |
| | | Pulp & Paper (0.4%) | |
| | 135,133 | | | International Paper Co. | | | 3,148,599 | | |
| | 135,799 | | | MeadWestvaco Corp. | | | 3,237,448 | | |
| | | | 6,386,047 | | |
| | | Railroads (0.8%) | |
| | 32,111 | | | Burlington Northern
Santa Fe Corp. | | | 3,207,568 | | |
| | 51,027 | | | CSX Corp. | | | 3,205,006 | | |
| | 51,900 | | | Norfolk Southern Corp. | | | 3,252,573 | | |
| | 43,029 | | | Union Pacific Corp. | | | 3,248,690 | | |
| | | | 12,913,837 | | |
| | | Real Estate
Development (0.2%) | |
| | 160,431 | | | CB Richard Ellis Group, Inc.
(Class A) (a) | | | 3,080,275 | | |
| | | Real Estate Investment
Trusts (2.6%) | |
| | 93,080 | | | Apartment Investment &
Management Co. (Class A) | | | 3,170,305 | | |
| | 35,689 | | | AvalonBay Communities, Inc. | | | 3,182,031 | | |
| | 34,568 | | | Boston Properties, Inc. | | | 3,118,725 | | |
| | 81,984 | | | Equity Residential | | | 3,137,528 | | |
| | 86,644 | | | General Growth
Properties, Inc. | | | 3,035,139 | | |
| | 101,102 | | | HCP INC | | | 3,216,055 | | |
| | 227,671 | | | Host Hotels & Resorts Inc. | | | 3,107,709 | | |
NUMBER OF
SHARES | |
| | VALUE | |
| | 90,955 | | | Kimco Realty Corp. | | $ | 3,139,767 | | |
| | 75,012 | | | Plum Creek Timber Co., Inc. | | | 3,203,763 | | |
| | 58,189 | | | ProLogis | | | 3,162,572 | | |
| | 40,273 | | | Public Storage, Inc. | | | 3,253,656 | | |
| | 34,789 | | | Simon Property Group, Inc. | | | 3,127,183 | | |
| | 35,853 | | | Vornado Realty Trust | | | 3,155,064 | | |
| | | | 41,009,497 | | |
| | | Recreational Products (0.6%) | |
| | 70,474 | | | Electronic Arts Inc. (a) | | | 3,131,160 | | |
| | 88,951 | | | Hasbro, Inc. | | | 3,177,330 | | |
| | 175,961 | | | Mattel, Inc. | | | 3,012,452 | | |
| | | | 9,320,942 | | |
| | | Regional Banks (1.2%) | |
| | 327,207 | | | Fifth Third Bancorp | | | 3,330,967 | | |
| | 422,486 | | | First Horizon
National Corp. | | | 3,139,071 | | |
| | 45,118 | | | M&T Bank Corp. | | | 3,182,624 | | |
| | 190,228 | | | Marshall & Ilsley
Corp | | | 2,916,195 | | |
| | 45,510 | | | Northern Trust Corp. | | | 3,120,621 | | |
| | 103,087 | | | Zions Bancorporation | | | 3,246,210 | | |
| | | | 18,935,688 | | |
| | | Restaurants (1.0%) | |
| | 104,553 | | | Darden Restaurants, Inc. | | | 3,339,423 | | |
| | 57,632 | | | McDonald's Corp. | | | 3,240,071 | | |
| | 191,994 | | | Starbucks Corp. (a) | | | 3,021,986 | | |
| | 110,086 | | | Wendy's International, Inc. | | | 2,996,541 | | |
| | 90,558 | | | Yum! Brands, Inc. | | | 3,177,680 | | |
| | | | 15,775,701 | | |
| | | Retail Strip Centers (0.2%) | |
| | 89,528 | | | Developers Diversified
Realty Corp. | | | 3,107,517 | | |
| | | Savings Banks (0.5%) | |
| | 192,329 | | | Hudson City Bancorp, Inc. | | | 3,208,048 | | |
| | 370,029 | | | Sovereign Bancorp, Inc. | | | 2,723,413 | | |
| | 518,505 | | | Washington Mutual, Inc. | | | 2,556,230 | | |
| | | | 8,487,691 | | |
See Notes to Financial Statements
21
Morgan Stanley Equally-Weighted S&P 500 Fund
Portfolio of Investment n June 30, 2008 continued
NUMBER OF
SHARES | |
| | VALUE | |
| | | Semiconductors (2.5%) | |
| | 473,258 | | | Advanced Micro
Devices, Inc. (a) | | $ | 2,759,094 | | |
| | 148,811 | | | Altera Corp. | | | 3,080,388 | | |
| | 99,491 | | | Analog Devices, Inc. | | | 3,160,829 | | |
| | 123,023 | | | Broadcom Corp.
(Class A) (a) | | | 3,357,298 | | |
| | 147,880 | | | Intel Corp. (b) | | | 3,176,462 | | |
| | 100,825 | | | Linear Technology Corp. | | | 3,283,870 | | |
| | 470,565 | | | LSI Logic Corp. (a) | | | 2,889,269 | | |
| | 104,388 | | | Microchip Technology Inc. | | | 3,188,010 | | |
| | 457,548 | | | Micron Technology, Inc. (a) | | | 2,745,288 | | |
| | 149,687 | | | National
Semiconductor Corp. | | | 3,074,571 | | |
| | 167,413 | | | NVIDIA Corp. (a) | | | 3,133,971 | | |
| | 112,514 | | | Texas Instruments Inc. | | | 3,168,394 | | |
| | 120,909 | | | Xilinx, Inc. | | | 3,052,952 | | |
| | | | 40,070,396 | | |
| | | Services to the Health
Industry (1.0%) | |
| | 52,195 | | | Express Scripts, Inc. (a) | | | 3,273,670 | | |
| | 142,774 | | | IMS Health Inc. | | | 3,326,634 | | |
| | 47,312 | | | Laboratory Corp. of
America Holdings (a) | | | 3,294,335 | | |
| | 73,627 | | | Medco Health
Solutions Inc. (a) | | | 3,475,194 | | |
| | 68,604 | | | Quest Diagnostics Inc. | | | 3,325,236 | | |
| | | | 16,695,069 | | |
| | | Specialty Insurance (0.5%) | |
| | 48,698 | | | Assurant, Inc. | | | 3,212,120 | | |
| | 591,782 | | | MBIA Inc. | | | 2,597,923 | | |
| | 359,572 | | | MGIC Investment Corp. | | | 2,196,985 | | |
| | | | 8,007,028 | | |
| | | Specialty Stores (1.2%) | |
| | 276,363 | | | AutoNation, Inc. (a) | | | 2,769,157 | | |
| | 28,765 | | | AutoZone, Inc. (a) | | | 3,480,853 | | |
| | 114,823 | | | Bed Bath & Beyond Inc. (a) | | | 3,226,526 | | |
| | 273,395 | | | Office Depot, Inc. (a) | | | 2,990,941 | | |
NUMBER OF
SHARES | |
| |
VALUE | |
| | 134,419 | | | Staples, Inc. | | $ | 3,192,451 | | |
| | 73,253 | | | Tiffany & Co. | | | 2,985,060 | | |
| | | | 18,644,988 | | |
| | | Specialty
Telecommunications (1.1%) | |
| | 76,399 | | | American Tower Corp.
(Class A) (a) | | | 3,227,858 | | |
| | 106,574 | | | CenturyTel, Inc. | | | 3,792,969 | | |
| | 299,101 | | | Citizens
Communications Co. | | | 3,391,805 | | |
| | 848,222 | | | Qwest Communications
International, Inc. (a) | | | 3,333,512 | | |
| | 259,254 | | | Windstream Corp. | | | 3,199,194 | | |
| | | | 16,945,338 | | |
| | | Steel (0.8%) | |
| | 43,270 | | | AK Steel Holding Corp. (a) | | | 2,985,630 | | |
| | 52,810 | | | Allegheny
Technologies, Inc. | | | 3,130,577 | | |
| | 43,781 | | | Nucor Corp. | | | 3,269,127 | | |
| | 18,098 | | | United States Steel Corp. | | | 3,344,148 | | |
| | | | 12,729,482 | | |
| | | Telecommunication
Equipment (0.9%) | |
| | 129,120 | | | Ciena Corp. (a) | | | 2,991,710 | | |
| | 130,961 | | | Corning Inc. (a) | | | 3,018,651 | | |
| | 416,633 | | | Motorola, Inc. | | | 3,058,086 | | |
| | 68,166 | | | QUALCOMM, Inc. | | | 3,024,525 | | |
| | 658,977 | | | Tellabs, Inc. (a) | | | 3,064,243 | | |
| | | | 15,157,215 | | |
| | | Tobacco (1.0%) | |
| | 159,194 | | | Altria Group, Inc. | | | 3,273,029 | | |
| | 46,651 | | | Lorillard, Inc. | | | 3,226,383 | | |
| | 65,871 | | | Philip Morris
International Inc. (a) | | | 3,253,369 | | |
| | 66,951 | | | Reynolds American, Inc. | | | 3,124,603 | | |
| | 61,972 | | | UST, Inc. | | | 3,384,291 | | |
| | | | 16,261,675 | | |
See Notes to Financial Statements
22
Morgan Stanley Equally-Weighted S&P 500 Fund
Portfolio of Investment n June 30, 2008 continued
NUMBER OF
SHARES | |
| | VALUE | |
| | | Tools/Hardware (0.6%) | |
| | 56,548 | | | Black & Decker Corp. | | $ | 3,252,075 | | |
| | 60,433 | | | Snap-On, Inc. | | | 3,143,120 | | |
| | 72,275 | | | Stanley Works (The) | | | 3,240,088 | | |
| | | | 9,635,283 | | |
| | | Trucks/Construction/
Farm Machinery (1.1%) | |
| | 41,832 | | | Caterpillar Inc. | | | 3,088,038 | | |
| | 46,817 | | | Cummins Inc. | | | 3,067,450 | | |
| | 43,316 | | | Deere & Co. | | | 3,124,383 | | |
| | 88,451 | | | Manitowoc Co., Inc. | | | 2,877,311 | | |
| | 73,676 | | | PACCAR, Inc. | | | 3,081,867 | | |
| | 53,808 | | | Terex Corp. (a) | | | 2,764,117 | | |
| | | | 18,003,166 | | |
| | | Wholesale Distributors (0.4%) | |
| | 79,598 | | | Genuine Parts Co. | | | 3,158,449 | | |
| | 38,112 | | | Grainger (W.W.), Inc. | | | 3,117,562 | | |
| | | | 6,276,011 | | |
| | | | | Total Common Stocks
(Cost $1,134,395,547) | | | 1,590,135,896 | | |
NUMBER OF
SHARES (000) | | | | VALUE | |
| | | Short-Term Investment (e) (0.1%) | | | |
| | | Investment Company | | | |
| | 2,091 | | | Morgan Stanley Institutional
Liquidity Money Market
Portfolio - Institutional Class
(Cost $2,090,660) | | $ | 2,090,660 | | |
Total Investments
(Cost $1,136,486,207) (f) (g) | | | 100.0 | % | | | 1,592,226,556 | | |
Liabilities in Excess of
Other Assets | | | (0.0 | ) | | | (238,786 | ) | |
| Net Assets | | | 100.0 | % | | $ | 1,591,987,770 | | |
(a) Non-income producing security.
(b) A portion of this security has been physically segregated in connection with open futures contracts in the amount of $234,000.
(c) Consists of one or more class of securities traded together as a unit; stocks with attached paired trust shares.
(d) A Security with total market value equal to $0 has been valued at its fair value as determined in good faith under procedures established by and under the general supervision of the Fund's Trustees.
(e) See Note 4 to the financial statements regarding investments in Morgan Stanley Institutional Liquidity Money Market Portfolio - Institutional Class.
(f) Securities have been designated as collateral in an amount equal to $6,427,720 in connection with open futures contracts.
(g) The aggregate cost for federal income tax purposes is $1,150,323,533. The aggregate gross unrealized appreciation is $601,749,315 and the aggregate gross unrealized depreciation is $159,846,292, resulting in net unrealized appreciation of $441,903,023.
See Notes to Financial Statements
23
Morgan Stanley Equally-Weighted S&P 500 Fund
Portfolio of Investment n June 30, 2008 continued
Futures Contracts Open at June 30, 2008:
NUMBER OF
CONTRACTS | | LONG/SHORT | | DESCRIPTION, DELIVERY
MONTH AND YEAR | | UNDERLYING FACE
AMOUNT AT VALUE | | UNREALIZED
DEPRECIATION | |
| | 65 | | | Long | | S&P 500 E-Mini Index
September 2008 | | $ | 4,163,575 | | | $ | (115,180 | ) | |
Summary of Investments
| SECTOR | | VALUE | | PERCENT OF
TOTAL
INVESTMENTS | |
| Finance | | $ | 269,600,720 | | | | 16.9 | % | |
| Electronic Technology | | | 152,884,314 | | | | 9.6 | | |
| Health Technology | | | 123,747,354 | | | | 7.8 | | |
| Consumer Non-Durables | | | 122,170,259 | | | | 7.7 | | |
| Retail Trade | | | 109,346,217 | | | | 6.9 | | |
| Utilities | | | 105,424,343 | | | | 6.6 | | |
| Technology Services | | | 92,501,247 | | | | 5.8 | | |
| Consumer Services | | | 85,253,395 | | | | 5.4 | | |
| Producer Manufacturing | | | 80,392,393 | | | | 5.0 | | |
| Energy Minerals | | | 78,179,986 | | | | 4.9 | | |
| Consumer Durables | | | 64,434,651 | | | | 4.1 | | |
| Industrial Services | | | 64,149,574 | | | | 4.0 | | |
| Process Industries | | | 59,744,709 | | | | 3.8 | | |
| Health Services | | | 39,496,736 | | | | 2.5 | | |
| Non-Energy Minerals | | | 32,180,592 | | | | 2.0 | | |
| Communications | | | 30,973,715 | | | | 1.9 | | |
| Transportation | | | 28,667,927 | | | | 1.8 | | |
| Commercial Services | | | 28,539,132 | | | | 1.8 | | |
| Distribution Services | | | 22,448,632 | | | | 1.4 | | |
| Investment Company | | | 2,090,660 | | | | 0.1 | | |
| | | $ | 1,592,226,556 | ^ | | | 100.0 | % | |
^ Does not include open long futures contracts with an underlying face amount of $4,163,575 with unrealized depreciation of $115,180.
See Notes to Financial Statements
24
Morgan Stanley Equally-Weighted S&P 500 Fund
Financial Statements
Statement of Assets and Liabilities
June 30, 2008
| Assets: | |
| Investments in securities, at value (cost $1,132,015,314) | | $ | 1,587,051,081 | | |
| Investment in affiliate, at value (cost $4,470,893) | | | 5,175,475 | | |
| Receivable for: | |
| Investments sold | | | 2,970,618 | | |
| Dividends | | | 2,251,319 | | |
| Shares of beneficial interest sold | | | 842,550 | | |
| Variation margin | | | 6,422 | | |
| Dividends from affiliate | | | 162 | | |
| Prepaid expenses and other assets | | | 367,387 | | |
| Total Assets | | | 1,598,665,014 | | |
| Liabilities: | |
| Payable for: | |
| Investments purchased | | | 2,986,495 | | |
| Shares of beneficial interest redeemed | | | 2,179,216 | | |
| Distribution fee | | | 582,879 | | |
| Investment advisory fee | | | 172,254 | | |
| Administration fee | | | 115,510 | | |
| Payable to bank | | | 15,180 | | |
| Accrued expenses and other payables | | | 625,710 | | |
| Total Liabilities | | | 6,677,244 | | |
| Net Assets | | $ | 1,591,987,770 | | |
| Composition of Net Assets: | |
| Paid-in-capital | | $ | 987,588,657 | | |
| Net unrealized appreciation | | | 455,625,169 | | |
| Accumulated undistributed net investment income | | | 11,361,084 | | |
| Accumulated undistributed net realized gain | | | 137,412,860 | | |
| Net Assets | | $ | 1,591,987,770 | | |
| Class A Shares: | |
| Net Assets | | $ | 799,622,224 | | |
| Shares Outstanding (unlimited authorized, $.01 par value) | | | 23,950,014 | | |
| Net Asset Value Per Share | | $ | 33.39 | | |
Maximum Offering Price Per Share,
(net asset value plus 5.54% of net asset value) | | $ | 35.24 | | |
| Class B Shares: | |
| Net Assets | | $ | 352,174,401 | | |
| Shares Outstanding (unlimited authorized, $.01 par value) | | | 10,664,193 | | |
| Net Asset Value Per Share | | $ | 33.02 | | |
| Class C Shares: | |
| Net Assets | | $ | 88,658,203 | | |
| Shares Outstanding (unlimited authorized, $.01 par value) | | | 2,742,682 | | |
| Net Asset Value Per Share | | $ | 32.33 | | |
| Class I Shares@@: | |
| Net Assets | | $ | 351,338,133 | | |
| Shares Outstanding (unlimited authorized, $.01 par value) | | | 10,451,187 | | |
| Net Asset Value Per Share | | $ | 33.62 | | |
| Class R Shares@@@: | |
| Net Assets | | $ | 97,387 | | |
| Shares Outstanding (unlimited authorized, $.01 par value) | | | 2,919 | | |
| Net Asset Value Per Share | | $ | 33.36 | | |
| Class W Shares@@@: | |
| Net Assets | | $ | 97,422 | | |
| Shares Outstanding (unlimited authorized, $.01 par value) | | | 2,919 | | |
| Net Asset Value Per Share | | $ | 33.38 | | |
@@ Formerly Class D shares. Renamed Class I shares effective March 31, 2008.
@@@ Shares were first issued on March 31, 2008.
See Notes to Financial Statements
25
Morgan Stanley Equally-Weighted S&P 500 Fund
Financial Statements continued
Statement of Operations
For the year ended June 30, 2008
Net Investment Income:
Income | |
| Dividends (net of $3,426 foreign withholding tax) | | $ | 35,878,387 | | |
| Dividends from affiliates | | | 856,409 | | |
| Total Income | | | 36,734,796 | | |
| Expenses | |
| Distribution fee (Class A shares) | | | 2,358,508 | | |
| Distribution fee (Class B shares) | | | 4,896,282 | | |
| Distribution fee (Class C shares) | | | 1,059,608 | | |
| Distribution fee (Class R shares)@@@ | | | 129 | | |
| Distribution fee (Class W shares)@@@ | | | 90 | | |
| Investment advisory fee | | | 2,373,197 | | |
| Transfer agent fees and expenses | | | 2,197,727 | | |
| Administration fee | | | 1,595,913 | | |
| Shareholder reports and notices | | | 539,980 | | |
| Custodian fees | | | 129,460 | | |
| Registration fees | | | 91,253 | | |
| Professional fees | | | 71,863 | | |
| Trustees' fees and expenses | | | 9,917 | | |
| Other | | | 329,899 | | |
| Total Expenses | | | 15,653,826 | | |
| Less: expense offset | | | (19,005 | ) | |
| Less: rebate from Morgan Stanley affiliated cash sweep (Note 4) | | | (9,818 | ) | |
| Net Expenses | | | 15,625,003 | | |
| Net Investment Income | | | 21,109,793 | | |
Realized and Unrealized Gain (Loss):
Realized Gain (Loss) on: | |
| Investments | | | 221,404,980 | | |
| Futures contracts | | | (5,167,851 | ) | |
| Net Realized Gain | | | 216,237,129 | | |
| Change in Unrealized Appreciation/Depreciation on: | |
| Investments | | | (613,863,288 | ) | |
| Futures contracts | | | 428,572 | | |
| Net Change in Unrealized Appreciation/Depreciation | | | (613,434,716 | ) | |
| Net Loss | | | (397,197,587 | ) | |
| Net Decrease | | $ | (376,087,794 | ) | |
@@@ Shares were first issued on March 31, 2008.
See Notes to Financial Statements
26
Morgan Stanley Equally-Weighted S&P 500 Fund
Financial Statements continued
Statements of Changes in Net Assets
| | | FOR THE YEAR
ENDED
JUNE 30, 2008 | | FOR THE YEAR
ENDED
JUNE 30, 2007 | |
Increase (Decrease) in Net Assets:
Operations: | |
| Net investment income | | $ | 21,109,793 | | | $ | 19,074,752 | | |
| Net realized gain | | | 216,237,129 | | | | 152,784,670 | | |
| Net change in unrealized appreciation/depreciation | | | (613,434,716 | ) | | | 238,637,014 | | |
| Net Increase (Decrease) | | | (376,087,794 | ) | | | 410,496,436 | | |
| Dividends and Distributions to Shareholders from: | |
| Net investment income | |
| Class A shares | | | (11,131,648 | ) | | | (8,619,668 | ) | |
| Class B shares | | | (1,029,812 | ) | | | (812,481 | ) | |
| Class C shares | | | (456,394 | ) | | | (302,572 | ) | |
| Class I shares@@ | | | (6,382,188 | ) | | | (5,765,287 | ) | |
| Net realized gain | |
| Class A shares | | | (96,878,079 | ) | | | (48,491,021 | ) | |
| Class B shares | | | (51,069,665 | ) | | | (35,064,685 | ) | |
| Class C shares | | | (11,353,637 | ) | | | (5,832,435 | ) | |
| Class I shares@@ | | | (45,346,132 | ) | | | (26,007,975 | ) | |
| Total Dividends and Distributions | | | (223,647,555 | ) | | | (130,896,124 | ) | |
| Net decrease from transactions in shares of beneficial interest | | | (170,960,516 | ) | | | (52,268,775 | ) | |
| Net Increase (Decrease) | | | (770,695,865 | ) | | | 227,331,537 | | |
| Net Assets: | |
| Beginning of period | | | 2,362,683,635 | | | | 2,135,352,098 | | |
End of Period
(Including accumulated undistributed net investment income of
$11,361,084 and $10,580,701, respectively) | | $ | 1,591,987,770 | | | $ | 2,362,683,635 | | |
@@ Formerly Class D shares. Renamed Class I shares effective March 31, 2008.
See Notes to Financial Statements
27
Morgan Stanley Equally-Weighted S&P 500 Fund
Notes to Financial Statements n June 30, 2008
1. Organization and Accounting Policies
Morgan Stanley Equally-Weighted S&P 500 Fund (the "Fund") is registered under the Investment Company Act of 1940, as amended (the "Act"), as a diversified, open-end management investment company. The Fund's investment objective is to achieve a high level of total return on its assets through a combination of capital appreciation and current income. The Fund was organized as a Massachusetts business trust on May 27, 1987 and commenced operations on December 1, 1987. On July 28, 1997, the Fund converted to a multiple class share structure and on March 31, 2008, commenced offering two additional classes (Class R and Class W shares).
The Fund offers Class A, Class B, Class C, Class I, Class R and Class W shares. The six classes are substantially the same except that most Class A shares are subject to a sales charge imposed at the time of purchase and some Class A, and most Class B and Class C shares are subject to a contingent deferred sales charge imposed on shares redeemed within eighteen months, six years and one year, respectively. Class I, Class R, and Class W shares are not subject to a sales charge. Additionally, Class A, Class B, Class C, Class R, and Class W shares incur distribution expenses. Effective March 31, 2008, Class D shares were renamed Class I shares.
The Fund will assess a 2% redemption fee, on Class A, Class B, Class C, Class I, Class R, and Class W shares, which is paid directly to the Fund, for shares redeemed or exchanged within seven days of purchase, subject to certain exceptions. The redemption fee is designed to protect the Fund and its remaining shareholders from the effects of short-term trading.
The following is a summary of significant accounting policies:
A. Valuation of Investments — (1) an equity portfolio security listed or traded on the New York Stock Exchange ("NYSE") or American Stock Exchange or other exchange is valued at its latest sale price prior to the time when assets are valued; if there were no sales that day, the security is valued at the mean between the last reported bid and asked price; (2) an equity portfolio security listed or traded on the Nasdaq is valued at the Nasdaq Official Closing Price; if there were no sales that day, the security is valued at the mean between the last reported bid and asked price; (3) all other portfolio securities for which over-the-counter market quotations are readily available are valued at the mean between the last reported bid and asked price. In cases where a security is traded on more than one exchange, the security is valued on the exchange designated as the primary market; (4) for equity securities traded on foreign e xchanges, the last reported sale price or the latest bid price may be used if there were no sales on a particular day; (5) futures are valued at the latest price published by the commodities exchange on which they trade; (6) when market quotations are not readily available including circumstances under which Morgan Stanley Investment Advisors Inc. (the "Investment Adviser") determines that the latest sale price, the bid price or the mean between the last reported bid and asked price do not reflect a security's market value, portfolio securities are valued at their fair value as determined in good faith under
28
Morgan Stanley Equally-Weighted S&P 500 Fund
Notes to Financial Statements n June 30, 2008 continued
procedures established by and under the general supervision of the Fund's Trustees. Occasionally, developments affecting the closing prices of securities and other assets may occur between the times at which valuations of such securities are determined (that is, close of the foreign market on which the securities trade) and the close of business on the NYSE. If developments occur during such periods that are expected to materially affect the value of such securities, such valuations may be adjusted to reflect the estimated fair value of such securities as of the close of the NYSE, as determined in good faith by the Fund's Trustees or by the Investment Adviser using a pricing service and/or procedures approved by the Trustees of the Fund; (7) investments in open-end mutual funds, including the Morgan Stanley Institutional Liquidity Funds, are valued at the net asset value as of the close of each business day; and (8) short-term d ebt securities having a maturity date of more than sixty days at time of purchase are valued on a mark-to-market basis until sixty days prior to maturity and thereafter at amortized cost based on their value on the 61st day. Short-term debt securities having a maturity date of sixty days or less at the time of purchase are valued at amortized cost.
B. Accounting for Investments — Security transactions are accounted for on the trade date (date the order to buy or sell is executed). Realized gains and losses on security transactions are determined by the identified cost method. Dividend income and other distributions are recorded on the ex-dividend date. Discounts are accreted and premiums are amortized over the life of the respective securities and are included in interest income. Interest income is accrued daily.
C. Multiple Class Allocations — Investment income, expenses (other than distribution fees), and realized and unrealized gains and losses are allocated to each class of shares based upon the relative net asset value on the date such items are recognized. Distribution fees are charged directly to the respective class.
D. Futures Contracts — A futures contract is an agreement between two parties to buy and sell financial instruments or contracts based on financial indices at a set price on a future date. Upon entering into such a contract, the Fund is required to pledge to the broker cash, U.S. Government securities or other liquid portfolio securities equal to the minimum initial margin requirements of the applicable futures exchange. Pursuant to the contract, the Fund agrees to receive from or pay to the broker an amount of cash equal to the daily fluctuation in the value of the contract. Such receipts or payments known as variation margin are recorded by the Fund as unrealized gains and losses. Upon closing of the contract, the Fund realizes a gain or loss equal to the difference between the value of the contract at the time it was opened and the value at the time it was closed.
E. Federal Income Tax Policy — It is the Fund's policy to comply with the requirements of Subchapter M of the Internal Revenue Code applicable to regulated investment companies and to distribute substantially all of its taxable income to its shareholders. Therefore, no provision for federal income tax is required. The Fund files tax returns with the U.S. Internal Revenue Service, New York State and New York City. The Fund adopted the provisions of the Financial Accounting Standards Board ("FASB")
29
Morgan Stanley Equally-Weighted S&P 500 Fund
Notes to Financial Statements n June 30, 2008 continued
Interpretation No. 48 ("FIN 48") Accounting for Uncertainty in Income Taxes on December 28, 2007. FIN 48 sets forth a minimum threshold for financial statement recognition of the benefit of a tax position taken or expected to be taken in a tax return. The implementation of FIN 48 did not result in any unrecognized tax benefits in the accompanying financial statements. If applicable, the Fund recognizes interest accrued related to unrecognized tax benefits in interest expense and penalties in other expenses in the Statement of Operations. Each of the tax years in the four year period ended June 30, 2008, remains subject to examination by ta xing authorities.
F. Dividends and Distributions to Shareholders — Dividends and distributions to shareholders are recorded on the ex-dividend date.
G. Use of Estimates — The preparation of financial statements in accordance with generally accepted accounting principles requires management to make estimates and assumptions that affect the reported amounts and disclosures. Actual results could differ from those estimates.
2. Investment Advisory/Administration Agreements
Pursuant to an Investment Advisory Agreement, the Fund pays the Investment Adviser an advisory fee, accrued daily and payable monthly, by applying the annual rates to the net asset of the Fund determined as of the close of each business day: 0.12% to the portion of the daily net assets not exceeding $2 billion and 0.10% to the portion of the daily net assets in excess of $2 billion.
Pursuant to an Administration Agreement with Morgan Stanley Services Company Inc. (the "Administrator"), an affiliate of the Investment Adviser, the Fund pays an administration fee, accrued daily and payable monthly, by applying the annual rate of 0.08% to the Fund's daily net assets.
Under an agreement between the Administrator and State Street Bank and Trust Company ("State Street"), State Street provides certain administrative services to the Fund. For such services, the Administrator pays State Street a portion of the fee the Administrator receives from the Fund.
3. Plan of Distribution
Shares of the Fund are distributed by Morgan Stanley Distributors Inc. (the "Distributor"), an affiliate of the Investment Adviser and Administrator. The Fund has adopted a Plan of Distribution (the "Plan") pursuant to Rule 12b-1 under the Act. The Plan provides that the Fund will pay the Distributor a fee which is accrued daily and paid monthly at the following annual rates: (i) Class A — up to 0.25% of the average daily net assets of Class A shares; (ii) Class B — up to 1.0% of the average daily net assets of Class B shares; (iii) Class C — up to 1.0% of the average daily net assets of Class C shares; (iv) Class R — up to 0.50% of the average daily net assets of Class R shares; and (v) Class W — up to 0.35% of the average daily net assets of Class W shares.
30
Morgan Stanley Equally-Weighted S&P 500 Fund
Notes to Financial Statements n June 30, 2008 continued
In the case of Class B shares, provided that the Plan continues in effect, any cumulative expenses incurred by the Distributor but not yet recovered may be recovered through the payment of future distribution fees from the Fund pursuant to the Plan and contingent deferred sales charges paid by investors upon redemption of Class B shares. Although there is no legal obligation for the Fund to pay expenses incurred in excess of payments made to the Distributor under the Plan and the proceeds of contingent deferred sales charges paid by investors upon redemption of shares, if for any reason the Plan is terminated, the Trustees will consider at that time the manner in which to treat such expenses. The Distributor has advised the Fund that such excess amounts totaled $40,337,337 at June 30, 2008.
In the case of Class A, Class C, Class R and Class W shares, expenses incurred pursuant to the Plan in any calendar year in excess of 0.25%, 1.0%, 0.50% or 0.35% of the average daily net assets of Class A, Class C, Class R and Class W shares, respectively, will not be reimbursed by the Fund through payments in any subsequent year, except that expenses representing a gross sales credit to Morgan Stanley Financial Advisors and other authorized financial representatives at the time of sale may be reimbursed in the subsequent calendar year. For the year ended June 30, 2008, the distribution fee was accrued for Class A, Class C, Class R and Class W shares at the annual rate of 0.25%, 0.98%, 0.49% and 0.35%, respectively.
The Distributor has informed the Fund that for the year ended June 30, 2008, it received contingent deferred sales charges from certain redemptions of the Fund's Class A shares, Class B shares and Class C shares of $893, $671,118 and $12,660, respectively and received $324,668 in front-end sales charges from sales of the Fund's Class A shares. The respective shareholders pay such charges which are not an expense of the Fund.
4. Security Transactions and Transactions with Affiliates
The Fund invests in Morgan Stanley Institutional Liquidity Money Market Portfolio — Institutional Class, an open-end management investment company managed by the Investment Adviser. Investment advisory fees paid by the Fund are reduced by an amount equal to the advisory and administrative service fees paid by Morgan Stanley Institutional Liquidity Money Market Portfolio — Institutional Class with respect to assets invested by the Fund in Morgan Stanley Institutional Liquidity Money Market Portfolio — Institutional Class. For the year ended June 30, 2008, advisory fees paid were reduced by $19,005 relating to the Fund's investment in Morgan Stanley Institutional Liquidity Money Market Portfolio — Institutional Class. Income distributions earned by the Fund are recorded as dividends from affiliates in the Statement of Operations and totaled $784,225 for the year ended June 30, 2008. For the year ended June 30, 2008, cost of purchases and sales of investments in Morgan Stanley Institutional Liquidity Money Market Portfolio — Institutional Class aggregated $349,539,236 and $386,585,430, respectively.
31
Morgan Stanley Equally-Weighted S&P 500 Fund
Notes to Financial Statements n June 30, 2008 continued
The cost of purchases and proceeds from sales of portfolio securities, excluding short-term investments, for the year ended June 30, 2008 aggregated $495,718,649 and $826,101,248, respectively. Included in the aforementioned are purchases and sales of Morgan Stanley Common Stock, an affiliate of the Investment Adviser, Administrator and Distributor, of $1,980,794 and $447,303, respectively, including net realized loss of $122,018.
Morgan Stanley Trust, an affiliate of the Investment Adviser, Administrator and Distributor, is the Fund's transfer agent.
The Fund has an unfunded noncontributory defined benefit pension plan covering certain independent Trustees of the Fund who will have served as independent Trustees for at least five years at the time of retirement. Benefits under this plan are based on factors which include years of service and compensation. The Trustees voted to close the plan to new participants and eliminate the future benefits growth due to increases to compensation after July 31, 2003. Aggregate pension costs for the year ended June 30, 2008, included in Trustees' fees and expenses in the Statement of Operations amounted to $7,939. At June 30, 2008, the Fund had an accrued pension liability of $70,187 which is included in accrued expenses in the Statement of Assets and Liabilities.
The Fund has an unfunded Deferred Compensation Plan (the "Compensation Plan") which allows each independent Trustee to defer payment of all, or a portion, of the fees he or she receives for serving on the Board of Trustees. Each eligible Trustee generally may elect to have the deferred amounts credited with a return equal to the total return on one or more of the Morgan Stanley funds that are offered as investment options under the Compensation Plan. Appreciation/depreciation and distributions received from these investments are recorded with an offsetting increase/decrease in the deferred compensation obligation and do not affect the net asset value of the Fund.
32
Morgan Stanley Equally-Weighted S&P 500 Fund
Notes to Financial Statements n June 30, 2008 continued
5. Shares of Beneficial Interest
Transactions in shares of beneficial interest were as follows:
| | | FOR THE YEAR
ENDED
JUNE 30, 2008 | | FOR THE YEAR
ENDED
JUNE 30, 2007 | |
| | | SHARES | | AMOUNT | | SHARES | | AMOUNT | |
| CLASS A SHARES | |
| Sold | | | 2,003,927 | | | $ | 78,555,770 | | | | 3,402,915 | | | $ | 145,080,587 | | |
| Conversion from Class B | | | 1,367,814 | | | | 55,358,227 | | | | 2,134,233 | | | | 91,973,031 | | |
| Reinvestment of dividends and distributions | | | 2,532,738 | | | | 95,433,560 | | | | 1,205,382 | | | | 50,855,059 | | |
| Redeemed | | | (5,544,025 | ) | | | (214,478,453 | ) | | | (4,396,126 | ) | | | (187,623,604 | ) | |
| Net increase — Class A | | | 360,454 | | | | 14,869,104 | | | | 2,346,404 | | | | 100,285,073 | | |
| CLASS B SHARES | |
| Sold | | | 525,541 | | | | 21,350,940 | | | | 1,736,386 | | | | 73,582,017 | | |
| Conversion to Class A | | | (1,383,465 | ) | | | (55,358,227 | ) | | | (2,158,605 | ) | | | (91,973,031 | ) | |
| Reinvestment of dividends and distributions | | | 1,255,182 | | | | 46,981,474 | | | | 776,946 | | | | 32,515,212 | | |
| Redeemed | | | (3,791,305 | ) | | | (144,603,444 | ) | | | (3,337,778 | ) | | | (140,776,075 | ) | |
| Net decrease — Class B | | | (3,394,047 | ) | | | (131,629,257 | ) | | | (2,983,051 | ) | | | (126,651,877 | ) | |
| CLASS C SHARES | |
| Sold | | | 250,623 | | | | 9,838,126 | | | | 514,089 | | | | 21,441,476 | | |
| Reinvestment of dividends and distributions | | | 303,863 | | | | 11,130,495 | | | | 140,710 | | | | 5,785,995 | | |
| Redeemed | | | (626,741 | ) | | | (23,589,547 | ) | | | (452,178 | ) | | | (18,824,712 | ) | |
| Net increase (decrease) — Class C | | | (72,255 | ) | | | (2,620,926 | ) | | | 202,621 | | | | 8,402,759 | | |
| CLASS I SHARES@@ | |
| Sold | | | 868,740 | | | | 34,795,984 | | | | 2,127,056 | | | | 90,204,605 | | |
| Reinvestment of dividends and distributions | | | 1,210,297 | | | | 45,858,133 | | | | 661,242 | | | | 28,036,627 | | |
| Redeemed | | | (3,389,304 | ) | | | (132,433,554 | ) | | | (3,651,315 | ) | | | (152,545,962 | ) | |
| Net decrease — Class I | | | (1,310,267 | ) | | | (51,779,437 | ) | | | (863,017 | ) | | | (34,304,730 | ) | |
| CLASS R SHARES@@@ | |
| Sold | | | 2,919 | | | | 100,000 | | | | — | | | | — | | |
| Increase — Class R | | | 2,919 | | | | 100,000 | | | | — | | | | — | | |
| CLASS W SHARES@@@ | |
| Sold | | | 2,919 | | | | 100,000 | | | | — | | | | — | | |
| Increase — Class W | | | 2,919 | | | | 100,000 | | | | — | | | | — | | |
| Net decrease in Fund | | | (4,410,277 | ) | | $ | (170,960,516 | ) | | | (1,297,043 | ) | | $ | (52,268,775 | ) | |
@@ Formerly Class D shares. Renamed Class I shares effective March 31, 2008.
@@@ Shares were first issued on March 31, 2008.
33
Morgan Stanley Equally-Weighted S&P 500 Fund
Notes to Financial Statements n June 30, 2008 continued
6. Expense Offset
The expense offset represents a reduction of the fees and expenses for interest earned on cash balances maintained by the Fund with the transfer agent.
7. Federal Income Tax Status
The amount of dividends and distributions from net investment income and net realized capital gains are determined in accordance with federal income tax regulations which may differ from generally accepted accounting principles. These "book/tax" differences are either considered temporary or permanent in nature. To the extent these differences are permanent in nature, such amounts are reclassified within the capital accounts based on their federal tax-basis treatment; temporary differences do not require reclassification. Dividends and distributions which exceed net investment income and net realized capital gains for tax purposes are reported as distributions of paid-in-capital.
The tax character of distributions paid was as follows:
| | | FOR THE YEAR
ENDED
JUNE 30, 2008 | | FOR THE YEAR
ENDED
JUNE 30, 2007 | |
| Ordinary income | | $ | 39,615,254 | | | $ | 27,720,209 | | |
| Long- term capital gains | | | 184,032,301 | | | | 103,175,915 | | |
| Total distributions | | $ | 223,647,555 | | | $ | 130,896,124 | | |
As of June 30, 2008, the tax-basis components of accumulated earnings were as follows:
| Undistributed ordinary income | | $ | 11,362,552 | | |
| Undistributed long-term gains | | | 151,221,977 | | |
| Net accumulated earnings | | | 162,584,529 | | |
| Temporary differences | | | (88,439 | ) | |
| Net unrealized appreciation | | | 441,903,023 | | |
| Total accumulated earnings | | $ | 604,399,113 | | |
As of June 30, 2008, the Fund had temporary book/tax differences primarily attributable to capital loss deferrals on wash sales, mark-to-market of open futures contracts and tax adjustments on real estate investment trusts ("REITs") held by the Fund.
34
Morgan Stanley Equally-Weighted S&P 500 Fund
Notes to Financial Statements n June 30, 2008 continued
Permanent differences, primarily due to tax adjustments on REITs sold/held by the Fund, resulted in the following reclassifications among the Fund's components of net assets at June 30, 2008:
ACCUMULATED
UNDISTRIBUTED
NET INVESTMENT
INCOME | | ACCUMULATED
UNDISTRIBUTED
NET REALIZED
GAIN | | PAID-IN-CAPITAL | |
| $ | (1,329,368 | ) | | $ | 1,330,752 | | | $ | (1,384 | ) | |
8. Purposes of and Risks Relating to Certain Financial Instruments
The Fund may purchase and sell stock index futures ("futures contracts") for the following reasons: to simulate full investment in the S&P 500 Index while retaining a cash balance for fund management purposes; to facilitate trading; to reduce transaction costs; or to seek higher investment returns when a futures contract is priced more attractively than stocks comprising the S&P 500 Index.
These futures contracts involve elements of market risk in excess of the amount reflected in the Statement of Assets and Liabilities. The Fund bears the risk of an unfavorable change in the value of the underlying securities. Risks may also arise upon entering into these contracts from the potential inability of the counterparties to meet the terms of their contracts.
9. New Accounting Pronouncements
On September 2006, Statement of Financial Accounting Standards No. 157, Fair Value Measurements ("SFAS 157"), was issued and is effective for fiscal years beginning after November 15, 2007. SFAS 157 defines fair value, establishes a framework for measuring fair value and expands disclosures about fair value measurements. Management is currently evaluating the impact the adoption of SFAS 157 will have on the Fund's financial statement disclosures.
On March 19, 2008, FASB released Statement of Financial Accounting Standards No. 161, Disclosures about Derivative Instruments and Hedging Activities ("SFAS 161"). SFAS 161 requires qualitative disclosures about objectives and strategies for using derivatives, quantitative disclosures about fair value amounts of gains and losses on derivative instruments, and disclosures about credit-risk related contingent features in derivative agreements. The application of SFAS 161 is required for fiscal years beginning after November 15, 2008 and interim periods within those fiscal years. At this time, management is evaluating the implications of SFAS 161 and its impact on the financial statements has not yet been determined.
35
Morgan Stanley Equally-Weighted S&P 500 Fund
Financial Highlights
Selected ratios and per share data for a share of beneficial interest outstanding throughout each period:
| | | FOR THE YEAR ENDED JUNE 30, | |
| | | 2008 | | 2007 | | 2006 | | 2005 | | 2004 | |
| Class A Shares | |
| Selected Per Share Data: | |
| Net asset value, beginning of period | | $ | 45.39 | | | $ | 40.04 | | | $ | 37.58 | | | $ | 34.88 | | | $ | 29.36 | | |
| Income (loss) from investment operations: | |
| Net investment income(1) | | | 0.48 | | | | 0.45 | | | | 0.39 | | | | 0.33 | | | | 0.22 | | |
| Net realized and unrealized gain (loss) | | | (7.81 | ) | | | 7.54 | | | | 3.79 | | | | 3.17 | | | | 7.54 | | |
Total income (loss) from investment
operations | | | (7.33 | ) | | | 7.99 | | | | 4.18 | | | | 3.50 | | | | 7.76 | | |
| Less dividends and distributions from: | |
| Net investment income | | | (0.48 | ) | | | (0.40 | ) | | | (0.36 | ) | | | (0.18 | ) | | | (0.12 | ) | |
| Net realized gain | | | (4.19 | ) | | | (2.24 | ) | | | (1.36 | ) | | | (0.62 | ) | | | (2.12 | ) | |
| Total dividends and distributions | | | (4.67 | ) | | | (2.64 | ) | | | (1.72 | ) | | | (0.80 | ) | | | (2.24 | ) | |
| Net asset value, end of period | | $ | 33.39 | | | $ | 45.39 | | | $ | 40.04 | | | $ | 37.58 | | | $ | 34.88 | | |
| Total Return(2) | | | (17.31 | )% | | | 20.44 | % | | | 11.22 | % | | | 10.07 | % | | | 27.26 | % | |
| Ratios to Average Net Assets(3): | |
| Total expenses (before expense offset) | | | 0.62 | %(4) | | | 0.62 | %(4) | | | 0.63 | % | | | 0.70 | % | | | 0.86 | % | |
| Net investment income | | | 1.22 | %(4) | | | 1.05 | %(4) | | | 0.98 | % | | | 0.91 | % | | | 0.66 | % | |
| Supplemental Data: | |
| Net assets, end of period, in thousands | | $ | 799,622 | | | $ | 1,070,820 | | | $ | 850,678 | | | $ | 729,440 | | | $ | 64,890 | | |
| Portfolio turnover rate | | | 25 | % | | | 14 | % | | | 16 | % | | | 14 | % | | | 11 | % | |
(1) The per share amounts were computed using an average number of shares outstanding during the period.
(2) Does not reflect the deduction of sales charge. Calculated based on the net asset value as of the last business day of the period.
(3) Reflects overall Fund ratios for investment income and non-class specific expenses.
(4) Reflects rebate of certain Fund expenses in connection with the investments in Morgan Stanley Institutional Liquidity – Money Market Portfolio during the period. As a result of such rebate, the expenses as a percentage of its net assets had an effect of less than 0.005%.
See Notes to Financial Statements
36
Morgan Stanley Equally-Weighted S&P 500 Fund
Financial Highlights continued
| | | FOR THE YEAR ENDED JUNE 30, | |
| | | 2008 | | 2007 | | 2006 | | 2005 | | 2004 | |
| Class B Shares | |
| Selected Per Share Data: | |
| Net asset value, beginning of period | | $ | 44.85 | | | $ | 39.57 | | | $ | 37.10 | | | $ | 34.52 | | | $ | 29.20 | | |
| Income (loss) from investment operations: | |
| Net investment income (loss)(1) | | | 0.18 | | | | 0.12 | | | | 0.09 | | | | 0.06 | | | | (0.04 | ) | |
| Net realized and unrealized gain (loss) | | | (7.74 | ) | | | 7.45 | | | | 3.74 | | | | 3.14 | | | | 7.49 | | |
Total income (loss) from investment
operations | | | (7.56 | ) | | | 7.57 | | | | 3.83 | | | | 3.20 | | | | 7.45 | | |
| Less dividends and distributions from: | |
| Net investment income | | | (0.08 | ) | | | (0.05 | ) | | | 0.00 | | | | 0.00 | | | | (0.01 | ) | |
| Net realized gain | | | (4.19 | ) | | | (2.24 | ) | | | (1.36 | ) | | | (0.62 | ) | | | (2.12 | ) | |
| Total dividends and distributions | | | (4.27 | ) | | | (2.29 | ) | | | (1.36 | ) | | | (0.62 | ) | | | (2.13 | ) | |
| Net asset value, end of period | | $ | 33.02 | | | $ | 44.85 | | | $ | 39.57 | | | $ | 37.10 | | | $ | 34.52 | | |
| Total Return(2) | | | (17.96 | )% | | | 19.54 | % | | | 10.38 | % | | | 9.29 | % | | | 26.29 | % | |
| Ratios to Average Net Assets(3): | |
| Total expenses (before expense offset) | | | 1.37 | %(4) | | | 1.38 | %(4) | | | 1.38 | % | | | 1.45 | % | | | 1.63 | % | |
| Net investment income (loss) | | | 0.47 | %(4) | | | 0.29 | %(4) | | | 0.23 | % | | | 0.16 | % | | | (0.11 | )% | |
| Supplemental Data: | |
| Net assets, end of period, in thousands | | $ | 352,174 | | | $ | 630,489 | | | $ | 674,371 | | | $ | 767,445 | | | $ | 1,279,687 | | |
| Portfolio turnover rate | | | 25 | % | | | 14 | % | | | 16 | % | | | 14 | % | | | 11 | % | |
(1) The per share amounts were computed using an average number of shares outstanding during the period.
(2) Does not reflect the deduction of sales charge. Calculated based on the net asset value as of the last business day of the period.
(3) Reflects overall Fund ratios for investment income and non-class specific expenses.
(4) Reflects rebate of certain Fund expenses in connection with the investments in Morgan Stanley Institutional Liquidity – Money Market Portfolio during the period. As a result of such rebate, the expenses as a percentage of its net assets had an effect of less than 0.005%.
See Notes to Financial Statements
37
Morgan Stanley Equally-Weighted S&P 500 Fund
Financial Highlights continued
| | | FOR THE YEAR ENDED JUNE 30, | |
| | | 2008 | | 2007 | | 2006 | | 2005 | | 2004 | |
| Class C Shares | |
| Selected Per Share Data: | |
| Net asset value, beginning of period | | $ | 44.08 | | | $ | 38.97 | | | $ | 36.60 | | | $ | 34.07 | | | $ | 28.87 | | |
| Income (loss) from investment operations: | |
| Net investment income (loss)(1) | | | 0.19 | | | | 0.14 | | | | 0.11 | | | | 0.06 | | | | (0.03 | ) | |
| Net realized and unrealized gain (loss) | | | (7.58 | ) | | | 7.33 | | | | 3.69 | | | | 3.09 | | | | 7.40 | | |
Total income (loss) from investment
operations | | | (7.39 | ) | | | 7.47 | | | | 3.80 | | | | 3.15 | | | | 7.37 | | |
| Less dividends and distributions from: | |
| Net investment income | | | (0.17 | ) | | | (0.12 | ) | | | (0.07 | ) | | | 0.00 | | | | (0.05 | ) | |
| Net realized gain | | | (4.19 | ) | | | (2.24 | ) | | | (1.36 | ) | | | (0.62 | ) | | | (2.12 | ) | |
| Total dividends and distributions | | | (4.36 | ) | | | (2.36 | ) | | | (1.43 | ) | | | (0.62 | ) | | | (2.17 | ) | |
| Net asset value, end of period | | $ | 32.33 | | | $ | 44.08 | | | $ | 38.97 | | | $ | 36.60 | | | $ | 34.07 | | |
| Total Return(2) | | | (17.89 | )% | | | 19.53 | % | | | 10.44 | % | | | 9.26 | % | | | 26.31 | % | |
| Ratios to Average Net Assets(3): | |
| Total expenses (before expense offset) | | | 1.35 | %(4) | | | 1.34 | %(4) | | | 1.33 | % | | | 1.45 | % | | | 1.63 | % | |
| Net investment income (loss) | | | 0.49 | %(4) | | | 0.33 | %(4) | | | 0.28 | % | | | 0.16 | % | | | (0.11 | )% | |
| Supplemental Data: | |
| Net assets, end of period, in thousands | | $ | 88,658 | | | $ | 124,080 | | | $ | 101,809 | | | $ | 92,529 | | | $ | 68,101 | | |
| Portfolio turnover rate | | | 25 | % | | | 14 | % | | | 16 | % | | | 14 | % | | | 11 | % | |
(1) The per share amounts were computed using an average number of shares outstanding during the period.
(2) Does not reflect the deduction of sales charge. Calculated based on the net asset value as of the last business day of the period.
(3) Reflects overall Fund ratios for investment income and non-class specific expenses.
(4) Reflects rebate of certain Fund expenses in connection with the investments in Morgan Stanley Institutional Liquidity – Money Market Portfolio during the period. As a result of such rebate, the expenses as a percentage of its net assets had an effect of less than 0.005%.
See Notes to Financial Statements
38
Morgan Stanley Equally-Weighted S&P 500 Fund
Financial Highlights continued
| | | FOR THE YEAR ENDED JUNE 30, | |
| | | 2008 | | 2007 | | 2006 | | 2005 | | 2004 | |
| Class I Shares@@ | |
| Selected Per Share Data: | |
| Net asset value, beginning of period | | $ | 45.68 | | | $ | 40.28 | | | $ | 37.77 | | | $ | 35.04 | | | $ | 29.44 | | |
| Income (loss) from investment operations: | |
| Net investment income(1) | | | 0.59 | | | | 0.56 | | | | 0.49 | | | | 0.42 | | | | 0.30 | | |
| Net realized and unrealized gain (loss) | | | (7.87 | ) | | | 7.58 | | | | 3.81 | | | | 3.20 | | | | 7.56 | | |
Total income (loss) from investment
operations | | | (7.28 | ) | | | 8.14 | | | | 4.30 | | | | 3.62 | | | | 7.86 | | |
| Less dividends and distributions from: | |
| Net investment income | | | (0.59 | ) | | | (0.50 | ) | | | (0.43 | ) | | | (0.27 | ) | | | (0.14 | ) | |
| Net realized gain | | | (4.19 | ) | | | (2.24 | ) | | | (1.36 | ) | | | (0.62 | ) | | | (2.12 | ) | |
| Total dividends and distributions | | | (4.78 | ) | | | (2.74 | ) | | | (1.79 | ) | | | (0.89 | ) | | | (2.26 | ) | |
| Net asset value, end of period | | $ | 33.62 | | | $ | 45.68 | | | $ | 40.28 | | | $ | 37.77 | | | $ | 35.04 | | |
| Total Return(2) | | | (17.11 | )% | | | 20.72 | % | | | 11.49 | % | | | 10.38 | % | | | 27.55 | % | |
| Ratios to Average Net Assets(3): | |
| Total expenses (before expense offset) | | | 0.37 | %(4) | | | 0.38 | %(4) | | | 0.38 | % | | | 0.45 | % | | | 0.63 | % | |
| Net investment income | | | 1.47 | %(4) | | | 1.29 | %(4) | | | 1.23 | % | | | 1.16 | % | | | 0.89 | % | |
| Supplemental Data: | |
| Net assets, end of period, in thousands | | $ | 351,338 | | | $ | 537,295 | | | $ | 508,494 | | | $ | 458,885 | | | $ | 295,414 | | |
| Portfolio turnover rate | | | 25 | % | | | 14 | % | | | 16 | % | | | 14 | % | | | 11 | % | |
@@ Formerly Class D shares. Renamed Class I shares effective March 31, 2008.
(1) The per share amounts were computed using an average number of shares outstanding during the period.
(2) Calculated based on the net asset value as of the last business day of the period.
(3) Reflects overall Fund ratios for investment income and non-class specific expenses.
(4) Reflects rebate of certain Fund expenses in connection with the investments in Morgan Stanley Institutional Liquidity – Money Market Portfolio during the period. As a result of such rebate, the expenses as a percentage of its net assets had an effect of less than 0.005%.
See Notes to Financial Statements
39
Morgan Stanley Equally-Weighted S&P 500 Fund
Financial Highlights continued
| | | FOR THE PERIOD
MARCH 31, 2008@@@
THROUGH
JUNE 30, 2008 | |
| Class R Shares | |
| Selected Per Share Data: | |
| Net asset value, beginning of period | | $ | 34.26 | | |
| Income (loss) from investment operations: | |
| Net investment income(1) | | | 0.09 | | |
| Net realized and unrealized loss | | | (0.99 | ) | |
| Total loss from investment operations | | | (0.90 | ) | |
| Net asset value, end of period | | $ | 33.36 | | |
| Total Return(2) | | | (2.63 | )%(6) | |
| Ratios to Average Net Assets(3)(5): | |
| Total expenses (before expense offset) | | | 0.86 | %(4) | |
| Net investment income | | | 0.98 | %(4) | |
| Supplemental Data: | |
| Net assets, end of period, in thousands | | $ | 97 | | |
| Portfolio turnover rate | | | 25 | % | |
@@@ The date shares were first issued.
(1) The per share amounts were computed using an average number of shares outstanding during the period.
(2) Calculated based on the net asset value as of the last business day of the period.
(3) Reflects overall Fund ratios for investment income and non-class specific expenses.
(4) Reflects rebate of certain Fund expenses in connection with the investments in Morgan Stanley Institutional Liquidity Money Market Portfolio – Institutional Class during the period. As a result of such rebate, the expenses as a percentage of its net assets had an effect of less than 0.005%.
(5) Annualized.
(6) Not annualized.
See Notes to Financial Statements
40
Morgan Stanley Equally-Weighted S&P 500 Fund
Financial Highlights continued
| | | FOR THE PERIOD
MARCH 31, 2008@@@
THROUGH
JUNE 30, 2008 | |
| Class W Shares | |
| Selected Per Share Data: | |
| Net asset value, beginning of period | | $ | 34.26 | | |
| Income (loss) from investment operations: | |
| Net investment income(1) | | | 0.10 | | |
| Net realized and unrealized loss | | | (0.98 | ) | |
| Total loss from investment operations | | | (0.88 | ) | |
| Net asset value, end of period | | $ | 33.38 | | |
| Total Return(2) | | | (2.57 | )%(6) | |
| Ratios to Average Net Assets(3)(5): | |
| Total expenses (before expense offset) | | | 0.71 | %(4) | |
| Net investment income | | | 1.13 | %(4) | |
| Supplemental Data: | |
| Net assets, end of period, in thousands | | $ | 97 | | |
| Portfolio turnover rate | | | 25 | % | |
@@@ The date shares were first issued.
(1) The per share amounts were computed using an average number of shares outstanding during the period.
(2) Calculated based on the net asset value as of the last business day of the period.
(3) Reflects overall Fund ratios for investment income and non-class specific expenses.
(4) Reflects rebate of certain Fund expenses in connection with the investments in Morgan Stanley Institutional Liquidity Money Market Portfolio – Institutional Class during the period. As a result of such rebate, the expenses as a percentage of its net assets had an effect of less than 0.005%.
(5) Annualized.
(6) Not annualized.
See Notes to Financial Statements
41
Morgan Stanley Equally-Weighted S&P 500 Fund
Report of Independent Registered Public Accounting Firm
To the Shareholders and Board of Trustees of
Morgan Stanley Equally-Weighted S&P 500 Fund:
We have audited the accompanying statement of assets and liabilities of Morgan Stanley Equally-Weighted S&P 500 Fund (the "Fund"), including the portfolio of investments, as of June 30, 2008, and the related statements of operations for the year then ended and changes in net assets for each of the two years in the period then ended, and the financial highlights for each of the five years in the period then ended. These financial statements and financial highlights are the responsibility of the Fund's management. Our responsibility is to express an opinion on these financial statements and financial highlights based on our audits.
We conducted our audits in accordance with the standards of the Public Company Accounting Oversight Board (United States). Those standards require that we plan and perform the audit to obtain reasonable assurance about whether the financial statements and financial highlights are free of material misstatement. The Fund is not required to have, nor were we engaged to perform, an audit of its internal control over financial reporting. Our audits included consideration of internal control over financial reporting as a basis for designing audit procedures that are appropriate in the circumstances, but not for the purpose of expressing an opinion on the effectiveness of the Fund's internal control over financial reporting. Accordingly, we express no such opinion. An audit also includes examining, on a test basis, evidence supporting the amounts and disclosures in the financial statements, assessing the accounting principles used and significant estimates made by management, as well as evaluating the overall financial statement presentation. Our procedures included confirmation of securities owned as of June 30, 2008, by correspondence with the custodian and brokers; where replies were not received from brokers, we performed other auditing procedures. We believe that our audits provide a reasonable basis for our opinion.
In our opinion, the financial statements and financial highlights referred to above present fairly, in all material respects, the financial position of Morgan Stanley Equally-Weighted S&P 500 Fund as of June 30, 2008, the results of its operations for the year then ended, the changes in its net assets for each of the two years in the period then ended, and the financial highlights for each of the five years in the period then ended, in conformity with accounting principles generally accepted in the United States of America.
Deloitte & Touche LLP
New York, New York
August 22, 2008
42
Morgan Stanley Equally-Weighted S&P 500 Fund
Trustee and Officer Information (unaudited)
Independent Trustees:
Name, Age and Address of
Independent Trustee | | Position(s)
Held with
Registrant | | Term of
Office and
Length of
Time Served* | | Principal Occupation(s)
During Past 5 Years | | Number of
Portfolios
in Fund
Complex
Overseen by
Independent
Trustee** | | Other Directorships
Held by Independent Trustee | |
Frank L. Bowman (63)
c/o Kramer Levin Naftalis & Frankel LLP
Counsel to the Independent Trustees
1177 Avenue of the Americas
New York, NY 10036 | | Trustee | | Since
August 2006 | | President and Chief Executive Officer, Nuclear Energy Institute (policy organization) (since February 2005); Director or Trustee of various Retail Funds and Institutional Funds (since August 2006); Chairperson of the Insurance Sub-Committee of the Insurance, Valuation and Compliance Committee (since February 2007); formerly, variously, Admiral in the U.S. Navy, Director of Naval Nuclear Propulsion Program and Deputy Administrator – Naval Reactors in the National Nuclear Security Administration at the U.S. Department of Energy (1996-2004). Honorary Knight Commander of the Most Excellent Order of the British Empire. | | | 180 | | | Director of the National Energy Foundation, the U.S. Energy Association, the American Council for Capital Formation and the Armed Services YMCA of the USA. | |
|
Michael Bozic (67)
c/o Kramer Levin Naftalis & Frankel LLP
Counsel to the Independent Trustees
1177 Avenue of the Americas
New York, NY 10036 | | Trustee | | Since
April 1994 | | Private investor; Chairperson of the Insurance, Valuation and Compliance Committee (since October 2006); Director or Trustee of the Retail Funds (since April 1994) and the Institutional Funds (since July 2003); formerly, Chairperson of the Insurance Committee (July 2006-September 2006); Vice Chairman of Kmart Corporation (December 1998-October 2000), Chairman and Chief Executive Officer of Levitz Furniture Corporation (November 1995-November 1998) and President and Chief Executive Officer of Hills Department Stores (May 1991-July 1995); variously Chairman, Chief Executive Officer, President and Chief Operating Officer (1987-1991) of the Sears Merchandise Group of Sears, Roebuck & Co. | | | 182 | | | Director of various business
organizations. | |
|
43
Morgan Stanley Equally-Weighted S&P 500 Fund
Trustee and Officer Information (unaudited) continued
Name, Age and Address of
Independent Trustee | | Position(s)
Held with
Registrant | | Term of
Office and
Length of
Time Served* | | Principal Occupation(s)
During Past 5 Years | | Number of
Portfolios
in Fund
Complex
Overseen by
Independent
Trustee** | | Other Directorships
Held by Independent Trustee | |
Kathleen A. Dennis (54)
c/o Kramer Levin Naftalis & Frankel LLP
Counsel to the Independent Trustees
1177 Avenue of the Americas
New York, NY 10036 | | Trustee | | Since
August 2006 | | President, Cedarwood Associates (mutual fund and investment management) (since July 2006); Chairperson of the Money Market and Alternatives Sub-Committee of the Investment Committee (since October 2006) and Director or Trustee of various Retail Funds and Institutional Funds (since August 2006); formerly, Senior Managing Director of Victory Capital Management (1993-2006). | | | 180 | | | Director of various non-profit organizations. | |
|
Dr. Manuel H. Johnson (59)
c/o Johnson Smick Group, Inc.
888 16th Street, N.W.
Suite 740
Washington, D.C. 20006 | | Trustee | | Since
July 1991 | | Senior Partner, Johnson Smick International, Inc. (consulting firm); Chairperson of the Investment Committee (since October 2006) and Director or Trustee of the Retail Funds (since July 1991) and the Institutional Funds (since July 2003); Co-Chairman and a founder of the Group of Seven Council (G7C) (international economic commission); formerly, Chairperson of the Audit Committee (July 1991-September 2006); Vice Chairman of the Board of Governors of the Federal Reserve System and Assistant Secretary of the U.S. Treasury. | | | 182 | | | Director of NVR, Inc. (home construction); Director of Evergreen Energy. | |
|
Joseph J. Kearns (65)
c/o Kearns & Associates LLC
PMB754
23852 Pacific Coast Highway
Malibu, CA 90265 | | Trustee | | Since
August 1994 | | President, Kearns & Associates LLC (investment consulting); Chairperson of the Audit Committee (since October 2006) and Director or Trustee of the Retail Funds (since July 2003) and the Institutional Funds (since August 1994); formerly, Deputy Chairperson of the Audit Committee (July 2003-September 2006) and Chairperson of the Audit Committee of the Institutional Funds (October 2001-July 2003); CFO of the J. Paul Getty Trust. | | | 183 | | | Director of Electro Rent Corporation (equipment leasing) and The Ford Family Foundation. | |
|
44
Morgan Stanley Equally-Weighted S&P 500 Fund
Trustee and Officer Information (unaudited) continued
Name, Age and Address of
Independent Trustee | | Position(s)
Held with
Registrant | | Term of
Office and
Length of
Time Served* | | Principal Occupation(s)
During Past 5 Years | | Number of
Portfolios
in Fund
Complex
Overseen by
Independent
Trustee** | | Other Directorships
Held by Independent Trustee | |
Michael F. Klein (49)
c/o Kramer Levin Naftalis & Frankel LLP
Counsel to the Independent Trustees
1177 Avenue of the Americas
New York, NY 10036 | | Trustee | | Since
August 2006 | | Managing Director, Aetos Capital, LLC (since March 2000) and Co-President, Aetos Alternatives Management, LLC (since January 2004); Chairperson of the Fixed-Income Sub-Committee of the Investment Committee (since October 2006) and Director or Trustee of various Retail Funds and Institutional Funds (since August 2006); formerly, Managing Director, Morgan Stanley & Co. Inc. and Morgan Stanley Dean Witter Investment Management, President, Morgan Stanley Institutional Funds (June 1998-March 2000) and Principal, Morgan Stanley & Co. Inc. and Morgan Stanley Dean Witter Investment Management (August 1997-December 1999). | | | 180 | | | Director of certain investment funds managed or sponsored by Aetos Capital, LLC. Director of Sanitized AG and Sanitized Marketing AG (specialty chemicals). | |
|
Michael E. Nugent (72)
c/o Triumph Capital, L.P.
445 Park Avenue
New York, NY 10022 | | Chairperson of the Board and Trustee | | Chairperson of the Boards since July 2006 and Trustee since July 1991 | | General Partner, Triumph Capital, L.P. (private investment partnership); Chairperson of the Boards of the Retail Funds and Institutional Funds (since July 2006); Director or Trustee of the Retail Funds (since July 1991) and the Institutional Funds (since July 2001); formerly, Chairperson of the Insurance Committee (until July 2006). | | | 182 | | | None. | |
|
45
Morgan Stanley Equally-Weighted S&P 500 Fund
Trustee and Officer Information (unaudited) continued
Name, Age and Address of
Independent Trustee | | Position(s)
Held with
Registrant | | Term of
Office and
Length of
Time Served* | | Principal Occupation(s)
During Past 5 Years | | Number of
Portfolios
in Fund
Complex
Overseen by
Independent
Trustee** | | Other Directorships
Held by Independent Trustee | |
W. Allen Reed (61)
c/o Kramer Levin Naftalis & Frankel LLP
Counsel to the Independent Trustees
1177 Avenue of the Americas
New York, NY 10036 | | Trustee | | Since
August 2006 | | Chairperson of the Equity Sub-Committee of the Investment Committee (since October 2006) and Director or Trustee of various Retail Funds and Institutional Funds (since August 2006); formerly, President and CEO of General Motors Asset Management; Chairman and Chief Executive Officer of the GM Trust Bank and Corporate Vice President of General Motors Corporation (August 1994-December 2005). | | | 180 | | | Director of Temple-Inland Industries (packaging and forest products); Director of Legg Mason, Inc. and Director of the Auburn University Foundation. | |
|
Fergus Reid (75)
c/o Lumelite Plastics Corporation
85 Charles Colman Blvd.
Pawling, NY 12564 | | Trustee | | Since
June 1992 | | Chairman of Lumelite Plastics Corporation; Chairperson of the Governance Committee and Director or Trustee of the Retail Funds (since July 2003) and the Institutional Funds (since June 1992). | | | 183 | | | Trustee and Director of certain investment companies in the JPMorgan Funds complex managed by J.P. Morgan Investment Management Inc. | |
|
46
Morgan Stanley Equally-Weighted S&P 500 Fund
Trustee and Officer Information (unaudited) continued
Interested Trustee:
Name, Age and Address of
Interested Trustee | | Position(s)
Held with
Registrant | | Term of
Office and
Length of
Time Served* | | Principal Occupation(s)
During Past 5 Years | | Number of
Portfolios
in Fund
Complex
Overseen by
Interested
Trustee** | | Other Directorships Held by
Interested Trustee | |
James F. Higgins (60)
c/o Morgan Stanley Trust
Harborside Financial Center
Plaza Two
Jersey City, NJ 07311 | | Trustee | | Since
June 2000 | | Director or Trustee of the Retail Funds (since June 2000) and the Institutional Funds (since July 2003); Senior
Advisor of Morgan Stanley (since August 2000). | | | 181 | | | Director of AXA Financial, Inc. and The Equitable Life Assurance Society of the United States (financial services). | |
|
* This is the earliest date the Trustee began serving the funds advised by Morgan Stanley Investment Advisors Inc. (the "Investment Adviser") (the "Retail Funds") or the funds advised by Morgan Stanley Investment Management Inc. and Morgan Stanley AIP GP LP (the "Institutional Funds").
** The Fund Complex includes all open-end and closed-end funds (including all of their portfolios) advised by the Investment Adviser and any funds that have an investment adviser that is an affiliated person of the Investment Adviser (including, but not limited to, Morgan Stanley Investment Management Inc.).
47
Morgan Stanley Equally-Weighted S&P 500 Fund
Trustee and Officer Information (unaudited) continued
Executive Officers:
Name, Age and Address of
Executive Officer | | Position(s)
Held with
Registrant | | Term of
Office and
Length of
Time Served* | | Principal Occupation(s) During Past 5 Years | |
Ronald E. Robison (69)
522 Fifth Avenue
New York, NY 10036 | | President and Principal Executive Officer | | President since September 2005 and Principal Executive Officer since May 2003 | | President (since September 2005) and Principal Executive Officer (since May 2003) of funds in the Fund Complex; President (since September 2005) and Principal Executive Officer (since May 2003) of the Van Kampen Funds; Managing Director, Director and/or Officer of the Investment Adviser and various entities affiliated with the Investment Adviser; Director of Morgan Stanley SICAV (since May 2004). Formerly, Executive Vice President (July 2003-September 2005) of funds in the Fund Complex and the Van Kampen Funds; President and Director of the Institutional Funds (March 2001-July 2003); Chief Administrative Officer of the Investment Adviser; Chief Administrative Officer of Morgan Stanley Services Company Inc. | |
|
Kevin Klingert (45)
522 Fifth Avenue
New York, NY 10036 | | Vice President | | Since June 2008 | | Chief Operating Officer of the Global Fixed Income Group of Morgan Stanley Investment Management Inc. and Morgan Stanley Investment Advisors Inc. (since March 2008). Head of Global Liquidity Portfolio Management and co-Head of Liquidity Credit Research of Morgan Stanley Investment Management (since December 2007). Managing Director of Morgan Stanley Investment Management Inc. and Morgan Stanley Investment Advisors Inc. (since December 2007). Previously, Managing Director on the Management Committee and head of Municipal Portfolio Management and Liquidity at BlackRock (October 1991 to January 2007). | |
|
Dennis F. Shea (55)
522 Fifth Avenue
New York, NY 10036 | | Vice President | | Since February 2006 | | Managing Director and (since February 2006) Chief Investment Officer – Global Equity of Morgan Stanley Investment Management; Vice President of the Retail Funds and Institutional Funds (since February 2006). Formerly, Managing Director and Director of Global Equity Research at Morgan Stanley. | |
|
Amy R. Doberman (46)
522 Fifth Avenue
New York, NY 10036 | | Vice President | | Since July 2004 | | Managing Director and General Counsel, U.S. Investment Management of Morgan Stanley Investment Management (since July 2004); Vice President of the Retail Funds and Institutional Funds (since July 2004); Vice President of the Van Kampen Funds (since August 2004); Secretary (since February 2006) and Managing Director (since July 2004) of the Investment Adviser and various entities affiliated with the Investment Adviser. Formerly, Managing Director and General Counsel – Americas, UBS Global Asset Management (July 2000-July 2004). | |
|
Carsten Otto (44)
522 Fifth Avenue
New York, NY 10036 | | Chief Compliance Officer | | Since October 2004 | | Managing Director and Global Head of Compliance for Morgan Stanley Investment Management (since April 2007); and Chief Compliance Officer of Morgan Stanley Retail Funds and Institutional Funds (since October 2004). Formerly, U.S. Director of Compliance (October 2004-April 2007) and Assistant Secretary and Assistant General Counsel of the Retail Funds. | |
|
Stefanie V. Chang Yu (41)
522 Fifth Avenue
New York, NY 10036 | | Vice President | | Since December1997 | | Managing Director of the Investment Adviser and various entities affiliated with the Investment Adviser; Vice President of the Retail Funds (since July 2002) and the Institutional Funds (since December 1997). Formerly, Secretary of various entities affiliated with the Investment Adviser. | |
|
48
Morgan Stanley Equally-Weighted S&P 500 Fund
Trustee and Officer Information (unaudited) continued
Name, Age and Address of
Executive Officer | | Position(s)
Held with
Registrant | | Term of
Office and
Length of
Time Served* | | Principal Occupation(s) During Past 5 Years | |
Francis J. Smith (42)
c/o Morgan Stanley Trust Harborside Financial Center Plaza Two
Jersey City, NJ 07311 | | Treasurer and Chief Financial Officer | | Treasurer since July 2003 and Chief Financial Officer since September 2002 | | Executive Director of the Investment Adviser and various entities affiliated with the Investment Adviser; Treasurer and Chief Financial Officer of the Retail Funds (since July 2003). Formerly, Vice President of the Retail Funds (September 2002-July 2003). | |
|
Mary E. Mullin (41)
522 Fifth Avenue
New York, NY 10036 | | Secretary | | Since June 1999 | | Executive Director of the Investment Adviser and various entities affiliated with the Investment Adviser; Secretary of the Retail Funds (since July 2003) and the Institutional Funds (since June 1999). | |
|
* This is the earliest date the Officer began serving the Retail Funds or Institutional Funds.
2008 Federal Tax Notice (unaudited)
For Federal income tax purposes, the following information is furnished with respect to the distributions paid by the Fund during its taxable year ended June 30, 2008. For corporate shareholders, 94.75% of the distributions qualify for the dividends received deduction. The Fund designated and paid $184,032,301 as a long-term capital gain distribution.
For Federal income tax purposes, the following information is furnished with respect to the Fund's earnings for its taxable year ended June 30, 2008. When distributed, certain earnings may be subject to a maximum tax rate of 15% as provided for by the Jobs and Growth Tax Relief Reconciliation Act of 2003. The fund designated up to a maximum of $33,116,948 as taxable at this lower rate. For non-U.S. residents, the Fund may designate up to a maximum of $20,615,212 as qualifying as short-term capital gain dividends.
In January, the Fund provides tax information to shareholders for the preceding calendar year.
49
(This page has been left blank intentionally.)
(This page has been left blank intentionally.)
Trustees
Frank L. Bowman
Michael Bozic
Kathleen A. Dennis
James F. Higgins
Dr. Manuel H. Johnson
Joseph J. Kearns
Michael F. Klein
Michael E. Nugent
W. Allen Reed
Fergus Reid
Officers
Michael E. Nugent
Chairperson of the Board
Ronald E. Robison
President and Principal Executive Officer
Kevin Klingert
Vice President
Dennis F. Shea
Vice President
Amy R. Doberman
Vice President
Carsten Otto
Chief Compliance Officer
Stefanie V. Chang Yu
Vice President
Francis J. Smith
Treasurer and Chief Financial Officer
Mary E. Mullin
Secretary
Transfer Agent
Morgan Stanley Trust
Harborside Financial Center, Plaza Two
Jersey City, New Jersey 07311
Independent Registered Public Accounting Firm
Deloitte & Touche LLP
Two World Financial Center
New York, New York 10281
Legal Counsel
Clifford Chance US LLP
31 West 52nd Street
New York, New York 10019
Counsel to the Independent Trustees
Kramer Levin Naftalis & Frankel LLP
1177 Avenue of the Americas
New York, New York 10036
Investment Adviser
Morgan Stanley Investment Advisors Inc.
522 Fifth Avenue
New York, New York 10036
This report is submitted for the general information of the shareholders of the Fund. For more detailed information about the Fund, its fees and expenses and other pertinent information, please read its Prospectus. The Fund's Statement of Additional Information contains additional information about the Fund, including its trustees. It is available, without charge, by calling (800) 869-NEWS.
This report is not authorized for distribution to prospective investors in the Fund unless preceded or accompanied by an effective Prospectus. Read the Prospectus carefully before investing.
Morgan Stanley Distributors Inc., member FINRA.
© 2008 Morgan Stanley


INVESTMENT MANAGEMENT
Morgan Stanley
Equally-Weighted
S&P 500 Fund

Annual Report
June 30, 2008
VADANN
IU08-04316P-Y06/08
Item 2. Code of Ethics.
(a) The Fund has adopted a code of ethics (the “Code of Ethics”) that applies to its principal executive officer, principal financial officer, principal accounting officer or controller, or persons performing similar functions, regardless of whether these individuals are employed by the Fund or a third party.
(b) No information need be disclosed pursuant to this paragraph.
(c) Not applicable.
(d) Not applicable.
(e) Not applicable.
(f)
(1) The Fund’s Code of Ethics is attached hereto as Exhibit 12 A.
(2) Not applicable.
(3) Not applicable.
Item 3. Audit Committee Financial Expert.
The Fund’s Board of Trustees has determined that Joseph J. Kearns, an “independent” Trustee, is an “audit committee financial expert” serving on its audit committee. Under applicable securities laws, a person who is determined to be an audit committee financial expert will not be deemed an “expert” for any purpose, including without limitation for the purposes of Section 11 of the Securities Act of 1933, as a result of being designated or identified as an audit committee financial expert. The designation or identification of a person as an audit committee financial expert does not impose on such person any duties, obligations, or liabilities that are greater than the duties, obligations, and liabilities imposed on such person as a member of the audit committee and Board of Trustees in the absence of such designation or identification
Item 4. Principal Accountant Fees and Services.
(a)(b)(c)(d) and (g). Based on fees billed for the periods shown:
2008
| | Registrant | | Covered Entities(1) | |
Audit Fees | | $ | 35,000 | | N/A | |
| | | | | |
Non-Audit Fees | | | | | |
Audit-Related Fees | | $ | 325 | (2) | $ | 4,336,000 | (2) |
Tax Fees | | $ | 5,940 | (3) | $ | 762,000 | (4) |
All Other Fees | | $ | | | $ | | |
Total Non-Audit Fees | | $ | 6,265 | | $ | 5,098,000 | |
| | | | | | |
Total | | $ | 41,265 | | $ | 5,098,000 | |
2007
| | Registrant | | Covered Entities(1) | |
Audit Fees | | $ | 33,600 | | N/A | |
| | | | | |
Non-Audit Fees | | | | | |
Audit-Related Fees | | $ | — | (2) | $ | 4,836,000 | (2) |
Tax Fees | | $ | 5,780 | (3) | $ | 621,000 | (4) |
All Other Fees | | $ | | | $ | | (5) |
Total Non-Audit Fees | | $ | 5,780 | | $ | 5,457,000 | |
| | | | | | |
Total | | $ | 39,380 | | $ | 5,457,000 | |
N/A- Not applicable, as not required by Item 4.
(1) | | Covered Entities include the Adviser (excluding sub-advisors) and any entity controlling, controlled by or under common control with the Adviser that provides ongoing services to the Registrant. |
(2) | | Audit-Related Fees represent assurance and related services provided that are reasonably related to the performance of the audit of the financial statements of the Covered Entities’ and funds advised by the Adviser or its affiliates, specifically data verification and agreed-upon procedures related to asset securitizations and agreed-upon procedures engagements. |
(3) | | Tax Fees represent tax compliance, tax planning and tax advice services provided in connection with the preparation and review of the Registrant’s tax returns. |
(4) | | Tax Fees represent tax compliance, tax planning and tax advice services provided in connection with the review of Covered Entities’ tax returns. |
(5) | | All other fees represent project management for future business applications and improving business and operational processes. |
(e)(1) The audit committee’s pre-approval policies and procedures are as follows:
APPENDIX A
AUDIT COMMITTEE
AUDIT AND NON-AUDIT SERVICES
PRE-APPROVAL POLICY AND PROCEDURES
OF THE
MORGAN STANLEY RETAIL AND INSTITUTIONAL FUNDS
AS ADOPTED AND AMENDED JULY 23, 2004,(1)
1. Statement of Principles
The Audit Committee of the Board is required to review and, in its sole discretion, pre-approve all Covered Services to be provided by the Independent Auditors to the Fund and Covered Entities in order to assure that services performed by the Independent Auditors do not impair the auditor’s independence from the Fund.
The SEC has issued rules specifying the types of services that an independent auditor may not provide to its audit client, as well as the audit committee’s administration of the engagement of the independent auditor. The SEC’s rules establish two different approaches to pre-approving services, which the SEC considers to be equally valid. Proposed services either: may be pre-approved without consideration of specific case-by-case services by the Audit Committee (“general pre-approval”); or require the specific pre-approval of the Audit Committee or its delegate (“specific pre-approval”). The Audit Committee believes that the combination of these two approaches in this Policy will result in an effective and efficient procedure to pre-approve services performed by the Independent Auditors. As set forth in this Policy, unless a type of service has received general pre-approval, it will require specific pre-approval by the Audit Committee (or by any member of the Audit Committee to which pre-approval authority has been delegated) if it is to be provided by the Independent Auditors. Any proposed services exceeding pre-approved cost levels or budgeted amounts will also require specific pre-approval by the Audit Committee.
The appendices to this Policy describe the Audit, Audit-related, Tax and All Other services that have the general pre-approval of the Audit Committee. The term of any general pre-approval is 12 months from the date of pre-approval, unless the Audit Committee considers and provides a different period and states otherwise. The Audit Committee will annually review and pre-approve the services that may be provided by the Independent Auditors without obtaining specific pre-approval from the Audit Committee. The Audit Committee will add to or subtract from the list of general pre-approved services from time to time, based on subsequent determinations.
(1) | | This Audit Committee Audit and Non-Audit Services Pre-Approval Policy and Procedures (the “Policy”), adopted as of the date above, supersedes and replaces all prior versions that may have been adopted from time to time. |
The purpose of this Policy is to set forth the policy and procedures by which the Audit Committee intends to fulfill its responsibilities. It does not delegate the Audit Committee’s responsibilities to pre-approve services performed by the Independent Auditors to management.
The Fund’s Independent Auditors have reviewed this Policy and believes that implementation of the Policy will not adversely affect the Independent Auditors’ independence.
2. Delegation
As provided in the Act and the SEC’s rules, the Audit Committee may delegate either type of pre-approval authority to one or more of its members. The member to whom such authority is delegated must report, for informational purposes only, any pre-approval decisions to the Audit Committee at its next scheduled meeting.
3. Audit Services
The annual Audit services engagement terms and fees are subject to the specific pre-approval of the Audit Committee. Audit services include the annual financial statement audit and other procedures required to be performed by the Independent Auditors to be able to form an opinion on the Fund’s financial statements. These other procedures include information systems and procedural reviews and testing performed in order to understand and place reliance on the systems of internal control, and consultations relating to the audit. The Audit Committee will approve, if necessary, any changes in terms, conditions and fees resulting from changes in audit scope, Fund structure or other items.
In addition to the annual Audit services engagement approved by the Audit Committee, the Audit Committee may grant general pre-approval to other Audit services, which are those services that only the Independent Auditors reasonably can provide. Other Audit services may include statutory audits and services associated with SEC registration statements (on Forms N-1A, N-2, N-3, N-4, etc.), periodic reports and other documents filed with the SEC or other documents issued in connection with securities offerings.
The Audit Committee has pre-approved the Audit services in Appendix B.1. All other Audit services not listed in Appendix B.1 must be specifically pre-approved by the Audit Committee (or by any member of the Audit Committee to which pre-approval has been delegated).
4. Audit-related Services
Audit-related services are assurance and related services that are reasonably related to the performance of the audit or review of the Fund’s financial statements and, to the extent they are Covered Services, the Covered Entities or that are traditionally performed by the Independent Auditors. Because the Audit Committee believes that the provision of Audit-related services does not impair the independence of the auditor and is consistent with the SEC’s rules on auditor independence, the Audit Committee may grant general pre-approval to Audit-related services. Audit-related services include, among others, accounting consultations related to accounting, financial reporting or disclosure matters
not classified as “Audit services”; assistance with understanding and implementing new accounting and financial reporting guidance from rulemaking authorities; agreed-upon or expanded audit procedures related to accounting and/or billing records required to respond to or comply with financial, accounting or regulatory reporting matters; and assistance with internal control reporting requirements under Forms N-SAR and/or N-CSR.
The Audit Committee has pre-approved the Audit-related services in Appendix B.2. All other Audit-related services not listed in Appendix B.2 must be specifically pre-approved by the Audit Committee (or by any member of the Audit Committee to which pre-approval has been delegated).
5. Tax Services
The Audit Committee believes that the Independent Auditors can provide Tax services to the Fund and, to the extent they are Covered Services, the Covered Entities, such as tax compliance, tax planning and tax advice without impairing the auditor’s independence, and the SEC has stated that the Independent Auditors may provide such services.
Pursuant to the preceding paragraph, the Audit Committee has pre-approved the Tax Services in Appendix B.3. All Tax services in Appendix B.3 must be specifically pre-approved by the Audit Committee (or by any member of the Audit Committee to which pre-approval has been delegated).
6. All Other Services
The Audit Committee believes, based on the SEC’s rules prohibiting the Independent Auditors from providing specific non-audit services, that other types of non-audit services are permitted. Accordingly, the Audit Committee believes it may grant general pre-approval to those permissible non-audit services classified as All Other services that it believes are routine and recurring services, would not impair the independence of the auditor and are consistent with the SEC’s rules on auditor independence.
The Audit Committee has pre-approved the All Other services in Appendix B.4. Permissible All Other services not listed in Appendix B.4 must be specifically pre-approved by the Audit Committee (or by any member of the Audit Committee to which pre-approval has been delegated).
7. Pre-Approval Fee Levels or Budgeted Amounts
Pre-approval fee levels or budgeted amounts for all services to be provided by the Independent Auditors will be established annually by the Audit Committee. Any proposed services exceeding these levels or amounts will require specific pre-approval by the Audit Committee. The Audit Committee is mindful of the overall relationship of fees for audit and non-audit services in determining whether to pre-approve any such services.
8. Procedures
All requests or applications for services to be provided by the Independent Auditors that do not require specific approval by the Audit Committee will be submitted to the Fund’s Chief Financial Officer and must include a detailed description of the services to be
rendered. The Fund’s Chief Financial Officer will determine whether such services are included within the list of services that have received the general pre-approval of the Audit Committee. The Audit Committee will be informed on a timely basis of any such services rendered by the Independent Auditors. Requests or applications to provide services that require specific approval by the Audit Committee will be submitted to the Audit Committee by both the Independent Auditors and the Fund’s Chief Financial Officer, and must include a joint statement as to whether, in their view, the request or application is consistent with the SEC’s rules on auditor independence.
The Audit Committee has designated the Fund’s Chief Financial Officer to monitor the performance of all services provided by the Independent Auditors and to determine whether such services are in compliance with this Policy. The Fund’s Chief Financial Officer will report to the Audit Committee on a periodic basis on the results of its monitoring. Both the Fund’s Chief Financial Officer and management will immediately report to the chairman of the Audit Committee any breach of this Policy that comes to the attention of the Fund’s Chief Financial Officer or any member of management.
9. Additional Requirements
The Audit Committee has determined to take additional measures on an annual basis to meet its responsibility to oversee the work of the Independent Auditors and to assure the auditor’s independence from the Fund, such as reviewing a formal written statement from the Independent Auditors delineating all relationships between the Independent Auditors and the Fund, consistent with Independence Standards Board No. 1, and discussing with the Independent Auditors its methods and procedures for ensuring independence.
10. Covered Entities
Covered Entities include the Fund’s investment adviser(s) and any entity controlling, controlled by or under common control with the Fund’s investment adviser(s) that provides ongoing services to the Fund(s). Beginning with non-audit service contracts entered into on or after May 6, 2003, the Fund’s audit committee must pre-approve non-audit services provided not only to the Fund but also to the Covered Entities if the engagements relate directly to the operations and financial reporting of the Fund. This list of Covered Entities would include:
Morgan Stanley Retail Funds
Morgan Stanley Investment Advisors Inc.
Morgan Stanley & Co. Incorporated
Morgan Stanley DW Inc.
Morgan Stanley Investment Management Inc.
Morgan Stanley Investment Management Limited
Morgan Stanley Investment Management Private Limited
Morgan Stanley Asset & Investment Trust Management Co., Limited
Morgan Stanley Investment Management Company
Van Kampen Asset Management
Morgan Stanley Services Company, Inc.
Morgan Stanley Distributors Inc.
Morgan Stanley Trust FSB
Morgan Stanley Institutional Funds
Morgan Stanley Investment Management Inc.
Morgan Stanley Investment Advisors Inc.
Morgan Stanley Investment Management Limited
Morgan Stanley Investment Management Private Limited
Morgan Stanley Asset & Investment Trust Management Co., Limited
Morgan Stanley Investment Management Company
Morgan Stanley & Co. Incorporated
Morgan Stanley Distribution, Inc.
Morgan Stanley AIP GP LP
Morgan Stanley Alternative Investment Partners LP
(e)(2) Beginning with non-audit service contracts entered into on or after May 6, 2003, the audit committee also is required to pre-approve services to Covered Entities to the extent that the services are determined to have a direct impact on the operations or financial reporting of the Registrant. 100% of such services were pre-approved by the audit committee pursuant to the Audit Committee’s pre-approval policies and procedures (attached hereto).
(f) Not applicable.
(g) See table above.
(h) The audit committee of the Board of Trustees has considered whether the provision of services other than audit services performed by the auditors to the Registrant and Covered Entities is compatible with maintaining the auditors’ independence in performing audit services.
Item 5. Audit Committee of Listed Registrants.
(a) | | The Fund has a separately-designated standing audit committee established in accordance with Section 3(a)(58)(A) of the Exchange Act whose members are: Joseph Kearns, Michael Nugent and Allen Reed. |
(b) Not applicable.
Item 6. Schedule of Investments
(a) Refer to Item 1.
(b) Not applicable.
Item 7. Disclosure of Proxy Voting Policies and Procedures for Closed-End Management Investment Companies.
Applicable only to reports filed by closed-end funds.
Item 8. Portfolio Managers of Closed-End Management Investment Companies
Applicable only to reports filed by closed-end funds.
Item 9. Closed-End Fund Repurchases
Applicable only to reports filed by closed-end funds.
Item 10. Submission of Matters to a Vote of Security Holders
Not applicable.
Item 11. Controls and Procedures
(a) The Fund’s principal executive officer and principal financial officer have concluded that the Fund’s disclosure controls and procedures are sufficient to ensure that information required to be disclosed by the Fund in this Form N-CSR was recorded, processed, summarized and reported within the time periods specified in the Securities and Exchange Commission’s rules and forms, based upon such officers’ evaluation of these controls and procedures as of a date within 90 days of the filing date of the report.
(b) There were no changes in the registrant’s internal control over financial reporting that occurred during the second fiscal quarter of the period covered by this report that has materially affected, or is reasonably likely to materially affect, the registrant’s internal control over financial reporting.
Item 12. Exhibits
(a) The Code of Ethics for Principal Executive and Senior Financial Officers is attached hereto.
(b) A separate certification for each principal executive officer and principal financial officer of the registrant are attached hereto as part of EX-99.CERT.
SIGNATURES
Pursuant to the requirements of the Securities Exchange Act of 1934 and the Investment Company Act of 1940, the registrant has duly caused this report to be signed on its behalf by the undersigned, thereunto duly authorized.
Morgan Stanley Equally Weighted S&P 500 Fund
/s/ Ronald E. Robison | |
Ronald E. Robison |
Principal Executive Officer |
August 15, 2008 |
Pursuant to the requirements of the Securities Exchange Act of 1934 and the Investment Company Act of 1940, this report has been signed by the following persons on behalf of the registrant and in the capacities and on the dates indicated.
/s/ Ronald E. Robison | |
Ronald E. Robison |
Principal Executive Officer |
August 15, 2008 |
|
/s/ Francis Smith | |
Francis Smith |
Principal Financial Officer |
August 15, 2008 |