
| Class | Costs of a $10,000 investment | Costs paid as a percentage of a $10,000 investment |
| Class 1 | $11 | 0.22% |
| Fund net assets | $244,271,666 |
| Total number of portfolio holdings | 70 |
| Portfolio turnover for the reporting period | 46% |
| Long | |
| Credit Risk | 2.5 % |
| Equity Risk | 5.3 % |
| Foreign Exchange Risk | 3.7 % |
| Interest Rate Risk | 4.4 % |
| Short | |
| Equity Risk | 38.4 % |
| Foreign Exchange Risk | 3.0 % |
| Interest Rate Risk | 0.5 % |


| Class | Costs of a $10,000 investment | Costs paid as a percentage of a $10,000 investment |
| Class 2 | $ 24 | 0.47 % |
| Fund net assets | $ 244,271,666 |
| Total number of portfolio holdings | 70 |
| Portfolio turnover for the reporting period | 46% |
| Long | |
| Credit Risk | 2.5 % |
| Equity Risk | 5.3 % |
| Foreign Exchange Risk | 3.7 % |
| Interest Rate Risk | 4.4 % |
| Short | |
| Equity Risk | 38.4 % |
| Foreign Exchange Risk | 3.0 % |
| Interest Rate Risk | 0.5 % |
Item 2. Code of Ethics.
Not applicable.
Item 3. Audit Committee Financial Expert.
Not applicable.
Item 4. Principal Accountant Fees and Services.
Not applicable.
Item 5. Audit Committee of Listed Registrants.
Not applicable.
Item 6. Investments.
(a) The registrant’s “Schedule I – Investments in securities of unaffiliated issuers” (as set forth in 17 CFR 210.12-12) is included in Item 7 of this Form N-CSR.
(b) Not applicable.
Item 7. Financial Statements and Financial Highlights for Open-End Management Investment Companies.

Not FDIC or NCUA Insured | No Financial Institution Guarantee | May Lose Value |
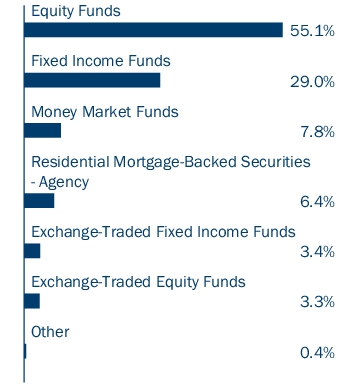
Equity Funds 55.1% | ||
Shares | Value ($) | |
International 16.2% | ||
Columbia Variable Portfolio – Overseas Core Fund, Class 1 Shares(a) | 1,372,620 | 17,995,042 |
Variable Portfolio – Partners International Core Equity Fund, Class 1 Shares(a) | 2,028,772 | 21,586,140 |
Total | 39,581,182 | |
U.S. Large Cap 34.9% | ||
Columbia Variable Portfolio – Disciplined Core Fund, Class 1 Shares(a),(b) | 154,005 | 16,042,711 |
Columbia Variable Portfolio – Select Large Cap Equity Fund, Class 1 Shares(a),(b) | 723,184 | 15,982,370 |
Variable Portfolio – Partners Core Equity Fund, Class 1 Shares(a),(b) | 1,216,493 | 53,099,933 |
Total | 85,125,014 | |
U.S. Small Cap 4.0% | ||
Variable Portfolio – Partners Small Cap Growth Fund, Class 1 Shares(a),(b) | 156,632 | 4,973,076 |
Variable Portfolio – Partners Small Cap Value Fund, Class 1 Shares(a),(b) | 133,643 | 4,831,173 |
Total | 9,804,249 | |
Total Equity Funds (Cost $92,521,511) | 134,510,445 | |
Exchange-Traded Equity Funds 3.3% | ||
U.S. Mid Cap 2.8% | ||
iShares Core S&P Mid-Cap ETF | 118,000 | 6,905,360 |
U.S. Mid Large Cap 0.5% | ||
iShares Russell 1000 Growth Index Fund | 3,000 | 1,093,530 |
Total Exchange-Traded Equity Funds (Cost $7,158,280) | 7,998,890 | |
Exchange-Traded Fixed Income Funds 3.4% | ||
Investment Grade 3.4% | ||
iShares Core U.S. Aggregate Bond ETF | 5,750 | 558,153 |
iShares iBoxx $ Investment Grade Corporate Bond ETF | 30,270 | 3,242,522 |
Vanguard Intermediate-Term Corporate Bond ETF | 51,450 | 4,112,399 |
Vanguard Total Bond Market ETF | 5,000 | 360,250 |
Total | 8,273,324 | |
Total Exchange-Traded Fixed Income Funds (Cost $8,143,644) | 8,273,324 | |
Fixed Income Funds 29.1% | ||
Shares | Value ($) | |
Investment Grade 29.1% | ||
Columbia Variable Portfolio – Intermediate Bond Fund, Class 1 Shares(a) | 4,005,763 | 34,249,276 |
Variable Portfolio – Partners Core Bond Fund, Class 1 Shares(a) | 3,774,754 | 36,728,350 |
Total | 70,977,626 | |
Total Fixed Income Funds (Cost $79,595,468) | 70,977,626 | |
Residential Mortgage-Backed Securities - Agency 6.4% | ||||
Issuer | Coupon Rate | Principal Amount ($) | Value ($) | |
Uniform Mortgage-Backed Security TBA(c) | ||||
07/18/2039- 07/15/2054 | 3.000% | 6,201,000 | 5,289,134 | |
07/18/2039- 07/15/2054 | 3.500% | 1,900,000 | 1,702,652 | |
07/18/2039- 07/15/2054 | 4.000% | 3,908,000 | 3,598,896 | |
07/15/2054 | 4.500% | 2,800,000 | 2,639,547 | |
07/15/2054 | 5.000% | 2,600,000 | 2,512,656 | |
Total Residential Mortgage-Backed Securities - Agency (Cost $15,803,907) | 15,742,885 | |||
Put Option Contracts Purchased 0.4% | ||||
Value ($) | ||||
(Cost $1,242,613) | 917,690 | |||
Money Market Funds 7.8% | ||
Shares | Value ($) | |
Columbia Short-Term Cash Fund, 5.547%(a),(d) | 19,182,361 | 19,176,606 |
Total Money Market Funds (Cost $19,172,785) | 19,176,606 | |
Total Investments in Securities (Cost: $223,638,208) | 257,597,466 | |
Other Assets & Liabilities, Net | (13,325,800 ) | |
Net Assets | 244,271,666 | |
Forward foreign currency exchange contracts | |||||
Currency to be sold | Currency to be purchased | Counterparty | Settlement date | Unrealized appreciation ($) | Unrealized depreciation ($) |
1,118,337 USD | 1,000,000 CHF | Barclays | 07/26/2024 | — | (1,986 ) |
217,089 USD | 200,000 EUR | Barclays | 07/26/2024 | — | (2,650 ) |
1,030,640 USD | 160,000,000 JPY | Barclays | 07/26/2024 | — | (32,414 ) |
500,000 EUR | 534,040 USD | Citi | 07/26/2024 | — | (2,059 ) |
500,000 GBP | 642,692 USD | Citi | 07/26/2024 | 10,549 | — |
566,617 USD | 6,000,000 SEK | Citi | 07/26/2024 | 173 | — |
1,000,000 GBP | 1,272,775 USD | Goldman Sachs International | 07/26/2024 | 8,491 | — |
583,798 USD | 800,000 CAD | Goldman Sachs International | 07/26/2024 | 1,308 | — |
258,286 USD | 40,000,000 JPY | Goldman Sachs International | 07/26/2024 | — | (8,730 ) |
777,400 USD | 1,250,000 NZD | Goldman Sachs International | 07/26/2024 | — | (16,015 ) |
1,250,000 AUD | 830,425 USD | HSBC | 07/26/2024 | — | (4,010 ) |
1,700,000 CHF | 1,889,687 USD | HSBC | 07/26/2024 | — | (8,109 ) |
1,277,275 USD | 1,000,000 GBP | Morgan Stanley | 07/26/2024 | — | (12,991 ) |
2,471,839 USD | 26,000,000 NOK | Morgan Stanley | 07/26/2024 | — | (35,139 ) |
200,000 EUR | 217,047 USD | UBS | 07/26/2024 | 2,607 | — |
7,000,000 NOK | 662,263 USD | UBS | 07/26/2024 | 6,228 | — |
837,650 USD | 1,250,000 AUD | UBS | 07/26/2024 | — | (3,215 ) |
1,250,000 NZD | 764,494 USD | Wells Fargo | 07/26/2024 | 3,109 | — |
6,000,000 SEK | 577,442 USD | Wells Fargo | 07/26/2024 | 10,654 | — |
Total | 43,119 | (127,318 ) | |||
Long futures contracts | ||||||
Description | Number of contracts | Expiration date | Trading currency | Notional amount | Value/Unrealized appreciation ($) | Value/Unrealized depreciation ($) |
IBEX 35 Index | 21 | 07/2024 | EUR | 2,283,960 | 406 | — |
MSCI Singapore Index | 1 | 07/2024 | SGD | 31,635 | 136 | — |
S&P 500 Index E-mini | 7 | 09/2024 | USD | 1,932,525 | 5,877 | — |
S&P 500 Index E-mini | 29 | 09/2024 | USD | 8,006,175 | — | (2,727 ) |
TOPIX Index | 3 | 09/2024 | JPY | 84,315,000 | 8,136 | — |
U.S. Long Bond | 10 | 09/2024 | USD | 1,183,125 | 12,870 | — |
U.S. Long Bond | 1 | 09/2024 | USD | 118,313 | — | (1,533 ) |
U.S. Treasury 2-Year Note | 22 | 09/2024 | USD | 4,492,813 | 11,820 | — |
U.S. Treasury 5-Year Note | 33 | 09/2024 | USD | 3,517,078 | 19,723 | — |
U.S. Treasury Ultra Bond | 10 | 09/2024 | USD | 1,253,438 | 14,198 | — |
U.S. Treasury Ultra Bond | 1 | 09/2024 | USD | 125,344 | — | (2,408 ) |
Total | 73,166 | (6,668 ) | ||||
Short futures contracts | ||||||
Description | Number of contracts | Expiration date | Trading currency | Notional amount | Value/Unrealized appreciation ($) | Value/Unrealized depreciation ($) |
DAX Index | (5) | 09/2024 | EUR | (2,300,375 ) | — | (22,273 ) |
Euro STOXX 50 Index | (2) | 09/2024 | EUR | (98,520 ) | 425 | — |
FTSE 100 Index | (10) | 09/2024 | GBP | (821,200 ) | — | (3,997 ) |
OMXS30 Index | (2) | 07/2024 | SEK | (515,600 ) | 49 | — |
Russell 2000 Index E-mini | (67) | 09/2024 | USD | (6,917,750 ) | — | (8,450 ) |
S&P 500 Index E-mini | (29) | 09/2024 | USD | (8,006,175 ) | 17,971 | — |
S&P 500 Index E-mini | (3) | 09/2024 | USD | (828,225 ) | — | (4,388 ) |
S&P/TSX 60 Index | (5) | 09/2024 | CAD | (1,310,500 ) | — | (9,343 ) |
SPI 200 Index | (10) | 09/2024 | AUD | (1,943,000 ) | — | (16,488 ) |
U.S. Treasury 10-Year Note | (11) | 09/2024 | USD | (1,209,828 ) | 5,150 | — |
Total | 23,595 | (64,939 ) | ||||
Put option contracts purchased | ||||||||
Description | Counterparty | Trading currency | Notional amount | Number of contracts | Exercise price/Rate | Expiration date | Cost ($) | Value ($) |
S&P 500 Index | Morgan Stanley | USD | 21,841,920 | 40 | 4,300.00 | 12/19/2025 | 336,501 | 328,200 |
S&P 500 Index | Morgan Stanley | USD | 18,019,584 | 33 | 4,200.00 | 12/19/2025 | 282,728 | 218,130 |
S&P 500 Index | Morgan Stanley | USD | 10,920,960 | 20 | 4,100.00 | 12/19/2025 | 223,331 | 133,100 |
S&P 500 Index | Morgan Stanley | USD | 11,467,008 | 21 | 4,000.00 | 12/19/2025 | 253,524 | 124,950 |
S&P 500 Index | Morgan Stanley | USD | 9,828,864 | 18 | 4,050.00 | 12/19/2025 | 146,529 | 113,310 |
Total | 1,242,613 | 917,690 | ||||||
Cleared credit default swap contracts - sell protection | ||||||||||||
Reference entity | Counterparty | Maturity date | Receive fixed rate (%) | Payment frequency | Implied credit spread (%)* | Notional currency | Notional amount | Value ($) | Upfront payments ($) | Upfront receipts ($) | Unrealized appreciation ($) | Unrealized depreciation ($) |
Markit CDX North America Investment Grade Index, Series 42 | Morgan Stanley | 06/20/2029 | 1.000 | Quarterly | 0.535 | USD | 6,000,000 | (413 ) | — | — | — | (413 ) |
(a) | As defined in the Investment Company Act of 1940, as amended, an affiliated company is one in which the Fund owns 5% or more of the company’s outstanding voting securities, or a company which is under common ownership or control with the Fund. The value of the holdings and transactions in these affiliated companies during the period ended June 30, 2024 are as follows: |
Affiliated issuers | Beginning of period($) | Purchases($) | Sales($) | Net change in unrealized appreciation (depreciation)($) | End of period($) | Capital gain distributions($) | Realized gain (loss)($) | Dividends — affiliated issuers ($) | End of period shares |
Columbia Short-Term Cash Fund, 5.547% | |||||||||
20,936,974 | 15,324,287 | (17,082,241 ) | (2,414 ) | 19,176,606 | — | 457 | 537,011 | 19,182,361 | |
Columbia Variable Portfolio – Disciplined Core Fund, Class 1 Shares | |||||||||
14,551,036 | 14,740 | (428,105 ) | 1,905,040 | 16,042,711 | — | 379,027 | — | 154,005 | |
Columbia Variable Portfolio – Intermediate Bond Fund, Class 1 Shares | |||||||||
33,909,426 | 530,092 | (52,206 ) | (138,036 ) | 34,249,276 | — | (13,382 ) | — | 4,005,763 | |
Columbia Variable Portfolio – Overseas Core Fund, Class 1 Shares | |||||||||
18,481,681 | 915,895 | (1,231,193 ) | (171,341 ) | 17,995,042 | — | (160,184 ) | 826,409 | 1,372,620 | |
Columbia Variable Portfolio – Select Large Cap Equity Fund, Class 1 Shares | |||||||||
14,420,722 | 6,567 | (566,198 ) | 2,121,279 | 15,982,370 | — | 190,570 | — | 723,184 | |
Variable Portfolio – Partners Core Bond Fund, Class 1 Shares | |||||||||
36,183,291 | 538,672 | — | 6,387 | 36,728,350 | — | — | — | 3,774,754 | |
Variable Portfolio – Partners Core Equity Fund, Class 1 Shares | |||||||||
48,309,589 | 19,360 | (2,398,645 ) | 7,169,629 | 53,099,933 | — | 804,510 | — | 1,216,493 | |
Variable Portfolio – Partners International Core Equity Fund, Class 1 Shares | |||||||||
20,303,869 | 524,633 | (124,861 ) | 882,499 | 21,586,140 | — | (21,803 ) | 271,362 | 2,028,772 | |
Variable Portfolio – Partners Small Cap Growth Fund, Class 1 Shares | |||||||||
7,588,032 | — | (2,912,762 ) | 297,806 | 4,973,076 | — | 275,433 | — | 156,632 | |
Variable Portfolio – Partners Small Cap Value Fund, Class 1 Shares | |||||||||
7,593,844 | 15,899 | (2,316,704 ) | (461,866 ) | 4,831,173 | — | 423,087 | — | 133,643 | |
Total | 222,278,464 | 11,608,983 | 224,664,677 | — | 1,877,715 | 1,634,782 | |||
(b) | Non-income producing investment. |
(c) | Represents a security purchased on a when-issued basis. |
(d) | The rate shown is the seven-day current annualized yield at June 30, 2024. |
TBA | To Be Announced |
AUD | Australian Dollar |
CAD | Canada Dollar |
CHF | Swiss Franc |
EUR | Euro |
GBP | British Pound |
JPY | Japanese Yen |
NOK | Norwegian Krone |
NZD | New Zealand Dollar |
SEK | Swedish Krona |
SGD | Singapore Dollar |
USD | US Dollar |
Level 1 ($) | Level 2 ($) | Level 3 ($) | Assets at NAV ($) | Total ($) | |
Investments in Securities | |||||
Equity Funds | — | — | — | 134,510,445 | 134,510,445 |
Exchange-Traded Equity Funds | 7,998,890 | — | — | — | 7,998,890 |
Exchange-Traded Fixed Income Funds | 8,273,324 | — | — | — | 8,273,324 |
Fixed Income Funds | — | — | — | 70,977,626 | 70,977,626 |
Residential Mortgage-Backed Securities - Agency | — | 15,742,885 | — | — | 15,742,885 |
Put Option Contracts Purchased | 917,690 | — | — | — | 917,690 |
Money Market Funds | 19,176,606 | — | — | — | 19,176,606 |
Total Investments in Securities | 36,366,510 | 15,742,885 | — | 205,488,071 | 257,597,466 |
Investments in Derivatives | |||||
Asset | |||||
Forward Foreign Currency Exchange Contracts | — | 43,119 | — | — | 43,119 |
Futures Contracts | 96,761 | — | — | — | 96,761 |
Liability | |||||
Forward Foreign Currency Exchange Contracts | — | (127,318 ) | — | — | (127,318 ) |
Futures Contracts | (71,607 ) | — | — | — | (71,607 ) |
Swap Contracts | — | (413 ) | — | — | (413 ) |
Total | 36,391,664 | 15,658,273 | — | 205,488,071 | 257,538,008 |
Assets | |
Investments in securities, at value | |
Unaffiliated issuers (cost $31,105,831) | $32,015,099 |
Affiliated issuers (cost $191,289,764) | 224,664,677 |
Option contracts purchased (cost $1,242,613) | 917,690 |
Cash | 6,086 |
Cash collateral held at broker for: | |
Option contracts purchased | 505,819 |
Margin deposits on: | |
Futures contracts | 1,989,937 |
Swap contracts | 146,030 |
Unrealized appreciation on forward foreign currency exchange contracts | 43,119 |
Receivable for: | |
Investments sold | 290,425 |
Investments sold on a delayed delivery basis | 455,964 |
Dividends | 82,430 |
Interest | 26,174 |
Variation margin for futures contracts | 53,463 |
Expense reimbursement due from Investment Manager | 129 |
Prepaid expenses | 939 |
Deferred compensation of board members | 29,776 |
Total assets | 261,227,757 |
Liabilities | |
Unrealized depreciation on forward foreign currency exchange contracts | 127,318 |
Payable for: | |
Investments purchased on a delayed delivery basis | 16,282,245 |
Capital shares redeemed | 348,837 |
Variation margin for futures contracts | 105,896 |
Variation margin for swap contracts | 1,049 |
Management services fees | 880 |
Distribution and/or service fees | 1,677 |
Service fees | 11,192 |
Compensation of chief compliance officer | 22 |
Compensation of board members | 1,570 |
Other expenses | 25,123 |
Deferred compensation of board members | 50,282 |
Total liabilities | 16,956,091 |
Net assets applicable to outstanding capital stock | $244,271,666 |
Represented by | |
Trust capital | $244,271,666 |
Total - representing net assets applicable to outstanding capital stock | $244,271,666 |
Class 1 | |
Net assets | $3,236 |
Shares outstanding | 239 |
Net asset value per share(a) | $13.56 |
Class 2 | |
Net assets | $244,268,430 |
Shares outstanding | 18,247,626 |
Net asset value per share | $13.39 |
(a) | Net asset value per share rounds to this amount due to fractional shares outstanding. |
Net investment income | |
Income: | |
Dividends — unaffiliated issuers | $193,733 |
Dividends — affiliated issuers | 1,634,782 |
Interest | 33,061 |
Total income | 1,861,576 |
Expenses: | |
Management services fees | 162,136 |
Distribution and/or service fees | |
Class 2 | 301,797 |
Service fees | 72,491 |
Custodian fees | 14,702 |
Printing and postage fees | 7,601 |
Accounting services fees | 15,328 |
Legal fees | 6,864 |
Compensation of chief compliance officer | 22 |
Compensation of board members | 6,759 |
Deferred compensation of board members | 3,527 |
Other | 4,003 |
Total expenses | 595,230 |
Fees waived or expenses reimbursed by Investment Manager and its affiliates | (23,297 ) |
Total net expenses | 571,933 |
Net investment income | 1,289,643 |
Realized and unrealized gain (loss) — net | |
Net realized gain (loss) on: | |
Investments — unaffiliated issuers | (23,577 ) |
Investments — affiliated issuers | 1,877,715 |
Foreign currency translations | (937 ) |
Forward foreign currency exchange contracts | 26,910 |
Futures contracts | (146,747 ) |
Option contracts purchased | (816,186 ) |
Option contracts written | 72,473 |
Swap contracts | 73,453 |
Net realized gain | 1,063,104 |
Net change in unrealized appreciation (depreciation) on: | |
Investments — unaffiliated issuers | (186,168 ) |
Investments — affiliated issuers | 11,608,983 |
Forward foreign currency exchange contracts | (102,286 ) |
Futures contracts | 394,024 |
Option contracts purchased | (182,161 ) |
Option contracts written | (5,158 ) |
Swap contracts | (32,859 ) |
Net change in unrealized appreciation (depreciation) | 11,494,375 |
Net realized and unrealized gain | 12,557,479 |
Net increase in net assets resulting from operations | $13,847,122 |
Six Months Ended June 30, 2024 (Unaudited) | Year Ended December 31, 2023 | |
Operations | ||
Net investment income | $1,289,643 | $2,794,119 |
Net realized gain (loss) | 1,063,104 | (3,309,253 ) |
Net change in unrealized appreciation (depreciation) | 11,494,375 | 27,322,235 |
Net increase in net assets resulting from operations | 13,847,122 | 26,807,101 |
Decrease in net assets from capital stock activity | (11,724,672 ) | (3,237,795 ) |
Total increase in net assets | 2,122,450 | 23,569,306 |
Net assets at beginning of period | 242,149,216 | 218,579,910 |
Net assets at end of period | $244,271,666 | $242,149,216 |
Six Months Ended | Year Ended | |||
June 30, 2024 (Unaudited) | December 31, 2023 | |||
Shares | Dollars ($) | Shares | Dollars ($) | |
Capital stock activity | ||||
Class 2 | ||||
Shares sold | 139,356 | 1,818,800 | 1,133,007 | 13,355,538 |
Shares redeemed | (1,044,454 ) | (13,543,472 ) | (1,398,035 ) | (16,593,333 ) |
Net decrease | (905,098 ) | (11,724,672 ) | (265,028 ) | (3,237,795 ) |
Total net decrease | (905,098 ) | (11,724,672 ) | (265,028 ) | (3,237,795 ) |
Net asset value, beginning of period | Net investment income | Net realized and unrealized gain (loss) | Total from investment operations | |
Class 1 | ||||
Six Months Ended 6/30/2024 (Unaudited) | $12.79 | 0.09 | 0.68 | 0.77 |
Year Ended 12/31/2023 | $11.36 | 0.18 | 1.25 | 1.43 |
Year Ended 12/31/2022 | $13.73 | 0.13 | (2.50 ) | (2.37 ) |
Year Ended 12/31/2021 | $12.37 | 0.12 | 1.24 | 1.36 |
Year Ended 12/31/2020 | $11.44 | 0.09 | 0.84 | 0.93 |
Year Ended 12/31/2019(d) | $10.48 | 0.15 | 0.81 | 0.96 |
Class 2 | ||||
Six Months Ended 6/30/2024 (Unaudited) | $12.64 | 0.07 | 0.68 | 0.75 |
Year Ended 12/31/2023 | $11.26 | 0.14 | 1.24 | 1.38 |
Year Ended 12/31/2022 | $13.63 | 0.09 | (2.46 ) | (2.37 ) |
Year Ended 12/31/2021 | $12.31 | 0.08 | 1.24 | 1.32 |
Year Ended 12/31/2020 | $11.42 | 0.06 | 0.83 | 0.89 |
Year Ended 12/31/2019 | $9.84 | 0.12 | 1.46 | 1.58 |
Notes to Financial Highlights | |
(a) | In addition to the fees and expenses that the Fund bears directly, the Fund indirectly bears a pro rata share of the fees and expenses of any other funds in which it invests. Such indirect expenses are not included in the Fund’s reported expense ratios. |
(b) | Total net expenses include the impact of certain fee waivers/expense reimbursements made by the Investment Manager and certain of its affiliates, if applicable. |
(c) | Ratios include interest on collateral expense. For the periods indicated below, if interest on collateral expense had been excluded, expenses would have been lower by: |
Class | 12/31/2022 | 12/31/2021 | 12/31/2020 |
Class 1 | less than 0.01% | 0.01% | 0.01% |
Class 2 | less than 0.01% | 0.01% | 0.01% |
(d) | Class 1 shares commenced operations on February 20, 2019. Per share data and total return reflect activity from that date. |
Net asset value, end of period | Total return | Total gross expense ratio to average net assets(a) | Total net expense ratio to average net assets(a),(b) | Net investment income ratio to average net assets | Portfolio turnover | Net assets, end of period (000’s) | |
Class 1 | |||||||
Six Months Ended 6/30/2024 (Unaudited) | $13.56 | 6.02% | 0.24% | 0.22% | 1.35% | 46% | $3 |
Year Ended 12/31/2023 | $12.79 | 12.59% | 0.24% | 0.23% | 1.48% | 110% | $3 |
Year Ended 12/31/2022 | $11.36 | (17.26% ) | 0.27% (c) | 0.25% (c) | 1.06% | 113% | $3 |
Year Ended 12/31/2021 | $13.73 | 10.99% | 0.25% (c) | 0.25% (c) | 0.88% | 116% | $3 |
Year Ended 12/31/2020 | $12.37 | 8.13% | 0.25% (c) | 0.25% (c) | 0.75% | 89% | $3 |
Year Ended 12/31/2019 (d) | $11.44 | 9.16% | 0.25% | 0.25% | 1.57% | 37% | $3 |
Class 2 | |||||||
Six Months Ended 6/30/2024 (Unaudited) | $13.39 | 5.93% | 0.49% | 0.47% | 1.07% | 46% | $244,268 |
Year Ended 12/31/2023 | $12.64 | 12.26% | 0.50% | 0.48% | 1.21% | 110% | $242,146 |
Year Ended 12/31/2022 | $11.26 | (17.39% ) | 0.52% (c) | 0.50% (c) | 0.78% | 113% | $218,577 |
Year Ended 12/31/2021 | $13.63 | 10.72% | 0.50% (c) | 0.50% (c) | 0.63% | 116% | $277,708 |
Year Ended 12/31/2020 | $12.31 | 7.79% | 0.50% (c) | 0.50% (c) | 0.49% | 89% | $230,561 |
Year Ended 12/31/2019 | $11.42 | 16.06% | 0.51% | 0.51% | 1.12% | 37% | $186,750 |
Asset derivatives | ||
Risk exposure category | Statement of assets and liabilities location | Fair value ($) |
Equity risk | Component of trust capital — unrealized appreciation on futures contracts | 33,000 * |
Equity risk | Investments, at value — Option contracts purchased | 917,690 |
Foreign exchange risk | Unrealized appreciation on forward foreign currency exchange contracts | 43,119 |
Interest rate risk | Component of trust capital — unrealized appreciation on futures contracts | 63,761 * |
Total | 1,057,570 |
Liability derivatives | ||
Risk exposure category | Statement of assets and liabilities location | Fair value ($) |
Credit risk | Component of trust capital - unrealized depreciation on swap contracts | 413 * |
Equity risk | Component of trust capital - unrealized depreciation on futures contracts | 67,666 * |
Foreign exchange risk | Unrealized depreciation on forward foreign currency exchange contracts | 127,318 |
Interest rate risk | Component of trust capital - unrealized depreciation on futures contracts | 3,941 * |
Total | 199,338 |
* | Includes cumulative appreciation (depreciation) as reported in the tables following the Portfolio of Investments. Only the current day’s variation margin for futures and centrally cleared swaps, if any, is reported in receivables or payables in the Statement of Assets and Liabilities. |
Amount of realized gain (loss) on derivatives recognized in income | ||||||
Risk exposure category | Forward foreign currency exchange contracts ($) | Futures contracts ($) | Option contracts purchased ($) | Option contracts written ($) | Swap contracts ($) | Total ($) |
Credit risk | — | — | — | — | 73,453 | 73,453 |
Equity risk | — | (135,574 ) | (816,186 ) | 72,473 | — | (879,287 ) |
Foreign exchange risk | 26,910 | — | — | — | — | 26,910 |
Interest rate risk | — | (11,173 ) | — | — | — | (11,173 ) |
Total | 26,910 | (146,747 ) | (816,186 ) | 72,473 | 73,453 | (790,097 ) |
Change in unrealized appreciation (depreciation) on derivatives recognized in income | ||||||
Risk exposure category | Forward foreign currency exchange contracts ($) | Futures contracts ($) | Option contracts purchased ($) | Option contracts written ($) | Swap contracts ($) | Total ($) |
Credit risk | — | — | — | — | (32,859 ) | (32,859 ) |
Equity risk | — | 702,917 | (182,161 ) | (5,158 ) | — | 515,598 |
Foreign exchange risk | (102,286 ) | — | — | — | — | (102,286 ) |
Interest rate risk | — | (308,893 ) | — | — | — | (308,893 ) |
Total | (102,286 ) | 394,024 | (182,161 ) | (5,158 ) | (32,859 ) | 71,560 |
Derivative instrument | Average notional amounts ($) |
Futures contracts — long | 17,993,158 |
Futures contracts — short | 16,738,672 |
Credit default swap contracts — sell protection | 6,000,000 |
Derivative instrument | Average value ($) |
Option contracts purchased | 1,140,019 |
Option contracts written | (7,569 ) |
Derivative instrument | Average unrealized appreciation ($) | Average unrealized depreciation ($) |
Forward foreign currency exchange contracts | 64,428 | (71,865 ) |
Barclays ($) | Citi ($) | Goldman Sachs International ($) | HSBC ($) | Morgan Stanley ($)(a) | Morgan Stanley ($)(a) | Morgan Stanley ($)(a) | UBS ($) | Wells Fargo ($) | Total ($) | |
Assets | ||||||||||
Forward foreign currency exchange contracts | - | 10,722 | 9,799 | - | - | - | - | 8,835 | 13,763 | 43,119 |
Put option contracts purchased | - | - | - | - | 917,690 | - | - | - | - | 917,690 |
Total assets | - | 10,722 | 9,799 | - | 917,690 | - | - | 8,835 | 13,763 | 960,809 |
Liabilities | ||||||||||
Centrally cleared credit default swap contracts (b) | - | - | - | - | - | - | 1,049 | - | - | 1,049 |
Forward foreign currency exchange contracts | 37,050 | 2,059 | 24,745 | 12,119 | - | 48,130 | - | 3,215 | - | 127,318 |
Total liabilities | 37,050 | 2,059 | 24,745 | 12,119 | - | 48,130 | 1,049 | 3,215 | - | 128,367 |
Total financial and derivative net assets | (37,050 ) | 8,663 | (14,946 ) | (12,119 ) | 917,690 | (48,130 ) | (1,049 ) | 5,620 | 13,763 | 832,442 |
Total collateral received (pledged) (c) | - | - | - | - | - | - | (1,049 ) | - | - | (1,049 ) |
Net amount (d) | (37,050 ) | 8,663 | (14,946 ) | (12,119 ) | 917,690 | (48,130 ) | - | 5,620 | 13,763 | 833,491 |
(a) | Exposure can only be netted across transactions governed under the same master agreement with the same legal entity. |
(b) | Centrally cleared swaps are included within payable/receivable for variation margin in the Statement of Assets and Liabilities. |
(c) | In some instances, the actual collateral received and/or pledged may be more than the amount shown due to overcollateralization. |
(d) | Represents the net amount due from/(to) counterparties in the event of default. |
May 1, 2024 through April 30, 2025 (%) | Prior to May 1, 2024 (%) | |
Class 1 | 0.77 | 0.78 |
Class 2 | 1.02 | 1.03 |

Item 8. Changes in and Disagreements with Accountants for Open-End Management Investment Companies.
Not applicable.
Item 9. Proxy Disclosures for Open-End Management Investment Companies.
Not applicable.
Item 10. Remuneration Paid to Directors, Officers, and Others of Open-End Management Investment Companies.
Remuneration Paid to Directors, Officers, and Others of Open-End Management Investment Companies is included in Item 7 of this Form N-CSR.
Item 11. Statement Regarding Basis for Approval of Investment Advisory Contract.
Statement regarding basis for approval of Investment Advisory Contract is included in Item 7 of this Form N-CSR.
Item 12. Disclosure of Proxy Voting Policies and Procedures for Closed-End Management Investment Companies.
Not applicable.
Item 13. Portfolio Managers of Closed-End Management Investment Companies.
Not applicable.
Item 14. Purchases of Equity Securities by Closed-End Management Investment Company and Affiliated Purchasers.
Not applicable.
Item 15. Submission of Matters to a Vote of Security Holders.
There were no material changes to the procedures by which shareholders may recommend nominees to the registrant’s board of directors implemented since the registrant last provided disclosure as to such procedures in response to the requirements of Item 407(c)(2)(iv) of Regulation S-K or Item 15 of Form N-CSR.
Item 16. Controls and Procedures.
(a) The registrant’s principal executive officer and principal financial officer, based on their evaluation of the registrant’s disclosure controls and procedures as of a date within 90 days of the filing of this report, have concluded that such controls and procedures are adequately designed to ensure that information required to be disclosed by the registrant in Form N-CSR is accumulated and communicated to the registrant’s management, including the principal executive officer and principal financial officer, or persons performing similar functions, as appropriate to allow timely decisions regarding required disclosure.
(b) There was no change in the registrant’s internal control over financial reporting that occurred during the period covered by this report that has materially affected, or is reasonably likely to materially affect, the registrant’s internal control over financial reporting.
Item 17. Disclosure of Securities Lending Activities for Closed-End Management Investment Companies.
Not applicable.
Item 18. Recovery of Erroneously Awarded Compensation.
Not applicable.
Item 19. Exhibits.
(a)(1) Not applicable.
SIGNATURES
Pursuant to the requirements of the Securities Exchange Act of 1934 and the Investment Company Act of 1940, the registrant has duly caused this report to be signed on its behalf by the undersigned, thereunto duly authorized.
| (registrant) | Columbia Funds Variable Insurance Trust |
| By (Signature and Title) | /s/ Daniel J. Beckman |
| Daniel J. Beckman, President and Principal Executive Officer | |
| Date | August 22, 2024 |
Pursuant to the requirements of the Securities Exchange Act of 1934 and the Investment Company Act of 1940, this report has been signed below by the following persons on behalf of the registrant and in the capacities and on the dates indicated.
| By (Signature and Title) | /s/ Daniel J. Beckman |
| Daniel J. Beckman, President and Principal Executive Officer | |
| Date | August 22, 2024 |
| By (Signature and Title) | /s/ Michael G. Clarke |
| Michael G. Clarke, Chief Financial Officer, | |
| Principal Financial Officer and Senior Vice President | |
| Date | August 22, 2024 |
| By (Signature and Title) | /s/ Charles H. Chiesa |
| Charles H. Chiesa, Treasurer, Chief Accounting | |
| Officer and Principal Financial Officer | |
| Date | August 22, 2024 |