UNITED STATES
SECURITIES AND EXCHANGE COMMISSION
Washington, D.C. 20549
FORM N-CSR
CERTIFIED SHAREHOLDER REPORT OF REGISTERED
MANAGEMENT INVESTMENT COMPANIES
Investment Company Act file number | 811-05199 | |||||||
| ||||||||
Columbia Funds Variable Insurance Trust | ||||||||
(Exact name of registrant as specified in charter) | ||||||||
| ||||||||
225 Franklin Street, Boston, Massachusetts |
| 02110 | ||||||
(Address of principal executive offices) |
| (Zip code) | ||||||
| ||||||||
Ryan Larrenaga c/o Columbia Management Investment Advisers, LLC 225 Franklin Street Boston, MA 02110 | ||||||||
(Name and address of agent for service) | ||||||||
| ||||||||
Registrant’s telephone number, including area code: | (800) 345-6611 |
| ||||||
| ||||||||
Date of fiscal year end: | December 31 |
| ||||||
| ||||||||
Date of reporting period: | December 31, 2016 |
| ||||||
Form N-CSR is to be used by management investment companies to file reports with the Commission not later than 10 days after the transmission to stockholders of any report that is required to be transmitted to stockholders under Rule 30e-1 under the Investment Company Act of 1940 (17 CFR 270.30e-1). The Commission may use the information provided on Form N-CSR in its regulatory, disclosure review, inspection, and policymaking roles.
A registrant is required to disclose the information specified by Form N-CSR, and the Commission will make this information public. A registrant is not required to respond to the collection of information contained in Form N-CSR unless the Form displays a currently valid Office of Management and Budget (“OMB”) control number. Please direct comments concerning the accuracy of the information collection burden estimate and any suggestions for reducing the burden to Secretary, Securities and Exchange Commission, 450 Fifth Street, NW, Washington, DC 20549-0609. The OMB has reviewed this collection of information under the clearance requirements of 44 U.S.C. § 3507.
Item 1. Reports to Stockholders.

ANNUAL REPORT
December 31, 2016

COLUMBIA VARIABLE PORTFOLIO — LONG GOVERNMENT/CREDIT BOND FUND
Please remember that you may not buy (nor will you own) shares of the Fund directly. The Fund is available through variable annuity contracts and variable life insurance policies offered by the separate accounts of participating insurance companies as well as qualified pension and retirement plans. Please contact your financial advisor or insurance representative for more information.

COLUMBIA VARIABLE PORTFOLIO — LONG GOVERNMENT/CREDIT BOND FUND
TABLE OF CONTENTS
Performance Overview | 2 | ||||||
Manager Discussion of Fund Performance | 4 | ||||||
Understanding Your Fund's Expenses | 6 | ||||||
Portfolio of Investments | 7 | ||||||
Statement of Assets and Liabilities | 17 | ||||||
Statement of Operations | 19 | ||||||
Statement of Changes in Net Assets | 20 | ||||||
Financial Highlights | 22 | ||||||
Notes to Financial Statements | 24 | ||||||
Report of Independent Registered Public Accounting Firm | 35 | ||||||
Trustees and Officers | 36 | ||||||
Important Information About This Report | 41 | ||||||
The views expressed in this report reflect the current views of the respective parties. These views are not guarantees of future performance and involve certain risks, uncertainties and assumptions that are difficult to predict, so actual outcomes and results may differ significantly from the views expressed. These views are subject to change at any time based upon economic, market or other conditions and the respective parties disclaim any responsibility to update such views. These views may not be relied on as investment advice and, because investment decisions for a Columbia fund are based on numerous factors, may not be relied on as an indication of trading intent on behalf of any particular Columbia fund. References to specific securities should not be construed as a recommendation or investment advice.
Annual Report 2016
COLUMBIA VARIABLE PORTFOLIO — LONG GOVERNMENT/CREDIT BOND FUND
PERFORMANCE OVERVIEW
Performance Summary
n Columbia Variable Portfolio — Long Government/Credit Bond Fund (the Fund) Class 2 shares returned 2.78% for the 12-month period that ended December 31, 2016.
n The Fund's benchmark, the Bloomberg Barclays U.S. Long Government/Credit Bond Index, returned 6.67% for the same time period.
n The Fund's overweight exposure to investment-grade corporate bonds and corresponding underweight to U.S. Treasuries added to performance relative to the benchmark, as credit spreads narrowed for the 12-month period.
Average Annual Total Returns (%) (for period ended December 31, 2016)
Inception | 1 Year | Life | |||||||||||||
Class 1 | 04/30/13 | 3.02 | 1.18 | ||||||||||||
Class 2 | 04/30/13 | 2.78 | 0.95 | ||||||||||||
Bloomberg Barclays U.S. Long Government/Credit Bond Index | 6.67 | 2.67 | |||||||||||||
Performance data quoted represents past performance and current performance may be lower or higher. Past performance is no guarantee of future results. The investment return and principal value will fluctuate so that shares, when redeemed, may be worth more or less than the original cost. For current month-end performance information, please contact your financial advisor or insurance representative.
Performance results reflect the effect of any fee waivers or reimbursements of fund expenses by Columbia Management Investment Advisers, LLC and/or any of its affiliates. Absent these fee waivers or expense reimbursement arrangements, performance results would have been lower.
Investment earnings, if any, are tax-deferred until distributed to shareholders, at which time taxes may become due. Total return performance includes changes in share price and assumes reinvestment of dividends and capital gains, if any. Performance results reflect the effect of all fund expenses, but do not include any fees and expenses imposed under your variable annuity contract and/or variable life insurance policy or qualified pension or retirement plan. If performance results included the effect of these additional charges, they would be lower.
The Fund's performance prior to May 2016 reflects returns achieved by the Investment Manager pursuant to different principal investment strategies. If the Fund's current strategies had been in place for the prior periods, results shown may have been different.
Effective May 1, 2016, the Fund compares its performance to that of the Bloomberg Barclays U.S. Long Government/Credit Bond Index (the New Index). Prior to this date, the Fund compared its performance to that of the Bloomberg Barclays U.S. Government/Credit Bond Index (effective July 1, 2015.) The Fund's investment manager believes that the New Index provides a more appropriate basis for comparing the Fund's performance.
The Bloomberg Barclays U.S. Long Government/Credit Bond Index tracks the performance of U.S. government and corporate bonds rated investment grade or better, with maturities of at least ten years.
Indices are not available for investment, are not professionally managed and do not reflect sales charges, fees, brokerage commissions, taxes or other expenses of investing. Securities in the Fund may not match those in an index.
Annual Report 2016
2
COLUMBIA VARIABLE PORTFOLIO — LONG GOVERNMENT/CREDIT BOND FUND
PERFORMANCE OVERVIEW (continued)
Performance of a Hypothetical $10,000 Investment (April 30, 2013 – December 31, 2016)

The chart above shows the change in value of a hypothetical $10,000 investment in Class 2 shares of Columbia Variable Portfolio — Long Government/Credit Bond Fund during the stated time period, and does not reflect the deduction of taxes, if any, that a shareholder may pay on Fund distributions or on the redemption of Fund shares. The returns also do not reflect fees and expenses imposed under your variable annuity contract and/or variable life insurance policy or qualified pension or retirement plan, if any.
Annual Report 2016
3
COLUMBIA VARIABLE PORTFOLIO — LONG GOVERNMENT/CREDIT BOND FUND
MANAGER DISCUSSION OF FUND PERFORMANCE
Portfolio Management
Carl Pappo, CFA
Jason Callan
Stephen Sheehan, CFA*
*Effective December 1, 2016, Mr. Sheehan was named a Portfolio Manager of the Fund.
| Portfolio Breakdown (%) (at December 31, 2016) | |||||||
| Asset-Backed Securities — Agency | 0.4 | ||||||
| Commercial Mortgage-Backed Securities — Non-Agency | 3.0 | ||||||
Corporate Bonds & Notes | 68.5 | ||||||
| Foreign Government Obligations | 3.8 | ||||||
Money Market Funds | 0.0 | (a) | |||||
Municipal Bonds | 4.7 | ||||||
Preferred Debt | 0.2 | ||||||
| U.S. Government & Agency Obligations | 3.3 | ||||||
U.S. Treasury Obligations | 16.1 | ||||||
Total | 100.0 | ||||||
Percentages indicated are based upon total investments. The Fund's portfolio composition is subject to change.
(a) Rounds to zero.
| Quality Breakdown (%) (at December 31, 2016) | |||||||
AAA rating | 25.9 | ||||||
AA rating | 7.5 | ||||||
A rating | 22.0 | ||||||
BBB rating | 42.4 | ||||||
BB rating | 1.7 | ||||||
B rating | 0.5 | ||||||
Total | 100.0 | ||||||
Percentages indicated are based upon total fixed income investments (excluding Money Market Funds).
At December 31, 2016, approximately 98.9% of the Fund's shares were owned in the aggregate by affiliated funds-of-funds managed by Columbia Management Investment Advisers, LLC (the Investment Manager). As a result of asset allocation decisions by the Investment Manager, it is possible that the Fund may experience relatively large purchases or redemptions from affiliated funds-of-funds. The Investment Manager seeks to minimize the impact of these transactions by structuring them over a reasonable period of time. The Fund may experience increased expenses as it buys and sells securities as a result of purchases or redemptions by affiliated funds-of-funds.
Columbia Variable Portfolio — Long Government/Credit Bond Fund (the Fund) Class 2 shares returned 2.78% for the 12-month period that ended December 31, 2016. The Fund's benchmark, the Bloomberg Barclays U.S. Long Government/Credit Bond Index, returned 6.67% during the same time period. Prior to May 1, 2016, the Fund compared its performance to that of the Bloomberg Barclays U.S. Government/Credit Bond Index. The Fund's overweight exposure to investment-grade corporate bonds and corresponding underweight to U.S. Treasuries added to performance relative to the benchmark, as credit spreads narrowed for the 12-month period.
Interest Rates Move Higher on U.S. Election Results
On the heels of the Federal Reserve's (the Fed) initial 25 basis point rate hike in December of 2015, markets were prepared entering 2016 for a series of additional, modest rate increases to be enacted at upcoming Fed meetings. However, these expectations were upturned at the outset of 2016 on a flaring up of concerns around slowing growth in China. Risk aversion was further heightened on renewed weakness in energy prices. Credit spreads widened and U.S. Treasury yields consistently trended lower well into February.
Beginning around mid-February, credit-sensitive assets embarked on a period of outperformance, supported by a more subdued outlook for Fed rate hikes and stepped-up efforts by central banks overseas to stimulate growth. A rebound in oil prices off their January lows also helped bolster sentiment.
In late June, markets were caught off guard by the results of a U.K. referendum which resulted in a vote to leave the European Union. The uncertainty around the fallout from a possible "Brexit" led to an investor flight to safety and pushed U.S. Treasury yields down to historically low levels. While wavering in the days following the Brexit vote, credit-sensitive areas of the market quickly stabilized against a backdrop of supportive central banks and continued strengthening for oil and other commodities.
Returns for the broad U.S. fixed-income market would turn negative in the wake of the November 8th U.S. elections. After declining for most of 2016, Treasury yields spiked to finish the full year modestly higher, as investors appeared to anticipate a pick-up in growth and inflation with the Republicans in control of the White House and both houses of Congress. Economically sensitive segments of the bond market held up better post-election than their more interest rate-sensitive, higher quality counterparts, as credit spreads tightened.
Annual Report 2016
4
COLUMBIA VARIABLE PORTFOLIO — LONG GOVERNMENT/CREDIT BOND FUND
MANAGER DISCUSSION OF FUND PERFORMANCE (continued)
Fund Performance Aided by Security Selection and Credit Exposure
In addition to a strong focus on individual security selection, the Fund actively manages its exposures to various segments of the U.S. fixed-income market, including U.S. Treasury and government agency issues, corporate bonds, and structured assets such as residential mortgage-backed securities (MBS), commercial mortgage-backed securities (CMBS) and asset-backed securities (ABS).
The Fund's overweight exposure to investment-grade corporate bonds and corresponding underweight to U.S. Treasuries added to performance relative to the benchmark, as credit spreads narrowed for the 12-month period. In addition, selection within investment-grade corporate bonds contributed positively to results for the period. In particular, the Fund moved to an overweight in energy-related issues as the sector cheapened in early 2016, and was well-positioned as the price of oil subsequently rebounded. Conversely, an underweight to metals and mining issues acted as a constraint on performance given the rebound in commodities broadly. Within investment-grade credit, we favored financials on the basis of the strengthened capital and liquidity requirements imposed on the sector in the wake of most recent financial crisis. Performance within financials benefited from an out-of-benchmark allocation to preferred equites viewed as "hybrid" instruments with features of both bonds and stocks.
The Fund's positioning along the yield curve and stance with respect to overall portfolio duration and corresponding interest rate sensitivity were essentially neutral factors in results for the period.
Derivative Positions
The Fund used Treasury futures contracts during the annual period to manage duration as well as affect curve positioning with a steepening bias. Also, credit derivative indices were used to manage overall credit risk, with a bias towards reducing risk and offset long cash positioning. On a stand-alone basis, the use of these derivatives had a negative impact on Fund performance during the period.
At Period's End
At the end of the reporting period, the Fund maintained an overweight stance with respect to credit exposure, along with a corresponding underweight to U.S. Treasuries versus the benchmark. Within corporate credit, we viewed the banking segment as displaying the best fundamentals, and accordingly were overweight there. Within structured assets, we trimmed the Fund's exposure to higher quality CMBS on valuation concerns.
Bond ratings apply to the underlying holdings of the Fund and not the Fund itself and are divided into categories ranging from highest to lowest credit quality, determined by using the middle rating of Moody's, S&P and Fitch, after dropping the highest and lowest available ratings. When ratings are available from only two rating agencies, the lower rating is used. When a rating is available from only one rating agency, that rating is used. When a bond is not rated by any rating agency, it is designated as "Not rated." Credit quality ratings assigned by a rating agency are subjective opinions, not statements of fact, and are subject to change, including daily. The ratings assigned by credit rating agencies are but one of the considerations that the Investment Manager and/or Fund's subadviser incorporates into its credit analysis process, along with such other issuer-specific factors as cash flows, capital structure and leverage ratios, ability to de-leverage (repay) through free cash flow, quality of management, market positioning and access to capital, as well as such security-specific factors as the terms of the security (e.g., interest rate and time to maturity) and the amount and type of any collateral.
Annual Report 2016
5
COLUMBIA VARIABLE PORTFOLIO — LONG GOVERNMENT/CREDIT BOND FUND
UNDERSTANDING YOUR FUND'S EXPENSES
(Unaudited)
As an investor, you incur ongoing costs, which generally include management fees, distribution and/or service fees, and other fund expenses. The following information is intended to help you understand your ongoing costs (in dollars) of investing in the Fund and to help you compare these costs with the ongoing costs of investing in other mutual funds.
The information below does not reflect fees and expenses imposed under your variable annuity contract and/or variable life insurance policy (collectively, Contracts) or qualified pension and retirement plan (Qualified Plan), if any. The total fees and expenses you bear may therefore be higher than those shown below.
Analyzing Your Fund's Expenses
To illustrate these ongoing costs, we have provided examples and calculated the expenses paid by investors in each share class of the Fund during the period. The actual and hypothetical information in the table is based on an initial investment of $1,000 at the beginning of the period indicated and held for the entire period. Expense information is calculated two ways and each method provides you with different information. The amount listed in the "Actual" column is calculated using the Fund's actual operating expenses and total return for the period. You may use the Actual information, together with the amount invested, to estimate the expenses that you paid over the period. Simply divide your account value by $1,000 (for example, an $8,600 account value divided by $1,000 = 8.6), then multiply the results by the expenses paid during the period under the "Actual" column. The amount listed in the "Hypothetical" column assumes a 5% annual rate of return before expenses (which is not the Fund's actual return) and then applies the Fund's actual expense ratio for the period to the hypothetical return. You should not use the hypothetical account values and expenses to estimate either your actual account balance at the end of the period or the expenses you paid during the period. See "Compare With Other Funds" below for details on how to use the hypothetical data.
Compare With Other Funds
Since all mutual funds are required to include the same hypothetical calculations about expenses in shareholder reports, you can use this information to compare the ongoing cost of investing in the Fund with other funds. To do so, compare the hypothetical example with the 5% hypothetical examples that appear in the shareholder reports of other funds. As you compare hypothetical examples of other funds, it is important to note that hypothetical examples are meant to highlight the ongoing costs of investing in a fund only and do not reflect any transaction costs, such as redemption or exchange fees, or expenses that apply to the subaccount or the Contract. Therefore, the hypothetical calculations are useful in comparing ongoing costs only, and will not help you determine the relative total costs of owning different funds. If the fees and expenses imposed under your Contract or Qualified Plan, if any, were included, your costs would be higher.
July 1, 2016 – December 31, 2016
| Account Value at the Beginning of the Period ($) | Account Value at the End of the Period ($) | Expenses Paid During the Period ($) | Fund's Annualized Expense Ratio (%) | ||||||||||||||||||||||||||||
Actual | Hypothetical | Actual | Hypothetical | Actual | Hypothetical | Actual | |||||||||||||||||||||||||
Class 1 | 1,000.00 | 1,000.00 | 935.90 | 1,022.20 | 2.71 | 2.83 | 0.56 | ||||||||||||||||||||||||
Class 2 | 1,000.00 | 1,000.00 | 934.80 | 1,020.95 | 3.92 | 4.09 | 0.81 | ||||||||||||||||||||||||
Expenses paid during the period are equal to the annualized expense ratio for each class as indicated above, multiplied by the average account value over the period and then multiplied by the number of days in the Fund's most recent fiscal half year and divided by 366.
Expenses do not include fees and expenses incurred indirectly by the Fund from its investment in underlying funds, including affiliated and non-affiliated pooled investment vehicles, such as mutual funds and exchange-traded funds.
Had Columbia Management Investment Advisers, LLC and/or certain of its affiliates not waived/reimbursed certain fees and expenses, account value at the end of the period would have been reduced.
Annual Report 2016
6
COLUMBIA VARIABLE PORTFOLIO — LONG GOVERNMENT/CREDIT BOND FUND
PORTFOLIO OF INVESTMENTS
December 31, 2016
(Percentages represent value of investments compared to net assets)
Corporate Bonds & Notes 68.1%
Issuer | Coupon Rate | Principal Amount ($) | Value ($) | ||||||||||||
AEROSPACE & DEFENSE 1.0% | |||||||||||||||
| L-3 Communications Corp. 12/15/26 | 3.850 | % | 5,055,000 | 5,024,736 | |||||||||||
| Lockheed Martin Corp. 09/01/36 | 6.150 | % | 4,662,000 | 5,832,293 | |||||||||||
12/15/42 | 4.070 | % | 3,505,000 | 3,459,617 | |||||||||||
Total | 14,316,646 | ||||||||||||||
AUTOMOTIVE 0.2% | |||||||||||||||
| Delphi Automotive PLC 10/01/46 | 4.400 | % | 3,825,000 | 3,514,372 | |||||||||||
BANKING 12.6% | |||||||||||||||
| Bank of New York Mellon Corp. (The)(a) Junior Subordinated 12/29/49 | 4.500 | % | 8,801,000 | 7,986,907 | |||||||||||
12/31/49 | 4.625 | % | 2,125,000 | 1,949,305 | |||||||||||
| Citigroup, Inc. Subordinated 07/25/28 | 4.125 | % | 10,000,000 | 9,878,240 | |||||||||||
05/18/46 | 4.750 | % | 6,635,000 | 6,642,657 | |||||||||||
| Citigroup, Inc.(a) 08/14/17 | 1.392 | % | 14,005,000 | 14,011,834 | |||||||||||
| Fifth Third Bancorp Junior Subordinated(a) 12/31/49 | 5.100 | % | 5,287,000 | 4,916,910 | |||||||||||
| JPMorgan Chase & Co. 07/15/41 | 5.600 | % | 5,080,000 | 6,074,659 | |||||||||||
| Subordinated 06/01/45 | 4.950 | % | 5,880,000 | 6,281,234 | |||||||||||
| JPMorgan Chase & Co.(a) Junior Subordinated 12/29/49 | 6.000 | % | 1,583,000 | 1,588,936 | |||||||||||
12/31/49 | 6.100 | % | 19,950,000 | 20,099,625 | |||||||||||
| JPMorgan Chase Capital XXI Junior Subordinated(a) 02/02/37 | 1.834 | % | 2,248,000 | 1,941,710 | |||||||||||
| JPMorgan Chase Capital XXIII Junior Subordinated(a) 05/15/47 | 1.906 | % | 1,635,000 | 1,349,693 | |||||||||||
| KeyCorp Capital I Junior Subordinated(a) 07/01/28 | 1.738 | % | 6,076,000 | 5,346,880 | |||||||||||
| Lloyds Banking Group PLC 12/01/45 | 5.300 | % | 3,700,000 | 3,820,912 | |||||||||||
| Subordinated 12/10/25 | 4.582 | % | 17,695,000 | 17,780,538 | |||||||||||
| M&T Bank Corp. Junior Subordinated(a) 12/31/49 | 5.125 | % | 6,328,000 | 6,122,340 | |||||||||||
Corporate Bonds & Notes (continued)
Issuer | Coupon Rate | Principal Amount ($) | Value ($) | ||||||||||||
| Mellon Capital IV Junior Subordinated(a) 06/29/49 | 4.000 | % | 180,000 | 145,800 | |||||||||||
| NTC Capital II(a) 04/15/27 | 1.470 | % | 415,000 | 375,575 | |||||||||||
| Northern Trust Corp. Junior Subordinated(a) 12/31/49 | 4.600 | % | 4,535,000 | 4,313,919 | |||||||||||
| PNC Financial Services Group, Inc. (The) Junior Subordinated(a) 12/31/49 | 4.850 | % | 10,449,000 | 10,033,130 | |||||||||||
| Santander Issuances SAU Subordinated 11/19/25 | 5.179 | % | 3,600,000 | 3,633,851 | |||||||||||
| Santander UK Group Holdings PLC(b) Subordinated 09/15/25 | 4.750 | % | 3,092,000 | 3,027,071 | |||||||||||
09/15/45 | 5.625 | % | 4,309,000 | 4,223,940 | |||||||||||
| Wells Fargo & Co. 05/01/45 | 3.900 | % | 5,920,000 | 5,615,161 | |||||||||||
| Subordinated 11/02/43 | 5.375 | % | 5,395,000 | 5,954,186 | |||||||||||
| Wells Fargo & Co.(a) Junior Subordinated 12/31/49 | 5.875 | % | 4,445,000 | 4,622,800 | |||||||||||
12/31/49 | 5.900 | % | 29,412,000 | 29,559,060 | |||||||||||
Total | 187,296,873 | ||||||||||||||
CABLE AND SATELLITE 2.2% | |||||||||||||||
| Charter Communication Operating LLC/Capital 10/23/45 | 6.484 | % | 2,240,000 | 2,589,617 | |||||||||||
| Comcast Corp. 11/15/35 | 6.500 | % | 7,540,000 | 9,655,558 | |||||||||||
03/01/40 | 6.400 | % | 3,000,000 | 3,904,770 | |||||||||||
08/15/45 | 4.600 | % | 1,870,000 | 1,960,261 | |||||||||||
| Sky PLC(b) 09/16/24 | 3.750 | % | 660,000 | 662,095 | |||||||||||
| Time Warner Cable LLC 06/15/39 | 6.750 | % | 10,116,000 | 11,809,408 | |||||||||||
| Time Warner Entertainment Co. LP 07/15/33 | 8.375 | % | 1,640,000 | 2,148,746 | |||||||||||
Total | 32,730,455 | ||||||||||||||
CHEMICALS 0.2% | |||||||||||||||
| LyondellBasell Industries NV 02/26/55 | 4.625 | % | 3,880,000 | 3,605,467 | |||||||||||
The accompanying Notes to Financial Statements are an integral part of this statement.
Annual Report 2016
7
COLUMBIA VARIABLE PORTFOLIO — LONG GOVERNMENT/CREDIT BOND FUND
PORTFOLIO OF INVESTMENTS (continued)
December 31, 2016
Corporate Bonds & Notes (continued)
Issuer | Coupon Rate | Principal Amount ($) | Value ($) | ||||||||||||
DIVERSIFIED MANUFACTURING 3.7% | |||||||||||||||
| General Electric Co. Junior Subordinated(a) 12/31/49 | 5.000 | % | 52,281,000 | 54,372,240 | |||||||||||
ELECTRIC 10.2% | |||||||||||||||
| Alabama Power Co. 01/02/46 | 4.300 | % | 3,000,000 | 3,104,220 | |||||||||||
| Arizona Public Service Co. 11/15/45 | 4.350 | % | 4,374,000 | 4,502,311 | |||||||||||
| Cleco Corporate Holdings LLC(b) 05/01/46 | 4.973 | % | 3,350,000 | 3,391,289 | |||||||||||
| Cleveland Electric Illuminating Co. (The) 12/15/36 | 5.950 | % | 7,507,000 | 8,335,187 | |||||||||||
| Commonwealth Edison Co. 03/15/36 | 5.900 | % | 9,045,000 | 11,111,547 | |||||||||||
| Consolidated Edison Co. of New York, Inc. 08/15/37 | 6.300 | % | 8,000,000 | 10,310,984 | |||||||||||
06/15/46 | 3.850 | % | 4,755,000 | 4,536,907 | |||||||||||
| DTE Electric Co. 07/01/44 | 4.300 | % | 6,135,000 | 6,441,781 | |||||||||||
06/01/46 | 3.700 | % | 3,970,000 | 3,819,096 | |||||||||||
| DTE Energy Co. 10/01/26 | 2.850 | % | 4,225,000 | 3,926,369 | |||||||||||
| Duke Energy Corp. 09/01/26 | 2.650 | % | 1,369,000 | 1,277,726 | |||||||||||
09/01/46 | 3.750 | % | 4,874,000 | 4,387,609 | |||||||||||
| Duke Energy Indiana LLC 10/15/35 | 6.120 | % | 4,820,000 | 5,808,298 | |||||||||||
| Duke Energy Ohio, Inc. 06/15/46 | 3.700 | % | 3,075,000 | 2,906,822 | |||||||||||
| Duke Energy Progress, Inc. 08/15/45 | 4.200 | % | 2,302,000 | 2,342,398 | |||||||||||
| Exelon Corp. 04/15/46 | 4.450 | % | 2,570,000 | 2,515,840 | |||||||||||
| Florida Power & Light Co. 1st Mortgage 02/01/41 | 5.250 | % | 8,439,000 | 9,942,560 | |||||||||||
| Jersey Central Power & Light Co. 06/01/37 | 6.150 | % | 1,910,000 | 2,185,579 | |||||||||||
| MidAmerican Energy Co. 05/01/46 | 4.250 | % | 7,480,000 | 7,703,861 | |||||||||||
| Nevada Power Co. 09/15/40 | 5.375 | % | 1,535,000 | 1,758,497 | |||||||||||
| Oncor Electric Delivery Co, LLC 09/01/38 | 7.500 | % | 2,380,000 | 3,428,019 | |||||||||||
| Oncor Electric Delivery Co. LLC 04/01/45 | 3.750 | % | 4,385,000 | 4,204,154 | |||||||||||
Corporate Bonds & Notes (continued)
Issuer | Coupon Rate | Principal Amount ($) | Value ($) | ||||||||||||
| PacifiCorp 07/15/38 | 6.350 | % | 7,756,000 | 10,155,101 | |||||||||||
| Pacific Gas & Electric Co. 03/15/46 | 4.250 | % | 6,593,000 | 6,700,011 | |||||||||||
| Progress Energy, Inc. 12/01/39 | 6.000 | % | 8,467,000 | 10,174,260 | |||||||||||
| Public Service Electric & Gas Co. 11/01/45 | 4.150 | % | 2,689,000 | 2,778,839 | |||||||||||
| Southern California Edison Co. 1st Refunding Mortgage 03/15/43 | 3.900 | % | 1,252,000 | 1,231,267 | |||||||||||
| Southern Co. (The) 07/01/36 | 4.250 | % | 3,025,000 | 3,008,296 | |||||||||||
07/01/46 | 4.400 | % | 6,320,000 | 6,251,207 | |||||||||||
| Toledo Edison Co. (The) 05/15/37 | 6.150 | % | 2,605,000 | 3,074,541 | |||||||||||
Total | 151,314,576 | ||||||||||||||
FINANCE COMPANIES 0.4% | |||||||||||||||
| HSBC Finance Corp. Subordinated 01/15/21 | 6.676 | % | 5,680,000 | 6,384,553 | |||||||||||
FOOD AND BEVERAGE 3.8% | |||||||||||||||
| Anheuser-Busch InBev Finance, Inc. 02/01/36 | 4.700 | % | 16,711,000 | 17,577,766 | |||||||||||
02/01/46 | 4.900 | % | 20,138,000 | 21,766,560 | |||||||||||
| Dr. Pepper Snapple Group, Inc. 06/15/27 | 3.430 | % | 2,385,000 | 2,377,542 | |||||||||||
| Kraft Heinz Foods Co.(b) 08/01/39 | 7.125 | % | 7,865,000 | 10,019,884 | |||||||||||
| Molson Coors Brewing Co. 05/01/42 | 5.000 | % | 3,495,000 | 3,653,509 | |||||||||||
07/15/46 | 4.200 | % | 1,379,000 | 1,285,676 | |||||||||||
Total | 56,680,937 | ||||||||||||||
HEALTH CARE 1.3% | |||||||||||||||
| Becton Dickinson and Co. 05/15/44 | 4.875 | % | 6,135,000 | 6,387,596 | |||||||||||
| Express Scripts Holding Co. 07/15/46 | 4.800 | % | 1,570,000 | 1,503,159 | |||||||||||
| Medtronic, Inc. 03/15/45 | 4.625 | % | 7,345,000 | 7,943,037 | |||||||||||
| New York and Presbyterian Hospital (The) 08/01/36 | 3.563 | % | 3,425,000 | 3,273,273 | |||||||||||
Total | 19,107,065 | ||||||||||||||
The accompanying Notes to Financial Statements are an integral part of this statement.
Annual Report 2016
8
COLUMBIA VARIABLE PORTFOLIO — LONG GOVERNMENT/CREDIT BOND FUND
PORTFOLIO OF INVESTMENTS (continued)
December 31, 2016
Corporate Bonds & Notes (continued)
Issuer | Coupon Rate | Principal Amount ($) | Value ($) | ||||||||||||
HEALTHCARE INSURANCE 0.3% | |||||||||||||||
| Aetna, Inc. 06/15/36 | 4.250 | % | 3,924,000 | 3,934,379 | |||||||||||
INDEPENDENT ENERGY 3.3% | |||||||||||||||
| Anadarko Petroleum Corp. 03/15/29 | 7.200 | % | 3,108,000 | 3,681,274 | |||||||||||
09/15/36 | 6.450 | % | 290,000 | 345,148 | |||||||||||
07/15/44 | 4.500 | % | 7,805,000 | 7,333,195 | |||||||||||
| Canadian Natural Resources Ltd. 02/15/37 | 6.500 | % | 2,022,000 | 2,313,688 | |||||||||||
02/01/39 | 6.750 | % | 1,945,000 | 2,269,576 | |||||||||||
| Noble Energy, Inc. 04/01/27 | 8.000 | % | 3,511,000 | 4,272,855 | |||||||||||
11/15/43 | 5.250 | % | 9,644,000 | 9,823,513 | |||||||||||
11/15/44 | 5.050 | % | 3,384,000 | 3,393,976 | |||||||||||
| Woodside Finance Ltd.(b) 03/05/25 | 3.650 | % | 11,490,000 | 11,224,397 | |||||||||||
09/15/26 | 3.700 | % | 4,130,000 | 4,038,715 | |||||||||||
Total | 48,696,337 | ||||||||||||||
INTEGRATED ENERGY 1.1% | |||||||||||||||
| Cenovus Energy, Inc. 11/15/39 | 6.750 | % | 14,035,000 | 15,648,604 | |||||||||||
LIFE INSURANCE 2.5% | |||||||||||||||
| Guardian Life Insurance Co. of America (The)(b) 09/30/39 | 7.375 | % | 5,000,000 | 6,666,125 | |||||||||||
| Subordinated 06/19/64 | 4.875 | % | 1,600,000 | 1,571,685 | |||||||||||
| Massachusetts Mutual Life Insurance Co. Subordinated(b) 04/15/65 | 4.500 | % | 4,408,000 | 4,029,243 | |||||||||||
| MetLife Capital Trust X Junior Subordinated(a)(b) 04/08/38 | 9.250 | % | 8,002,000 | 10,882,720 | |||||||||||
| Teachers Insurance & Annuity Association of America(b) 12/16/39 | 6.850 | % | 1,040,000 | 1,349,633 | |||||||||||
| Subordinated 09/15/44 | 4.900 | % | 4,980,000 | 5,358,714 | |||||||||||
| Voya Financial, Inc. 07/15/43 | 5.700 | % | 5,871,000 | 6,405,008 | |||||||||||
06/15/46 | 4.800 | % | 1,020,000 | 991,648 | |||||||||||
Total | 37,254,776 | ||||||||||||||
MEDIA AND ENTERTAINMENT 1.9% | |||||||||||||||
| 21st Century Fox America, Inc. 03/15/33 | 6.550 | % | 2,340,000 | 2,840,519 | |||||||||||
03/01/37 | 6.150 | % | 1,010,000 | 1,181,967 | |||||||||||
02/15/41 | 6.150 | % | 5,320,000 | 6,292,326 | |||||||||||
Corporate Bonds & Notes (continued)
Issuer | Coupon Rate | Principal Amount ($) | Value ($) | ||||||||||||
| Thomson Reuters Corp. 11/23/43 | 5.650 | % | 10,130,000 | 11,158,661 | |||||||||||
| Time Warner, Inc. 01/15/26 | 3.875 | % | 3,290,000 | 3,293,543 | |||||||||||
02/15/27 | 3.800 | % | 3,285,000 | 3,266,344 | |||||||||||
Total | 28,033,360 | ||||||||||||||
METALS 0.5% | |||||||||||||||
| BHP Billiton Finance USA Ltd. 09/30/43 | 5.000 | % | 6,408,000 | 7,157,480 | |||||||||||
MIDSTREAM 3.5% | |||||||||||||||
| Columbia Pipeline Group, Inc. 06/01/45 | 5.800 | % | 8,399,000 | 9,658,573 | |||||||||||
| El Paso LLC 01/15/32 | 7.750 | % | 2,223,000 | 2,724,184 | |||||||||||
| Enterprise Products Operating LLC Junior Subordinated(a) 08/01/66 | 4.593 | % | 3,338,000 | 3,139,489 | |||||||||||
| Kinder Morgan Energy Partners LP 01/15/38 | 6.950 | % | 5,654,000 | 6,558,465 | |||||||||||
11/15/40 | 7.500 | % | 3,000,000 | 3,587,262 | |||||||||||
| Kinder Morgan, Inc. 10/15/30 | 8.050 | % | 1,360,000 | 1,620,988 | |||||||||||
| Plains All American Pipeline LP/Finance Corp. 01/31/23 | 2.850 | % | 1,810,000 | 1,711,067 | |||||||||||
01/15/37 | 6.650 | % | 1,461,000 | 1,594,645 | |||||||||||
06/01/42 | 5.150 | % | 3,262,000 | 3,024,487 | |||||||||||
02/15/45 | 4.900 | % | 4,439,000 | 4,100,815 | |||||||||||
| Transcanada Trust Junior Subordinated(a) 08/15/76 | 5.875 | % | 2,655,000 | 2,761,200 | |||||||||||
| Williams Partners LP 04/15/40 | 6.300 | % | 2,975,000 | 3,175,488 | |||||||||||
09/15/45 | 5.100 | % | 9,224,000 | 8,766,942 | |||||||||||
Total | 52,423,605 | ||||||||||||||
NATURAL GAS 1.4% | |||||||||||||||
| KeySpan Corp. 11/15/30 | 8.000 | % | 590,000 | 788,666 | |||||||||||
| NiSource Finance Corp. 12/15/40 | 6.250 | % | 4,944,000 | 6,020,091 | |||||||||||
02/15/44 | 4.800 | % | 3,351,000 | 3,527,913 | |||||||||||
| Sempra Energy 11/15/25 | 3.750 | % | 2,550,000 | 2,575,862 | |||||||||||
10/15/39 | 6.000 | % | 6,600,000 | 7,864,217 | |||||||||||
Total | 20,776,749 | ||||||||||||||
The accompanying Notes to Financial Statements are an integral part of this statement.
Annual Report 2016
9
COLUMBIA VARIABLE PORTFOLIO — LONG GOVERNMENT/CREDIT BOND FUND
PORTFOLIO OF INVESTMENTS (continued)
December 31, 2016
Corporate Bonds & Notes (continued)
Issuer | Coupon Rate | Principal Amount ($) | Value ($) | ||||||||||||
OIL FIELD SERVICES 0.5% | |||||||||||||||
| Noble Holding International Ltd. 03/15/17 | 2.500 | % | 3,920,000 | 3,905,300 | |||||||||||
| Noble Holding International Ltd.(a) 03/16/18 | 5.250 | % | 3,549,000 | 3,540,128 | |||||||||||
Total | 7,445,428 | ||||||||||||||
OTHER INDUSTRY 0.6% | |||||||||||||||
| Massachusetts Institute of Technology 07/01/2114 | 4.678 | % | 2,335,000 | 2,334,911 | |||||||||||
07/01/2116 | 3.885 | % | 2,315,000 | 1,980,629 | |||||||||||
| President and Fellows of Harvard College 07/15/46 | 3.150 | % | 1,749,000 | 1,564,830 | |||||||||||
07/15/56 | 3.300 | % | 2,825,000 | 2,484,407 | |||||||||||
Total | 8,364,777 | ||||||||||||||
PHARMACEUTICALS 2.2% | |||||||||||||||
| Actavis Funding SCS 03/15/35 | 4.550 | % | 7,500,000 | 7,423,440 | |||||||||||
| Actavis, Inc. 10/01/42 | 4.625 | % | 3,195,000 | 3,093,888 | |||||||||||
| Amgen, Inc.(b) 06/15/48 | 4.563 | % | 1,345,000 | 1,300,959 | |||||||||||
| Johnson & Johnson 12/05/33 | 4.375 | % | 11,579,000 | 12,730,682 | |||||||||||
03/01/46 | 3.700 | % | 7,570,000 | 7,459,198 | |||||||||||
Total | 32,008,167 | ||||||||||||||
PROPERTY & CASUALTY 1.5% | |||||||||||||||
| Berkshire Hathaway Finance Corp. 05/15/43 | 4.300 | % | 3,860,000 | 3,987,890 | |||||||||||
| Berkshire Hathaway, Inc. 02/11/43 | 4.500 | % | 2,348,000 | 2,496,654 | |||||||||||
| Loews Corp. 05/15/43 | 4.125 | % | 16,730,000 | 16,050,561 | |||||||||||
Total | 22,535,105 | ||||||||||||||
RAILROADS 1.5% | |||||||||||||||
| BNSF Funding Trust I Junior Subordinated(a) 12/15/55 | 6.613 | % | 3,023,000 | 3,461,335 | |||||||||||
| Burlington Northern Santa Fe LLC 06/01/41 | 5.400 | % | 3,000,000 | 3,541,116 | |||||||||||
| Kansas City Southern 08/15/45 | 4.950 | % | 12,435,000 | 12,629,247 | |||||||||||
| Union Pacific Corp. 03/01/46 | 4.050 | % | 3,215,000 | 3,224,189 | |||||||||||
Total | 22,855,887 | ||||||||||||||
Corporate Bonds & Notes (continued)
Issuer | Coupon Rate | Principal Amount ($) | Value ($) | ||||||||||||
RETAILERS 2.1% | |||||||||||||||
| CVS Health Corp. 07/20/45 | 5.125 | % | 4,440,000 | 4,948,145 | |||||||||||
| CVS Pass-Through Trust(b) 01/10/36 | 4.704 | % | 9,188,814 | 9,671,089 | |||||||||||
08/11/36 | 4.163 | % | 4,382,667 | 4,466,745 | |||||||||||
| Wal-Mart Stores, Inc. 10/25/40 | 5.000 | % | 10,095,000 | 11,617,982 | |||||||||||
Total | 30,703,961 | ||||||||||||||
TECHNOLOGY 4.1% | |||||||||||||||
| Diamond 1 Finance Corp./Diamond 2 Finance Corp.(b) 06/15/23 | 5.450 | % | 8,500,000 | 9,016,281 | |||||||||||
06/15/26 | 6.020 | % | 5,000,000 | 5,416,480 | |||||||||||
| Hewlett Packard Enterprise Co.(a)(b) 10/15/45 | 6.350 | % | 6,953,000 | 7,023,232 | |||||||||||
| Intel Corp. 07/29/45 | 4.900 | % | 7,795,000 | 8,720,134 | |||||||||||
| Microsoft Corp. 08/08/46 | 3.700 | % | 11,845,000 | 11,151,653 | |||||||||||
| Oracle Corp. 07/08/34 | 4.300 | % | 8,755,000 | 9,052,530 | |||||||||||
07/15/36 | 3.850 | % | 3,620,000 | 3,532,830 | |||||||||||
07/15/46 | 4.000 | % | 995,000 | 951,714 | |||||||||||
05/15/55 | 4.375 | % | 6,635,000 | 6,599,304 | |||||||||||
Total | 61,464,158 | ||||||||||||||
TRANSPORTATION SERVICES 1.2% | |||||||||||||||
| ERAC U.S.A. Finance LLC(b) 10/15/37 | 7.000 | % | 8,050,000 | 10,199,801 | |||||||||||
11/01/46 | 4.200 | % | 4,025,000 | 3,678,142 | |||||||||||
| FedEx Corp. 04/01/46 | 4.550 | % | 3,359,000 | 3,384,894 | |||||||||||
Total | 17,262,837 | ||||||||||||||
WIRELESS 0.5% | |||||||||||||||
| America Movil SAB de CV 07/16/42 | 4.375 | % | 8,010,000 | 7,416,579 | |||||||||||
WIRELINES 3.8% | |||||||||||||||
| AT&T, Inc. 03/15/42 | 5.150 | % | 1,555,000 | 1,549,048 | |||||||||||
06/15/44 | 4.800 | % | 8,605,000 | 8,130,985 | |||||||||||
05/15/46 | 4.750 | % | 4,738,000 | 4,488,871 | |||||||||||
03/09/48 | 4.500 | % | 4,445,000 | 3,994,157 | |||||||||||
| Deutsche Telekom International Finance BV 06/01/32 | 9.250 | % | 625,000 | 964,092 | |||||||||||
| Orange SA 01/13/42 | 5.375 | % | 3,200,000 | 3,580,467 | |||||||||||
The accompanying Notes to Financial Statements are an integral part of this statement.
Annual Report 2016
10
COLUMBIA VARIABLE PORTFOLIO — LONG GOVERNMENT/CREDIT BOND FUND
PORTFOLIO OF INVESTMENTS (continued)
December 31, 2016
Corporate Bonds & Notes (continued)
Issuer | Coupon Rate | Principal Amount ($) | Value ($) | ||||||||||||
| Orange SA(a) 03/01/31 | 9.000 | % | 1,930,000 | 2,901,801 | |||||||||||
| Telefonica Emisiones SAU 06/20/36 | 7.045 | % | 2,960,000 | 3,435,693 | |||||||||||
| Verizon Communications, Inc. 03/15/34 | 5.050 | % | 5,059,000 | 5,327,309 | |||||||||||
09/15/43 | 6.550 | % | 9,035,000 | 11,284,507 | |||||||||||
08/21/46 | 4.862 | % | 493,000 | 499,554 | |||||||||||
09/15/48 | 4.522 | % | 9,960,000 | 9,550,764 | |||||||||||
Total | 55,707,248 | ||||||||||||||
| Total Corporate Bonds & Notes (Cost: $1,026,122,306) | 1,009,012,621 | ||||||||||||||
Commercial Mortgage-Backed Securities — Non-Agency 3.0%
| American Homes 4 Rent Series 2015-SFR1 Class A(b) 04/17/52 | 3.467 | % | 9,949,246 | 9,981,557 | |||||||||||
| Commercial Mortgage Trust Series 2015-CR22 Class A5 03/10/48 | 3.309 | % | 1,940,000 | 1,962,778 | |||||||||||
| Series 2015-LC19 Class A4 02/10/48 | 3.183 | % | 835,000 | 840,572 | |||||||||||
| Credit Suisse Mortgage Capital Certificates Trust Series 2016-NXSR Class A4 12/15/49 | 3.795 | % | 6,000,000 | 6,169,059 | |||||||||||
| GS Mortgage Securities Corp. II Series 2015-GC30 Class A3 05/10/50 | 3.119 | % | 5,000,000 | 5,024,955 | |||||||||||
| GS Mortgage Securities Trust Series 2015-GC34 Class A4 10/10/48 | 3.506 | % | 2,550,000 | 2,601,858 | |||||||||||
| JPMBB Commercial Mortgage Securities Trust Series 2015-C27 Class A4 02/15/48 | 3.179 | % | 1,765,000 | 1,768,996 | |||||||||||
| Wells Fargo Commercial Mortgage Trust Series 2014-LC18 Class A5 12/15/47 | 3.405 | % | 5,000,000 | 5,081,171 | |||||||||||
| Series 2015-C26 Class A4 02/15/48 | 3.166 | % | 1,780,000 | 1,777,883 | |||||||||||
| Series 2015-C27 Class A4 02/15/48 | 3.190 | % | 3,350,000 | 3,353,817 | |||||||||||
| Series 2015-LC20 Class A4 04/15/50 | 2.925 | % | 3,750,000 | 3,683,500 | |||||||||||
| Series 2015-LC20 Class A5 04/15/50 | 3.184 | % | 1,350,000 | 1,349,289 | |||||||||||
| Total Commercial Mortgage-Backed Securities — Non-Agency (Cost: $44,097,599) | 43,595,435 | ||||||||||||||
Asset-Backed Securities — Agency 0.4%
Issuer | Coupon Rate | Principal Amount ($) | Value ($) | ||||||||||||
| United States Small Business Administration Series 2016-20L Class 1 12/01/36 | 2.810 | % | 6,345,000 | 6,326,261 | |||||||||||
| Total Asset-Backed Securities — Agency (Cost: $6,345,000) | 6,326,261 | ||||||||||||||
U.S. Treasury Obligations 16.0%
| U.S. Treasury 11/30/18 | 1.000 | % | 2,925,000 | 2,915,402 | |||||||||||
12/15/19 | �� | 1.375 | % | 1,670,000 | 1,666,020 | ||||||||||
11/30/21 | 1.750 | % | 5,501,000 | 5,459,957 | |||||||||||
11/30/23 | 2.125 | % | 1,000,000 | 993,359 | |||||||||||
11/15/26 | 2.000 | % | 4,932,000 | 4,745,314 | |||||||||||
02/15/31 | 5.375 | % | 12,419,000 | 16,540,556 | |||||||||||
05/15/41 | 4.375 | % | 50,000,000 | 61,865,250 | |||||||||||
08/15/46 | 2.250 | % | 95,573,000 | 80,359,690 | |||||||||||
| U.S. Treasury(c) STRIPS 11/15/19 | 0.000 | % | 11,055,900 | 10,596,793 | |||||||||||
02/15/40 | 0.000 | % | 38,410,800 | 18,945,781 | |||||||||||
11/15/41 | 0.000 | % | 13,661,000 | 6,277,107 | |||||||||||
05/15/43 | 0.000 | % | 19,069,000 | 8,332,085 | |||||||||||
| U.S. Treasury(c)(d) STRIPS 11/15/18 | 0.000 | % | 19,436,000 | 19,011,557 | |||||||||||
| Total U.S. Treasury Obligations (Cost: $238,404,062) | 237,708,871 | ||||||||||||||
U.S. Government & Agency Obligations 3.3%
| Residual Funding Corp.(c) STRIPS 01/15/30 | 0.000 | % | 8,428,000 | 5,508,878 | |||||||||||
04/15/30 | 0.000 | % | 65,960,000 | 42,717,015 | |||||||||||
| Total U.S. Government & Agency Obligations (Cost: $51,903,953) | 48,225,893 | ||||||||||||||
Foreign Government Obligations(e) 3.8%
COLOMBIA 0.4% | |||||||||||||||
| Colombia Government International Bond 01/18/41 | 6.125 | % | 5,077,000 | 5,496,416 | |||||||||||
FRANCE 0.6% | |||||||||||||||
| Electricite de France SA(b) 10/13/55 | 5.250 | % | 9,479,000 | 9,439,055 | |||||||||||
The accompanying Notes to Financial Statements are an integral part of this statement.
Annual Report 2016
11
COLUMBIA VARIABLE PORTFOLIO — LONG GOVERNMENT/CREDIT BOND FUND
PORTFOLIO OF INVESTMENTS (continued)
December 31, 2016
Foreign Government Obligations(e) (continued)
Issuer | Coupon Rate | Principal Amount ($) | Value ($) | ||||||||||||
MEXICO 1.6% | |||||||||||||||
| Mexico Government International Bond 03/08/44 | 4.750 | % | 5,526,000 | 5,024,792 | |||||||||||
01/23/46 | 4.600 | % | 5,650,000 | 5,070,875 | |||||||||||
| Petroleos Mexicanos 06/15/35 | 6.625 | % | 12,380,000 | 12,194,300 | |||||||||||
| Petroleos Mexicanos(b) 03/13/27 | 6.500 | % | 1,189,000 | 1,226,453 | |||||||||||
Total | 23,516,420 | ||||||||||||||
PANAMA 0.1% | |||||||||||||||
| Panama Government International Bond 01/26/36 | 6.700 | % | 1,470,000 | 1,783,845 | |||||||||||
PERU 0.4% | |||||||||||||||
| Peruvian Government International Bond 03/14/37 | 6.550 | % | 4,715,000 | 5,919,683 | |||||||||||
PHILIPPINES 0.2% | |||||||||||||||
| Philippine Government International Bond 10/23/34 | 6.375 | % | 2,530,000 | 3,290,817 | |||||||||||
QATAR 0.3% | |||||||||||||||
| Nakilat, Inc.(b) 12/31/33 | 6.067 | % | 4,267,000 | 4,949,720 | |||||||||||
URUGUAY 0.2% | |||||||||||||||
| Uruguay Government International Bond 11/20/45 | 4.125 | % | 2,775,000 | 2,285,213 | |||||||||||
| Total Foreign Government Obligations (Cost: $58,599,069) | 56,681,169 | ||||||||||||||
Municipal Bonds 4.7%
| Issue Description | Coupon Rate | Principal Amount ($) | Value ($) | ||||||||||||
CALIFORNIA 2.5% | |||||||||||||||
| Los Angeles Community College District Unlimited General Obligation Bonds Build America Bonds Series 2010 08/01/49 | 6.750 | % | 4,735,000 | 6,803,769 | |||||||||||
| Los Angeles Unified School District Unlimited General Obligation Bonds Taxable Build America Bonds Series 2009 07/01/34 | 5.750 | % | 3,310,000 | 4,080,767 | |||||||||||
Municipal Bonds (continued)
| Issue Description | Coupon Rate | Principal Amount ($) | Value ($) | ||||||||||||
| State of California Unlimited General Obligation Bonds Taxable Build America Bonds Series 2009 04/01/39 | 7.550 | % | 11,170,000 | 16,587,562 | |||||||||||
| University of California Revenue Bonds General Tax Series 2012AD 05/15/2112 | 4.858 | % | 9,055,000 | 8,782,263 | |||||||||||
Total | 36,254,361 | ||||||||||||||
ILLINOIS 0.3% | |||||||||||||||
| City of Chicago Waterworks Revenue Bonds 2nd Lien Series 2012 11/01/42 | 5.000 | % | 2,320,000 | 2,464,374 | |||||||||||
| Build America Bonds Series 2010 11/01/40 | 6.742 | % | 625,000 | 789,344 | |||||||||||
| City of Chicago Unlimited General Obligation Taxable Bonds Series 2015B 01/01/33 | 7.375 | % | 550,000 | 555,483 | |||||||||||
Total | 3,809,201 | ||||||||||||||
MASSACHUSETTS 0.2% | |||||||||||||||
| Commonwealth of Massachusetts Limited Tax General Obligation Bonds Series 2016F 06/01/46 | 3.277 | % | 3,125,000 | 2,832,188 | |||||||||||
MISSISSIPPI —% | |||||||||||||||
| State of Mississippi Unlimited General Obligation Bonds Series 2016B 12/01/27 | 5.000 | % | 445,000 | 538,454 | |||||||||||
NEW YORK 1.2% | |||||||||||||||
| City of New York Unlimited General Obligation Bonds Series 2016B-1 12/01/41 | 5.000 | % | 770,000 | 879,247 | |||||||||||
| Metropolitan Transportation Authority Revenue Bonds Series 2010 (BAM) 11/15/39 | 6.648 | % | 5,200,000 | 6,779,344 | |||||||||||
| New York City Water & Sewer System Revenue Bonds Build America Bonds Series 2010 06/15/42 | 5.724 | % | 1,550,000 | 1,969,554 | |||||||||||
The accompanying Notes to Financial Statements are an integral part of this statement.
Annual Report 2016
12
COLUMBIA VARIABLE PORTFOLIO — LONG GOVERNMENT/CREDIT BOND FUND
PORTFOLIO OF INVESTMENTS (continued)
December 31, 2016
Municipal Bonds (continued)
| Issue Description | Coupon Rate | Principal Amount ($) | Value ($) | ||||||||||||
| Port Authority of New York & New Jersey Revenue Bonds Consolidated 174th Series 2012 10/01/62 | 4.458 | % | 8,175,000 | 8,202,223 | |||||||||||
Total | 17,830,368 | ||||||||||||||
OHIO 0.2% | |||||||||||||||
| JobsOhio Beverage System Taxable Revenue Bonds Series 2013B 01/01/35 | 4.532 | % | 3,315,000 | 3,578,277 | |||||||||||
TEXAS 0.2% | |||||||||||||||
| University of Texas System (The)(f) Revenue Bonds Series 2017J 08/15/25 | 5.000 | % | 1,440,000 | 1,737,432 | |||||||||||
08/15/26 | 5.000 | % | 1,300,000 | 1,584,440 | |||||||||||
Total | 3,321,872 | ||||||||||||||
WASHINGTON 0.1% | |||||||||||||||
| Central Puget Sound Regional Transit Authority Green Revenue Bonds Series 2016S-1 11/01/46 | 5.000 | % | 1,145,000 | 1,453,898 | |||||||||||
| Total Municipal Bonds (Cost: $71,577,035) | 69,618,619 | ||||||||||||||
Preferred Debt 0.2%
Issuer | Coupon Rate | Principal Amount ($) | Value ($) | ||||||||||||
BANKING 0.1% | |||||||||||||||
| M&T Bank Corp.(a) 12/31/49 | 6.375 | % | 270 | 289,449 | |||||||||||
| State Street Corp.(a) 12/31/49 | 5.350 | % | 43,300 | 1,083,366 | |||||||||||
Total | 1,372,815 | ||||||||||||||
PROPERTY & CASUALTY 0.1% | |||||||||||||||
| Allstate Corp. (The)(a) 01/15/53 | 5.100 | % | 36,723 | 924,318 | |||||||||||
| Total Preferred Debt (Cost: $2,243,765) | 2,297,133 | ||||||||||||||
Money Market Funds —%
Shares | Value ($) | ||||||||||||||
| Columbia Short-Term Cash Fund, 0.594%(g)(h) | 522,073 | 522,073 | |||||||||||||
| Total Money Market Funds (Cost: $522,073) | 522,073 | ||||||||||||||
| Total Investments (Cost: $1,499,814,862) | 1,473,988,075 | ||||||||||||||
Other Assets & Liabilities, Net | 7,896,624 | ||||||||||||||
Net Assets | 1,481,884,699 | ||||||||||||||
At December 31, 2016, securities and cash totaling $9,347,007 were pledged as collateral.
Investments in Derivatives
Futures Contracts Outstanding at December 31, 2016
Long Futures Contracts Outstanding
Contract Description | Number of Contracts | Trading Currency | Notional Market Value ($) | Expiration Date | Unrealized Appreciation ($) | Unrealized (Depreciation) ($) | |||||||||||||||||||||
U.S. Long Bond | 70 | USD | 10,545,938 | 03/2017 | 139,950 | — | |||||||||||||||||||||
U.S. Long Bond | 478 | USD | 72,013,688 | 03/2017 | — | (341,803 | ) | ||||||||||||||||||||
U.S. Treasury Ultra 10-Year Note | 30 | USD | 4,021,875 | 03/2017 | 54,145 | — | |||||||||||||||||||||
U.S. Treasury Ultra 10-Year Note | 25 | USD | 3,351,563 | 03/2017 | 50,355 | — | |||||||||||||||||||||
U.S. Ultra Bond | 145 | USD | 23,236,250 | 03/2017 | 208,852 | — | |||||||||||||||||||||
U.S. Ultra Bond | 1,047 | USD | 167,781,750 | 03/2017 | — | (1,704,469 | ) | ||||||||||||||||||||
Total | 280,951,064 | 453,302 | (2,046,272 | ) | |||||||||||||||||||||||
The accompanying Notes to Financial Statements are an integral part of this statement.
Annual Report 2016
13
COLUMBIA VARIABLE PORTFOLIO — LONG GOVERNMENT/CREDIT BOND FUND
PORTFOLIO OF INVESTMENTS (continued)
December 31, 2016
Futures Contracts Outstanding at December 31, 2016 (continued)
Short Futures Contracts Outstanding
Contract Description | Number of Contracts | Trading Currency | Notional Market Value ($) | Expiration Date | Unrealized Appreciation ($) | Unrealized (Depreciation) ($) | |||||||||||||||||||||
U.S. Treasury 10-Year Note | (962 | ) | USD | (119,558,563 | ) | 03/2017 | 490,733 | — | |||||||||||||||||||
U.S. Treasury 2-Year Note | (200 | ) | USD | (43,337,500 | ) | 03/2017 | 49,640 | — | |||||||||||||||||||
U.S. Treasury 2-Year Note | (31 | ) | USD | (6,717,313 | ) | 03/2017 | — | (2,481 | ) | ||||||||||||||||||
U.S. Treasury 5-Year Note | (410 | ) | USD | (48,242,266 | ) | 03/2017 | 223,246 | — | |||||||||||||||||||
U.S. Treasury 5-Year Note | (459 | ) | USD | (54,007,805 | ) | 03/2017 | — | (230,721 | ) | ||||||||||||||||||
Total | (271,863,447 | ) | 763,619 | (233,202 | ) | ||||||||||||||||||||||
Credit Default Swap Contracts Outstanding at December 31, 2016
Buy Protection
Counterparty | Reference Entity | Expiration Date | Pay Fixed Rate (%) | Notional Currency | Notional Amount | Market Value ($) | Premium Paid ($) | Premium Received ($) | Periodic Payments Receivable (Payable) ($) | Unrealized Appreciation ($) | Unrealized Depreciation ($) | ||||||||||||||||||||||||||||||||||||
Barclays | McDonald's Corp. | 12/20/2021 | 1.000 | USD | 1,390,000 | (42,923 | ) | — | (35,323 | ) | (425 | ) | — | (8,025 | ) | ||||||||||||||||||||||||||||||||
Citi | Goldman Sachs Group, Inc. | 12/20/2021 | 1.000 | USD | 2,625,000 | (13,055 | ) | 6,132 | — | (802 | ) | — | (19,989 | ) | |||||||||||||||||||||||||||||||||
JPMorgan | Goldman Sachs Group, Inc. | 12/20/2021 | 1.000 | USD | 18,645,000 | (92,731 | ) | — | (34,650 | ) | (5,697 | ) | — | (63,778 | ) | ||||||||||||||||||||||||||||||||
Total | 6,132 | (69,973 | ) | — | (91,792 | ) | |||||||||||||||||||||||||||||||||||||||||
Cleared Credit Default Swap Contracts Outstanding at December 31, 2016
Buy Protection
Counterparty | Reference Entity | Expiration Date | Pay Fixed Rate (%) | Notional Currency | Notional Amount | Unrealized Appreciation ($) | Unrealized Depreciation ($) | ||||||||||||||||||||||||
| Morgan Stanley | Markit CDX North America Investment Grade Index, Series 27 | 12/20/2021 | 1.000 | USD | 90,000,000 | — | (426,017) | ||||||||||||||||||||||||
Notes to Portfolio of Investments
(a) Variable rate security.
(b) Represents privately placed and other securities and instruments exempt from SEC registration (collectively, private placements), such as Section 4(a)(2) and Rule 144A eligible securities, which are often sold only to qualified institutional buyers. The Fund may invest in private placements determined to be liquid as well as those determined to be illiquid. Private placements may be determined to be liquid under guidelines established by the Fund's Board of Trustees. At December 31, 2016, the value of these securities amounted to $142,815,025 or 9.64% of net assets.
(c) Zero coupon bond.
(d) This security or a portion of this security has been pledged as collateral in connection with derivative contracts.
(e) Principal and interest may not be guaranteed by the government.
(f) Security, or a portion thereof, has been purchased on a when-issued or delayed delivery basis.
(g) The rate shown is the seven-day current annualized yield at December 31, 2016.
The accompanying Notes to Financial Statements are an integral part of this statement.
Annual Report 2016
14
COLUMBIA VARIABLE PORTFOLIO — LONG GOVERNMENT/CREDIT BOND FUND
PORTFOLIO OF INVESTMENTS (continued)
December 31, 2016
Notes to Portfolio of Investments (continued)
(h) As defined in the Investment Company Act of 1940, an affiliated company is one in which the Fund owns 5% or more of the company's outstanding voting securities, or a company which is under common ownership or control with the Fund. Holdings and transactions in these affiliated companies during the year ended December 31, 2016 are as follows:
Issuer | Beginning Cost ($) | Purchase Cost ($) | Proceeds From Sales ($) | Realized Gain (Loss) ($) | Ending Cost ($) | Dividends — Affiliated Issuers ($) | Value ($) | ||||||||||||||||||||||||
Columbia Short-Term Cash Fund | 5,950,743 | 380,562,501 | (385,991,467 | ) | 296 | 522,073 | 29,105 | 522,073 | |||||||||||||||||||||||
Abbreviation Legend
BAM Build America Mutual Assurance Co.
STRIPS Separate Trading of Registered Interest and Principal Securities
Currency Legend
USD US Dollar
Fair Value Measurements
The Fund categorizes its fair value measurements according to a three-level hierarchy that maximizes the use of observable inputs and minimizes the use of unobservable inputs by prioritizing that the most observable input be used when available. Observable inputs are those that market participants would use in pricing an investment based on market data obtained from sources independent of the reporting entity. Unobservable inputs are those that reflect the Fund's assumptions about the information market participants would use in pricing an investment. An investment's level within the fair value hierarchy is based on the lowest level of any input that is deemed significant to the asset's or liability's fair value measurement. The input levels are not necessarily an indication of the risk or liquidity associated with investments at that level. For example, certain U.S. government securities are generally high quality and liquid, however, they are reflected as Level 2 because the inputs used to determine fair value may not always be quoted prices in an active market.
Fair value inputs are summarized in the three broad levels listed below:
> Level 1 — Valuations based on quoted prices for investments in active markets that the Fund has the ability to access at the measurement date (including NAV for open-end mutual funds). Valuation adjustments are not applied to Level 1 investments.
> Level 2 — Valuations based on other significant observable inputs (including quoted prices for similar securities, interest rates, prepayment speeds, credit risks, etc.).
> Level 3 — Valuations based on significant unobservable inputs (including the Fund's own assumptions and judgment in determining the fair value of investments).
Inputs that are used in determining fair value of an investment may include price information, credit data, volatility statistics, and other factors. These inputs can be either observable or unobservable. The availability of observable inputs can vary between investments, and is affected by various factors such as the type of investment, and the volume and level of activity for that investment or similar investments in the marketplace. The inputs will be considered by the Investment Manager, along with any other relevant factors in the calculation of an investment's fair value. The Fund uses prices and inputs that are current as of the measurement date, which may include periods of market dislocations. During these periods, the availability of prices and inputs may be reduced for many investments. This condition could cause an investment to be reclassified between the various levels within the hierarchy.
Certain investments that have been measured at fair value using the net asset value (NAV) per share (or its equivalent) are not categorized in the fair value hierarchy. The fair value amounts presented in the table are intended to reconcile the fair value hierarchy to the amounts presented in the Portfolio of Investments. The Columbia Short-Term Cash Fund seeks to provide shareholders with maximum current income consistent with liquidity and stability of principal. Columbia Short-Term Cash Fund prices its shares with a floating NAV and no longer seeks to maintain a stable NAV.
Investments falling into the Level 3 category are primarily supported by quoted prices from brokers and dealers participating in the market for those investments. However, these may be classified as Level 3 investments due to lack of market transparency and corroboration to support these quoted prices. Additionally, valuation models may be used as the pricing source for any remaining investments classified as Level 3. These models may rely on one or more significant unobservable inputs and/or significant assumptions by the Investment Manager. Inputs used in valuations may include, but are not limited to, financial statement analysis, capital account balances, discount rates and estimated cash flows, and comparable company data.
Under the direction of the Fund's Board of Trustees (the Board), the Investment Manager's Valuation Committee (the Committee) is responsible for overseeing the valuation procedures approved by the Board. The Committee consists of voting and non-voting members from various groups within the Investment Manager's organization, including operations and accounting, trading and investments, compliance, risk management and legal.
The accompanying Notes to Financial Statements are an integral part of this statement.
Annual Report 2016
15
COLUMBIA VARIABLE PORTFOLIO — LONG GOVERNMENT/CREDIT BOND FUND
PORTFOLIO OF INVESTMENTS (continued)
December 31, 2016
Fair Value Measurements (continued)
The Committee meets at least monthly to review and approve valuation matters, which may include a description of specific valuation determinations, data regarding pricing information received from approved pricing vendors and brokers and the results of Board-approved valuation control policies and procedures (the Policies). The Policies address, among other things, instances when market quotations are or are not readily available, including recommendations of third party pricing vendors and a determination of appropriate pricing methodologies; events that require specific valuation determinations and assessment of fair value techniques; securities with a potential for stale pricing, including those that are illiquid, restricted, or in default; and the effectiveness of third party pricing vendors, including periodic reviews of vendors. The Committee meets more frequently, as needed, to discuss additional valuation matters, which may include the need to review back-testing results, review time-sensitive information or approve related valuation actions. The Committee reports to the Board, with members of the Committee meeting with the Board at each of its regularly scheduled meetings to discuss valuation matters and actions during the period, similar to those described earlier.
For investments categorized as Level 3, the Committee monitors information similar to that described above, which may include: (i) data specific to the issuer or comparable issuers, (ii) general market or specific sector news and (iii) quoted prices and specific or similar security transactions. The Committee considers this data and any changes from prior periods in order to assess the reasonableness of observable and unobservable inputs, any assumptions or internal models used to value those securities and changes in fair value. This data is also used to corroborate, when available, information received from approved pricing vendors and brokers. Various factors impact the frequency of monitoring this information (which may occur as often as daily). However, the Committee may determine that changes to inputs, assumptions and models are not required as a result of the monitoring procedures performed.
The following table is a summary of the inputs used to value the Fund's investments at December 31, 2016:
| Level 1 Quoted Prices in Active Markets for Identical Assets ($) | Level 2 Other Significant Observable Inputs ($) | Level 3 Significant Unobservable Inputs ($) | Total ($) | ||||||||||||||||
Investments | |||||||||||||||||||
Corporate Bonds & Notes | — | 1,009,012,621 | — | 1,009,012,621 | |||||||||||||||
| Commercial Mortgage-Backed Securities — Non-Agency | — | 43,595,435 | — | 43,595,435 | |||||||||||||||
Asset-Backed Securities — Agency | — | 6,326,261 | — | 6,326,261 | |||||||||||||||
U.S. Treasury Obligations | 174,545,548 | 63,163,323 | — | 237,708,871 | |||||||||||||||
U.S. Government & Agency Obligations | — | 48,225,893 | — | 48,225,893 | |||||||||||||||
Foreign Government Obligations | — | 56,681,169 | — | 56,681,169 | |||||||||||||||
Municipal Bonds | — | 69,618,619 | — | 69,618,619 | |||||||||||||||
Preferred Debt | 2,297,133 | — | — | 2,297,133 | |||||||||||||||
Investments measured at net asset value | |||||||||||||||||||
Money Market Funds | — | — | — | 522,073 | |||||||||||||||
Total Investments | 176,842,681 | 1,296,623,321 | — | 1,473,988,075 | |||||||||||||||
Derivatives | |||||||||||||||||||
Assets | |||||||||||||||||||
Futures Contracts | 1,216,921 | — | — | 1,216,921 | |||||||||||||||
Liabilities | |||||||||||||||||||
Futures Contracts | (2,279,474 | ) | — | — | (2,279,474 | ) | |||||||||||||
Swap Contracts | — | (517,809 | ) | — | (517,809 | ) | |||||||||||||
Total | 175,780,128 | 1,296,105,512 | — | �� | 1,472,407,713 | ||||||||||||||
See the Portfolio of Investments for all investment classifications not indicated in the table.
The Fund's assets assigned to the Level 2 input category are generally valued using the market approach, in which a security's value is determined through reference to prices and information from market transactions for similar or identical assets.
Derivative instruments are valued at unrealized appreciation (depreciation).
There were no transfers of financial assets between levels during the period.
The accompanying Notes to Financial Statements are an integral part of this statement.
Annual Report 2016
16
COLUMBIA VARIABLE PORTFOLIO — LONG GOVERNMENT/CREDIT BOND FUND
STATEMENT OF ASSETS AND LIABILITIES
December 31, 2016
Assets | |||||||
Investments, at value | |||||||
Unaffiliated issuers (identified cost $1,499,292,789) | $ | 1,473,466,002 | |||||
Affiliated issuers (identified cost $522,073) | 522,073 | ||||||
Total investments (identified cost $1,499,814,862) | 1,473,988,075 | ||||||
Margin deposits | 739,182 | ||||||
Premiums paid on outstanding swap contracts | 6,132 | ||||||
Receivable for: | |||||||
Capital shares sold | 54,175 | ||||||
Dividends | 12,946 | ||||||
Interest | 14,273,372 | ||||||
Foreign tax reclaims | 5,343 | ||||||
Variation margin | 1,613,044 | ||||||
Expense reimbursement due from Investment Manager | 12,633 | ||||||
Prepaid expenses | 9,538 | ||||||
Trustees' deferred compensation plan | 32,603 | ||||||
Total assets | 1,490,747,043 | ||||||
Liabilities | |||||||
Unrealized depreciation on swap contracts | 91,792 | ||||||
Premiums received on outstanding swap contracts | 69,973 | ||||||
Payable for: | |||||||
Investments purchased on a delayed delivery basis | 3,260,444 | ||||||
Capital shares purchased | 4,165,319 | ||||||
Variation margin | 496,380 | ||||||
Management services fees | 599,388 | ||||||
Distribution and/or service fees | 3,470 | ||||||
Transfer agent fees | 73,128 | ||||||
Compensation of board members | 2,497 | ||||||
Chief compliance officer expenses | 200 | ||||||
Other expenses | 67,150 | ||||||
Trustees' deferred compensation plan | 32,603 | ||||||
Total liabilities | 8,862,344 | ||||||
Net assets applicable to outstanding capital stock | $ | 1,481,884,699 | |||||
The accompanying Notes to Financial Statements are an integral part of this statement.
Annual Report 2016
17
COLUMBIA VARIABLE PORTFOLIO — LONG GOVERNMENT/CREDIT BOND FUND
STATEMENT OF ASSETS AND LIABILITIES (continued)
December 31, 2016
Represented by | |||||||
Paid-in capital | $ | 1,458,877,848 | |||||
Undistributed net investment income | 46,913,863 | ||||||
Accumulated net realized gain | 3,500,137 | ||||||
Unrealized appreciation (depreciation) on: | |||||||
Investments — unaffiliated issuers | (25,826,787 | ) | |||||
Futures contracts | (1,062,553 | ) | |||||
Swap contracts | (517,809 | ) | |||||
Total — representing net assets applicable to outstanding capital stock | $ | 1,481,884,699 | |||||
Class 1 | |||||||
Net assets | $ | 1,464,842,865 | |||||
Shares outstanding | 147,599,664 | ||||||
Net asset value per share | $ | 9.92 | |||||
Class 2 | |||||||
Net assets | $ | 17,041,834 | |||||
Shares outstanding | 1,721,474 | ||||||
Net asset value per share | $ | 9.90 | |||||
The accompanying Notes to Financial Statements are an integral part of this statement.
Annual Report 2016
18
COLUMBIA VARIABLE PORTFOLIO — LONG GOVERNMENT/CREDIT BOND FUND
STATEMENT OF OPERATIONS
Year Ended December 31, 2016
Net investment income | |||||||
Income: | |||||||
Dividends — unaffiliated issuers | $ | 385,066 | |||||
Dividends — affiliated issuers | 29,105 | ||||||
Interest | 56,076,122 | ||||||
Foreign taxes withheld | (189 | ) | |||||
Total income | 56,490,104 | ||||||
Expenses: | |||||||
Management services fees | 7,883,940 | ||||||
Distribution and/or service fees | |||||||
Class 2 | 43,512 | ||||||
Transfer agent fees | |||||||
Class 1 | 953,208 | ||||||
Class 2 | 10,443 | ||||||
Compensation of board members | 47,012 | ||||||
Custodian fees | 45,509 | ||||||
Printing and postage fees | 30,493 | ||||||
Audit fees | 41,893 | ||||||
Legal fees | 39,173 | ||||||
Chief compliance officer expenses | 761 | ||||||
Other | 47,056 | ||||||
Total expenses | 9,143,000 | ||||||
Fees waived or expenses reimbursed by Investment Manager and its affiliates | (103,399 | ) | |||||
Total net expenses | 9,039,601 | ||||||
Net investment income | 47,450,503 | ||||||
Realized and unrealized gain (loss) — net | |||||||
Net realized gain (loss) on: | |||||||
Investments — unaffiliated issuers | 29,691,018 | ||||||
Investments — affiliated issuers | 296 | ||||||
Futures contracts | (12,469,595 | ) | |||||
Swap contracts | 1,072,227 | ||||||
Net realized gain | 18,293,946 | ||||||
Net change in unrealized appreciation (depreciation) on: | |||||||
Investments — unaffiliated issuers | (16,117,680 | ) | |||||
Futures contracts | (884,939 | ) | |||||
Swap contracts | 316,467 | ||||||
Net change in unrealized depreciation | (16,686,152 | ) | |||||
Net realized and unrealized gain | 1,607,794 | ||||||
Net increase in net assets resulting from operations | $ | 49,058,297 | |||||
The accompanying Notes to Financial Statements are an integral part of this statement.
Annual Report 2016
19
COLUMBIA VARIABLE PORTFOLIO — LONG GOVERNMENT/CREDIT BOND FUND
STATEMENT OF CHANGES IN NET ASSETS
| Year Ended December 31, 2016 | Year Ended December 31, 2015 | ||||||||||
Operations | |||||||||||
Net investment income | $ | 47,450,503 | $ | 33,219,262 | |||||||
Net realized gain (loss) | 18,293,946 | (3,498,026 | ) | ||||||||
Net change in unrealized depreciation | (16,686,152 | ) | (29,161,983 | ) | |||||||
Net increase in net assets resulting from operations | 49,058,297 | 559,253 | |||||||||
Distributions to shareholders | |||||||||||
Net investment income | |||||||||||
Class 1 | (32,640,695 | ) | (33,510,853 | ) | |||||||
Class 2 | (306,838 | ) | (185,943 | ) | |||||||
Total distributions to shareholders | (32,947,533 | ) | (33,696,796 | ) | |||||||
Decrease in net assets from capital stock activity | (30,052,494 | ) | (29,046,474 | ) | |||||||
Total decrease in net assets | (13,941,730 | ) | (62,184,017 | ) | |||||||
Net assets at beginning of year | 1,495,826,429 | 1,558,010,446 | |||||||||
Net assets at end of year | $ | 1,481,884,699 | $ | 1,495,826,429 | |||||||
Undistributed net investment income | $ | 46,913,863 | $ | 32,424,776 | |||||||
The accompanying Notes to Financial Statements are an integral part of this statement.
Annual Report 2016
20
COLUMBIA VARIABLE PORTFOLIO — LONG GOVERNMENT/CREDIT BOND FUND
STATEMENT OF CHANGES IN NET ASSETS (continued)
Year Ended December 31, 2016 | Year Ended December 31, 2015 | ||||||||||||||||||
Shares | Dollars ($) | Shares | Dollars ($) | ||||||||||||||||
Capital stock activity | |||||||||||||||||||
Class 1 shares | |||||||||||||||||||
Subscriptions | 26,827,054 | 277,559,172 | 42,774,782 | 429,209,553 | |||||||||||||||
Distributions reinvested | 3,076,409 | 32,640,695 | 3,426,468 | 33,510,853 | |||||||||||||||
Redemptions | (33,457,990 | ) | (344,592,733 | ) | (49,857,413 | ) | (497,298,663 | ) | |||||||||||
Net decrease | (3,554,527 | ) | (34,392,866 | ) | (3,656,163 | ) | (34,578,257 | ) | |||||||||||
Class 2 shares | |||||||||||||||||||
Subscriptions | 871,789 | 8,900,456 | 751,390 | 7,473,039 | |||||||||||||||
Distributions reinvested | 28,947 | 306,838 | 19,032 | 185,943 | |||||||||||||||
Redemptions | (470,637 | ) | (4,866,922 | ) | (215,431 | ) | (2,127,199 | ) | |||||||||||
Net increase | 430,099 | 4,340,372 | 554,991 | 5,531,783 | |||||||||||||||
Total net decrease | (3,124,428 | ) | (30,052,494 | ) | (3,101,172 | ) | (29,046,474 | ) | |||||||||||
The accompanying Notes to Financial Statements are an integral part of this statement.
Annual Report 2016
21
COLUMBIA VARIABLE PORTFOLIO — LONG GOVERNMENT/CREDIT BOND FUND
FINANCIAL HIGHLIGHTS
The following tables are intended to help you understand the Fund's financial performance. Certain information reflects financial results for a single share of a class held for the periods shown. Per share net investment income (loss) amounts are calculated based on average shares outstanding during the period. Total return assumes reinvestment of all dividends and distributions, if any. Total return does not reflect any fees and expenses imposed under your Contract and/or Qualified Plan, as applicable; such fees and expenses would reduce the total returns for all periods shown. Total return and portfolio turnover are not annualized for periods of less than one year. The portfolio turnover rate is calculated without regard to purchase and sales transactions of short-term instruments and certain derivatives, if any. If such transactions were included, the Fund's portfolio turnover rate may be higher.
Year Ended December 31, | |||||||||||||||||||
Class 1 | 2016 | 2015 | 2014 | 2013(a) | |||||||||||||||
Per share data | |||||||||||||||||||
Net asset value, beginning of period | $ | 9.81 | $ | 10.02 | $ | 9.60 | $ | 10.00 | |||||||||||
Income from investment operations: | |||||||||||||||||||
Net investment income | 0.30 | 0.21 | 0.20 | 0.12 | |||||||||||||||
Net realized and unrealized gain (loss) | 0.01 | (0.22 | ) | 0.34 | (0.52 | ) | |||||||||||||
Total from investment operations | 0.31 | (0.01 | ) | 0.54 | (0.40 | ) | |||||||||||||
Less distributions to shareholders: | |||||||||||||||||||
Net investment income | (0.20 | ) | (0.20 | ) | (0.12 | ) | — | ||||||||||||
Total distributions to shareholders | (0.20 | ) | (0.20 | ) | (0.12 | ) | — | ||||||||||||
Net asset value, end of period | $ | 9.92 | $ | 9.81 | $ | 10.02 | $ | 9.60 | |||||||||||
Total return | 3.02 | % | (0.07 | %) | 5.62 | % | (4.00 | %) | |||||||||||
Ratios to average net assets(b) | |||||||||||||||||||
Total gross expenses | 0.57 | % | 0.57 | % | 0.56 | % | 0.57 | %(c) | |||||||||||
Total net expenses(d) | 0.56 | % | 0.56 | % | 0.56 | % | 0.57 | %(c) | |||||||||||
Net investment income | 2.96 | % | 2.09 | % | 2.02 | % | 1.91 | %(c) | |||||||||||
Supplemental data | |||||||||||||||||||
Net assets, end of period (in thousands) | $ | 1,464,843 | $ | 1,483,185 | $ | 1,550,651 | $ | 1,776,191 | |||||||||||
Portfolio turnover | 394 | % | 414 | % | 346 | % | 350 | % | |||||||||||
Notes to Financial Highlights
(a) Based on operations from April 30, 2013 (commencement of operations) through the stated period end.
(b) In addition to the fees and expenses that the Fund bears directly, the Fund indirectly bears a pro rata share of the fees and expenses of any other funds in which it invests. Such indirect expenses are not included in the Fund's reported expense ratios.
(c) Annualized.
(d) Total net expenses include the impact of certain fee waivers/expense reimbursements made by the Investment Manager and certain of its affiliates, if applicable.
The accompanying Notes to Financial Statements are an integral part of this statement.
Annual Report 2016
22
COLUMBIA VARIABLE PORTFOLIO — LONG GOVERNMENT/CREDIT BOND FUND
FINANCIAL HIGHLIGHTS (continued)
Year Ended December 31, | |||||||||||||||||||
Class 2 | 2016 | 2015 | 2014 | 2013(a) | |||||||||||||||
Per share data | |||||||||||||||||||
Net asset value, beginning of period | $ | 9.79 | $ | 9.99 | $ | 9.59 | $ | 10.00 | |||||||||||
Income from investment operations: | |||||||||||||||||||
Net investment income | 0.28 | 0.18 | 0.18 | 0.11 | |||||||||||||||
Net realized and unrealized gain (loss) | 0.00 | (b) | (0.20 | ) | 0.32 | (0.52 | ) | ||||||||||||
Total from investment operations | 0.28 | (0.02 | ) | 0.50 | (0.41 | ) | |||||||||||||
Less distributions to shareholders: | |||||||||||||||||||
Net investment income | (0.17 | ) | (0.18 | ) | (0.10 | ) | — | ||||||||||||
Total distributions to shareholders | (0.17 | ) | (0.18 | ) | (0.10 | ) | — | ||||||||||||
Net asset value, end of period | $ | 9.90 | $ | 9.79 | $ | 9.99 | $ | 9.59 | |||||||||||
Total return | 2.78 | % | (0.22 | %) | 5.25 | % | (4.10 | %) | |||||||||||
Ratios to average net assets(c) | |||||||||||||||||||
Total gross expenses | 0.82 | % | 0.82 | % | 0.82 | % | 0.82 | %(d) | |||||||||||
Total net expenses(e) | 0.81 | % | 0.81 | % | 0.81 | % | 0.82 | %(d) | |||||||||||
Net investment income | 2.73 | % | 1.86 | % | 1.82 | % | 1.69 | %(d) | |||||||||||
Supplemental data | |||||||||||||||||||
Net assets, end of period (in thousands) | $ | 17,042 | $ | 12,641 | $ | 7,359 | $ | 1,431 | |||||||||||
Portfolio turnover | 394 | % | 414 | % | 346 | % | 350 | % | |||||||||||
Notes to Financial Highlights
(a) Based on operations from April 30, 2013 (commencement of operations) through the stated period end.
(b) Rounds to zero.
(c) In addition to the fees and expenses that the Fund bears directly, the Fund indirectly bears a pro rata share of the fees and expenses of any other funds in which it invests. Such indirect expenses are not included in the Fund's reported expense ratios.
(d) Annualized.
(e) Total net expenses include the impact of certain fee waivers/expense reimbursements made by the Investment Manager and certain of its affiliates, if applicable.
The accompanying Notes to Financial Statements are an integral part of this statement.
Annual Report 2016
23
COLUMBIA VARIABLE PORTFOLIO — LONG GOVERNMENT/CREDIT BOND FUND
NOTES TO FINANCIAL STATEMENTS
December 31, 2016
Note 1. Organization
Columbia Variable Portfolio — Long Government/Credit Bond Fund (formerly known as Columbia Variable Portfolio — Core Bond Fund) (the Fund), a series of Columbia Funds Variable Insurance Trust (the Trust), is a diversified fund. The Trust is registered under the Investment Company Act of 1940, as amended (the 1940 Act), as an open-end management investment company organized as a Massachusetts business trust. Effective May 1, 2016, Columbia Variable Portfolio — Core Bond Fund was renamed Columbia Variable Portfolio — Long Government/Credit Bond Fund.
Fund Shares
The Trust may issue an unlimited number of shares (without par value). The Fund offers Class 1 and Class 2 shares to separate accounts funding variable annuity contracts and variable life insurance policies (collectively, Contracts) issued by affiliated and unaffiliated life insurance companies as well as qualified pension and retirement plans (Qualified Plans) and other qualified institutional investors (Qualified Investors) authorized by Columbia Management Investment Distributors, Inc. (the Distributor). You may not buy (nor will you own) shares of the Fund directly. You may invest by participating in a Qualified Plan or by buying a Contract and making allocations to the Fund. Although all share classes generally have identical voting, dividend and liquidation rights, each share class votes separately when required by the Trust's organizational documents or by law. Different share classes pay different distribution amounts to the extent the expenses of such share classes differ, and distributions in liquidation will be proportional to the net asset value of each share class. Each share class has its own cost structure and other features.
Note 2. Summary of Significant Accounting Policies
Basis of Preparation
The Fund is an investment company that applies the accounting and reporting guidance in the Financial Accounting Standards Board (FASB) Accounting Standards Codification Topic 946, Financial Services — Investment Companies (ASC 946). The financial statements are prepared in accordance with U.S. generally accepted accounting principles (GAAP), which requires management to make certain estimates and assumptions that affect the reported amounts of assets and liabilities, the disclosure of contingent assets and
liabilities at the date of the financial statements and the reported amounts of income and expenses during the reporting period. Actual results could differ from those estimates.
The following is a summary of significant accounting policies followed by the Fund in the preparation of its financial statements.
Security Valuation
Debt securities generally are valued by pricing services approved by the Board of Trustees based upon market transactions for normal, institutional-size trading units of similar securities. The services may use various pricing techniques that take into account, as applicable, factors such as yield, quality, coupon rate, maturity, type of issue, trading characteristics and other data, as well as approved independent broker-dealer quotes. Debt securities for which quotations are not readily available or not believed to be reflective of market value may also be valued based upon a bid quote from an approved independent broker-dealer. Debt securities maturing in 60 days or less are valued primarily at amortized cost value, unless this method results in a valuation that management believes does not approximate market value.
Asset- and mortgage-backed securities are generally valued by pricing services, which utilize pricing models that incorporate the securities' cash flow and loan performance data. These models also take into account available market data, including trades, market quotations, and benchmark yield curves for identical or similar securities. Factors used to identify similar securities may include, but are not limited to, issuer, collateral type, vintage, prepayment speeds, collateral performance, credit ratings, credit enhancement and expected life. Asset-backed securities for which quotations are readily available may also be valued based upon an over-the-counter or exchange bid quote from an approved independent broker-dealer.
Investments in open-end investment companies, including money market funds, are valued at their latest net asset value.
Futures and options on futures contracts are valued based upon the settlement price at the close of regular trading on their principal exchanges or, in the absence of transactions, at the mean of the latest quoted bid and ask prices.
Swap transactions are valued through an independent pricing service or broker, or if neither is available, through an internal model based upon observable inputs.
Annual Report 2016
24
COLUMBIA VARIABLE PORTFOLIO — LONG GOVERNMENT/CREDIT BOND FUND
NOTES TO FINANCIAL STATEMENTS (continued)
December 31, 2016
Investments for which market quotations are not readily available, or that have quotations which management believes are not reflective of market value or reliable, are valued at fair value as determined in good faith under procedures approved by and under the general supervision of the Board of Trustees. If a security or class of securities (such as foreign securities) is valued at fair value, such value is likely to be different from the quoted or published price for the security.
The determination of fair value often requires significant judgment. To determine fair value, management may use assumptions including but not limited to future cash flows and estimated risk premiums. Multiple inputs from various sources may be used to determine fair value.
GAAP requires disclosure regarding the inputs and valuation techniques used to measure fair value and any changes in valuation inputs or techniques. In addition, investments shall be disclosed by major category. This information is disclosed following the Fund's Portfolio of Investments.
Derivative Instruments
The Fund invests in certain derivative instruments, as detailed below, to meet its investment objectives. Derivatives are instruments whose values depend on, or are derived from, in whole or in part, the value of one or more securities, currencies, commodities, indices, or other assets or instruments. Derivatives may be used to increase investment flexibility (including to maintain cash reserves while maintaining desired exposure to certain assets), for risk management (hedging) purposes, to facilitate trading, to reduce transaction costs and to pursue higher investment returns. The Fund may also use derivative instruments to mitigate certain investment risks, such as foreign currency exchange rate risk, interest rate risk and credit risk. Derivatives may involve various risks, including the potential inability of the counterparty to fulfill its obligations under the terms of the contract, the potential for an illiquid secondary market (making it difficult for the Fund to sell or terminate, including at favorable prices) and the potential for market movements which may expose the Fund to gains or losses in excess of the amount shown in the Statement of Assets and Liabilities. The notional amounts of derivative instruments, if applicable, are not recorded in the financial statements.
A derivative instrument may suffer a marked-to-market loss if the value of the contract decreases due to an unfavorable change in the market rates or values of the underlying instrument. Losses can also occur if the
counterparty does not perform its obligations under the contract. The Fund's risk of loss from counterparty credit risk on over-the-counter derivatives is generally limited to the aggregate unrealized gain netted against any collateral held by the Fund and the amount of any variation margin held by the counterparty, plus any replacement costs or related amounts. With exchange-traded or centrally cleared derivatives, there is reduced counterparty credit risk to the Fund since the clearinghouse or central counterparty (CCP) provides some protection in the case of clearing member default. The clearinghouse or CCP stands between the buyer and the seller of the contract; therefore, additional counterparty credit risk is failure of the clearinghouse or CCP. However, credit risk still exists in exchange-traded or centrally cleared derivatives with respect to initial and variation margin that is held in a broker's customer account. While brokers are required to segregate customer margin from their own assets, in the event that a broker becomes insolvent or goes into bankruptcy and at that time there is a shortfall in the aggregate amount of margin held by the broker for all its clients, U.S. bankruptcy laws will typically allocate that shortfall on a pro-rata basis across all the broker's customers (including the Fund), potentially resulting in losses to the Fund.
In order to better define its contractual rights and to secure rights that will help the Fund mitigate its counterparty risk, the Fund may enter into an International Swaps and Derivatives Association, Inc. Master Agreement (ISDA Master Agreement) or similar agreement with its derivatives contract counterparties. An ISDA Master Agreement is an agreement between the Fund and a counterparty that governs over-the-counter derivatives and typically contains, among other things, collateral posting terms and netting provisions in the event of a default and/or termination event. Under an ISDA Master Agreement, the Fund may, under certain circumstances, offset with the counterparty certain derivative instrument's payables and/or receivables with collateral held and/or posted and create one single net payment. The provisions of the ISDA Master Agreement typically permit a single net payment in the event of default (close-out netting), including the bankruptcy or insolvency of the counterparty. Note, however, that bankruptcy or insolvency laws of a particular jurisdiction may impose restrictions on or prohibitions against the right of offset or netting in bankruptcy, insolvency or other events.
Annual Report 2016
25
COLUMBIA VARIABLE PORTFOLIO — LONG GOVERNMENT/CREDIT BOND FUND
NOTES TO FINANCIAL STATEMENTS (continued)
December 31, 2016
Collateral (margin) requirements differ by type of derivative. Margin requirements are established by the clearinghouse or CCP for exchange-traded and centrally cleared derivatives. Brokers can ask for margin in excess of the minimum in certain circumstances. Collateral terms are contract specific for over-the-counter derivatives. For over-the-counter derivatives traded under an ISDA Master Agreement, the collateral requirements are typically calculated by netting the marked-to-market amount for each transaction under such agreement and comparing that amount to the value of any variation margin currently pledged by the Fund and/or the counterparty. Generally, the amount of collateral due from or to a party has to exceed a minimum transfer amount threshold (e.g., $250,000) before a transfer has to be made. To the extent amounts due to the Fund from its counterparties are not fully collateralized, contractually or otherwise, the Fund bears the risk of loss from counterparty nonperformance. The Fund attempts to mitigate counterparty risk by only entering into agreements with counterparties that it believes have the financial resources to honor their obligations and by monitoring the financial stability of those counterparties.
Certain ISDA Master Agreements allow counterparties of over-the-counter derivatives transactions to terminate derivatives contracts prior to maturity in the event the Fund's net asset value declines by a stated percentage over a specified time period or if the Fund fails to meet certain terms of the ISDA Master Agreement, which would cause the Fund to accelerate payment of any net liability owed to the counterparty. The Fund also has termination rights if the counterparty fails to meet certain terms of the ISDA Master Agreement. In addition to considering counterparty credit risk, the Fund would consider terminating the derivatives contracts based on whether termination would result in a net liability owed from the counterparty.
For financial reporting purposes, the Fund does not offset derivative assets and derivative liabilities that are subject to netting arrangements in the Statement of Assets and Liabilities.
Futures Contracts
Futures contracts are exchange-traded and represent commitments for the future purchase or sale of an asset at a specified price on a specified date. The Fund bought and sold futures contracts to manage the duration and yield curve exposure of the Fund versus the benchmark. These instruments may be used for other purposes in future periods. Upon entering into futures contracts, the
Fund bears risks that it may not achieve the anticipated benefits of the futures contracts and may realize a loss. Additional risks include counterparty credit risk, the possibility of an illiquid market, and that a change in the value of the contract or option may not correlate with changes in the value of the underlying asset.
Upon entering into a futures contract, the Fund deposits cash or securities with the broker, known as a futures commission merchant (FCM), in an amount sufficient to meet the initial margin requirement. The initial margin deposit must be maintained at an established level over the life of the contract. Cash deposited as initial margin is recorded in the Statement of Assets and Liabilities as margin deposits. Securities deposited as initial margin are designated in the Portfolio of Investments. Subsequent payments (variation margin) are made or received by the Fund each day. The variation margin payments are equal to the daily change in the contract value and are recorded as variation margin receivable or payable and are offset in unrealized gains or losses. The Fund recognizes a realized gain or loss when the contract is closed or expires. Futures contracts involve, to varying degrees, risk of loss in excess of the variation margin disclosed in the Statement of Assets and Liabilities.
Swap Contracts
Swap contracts are negotiated in the over-the-counter market and may be entered into as a bilateral contract or centrally cleared (centrally cleared swap contract). In a centrally cleared swap contract, immediately following execution of the swap contract with a broker, the swap contract is novated to a central counterparty (the CCP) and the CCP becomes the Fund's counterparty to the centrally cleared swap contract. The Fund is required to deposit initial margin with the futures commission merchant (FCM), which pledges it through to the CCP in the form of cash or securities in an amount that varies depending on the size and risk profile of the particular swap contract. Securities deposited as initial margin are designated in the Portfolio of Investments and cash deposited is recorded in the Statement of Assets and Liabilities as margin deposits. Unlike a bilateral swap contract, for centrally cleared swap contracts, the Fund has minimal credit exposure to the FCM because the CCP stands between the Fund and the relevant buyer/seller on the other side of the contract. Swap contracts are marked-to-market daily and changes in value are recorded as unrealized appreciation (depreciation). The daily change in valuation of centrally cleared swap contracts, if any, is recorded as a
Annual Report 2016
26
COLUMBIA VARIABLE PORTFOLIO — LONG GOVERNMENT/CREDIT BOND FUND
NOTES TO FINANCIAL STATEMENTS (continued)
December 31, 2016
receivable or payable for variation margin in the Statement of Assets and Liabilities.
Entering into these contracts involves, to varying degrees, elements of interest, liquidity and counterparty credit risk in excess of the amounts recognized in the Statement of Assets and Liabilities. Such risks involve the possibility that there may be unfavorable changes in interest rates, market conditions or other conditions, it may be difficult to initiate a swap transaction or liquidate a position at an advantageous time or price which may result in significant losses, and that the FCM or CCP may not fulfill its obligation under the contract.
Credit Default Swap Contracts
The Fund entered into credit default swap contracts to increase or decrease its credit exposure to an index, increase or decrease its credit exposure to a single issuer of debt securities, manage credit risk exposure. Additionally, credit default swap contracts were used to hedge the Fund's exposure on a debt security that it owns or in lieu of selling such debt security. These instruments may be used for other purposes in future periods. Credit default swap contracts are agreements in which one party pays fixed periodic payments to a counterparty in consideration for an agreement from the counterparty to make a specific payment should a specified credit event(s) take place. Although specified credit events are contract specific, credit events are generally defined as bankruptcy, failure to pay, restructuring, obligation acceleration, obligation default, or repudiation/moratorium.
As the purchaser of a credit default swap contract, the Fund purchases protection by paying a periodic interest rate on the notional amount to the counterparty. The interest amount is accrued daily as a component of unrealized appreciation (depreciation) and is recorded as a realized loss upon payment. If a credit event as specified in the contract occurs, the Fund may have the option either to deliver the reference obligation to the seller in exchange for a cash payment of its par amount, or to receive a net cash settlement equal to the par amount less an agreed-upon value of the reference obligation as of the date of the credit event. The difference between the value of the obligation or cash delivered and the notional amount received will be recorded as a realized gain (loss).
Any premium paid or received by the Fund upon entering into a credit default swap contract is recorded as an asset or liability, respectively, and amortized daily as a component of realized gain (loss) in the Statement of Operations. Credit default swap contracts are valued
daily, and the change in value is recorded as unrealized appreciation (depreciation) until the termination of the swap, at which time a realized gain (loss) is recorded.
Credit default swap contracts can involve greater risks than if a fund had invested in the reference obligation directly since, in addition to general market risks, credit default swaps are subject to counterparty credit risk, leverage risk, hedging risk, correlation risk and liquidity risk.
Effects of Derivative Transactions in the Financial Statements
The following tables are intended to provide additional information about the effect of derivatives on the financial statements of the Fund, including: the fair value of derivatives by risk category and the location of those fair values in the Statement of Assets and Liabilities; and the impact of derivative transactions over the period in the Statement of Operations, including realized and unrealized gains (losses). The derivative instrument schedules following the Portfolio of Investments present additional information regarding derivative instruments outstanding at the end of the period, if any.
The following table is a summary of the fair value of derivative instruments (not considered to be hedging instruments for accounting disclosure purposes) at December 31, 2016:
Asset Derivatives | |||||||||||
| Risk Exposure Category | Statement of Assets and Liabilities Location | Fair Value ($) | |||||||||
| Credit risk | Premiums paid on outstanding swap contracts | 6,132 | |||||||||
| Interest rate risk | Net assets — unrealized appreciation on futures contracts | 1,216,921 | * | ||||||||
Total | 1,223,053 | ||||||||||
Liability Derivatives | |||||||||||
| Risk Exposure Category | Statement of Assets and Liabilities Location | Fair Value ($) | |||||||||
| Credit risk | Net assets — unrealized depreciation on swap contracts | 517,809 | * | ||||||||
| Credit risk | Premiums received on outstanding swap contracts | 69,973 | |||||||||
| Interest rate risk | Net assets — unrealized depreciation on futures contracts | 2,279,474 | * | ||||||||
Total | 2,867,256 | ||||||||||
*Includes cumulative appreciation (depreciation) as reported in the tables following the Portfolio of Investments. Only the current day's variation margin is reported in receivables or payables in the Statement of Assets and Liabilities.
Annual Report 2016
27
COLUMBIA VARIABLE PORTFOLIO — LONG GOVERNMENT/CREDIT BOND FUND
NOTES TO FINANCIAL STATEMENTS (continued)
December 31, 2016
The following table indicates the effect of derivative instruments (not considered to be hedging instruments for accounting disclosure purposes) in the Statement of Operations for the year ended December 31, 2016:
Amount of Realized Gain (Loss) on Derivatives Recognized in Income | |||||||||||||||
| Risk Exposure Category | Futures Contracts ($) | Swap Contracts ($) | Total ($) | ||||||||||||
Credit risk | — | 1,072,227 | 1,072,227 | ||||||||||||
Interest rate risk | (12,469,595 | ) | — | (12,469,595 | ) | ||||||||||
Total | (12,469,595 | ) | 1,072,227 | (11,397,368 | ) | ||||||||||
| Change in Unrealized Appreciation (Depreciation) on Derivatives Recognized in Income | |||||||||||||||
| Risk Exposure Category | Futures Contracts ($) | Swap Contracts ($) | Total ($) | ||||||||||||
Credit risk | — | 316,467 | 316,467 | ||||||||||||
Interest rate risk | (884,939 | ) | — | (884,939 | ) | ||||||||||
Total | (884,939 | ) | 316,467 | (568,472 | ) | ||||||||||
The following table provides a summary of the average outstanding volume by derivative instrument for the year ended December 31, 2016:
Derivative Instrument | Average Notional Amounts ($)* | ||||||
Futures contracts — Long | 312,726,346 | ||||||
Futures contracts — Short | 207,420,958 | ||||||
Credit default swap contracts — buy protection | 64,068,750 | ||||||
Credit default swap contracts — sell protection | 19,382,500 | ||||||
*Based on the ending quarterly outstanding amounts for the year ended December 31, 2016.
Asset- and Mortgage-Backed Securities
The Fund may invest in asset-backed and mortgage-backed securities. The maturity dates shown represent the original maturity of the underlying obligation. Actual maturity may vary based upon prepayment activity on these obligations. All, or a portion, of the obligation may be prepaid at any time because the underlying asset may be prepaid. As a result, decreasing market interest rates could result in an increased level of prepayment. An increased prepayment rate will have the effect of shortening the maturity of the security. Unless otherwise noted, the coupon rates presented are fixed rates.
Delayed Delivery Securities
The Fund may trade securities on other than normal settlement terms, including securities purchased or sold on a "when-issued" basis. This may increase risk to the Fund since the other party to the transaction may fail to deliver, which could cause the Fund to subsequently invest at less advantageous prices. The Fund designates
cash or liquid securities in an amount equal to the delayed delivery commitment.
To Be Announced Securities
The Fund may trade securities on a To Be Announced (TBA) basis. As with other delayed-delivery transactions, a seller agrees to issue a TBA security at a future date. However, the seller does not specify the particular securities to be delivered. Instead, the Fund agrees to accept any security that meets specified terms.
In some cases, Master Securities Forward Transaction Agreements (MSFTAs) may be used to govern transactions of certain forward-settling agency mortgage-backed securities, such as delayed-delivery and TBAs, between the Fund and counterparty. The MSFTA maintains provisions for, among other things, initiation and confirmation, payment and transfer, events of default, termination, and maintenance of collateral relating to such transactions.
Mortgage Dollar Roll Transactions
The Fund may enter into mortgage "dollar rolls" in which the Fund sells securities for delivery in the current month and simultaneously contracts with the same counterparty to repurchase similar but not identical securities (same type, coupon and maturity) on a specified future date. During the roll period, the Fund loses the right to receive principal and interest paid on the securities sold. However, the Fund will benefit because it receives negotiated amounts in the form of reductions of the purchase price for the future purchase plus the interest earned on the cash proceeds of the securities sold until the settlement date of the forward purchase. The Fund records the incremental difference between the forward purchase and sale of each forward roll as a realized gain or loss. Unless any realized gains exceed the income, capital appreciation, and gain or loss due to mortgage prepayments that would have been realized on the securities sold as part of the mortgage dollar roll, the use of this technique will diminish the investment performance of the Fund compared to what the performance would have been without the use of mortgage dollar rolls. All cash proceeds will be invested in instruments that are permissible investments for the Fund. The Fund identifies cash or liquid securities in an amount equal to the forward purchase price.
For financial reporting and tax purposes, the Fund treats "to be announced" mortgage dollar rolls as two separate transactions, one involving the purchase of a security and a separate transaction involving a sale. These transactions may increase the Fund's portfolio turnover
Annual Report 2016
28
COLUMBIA VARIABLE PORTFOLIO — LONG GOVERNMENT/CREDIT BOND FUND
NOTES TO FINANCIAL STATEMENTS (continued)
December 31, 2016
rate. The Fund does not currently enter into mortgage dollar rolls that are accounted for as financing transactions.
Mortgage dollar rolls involve the risk that the market value of the securities the Fund is obligated to repurchase may decline below the repurchase price, or that the counterparty may default on its obligations.
Interest only and principal only securities
The Fund may invest in Interest Only (IO) or Principal Only (PO) securities. IOs are stripped securities entitled to receive all of the security's interest, but none of its principal. IOs are particularly sensitive to changes in interest rates and therefore subject to greater fluctuations in price than typical interest bearing debt securities. IOs are also subject to credit risk because the Fund may not receive all or part of the interest payments if the issuer, obligor, guarantor or counterparty defaults
on its obligation. Payments received for IOs are included in interest income on the Statement of Operations. Because no principal will be received at the maturity of an IO, adjustments are made to the cost of the security on a monthly basis until maturity. These adjustments are included in interest income on the Statement of Operations. POs are stripped securities entitled to receive the principal from the underlying obligation, but not the interest. POs are particularly sensitive to changes in interest rates and therefore are subject to fluctuations in price. POs are also subject to credit risk because the Fund may not receive all or part of its principal if the issuer, obligor, guarantor or counterparty defaults on its obligation. The Fund may also invest in IO or PO stripped mortgage-backed securities. Payments received for POs are treated as reductions to the cost and par value of the securities.
Offsetting of Assets and Liabilities
The following table presents the Fund's gross and net amount of assets and liabilities available for offset under netting arrangements as well as any related collateral received or pledged by the Fund as of December 31, 2016:
Barclays ($) | Citi ($) | JPMorgan ($) | Morgan Stanley ($) | Total ($) | |||||||||||||||||||
Assets | |||||||||||||||||||||||
Centrally cleared credit default swap contracts(a) | — | — | — | 4,994 | 4,994 | ||||||||||||||||||
Liabilities | |||||||||||||||||||||||
OTC credit default swap contracts(b) | 43,348 | 13,857 | 98,428 | — | 155,633 | ||||||||||||||||||
Total Financial and Derivative Net Assets | (43,348 | ) | (13,857 | ) | (98,428 | ) | 4,994 | (150,639 | ) | ||||||||||||||
Total collateral received (pledged)(c) | — | — | — | — | — | ||||||||||||||||||
Net Amount(d) | (43,348 | ) | (13,857 | ) | (98,428 | ) | 4,994 | (150,639 | ) | ||||||||||||||
(a) Centrally cleared swaps are included within payable/receivable for variation margin on the Statement of Assets and Liabilities.
(b) Over-the-Counter Swap Contracts are presented at market value plus periodic payments receivable (payable), which is comprised of unrealized appreciation, unrealized depreciation, premiums paid and premiums received.
(c) In some instances, the actual collateral received and/or pledged may be more than the amount shown due to overcollateralization.
(d) Represents the net amount due from/(to) counterparties in the event of default.
Security Transactions
Security transactions are accounted for on the trade date. Cost is determined and gains (losses) are based upon the specific identification method for both financial statement and federal income tax purposes.
Income Recognition
Interest income is recorded on an accrual basis. Market premiums and discounts, including original issue discounts, are amortized and accreted, respectively, over the expected life of the security on all debt securities, unless otherwise noted. The Fund classifies gains and
losses realized on prepayments received on mortgage-backed securities as adjustments to interest income.
The Fund may place a debt security on non-accrual status and reduce related interest income when it becomes probable that the interest will not be collected and the amount of uncollectible interest can be reasonably estimated. A defaulted debt security is removed from non-accrual status when the issuer resumes interest payments or when collectibility of interest is reasonably assured.
Dividend income is recorded on the ex-dividend date.
Annual Report 2016
29
COLUMBIA VARIABLE PORTFOLIO — LONG GOVERNMENT/CREDIT BOND FUND
NOTES TO FINANCIAL STATEMENTS (continued)
December 31, 2016
Expenses
General expenses of the Trust are allocated to the Fund and other funds of the Trust based upon relative net assets or other expense allocation methodologies determined by the nature of the expense. Expenses directly attributable to the Fund are charged to the Fund. Expenses directly attributable to a specific class of shares are charged to that share class.
Determination of Class Net Asset Value
All income, expenses (other than class-specific expenses, which are charged to that share class, as shown in the Statement of Operations) and realized and unrealized gains (losses) are allocated to each class of the Fund on a daily basis, based on the relative net assets of each class, for purposes of determining the net asset value of each class.
Federal Income Tax Status
The Fund intends to qualify each year as a regulated investment company under Subchapter M of the Internal Revenue Code, as amended, and will distribute substantially all of its taxable income, if any, for its tax year, and as such will not be subject to federal income taxes. In addition, because the Fund meets the exception under Internal Revenue Code Section 4982(f), the Fund expects not to be subject to federal excise tax. Therefore, no federal income or excise tax provision is recorded.
Foreign Taxes
The Fund may be subject to foreign taxes on income, gains on investments or currency repatriation, a portion of which may be recoverable. The Fund will accrue such taxes and recoveries, as applicable, based upon its current interpretation of tax rules and regulations that exist in the markets in which it invests.
Realized gains in certain countries may be subject to foreign taxes at the Fund level, based on statutory rates. The Fund accrues for such foreign taxes on realized and unrealized gains at the appropriate rate for each jurisdiction, as applicable. The amount, if any, is disclosed as a liability on the Statement of Assets and Liabilities.
Distributions to Subaccounts
Distributions to the subaccounts of Contracts, Qualified Plans and Qualified Investors are recorded at the close of business on the record date and are payable on the first business day following the record date. Dividends from net investment income, if any, are declared and
distributed annually. Capital gains distributions, when available, will be made annually. However, an additional capital gain distribution may be made during the fiscal year in order to comply with the Internal Revenue Code, as applicable to registered investment companies. Income distributions and capital gain distributions are determined in accordance with federal income tax regulations, which may differ from GAAP. All dividends and distributions are reinvested in additional shares of the applicable share class of the Fund at the net asset value as of the ex-dividend date of the distribution.
Guarantees and Indemnifications
Under the Trust's organizational documents and, in some cases, by contract, its officers and trustees are indemnified against certain liabilities arising out of the performance of their duties to the Trust or its funds. In addition, certain of the Fund's contracts with its service providers contain general indemnification clauses. The Fund's maximum exposure under these arrangements is unknown since the amount of any future claims that may be made against the Fund cannot be determined, and the Fund has no historical basis for predicting the likelihood of any such claims.
Investment Company Reporting Modernization
In October 2016, the U.S. Securities and Exchange Commission adopted new rules and forms, and amendments to certain current rules and forms, to modernize reporting and disclosure of information by registered investment companies. The amendments to Regulation S-X will require standardized, enhanced disclosure about derivatives in investment company financial statements, and will also change the rules governing the form and content of such financial statements. The amendments to Regulation S-X take effect on August 1, 2017. At this time, management is assessing the anticipated impact of these regulatory developments.
Note 3. Fees and Other Transactions with Affiliates
Management Services Fees
Effective May 1, 2016, the Fund entered into a Management Agreement with Columbia Management Investment Advisers, LLC (the Investment Manager), a wholly-owned subsidiary of Ameriprise Financial, Inc. (Ameriprise Financial). Under the Management Agreement, the Investment Manager provides the Fund with investment research and advice, as well as
Annual Report 2016
30
COLUMBIA VARIABLE PORTFOLIO — LONG GOVERNMENT/CREDIT BOND FUND
NOTES TO FINANCIAL STATEMENTS (continued)
December 31, 2016
administrative and accounting services. The management services fee is an annual fee that is equal to a percentage of the Fund's average daily net assets that declines from 0.50% to 0.34% as the Fund's net assets increase. Prior to May 1, 2016, the Fund paid the Investment Manager an annual fee for advisory services under an Investment Management Services Agreement and a separate annual fee for administrative and accounting services under an Administrative Services Agreement. The effective management services fee rate for the year ended December 31, 2016 (reflecting all advisory and administrative services fees paid to the Investment Manager) was 0.49% of the Fund's average daily net assets. For the period from January 1, 2016 through April 30, 2016, the investment advisory services fee paid to the Investment Manager was $2,096,876, and the administrative services fee paid to the Investment Manager was $319,463.
Compensation of Board Members
Board of Trustee members, who are not officers or employees of the Investment Manager or Ameriprise Financial, are compensated for their services to the Fund as disclosed in the Statement of Operations. These Board of Trustee members may participate in a Deferred Compensation Plan (the Plan) which may be terminated at any time. Obligations of the Plan will be paid solely out of the Fund's assets, and all amounts payable under the Plan constitute a general unsecured obligation of the Fund.
Compensation of Chief Compliance Officer
The Board of Trustees has appointed a Chief Compliance Officer to the Fund in accordance with federal securities regulations. The Fund is allocated a portion of the expenses associated with the Chief Compliance Officer based on relative net assets of the Trust.
Transactions with Affiliates
For the year ended December 31, 2016, the Fund engaged in purchase and/or sale transactions with affiliates and/or accounts that have a common investment manager (or affiliated investment managers), common directors/trustees, and/or common officers. Those purchase and sale transactions complied with provisions of Rule 17a-7 under the 1940 Act and were $0 and $256,734 respectively. The sale transactions resulted in a net realized gain of $18,626.
Transfer Agency Fees
The Fund has a Transfer and Dividend Disbursing Agent Agreement with Columbia Management Investment Services Corp. (the Transfer Agent), an affiliate of the Investment Manager and a wholly-owned subsidiary of Ameriprise Financial. The annual fee rate under this agreement is 0.06% of the Fund's average daily net assets attributable to each share class.
Distribution Fees
The Fund has an agreement with the Distributor, an affiliate of the Investment Manager and a wholly-owned subsidiary of Ameriprise Financial, for distribution services. The Board of Trustees has approved, and the Fund has adopted, a distribution plan (the Plan) which sets the distribution fees for the Fund. These fees are calculated daily and are intended to compensate the Distributor for selling shares of the Fund. The Fund pays a monthly distribution fee to the Distributor at the maximum annual rate of 0.25% of the average daily net assets attributable to Class 2 shares of the Fund. The Fund pays no distribution and service fees for Class 1 shares.
Expenses Waived/Reimbursed by the Investment Manager and its Affiliates
The Investment Manager and certain of its affiliates have contractually agreed to waive fees and/or reimburse expenses (excluding certain fees and expenses described below) for the period disclosed below, unless sooner terminated at the sole discretion of the Board of Trustees, so that the Fund's net operating expenses, after giving effect to fees waived/expenses reimbursed and any balance credits and/or overdraft charges from the Fund's custodian, do not exceed the following annual rates as a percentage of the class' average daily net assets:
| Fee Rates Contractual through April 30, 2017 | |||||||
Class 1 | 0.56 | % | |||||
Class 2 | 0.81 | ||||||
Under the agreement governing these fee waivers and/or expense reimbursement arrangements, the following fees and expenses are excluded from the waiver/reimbursement commitment, and therefore will be paid by the Fund, if applicable: taxes (including foreign transaction taxes), expenses associated with investments in affiliated and non-affiliated pooled
Annual Report 2016
31
COLUMBIA VARIABLE PORTFOLIO — LONG GOVERNMENT/CREDIT BOND FUND
NOTES TO FINANCIAL STATEMENTS (continued)
December 31, 2016
investment vehicles (including mutual funds and exchange-traded funds), transaction costs and brokerage commissions, costs related to any securities lending program, dividend and interest expenses associated with securities sold short, inverse floater program fees and expenses, transaction charges and interest on borrowed money, interest, infrequent and/or unusual expenses and any other expenses the exclusion of which is specifically approved by the Board of Trustees. This agreement may be modified or amended only with approval from the Investment Manager, certain of its affiliates and the Fund. Any fees waived and/or expenses reimbursed under the expense reimbursement arrangements described above are not recoverable by the Investment Manager or its affiliates in future periods.
Note 4. Federal Tax Information
The timing and character of income and capital gain distributions are determined in accordance with income tax regulations, which may differ from GAAP because of temporary or permanent book to tax differences.
At December 31, 2016, these differences are primarily due to differing treatment for deferral/reversal of wash sale losses, Trustees' deferred compensation, derivative investments, tax straddles and swap reclassifications. To the extent these differences are permanent, reclassifications are made among the components of the Fund's net assets in the Statement of Assets and Liabilities. Temporary differences do not require reclassifications.
In the Statement of Assets and Liabilities the following reclassifications were made:
Undistributed net investment income | $ | (13,883 | ) | ||||
Accumulated net realized gain | 13,882 | ||||||
Paid-in capital | 1 | ||||||
Net investment income (loss) and net realized gains (losses), as disclosed in the Statement of Operations, and net assets were not affected by this reclassification.
The tax character of distributions paid during the years indicated was as follows:
Year Ended December 31, | 2016 | 2015 | |||||||||
Ordinary income | $ | 32,947,533 | $ | 33,696,796 | |||||||
Short-term capital gain distributions, if any, are considered ordinary income distributions for tax purposes.
At December 31, 2016, the components of distributable earnings on a tax basis were as follows:
Undistributed ordinary income | $ | 52,354,506 | |||||
Net unrealized depreciation | (26,908,504 | ) | |||||
At December 31, 2016, the cost of investments for federal income tax purposes was $1,500,896,578 and the aggregate gross unrealized appreciation and depreciation based on that cost was:
Unrealized appreciation | $ | 18,390,974 | |||||
Unrealized depreciation | (45,299,477 | ) | |||||
Net unrealized depreciation | $ | (26,908,503 | ) | ||||
For the year ended December 31, 2016, $12,302,135 of capital loss carryforward was utilized.
Management of the Fund has concluded that there are no significant uncertain tax positions in the Fund that would require recognition in the financial statements. However, management's conclusion may be subject to review and adjustment at a later date based on factors including, but not limited to, new tax laws, regulations, and administrative interpretations (including relevant court decisions). Generally, the Fund's federal tax returns for the prior three fiscal years remain subject to examination by the Internal Revenue Service.
Note 5. Portfolio Information
The cost of purchases and proceeds from sales of securities, excluding short-term investments and derivatives, if any, aggregated to $6,246,933,391 and $6,285,666,019, respectively, for the year ended December 31, 2016, of which $4,221,843,197 and $4,354,452,743, respectively, were U.S. government securities. The amount of purchase and sale activity impacts the portfolio turnover rate reported in the Financial Highlights.
Note 6. Affiliated Money Market Fund
The Fund invests in Columbia Short-Term Cash Fund, an affiliated money market fund established for the exclusive use by the Fund and other affiliated funds (the Affiliated MMF). The income earned by the Fund from such investments is included as Dividends — affiliated issuers in the Statement of Operations. As an investing fund, the Fund indirectly bears its proportionate share of the expenses of the Affiliated MMF. Effective October 1, 2016, the Affiliated MMF prices its shares with a floating net asset value (NAV) and no longer seeks to maintain a stable NAV. In addition, the Board of Trustees of the
Annual Report 2016
32
COLUMBIA VARIABLE PORTFOLIO — LONG GOVERNMENT/CREDIT BOND FUND
NOTES TO FINANCIAL STATEMENTS (continued)
December 31, 2016
Affiliated MMF may impose a fee on redemptions (sometimes referred to as a liquidity fee) or temporarily suspend redemptions (sometimes referred to as imposing a redemption gate) in the event its liquidity falls below regulatory limits.
Note 7. Line of Credit
The Fund has access to a revolving credit facility with a syndicate of banks led by Citibank, N.A., HSBC Bank USA, N.A. and JPMorgan Chase Bank, N.A. whereby the Fund may borrow for the temporary funding of shareholder redemptions or for other temporary or emergency purposes. The credit facility agreement, which is a collective agreement between the Fund and certain other funds managed by the Investment Manager, severally and not jointly, that permits collective borrowings up to $1 billion. Interest is charged to each participating fund based on its borrowings at a rate equal to the higher of (i) the overnight federal funds rate plus 1.00% or (ii) the one-month LIBOR rate plus 1.00%. Each borrowing under the credit facility matures no later than 60 days after the date of borrowing. The Fund also pays a commitment fee equal to its pro rata share of the amount of the credit facility at a rate of 0.15% per annum. The commitment fee is included in other expenses in the Statement of Operations.
The Fund had no borrowings during the year ended December 31, 2016.
Note 8. Significant Risks
Credit Risk
Credit risk is the risk that the value of debt securities in the Fund's portfolio may decline because the issuer may default and fail to pay interest or repay principal when due. Rating agencies assign credit ratings to debt securities to indicate their credit risk. Lower rated or unrated debt securities held by the Fund may present increased credit risk as compared to higher-rated debt securities.
Interest Rate Risk
Interest rate risk is the risk of losses attributable to changes in interest rates. In general, if prevailing interest rates rise, the values of debt securities tend to fall, and if interest rates fall, the values of debt securities tend to rise. Actions by governments and central banking authorities can result in increases in interest rates. Increasing interest rates may negatively affect the value of debt securities held by the Fund, resulting in a negative impact on the Fund's performance and net
asset value per share. In general, the longer the maturity or duration of a debt security, the greater its sensitivity to changes in interest rates.
Liquidity Risk
Liquidity risk is the risk associated with a lack of marketability of investments which may make it difficult to sell the investment at a desirable time or price. Changing regulatory, market or other conditions or environments (for example, the interest rate or credit environments) may adversely affect the liquidity of the Fund's investments. The Fund may have to accept a lower selling price for the holding, sell other investments, or forego another, more appealing investment opportunity. Generally, the less liquid the market at the time the Fund sells a portfolio investment, the greater the risk of loss or decline of value to the Fund. A less liquid market can lead to an increase in Fund redemptions, which may negatively impact Fund performance and net asset value per share, including, for example, if the Fund is forced to sell securities in a down market.
Shareholder Concentration Risk
At December 31, 2016, affiliated shareholders of record owned 100.0% of the outstanding shares of the Fund in one or more accounts. Subscription and redemption activity by concentrated accounts may have a significant effect on the operations of the Fund. In the case of a large redemption, the Fund may be forced to sell investments at inopportune times, including its liquid or more liquid positions, resulting in Fund losses and the Fund holding a higher percentage of less liquid or illiquid securities. Large redemptions could result in decreased economies of scale and increased operating expenses for non-redeeming Fund shareholders.
Note 9. Subsequent Events
Management has evaluated the events and transactions that have occurred through the date the financial statements were issued and noted no items requiring adjustment of the financial statements or additional disclosure.
Note 10. Information Regarding Pending and Settled Legal Proceedings
Ameriprise Financial and certain of its affiliates have historically been involved in a number of legal, arbitration and regulatory proceedings, including routine litigation, class actions, and governmental actions, concerning matters arising in connection with the conduct of their
Annual Report 2016
33
COLUMBIA VARIABLE PORTFOLIO — LONG GOVERNMENT/CREDIT BOND FUND
NOTES TO FINANCIAL STATEMENTS (continued)
December 31, 2016
business activities. Ameriprise Financial believes that the Funds are not currently the subject of, and that neither Ameriprise Financial nor any of its affiliates are the subject of, any pending legal, arbitration or regulatory proceedings that are likely to have a material adverse effect on the Funds or the ability of Ameriprise Financial or its affiliates to perform under their contracts with the Funds. Ameriprise Financial is required to make quarterly (10-Q), annual (10-K) and, as necessary, 8-K filings with the Securities and Exchange Commission (SEC) on legal and regulatory matters that relate to Ameriprise Financial and its affiliates. Copies of these filings may be obtained by accessing the SEC website at www.sec.gov.
There can be no assurance that these matters, or the adverse publicity associated with them, will not result in increased fund redemptions, reduced sale of fund shares or other adverse consequences to the Funds. Further, although we believe proceedings are not likely to have a material adverse effect on the Funds or the ability of Ameriprise Financial or its affiliates to perform under their contracts with the Funds, these proceedings are subject to uncertainties and, as such, we are unable to estimate the possible loss or range of loss that may result. An adverse outcome in one or more of these proceedings could result in adverse judgments, settlements, fines, penalties or other relief that could have a material adverse effect on the consolidated financial condition or results of operations of Ameriprise Financial.
Annual Report 2016
34
COLUMBIA VARIABLE PORTFOLIO — LONG GOVERNMENT/CREDIT BOND FUND
REPORT OF INDEPENDENT REGISTERED PUBLIC ACCOUNTING FIRM
To the Trustees of Columbia Funds Variable Insurance Trust and the Shareholders of
Columbia Variable Portfolio — Long Government/Credit Bond Fund (formerly known as Columbia Variable Portfolio — Core Bond Fund)
In our opinion, the accompanying statement of assets and liabilities, including the portfolio of investments, and the related statements of operations and of changes in net assets and the financial highlights present fairly, in all material respects, the financial position of Columbia Variable Portfolio — Long Government/Credit Bond Fund (formerly known as Columbia Variable Portfolio — Core Bond Fund) (the "Fund," a series of Columbia Funds Variable Insurance Trust) as of December 31, 2016, the results of its operations for the year then ended, the changes in its net assets for each of the two years in the period then ended and the financial highlights for each of the three years in the period then ended and for the period April 30, 2013 (commencement of operations) through December 31, 2013, in conformity with accounting principles generally accepted in the United States of America. These financial statements and financial highlights (hereafter referred to as "financial statements") are the responsibility of the Fund's management. Our responsibility is to express an opinion on these financial statements based on our audits. We conducted our audits of these financial statements in accordance with the standards of the Public Company Accounting Oversight Board (United States). Those standards require that we plan and perform the audit to obtain reasonable assurance about whether the financial statements are free of material misstatement. An audit includes examining, on a test basis, evidence supporting the amounts and disclosures in the financial statements, assessing the accounting principles used and significant estimates made by management, and evaluating the overall financial statement presentation. We believe that our audits, which included confirmation of securities as of December 31, 2016 by correspondence with the custodian, brokers and transfer agent, and the application of alternative auditing procedures where such confirmations had not been received, provide a reasonable basis for our opinion.
PricewaterhouseCoopers LLP
Minneapolis, MN
February 17, 2017
Annual Report 2016
35
COLUMBIA VARIABLE PORTFOLIO — LONG GOVERNMENT/CREDIT BOND FUND
TRUSTEES AND OFFICERS
Shareholders elect the Board that oversees the Fund's operations. The Board appoints officers who are responsible for day-to-day business decisions based on policies set by the Board. The following table provides basic biographical information about the Fund's Trustees, including their principal occupations during the past five years, although specific titles for individuals may have varied over the period. The year set forth beneath Length of Service in the table below is the year in which the Trustee was first appointed or elected as Trustee to any Fund currently in the Columbia Funds Complex or a predecessor thereof. Under current Board policy, members serve terms of indefinite duration.
Independent Trustees
| Name, Address, Year of Birth | Position Held With the Trust and Length of Service | Principal Occupation(s) During the Past Five Years and Other Relevant Professional Experience | Number of Funds in the Columbia Funds Complex Overseen | Other Directorships Held by Trustee During the Past Five Years | |||||||||||||||
| Janet Langford Carrig c/o Columbia Management Investment Advisers, LLC, 225 Franklin Street Mail Drop BX32 05228, Boston, MA 02110 1957 | Trustee 1996 | Senior Vice President, General Counsel and Corporate Secretary, ConocoPhillips (independent energy company) since September 2007 | 59 | None | |||||||||||||||
| Douglas A. Hacker c/o Columbia Management Investment Advisers, LLC, 225 Franklin Street Mail Drop BX32 05228, Boston, MA 02110 1955 | Trustee and Chairman of the Board 1996 | Independent business executive since May 2006; Executive Vice President — Strategy of United Airlines from December 2002 to May 2006; President of UAL Loyalty Services (airline marketing company) from September 2001 to December 2002; Executive Vice President and Chief Financial Officer of United Airlines from July 1999 to September 2001 | 59 | Spartan Nash Company (food distributor); Nash Finch Company (food distributor) from 2005 to 2013; Aircastle Limited (aircraft leasing); SeaCube Container Leasing Ltd. (container leasing) from 2010 to 2013; and Travelport Worldwide Limited (travel information technology) | |||||||||||||||
| Nancy T. Lukitsh c/o Columbia Management Investment Advisers, LLC, 225 Franklin Street Mail Drop BX32 05228, Boston, MA 02110 1956 | Trustee 2011 | Senior Vice President, Partner and Director of Marketing, Wellington Management Company, LLP (investment adviser) from 1997 to 2010; Chair, Wellington Management Portfolios (commingled non-U.S. investment pools) from 2007 to 2010; Director, Wellington Trust Company, NA and other Wellington affiliates from 1997 to 2010 | 59 | None | |||||||||||||||
Annual Report 2016
36
COLUMBIA VARIABLE PORTFOLIO — LONG GOVERNMENT/CREDIT BOND FUND
TRUSTEES AND OFFICERS (continued)
Independent Trustees (continued)
| Name, Address, Year of Birth | Position Held With the Trust and Length of Service | Principal Occupation(s) During the Past Five Years and Other Relevant Professional Experience | Number of Funds in the Columbia Funds Complex Overseen | Other Directorships Held by Trustee During the Past Five Years | |||||||||||||||
| David M. Moffett c/o Columbia Management Investment Advisers, LLC, 225 Franklin Street Mail Drop BX32 05228, Boston, MA 02110 1952 | Trustee 2011 | Retired. Consultant to Bridgewater and Associates | 59 | Director, CSX Corporation; Genworth Financial, Inc. (financial and insurance products and services); Paypal Holdings Inc. (payment and data processing services); Trustee University of Oklahoma Foundation; former Director eBay Inc. (online trading community), 2007-2015; and former Director, CIT Bank, CIT Group Inc. (commercial and consumer finance), 2010-2016 | |||||||||||||||
| Charles R. Nelson c/o Columbia Management Investment Advisers, LLC, 225 Franklin Street Mail Drop BX32 05228, Boston, MA 02110 1942 | Trustee 1981 | Retired. Professor Emeritus, University of Washington since 2011; Professor of Economics, University of Washington from 1976 to 2011; Ford and Louisa Van Voorhis Professor of Political Economy, University of Washington from 1993 to 2011; Adjunct Professor of Statistics, University of Washington from 1980 to 2011; Associate Editor, Journal of Money, Credit and Banking from September 1993 to 2008; consultant on econometric and statistical matters | 59 | None | |||||||||||||||
| John J. Neuhauser c/o Columbia Management Investment Advisers, LLC, 225 Franklin Street Mail Drop BX32 05228, Boston, MA 02110 1943 | Trustee 1984 | President, Saint Michael's College since August 2007; Director or Trustee of several non-profit organizations, including University of Vermont Medical Center; Academic Vice President and Dean of Faculties, Boston College from August 1999 to October 2005; University Professor, Boston College from November 2005 to August 2007 | 59 | Liberty All-Star Equity Fund and Liberty All-Star Growth Fund (closed-end funds) | |||||||||||||||
| Patrick J. Simpson c/o Columbia Management Investment Advisers, LLC, 225 Franklin Street Mail Drop BX32 05228, Boston, MA 02110 1944 | Trustee 2000 | Of Counsel, Perkins Coie LLP (law firm) since 2015; Partner, Perkins Coie LLP from 1988 to 2014 | 59 | None | |||||||||||||||
Annual Report 2016
37
COLUMBIA VARIABLE PORTFOLIO — LONG GOVERNMENT/CREDIT BOND FUND
TRUSTEES AND OFFICERS (continued)
Independent Trustees (continued)
| Name, Address, Year of Birth | Position Held With the Trust and Length of Service | Principal Occupation(s) During the Past Five Years and Other Relevant Professional Experience | Number of Funds in the Columbia Funds Complex Overseen | Other Directorships Held by Trustee During the Past Five Years | |||||||||||||||
| Anne-Lee Verville c/o Columbia Management Investment Advisers, LLC, 225 Franklin Street Mail Drop BX32 05228, Boston, MA 02110 1945 | Trustee 1998 | Retired. General Manager, Global Education Industry from 1994 to 1997, President — Application Systems Division from 1991 to 1994, Chief Financial Officer — US Marketing & Services from 1988 to 1991, and Chief Information Officer from 1987 to 1988, IBM Corporation (computer and technology) | 59 | Enesco Group, Inc. (producer of giftware and home and garden decor products) from 2001 to 2006 | |||||||||||||||
Consultants to the Independent Trustees*
| Name, Address, Year of Birth | Position Held With the Trust and Length of Service | Principal Occupation(s) During the Past Five Years and Other Relevant Professional Experience | Number of Funds in the Columbia Funds Complex Overseen | Other Directorships Held by Trustee During the Past Five Years | |||||||||||||||
| J. Kevin Connaughton c/o Columbia Management Investment Advisers, LLC, 225 Franklin Street Mail Drop BX32 05228, Boston, MA 02110 1964 | Independent Trustee Consultant 2016 | Independent Trustee Consultant, Columbia Funds since March 2016; Managing Director and General Manager of Mutual Fund Products, Columbia Management Investment Advisers, LLC from May 2010 to February 2015; President, Columbia Funds from 2009 to 2015; and senior officer of Columbia Funds and affiliated funds from 2003 to 2015 | 59 | Board of Governors, Gateway Healthcare since January 2016; Trustee, New Century Portfolios since March 2015; and Director, The Autism Project since March 2015 | |||||||||||||||
| Natalie A. Trunow c/o Columbia Management Investment Advisers, LLC, 225 Franklin Street Mail Drop BX32 05228, Boston, MA 02110 1967 | Independent Trustee Consultant 2016 | Independent Trustee Consultant, Columbia Funds since September 2016; Senior Vice President and Chief Executive Officer, Millennial Partners (investment consulting services to institutions) since January 2016; Director of Investments, Casey Family Programs from April 2016 to September 2016; Chief Investment Officer, Calvert Investments from August 2008 to January 2016; Section Head and Portfolio Manager, General Motors Asset Management from June 1997 to August 2008 | 59 | Healthcare Services for Children with Special Needs | |||||||||||||||
* J. Kevin Connaughton was appointed consultant to the Independent Trustees effective March 1, 2016. Natalie A. Trunow was appointed consultant to the Independent Trustees effective September 1, 2016. Shareholders of the Funds are expected to be asked to elect each of Mr. Connaughton and Ms. Trunow as a Trustee at a future shareholder meeting.
Annual Report 2016
38
COLUMBIA VARIABLE PORTFOLIO — LONG GOVERNMENT/CREDIT BOND FUND
TRUSTEES AND OFFICERS (continued)
Interested Trustee Affiliated with Investment Manager*
| Name, Address, Year of Birth | Position Held With the Trust and Length of Service | Principal Occupation(s) During the Past Five Years and Other Relevant Professional Experience | Number of Funds in the Columbia Funds Complex Overseen | Other Directorships Held by Trustee During the Past Five Years | |||||||||||||||
| William F. Truscott c/o Columbia Management Investment Advisers, LLC, 225 Franklin Street Boston, MA 02110 1960 | Trustee 2012 | Chairman of the Board and President, Columbia Management Investment Advisers, LLC since May 2010 and February 2012, respectively; Chief Executive Officer, Global Asset Management, Ameriprise Financial, Inc. since September 2012 (previously Chief Executive Officer, U.S. Asset Management & President, Annuities, May 2010- September 2012); Director and Chief Executive Officer, Columbia Management Investment Distributors, Inc. since May 2010 and February 2012, respectively; Chairman of the Board and Chief Executive Officer, RiverSource Distributors, Inc. since 2006; Director, Threadneedle Asset Management Holdings, SARL since 2014; President and Chief Executive Officer, Ameriprise Certificate Company, 2006-August 2012. | 185 | Trustee to other Columbia Funds since 2001; Chairman of the Board, Columbia Management Investment Advisers, LLC since May 2010; Director, Columbia Management Investment Distributors, Inc. since May 2010; Former Director, Ameriprise Certificate Company, 2006-January 2013 | |||||||||||||||
* Interested person (as defined under the 1940 Act) by reason of being an officer, director, security holder and/or employee of the Investment Manager or Ameriprise Financial.
The Statement of Additional Information has additional information about the Fund's Board members and is available, without charge, upon request by calling 800.345.6611 or contacting your financial intermediary.
Annual Report 2016
39
COLUMBIA VARIABLE PORTFOLIO — LONG GOVERNMENT/CREDIT BOND FUND
TRUSTEES AND OFFICERS (continued)
The Board has appointed officers who are responsible for day-to-day business decisions based on policies it has established. The officers serve at the pleasure of the Board. The following table provides basic information about the Officers of the Fund, including principal occupations during the past five years, although their specific titles may have varied over the period. In addition to Mr. Truscott, who is Senior Vice President, the Fund's other officers are:
Fund Officers
| Name, Address and Year of Birth | Position and Year First Appointed to Position for any Fund in the Columbia Funds Complex or a Predecessor Thereof | Principal Occupation(s) During Past Five Years | |||||||||
| Christopher O. Petersen 5228 Ameriprise Financial Center Minneapolis, MN 55474 Born 1970 | President and Principal Executive Officer (2015) | Vice President and Lead Chief Counsel, Ameriprise Financial, Inc. since January 2015 (previously, Vice President and Chief Counsel January 2010-December 2014); officer of Columbia Funds and affiliated funds since 2007. | |||||||||
| Michael G. Clarke 225 Franklin Street Boston, MA 02110 Born 1969 | Treasurer (2011), Chief Financial Officer (2009) and Chief Accounting Officer (2015) | Vice President — Mutual Fund Administration, Columbia Management Investment Advisers, LLC, since May 2010; senior officer of Columbia Funds and affiliated funds since 2002. | |||||||||
| Paul B. Goucher 100 Park Avenue New York, NY 10017 Born 1968 | Senior Vice President (2011), Chief Legal Officer (2015) and Assistant Secretary (2008) | Senior Vice President and Assistant General Counsel, Ameriprise Financial, Inc. since January 2017 (previously Vice President and Lead Chief Counsel, November 2008-January 2017 and January 2013-2017, respectively, and Chief Counsel, January 2010-January 2013); Vice President, Chief Legal Officer and Assistant Secretary, Columbia Management Investment Advisers, LLC since May 2010. | |||||||||
| Thomas P. McGuire 225 Franklin Street Boston, MA 02110 Born 1972 | Senior Vice President and Chief Compliance Officer (2012) | Vice President — Asset Management Compliance, Ameriprise Financial, Inc., since May 2010; Chief Compliance Officer, Ameriprise Certificate Company since September 2010. | |||||||||
| Colin Moore 225 Franklin Street Boston, MA 02110 Born 1958 | Senior Vice President (2010) | Executive Vice President and Global Chief Investment Officer, Ameriprise Financial, Inc., since July 2013; Executive Vice President and Global Chief Investment Officer, Columbia Management Investment Advisers, LLC since July 2013 (previously Director and Global Chief Investment Officer, 2010-2013). | |||||||||
| Michael E. DeFao 225 Franklin Street Boston, MA 02110 Born 1968 | Vice President (2011) and Assistant Secretary (2010) | Vice President and Chief Counsel, Ameriprise Financial, Inc. since May 2010. | |||||||||
| Amy Johnson 5228 Ameriprise Financial Center Minneapolis, MN 55474 Born 1965 | Vice President (2006) | Managing Director and Global Head of Operations, Columbia Management Investment Advisers, LLC since April 2016 (previously Managing Director and Chief Operating Officer, 2010-2016). | |||||||||
| Lyn Kephart-Strong 5228 Ameriprise Financial Center Minneapolis, MN 55474 Born 1960 | Vice President (2015) | President, Columbia Management Investment Services Corp. since October 2014; Vice President & Resolution Officer, Ameriprise Trust Company since August 2009. | |||||||||
| Ryan C. Larrenaga 225 Franklin Street Boston, MA 02110 Born 1970 | Vice President and Secretary (2015) | Vice President and Group Counsel, Ameriprise Financial, Inc. since August 2011; officer of Columbia Funds and affiliated funds since 2005. | |||||||||
Annual Report 2016
40
COLUMBIA VARIABLE PORTFOLIO — LONG GOVERNMENT/CREDIT BOND FUND
IMPORTANT INFORMATION ABOUT THIS REPORT
The policy of the Board is to vote the proxies of the companies in which each fund holds investments consistent with the procedures as stated in the Statement of Additional Information (SAI). You may obtain a copy of the SAI without charge by calling 800.345.6611; contacting your financial intermediary or searching the website of the Securities and Exchange Commission (SEC) at sec.gov. Information regarding how each fund voted proxies relating to portfolio securities is filed with the SEC by August 31st for the most recent 12-month period ending June 30th of that year, and is available without charge by visiting investor.columbiathreadneedleus.com, or searching the website of the SEC at sec.gov.
Each fund files a complete schedule of portfolio holdings with the SEC for the first and third quarters of each fiscal year on Form N-Q. Each fund's Form N-Q is available on the SEC's website at sec.gov and may be reviewed and copied at the SEC's Public Reference Room in Washington, D.C. Information on the operation of the Public Reference Room may be obtained by calling 800.SEC.0330. Each fund's complete schedule of portfolio holdings, as filed on Form N-Q, can also be obtained without charge, upon request, by calling 800.345.6611.
Annual Report 2016
41
Columbia Variable Portfolio — Long Government/Credit Bond Fund
P.O. Box 8081
Boston, MA 02266-8081

Please read and consider the investment objectives, risks, charges and expenses for any fund carefully before investing. For fund and other investment product prospectuses, which contain this and other important information, contact your financial advisor or insurance representative. Please read the prospectus carefully before you invest. The Fund is distributed by Columbia Management Investment Distributors, Inc., member FINRA, and managed by Columbia Management Investment Advisers, LLC.
Columbia Threadneedle Investments (Columbia Threadneedle) is the global brand name of the Columbia and Threadneedle group of companies.
All rights reserved. Columbia Management Investment Distributors, Inc., 225 Franklin Street, Boston, MA 02110-2804
© 2017 Columbia Management Investment Advisers, LLC.
C-1876 AN (2/17)

ANNUAL REPORT
December 31, 2016

COLUMBIA VARIABLE PORTFOLIO — DIVERSIFIED ABSOLUTE RETURN FUND
Please remember that you may not buy (nor will you own) shares of the Fund directly. The Fund is available through variable annuity contracts and variable life insurance policies offered by the separate accounts of participating insurance companies as well as qualified pension and retirement plans. Please contact your financial advisor or insurance representative for more information.

COLUMBIA VARIABLE PORTFOLIO — DIVERSIFIED ABSOLUTE RETURN FUND
TABLE OF CONTENTS
Performance Overview | 2 | ||||||
Manager Discussion of Fund Performance | 4 | ||||||
Understanding Your Fund's Expenses | 6 | ||||||
Consolidated Portfolio of Investments | 7 | ||||||
Consolidated Statement of Assets and Liabilities | 24 | ||||||
Consolidated Statement of Operations | 26 | ||||||
Consolidated Statement of Changes in Net Assets | 27 | ||||||
Consolidated Financial Highlights | 29 | ||||||
Notes to Consolidated Financial Statements | 31 | ||||||
Report of Independent Registered Public Accounting Firm | 45 | ||||||
Trustees and Officers | 46 | ||||||
Important Information About This Report | 53 | ||||||
| |||
| |||
| |||
| |||
| |||
| |||
| |||
| |||
| |||
| |||
| |||
| |||
| |||
The views expressed in this report reflect the current views of the respective parties. These views are not guarantees of future performance and involve certain risks, uncertainties and assumptions that are difficult to predict, so actual outcomes and results may differ significantly from the views expressed. These views are subject to change at any time based upon economic, market or other conditions and the respective parties disclaim any responsibility to update such views. These views may not be relied on as investment advice and, because investment decisions for a Columbia fund are based on numerous factors, may not be relied on as an indication of trading intent on behalf of any particular Columbia fund. References to specific securities should not be construed as a recommendation or investment advice.
Annual Report 2016
COLUMBIA VARIABLE PORTFOLIO — DIVERSIFIED ABSOLUTE RETURN FUND
PERFORMANCE OVERVIEW
Performance Summary
n Columbia Variable Portfolio — Diversified Absolute Return Fund (the Fund) Class 2 shares returned -2.63% for the 12-month period that ended December 31, 2016.
n The Fund underperformed the Citi One-Month U.S. Treasury Bill Index, which returned 0.21% over the same time period.
n Losses incurred by the Fund's alpha strategies generally accounted for its shortfall relative to the benchmark.
Average Annual Total Returns (%) (for period ended December 31, 2016)
Inception | 1 Year | Life | |||||||||||||
Class 1 | 04/30/12 | -2.50 | -1.41 | ||||||||||||
Class 2 | 04/30/12 | -2.63 | -1.63 | ||||||||||||
Citi One-Month U.S. Treasury Bill Index | 0.21 | 0.07 | |||||||||||||
Performance data quoted represents past performance and current performance may be lower or higher. Past performance is no guarantee of future results. The investment return and principal value will fluctuate so that shares, when redeemed, may be worth more or less than the original cost. For current month-end performance information, please contact your financial advisor or insurance representative.
Performance results reflect the effect of any fee waivers or reimbursements of fund expenses by Columbia Management Investment Advisers, LLC and/or any of its affiliates. Absent these fee waivers or expense reimbursement arrangements, performance results would have been lower.
Investment earnings, if any, are tax-deferred until distributed to shareholders, at which time taxes may become due. Total return performance includes changes in share price and assumes reinvestment of dividends and capital gains, if any. Performance results reflect the effect of all fund expenses, but do not include any fees and expenses imposed under your variable annuity contract and/or variable life insurance policy or qualified pension or retirement plan. If performance results included the effect of these additional charges, they would be lower.
The Fund's performance prior to June 2015 reflects returns achieved pursuant to different principal investment strategies. If the Fund's current strategies had been in place for the prior periods, results shown may have been different.
The Citi One-Month U.S. Treasury Bill Index, an unmanaged index, is representative of the performance of one-month Treasury bills.
Indices are not available for investment, are not professionally managed and do not reflect sales charges, fees, brokerage commissions, taxes or other expenses of investing. Securities in the Fund may not match those in an index.
Annual Report 2016
2
COLUMBIA VARIABLE PORTFOLIO — DIVERSIFIED ABSOLUTE RETURN FUND
PERFORMANCE OVERVIEW (continued)
Performance of a Hypothetical $10,000 Investment (April 30, 2012 – December 31, 2016)

The chart above shows the change in value of a hypothetical $10,000 investment in Class 2 shares of Columbia Variable Portfolio — Diversified Absolute Return Fund during the stated time period, and does not reflect the deduction of taxes, if any, that a shareholder may pay on Fund distributions or on the redemption of Fund shares. The returns also do not reflect fees and expenses imposed under your variable annuity contract and/or variable life insurance policy or qualified pension or retirement plan, if any.
Annual Report 2016
3
COLUMBIA VARIABLE PORTFOLIO — DIVERSIFIED ABSOLUTE RETURN FUND
MANAGER DISCUSSION OF FUND PERFORMANCE
Portfolio Management
Jeffrey Knight, CFA
Joshua Kutin, CFA
Brian Virginia
Alexander Wilkinson*
*Effective January 27, 2017, William Landes and Kent Peterson no longer serve as portfolio managers of the Fund and Alexander Wilkinson was named a portfolio manager of the Fund.
| Portfolio Breakdown — Long Positions (%) (at December 31, 2016) | |||||||
Common Stocks | 32.3 | ||||||
Exchange-Traded Funds | 17.4 | ||||||
| Short-Term Investments Segregated in Connection with Open Derivatives Contracts(a) | 68.8 | ||||||
Total | 118.5 | ||||||
Percentages indicated are based upon total investments, net of investments sold short. The Fund's portfolio composition is subject to change.
(a) Includes investments in Money Market Funds (amounting to $168.5 million) which have been segregated to cover obligations relating to the Fund's investment in derivatives which provide exposure to multiple markets. For a description of the Fund's investments in derivatives, see Investments in Derivatives following the Consolidated Portfolio of Investments and Note 2 to the Notes to Consolidated Financial Statements.
| Portfolio Breakdown — Short Positions (%) (at December 31, 2016) | |||||||
Common Stocks | (18.5 | ) | |||||
Total | (18.5 | ) | |||||
Percentages indicated are based upon total investments, net of investments sold short. The Fund's portfolio composition is subject to change.
At December 31, 2016, approximately 98.4% of the Fund's shares were owned in the aggregate by affiliated funds-of-funds managed by Columbia Management Investment Advisers, LLC (the Investment Manager). As a result of asset allocation decisions by the Investment Manager, it is possible that the Fund may experience relatively large purchases or redemptions from affiliated funds-of-funds. The Investment Manager seeks to minimize the impact of these transactions by structuring them over a reasonable period of time. The Fund may experience increased expenses as it buys and sells securities as a result of purchases or redemptions by affiliated funds-of-funds.
For the 12-month period ended December 31, 2016, the Fund's Class 2 shares returned -2.63%. The Fund underperformed its benchmark, the Citi One-Month U.S. Treasury Bill Index, which returned 0.21% over the same period. The Fund's alpha strategies, which accounted for approximately 43% of assets under management for the period, generally accounted for its shortfall relative to the benchmark.
Global Markets Posted Mixed Results
Global events, political uncertainty and mixed economic data were enough to keep investors off balance in 2016, as financial markets moved sharply in reaction to each significant change on the world stage. Early in the year concerns about U.S. monetary policy, China and oil rattled the equity markets and drove stock prices downward. After a swift March rebound, the stock market swooned again in the early summer in reaction to the U.K. vote to exit the European Union, and U.S. Treasury yields also plummeted. Once again, the markets rebounded but investors retreated in in the third quarter in reaction to mixed economic data and uncertainty surrounding the U.S. Presidential race. Following the November election and with almost unanimously positive economic data, stocks moved higher in the fourth quarter to keep the eight-year bull market alive. In the United States, steady job growth drove unemployment down to 4.6%. Corporate earnings growth picked up. Manufacturing activity accelerated, and the price of oil stabilized. Growth was lackluster in developed foreign market countries. In Europe and Japan, GDP advanced less than 1% for the year. China expanded at an estimated pace of 7.5%, in line with expectations, while most emerging markets struggled with volatile international capital flows and currency fluctuations. South American economies contracted.
In December 2016, the Federal Reserve (the Fed) raised the target range of its benchmark interest rate by a quarter of a point, its first such move in a year. The Fed's action had been widely anticipated and had little or no impact on the financial markets when it occurred. The Fed indicated that it would continue to monitor inflation and the job market in considering future rate hikes.
Against this backdrop, the S&P 500 Index, a broad measure of U.S. stock market performance, rose 11.96%. Foreign stock markets lagged the U.S. markets. The MSCI EAFE Index, a broad measure of performance in developed markets outside the United States, rose just 1.00% for the year. Rising interest rates kept a lid on price in most sectors of the bond market. The Bloomberg Barclays U.S. Aggregate Bond Index, a broad
Annual Report 2016
4
COLUMBIA VARIABLE PORTFOLIO — DIVERSIFIED ABSOLUTE RETURN FUND
MANAGER DISCUSSION OF FUND PERFORMANCE (continued)
measure of the performance of investment-grade bonds, returned 2.65% for the year. High-yield bonds outperformed both stocks and investment-grade bonds, returning 17.49%, as measured by the Bank of America Merrill Lynch U.S. High Yield Constrained Index
Significant Performance Factors
The Fund employs strategies that are designed to seek positive returns, with low correlation to the performance of the broad equity and fixed-income markets. The Fund utilizes derivatives for both hedging and non-hedging purposes, including, for example, seeking to enhance returns or as a substitute for a position in an underlying asset or index. During the period, the Fund used forward foreign currency exchange contracts, futures, options and swaps to more efficiently and cost effectively manage its exposures. These flexible structures, which allow for direct and highly versatile portfolio management applications, detracted from the Fund's results during the period.
The portfolio is divided into three categories of investments: alpha, tactical beta and alternative beta. The components of the alpha strategy are global alpha opportunities, managed futures, a foreign currency focused strategy and equity-focused strategies, such as an equity research market neutral strategy, an equity long/short strategy and a fixed-income alpha strategy, the global opportunities bond strategy. The return on the alpha strategy was about equivalent to the return of the Fund — down approximately 2.50%, the result of losses from equity long/short and equity research market neutral. Global alpha opportunities and global opportunities bond also lost ground, but these losses were partially offset by gains from managed futures and the currency strategy. During the year, we discontinued the equity research market neutral and the global opportunities bond strategies. Results from the other two main strategies were mixed. Tactical beta made a positive contribution, while alternative beta strategies detracted from Fund results.
At Period's End
Intermittent spikes of volatility were a challenge for investors in 2016, and particularly challenging for the strategies employed by the Fund. However, given how high certain markets have moved, we believe that absolute return strategies, such as those employed by the Fund, continue to have potential for the role they can play in a diversified portfolio.
| Market Exposure Through Derivatives Investments (% of notional exposure) (at December 31, 2016)(a) | |||||||
| Fixed Income Derivative Contracts | (76.3 | ) | |||||
Equity Derivative Contracts | 58.2 | ||||||
| Foreign Currency Derivative Contracts | (81.9 | ) | |||||
| Total Notional Market Value of Derivative Contracts | (100.0 | ) | |||||
(a) The Fund has market exposure (long and/or short) to fixed income, equity asset classes and foreign currency through its investments in derivatives. The notional exposure of a financial instrument is the nominal or face amount that is used to calculate payments made on that instrument and/or changes in value for the instrument. The notional exposure is a hypothetical underlying quantity upon which payment obligations are computed. Notional exposures provide a gauge for how the Fund may behave given changes in individual markets. For a description of the Fund's investments in derivatives, see Investments in Derivatives following the Consolidated Portfolio of Investments, and Note 2 to the Notes to Consolidated Financial Statements.
Annual Report 2016
5
COLUMBIA VARIABLE PORTFOLIO — DIVERSIFIED ABSOLUTE RETURN FUND
UNDERSTANDING YOUR FUND'S EXPENSES
(Unaudited)
As an investor, you incur ongoing costs, which generally include management fees, distribution and/or service fees, and other fund expenses. The following information is intended to help you understand your ongoing costs (in dollars) of investing in the Fund and to help you compare these costs with the ongoing costs of investing in other mutual funds.
The information below does not reflect fees and expenses imposed under your variable annuity contract and/or variable life insurance policy (collectively, Contracts) or qualified pension and retirement plan (Qualified Plan), if any. The total fees and expenses you bear may therefore be higher than those shown below.
Analyzing Your Fund's Expenses
To illustrate these ongoing costs, we have provided examples and calculated the expenses paid by investors in each share class of the Fund during the period. The actual and hypothetical information in the table is based on an initial investment of $1,000 at the beginning of the period indicated and held for the entire period. Expense information is calculated two ways and each method provides you with different information. The amount listed in the "Actual" column is calculated using the Fund's actual operating expenses and total return for the period. You may use the Actual information, together with the amount invested, to estimate the expenses that you paid over the period. Simply divide your account value by $1,000 (for example, an $8,600 account value divided by $1,000 = 8.6), then multiply the results by the expenses paid during the period under the "Actual" column. The amount listed in the "Hypothetical" column assumes a 5% annual rate of return before expenses (which is not the Fund's actual return) and then applies the Fund's actual expense ratio for the period to the hypothetical return. You should not use the hypothetical account values and expenses to estimate either your actual account balance at the end of the period or the expenses you paid during the period. See "Compare With Other Funds" below for details on how to use the hypothetical data.
Compare With Other Funds
Since all mutual funds are required to include the same hypothetical calculations about expenses in shareholder reports, you can use this information to compare the ongoing cost of investing in the Fund with other funds. To do so, compare the hypothetical example with the 5% hypothetical examples that appear in the shareholder reports of other funds. As you compare hypothetical examples of other funds, it is important to note that hypothetical examples are meant to highlight the ongoing costs of investing in a fund only and do not reflect any transaction costs, such as redemption or exchange fees, or expenses that apply to the subaccount or the Contract. Therefore, the hypothetical calculations are useful in comparing ongoing costs only, and will not help you determine the relative total costs of owning different funds. If the fees and expenses imposed under your Contract or Qualified Plan, if any, were included, your costs would be higher.
July 1, 2016 – December 31, 2016
| Account Value at the Beginning of the Period ($) | Account Value at the End of the Period ($) | Expenses Paid During the Period ($) | Fund's Annualized Expense Ratio (%) | ||||||||||||||||||||||||||||
Actual | Hypothetical | Actual | Hypothetical | Actual | Hypothetical | Actual | |||||||||||||||||||||||||
Class 1 | 1,000.00 | 1,000.00 | 981.10 | 1,015.65 | 9.26 | 9.42 | 1.87 | ||||||||||||||||||||||||
Class 2 | 1,000.00 | 1,000.00 | 979.90 | 1,014.40 | 10.49 | 10.68 | 2.12 | ||||||||||||||||||||||||
Expenses paid during the period are equal to the annualized expense ratio for each class as indicated above, multiplied by the average account value over the period and then multiplied by the number of days in the Fund's most recent fiscal half year and divided by 366.
Expenses do not include fees and expenses incurred indirectly by the Fund from its investment in underlying funds, including affiliated and non-affiliated pooled investment vehicles, such as mutual funds and exchange-traded funds.
Had Columbia Management Investment Advisers, LLC and/or certain of its affiliates not waived/reimbursed certain fees and expenses, account value at the end of the period would have been reduced.
Annual Report 2016
6
COLUMBIA VARIABLE PORTFOLIO — DIVERSIFIED ABSOLUTE RETURN FUND
CONSOLIDATED PORTFOLIO OF INVESTMENTS
December 31, 2016
(Percentages represent value of investments compared to net assets)
Common Stocks 29.6%
Issuer | Shares | Value ($) | |||||||||
CONSUMER DISCRETIONARY 4.4% | |||||||||||
Auto Components 0.1% | |||||||||||
Magna International, Inc.(a) | 4,953 | 214,959 | |||||||||
Hotels, Restaurants & Leisure 0.8% | |||||||||||
Darden Restaurants, Inc.(a) | 8,835 | 642,481 | |||||||||
International Game Technology PLC(a) | 23,951 | 611,230 | |||||||||
Norwegian Cruise Line Holdings Ltd.(a)(b) | 10,465 | 445,077 | |||||||||
Yum China Holdings, Inc.(b) | 10,443 | 272,771 | |||||||||
Yum! Brands, Inc. | 4,498 | 284,858 | |||||||||
Total | 2,256,417 | ||||||||||
Household Durables 0.3% | |||||||||||
Mohawk Industries, Inc.(a)(b) | 2,002 | 399,760 | |||||||||
Newell Brands, Inc.(a) | 8,874 | 396,224 | |||||||||
Total | 795,984 | ||||||||||
Internet & Direct Marketing Retail 1.1% | |||||||||||
Amazon.com, Inc.(a)(b) | 2,241 | 1,680,458 | |||||||||
Ctrip.com International Ltd., ADR(a)(b) | 13,065 | 522,600 | |||||||||
Expedia, Inc.(a) | 3,200 | 362,496 | |||||||||
Liberty Interactive Corp., Class A(a)(b) | 23,562 | 470,769 | |||||||||
Total | 3,036,323 | ||||||||||
Media 0.8% | |||||||||||
Comcast Corp., Class A(a) | 16,308 | 1,126,068 | |||||||||
DISH Network Corp., Class A(a)(b) | 10,231 | 592,682 | |||||||||
Liberty Global PLC, Class A(a)(b) | 13,321 | 407,489 | |||||||||
Total | 2,126,239 | ||||||||||
Multiline Retail 0.1% | |||||||||||
Kohl's Corp.(a) | 1,288 | 63,601 | |||||||||
Macy's, Inc. | 8,428 | 301,807 | |||||||||
Total | 365,408 | ||||||||||
Specialty Retail 1.0% | |||||||||||
Burlington Stores, Inc.(a)(b) | 3,899 | 330,440 | |||||||||
Foot Locker, Inc.(a) | 5,530 | 392,022 | |||||||||
Home Depot, Inc. (The)(a) | 8,524 | 1,142,898 | |||||||||
TJX Companies, Inc. (The)(a) | 4,670 | 350,857 | |||||||||
Urban Outfitters, Inc.(a)(b) | 5,702 | 162,393 | |||||||||
Williams-Sonoma, Inc.(a) | 5,884 | 284,727 | |||||||||
Total | 2,663,337 | ||||||||||
Textiles, Apparel & Luxury Goods 0.2% | |||||||||||
PVH Corp.(a) | 3,624 | 327,030 | |||||||||
Common Stocks (continued)
Issuer | Shares | Value ($) | |||||||||
Sequential Brands Group, Inc.(b) | 21,826 | 102,145 | |||||||||
Total | 429,175 | ||||||||||
Total Consumer Discretionary | 11,887,842 | ||||||||||
CONSUMER STAPLES 3.0% | |||||||||||
Beverages 0.5% | |||||||||||
Constellation Brands, Inc., Class A(a) | 2,515 | 385,574 | |||||||||
Molson Coors Brewing Co., Class B(a) | 2,615 | 254,466 | |||||||||
PepsiCo, Inc.(a) | 6,470 | 676,956 | |||||||||
Total | 1,316,996 | ||||||||||
Food & Staples Retailing 0.5% | |||||||||||
Costco Wholesale Corp.(a) | 2,969 | 475,367 | |||||||||
Kroger Co. (The) | 6,482 | 223,694 | |||||||||
Rite Aid Corp.(a)(b) | 39,422 | 324,837 | |||||||||
SYSCO Corp.(a) | 8,130 | 450,158 | |||||||||
Total | 1,474,056 | ||||||||||
Food Products 0.9% | |||||||||||
General Mills, Inc.(a) | 3,095 | 191,178 | |||||||||
Hershey Co. (The)(a) | 3,972 | 410,824 | |||||||||
Mondelez International, Inc., Class A(a) | 10,653 | 472,247 | |||||||||
Pilgrim's Pride Corp.(a) | 28,237 | 536,221 | |||||||||
Tyson Foods, Inc., Class A(a) | 10,942 | 674,903 | |||||||||
Total | 2,285,373 | ||||||||||
Personal Products 0.5% | |||||||||||
| Estee Lauder Companies, Inc. (The), Class A(a) | 3,538 | 270,622 | |||||||||
Herbalife Ltd.(a)(b) | 9,043 | 435,330 | |||||||||
Nu Skin Enterprises, Inc., Class A(a) | 12,008 | 573,742 | |||||||||
Total | 1,279,694 | ||||||||||
Tobacco 0.6% | |||||||||||
Altria Group, Inc.(a) | 9,430 | 637,657 | |||||||||
Philip Morris International, Inc.(a) | 7,221 | 660,649 | |||||||||
Reynolds American, Inc.(a) | 4,109 | 230,268 | |||||||||
Total | 1,528,574 | ||||||||||
Total Consumer Staples | 7,884,693 | ||||||||||
ENERGY 2.0% | |||||||||||
Energy Equipment & Services 0.4% | |||||||||||
Baker Hughes, Inc.(a) | 5,289 | 343,626 | |||||||||
Halliburton Co.(a) | 4,932 | 266,772 | |||||||||
Oceaneering International, Inc.(a) | 3,703 | 104,461 | |||||||||
The accompanying Notes to Consolidated Financial Statements are an integral part of this statement.
Annual Report 2016
7
COLUMBIA VARIABLE PORTFOLIO — DIVERSIFIED ABSOLUTE RETURN FUND
CONSOLIDATED PORTFOLIO OF INVESTMENTS (continued)
December 31, 2016
Common Stocks (continued)
Issuer | Shares | Value ($) | |||||||||
Schlumberger Ltd.(a) | 4,884 | 410,012 | |||||||||
Superior Energy Services, Inc. | 6,644 | 112,151 | |||||||||
Total | 1,237,022 | ||||||||||
Oil, Gas & Consumable Fuels 1.6% | |||||||||||
Anadarko Petroleum Corp.(a) | 4,979 | 347,186 | |||||||||
| BP PLC, ADR(a) | 9,627 | 359,857 | |||||||||
Cabot Oil & Gas Corp.(a) | 5,959 | 139,202 | |||||||||
Canadian Natural Resources Ltd. | 6,656 | 212,193 | |||||||||
Cimarex Energy Co.(a) | 1,330 | 180,747 | |||||||||
Continental Resources, Inc.(a)(b) | 3,152 | 162,454 | |||||||||
Devon Energy Corp.(a) | 7,109 | 324,668 | |||||||||
EOG Resources, Inc.(a) | 1,948 | 196,943 | |||||||||
Exxon Mobil Corp.(a) | 2,879 | 259,859 | |||||||||
Hess Corp.(a) | 4,041 | 251,714 | |||||||||
Marathon Petroleum Corp.(a) | 3,024 | 152,258 | |||||||||
Noble Energy, Inc.(a) | 7,001 | 266,458 | |||||||||
RSP Permian, Inc.(a)(b) | 3,084 | 137,608 | |||||||||
Suncor Energy, Inc.(a) | 14,043 | 459,066 | |||||||||
Valero Energy Corp.(a) | 3,235 | 221,015 | |||||||||
World Fuel Services Corp.(a) | 12,251 | 562,444 | |||||||||
Total | 4,233,672 | ||||||||||
Total Energy | 5,470,694 | ||||||||||
FINANCIALS 4.2% | |||||||||||
Banks 1.3% | |||||||||||
Bank of America Corp.(a) | 34,341 | 758,936 | |||||||||
BankUnited, Inc.(a) | 9,867 | 371,887 | |||||||||
Citigroup, Inc.(a) | 11,512 | 684,158 | |||||||||
Fifth Third Bancorp(a) | 14,027 | 378,308 | |||||||||
SunTrust Banks, Inc. | 7,642 | 419,164 | |||||||||
Wells Fargo & Co.(a) | 17,412 | 959,576 | |||||||||
Total | 3,572,029 | ||||||||||
Capital Markets 0.8% | |||||||||||
Bank of New York Mellon Corp. (The)(a) | 6,965 | 330,002 | |||||||||
Intercontinental Exchange, Inc.(a) | 5,804 | 327,461 | |||||||||
Invesco Ltd.(a) | 13,930 | 422,636 | |||||||||
Morgan Stanley(a) | 9,964 | 420,979 | |||||||||
S&P Global, Inc.(a) | 4,711 | 506,621 | |||||||||
Total | 2,007,699 | ||||||||||
Common Stocks (continued)
Issuer | Shares | Value ($) | |||||||||
Consumer Finance 0.4% | |||||||||||
Navient Corp.(a) | 40,427 | 664,215 | |||||||||
Synchrony Financial | 10,514 | 381,343 | |||||||||
Total | 1,045,558 | ||||||||||
Diversified Financial Services 0.1% | |||||||||||
Berkshire Hathaway, Inc., Class B(a)(b) | 1,701 | 277,229 | |||||||||
Insurance 1.5% | |||||||||||
Aflac, Inc.(a) | 5,851 | 407,230 | |||||||||
Allstate Corp. (The)(a) | 10,738 | 795,900 | |||||||||
| American Equity Investment Life Holding Co.(a) | 12,472 | 281,119 | |||||||||
Amtrust Financial Services, Inc.(a) | 12,621 | 345,563 | |||||||||
| Hartford Financial Services Group, Inc. (The) | 10,937 | 521,148 | |||||||||
Lincoln National Corp.(a) | 1,318 | 87,344 | |||||||||
Prudential Financial, Inc.(a) | 7,863 | 818,224 | |||||||||
Reinsurance Group of America, Inc.(a) | 5,042 | 634,435 | |||||||||
Total | 3,890,963 | ||||||||||
Thrifts & Mortgage Finance 0.1% | |||||||||||
Radian Group, Inc.(a) | 16,446 | 295,699 | |||||||||
Total Financials | 11,089,177 | ||||||||||
HEALTH CARE 3.7% | |||||||||||
Biotechnology 0.9% | |||||||||||
ACADIA Pharmaceuticals, Inc.(a)(b) | 4,792 | 138,201 | |||||||||
Alexion Pharmaceuticals, Inc.(a)(b) | 5,886 | 720,152 | |||||||||
Biogen, Inc.(a)(b) | 882 | 250,118 | |||||||||
Celgene Corp.(a)(b) | 2,794 | 323,406 | |||||||||
Puma Biotechnology, Inc.(a)(b) | 4,349 | 133,514 | |||||||||
Shire PLC, ADR(a) | 930 | 158,454 | |||||||||
Spark Therapeutics, Inc.(a)(b) | 2,986 | 149,001 | |||||||||
Ultragenyx Pharmaceutical, Inc.(a)(b) | 2,183 | 153,487 | |||||||||
Vertex Pharmaceuticals, Inc.(a)(b) | 5,457 | 402,017 | |||||||||
Total | 2,428,350 | ||||||||||
Health Care Equipment & Supplies 0.6% | |||||||||||
Alere, Inc.(a)(b) | 5,822 | 226,883 | |||||||||
Hologic, Inc.(a)(b) | 1,758 | 70,531 | |||||||||
Medtronic PLC(a) | 6,475 | 461,214 | |||||||||
Quotient Ltd.(b) | 12,525 | 60,621 | |||||||||
Zimmer Biomet Holdings, Inc.(a) | 7,379 | 761,513 | |||||||||
Total | 1,580,762 | ||||||||||
The accompanying Notes to Consolidated Financial Statements are an integral part of this statement.
Annual Report 2016
8
COLUMBIA VARIABLE PORTFOLIO — DIVERSIFIED ABSOLUTE RETURN FUND
CONSOLIDATED PORTFOLIO OF INVESTMENTS (continued)
December 31, 2016
Common Stocks (continued)
Issuer | Shares | Value ($) | |||||||||
Health Care Providers & Services 1.0% | |||||||||||
Aetna, Inc.(a) | 5,174 | 641,628 | |||||||||
AmerisourceBergen Corp. | 6,205 | 485,169 | |||||||||
CIGNA Corp.(a) | 3,782 | 504,481 | |||||||||
Humana, Inc. | 1,630 | 332,569 | |||||||||
WellCare Health Plans, Inc.(a)(b) | 5,154 | 706,510 | |||||||||
Total | 2,670,357 | ||||||||||
Life Sciences Tools & Services 0.1% | |||||||||||
Thermo Fisher Scientific, Inc.(a) | 2,848 | 401,853 | |||||||||
Pharmaceuticals 1.1% | |||||||||||
Allergan PLC(a)(b) | 1,736 | 364,577 | |||||||||
Bristol-Myers Squibb Co.(a) | 7,326 | 428,131 | |||||||||
Eli Lilly & Co. | 6,350 | 467,043 | |||||||||
Jazz Pharmaceuticals PLC(a)(b) | 1,480 | 161,364 | |||||||||
Mallinckrodt PLC(a)(b) | 5,559 | 276,949 | |||||||||
Merck & Co., Inc.(a) | 12,487 | 735,110 | |||||||||
Pfizer, Inc. | 13,928 | 452,382 | |||||||||
Total | 2,885,556 | ||||||||||
Total Health Care | 9,966,878 | ||||||||||
INDUSTRIALS 2.9% | |||||||||||
Aerospace & Defense 0.2% | |||||||||||
Boeing Co. (The)(a) | 656 | 102,126 | |||||||||
L-3 Communications Holdings, Inc. | 3,150 | 479,147 | |||||||||
Total | 581,273 | ||||||||||
Airlines 0.8% | |||||||||||
Alaska Air Group, Inc.(a) | 9,252 | 820,930 | |||||||||
Delta Air Lines, Inc.(a) | 8,895 | 437,545 | |||||||||
Southwest Airlines Co. | 7,510 | 374,298 | |||||||||
United Continental Holdings, Inc.(a)(b) | 5,178 | 377,373 | |||||||||
Total | 2,010,146 | ||||||||||
Industrial Conglomerates 0.2% | |||||||||||
Carlisle Companies, Inc.(a) | 5,029 | 554,648 | |||||||||
Machinery 0.9% | |||||||||||
Cummins, Inc.(a) | 3,843 | 525,223 | |||||||||
Ingersoll-Rand PLC(a) | 7,439 | 558,222 | |||||||||
Oshkosh Corp.(a) | 5,740 | 370,861 | |||||||||
Snap-On, Inc.(a) | 1,984 | 339,800 | |||||||||
Timken Co. (The) | 13,738 | 545,399 | |||||||||
Total | 2,339,505 | ||||||||||
Common Stocks (continued)
Issuer | Shares | Value ($) | |||||||||
Professional Services 0.4% | |||||||||||
ManpowerGroup, Inc.(a) | 8,145 | 723,846 | |||||||||
Robert Half International, Inc. | 7,024 | 342,631 | |||||||||
Total | 1,066,477 | ||||||||||
Road & Rail 0.2% | |||||||||||
Norfolk Southern Corp.(a) | 6,170 | 666,792 | |||||||||
Trading Companies & Distributors 0.2% | |||||||||||
HD Supply Holdings, Inc.(a)(b) | 11,791 | 501,235 | |||||||||
Total Industrials | 7,720,076 | ||||||||||
INFORMATION TECHNOLOGY 6.0% | |||||||||||
Communications Equipment 0.6% | |||||||||||
Cisco Systems, Inc.(a) | 24,588 | 743,049 | |||||||||
F5 Networks, Inc.(a)(b) | 5,500 | 795,960 | |||||||||
Total | 1,539,009 | ||||||||||
Electronic Equipment, Instruments & Components 0.2% | |||||||||||
Zebra Technologies Corp., Class A(a)(b) | 7,095 | 608,467 | |||||||||
Internet Software & Services 1.0% | |||||||||||
Alphabet, Inc., Class A(a)(b) | 2,477 | 1,962,899 | |||||||||
VeriSign, Inc.(a)(b) | 8,036 | 611,298 | |||||||||
Total | 2,574,197 | ||||||||||
IT Services 1.1% | |||||||||||
Booz Allen Hamilton Holdings Corp.(a) | 12,935 | 466,566 | |||||||||
Leidos Holdings, Inc. | 10,590 | 541,573 | |||||||||
MasterCard, Inc., Class A(a) | 5,593 | 577,477 | |||||||||
Vantiv, Inc., Class A(b) | 7,071 | 421,573 | |||||||||
Visa, Inc., Class A | 13,419 | 1,046,950 | |||||||||
Total | 3,054,139 | ||||||||||
Semiconductors & Semiconductor Equipment 0.8% | |||||||||||
Broadcom Ltd.(a) | 4,139 | 731,651 | |||||||||
Micron Technology, Inc.(a)(b) | 33,361 | 731,273 | |||||||||
ON Semiconductor Corp.(a)(b) | 37,522 | 478,781 | |||||||||
QUALCOMM, Inc.(a) | 4,170 | 271,884 | |||||||||
Total | 2,213,589 | ||||||||||
Software 1.4% | |||||||||||
Activision Blizzard, Inc.(a) | 12,770 | 461,125 | |||||||||
Electronic Arts, Inc.(a)(b) | 6,020 | 474,135 | |||||||||
Microsoft Corp.(a) | 19,673 | 1,222,480 | |||||||||
Mobileye NV(a)(b) | 7,736 | 294,896 | |||||||||
Red Hat, Inc.(a)(b) | 2,205 | 153,689 | |||||||||
The accompanying Notes to Consolidated Financial Statements are an integral part of this statement.
Annual Report 2016
9
COLUMBIA VARIABLE PORTFOLIO — DIVERSIFIED ABSOLUTE RETURN FUND
CONSOLIDATED PORTFOLIO OF INVESTMENTS (continued)
December 31, 2016
Common Stocks (continued)
Issuer | Shares | Value ($) | |||||||||
Salesforce.com, Inc.(a)(b) | 10,155 | 695,211 | |||||||||
Workday, Inc., Class A(a)(b) | 5,023 | 331,970 | |||||||||
Total | 3,633,506 | ||||||||||
Technology Hardware, Storage & Peripherals 0.9% | |||||||||||
Apple, Inc.(a) | 15,902 | 1,841,770 | |||||||||
Electronics for Imaging, Inc.(a)(b) | 14,985 | 657,242 | |||||||||
Total | 2,499,012 | ||||||||||
Total Information Technology | 16,121,919 | ||||||||||
MATERIALS 1.4% | |||||||||||
Chemicals 0.8% | |||||||||||
Albemarle Corp.(a) | 1,616 | 139,105 | |||||||||
Cabot Corp.(a) | 12,122 | 612,646 | |||||||||
Dow Chemical Co. (The)(a) | 6,126 | 350,530 | |||||||||
Eastman Chemical Co.(a) | 2,504 | 188,326 | |||||||||
EI du Pont de Nemours & Co.(a) | 2,577 | 189,152 | |||||||||
LyondellBasell Industries NV, Class A(a) | 1,979 | 169,759 | |||||||||
Monsanto Co.(a) | 1,345 | 141,507 | |||||||||
PPG Industries, Inc.(a) | 2,820 | 267,223 | |||||||||
Total | 2,058,248 | ||||||||||
Containers & Packaging 0.1% | |||||||||||
International Paper Co.(a) | 4,021 | 213,354 | |||||||||
Sealed Air Corp.(a) | 3,847 | 174,423 | |||||||||
Total | 387,777 | ||||||||||
Metals & Mining 0.2% | |||||||||||
Newmont Mining Corp.(a) | 2,341 | 79,758 | |||||||||
Reliance Steel & Aluminum Co.(a) | 5,120 | 407,245 | |||||||||
Steel Dynamics, Inc.(a) | 5,073 | 180,497 | |||||||||
Total | 667,500 | ||||||||||
Paper & Forest Products 0.3% | |||||||||||
Domtar Corp.(a) | 17,482 | 682,323 | |||||||||
Total Materials | 3,795,848 | ||||||||||
REAL ESTATE 0.5% | |||||||||||
Equity Real Estate Investment Trusts (REITs) 0.5% | |||||||||||
CBL & Associates Properties, Inc.(a) | 27,327 | 314,260 | |||||||||
Equinix, Inc.(a) | 1,535 | 548,624 | |||||||||
Equity LifeStyle Properties, Inc.(a) | 7,546 | 544,067 | |||||||||
Total | 1,406,951 | ||||||||||
Total Real Estate | 1,406,951 | ||||||||||
Common Stocks (continued)
Issuer | Shares | Value ($) | |||||||||
TELECOMMUNICATION SERVICES 0.2% | |||||||||||
Diversified Telecommunication Services 0.2% | |||||||||||
CenturyLink, Inc.(a) | 20,506 | 487,633 | |||||||||
Total Telecommunication Services | 487,633 | ||||||||||
UTILITIES 1.3% | |||||||||||
Electric Utilities 0.4% | |||||||||||
American Electric Power Co., Inc.(a) | 3,883 | 244,474 | |||||||||
Edison International(a) | 4,347 | 312,941 | |||||||||
Entergy Corp.(a) | 7,454 | 547,645 | |||||||||
PG&E Corp.(a) | 1,974 | 119,960 | |||||||||
Total | 1,225,020 | ||||||||||
Gas Utilities 0.1% | |||||||||||
Atmos Energy Corp.(a) | 1,897 | 140,663 | |||||||||
Independent Power and Renewable Electricity Producers 0.1% | |||||||||||
AES Corp. (The)(a) | 15,699 | 182,422 | |||||||||
Multi-Utilities 0.7% | |||||||||||
Ameren Corp.(a) | 7,627 | 400,112 | |||||||||
CenterPoint Energy, Inc.(a) | 24,608 | 606,341 | |||||||||
DTE Energy Co.(a) | 3,707 | 365,177 | |||||||||
NiSource, Inc.(a) | 8,559 | 189,496 | |||||||||
SCANA Corp.(a) | 4,021 | 294,659 | |||||||||
Total | 1,855,785 | ||||||||||
Total Utilities | 3,403,890 | ||||||||||
| Total Common Stocks (Cost: $76,482,220) | 79,235,601 | ||||||||||
Exchange-Traded Funds 16.0%
Shares | Value ($) | ||||||||||
Vanguard Mortgage-Backed Securities ETF | 51,411 | 2,688,281 | |||||||||
Vanguard REIT ETF | 72,310 | 5,967,744 | |||||||||
| iPath Bloomberg Commodity Index Total Return ETN(b) | 248,241 | 6,014,880 | |||||||||
| iShares JPMorgan USD Emerging Markets Bond ETF | 38,297 | 4,221,096 | |||||||||
iShares TIPS Bond ETF | 111,424 | 12,609,854 | |||||||||
| iShares iBoxx $ High Yield Corporate Bond ETF | 76,624 | 6,631,807 | |||||||||
| iShares iBoxx $ Investment Grade Corporate Bond ETF | 38,629 | 4,526,546 | |||||||||
| Total Exchange-Traded Funds (Cost: $41,903,457) | 42,660,208 | ||||||||||
The accompanying Notes to Consolidated Financial Statements are an integral part of this statement.
Annual Report 2016
10
COLUMBIA VARIABLE PORTFOLIO — DIVERSIFIED ABSOLUTE RETURN FUND
CONSOLIDATED PORTFOLIO OF INVESTMENTS (continued)
December 31, 2016
Money Market Funds 63.0%
Shares | Value ($) | ||||||||||
| Columbia Short-Term Cash Fund, 0.594%(c)(d) | 168,540,026 | 168,540,026 | |||||||||
| Total Money Market Funds (Cost: $168,540,112) | 168,540,026 | ||||||||||
| Total Investments (Cost: $286,925,789) | 290,435,835 | ||||||||||
Investments Sold Short (16.9)%
Common Stocks (16.9)%
Issuer | Shares | Value ($) | |||||||||
CONSUMER DISCRETIONARY (2.4)% | |||||||||||
Auto Components (0.1)% | |||||||||||
BorgWarner, Inc. | (5,188 | ) | (204,615 | ) | |||||||
Automobiles (0.3)% | |||||||||||
Fiat Chrysler Automobiles NV(b) | (32,015 | ) | (291,977 | ) | |||||||
Tesla Motors, Inc.(b) | (1,204 | ) | (257,283 | ) | |||||||
Thor Industries, Inc. | (1,417 | ) | (141,771 | ) | |||||||
Total | (691,031 | ) | |||||||||
Distributors (0.1)% | |||||||||||
Genuine Parts Co. | (1,808 | ) | (172,736 | ) | |||||||
Hotels, Restaurants & Leisure (0.3)% | |||||||||||
Hyatt Hotels Corp., Class A(b) | (3,066 | ) | (169,427 | ) | |||||||
Marriott International, Inc., Class A | (1,841 | ) | (152,214 | ) | |||||||
McDonald's Corp. | (1,983 | ) | (241,371 | ) | |||||||
Texas Roadhouse, Inc. | (3,590 | ) | (173,181 | ) | |||||||
Wyndham Worldwide Corp. | (1,986 | ) | (151,671 | ) | |||||||
Total | (887,864 | ) | |||||||||
Internet & Direct Marketing Retail (0.1)% | |||||||||||
Netflix, Inc.(b) | (2,254 | ) | (279,045 | ) | |||||||
Leisure Products (0.1)% | |||||||||||
Hasbro, Inc. | (3,470 | ) | (269,931 | ) | |||||||
Media (0.4)% | |||||||||||
AMC Networks, Inc.(b) | (2,602 | ) | (136,189 | ) | |||||||
| Discovery Communications, Inc., Class A(b) | (6,010 | ) | (164,734 | ) | |||||||
Meredith Corp. | (2,760 | ) | (163,254 | ) | |||||||
Omnicom Group, Inc. | (3,160 | ) | (268,948 | ) | |||||||
Regal Entertainment Group, Class A | (4,939 | ) | (101,744 | ) | |||||||
Investments Sold Short (continued)
Common Stocks (continued)
Issuer | Shares | Value ($) | |||||||||
Walt Disney Co. (The) | (1,583 | ) | (164,980 | ) | |||||||
WPP PLC, ADR | (1,140 | ) | (126,152 | ) | |||||||
Total | (1,126,001 | ) | |||||||||
Multiline Retail (0.1)% | |||||||||||
Nordstrom, Inc. | (2,693 | ) | (129,076 | ) | |||||||
Target Corp. | (3,036 | ) | (219,290 | ) | |||||||
Total | (348,366 | ) | |||||||||
Specialty Retail (0.7)% | |||||||||||
AutoNation, Inc.(b) | (6,336 | ) | (308,247 | ) | |||||||
Best Buy Co., Inc. | (4,939 | ) | (210,747 | ) | |||||||
CarMax, Inc.(b) | (8,042 | ) | (517,824 | ) | |||||||
Dick's Sporting Goods, Inc. | (4,120 | ) | (218,772 | ) | |||||||
Finish Line, Inc., Class A (The) | (5,051 | ) | (95,009 | ) | |||||||
Penske Automotive Group, Inc. | (8,658 | ) | (448,831 | ) | |||||||
Tiffany & Co. | (1,735 | ) | (134,341 | ) | |||||||
Total | (1,933,771 | ) | |||||||||
Textiles, Apparel & Luxury Goods (0.2)% | |||||||||||
Carter's, Inc. | (1,582 | ) | (136,669 | ) | |||||||
Hanesbrands, Inc. | (4,410 | ) | (95,124 | ) | |||||||
Michael Kors Holdings Ltd.(b) | (2,583 | ) | (111,017 | ) | |||||||
Ralph Lauren Corp. | (1,463 | ) | (132,138 | ) | |||||||
Total | (474,948 | ) | |||||||||
Total Consumer Discretionary | (6,388,308 | ) | |||||||||
CONSUMER STAPLES (1.7)% | |||||||||||
Beverages (0.4)% | |||||||||||
Brown-Forman Corp., Class B | (4,663 | ) | (209,462 | ) | |||||||
Coca-Cola Co. (The) | (11,544 | ) | (478,614 | ) | |||||||
Monster Beverage Corp.(b) | (7,851 | ) | (348,114 | ) | |||||||
Total | (1,036,190 | ) | |||||||||
Food & Staples Retailing —% | |||||||||||
Wal-Mart Stores, Inc. | (1,486 | ) | (102,712 | ) | |||||||
Food Products (0.7)% | |||||||||||
B&G Foods, Inc. | (3,289 | ) | (144,058 | ) | |||||||
Campbell Soup Co. | (3,695 | ) | (223,437 | ) | |||||||
ConAgra Foods, Inc. | (7,704 | ) | (304,693 | ) | |||||||
Kraft Heinz Co. (The) | (2,640 | ) | (230,525 | ) | |||||||
McCormick & Co., Inc. | (2,232 | ) | (208,313 | ) | |||||||
The accompanying Notes to Consolidated Financial Statements are an integral part of this statement.
Annual Report 2016
11
COLUMBIA VARIABLE PORTFOLIO — DIVERSIFIED ABSOLUTE RETURN FUND
CONSOLIDATED PORTFOLIO OF INVESTMENTS (continued)
December 31, 2016
Investments Sold Short (continued)
Common Stocks (continued)
Issuer | Shares | Value ($) | |||||||||
Treehouse Foods, Inc.(b) | (3,808 | ) | (274,899 | ) | |||||||
WhiteWave Foods Co. (The)(b) | (6,414 | ) | (356,618 | ) | |||||||
Total | (1,742,543 | ) | |||||||||
Household Products (0.5)% | |||||||||||
Church & Dwight Co., Inc. | (4,460 | ) | (197,087 | ) | |||||||
Clorox Co. (The) | (1,682 | ) | (201,874 | ) | |||||||
Kimberly-Clark Corp. | (3,629 | ) | (414,141 | ) | |||||||
Procter & Gamble Co. (The) | (6,574 | ) | (552,742 | ) | |||||||
Total | (1,365,844 | ) | |||||||||
Personal Products (0.1)% | |||||||||||
Avon Products, Inc.(b) | (13,401 | ) | (67,541 | ) | |||||||
Coty, Inc., Class A | (4,767 | ) | (87,284 | ) | |||||||
Edgewell Personal Care Co.(b) | (2,513 | ) | (183,424 | ) | |||||||
Total | (338,249 | ) | |||||||||
Total Consumer Staples | (4,585,538 | ) | |||||||||
ENERGY (1.2)% | |||||||||||
Energy Equipment & Services (0.2)% | |||||||||||
Core Laboratories NV | (668 | ) | (80,187 | ) | |||||||
Ensco PLC, Class A | (7,131 | ) | (69,313 | ) | |||||||
National Oilwell Varco, Inc. | (3,993 | ) | (149,498 | ) | |||||||
Noble Corp. PLC | (6,308 | ) | (37,343 | ) | |||||||
Rowan Companies PLC, Class A(b) | (4,380 | ) | (82,738 | ) | |||||||
SEACOR Holdings, Inc.(b) | (1,252 | ) | (89,243 | ) | |||||||
Total | (508,322 | ) | |||||||||
Oil, Gas & Consumable Fuels (1.0)% | |||||||||||
Apache Corp. | (2,095 | ) | (132,970 | ) | |||||||
Cenovus Energy, Inc. | (17,450 | ) | (264,018 | ) | |||||||
Cheniere Energy, Inc.(b) | (10,555 | ) | (437,294 | ) | |||||||
Chevron Corp. | (2,409 | ) | (283,539 | ) | |||||||
ConocoPhillips | (2,269 | ) | (113,768 | ) | |||||||
Enbridge, Inc. | (1,348 | ) | (56,778 | ) | |||||||
Marathon Oil Corp. | (6,102 | ) | (105,626 | ) | |||||||
Murphy Oil Corp. | (2,480 | ) | (77,202 | ) | |||||||
Occidental Petroleum Corp. | (1,192 | ) | (84,906 | ) | |||||||
Oneok, Inc. | (2,006 | ) | (115,164 | ) | |||||||
Royal Dutch Shell PLC, ADR, Class A | (7,907 | ) | (429,983 | ) | |||||||
Southwestern Energy Co.(b) | (9,000 | ) | (97,380 | ) | |||||||
Investments Sold Short (continued)
Common Stocks (continued)
Issuer | Shares | Value ($) | |||||||||
Total SA, ADR | (8,573 | ) | (436,966 | ) | |||||||
Williams Companies, Inc. (The) | (3,636 | ) | (113,225 | ) | |||||||
Total | (2,748,819 | ) | |||||||||
Total Energy | (3,257,141 | ) | |||||||||
FINANCIALS (2.3)% | |||||||||||
Banks (0.7)% | |||||||||||
Cullen/Frost Bankers, Inc. | (2,115 | ) | (186,606 | ) | |||||||
First Horizon National Corp. | (13,874 | ) | (277,619 | ) | |||||||
M&T Bank Corp. | (2,839 | ) | (444,105 | ) | |||||||
People's United Financial | (13,269 | ) | (256,888 | ) | |||||||
Signature Bank(b) | (2,874 | ) | (431,675 | ) | |||||||
Synovus Financial Corp. | (6,270 | ) | (257,571 | ) | |||||||
Total | (1,854,464 | ) | |||||||||
Capital Markets (0.8)% | |||||||||||
Cboe Holdings, Inc. | (3,407 | ) | (251,743 | ) | |||||||
Factset Research Systems, Inc. | (1,042 | ) | (170,294 | ) | |||||||
Franklin Resources, Inc. | (6,293 | ) | (249,077 | ) | |||||||
Janus Capital Group, Inc. | (14,116 | ) | (187,319 | ) | |||||||
Legg Mason, Inc. | (14,784 | ) | (442,190 | ) | |||||||
Northern Trust Corp. | (3,147 | ) | (280,240 | ) | |||||||
TD Ameritrade Holding Corp. | (6,468 | ) | (282,005 | ) | |||||||
Thomson Reuters Corp. | (3,883 | ) | (169,998 | ) | |||||||
Total | (2,032,866 | ) | |||||||||
Insurance (0.7)% | |||||||||||
Aon PLC | (1,803 | ) | (201,089 | ) | |||||||
Arch Capital Group Ltd.(b) | (1,812 | ) | (156,358 | ) | |||||||
Assurant, Inc. | (3,635 | ) | (337,546 | ) | |||||||
Markel Corp.(b) | (312 | ) | (282,204 | ) | |||||||
Mercury General Corp. | (7,725 | ) | (465,122 | ) | |||||||
Principal Financial Group, Inc. | (1,678 | ) | (97,089 | ) | |||||||
Unum Group | (4,953 | ) | (217,585 | ) | |||||||
WR Berkley Corp. | (2,969 | ) | (197,468 | ) | |||||||
Total | (1,954,461 | ) | |||||||||
Thrifts & Mortgage Finance (0.1)% | |||||||||||
New York Community Bancorp | (23,489 | ) | (373,710 | ) | |||||||
Total Financials | (6,215,501 | ) | |||||||||
The accompanying Notes to Consolidated Financial Statements are an integral part of this statement.
Annual Report 2016
12
COLUMBIA VARIABLE PORTFOLIO — DIVERSIFIED ABSOLUTE RETURN FUND
CONSOLIDATED PORTFOLIO OF INVESTMENTS (continued)
December 31, 2016
Investments Sold Short (continued)
Common Stocks (continued)
Issuer | Shares | Value ($) | |||||||||
HEALTH CARE (2.1)% | |||||||||||
Biotechnology (0.2)% | |||||||||||
CoLucid Pharmaceuticals, Inc.(b) | (3,033 | ) | (110,401 | ) | |||||||
Exact Sciences Corp.(b) | (7,728 | ) | (103,246 | ) | |||||||
Sarepta Therapeutics, Inc.(b) | (3,941 | ) | (108,102 | ) | |||||||
Seattle Genetics, Inc.(b) | (3,239 | ) | (170,922 | ) | |||||||
Total | (492,671 | ) | |||||||||
Health Care Equipment & Supplies (0.6)% | |||||||||||
ABIOMED, Inc.(b) | (2,373 | ) | (267,390 | ) | |||||||
Baxter International, Inc. | (4,232 | ) | (187,647 | ) | |||||||
Hill-Rom Holdings, Inc. | (4,852 | ) | (272,391 | ) | |||||||
Intuitive Surgical, Inc.(b) | (415 | ) | (263,181 | ) | |||||||
Stryker Corp. | (1,799 | ) | (215,538 | ) | |||||||
Varian Medical Systems, Inc.(b) | (3,372 | ) | (302,738 | ) | |||||||
Total | (1,508,885 | ) | |||||||||
Health Care Providers & Services (0.3)% | |||||||||||
DaVita HealthCare Partners, Inc.(b) | (1,696 | ) | (108,883 | ) | |||||||
Lifepoint Hospitals, Inc.(b) | (4,917 | ) | (279,286 | ) | |||||||
Mckesson Corp. | (1,465 | ) | (205,759 | ) | |||||||
Quest Diagnostics, Inc. | (2,409 | ) | (221,387 | ) | |||||||
Universal Health Services-b | (840 | ) | (89,359 | ) | |||||||
Total | (904,674 | ) | |||||||||
Health Care Technology (0.2)% | |||||||||||
Allscripts Healthcare Solutions, Inc.(b) | (4,900 | ) | (50,029 | ) | |||||||
Cerner Corp.(b) | (5,148 | ) | (243,860 | ) | |||||||
Inovalon Holdings, Inc.(b) | (22,603 | ) | (232,811 | ) | |||||||
Total | (526,700 | ) | |||||||||
Life Sciences Tools & Services (0.3)% | |||||||||||
Bruker Corp. | (8,923 | ) | (188,989 | ) | |||||||
Mettler-Toledo International, Inc.(b) | (258 | ) | (107,988 | ) | |||||||
QIAGEN NV(b) | (6,109 | ) | (171,174 | ) | |||||||
Quintiles Ims Holdings, Inc.(b) | (2,613 | ) | (198,719 | ) | |||||||
Waters Corp.(b) | (727 | ) | (97,702 | ) | |||||||
Total | (764,572 | ) | |||||||||
Pharmaceuticals (0.5)% | |||||||||||
Astrazeneca PLC, ADR | (7,597 | ) | (207,550 | ) | |||||||
Glaxosmithkline PLC, ADR | (4,536 | ) | (174,681 | ) | |||||||
Mylan NV(b) | (7,570 | ) | (288,796 | ) | |||||||
Investments Sold Short (continued)
Common Stocks (continued)
Issuer | Shares | Value ($) | |||||||||
Novo Nordisk A/S, ADR | (5,820 | ) | (208,705 | ) | |||||||
Roche Holding AG, ADR | (8,470 | ) | (241,649 | ) | |||||||
Sanofi, ADR | (4,158 | ) | (168,150 | ) | |||||||
Total | (1,289,531 | ) | |||||||||
Total Health Care | (5,487,033 | ) | |||||||||
INDUSTRIALS (1.8)% | |||||||||||
Aerospace & Defense (0.1)% | |||||||||||
Triumph Group, Inc. | (6,059 | ) | (160,564 | ) | |||||||
Airlines (0.1)% | |||||||||||
Copa Holdings SA, Class A | (2,774 | ) | (251,963 | ) | |||||||
Building Products (0.2)% | |||||||||||
Armstrong World Industries, Inc.(b) | (11,334 | ) | (473,761 | ) | |||||||
Commercial Services & Supplies —% | |||||||||||
Clean Harbors, Inc.(b) | (985 | ) | (54,815 | ) | |||||||
Construction & Engineering (0.1)% | |||||||||||
Fluor Corp. | (5,068 | ) | (266,171 | ) | |||||||
Electrical Equipment (0.1)% | |||||||||||
Emerson Electric Co. | (7,280 | ) | (405,860 | ) | |||||||
Industrial Conglomerates (0.4)% | |||||||||||
3M Co. | (2,414 | ) | (431,068 | ) | |||||||
General Electric Co. | (10,730 | ) | (339,068 | ) | |||||||
Roper Industries, Inc. | (1,930 | ) | (353,344 | ) | |||||||
Total | (1,123,480 | ) | |||||||||
Machinery (0.2)% | |||||||||||
Caterpillar, Inc. | (2,235 | ) | (207,274 | ) | |||||||
Parker Hannifin Corp. | (2,522 | ) | (353,080 | ) | |||||||
Total | (560,354 | ) | |||||||||
Professional Services (0.1)% | |||||||||||
IHS Markit Ltd.(b) | (6,632 | ) | (234,839 | ) | |||||||
Road & Rail (0.2)% | |||||||||||
Avis Budget Group, Inc.(b) | (4,705 | ) | (172,579 | ) | |||||||
Genesee & Wyoming, Inc., Class A(b) | (5,216 | ) | (362,043 | ) | |||||||
Total | (534,622 | ) | |||||||||
Trading Companies & Distributors (0.3)% | |||||||||||
Air Lease Corp. | (12,799 | ) | (439,390 | ) | |||||||
MSC Industrial Direct Co., Inc., Class A | (3,439 | ) | (317,729 | ) | |||||||
Total | (757,119 | ) | |||||||||
Total Industrials | (4,823,548 | ) | |||||||||
The accompanying Notes to Consolidated Financial Statements are an integral part of this statement.
Annual Report 2016
13
COLUMBIA VARIABLE PORTFOLIO — DIVERSIFIED ABSOLUTE RETURN FUND
CONSOLIDATED PORTFOLIO OF INVESTMENTS (continued)
December 31, 2016
Investments Sold Short (continued)
Common Stocks (continued)
Issuer | Shares | Value ($) | |||||||||
INFORMATION TECHNOLOGY (3.4)% | |||||||||||
Communications Equipment (0.3)% | |||||||||||
EchoStar Corp., Class A(b) | (7,229 | ) | (371,498 | ) | |||||||
Juniper Networks, Inc. | (8,835 | ) | (249,677 | ) | |||||||
Total | (621,175 | ) | |||||||||
Electronic Equipment, Instruments & Components (0.5)% | |||||||||||
IPG Photonics Corp.(b) | (2,507 | ) | (247,466 | ) | |||||||
Knowles Corp.(b) | (19,563 | ) | (326,898 | ) | |||||||
Verifone Systems, Inc.(b) | (20,673 | ) | (366,532 | ) | |||||||
Vishay Intertechnology, Inc. | (29,760 | ) | (482,112 | ) | |||||||
Total | (1,423,008 | ) | |||||||||
IT Services (1.1)% | |||||||||||
Accenture PLC, Class A | (4,100 | ) | (480,233 | ) | |||||||
First Data Corp., Class A(b) | (28,547 | ) | (405,082 | ) | |||||||
International Business Machines Corp. | (3,133 | ) | (520,047 | ) | |||||||
Jack Henry & Associates, Inc. | (3,672 | ) | (326,000 | ) | |||||||
Paychex, Inc. | (5,299 | ) | (322,603 | ) | |||||||
Teradata Corp.(b) | (18,003 | ) | (489,141 | ) | |||||||
Xerox Corp. | (47,209 | ) | (412,135 | ) | |||||||
Total | (2,955,241 | ) | |||||||||
Semiconductors & Semiconductor Equipment (0.7)% | |||||||||||
Advanced Micro Devices, Inc.(b) | (31,186 | ) | (353,649 | ) | |||||||
Amkor Technology, Inc.(b) | (31,661 | ) | (334,024 | ) | |||||||
| ASML Holding NV | (2,750 | ) | (308,550 | ) | |||||||
Intel Corp. | (13,971 | ) | (506,728 | ) | |||||||
Teradyne, Inc. | (13,053 | ) | (331,546 | ) | |||||||
Total | (1,834,497 | ) | |||||||||
Software (0.6)% | |||||||||||
Ca, Inc. | (14,675 | ) | (466,225 | ) | |||||||
FireEye, Inc.(b) | (25,463 | ) | (303,010 | ) | |||||||
Intuit, Inc. | (2,822 | ) | (323,429 | ) | |||||||
Oracle Corp. | (15,246 | ) | (586,209 | ) | |||||||
Total | (1,678,873 | ) | |||||||||
Technology Hardware, Storage & Peripherals (0.2)% | |||||||||||
Hewlett Packard Enterprise Co. | (13,176 | ) | (304,893 | ) | |||||||
NetApp, Inc. | (8,706 | ) | (307,060 | ) | |||||||
Total | (611,953 | ) | |||||||||
Total Information Technology | (9,124,747 | ) | |||||||||
Investments Sold Short (continued)
Common Stocks (continued)
Issuer | Shares | Value ($) | |||||||||
MATERIALS (1.0)% | |||||||||||
Chemicals (0.5)% | |||||||||||
Agrium, Inc. | (1,989 | ) | (199,994 | ) | |||||||
Air Products & Chemicals, Inc. | (776 | ) | (111,604 | ) | |||||||
Axalta Coating Systems Ltd.(b) | (5,462 | ) | (148,566 | ) | |||||||
Ecolab, Inc. | (985 | ) | (115,462 | ) | |||||||
International Flavors & Fragrances, Inc. | (874 | ) | (102,984 | ) | |||||||
Platform Specialty Products Corp.(b) | (46,072 | ) | (451,966 | ) | |||||||
Versum Materials, Inc.(b) | (388 | ) | (10,891 | ) | |||||||
WR Grace & Co. | (3,676 | ) | (248,645 | ) | |||||||
Total | (1,390,112 | ) | |||||||||
Construction Materials (0.1)% | |||||||||||
Vulcan Materials Co. | (1,665 | ) | (208,375 | ) | |||||||
Containers & Packaging (0.1)% | |||||||||||
Sonoco Products Co. | (3,504 | ) | (184,661 | ) | |||||||
Metals & Mining (0.3)% | |||||||||||
Arcelormittal(b) | (38,970 | ) | (284,481 | ) | |||||||
BHP Billiton Ltd., ADR | (7,500 | ) | (268,350 | ) | |||||||
Southern Copper Corp. | (8,665 | ) | (276,760 | ) | |||||||
Total | (829,591 | ) | |||||||||
Total Materials | (2,612,739 | ) | |||||||||
REAL ESTATE (0.1)% | |||||||||||
Equity Real Estate Investment Trusts (REITs) (0.1)% | |||||||||||
Lamar Advertising Co., Class A | (2,772 | ) | (186,389 | ) | |||||||
Life Storage, Inc. | (471 | ) | (40,158 | ) | |||||||
Total | (226,547 | ) | |||||||||
Total Real Estate | (226,547 | ) | |||||||||
TELECOMMUNICATION SERVICES (0.1)% | |||||||||||
Diversified Telecommunication Services (0.1)% | |||||||||||
SBA Communications Corp., Class A(b) | (468 | ) | (48,325 | ) | |||||||
Verizon Communications, Inc. | (6,086 | ) | (324,871 | ) | |||||||
Total | (373,196 | ) | |||||||||
Total Telecommunication Services | (373,196 | ) | |||||||||
UTILITIES (0.8)% | |||||||||||
Electric Utilities (0.2)% | |||||||||||
PPL Corp. | (8,238 | ) | (280,504 | ) | |||||||
The accompanying Notes to Consolidated Financial Statements are an integral part of this statement.
Annual Report 2016
14
COLUMBIA VARIABLE PORTFOLIO — DIVERSIFIED ABSOLUTE RETURN FUND
CONSOLIDATED PORTFOLIO OF INVESTMENTS (continued)
December 31, 2016
Investments Sold Short (continued)
Common Stocks (continued)
Issuer | Shares | Value ($) | |||||||||
Southern Co. (The) | (6,872 | ) | (338,033 | ) | |||||||
Total | (618,537 | ) | |||||||||
Independent Power and Renewable Electricity Producers (0.1)% | |||||||||||
Calpine Corp.(b) | (25,655 | ) | (293,237 | ) | |||||||
Multi-Utilities (0.4)% | |||||||||||
Consolidated Edison, Inc. | (5,034 | ) | (370,905 | ) | |||||||
Dominion Resources, Inc. | (4,092 | ) | (313,406 | ) | |||||||
Sempra Energy | (3,562 | ) | (358,480 | ) | |||||||
Total | (1,042,791 | ) | |||||||||
Investments Sold Short (continued)
Common Stocks (continued)
Issuer | Shares | Value ($) | |||||||||
Water Utilities (0.1)% | |||||||||||
Aqua America, Inc. | (7,479 | ) | (224,669 | ) | |||||||
Total Utilities | (2,179,234 | ) | |||||||||
| Total Common Stocks (Proceeds: $43,967,189) | (45,273,532 | ) | |||||||||
| Total Investments Sold Short (Proceeds: $43,967,189) | (45,273,532 | ) | |||||||||
Total Investments, Net of Investments Sold Short | 245,162,303 | ||||||||||
Other Assets & Liabilities, Net | 22,154,306 | ||||||||||
Net Assets | 267,316,609 | ||||||||||
At December 31, 2016, securities and cash totaling $91,150,655 were pledged as collateral.
Investments in Derivatives
Forward Foreign Currency Exchange Contracts Open at December 31, 2016
Counterparty | Exchange Date | Currency to be Delivered | Currency to be Received | Unrealized Appreciation ($) | Unrealized Depreciation ($) | ||||||||||||||||||||||||||
BNP Paribas | 02/03/2017 | 6,200,000 | CAD | 4,679,139 | USD | 59,617 | — | ||||||||||||||||||||||||
BNP Paribas | 02/03/2017 | 200,000 | CAD | 150,940 | USD | 1,923 | — | ||||||||||||||||||||||||
BNP Paribas | 02/03/2017 | 9,000,000 | EUR | 9,690,300 | USD | 200,793 | — | ||||||||||||||||||||||||
BNP Paribas | 02/03/2017 | 5,500,000 | NOK | 657,211 | USD | 20,106 | — | ||||||||||||||||||||||||
BNP Paribas | 02/03/2017 | 4,900,000 | NOK | 585,515 | USD | 17,912 | — | ||||||||||||||||||||||||
BNP Paribas | 02/03/2017 | 2,500,000 | NZD | 1,780,813 | USD | 45,988 | — | ||||||||||||||||||||||||
BNP Paribas | 02/03/2017 | 200,000 | NZD | 142,465 | USD | 3,679 | — | ||||||||||||||||||||||||
BNP Paribas | 02/03/2017 | 2,855,157 | SEK | 313,272 | USD | — | (767 | ) | |||||||||||||||||||||||
BNP Paribas | 02/03/2017 | 43,100,000 | SGD | 30,304,096 | USD | 549,382 | — | ||||||||||||||||||||||||
BNP Paribas | 02/03/2017 | 373,440 | USD | 500,000 | AUD | — | (12,910 | ) | |||||||||||||||||||||||
BNP Paribas | 02/03/2017 | 3,062,208 | USD | 4,100,000 | AUD | — | (105,862 | ) | |||||||||||||||||||||||
BNP Paribas | 02/03/2017 | 397,891 | USD | 400,000 | CHF | — | (4,171 | ) | |||||||||||||||||||||||
BNP Paribas | 02/03/2017 | 4,973,640 | USD | 5,000,000 | CHF | — | (52,138 | ) | |||||||||||||||||||||||
BNP Paribas | 02/03/2017 | 1,197,136 | USD | 1,111,857 | EUR | — | (24,806 | ) | |||||||||||||||||||||||
BNP Paribas | 02/03/2017 | 127,324 | USD | 100,000 | GBP | — | (3,976 | ) | |||||||||||||||||||||||
BNP Paribas | 02/03/2017 | 17,443,388 | USD | 13,700,000 | GBP | — | (544,704 | ) | |||||||||||||||||||||||
BNP Paribas | 02/03/2017 | 2,988,752 | USD | 340,030,284 | JPY | — | (74,179 | ) | |||||||||||||||||||||||
BNP Paribas | 02/03/2017 | 17,734,025 | USD | 2,017,600,000 | JPY | — | (440,145 | ) | |||||||||||||||||||||||
BNP Paribas | 02/03/2017 | 7,439,105 | USD | 67,800,000 | SEK | 18,206 | — | ||||||||||||||||||||||||
BNP Paribas | 02/03/2017 | 1,232,641 | USD | 1,753,123 | SGD | — | (22,347 | ) | |||||||||||||||||||||||
Barclays | 01/11/2017 | 21,922,000 | CHF | 21,735,995 | USD | 196,339 | — | ||||||||||||||||||||||||
Barclays | 01/11/2017 | 8,923,000 | CHF | 8,683,298 | USD | — | (84,075 | ) | |||||||||||||||||||||||
Barclays | 01/11/2017 | 8,416,238 | USD | 8,612,000 | CHF | 45,559 | — | ||||||||||||||||||||||||
Barclays | 02/03/2017 | 1,900,000 | AUD | 1,414,282 | USD | 44,268 | — | ||||||||||||||||||||||||
The accompanying Notes to Consolidated Financial Statements are an integral part of this statement.
Annual Report 2016
15
COLUMBIA VARIABLE PORTFOLIO — DIVERSIFIED ABSOLUTE RETURN FUND
CONSOLIDATED PORTFOLIO OF INVESTMENTS (continued)
December 31, 2016
Forward Foreign Currency Exchange Contracts Open at December 31, 2016 (continued)
Counterparty | Exchange Date | Currency to be Delivered | Currency to be Received | Unrealized Appreciation ($) | Unrealized Depreciation ($) | ||||||||||||||||||||||||||
Barclays | 02/03/2017 | 3,600,000 | CHF | 3,586,658 | USD | 43,176 | — | ||||||||||||||||||||||||
Barclays | 02/03/2017 | 400,000 | CHF | 398,544 | USD | 4,824 | — | ||||||||||||||||||||||||
Barclays | 02/03/2017 | 300,000 | CHF | 292,409 | USD | — | (2,881 | ) | |||||||||||||||||||||||
Barclays | 02/03/2017 | 23,700,000 | JPY | 208,645 | USD | 5,501 | — | ||||||||||||||||||||||||
Barclays | 02/03/2017 | 5,100,000 | NOK | 586,680 | USD | — | (4,090 | ) | |||||||||||||||||||||||
Barclays | 02/03/2017 | 301,565 | USD | 400,000 | CAD | — | (3,531 | ) | |||||||||||||||||||||||
Barclays | 02/03/2017 | 430,762 | USD | 400,000 | EUR | — | (9,006 | ) | |||||||||||||||||||||||
Barclays | 02/03/2017 | 127,406 | USD | 100,000 | GBP | — | (4,058 | ) | |||||||||||||||||||||||
Barclays | 02/03/2017 | 95,510 | USD | 800,000 | NOK | — | (2,840 | ) | |||||||||||||||||||||||
Barclays | 02/03/2017 | 137,941 | USD | 200,000 | NZD | 845 | — | ||||||||||||||||||||||||
Barclays | 02/03/2017 | 497,165 | USD | 700,000 | NZD | — | (11,414 | ) | |||||||||||||||||||||||
Barclays | 02/03/2017 | 1,198,289 | USD | 1,700,000 | SGD | — | (24,669 | ) | |||||||||||||||||||||||
Citi | 01/11/2017 | 20,172,000 | EUR | 21,693,171 | USD | 450,920 | — | ||||||||||||||||||||||||
Citi | 01/11/2017 | 119,732,000 | SEK | 12,976,215 | USD | — | (172,197 | ) | |||||||||||||||||||||||
Citi | 01/11/2017 | 8,508,328 | USD | 8,138,000 | EUR | 61,444 | — | ||||||||||||||||||||||||
Citi | 01/11/2017 | 12,793,658 | USD | 12,034,000 | EUR | — | (121,180 | ) | |||||||||||||||||||||||
Citi | 02/03/2017 | 5,200,000 | SGD | 3,660,101 | USD | 70,205 | — | ||||||||||||||||||||||||
Citi | 02/03/2017 | 35,404,434 | USD | 50,300,000 | SGD | — | (679,096 | ) | |||||||||||||||||||||||
Credit Suisse | 02/03/2017 | 3,000,000 | AUD | 2,243,085 | USD | 79,905 | — | ||||||||||||||||||||||||
Credit Suisse | 02/03/2017 | 1,100,000 | AUD | �� | 822,465 | USD | 29,298 | — | |||||||||||||||||||||||
Credit Suisse | 02/03/2017 | 9,600,000 | CAD | 7,253,111 | USD | 100,302 | — | ||||||||||||||||||||||||
Credit Suisse | 02/03/2017 | 2,500,000 | CAD | 1,888,831 | USD | 26,120 | — | ||||||||||||||||||||||||
Credit Suisse | 02/03/2017 | 3,900,000 | CHF | 3,886,204 | USD | 47,432 | — | ||||||||||||||||||||||||
Credit Suisse | 02/03/2017 | 2,900,000 | CHF | 2,889,741 | USD | 35,270 | — | ||||||||||||||||||||||||
Credit Suisse | 02/03/2017 | 2,086,868 | EUR | 2,250,958 | USD | 50,586 | — | ||||||||||||||||||||||||
Credit Suisse | 02/03/2017 | 2,400,000 | GBP | 3,055,800 | USD | 95,447 | — | ||||||||||||||||||||||||
Credit Suisse | 02/03/2017 | 700,000 | GBP | 891,275 | USD | 27,839 | — | ||||||||||||||||||||||||
Credit Suisse | 02/03/2017 | 276,600,000 | JPY | 2,439,229 | USD | 68,349 | — | ||||||||||||||||||||||||
Credit Suisse | 02/03/2017 | 79,900,000 | NOK | 9,556,211 | USD | 300,813 | — | ||||||||||||||||||||||||
Credit Suisse | 02/03/2017 | 6,100,000 | NZD | 4,353,296 | USD | 120,324 | — | ||||||||||||||||||||||||
Credit Suisse | 02/03/2017 | 29,200,000 | SEK | 3,209,308 | USD | — | (2,395 | ) | |||||||||||||||||||||||
Credit Suisse | 02/03/2017 | 76,800,000 | SEK | 8,440,920 | USD | — | (6,298 | ) | |||||||||||||||||||||||
Credit Suisse | 02/03/2017 | 1,753,123 | SGD | 1,233,412 | USD | 23,118 | — | ||||||||||||||||||||||||
Credit Suisse | 02/03/2017 | 5,594,529 | USD | 634,400,000 | JPY | — | (156,763 | ) | |||||||||||||||||||||||
Credit Suisse | 02/03/2017 | 518,177 | USD | 4,332,504 | NOK | — | (16,311 | ) | |||||||||||||||||||||||
Credit Suisse | 02/03/2017 | 71,366 | USD | 100,000 | NZD | — | (1,973 | ) | |||||||||||||||||||||||
Credit Suisse | 02/03/2017 | 351,776 | USD | 500,000 | SGD | — | (6,593 | ) | |||||||||||||||||||||||
Deutsche Bank | 02/03/2017 | 5,000,000 | AUD | 3,740,010 | USD | 134,710 | — | ||||||||||||||||||||||||
Deutsche Bank | 02/03/2017 | 1,133,347 | AUD | 847,746 | USD | 30,535 | — | ||||||||||||||||||||||||
Deutsche Bank | 02/03/2017 | 3,039,461 | CAD | 2,296,774 | USD | 32,119 | — | ||||||||||||||||||||||||
Deutsche Bank | 02/03/2017 | 200,000 | CAD | 152,551 | USD | 3,534 | — | ||||||||||||||||||||||||
Deutsche Bank | 02/03/2017 | 1,100,000 | CHF | 1,097,038 | USD | 14,308 | — | ||||||||||||||||||||||||
The accompanying Notes to Consolidated Financial Statements are an integral part of this statement.
Annual Report 2016
16
COLUMBIA VARIABLE PORTFOLIO — DIVERSIFIED ABSOLUTE RETURN FUND
CONSOLIDATED PORTFOLIO OF INVESTMENTS (continued)
December 31, 2016
Forward Foreign Currency Exchange Contracts Open at December 31, 2016 (continued)
Counterparty | Exchange Date | Currency to be Delivered | Currency to be Received | Unrealized Appreciation ($) | Unrealized Depreciation ($) | ||||||||||||||||||||||||||
Deutsche Bank | 02/03/2017 | 10,700,000 | EUR | 11,546,666 | USD | 264,697 | — | ||||||||||||||||||||||||
Deutsche Bank | 02/03/2017 | 1,524,989 | EUR | 1,646,157 | USD | 38,224 | — | ||||||||||||||||||||||||
Deutsche Bank | 02/03/2017 | 15,500,000 | GBP | 19,745,838 | USD | 626,888 | — | ||||||||||||||||||||||||
Deutsche Bank | 02/03/2017 | 2,900,000 | GBP | 3,694,383 | USD | 117,289 | — | ||||||||||||||||||||||||
Deutsche Bank | 02/03/2017 | 300,430,284 | JPY | 2,655,416 | USD | 80,274 | — | ||||||||||||||||||||||||
Deutsche Bank | 02/03/2017 | 10,300,000 | JPY | 89,720 | USD | 1,434 | — | ||||||||||||||||||||||||
Deutsche Bank | 02/03/2017 | 2,203,329 | NOK | 263,425 | USD | 8,198 | — | ||||||||||||||||||||||||
Deutsche Bank | 02/03/2017 | 17,700,000 | NZD | 12,629,924 | USD | 347,366 | — | ||||||||||||||||||||||||
Deutsche Bank | 02/03/2017 | 2,100,000 | NZD | 1,498,466 | USD | 41,213 | — | ||||||||||||||||||||||||
Deutsche Bank | 02/03/2017 | 36,400,000 | SEK | 4,003,713 | USD | 83 | — | ||||||||||||||||||||||||
Deutsche Bank | 02/03/2017 | 19,873,640 | USD | 26,300,000 | CAD | — | (277,923 | ) | |||||||||||||||||||||||
Deutsche Bank | 02/03/2017 | 25,431,335 | USD | 25,500,000 | CHF | — | (331,675 | ) | |||||||||||||||||||||||
Deutsche Bank | 02/03/2017 | 312,150 | USD | 300,000 | EUR | 4,167 | — | ||||||||||||||||||||||||
Deutsche Bank | 02/03/2017 | 15,220,256 | USD | 1,722,000,000 | JPY | — | (460,115 | ) | |||||||||||||||||||||||
Deutsche Bank | 02/03/2017 | 14,562,142 | USD | 121,800,000 | NOK | — | (453,163 | ) | |||||||||||||||||||||||
Deutsche Bank | 02/03/2017 | 97,139 | USD | 900,000 | SEK | 1,852 | — | ||||||||||||||||||||||||
Deutsche Bank | 02/03/2017 | 2,843,863 | USD | 25,855,157 | SEK | — | (59 | ) | |||||||||||||||||||||||
Deutsche Bank | 02/03/2017 | 352,386 | USD | 500,000 | SGD | — | (7,203 | ) | |||||||||||||||||||||||
Deutsche Bank | 02/03/2017 | 2,678,131 | USD | 3,800,000 | SGD | — | (54,746 | ) | |||||||||||||||||||||||
HSBC | 01/11/2017 | 76,000 | AUD | 56,935 | USD | 2,100 | — | ||||||||||||||||||||||||
HSBC | 01/11/2017 | 13,034,111 | USD | 18,127,000 | AUD | 44,746 | — | ||||||||||||||||||||||||
HSBC | 01/11/2017 | 8,919,128 | USD | 11,988,000 | AUD | — | (269,637 | ) | |||||||||||||||||||||||
HSBC | 02/03/2017 | 39,600,000 | AUD | 29,623,849 | USD | 1,069,870 | — | ||||||||||||||||||||||||
HSBC | 02/03/2017 | 966,653 | AUD | 723,131 | USD | 26,116 | — | ||||||||||||||||||||||||
HSBC | 02/03/2017 | 10,400,000 | CAD | 7,858,754 | USD | 109,877 | — | ||||||||||||||||||||||||
HSBC | 02/03/2017 | 500,000 | CAD | 377,825 | USD | 5,283 | — | ||||||||||||||||||||||||
HSBC | 02/03/2017 | 7,700,000 | CHF | 7,685,398 | USD | 106,285 | — | ||||||||||||||||||||||||
HSBC | 02/03/2017 | 8,400,000 | EUR | 9,085,180 | USD | 228,307 | — | ||||||||||||||||||||||||
HSBC | 02/03/2017 | 7,700,000 | GBP | 9,822,313 | USD | 324,512 | — | ||||||||||||||||||||||||
HSBC | 02/03/2017 | 800,000 | JPY | 7,076 | USD | 218 | — | ||||||||||||||||||||||||
HSBC | 02/03/2017 | 11,129,175 | NOK | 1,332,596 | USD | 43,423 | — | ||||||||||||||||||||||||
HSBC | 02/03/2017 | 300,000 | NZD | 214,153 | USD | 5,974 | — | ||||||||||||||||||||||||
HSBC | 02/03/2017 | 199,621 | USD | 200,000 | CHF | — | (2,761 | ) | |||||||||||||||||||||||
HSBC | 02/03/2017 | 432,628 | USD | 400,000 | EUR | — | (10,872 | ) | |||||||||||||||||||||||
HSBC | 02/03/2017 | 1,913,438 | USD | 1,500,000 | GBP | — | (63,217 | ) | |||||||||||||||||||||||
HSBC | 02/03/2017 | 315,848 | USD | 37,200,000 | JPY | 3,012 | — | ||||||||||||||||||||||||
HSBC | 02/03/2017 | 13,406,566 | USD | 1,515,800,000 | JPY | — | (413,870 | ) | |||||||||||||||||||||||
HSBC | 02/03/2017 | 323,295 | USD | 2,700,000 | NOK | — | (10,535 | ) | |||||||||||||||||||||||
HSBC | 02/03/2017 | 21,343,906 | USD | 29,900,000 | NZD | — | (595,405 | ) | |||||||||||||||||||||||
HSBC | 02/03/2017 | 925,856 | USD | 8,400,000 | SEK | — | (1,941 | ) | |||||||||||||||||||||||
HSBC | 02/03/2017 | 9,710,464 | USD | 88,100,000 | SEK | — | (20,360 | ) | |||||||||||||||||||||||
HSBC | 02/03/2017 | 1,692,724 | USD | 2,400,000 | SGD | — | (35,849 | ) | |||||||||||||||||||||||
HSBC | 02/03/2017 | 2,680,146 | USD | 3,800,000 | SGD | — | (56,761 | ) | |||||||||||||||||||||||
The accompanying Notes to Consolidated Financial Statements are an integral part of this statement.
Annual Report 2016
17
COLUMBIA VARIABLE PORTFOLIO — DIVERSIFIED ABSOLUTE RETURN FUND
CONSOLIDATED PORTFOLIO OF INVESTMENTS (continued)
December 31, 2016
Forward Foreign Currency Exchange Contracts Open at December 31, 2016 (continued)
Counterparty | Exchange Date | Currency to be Delivered | Currency to be Received | Unrealized Appreciation ($) | Unrealized Depreciation ($) | ||||||||||||||||||||||||||
Morgan Stanley | 01/11/2017 | 17,455,000 | GBP | 21,956,099 | USD | 440,159 | — | ||||||||||||||||||||||||
Morgan Stanley | 01/11/2017 | 12,449,000 | NZD | 8,638,568 | USD | — | (7,517 | ) | |||||||||||||||||||||||
Morgan Stanley | 01/11/2017 | 12,757,779 | USD | 10,399,000 | GBP | 60,569 | — | ||||||||||||||||||||||||
Morgan Stanley | 01/11/2017 | 17,220,472 | USD | 24,993,000 | NZD | 137,676 | — | ||||||||||||||||||||||||
Standard Chartered | 01/11/2017 | 2,529,144,000 | JPY | 21,537,369 | USD | — | (111,431 | ) | |||||||||||||||||||||||
Standard Chartered | 01/11/2017 | 315,600 | USD | 36,936,000 | JPY | 563 | — | ||||||||||||||||||||||||
Standard Chartered | 01/11/2017 | 21,847,060 | USD | 2,492,208,000 | JPY | — | (514,422 | ) | |||||||||||||||||||||||
State Street | 01/11/2017 | 429,133 | USD | 3,720,000 | NOK | 1,685 | — | ||||||||||||||||||||||||
State Street | 01/11/2017 | 13,048,191 | USD | 109,254,000 | NOK | — | (395,371 | ) | |||||||||||||||||||||||
State Street | 02/03/2017 | 600,000 | CAD | 453,405 | USD | 6,355 | — | ||||||||||||||||||||||||
State Street | 02/03/2017 | 2,900,000 | CHF | 2,895,067 | USD | 40,596 | — | ||||||||||||||||||||||||
State Street | 02/03/2017 | 1,900,000 | GBP | 2,425,346 | USD | 81,733 | — | ||||||||||||||||||||||||
State Street | 02/03/2017 | 1,197,600,000 | JPY | 10,587,914 | USD | 322,673 | — | ||||||||||||||||||||||||
State Street | 02/03/2017 | 65,100,000 | NOK | 7,791,853 | USD | 250,847 | — | ||||||||||||||||||||||||
State Street | 02/03/2017 | 7,100,000 | NZD | 5,069,081 | USD | 142,179 | — | ||||||||||||||||||||||||
State Street | 02/03/2017 | 18,200,000 | SGD | 12,835,359 | USD | 270,724 | — | ||||||||||||||||||||||||
State Street | 02/03/2017 | 523,853 | USD | 700,000 | AUD | — | (19,111 | ) | |||||||||||||||||||||||
State Street | 02/03/2017 | 6,286,232 | USD | 8,400,000 | AUD | — | (229,328 | ) | |||||||||||||||||||||||
State Street | 02/03/2017 | 2,871,568 | USD | 3,800,000 | CAD | — | (40,247 | ) | |||||||||||||||||||||||
State Street | 02/03/2017 | 3,294,386 | USD | 3,300,000 | CHF | — | (46,195 | ) | |||||||||||||||||||||||
State Street | 02/03/2017 | 865,626 | USD | 800,000 | EUR | — | (22,114 | ) | |||||||||||||||||||||||
State Street | 02/03/2017 | 5,951,176 | USD | 5,500,000 | EUR | — | (152,033 | ) | |||||||||||||||||||||||
State Street | 02/03/2017 | 494,855 | USD | 400,000 | GBP | — | (1,463 | ) | |||||||||||||||||||||||
State Street | 02/03/2017 | 638,249 | USD | 500,000 | GBP | — | (21,509 | ) | |||||||||||||||||||||||
State Street | 02/03/2017 | 3,420,561 | USD | 386,900,000 | JPY | — | (104,244 | ) | |||||||||||||||||||||||
State Street | 02/03/2017 | 287,257 | USD | 2,400,000 | NOK | — | (9,248 | ) | |||||||||||||||||||||||
State Street | 02/03/2017 | 1,570,701 | USD | 2,200,000 | NZD | — | (44,055 | ) | |||||||||||||||||||||||
State Street | 02/03/2017 | 396,607 | USD | 3,600,000 | SEK | — | (643 | ) | |||||||||||||||||||||||
State Street | 02/03/2017 | 7,381,292 | USD | 67,000,000 | SEK | — | (11,973 | ) | |||||||||||||||||||||||
State Street | 02/03/2017 | 2,327,290 | USD | 3,300,000 | SGD | — | (49,087 | ) | |||||||||||||||||||||||
UBS | 02/03/2017 | 300,000 | AUD | 216,830 | USD | 512 | — | ||||||||||||||||||||||||
UBS | 02/03/2017 | 2,000,000 | CAD | 1,511,305 | USD | 21,136 | — | ||||||||||||||||||||||||
UBS | 02/03/2017 | 15,200,000 | CHF | 15,170,872 | USD | 209,506 | — | ||||||||||||||||||||||||
UBS | 02/03/2017 | 100,000 | CHF | 99,808 | USD | 1,378 | — | ||||||||||||||||||||||||
UBS | 02/03/2017 | 300,000 | EUR | 324,597 | USD | 8,280 | — | ||||||||||||||||||||||||
UBS | 02/03/2017 | 4,680,500,000 | JPY | 41,378,975 | USD | 1,260,016 | — | ||||||||||||||||||||||||
UBS | 02/03/2017 | 149,100,000 | JPY | 1,318,151 | USD | 40,139 | — | ||||||||||||||||||||||||
UBS | 02/03/2017 | 1,100,000 | NOK | 130,868 | USD | 3,447 | — | ||||||||||||||||||||||||
UBS | 02/03/2017 | 115,400,000 | SEK | 12,710,959 | USD | 18,133 | — | ||||||||||||||||||||||||
UBS | 02/03/2017 | 18,100,000 | SEK | 1,993,660 | USD | 2,844 | — | ||||||||||||||||||||||||
UBS | 02/03/2017 | 7,000,000 | SGD | 4,935,761 | USD | 103,209 | — | ||||||||||||||||||||||||
UBS | 02/03/2017 | 100,000 | SGD | 69,172 | USD | 135 | — | ||||||||||||||||||||||||
The accompanying Notes to Consolidated Financial Statements are an integral part of this statement.
Annual Report 2016
18
COLUMBIA VARIABLE PORTFOLIO — DIVERSIFIED ABSOLUTE RETURN FUND
CONSOLIDATED PORTFOLIO OF INVESTMENTS (continued)
December 31, 2016
Forward Foreign Currency Exchange Contracts Open at December 31, 2016 (continued)
Counterparty | Exchange Date | Currency to be Delivered | Currency to be Received | Unrealized Appreciation ($) | Unrealized Depreciation ($) | ||||||||||||||||||||||||||
UBS | 02/03/2017 | 1,496,500 | USD | 2,000,000 | AUD | — | (54,380 | ) | |||||||||||||||||||||||
UBS | 02/03/2017 | 26,713,100 | USD | 35,700,000 | AUD | — | (971,251 | ) | |||||||||||||||||||||||
UBS | 02/03/2017 | 3,702,696 | USD | 4,900,000 | CAD | — | (51,783 | ) | |||||||||||||||||||||||
UBS | 02/03/2017 | 794,224 | USD | 800,000 | CHF | — | (6,783 | ) | |||||||||||||||||||||||
UBS | 02/03/2017 | 23,370,984 | USD | 21,600,000 | EUR | — | (596,168 | ) | |||||||||||||||||||||||
UBS | 02/03/2017 | 1,915,155 | USD | 1,500,000 | GBP | — | (64,934 | ) | |||||||||||||||||||||||
UBS | 02/03/2017 | 16,981,041 | USD | 13,300,000 | GBP | — | (575,749 | ) | |||||||||||||||||||||||
UBS | 02/03/2017 | 1,448,297 | USD | 12,100,000 | NOK | — | (46,666 | ) | |||||||||||||||||||||||
UBS | 02/03/2017 | 3,770,360 | USD | 31,500,000 | NOK | — | (121,486 | ) | |||||||||||||||||||||||
UBS | 02/03/2017 | 214,161 | USD | 300,000 | NZD | — | (5,982 | ) | |||||||||||||||||||||||
UBS | 02/03/2017 | 1,713,288 | USD | 2,400,000 | NZD | — | (47,857 | ) | |||||||||||||||||||||||
UBS | 02/03/2017 | 4,864,785 | USD | 6,900,000 | SGD | — | (101,269 | ) | |||||||||||||||||||||||
Total | 9,986,598 | (10,085,766 | ) | ||||||||||||||||||||||||||||
Futures Contracts Outstanding at December 31, 2016
Long Futures Contracts Outstanding
Contract Description | Number of Contracts | Trading Currency | Notional Market Value ($) | Expiration Date | Unrealized Appreciation ($) | Unrealized (Depreciation) ($) | |||||||||||||||||||||
3-Month Euro Euribor | 41 | EUR | 10,822,036 | 06/2017 | 2,602 | — | |||||||||||||||||||||
| 3-Month Euroyen TFX | 31 | JPY | 6,627,369 | 06/2017 | 381 | — | |||||||||||||||||||||
| 90-Day Sterling | 71 | GBP | 10,891,610 | 06/2017 | 3,179 | — | |||||||||||||||||||||
Australian 10-Year Bond | 170 | AUD | 15,671,522 | 03/2017 | 21,154 | — | |||||||||||||||||||||
| EURO STOXX 50 | 41 | EUR | 1,414,310 | 03/2017 | 23,377 | — | |||||||||||||||||||||
Euro CHF 3 Month ICE | 1 | CHF | 247,398 | 06/2017 | — | (51 | ) | ||||||||||||||||||||
Euro-Bund | 62 | EUR | 10,713,139 | 03/2017 | 155,424 | — | |||||||||||||||||||||
FTSE 100 Index | 11 | GBP | 955,726 | 03/2017 | 19,345 | — | |||||||||||||||||||||
Hang Seng Index | 1 | HKD | 141,608 | 01/2017 | 2,511 | — | |||||||||||||||||||||
Long Gilt | 13 | GBP | 2,015,947 | 03/2017 | 32,173 | — | |||||||||||||||||||||
MSCI Singapore IX ETS | 35 | SGD | 772,917 | 01/2017 | — | (513 | ) | ||||||||||||||||||||
Mini MSCI Emerging Markets Index | 98 | USD | 4,208,610 | 03/2017 | — | (69,827 | ) | ||||||||||||||||||||
OMXS30 Index | 59 | SEK | 983,700 | 01/2017 | — | (17,124 | ) | ||||||||||||||||||||
S&P 500 E-mini | 9 | USD | 1,006,290 | 03/2017 | 14,130 | — | |||||||||||||||||||||
S&P 500 E-mini | 86 | USD | 9,615,660 | 03/2017 | — | (61,917 | ) | ||||||||||||||||||||
S&P/TSX 60 Index | 21 | CAD | 2,805,631 | 03/2017 | — | (34 | ) | ||||||||||||||||||||
SPI 200 Index | 19 | AUD | 1,930,216 | 03/2017 | 33,230 | — | |||||||||||||||||||||
TOPIX Index | 20 | JPY | 2,597,647 | 03/2017 | 79,815 | — | |||||||||||||||||||||
U.S. Long Bond | 2 | USD | 301,313 | 03/2017 | 3,496 | — | |||||||||||||||||||||
U.S. Treasury 10-Year Note | 17 | USD | 2,112,781 | 03/2017 | — | (10,522 | ) | ||||||||||||||||||||
U.S. Treasury 5-Year Note | 63 | USD | 7,412,835 | 03/2017 | — | (35,551 | ) | ||||||||||||||||||||
Total | 93,248,265 | 390,817 | (195,539 | ) | |||||||||||||||||||||||
The accompanying Notes to Consolidated Financial Statements are an integral part of this statement.
Annual Report 2016
19
COLUMBIA VARIABLE PORTFOLIO — DIVERSIFIED ABSOLUTE RETURN FUND
CONSOLIDATED PORTFOLIO OF INVESTMENTS (continued)
December 31, 2016
Futures Contracts Outstanding at December 31, 2016 (continued)
Short Futures Contracts Outstanding
Contract Description | Number of Contracts | Trading Currency | Notional Market Value ($) | Expiration Date | Unrealized Appreciation ($) | Unrealized (Depreciation) ($) | |||||||||||||||||||||
| 10-Year Mini JGB | (150 | ) | JPY | (19,287,273 | ) | 03/2017 | — | (18,826 | ) | ||||||||||||||||||
3-Month Euro Euribor | (73 | ) | EUR | (19,268,503 | ) | 06/2017 | — | (2,881 | ) | ||||||||||||||||||
| 3-Month Euroyen TFX | (50 | ) | JPY | (10,689,305 | ) | 06/2017 | 5,148 | — | |||||||||||||||||||
| 90-Day Euro$ | (109 | ) | USD | (26,921,638 | ) | 06/2017 | 28,492 | — | |||||||||||||||||||
| 90-Day Sterling | (60 | ) | GBP | (9,204,178 | ) | 06/2017 | — | (1,072 | ) | ||||||||||||||||||
Banker's Acceptance | (182 | ) | CAD | (33,561,185 | ) | 06/2017 | 17,151 | — | |||||||||||||||||||
CAC40 Index | (1 | ) | EUR | (51,190 | ) | 01/2017 | — | (724 | ) | ||||||||||||||||||
| Canadian Government 10-Year Bond | (17 | ) | CAD | (1,741,340 | ) | 03/2017 | 13,819 | — | |||||||||||||||||||
DAX Index | (2 | ) | EUR | (603,432 | ) | 03/2017 | — | (8,916 | ) | ||||||||||||||||||
| EURO STOXX 50 | (24 | ) | EUR | (827,888 | ) | 03/2017 | — | (13,025 | ) | ||||||||||||||||||
FTSE 100 Index | (2 | ) | GBP | (173,768 | ) | 03/2017 | — | (3,347 | ) | ||||||||||||||||||
FTSE/MIB Index | (6 | ) | EUR | (606,485 | ) | 03/2017 | — | (15,802 | ) | ||||||||||||||||||
IBEX 35 Index | (6 | ) | EUR | (588,225 | ) | 01/2017 | — | (4,184 | ) | ||||||||||||||||||
Long Gilt | (12 | ) | GBP | (1,860,874 | ) | 03/2017 | — | (37,582 | ) | ||||||||||||||||||
TOPIX Index | (1 | ) | JPY | (129,882 | ) | 03/2017 | 3,751 | — | |||||||||||||||||||
Total | (125,515,166 | ) | 68,361 | (106,359 | ) | ||||||||||||||||||||||
Notes to Consolidated Portfolio of Investments
(a) This security or a portion of this security has been pledged as collateral in connection with securities sold short.
(b) Non-income producing investment.
(c) The rate shown is the seven-day current annualized yield at December 31, 2016.
(d) As defined in the Investment Company Act of 1940, an affiliated company is one in which the Fund owns 5% or more of the company's outstanding voting securities, or a company which is under common ownership or control with the Fund. Holdings and transactions in these affiliated companies during the year ended December 31, 2016 are as follows:
Issuer | Beginning Cost ($) | Purchase Cost ($) | Proceeds From Sales ($) | Realized Gain (Loss) ($) | Ending Cost ($) | Dividends — Affiliated Issuers ($) | Value ($) | ||||||||||||||||||||||||
| Columbia Short-Term Cash Fund | 149,951,908 | 216,338,769 | (197,750,711 | ) | 146 | 168,540,112 | 656,880 | 168,540,026 | |||||||||||||||||||||||
Abbreviation Legend
ADR American Depositary Receipt
Currency Legend
AUD Australian Dollar
CAD Canadian Dollar
CHF Swiss Franc
The accompanying Notes to Consolidated Financial Statements are an integral part of this statement.
Annual Report 2016
20
COLUMBIA VARIABLE PORTFOLIO — DIVERSIFIED ABSOLUTE RETURN FUND
CONSOLIDATED PORTFOLIO OF INVESTMENTS (continued)
December 31, 2016
Currency Legend (continued)
EUR Euro
GBP British Pound
HKD Hong Kong Dollar
JPY Japanese Yen
NOK Norwegian Krone
NZD New Zealand Dollar
SEK Swedish Krona
SGD Singapore Dollar
USD US Dollar
Fair Value Measurements
The Fund categorizes its fair value measurements according to a three-level hierarchy that maximizes the use of observable inputs and minimizes the use of unobservable inputs by prioritizing that the most observable input be used when available. Observable inputs are those that market participants would use in pricing an investment based on market data obtained from sources independent of the reporting entity. Unobservable inputs are those that reflect the Fund's assumptions about the information market participants would use in pricing an investment. An investment's level within the fair value hierarchy is based on the lowest level of any input that is deemed significant to the asset's or liability's fair value measurement. The input levels are not necessarily an indication of the risk or liquidity associated with investments at that level. For example, certain U.S. government securities are generally high quality and liquid, however, they are reflected as Level 2 because the inputs used to determine fair value may not always be quoted prices in an active market.
Fair value inputs are summarized in the three broad levels listed below:
> Level 1 — Valuations based on quoted prices for investments in active markets that the Fund has the ability to access at the measurement date (including NAV for open-end mutual funds). Valuation adjustments are not applied to Level 1 investments.
> Level 2 — Valuations based on other significant observable inputs (including quoted prices for similar securities, interest rates, prepayment speeds, credit risks, etc.).
> Level 3 — Valuations based on significant unobservable inputs (including the Fund's own assumptions and judgment in determining the fair value of investments).
Inputs that are used in determining fair value of an investment may include price information, credit data, volatility statistics, and other factors. These inputs can be either observable or unobservable. The availability of observable inputs can vary between investments, and is affected by various factors such as the type of investment, and the volume and level of activity for that investment or similar investments in the marketplace. The inputs will be considered by the Investment Manager, along with any other relevant factors in the calculation of an investment's fair value. The Fund uses prices and inputs that are current as of the measurement date, which may include periods of market dislocations. During these periods, the availability of prices and inputs may be reduced for many investments. This condition could cause an investment to be reclassified between the various levels within the hierarchy.
Certain investments that have been measured at fair value using the net asset value (NAV) per share (or its equivalent) are not categorized in the fair value hierarchy. The fair value amounts presented in the table are intended to reconcile the fair value hierarchy to the amounts presented in the Consolidated Portfolio of Investments. The Columbia Short-Term Cash Fund seeks to provide shareholders with maximum current income consistent with liquidity and stability of principal. Columbia Short-Term Cash Fund prices its shares with a floating NAV and no longer seeks to maintain a stable NAV.
Investments falling into the Level 3 category are primarily supported by quoted prices from brokers and dealers participating in the market for those investments. However, these may be classified as Level 3 investments due to lack of market transparency and corroboration to support these quoted prices. Additionally, valuation models may be used as the pricing source for any remaining investments classified as Level 3. These models may rely on one or more significant unobservable inputs and/or significant assumptions by the Investment Manager. Inputs used in valuations may include, but are not limited to, financial statement analysis, capital account balances, discount rates and estimated cash flows, and comparable company data.
Under the direction of the Fund's Board of Trustees (the Board), the Investment Manager's Valuation Committee (the Committee) is responsible for overseeing the valuation procedures approved by the Board. The Committee consists of voting and non-voting members from various groups within the Investment Manager's organization, including operations and accounting, trading and investments, compliance, risk management and legal.
The Committee meets at least monthly to review and approve valuation matters, which may include a description of specific valuation determinations, data regarding pricing information received from approved pricing vendors and brokers and the results of Board-approved valuation control policies and procedures (the Policies). The Policies address, among other things, instances when market quotations are or
The accompanying Notes to Consolidated Financial Statements are an integral part of this statement.
Annual Report 2016
21
COLUMBIA VARIABLE PORTFOLIO — DIVERSIFIED ABSOLUTE RETURN FUND
CONSOLIDATED PORTFOLIO OF INVESTMENTS (continued)
December 31, 2016
Fair Value Measurements (continued)
are not readily available, including recommendations of third party pricing vendors and a determination of appropriate pricing methodologies; events that require specific valuation determinations and assessment of fair value techniques; securities with a potential for stale pricing, including those that are illiquid, restricted, or in default; and the effectiveness of third party pricing vendors, including periodic reviews of vendors. The Committee meets more frequently, as needed, to discuss additional valuation matters, which may include the need to review back-testing results, review time-sensitive information or approve related valuation actions. The Committee reports to the Board, with members of the Committee meeting with the Board at each of its regularly scheduled meetings to discuss valuation matters and actions during the period, similar to those described earlier.
For investments categorized as Level 3, the Committee monitors information similar to that described above, which may include: (i) data specific to the issuer or comparable issuers, (ii) general market or specific sector news and (iii) quoted prices and specific or similar security transactions. The Committee considers this data and any changes from prior periods in order to assess the reasonableness of observable and unobservable inputs, any assumptions or internal models used to value those securities and changes in fair value. This data is also used to corroborate, when available, information received from approved pricing vendors and brokers. Various factors impact the frequency of monitoring this information (which may occur as often as daily). However, the Committee may determine that changes to inputs, assumptions and models are not required as a result of the monitoring procedures performed.
The following table is a summary of the inputs used to value the Fund's investments at December 31, 2016:
| Level 1 Quoted Prices in Active Markets for Identical Assets ($) | Level 2 Other Significant Observable Inputs ($) | Level 3 Significant Unobservable Inputs ($) | Total ($) | ||||||||||||||||
Investments | |||||||||||||||||||
Common Stocks | |||||||||||||||||||
Consumer Discretionary | 11,887,842 | — | — | 11,887,842 | |||||||||||||||
Consumer Staples | 7,884,693 | — | — | 7,884,693 | |||||||||||||||
Energy | 5,470,694 | — | — | 5,470,694 | |||||||||||||||
Financials | 11,089,177 | — | — | 11,089,177 | |||||||||||||||
Health Care | 9,966,878 | — | — | 9,966,878 | |||||||||||||||
Industrials | 7,720,076 | — | — | 7,720,076 | |||||||||||||||
Information Technology | 16,121,919 | — | — | 16,121,919 | |||||||||||||||
Materials | 3,795,848 | — | — | 3,795,848 | |||||||||||||||
Real Estate | 1,406,951 | — | — | 1,406,951 | |||||||||||||||
Telecommunication Services | 487,633 | — | — | 487,633 | |||||||||||||||
Utilities | 3,403,890 | — | — | 3,403,890 | |||||||||||||||
Total Common Stocks | 79,235,601 | — | — | 79,235,601 | |||||||||||||||
Exchange-Traded Funds | 42,660,208 | — | — | 42,660,208 | |||||||||||||||
| Investments measured at net asset value Money Market Funds | — | — | — | 168,540,026 | |||||||||||||||
Total Investments | 121,895,809 | — | — | 290,435,835 | |||||||||||||||
Investments Sold Short | |||||||||||||||||||
Common Stocks | |||||||||||||||||||
Consumer Discretionary | (6,388,308 | ) | — | — | (6,388,308 | ) | |||||||||||||
Consumer Staples | (4,585,538 | ) | — | — | (4,585,538 | ) | |||||||||||||
Energy | (3,257,141 | ) | — | — | (3,257,141 | ) | |||||||||||||
Financials | (6,215,501 | ) | — | — | (6,215,501 | ) | |||||||||||||
Health Care | (5,487,033 | ) | — | — | (5,487,033 | ) | |||||||||||||
Industrials | (4,823,548 | ) | — | — | (4,823,548 | ) | |||||||||||||
Information Technology | (9,124,747 | ) | — | — | (9,124,747 | ) | |||||||||||||
Materials | (2,612,739 | ) | — | — | (2,612,739 | ) | |||||||||||||
The accompanying Notes to Consolidated Financial Statements are an integral part of this statement.
Annual Report 2016
22
COLUMBIA VARIABLE PORTFOLIO — DIVERSIFIED ABSOLUTE RETURN FUND
CONSOLIDATED PORTFOLIO OF INVESTMENTS (continued)
December 31, 2016
Fair Value Measurements (continued)
| Level 1 Quoted Prices in Active Markets for Identical Assets ($) | Level 2 Other Significant Observable Inputs ($) | Level 3 Significant Unobservable Inputs ($) | Total ($) | ||||||||||||||||
Real Estate | (226,547 | ) | — | — | (226,547 | ) | |||||||||||||
Telecommunication Services | (373,196 | ) | — | — | (373,196 | ) | |||||||||||||
Utilities | (2,179,234 | ) | — | — | (2,179,234 | ) | |||||||||||||
Total Common Stocks | (45,273,532 | ) | — | — | (45,273,532 | ) | |||||||||||||
Total Investments Sold Short | (45,273,532 | ) | — | — | (45,273,532 | ) | |||||||||||||
Total Investments, Net of Investments Sold Short | 76,622,277 | — | — | 245,162,303 | |||||||||||||||
Derivatives | |||||||||||||||||||
Assets | |||||||||||||||||||
Forward Foreign Currency Exchange Contracts | — | 9,986,598 | — | 9,986,598 | |||||||||||||||
Futures Contracts | 459,178 | — | — | 459,178 | |||||||||||||||
Liabilities | |||||||||||||||||||
Forward Foreign Currency Exchange Contracts | — | (10,085,766 | ) | — | (10,085,766 | ) | |||||||||||||
Futures Contracts | (301,898 | ) | — | — | (301,898 | ) | |||||||||||||
Total | 76,779,557 | (99,168 | ) | — | 245,220,415 | ||||||||||||||
See the Consolidated Portfolio of Investments for all investment classifications not indicated in the table.
Derivative instruments are valued at unrealized appreciation (depreciation).
There were no transfers of financial assets between levels during the period.
The accompanying Notes to Consolidated Financial Statements are an integral part of this statement.
Annual Report 2016
23
COLUMBIA VARIABLE PORTFOLIO — DIVERSIFIED ABSOLUTE RETURN FUND
CONSOLIDATED STATEMENT OF ASSETS AND LIABILITIES
December 31, 2016
Assets | |||||||
Investments, at value | |||||||
Unaffiliated issuers (identified cost $118,385,677) | $ | 121,895,809 | |||||
Affiliated issuers (identified cost $168,540,112) | 168,540,026 | ||||||
Total investments (identified cost $286,925,789) | 290,435,835 | ||||||
Cash | 15,181 | ||||||
Foreign currency (identified cost $464,536) | 457,849 | ||||||
Cash collateral held at broker | 19,435,475 | ||||||
Margin deposits | 2,480,953 | ||||||
Unrealized appreciation on forward foreign currency exchange contracts | 9,986,598 | ||||||
Receivable for: | |||||||
Investments sold | 872,581 | ||||||
Capital shares sold | 649 | ||||||
Dividends | 159,669 | ||||||
Foreign tax reclaims | 7,493 | ||||||
Variation margin | 60,128 | ||||||
Prepaid expenses | 1,456 | ||||||
Trustees' deferred compensation plan | 18,516 | ||||||
Total assets | 323,932,383 | ||||||
Liabilities | |||||||
Securities sold short, at value (proceeds $43,967,189) | 45,273,532 | ||||||
Unrealized depreciation on forward foreign currency exchange contracts | 10,085,766 | ||||||
Payable for: | |||||||
Investments purchased | 898,917 | ||||||
Capital shares purchased | 68 | ||||||
Dividends and interest on securities sold short | 96,310 | ||||||
Variation margin | 161,790 | ||||||
Management services fees | 8,047 | ||||||
Distribution and/or service fees | 29 | ||||||
Transfer agent fees | 439 | ||||||
Compensation of board members | 1,132 | ||||||
Chief compliance officer expenses | 30 | ||||||
Other expenses | 71,198 | ||||||
Trustees' deferred compensation plan | 18,516 | ||||||
Total liabilities | 56,615,774 | ||||||
Net assets applicable to outstanding capital stock | $ | 267,316,609 | |||||
Represented by | |||||||
Trust capital | $ | 267,316,609 | |||||
Total — representing net assets applicable to outstanding capital stock | $ | 267,316,609 | |||||
The accompanying Notes to Consolidated Financial Statements are an integral part of this statement.
Annual Report 2016
24
COLUMBIA VARIABLE PORTFOLIO — DIVERSIFIED ABSOLUTE RETURN FUND
CONSOLIDATED STATEMENT OF ASSETS AND LIABILITIES (continued)
December 31, 2016
Class 1 | |||||||
Net assets | $ | 263,020,199 | |||||
Shares outstanding | 28,090,716 | ||||||
Net asset value per share | $ | 9.36 | |||||
Class 2 | |||||||
Net assets | $ | 4,296,410 | |||||
Shares outstanding | 463,955 | ||||||
Net asset value per share | $ | 9.26 | |||||
The accompanying Notes to Consolidated Financial Statements are an integral part of this statement.
Annual Report 2016
25
COLUMBIA VARIABLE PORTFOLIO — DIVERSIFIED ABSOLUTE RETURN FUND
CONSOLIDATED STATEMENT OF OPERATIONS
Year Ended December 31, 2016
Net investment income | |||||||
Income: | |||||||
Dividends — unaffiliated issuers | $ | 2,565,816 | |||||
Dividends — affiliated issuers | 656,880 | ||||||
Interest | 404,052 | ||||||
Foreign taxes withheld | (5,110 | ) | |||||
Total income | 3,621,638 | ||||||
Expenses: | |||||||
Management services fees | 2,915,828 | ||||||
Distribution and/or service fees | |||||||
Class 2 | 12,198 | ||||||
Transfer agent fees | |||||||
Class 1 | 156,118 | ||||||
Class 2 | 2,927 | ||||||
Compensation of board members | 22,275 | ||||||
Custodian fees | 101,829 | ||||||
Printing and postage fees | 23,170 | ||||||
Audit fees | 49,679 | ||||||
Legal fees | 5,974 | ||||||
Dividends and interest on securities sold short | 1,640,172 | ||||||
Chief compliance officer expenses | 121 | ||||||
Other | 21,481 | ||||||
Total expenses | 4,951,772 | ||||||
Fees waived or expenses reimbursed by Investment Manager and its affiliates | (18,968 | ) | |||||
Total net expenses | 4,932,804 | ||||||
Net investment loss | (1,311,166 | ) | |||||
Realized and unrealized gain (loss) — net | |||||||
Net realized gain (loss) on: | |||||||
Investments — unaffiliated issuers | (1,854,516 | ) | |||||
Investments — affiliated issuers | 146 | ||||||
Foreign currency translations | (15,753 | ) | |||||
Forward foreign currency exchange contracts | (712,779 | ) | |||||
Futures contracts | (919,918 | ) | |||||
Options purchased | (53,504 | ) | |||||
Securities sold short | (1,226,430 | ) | |||||
Swap contracts | (2,541,633 | ) | |||||
Net realized loss | (7,324,387 | ) | |||||
Net change in unrealized appreciation (depreciation) on: | |||||||
Investments — unaffiliated issuers | 6,510,713 | ||||||
Investments — affiliated issuers | (86 | ) | |||||
Foreign currency translations | (68,347 | ) | |||||
Forward foreign currency exchange contracts | (307,741 | ) | |||||
Futures contracts | (21,148 | ) | |||||
Options purchased | 6,606 | ||||||
Securities sold short | (4,545,043 | ) | |||||
Swap contracts | 587,722 | ||||||
Net change in unrealized appreciation | 2,162,676 | ||||||
Net realized and unrealized loss | (5,161,711 | ) | |||||
Net decrease in net assets from operations | $ | (6,472,877 | ) | ||||
The accompanying Notes to Consolidated Financial Statements are an integral part of this statement.
Annual Report 2016
26
COLUMBIA VARIABLE PORTFOLIO — DIVERSIFIED ABSOLUTE RETURN FUND
CONSOLIDATED STATEMENT OF CHANGES IN NET ASSETS
| Year Ended December 31, 2016 | Year Ended December 31, 2015 | ||||||||||
Operations | |||||||||||
Net investment loss | $ | (1,311,166 | ) | $ | (1,706,154 | ) | |||||
Net realized gain (loss) | (7,324,387 | ) | 13,839,619 | ||||||||
Net change in unrealized appreciation (depreciation) | 2,162,676 | (12,937,656 | ) | ||||||||
Net decrease in net assets resulting from operations | (6,472,877 | ) | (804,191 | ) | |||||||
Increase (decrease) in net assets from capital stock activity | 5,509,149 | (65,619,876 | ) | ||||||||
Total decrease in net assets | (963,728 | ) | (66,424,067 | ) | |||||||
Net assets at beginning of year | 268,280,337 | 334,704,404 | |||||||||
Net assets at end of year | $ | 267,316,609 | $ | 268,280,337 | |||||||
The accompanying Notes to Consolidated Financial Statements are an integral part of this statement.
Annual Report 2016
27
COLUMBIA VARIABLE PORTFOLIO — DIVERSIFIED ABSOLUTE RETURN FUND
CONSOLIDATED STATEMENT OF CHANGES IN NET ASSETS (continued)
Year Ended December 31, 2016 | Year Ended December 31, 2015 | ||||||||||||||||||
Shares | Dollars ($) | Shares | Dollars ($) | ||||||||||||||||
Capital stock activity | |||||||||||||||||||
Class 1 shares | |||||||||||||||||||
Subscriptions | 1,100,243 | 10,268,682 | 200,423 | 1,926,454 | |||||||||||||||
Redemptions | (424,133 | ) | (3,958,290 | ) | (7,052,653 | ) | (68,670,999 | ) | |||||||||||
Net increase (decrease) | 676,110 | 6,310,392 | (6,852,230 | ) | (66,744,545 | ) | |||||||||||||
Class 2 shares | |||||||||||||||||||
Subscriptions | 90,097 | 845,302 | 213,924 | 2,067,482 | |||||||||||||||
Redemptions | (175,599 | ) | (1,646,545 | ) | (97,792 | ) | (942,813 | ) | |||||||||||
Net increase (decrease) | (85,502 | ) | (801,243 | ) | 116,132 | 1,124,669 | |||||||||||||
Total net increase (decrease) | 590,608 | 5,509,149 | (6,736,098 | ) | (65,619,876 | ) | |||||||||||||
The accompanying Notes to Consolidated Financial Statements are an integral part of this statement.
Annual Report 2016
28
COLUMBIA VARIABLE PORTFOLIO — DIVERSIFIED ABSOLUTE RETURN FUND
CONSOLIDATED FINANCIAL HIGHLIGHTS
The following tables are intended to help you understand the Fund's financial performance. Certain information reflects financial results for a single share of a class held for the periods shown. Per share net investment income (loss) amounts are calculated based on average shares outstanding during the period. Total return assumes reinvestment of all dividends and distributions, if any. Total return does not reflect any fees and expenses imposed under your Contract and/or Qualified Plan, as applicable; such fees and expenses would reduce the total returns for all periods shown. Total return and portfolio turnover are not annualized for periods of less than one year. The portfolio turnover rate is calculated without regard to purchase and sales transactions of short-term instruments and certain derivatives, if any. If such transactions were included, the Fund's portfolio turnover rate may be higher.
Year Ended December 31, | |||||||||||||||||||||||
Class 1 | 2016 | 2015 | 2014 | 2013 | 2012(a) | ||||||||||||||||||
Per share data | |||||||||||||||||||||||
Net asset value, beginning of period | $ | 9.60 | $ | 9.65 | $ | 9.82 | $ | 10.04 | $ | 10.00 | |||||||||||||
Income from investment operations: | |||||||||||||||||||||||
Net investment income (loss) | (0.05 | ) | (0.05 | )(b) | (0.03 | ) | 0.14 | 0.17 | |||||||||||||||
Net realized and unrealized gain (loss) | (0.19 | ) | 0.00 | (c) | (0.14 | ) | (0.36 | ) | (0.13 | ) | |||||||||||||
Total from investment operations | (0.24 | ) | (0.05 | ) | (0.17 | ) | (0.22 | ) | 0.04 | ||||||||||||||
Net asset value, end of period | $ | 9.36 | $ | 9.60 | $ | 9.65 | $ | 9.82 | $ | 10.04 | |||||||||||||
Total return | (2.50 | %) | (0.52 | %) | (1.73 | %) | (2.19 | %) | 0.40 | % | |||||||||||||
Ratios to average net assets(d) | |||||||||||||||||||||||
Total gross expenses | 1.86 | %(e) | 1.45 | %(e) | 1.19 | % | 1.25 | %(e) | 1.28 | %(e)(f) | |||||||||||||
Total net expenses(g) | 1.86 | %(e) | 1.45 | %(e) | 1.16 | % | 1.18 | %(e) | 1.28 | %(e)(f) | |||||||||||||
Net investment income (loss) | (0.49 | %) | (0.54 | %) | (0.37 | %) | 1.41 | % | 2.49 | %(f) | |||||||||||||
Supplemental data | |||||||||||||||||||||||
Net assets, end of period (in thousands) | $ | 263,020 | $ | 263,053 | $ | 330,550 | $ | 336,391 | $ | 337,841 | |||||||||||||
Portfolio turnover | 165 | % | 221 | % | 100 | % | 213 | % | 57 | % | |||||||||||||
Notes to Consolidated Financial Highlights
(a) Based on operations from April 30, 2012 (commencement of operations) through the stated period end.
(b) Net investment income per share includes special dividends. The effect of these dividends amounted to $0.01 per share.
(c) Rounds to zero.
(d) In addition to the fees and expenses that the Fund bears directly, the Fund indirectly bears a pro rata share of the fees and expenses of any other funds in which it invests. Such indirect expenses are not included in the Fund's reported expense ratios.
(e) Ratios include dividends and interest on securities sold short. If dividends and interest on securities sold short had been excluded, expenses would have been lower by 0.62%, 0.24%, 0.01% and 0.01% for the years ended December 31, 2016, 2015, 2013 and 2012 respectively.
(f) Annualized.
(g) Total net expenses include the impact of certain fee waivers/expense reimbursements made by the Investment Manager and certain of its affiliates, if applicable.
The accompanying Notes to Consolidated Financial Statements are an integral part of this statement.
Annual Report 2016
29
COLUMBIA VARIABLE PORTFOLIO — DIVERSIFIED ABSOLUTE RETURN FUND
CONSOLIDATED FINANCIAL HIGHLIGHTS (continued)
Year Ended December 31, | |||||||||||||||||||||||
Class 2 | 2016 | 2015 | 2014 | 2013 | 2012(a) | ||||||||||||||||||
Per share data | |||||||||||||||||||||||
Net asset value, beginning of period | $ | 9.51 | $ | 9.59 | $ | 9.78 | $ | 10.03 | $ | 10.00 | |||||||||||||
Income from investment operations: | |||||||||||||||||||||||
Net investment income (loss) | (0.07 | ) | (0.08 | )(b) | (0.06 | ) | 0.07 | 0.15 | |||||||||||||||
Net realized and unrealized gain (loss) | (0.18 | ) | 0.00 | (c) | (0.13 | ) | (0.32 | ) | (0.12 | ) | |||||||||||||
Total from investment operations | (0.25 | ) | (0.08 | ) | (0.19 | ) | (0.25 | ) | 0.03 | ||||||||||||||
Net asset value, end of period | $ | 9.26 | $ | 9.51 | $ | 9.59 | $ | 9.78 | $ | 10.03 | |||||||||||||
Total return | (2.63 | %) | (0.83 | %) | (1.94 | %) | (2.49 | %) | 0.30 | % | |||||||||||||
Ratios to average net assets(d) | |||||||||||||||||||||||
Total gross expenses | 2.11 | %(e) | 1.75 | %(e) | 1.44 | % | 1.50 | %(f) | 1.48 | %(e)(g) | |||||||||||||
Total net expenses(h) | 2.10 | %(e) | 1.74 | %(e) | 1.41 | % | 1.38 | %(f) | 1.48 | %(e)(g) | |||||||||||||
Net investment income (loss) | (0.75 | %) | (0.81 | %) | (0.62 | %) | 0.74 | % | 2.22 | %(g) | |||||||||||||
Supplemental data | |||||||||||||||||||||||
Net assets, end of period (in thousands) | $ | 4,296 | $ | 5,227 | $ | 4,155 | $ | 4,287 | $ | 3 | |||||||||||||
Portfolio turnover | 165 | % | 221 | % | 100 | % | 213 | % | 57 | % | |||||||||||||
Notes to Consolidated Financial Highlights
(a) Based on operations from April 30, 2012 (commencement of operations) through the stated period end.
(b) Net investment income per share includes special dividends. The effect of these dividends amounted to $0.02 per share.
(c) Rounds to zero.
(d) In addition to the fees and expenses that the Fund bears directly, the Fund indirectly bears a pro rata share of the fees and expenses of any other funds in which it invests. Such indirect expenses are not included in the Fund's reported expense ratios.
(e) Ratios include dividends and interest on securities sold short. If dividends and interest on securities sold short had been excluded, expenses would have been lower by 0.62%, 0.28% and 0.01% for the years ended December 31, 2016, 2015 and 2012, respectively.
(f) Ratios include dividends and interest on securities sold short which is less than 0.01% for the year ended December 31, 2013.
(g) Annualized.
(h) Total net expenses include the impact of certain fee waivers/expense reimbursements made by the Investment Manager and certain of its affiliates, if applicable.
The accompanying Notes to Consolidated Financial Statements are an integral part of this statement.
Annual Report 2016
30
COLUMBIA VARIABLE PORTFOLIO — DIVERSIFIED ABSOLUTE RETURN FUND
NOTES TO CONSOLIDATED FINANCIAL STATEMENTS
December 31, 2016
Note 1. Organization
Columbia Variable Portfolio — Diversified Absolute Return Fund (the Fund), a series of Columbia Funds Variable Insurance Trust (the Trust), is a diversified fund. The Trust is registered under the Investment Company Act of 1940, as amended (the 1940 Act), as an open-end management investment company organized as a Massachusetts business trust.
Basis for Consolidation
CVPDAR1 Offshore Fund, Ltd., CVPDAR2 Offshore Fund, Ltd. and CVPDAR3 Offshore Fund, Ltd. (each, a Subsidiary) are each a Cayman Islands exempted company and wholly-owned subsidiary of the Fund. Each Subsidiary acts as an investment vehicle in order to effect certain investment strategies consistent with the Fund's investment objective and policies as stated in its current prospectus and statement of additional information. In accordance with the Memorandum and Articles of Association of the Subsidiary (the Articles), the Fund owns the sole issued share of each Subsidiary and retains all rights associated with such share, including the right to receive notice of, attend and vote at general meetings of the Subsidiaries, rights in a winding-up or repayment of capital and the right to participate in the profits or assets of the Subsidiaries. The consolidated financial statements (financial statements) include the accounts of the consolidated Fund and each respective Subsidiary. Subsequent references to the Fund within the Notes to Consolidated Financial Statements collectively refer to the Fund and each Subsidiary. All intercompany transactions and balances have been eliminated in the consolidation process.
At December 31, 2016, each Subsidiary's financial statement information is as follows:
| CVPDAR1 Offshore Fund, Ltd | CVPDAR2 Offshore Fund, Ltd | CVPDAR3 Offshore Fund, Ltd | |||||||||||||
| % of consolidated fund net assets | 0.03 | % | 2.68 | % | 5.26 | % | |||||||||
Net assets | 67,615 | 7,166,565 | 14,072,702 | ||||||||||||
| Net investment income (loss) | (6,014 | ) | (58,564 | ) | (116,688 | ) | |||||||||
Net realized gain (loss) | — | 11,834 | (1,975,647 | ) | |||||||||||
| Net change in unrealized appreciation (depreciation) | — | 444,529 | 588,404 | ||||||||||||
The financial statements present the portfolio holdings, financial position and results of operations of the Fund and the Subsidiaries on a consolidated basis.
Fund Shares
The Trust may issue an unlimited number of shares (without par value). The Fund offers Class 1 and Class 2 shares to separate accounts funding variable annuity contracts and variable life insurance policies (collectively, Contracts) issued by affiliated and unaffiliated life insurance companies as well as qualified pension and retirement plans (Qualified Plans) and other qualified institutional investors (Qualified Investors) authorized by Columbia Management Investment Distributors, Inc. (the Distributor). You may not buy (nor will you own) shares of the Fund directly. You may invest by participating in a Qualified Plan or by buying a Contract and making allocations to the Fund. Although all share classes generally have identical voting, dividend and liquidation rights, each share class votes separately when required by the Trust's organizational documents or by law. Different share classes pay different distribution amounts to the extent the expenses of such share classes differ, and distributions in liquidation will be proportional to the net asset value of each share class. Each share class has its own cost structure and other features.
Note 2. Summary of Significant Accounting Policies
Basis of Preparation
The Fund is an investment company that applies the accounting and reporting guidance in the Financial Accounting Standards Board (FASB) Accounting Standards Codification Topic 946, Financial Services — Investment Companies (ASC 946). The financial statements are prepared in accordance with U.S. generally accepted accounting principles (GAAP), which requires management to make certain estimates and assumptions that affect the reported amounts of assets and liabilities, the disclosure of contingent assets and liabilities at the date of the financial statements and the reported amounts of income and expenses during the reporting period. Actual results could differ from those estimates.
The following is a summary of significant accounting policies followed by the Fund in the preparation of its financial statements.
Security Valuation
All equity securities and exchange-traded funds are valued at the close of business of the New York Stock Exchange. Equity securities and exchange-traded funds are valued at the last quoted sales price on the principal
Annual Report 2016
31
COLUMBIA VARIABLE PORTFOLIO — DIVERSIFIED ABSOLUTE RETURN FUND
NOTES TO CONSOLIDATED FINANCIAL STATEMENTS (continued)
December 31, 2016
exchange or market on which they trade, except for securities traded on the NASDAQ Stock Market, which are valued at the NASDAQ official close price. Unlisted securities or listed securities for which there were no sales during the day are valued at the mean of the latest quoted bid and ask prices on such exchanges or markets.
Debt securities generally are valued by pricing services approved by the Board of Trustees based upon market transactions for normal, institutional-size trading units of similar securities. The services may use various pricing techniques that take into account, as applicable, factors such as yield, quality, coupon rate, maturity, type of issue, trading characteristics and other data, as well as approved independent broker-dealer quotes. Debt securities for which quotations are not readily available or not believed to be reflective of market value may also be valued based upon a bid quote from an approved independent broker-dealer. Debt securities maturing in 60 days or less are valued primarily at amortized cost value, unless this method results in a valuation that management believes does not approximate market value.
Foreign equity securities are valued based on the closing price on the foreign exchange in which such securities are primarily traded. If any foreign equity security closing prices are not readily available, the securities are valued at the mean of the latest quoted bid and ask prices on such exchanges or markets. Foreign currency exchange rates are generally determined at 4:00 p.m. Eastern (U.S.) time. Many securities markets and exchanges outside the U.S. close prior to the close of the New York Stock Exchange; therefore, the closing prices for securities in such markets or on such exchanges may not fully reflect events that occur after such close but before the close of the New York Stock Exchange. In those situations, foreign securities will be fair valued pursuant to a policy adopted by the Board of Trustees, including, if available, utilizing a third party pricing service to determine these fair values. The third party pricing service takes into account multiple factors, including, but not limited to, movements in the U.S. securities markets, certain depositary receipts, futures contracts and foreign exchange rates that have occurred subsequent to the close of the foreign exchange or market, to determine a good faith estimate that reasonably reflects the current market conditions as of the close of the New York Stock Exchange. The fair value of a security is likely to be different from the quoted or published price, if available.
Investments in open-end investment companies, including money market funds, are valued at their latest net asset value.
Forward foreign currency exchange contracts are marked-to-market based upon foreign currency exchange rates provided by a pricing service.
Futures and options on futures contracts are valued based upon the settlement price at the close of regular trading on their principal exchanges or, in the absence of transactions, at the mean of the latest quoted bid and ask prices.
Investments for which market quotations are not readily available, or that have quotations which management believes are not reflective of market value or reliable, are valued at fair value as determined in good faith under procedures approved by and under the general supervision of the Board of Trustees. If a security or class of securities (such as foreign securities) is valued at fair value, such value is likely to be different from the quoted or published price for the security.
The determination of fair value often requires significant judgment. To determine fair value, management may use assumptions including but not limited to future cash flows and estimated risk premiums. Multiple inputs from various sources may be used to determine fair value.
GAAP requires disclosure regarding the inputs and valuation techniques used to measure fair value and any changes in valuation inputs or techniques. In addition, investments shall be disclosed by major category. This information is disclosed following the Fund's Consolidated Portfolio of Investments.
Foreign Currency Transactions and Translations
The values of all assets and liabilities denominated in foreign currencies are generally translated into U.S. dollars at exchange rates determined at the close of regular trading on the New York Stock Exchange. Net realized and unrealized gains (losses) on foreign currency transactions and translations include gains (losses) arising from the fluctuation in exchange rates between trade and settlement dates on securities transactions, gains (losses) arising from the disposition of foreign currency and currency gains (losses) between the accrual and payment dates on dividends, interest income and foreign withholding taxes.
For financial statement purposes, the Fund does not distinguish that portion of gains (losses) on investments which is due to changes in foreign exchange rates from that which is due to changes in market prices of the investments. Such fluctuations are included with the net realized and unrealized gains (losses) on investments in the Consolidated Statement of Operations.
Annual Report 2016
32
COLUMBIA VARIABLE PORTFOLIO — DIVERSIFIED ABSOLUTE RETURN FUND
NOTES TO CONSOLIDATED FINANCIAL STATEMENTS (continued)
December 31, 2016
Derivative Instruments
The Fund invests in certain derivative instruments, as detailed below, to meet its investment objectives. Derivatives are instruments whose values depend on, or are derived from, in whole or in part, the value of one or more securities, currencies, commodities, indices, or other assets or instruments. Derivatives may be used to increase investment flexibility (including to maintain cash reserves while maintaining desired exposure to certain assets), for risk management (hedging) purposes, to facilitate trading, to reduce transaction costs and to pursue higher investment returns. The Fund may also use derivative instruments to mitigate certain investment risks, such as foreign currency exchange rate risk, interest rate risk and credit risk. Derivatives may involve various risks, including the potential inability of the counterparty to fulfill its obligations under the terms of the contract, the potential for an illiquid secondary market (making it difficult for the Fund to sell or terminate, including at favorable prices) and the potential for market movements which may expose the Fund to gains or losses in excess of the amount shown in the Consolidated Statement of Assets and Liabilities. The notional amounts of derivative instruments, if applicable, are not recorded in the financial statements.
A derivative instrument may suffer a marked-to-market loss if the value of the contract decreases due to an unfavorable change in the market rates or values of the underlying instrument. Losses can also occur if the counterparty does not perform its obligations under the contract. The Fund's risk of loss from counterparty credit risk on over-the-counter derivatives is generally limited to the aggregate unrealized gain netted against any collateral held by the Fund and the amount of any variation margin held by the counterparty, plus any replacement costs or related amounts. With exchange-traded or centrally cleared derivatives, there is reduced counterparty credit risk to the Fund since the clearinghouse or central counterparty (CCP) provides some protection in the case of clearing member default. The clearinghouse or CCP stands between the buyer and the seller of the contract; therefore, additional counterparty credit risk is failure of the clearinghouse or CCP. However, credit risk still exists in exchange-traded or centrally cleared derivatives with respect to initial and variation margin that is held in a broker's customer account. While brokers are required to segregate customer margin from their own assets, in the event that a broker becomes insolvent or goes into bankruptcy and at that time there is a shortfall in the aggregate amount
of margin held by the broker for all its clients, U.S. bankruptcy laws will typically allocate that shortfall on a pro-rata basis across all the broker's customers (including the Fund), potentially resulting in losses to the Fund.
In order to better define its contractual rights and to secure rights that will help the Fund mitigate its counterparty risk, the Fund may enter into an International Swaps and Derivatives Association, Inc. Master Agreement (ISDA Master Agreement) or similar agreement with its derivatives contract counterparties. An ISDA Master Agreement is an agreement between the Fund and a counterparty that governs over-the-counter derivatives and typically contains, among other things, collateral posting terms and netting provisions in the event of a default and/or termination event. Under an ISDA Master Agreement, the Fund may, under certain circumstances, offset with the counterparty certain derivative instrument's payables and/or receivables with collateral held and/or posted and create one single net payment. The provisions of the ISDA Master Agreement typically permit a single net payment in the event of default (close-out netting), including the bankruptcy or insolvency of the counterparty. Note, however, that bankruptcy or insolvency laws of a particular jurisdiction may impose restrictions on or prohibitions against the right of offset or netting in bankruptcy, insolvency or other events.
Collateral (margin) requirements differ by type of derivative. Margin requirements are established by the clearinghouse or CCP for exchange-traded and centrally cleared derivatives. Brokers can ask for margin in excess of the minimum in certain circumstances. Collateral terms are contract specific for over-the-counter derivatives. For over-the-counter derivatives traded under an ISDA Master Agreement, the collateral requirements are typically calculated by netting the marked-to-market amount for each transaction under such agreement and comparing that amount to the value of any variation margin currently pledged by the Fund and/or the counterparty. Generally, the amount of collateral due from or to a party has to exceed a minimum transfer amount threshold (e.g., $250,000) before a transfer has to be made. To the extent amounts due to the Fund from its counterparties are not fully collateralized, contractually or otherwise, the Fund bears the risk of loss from counterparty nonperformance. The Fund attempts to mitigate counterparty risk by only entering into agreements with counterparties that it believes have the financial resources to honor their obligations and by monitoring the financial stability of those counterparties.
Annual Report 2016
33
COLUMBIA VARIABLE PORTFOLIO — DIVERSIFIED ABSOLUTE RETURN FUND
NOTES TO CONSOLIDATED FINANCIAL STATEMENTS (continued)
December 31, 2016
Certain ISDA Master Agreements allow counterparties of over-the-counter derivatives transactions to terminate derivatives contracts prior to maturity in the event the Fund's net asset value declines by a stated percentage over a specified time period or if the Fund fails to meet certain terms of the ISDA Master Agreement, which would cause the Fund to accelerate payment of any net liability owed to the counterparty. The Fund also has termination rights if the counterparty fails to meet certain terms of the ISDA Master Agreement. In addition to considering counterparty credit risk, the Fund would consider terminating the derivatives contracts based on whether termination would result in a net liability owed from the counterparty.
For financial reporting purposes, the Fund does not offset derivative assets and derivative liabilities that are subject to netting arrangements in the Consolidated Statement of Assets and Liabilities.
Forward Foreign Currency Exchange Contracts
Forward foreign currency exchange contracts are over-the-counter agreements between two parties to buy and sell a currency at a set price on a future date. The Fund utilized forward foreign currency exchange contracts primarily for the purpose of gaining market exposure to various foreign currencies. These instruments may be used for other purposes in future periods.
The values of forward foreign currency exchange contracts fluctuate daily with changes in foreign currency exchange rates. Changes in the value of these contracts are recorded as unrealized appreciation or depreciation until the contract is exercised or has expired. The Fund will realize a gain or loss when the forward foreign currency exchange contract is closed or expires.
The use of forward foreign currency exchange contracts does not eliminate fluctuations in the prices of the Fund's portfolio securities. The risks of forward foreign currency exchange contracts include movement in the values of the foreign currencies relative to the U.S. dollar (or other foreign currencies) and the possibility that counterparties will not complete their contractual obligations, which may be in excess of the amount reflected, if any, in the Consolidated Statement of Assets and Liabilities.
Futures Contracts
Futures contracts are exchange-traded and represent commitments for the future purchase or sale of an asset at a specified price on a specified date. The Fund bought
and sold futures contracts to produce incremental earnings, to manage exposure to movements in interest rates, to manage exposure to the securities market and to manage exposure to commodities markets. These instruments may be used for other purposes in future periods. Upon entering into futures contracts, the Fund bears risks that it may not achieve the anticipated benefits of the futures contracts and may realize a loss. Additional risks include counterparty credit risk, the possibility of an illiquid market, and that a change in the value of the contract or option may not correlate with changes in the value of the underlying asset.
Upon entering into a futures contract, the Fund deposits cash or securities with the broker, known as a futures commission merchant (FCM), in an amount sufficient to meet the initial margin requirement. The initial margin deposit must be maintained at an established level over the life of the contract. Cash deposited as initial margin is recorded in the Consolidated Statement of Assets and Liabilities as margin deposits. Securities deposited as initial margin are designated in the Consolidated Portfolio of Investments. Subsequent payments (variation margin) are made or received by the Fund each day. The variation margin payments are equal to the daily change in the contract value and are recorded as variation margin receivable or payable and are offset in unrealized gains or losses. The Fund recognizes a realized gain or loss when the contract is closed or expires. Futures contracts involve, to varying degrees, risk of loss in excess of the variation margin disclosed in the Consolidated Statement of Assets and Liabilities.
Options Contracts
Options are contracts which entitle the holder to purchase or sell securities or other identified assets at a specified price, or in the case of index option contracts, to receive or pay the difference between the index value and the strike price of the index option contract. Option contracts can be either exchange-traded or over-the-counter. The Fund purchased and wrote option contracts to produce incremental earnings, to decrease the Fund's exposure to equity market risk and to increase return on investments, to protect gains, to manage exposure to fluctuations in interest rates and to hedge the fair value of the Fund's investments. These instruments may be used for other purposes in future periods. Completion of transactions for option contracts traded in the over-the-counter market depends upon the performance of the other party. Cash collateral may be collected or posted by the Fund to secure certain over-the-counter
Annual Report 2016
34
COLUMBIA VARIABLE PORTFOLIO — DIVERSIFIED ABSOLUTE RETURN FUND
NOTES TO CONSOLIDATED FINANCIAL STATEMENTS (continued)
December 31, 2016
option contract trades. Cash collateral held or posted by the Fund for such option contract trades must be returned to the broker or the Fund upon closure, exercise or expiration of the contract.
Options contracts purchased are recorded as investments. When the Fund writes an options contract, the premium received is recorded as an asset and an amount equivalent to the premium is recorded as a liability in the Consolidated Statement of Assets and Liabilities and is subsequently adjusted to reflect the current fair value of the option written. Changes in the fair value of the written option are recorded as unrealized appreciation or depreciation until the contract is exercised or has expired. The Fund will realize a gain or loss when the option contract is closed or expires. When option contracts are exercised, the proceeds on sales for a written call or purchased put option contract, or the purchase cost for a written put or purchased call option contract, is adjusted by the amount of premium received or paid.
For over-the-counter options purchased, the Fund bears the risk of loss of the amount of the premiums paid plus the positive change in market values net of any collateral held by the Fund should the counterparty fail to perform under the contracts. Option contracts written by the Fund do not typically give rise to significant counterparty credit risk, as options written generally obligate the Fund and not the counterparty to perform. The risk in writing a call option contract is that the Fund gives up the opportunity for profit if the market price of the security increases above the strike price and the option contract is exercised. The risk in writing a put option contract is that the Fund may incur a loss if the market price of the security decreases below the strike price and the option contract is exercised. Exercise of a written option could result in the Fund purchasing or selling a security or foreign currency when it otherwise would not, or at a price different from the current market value. In purchasing and writing options, the Fund bears the risk of an unfavorable change in the value of the underlying instrument or the risk that the Fund may not be able to enter into a closing transaction due to an illiquid market.
Interest Rate Swaption Contracts
Interest rate swaption contracts entered into by the Fund typically represent an option that gives the purchaser the right, but not the obligation, to enter into an interest rate swap contract on a future date. Each interest rate swaption agreement will specify if the buyer is entitled to receive the fixed or floating rate if the interest rate is
exercised. Changes in the value of a purchased interest rate swaption contracts are reported as unrealized appreciation or depreciation on options in the Consolidated Statement of Assets and Liabilities. Gain or loss is recognized in the Consolidated Statement of Operations when the interest rate swaption contract is closed or expires.
When the Fund writes an interest rate swaption contract, the premium received is recorded as an asset and an amount equivalent to the premium is recorded as a liability in the Consolidated Statement of Assets and Liabilities and is subsequently adjusted to reflect the current fair value of the interest rate swaption contract written. Premiums received from writing interest rate swaption contracts that expire unexercised are recorded by the Fund on the expiration date as realized gains from options written in the Consolidated Statement of Operations. The difference between the premium and the amount paid on effecting a closing purchase transaction, including brokerage commissions, is also recorded as realized gain, or if the premium is less than the amount paid for the closing purchase, as realized loss. These amounts are reflected as net realized gain (loss) on options written in the Consolidated Statement of Operations.
Swap Contracts
Swap contracts are negotiated in the over-the-counter market and may be entered into as a bilateral contract or centrally cleared (centrally cleared swap contract). In a centrally cleared swap contract, immediately following execution of the swap contract with a broker, the swap contract is novated to a central counterparty (the CCP) and the CCP becomes the Fund's counterparty to the centrally cleared swap contract. The Fund is required to deposit initial margin with the futures commission merchant (FCM), which pledges it through to the CCP in the form of cash or securities in an amount that varies depending on the size and risk profile of the particular swap contract. Securities deposited as initial margin are designated in the Consolidated Portfolio of Investments and cash deposited is recorded in the Consolidated Statement of Assets and Liabilities as margin deposits. Unlike a bilateral swap contract, for centrally cleared swap contracts, the Fund has minimal credit exposure to the FCM because the CCP stands between the Fund and the relevant buyer/seller on the other side of the contract. Swap contracts are marked-to-market daily and changes in value are recorded as unrealized appreciation (depreciation). The daily change in valuation of centrally
Annual Report 2016
35
COLUMBIA VARIABLE PORTFOLIO — DIVERSIFIED ABSOLUTE RETURN FUND
NOTES TO CONSOLIDATED FINANCIAL STATEMENTS (continued)
December 31, 2016
cleared swap contracts, if any, is recorded as a receivable or payable for variation margin in the Consolidated Statement of Assets and Liabilities.
Entering into these contracts involves, to varying degrees, elements of interest, liquidity and counterparty credit risk in excess of the amounts recognized in the Consolidated Statement of Assets and Liabilities. Such risks involve the possibility that there may be unfavorable changes in interest rates, market conditions or other conditions, it may be difficult to initiate a swap transaction or liquidate a position at an advantageous time or price which may result in significant losses, and that the FCM or CCP may not fulfill its obligation under the contract.
Credit Default Swap Contracts
The Fund entered into credit default swap contracts to increase or decrease its credit exposure to an index, increase or decrease its credit exposure to a specific debt security or a basket of debt securities, as a protection buyer to reduce overall credit exposure. Additionally, credit default swap contracts were used to manage credit risk exposure. These instruments may be used for other purposes in future periods. Credit default swap contracts are agreements in which one party pays fixed periodic payments to a counterparty in consideration for an agreement from the counterparty to make a specific payment should a specified credit event(s) take place. Although specified credit events are contract specific, credit events are generally defined as bankruptcy, failure to pay, restructuring, obligation acceleration, obligation default, or repudiation/moratorium.
As the purchaser of a credit default swap contract, the Fund purchases protection by paying a periodic interest rate on the notional amount to the counterparty. The interest amount is accrued daily as a component of unrealized appreciation (depreciation) and is recorded as a realized loss upon payment. If a credit event as specified in the contract occurs, the Fund may have the option either to deliver the reference obligation to the seller in exchange for a cash payment of its par amount, or to receive a net cash settlement equal to the par amount less an agreed-upon value of the reference obligation as of the date of the credit event. The difference between the value of the obligation or cash delivered and the notional amount received will be recorded as a realized gain (loss).
As the seller of a credit default swap contract, the Fund sells protection to a buyer and will generally receive a periodic interest rate on a notional amount. The interest amount is accrued daily as a component of unrealized appreciation (depreciation) and is recorded as a realized gain upon receipt of the payment. If a credit event as specified in the contract with the counterparty occurs, the Fund may either be required to accept the reference obligation from the buyer in exchange for a cash payment of its notional amount, or to pay the buyer a net cash settlement equal to the notional amount less an agreed-upon value of the reference obligation (recovery value) as of the date of the credit event. The difference between the value of the obligation or cash received and the notional amount paid will be recorded as a realized gain (loss). The maximum potential amount of undiscounted future payments the Fund could be required to make as the seller of protection under a credit default swap contract is equal to the notional amount of the reference obligation. These potential amounts may be partially offset by any recovery values of the respective reference obligations or premiums received upon entering into the agreement. The notional amounts and market values of all credit default swap contracts in which the Fund is the seller of protection, if any, are disclosed in the Credit Default Swap Contracts Outstanding schedule following the Portfolio of Investments. These potential amounts may be partially offset by any recovery values of the respective reference obligations or premiums received upon entering into the agreement.
As a protection seller, the Fund bears the risk of loss from the credit events specified in the contract with the counterparty. For credit default swap contracts on credit indices, quoted market prices and resulting market values serve as an indicator of the current status of the payment/performance risk. Increasing market values, in absolute terms when compared to the notional amount of the swap, represent a deterioration of the reference entity's credit soundness and a greater likelihood or risk of default or other credit event occurring as defined under the terms of the contract.
Any premium paid or received by the Fund upon entering into a credit default swap contract is recorded as an asset or liability, respectively, and amortized daily as a component of realized gain (loss) in the Consolidated Statement of Operations. Credit default swap contracts are valued daily, and the change in value is recorded as unrealized appreciation (depreciation) until the termination of the swap, at which time a realized gain (loss) is recorded.
Annual Report 2016
36
COLUMBIA VARIABLE PORTFOLIO — DIVERSIFIED ABSOLUTE RETURN FUND
NOTES TO CONSOLIDATED FINANCIAL STATEMENTS (continued)
December 31, 2016
Credit default swap contracts can involve greater risks than if a fund had invested in the reference obligation directly since, in addition to general market risks, credit default swaps are subject to counterparty credit risk, leverage risk, hedging risk, correlation risk and liquidity risk.
Interest Rate Swap Contracts
The Fund entered into interest rate swap transactions which may include inflation rate swap contracts to produce incremental earnings, to manage interest rate and market risk exposure to produce incremental earnings, to gain exposure to or protect itself from market rate changes, to synthetically add or subtract principal exposure to a market, to manage long or short exposure to an inflation index, to manage long or short exposure to the total return on a reference index in return for periodic payments based on a fixed or variable interest rate and to hedge the portfolio risk associated with some or all of the Fund's securities. These instruments may be used for other purposes in future periods. An interest rate swap is an agreement between two parties where there are two flows and payments are made between the two counterparties and the payments are dependent upon changes in an interest rate, inflation rate or inflation index calculated on a nominal amount. Interest rate swaps are agreements between two parties that involve the exchange of one type of interest rate for another type of interest rate cash flow on specified dates in the future, based on a predetermined, specified notional amount. Certain interest rate swaps are considered forward-starting, whereby the accrual for the exchange of cash flows does not begin until a specified date in the future. The net cash flow for a standard interest rate swap transaction is generally the difference between a floating market interest rate versus a fixed interest rate.
Interest rate swaps are valued daily and unrealized appreciation (depreciation) is recorded. Certain interest rate swaps may accrue periodic interest on a daily basis as a component of unrealized appreciation (depreciation); the Fund will realize a gain or loss upon the payment or receipt of accrued interest. The Fund will realize a gain or a loss when the interest rate swap is terminated.
Total Return Swap Contracts
The Fund entered into total return swap contracts to manage long or short exposure to the total return on a
specified reference security in return for periodic payments based on a fixed or variable interest rate, to manage long or short exposure to the total return on a basket of reference securities in return for periodic payments based on a fixed or variable interest rate, to manage long or short exposure to the total return on a reference security index in return for periodic payments based on a fixed or variable interest rate and to manage long or short exposure to a commodities index. These instruments may be used for other purposes in future periods. Total return swap contracts may be used to obtain exposure to an underlying reference security, instrument, or other asset or index or market without owning, taking physical custody of, or short selling any such security, instrument or asset in a market.
Total return swap contracts are valued daily, and the change in value is recorded as unrealized appreciation (depreciation) until the termination of the swap, at which time the Fund will realize a gain (loss). Periodic payments received (or made) by the Fund over the term of the contract are recorded as realized gains (losses). Total return swap contracts are subject to the risk associated with the investment in the underlying reference security, instrument or asset. The risk in the case of short total return swap contracts is unlimited based on the potential for unlimited increases in the market value of the underlying reference security, instrument or asset. This risk may be offset if the Fund holds any of the underlying reference security, instrument or asset. The risk in the case of long total return swap contracts is limited to the current notional amount of the total return swap contract.
Effects of Derivative Transactions in the Financial Statements
The following tables are intended to provide additional information about the effect of derivatives on the financial statements of the Fund, including: the fair value of derivatives by risk category and the location of those fair values in the Consolidated Statement of Assets and Liabilities; and the impact of derivative transactions over the period in the Consolidated Statement of Operations, including realized and unrealized gains (losses). The derivative instrument schedules following the Consolidated Portfolio of Investments present additional information regarding derivative instruments outstanding at the end of the period, if any.
The following table is a summary of the fair value of derivative instruments (not considered to be hedging
Annual Report 2016
37
COLUMBIA VARIABLE PORTFOLIO — DIVERSIFIED ABSOLUTE RETURN FUND
NOTES TO CONSOLIDATED FINANCIAL STATEMENTS (continued)
December 31, 2016
instruments for accounting disclosure purposes) at December 31, 2016:
Asset Derivatives | |||||||||||
| Risk Exposure Category | Consolidated Statement of Assets and Liabilities Location | Fair Value ($) | |||||||||
| Equity risk | Component of trust capital — unrealized appreciation on futures contracts | 176,158 | * | ||||||||
| Foreign exchange risk | Unrealized appreciation on forward foreign currency exchange contracts | 9,986,598 | |||||||||
| Interest rate risk | Component of trust capital — unrealized appreciation on futures contracts | 283,020 | * | ||||||||
Total | 10,445,776 | ||||||||||
Liability Derivatives | |||||||||||
| Risk Exposure Category | Consolidated Statement of Assets and Liabilities Location | Fair Value ($) | |||||||||
| Equity risk | Component of trust capital — unrealized depreciation on futures contracts | 195,414 | * | ||||||||
| Foreign exchange risk | Unrealized depreciation on forward foreign currency exchange contracts | 10,085,766 | |||||||||
| Interest rate risk | Component of trust capital — unrealized depreciation on futures contracts | 106,484 | * | ||||||||
Total | 10,387,664 | ||||||||||
*Includes cumulative appreciation (depreciation) as reported in the tables following the Consolidated Portfolio of Investments. Only the current day's variation margin is reported in receivables or payables in the Consolidated Statement of Assets and Liabilities.
The following table indicates the effect of derivative instruments (not considered to be hedging instruments for accounting disclosure purposes) in the Consolidated Statement of Operations for the year ended December 31, 2016:
Amount of Realized Gain (Loss) on Derivatives Recognized in Income | |||||||||||||||||||||||
Risk Exposure Category | Forward Foreign Currency Exchange Contracts ($) | Futures Contracts ($) | Options Contracts Purchased ($) | Swap Contracts ($) | Total ($) | ||||||||||||||||||
Credit risk | — | — | — | 483 | 483 | ||||||||||||||||||
Equity risk | — | 548,819 | — | (1,975,685 | ) | (1,426,866 | ) | ||||||||||||||||
Foreign exchange risk | (712,779 | ) | — | — | — | (712,779 | ) | ||||||||||||||||
Interest rate risk | — | (1,468,737 | ) | (53,504 | ) | (566,431 | ) | (2,088,672 | ) | ||||||||||||||
Total | (712,779 | ) | (919,918 | ) | (53,504 | ) | (2,541,633 | ) | (4,227,834 | ) | |||||||||||||
Change in Unrealized Appreciation (Depreciation) on Derivatives Recognized in Income | |||||||||||||||||||||||
Risk Exposure Category | Forward Foreign Currency Exchange Contracts ($) | Futures Contracts ($) | Options Contracts Purchased ($) | Swap Contracts ($) | Total ($) | ||||||||||||||||||
Credit risk | — | — | — | (9,553 | ) | (9,553 | ) | ||||||||||||||||
Equity risk | — | (241,390 | ) | — | 588,404 | 347,014 | |||||||||||||||||
Foreign exchange risk | (307,741 | ) | — | — | — | (307,741 | ) | ||||||||||||||||
Interest rate risk | — | 220,242 | 6,606 | 8,871 | 235,719 | ||||||||||||||||||
Total | (307,741 | ) | (21,148 | ) | 6,606 | 587,722 | 265,439 | ||||||||||||||||
The following table provides a summary of the average outstanding volume by derivative instrument for the year ended December 31, 2016:
Derivative Instrument | Average Notional Amounts ($)* | ||||||
Futures contracts — Long | 179,420,994 | ||||||
Futures contracts — Short | 125,812,488 | ||||||
Credit default swap contracts — buy protection | 1,212,500 | ||||||
Credit default swap contracts — sell protection | 3,470,000 | ||||||
Derivative Instrument | Average Market Value ($)* | ||||||
Options contracts — Purchased | 1,819 | ||||||
Derivative Instrument | Average Unrealized Appreciation ($)* | Average Unrealized Depreciation ($)* | |||||||||
| Forward foreign currency exchange contracts | 9,816,209 | (9,786,816 | ) | ||||||||
Interest rate swap contracts | — | (232,311 | ) | ||||||||
Total return swap contracts | 241,253 | — | |||||||||
*Based on the ending quarterly outstanding amounts for the year ended December 31, 2016.
Annual Report 2016
38
COLUMBIA VARIABLE PORTFOLIO — DIVERSIFIED ABSOLUTE RETURN FUND
NOTES TO CONSOLIDATED FINANCIAL STATEMENTS (continued)
December 31, 2016
Mortgage Dollar Roll Transactions
The Fund may enter into mortgage "dollar rolls" in which the Fund sells securities for delivery in the current month and simultaneously contracts with the same counterparty to repurchase similar but not identical securities (same type, coupon and maturity) on a specified future date. During the roll period, the Fund loses the right to receive principal and interest paid on the securities sold. However, the Fund will benefit because it receives negotiated amounts in the form of reductions of the purchase price for the future purchase plus the interest earned on the cash proceeds of the securities sold until the settlement date of the forward purchase. The Fund records the incremental difference between the forward purchase and sale of each forward roll as a realized gain or loss. Unless any realized gains exceed the income, capital appreciation, and gain or loss due to mortgage prepayments that would have been realized on the securities sold as part of the mortgage dollar roll, the use of this technique will diminish the investment performance of the Fund compared to what the performance would have been without the use of mortgage dollar rolls. All cash proceeds will be invested in instruments that are permissible investments for the Fund. The Fund identifies cash or liquid securities in an amount equal to the forward purchase price.
For financial reporting and tax purposes, the Fund treats "to be announced" mortgage dollar rolls as two separate transactions, one involving the purchase of a security and a separate transaction involving a sale. These transactions may increase the Fund's portfolio turnover rate. The Fund does not currently enter into mortgage dollar rolls that are accounted for as financing transactions.
Mortgage dollar rolls involve the risk that the market value of the securities the Fund is obligated to repurchase may decline below the repurchase price, or that the counterparty may default on its obligations.
Treasury Inflation Protected Securities
The Fund may invest in treasury inflation protected securities (TIPS). The principal amount of TIPS is adjusted periodically and is increased for inflation or decreased for deflation based on a monthly published index. These adjustments are recorded as interest income in the Consolidated Statement of Operations. Coupon payments are based on the adjusted principal at the time the interest is paid.
Short Sales
The Fund may sell a security it does not own in anticipation of a decline in the fair value of the security. When the Fund sells a security short, it must borrow the security sold short and deliver it to the broker-dealer through which it made the short sale. The Fund is required to maintain a margin account with the broker and to pledge assets to the broker as collateral for the borrowed security. Securities pledged as collateral are designated in the Consolidated Portfolio of Investments. The Fund can purchase the same security at the current market price and deliver it to the broker to close out the short sale. The Fund is obligated to pay the broker a fee for borrowing the security. The fee is included in "Dividends and interest on securities sold short" in the Consolidated Statement of Operations and a short position is reported as a liability at fair value in the Consolidated Statement of Assets and Liabilities. The Fund must also pay the broker for any dividends accrued (recognized on ex-date) on the borrowed security. This amount is recorded as an expense in the Consolidated Statement of Operations. The Fund will record a gain if the security declines in value, and will realize a loss if the security appreciates. Such gain, limited to the price at which the Fund sold the security short, or such loss, potentially unlimited in size because the short position loses value as the market price of the security sold short increases, will be recognized upon the termination of a short sale.
Annual Report 2016
39
COLUMBIA VARIABLE PORTFOLIO — DIVERSIFIED ABSOLUTE RETURN FUND
NOTES TO CONSOLIDATED FINANCIAL STATEMENTS (continued)
December 31, 2016
Offsetting of Assets and Liabilities
The following table presents the Fund's gross and net amount of assets and liabilities available for offset under netting arrangements as well as any related collateral received or pledged by the Fund as of December 31, 2016:
| Barclays ($) | BNP Paribas ($) | Citi ($) | Credit Suisse ($) | Deutsche Bank ($) | HSBC ($) | JP Morgan ($) | Morgan Stanley ($) | Standard Chartered ($) | State Street ($) | UBS ($) | Total ($) | ||||||||||||||||||||||||||||||||||||||||
Assets | |||||||||||||||||||||||||||||||||||||||||||||||||||
| Forward foreign currency exchange contracts | 340,512 | 917,606 | 582,569 | 1,004,803 | 1,746,891 | 1,969,723 | — | 638,404 | 563 | 1,116,792 | 1,668,735 | 9,986,598 | |||||||||||||||||||||||||||||||||||||||
Total Assets | 340,512 | 917,606 | 582,569 | 1,004,803 | 1,746,891 | 1,969,723 | — | 638,404 | 563 | 1,116,792 | 1,668,735 | 9,986,598 | |||||||||||||||||||||||||||||||||||||||
Liabilities | |||||||||||||||||||||||||||||||||||||||||||||||||||
| Forward foreign currency exchange contracts | 146,564 | 1,286,005 | 972,473 | 190,333 | 1,584,884 | 1,481,208 | — | 7,517 | 625,853 | 1,146,621 | 2,644,308 | 10,085,766 | |||||||||||||||||||||||||||||||||||||||
| Securities borrowed | — | — | — | — | — | — | 45,273,532 | — | — | — | — | 45,273,532 | |||||||||||||||||||||||||||||||||||||||
Total Liabilities | 146,564 | 1,286,005 | 972,473 | 190,333 | 1,584,884 | 1,481,208 | 45,273,532 | 7,517 | 625,853 | 1,146,621 | 2,644,308 | 55,359,298 | |||||||||||||||||||||||||||||||||||||||
| Total Financial and Derivative Net Assets | 193,948 | (368,399 | ) | (389,904 | ) | 814,470 | 162,007 | 488,515 | (45,273,532 | ) | 630,887 | (625,290 | ) | (29,829 | ) | (975,573 | ) | (45,372,700 | ) | ||||||||||||||||||||||||||||||||
| Total collateral received (pledged)(a) | — | — | — | — | — | — | (45,273,532 | ) | — | — | — | — | (45,273,532 | ) | |||||||||||||||||||||||||||||||||||||
Net Amount(b) | 193,948 | (368,399 | ) | (389,904 | ) | 814,470 | 162,007 | 488,515 | — | 630,887 | (625,290 | ) | (29,829 | ) | (975,573 | ) | (99,168 | ) | |||||||||||||||||||||||||||||||||
(a) In some instances, the actual collateral received and/or pledged may be more than the amount shown due to overcollateralization.
(b) Represents the net amount due from/(to) counterparties in the event of default.
Security Transactions
Security transactions are accounted for on the trade date. Cost is determined and gains (losses) are based upon the specific identification method for both financial statement and federal income tax purposes.
Income Recognition
Interest income is recorded on an accrual basis. Market premiums and discounts, including original issue discounts, are amortized and accreted, respectively, over the expected life of the security on all debt securities, unless otherwise noted.
The Fund may place a debt security on non-accrual status and reduce related interest income when it becomes probable that the interest will not be collected and the amount of uncollectible interest can be reasonably estimated. A defaulted debt security is removed from non-accrual status when the issuer resumes interest payments or when collectibility of interest is reasonably assured.
Corporate actions and dividend income are generally recorded net of any non-reclaimable tax withholdings, on
the ex-dividend date or upon receipt of ex-dividend notification in the case of certain foreign securities.
The Fund may receive distributions from holdings in equity securities, business development companies (BDCs), exchange traded funds, other regulated investment companies (RICs), and real estate investment trusts (REITs), which report information on the tax character of their distributions annually. These distributions are allocated to dividend income, capital gain and return of capital based on actual information reported. Return of capital is recorded as a reduction of the cost basis of securities held. If the Fund no longer owns the applicable securities, return of capital is recorded as a realized gain. With respect to REITs, to the extent actual information has not yet been reported, estimates for return of capital are made by the Fund's management. Management's estimates are subsequently adjusted when the actual character of the distributions is disclosed by the REITs, which could result in a proportionate change in return of capital to shareholders.
Annual Report 2016
40
COLUMBIA VARIABLE PORTFOLIO — DIVERSIFIED ABSOLUTE RETURN FUND
NOTES TO CONSOLIDATED FINANCIAL STATEMENTS (continued)
December 31, 2016
Awards from class action litigation are recorded as a reduction of cost basis if the Fund still owns the applicable securities on the payment date. If the Fund no longer owns the applicable securities, the proceeds are recorded as realized gains.
Expenses
General expenses of the Trust are allocated to the Fund and other funds of the Trust based upon relative net assets or other expense allocation methodologies determined by the nature of the expense. Expenses directly attributable to the Fund are charged to the Fund. Expenses directly attributable to a specific class of shares are charged to that share class.
Determination of Class Net Asset Value
All income, expenses (other than class-specific expenses, which are charged to that share class, as shown in the Consolidated Statement of Operations) and realized and unrealized gains (losses) are allocated to each class of the Fund on a daily basis, based on the relative net assets of each class, for purposes of determining the net asset value of each class.
Federal Income Tax Status
The Fund is treated as a partnership for federal income tax purposes, and the Fund does not expect to make regular distributions. The Fund will not be subject to federal income tax, and therefore, there is no provision for federal income taxes. The partners of the Fund are subject to tax on their distributive share of the Fund's income and loss. The components of the Fund's net assets are reported at the partner-level for federal income tax purposes, and therefore, are not presented in the Consolidated Statement of Assets and Liabilities.
Management of the Fund has concluded that there are no significant uncertain tax positions in the Fund that would require recognition in the financial statements. However, management's conclusion may be subject to review and adjustment at a later date based on factors including, but not limited to, new tax laws, regulations, and administrative interpretations (including relevant court decisions). Generally, the Fund's federal tax returns for the prior three fiscal years remain subject to examination by the Internal Revenue Service.
Foreign Taxes
The Fund may be subject to foreign taxes on income, gains on investments or currency repatriation, a portion of which may be recoverable. The Fund will accrue such taxes and recoveries, as applicable, based upon its
current interpretation of tax rules and regulations that exist in the markets in which it invests.
Realized gains in certain countries may be subject to foreign taxes at the Fund level, based on statutory rates. The Fund accrues for such foreign taxes on realized and unrealized gains at the appropriate rate for each jurisdiction, as applicable. The amount, if any, is disclosed as a liability on the Consolidated Statement of Assets and Liabilities.
Guarantees and Indemnifications
Under the Trust's organizational documents and, in some cases, by contract, its officers and trustees are indemnified against certain liabilities arising out of the performance of their duties to the Trust or its funds. In addition, certain of the Fund's contracts with its service providers contain general indemnification clauses. The Fund's maximum exposure under these arrangements is unknown since the amount of any future claims that may be made against the Fund cannot be determined, and the Fund has no historical basis for predicting the likelihood of any such claims.
Investment Company Reporting Modernization
In October 2016, the U.S. Securities and Exchange Commission adopted new rules and forms, and amendments to certain current rules and forms, to modernize reporting and disclosure of information by registered investment companies. The amendments to Regulation S-X will require standardized, enhanced disclosure about derivatives in investment company financial statements, and will also change the rules governing the form and content of such financial statements. The amendments to Regulation S-X take effect on August 1, 2017. At this time, management is assessing the anticipated impact of these regulatory developments.
Note 3. Fees and Other Transactions with Affiliates
Management Services Fees
Effective May 1, 2016, the Fund entered into a Management Agreement with Columbia Management Investment Advisers, LLC (the Investment Manager), a wholly-owned subsidiary of Ameriprise Financial, Inc. (Ameriprise Financial). Under the Management Agreement, the Investment Manager provides the Fund with investment research and advice, as well as administrative and accounting services. The management services fee is an annual fee that is equal
Annual Report 2016
41
COLUMBIA VARIABLE PORTFOLIO — DIVERSIFIED ABSOLUTE RETURN FUND
NOTES TO CONSOLIDATED FINANCIAL STATEMENTS (continued)
December 31, 2016
to a percentage of the Fund's average daily net assets that declines from 1.10% to 0.95% as the Fund's net assets increase. Prior to May 1, 2016, the Fund paid the Investment Manager an annual fee for advisory services under an Investment Management Services Agreement and a separate annual fee for administrative and accounting services under an Administrative Services Agreement. The effective management services fee rate for the year ended December 31, 2016 (reflecting all advisory and administrative services fees paid to the Investment Manager) was 1.10% of the Fund's average daily net assets. For the period from January 1, 2016 through April 30, 2016, the investment advisory services fee paid to the Investment Manager was $890,627, and the administrative services fee paid to the Investment Manager was $69,853.
Compensation of Board Members
Board of Trustee members, who are not officers or employees of the Investment Manager or Ameriprise Financial, are compensated for their services to the Fund as disclosed in the Consolidated Statement of Operations. These Board of Trustee members may participate in a Deferred Compensation Plan (the Plan) which may be terminated at any time. Obligations of the Plan will be paid solely out of the Fund's assets, and all amounts payable under the Plan constitute a general unsecured obligation of the Fund.
Compensation of Chief Compliance Officer
The Board of Trustees has appointed a Chief Compliance Officer to the Fund in accordance with federal securities regulations. The Fund is allocated a portion of the expenses associated with the Chief Compliance Officer based on relative net assets of the Trust.
Transfer Agency Fees
The Fund has a Transfer and Dividend Disbursing Agent Agreement with Columbia Management Investment Services Corp. (the Transfer Agent), an affiliate of the Investment Manager and a wholly-owned subsidiary of Ameriprise Financial. The annual fee rate under this agreement is 0.06% of the Fund's average daily net assets attributable to each share class.
Distribution Fees
The Fund has an agreement with the Distributor, an affiliate of the Investment Manager and a wholly-owned subsidiary of Ameriprise Financial, for distribution services. The Board of Trustees has approved, and the Fund has adopted, a distribution plan (the Plan) which
sets the distribution fees for the Fund. These fees are calculated daily and are intended to compensate the Distributor for selling shares of the Fund. The Fund pays a monthly distribution fee to the Distributor at the maximum annual rate of 0.25% of the average daily net assets attributable to Class 2 shares of the Fund. The Fund pays no distribution and service fees for Class 1 shares.
Expenses Waived/Reimbursed by the Investment Manager and its Affiliates
The Investment Manager and certain of its affiliates have contractually agreed to waive fees and/or reimburse expenses (excluding certain fees and expenses described below) for the periods disclosed below, unless sooner terminated at the sole discretion of the Board of Trustees, so that the Fund's net operating expenses, including indirect expenses of the Underlying Funds, after giving effect to fees waived/expenses reimbursed and any balance credits and/or overdraft charges from the Fund's custodian, do not exceed the following annual rates as a percentage of the class' average daily net assets:
| May 1, 2016 through April 30, 2017 | Prior to May 1, 2016 | ||||||||||
Class 1 | 1.30 | % | 1.24 | % | |||||||
Class 2 | 1.55 | 1.49 | |||||||||
Under the agreement governing these fee waivers and/or expense reimbursement arrangements, the following fees and expenses are excluded from the waiver/reimbursement commitment, and therefore will be paid by the Fund, if applicable: taxes (including foreign transaction taxes), transaction costs and brokerage commissions, costs related to any securities lending program, dividend and interest expenses associated with securities sold short, inverse floater program fees and expenses, transaction charges and interest on borrowed money, interest, infrequent and/or unusual expenses and any other expenses the exclusion of which is specifically approved by the Board of Trustees. This agreement may be modified or amended only with approval from the Investment Manager, certain of its affiliates and the Fund. Any fees waived and/or expenses reimbursed under the expense reimbursement arrangements described above are not recoverable by the Investment Manager or its affiliates in future periods.
Annual Report 2016
42
COLUMBIA VARIABLE PORTFOLIO — DIVERSIFIED ABSOLUTE RETURN FUND
NOTES TO CONSOLIDATED FINANCIAL STATEMENTS (continued)
December 31, 2016
Note 4. Portfolio Information
The cost of purchases and proceeds from sales of securities, excluding short-term investments and derivatives, if any, aggregated to $321,516,333 and $307,278,196, respectively, for the year ended December 31, 2016, of which $649,544 and 15,590,703, respectively, were U.S. government securities. The amount of purchase and sale activity impacts the portfolio turnover rate reported in the Consolidated Financial Highlights.
Note 5. Affiliated Money Market Fund
The Fund invests significantly in Columbia Short-Term Cash Fund, an affiliated money market fund established for the exclusive use by the Fund and other affiliated funds (the Affiliated MMF). The income earned by the Fund from such investments is included as Dividends — affiliated issuers in the Consolidated Statement of Operations. As an investing fund, the Fund indirectly bears its proportionate share of the expenses of the Affiliated MMF. Effective October 1, 2016, the Affiliated MMF prices its shares with a floating net asset value (NAV) and no longer seeks to maintain a stable NAV. In addition, the Board of Trustees of the Affiliated MMF may impose a fee on redemptions (sometimes referred to as a liquidity fee) or temporarily suspend redemptions (sometimes referred to as imposing a redemption gate) in the event its liquidity falls below regulatory limits.
Note 6. Line of Credit
The Fund has access to a revolving credit facility with a syndicate of banks led by Citibank, N.A., HSBC Bank USA, N.A. and JPMorgan Chase Bank, N.A. whereby the Fund may borrow for the temporary funding of shareholder redemptions or for other temporary or emergency purposes. The credit facility agreement, which is a collective agreement between the Fund and certain other funds managed by the Investment Manager, severally and not jointly, that permits collective borrowings up to $1 billion. Interest is charged to each participating fund based on its borrowings at a rate equal to the higher of (i) the overnight federal funds rate plus 1.00% or (ii) the one-month LIBOR rate plus 1.00%. Each borrowing under the credit facility matures no later than 60 days after the date of borrowing. The Fund also pays a commitment fee equal to its pro rata share of the amount of the credit facility at a rate of 0.15% per annum. The commitment fee is included in other expenses in the Consolidated Statement of Operations.
The Fund had no borrowings during the year ended December 31, 2016.
Note 7. Significant Risks
Derivatives Risk
Losses involving derivative instruments may be substantial, because a relatively small price movement in the underlying security(ies), commodity, currency or index or other instrument or asset may result in a substantial loss for the Fund. In addition to the potential for increased losses, the use of derivative instruments may lead to increased volatility within the Fund. Derivatives will typically increase the Fund's exposure to principal risks to which it is otherwise exposed, and may expose the Fund to additional risks, including correlation risk, counterparty risk, hedging risk, leverage risk and liquidity risk.
Money Market Fund Investment Risk
An investment in a money market fund is not a bank deposit and is not insured or guaranteed by any bank, the FDIC or any other government agency. Certain money market funds float their net asset value while others seek to preserve the value of investments at a stable net asset value (typically, $1.00 per share). An investment in a money market fund, even an investment in a fund seeking to maintain a stable net asset value per share, is not guaranteed and it is possible for the Fund to lose money by investing in these and other types of money market funds. If the liquidity of a money market fund's portfolio deteriorates below certain levels, the money market fund may suspend redemptions (i.e., impose a redemption gate) and thereby prevent the Fund from selling its investment in the money market fund or impose a fee of up to 2% on amounts the Fund redeems from the money market fund (i.e., impose a liquidity fee). These measures may result in an investment loss or prohibit the Fund from redeeming shares when the Investment Manager would otherwise redeem shares. In addition to the fees and expenses that the Fund directly bears, the Fund indirectly bears the fees and expenses of any money market funds in which it invests, including affiliated money market funds. The Fund will also be exposed to the investment risks of the money market fund. To the extent the Fund invests in instruments such as derivatives, the Fund may hold investments, which may be significant, in money market fund shares to cover its obligations resulting from its investments in derivatives. Money market funds and the securities they invest in are subject to comprehensive regulations. The enactment of new legislation or regulations, as well as
Annual Report 2016
43
COLUMBIA VARIABLE PORTFOLIO — DIVERSIFIED ABSOLUTE RETURN FUND
NOTES TO CONSOLIDATED FINANCIAL STATEMENTS (continued)
December 31, 2016
changes in interpretation and enforcement of current laws, may affect the manner of operation, performance and/or yield of money market funds.
Shareholder Concentration Risk
At December 31, 2016, affiliated shareholders of record owned 100.0% of the outstanding shares of the Fund in one or more accounts. Subscription and redemption activity by concentrated accounts may have a significant effect on the operations of the Fund. In the case of a large redemption, the Fund may be forced to sell investments at inopportune times, including its liquid or more liquid positions, resulting in Fund losses and the Fund holding a higher percentage of less liquid or illiquid securities. Large redemptions could result in decreased economies of scale and increased operating expenses for non-redeeming Fund shareholders.
Short Selling Risk
Leverage occurs when the Fund increases its assets available for investment using borrowings, short sales, derivatives, or similar instruments or techniques. Because short sales involve borrowing securities and then selling them, the Fund's short sales effectively leverage the Fund's assets. The Fund's assets that are used as collateral to secure the Fund's obligations to return the securities sold short may decrease in value while the short positions are outstanding, which may force the Fund to use its other assets to increase the collateral. Leverage can create an interest expense that may lower the Fund's overall returns. Leverage presents the opportunity for increased net income and capital gains, but may also exaggerate the Fund's volatility and risk of loss. There can be no guarantee that a leveraging strategy will be successful.
Note 8. Subsequent Events
Management has evaluated the events and transactions that have occurred through the date the financial statements were issued and noted no items requiring adjustment of the financial statements or additional disclosure.
Note 9. Information Regarding Pending and Settled Legal Proceedings
Ameriprise Financial and certain of its affiliates have historically been involved in a number of legal, arbitration and regulatory proceedings, including routine litigation, class actions, and governmental actions, concerning matters arising in connection with the conduct of their business activities. Ameriprise Financial believes that
the Funds are not currently the subject of, and that neither Ameriprise Financial nor any of its affiliates are the subject of, any pending legal, arbitration or regulatory proceedings that are likely to have a material adverse effect on the Funds or the ability of Ameriprise Financial or its affiliates to perform under their contracts with the Funds. Ameriprise Financial is required to make quarterly (10-Q), annual (10-K) and, as necessary, 8-K filings with the Securities and Exchange Commission (SEC) on legal and regulatory matters that relate to Ameriprise Financial and its affiliates. Copies of these filings may be obtained by accessing the SEC website at www.sec.gov.
There can be no assurance that these matters, or the adverse publicity associated with them, will not result in increased fund redemptions, reduced sale of fund shares or other adverse consequences to the Funds. Further, although we believe proceedings are not likely to have a material adverse effect on the Funds or the ability of Ameriprise Financial or its affiliates to perform under their contracts with the Funds, these proceedings are subject to uncertainties and, as such, we are unable to estimate the possible loss or range of loss that may result. An adverse outcome in one or more of these proceedings could result in adverse judgments, settlements, fines, penalties or other relief that could have a material adverse effect on the consolidated financial condition or results of operations of Ameriprise Financial.
Annual Report 2016
44
COLUMBIA VARIABLE PORTFOLIO — DIVERSIFIED ABSOLUTE RETURN FUND
REPORT OF INDEPENDENT REGISTERED PUBLIC ACCOUNTING FIRM
To the Trustees of Columbia Funds Variable Insurance Trust and the Shareholders of
Columbia Variable Portfolio — Diversified Absolute Return Fund
In our opinion, the accompanying consolidated statement of assets and liabilities, including the consolidated portfolio of investments, and the related consolidated statements of operations and of changes in net assets and the consolidated financial highlights present fairly, in all material respects, the financial position of Columbia Variable Portfolio — Diversified Absolute Return Fund (the "Fund," a series of Columbia Funds Variable Insurance Trust) as of December 31, 2016, the results of its operations for the year then ended, the changes in its net assets for each of the two years in the period then ended and the financial highlights for each of the four years in the period then ended and for the period April 30, 2012 (commencement of operations) through December 31, 2012, in conformity with accounting principles generally accepted in the United States of America. These financial statements and financial highlights (hereafter referred to as "financial statements") are the responsibility of the Fund's management. Our responsibility is to express an opinion on these financial statements based on our audits. We conducted our audits of these financial statements in accordance with the standards of the Public Company Accounting Oversight Board (United States). Those standards require that we plan and perform the audit to obtain reasonable assurance about whether the financial statements are free of material misstatement. An audit includes examining, on a test basis, evidence supporting the amounts and disclosures in the financial statements, assessing the accounting principles used and significant estimates made by management, and evaluating the overall financial statement presentation. We believe that our audits, which included confirmation of securities as of December 31, 2016 by correspondence with the custodian, brokers and transfer agent, and the application of alternative auditing procedures where such confirmations had not been received, provide a reasonable basis for our opinion.
PricewaterhouseCoopers LLP
Minneapolis, MN
February 17, 2017
Annual Report 2016
45
COLUMBIA VARIABLE PORTFOLIO — DIVERSIFIED ABSOLUTE RETURN FUND
TRUSTEES AND OFFICERS
Shareholders elect the Board that oversees the Fund's operations. The Board appoints officers who are responsible for day-to-day business decisions based on policies set by the Board. The following table provides basic biographical information about the Fund's Trustees, including their principal occupations during the past five years, although specific titles for individuals may have varied over the period. The year set forth beneath Length of Service in the table below is the year in which the Trustee was first appointed or elected as Trustee to any Fund currently in the Columbia Funds Complex or a predecessor thereof. Under current Board policy, members serve terms of indefinite duration.
Independent Trustees
| Name, Address, Year of Birth | Position Held With the Trust and Length of Service | Principal Occupation(s) During the Past Five Years and Other Relevant Professional Experience | Number of Funds in the Columbia Funds Complex Overseen | Other Directorships Held by Trustee During the Past Five Years | |||||||||||||||
| Janet Langford Carrig c/o Columbia Management Investment Advisers, LLC, 225 Franklin Street Mail Drop BX32 05228, Boston, MA 02110 1957 | Trustee 1996 | Senior Vice President, General Counsel and Corporate Secretary, ConocoPhillips (independent energy company) since September 2007 | 59 | None | |||||||||||||||
| Douglas A. Hacker c/o Columbia Management Investment Advisers, LLC, 225 Franklin Street Mail Drop BX32 05228, Boston, MA 02110 1955 | Trustee and Chairman of the Board 1996 | Independent business executive since May 2006; Executive Vice President — Strategy of United Airlines from December 2002 to May 2006; President of UAL Loyalty Services (airline marketing company) from September 2001 to December 2002; Executive Vice President and Chief Financial Officer of United Airlines from July 1999 to September 2001 | 59 | Spartan Nash Company (food distributor); Nash Finch Company (food distributor) from 2005 to 2013; Aircastle Limited (aircraft leasing); SeaCube Container Leasing Ltd. (container leasing) from 2010 to 2013; and Travelport Worldwide Limited (travel information technology) | |||||||||||||||
| Nancy T. Lukitsh c/o Columbia Management Investment Advisers, LLC, 225 Franklin Street Mail Drop BX32 05228, Boston, MA 02110 1956 | Trustee 2011 | Senior Vice President, Partner and Director of Marketing, Wellington Management Company, LLP (investment adviser) from 1997 to 2010; Chair, Wellington Management Portfolios (commingled non-U.S. investment pools) from 2007 to 2010; Director, Wellington Trust Company, NA and other Wellington affiliates from 1997 to 2010 | 59 | None | |||||||||||||||
Annual Report 2016
46
COLUMBIA VARIABLE PORTFOLIO — DIVERSIFIED ABSOLUTE RETURN FUND
TRUSTEES AND OFFICERS (continued)
Independent Trustees (continued)
| Name, Address, Year of Birth | Position Held With the Trust and Length of Service | Principal Occupation(s) During the Past Five Years and Other Relevant Professional Experience | Number of Funds in the Columbia Funds Complex Overseen | Other Directorships Held by Trustee During the Past Five Years | |||||||||||||||
| David M. Moffett c/o Columbia Management Investment Advisers, LLC, 225 Franklin Street Mail Drop BX32 05228, Boston, MA 02110 1952 | Trustee 2011 | Retired. Consultant to Bridgewater and Associates | 59 | Director, CSX Corporation; Genworth Financial, Inc. (financial and insurance products and services); Paypal Holdings Inc. (payment and data processing services); Trustee University of Oklahoma Foundation; former Director eBay Inc. (online trading community), 2007-2015; and former Director, CIT Bank, CIT Group Inc. (commercial and consumer finance), 2010-2016 | |||||||||||||||
| Charles R. Nelson c/o Columbia Management Investment Advisers, LLC, 225 Franklin Street Mail Drop BX32 05228, Boston, MA 02110 1942 | Trustee 1981 | Retired. Professor Emeritus, University of Washington since 2011; Professor of Economics, University of Washington from 1976 to 2011; Ford and Louisa Van Voorhis Professor of Political Economy, University of Washington from 1993 to 2011; Adjunct Professor of Statistics, University of Washington from 1980 to 2011; Associate Editor, Journal of Money, Credit and Banking from September 1993 to 2008; consultant on econometric and statistical matters | 59 | None | |||||||||||||||
| John J. Neuhauser c/o Columbia Management Investment Advisers, LLC, 225 Franklin Street Mail Drop BX32 05228, Boston, MA 02110 1943 | Trustee 1984 | President, Saint Michael's College since August 2007; Director or Trustee of several non-profit organizations, including University of Vermont Medical Center; Academic Vice President and Dean of Faculties, Boston College from August 1999 to October 2005; University Professor, Boston College from November 2005 to August 2007 | 59 | Liberty All-Star Equity Fund and Liberty All-Star Growth Fund (closed-end funds) | |||||||||||||||
| Patrick J. Simpson c/o Columbia Management Investment Advisers, LLC, 225 Franklin Street Mail Drop BX32 05228, Boston, MA 02110 1944 | Trustee 2000 | Of Counsel, Perkins Coie LLP (law firm) since 2015; Partner, Perkins Coie LLP from 1988 to 2014 | 59 | None | |||||||||||||||
Annual Report 2016
47
COLUMBIA VARIABLE PORTFOLIO — DIVERSIFIED ABSOLUTE RETURN FUND
TRUSTEES AND OFFICERS (continued)
Independent Trustees (continued)
| Name, Address, Year of Birth | Position Held With the Trust and Length of Service | Principal Occupation(s) During the Past Five Years and Other Relevant Professional Experience | Number of Funds in the Columbia Funds Complex Overseen | Other Directorships Held by Trustee During the Past Five Years | |||||||||||||||
| Anne-Lee Verville c/o Columbia Management Investment Advisers, LLC, 225 Franklin Street Mail Drop BX32 05228, Boston, MA 02110 1945 | Trustee 1998 | Retired. General Manager, Global Education Industry from 1994 to 1997, President — Application Systems Division from 1991 to 1994, Chief Financial Officer — US Marketing & Services from 1988 to 1991, and Chief Information Officer from 1987 to 1988, IBM Corporation (computer and technology) | 59 | Enesco Group, Inc. (producer of giftware and home and garden decor products) from 2001 to 2006 | |||||||||||||||
Consultants to the Independent Trustees*
| Name, Address, Year of Birth | Position Held With the Trust and Length of Service | Principal Occupation(s) During the Past Five Years and Other Relevant Professional Experience | Number of Funds in the Columbia Funds Complex Overseen | Other Directorships Held by Trustee During the Past Five Years | |||||||||||||||
| J. Kevin Connaughton c/o Columbia Management Investment Advisers, LLC, 225 Franklin Street Mail Drop BX32 05228, Boston, MA 02110 1964 | Independent Trustee Consultant 2016 | Independent Trustee Consultant, Columbia Funds since March 2016; Managing Director and General Manager of Mutual Fund Products, Columbia Management Investment Advisers, LLC from May 2010 to February 2015; President, Columbia Funds from 2009 to 2015; and senior officer of Columbia Funds and affiliated funds from 2003 to 2015 | 59 | Board of Governors, Gateway Healthcare since January 2016; Trustee, New Century Portfolios since March 2015; and Director, The Autism Project since March 2015 | |||||||||||||||
| Natalie A. Trunow c/o Columbia Management Investment Advisers, LLC, 225 Franklin Street Mail Drop BX32 05228, Boston, MA 02110 1967 | Independent Trustee Consultant 2016 | Independent Trustee Consultant, Columbia Funds since September 2016; Senior Vice President and Chief Executive Officer, Millennial Partners (investment consulting services to institutions) since January 2016; Director of Investments, Casey Family Programs from April 2016 to September 2016; Chief Investment Officer, Calvert Investments from August 2008 to January 2016; Section Head and Portfolio Manager, General Motors Asset Management from June 1997 to August 2008 | 59 | Healthcare Services for Children with Special Needs | |||||||||||||||
* J. Kevin Connaughton was appointed consultant to the Independent Trustees effective March 1, 2016. Natalie A. Trunow was appointed consultant to the Independent Trustees effective September 1, 2016. Shareholders of the Funds are expected to be asked to elect each of Mr. Connaughton and Ms. Trunow as a Trustee at a future shareholder meeting.
Annual Report 2016
48
COLUMBIA VARIABLE PORTFOLIO — DIVERSIFIED ABSOLUTE RETURN FUND
TRUSTEES AND OFFICERS (continued)
Interested Trustee Affiliated with Investment Manager*
| Name, Address, Year of Birth | Position Held With the Trust and Length of Service | Principal Occupation(s) During the Past Five Years and Other Relevant Professional Experience | Number of Funds in the Columbia Funds Complex Overseen | Other Directorships Held by Trustee During the Past Five Years | |||||||||||||||
| William F. Truscott c/o Columbia Management Investment Advisers, LLC, 225 Franklin Street Boston, MA 02110 1960 | Trustee 2012 | Chairman of the Board and President, Columbia Management Investment Advisers, LLC since May 2010 and February 2012, respectively; Chief Executive Officer, Global Asset Management, Ameriprise Financial, Inc. since September 2012 (previously Chief Executive Officer, U.S. Asset Management & President, Annuities, May 2010- September 2012); Director and Chief Executive Officer, Columbia Management Investment Distributors, Inc. since May 2010 and February 2012, respectively; Chairman of the Board and Chief Executive Officer, RiverSource Distributors, Inc. since 2006; Director, Threadneedle Asset Management Holdings, SARL since 2014; President and Chief Executive Officer, Ameriprise Certificate Company, 2006-August 2012. | 185 | Trustee to other Columbia Funds since 2001; Chairman of the Board, Columbia Management Investment Advisers, LLC since May 2010; Director, Columbia Management Investment Distributors, Inc. since May 2010; Former Director, Ameriprise Certificate Company, 2006-January 2013 | |||||||||||||||
* Interested person (as defined under the 1940 Act) by reason of being an officer, director, security holder and/or employee of the Investment Manager or Ameriprise Financial.
The Statement of Additional Information has additional information about the Fund's Board members and is available, without charge, upon request by calling 800.345.6611 or contacting your financial intermediary.
Annual Report 2016
49
COLUMBIA VARIABLE PORTFOLIO — DIVERSIFIED ABSOLUTE RETURN FUND
TRUSTEES AND OFFICERS (continued)
The Board has appointed officers who are responsible for day-to-day business decisions based on policies it has established. The officers serve at the pleasure of the Board. The following table provides basic information about the Officers of the Fund, including principal occupations during the past five years, although their specific titles may have varied over the period. In addition to Mr. Truscott, who is Senior Vice President, the Fund's other officers are:
Fund Officers
| Name, Address and Year of Birth | Position and Year First Appointed to Position for any Fund in the Columbia Funds Complex or a Predecessor Thereof | Principal Occupation(s) During Past Five Years | |||||||||
| Christopher O. Petersen 5228 Ameriprise Financial Center Minneapolis, MN 55474 Born 1970 | President and Principal Executive Officer (2015) | Vice President and Lead Chief Counsel, Ameriprise Financial, Inc. since January 2015 (previously, Vice President and Chief Counsel January 2010-December 2014); officer of Columbia Funds and affiliated funds since 2007. | |||||||||
| Michael G. Clarke 225 Franklin Street Boston, MA 02110 Born 1969 | Treasurer (2011), Chief Financial Officer (2009) and Chief Accounting Officer (2015) | Vice President — Mutual Fund Administration, Columbia Management Investment Advisers, LLC, since May 2010; senior officer of Columbia Funds and affiliated funds since 2002. | |||||||||
| Paul B. Goucher 100 Park Avenue New York, NY 10017 Born 1968 | Senior Vice President (2011), Chief Legal Officer (2015) and Assistant Secretary (2008) | Senior Vice President and Assistant General Counsel, Ameriprise Financial, Inc. since January 2017 (previously Vice President and Lead Chief Counsel, November 2008-January 2017 and January 2013-2017, respectively, and Chief Counsel, January 2010-January 2013); Vice President, Chief Legal Officer and Assistant Secretary, Columbia Management Investment Advisers, LLC since May 2010. | |||||||||
| Thomas P. McGuire 225 Franklin Street Boston, MA 02110 Born 1972 | Senior Vice President and Chief Compliance Officer (2012) | Vice President — Asset Management Compliance, Ameriprise Financial, Inc., since May 2010; Chief Compliance Officer, Ameriprise Certificate Company since September 2010. | |||||||||
| Colin Moore 225 Franklin Street Boston, MA 02110 Born 1958 | Senior Vice President (2010) | Executive Vice President and Global Chief Investment Officer, Ameriprise Financial, Inc., since July 2013; Executive Vice President and Global Chief Investment Officer, Columbia Management Investment Advisers, LLC since July 2013 (previously Director and Global Chief Investment Officer, 2010-2013). | |||||||||
| Michael E. DeFao 225 Franklin Street Boston, MA 02110 Born 1968 | Vice President (2011) and Assistant Secretary (2010) | Vice President and Chief Counsel, Ameriprise Financial, Inc. since May 2010. | |||||||||
| Amy Johnson 5228 Ameriprise Financial Center Minneapolis, MN 55474 Born 1965 | Vice President (2006) | Managing Director and Global Head of Operations, Columbia Management Investment Advisers, LLC since April 2016 (previously Managing Director and Chief Operating Officer, 2010-2016). | |||||||||
| Lyn Kephart-Strong 5228 Ameriprise Financial Center Minneapolis, MN 55474 Born 1960 | Vice President (2015) | President, Columbia Management Investment Services Corp. since October 2014; Vice President & Resolution Officer, Ameriprise Trust Company since August 2009. | |||||||||
| Ryan C. Larrenaga 225 Franklin Street Boston, MA 02110 Born 1970 | Vice President and Secretary (2015) | Vice President and Group Counsel, Ameriprise Financial, Inc. since August 2011; officer of Columbia Funds and affiliated funds since 2005. | |||||||||
Annual Report 2016
50
This page intentionally left blank.
Annual Report 2016
51
This page intentionally left blank.
Annual Report 2016
52
COLUMBIA VARIABLE PORTFOLIO — DIVERSIFIED ABSOLUTE RETURN FUND
IMPORTANT INFORMATION ABOUT THIS REPORT
The policy of the Board is to vote the proxies of the companies in which each fund holds investments consistent with the procedures as stated in the Statement of Additional Information (SAI). You may obtain a copy of the SAI without charge by calling 800.345.6611; contacting your financial intermediary or searching the website of the Securities and Exchange Commission (SEC) at sec.gov. Information regarding how each fund voted proxies relating to portfolio securities is filed with the SEC by August 31st for the most recent 12-month period ending June 30th of that year, and is available without charge by visiting investor.columbiathreadneedleus.com, or searching the website of the SEC at sec.gov.
Each fund files a complete schedule of portfolio holdings with the SEC for the first and third quarters of each fiscal year on Form N-Q. Each fund's Form N-Q is available on the SEC's website at sec.gov and may be reviewed and copied at the SEC's Public Reference Room in Washington, D.C. Information on the operation of the Public Reference Room may be obtained by calling 800.SEC.0330. Each fund's complete schedule of portfolio holdings, as filed on Form N-Q, can also be obtained without charge, upon request, by calling 800.345.6611.
You may obtain the current net asset value (NAV) of Fund shares at no cost by calling 800.345.6611 or by sending an e-mail to serviceinquiries@columbiathreadneedle.com.
Annual Report 2016
53
Columbia Variable Portfolio — Diversified Absolute Return Fund
P.O. Box 8081
Boston, MA 02266-8081

Please read and consider the investment objectives, risks, charges and expenses for any fund carefully before investing. For fund and other investment product prospectuses, which contain this and other important information, contact your financial advisor or insurance representative. Please read the prospectus carefully before you invest. The Fund is distributed by Columbia Management Investment Distributors, Inc., member FINRA, and managed by Columbia Management Investment Advisers, LLC.
Columbia Threadneedle Investments (Columbia Threadneedle) is the global brand name of the Columbia and Threadneedle group of companies.
All rights reserved. Columbia Management Investment Distributors, Inc., 225 Franklin Street, Boston, MA 02110-2804
© 2017 Columbia Management Investment Advisers, LLC.
C-1473 AN (2/17)

ANNUAL REPORT
December 31, 2016

COLUMBIA VARIABLE PORTFOLIO — U.S. FLEXIBLE CONSERVATIVE GROWTH FUND
Please remember that you may not buy (nor will you own) shares of the Fund directly. The Fund is available through variable annuity contracts or life insurance policies offered by the separate accounts of affiliated insurance companies and other qualified institutional investors authorized by Columbia Management Investment Distributors, Inc. Please contact your financial advisor or insurance representative for more information.

COLUMBIA VARIABLE PORTFOLIO — U.S. FLEXIBLE CONSERVATIVE GROWTH FUND
TABLE OF CONTENTS
Portfolio Overview | 2 | ||||||
Understanding Your Fund's Expenses | 3 | ||||||
Portfolio of Investments | 4 | ||||||
Statement of Assets and Liabilities | 9 | ||||||
Statement of Operations | 10 | ||||||
Statement of Changes in Net Assets | 11 | ||||||
Financial Highlights | 13 | ||||||
Notes to Financial Statements | 14 | ||||||
Report of Independent Registered Public Accounting Firm | 22 | ||||||
Trustees and Officers | 23 | ||||||
| Board Consideration and Approval of Management Agreement | 28 | ||||||
Important Information About This Report | 33 | ||||||
The views expressed in this report reflect the current views of the respective parties. These views are not guarantees of future performance and involve certain risks, uncertainties and assumptions that are difficult to predict, so actual outcomes and results may differ significantly from the views expressed. These views are subject to change at any time based upon economic, market or other conditions and the respective parties disclaim any responsibility to update such views. These views may not be relied on as investment advice and, because investment decisions for a Columbia fund are based on numerous factors, may not be relied on as an indication of trading intent on behalf of any particular Columbia fund. References to specific securities should not be construed as a recommendation or investment advice.
Annual Report 2016
COLUMBIA VARIABLE PORTFOLIO — U.S. FLEXIBLE CONSERVATIVE GROWTH FUND
PORTFOLIO OVERVIEW
(Unaudited)
Portfolio Management
Jeffrey Knight, CFA
Anwiti Bahuguna, Ph.D.
David Weiss, CFA
Brian Virginia
Effective January 27, 2017, Kent Peterson no longer serves as a portfolio manager of the Fund.
| Portfolio Allocation (%) (at December 31, 2016) | |||||||
Allocations to Underlying Funds | |||||||
Underlying Funds: Equity | 31.0 | ||||||
U.S. Large Cap | 31.0 | ||||||
Underlying Funds: Fixed Income | 39.1 | ||||||
High Yield | 2.3 | ||||||
Investment Grade | 36.8 | ||||||
Exchange-Traded Funds | 6.4 | ||||||
Money Market Fund Shares Held to Cover Open Derivatives Instruments(a) | 20.7 | ||||||
Residential Mortgage-Backed Securities — Agency | 2.8 | ||||||
Total | 100.0 | ||||||
Percentages indicated are based upon total investments. The Fund's portfolio composition is subject to change.
(a) Includes investments in an affiliated money market fund (amounting to $3.8 million) which have been segregated to cover obligations relating to the Fund's investment in derivatives as part of its tactical allocation strategy. For a description of the Fund's investments in derivatives, see Investments in Derivatives following the Portfolio of Investments, and Note 2 to the financial statements.
Annual Report 2016
2
COLUMBIA VARIABLE PORTFOLIO — U.S. FLEXIBLE CONSERVATIVE GROWTH FUND
UNDERSTANDING YOUR FUND'S EXPENSES
(Unaudited)
As an investor, you incur ongoing costs, which generally include management fees, distribution and/or service fees, and other fund expenses. The following information is intended to help you understand your ongoing costs (in dollars) of investing in the Fund and to help you compare these costs with the ongoing costs of investing in other mutual funds.
The information below does not reflect fees and expenses imposed under your variable annuity contract and/or variable life insurance policy (collectively, Contracts) or qualified pension and retirement plan (Qualified Plan), if any. The total fees and expenses you bear may therefore be higher than those shown below.
Analyzing Your Fund's Expenses
To illustrate these ongoing costs, we have provided examples and calculated the expenses paid by investors in Class 2 shares of the Fund during the period. The actual and hypothetical information in the table is based on an initial investment of $1,000 at the beginning of the period indicated and held for the entire period. Expense information is calculated two ways and each method provides you with different information. The amount listed in the "Actual" column is calculated using the Fund's actual operating expenses and total return for the period. You may use the Actual information, together with the amount invested, to estimate the expenses that you paid over the period. Simply divide your account value by $1,000 (for example, an $8,600 account value divided by $1,000 = 8.6), then multiply the results by the expenses paid during the period under the "Actual" column. The amount listed in the "Hypothetical" column assumes a 5% annual rate of return before expenses (which is not the Fund's actual return) and then applies the Fund's actual expense ratio for the period to the hypothetical return. You should not use the hypothetical account values and expenses to estimate either your actual account balance at the end of the period or the expenses you paid during the period. See "Compare With Other Funds" below for details on how to use the hypothetical data.
In addition to the ongoing expenses which the Fund bears directly, the Fund's shareholders indirectly bear the Fund's allocable share of the costs and expenses of each underlying fund in which the Fund invests. You can estimate the effective expenses paid during the period, which includes the indirect fees associated with investing in the underlying funds, by using the amounts listed in the "Effective Expenses Paid During the Period" column.
Compare With Other Funds
Since all mutual funds are required to include the same hypothetical calculations about expenses in shareholder reports, you can use this information to compare the ongoing cost of investing in the Fund with other funds. To do so, compare the hypothetical example with the 5% hypothetical examples that appear in the shareholder reports of other funds. As you compare hypothetical examples of other funds, it is important to note that hypothetical examples are meant to highlight the ongoing costs of investing in a fund only and do not reflect any transaction costs, such as redemption or exchange fees, or expenses that apply to the subaccount or the Contract. Therefore, the hypothetical calculations are useful in comparing ongoing costs only, and will not help you determine the relative total costs of owning different funds. If the fees and expenses imposed under your Contract or Qualified Plan, if any, were included, your costs would be higher.
July 1, 2016 – December 31, 2016
| Account Value at the Beginning of the Period ($) | Account Value at the End of the Period ($) | Expenses Paid During the Period ($) | Fund's Annualized Expense Ratio (%) | Effective Expenses Paid During the Period ($) | Fund's Effective Annualized Expense Ratio (%) | ||||||||||||||||||||||||||||||||||||||
Actual | Hypothetical | Actual | Hypothetical | Actual | Hypothetical | Actual | Actual | Hypothetical | Actual | ||||||||||||||||||||||||||||||||||
Class 2 | 1,000.00 | 1,000.00 | 1,007.00 | (a) | 1,021.70 | 1.05 | (a) | 3.34 | 0.66 | (a) | 1.75 | (a) | 5.56 | 1.10 | (a) | ||||||||||||||||||||||||||||
(a) Based on operations from November 2, 2016 (commencement of operations) through the stated period end.
Expenses paid during the period are equal to the annualized expense ratio for each class as indicated above, multiplied by the average account value over the period and then multiplied by the number of days in the Fund's most recent fiscal half year and divided by 366.
Effective expenses paid during the period and the Fund's effective annualized expense ratio include expenses borne directly to the class plus the Fund's indirect pro rata portion of the ongoing expenses charged by the underlying funds using the expense ratio of each class of the underlying funds as of the underlying fund's most recent shareholder report.
Had Columbia Management Investment Advisers, LLC and/or certain of its affiliates not waived/reimbursed certain fees and expenses, account value at the end of the period would have been reduced.
Annual Report 2016
3
COLUMBIA VARIABLE PORTFOLIO — U.S. FLEXIBLE CONSERVATIVE GROWTH FUND
PORTFOLIO OF INVESTMENTS
December 31, 2016
(Percentages represent value of investments compared to net assets)
Equity Funds 31.4%
Shares | Value ($) | ||||||||||
U.S. LARGE CAP 31.4% | |||||||||||
| Columbia Variable Portfolio — Large Cap Index Fund, Class 1 Shares(a)(b) | 74,739 | 1,275,044 | |||||||||
| Columbia Variable Portfolio — Disciplined Core Fund, Class 1 Shares(a)(b) | 16,317 | 638,170 | |||||||||
| Columbia Variable Portfolio — Select Large-Cap Value Fund, Class 1 Shares(a)(b) | 31,039 | 638,171 | |||||||||
| Variable Portfolio — Loomis Sayles Growth Fund, Class 1 Shares(a)(b) | 29,074 | 638,170 | |||||||||
| Variable Portfolio — MFS® Blended Research® Core Equity Fund, Class 1 Shares(a)(b) | 74,850 | 1,272,450 | |||||||||
| Variable Portfolio — Morgan Stanley Advantage Fund, Class 1 Shares(a)(b) | 31,130 | 638,170 | |||||||||
| Variable Portfolio — T. Rowe Price Large Cap Value Fund, Class 1 Shares(a)(b) | 32,527 | 638,171 | |||||||||
Total | 5,738,346 | ||||||||||
| Total Equity Funds (Cost: $5,565,213) | 5,738,346 | ||||||||||
Fixed-Income Funds 39.6%
HIGH YIELD 2.3% | |||||||||||
| Columbia Variable Portfolio — Income Opportunities Fund, Class 1 Shares(b) | 55,590 | 420,259 | |||||||||
INVESTMENT GRADE 37.3% | |||||||||||
| Columbia Variable Portfolio — Intermediate Bond Fund, Class 1 Shares(b) | 138,984 | 1,438,481 | |||||||||
| Columbia Variable Portfolio — Limited Duration Credit Fund, Class 1 Shares(b) | 44,652 | 422,853 | |||||||||
| Columbia Variable Portfolio — Long Government/Credit Bond Fund, Class 1 Shares(b) | 34,781 | 345,028 | |||||||||
| Columbia Variable Portfolio — U.S. Government Mortgage Fund, Class 1 Shares(b) | 40,974 | 422,854 | |||||||||
| Variable Portfolio — American Century Diversified Bond Fund, Class 1 Shares(b) | 127,341 | 1,394,379 | |||||||||
| Variable Portfolio — J.P. Morgan Core Bond Fund, Class 1 Shares(b) | 115,324 | 1,247,807 | |||||||||
| Variable Portfolio — TCW Core Plus Bond Fund, Class 1 Shares(b) | 128,596 | 1,347,684 | |||||||||
Fixed-Income Funds (continued)
Shares | Value ($) | ||||||||||
| Variable Portfolio — Wells Fargo Short Duration Government Fund, Class 1 Shares(b) | 19,173 | 193,267 | |||||||||
Total | 6,812,353 | ||||||||||
| Total Fixed-Income Funds (Cost: $7,292,212) | 7,232,612 | ||||||||||
Exchange-Traded Funds 6.5%
SPDR S&P 500 ETF Trust | 900 | 201,177 | |||||||||
Vanguard Total Bond Market ETF | 5,660 | 457,271 | |||||||||
iShares Core U.S. Aggregate Bond ETF | 1,410 | 152,365 | |||||||||
| iShares iBoxx $ Investment Grade Corporate Bond ETF | 3,277 | 383,999 | |||||||||
| Total Exchange-Traded Funds (Cost: $1,218,206) | 1,194,812 | ||||||||||
Residential Mortgage-Backed
Securities — Agency 2.9%
Issuer | Coupon Rate | Principal Amount ($) | Value ($) | ||||||||||||
| Federal National Mortgage Association(c) 01/18/47 | 4.000 | % | 500,000 | 525,654 | |||||||||||
| Total Residential Mortgage-Backed Securities — Agency (Cost: $525,527) | 525,654 | ||||||||||||||
Money Market Funds 21.0%
Shares | Value ($) | ||||||||||
| Columbia Short-Term Cash Fund, 0.594%(b)(d) | 3,844,399 | 3,844,399 | |||||||||
| Total Money Market Funds (Cost: $3,844,421) | 3,844,399 | ||||||||||
| Total Investments (Cost: $18,445,579) | 18,535,823 | ||||||||||
Other Assets & Liabilities, Net | (263,332 | ) | |||||||||
Net Assets | 18,272,491 | ||||||||||
The accompanying Notes to Financial Statements are an integral part of this statement.
Annual Report 2016
4
COLUMBIA VARIABLE PORTFOLIO — U.S. FLEXIBLE CONSERVATIVE GROWTH FUND
PORTFOLIO OF INVESTMENTS (continued)
December 31, 2016
At December 31, 2016, cash totaling $113,350 was pledged as collateral.
Investments in Derivatives
Futures Contracts Outstanding at December 31, 2016
Long Futures Contracts Outstanding
Contract Description | Number of Contracts | Trading Currency | Notional Market Value ($) | Expiration Date | Unrealized Appreciation ($) | Unrealized (Depreciation) ($) | |||||||||||||||||||||
S&P 500 E-mini | 23 | USD | 2,571,630 | 03/2017 | 15,011 | — | |||||||||||||||||||||
U.S. Long Bond | 1 | USD | 150,656 | 03/2017 | 2,061 | — | |||||||||||||||||||||
U.S. Treasury 10-Year Note | 1 | USD | 124,281 | 03/2017 | — | (830 | ) | ||||||||||||||||||||
U.S. Treasury 2-Year Note | 2 | USD | 433,375 | 03/2017 | — | (526 | ) | ||||||||||||||||||||
U.S. Treasury 5-Year Note | 2 | USD | 235,328 | 03/2017 | — | (1,129 | ) | ||||||||||||||||||||
Total | 3,515,270 | 17,072 | (2,485 | ) | |||||||||||||||||||||||
Notes to Portfolio of Investments
(a) Non-income producing investment.
(b) As defined in the Investment Company Act of 1940, an affiliated company is one in which the Fund owns 5% or more of the company's outstanding voting securities, or a company which is under common ownership or control with the Fund. Holdings and transactions in these affiliated companies during the year ended December 31, 2016 are as follows:
Issuer | Beginning Cost ($) | Purchase Cost ($) | Proceeds From Sales ($) | Realized Gain (Loss) ($) | Ending Cost ($) | Dividends — Affiliated Issuers ($) | Value ($) | ||||||||||||||||||||||||
| Columbia Short-Term Cash Fund | 10,000,000 | 2,276,779 | (8,432,350 | ) | (8 | ) | 3,844,421 | 2,290 | 3,844,399 | ||||||||||||||||||||||
| Columbia Variable Portfolio — Disciplined Core Fund, Class 1 Shares | — | 617,020 | — | — | 617,020 | — | 638,170 | ||||||||||||||||||||||||
| Columbia Variable Portfolio — Income Opportunities Fund, Class 1 Shares | — | 415,785 | — | — | 415,785 | — | 420,259 | ||||||||||||||||||||||||
| Columbia Variable Portfolio — Intermediate Bond Fund, Class 1 Shares | — | 1,451,315 | — | — | 1,451,315 | — | 1,438,481 | ||||||||||||||||||||||||
| Columbia Variable Portfolio — Large Cap Index Fund, Class 1 Shares | — | 1,224,611 | — | — | 1,224,611 | — | 1,275,044 | ||||||||||||||||||||||||
| Columbia Variable Portfolio — Limited Duration Credit Fund, Class 1 Shares | — | 423,104 | — | — | 423,104 | — | 422,853 | ||||||||||||||||||||||||
| Columbia Variable Portfolio — Long Government/Credit Bond Fund, Class 1 Shares | — | 353,274 | — | — | 353,274 | — | 345,028 | ||||||||||||||||||||||||
The accompanying Notes to Financial Statements are an integral part of this statement.
Annual Report 2016
5
COLUMBIA VARIABLE PORTFOLIO — U.S. FLEXIBLE CONSERVATIVE GROWTH FUND
PORTFOLIO OF INVESTMENTS (continued)
December 31, 2016
Notes to Portfolio of Investments (continued)
Issuer | Beginning Cost ($) | Purchase Cost ($) | Proceeds From Sales ($) | Realized Gain (Loss) ($) | Ending Cost ($) | Dividends — Affiliated Issuers ($) | Value ($) | ||||||||||||||||||||||||
| Columbia Variable Portfolio — Select Large-Cap Value Fund, Class 1 Shares | — | 595,519 | — | — | 595,519 | — | 638,171 | ||||||||||||||||||||||||
| Columbia Variable Portfolio — U.S. Government Mortgage Fund, Class 1 Shares | — | 426,348 | — | — | 426,348 | — | 422,854 | ||||||||||||||||||||||||
| Variable Portfolio — American Century Diversified Bond Fund, Class 1 Shares | — | 1,406,674 | — | — | 1,406,674 | — | 1,394,379 | ||||||||||||||||||||||||
| Variable Portfolio — J.P. Morgan Core Bond Fund, Class 1 Shares | — | 1,260,898 | — | — | 1,260,898 | — | 1,247,807 | ||||||||||||||||||||||||
| Variable Portfolio — Loomis Sayles Growth Fund, Class 1 Shares | — | 640,041 | — | — | 640,041 | — | 638,170 | ||||||||||||||||||||||||
| Variable Portfolio — MFS® Blended Research® Core Equity Fund, Class 1 Shares | — | 1,236,277 | — | — | 1,236,277 | — | 1,272,450 | ||||||||||||||||||||||||
| Variable Portfolio — Morgan Stanley Advantage Fund, Class 1 Shares | — | 642,351 | — | — | 642,351 | — | 638,170 | ||||||||||||||||||||||||
| Variable Portfolio — T. Rowe Price Large Cap Value Fund, Class 1 Shares | — | 609,394 | — | — | 609,394 | — | 638,171 | ||||||||||||||||||||||||
| Variable Portfolio — TCW Core Plus Bond Fund, Class 1 Shares | — | 1,360,828 | — | — | 1,360,828 | — | 1,347,684 | ||||||||||||||||||||||||
| Variable Portfolio — Wells Fargo Short Duration Government Fund, Class 1 Shares | — | 193,986 | — | — | 193,986 | — | 193,267 | ||||||||||||||||||||||||
Total | 10,000,000 | 15,134,204 | (8,432,350 | ) | (8 | ) | 16,701,846 | 2,290 | 16,815,357 | ||||||||||||||||||||||
(c) Security, or a portion thereof, has been purchased on a when-issued or delayed delivery basis.
(d) The rate shown is the seven-day current annualized yield at December 31, 2016.
Currency Legend
USD US Dollar
Fair Value Measurements
The Fund categorizes its fair value measurements according to a three-level hierarchy that maximizes the use of observable inputs and minimizes the use of unobservable inputs by prioritizing that the most observable input be used when available. Observable inputs are those that market participants would use in pricing an investment based on market data obtained from sources independent of the reporting entity. Unobservable inputs are those that reflect the Fund's assumptions about the information market participants would use in pricing an
The accompanying Notes to Financial Statements are an integral part of this statement.
Annual Report 2016
6
COLUMBIA VARIABLE PORTFOLIO — U.S. FLEXIBLE CONSERVATIVE GROWTH FUND
PORTFOLIO OF INVESTMENTS (continued)
December 31, 2016
Fair Value Measurements (continued)
investment. An investment's level within the fair value hierarchy is based on the lowest level of any input that is deemed significant to the asset's or liability's fair value measurement. The input levels are not necessarily an indication of the risk or liquidity associated with investments at that level. For example, certain U.S. government securities are generally high quality and liquid, however, they are reflected as Level 2 because the inputs used to determine fair value may not always be quoted prices in an active market.
Fair value inputs are summarized in the three broad levels listed below:
> Level 1 — Valuations based on quoted prices for investments in active markets that the Fund has the ability to access at the measurement date (including NAV for open-end mutual funds). Valuation adjustments are not applied to Level 1 investments.
> Level 2 — Valuations based on other significant observable inputs (including quoted prices for similar securities, interest rates, prepayment speeds, credit risks, etc.).
> Level 3 — Valuations based on significant unobservable inputs (including the Fund's own assumptions and judgment in determining the fair value of investments).
Inputs that are used in determining fair value of an investment may include price information, credit data, volatility statistics, and other factors. These inputs can be either observable or unobservable. The availability of observable inputs can vary between investments, and is affected by various factors such as the type of investment, and the volume and level of activity for that investment or similar investments in the marketplace. The inputs will be considered by the Investment Manager, along with any other relevant factors in the calculation of an investment's fair value. The Fund uses prices and inputs that are current as of the measurement date, which may include periods of market dislocations. During these periods, the availability of prices and inputs may be reduced for many investments. This condition could cause an investment to be reclassified between the various levels within the hierarchy.
Certain investments that have been measured at fair value using the net asset value (NAV) per share (or its equivalent) are not categorized in the fair value hierarchy. The fair value amounts presented in the table are intended to reconcile the fair value hierarchy to the amounts presented in the Portfolio of Investments. The Variable Portfolios serve as investment vehicles for variable annuity contracts and variable life insurance policies. Principle investment strategies within these Variable Portfolios vary based on the Portfolios investment objective. Investments in the Variable Portfolios may be redeemed on a daily basis without restriction. The Columbia Short-Term Cash Fund seeks to provide shareholders with maximum current income consistent with liquidity and stability of principal. Columbia Short-Term Cash Fund prices its shares with a floating NAV and no longer seeks to maintain a stable NAV.
Investments falling into the Level 3 category are primarily supported by quoted prices from brokers and dealers participating in the market for those investments. However, these may be classified as Level 3 investments due to lack of market transparency and corroboration to support these quoted prices. Additionally, valuation models may be used as the pricing source for any remaining investments classified as Level 3. These models may rely on one or more significant unobservable inputs and/or significant assumptions by the Investment Manager. Inputs used in valuations may include, but are not limited to, financial statement analysis, capital account balances, discount rates and estimated cash flows, and comparable company data.
Under the direction of the Fund's Board of Trustees (the Board), the Investment Manager's Valuation Committee (the Committee) is responsible for overseeing the valuation procedures approved by the Board. The Committee consists of voting and non-voting members from various groups within the Investment Manager's organization, including operations and accounting, trading and investments, compliance, risk management and legal.
The Committee meets at least monthly to review and approve valuation matters, which may include a description of specific valuation determinations, data regarding pricing information received from approved pricing vendors and brokers and the results of Board-approved valuation control policies and procedures (the Policies). The Policies address, among other things, instances when market quotations are or are not readily available, including recommendations of third party pricing vendors and a determination of appropriate pricing methodologies; events that require specific valuation determinations and assessment of fair value techniques; securities with a potential for stale pricing, including those that are illiquid, restricted, or in default; and the effectiveness of third party pricing vendors, including periodic reviews of vendors. The Committee meets more frequently, as needed, to discuss additional valuation matters, which may include the need to review back-testing results, review time-sensitive information or approve related valuation actions. The Committee reports to the Board, with members of the Committee meeting with the Board at each of its regularly scheduled meetings to discuss valuation matters and actions during the period, similar to those described earlier.
For investments categorized as Level 3, the Committee monitors information similar to that described above, which may include: (i) data specific to the issuer or comparable issuers, (ii) general market or specific sector news and (iii) quoted prices and specific or similar security transactions. The Committee considers this data and any changes from prior periods in order to assess the reasonableness of observable and unobservable inputs, any assumptions or internal models used to value those securities and changes in fair value. This data is also used to corroborate, when available, information received from approved pricing vendors and brokers. Various factors impact the frequency of monitoring this information (which may occur as often as daily). However, the Committee may determine that changes to inputs, assumptions and models are not required as a result of the monitoring procedures performed.
The accompanying Notes to Financial Statements are an integral part of this statement.
Annual Report 2016
7
COLUMBIA VARIABLE PORTFOLIO — U.S. FLEXIBLE CONSERVATIVE GROWTH FUND
PORTFOLIO OF INVESTMENTS (continued)
December 31, 2016
Fair Value Measurements (continued)
The following table is a summary of the inputs used to value the Fund's investments at December 31, 2016:
| Level 1 Quoted Prices in Active Markets for Identical Assets ($) | Level 2 Other Significant Observable Inputs ($) | Level 3 Significant Unobservable Inputs ($) | Total ($) | ||||||||||||||||
Investments | |||||||||||||||||||
Exchange-Traded Funds | 1,194,812 | — | — | 1,194,812 | |||||||||||||||
| Residential Mortgage-Backed Securities — Agency | — | 525,654 | — | 525,654 | |||||||||||||||
Equity Funds | — | — | — | 5,738,346 | |||||||||||||||
Fixed-Income Funds | — | — | — | 7,232,612 | |||||||||||||||
Money Market Funds | — | — | — | 3,844,399 | |||||||||||||||
Total Investments | 1,194,812 | 525,654 | — | 18,535,823 | |||||||||||||||
Derivatives | |||||||||||||||||||
Assets | |||||||||||||||||||
Futures Contracts | 17,072 | — | — | 17,072 | |||||||||||||||
Liabilities | |||||||||||||||||||
Futures Contracts | (2,485 | ) | — | — | (2,485 | ) | |||||||||||||
Total | 1,209,399 | 525,654 | — | 18,550,410 | |||||||||||||||
See the Portfolio of Investments for all investment classifications not indicated in the table.
The Fund's assets assigned to the Level 2 input category are generally valued using the market approach, in which a security's value is determined through reference to prices and information from market transactions for similar or identical assets.
Derivative instruments are valued at unrealized appreciation (depreciation).
There were no transfers of financial assets between levels during the period.
The accompanying Notes to Financial Statements are an integral part of this statement.
Annual Report 2016
8
COLUMBIA VARIABLE PORTFOLIO — U.S. FLEXIBLE CONSERVATIVE GROWTH FUND
STATEMENT OF ASSETS AND LIABILITIES
December 31, 2016
Assets | |||||||
Investments, at value | |||||||
Unaffiliated issuers (identified cost $1,743,733) | $ | 1,720,466 | |||||
Affiliated issuers (identified cost $16,701,846) | 16,815,357 | ||||||
Total investments (identified cost $18,445,579) | 18,535,823 | ||||||
Margin deposits | 113,350 | ||||||
Receivable for: | |||||||
Capital shares sold | 632,821 | ||||||
Dividends | 1,749 | ||||||
Interest | 944 | ||||||
Variation margin | 1,654 | ||||||
Trustees' deferred compensation plan | 74 | ||||||
Total assets | 19,286,415 | ||||||
Liabilities | |||||||
Payable for: | |||||||
Investments purchased | 442,909 | ||||||
Investments purchased on a delayed delivery basis | 526,472 | ||||||
Capital shares purchased | 94 | ||||||
Variation margin | 9,790 | ||||||
Management services fees | 104 | ||||||
Distribution and/or service fees | 117 | ||||||
Transfer agent fees | 8 | ||||||
Compensation of board members | 750 | ||||||
Chief compliance officer expenses | 1 | ||||||
Other expenses | 33,605 | ||||||
Trustees' deferred compensation plan | 74 | ||||||
Total liabilities | 1,013,924 | ||||||
Net assets applicable to outstanding capital stock | $ | 18,272,491 | |||||
Represented by | |||||||
Trust capital | $ | 18,272,491 | |||||
Total — representing net assets applicable to outstanding capital stock | $ | 18,272,491 | |||||
Class 2 | |||||||
Net assets | $ | 18,272,491 | |||||
Shares outstanding | 1,814,181 | ||||||
Net asset value per share | $ | 10.07 | |||||
The accompanying Notes to Financial Statements are an integral part of this statement.
Annual Report 2016
9
COLUMBIA VARIABLE PORTFOLIO — U.S. FLEXIBLE CONSERVATIVE GROWTH FUND
STATEMENT OF OPERATIONS
Year Ended December 31, 2016(a)
Net investment income | |||||||
Income: | |||||||
Dividends — unaffiliated issuers | $ | 5,127 | |||||
Dividends — affiliated issuers | 2,290 | ||||||
Total income | 7,417 | ||||||
Expenses: | |||||||
Management services fees | 4,508 | ||||||
Distribution and/or service fees | |||||||
Class 2 | 4,952 | ||||||
Transfer agent fees | |||||||
Class 2 | 352 | ||||||
Compensation of board members | 750 | ||||||
Custodian fees | 3,852 | ||||||
Printing and postage fees | 10,856 | ||||||
Audit fees | 17,621 | ||||||
Legal fees | 84 | ||||||
Chief compliance officer expenses | 1 | ||||||
Other | 2,291 | ||||||
Total expenses | 45,267 | ||||||
Fees waived or expenses reimbursed by Investment Manager and its affiliates | (8,300 | ) | |||||
Total net expenses | 36,967 | ||||||
Net investment loss | (29,550 | ) | |||||
Realized and unrealized gain (loss) — net | |||||||
Net realized gain (loss) on: | |||||||
Investments — unaffiliated issuers | (13,580 | ) | |||||
Investments — affiliated issuers | (8 | ) | |||||
Futures contracts | 12,028 | ||||||
Net realized loss | (1,560 | ) | |||||
Net change in unrealized appreciation (depreciation) on: | |||||||
Investments — unaffiliated issuers | (23,267 | ) | |||||
Investments — affiliated issuers | 113,511 | ||||||
Futures contracts | 14,587 | ||||||
Net change in unrealized appreciation | 104,831 | ||||||
Net realized and unrealized gain | 103,271 | ||||||
Net increase in net assets resulting from operations | $ | 73,721 | |||||
(a) Based on operations from November 2, 2016 (commencement of operations) through the stated period end.
The accompanying Notes to Financial Statements are an integral part of this statement.
Annual Report 2016
10
COLUMBIA VARIABLE PORTFOLIO — U.S. FLEXIBLE CONSERVATIVE GROWTH FUND
STATEMENT OF CHANGES IN NET ASSETS
| Year Ended December 31, 2016(a) | |||||||
Operations | |||||||
Net investment loss | $ | (29,550 | ) | ||||
Net realized loss | (1,560 | ) | |||||
Net change in unrealized appreciation | 104,831 | ||||||
Net increase in net assets resulting from operations | 73,721 | ||||||
Increase in net assets from capital stock activity | 8,198,770 | ||||||
Total increase in net assets | 8,272,491 | ||||||
Net assets at beginning of year | 10,000,000 | ||||||
Net assets at end of year | $ | 18,272,491 | |||||
(a) Based on operations from November 2, 2016 (commencement of operations) through the stated period end.
The accompanying Notes to Financial Statements are an integral part of this statement.
Annual Report 2016
11
COLUMBIA VARIABLE PORTFOLIO — U.S. FLEXIBLE CONSERVATIVE GROWTH FUND
STATEMENT OF CHANGES IN NET ASSETS (continued)
Year Ended December 31, 2016(a) | |||||||||||
Shares | Dollars ($) | ||||||||||
Capital stock activity | |||||||||||
Class 2 shares | |||||||||||
Subscriptions | 814,190 | 8,198,864 | |||||||||
Redemptions | (9 | ) | (94 | ) | |||||||
Net increase | 814,181 | 8,198,770 | |||||||||
Total net increase | 814,181 | 8,198,770 | |||||||||
(a) Based on operations from November 2, 2016 (commencement of operations) through the stated period end.
The accompanying Notes to Financial Statements are an integral part of this statement.
Annual Report 2016
12
COLUMBIA VARIABLE PORTFOLIO — U.S. FLEXIBLE CONSERVATIVE GROWTH FUND
FINANCIAL HIGHLIGHTS
The following table is intended to help you understand the Fund's financial performance. Certain information reflects financial results for a single share of a class held for the periods shown. Per share net investment income (loss) amounts are calculated based on average shares outstanding during the period. Total return assumes reinvestment of all dividends and distributions, if any. Total return does not reflect any fees and expenses imposed under your Contract and/or Qualified Plan, as applicable; such fees and expenses would reduce the total returns for all periods shown. Total return and portfolio turnover are not annualized for periods of less than one year. The portfolio turnover rate is calculated without regard to purchase and sales transactions of short-term instruments and certain derivatives, if any. If such transactions were included, the Fund's portfolio turnover rate may be higher.
Class 2 | Year Ended December 31, 2016(a) | ||||||
Per share data | |||||||
Net asset value, beginning of period | $ | 10.00 | |||||
Income from investment operations: | |||||||
Net investment loss | (0.02 | ) | |||||
Net realized and unrealized gain | 0.09 | ||||||
Total from investment operations | 0.07 | ||||||
Net asset value, end of period | $ | 10.07 | |||||
Total return | 0.70 | % | |||||
Ratios to average net assets(b) | |||||||
Total gross expenses | 1.08 | %(c) | |||||
Total net expenses(d) | 0.66 | %(c) | |||||
Net investment loss | (0.28 | %)(c) | |||||
Supplemental data | |||||||
Net assets, end of period (in thousands) | $ | 18,272 | |||||
Portfolio turnover | 10 | % | |||||
Notes to Financial Highlights
(a) Based on operations from November 2, 2016 (commencement of operations) through the stated period end.
(b) In addition to the fees and expenses that the Fund bears directly, the Fund indirectly bears a pro rata share of the fees and expenses of the underlying funds in which the Fund invests. Such indirect expenses are not included in the Fund's reported expense ratios.
(c) Annualized.
(d) Total net expenses include the impact of certain fee waivers/expense reimbursements made by the Investment Manager and certain of its affiliates, if applicable.
The accompanying Notes to Financial Statements are an integral part of this statement.
Annual Report 2016
13
COLUMBIA VARIABLE PORTFOLIO — U.S. FLEXIBLE CONSERVATIVE GROWTH FUND
NOTES TO FINANCIAL STATEMENTS
December 31, 2016
Note 1. Organization
Columbia Variable Portfolio — U.S. Flexible Conservative Growth Fund (the Fund), a series of Columbia Funds Variable Insurance Trust (the Trust), is a diversified fund. The Trust is registered under the Investment Company Act of 1940, as amended (the 1940 Act), as an open-end management investment company organized as a Massachusetts business trust.
On November 1, 2016, Columbia Management Investment Advisers, LLC (the Investment Manager), a wholly-owned subsidiary of Ameriprise Financial, Inc. (Ameriprise Financial), invested $10,000,000 in the Fund (1,000,000 shares for Class 2), which represented the initial capital at $10 per share. Shares of the Fund were first offered to the public on November 14, 2016.
These financial statements cover the period from November 2, 2016 (commencement of operations) through December 31, 2016.
The Fund is a "fund-of-funds", investing significantly in affiliated funds managed by the Investment Manager, a wholly-owned subsidiary of Ameriprise Financial, its affiliates, or third-party advised (unaffiliated) funds, including exchange-traded funds (collectively, Underlying Funds).
For information on the Underlying Funds, please refer to the Fund's current prospectus and the prospectuses of the Underlying Funds, which are available, free of charge, from the Securities and Exchange Commission website, www.sec.gov.
Fund Shares
The Trust may issue an unlimited number of shares (without par value). The Fund offers Class 2 shares to separate accounts funding variable annuity contracts and variable life insurance policies (collectively, Contracts) issued by affiliated and unaffiliated life insurance companies as well as other qualified institutional investors (Qualified Investors) authorized by Columbia Management Investment Distributors, Inc. (the Distributor). You may not buy (nor will you own) shares of the Fund directly. You may invest by buying a Contract.
Note 2. Summary of Significant Accounting Policies
Basis of Preparation
The Fund is an investment company that applies the accounting and reporting guidance in the Financial Accounting Standards Board (FASB) Accounting
Standards Codification Topic 946, Financial Services — Investment Companies (ASC 946). The financial statements are prepared in accordance with U.S. generally accepted accounting principles (GAAP), which requires management to make certain estimates and assumptions that affect the reported amounts of assets and liabilities, the disclosure of contingent assets and liabilities at the date of the financial statements and the reported amounts of income and expenses during the reporting period. Actual results could differ from those estimates.
The following is a summary of significant accounting policies followed by the Fund in the preparation of its financial statements.
Security Valuation
All equity securities and exchange-traded funds are valued at the close of business of the New York Stock Exchange. Equity securities and exchange-traded funds are valued at the last quoted sales price on the principal exchange or market on which they trade, except for securities traded on the NASDAQ Stock Market, which are valued at the NASDAQ official close price. Unlisted securities or listed securities for which there were no sales during the day are valued at the mean of the latest quoted bid and ask prices on such exchanges or markets.
Asset- and mortgage-backed securities are generally valued by pricing services, which utilize pricing models that incorporate the securities' cash flow and loan performance data. These models also take into account available market data, including trades, market quotations, and benchmark yield curves for identical or similar securities. Factors used to identify similar securities may include, but are not limited to, issuer, collateral type, vintage, prepayment speeds, collateral performance, credit ratings, credit enhancement and expected life. Asset-backed securities for which quotations are readily available may also be valued based upon an over-the-counter or exchange bid quote from an approved independent broker-dealer.
Investments in the Underlying Funds are valued at the net asset value of the applicable class of the Underlying Fund determined as of the close of the New York Stock Exchange on the valuation date.
Futures and options on futures contracts are valued based upon the settlement price at the close of regular trading on their principal exchanges or, in the absence of transactions, at the mean of the latest quoted bid and ask prices.
Annual Report 2016
14
COLUMBIA VARIABLE PORTFOLIO — U.S. FLEXIBLE CONSERVATIVE GROWTH FUND
NOTES TO FINANCIAL STATEMENTS (continued)
December 31, 2016
Investments for which market quotations are not readily available, or that have quotations which management believes are not reflective of market value or reliable, are valued at fair value as determined in good faith under procedures approved by and under the general supervision of the Board of Trustees. If a security or class of securities (such as foreign securities) is valued at fair value, such value is likely to be different from the quoted or published price for the security.
The determination of fair value often requires significant judgment. To determine fair value, management may use assumptions including but not limited to future cash flows and estimated risk premiums. Multiple inputs from various sources may be used to determine fair value.
GAAP requires disclosure regarding the inputs and valuation techniques used to measure fair value and any changes in valuation inputs or techniques. In addition, investments shall be disclosed by major category. This information is disclosed following the Fund's Portfolio of Investments.
Derivative Instruments
The Fund invests in certain derivative instruments, as detailed below, to meet its investment objectives. Derivatives are instruments whose values depend on, or are derived from, in whole or in part, the value of one or more securities, currencies, commodities, indices, or other assets or instruments. Derivatives may be used to increase investment flexibility (including to maintain cash reserves while maintaining desired exposure to certain assets), for risk management (hedging) purposes, to facilitate trading, to reduce transaction costs and to pursue higher investment returns. The Fund may also use derivative instruments to mitigate certain investment risks, such as foreign currency exchange rate risk, interest rate risk and credit risk. Derivatives may involve various risks, including the potential inability of the counterparty to fulfill its obligations under the terms of the contract, the potential for an illiquid secondary market (making it difficult for the Fund to sell or terminate, including at favorable prices) and the potential for market movements which may expose the Fund to gains or losses in excess of the amount shown in the Statement of Assets and Liabilities. The notional amounts of derivative instruments, if applicable, are not recorded in the financial statements.
A derivative instrument may suffer a marked-to-market loss if the value of the contract decreases due to an unfavorable change in the market rates or values of the underlying instrument. Losses can also occur if the
counterparty does not perform its obligations under the contract. The Fund's risk of loss from counterparty credit risk on over-the-counter derivatives is generally limited to the aggregate unrealized gain netted against any collateral held by the Fund and the amount of any variation margin held by the counterparty, plus any replacement costs or related amounts. With exchange-traded or centrally cleared derivatives, there is reduced counterparty credit risk to the Fund since the clearinghouse or central counterparty (CCP) provides some protection in the case of clearing member default. The clearinghouse or CCP stands between the buyer and the seller of the contract; therefore, additional counterparty credit risk is failure of the clearinghouse or CCP. However, credit risk still exists in exchange-traded or centrally cleared derivatives with respect to initial and variation margin that is held in a broker's customer account. While brokers are required to segregate customer margin from their own assets, in the event that a broker becomes insolvent or goes into bankruptcy and at that time there is a shortfall in the aggregate amount of margin held by the broker for all its clients, U.S. bankruptcy laws will typically allocate that shortfall on a pro-rata basis across all the broker's customers (including the Fund), potentially resulting in losses to the Fund.
In order to better define its contractual rights and to secure rights that will help the Fund mitigate its counterparty risk, the Fund may enter into an International Swaps and Derivatives Association, Inc. Master Agreement (ISDA Master Agreement) or similar agreement with its derivatives contract counterparties. An ISDA Master Agreement is an agreement between the Fund and a counterparty that governs over-the-counter derivatives and typically contains, among other things, collateral posting terms and netting provisions in the event of a default and/or termination event. Under an ISDA Master Agreement, the Fund may, under certain circumstances, offset with the counterparty certain derivative instrument's payables and/or receivables with collateral held and/or posted and create one single net payment. The provisions of the ISDA Master Agreement typically permit a single net payment in the event of default (close-out netting), including the bankruptcy or insolvency of the counterparty. Note, however, that bankruptcy or insolvency laws of a particular jurisdiction may impose restrictions on or prohibitions against the right of offset or netting in bankruptcy, insolvency or other events.
Annual Report 2016
15
COLUMBIA VARIABLE PORTFOLIO — U.S. FLEXIBLE CONSERVATIVE GROWTH FUND
NOTES TO FINANCIAL STATEMENTS (continued)
December 31, 2016
Collateral (margin) requirements differ by type of derivative. Margin requirements are established by the clearinghouse or CCP for exchange-traded and centrally cleared derivatives. Brokers can ask for margin in excess of the minimum in certain circumstances. Collateral terms are contract specific for over-the-counter derivatives. For over-the-counter derivatives traded under an ISDA Master Agreement, the collateral requirements are typically calculated by netting the marked-to-market amount for each transaction under such agreement and comparing that amount to the value of any variation margin currently pledged by the Fund and/or the counterparty. Generally, the amount of collateral due from or to a party has to exceed a minimum transfer amount threshold (e.g., $250,000) before a transfer has to be made. To the extent amounts due to the Fund from its counterparties are not fully collateralized, contractually or otherwise, the Fund bears the risk of loss from counterparty nonperformance. The Fund attempts to mitigate counterparty risk by only entering into agreements with counterparties that it believes have the financial resources to honor their obligations and by monitoring the financial stability of those counterparties.
Certain ISDA Master Agreements allow counterparties of over-the-counter derivatives transactions to terminate derivatives contracts prior to maturity in the event the Fund's net asset value declines by a stated percentage over a specified time period or if the Fund fails to meet certain terms of the ISDA Master Agreement, which would cause the Fund to accelerate payment of any net liability owed to the counterparty. The Fund also has termination rights if the counterparty fails to meet certain terms of the ISDA Master Agreement. In addition to considering counterparty credit risk, the Fund would consider terminating the derivatives contracts based on whether termination would result in a net liability owed from the counterparty.
For financial reporting purposes, the Fund does not offset derivative assets and derivative liabilities that are subject to netting arrangements in the Statement of Assets and Liabilities.
Futures Contracts
Futures contracts are exchange-traded and represent commitments for the future purchase or sale of an asset at a specified price on a specified date. The Fund bought and sold futures contracts to produce incremental earnings, to manage the duration and yield curve
exposure of the Fund versus the benchmark, to manage exposure to movements in interest rates, to manage exposure to the securities market and to maintain appropriate equity market exposure while keeping sufficient cash to accommodate daily redemptions. These instruments may be used for other purposes in future periods. Upon entering into futures contracts, the Fund bears risks that it may not achieve the anticipated benefits of the futures contracts and may realize a loss. Additional risks include counterparty credit risk, the possibility of an illiquid market, and that a change in the value of the contract or option may not correlate with changes in the value of the underlying asset.
Upon entering into a futures contract, the Fund deposits cash or securities with the broker, known as a futures commission merchant (FCM), in an amount sufficient to meet the initial margin requirement. The initial margin deposit must be maintained at an established level over the life of the contract. Cash deposited as initial margin is recorded in the Statement of Assets and Liabilities as margin deposits. Securities deposited as initial margin are designated in the Portfolio of Investments. Subsequent payments (variation margin) are made or received by the Fund each day. The variation margin payments are equal to the daily change in the contract value and are recorded as variation margin receivable or payable and are offset in unrealized gains or losses. The Fund recognizes a realized gain or loss when the contract is closed or expires. Futures contracts involve, to varying degrees, risk of loss in excess of the variation margin disclosed in the Statement of Assets and Liabilities.
Effects of Derivative Transactions in the Financial Statements
The following tables are intended to provide additional information about the effect of derivatives on the financial statements of the Fund, including: the fair value of derivatives by risk category and the location of those fair values in the Statement of Assets and Liabilities; and the impact of derivative transactions over the period in the Statement of Operations, including realized and unrealized gains (losses). The derivative instrument schedules following the Portfolio of Investments present additional information regarding derivative instruments outstanding at the end of the period, if any.
The following table is a summary of the fair value of derivative instruments (not considered to be hedging
Annual Report 2016
16
COLUMBIA VARIABLE PORTFOLIO — U.S. FLEXIBLE CONSERVATIVE GROWTH FUND
NOTES TO FINANCIAL STATEMENTS (continued)
December 31, 2016
instruments for accounting disclosure purposes) at December 31, 2016:
Asset Derivatives | |||||||||||
| Risk Exposure Category | Statement of Assets and Liabilities Location | Fair Value ($) | |||||||||
| Equity risk | Component of trust capital — unrealized appreciation on futures contracts | 15,011 | * | ||||||||
| Interest rate risk | Component of trust capital — unrealized appreciation on futures contracts | 2,061 | * | ||||||||
Total | 17,072 | ||||||||||
Liability Derivatives | |||||||||||
| Risk Exposure Category | Statement of Assets and Liabilities Location | Fair Value ($) | |||||||||
| Interest rate risk | Component of trust capital — unrealized depreciation on futures contracts | 2,485 | * | ||||||||
*Includes cumulative appreciation (depreciation) as reported in the tables following the Portfolio of Investments. Only the current day's variation margin is reported in receivables or payables in the Statement of Assets and Liabilities.
The following table indicates the effect of derivative instruments (not considered to be hedging instruments for accounting disclosure purposes) in the Statement of Operations for the period ended December 31, 2016:
Amount of Realized Gain (Loss) on Derivatives Recognized in Income | |||||||
Risk Exposure Category | Futures Contracts ($) | ||||||
Equity risk | 34,838 | ||||||
Interest rate risk | (22,810 | ) | |||||
Total | 12,028 | ||||||
| Change in Unrealized Appreciation (Depreciation) on Derivatives Recognized in Income | |||||||
Risk Exposure Category | Futures Contracts ($) | ||||||
Equity risk | 15,011 | ||||||
Interest rate risk | (424 | ) | |||||
Total | 14,587 | ||||||
The following table provides a summary of the average outstanding volume by derivative instrument for the period ended December 31, 2016:
Derivative Instrument | Average Notional Amounts ($)* | ||||||
Futures contracts — Long | 2,287,450 | ||||||
*Based on the daily outstanding amounts for the period ended December 31, 2016.
Asset- and Mortgage-Backed Securities
The Fund may invest in asset-backed and mortgage-backed securities. The maturity dates shown represent
the original maturity of the underlying obligation. Actual maturity may vary based upon prepayment activity on these obligations. All, or a portion, of the obligation may be prepaid at any time because the underlying asset may be prepaid. As a result, decreasing market interest rates could result in an increased level of prepayment. An increased prepayment rate will have the effect of shortening the maturity of the security. Unless otherwise noted, the coupon rates presented are fixed rates.
Delayed Delivery Securities
The Fund may trade securities on other than normal settlement terms, including securities purchased or sold on a "when-issued" basis. This may increase risk to the Fund since the other party to the transaction may fail to deliver, which could cause the Fund to subsequently invest at less advantageous prices. The Fund designates cash or liquid securities in an amount equal to the delayed delivery commitment.
To Be Announced Securities
The Fund may trade securities on a To Be Announced (TBA) basis. As with other delayed-delivery transactions, a seller agrees to issue a TBA security at a future date. However, the seller does not specify the particular securities to be delivered. Instead, the Fund agrees to accept any security that meets specified terms.
In some cases, Master Securities Forward Transaction Agreements (MSFTAs) may be used to govern transactions of certain forward-settling agency mortgage-backed securities, such as delayed-delivery and TBAs, between the Fund and counterparty. The MSFTA maintains provisions for, among other things, initiation and confirmation, payment and transfer, events of default, termination, and maintenance of collateral relating to such transactions.
Mortgage- and other asset-backed securities risk
The value of any mortgage-backed and other asset-backed securities held by the Fund may be affected by, among other things, changes or perceived changes in: interest rates; factors concerning the interests in and structure of the issuer or the originator of the mortgages or other assets; the creditworthiness of the entities that provide any supporting letters of credit, surety bonds or other credit enhancements; or the market's assessment of the quality of underlying assets. Payment of principal and interest on some mortgage-backed securities (but not the market value of the securities themselves) may be guaranteed by the full faith and credit of a particular U.S. Government agency, authority, enterprise or
Annual Report 2016
17
COLUMBIA VARIABLE PORTFOLIO — U.S. FLEXIBLE CONSERVATIVE GROWTH FUND
NOTES TO FINANCIAL STATEMENTS (continued)
December 31, 2016
instrumentality, and some, but not all, are also insured or guaranteed by the U.S. Government. Mortgage-backed securities issued by non-governmental issuers (such as commercial banks, savings and loan institutions, private mortgage insurance companies, mortgage bankers and other secondary market issuers) may entail greater risk than obligations guaranteed by the U.S. Government. Mortgage- and other asset-backed securities are subject to prepayment risk, which is the possibility that the underlying mortgage or other asset may be refinanced or prepaid prior to maturity during periods of declining or low interest rates, causing the Fund to have to reinvest the money received in securities that have lower yields. Rising or high interest rates tend to extend the duration of mortgage- and other asset-backed securities, making their prices more volatile and more sensitive to changes in interest rates.
Security Transactions
Security transactions are accounted for on the trade date. Cost is determined and gains (losses) are based upon the specific identification method for both financial statement and federal income tax purposes.
Income Recognition
Interest income is recorded on an accrual basis. Market premiums and discounts, including original issue discounts, are amortized and accreted, respectively, over the expected life of the security on all debt securities, unless otherwise noted. The Fund classifies gains and losses realized on prepayments received on mortgage-backed securities as adjustments to interest income.
The Fund may place a debt security on non-accrual status and reduce related interest income when it becomes probable that the interest will not be collected and the amount of uncollectible interest can be reasonably estimated. A defaulted debt security is removed from non-accrual status when the issuer resumes interest payments or when collectibility of interest is reasonably assured.
Corporate actions and dividend income are recorded on the ex-dividend date.
The Fund may receive distributions from holdings in equity securities, business development companies (BDCs), exchange-traded funds, other regulated investment companies (RICs), and real estate investment trusts (REITs), which report information on the tax character of their distributions annually. These distributions are allocated to dividend income, capital gain and return of capital based on actual information reported. Return of capital is recorded as a reduction of the cost basis of
securities held. If the Fund no longer owns the applicable securities, return of capital is recorded as a realized gain. With respect to REITs, to the extent actual information has not yet been reported, estimates for return of capital are made by the Fund's management. Management's estimates are subsequently adjusted when the actual character of the distributions is disclosed by the REITs, which could result in a proportionate change in return of capital to shareholders.
Awards from class action litigation are recorded as a reduction of cost basis if the Fund still owns the applicable securities on the payment date. If the Fund no longer owns the applicable securities, the proceeds are recorded as realized gains.
Income and capital gain distributions from the Underlying Funds, if any, are recorded on the ex-dividend date.
Expenses
General expenses of the Trust are allocated to the Fund and other funds of the Trust based upon relative net assets or other expense allocation methodologies determined by the nature of the expense. Expenses directly attributable to the Fund are charged to the Fund. Expenses directly attributable to a specific class of shares are charged to that share class.
Federal Income Tax Status
The Fund is treated as a partnership for federal income tax purposes, and the Fund does not expect to make regular distributions. The Fund will not be subject to federal income tax, and therefore, there is no provision for federal income taxes. The partners of the Fund are subject to tax on their distributive share of the Fund's income and loss. The components of the Fund's net assets are reported at the partner-level for federal income tax purposes, and therefore, are not presented in the Statement of Assets and Liabilities.
Management of the Fund has concluded that there are no significant uncertain tax positions in the Fund that would require recognition in the financial statements. However, management's conclusion may be subject to review and adjustment at a later date based on factors including, but not limited to, new tax laws, regulations, and administrative interpretations (including relevant court decisions). Generally, the Fund's federal tax returns for the prior three fiscal years remain subject to examination by the Internal Revenue Service.
Guarantees and Indemnifications
Under the Trust's organizational documents and, in some cases, by contract, its officers and trustees are
Annual Report 2016
18
COLUMBIA VARIABLE PORTFOLIO — U.S. FLEXIBLE CONSERVATIVE GROWTH FUND
NOTES TO FINANCIAL STATEMENTS (continued)
December 31, 2016
indemnified against certain liabilities arising out of the performance of their duties to the Trust or its funds. In addition, certain of the Fund's contracts with its service providers contain general indemnification clauses. The Fund's maximum exposure under these arrangements is unknown since the amount of any future claims that may be made against the Fund cannot be determined, and the Fund has no historical basis for predicting the likelihood of any such claims.
Investment Company Reporting Modernization
In October 2016, the U.S. Securities and Exchange Commission adopted new rules and forms, and amendments to certain current rules and forms, to modernize reporting and disclosure of information by registered investment companies. The amendments to Regulation S-X will require standardized, enhanced disclosure about derivatives in investment company financial statements, and will also change the rules governing the form and content of such financial statements. The amendments to Regulation S-X take effect on August 1, 2017. At this time, management is assessing the anticipated impact of these regulatory developments.
Note 3. Fees and Other Transactions with Affiliates
Management Services Fees and Underlying Fund Fees
The Fund entered into a Management Agreement with the Investment Manager. Under the Management Agreement, the Investment Manager provides the Fund with investment research and advice, as well as administrative and accounting services. The management services fee is an annual fee that is a blend of (i) 0.020% on assets invested in affiliated underlying funds (including exchange-traded funds and closed-end funds) that pay a management services fee (or investment advisory services fee, as applicable) to the Investment Manager and (ii) a fee that declines from 0.720% to 0.520%, depending on asset levels, on assets invested in securities (other than affiliated underlying funds (including exchange-traded funds and closed-end funds) that pay a management services fee (or investment advisory services fee, as applicable) to the Investment Manager), including other funds advised by the Investment Manager that do not pay a management services fee to the Investment Manager, third party funds, derivatives and individual securities. The
annualized effective management services fee rate for the period ended December 31, 2016 was 0.228% of the Fund's average daily net assets.
In addition to the fees and expenses which the Fund bears directly, the Fund indirectly bears a pro rata share of the fees and expenses of the Underlying Funds in which the Fund invests. Because the Underlying Funds have varied expense and fee levels and the Fund may own different proportions of Underlying Funds at different times, the amount of fees and expenses incurred indirectly by the Fund will vary. These expenses are not reflected in the expenses shown in Statement of Operations and are not included in the ratios to average net assets shown in the Financial Highlights.
Other Expenses
Other expenses include offering costs which were incurred prior to the shares of the Fund being offered. Offering costs include printing costs and as applicable, miscellaneous and legal fees. The Fund amortizes offering costs over a period of 12 months from the commencement of operations.
Compensation of Board Members
Board of Trustee members, who are not officers or employees of the Investment Manager or Ameriprise Financial, are compensated for their services to the Fund as disclosed in the Statement of Operations. These Board of Trustee members may participate in a Deferred Compensation Plan (the Plan) which may be terminated at any time. Obligations of the Plan will be paid solely out of the Fund's assets, and all amounts payable under the Plan constitute a general unsecured obligation of the Fund.
Compensation of Chief Compliance Officer
The Board of Trustees has appointed a Chief Compliance Officer to the Fund in accordance with federal securities regulations. The Fund is allocated a portion of the expenses associated with the Chief Compliance Officer based on relative net assets of the Trust.
Transfer Agency Fees
The Fund has a Transfer and Dividend Disbursing Agent Agreement with Columbia Management Investment Services Corp. (the Transfer Agent), an affiliate of the Investment Manager and a wholly-owned subsidiary of Ameriprise Financial. The annual fee rate under this agreement is 0.00% on assets invested in Underlying Funds that pay a transfer agency fee to the Transfer Agent and 0.06% of the Fund's average daily net assets
Annual Report 2016
19
COLUMBIA VARIABLE PORTFOLIO — U.S. FLEXIBLE CONSERVATIVE GROWTH FUND
NOTES TO FINANCIAL STATEMENTS (continued)
December 31, 2016
on assets invested in securities (other than Underlying Funds that pay a transfer agency fee to the Transfer Agent), including other funds that do not pay a transfer agency fee to the Transfer Agent, exchange-traded funds, derivatives and individual securities.
For the period ended December 31, 2016, the Fund's annualized effective transfer agency fee rate as a percentage of average daily net assets of Class 2 shares was 0.02%.
Distribution Fees
The Fund has an agreement with the Distributor, an affiliate of the Investment Manager and a wholly-owned subsidiary of Ameriprise Financial, for distribution services. The Board of Trustees has approved, and the Fund has adopted, a distribution plan (the Plan) which sets the distribution fees for the Fund. These fees are calculated daily and are intended to compensate the Distributor for selling shares of the Fund. The Fund pays a monthly distribution fee to the Distributor at the maximum annual rate of 0.25% of the average daily net assets attributable to Class 2 shares of the Fund.
Expenses Waived/Reimbursed by the Investment Manager and its Affiliates
The Investment Manager and certain of its affiliates have contractually agreed to waive fees and/or reimburse expenses (excluding certain fees and expenses described below) for the period(s) disclosed below, so that the Fund's net operating expenses, including indirect expenses of the Underlying Funds, after giving effect to fees waived/expenses reimbursed and any balance credits and/or overdraft charges from the Fund's custodian, do not exceed the following annual rate(s) as a percentage of the class' average daily net assets:
| Fee Rate(s) Contractual through April 30, 2017 | |||||||
Class 2 | 1.10 | % | |||||
Under the agreement governing these fee waivers and/or expense reimbursement arrangements, the following fees and expenses are excluded from the waiver/reimbursement commitment, and therefore will be paid by the Fund, if applicable: taxes (including foreign transaction taxes), transaction costs and brokerage commissions, costs related to any securities lending program, dividend and interest expenses associated with securities sold short, inverse floater program fees and expenses, transaction charges and interest on borrowed money, interest, infrequent and/or unusual expenses and any other expenses the exclusion of which is specifically
approved by the Board of Trustees. This agreement may be modified or amended only with approval from the Investment Manager, certain of its affiliates and the Fund. Any fees waived and/or expenses reimbursed under the expense reimbursement arrangements described above are not recoverable by the Investment Manager or its affiliates in future periods.
Note 4. Portfolio Information
The cost of purchases and proceeds from sales of securities, excluding short-term investments and derivatives, if any, aggregated to $15,826,146 and $1,211,408, respectively, for the period ended December 31, 2016, of which $1,595,603 and $1,061,091, respectively, were U.S. government securities. The amount of purchase and sale activity impacts the portfolio turnover rate reported in the Financial Highlights.
Note 5. Affiliated Money Market Fund
The Fund invests in Columbia Short-Term Cash Fund, an affiliated money market fund established for the exclusive use by the Fund and other affiliated funds (the Affiliated MMF). The income earned by the Fund from such investments is included as Dividends — affiliated issuers in the Statement of Operations. As an investing fund, the Fund indirectly bears its proportionate share of the expenses of the Affiliated MMF. Effective October 1, 2016, the Affiliated MMF prices its shares with a floating net asset value (NAV) and no longer seeks to maintain a stable NAV. In addition, the Board of Trustees of the Affiliated MMF may impose a fee on redemptions (sometimes referred to as a liquidity fee) or temporarily suspend redemptions (sometimes referred to as imposing a redemption gate) in the event its liquidity falls below regulatory limits.
Note 6. Line of Credit
The Fund has access to a revolving credit facility with a syndicate of banks led by Citibank, N.A., HSBC Bank USA, N.A. and JPMorgan Chase Bank, N.A. whereby the Fund may borrow for the temporary funding of shareholder redemptions or for other temporary or emergency purposes. The credit facility agreement, which is a collective agreement between the Fund and certain other funds managed by the Investment Manager, severally and not jointly, that permits collective borrowings up to $1 billion. Interest is charged to each participating fund based on its borrowings at a rate equal to the higher of (i) the overnight federal funds rate plus 1.00% or (ii) the one-month LIBOR rate plus 1.00%. Each borrowing under the credit facility matures no later than
Annual Report 2016
20
COLUMBIA VARIABLE PORTFOLIO — U.S. FLEXIBLE CONSERVATIVE GROWTH FUND
NOTES TO FINANCIAL STATEMENTS (continued)
December 31, 2016
60 days after the date of borrowing. The Fund also pays a commitment fee equal to its pro rata share of the amount of the credit facility at a rate of 0.15% per annum. The commitment fee is included in other expenses in the Statement of Operations.
The Fund had no borrowings during the period ended December 31, 2016.
Note 7. Significant Risks
Shareholder Concentration Risk
At December 31, 2016, affiliated shareholders of record owned 100.0% of the outstanding shares of the Fund in one or more accounts. Subscription and redemption activity by concentrated accounts may have a significant effect on the operations of the Fund. In the case of a large redemption, the Fund may be forced to sell investments at inopportune times, including its liquid or more liquid positions, resulting in Fund losses and the Fund holding a higher percentage of less liquid or illiquid securities. Large redemptions could result in decreased economies of scale and increased operating expenses for non-redeeming Fund shareholders.
Note 8. Subsequent Events
Management has evaluated the events and transactions that have occurred through the date the financial statements were issued and noted no items requiring adjustment of the financial statements or additional disclosure.
Note 9. Information Regarding Pending and Settled Legal Proceedings
Ameriprise Financial and certain of its affiliates have historically been involved in a number of legal, arbitration and regulatory proceedings, including routine litigation, class actions, and governmental actions, concerning matters arising in connection with the conduct of their business activities. Ameriprise Financial believes that the Funds are not currently the subject of, and that neither Ameriprise Financial nor any of its affiliates are the subject of, any pending legal, arbitration or regulatory proceedings that are likely to have a material adverse effect on the Funds or the ability of Ameriprise Financial or its affiliates to perform under their contracts with the Funds. Ameriprise Financial is required to make quarterly (10-Q), annual (10-K) and, as necessary, 8-K filings with the Securities and Exchange Commission (SEC) on legal and regulatory matters that relate to Ameriprise Financial and its affiliates. Copies of these
filings may be obtained by accessing the SEC website at www.sec.gov.
There can be no assurance that these matters, or the adverse publicity associated with them, will not result in increased fund redemptions, reduced sale of fund shares or other adverse consequences to the Funds. Further, although we believe proceedings are not likely to have a material adverse effect on the Funds or the ability of Ameriprise Financial or its affiliates to perform under their contracts with the Funds, these proceedings are subject to uncertainties and, as such, we are unable to estimate the possible loss or range of loss that may result. An adverse outcome in one or more of these proceedings could result in adverse judgments, settlements, fines, penalties or other relief that could have a material adverse effect on the consolidated financial condition or results of operations of Ameriprise Financial.
Annual Report 2016
21
COLUMBIA VARIABLE PORTFOLIO — U.S. FLEXIBLE CONSERVATIVE GROWTH FUND
REPORT OF INDEPENDENT REGISTERED PUBLIC ACCOUNTING FIRM
To the Trustees of Columbia Funds Variable Insurance Trust and the Shareholders of
Columbia Variable Portfolio — U.S. Flexible Conservative Growth Fund
In our opinion, the accompanying statement of assets and liabilities, including the portfolio of investments, and the related statements of operations and of changes in net assets and the financial highlights present fairly, in all material respects, the financial position of Columbia Variable Portfolio — U.S. Flexible Conservative Growth Fund (the "Fund," a series of Columbia Funds Variable Insurance Trust) at December 31, 2016 and the results of its operations, the changes in its net assets and the financial highlights for the period November 2, 2016 (commencement of operations) through December 31, 2016, in conformity with accounting principles generally accepted in the United States of America. These financial statements and financial highlights (hereafter referred to as "financial statements") are the responsibility of the Fund's management. Our responsibility is to express an opinion on these financial statements based on our audit. We conducted our audit of these financial statements in accordance with the standards of the Public Company Accounting Oversight Board (United States). Those standards require that we plan and perform the audit to obtain reasonable assurance about whether the financial statements are free of material misstatement. An audit includes examining, on a test basis, evidence supporting the amounts and disclosures in the financial statements, assessing the accounting principles used and significant estimates made by management, and evaluating the overall financial statement presentation. We believe that our audit, which included confirmation of securities as of December 31, 2016 by correspondence with the custodian, brokers and transfer agent, and the application of alternative auditing procedures where such confirmations had not been received, provide a reasonable basis for our opinion.
PricewaterhouseCoopers LLP
Minneapolis, MN
February 17, 2017
Annual Report 2016
22
COLUMBIA VARIABLE PORTFOLIO — U.S. FLEXIBLE CONSERVATIVE GROWTH FUND
TRUSTEES AND OFFICERS
Shareholders elect the Board that oversees the Fund's operations. The Board appoints officers who are responsible for day-to-day business decisions based on policies set by the Board. The following table provides basic biographical information about the Fund's Trustees, including their principal occupations during the past five years, although specific titles for individuals may have varied over the period. The year set forth beneath Length of Service in the table below is the year in which the Trustee was first appointed or elected as Trustee to any Fund currently in the Columbia Funds Complex or a predecessor thereof. Under current Board policy, members serve terms of indefinite duration.
Independent Trustees
| Name, Address, Year of Birth | Position Held With the Trust and Length of Service | Principal Occupation(s) During the Past Five Years and Other Relevant Professional Experience | Number of Funds in the Columbia Funds Complex Overseen | Other Directorships Held by Trustee During the Past Five Years | |||||||||||||||
| Janet Langford Carrig c/o Columbia Management Investment Advisers, LLC, 225 Franklin Street Mail Drop BX32 05228, Boston, MA 02110 1957 | Trustee 1996 | Senior Vice President, General Counsel and Corporate Secretary, ConocoPhillips (independent energy company) since September 2007 | 59 | None | |||||||||||||||
| Douglas A. Hacker c/o Columbia Management Investment Advisers, LLC, 225 Franklin Street Mail Drop BX32 05228, Boston, MA 02110 1955 | Trustee and Chairman of the Board 1996 | Independent business executive since May 2006; Executive Vice President — Strategy of United Airlines from December 2002 to May 2006; President of UAL Loyalty Services (airline marketing company) from September 2001 to December 2002; Executive Vice President and Chief Financial Officer of United Airlines from July 1999 to September 2001 | 59 | Spartan Nash Company (food distributor); Nash Finch Company (food distributor) from 2005 to 2013; Aircastle Limited (aircraft leasing); SeaCube Container Leasing Ltd. (container leasing) from 2010 to 2013; and Travelport Worldwide Limited (travel information technology) | |||||||||||||||
| Nancy T. Lukitsh c/o Columbia Management Investment Advisers, LLC, 225 Franklin Street Mail Drop BX32 05228, Boston, MA 02110 1956 | Trustee 2011 | Senior Vice President, Partner and Director of Marketing, Wellington Management Company, LLP (investment adviser) from 1997 to 2010; Chair, Wellington Management Portfolios (commingled non-U.S. investment pools) from 2007 to 2010; Director, Wellington Trust Company, NA and other Wellington affiliates from 1997 to 2010 | 59 | None | |||||||||||||||
Annual Report 2016
23
COLUMBIA VARIABLE PORTFOLIO — U.S. FLEXIBLE CONSERVATIVE GROWTH FUND
TRUSTEES AND OFFICERS (continued)
Independent Trustees (continued)
| Name, Address, Year of Birth | Position Held With the Trust and Length of Service | Principal Occupation(s) During the Past Five Years and Other Relevant Professional Experience | Number of Funds in the Columbia Funds Complex Overseen | Other Directorships Held by Trustee During the Past Five Years | |||||||||||||||
| David M. Moffett c/o Columbia Management Investment Advisers, LLC, 225 Franklin Street Mail Drop BX32 05228, Boston, MA 02110 1952 | Trustee 2011 | Retired. Consultant to Bridgewater and Associates | 59 | Director, CSX Corporation; Genworth Financial, Inc. (financial and insurance products and services); Paypal Holdings Inc. (payment and data processing services); Trustee University of Oklahoma Foundation; former Director eBay Inc. (online trading community), 2007-2015; and former Director, CIT Bank, CIT Group Inc. (commercial and consumer finance), 2010-2016 | |||||||||||||||
| Charles R. Nelson c/o Columbia Management Investment Advisers, LLC, 225 Franklin Street Mail Drop BX32 05228, Boston, MA 02110 1942 | Trustee 1981 | Retired. Professor Emeritus, University of Washington since 2011; Professor of Economics, University of Washington from 1976 to 2011; Ford and Louisa Van Voorhis Professor of Political Economy, University of Washington from 1993 to 2011; Adjunct Professor of Statistics, University of Washington from 1980 to 2011; Associate Editor, Journal of Money, Credit and Banking from September 1993 to 2008; consultant on econometric and statistical matters | 59 | None | |||||||||||||||
| John J. Neuhauser c/o Columbia Management Investment Advisers, LLC, 225 Franklin Street Mail Drop BX32 05228, Boston, MA 02110 1943 | Trustee 1984 | President, Saint Michael's College since August 2007; Director or Trustee of several non-profit organizations, including University of Vermont Medical Center; Academic Vice President and Dean of Faculties, Boston College from August 1999 to October 2005; University Professor, Boston College from November 2005 to August 2007 | 59 | Liberty All-Star Equity Fund and Liberty All-Star Growth Fund (closed-end funds) | |||||||||||||||
| Patrick J. Simpson c/o Columbia Management Investment Advisers, LLC, 225 Franklin Street Mail Drop BX32 05228, Boston, MA 02110 1944 | Trustee 2000 | Of Counsel, Perkins Coie LLP (law firm) since 2015; Partner, Perkins Coie LLP from 1988 to 2014 | 59 | None | |||||||||||||||
Annual Report 2016
24
COLUMBIA VARIABLE PORTFOLIO — U.S. FLEXIBLE CONSERVATIVE GROWTH FUND
TRUSTEES AND OFFICERS (continued)
Independent Trustees (continued)
| Name, Address, Year of Birth | Position Held With the Trust and Length of Service | Principal Occupation(s) During the Past Five Years and Other Relevant Professional Experience | Number of Funds in the Columbia Funds Complex Overseen | Other Directorships Held by Trustee During the Past Five Years | |||||||||||||||
| Anne-Lee Verville c/o Columbia Management Investment Advisers, LLC, 225 Franklin Street Mail Drop BX32 05228, Boston, MA 02110 1945 | Trustee 1998 | Retired. General Manager, Global Education Industry from 1994 to 1997, President — Application Systems Division from 1991 to 1994, Chief Financial Officer — US Marketing & Services from 1988 to 1991, and Chief Information Officer from 1987 to 1988, IBM Corporation (computer and technology) | 59 | Enesco Group, Inc. (producer of giftware and home and garden decor products) from 2001 to 2006 | |||||||||||||||
Consultants to the Independent Trustees*
| Name, Address, Year of Birth | Position Held With the Trust and Length of Service | Principal Occupation(s) During the Past Five Years and Other Relevant Professional Experience | Number of Funds in the Columbia Funds Complex Overseen | Other Directorships Held by Trustee During the Past Five Years | |||||||||||||||
| J. Kevin Connaughton c/o Columbia Management Investment Advisers, LLC, 225 Franklin Street Mail Drop BX32 05228, Boston, MA 02110 1964 | Independent Trustee Consultant 2016 | Independent Trustee Consultant, Columbia Funds since March 2016; Managing Director and General Manager of Mutual Fund Products, Columbia Management Investment Advisers, LLC from May 2010 to February 2015; President, Columbia Funds from 2009 to 2015; and senior officer of Columbia Funds and affiliated funds from 2003 to 2015 | 59 | Board of Governors, Gateway Healthcare since January 2016; Trustee, New Century Portfolios since March 2015; and Director, The Autism Project since March 2015 | |||||||||||||||
| Natalie A. Trunow c/o Columbia Management Investment Advisers, LLC, 225 Franklin Street Mail Drop BX32 05228, Boston, MA 02110 1967 | Independent Trustee Consultant 2016 | Independent Trustee Consultant, Columbia Funds since September 2016; Senior Vice President and Chief Executive Officer, Millennial Partners (investment consulting services to institutions) since January 2016; Director of Investments, Casey Family Programs from April 2016 to September 2016; Chief Investment Officer, Calvert Investments from August 2008 to January 2016; Section Head and Portfolio Manager, General Motors Asset Management from June 1997 to August 2008 | 59 | Healthcare Services for Children with Special Needs | |||||||||||||||
* J. Kevin Connaughton was appointed consultant to the Independent Trustees effective March 1, 2016. Natalie A. Trunow was appointed consultant to the Independent Trustees effective September 1, 2016. Shareholders of the Funds are expected to be asked to elect each of Mr. Connaughton and Ms. Trunow as a Trustee at a future shareholder meeting.
Annual Report 2016
25
COLUMBIA VARIABLE PORTFOLIO — U.S. FLEXIBLE CONSERVATIVE GROWTH FUND
TRUSTEES AND OFFICERS (continued)
Interested Trustee Affiliated with Investment Manager*
| Name, Address, Year of Birth | Position Held With the Trust and Length of Service | Principal Occupation(s) During the Past Five Years and Other Relevant Professional Experience | Number of Funds in the Columbia Funds Complex Overseen | Other Directorships Held by Trustee During the Past Five Years | |||||||||||||||
| William F. Truscott c/o Columbia Management Investment Advisers, LLC, 225 Franklin Street Boston, MA 02110 1960 | Trustee 2012 | Chairman of the Board and President, Columbia Management Investment Advisers, LLC since May 2010 and February 2012, respectively; Chief Executive Officer, Global Asset Management, Ameriprise Financial, Inc. since September 2012 (previously Chief Executive Officer, U.S. Asset Management & President, Annuities, May 2010- September 2012); Director and Chief Executive Officer, Columbia Management Investment Distributors, Inc. since May 2010 and February 2012, respectively; Chairman of the Board and Chief Executive Officer, RiverSource Distributors, Inc. since 2006; Director, Threadneedle Asset Management Holdings, SARL since 2014; President and Chief Executive Officer, Ameriprise Certificate Company, 2006-August 2012. | 185 | Trustee to other Columbia Funds since 2001; Chairman of the Board, Columbia Management Investment Advisers, LLC since May 2010; Director, Columbia Management Investment Distributors, Inc. since May 2010; Former Director, Ameriprise Certificate Company, 2006-January 2013 | |||||||||||||||
* Interested person (as defined under the 1940 Act) by reason of being an officer, director, security holder and/or employee of the Investment Manager or Ameriprise Financial.
The Statement of Additional Information has additional information about the Fund's Board members and is available, without charge, upon request by calling 800.345.6611 or contacting your financial intermediary.
Annual Report 2016
26
COLUMBIA VARIABLE PORTFOLIO — U.S. FLEXIBLE CONSERVATIVE GROWTH FUND
TRUSTEES AND OFFICERS (continued)
The Board has appointed officers who are responsible for day-to-day business decisions based on policies it has established. The officers serve at the pleasure of the Board. The following table provides basic information about the Officers of the Fund, including principal occupations during the past five years, although their specific titles may have varied over the period. In addition to Mr. Truscott, who is Senior Vice President, the Fund's other officers are:
Fund Officers
| Name, Address and Year of Birth | Position and Year First Appointed to Position for any Fund in the Columbia Funds Complex or a Predecessor Thereof | Principal Occupation(s) During Past Five Years | |||||||||
| Christopher O. Petersen 5228 Ameriprise Financial Center Minneapolis, MN 55474 Born 1970 | President and Principal Executive Officer (2015) | Vice President and Lead Chief Counsel, Ameriprise Financial, Inc. since January 2015 (previously, Vice President and Chief Counsel January 2010-December 2014); officer of Columbia Funds and affiliated funds since 2007. | |||||||||
| Michael G. Clarke 225 Franklin Street Boston, MA 02110 Born 1969 | Treasurer (2011), Chief Financial Officer (2009) and Chief Accounting Officer (2015) | Vice President — Mutual Fund Administration, Columbia Management Investment Advisers, LLC, since May 2010; senior officer of Columbia Funds and affiliated funds since 2002. | |||||||||
| Paul B. Goucher 100 Park Avenue New York, NY 10017 Born 1968 | Senior Vice President (2011), Chief Legal Officer (2015) and Assistant Secretary (2008) | Senior Vice President and Assistant General Counsel, Ameriprise Financial, Inc. since January 2017 (previously Vice President and Lead Chief Counsel, November 2008-January 2017 and January 2013-2017, respectively, and Chief Counsel, January 2010-January 2013); Vice President, Chief Legal Officer and Assistant Secretary, Columbia Management Investment Advisers, LLC since May 2010. | |||||||||
| Thomas P. McGuire 225 Franklin Street Boston, MA 02110 Born 1972 | Senior Vice President and Chief Compliance Officer (2012) | Vice President — Asset Management Compliance, Ameriprise Financial, Inc., since May 2010; Chief Compliance Officer, Ameriprise Certificate Company since September 2010. | |||||||||
| Colin Moore 225 Franklin Street Boston, MA 02110 Born 1958 | Senior Vice President (2010) | Executive Vice President and Global Chief Investment Officer, Ameriprise Financial, Inc., since July 2013; Executive Vice President and Global Chief Investment Officer, Columbia Management Investment Advisers, LLC since July 2013 (previously Director and Global Chief Investment Officer, 2010-2013). | |||||||||
| Michael E. DeFao 225 Franklin Street Boston, MA 02110 Born 1968 | Vice President (2011) and Assistant Secretary (2010) | Vice President and Chief Counsel, Ameriprise Financial, Inc. since May 2010. | |||||||||
| Amy Johnson 5228 Ameriprise Financial Center Minneapolis, MN 55474 Born 1965 | Vice President (2006) | Managing Director and Global Head of Operations, Columbia Management Investment Advisers, LLC since April 2016 (previously Managing Director and Chief Operating Officer, 2010-2016). | |||||||||
| Lyn Kephart-Strong 5228 Ameriprise Financial Center Minneapolis, MN 55474 Born 1960 | Vice President (2015) | President, Columbia Management Investment Services Corp. since October 2014; Vice President & Resolution Officer, Ameriprise Trust Company since August 2009. | |||||||||
| Ryan C. Larrenaga 225 Franklin Street Boston, MA 02110 Born 1970 | Vice President and Secretary (2015) | Vice President and Group Counsel, Ameriprise Financial, Inc. since August 2011; officer of Columbia Funds and affiliated funds since 2005. | |||||||||
Annual Report 2016
27
COLUMBIA VARIABLE PORTFOLIO — U.S. FLEXIBLE CONSERVATIVE GROWTH FUND
BOARD CONSIDERATION AND APPROVAL OF MANAGEMENT AGREEMENT
On October 25, 2016, the Board of Trustees (the Board) and the Trustees who are not interested persons (as defined in the Investment Company Act of 1940) (the Independent Trustees) of Columbia Funds Variable Insurance Trust (the Trust) unanimously approved, for an initial two-year term, the Management Agreement (the Management Agreement) with Columbia Management Investment Advisers, LLC (the Investment Manager) with respect to Columbia Variable Portfolio — U.S. Flexible Conservative Growth Fund (the Fund), a series of the Trust. As detailed below, the Board met on multiple occasions to review and discuss, both among themselves and with the management team of the Investment Manager, materials provided by the Investment Manager and others before determining to approve the Management Agreement.
In connection with their deliberations regarding the proposed Management Agreement, the Board evaluated materials requested from the Investment Manager regarding the Fund and the Management Agreement, and discussed these materials, as well as other materials provided by the Investment Manager in connection with the Board's most recent annual approval of the continuation of the management agreements with respect to other series of the Trust, with representatives of the Investment Manager at the Product and Distribution Committee meeting held on June 9, 2016 and at Board meetings held on June 10, 2016 and October 24, 2016. The Board also consulted with Fund counsel and with the Independent Trustees' independent legal counsel, who advised on various matters with respect to the Board's considerations and otherwise assisted the Board in their deliberations.
The Board considered all information that they, their legal counsel or the Investment Manager believed reasonably necessary to evaluate and to determine whether to approve the Management Agreement. The information and factors considered by the Board in approving the Management Agreement for the Fund included the following:
• Information regarding the reputation, regulatory history and resources of the Investment Manager, including information regarding senior management, portfolio managers and other personnel;
• Information regarding the capabilities of the Investment Manager with respect to compliance monitoring services, including an assessment of the Investment Manager's compliance system by the Fund's Chief Compliance Officer;
• The terms and conditions of the Management Agreement;
• The current and proposed terms and conditions of other agreements and arrangements with affiliates of the Investment Manager relating to the operations of the Fund, including agreements with respect to the provision of distribution and transfer agency services to the Fund;
• The Investment Manager's agreement to contractually limit or cap total operating expenses for the Fund through April 30, 2017 so that total operating expenses (excluding certain fees and expenses, such as transaction costs and certain other investment related expenses, interest, taxes, and infrequent and/or unusual expenses) would not exceed a specified annual rate, as a percentage of the Fund's net assets;
• Descriptions of various functions performed by the Investment Manager under the Management Agreement, including portfolio management and portfolio trading practices; and
• Information regarding the investment management fees and other expenses of the Fund relative to those of comparable funds determined by the independent third-party data provider to be in the same peer group or universe of funds.
Nature, Extent and Quality of Services to be Provided under the Management Agreement
The Board considered the nature, extent and quality of services to be provided to the Fund by the Investment Manager and its affiliates under the Management Agreement and under separate agreements for the provision of transfer agency services, the similar type of services currently provided by the Investment Manager to other funds in the fund complex, and the resources to be dedicated to the Fund and the other Columbia Funds by the Investment Manager and its affiliates. The Board considered, among other things, the Investment Manager's ability to attract, motivate and retain highly qualified research, advisory and supervisory investment professionals (including personnel and other resources, compensation programs for personnel involved in fund management, reputation and other attributes), the portfolio management services provided by those investment professionals,
Annual Report 2016
28
COLUMBIA VARIABLE PORTFOLIO — U.S. FLEXIBLE CONSERVATIVE GROWTH FUND
BOARD CONSIDERATION AND APPROVAL OF MANAGEMENT AGREEMENT (continued)
and the quality of the Investment Manager's investment research capabilities and trade execution services. The Board also considered the potential benefits to shareholders of investing in a mutual fund that is part of a fund complex offering exposure to a variety of asset classes and investment disciplines and providing a variety of fund and shareholder services.
The Board also considered the professional experience and qualifications of the senior personnel of the Investment Manager, which included consideration of the Investment Manager's experience with similarly-structured funds. The Board noted the compliance programs of and the compliance-related resources provided to the Fund by the Investment Manager and its affiliates, and considered the Investment Manager's ability to provide administrative services to the Fund and coordinate the activities of the Fund's other service providers.
After reviewing these and related factors, the Board concluded, within the context of their overall conclusions, that the expected nature, extent and quality of the services to be provided to the Fund under the Management Agreement supported the approval of the Management Agreement.
Investment Performance
Because the Fund had not yet commenced operations, the Board did not have investment performance to compare to the returns of a group of comparable mutual funds. However, the Board expected to consider, in connection with their next review and consideration of the continuation of the Management Agreement, the investment performance of the Fund in relation to the annualized return for various time periods of both a group of comparable funds, as determined by the independent third-party data provider, and a benchmark.
The Board also considered the Investment Manager's performance and reputation generally, the Investment Manager's historical responsiveness to Board concerns about performance, and the Investment Manager's willingness to take steps intended to improve performance. After reviewing these and related factors, the Board concluded, within the context of their overall conclusions, that the performance of the Investment Manager was sufficient, in light of other considerations, to warrant the approval of the Management Agreement.
Investment Management Fee Rates and Other Expenses
The Board considered the fees to be charged to the Fund under the Management Agreement, as well as the total expenses expected to be incurred by the Fund. In assessing the reasonableness of the proposed fees under the Management Agreement, the Board considered, among other information, the Fund's proposed management fee and its expected total expense ratio as a percentage of average daily net assets. The Board also took into account the proposed fee waiver and expense limitation arrangements that the Investment Manager would observe during the Fund's first year, and the management fees and total expense ratios of comparable funds identified by the independent third-party data provider for purposes of expense comparison.
After reviewing these and related factors, the Board concluded, within the context of their overall conclusions, that the management fee rates and expenses of the Fund supported the approval of the Management Agreement.
Costs of Services to be Provided and Profitability
The Board considered information provided by the Investment Manager with respect to estimated costs of services and profitability, and expected to consider the costs of services and the profitability of the Investment Manager and its affiliates in connection with the Board's next review and consideration of the continuation of the Management Agreement. The Board also considered court cases in which adviser profitability was an issue in whole or in part, the expected expense ratio of the Fund, and the implementation of expense limitations with respect to the Fund. In addition, the Board considered information provided by the Investment Manager regarding its financial condition.
After reviewing these and related factors, the Board concluded, within the context of their overall conclusions, that the anticipated costs of services to be provided and the expected profitability to the Investment Manager and its affiliates from their relationships with the Fund supported the approval of the Management Agreement.
Annual Report 2016
29
COLUMBIA VARIABLE PORTFOLIO — U.S. FLEXIBLE CONSERVATIVE GROWTH FUND
BOARD CONSIDERATION AND APPROVAL OF MANAGEMENT AGREEMENT (continued)
Economies of Scale
The Board considered the potential existence of economies of scale in the provision by the Investment Manager of services to the Fund, to groups of related funds, and to the Investment Manager's investment advisory clients as a whole, and whether those economies of scale were expected to be shared with the Fund through breakpoints in the proposed investment management fees or other means, such as expense limitation arrangements and additional investments by the Investment Manager in investment, trading and compliance resources. The Board noted that the management fee schedules for the Fund contained breakpoints that would reduce the fee rate on assets above specified threshold levels.
After reviewing these and related factors, the Board concluded, within the context of their overall conclusions, that the extent to which any economies of scale were expected to be shared with the Fund supported the approval of the Management Agreement.
Other Benefits to the Investment Manager
The Board received and considered information regarding "fall-out" or ancillary benefits to be received by the Investment Manager and its affiliates as a result of their relationships with the Fund, such as the engagement of the Investment Manager's affiliates to provide distribution and transfer agency services to the Fund. The Board considered that the Fund's distributor retains a portion of the distribution fees from the Fund. The Board also considered the benefits of research made available to the Investment Manager by reason of brokerage commissions to be generated by the Fund's securities transactions, and reviewed information about the Investment Manager's practices with respect to allocating portfolio transactions for brokerage and research services. The Board considered the possible conflicts of interest associated with certain fall-out or other ancillary benefits and the reporting, disclosure and other processes that are in place to address such possible conflicts of interest. The Board recognized that the Investment Manager's profitability would be somewhat lower without these benefits.
Conclusion
The Board reviewed all of the above considerations in reaching their decisions to approve the proposed Management Agreement. In their deliberations, the Trustees did not identify any particular information that was all-important or controlling, and individual Trustees may have attributed different weights to the various factors. Based on their evaluation of all factors that they deemed to be material, including those factors described above, and assisted by the advice of independent legal counsel, the Board, including the Independent Trustees, voting separately, approved the Management Agreement.
Annual Report 2016
30
This page intentionally left blank.
Annual Report 2016
31
This page intentionally left blank.
Annual Report 2016
32
COLUMBIA VARIABLE PORTFOLIO — U.S. FLEXIBLE CONSERVATIVE GROWTH FUND
IMPORTANT INFORMATION ABOUT THIS REPORT
The policy of the Board is to vote the proxies of the companies in which each fund holds investments consistent with the procedures as stated in the Statement of Additional Information (SAI). You may obtain a copy of the SAI without charge by calling 800.345.6611; contacting your financial intermediary or searching the website of the Securities and Exchange Commission (SEC) at sec.gov. Information regarding how each fund voted proxies relating to portfolio securities is filed with the SEC by August 31st for the most recent 12-month period ending June 30th of that year, and is available without charge by visiting investor.columbiathreadneedleus.com, or searching the website of the SEC at sec.gov.
Each fund files a complete schedule of portfolio holdings with the SEC for the first and third quarters of each fiscal year on Form N-Q. Each fund's Form N-Q is available on the SEC's website at sec.gov and may be reviewed and copied at the SEC's Public Reference Room in Washington, D.C. Information on the operation of the Public Reference Room may be obtained by calling 800.SEC.0330. Each fund's complete schedule of portfolio holdings, as filed on Form N-Q, can also be obtained without charge, upon request, by calling 800.345.6611.
Annual Report 2016
33
Columbia Variable Portfolio — U.S. Flexible Conservative Growth Fund
P.O. Box 8081
Boston, MA 02266-8081

Please read and consider the investment objectives, risks, charges and expenses for any fund carefully before investing. For fund and other investment product prospectuses, which contain this and other important information, contact your financial advisor or insurance representative. Please read the prospectus carefully before you invest. The Fund is distributed by Columbia Management Investment Distributors, Inc., member FINRA, and managed by Columbia Management Investment Advisers, LLC.
Columbia Threadneedle Investments (Columbia Threadneedle) is the global brand name of the Columbia and Threadneedle group of companies.
All rights reserved. Columbia Management Investment Distributors, Inc., 225 Franklin Street, Boston, MA 02110-2804
© 2017 Columbia Management Investment Advisers, LLC.
S-2025 AN (2/17)

ANNUAL REPORT
December 31, 2016

VARIABLE PORTFOLIO — MULTI-MANAGER INTEREST RATE ADAPTIVE FUND
Please remember that you may not buy (nor will you own) shares of the Fund directly. The Fund is available through variable annuity contracts and variable life insurance policies offered by the separate accounts of participating insurance companies as well as qualified pension and retirement plans. Please contact your financial advisor or insurance representative for more information.

VARIABLE PORTFOLIO — MULTI-MANAGER INTEREST RATE ADAPTIVE FUND
TABLE OF CONTENTS
Performance Overview | 2 | ||||||
Manager Discussion of Fund Performance | 4 | ||||||
Understanding Your Fund's Expenses | 6 | ||||||
Portfolio of Investments | 7 | ||||||
Statement of Assets and Liabilities | 10 | ||||||
Statement of Operations | 11 | ||||||
Statement of Changes in Net Assets | 12 | ||||||
Financial Highlights | 14 | ||||||
Notes to Financial Statements | 15 | ||||||
Report of Independent Registered Public Accounting Firm | 20 | ||||||
Trustees and Officers | 21 | ||||||
Important Information About This Report | 29 | ||||||
The views expressed in this report reflect the current views of the respective parties. These views are not guarantees of future performance and involve certain risks, uncertainties and assumptions that are difficult to predict, so actual outcomes and results may differ significantly from the views expressed. These views are subject to change at any time based upon economic, market or other conditions and the respective parties disclaim any responsibility to update such views. These views may not be relied on as investment advice and, because investment decisions for a Columbia fund are based on numerous factors, may not be relied on as an indication of trading intent on behalf of any particular Columbia fund. References to specific securities should not be construed as a recommendation or investment advice.
Annual Report 2016
VARIABLE PORTFOLIO — MULTI-MANAGER INTEREST RATE ADAPTIVE FUND
PERFORMANCE OVERVIEW
Performance Summary
n Variable Portfolio — Multi-Manager Interest Rate Adaptive Fund (the Fund) Class 2 shares returned 5.88% for the 12-month period that ended December 31, 2016.
n During the same time period, the Fund's Blended Benchmark returned 6.65% and the Citi Three-Month U.S. Treasury Bill Index returned 0.27%.
n Despite solid gains, high-yield positions lagged the Blended Benchmark and generally accounted for the Fund's modest performance shortfall.
Average Annual Total Returns (%) (for period ended December 31, 2016)
Inception | 1 Year | Life | |||||||||||||
Class 2 | 06/24/14 | 5.88 | 1.51 | ||||||||||||
Blended Benchmark | 6.65 | 2.29 | |||||||||||||
Citi Three-Month U.S. Treasury Bill Index | 0.27 | 0.12 | |||||||||||||
Performance data quoted represents past performance and current performance may be lower or higher. Past performance is no guarantee of future results. The investment return and principal value will fluctuate so that shares, when redeemed, may be worth more or less than the original cost. For current month-end performance information, please contact your financial advisor or insurance representative.
Performance results reflect the effect of any fee waivers or reimbursements of fund expenses by Columbia Management Investment Advisers, LLC and/or any of its affiliates. Absent these fee waivers or expense reimbursement arrangements, performance results would have been lower.
Investment earnings, if any, are tax-deferred until distributed to shareholders, at which time taxes may become due. Total return performance includes changes in share price and assumes reinvestment of dividends and capital gains, if any. Performance results reflect the effect of all fund expenses, but do not include any fees and expenses imposed under your variable annuity contract and/or variable life insurance policy or qualified pension or retirement plan. If performance results included the effect of these additional charges, they would be lower.
The Blended Benchmark, a weighted custom composite established by the Investment Manager, consists of 35% Bloomberg Barclays U.S. Aggregate Bond Index, 25% Bloomberg Barclays U.S. Corporate High-Yield Index, 20% Bloomberg Barclays U.S. 1-5 Year Credit Index, 10% JPMorgan Emerging Markets Bond Index (EMBI) — Global and 10% Citi Three-Month U.S. Treasury Bill Index. The Bloomberg Barclays U.S. Aggregate Bond Index is a broad-based benchmark that measures the investment-grade, U.S. dollar-denominated, fixed-rate taxable bond market, including Treasuries, government-related and corporate securities, mortgage-backed securities (agency fixed-rate and hybrid adjustable-rate mortgage passthroughs), asset-backed securities, and commercial mortgage-backed securities. The Bloomberg Barclays U.S. Corporate High-Yield Index is a market value-weighted index, which covers the U.S. non-investment grade fixed-rate debt market. The index is composed of U.S. dollar-denominated corporate debt in industrial, utility and finance sectors with a minimum $150 million par amount outstanding and a maturity greater than one year. The Bloomberg Barclays U.S. 1-5 Year Credit Index is an unmanaged index of dollar-denominated, nonconvertible U.S. corporate fixed income securities. The index also includes specified foreign fixed-income securities that meet its maturity, liquidity and quality requirements. Only publicly issued fixed-income securities with a remaining maturity from one to five years are included. The JPMorgan EMBI — Global is based on U.S. dollar-denominated debt instruments issued by emerging market sovereign and quasi-sovereign entities, such as Brady bonds, Eurobonds and loans, and reflects reinvestment of all distributions and changes in market prices.
The Citi Three-Month U.S. Treasury Bill Index, an unmanaged index, is representative of the performance of three-month Treasury bills.
Indices are not available for investment, are not professionally managed and do not reflect sales charges, fees, brokerage commissions, taxes or other expenses of investing. Securities in the Fund may not match those in an index.
Annual Report 2016
2
VARIABLE PORTFOLIO — MULTI-MANAGER INTEREST RATE ADAPTIVE FUND
PERFORMANCE OVERVIEW (continued)
Performance of a Hypothetical $10,000 Investment (June 24, 2014 – December 31, 2016)

The chart above shows the change in value of a hypothetical $10,000 investment in Class 2 shares of Variable Portfolio — Multi-Manager Interest Rate Adaptive Fund during the stated time period, and does not reflect the deduction of taxes, if any, that a shareholder may pay on Fund distributions or on the redemption of Fund shares. The returns also do not reflect fees and expenses imposed under your variable annuity contract and/or variable life insurance policy or qualified pension or retirement plan, if any.
Annual Report 2016
3
VARIABLE PORTFOLIO — MULTI-MANAGER INTEREST RATE ADAPTIVE FUND
MANAGER DISCUSSION OF FUND PERFORMANCE
Portfolio Management
Jeffrey Knight, CFA
Anwiti Bahuguna, Ph.D.
David Weiss, CFA
Dan Boncarosky, CFA
| Portfolio Breakdown (%) (at December 31, 2016) | |||||||
Alternative Investment Funds | 5.8 | ||||||
Fixed-Income Funds | 91.7 | ||||||
Money Market Funds | 2.5 | ||||||
Total | 100.0 | ||||||
Percentages indicated are based upon total investments. The Fund's portfolio composition is subject to change.
For the 12-month period that ended December 31, 2016, the Fund's Class 2 shares returned 5.88%. During the same time period, the Fund's Blended Benchmark returned 6.65% and the Citi Three-Month U.S. Treasury Bill Index returned 0.27%. Despite solid gains, high-yield positions lagged the Blended Benchmark and generally accounted for the Fund's modest performance shortfall.
Global Markets Posted Mixed Results
Global events, political uncertainty and mixed economic data were enough to keep investors off balance in 2016, as financial markets moved sharply in reaction to each significant change on the world stage. Early in the year concerns about U.S. monetary policy, China and oil rattled the financial markets, driving bond prices higher and stock prices lower. After a swift March rebound, U.S. Treasury yields plummeted and the stock market swooned again in the early summer in reaction to the U.K. vote to exit the European Union. The stock market rebounded but investors retreated to bonds again in the third quarter in reaction to mixed economic data and uncertainty surrounding the U.S. Presidential race. Following the November election and with almost unanimously positive economic data, interest rates backed up and bond prices fell in the fourth quarter. In the United States, steady job growth drove unemployment down to 4.6%. Corporate earnings growth picked up. Manufacturing activity accelerated. Inflationary pressures increased, commodity prices rose — oil prices, in particular — and concerns about the impact of fiscal stimulus, infrastructure spending and tax cuts in a new administration also weighed on the bond market. Growth was lackluster in developed foreign market countries. In Europe and Japan, gross domestic product advanced less than 1% for the year. China expanded at an estimated pace of 7.5%, in line with expectations, while most emerging markets struggled with volatile international capital flows and currency fluctuations. South American economies contracted.
In December 2016, the Federal Reserve (the Fed) raised the target range of its benchmark interest rate by a quarter of a point, its first such move in a year. The Fed's action had been widely anticipated and had little or no impact on the financial markets when it occurred. The Fed indicated that it would continue to monitor inflation and the job market in considering future rate hikes.
Against this backdrop, the Bloomberg Barclays U.S. Aggregate Bond Index, a broad measure of the performance of investment-grade bonds, returned 2.65% for the year. High-yield bonds outperformed both stocks and investment-grade bonds, returning 17.49%, as measured by the Bank of America/Merrill Lynch U.S. High Yield Constrained Index.
Significant Performance Factors
The Fund's objective is to seek total return by investing in underlying funds that invest in income-generating securities while adapting to interest rate, credit and inflation environments.
During the year, the Fund's high-yield positions underperformed the Blended Benchmark even though they generated solid gains. The lowest-quality high-yield bonds were the year's biggest winners, and the Fund's
Annual Report 2016
4
VARIABLE PORTFOLIO — MULTI-MANAGER INTEREST RATE ADAPTIVE FUND
MANAGER DISCUSSION OF FUND PERFORMANCE (continued)
underlying holdings were more conservatively positioned in the sector. By contrast, emerging market bonds delivered solid results for the year, despite a struggle in the fourth quarter. Short-duration corporate credit was another big contributor to relative results, followed by core bonds, including investment-grade corporates, mortgage and asset-backed securities, as underlying core fixed-income funds outperformed.
Annual Report 2016
5
VARIABLE PORTFOLIO — MULTI-MANAGER INTEREST RATE ADAPTIVE FUND
UNDERSTANDING YOUR FUND'S EXPENSES
(Unaudited)
As an investor, you incur ongoing costs, which generally include management fees, distribution and/or service fees, and other fund expenses. The following information is intended to help you understand your ongoing costs (in dollars) of investing in the Fund and to help you compare these costs with the ongoing costs of investing in other mutual funds.
The information below does not reflect fees and expenses imposed under your variable annuity contract and/or variable life insurance policy (collectively, Contracts) or qualified pension and retirement plan (Qualified Plan), if any. The total fees and expenses you bear may therefore be higher than those shown below.
Analyzing Your Fund's Expenses
To illustrate these ongoing costs, we have provided examples and calculated the expenses paid by investors in Class 2 shares of the Fund during the period. The actual and hypothetical information in the table is based on an initial investment of $1,000 at the beginning of the period indicated and held for the entire period. Expense information is calculated two ways and each method provides you with different information. The amount listed in the "Actual" column is calculated using the Fund's actual operating expenses and total return for the period. You may use the Actual information, together with the amount invested, to estimate the expenses that you paid over the period. Simply divide your account value by $1,000 (for example, an $8,600 account value divided by $1,000 = 8.6), then multiply the results by the expenses paid during the period under the "Actual" column. The amount listed in the "Hypothetical" column assumes a 5% annual rate of return before expenses (which is not the Fund's actual return) and then applies the Fund's actual expense ratio for the period to the hypothetical return. You should not use the hypothetical account values and expenses to estimate either your actual account balance at the end of the period or the expenses you paid during the period. See "Compare With Other Funds" below for details on how to use the hypothetical data.
In addition to the ongoing expenses which the Fund bears directly, the Fund's shareholders indirectly bear the Fund's allocable share of the costs and expenses of each underlying fund in which the Fund invests. You can estimate the effective expenses paid during the period, which includes the indirect fees associated with investing in the underlying funds, by using the amounts listed in the "Effective Expenses Paid During the Period" column.
Compare With Other Funds
Since all mutual funds are required to include the same hypothetical calculations about expenses in shareholder reports, you can use this information to compare the ongoing cost of investing in the Fund with other funds. To do so, compare the hypothetical example with the 5% hypothetical examples that appear in the shareholder reports of other funds. As you compare hypothetical examples of other funds, it is important to note that hypothetical examples are meant to highlight the ongoing costs of investing in a fund only and do not reflect any transaction costs, such as redemption or exchange fees, or expenses that apply to the subaccount or the Contract. Therefore, the hypothetical calculations are useful in comparing ongoing costs only, and will not help you determine the relative total costs of owning different funds. If the fees and expenses imposed under your Contract or Qualified Plan, if any, were included, your costs would be higher.
July 1, 2016 – December 31, 2016
| Account Value at the Beginning of the Period ($) | Account Value at the End of the Period ($) | Expenses Paid During the Period ($) | Fund's Annualized Expense Ratio (%) | Effective Expenses Paid During the Period ($) | Fund's Effective Annualized Expense Ratio (%) | ||||||||||||||||||||||||||||||||||||||
Actual | Hypothetical | Actual | Hypothetical | Actual | Hypothetical | Actual | Actual | Hypothetical | Actual | ||||||||||||||||||||||||||||||||||
Class 2 | 1,000.00 | 1,000.00 | 1,004.60 | 1,023.20 | 1.80 | 1.82 | 0.36 | 5.16 | 5.21 | 1.03 | |||||||||||||||||||||||||||||||||
Expenses paid during the period are equal to the annualized expense ratio for each class as indicated above, multiplied by the average account value over the period and then multiplied by the number of days in the Fund's most recent fiscal half year and divided by 366.
Effective expenses paid during the period and the Fund's effective annualized expense ratio include expenses borne directly to the class plus the Fund's indirect pro rata portion of the ongoing expenses charged by the underlying funds using the expense ratio of each class of the underlying funds as of the underlying fund's most recent shareholder report.
Had Columbia Management Investment Advisers, LLC and/or certain of its affiliates not waived/reimbursed certain fees and expenses, account value at the end of the period would have been reduced.
Annual Report 2016
6
VARIABLE PORTFOLIO — MULTI-MANAGER INTEREST RATE ADAPTIVE FUND
PORTFOLIO OF INVESTMENTS
December 31, 2016
(Percentages represent value of investments compared to net assets)
Fixed-Income Funds 92.3%
Shares | Value ($) | ||||||||||
EMERGING MARKETS 12.7% | |||||||||||
| Columbia Variable Portfolio — Emerging Markets Bond Fund, Class 1 Shares(a) | 65,543 | 622,655 | |||||||||
HIGH YIELD 25.8% | |||||||||||
| Columbia Variable Portfolio — High Yield Bond Fund, Class 1 Shares(a) | 186,590 | 1,266,948 | |||||||||
INVESTMENT GRADE 53.8% | |||||||||||
| Columbia Variable Portfolio — Intermediate Bond Fund, Class 1 Shares(a) | 48,482 | 501,785 | |||||||||
| Columbia Variable Portfolio — Limited Duration Credit Fund, Class 1 Shares(a) | 84,903 | 804,037 | |||||||||
| Columbia Variable Portfolio — U.S. Government Mortgage Fund, Class 1 Shares(a) | 6,991 | 72,146 | |||||||||
| Variable Portfolio — American Century Diversified Bond Fund, Class 1 Shares(a) | 46,860 | 513,115 | |||||||||
| Variable Portfolio — J.P. Morgan Core Bond Fund, Class 1 Shares(a) | 21,824 | 236,133 | |||||||||
| Variable Portfolio — TCW Core Plus Bond Fund, Class 1 Shares(a) | 46,809 | 490,561 | |||||||||
| Variable Portfolio — Wells Fargo Short Duration Government Fund, Class 1 Shares(a) | 1,743 | 17,569 | |||||||||
Total | 2,635,346 | ||||||||||
| Total Fixed-Income Funds (Cost: $4,489,116) | 4,524,949 | ||||||||||
Alternative Investment Funds 5.8%
Shares | Value ($) | ||||||||||
| Columbia Variable Portfolio — Diversified Absolute Return Fund, Class 1 Shares(a)(b) | 15,447 | 144,583 | |||||||||
| Variable Portfolio — AQR Managed Futures Strategy Fund, Class 1 Shares(a) | 17,836 | 140,011 | |||||||||
| Total Alternative Investment Funds (Cost: $301,669) | 284,594 | ||||||||||
Money Market Funds 2.5%
| Columbia Variable Portfolio — Government Money Market Fund, Class 1 Shares, 0.010%(a)(c) | 122,828 | 122,828 | |||||||||
| Total Money Market Funds (Cost: $122,828) | 122,828 | ||||||||||
| Total Investments (Cost: $4,913,613) | 4,932,371 | ||||||||||
Other Assets & Liabilities, Net | (28,166 | ) | |||||||||
Net Assets | 4,904,205 | ||||||||||
Notes to Portfolio of Investments
(a) As defined in the Investment Company Act of 1940, an affiliated company is one in which the Fund owns 5% or more of the company's outstanding voting securities, or a company which is under common ownership or control with the Fund. Holdings and transactions in these affiliated companies during the year ended December 31, 2016 are as follows:
Issuer | Beginning Cost ($) | Purchase Cost ($) | Proceeds From Sales ($) | Realized Gain (Loss) ($) | Ending Cost ($) | Capital Gain Distributions ($) | Dividends — Affiliated Issuers ($) | Value ($) | |||||||||||||||||||||||||||
| Columbia Variable Portfolio — Diversified Absolute Return Fund, Class 1 Shares | 105,289 | 101,123 | (58,290 | ) | (1,495 | ) | 146,627 | — | — | 144,583 | |||||||||||||||||||||||||
| Columbia Variable Portfolio — Emerging Markets Bond Fund, Class 1 Shares | 428,551 | 315,881 | (145,208 | ) | (905 | ) | 598,319 | — | 13,186 | 622,655 | |||||||||||||||||||||||||
| Columbia Variable Portfolio — Government Money Market Fund, Class 1 Shares | 53,274 | 166,511 | (96,957 | ) | — | 122,828 | — | 3 | 122,828 | ||||||||||||||||||||||||||
| Columbia Variable Portfolio — High Yield Bond Fund, Class 1 Shares | 1,026,507 | 579,132 | (328,398 | ) | (19,751 | ) | 1,257,490 | — | 58,195 | 1,266,948 | |||||||||||||||||||||||||
The accompanying Notes to Financial Statements are an integral part of this statement.
Annual Report 2016
7
VARIABLE PORTFOLIO — MULTI-MANAGER INTEREST RATE ADAPTIVE FUND
PORTFOLIO OF INVESTMENTS (continued)
December 31, 2016
Notes to Portfolio of Investments (continued)
Issuer | Beginning Cost ($) | Purchase Cost ($) | Proceeds From Sales ($) | Realized Gain (Loss) ($) | Ending Cost ($) | Capital Gain Distributions ($) | Dividends — Affiliated Issuers ($) | Value ($) | |||||||||||||||||||||||||||
| Columbia Variable Portfolio — Intermediate Bond Fund, Class 1 Shares | 371,776 | 210,596 | (85,174 | ) | (652 | ) | 496,546 | 236 | 6,937 | 501,785 | |||||||||||||||||||||||||
| Columbia Variable Portfolio — Limited Duration Credit Fund, Class 1 Shares | 706,435 | 447,387 | (317,624 | ) | (30,540 | ) | 805,658 | — | 24,926 | 804,037 | |||||||||||||||||||||||||
| Columbia Variable Portfolio — U.S. Government Mortgage Fund, Class 1 Shares | 53,756 | 32,360 | (12,437 | ) | (353 | ) | 73,326 | 419 | 1,614 | 72,146 | |||||||||||||||||||||||||
| Variable Portfolio — American Century Diversified Bond Fund, Class 1 Shares | 379,674 | 217,777 | (83,589 | ) | (974 | ) | 512,888 | 225 | 7,176 | 513,115 | |||||||||||||||||||||||||
| Variable Portfolio — AQR Managed Futures Strategy Fund, Class 1 Shares | 108,891 | 99,812 | (49,391 | ) | (4,270 | ) | 155,042 | — | 5,858 | 140,011 | |||||||||||||||||||||||||
| Variable Portfolio — J.P. Morgan Core Bond Fund, Class 1 Shares | — | 271,892 | (33,486 | ) | (231 | ) | 238,175 | 303 | 3,857 | 236,133 | |||||||||||||||||||||||||
| Variable Portfolio — TCW Core Plus Bond Fund, Class 1 Shares | 362,162 | 210,198 | (82,858 | ) | (444 | ) | 489,058 | 1,592 | 4,620 | 490,561 | |||||||||||||||||||||||||
| Variable Portfolio — Wells Fargo Short Duration Government Fund, Class 1 Shares | 17,424 | 232 | — | — | 17,656 | 69 | 163 | 17,569 | |||||||||||||||||||||||||||
Total | 3,613,739 | 2,652,901 | (1,293,412 | ) | (59,615 | ) | 4,913,613 | 2,844 | 126,535 | 4,932,371 | |||||||||||||||||||||||||
(b) Non-income producing investment.
(c) The rate shown is the seven-day current annualized yield at December 31, 2016.
Fair Value Measurements
The Fund categorizes its fair value measurements according to a three-level hierarchy that maximizes the use of observable inputs and minimizes the use of unobservable inputs by prioritizing that the most observable input be used when available. Observable inputs are those that market participants would use in pricing an investment based on market data obtained from sources independent of the reporting entity. Unobservable inputs are those that reflect the Fund's assumptions about the information market participants would use in pricing an investment. An investment's level within the fair value hierarchy is based on the lowest level of any input that is deemed significant to the asset's or liability's fair value measurement. The input levels are not necessarily an indication of the risk or liquidity associated with investments at that level. For example, certain U.S. government securities are generally high quality and liquid, however, they are reflected as Level 2 because the inputs used to determine fair value may not always be quoted prices in an active market.
Fair value inputs are summarized in the three broad levels listed below:
> Level 1 — Valuations based on quoted prices for investments in active markets that the Fund has the ability to access at the measurement date (including NAV for open-end mutual funds). Valuation adjustments are not applied to Level 1 investments.
> Level 2 — Valuations based on other significant observable inputs (including quoted prices for similar securities, interest rates, prepayment speeds, credit risks, etc.).
> Level 3 — Valuations based on significant unobservable inputs (including the Fund's own assumptions and judgment in determining the fair value of investments).
Inputs that are used in determining fair value of an investment may include price information, credit data, volatility statistics, and other factors. These inputs can be either observable or unobservable. The availability of observable inputs can vary between investments, and is affected by various factors such as the type of investment, and the volume and level of activity for that investment or similar investments in the marketplace. The inputs will be considered by the Investment Manager, along with any other relevant factors in the calculation of an investment's fair value. The Fund uses prices and inputs that are current as of the measurement date, which may include periods of market dislocations. During these periods, the availability of prices and inputs may be reduced for many investments. This condition could cause an investment to be reclassified between the various levels within the hierarchy.
The accompanying Notes to Financial Statements are an integral part of this statement.
Annual Report 2016
8
VARIABLE PORTFOLIO — MULTI-MANAGER INTEREST RATE ADAPTIVE FUND
PORTFOLIO OF INVESTMENTS (continued)
December 31, 2016
Fair Value Measurements (continued)
Certain investments that have been measured at fair value using the net asset value per share (or its equivalent) are not categorized in the fair value hierarchy. The fair value amounts presented in the table are intended to reconcile the fair value hierarchy to the amounts presented in the Portfolio of Investments. The Variable Portfolios serve as investment vehicles for variable annuity contracts and variable life insurance policies. Principle investment strategies within these Variable Portfolios vary based on the Portfolios investment objective. Investments in the Variable Portfolios may be redeemed on a daily basis without restriction.
Investments falling into the Level 3 category are primarily supported by quoted prices from brokers and dealers participating in the market for those investments. However, these may be classified as Level 3 investments due to lack of market transparency and corroboration to support these quoted prices. Additionally, valuation models may be used as the pricing source for any remaining investments classified as Level 3. These models may rely on one or more significant unobservable inputs and/or significant assumptions by the Investment Manager. Inputs used in valuations may include, but are not limited to, financial statement analysis, capital account balances, discount rates and estimated cash flows, and comparable company data.
Under the direction of the Fund's Board of Trustees (the Board), the Investment Manager's Valuation Committee (the Committee) is responsible for overseeing the valuation procedures approved by the Board. The Committee consists of voting and non-voting members from various groups within the Investment Manager's organization, including operations and accounting, trading and investments, compliance, risk management and legal.
The Committee meets at least monthly to review and approve valuation matters, which may include a description of specific valuation determinations, data regarding pricing information received from approved pricing vendors and brokers and the results of Board-approved valuation control policies and procedures (the Policies). The Policies address, among other things, instances when market quotations are or are not readily available, including recommendations of third party pricing vendors and a determination of appropriate pricing methodologies; events that require specific valuation determinations and assessment of fair value techniques; securities with a potential for stale pricing, including those that are illiquid, restricted, or in default; and the effectiveness of third party pricing vendors, including periodic reviews of vendors. The Committee meets more frequently, as needed, to discuss additional valuation matters, which may include the need to review back-testing results, review time-sensitive information or approve related valuation actions. The Committee reports to the Board, with members of the Committee meeting with the Board at each of its regularly scheduled meetings to discuss valuation matters and actions during the period, similar to those described earlier.
For investments categorized as Level 3, the Committee monitors information similar to that described above, which may include: (i) data specific to the issuer or comparable issuers, (ii) general market or specific sector news and (iii) quoted prices and specific or similar security transactions. The Committee considers this data and any changes from prior periods in order to assess the reasonableness of observable and unobservable inputs, any assumptions or internal models used to value those securities and changes in fair value. This data is also used to corroborate, when available, information received from approved pricing vendors and brokers. Various factors impact the frequency of monitoring this information (which may occur as often as daily). However, the Committee may determine that changes to inputs, assumptions and models are not required as a result of the monitoring procedures performed.
The following table is a summary of the inputs used to value the Fund's investments at December 31, 2016:
| Level 1 Quoted Prices in Active Markets for Identical Assets ($) | Level 2 Other Significant Observable Inputs ($) | Level 3 Significant Unobservable Inputs ($) | Total ($) | ||||||||||||||||
Investments measured at net asset value | |||||||||||||||||||
Fixed-Income Funds | — | — | — | 4,524,949 | |||||||||||||||
Alternative Investment Funds | — | — | — | 284,594 | |||||||||||||||
Money Market Funds | — | — | — | 122,828 | |||||||||||||||
Total Investments | — | — | — | 4,932,371 | |||||||||||||||
See the Portfolio of Investments for all investment classifications not indicated in the table.
There were no transfers of financial assets between levels during the period.
The accompanying Notes to Financial Statements are an integral part of this statement.
Annual Report 2016
9
VARIABLE PORTFOLIO — MULTI-MANAGER INTEREST RATE ADAPTIVE FUND
STATEMENT OF ASSETS AND LIABILITIES
December 31, 2016
Assets | |||||||
Investments, at value | |||||||
Affiliated issuers (identified cost $4,913,613) | $ | 4,932,371 | |||||
Receivable for: | |||||||
Investments sold | 2,732 | ||||||
Expense reimbursement due from Investment Manager | 268 | ||||||
Prepaid expenses | 21 | ||||||
Trustees' deferred compensation plan | 7,650 | ||||||
Total assets | 4,943,042 | ||||||
Liabilities | |||||||
Payable for: | |||||||
Capital shares purchased | 2,732 | ||||||
Management services fees | 1 | ||||||
Distribution and/or service fees | 33 | ||||||
Compensation of board members | 991 | ||||||
Audit fees | 19,712 | ||||||
Custodian fees | 3,685 | ||||||
Printing and postage fees | 3,318 | ||||||
Other expenses | 715 | ||||||
Trustees' deferred compensation plan | 7,650 | ||||||
Total liabilities | 38,837 | ||||||
Net assets applicable to outstanding capital stock | $ | 4,904,205 | |||||
Represented by | |||||||
Trust capital | $ | 4,904,205 | |||||
Total — representing net assets applicable to outstanding capital stock | $ | 4,904,205 | |||||
Class 2 | |||||||
Net assets | $ | 4,904,205 | |||||
Shares outstanding | 506,242 | ||||||
Net asset value per share | $ | 9.69 | |||||
The accompanying Notes to Financial Statements are an integral part of this statement.
Annual Report 2016
10
VARIABLE PORTFOLIO — MULTI-MANAGER INTEREST RATE ADAPTIVE FUND
STATEMENT OF OPERATIONS
Year Ended December 31, 2016
Net investment income | |||||||
Income: | |||||||
Dividends — unaffiliated issuers | $ | 1,945 | |||||
Dividends — affiliated issuers | 126,535 | ||||||
Total income | 128,480 | ||||||
Expenses: | |||||||
Management services fees | 1,200 | ||||||
Distribution and/or service fees | |||||||
Class 2 | 9,801 | ||||||
Transfer agent fees | |||||||
Class 2 | 37 | ||||||
Compensation of board members | 17,496 | ||||||
Custodian fees | 14,838 | ||||||
Printing and postage fees | 19,974 | ||||||
Audit fees | 20,440 | ||||||
Legal fees | 102 | ||||||
Chief compliance officer expenses | 2 | ||||||
Other | 4,370 | ||||||
Total expenses | 88,260 | ||||||
Fees waived or expenses reimbursed by Investment Manager and its affiliates | (73,911 | ) | |||||
Total net expenses | 14,349 | ||||||
Net investment income | 114,131 | ||||||
Realized and unrealized gain (loss) — net | |||||||
Net realized gain (loss) on: | |||||||
Investments — unaffiliated issuers | (3,290 | ) | |||||
Investments — affiliated issuers | (59,615 | ) | |||||
Capital gain distributions from underlying affiliated funds | 2,844 | �� | |||||
Net realized loss | (60,061 | ) | |||||
Net change in unrealized appreciation (depreciation) on: | |||||||
Investments — affiliated issuers | 151,969 | ||||||
Net change in unrealized appreciation | 151,969 | ||||||
Net realized and unrealized gain | 91,908 | ||||||
Net increase in net assets resulting from operations | $ | 206,039 | |||||
The accompanying Notes to Financial Statements are an integral part of this statement.
Annual Report 2016
11
VARIABLE PORTFOLIO — MULTI-MANAGER INTEREST RATE ADAPTIVE FUND
STATEMENT OF CHANGES IN NET ASSETS
| Year Ended December 31, 2016 | Year Ended December 31, 2015 | ||||||||||
Operations | |||||||||||
Net investment income | $ | 114,131 | $ | 87,160 | |||||||
Net realized loss | (60,061 | ) | (32,680 | ) | |||||||
Net change in unrealized appreciation (depreciation) | 151,969 | (127,584 | ) | ||||||||
Net increase (decrease) in net assets resulting from operations | 206,039 | (73,104 | ) | ||||||||
Distributions to shareholders | |||||||||||
Net investment income | |||||||||||
Class 2 | (116,431 | ) | (92,008 | ) | |||||||
Total distributions to shareholders | (116,431 | ) | (92,008 | ) | |||||||
Increase in net assets from capital stock activity | 1,360,108 | 2,533,559 | |||||||||
Total increase in net assets | 1,449,716 | 2,368,447 | |||||||||
Net assets at beginning of year | 3,454,489 | 1,086,042 | |||||||||
Net assets at end of year | $ | 4,904,205 | $ | 3,454,489 | |||||||
The accompanying Notes to Financial Statements are an integral part of this statement.
Annual Report 2016
12
VARIABLE PORTFOLIO — MULTI-MANAGER INTEREST RATE ADAPTIVE FUND
STATEMENT OF CHANGES IN NET ASSETS (continued)
Year Ended December 31, 2016 | Year Ended December 31, 2015 | ||||||||||||||||||
Shares | Dollars ($) | Shares | Dollars ($) | ||||||||||||||||
Capital stock activity | |||||||||||||||||||
Class 2 shares | |||||||||||||||||||
Subscriptions | 224,042 | 2,193,026 | 288,194 | 2,832,726 | |||||||||||||||
Distributions reinvested | 11,872 | 116,431 | 9,574 | 92,008 | |||||||||||||||
Redemptions | (97,034 | ) | (949,349 | ) | (40,320 | ) | (391,175 | ) | |||||||||||
Net increase | 138,880 | 1,360,108 | 257,448 | 2,533,559 | |||||||||||||||
Total net increase | 138,880 | 1,360,108 | 257,448 | 2,533,559 | |||||||||||||||
The accompanying Notes to Financial Statements are an integral part of this statement.
Annual Report 2016
13
VARIABLE PORTFOLIO — MULTI-MANAGER INTEREST RATE ADAPTIVE FUND
FINANCIAL HIGHLIGHTS
The following table is intended to help you understand the Fund's financial performance. Certain information reflects financial results for a single share of a class held for the periods shown. Per share net investment income (loss) amounts are calculated based on average shares outstanding during the period. Total return assumes reinvestment of all dividends and distributions, if any. Total return does not reflect any fees and expenses imposed under your Contract and/or Qualified Plan, as applicable; such fees and expenses would reduce the total returns for all periods shown. Total return and portfolio turnover are not annualized for periods of less than one year. The portfolio turnover rate is calculated without regard to purchase and sales transactions of short-term instruments and certain derivatives, if any. If such transactions were included, the Fund's portfolio turnover rate may be higher.
Year Ended December 31, | |||||||||||||||
Class 2 | 2016 | 2015 | 2014(a) | ||||||||||||
Per share data | |||||||||||||||
Net asset value, beginning of period | $ | 9.40 | $ | 9.88 | $ | 10.00 | |||||||||
Income from investment operations: | |||||||||||||||
Net investment income | 0.28 | 0.37 | 0.09 | ||||||||||||
Net realized and unrealized gain (loss) | 0.27 | (0.51 | ) | (0.14 | ) | ||||||||||
Total from investment operations | 0.55 | (0.14 | ) | (0.05 | ) | ||||||||||
Less distributions to shareholders: | |||||||||||||||
Net investment income | (0.26 | ) | (0.34 | ) | (0.07 | ) | |||||||||
Total distributions to shareholders | (0.26 | ) | (0.34 | ) | (0.07 | ) | |||||||||
Net asset value, end of period | $ | 9.69 | $ | 9.40 | $ | 9.88 | |||||||||
Total return | 5.88 | % | (1.47 | %) | (0.46 | %) | |||||||||
Ratios to average net assets(b) | |||||||||||||||
Total gross expenses | 2.25 | % | 3.43 | % | 11.30 | %(c) | |||||||||
Total net expenses(d) | 0.37 | % | 0.39 | % | 0.33 | %(c) | |||||||||
Net investment income | 2.91 | % | 3.78 | % | 1.74 | %(c) | |||||||||
Supplemental data | |||||||||||||||
Net assets, end of period (in thousands) | $ | 4,904 | $ | 3,454 | $ | 1,086 | |||||||||
Portfolio turnover | 34 | % | 47 | % | 28 | % | |||||||||
Notes to Financial Highlights
(a) Based on operations from June 24, 2014 (commencement of operations) through the stated period end.
(b) In addition to the fees and expenses that the Fund bears directly, the Fund indirectly bears a pro rata share of the fees and expenses of the underlying funds in which the Fund invests. Such indirect expenses are not included in the Fund's reported expense ratios.
(c) Annualized.
(d) Total net expenses include the impact of certain fee waivers/expense reimbursements made by the Investment Manager and certain of its affiliates, if applicable.
The accompanying Notes to Financial Statements are an integral part of this statement.
Annual Report 2016
14
VARIABLE PORTFOLIO — MULTI-MANAGER INTEREST RATE ADAPTIVE FUND
NOTES TO FINANCIAL STATEMENTS
December 31, 2016
Note 1. Organization
Variable Portfolio — Multi-Manager Interest Rate Adaptive Fund (the Fund), a series of Columbia Funds Variable Insurance Trust (the Trust), is a diversified fund. The Trust is registered under the Investment Company Act of 1940, as amended (the 1940 Act), as an open-end management investment company organized as a Massachusetts business trust.
The Fund is a "fund-of-funds", investing significantly in funds managed by Columbia Management Investment Advisers, LLC (the Investment Manager), a wholly-owned subsidiary of Ameriprise Financial, Inc. (Ameriprise Financial), or its affiliates (Underlying Funds).
For information on the Underlying Funds, please refer to the Fund's current prospectus and the prospectuses of the Underlying Funds, which are available, free of charge, from the Securities and Exchange Commision website, www.sec.gov.
Fund Shares
The Trust may issue an unlimited number of shares (without par value). The Fund offers Class 2 shares to separate accounts funding variable annuity contracts and variable life insurance policies (collectively, Contracts) issued by affiliated and unaffiliated life insurance companies as well as qualified pension and retirement plans (Qualified Plans) and other qualified institutional investors (Qualified Investors) authorized by Columbia Management Investment Distributors, Inc. (the Distributor). You may not buy (nor will you own) shares of the Fund directly. You may invest by participating in a Qualified Plan or by buying a Contract and making allocations to the Fund.
Note 2. Summary of Significant Accounting Policies
Basis of Preparation
The Fund is an investment company that applies the accounting and reporting guidance in the Financial Accounting Standards Board (FASB) Accounting Standards Codification Topic 946, Financial Services — Investment Companies (ASC 946). The financial statements are prepared in accordance with U.S. generally accepted accounting principles (GAAP), which requires management to make certain estimates and assumptions that affect the reported amounts of assets and liabilities, the disclosure of contingent assets and liabilities at the date of the financial statements and the reported amounts of income and expenses during the
reporting period. Actual results could differ from those estimates.
The following is a summary of significant accounting policies followed by the Fund in the preparation of its financial statements.
Security Valuation
Investments in the Underlying Funds are valued at the net asset value of the applicable class of the Underlying Fund determined as of the close of the New York Stock Exchange on the valuation date.
GAAP requires disclosure regarding the inputs and valuation techniques used to measure fair value and any changes in valuation inputs or techniques. In addition, investments shall be disclosed by major category. This information is disclosed following the Fund's Portfolio of Investments.
Security Transactions
Security transactions are accounted for on the trade date. Cost is determined and gains (losses) are based upon the specific identification method for both financial statement and federal income tax purposes.
Income Recognition
The Fund may receive distributions from holdings in equity securities, business development companies (BDCs), exchange-traded funds, other regulated investment companies (RICs), and real estate investment trusts (REITs), which report information on the tax character of their distributions annually. These distributions are allocated to dividend income, capital gain and return of capital based on actual information reported. Return of capital is recorded as a reduction of the cost basis of securities held. If the Fund no longer owns the applicable securities, return of capital is recorded as a realized gain. With respect to REITs, to the extent actual information has not yet been reported, estimates for return of capital are made by the Fund's management. Management's estimates are subsequently adjusted when the actual character of the distributions is disclosed by the REITs, which could result in a proportionate change in return of capital to shareholders.
Income and capital gain distributions from the Underlying Funds, if any, are recorded on the ex-dividend date.
Expenses
General expenses of the Trust are allocated to the Fund and other funds of the Trust based upon relative net
Annual Report 2016
15
VARIABLE PORTFOLIO — MULTI-MANAGER INTEREST RATE ADAPTIVE FUND
NOTES TO FINANCIAL STATEMENTS (continued)
December 31, 2016
assets or other expense allocation methodologies determined by the nature of the expense. Expenses directly attributable to the Fund are charged to the Fund. Expenses directly attributable to a specific class of shares are charged to that share class.
Federal Income Tax Status
The Fund is treated as a partnership for federal income tax purposes, and the Fund does not expect to make regular distributions. The Fund will not be subject to federal income tax, and therefore, there is no provision for federal income taxes. The partners of the Fund are subject to tax on their distributive share of the Fund's income and loss. The components of the Fund's net assets are reported at the partner-level for federal income tax purposes, and therefore, are not presented in the Statement of Assets and Liabilities.
Management of the Fund has concluded that there are no significant uncertain tax positions in the Fund that would require recognition in the financial statements. However, management's conclusion may be subject to review and adjustment at a later date based on factors including, but not limited to, new tax laws, regulations, and administrative interpretations (including relevant court decisions). Generally, the Fund's federal tax returns for the prior three fiscal years remain subject to examination by the Internal Revenue Service.
Distributions to Subaccounts
Distributions to the subaccounts of Contracts, Qualified Plans and Qualified Investors are recorded at the close of business on the record date and are payable on the first business day following the record date. Distributions from net investment income, if any, are made quarterly. Capital gains distributions, when available, will be made annually. All distributions are reinvested in additional shares of the applicable share class of the Fund at the net asset value as of the ex-dividend date of the distribution.
Guarantees and Indemnifications
Under the Trust's organizational documents and, in some cases, by contract, its officers and trustees are indemnified against certain liabilities arising out of the performance of their duties to the Trust or its funds. In addition, certain of the Fund's contracts with its service providers contain general indemnification clauses. The Fund's maximum exposure under these arrangements is unknown since the amount of any future claims that may be made against the Fund cannot be
determined, and the Fund has no historical basis for predicting the likelihood of any such claims.
Investment Company Reporting Modernization
In October 2016, the U.S. Securities and Exchange Commission adopted new rules and forms, and amendments to certain current rules and forms, to modernize reporting and disclosure of information by registered investment companies. The amendments to Regulation S-X will require standardized, enhanced disclosure about derivatives in investment company financial statements, and will also change the rules governing the form and content of such financial statements. The amendments to Regulation S-X take effect on August 1, 2017. At this time, management is assessing the anticipated impact of these regulatory developments.
Note 3. Fees and Other Transactions with Affiliates
Management Services Fees and Underlying Fund Fees
Effective May 1, 2016, the Fund entered into a Management Agreement with the Investment Manager. Under the Management Agreement, the Investment Manager provides the Fund with investment research and advice, as well as administrative and accounting services. The management services fee is an annual fee that is a blend of (i) 0.02% on assets invested in affiliated underlying funds (including exchange-traded funds and closed-end funds) that pay a management services fee (or investment advisory services fee, as applicable) to the Investment Manager and (ii) a fee that declines from 0.72% to 0.52%, depending on asset levels, on assets invested in securities (other than affiliated underlying funds (including exchange-traded funds and closed-end funds) that pay a management services fee (or investment advisory services fee, as applicable) to the Investment Manager), including other funds advised by the Investment Manager that do not pay a management services fee to the Investment Manager, third party funds, derivatives and individual securities. Prior to May 1, 2016, the Fund paid the Investment Manager an annual fee for advisory services under an Investment Management Services Agreement and a separate annual fee for administrative and accounting services under an Administrative Services Agreement. The effective management services fee rate for the year ended December 31, 2016 (reflecting all advisory and administrative services fees paid to the Investment
Annual Report 2016
16
VARIABLE PORTFOLIO — MULTI-MANAGER INTEREST RATE ADAPTIVE FUND
NOTES TO FINANCIAL STATEMENTS (continued)
December 31, 2016
Manager) was 0.03% of the Fund's average daily net assets. For the period from January 1, 2016 through April 30, 2016, the investment advisory services fee paid to the Investment Manager was $18, and the administrative services fee paid to the Investment Manager was $233.
In addition to the fees and expenses which the Fund bears directly, the Fund indirectly bears a pro rata share of the fees and expenses of the Underlying Funds in which the Fund invests. Because the Underlying Funds have varied expense and fee levels and the Fund may own different proportions of Underlying Funds at different times, the amount of fees and expenses incurred indirectly by the Fund will vary. These expenses are not reflected in the expenses shown in Statement of Operations and are not included in the ratios to average net assets shown in the Financial Highlights.
Subadvisory Agreement
The Fund's Board of Trustees has approved a subadvisory agreement between the Investment Manager and Threadneedle International Limited (Threadneedle), an affiliate of the Investment Manager and an indirect wholly-owned subsidiary of Ameriprise Financial. As of December 31, 2016, Threadneedle is not providing services to the Fund pursuant to the subadvisory agreement.
Compensation of Board Members
Board of Trustee members, who are not officers or employees of the Investment Manager or Ameriprise Financial, are compensated for their services to the Fund as disclosed in the Statement of Operations. These Board of Trustee members may participate in a Deferred Compensation Plan (the Plan) which may be terminated at any time. Obligations of the Plan will be paid solely out of the Fund's assets, and all amounts payable under the Plan constitute a general unsecured obligation of the Fund.
Compensation of Chief Compliance Officer
The Board of Trustees has appointed a Chief Compliance Officer to the Fund in accordance with federal securities regulations. The Fund is allocated a portion of the expenses associated with the Chief Compliance Officer based on relative net assets of the Trust.
Transfer Agency Fees
The Fund has a Transfer and Dividend Disbursing Agent Agreement with Columbia Management Investment Services Corp. (the Transfer Agent), an affiliate of the
Investment Manager and a wholly-owned subsidiary of Ameriprise Financial. The annual fee rate under this agreement is 0.00% on assets invested in Underlying Funds that pay a transfer agency fee to the Transfer Agent and 0.06% of the Fund's average daily net assets on assets invested in securities (other than Underlying Funds that pay a transfer agency fee to the Transfer Agent), including other funds that do not pay a transfer agency fee to the Transfer Agent, exchange-traded funds, derivatives and individual securities.
For the year ended December 31, 2016, the Fund's effective transfer agency fee rate as a percentage of average daily net assets of Class 2 shares was less than 0.01%.
Distribution Fees
The Fund has an agreement with the Distributor, an affiliate of the Investment Manager and a wholly-owned subsidiary of Ameriprise Financial, for distribution services. The Board of Trustees has approved, and the Fund has adopted, a distribution plan (the Plan) which sets the distribution fees for the Fund. These fees are calculated daily and are intended to compensate the Distributor for selling shares of the Fund. The Fund pays a monthly distribution fee to the Distributor at the maximum annual rate of 0.25% of the average daily net assets attributable to Class 2 shares of the Fund.
Expenses Waived/Reimbursed by the Investment Manager and its Affiliates
The Investment Manager and certain of its affiliates have contractually agreed to waive fees and/or reimburse expenses (excluding certain fees and expenses described below) for the period(s) disclosed below, so that the Fund's net operating expenses, including indirect expenses of the Underlying Funds, after giving effect to fees waived/expenses reimbursed and any balance credits and/or overdraft charges from the Fund's custodian, do not exceed the following annual rate(s) as a percentage of the class' average daily net assets:
| Fee Rate(s) Contractual through April 30, 2017 | |||||||
Class 2 | 1.04 | % | |||||
Under the agreement governing these fee waivers and/or expense reimbursement arrangements, the following fees and expenses are excluded from the waiver/reimbursement commitment, and therefore will be paid by the Fund, if applicable: taxes (including foreign transaction taxes), transaction costs and brokerage commissions,
Annual Report 2016
17
VARIABLE PORTFOLIO — MULTI-MANAGER INTEREST RATE ADAPTIVE FUND
NOTES TO FINANCIAL STATEMENTS (continued)
December 31, 2016
costs related to any securities lending program, dividend and interest expenses associated with securities sold short, inverse floater program fees and expenses, transaction charges and interest on borrowed money, interest, infrequent and/or unusual expenses and any other expenses the exclusion of which is specifically approved by the Board of Trustees. This agreement may be modified or amended only with approval from the Investment Manager, certain of its affiliates and the Fund. Any fees waived and/or expenses reimbursed under the expense reimbursement arrangements described above are not recoverable by the Investment Manager or its affiliates in future periods.
Note 4. Portfolio Information
The cost of purchases and proceeds from sales of securities, excluding short-term investments and derivatives, if any, aggregated to $2,636,542 and $1,343,317, respectively, for the year ended December 31, 2016. The amount of purchase and sale activity impacts the portfolio turnover rate reported in the Financial Highlights.
Note 5. Line of Credit
The Fund has access to a revolving credit facility with a syndicate of banks led by Citibank, N.A., HSBC Bank USA, N.A. and JPMorgan Chase Bank, N.A. whereby the Fund may borrow for the temporary funding of shareholder redemptions or for other temporary or emergency purposes. The credit facility agreement, which is a collective agreement between the Fund and certain other funds managed by the Investment Manager, severally and not jointly, that permits collective borrowings up to $1 billion. Interest is charged to each participating fund based on its borrowings at a rate equal to the higher of (i) the overnight federal funds rate plus 1.00% or (ii) the one-month LIBOR rate plus 1.00%. Each borrowing under the credit facility matures no later than 60 days after the date of borrowing. The Fund also pays a commitment fee equal to its pro rata share of the amount of the credit facility at a rate of 0.15% per annum. The commitment fee is included in other expenses in the Statement of Operations.
The Fund had no borrowings during the year ended December 31, 2016.
Note 6. Significant Risk
Shareholder Concentration Risk
At December 31, 2016, affiliated shareholders of record owned 100.0% of the outstanding shares of the Fund in one or more accounts. Subscription and redemption activity by concentrated accounts may have a significant effect on the operations of the Fund. In the case of a large redemption, the Fund may be forced to sell investments at inopportune times, including its liquid or more liquid positions, resulting in Fund losses and the Fund holding a higher percentage of less liquid or illiquid securities. Large redemptions could result in decreased economies of scale and increased operating expenses for non-redeeming Fund shareholders.
Note 7. Subsequent Events
Management has evaluated the events and transactions that have occurred through the date the financial statements were issued and noted no items requiring adjustment of the financial statements or additional disclosure.
The Fund's Board of Trustees approved the liquidation and termination of the Fund. Completion of a transaction (the Transaction) involving the liquidation of the Fund and the substitution of shares of another fund for shares of the Fund held by participating insurance companies on behalf of variable annuity and variable life insurance contract owners (contract owners) (that is, the reinvestment of liquidation proceeds into another fund) is subject to a number of conditions, including shareholder approval of the Transaction. If shareholder approval is obtained, it is anticipated that the Fund will be liquidated on or about April 28, 2017 (the Liquidation Date) at which time the Fund's shareholders will receive a liquidating distribution in an amount equal to the net asset value of their Fund shares. Shareholders of the Fund may redeem their investments in the Fund at any time prior to the Liquidation Date. As of the close of business on the business day preceding the Liquidation Date, the Fund will not accept any orders for the purchase of shares of the Fund.
Note 8. Information Regarding Pending and Settled Legal Proceedings
Ameriprise Financial and certain of its affiliates have historically been involved in a number of legal, arbitration and regulatory proceedings, including routine litigation, class actions, and governmental actions, concerning matters arising in connection with the conduct of their
Annual Report 2016
18
VARIABLE PORTFOLIO — MULTI-MANAGER INTEREST RATE ADAPTIVE FUND
NOTES TO FINANCIAL STATEMENTS (continued)
December 31, 2016
business activities. Ameriprise Financial believes that the Funds are not currently the subject of, and that neither Ameriprise Financial nor any of its affiliates are the subject of, any pending legal, arbitration or regulatory proceedings that are likely to have a material adverse effect on the Funds or the ability of Ameriprise Financial or its affiliates to perform under their contracts with the Funds. Ameriprise Financial is required to make quarterly (10-Q), annual (10-K) and, as necessary, 8-K filings with the Securities and Exchange Commission (SEC) on legal and regulatory matters that relate to Ameriprise Financial and its affiliates. Copies of these filings may be obtained by accessing the SEC website at www.sec.gov.
There can be no assurance that these matters, or the adverse publicity associated with them, will not result in increased fund redemptions, reduced sale of fund shares or other adverse consequences to the Funds. Further, although we believe proceedings are not likely to have a material adverse effect on the Funds or the ability of Ameriprise Financial or its affiliates to perform under their contracts with the Funds, these proceedings are subject to uncertainties and, as such, we are unable to estimate the possible loss or range of loss that may result. An adverse outcome in one or more of these proceedings could result in adverse judgments, settlements, fines, penalties or other relief that could have a material adverse effect on the consolidated financial condition or results of operations of Ameriprise Financial.
Annual Report 2016
19
VARIABLE PORTFOLIO — MULTI-MANAGER INTEREST RATE ADAPTIVE FUND
REPORT OF INDEPENDENT REGISTERED PUBLIC ACCOUNTING FIRM
To the Trustees of Columbia Funds Variable Insurance Trust and the Shareholders of
Variable Portfolio — Multi-Manager Interest Rate Adaptive Fund
In our opinion, the accompanying statement of assets and liabilities, including the portfolio of investments, and the related statements of operations and of changes in net assets and the financial highlights present fairly, in all material respects, the financial position of Variable Portfolio — Multi-Manager Interest Rate Adaptive Fund (the "Fund," a series of Columbia Funds Variable Insurance Trust) as of December 31, 2016, the results of its operations for the year then ended, the changes in its net assets for each of the two years in the period then ended and the financial highlights for each of the two years in the period then ended and for the period June 24, 2014 (commencement of operations) through December 31, 2014, in conformity with accounting principles generally accepted in the United States of America. These financial statements and financial highlights (hereafter referred to as "financial statements") are the responsibility of the Fund's management. Our responsibility is to express an opinion on these financial statements based on our audits. We conducted our audits of these financial statements in accordance with the standards of the Public Company Accounting Oversight Board (United States). Those standards require that we plan and perform the audit to obtain reasonable assurance about whether the financial statements are free of material misstatement. An audit includes examining, on a test basis, evidence supporting the amounts and disclosures in the financial statements, assessing the accounting principles used and significant estimates made by management, and evaluating the overall financial statement presentation. We believe that our audits, which included confirmation of securities as of December 31, 2016 by correspondence with the transfer agent, provide a reasonable basis for our opinion.
PricewaterhouseCoopers LLP
Minneapolis, MN
February 17, 2017
Annual Report 2016
20
VARIABLE PORTFOLIO — MULTI-MANAGER INTEREST RATE ADAPTIVE FUND
TRUSTEES AND OFFICERS
Shareholders elect the Board that oversees the Fund's operations. The Board appoints officers who are responsible for day-to-day business decisions based on policies set by the Board. The following table provides basic biographical information about the Fund's Trustees, including their principal occupations during the past five years, although specific titles for individuals may have varied over the period. The year set forth beneath Length of Service in the table below is the year in which the Trustee was first appointed or elected as Trustee to any Fund currently in the Columbia Funds Complex or a predecessor thereof. Under current Board policy, members serve terms of indefinite duration.
Independent Trustees
| Name, Address, Year of Birth | Position Held With the Trust and Length of Service | Principal Occupation(s) During the Past Five Years and Other Relevant Professional Experience | Number of Funds in the Columbia Funds Complex Overseen | Other Directorships Held by Trustee During the Past Five Years | |||||||||||||||
| Janet Langford Carrig c/o Columbia Management Investment Advisers, LLC, 225 Franklin Street Mail Drop BX32 05228, Boston, MA 02110 1957 | Trustee 1996 | Senior Vice President, General Counsel and Corporate Secretary, ConocoPhillips (independent energy company) since September 2007 | 59 | None | |||||||||||||||
| Douglas A. Hacker c/o Columbia Management Investment Advisers, LLC, 225 Franklin Street Mail Drop BX32 05228, Boston, MA 02110 1955 | Trustee and Chairman of the Board 1996 | Independent business executive since May 2006; Executive Vice President — Strategy of United Airlines from December 2002 to May 2006; President of UAL Loyalty Services (airline marketing company) from September 2001 to December 2002; Executive Vice President and Chief Financial Officer of United Airlines from July 1999 to September 2001 | 59 | Spartan Nash Company (food distributor); Nash Finch Company (food distributor) from 2005 to 2013; Aircastle Limited (aircraft leasing); SeaCube Container Leasing Ltd. (container leasing) from 2010 to 2013; and Travelport Worldwide Limited (travel information technology) | |||||||||||||||
| Nancy T. Lukitsh c/o Columbia Management Investment Advisers, LLC, 225 Franklin Street Mail Drop BX32 05228, Boston, MA 02110 1956 | Trustee 2011 | Senior Vice President, Partner and Director of Marketing, Wellington Management Company, LLP (investment adviser) from 1997 to 2010; Chair, Wellington Management Portfolios (commingled non-U.S. investment pools) from 2007 to 2010; Director, Wellington Trust Company, NA and other Wellington affiliates from 1997 to 2010 | 59 | None | |||||||||||||||
Annual Report 2016
21
VARIABLE PORTFOLIO — MULTI-MANAGER INTEREST RATE ADAPTIVE FUND
TRUSTEES AND OFFICERS (continued)
Independent Trustees (continued)
| Name, Address, Year of Birth | Position Held With the Trust and Length of Service | Principal Occupation(s) During the Past Five Years and Other Relevant Professional Experience | Number of Funds in the Columbia Funds Complex Overseen | Other Directorships Held by Trustee During the Past Five Years | |||||||||||||||
| David M. Moffett c/o Columbia Management Investment Advisers, LLC, 225 Franklin Street Mail Drop BX32 05228, Boston, MA 02110 1952 | Trustee 2011 | Retired. Consultant to Bridgewater and Associates | 59 | Director, CSX Corporation; Genworth Financial, Inc. (financial and insurance products and services); Paypal Holdings Inc. (payment and data processing services); Trustee University of Oklahoma Foundation; former Director eBay Inc. (online trading community), 2007-2015; and former Director, CIT Bank, CIT Group Inc. (commercial and consumer finance), 2010-2016 | |||||||||||||||
| Charles R. Nelson c/o Columbia Management Investment Advisers, LLC, 225 Franklin Street Mail Drop BX32 05228, Boston, MA 02110 1942 | Trustee 1981 | Retired. Professor Emeritus, University of Washington since 2011; Professor of Economics, University of Washington from 1976 to 2011; Ford and Louisa Van Voorhis Professor of Political Economy, University of Washington from 1993 to 2011; Adjunct Professor of Statistics, University of Washington from 1980 to 2011; Associate Editor, Journal of Money, Credit and Banking from September 1993 to 2008; consultant on econometric and statistical matters | 59 | None | |||||||||||||||
| John J. Neuhauser c/o Columbia Management Investment Advisers, LLC, 225 Franklin Street Mail Drop BX32 05228, Boston, MA 02110 1943 | Trustee 1984 | President, Saint Michael's College since August 2007; Director or Trustee of several non-profit organizations, including University of Vermont Medical Center; Academic Vice President and Dean of Faculties, Boston College from August 1999 to October 2005; University Professor, Boston College from November 2005 to August 2007 | 59 | Liberty All-Star Equity Fund and Liberty All-Star Growth Fund (closed-end funds) | |||||||||||||||
| Patrick J. Simpson c/o Columbia Management Investment Advisers, LLC, 225 Franklin Street Mail Drop BX32 05228, Boston, MA 02110 1944 | Trustee 2000 | Of Counsel, Perkins Coie LLP (law firm) since 2015; Partner, Perkins Coie LLP from 1988 to 2014 | 59 | None | |||||||||||||||
Annual Report 2016
22
VARIABLE PORTFOLIO — MULTI-MANAGER INTEREST RATE ADAPTIVE FUND
TRUSTEES AND OFFICERS (continued)
Independent Trustees (continued)
| Name, Address, Year of Birth | Position Held With the Trust and Length of Service | Principal Occupation(s) During the Past Five Years and Other Relevant Professional Experience | Number of Funds in the Columbia Funds Complex Overseen | Other Directorships Held by Trustee During the Past Five Years | |||||||||||||||
| Anne-Lee Verville c/o Columbia Management Investment Advisers, LLC, 225 Franklin Street Mail Drop BX32 05228, Boston, MA 02110 1945 | Trustee 1998 | Retired. General Manager, Global Education Industry from 1994 to 1997, President — Application Systems Division from 1991 to 1994, Chief Financial Officer — US Marketing & Services from 1988 to 1991, and Chief Information Officer from 1987 to 1988, IBM Corporation (computer and technology) | 59 | Enesco Group, Inc. (producer of giftware and home and garden decor products) from 2001 to 2006 | |||||||||||||||
Consultants to the Independent Trustees*
| Name, Address, Year of Birth | Position Held With the Trust and Length of Service | Principal Occupation(s) During the Past Five Years and Other Relevant Professional Experience | Number of Funds in the Columbia Funds Complex Overseen | Other Directorships Held by Trustee During the Past Five Years | |||||||||||||||
| J. Kevin Connaughton c/o Columbia Management Investment Advisers, LLC, 225 Franklin Street Mail Drop BX32 05228, Boston, MA 02110 1964 | Independent Trustee Consultant 2016 | Independent Trustee Consultant, Columbia Funds since March 2016; Managing Director and General Manager of Mutual Fund Products, Columbia Management Investment Advisers, LLC from May 2010 to February 2015; President, Columbia Funds from 2009 to 2015; and senior officer of Columbia Funds and affiliated funds from 2003 to 2015 | 59 | Board of Governors, Gateway Healthcare since January 2016; Trustee, New Century Portfolios since March 2015; and Director, The Autism Project since March 2015 | |||||||||||||||
| Natalie A. Trunow c/o Columbia Management Investment Advisers, LLC, 225 Franklin Street Mail Drop BX32 05228, Boston, MA 02110 1967 | Independent Trustee Consultant 2016 | Independent Trustee Consultant, Columbia Funds since September 2016; Senior Vice President and Chief Executive Officer, Millennial Partners (investment consulting services to institutions) since January 2016; Director of Investments, Casey Family Programs from April 2016 to September 2016; Chief Investment Officer, Calvert Investments from August 2008 to January 2016; Section Head and Portfolio Manager, General Motors Asset Management from June 1997 to August 2008 | 59 | Healthcare Services for Children with Special Needs | |||||||||||||||
* J. Kevin Connaughton was appointed consultant to the Independent Trustees effective March 1, 2016. Natalie A. Trunow was appointed consultant to the Independent Trustees effective September 1, 2016. Shareholders of the Funds are expected to be asked to elect each of Mr. Connaughton and Ms. Trunow as a Trustee at a future shareholder meeting.
Annual Report 2016
23
VARIABLE PORTFOLIO — MULTI-MANAGER INTEREST RATE ADAPTIVE FUND
TRUSTEES AND OFFICERS (continued)
Interested Trustee Affiliated with Investment Manager*
| Name, Address, Year of Birth | Position Held With the Trust and Length of Service | Principal Occupation(s) During the Past Five Years and Other Relevant Professional Experience | Number of Funds in the Columbia Funds Complex Overseen | Other Directorships Held by Trustee During the Past Five Years | |||||||||||||||
| William F. Truscott c/o Columbia Management Investment Advisers, LLC, 225 Franklin Street Boston, MA 02110 1960 | Trustee 2012 | Chairman of the Board and President, Columbia Management Investment Advisers, LLC since May 2010 and February 2012, respectively; Chief Executive Officer, Global Asset Management, Ameriprise Financial, Inc. since September 2012 (previously Chief Executive Officer, U.S. Asset Management & President, Annuities, May 2010- September 2012); Director and Chief Executive Officer, Columbia Management Investment Distributors, Inc. since May 2010 and February 2012, respectively; Chairman of the Board and Chief Executive Officer, RiverSource Distributors, Inc. since 2006; Director, Threadneedle Asset Management Holdings, SARL since 2014; President and Chief Executive Officer, Ameriprise Certificate Company, 2006-August 2012. | 185 | Trustee to other Columbia Funds since 2001; Chairman of the Board, Columbia Management Investment Advisers, LLC since May 2010; Director, Columbia Management Investment Distributors, Inc. since May 2010; Former Director, Ameriprise Certificate Company, 2006-January 2013 | |||||||||||||||
* Interested person (as defined under the 1940 Act) by reason of being an officer, director, security holder and/or employee of the Investment Manager or Ameriprise Financial.
The Statement of Additional Information has additional information about the Fund's Board members and is available, without charge, upon request by calling 800.345.6611 or contacting your financial intermediary.
Annual Report 2016
24
VARIABLE PORTFOLIO — MULTI-MANAGER INTEREST RATE ADAPTIVE FUND
TRUSTEES AND OFFICERS (continued)
The Board has appointed officers who are responsible for day-to-day business decisions based on policies it has established. The officers serve at the pleasure of the Board. The following table provides basic information about the Officers of the Fund, including principal occupations during the past five years, although their specific titles may have varied over the period. In addition to Mr. Truscott, who is Senior Vice President, the Fund's other officers are:
Fund Officers
| Name, Address and Year of Birth | Position and Year First Appointed to Position for any Fund in the Columbia Funds Complex or a Predecessor Thereof | Principal Occupation(s) During Past Five Years | |||||||||
| Christopher O. Petersen 5228 Ameriprise Financial Center Minneapolis, MN 55474 Born 1970 | President and Principal Executive Officer (2015) | Vice President and Lead Chief Counsel, Ameriprise Financial, Inc. since January 2015 (previously, Vice President and Chief Counsel January 2010-December 2014); officer of Columbia Funds and affiliated funds since 2007. | |||||||||
| Michael G. Clarke 225 Franklin Street Boston, MA 02110 Born 1969 | Treasurer (2011), Chief Financial Officer (2009) and Chief Accounting Officer (2015) | Vice President — Mutual Fund Administration, Columbia Management Investment Advisers, LLC, since May 2010; senior officer of Columbia Funds and affiliated funds since 2002. | |||||||||
| Paul B. Goucher 100 Park Avenue New York, NY 10017 Born 1968 | Senior Vice President (2011), Chief Legal Officer (2015) and Assistant Secretary (2008) | Senior Vice President and Assistant General Counsel, Ameriprise Financial, Inc. since January 2017 (previously Vice President and Lead Chief Counsel, November 2008-January 2017 and January 2013-January 2017, respectively, and Chief Counsel, January 2010-January 2013); Vice President, Chief Legal Officer and Assistant Secretary, Columbia Management Investment Advisers, LLC since May 2010. | |||||||||
| Thomas P. McGuire 225 Franklin Street Boston, MA 02110 Born 1972 | Senior Vice President and Chief Compliance Officer (2012) | Vice President — Asset Management Compliance, Ameriprise Financial, Inc., since May 2010; Chief Compliance Officer, Ameriprise Certificate Company since September 2010. | |||||||||
| Colin Moore 225 Franklin Street Boston, MA 02110 Born 1958 | Senior Vice President (2010) | Executive Vice President and Global Chief Investment Officer, Ameriprise Financial, Inc., since July 2013; Executive Vice President and Global Chief Investment Officer, Columbia Management Investment Advisers, LLC since July 2013 (previously Director and Global Chief Investment Officer, 2010-2013). | |||||||||
| Michael E. DeFao 225 Franklin Street Boston, MA 02110 Born 1968 | Vice President (2011) and Assistant Secretary (2010) | Vice President and Chief Counsel, Ameriprise Financial, Inc. since May 2010. | |||||||||
| Amy Johnson 5228 Ameriprise Financial Center Minneapolis, MN 55474 Born 1965 | Vice President (2006) | Managing Director and Global Head of Operations, Columbia Management Investment Advisers, LLC since April 2016 (previously Managing Director and Chief Operating Officer, 2010-2016). | |||||||||
| Lyn Kephart-Strong 5228 Ameriprise Financial Center Minneapolis, MN 55474 Born 1960 | Vice President (2015) | President, Columbia Management Investment Services Corp. since October 2014; Vice President & Resolution Officer, Ameriprise Trust Company since August 2009. | |||||||||
| Ryan C. Larrenaga 225 Franklin Street Boston, MA 02110 Born 1970 | Vice President and Secretary (2015) | Vice President and Group Counsel, Ameriprise Financial, Inc. since August 2011; officer of Columbia Funds and affiliated funds since 2005. | |||||||||
Annual Report 2016
25
This page intentionally left blank.
Annual Report 2016
26
This page intentionally left blank.
Annual Report 2016
27
This page intentionally left blank.
Annual Report 2016
28
VARIABLE PORTFOLIO — MULTI-MANAGER INTEREST RATE ADAPTIVE FUND
IMPORTANT INFORMATION ABOUT THIS REPORT
The policy of the Board is to vote the proxies of the companies in which each fund holds investments consistent with the procedures as stated in the Statement of Additional Information (SAI). You may obtain a copy of the SAI without charge by calling 800.345.6611; contacting your financial intermediary or searching the website of the Securities and Exchange Commission (SEC) at sec.gov. Information regarding how each fund voted proxies relating to portfolio securities is filed with the SEC by August 31st for the most recent 12-month period ending June 30th of that year, and is available without charge by visiting investor.columbiathreadneedleus.com, or searching the website of the SEC at sec.gov.
Each fund files a complete schedule of portfolio holdings with the SEC for the first and third quarters of each fiscal year on Form N-Q. Each fund's Form N-Q is available on the SEC's website at sec.gov and may be reviewed and copied at the SEC's Public Reference Room in Washington, D.C. Information on the operation of the Public Reference Room may be obtained by calling 800.SEC.0330. Each fund's complete schedule of portfolio holdings, as filed on Form N-Q, can also be obtained without charge, upon request, by calling 800.345.6611.
Annual Report 2016
29
Variable Portfolio — Multi-Manager Interest Rate Adaptive Fund
P.O. Box 8081
Boston, MA 02266-8081

Please read and consider the investment objectives, risks, charges and expenses for any fund carefully before investing. For fund and other investment product prospectuses, which contain this and other important information, contact your financial advisor or insurance representative. Please read the prospectus carefully before you invest. The Fund is distributed by Columbia Management Investment Distributors, Inc., member FINRA, and managed by Columbia Management Investment Advisers, LLC.
Columbia Threadneedle Investments (Columbia Threadneedle) is the global brand name of the Columbia and Threadneedle group of companies.
All rights reserved. Columbia Management Investment Distributors, Inc., 225 Franklin Street, Boston, MA 02110-2804
© 2017 Columbia Management Investment Advisers, LLC.
S-6659 AN (2/17)

ANNUAL REPORT
December 31, 2016

VARIABLE PORTFOLIO — LAZARD INTERNATIONAL EQUITY ADVANTAGE FUND
Please remember that you may not buy (nor will you own) shares of the Fund directly. The Fund is available through variable annuity contracts and variable life insurance policies offered by the separate accounts of participating insurance companies as well as qualified pension and retirement plans. Please contact your financial advisor or insurance representative for more information.

VARIABLE PORTFOLIO — LAZARD INTERNATIONAL EQUITY ADVANTAGE FUND
TABLE OF CONTENTS
Performance Overview | 2 | ||||||
Manager Discussion of Fund Performance | 4 | ||||||
Understanding Your Fund's Expenses | 7 | ||||||
Portfolio of Investments | 8 | ||||||
Statement of Assets and Liabilities | 14 | ||||||
Statement of Operations | 16 | ||||||
Statement of Changes in Net Assets | 17 | ||||||
Financial Highlights | 19 | ||||||
Notes to Financial Statements | 21 | ||||||
Report of Independent Registered Public Accounting Firm | 27 | ||||||
Federal Income Tax Information | 28 | ||||||
Trustees and Officers | 29 | ||||||
Important Information About This Report | 37 | ||||||
The views expressed in this report reflect the current views of the respective parties. These views are not guarantees of future performance and involve certain risks, uncertainties and assumptions that are difficult to predict, so actual outcomes and results may differ significantly from the views expressed. These views are subject to change at any time based upon economic, market or other conditions and the respective parties disclaim any responsibility to update such views. These views may not be relied on as investment advice and, because investment decisions for a Columbia fund are based on numerous factors, may not be relied on as an indication of trading intent on behalf of any particular Columbia fund. References to specific securities should not be construed as a recommendation or investment advice.
Annual Report 2016
VARIABLE PORTFOLIO — LAZARD INTERNATIONAL EQUITY ADVANTAGE FUND
PERFORMANCE OVERVIEW
Performance Summary
n Variable Portfolio — Lazard International Equity Advantage Fund (the Fund) Class 2 shares returned 3.87% for the 12-month period that ended December 31, 2016.
n The Fund outperformed its benchmark, the MSCI EAFE Index (Net), which returned 1.00% over the same time period.
n The Fund benefited from its holdings in banks and information technology, as well as food and beverages, while stock selection in pharmaceuticals, energy and automobiles detracted from performance.
Average Annual Total Returns (%) (for period ended December 31, 2016)
Inception | 1 Year | Life | |||||||||||||
Class 1 | 04/30/13 | 4.06 | 1.76 | ||||||||||||
Class 2 | 04/30/13 | 3.87 | 1.52 | ||||||||||||
MSCI EAFE Index (Net) | 1.00 | 1.53 | |||||||||||||
Performance data quoted represents past performance and current performance may be lower or higher. Past performance is no guarantee of future results. The investment return and principal value will fluctuate so that shares, when redeemed, may be worth more or less than the original cost. For current month-end performance information, please contact your financial advisor or insurance representative.
Performance results reflect the effect of any fee waivers or reimbursements of fund expenses by Columbia Management Investment Advisers, LLC and/or any of its affiliates. Absent these fee waivers or expense reimbursement arrangements, performance results would have been lower.
Investment earnings, if any, are tax-deferred until distributed to shareholders, at which time taxes may become due. Total return performance includes changes in share price and assumes reinvestment of dividends and capital gains, if any. Performance results reflect the effect of all fund expenses, but do not include any fees and expenses imposed under your variable annuity contract and/or variable life insurance policy or qualified pension or retirement plan. If performance results included the effect of these additional charges, they would be lower.
The Fund's performance prior to May 2016 reflects returns achieved by one or more different subadviser(s) that managed the Fund according to different principal investment strategies. If the Fund's current subadviser and strategies had been in place for the prior periods, results shown may have been different.
The MSCI EAFE Index (Net) is a free float-adjusted market capitalization index that is designed to measure the equity market performance of developed markets, excluding the U.S. and Canada. The index is compiled from a composite of securities markets of Europe, Australasia and the Far East and is widely recognized by investors in foreign markets as the measurement index for portfolios of non-North American securities.
Indices are not available for investment, are not professionally managed and do not reflect sales charges, fees, brokerage commissions, taxes (except the MSCI EAFE Index (Net), which reflects reinvested dividends net of withholding taxes) or other expenses of investing. Securities in the Fund may not match those in an index.
Annual Report 2016
2
VARIABLE PORTFOLIO — LAZARD INTERNATIONAL EQUITY ADVANTAGE FUND
PERFORMANCE OVERVIEW (continued)
Performance of a Hypothetical $10,000 Investment (April 30, 2013 – December 31, 2016)
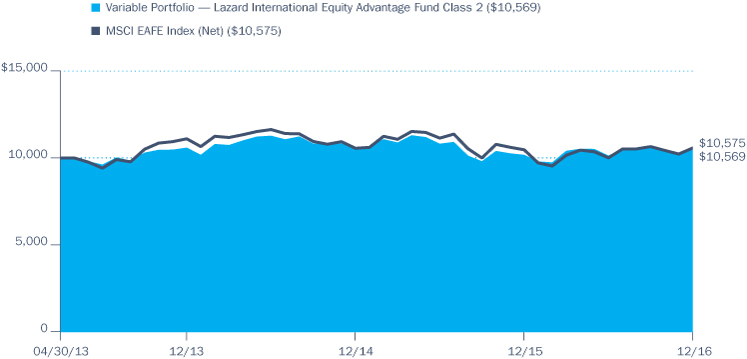
The chart above shows the change in value of a hypothetical $10,000 investment in Class 2 shares of Variable Portfolio — Lazard International Equity Advantage Fund during the stated time period, and does not reflect the deduction of taxes, if any, that a shareholder may pay on Fund distributions or on the redemption of Fund shares. The returns also do not reflect fees and expenses imposed under your variable annuity contract and/or variable life insurance policy or qualified pension or retirement plan, if any.
Annual Report 2016
3
VARIABLE PORTFOLIO — LAZARD INTERNATIONAL EQUITY ADVANTAGE FUND
MANAGER DISCUSSION OF FUND PERFORMANCE
Portfolio Management
Lazard Asset Management LLC
Paul Moghtader, CFA
Taras Ivanenko, CFA, PhD
Ciprian Marin
Craig Scholl, CFA
Susanne Willumsen
| Top Ten Holdings (%) (at December 31, 2016) | |||||||
| Roche Holding AG, Genusschein Shares (Switzerland) | 2.9 | ||||||
| Sumitomo Mitsui Financial Group, Inc. (Japan) | 2.8 | ||||||
| Nestlé SA, Registered Shares (Switzerland) | 2.8 | ||||||
| Mitsubishi UFJ Financial Group, Inc. (Japan) | 2.2 | ||||||
| Scottish & Southern Energy PLC (United Kingdom) | 2.1 | ||||||
| Mitsubishi Electric Corp. (Japan) | 2.0 | ||||||
Banco Santander SA (Spain) | 2.0 | ||||||
| Reckitt Benckiser Group PLC (United Kingdom) | 1.9 | ||||||
Nissan Motor Co., Ltd. (Japan) | 1.9 | ||||||
AXA SA (France) | 1.9 | ||||||
Percentages indicated are based upon total investments (excluding Money Market Funds).
For further detail about these holdings, please refer to the section entitled "Portfolio of Investments."
Fund holdings are as of the date given, are subject to change at any time, and are not recommendations to buy or sell any security.
Effective April 28, 2016, Pyrford International Ltd. (Pyrford) was terminated as subadviser to the Fund and Lazard Asset Management LLC (Lazard) was named as the Fund's new subadviser. In conjunction with this change, the Fund was renamed Variable Portfolio — Lazard International Equity Advantage Fund.
At December 31, 2016, approximately 99.6% of the Fund's shares were owned in the aggregate by affiliated funds-of-funds managed by Columbia Management Investment Advisers, LLC (the Investment Manager). As a result of asset allocation decisions by the Investment Manager, it is possible that the Fund may experience relatively large purchases or redemptions from affiliated funds-of-funds. The Investment Manager seeks to minimize the impact of these transactions by structuring them over a reasonable period of time. The Fund may experience increased expenses as it buys and sells securities as a result of purchases or redemptions by affiliated funds-of-funds.
For the 12-month period that ended December 31, 2016, the Fund's Class 2 shares returned 3.87%. The Fund outperformed its benchmark, the MSCI EAFE Index (Net), which returned 1.00% over the same time period. The Fund benefited from its holdings in banks and information technology, as well as food and beverages, while stock selection in pharmaceuticals, energy and automobiles detracted from performance.
Political Events Dominated Global Stock Markets
Global stock markets spent most of the year dominated by the potential and actual impact of political events. In May, with oil prices having recovered significantly from their lows, and no longer dominating the headlines, the possibility of the U.K. voting to leave the European Union moved to the front of investors' minds. Despite the polls indicating a coin toss result, investors anticipated a "stay" vote only to see the "leave" vote come out on top on June 24. While the day after the vote saw a strong negative reaction and a flight to safe havens in global markets, investors ultimately decided that the vote would have no lasting impact on the global economy. As the second half of the year progressed, and with economic data remaining positive and consumer confidence surveys strong across developed markets, investors increasingly anticipated that the outlook for global growth was in fact strong. A preference for defensive securities that had dominated market leadership in the first half of the year was progressively unwound throughout the second half. As investors took on more risk, financials — and banks in particular — which have been consistent underperformers for many years, finally came back in favor.
As we approached the U.S. election, risk appetite improved. Returns, however, were seemingly held back by the possibility that Donald Trump could be elected president. With strong echoes of the "Brexit" vote, fears that his election would be a negative shock were, in the end, unfounded. Trump's win spurred a significant acceleration in risk appetite as investors digested the possibility of a gigantic $1 trillion stimulus package and the enactment of market-friendly economic policies. Trump's election, as well as a sense that the outlook for the Chinese economy had not only stabilized but was now improving, also spurred a sharp move higher in
Annual Report 2016
4
VARIABLE PORTFOLIO — LAZARD INTERNATIONAL EQUITY ADVANTAGE FUND
MANAGER DISCUSSION OF FUND PERFORMANCE (continued)
commodity prices. This enabled miners and energy stocks to build on the growing outperformance they had seen throughout the second half of the year. The year ended with the U.S. Federal Reserve (the Fed) raising interest rates for just the second time since the financial crisis, leaving investors with the impression that the Fed expected to raise rates three times in 2017.
Contributors and Detractors
Pyrford: We managed the Fund's portfolio until April 28, 2016. During our reporting period, the three strongest-contributing market sectors to the Fund were financials, where we were underweight relative to the benchmark; materials, which was also an underweight allocation; and utilities, where we were overweight. Among individual holdings, the top three contributors were Belgian retailer Colruyt, Japanese telecommunications operator KDDI and Swedish consumer goods company SCA SV Cellulosa. The three sectors that detracted most from performance were information technology, where the Fund was overweight relative to the benchmark; health care, where we were underweight; and energy, which was an overweight allocation. Among individual holdings, Taiwanese semiconductor company Mediatek, Hong Kong-based ASM Pacific Technology and Norwegian telecommunications company Telenor detracted the most from Fund performance.
There were few notable shifts in country allocations/weightings over our reporting period. We reduced our oil holdings in the U.K., reallocating across existing U.K. holdings. In Taiwan, we added Merida, a leading bicycle manufacturer of high-end mountain and road bikes. The company has benefited from a global pick-up in recreational cycling in developed markets and has recently expanded into China where bicycle penetration is low. In Japan, we added ABC-Mart, selling out of Makita in the process.
Lazard: We assumed day-to-day portfolio management of the Fund's portfolio on May 1, 2016. During our reporting period, neither sector nor country positioning added or detracted meaningfully from overall relative performance. Within industries, our strongest stock selection was in the bank segment, followed by technology hardware, and food and beverages. Our weakest area of stock selection was pharmaceuticals, followed by energy and automobiles. Two of our top three stock picks came from Japanese banks: Sumitomo Mitsui Financial Group and Mitsubishi UFJ Financial Group, which both reacted particularly strongly to the prospect of increasing interest rates. Further, our large overweight in Japanese industrial company Mitsubishi Electric outperformed on the back of a falling yen and a stronger than expected first-half results.
Our largest detractor came from an overweight in Danish Pharmaceutical company Novo Nordisk, which fell after the company downgraded its long-term profit guidance on increased competition and pricing pressure in the U.S. Following these results, we immediately trimmed our position towards benchmark weight. Australian Biotechnology company CSL was our second largest detractor after it moderately underperformed within the out-of-favor health care industry in the second half of the year. The company continues to deliver strong results and we retained the overweight position on robust quality of earnings, strong productivity
| Country Breakdown (%) (at December 31, 2016) | |||||||
Australia | 7.0 | ||||||
Austria | 0.2 | ||||||
Belgium | 0.3 | ||||||
Cayman Islands | 0.2 | ||||||
China | 1.1 | ||||||
Denmark | 1.3 | ||||||
Finland | 1.2 | ||||||
France | 9.9 | ||||||
Germany | 6.7 | ||||||
Hong Kong | 3.4 | ||||||
Ireland | 0.1 | ||||||
Israel | 0.3 | ||||||
Italy | 0.9 | ||||||
Japan | 24.9 | ||||||
Netherlands | 2.7 | ||||||
Norway | 1.7 | ||||||
Portugal | 1.1 | ||||||
Singapore | 1.3 | ||||||
Spain | 4.4 | ||||||
Sweden | 2.2 | ||||||
Switzerland | 8.9 | ||||||
United Kingdom | 18.7 | ||||||
United States(a) | 1.5 | ||||||
Total | 100.0 | ||||||
Country Breakdown is based primarily on issuer's place of organization/incorporation. Percentages indicated are based upon total investments. The Fund's portfolio composition is subject to change.
(a) Includes investments in Money Market Funds.
Annual Report 2016
5
VARIABLE PORTFOLIO — LAZARD INTERNATIONAL EQUITY ADVANTAGE FUND
MANAGER DISCUSSION OF FUND PERFORMANCE (continued)
| Equity Sector Breakdown (%) (at December 31, 2016) | |||||||
Consumer Discretionary | 13.0 | ||||||
Consumer Staples | 10.0 | ||||||
Energy | 5.4 | ||||||
Financials | 22.9 | ||||||
Health Care | 10.1 | ||||||
Industrials | 13.3 | ||||||
Information Technology | 6.4 | ||||||
Materials | 5.5 | ||||||
Real Estate | 4.2 | ||||||
Telecommunication Services | 5.1 | ||||||
Utilities | 4.1 | ||||||
Total | 100.0 | ||||||
Percentages indicated are based upon total equity investments. The Fund's portfolio composition is subject to change.
improvements and high return on equity. Our third largest detractor came from our overweight in U.K. telecommunications provider, BT Group. The company underperformed notably over the period after the Brexit vote sent U.K. bond yields significantly lower, widening the company's already large pension deficit. We initially pared back the position after the Brexit vote, although more recently have increased it again to a large overweight as pension risks have subsided and as the company continued to deliver strong results.
In addition to increasing our exposure to BT Group, we purchased Daiwa House Industries, a Japanese homebuilder. The company underperformed for most of 2016 on fears that its earnings growth was slowing, allowing for an attractive entry point. Strong results in November prompted us to add to the position through the remainder of the fourth quarter. One of our largest sells came from our overweight in Swiss Biotechnology stock, Actelion. As the company became subject to a bid from Johnson & Johnson, we increased our overweight. A number of uncertainties surrounding the outcome of the bid, however, led us to substantially pare the position. We also sold Telenor during the latter part of the year. Despite a discounted valuation, this was more than offset by declining returns and earnings quality with sentiment having been depressed for some time as the company struggles with returns from its emerging market franchises.
Annual Report 2016
6
VARIABLE PORTFOLIO — LAZARD INTERNATIONAL EQUITY ADVANTAGE FUND
UNDERSTANDING YOUR FUND'S EXPENSES
(Unaudited)
As an investor, you incur ongoing costs, which generally include management fees, distribution and/or service fees, and other fund expenses. The following information is intended to help you understand your ongoing costs (in dollars) of investing in the Fund and to help you compare these costs with the ongoing costs of investing in other mutual funds.
The information below does not reflect fees and expenses imposed under your variable annuity contract and/or variable life insurance policy (collectively, Contracts) or qualified pension and retirement plan (Qualified Plan), if any. The total fees and expenses you bear may therefore be higher than those shown below.
Analyzing Your Fund's Expenses
To illustrate these ongoing costs, we have provided examples and calculated the expenses paid by investors in each share class of the Fund during the period. The actual and hypothetical information in the table is based on an initial investment of $1,000 at the beginning of the period indicated and held for the entire period. Expense information is calculated two ways and each method provides you with different information. The amount listed in the "Actual" column is calculated using the Fund's actual operating expenses and total return for the period. You may use the Actual information, together with the amount invested, to estimate the expenses that you paid over the period. Simply divide your account value by $1,000 (for example, an $8,600 account value divided by $1,000 = 8.6), then multiply the results by the expenses paid during the period under the "Actual" column. The amount listed in the "Hypothetical" column assumes a 5% annual rate of return before expenses (which is not the Fund's actual return) and then applies the Fund's actual expense ratio for the period to the hypothetical return. You should not use the hypothetical account values and expenses to estimate either your actual account balance at the end of the period or the expenses you paid during the period. See "Compare With Other Funds" below for details on how to use the hypothetical data.
Compare With Other Funds
Since all mutual funds are required to include the same hypothetical calculations about expenses in shareholder reports, you can use this information to compare the ongoing cost of investing in the Fund with other funds. To do so, compare the hypothetical example with the 5% hypothetical examples that appear in the shareholder reports of other funds. As you compare hypothetical examples of other funds, it is important to note that hypothetical examples are meant to highlight the ongoing costs of investing in a fund only and do not reflect any transaction costs, such as redemption or exchange fees, or expenses that apply to the subaccount or the Contract. Therefore, the hypothetical calculations are useful in comparing ongoing costs only, and will not help you determine the relative total costs of owning different funds. If the fees and expenses imposed under your Contract or Qualified Plan, if any, were included, your costs would be higher.
July 1, 2016 – December 31, 2016
| Account Value at the Beginning of the Period ($) | Account Value at the End of the Period ($) | Expenses Paid During the Period ($) | Fund's Annualized Expense Ratio (%) | ||||||||||||||||||||||||||||
Actual | Hypothetical | Actual | Hypothetical | Actual | Hypothetical | Actual | |||||||||||||||||||||||||
Class 1 | 1,000.00 | 1,000.00 | 1,044.80 | 1,020.45 | 4.65 | 4.60 | 0.91 | ||||||||||||||||||||||||
Class 2 | 1,000.00 | 1,000.00 | 1,043.00 | 1,019.20 | 5.92 | 5.86 | 1.16 | ||||||||||||||||||||||||
Expenses paid during the period are equal to the annualized expense ratio for each class as indicated above, multiplied by the average account value over the period and then multiplied by the number of days in the Fund's most recent fiscal half year and divided by 366.
Expenses do not include fees and expenses incurred indirectly by the Fund from its investment in underlying funds, including affiliated and non-affiliated pooled investment vehicles, such as mutual funds and exchange-traded funds.
Annual Report 2016
7
VARIABLE PORTFOLIO — LAZARD INTERNATIONAL EQUITY ADVANTAGE FUND
PORTFOLIO OF INVESTMENTS
December 31, 2016
(Percentages represent value of investments compared to net assets)
Common Stocks 98.3%
Issuer | Shares | Value ($) | |||||||||
AUSTRALIA 7.0% | |||||||||||
Aristocrat Leisure Ltd. | 909,925 | 10,151,672 | |||||||||
BlueScope Steel Ltd. | 429,182 | 2,852,372 | |||||||||
Centamin PLC | 1,332,291 | 2,255,123 | |||||||||
Cochlear Ltd. | 164,720 | 14,538,290 | |||||||||
Computershare Ltd. | 1,069,421 | 9,594,925 | |||||||||
CSL Ltd. | 283,042 | 20,469,548 | |||||||||
Fortescue Metals Group Ltd. | 804,264 | 3,361,021 | |||||||||
Harvey Norman Holdings Ltd. | 1,283,582 | 4,755,989 | |||||||||
JB Hi-Fi Ltd. | 305,252 | 6,169,907 | |||||||||
Magellan Financial Group Ltd. | 178,054 | 3,043,347 | |||||||||
Mineral Resources Ltd. | 265,452 | 2,310,556 | |||||||||
Newcrest Mining Ltd. | 575,613 | 8,253,749 | |||||||||
Saracen Mineral Holdings Ltd.(a) | 1,479,651 | 1,037,950 | |||||||||
Whitehaven Coal Ltd.(a) | 2,400,126 | 4,492,797 | |||||||||
Total | 93,287,246 | ||||||||||
AUSTRIA 0.2% | |||||||||||
Erste Group Bank AG | 91,100 | 2,668,319 | |||||||||
BELGIUM 0.2% | |||||||||||
Colruyt SA | 67,387 | 3,334,297 | |||||||||
CAYMAN ISLANDS 0.2% | |||||||||||
Phoenix Group Holdings | 300,278 | 2,718,175 | |||||||||
CHINA 1.1% | |||||||||||
WH Group Ltd. | 18,891,500 | 15,228,381 | |||||||||
DENMARK 1.3% | |||||||||||
Novo Nordisk A/S, Class B | 314,282 | 11,334,177 | |||||||||
Vestas Wind Systems A/S | 99,201 | 6,447,187 | |||||||||
Total | 17,781,364 | ||||||||||
FINLAND 1.2% | |||||||||||
KONE OYJ, Class B | 367,814 | 16,482,234 | |||||||||
FRANCE 9.9% | |||||||||||
Airbus Group SE | 70,046 | 4,633,442 | |||||||||
AXA SA | 978,970 | 24,716,859 | |||||||||
BNP Paribas SA | 237,998 | 15,169,513 | |||||||||
CNP Assurances | 318,295 | 5,896,939 | |||||||||
Faurecia | 270,848 | 10,501,963 | |||||||||
Hermes International | 15,275 | 6,270,902 | |||||||||
Common Stocks (continued)
Issuer | Shares | Value ($) | |||||||||
Orange SA | 714,462 | 10,856,256 | |||||||||
Peugeot SA(a) | 703,808 | 11,479,684 | |||||||||
Rubis SCA | 22,740 | 1,875,006 | |||||||||
Safran SA | 37,419 | 2,695,004 | |||||||||
Societe Generale SA | 361,477 | 17,786,889 | |||||||||
Ubisoft Entertainment SA(a) | 71,564 | 2,546,217 | |||||||||
Unibail-Rodamco SE | 9,861 | 2,353,707 | |||||||||
Valeo SA | 254,545 | 14,632,580 | |||||||||
Total | 131,414,961 | ||||||||||
GERMANY 6.7% | |||||||||||
Allianz SE, Registered Shares | 40,326 | 6,655,319 | |||||||||
BASF SE | 141,023 | 13,069,511 | |||||||||
Bayer AG, Registered Shares | 87,428 | 9,108,554 | |||||||||
Beiersdorf AG | 30,688 | 2,599,515 | |||||||||
Continental AG | 45,330 | 8,733,132 | |||||||||
Infineon Technologies AG | 461,377 | 7,980,661 | |||||||||
MTU Aero Engines AG | 32,307 | 3,726,608 | |||||||||
| Muenchener Rueckversicherungs- Gesellschaft AG in Muenchen, Registered Shares | 58,470 | 11,043,695 | |||||||||
Rheinmetall AG | 51,487 | 3,455,333 | |||||||||
SAP SE | 114,538 | 9,908,116 | |||||||||
Siemens AG, Registered Shares | 50,223 | 6,149,303 | |||||||||
Uniper SE(a) | 389,797 | 5,365,352 | |||||||||
United Internet AG | 53,408 | 2,084,113 | |||||||||
Total | 89,879,212 | ||||||||||
HONG KONG 3.4% | |||||||||||
CK Hutchison Holdings Ltd. | 473,000 | 5,339,441 | |||||||||
Jardine Matheson Holdings Ltd. | 188,600 | 10,406,528 | |||||||||
Swire Properties Ltd. | 964,400 | 2,654,890 | |||||||||
VTech Holdings Ltd. | 1,152,700 | 15,388,935 | |||||||||
Wharf Holdings Ltd. (The) | 1,017,000 | 6,736,587 | |||||||||
Wheelock & Co., Ltd. | 443,000 | 2,486,225 | |||||||||
Xinyi Glass Holdings Ltd. | 2,702,000 | 2,201,258 | |||||||||
Total | 45,213,864 | ||||||||||
IRELAND 0.1% | |||||||||||
Ryanair Holdings PLC, ADR(a) | 14,486 | 1,206,104 | |||||||||
ISRAEL 0.3% | |||||||||||
Orbotech Ltd.(a) | 134,600 | 4,496,986 | |||||||||
The accompanying Notes to Financial Statements are an integral part of this statement.
Annual Report 2016
8
VARIABLE PORTFOLIO — LAZARD INTERNATIONAL EQUITY ADVANTAGE FUND
PORTFOLIO OF INVESTMENTS (continued)
December 31, 2016
Common Stocks (continued)
Issuer | Shares | Value ($) | |||||||||
ITALY 0.9% | |||||||||||
Assicurazioni Generali SpA | 168,371 | 2,502,570 | |||||||||
Enel SpA | 871,774 | 3,843,216 | |||||||||
Poste Italiane SpA | 385,401 | 2,557,891 | |||||||||
UniCredit SpA | 1,073,592 | 3,089,740 | |||||||||
Total | 11,993,417 | ||||||||||
JAPAN 24.8% | |||||||||||
Asahi Glass Co., Ltd. | 772,000 | 5,237,754 | |||||||||
Astellas Pharma, Inc. | 524,700 | 7,279,349 | |||||||||
Central Japan Railway Co. | 52,400 | 8,603,537 | |||||||||
Daito Trust Construction Co., Ltd. | 158,200 | 23,783,442 | |||||||||
Daiwa House Industry Co., Ltd. | 431,800 | 11,775,349 | |||||||||
Digital Garage, Inc. | 105,500 | 1,816,450 | |||||||||
Fujitsu Ltd. | 437,000 | 2,419,909 | |||||||||
Haseko Corp. | 719,200 | 7,291,984 | |||||||||
Hitachi High-Technologies Corp. | 214,300 | 8,619,240 | |||||||||
Idemitsu Kosan Co., Ltd. | 110,100 | 2,920,439 | |||||||||
JAC Recruitment Co., Ltd. | 126,100 | 1,413,671 | |||||||||
Kakaku.com, Inc. | 329,700 | 5,447,670 | |||||||||
Kanamoto Co., Ltd. | 86,400 | 2,281,939 | |||||||||
KDDI Corp. | 885,900 | 22,371,614 | |||||||||
Lion Corp. | 106,000 | 1,737,486 | |||||||||
Mebuki Financial Group, Inc. | 730,200 | 2,698,767 | |||||||||
Mitsubishi Chemical Holdings Corp. | 2,046,600 | 13,232,625 | |||||||||
Mitsubishi Electric Corp. | 1,910,000 | 26,566,503 | |||||||||
Mitsubishi UFJ Financial Group, Inc. | 4,690,900 | 28,930,302 | |||||||||
Mitsui Chemicals, Inc. | 1,286,000 | 5,761,975 | |||||||||
| MS&AD Insurance Group Holdings, Inc. | 60,000 | 1,858,054 | |||||||||
Nichirei Corp. | 217,000 | 4,486,722 | |||||||||
Nippon Light Metal Holdings Co., Ltd. | 2,654,000 | 5,587,677 | |||||||||
Nippon Telegraph & Telephone Corp. | 237,000 | 9,976,553 | |||||||||
Nissan Motor Co., Ltd. | 2,473,600 | 24,813,036 | |||||||||
ORIX Corp. | 1,279,600 | 19,916,020 | |||||||||
Sumitomo Mitsui Financial Group, Inc. | 963,300 | 36,685,328 | |||||||||
Takeuchi Manufacturing Co., Ltd. | 182,800 | 4,051,249 | |||||||||
Teijin Ltd. | 351,800 | 7,108,365 | |||||||||
Tokyu Fudosan Holdings Corp. | 460,500 | 2,712,144 | |||||||||
Toray Industries, Inc. | 293,000 | 2,366,131 | |||||||||
Common Stocks (continued)
Issuer | Shares | Value ($) | |||||||||
Unitika Ltd.(a) | 3,382,000 | 2,423,343 | |||||||||
West Japan Railway Co. | 311,100 | 19,056,729 | |||||||||
Total | 331,231,356 | ||||||||||
NETHERLANDS 2.7% | |||||||||||
AerCap Holdings NV(a) | 160,228 | 6,667,087 | |||||||||
| ASML Holding NV | 24,934 | 2,799,220 | |||||||||
Koninklijke Vopak NV | 129,631 | 6,123,469 | |||||||||
NN Group NV | 342,616 | 11,611,284 | |||||||||
Unilever NV-CVA | 198,661 | 8,179,751 | |||||||||
Total | 35,380,811 | ||||||||||
NORWAY 1.7% | |||||||||||
Aker BP ASA | 275,122 | 4,922,366 | |||||||||
DNB ASA | 278,992 | 4,148,364 | |||||||||
SalMar ASA | 108,251 | 3,235,489 | |||||||||
Subsea 7 SA(a) | 819,286 | 10,369,928 | |||||||||
Total | 22,676,147 | ||||||||||
PORTUGAL 1.1% | |||||||||||
Galp Energia SGPS SA | 509,198 | 7,605,946 | |||||||||
Jeronimo Martins SGPS SA | 446,270 | 6,924,355 | |||||||||
Total | 14,530,301 | ||||||||||
SINGAPORE 1.3% | |||||||||||
CapitaLand Ltd. | 1,507,200 | 3,132,132 | |||||||||
Singapore Exchange Ltd. | 484,000 | 2,386,705 | |||||||||
United Overseas Bank Ltd. | 807,400 | 11,343,081 | |||||||||
Total | 16,861,918 | ||||||||||
SPAIN 4.4% | |||||||||||
Banco Bilbao Vizcaya Argentaria SA | 1,144,001 | 7,723,951 | |||||||||
Banco Santander SA | 5,019,741 | 26,203,517 | |||||||||
CaixaBank SA | 2,451,183 | 8,101,950 | |||||||||
Ebro Foods SA | 143,654 | 3,009,983 | |||||||||
Industria de Diseno Textil SA | 312,970 | 10,683,999 | |||||||||
| International Consolidated Airlines Group SA | 483,480 | 2,610,330 | |||||||||
Total | 58,333,730 | ||||||||||
SWEDEN 2.2% | |||||||||||
Atlas Copco AB, Class A | 125,343 | 3,817,826 | |||||||||
Bonava AB, Class B(a) | 161,955 | 2,510,048 | |||||||||
Electrolux AB, Class B | 501,806 | 12,464,459 | |||||||||
The accompanying Notes to Financial Statements are an integral part of this statement.
Annual Report 2016
9
VARIABLE PORTFOLIO — LAZARD INTERNATIONAL EQUITY ADVANTAGE FUND
PORTFOLIO OF INVESTMENTS (continued)
December 31, 2016
Common Stocks (continued)
Issuer | Shares | Value ($) | |||||||||
Husqvarna AB, Class B | 273,224 | 2,124,769 | |||||||||
Intrum Justitia AB | 123,486 | 4,166,531 | |||||||||
NCC AB, Class B | 161,955 | 4,006,833 | |||||||||
Total | 29,090,466 | ||||||||||
SWITZERLAND 8.9% | |||||||||||
Actelion Ltd., Registered Shares | 52,098 | 11,281,164 | |||||||||
Geberit AG | 4,414 | 1,769,414 | |||||||||
Georg Fischer AG, Registered Shares | 2,884 | 2,362,031 | |||||||||
Logitech International SA | 245,998 | 6,136,059 | |||||||||
Nestlé SA, Registered Shares | 509,065 | 36,518,902 | |||||||||
Partners Group Holding AG | 35,322 | 16,554,478 | |||||||||
| Roche Holding AG, Genusschein Shares | 167,150 | 38,180,389 | |||||||||
| Swiss Life Holding AG, Registered Shares | 12,579 | 3,560,118 | |||||||||
Syngenta AG, Registered Shares | 5,029 | 1,987,796 | |||||||||
Total | 118,350,351 | ||||||||||
UNITED KINGDOM 18.7% | |||||||||||
Admiral Group PLC | 277,695 | 6,245,103 | |||||||||
Bellway PLC | 174,757 | 5,327,067 | |||||||||
Berendsen PLC | 151,683 | 1,626,272 | |||||||||
| BP PLC | 750,740 | 4,702,206 | |||||||||
British American Tobacco PLC | 364,295 | 20,646,571 | |||||||||
BT Group PLC | 5,187,552 | 23,418,173 | |||||||||
Centrica PLC | 4,314,812 | 12,426,850 | |||||||||
Compass Group PLC | 420,996 | 7,780,661 | |||||||||
DS Smith PLC | 500,225 | 2,511,925 | |||||||||
Experian PLC | 464,929 | 9,001,785 | |||||||||
GlaxoSmithKline PLC | 1,024,029 | 19,670,063 | |||||||||
Common Stocks (continued)
Issuer | Shares | Value ($) | |||||||||
Hargreaves Lansdown PLC | 366,010 | 5,446,366 | |||||||||
HSBC Holdings PLC | 803,328 | 6,481,744 | |||||||||
| International Consolidated Airlines Group SA | 324,287 | 1,757,118 | |||||||||
International Game Technology PLC | 311,294 | 7,944,223 | |||||||||
Marks & Spencer Group PLC | 315,560 | 1,359,333 | |||||||||
National Grid PLC | 270,899 | 3,165,115 | |||||||||
Provident Financial PLC | 59,783 | 2,090,753 | |||||||||
Reckitt Benckiser Group PLC | 298,145 | 25,255,258 | |||||||||
Rightmove PLC | 101,613 | 4,881,123 | |||||||||
Royal Dutch Shell PLC, Class A | 808,792 | 22,122,986 | |||||||||
Royal Dutch Shell PLC, Class B | 253,861 | 7,293,909 | |||||||||
Scottish & Southern Energy PLC | 1,443,144 | 27,555,482 | |||||||||
Sky PLC | 743,140 | 9,059,569 | |||||||||
William Hill PLC | 659,262 | 2,354,716 | |||||||||
Wolseley PLC | 145,787 | 8,899,739 | |||||||||
Total | 249,024,110 | ||||||||||
| Total Common Stocks (Cost: $1,281,344,360) | 1,311,183,750 | ||||||||||
Money Market Funds 1.5%
Shares | Value ($) | ||||||||||
| Columbia Short-Term Cash Fund, 0.594%(b)(c) | 20,307,263 | 20,307,263 | |||||||||
| Total Money Market Funds (Cost: $20,307,263) | 20,307,263 | ||||||||||
| Total Investments (Cost: $1,301,651,623) | 1,331,491,013 | ||||||||||
Other Assets & Liabilities, Net | 2,226,376 | ||||||||||
Net Assets | 1,333,717,389 | ||||||||||
The accompanying Notes to Financial Statements are an integral part of this statement.
Annual Report 2016
10
VARIABLE PORTFOLIO — LAZARD INTERNATIONAL EQUITY ADVANTAGE FUND
PORTFOLIO OF INVESTMENTS (continued)
December 31, 2016
Notes to Portfolio of Investments
(a) Non-income producing investment.
(b) The rate shown is the seven-day current annualized yield at December 31, 2016.
(c) As defined in the Investment Company Act of 1940, an affiliated company is one in which the Fund owns 5% or more of the company's outstanding voting securities, or a company which is under common ownership or control with the Fund. Holdings and transactions in these affiliated companies during the year ended December 31, 2016 are as follows:
Issuer | Beginning Cost ($) | Purchase Cost ($) | Proceeds From Sales ($) | Realized Gain (Loss) ($) | Ending Cost ($) | Dividends — Affiliated Issuers ($) | Value ($) | ||||||||||||||||||||||||
| Columbia Short-Term Cash Fund | 52,236,119 | 511,005,808 | (542,936,357 | ) | 1,693 | 20,307,263 | 133,083 | 20,307,263 | |||||||||||||||||||||||
Abbreviation Legend
ADR American Depositary Receipt
Fair Value Measurements
The Fund categorizes its fair value measurements according to a three-level hierarchy that maximizes the use of observable inputs and minimizes the use of unobservable inputs by prioritizing that the most observable input be used when available. Observable inputs are those that market participants would use in pricing an investment based on market data obtained from sources independent of the reporting entity. Unobservable inputs are those that reflect the Fund's assumptions about the information market participants would use in pricing an investment. An investment's level within the fair value hierarchy is based on the lowest level of any input that is deemed significant to the asset's or liability's fair value measurement. The input levels are not necessarily an indication of the risk or liquidity associated with investments at that level. For example, certain U.S. government securities are generally high quality and liquid, however, they are reflected as Level 2 because the inputs used to determine fair value may not always be quoted prices in an active market.
Fair value inputs are summarized in the three broad levels listed below:
> Level 1 — Valuations based on quoted prices for investments in active markets that the Fund has the ability to access at the measurement date (including NAV for open-end mutual funds). Valuation adjustments are not applied to Level 1 investments.
> Level 2 — Valuations based on other significant observable inputs (including quoted prices for similar securities, interest rates, prepayment speeds, credit risks, etc.).
> Level 3 — Valuations based on significant unobservable inputs (including the Fund's own assumptions and judgment in determining the fair value of investments).
Inputs that are used in determining fair value of an investment may include price information, credit data, volatility statistics, and other factors. These inputs can be either observable or unobservable. The availability of observable inputs can vary between investments, and is affected by various factors such as the type of investment, and the volume and level of activity for that investment or similar investments in the marketplace. The inputs will be considered by the Investment Manager, along with any other relevant factors in the calculation of an investment's fair value. The Fund uses prices and inputs that are current as of the measurement date, which may include periods of market dislocations. During these periods, the availability of prices and inputs may be reduced for many investments. This condition could cause an investment to be reclassified between the various levels within the hierarchy.
Foreign equity securities actively traded in markets where there is a significant delay in the local close relative to the New York Stock Exchange (NYSE) are classified as Level 2. The values of these securities may include an adjustment to reflect the impact of significant market movements following the close of local trading, as described in Note 2 to the financial statements — Security Valuation.
Certain investments that have been measured at fair value using the net asset value (NAV) per share (or its equivalent) are not categorized in the fair value hierarchy. The fair value amounts presented in the table are intended to reconcile the fair value hierarchy to the amounts presented in the Portfolio of Investments. The Columbia Short-Term Cash Fund seeks to provide shareholders with maximum current income consistent with liquidity and stability of principal. Columbia Short-Term Cash Fund prices its shares with a floating NAV and no longer seeks to maintain a stable NAV.
Investments falling into the Level 3 category are primarily supported by quoted prices from brokers and dealers participating in the market for those investments. However, these may be classified as Level 3 investments due to lack of market transparency and corroboration to support these quoted prices. Additionally, valuation models may be used as the pricing source for any remaining investments classified as Level 3. These models may rely on one or more significant unobservable inputs and/or significant assumptions by the Investment Manager. Inputs used in valuations may include, but are not limited to, financial statement analysis, capital account balances, discount rates and estimated cash flows, and comparable company data.
The accompanying Notes to Financial Statements are an integral part of this statement.
Annual Report 2016
11
VARIABLE PORTFOLIO — LAZARD INTERNATIONAL EQUITY ADVANTAGE FUND
PORTFOLIO OF INVESTMENTS (continued)
December 31, 2016
Fair Value Measurements (continued)
Under the direction of the Fund's Board of Trustees (the Board), the Investment Manager's Valuation Committee (the Committee) is responsible for overseeing the valuation procedures approved by the Board. The Committee consists of voting and non-voting members from various groups within the Investment Manager's organization, including operations and accounting, trading and investments, compliance, risk management and legal.
The Committee meets at least monthly to review and approve valuation matters, which may include a description of specific valuation determinations, data regarding pricing information received from approved pricing vendors and brokers and the results of Board-approved valuation control policies and procedures (the Policies). The Policies address, among other things, instances when market quotations are or are not readily available, including recommendations of third party pricing vendors and a determination of appropriate pricing methodologies; events that require specific valuation determinations and assessment of fair value techniques; securities with a potential for stale pricing, including those that are illiquid, restricted, or in default; and the effectiveness of third party pricing vendors, including periodic reviews of vendors. The Committee meets more frequently, as needed, to discuss additional valuation matters, which may include the need to review back-testing results, review time-sensitive information or approve related valuation actions. The Committee reports to the Board, with members of the Committee meeting with the Board at each of its regularly scheduled meetings to discuss valuation matters and actions during the period, similar to those described earlier.
For investments categorized as Level 3, the Committee monitors information similar to that described above, which may include: (i) data specific to the issuer or comparable issuers, (ii) general market or specific sector news and (iii) quoted prices and specific or similar security transactions. The Committee considers this data and any changes from prior periods in order to assess the reasonableness of observable and unobservable inputs, any assumptions or internal models used to value those securities and changes in fair value. This data is also used to corroborate, when available, information received from approved pricing vendors and brokers. Various factors impact the frequency of monitoring this information (which may occur as often as daily). However, the Committee may determine that changes to inputs, assumptions and models are not required as a result of the monitoring procedures performed.
The following table is a summary of the inputs used to value the Fund's investments at December 31, 2016:
| Level 1 Quoted Prices in Active Markets for Identical Assets ($) | Level 2 Other Significant Observable Inputs ($) | Level 3 Significant Unobservable Inputs ($) | Total ($) | ||||||||||||||||
Investments | |||||||||||||||||||
Common Stocks | |||||||||||||||||||
Australia | — | 93,287,246 | — | 93,287,246 | |||||||||||||||
Austria | — | 2,668,319 | — | 2,668,319 | |||||||||||||||
Belgium | — | 3,334,297 | — | 3,334,297 | |||||||||||||||
Cayman Islands | — | 2,718,175 | — | 2,718,175 | |||||||||||||||
China | — | 15,228,381 | — | 15,228,381 | |||||||||||||||
Denmark | — | 17,781,364 | — | 17,781,364 | |||||||||||||||
Finland | — | 16,482,234 | — | 16,482,234 | |||||||||||||||
France | — | 131,414,961 | — | 131,414,961 | |||||||||||||||
Germany | — | 89,879,212 | — | 89,879,212 | |||||||||||||||
Hong Kong | — | 45,213,864 | — | 45,213,864 | |||||||||||||||
Ireland | 1,206,104 | — | — | 1,206,104 | |||||||||||||||
Israel | 4,496,986 | — | — | 4,496,986 | |||||||||||||||
Italy | — | 11,993,417 | — | 11,993,417 | |||||||||||||||
Japan | — | 331,231,356 | — | 331,231,356 | |||||||||||||||
Netherlands | 6,667,087 | 28,713,724 | — | 35,380,811 | |||||||||||||||
Norway | — | 22,676,147 | — | 22,676,147 | |||||||||||||||
Portugal | — | 14,530,301 | — | 14,530,301 | |||||||||||||||
Singapore | — | 16,861,918 | — | 16,861,918 | |||||||||||||||
Spain | — | 58,333,730 | — | 58,333,730 | |||||||||||||||
Sweden | — | 29,090,466 | — | 29,090,466 | |||||||||||||||
The accompanying Notes to Financial Statements are an integral part of this statement.
Annual Report 2016
12
VARIABLE PORTFOLIO — LAZARD INTERNATIONAL EQUITY ADVANTAGE FUND
PORTFOLIO OF INVESTMENTS (continued)
December 31, 2016
Fair Value Measurements (continued)
| Level 1 Quoted Prices in Active Markets for Identical Assets ($) | Level 2 Other Significant Observable Inputs ($) | Level 3 Significant Unobservable Inputs ($) | Total ($) | ||||||||||||||||
Switzerland | — | 118,350,351 | — | 118,350,351 | |||||||||||||||
United Kingdom | 7,944,223 | 241,079,887 | — | 249,024,110 | |||||||||||||||
Total Common Stocks | 20,314,400 | 1,290,869,350 | — | 1,311,183,750 | |||||||||||||||
Investments measured at net asset value | |||||||||||||||||||
Money Market Funds | — | — | — | 20,307,263 | |||||||||||||||
Total Investments | 20,314,400 | 1,290,869,350 | — | 1,331,491,013 | |||||||||||||||
See the Portfolio of Investments for all investment classifications not indicated in the table.
The Fund's assets assigned to the Level 2 input category are generally valued using the market approach, in which a security's value is determined through reference to prices and information from market transactions for similar or identical assets. These assets include certain foreign securities for which a third party statistical pricing service may be employed for purposes of fair market valuation. The model utilized by such third party statistical pricing service takes into account a security's correlation to available market data including, but not limited to, intraday index, ADR, and exchange-traded fund movements.
There were no transfers of financial assets between levels during the period.
The accompanying Notes to Financial Statements are an integral part of this statement.
Annual Report 2016
13
VARIABLE PORTFOLIO — LAZARD INTERNATIONAL EQUITY ADVANTAGE FUND
STATEMENT OF ASSETS AND LIABILITIES
December 31, 2016
Assets | |||||||
Investments, at value | |||||||
Unaffiliated issuers (identified cost $1,281,344,360) | $ | 1,311,183,750 | |||||
Affiliated issuers (identified cost $20,307,263) | 20,307,263 | ||||||
Total investments (identified cost $1,301,651,623) | 1,331,491,013 | ||||||
Receivable for: | |||||||
Capital shares sold | 7,923 | ||||||
Dividends | 700,898 | ||||||
Foreign tax reclaims | 2,566,105 | ||||||
Prepaid expenses | 6,912 | ||||||
Trustees' deferred compensation plan | 26,433 | ||||||
Total assets | 1,334,799,284 | ||||||
Liabilities | |||||||
Payable for: | |||||||
Capital shares purchased | 15,979 | ||||||
Management services fees | 895,342 | ||||||
Distribution and/or service fees | 1,108 | ||||||
Transfer agent fees | 64,975 | ||||||
Compensation of board members | 2,126 | ||||||
Chief compliance officer expenses | 146 | ||||||
Other expenses | 75,786 | ||||||
Trustees' deferred compensation plan | 26,433 | ||||||
Total liabilities | 1,081,895 | ||||||
Net assets applicable to outstanding capital stock | $ | 1,333,717,389 | |||||
Represented by | |||||||
Paid-in capital | $ | 1,375,490,029 | |||||
Undistributed net investment income | 2,265,631 | ||||||
Accumulated net realized loss | (73,691,396 | ) | |||||
Unrealized appreciation (depreciation) on: | |||||||
Investments — unaffiliated issuers | 29,839,390 | ||||||
Foreign currency translations | (186,265 | ) | |||||
Total — representing net assets applicable to outstanding capital stock | $ | 1,333,717,389 | |||||
The accompanying Notes to Financial Statements are an integral part of this statement.
Annual Report 2016
14
VARIABLE PORTFOLIO — LAZARD INTERNATIONAL EQUITY ADVANTAGE FUND
STATEMENT OF ASSETS AND LIABILITIES (continued)
December 31, 2016
Class 1 | |||||||
Net assets | $ | 1,327,953,623 | |||||
Shares outstanding | 135,753,528 | ||||||
Net asset value per share | $ | 9.78 | |||||
Class 2 | |||||||
Net assets | $ | 5,763,766 | |||||
Shares outstanding | 589,316 | ||||||
Net asset value per share | $ | 9.78 | |||||
The accompanying Notes to Financial Statements are an integral part of this statement.
Annual Report 2016
15
VARIABLE PORTFOLIO — LAZARD INTERNATIONAL EQUITY ADVANTAGE FUND
STATEMENT OF OPERATIONS
Year Ended December 31, 2016
Net investment income | |||||||
Income: | |||||||
Dividends — unaffiliated issuers | $ | 41,508,675 | |||||
Dividends — affiliated issuers | 133,083 | ||||||
Foreign taxes withheld | (3,247,186 | ) | |||||
Total income | 38,394,572 | ||||||
Expenses: | |||||||
Management services fees | 10,521,352 | ||||||
Distribution and/or service fees | |||||||
Class 2 | 9,425 | ||||||
Transfer agent fees | |||||||
Class 1 | 759,280 | ||||||
Class 2 | 2,262 | ||||||
Compensation of board members | 40,495 | ||||||
Custodian fees | 163,041 | ||||||
Printing and postage fees | 18,696 | ||||||
Audit fees | 35,736 | ||||||
Legal fees | 30,384 | ||||||
Chief compliance officer expenses | 595 | ||||||
Other | 37,624 | ||||||
Total expenses | 11,618,890 | ||||||
Net investment income | 26,775,682 | ||||||
Realized and unrealized gain (loss) — net | |||||||
Net realized gain (loss) on: | |||||||
Investments — unaffiliated issuers | (58,261,977 | ) | |||||
Investments — affiliated issuers | 1,693 | ||||||
Foreign currency translations | (1,461,221 | ) | |||||
Net realized loss | (59,721,505 | ) | |||||
Net change in unrealized appreciation (depreciation) on: | |||||||
Investments — unaffiliated issuers | 85,236,415 | ||||||
Foreign currency translations | 27,923 | ||||||
Net change in unrealized appreciation | 85,264,338 | ||||||
Net realized and unrealized gain | 25,542,833 | ||||||
Net increase in net assets resulting from operations | $ | 52,318,515 | |||||
The accompanying Notes to Financial Statements are an integral part of this statement.
Annual Report 2016
16
VARIABLE PORTFOLIO — LAZARD INTERNATIONAL EQUITY ADVANTAGE FUND
STATEMENT OF CHANGES IN NET ASSETS
| Year Ended December 31, 2016 | Year Ended December 31, 2015 | ||||||||||
Operations | |||||||||||
Net investment income | $ | 26,775,682 | $ | 29,922,717 | |||||||
Net realized gain (loss) | (59,721,505 | ) | 4,063,817 | ||||||||
Net change in unrealized appreciation (depreciation) | 85,264,338 | (74,400,065 | ) | ||||||||
Net increase (decrease) in net assets resulting from operations | 52,318,515 | (40,413,531 | ) | ||||||||
Distributions to shareholders | |||||||||||
Net investment income | |||||||||||
Class 1 | (26,921,487 | ) | (37,229,908 | ) | |||||||
Class 2 | (70,854 | ) | (86,978 | ) | |||||||
Total distributions to shareholders | (26,992,341 | ) | (37,316,886 | ) | |||||||
Increase in net assets from capital stock activity | 64,804,875 | 72,077,944 | |||||||||
Total increase (decrease) in net assets | 90,131,049 | (5,652,473 | ) | ||||||||
Net assets at beginning of year | 1,243,586,340 | 1,249,238,813 | |||||||||
Net assets at end of year | $ | 1,333,717,389 | $ | 1,243,586,340 | |||||||
Undistributed net investment income | $ | 2,265,631 | $ | 3,785,796 | |||||||
The accompanying Notes to Financial Statements are an integral part of this statement.
Annual Report 2016
17
VARIABLE PORTFOLIO — LAZARD INTERNATIONAL EQUITY ADVANTAGE FUND
STATEMENT OF CHANGES IN NET ASSETS (continued)
Year Ended December 31, 2016 | Year Ended December 31, 2015 | ||||||||||||||||||
Shares | Dollars ($) | Shares | Dollars ($) | ||||||||||||||||
Capital stock activity | |||||||||||||||||||
Class 1 shares | |||||||||||||||||||
Subscriptions | 3,976,683 | 38,069,425 | 30,646,292 | 318,302,806 | |||||||||||||||
Distributions reinvested | 2,808,550 | 26,921,487 | 3,751,883 | 37,229,908 | |||||||||||||||
Redemptions | (250,766 | ) | (2,429,698 | ) | (26,896,309 | ) | (284,910,440 | ) | |||||||||||
Net increase | 6,534,467 | 62,561,214 | 7,501,866 | 70,622,274 | |||||||||||||||
Class 2 shares | |||||||||||||||||||
Subscriptions | 329,607 | 3,173,878 | 194,258 | 2,021,329 | |||||||||||||||
Distributions reinvested | 7,390 | 70,854 | 8,795 | 86,978 | |||||||||||||||
Redemptions | (107,151 | ) | (1,001,071 | ) | (63,217 | ) | (652,637 | ) | |||||||||||
Net increase | 229,846 | 2,243,661 | 139,836 | 1,455,670 | |||||||||||||||
Total net increase | 6,764,313 | 64,804,875 | 7,641,702 | 72,077,944 | |||||||||||||||
The accompanying Notes to Financial Statements are an integral part of this statement.
Annual Report 2016
18
VARIABLE PORTFOLIO — LAZARD INTERNATIONAL EQUITY ADVANTAGE FUND
FINANCIAL HIGHLIGHTS
The following tables are intended to help you understand the Fund's financial performance. Certain information reflects financial results for a single share of a class held for the periods shown. Per share net investment income (loss) amounts are calculated based on average shares outstanding during the period. Total return assumes reinvestment of all dividends and distributions, if any. Total return does not reflect any fees and expenses imposed under your Contract and/or Qualified Plan, as applicable; such fees and expenses would reduce the total returns for all periods shown. Total return and portfolio turnover are not annualized for periods of less than one year. The portfolio turnover rate is calculated without regard to purchase and sales transactions of short-term instruments and certain derivatives, if any. If such transactions were included, the Fund's portfolio turnover rate may be higher.
Year Ended December 31, | |||||||||||||||||||
Class 1 | 2016 | 2015 | 2014 | 2013(a) | |||||||||||||||
Per share data | |||||||||||||||||||
Net asset value, beginning of period | $ | 9.60 | $ | 10.24 | $ | 10.52 | $ | 10.00 | |||||||||||
Income from investment operations: | |||||||||||||||||||
Net investment income | 0.20 | 0.24 | 0.26 | 0.10 | |||||||||||||||
Net realized and unrealized gain (loss) | 0.18 | (0.58 | ) | (0.26 | ) | 0.50 | |||||||||||||
Total from investment operations | 0.38 | (0.34 | ) | — | 0.60 | ||||||||||||||
Less distributions to shareholders: | |||||||||||||||||||
Net investment income | (0.20 | ) | (0.30 | ) | (0.27 | ) | (0.08 | ) | |||||||||||
Net realized gains | — | — | (0.01 | ) | — | ||||||||||||||
Total distributions to shareholders | (0.20 | ) | (0.30 | ) | (0.28 | ) | (0.08 | ) | |||||||||||
Net asset value, end of period | $ | 9.78 | $ | 9.60 | $ | 10.24 | $ | 10.52 | |||||||||||
Total return | 4.06 | % | (3.37 | %) | (0.05 | %) | 6.06 | % | |||||||||||
Ratios to average net assets(b) | |||||||||||||||||||
Total gross expenses | 0.91 | % | 0.92 | % | 0.93 | % | 0.95 | %(c) | |||||||||||
Total net expenses(d) | 0.91 | % | 0.92 | % | 0.90 | % | 0.95 | %(c) | |||||||||||
Net investment income | 2.11 | % | 2.35 | % | 2.43 | % | 1.42 | %(c) | |||||||||||
Supplemental data | |||||||||||||||||||
Net assets, end of period (in thousands) | $ | 1,327,954 | $ | 1,240,134 | $ | 1,246,988 | $ | 922,325 | |||||||||||
Portfolio turnover | 129 | % | 12 | % | 8 | % | 3 | % | |||||||||||
Notes to Financial Highlights
(a) Based on operations from April 30, 2013 (commencement of operations) through the stated period end.
(b) In addition to the fees and expenses that the Fund bears directly, the Fund indirectly bears a pro rata share of the fees and expenses of any other funds in which it invests. Such indirect expenses are not included in the Fund's reported expense ratios.
(c) Annualized.
(d) Total net expenses include the impact of certain fee waivers/expense reimbursements made by the Investment Manager and certain of its affiliates, if applicable.
The accompanying Notes to Financial Statements are an integral part of this statement.
Annual Report 2016
19
VARIABLE PORTFOLIO — LAZARD INTERNATIONAL EQUITY ADVANTAGE FUND
FINANCIAL HIGHLIGHTS (continued)
Year Ended December 31, | |||||||||||||||||||
Class 2 | 2016 | 2015 | 2014 | 2013(a) | |||||||||||||||
Per share data | |||||||||||||||||||
Net asset value, beginning of period | $ | 9.60 | $ | 10.25 | $ | 10.52 | $ | 10.00 | |||||||||||
Income from investment operations: | |||||||||||||||||||
Net investment income | 0.16 | 0.21 | 0.21 | 0.06 | |||||||||||||||
Net realized and unrealized gain (loss) | 0.21 | (0.58 | ) | (0.22 | ) | 0.53 | |||||||||||||
Total from investment operations | 0.37 | (0.37 | ) | (0.01 | ) | 0.59 | |||||||||||||
Less distributions to shareholders: | |||||||||||||||||||
Net investment income | (0.19 | ) | (0.28 | ) | (0.25 | ) | (0.07 | ) | |||||||||||
Net realized gains | — | — | (0.01 | ) | — | ||||||||||||||
Total distributions to shareholders | (0.19 | ) | (0.28 | ) | (0.26 | ) | (0.07 | ) | |||||||||||
Net asset value, end of period | $ | 9.78 | $ | 9.60 | $ | 10.25 | $ | 10.52 | |||||||||||
Total return | 3.87 | % | (3.71 | %) | (0.20 | %) | 5.88 | % | |||||||||||
Ratios to average net assets(b) | |||||||||||||||||||
Total gross expenses | 1.17 | % | 1.17 | % | 1.18 | % | 1.21 | %(c) | |||||||||||
Total net expenses(d) | 1.17 | % | 1.17 | % | 1.15 | % | 1.21 | %(c) | |||||||||||
Net investment income | 1.68 | % | 2.09 | % | 1.99 | % | 0.87 | %(c) | |||||||||||
Supplemental data | |||||||||||||||||||
Net assets, end of period (in thousands) | $ | 5,764 | $ | 3,452 | $ | 2,251 | $ | 876 | |||||||||||
Portfolio turnover | 129 | % | 12 | % | 8 | % | 3 | % | |||||||||||
Notes to Financial Highlights
(a) Based on operations from April 30, 2013 (commencement of operations) through the stated period end.
(b) In addition to the fees and expenses that the Fund bears directly, the Fund indirectly bears a pro rata share of the fees and expenses of any other funds in which it invests. Such indirect expenses are not included in the Fund's reported expense ratios.
(c) Annualized.
(d) Total net expenses include the impact of certain fee waivers/expense reimbursements made by the Investment Manager and certain of its affiliates, if applicable.
The accompanying Notes to Financial Statements are an integral part of this statement.
Annual Report 2016
20
VARIABLE PORTFOLIO — LAZARD INTERNATIONAL EQUITY ADVANTAGE FUND
NOTES TO FINANCIAL STATEMENTS
December 31, 2016
Note 1. Organization
Variable Portfolio — Lazard International Equity Advantage Fund (formerly known as Variable Portfolio — Pyrford International Equity Fund) (the Fund), a series of Columbia Funds Variable Insurance Trust (the Trust), is a diversified fund. The Trust is registered under the Investment Company Act of 1940, as amended (the 1940 Act), as an open-end management investment company organized as a Massachusetts business trust. Effective May 1, 2016, Variable Portfolio — Pyrford International Equity Fund was renamed Variable Portfolio — Lazard International Equity Advantage Fund.
Fund Shares
The Trust may issue an unlimited number of shares (without par value). The Fund offers Class 1 and Class 2 shares to separate accounts funding variable annuity contracts and variable life insurance policies (collectively, Contracts) issued by affiliated and unaffiliated life insurance companies as well as qualified pension and retirement plans (Qualified Plans) and other qualified institutional investors (Qualified Investors) authorized by Columbia Management Investment Distributors, Inc. (the Distributor). You may not buy (nor will you own) shares of the Fund directly. You may invest by participating in a Qualified Plan or by buying a Contract and making allocations to the Fund. Although all share classes generally have identical voting, dividend and liquidation rights, each share class votes separately when required by the Trust's organizational documents or by law. Different share classes pay different distribution amounts to the extent the expenses of such share classes differ, and distributions in liquidation will be proportional to the net asset value of each share class. Each share class has its own cost structure and other features.
Note 2. Summary of Significant Accounting Policies
Basis of Preparation
The Fund is an investment company that applies the accounting and reporting guidance in the Financial Accounting Standards Board (FASB) Accounting Standards Codification Topic 946, Financial Services — Investment Companies (ASC 946). The financial statements are prepared in accordance with U.S. generally accepted accounting principles (GAAP), which requires management to make certain estimates and assumptions that affect the reported amounts of assets and liabilities, the disclosure of contingent assets and
liabilities at the date of the financial statements and the reported amounts of income and expenses during the reporting period. Actual results could differ from those estimates.
The following is a summary of significant accounting policies followed by the Fund in the preparation of its financial statements.
Security Valuation
All equity securities are valued at the close of business of the New York Stock Exchange. Equity securities are valued at the last quoted sales price on the principal exchange or market on which they trade, except for securities traded on the NASDAQ Stock Market, which are valued at the NASDAQ official close price. Unlisted securities or listed securities for which there were no sales during the day are valued at the mean of the latest quoted bid and ask prices on such exchanges or markets.
Foreign equity securities are valued based on the closing price on the foreign exchange in which such securities are primarily traded. If any foreign equity security closing prices are not readily available, the securities are valued at the mean of the latest quoted bid and ask prices on such exchanges or markets. Foreign currency exchange rates are generally determined at 4:00 p.m. Eastern (U.S.) time. Many securities markets and exchanges outside the U.S. close prior to the close of the New York Stock Exchange; therefore, the closing prices for securities in such markets or on such exchanges may not fully reflect events that occur after such close but before the close of the New York Stock Exchange. In those situations, foreign securities will be fair valued pursuant to a policy adopted by the Board of Trustees, including, if available, utilizing a third party pricing service to determine these fair values. The third party pricing service takes into account multiple factors, including, but not limited to, movements in the U.S. securities markets, certain depositary receipts, futures contracts and foreign exchange rates that have occurred subsequent to the close of the foreign exchange or market, to determine a good faith estimate that reasonably reflects the current market conditions as of the close of the New York Stock Exchange. The fair value of a security is likely to be different from the quoted or published price, if available.
Investments in open-end investment companies, including money market funds, are valued at their latest net asset value.
Annual Report 2016
21
VARIABLE PORTFOLIO — LAZARD INTERNATIONAL EQUITY ADVANTAGE FUND
NOTES TO FINANCIAL STATEMENTS (continued)
December 31, 2016
Investments for which market quotations are not readily available, or that have quotations which management believes are not reflective of market value or reliable, are valued at fair value as determined in good faith under procedures approved by and under the general supervision of the Board of Trustees. If a security or class of securities (such as foreign securities) is valued at fair value, such value is likely to be different from the quoted or published price for the security.
The determination of fair value often requires significant judgment. To determine fair value, management may use assumptions including but not limited to future cash flows and estimated risk premiums. Multiple inputs from various sources may be used to determine fair value.
GAAP requires disclosure regarding the inputs and valuation techniques used to measure fair value and any changes in valuation inputs or techniques. In addition, investments shall be disclosed by major category. This information is disclosed following the Fund's Portfolio of Investments.
Foreign Currency Transactions and Translations
The values of all assets and liabilities denominated in foreign currencies are generally translated into U.S. dollars at exchange rates determined at the close of regular trading on the New York Stock Exchange. Net realized and unrealized gains (losses) on foreign currency transactions and translations include gains (losses) arising from the fluctuation in exchange rates between trade and settlement dates on securities transactions, gains (losses) arising from the disposition of foreign currency and currency gains (losses) between the accrual and payment dates on dividends, interest income and foreign withholding taxes.
For financial statement purposes, the Fund does not distinguish that portion of gains (losses) on investments which is due to changes in foreign exchange rates from that which is due to changes in market prices of the investments. Such fluctuations are included with the net realized and unrealized gains (losses) on investments in the Statement of Operations.
Security Transactions
Security transactions are accounted for on the trade date. Cost is determined and gains (losses) are based upon the specific identification method for both financial statement and federal income tax purposes.
Income Recognition
Corporate actions and dividend income are generally recorded net of any non-reclaimable tax withholdings, on the ex-dividend date or upon receipt of ex-dividend notification in the case of certain foreign securities.
Awards from class action litigation are recorded as a reduction of cost basis if the Fund still owns the applicable securities on the payment date. If the Fund no longer owns the applicable securities, the proceeds are recorded as realized gains.
Expenses
General expenses of the Trust are allocated to the Fund and other funds of the Trust based upon relative net assets or other expense allocation methodologies determined by the nature of the expense. Expenses directly attributable to the Fund are charged to the Fund. Expenses directly attributable to a specific class of shares are charged to that share class.
Determination of Class Net Asset Value
All income, expenses (other than class-specific expenses, which are charged to that share class, as shown in the Statement of Operations) and realized and unrealized gains (losses) are allocated to each class of the Fund on a daily basis, based on the relative net assets of each class, for purposes of determining the net asset value of each class.
Federal Income Tax Status
The Fund intends to qualify each year as a regulated investment company under Subchapter M of the Internal Revenue Code, as amended, and will distribute substantially all of its taxable income, if any, for its tax year, and as such will not be subject to federal income taxes. In addition, because the Fund meets the exception under Internal Revenue Code Section 4982(f), the Fund expects not to be subject to federal excise tax. Therefore, no federal income or excise tax provision is recorded.
Foreign Taxes
The Fund may be subject to foreign taxes on income, gains on investments or currency repatriation, a portion of which may be recoverable. The Fund will accrue such taxes and recoveries, as applicable, based upon its current interpretation of tax rules and regulations that exist in the markets in which it invests.
Realized gains in certain countries may be subject to foreign taxes at the Fund level, based on statutory rates.
Annual Report 2016
22
VARIABLE PORTFOLIO — LAZARD INTERNATIONAL EQUITY ADVANTAGE FUND
NOTES TO FINANCIAL STATEMENTS (continued)
December 31, 2016
The Fund accrues for such foreign taxes on realized and unrealized gains at the appropriate rate for each jurisdiction, as applicable. The amount, if any, is disclosed as a liability on the Statement of Assets and Liabilities.
Distributions to Subaccounts
Distributions to the subaccounts of Contracts, Qualified Plans and Qualified Investors are recorded at the close of business on the record date and are payable on the first business day following the record date. Dividends from net investment income, if any, are declared and distributed quarterly. Capital gains distributions, when available, will be made annually. However, an additional capital gain distribution may be made during the fiscal year in order to comply with the Internal Revenue Code, as applicable to registered investment companies. Income distributions and capital gain distributions are determined in accordance with federal income tax regulations, which may differ from GAAP. All dividends and distributions are reinvested in additional shares of the applicable share class of the Fund at the net asset value as of the ex-dividend date of the distribution.
Guarantees and Indemnifications
Under the Trust's organizational documents and, in some cases, by contract, its officers and trustees are indemnified against certain liabilities arising out of the performance of their duties to the Trust or its funds. In addition, certain of the Fund's contracts with its service providers contain general indemnification clauses. The Fund's maximum exposure under these arrangements is unknown since the amount of any future claims that may be made against the Fund cannot be determined, and the Fund has no historical basis for predicting the likelihood of any such claims.
Investment Company Reporting Modernization
In October 2016, the U.S. Securities and Exchange Commission adopted new rules and forms, and amendments to certain current rules and forms, to modernize reporting and disclosure of information by registered investment companies. The amendments to Regulation S-X will require standardized, enhanced disclosure about derivatives in investment company financial statements, and will also change the rules governing the form and content of such financial statements. The amendments to Regulation S-X take effect on August 1, 2017. At this time, management is assessing the anticipated impact of these regulatory developments.
Note 3. Fees and Other Transactions with Affiliates
Management Services Fees
Effective May 1, 2016, the Fund entered into a Management Agreement with Columbia Management Investment Advisers, LLC (the Investment Manager), a wholly-owned subsidiary of Ameriprise Financial, Inc. (Ameriprise Financial). Under the Management Agreement, the Investment Manager provides the Fund with investment research and advice, as well as administrative and accounting services. The Investment Manager is responsible for the ultimate oversight of investments made by the Fund. The Fund's subadviser (see Subadvisory Agreement below) has the primary responsibility for the day-to-day portfolio management of the Fund. The management services fee is an annual fee that is equal to a percentage of the Fund's average daily net assets that declines from 0.87% to 0.67% as the Fund's net assets increase. Prior to May 1, 2016, the Fund paid the Investment Manager an annual fee for advisory services under an Investment Management Services Agreement and a separate annual fee for administrative and accounting services under an Administrative Services Agreement. The effective management services fee rate for the year ended December 31, 2016 (reflecting all advisory and administrative services fees paid to the Investment Manager) was 0.83% of the Fund's average daily net assets. For the period from January 1, 2016 through April 30, 2016, the investment advisory services fee paid to the Investment Manager was $3,038,571, and the administrative services fee paid to the Investment Manager was $306,319.
Subadvisory Agreement
Effective May 2, 2016, the Investment Manager entered into a Subadvisory Agreement with Lazard Asset Management LLC (Lazard) to serve as the subadviser to the Fund. The Investment Manager compensates Lazard to manage the investment of the Fund's assets. Prior to May 2, 2016, Pyrford International Ltd. served as the subadviser to the Fund.
Compensation of Board Members
Board of Trustee members, who are not officers or employees of the Investment Manager or Ameriprise Financial, are compensated for their services to the Fund as disclosed in the Statement of Operations. These Board of Trustee members may participate in a Deferred Compensation Plan (the Plan) which may be terminated
Annual Report 2016
23
VARIABLE PORTFOLIO — LAZARD INTERNATIONAL EQUITY ADVANTAGE FUND
NOTES TO FINANCIAL STATEMENTS (continued)
December 31, 2016
at any time. Obligations of the Plan will be paid solely out of the Fund's assets, and all amounts payable under the Plan constitute a general unsecured obligation of the Fund.
Compensation of Chief Compliance Officer
The Board of Trustees has appointed a Chief Compliance Officer to the Fund in accordance with federal securities regulations. The Fund is allocated a portion of the expenses associated with the Chief Compliance Officer based on relative net assets of the Trust.
Transfer Agency Fees
The Fund has a Transfer and Dividend Disbursing Agent Agreement with Columbia Management Investment Services Corp. (the Transfer Agent), an affiliate of the Investment Manager and a wholly-owned subsidiary of Ameriprise Financial. The annual fee rate under this agreement is 0.06% of the Fund's average daily net assets attributable to each share class.
Distribution Fees
The Fund has an agreement with the Distributor, an affiliate of the Investment Manager and a wholly-owned subsidiary of Ameriprise Financial, for distribution services. The Board of Trustees has approved, and the Fund has adopted, a distribution plan (the Plan) which sets the distribution fees for the Fund. These fees are calculated daily and are intended to compensate the Distributor for selling shares of the Fund. The Fund pays a monthly distribution fee to the Distributor at the maximum annual rate of 0.25% of the average daily net assets attributable to Class 2 shares of the Fund. The Fund pays no distribution and service fees for Class 1 shares.
Expenses Waived/Reimbursed by the Investment Manager and its Affiliates
The Investment Manager and certain of its affiliates have contractually agreed to waive fees and/or reimburse expenses (excluding certain fees and expenses described below) for the periods disclosed below, unless sooner terminated at the sole discretion of the Board of Trustees, so that the Fund's net operating expenses, after giving effect to fees waived/expenses reimbursed and any balance credits and/or overdraft charges from the Fund's custodian, do not exceed the following annual
rates as a percentage of the class' average daily net assets:
| May 1, 2016 through April 30, 2017 | Prior to May 1, 2016 | ||||||||||
Class 1 | 0.94 | % | 1.03 | % | |||||||
Class 2 | 1.19 | 1.28 | |||||||||
Under the agreement governing these fee waivers and/or expense reimbursement arrangements, the following fees and expenses are excluded from the waiver/reimbursement commitment, and therefore will be paid by the Fund, if applicable: taxes (including foreign transaction taxes), expenses associated with investments in affiliated and non-affiliated pooled investment vehicles (including mutual funds and exchange-traded funds), transaction costs and brokerage commissions, costs related to any securities lending program, dividend and interest expenses associated with securities sold short, inverse floater program fees and expenses, transaction charges and interest on borrowed money, interest, infrequent and/or unusual expenses and any other expenses the exclusion of which is specifically approved by the Board of Trustees. This agreement may be modified or amended only with approval from the Investment Manager, certain of its affiliates and the Fund. Any fees waived and/or expenses reimbursed under the expense reimbursement arrangements described above are not recoverable by the Investment Manager or its affiliates in future periods.
Note 4. Federal Tax Information
The timing and character of income and capital gain distributions are determined in accordance with income tax regulations, which may differ from GAAP because of temporary or permanent book to tax differences.
At December 31, 2016, these differences are primarily due to differing treatment for capital loss carryforwards, deferral/reversal of wash sale losses, Trustees' deferred compensation, foreign currency transactions and passive foreign investment company (PFIC) holdings. To the extent these differences are permanent, reclassifications are made among the components of the Fund's net assets in the Statement of Assets and Liabilities. Temporary differences do not require reclassifications.
In the Statement of Assets and Liabilities the following reclassifications were made:
Undistributed net investment income | $ | (1,303,506 | ) | ||||
Accumulated net realized loss | 1,303,507 | ||||||
Paid-in capital | (1 | ) | |||||
Annual Report 2016
24
VARIABLE PORTFOLIO — LAZARD INTERNATIONAL EQUITY ADVANTAGE FUND
NOTES TO FINANCIAL STATEMENTS (continued)
December 31, 2016
Net investment income (loss) and net realized gains (losses), as disclosed in the Statement of Operations, and net assets were not affected by this reclassification.
The tax character of distributions paid during the years indicated was as follows:
Year Ended December 31, | 2016 | 2015 | |||||||||
Ordinary income | $ | 26,992,341 | $ | 37,316,886 | |||||||
Short-term capital gain distributions, if any, are considered ordinary income distributions for tax purposes.
At December 31, 2016, the components of distributable earnings on a tax basis were as follows:
Undistributed ordinary income | $ | 4,015,262 | |||||
Capital loss carryforwards | (72,372,921 | ) | |||||
Net unrealized appreciation | 26,795,464 | ||||||
At December 31, 2016, the cost of investments for federal income tax purposes was $1,304,695,549 and the aggregate gross unrealized appreciation and depreciation based on that cost was:
Unrealized appreciation | $ | 82,244,622 | |||||
Unrealized depreciation | (55,449,158 | ) | |||||
Net unrealized appreciation | $ | 26,795,464 | |||||
The following capital loss carryforwards, determined at December 31, 2016, may be available to reduce taxable income arising from future net realized gains on investments, if any, to the extent permitted by the Internal Revenue Code:
Year of Expiration | Amount ($) | ||||||
No expiration — short-term | 15,816,814 | ||||||
No expiration — long-term | 56,556,107 | ||||||
Total | 72,372,921 | ||||||
Management of the Fund has concluded that there are no significant uncertain tax positions in the Fund that would require recognition in the financial statements. However, management's conclusion may be subject to review and adjustment at a later date based on factors including, but not limited to, new tax laws, regulations, and administrative interpretations (including relevant court decisions). Generally, the Fund's federal tax returns for the prior three fiscal years remain subject to examination by the Internal Revenue Service.
Note 5. Portfolio Information
The cost of purchases and proceeds from sales of securities, excluding short-term investments and derivatives, if any, aggregated to $1,695,921,123 and $1,601,261,246, respectively, for the year ended December 31, 2016. The amount of purchase and sale activity impacts the portfolio turnover rate reported in the Financial Highlights.
Note 6. Affiliated Money Market Fund
The Fund invests in Columbia Short-Term Cash Fund, an affiliated money market fund established for the exclusive use by the Fund and other affiliated funds (the Affiliated MMF). The income earned by the Fund from such investments is included as Dividends — affiliated issuers in the Statement of Operations. As an investing fund, the Fund indirectly bears its proportionate share of the expenses of the Affiliated MMF. Effective October 1, 2016, the Affiliated MMF prices its shares with a floating net asset value (NAV) and no longer seeks to maintain a stable NAV. In addition, the Board of Trustees of the Affiliated MMF may impose a fee on redemptions (sometimes referred to as a liquidity fee) or temporarily suspend redemptions (sometimes referred to as imposing a redemption gate) in the event its liquidity falls below regulatory limits.
Note 7. Line of Credit
The Fund has access to a revolving credit facility with a syndicate of banks led by Citibank, N.A., HSBC Bank USA, N.A. and JPMorgan Chase Bank, N.A. whereby the Fund may borrow for the temporary funding of shareholder redemptions or for other temporary or emergency purposes. The credit facility agreement, which is a collective agreement between the Fund and certain other funds managed by the Investment Manager, severally and not jointly, that permits collective borrowings up to $1 billion. Interest is charged to each participating fund based on its borrowings at a rate equal to the higher of (i) the overnight federal funds rate plus 1.00% or (ii) the one-month LIBOR rate plus 1.00%. Each borrowing under the credit facility matures no later than 60 days after the date of borrowing. The Fund also pays a commitment fee equal to its pro rata share of the amount of the credit facility at a rate of 0.15% per annum. The commitment fee is included in other expenses in the Statement of Operations.
The Fund had no borrowings during the year ended December 31, 2016.
Annual Report 2016
25
VARIABLE PORTFOLIO — LAZARD INTERNATIONAL EQUITY ADVANTAGE FUND
NOTES TO FINANCIAL STATEMENTS (continued)
December 31, 2016
Note 8. Significant Risks
Financial Sector Risk
The Fund may be more susceptible to the particular risks that may affect companies in the financial services sector than if it were invested in a wider variety of companies in unrelated sectors. Companies in the financial services sector are subject to certain risks, including the risk of regulatory change, decreased liquidity in credit markets and unstable interest rates. Such companies may have concentrated portfolios, such as a high level of loans to real estate developers, which makes them vulnerable to economic conditions that affect that industry. Performance of such companies may be affected by competitive pressures and exposure to investments or agreements that, under certain circumstances, may lead to losses (e.g., subprime loans). Companies in the financial services sector are subject to extensive governmental regulation that may limit the amount and types of loans and other financial commitments they can make, and interest rates and fees that they may charge. In addition, profitability of such companies is largely dependent upon the availability and the cost of capital.
Foreign Securities and Emerging Market Countries Risk
Investing in foreign securities may include certain risks and considerations not typically associated with investing in U.S. securities, such as fluctuating currency values and changing local and regional economic, political and social conditions, which may result in greater market volatility. In addition, certain foreign securities may not be as liquid as U.S. securities. Investing in emerging markets may accentuate these risks. These countries are also more likely to experience high levels of inflation, deflation or currency devaluation which could hurt their economies and securities markets. To the extent that the Fund concentrates its investment exposure to any one or a few specific countries, the Fund will be particularly susceptible to the various conditions, events or other factors impacting those countries and may, therefore, have a greater risk than that of a fund which is more geographically diversified.
Shareholder Concentration Risk
At December 31, 2016, affiliated shareholders of record owned 100.0% of the outstanding shares of the Fund in one or more accounts. Subscription and redemption activity by concentrated accounts may have a significant effect on the operations of the Fund. In the case of a large redemption, the Fund may be forced to sell
investments at inopportune times, including its liquid or more liquid positions, resulting in Fund losses and the Fund holding a higher percentage of less liquid or illiquid securities. Large redemptions could result in decreased economies of scale and increased operating expenses for non-redeeming Fund shareholders.
Note 9. Subsequent Events
Management has evaluated the events and transactions that have occurred through the date the financial statements were issued and noted no items requiring adjustment of the financial statements or additional disclosure.
Note 10. Information Regarding Pending and Settled Legal Proceedings
Ameriprise Financial and certain of its affiliates have historically been involved in a number of legal, arbitration and regulatory proceedings, including routine litigation, class actions, and governmental actions, concerning matters arising in connection with the conduct of their business activities. Ameriprise Financial believes that the Funds are not currently the subject of, and that neither Ameriprise Financial nor any of its affiliates are the subject of, any pending legal, arbitration or regulatory proceedings that are likely to have a material adverse effect on the Funds or the ability of Ameriprise Financial or its affiliates to perform under their contracts with the Funds. Ameriprise Financial is required to make quarterly (10-Q), annual (10-K) and, as necessary, 8-K filings with the Securities and Exchange Commission (SEC) on legal and regulatory matters that relate to Ameriprise Financial and its affiliates. Copies of these filings may be obtained by accessing the SEC website at www.sec.gov.
There can be no assurance that these matters, or the adverse publicity associated with them, will not result in increased fund redemptions, reduced sale of fund shares or other adverse consequences to the Funds. Further, although we believe proceedings are not likely to have a material adverse effect on the Funds or the ability of Ameriprise Financial or its affiliates to perform under their contracts with the Funds, these proceedings are subject to uncertainties and, as such, we are unable to estimate the possible loss or range of loss that may result. An adverse outcome in one or more of these proceedings could result in adverse judgments, settlements, fines, penalties or other relief that could have a material adverse effect on the consolidated financial condition or results of operations of Ameriprise Financial.
Annual Report 2016
26
VARIABLE PORTFOLIO — LAZARD INTERNATIONAL EQUITY ADVANTAGE FUND
REPORT OF INDEPENDENT REGISTERED PUBLIC ACCOUNTING FIRM
To the Trustees of Columbia Funds Variable Insurance Trust and the Shareholders of
Variable Portfolio — Lazard International Equity Advantage Fund (formerly known as Variable Portfolio — Pyrford International Equity Fund)
In our opinion, the accompanying statement of assets and liabilities, including the portfolio of investments, and the related statements of operations and of changes in net assets and the financial highlights present fairly, in all material respects, the financial position of Variable Portfolio — Lazard International Equity Advantage Fund (formerly known as Variable Portfolio — Pyrford International Equity Fund) (the "Fund," a series of Columbia Funds Variable Insurance Trust) as of December 31, 2016, the results of its operations for the year then ended, the changes in its net assets for each of the two years in the period then ended and the financial highlights for each of the three years in the period then ended and for the period April 30, 2013 (commencement of operations) through December 31, 2013, in conformity with accounting principles generally accepted in the United States of America. These financial statements and financial highlights (hereafter referred to as "financial statements") are the responsibility of the Fund's management. Our responsibility is to express an opinion on these financial statements based on our audits. We conducted our audits of these financial statements in accordance with the standards of the Public Company Accounting Oversight Board (United States). Those standards require that we plan and perform the audit to obtain reasonable assurance about whether the financial statements are free of material misstatement. An audit includes examining, on a test basis, evidence supporting the amounts and disclosures in the financial statements, assessing the accounting principles used and significant estimates made by management, and evaluating the overall financial statement presentation. We believe that our audits, which included confirmation of securities as of December 31, 2016 by correspondence with the custodian, brokers and transfer agent, and the application of alternative auditing procedures where such confirmations had not been received, provide a reasonable basis for our opinion.
PricewaterhouseCoopers LLP
Minneapolis, MN
February 17, 2017
Annual Report 2016
27
VARIABLE PORTFOLIO — LAZARD INTERNATIONAL EQUITY ADVANTAGE FUND
FEDERAL INCOME TAX INFORMATION
(Unaudited)
The Fund hereby designates the following tax attributes for the fiscal year ended December 31, 2016.
Tax Designations
Foreign Taxes Paid | $ | 2,927,455 | |||||
Foreign Taxes Paid Per Share | $ | 0.02 | |||||
Foreign Source Income | $ | 41,508,659 | |||||
Foreign Source Income Per Share | $ | 0.30 | |||||
Foreign Taxes. The Fund makes the election to pass through to shareholders the foreign taxes paid. Eligible shareholders may claim a foreign tax credit. These taxes, and the corresponding foreign source income, are provided.
Annual Report 2016
28
VARIABLE PORTFOLIO — LAZARD INTERNATIONAL EQUITY ADVANTAGE FUND
TRUSTEES AND OFFICERS
Shareholders elect the Board that oversees the Fund's operations. The Board appoints officers who are responsible for day-to-day business decisions based on policies set by the Board. The following table provides basic biographical information about the Fund's Trustees, including their principal occupations during the past five years, although specific titles for individuals may have varied over the period. The year set forth beneath Length of Service in the table below is the year in which the Trustee was first appointed or elected as Trustee to any Fund currently in the Columbia Funds Complex or a predecessor thereof. Under current Board policy, members serve terms of indefinite duration.
Independent Trustees
| Name, Address, Year of Birth | Position Held With the Trust and Length of Service | Principal Occupation(s) During the Past Five Years and Other Relevant Professional Experience | Number of Funds in the Columbia Funds Complex Overseen | Other Directorships Held by Trustee During the Past Five Years | |||||||||||||||
| Janet Langford Carrig c/o Columbia Management Investment Advisers, LLC, 225 Franklin Street Mail Drop BX32 05228, Boston, MA 02110 1957 | Trustee 1996 | Senior Vice President, General Counsel and Corporate Secretary, ConocoPhillips (independent energy company) since September 2007 | 59 | None | |||||||||||||||
| Douglas A. Hacker c/o Columbia Management Investment Advisers, LLC, 225 Franklin Street Mail Drop BX32 05228, Boston, MA 02110 1955 | Trustee and Chairman of the Board 1996 | Independent business executive since May 2006; Executive Vice President — Strategy of United Airlines from December 2002 to May 2006; President of UAL Loyalty Services (airline marketing company) from September 2001 to December 2002; Executive Vice President and Chief Financial Officer of United Airlines from July 1999 to September 2001 | 59 | Spartan Nash Company (food distributor); Nash Finch Company (food distributor) from 2005 to 2013; Aircastle Limited (aircraft leasing); SeaCube Container Leasing Ltd. (container leasing) from 2010 to 2013; and Travelport Worldwide Limited (travel information technology) | |||||||||||||||
| Nancy T. Lukitsh c/o Columbia Management Investment Advisers, LLC, 225 Franklin Street Mail Drop BX32 05228, Boston, MA 02110 1956 | Trustee 2011 | Senior Vice President, Partner and Director of Marketing, Wellington Management Company, LLP (investment adviser) from 1997 to 2010; Chair, Wellington Management Portfolios (commingled non-U.S. investment pools) from 2007 to 2010; Director, Wellington Trust Company, NA and other Wellington affiliates from 1997 to 2010 | 59 | None | |||||||||||||||
Annual Report 2016
29
VARIABLE PORTFOLIO — LAZARD INTERNATIONAL EQUITY ADVANTAGE FUND
TRUSTEES AND OFFICERS (continued)
Independent Trustees (continued)
| Name, Address, Year of Birth | Position Held With the Trust and Length of Service | Principal Occupation(s) During the Past Five Years and Other Relevant Professional Experience | Number of Funds in the Columbia Funds Complex Overseen | Other Directorships Held by Trustee During the Past Five Years | |||||||||||||||
| David M. Moffett c/o Columbia Management Investment Advisers, LLC, 225 Franklin Street Mail Drop BX32 05228, Boston, MA 02110 1952 | Trustee 2011 | Retired. Consultant to Bridgewater and Associates | 59 | Director, CSX Corporation; Genworth Financial, Inc. (financial and insurance products and services); Paypal Holdings Inc. (payment and data processing services); Trustee University of Oklahoma Foundation; former Director eBay Inc. (online trading community), 2007-2015; and former Director, CIT Bank, CIT Group Inc. (commercial and consumer finance), 2010-2016 | |||||||||||||||
| Charles R. Nelson c/o Columbia Management Investment Advisers, LLC, 225 Franklin Street Mail Drop BX32 05228, Boston, MA 02110 1942 | Trustee 1981 | Retired. Professor Emeritus, University of Washington since 2011; Professor of Economics, University of Washington from 1976 to 2011; Ford and Louisa Van Voorhis Professor of Political Economy, University of Washington from 1993 to 2011; Adjunct Professor of Statistics, University of Washington from 1980 to 2011; Associate Editor, Journal of Money, Credit and Banking from September 1993 to 2008; consultant on econometric and statistical matters | 59 | None | |||||||||||||||
| John J. Neuhauser c/o Columbia Management Investment Advisers, LLC, 225 Franklin Street Mail Drop BX32 05228, Boston, MA 02110 1943 | Trustee 1984 | President, Saint Michael's College since August 2007; Director or Trustee of several non-profit organizations, including University of Vermont Medical Center; Academic Vice President and Dean of Faculties, Boston College from August 1999 to October 2005; University Professor, Boston College from November 2005 to August 2007 | 59 | Liberty All-Star Equity Fund and Liberty All-Star Growth Fund (closed-end funds) | |||||||||||||||
| Patrick J. Simpson c/o Columbia Management Investment Advisers, LLC, 225 Franklin Street Mail Drop BX32 05228, Boston, MA 02110 1944 | Trustee 2000 | Of Counsel, Perkins Coie LLP (law firm) since 2015; Partner, Perkins Coie LLP from 1988 to 2014 | 59 | None | |||||||||||||||
Annual Report 2016
30
VARIABLE PORTFOLIO — LAZARD INTERNATIONAL EQUITY ADVANTAGE FUND
TRUSTEES AND OFFICERS (continued)
Independent Trustees (continued)
| Name, Address, Year of Birth | Position Held With the Trust and Length of Service | Principal Occupation(s) During the Past Five Years and Other Relevant Professional Experience | Number of Funds in the Columbia Funds Complex Overseen | Other Directorships Held by Trustee During the Past Five Years | |||||||||||||||
| Anne-Lee Verville c/o Columbia Management Investment Advisers, LLC, 225 Franklin Street Mail Drop BX32 05228, Boston, MA 02110 1945 | Trustee 1998 | Retired. General Manager, Global Education Industry from 1994 to 1997, President — Application Systems Division from 1991 to 1994, Chief Financial Officer — US Marketing & Services from 1988 to 1991, and Chief Information Officer from 1987 to 1988, IBM Corporation (computer and technology) | 59 | Enesco Group, Inc. (producer of giftware and home and garden decor products) from 2001 to 2006 | |||||||||||||||
Consultants to the Independent Trustees*
| Name, Address, Year of Birth | Position Held With the Trust and Length of Service | Principal Occupation(s) During the Past Five Years and Other Relevant Professional Experience | Number of Funds in the Columbia Funds Complex Overseen | Other Directorships Held by Trustee During the Past Five Years | |||||||||||||||
| J. Kevin Connaughton c/o Columbia Management Investment Advisers, LLC, 225 Franklin Street Mail Drop BX32 05228, Boston, MA 02110 1964 | Independent Trustee Consultant 2016 | Independent Trustee Consultant, Columbia Funds since March 2016; Managing Director and General Manager of Mutual Fund Products, Columbia Management Investment Advisers, LLC from May 2010 to February 2015; President, Columbia Funds from 2009 to 2015; and senior officer of Columbia Funds and affiliated funds from 2003 to 2015 | 59 | Board of Governors, Gateway Healthcare since January 2016; Trustee, New Century Portfolios since March 2015; and Director, The Autism Project since March 2015 | |||||||||||||||
| Natalie A. Trunow c/o Columbia Management Investment Advisers, LLC, 225 Franklin Street Mail Drop BX32 05228, Boston, MA 02110 1967 | Independent Trustee Consultant 2016 | Independent Trustee Consultant, Columbia Funds since September 2016; Senior Vice President and Chief Executive Officer, Millennial Partners (investment consulting services to institutions) since January 2016; Director of Investments, Casey Family Programs from April 2016 to September 2016; Chief Investment Officer, Calvert Investments from August 2008 to January 2016; Section Head and Portfolio Manager, General Motors Asset Management from June 1997 to August 2008 | 59 | Healthcare Services for Children with Special Needs | |||||||||||||||
* J. Kevin Connaughton was appointed consultant to the Independent Trustees effective March 1, 2016. Natalie A. Trunow was appointed consultant to the Independent Trustees effective September 1, 2016. Shareholders of the Funds are expected to be asked to elect each of Mr. Connaughton and Ms. Trunow as a Trustee at a future shareholder meeting.
Annual Report 2016
31
VARIABLE PORTFOLIO — LAZARD INTERNATIONAL EQUITY ADVANTAGE FUND
TRUSTEES AND OFFICERS (continued)
Interested Trustee Affiliated with Investment Manager*
| Name, Address, Year of Birth | Position Held With the Trust and Length of Service | Principal Occupation(s) During the Past Five Years and Other Relevant Professional Experience | Number of Funds in the Columbia Funds Complex Overseen | Other Directorships Held by Trustee During the Past Five Years | |||||||||||||||
| William F. Truscott c/o Columbia Management Investment Advisers, LLC, 225 Franklin Street Boston, MA 02110 1960 | Trustee 2012 | Chairman of the Board and President, Columbia Management Investment Advisers, LLC since May 2010 and February 2012, respectively; Chief Executive Officer, Global Asset Management, Ameriprise Financial, Inc. since September 2012 (previously Chief Executive Officer, U.S. Asset Management & President, Annuities, May 2010- September 2012); Director and Chief Executive Officer, Columbia Management Investment Distributors, Inc. since May 2010 and February 2012, respectively; Chairman of the Board and Chief Executive Officer, RiverSource Distributors, Inc. since 2006; Director, Threadneedle Asset Management Holdings, SARL since 2014; President and Chief Executive Officer, Ameriprise Certificate Company, 2006-August 2012. | 185 | Trustee to other Columbia Funds since 2001; Chairman of the Board, Columbia Management Investment Advisers, LLC since May 2010; Director, Columbia Management Investment Distributors, Inc. since May 2010; Former Director, Ameriprise Certificate Company, 2006-January 2013 | |||||||||||||||
* Interested person (as defined under the 1940 Act) by reason of being an officer, director, security holder and/or employee of the Investment Manager or Ameriprise Financial.
The Statement of Additional Information has additional information about the Fund's Board members and is available, without charge, upon request by calling 800.345.6611 or contacting your financial intermediary.
Annual Report 2016
32
VARIABLE PORTFOLIO — LAZARD INTERNATIONAL EQUITY ADVANTAGE FUND
TRUSTEES AND OFFICERS (continued)
The Board has appointed officers who are responsible for day-to-day business decisions based on policies it has established. The officers serve at the pleasure of the Board. The following table provides basic information about the Officers of the Fund, including principal occupations during the past five years, although their specific titles may have varied over the period. In addition to Mr. Truscott, who is Senior Vice President, the Fund's other officers are:
Fund Officers
| Name, Address and Year of Birth | Position and Year First Appointed to Position for any Fund in the Columbia Funds Complex or a Predecessor Thereof | Principal Occupation(s) During Past Five Years | |||||||||
| Christopher O. Petersen 5228 Ameriprise Financial Center Minneapolis, MN 55474 Born 1970 | President and Principal Executive Officer (2015) | Vice President and Lead Chief Counsel, Ameriprise Financial, Inc. since January 2015 (previously, Vice President and Chief Counsel January 2010-December 2014); officer of Columbia Funds and affiliated funds since 2007. | |||||||||
| Michael G. Clarke 225 Franklin Street Boston, MA 02110 Born 1969 | Treasurer (2011), Chief Financial Officer (2009) and Chief Accounting Officer (2015) | Vice President — Mutual Fund Administration, Columbia Management Investment Advisers, LLC, since May 2010; senior officer of Columbia Funds and affiliated funds since 2002. | |||||||||
| Paul B. Goucher 100 Park Avenue New York, NY 10017 Born 1968 | Senior Vice President (2011), Chief Legal Officer (2015) and Assistant Secretary (2008) | Senior Vice President and Assistant General Counsel, Ameriprise Financial, Inc. since January 2017 (previously Vice President and Lead Chief Counsel, November 2008-January 2017 and January 2013-January 2017, respectively, and Chief Counsel, January 2010-January 2013); Vice President, Chief Legal Officer and Assistant Secretary, Columbia Management Investment Advisers, LLC since May 2010. | |||||||||
| Thomas P. McGuire 225 Franklin Street Boston, MA 02110 Born 1972 | Senior Vice President and Chief Compliance Officer (2012) | Vice President — Asset Management Compliance, Ameriprise Financial, Inc., since May 2010; Chief Compliance Officer, Ameriprise Certificate Company since September 2010. | |||||||||
| Colin Moore 225 Franklin Street Boston, MA 02110 Born 1958 | Senior Vice President (2010) | Executive Vice President and Global Chief Investment Officer, Ameriprise Financial, Inc., since July 2013; Executive Vice President and Global Chief Investment Officer, Columbia Management Investment Advisers, LLC since July 2013 (previously Director and Global Chief Investment Officer, 2010-2013). | |||||||||
| Michael E. DeFao 225 Franklin Street Boston, MA 02110 Born 1968 | Vice President (2011) and Assistant Secretary (2010) | Vice President and Chief Counsel, Ameriprise Financial, Inc. since May 2010. | |||||||||
| Amy Johnson 5228 Ameriprise Financial Center Minneapolis, MN 55474 Born 1965 | Vice President (2006) | Managing Director and Global Head of Operations, Columbia Management Investment Advisers, LLC since April 2016 (previously Managing Director and Chief Operating Officer, 2010-2016). | |||||||||
| Lyn Kephart-Strong 5228 Ameriprise Financial Center Minneapolis, MN 55474 Born 1960 | Vice President (2015) | President, Columbia Management Investment Services Corp. since October 2014; Vice President & Resolution Officer, Ameriprise Trust Company since August 2009. | |||||||||
| Ryan C. Larrenaga 225 Franklin Street Boston, MA 02110 Born 1970 | Vice President and Secretary (2015) | Vice President and Group Counsel, Ameriprise Financial, Inc. since August 2011; officer of Columbia Funds and affiliated funds since 2005. | |||||||||
Annual Report 2016
33
This page intentionally left blank.
Annual Report 2016
34
This page intentionally left blank.
Annual Report 2016
35
This page intentionally left blank.
Annual Report 2016
36
VARIABLE PORTFOLIO — LAZARD INTERNATIONAL EQUITY ADVANTAGE FUND
IMPORTANT INFORMATION ABOUT THIS REPORT
The policy of the Board is to vote the proxies of the companies in which each fund holds investments consistent with the procedures as stated in the Statement of Additional Information (SAI). You may obtain a copy of the SAI without charge by calling 800.345.6611; contacting your financial intermediary or searching the website of the Securities and Exchange Commission (SEC) at sec.gov. Information regarding how each fund voted proxies relating to portfolio securities is filed with the SEC by August 31st for the most recent 12-month period ending June 30th of that year, and is available without charge by visiting investor.columbiathreadneedleus.com, or searching the website of the SEC at sec.gov.
Each fund files a complete schedule of portfolio holdings with the SEC for the first and third quarters of each fiscal year on Form N-Q. Each fund's Form N-Q is available on the SEC's website at sec.gov and may be reviewed and copied at the SEC's Public Reference Room in Washington, D.C. Information on the operation of the Public Reference Room may be obtained by calling 800.SEC.0330. Each fund's complete schedule of portfolio holdings, as filed on Form N-Q, can also be obtained without charge, upon request, by calling 800.345.6611.
Annual Report 2016
37
Variable Portfolio — Lazard International Equity Advantage Fund
P.O. Box 8081
Boston, MA 02266-8081

Please read and consider the investment objectives, risks, charges and expenses for any fund carefully before investing. For fund and other investment product prospectuses, which contain this and other important information, contact your financial advisor or insurance representative. Please read the prospectus carefully before you invest. The Fund is distributed by Columbia Management Investment Distributors, Inc., member FINRA, and managed by Columbia Management Investment Advisers, LLC.
Columbia Threadneedle Investments (Columbia Threadneedle) is the global brand name of the Columbia and Threadneedle group of companies.
All rights reserved. Columbia Management Investment Distributors, Inc., 225 Franklin Street, Boston, MA 02110-2804
© 2017 Columbia Management Investment Advisers, LLC.
S-6596 AN (2/17)

ANNUAL REPORT
December 31, 2016

COLUMBIA VARIABLE PORTFOLIO — ASSET ALLOCATION FUND
Please remember that you may not buy (nor will you own) shares of the Fund directly. The Fund is available through variable annuity contracts and variable life insurance policies offered by the separate accounts of participating insurance companies as well as qualified pension and retirement plans. Please contact your financial advisor or insurance representative for more information.

COLUMBIA VARIABLE PORTFOLIO — ASSET ALLOCATION FUND
TABLE OF CONTENTS
Performance Overview | 2 | ||||||
Manager Discussion of Fund Performance | 4 | ||||||
Understanding Your Fund's Expenses | 6 | ||||||
Portfolio of Investments | 7 | ||||||
Statement of Assets and Liabilities | 11 | ||||||
Statement of Operations | 13 | ||||||
Statement of Changes in Net Assets | 14 | ||||||
Financial Highlights | 16 | ||||||
Notes to Financial Statements | 18 | ||||||
Report of Independent Registered Public Accounting Firm | 26 | ||||||
Federal Income Tax Information | 27 | ||||||
Trustees and Officers | 28 | ||||||
Important Information About This Report | 33 | ||||||
The views expressed in this report reflect the current views of the respective parties. These views are not guarantees of future performance and involve certain risks, uncertainties and assumptions that are difficult to predict, so actual outcomes and results may differ significantly from the views expressed. These views are subject to change at any time based upon economic, market or other conditions and the respective parties disclaim any responsibility to update such views. These views may not be relied on as investment advice and, because investment decisions for a Columbia fund are based on numerous factors, may not be relied on as an indication of trading intent on behalf of any particular Columbia fund. References to specific securities should not be construed as a recommendation or investment advice.
Annual Report 2016
COLUMBIA VARIABLE PORTFOLIO — ASSET ALLOCATION FUND
PERFORMANCE OVERVIEW
Performance Summary
n Columbia Variable Portfolio — Asset Allocation Fund (the Fund) Class 2 shares returned 5.06% for the 12-month period that ended December 31, 2016.
n The Fund trailed its Blended Benchmark, which returned 8.31% over the same period.
n During the same time period, the S&P 500 Index returned 11.96% and the Bloomberg Barclays U.S. Aggregate Bond Index returned 2.65%.
n The Fund's exposure to U.S. large- and mid-cap equities detracted from relative results, primarily because of weak performance from underlying funds.
Average Annual Total Returns (%) (for period ended December 31, 2016)
Inception | 1 Year | 5 Years | 10 Years | ||||||||||||||||
Class 1 | 01/01/89 | 5.36 | 9.37 | 5.50 | |||||||||||||||
Class 2 | 06/01/00 | 5.06 | 9.09 | 5.27 | |||||||||||||||
Blended Benchmark | 8.31 | 9.69 | 6.21 | ||||||||||||||||
S&P 500 Index | 11.96 | 14.66 | 6.95 | ||||||||||||||||
Bloomberg Barclays U.S. Aggregate Bond Index | 2.65 | 2.23 | 4.34 | ||||||||||||||||
Performance data quoted represents past performance and current performance may be lower or higher. Past performance is no guarantee of future results. The investment return and principal value will fluctuate so that shares, when redeemed, may be worth more or less than the original cost. For current month-end performance information, please contact your financial advisor or insurance representative.
Performance results reflect the effect of any fee waivers or reimbursements of fund expenses by Columbia Management Investment Advisers, LLC and/or any of its affiliates. Absent these fee waivers or expense reimbursement arrangements, performance results would have been lower.
Investment earnings, if any, are tax-deferred until distributed to shareholders, at which time taxes may become due. Total return performance includes changes in share price and assumes reinvestment of dividends and capital gains, if any. Performance results reflect the effect of all fund expenses, but do not include any fees and expenses imposed under your variable annuity contract and/or variable life insurance policy or qualified pension or retirement plan. If performance results included the effect of these additional charges, they would be lower.
The Blended Benchmark, a weighted custom composite established by the Investment Manager, consists of a 60% weighting in the S&P 500 Index and a 40% weighting in the Bloomberg Barclays U.S. Aggregate Bond Index.
The S&P 500 Index, an unmanaged index, measures the performance of 500 widely held, large-capitalization U.S. stocks and is frequently used as a general measure of market performance.
The Bloomberg Barclays U.S. Aggregate Bond Index is a broad-based benchmark that measures the investment-grade, U.S. dollar-denominated, fixed-rate taxable bond market, including Treasuries, government-related and corporate securities, mortgage-backed securities (agency fixed-rate and hybrid adjustable-rate mortgage passthroughs), asset-backed securities, and commercial mortgage-backed securities.
Indices are not available for investment, are not professionally managed and do not reflect sales charges, fees, brokerage commissions, taxes or other expenses of investing. Securities in the Fund may not match those in an index.
Annual Report 2016
2
COLUMBIA VARIABLE PORTFOLIO — ASSET ALLOCATION FUND
PERFORMANCE OVERVIEW (continued)
Performance of a Hypothetical $10,000 Investment (January 1, 2007 – December 31, 2016)

The chart above shows the change in value of a hypothetical $10,000 investment in Class 2 shares of Columbia Variable Portfolio — Asset Allocation Fund during the stated time period, and does not reflect the deduction of taxes, if any, that a shareholder may pay on Fund distributions or on the redemption of Fund shares. The returns also do not reflect fees and expenses imposed under your variable annuity contract and/or variable life insurance policy or qualified pension or retirement plan, if any.
Annual Report 2016
3
COLUMBIA VARIABLE PORTFOLIO — ASSET ALLOCATION FUND
MANAGER DISCUSSION OF FUND PERFORMANCE
Portfolio Management
Jeffrey Knight, CFA
Anwiti Bahuguna, Ph.D.
Joshua Kutin*
Dan Boncarosky*
*Effective January 27, 2017, Marie Schofield and Beth Vanney no longer serve as portfolio managers of the Fund. On the same date, Messrs. Kutin and Boncarosky were named as portfolio managers of the Fund.
| Portfolio Breakdown (%) (at December 31, 2016) | |||||||
Equity Funds | 54.7 | ||||||
Exchange-Traded Funds | 1.0 | ||||||
Fixed-Income Funds | 41.5 | ||||||
Money Market Funds | 2.8 | ||||||
Total | 100.0 | ||||||
Percentages indicated are based upon total investments. The Fund's portfolio composition is subject to change.
For the 12-month period that ended December 31, 2016, the Fund's Class 2 shares returned 5.06%. The Fund trailed its Blended Benchmark, which returned 8.31% over the same period. During the same time period, the S&P 500 Index returned 11.96% and the Bloomberg Barclays U.S. Aggregate Bond Index returned 2.65%. The Fund's exposure to U.S. large- and mid-cap equities detracted from relative results, primarily because of weak performance from underlying funds.
Global Markets Posted Mixed Results
Global events, political uncertainty and mixed economic data were enough to keep investors off balance in 2016, as financial markets moved sharply in reaction to each significant change on the world stage. Early in the year, concerns about U.S. monetary policy, China and oil rattled the equity markets and drove stock prices downward. After a swift March rebound, the U.S. stock market fell again in the early summer in reaction to the U.K. vote to exit the European Union, and U.S. Treasury yields also plummeted. Once again, the markets rebounded but investors retreated in the third quarter in reaction to mixed economic data and uncertainty surrounding the U.S. Presidential race. Following the November election and with solidly positive economic data, stocks moved higher in the fourth quarter to keep the eight-year bull market alive. In the United States, steady job growth drove unemployment down, corporate earnings growth picked up, manufacturing activity accelerated, and the price of oil stabilized. Growth was lackluster in developed foreign market countries. In Europe and Japan, GDP advanced less than 1% for the year. China expanded at an estimated pace of 7.5%, in line with expectations, while most emerging markets struggled with volatile international capital flows and currency fluctuations.
In December 2016, the Federal Reserve (the Fed) raised the target range of its benchmark interest rate by a quarter of a point to between 0.50% and 0.75%, its first such move in a year. The Fed's action had been widely anticipated and had little or no impact on the financial markets when it occurred. The Fed indicated that it would continue to monitor inflation and the job market in considering future rate hikes.
Against this backdrop, the S&P 500 Index, a broad measure of U.S. stock market performance, rose 11.96%. Foreign stock markets lagged the U. S. markets. The MSCI EAFE Index (Net), a broad measure of performance in developed markets outside the United States, rose just 1.00% for the year. Rising interest rates kept a lid on price in most sectors of the bond market. The Bloomberg Barclays U.S. Aggregate Bond Index, a broad measure of the performance of investment-grade bonds, returned 2.65% for the year. High-yield bonds outperformed both stocks and investment-grade bonds, returning 17.49%, as measured by the Bank of America/Merrill Lynch U.S. High Yield Constrained Index.
Significant Performance Factors
The performance of underlying funds, especially U.S. large- and mid-caps, was the primary detractor from the Fund's results compared to the Blended Benchmark. International equities also detracted from overall returns as there were better-performing asset classes during the year. A
Annual Report 2016
4
COLUMBIA VARIABLE PORTFOLIO — ASSET ALLOCATION FUND
MANAGER DISCUSSION OF FUND PERFORMANCE (continued)
strong dollar reduced returns to U.S. investors on overseas investments denominated in dollars. A position in absolute return strategies also detracted from relative performance. Many other allocations produced favorable results. A small allocation to U.S. small cap equities aided returns. U.S. small caps were among the strongest performing market sectors for the year. A small allocation to commodities also aided results, despite modest underperformance from the underlying fund. Allocation to and manager selection within core fixed income aided performance as the Fund's tactical positioning moves proved well timed. High-yield bonds contributed to relative returns even though underlying fund performance was disappointing.
Portfolio Changes
We modestly lowered the Fund's large cap equity allocation. We also eliminated positions in Columbia Disciplined Value Fund, Columbia Disciplined Growth Fund, Columbia Select Large Cap Growth Fund and Columbia Select Large-Cap Value Fund during the period. With the proceeds, we increased the Fund's positions in Columbia Contrarian Core Fund, Columbia Disciplined Core Fund and S&P futures.
During the period, we initiated a position in international equities, both in emerging markets and developed markets. Our research continues to favor non U.S. equity markets, in general, and emerging market equities in particular. We eliminated the Fund's position in high-yield bonds and increased its allocation to investment-grade corporate bonds. We initiated a position in commodities during the period, as we believe that momentum and dynamics remain favorable and that commodities offer the potential for tactical "catch-up" within the Fund's risk asset holdings.
Annual Report 2016
5
COLUMBIA VARIABLE PORTFOLIO — ASSET ALLOCATION FUND
UNDERSTANDING YOUR FUND'S EXPENSES
(Unaudited)
As an investor, you incur ongoing costs, which generally include management fees, distribution and/or service fees, and other fund expenses. The following information is intended to help you understand your ongoing costs (in dollars) of investing in the Fund and to help you compare these costs with the ongoing costs of investing in other mutual funds.
The information below does not reflect fees and expenses imposed under your variable annuity contract and/or variable life insurance policy (collectively, Contracts) or qualified pension and retirement plan (Qualified Plan), if any. The total fees and expenses you bear may therefore be higher than those shown below.
Analyzing Your Fund's Expenses
To illustrate these ongoing costs, we have provided examples and calculated the expenses paid by investors in each share class of the Fund during the period. The actual and hypothetical information in the table is based on an initial investment of $1,000 at the beginning of the period indicated and held for the entire period. Expense information is calculated two ways and each method provides you with different information. The amount listed in the "Actual" column is calculated using the Fund's actual operating expenses and total return for the period. You may use the Actual information, together with the amount invested, to estimate the expenses that you paid over the period. Simply divide your account value by $1,000 (for example, an $8,600 account value divided by $1,000 = 8.6), then multiply the results by the expenses paid during the period under the "Actual" column. The amount listed in the "Hypothetical" column assumes a 5% annual rate of return before expenses (which is not the Fund's actual return) and then applies the Fund's actual expense ratio for the period to the hypothetical return. You should not use the hypothetical account values and expenses to estimate either your actual account balance at the end of the period or the expenses you paid during the period. See "Compare With Other Funds" below for details on how to use the hypothetical data.
In addition to the ongoing expenses which the Fund bears directly, the Fund's shareholders indirectly bear the Fund's allocable share of the costs and expenses of each underlying fund in which the Fund invests. You can also estimate the effective expenses paid during the period, which includes the indirect fees associated with investing in the underlying funds, by using the amounts listed in the "Effective Expenses Paid During the Period" column.
Compare With Other Funds
Since all mutual funds are required to include the same hypothetical calculations about expenses in shareholder reports, you can use this information to compare the ongoing cost of investing in the Fund with other funds. To do so, compare the hypothetical example with the 5% hypothetical examples that appear in the shareholder reports of other funds. As you compare hypothetical examples of other funds, it is important to note that hypothetical examples are meant to highlight the ongoing costs of investing in a fund only and do not reflect any transaction costs, such as redemption or exchange fees, or expenses that apply to the subaccount or the Contract. Therefore, the hypothetical calculations are useful in comparing ongoing costs only, and will not help you determine the relative total costs of owning different funds. If the fees and expenses imposed under your Contract or Qualified Plan, if any, were included, your costs would be higher.
July 1, 2016 – December 31, 2016
| Account Value at the Beginning of the Period ($) | Account Value at the End of the Period ($) | Expenses Paid During the Period ($) | Fund's Annualized Expense Ratio (%) | Effective Expenses Paid During the Period ($) | Fund's Effective Annualized Expense Ratio (%) | ||||||||||||||||||||||||||||||||||||||
Actual | Hypothetical | Actual | Hypothetical | Actual | Hypothetical | Actual | Actual | Hypothetical | Actual | ||||||||||||||||||||||||||||||||||
Class 1 | 1,000.00 | 1,000.00 | 1,032.20 | 1,023.75 | 1.27 | 1.26 | 0.25 | 4.06 | 4.05 | 0.80 | |||||||||||||||||||||||||||||||||
Class 2 | 1,000.00 | 1,000.00 | 1,030.50 | 1,022.50 | 2.54 | 2.53 | 0.50 | 5.33 | 5.31 | 1.05 | |||||||||||||||||||||||||||||||||
Expenses paid during the period are equal to the annualized expense ratio for each class as indicated above, multiplied by the average account value over the period and then multiplied by the number of days in the Fund's most recent fiscal half year and divided by 366.
Effective expenses paid during the period and the Fund's effective annualized expense ratio include expenses borne directly to the class plus the Fund's pro rata portion of the ongoing expenses charged by the underlying funds using the expense ratio of each class of the underlying funds as of the underlying fund's most recent shareholder report.
Annual Report 2016
6
COLUMBIA VARIABLE PORTFOLIO — ASSET ALLOCATION FUND
PORTFOLIO OF INVESTMENTS
December 31, 2016
(Percentages represent value of investments compared to net assets)
Equity Funds 54.6%
Shares | Value ($) | ||||||||||
U.S. LARGE CAP 54.6% | |||||||||||
| Columbia Contrarian Core Fund, Class I Shares(a) | 836,536 | 18,805,341 | |||||||||
| Columbia Disciplined Core Fund, Class I Shares(a) | 2,032,240 | 20,891,427 | |||||||||
Total | 39,696,768 | ||||||||||
| Total Equity Funds (Cost: $28,987,394) | 39,696,768 | ||||||||||
Fixed-Income Funds 41.4%
ALTERNATIVE INVESTMENTS 9.0% | |||||||||||
| Columbia Commodity Strategy Fund, Class I Shares(a)(b) | 624,585 | 3,522,661 | |||||||||
| Columbia Diversified Absolute Return Fund, Class I Shares(a)(b) | 156,385 | 1,471,578 | |||||||||
| Columbia Multi-Asset Income Fund, Class I Shares(a) | 166,014 | 1,578,790 | |||||||||
Total | 6,573,029 | ||||||||||
INVESTMENT GRADE 32.4% | |||||||||||
| Columbia Corporate Income Fund, Class I Shares(a) | 524,933 | 5,249,334 | |||||||||
| Columbia Total Return Bond Fund, Class I Shares(a) | 649,723 | 5,821,517 | |||||||||
Fixed-Income Funds (continued)
Shares | Value ($) | ||||||||||
| Columbia U.S. Government Mortgage Fund, Class I Shares(a) | 902,090 | 4,862,264 | |||||||||
| Columbia U.S. Treasury Index Fund, Class I Shares(a) | 692,816 | 7,600,194 | |||||||||
Total | 23,533,309 | ||||||||||
| Total Fixed-Income Funds (Cost: $30,013,553) | 30,106,338 | ||||||||||
Exchange-Traded Funds 1.0%
| iShares iBoxx $ Investment Grade Corporate Bond ETF | 6,127 | 717,962 | |||||||||
| Total Exchange-Traded Funds (Cost: $731,012) | 717,962 | ||||||||||
Money Market Funds 2.7%
| Columbia Short-Term Cash Fund, 0.594%(a)(c) | 1,993,475 | 1,993,475 | |||||||||
| Total Money Market Funds (Cost: $1,993,475) | 1,993,475 | ||||||||||
| Total Investments (Cost: $61,725,434) | 72,514,543 | ||||||||||
Other Assets & Liabilities, Net | 209,344 | ||||||||||
Net Assets | 72,723,887 | ||||||||||
At December 31, 2016, cash totaling $260,176 was pledged as collateral.
Investments in Derivatives
Futures Contracts Outstanding at December 31, 2016
Long Futures Contracts Outstanding
Contract Description | Number of Contracts | Trading Currency | Notional Market Value ($) | Expiration Date | Unrealized Appreciation ($) | Unrealized (Depreciation) ($) | |||||||||||||||||||||
Mini MSCI Emerging Markets Index | 60 | USD | 2,576,700 | 03/2017 | — | (59,551 | ) | ||||||||||||||||||||
S&P 500 E-mini | 20 | USD | 2,236,200 | 03/2017 | — | (6,737 | ) | ||||||||||||||||||||
TOPIX Index | 8 | JPY | 1,039,059 | 03/2017 | — | (15,867 | ) | ||||||||||||||||||||
Total | 5,851,959 | — | (82,155 | ) | |||||||||||||||||||||||
The accompanying Notes to Financial Statements are an integral part of this statement.
Annual Report 2016
7
COLUMBIA VARIABLE PORTFOLIO — ASSET ALLOCATION FUND
PORTFOLIO OF INVESTMENTS (continued)
December 31, 2016
Notes to Portfolio of Investments
(a) As defined in the Investment Company Act of 1940, an affiliated company is one in which the Fund owns 5% or more of the company's outstanding voting securities, or a company which is under common ownership or control with the Fund. Holdings and transactions in these affiliated companies during the year ended December 31, 2016 are as follows:
Issuer | Beginning Cost ($) | Purchase Cost ($) | Proceeds From Sales ($) | Realized Gain (Loss) ($) | Ending Cost ($) | Capital Gain Distributions ($) | Dividends — Affiliated Issuers ($) | Value ($) | |||||||||||||||||||||||||||
| Columbia Commodity Strategy Fund, Class I Shares | — | 3,744,119 | (316,341 | ) | 4,049 | 3,431,827 | — | — | 3,522,661 | ||||||||||||||||||||||||||
| Columbia Contrarian Core Fund, Class I Shares | 13,981,568 | 3,968,913 | (3,617,008 | ) | 189,715 | 14,523,188 | 144,682 | 201,969 | 18,805,341 | ||||||||||||||||||||||||||
| Columbia Corporate Income Fund, Class I Shares | 7,288,520 | 2,467,295 | (4,452,258 | ) | (110,807 | ) | 5,192,750 | — | 119,833 | 5,249,334 | |||||||||||||||||||||||||
| Columbia Disciplined Core Fund, Class I Shares | 14,224,409 | 4,528,336 | (4,564,525 | ) | 275,986 | 14,464,206 | — | 343,125 | 20,891,427 | ||||||||||||||||||||||||||
| Columbia Disciplined Growth Fund, Class I Shares | 3,186,894 | 4,487 | (3,035,640 | ) | (155,741 | ) | — | — | — | — | |||||||||||||||||||||||||
| Columbia Disciplined Value Fund, Class I Shares | 1,272,224 | 1,943 | (1,519,247 | ) | 245,080 | — | — | — | — | ||||||||||||||||||||||||||
| Columbia Diversified Absolute Return Fund, Class I Shares | 1,644,091 | 1,690,521 | (1,760,882 | ) | (79,035 | ) | 1,494,695 | — | — | 1,471,578 | |||||||||||||||||||||||||
| Columbia Income Opportunities Fund, Class I Shares | 3,291,797 | 85,688 | (3,327,840 | ) | (49,645 | ) | — | — | 75,780 | — | |||||||||||||||||||||||||
| Columbia Inflation Protected Securities Fund, Class I Shares | 778,794 | 8,805 | (788,995 | ) | 1,396 | — | — | — | — | ||||||||||||||||||||||||||
| Columbia Multi-Asset Income Fund, Class I Shares | — | 1,622,898 | — | — | 1,622,898 | — | 40,898 | 1,578,790 | |||||||||||||||||||||||||||
| Columbia Select Large Cap Growth Fund, Class I Shares | 3,046,727 | 26,168 | (2,395,590 | ) | (677,305 | ) | — | — | — | — | |||||||||||||||||||||||||
| Columbia Select Large-Cap Value Fund, Class I Shares | 2,094,798 | 4,335 | (2,229,651 | ) | 130,518 | — | — | — | — | ||||||||||||||||||||||||||
Columbia Short-Term Cash Fund | 4,528,519 | 4,208,240 | (6,743,284 | ) | — | 1,993,475 | — | 11,896 | 1,993,475 | ||||||||||||||||||||||||||
| Columbia Total Return Bond Fund, Class I Shares | — | 6,649,206 | (836,562 | ) | 16,385 | 5,829,029 | 89,860 | 166,574 | 5,821,517 | ||||||||||||||||||||||||||
| Columbia U.S. Government Mortgage Fund, Class I Shares | 6,687,830 | 309,847 | (2,143,494 | ) | (19,276 | ) | 4,834,907 | 23,089 | 132,318 | 4,862,264 | |||||||||||||||||||||||||
| Columbia U.S. Treasury Index Fund, Class I Shares | 9,685,591 | 3,081,928 | (5,205,490 | ) | 45,418 | 7,607,447 | 21,928 | 149,617 | 7,600,194 | ||||||||||||||||||||||||||
Total | 71,711,762 | 32,402,729 | (42,936,807 | ) | (183,262 | ) | 60,994,422 | 279,559 | 1,242,010 | 71,796,581 | |||||||||||||||||||||||||
(b) Non-income producing investment.
(c) The rate shown is the seven-day current annualized yield at December 31, 2016.
Currency Legend
JPY Japanese Yen
USD US Dollar
The accompanying Notes to Financial Statements are an integral part of this statement.
Annual Report 2016
8
COLUMBIA VARIABLE PORTFOLIO — ASSET ALLOCATION FUND
PORTFOLIO OF INVESTMENTS (continued)
December 31, 2016
Fair Value Measurements
The Fund categorizes its fair value measurements according to a three-level hierarchy that maximizes the use of observable inputs and minimizes the use of unobservable inputs by prioritizing that the most observable input be used when available. Observable inputs are those that market participants would use in pricing an investment based on market data obtained from sources independent of the reporting entity. Unobservable inputs are those that reflect the Fund's assumptions about the information market participants would use in pricing an investment. An investment's level within the fair value hierarchy is based on the lowest level of any input that is deemed significant to the asset's or liability's fair value measurement. The input levels are not necessarily an indication of the risk or liquidity associated with investments at that level. For example, certain U.S. government securities are generally high quality and liquid, however, they are reflected as Level 2 because the inputs used to determine fair value may not always be quoted prices in an active market.
Fair value inputs are summarized in the three broad levels listed below:
> Level 1 — Valuations based on quoted prices for investments in active markets that the Fund has the ability to access at the measurement date (including NAV for open-end mutual funds). Valuation adjustments are not applied to Level 1 investments.
> Level 2 — Valuations based on other significant observable inputs (including quoted prices for similar securities, interest rates, prepayment speeds, credit risks, etc.).
> Level 3 — Valuations based on significant unobservable inputs (including the Fund's own assumptions and judgment in determining the fair value of investments).
Inputs that are used in determining fair value of an investment may include price information, credit data, volatility statistics, and other factors. These inputs can be either observable or unobservable. The availability of observable inputs can vary between investments, and is affected by various factors such as the type of investment, and the volume and level of activity for that investment or similar investments in the marketplace. The inputs will be considered by the Investment Manager, along with any other relevant factors in the calculation of an investment's fair value. The Fund uses prices and inputs that are current as of the measurement date, which may include periods of market dislocations. During these periods, the availability of prices and inputs may be reduced for many investments. This condition could cause an investment to be reclassified between the various levels within the hierarchy.
Certain investments that have been measured at fair value using the net asset value (NAV) per share (or its equivalent) are not categorized in the fair value hierarchy. The fair value amounts presented in the table are intended to reconcile the fair value hierarchy to the amounts presented in the Portfolio of Investments. The Columbia Short-Term Cash Fund seeks to provide shareholders with maximum current income consistent with liquidity and stability of principal. Columbia Short-Term Cash Fund prices its shares with a floating NAV and no longer seeks to maintain a stable NAV.
Investments falling into the Level 3 category are primarily supported by quoted prices from brokers and dealers participating in the market for those investments. However, these may be classified as Level 3 investments due to lack of market transparency and corroboration to support these quoted prices. Additionally, valuation models may be used as the pricing source for any remaining investments classified as Level 3. These models may rely on one or more significant unobservable inputs and/or significant assumptions by the Investment Manager. Inputs used in valuations may include, but are not limited to, financial statement analysis, capital account balances, discount rates and estimated cash flows, and comparable company data.
Under the direction of the Fund's Board of Trustees (the Board), the Investment Manager's Valuation Committee (the Committee) is responsible for overseeing the valuation procedures approved by the Board. The Committee consists of voting and non-voting members from various groups within the Investment Manager's organization, including operations and accounting, trading and investments, compliance, risk management and legal.
The Committee meets at least monthly to review and approve valuation matters, which may include a description of specific valuation determinations, data regarding pricing information received from approved pricing vendors and brokers and the results of Board-approved valuation control policies and procedures (the Policies). The Policies address, among other things, instances when market quotations are or are not readily available, including recommendations of third party pricing vendors and a determination of appropriate pricing methodologies; events that require specific valuation determinations and assessment of fair value techniques; securities with a potential for stale pricing, including those that are illiquid, restricted, or in default; and the effectiveness of third party pricing vendors, including periodic reviews of vendors. The Committee meets more frequently, as needed, to discuss additional valuation matters, which may include the need to review back-testing results, review time-sensitive information or approve related valuation actions. The Committee reports to the Board, with members of the Committee meeting with the Board at each of its regularly scheduled meetings to discuss valuation matters and actions during the period, similar to those described earlier.
For investments categorized as Level 3, the Committee monitors information similar to that described above, which may include: (i) data specific to the issuer or comparable issuers, (ii) general market or specific sector news and (iii) quoted prices and specific or similar security transactions. The Committee considers this data and any changes from prior periods in order to assess the reasonableness of observable and unobservable inputs, any assumptions or internal models used to value those securities and changes in fair value. This data is also used to corroborate, when available, information received from approved pricing vendors and brokers. Various factors impact the frequency of monitoring this information (which may occur as often as daily). However, the Committee may determine that changes to inputs, assumptions and models are not required as a result of the monitoring procedures performed.
The accompanying Notes to Financial Statements are an integral part of this statement.
Annual Report 2016
9
COLUMBIA VARIABLE PORTFOLIO — ASSET ALLOCATION FUND
PORTFOLIO OF INVESTMENTS (continued)
December 31, 2016
Fair Value Measurements (continued)
The following table is a summary of the inputs used to value the Fund's investments at December 31, 2016:
| Level 1 Quoted Prices in Active Markets for Identical Assets ($) | Level 2 Other Significant Observable Inputs ($) | Level 3 Significant Unobservable Inputs ($) | Total ($) | ||||||||||||||||
Investments | |||||||||||||||||||
Equity Funds | 39,696,768 | — | — | 39,696,768 | |||||||||||||||
Fixed-Income Funds | 30,106,338 | — | — | 30,106,338 | |||||||||||||||
Exchange-Traded Funds | 717,962 | — | — | 717,962 | |||||||||||||||
Investments measured at net asset value | |||||||||||||||||||
Money Market Funds | — | — | — | 1,993,475 | |||||||||||||||
Total Investments | 70,521,068 | — | — | 72,514,543 | |||||||||||||||
Derivatives | |||||||||||||||||||
Liabilities | |||||||||||||||||||
Futures Contracts | (82,155 | ) | — | — | (82,155 | ) | |||||||||||||
Total | 70,438,913 | — | — | 72,432,388 | |||||||||||||||
See the Portfolio of Investments for all investment classifications not indicated in the table.
Derivative instruments are valued at unrealized appreciation (depreciation).
There were no transfers of financial assets between levels during the period.
The accompanying Notes to Financial Statements are an integral part of this statement.
Annual Report 2016
10
COLUMBIA VARIABLE PORTFOLIO — ASSET ALLOCATION FUND
STATEMENT OF ASSETS AND LIABILITIES
December 31, 2016
Assets | |||||||
Investments, at value | |||||||
Unaffiliated issuers (identified cost $731,012) | $ | 717,962 | |||||
Affiliated issuers (identified cost $60,994,422) | 71,796,581 | ||||||
Total investments (identified cost $61,725,434) | 72,514,543 | ||||||
Margin deposits | 260,176 | ||||||
Receivable for: | |||||||
Investments sold | 14,615 | ||||||
Capital shares sold | 28,536 | ||||||
Dividends | 49,578 | ||||||
Variation margin | 2,053 | ||||||
Prepaid expenses | 419 | ||||||
Trustees' deferred compensation plan | 45,256 | ||||||
Total assets | 72,915,176 | ||||||
Liabilities | |||||||
Payable for: | |||||||
Investments purchased | 48,646 | ||||||
Capital shares purchased | 18,647 | ||||||
Variation margin | 26,300 | ||||||
Management services fees | 85 | ||||||
Distribution and/or service fees | 83 | ||||||
Transfer agent fees | 120 | ||||||
Compensation of board members | 25,952 | ||||||
Chief compliance officer expenses | 9 | ||||||
Audit fees | 15,230 | ||||||
Other expenses | 10,961 | ||||||
Trustees' deferred compensation plan | 45,256 | ||||||
Total liabilities | 191,289 | ||||||
Net assets applicable to outstanding capital stock | $ | 72,723,887 | |||||
Represented by | |||||||
Paid-in capital | $ | 60,877,163 | |||||
Undistributed net investment income | 1,076,113 | ||||||
Accumulated net realized gain | 63,396 | ||||||
Unrealized appreciation (depreciation) on: | |||||||
Investments — unaffiliated issuers | (13,050 | ) | |||||
Investments — affiliated issuers | 10,802,159 | ||||||
Foreign currency translations | 261 | ||||||
Futures contracts | (82,155 | ) | |||||
Total — representing net assets applicable to outstanding capital stock | $ | 72,723,887 | |||||
The accompanying Notes to Financial Statements are an integral part of this statement.
Annual Report 2016
11
COLUMBIA VARIABLE PORTFOLIO — ASSET ALLOCATION FUND
STATEMENT OF ASSETS AND LIABILITIES (continued)
December 31, 2016
Class 1 | |||||||
Net assets | $ | 60,526,939 | |||||
Shares outstanding | 4,254,926 | ||||||
Net asset value per share | $ | 14.23 | |||||
Class 2 | |||||||
Net assets | $ | 12,196,948 | |||||
Shares outstanding | 865,492 | ||||||
Net asset value per share | $ | 14.09 | |||||
The accompanying Notes to Financial Statements are an integral part of this statement.
Annual Report 2016
12
COLUMBIA VARIABLE PORTFOLIO — ASSET ALLOCATION FUND
STATEMENT OF OPERATIONS
Year Ended December 31, 2016
Net investment income | |||||||
Income: | |||||||
Dividends — unaffiliated issuers | $ | 13,266 | |||||
Dividends — affiliated issuers | 1,242,010 | ||||||
Total income | 1,255,276 | ||||||
Expenses: | |||||||
Management services fees | 33,552 | ||||||
Distribution and/or service fees | |||||||
Class 2 | 32,029 | ||||||
Transfer agent fees | |||||||
Class 1 | 37,888 | ||||||
Class 2 | 7,687 | ||||||
Compensation of board members | 20,391 | ||||||
Custodian fees | 21,099 | ||||||
Printing and postage fees | 28,410 | ||||||
Audit fees | 18,358 | ||||||
Legal fees | 1,784 | ||||||
Chief compliance officer expenses | 35 | ||||||
Other | 6,262 | ||||||
Total expenses | 207,495 | ||||||
Net investment income | 1,047,781 | ||||||
Realized and unrealized gain (loss) — net | |||||||
Net realized gain (loss) on: | |||||||
Investments — unaffiliated issuers | 7,774 | ||||||
Investments — affiliated issuers | (183,262 | ) | |||||
Capital gain distributions from underlying affiliated funds | 279,559 | ||||||
Foreign currency translations | (573 | ) | |||||
Futures contracts | 191,338 | ||||||
Net realized gain | 294,836 | ||||||
Net change in unrealized appreciation (depreciation) on: | |||||||
Investments — unaffiliated issuers | (13,050 | ) | |||||
Investments — affiliated issuers | 2,635,489 | ||||||
Foreign currency translations | 380 | ||||||
Futures contracts | (89,575 | ) | |||||
Net change in unrealized appreciation | 2,533,244 | ||||||
Net realized and unrealized gain | 2,828,080 | ||||||
Net increase in net assets resulting from operations | $ | 3,875,861 | |||||
The accompanying Notes to Financial Statements are an integral part of this statement.
Annual Report 2016
13
COLUMBIA VARIABLE PORTFOLIO — ASSET ALLOCATION FUND
STATEMENT OF CHANGES IN NET ASSETS
| Year Ended December 31, 2016 | Year Ended December 31, 2015 | ||||||||||
Operations | |||||||||||
Net investment income | $ | 1,047,781 | $ | 1,530,699 | |||||||
Net realized gain | 294,836 | 1,148,487 | |||||||||
Net change in unrealized appreciation (depreciation) | 2,533,244 | (1,739,004 | ) | ||||||||
Net increase in net assets resulting from operations | 3,875,861 | 940,182 | |||||||||
Distributions to shareholders | |||||||||||
Net investment income | |||||||||||
Class 1 | (1,426,725 | ) | (1,467,059 | ) | |||||||
Class 2 | (253,284 | ) | (277,950 | ) | |||||||
Net realized gains | |||||||||||
Class 1 | (719,431 | ) | (7,424,408 | ) | |||||||
Class 2 | (144,737 | ) | (1,589,802 | ) | |||||||
Total distributions to shareholders | (2,544,177 | ) | (10,759,219 | ) | |||||||
Decrease in net assets from capital stock activity | (8,362,931 | ) | (2,398,017 | ) | |||||||
Total decrease in net assets | (7,031,247 | ) | (12,217,054 | ) | |||||||
Net assets at beginning of year | 79,755,134 | 91,972,188 | |||||||||
Net assets at end of year | $ | 72,723,887 | $ | 79,755,134 | |||||||
Undistributed net investment income | $ | 1,076,113 | $ | 1,604,800 | |||||||
The accompanying Notes to Financial Statements are an integral part of this statement.
Annual Report 2016
14
COLUMBIA VARIABLE PORTFOLIO — ASSET ALLOCATION FUND
STATEMENT OF CHANGES IN NET ASSETS (continued)
Year Ended December 31, 2016 | Year Ended December 31, 2015 | ||||||||||||||||||
Shares | Dollars ($) | Shares | Dollars ($) | ||||||||||||||||
Capital stock activity | |||||||||||||||||||
Class 1 shares | |||||||||||||||||||
Subscriptions | 104,655 | 1,470,397 | 48,144 | 695,875 | |||||||||||||||
Distributions reinvested | 152,102 | 2,146,156 | 625,719 | 8,891,467 | |||||||||||||||
Redemptions | (717,801 | ) | (10,068,708 | ) | (732,613 | ) | (11,038,069 | ) | |||||||||||
Net decrease | (461,044 | ) | (6,452,155 | ) | (58,750 | ) | (1,450,727 | ) | |||||||||||
Class 2 shares | |||||||||||||||||||
Subscriptions | 24,581 | 341,808 | 44,531 | 670,953 | |||||||||||||||
Distributions reinvested | 28,450 | 398,021 | 132,559 | 1,867,752 | |||||||||||||||
Redemptions | (190,646 | ) | (2,650,605 | ) | (230,685 | ) | (3,485,995 | ) | |||||||||||
Net decrease | (137,615 | ) | (1,910,776 | ) | (53,595 | ) | (947,290 | ) | |||||||||||
Total net decrease | (598,659 | ) | (8,362,931 | ) | (112,345 | ) | (2,398,017 | ) | |||||||||||
The accompanying Notes to Financial Statements are an integral part of this statement.
Annual Report 2016
15
COLUMBIA VARIABLE PORTFOLIO — ASSET ALLOCATION FUND
FINANCIAL HIGHLIGHTS
The following tables are intended to help you understand the Fund's financial performance. Certain information reflects financial results for a single share of a class held for the periods shown. Per share net investment income (loss) amounts are calculated based on average shares outstanding during the period. Total return assumes reinvestment of all dividends and distributions, if any. Total return does not reflect any fees and expenses imposed under your Contract and/or Qualified Plan, as applicable; such fees and expenses would reduce the total returns for all periods shown. Total return and portfolio turnover are not annualized for periods of less than one year. The portfolio turnover rate is calculated without regard to purchase and sales transactions of short-term instruments and certain derivatives, if any. If such transactions were included, the Fund's portfolio turnover rate may be higher.
Year Ended December 31, | |||||||||||||||||||||||
Class 1 | 2016 | 2015 | 2014 | 2013 | 2012 | ||||||||||||||||||
Per share data | |||||||||||||||||||||||
Net asset value, beginning of period | $ | 13.97 | $ | 15.79 | $ | 15.05 | $ | 13.05 | $ | 11.81 | |||||||||||||
Income from investment operations: | |||||||||||||||||||||||
Net investment income | 0.20 | 0.27 | 0.23 | 0.24 | 0.25 | ||||||||||||||||||
Net realized and unrealized gain (loss) | 0.54 | (0.07 | ) | 1.25 | 2.11 | 1.27 | |||||||||||||||||
Total from investment operations | 0.74 | 0.20 | 1.48 | 2.35 | 1.52 | ||||||||||||||||||
Less distributions to shareholders: | |||||||||||||||||||||||
Net investment income | (0.32 | ) | (0.33 | ) | (0.39 | ) | (0.35 | ) | (0.28 | ) | |||||||||||||
Net realized gains | (0.16 | ) | (1.69 | ) | (0.35 | ) | — | — | |||||||||||||||
Total distributions to shareholders | (0.48 | ) | (2.02 | ) | (0.74 | ) | (0.35 | ) | (0.28 | ) | |||||||||||||
Net asset value, end of period | $ | 14.23 | $ | 13.97 | $ | 15.79 | $ | 15.05 | $ | 13.05 | |||||||||||||
Total return | 5.36 | % | 1.07 | % | 10.05 | % | 18.17 | % | 13.03 | % | |||||||||||||
Ratios to average net assets(a) | |||||||||||||||||||||||
Total gross expenses | 0.23 | % | 0.23 | % | 0.20 | % | 0.19 | % | 0.24 | % | |||||||||||||
Total net expenses(b) | 0.23 | % | 0.22 | % | 0.15 | % | 0.15 | % | 0.16 | % | |||||||||||||
Net investment income | 1.42 | % | 1.82 | % | 1.51 | % | 1.67 | % | 1.99 | % | |||||||||||||
Supplemental data | |||||||||||||||||||||||
Net assets, end of period (in thousands) | $ | 60,527 | $ | 65,872 | $ | 75,415 | $ | 78,390 | $ | 77,976 | |||||||||||||
Portfolio turnover | 39 | % | 19 | % | 41 | % | 15 | % | 51 | % | |||||||||||||
Notes to Financial Highlights
(a) In addition to the fees and expenses that the Fund bears directly, the Fund indirectly bears a pro rata share of the fees and expenses of any other funds in which it invests. Such indirect expenses are not included in the Fund's reported expense ratios.
(b) Total net expenses include the impact of certain fee waivers/expense reimbursements made by the Investment Manager and certain of its affiliates, if applicable.
The accompanying Notes to Financial Statements are an integral part of this statement.
Annual Report 2016
16
COLUMBIA VARIABLE PORTFOLIO — ASSET ALLOCATION FUND
FINANCIAL HIGHLIGHTS (continued)
Year Ended December 31, | |||||||||||||||||||||||
Class 2 | 2016 | 2015 | 2014 | 2013 | 2012 | ||||||||||||||||||
Per share data | |||||||||||||||||||||||
Net asset value, beginning of period | $ | 13.84 | $ | 15.67 | $ | 14.94 | $ | 12.96 | $ | 11.73 | |||||||||||||
Income from investment operations: | |||||||||||||||||||||||
Net investment income | 0.16 | 0.24 | 0.19 | 0.20 | 0.22 | ||||||||||||||||||
Net realized and unrealized gain (loss) | 0.54 | (0.09 | ) | 1.25 | 2.09 | 1.26 | |||||||||||||||||
Total from investment operations | 0.70 | 0.15 | 1.44 | 2.29 | 1.48 | ||||||||||||||||||
Less distributions to shareholders: | |||||||||||||||||||||||
Net investment income | (0.29 | ) | (0.29 | ) | (0.36 | ) | (0.31 | ) | (0.25 | ) | |||||||||||||
Net realized gains | (0.16 | ) | (1.69 | ) | (0.35 | ) | — | — | |||||||||||||||
Total distributions to shareholders | (0.45 | ) | (1.98 | ) | (0.71 | ) | (0.31 | ) | (0.25 | ) | |||||||||||||
Net asset value, end of period | $ | 14.09 | $ | 13.84 | $ | 15.67 | $ | 14.94 | $ | 12.96 | |||||||||||||
Total return | 5.06 | % | 0.76 | % | 9.80 | % | 17.88 | % | 12.76 | % | |||||||||||||
Ratios to average net assets(a) | |||||||||||||||||||||||
Total gross expenses | 0.48 | % | 0.48 | % | 0.45 | % | 0.44 | % | 0.49 | % | |||||||||||||
Total net expenses(b) | 0.48 | % | 0.47 | % | 0.40 | % | 0.40 | % | 0.41 | % | |||||||||||||
Net investment income | 1.16 | % | 1.57 | % | 1.26 | % | 1.42 | % | 1.72 | % | |||||||||||||
Supplemental data | |||||||||||||||||||||||
Net assets, end of period (in thousands) | $ | 12,197 | $ | 13,883 | $ | 16,557 | $ | 17,832 | $ | 17,976 | |||||||||||||
Portfolio turnover | 39 | % | 19 | % | 41 | % | 15 | % | 51 | % | |||||||||||||
Notes to Financial Highlights
(a) In addition to the fees and expenses that the Fund bears directly, the Fund indirectly bears a pro rata share of the fees and expenses of any other funds in which it invests. Such indirect expenses are not included in the Fund's reported expense ratios.
(b) Total net expenses include the impact of certain fee waivers/expense reimbursements made by the Investment Manager and certain of its affiliates, if applicable.
The accompanying Notes to Financial Statements are an integral part of this statement.
Annual Report 2016
17
COLUMBIA VARIABLE PORTFOLIO — ASSET ALLOCATION FUND
NOTES TO FINANCIAL STATEMENTS
December 31, 2016
Note 1. Organization
Columbia Variable Portfolio — Asset Allocation Fund (the Fund), a series of Columbia Funds Variable Insurance Trust (the Trust), is a diversified fund. The Trust is registered under the Investment Company Act of 1940, as amended (the 1940 Act), as an open-end management investment company organized as a Massachusetts Business trust.
The Fund is a "fund-of-funds", investing significantly in affiliated funds managed by Columbia Management Investment Advisers, LLC (the Investment Manager), a wholly-owned subsidiary of Ameriprise Financial, Inc. (Ameriprise Financial), its affiliates, or third-party advised (unaffiliated) funds, including exchange-traded funds (collectively, Underlying Funds).
For information on the Underlying Funds, please refer to the Fund's current prospectus and the prospectuses of the Underlying Funds, which are available, free of charge, from the Securities and Exchange Commission website, www.sec.gov.
Fund Shares
The Trust may issue an unlimited number of shares (without par value). The Fund offers Class 1 and Class 2 shares to separate accounts funding variable annuity contracts and variable life insurance policies (collectively, Contracts) issued by affiliated and unaffiliated life insurance companies as well as qualified pension and retirement plans (Qualified Plans) and other qualified institutional investors (Qualified Investors) authorized by Columbia Management Investment Distributors, Inc. (the Distributor). You may not buy (nor will you own) shares of the Fund directly. You may invest by participating in a Qualified Plan or by buying a Contract and making allocations to the Fund. Although all share classes generally have identical voting, dividend and liquidation rights, each share class votes separately when required by the Trust's organizational documents or by law. Different share classes pay different distribution amounts to the extent the expenses of such share classes differ, and distributions in liquidation will be proportional to the net asset value of each share class. Each share class has its own cost structure and other features.
Note 2. Summary of Significant Accounting Policies
Basis of Preparation
The Fund is an investment company that applies the accounting and reporting guidance in the Financial Accounting Standards Board (FASB) Accounting Standards Codification Topic 946, Financial Services — Investment Companies (ASC 946). The financial statements are prepared in accordance with U.S. generally accepted accounting principles (GAAP), which requires management to make certain estimates and assumptions that affect the reported amounts of assets and liabilities, the disclosure of contingent assets and liabilities at the date of the financial statements and the reported amounts of income and expenses during the reporting period. Actual results could differ from those estimates.
The following is a summary of significant accounting policies followed by the Fund in the preparation of its financial statements.
Security Valuation
All equity securities and exchange-traded funds are valued at the close of business of the New York Stock Exchange. Equity securities and exchange-traded funds are valued at the last quoted sales price on the principal exchange or market on which they trade, except for securities traded on the NASDAQ Stock Market, which are valued at the NASDAQ official close price. Unlisted securities or listed securities for which there were no sales during the day are valued at the mean of the latest quoted bid and ask prices on such exchanges or markets.
Investments in the Underlying Funds are valued at the net asset value of the applicable class of the Underlying Fund determined as of the close of the New York Stock Exchange on the valuation date.
Futures and options on futures contracts are valued based upon the settlement price at the close of regular trading on their principal exchanges or, in the absence of transactions, at the mean of the latest quoted bid and ask prices.
Investments for which market quotations are not readily available, or that have quotations which management believes are not reflective of market value or reliable, are valued at fair value as determined in good faith under procedures approved by and under the general supervision of the Board of Trustees. If a security or
Annual Report 2016
18
COLUMBIA VARIABLE PORTFOLIO — ASSET ALLOCATION FUND
NOTES TO FINANCIAL STATEMENTS (continued)
December 31, 2016
class of securities (such as foreign securities) is valued at fair value, such value is likely to be different from the quoted or published price for the security.
The determination of fair value often requires significant judgment. To determine fair value, management may use assumptions including but not limited to future cash flows and estimated risk premiums. Multiple inputs from various sources may be used to determine fair value.
GAAP requires disclosure regarding the inputs and valuation techniques used to measure fair value and any changes in valuation inputs or techniques. In addition, investments shall be disclosed by major category. This information is disclosed following the Fund's Portfolio of Investments.
Foreign Currency Transactions and Translations
The values of all assets and liabilities denominated in foreign currencies are generally translated into U.S. dollars at exchange rates determined at the close of regular trading on the New York Stock Exchange. Net realized and unrealized gains (losses) on foreign currency transactions and translations include gains (losses) arising from the fluctuation in exchange rates between trade and settlement dates on securities transactions, gains (losses) arising from the disposition of foreign currency and currency gains (losses) between the accrual and payment dates on dividends, interest income and foreign withholding taxes.
For financial statement purposes, the Fund does not distinguish that portion of gains (losses) on investments which is due to changes in foreign exchange rates from that which is due to changes in market prices of the investments. Such fluctuations are included with the net realized and unrealized gains (losses) on investments in the Statement of Operations.
Derivative Instruments
The Fund invests in certain derivative instruments, as detailed below, to meet its investment objectives. Derivatives are instruments whose values depend on, or are derived from, in whole or in part, the value of one or more securities, currencies, commodities, indices, or other assets or instruments. Derivatives may be used to increase investment flexibility (including to maintain cash reserves while maintaining desired exposure to certain assets), for risk management (hedging) purposes, to facilitate trading, to reduce transaction costs and to pursue higher investment returns. The Fund may also use derivative instruments to mitigate certain investment risks, such as foreign currency exchange rate risk,
interest rate risk and credit risk. Derivatives may involve various risks, including the potential inability of the counterparty to fulfill its obligations under the terms of the contract, the potential for an illiquid secondary market (making it difficult for the Fund to sell or terminate, including at favorable prices) and the potential for market movements which may expose the Fund to gains or losses in excess of the amount shown in the Statement of Assets and Liabilities. The notional amounts of derivative instruments, if applicable, are not recorded in the financial statements.
A derivative instrument may suffer a marked-to-market loss if the value of the contract decreases due to an unfavorable change in the market rates or values of the underlying instrument. Losses can also occur if the counterparty does not perform its obligations under the contract. The Fund's risk of loss from counterparty credit risk on over-the-counter derivatives is generally limited to the aggregate unrealized gain netted against any collateral held by the Fund and the amount of any variation margin held by the counterparty, plus any replacement costs or related amounts. With exchange-traded or centrally cleared derivatives, there is reduced counterparty credit risk to the Fund since the clearinghouse or central counterparty (CCP) provides some protection in the case of clearing member default. The clearinghouse or CCP stands between the buyer and the seller of the contract; therefore, additional counterparty credit risk is failure of the clearinghouse or CCP. However, credit risk still exists in exchange-traded or centrally cleared derivatives with respect to initial and variation margin that is held in a broker's customer account. While brokers are required to segregate customer margin from their own assets, in the event that a broker becomes insolvent or goes into bankruptcy and at that time there is a shortfall in the aggregate amount of margin held by the broker for all its clients, U.S. bankruptcy laws will typically allocate that shortfall on a pro-rata basis across all the broker's customers (including the Fund), potentially resulting in losses to the Fund.
In order to better define its contractual rights and to secure rights that will help the Fund mitigate its counterparty risk, the Fund may enter into an International Swaps and Derivatives Association, Inc. Master Agreement (ISDA Master Agreement) or similar agreement with its derivatives contract counterparties. An ISDA Master Agreement is an agreement between the Fund and a counterparty that governs over-the-counter derivatives and typically contains, among other things, collateral posting terms and netting provisions in the
Annual Report 2016
19
COLUMBIA VARIABLE PORTFOLIO — ASSET ALLOCATION FUND
NOTES TO FINANCIAL STATEMENTS (continued)
December 31, 2016
event of a default and/or termination event. Under an ISDA Master Agreement, the Fund may, under certain circumstances, offset with the counterparty certain derivative instrument's payables and/or receivables with collateral held and/or posted and create one single net payment. The provisions of the ISDA Master Agreement typically permit a single net payment in the event of default (close-out netting), including the bankruptcy or insolvency of the counterparty. Note, however, that bankruptcy or insolvency laws of a particular jurisdiction may impose restrictions on or prohibitions against the right of offset or netting in bankruptcy, insolvency or other events.
Collateral (margin) requirements differ by type of derivative. Margin requirements are established by the clearinghouse or CCP for exchange-traded and centrally cleared derivatives. Brokers can ask for margin in excess of the minimum in certain circumstances. Collateral terms are contract specific for over-the-counter derivatives. For over-the-counter derivatives traded under an ISDA Master Agreement, the collateral requirements are typically calculated by netting the marked-to-market amount for each transaction under such agreement and comparing that amount to the value of any variation margin currently pledged by the Fund and/or the counterparty. Generally, the amount of collateral due from or to a party has to exceed a minimum transfer amount threshold (e.g., $250,000) before a transfer has to be made. To the extent amounts due to the Fund from its counterparties are not fully collateralized, contractually or otherwise, the Fund bears the risk of loss from counterparty nonperformance. The Fund attempts to mitigate counterparty risk by only entering into agreements with counterparties that it believes have the financial resources to honor their obligations and by monitoring the financial stability of those counterparties.
Certain ISDA Master Agreements allow counterparties of over-the-counter derivatives transactions to terminate derivatives contracts prior to maturity in the event the Fund's net asset value declines by a stated percentage over a specified time period or if the Fund fails to meet certain terms of the ISDA Master Agreement, which would cause the Fund to accelerate payment of any net liability owed to the counterparty. The Fund also has termination rights if the counterparty fails to meet certain terms of the ISDA Master Agreement. In addition to considering counterparty credit risk, the Fund would consider terminating the derivatives contracts based on whether termination would result in a net liability owed from the counterparty.
For financial reporting purposes, the Fund does not offset derivative assets and derivative liabilities that are subject to netting arrangements in the Statement of Assets and Liabilities.
Futures Contracts
Futures contracts are exchange-traded and represent commitments for the future purchase or sale of an asset at a specified price on a specified date. The Fund bought and sold futures contracts to produce incremental earnings, to manage the duration and yield curve exposure of the Fund versus the benchmark, to manage exposure to movements in interest rates, to manage exposure to the securities market and maintain appropriate equity market exposure while keeping sufficient cash to accommodate daily redemptions. These instruments may be used for other purposes in future periods. Upon entering into futures contracts, the Fund bears risks that it may not achieve the anticipated benefits of the futures contracts and may realize a loss. Additional risks include counterparty credit risk, the possibility of an illiquid market, and that a change in the value of the contract or option may not correlate with changes in the value of the underlying asset.
Upon entering into a futures contract, the Fund deposits cash or securities with the broker, known as a futures commission merchant (FCM), in an amount sufficient to meet the initial margin requirement. The initial margin deposit must be maintained at an established level over the life of the contract. Cash deposited as initial margin is recorded in the Statement of Assets and Liabilities as margin deposits. Securities deposited as initial margin are designated in the Portfolio of Investments. Subsequent payments (variation margin) are made or received by the Fund each day. The variation margin payments are equal to the daily change in the contract value and are recorded as variation margin receivable or payable and are offset in unrealized gains or losses. The Fund recognizes a realized gain or loss when the contract is closed or expires. Futures contracts involve, to varying degrees, risk of loss in excess of the variation margin disclosed in the Statement of Assets and Liabilities.
Effects of Derivative Transactions in the Financial Statements
The following tables are intended to provide additional information about the effect of derivatives on the financial statements of the Fund, including: the fair value of derivatives by risk category and the location of those fair values in the Statement of Assets and Liabilities; and the impact of derivative transactions over the period
Annual Report 2016
20
COLUMBIA VARIABLE PORTFOLIO — ASSET ALLOCATION FUND
NOTES TO FINANCIAL STATEMENTS (continued)
December 31, 2016
in the Statement of Operations, including realized and unrealized gains (losses). The derivative instrument schedules following the Portfolio of Investments present additional information regarding derivative instruments outstanding at the end of the period, if any.
The following table is a summary of the fair value of derivative instruments (not considered to be hedging instruments for accounting disclosure purposes) at December 31, 2016:
Liability Derivatives | |||||||||||
| Risk Exposure Category | Statement of Assets and Liabilities Location | Fair Value ($) | |||||||||
| Equity risk | Net assets — unrealized depreciation on futures contracts | 82,155 | * | ||||||||
*Includes cumulative appreciation (depreciation) as reported in the tables following the Portfolio of Investments. Only the current day's variation margin is reported in receivables or payables in the Statement of Assets and Liabilities.
The following table indicates the effect of derivative instruments (not considered to be hedging instruments for accounting disclosure purposes) in the Statement of Operations for the year ended December 31, 2016:
Amount of Realized Gain (Loss) on Derivatives Recognized in Income | |||||||
Risk Exposure Category | Futures Contracts ($) | ||||||
Equity risk | 197,737 | ||||||
Interest rate risk | (6,399 | ) | |||||
Total | 191,338 | ||||||
Change in Unrealized Appreciation (Depreciation) on Derivatives Recognized in Income | |||||||
Risk Exposure Category | Futures Contracts ($) | ||||||
Equity risk | (89,575 | ) | |||||
The following table provides a summary of the average outstanding volume by derivative instrument for the year ended December 31, 2016:
Derivative Instrument | Average Notional Amounts ($)* | ||||||
Futures contracts — Long | 4,165,336 | ||||||
*Based on the ending quarterly outstanding amounts for the year ended December 31, 2016.
Security Transactions
Security transactions are accounted for on the trade date. Cost is determined and gains (losses) are based upon the specific identification method for both financial statement and federal income tax purposes.
Income Recognition
Corporate actions and dividend income are recorded on the ex-dividend date.
The Fund may receive distributions from holdings in equity securities, business development companies (BDCs), exchange-traded funds, other regulated investment companies (RICs), and real estate investment trusts (REITs), which report information on the tax character of their distributions annually. These distributions are allocated to dividend income, capital gain and return of capital based on actual information reported. Return of capital is recorded as a reduction of the cost basis of securities held. If the Fund no longer owns the applicable securities, return of capital is recorded as a realized gain. With respect to REITs, to the extent actual information has not yet been reported, estimates for return of capital are made by the Fund's management. Management's estimates are subsequently adjusted when the actual character of the distributions is disclosed by the REITs, which could result in a proportionate change in return of capital to shareholders.
Awards from class action litigation are recorded as a reduction of cost basis if the Fund still owns the applicable securities on the payment date. If the Fund no longer owns the applicable securities, the proceeds are recorded as realized gains.
Income and capital gain distributions from the Underlying Funds, if any, are recorded on the ex-dividend date.
Expenses
General expenses of the Trust are allocated to the Fund and other funds of the Trust based upon relative net assets or other expense allocation methodologies determined by the nature of the expense. Expenses directly attributable to the Fund are charged to the Fund. Expenses directly attributable to a specific class of shares are charged to that share class.
Determination of Class Net Asset Value
All income, expenses (other than class-specific expenses, which are charged to that share class, as shown in the Statement of Operations) and realized and unrealized gains (losses) are allocated to each class of the Fund on a daily basis, based on the relative net assets of each class, for purposes of determining the net asset value of each class.
Annual Report 2016
21
COLUMBIA VARIABLE PORTFOLIO — ASSET ALLOCATION FUND
NOTES TO FINANCIAL STATEMENTS (continued)
December 31, 2016
Federal Income Tax Status
The Fund intends to qualify each year as a regulated investment company under Subchapter M of the Internal Revenue Code, as amended, and will distribute substantially all of its taxable income, if any, for its tax year, and as such will not be subject to federal income taxes. In addition, because the Fund meets the exception under Internal Revenue Code Section 4982(f), the Fund expects not to be subject to federal excise tax. Therefore, no federal income or excise tax provision is recorded.
Distributions to Subaccounts
Distributions to the subaccounts of Contracts, Qualified Plans and Qualified Investors are recorded at the close of business on the record date and are payable on the first business day following the record date. Dividends from net investment income, if any, are declared and distributed annually. Capital gains distributions, when available, will be made annually. However, an additional capital gain distribution may be made during the fiscal year in order to comply with the Internal Revenue Code, as applicable to registered investment companies. Income distributions and capital gain distributions are determined in accordance with federal income tax regulations, which may differ from GAAP. All dividends and distributions are reinvested in additional shares of the applicable share class of the Fund at the net asset value as of the ex-dividend date of the distribution.
Guarantees and Indemnifications
Under the Trust's organizational documents and, in some cases, by contract, its officers and trustees are indemnified against certain liabilities arising out of the performance of their duties to the Trust or its funds. In addition, certain of the Fund's contracts with its service providers contain general indemnification clauses. The Fund's maximum exposure under these arrangements is unknown since the amount of any future claims that may be made against the Fund cannot be determined, and the Fund has no historical basis for predicting the likelihood of any such claims.
Investment Company Reporting Modernization
In October 2016, the U.S. Securities and Exchange Commission adopted new rules and forms, and amendments to certain current rules and forms, to modernize reporting and disclosure of information by registered investment companies. The amendments to Regulation S-X will require standardized, enhanced disclosure about derivatives in investment company
financial statements, and will also change the rules governing the form and content of such financial statements. The amendments to Regulation S-X take effect on August 1, 2017. At this time, management is assessing the anticipated impact of these regulatory developments.
Note 3. Fees and Other Transactions with Affiliates
Management Services Fees and Underlying Fund Fees
Effective May 1, 2016, the Fund entered into a Management Agreement with Columbia Management Investment Advisers, LLC (the Investment Manager), a wholly-owned subsidiary of Ameriprise Financial, Inc. (Ameriprise Financial). Under the Management Agreement, the Investment Manager provides the Fund with investment research and advice, as well as administrative and accounting services. The management services fee is an annual fee that is a blend of (i) 0.020% on assets invested in underlying funds that pay a management services fee to the Investment Manager, (ii) 0.120% on assets invested in non-exchange traded, third-party advised mutual funds and (iii) 0.570% on assets invested in securities (other than third-party advised mutual funds and funds that pay a management services fee to the Investment Manager), including other Columbia funds that do not pay a management services fee, exchange-traded funds, derivatives and individual securities. Prior to May 1, 2016, the Fund paid the Investment Manager an annual fee for advisory services under an Investment Management Services Agreement and a separate annual fee for administrative and accounting services under an Administrative Services Agreement. The effective management fee rate, net of any waivers, for the year ended December 31, 2016 (reflecting all advisory and administrative services fees paid to the Investment Manager) was 0.04% of the Fund's average daily net assets. For the period from January 1, 2016 through April 30, 2016, the investment advisory services fee paid to the Investment Manager was $3,218, and the administrative services fee paid to the Investment Manager was $5,036.
In addition to the fees and expenses which the Fund bears directly, the Fund indirectly bears a pro rata share of the fees and expenses of the Underlying Funds in which the Fund invests. Because the Underlying Funds have varied expense and fee levels and the Fund may
Annual Report 2016
22
COLUMBIA VARIABLE PORTFOLIO — ASSET ALLOCATION FUND
NOTES TO FINANCIAL STATEMENTS (continued)
December 31, 2016
own different proportions of Underlying Funds at different times, the amount of fees and expenses incurred indirectly by the Fund will vary. These expenses are not reflected in the expenses shown in Statement of Operations and are not included in the ratios to average net assets shown in the Financial Highlights.
Compensation of Board Members
Board of Trustee members, who are not officers or employees of the Investment Manager or Ameriprise Financial, are compensated for their services to the Fund as disclosed in the Statement of Operations. These Board of Trustee members may participate in a Deferred Compensation Plan (the Plan) which may be terminated at any time. Obligations of the Plan will be paid solely out of the Fund's assets, and all amounts payable under the Plan constitute a general unsecured obligation of the Fund.
Compensation of Chief Compliance Officer
The Board of Trustees has appointed a Chief Compliance Officer to the Fund in accordance with federal securities regulations. The Fund is allocated a portion of the expenses associated with the Chief Compliance Officer based on relative net assets of the Trust.
Transfer Agency Fees
The Fund has a Transfer and Dividend Disbursing Agent Agreement with Columbia Management Investment Services Corp. (the Transfer Agent), an affiliate of the Investment Manager and a wholly-owned subsidiary of Ameriprise Financial. The annual fee rate under this agreement is 0.06% of the Fund's average daily net assets attributable to each share class.
Distribution Fees
The Fund has an agreement with the Distributor, an affiliate of the Investment Manager and a wholly-owned subsidiary of Ameriprise Financial, for distribution services. The Board of Trustees has approved, and the Fund has adopted, a distribution plan (the Plan) which sets the distribution fees for the Fund. These fees are calculated daily and are intended to compensate the Distributor for selling shares of the Fund. The Fund pays a monthly distribution fee to the Distributor at the maximum annual rate of 0.25% of the average daily net assets attributable to Class 2 shares of the Fund. The Fund pays no distribution and service fees for Class 1 shares.
Expenses Waived/Reimbursed by the Investment Manager and its Affiliates
The Investment Manager and certain of its affiliates have contractually agreed to waive fees and/or reimburse expenses (excluding certain fees and expenses described below) for the periods disclosed below, unless sooner terminated at the sole discretion of the Board of Trustees, so that the Fund's net operating expenses, after giving effect to fees waived/expenses reimbursed and any balance credits and/or overdraft charges from the Fund's custodian, do not exceed the following annual rates as a percentage of the class' average daily net assets:
| May 1, 2016 through April 30, 2017 | Prior to May 1, 2016 | ||||||||||
Class 1 | 0.20 | % | 0.22 | % | |||||||
Class 2 | 0.45 | 0.47 | |||||||||
Under the agreement governing these fee waivers and/or expense reimbursement arrangements, the following fees and expenses are excluded from the waiver/reimbursement commitment, and therefore will be paid by the Fund, if applicable: taxes (including foreign transaction taxes), expenses associated with investments in affiliated and non-affiliated pooled investment vehicles (including mutual funds and exchange-traded funds), transaction costs and brokerage commissions, costs related to any securities lending program, dividend and interest expenses associated with securities sold short, inverse floater program fees and expenses, transaction charges and interest on borrowed money, interest, infrequent and/or unusual expenses and any other expenses the exclusion of which is specifically approved by the Board of Trustees. This agreement may be modified or amended only with approval from the Investment Manager, certain of its affiliates and the Fund. The Fund's management services fee is also excluded from the waiver/reimbursement commitment and is therefore paid by the Fund. Any fees waived and/or expenses reimbursed under the expense reimbursement arrangements described above are not recoverable by the Investment Manager or its affiliates in future periods.
Note 4. Federal Tax Information
The timing and character of income and capital gain distributions are determined in accordance with income tax regulations, which may differ from GAAP because of temporary or permanent book to tax differences.
Annual Report 2016
23
COLUMBIA VARIABLE PORTFOLIO — ASSET ALLOCATION FUND
NOTES TO FINANCIAL STATEMENTS (continued)
December 31, 2016
At December 31, 2016, these differences are primarily due to differing treatment for deferral/reversal of wash sale losses, Trustees' deferred compensation, foreign currency transactions, re-characterization of distributions for investments and derivative investments. To the extent these differences are permanent, reclassifications are made among the components of the Fund's net assets in the Statement of Assets and Liabilities. Temporary differences do not require reclassifications.
In the Statement of Assets and Liabilities the following reclassifications were made:
Undistributed net investment income | $ | 103,541 | |||||
Accumulated net realized gain | (103,540 | ) | |||||
Paid-in capital | (1 | ) | |||||
Net investment income (loss) and net realized gains (losses), as disclosed in the Statement of Operations, and net assets were not affected by this reclassification.
The tax character of distributions paid during the years indicated was as follows:
Year Ended December 31, | 2016 | 2015 | |||||||||
Ordinary income | $ | 1,862,916 | $ | 2,218,011 | |||||||
Long-term capital gains | 681,261 | 8,541,208 | |||||||||
Total | $ | 2,544,177 | $ | 10,759,219 | |||||||
Short-term capital gain distributions, if any, are considered ordinary income distributions for tax purposes.
At December 31, 2016, the components of distributable earnings on a tax basis were as follows:
Undistributed ordinary income | $ | 1,208,944 | |||||
Net unrealized appreciation | 10,719,309 | ||||||
At December 31, 2016, the cost of investments for federal income tax purposes was $61,795,234 and the aggregate gross unrealized appreciation and depreciation based on that cost was:
Unrealized appreciation | $ | 10,814,349 | |||||
Unrealized depreciation | (95,040 | ) | |||||
Net unrealized appreciation | $ | 10,719,309 | |||||
Management of the Fund has concluded that there are no significant uncertain tax positions in the Fund that would require recognition in the financial statements. However, management's conclusion may be subject to review and adjustment at a later date based on factors including, but not limited to, new tax laws, regulations, and administrative interpretations (including relevant
court decisions). Generally, the Fund's federal tax returns for the prior three fiscal years remain subject to examination by the Internal Revenue Service.
Note 5. Portfolio Information
The cost of purchases and proceeds from sales of securities, excluding short-term investments and derivatives, if any, aggregated to $28,925,497 and $36,201,293, respectively, for the year ended December 31, 2016. The amount of purchase and sale activity impacts the portfolio turnover rate reported in the Financial Highlights.
Note 6. Affiliated Money Market Fund
The Fund invests in Columbia Short-Term Cash Fund, an affiliated money market fund established for the exclusive use by the Fund and other affiliated funds (the Affiliated MMF). The income earned by the Fund from such investments is included as Dividends — affiliated issuers in the Statement of Operations. As an investing fund, the Fund indirectly bears its proportionate share of the expenses of the Affiliated MMF. Effective October 1, 2016, the Affiliated MMF prices its shares with a floating net asset value (NAV) and no longer seeks to maintain a stable NAV. In addition, the Board of Trustees of the Affiliated MMF may impose a fee on redemptions (sometimes referred to as a liquidity fee) or temporarily suspend redemptions (sometimes referred to as imposing a redemption gate) in the event its liquidity falls below regulatory limits.
Note 7. Line of Credit
The Fund has access to a revolving credit facility with a syndicate of banks led by Citibank, N.A., HSBC Bank USA, N.A. and JPMorgan Chase Bank, N.A. whereby the Fund may borrow for the temporary funding of shareholder redemptions or for other temporary or emergency purposes. The credit facility agreement, which is a collective agreement between the Fund and certain other funds managed by the Investment Manager, severally and not jointly, that permits collective borrowings up to $1 billion. Interest is charged to each participating fund based on its borrowings at a rate equal to the higher of (i) the overnight federal funds rate plus 1.00% or (ii) the one-month LIBOR rate plus 1.00%. Each borrowing under the credit facility matures no later than 60 days after the date of borrowing. The Fund also pays a commitment fee equal to its pro rata share of the amount of the credit facility at a rate of 0.15% per annum. The commitment fee is included in other expenses in the Statement of Operations.
Annual Report 2016
24
COLUMBIA VARIABLE PORTFOLIO — ASSET ALLOCATION FUND
NOTES TO FINANCIAL STATEMENTS (continued)
December 31, 2016
The Fund had no borrowings during the year ended December 31, 2016.
Note 8. Significant Risks
Shareholder Concentration Risk
At December 31, 2016, two unaffiliated shareholders of record owned 82.1% of the outstanding shares of the Fund in one or more accounts. The Fund has no knowledge about whether any portion of those shares was owned beneficially. Subscription and redemption activity by concentrated accounts may have a significant effect on the operations of the Fund. In the case of a large redemption, the Fund may be forced to sell investments at inopportune times, including its liquid or more liquid positions, resulting in Fund losses and the Fund holding a higher percentage of less liquid or illiquid securities. Large redemptions could result in decreased economies of scale and increased operating expenses for non-redeeming Fund shareholders.
Note 9. Subsequent Events
Management has evaluated the events and transactions that have occurred through the date the financial statements were issued and noted no items requiring adjustment of the financial statements or additional disclosure.
Note 10. Information Regarding Pending and Settled Legal Proceedings
Ameriprise Financial and certain of its affiliates have historically been involved in a number of legal, arbitration and regulatory proceedings, including routine litigation, class actions, and governmental actions, concerning matters arising in connection with the conduct of their business activities. Ameriprise Financial believes that the Funds are not currently the subject of, and that neither Ameriprise Financial nor any of its affiliates are the subject of, any pending legal, arbitration or regulatory proceedings that are likely to have a material adverse effect on the Funds or the ability of Ameriprise Financial or its affiliates to perform under their contracts with the Funds. Ameriprise Financial is required to make quarterly (10-Q), annual (10-K) and, as necessary, 8-K filings with the Securities and Exchange Commission (SEC) on legal and regulatory matters that relate to Ameriprise Financial and its affiliates. Copies of these filings may be obtained by accessing the SEC website at www.sec.gov.
There can be no assurance that these matters, or the adverse publicity associated with them, will not result in
increased fund redemptions, reduced sale of fund shares or other adverse consequences to the Funds. Further, although we believe proceedings are not likely to have a material adverse effect on the Funds or the ability of Ameriprise Financial or its affiliates to perform under their contracts with the Funds, these proceedings are subject to uncertainties and, as such, we are unable to estimate the possible loss or range of loss that may result. An adverse outcome in one or more of these proceedings could result in adverse judgments, settlements, fines, penalties or other relief that could have a material adverse effect on the consolidated financial condition or results of operations of Ameriprise Financial.
Annual Report 2016
25
COLUMBIA VARIABLE PORTFOLIO — ASSET ALLOCATION FUND
REPORT OF INDEPENDENT REGISTERED PUBLIC ACCOUNTING FIRM
To the Trustees of Columbia Funds Variable Insurance Trust and the Shareholders of
Columbia Variable Portfolio — Asset Allocation Fund
In our opinion, the accompanying statement of assets and liabilities, including the portfolio of investments, and the related statements of operations and of changes in net assets and the financial highlights present fairly, in all material respects, the financial position of Columbia Variable Portfolio — Asset Allocation Fund (the "Fund," a series of Columbia Funds Variable Insurance Trust) as of December 31, 2016, the results of its operations for the year then ended, the changes in its net assets for each of the two years in the period then ended and the financial highlights for each of the five years in the period then ended, in conformity with accounting principles generally accepted in the United States of America. These financial statements and financial highlights (hereafter referred to as "financial statements") are the responsibility of the Fund's management. Our responsibility is to express an opinion on these financial statements based on our audits. We conducted our audits of these financial statements in accordance with the standards of the Public Company Accounting Oversight Board (United States). Those standards require that we plan and perform the audit to obtain reasonable assurance about whether the financial statements are free of material misstatement. An audit includes examining, on a test basis, evidence supporting the amounts and disclosures in the financial statements, assessing the accounting principles used and significant estimates made by management, and evaluating the overall financial statement presentation. We believe that our audits, which included confirmation of securities as of December 31, 2016 by correspondence with the custodian, brokers and transfer agent, and the application of alternative auditing procedures where such confirmations had not been received, provide a reasonable basis for our opinion.
PricewaterhouseCoopers LLP
Minneapolis, MN
February 17, 2017
Annual Report 2016
26
COLUMBIA VARIABLE PORTFOLIO — ASSET ALLOCATION FUND
FEDERAL INCOME TAX INFORMATION
(Unaudited)
The Fund hereby designates the following tax attributes for the fiscal year ended December 31, 2016.
Tax Designations
Dividends Received Deduction | 52.59 | % | |||||
Dividends Received Deduction. The percentage of ordinary income distributed during the fiscal year that qualifies for the corporate dividends received deduction.
Annual Report 2016
27
COLUMBIA VARIABLE PORTFOLIO — ASSET ALLOCATION FUND
TRUSTEES AND OFFICERS
Shareholders elect the Board that oversees the Fund's operations. The Board appoints officers who are responsible for day-to-day business decisions based on policies set by the Board. The following table provides basic biographical information about the Fund's Trustees, including their principal occupations during the past five years, although specific titles for individuals may have varied over the period. The year set forth beneath Length of Service in the table below is the year in which the Trustee was first appointed or elected as Trustee to any Fund currently in the Columbia Funds Complex or a predecessor thereof. Under current Board policy, members serve terms of indefinite duration.
Independent Trustees
| Name, Address, Year of Birth | Position Held With the Trust and Length of Service | Principal Occupation(s) During the Past Five Years and Other Relevant Professional Experience | Number of Funds in the Columbia Funds Complex Overseen | Other Directorships Held by Trustee During the Past Five Years | |||||||||||||||
| Janet Langford Carrig c/o Columbia Management Investment Advisers, LLC, 225 Franklin Street Mail Drop BX32 05228, Boston, MA 02110 1957 | Trustee 1996 | Senior Vice President, General Counsel and Corporate Secretary, ConocoPhillips (independent energy company) since September 2007 | 59 | None | |||||||||||||||
| Douglas A. Hacker c/o Columbia Management Investment Advisers, LLC, 225 Franklin Street Mail Drop BX32 05228, Boston, MA 02110 1955 | Trustee and Chairman of the Board 1996 | Independent business executive since May 2006; Executive Vice President — Strategy of United Airlines from December 2002 to May 2006; President of UAL Loyalty Services (airline marketing company) from September 2001 to December 2002; Executive Vice President and Chief Financial Officer of United Airlines from July 1999 to September 2001 | 59 | Spartan Nash Company (food distributor); Nash Finch Company (food distributor) from 2005 to 2013; Aircastle Limited (aircraft leasing); SeaCube Container Leasing Ltd. (container leasing) from 2010 to 2013; and Travelport Worldwide Limited (travel information technology) | |||||||||||||||
| Nancy T. Lukitsh c/o Columbia Management Investment Advisers, LLC, 225 Franklin Street Mail Drop BX32 05228, Boston, MA 02110 1956 | Trustee 2011 | Senior Vice President, Partner and Director of Marketing, Wellington Management Company, LLP (investment adviser) from 1997 to 2010; Chair, Wellington Management Portfolios (commingled non-U.S. investment pools) from 2007 to 2010; Director, Wellington Trust Company, NA and other Wellington affiliates from 1997 to 2010 | 59 | None | |||||||||||||||
Annual Report 2016
28
COLUMBIA VARIABLE PORTFOLIO — ASSET ALLOCATION FUND
TRUSTEES AND OFFICERS (continued)
Independent Trustees (continued)
| Name, Address, Year of Birth | Position Held With the Trust and Length of Service | Principal Occupation(s) During the Past Five Years and Other Relevant Professional Experience | Number of Funds in the Columbia Funds Complex Overseen | Other Directorships Held by Trustee During the Past Five Years | |||||||||||||||
| David M. Moffett c/o Columbia Management Investment Advisers, LLC, 225 Franklin Street Mail Drop BX32 05228, Boston, MA 02110 1952 | Trustee 2011 | Retired. Consultant to Bridgewater and Associates | 59 | Director, CSX Corporation; Genworth Financial, Inc. (financial and insurance products and services); Paypal Holdings Inc. (payment and data processing services); Trustee University of Oklahoma Foundation; former Director eBay Inc. (online trading community), 2007-2015; and former Director, CIT Bank, CIT Group Inc. (commercial and consumer finance), 2010-2016 | |||||||||||||||
| Charles R. Nelson c/o Columbia Management Investment Advisers, LLC, 225 Franklin Street Mail Drop BX32 05228, Boston, MA 02110 1942 | Trustee 1981 | Retired. Professor Emeritus, University of Washington since 2011; Professor of Economics, University of Washington from 1976 to 2011; Ford and Louisa Van Voorhis Professor of Political Economy, University of Washington from 1993 to 2011; Adjunct Professor of Statistics, University of Washington from 1980 to 2011; Associate Editor, Journal of Money, Credit and Banking from September 1993 to 2008; consultant on econometric and statistical matters | 59 | None | |||||||||||||||
| John J. Neuhauser c/o Columbia Management Investment Advisers, LLC, 225 Franklin Street Mail Drop BX32 05228, Boston, MA 02110 1943 | Trustee 1984 | President, Saint Michael's College since August 2007; Director or Trustee of several non-profit organizations, including University of Vermont Medical Center; Academic Vice President and Dean of Faculties, Boston College from August 1999 to October 2005; University Professor, Boston College from November 2005 to August 2007 | 59 | Liberty All-Star Equity Fund and Liberty All-Star Growth Fund (closed-end funds) | |||||||||||||||
| Patrick J. Simpson c/o Columbia Management Investment Advisers, LLC, 225 Franklin Street Mail Drop BX32 05228, Boston, MA 02110 1944 | Trustee 2000 | Of Counsel, Perkins Coie LLP (law firm) since 2015; Partner, Perkins Coie LLP from 1988 to 2014 | 59 | None | |||||||||||||||
Annual Report 2016
29
COLUMBIA VARIABLE PORTFOLIO — ASSET ALLOCATION FUND
TRUSTEES AND OFFICERS (continued)
Independent Trustees (continued)
| Name, Address, Year of Birth | Position Held With the Trust and Length of Service | Principal Occupation(s) During the Past Five Years and Other Relevant Professional Experience | Number of Funds in the Columbia Funds Complex Overseen | Other Directorships Held by Trustee During the Past Five Years | |||||||||||||||
| Anne-Lee Verville c/o Columbia Management Investment Advisers, LLC, 225 Franklin Street Mail Drop BX32 05228, Boston, MA 02110 1945 | Trustee 1998 | Retired. General Manager, Global Education Industry from 1994 to 1997, President — Application Systems Division from 1991 to 1994, Chief Financial Officer — US Marketing & Services from 1988 to 1991, and Chief Information Officer from 1987 to 1988, IBM Corporation (computer and technology) | 59 | Enesco Group, Inc. (producer of giftware and home and garden decor products) from 2001 to 2006 | |||||||||||||||
Consultants to the Independent Trustees*
| Name, Address, Year of Birth | Position Held With the Trust and Length of Service | Principal Occupation(s) During the Past Five Years and Other Relevant Professional Experience | Number of Funds in the Columbia Funds Complex Overseen | Other Directorships Held by Trustee During the Past Five Years | |||||||||||||||
| J. Kevin Connaughton c/o Columbia Management Investment Advisers, LLC, 225 Franklin Street Mail Drop BX32 05228, Boston, MA 02110 1964 | Independent Trustee Consultant 2016 | Independent Trustee Consultant, Columbia Funds since March 2016; Managing Director and General Manager of Mutual Fund Products, Columbia Management Investment Advisers, LLC from May 2010 to February 2015; President, Columbia Funds from 2009 to 2015; and senior officer of Columbia Funds and affiliated funds from 2003 to 2015 | 59 | Board of Governors, Gateway Healthcare since January 2016; Trustee, New Century Portfolios since March 2015; and Director, The Autism Project since March 2015 | |||||||||||||||
| Natalie A. Trunow c/o Columbia Management Investment Advisers, LLC, 225 Franklin Street Mail Drop BX32 05228, Boston, MA 02110 1967 | Independent Trustee Consultant 2016 | Independent Trustee Consultant, Columbia Funds since September 2016; Senior Vice President and Chief Executive Officer, Millennial Partners (investment consulting services to institutions) since January 2016; Director of Investments, Casey Family Programs from April 2016 to September 2016; Chief Investment Officer, Calvert Investments from August 2008 to January 2016; Section Head and Portfolio Manager, General Motors Asset Management from June 1997 to August 2008 | 59 | Healthcare Services for Children with Special Needs | |||||||||||||||
* J. Kevin Connaughton was appointed consultant to the Independent Trustees effective March 1, 2016. Natalie A. Trunow was appointed consultant to the Independent Trustees effective September 1, 2016. Shareholders of the Funds are expected to be asked to elect each of Mr. Connaughton and Ms. Trunow as a Trustee at a future shareholder meeting.
Annual Report 2016
30
COLUMBIA VARIABLE PORTFOLIO — ASSET ALLOCATION FUND
TRUSTEES AND OFFICERS (continued)
Interested Trustee Affiliated with Investment Manager*
| Name, Address, Year of Birth | Position Held With the Trust and Length of Service | Principal Occupation(s) During the Past Five Years and Other Relevant Professional Experience | Number of Funds in the Columbia Funds Complex Overseen | Other Directorships Held by Trustee During the Past Five Years | |||||||||||||||
| William F. Truscott c/o Columbia Management Investment Advisers, LLC, 225 Franklin Street Boston, MA 02110 1960 | Trustee 2012 | Chairman of the Board and President, Columbia Management Investment Advisers, LLC since May 2010 and February 2012, respectively; Chief Executive Officer, Global Asset Management, Ameriprise Financial, Inc. since September 2012 (previously Chief Executive Officer, U.S. Asset Management & President, Annuities, May 2010- September 2012); Director and Chief Executive Officer, Columbia Management Investment Distributors, Inc. since May 2010 and February 2012, respectively; Chairman of the Board and Chief Executive Officer, RiverSource Distributors, Inc. since 2006; Director, Threadneedle Asset Management Holdings, SARL since 2014; President and Chief Executive Officer, Ameriprise Certificate Company, 2006-August 2012. | 185 | Trustee to other Columbia Funds since 2001; Chairman of the Board, Columbia Management Investment Advisers, LLC since May 2010; Director, Columbia Management Investment Distributors, Inc. since May 2010; Former Director, Ameriprise Certificate Company, 2006-January 2013 | |||||||||||||||
* Interested person (as defined under the 1940 Act) by reason of being an officer, director, security holder and/or employee of the Investment Manager or Ameriprise Financial.
The Statement of Additional Information has additional information about the Fund's Board members and is available, without charge, upon request by calling 800.345.6611 or contacting your financial intermediary.
Annual Report 2016
31
COLUMBIA VARIABLE PORTFOLIO — ASSET ALLOCATION FUND
TRUSTEES AND OFFICERS (continued)
The Board has appointed officers who are responsible for day-to-day business decisions based on policies it has established. The officers serve at the pleasure of the Board. The following table provides basic information about the Officers of the Fund, including principal occupations during the past five years, although their specific titles may have varied over the period. In addition to Mr. Truscott, who is Senior Vice President, the Fund's other officers are:
Fund Officers
| Name, Address and Year of Birth | Position and Year First Appointed to Position for any Fund in the Columbia Funds Complex or a Predecessor Thereof | Principal Occupation(s) During Past Five Years | |||||||||
| Christopher O. Petersen 5228 Ameriprise Financial Center Minneapolis, MN 55474 Born 1970 | President and Principal Executive Officer (2015) | Vice President and Lead Chief Counsel, Ameriprise Financial, Inc. since January 2015 (previously, Vice President and Chief Counsel January 2010-December 2014); officer of Columbia Funds and affiliated funds since 2007. | |||||||||
| Michael G. Clarke 225 Franklin Street Boston, MA 02110 Born 1969 | Treasurer (2011), Chief Financial Officer (2009) and Chief Accounting Officer (2015) | Vice President — Mutual Fund Administration, Columbia Management Investment Advisers, LLC, since May 2010; senior officer of Columbia Funds and affiliated funds since 2002. | |||||||||
| Paul B. Goucher 100 Park Avenue New York, NY 10017 Born 1968 | Senior Vice President (2011), Chief Legal Officer (2015) and Assistant Secretary (2008) | Senior Vice President and Assistant General Counsel, Ameriprise Financial, Inc. since January 2017 (previously Vice President and Lead Chief Counsel, November 2008-January 2017 and January 2013-January 2017, respectively, and Chief Counsel, January 2010-January 2013); Vice President, Chief Legal Officer and Assistant Secretary, Columbia Management Investment Advisers, LLC since May 2010. | |||||||||
| Thomas P. McGuire 225 Franklin Street Boston, MA 02110 Born 1972 | Senior Vice President and Chief Compliance Officer (2012) | Vice President — Asset Management Compliance, Ameriprise Financial, Inc., since May 2010; Chief Compliance Officer, Ameriprise Certificate Company since September 2010. | |||||||||
| Colin Moore 225 Franklin Street Boston, MA 02110 Born 1958 | Senior Vice President (2010) | Executive Vice President and Global Chief Investment Officer, Ameriprise Financial, Inc., since July 2013; Executive Vice President and Global Chief Investment Officer, Columbia Management Investment Advisers, LLC since July 2013 (previously Director and Global Chief Investment Officer, 2010-2013). | |||||||||
| Michael E. DeFao 225 Franklin Street Boston, MA 02110 Born 1968 | Vice President (2011) and Assistant Secretary (2010) | Vice President and Chief Counsel, Ameriprise Financial, Inc. since May 2010. | |||||||||
| Amy Johnson 5228 Ameriprise Financial Center Minneapolis, MN 55474 Born 1965 | Vice President (2006) | Managing Director and Global Head of Operations, Columbia Management Investment Advisers, LLC since April 2016 (previously Managing Director and Chief Operating Officer, 2010-2016). | |||||||||
| Lyn Kephart-Strong 5228 Ameriprise Financial Center Minneapolis, MN 55474 Born 1960 | Vice President (2015) | President, Columbia Management Investment Services Corp. since October 2014; Vice President & Resolution Officer, Ameriprise Trust Company since August 2009. | |||||||||
| Ryan C. Larrenaga 225 Franklin Street Boston, MA 02110 Born 1970 | Vice President and Secretary (2015) | Vice President and Group Counsel, Ameriprise Financial, Inc. since August 2011; officer of Columbia Funds and affiliated funds since 2005. | |||||||||
Annual Report 2016
32
COLUMBIA VARIABLE PORTFOLIO — ASSET ALLOCATION FUND
IMPORTANT INFORMATION ABOUT THIS REPORT
The policy of the Board is to vote the proxies of the companies in which each fund holds investments consistent with the procedures as stated in the Statement of Additional Information (SAI). You may obtain a copy of the SAI without charge by calling 800.345.6611; contacting your financial intermediary or searching the website of the Securities and Exchange Commission (SEC) at sec.gov. Information regarding how each fund voted proxies relating to portfolio securities is filed with the SEC by August 31st for the most recent 12-month period ending June 30th of that year, and is available without charge by visiting investor.columbiathreadneedleus.com, or searching the website of the SEC at sec.gov.
Each fund files a complete schedule of portfolio holdings with the SEC for the first and third quarters of each fiscal year on Form N-Q. Each fund's Form N-Q is available on the SEC's website at sec.gov and may be reviewed and copied at the SEC's Public Reference Room in Washington, D.C. Information on the operation of the Public Reference Room may be obtained by calling 800.SEC.0330. Each fund's complete schedule of portfolio holdings, as filed on Form N-Q, can also be obtained without charge, upon request, by calling 800.345.6611.
Annual Report 2016
33
Columbia Variable Portfolio — Asset Allocation Fund
P.O. Box 8081
Boston, MA 02266-8081

Please read and consider the investment objectives, risks, charges and expenses for any fund carefully before investing. For fund and other investment product prospectuses, which contain this and other important information, contact your financial advisor or insurance representative. Please read the prospectus carefully before you invest. The Fund is distributed by Columbia Management Investment Distributors, Inc., member FINRA, and managed by Columbia Management Investment Advisers, LLC.
Columbia Threadneedle Investments (Columbia Threadneedle) is the global brand name of the Columbia and Threadneedle group of companies.
All rights reserved. Columbia Management Investment Distributors, Inc., 225 Franklin Street, Boston, MA 02110-2804
© 2017 Columbia Management Investment Advisers, LLC.
C-1471 AN (2/17)

ANNUAL REPORT
December 31, 2016

COLUMBIA VARIABLE PORTFOLIO — CONTRARIAN CORE FUND
Please remember that you may not buy (nor will you own) shares of the Fund directly. The Fund is available through variable annuity contracts and variable life insurance policies offered by the separate accounts of participating insurance companies as well as qualified pension and retirement plans. Please contact your financial advisor or insurance representative for more information.

COLUMBIA VARIABLE PORTFOLIO — CONTRARIAN CORE FUND
TABLE OF CONTENTS
Performance Overview | 2 | ||||||
Manager Discussion of Fund Performance | 4 | ||||||
Understanding Your Fund's Expenses | 6 | ||||||
Portfolio of Investments | 7 | ||||||
Statement of Assets and Liabilities | 12 | ||||||
Statement of Operations | 13 | ||||||
Statement of Changes in Net Assets | 14 | ||||||
Financial Highlights | 16 | ||||||
Notes to Financial Statements | 18 | ||||||
Report of Independent Registered Public Accounting Firm | 23 | ||||||
Trustees and Officers | 24 | ||||||
Important Information About This Report | 29 | ||||||
The views expressed in this report reflect the current views of the respective parties. These views are not guarantees of future performance and involve certain risks, uncertainties and assumptions that are difficult to predict, so actual outcomes and results may differ significantly from the views expressed. These views are subject to change at any time based upon economic, market or other conditions and the respective parties disclaim any responsibility to update such views. These views may not be relied on as investment advice and, because investment decisions for a Columbia fund are based on numerous factors, may not be relied on as an indication of trading intent on behalf of any particular Columbia fund. References to specific securities should not be construed as a recommendation or investment advice.
Annual Report 2016
COLUMBIA VARIABLE PORTFOLIO — CONTRARIAN CORE FUND
PERFORMANCE OVERVIEW
Performance Summary
n Columbia Variable Portfolio — Contrarian Core Fund (the Fund) Class 2 shares returned 8.41% for the 12-month period that ended December 31, 2016.
n The Fund underperformed its benchmark, the Russell 1000 Index, which returned 12.05% for the same time period.
n Stock selection within the consumer staples, industrial, and health care sectors detracted from results, while an overweight in the financials sector helped boost returns.
Average Annual Total Returns (%) (for period ended December 31, 2016)
Inception | 1 Year | Life | |||||||||||||
Class 1 | 04/30/12 | 8.70 | 13.57 | ||||||||||||
Class 2 | 04/30/12 | 8.41 | 13.30 | ||||||||||||
Russell 1000 Index | 12.05 | 12.97 | |||||||||||||
Performance data quoted represents past performance and current performance may be lower or higher. Past performance is no guarantee of future results. The investment return and principal value will fluctuate so that shares, when redeemed, may be worth more or less than the original cost. For current month-end performance information, please contact your financial advisor or insurance representative.
Performance results reflect the effect of any fee waivers or reimbursements of fund expenses by Columbia Management Investment Advisers, LLC and/or any of its affiliates. Absent these fee waivers or expense reimbursement arrangements, performance results would have been lower.
Investment earnings, if any, are tax-deferred until distributed to shareholders, at which time taxes may become due. Total return performance includes changes in share price and assumes reinvestment of dividends and capital gains, if any. Performance results reflect the effect of all fund expenses, but do not include any fees and expenses imposed under your variable annuity contract and/or variable life insurance policy or qualified pension or retirement plan. If performance results included the effect of these additional charges, they would be lower.
The Russell 1000 Index measures the performance of the large-cap segment of the U.S. equity universe. It is a subset of the Russell 3000 Index and includes approximately 1000 of the largest securities based on a combination of their market cap and current index membership. The Russell 1000 represents approximately 92% of the U.S. market.
Indices are not available for investment, are not professionally managed and do not reflect sales charges, fees, brokerage commissions, taxes or other expenses of investing. Securities in the Fund may not match those in an index.
Annual Report 2016
2
COLUMBIA VARIABLE PORTFOLIO — CONTRARIAN CORE FUND
PERFORMANCE OVERVIEW (continued)
Performance of a Hypothetical $10,000 Investment (April 30, 2012 – December 31, 2016)

The chart above shows the change in value of a hypothetical $10,000 investment in Class 2 shares of Columbia Variable Portfolio — Contrarian Core Fund during the stated time period, and does not reflect the deduction of taxes, if any, that a shareholder may pay on Fund distributions or on the redemption of Fund shares. The returns also do not reflect fees and expenses imposed under your variable annuity contract and/or variable life insurance policy or qualified pension or retirement plan, if any.
Annual Report 2016
3
COLUMBIA VARIABLE PORTFOLIO — CONTRARIAN CORE FUND
MANAGER DISCUSSION OF FUND PERFORMANCE
Portfolio Management
Guy Pope, CFA
| Top Ten Holdings (%) (at December 31, 2016) | |||||||
Apple, Inc. | 4.1 | ||||||
Citigroup, Inc. | 3.7 | ||||||
JPMorgan Chase & Co. | 3.5 | ||||||
| Berkshire Hathaway, Inc., Class B | 3.1 | ||||||
Alphabet, Inc., Class C | 3.0 | ||||||
Microsoft Corp. | 2.9 | ||||||
Philip Morris International, Inc. | 2.8 | ||||||
Comcast Corp., Class A | 2.8 | ||||||
Verizon Communications, Inc. | 2.7 | ||||||
Morgan Stanley | 2.6 | ||||||
Percentages indicated are based upon total investments (excluding Money Market Funds).
For further detail about these holdings, please refer to the section entitled "Portfolio of Investments."
Fund holdings are as of the date given, are subject to change at any time, and are not recommendations to buy or sell any security.
| Portfolio Breakdown (%) (at December 31, 2016) | |||||||
Common Stocks | 99.2 | ||||||
Money Market Funds | 0.8 | ||||||
Total | 100.0 | ||||||
Percentages indicated are based upon total investments. The Fund's portfolio composition is subject to change.
At December 31, 2016, approximately 96.4% of the Fund's shares were owned in the aggregate by affiliated funds-of-funds managed by Columbia Management Investment Advisers, LLC (the Investment Manager). As a result of asset allocation decisions by the Investment Manager, it is possible that the Fund may experience relatively large purchases or redemptions from affiliated funds-of-funds. The Investment Manager seeks to minimize the impact of these transactions by structuring them over a reasonable period of time. The Fund may experience increased expenses as it buys and sells securities as a result of purchases or redemptions by affiliated funds-of-funds
For the 12-month period that ended December 31, 2016, the Fund's Class 2 shares returned 8.41%. The Fund's benchmark, the Russell 1000 Index, returned 12.05%. Stock selection within the consumer staples, industrial, and health care sectors detracted from results, while an overweight in the financials sector helped boost returns.
U.S. Markets Logged Solid Gains
Global events, political uncertainty and mixed economic data were enough to keep investors off balance in 2016, as financial markets moved sharply in reaction to each significant change on the world stage. Early in the year, concerns about China and oil rattled the equity markets and drove stock prices down in February. After a swift rebound, the U.S. stock market fell again in the early summer in reaction to the U.K. vote to exit the European Union. U.S. Treasury yields also plummeted. Once again, the markets rebounded, but investors again retreated in reaction to mixed economic data and political uncertainty. However, the end of a contentious U.S. Presidential contest eliminated a key element of uncertainty, and economic data turned almost unanimously positive. Steady job growth drove unemployment down, corporate earnings growth picked up, manufacturing activity accelerated, and the price of oil stabilized.
In December 2016, the Federal Reserve (the Fed) raised the target range of its benchmark interest rate by a quarter of a point, its first such move in a year. The Fed's action had been widely anticipated and had little or no impact on the financial markets when it occurred. The Fed indicated that it would continue to monitor inflation and the job market in considering future rate hikes.
Against this backdrop, the S&P 500 Index, a broad measure of U.S. stock market performance, rose 11.96%. Small and mid-cap stocks outperformed large-cap stocks, and value outperformed growth by an especially large margin. As interest rates rose during the period, energy and interest-rate sensitive financials were the strongest performing equity sectors. Foreign stock markets lagged the U.S. markets. The MSCI EAFE Index, a broad measure of performance in developed markets outside the United States, rose just 1.00% for the year. Rising interest rates kept a lid on bond prices. The Bloomberg Barclays U.S. Aggregate Bond Index, a broad measure of the performance of investment-grade bonds, returned 2.65% for the year.
Annual Report 2016
4
COLUMBIA VARIABLE PORTFOLIO — CONTRARIAN CORE FUND
MANAGER DISCUSSION OF FUND PERFORMANCE (continued)
Contributors and Detractors
An overweight within financials aided returns. Rising interest rates helped investor confidence in the sector. Financials also responded favorably to the possibility of relaxed regulatory control from a new administration. Against this backdrop, the Fund's position in Morgan Stanley was a standout performer. The company's focus on improving its return on equity for shareholders gained traction. Other strong performers from the sector included JPMorgan Chase & Co., Berkshire Hathaway and Aon.
Within the consumer discretionary sector, PVH performed well. This retailer of premium clothing brands Tommy Hilfiger and Calvin Klein benefited from robust sales, particularly in Europe. Comcast, a global telecommunications, broadcasting, and cable television conglomerate, was another standout. Despite the challenge of customers dropping cable TV packages and landlines for their phones, Comcast managed to outpace its peers while also maintaining pricing power.
Stock selection within the health care sector detracted from Fund performance. Uncertainty over the future of the Affordable Care Act and rising concerns about the high price of prescription drugs weighed on many companies with exposure to the health care sector. This included CVS Caremark, which came under pressure due to concerns about increased competition within its pharmacy benefit management business. Several biotech and pharmaceutical companies also underperformed, including Abbott Labs, Allergan, and Vertex Pharmaceuticals. Medtronic, a medical technology company, underperformed due in part to concerns that a potential reduction in the number of Americans with health insurance could reduce demand for medical devices and medical technology.
Stock selection within the industrials sector also hurt performance. The Fund's preference for defensive industrial companies, such as Dun & Bradstreet and Nielsen, over more cyclical industrial stocks detracted from returns.
At Period's End
After a volatile 2016, the most obvious challenge in the year ahead will be to assess the potential impact of the incoming administration's yet-to-be-defined economic policies on markets, sectors and individual companies. As always, we will follow our contrarian approach to identify what we believe to be solid opportunities for long-term capital growth.
| Equity Sector Breakdown (%) (at December 31, 2016) | |||||||
Consumer Discretionary | 12.6 | ||||||
Consumer Staples | 9.3 | ||||||
Energy | 7.4 | ||||||
Financials | 17.9 | ||||||
Health Care | 14.3 | ||||||
Industrials | 9.4 | ||||||
Information Technology | 20.9 | ||||||
Materials | 1.9 | ||||||
Real Estate | 1.4 | ||||||
Telecommunication Services | 3.6 | ||||||
Utilities | 1.3 | ||||||
Total | 100.0 | ||||||
Percentages indicated are based upon total equity investments. The Fund's portfolio composition is subject to change.
Annual Report 2016
5
COLUMBIA VARIABLE PORTFOLIO — CONTRARIAN CORE FUND
UNDERSTANDING YOUR FUND'S EXPENSES
(Unaudited)
As an investor, you incur ongoing costs, which generally include management fees, distribution and/or service fees, and other fund expenses. The following information is intended to help you understand your ongoing costs (in dollars) of investing in the Fund and to help you compare these costs with the ongoing costs of investing in other mutual funds.
The information below does not reflect fees and expenses imposed under your variable annuity contract and/or variable life insurance policy (collectively, Contracts) or qualified pension and retirement plan (Qualified Plan), if any. The total fees and expenses you bear may therefore be higher than those shown below.
Analyzing Your Fund's Expenses
To illustrate these ongoing costs, we have provided examples and calculated the expenses paid by investors in each share class of the Fund during the period. The actual and hypothetical information in the table is based on an initial investment of $1,000 at the beginning of the period indicated and held for the entire period. Expense information is calculated two ways and each method provides you with different information. The amount listed in the "Actual" column is calculated using the Fund's actual operating expenses and total return for the period. You may use the Actual information, together with the amount invested, to estimate the expenses that you paid over the period. Simply divide your account value by $1,000 (for example, an $8,600 account value divided by $1,000 = 8.6), then multiply the results by the expenses paid during the period under the "Actual" column. The amount listed in the "Hypothetical" column assumes a 5% annual rate of return before expenses (which is not the Fund's actual return) and then applies the Fund's actual expense ratio for the period to the hypothetical return. You should not use the hypothetical account values and expenses to estimate either your actual account balance at the end of the period or the expenses you paid during the period. See "Compare With Other Funds" below for details on how to use the hypothetical data.
Compare With Other Funds
Since all mutual funds are required to include the same hypothetical calculations about expenses in shareholder reports, you can use this information to compare the ongoing cost of investing in the Fund with other funds. To do so, compare the hypothetical example with the 5% hypothetical examples that appear in the shareholder reports of other funds. As you compare hypothetical examples of other funds, it is important to note that hypothetical examples are meant to highlight the ongoing costs of investing in a fund only and do not reflect any transaction costs, such as redemption or exchange fees, or expenses that apply to the subaccount or the Contract. Therefore, the hypothetical calculations are useful in comparing ongoing costs only, and will not help you determine the relative total costs of owning different funds. If the fees and expenses imposed under your Contract or Qualified Plan, if any, were included, your costs would be higher.
July 1, 2016 – December 31, 2016
| Account Value at the Beginning of the Period ($) | Account Value at the End of the Period ($) | Expenses Paid During the Period ($) | Fund's Annualized Expense Ratio (%) | ||||||||||||||||||||||||||||
Actual | Hypothetical | Actual | Hypothetical | Actual | Hypothetical | Actual | |||||||||||||||||||||||||
Class 1 | 1,000.00 | 1,000.00 | 1,062.80 | 1,021.20 | 3.92 | 3.84 | 0.76 | ||||||||||||||||||||||||
Class 2 | 1,000.00 | 1,000.00 | 1,061.60 | 1,019.95 | 5.21 | 5.10 | 1.01 | ||||||||||||||||||||||||
Expenses paid during the period are equal to the annualized expense ratio for each class as indicated above, multiplied by the average account value over the period and then multiplied by the number of days in the Fund's most recent fiscal half year and divided by 366.
Expenses do not include fees and expenses incurred indirectly by the Fund from its investment in underlying funds, including affiliated and non-affiliated pooled investment vehicles, such as mutual funds and exchange-traded funds.
Annual Report 2016
6
COLUMBIA VARIABLE PORTFOLIO — CONTRARIAN CORE FUND
PORTFOLIO OF INVESTMENTS
December 31, 2016
(Percentages represent value of investments compared to net assets)
Common Stocks 99.2%
Issuer | Shares | Value ($) | |||||||||
CONSUMER DISCRETIONARY 12.6% | |||||||||||
Hotels, Restaurants & Leisure 3.0% | |||||||||||
Aramark | 296,028 | 10,574,120 | |||||||||
Chipotle Mexican Grill, Inc.(a) | 20,865 | 7,872,782 | |||||||||
Marriott International, Inc., Class A | 152,512 | 12,609,692 | |||||||||
McDonald's Corp. | 226,360 | 27,552,539 | |||||||||
Royal Caribbean Cruises Ltd. | 113,735 | 9,330,820 | |||||||||
Total | 67,939,953 | ||||||||||
Household Durables 0.5% | |||||||||||
Newell Brands, Inc. | 255,960 | 11,428,614 | |||||||||
Internet & Direct Marketing Retail 0.7% | |||||||||||
Expedia, Inc. | 101,579 | 11,506,869 | |||||||||
Liberty Interactive Corp., Class A(a) | 231,480 | 4,624,970 | |||||||||
Total | 16,131,839 | ||||||||||
Media 3.9% | |||||||||||
Comcast Corp., Class A | 910,079 | 62,840,955 | |||||||||
Walt Disney Co. (The) | 260,150 | 27,112,833 | |||||||||
Total | 89,953,788 | ||||||||||
Specialty Retail 3.0% | |||||||||||
Advance Auto Parts, Inc. | 47,535 | 8,039,119 | |||||||||
Lowe's Companies, Inc. | 734,615 | 52,245,819 | |||||||||
Michaels Companies, Inc. (The)(a) | 453,184 | 9,267,613 | |||||||||
Total | 69,552,551 | ||||||||||
Textiles, Apparel & Luxury Goods 1.5% | |||||||||||
Coach, Inc. | 562,010 | 19,681,590 | |||||||||
PVH Corp. | 152,357 | 13,748,696 | |||||||||
Total | 33,430,286 | ||||||||||
Total Consumer Discretionary | 288,437,031 | ||||||||||
CONSUMER STAPLES 9.2% | |||||||||||
Beverages 2.4% | |||||||||||
Coca-Cola Co. (The) | 486,623 | 20,175,389 | |||||||||
PepsiCo, Inc. | 346,398 | 36,243,623 | |||||||||
Total | 56,419,012 | ||||||||||
Food & Staples Retailing 4.0% | |||||||||||
CVS Health Corp. | 599,382 | 47,297,234 | |||||||||
Kroger Co. (The) | 833,065 | 28,749,073 | |||||||||
Walgreens Boots Alliance, Inc. | 194,249 | 16,076,047 | |||||||||
Total | 92,122,354 | ||||||||||
Common Stocks (continued)
Issuer | Shares | Value ($) | |||||||||
Tobacco 2.8% | |||||||||||
Philip Morris International, Inc. | 692,940 | 63,397,081 | |||||||||
Total Consumer Staples | 211,938,447 | ||||||||||
ENERGY 7.3% | |||||||||||
Energy Equipment & Services 1.0% | |||||||||||
Schlumberger Ltd. | 281,775 | 23,655,011 | |||||||||
Oil, Gas & Consumable Fuels 6.3% | |||||||||||
Canadian Natural Resources Ltd. | 324,900 | 10,357,812 | |||||||||
Chevron Corp. | 314,147 | 36,975,102 | |||||||||
ConocoPhillips | 571,570 | 28,658,520 | |||||||||
EQT Corp. | 145,855 | 9,538,917 | |||||||||
Exxon Mobil Corp. | 467,230 | 42,172,180 | |||||||||
Noble Energy, Inc. | 455,409 | 17,332,866 | |||||||||
Total | 145,035,397 | ||||||||||
Total Energy | 168,690,408 | ||||||||||
FINANCIALS 17.8% | |||||||||||
Banks 8.7% | |||||||||||
Citigroup, Inc. | 1,419,297 | 84,348,820 | |||||||||
JPMorgan Chase & Co. | 936,238 | 80,787,977 | |||||||||
Wells Fargo & Co. | 638,043 | 35,162,550 | |||||||||
Total | 200,299,347 | ||||||||||
Capital Markets 5.5% | |||||||||||
Bank of New York Mellon Corp. (The) | 975,713 | 46,229,282 | |||||||||
BlackRock, Inc. | 18,186 | 6,920,500 | |||||||||
Invesco Ltd. | 184,275 | 5,590,904 | |||||||||
Morgan Stanley | 1,395,150 | 58,945,087 | |||||||||
S&P Global, Inc. | 68,235 | 7,337,992 | |||||||||
Total | 125,023,765 | ||||||||||
Diversified Financial Services 3.1% | |||||||||||
Berkshire Hathaway, Inc., Class B(a) | 438,641 | 71,489,710 | |||||||||
Insurance 0.5% | |||||||||||
Aon PLC | 104,818 | 11,690,352 | |||||||||
Total Financials | 408,503,174 | ||||||||||
HEALTH CARE 14.1% | |||||||||||
Biotechnology 3.4% | |||||||||||
Alexion Pharmaceuticals, Inc.(a) | 94,055 | 11,507,629 | |||||||||
Biogen, Inc.(a) | 111,685 | 31,671,632 | |||||||||
The accompanying Notes to Financial Statements are an integral part of this statement.
Annual Report 2016
7
COLUMBIA VARIABLE PORTFOLIO — CONTRARIAN CORE FUND
PORTFOLIO OF INVESTMENTS (continued)
December 31, 2016
Common Stocks (continued)
Issuer | Shares | Value ($) | |||||||||
Celgene Corp.(a) | 226,744 | 26,245,618 | |||||||||
Vertex Pharmaceuticals, Inc.(a) | 124,223 | 9,151,509 | |||||||||
Total | 78,576,388 | ||||||||||
Health Care Equipment & Supplies 2.9% | |||||||||||
Abbott Laboratories | 367,861 | 14,129,541 | |||||||||
Cooper Companies, Inc. (The) | 77,831 | 13,614,977 | |||||||||
Medtronic PLC | 226,718 | 16,149,123 | |||||||||
Zimmer Biomet Holdings, Inc. | 227,145 | 23,441,364 | |||||||||
Total | 67,335,005 | ||||||||||
Health Care Providers & Services 3.0% | |||||||||||
Anthem, Inc. | 177,805 | 25,563,025 | |||||||||
Cardinal Health, Inc. | 224,250 | 16,139,272 | |||||||||
CIGNA Corp. | 211,520 | 28,214,653 | |||||||||
Total | 69,916,950 | ||||||||||
Pharmaceuticals 4.8% | |||||||||||
Allergan PLC(a) | 92,600 | 19,446,926 | |||||||||
Johnson & Johnson | 390,218 | 44,957,016 | |||||||||
Pfizer, Inc. | 1,379,240 | 44,797,715 | |||||||||
Total | 109,201,657 | ||||||||||
Total Health Care | 325,030,000 | ||||||||||
INDUSTRIALS 9.3% | |||||||||||
Air Freight & Logistics 2.2% | |||||||||||
FedEx Corp. | 275,818 | 51,357,311 | |||||||||
Building Products 0.6% | |||||||||||
Johnson Controls International PLC | 304,851 | 12,556,813 | |||||||||
Commercial Services & Supplies 0.2% | |||||||||||
Stericycle, Inc.(a) | 60,875 | 4,689,810 | |||||||||
Electrical Equipment 0.5% | |||||||||||
Eaton Corp. PLC | 179,026 | 12,010,854 | |||||||||
Industrial Conglomerates 4.3% | |||||||||||
General Electric Co. | 1,569,267 | 49,588,837 | |||||||||
Honeywell International, Inc. | 422,210 | 48,913,029 | |||||||||
Total | 98,501,866 | ||||||||||
Professional Services 1.5% | |||||||||||
Dun & Bradstreet Corp. (The) | 92,830 | 11,262,136 | |||||||||
Nielsen Holdings PLC | 567,975 | 23,826,551 | |||||||||
Total | 35,088,687 | ||||||||||
Total Industrials | 214,205,341 | ||||||||||
Common Stocks (continued)
Issuer | Shares | Value ($) | |||||||||
INFORMATION TECHNOLOGY 20.7% | |||||||||||
Communications Equipment 0.6% | |||||||||||
Palo Alto Networks, Inc.(a) | 101,370 | 12,676,319 | |||||||||
Internet Software & Services 7.2% | |||||||||||
Akamai Technologies, Inc.(a) | 199,865 | 13,326,998 | |||||||||
Alphabet, Inc., Class A(a) | 37,916 | 30,046,534 | |||||||||
Alphabet, Inc., Class C(a) | 87,523 | 67,552,002 | |||||||||
Facebook, Inc., Class A(a) | 467,620 | 53,799,681 | |||||||||
Total | 164,725,215 | ||||||||||
IT Services 2.2% | |||||||||||
Fidelity National Information Services, Inc. | 247,885 | 18,750,022 | |||||||||
MasterCard, Inc., Class A | 307,729 | 31,773,019 | |||||||||
Total | 50,523,041 | ||||||||||
Semiconductors & Semiconductor Equipment 2.3% | |||||||||||
Broadcom Ltd. | 215,951 | 38,173,658 | |||||||||
QUALCOMM, Inc. | 243,685 | 15,888,262 | |||||||||
Total | 54,061,920 | ||||||||||
Software 4.4% | |||||||||||
Activision Blizzard, Inc. | 378,275 | 13,659,510 | |||||||||
Electronic Arts, Inc.(a) | 269,568 | 21,231,176 | |||||||||
Microsoft Corp. | 1,078,482 | 67,016,871 | |||||||||
Total | 101,907,557 | ||||||||||
Technology Hardware, Storage & Peripherals 4.0% | |||||||||||
Apple, Inc. | 802,969 | 92,999,870 | |||||||||
Total Information Technology | 476,893,922 | ||||||||||
MATERIALS 1.9% | |||||||||||
Chemicals 1.9% | |||||||||||
Monsanto Co. | 128,300 | 13,498,443 | |||||||||
Sherwin-Williams Co. (The) | 112,068 | 30,117,154 | |||||||||
Total | 43,615,597 | ||||||||||
Total Materials | 43,615,597 | ||||||||||
REAL ESTATE 1.4% | |||||||||||
Equity Real Estate Investment Trusts (REITs) 1.4% | |||||||||||
American Tower Corp. | 299,225 | 31,622,098 | |||||||||
Total Real Estate | 31,622,098 | ||||||||||
The accompanying Notes to Financial Statements are an integral part of this statement.
Annual Report 2016
8
COLUMBIA VARIABLE PORTFOLIO — CONTRARIAN CORE FUND
PORTFOLIO OF INVESTMENTS (continued)
December 31, 2016
Common Stocks (continued)
Issuer | Shares | Value ($) | |||||||||
TELECOMMUNICATION SERVICES 3.6% | |||||||||||
Diversified Telecommunication Services 3.6% | |||||||||||
AT&T, Inc. | 443,745 | 18,872,475 | |||||||||
Verizon Communications, Inc. | 1,174,521 | 62,695,931 | |||||||||
Total | 81,568,406 | ||||||||||
Total Telecommunication Services | 81,568,406 | ||||||||||
UTILITIES 1.3% | |||||||||||
Electric Utilities 0.8% | |||||||||||
Edison International | 255,403 | 18,386,462 | |||||||||
Multi-Utilities 0.5% | |||||||||||
DTE Energy Co. | 123,743 | 12,189,923 | |||||||||
Total Utilities | 30,576,385 | ||||||||||
| Total Common Stocks (Cost: $1,996,791,524) | 2,281,080,809 | ||||||||||
Money Market Funds 0.8%
Shares | Value ($) | ||||||||||
| Columbia Short-Term Cash Fund, 0.594%(b)(c) | 18,521,119 | 18,521,119 | |||||||||
| Total Money Market Funds (Cost: $18,521,119) | 18,521,119 | ||||||||||
| Total Investments (Cost: $2,015,312,643) | 2,299,601,928 | ||||||||||
Other Assets & Liabilities, Net | (168,262 | ) | |||||||||
Net Assets | 2,299,433,666 | ||||||||||
Notes to Portfolio of Investments
(a) Non-income producing investment.
(b) The rate shown is the seven-day current annualized yield at December 31, 2016.
(c) As defined in the Investment Company Act of 1940, an affiliated company is one in which the Fund owns 5% or more of the company's outstanding voting securities, or a company which is under common ownership or control with the Fund. Holdings and transactions in these affiliated companies during the year ended December 31, 2016 are as follows:
Issuer | Beginning Cost ($) | Purchase Cost ($) | Proceeds From Sales ($) | Realized Gain (Loss) ($) | Ending Cost ($) | Dividends — Affiliated Issuers ($) | Value ($) | ||||||||||||||||||||||||
| Columbia Short-Term Cash Fund | 37,008,721 | 534,585,056 | (553,073,442 | ) | 784 | 18,521,119 | 143,154 | 18,521,119 | |||||||||||||||||||||||
Fair Value Measurements
The Fund categorizes its fair value measurements according to a three-level hierarchy that maximizes the use of observable inputs and minimizes the use of unobservable inputs by prioritizing that the most observable input be used when available. Observable inputs are those that market participants would use in pricing an investment based on market data obtained from sources independent of the reporting entity. Unobservable inputs are those that reflect the Fund's assumptions about the information market participants would use in pricing an investment. An investment's level within the fair value hierarchy is based on the lowest level of any input that is deemed significant to the asset's or liability's fair value measurement. The input levels are not necessarily an indication of the risk or liquidity associated with investments at that level. For example, certain U.S. government securities are generally high quality and liquid, however, they are reflected as Level 2 because the inputs used to determine fair value may not always be quoted prices in an active market.
Fair value inputs are summarized in the three broad levels listed below:
> Level 1 — Valuations based on quoted prices for investments in active markets that the Fund has the ability to access at the measurement date (including NAV for open-end mutual funds). Valuation adjustments are not applied to Level 1 investments.
> Level 2 — Valuations based on other significant observable inputs (including quoted prices for similar securities, interest rates, prepayment speeds, credit risks, etc.).
> Level 3 — Valuations based on significant unobservable inputs (including the Fund's own assumptions and judgment in determining the fair value of investments).
The accompanying Notes to Financial Statements are an integral part of this statement.
Annual Report 2016
9
COLUMBIA VARIABLE PORTFOLIO — CONTRARIAN CORE FUND
PORTFOLIO OF INVESTMENTS (continued)
December 31, 2016
Fair Value Measurements (continued)
Inputs that are used in determining fair value of an investment may include price information, credit data, volatility statistics, and other factors. These inputs can be either observable or unobservable. The availability of observable inputs can vary between investments, and is affected by various factors such as the type of investment, and the volume and level of activity for that investment or similar investments in the marketplace. The inputs will be considered by the Investment Manager, along with any other relevant factors in the calculation of an investment's fair value. The Fund uses prices and inputs that are current as of the measurement date, which may include periods of market dislocations. During these periods, the availability of prices and inputs may be reduced for many investments. This condition could cause an investment to be reclassified between the various levels within the hierarchy.
Certain investments that have been measured at fair value using the net asset value (NAV) per share (or its equivalent) are not categorized in the fair value hierarchy. The fair value amounts presented in the table are intended to reconcile the fair value hierarchy to the amounts presented in the Portfolio of Investments. The Columbia Short-Term Cash Fund seeks to provide shareholders with maximum current income consistent with liquidity and stability of principal. Columbia Short-Term Cash Fund prices its shares with a floating NAV and no longer seeks to maintain a stable NAV.
Investments falling into the Level 3 category are primarily supported by quoted prices from brokers and dealers participating in the market for those investments. However, these may be classified as Level 3 investments due to lack of market transparency and corroboration to support these quoted prices. Additionally, valuation models may be used as the pricing source for any remaining investments classified as Level 3. These models may rely on one or more significant unobservable inputs and/or significant assumptions by the Investment Manager. Inputs used in valuations may include, but are not limited to, financial statement analysis, capital account balances, discount rates and estimated cash flows, and comparable company data.
Under the direction of the Fund's Board of Trustees (the Board), the Investment Manager's Valuation Committee (the Committee) is responsible for overseeing the valuation procedures approved by the Board. The Committee consists of voting and non-voting members from various groups within the Investment Manager's organization, including operations and accounting, trading and investments, compliance, risk management and legal.
The Committee meets at least monthly to review and approve valuation matters, which may include a description of specific valuation determinations, data regarding pricing information received from approved pricing vendors and brokers and the results of Board-approved valuation control policies and procedures (the Policies). The Policies address, among other things, instances when market quotations are or are not readily available, including recommendations of third party pricing vendors and a determination of appropriate pricing methodologies; events that require specific valuation determinations and assessment of fair value techniques; securities with a potential for stale pricing, including those that are illiquid, restricted, or in default; and the effectiveness of third party pricing vendors, including periodic reviews of vendors. The Committee meets more frequently, as needed, to discuss additional valuation matters, which may include the need to review back-testing results, review time-sensitive information or approve related valuation actions. The Committee reports to the Board, with members of the Committee meeting with the Board at each of its regularly scheduled meetings to discuss valuation matters and actions during the period, similar to those described earlier.
For investments categorized as Level 3, the Committee monitors information similar to that described above, which may include: (i) data specific to the issuer or comparable issuers, (ii) general market or specific sector news and (iii) quoted prices and specific or similar security transactions. The Committee considers this data and any changes from prior periods in order to assess the reasonableness of observable and unobservable inputs, any assumptions or internal models used to value those securities and changes in fair value. This data is also used to corroborate, when available, information received from approved pricing vendors and brokers. Various factors impact the frequency of monitoring this information (which may occur as often as daily). However, the Committee may determine that changes to inputs, assumptions and models are not required as a result of the monitoring procedures performed.
The accompanying Notes to Financial Statements are an integral part of this statement.
Annual Report 2016
10
COLUMBIA VARIABLE PORTFOLIO — CONTRARIAN CORE FUND
PORTFOLIO OF INVESTMENTS (continued)
December 31, 2016
Fair Value Measurements (continued)
The following table is a summary of the inputs used to value the Fund's investments at December 31, 2016:
| Level 1 Quoted Prices in Active Markets for Identical Assets ($) | Level 2 Other Significant Observable Inputs ($) | Level 3 Significant Unobservable Inputs ($) | Total ($) | ||||||||||||||||
Investments | |||||||||||||||||||
Common Stocks | |||||||||||||||||||
Consumer Discretionary | 288,437,031 | — | — | 288,437,031 | |||||||||||||||
Consumer Staples | 211,938,447 | — | — | 211,938,447 | |||||||||||||||
Energy | 168,690,408 | — | — | 168,690,408 | |||||||||||||||
Financials | 408,503,174 | — | — | 408,503,174 | |||||||||||||||
Health Care | 325,030,000 | — | — | 325,030,000 | |||||||||||||||
Industrials | 214,205,341 | — | — | 214,205,341 | |||||||||||||||
Information Technology | 476,893,922 | — | — | 476,893,922 | |||||||||||||||
Materials | 43,615,597 | — | — | 43,615,597 | |||||||||||||||
Real Estate | 31,622,098 | — | — | 31,622,098 | |||||||||||||||
Telecommunication Services | 81,568,406 | — | — | 81,568,406 | |||||||||||||||
Utilities | 30,576,385 | — | — | 30,576,385 | |||||||||||||||
Total Common Stocks | 2,281,080,809 | — | — | 2,281,080,809 | |||||||||||||||
Investments measured at net asset value | |||||||||||||||||||
Money Market Funds | — | — | — | 18,521,119 | |||||||||||||||
Total Investments | 2,281,080,809 | — | — | 2,299,601,928 | |||||||||||||||
See the Portfolio of Investments for all investment classifications not indicated in the table.
There were no transfers of financial assets between levels during the period.
The accompanying Notes to Financial Statements are an integral part of this statement.
Annual Report 2016
11
COLUMBIA VARIABLE PORTFOLIO — CONTRARIAN CORE FUND
STATEMENT OF ASSETS AND LIABILITIES
December 31, 2016
Assets | |||||||
Investments, at value | |||||||
Unaffiliated issuers (identified cost $1,996,791,524) | $ | 2,281,080,809 | |||||
Affiliated issuers (identified cost $18,521,119) | 18,521,119 | ||||||
Total investments (identified cost $2,015,312,643) | 2,299,601,928 | ||||||
Receivable for: | |||||||
Investments sold | 29,233,142 | ||||||
Dividends | 3,203,883 | ||||||
Foreign tax reclaims | 54,090 | ||||||
Prepaid expenses | 12,553 | ||||||
Trustees' deferred compensation plan | 45,403 | ||||||
Total assets | 2,332,150,999 | ||||||
Liabilities | |||||||
Payable for: | |||||||
Investments purchased | 28,506,405 | ||||||
Capital shares purchased | 2,676,503 | ||||||
Management services fees | 1,304,202 | ||||||
Distribution and/or service fees | 16,888 | ||||||
Transfer agent fees | 114,312 | ||||||
Compensation of board members | 3,063 | ||||||
Chief compliance officer expenses | 263 | ||||||
Other expenses | 50,294 | ||||||
Trustees' deferred compensation plan | 45,403 | ||||||
Total liabilities | 32,717,333 | ||||||
Net assets applicable to outstanding capital stock | $ | 2,299,433,666 | |||||
Represented by | |||||||
Trust capital | $ | 2,299,433,666 | |||||
Total — representing net assets applicable to outstanding capital stock | $ | 2,299,433,666 | |||||
Class 1 | |||||||
Net assets | $ | 2,216,643,286 | |||||
Shares outstanding | 122,310,617 | ||||||
Net asset value per share | $ | 18.12 | |||||
Class 2 | |||||||
Net assets | $ | 82,790,380 | |||||
Shares outstanding | 4,619,735 | ||||||
Net asset value per share | $ | 17.92 | |||||
The accompanying Notes to Financial Statements are an integral part of this statement.
Annual Report 2016
12
COLUMBIA VARIABLE PORTFOLIO — CONTRARIAN CORE FUND
STATEMENT OF OPERATIONS
Year Ended December 31, 2016
Net investment income | |||||||
Income: | |||||||
Dividends — unaffiliated issuers | $ | 44,316,925 | |||||
Dividends — affiliated issuers | 143,154 | ||||||
Foreign taxes withheld | (258,696 | ) | |||||
Total income | 44,201,383 | ||||||
Expenses: | |||||||
Management services fees | 15,670,155 | ||||||
Distribution and/or service fees | |||||||
Class 2 | 170,283 | ||||||
Transfer agent fees | |||||||
Class 1 | 1,330,798 | ||||||
Class 2 | 40,867 | ||||||
Compensation of board members | 59,618 | ||||||
Custodian fees | 31,858 | ||||||
Printing and postage fees | 23,397 | ||||||
Audit fees | 28,738 | ||||||
Legal fees | 54,142 | ||||||
Chief compliance officer expenses | 1,073 | ||||||
Other | 65,806 | ||||||
Total expenses | 17,476,735 | ||||||
Net investment income | 26,724,648 | ||||||
Realized and unrealized gain (loss) — net | |||||||
Net realized gain (loss) on: | |||||||
Investments — unaffiliated issuers | 93,406,867 | ||||||
Investments — affiliated issuers | 784 | ||||||
Foreign currency translations | 4,510 | ||||||
Net realized gain | 93,412,161 | ||||||
Net change in unrealized appreciation (depreciation) on: | |||||||
Investments — unaffiliated issuers | 72,718,723 | ||||||
Foreign currency translations | (1,726 | ) | |||||
Net change in unrealized appreciation | 72,716,997 | ||||||
Net realized and unrealized gain | 166,129,158 | ||||||
Net increase in net assets resulting from operations | $ | 192,853,806 | |||||
The accompanying Notes to Financial Statements are an integral part of this statement.
Annual Report 2016
13
COLUMBIA VARIABLE PORTFOLIO — CONTRARIAN CORE FUND
STATEMENT OF CHANGES IN NET ASSETS
| Year Ended December 31, 2016 | Year Ended December 31, 2015 | ||||||||||
Operations | |||||||||||
Net investment income | $ | 26,724,648 | $ | 80,339,429 | |||||||
Net realized gain | 93,412,161 | 161,475,215 | |||||||||
Net change in unrealized appreciation (depreciation) | 72,716,997 | (164,875,912 | ) | ||||||||
Net increase in net assets resulting from operations | 192,853,806 | 76,938,732 | |||||||||
Decrease in net assets from capital stock activity | (227,793,079 | ) | (217,310,970 | ) | |||||||
Total decrease in net assets | (34,939,273 | ) | (140,372,238 | ) | |||||||
Net assets at beginning of year | 2,334,372,939 | 2,474,745,177 | |||||||||
Net assets at end of year | $ | 2,299,433,666 | $ | 2,334,372,939 | |||||||
The accompanying Notes to Financial Statements are an integral part of this statement.
Annual Report 2016
14
COLUMBIA VARIABLE PORTFOLIO — CONTRARIAN CORE FUND
STATEMENT OF CHANGES IN NET ASSETS (continued)
Year Ended December 31, 2016 | Year Ended December 31, 2015 | ||||||||||||||||||
Shares | Dollars ($) | Shares | Dollars ($) | ||||||||||||||||
Capital stock activity | |||||||||||||||||||
Class 1 shares | |||||||||||||||||||
Subscriptions | 2,587,340 | 42,272,030 | 4,524,319 | 74,805,923 | |||||||||||||||
Redemptions | (16,949,418 | ) | (290,917,493 | ) | (18,953,157 | ) | (318,607,228 | ) | |||||||||||
Net decrease | (14,362,078 | ) | (248,645,463 | ) | (14,428,838 | ) | (243,801,305 | ) | |||||||||||
Class 2 shares | |||||||||||||||||||
Subscriptions | 1,418,521 | 23,974,785 | 1,706,326 | 27,956,762 | |||||||||||||||
Redemptions | (180,799 | ) | (3,122,401 | ) | (88,817 | ) | (1,466,427 | ) | |||||||||||
Net increase | 1,237,722 | 20,852,384 | 1,617,509 | 26,490,335 | |||||||||||||||
Total net decrease | (13,124,356 | ) | (227,793,079 | ) | (12,811,329 | ) | (217,310,970 | ) | |||||||||||
The accompanying Notes to Financial Statements are an integral part of this statement.
Annual Report 2016
15
COLUMBIA VARIABLE PORTFOLIO — CONTRARIAN CORE FUND
FINANCIAL HIGHLIGHTS
The following tables are intended to help you understand the Fund's financial performance. Certain information reflects financial results for a single share of a class held for the periods shown. Per share net investment income (loss) amounts are calculated based on average shares outstanding during the period. Total return assumes reinvestment of all dividends and distributions, if any. Total return does not reflect any fees and expenses imposed under your Contract and/or Qualified Plan, as applicable; such fees and expenses would reduce the total returns for all periods shown. Total return and portfolio turnover are not annualized for periods of less than one year. The portfolio turnover rate is calculated without regard to purchase and sales transactions of short-term instruments and certain derivatives, if any. If such transactions were included, the Fund's portfolio turnover rate may be higher.
Year Ended December 31, | |||||||||||||||||||||||
Class 1 | 2016 | 2015 | 2014 | 2013 | 2012(a) | ||||||||||||||||||
Per share data | |||||||||||||||||||||||
Net asset value, beginning of period | $ | 16.67 | $ | 16.19 | $ | 14.32 | $ | 10.54 | $ | 10.00 | |||||||||||||
Income from investment operations: | |||||||||||||||||||||||
Net investment income | 0.20 | 0.54 | (b) | 0.13 | 0.13 | 0.10 | |||||||||||||||||
Net realized and unrealized gain (loss) | 1.25 | (0.06 | ) | 1.74 | 3.65 | 0.44 | |||||||||||||||||
Total from investment operations | 1.45 | 0.48 | 1.87 | 3.78 | 0.54 | ||||||||||||||||||
Net asset value, end of period | $ | 18.12 | $ | 16.67 | $ | 16.19 | $ | 14.32 | $ | 10.54 | |||||||||||||
Total return | 8.70 | % | 2.97 | % | 13.06 | % | 35.86 | % | 5.40 | % | |||||||||||||
Ratios to average net assets(c) | |||||||||||||||||||||||
Total gross expenses | 0.76 | % | 0.75 | % | 0.76 | % | 0.81 | % | 0.86 | %(d) | |||||||||||||
Total net expenses(e) | 0.76 | % | 0.75 | % | 0.76 | % | 0.76 | % | 0.72 | %(d) | |||||||||||||
Net investment income | 1.18 | % | 3.29 | % | 0.83 | % | 1.01 | % | 1.45 | %(d) | |||||||||||||
Supplemental data | |||||||||||||||||||||||
Net assets, end of period (in thousands) | $ | 2,216,643 | $ | 2,278,481 | $ | 2,446,355 | $ | 1,598,115 | $ | 521,933 | |||||||||||||
Portfolio turnover | 53 | % | 67 | % | 59 | % | 57 | % | 48 | % | |||||||||||||
Notes to Financial Highlights
(a) Based on operations from April 30, 2012 (commencement of operations) through the stated period end.
(b) Net investment income per share includes special dividends. The effect of these dividends amounted to $0.40 per share.
(c) In addition to the fees and expenses that the Fund bears directly, the Fund indirectly bears a pro rata share of the fees and expenses of any other funds in which it invests. Such indirect expenses are not included in the Fund's reported expense ratios.
(d) Annualized.
(e) Total net expenses include the impact of certain fee waivers/expense reimbursements made by the Investment Manager and certain of its affiliates, if applicable.
The accompanying Notes to Financial Statements are an integral part of this statement.
Annual Report 2016
16
COLUMBIA VARIABLE PORTFOLIO — CONTRARIAN CORE FUND
FINANCIAL HIGHLIGHTS (continued)
Year Ended December 31, | |||||||||||||||||||||||
Class 2 | 2016 | 2015 | 2014 | 2013 | 2012(a) | ||||||||||||||||||
Per share data | |||||||||||||||||||||||
Net asset value, beginning of period | $ | 16.53 | $ | 16.09 | $ | 14.26 | $ | 10.53 | $ | 10.00 | |||||||||||||
Income from investment operations: | |||||||||||||||||||||||
Net investment income | 0.16 | 0.58 | (b) | 0.08 | 0.10 | 0.08 | |||||||||||||||||
Net realized and unrealized gain (loss) | 1.23 | (0.14 | ) | 1.75 | 3.63 | 0.45 | |||||||||||||||||
Total from investment operations | 1.39 | 0.44 | 1.83 | 3.73 | 0.53 | ||||||||||||||||||
Net asset value, end of period | $ | 17.92 | $ | 16.53 | $ | 16.09 | $ | 14.26 | $ | 10.53 | |||||||||||||
Total return | 8.41 | % | 2.73 | % | 12.83 | % | 35.42 | % | 5.30 | % | |||||||||||||
Ratios to average net assets(c) | |||||||||||||||||||||||
Total gross expenses | 1.01 | % | 1.01 | % | 1.01 | % | 1.06 | % | 1.08 | %(d) | |||||||||||||
Total net expenses(e) | 1.01 | % | 1.01 | % | 1.01 | % | 1.02 | % | 0.97 | %(d) | |||||||||||||
Net investment income | 0.94 | % | 3.52 | % | 0.54 | % | 0.73 | % | 1.20 | %(d) | |||||||||||||
Supplemental data | |||||||||||||||||||||||
Net assets, end of period (in thousands) | $ | 82,790 | $ | 55,892 | $ | 28,390 | $ | 9,470 | $ | 3 | |||||||||||||
Portfolio turnover | 53 | % | 67 | % | 59 | % | 57 | % | 48 | % | |||||||||||||
Notes to Financial Highlights
(a) Based on operations from April 30, 2012 (commencement of operations) through the stated period end.
(b) Net investment income per share includes special dividends. The effect of these dividends amounted to $0.47 per share.
(c) In addition to the fees and expenses that the Fund bears directly, the Fund indirectly bears a pro rata share of the fees and expenses of any other funds in which it invests. Such indirect expenses are not included in the Fund's reported expense ratios.
(d) Annualized.
(e) Total net expenses include the impact of certain fee waivers/expense reimbursements made by the Investment Manager and certain of its affiliates, if applicable.
The accompanying Notes to Financial Statements are an integral part of this statement.
Annual Report 2016
17
COLUMBIA VARIABLE PORTFOLIO — CONTRARIAN CORE FUND
NOTES TO FINANCIAL STATEMENTS
December 31, 2016
Note 1. Organization
Columbia Variable Portfolio — Contrarian Core Fund (the Fund), a series of Columbia Funds Variable Insurance Trust (the Trust), is a diversified fund. The Trust is registered under the Investment Company Act of 1940, as amended (the 1940 Act), as an open-end management investment company organized as a Massachusetts business trust.
Fund Shares
The Trust may issue an unlimited number of shares (without par value). The Fund offers Class 1 and Class 2 shares to separate accounts funding variable annuity contracts and variable life insurance policies (collectively, Contracts) issued by affiliated and unaffiliated life insurance companies as well as qualified pension and retirement plans (Qualified Plans) and other qualified institutional investors (Qualified Investors) authorized by Columbia Management Investment Distributors, Inc. (the Distributor). You may not buy (nor will you own) shares of the Fund directly. You may invest by participating in a Qualified Plan or by buying a Contract and making allocations to the Fund. Although all share classes generally have identical voting, dividend and liquidation rights, each share class votes separately when required by the Trust's organizational documents or by law. Different share classes pay different distribution amounts to the extent the expenses of such share classes differ, and distributions in liquidation will be proportional to the net asset value of each share class. Each share class has its own cost structure and other features.
Note 2. Summary of Significant Accounting Policies
Basis of Preparation
The Fund is an investment company that applies the accounting and reporting guidance in the Financial Accounting Standards Board (FASB) Accounting Standards Codification Topic 946, Financial Services — Investment Companies (ASC 946). The financial statements are prepared in accordance with U.S. generally accepted accounting principles (GAAP), which requires management to make certain estimates and assumptions that affect the reported amounts of assets and liabilities, the disclosure of contingent assets and liabilities at the date of the financial statements and the reported amounts of income and expenses during the reporting period. Actual results could differ from those estimates.
The following is a summary of significant accounting policies followed by the Fund in the preparation of its financial statements.
Security Valuation
All equity securities are valued at the close of business of the New York Stock Exchange. Equity securities are valued at the last quoted sales price on the principal exchange or market on which they trade, except for securities traded on the NASDAQ Stock Market, which are valued at the NASDAQ official close price. Unlisted securities or listed securities for which there were no sales during the day are valued at the mean of the latest quoted bid and ask prices on such exchanges or markets.
Foreign equity securities are valued based on the closing price on the foreign exchange in which such securities are primarily traded. If any foreign equity security closing prices are not readily available, the securities are valued at the mean of the latest quoted bid and ask prices on such exchanges or markets. Foreign currency exchange rates are generally determined at 4:00 p.m. Eastern (U.S.) time. Many securities markets and exchanges outside the U.S. close prior to the close of the New York Stock Exchange; therefore, the closing prices for securities in such markets or on such exchanges may not fully reflect events that occur after such close but before the close of the New York Stock Exchange. In those situations, foreign securities will be fair valued pursuant to a policy adopted by the Board of Trustees, including, if available, utilizing a third party pricing service to determine these fair values. The third party pricing service takes into account multiple factors, including, but not limited to, movements in the U.S. securities markets, certain depositary receipts, futures contracts and foreign exchange rates that have occurred subsequent to the close of the foreign exchange or market, to determine a good faith estimate that reasonably reflects the current market conditions as of the close of the New York Stock Exchange. The fair value of a security is likely to be different from the quoted or published price, if available.
Investments in open-end investment companies, including money market funds, are valued at their latest net asset value.
Investments for which market quotations are not readily available, or that have quotations which management believes are not reflective of market value or reliable, are valued at fair value as determined in good faith under procedures approved by and under the general supervision of the Board of Trustees. If a security or
Annual Report 2016
18
COLUMBIA VARIABLE PORTFOLIO — CONTRARIAN CORE FUND
NOTES TO FINANCIAL STATEMENTS (continued)
December 31, 2016
class of securities (such as foreign securities) is valued at fair value, such value is likely to be different from the quoted or published price for the security.
The determination of fair value often requires significant judgment. To determine fair value, management may use assumptions including but not limited to future cash flows and estimated risk premiums. Multiple inputs from various sources may be used to determine fair value.
GAAP requires disclosure regarding the inputs and valuation techniques used to measure fair value and any changes in valuation inputs or techniques. In addition, investments shall be disclosed by major category. This information is disclosed following the Fund's Portfolio of Investments.
Foreign Currency Transactions and Translations
The values of all assets and liabilities denominated in foreign currencies are generally translated into U.S. dollars at exchange rates determined at the close of regular trading on the New York Stock Exchange. Net realized and unrealized gains (losses) on foreign currency transactions and translations include gains (losses) arising from the fluctuation in exchange rates between trade and settlement dates on securities transactions, gains (losses) arising from the disposition of foreign currency and currency gains (losses) between the accrual and payment dates on dividends, interest income and foreign withholding taxes.
For financial statement purposes, the Fund does not distinguish that portion of gains (losses) on investments which is due to changes in foreign exchange rates from that which is due to changes in market prices of the investments. Such fluctuations are included with the net realized and unrealized gains (losses) on investments in the Statement of Operations.
Security Transactions
Security transactions are accounted for on the trade date. Cost is determined and gains (losses) are based upon the specific identification method for both financial statement and federal income tax purposes.
Income Recognition
Corporate actions and dividend income are generally recorded net of any non-reclaimable tax withholdings, on the ex-dividend date or upon receipt of ex-dividend notification in the case of certain foreign securities.
The Fund may receive distributions from holdings in equity securities, business development companies (BDCs), exchange traded funds, other regulated
investment companies (RICs), and real estate investment trusts (REITs), which report information on the tax character of their distributions annually. These distributions are allocated to dividend income, capital gain and return of capital based on actual information reported. Return of capital is recorded as a reduction of the cost basis of securities held. If the Fund no longer owns the applicable securities, return of capital is recorded as a realized gain. With respect to REITs, to the extent actual information has not yet been reported, estimates for return of capital are made by the Fund's management. Management's estimates are subsequently adjusted when the actual character of the distributions is disclosed by the REITs, which could result in a proportionate change in return of capital to shareholders.
Awards from class action litigation are recorded as a reduction of cost basis if the Fund still owns the applicable securities on the payment date. If the Fund no longer owns the applicable securities, the proceeds are recorded as realized gains.
Expenses
General expenses of the Trust are allocated to the Fund and other funds of the Trust based upon relative net assets or other expense allocation methodologies determined by the nature of the expense. Expenses directly attributable to the Fund are charged to the Fund. Expenses directly attributable to a specific class of shares are charged to that share class.
Determination of Class Net Asset Value
All income, expenses (other than class-specific expenses, which are charged to that share class, as shown in the Statement of Operations) and realized and unrealized gains (losses) are allocated to each class of the Fund on a daily basis, based on the relative net assets of each class, for purposes of determining the net asset value of each class.
Federal Income Tax Status
The Fund is treated as a partnership for federal income tax purposes, and the Fund does not expect to make regular distributions. The Fund will not be subject to federal income tax, and therefore, there is no provision for federal income taxes. The partners of the Fund are subject to tax on their distributive share of the Fund's income and loss. The components of the Fund's net assets are reported at the partner-level for federal income tax purposes, and therefore, are not presented in the Statement of Assets and Liabilities.
Annual Report 2016
19
COLUMBIA VARIABLE PORTFOLIO — CONTRARIAN CORE FUND
NOTES TO FINANCIAL STATEMENTS (continued)
December 31, 2016
Management of the Fund has concluded that there are no significant uncertain tax positions in the Fund that would require recognition in the financial statements. However, management's conclusion may be subject to review and adjustment at a later date based on factors including, but not limited to, new tax laws, regulations, and administrative interpretations (including relevant court decisions). Generally, the Fund's federal tax returns for the prior three fiscal years remain subject to examination by the Internal Revenue Service.
Foreign Taxes
The Fund may be subject to foreign taxes on income, gains on investments or currency repatriation, a portion of which may be recoverable. The Fund will accrue such taxes and recoveries, as applicable, based upon its current interpretation of tax rules and regulations that exist in the markets in which it invests.
Realized gains in certain countries may be subject to foreign taxes at the Fund level, based on statutory rates. The Fund accrues for such foreign taxes on realized and unrealized gains at the appropriate rate for each jurisdiction, as applicable. The amount, if any, is disclosed as a liability on the Statement of Assets and Liabilities.
Guarantees and Indemnifications
Under the Trust's organizational documents and, in some cases, by contract, its officers and trustees are indemnified against certain liabilities arising out of the performance of their duties to the Trust or its funds. In addition, certain of the Fund's contracts with its service providers contain general indemnification clauses. The Fund's maximum exposure under these arrangements is unknown since the amount of any future claims that may be made against the Fund cannot be determined, and the Fund has no historical basis for predicting the likelihood of any such claims.
Investment Company Reporting Modernization
In October 2016, the U.S. Securities and Exchange Commission adopted new rules and forms, and amendments to certain current rules and forms, to modernize reporting and disclosure of information by registered investment companies. The amendments to Regulation S-X will require standardized, enhanced disclosure about derivatives in investment company financial statements, and will also change the rules governing the form and content of such financial statements. The amendments to Regulation S-X take effect on August 1, 2017. At this time, management is
assessing the anticipated impact of these regulatory developments.
Note 3. Fees and Other Transactions with Affiliates
Management Services Fees
Effective May 1, 2016, the Fund entered into a Management Agreement with Columbia Management Investment Advisers, LLC (the Investment Manager), a wholly-owned subsidiary of Ameriprise Financial, Inc. (Ameriprise Financial). Under the Management Agreement, the Investment Manager provides the Fund with investment research and advice, as well as administrative and accounting services. The management services fee is an annual fee that is equal to a percentage of the Fund's average daily net assets that declines from 0.77% to 0.57% as the Fund's net assets increase. Prior to May 1, 2016, the Fund paid the Investment Manager an annual fee for advisory services under an Investment Management Services Agreement and a separate annual fee for administrative and accounting services under an Administrative Services Agreement. The effective management services fee rate for the year ended December 31, 2016 (reflecting all advisory and administrative services fees paid to the Investment Manager) was 0.69% of the Fund's average daily net assets. For the period from January 1, 2016 through April 30, 2016, the investment advisory services fee paid to the Investment Manager was $4,656,317, and the administrative services fee paid to the Investment Manager was $392,048.
Compensation of Board Members
Board of Trustee members, who are not officers or employees of the Investment Manager or Ameriprise Financial, are compensated for their services to the Fund as disclosed in the Statement of Operations. These Board of Trustee members may participate in a Deferred Compensation Plan (the Plan) which may be terminated at any time. Obligations of the Plan will be paid solely out of the Fund's assets, and all amounts payable under the Plan constitute a general unsecured obligation of the Fund.
Compensation of Chief Compliance Officer
The Board of Trustees has appointed a Chief Compliance Officer to the Fund in accordance with federal securities regulations. The Fund is allocated a portion of the expenses associated with the Chief Compliance Officer based on relative net assets of the Trust.
Annual Report 2016
20
COLUMBIA VARIABLE PORTFOLIO — CONTRARIAN CORE FUND
NOTES TO FINANCIAL STATEMENTS (continued)
December 31, 2016
Transfer Agency Fees
The Fund has a Transfer and Dividend Disbursing Agent Agreement with Columbia Management Investment Services Corp. (the Transfer Agent), an affiliate of the Investment Manager and a wholly-owned subsidiary of Ameriprise Financial. The annual fee rate under this agreement is 0.06% of the Fund's average daily net assets attributable to each share class.
Distribution Fees
The Fund has an agreement with the Distributor, an affiliate of the Investment Manager and a wholly-owned subsidiary of Ameriprise Financial, for distribution services. The Board of Trustees has approved, and the Fund has adopted, a distribution plan (the Plan) which sets the distribution fees for the Fund. These fees are calculated daily and are intended to compensate the Distributor for selling shares of the Fund. The Fund pays a monthly distribution fee to the Distributor at the maximum annual rate of 0.25% of the average daily net assets attributable to Class 2 shares of the Fund. The Fund pays no distribution and service fees for Class 1 shares.
Expenses Waived/Reimbursed by the Investment Manager and its Affiliates
The Investment Manager and certain of its affiliates have contractually agreed to waive fees and/or reimburse expenses (excluding certain fees and expenses described below) for the periods disclosed below, unless sooner terminated at the sole discretion of the Board of Trustees, so that the Fund's net operating expenses, after giving effect to fees waived/expenses reimbursed and any balance credits and/or overdraft charges from the Fund's custodian, do not exceed the following annual rates as a percentage of the class' average daily net assets:
| May 1, 2016 through April 30, 2017 | Prior to May 1, 2016 | ||||||||||
Class 1 | 0.77 | % | 0.79 | % | |||||||
Class 2 | 1.02 | 1.04 | |||||||||
Under the agreement governing these fee waivers and/or expense reimbursement arrangements, the following fees and expenses are excluded from the waiver/reimbursement commitment, and therefore will be paid by the Fund, if applicable: taxes (including foreign transaction taxes), expenses associated with investments in affiliated and non-affiliated pooled investment vehicles (including mutual funds and
exchange-traded funds), transaction costs and brokerage commissions, costs related to any securities lending program, dividend and interest expenses associated with securities sold short, inverse floater program fees and expenses, transaction charges and interest on borrowed money, interest, infrequent and/or unusual expenses and any other expenses the exclusion of which is specifically approved by the Board of Trustees. This agreement may be modified or amended only with approval from the Investment Manager, certain of its affiliates and the Fund. Any fees waived and/or expenses reimbursed under the expense reimbursement arrangements described above are not recoverable by the Investment Manager or its affiliates in future periods.
Note 4. Portfolio Information
The cost of purchases and proceeds from sales of securities, excluding short-term investments and derivatives, if any, aggregated to $1,193,200,696 and $1,380,993,549, respectively, for the year ended December 31, 2016. The amount of purchase and sale activity impacts the portfolio turnover rate reported in the Financial Highlights.
Note 5. Affiliated Money Market Fund
The Fund invests in Columbia Short-Term Cash Fund, an affiliated money market fund established for the exclusive use by the Fund and other affiliated funds (the Affiliated MMF). The income earned by the Fund from such investments is included as Dividends — affiliated issuers in the Statement of Operations. As an investing fund, the Fund indirectly bears its proportionate share of the expenses of the Affiliated MMF. Effective October 1, 2016, the Affiliated MMF prices its shares with a floating net asset value (NAV) and no longer seeks to maintain a stable NAV. In addition, the Board of Trustees of the Affiliated MMF may impose a fee on redemptions (sometimes referred to as a liquidity fee) or temporarily suspend redemptions (sometimes referred to as imposing a redemption gate) in the event its liquidity falls below regulatory limits.
Note 6. Line of Credit
The Fund has access to a revolving credit facility with a syndicate of banks led by Citibank, N.A., HSBC Bank USA, N.A. and JPMorgan Chase Bank, N.A. whereby the Fund may borrow for the temporary funding of shareholder redemptions or for other temporary or emergency purposes. The credit facility agreement, which is a collective agreement between the Fund and certain other funds managed by the Investment Manager,
Annual Report 2016
21
COLUMBIA VARIABLE PORTFOLIO — CONTRARIAN CORE FUND
NOTES TO FINANCIAL STATEMENTS (continued)
December 31, 2016
severally and not jointly, that permits collective borrowings up to $1 billion. Interest is charged to each participating fund based on its borrowings at a rate equal to the higher of (i) the overnight federal funds rate plus 1.00% or (ii) the one-month LIBOR rate plus 1.00%. Each borrowing under the credit facility matures no later than 60 days after the date of borrowing. The Fund also pays a commitment fee equal to its pro rata share of the amount of the credit facility at a rate of 0.15% per annum. The commitment fee is included in other expenses in the Statement of Operations.
The Fund had no borrowings during the year ended December 31, 2016.
Note 7. Significant Risks
Shareholder Concentration Risk
At December 31, 2016, affiliated shareholders of record owned 99.9% of the outstanding shares of the Fund in one or more accounts. Subscription and redemption activity by concentrated accounts may have a significant effect on the operations of the Fund. In the case of a large redemption, the Fund may be forced to sell investments at inopportune times, including its liquid or more liquid positions, resulting in Fund losses and the Fund holding a higher percentage of less liquid or illiquid securities. Large redemptions could result in decreased economies of scale and increased operating expenses for non-redeeming Fund shareholders.
Technology and Technology-Related Investment Risk
The Fund may be more susceptible to the particular risks that may affect companies in the information technology sector, as well as other technology-related sectors (collectively, the technology sectors) than if it were invested in a wider variety of companies in unrelated sectors. Companies in the technology sectors are subject to certain risks, including the risk that new services, equipment or technologies will not be accepted by consumers and businesses or will become rapidly obsolete. Performance of such companies may be affected by factors including obtaining and protecting patents (or the failure to do so) and significant competitive pressures, including aggressive pricing of their products or services, new market entrants, competition for market share and short product cycles due to an accelerated rate of technological developments. Such competitive pressures may lead to limited earnings and/or falling profit margins. As a result, the value of their securities may fall or fail to rise. In addition, many technology sector companies have
limited operating histories and prices of these companies' securities historically have been more volatile than other securities, especially over the short term.
Note 8. Subsequent Events
Management has evaluated the events and transactions that have occurred through the date the financial statements were issued and noted no items requiring adjustment of the financial statements or additional disclosure.
Note 9. Information Regarding Pending and Settled Legal Proceedings
Ameriprise Financial and certain of its affiliates have historically been involved in a number of legal, arbitration and regulatory proceedings, including routine litigation, class actions, and governmental actions, concerning matters arising in connection with the conduct of their business activities. Ameriprise Financial believes that the Funds are not currently the subject of, and that neither Ameriprise Financial nor any of its affiliates are the subject of, any pending legal, arbitration or regulatory proceedings that are likely to have a material adverse effect on the Funds or the ability of Ameriprise Financial or its affiliates to perform under their contracts with the Funds. Ameriprise Financial is required to make quarterly (10-Q), annual (10-K) and, as necessary, 8-K filings with the Securities and Exchange Commission (SEC) on legal and regulatory matters that relate to Ameriprise Financial and its affiliates. Copies of these filings may be obtained by accessing the SEC website at www.sec.gov.
There can be no assurance that these matters, or the adverse publicity associated with them, will not result in increased fund redemptions, reduced sale of fund shares or other adverse consequences to the Funds. Further, although we believe proceedings are not likely to have a material adverse effect on the Funds or the ability of Ameriprise Financial or its affiliates to perform under their contracts with the Funds, these proceedings are subject to uncertainties and, as such, we are unable to estimate the possible loss or range of loss that may result. An adverse outcome in one or more of these proceedings could result in adverse judgments, settlements, fines, penalties or other relief that could have a material adverse effect on the consolidated financial condition or results of operations of Ameriprise Financial.
Annual Report 2016
22
COLUMBIA VARIABLE PORTFOLIO — CONTRARIAN CORE FUND
REPORT OF INDEPENDENT REGISTERED PUBLIC ACCOUNTING FIRM
To the Trustees of Columbia Funds Variable Insurance Trust and the Shareholders of
Columbia Variable Portfolio — Contrarian Core Fund
In our opinion, the accompanying statement of assets and liabilities, including the portfolio of investments, and the related statements of operations and of changes in net assets and the financial highlights present fairly, in all material respects, the financial position of Columbia Variable Portfolio — Contrarian Core Fund (the "Fund," a series of Columbia Funds Variable Insurance Trust) as of December 31, 2016, the results of its operations for the year then ended, the changes in its net assets for each of the two years in the period then ended and the financial highlights for each of the four years in the period then ended and for the period April 30, 2012 (commencement of operations) through December 31, 2012, in conformity with accounting principles generally accepted in the United States of America. These financial statements and financial highlights (hereafter referred to as "financial statements") are the responsibility of the Fund's management. Our responsibility is to express an opinion on these financial statements based on our audits. We conducted our audits of these financial statements in accordance with the standards of the Public Company Accounting Oversight Board (United States). Those standards require that we plan and perform the audit to obtain reasonable assurance about whether the financial statements are free of material misstatement. An audit includes examining, on a test basis, evidence supporting the amounts and disclosures in the financial statements, assessing the accounting principles used and significant estimates made by management, and evaluating the overall financial statement presentation. We believe that our audits, which included confirmation of securities as of December 31, 2016 by correspondence with the custodian, brokers and transfer agent, and the application of alternative auditing procedures where such confirmations had not been received, provide a reasonable basis for our opinion.
PricewaterhouseCoopers LLP
Minneapolis, MN
February 17, 2017
Annual Report 2016
23
COLUMBIA VARIABLE PORTFOLIO — STRATEGIC INCOME FUND
TRUSTEES AND OFFICERS
Shareholders elect the Board that oversees the Fund's operations. The Board appoints officers who are responsible for day-to-day business decisions based on policies set by the Board. The following table provides basic biographical information about the Fund's Trustees, including their principal occupations during the past five years, although specific titles for individuals may have varied over the period. The year set forth beneath Length of Service in the table below is the year in which the Trustee was first appointed or elected as Trustee to any Fund currently in the Columbia Funds Complex or a predecessor thereof. Under current Board policy, members serve terms of indefinite duration.
Independent Trustees
| Name, Address, Year of Birth | Position Held With the Trust and Length of Service | Principal Occupation(s) During the Past Five Years and Other Relevant Professional Experience | Number of Funds in the Columbia Funds Complex Overseen | Other Directorships Held by Trustee During the Past Five Years | |||||||||||||||
| Janet Langford Carrig c/o Columbia Management Investment Advisers, LLC, 225 Franklin Street Mail Drop BX32 05228, Boston, MA 02110 1957 | Trustee 1996 | Senior Vice President, General Counsel and Corporate Secretary, ConocoPhillips (independent energy company) since September 2007 | 59 | None | |||||||||||||||
| Douglas A. Hacker c/o Columbia Management Investment Advisers, LLC, 225 Franklin Street Mail Drop BX32 05228, Boston, MA 02110 1955 | Trustee and Chairman of the Board 1996 | Independent business executive since May 2006; Executive Vice President — Strategy of United Airlines from December 2002 to May 2006; President of UAL Loyalty Services (airline marketing company) from September 2001 to December 2002; Executive Vice President and Chief Financial Officer of United Airlines from July 1999 to September 2001 | 59 | Spartan Nash Company (food distributor); Nash Finch Company (food distributor) from 2005 to 2013; Aircastle Limited (aircraft leasing); SeaCube Container Leasing Ltd. (container leasing) from 2010 to 2013; and Travelport Worldwide Limited (travel information technology) | |||||||||||||||
| Nancy T. Lukitsh c/o Columbia Management Investment Advisers, LLC, 225 Franklin Street Mail Drop BX32 05228, Boston, MA 02110 1956 | Trustee 2011 | Senior Vice President, Partner and Director of Marketing, Wellington Management Company, LLP (investment adviser) from 1997 to 2010; Chair, Wellington Management Portfolios (commingled non-U.S. investment pools) from 2007 to 2010; Director, Wellington Trust Company, NA and other Wellington affiliates from 1997 to 2010 | 59 | None | |||||||||||||||
Annual Report 2016
24
COLUMBIA VARIABLE PORTFOLIO — STRATEGIC INCOME FUND
TRUSTEES AND OFFICERS (continued)
Independent Trustees (continued)
| Name, Address, Year of Birth | Position Held With the Trust and Length of Service | Principal Occupation(s) During the Past Five Years and Other Relevant Professional Experience | Number of Funds in the Columbia Funds Complex Overseen | Other Directorships Held by Trustee During the Past Five Years | |||||||||||||||
| David M. Moffett c/o Columbia Management Investment Advisers, LLC, 225 Franklin Street Mail Drop BX32 05228, Boston, MA 02110 1952 | Trustee 2011 | Retired. Consultant to Bridgewater and Associates | 59 | Director, CSX Corporation; Genworth Financial, Inc. (financial and insurance products and services); Paypal Holdings Inc. (payment and data processing services); Trustee University of Oklahoma Foundation; former Director eBay Inc. (online trading community), 2007-2015; and former Director, CIT Bank, CIT Group Inc. (commercial and consumer finance), 2010-2016 | |||||||||||||||
| Charles R. Nelson c/o Columbia Management Investment Advisers, LLC, 225 Franklin Street Mail Drop BX32 05228, Boston, MA 02110 1942 | Trustee 1981 | Retired. Professor Emeritus, University of Washington since 2011; Professor of Economics, University of Washington from 1976 to 2011; Ford and Louisa Van Voorhis Professor of Political Economy, University of Washington from 1993 to 2011; Adjunct Professor of Statistics, University of Washington from 1980 to 2011; Associate Editor, Journal of Money, Credit and Banking from September 1993 to 2008; consultant on econometric and statistical matters | 59 | None | |||||||||||||||
| John J. Neuhauser c/o Columbia Management Investment Advisers, LLC, 225 Franklin Street Mail Drop BX32 05228, Boston, MA 02110 1943 | Trustee 1984 | President, Saint Michael's College since August 2007; Director or Trustee of several non-profit organizations, including University of Vermont Medical Center; Academic Vice President and Dean of Faculties, Boston College from August 1999 to October 2005; University Professor, Boston College from November 2005 to August 2007 | 59 | Liberty All-Star Equity Fund and Liberty All-Star Growth Fund (closed-end funds) | |||||||||||||||
| Patrick J. Simpson c/o Columbia Management Investment Advisers, LLC, 225 Franklin Street Mail Drop BX32 05228, Boston, MA 02110 1944 | Trustee 2000 | Of Counsel, Perkins Coie LLP (law firm) since 2015; Partner, Perkins Coie LLP from 1988 to 2014 | 59 | None | |||||||||||||||
Annual Report 2016
25
COLUMBIA VARIABLE PORTFOLIO — STRATEGIC INCOME FUND
TRUSTEES AND OFFICERS (continued)
Independent Trustees (continued)
| Name, Address, Year of Birth | Position Held With the Trust and Length of Service | Principal Occupation(s) During the Past Five Years and Other Relevant Professional Experience | Number of Funds in the Columbia Funds Complex Overseen | Other Directorships Held by Trustee During the Past Five Years | |||||||||||||||
| Anne-Lee Verville c/o Columbia Management Investment Advisers, LLC, 225 Franklin Street Mail Drop BX32 05228, Boston, MA 02110 1945 | Trustee 1998 | Retired. General Manager, Global Education Industry from 1994 to 1997, President — Application Systems Division from 1991 to 1994, Chief Financial Officer — US Marketing & Services from 1988 to 1991, and Chief Information Officer from 1987 to 1988, IBM Corporation (computer and technology) | 59 | Enesco Group, Inc. (producer of giftware and home and garden decor products) from 2001 to 2006 | |||||||||||||||
Consultants to the Independent Trustees*
| Name, Address, Year of Birth | Position Held With the Trust and Length of Service | Principal Occupation(s) During the Past Five Years and Other Relevant Professional Experience | Number of Funds in the Columbia Funds Complex Overseen | Other Directorships Held by Trustee During the Past Five Years | |||||||||||||||
| J. Kevin Connaughton c/o Columbia Management Investment Advisers, LLC, 225 Franklin Street Mail Drop BX32 05228, Boston, MA 02110 1964 | Independent Trustee Consultant 2016 | Independent Trustee Consultant, Columbia Funds since March 2016; Managing Director and General Manager of Mutual Fund Products, Columbia Management Investment Advisers, LLC from May 2010 to February 2015; President, Columbia Funds from 2009 to 2015; and senior officer of Columbia Funds and affiliated funds from 2003 to 2015 | 59 | Board of Governors, Gateway Healthcare since January 2016; Trustee, New Century Portfolios since March 2015; and Director, The Autism Project since March 2015 | |||||||||||||||
| Natalie A. Trunow c/o Columbia Management Investment Advisers, LLC, 225 Franklin Street Mail Drop BX32 05228, Boston, MA 02110 1967 | Independent Trustee Consultant 2016 | Independent Trustee Consultant, Columbia Funds since September 2016; Senior Vice President and Chief Executive Officer, Millennial Partners (investment consulting services to institutions) since January 2016; Director of Investments, Casey Family Programs from April 2016 to September 2016; Chief Investment Officer, Calvert Investments from August 2008 to January 2016; Section Head and Portfolio Manager, General Motors Asset Management from June 1997 to August 2008 | 59 | Healthcare Services for Children with Special Needs | |||||||||||||||
* J. Kevin Connaughton was appointed consultant to the Independent Trustees effective March 1, 2016. Natalie A. Trunow was appointed consultant to the Independent Trustees effective September 1, 2016. Shareholders of the Funds are expected to be asked to elect each of Mr. Connaughton and Ms. Trunow as a Trustee at a future shareholder meeting.
Annual Report 2016
26
COLUMBIA VARIABLE PORTFOLIO — STRATEGIC INCOME FUND
TRUSTEES AND OFFICERS (continued)
Interested Trustee Affiliated with Investment Manager*
| Name, Address, Year of Birth | Position Held With the Trust and Length of Service | Principal Occupation(s) During the Past Five Years and Other Relevant Professional Experience | Number of Funds in the Columbia Funds Complex Overseen | Other Directorships Held by Trustee During the Past Five Years | |||||||||||||||
| William F. Truscott c/o Columbia Management Investment Advisers, LLC, 225 Franklin Street Boston, MA 02110 1960 | Trustee 2012 | Chairman of the Board and President, Columbia Management Investment Advisers, LLC since May 2010 and February 2012, respectively; Chief Executive Officer, Global Asset Management, Ameriprise Financial, Inc. since September 2012 (previously Chief Executive Officer, U.S. Asset Management & President, Annuities, May 2010- September 2012); Director and Chief Executive Officer, Columbia Management Investment Distributors, Inc. since May 2010 and February 2012, respectively; Chairman of the Board and Chief Executive Officer, RiverSource Distributors, Inc. since 2006; Director, Threadneedle Asset Management Holdings, SARL since 2014; President and Chief Executive Officer, Ameriprise Certificate Company, 2006-August 2012. | 185 | Trustee to other Columbia Funds since 2001; Chairman of the Board, Columbia Management Investment Advisers, LLC since May 2010; Director, Columbia Management Investment Distributors, Inc. since May 2010; Former Director, Ameriprise Certificate Company, 2006-January 2013 | |||||||||||||||
* Interested person (as defined under the 1940 Act) by reason of being an officer, director, security holder and/or employee of the Investment Manager or Ameriprise Financial.
The Statement of Additional Information has additional information about the Fund's Board members and is available, without charge, upon request by calling 800.345.6611 or contacting your financial intermediary.
Annual Report 2016
27
COLUMBIA VARIABLE PORTFOLIO — STRATEGIC INCOME FUND
TRUSTEES AND OFFICERS (continued)
The Board has appointed officers who are responsible for day-to-day business decisions based on policies it has established. The officers serve at the pleasure of the Board. The following table provides basic information about the Officers of the Fund, including principal occupations during the past five years, although their specific titles may have varied over the period. In addition to Mr. Truscott, who is Senior Vice President, the Fund's other officers are:
Fund Officers
| Name, Address and Year of Birth | Position and Year First Appointed to Position for any Fund in the Columbia Funds Complex or a Predecessor Thereof | Principal Occupation(s) During Past Five Years | |||||||||
| Christopher O. Petersen 5228 Ameriprise Financial Center Minneapolis, MN 55474 Born 1970 | President and Principal Executive Officer (2015) | Vice President and Lead Chief Counsel, Ameriprise Financial, Inc. since January 2015 (previously, Vice President and Chief Counsel January 2010-December 2014); officer of Columbia Funds and affiliated funds since 2007. | |||||||||
| Michael G. Clarke 225 Franklin Street Boston, MA 02110 Born 1969 | Treasurer (2011), Chief Financial Officer (2009) and Chief Accounting Officer (2015) | Vice President — Mutual Fund Administration, Columbia Management Investment Advisers, LLC, since May 2010; senior officer of Columbia Funds and affiliated funds since 2002. | |||||||||
| Paul B. Goucher 100 Park Avenue New York, NY 10017 Born 1968 | Senior Vice President (2011), Chief Legal Officer (2015) and Assistant Secretary (2008) | Senior Vice President and Assistant General Counsel, Ameriprise Financial, Inc. since January 2017 (previously Vice President and Lead Chief Counsel, November 2008-January 2017 and January 2013-January 2017, respectively, and Chief Counsel, January 2010-January 2013); Vice President, Chief Legal Officer and Assistant Secretary, Columbia Management Investment Advisers, LLC since May 2010. | |||||||||
| Thomas P. McGuire 225 Franklin Street Boston, MA 02110 Born 1972 | Senior Vice President and Chief Compliance Officer (2012) | Vice President — Asset Management Compliance, Ameriprise Financial, Inc., since May 2010; Chief Compliance Officer, Ameriprise Certificate Company since September 2010. | |||||||||
| Colin Moore 225 Franklin Street Boston, MA 02110 Born 1958 | Senior Vice President (2010) | Executive Vice President and Global Chief Investment Officer, Ameriprise Financial, Inc., since July 2013; Executive Vice President and Global Chief Investment Officer, Columbia Management Investment Advisers, LLC since July 2013 (previously Director and Global Chief Investment Officer, 2010-2013). | |||||||||
| Michael E. DeFao 225 Franklin Street Boston, MA 02110 Born 1968 | Vice President (2011) and Assistant Secretary (2010) | Vice President and Chief Counsel, Ameriprise Financial, Inc. since May 2010. | |||||||||
| Amy Johnson 5228 Ameriprise Financial Center Minneapolis, MN 55474 Born 1965 | Vice President (2006) | Managing Director and Global Head of Operations, Columbia Management Investment Advisers, LLC since April 2016 (previously Managing Director and Chief Operating Officer, 2010-2016). | |||||||||
| Lyn Kephart-Strong 5228 Ameriprise Financial Center Minneapolis, MN 55474 Born 1960 | Vice President (2015) | President, Columbia Management Investment Services Corp. since October 2014; Vice President & Resolution Officer, Ameriprise Trust Company since August 2009. | |||||||||
| Ryan C. Larrenaga 225 Franklin Street Boston, MA 02110 Born 1970 | Vice President and Secretary (2015) | Vice President and Group Counsel, Ameriprise Financial, Inc. since August 2011; officer of Columbia Funds and affiliated funds since 2005. | |||||||||
Annual Report 2016
28
COLUMBIA VARIABLE PORTFOLIO — CONTRARIAN CORE FUND
IMPORTANT INFORMATION ABOUT THIS REPORT
The policy of the Board is to vote the proxies of the companies in which each fund holds investments consistent with the procedures as stated in the Statement of Additional Information (SAI). You may obtain a copy of the SAI without charge by calling 800.345.6611; contacting your financial intermediary or searching the website of the Securities and Exchange Commission (SEC) at sec.gov. Information regarding how each fund voted proxies relating to portfolio securities is filed with the SEC by August 31st for the most recent 12-month period ending June 30th of that year, and is available without charge by visiting investor.columbiathreadneedleus.com, or searching the website of the SEC at sec.gov.
Each fund files a complete schedule of portfolio holdings with the SEC for the first and third quarters of each fiscal year on Form N-Q. Each fund's Form N-Q is available on the SEC's website at sec.gov and may be reviewed and copied at the SEC's Public Reference Room in Washington, D.C. Information on the operation of the Public Reference Room may be obtained by calling 800.SEC.0330. Each fund's complete schedule of portfolio holdings, as filed on Form N-Q, can also be obtained without charge, upon request, by calling 800.345.6611.
Annual Report 2016
29
Columbia Variable Portfolio — Contrarian Core Fund
P.O. Box 8081
Boston, MA 02266-8081

Please read and consider the investment objectives, risks, charges and expenses for any fund carefully before investing. For fund and other investment product prospectuses, which contain this and other important information, contact your financial advisor or insurance representative. Please read the prospectus carefully before you invest. The Fund is distributed by Columbia Management Investment Distributors, Inc., member FINRA, and managed by Columbia Management Investment Advisers, LLC.
Columbia Threadneedle Investments (Columbia Threadneedle) is the global brand name of the Columbia and Threadneedle group of companies.
All rights reserved. Columbia Management Investment Distributors, Inc., 225 Franklin Street, Boston, MA 02110-2804
© 2017 Columbia Management Investment Advisers, LLC.
C-1543 AN (2/17)

ANNUAL REPORT
December 31, 2016

COLUMBIA VARIABLE PORTFOLIO — SMALL CAP VALUE FUND
Please remember that you may not buy (nor will you own) shares of the Fund directly. The Fund is available through variable annuity contracts and variable life insurance policies offered by the separate accounts of participating insurance companies as well as qualified pension and retirement plans. Please contact your financial advisor or insurance representative for more information.

COLUMBIA VARIABLE PORTFOLIO — SMALL CAP VALUE FUND
TABLE OF CONTENTS
Performance Overview | 2 | ||||||
Manager Discussion of Fund Performance | 4 | ||||||
Understanding Your Fund's Expenses | 7 | ||||||
Portfolio of Investments | 8 | ||||||
Statement of Assets and Liabilities | 15 | ||||||
Statement of Operations | 16 | ||||||
Statement of Changes in Net Assets | 17 | ||||||
Financial Highlights | 19 | ||||||
Notes to Financial Statements | 21 | ||||||
Report of Independent Registered Public Accounting Firm | 27 | ||||||
Federal Income Tax Information | 28 | ||||||
Trustees and Officers | 29 | ||||||
Important Information About This Report | 37 | ||||||
| |||
| |||
| |||
| |||
| |||
| |||
| |||
| |||
| |||
| |||
| |||
| |||
| |||
| |||
| |||
| |||
The views expressed in this report reflect the current views of the respective parties. These views are not guarantees of future performance and involve certain risks, uncertainties and assumptions that are difficult to predict, so actual outcomes and results may differ significantly from the views expressed. These views are subject to change at any time based upon economic, market or other conditions and the respective parties disclaim any responsibility to update such views. These views may not be relied on as investment advice and, because investment decisions for a Columbia fund are based on numerous factors, may not be relied on as an indication of trading intent on behalf of any particular Columbia fund. References to specific securities should not be construed as a recommendation or investment advice.
Annual Report 2016
COLUMBIA VARIABLE PORTFOLIO — SMALL CAP VALUE FUND
PERFORMANCE OVERVIEW
Performance Summary
n Columbia Variable Portfolio — Small Cap Value Fund (the Fund) Class 2 shares returned 32.74% for the 12-month period that ended December 31, 2016.
n The Fund outperformed its benchmark, the Russell 2000 Value Index, which returned 31.74% for the same time period.
n Stock selection in the consumer discretionary and materials sectors, positioning in real estate and an underweight in utilities helped the Fund outperform its benchmark.
Average Annual Total Returns (%) (for period ended December 31, 2016)
Inception | 1 Year | 5 Years | 10 Years | ||||||||||||||||
Class 1 | 05/19/98 | 33.04 | 14.04 | 7.30 | |||||||||||||||
Class 2 | 06/01/00 | 32.74 | 13.83 | 7.10 | |||||||||||||||
Russell 2000 Value Index | 31.74 | 15.07 | 6.26 | ||||||||||||||||
Performance data quoted represents past performance and current performance may be lower or higher. Past performance is no guarantee of future results. The investment return and principal value will fluctuate so that shares, when redeemed, may be worth more or less than the original cost. For current month-end performance information, please contact your financial advisor or insurance representative.
Performance results reflect the effect of any fee waivers or reimbursements of fund expenses by Columbia Management Investment Advisers, LLC and/or any of its affiliates. Absent these fee waivers or expense reimbursement arrangements, performance results would have been lower.
Investment earnings, if any, are tax-deferred until distributed to shareholders, at which time taxes may become due. Total return performance includes changes in share price and assumes reinvestment of dividends and capital gains, if any. Performance results reflect the effect of all fund expenses, but do not include any fees and expenses imposed under your variable annuity contract and/or variable life insurance policy or qualified pension or retirement plan. If performance results included the effect of these additional charges, they would be lower.
The Russell 2000 Value Index, an unmanaged index, tracks the performance of those Russell 2000 Index companies with lower price-to-book ratios and lower forecasted growth values.
Indices are not available for investment, are not professionally managed and do not reflect sales charges, fees, brokerage commissions, taxes or other expenses of investing. Securities in the Fund may not match those in an index.
Annual Report 2016
2
COLUMBIA VARIABLE PORTFOLIO — SMALL CAP VALUE FUND
PERFORMANCE OVERVIEW (continued)
Performance of a Hypothetical $10,000 Investment (January 1, 2007 – December 31, 2016)
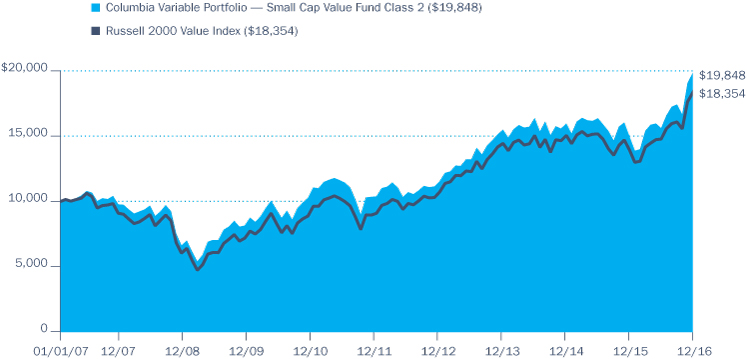
The chart above shows the change in value of a hypothetical $10,000 investment in Class 2 shares of Columbia Variable Portfolio — Small Cap Value Fund during the stated time period, and does not reflect the deduction of taxes, if any, that a shareholder may pay on Fund distributions or on the redemption of Fund shares. The returns also do not reflect fees and expenses imposed under your variable annuity contract and/or variable life insurance policy or qualified pension or retirement plan, if any.
Annual Report 2016
3
COLUMBIA VARIABLE PORTFOLIO — SMALL CAP VALUE FUND
MANAGER DISCUSSION OF FUND PERFORMANCE
Portfolio Management
Jeremy Javidi, CFA
| Top Ten Holdings (%) (at December 31, 2016) | |||||||
Sunstone Hotel Investors, Inc. | 1.3 | ||||||
| First Citizens BancShares Inc., Class A | 1.2 | ||||||
Webster Financial Corp. | 1.2 | ||||||
UMB Financial Corp. | 1.2 | ||||||
Investors Bancorp, Inc. | 1.1 | ||||||
Radian Group, Inc. | 1.1 | ||||||
Chesapeake Lodging Trust | 1.1 | ||||||
MGIC Investment Corp. | 1.0 | ||||||
Cooper Tire & Rubber Co. | 1.0 | ||||||
BancFirst Corp. | 1.0 | ||||||
Percentages indicated are based upon total investments (excluding Money Market Funds).
For further detail about these holdings, please refer to the section entitled "Portfolio of Investments."
Fund holdings are as of the date given, are subject to change at any time, and are not recommendations to buy or sell any security.
| Portfolio Breakdown (%) (at December 31, 2016) | |||||||
Common Stocks | 98.9 | ||||||
Exchange-Traded Funds | 0.3 | ||||||
Money Market Funds | 0.8 | ||||||
Total | 100.0 | ||||||
Percentages indicated are based upon total investments. The Fund's portfolio composition is subject to change.
For the 12-month period that ended December 31, 2016, the Fund's Class 2 shares returned 32.74%. The Fund outperformed its benchmark, the Russell 2000 Value Index, which returned 31.74% for the same time period. Stock selection in the consumer discretionary and materials sectors, positioning in real estate and an underweight in utilities helped the Fund outperform its benchmark. Our security selection remained focused on companies that have market capitalization of less than $4 billion, good earnings growth prospects, solid balance sheets and strong cash flows, and are trading below intrinsic value or the value of the ongoing business.
U.S. Stock Market Posted Strong Gains
Global events, political uncertainty and mixed economic data kept investors off balance in 2016 as financial markets reacted to each significant change on the world stage. Early in the year, concerns about China and oil rattled equity markets, driving stock prices sharply lower in February. After a swift rebound, the stock market swooned again in the early summer following the U.K.'s surprise vote to exit the European Union. U.S. Treasury yields also plummeted. The markets quickly rebounded as central banks offered support, but mixed U.S. economic data and political uncertainty hampered returns in the fall. However, the end of a contentious U.S. Presidential contest eliminated a key element of uncertainty, and domestic economic data turned almost unanimously positive. The Federal Reserve inched its short-term target interest rate higher for the first time in a year, and stocks finished the year strong.
Against this backdrop, the S&P 500 Index, a broad measure of U.S. stock market performance, rose 11.96%, beating returns in most foreign equity markets. Energy and financials were the strongest performing sectors in the benchmark. Small-cap stocks beat large and mid-cap companies, benefiting in part from their U.S. focus and post-election expectations of lower corporate tax rates. Within small cap, value beat growth by a wide margin. Small-cap value stocks were significantly undervalued, which attracted investor interest. In addition, the benchmark had a roughly 30% weight in financials, which rallied 37% this past year, buoyed by the prospect of higher interest rates, less government regulation, lower corporate tax rates and better economic growth.
Contributors and Detractors
Stock selection in the consumer discretionary and materials sectors, positioning in real estate, and an underweight in utilities benefited the Fund's relative performance. In the consumer discretionary sector, most of the outperformance came from stock selection in the household durables and specialty retail segments. In household durables, individual contributors included homebuilder UCP, furniture manufacturer Hooker Furniture and furniture retailer Ethan Allen Interiors, each of which posted a sizable gain fueled by the U.S. housing recovery. In specialty retail, a top contributor was Aaron's, a rent-to-own retailer seeing strong demand from first-time, lower income and credit-impaired homebuyers.
The Fund's underweight in real estate also helped relative performance, as the prospect of higher interest rates caused the sector to lag the
Annual Report 2016
4
COLUMBIA VARIABLE PORTFOLIO — SMALL CAP VALUE FUND
MANAGER DISCUSSION OF FUND PERFORMANCE (continued)
benchmark. In addition, stock selection was positive. Standouts included Getty Realty, a real estate investment trust (REIT) that owns gas station/convenience store properties. It benefited as management began to unlock value from the company's portfolio of properties. In addition, timely purchases of two private prison management companies — CoreCivic (previously Corrections Corp. of America) and GEO Group — helped. The Fund purchased both stocks after they had been beaten down by a presidential candidate's disparaging tweet and a report that private prisons were more dangerous than government-run facilities. The stocks rebounded after the election, each posting gains of more than 50% for the Fund.
Stock selection within materials also contributed to outperformance, notably in the chemicals segment. Individual standouts included Tronox, a titanium dioxide manufacturer that was an overweight in the portfolio. Demand for titanium dioxide, which is used to add brightness, whiteness and opacity to a wide range of products from paint to plastics, outstripped supply for the first time in five years, allowing Tronox to increase prices. An investment in Axiall also contributed. The company makes chlorovinyls, which are used in plastics, and caustic soda (sodium hydroxide), which goes into a variety of products from soaps and detergents to pulp and paper. Axiall's stock soared following a buyout offer this past summer. We locked in gains and sold the Fund's stake. Elsewhere, an underweight in utilities aided relative performance, as a rotation out of more defensive havens and the prospect of higher interest rates pressured returns.
By contrast, security selection in the information technology and health care sectors hampered relative performance. In tech, stock selection in the electronic equipment segment was a source of underperformance. A non-benchmark position in Fitbit, known for its wearable activity trackers, disappointed. While the company continued to innovate and generate significant free cash flow, the stock plunged as sales trends slowed heading into the holidays. Another tech detractor was OSI Systems, which sells scanning equipment used in hospitals and airports. A misstep in unveiling the company's latest health care device led to a downward revision in earnings guidance, resulting in the stock's sizable decline.
Stock selection in health care also detracted, notably in the specialty pharmaceuticals and biotechnology segments. Disappointments included Novavax, a clinical stage vaccine company, and Infinity Pharmaceuticals, which is developing a new treatment for blood cancer. Both stocks plunged when the companies' mid- or late-stage drug trials fell short of expectations. We eliminated them from the portfolio before period end. Near-term performance in health care also suffered because we added to the Fund's stake as concern over potential caps on drug prices put downward pressure on returns.
Portfolio Positioning
The Fund's largest overweight at year end was health care, a big change from the significant underweight it had at the start of 2016. Our bias has been toward attractively valued pharmaceuticals companies that we think have exciting prospects for scientific innovation. Over time, the health care sector has tended not to be closely correlated with the economy or
| Equity Sector Breakdown (%) (at December 31, 2016) | |||||||
Consumer Discretionary | 10.3 | ||||||
Consumer Staples | 2.1 | ||||||
Energy | 7.4 | ||||||
Financials | 35.9 | ||||||
Health Care | 9.1 | ||||||
Industrials | 12.9 | ||||||
Information Technology | 8.8 | ||||||
Materials | 5.4 | ||||||
Real Estate | 6.3 | ||||||
Telecommunication Services | 0.7 | ||||||
Utilities | 1.1 | ||||||
Total | 100.0 | ||||||
Percentages indicated are based upon total equity investments. The Fund's portfolio composition is subject to change.
Annual Report 2016
5
COLUMBIA VARIABLE PORTFOLIO — SMALL CAP VALUE FUND
MANAGER DISCUSSION OF FUND PERFORMANCE (continued)
the broader market, which we view as a plus for portfolio diversification. Another large overweight at period end was financials. We found the most attractive valuations in insurance, a segment that typically gains from higher interest rates and continued economic expansion. We also maintained an overweight — albeit slightly reduced — in energy, which is positioned to benefit from production cuts. We took some profits as oil prices nearly doubled off their bottom last February. We cut the Fund's stake in information technology because valuations had climbed, ending the year with an underweight. Real estate and utilities remained underweights, partly because of the fact that these dividend-paying sectors typically underperform as interest rates rise. We continue to run the Fund with the same disciplined philosophy we've used since taking over its management nearly 15 years ago. Our focus remains on small companies that have strong balance sheets, strong cash flows and good earnings growth prospects, and are trading at a discount to intrinsic value.
Annual Report 2016
6
COLUMBIA VARIABLE PORTFOLIO — SMALL CAP VALUE FUND
UNDERSTANDING YOUR FUND'S EXPENSES
(Unaudited)
As an investor, you incur ongoing costs, which generally include management fees, distribution and/or service fees, and other fund expenses. The following information is intended to help you understand your ongoing costs (in dollars) of investing in the Fund and to help you compare these costs with the ongoing costs of investing in other mutual funds.
The information below does not reflect fees and expenses imposed under your variable annuity contract and/or variable life insurance policy (collectively, Contracts) or qualified pension and retirement plan (Qualified Plan), if any. The total fees and expenses you bear may therefore be higher than those shown below.
Analyzing Your Fund's Expenses
To illustrate these ongoing costs, we have provided examples and calculated the expenses paid by investors in each share class of the Fund during the period. The actual and hypothetical information in the table is based on an initial investment of $1,000 at the beginning of the period indicated and held for the entire period. Expense information is calculated two ways and each method provides you with different information. The amount listed in the "Actual" column is calculated using the Fund's actual operating expenses and total return for the period. You may use the Actual information, together with the amount invested, to estimate the expenses that you paid over the period. Simply divide your account value by $1,000 (for example, an $8,600 account value divided by $1,000 = 8.6), then multiply the results by the expenses paid during the period under the "Actual" column. The amount listed in the "Hypothetical" column assumes a 5% annual rate of return before expenses (which is not the Fund's actual return) and then applies the Fund's actual expense ratio for the period to the hypothetical return. You should not use the hypothetical account values and expenses to estimate either your actual account balance at the end of the period or the expenses you paid during the period. See "Compare With Other Funds" below for details on how to use the hypothetical data.
Compare With Other Funds
Since all mutual funds are required to include the same hypothetical calculations about expenses in shareholder reports, you can use this information to compare the ongoing cost of investing in the Fund with other funds. To do so, compare the hypothetical example with the 5% hypothetical examples that appear in the shareholder reports of other funds. As you compare hypothetical examples of other funds, it is important to note that hypothetical examples are meant to highlight the ongoing costs of investing in a fund only and do not reflect any transaction costs, such as redemption or exchange fees, or expenses that apply to the subaccount or the Contract. Therefore, the hypothetical calculations are useful in comparing ongoing costs only, and will not help you determine the relative total costs of owning different funds. If the fees and expenses imposed under your Contract or Qualified Plan, if any, were included, your costs would be higher.
July 1, 2016 – December 31, 2016
| Account Value at the Beginning of the Period ($) | Account Value at the End of the Period ($) | Expenses Paid During the Period ($) | Fund's Annualized Expense Ratio (%) | ||||||||||||||||||||||||||||
Actual | Hypothetical | Actual | Hypothetical | Actual | Hypothetical | Actual | |||||||||||||||||||||||||
Class 1 | 1,000.00 | 1,000.00 | 1,273.20 | 1,020.35 | 5.29 | 4.70 | 0.93 | ||||||||||||||||||||||||
Class 2 | 1,000.00 | 1,000.00 | 1,271.60 | 1,019.10 | 6.70 | 5.96 | 1.18 | ||||||||||||||||||||||||
Expenses paid during the period are equal to the annualized expense ratio for each class as indicated above, multiplied by the average account value over the period and then multiplied by the number of days in the Fund's most recent fiscal half year and divided by 366.
Expenses do not include fees and expenses incurred indirectly by the Fund from its investment in underlying funds, including affiliated and non-affiliated pooled investment vehicles, such as mutual funds and exchange-traded funds.
Had Columbia Management Investment Advisers, LLC and/or certain of its affiliates not waived/reimbursed certain fees and expenses, account value at the end of the period would have been reduced.
Annual Report 2016
7
COLUMBIA VARIABLE PORTFOLIO — SMALL CAP VALUE FUND
PORTFOLIO OF INVESTMENTS
December 31, 2016
(Percentages represent value of investments compared to net assets)
Common Stocks 98.9%
Issuer | Shares | Value ($) | |||||||||
CONSUMER DISCRETIONARY 10.2% | |||||||||||
Auto Components 2.7% | |||||||||||
Cooper Tire & Rubber Co. | 102,014 | 3,963,244 | |||||||||
Gentherm, Inc.(a) | 54,829 | 1,855,961 | |||||||||
Modine Manufacturing Co.(a) | 144,888 | 2,158,831 | |||||||||
Tenneco, Inc.(a) | 47,659 | 2,977,258 | |||||||||
Total | 10,955,294 | ||||||||||
Automobiles 0.5% | |||||||||||
Winnebago Industries, Inc. | 57,259 | 1,812,247 | |||||||||
Hotels, Restaurants & Leisure 0.2% | |||||||||||
Ignite Restaurant Group, Inc.(a) | 214,426 | 115,790 | |||||||||
Marcus Corp. (The) | 24,570 | 773,955 | |||||||||
Total | 889,745 | ||||||||||
Household Durables 2.4% | |||||||||||
Cavco Industries, Inc.(a) | 19,027 | 1,899,846 | |||||||||
Ethan Allen Interiors, Inc. | 63,880 | 2,353,978 | |||||||||
Hooker Furniture Corp. | 39,143 | 1,485,477 | |||||||||
Lifetime Brands, Inc. | 75,747 | 1,344,509 | |||||||||
UCP, Inc., Class A(a) | 211,975 | 2,554,299 | |||||||||
Total | 9,638,109 | ||||||||||
Leisure Products 0.8% | |||||||||||
Johnson Outdoors, Inc., Class A | 35,072 | 1,392,008 | |||||||||
Malibu Boats, Inc., Class A(a) | 92,102 | 1,757,306 | |||||||||
Total | 3,149,314 | ||||||||||
Media 1.5% | |||||||||||
| AMC Entertainment Holdings, Inc., Class A | 101,237 | 3,406,625 | |||||||||
| Lions Gate Entertainment Corp., Class A | 50,880 | 1,368,672 | |||||||||
| Lions Gate Entertainment Corp., Class B(a) | 50,880 | 1,248,595 | |||||||||
Total | 6,023,892 | ||||||||||
Specialty Retail 1.0% | |||||||||||
Aaron's, Inc. | 88,078 | 2,817,615 | |||||||||
DSW, Inc., Class A | 59,600 | 1,349,940 | |||||||||
Total | 4,167,555 | ||||||||||
Common Stocks (continued)
Issuer | Shares | Value ($) | |||||||||
Textiles, Apparel & Luxury Goods 1.1% | |||||||||||
Deckers Outdoor Corp.(a) | 20,787 | 1,151,392 | |||||||||
Skechers U.S.A., Inc., Class A(a) | 88,470 | 2,174,593 | |||||||||
Steven Madden Ltd.(a) | 36,448 | 1,303,016 | |||||||||
Total | 4,629,001 | ||||||||||
Total Consumer Discretionary | 41,265,157 | ||||||||||
CONSUMER STAPLES 2.1% | |||||||||||
Food & Staples Retailing 0.7% | |||||||||||
Andersons, Inc. (The) | 61,533 | 2,750,525 | |||||||||
Food Products 1.0% | |||||||||||
Fresh Del Monte Produce, Inc. | 41,079 | 2,490,620 | |||||||||
Sanderson Farms, Inc. | 16,790 | 1,582,289 | |||||||||
Total | 4,072,909 | ||||||||||
Personal Products 0.4% | |||||||||||
Inter Parfums, Inc. | 48,822 | 1,598,921 | |||||||||
Total Consumer Staples | 8,422,355 | ||||||||||
ENERGY 7.3% | |||||||||||
Energy Equipment & Services 1.5% | |||||||||||
Aspen Aerogels, Inc.(a) | 285,075 | 1,177,360 | |||||||||
CARBO Ceramics, Inc.(a) | 121,646 | 1,272,417 | |||||||||
Dawson Geophysical Co.(a) | 119,460 | 960,458 | |||||||||
Geospace Technologies Corp.(a) | 53,077 | 1,080,648 | |||||||||
Natural Gas Services Group, Inc.(a) | 52,878 | 1,700,028 | |||||||||
Total | 6,190,911 | ||||||||||
Oil, Gas & Consumable Fuels 5.8% | |||||||||||
Alon USA Energy, Inc. | 200,198 | 2,278,253 | |||||||||
Callon Petroleum Co.(a) | 153,798 | 2,363,875 | |||||||||
Cobalt International Energy, Inc.(a) | 871,506 | 1,063,237 | |||||||||
Contango Oil & Gas Co.(a) | 172,573 | 1,611,832 | |||||||||
CVR Energy, Inc. | 69,390 | 1,761,812 | |||||||||
Earthstone Energy, Inc.(a) | 95,885 | 1,317,460 | |||||||||
Eclipse Resources Corp.(a) | 504,893 | 1,348,064 | |||||||||
Gulfport Energy Corp.(a) | 87,030 | 1,883,329 | |||||||||
Jones Energy, Inc., Class A(a) | 301,669 | 1,508,345 | |||||||||
Peabody Energy Corp.(a) | 1 | 5 | |||||||||
Sanchez Energy Corp.(a) | 151,350 | 1,366,691 | |||||||||
SM Energy Co. | 77,740 | 2,680,475 | |||||||||
The accompanying Notes to Financial Statements are an integral part of this statement.
Annual Report 2016
8
COLUMBIA VARIABLE PORTFOLIO — SMALL CAP VALUE FUND
PORTFOLIO OF INVESTMENTS (continued)
December 31, 2016
Common Stocks (continued)
Issuer | Shares | Value ($) | |||||||||
Synergy Resources Corp.(a) | 247,379 | 2,204,147 | |||||||||
WPX Energy, Inc.(a) | 136,210 | 1,984,580 | |||||||||
Total | 23,372,105 | ||||||||||
Total Energy | 29,563,016 | ||||||||||
FINANCIALS 35.5% | |||||||||||
Banks 20.1% | |||||||||||
BancFirst Corp. | 42,022 | 3,910,147 | |||||||||
BankUnited, Inc. | 85,753 | 3,232,031 | |||||||||
Banner Corp. | 61,000 | 3,404,410 | |||||||||
Boston Private Financial Holdings, Inc. | 200,316 | 3,315,230 | |||||||||
Bridge Bancorp, Inc. | 50,601 | 1,917,778 | |||||||||
Brookline Bancorp, Inc. | 168,331 | 2,760,628 | |||||||||
Capital City Bank Group, Inc. | 115,745 | 2,370,458 | |||||||||
Centerstate Banks, Inc. | 148,503 | 3,737,821 | |||||||||
Columbia Banking System, Inc. | 79,429 | 3,548,888 | |||||||||
Community Trust Bancorp, Inc. | 41,827 | 2,074,619 | |||||||||
| FCB Financial Holdings, Inc., Class A(a) | 81,549 | 3,889,887 | |||||||||
First Citizens BancShares Inc., Class A | 13,818 | 4,905,390 | |||||||||
First Financial Corp. | 42,459 | 2,241,835 | |||||||||
First NBC Bank Holding Co.(a) | 412,625 | 3,012,162 | |||||||||
First of Long Island Corp. (The) | 72,050 | 2,057,028 | |||||||||
Heritage Financial Corp. | 45,696 | 1,176,672 | |||||||||
Investors Bancorp, Inc. | 328,554 | 4,583,328 | |||||||||
National Bank Holdings Corp., Class A | 71,625 | 2,284,121 | |||||||||
Northrim BanCorp, Inc. | 83,088 | 2,625,581 | |||||||||
Sierra Bancorp | 38,971 | 1,036,239 | |||||||||
Synovus Financial Corp. | 77,310 | 3,175,895 | |||||||||
Towne Bank | 116,566 | 3,875,819 | |||||||||
Trustmark Corp. | 108,062 | 3,852,410 | |||||||||
UMB Financial Corp. | 59,900 | 4,619,488 | |||||||||
Union Bankshares Corp. | 77,130 | 2,756,626 | |||||||||
Webster Financial Corp. | 87,150 | 4,730,502 | |||||||||
Total | 81,094,993 | ||||||||||
Capital Markets 1.5% | |||||||||||
GAIN Capital Holdings, Inc. | 265,512 | 1,747,069 | |||||||||
INTL FCStone, Inc.(a) | 66,005 | 2,613,798 | |||||||||
Moelis & Co., ADR, Class A | 48,954 | 1,659,541 | |||||||||
Total | 6,020,408 | ||||||||||
Common Stocks (continued)
Issuer | Shares | Value ($) | |||||||||
Consumer Finance 1.0% | |||||||||||
Enova International, Inc.(a) | 100,071 | 1,255,891 | |||||||||
FirstCash, Inc. | 57,174 | 2,687,178 | |||||||||
Total | 3,943,069 | ||||||||||
Diversified Financial Services 0.4% | |||||||||||
Pico Holdings, Inc.(a) | 100,456 | 1,521,909 | |||||||||
Insurance 6.6% | |||||||||||
| American Equity Investment Life Holding Co. | 171,950 | 3,875,753 | |||||||||
Baldwin & Lyons, Inc., Class B | 60,286 | 1,519,207 | |||||||||
EMC Insurance Group, Inc. | 56,802 | 1,704,628 | |||||||||
Employers Holdings, Inc. | 71,865 | 2,845,854 | |||||||||
FBL Financial Group, Inc., Class A | 40,329 | 3,151,711 | |||||||||
Global Indemnity Ltd.(a) | 33,770 | 1,290,352 | |||||||||
Heritage Insurance Holdings, Inc. | 99,430 | 1,558,068 | |||||||||
Horace Mann Educators Corp. | 47,711 | 2,042,031 | |||||||||
| National Western Life Group, Inc., Class A | 11,006 | 3,420,665 | |||||||||
Navigators Group, Inc. (The) | 24,680 | 2,906,070 | |||||||||
United Fire Group, Inc. | 51,630 | 2,538,647 | |||||||||
Total | 26,852,986 | ||||||||||
Mortgage Real Estate Investment Trusts (REITs) 0.8% | |||||||||||
Altisource Residential Corp. | 172,267 | 1,901,828 | |||||||||
Resource Capital Corp. | 169,347 | 1,410,660 | |||||||||
Total | 3,312,488 | ||||||||||
Thrifts & Mortgage Finance 5.1% | |||||||||||
HomeStreet, Inc.(a) | 84,910 | 2,683,156 | |||||||||
MGIC Investment Corp.(a) | 400,760 | 4,083,744 | |||||||||
Provident Financial Holdings, Inc. | 53,550 | 1,082,781 | |||||||||
Radian Group, Inc. | 237,100 | 4,263,058 | |||||||||
Washington Federal, Inc. | 108,015 | 3,710,315 | |||||||||
Western New England Bancorp, Inc. | 238,765 | 2,232,453 | |||||||||
WSFS Financial Corp. | 57,205 | 2,651,452 | |||||||||
Total | 20,706,959 | ||||||||||
Total Financials | 143,452,812 | ||||||||||
HEALTH CARE 9.0% | |||||||||||
Biotechnology 4.2% | |||||||||||
ACADIA Pharmaceuticals, Inc.(a) | 65,690 | 1,894,499 | |||||||||
bluebird bio, Inc.(a) | 33,420 | 2,062,014 | |||||||||
Coherus Biosciences, Inc.(a) | 40,660 | 1,144,579 | |||||||||
The accompanying Notes to Financial Statements are an integral part of this statement.
Annual Report 2016
9
COLUMBIA VARIABLE PORTFOLIO — SMALL CAP VALUE FUND
PORTFOLIO OF INVESTMENTS (continued)
December 31, 2016
Common Stocks (continued)
Issuer | Shares | Value ($) | |||||||||
Dynavax Technologies Corp.(a) | 229,446 | 906,312 | |||||||||
Eagle Pharmaceuticals, Inc.(a) | 19,776 | 1,569,028 | |||||||||
Exelixis, Inc.(a) | 95,860 | 1,429,272 | |||||||||
Juno Therapeutics, Inc.(a) | 115,620 | 2,179,437 | |||||||||
Keryx Biopharmaceuticals, Inc.(a) | 240,380 | 1,408,627 | |||||||||
PTC Therapeutics, Inc.(a) | 83,636 | 912,469 | |||||||||
Puma Biotechnology, Inc.(a) | 62,260 | 1,911,382 | |||||||||
Spark Therapeutics, Inc.(a) | 30,110 | 1,502,489 | |||||||||
Total | 16,920,108 | ||||||||||
Health Care Equipment & Supplies 1.2% | |||||||||||
Alere, Inc.(a) | 73,790 | 2,875,596 | |||||||||
Quotient Ltd.(a) | 108,851 | 526,839 | |||||||||
Sientra, Inc.(a) | 179,434 | 1,528,778 | |||||||||
Total | 4,931,213 | ||||||||||
Health Care Providers & Services 0.4% | |||||||||||
Molina Healthcare, Inc.(a) | 25,430 | 1,379,832 | |||||||||
Life Sciences Tools & Services 0.3% | |||||||||||
PAREXEL International Corp.(a) | 19,900 | 1,307,828 | |||||||||
Pharmaceuticals 2.9% | |||||||||||
Aerie Pharmaceuticals, Inc.(a) | 33,980 | 1,286,143 | |||||||||
Akorn, Inc.(a) | 62,290 | 1,359,791 | |||||||||
| BioDelivery Sciences International, Inc.(a) | 1,014,014 | 1,774,525 | |||||||||
Flex Pharma, Inc.(a) | 122,035 | 644,345 | |||||||||
Impax Laboratories, Inc.(a) | 231,750 | 3,070,687 | |||||||||
Lannett Co., Inc.(a) | 66,360 | 1,463,238 | |||||||||
Supernus Pharmaceuticals, Inc.(a) | 85,705 | 2,164,051 | |||||||||
Total | 11,762,780 | ||||||||||
Total Health Care | 36,301,761 | ||||||||||
INDUSTRIALS 12.7% | |||||||||||
Building Products 1.2% | |||||||||||
Simpson Manufacturing Co., Inc. | 61,730 | 2,700,687 | |||||||||
Universal Forest Products, Inc. | 19,615 | 2,004,261 | |||||||||
Total | 4,704,948 | ||||||||||
Commercial Services & Supplies 0.7% | |||||||||||
Unifirst Corp. | 19,033 | 2,734,091 | |||||||||
Construction & Engineering 0.5% | |||||||||||
Northwest Pipe Co.(a) | 107,346 | 1,848,498 | |||||||||
Common Stocks (continued)
Issuer | Shares | Value ($) | |||||||||
Electrical Equipment 1.4% | |||||||||||
Babcock & Wilcox Enterprises, Inc.(a) | 99,980 | 1,658,668 | |||||||||
Encore Wire Corp. | 53,759 | 2,330,453 | |||||||||
General Cable Corp. | 93,710 | 1,785,175 | |||||||||
Total | 5,774,296 | ||||||||||
Industrial Conglomerates 0.4% | |||||||||||
Raven Industries, Inc. | 59,190 | 1,491,588 | |||||||||
Machinery 6.2% | |||||||||||
Albany International Corp., Class A | 52,915 | 2,449,965 | |||||||||
Altra Industrial Motion Corp. | 63,337 | 2,337,135 | |||||||||
DMC Global, Inc. | 115,814 | 1,835,652 | |||||||||
EnPro Industries, Inc. | 30,006 | 2,021,204 | |||||||||
Gorman-Rupp Co. | 50,306 | 1,556,971 | |||||||||
Hardinge, Inc. | 54,162 | 600,115 | |||||||||
Kadant, Inc. | 23,677 | 1,449,032 | |||||||||
LB Foster Co., Class A | 73,830 | 1,004,088 | |||||||||
Lydall, Inc.(a) | 42,878 | 2,652,004 | |||||||||
Mueller Industries, Inc. | 85,118 | 3,401,315 | |||||||||
Standex International Corp. | 26,540 | 2,331,539 | |||||||||
Titan International, Inc. | 128,724 | 1,442,996 | |||||||||
Wabash National Corp. | 135,340 | 2,141,079 | |||||||||
Total | 25,223,095 | ||||||||||
Professional Services 0.9% | |||||||||||
FTI Consulting, Inc.(a) | 49,480 | 2,230,558 | |||||||||
TrueBlue, Inc.(a) | 61,933 | 1,526,649 | |||||||||
Total | 3,757,207 | ||||||||||
Road & Rail 1.0% | |||||||||||
Heartland Express, Inc. | 47,030 | 957,531 | |||||||||
Landstar System, Inc. | 17,294 | 1,475,178 | |||||||||
Werner Enterprises, Inc. | 60,878 | 1,640,662 | |||||||||
Total | 4,073,371 | ||||||||||
Trading Companies & Distributors 0.4% | |||||||||||
CAI International, Inc.(a) | 25,287 | 219,238 | |||||||||
Houston Wire & Cable Co. | 124,186 | 807,209 | |||||||||
Textainer Group Holdings Ltd. | 92,262 | 687,352 | |||||||||
Total | 1,713,799 | ||||||||||
Total Industrials | 51,320,893 | ||||||||||
The accompanying Notes to Financial Statements are an integral part of this statement.
Annual Report 2016
10
COLUMBIA VARIABLE PORTFOLIO — SMALL CAP VALUE FUND
PORTFOLIO OF INVESTMENTS (continued)
December 31, 2016
Common Stocks (continued)
Issuer | Shares | Value ($) | |||||||||
INFORMATION TECHNOLOGY 8.7% | |||||||||||
Communications Equipment 0.9% | |||||||||||
Digi International, Inc.(a) | 115,790 | 1,592,113 | |||||||||
Plantronics, Inc. | 36,320 | 1,988,883 | |||||||||
Total | 3,580,996 | ||||||||||
Electronic Equipment, Instruments & Components 3.0% | |||||||||||
AVX Corp. | 187,616 | 2,932,438 | |||||||||
Benchmark Electronics, Inc.(a) | 96,170 | 2,933,185 | |||||||||
Fitbit, Inc., Class A(a) | 302,610 | 2,215,105 | |||||||||
MTS Systems Corp. | 28,079 | 1,592,079 | |||||||||
OSI Systems, Inc.(a) | 32,720 | 2,490,647 | |||||||||
Total | 12,163,454 | ||||||||||
Internet Software & Services 0.6% | |||||||||||
WebMD Health Corp.(a) | 50,977 | 2,526,930 | |||||||||
IT Services 1.0% | |||||||||||
Mantech International Corp., Class A | 45,125 | 1,906,531 | |||||||||
TeleTech Holdings, Inc. | 67,230 | 2,050,515 | |||||||||
Total | 3,957,046 | ||||||||||
Semiconductors & Semiconductor Equipment 2.2% | |||||||||||
Entegris, Inc.(a) | 176,640 | 3,161,856 | |||||||||
IXYS Corp. | 143,751 | 1,710,637 | |||||||||
| MACOM Technology Solutions Holdings, Inc.(a) | 52,473 | 2,428,450 | |||||||||
Silicon Laboratories, Inc.(a) | 24,470 | 1,590,550 | |||||||||
Total | 8,891,493 | ||||||||||
Software 0.7% | |||||||||||
MicroStrategy, Inc., Class A(a) | 7,780 | 1,535,772 | |||||||||
Silver Spring Networks, Inc.(a) | 105,738 | 1,407,373 | |||||||||
Total | 2,943,145 | ||||||||||
Technology Hardware, Storage & Peripherals 0.3% | |||||||||||
Stratasys Ltd.(a) | 76,674 | 1,268,188 | |||||||||
Total Information Technology | 35,331,252 | ||||||||||
MATERIALS 5.4% | |||||||||||
Chemicals 1.5% | |||||||||||
Flotek Industries, Inc.(a) | 156,560 | 1,470,098 | |||||||||
Olin Corp. | 101,840 | 2,608,123 | |||||||||
Tronox Ltd., Class A | 205,322 | 2,116,870 | |||||||||
Total | 6,195,091 | ||||||||||
Common Stocks (continued)
Issuer | Shares | Value ($) | |||||||||
Containers & Packaging 0.4% | |||||||||||
Greif, Inc., Class A | 31,215 | 1,601,642 | |||||||||
Metals & Mining 2.9% | |||||||||||
Allegheny Technologies, Inc. | 122,510 | 1,951,584 | |||||||||
Commercial Metals Co. | 136,920 | 2,982,117 | |||||||||
Ferroglobe PLC | 236,840 | 2,564,977 | |||||||||
Olympic Steel, Inc. | 24,773 | 600,250 | |||||||||
TimkenSteel Corp.(a) | 106,020 | 1,641,190 | |||||||||
| Universal Stainless & Alloy Products, Inc.(a) | 129,237 | 1,745,992 | |||||||||
Total | 11,486,110 | ||||||||||
Paper & Forest Products 0.6% | |||||||||||
Louisiana-Pacific Corp.(a) | 128,680 | 2,435,912 | |||||||||
Total Materials | 21,718,755 | ||||||||||
REAL ESTATE 6.3% | |||||||||||
Equity Real Estate Investment Trusts (REITs) 6.3% | |||||||||||
Chesapeake Lodging Trust | 163,043 | 4,216,292 | |||||||||
CoreCivic, Inc. | 39,160 | 957,854 | |||||||||
Cousins Properties, Inc. | 209,101 | 1,779,450 | |||||||||
EastGroup Properties, Inc. | 24,669 | 1,821,559 | |||||||||
GEO Group, Inc. (The) | 41,020 | 1,473,849 | |||||||||
Getty Realty Corp. | 109,575 | 2,793,067 | |||||||||
LaSalle Hotel Properties | 121,090 | 3,689,612 | |||||||||
National Health Investors, Inc. | 18,367 | 1,362,280 | |||||||||
Potlatch Corp. | 48,197 | 2,007,405 | |||||||||
Sunstone Hotel Investors, Inc. | 339,782 | 5,181,675 | |||||||||
Total | 25,283,043 | ||||||||||
Total Real Estate | 25,283,043 | ||||||||||
TELECOMMUNICATION SERVICES 0.7% | |||||||||||
Diversified Telecommunication Services 0.2% | |||||||||||
magicJack VocalTec Ltd.(a) | 114,115 | 781,688 | |||||||||
Wireless Telecommunication Services 0.5% | |||||||||||
Shenandoah Telecommunications Co. | 70,264 | 1,918,207 | |||||||||
Total Telecommunication Services | 2,699,895 | ||||||||||
UTILITIES 1.0% | |||||||||||
Electric Utilities 0.4% | |||||||||||
IDACORP, Inc. | 20,350 | 1,639,192 | |||||||||
The accompanying Notes to Financial Statements are an integral part of this statement.
Annual Report 2016
11
COLUMBIA VARIABLE PORTFOLIO — SMALL CAP VALUE FUND
PORTFOLIO OF INVESTMENTS (continued)
December 31, 2016
Common Stocks (continued)
Issuer | Shares | Value ($) | |||||||||
Gas Utilities 0.5% | |||||||||||
Southwest Gas Corp. | 30,821 | 2,361,505 | |||||||||
Water Utilities 0.1% | |||||||||||
Consolidated Water Co., Ltd. | 19,342 | 209,861 | |||||||||
Total Utilities | 4,210,558 | ||||||||||
| Total Common Stocks (Cost: $332,507,217) | 399,569,497 | ||||||||||
Exchange-Traded Funds 0.3%
Shares | Value ($) | ||||||||||
iShares Russell 2000 Value ETF | 10,220 | 1,215,567 | |||||||||
| Total Exchange-Traded Funds (Cost: $1,223,741) | 1,215,567 | ||||||||||
Money Market Funds 0.8%
| Columbia Short-Term Cash Fund, 0.594%(b)(c) | 3,373,438 | 3,373,438 | |||||||||
| Total Money Market Funds (Cost: $3,373,486) | 3,373,438 | ||||||||||
| Total Investments (Cost: $337,104,444) | 404,158,502 | ||||||||||
Other Assets & Liabilities, Net | 28,073 | ||||||||||
Net Assets | 404,186,575 | ||||||||||
Notes to Portfolio of Investments
(a) Non-income producing investment.
(b) The rate shown is the seven-day current annualized yield at December 31, 2016.
(c) As defined in the Investment Company Act of 1940, an affiliated company is one in which the Fund owns 5% or more of the company's outstanding voting securities, or a company which is under common ownership or control with the Fund. Holdings and transactions in these affiliated companies during the year ended December 31, 2016 are as follows:
Issuer | Beginning Cost ($) | Purchase Cost ($) | Proceeds From Sales ($) | Realized Gain (Loss) ($) | Ending Cost ($) | Dividends — Affiliated Issuers ($) | Value ($) | ||||||||||||||||||||||||
| Columbia Short-Term Cash Fund | 8,915,326 | 98,459,373 | (104,001,309 | ) | 96 | 3,373,486 | 19,057 | 3,373,438 | |||||||||||||||||||||||
Abbreviation Legend
ADR American Depositary Receipt
Fair Value Measurements
The Fund categorizes its fair value measurements according to a three-level hierarchy that maximizes the use of observable inputs and minimizes the use of unobservable inputs by prioritizing that the most observable input be used when available. Observable inputs are those that market participants would use in pricing an investment based on market data obtained from sources independent of the reporting entity. Unobservable inputs are those that reflect the Fund's assumptions about the information market participants would use in pricing an investment. An investment's level within the fair value hierarchy is based on the lowest level of any input that is deemed significant to the asset's or liability's fair value measurement. The input levels are not necessarily an indication of the risk or liquidity associated with investments at that level. For example, certain U.S. government securities are generally high quality and liquid, however, they are reflected as Level 2 because the inputs used to determine fair value may not always be quoted prices in an active market.
Fair value inputs are summarized in the three broad levels listed below:
> Level 1 — Valuations based on quoted prices for investments in active markets that the Fund has the ability to access at the measurement date (including NAV for open-end mutual funds). Valuation adjustments are not applied to Level 1 investments.
> Level 2 — Valuations based on other significant observable inputs (including quoted prices for similar securities, interest rates, prepayment speeds, credit risks, etc.).
> Level 3 — Valuations based on significant unobservable inputs (including the Fund's own assumptions and judgment in determining the fair value of investments).
The accompanying Notes to Financial Statements are an integral part of this statement.
Annual Report 2016
12
COLUMBIA VARIABLE PORTFOLIO — SMALL CAP VALUE FUND
PORTFOLIO OF INVESTMENTS (continued)
December 31, 2016
Fair Value Measurements (continued)
Inputs that are used in determining fair value of an investment may include price information, credit data, volatility statistics, and other factors. These inputs can be either observable or unobservable. The availability of observable inputs can vary between investments, and is affected by various factors such as the type of investment, and the volume and level of activity for that investment or similar investments in the marketplace. The inputs will be considered by the Investment Manager, along with any other relevant factors in the calculation of an investment's fair value. The Fund uses prices and inputs that are current as of the measurement date, which may include periods of market dislocations. During these periods, the availability of prices and inputs may be reduced for many investments. This condition could cause an investment to be reclassified between the various levels within the hierarchy.
Certain investments that have been measured at fair value using the net asset value (NAV) per share (or its equivalent) are not categorized in the fair value hierarchy. The fair value amounts presented in the table are intended to reconcile the fair value hierarchy to the amounts presented in the Portfolio of Investments. The Columbia Short-Term Cash Fund seeks to provide shareholders with maximum current income consistent with liquidity and stability of principal. Columbia Short-Term Cash Fund prices its shares with a floating NAV and no longer seeks to maintain a stable NAV.
Investments falling into the Level 3 category are primarily supported by quoted prices from brokers and dealers participating in the market for those investments. However, these may be classified as Level 3 investments due to lack of market transparency and corroboration to support these quoted prices. Additionally, valuation models may be used as the pricing source for any remaining investments classified as Level 3. These models may rely on one or more significant unobservable inputs and/or significant assumptions by the Investment Manager. Inputs used in valuations may include, but are not limited to, financial statement analysis, capital account balances, discount rates and estimated cash flows, and comparable company data.
Under the direction of the Fund's Board of Trustees (the Board), the Investment Manager's Valuation Committee (the Committee) is responsible for overseeing the valuation procedures approved by the Board. The Committee consists of voting and non-voting members from various groups within the Investment Manager's organization, including operations and accounting, trading and investments, compliance, risk management and legal.
The Committee meets at least monthly to review and approve valuation matters, which may include a description of specific valuation determinations, data regarding pricing information received from approved pricing vendors and brokers and the results of Board-approved valuation control policies and procedures (the Policies). The Policies address, among other things, instances when market quotations are or are not readily available, including recommendations of third party pricing vendors and a determination of appropriate pricing methodologies; events that require specific valuation determinations and assessment of fair value techniques; securities with a potential for stale pricing, including those that are illiquid, restricted, or in default; and the effectiveness of third party pricing vendors, including periodic reviews of vendors. The Committee meets more frequently, as needed, to discuss additional valuation matters, which may include the need to review back-testing results, review time-sensitive information or approve related valuation actions. The Committee reports to the Board, with members of the Committee meeting with the Board at each of its regularly scheduled meetings to discuss valuation matters and actions during the period, similar to those described earlier.
For investments categorized as Level 3, the Committee monitors information similar to that described above, which may include: (i) data specific to the issuer or comparable issuers, (ii) general market or specific sector news and (iii) quoted prices and specific or similar security transactions. The Committee considers this data and any changes from prior periods in order to assess the reasonableness of observable and unobservable inputs, any assumptions or internal models used to value those securities and changes in fair value. This data is also used to corroborate, when available, information received from approved pricing vendors and brokers. Various factors impact the frequency of monitoring this information (which may occur as often as daily). However, the Committee may determine that changes to inputs, assumptions and models are not required as a result of the monitoring procedures performed.
The accompanying Notes to Financial Statements are an integral part of this statement.
Annual Report 2016
13
COLUMBIA VARIABLE PORTFOLIO — SMALL CAP VALUE FUND
PORTFOLIO OF INVESTMENTS (continued)
December 31, 2016
Fair Value Measurements (continued)
The following table is a summary of the inputs used to value the Fund's investments at December 31, 2016:
| Level 1 Quoted Prices in Active Markets for Identical Assets ($) | Level 2 Other Significant Observable Inputs ($) | Level 3 Significant Unobservable Inputs ($) | Total ($) | ||||||||||||||||
Investments | |||||||||||||||||||
Common Stocks | |||||||||||||||||||
Consumer Discretionary | 41,265,157 | — | — | 41,265,157 | |||||||||||||||
Consumer Staples | 8,422,355 | — | — | 8,422,355 | |||||||||||||||
Energy | 29,563,016 | — | — | 29,563,016 | |||||||||||||||
Financials | 143,452,812 | — | — | 143,452,812 | |||||||||||||||
Health Care | 36,301,761 | — | — | 36,301,761 | |||||||||||||||
Industrials | 51,320,893 | — | — | 51,320,893 | |||||||||||||||
Information Technology | 35,331,252 | — | — | 35,331,252 | |||||||||||||||
Materials | 21,718,755 | — | — | 21,718,755 | |||||||||||||||
Real Estate | 25,283,043 | — | — | 25,283,043 | |||||||||||||||
Telecommunication Services | 2,699,895 | — | — | 2,699,895 | |||||||||||||||
Utilities | 4,210,558 | — | — | 4,210,558 | |||||||||||||||
Total Common Stocks | 399,569,497 | — | — | 399,569,497 | |||||||||||||||
Exchange-Traded Funds | 1,215,567 | — | — | 1,215,567 | |||||||||||||||
Investments measured at net asset value | |||||||||||||||||||
Money Market Funds | — | — | — | 3,373,438 | |||||||||||||||
Total Investments | 400,785,064 | — | — | 404,158,502 | |||||||||||||||
See the Portfolio of Investments for all investment classifications not indicated in the table.
There were no transfers of financial assets between levels during the period.
The accompanying Notes to Financial Statements are an integral part of this statement.
Annual Report 2016
14
COLUMBIA VARIABLE PORTFOLIO — SMALL CAP VALUE FUND
STATEMENT OF ASSETS AND LIABILITIES
December 31, 2016
Assets | |||||||
Investments, at value | |||||||
Unaffiliated issuers (identified cost $333,730,958) | $ | 400,785,064 | |||||
Affiliated issuers (identified cost $3,373,486) | 3,373,438 | ||||||
Total investments (identified cost $337,104,444) | 404,158,502 | ||||||
Receivable for: | |||||||
Capital shares sold | 136,776 | ||||||
Dividends | 618,785 | ||||||
Expense reimbursement due from Investment Manager | 20,798 | ||||||
Prepaid expenses | 1,837 | ||||||
Trustees' deferred compensation plan | 54,774 | ||||||
Total assets | 404,991,472 | ||||||
Liabilities | |||||||
Payable for: | |||||||
Investments purchased | 139,893 | ||||||
Capital shares purchased | 144,016 | ||||||
Management services fees | 288,054 | ||||||
Distribution and/or service fees | 81,456 | ||||||
Transfer agent fees | 19,865 | ||||||
Compensation of board members | 1,218 | ||||||
Chief compliance officer expenses | 39 | ||||||
Printing and postage fees | 44,207 | ||||||
Other expenses | 31,375 | ||||||
Trustees' deferred compensation plan | 54,774 | ||||||
Total liabilities | 804,897 | ||||||
Net assets applicable to outstanding capital stock | $ | 404,186,575 | |||||
Represented by | |||||||
Paid-in capital | $ | 311,102,353 | |||||
Undistributed net investment income | 1,302,903 | ||||||
Accumulated net realized gain | 24,727,261 | ||||||
Unrealized appreciation (depreciation) on: | |||||||
Investments — unaffiliated issuers | 67,054,106 | ||||||
Investments — affiliated issuers | (48 | ) | |||||
Total — representing net assets applicable to outstanding capital stock | $ | 404,186,575 | |||||
Class 1 | |||||||
Net assets | $ | 6,081,242 | |||||
Shares outstanding | 318,171 | ||||||
Net asset value per share | $ | 19.11 | |||||
Class 2 | |||||||
Net assets | $ | 398,105,333 | |||||
Shares outstanding | 20,944,504 | ||||||
Net asset value per share | $ | 19.01 | |||||
The accompanying Notes to Financial Statements are an integral part of this statement.
Annual Report 2016
15
COLUMBIA VARIABLE PORTFOLIO — SMALL CAP VALUE FUND
STATEMENT OF OPERATIONS
Year Ended December 31, 2016
Net investment income | |||||||
Income: | |||||||
Dividends — unaffiliated issuers | $ | 5,306,246 | |||||
Dividends — affiliated issuers | 19,057 | ||||||
Foreign taxes withheld | (2,187 | ) | |||||
Total income | 5,323,116 | ||||||
Expenses: | |||||||
Management services fees | 2,987,029 | ||||||
Distribution and/or service fees | |||||||
Class 2 | 843,810 | ||||||
Transfer agent fees | |||||||
Class 1 | 3,487 | ||||||
Class 2 | 202,509 | ||||||
Compensation of board members | 23,618 | ||||||
Custodian fees | 18,555 | ||||||
Printing and postage fees | 101,954 | ||||||
Audit fees | 26,015 | ||||||
Legal fees | 8,014 | ||||||
Chief compliance officer expenses | 156 | ||||||
Other | 1,335 | ||||||
Total expenses | 4,216,482 | ||||||
Fees waived or expenses reimbursed by Investment Manager and its affiliates | (191,105 | ) | |||||
Total net expenses | 4,025,377 | ||||||
Net investment income | 1,297,739 | ||||||
Realized and unrealized gain (loss) — net | |||||||
Net realized gain (loss) on: | |||||||
Investments — unaffiliated issuers | 25,190,407 | ||||||
Investments — affiliated issuers | 96 | ||||||
Foreign currency translations | (23 | ) | |||||
Net realized gain | 25,190,480 | ||||||
Net change in unrealized appreciation (depreciation) on: | |||||||
Investments — unaffiliated issuers | 76,572,545 | ||||||
Investments — affiliated issuers | (48 | ) | |||||
Foreign currency translations | 20 | ||||||
Net change in unrealized appreciation | 76,572,517 | ||||||
Net realized and unrealized gain | 101,762,997 | ||||||
Net increase in net assets resulting from operations | $ | 103,060,736 | |||||
The accompanying Notes to Financial Statements are an integral part of this statement.
Annual Report 2016
16
COLUMBIA VARIABLE PORTFOLIO — SMALL CAP VALUE FUND
STATEMENT OF CHANGES IN NET ASSETS
| Year Ended December 31, 2016 | Year Ended December 31, 2015 | ||||||||||
Operations | |||||||||||
Net investment income | $ | 1,297,739 | $ | 1,150,886 | |||||||
Net realized gain | 25,190,480 | 34,035,482 | |||||||||
Net change in unrealized appreciation (depreciation) | 76,572,517 | (56,973,737 | ) | ||||||||
Net increase (decrease) in net assets resulting from operations | 103,060,736 | (21,787,369 | ) | ||||||||
Distributions to shareholders | |||||||||||
Net investment income | |||||||||||
Class 1 | (37,766 | ) | (54,657 | ) | |||||||
Class 2 | (1,313,929 | ) | (1,997,714 | ) | |||||||
Net realized gains | |||||||||||
Class 1 | (581,164 | ) | (447,373 | ) | |||||||
Class 2 | (33,428,352 | ) | (23,054,939 | ) | |||||||
Total distributions to shareholders | (35,361,211 | ) | (25,554,683 | ) | |||||||
Increase (decrease) in net assets from capital stock activity | 10,257,528 | (2,465,863 | ) | ||||||||
Total increase (decrease) in net assets | 77,957,053 | (49,807,915 | ) | ||||||||
Net assets at beginning of year | 326,229,522 | 376,037,437 | |||||||||
Net assets at end of year | $ | 404,186,575 | $ | 326,229,522 | |||||||
Undistributed net investment income | $ | 1,302,903 | $ | 1,356,882 | |||||||
The accompanying Notes to Financial Statements are an integral part of this statement.
Annual Report 2016
17
COLUMBIA VARIABLE PORTFOLIO — SMALL CAP VALUE FUND
STATEMENT OF CHANGES IN NET ASSETS (continued)
Year Ended December 31, 2016 | Year Ended December 31, 2015 | ||||||||||||||||||
Shares | Dollars ($) | Shares | Dollars ($) | ||||||||||||||||
Capital stock activity | |||||||||||||||||||
Class 1 shares | |||||||||||||||||||
Subscriptions | 103,884 | 1,683,944 | 33,534 | 579,664 | |||||||||||||||
Distributions reinvested | 38,951 | 618,930 | 29,549 | 502,030 | |||||||||||||||
Redemptions | (202,030 | ) | (3,361,239 | ) | (80,443 | ) | (1,417,603 | ) | |||||||||||
Net decrease | (59,195 | ) | (1,058,365 | ) | (17,360 | ) | (335,909 | ) | |||||||||||
Class 2 shares | |||||||||||||||||||
Subscriptions | 1,898,391 | 30,558,768 | 1,157,841 | 20,033,756 | |||||||||||||||
Distributions reinvested | 2,196,099 | 34,742,281 | 1,480,653 | 25,052,653 | |||||||||||||||
Redemptions | (3,239,544 | ) | (53,985,156 | ) | (2,665,425 | ) | (47,216,363 | ) | |||||||||||
Net increase (decrease) | 854,946 | 11,315,893 | (26,931 | ) | (2,129,954 | ) | |||||||||||||
Total net increase (decrease) | 795,751 | 10,257,528 | (44,291 | ) | (2,465,863 | ) | |||||||||||||
The accompanying Notes to Financial Statements are an integral part of this statement.
Annual Report 2016
18
COLUMBIA VARIABLE PORTFOLIO — SMALL CAP VALUE FUND
FINANCIAL HIGHLIGHTS
The following tables are intended to help you understand the Fund's financial performance. Certain information reflects financial results for a single share of a class held for the periods shown. Per share net investment income (loss) amounts are calculated based on average shares outstanding during the period. Total return assumes reinvestment of all dividends and distributions, if any. Total return does not reflect any fees and expenses imposed under your Contract and/or Qualified Plan, as applicable; such fees and expenses would reduce the total returns for all periods shown. Total return and portfolio turnover are not annualized for periods of less than one year. The portfolio turnover rate is calculated without regard to purchase and sales transactions of short-term instruments and certain derivatives, if any. If such transactions were included, the Fund's portfolio turnover rate may be higher.
Year Ended December 31, | |||||||||||||||||||||||
Class 1 | 2016 | 2015 | 2014 | 2013 | 2012 | ||||||||||||||||||
Per share data | |||||||||||||||||||||||
Net asset value, beginning of period | $ | 16.02 | $ | 18.42 | $ | 20.46 | $ | 15.41 | $ | 14.59 | |||||||||||||
Income from investment operations: | |||||||||||||||||||||||
Net investment income | 0.10 | 0.10 | 0.16 | 0.11 | 0.16 | ||||||||||||||||||
Net realized and unrealized gain (loss) | 4.82 | (1.15 | ) | 0.46 | 5.14 | 1.44 | |||||||||||||||||
Total from investment operations | 4.92 | (1.05 | ) | 0.62 | 5.25 | 1.60 | |||||||||||||||||
Less distributions to shareholders: | |||||||||||||||||||||||
Net investment income | (0.11 | ) | (0.15 | ) | (0.12 | ) | (0.20 | ) | (0.07 | ) | |||||||||||||
Net realized gains | (1.72 | ) | (1.20 | ) | (2.54 | ) | — | (0.71 | ) | ||||||||||||||
Total distributions to shareholders | (1.83 | ) | (1.35 | ) | (2.66 | ) | (0.20 | ) | (0.78 | ) | |||||||||||||
Net asset value, end of period | $ | 19.11 | $ | 16.02 | $ | 18.42 | $ | 20.46 | $ | 15.41 | |||||||||||||
Total return | 33.04 | % | (6.12 | %) | 3.28 | % | 34.22 | % | 11.40 | % | |||||||||||||
Ratios to average net assets(a) | |||||||||||||||||||||||
Total gross expenses | 0.98 | % | 0.98 | % | 0.98 | % | 0.98 | %(b) | 1.00 | % | |||||||||||||
Total net expenses(c) | 0.93 | % | 0.93 | % | 0.88 | % | 0.88 | %(b) | 0.88 | % | |||||||||||||
Net investment income | 0.60 | % | 0.56 | % | 0.81 | % | 0.63 | % | 1.06 | % | |||||||||||||
Supplemental data | |||||||||||||||||||||||
Net assets, end of period (in thousands) | $ | 6,081 | $ | 6,045 | $ | 7,270 | $ | 8,084 | $ | 20,532 | |||||||||||||
Portfolio turnover | 62 | % | 64 | % | 51 | % | 58 | % | 49 | % | |||||||||||||
Notes to Financial Highlights
(a) In addition to the fees and expenses that the Fund bears directly, the Fund indirectly bears a pro rata share of the fees and expenses of any other funds in which it invests. Such indirect expenses are not included in the Fund's reported expense ratios.
(b) Ratios include line of credit interest expense which is less than 0.01%.
(c) Total net expenses include the impact of certain fee waivers/expense reimbursements made by the Investment Manager and certain of its affiliates, if applicable.
The accompanying Notes to Financial Statements are an integral part of this statement.
Annual Report 2016
19
COLUMBIA VARIABLE PORTFOLIO — SMALL CAP VALUE FUND
FINANCIAL HIGHLIGHTS (continued)
Year Ended December 31, | |||||||||||||||||||||||
Class 2 | 2016 | 2015 | 2014 | 2013 | 2012 | ||||||||||||||||||
Per share data | |||||||||||||||||||||||
Net asset value, beginning of period | $ | 15.94 | $ | 18.33 | $ | 20.39 | $ | 15.36 | $ | 14.54 | |||||||||||||
Income from investment operations: | |||||||||||||||||||||||
Net investment income | 0.06 | 0.06 | 0.12 | 0.09 | 0.14 | ||||||||||||||||||
Net realized and unrealized gain (loss) | 4.80 | (1.14 | ) | 0.46 | 5.12 | 1.43 | |||||||||||||||||
Total from investment operations | 4.86 | (1.08 | ) | 0.58 | 5.21 | 1.57 | |||||||||||||||||
Less distributions to shareholders: | |||||||||||||||||||||||
Net investment income | (0.07 | ) | (0.11 | ) | (0.10 | ) | (0.18 | ) | (0.04 | ) | |||||||||||||
Net realized gains | (1.72 | ) | (1.20 | ) | (2.54 | ) | — | (0.71 | ) | ||||||||||||||
Total distributions to shareholders | (1.79 | ) | (1.31 | ) | (2.64 | ) | (0.18 | ) | (0.75 | ) | |||||||||||||
Net asset value, end of period | $ | 19.01 | $ | 15.94 | $ | 18.33 | $ | 20.39 | $ | 15.36 | |||||||||||||
Total return | 32.74 | % | (6.32 | %) | 3.05 | % | 34.04 | % | 11.25 | % | |||||||||||||
Ratios to average net assets(a) | |||||||||||||||||||||||
Total gross expenses | 1.23 | % | 1.23 | % | 1.23 | % | 1.23 | %(b) | 1.25 | % | |||||||||||||
Total net expenses(c) | 1.18 | % | 1.18 | % | 1.10 | % | 1.03 | %(b) | 1.03 | % | |||||||||||||
Net investment income | 0.37 | % | 0.32 | % | 0.60 | % | 0.51 | % | 0.93 | % | |||||||||||||
Supplemental data | |||||||||||||||||||||||
Net assets, end of period (in thousands) | $ | 398,105 | $ | 320,184 | $ | 368,768 | $ | 379,959 | $ | 298,663 | |||||||||||||
Portfolio turnover | 62 | % | 64 | % | 51 | % | 58 | % | 49 | % | |||||||||||||
Notes to Financial Highlights
(a) In addition to the fees and expenses that the Fund bears directly, the Fund indirectly bears a pro rata share of the fees and expenses of any other funds in which it invests. Such indirect expenses are not included in the Fund's reported expense ratios.
(b) Ratios include line of credit interest expense which is less than 0.01%.
(c) Total net expenses include the impact of certain fee waivers/expense reimbursements made by the Investment Manager and certain of its affiliates, if applicable.
The accompanying Notes to Financial Statements are an integral part of this statement.
Annual Report 2016
20
COLUMBIA VARIABLE PORTFOLIO — SMALL CAP VALUE FUND
NOTES TO FINANCIAL STATEMENTS
December 31, 2016
Note 1. Organization
Columbia Variable Portfolio — Small Cap Value Fund (the Fund), a series of Columbia Funds Variable Insurance Trust (the Trust), is a diversified fund. The Trust is registered under the Investment Company Act of 1940, as amended (the 1940 Act), as an open-end management investment company organized as a Massachusetts business trust.
Fund Shares
The Trust may issue an unlimited number of shares (without par value). The Fund offers Class 1 and Class 2 shares to separate accounts funding variable annuity contracts and variable life insurance policies (collectively, Contracts) issued by affiliated and unaffiliated life insurance companies as well as qualified pension and retirement plans (Qualified Plans) and other qualified institutional investors (Qualified Investors) authorized by Columbia Management Investment Distributors, Inc. (the Distributor). You may not buy (nor will you own) shares of the Fund directly. You may invest by participating in a Qualified Plan or by buying a Contract and making allocations to the Fund. Although all share classes generally have identical voting, dividend and liquidation rights, each share class votes separately when required by the Trust's organizational documents or by law. Different share classes pay different distribution amounts to the extent the expenses of such share classes differ, and distributions in liquidation will be proportional to the net asset value of each share class. Each share class has its own cost structure and other features.
Note 2. Summary of Significant Accounting Policies
Basis of Preparation
The Fund is an investment company that applies the accounting and reporting guidance in the Financial Accounting Standards Board (FASB) Accounting Standards Codification Topic 946, Financial Services — Investment Companies (ASC 946). The financial statements are prepared in accordance with U.S. generally accepted accounting principles (GAAP), which requires management to make certain estimates and assumptions that affect the reported amounts of assets and liabilities, the disclosure of contingent assets and liabilities at the date of the financial statements and the reported amounts of income and expenses during the reporting period. Actual results could differ from those estimates.
The following is a summary of significant accounting policies followed by the Fund in the preparation of its financial statements.
Security Valuation
All equity securities and exchange-traded funds are valued at the close of business of the New York Stock Exchange. Equity securities and exchange-traded funds are valued at the last quoted sales price on the principal exchange or market on which they trade, except for securities traded on the NASDAQ Stock Market, which are valued at the NASDAQ official close price. Unlisted securities or listed securities for which there were no sales during the day are valued at the mean of the latest quoted bid and ask prices on such exchanges or markets.
Foreign equity securities are valued based on the closing price on the foreign exchange in which such securities are primarily traded. If any foreign equity security closing prices are not readily available, the securities are valued at the mean of the latest quoted bid and ask prices on such exchanges or markets. Foreign currency exchange rates are generally determined at 4:00 p.m. Eastern (U.S.) time. Many securities markets and exchanges outside the U.S. close prior to the close of the New York Stock Exchange; therefore, the closing prices for securities in such markets or on such exchanges may not fully reflect events that occur after such close but before the close of the New York Stock Exchange. In those situations, foreign securities will be fair valued pursuant to a policy adopted by the Board of Trustees, including, if available, utilizing a third party pricing service to determine these fair values. The third party pricing service takes into account multiple factors, including, but not limited to, movements in the U.S. securities markets, certain depositary receipts, futures contracts and foreign exchange rates that have occurred subsequent to the close of the foreign exchange or market, to determine a good faith estimate that reasonably reflects the current market conditions as of the close of the New York Stock Exchange. The fair value of a security is likely to be different from the quoted or published price, if available.
Investments in open-end investment companies, including money market funds, are valued at their latest net asset value.
Investments for which market quotations are not readily available, or that have quotations which management believes are not reflective of market value or reliable, are valued at fair value as determined in good faith under procedures approved by and under the general
Annual Report 2016
21
COLUMBIA VARIABLE PORTFOLIO — SMALL CAP VALUE FUND
NOTES TO FINANCIAL STATEMENTS (continued)
December 31, 2016
supervision of the Board of Trustees. If a security or class of securities (such as foreign securities) is valued at fair value, such value is likely to be different from the quoted or published price for the security.
The determination of fair value often requires significant judgment. To determine fair value, management may use assumptions including but not limited to future cash flows and estimated risk premiums. Multiple inputs from various sources may be used to determine fair value.
GAAP requires disclosure regarding the inputs and valuation techniques used to measure fair value and any changes in valuation inputs or techniques. In addition, investments shall be disclosed by major category. This information is disclosed following the Fund's Portfolio of Investments.
Foreign Currency Transactions and Translations
The values of all assets and liabilities denominated in foreign currencies are generally translated into U.S. dollars at exchange rates determined at the close of regular trading on the New York Stock Exchange. Net realized and unrealized gains (losses) on foreign currency transactions and translations include gains (losses) arising from the fluctuation in exchange rates between trade and settlement dates on securities transactions, gains (losses) arising from the disposition of foreign currency and currency gains (losses) between the accrual and payment dates on dividends, interest income and foreign withholding taxes.
For financial statement purposes, the Fund does not distinguish that portion of gains (losses) on investments which is due to changes in foreign exchange rates from that which is due to changes in market prices of the investments. Such fluctuations are included with the net realized and unrealized gains (losses) on investments in the Statement of Operations.
Security Transactions
Security transactions are accounted for on the trade date. Cost is determined and gains (losses) are based upon the specific identification method for both financial statement and federal income tax purposes.
Income Recognition
Corporate actions and dividend income are generally recorded net of any non-reclaimable tax withholdings, on the ex-dividend date or upon receipt of ex-dividend notification in the case of certain foreign securities.
The Fund may receive distributions from holdings in equity securities, business development companies
(BDCs), exchange-traded funds, other regulated investment companies (RICs), and real estate investment trusts (REITs), which report information on the tax character of their distributions annually. These distributions are allocated to dividend income, capital gain and return of capital based on actual information reported. Return of capital is recorded as a reduction of the cost basis of securities held. If the Fund no longer owns the applicable securities, return of capital is recorded as a realized gain. With respect to REITs, to the extent actual information has not yet been reported, estimates for return of capital are made by the Fund's management. Management's estimates are subsequently adjusted when the actual character of the distributions is disclosed by the REITs, which could result in a proportionate change in return of capital to shareholders.
Awards from class action litigation are recorded as a reduction of cost basis if the Fund still owns the applicable securities on the payment date. If the Fund no longer owns the applicable securities, the proceeds are recorded as realized gains.
Expenses
General expenses of the Trust are allocated to the Fund and other funds of the Trust based upon relative net assets or other expense allocation methodologies determined by the nature of the expense. Expenses directly attributable to the Fund are charged to the Fund. Expenses directly attributable to a specific class of shares are charged to that share class.
Determination of Class Net Asset Value
All income, expenses (other than class-specific expenses, which are charged to that share class, as shown in the Statement of Operations) and realized and unrealized gains (losses) are allocated to each class of the Fund on a daily basis, based on the relative net assets of each class, for purposes of determining the net asset value of each class.
Federal Income Tax Status
The Fund intends to qualify each year as a regulated investment company under Subchapter M of the Internal Revenue Code, as amended, and will distribute substantially all of its taxable income, if any, for its tax year, and as such will not be subject to federal income taxes. In addition, because the Fund meets the exception under Internal Revenue Code Section 4982(f), the Fund expects not to be subject to federal excise tax. Therefore, no federal income or excise tax provision is recorded.
Annual Report 2016
22
COLUMBIA VARIABLE PORTFOLIO — SMALL CAP VALUE FUND
NOTES TO FINANCIAL STATEMENTS (continued)
December 31, 2016
Foreign Taxes
The Fund may be subject to foreign taxes on income, gains on investments or currency repatriation, a portion of which may be recoverable. The Fund will accrue such taxes and recoveries, as applicable, based upon its current interpretation of tax rules and regulations that exist in the markets in which it invests.
Realized gains in certain countries may be subject to foreign taxes at the Fund level, based on statutory rates. The Fund accrues for such foreign taxes on realized and unrealized gains at the appropriate rate for each jurisdiction, as applicable. The amount, if any, is disclosed as a liability on the Statement of Assets and Liabilities.
Distributions to Subaccounts
Distributions to the subaccounts of Contracts, Qualified Plans and Qualified Investors are recorded at the close of business on the record date and are payable on the first business day following the record date. Dividends from net investment income, if any, are declared and distributed annually. Capital gains distributions, when available, will be made annually. However, an additional capital gain distribution may be made during the fiscal year in order to comply with the Internal Revenue Code, as applicable to registered investment companies. Income distributions and capital gain distributions are determined in accordance with federal income tax regulations, which may differ from GAAP. All dividends and distributions are reinvested in additional shares of the applicable share class of the Fund at the net asset value as of the ex-dividend date of the distribution.
Guarantees and Indemnifications
Under the Trust's organizational documents and, in some cases, by contract, its officers and trustees are indemnified against certain liabilities arising out of the performance of their duties to the Trust or its funds. In addition, certain of the Fund's contracts with its service providers contain general indemnification clauses. The Fund's maximum exposure under these arrangements is unknown since the amount of any future claims that may be made against the Fund cannot be determined, and the Fund has no historical basis for predicting the likelihood of any such claims.
Investment Company Reporting Modernization
In October 2016, the U.S. Securities and Exchange Commission adopted new rules and forms, and amendments to certain current rules and forms, to
modernize reporting and disclosure of information by registered investment companies. The amendments to Regulation S-X will require standardized, enhanced disclosure about derivatives in investment company financial statements, and will also change the rules governing the form and content of such financial statements. The amendments to Regulation S-X take effect on August 1, 2017. At this time, management is assessing the anticipated impact of these regulatory developments.
Note 3. Fees and Other Transactions with Affiliates
Management Services Fees
Effective May 1, 2016, the Fund entered into a Management Agreement with Columbia Management Investment Advisers, LLC (the Investment Manager), a wholly-owned subsidiary of Ameriprise Financial, Inc. (Ameriprise Financial). Under the Management Agreement, the Investment Manager provides the Fund with investment research and advice, as well as administrative and accounting services. The management services fee is an annual fee that is equal to a percentage of the Fund's average daily net assets that declines from 0.87% to 0.75% as the Fund's net assets increase. Prior to May 1, 2016, the Fund paid the Investment Manager an annual fee for advisory services under an Investment Management Services Agreement and a separate annual fee for administrative and accounting services under an Administrative Services Agreement. The effective management services fee rate for the year ended December 31, 2016 (reflecting all advisory and administrative services fees paid to the Investment Manager) was 0.87% of the Fund's average daily net assets. For the period from January 1, 2016 through April 30, 2016, the investment advisory services fee paid to the Investment Manager was $827,761, and the administrative services fee paid to the Investment Manager was $83,824.
Compensation of Board Members
Board of Trustee members, who are not officers or employees of the Investment Manager or Ameriprise Financial, are compensated for their services to the Fund as disclosed in the Statement of Operations. These Board of Trustee members may participate in a Deferred Compensation Plan (the Plan) which may be terminated at any time. Obligations of the Plan will be paid solely out of the Fund's assets, and all amounts payable under the Plan constitute a general unsecured obligation of the Fund.
Annual Report 2016
23
COLUMBIA VARIABLE PORTFOLIO — SMALL CAP VALUE FUND
NOTES TO FINANCIAL STATEMENTS (continued)
December 31, 2016
Compensation of Chief Compliance Officer
The Board of Trustees has appointed a Chief Compliance Officer to the Fund in accordance with federal securities regulations. The Fund is allocated a portion of the expenses associated with the Chief Compliance Officer based on relative net assets of the Trust.
Transfer Agency Fees
The Fund has a Transfer and Dividend Disbursing Agent Agreement with Columbia Management Investment Services Corp. (the Transfer Agent), an affiliate of the Investment Manager and a wholly-owned subsidiary of Ameriprise Financial. The annual fee rate under this agreement is 0.06% of the Fund's average daily net assets attributable to each share class.
Distribution Fees
The Fund has an agreement with the Distributor, an affiliate of the Investment Manager and a wholly-owned subsidiary of Ameriprise Financial, for distribution services. The Board of Trustees has approved, and the Fund has adopted, a distribution plan (the Plan) which sets the distribution fees for the Fund. These fees are calculated daily and are intended to compensate the Distributor for selling shares of the Fund. The Fund pays a monthly distribution fee to the Distributor at the maximum annual rate of 0.25% of the average daily net assets attributable to Class 2 shares of the Fund. The Fund pays no distribution and service fees for Class 1 shares.
Expenses Waived/Reimbursed by the Investment Manager and its Affiliates
The Investment Manager and certain of its affiliates have contractually agreed to waive fees and/or reimburse expenses (excluding certain fees and expenses described below) for the period disclosed below, unless sooner terminated at the sole discretion of the Board of Trustees, so that the Fund's net operating expenses, after giving effect to fees waived/expenses reimbursed and any balance credits and/or overdraft charges from the Fund's custodian, do not exceed the following annual rates as a percentage of the class' average daily net assets:
| Fee Rates Contractual through April 30, 2017 | |||||||
Class 1 | 0.93 | % | |||||
Class 2 | 1.18 | ||||||
Under the agreement governing these fee waivers and/or expense reimbursement arrangements, the following
fees and expenses are excluded from the waiver/reimbursement commitment, and therefore will be paid by the Fund, if applicable: taxes (including foreign transaction taxes), expenses associated with investments in affiliated and non-affiliated pooled investment vehicles (including mutual funds and exchange-traded funds), transaction costs and brokerage commissions, costs related to any securities lending program, dividend and interest expenses associated with securities sold short, inverse floater program fees and expenses, transaction charges and interest on borrowed money, interest, infrequent and/or unusual expenses and any other expenses the exclusion of which is specifically approved by the Board of Trustees. This agreement may be modified or amended only with approval from the Investment Manager, certain of its affiliates and the Fund. Any fees waived and/or expenses reimbursed under the expense reimbursement arrangements described above are not recoverable by the Investment Manager or its affiliates in future periods.
Note 4. Federal Tax Information
The timing and character of income and capital gain distributions are determined in accordance with income tax regulations, which may differ from GAAP because of temporary or permanent book to tax differences.
At December 31, 2016, these differences are primarily due to differing treatment for deferral/reversal of wash sale losses, Trustees' deferred compensation and foreign currency transactions. To the extent these differences are permanent, reclassifications are made among the components of the Fund's net assets in the Statement of Assets and Liabilities. Temporary differences do not require reclassifications.
In the Statement of Assets and Liabilities the following reclassifications were made:
Undistributed net investment income | $ | (23 | ) | ||||
Accumulated net realized gain | 23 | ||||||
Net investment income (loss) and net realized gains (losses), as disclosed in the Statement of Operations, and net assets were not affected by this reclassification.
The tax character of distributions paid during the years indicated was as follows:
Year Ended December 31, | 2016 | 2015 | |||||||||
Ordinary income | $ | 1,351,695 | $ | 2,978,434 | |||||||
Long-term capital gains | 34,009,516 | 22,576,249 | |||||||||
Total | $ | 35,361,211 | $ | 25,554,683 | |||||||
Annual Report 2016
24
COLUMBIA VARIABLE PORTFOLIO — SMALL CAP VALUE FUND
NOTES TO FINANCIAL STATEMENTS (continued)
December 31, 2016
Short-term capital gain distributions, if any, are considered ordinary income distributions for tax purposes.
At December 31, 2016, the components of distributable earnings on a tax basis were as follows:
Undistributed ordinary income | $ | 11,764,016 | |||||
Undistributed long-term capital gains | 14,516,703 | ||||||
Net unrealized appreciation | 66,853,882 | ||||||
At December 31, 2016, the cost of investments for federal income tax purposes was $337,304,620 and the aggregate gross unrealized appreciation and depreciation based on that cost was:
Unrealized appreciation | $ | 89,868,346 | |||||
Unrealized depreciation | (23,014,464 | ) | |||||
Net unrealized appreciation | $ | 66,853,882 | |||||
Management of the Fund has concluded that there are no significant uncertain tax positions in the Fund that would require recognition in the financial statements. However, management's conclusion may be subject to review and adjustment at a later date based on factors including, but not limited to, new tax laws, regulations, and administrative interpretations (including relevant court decisions). Generally, the Fund's federal tax returns for the prior three fiscal years remain subject to examination by the Internal Revenue Service.
Note 5. Portfolio Information
The cost of purchases and proceeds from sales of securities, excluding short-term investments and derivatives, if any, aggregated to $213,205,752 and $234,298,699, respectively, for the year ended December 31, 2016. The amount of purchase and sale activity impacts the portfolio turnover rate reported in the Financial Highlights.
Note 6. Affiliated Money Market Fund
The Fund invests in Columbia Short-Term Cash Fund, an affiliated money market fund established for the exclusive use by the Fund and other affiliated funds (the Affiliated MMF). The income earned by the Fund from such investments is included as Dividends — affiliated issuers in the Statement of Operations. As an investing fund, the Fund indirectly bears its proportionate share of the expenses of the Affiliated MMF. Effective October 1, 2016, the Affiliated MMF prices its shares with a floating net asset value (NAV) and no longer seeks to maintain a stable NAV. In addition, the Board of Trustees of the
Affiliated MMF may impose a fee on redemptions (sometimes referred to as a liquidity fee) or temporarily suspend redemptions (sometimes referred to as imposing a redemption gate) in the event its liquidity falls below regulatory limits.
Note 7. Line of Credit
The Fund has access to a revolving credit facility with a syndicate of banks led by Citibank, N.A., HSBC Bank USA, N.A. and JPMorgan Chase Bank, N.A. whereby the Fund may borrow for the temporary funding of shareholder redemptions or for other temporary or emergency purposes. The credit facility agreement, which is a collective agreement between the Fund and certain other funds managed by the Investment Manager, severally and not jointly, that permits collective borrowings up to $1 billion. Interest is charged to each participating fund based on its borrowings at a rate equal to the higher of (i) the overnight federal funds rate plus 1.00% or (ii) the one-month LIBOR rate plus 1.00%. Each borrowing under the credit facility matures no later than 60 days after the date of borrowing. The Fund also pays a commitment fee equal to its pro rata share of the amount of the credit facility at a rate of 0.15% per annum. The commitment fee is included in other expenses in the Statement of Operations.
The Fund had no borrowings during the year ended December 31, 2016.
Note 8. Significant Risks
Financial Sector Risk
The Fund may be more susceptible to the particular risks that may affect companies in the financial services sector than if it were invested in a wider variety of companies in unrelated sectors. Companies in the financial services sector are subject to certain risks, including the risk of regulatory change, decreased liquidity in credit markets and unstable interest rates. Such companies may have concentrated portfolios, such as a high level of loans to real estate developers, which makes them vulnerable to economic conditions that affect that industry. Performance of such companies may be affected by competitive pressures and exposure to investments or agreements that, under certain circumstances, may lead to losses (e.g., subprime loans). Companies in the financial services sector are subject to extensive governmental regulation that may limit the amount and types of loans and other financial commitments they can make, and interest rates and fees that they may charge.
Annual Report 2016
25
COLUMBIA VARIABLE PORTFOLIO — SMALL CAP VALUE FUND
NOTES TO FINANCIAL STATEMENTS (continued)
December 31, 2016
In addition, profitability of such companies is largely dependent upon the availability and the cost of capital.
Shareholder Concentration Risk
At December 31, 2016, three unaffiliated shareholders of record owned 94.3% of the outstanding shares of the Fund in one or more accounts. The Fund has no knowledge about whether any portion of those shares was owned beneficially. Subscription and redemption activity by concentrated accounts may have a significant effect on the operations of the Fund. In the case of a large redemption, the Fund may be forced to sell investments at inopportune times, including its liquid or more liquid positions, resulting in Fund losses and the Fund holding a higher percentage of less liquid or illiquid securities. Large redemptions could result in decreased economies of scale and increased operating expenses for non-redeeming Fund shareholders.
Note 9. Subsequent Events
Management has evaluated the events and transactions that have occurred through the date the financial statements were issued and noted no items requiring adjustment of the financial statements or additional disclosure.
Note 10. Information Regarding Pending and Settled Legal Proceedings
Ameriprise Financial and certain of its affiliates have historically been involved in a number of legal, arbitration and regulatory proceedings, including routine litigation, class actions, and governmental actions, concerning matters arising in connection with the conduct of their business activities. Ameriprise Financial believes that the Funds are not currently the subject of, and that neither Ameriprise Financial nor any of its affiliates are the subject of, any pending legal, arbitration or regulatory proceedings that are likely to have a material adverse effect on the Funds or the ability of Ameriprise Financial or its affiliates to perform under their contracts with the Funds. Ameriprise Financial is required to make quarterly (10-Q), annual (10-K) and, as necessary, 8-K filings with the Securities and Exchange Commission (SEC) on legal and regulatory matters that relate to Ameriprise Financial and its affiliates. Copies of these filings may be obtained by accessing the SEC website at www.sec.gov.
There can be no assurance that these matters, or the adverse publicity associated with them, will not result in increased fund redemptions, reduced sale of fund shares or other adverse consequences to the Funds. Further,
although we believe proceedings are not likely to have a material adverse effect on the Funds or the ability of Ameriprise Financial or its affiliates to perform under their contracts with the Funds, these proceedings are subject to uncertainties and, as such, we are unable to estimate the possible loss or range of loss that may result. An adverse outcome in one or more of these proceedings could result in adverse judgments, settlements, fines, penalties or other relief that could have a material adverse effect on the consolidated financial condition or results of operations of Ameriprise Financial.
Annual Report 2016
26
COLUMBIA VARIABLE PORTFOLIO — SMALL CAP VALUE FUND
REPORT OF INDEPENDENT REGISTERED PUBLIC ACCOUNTING FIRM
To the Trustees of Columbia Funds Variable Insurance Trust and the Shareholders of
Columbia Variable Portfolio — Small Cap Value Fund
In our opinion, the accompanying statement of assets and liabilities, including the portfolio of investments, and the related statements of operations and of changes in net assets and the financial highlights present fairly, in all material respects, the financial position of Columbia Variable Portfolio — Small Cap Value Fund (the "Fund," a series of Columbia Funds Variable Insurance Trust) as of December 31, 2016, the results of its operations for the year then ended, the changes in its net assets for each of the two years in the period then ended and the financial highlights for each of the five years in the period then ended, in conformity with accounting principles generally accepted in the United States of America. These financial statements and financial highlights (hereafter referred to as "financial statements") are the responsibility of the Fund's management. Our responsibility is to express an opinion on these financial statements based on our audits. We conducted our audits of these financial statements in accordance with the standards of the Public Company Accounting Oversight Board (United States). Those standards require that we plan and perform the audit to obtain reasonable assurance about whether the financial statements are free of material misstatement. An audit includes examining, on a test basis, evidence supporting the amounts and disclosures in the financial statements, assessing the accounting principles used and significant estimates made by management, and evaluating the overall financial statement presentation. We believe that our audits, which included confirmation of securities as of December 31, 2016 by correspondence with the custodian, brokers and transfer agent, and the application of alternative auditing procedures where such confirmations had not been received, provide a reasonable basis for our opinion.
PricewaterhouseCoopers LLP
Minneapolis, MN
February 17, 2017
Annual Report 2016
27
COLUMBIA VARIABLE PORTFOLIO — SMALL CAP VALUE FUND
FEDERAL INCOME TAX INFORMATION
(Unaudited)
The Fund hereby designates the following tax attributes for the fiscal year ended December 31, 2016.
Tax Designations
| Dividends Received Deduction | 99.53 | % | |||||
Capital Gain Dividend | $ | 15,326,926 | |||||
Dividends Received Deduction. The percentage of ordinary income distributed during the fiscal year that qualifies for the corporate dividends received deduction.
Capital Gain Dividend. The Fund designates as a capital gain dividend the amount reflected above, or if subsequently determined to be different, the net capital gain of such fiscal period.
Annual Report 2016
28
COLUMBIA VARIABLE PORTFOLIO — SMALL CAP VALUE FUND
TRUSTEES AND OFFICERS
Shareholders elect the Board that oversees the Fund's operations. The Board appoints officers who are responsible for day-to-day business decisions based on policies set by the Board. The following table provides basic biographical information about the Fund's Trustees, including their principal occupations during the past five years, although specific titles for individuals may have varied over the period. The year set forth beneath Length of Service in the table below is the year in which the Trustee was first appointed or elected as Trustee to any Fund currently in the Columbia Funds Complex or a predecessor thereof. Under current Board policy, members serve terms of indefinite duration.
Independent Trustees
| Name, Address, Year of Birth | Position Held With the Trust and Length of Service | Principal Occupation(s) During the Past Five Years and Other Relevant Professional Experience | Number of Funds in the Columbia Funds Complex Overseen | Other Directorships Held by Trustee During the Past Five Years | |||||||||||||||
| Janet Langford Carrig c/o Columbia Management Investment Advisers, LLC, 225 Franklin Street Mail Drop BX32 05228, Boston, MA 02110 1957 | Trustee 1996 | Senior Vice President, General Counsel and Corporate Secretary, ConocoPhillips (independent energy company) since September 2007 | 59 | None | |||||||||||||||
| Douglas A. Hacker c/o Columbia Management Investment Advisers, LLC, 225 Franklin Street Mail Drop BX32 05228, Boston, MA 02110 1955 | Trustee and Chairman of the Board 1996 | Independent business executive since May 2006; Executive Vice President — Strategy of United Airlines from December 2002 to May 2006; President of UAL Loyalty Services (airline marketing company) from September 2001 to December 2002; Executive Vice President and Chief Financial Officer of United Airlines from July 1999 to September 2001 | 59 | Spartan Nash Company (food distributor); Nash Finch Company (food distributor) from 2005 to 2013; Aircastle Limited (aircraft leasing); SeaCube Container Leasing Ltd. (container leasing) from 2010 to 2013; and Travelport Worldwide Limited (travel information technology) | |||||||||||||||
| Nancy T. Lukitsh c/o Columbia Management Investment Advisers, LLC, 225 Franklin Street Mail Drop BX32 05228, Boston, MA 02110 1956 | Trustee 2011 | Senior Vice President, Partner and Director of Marketing, Wellington Management Company, LLP (investment adviser) from 1997 to 2010; Chair, Wellington Management Portfolios (commingled non-U.S. investment pools) from 2007 to 2010; Director, Wellington Trust Company, NA and other Wellington affiliates from 1997 to 2010 | 59 | None | |||||||||||||||
Annual Report 2016
29
COLUMBIA VARIABLE PORTFOLIO — SMALL CAP VALUE FUND
TRUSTEES AND OFFICERS (continued)
Independent Trustees (continued)
| Name, Address, Year of Birth | Position Held With the Trust and Length of Service | Principal Occupation(s) During the Past Five Years and Other Relevant Professional Experience | Number of Funds in the Columbia Funds Complex Overseen | Other Directorships Held by Trustee During the Past Five Years | |||||||||||||||
| David M. Moffett c/o Columbia Management Investment Advisers, LLC, 225 Franklin Street Mail Drop BX32 05228, Boston, MA 02110 1952 | Trustee 2011 | Retired. Consultant to Bridgewater and Associates | 59 | Director, CSX Corporation; Genworth Financial, Inc. (financial and insurance products and services); Paypal Holdings Inc. (payment and data processing services); Trustee University of Oklahoma Foundation; former Director eBay Inc. (online trading community), 2007-2015; and former Director, CIT Bank, CIT Group Inc. (commercial and consumer finance), 2010-2016 | |||||||||||||||
| Charles R. Nelson c/o Columbia Management Investment Advisers, LLC, 225 Franklin Street Mail Drop BX32 05228, Boston, MA 02110 1942 | Trustee 1981 | Retired. Professor Emeritus, University of Washington since 2011; Professor of Economics, University of Washington from 1976 to 2011; Ford and Louisa Van Voorhis Professor of Political Economy, University of Washington from 1993 to 2011; Adjunct Professor of Statistics, University of Washington from 1980 to 2011; Associate Editor, Journal of Money, Credit and Banking from September 1993 to 2008; consultant on econometric and statistical matters | 59 | None | |||||||||||||||
| John J. Neuhauser c/o Columbia Management Investment Advisers, LLC, 225 Franklin Street Mail Drop BX32 05228, Boston, MA 02110 1943 | Trustee 1984 | President, Saint Michael's College since August 2007; Director or Trustee of several non-profit organizations, including University of Vermont Medical Center; Academic Vice President and Dean of Faculties, Boston College from August 1999 to October 2005; University Professor, Boston College from November 2005 to August 2007 | 59 | Liberty All-Star Equity Fund and Liberty All-Star Growth Fund (closed-end funds) | |||||||||||||||
| Patrick J. Simpson c/o Columbia Management Investment Advisers, LLC, 225 Franklin Street Mail Drop BX32 05228, Boston, MA 02110 1944 | Trustee 2000 | Of Counsel, Perkins Coie LLP (law firm) since 2015; Partner, Perkins Coie LLP from 1988 to 2014 | 59 | None | |||||||||||||||
Annual Report 2016
30
COLUMBIA VARIABLE PORTFOLIO — SMALL CAP VALUE FUND
TRUSTEES AND OFFICERS (continued)
Independent Trustees (continued)
| Name, Address, Year of Birth | Position Held With the Trust and Length of Service | Principal Occupation(s) During the Past Five Years and Other Relevant Professional Experience | Number of Funds in the Columbia Funds Complex Overseen | Other Directorships Held by Trustee During the Past Five Years | |||||||||||||||
| Anne-Lee Verville c/o Columbia Management Investment Advisers, LLC, 225 Franklin Street Mail Drop BX32 05228, Boston, MA 02110 1945 | Trustee 1998 | Retired. General Manager, Global Education Industry from 1994 to 1997, President — Application Systems Division from 1991 to 1994, Chief Financial Officer — US Marketing & Services from 1988 to 1991, and Chief Information Officer from 1987 to 1988, IBM Corporation (computer and technology) | 59 | Enesco Group, Inc. (producer of giftware and home and garden decor products) from 2001 to 2006 | |||||||||||||||
Consultants to the Independent Trustees*
| Name, Address, Year of Birth | Position Held With the Trust and Length of Service | Principal Occupation(s) During the Past Five Years and Other Relevant Professional Experience | Number of Funds in the Columbia Funds Complex Overseen | Other Directorships Held by Trustee During the Past Five Years | |||||||||||||||
| J. Kevin Connaughton c/o Columbia Management Investment Advisers, LLC, 225 Franklin Street Mail Drop BX32 05228, Boston, MA 02110 1964 | Independent Trustee Consultant 2016 | Independent Trustee Consultant, Columbia Funds since March 2016; Managing Director and General Manager of Mutual Fund Products, Columbia Management Investment Advisers, LLC from May 2010 to February 2015; President, Columbia Funds from 2009 to 2015; and senior officer of Columbia Funds and affiliated funds from 2003 to 2015 | 59 | Board of Governors, Gateway Healthcare since January 2016; Trustee, New Century Portfolios since March 2015; and Director, The Autism Project since March 2015 | |||||||||||||||
| Natalie A. Trunow c/o Columbia Management Investment Advisers, LLC, 225 Franklin Street Mail Drop BX32 05228, Boston, MA 02110 1967 | Independent Trustee Consultant 2016 | Independent Trustee Consultant, Columbia Funds since September 2016; Senior Vice President and Chief Executive Officer, Millennial Partners (investment consulting services to institutions) since January 2016; Director of Investments, Casey Family Programs from April 2016 to September 2016; Chief Investment Officer, Calvert Investments from August 2008 to January 2016; Section Head and Portfolio Manager, General Motors Asset Management from June 1997 to August 2008 | 59 | Healthcare Services for Children with Special Needs | |||||||||||||||
* J. Kevin Connaughton was appointed consultant to the Independent Trustees effective March 1, 2016. Natalie A. Trunow was appointed consultant to the Independent Trustees effective September 1, 2016. Shareholders of the Funds are expected to be asked to elect each of Mr. Connaughton and Ms. Trunow as a Trustee at a future shareholder meeting.
Annual Report 2016
31
COLUMBIA VARIABLE PORTFOLIO — SMALL CAP VALUE FUND
TRUSTEES AND OFFICERS (continued)
Interested Trustee Affiliated with Investment Manager*
| Name, Address, Year of Birth | Position Held With the Trust and Length of Service | Principal Occupation(s) During the Past Five Years and Other Relevant Professional Experience | Number of Funds in the Columbia Funds Complex Overseen | Other Directorships Held by Trustee During the Past Five Years | |||||||||||||||
| William F. Truscott c/o Columbia Management Investment Advisers, LLC, 225 Franklin Street Boston, MA 02110 1960 | Trustee 2012 | Chairman of the Board and President, Columbia Management Investment Advisers, LLC since May 2010 and February 2012, respectively; Chief Executive Officer, Global Asset Management, Ameriprise Financial, Inc. since September 2012 (previously Chief Executive Officer, U.S. Asset Management & President, Annuities, May 2010- September 2012); Director and Chief Executive Officer, Columbia Management Investment Distributors, Inc. since May 2010 and February 2012, respectively; Chairman of the Board and Chief Executive Officer, RiverSource Distributors, Inc. since 2006; Director, Threadneedle Asset Management Holdings, SARL since 2014; President and Chief Executive Officer, Ameriprise Certificate Company, 2006-August 2012. | 185 | Trustee to other Columbia Funds since 2001; Chairman of the Board, Columbia Management Investment Advisers, LLC since May 2010; Director, Columbia Management Investment Distributors, Inc. since May 2010; Former Director, Ameriprise Certificate Company, 2006-January 2013 | |||||||||||||||
* Interested person (as defined under the 1940 Act) by reason of being an officer, director, security holder and/or employee of the Investment Manager or Ameriprise Financial.
The Statement of Additional Information has additional information about the Fund's Board members and is available, without charge, upon request by calling 800.345.6611 or contacting your financial intermediary.
Annual Report 2016
32
COLUMBIA VARIABLE PORTFOLIO — SMALL CAP VALUE FUND
TRUSTEES AND OFFICERS (continued)
The Board has appointed officers who are responsible for day-to-day business decisions based on policies it has established. The officers serve at the pleasure of the Board. The following table provides basic information about the Officers of the Fund, including principal occupations during the past five years, although their specific titles may have varied over the period. In addition to Mr. Truscott, who is Senior Vice President, the Fund's other officers are:
Fund Officers
| Name, Address and Year of Birth | Position and Year First Appointed to Position for any Fund in the Columbia Funds Complex or a Predecessor Thereof | Principal Occupation(s) During Past Five Years | |||||||||
| Christopher O. Petersen 5228 Ameriprise Financial Center Minneapolis, MN 55474 Born 1970 | President and Principal Executive Officer (2015) | Vice President and Lead Chief Counsel, Ameriprise Financial, Inc. since January 2015 (previously, Vice President and Chief Counsel January 2010-December 2014); officer of Columbia Funds and affiliated funds since 2007. | |||||||||
| Michael G. Clarke 225 Franklin Street Boston, MA 02110 Born 1969 | Treasurer (2011), Chief Financial Officer (2009) and Chief Accounting Officer (2015) | Vice President — Mutual Fund Administration, Columbia Management Investment Advisers, LLC, since May 2010; senior officer of Columbia Funds and affiliated funds since 2002. | |||||||||
| Paul B. Goucher 100 Park Avenue New York, NY 10017 Born 1968 | Senior Vice President (2011), Chief Legal Officer (2015) and Assistant Secretary (2008) | Senior Vice President and Assistant General Counsel, Ameriprise Financial, Inc. since January 2017 (previously Vice President and Lead Chief Counsel, November 2008-January 2017 and January 2013-January 2017, respectively, and Chief Counsel, January 2010-January 2013); Vice President, Chief Legal Officer and Assistant Secretary, Columbia Management Investment Advisers, LLC since May 2010. | |||||||||
| Thomas P. McGuire 225 Franklin Street Boston, MA 02110 Born 1972 | Senior Vice President and Chief Compliance Officer (2012) | Vice President — Asset Management Compliance, Ameriprise Financial, Inc., since May 2010; Chief Compliance Officer, Ameriprise Certificate Company since September 2010. | |||||||||
| Colin Moore 225 Franklin Street Boston, MA 02110 Born 1958 | Senior Vice President (2010) | Executive Vice President and Global Chief Investment Officer, Ameriprise Financial, Inc., since July 2013; Executive Vice President and Global Chief Investment Officer, Columbia Management Investment Advisers, LLC since July 2013 (previously Director and Global Chief Investment Officer, 2010-2013). | |||||||||
| Michael E. DeFao 225 Franklin Street Boston, MA 02110 Born 1968 | Vice President (2011) and Assistant Secretary (2010) | Vice President and Chief Counsel, Ameriprise Financial, Inc. since May 2010. | |||||||||
| Amy Johnson 5228 Ameriprise Financial Center Minneapolis, MN 55474 Born 1965 | Vice President (2006) | Managing Director and Global Head of Operations, Columbia Management Investment Advisers, LLC since April 2016 (previously Managing Director and Chief Operating Officer, 2010-2016). | |||||||||
| Lyn Kephart-Strong 5228 Ameriprise Financial Center Minneapolis, MN 55474 Born 1960 | Vice President (2015) | President, Columbia Management Investment Services Corp. since October 2014; Vice President & Resolution Officer, Ameriprise Trust Company since August 2009. | |||||||||
| Ryan C. Larrenaga 225 Franklin Street Boston, MA 02110 Born 1970 | Vice President and Secretary (2015) | Vice President and Group Counsel, Ameriprise Financial, Inc. since August 2011; officer of Columbia Funds and affiliated funds since 2005. | |||||||||
Annual Report 2016
33
This page intentionally left blank.
Annual Report 2016
34
This page intentionally left blank.
Annual Report 2016
35
This page intentionally left blank.
Annual Report 2016
36
COLUMBIA VARIABLE PORTFOLIO — SMALL CAP VALUE FUND
IMPORTANT INFORMATION ABOUT THIS REPORT
The policy of the Board is to vote the proxies of the companies in which each fund holds investments consistent with the procedures as stated in the Statement of Additional Information (SAI). You may obtain a copy of the SAI without charge by calling 800.345.6611; contacting your financial intermediary or searching the website of the Securities and Exchange Commission (SEC) at sec.gov. Information regarding how each fund voted proxies relating to portfolio securities is filed with the SEC by August 31st for the most recent 12-month period ending June 30th of that year, and is available without charge by visiting investor.columbiathreadneedleus.com, or searching the website of the SEC at sec.gov.
Each fund files a complete schedule of portfolio holdings with the SEC for the first and third quarters of each fiscal year on Form N-Q. Each fund's Form N-Q is available on the SEC's website at sec.gov and may be reviewed and copied at the SEC's Public Reference Room in Washington, D.C. Information on the operation of the Public Reference Room may be obtained by calling 800.SEC.0330. Each fund's complete schedule of portfolio holdings, as filed on Form N-Q, can also be obtained without charge, upon request, by calling 800.345.6611.
Annual Report 2016
37
Columbia Variable Portfolio — Small Cap Value Fund
P.O. Box 8081
Boston, MA 02266-8081

Please read and consider the investment objectives, risks, charges and expenses for any fund carefully before investing. For fund and other investment product prospectuses, which contain this and other important information, contact your financial advisor or insurance representative. Please read the prospectus carefully before you invest. The Fund is distributed by Columbia Management Investment Distributors, Inc., member FINRA, and managed by Columbia Management Investment Advisers, LLC.
Columbia Threadneedle Investments (Columbia Threadneedle) is the global brand name of the Columbia and Threadneedle group of companies.
All rights reserved. Columbia Management Investment Distributors, Inc., 225 Franklin Street, Boston, MA 02110-2804
© 2017 Columbia Management Investment Advisers, LLC.
C-1501 AN (2/17)

ANNUAL REPORT
December 31, 2016

VARIABLE PORTFOLIO — AQR MANAGED FUTURES STRATEGY FUND
Please remember that you may not buy (nor will you own) shares of the Fund directly. The Fund is available through variable annuity contracts and variable life insurance policies offered by the separate accounts of participating insurance companies as well as qualified pension and retirement plans. Please contact your financial advisor or insurance representative for more information.

VARIABLE PORTFOLIO — AQR MANAGED FUTURES STRATEGY FUND
TABLE OF CONTENTS
Performance Overview | 2 | ||||||
Manager Discussion of Fund Performance | 4 | ||||||
Understanding Your Fund's Expenses | 6 | ||||||
Consolidated Portfolio of Investments | 7 | ||||||
Consolidated Statement of Assets and Liabilities | 16 | ||||||
Consolidated Statement of Operations | 18 | ||||||
Consolidated Statement of Changes in Net Assets | 19 | ||||||
Consolidated Financial Highlights | 21 | ||||||
Notes to Consolidated Financial Statements | 23 | ||||||
Report of Independent Registered Public Accounting Firm | 34 | ||||||
Trustees and Officers | 35 | ||||||
Important Information About This Report | 41 | ||||||
The views expressed in this report reflect the current views of the respective parties. These views are not guarantees of future performance and involve certain risks, uncertainties and assumptions that are difficult to predict, so actual outcomes and results may differ significantly from the views expressed. These views are subject to change at any time based upon economic, market or other conditions and the respective parties disclaim any responsibility to update such views. These views may not be relied on as investment advice and, because investment decisions for a Columbia fund are based on numerous factors, may not be relied on as an indication of trading intent on behalf of any particular Columbia fund. References to specific securities should not be construed as a recommendation or investment advice.
Annual Report 2016
VARIABLE PORTFOLIO — AQR MANAGED FUTURES STRATEGY FUND
PERFORMANCE OVERVIEW
Performance Summary
n Variable Portfolio — AQR Managed Futures Strategy Fund (the Fund) Class 2 shares returned -9.09% over the 12-month period that ended December 31, 2016.
n The Fund underperformed its benchmark, the Citi Three-Month U.S. Treasury Bill Index, which returned 0.27% for the same time period.
n The Fund's strongest gains came from fixed income. Currencies, commodities and equities detracted from Fund results.
Average Annual Total Returns (%) (for period ended December 31, 2016)
Inception | 1 Year | Life | |||||||||||||
Class 1 | 04/30/12 | -8.90 | 2.91 | ||||||||||||
Class 2 | 04/30/12 | -9.09 | 2.66 | ||||||||||||
Citi Three-Month U.S. Treasury Bill Index | 0.27 | 0.09 | |||||||||||||
Performance data quoted represents past performance and current performance may be lower or higher. Past performance is no guarantee of future results. The investment return and principal value will fluctuate so that shares, when redeemed, may be worth more or less than the original cost. For current month-end performance information, please contact your financial advisor or insurance representative.
Performance results reflect the effect of any fee waivers or reimbursements of fund expenses by Columbia Management Investment Advisers, LLC and/or any of its affiliates. Absent these fee waivers or expense reimbursement arrangements, performance results would have been lower.
Investment earnings, if any, are tax-deferred until distributed to shareholders, at which time taxes may become due. Total return performance includes changes in share price and assumes reinvestment of dividends and capital gains, if any. Performance results reflect the effect of all fund expenses, but do not include any fees and expenses imposed under your variable annuity contract and/or variable life insurance policy or qualified pension or retirement plan. If performance results included the effect of these additional charges, they would be lower.
The Citi Three-Month U.S. Treasury Bill Index, an unmanaged index, is representative of the performance of three-month Treasury bills.
Indices are not available for investment, are not professionally managed and do not reflect sales charges, fees, brokerage commissions, taxes or other expenses of investing. Securities in the Fund may not match those in an index.
Annual Report 2016
2
VARIABLE PORTFOLIO — AQR MANAGED FUTURES STRATEGY FUND
PERFORMANCE OVERVIEW (continued)
Performance of a Hypothetical $10,000 Investment (April 30, 2012 – December 31, 2016)

The chart above shows the change in value of a hypothetical $10,000 investment in Class 2 shares of Variable Portfolio — AQR Managed Futures Strategy Fund during the stated time period, and does not reflect the deduction of taxes, if any, that a shareholder may pay on Fund distributions or on the redemption of Fund shares. The returns also do not reflect fees and expenses imposed under your variable annuity contract and/or variable life insurance policy or qualified pension or retirement plan, if any.
Annual Report 2016
3
VARIABLE PORTFOLIO — AQR MANAGED FUTURES STRATEGY FUND
MANAGER DISCUSSION OF FUND PERFORMANCE
Portfolio Management
AQR Capital Management, LLC
Clifford Asness, Ph.D.
John Liew, Ph.D.
Brian Hurst
Yao Hua Ooi
Ari Levine, M.S.
| Portfolio Holdings (%) (at December 31, 2016) | |||||||
Money Market Funds | 66.5 | ||||||
Treasury Bills | 28.2 | ||||||
Other Assets & Liabilities | 5.3 | ||||||
Total | 100.0 | ||||||
Percentages indicated are based upon net assets. At year end, the Fund held investments in money market funds (including an affiliated fund) and U.S. Government obligations, which have been segregated to cover obligations relating to the Fund's investments in open futures contracts which provide exposure to the commodities market. For a description of the Fund's investment in derivatives, see Investments in Derivatives following the Consolidated Portfolio of Investments and Note 2 to the Notes to Consolidated Financial Statements.
At December 31, 2016, approximately 88% of the Fund's shares were owned in the aggregate by affiliated funds-of-funds managed by Columbia Management Investment Advisers, LLC (the Investment Manager). As a result of asset allocation decisions by the Investment Manager, it is possible that the Fund may experience relatively large purchases or redemptions from affiliated funds-of-funds. The Investment Manager seeks to minimize the impact of these transactions by structuring them over a reasonable period of time. The Fund may experience increased expenses as it buys and sells securities as a result of purchases or redemptions by affiliated funds-of-funds.
For the 12-month period ended December 31, 2016, the Fund's Class 2 shares returned -9.09%. The Fund underperformed its benchmark, the Citi Three-Month U.S. Treasury Bill Index, which returned 0.27% for the same time period. During 2016, the Fund's strongest gains came from fixed income. Currencies, commodities and equities detracted from Fund results.
Fund Strategy
The Fund pursues an actively-managed futures strategy, investing in a diverse portfolio of futures and forward contracts across global equity, fixed-income, currency and commodity markets. The Fund uses both short- and long-term trend signals in an effort to profit from different types of trends that occur in these markets. Trend following can be described simply as going long in markets that have been rising in price and going short in markets that have been falling in price. In addition to trend-following signals, we incorporate signals that seek to identify overextended trends to help us reduce risk when the chance of a reversal is perceived as higher than normal, since market reversals generally cause losses for trend-following strategies.
Market Themes
Within the Fund, equities detracted as global equity markets began a correction at the start of the year only to sharply reverse a number of times through the end of the year. Significant shifts in sentiment created a difficult environment for trend following in equities. Trend following in commodities was another key detractor from Fund performance, as most markets reversed their long-term bearish trends early in the year and exhibited choppiness thereafter. Currencies also detracted from Fund performance during the period, as many currencies were susceptible to the sentiment shifts that affected equities, as well as some of the reversals in commodities, which affected commodity sensitive currencies. For the year as a whole, the reversals in the U.S. dollar were the primary driver of losses, as a large sell-off late in the first quarter set the stage for a bearish view of the U.S. dollar through the third quarter. The dollar reversed sharply in the fourth quarter as the Fed shifted focus towards a rate hike and the U.S. election accelerated these directional shifts.
Significant Performance Factors
The largest positive contributors to Fund performance were the Japanese yen vs. British pound, the Japanese 10-Year Government bonds and the
Annual Report 2016
4
VARIABLE PORTFOLIO — AQR MANAGED FUTURES STRATEGY FUND
MANAGER DISCUSSION OF FUND PERFORMANCE (continued)
Japanese yen vs. U.S. dollar. Gold, copper and the Nasdaq 100 Index detracted from returns.
Changes in Portfolio Positioning
Within equities, the Fund ended broadly long across geographies, with a third of long exposure coming from U.S. equity markets. Within fixed income, the Fund ended the period long in German bond futures and short in U.S. bond futures and Eurodollar futures.
Within currencies, the Fund ended the period long in the U.S. dollar, short in the euro and slightly short in the Japanese yen. Within commodities, the Fund ended the period long in energies and base metals and short in livestock.
Positioning is a function of market returns, since a trend following strategy is reactive to past returns. Changes in asset allocation are a function of how attractive trends are within an asset class. In the long-term, we manage a balanced asset allocation; we have generally maintained an average negative predicted beta to equities during the first half of the year, and a positive predicted beta in the second half of the year, in line with the shift in sentiment we observed.
Fund Achieved Exposures with Derivative Securities
All of the Fund's exposures are achieved using derivative securities. We trade futures, forwards and swaps across the four major asset classes, equities, commodities, fixed income and foreign exchange. The Fund uses these instruments to gain economic exposure to the markets it wishes to trade. Given the way these derivatives work, the Fund is heavily in cash at all times and uses some percentage, usually between 10% and 20% of that cash as collateral to support its derivative positions. The portfolio's gains came from the derivatives it trades.
| Market Exposure Through Derivatives Investments (% of notional exposure) (at December 31, 2016)(a) | |||||||||||||||
Long | Short | Net | |||||||||||||
| Fixed Income Derivative Contracts | 22.7 | (138.8 | ) | (116.1 | ) | ||||||||||
| Commodities Derivative Contracts | 8.3 | (1.7 | ) | 6.6 | |||||||||||
| Equity Derivative Contracts | 15.8 | (0.3 | ) | 15.5 | |||||||||||
| Foreign Currency Derivative Contracts | 34.6 | (40.6 | ) | (6.0 | ) | ||||||||||
| Total Notional Market Value of Derivative Contracts | 81.4 | (181.4 | ) | (100.0 | ) | ||||||||||
(a) The Fund has market exposure (long and/or short) to fixed income, commodity and equity asset classes and foreign currency through its investments in derivatives. The notional exposure of a financial instrument is the nominal or face amount that is used to calculate payments made on that instrument and/or changes in value for the instrument. The notional exposure is a hypothetical underlying quantity upon which payment obligations are computed. Notional exposures provide a gauge for how the Fund may behave given changes in individual markets. For a description of the Fund's investments in derivatives, see Investments in Derivatives following the Consolidated Portfolio of Investments, and Note 2 to the Notes to Consolidated Financial Statements.
Annual Report 2016
5
VARIABLE PORTFOLIO — AQR MANAGED FUTURES STRATEGY FUND
UNDERSTANDING YOUR FUND'S EXPENSES
(Unaudited)
As an investor, you incur ongoing costs, which generally include management fees, distribution and/or service fees, and other fund expenses. The following information is intended to help you understand your ongoing costs (in dollars) of investing in the Fund and to help you compare these costs with the ongoing costs of investing in other mutual funds.
The information below does not reflect fees and expenses imposed under your variable annuity contract and/or variable life insurance policy (collectively, Contracts) or qualified pension and retirement plan (Qualified Plan), if any. The total fees and expenses you bear may therefore be higher than those shown below.
Analyzing Your Fund's Expenses
To illustrate these ongoing costs, we have provided examples and calculated the expenses paid by investors in each share class of the Fund during the period. The actual and hypothetical information in the table is based on an initial investment of $1,000 at the beginning of the period indicated and held for the entire period. Expense information is calculated two ways and each method provides you with different information. The amount listed in the "Actual" column is calculated using the Fund's actual operating expenses and total return for the period. You may use the Actual information, together with the amount invested, to estimate the expenses that you paid over the period. Simply divide your account value by $1,000 (for example, an $8,600 account value divided by $1,000 = 8.6), then multiply the results by the expenses paid during the period under the "Actual" column. The amount listed in the "Hypothetical" column assumes a 5% annual rate of return before expenses (which is not the Fund's actual return) and then applies the Fund's actual expense ratio for the period to the hypothetical return. You should not use the hypothetical account values and expenses to estimate either your actual account balance at the end of the period or the expenses you paid during the period. See "Compare With Other Funds" below for details on how to use the hypothetical data.
Compare With Other Funds
Since all mutual funds are required to include the same hypothetical calculations about expenses in shareholder reports, you can use this information to compare the ongoing cost of investing in the Fund with other funds. To do so, compare the hypothetical example with the 5% hypothetical examples that appear in the shareholder reports of other funds. As you compare hypothetical examples of other funds, it is important to note that hypothetical examples are meant to highlight the ongoing costs of investing in a fund only and do not reflect any transaction costs, such as redemption or exchange fees, or expenses that apply to the subaccount or the Contract. Therefore, the hypothetical calculations are useful in comparing ongoing costs only, and will not help you determine the relative total costs of owning different funds. If the fees and expenses imposed under your Contract or Qualified Plan, if any, were included, your costs would be higher.
July 1, 2016 – December 31, 2016
| Account Value at the Beginning of the Period ($) | Account Value at the End of the Period ($) | Expenses Paid During the Period ($) | Fund's Annualized Expense Ratio (%) | ||||||||||||||||||||||||||||
Actual | Hypothetical | Actual | Hypothetical | Actual | Hypothetical | Actual | |||||||||||||||||||||||||
Class 1 | 1,000.00 | 1,000.00 | 900.20 | 1,018.95 | 5.75 | 6.11 | 1.21 | ||||||||||||||||||||||||
Class 2 | 1,000.00 | 1,000.00 | 899.10 | 1,017.70 | 6.93 | 7.36 | 1.46 | ||||||||||||||||||||||||
Expenses paid during the period are equal to the annualized expense ratio for each class as indicated above, multiplied by the average account value over the period and then multiplied by the number of days in the Fund's most recent fiscal half year and divided by 366.
Expenses do not include fees and expenses incurred indirectly by the Fund from its investment in underlying funds, including affiliated and non-affiliated pooled investment vehicles, such as mutual funds and exchange-traded funds.
Annual Report 2016
6
VARIABLE PORTFOLIO — AQR MANAGED FUTURES STRATEGY FUND
CONSOLIDATED PORTFOLIO OF INVESTMENTS
December 31, 2016
(Percentages represent value of investments compared to net assets)
Treasury Bills 28.2%
Issuer | Effective Yield | Principal Amount ($) | Value ($) | ||||||||||||
| U.S. Treasury Bills 01/05/17 | 0.250 | % | 1,805,000 | 1,804,925 | |||||||||||
01/26/17 | 0.350 | % | 36,518,001 | 36,508,461 | |||||||||||
02/02/17 | 0.400 | % | 22,864,000 | 22,855,384 | |||||||||||
02/09/17 | 0.460 | % | 1,239,000 | 1,238,358 | |||||||||||
02/16/17 | 0.460 | % | 4,830,000 | 4,827,059 | |||||||||||
03/23/17 | 0.480 | % | 186,000 | 185,796 | |||||||||||
06/01/17 | 0.620 | % | 9,166,000 | 9,142,333 | |||||||||||
06/15/17 | 0.600 | % | 2,278,000 | 2,271,733 | |||||||||||
06/22/17 | 0.620 | % | 2,152,000 | 2,145,706 | |||||||||||
| Total Treasury Bills (Cost: $80,977,818) | 80,979,755 | ||||||||||||||
Money Market Funds 66.5%
Shares | Value ($) | ||||||||||
| Columbia Short-Term Cash Fund, 0.594%(a)(b) | 119,726,635 | 119,726,635 | |||||||||
| JPMorgan Prime Money Market Fund, Capital Shares, 0.856%(a) | 34,989,503 | 35,000,000 | |||||||||
| JPMorgan U.S. Treasury Plus Money Market Fund, Institutional Shares, 0.368%(a)(c) | 36,897,877 | 36,897,877 | |||||||||
| Total Money Market Funds (Cost: $191,624,863) | 191,624,512 | ||||||||||
| Total Investments (Cost: $272,602,681) | 272,604,267 | ||||||||||
Other Assets & Liabilities, Net | 15,384,565 | ||||||||||
Net Assets | 287,988,832 | ||||||||||
At December 31, 2016, securities and cash totaling $20,008,517 were pledged as collateral.
Investments in Derivatives
Forward Foreign Currency Exchange Contracts Open at December 31, 2016
Counterparty | Exchange Date | Currency to be Delivered | Currency to be Received | Unrealized Appreciation ($) | Unrealized Depreciation ($) | ||||||||||||||||||||||||||
Citi | 01/04/2017 | 4,066,000 | JPY | 34,826 | USD | 37 | — | ||||||||||||||||||||||||
Citi | 01/04/2017 | 1,092,000 | NZD | 759,483 | USD | 871 | — | ||||||||||||||||||||||||
Citi | 01/04/2017 | 34,840 | USD | 4,066,000 | JPY | — | (51 | ) | |||||||||||||||||||||||
Citi | 01/04/2017 | 758,177 | USD | 1,092,000 | NZD | 435 | — | ||||||||||||||||||||||||
Citi | 01/05/2017 | 27,297,000 | JPY | 234,033 | USD | 462 | — | ||||||||||||||||||||||||
Citi | 01/05/2017 | 1,091,000 | NZD | 758,679 | USD | 789 | — | ||||||||||||||||||||||||
Citi | 01/05/2017 | 233,794 | USD | 27,297,000 | JPY | — | (223 | ) | |||||||||||||||||||||||
Citi | 01/05/2017 | 760,077 | USD | 1,091,000 | NZD | — | (2,187 | ) | |||||||||||||||||||||||
Citi | 03/15/2017 | 4,282,000 | AUD | 3,097,770 | USD | 12,989 | — | ||||||||||||||||||||||||
Citi | 03/15/2017 | 13,132,000 | AUD | 9,401,569 | USD | — | (58,812 | ) | |||||||||||||||||||||||
Citi | 03/15/2017 | 3,272,000 | BRL | 924,779 | USD | — | (61,098 | ) | |||||||||||||||||||||||
Citi | 03/15/2017 | 1,167,000 | CAD | 876,882 | USD | 6,984 | — | ||||||||||||||||||||||||
Citi | 03/15/2017 | 5,875,000 | CAD | 4,342,384 | USD | — | (36,923 | ) | |||||||||||||||||||||||
Citi | 03/15/2017 | 348,000 | CHF | 344,289 | USD | 1,028 | — | ||||||||||||||||||||||||
Citi | 03/15/2017 | 134,000 | CHF | 131,166 | USD | — | (1,010 | ) | |||||||||||||||||||||||
Citi | 03/15/2017 | 44,489,000 | CLP | 66,269 | USD | 175 | — | ||||||||||||||||||||||||
Citi | 03/15/2017 | 759,483,000 | CLP | 1,120,777 | USD | — | (7,524 | ) | |||||||||||||||||||||||
Citi | 03/15/2017 | 551,447,000 | COP | 177,086 | USD | — | (4,367 | ) | |||||||||||||||||||||||
Citi | 03/15/2017 | 27,515,000 | EUR | 29,372,534 | USD | 306,790 | — | ||||||||||||||||||||||||
Citi | 03/15/2017 | 6,831,000 | EUR | 7,154,914 | USD | — | (61,080 | ) | |||||||||||||||||||||||
Citi | 03/15/2017 | 8,338,000 | GBP | 10,451,828 | USD | 158,096 | — | ||||||||||||||||||||||||
The accompanying Notes to Consolidated Financial Statements are an integral part of this statement.
Annual Report 2016
7
VARIABLE PORTFOLIO — AQR MANAGED FUTURES STRATEGY FUND
CONSOLIDATED PORTFOLIO OF INVESTMENTS (continued)
December 31, 2016
Forward Foreign Currency Exchange Contracts Open at December 31, 2016 (continued)
Counterparty | Exchange Date | Currency to be Delivered | Currency to be Received | Unrealized Appreciation ($) | Unrealized Depreciation ($) | ||||||||||||||||||||||||||
Citi | 03/15/2017 | 1,786,000 | GBP | 2,192,127 | USD | — | (12,791 | ) | |||||||||||||||||||||||
Citi | 03/15/2017 | 4,299,000 | HKD | 554,727 | USD | 184 | — | ||||||||||||||||||||||||
Citi | 03/15/2017 | 3,845,379,000 | IDR | 282,363 | USD | 505 | — | ||||||||||||||||||||||||
Citi | 03/15/2017 | 2,415,157,000 | IDR | 176,136 | USD | — | (890 | ) | |||||||||||||||||||||||
Citi | 03/15/2017 | 5,252,000 | ILS | 1,378,524 | USD | 12,419 | — | ||||||||||||||||||||||||
Citi | 03/15/2017 | 2,020,000 | ILS | 523,913 | USD | — | (1,512 | ) | |||||||||||||||||||||||
Citi | 03/15/2017 | 14,540,000 | INR | 212,556 | USD | 189 | — | ||||||||||||||||||||||||
Citi | 03/15/2017 | 71,574,000 | INR | 1,040,127 | USD | — | (5,262 | ) | |||||||||||||||||||||||
Citi | 03/15/2017 | 1,002,959,000 | JPY | 8,760,066 | USD | 148,603 | — | ||||||||||||||||||||||||
Citi | 03/15/2017 | 563,701,000 | JPY | 4,785,087 | USD | — | (54,882 | ) | |||||||||||||||||||||||
Citi | 03/15/2017 | 16,941,840,000 | KRW | 14,451,465 | USD | 421,232 | — | ||||||||||||||||||||||||
Citi | 03/15/2017 | 271,237,000 | KRW | 224,484 | USD | — | (138 | ) | |||||||||||||||||||||||
Citi | 03/15/2017 | 24,328,000 | MXN | 1,175,692 | USD | 13,087 | — | ||||||||||||||||||||||||
Citi | 03/15/2017 | 145,057,000 | MXN | 6,899,691 | USD | — | (32,402 | ) | |||||||||||||||||||||||
Citi | 03/15/2017 | 7,708,000 | NOK | 901,363 | USD | 8,338 | — | ||||||||||||||||||||||||
Citi | 03/15/2017 | 68,623,000 | NOK | 7,914,057 | USD | — | (36,392 | ) | |||||||||||||||||||||||
Citi | 03/15/2017 | 16,900,000 | NZD | 12,020,080 | USD | 304,323 | — | ||||||||||||||||||||||||
Citi | 03/15/2017 | 841,000 | NZD | 582,210 | USD | — | (805 | ) | |||||||||||||||||||||||
Citi | 03/15/2017 | 162,860,000 | PHP | 3,236,694 | USD | — | (13,800 | ) | |||||||||||||||||||||||
Citi | 03/15/2017 | 9,551,000 | PLN | 2,291,878 | USD | 12,304 | — | ||||||||||||||||||||||||
Citi | 03/15/2017 | 24,695,000 | PLN | 5,867,970 | USD | — | (26,083 | ) | |||||||||||||||||||||||
Citi | 03/15/2017 | 314,965,000 | SEK | 34,360,065 | USD | — | (355,098 | ) | |||||||||||||||||||||||
Citi | 03/15/2017 | 3,765,000 | SGD | 2,643,135 | USD | 44,217 | — | ||||||||||||||||||||||||
Citi | 03/15/2017 | 40,000 | SGD | 27,550 | USD | — | (62 | ) | |||||||||||||||||||||||
Citi | 03/15/2017 | 38,004,000 | TRY | 10,792,235 | USD | 177,119 | — | ||||||||||||||||||||||||
Citi | 03/15/2017 | 16,353,000 | TRY | 4,550,283 | USD | — | (17,367 | ) | |||||||||||||||||||||||
Citi | 03/15/2017 | 16,165,000 | TWD | 502,656 | USD | 3,685 | — | ||||||||||||||||||||||||
Citi | 03/15/2017 | 8,818,412 | USD | 11,896,000 | AUD | — | (248,455 | ) | |||||||||||||||||||||||
Citi | 03/15/2017 | 6,123,519 | USD | 21,410,000 | BRL | 327,466 | — | ||||||||||||||||||||||||
Citi | 03/15/2017 | 384,204 | USD | 518,000 | CAD | 1,920 | — | ||||||||||||||||||||||||
Citi | 03/15/2017 | 27,719,424 | USD | 36,410,000 | CAD | — | (578,905 | ) | |||||||||||||||||||||||
Citi | 03/15/2017 | 2,665,676 | USD | 1,804,888,000 | CLP | 15,696 | — | ||||||||||||||||||||||||
Citi | 03/15/2017 | 647,899 | USD | 428,173,000 | CLP | — | (11,798 | ) | |||||||||||||||||||||||
Citi | 03/15/2017 | 702,470 | USD | 2,151,120,000 | COP | 5,352 | — | ||||||||||||||||||||||||
Citi | 03/15/2017 | 445,505 | USD | 1,348,374,000 | COP | — | (1,826 | ) | |||||||||||||||||||||||
Citi | 03/15/2017 | 1,587,884 | USD | 1,513,000 | EUR | 10,388 | — | ||||||||||||||||||||||||
Citi | 03/15/2017 | 23,739,628 | USD | 22,177,000 | EUR | — | (312,734 | ) | |||||||||||||||||||||||
Citi | 03/15/2017 | 6,136,292 | USD | 4,831,000 | GBP | — | (172,150 | ) | |||||||||||||||||||||||
Citi | 03/15/2017 | 571,512 | USD | 4,430,000 | HKD | — | (71 | ) | |||||||||||||||||||||||
The accompanying Notes to Consolidated Financial Statements are an integral part of this statement.
Annual Report 2016
8
VARIABLE PORTFOLIO — AQR MANAGED FUTURES STRATEGY FUND
CONSOLIDATED PORTFOLIO OF INVESTMENTS (continued)
December 31, 2016
Forward Foreign Currency Exchange Contracts Open at December 31, 2016 (continued)
Counterparty | Exchange Date | Currency to be Delivered | Currency to be Received | Unrealized Appreciation ($) | Unrealized Depreciation ($) | ||||||||||||||||||||||||||
Citi | 03/15/2017 | 1,536,505 | USD | 21,274,568,119 | IDR | 22,877 | — | ||||||||||||||||||||||||
Citi | 03/15/2017 | 1,770,851 | USD | 23,997,550,881 | IDR | — | (11,879 | ) | |||||||||||||||||||||||
Citi | 03/15/2017 | 1,834,871 | USD | 6,990,000 | ILS | — | (16,692 | ) | |||||||||||||||||||||||
Citi | 03/15/2017 | 2,239,495 | USD | 154,570,676 | INR | 18,119 | — | ||||||||||||||||||||||||
Citi | 03/15/2017 | 2,639,254 | USD | 179,739,212 | INR | — | (14,036 | ) | |||||||||||||||||||||||
Citi | 03/15/2017 | 221,146 | USD | 26,035,000 | JPY | 2,392 | — | ||||||||||||||||||||||||
Citi | 03/15/2017 | 869,858 | USD | 99,706,000 | JPY | — | (13,777 | ) | |||||||||||||||||||||||
Citi | 03/15/2017 | 9,086,525 | USD | 10,629,845,000 | KRW | — | (283,515 | ) | |||||||||||||||||||||||
Citi | 03/15/2017 | 2,160,164 | USD | 44,823,000 | MXN | — | (18,129 | ) | |||||||||||||||||||||||
Citi | 03/15/2017 | 20,231,720 | USD | 169,949,000 | NOK | — | (541,954 | ) | |||||||||||||||||||||||
Citi | 03/15/2017 | 948,257 | USD | 1,378,000 | NZD | 7,028 | — | ||||||||||||||||||||||||
Citi | 03/15/2017 | 40,480,070 | USD | 57,089,000 | NZD | — | (903,688 | ) | |||||||||||||||||||||||
Citi | 03/15/2017 | 1,104,678 | USD | 55,846,000 | PHP | 9,942 | — | ||||||||||||||||||||||||
Citi | 03/15/2017 | 61,084 | USD | 3,056,000 | PHP | — | (89 | ) | |||||||||||||||||||||||
Citi | 03/15/2017 | 2,393,669 | USD | 10,142,000 | PLN | 26,963 | — | ||||||||||||||||||||||||
Citi | 03/15/2017 | 302,793 | USD | 1,268,000 | PLN | — | (154 | ) | |||||||||||||||||||||||
Citi | 03/15/2017 | 16,509,513 | USD | 151,807,000 | SEK | 222,521 | — | ||||||||||||||||||||||||
Citi | 03/15/2017 | 2,667,151 | USD | 24,124,000 | SEK | — | (8,225 | ) | |||||||||||||||||||||||
Citi | 03/15/2017 | 1,283,426 | USD | 1,836,000 | SGD | — | (16,065 | ) | |||||||||||||||||||||||
Citi | 03/15/2017 | 388,617 | USD | 1,396,000 | TRY | 1,308 | — | ||||||||||||||||||||||||
Citi | 03/15/2017 | 1,073,624 | USD | 3,838,000 | TRY | — | (1,610 | ) | |||||||||||||||||||||||
Citi | 03/15/2017 | 1,536,466 | USD | 48,836,000 | TWD | — | (29,027 | ) | |||||||||||||||||||||||
Citi | 03/15/2017 | 10,722,519 | USD | 153,502,000 | ZAR | 307,646 | — | ||||||||||||||||||||||||
Citi | 03/15/2017 | 106,573 | USD | 1,480,000 | ZAR | — | (225 | ) | |||||||||||||||||||||||
Citi | 03/15/2017 | 106,000 | ZAR | 7,646 | USD | 29 | — | ||||||||||||||||||||||||
Citi | 03/15/2017 | 271,000 | ZAR | 19,443 | USD | — | (30 | ) | |||||||||||||||||||||||
Citi | 03/16/2017 | 425,295,000 | HUF | 1,459,389 | USD | 9,072 | — | ||||||||||||||||||||||||
Citi | 03/16/2017 | 1,101,680,000 | HUF | 3,725,113 | USD | — | (31,774 | ) | |||||||||||||||||||||||
Citi | 03/16/2017 | 2,320,194 | USD | 687,236,118 | HUF | 23,379 | — | ||||||||||||||||||||||||
Citi | 03/16/2017 | 4,502,638 | USD | 1,313,002,882 | HUF | — | (25,109 | ) | |||||||||||||||||||||||
Total | 2,646,959 | (4,032,676 | ) | ||||||||||||||||||||||||||||
Futures Contracts Outstanding at December 31, 2016
Long Futures Contracts Outstanding
Contract Description | Number of Contracts | Trading Currency | Notional Market Value ($) | Expiration Date | Unrealized Appreciation ($) | Unrealized (Depreciation) ($) | |||||||||||||||||||||
Amsterdam IDX | 29 | EUR | 2,949,505 | 01/2017 | 61,855 | — | |||||||||||||||||||||
Brent Crude | 95 | USD | 5,397,900 | 01/2017 | 112,524 | — | |||||||||||||||||||||
| C$ Currency | 72 | USD | 5,357,880 | 03/2017 | — | (128,233 | ) | ||||||||||||||||||||
CAC40 Index | 61 | EUR | 3,122,614 | 01/2017 | 46,105 | — | |||||||||||||||||||||
The accompanying Notes to Consolidated Financial Statements are an integral part of this statement.
Annual Report 2016
9
VARIABLE PORTFOLIO — AQR MANAGED FUTURES STRATEGY FUND
CONSOLIDATED PORTFOLIO OF INVESTMENTS (continued)
December 31, 2016
Long Futures Contracts Outstanding (continued)
Contract Description | Number of Contracts | Trading Currency | Notional Market Value ($) | Expiration Date | Unrealized Appreciation ($) | Unrealized (Depreciation) ($) | |||||||||||||||||||||
Copper | 5 | USD | 691,844 | 03/2017 | — | (34,483 | ) | ||||||||||||||||||||
Copper | 96 | USD | 6,013,200 | 03/2017 | 11,248 | — | |||||||||||||||||||||
Corn | 16 | USD | 281,600 | 03/2017 | — | (6,416 | ) | ||||||||||||||||||||
DAX Index | 24 | EUR | 7,241,182 | 03/2017 | 104,384 | — | |||||||||||||||||||||
DJIA Mini E-CBOT | 103 | USD | 10,155,800 | 03/2017 | — | (945 | ) | ||||||||||||||||||||
| EURO STOXX 50 | 183 | EUR | 6,312,650 | 03/2017 | 105,230 | — | |||||||||||||||||||||
Euro-Bobl | 265 | EUR | 37,276,404 | 03/2017 | 187,742 | — | |||||||||||||||||||||
Euro-Bund | 2 | EUR | 345,585 | 03/2017 | — | (341 | ) | ||||||||||||||||||||
Euro-Schatz | 270 | EUR | 31,914,571 | 03/2017 | 25,474 | — | |||||||||||||||||||||
FTSE 100 Index | 83 | GBP | 7,211,387 | 03/2017 | 175,416 | — | |||||||||||||||||||||
FTSE/MIB Index | 19 | EUR | 1,920,534 | 03/2017 | 31,989 | — | |||||||||||||||||||||
IBEX 35 Index | 13 | EUR | 1,274,488 | 01/2017 | — | (1,090 | ) | ||||||||||||||||||||
Low Sulphur Gasoil | 118 | USD | 5,956,050 | 02/2017 | 212,554 | — | |||||||||||||||||||||
MSCI Singapore IX ETS | 22 | SGD | 485,834 | 01/2017 | — | (3,348 | ) | ||||||||||||||||||||
Mini MSCI EAFE Index | 16 | USD | 1,340,480 | 03/2017 | 538 | — | |||||||||||||||||||||
NASDAQ 100 E-mini | 73 | USD | 7,101,440 | 03/2017 | — | (20,239 | ) | ||||||||||||||||||||
NY Harbor ULSD | 86 | USD | 6,242,258 | 01/2017 | 225,705 | — | |||||||||||||||||||||
Natural Gas | 40 | USD | 1,489,600 | 01/2017 | 61,709 | — | |||||||||||||||||||||
New Zealand $ | 171 | USD | 11,840,040 | 03/2017 | — | (451,446 | ) | ||||||||||||||||||||
Nickel | 17 | USD | 1,021,122 | 03/2017 | — | (181,245 | ) | ||||||||||||||||||||
Nikkei 225 | 16 | JPY | 2,614,759 | 03/2017 | 58,895 | — | |||||||||||||||||||||
OMXS30 Index | 204 | SEK | 3,401,269 | 01/2017 | — | (53,072 | ) | ||||||||||||||||||||
Primary Aluminum | 43 | USD | 1,819,706 | 03/2017 | — | (72,421 | ) | ||||||||||||||||||||
RBOB Gasoline | 62 | USD | 4,351,024 | 01/2017 | 269,303 | — | |||||||||||||||||||||
Russell 2000 Mini | 65 | USD | 4,409,925 | 03/2017 | — | (69,750 | ) | ||||||||||||||||||||
S&P 500 E-mini | 65 | USD | 7,267,650 | 03/2017 | — | (53,265 | ) | ||||||||||||||||||||
S&P Mid 400 E-mini | 31 | USD | 5,143,210 | 03/2017 | — | (83,773 | ) | ||||||||||||||||||||
S&P/TSX 60 Index | 92 | CAD | 12,291,334 | 03/2017 | 401 | — | |||||||||||||||||||||
SPI 200 Index | 74 | AUD | 7,517,682 | 03/2017 | 145,469 | — | |||||||||||||||||||||
Silver | 11 | USD | 879,395 | 03/2017 | — | (38,433 | ) | ||||||||||||||||||||
Soybean Meal | 35 | USD | 1,108,100 | 03/2017 | — | (14,555 | ) | ||||||||||||||||||||
Sugar #11 | 74 | USD | 1,616,989 | 02/2017 | — | (319,172 | ) | ||||||||||||||||||||
TOPIX Index | 29 | JPY | 3,766,588 | 03/2017 | 22,169 | — | |||||||||||||||||||||
WTI Crude | 66 | USD | 3,545,520 | 01/2017 | 83,066 | — | |||||||||||||||||||||
Zinc | 14 | USD | 900,900 | 03/2017 | — | (118,779 | ) | ||||||||||||||||||||
Total | 223,578,019 | 1,941,776 | (1,651,006 | ) | |||||||||||||||||||||||
The accompanying Notes to Consolidated Financial Statements are an integral part of this statement.
Annual Report 2016
10
VARIABLE PORTFOLIO — AQR MANAGED FUTURES STRATEGY FUND
CONSOLIDATED PORTFOLIO OF INVESTMENTS (continued)
December 31, 2016
Short Futures Contracts Outstanding
Contract Description | Number of Contracts | Trading Currency | Notional Market Value ($) | Expiration Date | Unrealized Appreciation ($) | Unrealized (Depreciation) ($) | |||||||||||||||||||||
3-Month Euro Euribor | (108 | ) | EUR | (28,506,826 | ) | 06/2017 | — | (7,986 | ) | ||||||||||||||||||
3-Month Euro Euribor | (151 | ) | EUR | (39,848,818 | ) | 09/2017 | — | (7,268 | ) | ||||||||||||||||||
3-Month Euro Euribor | (132 | ) | EUR | (34,829,518 | ) | 12/2017 | — | (7,757 | ) | ||||||||||||||||||
3-Month Euro Euribor | (131 | ) | EUR | (34,558,763 | ) | 03/2018 | — | (13,870 | ) | ||||||||||||||||||
3-Month Euro Euribor | (124 | ) | EUR | (32,707,217 | ) | 06/2018 | — | (13,403 | ) | ||||||||||||||||||
3-Month Euro Euribor | (99 | ) | EUR | (26,107,809 | ) | 09/2018 | — | (17,832 | ) | ||||||||||||||||||
3-Month Euro Euribor | (53 | ) | EUR | (13,973,421 | ) | 12/2018 | — | (5,824 | ) | ||||||||||||||||||
| 90-Day Euro$ | (238 | ) | USD | (58,783,025 | ) | 06/2017 | 55,174 | — | |||||||||||||||||||
| 90-Day Euro$ | (238 | ) | USD | (58,693,775 | ) | 09/2017 | 96,960 | — | |||||||||||||||||||
| 90-Day Euro$ | (197 | ) | USD | (48,501,400 | ) | 12/2017 | 94,716 | — | |||||||||||||||||||
| 90-Day Euro$ | (184 | ) | USD | (45,245,600 | ) | 03/2018 | 85,965 | — | |||||||||||||||||||
| 90-Day Euro$ | (170 | ) | USD | (41,752,000 | ) | 06/2018 | 60,083 | — | |||||||||||||||||||
| 90-Day Euro$ | (152 | ) | USD | (37,287,500 | ) | 09/2018 | 44,992 | — | |||||||||||||||||||
| 90-Day Euro$ | (137 | ) | USD | (33,565,000 | ) | 12/2018 | 26,119 | — | |||||||||||||||||||
| 90-Day Sterling | (87 | ) | GBP | (13,346,058 | ) | 06/2017 | — | (2,388 | ) | ||||||||||||||||||
| 90-Day Sterling | (68 | ) | GBP | (10,429,306 | ) | 09/2017 | — | (5,249 | ) | ||||||||||||||||||
| 90-Day Sterling | (34 | ) | GBP | (5,213,082 | ) | 12/2017 | — | (5,468 | ) | ||||||||||||||||||
| 90-Day Sterling | (11 | ) | GBP | (1,685,908 | ) | 03/2018 | — | (1,956 | ) | ||||||||||||||||||
| 90-Day Sterling | (21 | ) | GBP | (3,217,257 | ) | 06/2018 | — | (1,407 | ) | ||||||||||||||||||
| 90-Day Sterling | (16 | ) | GBP | (2,450,011 | ) | 09/2018 | — | (503 | ) | ||||||||||||||||||
| AUD/USD Currency | (16 | ) | USD | (1,152,320 | ) | 03/2017 | — | (1,129 | ) | ||||||||||||||||||
Australian 10-Year Bond | (40 | ) | AUD | (3,687,417 | ) | 03/2017 | — | (20,071 | ) | ||||||||||||||||||
Australian 3-Year Bond | (464 | ) | AUD | (37,324,296 | ) | 03/2017 | 64,619 | — | |||||||||||||||||||
| BP Currency | (178 | ) | USD | (13,748,275 | ) | 03/2017 | 323,326 | — | |||||||||||||||||||
Banker's Acceptance | (49 | ) | CAD | (9,039,353 | ) | 03/2017 | 1,945 | — | |||||||||||||||||||
Banker's Acceptance | (171 | ) | CAD | (31,532,762 | ) | 06/2017 | 2,978 | — | |||||||||||||||||||
Banker's Acceptance | (154 | ) | CAD | (28,380,721 | ) | 09/2017 | — | (7,776 | ) | ||||||||||||||||||
Canadian Government 10-Year Bond | (28 | ) | CAD | (2,868,089 | ) | 03/2017 | — | (6,386 | ) | ||||||||||||||||||
Cocoa ICE | (71 | ) | GBP | (1,515,507 | ) | 03/2017 | 239,290 | — | |||||||||||||||||||
Euro CHF 3-Month ICE | (26 | ) | CHF | (6,432,338 | ) | 06/2017 | 1,391 | — | |||||||||||||||||||
Euro CHF 3-Month ICE | (20 | ) | CHF | (4,947,461 | ) | 09/2017 | 2,071 | — | |||||||||||||||||||
Euro CHF 3-Month ICE | (14 | ) | CHF | (3,462,192 | ) | 12/2017 | 1,062 | — | |||||||||||||||||||
Euro FX | (371 | ) | USD | (49,036,925 | ) | 03/2017 | 1,174,401 | — | |||||||||||||||||||
Euro-Buxl 30-Year | (1 | ) | EUR | (182,656 | ) | 03/2017 | 1,695 | — | |||||||||||||||||||
FTSE/JSE Top 40 Index | (1 | ) | ZAR | (32,261 | ) | 03/2017 | 292 | — | |||||||||||||||||||
Gold 100 oz. | (1 | ) | USD | (115,170 | ) | 02/2017 | 592 | — | |||||||||||||||||||
HRW Wheat | (33 | ) | USD | (690,525 | ) | 03/2017 | 13,553 | — | |||||||||||||||||||
Lean Hogs | (6 | ) | USD | (158,760 | ) | 02/2017 | — | (26,418 | ) | ||||||||||||||||||
Platinum | (8 | ) | USD | (362,280 | ) | 04/2017 | 5,595 | — | |||||||||||||||||||
The accompanying Notes to Consolidated Financial Statements are an integral part of this statement.
Annual Report 2016
11
VARIABLE PORTFOLIO — AQR MANAGED FUTURES STRATEGY FUND
CONSOLIDATED PORTFOLIO OF INVESTMENTS (continued)
December 31, 2016
Short Futures Contracts Outstanding (continued)
Contract Description | Number of Contracts | Trading Currency | Notional Market Value ($) | Expiration Date | Unrealized Appreciation ($) | Unrealized (Depreciation) ($) | |||||||||||||||||||||
U.S. Long Bond | (74 | ) | USD | (11,148,563 | ) | 03/2017 | — | (59,268 | ) | ||||||||||||||||||
U.S. Treasury 10-Year Note | (182 | ) | USD | (22,619,188 | ) | 03/2017 | — | (17,543 | ) | ||||||||||||||||||
U.S. Treasury 2-Year Note | (555 | ) | USD | (120,261,563 | ) | 03/2017 | 92,395 | — | |||||||||||||||||||
U.S. Treasury 5-Year Note | (305 | ) | USD | (35,887,539 | ) | 03/2017 | 18,370 | — | |||||||||||||||||||
U.S. Ultra Bond | (52 | ) | USD | (8,333,000 | ) | 03/2017 | — | (40,403 | ) | ||||||||||||||||||
Total | (963,621,455 | ) | 2,407,584 | (269,905 | ) | ||||||||||||||||||||||
Total Return Swap Contracts on Futures at December 31, 2016
Counterparty | Reference Instrument | Expiration Date | Trading Currency | Notional Amount | Unrealized Appreciation ($) | Unrealized (Depreciation) ($) | |||||||||||||||||||||
Barclays | Euro-Schatz Mar 17 | 03/08/2017 | EUR | 76,949,577 | 54,160 | — | |||||||||||||||||||||
Barclays | Japanese 10-Year Government Bond Mar 17 | 03/13/2017 | JPY | (11,569,283 | ) | — | (1,597 | ) | |||||||||||||||||||
Barclays | Canadian Government 10-Year Bond Mar 17 | 03/22/2017 | CAD | (3,380,248 | ) | 3,943 | — | ||||||||||||||||||||
Barclays | Long Gilt Mar 17 | 03/29/2017 | GBP | 2,636,239 | 55,454 | — | |||||||||||||||||||||
Citi | Cotton Mar 17 | 03/09/2017 | USD | 1,766,250 | — | (30,540 | ) | ||||||||||||||||||||
Citi | Soybean Oil Mar 17 | 03/14/2017 | USD | 2,807,460 | — | (209,630 | ) | ||||||||||||||||||||
Citi | Wheat Mar 17 | 03/14/2017 | USD | (648,675 | ) | 13,405 | — | ||||||||||||||||||||
Citi | Soybean Mar 17 | 03/14/2017 | USD | 7,530,000 | — | (287,146 | ) | ||||||||||||||||||||
Citi | Soybean Meal Mar 17 | 03/14/2017 | USD | 759,840 | — | (11,210 | ) | ||||||||||||||||||||
Citi | Wheat Mar 17 | 03/14/2017 | USD | (6,528,000 | ) | 242,400 | — | ||||||||||||||||||||
Citi | Cocoa Mar 17 | 03/16/2017 | USD | (1,254,340 | ) | 264,392 | — | ||||||||||||||||||||
Citi | Coffee Mar 17 | 03/21/2017 | USD | 411,150 | — | (86,025 | ) | ||||||||||||||||||||
JPMorgan | MSCI Taiwan Index Jan 17 | 01/23/2017 | USD | 5,707,080 | 70,786 | — | |||||||||||||||||||||
JPMorgan | H-Shares Index Jan 17 | 01/26/2017 | HKD | 1,392,250 | 37,979 | — | |||||||||||||||||||||
JPMorgan | Hang Seng Index Jan 17 | 01/26/2017 | HKD | 1,416,081 | 27,996 | — | |||||||||||||||||||||
JPMorgan | Swiss Market Indexx Mar 17 | 03/17/2017 | CHF | (2,167,053 | ) | — | (48,971 | ) | |||||||||||||||||||
Total | 770,515 | (675,119 | ) | ||||||||||||||||||||||||
Notes to Consolidated Portfolio of Investments
(a) The rate shown is the seven-day current annualized yield at December 31, 2016.
(b) As defined in the Investment Company Act of 1940, an affiliated company is one in which the Fund owns 5% or more of the company's outstanding voting securities, or a company which is under common ownership or control with the Fund. Holdings and transactions in these affiliated companies during the year ended December 31, 2016 are as follows:
Issuer | Beginning Cost ($) | Purchase Cost ($) | Proceeds From Sales ($) | Realized Gain (Loss) ($) | Ending Cost ($) | Dividends — Affiliated Issuers ($) | Value ($) | ||||||||||||||||||||||||
Columbia Short-Term Cash Fund | 123,856,886 | 512,223,786 | (516,354,133 | ) | 447 | 119,726,986 | 837,407 | 119,726,635 | |||||||||||||||||||||||
(c) This security or a portion of this security has been pledged as collateral in connection with derivative contracts.
The accompanying Notes to Consolidated Financial Statements are an integral part of this statement.
Annual Report 2016
12
VARIABLE PORTFOLIO — AQR MANAGED FUTURES STRATEGY FUND
CONSOLIDATED PORTFOLIO OF INVESTMENTS (continued)
December 31, 2016
Currency Legend
AUD Australian Dollar
BRL Brazilian Real
CAD Canadian Dollar
CHF Swiss Franc
CLP Chilean Peso
COP Colombian Peso
EUR Euro
GBP British Pound
HKD Hong Kong Dollar
HUF Hungarian Forint
IDR Indonesian Rupiah
ILS Israeli Shekel
INR Indian Rupee
JPY Japanese Yen
KRW Korean Won
MXN Mexican Peso
NOK Norwegian Krone
NZD New Zealand Dollar
PHP Philippine Peso
PLN Polish Zloty
SEK Swedish Krona
SGD Singapore Dollar
TRY Turkish Lira
TWD Taiwan Dollar
USD US Dollar
ZAR South African Rand
Fair Value Measurements
The Fund categorizes its fair value measurements according to a three-level hierarchy that maximizes the use of observable inputs and minimizes the use of unobservable inputs by prioritizing that the most observable input be used when available. Observable inputs are those that market participants would use in pricing an investment based on market data obtained from sources independent of the reporting entity. Unobservable inputs are those that reflect the Fund's assumptions about the information market participants would use in pricing an investment. An investment's level within the fair value hierarchy is based on the lowest level of any input that is deemed significant to the asset's or liability's fair value measurement. The input levels are not necessarily an indication of the risk or liquidity associated with investments at that level. For example, certain U.S. government securities are generally high quality and liquid, however, they are reflected as Level 2 because the inputs used to determine fair value may not always be quoted prices in an active market.
Fair value inputs are summarized in the three broad levels listed below:
> Level 1 — Valuations based on quoted prices for investments in active markets that the Fund has the ability to access at the measurement date (including NAV for open-end mutual funds). Valuation adjustments are not applied to Level 1 investments.
> Level 2 — Valuations based on other significant observable inputs (including quoted prices for similar securities, interest rates, prepayment speeds, credit risks, etc.).
> Level 3 — Valuations based on significant unobservable inputs (including the Fund's own assumptions and judgment in determining the fair value of investments).
The accompanying Notes to Consolidated Financial Statements are an integral part of this statement.
Annual Report 2016
13
VARIABLE PORTFOLIO — AQR MANAGED FUTURES STRATEGY FUND
CONSOLIDATED PORTFOLIO OF INVESTMENTS (continued)
December 31, 2016
Fair Value Measurements (continued)
Inputs that are used in determining fair value of an investment may include price information, credit data, volatility statistics, and other factors. These inputs can be either observable or unobservable. The availability of observable inputs can vary between investments, and is affected by various factors such as the type of investment, and the volume and level of activity for that investment or similar investments in the marketplace. The inputs will be considered by the Investment Manager, along with any other relevant factors in the calculation of an investment's fair value. The Fund uses prices and inputs that are current as of the measurement date, which may include periods of market dislocations. During these periods, the availability of prices and inputs may be reduced for many investments. This condition could cause an investment to be reclassified between the various levels within the hierarchy.
Certain investments that have been measured at fair value using the net asset value (NAV) per share (or its equivalent) are not categorized in the fair value hierarchy. The fair value amounts presented in the table are intended to reconcile the fair value hierarchy to the amounts presented in the Consolidated Portfolio of Investments. The Columbia Short-Term Cash Fund seeks to provide shareholders with maximum current income consistent with liquidity and stability of principal. Columbia Short-Term Cash Fund prices its shares with a floating NAV and no longer seeks to maintain a stable NAV.
Investments falling into the Level 3 category are primarily supported by quoted prices from brokers and dealers participating in the market for those investments. However, these may be classified as Level 3 investments due to lack of market transparency and corroboration to support these quoted prices. Additionally, valuation models may be used as the pricing source for any remaining investments classified as Level 3. These models may rely on one or more significant unobservable inputs and/or significant assumptions by the Investment Manager. Inputs used in valuations may include, but are not limited to, financial statement analysis, capital account balances, discount rates and estimated cash flows, and comparable company data.
Under the direction of the Fund's Board of Trustees (the Board), the Investment Manager's Valuation Committee (the Committee) is responsible for overseeing the valuation procedures approved by the Board. The Committee consists of voting and non-voting members from various groups within the Investment Manager's organization, including operations and accounting, trading and investments, compliance, risk management and legal.
The Committee meets at least monthly to review and approve valuation matters, which may include a description of specific valuation determinations, data regarding pricing information received from approved pricing vendors and brokers and the results of Board-approved valuation control policies and procedures (the Policies). The Policies address, among other things, instances when market quotations are or are not readily available, including recommendations of third party pricing vendors and a determination of appropriate pricing methodologies; events that require specific valuation determinations and assessment of fair value techniques; securities with a potential for stale pricing, including those that are illiquid, restricted, or in default; and the effectiveness of third party pricing vendors, including periodic reviews of vendors. The Committee meets more frequently, as needed, to discuss additional valuation matters, which may include the need to review back-testing results, review time-sensitive information or approve related valuation actions. The Committee reports to the Board, with members of the Committee meeting with the Board at each of its regularly scheduled meetings to discuss valuation matters and actions during the period, similar to those described earlier.
For investments categorized as Level 3, the Committee monitors information similar to that described above, which may include: (i) data specific to the issuer or comparable issuers, (ii) general market or specific sector news and (iii) quoted prices and specific or similar security transactions. The Committee considers this data and any changes from prior periods in order to assess the reasonableness of observable and unobservable inputs, any assumptions or internal models used to value those securities and changes in fair value. This data is also used to corroborate, when available, information received from approved pricing vendors and brokers. Various factors impact the frequency of monitoring this information (which may occur as often as daily). However, the Committee may determine that changes to inputs, assumptions and models are not required as a result of the monitoring procedures performed.
The accompanying Notes to Consolidated Financial Statements are an integral part of this statement.
Annual Report 2016
14
VARIABLE PORTFOLIO — AQR MANAGED FUTURES STRATEGY FUND
CONSOLIDATED PORTFOLIO OF INVESTMENTS (continued)
December 31, 2016
Fair Value Measurements (continued)
The following table is a summary of the inputs used to value the Fund's investments at December 31, 2016:
| Level 1 Quoted Prices in Active Markets for Identical Assets ($) | Level 2 Other Significant Observable Inputs ($) | Level 3 Significant Unobservable Inputs ($) | Total ($) | ||||||||||||||||
Investments | |||||||||||||||||||
Treasury Bills | 80,979,755 | — | — | 80,979,755 | |||||||||||||||
Money Market Funds | 71,897,877 | — | — | 71,897,877 | |||||||||||||||
Investments measured at net asset value | |||||||||||||||||||
Money Market Funds | — | — | — | 119,726,635 | |||||||||||||||
Total Investments | 152,877,632 | — | — | 272,604,267 | |||||||||||||||
Derivatives | |||||||||||||||||||
Assets | |||||||||||||||||||
| Forward Foreign Currency Exchange Contracts | — | 2,646,959 | — | 2,646,959 | |||||||||||||||
Futures Contracts | 4,349,360 | — | — | 4,349,360 | |||||||||||||||
Swap Contracts | — | 770,515 | — | 770,515 | |||||||||||||||
Liabilities | |||||||||||||||||||
| Forward Foreign Currency Exchange Contracts | — | (4,032,676 | ) | — | (4,032,676 | ) | |||||||||||||
Futures Contracts | (1,920,911 | ) | — | — | (1,920,911 | ) | |||||||||||||
Swap Contracts | — | (675,119 | ) | — | (675,119 | ) | |||||||||||||
Total | 155,306,081 | (1,290,321 | ) | — | 273,742,395 | ||||||||||||||
See the Consolidated Portfolio of Investments for all investment classifications not indicated in the table.
Derivative instruments are valued at unrealized appreciation (depreciation).
There were no transfers of financial assets between levels during the period.
The accompanying Notes to Consolidated Financial Statements are an integral part of this statement.
Annual Report 2016
15
VARIABLE PORTFOLIO — AQR MANAGED FUTURES STRATEGY FUND
CONSOLIDATED STATEMENT OF ASSETS AND LIABILITIES
December 31, 2016
Assets | |||||||
Investments, at value | |||||||
Unaffiliated issuers (identified cost $152,875,695) | $ | 152,877,632 | |||||
Affiliated issuers (identified cost $119,726,986) | 119,726,635 | ||||||
Total investments (identified cost $272,602,681) | 272,604,267 | ||||||
Cash | 110,001 | ||||||
Foreign currency (identified cost $36,438) | 36,410 | ||||||
Cash collateral held at broker | 4,830,000 | ||||||
Margin deposits | 13,280,639 | ||||||
Unrealized appreciation on forward foreign currency exchange contracts | 2,646,959 | ||||||
Unrealized appreciation on swap contracts | 770,515 | ||||||
Receivable for: | |||||||
Investments sold | 1,063,883 | ||||||
Capital shares sold | 35,924 | ||||||
Dividends | 80,971 | ||||||
Variation margin | 272,003 | ||||||
Prepaid expenses | 1,687 | ||||||
Trustees' deferred compensation plan | 19,446 | ||||||
Total assets | 295,752,705 | ||||||
Liabilities | |||||||
Unrealized depreciation on forward foreign currency exchange contracts | 4,032,676 | ||||||
Unrealized depreciation on swap contracts | 675,119 | ||||||
Payable for: | |||||||
Investments purchased | 1,558,961 | ||||||
Capital shares purchased | 12,446 | ||||||
Collateral and deposits | 160,000 | ||||||
Variation margin | 1,242,757 | ||||||
Management services fees | 8,685 | ||||||
Distribution and/or service fees | 235 | ||||||
Transfer agent fees | 474 | ||||||
Compensation of board members | 1,175 | ||||||
Chief compliance officer expenses | 35 | ||||||
Other expenses | 51,864 | ||||||
Trustees' deferred compensation plan | 19,446 | ||||||
Total liabilities | 7,763,873 | ||||||
Net assets applicable to outstanding capital stock | $ | 287,988,832 | |||||
The accompanying Notes to Consolidated Financial Statements are an integral part of this statement.
Annual Report 2016
16
VARIABLE PORTFOLIO — AQR MANAGED FUTURES STRATEGY FUND
CONSOLIDATED STATEMENT OF ASSETS AND LIABILITIES (continued)
December 31, 2016
Represented by | |||||||
Paid-in capital | $ | 350,783,048 | |||||
Excess of distributions over net investment income | (50,007,626 | ) | |||||
Accumulated net realized loss | (13,842,773 | ) | |||||
Unrealized appreciation (depreciation) on: | |||||||
Investments — unaffiliated issuers | 1,937 | ||||||
Investments — affiliated issuers | (351 | ) | |||||
Foreign currency translations | (83,531 | ) | |||||
Forward foreign currency exchange contracts | (1,385,717 | ) | |||||
Futures contracts | 2,428,449 | ||||||
Swap contracts | 95,396 | ||||||
Total — representing net assets applicable to outstanding capital stock | $ | 287,988,832 | |||||
Class 1 | |||||||
Net assets | $ | 253,548,307 | |||||
Shares outstanding | 32,287,353 | ||||||
Net asset value per share | $ | 7.85 | |||||
Class 2 | |||||||
Net assets | $ | 34,440,525 | |||||
Shares outstanding | 4,391,248 | ||||||
Net asset value per share | $ | 7.84 | |||||
The accompanying Notes to Consolidated Financial Statements are an integral part of this statement.
Annual Report 2016
17
VARIABLE PORTFOLIO — AQR MANAGED FUTURES STRATEGY FUND
CONSOLIDATED STATEMENT OF OPERATIONS
Year Ended December 31, 2016
Net investment income | |||||||
Income: | |||||||
Dividends — unaffiliated issuers | $ | 1,588 | |||||
Dividends — affiliated issuers | 837,407 | ||||||
Interest | 358,205 | ||||||
Total income | 1,197,200 | ||||||
Expenses: | |||||||
Management services fees | 3,387,825 | ||||||
Distribution and/or service fees | |||||||
Class 2 | 85,407 | ||||||
Transfer agent fees | |||||||
Class 1 | 164,293 | ||||||
Class 2 | 20,498 | ||||||
Compensation of board members | 23,075 | ||||||
Custodian fees | 34,073 | ||||||
Printing and postage fees | 23,313 | ||||||
Audit fees | 39,746 | ||||||
Legal fees | 6,999 | ||||||
Chief compliance officer expenses | 145 | ||||||
Other | 12,337 | ||||||
Total expenses | 3,797,711 | ||||||
Net investment loss | (2,600,511 | ) | |||||
Realized and unrealized gain (loss) — net | |||||||
Net realized gain (loss) on: | |||||||
Investments — affiliated issuers | 447 | ||||||
Foreign currency translations | 64,376 | ||||||
Forward foreign currency exchange contracts | (2,911,412 | ) | |||||
Futures contracts | (23,755,928 | ) | |||||
Swap contracts | (190,309 | ) | |||||
Net realized loss | (26,792,826 | ) | |||||
Net change in unrealized appreciation (depreciation) on: | |||||||
Investments — unaffiliated issuers | 495 | ||||||
Investments — affiliated issuers | (351 | ) | |||||
Foreign currency translations | (90,483 | ) | |||||
Forward foreign currency exchange contracts | (342,064 | ) | |||||
Futures contracts | 769,402 | ||||||
Swap contracts | 579,776 | ||||||
Net change in unrealized appreciation | 916,775 | ||||||
Net realized and unrealized loss | (25,876,051 | ) | |||||
Net decrease in net assets from operations | $ | (28,476,562 | ) | ||||
The accompanying Notes to Consolidated Financial Statements are an integral part of this statement.
Annual Report 2016
18
VARIABLE PORTFOLIO — AQR MANAGED FUTURES STRATEGY FUND
CONSOLIDATED STATEMENT OF CHANGES IN NET ASSETS
| Year Ended December 31, 2016 | Year Ended December 31, 2015 | ||||||||||
Operations | |||||||||||
Net investment loss | $ | (2,600,511 | ) | $ | (4,011,973 | ) | |||||
Net realized gain (loss) | (26,792,826 | ) | 28,672,431 | ||||||||
Net change in unrealized appreciation (depreciation) | 916,775 | (20,570,968 | ) | ||||||||
Net increase (decrease) in net assets resulting from operations | (28,476,562 | ) | 4,089,490 | ||||||||
Distributions to shareholders | |||||||||||
Net investment income | |||||||||||
Class 1 | (15,260,594 | ) | (49,859,467 | ) | |||||||
Class 2 | (1,813,356 | ) | (2,849,028 | ) | |||||||
Total distributions to shareholders | (17,073,950 | ) | (52,708,495 | ) | |||||||
Increase (decrease) in net assets from capital stock activity | 32,038,164 | (71,083,830 | ) | ||||||||
Total decrease in net assets | (13,512,348 | ) | (119,702,835 | ) | |||||||
Net assets at beginning of year | 301,501,180 | 421,204,015 | |||||||||
Net assets at end of year | $ | 287,988,832 | $ | 301,501,180 | |||||||
Excess of distributions over net investment income | $ | (50,007,626 | ) | $ | (34,844,752 | ) | |||||
The accompanying Notes to Consolidated Financial Statements are an integral part of this statement.
Annual Report 2016
19
VARIABLE PORTFOLIO — AQR MANAGED FUTURES STRATEGY FUND
CONSOLIDATED STATEMENT OF CHANGES IN NET ASSETS (continued)
Year Ended December 31, 2016 | Year Ended December 31, 2015 | ||||||||||||||||||
Shares | Dollars ($) | Shares | Dollars ($) | ||||||||||||||||
Capital stock activity | |||||||||||||||||||
Class 1 shares | |||||||||||||||||||
Subscriptions | 11,147 | 93,955 | 549,510 | 6,083,704 | |||||||||||||||
Distributions reinvested | 1,746,063 | 15,260,594 | 5,491,131 | 49,859,467 | |||||||||||||||
Redemptions | (5,611 | ) | (49,391 | ) | (12,783,439 | ) | (142,027,181 | ) | |||||||||||
Net increase (decrease) | 1,751,599 | 15,305,158 | (6,742,798 | ) | (86,084,010 | ) | |||||||||||||
Class 2 shares | |||||||||||||||||||
Subscriptions | 2,807,196 | 25,258,448 | 1,261,607 | 12,761,983 | |||||||||||||||
Distributions reinvested | 207,478 | 1,813,356 | 313,770 | 2,849,028 | |||||||||||||||
Redemptions | (1,193,897 | ) | (10,338,798 | ) | (62,006 | ) | (610,831 | ) | |||||||||||
Net increase | 1,820,777 | 16,733,006 | 1,513,371 | 15,000,180 | |||||||||||||||
Total net increase (decrease) | 3,572,376 | 32,038,164 | (5,229,427 | ) | (71,083,830 | ) | |||||||||||||
The accompanying Notes to Consolidated Financial Statements are an integral part of this statement.
Annual Report 2016
20
VARIABLE PORTFOLIO — AQR MANAGED FUTURES STRATEGY FUND
CONSOLIDATED FINANCIAL HIGHLIGHTS
The following tables are intended to help you understand the Fund's financial performance. Certain information reflects financial results for a single share of a class held for the periods shown. Per share net investment income (loss) amounts are calculated based on average shares outstanding during the period. Total return assumes reinvestment of all dividends and distributions, if any. Total return does not reflect any fees and expenses imposed under your Contract and/or Qualified Plan, as applicable; such fees and expenses would reduce the total returns for all periods shown. Total return and portfolio turnover are not annualized for periods of less than one year. The portfolio turnover rate is calculated without regard to purchase and sales transactions of short-term instruments and certain derivatives, if any. If such transactions were included, the Fund's portfolio turnover rate may be higher.
Year Ended December 31, | |||||||||||||||||||||||
Class 1 | 2016 | 2015 | 2014 | 2013 | 2012(a) | ||||||||||||||||||
Per share data | |||||||||||||||||||||||
Net asset value, beginning of period | $ | 9.11 | $ | 10.99 | $ | 10.83 | $ | 10.43 | $ | 10.00 | |||||||||||||
Income from investment operations: | |||||||||||||||||||||||
Net investment loss | (0.07 | ) | (0.11 | ) | (0.11 | ) | (0.10 | ) | (0.06 | ) | |||||||||||||
Net realized and unrealized gain (loss) | (0.69 | ) | 0.12 | 1.09 | 1.00 | 0.49 | |||||||||||||||||
Increase from payment by affiliate | — | — | — | — | 0.00 | (b) | |||||||||||||||||
Total from investment operations | (0.76 | ) | 0.01 | 0.98 | 0.90 | 0.43 | |||||||||||||||||
Less distributions to shareholders: | |||||||||||||||||||||||
Net investment income | (0.50 | ) | (1.89 | ) | (0.16 | ) | (0.42 | ) | — | ||||||||||||||
Net realized gains | — | — | (0.66 | ) | (0.08 | ) | — | ||||||||||||||||
Total distributions to shareholders | (0.50 | ) | (1.89 | ) | (0.82 | ) | (0.50 | ) | — | ||||||||||||||
Net asset value, end of period | $ | 7.85 | $ | 9.11 | $ | 10.99 | $ | 10.83 | $ | 10.43 | |||||||||||||
Total return | (8.90 | %) | 0.19 | % | 10.34 | % | 8.86 | % | 4.30 | %(c) | |||||||||||||
Ratios to average net assets(d) | |||||||||||||||||||||||
Total gross expenses | 1.21 | % | 1.20 | % | 1.19 | % | 1.19 | % | 1.20 | %(e) | |||||||||||||
Total net expenses(f) | 1.21 | % | 1.20 | % | 1.13 | % | 1.03 | % | 1.09 | %(e) | |||||||||||||
Net investment loss | (0.82 | %) | (1.09 | %) | (1.06 | %) | (0.94 | %) | (0.95 | %)(e) | |||||||||||||
Supplemental data | |||||||||||||||||||||||
Net assets, end of period (in thousands) | $ | 253,548 | $ | 278,128 | $ | 409,606 | $ | 450,391 | $ | 375,642 | |||||||||||||
Portfolio turnover | 0 | % | 0 | % | 0 | % | 0 | % | 0 | % | |||||||||||||
Notes to Consolidated Financial Highlights
(a) Based on operations from April 30, 2012 (commencement of operations) through the stated period end.
(b) Rounds to zero.
(c) Ameriprise Financial reimbursed the Fund for a loss on a trading error. Had the Fund not received this reimbursement, total return would have been lower by 0.01%.
(d) In addition to the fees and expenses that the Fund bears directly, the Fund indirectly bears a pro rata share of the fees and expenses of any other funds in which it invests. Such indirect expenses are not included in the Fund's reported expense ratios.
(e) Annualized.
(f) Total net expenses include the impact of certain fee waivers/expense reimbursements made by the Investment Manager and certain of its affiliates, if applicable.
The accompanying Notes to Consolidated Financial Statements are an integral part of this statement.
Annual Report 2016
21
VARIABLE PORTFOLIO — AQR MANAGED FUTURES STRATEGY FUND
CONSOLIDATED FINANCIAL HIGHLIGHTS (continued)
Year Ended December 31, | |||||||||||||||||||||||
Class 2 | 2016 | 2015 | 2014 | 2013 | 2012(a) | ||||||||||||||||||
Per share data | |||||||||||||||||||||||
Net asset value, beginning of period | $ | 9.09 | $ | 10.97 | $ | 10.82 | $ | 10.41 | $ | 10.00 | |||||||||||||
Income from investment operations: | |||||||||||||||||||||||
Net investment loss | (0.09 | ) | (0.13 | ) | (0.13 | ) | (0.12 | ) | (0.08 | ) | |||||||||||||
Net realized and unrealized gain (loss) | (0.69 | ) | 0.12 | 1.08 | 1.00 | 0.49 | |||||||||||||||||
Total from investment operations | (0.78 | ) | (0.01 | ) | 0.95 | 0.88 | 0.41 | ||||||||||||||||
Less distributions to shareholders: | |||||||||||||||||||||||
Net investment income | (0.47 | ) | (1.87 | ) | (0.14 | ) | (0.39 | ) | — | ||||||||||||||
Net realized gains | — | — | (0.66 | ) | (0.08 | ) | — | ||||||||||||||||
Total distributions to shareholders | (0.47 | ) | (1.87 | ) | (0.80 | ) | (0.47 | ) | — | ||||||||||||||
Net asset value, end of period | $ | 7.84 | $ | 9.09 | $ | 10.97 | $ | 10.82 | $ | 10.41 | |||||||||||||
Total return | (9.09 | %) | (0.09 | %) | 10.00 | % | 8.71 | % | 4.10 | % | |||||||||||||
Ratios to average net assets(b) | |||||||||||||||||||||||
Total gross expenses | 1.46 | % | 1.46 | % | 1.44 | % | 1.46 | % | 1.44 | %(c) | |||||||||||||
Total net expenses(d) | 1.46 | % | 1.46 | % | 1.39 | % | 1.25 | % | 1.34 | %(c) | |||||||||||||
Net investment loss | (1.07 | %) | (1.34 | %) | (1.32 | %) | (1.17 | %) | (1.17 | %)(c) | |||||||||||||
Supplemental data | |||||||||||||||||||||||
Net assets, end of period (in thousands) | $ | 34,441 | $ | 23,373 | $ | 11,598 | $ | 6,895 | $ | 3 | |||||||||||||
Portfolio turnover | 0 | % | 0 | % | 0 | % | 0 | % | 0 | % | |||||||||||||
Notes to Consolidated Financial Highlights
(a) Based on operations from April 30, 2012 (commencement of operations) through the stated period end.
(b) In addition to the fees and expenses that the Fund bears directly, the Fund indirectly bears a pro rata share of the fees and expenses of any other funds in which it invests. Such indirect expenses are not included in the Fund's reported expense ratios.
(c) Annualized.
(d) Total net expenses include the impact of certain fee waivers/expense reimbursements made by the Investment Manager and certain of its affiliates, if applicable.
The accompanying Notes to Consolidated Financial Statements are an integral part of this statement.
Annual Report 2016
22
VARIABLE PORTFOLIO — AQR MANAGED FUTURES STRATEGY FUND
NOTES TO CONSOLIDATED FINANCIAL STATEMENTS
December 31, 2016
Note 1. Organization
Variable Portfolio — AQR Managed Futures Strategy Fund (the Fund), a series of Columbia Funds Variable Insurance Trust (the Trust), is a non-diversified fund. The Trust is registered under the Investment Company Act of 1940, as amended (the 1940 Act), as an open-end management investment company organized as a Massachusetts business trust.
Basis for Consolidation
VPMF Offshore Fund, Ltd. (the Subsidiary) is a Cayman Islands exempted company and wholly-owned subsidiary of the Fund. The Subsidiary acts as an investment vehicle in order to effect certain investment strategies consistent with the Fund's investment objective and policies as stated in its current prospectus and statement of additional information. In accordance with the Memorandum and Articles of Association of the Subsidiary (the Articles), the Fund owns the sole issued share of the Subsidiary and retains all rights associated with such share, including the right to receive notice of, attend and vote at general meetings of the Subsidiary, rights in a winding-up or repayment of capital and the right to participate in the profits or assets of the Subsidiary. The consolidated financial statements (financial statements) include the accounts of the consolidated Fund and the respective Subsidiary. Subsequent references to the Fund within the Notes to Consolidated Financial Statements collectively refer to the Fund and the Subsidiary. All intercompany transactions and balances have been eliminated in the consolidation process.
At December 31, 2016, the Subsidiary financial statement information is as follows:
% of consolidated fund net assets | 23.22 | % | |||||
Net assets | $ | 66,880,413 | |||||
Net investment loss | $ | (516,116 | ) | ||||
Net realized loss | $ | (14,173,616 | ) | ||||
| Net change in unrealized appreciation (depreciation) | $ | (932,151 | ) | ||||
The financial statements present the portfolio holdings, financial position and results of operations of the Fund and the Subsidiary on a consolidated basis.
Fund Shares
The Trust may issue an unlimited number of shares (without par value). The Fund offers Class 1 and Class 2 shares to separate accounts funding variable annuity contracts and variable life insurance policies (collectively,
Contracts) issued by affiliated and unaffiliated life insurance companies as well as qualified pension and retirement plans (Qualified Plans) and other qualified institutional investors (Qualified Investors) authorized by Columbia Management Investment Distributors, Inc. (the Distributor). You may not buy (nor will you own) shares of the Fund directly. You may invest by participating in a Qualified Plan or by buying a Contract and making allocations to the Fund. Although all share classes generally have identical voting, dividend and liquidation rights, each share class votes separately when required by the Trust's organizational documents or by law. Different share classes pay different distribution amounts to the extent the expenses of such share classes differ, and distributions in liquidation will be proportional to the net asset value of each share class. Each share class has its own cost structure and other features.
Note 2. Summary of Significant Accounting Policies
Basis of Preparation
The Fund is an investment company that applies the accounting and reporting guidance in the Financial Accounting Standards Board (FASB) Accounting Standards Codification Topic 946, Financial Services — Investment Companies (ASC 946). The financial statements are prepared in accordance with U.S. generally accepted accounting principles (GAAP), which requires management to make certain estimates and assumptions that affect the reported amounts of assets and liabilities, the disclosure of contingent assets and liabilities at the date of the financial statements and the reported amounts of income and expenses during the reporting period. Actual results could differ from those estimates.
The following is a summary of significant accounting policies followed by the Fund in the preparation of its financial statements.
Security Valuation
Debt securities generally are valued by pricing services approved by the Board of Trustees based upon market transactions for normal, institutional-size trading units of similar securities. The services may use various pricing techniques that take into account, as applicable, factors such as yield, quality, coupon rate, maturity, type of issue, trading characteristics and other data, as well as approved independent broker-dealer quotes. Debt securities for which quotations are not readily available
Annual Report 2016
23
VARIABLE PORTFOLIO — AQR MANAGED FUTURES STRATEGY FUND
NOTES TO CONSOLIDATED FINANCIAL STATEMENTS (continued)
December 31, 2016
or not believed to be reflective of market value may also be valued based upon a bid quote from an approved independent broker-dealer. Debt securities maturing in 60 days or less are valued primarily at amortized cost value, unless this method results in a valuation that management believes does not approximate market value.
Investments in open-end investment companies, including money market funds, are valued at their latest net asset value.
Forward foreign currency exchange contracts are marked-to-market based upon foreign currency exchange rates provided by a pricing service.
Futures and options on futures contracts are valued based upon the settlement price at the close of regular trading on their principal exchanges or, in the absence of transactions, at the mean of the latest quoted bid and ask prices.
Swap transactions are valued through an independent pricing service or broker, or if neither is available, through an internal model based upon observable inputs.
Investments for which market quotations are not readily available, or that have quotations which management believes are not reflective of market value or reliable, are valued at fair value as determined in good faith under procedures approved by and under the general supervision of the Board of Trustees. If a security or class of securities (such as foreign securities) is valued at fair value, such value is likely to be different from the quoted or published price for the security.
The determination of fair value often requires significant judgment. To determine fair value, management may use assumptions including but not limited to future cash flows and estimated risk premiums. Multiple inputs from various sources may be used to determine fair value.
GAAP requires disclosure regarding the inputs and valuation techniques used to measure fair value and any changes in valuation inputs or techniques. In addition, investments shall be disclosed by major category. This information is disclosed following the Fund's Consolidated Portfolio of Investments.
Foreign Currency Transactions and Translations
The values of all assets and liabilities denominated in foreign currencies are generally translated into U.S. dollars at exchange rates determined at the close of regular trading on the New York Stock Exchange. Net
realized and unrealized gains (losses) on foreign currency transactions and translations include gains (losses) arising from the fluctuation in exchange rates between trade and settlement dates on securities transactions, gains (losses) arising from the disposition of foreign currency and currency gains (losses) between the accrual and payment dates on dividends, interest income and foreign withholding taxes.
For financial statement purposes, the Fund does not distinguish that portion of gains (losses) on investments which is due to changes in foreign exchange rates from that which is due to changes in market prices of the investments. Such fluctuations are included with the net realized and unrealized gains (losses) on investments in the Consolidated Statement of Operations.
Derivative Instruments
The Fund invests in certain derivative instruments, as detailed below, to meet its investment objectives. Derivatives are instruments whose values depend on, or are derived from, in whole or in part, the value of one or more securities, currencies, commodities, indices, or other assets or instruments. Derivatives may be used to increase investment flexibility (including to maintain cash reserves while maintaining desired exposure to certain assets), for risk management (hedging) purposes, to facilitate trading, to reduce transaction costs and to pursue higher investment returns. The Fund may also use derivative instruments to mitigate certain investment risks, such as foreign currency exchange rate risk, interest rate risk and credit risk. Derivatives may involve various risks, including the potential inability of the counterparty to fulfill its obligations under the terms of the contract, the potential for an illiquid secondary market (making it difficult for the Fund to sell or terminate, including at favorable prices) and the potential for market movements which may expose the Fund to gains or losses in excess of the amount shown in the Consolidated Statement of Assets and Liabilities. The notional amounts of derivative instruments, if applicable, are not recorded in the financial statements.
A derivative instrument may suffer a marked-to-market loss if the value of the contract decreases due to an unfavorable change in the market rates or values of the underlying instrument. Losses can also occur if the counterparty does not perform its obligations under the contract. The Fund's risk of loss from counterparty credit risk on over-the-counter derivatives is generally limited to the aggregate unrealized gain netted against any
Annual Report 2016
24
VARIABLE PORTFOLIO — AQR MANAGED FUTURES STRATEGY FUND
NOTES TO CONSOLIDATED FINANCIAL STATEMENTS (continued)
December 31, 2016
collateral held by the Fund and the amount of any variation margin held by the counterparty, plus any replacement costs or related amounts. With exchange-traded or centrally cleared derivatives, there is reduced counterparty credit risk to the Fund since the clearinghouse or central counterparty (CCP) provides some protection in the case of clearing member default. The clearinghouse or CCP stands between the buyer and the seller of the contract; therefore, additional counterparty credit risk is failure of the clearinghouse or CCP. However, credit risk still exists in exchange-traded or centrally cleared derivatives with respect to initial and variation margin that is held in a broker's customer account. While brokers are required to segregate customer margin from their own assets, in the event that a broker becomes insolvent or goes into bankruptcy and at that time there is a shortfall in the aggregate amount of margin held by the broker for all its clients, U.S. bankruptcy laws will typically allocate that shortfall on a pro-rata basis across all the broker's customers (including the Fund), potentially resulting in losses to the Fund.
In order to better define its contractual rights and to secure rights that will help the Fund mitigate its counterparty risk, the Fund may enter into an International Swaps and Derivatives Association, Inc. Master Agreement (ISDA Master Agreement) or similar agreement with its derivatives contract counterparties. An ISDA Master Agreement is an agreement between the Fund and a counterparty that governs over-the-counter derivatives and typically contains, among other things, collateral posting terms and netting provisions in the event of a default and/or termination event. Under an ISDA Master Agreement, the Fund may, under certain circumstances, offset with the counterparty certain derivative instrument's payables and/or receivables with collateral held and/or posted and create one single net payment. The provisions of the ISDA Master Agreement typically permit a single net payment in the event of default (close-out netting), including the bankruptcy or insolvency of the counterparty. Note, however, that bankruptcy or insolvency laws of a particular jurisdiction may impose restrictions on or prohibitions against the right of offset or netting in bankruptcy, insolvency or other events.
Collateral (margin) requirements differ by type of derivative. Margin requirements are established by the clearinghouse or CCP for exchange-traded and centrally cleared derivatives. Brokers can ask for margin in excess of the minimum in certain circumstances. Collateral terms are contract specific for over-the-counter
derivatives. For over-the-counter derivatives traded under an ISDA Master Agreement, the collateral requirements are typically calculated by netting the marked-to-market amount for each transaction under such agreement and comparing that amount to the value of any variation margin currently pledged by the Fund and/or the counterparty. Generally, the amount of collateral due from or to a party has to exceed a minimum transfer amount threshold (e.g., $250,000) before a transfer has to be made. To the extent amounts due to the Fund from its counterparties are not fully collateralized, contractually or otherwise, the Fund bears the risk of loss from counterparty nonperformance. The Fund attempts to mitigate counterparty risk by only entering into agreements with counterparties that it believes have the financial resources to honor their obligations and by monitoring the financial stability of those counterparties.
Certain ISDA Master Agreements allow counterparties of over-the-counter derivatives transactions to terminate derivatives contracts prior to maturity in the event the Fund's net asset value declines by a stated percentage over a specified time period or if the Fund fails to meet certain terms of the ISDA Master Agreement, which would cause the Fund to accelerate payment of any net liability owed to the counterparty. The Fund also has termination rights if the counterparty fails to meet certain terms of the ISDA Master Agreement. In addition to considering counterparty credit risk, the Fund would consider terminating the derivatives contracts based on whether termination would result in a net liability owed from the counterparty.
For financial reporting purposes, the Fund does not offset derivative assets and derivative liabilities that are subject to netting arrangements in the Consolidated Statement of Assets and Liabilities.
Forward Foreign Currency Exchange Contracts
Forward foreign currency exchange contracts are over-the-counter agreements between two parties to buy and sell a currency at a set price on a future date. The Fund utilized forward foreign currency exchange contracts to hedge the currency exposure associated with some or all of the Fund's securities, to shift foreign currency exposure back to U.S. dollars and to generate total return through long and short positions versus the U.S. dollar. These instruments may be used for other purposes in future periods.
The values of forward foreign currency exchange contracts fluctuate daily with changes in foreign currency exchange rates. Changes in the value of these contracts
Annual Report 2016
25
VARIABLE PORTFOLIO — AQR MANAGED FUTURES STRATEGY FUND
NOTES TO CONSOLIDATED FINANCIAL STATEMENTS (continued)
December 31, 2016
are recorded as unrealized appreciation or depreciation until the contract is exercised or has expired. The Fund will realize a gain or loss when the forward foreign currency exchange contract is closed or expires.
The use of forward foreign currency exchange contracts does not eliminate fluctuations in the prices of the Fund's portfolio securities. The risks of forward foreign currency exchange contracts include movement in the values of the foreign currencies relative to the U.S. dollar (or other foreign currencies) and the possibility that counterparties will not complete their contractual obligations, which may be in excess of the amount reflected, if any, in the Consolidated Statement of Assets and Liabilities.
Futures Contracts
Futures contracts are exchange-traded and represent commitments for the future purchase or sale of an asset at a specified price on a specified date. The Fund bought and sold futures contracts to produce incremental earnings, to manage exposure to movements in interest rates, to manage exposure to the securities market and to gain commodity and currency exposure. These instruments may be used for other purposes in future periods. Upon entering into futures contracts, the Fund bears risks that it may not achieve the anticipated benefits of the futures contracts and may realize a loss. Additional risks include counterparty credit risk, the possibility of an illiquid market, and that a change in the value of the contract or option may not correlate with changes in the value of the underlying asset.
Upon entering into a futures contract, the Fund deposits cash or securities with the broker, known as a futures commission merchant (FCM), in an amount sufficient to meet the initial margin requirement. The initial margin deposit must be maintained at an established level over the life of the contract. Cash deposited as initial margin is recorded in the Consolidated Statement of Assets and Liabilities as margin deposits. Securities deposited as initial margin are designated in the Consolidated Portfolio of Investments. Subsequent payments (variation margin) are made or received by the Fund each day. The variation margin payments are equal to the daily change in the contract value and are recorded as variation margin receivable or payable and are offset in unrealized gains or losses. The Fund recognizes a realized gain or loss when the contract is closed or expires. Futures contracts involve, to varying degrees, risk of loss in excess of the variation margin disclosed in the Consolidated Statement of Assets and Liabilities.
Swap Contracts
Swap contracts are negotiated in the over-the-counter market and may be entered into as a bilateral contract or centrally cleared (centrally cleared swap contract). In a centrally cleared swap contract, immediately following execution of the swap contract with a broker, the swap contract is novated to a central counterparty (the CCP) and the CCP becomes the Fund's counterparty to the centrally cleared swap contract. The Fund is required to deposit initial margin with the futures commission merchant (FCM), which pledges it through to the CCP in the form of cash or securities in an amount that varies depending on the size and risk profile of the particular swap contract. Securities deposited as initial margin are designated in the Consolidated Portfolio of Investments and cash deposited is recorded in the Consolidated Statement of Assets and Liabilities as margin deposits. Unlike a bilateral swap contract, for centrally cleared swap contracts, the Fund has minimal credit exposure to the FCM because the CCP stands between the Fund and the relevant buyer/seller on the other side of the contract. Swap contracts are marked-to-market daily and changes in value are recorded as unrealized appreciation (depreciation). The daily change in valuation of centrally cleared swap contracts, if any, is recorded as a receivable or payable for variation margin in the Consolidated Statement of Assets and Liabilities.
Entering into these contracts involves, to varying degrees, elements of interest, liquidity and counterparty credit risk in excess of the amounts recognized in the Consolidated Statement of Assets and Liabilities. Such risks involve the possibility that there may be unfavorable changes in interest rates, market conditions or other conditions, it may be difficult to initiate a swap transaction or liquidate a position at an advantageous time or price which may result in significant losses, and that the FCM or CCP may not fulfill its obligation under the contract.
Total Return Swap Contracts
The Fund entered into total return swap contracts to obtain synthetic exposure to bond, commodity and equity index futures. These instruments may be used for other purposes in future periods. Total return swap contracts may be used to obtain exposure to an underlying reference security, instrument, or other asset or index or market without owning, taking physical custody of, or short selling any such security, instrument or asset in a market.
Annual Report 2016
26
VARIABLE PORTFOLIO — AQR MANAGED FUTURES STRATEGY FUND
NOTES TO CONSOLIDATED FINANCIAL STATEMENTS (continued)
December 31, 2016
Total return swap contracts are valued daily, and the change in value is recorded as unrealized appreciation (depreciation) until the termination of the swap, at which time the Fund will realize a gain (loss). Periodic payments received (or made) by the Fund over the term of the contract are recorded as realized gains (losses). Total return swap contracts are subject to the risk associated with the investment in the underlying reference security, instrument or asset. The risk in the case of short total return swap contracts is unlimited based on the potential for unlimited increases in the market value of the underlying reference security, instrument or asset. This risk may be offset if the Fund holds any of the underlying reference security, instrument or asset. The risk in the case of long total return swap contracts is limited to the current notional amount of the total return swap contract.
Effects of Derivative Transactions in the Financial Statements
The following tables are intended to provide additional information about the effect of derivatives on the financial statements of the Fund, including: the fair value of derivatives by risk category and the location of those fair values in the Consolidated Statement of Assets and Liabilities; and the impact of derivative transactions over the period in the Consolidated Statement of Operations, including realized and unrealized gains (losses). The derivative instrument schedules following the Consolidated Portfolio of Investments present additional information regarding derivative instruments outstanding at the end of the period, if any.
The following table is a summary of the fair value of derivative instruments (not considered to be hedging instruments for accounting disclosure purposes) at December 31, 2016:
Asset Derivatives | |||||||||||
| Risk Exposure Category | Consolidated Statement of Assets and Liabilities Location | Fair Value ($) | |||||||||
| Equity risk | Net assets — unrealized appreciation on futures contracts | 752,743 | * | ||||||||
| Equity risk | Net assets — unrealized appreciation on swap contracts | 136,761 | * | ||||||||
| Foreign exchange risk | Unrealized appreciation on forward foreign currency exchange contracts | 2,646,959 | |||||||||
Asset Derivatives | |||||||||||
| Risk Exposure Category | Consolidated Statement of Assets and Liabilities Location | Fair Value ($) | |||||||||
| Foreign exchange risk | Net assets — unrealized appreciation on futures contracts | 1,497,727 | * | ||||||||
| Interest rate risk | Net assets — unrealized appreciation on futures contracts | 863,751 | * | ||||||||
| Interest rate risk | Net assets — unrealized appreciation on swap contracts | 113,557 | * | ||||||||
| Commodity-related investment risk | Net assets — unrealized appreciation on futures contracts | 1,235,139 | * | ||||||||
| Commodity-related investment risk | Net assets — unrealized appreciation on swap contracts | 520,197 | * | ||||||||
Total | 7,766,834 | ||||||||||
Liability Derivatives | |||||||||||
| Risk Exposure Category | Consolidated Statement of Assets and Liabilities Location | Fair Value ($) | |||||||||
| Equity risk | Net assets — unrealized depreciation on futures contracts | 285,482 | * | ||||||||
| Equity risk | Net assets — unrealized depreciation on swap contracts | 48,971 | * | ||||||||
| Foreign exchange risk | Unrealized depreciation on forward foreign currency exchange contracts | 4,032,676 | |||||||||
| Foreign exchange risk | Net assets — unrealized depreciation on futures contracts | 580,808 | * | ||||||||
| Interest rate risk | Net assets — unrealized depreciation on futures contracts | 242,700 | * | ||||||||
| Interest rate risk | Net assets — unrealized depreciation on swap contracts | 1,597 | * | ||||||||
| Commodity-related investment risk | Net assets — unrealized depreciation on futures contracts | 811,921 | * | ||||||||
| Commodity-related investment risk | Net assets — Unrealized depreciation on swap contracts | 624,551 | * | ||||||||
Total | 6,628,706 | ||||||||||
*Includes cumulative appreciation (depreciation) as reported in the tables following the Consolidated Portfolio of Investments. Only the current day's variation margin is reported in receivables or payables in the Consolidated Statement of Assets and Liabilities.
Annual Report 2016
27
VARIABLE PORTFOLIO — AQR MANAGED FUTURES STRATEGY FUND
NOTES TO CONSOLIDATED FINANCIAL STATEMENTS (continued)
December 31, 2016
The following table indicates the effect of derivative instruments (not considered to be hedging instruments for accounting disclosure purposes) in the Consolidated Statement of Operations for the year ended December 31, 2016:
Amount of Realized Gain (Loss) on Derivatives Recognized in Income | |||||||||||||||||||
Risk Exposure Category | Forward Foreign Currency Exchange Contracts ($) | Futures Contracts ($) | Swap Contracts ($) | Total ($) | |||||||||||||||
Commodity-related investment risk | — | (12,608,981 | ) | (1,475,980 | ) | (14,084,961 | ) | ||||||||||||
Equity risk | — | (13,453,818 | ) | (2,060,468 | ) | (15,514,286 | ) | ||||||||||||
Foreign exchange risk | (2,911,412 | ) | 1,225,149 | — | (1,686,263 | ) | |||||||||||||
Interest rate risk | — | 1,081,722 | 3,346,139 | 4,427,861 | |||||||||||||||
Total | (2,911,412 | ) | (23,755,928 | ) | (190,309 | ) | (26,857,649 | ) | |||||||||||
Change in Unrealized Appreciation (Depreciation) on Derivatives Recognized in Income | |||||||||||||||||||
Risk Exposure Category | Forward Foreign Currency Exchange Contracts ($) | Futures Contracts ($) | Swap Contracts ($) | Total ($) | |||||||||||||||
Commodity-related investment risk | — | (720,869 | ) | (318,014 | ) | (1,038,883 | ) | ||||||||||||
Equity risk | — | 251,093 | 255,646 | 506,739 | |||||||||||||||
Foreign exchange risk | (342,064 | ) | 377,006 | — | 34,942 | ||||||||||||||
Interest rate risk | — | 862,172 | 642,144 | 1,504,316 | |||||||||||||||
Total | (342,064 | ) | 769,402 | 579,776 | 1,007,114 | ||||||||||||||
The following table provides a summary of the average outstanding volume by derivative instrument for the year ended December 31, 2016:
Derivative Instrument | Average Notional Amounts ($)* | ||||||
Futures contracts — Long | 891,664,465 | ||||||
Futures contracts — Short | 413,438,070 | ||||||
Derivative Instrument | Average Unrealized Appreciation ($)* | Average Unrealized Depreciation ($)* | |||||||||
| Forward foreign currency exchange contracts | 5,295,395 | (5,799,643 | ) | ||||||||
Total return swap contracts | 1,071,454 | (821,501 | ) | ||||||||
*Based on the ending quarterly outstanding amounts for the year ended December 31, 2016.
Offsetting of Assets and Liabilities
The following table presents the Fund's gross and net amount of assets and liabilities available for offset under netting arrangements as well as any related collateral received or pledged by the Fund as of December 31, 2016:
Barclays ($) | Citi ($)(a) | Citi ($)(a) | JPMorgan ($) | Total ($) | |||||||||||||||||||
Assets | |||||||||||||||||||||||
Forward foreign currency exchange contracts | — | 2,646,959 | — | — | 2,646,959 | ||||||||||||||||||
OTC total return swap contracts on futures(b) | 113,557 | — | 520,197 | 136,761 | 770,515 | ||||||||||||||||||
Total Assets | 113,557 | 2,646,959 | 520,197 | 136,761 | 3,417,474 | ||||||||||||||||||
Annual Report 2016
28
VARIABLE PORTFOLIO — AQR MANAGED FUTURES STRATEGY FUND
NOTES TO CONSOLIDATED FINANCIAL STATEMENTS (continued)
December 31, 2016
Barclays ($) | Citi ($)(a) | Citi ($)(a) | JPMorgan ($) | Total ($) | |||||||||||||||||||
Liabilities | |||||||||||||||||||||||
Forward foreign currency exchange contracts | — | 4,032,676 | — | — | 4,032,676 | ||||||||||||||||||
OTC total return swap contracts on futures(b) | 1,597 | — | 624,551 | 48,971 | 675,119 | ||||||||||||||||||
Total Liabilities | 1,597 | 4,032,676 | 624,551 | 48,971 | 4,707,795 | ||||||||||||||||||
Total Financial and Derivative Net Assets | 111,960 | (1,385,717 | ) | (104,354 | ) | 87,790 | (1,290,321 | ) | |||||||||||||||
Total collateral received (pledged)(c) | 111,960 | (1,385,717 | ) | (104,354 | ) | — | (1,378,111 | ) | |||||||||||||||
Net Amount(d) | — | — | — | 87,790 | 87,790 | ||||||||||||||||||
(a) Exposure can only be netted across transactions governed under the same master agreement with the same legal entity.
(b) Over-the-Counter Swap Contracts are presented at market value plus periodic payments receivable (payable), which is comprised of unrealized appreciation, unrealized depreciation, premiums paid and premiums received.
(c) In some instances, the actual collateral received and/or pledged may be more than the amount shown due to overcollateralization.
(d) Represents the net amount due from/(to) counterparties in the event of default.
Security Transactions
Security transactions are accounted for on the trade date. Cost is determined and gains (losses) are based upon the specific identification method for both financial statement and federal income tax purposes.
Income Recognition
Interest income is recorded on an accrual basis. Market premiums and discounts, including original issue discounts, are amortized and accreted, respectively, over the expected life of the security on all debt securities, unless otherwise noted.
The Fund may place a debt security on non-accrual status and reduce related interest income when it becomes probable that the interest will not be collected and the amount of uncollectible interest can be reasonably estimated. A defaulted debt security is removed from non-accrual status when the issuer resumes interest payments or when collectibility of interest is reasonably assured.
Dividend income is recorded on the ex-dividend date.
Expenses
General expenses of the Trust are allocated to the Fund and other funds of the Trust based upon relative net assets or other expense allocation methodologies determined by the nature of the expense. Expenses directly attributable to the Fund are charged to the Fund. Expenses directly attributable to a specific class of shares are charged to that share class.
Determination of Class Net Asset Value
All income, expenses (other than class-specific expenses, which are charged to that share class, as shown in the Consolidated Statement of Operations) and
realized and unrealized gains (losses) are allocated to each class of the Fund on a daily basis, based on the relative net assets of each class, for purposes of determining the net asset value of each class.
Federal Income Tax Status
The Fund intends to qualify each year as a regulated investment company under Subchapter M of the Internal Revenue Code, as amended, and will distribute substantially all of its taxable income, if any, for its tax year, and as such will not be subject to federal income taxes. In addition, because the Fund meets the exception under Internal Revenue Code Section 4982(f), the Fund expects not to be subject to federal excise tax. Therefore, no federal income or excise tax provision is recorded.
Distributions to Subaccounts
Distributions to the subaccounts of Contracts, Qualified Plans and Qualified Investors are recorded at the close of business on the record date and are payable on the first business day following the record date. Dividends from net investment income, if any, are declared and distributed annually. Capital gains distributions, when available, will be made annually. However, an additional capital gain distribution may be made during the fiscal year in order to comply with the Internal Revenue Code, as applicable to registered investment companies. Income distributions and capital gain distributions are determined in accordance with federal income tax regulations, which may differ from GAAP. All dividends and distributions are reinvested in additional shares of the applicable share class of the Fund at the net asset value as of the ex-dividend date of the distribution.
Annual Report 2016
29
VARIABLE PORTFOLIO — AQR MANAGED FUTURES STRATEGY FUND
NOTES TO CONSOLIDATED FINANCIAL STATEMENTS (continued)
December 31, 2016
Guarantees and Indemnifications
Under the Trust's organizational documents and, in some cases, by contract, its officers and trustees are indemnified against certain liabilities arising out of the performance of their duties to the Trust or its funds. In addition, certain of the Fund's contracts with its service providers contain general indemnification clauses. The Fund's maximum exposure under these arrangements is unknown since the amount of any future claims that may be made against the Fund cannot be determined, and the Fund has no historical basis for predicting the likelihood of any such claims.
Investment Company Reporting Modernization
In October 2016, the U.S. Securities and Exchange Commission adopted new rules and forms, and amendments to certain current rules and forms, to modernize reporting and disclosure of information by registered investment companies. The amendments to Regulation S-X will require standardized, enhanced disclosure about derivatives in investment company financial statements, and will also change the rules governing the form and content of such financial statements. The amendments to Regulation S-X take effect on August 1, 2017. At this time, management is assessing the anticipated impact of these regulatory developments.
Note 3. Fees and Other Transactions with Affiliates
Management Services Fees
Effective May 1, 2016, the Fund entered into a Management Agreement with Columbia Management Investment Advisers, LLC (the Investment Manager), a wholly-owned subsidiary of Ameriprise Financial, Inc. (Ameriprise Financial). Under the Management Agreement, the Investment Manager provides the Fund with investment research and advice, as well as administrative and accounting services. The Investment Manager is responsible for the ultimate oversight of investments made by the Fund. The Fund's subadviser (see Subadvisory Agreement below) has the primary responsibility for the day-to-day portfolio management of the Fund. The management services fee is an annual fee that is equal to a percentage of the Fund's average daily net assets that declines from 1.10% to 0.95% as the Fund's net assets increase. Prior to May 1, 2016, the Fund paid the Investment Manager an annual fee for advisory services under an Investment Management Services Agreement and a separate annual fee for
administrative and accounting services under an Administrative Services Agreement. The effective management services fee rate for the year ended December 31, 2016 (reflecting all advisory and administrative services fees paid to the Investment Manager) was 1.10% of the Fund's average daily net assets. For the period from January 1, 2016 through April 30, 2016, the investment advisory services fee paid to the Investment Manager was $1,049,958, and the administrative services fee paid to the Investment Manager was $82,350.
Subadvisory Agreement
The Investment Manager has entered into a Subadvisory Agreement with AQR Capital Management, LLC (AQR) to serve as the subadviser to the Fund. The Investment Manager compensates AQR to manage the investment of the Fund's assets.
Compensation of Board Members
Board of Trustee members, who are not officers or employees of the Investment Manager or Ameriprise Financial, are compensated for their services to the Fund as disclosed in the Consolidated Statement of Operations. These Board of Trustee members may participate in a Deferred Compensation Plan (the Plan) which may be terminated at any time. Obligations of the Plan will be paid solely out of the Fund's assets, and all amounts payable under the Plan constitute a general unsecured obligation of the Fund.
Compensation of Chief Compliance Officer
The Board of Trustees has appointed a Chief Compliance Officer to the Fund in accordance with federal securities regulations. The Fund is allocated a portion of the expenses associated with the Chief Compliance Officer based on relative net assets of the Trust.
Transfer Agency Fees
The Fund has a Transfer and Dividend Disbursing Agent Agreement with Columbia Management Investment Services Corp. (the Transfer Agent), an affiliate of the Investment Manager and a wholly-owned subsidiary of Ameriprise Financial. The annual fee rate under this agreement is 0.06% of the Fund's average daily net assets attributable to each share class.
Distribution Fees
The Fund has an agreement with the Distributor, an affiliate of the Investment Manager and a wholly-owned subsidiary of Ameriprise Financial, for distribution services. The Board of Trustees has approved, and the
Annual Report 2016
30
VARIABLE PORTFOLIO — AQR MANAGED FUTURES STRATEGY FUND
NOTES TO CONSOLIDATED FINANCIAL STATEMENTS (continued)
December 31, 2016
Fund has adopted, a distribution plan (the Plan) which sets the distribution fees for the Fund. These fees are calculated daily and are intended to compensate the Distributor for selling shares of the Fund. The Fund pays a monthly distribution fee to the Distributor at the maximum annual rate of 0.25% of the average daily net assets attributable to Class 2 shares of the Fund. The Fund pays no distribution and service fees for Class 1 shares.
Expenses Waived/Reimbursed by the Investment Manager and its Affiliates
The Investment Manager and certain of its affiliates have contractually agreed to waive fees and/or reimburse expenses (excluding certain fees and expenses described below) for the periods disclosed below, unless sooner terminated at the sole discretion of the Board of Trustees, so that the Fund's net operating expenses, after giving effect to fees waived/expenses reimbursed and any balance credits and/or overdraft charges from the Fund's custodian, do not exceed the following annual rates as a percentage of the class' average daily net assets:
| May 1, 2016 through April 30, 2017 | Prior to May 1, 2016 | ||||||||||
Class 1 | 1.71 | % | 1.78 | % | |||||||
Class 2 | 1.96 | 2.03 | |||||||||
Under the agreement governing these fee waivers and/or expense reimbursement arrangements, the following fees and expenses are excluded from the waiver/reimbursement commitment, and therefore will be paid by the Fund, if applicable: taxes (including foreign transaction taxes), expenses associated with investments in affiliated and non-affiliated pooled investment vehicles (including mutual funds and exchange-traded funds), transaction costs and brokerage commissions, costs related to any securities lending program, dividend and interest expenses associated with securities sold short, inverse floater program fees and expenses, transaction charges and interest on borrowed money, interest, infrequent and/or unusual expenses and any other expenses the exclusion of which is specifically approved by the Board of Trustees. This agreement may be modified or amended only with approval from the Investment Manager, certain of its affiliates and the Fund. Any fees waived and/or expenses reimbursed under the expense reimbursement arrangements described above are not recoverable by the Investment Manager or its affiliates in future periods.
Note 4. Federal Tax Information
The timing and character of income and capital gain distributions are determined in accordance with income tax regulations, which may differ from GAAP because of temporary or permanent book to tax differences.
At December 31, 2016, these differences are primarily due to differing treatment for capital loss carryforwards, Trustees' deferred compensation, foreign currency transactions, investments in a commodity subsidiary and derivative investments. To the extent these differences are permanent, reclassifications are made among the components of the Fund's net assets in the Statement of Assets and Liabilities. Temporary differences do not require reclassifications.
In the Statement of Assets and Liabilities the following reclassifications were made:
Excess of distributions over net investment income | $ | 4,511,587 | |||||
Accumulated net realized loss | (3,274,637 | ) | |||||
Paid-in capital | (1,236,950 | ) | |||||
Net investment income (loss) and net realized gains (losses), as disclosed in the Statement of Operations, and net assets were not affected by this reclassification.
The tax character of distributions paid during the years indicated was as follows:
Year Ended December 31, | 2016 | 2015 | |||||||||
Ordinary income | $ | 17,073,950 | $ | 52,708,495 | |||||||
Short-term capital gain distributions, if any, are considered ordinary income distributions for tax purposes.
At December 31, 2016, the components of distributable earnings on a tax basis were as follows:
Undistributed ordinary income | $ | 1,532,271 | |||||
Capital loss carryforwards | (38,294,301 | ) | |||||
Net unrealized depreciation | (26,580,899 | ) | |||||
At December 31, 2016, the cost of investments for federal income tax purposes was $303,424,686 and the aggregate gross unrealized appreciation and depreciation based on that cost was:
Unrealized appreciation | $ | 2,566 | |||||
Unrealized depreciation | (26,583,465 | ) | |||||
Net unrealized depreciation | $ | (26,580,899 | ) | ||||
The following capital loss carryforwards, determined at December 31, 2016, may be available to reduce taxable income arising from future net realized gains on
Annual Report 2016
31
VARIABLE PORTFOLIO — AQR MANAGED FUTURES STRATEGY FUND
NOTES TO CONSOLIDATED FINANCIAL STATEMENTS (continued)
December 31, 2016
investments, if any, to the extent permitted by the Internal Revenue Code:
Year of Expiration | Amount ($) | ||||||
No expiration — short-term | 24,638,647 | ||||||
No expiration — long-term | 13,655,654 | ||||||
Total | 38,294,301 | ||||||
Management of the Fund has concluded that there are no significant uncertain tax positions in the Fund that would require recognition in the financial statements. However, management's conclusion may be subject to review and adjustment at a later date based on factors including, but not limited to, new tax laws, regulations, and administrative interpretations (including relevant court decisions). Generally, the Fund's federal tax returns for the prior three fiscal years remain subject to examination by the Internal Revenue Service.
Note 5. Portfolio Information
For the year ended December 31, 2016, there were no purchases or proceeds from the sale of securities other than short-term investment transactions and derivative activity, if any. Only the amount of long-term security purchases and sales activity, excluding derivatives, impacts the portfolio turnover reported in the Consolidated Financial Highlights.
Note 6. Affiliated Money Market Fund
The Fund invests significantly in Columbia Short-Term Cash Fund, an affiliated money market fund established for the exclusive use by the Fund and other affiliated funds (the Affiliated MMF). The income earned by the Fund from such investments is included as Dividends — affiliated issuers in the Consolidated Statement of Operations. As an investing fund, the Fund indirectly bears its proportionate share of the expenses of the Affiliated MMF. Effective October 1, 2016, the Affiliated MMF prices its shares with a floating net asset value (NAV) and no longer seeks to maintain a stable NAV. In addition, the Board of Trustees of the Affiliated MMF may impose a fee on redemptions (sometimes referred to as a liquidity fee) or temporarily suspend redemptions (sometimes referred to as imposing a redemption gate) in the event its liquidity falls below regulatory limits.
Note 7. Line of Credit
The Fund has access to a revolving credit facility with a syndicate of banks led by Citibank, N.A., HSBC Bank USA, N.A. and JPMorgan Chase Bank, N.A. whereby the Fund may borrow for the temporary funding of
shareholder redemptions or for other temporary or emergency purposes. The credit facility agreement, which is a collective agreement between the Fund and certain other funds managed by the Investment Manager, severally and not jointly, that permits collective borrowings up to $1 billion. Interest is charged to each participating fund based on its borrowings at a rate equal to the higher of (i) the overnight federal funds rate plus 1.00% or (ii) the one-month LIBOR rate plus 1.00%. Each borrowing under the credit facility matures no later than 60 days after the date of borrowing. The Fund also pays a commitment fee equal to its pro rata share of the amount of the credit facility at a rate of 0.15% per annum. The commitment fee is included in other expenses in the Consolidated Statement of Operations.
The Fund had no borrowings during the year ended December 31, 2016.
Note 8. Significant Risks
Commodity-Related Investment Risk
The value of commodities investments will generally be affected by overall market movements and factors specific to a particular industry or commodity, which may include demand for the commodity, weather, embargoes, tariffs, and economic health, political, international, regulatory and other developments. Exposure to commodities and commodities markets may subject the value of the Fund's investments to greater volatility than other types of investments. Commodities investments may also subject the Fund to counterparty risk and liquidity risk. The Fund may make commodity-related investments through one or more wholly-owned subsidiaries organized outside the U.S. that are generally not subject to U.S. laws (including securities laws) and their protections.
Derivatives Risk
Losses involving derivative instruments may be substantial, because a relatively small price movement in the underlying security(ies), commodity, currency or index or other instrument or asset may result in a substantial loss for the Fund. In addition to the potential for increased losses, the use of derivative instruments may lead to increased volatility within the Fund. Derivatives will typically increase the Fund's exposure to principal risks to which it is otherwise exposed, and may expose the Fund to additional risks, including correlation risk, counterparty risk, hedging risk, leverage risk and liquidity risk.
Annual Report 2016
32
VARIABLE PORTFOLIO — AQR MANAGED FUTURES STRATEGY FUND
NOTES TO CONSOLIDATED FINANCIAL STATEMENTS (continued)
December 31, 2016
Non-Diversification Risk
A non-diversified fund is permitted to invest a greater percentage of its total assets in fewer issuers than a diversified fund. The Fund may, therefore, have a greater risk of loss from a few issuers than a similar fund that invests more broadly.
Shareholder Concentration Risk
At December 31, 2016, affiliated shareholders of record owned 96.6% of the outstanding shares of the Fund in one or more accounts. Subscription and redemption activity by concentrated accounts may have a significant effect on the operations of the Fund. In the case of a large redemption, the Fund may be forced to sell investments at inopportune times, including its liquid or more liquid positions, resulting in Fund losses and the Fund holding a higher percentage of less liquid or illiquid securities. Large redemptions could result in decreased economies of scale and increased operating expenses for non-redeeming Fund shareholders.
Note 9. Subsequent Events
Management has evaluated the events and transactions that have occurred through the date the financial statements were issued and noted no items requiring adjustment of the financial statements or additional disclosure.
Note 10. Information Regarding Pending and Settled Legal Proceedings
Ameriprise Financial and certain of its affiliates have historically been involved in a number of legal, arbitration and regulatory proceedings, including routine litigation, class actions, and governmental actions, concerning matters arising in connection with the conduct of their business activities. Ameriprise Financial believes that the Funds are not currently the subject of, and that neither Ameriprise Financial nor any of its affiliates are the subject of, any pending legal, arbitration or regulatory proceedings that are likely to have a material adverse effect on the Funds or the ability of Ameriprise Financial or its affiliates to perform under their contracts with the Funds. Ameriprise Financial is required to make quarterly (10-Q), annual (10-K) and, as necessary, 8-K filings with the Securities and Exchange Commission (SEC) on legal and regulatory matters that relate to Ameriprise Financial and its affiliates. Copies of these filings may be obtained by accessing the SEC website at www.sec.gov.
There can be no assurance that these matters, or the adverse publicity associated with them, will not result in increased fund redemptions, reduced sale of fund shares or other adverse consequences to the Funds. Further, although we believe proceedings are not likely to have a material adverse effect on the Funds or the ability of Ameriprise Financial or its affiliates to perform under their contracts with the Funds, these proceedings are subject to uncertainties and, as such, we are unable to estimate the possible loss or range of loss that may result. An adverse outcome in one or more of these proceedings could result in adverse judgments, settlements, fines, penalties or other relief that could have a material adverse effect on the consolidated financial condition or results of operations of Ameriprise Financial.
Annual Report 2016
33
VARIABLE PORTFOLIO — AQR MANAGED FUTURES STRATEGY FUND
REPORT OF INDEPENDENT REGISTERED PUBLIC ACCOUNTING FIRM
To the Trustees of Columbia Funds Variable Insurance Trust and the Shareholders of
Variable Portfolio — AQR Managed Futures Strategy Fund
In our opinion, the accompanying consolidated statement of assets and liabilities, including the consolidated portfolio of investments, and the related consolidated statements of operations and of changes in net assets and the consolidated financial highlights present fairly, in all material respects, the financial position of Variable Portfolio — AQR Managed Futures Strategy Fund (the "Fund," a series of Columbia Funds Variable Insurance Trust) as of December 31, 2016, the results of its operations for the year then ended, the changes in its net assets for each of the two years in the period then ended and the financial highlights for each of the four years in the period then ended and for the period April 30, 2012 (commencement of operations) through December 31, 2012, in conformity with accounting principles generally accepted in the United States of America. These financial statements and financial highlights (hereafter referred to as "financial statements") are the responsibility of the Fund's management. Our responsibility is to express an opinion on these financial statements based on our audits. We conducted our audits of these financial statements in accordance with the standards of the Public Company Accounting Oversight Board (United States). Those standards require that we plan and perform the audit to obtain reasonable assurance about whether the financial statements are free of material misstatement. An audit includes examining, on a test basis, evidence supporting the amounts and disclosures in the financial statements, assessing the accounting principles used and significant estimates made by management, and evaluating the overall financial statement presentation. We believe that our audits, which included confirmation of securities as of December 31, 2016 by correspondence with the custodian, brokers and transfer agent, and the application of alternative auditing procedures where such confirmations had not been received, provide a reasonable basis for our opinion.
PricewaterhouseCoopers LLP
Minneapolis, MN
February 17, 2017
Annual Report 2016
34
VARIABLE PORTFOLIO — AQR MANAGED FUTURES STRATEGY FUND
TRUSTEES AND OFFICERS
Shareholders elect the Board that oversees the Fund's operations. The Board appoints officers who are responsible for day-to-day business decisions based on policies set by the Board. The following table provides basic biographical information about the Fund's Trustees, including their principal occupations during the past five years, although specific titles for individuals may have varied over the period. The year set forth beneath Length of Service in the table below is the year in which the Trustee was first appointed or elected as Trustee to any Fund currently in the Columbia Funds Complex or a predecessor thereof. Under current Board policy, members serve terms of indefinite duration.
Independent Trustees
| Name, Address, Year of Birth | Position Held With the Trust and Length of Service | Principal Occupation(s) During the Past Five Years and Other Relevant Professional Experience | Number of Funds in the Columbia Funds Complex Overseen | Other Directorships Held by Trustee During the Past Five Years | |||||||||||||||
| Janet Langford Carrig c/o Columbia Management Investment Advisers, LLC, 225 Franklin Street Mail Drop BX32 05228, Boston, MA 02110 1957 | Trustee 1996 | Senior Vice President, General Counsel and Corporate Secretary, ConocoPhillips (independent energy company) since September 2007 | 59 | None | |||||||||||||||
| Douglas A. Hacker c/o Columbia Management Investment Advisers, LLC, 225 Franklin Street Mail Drop BX32 05228, Boston, MA 02110 1955 | Trustee and Chairman of the Board 1996 | Independent business executive since May 2006; Executive Vice President — Strategy of United Airlines from December 2002 to May 2006; President of UAL Loyalty Services (airline marketing company) from September 2001 to December 2002; Executive Vice President and Chief Financial Officer of United Airlines from July 1999 to September 2001 | 59 | Spartan Nash Company (food distributor); Nash Finch Company (food distributor) from 2005 to 2013; Aircastle Limited (aircraft leasing); SeaCube Container Leasing Ltd. (container leasing) from 2010 to 2013; and Travelport Worldwide Limited (travel information technology) | |||||||||||||||
| Nancy T. Lukitsh c/o Columbia Management Investment Advisers, LLC, 225 Franklin Street Mail Drop BX32 05228, Boston, MA 02110 1956 | Trustee 2011 | Senior Vice President, Partner and Director of Marketing, Wellington Management Company, LLP (investment adviser) from 1997 to 2010; Chair, Wellington Management Portfolios (commingled non-U.S. investment pools) from 2007 to 2010; Director, Wellington Trust Company, NA and other Wellington affiliates from 1997 to 2010 | 59 | None | |||||||||||||||
Annual Report 2016
35
VARIABLE PORTFOLIO — AQR MANAGED FUTURES STRATEGY FUND
TRUSTEES AND OFFICERS (continued)
Independent Trustees (continued)
| Name, Address, Year of Birth | Position Held With the Trust and Length of Service | Principal Occupation(s) During the Past Five Years and Other Relevant Professional Experience | Number of Funds in the Columbia Funds Complex Overseen | Other Directorships Held by Trustee During the Past Five Years | |||||||||||||||
| David M. Moffett c/o Columbia Management Investment Advisers, LLC, 225 Franklin Street Mail Drop BX32 05228, Boston, MA 02110 1952 | Trustee 2011 | Retired. Consultant to Bridgewater and Associates | 59 | Director, CSX Corporation; Genworth Financial, Inc. (financial and insurance products and services); Paypal Holdings Inc. (payment and data processing services); Trustee University of Oklahoma Foundation; former Director eBay Inc. (online trading community), 2007-2015; and former Director, CIT Bank, CIT Group Inc. (commercial and consumer finance), 2010-2016 | |||||||||||||||
| Charles R. Nelson c/o Columbia Management Investment Advisers, LLC, 225 Franklin Street Mail Drop BX32 05228, Boston, MA 02110 1942 | Trustee 1981 | Retired. Professor Emeritus, University of Washington since 2011; Professor of Economics, University of Washington from 1976 to 2011; Ford and Louisa Van Voorhis Professor of Political Economy, University of Washington from 1993 to 2011; Adjunct Professor of Statistics, University of Washington from 1980 to 2011; Associate Editor, Journal of Money, Credit and Banking from September 1993 to 2008; consultant on econometric and statistical matters | 59 | None | |||||||||||||||
| John J. Neuhauser c/o Columbia Management Investment Advisers, LLC, 225 Franklin Street Mail Drop BX32 05228, Boston, MA 02110 1943 | Trustee 1984 | President, Saint Michael's College since August 2007; Director or Trustee of several non-profit organizations, including University of Vermont Medical Center; Academic Vice President and Dean of Faculties, Boston College from August 1999 to October 2005; University Professor, Boston College from November 2005 to August 2007 | 59 | Liberty All-Star Equity Fund and Liberty All-Star Growth Fund (closed-end funds) | |||||||||||||||
| Patrick J. Simpson c/o Columbia Management Investment Advisers, LLC, 225 Franklin Street Mail Drop BX32 05228, Boston, MA 02110 1944 | Trustee 2000 | Of Counsel, Perkins Coie LLP (law firm) since 2015; Partner, Perkins Coie LLP from 1988 to 2014 | 59 | None | |||||||||||||||
Annual Report 2016
36
VARIABLE PORTFOLIO — AQR MANAGED FUTURES STRATEGY FUND
TRUSTEES AND OFFICERS (continued)
Independent Trustees (continued)
| Name, Address, Year of Birth | Position Held With the Trust and Length of Service | Principal Occupation(s) During the Past Five Years and Other Relevant Professional Experience | Number of Funds in the Columbia Funds Complex Overseen | Other Directorships Held by Trustee During the Past Five Years | |||||||||||||||
| Anne-Lee Verville c/o Columbia Management Investment Advisers, LLC, 225 Franklin Street Mail Drop BX32 05228, Boston, MA 02110 1945 | Trustee 1998 | Retired. General Manager, Global Education Industry from 1994 to 1997, President — Application Systems Division from 1991 to 1994, Chief Financial Officer — US Marketing & Services from 1988 to 1991, and Chief Information Officer from 1987 to 1988, IBM Corporation (computer and technology) | 59 | Enesco Group, Inc. (producer of giftware and home and garden decor products) from 2001 to 2006 | |||||||||||||||
Consultants to the Independent Trustees*
| Name, Address, Year of Birth | Position Held With the Trust and Length of Service | Principal Occupation(s) During the Past Five Years and Other Relevant Professional Experience | Number of Funds in the Columbia Funds Complex Overseen | Other Directorships Held by Trustee During the Past Five Years | |||||||||||||||
| J. Kevin Connaughton c/o Columbia Management Investment Advisers, LLC, 225 Franklin Street Mail Drop BX32 05228, Boston, MA 02110 1964 | Independent Trustee Consultant 2016 | Independent Trustee Consultant, Columbia Funds since March 2016; Managing Director and General Manager of Mutual Fund Products, Columbia Management Investment Advisers, LLC from May 2010 to February 2015; President, Columbia Funds from 2009 to 2015; and senior officer of Columbia Funds and affiliated funds from 2003 to 2015 | 59 | Board of Governors, Gateway Healthcare since January 2016; Trustee, New Century Portfolios since March 2015; and Director, The Autism Project since March 2015 | |||||||||||||||
| Natalie A. Trunow c/o Columbia Management Investment Advisers, LLC, 225 Franklin Street Mail Drop BX32 05228, Boston, MA 02110 1967 | Independent Trustee Consultant 2016 | Independent Trustee Consultant, Columbia Funds since September 2016; Senior Vice President and Chief Executive Officer, Millennial Partners (investment consulting services to institutions) since January 2016; Director of Investments, Casey Family Programs from April 2016 to September 2016; Chief Investment Officer, Calvert Investments from August 2008 to January 2016; Section Head and Portfolio Manager, General Motors Asset Management from June 1997 to August 2008 | 59 | Healthcare Services for Children with Special Needs | |||||||||||||||
* J. Kevin Connaughton was appointed consultant to the Independent Trustees effective March 1, 2016. Natalie A. Trunow was appointed consultant to the Independent Trustees effective September 1, 2016. Shareholders of the Funds are expected to be asked to elect each of Mr. Connaughton and Ms. Trunow as a Trustee at a future shareholder meeting.
Annual Report 2016
37
VARIABLE PORTFOLIO — AQR MANAGED FUTURES STRATEGY FUND
TRUSTEES AND OFFICERS (continued)
Interested Trustee Affiliated with Investment Manager*
| Name, Address, Year of Birth | Position Held With the Trust and Length of Service | Principal Occupation(s) During the Past Five Years and Other Relevant Professional Experience | Number of Funds in the Columbia Funds Complex Overseen | Other Directorships Held by Trustee During the Past Five Years | |||||||||||||||
| William F. Truscott c/o Columbia Management Investment Advisers, LLC, 225 Franklin Street Boston, MA 02110 1960 | Trustee 2012 | Chairman of the Board and President, Columbia Management Investment Advisers, LLC since May 2010 and February 2012, respectively; Chief Executive Officer, Global Asset Management, Ameriprise Financial, Inc. since September 2012 (previously Chief Executive Officer, U.S. Asset Management & President, Annuities, May 2010- September 2012); Director and Chief Executive Officer, Columbia Management Investment Distributors, Inc. since May 2010 and February 2012, respectively; Chairman of the Board and Chief Executive Officer, RiverSource Distributors, Inc. since 2006; Director, Threadneedle Asset Management Holdings, SARL since 2014; President and Chief Executive Officer, Ameriprise Certificate Company, 2006-August 2012. | 185 | Trustee to other Columbia Funds since 2001; Chairman of the Board, Columbia Management Investment Advisers, LLC since May 2010; Director, Columbia Management Investment Distributors, Inc. since May 2010; Former Director, Ameriprise Certificate Company, 2006-January 2013 | |||||||||||||||
* Interested person (as defined under the 1940 Act) by reason of being an officer, director, security holder and/or employee of the Investment Manager or Ameriprise Financial.
The Statement of Additional Information has additional information about the Fund's Board members and is available, without charge, upon request by calling 800.345.6611 or contacting your financial intermediary.
Annual Report 2016
38
VARIABLE PORTFOLIO — AQR MANAGED FUTURES STRATEGY FUND
TRUSTEES AND OFFICERS (continued)
The Board has appointed officers who are responsible for day-to-day business decisions based on policies it has established. The officers serve at the pleasure of the Board. The following table provides basic information about the Officers of the Fund, including principal occupations during the past five years, although their specific titles may have varied over the period. In addition to Mr. Truscott, who is Senior Vice President, the Fund's other officers are:
Fund Officers
| Name, Address and Year of Birth | Position and Year First Appointed to Position for any Fund in the Columbia Funds Complex or a Predecessor Thereof | Principal Occupation(s) During Past Five Years | |||||||||
| Christopher O. Petersen 5228 Ameriprise Financial Center Minneapolis, MN 55474 Born 1970 | President and Principal Executive Officer (2015) | Vice President and Lead Chief Counsel, Ameriprise Financial, Inc. since January 2015 (previously, Vice President and Chief Counsel January 2010-December 2014); officer of Columbia Funds and affiliated funds since 2007. | |||||||||
| Michael G. Clarke 225 Franklin Street Boston, MA 02110 Born 1969 | Treasurer (2011), Chief Financial Officer (2009) and Chief Accounting Officer (2015) | Vice President — Mutual Fund Administration, Columbia Management Investment Advisers, LLC, since May 2010; senior officer of Columbia Funds and affiliated funds since 2002. | |||||||||
| Paul B. Goucher 100 Park Avenue New York, NY 10017 Born 1968 | Senior Vice President (2011), Chief Legal Officer (2015) and Assistant Secretary (2008) | Senior Vice President and Assistant General Counsel, Ameriprise Financial, Inc. since January 2017 (previously Vice President and Lead Chief Counsel, November 2008-January 2017 and January 2013-January 2017, respectively, and Chief Counsel, January 2010-January 2013); Vice President, Chief Legal Officer and Assistant Secretary, Columbia Management Investment Advisers, LLC since May 2010. | |||||||||
| Thomas P. McGuire 225 Franklin Street Boston, MA 02110 Born 1972 | Senior Vice President and Chief Compliance Officer (2012) | Vice President — Asset Management Compliance, Ameriprise Financial, Inc., since May 2010; Chief Compliance Officer, Ameriprise Certificate Company since September 2010. | |||||||||
| Colin Moore 225 Franklin Street Boston, MA 02110 Born 1958 | Senior Vice President (2010) | Executive Vice President and Global Chief Investment Officer, Ameriprise Financial, Inc., since July 2013; Executive Vice President and Global Chief Investment Officer, Columbia Management Investment Advisers, LLC since July 2013 (previously Director and Global Chief Investment Officer, 2010-2013). | |||||||||
| Michael E. DeFao 225 Franklin Street Boston, MA 02110 Born 1968 | Vice President (2011) and Assistant Secretary (2010) | Vice President and Chief Counsel, Ameriprise Financial, Inc. since May 2010. | |||||||||
| Amy Johnson 5228 Ameriprise Financial Center Minneapolis, MN 55474 Born 1965 | Vice President (2006) | Managing Director and Global Head of Operations, Columbia Management Investment Advisers, LLC since April 2016 (previously Managing Director and Chief Operating Officer, 2010-2016). | |||||||||
| Lyn Kephart-Strong 5228 Ameriprise Financial Center Minneapolis, MN 55474 Born 1960 | Vice President (2015) | President, Columbia Management Investment Services Corp. since October 2014; Vice President & Resolution Officer, Ameriprise Trust Company since August 2009. | |||||||||
| Ryan C. Larrenaga 225 Franklin Street Boston, MA 02110 Born 1970 | Vice President and Secretary (2015) | Vice President and Group Counsel, Ameriprise Financial, Inc. since August 2011; officer of Columbia Funds and affiliated funds since 2005. | |||||||||
Annual Report 2016
39
This page intentionally left blank.
Annual Report 2016
40
VARIABLE PORTFOLIO — AQR MANAGED FUTURES STRATEGY FUND
IMPORTANT INFORMATION ABOUT THIS REPORT
The policy of the Board is to vote the proxies of the companies in which each fund holds investments consistent with the procedures as stated in the Statement of Additional Information (SAI). You may obtain a copy of the SAI without charge by calling 800.345.6611; contacting your financial intermediary or searching the website of the Securities and Exchange Commission (SEC) at sec.gov. Information regarding how each fund voted proxies relating to portfolio securities is filed with the SEC by August 31st for the most recent 12-month period ending June 30th of that year, and is available without charge by visiting investor.columbiathreadneedleus.com, or searching the website of the SEC at sec.gov.
Each fund files a complete schedule of portfolio holdings with the SEC for the first and third quarters of each fiscal year on Form N-Q. Each fund's Form N-Q is available on the SEC's website at sec.gov and may be reviewed and copied at the SEC's Public Reference Room in Washington, D.C. Information on the operation of the Public Reference Room may be obtained by calling 800.SEC.0330. Each fund's complete schedule of portfolio holdings, as filed on Form N-Q, can also be obtained without charge, upon request, by calling 800.345.6611.
You may obtain the current net asset value (NAV) of Fund shares at no cost by calling 800.345.6611 or by sending an e-mail to serviceinquiries@columbiathreadneedle.com.
Annual Report 2016
41
Variable Portfolio — AQR Managed Futures Strategy Fund
P.O. Box 8081
Boston, MA 02266-8081

Please read and consider the investment objectives, risks, charges and expenses for any fund carefully before investing. For fund and other investment product prospectuses, which contain this and other important information, contact your financial advisor or insurance representative. Please read the prospectus carefully before you invest. The Fund is distributed by Columbia Management Investment Distributors, Inc., member FINRA, and managed by Columbia Management Investment Advisers, LLC.
Columbia Threadneedle Investments (Columbia Threadneedle) is the global brand name of the Columbia and Threadneedle group of companies.
All rights reserved. Columbia Management Investment Distributors, Inc., 225 Franklin Street, Boston, MA 02110-2804
© 2017 Columbia Management Investment Advisers, LLC.
C-1538 AN (2/17)

ANNUAL REPORT
December 31, 2016

COLUMBIA VARIABLE PORTFOLIO — SMALL COMPANY GROWTH FUND
Please remember that you may not buy (nor will you own) shares of the Fund directly. The Fund is available through variable annuity contracts and variable life insurance policies offered by the separate accounts of participating insurance companies as well as qualified pension and retirement plans. Please contact your financial advisor or insurance representative for more information.

COLUMBIA VARIABLE PORTFOLIO — SMALL COMPANY GROWTH FUND
TABLE OF CONTENTS
Performance Overview | 2 | ||||||
Manager Discussion of Fund Performance | 4 | ||||||
Understanding Your Fund's Expenses | 6 | ||||||
Portfolio of Investments | 7 | ||||||
Statement of Assets and Liabilities | 12 | ||||||
Statement of Operations | 14 | ||||||
Statement of Changes in Net Assets | 15 | ||||||
Financial Highlights | 17 | ||||||
Notes to Financial Statements | 19 | ||||||
Report of Independent Registered Public Accounting Firm | 25 | ||||||
Federal Income Tax Information | 26 | ||||||
Trustees and Officers | 27 | ||||||
Important Information About This Report | 33 | ||||||
The views expressed in this report reflect the current views of the respective parties. These views are not guarantees of future performance and involve certain risks, uncertainties and assumptions that are difficult to predict, so actual outcomes and results may differ significantly from the views expressed. These views are subject to change at any time based upon economic, market or other conditions and the respective parties disclaim any responsibility to update such views. These views may not be relied on as investment advice and, because investment decisions for a Columbia fund are based on numerous factors, may not be relied on as an indication of trading intent on behalf of any particular Columbia fund. References to specific securities should not be construed as a recommendation or investment advice.
Annual Report 2016
COLUMBIA VARIABLE PORTFOLIO — SMALL COMPANY GROWTH FUND
PERFORMANCE OVERVIEW
Performance Summary
n Columbia Variable Portfolio — Small Company Growth Fund (the Fund) Class 2 shares returned 12.53% for the 12 months that ended December 31, 2016.
n The Fund outperformed its benchmark, the Russell 2000 Growth Index, which returned 11.32% during the same time period.
n Stock selection in the health care, energy, materials and financials sectors contributed the most to the Fund's performance advantage over the benchmark.
Average Annual Total Returns (%) (for period ended December 31, 2016)
Inception | 1 Year | 5 Years | 10 Years | ||||||||||||||||
Class 1 | 01/01/89 | 12.74 | 11.92 | 6.03 | |||||||||||||||
Class 2 | 06/01/00 | 12.53 | 11.64 | 5.77 | |||||||||||||||
Russell 2000 Growth Index | 11.32 | 13.74 | 7.76 | ||||||||||||||||
Performance data quoted represents past performance and current performance may be lower or higher. Past performance is no guarantee of future results. The investment return and principal value will fluctuate so that shares, when redeemed, may be worth more or less than the original cost. For current month-end performance information, please contact your financial advisor or insurance representative.
Performance results reflect the effect of any fee waivers or reimbursements of fund expenses by Columbia Management Investment Advisers, LLC and/or any of its affiliates. Absent these fee waivers or expense reimbursement arrangements, performance results would have been lower.
Investment earnings, if any, are tax-deferred until distributed to shareholders, at which time taxes may become due. Total return performance includes changes in share price and assumes reinvestment of dividends and capital gains, if any. Performance results reflect the effect of all fund expenses, but do not include any fees and expenses imposed under your variable annuity contract and/or variable life insurance policy or qualified pension or retirement plan. If performance results included the effect of these additional charges, they would be lower.
The Russell 2000 Growth Index measures the performance of those Russell 2000 Index companies with higher price-to-book ratios and higher forecasted growth values.
Indices are not available for investment, are not professionally managed and do not reflect sales charges, fees, brokerage commissions, taxes or other expenses of investing. Securities in the Fund may not match those in an index.
Annual Report 2016
2
COLUMBIA VARIABLE PORTFOLIO — SMALL COMPANY GROWTH FUND
PERFORMANCE OVERVIEW (continued)
Performance of a Hypothetical $10,000 Investment (January 1, 2007 – December 31, 2016)

The chart above shows the change in value of a hypothetical $10,000 investment in Class 2 shares of Columbia Variable Portfolio — Small Company Growth Fund during the stated time period, and does not reflect the deduction of taxes, if any, that a shareholder may pay on Fund distributions or on the redemption of Fund shares. The returns also do not reflect fees and expenses imposed under your variable annuity contract and/or variable life insurance policy or qualified pension or retirement plan, if any.
Annual Report 2016
3
COLUMBIA VARIABLE PORTFOLIO — SMALL COMPANY GROWTH FUND
MANAGER DISCUSSION OF FUND PERFORMANCE
Portfolio Management
Daniel Cole, CFA
Wayne Collette, CFA
Lawrence Lin, CFA
Rahul Narang*
*Effective January 27, 2016, Mr. Narang no longer serves as a Portfolio Manager of the Fund.
| Top Ten Holdings (%) (at December 31, 2016) | |||||||
Veeva Systems Inc., Class A | 2.2 | ||||||
Six Flags Entertainment Corp. | 2.2 | ||||||
| West Pharmaceutical Services, Inc. | 2.2 | ||||||
Cognex Corp. | 2.1 | ||||||
Paycom Software, Inc. | 2.0 | ||||||
Fair Isaac Corp. | 2.0 | ||||||
Match Group, Inc. | 1.9 | ||||||
ICU Medical, Inc. | 1.8 | ||||||
Chemed Corp. | 1.6 | ||||||
Shopify, Inc., Class A | 1.6 | ||||||
Percentages indicated are based upon total investments (excluding Money Market Funds).
For further detail about these holdings, please refer to the section entitled "Portfolio of Investments."
Fund holdings are as of the date given, are subject to change at any time, and are not recommendations to buy or sell any security.
| Portfolio Breakdown (%) (at December 31, 2016) | |||||||
Common Stocks | 97.0 | ||||||
Money Market Funds | 3.0 | ||||||
Total | 100.0 | ||||||
Percentages indicated are based upon total investments. The Fund's portfolio composition is subject to change.
For the 12-month period that ended December 31, 2016, the Fund's Class 2 shares returned 12.53%. The Fund outperformed its benchmark, the Russell 2000 Growth Index, which returned 11.32% for the same time period. Fund performance was largely driven by stock selection, as we tend to maintain sector weights close to that of the benchmark. Stock selection in health care, energy, materials and financials were the top contributors to relative performance, while stock selection in consumer staples detracted the most from relative returns.
U.S. Markets Logged Solid Gains
Global events, political uncertainty and mixed economic data were enough to keep investors off balance in 2016 as financial markets moved sharply in reaction to each significant change on the world stage. Early in the year concerns about China and oil rattled the equity markets and drove stock prices down in February. After a swift rebound, the stock market swooned again in the early summer in reaction to the U.K. vote to exit the European Union. U.S. Treasury yields also plummeted. Once again, the markets rebounded, but investors again retreated in the third quarter in reaction to mixed economic data and political uncertainty. However, the end of a contentious U.S. Presidential contest eliminated a key element of uncertainty, and economic data turned almost unanimously positive. Steady job growth drove unemployment down to 4.6%. Corporate earnings growth picked up. Manufacturing activity accelerated, and the price of oil stabilized.
In December 2016, the Federal Reserve (the Fed) raised the target range of its benchmark interest rate by a quarter of a point to between 0.50% and 0.75%, its first such move in a year. The Fed's action had been widely anticipated and had little or no impact on the financial markets when it occurred. The Fed indicated that it would continue to monitor inflation and the job market in considering future rate hikes.
Against this backdrop, the S&P 500 Index, a broad measure of U.S. stock market performance, rose 11.96%. Small and mid-cap stocks outperformed large-cap stocks, and value outperformed growth by an especially large margin. As interest rates rose during the period, energy and interest-rate sensitive financials were the strongest performing equity sectors.
Contributors and Detractors
Stock selection in the health care sector was particularly strong, with top contributions from Align Technology and Tesaro. Align Technology manufactures Invisalign, a system of nearly invisible removable teeth aligners. Invisalign's steady disruption of the traditional use of "wires and brackets" by dentists has marched higher as each successive generation of the product has gotten better. In addition to product innovation, the company has done an excellent job of innovating the manufacturing process, thus making it increasingly difficult to copy once current patents begin to expire. Align Technology ended the year with a market capitalization well above $7 billion, and we harvested gains after many years of following the company's progress. Biotechnology firm Tesaro more than doubled on a single day during the fourth quarter, after
Annual Report 2016
4
COLUMBIA VARIABLE PORTFOLIO — SMALL COMPANY GROWTH FUND
MANAGER DISCUSSION OF FUND PERFORMANCE (continued)
reporting strong data from a pivotal phase III ovarian cancer trial. In the energy sector, positions in Oasis Petroleum, which is engaged in the exploration and production of oil and natural gas in the Williston Basin in North Dakota and Montana, and WPX Energy, a petroleum and natural gas exploration company, aided relative results with substantial gains. Neither is in the benchmark.
The materials sector produced the Fund's top individual contributor, KapStone Paper and Packaging. The producer of containerboard and kraft paper reported solid earnings and pricing increases for 2017. In the financials sector, Webster Financial aided relative returns. In addition to its core banking business with branches in CT, MA, RI and NY, the company is one of the larger managers of Health Savings Accounts (HSAs) in the country. These HSA deposits provide Webster with a low cost and stable source of funds for the core business.
In the consumer staples sector, Sprouts Farmers Markets was the largest detractor from performance. The natural and organic market chain significantly lowered its earnings guidance because of heightened competition in the specialty grocer segment as well as pricing pressures. We're hopeful that the deflationary pressures that have prevailed for food prices for a longer-than-normal amount of time are now stabilizing and will provide a better industry backdrop. Sprout's core focus on fresh fruits and vegetables has been a key source of differentiation versus other grocers and has helped produce excellent store-level returns on capital for the company. Elsewhere in the portfolio, Ultragenyx Pharmaceutical, a biopharmaceutical firm focused on the treatment of rare diseases, particularly genetic diseases, declined in price due primarily to the broad decline in the biotech industry in 2016. The group was a particular focus during the presidential election cycle, based on fears of potential negative changes in drug pricing policy. This policy risk is of less concern to us because we're confident that early stage biotech companies that focus on innovating new, life-saving drugs will continue to provide unique opportunities for significant value creation.
At Period's End
We believe it is prudent to monitor factors such as interest rates, trade agreements, tax policy and regulations as a new economic cycle potentially unfolds. Most of all, we will continue to adhere to our bottom-up, fundamental research process to help us identify stocks that trade at substantial discounts to fair value, management teams that are committed to maximizing shareholder value and businesses with key competitive advantages that generate value over time.
| Equity Sector Breakdown (%) (at December 31, 2016) | |||||||
Consumer Discretionary | 18.9 | ||||||
Consumer Staples | 1.8 | ||||||
Energy | 3.8 | ||||||
Financials | 5.3 | ||||||
Health Care | 26.7 | ||||||
Industrials | 11.8 | ||||||
Information Technology | 22.7 | ||||||
Materials | 3.0 | ||||||
Real Estate | 5.1 | ||||||
Telecommunication Services | 0.9 | ||||||
Total | 100.0 | ||||||
Percentages indicated are based upon total equity investments. The Fund's portfolio composition is subject to change.
Annual Report 2016
5
COLUMBIA VARIABLE PORTFOLIO — SMALL COMPANY GROWTH FUND
UNDERSTANDING YOUR FUND'S EXPENSES
(Unaudited)
As an investor, you incur ongoing costs, which generally include management fees, distribution and/or service fees, and other fund expenses. The following information is intended to help you understand your ongoing costs (in dollars) of investing in the Fund and to help you compare these costs with the ongoing costs of investing in other mutual funds.
The information below does not reflect fees and expenses imposed under your variable annuity contract and/or variable life insurance policy (collectively, Contracts) or qualified pension and retirement plan (Qualified Plan), if any. The total fees and expenses you bear may therefore be higher than those shown below.
Analyzing Your Fund's Expenses
To illustrate these ongoing costs, we have provided examples and calculated the expenses paid by investors in each share class of the Fund during the period. The actual and hypothetical information in the table is based on an initial investment of $1,000 at the beginning of the period indicated and held for the entire period. Expense information is calculated two ways and each method provides you with different information. The amount listed in the "Actual" column is calculated using the Fund's actual operating expenses and total return for the period. You may use the Actual information, together with the amount invested, to estimate the expenses that you paid over the period. Simply divide your account value by $1,000 (for example, an $8,600 account value divided by $1,000 = 8.6), then multiply the results by the expenses paid during the period under the "Actual" column. The amount listed in the "Hypothetical" column assumes a 5% annual rate of return before expenses (which is not the Fund's actual return) and then applies the Fund's actual expense ratio for the period to the hypothetical return. You should not use the hypothetical account values and expenses to estimate either your actual account balance at the end of the period or the expenses you paid during the period. See "Compare With Other Funds" below for details on how to use the hypothetical data.
Compare With Other Funds
Since all mutual funds are required to include the same hypothetical calculations about expenses in shareholder reports, you can use this information to compare the ongoing cost of investing in the Fund with other funds. To do so, compare the hypothetical example with the 5% hypothetical examples that appear in the shareholder reports of other funds. As you compare hypothetical examples of other funds, it is important to note that hypothetical examples are meant to highlight the ongoing costs of investing in a fund only and do not reflect any transaction costs, such as redemption or exchange fees, or expenses that apply to the subaccount or the Contract. Therefore, the hypothetical calculations are useful in comparing ongoing costs only, and will not help you determine the relative total costs of owning different funds. If the fees and expenses imposed under your Contract or Qualified Plan, if any, were included, your costs would be higher.
July 1, 2016 – December 31, 2016
| Account Value at the Beginning of the Period ($) | Account Value at the End of the Period ($) | Expenses Paid During the Period ($) | Fund's Annualized Expense Ratio (%) | ||||||||||||||||||||||||||||
Actual | Hypothetical | Actual | Hypothetical | Actual | Hypothetical | Actual | |||||||||||||||||||||||||
Class 1 | 1,000.00 | 1,000.00 | 1,118.10 | 1,020.35 | 4.92 | 4.70 | 0.93 | ||||||||||||||||||||||||
Class 2 | 1,000.00 | 1,000.00 | 1,117.10 | 1,019.10 | 6.25 | 5.96 | 1.18 | ||||||||||||||||||||||||
Expenses paid during the period are equal to the annualized expense ratio for each class as indicated above, multiplied by the average account value over the period and then multiplied by the number of days in the Fund's most recent fiscal half year and divided by 366.
Expenses do not include fees and expenses incurred indirectly by the Fund from its investment in underlying funds, including affiliated and non-affiliated pooled investment vehicles, such as mutual funds and exchange-traded funds.
Had Columbia Management Investment Advisers, LLC and/or certain of its affiliates not waived/reimbursed certain fees and expenses, account value at the end of the period would have been reduced.
Annual Report 2016
6
COLUMBIA VARIABLE PORTFOLIO — SMALL COMPANY GROWTH FUND
PORTFOLIO OF INVESTMENTS
December 31, 2016
(Percentages represent value of investments compared to net assets)
Common Stocks 97.3%
Issuer | Shares | Value ($) | |||||||||
CONSUMER DISCRETIONARY 18.4% | |||||||||||
Auto Components 1.1% | |||||||||||
Cooper-Standard Holding, Inc.(a) | 2,870 | 296,700 | |||||||||
Hotels, Restaurants & Leisure 9.7% | |||||||||||
Chuy's Holdings, Inc.(a) | 2,295 | 74,473 | |||||||||
Domino's Pizza Enterprises Ltd. | 4,845 | 226,568 | |||||||||
Extended Stay America, Inc. | 22,312 | 360,339 | |||||||||
Habit Restaurants, Inc. (The), Class A(a) | 6,392 | 110,262 | |||||||||
Papa John's International, Inc. | 4,062 | 347,626 | |||||||||
Planet Fitness, Inc., Class A | 8,782 | 176,518 | |||||||||
Red Rock Resorts, Inc., Class A | 9,066 | 210,241 | |||||||||
Six Flags Entertainment Corp. | 9,823 | 588,987 | |||||||||
Sonic Corp. | 14,191 | 376,203 | |||||||||
Wingstop, Inc. | 5,937 | 175,676 | |||||||||
Total | 2,646,893 | ||||||||||
Internet & Direct Marketing Retail 0.2% | |||||||||||
Liberty TripAdvisor Holdings, Inc., Class A(a) | 3,865 | 58,168 | |||||||||
Media 2.6% | |||||||||||
IMAX Corp.(a) | 9,604 | 301,566 | |||||||||
Lions Gate Entertainment Corp.(a) | 10,395 | 255,093 | |||||||||
Nexstar Broadcasting Group, Inc., Class A | 2,656 | 168,125 | |||||||||
Total | 724,784 | ||||||||||
Specialty Retail 4.3% | |||||||||||
American Eagle Outfitters, Inc. | 8,018 | 121,633 | |||||||||
Five Below, Inc.(a) | 6,985 | 279,120 | |||||||||
Hibbett Sports, Inc.(a) | 5,367 | 200,189 | |||||||||
Monro Muffler Brake, Inc. | 4,773 | 273,016 | |||||||||
Pier 1 Imports, Inc. | 16,550 | 141,337 | |||||||||
Select Comfort Corp.(a) | 6,545 | 148,048 | |||||||||
Total | 1,163,343 | ||||||||||
Textiles, Apparel & Luxury Goods 0.5% | |||||||||||
G-III Apparel Group Ltd.(a) | 4,675 | 138,193 | |||||||||
Total Consumer Discretionary | 5,028,081 | ||||||||||
CONSUMER STAPLES 1.7% | |||||||||||
Beverages 0.9% | |||||||||||
Coca-Cola Bottling Co. Consolidated | 1,473 | 263,446 | |||||||||
Common Stocks (continued)
Issuer | Shares | Value ($) | |||||||||
Food & Staples Retailing 0.8% | |||||||||||
Sprouts Farmers Market, Inc.(a) | 11,473 | 217,069 | |||||||||
Total Consumer Staples | 480,515 | ||||||||||
ENERGY 3.7% | |||||||||||
Energy Equipment & Services 3.7% | |||||||||||
Calfrac Well Services Ltd. | 32,635 | 115,699 | |||||||||
Independence Contract Drilling, Inc.(a) | 13,535 | 90,684 | |||||||||
Patterson-UTI Energy, Inc. | 6,490 | 174,711 | |||||||||
Pioneer Energy Services Corp.(a) | 22,995 | 157,516 | |||||||||
Precision Drilling Corp.(a) | 37,810 | 206,064 | |||||||||
Superior Energy Services, Inc. | 7,940 | 134,027 | |||||||||
Trican Well Service Ltd.(a) | 36,555 | 125,240 | |||||||||
Total | 1,003,941 | ||||||||||
Total Energy | 1,003,941 | ||||||||||
FINANCIALS 5.2% | |||||||||||
Banks 1.5% | |||||||||||
BankUnited, Inc. | 5,275 | 198,815 | |||||||||
Webster Financial Corp. | 3,985 | 216,306 | |||||||||
Total | 415,121 | ||||||||||
Capital Markets 2.4% | |||||||||||
Evercore Partners, Inc., Class A | 3,145 | 216,061 | |||||||||
MarketAxess Holdings, Inc. | 1,691 | 248,442 | |||||||||
| Pzena Investment Management, Inc., Class A | 16,136 | 179,271 | |||||||||
Total | 643,774 | ||||||||||
Thrifts & Mortgage Finance 1.3% | |||||||||||
BofI Holding, Inc.(a) | 12,787 | 365,069 | |||||||||
Total Financials | 1,423,964 | ||||||||||
HEALTH CARE 25.9% | |||||||||||
Biotechnology 7.1% | |||||||||||
ACADIA Pharmaceuticals, Inc.(a) | 4,722 | 136,182 | |||||||||
Alder Biopharmaceuticals, Inc.(a) | 3,649 | 75,899 | |||||||||
ARIAD Pharmaceuticals, Inc.(a) | 14,757 | 183,577 | |||||||||
Axovant Sciences Ltd.(a) | 3,991 | 49,568 | |||||||||
bluebird bio, Inc.(a) | 1,581 | 97,548 | |||||||||
Curis, Inc.(a) | 28,004 | 86,252 | |||||||||
Dynavax Technologies Corp.(a) | 6,377 | 25,189 | |||||||||
The accompanying Notes to Financial Statements are an integral part of this statement.
Annual Report 2016
7
COLUMBIA VARIABLE PORTFOLIO — SMALL COMPANY GROWTH FUND
PORTFOLIO OF INVESTMENTS (continued)
December 31, 2016
Common Stocks (continued)
Issuer | Shares | Value ($) | |||||||||
Exact Sciences Corp.(a) | 4,065 | 54,308 | |||||||||
Halozyme Therapeutics, Inc.(a) | 10,001 | 98,810 | |||||||||
Insys Therapeutics, Inc.(a) | 5,762 | 53,010 | |||||||||
Keryx Biopharmaceuticals, Inc.(a) | 23,944 | 140,312 | |||||||||
Kite Pharma, Inc.(a) | 3,153 | 141,381 | |||||||||
MacroGenics, Inc.(a) | 3,129 | 63,957 | |||||||||
Puma Biotechnology, Inc.(a) | 4,554 | 139,808 | |||||||||
Ra Pharmaceuticals, Inc.(a) | 6,931 | 105,282 | |||||||||
Sage Therapeutics, Inc.(a) | 1,256 | 64,131 | |||||||||
Spark Therapeutics, Inc.(a) | 2,467 | 123,103 | |||||||||
TESARO, Inc.(a) | 870 | 116,998 | |||||||||
Ultragenyx Pharmaceutical, Inc.(a) | 2,197 | 154,471 | |||||||||
vTv Therapeutics, Inc., Class A(a) | 10,667 | 51,522 | |||||||||
Total | 1,961,308 | ||||||||||
Health Care Equipment & Supplies 7.2% | |||||||||||
Abaxis, Inc. | 5,595 | 295,248 | |||||||||
ABIOMED, Inc.(a) | 2,089 | 235,388 | |||||||||
ICU Medical, Inc.(a) | 3,248 | 478,593 | |||||||||
Natus Medical, Inc.(a) | 5,047 | 175,636 | |||||||||
NuVasive, Inc.(a) | 3,157 | 212,656 | |||||||||
West Pharmaceutical Services, Inc. | 6,887 | 584,224 | |||||||||
Total | 1,981,745 | ||||||||||
Health Care Providers & Services 4.5% | |||||||||||
Air Methods Corp.(a) | 6,315 | 201,133 | |||||||||
Chemed Corp. | 2,661 | 426,851 | |||||||||
HealthEquity, Inc.(a) | 10,261 | 415,776 | |||||||||
Molina Healthcare, Inc.(a) | 3,366 | 182,639 | |||||||||
Total | 1,226,399 | ||||||||||
Health Care Technology 2.2% | |||||||||||
Veeva Systems Inc., Class A(a) | 14,661 | 596,703 | |||||||||
Life Sciences Tools & Services 2.2% | |||||||||||
INC Research Holdings, Inc. Class A(a) | 6,083 | 319,966 | |||||||||
Pra Health Sciences, Inc.(a) | 5,008 | 276,041 | |||||||||
Total | 596,007 | ||||||||||
Pharmaceuticals 2.7% | |||||||||||
Aerie Pharmaceuticals, Inc.(a) | 2,397 | 90,727 | |||||||||
Akorn, Inc.(a) | 9,868 | 215,418 | |||||||||
Common Stocks (continued)
Issuer | Shares | Value ($) | |||||||||
Impax Laboratories, Inc.(a) | 13,537 | 179,365 | |||||||||
Supernus Pharmaceuticals, Inc.(a) | 9,933 | 250,808 | |||||||||
Total | 736,318 | ||||||||||
Total Health Care | 7,098,480 | ||||||||||
INDUSTRIALS 11.5% | |||||||||||
Aerospace & Defense 1.0% | |||||||||||
Teledyne Technologies, Inc.(a) | 2,263 | 278,349 | |||||||||
Building Products 1.7% | |||||||||||
Gibraltar Industries, Inc.(a) | 3,718 | 154,855 | |||||||||
Masonite International Corp.(a) | 4,715 | 310,247 | |||||||||
Total | 465,102 | ||||||||||
Commercial Services & Supplies 2.7% | |||||||||||
ARC Document Solutions, Inc.(a) | 37,822 | 192,136 | |||||||||
Casella Waste Systems, Inc., Class A(a) | 22,772 | 282,600 | |||||||||
Heritage-Crystal Clean, Inc.(a) | 16,011 | 251,373 | |||||||||
Total | 726,109 | ||||||||||
Electrical Equipment 1.1% | |||||||||||
Generac Holdings, Inc.(a) | 7,334 | 298,787 | |||||||||
Machinery 1.3% | |||||||||||
Manitowoc Foodservice, Inc.(a) | 8,940 | 172,810 | |||||||||
Terex Corp. | 6,184 | 194,982 | |||||||||
Total | 367,792 | ||||||||||
Marine 0.6% | |||||||||||
Kirby Corp.(a) | 2,562 | 170,373 | |||||||||
Road & Rail 1.2% | |||||||||||
Swift Transportation Co.(a) | 13,695 | 333,610 | |||||||||
Trading Companies & Distributors 1.9% | |||||||||||
H&E Equipment Services, Inc. | 9,600 | 223,200 | |||||||||
SiteOne Landscape Supply, Inc.(a) | 8,105 | 281,486 | |||||||||
Total | 504,686 | ||||||||||
Total Industrials | 3,144,808 | ||||||||||
INFORMATION TECHNOLOGY 22.1% | |||||||||||
Communications Equipment 1.3% | |||||||||||
Acacia Communications, Inc.(a) | 2,300 | 142,025 | |||||||||
Finisar Corp.(a) | 7,236 | 219,034 | |||||||||
Total | 361,059 | ||||||||||
The accompanying Notes to Financial Statements are an integral part of this statement.
Annual Report 2016
8
COLUMBIA VARIABLE PORTFOLIO — SMALL COMPANY GROWTH FUND
PORTFOLIO OF INVESTMENTS (continued)
December 31, 2016
Common Stocks (continued)
Issuer | Shares | Value ($) | |||||||||
Electronic Equipment, Instruments & Components 2.1% | |||||||||||
Cognex Corp. | 8,947 | 569,208 | |||||||||
Internet Software & Services 7.2% | |||||||||||
GTT Communications, Inc.(a) | 1,975 | 56,781 | |||||||||
j2 Global, Inc. | 3,147 | 257,425 | |||||||||
Match Group, Inc.(a) | 29,899 | 511,273 | |||||||||
Mimecast Ltd.(a) | 12,918 | 231,232 | |||||||||
Shopify, Inc., Class A(a) | 9,952 | 426,642 | |||||||||
SPS Commerce, Inc.(a) | 4,981 | 348,122 | |||||||||
Xactly Corp.(a) | 12,316 | 135,476 | |||||||||
Total | 1,966,951 | ||||||||||
IT Services 2.1% | |||||||||||
EPAM Systems, Inc.(a) | 2,271 | 146,048 | |||||||||
Euronet Worldwide, Inc.(a) | 5,877 | 425,671 | |||||||||
Total | 571,719 | ||||||||||
Semiconductors & Semiconductor Equipment 0.8% | |||||||||||
Cirrus Logic, Inc.(a) | 4,038 | 228,308 | |||||||||
Software 8.6% | |||||||||||
BroadSoft, Inc.(a) | 8,794 | 362,752 | |||||||||
CyberArk Software Ltd.(a) | 7,162 | 325,871 | |||||||||
Ellie Mae, Inc.(a) | 3,163 | 264,680 | |||||||||
Fair Isaac Corp. | 4,471 | 533,033 | |||||||||
Globant SA(a) | 5,119 | 170,719 | |||||||||
Paycom Software, Inc.(a) | 11,855 | 539,284 | |||||||||
Take-Two Interactive Software, Inc.(a) | 3,045 | 150,088 | |||||||||
Total | 2,346,427 | ||||||||||
Total Information Technology | 6,043,672 | ||||||||||
MATERIALS 3.0% | |||||||||||
Chemicals 0.8% | |||||||||||
Intrepid Potash, Inc.(a) | 36,991 | 76,941 | |||||||||
Trinseo SA | 2,544 | 150,859 | |||||||||
Total | 227,800 | ||||||||||
Common Stocks (continued)
Issuer | Shares | Value ($) | |||||||||
Construction Materials 1.6% | |||||||||||
Summit Materials, Inc., Class A(a) | 17,663 | 420,203 | |||||||||
Metals & Mining 0.6% | |||||||||||
Detour Gold Corp.(a) | 6,265 | 85,344 | |||||||||
Pan American Silver Corp. | 5,100 | 76,857 | |||||||||
Total | 162,201 | ||||||||||
Total Materials | 810,204 | ||||||||||
REAL ESTATE 4.9% | |||||||||||
Equity Real Estate Investment Trusts (REITs) 4.9% | |||||||||||
Coresite Realty Corp. | 1,775 | 140,882 | |||||||||
CyrusOne, Inc. | 6,656 | 297,723 | |||||||||
DuPont Fabros Technology, Inc. | 5,181 | 227,601 | |||||||||
National Storage Affiliates Trust | 14,612 | 322,487 | |||||||||
STORE Capital Corp. | 14,735 | 364,102 | |||||||||
Total | 1,352,795 | ||||||||||
Total Real Estate | 1,352,795 | ||||||||||
TELECOMMUNICATION SERVICES 0.9% | |||||||||||
Diversified Telecommunication Services 0.9% | |||||||||||
Cogent Communications Holdings, Inc. | 5,674 | 234,620 | |||||||||
Total Telecommunication Services | 234,620 | ||||||||||
| Total Common Stocks (Cost: $24,921,818) | 26,621,080 | ||||||||||
Money Market Funds 3.0%
Shares | Value ($) | ||||||||||
| Columbia Short-Term Cash Fund, 0.594%(b)(c) | 816,416 | 816,416 | |||||||||
| Total Money Market Funds (Cost: $816,416) | 816,416 | ||||||||||
| Total Investments (Cost: $25,738,234) | 27,437,496 | ||||||||||
Other Assets & Liabilities, Net | (72,268 | ) | |||||||||
Net Assets | 27,365,228 | ||||||||||
The accompanying Notes to Financial Statements are an integral part of this statement.
Annual Report 2016
9
COLUMBIA VARIABLE PORTFOLIO — SMALL COMPANY GROWTH FUND
PORTFOLIO OF INVESTMENTS (continued)
December 31, 2016
Notes to Portfolio of Investments
(a) Non-income producing investment.
(b) The rate shown is the seven-day current annualized yield at December 31, 2016.
(c) As defined in the Investment Company Act of 1940, an affiliated company is one in which the Fund owns 5% or more of the company's outstanding voting securities, or a company which is under common ownership or control with the Fund. Holdings and transactions in these affiliated companies during the year ended December 31, 2016 are as follows:
Issuer | Beginning Cost ($) | Purchase Cost ($) | Proceeds From Sales ($) | Realized Gain (Loss) ($) | Ending Cost ($) | Dividends — Affiliated Issuers ($) | Value ($) | ||||||||||||||||||||||||
Columbia Short-Term Cash Fund | 800,654 | 16,591,153 | (16,575,359 | ) | (32 | ) | 816,416 | 3,217 | 816,416 | ||||||||||||||||||||||
Fair Value Measurements
The Fund categorizes its fair value measurements according to a three-level hierarchy that maximizes the use of observable inputs and minimizes the use of unobservable inputs by prioritizing that the most observable input be used when available. Observable inputs are those that market participants would use in pricing an investment based on market data obtained from sources independent of the reporting entity. Unobservable inputs are those that reflect the Fund's assumptions about the information market participants would use in pricing an investment. An investment's level within the fair value hierarchy is based on the lowest level of any input that is deemed significant to the asset's or liability's fair value measurement. The input levels are not necessarily an indication of the risk or liquidity associated with investments at that level. For example, certain U.S. government securities are generally high quality and liquid, however, they are reflected as Level 2 because the inputs used to determine fair value may not always be quoted prices in an active market.
Fair value inputs are summarized in the three broad levels listed below:
> Level 1 — Valuations based on quoted prices for investments in active markets that the Fund has the ability to access at the measurement date (including NAV for open-end mutual funds). Valuation adjustments are not applied to Level 1 investments.
> Level 2 — Valuations based on other significant observable inputs (including quoted prices for similar securities, interest rates, prepayment speeds, credit risks, etc.).
> Level 3 — Valuations based on significant unobservable inputs (including the Fund's own assumptions and judgment in determining the fair value of investments).
Inputs that are used in determining fair value of an investment may include price information, credit data, volatility statistics, and other factors. These inputs can be either observable or unobservable. The availability of observable inputs can vary between investments, and is affected by various factors such as the type of investment, and the volume and level of activity for that investment or similar investments in the marketplace. The inputs will be considered by the Investment Manager, along with any other relevant factors in the calculation of an investment's fair value. The Fund uses prices and inputs that are current as of the measurement date, which may include periods of market dislocations. During these periods, the availability of prices and inputs may be reduced for many investments. This condition could cause an investment to be reclassified between the various levels within the hierarchy.
Foreign equity securities actively traded in markets where there is a significant delay in the local close relative to the New York Stock Exchange (NYSE) are classified as Level 2. The values of these securities may include an adjustment to reflect the impact of significant market movements following the close of local trading, as described in Note 2 to the financial statements — Security Valuation.
Certain investments that have been measured at fair value using the net asset value (NAV) per share (or its equivalent) are not categorized in the fair value hierarchy. The fair value amounts presented in the table are intended to reconcile the fair value hierarchy to the amounts presented in the Portfolio of Investments. The Columbia Short-Term Cash Fund seeks to provide shareholders with maximum current income consistent with liquidity and stability of principal. Columbia Short-Term Cash Fund prices its shares with a floating NAV and no longer seeks to maintain a stable NAV.
Investments falling into the Level 3 category are primarily supported by quoted prices from brokers and dealers participating in the market for those investments. However, these may be classified as Level 3 investments due to lack of market transparency and corroboration to support these quoted prices. Additionally, valuation models may be used as the pricing source for any remaining investments classified as Level 3. These models may rely on one or more significant unobservable inputs and/or significant assumptions by the Investment Manager. Inputs used in valuations may include, but are not limited to, financial statement analysis, capital account balances, discount rates and estimated cash flows, and comparable company data.
Under the direction of the Fund's Board of Trustees (the Board), the Investment Manager's Valuation Committee (the Committee) is responsible for overseeing the valuation procedures approved by the Board. The Committee consists of voting and non-voting members from various groups within the Investment Manager's organization, including operations and accounting, trading and investments, compliance, risk management and legal.
The accompanying Notes to Financial Statements are an integral part of this statement.
Annual Report 2016
10
COLUMBIA VARIABLE PORTFOLIO — SMALL COMPANY GROWTH FUND
PORTFOLIO OF INVESTMENTS (continued)
December 31, 2016
Fair Value Measurements (continued)
The Committee meets at least monthly to review and approve valuation matters, which may include a description of specific valuation determinations, data regarding pricing information received from approved pricing vendors and brokers and the results of Board-approved valuation control policies and procedures (the Policies). The Policies address, among other things, instances when market quotations are or are not readily available, including recommendations of third party pricing vendors and a determination of appropriate pricing methodologies; events that require specific valuation determinations and assessment of fair value techniques; securities with a potential for stale pricing, including those that are illiquid, restricted, or in default; and the effectiveness of third party pricing vendors, including periodic reviews of vendors. The Committee meets more frequently, as needed, to discuss additional valuation matters, which may include the need to review back-testing results, review time-sensitive information or approve related valuation actions. The Committee reports to the Board, with members of the Committee meeting with the Board at each of its regularly scheduled meetings to discuss valuation matters and actions during the period, similar to those described earlier.
For investments categorized as Level 3, the Committee monitors information similar to that described above, which may include: (i) data specific to the issuer or comparable issuers, (ii) general market or specific sector news and (iii) quoted prices and specific or similar security transactions. The Committee considers this data and any changes from prior periods in order to assess the reasonableness of observable and unobservable inputs, any assumptions or internal models used to value those securities and changes in fair value. This data is also used to corroborate, when available, information received from approved pricing vendors and brokers. Various factors impact the frequency of monitoring this information (which may occur as often as daily). However, the Committee may determine that changes to inputs, assumptions and models are not required as a result of the monitoring procedures performed.
The following table is a summary of the inputs used to value the Fund's investments at December 31, 2016:
| Level 1 Quoted Prices in Active Markets for Identical Assets ($) | Level 2 Other Significant Observable Inputs ($) | Level 3 Significant Unobservable Inputs ($) | Total ($) | ||||||||||||||||
Investments | |||||||||||||||||||
Common Stocks | |||||||||||||||||||
Consumer Discretionary | 4,801,513 | 226,568 | — | 5,028,081 | |||||||||||||||
Consumer Staples | 480,515 | — | — | 480,515 | |||||||||||||||
Energy | 1,003,941 | — | — | 1,003,941 | |||||||||||||||
Financials | 1,423,964 | — | — | 1,423,964 | |||||||||||||||
Health Care | 7,098,480 | — | — | 7,098,480 | |||||||||||||||
Industrials | 3,144,808 | — | — | 3,144,808 | |||||||||||||||
Information Technology | 6,043,672 | — | — | 6,043,672 | |||||||||||||||
Materials | 810,204 | — | — | 810,204 | |||||||||||||||
Real Estate | 1,352,795 | — | — | 1,352,795 | |||||||||||||||
Telecommunication Services | 234,620 | — | — | 234,620 | |||||||||||||||
Total Common Stocks | 26,394,512 | 226,568 | — | 26,621,080 | |||||||||||||||
Investments measured at net asset value | |||||||||||||||||||
Money Market Funds | — | — | — | 816,416 | |||||||||||||||
Total Investments | 26,394,512 | 226,568 | — | 27,437,496 | |||||||||||||||
See the Portfolio of Investments for all investment classifications not indicated in the table.
The Fund's assets assigned to the Level 2 input category are generally valued using the market approach, in which a security's value is determined through reference to prices and information from market transactions for similar or identical assets. These assets include certain foreign securities for which a third party statistical pricing service may be employed for purposes of fair market valuation. The model utilized by such third party statistical pricing service takes into account a security's correlation to available market data including, but not limited to, intraday index, ADR, and exchange-traded fund movements.
There were no transfers of financial assets between levels during the period.
The accompanying Notes to Financial Statements are an integral part of this statement.
Annual Report 2016
11
COLUMBIA VARIABLE PORTFOLIO — SMALL COMPANY GROWTH FUND
STATEMENT OF ASSETS AND LIABILITIES
December 31, 2016
Assets | |||||||
Investments, at value | |||||||
Unaffiliated issuers (identified cost $24,921,818) | $ | 26,621,080 | |||||
Affiliated issuers (identified cost $816,416) | 816,416 | ||||||
Total investments (identified cost $25,738,234) | 27,437,496 | ||||||
Receivable for: | |||||||
Investments sold | 82,590 | ||||||
Dividends | 10,718 | ||||||
Expense reimbursement due from Investment Manager | 4,423 | ||||||
Prepaid expenses | 145 | ||||||
Trustees' deferred compensation plan | 33,296 | ||||||
Total assets | 27,568,668 | ||||||
Liabilities | |||||||
Payable for: | |||||||
Investments purchased | 42,295 | ||||||
Capital shares purchased | 41,812 | ||||||
Management services fees | 19,837 | ||||||
Distribution and/or service fees | 103 | ||||||
Transfer agent fees | 1,368 | ||||||
Compensation of board members | 25,907 | ||||||
Chief compliance officer expenses | 3 | ||||||
Audit fees | 24,215 | ||||||
Printing and postage fees | 11,625 | ||||||
Other expenses | 2,979 | ||||||
Trustees' deferred compensation plan | 33,296 | ||||||
Total liabilities | 203,440 | ||||||
Net assets applicable to outstanding capital stock | $ | 27,365,228 | |||||
Represented by | |||||||
Paid-in capital | $ | 24,281,413 | |||||
Excess of distributions over net investment income | (55,451 | ) | |||||
Accumulated net realized gain | 1,440,004 | ||||||
Unrealized appreciation (depreciation) on: | |||||||
Investments -— unaffiliated issuers | 1,699,262 | ||||||
Total — representing net assets applicable to outstanding capital stock | $ | 27,365,228 | |||||
The accompanying Notes to Financial Statements are an integral part of this statement.
Annual Report 2016
12
COLUMBIA VARIABLE PORTFOLIO — SMALL COMPANY GROWTH FUND
STATEMENT OF ASSETS AND LIABILITIES (continued)
December 31, 2016
Class 1 | |||||||
Net assets | $ | 26,911,561 | |||||
Shares outstanding | 1,757,354 | ||||||
Net asset value per share | $ | 15.31 | |||||
Class 2 | |||||||
Net assets | $ | 453,667 | |||||
Shares outstanding | 30,767 | ||||||
Net asset value per share | $ | 14.75 | |||||
The accompanying Notes to Financial Statements are an integral part of this statement.
Annual Report 2016
13
COLUMBIA VARIABLE PORTFOLIO — SMALL COMPANY GROWTH FUND
STATEMENT OF OPERATIONS
Year Ended December 31, 2016
Net investment income | |||||||
Income: | |||||||
Dividends — unaffiliated issuers | $ | 210,349 | |||||
Dividends — affiliated issuers | 3,217 | ||||||
Foreign taxes withheld | (216 | ) | |||||
Total income | 213,350 | ||||||
Expenses: | |||||||
Management services fees | 230,834 | ||||||
Distribution and/or service fees | |||||||
Class 2 | 1,182 | ||||||
Transfer agent fees | |||||||
Class 1 | 15,635 | ||||||
Class 2 | 284 | ||||||
Compensation of board members | 19,373 | ||||||
Custodian fees | 14,244 | ||||||
Printing and postage fees | 29,137 | ||||||
Audit fees | 27,015 | ||||||
Legal fees | 613 | ||||||
Chief compliance officer expenses | 12 | ||||||
Other | 4,856 | ||||||
Total expenses | 343,185 | ||||||
Fees waived or expenses reimbursed by Investment Manager and its affiliates | (93,043 | ) | |||||
Total net expenses | 250,142 | ||||||
Net investment income | (36,792 | ) | |||||
Realized and unrealized gain (loss) — net | |||||||
Net realized gain (loss) on: | |||||||
Investments — unaffiliated issuers | 1,654,790 | ||||||
Investments — affiliated issuers | (32 | ) | |||||
Foreign currency translations | (212 | ) | |||||
Net realized gain | 1,654,546 | ||||||
Net change in unrealized appreciation (depreciation) on: | |||||||
Investments — unaffiliated issuers | 1,569,748 | ||||||
Net change in unrealized appreciation | 1,569,748 | ||||||
Net realized and unrealized gain | 3,224,294 | ||||||
Net increase in net assets resulting from operations | $ | 3,187,502 | |||||
The accompanying Notes to Financial Statements are an integral part of this statement.
Annual Report 2016
14
COLUMBIA VARIABLE PORTFOLIO — SMALL COMPANY GROWTH FUND
STATEMENT OF CHANGES IN NET ASSETS
| Year Ended December 31, 2016 | Year Ended December 31, 2015 | ||||||||||
Operations | |||||||||||
Net investment income (loss) | $ | (36,792 | ) | $ | (146,339 | ) | |||||
Net realized gain | 1,654,546 | 5,567,948 | |||||||||
Net change in unrealized appreciation (depreciation) | 1,569,748 | (4,135,163 | ) | ||||||||
Net increase in net assets resulting from operations | 3,187,502 | 1,286,446 | |||||||||
Distributions to shareholders | |||||||||||
Net realized gains | |||||||||||
Class 1 | (5,250,673 | ) | (1,514,444 | ) | |||||||
Class 2 | (96,539 | ) | (22,735 | ) | |||||||
Total distributions to shareholders | (5,347,212 | ) | (1,537,179 | ) | |||||||
Increase (decrease) in net assets from capital stock activity | 1,551,337 | (2,701,057 | ) | ||||||||
Total decrease in net assets | (608,373 | ) | (2,951,790 | ) | |||||||
Net assets at beginning of year | 27,973,601 | 30,925,391 | |||||||||
Net assets at end of year | $ | 27,365,228 | $ | 27,973,601 | |||||||
Excess of distributions over net investment income | $ | (55,451 | ) | $ | (52,968 | ) | |||||
The accompanying Notes to Financial Statements are an integral part of this statement.
Annual Report 2016
15
COLUMBIA VARIABLE PORTFOLIO — SMALL COMPANY GROWTH FUND
STATEMENT OF CHANGES IN NET ASSETS (continued)
Year Ended December 31, 2016 | Year Ended December 31, 2015 | ||||||||||||||||||
Shares | Dollars ($) | Shares | Dollars ($) | ||||||||||||||||
Capital stock activity | |||||||||||||||||||
Class 1 shares | |||||||||||||||||||
Subscriptions | 106,399 | 1,667,671 | 114,143 | 2,075,724 | |||||||||||||||
Distributions reinvested | 366,667 | 5,250,673 | 81,160 | 1,514,444 | |||||||||||||||
Redemptions | (346,728 | ) | (5,365,548 | ) | (353,910 | ) | (6,362,994 | ) | |||||||||||
Net increase (decrease) | 126,338 | 1,552,796 | (158,607 | ) | (2,772,826 | ) | |||||||||||||
Class 2 shares | |||||||||||||||||||
Subscriptions | 5,656 | 83,761 | 10,999 | 192,275 | |||||||||||||||
Distributions reinvested | 6,996 | 96,539 | 1,255 | 22,735 | |||||||||||||||
Redemptions | (12,171 | ) | (181,759 | ) | (8,332 | ) | (143,241 | ) | |||||||||||
Net increase | 481 | (1,459 | ) | 3,922 | 71,769 | ||||||||||||||
Total net increase (decrease) | 126,819 | 1,551,337 | (154,685 | ) | (2,701,057 | ) | |||||||||||||
The accompanying Notes to Financial Statements are an integral part of this statement.
Annual Report 2016
16
COLUMBIA VARIABLE PORTFOLIO — SMALL COMPANY GROWTH FUND
FINANCIAL HIGHLIGHTS
The following tables are intended to help you understand the Fund's financial performance. Certain information reflects financial results for a single share of a class held for the periods shown. Per share net investment income (loss) amounts are calculated based on average shares outstanding during the period. Total return assumes reinvestment of all dividends and distributions, if any. Total return does not reflect any fees and expenses imposed under your Contract and/or Qualified Plan, as applicable; such fees and expenses would reduce the total returns for all periods shown. Total return and portfolio turnover are not annualized for periods of less than one year. The portfolio turnover rate is calculated without regard to purchase and sales transactions of short-term instruments and certain derivatives, if any. If such transactions were included, the Fund's portfolio turnover rate may be higher.
Year Ended December 31, | |||||||||||||||||||||||
Class 1 | 2016 | 2015 | 2014 | 2013 | 2012 | ||||||||||||||||||
Per share data | |||||||||||||||||||||||
Net asset value, beginning of period | $ | 16.85 | $ | 17.04 | $ | 18.20 | $ | 12.97 | $ | 11.58 | |||||||||||||
Income from investment operations: | |||||||||||||||||||||||
Net investment income (loss) | (0.02 | ) | (0.08 | ) | (0.08 | ) | (0.09 | ) | (0.02 | ) | |||||||||||||
Net realized and unrealized gain (loss) | 1.93 | 0.82 | (0.78 | ) | 5.34 | 1.41 | |||||||||||||||||
Total from investment operations | 1.91 | 0.74 | (0.86 | ) | 5.25 | 1.39 | |||||||||||||||||
Less distributions to shareholders: | |||||||||||||||||||||||
Net investment income | — | — | — | (0.02 | ) | — | |||||||||||||||||
Net realized gains | (3.45 | ) | (0.93 | ) | (0.30 | ) | — | — | |||||||||||||||
Total distributions to shareholders | (3.45 | ) | (0.93 | ) | (0.30 | ) | (0.02 | ) | — | ||||||||||||||
Net asset value, end of period | $ | 15.31 | $ | 16.85 | $ | 17.04 | $ | 18.20 | $ | 12.97 | |||||||||||||
Total return | 12.74 | % | 3.83 | % | (4.64 | %) | 40.47 | % | 12.00 | % | |||||||||||||
Ratios to average net assets(a) | |||||||||||||||||||||||
Total gross expenses | 1.29 | % | 1.17 | % | 1.17 | % | 1.14 | % | 1.12 | % | |||||||||||||
Total net expenses(b) | 0.94 | % | 0.96 | % | 0.96 | % | 0.97 | % | 0.99 | % | |||||||||||||
Net investment income (loss) | (0.13 | %) | (0.47 | %) | (0.50 | %) | (0.55 | %) | (0.13 | %) | |||||||||||||
Supplemental data | |||||||||||||||||||||||
Net assets, end of period (in thousands) | $ | 26,912 | $ | 27,479 | $ | 30,488 | $ | 38,072 | $ | 32,714 | |||||||||||||
Portfolio turnover | 183 | % | 150 | % | 138 | % | 127 | % | 116 | % | |||||||||||||
Notes to Financial Highlights
(a) In addition to the fees and expenses that the Fund bears directly, the Fund indirectly bears a pro rata share of the fees and expenses of any other funds in which it invests. Such indirect expenses are not included in the Fund's reported expense ratios.
(b) Total net expenses include the impact of certain fee waivers/expense reimbursements made by the Investment Manager and certain of its affiliates, if applicable.
The accompanying Notes to Financial Statements are an integral part of this statement.
Annual Report 2016
17
COLUMBIA VARIABLE PORTFOLIO — SMALL COMPANY GROWTH FUND
FINANCIAL HIGHLIGHTS (continued)
Year Ended December 31, | |||||||||||||||||||||||
Class 2 | 2016 | 2015 | 2014 | 2013 | 2012 | ||||||||||||||||||
Per share data | |||||||||||||||||||||||
Net asset value, beginning of period | $ | 16.34 | $ | 16.59 | $ | 17.77 | $ | 12.69 | $ | 11.36 | |||||||||||||
Income from investment operations: | |||||||||||||||||||||||
Net investment loss | (0.06 | ) | (0.12 | ) | (0.12 | ) | (0.12 | ) | (0.05 | ) | |||||||||||||
Net realized and unrealized gain (loss) | 1.87 | 0.80 | (0.76 | ) | 5.20 | 1.38 | |||||||||||||||||
Total from investment operations | 1.81 | 0.68 | (0.88 | ) | 5.08 | 1.33 | |||||||||||||||||
Less distributions to shareholders: | |||||||||||||||||||||||
Net realized gains | (3.40 | ) | (0.93 | ) | (0.30 | ) | — | — | |||||||||||||||
Total distributions to shareholders | (3.40 | ) | (0.93 | ) | (0.30 | ) | — | — | |||||||||||||||
Net asset value, end of period | $ | 14.75 | $ | 16.34 | $ | 16.59 | $ | 17.77 | $ | 12.69 | |||||||||||||
Total return | 12.53 | % | 3.56 | % | (4.86 | %) | 40.03 | % | 11.71 | % | |||||||||||||
Ratios to average net assets(a) | |||||||||||||||||||||||
Total gross expenses | 1.54 | % | 1.42 | % | 1.43 | % | 1.39 | % | 1.42 | % | |||||||||||||
Total net expenses(b) | 1.19 | % | 1.21 | % | 1.21 | % | 1.22 | % | 1.24 | % | |||||||||||||
Net investment loss | (0.38 | %) | (0.72 | %) | (0.75 | %) | (0.79 | %) | (0.44 | %) | |||||||||||||
Supplemental data | |||||||||||||||||||||||
Net assets, end of period (in thousands) | $ | 454 | $ | 495 | $ | 437 | $ | 471 | $ | 438 | |||||||||||||
Portfolio turnover | 183 | % | 150 | % | 138 | % | 127 | % | 116 | % | |||||||||||||
Notes to Financial Highlights
(a) In addition to the fees and expenses that the Fund bears directly, the Fund indirectly bears a pro rata share of the fees and expenses of any other funds in which it invests. Such indirect expenses are not included in the Fund's reported expense ratios.
(b) Total net expenses include the impact of certain fee waivers/expense reimbursements made by the Investment Manager and certain of its affiliates, if applicable.
The accompanying Notes to Financial Statements are an integral part of this statement.
Annual Report 2016
18
COLUMBIA VARIABLE PORTFOLIO — SMALL COMPANY GROWTH FUND
NOTES TO FINANCIAL STATEMENTS
December 31, 2016
Note 1. Organization
Columbia Variable Portfolio — Small Company Growth Fund (the Fund), a series of Columbia Funds Variable Insurance Trust (the Trust), is a diversified fund. The Trust is registered under the Investment Company Act of 1940, as amended (the 1940 Act), as an open-end management investment company organized as a Massachusetts business trust.
Fund Shares
The Trust may issue an unlimited number of shares (without par value). The Fund offers Class 1 and Class 2 shares to separate accounts funding variable annuity contracts and variable life insurance policies (collectively, Contracts) issued by affiliated and unaffiliated life insurance companies as well as qualified pension and retirement plans (Qualified Plans) and other qualified institutional investors (Qualified Investors) authorized by Columbia Management Investment Distributors, Inc. (the Distributor). You may not buy (nor will you own) shares of the Fund directly. You may invest by participating in a Qualified Plan or by buying a Contract and making allocations to the Fund. Although all share classes generally have identical voting, dividend and liquidation rights, each share class votes separately when required by the Trust's organizational documents or by law. Different share classes pay different distribution amounts to the extent the expenses of such share classes differ, and distributions in liquidation will be proportional to the net asset value of each share class. Each share class has its own cost structure and other features.
Note 2. Summary of Significant Accounting Policies
Basis of Preparation
The Fund is an investment company that applies the accounting and reporting guidance in the Financial Accounting Standards Board (FASB) Accounting Standards Codification Topic 946, Financial Services — Investment Companies (ASC 946). The financial statements are prepared in accordance with U.S. generally accepted accounting principles (GAAP), which requires management to make certain estimates and assumptions that affect the reported amounts of assets and liabilities, the disclosure of contingent assets and liabilities at the date of the financial statements and the reported amounts of income and expenses during the reporting period. Actual results could differ from those estimates.
The following is a summary of significant accounting policies followed by the Fund in the preparation of its financial statements.
Security Valuation
All equity securities are valued at the close of business of the New York Stock Exchange. Equity securities are valued at the last quoted sales price on the principal exchange or market on which they trade, except for securities traded on the NASDAQ Stock Market, which are valued at the NASDAQ official close price. Unlisted securities or listed securities for which there were no sales during the day are valued at the mean of the latest quoted bid and ask prices on such exchanges or markets.
Foreign equity securities are valued based on the closing price on the foreign exchange in which such securities are primarily traded. If any foreign equity security closing prices are not readily available, the securities are valued at the mean of the latest quoted bid and ask prices on such exchanges or markets. Foreign currency exchange rates are generally determined at 4:00 p.m. Eastern (U.S.) time. Many securities markets and exchanges outside the U.S. close prior to the close of the New York Stock Exchange; therefore, the closing prices for securities in such markets or on such exchanges may not fully reflect events that occur after such close but before the close of the New York Stock Exchange. In those situations, foreign securities will be fair valued pursuant to a policy adopted by the Board of Trustees, including, if available, utilizing a third party pricing service to determine these fair values. The third party pricing service takes into account multiple factors, including, but not limited to, movements in the U.S. securities markets, certain depositary receipts, futures contracts and foreign exchange rates that have occurred subsequent to the close of the foreign exchange or market, to determine a good faith estimate that reasonably reflects the current market conditions as of the close of the New York Stock Exchange. The fair value of a security is likely to be different from the quoted or published price, if available.
Investments in open-end investment companies, including money market funds, are valued at their latest net asset value.
Investments for which market quotations are not readily available, or that have quotations which management believes are not reflective of market value or reliable, are valued at fair value as determined in good faith under procedures approved by and under the general supervision of the Board of Trustees. If a security or
Annual Report 2016
19
COLUMBIA VARIABLE PORTFOLIO — SMALL COMPANY GROWTH FUND
NOTES TO FINANCIAL STATEMENTS (continued)
December 31, 2016
class of securities (such as foreign securities) is valued at fair value, such value is likely to be different from the quoted or published price for the security.
The determination of fair value often requires significant judgment. To determine fair value, management may use assumptions including but not limited to future cash flows and estimated risk premiums. Multiple inputs from various sources may be used to determine fair value.
GAAP requires disclosure regarding the inputs and valuation techniques used to measure fair value and any changes in valuation inputs or techniques. In addition, investments shall be disclosed by major category. This information is disclosed following the Fund's Portfolio of Investments.
Foreign Currency Transactions and Translations
The values of all assets and liabilities denominated in foreign currencies are generally translated into U.S. dollars at exchange rates determined at the close of regular trading on the New York Stock Exchange. Net realized and unrealized gains (losses) on foreign currency transactions and translations include gains (losses) arising from the fluctuation in exchange rates between trade and settlement dates on securities transactions, gains (losses) arising from the disposition of foreign currency and currency gains (losses) between the accrual and payment dates on dividends, interest income and foreign withholding taxes.
For financial statement purposes, the Fund does not distinguish that portion of gains (losses) on investments which is due to changes in foreign exchange rates from that which is due to changes in market prices of the investments. Such fluctuations are included with the net realized and unrealized gains (losses) on investments in the Statement of Operations.
Security Transactions
Security transactions are accounted for on the trade date. Cost is determined and gains (losses) are based upon the specific identification method for both financial statement and federal income tax purposes.
Income Recognition
Corporate actions and dividend income are generally recorded net of any non-reclaimable tax withholdings, on the ex-dividend date or upon receipt of ex-dividend notification in the case of certain foreign securities.
The Fund may receive distributions from holdings in equity securities, business development companies (BDCs), exchange-traded funds, other regulated
investment companies (RICs), and real estate investment trusts (REITs), which report information on the tax character of their distributions annually. These distributions are allocated to dividend income, capital gain and return of capital based on actual information reported. Return of capital is recorded as a reduction of the cost basis of securities held. If the Fund no longer owns the applicable securities, return of capital is recorded as a realized gain. With respect to REITs, to the extent actual information has not yet been reported, estimates for return of capital are made by the Fund's management. Management's estimates are subsequently adjusted when the actual character of the distributions is disclosed by the REITs, which could result in a proportionate change in return of capital to shareholders.
Awards from class action litigation are recorded as a reduction of cost basis if the Fund still owns the applicable securities on the payment date. If the Fund no longer owns the applicable securities, the proceeds are recorded as realized gains.
Expenses
General expenses of the Trust are allocated to the Fund and other funds of the Trust based upon relative net assets or other expense allocation methodologies determined by the nature of the expense. Expenses directly attributable to the Fund are charged to the Fund. Expenses directly attributable to a specific class of shares are charged to that share class.
Determination of Class Net Asset Value
All income, expenses (other than class-specific expenses, which are charged to that share class, as shown in the Statement of Operations) and realized and unrealized gains (losses) are allocated to each class of the Fund on a daily basis, based on the relative net assets of each class, for purposes of determining the net asset value of each class.
Federal Income Tax Status
The Fund intends to qualify each year as a regulated investment company under Subchapter M of the Internal Revenue Code, as amended, and will distribute substantially all of its taxable income, if any, for its tax year, and as such will not be subject to federal income taxes. In addition, because the Fund meets the exception under Internal Revenue Code Section 4982(f), the Fund expects not to be subject to federal excise tax. Therefore, no federal income or excise tax provision is recorded.
Annual Report 2016
20
COLUMBIA VARIABLE PORTFOLIO — SMALL COMPANY GROWTH FUND
NOTES TO FINANCIAL STATEMENTS (continued)
December 31, 2016
Foreign Taxes
The Fund may be subject to foreign taxes on income, gains on investments or currency repatriation, a portion of which may be recoverable. The Fund will accrue such taxes and recoveries, as applicable, based upon its current interpretation of tax rules and regulations that exist in the markets in which it invests.
Realized gains in certain countries may be subject to foreign taxes at the Fund level, based on statutory rates. The Fund accrues for such foreign taxes on realized and unrealized gains at the appropriate rate for each jurisdiction, as applicable. The amount, if any, is disclosed as a liability on the Statement of Assets and Liabilities.
Distributions to Subaccounts
Distributions to the subaccounts of Contracts, Qualified Plans and Qualified Investors are recorded at the close of business on the record date and are payable on the first business day following the record date. Dividends from net investment income, if any, are declared and distributed annually. Capital gains distributions, when available, will be made annually. However, an additional capital gain distribution may be made during the fiscal year in order to comply with the Internal Revenue Code, as applicable to registered investment companies. Income distributions and capital gain distributions are determined in accordance with federal income tax regulations, which may differ from GAAP. All dividends and distributions are reinvested in additional shares of the applicable share class of the Fund at the net asset value as of the ex-dividend date of the distribution.
Guarantees and Indemnifications
Under the Trust's organizational documents and, in some cases, by contract, its officers and trustees are indemnified against certain liabilities arising out of the performance of their duties to the Trust or its funds. In addition, certain of the Fund's contracts with its service providers contain general indemnification clauses. The Fund's maximum exposure under these arrangements is unknown since the amount of any future claims that may be made against the Fund cannot be determined, and the Fund has no historical basis for predicting the likelihood of any such claims.
Investment Company Reporting Modernization
In October 2016, the U.S. Securities and Exchange Commission adopted new rules and forms, and amendments to certain current rules and forms, to
modernize reporting and disclosure of information by registered investment companies. The amendments to Regulation S-X will require standardized, enhanced disclosure about derivatives in investment company financial statements, and will also change the rules governing the form and content of such financial statements. The amendments to Regulation S-X take effect on August 1, 2017. At this time, management is assessing the anticipated impact of these regulatory developments.
Note 3. Fees and Other Transactions with Affiliates
Management Services Fees
Effective May 1, 2016, the Fund entered into a Management Agreement with Columbia Management Investment Advisers, LLC (the Investment Manager), a wholly-owned subsidiary of Ameriprise Financial, Inc. (Ameriprise Financial). Under the Management Agreement, the Investment Manager provides the Fund with investment research and advice, as well as administrative and accounting services. The management services fee is an annual fee that is equal to a percentage of the Fund's average daily net assets that declines from 0.87% to 0.75% as the Fund's net assets increase. Prior to May 1, 2016, the Fund paid the Investment Manager an annual fee for advisory services under an Investment Management Services Agreement and a separate annual fee for administrative and accounting services under an Administrative Services Agreement. The effective management services fee rate for the year ended December 31, 2016 (reflecting all advisory and administrative services fees paid to the Investment Manager) was 0.87% of the Fund's average daily net assets. For the period from January 1, 2016 through April 30, 2016, the investment advisory services fee paid to the Investment Manager was $65,979, and the administrative services fee paid to the Investment Manager was $6,681.
Compensation of Board Members
Board of Trustee members, who are not officers or employees of the Investment Manager or Ameriprise Financial, are compensated for their services to the Fund as disclosed in the Statement of Operations. These Board of Trustee members may participate in a Deferred Compensation Plan (the Plan) which may be terminated at any time. Obligations of the Plan will be paid solely out of the Fund's assets, and all amounts payable under the
Annual Report 2016
21
COLUMBIA VARIABLE PORTFOLIO — SMALL COMPANY GROWTH FUND
NOTES TO FINANCIAL STATEMENTS (continued)
December 31, 2016
Plan constitute a general unsecured obligation of the Fund.
Compensation of Chief Compliance Officer
The Board of Trustees has appointed a Chief Compliance Officer to the Fund in accordance with federal securities regulations. The Fund is allocated a portion of the expenses associated with the Chief Compliance Officer based on relative net assets of the Trust.
Transfer Agency Fees
The Fund has a Transfer and Dividend Disbursing Agent Agreement with Columbia Management Investment Services Corp. (the Transfer Agent), an affiliate of the Investment Manager and a wholly-owned subsidiary of Ameriprise Financial. The annual fee rate under this agreement is 0.06% of the Fund's average daily net assets attributable to each share class.
Distribution Fees
The Fund has an agreement with the Distributor, an affiliate of the Investment Manager and a wholly-owned subsidiary of Ameriprise Financial, for distribution services. The Board of Trustees has approved, and the Fund has adopted, a distribution plan (the Plan) which sets the distribution fees for the Fund. These fees are calculated daily and are intended to compensate the Distributor for selling shares of the Fund. The Fund pays a monthly distribution fee to the Distributor at the maximum annual rate of 0.25% of the average daily net assets attributable to Class 2 shares of the Fund. The Fund pays no distribution and service fees for Class 1 shares.
Expenses Waived/Reimbursed by the Investment Manager and its Affiliates
The Investment Manager and certain of its affiliates have contractually agreed to waive fees and/or reimburse expenses (excluding certain fees and expenses described below) for the periods disclosed below, unless sooner terminated at the sole discretion of the Board of Trustees, so that the Fund's net operating expenses, after giving effect to fees waived/expenses reimbursed and any balance credits and/or overdraft charges from the Fund's custodian, do not exceed the following annual rates as a percentage of the class' average daily net assets:
| May 1, 2016 through April 30, 2017 | Prior to May 1, 2016 | ||||||||||
Class 1 | 0.93 | % | 0.96 | % | |||||||
Class 2 | 1.18 | 1.21 | |||||||||
Under the agreement governing these fee waivers and/or expense reimbursement arrangements, the following fees and expenses are excluded from the waiver/reimbursement commitment, and therefore will be paid by the Fund, if applicable: taxes (including foreign transaction taxes), expenses associated with investments in affiliated and non-affiliated pooled investment vehicles (including mutual funds and exchange-traded funds), transaction costs and brokerage commissions, costs related to any securities lending program, dividend and interest expenses associated with securities sold short, inverse floater program fees and expenses, transaction charges and interest on borrowed money, interest, infrequent and/or unusual expenses and any other expenses the exclusion of which is specifically approved by the Board of Trustees. This agreement may be modified or amended only with approval from the Investment Manager, certain of its affiliates and the Fund. Any fees waived and/or expenses reimbursed under the expense reimbursement arrangements described above are not recoverable by the Investment Manager or its affiliates in future periods.
Note 4. Federal Tax Information
The timing and character of income and capital gain distributions are determined in accordance with income tax regulations, which may differ from GAAP because of temporary or permanent book to tax differences.
At December 30, 2016, these differences are primarily due to differing treatment for deferral/reversal of wash sale losses, Trustees' deferred compensation, foreign currency transactions, investments in partnerships, net operating loss reclassification, passive foreign investment company (PFIC) holdings and re-characterization of distributions for investments. To the extent these differences are permanent, reclassifications are made among the components of the Fund's net assets in the Statement of Assets and Liabilities. Temporary differences do not require reclassifications.
In the Statement of Assets and Liabilities the following reclassifications were made:
Excess of distributions over net investment income | $ | 34,309 | |||||
Accumulated net realized gain | (34,306 | ) | |||||
Paid-in capital | (3 | ) | |||||
Net investment income (loss) and net realized gains (losses), as disclosed in the Statement of Operations, and net assets were not affected by this reclassification.
Annual Report 2016
22
COLUMBIA VARIABLE PORTFOLIO — SMALL COMPANY GROWTH FUND
NOTES TO FINANCIAL STATEMENTS (continued)
December 31, 2016
The tax character of distributions paid during the years indicated was as follows:
Year Ended December 30, | 2016 | 2015 | |||||||||
Ordinary income | $ | 2,721,753 | $ | — | |||||||
Long-term capital gains | 2,625,459 | 1,537,179 | |||||||||
Total | $ | 5,347,212 | $ | 1,537,179 | |||||||
Short-term capital gain distributions, if any, are considered ordinary income distributions for tax purposes.
At December 30, 2016, the components of distributable earnings on a tax basis were as follows:
Undistributed ordinary income | $ | 1,289,216 | |||||
Undistributed long-term capital gains | 284,102 | ||||||
Net unrealized appreciation | 1,565,948 | ||||||
At December 30, 2016, the cost of investments for federal income tax purposes was $25,871,548 and the aggregate gross unrealized appreciation and depreciation based on that cost was:
Unrealized appreciation | $ | 2,509,889 | |||||
Unrealized depreciation | (943,941 | ) | |||||
Net unrealized appreciation | $ | 1,565,948 | |||||
Management of the Fund has concluded that there are no significant uncertain tax positions in the Fund that would require recognition in the financial statements. However, management's conclusion may be subject to review and adjustment at a later date based on factors including, but not limited to, new tax laws, regulations, and administrative interpretations (including relevant court decisions). Generally, the Fund's federal tax returns for the prior three fiscal years remain subject to examination by the Internal Revenue Service.
Note 5. Portfolio Information
The cost of purchases and proceeds from sales of securities, excluding short-term investments and derivatives, if any, aggregated to $47,832,194 and $51,855,306, respectively, for the year ended December 31, 2016. The amount of purchase and sale activity impacts the portfolio turnover rate reported in the Financial Highlights.
Note 6. Affiliated Money Market Fund
The Fund invests in Columbia Short-Term Cash Fund, an affiliated money market fund established for the exclusive use by the Fund and other affiliated funds (the Affiliated MMF). The income earned by the Fund from
such investments is included as Dividends — affiliated issuers in the Statement of Operations. As an investing fund, the Fund indirectly bears its proportionate share of the expenses of the Affiliated MMF. Effective October 1, 2016, the Affiliated MMF prices its shares with a floating net asset value (NAV) and no longer seeks to maintain a stable NAV. In addition, the Board of Trustees of the Affiliated MMF may impose a fee on redemptions (sometimes referred to as a liquidity fee) or temporarily suspend redemptions (sometimes referred to as imposing a redemption gate) in the event its liquidity falls below regulatory limits.
Note 7. Line of Credit
The Fund has access to a revolving credit facility with a syndicate of banks led by Citibank, N.A., HSBC Bank USA, N.A. and JPMorgan Chase Bank, N.A. whereby the Fund may borrow for the temporary funding of shareholder redemptions or for other temporary or emergency purposes. The credit facility agreement, which is a collective agreement between the Fund and certain other funds managed by the Investment Manager, severally and not jointly, that permits collective borrowings up to $1 billion. Interest is charged to each participating fund based on its borrowings at a rate equal to the higher of (i) the overnight federal funds rate plus 1.00% or (ii) the one-month LIBOR rate plus 1.00%. Each borrowing under the credit facility matures no later than 60 days after the date of borrowing. The Fund also pays a commitment fee equal to its pro rata share of the amount of the credit facility at a rate of 0.15% per annum. The commitment fee is included in other expenses in the Statement of Operations.
The Fund had no borrowings during the year ended December 31, 2016.
Note 8. Significant Risks
Health Care Sector Risk
The Fund may be more susceptible to the particular risks that may affect companies in the health care sector than if it were invested in a wider variety of companies in unrelated sectors. Companies in the health care sector are subject to certain risks, including restrictions on government reimbursement for medical expenses, government approval of medical products and services, competitive pricing pressures, and the rising cost of medical products and services (especially for companies dependent upon a relatively limited number of products or services). Performance of such companies may be affected by factors including, government regulation,
Annual Report 2016
23
COLUMBIA VARIABLE PORTFOLIO — SMALL COMPANY GROWTH FUND
NOTES TO FINANCIAL STATEMENTS (continued)
December 31, 2016
obtaining and protecting patents (or the failure to do so), product liability and other similar litigation as well as product obsolescence.
Shareholder Concentration Risk
At December 31, 2016, two unaffiliated shareholders of record owned 79.2% of the outstanding shares of the Fund in one or more accounts. The Fund has no knowledge about whether any portion of those shares was owned beneficially. Subscription and redemption activity by concentrated accounts may have a significant effect on the operations of the Fund. In the case of a large redemption, the Fund may be forced to sell investments at inopportune times, including its liquid or more liquid positions, resulting in Fund losses and the Fund holding a higher percentage of less liquid or illiquid securities. Large redemptions could result in decreased economies of scale and increased operating expenses for non-redeeming Fund shareholders.
Technology and Technology-related Investment Risk
The Fund may be more susceptible to the particular risks that may affect companies in the information technology sector, as well as other technology-related sectors (collectively, the technology sectors) than if it were invested in a wider variety of companies in unrelated sectors. Companies in the technology sectors are subject to certain risks, including the risk that new services, equipment or technologies will not be accepted by consumers and businesses or will become rapidly obsolete. Performance of such companies may be affected by factors including obtaining and protecting patents (or the failure to do so) and significant competitive pressures, including aggressive pricing of their products or services, new market entrants, competition for market share and short product cycles due to an accelerated rate of technological developments. Such competitive pressures may lead to limited earnings and/or falling profit margins. As a result, the value of their securities may fall or fail to rise. In addition, many technology sector companies have limited operating histories and prices of these companies' securities historically have been more volatile than other securities, especially over the short term.
Note 9. Subsequent Events
Management has evaluated the events and transactions that have occurred through the date the financial statements were issued and noted no items requiring
adjustment of the financial statements or additional disclosure.
Note 10. Information Regarding Pending and Settled Legal Proceedings
Ameriprise Financial and certain of its affiliates have historically been involved in a number of legal, arbitration and regulatory proceedings, including routine litigation, class actions, and governmental actions, concerning matters arising in connection with the conduct of their business activities. Ameriprise Financial believes that the Funds are not currently the subject of, and that neither Ameriprise Financial nor any of its affiliates are the subject of, any pending legal, arbitration or regulatory proceedings that are likely to have a material adverse effect on the Funds or the ability of Ameriprise Financial or its affiliates to perform under their contracts with the Funds. Ameriprise Financial is required to make quarterly (10-Q), annual (10-K) and, as necessary, 8-K filings with the Securities and Exchange Commission (SEC) on legal and regulatory matters that relate to Ameriprise Financial and its affiliates. Copies of these filings may be obtained by accessing the SEC website at www.sec.gov.
There can be no assurance that these matters, or the adverse publicity associated with them, will not result in increased fund redemptions, reduced sale of fund shares or other adverse consequences to the Funds. Further, although we believe proceedings are not likely to have a material adverse effect on the Funds or the ability of Ameriprise Financial or its affiliates to perform under their contracts with the Funds, these proceedings are subject to uncertainties and, as such, we are unable to estimate the possible loss or range of loss that may result. An adverse outcome in one or more of these proceedings could result in adverse judgments, settlements, fines, penalties or other relief that could have a material adverse effect on the consolidated financial condition or results of operations of Ameriprise Financial.
Annual Report 2016
24
COLUMBIA VARIABLE PORTFOLIO — SMALL COMPANY GROWTH FUND
REPORT OF INDEPENDENT REGISTERED PUBLIC ACCOUNTING FIRM
To the Trustees of Columbia Funds Variable Insurance Trust and the Shareholders of
Columbia Variable Portfolio — Small Company Growth Fund
In our opinion, the accompanying statement of assets and liabilities, including the portfolio of investments, and the related statements of operations and of changes in net assets and the financial highlights present fairly, in all material respects, the financial position of Columbia Variable Portfolio — Small Company Growth Fund (the "Fund," a series of Columbia Funds Variable Insurance Trust) as of December 31, 2016, the results of its operations for the year then ended, the changes in its net assets for each of the two years in the period then ended and the financial highlights for each of the five years in the period then ended, in conformity with accounting principles generally accepted in the United States of America. These financial statements and financial highlights (hereafter referred to as "financial statements") are the responsibility of the Fund's management. Our responsibility is to express an opinion on these financial statements based on our audits. We conducted our audits of these financial statements in accordance with the standards of the Public Company Accounting Oversight Board (United States). Those standards require that we plan and perform the audit to obtain reasonable assurance about whether the financial statements are free of material misstatement. An audit includes examining, on a test basis, evidence supporting the amounts and disclosures in the financial statements, assessing the accounting principles used and significant estimates made by management, and evaluating the overall financial statement presentation. We believe that our audits, which included confirmation of securities as of December 31, 2016 by correspondence with the custodian, brokers and transfer agent, and the application of alternative auditing procedures where such confirmations had not been received, provide a reasonable basis for our opinion.
PricewaterhouseCoopers LLP
Minneapolis, MN
February 17, 2017
Annual Report 2016
25
COLUMBIA VARIABLE PORTFOLIO — SMALL COMPANY GROWTH FUND
FEDERAL INCOME TAX INFORMATION
(Unaudited)
The Fund hereby designates the following tax attributes for the fiscal year ended December 31, 2016.
Tax Designations
| Dividends Received Deduction | 0.02 | % | |||||
| Capital Gain Dividend | $ | 300,008 | |||||
Dividends Received Deduction. The percentage of ordinary income distributed during the fiscal year that qualifies for the corporate dividends received deduction.
Capital Gain Dividend. The Fund designates as a capital gain dividend the amount reflected above, or if subsequently determined to be different, the net capital gain of such fiscal period.
Annual Report 2016
26
COLUMBIA VARIABLE PORTFOLIO — SMALL COMPANY GROWTH FUND
TRUSTEES AND OFFICERS
Shareholders elect the Board that oversees the Fund's operations. The Board appoints officers who are responsible for day-to-day business decisions based on policies set by the Board. The following table provides basic biographical information about the Fund's Trustees, including their principal occupations during the past five years, although specific titles for individuals may have varied over the period. The year set forth beneath Length of Service in the table below is the year in which the Trustee was first appointed or elected as Trustee to any Fund currently in the Columbia Funds Complex or a predecessor thereof. Under current Board policy, members serve terms of indefinite duration.
Independent Trustees
| Name, Address, Year of Birth | Position Held With the Trust and Length of Service | Principal Occupation(s) During the Past Five Years and Other Relevant Professional Experience | Number of Funds in the Columbia Funds Complex Overseen | Other Directorships Held by Trustee During the Past Five Years | |||||||||||||||
| Janet Langford Carrig c/o Columbia Management Investment Advisers, LLC, 225 Franklin Street Mail Drop BX32 05228, Boston, MA 02110 1957 | Trustee 1996 | Senior Vice President, General Counsel and Corporate Secretary, ConocoPhillips (independent energy company) since September 2007 | 59 | None | |||||||||||||||
| Douglas A. Hacker c/o Columbia Management Investment Advisers, LLC, 225 Franklin Street Mail Drop BX32 05228, Boston, MA 02110 1955 | Trustee and Chairman of the Board 1996 | Independent business executive since May 2006; Executive Vice President — Strategy of United Airlines from December 2002 to May 2006; President of UAL Loyalty Services (airline marketing company) from September 2001 to December 2002; Executive Vice President and Chief Financial Officer of United Airlines from July 1999 to September 2001 | 59 | Spartan Nash Company (food distributor); Nash Finch Company (food distributor) from 2005 to 2013; Aircastle Limited (aircraft leasing); SeaCube Container Leasing Ltd. (container leasing) from 2010 to 2013; and Travelport Worldwide Limited (travel information technology) | |||||||||||||||
| Nancy T. Lukitsh c/o Columbia Management Investment Advisers, LLC, 225 Franklin Street Mail Drop BX32 05228, Boston, MA 02110 1956 | Trustee 2011 | Senior Vice President, Partner and Director of Marketing, Wellington Management Company, LLP (investment adviser) from 1997 to 2010; Chair, Wellington Management Portfolios (commingled non-U.S. investment pools) from 2007 to 2010; Director, Wellington Trust Company, NA and other Wellington affiliates from 1997 to 2010 | 59 | None | |||||||||||||||
Annual Report 2016
27
COLUMBIA VARIABLE PORTFOLIO — SMALL COMPANY GROWTH FUND
TRUSTEES AND OFFICERS (continued)
Independent Trustees (continued)
| Name, Address, Year of Birth | Position Held With the Trust and Length of Service | Principal Occupation(s) During the Past Five Years and Other Relevant Professional Experience | Number of Funds in the Columbia Funds Complex Overseen | Other Directorships Held by Trustee During the Past Five Years | |||||||||||||||
| David M. Moffett c/o Columbia Management Investment Advisers, LLC, 225 Franklin Street Mail Drop BX32 05228, Boston, MA 02110 1952 | Trustee 2011 | Retired. Consultant to Bridgewater and Associates | 59 | Director, CSX Corporation; Genworth Financial, Inc. (financial and insurance products and services); Paypal Holdings Inc. (payment and data processing services); Trustee University of Oklahoma Foundation; former Director eBay Inc. (online trading community), 2007-2015; and former Director, CIT Bank, CIT Group Inc. (commercial and consumer finance), 2010-2016 | |||||||||||||||
| Charles R. Nelson c/o Columbia Management Investment Advisers, LLC, 225 Franklin Street Mail Drop BX32 05228, Boston, MA 02110 1942 | Trustee 1981 | Retired. Professor Emeritus, University of Washington since 2011; Professor of Economics, University of Washington from 1976 to 2011; Ford and Louisa Van Voorhis Professor of Political Economy, University of Washington from 1993 to 2011; Adjunct Professor of Statistics, University of Washington from 1980 to 2011; Associate Editor, Journal of Money, Credit and Banking from September 1993 to 2008; consultant on econometric and statistical matters | 59 | None | |||||||||||||||
| John J. Neuhauser c/o Columbia Management Investment Advisers, LLC, 225 Franklin Street Mail Drop BX32 05228, Boston, MA 02110 1943 | Trustee 1984 | President, Saint Michael's College since August 2007; Director or Trustee of several non-profit organizations, including University of Vermont Medical Center; Academic Vice President and Dean of Faculties, Boston College from August 1999 to October 2005; University Professor, Boston College from November 2005 to August 2007 | 59 | Liberty All-Star Equity Fund and Liberty All-Star Growth Fund (closed-end funds) | |||||||||||||||
| Patrick J. Simpson c/o Columbia Management Investment Advisers, LLC, 225 Franklin Street Mail Drop BX32 05228, Boston, MA 02110 1944 | Trustee 2000 | Of Counsel, Perkins Coie LLP (law firm) since 2015; Partner, Perkins Coie LLP from 1988 to 2014 | 59 | None | |||||||||||||||
Annual Report 2016
28
COLUMBIA VARIABLE PORTFOLIO — SMALL COMPANY GROWTH FUND
TRUSTEES AND OFFICERS (continued)
Independent Trustees (continued)
| Name, Address, Year of Birth | Position Held With the Trust and Length of Service | Principal Occupation(s) During the Past Five Years and Other Relevant Professional Experience | Number of Funds in the Columbia Funds Complex Overseen | Other Directorships Held by Trustee During the Past Five Years | |||||||||||||||
| Anne-Lee Verville c/o Columbia Management Investment Advisers, LLC, 225 Franklin Street Mail Drop BX32 05228, Boston, MA 02110 1945 | Trustee 1998 | Retired. General Manager, Global Education Industry from 1994 to 1997, President — Application Systems Division from 1991 to 1994, Chief Financial Officer — US Marketing & Services from 1988 to 1991, and Chief Information Officer from 1987 to 1988, IBM Corporation (computer and technology) | 59 | Enesco Group, Inc. (producer of giftware and home and garden decor products) from 2001 to 2006 | |||||||||||||||
Consultants to the Independent Trustees*
| Name, Address, Year of Birth | Position Held With the Trust and Length of Service | Principal Occupation(s) During the Past Five Years and Other Relevant Professional Experience | Number of Funds in the Columbia Funds Complex Overseen | Other Directorships Held by Trustee During the Past Five Years | |||||||||||||||
| J. Kevin Connaughton c/o Columbia Management Investment Advisers, LLC, 225 Franklin Street Mail Drop BX32 05228, Boston, MA 02110 1964 | Independent Trustee Consultant 2016 | Independent Trustee Consultant, Columbia Funds since March 2016; Managing Director and General Manager of Mutual Fund Products, Columbia Management Investment Advisers, LLC from May 2010 to February 2015; President, Columbia Funds from 2009 to 2015; and senior officer of Columbia Funds and affiliated funds from 2003 to 2015 | 59 | Board of Governors, Gateway Healthcare since January 2016; Trustee, New Century Portfolios since March 2015; and Director, The Autism Project since March 2015 | |||||||||||||||
| Natalie A. Trunow c/o Columbia Management Investment Advisers, LLC, 225 Franklin Street Mail Drop BX32 05228, Boston, MA 02110 1967 | Independent Trustee Consultant 2016 | Independent Trustee Consultant, Columbia Funds since September 2016; Senior Vice President and Chief Executive Officer, Millennial Partners (investment consulting services to institutions) since January 2016; Director of Investments, Casey Family Programs from April 2016 to September 2016; Chief Investment Officer, Calvert Investments from August 2008 to January 2016; Section Head and Portfolio Manager, General Motors Asset Management from June 1997 to August 2008 | 59 | Healthcare Services for Children with Special Needs | |||||||||||||||
* J. Kevin Connaughton was appointed consultant to the Independent Trustees effective March 1, 2016. Natalie A. Trunow was appointed consultant to the Independent Trustees effective September 1, 2016. Shareholders of the Funds are expected to be asked to elect each of Mr. Connaughton and Ms. Trunow as a Trustee at a future shareholder meeting.
Annual Report 2016
29
COLUMBIA VARIABLE PORTFOLIO — SMALL COMPANY GROWTH FUND
TRUSTEES AND OFFICERS (continued)
Interested Trustee Affiliated with Investment Manager*
| Name, Address, Year of Birth | Position Held With the Trust and Length of Service | Principal Occupation(s) During the Past Five Years and Other Relevant Professional Experience | Number of Funds in the Columbia Funds Complex Overseen | Other Directorships Held by Trustee During the Past Five Years | |||||||||||||||
| William F. Truscott c/o Columbia Management Investment Advisers, LLC, 225 Franklin Street Boston, MA 02110 1960 | Trustee 2012 | Chairman of the Board and President, Columbia Management Investment Advisers, LLC since May 2010 and February 2012, respectively; Chief Executive Officer, Global Asset Management, Ameriprise Financial, Inc. since September 2012 (previously Chief Executive Officer, U.S. Asset Management & President, Annuities, May 2010- September 2012); Director and Chief Executive Officer, Columbia Management Investment Distributors, Inc. since May 2010 and February 2012, respectively; Chairman of the Board and Chief Executive Officer, RiverSource Distributors, Inc. since 2006; Director, Threadneedle Asset Management Holdings, SARL since 2014; President and Chief Executive Officer, Ameriprise Certificate Company, 2006-August 2012. | 185 | Trustee to other Columbia Funds since 2001; Chairman of the Board, Columbia Management Investment Advisers, LLC since May 2010; Director, Columbia Management Investment Distributors, Inc. since May 2010; Former Director, Ameriprise Certificate Company, 2006-January 2013 | |||||||||||||||
* Interested person (as defined under the 1940 Act) by reason of being an officer, director, security holder and/or employee of the Investment Manager or Ameriprise Financial.
The Statement of Additional Information has additional information about the Fund's Board members and is available, without charge, upon request by calling 800.345.6611 or contacting your financial intermediary.
Annual Report 2016
30
COLUMBIA VARIABLE PORTFOLIO — SMALL COMPANY GROWTH FUND
TRUSTEES AND OFFICERS (continued)
The Board has appointed officers who are responsible for day-to-day business decisions based on policies it has established. The officers serve at the pleasure of the Board. The following table provides basic information about the Officers of the Fund, including principal occupations during the past five years, although their specific titles may have varied over the period. In addition to Mr. Truscott, who is Senior Vice President, the Fund's other officers are:
Fund Officers
| Name, Address and Year of Birth | Position and Year First Appointed to Position for any Fund in the Columbia Funds Complex or a Predecessor Thereof | Principal Occupation(s) During Past Five Years | |||||||||
| Christopher O. Petersen 5228 Ameriprise Financial Center Minneapolis, MN 55474 Born 1970 | President and Principal Executive Officer (2015) | Vice President and Lead Chief Counsel, Ameriprise Financial, Inc. since January 2015 (previously, Vice President and Chief Counsel January 2010-December 2014); officer of Columbia Funds and affiliated funds since 2007. | |||||||||
| Michael G. Clarke 225 Franklin Street Boston, MA 02110 Born 1969 | Treasurer (2011), Chief Financial Officer (2009) and Chief Accounting Officer (2015) | Vice President — Mutual Fund Administration, Columbia Management Investment Advisers, LLC, since May 2010; senior officer of Columbia Funds and affiliated funds since 2002. | |||||||||
| Paul B. Goucher 100 Park Avenue New York, NY 10017 Born 1968 | Senior Vice President (2011), Chief Legal Officer (2015) and Assistant Secretary (2008) | Senior Vice President and Assistant General Counsel, Ameriprise Financial, Inc. since January 2017 (previously Vice President and Lead Chief Counsel, November 2008-January 2017 and January 2013-January 2017, respectively, and Chief Counsel, January 2010-January 2013); Vice President, Chief Legal Officer and Assistant Secretary, Columbia Management Investment Advisers, LLC since May 2010. | |||||||||
| Thomas P. McGuire 225 Franklin Street Boston, MA 02110 Born 1972 | Senior Vice President and Chief Compliance Officer (2012) | Vice President — Asset Management Compliance, Ameriprise Financial, Inc., since May 2010; Chief Compliance Officer, Ameriprise Certificate Company since September 2010. | |||||||||
| Colin Moore 225 Franklin Street Boston, MA 02110 Born 1958 | Senior Vice President (2010) | Executive Vice President and Global Chief Investment Officer, Ameriprise Financial, Inc., since July 2013; Executive Vice President and Global Chief Investment Officer, Columbia Management Investment Advisers, LLC since July 2013 (previously Director and Global Chief Investment Officer, 2010-2013). | |||||||||
| Michael E. DeFao 225 Franklin Street Boston, MA 02110 Born 1968 | Vice President (2011) and Assistant Secretary (2010) | Vice President and Chief Counsel, Ameriprise Financial, Inc. since May 2010. | |||||||||
| Amy Johnson 5228 Ameriprise Financial Center Minneapolis, MN 55474 Born 1965 | Vice President (2006) | Managing Director and Global Head of Operations, Columbia Management Investment Advisers, LLC since April 2016 (previously Managing Director and Chief Operating Officer, 2010-2016). | |||||||||
| Lyn Kephart-Strong 5228 Ameriprise Financial Center Minneapolis, MN 55474 Born 1960 | Vice President (2015) | President, Columbia Management Investment Services Corp. since October 2014; Vice President & Resolution Officer, Ameriprise Trust Company since August 2009. | |||||||||
| Ryan C. Larrenaga 225 Franklin Street Boston, MA 02110 Born 1970 | Vice President and Secretary (2015) | Vice President and Group Counsel, Ameriprise Financial, Inc. since August 2011; officer of Columbia Funds and affiliated funds since 2005. | |||||||||
Annual Report 2016
31
This page intentionally left blank.
Annual Report 2016
32
COLUMBIA VARIABLE PORTFOLIO — SMALL COMPANY GROWTH FUND
IMPORTANT INFORMATION ABOUT THIS REPORT
The policy of the Board is to vote the proxies of the companies in which each fund holds investments consistent with the procedures as stated in the Statement of Additional Information (SAI). You may obtain a copy of the SAI without charge by calling 800.345.6611; contacting your financial intermediary or searching the website of the Securities and Exchange Commission (SEC) at sec.gov. Information regarding how each fund voted proxies relating to portfolio securities is filed with the SEC by August 31st for the most recent 12-month period ending June 30th of that year, and is available without charge by visiting investor.columbiathreadneedleus.com, or searching the website of the SEC at sec.gov.
Each fund files a complete schedule of portfolio holdings with the SEC for the first and third quarters of each fiscal year on Form N-Q. Each fund's Form N-Q is available on the SEC's website at sec.gov and may be reviewed and copied at the SEC's Public Reference Room in Washington, D.C. Information on the operation of the Public Reference Room may be obtained by calling 800.SEC.0330. Each fund's complete schedule of portfolio holdings, as filed on Form N-Q, can also be obtained without charge, upon request, by calling 800.345.6611.
Annual Report 2016
33
Columbia Variable Portfolio — Small Company Growth Fund
P.O. Box 8081
Boston, MA 02266-8081

Please read and consider the investment objectives, risks, charges and expenses for any fund carefully before investing. For fund and other investment product prospectuses, which contain this and other important information, contact your financial advisor or insurance representative. Please read the prospectus carefully before you invest. The Fund is distributed by Columbia Management Investment Distributors, Inc., member FINRA, and managed by Columbia Management Investment Advisers, LLC.
Columbia Threadneedle Investments (Columbia Threadneedle) is the global brand name of the Columbia and Threadneedle group of companies.
All rights reserved. Columbia Management Investment Distributors, Inc., 225 Franklin Street, Boston, MA 02110-2804
© 2017 Columbia Management Investment Advisers, LLC.
C-1506 AN (2/17)

ANNUAL REPORT
December 31, 2016

COLUMBIA VARIABLE PORTFOLIO — STRATEGIC INCOME FUND
Please remember that you may not buy (nor will you own) shares of the Fund directly. The Fund is available through variable annuity contracts and variable life insurance policies offered by the separate accounts of participating insurance companies as well as qualified pension and retirement plans. Please contact your financial advisor or insurance representative for more information.

COLUMBIA VARIABLE PORTFOLIO — STRATEGIC INCOME FUND
TABLE OF CONTENTS
Performance Overview | 2 | ||||||
Manager Discussion of Fund Performance | 4 | ||||||
Understanding Your Fund's Expenses | 7 | ||||||
Portfolio of Investments | 8 | ||||||
Statement of Assets and Liabilities | 29 | ||||||
Statement of Operations | 31 | ||||||
Statement of Changes in Net Assets | 32 | ||||||
Financial Highlights | 34 | ||||||
Notes to Financial Statements | 36 | ||||||
Report of Independent Registered Public Accounting Firm | 52 | ||||||
Trustees and Officers | 53 | ||||||
Important Information About This Report | 61 | ||||||
The views expressed in this report reflect the current views of the respective parties. These views are not guarantees of future performance and involve certain risks, uncertainties and assumptions that are difficult to predict, so actual outcomes and results may differ significantly from the views expressed. These views are subject to change at any time based upon economic, market or other conditions and the respective parties disclaim any responsibility to update such views. These views may not be relied on as investment advice and, because investment decisions for a Columbia fund are based on numerous factors, may not be relied on as an indication of trading intent on behalf of any particular Columbia fund. References to specific securities should not be construed as a recommendation or investment advice.
Annual Report 2016
COLUMBIA VARIABLE PORTFOLIO — STRATEGIC INCOME FUND
PERFORMANCE OVERVIEW
Performance Summary
n Columbia Variable Portfolio — Strategic Income Fund (the Fund) Class 2 shares returned 9.05% for the 12-month period that ended December 31, 2016.
n The Fund outperformed its benchmark, the Bloomberg Barclays U.S. Aggregate Bond Index, which returned 2.65% for the same time period.
n During the same time period, the Bank of America Merrill Lynch (BofAML) US Cash Pay High Yield Constrained Index returned 17.34%, the Citi Non-U.S. World Government Bond (All Maturities) Index (WGBI) — Unhedged returned 1.81% and the JPMorgan Emerging Markets Bond Index (EMBI) — Global returned 10.19%.
n Sector allocation and security selection overall contributed positively, while duration and currency positioning as a whole detracted from the Fund's performance.
Average Annual Total Returns (%) (for period ended December 31, 2016)
Inception | 1 Year | 5 Years | 10 Years | ||||||||||||||||
Class 1 | 07/05/94 | 9.15 | 4.62 | 5.70 | |||||||||||||||
Class 2 | 06/01/00 | 9.05 | 4.39 | 5.47 | |||||||||||||||
Bloomberg Barclays U.S. Aggregate Bond Index | 2.65 | 2.23 | 4.34 | ||||||||||||||||
BofAML US Cash Pay High Yield Constrained Index | 17.34 | 7.30 | 7.36 | ||||||||||||||||
Citi Non-U.S. WGBI — Unhedged | 1.81 | -1.94 | 2.54 | ||||||||||||||||
JPMorgan EMBI — Global | 10.19 | 5.44 | 6.75 | ||||||||||||||||
Performance data quoted represents past performance and current performance may be lower or higher. Past performance is no guarantee of future results. The investment return and principal value will fluctuate so that shares, when redeemed, may be worth more or less than the original cost. For current month-end performance information, please contact your financial advisor or insurance representative.
Performance results reflect the effect of any fee waivers or reimbursements of fund expenses by Columbia Management Investment Advisers, LLC and/or any of its affiliates. Absent these fee waivers or expense reimbursement arrangements, performance results would have been lower.
Investment earnings, if any, are tax-deferred until distributed to shareholders, at which time taxes may become due. Total return performance includes changes in share price and assumes reinvestment of dividends and capital gains, if any. Performance results reflect the effect of all fund expenses, but do not include any fees and expenses imposed under your variable annuity contract and/or variable life insurance policy or qualified pension or retirement plan. If performance results included the effect of these additional charges, they would be lower.
The Fund's performance prior to August 2014 reflects returns achieved pursuant to different principal investment strategies. If the Fund's current strategies had been in place for the prior periods, results shown may have been different.
The Bloomberg Barclays U.S. Aggregate Bond Index is a market value-weighted index that tracks the daily price, coupon, pay-downs and total return performance of fixed-rate, publicly placed, dollar-denominated and nonconvertible investment grade debt issues with at least $250 million par amount outstanding and with at least one year to final maturity.
The BofAML US Cash Pay High Yield Constrained Index tracks the performance of U.S. dollar-denominated below investment grade corporate debt, currently in a coupon paying period, that is publicly issued in the U.S. domestic market.
The Citi Non-U.S. WGBI — Unhedged is calculated on a market-weighted basis and includes all fixed-rate bonds with a remaining maturity of one year or longer and with amounts outstanding of at least the equivalent of U.S. $25 million, while excluding floating or variable rate bonds, securities aimed principally at non-institutional investors and private placement-type securities.
The JPMorgan EMBI — Global is based on U.S. dollar-denominated debt instruments issued by emerging market sovereign and quasi-sovereign entities, such as Brady bonds, Eurobonds and loans, and reflects reinvestment of all distributions and changes in market prices.
Indices are not available for investment, are not professionally managed and do not reflect sales charges, fees, brokerage commissions, taxes or other expenses of investing. Securities in the Fund may not match those in an index.
Annual Report 2016
2
COLUMBIA VARIABLE PORTFOLIO — STRATEGIC INCOME FUND
PERFORMANCE OVERVIEW (continued)
Performance of a Hypothetical $10,000 Investment (January 1, 2007 – December 31, 2016)

The chart above shows the change in value of a hypothetical $10,000 investment in Class 2 shares of Columbia Variable Portfolio — Strategic Income Fund during the stated time period, and does not reflect the deduction of taxes, if any, that a shareholder may pay on Fund distributions or on the redemption of Fund shares. The returns also do not reflect fees and expenses imposed under your variable annuity contract and/or variable life insurance policy or qualified pension or retirement plan, if any.
Annual Report 2016
3
COLUMBIA VARIABLE PORTFOLIO — STRATEGIC INCOME FUND
MANAGER DISCUSSION OF FUND PERFORMANCE
Portfolio Management
Brian Lavin, CFA
Colin Lundgren, CFA
Gene Tannuzzo, CFA
| Portfolio Breakdown (%) (at December 31, 2016) | |||||||
| Asset-Backed Securities — Non-Agency | 3.9 | ||||||
| Commercial Mortgage-Backed Securities — Non-Agency | 3.2 | ||||||
Common Stocks | 0.3 | ||||||
Corporate Bonds & Notes | 38.4 | ||||||
| Foreign Government Obligations | 8.7 | ||||||
Inflation-Indexed Bonds | 2.6 | ||||||
Money Market Funds | 6.2 | ||||||
| Residential Mortgage-Backed Securities — Agency | 12.9 | ||||||
| Residential Mortgage-Backed Securities — Non-Agency | 15.9 | ||||||
Senior Loans | 6.3 | ||||||
U.S. Treasury Obligations | 1.6 | ||||||
Total | 100.0 | ||||||
Percentages indicated are based upon total investments. The Fund's portfolio composition is subject to change.
At December 31, 2016, approximately 55.1% of the Fund's shares were owned in the aggregate by affiliated funds-of-funds managed by Columbia Management Investment Advisers, LLC (the Investment Manager). As a result of asset allocation decisions by the Investment Manager, it is possible that the Fund may experience relatively large purchases or redemptions from affiliated funds-of-funds. The Investment Manager seeks to minimize the impact of these transactions by structuring them over a reasonable period of time. The Fund may experience increased expenses as it buys and sells securities as a result of purchases or redemptions by affiliated funds-of-funds.
For the 12-month period that ended December 31, 2016, the Fund's Class 2 shares returned 9.05%. The Fund outperformed its benchmark, the Bloomberg Barclays U.S. Aggregate Bond Index, which returned 2.65% for the same period. During the same time period, the Bank of America Merrill Lynch (BofAML) US Cash Pay High Yield Constrained Index returned 17.34%, the Citi Non-U.S. WGBI — Unhedged returned 1.81% and the JPMorgan EMBI — Global returned 10.19%. Sector allocation and security selection overall contributed positively, while duration and currency positioning as a whole detracted from the Fund's performance.
Bond Markets Posted Solid Gains Despite Volatility
During the annual period, global bond markets posted gains across most sectors following lackluster performance for most of the prior calendar year. As was the case at the end of 2015, commodity prices continued to decline to start 2016, with crude oil hitting a low of $26.21 per barrel in mid-February 2016. This weighed on commodities specifically but also on global trade more broadly. For the first half of 2016, gross domestic product (GDP) growth averaged an anemic 1.1% in the U.S. before rebounding to 3.5% in the third calendar quarter. Generally speaking, central banks responded in an accommodative way. The Bank of Japan reduced its interest rates into negative territory; the European Central Bank expanded its asset purchases to include corporate bonds; and the Bank of England reduced its interest rates and expanded asset purchases following the Brexit vote, or the U.K. referendum on membership in the European Union. The U.S. Federal Reserve (the Fed) indicated it would likely be less aggressive in its rate hiking cycle than previously stated. As the year progressed, the backdrop of low but positive economic growth, low inflation and accommodative monetary policy turned out to be rather friendly to the bond markets. The tune changed, however, in the last quarter of the year, as economic growth stabilized, and the election of a U.S. president who is seen as business-friendly helped instill market confidence and pushed yields higher.
Overall, the most credit-sensitive sectors of the market performed best in 2016, led by CCC-rated corporate bonds, as measured by the BofAML U.S. High Yield Cash Pay Constrained CCC Index. The U.S. Treasury yield curve flattened, as short-term rates rose more than longer term yields did.
Annual Report 2016
4
COLUMBIA VARIABLE PORTFOLIO — STRATEGIC INCOME FUND
MANAGER DISCUSSION OF FUND PERFORMANCE (continued)
Corporate Bond Overweights Supported Fund Results
Relative to the benchmark, having overweighted allocations to high-yield and investment-grade corporate bonds contributed positively to the Fund's results, as both of these sectors outpaced the benchmark during the annual period. Effective security selection among structured products, including mortgage-backed securities, commercial mortgage-backed securities and asset-backed securities, also boosted the Fund's relative performance. Non-U.S. duration positioning added value as well, including exposure to bonds in Australia, Brazil, Hungary and Indonesia. Finally, yield curve positioning contributed positively to the Fund's results, as the Fund benefited from the flattening yield curve, meaning the narrowing of the yield differential between shorter term and longer term maturities.
U.S. Duration Positioning Hurt Performance
The Fund maintained a shorter U.S. duration position than that of the benchmark, which hurt its performance. Duration is a measure of the Fund's sensitivity to changes in interest rates. Also, the Fund's defensive position in developed market currencies was a drag on relative results, as the U.S. dollar weakened versus most other developed market currencies for much of the annual period. Issue selection among high-yield corporate bonds hurt as well, as the Fund did not have as much exposure to the riskiest segments of the sector, which posted the strongest results. These strongly performing segments, where the Fund was underweighted, included bonds rated CCC and those in the energy and metals and mining industries.
Shifting Market Conditions Drove Portfolio Changes
Early in the annual period, when conditions were particularly volatile, we added to the Fund's exposure to credit-sensitive sectors, including investment-grade and high-yield corporate bonds. The Fund's high-yield corporate bond exposure reached a high of approximately 40% of total net assets in February 2016 when we viewed valuations as most attractive. Following the post-February rally in credit, we took the opportunity to reduce the Fund's credit exposure in favor of mortgage-backed securities and Treasury inflation protected securities (TIPS). By the end of the annual period, the Fund's exposure to high-yield corporate bonds had been reduced by half of its peak level, bringing it down to approximately 19% of the Fund's total net assets. Also, we modestly adjusted the Fund's duration throughout the annual period as market conditions shifted, although we maintained a shorter duration than that of the benchmark throughout. Overall, the Fund's portfolio turnover rate for the 12-month period was 179%. A significant portion of the turnover was the result of rolling-maturity mortgage securities, processing of prepayments and opportunistic changes our managers made at the margin in response to valuations or market developments.
Derivatives Usage
The Fund utilized government bond futures and swaps to manage duration and yield curve exposure, credit default swaps to tactically adjust credit exposure in the high yield and emerging market debt sectors, currency
| Quality Breakdown (%) (at December 31, 2016) | |||||||
AAA rating | 19.9 | ||||||
AA rating | 0.4 | ||||||
A rating | 2.6 | ||||||
BBB rating | 21.2 | ||||||
BB rating | 15.9 | ||||||
B rating | 16.4 | ||||||
CCC rating | 6.2 | ||||||
CC rating | 0.2 | ||||||
D rating | 0.1 | ||||||
Not rated | 17.1 | ||||||
Total | 100.0 | ||||||
Percentages indicated are based upon total fixed income investments (excluding Money Market Funds).
Bond ratings apply to the underlying holdings of the Fund and not the Fund itself and are divided into categories ranging from highest to lowest credit quality, determined by using the middle rating of Moody's, S&P and Fitch, after dropping the highest and lowest available ratings. When ratings are available from only two rating agencies, the lower rating is used. When a rating is available from only one rating agency, that rating is used. When a bond is not rated by any rating agency, it is designated as "Not rated." Credit quality ratings assigned by a rating agency are subjective opinions, not statements of fact, and are subject to change, including daily. The ratings assigned by credit rating agencies are but one of the considerations that the Investment Manager and/or Fund's subadviser incorporates into its credit analysis process, along with such other issuer-specific factors as cash flows, capital structure and leverage ratios, ability to de-leverage (repay) through free cash flow, quality of management, market positioning and access to capital, as well as such security-specific factors as the terms of the security (e.g., interest rate and time to maturity) and the amount and type of any collateral.
Annual Report 2016
5
COLUMBIA VARIABLE PORTFOLIO — STRATEGIC INCOME FUND
MANAGER DISCUSSION OF FUND PERFORMANCE (continued)
| Market Exposure Through Derivatives Investments (% of notional exposure) (at December 31, 2016)(a) | |||||||||||||||
Long | Short | Net | |||||||||||||
| Fixed Income Derivative Contracts | 193.9 | (75.9 | ) | 118.0 | |||||||||||
| Foreign Currency Derivative Contracts | 4.3 | (22.3 | ) | (18.0 | ) | ||||||||||
| Total Notional Market Value of Derivative Contracts | 198.2 | (98.2 | ) | 100.0 | |||||||||||
(a) The Fund has market exposure (long and/or short) to the fixed income asset class and foreign currency through its investments in derivatives. The notional exposure of a financial instrument is the nominal or face amount that is used to calculate payments made on that instrument and/or changes in value for the instrument. The notional exposure is a hypothetical underlying quantity upon which payment obligations are computed. Notional exposures provide a gauge for how the Fund may behave given changes in individual markets. For a description of the Fund's investments in derivatives, see Investments in Derivatives following the Portfolio of Investments, and Note 2 to the Notes to Financial Statements.
forwards for hedging foreign currency risk and total return purposes and mortgage TBAs to add exposure to agency mortgage-backed securities (MBS). TBAs, which stands for "to be announced," are mortgage securities bought and sold for future settlement with an agreed upon price, coupon and face value, but without reference to the characteristics of the underlying pool of mortgages until 48 hours before delivery is taken. This feature gives TBA participants immediate exposure to agency MBS without having to value each individual security. On a stand-alone basis, these derivative positions had a net negative impact on the Fund's performance.
Annual Report 2016
6
COLUMBIA VARIABLE PORTFOLIO — STRATEGIC INCOME FUND
UNDERSTANDING YOUR FUND'S EXPENSES
(Unaudited)
As an investor, you incur ongoing costs, which generally include management fees, distribution and/or service fees, and other fund expenses. The following information is intended to help you understand your ongoing costs (in dollars) of investing in the Fund and to help you compare these costs with the ongoing costs of investing in other mutual funds.
The information below does not reflect fees and expenses imposed under your variable annuity contract and/or variable life insurance policy (collectively, Contracts) or qualified pension and retirement plan (Qualified Plan), if any. The total fees and expenses you bear may therefore be higher than those shown below.
Analyzing Your Fund's Expenses
To illustrate these ongoing costs, we have provided examples and calculated the expenses paid by investors in each share class of the Fund during the period. The actual and hypothetical information in the table is based on an initial investment of $1,000 at the beginning of the period indicated and held for the entire period. Expense information is calculated two ways and each method provides you with different information. The amount listed in the "Actual" column is calculated using the Fund's actual operating expenses and total return for the period. You may use the Actual information, together with the amount invested, to estimate the expenses that you paid over the period. Simply divide your account value by $1,000 (for example, an $8,600 account value divided by $1,000 = 8.6), then multiply the results by the expenses paid during the period under the "Actual" column. The amount listed in the "Hypothetical" column assumes a 5% annual rate of return before expenses (which is not the Fund's actual return) and then applies the Fund's actual expense ratio for the period to the hypothetical return. You should not use the hypothetical account values and expenses to estimate either your actual account balance at the end of the period or the expenses you paid during the period. See "Compare With Other Funds" below for details on how to use the hypothetical data.
Compare With Other Funds
Since all mutual funds are required to include the same hypothetical calculations about expenses in shareholder reports, you can use this information to compare the ongoing cost of investing in the Fund with other funds. To do so, compare the hypothetical example with the 5% hypothetical examples that appear in the shareholder reports of other funds. As you compare hypothetical examples of other funds, it is important to note that hypothetical examples are meant to highlight the ongoing costs of investing in a fund only and do not reflect any transaction costs, such as redemption or exchange fees, or expenses that apply to the subaccount or the Contract. Therefore, the hypothetical calculations are useful in comparing ongoing costs only, and will not help you determine the relative total costs of owning different funds. If the fees and expenses imposed under your Contract or Qualified Plan, if any, were included, your costs would be higher.
July 1, 2016 – December 31, 2016
| Account Value at the Beginning of the Period ($) | Account Value at the End of the Period ($) | Expenses Paid During the Period ($) | Fund's Annualized Expense Ratio (%) | ||||||||||||||||||||||||||||
Actual | Hypothetical | Actual | Hypothetical | Actual | Hypothetical | Actual | |||||||||||||||||||||||||
Class 1 | 1,000.00 | 1,000.00 | 1,033.50 | 1,021.55 | 3.51 | 3.49 | 0.69 | ||||||||||||||||||||||||
Class 2 | 1,000.00 | 1,000.00 | 1,034.20 | 1,020.30 | 4.78 | 4.75 | 0.94 | ||||||||||||||||||||||||
Expenses paid during the period are equal to the annualized expense ratio for each class as indicated above, multiplied by the average account value over the period and then multiplied by the number of days in the Fund's most recent fiscal half year and divided by 366.
Expenses do not include fees and expenses incurred indirectly by the Fund from its investment in underlying funds, including affiliated and non-affiliated pooled investment vehicles, such as mutual funds and exchange-traded funds.
Had Columbia Management Investment Advisers, LLC and/or certain of its affiliates not waived/reimbursed certain fees and expenses, account value at the end of the period would have been reduced.
Annual Report 2016
7
COLUMBIA VARIABLE PORTFOLIO — STRATEGIC INCOME FUND
PORTFOLIO OF INVESTMENTS
December 31, 2016
(Percentages represent value of investments compared to net assets)
Corporate Bonds & Notes(a) 42.0%
Issuer | Coupon Rate | Principal Amount ($) | Value ($) | ||||||||||||
AEROSPACE & DEFENSE 0.7% | |||||||||||||||
| Bombardier, Inc.(b) 12/01/21 | 8.750 | % | 74,000 | 78,533 | |||||||||||
| L-3 Communications Corp. 05/28/24 | 3.950 | % | 556,000 | 565,483 | |||||||||||
| TransDigm, Inc. 07/15/22 | 6.000 | % | 245,000 | 254,800 | |||||||||||
05/15/25 | 6.500 | % | 101,000 | 105,797 | |||||||||||
| TransDigm, Inc.(b) 06/15/26 | 6.375 | % | 18,000 | 18,486 | |||||||||||
Total | 1,023,099 | ||||||||||||||
AUTOMOTIVE 0.1% | |||||||||||||||
| Gates Global LLC/Co.(b) 07/15/22 | 6.000 | % | 117,000 | 114,426 | |||||||||||
| IHO Verwaltungs GmbH PIK(b) 09/15/26 | 4.750 | % | 80,000 | 77,200 | |||||||||||
Total | 191,626 | ||||||||||||||
BANKING 1.6% | |||||||||||||||
| Agromercantil Senior Trust(b) 04/10/19 | 6.250 | % | 108,000 | 110,758 | |||||||||||
| Ally Financial, Inc. 11/01/31 | 8.000 | % | 277,000 | 321,298 | |||||||||||
| Banco Mercantil del Norte SA Subordinated(b)(c) 10/04/31 | 5.750 | % | 200,000 | 185,750 | |||||||||||
| Banco de Bogota SA Subordinated(b) 05/12/26 | 6.250 | % | 200,000 | 203,928 | |||||||||||
| Bank of America Corp. 04/19/26 | 3.500 | % | 385,000 | 379,869 | |||||||||||
| Citigroup, Inc. 05/01/26 | 3.400 | % | 360,000 | 349,798 | |||||||||||
| Industrial Senior Trust(b) 11/01/22 | 5.500 | % | 102,000 | 97,853 | |||||||||||
| Popular, Inc. 07/01/19 | 7.000 | % | 95,000 | 97,969 | |||||||||||
| Synovus Financial Corp. 02/15/19 | 7.875 | % | 274,000 | 301,400 | |||||||||||
| Wells Fargo & Co. 10/23/26 | 3.000 | % | 270,000 | 257,147 | |||||||||||
Total | 2,305,770 | ||||||||||||||
BROKERAGE/ASSET MANAGERS/EXCHANGES 0.1% | |||||||||||||||
| E*TRADE Financial Corp. 09/15/23 | 4.625 | % | 194,000 | 197,880 | |||||||||||
Corporate Bonds & Notes(a) (continued)
Issuer | Coupon Rate | Principal Amount ($) | Value ($) | ||||||||||||
BUILDING MATERIALS 0.5% | |||||||||||||||
| Allegion PLC 09/15/23 | 5.875 | % | 134,000 | 142,040 | |||||||||||
| American Builders & Contractors Supply Co., Inc.(b) 04/15/21 | 5.625 | % | 92,000 | 94,990 | |||||||||||
12/15/23 | 5.750 | % | 26,000 | 26,780 | |||||||||||
| Beacon Roofing Supply, Inc. 10/01/23 | 6.375 | % | 116,000 | 123,758 | |||||||||||
| Cemex SAB de CV(b) 04/16/26 | 7.750 | % | 200,000 | 221,250 | |||||||||||
| Eagle Materials, Inc. 08/01/26 | 4.500 | % | 23,000 | 22,943 | |||||||||||
| HD Supply, Inc.(b) 04/15/24 | 5.750 | % | 46,000 | 48,562 | |||||||||||
Total | 680,323 | ||||||||||||||
CABLE AND SATELLITE 2.6% | |||||||||||||||
| Altice US Finance I Corp.(b) 05/15/26 | 5.500 | % | 190,000 | 193,800 | |||||||||||
| CCO Holdings LLC/Capital Corp.(b) 05/01/23 | 5.125 | % | 56,000 | 57,680 | |||||||||||
04/01/24 | 5.875 | % | 16,000 | 17,080 | |||||||||||
05/01/25 | 5.375 | % | 180,000 | 185,400 | |||||||||||
02/15/26 | 5.750 | % | 140,000 | 144,900 | |||||||||||
05/01/26 | 5.500 | % | 5,000 | 5,100 | |||||||||||
| CSC Holdings LLC(b) 10/15/25 | 6.625 | % | 188,000 | 204,920 | |||||||||||
10/15/25 | 10.875 | % | 214,000 | 253,590 | |||||||||||
| Cequel Communications Holdings I LLC/Capital Corp.(b) 12/15/21 | 5.125 | % | 97,000 | 98,698 | |||||||||||
| DISH DBS Corp. 11/15/24 | 5.875 | % | 236,000 | 242,844 | |||||||||||
07/01/26 | 7.750 | % | 195,000 | 219,862 | |||||||||||
| Quebecor Media, Inc. 01/15/23 | 5.750 | % | 199,000 | 206,462 | |||||||||||
| Sirius XM Radio, Inc.(b) 04/15/25 | 5.375 | % | 113,000 | 112,718 | |||||||||||
| Sky PLC(b) 11/26/22 | 3.125 | % | 885,000 | 877,809 | |||||||||||
| Unitymedia Hessen GmbH & Co. KG NRW(b) 01/15/25 | 5.000 | % | 256,000 | 254,720 | |||||||||||
| Virgin Media Secured Finance PLC(b) 01/15/26 | 5.250 | % | 338,000 | 333,775 | |||||||||||
| Ziggo Secured Finance BV(b) 01/15/27 | 5.500 | % | 265,000 | 258,322 | |||||||||||
Total | 3,667,680 | ||||||||||||||
The accompanying Notes to Financial Statements are an integral part of this statement.
Annual Report 2016
8
COLUMBIA VARIABLE PORTFOLIO — STRATEGIC INCOME FUND
PORTFOLIO OF INVESTMENTS (continued)
December 31, 2016
Corporate Bonds & Notes(a) (continued)
Issuer | Coupon Rate | Principal Amount ($) | Value ($) | ||||||||||||
CHEMICALS 0.8% | |||||||||||||||
| Angus Chemical Co.(b) 02/15/23 | 8.750 | % | 109,000 | 111,180 | |||||||||||
| Chemours Co. (The) 05/15/23 | 6.625 | % | 137,000 | 135,630 | |||||||||||
05/15/25 | 7.000 | % | 34,000 | 33,490 | |||||||||||
| Eco Services Operations LLC/Finance Corp.(b) 11/01/22 | 8.500 | % | 83,000 | 88,187 | |||||||||||
| INEOS Group Holdings SA(b) 08/01/24 | 5.625 | % | 132,000 | 131,010 | |||||||||||
| Mexichem SAB de CV(b) 09/17/44 | 5.875 | % | 200,000 | 178,250 | |||||||||||
| PQ Corp.(b) 11/15/22 | 6.750 | % | 249,000 | 266,430 | |||||||||||
| Platform Specialty Products Corp.(b) 05/01/21 | 10.375 | % | 109,000 | 120,717 | |||||||||||
02/01/22 | 6.500 | % | 57,000 | 57,428 | |||||||||||
Total | 1,122,322 | ||||||||||||||
CONSTRUCTION MACHINERY 0.2% | |||||||||||||||
| Herc Rentals, Inc.(b) 06/01/24 | 7.750 | % | 24,000 | 25,230 | |||||||||||
| United Rentals North America, Inc. 09/15/26 | 5.875 | % | 195,000 | 200,606 | |||||||||||
05/15/27 | 5.500 | % | 29,000 | 28,783 | |||||||||||
Total | 254,619 | ||||||||||||||
CONSUMER CYCLICAL SERVICES 0.6% | |||||||||||||||
| APX Group, Inc. 12/01/20 | 8.750 | % | 177,000 | 178,327 | |||||||||||
12/01/22 | 7.875 | % | 296,000 | 320,420 | |||||||||||
| IHS Markit Ltd.(b) 11/01/22 | 5.000 | % | 123,000 | 127,613 | |||||||||||
| Interval Acquisition Corp. 04/15/23 | 5.625 | % | 170,000 | 173,400 | |||||||||||
| Ritchie Bros. Auctioneers, Inc.(b) 01/15/25 | 5.375 | % | 24,000 | 24,480 | |||||||||||
Total | 824,240 | ||||||||||||||
CONSUMER PRODUCTS 0.5% | |||||||||||||||
| Prestige Brands, Inc.(b) 03/01/24 | 6.375 | % | 92,000 | 96,600 | |||||||||||
| Scotts Miracle-Gro Co. (The)(b) 10/15/23 | 6.000 | % | 100,000 | 105,750 | |||||||||||
12/15/26 | 5.250 | % | 17,000 | 17,021 | |||||||||||
| Spectrum Brands, Inc. 07/15/25 | 5.750 | % | 110,000 | 114,125 | |||||||||||
Corporate Bonds & Notes(a) (continued)
Issuer | Coupon Rate | Principal Amount ($) | Value ($) | ||||||||||||
| Springs Industries, Inc. 06/01/21 | 6.250 | % | 163,000 | 168,705 | |||||||||||
| Tempur Sealy International, Inc. 10/15/23 | 5.625 | % | 129,000 | 133,193 | |||||||||||
| Valvoline, Inc.(b) 07/15/24 | 5.500 | % | 16,000 | 16,560 | |||||||||||
Total | 651,954 | ||||||||||||||
DIVERSIFIED MANUFACTURING 0.2% | |||||||||||||||
| Entegris, Inc.(b) 04/01/22 | 6.000 | % | 82,000 | 85,280 | |||||||||||
| SPX FLOW, Inc.(b) 08/15/24 | 5.625 | % | 27,000 | 27,203 | |||||||||||
08/15/26 | 5.875 | % | 99,000 | 99,000 | |||||||||||
| Zekelman Industries, Inc.(b) 06/15/23 | 9.875 | % | 38,000 | 42,560 | |||||||||||
Total | 254,043 | ||||||||||||||
ELECTRIC 3.4% | |||||||||||||||
| AES Corp. (The) 07/01/21 | 7.375 | % | 67,000 | 74,631 | |||||||||||
05/15/26 | 6.000 | % | 69,000 | 70,035 | |||||||||||
| Appalachian Power Co. 06/01/45 | 4.450 | % | 321,000 | 327,984 | |||||||||||
| Berkshire Hathaway Energy Co. 11/15/43 | 5.150 | % | 169,000 | 189,750 | |||||||||||
| CMS Energy Corp. 02/15/27 | 2.950 | % | 165,000 | 156,600 | |||||||||||
| Calpine Corp.(b) 01/15/22 | 6.000 | % | 144,000 | 150,480 | |||||||||||
06/01/26 | 5.250 | % | 21,000 | 20,685 | |||||||||||
| DTE Energy Co. 12/01/23 | 3.850 | % | 85,000 | 87,962 | |||||||||||
06/01/24 | 3.500 | % | 340,000 | 342,657 | |||||||||||
10/01/26 | 2.850 | % | 450,000 | 418,193 | |||||||||||
| Duke Energy Corp. 10/15/23 | 3.950 | % | 464,000 | 486,679 | |||||||||||
| Dynegy, Inc. 11/01/24 | 7.625 | % | 32,000 | 29,520 | |||||||||||
| Emera US Finance LP(b) 06/15/46 | 4.750 | % | 240,000 | 242,027 | |||||||||||
| NRG Energy, Inc. 07/15/22 | 6.250 | % | 117,000 | 117,293 | |||||||||||
05/01/24 | 6.250 | % | 16,000 | 15,560 | |||||||||||
| NRG Energy, Inc.(b) 01/15/27 | 6.625 | % | 206,000 | 194,670 | |||||||||||
| NRG Yield Operating LLC 08/15/24 | 5.375 | % | 292,000 | 293,460 | |||||||||||
The accompanying Notes to Financial Statements are an integral part of this statement.
Annual Report 2016
9
COLUMBIA VARIABLE PORTFOLIO — STRATEGIC INCOME FUND
PORTFOLIO OF INVESTMENTS (continued)
December 31, 2016
Corporate Bonds & Notes(a) (continued)
Issuer | Coupon Rate | Principal Amount ($) | Value ($) | ||||||||||||
| PPL Capital Funding, Inc. 06/01/23 | 3.400 | % | 275,000 | 276,874 | |||||||||||
03/15/24 | 3.950 | % | 430,000 | 445,010 | |||||||||||
| Pacific Gas & Electric Co. 02/15/44 | 4.750 | % | 244,000 | 267,650 | |||||||||||
| Progress Energy, Inc. 04/01/22 | 3.150 | % | 382,000 | 385,453 | |||||||||||
| Southern Co. (The) 07/01/46 | 4.400 | % | 300,000 | 296,735 | |||||||||||
Total | 4,889,908 | ||||||||||||||
FINANCE COMPANIES 0.7% | |||||||||||||||
| Aircastle Ltd. 02/15/22 | 5.500 | % | 96,000 | 101,760 | |||||||||||
| Navient Corp. 03/25/20 | 8.000 | % | 171,000 | 189,707 | |||||||||||
07/26/21 | 6.625 | % | 67,000 | 70,853 | |||||||||||
10/25/24 | 5.875 | % | 44,000 | 41,800 | |||||||||||
| OneMain Financial Holdings LLC(b) 12/15/19 | 6.750 | % | 65,000 | 68,088 | |||||||||||
12/15/21 | 7.250 | % | 137,000 | 142,822 | |||||||||||
| Provident Funding Associates LP/Finance Corp.(b) 06/15/21 | 6.750 | % | 323,000 | 324,615 | |||||||||||
| Quicken Loans, Inc.(b) 05/01/25 | 5.750 | % | 98,000 | 95,305 | |||||||||||
Total | 1,034,950 | ||||||||||||||
FOOD AND BEVERAGE 2.4% | |||||||||||||||
| Anheuser-Busch InBev Finance, Inc. 02/01/23 | 3.300 | % | 400,000 | 407,093 | |||||||||||
| ConAgra Foods, Inc. 01/25/23 | 3.200 | % | 483,000 | 482,552 | |||||||||||
| FAGE International SA/USA Dairy Industry, Inc.(b) 08/15/26 | 5.625 | % | 72,000 | 72,180 | |||||||||||
| Grupo Bimbo SAB de CV(b) 06/27/44 | 4.875 | % | 750,000 | 675,988 | |||||||||||
| Lamb Weston Holdings, Inc.(b) 11/01/24 | 4.625 | % | 33,000 | 33,083 | |||||||||||
11/01/26 | 4.875 | % | 54,000 | 53,426 | |||||||||||
| MHP SA(b) 04/02/20 | 8.250 | % | 207,000 | 198,720 | |||||||||||
| Molson Coors Brewing Co. 07/15/26 | 3.000 | % | 180,000 | 170,156 | |||||||||||
05/01/42 | 5.000 | % | 306,000 | 319,878 | |||||||||||
07/15/46 | 4.200 | % | 102,000 | 95,097 | |||||||||||
| Mondelez International Holdings Netherlands BV(b) 10/28/19 | 1.625 | % | 445,000 | 436,357 | |||||||||||
| Pinnacle Foods Finance LLC/Corp. 01/15/24 | 5.875 | % | 15,000 | 15,900 | |||||||||||
Corporate Bonds & Notes(a) (continued)
Issuer | Coupon Rate | Principal Amount ($) | Value ($) | ||||||||||||
| Post Holdings, Inc.(b) 03/15/24 | 7.750 | % | 132,000 | 146,520 | |||||||||||
08/15/26 | 5.000 | % | 143,000 | 136,922 | |||||||||||
| Treehouse Foods, Inc.(b) 02/15/24 | 6.000 | % | 22,000 | 23,100 | |||||||||||
| WhiteWave Foods Co. (The) 10/01/22 | 5.375 | % | 95,000 | 104,025 | |||||||||||
Total | 3,370,997 | ||||||||||||||
GAMING 1.2% | |||||||||||||||
| Boyd Gaming Corp.(b) 04/01/26 | 6.375 | % | 129,000 | 138,933 | |||||||||||
| GLP Capital LP/Financing II, Inc. 04/15/26 | 5.375 | % | 71,000 | 74,046 | |||||||||||
| International Game Technology PLC(b) 02/15/25 | 6.500 | % | 223,000 | 239,167 | |||||||||||
| Jack Ohio Finance LLC/1 Corp.(b) 11/15/21 | 6.750 | % | 100,000 | 101,250 | |||||||||||
| MGM Growth Properties Operating Partnership LP/Finance Co-Issuer, Inc.(b) 09/01/26 | 4.500 | % | 45,000 | 43,200 | |||||||||||
| MGM Growth Properties Operating Partnership LP/MGP Finance Co-Issuer, Inc.(b) 05/01/24 | 5.625 | % | 48,000 | 50,280 | |||||||||||
| MGM Resorts International 09/01/26 | 4.625 | % | 268,000 | 257,950 | |||||||||||
| Scientific Games International, Inc. 12/01/22 | 10.000 | % | 180,000 | 179,100 | |||||||||||
| Scientific Games International, Inc.(b) 01/01/22 | 7.000 | % | 123,000 | 131,918 | |||||||||||
| SugarHouse HSP Gaming LP/Finance Corp.(b) 06/01/21 | 6.375 | % | 200,000 | 199,500 | |||||||||||
| Tunica-Biloxi Gaming Authority(b)(d) 11/15/16 | 0.000 | % | 923,000 | 323,050 | |||||||||||
Total | 1,738,394 | ||||||||||||||
HEALTH CARE 1.6% | |||||||||||||||
| Acadia Healthcare Co., Inc. 03/01/24 | 6.500 | % | 125,000 | 127,813 | |||||||||||
| Alere, Inc.(b) 07/01/23 | 6.375 | % | 90,000 | 89,438 | |||||||||||
| Change Healthcare Holdings, Inc.(b) 02/15/21 | 6.000 | % | 60,000 | 62,700 | |||||||||||
| DaVita, Inc. 05/01/25 | 5.000 | % | 194,000 | 190,847 | |||||||||||
| Envision Healthcare Corp.(b) 12/01/24 | 6.250 | % | 77,000 | 81,235 | |||||||||||
The accompanying Notes to Financial Statements are an integral part of this statement.
Annual Report 2016
10
COLUMBIA VARIABLE PORTFOLIO — STRATEGIC INCOME FUND
PORTFOLIO OF INVESTMENTS (continued)
December 31, 2016
Corporate Bonds & Notes(a) (continued)
Issuer | Coupon Rate | Principal Amount ($) | Value ($) | ||||||||||||
| Express Scripts Holding Co. 07/15/46 | 4.800 | % | 165,000 | 157,975 | |||||||||||
| Fresenius Medical Care U.S. Finance II, Inc.(b) 10/15/24 | 4.750 | % | 132,000 | 133,320 | |||||||||||
| HCA, Inc. 05/01/23 | 4.750 | % | 337,000 | 345,004 | |||||||||||
02/01/25 | 5.375 | % | 155,000 | 155,387 | |||||||||||
02/15/27 | 4.500 | % | 158,000 | 155,235 | |||||||||||
| MEDNAX, Inc.(b) 12/01/23 | 5.250 | % | 62,000 | 63,860 | |||||||||||
| MPH Acquisition Holdings LLC(b) 06/01/24 | 7.125 | % | 139,000 | 145,602 | |||||||||||
| Quintiles IMS, Inc.(b) 05/15/23 | 4.875 | % | 102,000 | 103,530 | |||||||||||
10/15/26 | 5.000 | % | 126,000 | 126,315 | |||||||||||
| Sterigenics-Nordion Holdings LLC(b) 05/15/23 | 6.500 | % | 131,000 | 133,292 | |||||||||||
| Teleflex, Inc. 06/01/26 | 4.875 | % | 28,000 | 27,720 | |||||||||||
| Tenet Healthcare Corp. 06/15/23 | 6.750 | % | 55,000 | 48,538 | |||||||||||
| Tenet Healthcare Corp.(b) 01/01/22 | 7.500 | % | 41,000 | 42,743 | |||||||||||
| Universal Health Services, Inc.(b) 06/01/26 | 5.000 | % | 160,000 | 156,000 | |||||||||||
Total | 2,346,554 | ||||||||||||||
HEALTHCARE INSURANCE 0.4% | |||||||||||||||
| Centene Corp. 05/15/22 | 4.750 | % | 280,000 | 282,800 | |||||||||||
01/15/25 | 4.750 | % | 45,000 | 43,931 | |||||||||||
| Molina Healthcare, Inc. 11/15/22 | 5.375 | % | 169,000 | 170,690 | |||||||||||
Total | 497,421 | ||||||||||||||
HOME CONSTRUCTION 0.1% | |||||||||||||||
| Meritage Homes Corp. 04/01/22 | 7.000 | % | 90,000 | 97,425 | |||||||||||
INDEPENDENT ENERGY 3.6% | |||||||||||||||
| Anadarko Petroleum Corp. 07/15/44 | 4.500 | % | 85,000 | 79,862 | |||||||||||
| Callon Petroleum Co.(b) 10/01/24 | 6.125 | % | 30,000 | 30,900 | |||||||||||
| Canadian Natural Resources Ltd. 03/15/38 | 6.250 | % | 315,000 | 358,364 | |||||||||||
| Carrizo Oil & Gas, Inc. 04/15/23 | 6.250 | % | 374,000 | 383,350 | |||||||||||
Corporate Bonds & Notes(a) (continued)
Issuer | Coupon Rate | Principal Amount ($) | Value ($) | ||||||||||||
| Chesapeake Energy Corp.(b) 01/15/25 | 8.000 | % | 53,000 | 54,060 | |||||||||||
| Concho Resources, Inc. 04/01/23 | 5.500 | % | 412,000 | 426,956 | |||||||||||
| Continental Resources, Inc. 09/15/22 | 5.000 | % | 205,000 | 206,925 | |||||||||||
| CrownRock LP/Finance, Inc.(b) 02/15/23 | 7.750 | % | 279,000 | 301,320 | |||||||||||
| Diamondback Energy, Inc.(b) 11/01/24 | 4.750 | % | 25,000 | 24,500 | |||||||||||
05/31/25 | 5.375 | % | 109,000 | 109,621 | |||||||||||
| Extraction Oil & Gas Holdings LLC/Finance Corp.(b) 07/15/21 | 7.875 | % | 235,000 | 251,450 | |||||||||||
| Kosmos Energy Ltd.(b) 08/01/21 | 7.875 | % | 200,000 | 199,000 | |||||||||||
| Laredo Petroleum, Inc. 03/15/23 | 6.250 | % | 512,000 | 529,920 | |||||||||||
| Newfield Exploration Co. 01/30/22 | 5.750 | % | 9,000 | 9,484 | |||||||||||
07/01/24 | 5.625 | % | 117,000 | 121,973 | |||||||||||
| Noble Energy, Inc. 11/15/43 | 5.250 | % | 125,000 | 127,327 | |||||||||||
| Oasis Petroleum, Inc. 01/15/23 | 6.875 | % | 148,000 | 151,700 | |||||||||||
| PDC Energy, Inc.(b) 09/15/24 | 6.125 | % | 156,000 | 159,510 | |||||||||||
| Parsley Energy LLC/Finance Corp.(b) 06/01/24 | 6.250 | % | 101,000 | 106,282 | |||||||||||
01/15/25 | 5.375 | % | 118,000 | 118,401 | |||||||||||
| QEP Resources, Inc. 05/01/23 | 5.250 | % | 5,000 | 5,013 | |||||||||||
| RSP Permian, Inc. 10/01/22 | 6.625 | % | 184,000 | 194,580 | |||||||||||
| RSP Permian, Inc.(b) 01/15/25 | 5.250 | % | 150,000 | 150,750 | |||||||||||
| SM Energy Co. 06/01/25 | 5.625 | % | 32,000 | 30,880 | |||||||||||
09/15/26 | 6.750 | % | 122,000 | 125,660 | |||||||||||
| WPX Energy, Inc. 01/15/22 | 6.000 | % | 375,000 | 384,375 | |||||||||||
| Whiting Petroleum Corp. 03/15/21 | 5.750 | % | 147,000 | 146,388 | |||||||||||
04/01/23 | 6.250 | % | 46,000 | 46,000 | |||||||||||
| Woodside Finance Ltd.(b) 03/05/25 | 3.650 | % | 290,000 | 283,296 | |||||||||||
Total | 5,117,847 | ||||||||||||||
The accompanying Notes to Financial Statements are an integral part of this statement.
Annual Report 2016
11
COLUMBIA VARIABLE PORTFOLIO — STRATEGIC INCOME FUND
PORTFOLIO OF INVESTMENTS (continued)
December 31, 2016
Corporate Bonds & Notes(a) (continued)
Issuer | Coupon Rate | Principal Amount ($) | Value ($) | ||||||||||||
INTEGRATED ENERGY 0.3% | |||||||||||||||
| Cenovus Energy, Inc. 09/15/42 | 4.450 | % | 93,000 | 80,535 | |||||||||||
09/15/43 | 5.200 | % | 390,000 | 371,475 | |||||||||||
Total | 452,010 | ||||||||||||||
LEISURE 0.1% | |||||||||||||||
| LTF Merger Sub, Inc.(b) 06/15/23 | 8.500 | % | 78,000 | 80,730 | |||||||||||
| Live Nation Entertainment, Inc.(b) 11/01/24 | 4.875 | % | 75,000 | 75,188 | |||||||||||
Total | 155,918 | ||||||||||||||
LIFE INSURANCE 2.2% | |||||||||||||||
| Five Corners Funding Trust(b) 11/15/23 | 4.419 | % | 1,189,000 | 1,254,238 | |||||||||||
| Guardian Life Insurance Co. of America (The) Subordinated(b) 06/19/64 | 4.875 | % | 224,000 | 220,036 | |||||||||||
| MetLife, Inc. 09/15/23 | 4.368 | % | 105,000 | 112,990 | |||||||||||
03/01/45 | 4.050 | % | 495,000 | 474,680 | |||||||||||
| Peachtree Corners Funding Trust(b) 02/15/25 | 3.976 | % | 755,000 | 736,663 | |||||||||||
| Teachers Insurance & Annuity Association of America Subordinated(b) 09/15/44 | 4.900 | % | 340,000 | 365,856 | |||||||||||
Total | 3,164,463 | ||||||||||||||
LODGING 0.3% | |||||||||||||||
| Grupo Posadas SAB de CV(b) 06/30/22 | 7.875 | % | 150,000 | 148,500 | |||||||||||
| Hilton Domestic Operating Co., Inc.(b) 09/01/24 | 4.250 | % | 83,000 | 80,510 | |||||||||||
| Hilton Grand Vacations Borrower LLC/Inc.(b) 12/01/24 | 6.125 | % | 35,000 | 36,356 | |||||||||||
| Playa Resorts Holding BV(b) 08/15/20 | 8.000 | % | 215,000 | 222,525 | |||||||||||
Total | 487,891 | ||||||||||||||
MEDIA AND ENTERTAINMENT 2.2% | |||||||||||||||
| 21st Century Fox America, Inc. 09/15/44 | 4.750 | % | 465,000 | 464,802 | |||||||||||
| AMC Networks, Inc. 04/01/24 | 5.000 | % | 113,000 | 113,565 | |||||||||||
| CBS Radio, Inc.(b) 11/01/24 | 7.250 | % | 21,000 | 22,050 | |||||||||||
Corporate Bonds & Notes(a) (continued)
Issuer | Coupon Rate | Principal Amount ($) | Value ($) | ||||||||||||
| MDC Partners, Inc.(b) 05/01/24 | 6.500 | % | 266,000 | 239,400 | |||||||||||
| Match Group, Inc. 06/01/24 | 6.375 | % | 117,000 | 123,435 | |||||||||||
| Netflix, Inc. 02/15/25 | 5.875 | % | 279,000 | 300,971 | |||||||||||
| Netflix, Inc.(b) 11/15/26 | 4.375 | % | 163,000 | 158,110 | |||||||||||
| Outfront Media Capital LLC/Corp. 03/15/25 | 5.875 | % | 290,000 | 303,050 | |||||||||||
| Scripps Networks Interactive, Inc. 11/15/24 | 3.900 | % | 450,000 | 457,305 | |||||||||||
06/15/25 | 3.950 | % | 322,000 | 325,766 | |||||||||||
| Thomson Reuters Corp. 05/23/43 | 4.500 | % | 477,000 | 447,395 | |||||||||||
| Univision Communications, Inc.(b) 02/15/25 | 5.125 | % | 258,000 | 246,713 | |||||||||||
Total | 3,202,562 | ||||||||||||||
METALS 0.9% | |||||||||||||||
| ArcelorMittal(c) 02/25/22 | 7.250 | % | 176,000 | 198,880 | |||||||||||
| Constellium NV(b) 05/15/24 | 5.750 | % | 138,000 | 129,030 | |||||||||||
| Freeport-McMoRan, Inc. 03/01/22 | 3.550 | % | 42,000 | 39,060 | |||||||||||
03/15/23 | 3.875 | % | 93,000 | 85,328 | |||||||||||
11/14/24 | 4.550 | % | 217,000 | 203,437 | |||||||||||
| Grinding Media, Inc./MC Canada, Inc.(b) 12/15/23 | 7.375 | % | 55,000 | 57,783 | |||||||||||
| HudBay Minerals, Inc.(b) 01/15/23 | 7.250 | % | 23,000 | 23,805 | |||||||||||
01/15/25 | 7.625 | % | 68,000 | 70,678 | |||||||||||
| Novelis Corp.(b) 08/15/24 | 6.250 | % | 48,000 | 50,880 | |||||||||||
09/30/26 | 5.875 | % | 210,000 | 212,100 | |||||||||||
| Teck Resources Ltd. 07/15/41 | 6.250 | % | 201,000 | 193,700 | |||||||||||
| Teck Resources Ltd.(b) 06/01/24 | 8.500 | % | 34,000 | 39,185 | |||||||||||
Total | 1,303,866 | ||||||||||||||
MIDSTREAM 3.8% | |||||||||||||||
| Cheniere Corpus Christi Holdings LLC(b) 06/30/24 | 7.000 | % | 63,000 | 68,198 | |||||||||||
03/31/25 | 5.875 | % | 62,000 | 63,259 | |||||||||||
| Columbia Pipeline Group, Inc. 06/01/45 | 5.800 | % | 119,000 | 136,846 | |||||||||||
The accompanying Notes to Financial Statements are an integral part of this statement.
Annual Report 2016
12
COLUMBIA VARIABLE PORTFOLIO — STRATEGIC INCOME FUND
PORTFOLIO OF INVESTMENTS (continued)
December 31, 2016
Corporate Bonds & Notes(a) (continued)
Issuer | Coupon Rate | Principal Amount ($) | Value ($) | ||||||||||||
| Energy Transfer Equity LP 06/01/27 | 5.500 | % | 208,000 | 202,800 | |||||||||||
| Enterprise Products Operating LLC 02/15/45 | 5.100 | % | 365,000 | 384,947 | |||||||||||
| Kinder Morgan Energy Partners LP 03/01/43 | 5.000 | % | 1,000,000 | 964,267 | |||||||||||
| Plains All American Pipeline LP/Finance Corp. 10/15/23 | 3.850 | % | 453,000 | 447,867 | |||||||||||
06/15/44 | 4.700 | % | 1,026,000 | 914,199 | |||||||||||
| Sabine Pass Liquefaction LLC 03/01/25 | 5.625 | % | 363,000 | 388,410 | |||||||||||
| Sabine Pass Liquefaction LLC(b) 06/30/26 | 5.875 | % | 36,000 | 38,790 | |||||||||||
03/15/27 | 5.000 | % | 93,000 | 93,814 | |||||||||||
| Targa Resources Partners LP/Finance Corp. 03/15/24 | 6.750 | % | 92,000 | 98,670 | |||||||||||
| Targa Resources Partners LP/Finance Corp.(b) 02/01/27 | 5.375 | % | 262,000 | 259,380 | |||||||||||
| Tesoro Logistics LP/Finance Corp. 10/15/22 | 6.250 | % | 120,000 | 127,200 | |||||||||||
05/01/24 | 6.375 | % | 47,000 | 50,290 | |||||||||||
01/15/25 | 5.250 | % | 167,000 | 170,549 | |||||||||||
| Williams Companies, Inc. (The) 01/15/23 | 3.700 | % | 48,000 | 46,320 | |||||||||||
06/24/24 | 4.550 | % | 391,000 | 388,067 | |||||||||||
| Williams Partners LP 09/15/45 | 5.100 | % | 526,000 | 499,936 | |||||||||||
Total | 5,343,809 | ||||||||||||||
NATURAL GAS 0.4% | |||||||||||||||
| Sempra Energy 12/01/23 | 4.050 | % | 206,000 | 215,152 | |||||||||||
06/15/24 | 3.550 | % | 350,000 | 354,205 | |||||||||||
Total | 569,357 | ||||||||||||||
OIL FIELD SERVICES 0.2% | |||||||||||||||
| Nabors Industries, Inc.(b) 01/15/23 | 5.500 | % | 17,000 | 17,701 | |||||||||||
| Precision Drilling Corp.(b) 12/15/23 | 7.750 | % | 8,000 | 8,440 | |||||||||||
| SESI LLC 05/01/19 | 6.375 | % | 70,000 | 70,000 | |||||||||||
12/15/21 | 7.125 | % | 19,000 | 19,333 | |||||||||||
| Weatherford International Ltd. 06/15/21 | 7.750 | % | 136,000 | 137,360 | |||||||||||
06/15/23 | 8.250 | % | 45,000 | 45,787 | |||||||||||
| Weatherford International Ltd.(b) 02/15/24 | 9.875 | % | 24,000 | 25,575 | |||||||||||
Total | 324,196 | ||||||||||||||
Corporate Bonds & Notes(a) (continued)
Issuer | Coupon Rate | Principal Amount ($) | Value ($) | ||||||||||||
OTHER INDUSTRY 0.6% | |||||||||||||||
| CB Richard Ellis Services, Inc. 03/15/25 | 5.250 | % | 839,000 | 865,143 | |||||||||||
OTHER REIT —% | |||||||||||||||
| Starwood Property Trust, Inc.(b) 12/15/21 | 5.000 | % | 59,000 | 59,791 | |||||||||||
PACKAGING 0.9% | |||||||||||||||
| ARD Finance SA PIK(b) 09/15/23 | 7.125 | % | 67,000 | 66,162 | |||||||||||
| Ardagh Packaging Finance PLC/Holdings USA, Inc.(b) 01/31/21 | 6.750 | % | 160,000 | 164,800 | |||||||||||
05/15/24 | 7.250 | % | 112,000 | 118,020 | |||||||||||
| Berry Plastics Corp. 10/15/22 | 6.000 | % | 145,000 | 153,337 | |||||||||||
07/15/23 | 5.125 | % | 120,000 | 122,100 | |||||||||||
| Owens-Brockway Glass Container, Inc.(b) 08/15/23 | 5.875 | % | 27,000 | 28,148 | |||||||||||
08/15/25 | 6.375 | % | 100,000 | 105,500 | |||||||||||
| Plastipak Holdings, Inc.(b) 10/01/21 | 6.500 | % | 158,000 | 165,110 | |||||||||||
| Reynolds Group Issuer, Inc./LLC(b) 07/15/23 | 5.125 | % | 120,000 | 122,550 | |||||||||||
07/15/24 | 7.000 | % | 160,000 | 170,100 | |||||||||||
| Reynolds Group Issuer, Inc./LLC(c) 02/15/21 | 8.250 | % | 30,518 | 31,510 | |||||||||||
Total | 1,247,337 | ||||||||||||||
PHARMACEUTICALS 0.9% | |||||||||||||||
| Actavis Funding 03/15/45 | 4.750 | % | 210,000 | 206,164 | |||||||||||
| Endo Finance LLC/Finco, Inc.(b)(c) 02/01/25 | 6.000 | % | 96,000 | 80,400 | |||||||||||
| Grifols Worldwide Operations Ltd. 04/01/22 | 5.250 | % | 145,000 | 150,075 | |||||||||||
| Jaguar Holding Co. II/Pharmaceutical Product Development LLC(b) 08/01/23 | 6.375 | % | 166,000 | 177,620 | |||||||||||
| Mallinckrodt International Finance SA/CB LLC(b) 04/15/25 | 5.500 | % | 56,000 | 50,120 | |||||||||||
| Valeant Pharmaceuticals International, Inc.(b) 10/15/20 | 6.375 | % | 35,000 | 30,013 | |||||||||||
04/15/25 | 6.125 | % | 716,000 | 537,895 | |||||||||||
Total | 1,232,287 | ||||||||||||||
PROPERTY & CASUALTY 1.3% | |||||||||||||||
| Alliant Holdings Intermediate LP(b) 08/01/23 | 8.250 | % | 8,000 | 8,260 | |||||||||||
The accompanying Notes to Financial Statements are an integral part of this statement.
Annual Report 2016
13
COLUMBIA VARIABLE PORTFOLIO — STRATEGIC INCOME FUND
PORTFOLIO OF INVESTMENTS (continued)
December 31, 2016
Corporate Bonds & Notes(a) (continued)
Issuer | Coupon Rate | Principal Amount ($) | Value ($) | ||||||||||||
| HUB International Ltd.(b) 10/01/21 | 7.875 | % | 321,000 | 339,108 | |||||||||||
| Liberty Mutual Group, Inc.(b) 06/15/23 | 4.250 | % | 885,000 | 926,573 | |||||||||||
| Loews Corp. 04/01/26 | 3.750 | % | 585,000 | 594,661 | |||||||||||
Total | 1,868,602 | ||||||||||||||
RAILROADS 0.2% | |||||||||||||||
| CSX Corp. 11/01/46 | 3.800 | % | 220,000 | 203,958 | |||||||||||
| Panama Canal Railway Co.(b) 11/01/26 | 7.000 | % | 140,998 | 139,588 | |||||||||||
Total | 343,546 | ||||||||||||||
RESTAURANTS 0.1% | |||||||||||||||
| KFC Holding Co./Pizza Hut Holdings LLC/Taco Bell of America LLC(b) 06/01/26 | 5.250 | % | 151,000 | 153,265 | |||||||||||
RETAILERS 0.5% | |||||||||||||||
| Asbury Automotive Group, Inc. 12/15/24 | 6.000 | % | 114,000 | 116,565 | |||||||||||
| Group 1 Automotive, Inc.(b) 12/15/23 | 5.250 | % | 81,000 | 80,190 | |||||||||||
| Neiman Marcus Group Ltd. LLC(b) 10/15/21 | 8.000 | % | 34,000 | 25,245 | |||||||||||
| Penske Automotive Group, Inc. 12/01/24 | 5.375 | % | 78,000 | 77,805 | |||||||||||
05/15/26 | 5.500 | % | 17,000 | 16,787 | |||||||||||
| Rite Aid Corp. Junior Subordinated 02/15/27 | 7.700 | % | 274,000 | 342,500 | |||||||||||
Total | 659,092 | ||||||||||||||
SUPERMARKETS 0.1% | |||||||||||||||
| Cencosud SA(b) 02/12/45 | 6.625 | % | 200,000 | 192,414 | |||||||||||
TECHNOLOGY 1.4% | |||||||||||||||
| Camelot Finance SA(b) 10/15/24 | 7.875 | % | 58,000 | 60,030 | |||||||||||
| Diamond 1 Finance Corp./Diamond 2 Finance Corp.(b) 06/15/23 | 5.450 | % | 90,000 | 95,467 | |||||||||||
06/15/26 | 6.020 | % | 180,000 | 194,993 | |||||||||||
| Equinix, Inc. 01/15/26 | 5.875 | % | 258,000 | 271,545 | |||||||||||
| First Data Corp.(b) 12/01/23 | 7.000 | % | 335,000 | 356,775 | |||||||||||
01/15/24 | 5.750 | % | 114,000 | 117,634 | |||||||||||
Corporate Bonds & Notes(a) (continued)
Issuer | Coupon Rate | Principal Amount ($) | Value ($) | ||||||||||||
| Infor US, Inc.(b) 08/15/20 | 5.750 | % | 23,000 | 24,093 | |||||||||||
| Informatica LLC(b) 07/15/23 | 7.125 | % | 39,000 | 37,245 | |||||||||||
| MSCI, Inc.(b) 08/01/26 | 4.750 | % | 36,000 | 35,820 | |||||||||||
| PTC, Inc. 05/15/24 | 6.000 | % | 128,000 | 135,040 | |||||||||||
| Qualitytech LP/Finance Corp. 08/01/22 | 5.875 | % | 236,000 | 240,130 | |||||||||||
| Solera LLC/Finance, Inc.(b) 03/01/24 | 10.500 | % | 110,000 | 123,750 | |||||||||||
| VeriSign, Inc. 04/01/25 | 5.250 | % | 233,000 | 238,825 | |||||||||||
Total | 1,931,347 | ||||||||||||||
TRANSPORTATION SERVICES 0.6% | |||||||||||||||
| Avis Budget Car Rental LLC/Finance, Inc.(b) 03/15/25 | 5.250 | % | 37,000 | 34,502 | |||||||||||
| Carlson Travel, Inc.(b) 12/15/23 | 6.750 | % | 54,000 | 56,160 | |||||||||||
| Concesionaria Mexiquense SA de CV (linked to Mexican Unidad de Inversion Index)(b) 12/15/35 | 5.950 | % | MXN | 4,538,136 | 215,943 | ||||||||||
| ERAC U.S.A. Finance LLC(b) 12/01/26 | 3.300 | % | 220,000 | 211,094 | |||||||||||
| Global Ports Finance PLC(b) 09/22/23 | 6.500 | % | 300,000 | 298,875 | |||||||||||
| Hertz Corp. (The)(b) 10/15/24 | 5.500 | % | 88,000 | 76,890 | |||||||||||
Total | 893,464 | ||||||||||||||
WIRELESS 1.8% | |||||||||||||||
| Comcel Trust(b) 02/06/24 | 6.875 | % | 202,000 | 203,515 | |||||||||||
| SBA Communications Corp.(b) 09/01/24 | 4.875 | % | 281,000 | 277,487 | |||||||||||
| SFR Group SA(b) 05/15/22 | 6.000 | % | 120,000 | 123,150 | |||||||||||
05/15/24 | 6.250 | % | 214,000 | 215,070 | |||||||||||
05/01/26 | 7.375 | % | 141,000 | 144,525 | |||||||||||
| Sprint Communications, Inc.(b) 03/01/20 | 7.000 | % | 60,000 | 65,100 | |||||||||||
| Sprint Corp. 09/15/23 | 7.875 | % | 227,000 | 242,322 | |||||||||||
02/15/25 | 7.625 | % | 321,000 | 337,451 | |||||||||||
| T-Mobile USA, Inc. 03/01/23 | 6.000 | % | 115,000 | 121,469 | |||||||||||
The accompanying Notes to Financial Statements are an integral part of this statement.
Annual Report 2016
14
COLUMBIA VARIABLE PORTFOLIO — STRATEGIC INCOME FUND
PORTFOLIO OF INVESTMENTS (continued)
December 31, 2016
Corporate Bonds & Notes(a) (continued)
Issuer | Coupon Rate | Principal Amount ($) | Value ($) | ||||||||||||
01/15/24 | 6.500 | % | 47,000 | 50,408 | |||||||||||
03/01/25 | 6.375 | % | 265,000 | 283,219 | |||||||||||
01/15/26 | 6.500 | % | 291,000 | 314,644 | |||||||||||
| Wind Acquisition Finance SA(b) 07/15/20 | 4.750 | % | 201,000 | 202,507 | |||||||||||
04/23/21 | 7.375 | % | 41,000 | 42,640 | |||||||||||
Total | 2,623,507 | ||||||||||||||
WIRELINES 1.9% | |||||||||||||||
| AT&T, Inc. 06/15/45 | 4.350 | % | 900,000 | 801,929 | |||||||||||
| CenturyLink, Inc. 04/01/24 | 7.500 | % | 96,000 | 100,800 | |||||||||||
04/01/25 | 5.625 | % | 130,000 | 123,500 | |||||||||||
| Frontier Communications Corp. 09/15/22 | 10.500 | % | 105,000 | 110,387 | |||||||||||
09/15/25 | 11.000 | % | 392,000 | 404,740 | |||||||||||
| Level 3 Communications, Inc. 12/01/22 | 5.750 | % | 135,000 | 138,713 | |||||||||||
| Level 3 Financing, Inc. 01/15/24 | 5.375 | % | 49,000 | 49,551 | |||||||||||
| Telecom Italia SpA(b) 05/30/24 | 5.303 | % | 123,000 | 120,386 | |||||||||||
| Verizon Communications, Inc. 11/01/42 | 3.850 | % | 632,000 | 545,470 | |||||||||||
| Zayo Group LLC/Capital, Inc. 04/01/23 | 6.000 | % | 154,000 | 160,160 | |||||||||||
05/15/25 | 6.375 | % | 82,000 | 85,690 | |||||||||||
Total | 2,641,326 | ||||||||||||||
| Total Corporate Bonds & Notes (Cost: $58,860,859) | 59,982,245 | ||||||||||||||
Residential Mortgage-Backed Securities —
Agency 14.2%
| Federal Home Loan Mortgage Corp. 10/01/26 | 8.000 | % | 38,288 | 40,179 | |||||||||||
| Federal Home Loan Mortgage Corp.(c)(e) CMO IO Series 2957 Class SW 04/15/35 | 5.296 | % | 1,642,091 | 251,256 | |||||||||||
| CMO IO Series 311 Class S1 08/15/43 | 5.246 | % | 665,551 | 136,944 | |||||||||||
| CMO IO Series 318 Class S1 11/15/43 | 5.246 | % | 4,119,218 | 836,780 | |||||||||||
| CMO IO Series 326 Class S2 03/15/44 | 5.246 | % | 764,395 | 153,833 | |||||||||||
| CMO IO Series 3761 Class KS 06/15/40 | 5.296 | % | 2,099,722 | 166,873 | |||||||||||
Residential Mortgage-Backed Securities —
Agency (continued)
Issuer | Coupon Rate | Principal Amount ($) | Value ($) | ||||||||||||
| CMO IO Series 4620 Class AS 11/15/42 | 1.871 | % | 3,789,996 | 232,253 | |||||||||||
| Federal Home Loan Mortgage Corp.(e) CMO IO Series 4120 Class AI 11/15/39 | 3.500 | % | 3,876,074 | 491,641 | |||||||||||
| Federal National Mortgage Association 05/01/41 | 4.000 | % | 228,601 | 240,505 | |||||||||||
| Federal National Mortgage Association(c)(e) CMO IO Series 2006-5 Class N1 08/25/34 | 0.000 | % | 5,610,280 | 365 | |||||||||||
| CMO IO Series 2006-5 Class N2 02/25/35 | 2.037 | % | 8,592,236 | 221,607 | |||||||||||
| CMO IO Series 2010-135 Class MS 12/25/40 | 5.194 | % | 1,390,239 | 185,701 | |||||||||||
| CMO IO Series 2013-107 Class SB 02/25/43 | 5.194 | % | 172,479 | 40,020 | |||||||||||
| CMO IO Series 2014-93 Class ES 01/25/45 | 5.394 | % | 751,397 | 154,558 | |||||||||||
| CMO IO Series 2016-31 Class HS 06/25/46 | 5.244 | % | 1,376,899 | 300,819 | |||||||||||
| CMO IO Series 2016-31 Class VS 06/25/46 | 5.244 | % | 1,883,382 | 325,553 | |||||||||||
| CMO IO Series 2016-39 Class LS 07/25/46 | 5.244 | % | 943,525 | 206,426 | |||||||||||
| CMO IO Series 2016-42 Class SB 07/25/46 | 5.244 | % | 2,836,472 | 648,488 | |||||||||||
| Federal National Mortgage Association(e) CMO IO Series 2012-133 Class EI 07/25/31 | 3.500 | % | 2,312,868 | 276,157 | |||||||||||
| CMO IO Series 2012-139 Class IL 04/25/40 | 3.500 | % | 3,583,638 | 513,022 | |||||||||||
| CMO IO Series 2013-1 Class AI 02/25/43 | 3.500 | % | 2,493,331 | 484,518 | |||||||||||
| Federal National Mortgage Association(f) 01/23/32- 01/18/47 | 3.000 | % | 4,000,000 | 4,006,413 | |||||||||||
01/18/47 | 3.500 | % | 7,000,000 | 7,174,453 | |||||||||||
| Government National Mortgage Association(c)(e) CMO IO Series 2015-144 Class SA 10/20/45 | 5.461 | % | 925,242 | 220,840 | |||||||||||
| CMO IO Series 2016-108 Class SN 08/20/46 | 5.341 | % | 990,937 | 250,337 | |||||||||||
| CMO IO Series 2016-146 Class NS 10/20/46 | 5.361 | % | 497,300 | 126,821 | |||||||||||
| CMO IO Series 2016-91 Class NS 07/20/46 | 5.341 | % | 986,284 | 252,660 | |||||||||||
| Government National Mortgage Association(e) CMO IO Series 2014-190 Class AI 12/20/38 | 3.500 | % | 2,166,252 | 280,496 | |||||||||||
| Government National Mortgage Association(f) 01/24/47 | 3.000 | % | 2,000,000 | 2,025,039 | |||||||||||
| Total Residential Mortgage-Backed Securities — Agency (Cost: $19,836,504) | 20,244,557 | ||||||||||||||
The accompanying Notes to Financial Statements are an integral part of this statement.
Annual Report 2016
15
COLUMBIA VARIABLE PORTFOLIO — STRATEGIC INCOME FUND
PORTFOLIO OF INVESTMENTS (continued)
December 31, 2016
Residential Mortgage-Backed Securities —
Non-Agency 17.5%
Issuer | Coupon Rate | Principal Amount ($) | Value ($) | ||||||||||||
| Ajax Mortgage Loan Trust CMO Series 2016-C Class A(b) 10/25/57 | 4.000 | % | 789,336 | 790,519 | |||||||||||
| BCAP LLC Trust CMO Series 2012-RR11 Class 9A2(b) 07/26/37 | 4.000 | % | 1,696,706 | 1,697,320 | |||||||||||
| Banc of America Funding Trust Series 2016-R1 Class M2(b)(c) 03/25/40 | 3.500 | % | 505,859 | 479,504 | |||||||||||
| Bayview Opportunity Master Fund IIIa Trust CMO Series 2016-RN3 Class A1(b) 09/28/31 | 3.598 | % | 1,367,335 | 1,367,451 | |||||||||||
| Bayview Opportunity Master Fund IVB Trust CMO Series 2016-RN4 Class A1(b) 10/28/31 | 3.475 | % | 870,857 | 867,418 | |||||||||||
| Bayview Opportunity Master Fund Trust CMO Series 2016-LT1 Class A1(b) 10/28/31 | 3.475 | % | 489,538 | 487,604 | |||||||||||
| CAM Mortgage Trust CMO Series 2016-2 Class A1(b) 06/15/57 | 3.250 | % | 3,185,606 | 3,167,619 | |||||||||||
| COLT Mortgage Loan Trust(b) CMO Series 2016-1 Class A2 05/25/46 | 3.500 | % | 184,521 | 185,098 | |||||||||||
COLT Mortgage Loan Trust(b)(c) | |||||||||||||||
| CMO Series 2016-2 Class A2 09/25/46 | 3.250 | % | 834,693 | 838,818 | |||||||||||
| CTS Corp.(b) 02/27/36 | 3.750 | % | 792,215 | 785,077 | |||||||||||
| Citigroup Mortgage Loan Trust, Inc. CMO Series 2013-2 Class 1A1(b)(c) 11/25/37 | 3.150 | % | 833,324 | 833,131 | |||||||||||
| Credit Suisse Mortgage Capital Certificates(b) CMO Series 2010-9R Class 7A5 05/27/37 | 4.000 | % | 937,218 | 934,203 | |||||||||||
Credit Suisse Mortgage Capital Certificates(b)(c) | |||||||||||||||
| CMO Series 2014-RPL4 Class A1 08/25/62 | 3.625 | % | 204,114 | 207,351 | |||||||||||
| Series 2008-4R Class 3A4 01/26/38 | 3.202 | % | 3,250,000 | 3,122,738 | |||||||||||
| Deephaven Residential Mortgage Trust Series 2016-1A Class A1(b) 07/25/46 | 4.000 | % | 782,961 | 781,875 | |||||||||||
| Deutsche Mortgage Securities, Inc. Mortgage Loan Trust CMO Series 2003-1 Class 1A7 04/25/33 | 5.500 | % | 328,577 | 332,356 | |||||||||||
| GMAC Mortgage Home Equity Loan Trust CMO Series 2004-HE5 Class A5 (FGIC) 09/25/34 | 5.865 | % | 86,527 | 88,062 | |||||||||||
Residential Mortgage-Backed Securities —
Non-Agency (continued)
Issuer | Coupon Rate | Principal Amount ($) | Value ($) | ||||||||||||
| Pretium Mortgage Credit Partners I LLC CMO Series 2016-NPL6 Class A1(b) 10/25/31 | 3.500 | % | 977,027 | 977,994 | |||||||||||
| SGR Residential Mortgage Trust CMO Series 2016-1 Class A1(b) 11/25/46 | 3.750 | % | 920,992 | 921,607 | |||||||||||
| Vericrest Opportunity Loan Transferee L LLC CMO Series 2016-NP10 Class A1(b) 09/25/46 | 3.500 | % | 1,479,938 | 1,476,009 | |||||||||||
| Vericrest Opportunity Loan Transferee LI LLC Series 2016-NP11 Class A1(b) 10/25/46 | 3.500 | % | 1,483,996 | 1,483,958 | |||||||||||
| Vericrest Opportunity Loan Transferee LIII LLC CMO Series 2014-NPL9 Class A1(b)(c) 11/25/54 | 3.375 | % | 408,627 | 408,779 | |||||||||||
| Vericrest Opportunity Loan Transferee XXXV LLC CMO Series 2016-NPL9 Class A1(b) 09/25/46 | 3.500 | % | 2,670,723 | 2,664,495 | |||||||||||
| Total Residential Mortgage-Backed Securities — Non-Agency (Cost: $24,849,970) | 24,898,986 | ||||||||||||||
Commercial Mortgage-Backed Securities —
Non-Agency 3.5%
| Banc of America Merrill Lynch Commercial Mortgage Securities Trust Series 2013-DSNY Class F(b)(c) 09/15/26 | 4.204 | % | 350,805 | 351,047 | |||||||||||
| Hilton USA Trust(b) Subordinated, Series 2016-SFP Class E 11/05/35 | 5.519 | % | 500,000 | 483,241 | |||||||||||
Hilton USA Trust(b)(c) | |||||||||||||||
| Series 2016-HHV Class F 11/05/38 | 4.194 | % | 1,500,000 | 1,152,181 | |||||||||||
| Invitation Homes Trust(b)(c) Series 2015-SFR3 Class F 08/17/32 | 5.454 | % | 1,000,000 | 1,004,929 | |||||||||||
| Subordinated, Series 2014-SFR3 Class D 12/17/31 | 3.704 | % | 500,000 | 499,999 | |||||||||||
| JPMCC Re-REMIC Trust Series 2016-GG10 Class AMB(b)(c) 08/15/45 | 5.793 | % | 500,000 | 499,386 | |||||||||||
| Rialto Real Estate Fund LLC Subordinated, Series 2015-LT7 Class B(b) 12/25/32 | 5.071 | % | 1,000,000 | 1,000,000 | |||||||||||
| Total Commercial Mortgage-Backed Securities — Non-Agency (Cost: $4,988,710) | 4,990,783 | ||||||||||||||
The accompanying Notes to Financial Statements are an integral part of this statement.
Annual Report 2016
16
COLUMBIA VARIABLE PORTFOLIO — STRATEGIC INCOME FUND
PORTFOLIO OF INVESTMENTS (continued)
December 31, 2016
Asset-Backed Securities — Non-Agency 4.3%
Issuer | Coupon Rate | Principal Amount ($) | Value ($) | ||||||||||||
| Ballyrock CLO LLC Series 2014-1A Class A1(b)(c) 10/20/26 | 2.361 | % | 1,000,000 | 1,000,946 | |||||||||||
| Conn's Receivables Funding LLC Series 2016-B Class B(b) 03/15/19 | 7.340 | % | 1,500,000 | 1,508,151 | |||||||||||
| Dryden 33 Senior Loan Fund Series 2014-33A Class ER(b)(c) 10/15/28 | 8.386 | % | 1,000,000 | 961,233 | |||||||||||
| Octagon Investment Partners XVII Ltd. Series 2013-1A Class A1(b)(c) 10/25/25 | 2.212 | % | 1,000,000 | 1,000,005 | |||||||||||
| SoFi Consumer Loan Program LLC Series 2016-2A Class A(b) 10/27/25 | 3.090 | % | 344,842 | 343,805 | |||||||||||
| SoFi Professional Loan Program LLC Series 2016-A Class RPO(b)(g) 01/25/38 | 0.000 | % | 1 | 711,874 | |||||||||||
| Sofi Consumer Loan Program LLC Series 2016-3 Class A(b) 12/26/25 | 3.050 | % | 579,630 | 577,335 | |||||||||||
| Total Asset-Backed Securities — Non-Agency (Cost: $5,883,973) | 6,103,349 | ||||||||||||||
Inflation-Indexed Bonds 2.9%
UNITED STATES 2.9% | |||||||||||||||
| U.S. Treasury Inflation-Indexed Bond 07/15/26 | 0.125 | % | 1,008,420 | 975,143 | |||||||||||
02/15/46 | 1.000 | % | 3,121,659 | 3,134,851 | |||||||||||
Total | 4,109,994 | ||||||||||||||
| Total Inflation-Indexed Bonds (Cost: $4,378,596) | 4,109,994 | ||||||||||||||
U.S. Treasury Obligations 1.7%
| U.S. Treasury 08/31/17 | 0.625 | % | 2,500,000 | 2,498,047 | |||||||||||
| Total U.S. Treasury Obligations (Cost: $2,500,004) | 2,498,047 | ||||||||||||||
Foreign Government Obligations(a)(h) 9.5%
ARGENTINA 0.9% | |||||||||||||||
| Argentina Republic Government International Bond(b) 04/22/26 | 7.500 | % | 150,000 | 157,125 | |||||||||||
Foreign Government Obligations(a)(h) (continued)
Issuer | Coupon Rate | Principal Amount ($) | Value ($) | ||||||||||||
07/06/28 | 6.625 | % | 400,000 | 393,491 | |||||||||||
| Argentina Republic Government International Bond(c) 12/31/33 | 8.280 | % | 91,132 | 94,550 | |||||||||||
| City of Buenos Aires Argentina(b) 06/01/27 | 7.500 | % | 250,000 | 255,625 | |||||||||||
| Provincia de Buenos Aires(b) 03/16/24 | 9.125 | % | 150,000 | 163,200 | |||||||||||
| Provincia de Cordoba(b) 06/10/21 | 7.125 | % | 150,000 | 153,562 | |||||||||||
Total | 1,217,553 | ||||||||||||||
BRAZIL 1.3% | |||||||||||||||
| Brazil Minas SPE via State of Minas Gerais(b) 02/15/28 | 5.333 | % | 200,000 | 186,500 | |||||||||||
| Brazil Notas do Tesouro Nacional Series F 01/01/25 | 10.000 | % | BRL | 3,000,000 | 857,340 | ||||||||||
| Brazilian Government International Bond 01/07/41 | 5.625 | % | 150,000 | 133,125 | |||||||||||
| Petrobras Global Finance BV 03/15/19 | 7.875 | % | 86,000 | 92,178 | |||||||||||
05/23/21 | 8.375 | % | 200,000 | 215,750 | |||||||||||
05/23/26 | 8.750 | % | 380,000 | 409,925 | |||||||||||
Total | 1,894,818 | ||||||||||||||
CANADA 0.1% | |||||||||||||||
| NOVA Chemicals Corp.(b) 05/01/25 | 5.000 | % | 113,000 | 110,705 | |||||||||||
COLOMBIA 0.8% | |||||||||||||||
| Colombia Government International Bond 06/28/27 | 9.850 | % | COP | 1,500,000,000 | 587,708 | ||||||||||
| Ecopetrol SA 09/18/43 | 7.375 | % | 480,000 | 487,200 | |||||||||||
Total | 1,074,908 | ||||||||||||||
COSTA RICA 0.2% | |||||||||||||||
| Costa Rica Government International Bond(b) 03/12/45 | 7.158 | % | 357,000 | 330,796 | |||||||||||
CROATIA 0.3% | |||||||||||||||
| Croatia Government International Bond(b) 01/26/24 | 6.000 | % | 425,000 | 460,594 | |||||||||||
DOMINICAN REPUBLIC 0.9% | |||||||||||||||
| Banco de Reservas de la Republica Dominicana Subordinated(b) 02/01/23 | 7.000 | % | 208,000 | 208,040 | |||||||||||
| Dominican Republic International Bond(b) 02/10/23 | 14.500 | % | DOP | 3,600,000 | 89,501 | ||||||||||
The accompanying Notes to Financial Statements are an integral part of this statement.
Annual Report 2016
17
COLUMBIA VARIABLE PORTFOLIO — STRATEGIC INCOME FUND
PORTFOLIO OF INVESTMENTS (continued)
December 31, 2016
Foreign Government Obligations(a)(h) (continued)
Issuer | Coupon Rate | Principal Amount ($) | Value ($) | ||||||||||||
04/20/27 | 8.625 | % | 468,000 | 525,868 | |||||||||||
04/30/44 | 7.450 | % | 281,000 | 281,702 | |||||||||||
| Dominican Republic International Bond(b)(i) 01/08/21 | 14.000 | % | DOP | 5,392,000 | 128,504 | ||||||||||
Total | 1,233,615 | ||||||||||||||
ECUADOR 0.1% | |||||||||||||||
| Ecuador Government International Bond(b) 03/24/20 | 10.500 | % | 200,000 | 214,500 | |||||||||||
EL SALVADOR 0.1% | |||||||||||||||
| El Salvador Government International Bond(b) 01/18/27 | 6.375 | % | 65,000 | 59,800 | |||||||||||
06/15/35 | 7.650 | % | 80,000 | 74,200 | |||||||||||
Total | 134,000 | ||||||||||||||
HUNGARY 0.5% | |||||||||||||||
| Hungary Government Bond 10/27/27 | 3.000 | % | HUF | 200,000,000 | 668,128 | ||||||||||
INDONESIA 1.3% | |||||||||||||||
| Indonesia Government International Bond(b) 04/25/22 | 3.750 | % | 200,000 | 200,749 | |||||||||||
01/15/45 | 5.125 | % | 200,000 | 199,551 | |||||||||||
| Indonesia Treasury Bond 05/15/31 | 8.750 | % | IDR | 9,600,000,000 | 742,490 | ||||||||||
| Majapahit Holding BV(b) 06/29/37 | 7.875 | % | 138,000 | 163,019 | |||||||||||
| PT Pertamina Persero(b) 05/30/44 | 6.450 | % | 500,000 | 506,176 | |||||||||||
Total | 1,811,985 | ||||||||||||||
ISRAEL 0.5% | |||||||||||||||
| Israel Government Bond 08/31/25 | 1.750 | % | ILS | 3,000,000 | 763,931 | ||||||||||
IVORY COAST 0.2% | |||||||||||||||
| Ivory Coast Government International Bond(b)(c) 12/31/32 | 5.750 | % | 305,910 | 282,731 | |||||||||||
KAZAKHSTAN 0.2% | |||||||||||||||
| Kazakhstan Government International Bond(b) 07/21/45 | 6.500 | % | 200,000 | 229,000 | |||||||||||
MALAYSIA 0.1% | |||||||||||||||
| Petronas Capital Ltd.(b) 08/12/19 | 5.250 | % | 75,000 | 80,334 | |||||||||||
Foreign Government Obligations(a)(h) (continued)
Issuer | Coupon Rate | Principal Amount ($) | Value ($) | ||||||||||||
MEXICO 0.8% | |||||||||||||||
| Mexican Bonos 06/10/21 | 6.500 | % | MXN | 50,000 | 2,352 | ||||||||||
06/09/22 | 6.500 | % | MXN | 6,480,000 | 303,186 | ||||||||||
06/03/27 | 7.500 | % | MXN | 1,980,000 | 95,060 | ||||||||||
| Pemex Finance Ltd. (NPFGC) 08/15/17 | 10.610 | % | 40,313 | 41,553 | |||||||||||
| Pemex Finance Ltd. 11/15/18 | 9.150 | % | 155,000 | 163,658 | |||||||||||
| Petroleos Mexicanos 01/23/26 | 4.500 | % | 102,000 | 92,922 | |||||||||||
11/12/26 | 7.470 | % | MXN | 4,700,000 | 185,350 | ||||||||||
| Petroleos Mexicanos(b) 09/12/24 | 7.190 | % | MXN | 260,000 | 10,662 | ||||||||||
08/04/26 | 6.875 | % | 200,000 | 211,829 | |||||||||||
03/13/27 | 6.500 | % | 100,000 | 103,150 | |||||||||||
Total | 1,209,722 | ||||||||||||||
PARAGUAY 0.1% | |||||||||||||||
| Paraguay Government International Bond(b) 08/11/44 | 6.100 | % | 212,000 | 212,000 | |||||||||||
REPUBLIC OF NAMIBIA 0.1% | |||||||||||||||
| Namibia International Bonds(b) 11/03/21 | 5.500 | % | 200,000 | 208,500 | |||||||||||
RUSSIAN FEDERATION 0.6% | |||||||||||||||
| Gazprom Neft OAO Via GPN Capital SA(b) 09/19/22 | 4.375 | % | 426,000 | 420,143 | |||||||||||
| Gazprom OAO Via Gaz Capital SA(b) 02/06/28 | 4.950 | % | 425,000 | 417,248 | |||||||||||
Total | 837,391 | ||||||||||||||
SERBIA 0.1% | |||||||||||||||
| Serbia International Bond(b) 12/03/18 | 5.875 | % | 200,000 | 209,250 | |||||||||||
TRINIDAD AND TOBAGO 0.3% | |||||||||||||||
| Petroleum Co. of Trinidad & Tobago Ltd.(b) 08/14/19 | 9.750 | % | 398,000 | 428,292 | |||||||||||
| Total Foreign Government Obligations (Cost: $13,928,593) | 13,612,753 | ||||||||||||||
The accompanying Notes to Financial Statements are an integral part of this statement.
Annual Report 2016
18
COLUMBIA VARIABLE PORTFOLIO — STRATEGIC INCOME FUND
PORTFOLIO OF INVESTMENTS (continued)
December 31, 2016
Senior Loans 6.9%
Borrower | Weighted Average Coupon | Principal Amount ($) | Value ($) | ||||||||||||
BROKERAGE/ASSET MANAGERS/EXCHANGES 0.4% | |||||||||||||||
| Aretec Group, Inc.(c)(j) 1st Lien Term Loan 11/23/20 | 8.000 | % | 181,235 | 181,235 | |||||||||||
| 2nd Lien Term Loan PIK 05/23/21 | 2.000 | % | 438,637 | 379,421 | |||||||||||
Total | 560,656 | ||||||||||||||
CABLE AND SATELLITE 0.3% | |||||||||||||||
| Encompass Digital Media, Inc. Tranche B 1st Lien Term Loan(c)(j) 06/06/21 | 5.500 | % | 430,016 | 406,365 | |||||||||||
CHEMICALS 1.0% | |||||||||||||||
| ColourOz Investment 1 GmbH Tranche C 1st Lien Term Loan(c)(f)(j) 09/07/21 | 0.000 | % | 70,749 | 71,015 | |||||||||||
| ColourOz Investment 2 GmbH Tranche B2 1st Lien Term Loan(c)(f)(j) 09/07/21 | 0.000 | % | 427,975 | 429,580 | |||||||||||
| HII Holding Corp. 2nd Lien Term Loan(c)(j) 12/21/20 | 9.750 | % | 500,000 | 497,500 | |||||||||||
| Kraton Polymers LLC Term Loan(c)(f)(j) 01/06/22 | 0.000 | % | 500,000 | 505,270 | |||||||||||
Total | 1,503,365 | ||||||||||||||
CONSUMER CYCLICAL SERVICES 0.1% | |||||||||||||||
| Creative Artists Agency LLC Term Loan(c)(j) 12/17/21 | 5.000 | % | 122,820 | 124,304 | |||||||||||
CONSUMER PRODUCTS 0.1% | |||||||||||||||
| Fender Musical Instruments Corp. Term Loan(c)(j) 04/03/19 | 5.750 | % | 73,875 | 73,783 | |||||||||||
| Serta Simmons Holdings, LLC 2nd Lien Term Loan(c)(j) 11/08/24 | 9.000 | % | 131,944 | 132,383 | |||||||||||
Total | 206,166 | ||||||||||||||
DIVERSIFIED MANUFACTURING 0.1% | |||||||||||||||
| William Morris Endeavor Entertainment LLC 2nd Lien Term Loan(c)(j) 05/06/22 | 8.250 | % | 150,000 | 151,875 | |||||||||||
Senior Loans (continued)
Borrower | Weighted Average Coupon | Principal Amount ($) | Value ($) | ||||||||||||
ELECTRIC 0.4% | |||||||||||||||
| Astoria Energy LLC Tranche B Term Loan(c)(j) 12/24/21 | 5.000 | % | 498,436 | 495,166 | |||||||||||
| Windsor Financing LLC Tranche B Term Loan(c)(j) 12/05/17 | 6.250 | % | 97,729 | 96,996 | |||||||||||
Total | 592,162 | ||||||||||||||
ENVIRONMENTAL 0.2% | |||||||||||||||
| STI Infrastructure SARL Term Loan(c)(j) 08/22/20 | 6.250 | % | 339,230 | 291,738 | |||||||||||
GAMING 1.0% | |||||||||||||||
| Affinity Gaming 2nd Lien Term Loan(c)(f)(j) 01/16/25 | 0.000 | % | 1,000,000 | 980,000 | |||||||||||
| Amaya Holdings BV Tranche B 1st Lien Term Loan(c)(j) 08/01/21 | 5.000 | % | 491,263 | 492,766 | |||||||||||
Total | 1,472,766 | ||||||||||||||
INDEPENDENT ENERGY 0.2% | |||||||||||||||
| Chesapeake Energy Corp. Tranche A Term Loan(c)(j) 08/23/21 | 8.500 | % | 104,420 | 113,513 | |||||||||||
| Samson Investment Co. Tranche 1 2nd Lien Term Loan(d)(j) 09/25/18 | 0.000 | % | 530,000 | 133,825 | |||||||||||
Total | 247,338 | ||||||||||||||
MEDIA AND ENTERTAINMENT —% | |||||||||||||||
| UFC Holdings LLC 2nd Lien Term Loan(c)(j) 08/18/24 | 8.500 | % | 9,000 | 9,236 | |||||||||||
OIL FIELD SERVICES 1.1% | |||||||||||||||
| Drillships Financing Holding, Inc. Tranche B1 Term Loan(c)(j) 03/31/21 | 6.000 | % | 864,258 | 556,582 | |||||||||||
| Fieldwood Energy LLC(c)(j) 1st Lien Term Loan 09/30/20 | 8.375 | % | 372,536 | 323,175 | |||||||||||
| 2nd Lien Term Loan 09/30/20 | 8.375 | % | 627,464 | 439,225 | |||||||||||
| Term Loan 08/31/20 | 8.000 | % | 275,952 | 260,775 | |||||||||||
Total | 1,579,757 | ||||||||||||||
The accompanying Notes to Financial Statements are an integral part of this statement.
Annual Report 2016
19
COLUMBIA VARIABLE PORTFOLIO — STRATEGIC INCOME FUND
PORTFOLIO OF INVESTMENTS (continued)
December 31, 2016
Senior Loans (continued)
Borrower | Weighted Average Coupon | Principal Amount ($) | Value ($) | ||||||||||||
OTHER INDUSTRY 0.1% | |||||||||||||||
| Hercules Achievement, Inc. 1st Lien Term Loan(c)(j) 12/10/21 | 5.000 | % | 98,000 | 99,323 | |||||||||||
PACKAGING 1.1% | |||||||||||||||
| Exopack Holdings SA Term Loan(c)(f)(j) 05/08/19 | 0.000 | % | 500,000 | 502,290 | |||||||||||
| ProAmpac PG Borrower LLC 1st Lien Term Loan(c)(f)(j) 11/17/23 | 0.000 | % | 1,000,000 | 1,010,630 | |||||||||||
Total | 1,512,920 | ||||||||||||||
PAPER 0.2% | |||||||||||||||
| Caraustar Industries, Inc. Term Loan(c)(j) 05/01/19 | 8.000 | % | 336,757 | 342,370 | |||||||||||
RETAILERS 0.5% | |||||||||||||||
| Academy Ltd. Term Loan(c)(j) 07/01/22 | 5.000 | % | 568,425 | 524,941 | |||||||||||
| Sports Authority, Inc. (The) Tranche B Term Loan(d)(j) 11/16/17 | 0.000 | % | 805,833 | 146,395 | |||||||||||
Total | 671,336 | ||||||||||||||
TECHNOLOGY 0.1% | |||||||||||||||
| Ancestry.com Operations, Inc. 2nd Lien Term Loan(c)(j) 10/19/24 | 9.250 | % | 30,377 | 30,985 | |||||||||||
| Greeneden U.S. Holdings I, LLC Term Loan(c)(f)(j) 12/01/23 | 0.000 | % | 30,000 | 30,506 | |||||||||||
| Kronos, Inc. 2nd Lien Term Loan(c)(j) 11/01/24 | 9.250 | % | 44,000 | 45,293 | |||||||||||
Total | 106,784 | ||||||||||||||
| Total Senior Loans (Cost: $11,241,724) | 9,878,461 | ||||||||||||||
Common Stocks 0.3%
Issuer | Shares | Value ($) | |||||||||
FINANCIALS 0.1% | |||||||||||
Capital Markets 0.1% | |||||||||||
RCS Capital Corp.(k) | 5,448 | 78,996 | |||||||||
Diversified Financial Services —% | |||||||||||
Fairlane Management Corp.(i)(k)(l) | 2,000 | ��� | |||||||||
Total Financials | 78,996 | ||||||
UTILITIES 0.2% | |||||||
Electric Utilities 0.1% | |||||||
Vistra Energy Corp. | 10,180 | 157,281 | |||||||||
Independent Power and Renewable Electricity Producers 0.1% | |||||||||||
Templar Energy LLC(k) | 24,262 | 181,966 | |||||||||
Total Utilities | 339,247 | ||||||
| Total Common Stocks (Cost: $382,454) | 418,243 | ||||||
Money Market Funds 6.8%
Shares | Value ($) | ||||||||||
| Columbia Short-Term Cash Fund, 0.594%(m)(n) | 9,664,515 | 9,664,515 | |||||||||
| Total Money Market Funds (Cost: $9,664,515) | 9,664,515 | ||||||||||
| Total Investments (Cost: $156,515,902) | 156,401,933 | ||||||||||
Other Assets & Liabilities, Net | (13,754,628 | ) | |||||||||
Net Assets | 142,647,305 | ||||||||||
The accompanying Notes to Financial Statements are an integral part of this statement.
Annual Report 2016
20
COLUMBIA VARIABLE PORTFOLIO — STRATEGIC INCOME FUND
PORTFOLIO OF INVESTMENTS (continued)
December 31, 2016
At December 31, 2016, cash totaling $1,668,940 was pledged as collateral.
Investments in Derivatives
Forward Foreign Currency Exchange Contracts Open at December 31, 2016
Counterparty | Exchange Date | Currency to be Delivered | Currency to be Received | Unrealized Appreciation ($) | Unrealized Depreciation ($) | ||||||||||||||||||||||||||
BNP Paribas | 01/13/2017 | 3,000,000 | ILS | 777,283 | USD | — | (1,700 | ) | |||||||||||||||||||||||
BNP Paribas | 01/13/2017 | 75,000,000 | JPY | 679,212 | USD | 37,156 | — | ||||||||||||||||||||||||
Barclays | 01/13/2017 | 201,000,000 | HUF | 691,784 | USD | 7,409 | — | ||||||||||||||||||||||||
Barclays | 01/13/2017 | 12,930,000 | MXN | 625,959 | USD | 3,104 | — | ||||||||||||||||||||||||
Citi | 01/13/2017 | 1,223,870 | EUR | 1,303,923 | USD | 14,978 | — | ||||||||||||||||||||||||
Citi | 01/13/2017 | 758,144 | USD | 723,870 | EUR | 4,216 | — | ||||||||||||||||||||||||
Citi | 01/13/2017 | 537,577 | USD | 500,000 | EUR | — | (10,990 | ) | |||||||||||||||||||||||
Credit Suisse | 01/13/2017 | 723,000 | EUR | 757,061 | USD | — | (4,383 | ) | |||||||||||||||||||||||
Credit Suisse | 01/13/2017 | 692,728 | USD | 650,000 | EUR | — | (8,166 | ) | |||||||||||||||||||||||
HSBC | 01/13/2017 | 1,841,896,000 | COP | 581,315 | USD | — | (31,082 | ) | |||||||||||||||||||||||
Standard Chartered | 01/12/2017 | 18,500,000 | CNH | 2,666,013 | USD | 20,898 | — | ||||||||||||||||||||||||
Standard Chartered | 01/13/2017 | 2,745,000 | BRL | 806,523 | USD | — | (34,524 | ) | |||||||||||||||||||||||
Standard Chartered | 01/13/2017 | 10,746,518,000 | IDR | 786,139 | USD | — | (10,103 | ) | |||||||||||||||||||||||
UBS | 01/12/2017 | 810,000,000 | KRW | 691,333 | USD | 20,632 | — | ||||||||||||||||||||||||
Total | 108,393 | (100,948 | ) | ||||||||||||||||||||||||||||
Futures Contracts Outstanding at December 31, 2016
Long Futures Contracts Outstanding
Contract Description | Number of Contracts | Trading Currency | Notional Market Value ($) | Expiration Date | Unrealized Appreciation ($) | Unrealized (Depreciation) ($) | |||||||||||||||||||||
Australian 10-Year Bond | 101 | AUD | 9,310,728 | 03/2017 | 42,220 | — | |||||||||||||||||||||
U.S. Treasury 2-Year Note | 68 | USD | 14,734,750 | 03/2017 | — | (13,885 | ) | ||||||||||||||||||||
U.S. Treasury 5-Year Note | 220 | USD | 25,886,094 | 03/2017 | 19,387 | — | |||||||||||||||||||||
Total | 49,931,572 | 61,607 | (13,885 | ) | |||||||||||||||||||||||
Short Futures Contracts Outstanding
Contract Description | Number of Contracts | Trading Currency | Notional Market Value ($) | Expiration Date | Unrealized Appreciation ($) | Unrealized (Depreciation) ($) | |||||||||||||||||||||
Euro-BTP | (32 | ) | EUR | (4,557,892 | ) | 03/2017 | — | (92,296 | ) | ||||||||||||||||||
Euro-Buxl 30-Year | (13 | ) | EUR | (2,374,527 | ) | 03/2017 | — | (27,610 | ) | ||||||||||||||||||
U.S. Treasury 10-Year Note | (193 | ) | USD | (23,986,281 | ) | 03/2017 | 28,522 | — | |||||||||||||||||||
U.S. Ultra Bond | (27 | ) | USD | (4,326,750 | ) | 03/2017 | — | (26,179 | ) | ||||||||||||||||||
Total | (35,245,450 | ) | 28,522 | (146,085 | ) | ||||||||||||||||||||||
The accompanying Notes to Financial Statements are an integral part of this statement.
Annual Report 2016
21
COLUMBIA VARIABLE PORTFOLIO — STRATEGIC INCOME FUND
PORTFOLIO OF INVESTMENTS (continued)
December 31, 2016
Open Options Contracts Written at December 31, 2016
Issuer | Puts/Calls | Trading Currency | Number of Contracts | Exercise Price | Premium Received ($) | Expiration Date | Value ($) | ||||||||||||||||||||||||
| Put — OTC 5-Year Interest Rate Swap(o) | Put | USD | (5,000,000 | ) | 2.00 | (28,000 | ) | 02/21/2017 | (30,232 | ) | |||||||||||||||||||||
Credit Default Swap Contracts Outstanding at December 31, 2016
Buy Protection
Counterparty | Reference Entity | Expiration Date | Pay Fixed Rate (%) | Notional Currency | Notional Amount | Market Value ($) | Premium Paid ($) | Premium Received ($) | Periodic Payments Receivable (Payable) ($) | Unrealized Appreciation ($) | Unrealized Depreciation ($) | ||||||||||||||||||||||||||||||||||||
| Barclays | Markit CDX Emerging Markets Index, Series 26 | 12/20/2021 | 1.000 | USD | 700,000 | 43,672 | 44,825 | — | (215 | ) | — | (1,368 | ) | ||||||||||||||||||||||||||||||||||
| Barclays | People's Republic of China | 12/20/2021 | 1.000 | USD | 1,350,000 | 11,295 | 4,407 | — | (413 | ) | 6,475 | — | |||||||||||||||||||||||||||||||||||
Total | 49,232 | — | 6,475 | (1,368 | ) | ||||||||||||||||||||||||||||||||||||||||||
Cleared Credit Default Swap Contracts Outstanding at December 31, 2016
Buy Protection
Counterparty | Reference Entity | Expiration Date | Pay Fixed Rate (%) | Notional Currency | Notional Amount | Unrealized Appreciation ($) | Unrealized Depreciation ($) | ||||||||||||||||||||||||
| Morgan Stanley | Markit CDX North America High Yield Index, Series 27 | 12/20/2021 | 5.000 | USD | 4,400,000 | — | (119,754 | ) | |||||||||||||||||||||||
| Morgan Stanley | Markit iTraxx Europe Crossover Index, Series 26 | 12/20/2021 | 5.000 | EUR | 2,200,000 | — | (44,240 | ) | |||||||||||||||||||||||
Total | — | (163,994 | ) | ||||||||||||||||||||||||||||
Credit Default Swap Contracts Outstanding at December 31, 2016
Sell Protection
Counterparty | Reference Entity | Expiration Date | Receive Fixed Rate (%) | Implied Credit Spread (%)* | Notional Currency | Notional Amount | Market Value ($) | Premium Paid ($) | Premium Received ($) | Periodic Payments Receivable (Payable) ($) | Unrealized Appreciation ($) | Unrealized Depreciation ($) | |||||||||||||||||||||||||||||||||||||||
| Credit Suisse | Markit CMBX North America Index, Series 6 BBB- | 05/11/2063 | 3.000 | 4.189 | USD | (250,000 | ) | (14,325 | ) | — | (31,934 | ) | 125 | 17,734 | — | ||||||||||||||||||||||||||||||||||||
| Credit Suisse | Markit CMBX North America Index, Series 7 BBB- | 01/17/2047 | 3.000 | 4.019 | USD | (500,000 | ) | (28,650 | ) | — | (45,791 | ) | 250 | 17,391 | — | ||||||||||||||||||||||||||||||||||||
The accompanying Notes to Financial Statements are an integral part of this statement.
Annual Report 2016
22
COLUMBIA VARIABLE PORTFOLIO — STRATEGIC INCOME FUND
PORTFOLIO OF INVESTMENTS (continued)
December 31, 2016
Credit Default Swap Contracts Outstanding at December 31, 2016 (continued)
Sell Protection
Counterparty | Reference Entity | Expiration Date | Receive Fixed Rate (%) | Implied Credit Spread (%)* | Notional Currency | Notional Amount | Market Value ($) | Premium Paid ($) | Premium Received ($) | Periodic Payments Receivable (Payable) ($) | Unrealized Appreciation ($) | Unrealized Depreciation ($) | |||||||||||||||||||||||||||||||||||||||
| Morgan Stanley | Markit CMBX North America Index, Series 6 BBB- | 05/11/2063 | 3.000 | 4.189 | USD | (550,000 | ) | (31,515 | ) | — | (33,572 | ) | 275 | 2,332 | — | ||||||||||||||||||||||||||||||||||||
| Morgan Stanley | Markit CMBX North America Index, Series 7 BBB- | 01/17/2047 | 3.000 | 4.019 | USD | (800,000 | ) | (45,840 | ) | — | (94,126 | ) | 400 | 48,686 | — | ||||||||||||||||||||||||||||||||||||
Total | — | (205,423 | ) | 86,143 | — | ||||||||||||||||||||||||||||||||||||||||||||||
*Implied credit spreads, represented in absolute terms, utilized in determining the market value of credit default swap agreements on corporate or sovereign issues as of period end serve as an indicator of the current status of the payment/performance risk and represent the likelihood or risk of default for the credit derivative. The implied credit spread of a particular referenced entity reflects the cost of buying/selling protection and may include upfront payments required to be made to enter into the agreement. Wider credit spreads represent a deterioration of the referenced entity's credit soundness and a greater likelihood or risk of default or other credit event occurring as defined under the terms of the agreement.
Cleared Interest Rate Swap Contracts Outstanding at December 31, 2016
Counterparty | Fund Receives | Fund Pays | Expiration Date | Notional Currency | Notional Amount | Unrealized Appreciation ($) | Unrealized Depreciation ($) | ||||||||||||||||||||||||
| Morgan Stanley | Fixed rate of 1.261% | 3-Month USD LIBOR-BBA | 10/21/2021 | USD | 7,500,000 | — | (233,214 | ) | |||||||||||||||||||||||
| Morgan Stanley | Fixed rate of 1.377% | 3-Month USD LIBOR-BBA | 11/01/2021 | USD | 7,500,000 | — | (194,695 | ) | |||||||||||||||||||||||
| Morgan Stanley | Fixed rate of 1.335% | 3-Month USD LIBOR-BBA | 11/09/2021 | USD | 7,000,000 | — | (198,069 | ) | |||||||||||||||||||||||
| Morgan Stanley | Fixed rate of 1.728% | 3-Month USD LIBOR-BBA | 11/17/2021 | USD | 7,400,000 | — | (72,117 | ) | |||||||||||||||||||||||
| Morgan Stanley | Fixed Rate of 6.361% | 28-Day MXN TIIE-Banxico | 10/24/2025 | MXN | 17,000,000 | — | (81,535 | ) | |||||||||||||||||||||||
| Morgan Stanley | Fixed rate of 5.985% | 28-Day MXN TIIE-Banxico | 01/21/2026 | MXN | 8,000,000 | — | (49,236 | ) | |||||||||||||||||||||||
| Morgan Stanley | Fixed rate of 5.960% | 28-Day MXN TIIE-Banxico | 02/02/2026 | MXN | 20,000,000 | — | (125,561 | ) | |||||||||||||||||||||||
| Morgan Stanley | 3-Month USD LIBOR-BBA | Fixed rate of 1.783% | 02/04/2026 | USD | 900,000 | 34,010 | — | ||||||||||||||||||||||||
| Morgan Stanley | 3-Month USD LIBOR-BBA | Fixed rate of 1.980% | 10/21/2046 | USD | 1,486,880 | 203,268 | — | ||||||||||||||||||||||||
| Morgan Stanley | 3-Month USD LIBOR-BBA | Fixed rate of 2.113% | 11/01/2046 | USD | 1,517,910 | 163,855 | — | ||||||||||||||||||||||||
| Morgan Stanley | 3-Month USD LIBOR-BBA | Fixed rate of 2.086% | 11/09/2046 | USD | 1,413,376 | 161,271 | — | ||||||||||||||||||||||||
| Morgan Stanley | 3-Month USD LIBOR-BBA | Fixed rate of 2.431% | 11/17/2046 | USD | 1,700,000 | 65,825 | — | ||||||||||||||||||||||||
Total | 628,229 | (954,427 | ) | ||||||||||||||||||||||||||||
The accompanying Notes to Financial Statements are an integral part of this statement.
Annual Report 2016
23
COLUMBIA VARIABLE PORTFOLIO — STRATEGIC INCOME FUND
PORTFOLIO OF INVESTMENTS (continued)
December 31, 2016
Notes to Portfolio of Investments
(a) Principal amounts are denominated in United States Dollars unless otherwise noted.
(b) Represents privately placed and other securities and instruments exempt from SEC registration (collectively, private placements), such as Section 4(a)(2) and Rule 144A eligible securities, which are often sold only to qualified institutional buyers. The Fund may invest in private placements determined to be liquid as well as those determined to be illiquid. Private placements may be determined to be liquid under guidelines established by the Fund's Board of Trustees. At December 31, 2016, the value of these securities amounted to $68,436,001 or 47.98% of net assets.
(c) Variable rate security.
(d) Represents securities that have defaulted on payment of interest. The Fund has stopped accruing interest on these securities. At December 31, 2016, the value of these securities amounted to $603,270, which represents 0.42% of net assets.
(e) Interest Only (IO) represents the right to receive the monthly interest payments on an underlying pool of mortgage loans.
(f) Security, or a portion thereof, has been purchased on a when-issued or delayed delivery basis.
(g) Zero coupon bond.
(h) Principal and interest may not be guaranteed by the government.
(i) Represents fair value as determined in good faith under procedures approved by the Board of Trustees. At December 31, 2016, the value of these securities amounted to $128,504, which represents 0.09% of net assets.
(j) Senior loans have interest rates that float periodically based primarily on the London Interbank Offered Rate ("LIBOR") and other short-term rates. The interest rate shown reflects the weighted average coupon as of December 31, 2016. The interest rate shown for senior loans purchased on a when-issued or delayed delivery basis, if any, reflects an estimated average coupon. Remaining maturities of senior loans may be less than the stated maturities shown as a result of contractual or optional prepayments by the borrower. Such prepayments cannot be predicted.
(k) Non-income producing investment.
(l) Negligible market value.
(m) The rate shown is the seven-day current annualized yield at December 31, 2016.
(n) As defined in the Investment Company Act of 1940, an affiliated company is one in which the Fund owns 5% or more of the company's outstanding voting securities, or a company which is under common ownership or control with the Fund. Holdings and transactions in these affiliated companies during the year ended December 31, 2016 are as follows:
Issuer | Beginning Cost ($) | Purchase Cost ($) | Proceeds From Sales ($) | Realized Gain Loss ($) | Ending Cost ($) | Dividends — Affiliated Issuers ($) | Value ($) | ||||||||||||||||||||||||
| Columbia Short-Term Cash Fund | 6,187,337 | 61,507,739 | (58,030,489 | ) | (72 | ) | 9,664,515 | 39,810 | 9,664,515 | ||||||||||||||||||||||
(o) Written swaption contracts outstanding at December 31, 2016:
Written Swaption Contracts Outstanding at December 31, 2016
Description | Counterparty | Fund Receives | Fund Pays | Exercise Rate (%) | Expiration Date | Notional Amount ($) | Premium Received ($) | Market Value ($) | |||||||||||||||||||||||||||
| Put — OTC 5-Year Interest Rate Swap | Morgan Stanley | Fixed rate of 2.000% | 3-Month USD LIBOR BBA | 2.000 | 02/21/2022 | (5,000,000 | ) | (28,000 | ) | (30,232 | ) | ||||||||||||||||||||||||
Abbreviation Legend
CMO Collateralized Mortgage Obligation
FGIC Financial Guaranty Insurance Company
NPFGC National Public Finance Guarantee Corporation
PIK Payment-in-Kind
The accompanying Notes to Financial Statements are an integral part of this statement.
Annual Report 2016
24
COLUMBIA VARIABLE PORTFOLIO — STRATEGIC INCOME FUND
PORTFOLIO OF INVESTMENTS (continued)
December 31, 2016
Currency Legend
AUD Australian Dollar
BRL Brazilian Real
CNH Yuan Offshore Renminbi
COP Colombian Peso
DOP Dominican Republic Peso
EUR Euro
HUF Hungarian Forint
IDR Indonesian Rupiah
ILS Israeli Shekel
JPY Japanese Yen
KRW Korean Won
MXN Mexican Peso
USD US Dollar
Fair Value Measurements
The Fund categorizes its fair value measurements according to a three-level hierarchy that maximizes the use of observable inputs and minimizes the use of unobservable inputs by prioritizing that the most observable input be used when available. Observable inputs are those that market participants would use in pricing an investment based on market data obtained from sources independent of the reporting entity. Unobservable inputs are those that reflect the Fund's assumptions about the information market participants would use in pricing an investment. An investment's level within the fair value hierarchy is based on the lowest level of any input that is deemed significant to the asset's or liability's fair value measurement. The input levels are not necessarily an indication of the risk or liquidity associated with investments at that level. For example, certain U.S. government securities are generally high quality and liquid, however, they are reflected as Level 2 because the inputs used to determine fair value may not always be quoted prices in an active market.
Fair value inputs are summarized in the three broad levels listed below:
> Level 1 — Valuations based on quoted prices for investments in active markets that the Fund has the ability to access at the measurement date (including NAV for open-end mutual funds). Valuation adjustments are not applied to Level 1 investments.
> Level 2 — Valuations based on other significant observable inputs (including quoted prices for similar securities, interest rates, prepayment speeds, credit risks, etc.).
> Level 3 — Valuations based on significant unobservable inputs (including the Fund's own assumptions and judgment in determining the fair value of investments).
Inputs that are used in determining fair value of an investment may include price information, credit data, volatility statistics, and other factors. These inputs can be either observable or unobservable. The availability of observable inputs can vary between investments, and is affected by various factors such as the type of investment, and the volume and level of activity for that investment or similar investments in the marketplace. The inputs will be considered by the Investment Manager, along with any other relevant factors in the calculation of an investment's fair value. The Fund uses prices and inputs that are current as of the measurement date, which may include periods of market dislocations. During these periods, the availability of prices and inputs may be reduced for many investments. This condition could cause an investment to be reclassified between the various levels within the hierarchy.
Certain investments that have been measured at fair value using the net asset value (NAV) per share (or its equivalent) are not categorized in the fair value hierarchy. The fair value amounts presented in the table are intended to reconcile the fair value hierarchy to the amounts presented in the Portfolio of Investments. The Columbia Short-Term Cash Fund seeks to provide shareholders with maximum current income consistent with liquidity and stability of principal. Columbia Short-Term Cash Fund prices its shares with a floating NAV and no longer seeks to maintain a stable NAV.
Investments falling into the Level 3 category are primarily supported by quoted prices from brokers and dealers participating in the market for those investments. However, these may be classified as Level 3 investments due to lack of market transparency and corroboration to support these quoted prices. Additionally, valuation models may be used as the pricing source for any remaining investments classified as Level 3. These models may rely on one or more significant unobservable inputs and/or significant assumptions by the Investment Manager. Inputs used in valuations may include, but are not limited to, financial statement analysis, capital account balances, discount rates and estimated cash flows, and comparable company data.
The accompanying Notes to Financial Statements are an integral part of this statement.
Annual Report 2016
25
COLUMBIA VARIABLE PORTFOLIO — STRATEGIC INCOME FUND
PORTFOLIO OF INVESTMENTS (continued)
December 31, 2016
Fair Value Measurements (continued)
Under the direction of the Fund's Board of Trustees (the Board), the Investment Manager's Valuation Committee (the Committee) is responsible for overseeing the valuation procedures approved by the Board. The Committee consists of voting and non-voting members from various groups within the Investment Manager's organization, including operations and accounting, trading and investments, compliance, risk management and legal.
The Committee meets at least monthly to review and approve valuation matters, which may include a description of specific valuation determinations, data regarding pricing information received from approved pricing vendors and brokers and the results of Board-approved valuation control policies and procedures (the Policies). The Policies address, among other things, instances when market quotations are or are not readily available, including recommendations of third party pricing vendors and a determination of appropriate pricing methodologies; events that require specific valuation determinations and assessment of fair value techniques; securities with a potential for stale pricing, including those that are illiquid, restricted, or in default; and the effectiveness of third party pricing vendors, including periodic reviews of vendors. The Committee meets more frequently, as needed, to discuss additional valuation matters, which may include the need to review back-testing results, review time-sensitive information or approve related valuation actions. The Committee reports to the Board, with members of the Committee meeting with the Board at each of its regularly scheduled meetings to discuss valuation matters and actions during the period, similar to those described earlier.
For investments categorized as Level 3, the Committee monitors information similar to that described above, which may include: (i) data specific to the issuer or comparable issuers, (ii) general market or specific sector news and (iii) quoted prices and specific or similar security transactions. The Committee considers this data and any changes from prior periods in order to assess the reasonableness of observable and unobservable inputs, any assumptions or internal models used to value those securities and changes in fair value. This data is also used to corroborate, when available, information received from approved pricing vendors and brokers. Various factors impact the frequency of monitoring this information (which may occur as often as daily). However, the Committee may determine that changes to inputs, assumptions and models are not required as a result of the monitoring procedures performed.
The following table is a summary of the inputs used to value the Fund's investments at December 31, 2016:
| Level 1 Quoted Prices in Active Markets for Identical Assets ($) | Level 2 Other Significant Observable Inputs ($) | Level 3 Significant Unobservable Inputs ($) | Total ($) | ||||||||||||||||
Investments | |||||||||||||||||||
Corporate Bonds & Notes | — | 59,982,245 | — | 59,982,245 | |||||||||||||||
| Residential Mortgage-Backed Securities — Agency | — | 20,244,557 | — | 20,244,557 | |||||||||||||||
| Residential Mortgage-Backed Securities — Non-Agency | — | 22,527,700 | 2,371,286 | 24,898,986 | |||||||||||||||
| Commercial Mortgage-Backed Securities — Non-Agency | — | 4,990,783 | — | 4,990,783 | |||||||||||||||
| Asset-Backed Securities — Non-Agency | — | 5,391,475 | 711,874 | 6,103,349 | |||||||||||||||
Inflation-Indexed Bonds | — | 4,109,994 | — | 4,109,994 | |||||||||||||||
U.S. Treasury Obligations | 2,498,047 | — | — | 2,498,047 | |||||||||||||||
Foreign Government Obligations | — | 13,484,249 | 128,504 | 13,612,753 | |||||||||||||||
Senior Loans | — | 8,725,725 | 1,152,736 | 9,878,461 | |||||||||||||||
Common Stocks | |||||||||||||||||||
Financials | — | — | 78,996 | 78,996 | |||||||||||||||
Utilities | 157,281 | 181,966 | — | 339,247 | |||||||||||||||
Total Common Stocks | 157,281 | 181,966 | 78,996 | 418,243 | |||||||||||||||
Investments measured at net asset value | |||||||||||||||||||
Money Market Funds | — | — | — | 9,664,515 | |||||||||||||||
Total Investments | 2,655,328 | 139,638,694 | 4,443,396 | 156,401,933 | |||||||||||||||
The accompanying Notes to Financial Statements are an integral part of this statement.
Annual Report 2016
26
COLUMBIA VARIABLE PORTFOLIO — STRATEGIC INCOME FUND
PORTFOLIO OF INVESTMENTS (continued)
December 31, 2016
Fair Value Measurements (continued)
| Level 1 Quoted Prices in Active Markets for Identical Assets ($) | Level 2 Other Significant Observable Inputs ($) | Level 3 Significant Unobservable Inputs ($) | Total ($) | ||||||||||||||||
Derivatives | |||||||||||||||||||
Assets | |||||||||||||||||||
| Forward Foreign Currency Exchange Contracts | — | 108,393 | — | 108,393 | |||||||||||||||
Futures Contracts | 90,129 | — | — | 90,129 | |||||||||||||||
Swap Contracts | — | 720,847 | — | 720,847 | |||||||||||||||
Liabilities | |||||||||||||||||||
| Forward Foreign Currency Exchange Contracts | — | (100,948 | ) | — | (100,948 | ) | |||||||||||||
Futures Contracts | (159,970 | ) | — | — | (159,970 | ) | |||||||||||||
Options Contracts Written | — | (30,232 | ) | — | (30,232 | ) | |||||||||||||
Swap Contracts | — | (1,119,789 | ) | — | (1,119,789 | ) | |||||||||||||
Total | 2,585,487 | 139,216,965 | 4,443,396 | 155,910,363 | |||||||||||||||
See the Portfolio of Investments for all investment classifications not indicated in the table.
The Fund's assets assigned to the Level 2 input category are generally valued using the market approach, in which a security's value is determined through reference to prices and information from market transactions for similar or identical assets.
Forward foreign currency exchange contracts, futures contracts and swap contracts are valued at unrealized appreciation (depreciation).
There were no transfers of financial assets between Levels 1 and 2 during the period.
The following table is a reconciliation of Level 3 assets for which significant observable and unobservable inputs were used to determine fair value:
| Residential Mortgage- Backed Securities — Non-Agency ($) | Asset-Backed Securities — Non-Agency ($) | Foreign Government Obligations ($) | Senior Loans ($) | Common Stocks ($) | Total ($) | ||||||||||||||||||||||
Balance as of December 31, 2015 | 4,176,498 | — | 130,020 | 2,536,783 | 0 | (a) | 6,843,301 | ||||||||||||||||||||
| Increase (decrease) in accrued discounts/premiums | (8,836 | ) | — | (660 | ) | (971 | ) | — | (10,467 | ) | |||||||||||||||||
Realized gain (loss) | (18,275 | ) | — | — | (103,106 | ) | — | (121,381 | ) | ||||||||||||||||||
| Change in unrealized appreciation (depreciation)(b) | 66,461 | 211,874 | (856 | ) | 213,872 | 46,308 | 537,659 | ||||||||||||||||||||
Sales | (3,575,972 | ) | — | — | (2,122,187 | ) | — | (5,698,159 | ) | ||||||||||||||||||
Purchases | 1,731,410 | 500,000 | — | — | 32,688 | 2,264,098 | |||||||||||||||||||||
Transfers into Level 3 | — | — | — | 916,691 | — | 916,691 | |||||||||||||||||||||
Transfers out of Level 3 | — | — | — | (288,346 | ) | — | (288,346 | ) | |||||||||||||||||||
Balance as of December 31, 2016 | 2,371,286 | 711,874 | 128,504 | 1,152,736 | 78,996 | 4,443,396 | |||||||||||||||||||||
(a) Rounds to zero.
(b) Change in unrealized appreciation (depreciation) relating to securities held at December 31, 2016 was $278,579, which is comprised of Residential Mortgage-Backed Securities — Non-Agency of $7,724, Asset-Backed Securities — Non-Agency of $211,874, Foreign Government Obligations of $(856), Senior Loans of $13,529 and Common Stocks of $46,308.
The accompanying Notes to Financial Statements are an integral part of this statement.
Annual Report 2016
27
COLUMBIA VARIABLE PORTFOLIO — STRATEGIC INCOME FUND
PORTFOLIO OF INVESTMENTS (continued)
December 31, 2016
Fair Value Measurements (continued)
The Fund's assets assigned to the Level 3 category are valued utilizing the valuation technique deemed the most appropriate in the circumstances. Certain senior loans, foreign government obligations, and residential mortgage backed securities classified as Level 3 securities are valued using the market approach and utilize single market quotations from broker dealers which may have included, but were not limited to, observable transactions for identical or similar assets in the market and the distressed nature of the security. The appropriateness of fair values for these securities is monitored on an ongoing basis which may include results of back testing, manual price reviews and other control procedures. Significant increases (decreases) to any of these inputs would result in a significantly lower (higher) fair value measurement.
Financial assets were transferred from Level 3 to Level 2 as observable market inputs were utilized and management determined that there was sufficient, reliable and observable market data to value these assets as of period end.
Financial Assets were transferred from Level 2 to Level 3 due to utilizing a single market quotation from a broker dealer. As a result, Management concluded that the market input(s) were generally unobservable.
The accompanying Notes to Financial Statements are an integral part of this statement.
Annual Report 2016
28
COLUMBIA VARIABLE PORTFOLIO — STRATEGIC INCOME FUND
STATEMENT OF ASSETS AND LIABILITIES
December 31, 2016
Assets | |||||||
Investments, at value | |||||||
Unaffiliated issuers (identified cost $146,851,387) | $ | 146,737,418 | |||||
Affiliated issuers (identified cost $9,664,515) | 9,664,515 | ||||||
Total investments (identified cost $156,515,902) | 156,401,933 | ||||||
Cash | 68,711 | ||||||
Foreign currency (identified cost $29,852) | 29,732 | ||||||
Cash collateral held at broker | 237,000 | ||||||
Margin deposits | 1,431,940 | ||||||
Unrealized appreciation on forward foreign currency exchange contracts | 108,393 | ||||||
Unrealized appreciation on swap contracts | 92,618 | ||||||
Premiums paid on outstanding swap contracts | 49,232 | ||||||
Receivable for: | |||||||
Investments sold | 15,102 | ||||||
Investments sold on a delayed delivery basis | 3,562,660 | ||||||
Capital shares sold | 24,363 | ||||||
Dividends | 3,808 | ||||||
Interest | 1,284,047 | ||||||
Foreign tax reclaims | 71,148 | ||||||
Variation margin | 150,039 | ||||||
Expense reimbursement due from Investment Manager | 11,575 | ||||||
Prepaid expenses | 731 | ||||||
Trustees' deferred compensation plan | 56,023 | ||||||
Total assets | 163,599,055 | ||||||
Liabilities | |||||||
Option contracts written, at value (premiums received $28,000) | 30,232 | ||||||
Unrealized depreciation on forward foreign currency exchange contracts | 100,948 | ||||||
Unrealized depreciation on swap contracts | 1,368 | ||||||
Premiums received on outstanding swap contracts | 205,423 | ||||||
Payable for: | |||||||
Investments purchased | 1,284 | ||||||
Investments purchased on a delayed delivery basis | 20,202,637 | ||||||
Capital shares purchased | 31,901 | ||||||
Variation margin | 172,943 | ||||||
Management services fees | 69,599 | ||||||
Distribution and/or service fees | 9,438 | ||||||
Transfer agent fees | 6,960 | ||||||
Compensation of board members | 1,019 | ||||||
Chief compliance officer expenses | 16 | ||||||
Other expenses | 61,959 | ||||||
Trustees' deferred compensation plan | 56,023 | ||||||
Total liabilities | 20,951,750 | ||||||
Net assets applicable to outstanding capital stock | $ | 142,647,305 | |||||
The accompanying Notes to Financial Statements are an integral part of this statement.
Annual Report 2016
29
COLUMBIA VARIABLE PORTFOLIO — STRATEGIC INCOME FUND
STATEMENT OF ASSETS AND LIABILITIES (continued)
December 31, 2016
Represented by | |||||||
Paid-in capital | $ | 141,512,969 | |||||
Undistributed net investment income | 4,065,184 | ||||||
Accumulated net realized loss | (2,323,411 | ) | |||||
Unrealized appreciation (depreciation) on: | |||||||
Investments — unaffiliated issuers | (113,969 | ) | |||||
Foreign currency translations | (29,898 | ) | |||||
Forward foreign currency exchange contracts | 7,445 | ||||||
Futures contracts | (69,841 | ) | |||||
Options contracts written | (2,232 | ) | |||||
Swap contracts | (398,942 | ) | |||||
Total — representing net assets applicable to outstanding capital stock | $ | 142,647,305 | |||||
Class 1 | |||||||
Net assets | $ | 95,971,449 | |||||
Shares outstanding | 23,671,611 | ||||||
Net asset value per share | $ | 4.05 | |||||
Class 2 | |||||||
Net assets | $ | 46,675,856 | |||||
Shares outstanding | 11,624,181 | ||||||
Net asset value per share | $ | 4.02 | |||||
The accompanying Notes to Financial Statements are an integral part of this statement.
Annual Report 2016
30
COLUMBIA VARIABLE PORTFOLIO �� STRATEGIC INCOME FUND
STATEMENT OF OPERATIONS
Year Ended December 31, 2016
Net investment income | |||||||
Income: | |||||||
Dividends — unaffiliated issuers | $ | 23,618 | |||||
Dividends — affiliated issuers | 39,810 | ||||||
Interest | 6,882,571 | ||||||
Foreign taxes withheld | (11,125 | ) | |||||
Total income | 6,934,874 | ||||||
Expenses: | |||||||
Management services fees | 807,356 | ||||||
Distribution and/or service fees | |||||||
Class 2 | 103,662 | ||||||
Transfer agent fees | |||||||
Class 1 | 55,855 | ||||||
Class 2 | 24,878 | ||||||
Compensation of board members | 19,247 | ||||||
Printing and postage fees | 29,848 | ||||||
Audit fees | 48,628 | ||||||
Legal fees | 1,858 | ||||||
Chief compliance officer expenses | 60 | ||||||
Total expenses | 1,091,392 | ||||||
Fees waived or expenses reimbursed by Investment Manager and its affiliates | (106,600 | ) | |||||
Total net expenses | 984,792 | ||||||
Net investment income | 5,950,082 | ||||||
Realized and unrealized gain (loss) — net | |||||||
Net realized gain (loss) on: | |||||||
Investments — unaffiliated issuers | (2,346,179 | ) | |||||
Investments — affiliated issuers | (72 | ) | |||||
Foreign currency translations | (23,605 | ) | |||||
Forward foreign currency exchange contracts | (535,609 | ) | |||||
Futures contracts | (731,600 | ) | |||||
Options purchased | 36,875 | ||||||
Swap contracts | (15,396 | ) | |||||
Net realized loss | (3,615,586 | ) | |||||
Net change in unrealized appreciation (depreciation) on: | |||||||
Investments — unaffiliated issuers | 9,897,307 | ||||||
Foreign currency translations | (4,566 | ) | |||||
Forward foreign currency exchange contracts | 106,642 | ||||||
Futures contracts | (265,998 | ) | |||||
Options purchased | 54,061 | ||||||
Options contracts written | (2,232 | ) | |||||
Swap contracts | (357,986 | ) | |||||
Net change in unrealized appreciation | 9,427,228 | ||||||
Net realized and unrealized gain | 5,811,642 | ||||||
Net increase in net assets resulting from operations | $ | 11,761,724 | |||||
The accompanying Notes to Financial Statements are an integral part of this statement.
Annual Report 2016
31
COLUMBIA VARIABLE PORTFOLIO — STRATEGIC INCOME FUND
STATEMENT OF CHANGES IN NET ASSETS
| Year Ended December 31, 2016 | Year Ended December 31, 2015 | ||||||||||
Operations | |||||||||||
Net investment income | $ | 5,950,082 | $ | 18,229,967 | |||||||
Net realized gain (loss) | (3,615,586 | ) | 5,383,951 | ||||||||
Net change in unrealized appreciation | 9,427,228 | 589,439 | |||||||||
Net increase in net assets resulting from operations | 11,761,724 | 24,203,357 | |||||||||
Distributions to shareholders | |||||||||||
Net investment income | |||||||||||
Class 1 | (10,459,721 | ) | (36,796,280 | ) | |||||||
Class 2 | (4,622,202 | ) | (13,249,306 | ) | |||||||
Net realized gains | |||||||||||
Class 1 | (5,358,926 | ) | (12,417,358 | ) | |||||||
Class 2 | (2,453,454 | ) | (4,502,537 | ) | |||||||
Total distributions to shareholders | (22,894,303 | ) | (66,965,481 | ) | |||||||
Increase (decrease) in net assets from capital stock activity | 27,927,209 | (766,131,580 | ) | ||||||||
Total increase (decrease) in net assets | 16,794,630 | (808,893,704 | ) | ||||||||
Net assets at beginning of year | 125,852,675 | 934,746,379 | |||||||||
Net assets at end of year | $ | 142,647,305 | $ | 125,852,675 | |||||||
Undistributed net investment income | $ | 4,065,184 | $ | 14,777,640 | |||||||
The accompanying Notes to Financial Statements are an integral part of this statement.
Annual Report 2016
32
COLUMBIA VARIABLE PORTFOLIO — STRATEGIC INCOME FUND
STATEMENT OF CHANGES IN NET ASSETS (continued)
Year Ended December 31, 2016 | Year Ended December 31, 2015 | ||||||||||||||||||
Shares | Dollars ($) | Shares | Dollars ($) | ||||||||||||||||
Capital stock activity | |||||||||||||||||||
Class 1 shares | |||||||||||||||||||
Subscriptions | 221,599 | 953,192 | 811,160 | 6,568,693 | |||||||||||||||
Distributions reinvested | 3,964,573 | 15,818,647 | 10,606,387 | 49,213,638 | |||||||||||||||
Redemptions | (741,151 | ) | (3,222,705 | ) | (94,676,082 | ) | (842,528,456 | ) | |||||||||||
Net increase (decrease) | 3,445,021 | 13,549,134 | (83,258,535 | ) | (786,746,125 | ) | |||||||||||||
Class 2 shares | |||||||||||||||||||
Subscriptions | 3,363,809 | 14,418,843 | 1,333,484 | 8,233,310 | |||||||||||||||
Distributions reinvested | 1,786,782 | 7,075,656 | 3,859,096 | 17,751,843 | |||||||||||||||
Redemptions | (1,663,055 | ) | (7,116,424 | ) | (956,128 | ) | (5,370,608 | ) | |||||||||||
Net increase | 3,487,536 | 14,378,075 | 4,236,452 | 20,614,545 | |||||||||||||||
Total net increase (decrease) | 6,932,557 | 27,927,209 | (79,022,083 | ) | (766,131,580 | ) | |||||||||||||
The accompanying Notes to Financial Statements are an integral part of this statement.
Annual Report 2016
33
COLUMBIA VARIABLE PORTFOLIO — STRATEGIC INCOME FUND
FINANCIAL HIGHLIGHTS
The following tables are intended to help you understand the Fund's financial performance. Certain information reflects financial results for a single share of a class held for the periods shown. Per share net investment income (loss) amounts are calculated based on average shares outstanding during the period. Total return assumes reinvestment of all dividends and distributions, if any. Total return does not reflect any fees and expenses imposed under your Contract and/or Qualified Plan, as applicable; such fees and expenses would reduce the total returns for all periods shown. Total return and portfolio turnover are not annualized for periods of less than one year. The portfolio turnover rate is calculated without regard to purchase and sales transactions of short-term instruments and certain derivatives, if any. If such transactions were included, the Fund's portfolio turnover rate may be higher.
Year Ended December 31, | |||||||||||||||||||||||
Class 1 | 2016 | 2015 | 2014 | 2013 | 2012 | ||||||||||||||||||
Per share data | |||||||||||||||||||||||
Net asset value, beginning of period | $ | 4.45 | $ | 8.71 | $ | 8.77 | $ | 9.37 | $ | 8.73 | |||||||||||||
Income from investment operations: | |||||||||||||||||||||||
Net investment income | 0.19 | 0.34 | 0.39 | 0.40 | 0.42 | ||||||||||||||||||
Net realized and unrealized gain (loss) | 0.21 | (0.32 | )(a) | (0.05 | ) | (0.37 | ) | 0.63 | |||||||||||||||
Total from investment operations | 0.40 | 0.02 | 0.34 | 0.03 | 1.05 | ||||||||||||||||||
Less distributions to shareholders: | |||||||||||||||||||||||
Net investment income | (0.53 | ) | (3.20 | ) | (0.30 | ) | (0.40 | ) | (0.41 | ) | |||||||||||||
Net realized gains | (0.27 | ) | (1.08 | ) | (0.10 | ) | (0.23 | ) | — | ||||||||||||||
Total distributions to shareholders | (0.80 | ) | (4.28 | ) | (0.40 | ) | (0.63 | ) | (0.41 | ) | |||||||||||||
Net asset value, end of period | $ | 4.05 | $ | 4.45 | $ | 8.71 | $ | 8.77 | $ | 9.37 | |||||||||||||
Total return | 9.15 | % | (1.77 | %) | 3.77 | % | 0.37 | % | 12.25 | % | |||||||||||||
Ratios to average net assets(b) | |||||||||||||||||||||||
Total gross expenses | 0.73 | % | 0.69 | % | 0.67 | % | 0.67 | % | 0.67 | % | |||||||||||||
Total net expenses(c) | 0.66 | % | 0.68 | % | 0.67 | % | 0.67 | % | 0.65 | % | |||||||||||||
Net investment income | 4.50 | % | 4.23 | % | 4.39 | % | 4.37 | % | 4.63 | % | |||||||||||||
Supplemental data | |||||||||||||||||||||||
Net assets, end of period (in thousands) | $ | 95,971 | $ | 89,998 | $ | 900,978 | $ | 1,147,222 | $ | 1,011,055 | |||||||||||||
Portfolio turnover | 179 | % | 192 | % | 130 | % | 116 | % | 112 | % | |||||||||||||
Notes to Financial Highlights
(a) Calculation of the net gain (loss) per share (both realized and unrealized) does not correlate to the aggregate realized and unrealized gain (loss) presented in the Statement of Operations due to the timing of subscriptions and redemptions of Fund shares in relation to fluctuations in the market value of the portfolio.
(b) In addition to the fees and expenses that the Fund bears directly, the Fund indirectly bears a pro rata share of the fees and expenses of any other funds in which it invests. Such indirect expenses are not included in the Fund's reported expense ratios.
(c) Total net expenses include the impact of certain fee waivers/expense reimbursements made by the Investment Manager and certain of its affiliates, if applicable.
The accompanying Notes to Financial Statements are an integral part of this statement.
Annual Report 2016
34
COLUMBIA VARIABLE PORTFOLIO — STRATEGIC INCOME FUND
FINANCIAL HIGHLIGHTS (continued)
Year Ended December 31, | |||||||||||||||||||||||
Class 2 | 2016 | 2015 | 2014 | 2013 | 2012 | ||||||||||||||||||
Per share data | |||||||||||||||||||||||
Net asset value, beginning of period | $ | 4.41 | $ | 8.66 | $ | 8.73 | $ | 9.33 | $ | 8.69 | |||||||||||||
Income from investment operations: | |||||||||||||||||||||||
Net investment income | 0.18 | 0.26 | 0.37 | 0.37 | 0.40 | ||||||||||||||||||
Net realized and unrealized gain (loss) | 0.21 | (0.25 | )(a) | (0.07 | ) | (0.37 | ) | 0.62 | |||||||||||||||
Total from investment operations | 0.39 | 0.01 | 0.30 | — | 1.02 | ||||||||||||||||||
Less distributions to shareholders: | |||||||||||||||||||||||
Net investment income | (0.51 | ) | (3.18 | ) | (0.27 | ) | (0.37 | ) | (0.38 | ) | |||||||||||||
Net realized gains | (0.27 | ) | (1.08 | ) | (0.10 | ) | (0.23 | ) | — | ||||||||||||||
Total distributions to shareholders | (0.78 | ) | (4.26 | ) | (0.37 | ) | (0.60 | ) | (0.38 | ) | |||||||||||||
Net asset value, end of period | $ | 4.02 | $ | 4.41 | $ | 8.66 | $ | 8.73 | $ | 9.33 | |||||||||||||
Total return | 9.05 | % | (1.93 | %) | 3.41 | % | 0.12 | % | 11.96 | % | |||||||||||||
Ratios to average net assets(b) | |||||||||||||||||||||||
Total gross expenses | 0.98 | % | 0.98 | % | 0.92 | % | 0.92 | % | 0.93 | % | |||||||||||||
Total net expenses(c) | 0.90 | % | 0.94 | % | 0.92 | % | 0.92 | % | 0.90 | % | |||||||||||||
Net investment income | 4.24 | % | 4.23 | % | 4.14 | % | 4.11 | % | 4.36 | % | |||||||||||||
Supplemental data | |||||||||||||||||||||||
Net assets, end of period (in thousands) | $ | 46,676 | $ | 35,854 | $ | 33,769 | $ | 35,218 | $ | 37,516 | |||||||||||||
Portfolio turnover | 179 | % | 192 | % | 130 | % | 116 | % | 112 | % | |||||||||||||
Notes to Financial Highlights
(a) Calculation of the net gain (loss) per share (both realized and unrealized) does not correlate to the aggregate realized and unrealized gain (loss) presented in the Statement of Operations due to the timing of subscriptions and redemptions of Fund shares in relation to fluctuations in the market value of the portfolio.
(b) In addition to the fees and expenses that the Fund bears directly, the Fund indirectly bears a pro rata share of the fees and expenses of any other funds in which it invests. Such indirect expenses are not included in the Fund's reported expense ratios.
(c) Total net expenses include the impact of certain fee waivers/expense reimbursements made by the Investment Manager and certain of its affiliates, if applicable.
The accompanying Notes to Financial Statements are an integral part of this statement.
Annual Report 2016
35
COLUMBIA VARIABLE PORTFOLIO — STRATEGIC INCOME FUND
NOTES TO FINANCIAL STATEMENTS
December 31, 2016
Note 1. Organization
Columbia Variable Portfolio — Strategic Income Fund (the Fund), a series of Columbia Funds Variable Insurance Trust (the Trust), is a diversified fund. The Trust is registered under the Investment Company Act of 1940, as amended (the 1940 Act), as an open-end management investment company organized as a Massachusetts business trust.
Fund Shares
The Trust may issue an unlimited number of shares (without par value). The Fund offers Class 1 and Class 2 shares to separate accounts funding variable annuity contracts and variable life insurance policies (collectively, Contracts) issued by affiliated and unaffiliated life insurance companies as well as qualified pension and retirement plans (Qualified Plans) and other qualified institutional investors (Qualified Investors) authorized by Columbia Management Investment Distributors, Inc. (the Distributor). You may not buy (nor will you own) shares of the Fund directly. You may invest by participating in a Qualified Plan or by buying a Contract and making allocations to the Fund. Although all share classes generally have identical voting, dividend and liquidation rights, each share class votes separately when required by the Trust's organizational documents or by law. Different share classes pay different distribution amounts to the extent the expenses of such share classes differ, and distributions in liquidation will be proportional to the net asset value of each share class. Each share class has its own cost structure and other features.
Note 2. Summary of Significant Accounting Policies
Basis of Preparation
The Fund is an investment company that applies the accounting and reporting guidance in the Financial Accounting Standards Board (FASB) Accounting Standards Codification Topic 946, Financial Services — Investment Companies (ASC 946). The financial statements are prepared in accordance with U.S. generally accepted accounting principles (GAAP), which requires management to make certain estimates and assumptions that affect the reported amounts of assets and liabilities, the disclosure of contingent assets and liabilities at the date of the financial statements and the reported amounts of income and expenses during the reporting period. Actual results could differ from those estimates.
The following is a summary of significant accounting policies followed by the Fund in the preparation of its financial statements.
Security Valuation
All equity securities are valued at the close of business of the New York Stock Exchange. Equity securities are valued at the last quoted sales price on the principal exchange or market on which they trade, except for securities traded on the NASDAQ Stock Market, which are valued at the NASDAQ official close price. Unlisted securities or listed securities for which there were no sales during the day are valued at the mean of the latest quoted bid and ask prices on such exchanges or markets.
Debt securities generally are valued by pricing services approved by the Board of Trustees based upon market transactions for normal, institutional-size trading units of similar securities. The services may use various pricing techniques that take into account, as applicable, factors such as yield, quality, coupon rate, maturity, type of issue, trading characteristics and other data, as well as approved independent broker-dealer quotes. Debt securities for which quotations are not readily available or not believed to be reflective of market value may also be valued based upon a bid quote from an approved independent broker-dealer. Debt securities maturing in 60 days or less are valued primarily at amortized cost value, unless this method results in a valuation that management believes does not approximate market value.
Asset- and mortgage-backed securities are generally valued by pricing services, which utilize pricing models that incorporate the securities' cash flow and loan performance data. These models also take into account available market data, including trades, market quotations, and benchmark yield curves for identical or similar securities. Factors used to identify similar securities may include, but are not limited to, issuer, collateral type, vintage, prepayment speeds, collateral performance, credit ratings, credit enhancement and expected life. Asset-backed securities for which quotations are readily available may also be valued based upon an over-the-counter or exchange bid quote from an approved independent broker-dealer.
Senior loan securities for which reliable market quotations are readily available are generally valued by pricing services at the average of the bids received.
Annual Report 2016
36
COLUMBIA VARIABLE PORTFOLIO — STRATEGIC INCOME FUND
NOTES TO FINANCIAL STATEMENTS (continued)
December 31, 2016
Investments in open-end investment companies, including money market funds, are valued at their latest net asset value.
Forward foreign currency exchange contracts are marked-to-market based upon foreign currency exchange rates provided by a pricing service.
Futures and options on futures contracts are valued based upon the settlement price at the close of regular trading on their principal exchanges or, in the absence of transactions, at the mean of the latest quoted bid and ask prices.
Option contracts are valued at the mean of the latest quoted bid and asked prices on their primary exchanges. Option contracts, including over-the-counter option contracts, with no readily available market quotations are valued using quotes obtained from independent brokers as of the close of the New York Stock Exchange.
Swap transactions are valued through an independent pricing service or broker, or if neither is available, through an internal model based upon observable inputs.
Investments for which market quotations are not readily available, or that have quotations which management believes are not reflective of market value or reliable, are valued at fair value as determined in good faith under procedures approved by and under the general supervision of the Board of Trustees. If a security or class of securities (such as foreign securities) is valued at fair value, such value is likely to be different from the quoted or published price for the security.
The determination of fair value often requires significant judgment. To determine fair value, management may use assumptions including but not limited to future cash flows and estimated risk premiums. Multiple inputs from various sources may be used to determine fair value.
GAAP requires disclosure regarding the inputs and valuation techniques used to measure fair value and any changes in valuation inputs or techniques. In addition, investments shall be disclosed by major category. This information is disclosed following the Fund's Portfolio of Investments.
Foreign Currency Transactions and Translations
The values of all assets and liabilities denominated in foreign currencies are generally translated into U.S. dollars at exchange rates determined at the close of regular trading on the New York Stock Exchange. Net realized and unrealized gains (losses) on foreign currency transactions and translations include gains (losses)
arising from the fluctuation in exchange rates between trade and settlement dates on securities transactions, gains (losses) arising from the disposition of foreign currency and currency gains (losses) between the accrual and payment dates on dividends, interest income and foreign withholding taxes.
For financial statement purposes, the Fund does not distinguish that portion of gains (losses) on investments which is due to changes in foreign exchange rates from that which is due to changes in market prices of the investments. Such fluctuations are included with the net realized and unrealized gains (losses) on investments in the Statement of Operations.
Derivative Instruments
The Fund invests in certain derivative instruments, as detailed below, to meet its investment objectives. Derivatives are instruments whose values depend on, or are derived from, in whole or in part, the value of one or more securities, currencies, commodities, indices, or other assets or instruments. Derivatives may be used to increase investment flexibility (including to maintain cash reserves while maintaining desired exposure to certain assets), for risk management (hedging) purposes, to facilitate trading, to reduce transaction costs and to pursue higher investment returns. The Fund may also use derivative instruments to mitigate certain investment risks, such as foreign currency exchange rate risk, interest rate risk and credit risk. Derivatives may involve various risks, including the potential inability of the counterparty to fulfill its obligations under the terms of the contract, the potential for an illiquid secondary market (making it difficult for the Fund to sell or terminate, including at favorable prices) and the potential for market movements which may expose the Fund to gains or losses in excess of the amount shown in the Statement of Assets and Liabilities. The notional amounts of derivative instruments, if applicable, are not recorded in the financial statements.
A derivative instrument may suffer a marked-to-market loss if the value of the contract decreases due to an unfavorable change in the market rates or values of the underlying instrument. Losses can also occur if the counterparty does not perform its obligations under the contract. The Fund's risk of loss from counterparty credit risk on over-the-counter derivatives is generally limited to the aggregate unrealized gain netted against any collateral held by the Fund and the amount of any variation margin held by the counterparty, plus any replacement costs or related amounts. With exchange-traded or centrally
Annual Report 2016
37
COLUMBIA VARIABLE PORTFOLIO — STRATEGIC INCOME FUND
NOTES TO FINANCIAL STATEMENTS (continued)
December 31, 2016
cleared derivatives, there is reduced counterparty credit risk to the Fund since the clearinghouse or central counterparty (CCP) provides some protection in the case of clearing member default. The clearinghouse or CCP stands between the buyer and the seller of the contract; therefore, additional counterparty credit risk is failure of the clearinghouse or CCP. However, credit risk still exists in exchange-traded or centrally cleared derivatives with respect to initial and variation margin that is held in a broker's customer account. While brokers are required to segregate customer margin from their own assets, in the event that a broker becomes insolvent or goes into bankruptcy and at that time there is a shortfall in the aggregate amount of margin held by the broker for all its clients, U.S. bankruptcy laws will typically allocate that shortfall on a pro-rata basis across all the broker's customers (including the Fund), potentially resulting in losses to the Fund.
In order to better define its contractual rights and to secure rights that will help the Fund mitigate its counterparty risk, the Fund may enter into an International Swaps and Derivatives Association, Inc. Master Agreement (ISDA Master Agreement) or similar agreement with its derivatives contract counterparties. An ISDA Master Agreement is an agreement between the Fund and a counterparty that governs over-the-counter derivatives and typically contains, among other things, collateral posting terms and netting provisions in the event of a default and/or termination event. Under an ISDA Master Agreement, the Fund may, under certain circumstances, offset with the counterparty certain derivative instrument's payables and/or receivables with collateral held and/or posted and create one single net payment. The provisions of the ISDA Master Agreement typically permit a single net payment in the event of default (close-out netting), including the bankruptcy or insolvency of the counterparty. Note, however, that bankruptcy or insolvency laws of a particular jurisdiction may impose restrictions on or prohibitions against the right of offset or netting in bankruptcy, insolvency or other events.
Collateral (margin) requirements differ by type of derivative. Margin requirements are established by the clearinghouse or CCP for exchange-traded and centrally cleared derivatives. Brokers can ask for margin in excess of the minimum in certain circumstances. Collateral terms are contract specific for over-the-counter derivatives. For over-the-counter derivatives traded under an ISDA Master Agreement, the collateral requirements are typically calculated by netting the marked-to-market
amount for each transaction under such agreement and comparing that amount to the value of any variation margin currently pledged by the Fund and/or the counterparty. Generally, the amount of collateral due from or to a party has to exceed a minimum transfer amount threshold (e.g., $250,000) before a transfer has to be made. To the extent amounts due to the Fund from its counterparties are not fully collateralized, contractually or otherwise, the Fund bears the risk of loss from counterparty nonperformance. The Fund attempts to mitigate counterparty risk by only entering into agreements with counterparties that it believes have the financial resources to honor their obligations and by monitoring the financial stability of those counterparties.
Certain ISDA Master Agreements allow counterparties of over-the-counter derivatives transactions to terminate derivatives contracts prior to maturity in the event the Fund's net asset value declines by a stated percentage over a specified time period or if the Fund fails to meet certain terms of the ISDA Master Agreement, which would cause the Fund to accelerate payment of any net liability owed to the counterparty. The Fund also has termination rights if the counterparty fails to meet certain terms of the ISDA Master Agreement. In addition to considering counterparty credit risk, the Fund would consider terminating the derivatives contracts based on whether termination would result in a net liability owed from the counterparty.
For financial reporting purposes, the Fund does not offset derivative assets and derivative liabilities that are subject to netting arrangements in the Statement of Assets and Liabilities.
Forward Foreign Currency Exchange Contracts
Forward foreign currency exchange contracts are over-the-counter agreements between two parties to buy and sell a currency at a set price on a future date. The Fund utilized forward foreign currency exchange contracts to hedge the currency exposure associated with some or all of the Fund's securities and to generate total return through long and short positions versus the U.S. dollar. These instruments may be used for other purposes in future periods.
The values of forward foreign currency exchange contracts fluctuate daily with changes in foreign currency exchange rates. Changes in the value of these contracts are recorded as unrealized appreciation or depreciation until the contract is exercised or has expired. The Fund will realize a gain or loss when the forward foreign currency exchange contract is closed or expires.
Annual Report 2016
38
COLUMBIA VARIABLE PORTFOLIO — STRATEGIC INCOME FUND
NOTES TO FINANCIAL STATEMENTS (continued)
December 31, 2016
The use of forward foreign currency exchange contracts does not eliminate fluctuations in the prices of the Fund's portfolio securities. The risks of forward foreign currency exchange contracts include movement in the values of the foreign currencies relative to the U.S. dollar (or other foreign currencies) and the possibility that counterparties will not complete their contractual obligations, which may be in excess of the amount reflected, if any, in the Statement of Assets and Liabilities.
Futures Contracts
Futures contracts are exchange-traded and represent commitments for the future purchase or sale of an asset at a specified price on a specified date. The Fund bought and sold futures contracts to manage exposure to movements in interest rates. These instruments may be used for other purposes in future periods. Upon entering into futures contracts, the Fund bears risks that it may not achieve the anticipated benefits of the futures contracts and may realize a loss. Additional risks include counterparty credit risk, the possibility of an illiquid market, and that a change in the value of the contract or option may not correlate with changes in the value of the underlying asset.
Upon entering into a futures contract, the Fund deposits cash or securities with the broker, known as a futures commission merchant (FCM), in an amount sufficient to meet the initial margin requirement. The initial margin deposit must be maintained at an established level over the life of the contract. Cash deposited as initial margin is recorded in the Statement of Assets and Liabilities as margin deposits. Securities deposited as initial margin are designated in the Portfolio of Investments. Subsequent payments (variation margin) are made or received by the Fund each day. The variation margin payments are equal to the daily change in the contract value and are recorded as variation margin receivable or payable and are offset in unrealized gains or losses. The Fund recognizes a realized gain or loss when the contract is closed or expires. Futures contracts involve, to varying degrees, risk of loss in excess of the variation margin disclosed in the Statement of Assets and Liabilities.
Options Contracts
Options are contracts which entitle the holder to purchase or sell securities or other identified assets at a specified price, or in the case of index option contracts, to receive or pay the difference between the index value and the strike price of the index option
contract. Option contracts can be either exchange-traded or over-the-counter. The Fund purchased and wrote option contracts to manage exposure to fluctuations in interest rates. These instruments may be used for other purposes in future periods. Completion of transactions for option contracts traded in the over-the-counter market depends upon the performance of the other party. Cash collateral may be collected or posted by the Fund to secure certain over-the-counter option contract trades. Cash collateral held or posted by the Fund for such option contract trades must be returned to the broker or the Fund upon closure, exercise or expiration of the contract.
Options contracts purchased are recorded as investments. When the Fund writes an options contract, the premium received is recorded as an asset and an amount equivalent to the premium is recorded as a liability in the Statement of Assets and Liabilities and is subsequently adjusted to reflect the current fair value of the option written. Changes in the fair value of the written option are recorded as unrealized appreciation or depreciation until the contract is exercised or has expired. The Fund will realize a gain or loss when the option contract is closed or expires. When option contracts are exercised, the proceeds on sales for a written call or purchased put option contract, or the purchase cost for a written put or purchased call option contract, is adjusted by the amount of premium received or paid.
For over-the-counter options purchased, the Fund bears the risk of loss of the amount of the premiums paid plus the positive change in market values net of any collateral held by the Fund should the counterparty fail to perform under the contracts. Option contracts written by the Fund do not typically give rise to significant counterparty credit risk, as options written generally obligate the Fund and not the counterparty to perform. The risk in writing a call option contract is that the Fund gives up the opportunity for profit if the market price of the security increases above the strike price and the option contract is exercised. The risk in writing a put option contract is that the Fund may incur a loss if the market price of the security decreases below the strike price and the option contract is exercised. Exercise of a written option could result in the Fund purchasing or selling a security or foreign currency when it otherwise would not, or at a price different from the current market value. In purchasing and writing options, the Fund bears the risk of an unfavorable change in the value of the underlying
Annual Report 2016
39
COLUMBIA VARIABLE PORTFOLIO — STRATEGIC INCOME FUND
NOTES TO FINANCIAL STATEMENTS (continued)
December 31, 2016
instrument or the risk that the Fund may not be able to enter into a closing transaction due to an illiquid market.
Interest Rate Swaption Contracts
Interest rate swaption contracts entered into by the Fund typically represent an option that gives the purchaser the right, but not the obligation, to enter into an interest rate swap contract on a future date. Each interest rate swaption agreement will specify if the buyer is entitled to receive the fixed or floating rate if the interest rate is exercised. Changes in the value of a purchased interest rate swaption contracts are reported as unrealized appreciation or depreciation on options in the Statement of Assets and Liabilities. Gain or loss is recognized in the Statement of Operations when the interest rate swaption contract is closed or expires.
When the Fund writes an interest rate swaption contract, the premium received is recorded as an asset and an amount equivalent to the premium is recorded as a liability in the Statement of Assets and Liabilities and is subsequently adjusted to reflect the current fair value of the interest rate swaption contract written. Premiums received from writing interest rate swaption contracts that expire unexercised are recorded by the Fund on the expiration date as realized gains from options written in the Statement of Operations. The difference between the premium and the amount paid on effecting a closing purchase transaction, including brokerage commissions, is also recorded as realized gain, or if the premium is less than the amount paid for the closing purchase, as realized loss. These amounts are reflected as net realized gain (loss) on options written in the Statement of Operations.
Contracts and premiums associated with options contracts written for the year ended December 31, 2016 are as follows:
Puts | |||||||||||
Contracts | Premiums ($) | ||||||||||
Balance at December 31, 2015 | — | — | |||||||||
Opened | (5,000,000 | ) | (28,000 | ) | |||||||
Balance at December 31, 2016 | (5,000,000 | ) | (28,000 | ) | |||||||
Swap Contracts
Swap contracts are negotiated in the over-the-counter market and may be entered into as a bilateral contract or centrally cleared (centrally cleared swap contract). In a centrally cleared swap contract, immediately following execution of the swap contract with a broker, the swap
contract is novated to a central counterparty (the CCP) and the CCP becomes the Fund's counterparty to the centrally cleared swap contract. The Fund is required to deposit initial margin with the futures commission merchant (FCM), which pledges it through to the CCP in the form of cash or securities in an amount that varies depending on the size and risk profile of the particular swap contract. Securities deposited as initial margin are designated in the Portfolio of Investments and cash deposited is recorded in the Statement of Assets and Liabilities as margin deposits. Unlike a bilateral swap contract, for centrally cleared swap contracts, the Fund has minimal credit exposure to the FCM because the CCP stands between the Fund and the relevant buyer/seller on the other side of the contract. Swap contracts are marked-to-market daily and changes in value are recorded as unrealized appreciation (depreciation). The daily change in valuation of centrally cleared swap contracts, if any, is recorded as a receivable or payable for variation margin in the Statement of Assets and Liabilities.
Entering into these contracts involves, to varying degrees, elements of interest, liquidity and counterparty credit risk in excess of the amounts recognized in the Statement of Assets and Liabilities. Such risks involve the possibility that there may be unfavorable changes in interest rates, market conditions or other conditions, it may be difficult to initiate a swap transaction or liquidate a position at an advantageous time or price which may result in significant losses, and that the FCM or CCP may not fulfill its obligation under the contract.
Credit Default Swap Contracts
The Fund entered into credit default swap contracts to increase or decrease its credit exposure to an index and to increase or decrease its credit exposure to a single issuer of debt securities. These instruments may be used for other purposes in future periods. Credit default swap contracts are agreements in which one party pays fixed periodic payments to a counterparty in consideration for an agreement from the counterparty to make a specific payment should a specified credit event(s) take place. Although specified credit events are contract specific, credit events are generally defined as bankruptcy, failure to pay, restructuring, obligation acceleration, obligation default, or repudiation/moratorium.
As the purchaser of a credit default swap contract, the Fund purchases protection by paying a periodic interest rate on the notional amount to the counterparty. The
Annual Report 2016
40
COLUMBIA VARIABLE PORTFOLIO — STRATEGIC INCOME FUND
NOTES TO FINANCIAL STATEMENTS (continued)
December 31, 2016
interest amount is accrued daily as a component of unrealized appreciation (depreciation) and is recorded as a realized loss upon payment. If a credit event as specified in the contract occurs, the Fund may have the option either to deliver the reference obligation to the seller in exchange for a cash payment of its par amount, or to receive a net cash settlement equal to the par amount less an agreed-upon value of the reference obligation as of the date of the credit event. The difference between the value of the obligation or cash delivered and the notional amount received will be recorded as a realized gain (loss).
As the seller of a credit default swap contract, the Fund sells protection to a buyer and will generally receive a periodic interest rate on a notional amount. The interest amount is accrued daily as a component of unrealized appreciation (depreciation) and is recorded as a realized gain upon receipt of the payment. If a credit event as specified in the contract with the counterparty occurs, the Fund may either be required to accept the reference obligation from the buyer in exchange for a cash payment of its notional amount, or to pay the buyer a net cash settlement equal to the notional amount less an agreed-upon value of the reference obligation (recovery value) as of the date of the credit event. The difference between the value of the obligation or cash received and the notional amount paid will be recorded as a realized gain (loss). The maximum potential amount of undiscounted future payments the Fund could be required to make as the seller of protection under a credit default swap contract is equal to the notional amount of the reference obligation. These potential amounts may be partially offset by any recovery values of the respective reference obligations or premiums received upon entering into the agreement. The notional amounts and market values of all credit default swap contracts in which the Fund is the seller of protection, if any, are disclosed in the Credit Default Swap Contracts Outstanding schedule following the Portfolio of Investments. These potential amounts may be partially offset by any recovery values of the respective reference obligations or premiums received upon entering into the agreement.
As a protection seller, the Fund bears the risk of loss from the credit events specified in the contract with the counterparty. For credit default swap contracts on credit indices, quoted market prices and resulting market values serve as an indicator of the current status of the payment/performance risk. Increasing market values, in absolute terms when compared to the notional amount
of the swap, represent a deterioration of the reference entity's credit soundness and a greater likelihood or risk of default or other credit event occurring as defined under the terms of the contract.
Any premium paid or received by the Fund upon entering into a credit default swap contract is recorded as an asset or liability, respectively, and amortized daily as a component of realized gain (loss) in the Statement of Operations. Credit default swap contracts are valued daily, and the change in value is recorded as unrealized appreciation (depreciation) until the termination of the swap, at which time a realized gain (loss) is recorded.
Credit default swap contracts can involve greater risks than if a fund had invested in the reference obligation directly since, in addition to general market risks, credit default swaps are subject to counterparty credit risk, leverage risk, hedging risk, correlation risk and liquidity risk.
Interest Rate Swap Contracts
The Fund entered into interest rate swap transactions which may include inflation rate swap contracts to manage exposure to fluctuations in interest rates and inflation. These instruments may be used for other purposes in future periods. An interest rate swap is an agreement between two parties where there are two flows and payments are made between the two counterparties and the payments are dependent upon changes in an interest rate, inflation rate or inflation index calculated on a nominal amount. Interest rate swaps are agreements between two parties that involve the exchange of one type of interest rate for another type of interest rate cash flow on specified dates in the future, based on a predetermined, specified notional amount. Certain interest rate swaps are considered forward-starting, whereby the accrual for the exchange of cash flows does not begin until a specified date in the future. The net cash flow for a standard interest rate swap transaction is generally the difference between a floating market interest rate versus a fixed interest rate.
Interest rate swaps are valued daily and unrealized appreciation (depreciation) is recorded. Certain interest rate swaps may accrue periodic interest on a daily basis as a component of unrealized appreciation (depreciation); the Fund will realize a gain or loss upon the payment or receipt of accrued interest. The Fund will realize a gain or a loss when the interest rate swap is terminated.
Annual Report 2016
41
COLUMBIA VARIABLE PORTFOLIO — STRATEGIC INCOME FUND
NOTES TO FINANCIAL STATEMENTS (continued)
December 31, 2016
Effects of Derivative Transactions in the Financial Statements
The following tables are intended to provide additional information about the effect of derivatives on the financial statements of the Fund, including: the fair value of derivatives by risk category and the location of those fair values in the Statement of Assets and Liabilities; and the impact of derivative transactions over the period in the Statement of Operations, including realized and unrealized gains (losses). The derivative instrument schedules following the Portfolio of Investments present additional information regarding derivative instruments outstanding at the end of the period, if any.
The following table is a summary of the fair value of derivative instruments (not considered to be hedging instruments for accounting disclosure purposes) at December 31, 2016:
The following table is a summary of the average outstanding volume by derivative instrument for the year ended December 31, 2016:
Derivative Instrument | Average Notional Amounts ($) | ||||||
Futures contracts — Long | 26,719,609 | ||||||
Futures contracts — Short | 47,812,081 | ||||||
Credit default swap contracts — buy protection | 9,683,809 | ||||||
Credit default swap contracts — sell protection | 4,375,000 | ||||||
Derivative Instrument | Average Market Value ($) | ||||||
Options contracts — Purchased | 17,602 | ||||||
Options contracts — Written | (7,558 | ) | |||||
Derivative Instrument | Average Unrealized Appreciation ($) | Average Unrealized Depreciation ($) | |||||||||
| Forward foreign currency exchange contracts | 104,713 | (149,464 | ) | ||||||||
Interest rate swap contracts | 171,110 | (413,252 | ) | ||||||||
The following table is a summary of the fair value of derivative instruments (not considered to be hedging instruments for accounting disclosure purposes) at December 31, 2016:
Asset Derivatives | |||||||||||
| Risk Exposure Category | Statement of Assets and Liabilities Location | Fair Value ($) | |||||||||
| Credit risk | Net assets — unrealized appreciation on swap contracts | 92,618 | * | ||||||||
| Credit risk | Premiums paid on outstanding swap contracts | 49,232 | |||||||||
| Foreign exchange risk | Unrealized appreciation on forward foreign currency exchange contracts | 108,393 | |||||||||
| Interest rate risk | Net assets — unrealized appreciation on futures contracts | 90,129 | * | ||||||||
| Interest rate risk | Net assets — unrealized appreciation on swap contracts | 628,229 | * | ||||||||
Total | 968,601 | ||||||||||
Liability Derivatives | |||||||||||
| Risk Exposure Category | Statement of Assets and Liabilities Location | Fair Value ($) | |||||||||
| Credit risk | Net assets — unrealized depreciation on swap contracts | 165,362 | * | ||||||||
| Credit risk | Premiums received on outstanding swap contracts | 205,423 | |||||||||
| Foreign exchange risk | Unrealized depreciation on forward foreign currency exchange contracts | 100,948 | |||||||||
| Interest rate risk | Net assets — unrealized depreciation on futures contracts | 159,970 | * | ||||||||
| Interest rate risk | Options contracts written, at value | 30,232 | |||||||||
| Interest rate risk | Net assets — unrealized depreciation on swap contracts | 954,427 | * | ||||||||
Total | 1,616,362 | ||||||||||
*Includes cumulative appreciation (depreciation) as reported in the tables following the Portfolio of Investments. Only the current day's variation margin is reported in receivables or payables in the Statement of Assets and Liabilities.
The following table indicates the effect of derivative instruments (not considered to be hedging instruments for accounting disclosure purposes) in the Statement of Operations for the year ended December 31, 2016:
Amount of Realized Gain (Loss) on Derivatives Recognized in Income | |||||||||||||||||||||||
| Risk Exposure Category | Forward Foreign Currency Exchange Contracts ($) | Futures Contracts ($) | Options Contracts Purchased ($) | Swap Contracts ($) | Total ($) | ||||||||||||||||||
Credit risk | — | — | — | 13,330 | 13,330 | ||||||||||||||||||
Foreign exchange risk | (535,609 | ) | — | — | — | (535,609 | ) | ||||||||||||||||
Interest rate risk | — | (731,600 | ) | 36,875 | (28,726 | ) | (723,451 | ) | |||||||||||||||
Total | (535,609 | ) | (731,600 | ) | 36,875 | (15,396 | ) | (1,245,730 | ) | ||||||||||||||
Annual Report 2016
42
COLUMBIA VARIABLE PORTFOLIO — STRATEGIC INCOME FUND
NOTES TO FINANCIAL STATEMENTS (continued)
December 31, 2016
Change in Unrealized Appreciation (Depreciation) on Derivatives Recognized in Income | |||||||||||||||||||||||||||
Risk Exposure Category | Forward Foreign Currency Exchange Contracts ($) | Futures Contracts ($) | Options Contracts Written ($) | Options Contracts Purchased ($) | Swap Contracts ($) | Total ($) | |||||||||||||||||||||
Credit risk | — | — | — | — | (77,370 | ) | (77,370 | ) | |||||||||||||||||||
Foreign exchange risk | 106,642 | — | — | — | — | 106,642 | |||||||||||||||||||||
Interest rate risk | — | (265,998 | ) | (2,232 | ) | 54,061 | (280,616 | ) | (494,785 | ) | |||||||||||||||||
Total | 106,642 | (265,998 | ) | (2,232 | ) | 54,061 | (357,986 | ) | (465,513 | ) | |||||||||||||||||
Investments in Senior Loans
The Fund may invest in senior loan participations and assignments of all or a portion of a loan. When the Fund purchases a senior loan participation, the Fund typically enters into a contractual relationship with the lender or third party selling such participations (Selling Participant), but not the borrower, and assumes the credit risk of the borrower, Selling Participant and any other parties positioned between the Fund and the borrower. In addition, the Fund may not directly benefit from the collateral supporting the senior loan that it has purchased from the Selling Participant. In contrast, when the Fund purchases an assignment of a senior loan, the Fund typically has direct rights against the borrower; provided, however, that the Fund's rights may be more limited than the lender from which it acquired the assignment and the Fund may be able to enforce its rights only through an administrative agent. Although certain senior loan participations or assignments are secured by collateral, the Fund could experience delays or limitations in realizing such collateral or have its interest subordinated to other indebtedness of the obligor. In the event that the administrator or collateral agent of a loan becomes insolvent, enters into receivership or bankruptcy, the Fund may incur costs and delays in realizing payment or may suffer a loss of principal and/or interest.The risk of loss is greater for unsecured or subordinated loans. In addition, senior loan participations and assignments are vulnerable to market, economic or other conditions or events that may reduce the demand for loan participations and assignments and certain loan participations and assignments which were liquid, when purchased, may become illiquid.
The Fund may enter into senior loan participations and assignments where all or a portion of the loan may be unfunded. The Fund is obligated to fund these commitments at the borrower's discretion. These commitments are generally traded and priced in the same manner as other senior loan securities and are disclosed as unfunded senior loan commitments in the Fund's Portfolio of Investments with a corresponding
payable for investments purchased. The Fund designates cash or liquid securities to cover these commitments.
Asset- and Mortgage-Backed Securities
The Fund may invest in asset-backed and mortgage-backed securities. The maturity dates shown represent the original maturity of the underlying obligation. Actual maturity may vary based upon prepayment activity on these obligations. All, or a portion, of the obligation may be prepaid at any time because the underlying asset may be prepaid. As a result, decreasing market interest rates could result in an increased level of prepayment. An increased prepayment rate will have the effect of shortening the maturity of the security. Unless otherwise noted, the coupon rates presented are fixed rates.
Delayed Delivery Securities
The Fund may trade securities on other than normal settlement terms, including securities purchased or sold on a "when-issued" basis. This may increase risk to the Fund since the other party to the transaction may fail to deliver, which could cause the Fund to subsequently invest at less advantageous prices. The Fund designates cash or liquid securities in an amount equal to the delayed delivery commitment.
To Be Announced Securities
The Fund may trade securities on a To Be Announced (TBA) basis. As with other delayed-delivery transactions, a seller agrees to issue a TBA security at a future date. However, the seller does not specify the particular securities to be delivered. Instead, the Fund agrees to accept any security that meets specified terms.
In some cases, Master Securities Forward Transaction Agreements (MSFTAs) may be used to govern transactions of certain forward-settling agency mortgage-backed securities, such as delayed-delivery and TBAs, between the Fund and counterparty. The MSFTA maintains provisions for, among other things, initiation and confirmation, payment and transfer, events of default, termination, and maintenance of collateral relating to such transactions.
Annual Report 2016
43
COLUMBIA VARIABLE PORTFOLIO — STRATEGIC INCOME FUND
NOTES TO FINANCIAL STATEMENTS (continued)
December 31, 2016
Mortgage Dollar Roll Transactions
The Fund may enter into mortgage "dollar rolls" in which the Fund sells securities for delivery in the current month and simultaneously contracts with the same counterparty to repurchase similar but not identical securities (same type, coupon and maturity) on a specified future date. During the roll period, the Fund loses the right to receive principal and interest paid on the securities sold. However, the Fund will benefit because it receives negotiated amounts in the form of reductions of the purchase price for the future purchase plus the interest earned on the cash proceeds of the securities sold until the settlement date of the forward purchase. The Fund records the incremental difference between the forward purchase and sale of each forward roll as a realized gain or loss. Unless any realized gains exceed the income, capital appreciation, and gain or loss due to mortgage prepayments that would have been realized on the securities sold as part of the mortgage dollar roll, the use of this technique will diminish the investment performance of the Fund compared to what the performance would have been without the use of mortgage dollar rolls. All cash proceeds will be invested in instruments that are permissible investments for the Fund. The Fund identifies cash or liquid securities in an amount equal to the forward purchase price.
For financial reporting and tax purposes, the Fund treats "to be announced" mortgage dollar rolls as two separate transactions, one involving the purchase of a security and a separate transaction involving a sale. These transactions may increase the Fund's portfolio turnover rate. The Fund does not currently enter into mortgage dollar rolls that are accounted for as financing transactions.
Mortgage dollar rolls involve the risk that the market value of the securities the Fund is obligated to repurchase may decline below the repurchase price, or that the counterparty may default on its obligations.
Treasury Inflation Protected Securities
The Fund may invest in treasury inflation protected securities (TIPS). The principal amount of TIPS is adjusted periodically and is increased for inflation or decreased for deflation based on a monthly published index. These adjustments are recorded as interest income in the Statement of Operations. Coupon payments are based on the adjusted principal at the time the interest is paid.
Interest Only and Principal Only Securities
The Fund may invest in Interest Only (IO) or Principal Only (PO) securities. IOs are stripped securities entitled to receive all of the security's interest, but none of its principal. IOs are particularly sensitive to changes in interest rates and therefore subject to greater fluctuations in price than typical interest bearing debt securities. IOs are also subject to credit risk because the Fund may not receive all or part of the interest payments if the issuer, obligor, guarantor or counterparty defaults on its obligation. Payments received for IOs are included in interest income on the Statement of Operations. Because no principal will be received at the maturity of an IO, adjustments are made to the cost of the security on a monthly basis until maturity. These adjustments are included in interest income on the Statement of Operations. POs are stripped securities entitled to receive the principal from the underlying obligation, but not the interest. POs are particularly sensitive to changes in interest rates and therefore are subject to fluctuations in price. POs are also subject to credit risk because the Fund may not receive all or part of its principal if the issuer, obligor, guarantor or counterparty defaults on its obligation. The Fund may also invest in IO or PO stripped mortgage-backed securities. Payments received for POs are treated as reductions to the cost and par value of the securities.
Offsetting of Assets and Liabilities
The following table presents the Fund's gross and net amount of assets and liabilities available for offset under netting arrangements as well as any related collateral received or pledged by the Fund as of December 31, 2016:
| Barclays ($) | BNP Paribas ($) | Citi ($) | Credit Suisse ($) | HSBC ($) | Morgan Stanley ($)(a) | Morgan Stanley ($)(a) | Standard Chartered ($) | UBS ($) | Total ($) | ||||||||||||||||||||||||||||||||||
Assets | |||||||||||||||||||||||||||||||||||||||||||
| Centrally cleared interest rate swap contracts(a) | — | — | — | — | — | — | 57,600 | — | — | — | |||||||||||||||||||||||||||||||||
| Forward foreign currency exchange contracts | 10,513 | 37,156 | 19,194 | — | — | — | — | 20,898 | 20,632 | 108,393 | |||||||||||||||||||||||||||||||||
Options purchased calls | — | — | — | — | — | — | — | — | — | — | |||||||||||||||||||||||||||||||||
OTC credit default swap contracts(c) | 54,339 | — | — | — | — | — | — | — | — | 54,339 | |||||||||||||||||||||||||||||||||
Total Assets 64,852 37,156 19,194 — — — 57,600 20,898 20,632 220,332
Annual Report 2016
44
COLUMBIA VARIABLE PORTFOLIO — STRATEGIC INCOME FUND
NOTES TO FINANCIAL STATEMENTS (continued)
December 31, 2016
| Barclays ($) | BNP Paribas ($) | Citi ($) | Credit Suisse ($) | HSBC ($) | Morgan Stanley ($)(a) | Morgan Stanley ($)(a) | Standard Chartered ($) | UBS ($) | Total ($) | ||||||||||||||||||||||||||||||||||
Liabilities | |||||||||||||||||||||||||||||||||||||||||||
| Centrally cleared credit default swap contracts(b) | — | — | — | — | — | — | 10,252 | — | — | 10,252 | |||||||||||||||||||||||||||||||||
| Centrally cleared interest rate swap contracts(b) | — | — | — | — | — | — | 70,191 | — | — | 70,191 | |||||||||||||||||||||||||||||||||
| Forward foreign currency exchange contracts | — | 1,700 | 10,990 | 12,549 | 31,082 | — | — | 44,627 | — | 100,948 | |||||||||||||||||||||||||||||||||
Options contracts written | — | — | — | — | — | 30,232 | — | — | — | 30,232 | |||||||||||||||||||||||||||||||||
OTC credit default swap contracts(c) | — | — | — | 42,600 | — | 76,680 | — | — | — | 119,280 | |||||||||||||||||||||||||||||||||
Total Liabilities | — | 1,700 | 10,990 | 55,149 | 31,082 | 106,912 | 80,443 | 44,627 | — | 330,903 | |||||||||||||||||||||||||||||||||
| Total Financial and Derivative Net Assets | 64,852 | 35,456 | 8,204 | (55,149 | ) | (31,082 | ) | (106,912 | ) | (22,843 | ) | (23,729 | ) | 20,632 | (110,571 | ) | |||||||||||||||||||||||||||
Total collateral received (pledged)(d) | 64,852 | — | — | — | — | (106,912 | ) | (22,843 | ) | — | — | (64,903 | ) | ||||||||||||||||||||||||||||||
Net Amount(e) | — | 35,456 | 8,204 | (55,149 | ) | (31,082 | ) | — | — | (23,729 | ) | 20,632 | (45,668 | ) | |||||||||||||||||||||||||||||
(a) Exposure can only be netted across transactions governed under the same master agreement with the same legal entity.
(b) Centrally cleared swaps are included within payable/receivable for variation margin on the Statement of Assets and Liabilities.
(c) Over-the-Counter Swap Contracts are presented at market value plus periodic payments receivable (payable), which is comprised of unrealized appreciation, unrealized depreciation, premiums paid and premiums received.
(d) In some instances, the actual collateral received and/or pledged may be more than the amount shown due to overcollateralization.
(e) Represents the net amount due from/(to) counterparties in the event of default.
Security Transactions
Security transactions are accounted for on the trade date. Cost is determined and gains (losses) are based upon the specific identification method for both financial statement and federal income tax purposes.
Trade date for senior loans purchased in the primary market is the date on which the loan is allocated. Trade date for senior loans purchased in the secondary market is the date on which the transaction is entered into.
Income Recognition
Interest income is recorded on an accrual basis. Market premiums and discounts, including original issue discounts, are amortized and accreted, respectively, over the expected life of the security on all debt securities, unless otherwise noted. The Fund classifies gains and losses realized on prepayments received on mortgage-backed securities as adjustments to interest income.
The Fund may place a debt security on non-accrual status and reduce related interest income when it becomes probable that the interest will not be collected and the amount of uncollectible interest can be reasonably estimated. A defaulted debt security is removed from non-accrual status when the issuer resumes interest payments or when collectibility of interest is reasonably assured.
Corporate actions and dividend income are recorded on the ex-dividend date.
The Fund may receive distributions from holdings in equity securities, business development companies (BDCs), exchange-traded funds, other regulated investment companies (RICs), and real estate investment trusts (REITs), which report information on the tax character of their distributions annually. These distributions are allocated to dividend income, capital gain and return of capital based on actual information reported. Return of capital is recorded as a reduction of the cost basis of securities held. If the Fund no longer owns the applicable securities, return of capital is recorded as a realized gain. With respect to REITs, to the extent actual information has not yet been reported, estimates for return of capital are made by the Fund's management. Management's estimates are subsequently adjusted when the actual character of the distributions is disclosed by the REITs, which could result in a proportionate change in return of capital to shareholders.
Awards from class action litigation are recorded as a reduction of cost basis if the Fund still owns the applicable securities on the payment date. If the Fund no longer owns the applicable securities, the proceeds are recorded as realized gains.
Annual Report 2016
45
COLUMBIA VARIABLE PORTFOLIO — STRATEGIC INCOME FUND
NOTES TO FINANCIAL STATEMENTS (continued)
December 31, 2016
The value of additional securities received as an income payment is recorded as income and increases the cost basis of such securities.
The Fund may receive other income from senior loans, including amendment fees, consent fees and commitment fees. These fees are recorded as income when received by the Fund. These amounts are included in Interest Income in the Statement of Operations.
Expenses
General expenses of the Trust are allocated to the Fund and other funds of the Trust based upon relative net assets or other expense allocation methodologies determined by the nature of the expense. Expenses directly attributable to the Fund are charged to the Fund. Expenses directly attributable to a specific class of shares are charged to that share class.
Determination of Class Net Asset Value
All income, expenses (other than class-specific expenses, which are charged to that share class, as shown in the Statement of Operations) and realized and unrealized gains (losses) are allocated to each class of the Fund on a daily basis, based on the relative net assets of each class, for purposes of determining the net asset value of each class.
Federal Income Tax Status
The Fund intends to qualify each year as a regulated investment company under Subchapter M of the Internal Revenue Code, as amended, and will distribute substantially all of its taxable income, if any, for its tax year, and as such will not be subject to federal income taxes. In addition, because the Fund meets the exception under Internal Revenue Code Section 4982(f), the Fund expects not to be subject to federal excise tax. Therefore, no federal income or excise tax provision is recorded.
Foreign Taxes
The Fund may be subject to foreign taxes on income, gains on investments or currency repatriation, a portion of which may be recoverable. The Fund will accrue such taxes and recoveries, as applicable, based upon its current interpretation of tax rules and regulations that exist in the markets in which it invests.
Realized gains in certain countries may be subject to foreign taxes at the Fund level, based on statutory rates. The Fund accrues for such foreign taxes on realized and unrealized gains at the appropriate rate for each jurisdiction, as applicable. The amount, if any, is
disclosed as a liability on the Statement of Assets and Liabilities.
Distributions to Subaccounts
Distributions to the subaccounts of Contracts, Qualified Plans and Qualified Investors are recorded at the close of business on the record date and are payable on the first business day following the record date. Dividends from net investment income, if any, are declared and distributed annually. Capital gains distributions, when available, will be made annually. However, an additional capital gain distribution may be made during the fiscal year in order to comply with the Internal Revenue Code, as applicable to registered investment companies. Income distributions and capital gain distributions are determined in accordance with federal income tax regulations, which may differ from GAAP. All dividends and distributions are reinvested in additional shares of the applicable share class of the Fund at the net asset value as of the ex-dividend date of the distribution.
Guarantees and Indemnifications
Under the Trust's organizational documents and, in some cases, by contract, its officers and trustees are indemnified against certain liabilities arising out of the performance of their duties to the Trust or its funds. In addition, certain of the Fund's contracts with its service providers contain general indemnification clauses. The Fund's maximum exposure under these arrangements is unknown since the amount of any future claims that may be made against the Fund cannot be determined, and the Fund has no historical basis for predicting the likelihood of any such claims.
Investment Company Reporting Modernization
In October 2016, the U.S. Securities and Exchange Commission adopted new rules and forms, and amendments to certain current rules and forms, to modernize reporting and disclosure of information by registered investment companies. The amendments to Regulation S-X will require standardized, enhanced disclosure about derivatives in investment company financial statements, and will also change the rules governing the form and content of such financial statements. The amendments to Regulation S-X take effect on August 1, 2017. At this time, management is assessing the anticipated impact of these regulatory developments.
Annual Report 2016
46
COLUMBIA VARIABLE PORTFOLIO — STRATEGIC INCOME FUND
NOTES TO FINANCIAL STATEMENTS (continued)
December 31, 2016
Note 3. Fees and Other Transactions with Affiliates
Management Services Fees
Effective May 1, 2016, the Fund entered into a Management Agreement with Columbia Management Investment Advisers, LLC (the Investment Manager), a wholly-owned subsidiary of Ameriprise Financial, Inc. (Ameriprise Financial). Under the Management Agreement, the Investment Manager provides the Fund with investment research and advice, as well as administrative and accounting services. The management services fee is an annual fee that is equal to a percentage of the Fund's average daily net assets that declines from 0.600% to 0.393% as the Fund's net assets increase. Prior to May 1, 2016, the Fund paid the Investment Manager an annual fee for advisory services under an Investment Management Services Agreement and a separate annual fee for administrative and accounting services under an Administrative Services Agreement. The effective management services fee rate for the year ended December 31, 2016 (reflecting all advisory and administrative services fees paid to the Investment Manager) was 0.600% of the Fund's average daily net assets. For the period from January 1, 2016 through April 30, 2016, the investment advisory services fee paid to the Investment Manager was $221,379, and the administrative services fee paid to the Investment Manager was $29,239.
Compensation of Board Members
Board of Trustee members, who are not officers or employees of the Investment Manager or Ameriprise Financial, are compensated for their services to the Fund as disclosed in the Statement of Operations. These Board of Trustee members may participate in a Deferred Compensation Plan (the Plan) which may be terminated at any time. Obligations of the Plan will be paid solely out of the Fund's assets, and all amounts payable under the Plan constitute a general unsecured obligation of the Fund.
Compensation of Chief Compliance Officer
The Board of Trustees has appointed a Chief Compliance Officer to the Fund in accordance with federal securities regulations. The Fund is allocated a portion of the expenses associated with the Chief Compliance Officer based on relative net assets of the Trust.
Transfer Agency Fees
The Fund has a Transfer and Dividend Disbursing Agent Agreement with Columbia Management Investment Services Corp. (the Transfer Agent), an affiliate of the Investment Manager and a wholly-owned subsidiary of Ameriprise Financial. The annual fee rate under this agreement is 0.06% of the Fund's average daily net assets attributable to each share class.
Distribution Fees
The Fund has an agreement with the Distributor, an affiliate of the Investment Manager and a wholly-owned subsidiary of Ameriprise Financial, for distribution services. The Board of Trustees has approved, and the Fund has adopted, a distribution plan (the Plan) which sets the distribution fees for the Fund. These fees are calculated daily and are intended to compensate the Distributor for selling shares of the Fund. The Fund pays a monthly distribution fee to the Distributor at the maximum annual rate of 0.25% of the average daily net assets attributable to Class 2 shares of the Fund. The Fund pays no distribution and service fees for Class 1 shares.
Expenses Waived/Reimbursed by the Investment Manager and its Affiliates
The Investment Manager and certain of its affiliates have contractually agreed to waive fees and/or reimburse expenses (excluding certain fees and expenses described below) for the period disclosed below, unless sooner terminated at the sole discretion of the Board of Trustees, so that the Fund's net operating expenses, after giving effect to fees waived/expenses reimbursed and any balance credits and/or overdraft charges from the Fund's custodian, do not exceed the following annual rates as a percentage of the class' average daily net assets:
| Fee Rates Contractual through April 30, 2017 | |||||||
Class 1 | 0.69 | % | |||||
Class 2 | 0.94 | ||||||
Under the agreement governing these fee waivers and/or expense reimbursement arrangements, the following fees and expenses are excluded from the waiver/reimbursement commitment, and therefore will be paid by the Fund, if applicable: taxes (including foreign transaction taxes), expenses associated with investments in affiliated and non-affiliated pooled
Annual Report 2016
47
COLUMBIA VARIABLE PORTFOLIO — STRATEGIC INCOME FUND
NOTES TO FINANCIAL STATEMENTS (continued)
December 31, 2016
investment vehicles (including mutual funds and exchange-traded funds), transaction costs and brokerage commissions, costs related to any securities lending program, dividend and interest expenses associated with securities sold short, inverse floater program fees and expenses, transaction charges and interest on borrowed money, interest, infrequent and/or unusual expenses and any other expenses the exclusion of which is specifically approved by the Board of Trustees. This agreement may be modified or amended only with approval from the Investment Manager, certain of its affiliates and the Fund. Any fees waived and/or expenses reimbursed under the expense reimbursement arrangements described above are not recoverable by the Investment Manager or its affiliates in future periods.
Note 4. Federal Tax Information
The timing and character of income and capital gain distributions are determined in accordance with income tax regulations, which may differ from GAAP because of temporary or permanent book to tax differences.
At December 31, 2016, these differences are primarily due to differing treatment for capital loss carryforwards, principal and/or interest from fixed income securities, deferral/reversal of wash sale losses, Trustees' deferred compensation, distribution reclassifications, foreign currency transactions, derivative investments, tax straddles and swap investments. To the extent these differences are permanent, reclassifications are made among the components of the Fund's net assets in the Statement of Assets and Liabilities. Temporary differences do not require reclassifications.
In the Statement of Assets and Liabilities the following reclassifications were made:
Undistributed net investment income | $ | (1,580,615 | ) | ||||
Accumulated net realized loss | 1,580,617 | ||||||
Paid-in capital | (2 | ) | |||||
Net investment income (loss) and net realized gains (losses), as disclosed in the Statement of Operations, and net assets were not affected by this reclassification.
The tax character of distributions paid during the years indicated was as follows:
Year Ended December 31, | 2016 | 2015 | |||||||||
Ordinary income | $ | 15,131,905 | $ | 54,147,431 | |||||||
Long-term capital gains | 7,762,398 | 12,818,050 | |||||||||
Total | $ | 22,894,303 | $ | 66,965,481 | |||||||
Short-term capital gain distributions, if any, are considered ordinary income distributions for tax purposes.
At December 31, 2016, the components of distributable earnings on a tax basis were as follows:
Undistributed ordinary income | $ | 4,432,327 | |||||
Capital loss carryforwards | (2,292,742 | ) | |||||
Net unrealized depreciation | (138,707 | ) | |||||
At December 31, 2016, the cost of investments for federal income tax purposes was $156,540,640 and the aggregate gross unrealized appreciation and depreciation based on that cost was:
Unrealized appreciation | $ | 4,395,076 | |||||
Unrealized depreciation | (4,533,783 | ) | |||||
Net unrealized depreciation | $ | (138,707 | ) | ||||
The following capital loss carryforwards, determined at December 31, 2016, may be available to reduce taxable income arising from future net realized gains on investments, if any, to the extent permitted by the Internal Revenue Code:
Year of Expiration | Amount ($) | ||||||
No expiration — long-term | 2,292,742 | ||||||
Management of the Fund has concluded that there are no significant uncertain tax positions in the Fund that would require recognition in the financial statements. However, management's conclusion may be subject to review and adjustment at a later date based on factors including, but not limited to, new tax laws, regulations, and administrative interpretations (including relevant court decisions). Generally, the Fund's federal tax returns for the prior three fiscal years remain subject to examination by the Internal Revenue Service.
Note 5. Portfolio Information
The cost of purchases and proceeds from sales of securities, excluding short-term investments and derivatives, if any, aggregated to $254,295,948 and $240,314,301, respectively, for the year ended December 31, 2016, of which $162,409,770 and $156,242,198, respectively, were U.S. government securities. The amount of purchase and sale activity impacts the portfolio turnover rate reported in the Financial Highlights.
Annual Report 2016
48
COLUMBIA VARIABLE PORTFOLIO — STRATEGIC INCOME FUND
NOTES TO FINANCIAL STATEMENTS (continued)
December 31, 2016
Note 6. Affiliated Money Market Fund
The Fund invests in Columbia Short-Term Cash Fund, an affiliated money market fund established for the exclusive use by the Fund and other affiliated funds (the Affiliated MMF). The income earned by the Fund from such investments is included as Dividends — affiliated issuers in the Statement of Operations. As an investing fund, the Fund indirectly bears its proportionate share of the expenses of the Affiliated MMF. Effective October 1, 2016, the Affiliated MMF prices its shares with a floating net asset value (NAV) and no longer seeks to maintain a stable NAV. In addition, the Board of Trustees of the Affiliated MMF may impose a fee on redemptions (sometimes referred to as a liquidity fee) or temporarily suspend redemptions (sometimes referred to as imposing a redemption gate) in the event its liquidity falls below regulatory limits.
Note 7. Line of Credit
The Fund has access to a revolving credit facility with a syndicate of banks led by Citibank, N.A., HSBC Bank USA, N.A. and JPMorgan Chase Bank, N.A. whereby the Fund may borrow for the temporary funding of shareholder redemptions or for other temporary or emergency purposes. The credit facility agreement, which is a collective agreement between the Fund and certain other funds managed by the Investment Manager, severally and not jointly, that permits collective borrowings up to $1 billion. Interest is charged to each participating fund based on its borrowings at a rate equal to the higher of (i) the overnight federal funds rate plus 1.00% or (ii) the one-month LIBOR rate plus 1.00%. Each borrowing under the credit facility matures no later than 60 days after the date of borrowing. The Fund also pays a commitment fee equal to its pro rata share of the amount of the credit facility at a rate of 0.15% per annum. The commitment fee is included in other expenses in the Statement of Operations.
The Fund had no borrowings during the year ended December 31, 2016.
Note 8. Significant Risks
Credit Risk
Credit risk is the risk that the value of debt securities in the Fund's portfolio may decline because the issuer may default and fail to pay interest or repay principal when due. Rating agencies assign credit ratings to debt securities to indicate their credit risk. Lower rated or unrated debt securities held by the Fund may present
increased credit risk as compared to higher-rated debt securities.
Derivatives Risk
Losses involving derivative instruments may be substantial, because a relatively small price movement in the underlying security(ies), commodity, currency or index or other instrument or asset may result in a substantial loss for the Fund. In addition to the potential for increased losses, the use of derivative instruments may lead to increased volatility within the Fund. Derivatives will typically increase the Fund's exposure to principal risks to which it is otherwise exposed, and may expose the Fund to additional risks, including correlation risk, counterparty risk, hedging risk, leverage risk and liquidity risk.
Foreign Securities and Emerging Market Countries Risk
Investing in foreign securities may include certain risks and considerations not typically associated with investing in U.S. securities, such as fluctuating currency values and changing local and regional economic, political and social conditions, which may result in greater market volatility. In addition, certain foreign securities may not be as liquid as U.S. securities. Investing in emerging markets may accentuate these risks. These countries are also more likely to experience high levels of inflation, deflation or currency devaluation which could hurt their economies and securities markets. To the extent that the Fund concentrates its investment exposure to any one or a few specific countries, the Fund will be particularly susceptible to the various conditions, events or other factors impacting those countries and may, therefore, have a greater risk than that of a fund which is more geographically diversified.
High-Yield Investments Risk
Securities and other debt instruments held by the Fund that are rated below investment grade (commonly called "high-yield" or "junk" bonds) and unrated debt instruments of comparable quality expose the Fund to a greater risk of loss of principal and income than a fund that invests solely or primarily in investment grade securities. In addition, these investments have greater price fluctuations, are less liquid and are more likely to experience a default than higher-rated debt instruments. High-yield debt instruments are considered to be predominantly speculative with respect to the issuer's capacity to pay interest and repay principal.
Annual Report 2016
49
COLUMBIA VARIABLE PORTFOLIO — STRATEGIC INCOME FUND
NOTES TO FINANCIAL STATEMENTS (continued)
December 31, 2016
Interest Rate Risk
Interest rate risk is the risk of losses attributable to changes in interest rates. In general, if prevailing interest rates rise, the values of debt securities tend to fall, and if interest rates fall, the values of debt securities tend to rise. Actions by governments and central banking authorities can result in increases in interest rates. Increasing interest rates may negatively affect the value of debt securities held by the Fund, resulting in a negative impact on the Fund's performance and net asset value per share. In general, the longer the maturity or duration of a debt security, the greater its sensitivity to changes in interest rates.
Liquidity Risk
Liquidity risk is the risk associated with a lack of marketability of investments which may make it difficult to sell the investment at a desirable time or price. Changing regulatory, market or other conditions or environments (for example, the interest rate or credit environments) may adversely affect the liquidity of the Fund's investments. The Fund may have to accept a lower selling price for the holding, sell other investments, or forego another, more appealing investment opportunity. Generally, the less liquid the market at the time the Fund sells a portfolio investment, the greater the risk of loss or decline of value to the Fund. A less liquid market can lead to an increase in Fund redemptions, which may negatively impact Fund performance and net asset value per share, including, for example, if the Fund is forced to sell securities in a down market.
Mortgage- and Other Asset-Backed Securities Risk
The value of any mortgage-backed and other asset-backed securities held by the Fund may be affected by, among other things, changes or perceived changes in: interest rates; factors concerning the interests in and structure of the issuer or the originator of the mortgages or other assets; the creditworthiness of the entities that provide any supporting letters of credit, surety bonds or other credit enhancements; or the market's assessment of the quality of underlying assets. Payment of principal and interest on some mortgage-backed securities (but not the market value of the securities themselves) may be guaranteed by the full faith and credit of a particular U.S. Government agency, authority, enterprise or instrumentality, and some, but not all, are also insured or guaranteed by the U.S. Government. Mortgage-backed securities issued by non-governmental issuers (such as commercial banks, savings and loan institutions, private
mortgage insurance companies, mortgage bankers and other secondary market issuers) may entail greater risk than obligations guaranteed by the U.S. Government. Mortgage- and other asset-backed securities are subject to prepayment risk, which is the possibility that the underlying mortgage or other asset may be refinanced or prepaid prior to maturity during periods of declining or low interest rates, causing the Fund to have to reinvest the money received in securities that have lower yields. Rising or high interest rates tend to extend the duration of mortgage- and other asset-backed securities, making their prices more volatile and more sensitive to changes in interest rates.
Shareholder Concentration Risk
At December 31, 2016, one unaffiliated shareholder of record owned 16.9% of the outstanding shares of the Fund in one or more accounts. The Fund has no knowledge about whether any portion of those shares was owned beneficially. Affiliated shareholders of record owned 80.0% of the outstanding shares of the Fund in one or more accounts. Subscription and redemption activity by concentrated accounts may have a significant effect on the operations of the Fund. In the case of a large redemption, the Fund may be forced to sell investments at inopportune times, including its liquid or more liquid positions, resulting in Fund losses and the Fund holding a higher percentage of less liquid or illiquid securities. Large redemptions could result in decreased economies of scale and increased operating expenses for non-redeeming Fund shareholders.
Note 9. Subsequent Events
Management has evaluated the events and transactions that have occurred through the date the financial statements were issued and noted no items requiring adjustment of the financial statements or additional disclosure.
Note 10. Information Regarding Pending and Settled Legal Proceedings
Ameriprise Financial and certain of its affiliates have historically been involved in a number of legal, arbitration and regulatory proceedings, including routine litigation, class actions, and governmental actions, concerning matters arising in connection with the conduct of their business activities. Ameriprise Financial believes that the Funds are not currently the subject of, and that neither Ameriprise Financial nor any of its affiliates are the subject of, any pending legal, arbitration or regulatory proceedings that are likely to have a material adverse
Annual Report 2016
50
COLUMBIA VARIABLE PORTFOLIO — STRATEGIC INCOME FUND
NOTES TO FINANCIAL STATEMENTS (continued)
December 31, 2016
effect on the Funds or the ability of Ameriprise Financial or its affiliates to perform under their contracts with the Funds. Ameriprise Financial is required to make quarterly (10-Q), annual (10-K) and, as necessary, 8-K filings with the Securities and Exchange Commission (SEC) on legal and regulatory matters that relate to Ameriprise Financial and its affiliates. Copies of these filings may be obtained by accessing the SEC website at www.sec.gov.
There can be no assurance that these matters, or the adverse publicity associated with them, will not result in increased fund redemptions, reduced sale of fund shares or other adverse consequences to the Funds. Further, although we believe proceedings are not likely to have a material adverse effect on the Funds or the ability of Ameriprise Financial or its affiliates to perform under their contracts with the Funds, these proceedings are subject to uncertainties and, as such, we are unable to estimate the possible loss or range of loss that may result. An adverse outcome in one or more of these proceedings could result in adverse judgments, settlements, fines, penalties or other relief that could have a material adverse effect on the consolidated financial condition or results of operations of Ameriprise Financial.
Annual Report 2016
51
COLUMBIA VARIABLE PORTFOLIO — STRATEGIC INCOME FUND
REPORT OF INDEPENDENT REGISTERED PUBLIC ACCOUNTING FIRM
To the Trustees of Columbia Funds Variable Insurance Trust and the Shareholders of
Columbia Variable Portfolio — Strategic Income Fund
In our opinion, the accompanying statement of assets and liabilities, including the portfolio of investments, and the related statements of operations and of changes in net assets and the financial highlights present fairly, in all material respects, the financial position of Columbia Variable Portfolio — Strategic Income Fund (the "Fund," a series of Columbia Funds Variable Insurance Trust) as of December 31, 2016, the results of its operations for the year then ended, the changes in its net assets for each of the two years in the period then ended and the financial highlights for each of the five years in the period then ended, in conformity with accounting principles generally accepted in the United States of America. These financial statements and financial highlights (hereafter referred to as "financial statements") are the responsibility of the Fund's management. Our responsibility is to express an opinion on these financial statements based on our audits. We conducted our audits of these financial statements in accordance with the standards of the Public Company Accounting Oversight Board (United States). Those standards require that we plan and perform the audit to obtain reasonable assurance about whether the financial statements are free of material misstatement. An audit includes examining, on a test basis, evidence supporting the amounts and disclosures in the financial statements, assessing the accounting principles used and significant estimates made by management, and evaluating the overall financial statement presentation. We believe that our audits, which included confirmation of securities as of December 31, 2016 by correspondence with the custodian, brokers, agent banks and transfer agent, and the application of alternative auditing procedures where such confirmations had not been received, provide a reasonable basis for our opinion.
PricewaterhouseCoopers LLP
Minneapolis, MN
February 17, 2017
Annual Report 2016
52
COLUMBIA VARIABLE PORTFOLIO — STRATEGIC INCOME FUND
TRUSTEES AND OFFICERS
Shareholders elect the Board that oversees the Fund's operations. The Board appoints officers who are responsible for day-to-day business decisions based on policies set by the Board. The following table provides basic biographical information about the Fund's Trustees, including their principal occupations during the past five years, although specific titles for individuals may have varied over the period. The year set forth beneath Length of Service in the table below is the year in which the Trustee was first appointed or elected as Trustee to any Fund currently in the Columbia Funds Complex or a predecessor thereof. Under current Board policy, members serve terms of indefinite duration.
Independent Trustees
| Name, Address, Year of Birth | Position Held With the Trust and Length of Service | Principal Occupation(s) During the Past Five Years and Other Relevant Professional Experience | Number of Funds in the Columbia Funds Complex Overseen | Other Directorships Held by Trustee During the Past Five Years | |||||||||||||||
| Janet Langford Carrig c/o Columbia Management Investment Advisers, LLC, 225 Franklin Street Mail Drop BX32 05228, Boston, MA 02110 1957 | Trustee 1996 | Senior Vice President, General Counsel and Corporate Secretary, ConocoPhillips (independent energy company) since September 2007 | 59 | None | |||||||||||||||
| Douglas A. Hacker c/o Columbia Management Investment Advisers, LLC, 225 Franklin Street Mail Drop BX32 05228, Boston, MA 02110 1955 | Trustee and Chairman of the Board 1996 | Independent business executive since May 2006; Executive Vice President — Strategy of United Airlines from December 2002 to May 2006; President of UAL Loyalty Services (airline marketing company) from September 2001 to December 2002; Executive Vice President and Chief Financial Officer of United Airlines from July 1999 to September 2001 | 59 | Spartan Nash Company (food distributor); Nash Finch Company (food distributor) from 2005 to 2013; Aircastle Limited (aircraft leasing); SeaCube Container Leasing Ltd. (container leasing) from 2010 to 2013; and Travelport Worldwide Limited (travel information technology) | |||||||||||||||
| Nancy T. Lukitsh c/o Columbia Management Investment Advisers, LLC, 225 Franklin Street Mail Drop BX32 05228, Boston, MA 02110 1956 | Trustee 2011 | Senior Vice President, Partner and Director of Marketing, Wellington Management Company, LLP (investment adviser) from 1997 to 2010; Chair, Wellington Management Portfolios (commingled non-U.S. investment pools) from 2007 to 2010; Director, Wellington Trust Company, NA and other Wellington affiliates from 1997 to 2010 | 59 | None | |||||||||||||||
Annual Report 2016
53
COLUMBIA VARIABLE PORTFOLIO — STRATEGIC INCOME FUND
TRUSTEES AND OFFICERS (continued)
Independent Trustees (continued)
| Name, Address, Year of Birth | Position Held With the Trust and Length of Service | Principal Occupation(s) During the Past Five Years and Other Relevant Professional Experience | Number of Funds in the Columbia Funds Complex Overseen | Other Directorships Held by Trustee During the Past Five Years | |||||||||||||||
| David M. Moffett c/o Columbia Management Investment Advisers, LLC, 225 Franklin Street Mail Drop BX32 05228, Boston, MA 02110 1952 | Trustee 2011 | Retired. Consultant to Bridgewater and Associates | 59 | Director, CSX Corporation; Genworth Financial, Inc. (financial and insurance products and services); Paypal Holdings Inc. (payment and data processing services); Trustee University of Oklahoma Foundation; former Director eBay Inc. (online trading community), 2007-2015; and former Director, CIT Bank, CIT Group Inc. (commercial and consumer finance), 2010-2016 | |||||||||||||||
| Charles R. Nelson c/o Columbia Management Investment Advisers, LLC, 225 Franklin Street Mail Drop BX32 05228, Boston, MA 02110 1942 | Trustee 1981 | Retired. Professor Emeritus, University of Washington since 2011; Professor of Economics, University of Washington from 1976 to 2011; Ford and Louisa Van Voorhis Professor of Political Economy, University of Washington from 1993 to 2011; Adjunct Professor of Statistics, University of Washington from 1980 to 2011; Associate Editor, Journal of Money, Credit and Banking from September 1993 to 2008; consultant on econometric and statistical matters | 59 | None | |||||||||||||||
| John J. Neuhauser c/o Columbia Management Investment Advisers, LLC, 225 Franklin Street Mail Drop BX32 05228, Boston, MA 02110 1943 | Trustee 1984 | President, Saint Michael's College since August 2007; Director or Trustee of several non-profit organizations, including University of Vermont Medical Center; Academic Vice President and Dean of Faculties, Boston College from August 1999 to October 2005; University Professor, Boston College from November 2005 to August 2007 | 59 | Liberty All-Star Equity Fund and Liberty All-Star Growth Fund (closed-end funds) | |||||||||||||||
| Patrick J. Simpson c/o Columbia Management Investment Advisers, LLC, 225 Franklin Street Mail Drop BX32 05228, Boston, MA 02110 1944 | Trustee 2000 | Of Counsel, Perkins Coie LLP (law firm) since 2015; Partner, Perkins Coie LLP from 1988 to 2014 | 59 | None | |||||||||||||||
Annual Report 2016
54
COLUMBIA VARIABLE PORTFOLIO — STRATEGIC INCOME FUND
TRUSTEES AND OFFICERS (continued)
Independent Trustees (continued)
| Name, Address, Year of Birth | Position Held With the Trust and Length of Service | Principal Occupation(s) During the Past Five Years and Other Relevant Professional Experience | Number of Funds in the Columbia Funds Complex Overseen | Other Directorships Held by Trustee During the Past Five Years | |||||||||||||||
| Anne-Lee Verville c/o Columbia Management Investment Advisers, LLC, 225 Franklin Street Mail Drop BX32 05228, Boston, MA 02110 1945 | Trustee 1998 | Retired. General Manager, Global Education Industry from 1994 to 1997, President — Application Systems Division from 1991 to 1994, Chief Financial Officer — US Marketing & Services from 1988 to 1991, and Chief Information Officer from 1987 to 1988, IBM Corporation (computer and technology) | 59 | Enesco Group, Inc. (producer of giftware and home and garden decor products) from 2001 to 2006 | |||||||||||||||
Consultants to the Independent Trustees*
| Name, Address, Year of Birth | Position Held With the Trust and Length of Service | Principal Occupation(s) During the Past Five Years and Other Relevant Professional Experience | Number of Funds in the Columbia Funds Complex Overseen | Other Directorships Held by Trustee During the Past Five Years | |||||||||||||||
| J. Kevin Connaughton c/o Columbia Management Investment Advisers, LLC, 225 Franklin Street Mail Drop BX32 05228, Boston, MA 02110 1964 | Independent Trustee Consultant 2016 | Independent Trustee Consultant, Columbia Funds since March 2016; Managing Director and General Manager of Mutual Fund Products, Columbia Management Investment Advisers, LLC from May 2010 to February 2015; President, Columbia Funds from 2009 to 2015; and senior officer of Columbia Funds and affiliated funds from 2003 to 2015 | 59 | Board of Governors, Gateway Healthcare since January 2016; Trustee, New Century Portfolios since March 2015; and Director, The Autism Project since March 2015 | |||||||||||||||
| Natalie A. Trunow c/o Columbia Management Investment Advisers, LLC, 225 Franklin Street Mail Drop BX32 05228, Boston, MA 02110 1967 | Independent Trustee Consultant 2016 | Independent Trustee Consultant, Columbia Funds since September 2016; Senior Vice President and Chief Executive Officer, Millennial Partners (investment consulting services to institutions) since January 2016; Director of Investments, Casey Family Programs from April 2016 to September 2016; Chief Investment Officer, Calvert Investments from August 2008 to January 2016; Section Head and Portfolio Manager, General Motors Asset Management from June 1997 to August 2008 | 59 | Healthcare Services for Children with Special Needs | |||||||||||||||
* J. Kevin Connaughton was appointed consultant to the Independent Trustees effective March 1, 2016. Natalie A. Trunow was appointed consultant to the Independent Trustees effective September 1, 2016. Shareholders of the Funds are expected to be asked to elect each of Mr. Connaughton and Ms. Trunow as a Trustee at a future shareholder meeting.
Annual Report 2016
55
COLUMBIA VARIABLE PORTFOLIO — STRATEGIC INCOME FUND
TRUSTEES AND OFFICERS (continued)
Interested Trustee Affiliated with Investment Manager*
| Name, Address, Year of Birth | Position Held With the Trust and Length of Service | Principal Occupation(s) During the Past Five Years and Other Relevant Professional Experience | Number of Funds in the Columbia Funds Complex Overseen | Other Directorships Held by Trustee During the Past Five Years | |||||||||||||||
| William F. Truscott c/o Columbia Management Investment Advisers, LLC, 225 Franklin Street Boston, MA 02110 1960 | Trustee 2012 | Chairman of the Board and President, Columbia Management Investment Advisers, LLC since May 2010 and February 2012, respectively; Chief Executive Officer, Global Asset Management, Ameriprise Financial, Inc. since September 2012 (previously Chief Executive Officer, U.S. Asset Management & President, Annuities, May 2010- September 2012); Director and Chief Executive Officer, Columbia Management Investment Distributors, Inc. since May 2010 and February 2012, respectively; Chairman of the Board and Chief Executive Officer, RiverSource Distributors, Inc. since 2006; Director, Threadneedle Asset Management Holdings, SARL since 2014; President and Chief Executive Officer, Ameriprise Certificate Company, 2006-August 2012. | 185 | Trustee to other Columbia Funds since 2001; Chairman of the Board, Columbia Management Investment Advisers, LLC since May 2010; Director, Columbia Management Investment Distributors, Inc. since May 2010; Former Director, Ameriprise Certificate Company, 2006-January 2013 | |||||||||||||||
* Interested person (as defined under the 1940 Act) by reason of being an officer, director, security holder and/or employee of the Investment Manager or Ameriprise Financial.
The Statement of Additional Information has additional information about the Fund's Board members and is available, without charge, upon request by calling 800.345.6611 or contacting your financial intermediary.
Annual Report 2016
56
COLUMBIA VARIABLE PORTFOLIO — STRATEGIC INCOME FUND
TRUSTEES AND OFFICERS (continued)
The Board has appointed officers who are responsible for day-to-day business decisions based on policies it has established. The officers serve at the pleasure of the Board. The following table provides basic information about the Officers of the Fund, including principal occupations during the past five years, although their specific titles may have varied over the period. In addition to Mr. Truscott, who is Senior Vice President, the Fund's other officers are:
Fund Officers
| Name, Address and Year of Birth | Position and Year First Appointed to Position for any Fund in the Columbia Funds Complex or a Predecessor Thereof | Principal Occupation(s) During Past Five Years | |||||||||
| Christopher O. Petersen 5228 Ameriprise Financial Center Minneapolis, MN 55474 Born 1970 | President and Principal Executive Officer (2015) | Vice President and Lead Chief Counsel, Ameriprise Financial, Inc. since January 2015 (previously, Vice President and Chief Counsel January 2010-December 2014); officer of Columbia Funds and affiliated funds since 2007. | |||||||||
| Michael G. Clarke 225 Franklin Street Boston, MA 02110 Born 1969 | Treasurer (2011), Chief Financial Officer (2009) and Chief Accounting Officer (2015) | Vice President — Mutual Fund Administration, Columbia Management Investment Advisers, LLC, since May 2010; senior officer of Columbia Funds and affiliated funds since 2002. | |||||||||
| Paul B. Goucher 100 Park Avenue New York, NY 10017 Born 1968 | Senior Vice President (2011), Chief Legal Officer (2015) and Assistant Secretary (2008) | Senior Vice President and Assistant General Counsel, Ameriprise Financial, Inc. since January 2017 (previously Vice President and Lead Chief Counsel, November 2008-January 2017 and January 2013-2017, respectively, and Chief Counsel, January 2010-January 2013); Vice President, Chief Legal Officer and Assistant Secretary, Columbia Management Investment Advisers, LLC since May 2010. | |||||||||
| Thomas P. McGuire 225 Franklin Street Boston, MA 02110 Born 1972 | Senior Vice President and Chief Compliance Officer (2012) | Vice President — Asset Management Compliance, Ameriprise Financial, Inc., since May 2010; Chief Compliance Officer, Ameriprise Certificate Company since September 2010. | |||||||||
| Colin Moore 225 Franklin Street Boston, MA 02110 Born 1958 | Senior Vice President (2010) | Executive Vice President and Global Chief Investment Officer, Ameriprise Financial, Inc., since July 2013; Executive Vice President and Global Chief Investment Officer, Columbia Management Investment Advisers, LLC since July 2013 (previously Director and Global Chief Investment Officer, 2010-2013). | |||||||||
| Michael E. DeFao 225 Franklin Street Boston, MA 02110 Born 1968 | Vice President (2011) and Assistant Secretary (2010) | Vice President and Chief Counsel, Ameriprise Financial, Inc. since May 2010. | |||||||||
| Amy Johnson 5228 Ameriprise Financial Center Minneapolis, MN 55474 Born 1965 | Vice President (2006) | Managing Director and Global Head of Operations, Columbia Management Investment Advisers, LLC since April 2016 (previously Managing Director and Chief Operating Officer, 2010-2016). | |||||||||
| Lyn Kephart-Strong 5228 Ameriprise Financial Center Minneapolis, MN 55474 Born 1960 | Vice President (2015) | President, Columbia Management Investment Services Corp. since October 2014; Vice President & Resolution Officer, Ameriprise Trust Company since August 2009. | |||||||||
| Ryan C. Larrenaga 225 Franklin Street Boston, MA 02110 Born 1970 | Vice President and Secretary (2015) | Vice President and Group Counsel, Ameriprise Financial, Inc. since August 2011; officer of Columbia Funds and affiliated funds since 2005. | |||||||||
Annual Report 2016
57
This page intentionally left blank.
Annual Report 2016
58
This page intentionally left blank.
Annual Report 2016
59
This page intentionally left blank.
Annual Report 2016
60
COLUMBIA VARIABLE PORTFOLIO — STRATEGIC INCOME FUND
IMPORTANT INFORMATION ABOUT THIS REPORT
The policy of the Board is to vote the proxies of the companies in which each fund holds investments consistent with the procedures as stated in the Statement of Additional Information (SAI). You may obtain a copy of the SAI without charge by calling 800.345.6611; contacting your financial intermediary or searching the website of the Securities and Exchange Commission (SEC) at sec.gov. Information regarding how each fund voted proxies relating to portfolio securities is filed with the SEC by August 31st for the most recent 12-month period ending June 30th of that year, and is available without charge by visiting investor.columbiathreadneedleus.com, or searching the website of the SEC at sec.gov.
Each fund files a complete schedule of portfolio holdings with the SEC for the first and third quarters of each fiscal year on Form N-Q. Each fund's Form N-Q is available on the SEC's website at sec.gov and may be reviewed and copied at the SEC's Public Reference Room in Washington, D.C. Information on the operation of the Public Reference Room may be obtained by calling 800.SEC.0330. Each fund's complete schedule of portfolio holdings, as filed on Form N-Q, can also be obtained without charge, upon request, by calling 800.345.6611.
Annual Report 2016
61
Columbia Variable Portfolio — Strategic Income Fund
P.O. Box 8081
Boston, MA 02266-8081

Please read and consider the investment objectives, risks, charges and expenses for any fund carefully before investing. For fund and other investment product prospectuses, which contain this and other important information, contact your financial advisor or insurance representative. Please read the prospectus carefully before you invest. The Fund is distributed by Columbia Management Investment Distributors, Inc., member FINRA, and managed by Columbia Management Investment Advisers, LLC.
Columbia Threadneedle Investments (Columbia Threadneedle) is the global brand name of the Columbia and Threadneedle group of companies.
All rights reserved. Columbia Management Investment Distributors, Inc., 225 Franklin Street, Boston, MA 02110-2804
© 2017 Columbia Management Investment Advisers, LLC.
C-1522 AN (2/17)

ANNUAL REPORT
December 31, 2016

VARIABLE PORTFOLIO — MULTI-MANAGER DIVERSIFIED INCOME FUND
Please remember that you may not buy (nor will you own) shares of the Fund directly. The Fund is available through variable annuity contracts and variable life insurance policies offered by the separate accounts of participating insurance companies as well as qualified pension and retirement plans. Please contact your financial advisor or insurance representative for more information.

VARIABLE PORTFOLIO — MULTI-MANAGER DIVERSIFIED INCOME FUND
TABLE OF CONTENTS
Performance Overview | 2 | ||||||
Manager Discussion of Fund Performance | 4 | ||||||
Understanding Your Fund's Expenses | 6 | ||||||
Portfolio of Investments | 7 | ||||||
Statement of Assets and Liabilities | 10 | ||||||
Statement of Operations | 11 | ||||||
Statement of Changes in Net Assets | 12 | ||||||
Financial Highlights | 14 | ||||||
Notes to Financial Statements | 15 | ||||||
Report of Independent Registered Public Accounting Firm | 20 | ||||||
Trustees and Officers | 21 | ||||||
Important Information About This Report | 29 | ||||||
The views expressed in this report reflect the current views of the respective parties. These views are not guarantees of future performance and involve certain risks, uncertainties and assumptions that are difficult to predict, so actual outcomes and results may differ significantly from the views expressed. These views are subject to change at any time based upon economic, market or other conditions and the respective parties disclaim any responsibility to update such views. These views may not be relied on as investment advice and, because investment decisions for a Columbia fund are based on numerous factors, may not be relied on as an indication of trading intent on behalf of any particular Columbia fund. References to specific securities should not be construed as a recommendation or investment advice.
Annual Report 2016
VARIABLE PORTFOLIO — MULTI-MANAGER DIVERSIFIED INCOME FUND
PERFORMANCE OVERVIEW
Performance Summary
n Variable Portfolio — Multi-Manager Diversified Income Fund (the Fund) Class 2 shares returned 8.52% for the 12-month period that ended December 31, 2016.
n During the same time period, the Fund underperformed its Blended Benchmark, which returned 9.72% and outperformed the broad U.S. fixed-income market, as measured by the Bloomberg Barclays U.S. Aggregate Bond Index, which returned 2.65%.
n Despite solid gains, the Fund's high-yield positions lagged the Blended Benchmark and generally accounted for the Fund's modest performance shortfall.
Average Annual Total Returns (%) (for period ended December 31, 2016)
Inception | 1 Year | Life | |||||||||||||
Class 2 | 06/24/14 | 8.52 | 2.69 | ||||||||||||
Blended Benchmark | 9.72 | 3.35 | |||||||||||||
Bloomberg Barclays U.S. Aggregate Bond Index | 2.65 | 2.19 | |||||||||||||
Performance data quoted represents past performance and current performance may be lower or higher. Past performance is no guarantee of future results. The investment return and principal value will fluctuate so that shares, when redeemed, may be worth more or less than the original cost. For current month-end performance information, please contact your financial advisor or insurance representative.
Performance results reflect the effect of any fee waivers or reimbursements of fund expenses by Columbia Management Investment Advisers, LLC and/or any of its affiliates. Absent these fee waivers or expense reimbursement arrangements, performance results would have been lower.
Investment earnings, if any, are tax-deferred until distributed to shareholders, at which time taxes may become due. Total return performance includes changes in share price and assumes reinvestment of dividends and capital gains, if any. Performance results reflect the effect of all fund expenses, but do not include any fees and expenses imposed under your variable annuity contract and/or variable life insurance policy or qualified pension or retirement plan. If performance results included the effect of these additional charges, they would be lower.
The Blended Benchmark, a weighted custom composite established by the Investment Manager, consists of 40% Bloomberg Barclays U.S. Aggregate Bond Index, 35% Bloomberg Barclays U.S. Corporate High-Yield Index, 15% JPMorgan Emerging Markets Bond Index (EMBI) — Global and 10% Russell 1000 Index. The Bloomberg Barclays U.S. Corporate High-Yield Index is a market value-weighted index, which covers the U.S. non-investment-grade fixed-rate debt market. The index is composed of U.S. dollar-denominated corporate debt in industrial, utility and finance sectors with a minimum $150 million par amount outstanding and a maturity greater than one year. The JPMorgan EMBI — Global is based on U.S. dollar-denominated debt instruments issued by emerging market sovereign and quasi-sovereign entities, such as Brady bonds, Eurobonds and loans, and reflects reinvestment of all distributions and changes in market prices. The Russell 1000 Index measures the performance of the large-cap segment of the U.S. equity universe.
The Bloomberg Barclays U.S. Aggregate Bond Index is a broad-based benchmark that measures the investment-grade, U.S. dollar-denominated, fixed-rate taxable bond market, including Treasuries, government-related and corporate securities, mortgage-backed securities (agency fixed-rate and hybrid adjustable-rate mortgage passthroughs), asset-backed securities, and commercial mortgage-backed securities.
Indices are not available for investment, are not professionally managed and do not reflect sales charges, fees, brokerage commissions, taxes or other expenses of investing. Securities in the Fund may not match those in an index.
Annual Report 2016
2
VARIABLE PORTFOLIO — MULTI-MANAGER DIVERSIFIED INCOME FUND
PERFORMANCE OVERVIEW (continued)
Performance of a Hypothetical $10,000 Investment (June 24, 2014 – December 31, 2016)

The chart above shows the change in value of a hypothetical $10,000 investment in Class 2 shares of Variable Portfolio — Multi-Manager Diversified Income Fund during the stated time period, and does not reflect the deduction of taxes, if any, that a shareholder may pay on Fund distributions or on the redemption of Fund shares. The returns also do not reflect fees and expenses imposed under your variable annuity contract and/or variable life insurance policy or qualified pension or retirement plan, if any.
Annual Report 2016
3
VARIABLE PORTFOLIO — MULTI-MANAGER DIVERSIFIED INCOME FUND
MANAGER DISCUSSION OF FUND PERFORMANCE
Portfolio Management
Jeffrey Knight, CFA
Anwiti Bahuguna, Ph.D.
David Weiss, CFA
Dan Boncarosky, CFA
| Portfolio Breakdown (%) (at December 31, 2016) | |||||||
Equity Funds | 12.2 | ||||||
Exchange-Traded Funds | 2.8 | ||||||
Fixed-Income Funds | 83.8 | ||||||
Money Market Funds | 1.2 | ||||||
Total | 100.0 | ||||||
Percentages indicated are based upon total investments. The Fund's portfolio composition is subject to change.
For the 12-month period that ended December 31, 2016, the Fund's Class 2 shares returned 8.52%. During the same time period, the Fund underperformed its Blended Benchmark, which returned 9.72% and outperformed the broad U.S. fixed-income market, as measured by the Bloomberg Barclays U.S. Aggregate Bond Index, which returned 2.65%. Despite solid gains, underlying high-yield funds lagged the Blended Benchmark and generally accounted for the Fund's modest performance shortfall.
Global Markets Posted Mixed Results
Global events, political uncertainty and mixed economic data were enough to keep investors off balance in 2016, as financial markets moved sharply in reaction to each significant change on the world stage. Early in the year concerns about U.S. monetary policy, China and oil rattled the financial markets, driving bond prices higher and stock prices lower. After a swift March rebound, U.S. Treasury yields plummeted and the stock market swooned again in the early summer in reaction to the U.K. vote to exit the European Union. Once again, the stock market rebounded but investors retreated to bonds again in the third quarter in reaction to mixed economic data and uncertainty surrounding the U.S. Presidential race. Following the November election and with almost unanimously positive economic data, interest rates backed up and bond prices fell in the fourth quarter. In the United States, steady job growth drove unemployment down to 4.6%. Corporate earnings growth picked up. Manufacturing activity accelerated. Inflationary pressures increased, commodity prices rose — oil prices, in particular — and concerns about the impact of fiscal stimulus, infrastructure spending and tax cuts in a new administration also weighed on the bond market. Growth was lackluster in developed foreign market countries. In Europe and Japan, GDP advanced less than 1% for the year. China expanded at an estimated pace of 7.5%, in line with expectations, while most emerging markets struggled with volatile international capital flows and currency fluctuations. South American economies contracted.
In December 2016, the Federal Reserve (the Fed) raised the target range of its benchmark interest rate by a quarter of a point to between 0.50% and 0.75%, its first such move in a year. The Fed's action had been widely anticipated and had little or no impact on the financial markets when it occurred. The Fed indicated that it would continue to monitor inflation and the job market in considering future rate hikes.
Against this backdrop, the Bloomberg Barclays U.S. Aggregate Bond Index, a broad measure of the performance of investment grade bonds, returned 2.65% for the year. High-yield bonds outperformed both stocks and investment-grade bonds, returning 17.49%, as measured by the Bank of America/Merrill Lynch U.S. High Yield Constrained Index.
Significant Performance Factors
The Fund seeks a high level of current income, with capital preservation as a secondary objective. Generally, the Fund will seek to achieve this objective by investing in a diversified mix of underlying funds that hold
Annual Report 2016
4
VARIABLE PORTFOLIO — MULTI-MANAGER DIVERSIFIED INCOME FUND
MANAGER DISCUSSION OF FUND PERFORMANCE (continued)
income-generating securities, including equities, core fixed-income investments, high-yield and emerging market bonds.
The Fund's positions in high-yield securities — overall and within underlying multi-sector funds — generated solid gains but modestly hampered results relative to its Blended Benchmark. The lowest-quality high-yield bonds were the year's biggest winners, and the Fund's underlying positions were more conservatively positioned in the sector. Disappointing performance from underlying equity funds was also a drag on relative results. Emerging-market bonds delivered solid results for the year, despite a struggle in the fourth quarter. Core bonds, including investment-grade corporates, mortgage- and asset-backed securities, also aided relative performance as underlying core fixed-income funds outperformed.
Annual Report 2016
5
VARIABLE PORTFOLIO — MULTI-MANAGER DIVERSIFIED INCOME FUND
UNDERSTANDING YOUR FUND'S EXPENSES
(Unaudited)
As an investor, you incur ongoing costs, which generally include management fees, distribution and/or service fees, and other fund expenses. The following information is intended to help you understand your ongoing costs (in dollars) of investing in the Fund and to help you compare these costs with the ongoing costs of investing in other mutual funds.
The information below does not reflect fees and expenses imposed under your variable annuity contract and/or variable life insurance policy (collectively, Contracts) or qualified pension and retirement plan (Qualified Plan), if any. The total fees and expenses you bear may therefore be higher than those shown below.
Analyzing Your Fund's Expenses
To illustrate these ongoing costs, we have provided examples and calculated the expenses paid by investors in Class 2 shares of the Fund during the period. The actual and hypothetical information in the table is based on an initial investment of $1,000 at the beginning of the period indicated and held for the entire period. Expense information is calculated two ways and each method provides you with different information. The amount listed in the "Actual" column is calculated using the Fund's actual operating expenses and total return for the period. You may use the Actual information, together with the amount invested, to estimate the expenses that you paid over the period. Simply divide your account value by $1,000 (for example, an $8,600 account value divided by $1,000 = 8.6), then multiply the results by the expenses paid during the period under the "Actual" column. The amount listed in the "Hypothetical" column assumes a 5% annual rate of return before expenses (which is not the Fund's actual return) and then applies the Fund's actual expense ratio for the period to the hypothetical return. You should not use the hypothetical account values and expenses to estimate either your actual account balance at the end of the period or the expenses you paid during the period. See "Compare With Other Funds" below for details on how to use the hypothetical data.
In addition to the ongoing expenses which the Fund bears directly, the Fund's shareholders indirectly bear the Fund's allocable share of the costs and expenses of each underlying fund in which the Fund invests. You can estimate the effective expenses paid during the period, which includes the indirect fees associated with investing in the underlying funds, by using the amounts listed in the "Effective Expenses Paid During the Period" column.
Compare With Other Funds
Since all mutual funds are required to include the same hypothetical calculations about expenses in shareholder reports, you can use this information to compare the ongoing cost of investing in the Fund with other funds. To do so, compare the hypothetical example with the 5% hypothetical examples that appear in the shareholder reports of other funds. As you compare hypothetical examples of other funds, it is important to note that hypothetical examples are meant to highlight the ongoing costs of investing in a fund only and do not reflect any transaction costs, such as redemption or exchange fees, or expenses that apply to the subaccount or the Contract. Therefore, the hypothetical calculations are useful in comparing ongoing costs only, and will not help you determine the relative total costs of owning different funds. If the fees and expenses imposed under your Contract or Qualified Plan, if any, were included, your costs would be higher.
July 1, 2016 – December 31, 2016
| Account Value at the Beginning of the Period ($) | Account Value at the End of the Period ($) | Expenses Paid During the Period ($) | Fund's Annualized Expense Ratio (%) | Effective Expenses Paid During the Period ($) | Fund's Effective Annualized Expense Ratio (%) | ||||||||||||||||||||||||||||||||||||||
Actual | Hypothetical | Actual | Hypothetical | Actual | Hypothetical | Actual | Actual | Hypothetical | Actual | ||||||||||||||||||||||||||||||||||
Class 2 | 1,000.00 | 1,000.00 | 1,021.50 | 1,023.75 | 1.26 | 1.26 | 0.25 | 4.60 | 4.60 | 0.91 | |||||||||||||||||||||||||||||||||
Expenses paid during the period are equal to the annualized expense ratio for each class as indicated above, multiplied by the average account value over the period and then multiplied by the number of days in the Fund's most recent fiscal half year and divided by 366.
Effective expenses paid during the period and the Fund's effective annualized expense ratio include expenses borne directly to the class plus the Fund's indirect pro rata portion of the ongoing expenses charged by the underlying funds using the expense ratio of each class of the underlying funds as of the underlying fund's most recent shareholder report.
Had Columbia Management Investment Advisers, LLC and/or certain of its affiliates not waived/reimbursed certain fees and expenses, account value at the end of the period would have been reduced.
Annual Report 2016
6
VARIABLE PORTFOLIO — MULTI-MANAGER DIVERSIFIED INCOME FUND
PORTFOLIO OF INVESTMENTS
December 31, 2016
(Percentages represent value of investments compared to net assets)
Equity Funds 12.3%
Shares | Value ($) | ||||||||||
U.S. LARGE CAP 12.3% | |||||||||||
| Columbia Variable Portfolio — Contrarian Core Fund, Class 1 Shares(a)(b) | 16,554 | 299,959 | |||||||||
| Columbia Variable Portfolio — Disciplined Core Fund, Class 1 Shares(a)(b) | 7,771 | 303,929 | |||||||||
Total | 603,888 | ||||||||||
| Total Equity Funds (Cost: $567,140) | 603,888 | ||||||||||
Fixed-Income Funds 84.2%
EMERGING MARKETS 16.6% | |||||||||||
| Columbia Variable Portfolio — Emerging Markets Bond Fund, Class 1 Shares(b) | 86,043 | 817,403 | |||||||||
HIGH YIELD 37.7% | |||||||||||
| Columbia Variable Portfolio — High Yield Bond Fund, Class 1 Shares(b) | 273,237 | 1,855,282 | |||||||||
INVESTMENT GRADE 29.9% | |||||||||||
| Columbia Variable Portfolio — Intermediate Bond Fund, Class 1 Shares(b) | 67,398 | 697,567 | |||||||||
| Columbia Variable Portfolio — U.S. Government Mortgage Fund, Class 1 Shares(b) | 11,805 | 121,824 | |||||||||
| Variable Portfolio — American Century Diversified Bond Fund, Class 1 Shares(b) | 23,621 | 258,657 | |||||||||
Fixed-Income Funds (continued)
Shares | Value ($) | ||||||||||
| Variable Portfolio — TCW Core Plus Bond Fund, Class 1 Shares(b) | 37,407 | 392,024 | |||||||||
Total | 1,470,072 | ||||||||||
| Total Fixed-Income Funds (Cost: $4,138,949) | 4,142,757 | ||||||||||
Exchange-Traded Funds 2.8%
| iShares iBoxx $ Investment Grade Corporate Bond ETF | 1,167 | 136,749 | |||||||||
| Total Exchange-Traded Funds (Cost: $139,786) | 136,749 | ||||||||||
Money Market Funds 1.3%
| Columbia Variable Portfolio — Government Money Market Fund, Class 1 Shares, 0.010%(b)(c) | 61,792 | 61,792 | |||||||||
| Total Money Market Funds (Cost: $61,792) | 61,792 | ||||||||||
| Total Investments (Cost: $4,907,667) | 4,945,186 | ||||||||||
Other Assets & Liabilities, Net | (28,015 | ) | |||||||||
Net Assets | 4,917,171 | ||||||||||
Notes to Portfolio of Investments
(a) Non-income producing investment.
(b) As defined in the Investment Company Act of 1940, an affiliated company is one in which the Fund owns 5% or more of the company's outstanding voting securities, or a company which is under common ownership or control with the Fund. Holdings and transactions in these affiliated companies during the year ended December 31, 2016 are as follows:
| Issuer | Beginning Cost ($) | Purchase Cost ($) | Proceeds From Sales ($) | Realized Gain (Loss) ($) | Ending Cost ($) | Capital Gain Distributions ($) | Dividends — Affiliated Issuers ($) | Value ($) | |||||||||||||||||||||||||||
| Columbia Variable Portfolio — Contrarian Core Fund, Class 1 Shares | 108,874 | 208,202 | (32,998 | ) | (656 | ) | 283,422 | — | — | 299,959 | |||||||||||||||||||||||||
| Columbia Variable Portfolio — Disciplined Core Fund, Class 1 Shares | 143,377 | 277,711 | (134,403 | ) | (2,967 | ) | 283,718 | — | — | 303,929 | |||||||||||||||||||||||||
| Columbia Variable Portfolio — Emerging Markets Bond Fund, Class 1 Shares | 448,426 | 441,509 | (90,099 | ) | (1,582 | ) | 798,254 | — | 15,677 | 817,403 | |||||||||||||||||||||||||
The accompanying Notes to Financial Statements are an integral part of this statement.
Annual Report 2016
7
VARIABLE PORTFOLIO — MULTI-MANAGER DIVERSIFIED INCOME FUND
PORTFOLIO OF INVESTMENTS (continued)
December 31, 2016
Notes to Portfolio of Investments (continued)
| Issuer | Beginning Cost ($) | Purchase Cost ($) | Proceeds From Sales ($) | Realized Gain (Loss) ($) | Ending Cost ($) | Capital Gain Distributions ($) | Dividends — Affiliated Issuers ($) | Value ($) | |||||||||||||||||||||||||||
| Columbia Variable Portfolio — Government Money Market Fund, Class 1 Shares | 25,000 | 144,674 | (107,882 | ) | — | 61,792 | — | 3 | 61,792 | ||||||||||||||||||||||||||
| Columbia Variable Portfolio — High Yield Bond Fund, Class 1 Shares | 1,038,951 | 985,365 | (148,329 | ) | (10,705 | ) | 1,865,282 | — | 84,663 | 1,855,282 | |||||||||||||||||||||||||
| Columbia Variable Portfolio — Income Opportunities Fund, Class 1 Shares | 71,993 | 10,087 | (79,232 | ) | (2,848 | ) | — | — | — | — | |||||||||||||||||||||||||
| Columbia Variable Portfolio — Intermediate Bond Fund, Class 1 Shares | 371,532 | 385,825 | (60,193 | ) | (337 | ) | 696,827 | 271 | 7,969 | 697,567 | |||||||||||||||||||||||||
| Columbia Variable Portfolio — U.S. Government Mortgage Fund, Class 1 Shares | 65,413 | 89,351 | (30,764 | ) | (697 | ) | 123,303 | 581 | 2,235 | 121,824 | |||||||||||||||||||||||||
| Variable Portfolio — American Century Diversified Bond Fund, Class 1 Shares | 138,133 | 147,472 | (24,141 | ) | (273 | ) | 261,191 | 93 | 2,985 | 258,657 | |||||||||||||||||||||||||
| Variable Portfolio — MFS® Blended Research® Core Equity Fund, Class 1 Shares | 15,526 | 38,805 | (57,205 | ) | 2,874 | — | — | — | — | ||||||||||||||||||||||||||
| Variable Portfolio — TCW Core Plus Bond Fund, Class 1 Shares | 208,562 | 253,747 | (68,027 | ) | (190 | ) | 394,092 | 1,050 | 3,046 | 392,024 | |||||||||||||||||||||||||
Total | 2,635,787 | 2,982,748 | (833,273 | ) | (17,381 | ) | 4,767,881 | 1,995 | 116,578 | 4,808,437 | |||||||||||||||||||||||||
(c) The rate shown is the seven-day current annualized yield at December 31, 2016.
Fair Value Measurements
The Fund categorizes its fair value measurements according to a three-level hierarchy that maximizes the use of observable inputs and minimizes the use of unobservable inputs by prioritizing that the most observable input be used when available. Observable inputs are those that market participants would use in pricing an investment based on market data obtained from sources independent of the reporting entity. Unobservable inputs are those that reflect the Fund's assumptions about the information market participants would use in pricing an investment. An investment's level within the fair value hierarchy is based on the lowest level of any input that is deemed significant to the asset's or liability's fair value measurement. The input levels are not necessarily an indication of the risk or liquidity associated with investments at that level. For example, certain U.S. government securities are generally high quality and liquid, however, they are reflected as Level 2 because the inputs used to determine fair value may not always be quoted prices in an active market.
Fair value inputs are summarized in the three broad levels listed below:
> Level 1 — Valuations based on quoted prices for investments in active markets that the Fund has the ability to access at the measurement date (including NAV for open-end mutual funds). Valuation adjustments are not applied to Level 1 investments.
> Level 2 — Valuations based on other significant observable inputs (including quoted prices for similar securities, interest rates, prepayment speeds, credit risks, etc.).
> Level 3 — Valuations based on significant unobservable inputs (including the Fund's own assumptions and judgment in determining the fair value of investments).
Inputs that are used in determining fair value of an investment may include price information, credit data, volatility statistics, and other factors. These inputs can be either observable or unobservable. The availability of observable inputs can vary between investments, and is affected by various factors such as the type of investment, and the volume and level of activity for that investment or similar investments in the marketplace. The inputs will be considered by the Investment Manager, along with any other relevant factors in the calculation of an investment's fair value. The Fund uses prices and inputs that are current as of the measurement date, which may include periods of market dislocations. During these periods, the availability of prices and inputs may be reduced for many investments. This condition could cause an investment to be reclassified between the various levels within the hierarchy.
Certain investments that have been measured at fair value using the net asset value per share (or its equivalent) are not categorized in the fair value hierarchy. The fair value amounts presented in the table are intended to reconcile the fair value hierarchy to the amounts presented
The accompanying Notes to Financial Statements are an integral part of this statement.
Annual Report 2016
8
VARIABLE PORTFOLIO — MULTI-MANAGER DIVERSIFIED INCOME FUND
PORTFOLIO OF INVESTMENTS (continued)
December 31, 2016
Fair Value Measurements (continued)
in the Portfolio of Investments. The Variable Portfolios serve as investment vehicles for variable annuity contracts and variable life insurance policies. Principle investment strategies within these Variable Portfolios vary based on the Portfolios investment objective. Investments in the Variable Portfolios may be redeemed on a daily basis without restriction.
Investments falling into the Level 3 category are primarily supported by quoted prices from brokers and dealers participating in the market for those investments. However, these may be classified as Level 3 investments due to lack of market transparency and corroboration to support these quoted prices. Additionally, valuation models may be used as the pricing source for any remaining investments classified as Level 3. These models may rely on one or more significant unobservable inputs and/or significant assumptions by the Investment Manager. Inputs used in valuations may include, but are not limited to, financial statement analysis, capital account balances, discount rates and estimated cash flows, and comparable company data.
Under the direction of the Fund's Board of Trustees (the Board), the Investment Manager's Valuation Committee (the Committee) is responsible for overseeing the valuation procedures approved by the Board. The Committee consists of voting and non-voting members from various groups within the Investment Manager's organization, including operations and accounting, trading and investments, compliance, risk management and legal.
The Committee meets at least monthly to review and approve valuation matters, which may include a description of specific valuation determinations, data regarding pricing information received from approved pricing vendors and brokers and the results of Board-approved valuation control policies and procedures (the Policies). The Policies address, among other things, instances when market quotations are or are not readily available, including recommendations of third party pricing vendors and a determination of appropriate pricing methodologies; events that require specific valuation determinations and assessment of fair value techniques; securities with a potential for stale pricing, including those that are illiquid, restricted, or in default; and the effectiveness of third party pricing vendors, including periodic reviews of vendors. The Committee meets more frequently, as needed, to discuss additional valuation matters, which may include the need to review back-testing results, review time-sensitive information or approve related valuation actions. The Committee reports to the Board, with members of the Committee meeting with the Board at each of its regularly scheduled meetings to discuss valuation matters and actions during the period, similar to those described earlier.
For investments categorized as Level 3, the Committee monitors information similar to that described above, which may include: (i) data specific to the issuer or comparable issuers, (ii) general market or specific sector news and (iii) quoted prices and specific or similar security transactions. The Committee considers this data and any changes from prior periods in order to assess the reasonableness of observable and unobservable inputs, any assumptions or internal models used to value those securities and changes in fair value. This data is also used to corroborate, when available, information received from approved pricing vendors and brokers. Various factors impact the frequency of monitoring this information (which may occur as often as daily). However, the Committee may determine that changes to inputs, assumptions and models are not required as a result of the monitoring procedures performed.
The following table is a summary of the inputs used to value the Fund's investments at December 31, 2016:
| Level 1 Quoted Prices in Active Markets for Identical Assets ($) | Level 2 Other Significant Observable Inputs ($) | Level 3 Significant Unobservable Inputs ($) | Total ($) | ||||||||||||||||
Investments | |||||||||||||||||||
Exchange-Traded Funds | 136,749 | — | — | 136,749 | |||||||||||||||
Investments measured at net asset value | |||||||||||||||||||
Equity Funds | — | — | — | 603,888 | |||||||||||||||
Fixed-Income Funds | — | — | — | 4,142,757 | |||||||||||||||
Money Market Funds | — | — | — | 61,792 | |||||||||||||||
Total Investments | 136,749 | — | — | 4,945,186 | |||||||||||||||
See the Portfolio of Investments for all investment classifications not indicated in the table.
There were no transfers of financial assets between levels during the period.
The accompanying Notes to Financial Statements are an integral part of this statement.
Annual Report 2016
9
VARIABLE PORTFOLIO — MULTI-MANAGER DIVERSIFIED INCOME FUND
STATEMENT OF ASSETS AND LIABILITIES
December 31, 2016
Assets | |||||||
Investments, at value | |||||||
Unaffiliated issuers (identified cost $139,786) | $ | 136,749 | |||||
Affiliated issuers (identified cost $4,767,881) | 4,808,437 | ||||||
Total investments (identified cost $4,907,667) | 4,945,186 | ||||||
Receivable for: | |||||||
Investments sold | 3,735 | ||||||
Expense reimbursement due from Investment Manager | 400 | ||||||
Prepaid expenses | 17 | ||||||
Trustees' deferred compensation plan | 7,645 | ||||||
Total assets | 4,956,983 | ||||||
Liabilities | |||||||
Payable for: | |||||||
Capital shares purchased | 3,735 | ||||||
Management services fees | 4 | ||||||
Distribution and/or service fees | 33 | ||||||
Compensation of board members | 991 | ||||||
Audit fees | 19,712 | ||||||
Custodian fees | 3,675 | ||||||
Printing and postage fees | 3,303 | ||||||
Other expenses | 714 | ||||||
Trustees' deferred compensation plan | 7,645 | ||||||
Total liabilities | 39,812 | ||||||
Net assets applicable to outstanding capital stock | $ | 4,917,171 | |||||
Represented by | |||||||
Trust capital | $ | 4,917,171 | |||||
Total — representing net assets applicable to outstanding capital stock | $ | 4,917,171 | |||||
Class 2 | |||||||
Net assets | $ | 4,917,171 | |||||
Shares outstanding | 490,858 | ||||||
Net asset value per share | $ | 10.02 | |||||
The accompanying Notes to Financial Statements are an integral part of this statement.
Annual Report 2016
10
VARIABLE PORTFOLIO — MULTI-MANAGER DIVERSIFIED INCOME FUND
STATEMENT OF OPERATIONS
Year Ended December 31, 2016
Net investment income | |||||||
Income: | |||||||
Dividends — unaffiliated issuers | $ | 4,512 | |||||
Dividends — affiliated issuers | 116,578 | ||||||
Total income | 121,090 | ||||||
Expenses: | |||||||
Management services fees | 1,589 | ||||||
Distribution and/or service fees | |||||||
Class 2 | 8,722 | ||||||
Transfer agent fees | |||||||
Class 2 | 76 | ||||||
Compensation of board members | 17,484 | ||||||
Custodian fees | 14,821 | ||||||
Printing and postage fees | 19,578 | ||||||
Audit fees | 20,440 | ||||||
Legal fees | 87 | ||||||
Chief compliance officer expenses | 2 | ||||||
Other | 4,359 | ||||||
Total expenses | 87,158 | ||||||
Fees waived or expenses reimbursed by Investment Manager and its affiliates | (78,109 | ) | |||||
Total net expenses | 9,049 | ||||||
Net investment income | 112,041 | ||||||
Realized and unrealized gain (loss) — net | |||||||
Net realized gain (loss) on: | |||||||
Investments — unaffiliated issuers | (1,422 | ) | |||||
Investments — affiliated issuers | (17,381 | ) | |||||
Capital gain distributions from underlying affiliated funds | 1,995 | ||||||
Net realized loss | (16,808 | ) | |||||
Net change in unrealized appreciation (depreciation) on: | |||||||
Investments — unaffiliated issuers | (267 | ) | |||||
Investments — affiliated issuers | 142,037 | ||||||
Net change in unrealized appreciation | 141,770 | ||||||
Net realized and unrealized gain | 124,962 | ||||||
Net increase in net assets resulting from operations | $ | 237,003 | |||||
The accompanying Notes to Financial Statements are an integral part of this statement.
Annual Report 2016
11
VARIABLE PORTFOLIO — MULTI-MANAGER DIVERSIFIED INCOME FUND
STATEMENT OF CHANGES IN NET ASSETS
| Year Ended December 31, 2016 | Year Ended December 31, 2015 | ||||||||||
Operations | |||||||||||
Net investment income | $ | 112,041 | $ | 69,627 | |||||||
Net realized loss | (16,808 | ) | (16,827 | ) | |||||||
Net change in unrealized appreciation (depreciation) | 141,770 | (97,825 | ) | ||||||||
Net increase (decrease) in net assets resulting from operations | 237,003 | (45,025 | ) | ||||||||
Distributions to shareholders | |||||||||||
Net investment income | |||||||||||
Class 2 | (113,815 | ) | (70,701 | ) | |||||||
Total distributions to shareholders | (113,815 | ) | (70,701 | ) | |||||||
Increase in net assets from capital stock activity | 2,238,930 | 1,847,974 | |||||||||
Total increase in net assets | 2,362,118 | 1,732,248 | |||||||||
Net assets at beginning of year | 2,555,053 | 822,805 | |||||||||
Net assets at end of year | $ | 4,917,171 | $ | 2,555,053 | |||||||
The accompanying Notes to Financial Statements are an integral part of this statement.
Annual Report 2016
12
VARIABLE PORTFOLIO — MULTI-MANAGER DIVERSIFIED INCOME FUND
STATEMENT OF CHANGES IN NET ASSETS (continued)
Year Ended December 31, 2016 | Year Ended December 31, 2015 | ||||||||||||||||||
Shares | Dollars ($) | Shares | Dollars ($) | ||||||||||||||||
Capital stock activity | |||||||||||||||||||
Class 2 shares | |||||||||||||||||||
Subscriptions | 253,335 | 2,554,793 | 210,829 | 2,093,597 | |||||||||||||||
Distributions reinvested | 11,284 | 113,815 | 7,398 | 70,701 | |||||||||||||||
Redemptions | (43,204 | ) | (429,678 | ) | (32,337 | ) | (316,324 | ) | |||||||||||
Net increase | 221,415 | 2,238,930 | 185,890 | 1,847,974 | |||||||||||||||
Total net increase | 221,415 | 2,238,930 | 185,890 | 1,847,974 | |||||||||||||||
The accompanying Notes to Financial Statements are an integral part of this statement.
Annual Report 2016
13
VARIABLE PORTFOLIO — MULTI-MANAGER DIVERSIFIED INCOME FUND
FINANCIAL HIGHLIGHTS
The following table is intended to help you understand the Fund's financial performance. Certain information reflects financial results for a single share of a class held for the periods shown. Per share net investment income (loss) amounts are calculated based on average shares outstanding during the period. Total return assumes reinvestment of all dividends and distributions, if any. Total return does not reflect any fees and expenses imposed under your Contract and/or Qualified Plan, as applicable; such fees and expenses would reduce the total returns for all periods shown. Total return and portfolio turnover are not annualized for periods of less than one year. The portfolio turnover rate is calculated without regard to purchase and sales transactions of short-term instruments and certain derivatives, if any. If such transactions were included, the Fund's portfolio turnover rate may be higher.
Year Ended December 31, | |||||||||||||||
Class 2 | 2016 | 2015 | 2014(a) | ||||||||||||
Per share data | |||||||||||||||
Net asset value, beginning of period | $ | 9.48 | $ | 9.85 | $ | 10.00 | |||||||||
Income from investment operations: | |||||||||||||||
Net investment income | 0.32 | 0.34 | 0.14 | ||||||||||||
Net realized and unrealized gain (loss) | 0.49 | (0.43 | ) | (0.20 | ) | ||||||||||
Total from investment operations | 0.81 | (0.09 | ) | (0.06 | ) | ||||||||||
Less distributions to shareholders: | |||||||||||||||
Net investment income | (0.27 | ) | (0.28 | ) | (0.09 | ) | |||||||||
Total distributions to shareholders | (0.27 | ) | (0.28 | ) | (0.09 | ) | |||||||||
Net asset value, end of period | $ | 10.02 | $ | 9.48 | $ | 9.85 | |||||||||
Total return | 8.52 | % | (0.91 | %) | (0.56 | %) | |||||||||
Ratios to average net assets(b) | |||||||||||||||
Total gross expenses | 2.50 | % | 3.93 | % | 18.20 | %(c) | |||||||||
Total net expenses(d) | 0.26 | % | 0.30 | % | 0.26 | %(c) | |||||||||
Net investment income | 3.21 | % | 3.44 | % | 2.84 | %(c) | |||||||||
Supplemental data | |||||||||||||||
Net assets, end of period (in thousands) | $ | 4,917 | $ | 2,555 | $ | 823 | |||||||||
Portfolio turnover | 23 | % | 33 | % | 28 | % | |||||||||
Notes to Financial Highlights
(a) Based on operations from June 24, 2014 (commencement of operations) through the stated period end.
(b) In addition to the fees and expenses that the Fund bears directly, the Fund indirectly bears a pro rata share of the fees and expenses of the underlying funds in which the Fund invests. Such indirect expenses are not included in the Fund's reported expense ratios.
(c) Annualized.
(d) Total net expenses include the impact of certain fee waivers/expense reimbursements made by the Investment Manager and certain of its affiliates, if applicable.
The accompanying Notes to Financial Statements are an integral part of this statement.
Annual Report 2016
14
VARIABLE PORTFOLIO — MULTI-MANAGER DIVERSIFIED INCOME FUND
NOTES TO FINANCIAL STATEMENTS
December 31, 2016
Note 1. Organization
Variable Portfolio — Multi-Manager Diversified Income Fund (the Fund), a series of Columbia Funds Variable Insurance Trust (the Trust), is a diversified fund. The Trust is registered under the Investment Company Act of 1940, as amended (the 1940 Act), as an open-end management investment company organized as a Massachusetts business trust.
The Fund is a "fund-of-funds", investing significantly in affiliated funds managed by Columbia Management Investment Advisers, LLC (the Investment Manager), a wholly-owned subsidiary of Ameriprise Financial, Inc. (Ameriprise Financial), its affiliates, or third-party advised (unaffiliated) funds, including exchange-traded funds (collectively, Underlying Funds).
For information on the Underlying Funds, please refer to the Fund's current prospectus and the prospectuses of the Underlying Funds, which are available, free of charge, from the Securities and Exchange Commission website, www.sec.gov.
Fund Shares
The Trust may issue an unlimited number of shares (without par value). The Fund offers Class 2 shares to separate accounts funding variable annuity contracts and variable life insurance policies (collectively, Contracts) issued by affiliated and unaffiliated life insurance companies as well as qualified pension and retirement plans (Qualified Plans) and other qualified institutional investors (Qualified Investors) authorized by Columbia Management Investment Distributors, Inc. (the Distributor). You may not buy (nor will you own) shares of the Fund directly. You may invest by participating in a Qualified Plan or by buying a Contract and making allocations to the Fund.
Note 2. Summary of Significant Accounting Policies
Basis of Preparation
The Fund is an investment company that applies the accounting and reporting guidance in the Financial Accounting Standards Board (FASB) Accounting Standards Codification Topic 946, Financial Services — Investment Companies (ASC 946). The financial statements are prepared in accordance with U.S. generally accepted accounting principles (GAAP), which requires management to make certain estimates and assumptions that affect the reported amounts of assets and liabilities, the disclosure of contingent assets and
liabilities at the date of the financial statements and the reported amounts of income and expenses during the reporting period. Actual results could differ from those estimates.
The following is a summary of significant accounting policies followed by the Fund in the preparation of its financial statements.
Security Valuation
All equity securities and exchange-traded funds are valued at the close of business of the New York Stock Exchange. Equity securities and exchange-traded funds are valued at the last quoted sales price on the principal exchange or market on which they trade, except for securities traded on the NASDAQ Stock Market, which are valued at the NASDAQ official close price. Unlisted securities or listed securities for which there were no sales during the day are valued at the mean of the latest quoted bid and ask prices on such exchanges or markets.
Investments in the Underlying Funds are valued at the net asset value of the applicable class of the Underlying Fund determined as of the close of the New York Stock Exchange on the valuation date.
Investments for which market quotations are not readily available, or that have quotations which management believes are not reflective of market value or reliable, are valued at fair value as determined in good faith under procedures approved by and under the general supervision of the Board of Trustees. If a security or class of securities (such as foreign securities) is valued at fair value, such value is likely to be different from the quoted or published price for the security.
The determination of fair value often requires significant judgment. To determine fair value, management may use assumptions including but not limited to future cash flows and estimated risk premiums. Multiple inputs from various sources may be used to determine fair value.
GAAP requires disclosure regarding the inputs and valuation techniques used to measure fair value and any changes in valuation inputs or techniques. In addition, investments shall be disclosed by major category. This information is disclosed following the Fund's Portfolio of Investments.
Security Transactions
Security transactions are accounted for on the trade date. Cost is determined and gains (losses) are based
Annual Report 2016
15
VARIABLE PORTFOLIO — MULTI-MANAGER DIVERSIFIED INCOME FUND
NOTES TO FINANCIAL STATEMENTS (continued)
December 31, 2016
upon the specific identification method for both financial statement and federal income tax purposes.
Income Recognition
Corporate actions and dividend income are recorded on the ex-dividend date.
The Fund may receive distributions from holdings in equity securities, business development companies (BDCs), exchange-traded funds, other regulated investment companies (RICs), and real estate investment trusts (REITs), which report information on the tax character of their distributions annually. These distributions are allocated to dividend income, capital gain and return of capital based on actual information reported. Return of capital is recorded as a reduction of the cost basis of securities held. If the Fund no longer owns the applicable securities, return of capital is recorded as a realized gain. With respect to REITs, to the extent actual information has not yet been reported, estimates for return of capital are made by the Fund's management. Management's estimates are subsequently adjusted when the actual character of the distributions is disclosed by the REITs, which could result in a proportionate change in return of capital to shareholders.
Awards from class action litigation are recorded as a reduction of cost basis if the Fund still owns the applicable securities on the payment date. If the Fund no longer owns the applicable securities, the proceeds are recorded as realized gains.
Income and capital gain distributions from the Underlying Funds, if any, are recorded on the ex-dividend date.
Expenses
General expenses of the Trust are allocated to the Fund and other funds of the Trust based upon relative net assets or other expense allocation methodologies determined by the nature of the expense. Expenses directly attributable to the Fund are charged to the Fund. Expenses directly attributable to a specific class of shares are charged to that share class.
Federal Income Tax Status
The Fund is treated as a partnership for federal income tax purposes. The Fund will not be subject to federal income tax, and therefore, there is no provision for federal income taxes. The partners of the Fund are subject to tax on their distributive share of the Fund's income and loss. The components of the Fund's net assets are reported at the partner-level for federal income tax purposes, and therefore, are not presented in the Statement of Assets and Liabilities.
Management of the Fund has concluded that there are no significant uncertain tax positions in the Fund that would require recognition in the financial statements. However, management's conclusion may be subject to review and adjustment at a later date based on factors including, but not limited to, new tax laws, regulations, and administrative interpretations (including relevant court decisions). Generally, the Fund's federal tax returns for the prior three fiscal years remain subject to examination by the Internal Revenue Service.
Distributions to Subaccounts
Distributions to the subaccounts of Contracts, Qualified Plans and Qualified Investors are recorded at the close of business on the record date and are payable on the first business day following the record date. Distributions from net investment income, if any, are made quarterly. Capital gains distributions, when available, will be made annually. All distributions are reinvested in additional shares of the applicable share class of the Fund at the net asset value as of the ex-dividend date of the distribution.
Guarantees and Indemnifications
Under the Trust's organizational documents and, in some cases, by contract, its officers and trustees are indemnified against certain liabilities arising out of the performance of their duties to the Trust or its funds. In addition, certain of the Fund's contracts with its service providers contain general indemnification clauses. The Funds' maximum exposure under these arrangements is unknown since the amount of any future claims that may be made against the Funds cannot be determined, and the Funds have no historical basis for predicting the likelihood of any such claims.
Investment Company Reporting Modernization
In October 2016, the U.S. Securities and Exchange Commission adopted new rules and forms, and amendments to certain current rules and forms, to modernize reporting and disclosure of information by registered investment companies. The amendments to Regulation S-X will require standardized, enhanced disclosure about derivatives in investment company financial statements, and will also change the rules governing the form and content of such financial statements. The amendments to Regulation S-X take effect on August 1, 2017. At this time, management is assessing the anticipated impact of these regulatory developments.
Annual Report 2016
16
VARIABLE PORTFOLIO — MULTI-MANAGER DIVERSIFIED INCOME FUND
NOTES TO FINANCIAL STATEMENTS (continued)
December 31, 2016
Note 3. Fees and Other Transactions with Affiliates
Management Services Fees and Underlying Fund Fees
Effective May 1, 2016, the Fund entered into a Management Agreement with the Investment Manager. Under the Management Agreement, the Investment Manager provides the Fund with investment research and advice, as well as administrative and accounting services. The management services fee is an annual fee that is a blend of (i) 0.02% on assets invested in affiliated underlying funds (including exchange-traded funds and closed-end funds) that pay a management services fee (or investment advisory services fee, as applicable) to the Investment Manager and (ii) a fee that declines from 0.720% to 0.520%, depending on asset levels, on assets invested in securities (other than affiliated underlying funds (including exchange-traded funds and closed-end funds) that pay a management services fee (or investment advisory services fee, as applicable) to the Investment Manager), including other funds advised by the Investment Manager that do not pay a management services fee to the Investment Manager, third party funds, derivatives and individual securities. Prior to May 1, 2016, the Fund paid the Investment Manager an annual fee for advisory services under an Investment Management Services Agreement and a separate annual fee for administrative and accounting services under an Administrative Services Agreement. The effective management services fee rate for the year ended December 31, 2016 (reflecting all advisory and administrative services fees paid to the Investment Manager) was 0.05% of the Fund's average daily net assets. For the period from January 1, 2016 through April 30, 2016, the investment advisory services fee paid to the Investment Manager was $108, and the administrative services fee paid to the Investment Manager was $178.
In addition to the fees and expenses which the Fund bears directly, the Fund indirectly bears a pro rata share of the fees and expenses of the Underlying Funds in which the Fund invests. Because the Underlying Funds have varied expense and fee levels and the Fund may own different proportions of Underlying Funds at different times, the amount of fees and expenses incurred indirectly by the Fund will vary. These expenses are not reflected in the expenses shown in Statement of Operations and are not included in the ratios to average net assets shown in the Financial Highlights.
Subadvisory Agreement
The Fund's Board of Trustees has approved a subadvisory agreement between the Investment Manager and Threadneedle International Limited (Threadneedle), an affiliate of the Investment Manager and an indirect wholly-owned subsidiary of Ameriprise Financial. As of December 31, 2016, Threadneedle is not providing services to the Fund pursuant to the subadvisory agreement.
Compensation of Board Members
Board of Trustee members, who are not officers or employees of the Investment Manager or Ameriprise Financial, are compensated for their services to the Fund as disclosed in the Statement of Operations. These Board of Trustee members may participate in a Deferred Compensation Plan (the Plan) which may be terminated at any time. Obligations of the Plan will be paid solely out of the Fund's assets, and all amounts payable under the Plan constitute a general unsecured obligation of the Fund.
Compensation of Chief Compliance Officer
The Board of Trustees has appointed a Chief Compliance Officer to the Fund in accordance with federal securities regulations. The Fund is allocated a portion of the expenses associated with the Chief Compliance Officer based on relative net assets of the Trust.
Transfer Agency Fees
The Fund has a Transfer and Dividend Disbursing Agent Agreement with Columbia Management Investment Services Corp. (the Transfer Agent), an affiliate of the Investment Manager and a wholly-owned subsidiary of Ameriprise Financial. The annual fee rate under this agreement is 0.00% on assets invested in Underlying Funds that pay a transfer agency fee to the Transfer Agent and 0.06% of the Fund's average daily net assets on assets invested in securities (other than Underlying Funds that pay a transfer agency fee to the Transfer Agent), including other funds that do not pay a transfer agency fee to the Transfer Agent, exchange-traded funds, derivatives and individual securities.
For the year ended December 31, 2016, the Fund's effective transfer agency fee rate as a percentage of average daily net assets of Class 2 shares was less than 0.01%.
Annual Report 2016
17
VARIABLE PORTFOLIO — MULTI-MANAGER DIVERSIFIED INCOME FUND
NOTES TO FINANCIAL STATEMENTS (continued)
December 31, 2016
Distribution Fees
The Fund has an agreement with the Distributor, an affiliate of the Investment Manager and a wholly-owned subsidiary of Ameriprise Financial, for distribution services. The Board of Trustees has approved, and the Fund has adopted, a distribution plan (the Plan) which sets the distribution fees for the Fund. These fees are calculated daily and are intended to compensate the Distributor for selling shares of the Fund. The Fund pays a monthly distribution fee to the Distributor at the maximum annual rate of 0.25% of the average daily net assets attributable to Class 2 shares of the Fund.
Expenses Waived/Reimbursed by the Investment Manager and its Affiliates
The Investment Manager and certain of its affiliates have contractually agreed to waive fees and/or reimburse expenses (excluding certain fees and expenses described below) for the period(s) disclosed below, so that the Fund's net operating expenses, including indirect expenses of the Underlying Funds, after giving effect to fees waived/expenses reimbursed and any balance credits and/or overdraft charges from the Fund's custodian, do not exceed the following annual rates as a percentage of the class' average daily net assets:
| May 1, 2016 through April 30, 2017 | Prior to May 1, 2016 | ||||||||||
Class 2 | 0.91 | % | 0.97 | % | |||||||
Under the agreement governing these fee waivers and/or expense reimbursement arrangements, the following fees and expenses are excluded from the waiver/ reimbursement commitment, and therefore will be paid by the Fund, if applicable: taxes (including foreign transaction taxes), transaction costs and brokerage commissions, costs related to any securities lending program, dividend and interest expenses associated with securities sold short, inverse floater program fees and expenses, transaction charges and interest on borrowed money, interest, infrequent and/or unusual expenses and any other expenses the exclusion of which is specifically approved by the Board of Trustees. This agreement may be modified or amended only with approval from the Investment Manager, certain of its affiliates and the Fund. Any fees waived and/or expenses reimbursed under the expense reimbursement arrangements described above are not recoverable by the Investment Manager or its affiliates in future periods.
Note 4. Portfolio Information
The cost of purchases and proceeds from sales of securities, excluding short-term investments and derivatives, if any, aggregated to $3,019,779 and $815,744, respectively, for the year ended December 31, 2016. The amount of purchase and sale activity impacts the portfolio turnover rate reported in the Financial Highlights.
Note 5. Line of Credit
The Fund has access to a revolving credit facility with a syndicate of banks led by Citibank, N.A., HSBC Bank USA, N.A. and JPMorgan Chase Bank, N.A. whereby the Fund may borrow for the temporary funding of shareholder redemptions or for other temporary or emergency purposes. The credit facility agreement, which is a collective agreement between the Fund and certain other funds managed by the Investment Manager, severally and not jointly, that permits collective borrowings up to $1 billion. Interest is charged to each participating fund based on its borrowings at a rate equal to the higher of (i) the overnight federal funds rate plus 1.00% or (ii) the one-month LIBOR rate plus 1.00%. Each borrowing under the credit facility matures no later than 60 days after the date of borrowing. The Fund also pays a commitment fee equal to its pro rata share of the amount of the credit facility at a rate of 0.15% per annum. The commitment fee is included in other expenses in the Statement of Operations.
The Fund had no borrowings during the year ended December 31, 2016.
Note 6. Significant Risks
Shareholder Concentration Risk
At December 31, 2016, affiliated shareholders of record owned 100.0% of the outstanding shares of the Fund in one or more accounts. Subscription and redemption activity by concentrated accounts may have a significant effect on the operations of the Fund. In the case of a large redemption, the Fund may be forced to sell investments at inopportune times, including its liquid or more liquid positions, resulting in Fund losses and the Fund holding a higher percentage of less liquid or illiquid securities. Large redemptions could result in decreased economies of scale and increased operating expenses for non-redeeming Fund shareholders.
Annual Report 2016
18
VARIABLE PORTFOLIO — MULTI-MANAGER DIVERSIFIED INCOME FUND
NOTES TO FINANCIAL STATEMENTS (continued)
December 31, 2016
Note 7. Subsequent Events
Management has evaluated the events and transactions that have occurred through the date the financial statements were issued and noted no items requiring adjustment of the financial statements or additional disclosure.
The Fund's Board of Trustees approved the liquidation and termination of the Fund. Completion of a transaction (the Transaction) involving the liquidation of the Fund and the substitution of shares of another fund for shares of the Fund held by participating insurance companies on behalf of variable annuity and variable life insurance contract owners (contract owners) (that is, the reinvestment of liquidation proceeds into another fund) is subject to a number of conditions, including shareholder approval of the Transaction. If shareholder approval is obtained, it is anticipated that the Fund will be liquidated on or about April 28, 2017 (the Liquidation Date) at which time the Fund's shareholders will receive a liquidating distribution in an amount equal to the net asset value of their Fund shares. Shareholders of the Fund may redeem their investments in the Fund at any time prior to the Liquidation Date. As of the close of business on the business day preceding the Liquidation Date, the Fund will not accept any orders for the purchase of shares of the Fund.
Note 8. Information Regarding Pending and Settled Legal Proceedings
Ameriprise Financial and certain of its affiliates have historically been involved in a number of legal, arbitration and regulatory proceedings, including routine litigation, class actions, and governmental actions, concerning matters arising in connection with the conduct of their business activities. Ameriprise Financial believes that the Funds are not currently the subject of, and that neither Ameriprise Financial nor any of its affiliates are the subject of, any pending legal, arbitration or regulatory proceedings that are likely to have a material adverse effect on the Funds or the ability of Ameriprise Financial or its affiliates to perform under their contracts with the Funds. Ameriprise Financial is required to make quarterly (10-Q), annual (10-K) and, as necessary, 8-K filings with the Securities and Exchange Commission (SEC) on legal and regulatory matters that relate to Ameriprise Financial and its affiliates. Copies of these filings may be obtained by accessing the SEC website at www.sec.gov.
There can be no assurance that these matters, or the adverse publicity associated with them, will not result in increased fund redemptions, reduced sale of fund shares or other adverse consequences to the Funds. Further, although we believe proceedings are not likely to have a material adverse effect on the Funds or the ability of Ameriprise Financial or its affiliates to perform under their contracts with the Funds, these proceedings are subject to uncertainties and, as such, we are unable to estimate the possible loss or range of loss that may result. An adverse outcome in one or more of these proceedings could result in adverse judgments, settlements, fines, penalties or other relief that could have a material adverse effect on the consolidated financial condition or results of operations of Ameriprise Financial.
Annual Report 2016
19
VARIABLE PORTFOLIO — MULTI-MANAGER DIVERSIFIED INCOME FUND
REPORT OF INDEPENDENT REGISTERED PUBLIC ACCOUNTING FIRM
To the Trustees of Columbia Funds Variable Insurance Trust and the Shareholders of
Variable Portfolio — Multi-Manager Diversified Income Fund
In our opinion, the accompanying statement of assets and liabilities, including the portfolio of investments, and the related statements of operations and of changes in net assets and the financial highlights present fairly, in all material respects, the financial position of Variable Portfolio — Multi-Manager Diversified Income Fund (the "Fund," a series of Columbia Funds Variable Insurance Trust) as of December 31, 2016, the results of its operations for the year then ended, the changes in its net assets for each of the two years in the period then ended and the financial highlights for each of the two years in the period then ended and for the period June 24, 2014 (commencement of operations) through December 31, 2014, in conformity with accounting principles generally accepted in the United States of America. These financial statements and financial highlights (hereafter referred to as "financial statements") are the responsibility of the Fund's management. Our responsibility is to express an opinion on these financial statements based on our audits. We conducted our audits of these financial statements in accordance with the standards of the Public Company Accounting Oversight Board (United States). Those standards require that we plan and perform the audit to obtain reasonable assurance about whether the financial statements are free of material misstatement. An audit includes examining, on a test basis, evidence supporting the amounts and disclosures in the financial statements, assessing the accounting principles used and significant estimates made by management, and evaluating the overall financial statement presentation. We believe that our audits, which included confirmation of securities as of December 31, 2016 by correspondence with the custodian and transfer agent, provide a reasonable basis for our opinion.
PricewaterhouseCoopers LLP
Minneapolis, MN
February 17, 2017
Annual Report 2016
20
VARIABLE PORTFOLIO — MULTI-MANAGER DIVERSIFIED INCOME FUND
TRUSTEES AND OFFICERS
Shareholders elect the Board that oversees the Fund's operations. The Board appoints officers who are responsible for day-to-day business decisions based on policies set by the Board. The following table provides basic biographical information about the Fund's Trustees, including their principal occupations during the past five years, although specific titles for individuals may have varied over the period. The year set forth beneath Length of Service in the table below is the year in which the Trustee was first appointed or elected as Trustee to any Fund currently in the Columbia Funds Complex or a predecessor thereof. Under current Board policy, members serve terms of indefinite duration.
Independent Trustees
| Name, Address, Year of Birth | Position Held With the Trust and Length of Service | Principal Occupation(s) During the Past Five Years and Other Relevant Professional Experience | Number of Funds in the Columbia Funds Complex Overseen | Other Directorships Held by Trustee During the Past Five Years | |||||||||||||||
| Janet Langford Carrig c/o Columbia Management Investment Advisers, LLC, 225 Franklin Street Mail Drop BX32 05228, Boston, MA 02110 1957 | Trustee 1996 | Senior Vice President, General Counsel and Corporate Secretary, ConocoPhillips (independent energy company) since September 2007 | 59 | None | |||||||||||||||
| Douglas A. Hacker c/o Columbia Management Investment Advisers, LLC, 225 Franklin Street Mail Drop BX32 05228, Boston, MA 02110 1955 | Trustee and Chairman of the Board 1996 | Independent business executive since May 2006; Executive Vice President — Strategy of United Airlines from December 2002 to May 2006; President of UAL Loyalty Services (airline marketing company) from September 2001 to December 2002; Executive Vice President and Chief Financial Officer of United Airlines from July 1999 to September 2001 | 59 | Spartan Nash Company (food distributor); Nash Finch Company (food distributor) from 2005 to 2013; Aircastle Limited (aircraft leasing); SeaCube Container Leasing Ltd. (container leasing) from 2010 to 2013; and Travelport Worldwide Limited (travel information technology) | |||||||||||||||
| Nancy T. Lukitsh c/o Columbia Management Investment Advisers, LLC, 225 Franklin Street Mail Drop BX32 05228, Boston, MA 02110 1956 | Trustee 2011 | Senior Vice President, Partner and Director of Marketing, Wellington Management Company, LLP (investment adviser) from 1997 to 2010; Chair, Wellington Management Portfolios (commingled non-U.S. investment pools) from 2007 to 2010; Director, Wellington Trust Company, NA and other Wellington affiliates from 1997 to 2010 | 59 | None | |||||||||||||||
Annual Report 2016
21
VARIABLE PORTFOLIO — MULTI-MANAGER DIVERSIFIED INCOME FUND
TRUSTEES AND OFFICERS (continued)
Independent Trustees (continued)
| Name, Address, Year of Birth | Position Held With the Trust and Length of Service | Principal Occupation(s) During the Past Five Years and Other Relevant Professional Experience | Number of Funds in the Columbia Funds Complex Overseen | Other Directorships Held by Trustee During the Past Five Years | |||||||||||||||
| David M. Moffett c/o Columbia Management Investment Advisers, LLC, 225 Franklin Street Mail Drop BX32 05228, Boston, MA 02110 1952 | Trustee 2011 | Retired. Consultant to Bridgewater and Associates | 59 | Director, CSX Corporation; Genworth Financial, Inc. (financial and insurance products and services); Paypal Holdings Inc. (payment and data processing services); Trustee University of Oklahoma Foundation; former Director eBay Inc. (online trading community), 2007-2015; and former Director, CIT Bank, CIT Group Inc. (commercial and consumer finance), 2010-2016 | |||||||||||||||
| Charles R. Nelson c/o Columbia Management Investment Advisers, LLC, 225 Franklin Street Mail Drop BX32 05228, Boston, MA 02110 1942 | Trustee 1981 | Retired. Professor Emeritus, University of Washington since 2011; Professor of Economics, University of Washington from 1976 to 2011; Ford and Louisa Van Voorhis Professor of Political Economy, University of Washington from 1993 to 2011; Adjunct Professor of Statistics, University of Washington from 1980 to 2011; Associate Editor, Journal of Money, Credit and Banking from September 1993 to 2008; consultant on econometric and statistical matters | 59 | None | |||||||||||||||
| John J. Neuhauser c/o Columbia Management Investment Advisers, LLC, 225 Franklin Street Mail Drop BX32 05228, Boston, MA 02110 1943 | Trustee 1984 | President, Saint Michael's College since August 2007; Director or Trustee of several non-profit organizations, including University of Vermont Medical Center; Academic Vice President and Dean of Faculties, Boston College from August 1999 to October 2005; University Professor, Boston College from November 2005 to August 2007 | 59 | Liberty All-Star Equity Fund and Liberty All-Star Growth Fund (closed-end funds) | |||||||||||||||
| Patrick J. Simpson c/o Columbia Management Investment Advisers, LLC, 225 Franklin Street Mail Drop BX32 05228, Boston, MA 02110 1944 | Trustee 2000 | Of Counsel, Perkins Coie LLP (law firm) since 2015; Partner, Perkins Coie LLP from 1988 to 2014 | 59 | None | |||||||||||||||
Annual Report 2016
22
VARIABLE PORTFOLIO — MULTI-MANAGER DIVERSIFIED INCOME FUND
TRUSTEES AND OFFICERS (continued)
Independent Trustees (continued)
| Name, Address, Year of Birth | Position Held With the Trust and Length of Service | Principal Occupation(s) During the Past Five Years and Other Relevant Professional Experience | Number of Funds in the Columbia Funds Complex Overseen | Other Directorships Held by Trustee During the Past Five Years | |||||||||||||||
| Anne-Lee Verville c/o Columbia Management Investment Advisers, LLC, 225 Franklin Street Mail Drop BX32 05228, Boston, MA 02110 1945 | Trustee 1998 | Retired. General Manager, Global Education Industry from 1994 to 1997, President — Application Systems Division from 1991 to 1994, Chief Financial Officer — US Marketing & Services from 1988 to 1991, and Chief Information Officer from 1987 to 1988, IBM Corporation (computer and technology) | 59 | Enesco Group, Inc. (producer of giftware and home and garden decor products) from 2001 to 2006 | |||||||||||||||
Consultants to the Independent Trustees*
| Name, Address, Year of Birth | Position Held With the Trust and Length of Service | Principal Occupation(s) During the Past Five Years and Other Relevant Professional Experience | Number of Funds in the Columbia Funds Complex Overseen | Other Directorships Held by Trustee During the Past Five Years | |||||||||||||||
| J. Kevin Connaughton c/o Columbia Management Investment Advisers, LLC, 225 Franklin Street Mail Drop BX32 05228, Boston, MA 02110 1964 | Independent Trustee Consultant 2016 | Independent Trustee Consultant, Columbia Funds since March 2016; Managing Director and General Manager of Mutual Fund Products, Columbia Management Investment Advisers, LLC from May 2010 to February 2015; President, Columbia Funds from 2009 to 2015; and senior officer of Columbia Funds and affiliated funds from 2003 to 2015 | 59 | Board of Governors, Gateway Healthcare since January 2016; Trustee, New Century Portfolios since March 2015; and Director, The Autism Project since March 2015 | |||||||||||||||
| Natalie A. Trunow c/o Columbia Management Investment Advisers, LLC, 225 Franklin Street Mail Drop BX32 05228, Boston, MA 02110 1967 | Independent Trustee Consultant 2016 | Independent Trustee Consultant, Columbia Funds since September 2016; Senior Vice President and Chief Executive Officer, Millennial Partners (investment consulting services to institutions) since January 2016; Director of Investments, Casey Family Programs from April 2016 to September 2016; Chief Investment Officer, Calvert Investments from August 2008 to January 2016; Section Head and Portfolio Manager, General Motors Asset Management from June 1997 to August 2008 | 59 | Healthcare Services for Children with Special Needs | |||||||||||||||
* J. Kevin Connaughton was appointed consultant to the Independent Trustees effective March 1, 2016. Natalie A. Trunow was appointed consultant to the Independent Trustees effective September 1, 2016. Shareholders of the Funds are expected to be asked to elect each of Mr. Connaughton and Ms. Trunow as a Trustee at a future shareholder meeting.
Annual Report 2016
23
VARIABLE PORTFOLIO — MULTI-MANAGER DIVERSIFIED INCOME FUND
TRUSTEES AND OFFICERS (continued)
Interested Trustee Affiliated with Investment Manager*
| Name, Address, Year of Birth | Position Held With the Trust and Length of Service | Principal Occupation(s) During the Past Five Years and Other Relevant Professional Experience | Number of Funds in the Columbia Funds Complex Overseen | Other Directorships Held by Trustee During the Past Five Years | |||||||||||||||
| William F. Truscott c/o Columbia Management Investment Advisers, LLC, 225 Franklin Street Boston, MA 02110 1960 | Trustee 2012 | Chairman of the Board and President, Columbia Management Investment Advisers, LLC since May 2010 and February 2012, respectively; Chief Executive Officer, Global Asset Management, Ameriprise Financial, Inc. since September 2012 (previously Chief Executive Officer, U.S. Asset Management & President, Annuities, May 2010- September 2012); Director and Chief Executive Officer, Columbia Management Investment Distributors, Inc. since May 2010 and February 2012, respectively; Chairman of the Board and Chief Executive Officer, RiverSource Distributors, Inc. since 2006; Director, Threadneedle Asset Management Holdings, SARL since 2014; President and Chief Executive Officer, Ameriprise Certificate Company, 2006-August 2012. | 185 | Trustee to other Columbia Funds since 2001; Chairman of the Board, Columbia Management Investment Advisers, LLC since May 2010; Director, Columbia Management Investment Distributors, Inc. since May 2010; Former Director, Ameriprise Certificate Company, 2006-January 2013 | |||||||||||||||
* Interested person (as defined under the 1940 Act) by reason of being an officer, director, security holder and/or employee of the Investment Manager or Ameriprise Financial.
The Statement of Additional Information has additional information about the Fund's Board members and is available, without charge, upon request by calling 800.345.6611 or contacting your financial intermediary.
Annual Report 2016
24
VARIABLE PORTFOLIO — MULTI-MANAGER DIVERSIFIED INCOME FUND
TRUSTEES AND OFFICERS (continued)
The Board has appointed officers who are responsible for day-to-day business decisions based on policies it has established. The officers serve at the pleasure of the Board. The following table provides basic information about the Officers of the Fund, including principal occupations during the past five years, although their specific titles may have varied over the period. In addition to Mr. Truscott, who is Senior Vice President, the Fund's other officers are:
Fund Officers
| Name, Address and Year of Birth | Position and Year First Appointed to Position for any Fund in the Columbia Funds Complex or a Predecessor Thereof | Principal Occupation(s) During Past Five Years | |||||||||
| Christopher O. Petersen 5228 Ameriprise Financial Center Minneapolis, MN 55474 Born 1970 | President and Principal Executive Officer (2015) | Vice President and Lead Chief Counsel, Ameriprise Financial, Inc. since January 2015 (previously, Vice President and Chief Counsel January 2010-December 2014); officer of Columbia Funds and affiliated funds since 2007. | |||||||||
| Michael G. Clarke 225 Franklin Street Boston, MA 02110 Born 1969 | Treasurer (2011), Chief Financial Officer (2009) and Chief Accounting Officer (2015) | Vice President — Mutual Fund Administration, Columbia Management Investment Advisers, LLC, since May 2010; senior officer of Columbia Funds and affiliated funds since 2002. | |||||||||
| Paul B. Goucher 100 Park Avenue New York, NY 10017 Born 1968 | Senior Vice President (2011), Chief Legal Officer (2015) and Assistant Secretary (2008) | Senior Vice President and Assistant General Counsel, Ameriprise Financial, Inc. since January 2017 (previously Vice President and Lead Chief Counsel, November 2008-January 2017 and January 2013-January 2017, respectively, and Chief Counsel, January 2010-January 2013); Vice President, Chief Legal Officer and Assistant Secretary, Columbia Management Investment Advisers, LLC since May 2010. | |||||||||
| Thomas P. McGuire 225 Franklin Street Boston, MA 02110 Born 1972 | Senior Vice President and Chief Compliance Officer (2012) | Vice President — Asset Management Compliance, Ameriprise Financial, Inc., since May 2010; Chief Compliance Officer, Ameriprise Certificate Company since September 2010. | |||||||||
| Colin Moore 225 Franklin Street Boston, MA 02110 Born 1958 | Senior Vice President (2010) | Executive Vice President and Global Chief Investment Officer, Ameriprise Financial, Inc., since July 2013; Executive Vice President and Global Chief Investment Officer, Columbia Management Investment Advisers, LLC since July 2013 (previously Director and Global Chief Investment Officer, 2010-2013). | |||||||||
| Michael E. DeFao 225 Franklin Street Boston, MA 02110 Born 1968 | Vice President (2011) and Assistant Secretary (2010) | Vice President and Chief Counsel, Ameriprise Financial, Inc. since May 2010. | |||||||||
| Amy Johnson 5228 Ameriprise Financial Center Minneapolis, MN 55474 Born 1965 | Vice President (2006) | Managing Director and Global Head of Operations, Columbia Management Investment Advisers, LLC since April 2016 (previously Managing Director and Chief Operating Officer, 2010-2016). | |||||||||
| Lyn Kephart-Strong 5228 Ameriprise Financial Center Minneapolis, MN 55474 Born 1960 | Vice President (2015) | President, Columbia Management Investment Services Corp. since October 2014; Vice President & Resolution Officer, Ameriprise Trust Company since August 2009. | |||||||||
| Ryan C. Larrenaga 225 Franklin Street Boston, MA 02110 Born 1970 | Vice President and Secretary (2015) | Vice President and Group Counsel, Ameriprise Financial, Inc. since August 2011; officer of Columbia Funds and affiliated funds since 2005. | |||||||||
Annual Report 2016
25
This page intentionally left blank.
Annual Report 2016
26
This page intentionally left blank.
Annual Report 2016
27
This page intentionally left blank.
Annual Report 2016
28
VARIABLE PORTFOLIO — MULTI-MANAGER DIVERSIFIED INCOME FUND
IMPORTANT INFORMATION ABOUT THIS REPORT
The policy of the Board is to vote the proxies of the companies in which each fund holds investments consistent with the procedures as stated in the Statement of Additional Information (SAI). You may obtain a copy of the SAI without charge by calling 800.345.6611; contacting your financial intermediary or searching the website of the Securities and Exchange Commission (SEC) at sec.gov. Information regarding how each fund voted proxies relating to portfolio securities is filed with the SEC by August 31st for the most recent 12-month period ending June 30th of that year, and is available without charge by visiting investor.columbiathreadneedleus.com, or searching the website of the SEC at sec.gov.
Each fund files a complete schedule of portfolio holdings with the SEC for the first and third quarters of each fiscal year on Form N-Q. Each fund's Form N-Q is available on the SEC's website at sec.gov and may be reviewed and copied at the SEC's Public Reference Room in Washington, D.C. Information on the operation of the Public Reference Room may be obtained by calling 800.SEC.0330. Each fund's complete schedule of portfolio holdings, as filed on Form N-Q, can also be obtained without charge, upon request, by calling 800.345.6611.
Annual Report 2016
29
Variable Portfolio — Multi-Manager Diversified Income Fund
P.O. Box 8081
Boston, MA 02266-8081

Please read and consider the investment objectives, risks, charges and expenses for any fund carefully before investing. For fund and other investment product prospectuses, which contain this and other important information, contact your financial advisor or insurance representative. Please read the prospectus carefully before you invest. The Fund is distributed by Columbia Management Investment Distributors, Inc., member FINRA, and managed by Columbia Management Investment Advisers, LLC.
Columbia Threadneedle Investments (Columbia Threadneedle) is the global brand name of the Columbia and Threadneedle group of companies.
All rights reserved. Columbia Management Investment Distributors, Inc., 225 Franklin Street, Boston, MA 02110-2804
© 2017 Columbia Management Investment Advisers, LLC.
S-6674 AN (2/17)

ANNUAL REPORT
December 31, 2016

COLUMBIA VARIABLE PORTFOLIO — MANAGED VOLATILITY CONSERVATIVE FUND
Please remember that you may not buy (nor will you own) shares of the Fund directly. The Fund is available through variable annuity contracts or life insurance policies offered by the separate accounts of affiliated insurance companies and other qualified institutional investors authorized by Columbia Management Investment Distributors, Inc. Please contact your financial advisor or insurance representative for more information.

COLUMBIA VARIABLE PORTFOLIO — MANAGED VOLATILITY CONSERVATIVE FUND
TABLE OF CONTENTS
Performance Overview | 2 | ||||||
Manager Discussion of Fund Performance | 4 | ||||||
Understanding Your Fund's Expenses | 6 | ||||||
Portfolio of Investments | 7 | ||||||
Statement of Assets and Liabilities | 18 | ||||||
Statement of Operations | 19 | ||||||
Statement of Changes in Net Assets | 20 | ||||||
Financial Highlights | 22 | ||||||
Notes to Financial Statements | 23 | ||||||
Report of Independent Registered Public Accounting Firm | 33 | ||||||
Trustees and Officers | 34 | ||||||
Important Information About This Report | 41 | ||||||
The views expressed in this report reflect the current views of the respective parties. These views are not guarantees of future performance and involve certain risks, uncertainties and assumptions that are difficult to predict, so actual outcomes and results may differ significantly from the views expressed. These views are subject to change at any time based upon economic, market or other conditions and the respective parties disclaim any responsibility to update such views. These views may not be relied on as investment advice and, because investment decisions for a Columbia fund are based on numerous factors, may not be relied on as an indication of trading intent on behalf of any particular Columbia fund. References to specific securities should not be construed as a recommendation or investment advice.
Annual Report 2016
COLUMBIA VARIABLE PORTFOLIO — MANAGED VOLATILITY CONSERVATIVE FUND
PERFORMANCE OVERVIEW
Performance Summary
n Columbia Variable Portfolio — Managed Volatility Conservative Fund (the Fund) Class 2 shares returned 3.06% for the 12-month period ended December 31, 2016.
n The Fund underperformed its Blended Benchmark, which gained 4.04% during the same time period.
n The Fund outperformed the broad U.S. fixed-income market, as measured by the Bloomberg Barclays U.S. Aggregate Bond Index, which returned 2.65% for the same 12 months.
n Disappointing results from underlying funds, especially U.S. large-cap equity funds, accounted for a significant portion of the Fund's shortfall relative to its Blended Benchmark. The Fund's dynamic algorithm-based allocation and event protection strategies also detracted modestly from relative results.
Average Annual Total Returns (%) (for period ended December 31, 2016)
Inception | 1 Year | Life | |||||||||||||
Class 2 | 04/12/13 | 3.06 | 2.04 | ||||||||||||
Blended Benchmark | 4.04 | 3.22 | |||||||||||||
Bloomberg Barclays U.S. Aggregate Bond Index | 2.65 | 1.70 | |||||||||||||
Performance data quoted represents past performance and current performance may be lower or higher. Past performance is no guarantee of future results. The investment return and principal value will fluctuate so that shares, when redeemed, may be worth more or less than the original cost. For current month-end performance information, please contact your financial advisor or insurance representative.
Performance results reflect the effect of any fee waivers or reimbursements of fund expenses by Columbia Management Investment Advisers, LLC and/or any of its affiliates. Absent these fee waivers or expense reimbursement arrangements, performance results would have been lower.
Investment earnings, if any, are tax-deferred until distributed to shareholders, at which time taxes may become due. Total return performance includes changes in share price and assumes reinvestment of dividends and capital gains, if any. Performance results reflect the effect of all fund expenses, but do not include any fees and expenses imposed under your variable annuity contract and/or variable life insurance policy or qualified pension or retirement plan. If performance results included the effect of these additional charges, they would be lower.
Effective March 10, 2016, the Fund compares its performance to that of an index consisting of 80% Bloomberg Barclays U.S. Aggregate Bond Index, 14% Russell 3000 Index and 6% MSCI EAFE Index (Net) (the New Blended Benchmark). Prior to this date, the Fund compared its performance to that of an index consisting of 80% Bloomberg Barclays U.S. Aggregate Bond Index, 10% S&P 500 Index, 6% MSCI EAFE Index (Net) and 4% Russell 2000 Index (the Former Blended Index). The Fund's investment manager believes that the New Blended Benchmark provides a more appropriate basis for comparing the Fund's performance.
The Bloomberg Barclays U.S. Aggregate Bond Index is a broad-based benchmark that measures the investment-grade, U.S. dollar-denominated, fixed-rate taxable bond market, including Treasuries, government-related and corporate securities, mortgage-backed securities (agency fixed-rate and hybrid adjustable-rate mortgage passthroughs), asset-backed securities, and commercial mortgage-backed securities. The Russell 3000 Index, an unmanaged index, measures the performance of the 3,000 largest U.S. companies based on total market capitalization, which represents approximately 98% of the investable U.S. equity market. The MSCI EAFE Index (Net) is a free float-adjusted market capitalization index that is designed to measure the equity market performance of developed markets, excluding the U.S. and Canada. The index is compiled from a composite of securities markets of Europe, Australasia and the Far East and is widely recognized by investors in foreign markets as the measurement index for portfolios of non-North American securities.
The S&P 500 Index, an unmanaged index, measures the performance of 500 widely held, large-capitalization U.S. stocks and is frequently used as a general measure of market performance. The Russell 2000 Index measures the performance of the small-cap segment of the U.S. equity universe. It is a subset of the Russell 3000 Index representing approximately 10% of the total market capitalization of that index. It includes approximately 2000 of the smallest securities based on a combination of their market cap and current index membership.
Indices are not available for investment, are not professionally managed and do not reflect sales charges, fees, brokerage commissions, taxes (except the MSCI EAFE Index (Net), which reflects reinvested dividends net of withholding taxes) or other expenses of investing. Securities in the Fund may not match those in an index.
Annual Report 2016
2
COLUMBIA VARIABLE PORTFOLIO — MANAGED VOLATILITY CONSERVATIVE FUND
PERFORMANCE OVERVIEW (continued)
Performance of a Hypothetical $10,000 Investment (April 12, 2013 – December 31, 2016)

The chart above shows the change in value of a hypothetical $10,000 investment in Class 2 shares of Columbia Variable Portfolio — Managed Volatility Conservative Fund during the stated time period, and does not reflect the deduction of taxes, if any, that a shareholder may pay on Fund distributions or on the redemption of Fund shares. The returns also do not reflect fees and expenses imposed under your variable annuity contract and/or variable life insurance policy or qualified pension or retirement plan, if any.
Annual Report 2016
3
COLUMBIA VARIABLE PORTFOLIO — MANAGED VOLATILITY CONSERVATIVE FUND
MANAGER DISCUSSION OF FUND PERFORMANCE
Portfolio Management
Jeffrey Knight, CFA
Anwiti Bahuguna, Ph.D.
David Weiss, CFA
Brian Virginia
Effective January 27, 2017, Kent Peterson no longer serves as a portfolio manager of the Fund.
| Portfolio Allocation (%) (at December 31, 2016) | |||||||
Allocations to Underlying Funds | |||||||
Underlying Funds: Equity | 14.9 | ||||||
International | 3.8 | ||||||
U.S. Large Cap | 8.7 | ||||||
U.S. Mid Cap | 1.0 | ||||||
U.S. Small Cap | 1.4 | ||||||
| Underlying Funds: Fixed Income | 52.0 | ||||||
Investment Grade | 52.0 | ||||||
Allocations to Tactical Assets | |||||||
Corporate Bonds & Notes | 1.1 | ||||||
Exchange-Traded Funds | 5.6 | ||||||
| Money Market Fund Shares Held to Cover Open Derivatives Instruments(b) | 20.7 | ||||||
Options Purchased Puts | 0.4 | ||||||
Residential Mortgage-Backed Securities — Agency | 5.3 | ||||||
U.S.Treasury Obligations | 0.0 | (a) | |||||
Total | 100.0 | ||||||
Percentages indicated are based upon total investments. The Fund's portfolio composition is subject to change.
(a) Rounds to zero.
(b) Includes investments in an affiliated money market fund (amounting to $96.6 million) which have been segregated to cover obligations relating to the Fund's investment in derivatives as part of its tactical allocation strategy. For a description of the Fund's investments in derivatives, see Investments in Derivatives following the Portfolio of Investments, and Note 2 to the financial statements.
For the 12-month period ended December 31, 2016, the Fund's Class 2 shares returned 3.06%. The Fund underperformed its Blended Benchmark, which gained 4.04% during the same time period. The Fund outperformed the broad U.S. fixed-income market, as measured by the Bloomberg Barclays U.S. Aggregate Bond Index, which returned 2.65% for the same 12 months. Disappointing results from underlying U.S. large-cap equity funds accounted for much of the Fund's shortfall relative to its Blended Benchmark. The Fund's dynamic algorithm-based allocation methodology, which helps guide the Fund's asset allocation strategy, also detracted from relative results, as did event protection strategies designed to minimize losses in the event of steep market declines. Performance from underlying fixed-income funds and a modest overweight in U.S. small caps, one of the year's best equity sectors, aided relative returns.
Global Markets Posted Mixed Results
Global events, political uncertainty and mixed economic data were enough to keep investors off balance in 2016, as financial markets moved sharply in reaction to each significant change on the world stage. Early in the year concerns about U.S. monetary policy, China and oil rattled the equity markets and drove stock prices downward. After a swift March rebound, the U.S. stock market fell again in the early summer in reaction to the U.K. vote to exit the European Union, and U.S. Treasury yields also plummeted. Once again, the markets rebounded but investors retreated in in the third quarter in reaction to mixed economic data and uncertainty surrounding the U.S. Presidential race. Following the November election and with mostly positive economic data, stocks moved higher in the fourth quarter to keep the eight-year bull market alive. In the United States, steady job growth drove unemployment down, corporate earnings growth picked up, manufacturing activity accelerated, and the price of oil stabilized. Growth was lackluster in developed foreign market countries. In Europe and Japan, GDP advanced less than 1% for the year. China expanded at an estimated pace of 7.5%, in line with expectations, while most emerging markets struggled with volatile international capital flows and currency fluctuations. South American economies contracted.
In December 2016, the Federal Reserve (the Fed) raised the target range of its benchmark interest rate by a quarter of a point to between 0.50% and 0.75%, its first such move in a year. The Fed's action had been widely anticipated and had little or no impact on the financial markets when it occurred. The Fed indicated that it would continue to monitor inflation and the job market in considering future rate hikes.
Against this backdrop, the S&P 500 Index, a broad measure of U.S. stock market performance, rose 11.96%. Foreign stock markets lagged the U.S. markets. The MSCI EAFE Index, a broad measure of performance in developed markets outside the United States, rose just 1.00% for the year. Rising interest rates kept a lid on price in most sectors of the bond market. As noted above, the Bloomberg Barclays U.S. Aggregate Bond Index, a broad measure of the performance of investment-grade bonds, returned 2.65% for the year. High-yield bonds outperformed both stocks
Annual Report 2016
4
COLUMBIA VARIABLE PORTFOLIO — MANAGED VOLATILITY CONSERVATIVE FUND
MANAGER DISCUSSION OF FUND PERFORMANCE (continued)
and investment-grade bonds, returning 17.49%, as measured by the Bank of America/Merrill Lynch U.S. High Yield Constrained Index.
Significant Performance Factors
Underlying fund performance had a significant impact on relative returns in 2016. Tactical asset allocation decisions also affected Fund performance.
Underlying fund performance detracted from relative performance, although results were mixed. U.S. fixed-income funds made a strong showing, which aided results relative to the Blended Benchmark. Multi-sector bond strategies with exposure to the strong-performing corporate credit markets were particularly beneficial to results. Equity funds detracted from relative returns, especially those centered on large-cap equities. Value funds generally outperformed growth- and blend-oriented funds.
The market's back-and-forth volatility undermined the effectiveness of the dynamic algorithm as it was executed during the year. We widened the range within which we could vary from the targets indicated by the dynamic algorithm. This additional degree of tactical discretion aided performance when we lowered equity exposure more than the methodology indicated in late June, just ahead of the U.K. referendum on leaving the European Union — and we felt it was prudently cautious to keep equity exposure lower than the target suggested by the algorithm. However, the equity markets snapped back quickly and exercising this added flexibility detracted from overall relative performance because it resulted in lower equity exposure during the sharp market rebounds of the second half of the year. It should be noted that safe haven assets, such as U.S. Treasury-related synthetic bond positions, currency hedging instruments and other tactical positioning within the funds also detracted from relative results.
Derivative securities such as forward foreign currency contracts, futures and options are used to execute the Fund's dynamic algorithm and event protection strategies, which account for approximately 30% of the portfolio. As noted above, these strategies detracted from relative performance for the year.
Subadvisor Changes
As part of an ongoing effort to monitor the individual teams that manage underlying funds, subadvisor changes were implemented for certain underlying funds during the second quarter of 2016 and again late in the period in an effort to improve results in the underlying funds. The Fund seeks to deliver a strong risk-adjusted return over time with broad diversification across asset classes. Tactical decisions and positioning changes are generally small in scope and magnitude.
Annual Report 2016
5
COLUMBIA VARIABLE PORTFOLIO — MANAGED VOLATILITY CONSERVATIVE FUND
UNDERSTANDING YOUR FUND'S EXPENSES
(Unaudited)
As an investor, you incur ongoing costs, which generally include management fees, distribution and/or service fees, and other fund expenses. The following information is intended to help you understand your ongoing costs (in dollars) of investing in the Fund and to help you compare these costs with the ongoing costs of investing in other mutual funds.
The information below does not reflect fees and expenses imposed under your variable annuity contract and/or variable life insurance policy (collectively, Contracts) or qualified pension and retirement plan (Qualified Plan), if any. The total fees and expenses you bear may therefore be higher than those shown below.
Analyzing Your Fund's Expenses
To illustrate these ongoing costs, we have provided examples and calculated the expenses paid by investors in Class 2 shares of the Fund during the period. The actual and hypothetical information in the table is based on an initial investment of $1,000 at the beginning of the period indicated and held for the entire period. Expense information is calculated two ways and each method provides you with different information. The amount listed in the "Actual" column is calculated using the Fund's actual operating expenses and total return for the period. You may use the Actual information, together with the amount invested, to estimate the expenses that you paid over the period. Simply divide your account value by $1,000 (for example, an $8,600 account value divided by $1,000 = 8.6), then multiply the results by the expenses paid during the period under the "Actual" column. The amount listed in the "Hypothetical" column assumes a 5% annual rate of return before expenses (which is not the Fund's actual return) and then applies the Fund's actual expense ratio for the period to the hypothetical return. You should not use the hypothetical account values and expenses to estimate either your actual account balance at the end of the period or the expenses you paid during the period. See "Compare With Other Funds" below for details on how to use the hypothetical data.
In addition to the ongoing expenses which the Fund bears directly, the Fund's shareholders indirectly bear the Fund's allocable share of the costs and expenses of each underlying fund in which the Fund invests. You can estimate the effective expenses paid during the period, which includes the indirect fees associated with investing in the underlying funds, by using the amounts listed in the "Effective Expenses Paid During the Period" column.
Compare With Other Funds
Since all mutual funds are required to include the same hypothetical calculations about expenses in shareholder reports, you can use this information to compare the ongoing cost of investing in the Fund with other funds. To do so, compare the hypothetical example with the 5% hypothetical examples that appear in the shareholder reports of other funds. As you compare hypothetical examples of other funds, it is important to note that hypothetical examples are meant to highlight the ongoing costs of investing in a fund only and do not reflect any transaction costs, such as redemption or exchange fees, or expenses that apply to the subaccount or the Contract. Therefore, the hypothetical calculations are useful in comparing ongoing costs only, and will not help you determine the relative total costs of owning different funds. If the fees and expenses imposed under your Contract or Qualified Plan, if any, were included, your costs would be higher.
July 1, 2016 – December 31, 2016
| Account Value at the Beginning of the Period ($) | Account Value at the End of the Period ($) | Expenses Paid During the Period ($) | Fund's Annualized Expense Ratio (%) | Effective Expenses Paid During the Period ($) | Fund's Effective Annualized Expense Ratio (%) | ||||||||||||||||||||||||||||||||||||||
Actual | Hypothetical | Actual | Hypothetical | Actual | Hypothetical | Actual | Actual | Hypothetical | Actual | ||||||||||||||||||||||||||||||||||
Class 2 | 1,000.00 | 1,000.00 | 993.50 | 1,022.35 | 2.64 | 2.68 | 0.53 | 4.83 | 4.90 | 0.97 | |||||||||||||||||||||||||||||||||
Expenses paid during the period are equal to the annualized expense ratio for each class as indicated above, multiplied by the average account value over the period and then multiplied by the number of days in the Fund's most recent fiscal half year and divided by 366.
Effective expenses paid during the period and the Fund's effective annualized expense ratio include expenses borne directly to the class plus the Fund's indirect pro rata portion of the ongoing expenses charged by the underlying funds using the expense ratio of each class of the underlying funds as of the underlying fund's most recent shareholder report.
Annual Report 2016
6
COLUMBIA VARIABLE PORTFOLIO — MANAGED VOLATILITY CONSERVATIVE FUND
PORTFOLIO OF INVESTMENTS
December 31, 2016
(Percentages represent value of investments compared to net assets)
Equity Funds 15.8%
Shares | Value ($) | ||||||||||
INTERNATIONAL 4.0% | |||||||||||
| Variable Portfolio — DFA International Value Fund, Class 1 Shares(a) | 548,273 | 5,120,873 | |||||||||
| Variable Portfolio — Lazard International Equity Advantage Fund, Class 1 Shares(a) | 210,675 | 2,060,397 | |||||||||
| Variable Portfolio — Oppenheimer International Growth Fund, Class 1 Shares(a) | 497,407 | 5,322,249 | |||||||||
| Variable Portfolio — Pyramis® International Equity Fund, Class 1 Shares(a) | 524,738 | 5,200,157 | |||||||||
Total | 17,703,676 | ||||||||||
U.S. LARGE CAP 9.2% | |||||||||||
| Columbia Variable Portfolio — Contrarian Core Fund, Class 1 Shares(a)(b) | 200,106 | 3,625,914 | |||||||||
| Columbia Variable Portfolio — Disciplined Core Fund, Class 1 Shares(a)(b) | 286,601 | 11,208,983 | |||||||||
| Columbia Variable Portfolio — Dividend Opportunity Fund, Class 1 Shares(a)(b) | 174,860 | 3,867,903 | |||||||||
| Columbia Variable Portfolio — Large Cap Growth Fund, Class 1 Shares(a)(b) | 252,029 | 3,296,541 | |||||||||
| Columbia Variable Portfolio — Select Large-Cap Value Fund, Class 1 Shares(a)(b) | 96,788 | 1,989,953 | |||||||||
| Variable Portfolio — Loomis Sayles Growth Fund, Class 1 Shares(a)(b) | 232,960 | 5,113,465 | |||||||||
| Variable Portfolio — MFS Value Fund, Class 1 Shares(a)(b) | 93,916 | 1,992,891 | |||||||||
| Variable Portfolio — MFS® Blended Research® Core Equity Fund, Class 1 Shares(a)(b) | 243,090 | 4,132,535 | |||||||||
| Variable Portfolio — Morgan Stanley Advantage Fund, Class 1 Shares(a)(b) | 80,287 | 1,645,877 | |||||||||
| Variable Portfolio — Nuveen Winslow Large Cap Growth Fund, Class 1 Shares(a)(b) | 97,884 | 1,982,152 | |||||||||
| Variable Portfolio — T. Rowe Price Large Cap Value Fund, Class 1 Shares(a)(b) | 101,303 | 1,987,575 | |||||||||
Total | 40,843,789 | ||||||||||
Equity Funds (continued)
Shares | Value ($) | ||||||||||
U.S. MID CAP 1.1% | |||||||||||
| Columbia Variable Portfolio — Mid Cap Growth Fund, Class 1 Shares(a)(b) | 48,196 | 1,010,677 | |||||||||
| Columbia Variable Portfolio — Mid Cap Value Fund, Class 1 Shares(a)(b) | 50,749 | 1,015,487 | |||||||||
| Variable Portfolio — Jennison Mid Cap Growth Fund, Class 1 Shares(a)(b) | 72,614 | 1,384,017 | |||||||||
| Variable Portfolio — Victory Sycamore Established Value Fund, Class 1 Shares(a)(b) | 61,162 | 1,387,160 | |||||||||
Total | 4,797,341 | ||||||||||
U.S. SMALL CAP 1.5% | |||||||||||
| Columbia Variable Portfolio — U.S. Equities Fund, Class 1 Shares(a)(b) | 127,273 | 2,648,552 | |||||||||
| Variable Portfolio — Partners Small Cap Growth Fund, Class 1 Shares(a)(b) | 104,754 | 1,935,863 | |||||||||
| Variable Portfolio — Partners Small Cap Value Fund, Class 1 Shares(a)(b) | 80,773 | 2,111,395 | |||||||||
Total | 6,695,810 | ||||||||||
| Total Equity Funds (Cost: $63,283,822) | 70,040,616 | ||||||||||
Fixed-Income Funds 54.7%
INVESTMENT GRADE 54.7% | |||||||||||
| Columbia Variable Portfolio — Intermediate Bond Fund, Class 1 Shares(a) | 4,695,723 | 48,600,731 | |||||||||
| Columbia Variable Portfolio — Limited Duration Credit Fund, Class 1 Shares(a) | 1,543,856 | 14,620,314 | |||||||||
| Columbia Variable Portfolio — Long Government/Credit Bond Fund, Class 1 Shares(a) | 2,498,706 | 24,787,167 | |||||||||
| Columbia Variable Portfolio — U.S. Government Mortgage Fund, Class 1 Shares(a) | 1,409,488 | 14,545,920 | |||||||||
| Variable Portfolio — American Century Diversified Bond Fund, Class 1 Shares(a) | 4,460,230 | 48,839,515 | |||||||||
| Variable Portfolio — J.P. Morgan Core Bond Fund, Class 1 Shares(a) | 3,439,791 | 37,218,539 | |||||||||
| Variable Portfolio — TCW Core Plus Bond Fund, Class 1 Shares(a) | 4,633,153 | 48,555,444 | |||||||||
The accompanying Notes to Financial Statements are an integral part of this statement.
Annual Report 2016
7
COLUMBIA VARIABLE PORTFOLIO — MANAGED VOLATILITY CONSERVATIVE FUND
PORTFOLIO OF INVESTMENTS (continued)
December 31, 2016
Fixed-Income Funds (continued)
Shares | Value ($) | ||||||||||
| Variable Portfolio — Wells Fargo Short Duration Government Fund, Class 1 Shares(a) | 600,150 | 6,049,519 | |||||||||
Total | 243,217,149 | ||||||||||
| Total Fixed-Income Funds (Cost: $244,809,516) | 243,217,149 | ||||||||||
Exchange-Traded Funds 5.8% | |||||||||||
SPDR S&P 500 ETF Trust | 76,425 | 17,083,280 | |||||||||
iShares MSCI EAFE ETF | 154,032 | 8,892,268 | |||||||||
| Total Exchange-Traded Funds (Cost: $24,500,073) | 25,975,548 | ||||||||||
Corporate Bonds & Notes(c) 1.1%
Issuer | Coupon Rate | Principal Amount ($) | Value ($) | ||||||||||||
AEROSPACE & DEFENSE 0.1% | |||||||||||||||
| BAE Systems Holdings, Inc.(d) 10/07/24 | 3.800 | % | 40,000 | 40,988 | |||||||||||
| L-3 Communications Corp. 02/15/21 | 4.950 | % | 7,000 | 7,478 | |||||||||||
05/28/24 | 3.950 | % | 38,000 | 38,648 | |||||||||||
| Lockheed Martin Corp. 11/23/18 | 1.850 | % | 17,000 | 17,068 | |||||||||||
01/15/23 | 3.100 | % | 5,000 | 5,055 | |||||||||||
| Northrop Grumman Corp. 06/01/18 | 1.750 | % | 65,000 | 65,179 | |||||||||||
08/01/23 | 3.250 | % | 6,000 | 6,117 | |||||||||||
Total | 180,533 | ||||||||||||||
BANKING 0.1% | |||||||||||||||
| Bank of America Corp. 04/19/26 | 3.500 | % | 50,000 | 49,334 | |||||||||||
| Bank of Nova Scotia (The) 06/11/18 | 1.700 | % | 35,000 | 35,012 | |||||||||||
| Citigroup, Inc. 05/01/26 | 3.400 | % | 30,000 | 29,150 | |||||||||||
10/21/26 | 3.200 | % | 35,000 | 33,468 | |||||||||||
| Goldman Sachs Group, Inc. (The) 01/23/25 | 3.500 | % | 25,000 | 24,669 | |||||||||||
02/25/26 | 3.750 | % | 14,000 | 14,030 | |||||||||||
| JPMorgan Chase & Co. 03/01/18 | 1.700 | % | 20,000 | 19,996 | |||||||||||
03/22/19 | 1.850 | % | 20,000 | 19,937 | |||||||||||
10/01/26 | 2.950 | % | 34,000 | 32,452 | |||||||||||
Corporate Bonds & Notes(c) (continued)
Issuer | Coupon Rate | Principal Amount ($) | Value ($) | ||||||||||||
| Morgan Stanley 04/21/21 | 2.500 | % | 15,000 | 14,837 | |||||||||||
07/27/26 | 3.125 | % | 15,000 | 14,331 | |||||||||||
| Wells Fargo & Co. 10/23/26 | 3.000 | % | 60,000 | 57,144 | |||||||||||
Total | 344,360 | ||||||||||||||
CABLE AND SATELLITE —% | |||||||||||||||
| Comcast Corp. 02/15/18 | 5.875 | % | 30,000 | 31,455 | |||||||||||
| Sky PLC(d) 11/24/23 | 1.875 | % | EUR | 100,000 | 110,454 | ||||||||||
Total | 141,909 | ||||||||||||||
CHEMICALS —% | |||||||||||||||
| LYB International Finance BV 03/15/44 | 4.875 | % | 10,000 | 10,356 | |||||||||||
DIVERSIFIED MANUFACTURING 0.1% | |||||||||||||||
| General Electric Co. 10/09/42 | 4.125 | % | 15,000 | 15,133 | |||||||||||
| Honeywell International, Inc. 10/30/19 | 1.400 | % | 40,000 | 39,630 | |||||||||||
02/22/23 | 1.300 | % | EUR | 100,000 | 109,390 | ||||||||||
| United Technologies Corp. 11/01/46 | 3.750 | % | 20,000 | 19,033 | |||||||||||
Total | 183,186 | ||||||||||||||
ELECTRIC 0.3% | |||||||||||||||
| Appalachian Power Co. 05/15/44 | 4.400 | % | 10,000 | 10,147 | |||||||||||
06/01/45 | 4.450 | % | 25,000 | 25,544 | |||||||||||
| Arizona Public Service Co. 05/15/46 | 3.750 | % | 15,000 | 14,068 | |||||||||||
| Berkshire Hathaway Energy Co. 11/15/23 | 3.750 | % | 25,000 | 26,143 | |||||||||||
02/01/45 | 4.500 | % | 29,000 | 30,085 | |||||||||||
| CMS Energy Corp. 03/15/22 | 5.050 | % | 10,000 | 10,955 | |||||||||||
03/01/24 | 3.875 | % | 35,000 | 36,401 | |||||||||||
11/15/25 | 3.600 | % | 45,000 | 45,553 | |||||||||||
02/15/27 | 2.950 | % | 25,000 | 23,727 | |||||||||||
| Consolidated Edison Co. of New York, Inc. 06/15/46 | 3.850 | % | 10,000 | 9,541 | |||||||||||
| DTE Energy Co. 06/01/24 | 3.500 | % | 35,000 | 35,273 | |||||||||||
10/01/26 | 2.850 | % | 115,000 | 106,872 | |||||||||||
| Dominion Resources, Inc. 06/15/18 | 1.900 | % | 45,000 | 45,024 | |||||||||||
The accompanying Notes to Financial Statements are an integral part of this statement.
Annual Report 2016
8
COLUMBIA VARIABLE PORTFOLIO — MANAGED VOLATILITY CONSERVATIVE FUND
PORTFOLIO OF INVESTMENTS (continued)
December 31, 2016
Corporate Bonds & Notes(c) (continued)
Issuer | Coupon Rate | Principal Amount ($) | Value ($) | ||||||||||||
| Duke Energy Corp. 10/15/23 | 3.950 | % | 129,000 | 135,305 | |||||||||||
09/01/46 | 3.750 | % | 15,000 | 13,503 | |||||||||||
| Duke Energy Progress LLC 10/15/46 | 3.700 | % | 10,000 | 9,469 | |||||||||||
| Emera US Finance LP(d) 06/15/46 | 4.750 | % | 40,000 | 40,338 | |||||||||||
| Eversource Energy 01/15/18 | 1.600 | % | 11,000 | 10,975 | |||||||||||
05/01/18 | 1.450 | % | 78,000 | 77,743 | |||||||||||
| Indiana Michigan Power Co. 03/15/23 | 3.200 | % | 20,000 | 20,192 | |||||||||||
| NextEra Energy Capital Holdings, Inc. 04/01/19 | 2.300 | % | 5,000 | 5,038 | |||||||||||
| Oncor Electric Delivery Co. LLC 09/30/17 | 5.000 | % | 76,000 | 78,004 | |||||||||||
| Pacific Gas & Electric Co. 02/15/24 | 3.750 | % | 15,000 | 15,655 | |||||||||||
02/15/44 | 4.750 | % | 30,000 | 32,908 | |||||||||||
| Public Service Enterprise Group, Inc. 11/15/19 | 1.600 | % | 15,000 | 14,784 | |||||||||||
| Sierra Pacific Power Co. 05/01/26 | 2.600 | % | 10,000 | 9,568 | |||||||||||
| Southern California Edison Co. 02/01/45 | 3.600 | % | 5,000 | 4,730 | |||||||||||
| Southern Co. (The) 07/01/46 | 4.400 | % | 40,000 | 39,565 | |||||||||||
| TransAlta Corp. 06/03/17 | 1.900 | % | 45,000 | 44,775 | |||||||||||
11/25/20 | 5.000 | % | CAD | 45,000 | 34,412 | ||||||||||
| Virginia Electric & Power Co. 11/15/46 | 4.000 | % | 5,000 | 4,985 | |||||||||||
| WEC Energy Group, Inc. 06/15/18 | 1.650 | % | 20,000 | 19,982 | |||||||||||
06/15/25 | 3.550 | % | 20,000 | 20,383 | |||||||||||
| Western Power Distribution PLC(d) 11/06/23 | 3.625 | % | GBP | 100,000 | 133,119 | ||||||||||
| Xcel Energy, Inc. 05/15/20 | 4.700 | % | 38,000 | 40,413 | |||||||||||
12/01/26 | 3.350 | % | 45,000 | 45,037 | |||||||||||
Total | 1,270,216 | ||||||||||||||
FOOD AND BEVERAGE 0.1% | |||||||||||||||
| Anheuser-Busch InBev Finance, Inc. 01/17/23 | 2.625 | % | 4,000 | 3,921 | |||||||||||
02/01/26 | 3.650 | % | 110,000 | 111,671 | |||||||||||
| Anheuser-Busch InBev Worldwide, Inc. 07/15/17 | 1.375 | % | 60,000 | 60,052 | |||||||||||
Corporate Bonds & Notes(c) (continued)
Issuer | Coupon Rate | Principal Amount ($) | Value ($) | ||||||||||||
| ConAgra Foods, Inc. 01/25/23 | 3.200 | % | 75,000 | 74,930 | |||||||||||
| General Mills, Inc. 10/20/17 | 1.400 | % | 20,000 | 20,023 | |||||||||||
| Kellogg Co. 12/01/23 | 2.650 | % | 50,000 | 48,370 | |||||||||||
| Kraft Heinz Foods Co. 06/01/26 | 3.000 | % | 15,000 | 14,083 | |||||||||||
06/01/46 | 4.375 | % | 25,000 | 23,524 | |||||||||||
| Kraft Heinz Foods Co 06/05/17 | 2.250 | % | 13,000 | 13,041 | |||||||||||
| Molson Coors Brewing Co. 07/15/26 | 3.000 | % | 40,000 | 37,812 | |||||||||||
05/01/42 | 5.000 | % | 2,000 | 2,091 | |||||||||||
07/15/46 | 4.200 | % | 11,000 | 10,256 | |||||||||||
| PepsiCo, Inc. 02/22/19 | 1.500 | % | 45,000 | 44,843 | |||||||||||
| Sysco Corp. 07/15/21 | 2.500 | % | 10,000 | 9,893 | |||||||||||
| Tyson Foods, Inc. 08/15/19 | 2.650 | % | 25,000 | 25,238 | |||||||||||
| Wm. Wrigley Jr., Co.(d) 10/21/18 | 2.400 | % | 8,000 | 8,072 | |||||||||||
10/21/19 | 2.900 | % | 60,000 | 61,048 | |||||||||||
Total | 568,868 | ||||||||||||||
HEALTH CARE —% | |||||||||||||||
| Becton Dickinson and Co. 12/15/44 | 4.685 | % | 10,000 | 10,360 | |||||||||||
| Express Scripts Holding Co. 07/15/46 | 4.800 | % | 5,000 | 4,787 | |||||||||||
Total | 15,147 | ||||||||||||||
HEALTHCARE INSURANCE —% | |||||||||||||||
| Aetna, Inc. 06/07/19 | 1.900 | % | 20,000 | 19,954 | |||||||||||
06/15/46 | 4.375 | % | 10,000 | 10,042 | |||||||||||
| UnitedHealth Group, Inc. 12/15/17 | 1.400 | % | 43,000 | 43,008 | |||||||||||
Total | 73,004 | ||||||||||||||
INDEPENDENT ENERGY —% | |||||||||||||||
| Anadarko Petroleum Corp. 07/15/44 | 4.500 | % | 15,000 | 14,093 | |||||||||||
| Canadian Natural Resources Ltd. 05/15/17 | 5.700 | % | 6,000 | 6,089 | |||||||||||
02/01/35 | 5.850 | % | 20,000 | 21,287 | |||||||||||
03/15/38 | 6.250 | % | 1,000 | 1,138 | |||||||||||
The accompanying Notes to Financial Statements are an integral part of this statement.
Annual Report 2016
9
COLUMBIA VARIABLE PORTFOLIO — MANAGED VOLATILITY CONSERVATIVE FUND
PORTFOLIO OF INVESTMENTS (continued)
December 31, 2016
Corporate Bonds & Notes(c) (continued)
Issuer | Coupon Rate | Principal Amount ($) | Value ($) | ||||||||||||
| Noble Energy, Inc. 11/15/43 | 5.250 | % | 11,000 | 11,205 | |||||||||||
| Woodside Finance Ltd.(d) 03/05/25 | 3.650 | % | 50,000 | 48,844 | |||||||||||
Total | 102,656 | ||||||||||||||
INTEGRATED ENERGY —% | |||||||||||||||
| Cenovus Energy, Inc. 09/15/42 | 4.450 | % | 37,000 | 32,041 | |||||||||||
09/15/43 | 5.200 | % | 25,000 | 23,812 | |||||||||||
Total | 55,853 | ||||||||||||||
LIFE INSURANCE 0.1% | |||||||||||||||
| Five Corners Funding Trust(d) 11/15/23 | 4.419 | % | 105,000 | 110,761 | |||||||||||
| Guardian Life Insurance Co. of America (The) Subordinated(d) 06/19/64 | 4.875 | % | 40,000 | 39,292 | |||||||||||
| MetLife, Inc. 12/15/17 | 1.756 | % | 5,000 | 5,008 | |||||||||||
09/15/23 | 4.368 | % | 25,000 | 26,903 | |||||||||||
03/01/45 | 4.050 | % | 5,000 | 4,795 | |||||||||||
| Northwestern Mutual Life Insurance Co. (The) Subordinated(d) 03/30/40 | 6.063 | % | 25,000 | 30,785 | |||||||||||
| Peachtree Corners Funding Trust(d) 02/15/25 | 3.976 | % | 100,000 | 97,571 | |||||||||||
| TIAA Asset Management Finance Co. LLC(d) 11/01/19 | 2.950 | % | 15,000 | 15,259 | |||||||||||
| Teachers Insurance & Annuity Association of America Subordinated(d) 09/15/44 | 4.900 | % | 60,000 | 64,563 | |||||||||||
Total | 394,937 | ||||||||||||||
MEDIA AND ENTERTAINMENT —% | |||||||||||||||
| 21st Century Fox America, Inc. 09/15/44 | 4.750 | % | 40,000 | 39,983 | |||||||||||
| 21st Century Fox America, Inc.(d) 11/15/46 | 4.750 | % | 5,000 | 5,015 | |||||||||||
| Scripps Networks Interactive, Inc. 11/15/24 | 3.900 | % | 47,000 | 47,763 | |||||||||||
| Thomson Reuters Corp. 10/15/19 | 4.700 | % | 15,000 | 15,926 | |||||||||||
05/23/43 | 4.500 | % | 20,000 | 18,759 | |||||||||||
| Time Warner, Inc. 03/29/41 | 6.250 | % | 10,000 | 11,668 | |||||||||||
Total | 139,114 | ||||||||||||||
Corporate Bonds & Notes(c) (continued)
Issuer | Coupon Rate | Principal Amount ($) | Value ($) | ||||||||||||
MIDSTREAM 0.1% | |||||||||||||||
| Columbia Pipeline Group, Inc. 06/01/45 | 5.800 | % | 3,000 | 3,450 | |||||||||||
| Enterprise Products Operating LLC 05/07/18 | 1.650 | % | 17,000 | 16,952 | |||||||||||
02/15/45 | 5.100 | % | 13,000 | 13,710 | |||||||||||
05/15/46 | 4.900 | % | 27,000 | 27,715 | |||||||||||
| Kinder Morgan Energy Partners LP 03/01/43 | 5.000 | % | 55,000 | 53,035 | |||||||||||
| Kinder Morgan, Inc. 02/15/46 | 5.050 | % | 5,000 | 4,950 | |||||||||||
| Plains All American Pipeline LP/Finance Corp. 01/31/23 | 2.850 | % | 32,000 | 30,251 | |||||||||||
10/15/23 | 3.850 | % | 45,000 | 44,490 | |||||||||||
11/01/24 | 3.600 | % | 5,000 | 4,788 | |||||||||||
06/15/44 | 4.700 | % | 6,000 | 5,346 | |||||||||||
| Southern Natural Gas Co. LLC(d) 04/01/17 | 5.900 | % | 10,000 | 10,104 | |||||||||||
| Williams Partners LP 09/15/45 | 5.100 | % | 31,000 | 29,464 | |||||||||||
Total | 244,255 | ||||||||||||||
NATURAL GAS —% | |||||||||||||||
| NiSource Finance Corp. 02/15/43 | 5.250 | % | 30,000 | 33,193 | |||||||||||
| Sempra Energy 04/01/17 | 2.300 | % | 25,000 | 25,049 | |||||||||||
06/15/24 | 3.550 | % | 100,000 | 101,201 | |||||||||||
Total | 159,443 | ||||||||||||||
OIL FIELD SERVICES —% | |||||||||||||||
| Noble Holding International Ltd. 03/15/42 | 5.250 | % | 26,000 | 17,160 | |||||||||||
PHARMACEUTICALS —% | |||||||||||||||
| Actavis Funding 03/15/45 | 4.750 | % | 15,000 | 14,726 | |||||||||||
| Amgen, Inc.(d) 06/15/51 | 4.663 | % | 33,000 | 31,820 | |||||||||||
| Pfizer, Inc. 06/01/18 | 1.200 | % | 65,000 | 64,830 | |||||||||||
12/15/46 | 4.125 | % | 10,000 | 10,172 | |||||||||||
| Shire Acquisitions Investments Ireland DAC 09/23/19 | 1.900 | % | 40,000 | 39,493 | |||||||||||
| Teva Pharmaceutical Finance Netherlands III BV 10/01/46 | 4.100 | % | 10,000 | 8,569 | |||||||||||
Total | 169,610 | ||||||||||||||
The accompanying Notes to Financial Statements are an integral part of this statement.
Annual Report 2016
10
COLUMBIA VARIABLE PORTFOLIO — MANAGED VOLATILITY CONSERVATIVE FUND
PORTFOLIO OF INVESTMENTS (continued)
December 31, 2016
Corporate Bonds & Notes(c) (continued)
Issuer | Coupon Rate | Principal Amount ($) | Value ($) | ||||||||||||
PROPERTY & CASUALTY —% | |||||||||||||||
| Berkshire Hathaway Finance Corp. 05/15/42 | 4.400 | % | 18,000 | 18,950 | |||||||||||
| CNA Financial Corp. 05/15/24 | 3.950 | % | 11,000 | 11,157 | |||||||||||
03/01/26 | 4.500 | % | 10,000 | 10,457 | |||||||||||
| Liberty Mutual Group, Inc.(d) 06/15/23 | 4.250 | % | 57,000 | 59,678 | |||||||||||
Total | 100,242 | ||||||||||||||
RAILROADS —% | |||||||||||||||
| CSX Corp. 11/01/46 | 3.800 | % | 25,000 | 23,177 | |||||||||||
REFINING —% | |||||||||||||||
| Phillips 66 05/01/17 | 2.950 | % | 30,000 | 30,167 | |||||||||||
RESTAURANTS —% | |||||||||||||||
| McDonald's Corp. 03/01/18 | 5.350 | % | 50,000 | 52,106 | |||||||||||
12/09/45 | 4.875 | % | 10,000 | 10,711 | |||||||||||
Total | 62,817 | ||||||||||||||
RETAILERS —% | |||||||||||||||
| CVS Health Corp. 06/01/21 | 2.125 | % | 30,000 | 29,416 | |||||||||||
06/01/26 | 2.875 | % | 30,000 | 28,595 | |||||||||||
| Wal-Mart Stores, Inc. 04/11/18 | 1.125 | % | 15,000 | 14,965 | |||||||||||
Total | 72,976 | ||||||||||||||
TECHNOLOGY 0.1% | |||||||||||||||
| Apple, Inc. 02/23/18 | 1.300 | % | 35,000 | 35,026 | |||||||||||
02/09/45 | 3.450 | % | 24,000 | 21,184 | |||||||||||
08/04/46 | 3.850 | % | 5,000 | 4,791 | |||||||||||
| Cisco Systems, Inc. 09/20/19 | 1.400 | % | 35,000 | 34,618 | |||||||||||
| International Business Machine Corp. 11/19/19 | 1.375 | % | EUR | 100,000 | 109,691 | ||||||||||
| Microsoft Corp. 11/03/18 | 1.300 | % | 10,000 | 9,992 | |||||||||||
| Oracle Corp. 09/15/21 | 1.900 | % | 20,000 | 19,544 | |||||||||||
07/15/46 | 4.000 | % | 25,000 | 23,912 | |||||||||||
Total | 258,758 | ||||||||||||||
Corporate Bonds & Notes(c) (continued)
Issuer | Coupon Rate | Principal Amount ($) | Value ($) | ||||||||||||
TRANSPORTATION SERVICES 0.1% | |||||||||||||||
| ERAC U.S.A. Finance LLC(d) 11/01/23 | 2.700 | % | 35,000 | 33,623 | |||||||||||
12/01/26 | 3.300 | % | 55,000 | 52,774 | |||||||||||
11/01/46 | 4.200 | % | 5,000 | 4,569 | |||||||||||
| FedEx Corp. 04/01/46 | 4.550 | % | 15,000 | 15,116 | |||||||||||
| Heathrow Funding Ltd.(d) 02/15/23 | 5.225 | % | GBP | 50,000 | 73,126 | ||||||||||
Total | 179,208 | ||||||||||||||
WIRELESS —% | |||||||||||||||
| Rogers Communications, Inc. 03/15/23 | 3.000 | % | 36,000 | 35,766 | |||||||||||
WIRELINES —% | |||||||||||||||
| AT&T, Inc. 06/15/45 | 4.350 | % | 40,000 | 35,641 | |||||||||||
| Verizon Communications, Inc. 11/01/42 | 3.850 | % | 35,000 | 30,208 | |||||||||||
03/15/55 | 4.672 | % | 10,000 | 9,391 | |||||||||||
Total | 75,240 | ||||||||||||||
| Total Corporate Bonds & Notes (Cost: $4,993,127) | 4,908,958 | ||||||||||||||
Residential Mortgage-Backed Securities —
Agency 5.5%
| Federal National Mortgage Association(e) 01/23/32 | 2.500 | % | 8,592,000 | 8,605,592 | |||||||||||
01/23/32 | 3.000 | % | 592,000 | 607,494 | |||||||||||
| 01/23/32- 01/18/47 | 3.500 | % | 14,340,000 | 14,773,405 | |||||||||||
01/18/47 | 4.000 | % | 592,000 | 622,375 | |||||||||||
| Total Residential Mortgage-Backed Securities — Agency (Cost: $24,577,278) | 24,608,866 | ||||||||||||||
U.S. Treasury Obligations —%
| U.S. Treasury 05/15/45 | 3.000 | % | 40,000 | 39,459 | |||||||||||
| Total U.S. Treasury Obligations (Cost: $39,173) | 39,459 | ||||||||||||||
The accompanying Notes to Financial Statements are an integral part of this statement.
Annual Report 2016
11
COLUMBIA VARIABLE PORTFOLIO — MANAGED VOLATILITY CONSERVATIVE FUND
PORTFOLIO OF INVESTMENTS (continued)
December 31, 2016
Options Purchased Puts 0.5%
Issuer | Notional ($)/ Contracts | Exercise Price ($) | Expiration Date | Value ($) | |||||||||||||||
S&P 500 Index | 25 | 1,700.00 | 06/15/18 | 138,750 | |||||||||||||||
S&P 500 Index | 65 | 1,800.00 | 06/15/18 | 463,775 | |||||||||||||||
S&P 500 Index | 70 | 1,850.00 | 06/15/18 | 564,550 | |||||||||||||||
S&P 500 Index | 39 | 1,800.00 | 12/21/18 | 380,445 | |||||||||||||||
S&P 500 Index | 43 | 1,850.00 | 12/21/18 | 468,915 | |||||||||||||||
| Total Options Purchased Puts (Cost: $2,385,754) | 2,016,435 | ||||||||||||||||||
Money Market Funds 21.7% | |||||||||||
Shares | Value ($) | ||||||||||
| Columbia Short-Term Cash Fund, 0.594%(a)(f) | 96,565,730 | 96,565,730 | |||||||||
| Total Money Market Funds (Cost: $96,565,730) | 96,565,730 | ||||||||||
| Total Investments (Cost: $461,154,473) | 467,372,761 | ||||||||||
Other Assets & Liabilities, Net | (22,581,051 | ) | |||||||||
Net Assets | 444,791,710 | ||||||||||
At December 31, 2016, cash totaling $1,620,930 was pledged as collateral.
Investments in Derivatives
Forward Foreign Currency Exchange Contracts Open at December 31, 2016
Counterparty | Exchange Date | Currency to be Delivered | Currency to be Received | Unrealized Appreciation ($) | Unrealized Depreciation ($) | ||||||||||||||||||||||||||
Standard Chartered | 01/13/2017 | 170,000 | GBP | 212,762 | USD | 3,199 | — | ||||||||||||||||||||||||
State Street | 01/13/2017 | 46,000 | CAD | 34,372 | USD | 108 | — | ||||||||||||||||||||||||
UBS | 01/13/2017 | 314,000 | EUR | 334,507 | USD | 3,811 | — | ||||||||||||||||||||||||
Total | 7,118 | — | |||||||||||||||||||||||||||||
Futures Contracts Outstanding at December 31, 2016
Long Futures Contracts Outstanding
Contract Description | Number of Contracts | Trading Currency | Notional Market Value ($) | Expiration Date | Unrealized Appreciation ($) | Unrealized (Depreciation) ($) | |||||||||||||||||||||
| BP Currency | 10 | USD | 772,375 | 03/2017 | — | (21,412 | ) | ||||||||||||||||||||
Canadian Government 10-Year Bond | 1 | CAD | 102,432 | 03/2017 | — | (1,033 | ) | ||||||||||||||||||||
Euro FX | 6 | USD | 793,050 | 03/2017 | — | (8,047 | ) | ||||||||||||||||||||
Euro-Bobl | 1 | EUR | 140,666 | 03/2017 | 1,108 | — | |||||||||||||||||||||
Euro-Bund | 2 | EUR | 345,585 | 03/2017 | 4,817 | — | |||||||||||||||||||||
| JPY Currency | 13 | USD | 1,397,013 | 03/2017 | — | (19,888 | ) | ||||||||||||||||||||
Long Gilt | 1 | GBP | 155,073 | 03/2017 | 2,766 | — | |||||||||||||||||||||
S&P 500 E-mini | 156 | USD | 17,442,360 | 03/2017 | 239,059 | — | |||||||||||||||||||||
S&P 500 Index | 1 | USD | 559,050 | 03/2017 | 7,859 | — | |||||||||||||||||||||
SPI 200 Index | 5 | AUD | 507,952 | 03/2017 | 11,549 | — | |||||||||||||||||||||
TOPIX Index | 14 | JPY | 1,818,353 | 03/2017 | 41,127 | — | |||||||||||||||||||||
U.S. Long Bond | 26 | USD | 3,917,063 | 03/2017 | — | (30,686 | ) | ||||||||||||||||||||
U.S. Treasury 10-Year Note | 172 | USD | 21,376,375 | 03/2017 | — | (106,457 | ) | ||||||||||||||||||||
U.S. Treasury 2-Year Note | 130 | USD | 28,169,375 | 03/2017 | — | (34,171 | ) | ||||||||||||||||||||
The accompanying Notes to Financial Statements are an integral part of this statement.
Annual Report 2016
12
COLUMBIA VARIABLE PORTFOLIO — MANAGED VOLATILITY CONSERVATIVE FUND
PORTFOLIO OF INVESTMENTS (continued)
December 31, 2016
Futures Contracts Outstanding at December 31, 2016 (continued)
Long Futures Contracts Outstanding (continued)
Contract Description | Number of Contracts | Trading Currency | Notional Market Value ($) | Expiration Date | Unrealized Appreciation ($) | Unrealized (Depreciation) ($) | |||||||||||||||||||||
U.S. Treasury 5-Year Note | 4 | USD | 470,656 | 03/2017 | — | (1,629 | ) | ||||||||||||||||||||
U.S. Treasury 5-Year Note | 161 | USD | 18,943,914 | 03/2017 | — | (90,852 | ) | ||||||||||||||||||||
U.S. Ultra Bond | 4 | USD | 641,000 | 03/2017 | — | (5,807 | ) | ||||||||||||||||||||
Total | 97,552,292 | 308,285 | (319,982 | ) | |||||||||||||||||||||||
Short Futures Contracts Outstanding
Contract Description | Number of Contracts | Trading Currency | Notional Market Value ($) | Expiration Date | Unrealized Appreciation ($) | Unrealized (Depreciation) ($) | |||||||||||||||||||||
U.S. Long Bond | (9 | ) | USD | (1,355,906 | ) | 03/2017 | 10,532 | — | |||||||||||||||||||
U.S. Treasury 2-Year Note | (17 | ) | USD | (3,683,688 | ) | 03/2017 | 4,219 | — | |||||||||||||||||||
U.S. Treasury Ultra 10-Year Note | (3 | ) | USD | (402,188 | ) | 03/2017 | 2,344 | — | |||||||||||||||||||
U.S. Ultra Bond | (5 | ) | USD | (801,250 | ) | 03/2017 | 8,740 | — | |||||||||||||||||||
Total | (6,243,032 | ) | 25,835 | — | |||||||||||||||||||||||
Notes to Portfolio of Investments
(a) As defined in the Investment Company Act of 1940, an affiliated company is one in which the Fund owns 5% or more of the company's outstanding voting securities, or a company which is under common ownership or control with the Fund. Holdings and transactions in these affiliated companies during the year ended December 31, 2016 are as follows:
Issuer | Beginning Cost ($) | Purchase Cost ($) | Proceeds From Sales ($) | Realized Gain (Loss) ($) | Ending Cost ($) | Capital Gain Distributions ($) | Dividends — Affiliated Issuers ($) | Value ($) | |||||||||||||||||||||||||||
Columbia Short-Term Cash Fund | 55,856,006 | 93,901,593 | (53,191,901 | ) | 32 | 96,565,730 | — | 386,249 | 96,565,730 | ||||||||||||||||||||||||||
| Columbia Variable Portfolio — Contrarian Core Fund, Class 1 Shares | 1,816,176 | 1,781,291 | (569,138 | ) | 8,632 | 3,036,961 | — | — | 3,625,914 | ||||||||||||||||||||||||||
| Columbia Variable Portfolio — Disciplined Core Fund, Class 1 Shares | 5,453,906 | 6,509,029 | (1,892,462 | ) | 56,667 | 10,127,140 | — | — | 11,208,983 | ||||||||||||||||||||||||||
| Columbia Variable Portfolio — Dividend Opportunity Fund, Class 1 Shares | 2,126,435 | 1,820,553 | (611,623 | ) | 1,375 | 3,336,740 | — | — | 3,867,903 | ||||||||||||||||||||||||||
| Columbia Variable Portfolio — Income Opportunities Fund, Class 1 Shares | 7,013,094 | 1,990,000 | (9,001,632 | ) | (1,462 | ) | — | — | — | — | |||||||||||||||||||||||||
| Columbia Variable Portfolio — Intermediate Bond Fund, Class 1 Shares | 26,799,772 | 24,364,803 | (2,805,188 | ) | (75,999 | ) | 48,283,388 | 24,858 | 732,054 | 48,600,731 | |||||||||||||||||||||||||
| Columbia Variable Portfolio — Large Cap Growth Fund, Class 1 Shares | 791,342 | 2,341,951 | (71,424 | ) | (2,456 | ) | 3,059,413 | — | — | 3,296,541 | |||||||||||||||||||||||||
| Columbia Variable Portfolio — Limited Duration Credit Fund, Class 1 Shares | 8,493,443 | 7,622,333 | (1,133,216 | ) | (100,151 | ) | 14,882,409 | — | 492,722 | 14,620,314 | |||||||||||||||||||||||||
The accompanying Notes to Financial Statements are an integral part of this statement.
Annual Report 2016
13
COLUMBIA VARIABLE PORTFOLIO — MANAGED VOLATILITY CONSERVATIVE FUND
PORTFOLIO OF INVESTMENTS (continued)
December 31, 2016
Notes to Portfolio of Investments (continued)
Issuer | Beginning Cost ($) | Purchase Cost ($) | Proceeds From Sales ($) | Realized Gain (Loss) ($) | Ending Cost ($) | Capital Gain Distributions ($) | Dividends — Affiliated Issuers ($) | Value ($) | |||||||||||||||||||||||||||
| Columbia Variable Portfolio — Long Government/Credit Bond Fund, Class 1 Shares | 6,722,165 | 20,018,494 | (1,009,962 | ) | (95,610 | ) | 25,635,087 | — | 397,611 | 24,787,167 | |||||||||||||||||||||||||
| Columbia Variable Portfolio — Mid Cap Growth Fund, Class 1 Shares | — | 1,786,612 | (822,829 | ) | (3,718 | ) | 960,065 | — | — | 1,010,677 | |||||||||||||||||||||||||
| Columbia Variable Portfolio — Mid Cap Value Fund, Class 1 Shares | — | 1,778,248 | (911,456 | ) | 23,303 | 890,095 | — | — | 1,015,487 | ||||||||||||||||||||||||||
| Columbia Variable Portfolio — Select Large Cap Growth Fund, Class 1 Shares | 855,419 | 1,205,844 | (1,966,721 | ) | (94,542 | ) | — | 194,106 | — | — | |||||||||||||||||||||||||
| Columbia Variable Portfolio — Select Large-Cap Value Fund, Class 1 Shares | 1,068,835 | 879,162 | (439,480 | ) | 31,489 | 1,540,006 | — | — | 1,989,953 | ||||||||||||||||||||||||||
| Columbia Variable Portfolio — U.S. Equities Fund, Class 1 Shares | 3,308,669 | 1,532,342 | (2,590,220 | ) | (136,835 | ) | 2,113,956 | — | — | 2,648,552 | |||||||||||||||||||||||||
| Columbia Variable Portfolio — U.S. Government Mortgage Fund, Class 1 Shares | 8,050,325 | 7,594,300 | (905,581 | ) | (35,856 | ) | 14,703,188 | 91,817 | 353,291 | 14,545,920 | |||||||||||||||||||||||||
| Variable Portfolio — American Century Diversified Bond Fund, Class 1 Shares | 27,000,237 | 24,880,276 | (2,821,340 | ) | (89,179 | ) | 48,969,994 | 23,302 | 744,603 | 48,839,515 | |||||||||||||||||||||||||
| Variable Portfolio — Columbia Wanger International Equities Fund, Class 1 Shares | 225,420 | 1,337 | (199,929 | ) | (26,828 | ) | — | — | 1,337 | — | |||||||||||||||||||||||||
| Variable Portfolio — DFA International Value Fund, Class 1 Shares | 3,146,777 | 2,596,454 | (849,868 | ) | (101,218 | ) | 4,792,145 | 20,074 | 131,365 | 5,120,873 | |||||||||||||||||||||||||
| Variable Portfolio — J.P. Morgan Core Bond Fund, Class 1 Shares | 19,790,049 | 19,850,449 | (2,055,217 | ) | (78,649 | ) | 37,506,632 | 52,132 | 662,992 | 37,218,539 | |||||||||||||||||||||||||
| Variable Portfolio — Jennison Mid Cap Growth Fund, Class 1 Shares | 2,113 | 2,125,667 | (805,980 | ) | (8,718 | ) | 1,313,082 | — | — | 1,384,017 | |||||||||||||||||||||||||
| Variable Portfolio — Lazard International Equity Advantage Fund, Class 1 Shares | 1,000,894 | 1,288,074 | (240,115 | ) | (14,979 | ) | 2,033,874 | — | 37,650 | 2,060,397 | |||||||||||||||||||||||||
| Variable Portfolio — Loomis Sayles Growth Fund, Class 1 Shares | 814,523 | 4,411,194 | (528,296 | ) | (12,230 | ) | 4,685,191 | — | — | 5,113,465 | |||||||||||||||||||||||||
| Variable Portfolio — MFS Value Fund, Class 1 Shares | 997,753 | 941,346 | (361,875 | ) | 8,177 | 1,585,401 | — | — | 1,992,891 | ||||||||||||||||||||||||||
| Variable Portfolio — MFS® Blended Research® Core Equity Fund, Class 1 Shares | 2,204,150 | 2,009,252 | (664,222 | ) | 11,457 | 3,560,637 | — | — | 4,132,535 | ||||||||||||||||||||||||||
| Variable Portfolio — Morgan Stanley Advantage Fund, Class 1 Shares | 841,830 | 821,970 | (214,259 | ) | (3,274 | ) | 1,446,267 | — | — | 1,645,877 | |||||||||||||||||||||||||
| Variable Portfolio — Nuveen Winslow Large Cap Growth Fund, Class 1 Shares | 998,777 | 1,087,040 | (258,518 | ) | (10,200 | ) | 1,817,099 | — | — | 1,982,152 | |||||||||||||||||||||||||
| Variable Portfolio — Oppenheimer International Growth Fund, Class 1 Shares | 2,910,937 | 3,161,177 | (506,830 | ) | (79,252 | ) | 5,486,032 | 50,288 | 63,309 | 5,322,249 | |||||||||||||||||||||||||
The accompanying Notes to Financial Statements are an integral part of this statement.
Annual Report 2016
14
COLUMBIA VARIABLE PORTFOLIO — MANAGED VOLATILITY CONSERVATIVE FUND
PORTFOLIO OF INVESTMENTS (continued)
December 31, 2016
Notes to Portfolio of Investments (continued)
Issuer | Beginning Cost ($) | Purchase Cost ($) | Proceeds From Sales ($) | Realized Gain (Loss) ($) | Ending Cost ($) | Capital Gain Distributions ($) | Dividends — Affiliated Issuers ($) | Value ($) | |||||||||||||||||||||||||||
| Variable Portfolio — Partners Small Cap Growth Fund, Class 1 Shares | 1,126,466 | 1,060,888 | (440,574 | ) | (14,433 | ) | 1,732,347 | — | — | 1,935,863 | |||||||||||||||||||||||||
| Variable Portfolio — Partners Small Cap Value Fund, Class 1 Shares | 2,588,518 | 1,075,802 | (2,130,683 | ) | 38,245 | 1,571,882 | — | — | 2,111,395 | ||||||||||||||||||||||||||
| Variable Portfolio — Pyramis® International Equity Fund, Class 1 Shares | 3,002,305 | 3,002,203 | (572,573 | ) | (98,769 | ) | 5,333,166 | — | 102,800 | 5,200,157 | |||||||||||||||||||||||||
| Variable Portfolio — T. Rowe Price Large Cap Value Fund, Class 1 Shares | 1,099,978 | 956,250 | (400,788 | ) | 15,943 | 1,671,383 | — | — | 1,987,575 | ||||||||||||||||||||||||||
| Variable Portfolio — TCW Core Plus Bond Fund, Class 1 Shares | 26,535,966 | 24,977,542 | (2,704,064 | ) | (73,623 | ) | 48,735,821 | 173,227 | 502,637 | 48,555,444 | |||||||||||||||||||||||||
| Variable Portfolio — Victory Sycamore Established Value Fund, Class 1 Shares | 1,099 | 2,027,054 | (857,682 | ) | 20,469 | 1,190,940 | — | — | 1,387,160 | ||||||||||||||||||||||||||
| Variable Portfolio — Wells Fargo Short Duration Government Fund, Class 1 Shares | 3,125,883 | 3,413,270 | (440,117 | ) | (6,039 | ) | 6,092,997 | 20,365 | 48,094 | 6,049,519 | |||||||||||||||||||||||||
Total | 225,769,262 | 274,813,800 | (94,975,763 | ) | (948,231 | ) | 404,659,068 | 650,169 | 4,656,714 | 409,823,495 | |||||||||||||||||||||||||
(b) Non-income producing investment.
(c) Principal amounts are denominated in United States Dollars unless otherwise noted.
(d) Represents privately placed and other securities and instruments exempt from SEC registration (collectively, private placements), such as Section 4(a)(2) and Rule 144A eligible securities, which are often sold only to qualified institutional buyers. The Fund may invest in private placements determined to be liquid as well as those determined to be illiquid. Private placements may be determined to be liquid under guidelines established by the Fund's Board of Trustees. At December 31, 2016, the value of these securities amounted to $1,071,803 or 0.24% of net assets.
(e) Security, or a portion thereof, has been purchased on a when-issued or delayed delivery basis.
(f) The rate shown is the seven-day current annualized yield at December 31, 2016.
Currency Legend
AUD Australian Dollar
CAD Canadian Dollar
EUR Euro
GBP British Pound
JPY Japanese Yen
USD US Dollar
Fair Value Measurements
The Fund categorizes its fair value measurements according to a three-level hierarchy that maximizes the use of observable inputs and minimizes the use of unobservable inputs by prioritizing that the most observable input be used when available. Observable inputs are those that market participants would use in pricing an investment based on market data obtained from sources independent of the reporting entity. Unobservable inputs are those that reflect the Fund's assumptions about the information market participants would use in pricing an investment. An investment's level within the fair value hierarchy is based on the lowest level of any input that is deemed significant to the
The accompanying Notes to Financial Statements are an integral part of this statement.
Annual Report 2016
15
COLUMBIA VARIABLE PORTFOLIO — MANAGED VOLATILITY CONSERVATIVE FUND
PORTFOLIO OF INVESTMENTS (continued)
December 31, 2016
Fair Value Measurements (continued)
asset's or liability's fair value measurement. The input levels are not necessarily an indication of the risk or liquidity associated with investments at that level. For example, certain U.S. government securities are generally high quality and liquid, however, they are reflected as Level 2 because the inputs used to determine fair value may not always be quoted prices in an active market.
Fair value inputs are summarized in the three broad levels listed below:
> Level 1 — Valuations based on quoted prices for investments in active markets that the Fund has the ability to access at the measurement date (including NAV for open-end mutual funds). Valuation adjustments are not applied to Level 1 investments.
> Level 2 — Valuations based on other significant observable inputs (including quoted prices for similar securities, interest rates, prepayment speeds, credit risks, etc.).
> Level 3 — Valuations based on significant unobservable inputs (including the Fund's own assumptions and judgment in determining the fair value of investments).
Inputs that are used in determining fair value of an investment may include price information, credit data, volatility statistics, and other factors. These inputs can be either observable or unobservable. The availability of observable inputs can vary between investments, and is affected by various factors such as the type of investment, and the volume and level of activity for that investment or similar investments in the marketplace. The inputs will be considered by the Investment Manager, along with any other relevant factors in the calculation of an investment's fair value. The Fund uses prices and inputs that are current as of the measurement date, which may include periods of market dislocations. During these periods, the availability of prices and inputs may be reduced for many investments. This condition could cause an investment to be reclassified between the various levels within the hierarchy.
Certain investments that have been measured at fair value using the net asset value (NAV) per share (or its equivalent) are not categorized in the fair value hierarchy. The fair value amounts presented in the table are intended to reconcile the fair value hierarchy to the amounts presented in the Portfolio of Investments. The Variable Portfolios serve as investment vehicles for variable annuity contracts and variable life insurance policies. Principle investment strategies within these Variable Portfolios vary based on the Portfolios investment objective. Investments in the Variable Portfolios may be redeemed on a daily basis without restriction. The Columbia Short-Term Cash Fund seeks to provide shareholders with maximum current income consistent with liquidity and stability of principal. Columbia Short-Term Cash Fund prices its shares with a floating NAV and no longer seeks to maintain a stable NAV.
Investments falling into the Level 3 category are primarily supported by quoted prices from brokers and dealers participating in the market for those investments. However, these may be classified as Level 3 investments due to lack of market transparency and corroboration to support these quoted prices. Additionally, valuation models may be used as the pricing source for any remaining investments classified as Level 3. These models may rely on one or more significant unobservable inputs and/or significant assumptions by the Investment Manager. Inputs used in valuations may include, but are not limited to, financial statement analysis, capital account balances, discount rates and estimated cash flows, and comparable company data.
Under the direction of the Fund's Board of Trustees (the Board), the Investment Manager's Valuation Committee (the Committee) is responsible for overseeing the valuation procedures approved by the Board. The Committee consists of voting and non-voting members from various groups within the Investment Manager's organization, including operations and accounting, trading and investments, compliance, risk management and legal.
The Committee meets at least monthly to review and approve valuation matters, which may include a description of specific valuation determinations, data regarding pricing information received from approved pricing vendors and brokers and the results of Board-approved valuation control policies and procedures (the Policies). The Policies address, among other things, instances when market quotations are or are not readily available, including recommendations of third party pricing vendors and a determination of appropriate pricing methodologies; events that require specific valuation determinations and assessment of fair value techniques; securities with a potential for stale pricing, including those that are illiquid, restricted, or in default; and the effectiveness of third party pricing vendors, including periodic reviews of vendors. The Committee meets more frequently, as needed, to discuss additional valuation matters, which may include the need to review back-testing results, review time-sensitive information or approve related valuation actions. The Committee reports to the Board, with members of the Committee meeting with the Board at each of its regularly scheduled meetings to discuss valuation matters and actions during the period, similar to those described earlier.
For investments categorized as Level 3, the Committee monitors information similar to that described above, which may include: (i) data specific to the issuer or comparable issuers, (ii) general market or specific sector news and (iii) quoted prices and specific or similar security transactions. The Committee considers this data and any changes from prior periods in order to assess the reasonableness of observable and unobservable inputs, any assumptions or internal models used to value those securities and changes in fair value. This data is also used to corroborate, when available, information received from approved pricing vendors and brokers. Various factors impact the frequency of monitoring this information (which may occur as often as daily). However, the Committee may determine that changes to inputs, assumptions and models are not required as a result of the monitoring procedures performed.
The accompanying Notes to Financial Statements are an integral part of this statement.
Annual Report 2016
16
COLUMBIA VARIABLE PORTFOLIO — MANAGED VOLATILITY CONSERVATIVE FUND
PORTFOLIO OF INVESTMENTS (continued)
December 31, 2016
Fair Value Measurements (continued)
The following table is a summary of the inputs used to value the Fund's investments at December 31, 2016:
| Level 1 Quoted Prices in Active Markets for Identical Assets ($) | Level 2 Other Significant Observable Inputs ($) | Level 3 Significant Unobservable Inputs ($) | Total ($) | ||||||||||||||||
Investments | |||||||||||||||||||
Exchange-Traded Funds | 25,975,548 | — | — | 25,975,548 | |||||||||||||||
Corporate Bonds & Notes | — | 4,908,958 | — | 4,908,958 | |||||||||||||||
| Residential Mortgage-Backed Securities — Agency | — | 24,608,866 | — | 24,608,866 | |||||||||||||||
U.S. Treasury Obligations | 39,459 | — | — | 39,459 | |||||||||||||||
Options Purchased Puts | 2,016,435 | — | — | 2,016,435 | |||||||||||||||
Total Investments | 28,031,442 | 29,517,824 | — | 57,549,266 | |||||||||||||||
Investments measured at net asset value | |||||||||||||||||||
Equity Funds | — | — | — | 70,040,616 | |||||||||||||||
Fixed-Income Funds | — | — | — | 243,217,149 | |||||||||||||||
Money Market Funds | — | — | — | 96,565,730 | |||||||||||||||
Total Investments | 28,031,442 | 29,517,824 | — | 467,372,761 | |||||||||||||||
Derivatives | |||||||||||||||||||
Assets | |||||||||||||||||||
| Forward Foreign Currency Exchange Contracts | — | 7,118 | — | 7,118 | |||||||||||||||
Futures Contracts | 334,120 | — | — | 334,120 | |||||||||||||||
Liabilities | |||||||||||||||||||
Futures Contracts | (319,982 | ) | — | — | (319,982 | ) | |||||||||||||
Total | 28,045,580 | 29,524,942 | — | 467,394,017 | |||||||||||||||
See the Portfolio of Investments for all investment classifications not indicated in the table.
The Fund's assets assigned to the Level 2 input category are generally valued using the market approach, in which a security's value is determined through reference to prices and information from market transactions for similar or identical assets.
Forward foreign currency exchange contracts and futures contracts are valued at unrealized appreciation (depreciation).
There were no transfers of financial assets between levels during the period.
The accompanying Notes to Financial Statements are an integral part of this statement.
Annual Report 2016
17
COLUMBIA VARIABLE PORTFOLIO — MANAGED VOLATILITY CONSERVATIVE FUND
STATEMENT OF ASSETS AND LIABILITIES
December 31, 2016
Assets | |||||||
Investments, at value | |||||||
Unaffiliated issuers (identified cost $54,109,651) | $ | 55,532,831 | |||||
Affiliated issuers (identified cost $404,659,068) | 409,823,495 | ||||||
Options purchased (identified cost $2,385,754) | 2,016,435 | ||||||
Total investments (identified cost $461,154,473) | 467,372,761 | ||||||
Cash | 260,000 | ||||||
Foreign currency (identified cost $8,729) | 8,727 | ||||||
Cash collateral held at broker | 30,000 | ||||||
Margin deposits | 1,590,930 | ||||||
Unrealized appreciation on forward foreign currency exchange contracts | 7,118 | ||||||
Receivable for: | |||||||
Investments sold | 194,491 | ||||||
Dividends | 145,733 | ||||||
Interest | 81,406 | ||||||
Foreign tax reclaims | 41 | ||||||
Variation margin | 130,588 | ||||||
Prepaid expenses | 2,056 | ||||||
Trustees' deferred compensation plan | 13,130 | ||||||
Total assets | 469,836,981 | ||||||
Liabilities | |||||||
Payable for: | |||||||
Investments purchased on a delayed delivery basis | 24,618,497 | ||||||
Capital shares purchased | 277,844 | ||||||
Variation margin | 91,203 | ||||||
Management services fees | 2,762 | ||||||
Distribution and/or service fees | 3,044 | ||||||
Transfer agent fees | 216 | ||||||
Compensation of board members | 1,322 | ||||||
Chief compliance officer expenses | 47 | ||||||
Other expenses | 37,206 | ||||||
Trustees' deferred compensation plan | 13,130 | ||||||
Total liabilities | 25,045,271 | ||||||
Net assets applicable to outstanding capital stock | $ | 444,791,710 | |||||
Represented by | |||||||
Trust capital | $ | 444,791,710 | |||||
Total — representing net assets applicable to outstanding capital stock | $ | 444,791,710 | |||||
Class 2 | |||||||
Net assets | $ | 444,791,710 | |||||
Shares outstanding | 41,270,293 | ||||||
Net asset value per share | $ | 10.78 | |||||
The accompanying Notes to Financial Statements are an integral part of this statement.
Annual Report 2016
18
COLUMBIA VARIABLE PORTFOLIO — MANAGED VOLATILITY CONSERVATIVE FUND
STATEMENT OF OPERATIONS
Year Ended December 31, 2016
Net investment income | |||||||
Income: | |||||||
Dividends — unaffiliated issuers | $ | 459,320 | |||||
Dividends — affiliated issuers | 4,656,714 | ||||||
Interest | 160,087 | ||||||
Total income | 5,276,121 | ||||||
Expenses: | |||||||
Management services fees | 862,287 | ||||||
Distribution and/or service fees | |||||||
Class 2 | 944,273 | ||||||
Transfer agent fees | |||||||
Class 2 | 67,435 | ||||||
Compensation of board members | 23,515 | ||||||
Custodian fees | 32,913 | ||||||
Printing and postage fees | 36,541 | ||||||
Audit fees | 22,542 | ||||||
Legal fees | 9,927 | ||||||
Chief compliance officer expenses | 176 | ||||||
Other | 11,656 | ||||||
Total expenses | 2,011,265 | ||||||
Net investment income | 3,264,856 | ||||||
Realized and unrealized gain (loss) — net | |||||||
Net realized gain (loss) on: | |||||||
Investments — unaffiliated issuers | (111,376 | ) | |||||
Investments — affiliated issuers | (948,231 | ) | |||||
Capital gain distributions from underlying affiliated funds | 650,169 | ||||||
Foreign currency translations | 6,308 | ||||||
Forward foreign currency exchange contracts | 55,156 | ||||||
Futures contracts | 726,620 | ||||||
Options purchased | (1,845,343 | ) | |||||
Net realized loss | (1,466,697 | ) | |||||
Net change in unrealized appreciation (depreciation) on: | |||||||
Investments — unaffiliated issuers | 1,348,666 | ||||||
Investments — affiliated issuers | 5,942,148 | ||||||
Foreign currency translations | (7,264 | ) | |||||
Forward foreign currency exchange contracts | 4,450 | ||||||
Futures contracts | (183,570 | ) | |||||
Options purchased | 191,103 | ||||||
Net change in unrealized appreciation | 7,295,533 | ||||||
Net realized and unrealized gain | 5,828,836 | ||||||
Net increase in net assets resulting from operations | $ | 9,093,692 | |||||
The accompanying Notes to Financial Statements are an integral part of this statement.
Annual Report 2016
19
COLUMBIA VARIABLE PORTFOLIO — MANAGED VOLATILITY CONSERVATIVE FUND
STATEMENT OF CHANGES IN NET ASSETS
| Year Ended December 31, 2016 | Year Ended December 31, 2015 | ||||||||||
Operations | |||||||||||
Net investment income | $ | 3,264,856 | $ | 1,844,448 | |||||||
Net realized loss | (1,466,697 | ) | (424,492 | ) | |||||||
Net change in unrealized appreciation (depreciation) | 7,295,533 | (4,247,546 | ) | ||||||||
Net increase (decrease) in net assets resulting from operations | 9,093,692 | (2,827,590 | ) | ||||||||
Increase in net assets from capital stock activity | 193,722,808 | 102,382,713 | |||||||||
Total increase in net assets | 202,816,500 | 99,555,123 | |||||||||
Net assets at beginning of year | 241,975,210 | 142,420,087 | |||||||||
Net assets at end of year | $ | 444,791,710 | $ | 241,975,210 | |||||||
The accompanying Notes to Financial Statements are an integral part of this statement.
Annual Report 2016
20
COLUMBIA VARIABLE PORTFOLIO — MANAGED VOLATILITY CONSERVATIVE FUND
STATEMENT OF CHANGES IN NET ASSETS (continued)
Year Ended December 31, 2016 | Year Ended December 31, 2015 | ||||||||||||||||||
Shares | Dollars ($) | Shares | Dollars ($) | ||||||||||||||||
Capital stock activity | |||||||||||||||||||
Class 2 shares | |||||||||||||||||||
Subscriptions | 22,185,260 | 237,339,879 | 11,813,595 | 125,160,398 | |||||||||||||||
Redemptions | (4,055,487 | ) | (43,617,071 | ) | (2,139,792 | ) | (22,777,685 | ) | |||||||||||
Net increase | 18,129,773 | 193,722,808 | 9,673,803 | 102,382,713 | |||||||||||||||
Total net increase | 18,129,773 | 193,722,808 | 9,673,803 | 102,382,713 | |||||||||||||||
The accompanying Notes to Financial Statements are an integral part of this statement.
Annual Report 2016
21
COLUMBIA VARIABLE PORTFOLIO — MANAGED VOLATILITY CONSERVATIVE FUND
FINANCIAL HIGHLIGHTS
The following table is intended to help you understand the Fund's financial performance. Certain information reflects financial results for a single share of a class held for the periods shown. Per share net investment income (loss) amounts are calculated based on average shares outstanding during the period. Total return assumes reinvestment of all dividends and distributions, if any. Total return does not reflect any fees and expenses imposed under your Contract and/or Qualified Plan, as applicable; such fees and expenses would reduce the total returns for all periods shown. Total return and portfolio turnover are not annualized for periods of less than one year. The portfolio turnover rate is calculated without regard to purchase and sales transactions of short-term instruments and certain derivatives, if any. If such transactions were included, the Fund's portfolio turnover rate may be higher.
Year Ended December 31, | |||||||||||||||||||
Class 2 | 2016 | 2015 | 2014 | 2013(a) | |||||||||||||||
Per share data | |||||||||||||||||||
Net asset value, beginning of period | $ | 10.46 | $ | 10.58 | $ | 10.13 | $ | 10.00 | |||||||||||
Income from investment operations: | |||||||||||||||||||
Net investment income | 0.09 | 0.10 | 0.06 | 0.10 | |||||||||||||||
Net realized and unrealized gain (loss) | 0.23 | (0.22 | ) | 0.39 | 0.03 | ||||||||||||||
Total from investment operations | 0.32 | (0.12 | ) | 0.45 | 0.13 | ||||||||||||||
Net asset value, end of period | $ | 10.78 | $ | 10.46 | $ | 10.58 | $ | 10.13 | |||||||||||
Total return | 3.06 | % | (1.13 | %) | 4.44 | % | 1.30 | % | |||||||||||
Ratios to average net assets(b) | |||||||||||||||||||
Total gross expenses | 0.53 | % | 0.56 | % | 0.61 | % | 0.91 | %(c) | |||||||||||
Total net expenses(d) | 0.53 | % | 0.56 | % | 0.60 | % | 0.67 | %(c) | |||||||||||
Net investment income | 0.86 | % | 0.98 | % | 0.54 | % | 1.34 | %(c) | |||||||||||
Supplemental data | |||||||||||||||||||
Net assets, end of period (in thousands) | $ | 444,792 | $ | 241,975 | $ | 142,420 | $ | 62,186 | |||||||||||
Portfolio turnover | 106 | % | 142 | % | 184 | % | 109 | % | |||||||||||
Notes to Financial Highlights
(a) Based on operations from April 12, 2013 (commencement of operations) through the stated period end.
(b) In addition to the fees and expenses that the Fund bears directly, the Fund indirectly bears a pro rata share of the fees and expenses of any other funds in which it invests. Such indirect expenses are not included in the Fund's reported expense ratios.
(c) Annualized.
(d) Total net expenses include the impact of certain fee waivers/expense reimbursements made by the Investment Manager and certain of its affiliates, if applicable.
The accompanying Notes to Financial Statements are an integral part of this statement.
Annual Report 2016
22
COLUMBIA VARIABLE PORTFOLIO — MANAGED VOLATILITY CONSERVATIVE FUND
NOTES TO FINANCIAL STATEMENTS
December 31, 2016
Note 1. Organization
Columbia Variable Portfolio — Managed Volatility Conservative Fund (the Fund), a series of Columbia Funds Variable Insurance Trust (the Trust), is a diversified fund. The Trust is registered under the Investment Company Act of 1940, as amended (the 1940 Act), as an open-end management investment company organized as a Massachusetts business trust.
The Fund is a "fund-of-funds", investing significantly in affiliated funds managed by Columbia Management Investment Advisers, LLC (the Investment Manager), a wholly-owned subsidiary of Ameriprise Financial, Inc. (Ameriprise Financial), its affiliates, or third-party advised (unaffiliated) funds, including exchange-traded funds (collectively, Underlying Funds).
For information on the Underlying Funds, please refer to the Fund's current prospectus and the prospectuses of the Underlying Funds, which are available, free of charge, from the Securities and Exchange Commission website, www.sec.gov.
Fund Shares
The Trust may issue an unlimited number of shares (without par value). The Fund offers Class 2 shares to separate accounts funding variable annuity contracts and variable life insurance policies (collectively, Contracts) issued by affiliated and unaffiliated life insurance companies as well as other qualified institutional investors (Qualified Investors) authorized by Columbia Management Investment Distributors, Inc. (the Distributor). You may not buy (nor will you own) shares of the Fund directly. You may invest by buying a Contract.
Note 2. Summary of Significant Accounting Policies
Basis of Preparation
The Fund is an investment company that applies the accounting and reporting guidance in the Financial Accounting Standards Board (FASB) Accounting Standards Codification Topic 946, Financial Services — Investment Companies (ASC 946). The financial statements are prepared in accordance with U.S. generally accepted accounting principles (GAAP), which requires management to make certain estimates and assumptions that affect the reported amounts of assets and liabilities, the disclosure of contingent assets and liabilities at the date of the financial statements and the reported amounts of income and expenses during the reporting period. Actual results could differ from those estimates.
The following is a summary of significant accounting policies followed by the Fund in the preparation of its financial statements.
Security Valuation
All equity securities and exchange-traded funds are valued at the close of business of the New York Stock Exchange. Equity securities and exchange-traded funds are valued at the last quoted sales price on the principal exchange or market on which they trade, except for securities traded on the NASDAQ Stock Market, which are valued at the NASDAQ official close price. Unlisted securities or listed securities for which there were no sales during the day are valued at the mean of the latest quoted bid and ask prices on such exchanges or markets.
Debt securities generally are valued by pricing services approved by the Board of Trustees based upon market transactions for normal, institutional-size trading units of similar securities. The services may use various pricing techniques that take into account, as applicable, factors such as yield, quality, coupon rate, maturity, type of issue, trading characteristics and other data, as well as approved independent broker-dealer quotes. Debt securities for which quotations are not readily available or not believed to be reflective of market value may also be valued based upon a bid quote from an approved independent broker-dealer. Debt securities maturing in 60 days or less are valued primarily at amortized cost value, unless this method results in a valuation that management believes does not approximate market value.
Asset- and mortgage-backed securities are generally valued by pricing services, which utilize pricing models that incorporate the securities' cash flow and loan performance data. These models also take into account available market data, including trades, market quotations, and benchmark yield curves for identical or similar securities. Factors used to identify similar securities may include, but are not limited to, issuer, collateral type, vintage, prepayment speeds, collateral performance, credit ratings, credit enhancement and expected life. Asset-backed securities for which quotations are readily available may also be valued based upon an over-the-counter or exchange bid quote from an approved independent broker-dealer.
Investments in the Underlying Funds are valued at the net asset value of the applicable class of the Underlying Fund determined as of the close of the New York Stock Exchange on the valuation date.
Annual Report 2016
23
COLUMBIA VARIABLE PORTFOLIO — MANAGED VOLATILITY CONSERVATIVE FUND
NOTES TO FINANCIAL STATEMENTS (continued)
December 31, 2016
Forward foreign currency exchange contracts are marked-to-market based upon foreign currency exchange rates provided by a pricing service.
Futures and options on futures contracts are valued based upon the settlement price at the close of regular trading on their principal exchanges or, in the absence of transactions, at the mean of the latest quoted bid and ask prices.
Option contracts are valued at the mean of the latest quoted bid and ask prices on their primary exchanges. Option contracts, including over-the-counter option contracts, with no readily available market quotations are valued using quotes obtained from independent brokers as of the close of the New York Stock Exchange.
Investments for which market quotations are not readily available, or that have quotations which management believes are not reflective of market value or reliable, are valued at fair value as determined in good faith under procedures approved by and under the general supervision of the Board of Trustees. If a security or class of securities (such as foreign securities) is valued at fair value, such value is likely to be different from the quoted or published price for the security.
The determination of fair value often requires significant judgment. To determine fair value, management may use assumptions including but not limited to future cash flows and estimated risk premiums. Multiple inputs from various sources may be used to determine fair value.
GAAP requires disclosure regarding the inputs and valuation techniques used to measure fair value and any changes in valuation inputs or techniques. In addition, investments shall be disclosed by major category. This information is disclosed following the Fund's Portfolio of Investments.
Foreign Currency Transactions and Translations
The values of all assets and liabilities denominated in foreign currencies are generally translated into U.S. dollars at exchange rates determined at the close of regular trading on the New York Stock Exchange. Net realized and unrealized gains (losses) on foreign currency transactions and translations include gains (losses) arising from the fluctuation in exchange rates between trade and settlement dates on securities transactions, gains (losses) arising from the disposition of foreign currency and currency gains (losses) between the accrual and payment dates on dividends, interest income and foreign withholding taxes.
For financial statement purposes, the Fund does not distinguish that portion of gains (losses) on investments which is due to changes in foreign exchange rates from that which is due to changes in market prices of the investments. Such fluctuations are included with the net realized and unrealized gains (losses) on investments in the Statement of Operations.
Derivative Instruments
The Fund invests in certain derivative instruments, as detailed below, to meet its investment objectives. Derivatives are instruments whose values depend on, or are derived from, in whole or in part, the value of one or more securities, currencies, commodities, indices, or other assets or instruments. Derivatives may be used to increase investment flexibility (including to maintain cash reserves while maintaining desired exposure to certain assets), for risk management (hedging) purposes, to facilitate trading, to reduce transaction costs and to pursue higher investment returns. The Fund may also use derivative instruments to mitigate certain investment risks, such as foreign currency exchange rate risk, interest rate risk and credit risk. Derivatives may involve various risks, including the potential inability of the counterparty to fulfill its obligations under the terms of the contract, the potential for an illiquid secondary market (making it difficult for the Fund to sell or terminate, including at favorable prices) and the potential for market movements which may expose the Fund to gains or losses in excess of the amount shown in the Statement of Assets and Liabilities. The notional amounts of derivative instruments, if applicable, are not recorded in the financial statements.
A derivative instrument may suffer a marked-to-market loss if the value of the contract decreases due to an unfavorable change in the market rates or values of the underlying instrument. Losses can also occur if the counterparty does not perform its obligations under the contract. The Fund's risk of loss from counterparty credit risk on over-the-counter derivatives is generally limited to the aggregate unrealized gain netted against any collateral held by the Fund and the amount of any variation margin held by the counterparty, plus any replacement costs or related amounts. With exchange-traded or centrally cleared derivatives, there is reduced counterparty credit risk to the Fund since the clearinghouse or central counterparty (CCP) provides some protection in the case of clearing member default. The clearinghouse or CCP stands between the buyer and the seller of the contract; therefore, additional
Annual Report 2016
24
COLUMBIA VARIABLE PORTFOLIO — MANAGED VOLATILITY CONSERVATIVE FUND
NOTES TO FINANCIAL STATEMENTS (continued)
December 31, 2016
counterparty credit risk is failure of the clearinghouse or CCP. However, credit risk still exists in exchange-traded or centrally cleared derivatives with respect to initial and variation margin that is held in a broker's customer account. While brokers are required to segregate customer margin from their own assets, in the event that a broker becomes insolvent or goes into bankruptcy and at that time there is a shortfall in the aggregate amount of margin held by the broker for all its clients, U.S. bankruptcy laws will typically allocate that shortfall on a pro-rata basis across all the broker's customers (including the Fund), potentially resulting in losses to the Fund.
In order to better define its contractual rights and to secure rights that will help the Fund mitigate its counterparty risk, the Fund may enter into an International Swaps and Derivatives Association, Inc. Master Agreement (ISDA Master Agreement) or similar agreement with its derivatives contract counterparties. An ISDA Master Agreement is an agreement between the Fund and a counterparty that governs over-the-counter derivatives and typically contains, among other things, collateral posting terms and netting provisions in the event of a default and/or termination event. Under an ISDA Master Agreement, the Fund may, under certain circumstances, offset with the counterparty certain derivative instrument's payables and/or receivables with collateral held and/or posted and create one single net payment. The provisions of the ISDA Master Agreement typically permit a single net payment in the event of default (close-out netting), including the bankruptcy or insolvency of the counterparty. Note, however, that bankruptcy or insolvency laws of a particular jurisdiction may impose restrictions on or prohibitions against the right of offset or netting in bankruptcy, insolvency or other events.
Collateral (margin) requirements differ by type of derivative. Margin requirements are established by the clearinghouse or CCP for exchange-traded and centrally cleared derivatives. Brokers can ask for margin in excess of the minimum in certain circumstances. Collateral terms are contract specific for over-the-counter derivatives. For over-the-counter derivatives traded under an ISDA Master Agreement, the collateral requirements are typically calculated by netting the marked-to-market amount for each transaction under such agreement and comparing that amount to the value of any variation margin currently pledged by the Fund and/or the counterparty. Generally, the amount of collateral due from or to a party has to exceed a minimum transfer amount threshold (e.g., $250,000) before a transfer has to be
made. To the extent amounts due to the Fund from its counterparties are not fully collateralized, contractually or otherwise, the Fund bears the risk of loss from counterparty nonperformance. The Fund attempts to mitigate counterparty risk by only entering into agreements with counterparties that it believes have the financial resources to honor their obligations and by monitoring the financial stability of those counterparties.
Certain ISDA Master Agreements allow counterparties of over-the-counter derivatives transactions to terminate derivatives contracts prior to maturity in the event the Fund's net asset value declines by a stated percentage over a specified time period or if the Fund fails to meet certain terms of the ISDA Master Agreement, which would cause the Fund to accelerate payment of any net liability owed to the counterparty. The Fund also has termination rights if the counterparty fails to meet certain terms of the ISDA Master Agreement. In addition to considering counterparty credit risk, the Fund would consider terminating the derivatives contracts based on whether termination would result in a net liability owed from the counterparty.
For financial reporting purposes, the Fund does not offset derivative assets and derivative liabilities that are subject to netting arrangements in the Statement of Assets and Liabilities.
Forward Foreign Currency Exchange Contracts
Forward foreign currency exchange contracts are over-the-counter agreements between two parties to buy and sell a currency at a set price on a future date. The Fund utilized forward foreign currency exchange contracts to hedge the currency exposure associated with some or all of the Fund's securities, to shift foreign currency exposure back to U.S. dollars, to shift investment exposure from one currency to another, to shift U.S. dollar exposure to achieve a representative weighted mix of major currencies in its benchmark. These instruments may be used for other purposes in future periods.
The values of forward foreign currency exchange contracts fluctuate daily with changes in foreign currency exchange rates. Changes in the value of these contracts are recorded as unrealized appreciation or depreciation until the contract is exercised or has expired. The Fund will realize a gain or loss when the forward foreign currency exchange contract is closed or expires.
The use of forward foreign currency exchange contracts does not eliminate fluctuations in the prices of the Fund's portfolio securities. The risks of forward foreign currency
Annual Report 2016
25
COLUMBIA VARIABLE PORTFOLIO — MANAGED VOLATILITY CONSERVATIVE FUND
NOTES TO FINANCIAL STATEMENTS (continued)
December 31, 2016
exchange contracts include movement in the values of the foreign currencies relative to the U.S. dollar (or other foreign currencies) and the possibility that counterparties will not complete their contractual obligations, which may be in excess of the amount reflected, if any, in the Statement of Assets and Liabilities.
Futures Contracts
Futures contracts are exchange-traded and represent commitments for the future purchase or sale of an asset at a specified price on a specified date. The Fund bought and sold futures contracts to produce incremental earnings, to manage the duration and yield curve exposure of the Fund versus the benchmark, to manage exposure to movements in interest rates, to manage exposure to the securities market and to maintain appropriate equity market exposure while keeping sufficient cash to accommodate daily redemptions. These instruments may be used for other purposes in future periods. Upon entering into futures contracts, the Fund bears risks that it may not achieve the anticipated benefits of the futures contracts and may realize a loss. Additional risks include counterparty credit risk, the possibility of an illiquid market, and that a change in the value of the contract or option may not correlate with changes in the value of the underlying asset.
Upon entering into a futures contract, the Fund deposits cash or securities with the broker, known as a futures commission merchant (FCM), in an amount sufficient to meet the initial margin requirement. The initial margin deposit must be maintained at an established level over the life of the contract. Cash deposited as initial margin is recorded in the Statement of Assets and Liabilities as margin deposits. Securities deposited as initial margin are designated in the Portfolio of Investments. Subsequent payments (variation margin) are made or received by the Fund each day. The variation margin payments are equal to the daily change in the contract value and are recorded as variation margin receivable or payable and are offset in unrealized gains or losses. The Fund recognizes a realized gain or loss when the contract is closed or expires. Futures contracts involve, to varying degrees, risk of loss in excess of the variation margin disclosed in the Statement of Assets and Liabilities.
Options Contracts
Options are contracts which entitle the holder to purchase or sell securities or other identified assets at a specified price, or in the case of index option contracts, to receive or pay the difference between the index value and the strike price of the index option contract. Option contracts can be either exchange-traded or over-the-counter. The Fund purchased and wrote option contracts to produce incremental earnings, to decrease the Fund's exposure to equity market risk and to increase return on investments and to facilitate buying and selling of securities for investments. These instruments may be used for other purposes in future periods. Completion of transactions for option contracts traded in the over-the-counter market depends upon the performance of the other party. Cash collateral may be collected or posted by the Fund to secure certain over-the-counter option contract trades. Cash collateral held or posted by the Fund for such option contract trades must be returned to the broker or the Fund upon closure, exercise or expiration of the contract.
Options contracts purchased are recorded as investments. When the Fund writes an options contract, the premium received is recorded as an asset and an amount equivalent to the premium is recorded as a liability in the Statement of Assets and Liabilities and is subsequently adjusted to reflect the current fair value of the option written. Changes in the fair value of the written option are recorded as unrealized appreciation or depreciation until the contract is exercised or has expired. The Fund will realize a gain or loss when the option contract is closed or expires. When option contracts are exercised, the proceeds on sales for a written call or purchased put option contract, or the purchase cost for a written put or purchased call option contract, is adjusted by the amount of premium received or paid.
For over-the-counter options purchased, the Fund bears the risk of loss of the amount of the premiums paid plus the positive change in market values net of any collateral held by the Fund should the counterparty fail to perform under the contracts. Option contracts written by the Fund do not typically give rise to significant counterparty credit risk, as options written generally obligate the Fund and not the counterparty to perform. The risk in writing a call option contract is that the Fund gives up the opportunity
Annual Report 2016
26
COLUMBIA VARIABLE PORTFOLIO — MANAGED VOLATILITY CONSERVATIVE FUND
NOTES TO FINANCIAL STATEMENTS (continued)
December 31, 2016
for profit if the market price of the security increases above the strike price and the option contract is exercised. The risk in writing a put option contract is that the Fund may incur a loss if the market price of the security decreases below the strike price and the option contract is exercised. Exercise of a written option could result in the Fund purchasing or selling a security or foreign currency when it otherwise would not, or at a price different from the current market value. In purchasing and writing options, the Fund bears the risk of an unfavorable change in the value of the underlying instrument or the risk that the Fund may not be able to enter into a closing transaction due to an illiquid market.
Effects of Derivative Transactions in the Financial Statements
The following tables are intended to provide additional information about the effect of derivatives on the financial statements of the Fund, including: the fair value of derivatives by risk category and the location of those fair values in the Statement of Assets and Liabilities; and the impact of derivative transactions over the period in the Statement of Operations, including realized and unrealized gains (losses). The derivative instrument schedules following the Portfolio of Investments present additional information regarding derivative instruments outstanding at the end of the period, if any.
The following table is a summary of the fair value of derivative instruments (not considered to be hedging
instruments for accounting disclosure purposes) at December 31, 2016:
Asset Derivatives | |||||||||||
| Risk Exposure Category | Statement of Assets and Liabilities Location | Fair Value ($) | |||||||||
| Equity risk | Component of trust capital — unrealized appreciation on futures contracts | 299,594 | * | ||||||||
| Equity risk | Investments, at value — Options purchased | 2,016,435 | |||||||||
| Foreign exchange risk | Unrealized appreciation on forward foreign currency exchange contracts | 7,118 | |||||||||
| Interest rate risk | Component of trust capital — unrealized appreciation on futures contracts | 34,526 | * | ||||||||
Total | 2,357,673 | ||||||||||
Liability Derivatives | |||||||||||
| Risk Exposure Category | Statement of Assets and Liabilities Location | Fair Value ($) | |||||||||
| Foreign exchange risk | Component of trust capital — unrealized depreciation on futures contracts | 49,347 | * | ||||||||
| Interest rate risk | Component of trust capital — unrealized depreciation on futures contracts | 270,635 | * | ||||||||
Total | 319,982 | ||||||||||
*Includes cumulative appreciation (depreciation) as reported in the tables following the Portfolio of Investments. Only the current day's variation margin is reported in receivables or payables in the Statement of Assets and Liabilities.
The following table indicates the effect of derivative instruments (not considered to be hedging instruments for accounting disclosure purposes) in the Statement of Operations for the year ended December 31, 2016:
Amount of Realized Gain (Loss) on Derivatives Recognized in Income | |||||||||||||||||||
Risk Exposure Category | Forward Foreign Currency Exchange Contracts ($) | Futures Contracts ($) | Options Contracts Purchased ($) | Total ($) | |||||||||||||||
Equity risk | — | 1,098,762 | (1,845,343 | ) | (746,581 | ) | |||||||||||||
Foreign exchange risk | 55,156 | (89,224 | ) | — | (34,068 | ) | |||||||||||||
Interest rate risk | — | (282,918 | ) | — | (282,918 | ) | |||||||||||||
Total | 55,156 | 726,620 | (1,845,343 | ) | (1,063,567 | ) | |||||||||||||
Change in Unrealized Appreciation (Depreciation) on Derivatives Recognized in Income | |||||||||||||||||||
Risk Exposure Category | Forward Foreign Currency Exchange Contracts ($) | Futures Contracts ($) | Options Contracts Purchased ($) | Total ($) | |||||||||||||||
Equity risk | — | 152,352 | 191,103 | 343,455 | |||||||||||||||
Foreign exchange risk | 4,450 | (70,115 | ) | — | (65,665 | ) | |||||||||||||
Interest rate risk | — | (265,807 | ) | — | (265,807 | ) | |||||||||||||
Total | 4,450 | (183,570 | ) | 191,103 | 11,983 | ||||||||||||||
Annual Report 2016
27
COLUMBIA VARIABLE PORTFOLIO — MANAGED VOLATILITY CONSERVATIVE FUND
NOTES TO FINANCIAL STATEMENTS (continued)
December 31, 2016
The following table provides a summary of the average outstanding volume by derivative instrument for the year ended December 31, 2016:
Derivative Instrument | Average Notional Amounts ($)* | ||||||
Futures contracts — Long | 93,657,661 | ||||||
Futures contracts — Short | 7,388,287 | ||||||
Derivative Instrument | Average Market Value ($)* | ||||||
Options contracts — Purchased | 1,659,673 | ||||||
Derivative Instrument | Average Unrealized Appreciation ($)* | Average Unrealized Depreciation ($)* | |||||||||
| Forward foreign currency exchange contracts | 8,595 | (614 | ) | ||||||||
*Based on the ending quarterly outstanding amounts for the year ended December 31, 2016.
Asset- and Mortgage-Backed Securities
The Fund may invest in asset-backed and mortgage-backed securities. The maturity dates shown represent the original maturity of the underlying obligation. Actual maturity may vary based upon prepayment activity on these obligations. All, or a portion, of the obligation may be prepaid at any time because the underlying asset may be prepaid. As a result, decreasing market interest rates could result in an increased level of prepayment. An increased prepayment rate will have the effect of shortening the maturity of the security. Unless otherwise noted, the coupon rates presented are fixed rates.
Delayed Delivery Securities
The Fund may trade securities on other than normal settlement terms, including securities purchased or sold on a "when-issued" basis. This may increase risk to the Fund since the other party to the transaction may fail to deliver, which could cause the Fund to subsequently invest at less advantageous prices. The Fund designates cash or liquid securities in an amount equal to the delayed delivery commitment.
To Be Announced Securities
The Fund may trade securities on a To Be Announced (TBA) basis. As with other delayed-delivery transactions, a seller agrees to issue a TBA security at a future date. However, the seller does not specify the particular securities to be delivered. Instead, the Fund agrees to accept any security that meets specified terms.
In some cases, Master Securities Forward Transaction Agreements (MSFTAs) may be used to govern transactions of certain forward-settling agency mortgage-backed securities, such as delayed-delivery and TBAs, between the Fund and counterparty. The MSFTA maintains provisions for, among other things, initiation and confirmation, payment and transfer, events of default, termination, and maintenance of collateral relating to such transactions.
Mortgage Dollar Roll Transactions
The Fund may enter into mortgage "dollar rolls" in which the Fund sells securities for delivery in the current month and simultaneously contracts with the same counterparty to repurchase similar but not identical securities (same type, coupon and maturity) on a specified future date. During the roll period, the Fund loses the right to receive principal and interest paid on the securities sold. However, the Fund will benefit because it receives negotiated amounts in the form of reductions of the purchase price for the future purchase plus the interest earned on the cash proceeds of the securities sold until the settlement date of the forward purchase. The Fund records the incremental difference between the forward purchase and sale of each forward roll as a realized gain or loss. Unless any realized gains exceed the income, capital appreciation, and gain or loss due to mortgage prepayments that would have been realized on the securities sold as part of the mortgage dollar roll, the use of this technique will diminish the investment performance of the Fund compared to what the performance would have been without the use of mortgage dollar rolls. All cash proceeds will be invested in instruments that are permissible investments for the Fund. The Fund identifies cash or liquid securities in an amount equal to the forward purchase price.
For financial reporting and tax purposes, the Fund treats "to be announced" mortgage dollar rolls as two separate transactions, one involving the purchase of a security and a separate transaction involving a sale. These transactions may increase the Fund's portfolio turnover rate. The Fund does not currently enter into mortgage dollar rolls that are accounted for as financing transactions.
Mortgage dollar rolls involve the risk that the market value of the securities the Fund is obligated to repurchase may decline below the repurchase price, or that the counterparty may default on its obligations.
Annual Report 2016
28
COLUMBIA VARIABLE PORTFOLIO — MANAGED VOLATILITY CONSERVATIVE FUND
NOTES TO FINANCIAL STATEMENTS (continued)
December 31, 2016
Offsetting of Assets and Liabilities
The following table presents the Fund's gross and net amount of assets and liabilities available for offset under netting arrangements as well as any related collateral received or pledged by the Fund as of December 31, 2016:
| Deutsche Bank ($) | Standard Chartered ($) | State Street ($) | UBS ($) | Total ($) | |||||||||||||||||||
Assets | |||||||||||||||||||||||
Forward foreign currency exchange contracts | — | 3,199 | 108 | 3,811 | 7,118 | ||||||||||||||||||
Options purchased puts | 2,016,435 | — | — | — | 2,016,435 | ||||||||||||||||||
Total Assets | 2,016,435 | 3,199 | 108 | 3,811 | 2,023,553 | ||||||||||||||||||
Total Financial and Derivative Net Assets | 2,016,435 | 3,199 | 108 | 3,811 | 2,023,553 | ||||||||||||||||||
Total collateral received (pledged)(a) | — | — | — | — | — | ||||||||||||||||||
Net Amount(b) | 2,016,435 | 3,199 | 108 | 3,811 | 2,023,553 | ||||||||||||||||||
(a) In some instances, the actual collateral received and/or pledged may be more than the amount shown due to overcollateralization.
(b) Represents the net amount due from/(to) counterparties in the event of default.
Security Transactions
Security transactions are accounted for on the trade date. Cost is determined and gains (losses) are based upon the specific identification method for both financial statement and federal income tax purposes.
Income Recognition
Interest income is recorded on an accrual basis. Market premiums and discounts, including original issue discounts, are amortized and accreted, respectively, over the expected life of the security on all debt securities, unless otherwise noted. The Fund classifies gains and losses realized on prepayments received on mortgage-backed securities as adjustments to interest income.
The Fund may place a debt security on non-accrual status and reduce related interest income when it becomes probable that the interest will not be collected and the amount of uncollectible interest can be reasonably estimated. A defaulted debt security is removed from non-accrual status when the issuer resumes interest payments or when collectibility of interest is reasonably assured.
Corporate actions and dividend income are recorded on the ex-dividend date.
The Fund may receive distributions from holdings in equity securities, business development companies (BDCs), exchange-traded funds, other regulated investment companies (RICs), and real estate investment trusts (REITs), which report information on the tax character of their distributions annually. These distributions are allocated to dividend income, capital gain and return of capital based on actual information reported. Return of capital is recorded as a reduction of
the cost basis of securities held. If the Fund no longer owns the applicable securities, return of capital is recorded as a realized gain. With respect to REITs, to the extent actual information has not yet been reported, estimates for return of capital are made by the Fund's management. Management's estimates are subsequently adjusted when the actual character of the distributions is disclosed by the REITs, which could result in a proportionate change in return of capital to shareholders.
Awards from class action litigation are recorded as a reduction of cost basis if the Fund still owns the applicable securities on the payment date. If the Fund no longer owns the applicable securities, the proceeds are recorded as realized gains.
Income and capital gain distributions from the Underlying Funds, if any, are recorded on the ex-dividend date.
Expenses
General expenses of the Trust are allocated to the Fund and other funds of the Trust based upon relative net assets or other expense allocation methodologies determined by the nature of the expense. Expenses directly attributable to the Fund are charged to the Fund.
Federal Income Tax Status
The Fund is treated as a partnership for federal income tax purposes, and the Fund does not expect to make regular distributions. The Fund will not be subject to federal income tax, and therefore, there is no provision for federal income taxes. The partners of the Fund are subject to tax on their distributive share of the Fund's income and loss. The components of the Fund's net assets are reported at the partner-level for federal
Annual Report 2016
29
COLUMBIA VARIABLE PORTFOLIO — MANAGED VOLATILITY CONSERVATIVE FUND
NOTES TO FINANCIAL STATEMENTS (continued)
December 31, 2016
income tax purposes, and therefore, are not presented in the Statement of Assets and Liabilities.
Management of the Fund has concluded that there are no significant uncertain tax positions in the Fund that would require recognition in the financial statements. However, management's conclusion may be subject to review and adjustment at a later date based on factors including, but not limited to, new tax laws, regulations, and administrative interpretations (including relevant court decisions). Generally, the Fund's federal tax returns for the prior three fiscal years remain subject to examination by the Internal Revenue Service.
Guarantees and Indemnifications
Under the Trust's organizational documents and, in some cases, by contract, its officers and trustees are indemnified against certain liabilities arising out of the performance of their duties to the Trust or its funds. In addition, certain of the Fund's contracts with its service providers contain general indemnification clauses. The Fund's maximum exposure under these arrangements is unknown since the amount of any future claims that may be made against the Fund cannot be determined, and the Fund has no historical basis for predicting the likelihood of any such claims.
Investment Company Reporting Modernization
In October 2016, the U.S. Securities and Exchange Commission adopted new rules and forms, and amendments to certain current rules and forms, to modernize reporting and disclosure of information by registered investment companies. The amendments to Regulation S-X will require standardized, enhanced disclosure about derivatives in investment company financial statements, and will also change the rules governing the form and content of such financial statements. The amendments to Regulation S-X take effect on August 1, 2017. At this time, management is assessing the anticipated impact of these regulatory developments.
Note 3. Fees and Other Transactions with Affiliates
Management Services Fees and Underlying Fund Fees
Effective May 1, 2016, the Fund entered into a Management Agreement with the Investment Manager. Under the Management Agreement, the Investment Manager provides the Fund with investment research and advice, as well as administrative and accounting services. The management services fee is an annual fee
that is a blend of (i) 0.02% on assets invested in affiliated underlying funds (including exchange-traded funds and closed-end funds) that pay a management services fee (or investment advisory services fee, as applicable) to the Investment Manager and (ii) a fee that declines from 0.72% to 0.52%, depending on asset levels, on assets invested in securities, (other than affiliated underlying funds (including exchange-traded funds and closed-end funds) that pay a management services fee (or investment advisory services fee, as applicable) to the Investment Manager), including other funds advised by the Investment Manager that do not pay a management services fee to the Investment Manager, third party funds, derivatives and individual securities. Prior to May 1, 2016, the Fund paid the Investment Manager an annual fee for advisory services under an Investment Management Services Agreement and a separate annual fee for administrative and accounting services under an Administrative Services Agreement. The effective management services fee rate for the year ended December 31, 2016 (reflecting all advisory and administrative services fees paid to the Investment Manager) was 0.23% of the Fund's average daily net assets. For the period from January 1, 2016 through April 30, 2016, the investment advisory services fee paid to the Investment Manager was $189,530, and the administrative services fee paid to the Investment Manager was $30,588.
In addition to the fees and expenses which the Fund bears directly, the Fund indirectly bears a pro rata share of the fees and expenses of the Underlying Funds in which the Fund invests. Because the Underlying Funds have varied expense and fee levels and the Fund may own different proportions of Underlying Funds at different times, the amount of fees and expenses incurred indirectly by the Fund will vary. These expenses are not reflected in the expenses shown in Statement of Operations and are not included in the ratios to average net assets shown in the Financial Highlights.
Compensation of Board Members
Board of Trustee members, who are not officers or employees of the Investment Manager or Ameriprise Financial, are compensated for their services to the Fund as disclosed in the Statement of Operations. These Board of Trustee members may participate in a Deferred Compensation Plan (the Plan) which may be terminated at any time. Obligations of the Plan will be paid solely out of the Fund's assets, and all amounts payable under the Plan constitute a general unsecured obligation of the Fund.
Annual Report 2016
30
COLUMBIA VARIABLE PORTFOLIO — MANAGED VOLATILITY CONSERVATIVE FUND
NOTES TO FINANCIAL STATEMENTS (continued)
December 31, 2016
Compensation of Chief Compliance Officer
The Board of Trustees has appointed a Chief Compliance Officer to the Fund in accordance with federal securities regulations. The Fund is allocated a portion of the expenses associated with the Chief Compliance Officer based on relative net assets of the Trust.
Transfer Agency Fees
The Fund has a Transfer and Dividend Disbursing Agent Agreement with Columbia Management Investment Services Corp. (the Transfer Agent), an affiliate of the Investment Manager and a wholly-owned subsidiary of Ameriprise Financial. The annual fee rate under this agreement is 0.00% on assets invested in Underlying Funds that pay a transfer agency fee to the Transfer Agent and 0.06% of the Fund's average daily net assets on assets invested in securities (other than Underlying Funds that pay a transfer agency fee to the Transfer Agent), including other funds that do not pay a transfer agency fee to the Transfer Agent, exchange-traded funds, derivatives and individual securities.
For the year ended December 31, 2016, the Fund's effective transfer agency fee rate as a percentage of average daily net assets of Class 2 shares was 0.02%.
Distribution Fees
The Fund has an agreement with the Distributor, an affiliate of the Investment Manager and a wholly-owned subsidiary of Ameriprise Financial, for distribution services. The Board of Trustees has approved, and the Fund has adopted, a distribution plan (the Plan) which sets the distribution fees for the Fund. These fees are calculated daily and are intended to compensate the Distributor for selling shares of the Fund. The Fund pays a monthly distribution fee to the Distributor at the maximum annual rate of 0.25% of the average daily net assets attributable to Class 2 shares of the Fund.
Expenses Waived/Reimbursed by the Investment Manager and its Affiliates
The Investment Manager and certain of its affiliates have contractually agreed to waive fees and/or reimburse expenses (excluding certain fees and expenses described below) for the period(s) disclosed below, so that the Fund's net operating expenses, including indirect expenses of the Underlying Funds, after giving effect to fees waived/expenses reimbursed and any balance credits and/or overdraft charges from the Fund's
custodian, do not exceed the following annual rates as a percentage of the class' average daily net assets:
| Fee Rate Contractual through April 30, 2017 | |||||||
Class 2 | 1.10 | % | |||||
Under the agreement governing these fee waivers and/or expense reimbursement arrangements, the following fees and expenses are excluded from the waiver/ reimbursement commitment, and therefore will be paid by the Fund, if applicable: taxes (including foreign transaction taxes), transaction costs and brokerage commissions, costs related to any securities lending program, dividend and interest expenses associated with securities sold short, inverse floater program fees and expenses, transaction charges and interest on borrowed money, interest, infrequent and/or unusual expenses and any other expenses the exclusion of which is specifically approved by the Board of Trustees. This agreement may be modified or amended only with approval from the Investment Manager, certain of its affiliates and the Fund. Any fees waived and/or expenses reimbursed under the expense reimbursement arrangements described above are not recoverable by the Investment Manager or its affiliates in future periods.
Note 4. Portfolio Information
The cost of purchases and proceeds from sales of securities, excluding short-term investments and derivatives, if any, aggregated to $491,540,640 and $326,058,509, respectively, for the year ended December 31, 2016, of which $276,642,602 and $264,627,839, respectively, were U.S. government securities. The amount of purchase and sale activity impacts the portfolio turnover rate reported in the Financial Highlights.
Note 5. Affiliated Money Market Fund
The Fund invests in Columbia Short-Term Cash Fund, an affiliated money market fund established for the exclusive use by the Fund and other affiliated funds (the Affiliated MMF). The income earned by the Fund from such investments is included as Dividends — affiliated issuers in the Statement of Operations. As an investing fund, the Fund indirectly bears its proportionate share of the expenses of the Affiliated MMF. Effective October 1, 2016, the Affiliated MMF prices its shares with a floating net asset value (NAV) and no longer seeks to maintain a stable NAV. In addition, the Board of Trustees of the
Annual Report 2016
31
COLUMBIA VARIABLE PORTFOLIO — MANAGED VOLATILITY CONSERVATIVE FUND
NOTES TO FINANCIAL STATEMENTS (continued)
December 31, 2016
Affiliated MMF may impose a fee on redemptions (sometimes referred to as a liquidity fee) or temporarily suspend redemptions (sometimes referred to as imposing a redemption gate) in the event its liquidity falls below regulatory limits.
Note 6. Line of Credit
The Fund has access to a revolving credit facility with a syndicate of banks led by Citibank, N.A., HSBC Bank USA, N.A. and JPMorgan Chase Bank, N.A. whereby the Fund may borrow for the temporary funding of shareholder redemptions or for other temporary or emergency purposes. The credit facility agreement, which is a collective agreement between the Fund and certain other funds managed by the Investment Manager, severally and not jointly, that permits collective borrowings up to $1 billion. Interest is charged to each participating fund based on its borrowings at a rate equal to the higher of (i) the overnight federal funds rate plus 1.00% or (ii) the one-month LIBOR rate plus 1.00%. Each borrowing under the credit facility matures no later than 60 days after the date of borrowing. The Fund also pays a commitment fee equal to its pro rata share of the amount of the credit facility at a rate of 0.15% per annum. The commitment fee is included in other expenses in the Statement of Operations.
The Fund had no borrowings during the year ended December 31, 2016.
Note 7. Significant Risks
Shareholder Concentration Risk
At December 31, 2016, one unaffiliated shareholder of record owned 100.0% of the outstanding shares of the Fund in one or more accounts. The Fund has no knowledge about whether any portion of those shares was owned beneficially. Subscription and redemption activity by concentrated accounts may have a significant effect on the operations of the Fund. In the case of a large redemption, the Fund may be forced to sell investments at inopportune times, including its liquid or more liquid positions, resulting in Fund losses and the Fund holding a higher percentage of less liquid or illiquid securities. Large redemptions could result in decreased economies of scale and increased operating expenses for non-redeeming Fund shareholders.
Note 8. Subsequent Events
Management has evaluated the events and transactions that have occurred through the date the financial statements were issued and noted no items requiring
adjustment of the financial statements or additional disclosure.
Note 9. Information Regarding Pending and Settled Legal Proceedings
Ameriprise Financial and certain of its affiliates have historically been involved in a number of legal, arbitration and regulatory proceedings, including routine litigation, class actions, and governmental actions, concerning matters arising in connection with the conduct of their business activities. Ameriprise Financial believes that the Funds are not currently the subject of, and that neither Ameriprise Financial nor any of its affiliates are the subject of, any pending legal, arbitration or regulatory proceedings that are likely to have a material adverse effect on the Funds or the ability of Ameriprise Financial or its affiliates to perform under their contracts with the Funds. Ameriprise Financial is required to make quarterly (10-Q), annual (10-K) and, as necessary, 8-K filings with the Securities and Exchange Commission (SEC) on legal and regulatory matters that relate to Ameriprise Financial and its affiliates. Copies of these filings may be obtained by accessing the SEC website at www.sec.gov.
There can be no assurance that these matters, or the adverse publicity associated with them, will not result in increased fund redemptions, reduced sale of fund shares or other adverse consequences to the Funds. Further, although we believe proceedings are not likely to have a material adverse effect on the Funds or the ability of Ameriprise Financial or its affiliates to perform under their contracts with the Funds, these proceedings are subject to uncertainties and, as such, we are unable to estimate the possible loss or range of loss that may result. An adverse outcome in one or more of these proceedings could result in adverse judgments, settlements, fines, penalties or other relief that could have a material adverse effect on the consolidated financial condition or results of operations of Ameriprise Financial.
Annual Report 2016
32
COLUMBIA VARIABLE PORTFOLIO — MANAGED VOLATILITY CONSERVATIVE FUND
REPORT OF INDEPENDENT REGISTERED PUBLIC ACCOUNTING FIRM
To the Trustees of Columbia Funds Variable Insurance Trust and the Shareholders of
Columbia Variable Portfolio — Managed Volatility Conservative Fund
In our opinion, the accompanying statement of assets and liabilities, including the portfolio of investments, and the related statements of operations and of changes in net assets and the financial highlights present fairly, in all material respects, the financial position of Columbia Variable Portfolio — Managed Volatility Conservative Fund (the "Fund," a series of Columbia Funds Variable Insurance Trust) as of December 31, 2016, the results of its operations for the year then ended, the changes in its net assets for each of the two years in the period then ended and the financial highlights for each of the three years in the period then ended and for the period April 12, 2013 (commencement of operations) through December 31, 2013, in conformity with accounting principles generally accepted in the United States of America. These financial statements and financial highlights (hereafter referred to as "financial statements") are the responsibility of the Fund's management. Our responsibility is to express an opinion on these financial statements based on our audits. We conducted our audits of these financial statements in accordance with the standards of the Public Company Accounting Oversight Board (United States). Those standards require that we plan and perform the audit to obtain reasonable assurance about whether the financial statements are free of material misstatement. An audit includes examining, on a test basis, evidence supporting the amounts and disclosures in the financial statements, assessing the accounting principles used and significant estimates made by management, and evaluating the overall financial statement presentation. We believe that our audits, which included confirmation of securities as of December 31, 2016 by correspondence with the custodian, brokers and transfer agent, and the application of alternative auditing procedures where such confirmations had not been received, provide a reasonable basis for our opinion.
PricewaterhouseCoopers LLP
Minneapolis, MN
February 17, 2017
Annual Report 2016
33
COLUMBIA VARIABLE PORTFOLIO — MANAGED VOLATILITY CONSERVATIVE FUND
TRUSTEES AND OFFICERS
Shareholders elect the Board that oversees the Fund's operations. The Board appoints officers who are responsible for day-to-day business decisions based on policies set by the Board. The following table provides basic biographical information about the Fund's Trustees, including their principal occupations during the past five years, although specific titles for individuals may have varied over the period. The year set forth beneath Length of Service in the table below is the year in which the Trustee was first appointed or elected as Trustee to any Fund currently in the Columbia Funds Complex or a predecessor thereof. Under current Board policy, members serve terms of indefinite duration.
Independent Trustees
| Name, Address, Year of Birth | Position Held With the Trust and Length of Service | Principal Occupation(s) During the Past Five Years and Other Relevant Professional Experience | Number of Funds in the Columbia Funds Complex Overseen | Other Directorships Held by Trustee During the Past Five Years | |||||||||||||||
| Janet Langford Carrig c/o Columbia Management Investment Advisers, LLC, 225 Franklin Street Mail Drop BX32 05228, Boston, MA 02110 1957 | Trustee 1996 | Senior Vice President, General Counsel and Corporate Secretary, ConocoPhillips (independent energy company) since September 2007 | 59 | None | |||||||||||||||
| Douglas A. Hacker c/o Columbia Management Investment Advisers, LLC, 225 Franklin Street Mail Drop BX32 05228, Boston, MA 02110 1955 | Trustee and Chairman of the Board 1996 | Independent business executive since May 2006; Executive Vice President — Strategy of United Airlines from December 2002 to May 2006; President of UAL Loyalty Services (airline marketing company) from September 2001 to December 2002; Executive Vice President and Chief Financial Officer of United Airlines from July 1999 to September 2001 | 59 | Spartan Nash Company (food distributor); Nash Finch Company (food distributor) from 2005 to 2013; Aircastle Limited (aircraft leasing); SeaCube Container Leasing Ltd. (container leasing) from 2010 to 2013; and Travelport Worldwide Limited (travel information technology) | |||||||||||||||
| Nancy T. Lukitsh c/o Columbia Management Investment Advisers, LLC, 225 Franklin Street Mail Drop BX32 05228, Boston, MA 02110 1956 | Trustee 2011 | Senior Vice President, Partner and Director of Marketing, Wellington Management Company, LLP (investment adviser) from 1997 to 2010; Chair, Wellington Management Portfolios (commingled non-U.S. investment pools) from 2007 to 2010; Director, Wellington Trust Company, NA and other Wellington affiliates from 1997 to 2010 | 59 | None | |||||||||||||||
Annual Report 2016
34
COLUMBIA VARIABLE PORTFOLIO — MANAGED VOLATILITY CONSERVATIVE FUND
TRUSTEES AND OFFICERS (continued)
Independent Trustees (continued)
| Name, Address, Year of Birth | Position Held With the Trust and Length of Service | Principal Occupation(s) During the Past Five Years and Other Relevant Professional Experience | Number of Funds in the Columbia Funds Complex Overseen | Other Directorships Held by Trustee During the Past Five Years | |||||||||||||||
| David M. Moffett c/o Columbia Management Investment Advisers, LLC, 225 Franklin Street Mail Drop BX32 05228, Boston, MA 02110 1952 | Trustee 2011 | Retired. Consultant to Bridgewater and Associates | 59 | Director, CSX Corporation; Genworth Financial, Inc. (financial and insurance products and services); Paypal Holdings Inc. (payment and data processing services); Trustee University of Oklahoma Foundation; former Director eBay Inc. (online trading community), 2007-2015; and former Director, CIT Bank, CIT Group Inc. (commercial and consumer finance), 2010-2016 | |||||||||||||||
| Charles R. Nelson c/o Columbia Management Investment Advisers, LLC, 225 Franklin Street Mail Drop BX32 05228, Boston, MA 02110 1942 | Trustee 1981 | Retired. Professor Emeritus, University of Washington since 2011; Professor of Economics, University of Washington from 1976 to 2011; Ford and Louisa Van Voorhis Professor of Political Economy, University of Washington from 1993 to 2011; Adjunct Professor of Statistics, University of Washington from 1980 to 2011; Associate Editor, Journal of Money, Credit and Banking from September 1993 to 2008; consultant on econometric and statistical matters | 59 | None | |||||||||||||||
| John J. Neuhauser c/o Columbia Management Investment Advisers, LLC, 225 Franklin Street Mail Drop BX32 05228, Boston, MA 02110 1943 | Trustee 1984 | President, Saint Michael's College since August 2007; Director or Trustee of several non-profit organizations, including University of Vermont Medical Center; Academic Vice President and Dean of Faculties, Boston College from August 1999 to October 2005; University Professor, Boston College from November 2005 to August 2007 | 59 | Liberty All-Star Equity Fund and Liberty All-Star Growth Fund (closed-end funds) | |||||||||||||||
| Patrick J. Simpson c/o Columbia Management Investment Advisers, LLC, 225 Franklin Street Mail Drop BX32 05228, Boston, MA 02110 1944 | Trustee 2000 | Of Counsel, Perkins Coie LLP (law firm) since 2015; Partner, Perkins Coie LLP from 1988 to 2014 | 59 | None | |||||||||||||||
Annual Report 2016
35
COLUMBIA VARIABLE PORTFOLIO — MANAGED VOLATILITY CONSERVATIVE FUND
TRUSTEES AND OFFICERS (continued)
Independent Trustees (continued)
| Name, Address, Year of Birth | Position Held With the Trust and Length of Service | Principal Occupation(s) During the Past Five Years and Other Relevant Professional Experience | Number of Funds in the Columbia Funds Complex Overseen | Other Directorships Held by Trustee During the Past Five Years | |||||||||||||||
| Anne-Lee Verville c/o Columbia Management Investment Advisers, LLC, 225 Franklin Street Mail Drop BX32 05228, Boston, MA 02110 1945 | Trustee 1998 | Retired. General Manager, Global Education Industry from 1994 to 1997, President — Application Systems Division from 1991 to 1994, Chief Financial Officer — US Marketing & Services from 1988 to 1991, and Chief Information Officer from 1987 to 1988, IBM Corporation (computer and technology) | 59 | Enesco Group, Inc. (producer of giftware and home and garden decor products) from 2001 to 2006 | |||||||||||||||
Consultants to the Independent Trustees*
| Name, Address, Year of Birth | Position Held With the Trust and Length of Service | Principal Occupation(s) During the Past Five Years and Other Relevant Professional Experience | Number of Funds in the Columbia Funds Complex Overseen | Other Directorships Held by Trustee During the Past Five Years | |||||||||||||||
| J. Kevin Connaughton c/o Columbia Management Investment Advisers, LLC, 225 Franklin Street Mail Drop BX32 05228, Boston, MA 02110 1964 | Independent Trustee Consultant 2016 | Independent Trustee Consultant, Columbia Funds since March 2016; Managing Director and General Manager of Mutual Fund Products, Columbia Management Investment Advisers, LLC from May 2010 to February 2015; President, Columbia Funds from 2009 to 2015; and senior officer of Columbia Funds and affiliated funds from 2003 to 2015 | 59 | Board of Governors, Gateway Healthcare since January 2016; Trustee, New Century Portfolios since March 2015; and Director, The Autism Project since March 2015 | |||||||||||||||
| Natalie A. Trunow c/o Columbia Management Investment Advisers, LLC, 225 Franklin Street Mail Drop BX32 05228, Boston, MA 02110 1967 | Independent Trustee Consultant 2016 | Independent Trustee Consultant, Columbia Funds since September 2016; Senior Vice President and Chief Executive Officer, Millennial Partners (investment consulting services to institutions) since January 2016; Director of Investments, Casey Family Programs from April 2016 to September 2016; Chief Investment Officer, Calvert Investments from August 2008 to January 2016; Section Head and Portfolio Manager, General Motors Asset Management from June 1997 to August 2008 | 59 | Healthcare Services for Children with Special Needs | |||||||||||||||
* J. Kevin Connaughton was appointed consultant to the Independent Trustees effective March 1, 2016. Natalie A. Trunow was appointed consultant to the Independent Trustees effective September 1, 2016. Shareholders of the Funds are expected to be asked to elect each of Mr. Connaughton and Ms. Trunow as a Trustee at a future shareholder meeting.
Annual Report 2016
36
COLUMBIA VARIABLE PORTFOLIO — MANAGED VOLATILITY CONSERVATIVE FUND
TRUSTEES AND OFFICERS (continued)
Interested Trustee Affiliated with Investment Manager*
| Name, Address, Year of Birth | Position Held With the Trust and Length of Service | Principal Occupation(s) During the Past Five Years and Other Relevant Professional Experience | Number of Funds in the Columbia Funds Complex Overseen | Other Directorships Held by Trustee During the Past Five Years | |||||||||||||||
| William F. Truscott c/o Columbia Management Investment Advisers, LLC, 225 Franklin Street Boston, MA 02110 1960 | Trustee 2012 | Chairman of the Board and President, Columbia Management Investment Advisers, LLC since May 2010 and February 2012, respectively; Chief Executive Officer, Global Asset Management, Ameriprise Financial, Inc. since September 2012 (previously Chief Executive Officer, U.S. Asset Management & President, Annuities, May 2010- September 2012); Director and Chief Executive Officer, Columbia Management Investment Distributors, Inc. since May 2010 and February 2012, respectively; Chairman of the Board and Chief Executive Officer, RiverSource Distributors, Inc. since 2006; Director, Threadneedle Asset Management Holdings, SARL since 2014; President and Chief Executive Officer, Ameriprise Certificate Company, 2006-August 2012. | 185 | Trustee to other Columbia Funds since 2001; Chairman of the Board, Columbia Management Investment Advisers, LLC since May 2010; Director, Columbia Management Investment Distributors, Inc. since May 2010; Former Director, Ameriprise Certificate Company, 2006-January 2013 | |||||||||||||||
* Interested person (as defined under the 1940 Act) by reason of being an officer, director, security holder and/or employee of the Investment Manager or Ameriprise Financial.
The Statement of Additional Information has additional information about the Fund's Board members and is available, without charge, upon request by calling 800.345.6611 or contacting your financial intermediary.
Annual Report 2016
37
COLUMBIA VARIABLE PORTFOLIO — MANAGED VOLATILITY CONSERVATIVE FUND
TRUSTEES AND OFFICERS (continued)
The Board has appointed officers who are responsible for day-to-day business decisions based on policies it has established. The officers serve at the pleasure of the Board. The following table provides basic information about the Officers of the Fund, including principal occupations during the past five years, although their specific titles may have varied over the period. In addition to Mr. Truscott, who is Senior Vice President, the Fund's other officers are:
Fund Officers
| Name, Address and Year of Birth | Position and Year First Appointed to Position for any Fund in the Columbia Funds Complex or a Predecessor Thereof | Principal Occupation(s) During Past Five Years | |||||||||
| Christopher O. Petersen 5228 Ameriprise Financial Center Minneapolis, MN 55474 Born 1970 | President and Principal Executive Officer (2015) | Vice President and Lead Chief Counsel, Ameriprise Financial, Inc. since January 2015 (previously, Vice President and Chief Counsel January 2010-December 2014); officer of Columbia Funds and affiliated funds since 2007. | |||||||||
| Michael G. Clarke 225 Franklin Street Boston, MA 02110 Born 1969 | Treasurer (2011), Chief Financial Officer (2009) and Chief Accounting Officer (2015) | Vice President — Mutual Fund Administration, Columbia Management Investment Advisers, LLC, since May 2010; senior officer of Columbia Funds and affiliated funds since 2002. | |||||||||
| Paul B. Goucher 100 Park Avenue New York, NY 10017 Born 1968 | Senior Vice President (2011), Chief Legal Officer (2015) and Assistant Secretary (2008) | Senior Vice President and Assistant General Counsel, Ameriprise Financial, Inc. since January 2017 (previously Vice President and Lead Chief Counsel, November 2008-January 2017 and January 2013-January 2017, respectively, and Chief Counsel, January 2010-January 2013); Vice President, Chief Legal Officer and Assistant Secretary, Columbia Management Investment Advisers, LLC since May 2010. | |||||||||
| Thomas P. McGuire 225 Franklin Street Boston, MA 02110 Born 1972 | Senior Vice President and Chief Compliance Officer (2012) | Vice President — Asset Management Compliance, Ameriprise Financial, Inc., since May 2010; Chief Compliance Officer, Ameriprise Certificate Company since September 2010. | |||||||||
| Colin Moore 225 Franklin Street Boston, MA 02110 Born 1958 | Senior Vice President (2010) | Executive Vice President and Global Chief Investment Officer, Ameriprise Financial, Inc., since July 2013; Executive Vice President and Global Chief Investment Officer, Columbia Management Investment Advisers, LLC since July 2013 (previously Director and Global Chief Investment Officer, 2010-2013). | |||||||||
| Michael E. DeFao 225 Franklin Street Boston, MA 02110 Born 1968 | Vice President (2011) and Assistant Secretary (2010) | Vice President and Chief Counsel, Ameriprise Financial, Inc. since May 2010. | |||||||||
| Amy Johnson 5228 Ameriprise Financial Center Minneapolis, MN 55474 Born 1965 | Vice President (2006) | Managing Director and Global Head of Operations, Columbia Management Investment Advisers, LLC since April 2016 (previously Managing Director and Chief Operating Officer, 2010-2016). | |||||||||
| Lyn Kephart-Strong 5228 Ameriprise Financial Center Minneapolis, MN 55474 Born 1960 | Vice President (2015) | President, Columbia Management Investment Services Corp. since October 2014; Vice President & Resolution Officer, Ameriprise Trust Company since August 2009. | |||||||||
| Ryan C. Larrenaga 225 Franklin Street Boston, MA 02110 Born 1970 | Vice President and Secretary (2015) | Vice President and Group Counsel, Ameriprise Financial, Inc. since August 2011; officer of Columbia Funds and affiliated funds since 2005. | |||||||||
Annual Report 2016
38
This page intentionally left blank.
Annual Report 2016
39
This page intentionally left blank.
Annual Report 2016
40
COLUMBIA VARIABLE PORTFOLIO — MANAGED VOLATILITY CONSERVATIVE FUND
IMPORTANT INFORMATION ABOUT THIS REPORT
The policy of the Board is to vote the proxies of the companies in which each fund holds investments consistent with the procedures as stated in the Statement of Additional Information (SAI). You may obtain a copy of the SAI without charge by calling 800.345.6611; contacting your financial intermediary or searching the website of the Securities and Exchange Commission (SEC) at sec.gov. Information regarding how each fund voted proxies relating to portfolio securities is filed with the SEC by August 31st for the most recent 12-month period ending June 30th of that year, and is available without charge by visiting investor.columbiathreadneedleus.com, or searching the website of the SEC at sec.gov.
Each fund files a complete schedule of portfolio holdings with the SEC for the first and third quarters of each fiscal year on Form N-Q. Each fund's Form N-Q is available on the SEC's website at sec.gov and may be reviewed and copied at the SEC's Public Reference Room in Washington, D.C. Information on the operation of the Public Reference Room may be obtained by calling 800.SEC.0330. Each fund's complete schedule of portfolio holdings, as filed on Form N-Q, can also be obtained without charge, upon request, by calling 800.345.6611.
Annual Report 2016
41
Columbia Variable Portfolio — Managed Volatility Conservative Fund
P.O. Box 8081
Boston, MA 02266-8081

Please read and consider the investment objectives, risks, charges and expenses for any fund carefully before investing. For fund and other investment product prospectuses, which contain this and other important information, contact your financial advisor or insurance representative. Please read the prospectus carefully before you invest. The Fund is distributed by Columbia Management Investment Distributors, Inc., member FINRA, and managed by Columbia Management Investment Advisers, LLC.
Columbia Threadneedle Investments (Columbia Threadneedle) is the global brand name of the Columbia and Threadneedle group of companies.
All rights reserved. Columbia Management Investment Distributors, Inc., 225 Franklin Street, Boston, MA 02110-2804
© 2017 Columbia Management Investment Advisers, LLC.
S-6624 AN (2/17)

ANNUAL REPORT
December 31, 2016

COLUMBIA VARIABLE PORTFOLIO — MANAGED VOLATILITY CONSERVATIVE GROWTH FUND
Please remember that you may not buy (nor will you own) shares of the Fund directly. The Fund is available through variable annuity contracts or life insurance policies offered by the separate accounts of affiliated insurance companies and other qualified institutional investors authorized by Columbia Management Investment Distributors, Inc. Please contact your financial advisor or insurance representative for more information.

COLUMBIA VARIABLE PORTFOLIO — MANAGED VOLATILITY CONSERVATIVE GROWTH FUND
TABLE OF CONTENTS
Performance Overview | 2 | ||||||
Manager Discussion of Fund Performance | 4 | ||||||
Understanding Your Fund's Expenses | 6 | ||||||
Portfolio of Investments | 7 | ||||||
Statement of Assets and Liabilities | 18 | ||||||
Statement of Operations | 19 | ||||||
Statement of Changes in Net Assets | 20 | ||||||
Financial Highlights | 22 | ||||||
Notes to Financial Statements | 23 | ||||||
Report of Independent Registered Public Accounting Firm | 33 | ||||||
Trustees and Officers | 34 | ||||||
Important Information About This Report | 41 | ||||||
The views expressed in this report reflect the current views of the respective parties. These views are not guarantees of future performance and involve certain risks, uncertainties and assumptions that are difficult to predict, so actual outcomes and results may differ significantly from the views expressed. These views are subject to change at any time based upon economic, market or other conditions and the respective parties disclaim any responsibility to update such views. These views may not be relied on as investment advice and, because investment decisions for a Columbia fund are based on numerous factors, may not be relied on as an indication of trading intent on behalf of any particular Columbia fund. References to specific securities should not be construed as a recommendation or investment advice.
Annual Report 2016
COLUMBIA VARIABLE PORTFOLIO — MANAGED VOLATILITY CONSERVATIVE GROWTH FUND
PERFORMANCE OVERVIEW
Performance Summary
n Columbia Variable Portfolio — Managed Volatility Conservative Growth Fund (the Fund) Class 2 shares returned 3.17% for the 12-month period that ended December 31, 2016.
n The Fund underperformed its Blended Benchmark, which gained 5.00% for the same time period.
n The broad U.S. fixed-income market, as measured by the Bloomberg Barclays U.S. Aggregate Bond Index, returned 2.65% for the same 12 months.
n Disappointing results from underlying funds, especially U.S. large-cap equity funds, accounted for a significant portion of the Fund's shortfall relative to its Blended Benchmark. The Fund's dynamic algorithm-based allocation and event protection strategies also detracted modestly from relative results.
Average Annual Total Returns (%) (for period ended December 31, 2016)
Inception | 1 Year | Life | |||||||||||||
Class 2 | 04/12/13 | 3.17 | 2.79 | ||||||||||||
Blended Benchmark | 5.00 | 4.28 | |||||||||||||
Bloomberg Barclays U.S. Aggregate Bond Index | 2.65 | 1.70 | |||||||||||||
Performance data quoted represents past performance and current performance may be lower or higher. Past performance is no guarantee of future results. The investment return and principal value will fluctuate so that shares, when redeemed, may be worth more or less than the original cost. For current month-end performance information, please contact your financial advisor or insurance representative.
Performance results reflect the effect of any fee waivers or reimbursements of fund expenses by Columbia Management Investment Advisers, LLC and/or any of its affiliates. Absent these fee waivers or expense reimbursement arrangements, performance results would have been lower.
Investment earnings, if any, are tax-deferred until distributed to shareholders, at which time taxes may become due. Total return performance includes changes in share price and assumes reinvestment of dividends and capital gains, if any. Performance results reflect the effect of all fund expenses, but do not include any fees and expenses imposed under your variable annuity contract and/or variable life insurance policy or qualified pension or retirement plan. If performance results included the effect of these additional charges, they would be lower.
Effective March 10, 2016, the Fund compares its performance to that of an index consisting of 65% Bloomberg Barclays U.S. Aggregate Bond Index, 24% Russell 3000 Index and 11% MSCI EAFE Index (Net) (the New Blended Benchmark). Prior to this date, the Fund compared its performance to that of an index consisting of 65% Bloomberg Barclays U.S. Aggregate Bond Index, 18% S&P 500 Index, 11% MSCI EAFE Index (Net) and 6% Russell 2000 Index (the Former Blended Benchmark). The Fund's investment manager believes that the New Blended Benchmark provides a more appropriate basis for comparing the Fund's performance.
The Bloomberg Barclays U.S. Aggregate Bond Index is a broad-based benchmark that measures the investment-grade, U.S. dollar-denominated, fixed-rate taxable bond market, including Treasuries, government-related and corporate securities, mortgage-backed securities (agency fixed-rate and hybrid adjustable-rate mortgage passthroughs), asset-backed securities, and commercial mortgage-backed securities. The Russell 3000 Index, an unmanaged index, measures the performance of the 3,000 largest U.S. companies based on total market capitalization, which represents approximately 98% of the investable U.S. equity market. The MSCI EAFE Index (Net) is a free float-adjusted market capitalization index that is designed to measure the equity market performance of developed markets, excluding the U.S. and Canada. The index is compiled from a composite of securities markets of Europe, Australasia and the Far East and is widely recognized by investors in foreign markets as the measurement index for portfolios of non-North American securities.
The S&P 500 Index, an unmanaged index, measures the performance of 500 widely held, large-capitalization U.S. stocks and is frequently used as a general measure of market performance. The Russell 2000 Index measures the performance of the small-cap segment of the U.S. equity universe. It is a subset of the Russell 3000 Index representing approximately 10% of the total market capitalization of that index. It includes approximately 2000 of the smallest securities based on a combination of their market cap and current index membership.
Indices are not available for investment, are not professionally managed and do not reflect sales charges, fees, brokerage commissions, taxes (except the MSCI EAFE Index (Net), which reflects reinvested dividends net of withholding taxes) or other expenses of investing. Securities in the Fund may not match those in an index.
Annual Report 2016
2
COLUMBIA VARIABLE PORTFOLIO — MANAGED VOLATILITY CONSERVATIVE GROWTH FUND
PERFORMANCE OVERVIEW (continued)
Performance of a Hypothetical $10,000 Investment (April 12, 2013 – December 31, 2016)
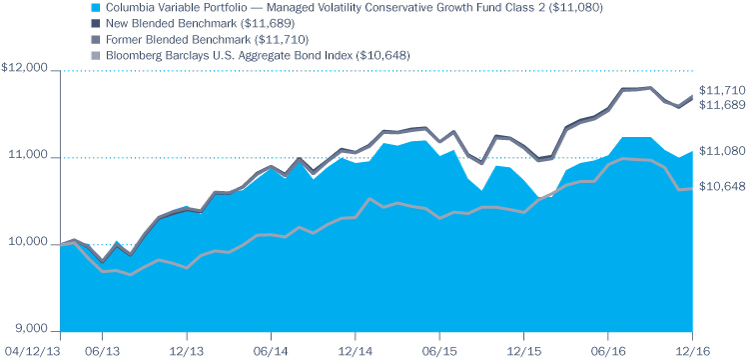
The chart above shows the change in value of a hypothetical $10,000 investment in Class 2 shares of Columbia Variable Portfolio — Managed Volatility Conservative Growth Fund during the stated time period, and does not reflect the deduction of taxes, if any, that a shareholder may pay on Fund distributions or on the redemption of Fund shares. The returns also do not reflect fees and expenses imposed under your variable annuity contract and/or variable life insurance policy or qualified pension or retirement plan, if any.
Annual Report 2016
3
COLUMBIA VARIABLE PORTFOLIO — MANAGED VOLATILITY CONSERVATIVE GROWTH FUND
MANAGER DISCUSSION OF FUND PERFORMANCE
Portfolio Management
Jeffrey Knight, CFA
Anwiti Bahuguna, Ph.D.
David Weiss
Brian Virginia
Effective January 27, 2017, Kent Peterson no longer serves as a portfolio manager of the Fund.
| Portfolio Allocation (%) (at December 31, 2016) | |||||||
Allocations to Underlying Funds | |||||||
Underlying Funds: Equity | 30.5 | ||||||
International | 8.3 | ||||||
U.S. Large Cap | 17.6 | ||||||
U.S. Mid Cap | 2.0 | ||||||
U.S. Small Cap | 2.6 | ||||||
Underlying Funds: Fixed Income | 37.2 | ||||||
Investment Grade | 37.2 | ||||||
Allocations to Tactical Assets | |||||||
Corporate Bonds & Notes | 0.8 | ||||||
Exchange-Traded Funds | 5.1 | ||||||
| Money Market Fund Shares Held to Cover Open Derivatives Instruments(a) | 20.1 | ||||||
Options Purchased Puts | 0.8 | ||||||
| Residential Mortgage-Backed Securities — Agency | 5.5 | ||||||
U.S. Treasury Obligations | 0.0 | (b) | |||||
Total | 100.0 | ||||||
Percentages indicated are based upon total investments. The Fund's portfolio composition is subject to change.
(a) Includes investments in an affiliated money market fund (amounting to $287.6 million) which have been segregated to cover obligations relating to the Fund's investment in derivatives as part of its tactical allocation strategy. For a description of the Fund's investments in derivatives, see Investments in Derivatives following the Portfolio of Investments, and Note 2 to the financial statements.
(b) Rounds to zero.
For the 12-month period that ended December 31, 2016, the Fund's Class 2 shares returned 3.17%. The Fund underperformed its Blended Benchmark, which gained 5.00% for the same time period. The broad U.S. fixed-income market, as represented by the Bloomberg Barclays U.S. Aggregate Bond Index, returned 2.65% over the same 12 months. Disappointing results from underlying U.S. large-cap equity funds accounted for much of the Fund's shortfall relative to its Blended Benchmark. The Fund's dynamic algorithm-based allocation methodology, which helps guide the Fund's asset allocation strategy, also detracted from relative results, as did event protection strategies designed to minimize losses in the event of steep market declines. Performance from underlying fixed-income funds and a modest overweight in U.S. small caps, one of the year's best equity sectors, aided relative returns.
Global Markets Posted Mixed Results
Global events, political uncertainty and mixed economic data were enough to keep investors off balance in 2016, as financial markets moved sharply in reaction to each significant change on the world stage. Early in the year, concerns about U.S. monetary policy, China and oil rattled the equity markets and drove stock prices downward. After a swift March rebound, the U.S. stock market fell again in the early summer in reaction to the U.K. vote to exit the European Union, and U.S. Treasury yields also plummeted. Once again, the markets rebounded but investors retreated in the third quarter in reaction to mixed economic data and uncertainty surrounding the U.S. Presidential race. Following the November election and with mostly positive economic data, stocks moved higher in the fourth quarter to keep the eight-year bull market alive. In the United States, steady job growth drove unemployment down, corporate earnings growth picked up, manufacturing activity accelerated, and the price of oil stabilized. Growth was lackluster in developed foreign market countries. In Europe and Japan, GDP advanced less than 1% for the year. China expanded at an estimated pace of 7.5%, in line with expectations, while most emerging markets struggled with volatile international capital flows and currency fluctuations. South American economies contracted.
In December 2016, the Federal Reserve (the Fed) raised the target range of its benchmark interest rate by a quarter of a point to between 0.50% and 0.75%, its first such move in a year. The Fed's action had been widely anticipated and had little or no impact on the financial markets when it occurred. The Fed indicated that it would continue to monitor inflation and the job market in considering future rate hikes.
Against this backdrop, the S&P 500 Index, a broad measure of U.S. stock market performance, rose 11.96%. Foreign stock markets lagged the U.S. markets. The MSCI EAFE Index (Net), a broad measure of performance in developed markets outside the United States, rose just 1.00% for the year. Rising interest rates kept a lid on price in most sectors of the bond market. As noted above, the Bloomberg Barclays U.S. Aggregate Bond Index, a broad measure of the performance of investment-grade bonds, returned 2.65% for the year. High-yield bonds outperformed both stocks and investment-grade bonds, returning 17.49%, as measured by the Bank of America Merrill Lynch U.S. High Yield Constrained Index.
Annual Report 2016
4
COLUMBIA VARIABLE PORTFOLIO — MANAGED VOLATILITY CONSERVATIVE GROWTH FUND
MANAGER DISCUSSION OF FUND PERFORMANCE (continued)
Significant Performance Factors
Underlying fund performance had a significant impact on relative returns in 2016. Tactical asset allocation decisions also affected Fund performance.
Underlying fund performance detracted from relative performance, although results were mixed. U.S. fixed-income funds made a strong showing, which aided results relative to the Blended Benchmark. Multi-sector bond strategies with exposure to the strong-performing corporate credit markets were particularly beneficial to results. Equity funds detracted from relative returns, especially those centered on large-cap equities. Value funds generally outperformed growth- and blend-oriented funds.
The market's back-and-forth volatility undermined the effectiveness of the dynamic algorithm as it was executed during the year. We widened the range within which we could vary from the targets indicated by the dynamic algorithm. This additional degree of tactical discretion aided performance when we lowered equity exposure more than the methodology indicated in late June, just ahead of the U.K. referendum on leaving the European Union — and we felt it was prudently cautious to keep equity exposure lower than the target suggested by the algorithm. However, the equity markets snapped back quickly and exercising this added flexibility detracted from overall relative performance because it resulted in lower equity exposure during the sharp market rebounds of the second half of the year. It should be noted that safe haven assets, such as U.S. Treasury-related synthetic bond positions, currency hedging instruments and other tactical positioning within the funds also detracted from relative results.
Derivative securities such as forward foreign currency exchange contracts, futures and options were used to execute the Fund's dynamic algorithm and event protection strategies, which account for approximately 30% of the portfolio. As noted above, these strategies detracted from relative performance for the year.
Subadvisor Changes
As part of an ongoing effort to monitor the individual teams that manage underlying funds, subadvisor changes were implemented for certain underlying funds during the second quarter of 2016 and again late in the period in an effort to improve results in the underlying funds. The Fund seeks to deliver a strong risk-adjusted return over time with broad diversification across asset classes. Tactical decisions and positioning changes are generally small in scope and magnitude.
Annual Report 2016
5
COLUMBIA VARIABLE PORTFOLIO — MANAGED VOLATILITY CONSERVATIVE GROWTH FUND
UNDERSTANDING YOUR FUND'S EXPENSES
(Unaudited)
As an investor, you incur ongoing costs, which generally include management fees, distribution and/or service fees, and other fund expenses. The following information is intended to help you understand your ongoing costs (in dollars) of investing in the Fund and to help you compare these costs with the ongoing costs of investing in other mutual funds.
The information below does not reflect fees and expenses imposed under your variable annuity contract and/or variable life insurance policy (collectively, Contracts) or qualified pension and retirement plan (Qualified Plan), if any. The total fees and expenses you bear may therefore be higher than those shown below.
Analyzing Your Fund's Expenses
To illustrate these ongoing costs, we have provided examples and calculated the expenses paid by investors in Class 2 shares of the Fund during the period. The actual and hypothetical information in the table is based on an initial investment of $1,000 at the beginning of the period indicated and held for the entire period. Expense information is calculated two ways and each method provides you with different information. The amount listed in the "Actual" column is calculated using the Fund's actual operating expenses and total return for the period. You may use the Actual information, together with the amount invested, to estimate the expenses that you paid over the period. Simply divide your account value by $1,000 (for example, an $8,600 account value divided by $1,000 = 8.6), then multiply the results by the expenses paid during the period under the "Actual" column. The amount listed in the "Hypothetical" column assumes a 5% annual rate of return before expenses (which is not the Fund's actual return) and then applies the Fund's actual expense ratio for the period to the hypothetical return. You should not use the hypothetical account values and expenses to estimate either your actual account balance at the end of the period or the expenses you paid during the period. See "Compare With Other Funds" below for details on how to use the hypothetical data.
In addition to the ongoing expenses which the Fund bears directly, the Fund's shareholders indirectly bear the Fund's allocable share of the costs and expenses of each underlying fund in which the Fund invests. You can estimate the effective expenses paid during the period, which includes the indirect fees associated with investing in the underlying funds, by using the amounts listed in the "Effective Expenses Paid During the Period" column.
Compare With Other Funds
Since all mutual funds are required to include the same hypothetical calculations about expenses in shareholder reports, you can use this information to compare the ongoing cost of investing in the Fund with other funds. To do so, compare the hypothetical example with the 5% hypothetical examples that appear in the shareholder reports of other funds. As you compare hypothetical examples of other funds, it is important to note that hypothetical examples are meant to highlight the ongoing costs of investing in a fund only and do not reflect any transaction costs, such as redemption or exchange fees, or expenses that apply to the subaccount or the Contract. Therefore, the hypothetical calculations are useful in comparing ongoing costs only, and will not help you determine the relative total costs of owning different funds. If the fees and expenses imposed under your Contract or Qualified Plan, if any, were included, your costs would be higher.
July 1, 2016 – December 31, 2016
| Account Value at the Beginning of the Period ($) | Account Value at the End of the Period ($) | Expenses Paid During the Period ($) | Fund's Annualized Expense Ratio (%) | Effective Expenses Paid During the Period ($) | Fund's Effective Annualized Expense Ratio (%) | ||||||||||||||||||||||||||||||||||||||
Actual | Hypothetical | Actual | Hypothetical | Actual | Hypothetical | Actual | Actual | Hypothetical | Actual | ||||||||||||||||||||||||||||||||||
Class 2 | 1,000.00 | 1,000.00 | 1,004.50 | 1,022.45 | 2.56 | 2.58 | 0.51 | 5.01 | 5.06 | 1.00 | |||||||||||||||||||||||||||||||||
Expenses paid during the period are equal to the annualized expense ratio for each class as indicated above, multiplied by the average account value over the period and then multiplied by the number of days in the Fund's most recent fiscal half year and divided by 366.
Effective expenses paid during the period and the Fund's effective annualized expense ratio include expenses borne directly to the class plus the Fund's indirect pro rata portion of the ongoing expenses charged by the underlying funds using the expense ratio of each class of the underlying funds as of the underlying fund's most recent shareholder report.
Annual Report 2016
6
COLUMBIA VARIABLE PORTFOLIO — MANAGED VOLATILITY CONSERVATIVE GROWTH FUND
PORTFOLIO OF INVESTMENTS
December 31, 2016
(Percentages represent value of investments compared to net assets)
Equity Funds 32.1%
Shares | Value ($) | ||||||||||
INTERNATIONAL 8.8% | |||||||||||
| Variable Portfolio — DFA International Value Fund, Class 1 Shares(a) | 3,608,400 | 33,702,460 | |||||||||
| Variable Portfolio — Lazard International Equity Advantage Fund, Class 1 Shares(a) | 1,381,080 | 13,506,960 | |||||||||
| Variable Portfolio — Oppenheimer International Growth Fund, Class 1 Shares(a) | 3,379,035 | 36,155,676 | |||||||||
| Variable Portfolio — Pyramis® International Equity Fund, Class 1 Shares(a) | 3,603,956 | 35,715,204 | |||||||||
Total | 119,080,300 | ||||||||||
U.S. LARGE CAP 18.5% | |||||||||||
| Columbia Variable Portfolio — Contrarian Core Fund, Class 1 Shares(a)(b) | 1,223,665 | 22,172,819 | |||||||||
| Columbia Variable Portfolio — Disciplined Core Fund, Class 1 Shares(a)(b) | 1,776,809 | 69,491,001 | |||||||||
| Columbia Variable Portfolio — Dividend Opportunity Fund, Class 1 Shares(a)(b) | 1,060,246 | 23,452,634 | |||||||||
| Columbia Variable Portfolio — Large Cap Growth Fund, Class 1 Shares(a)(b) | 1,557,802 | 20,376,049 | |||||||||
| Columbia Variable Portfolio — Select Large-Cap Value Fund, Class 1 Shares(a)(b) | 584,843 | 12,024,370 | |||||||||
| Variable Portfolio — Loomis Sayles Growth Fund, Class 1 Shares(a)(b) | 1,435,470 | 31,508,577 | |||||||||
| Variable Portfolio — MFS Value Fund, Class 1 Shares(a)(b) | 584,863 | 12,410,797 | |||||||||
| Variable Portfolio — MFS® Blended Research® Core Equity Fund, Class 1 Shares(a)(b) | 1,484,785 | 25,241,338 | |||||||||
| Variable Portfolio — Morgan Stanley Advantage Fund, Class 1 Shares(a)(b) | 484,189 | 9,925,864 | |||||||||
| Variable Portfolio — Nuveen Winslow Large Cap Growth Fund, Class 1 Shares(a)(b) | 612,951 | 12,412,264 | |||||||||
| Variable Portfolio — T. Rowe Price Large Cap Value Fund, Class 1 Shares(a)(b) | 610,173 | 11,971,602 | |||||||||
Total | 250,987,315 | ||||||||||
U.S. MID CAP 2.1% | |||||||||||
| Columbia Variable Portfolio — Mid Cap Growth Fund, Class 1 Shares(a)(b) | 278,217 | 5,834,216 | |||||||||
Equity Funds (continued)
Shares | Value ($) | ||||||||||
| Columbia Variable Portfolio — Mid Cap Value Fund, Class 1 Shares(a)(b) | 298,508 | 5,973,142 | |||||||||
| Variable Portfolio — Jennison Mid Cap Growth Fund, Class 1 Shares(a)(b) | 467,414 | 8,908,916 | |||||||||
| Variable Portfolio — Victory Sycamore Established Value Fund, Class 1 Shares(a)(b) | 375,955 | 8,526,643 | |||||||||
Total | 29,242,917 | ||||||||||
U.S. SMALL CAP 2.7% | |||||||||||
| Columbia Variable Portfolio — U.S. Equities Fund, Class 1 Shares(a)(b) | 633,729 | 13,187,893 | |||||||||
| Variable Portfolio — Partners Small Cap Growth Fund, Class 1 Shares(a)(b) | 605,396 | 11,187,728 | |||||||||
| Variable Portfolio — Partners Small Cap Value Fund, Class 1 Shares(a)(b) | 458,436 | 11,983,513 | |||||||||
Total | 36,359,134 | ||||||||||
| Total Equity Funds (Cost: $403,801,067) | 435,669,666 | ||||||||||
Fixed-Income Funds 39.2%
INVESTMENT GRADE 39.2% | |||||||||||
| Columbia Variable Portfolio — Intermediate Bond Fund, Class 1 Shares(a) | 10,014,207 | 103,647,047 | |||||||||
| Columbia Variable Portfolio — Limited Duration Credit Fund, Class 1 Shares(a) | 3,330,307 | 31,538,008 | |||||||||
| Columbia Variable Portfolio — Long Government/Credit Bond Fund, Class 1 Shares(a) | 5,480,137 | 54,362,955 | |||||||||
| Columbia Variable Portfolio — U.S. Government Mortgage Fund, Class 1 Shares(a) | 3,012,090 | 31,084,764 | |||||||||
| Variable Portfolio — American Century Diversified Bond Fund, Class 1 Shares(a) | 9,193,897 | 100,673,173 | |||||||||
| Variable Portfolio — J.P. Morgan Core Bond Fund, Class 1 Shares(a) | 8,896,045 | 96,255,206 | |||||||||
| Variable Portfolio — TCW Core Plus Bond Fund, Class 1 Shares(a) | 9,967,954 | 104,464,161 | |||||||||
| Variable Portfolio — Wells Fargo Short Duration Government Fund, Class 1 Shares(a) | 1,005,863 | 10,139,096 | |||||||||
Total | 532,164,410 | ||||||||||
| Total Fixed-Income Funds (Cost: $537,056,786) | 532,164,410 | ||||||||||
The accompanying Notes to Financial Statements are an integral part of this statement.
Annual Report 2016
7
COLUMBIA VARIABLE PORTFOLIO — MANAGED VOLATILITY CONSERVATIVE GROWTH FUND
PORTFOLIO OF INVESTMENTS (continued)
December 31, 2016
Exchange-Traded Funds 5.4%
Shares | Value ($) | ||||||||||
SPDR S&P 500 ETF Trust | 248,625 | 55,575,146 | |||||||||
iShares MSCI EAFE ETF | 306,987 | 17,722,360 | |||||||||
| Total Exchange-Traded Funds (Cost: $67,833,223) | 73,297,506 | ||||||||||
Corporate Bonds & Notes(c) 0.8%
Issuer | Coupon Rate | Principal Amount ($) | Value ($) | ||||||||||||
AEROSPACE & DEFENSE 0.1% | |||||||||||||||
| BAE Systems Holdings, Inc.(d) 10/07/24 | 3.800 | % | 95,000 | 97,347 | |||||||||||
| L-3 Communications Corp. 02/15/21 | 4.950 | % | 15,000 | 16,025 | |||||||||||
05/28/24 | 3.950 | % | 92,000 | 93,569 | |||||||||||
| Lockheed Martin Corp. 11/23/18 | 1.850 | % | 38,000 | 38,151 | |||||||||||
01/15/23 | 3.100 | % | 5,000 | 5,055 | |||||||||||
| Northrop Grumman Corp. 06/01/18 | 1.750 | % | 145,000 | 145,399 | |||||||||||
08/01/23 | 3.250 | % | 15,000 | 15,292 | |||||||||||
Total | 410,838 | �� | |||||||||||||
BANKING 0.1% | |||||||||||||||
| Bank of America Corp. 04/19/26 | 3.500 | % | 110,000 | 108,534 | |||||||||||
| Bank of Nova Scotia (The) 06/11/18 | 1.700 | % | 80,000 | 80,029 | |||||||||||
| Citigroup, Inc. 05/01/26 | 3.400 | % | 70,000 | 68,016 | |||||||||||
10/21/26 | 3.200 | % | 80,000 | 76,498 | |||||||||||
| Goldman Sachs Group, Inc. (The) 01/23/25 | 3.500 | % | 63,000 | 62,165 | |||||||||||
02/25/26 | 3.750 | % | 39,000 | 39,084 | |||||||||||
| JPMorgan Chase & Co. 03/01/18 | 1.700 | % | 50,000 | 49,991 | |||||||||||
03/22/19 | 1.850 | % | 50,000 | 49,842 | |||||||||||
10/01/26 | 2.950 | % | 71,000 | 67,769 | |||||||||||
| Morgan Stanley 04/21/21 | 2.500 | % | 40,000 | 39,565 | |||||||||||
07/27/26 | 3.125 | % | 35,000 | 33,438 | |||||||||||
| Wells Fargo & Co. 10/23/26 | 3.000 | % | 140,000 | 133,336 | |||||||||||
Total | 808,267 | ||||||||||||||
CABLE AND SATELLITE —% | |||||||||||||||
| Comcast Corp. 02/15/18 | 5.875 | % | 65,000 | 68,153 | |||||||||||
Corporate Bonds & Notes(c) (continued)
Issuer | Coupon Rate | Principal Amount ($) | Value ($) | ||||||||||||
| Sky PLC(d) 11/26/22 | 3.125 | % | 110,000 | 109,106 | |||||||||||
11/24/23 | 1.875 | % | EUR | 145,000 | 160,158 | ||||||||||
Total | 337,417 | ||||||||||||||
CHEMICALS —% | |||||||||||||||
| LYB International Finance BV 03/15/44 | 4.875 | % | 30,000 | 31,068 | |||||||||||
DIVERSIFIED MANUFACTURING —% | |||||||||||||||
| General Electric Co. 05/26/23 | 1.250 | % | EUR | 135,000 | 148,809 | ||||||||||
| Honeywell International, Inc. 10/30/19 | 1.400 | % | 90,000 | 89,168 | |||||||||||
02/22/23 | 1.300 | % | EUR | 105,000 | 114,859 | ||||||||||
| United Technologies Corp. 11/01/46 | 3.750 | % | 45,000 | 42,826 | |||||||||||
Total | 395,662 | ||||||||||||||
ELECTRIC 0.2% | |||||||||||||||
| Appalachian Power Co. 05/15/44 | 4.400 | % | 40,000 | 40,588 | |||||||||||
06/01/45 | 4.450 | % | 45,000 | 45,979 | |||||||||||
| Arizona Public Service Co. 05/15/46 | 3.750 | % | 35,000 | 32,826 | |||||||||||
| Berkshire Hathaway Energy Co. 11/15/23 | 3.750 | % | 55,000 | 57,514 | |||||||||||
02/01/45 | 4.500 | % | 73,000 | 75,732 | |||||||||||
| CMS Energy Corp. 03/15/22 | 5.050 | % | 25,000 | 27,387 | |||||||||||
03/01/24 | 3.875 | % | 45,000 | 46,801 | |||||||||||
11/15/25 | 3.600 | % | 160,000 | 161,968 | |||||||||||
02/15/27 | 2.950 | % | 40,000 | 37,964 | |||||||||||
03/01/44 | 4.875 | % | 1,000 | 1,072 | |||||||||||
| Consolidated Edison Co. of New York, Inc. 06/15/46 | 3.850 | % | 25,000 | 23,853 | |||||||||||
| DTE Energy Co. 06/01/24 | 3.500 | % | 90,000 | 90,703 | |||||||||||
10/01/26 | 2.850 | % | 260,000 | 241,623 | |||||||||||
| Dominion Resources, Inc. 06/15/18 | 1.900 | % | 105,000 | 105,055 | |||||||||||
| Duke Energy Corp. 10/15/23 | 3.950 | % | 337,000 | 353,472 | |||||||||||
09/01/46 | 3.750 | % | 20,000 | 18,004 | |||||||||||
| Duke Energy Progress LLC 10/15/46 | 3.700 | % | 30,000 | 28,407 | |||||||||||
| Emera US Finance LP(d) 06/15/46 | 4.750 | % | 90,000 | 90,760 | |||||||||||
The accompanying Notes to Financial Statements are an integral part of this statement.
Annual Report 2016
8
COLUMBIA VARIABLE PORTFOLIO — MANAGED VOLATILITY CONSERVATIVE GROWTH FUND
PORTFOLIO OF INVESTMENTS (continued)
December 31, 2016
Corporate Bonds & Notes(c) (continued)
Issuer | Coupon Rate | Principal Amount ($) | Value ($) | ||||||||||||
| Eversource Energy 01/15/18 | 1.600 | % | 27,000 | 26,939 | |||||||||||
05/01/18 | 1.450 | % | 180,000 | 179,408 | |||||||||||
| Indiana Michigan Power Co. 03/15/23 | 3.200 | % | 55,000 | 55,528 | |||||||||||
| NextEra Energy Capital Holdings, Inc. 04/01/19 | 2.300 | % | 15,000 | 15,114 | |||||||||||
| Oncor Electric Delivery Co. LLC 09/30/17 | 5.000 | % | 180,000 | 184,747 | |||||||||||
| Pacific Gas & Electric Co. 02/15/24 | 3.750 | % | 30,000 | 31,310 | |||||||||||
02/15/44 | 4.750 | % | 70,000 | 76,785 | |||||||||||
| Public Service Enterprise Group, Inc. 11/15/19 | 1.600 | % | 35,000 | 34,497 | |||||||||||
| Sierra Pacific Power Co. 05/01/26 | 2.600 | % | 15,000 | 14,351 | |||||||||||
| Southern California Edison Co. 02/01/45 | 3.600 | % | 10,000 | 9,459 | |||||||||||
| Southern Co. (The) 07/01/46 | 4.400 | % | 105,000 | 103,857 | |||||||||||
| TransAlta Corp. 06/03/17 | 1.900 | % | 105,000 | 104,475 | |||||||||||
11/25/20 | 5.000 | % | CAD | 105,000 | 80,295 | ||||||||||
| Virginia Electric & Power Co. 11/15/46 | 4.000 | % | 10,000 | 9,970 | |||||||||||
| WEC Energy Group, Inc. 06/15/18 | 1.650 | % | 45,000 | 44,959 | |||||||||||
06/15/25 | 3.550 | % | 39,000 | 39,746 | |||||||||||
| Western Power Distribution PLC(d) 11/06/23 | 3.625 | % | GBP | 155,000 | 206,334 | ||||||||||
| Xcel Energy, Inc. 05/15/20 | 4.700 | % | 91,000 | 96,778 | |||||||||||
12/01/26 | 3.350 | % | 110,000 | 110,091 | |||||||||||
Total | 2,904,351 | ||||||||||||||
FOOD AND BEVERAGE 0.1% | |||||||||||||||
| Anheuser-Busch InBev Finance, Inc. 01/17/23 | 2.625 | % | 7,000 | 6,861 | |||||||||||
02/01/23 | 3.300 | % | 5,000 | 5,089 | |||||||||||
02/01/26 | 3.650 | % | 260,000 | 263,949 | |||||||||||
| Anheuser-Busch InBev Worldwide, Inc. 07/15/17 | 1.375 | % | 140,000 | 140,122 | |||||||||||
| ConAgra Foods, Inc. 01/25/23 | 3.200 | % | 174,000 | 173,839 | |||||||||||
| General Mills, Inc. 10/20/17 | 1.400 | % | 52,000 | 52,060 | |||||||||||
11/16/20 | 2.100 | % | EUR | 106,000 | 119,435 | ||||||||||
Corporate Bonds & Notes(c) (continued)
Issuer | Coupon Rate | Principal Amount ($) | Value ($) | ||||||||||||
| JM Smucker Co. (The) 03/15/20 | 2.500 | % | 3,000 | 3,014 | |||||||||||
| Kellogg Co. 12/01/23 | 2.650 | % | 125,000 | 120,924 | |||||||||||
| Kraft Heinz Foods Co. 06/01/26 | 3.000 | % | 35,000 | 32,859 | |||||||||||
06/01/46 | 4.375 | % | 60,000 | 56,459 | |||||||||||
| Kraft Heinz Foods Co 06/05/17 | 2.250 | % | 34,000 | 34,109 | |||||||||||
| Molson Coors Brewing Co. 07/15/26 | 3.000 | % | 75,000 | 70,898 | |||||||||||
05/01/42 | 5.000 | % | 15,000 | 15,680 | |||||||||||
07/15/46 | 4.200 | % | 24,000 | 22,376 | |||||||||||
| PepsiCo, Inc. 02/22/19 | 1.500 | % | 105,000 | 104,633 | |||||||||||
| Sysco Corp. 07/15/21 | 2.500 | % | 20,000 | 19,787 | |||||||||||
| Tyson Foods, Inc. 08/15/19 | 2.650 | % | 65,000 | 65,620 | |||||||||||
| Wm. Wrigley Jr., Co.(d) 10/21/18 | 2.400 | % | 17,000 | 17,152 | |||||||||||
10/21/19 | 2.900 | % | 145,000 | 147,532 | |||||||||||
Total | 1,472,398 | ||||||||||||||
HEALTH CARE —% | |||||||||||||||
| Becton Dickinson and Co. 12/15/44 | 4.685 | % | 25,000 | 25,899 | |||||||||||
| Express Scripts Holding Co. 07/15/46 | 4.800 | % | 10,000 | 9,574 | |||||||||||
Total | 35,473 | ||||||||||||||
HEALTHCARE INSURANCE —% | |||||||||||||||
| Aetna, Inc. 06/07/19 | 1.900 | % | 61,000 | 60,860 | |||||||||||
06/15/46 | 4.375 | % | 25,000 | 25,104 | |||||||||||
| UnitedHealth Group, Inc. 12/15/17 | 1.400 | % | 85,000 | 85,016 | |||||||||||
Total | 170,980 | ||||||||||||||
INDEPENDENT ENERGY —% | |||||||||||||||
| Anadarko Petroleum Corp. 07/15/44 | 4.500 | % | 35,000 | 32,884 | |||||||||||
| Canadian Natural Resources Ltd. 05/15/17 | 5.700 | % | 13,000 | 13,194 | |||||||||||
02/01/35 | 5.850 | % | 45,000 | 47,895 | |||||||||||
03/15/38 | 6.250 | % | 14,000 | 15,927 | |||||||||||
| Noble Energy, Inc. 11/15/43 | 5.250 | % | 25,000 | 25,465 | |||||||||||
The accompanying Notes to Financial Statements are an integral part of this statement.
Annual Report 2016
9
COLUMBIA VARIABLE PORTFOLIO — MANAGED VOLATILITY CONSERVATIVE GROWTH FUND
PORTFOLIO OF INVESTMENTS (continued)
December 31, 2016
Corporate Bonds & Notes(c) (continued)
Issuer | Coupon Rate | Principal Amount ($) | Value ($) | ||||||||||||
| Woodside Finance Ltd.(d) 03/05/25 | 3.650 | % | 126,000 | 123,088 | |||||||||||
Total | 258,453 | ||||||||||||||
INTEGRATED ENERGY —% | |||||||||||||||
| Cenovus Energy, Inc. 09/15/42 | 4.450 | % | 84,000 | 72,741 | |||||||||||
09/15/43 | 5.200 | % | 65,000 | 61,912 | |||||||||||
Total | 134,653 | ||||||||||||||
LIFE INSURANCE 0.1% | |||||||||||||||
| Five Corners Funding Trust(d) 11/15/23 | 4.419 | % | 250,000 | 263,717 | |||||||||||
| Guardian Life Insurance Co. of America (The) Subordinated(d) 06/19/64 | 4.875 | % | 95,000 | 93,319 | |||||||||||
| MetLife, Inc. 12/15/17 | 1.756 | % | 15,000 | 15,025 | |||||||||||
09/15/23 | 4.368 | % | 56,000 | 60,262 | |||||||||||
03/01/45 | 4.050 | % | 15,000 | 14,384 | |||||||||||
| Northwestern Mutual Life Insurance Co. (The) Subordinated(d) 03/30/40 | 6.063 | % | 50,000 | 61,569 | |||||||||||
| Peachtree Corners Funding Trust(d) 02/15/25 | 3.976 | % | 100,000 | 97,571 | |||||||||||
| TIAA Asset Management Finance Co. LLC(d) 11/01/19 | 2.950 | % | 40,000 | 40,691 | |||||||||||
| Teachers Insurance & Annuity Association of America Subordinated(d) 09/15/44 | 4.900 | % | 135,000 | 145,266 | |||||||||||
| Voya Financial, Inc. 06/15/46 | 4.800 | % | 45,000 | 43,749 | |||||||||||
Total | 835,553 | ||||||||||||||
MEDIA AND ENTERTAINMENT —% | |||||||||||||||
| 21st Century Fox America, Inc. 09/15/44 | 4.750 | % | 85,000 | 84,964 | |||||||||||
| 21st Century Fox America, Inc.(d) 11/15/46 | 4.750 | % | 15,000 | 15,045 | |||||||||||
| Scripps Networks Interactive, Inc. 11/15/24 | 3.900 | % | 122,000 | 123,981 | |||||||||||
| Thomson Reuters Corp. 10/15/19 | 4.700 | % | 35,000 | 37,161 | |||||||||||
05/23/43 | 4.500 | % | 57,000 | 53,462 | |||||||||||
Total | 314,613 | ||||||||||||||
MIDSTREAM 0.1% | |||||||||||||||
| Columbia Pipeline Group, Inc. 06/01/45 | 5.800 | % | 6,000 | 6,900 | |||||||||||
Corporate Bonds & Notes(c) (continued)
Issuer | Coupon Rate | Principal Amount ($) | Value ($) | ||||||||||||
| Enterprise Products Operating LLC 05/07/18 | 1.650 | % | 42,000 | 41,882 | |||||||||||
02/15/45 | 5.100 | % | 25,000 | 26,366 | |||||||||||
05/15/46 | 4.900 | % | 79,000 | 81,094 | |||||||||||
| Kinder Morgan Energy Partners LP 03/01/43 | 5.000 | % | 122,000 | 117,640 | |||||||||||
| Kinder Morgan, Inc. 02/15/46 | 5.050 | % | 20,000 | 19,798 | |||||||||||
| Plains All American Pipeline LP/Finance Corp. 01/31/23 | 2.850 | % | 76,000 | 71,846 | |||||||||||
10/15/23 | 3.850 | % | 110,000 | 108,754 | |||||||||||
11/01/24 | 3.600 | % | 5,000 | 4,787 | |||||||||||
06/15/44 | 4.700 | % | 18,000 | 16,039 | |||||||||||
| Southern Natural Gas Co. LLC(d) 04/01/17 | 5.900 | % | 24,000 | 24,250 | |||||||||||
| Williams Partners LP 09/15/45 | 5.100 | % | 75,000 | 71,284 | |||||||||||
Total | 590,640 | ||||||||||||||
NATURAL GAS —% | |||||||||||||||
| NiSource Finance Corp. 02/15/43 | 5.250 | % | 50,000 | 55,321 | |||||||||||
| Sempra Energy 04/01/17 | 2.300 | % | 60,000 | 60,118 | |||||||||||
06/15/24 | 3.550 | % | 230,000 | 232,763 | |||||||||||
Total | 348,202 | ||||||||||||||
OIL FIELD SERVICES —% | |||||||||||||||
| Noble Holding International Ltd. 03/15/42 | 5.250 | % | 52,000 | 34,320 | |||||||||||
PHARMACEUTICALS —% | |||||||||||||||
| Actavis Funding 03/15/45 | 4.750 | % | 40,000 | 39,269 | |||||||||||
| Amgen, Inc.(d) 06/15/51 | 4.663 | % | 72,000 | 69,426 | |||||||||||
| Pfizer, Inc. 06/01/18 | 1.200 | % | 150,000 | 149,607 | |||||||||||
12/15/46 | 4.125 | % | 25,000 | 25,432 | |||||||||||
| Shire Acquisitions Investments Ireland DAC 09/23/19 | 1.900 | % | 90,000 | 88,859 | |||||||||||
| Teva Pharmaceutical Finance Netherlands III BV 10/01/46 | 4.100 | % | 20,000 | 17,137 | |||||||||||
Total | 389,730 | ||||||||||||||
PROPERTY & CASUALTY —% | |||||||||||||||
| Berkshire Hathaway Finance Corp. 05/15/42 | 4.400 | % | 29,000 | 30,530 | |||||||||||
The accompanying Notes to Financial Statements are an integral part of this statement.
Annual Report 2016
10
COLUMBIA VARIABLE PORTFOLIO — MANAGED VOLATILITY CONSERVATIVE GROWTH FUND
PORTFOLIO OF INVESTMENTS (continued)
December 31, 2016
Corporate Bonds & Notes(c) (continued)
Issuer | Coupon Rate | Principal Amount ($) | Value ($) | ||||||||||||
| CNA Financial Corp. 05/15/24 | 3.950 | % | 31,000 | 31,444 | |||||||||||
03/01/26 | 4.500 | % | 25,000 | 26,144 | |||||||||||
| Liberty Mutual Group, Inc.(d) 06/15/23 | 4.250 | % | 146,000 | 152,858 | |||||||||||
Total | 240,976 | ||||||||||||||
RAILROADS —% | |||||||||||||||
| CSX Corp. 11/01/46 | 3.800 | % | 65,000 | 60,260 | |||||||||||
REFINING —% | |||||||||||||||
| Phillips 66 05/01/17 | 2.950 | % | 75,000 | 75,418 | |||||||||||
RESTAURANTS —% | |||||||||||||||
| McDonald's Corp. 03/01/18 | 5.350 | % | 125,000 | 130,266 | |||||||||||
12/09/45 | 4.875 | % | 15,000 | 16,066 | |||||||||||
Total | 146,332 | ||||||||||||||
RETAILERS —% | |||||||||||||||
| CVS Health Corp. 06/01/21 | 2.125 | % | 75,000 | 73,541 | |||||||||||
06/01/26 | 2.875 | % | 65,000 | 61,956 | |||||||||||
| Target Corp. 01/15/18 | 6.000 | % | 100,000 | 104,553 | |||||||||||
| Wal-Mart Stores, Inc. 04/11/18 | 1.125 | % | 35,000 | 34,918 | |||||||||||
Total | 274,968 | ||||||||||||||
TECHNOLOGY 0.1% | |||||||||||||||
| Apple, Inc. 02/23/18 | 1.300 | % | 83,000 | 83,061 | |||||||||||
02/09/45 | 3.450 | % | 51,000 | 45,015 | |||||||||||
08/04/46 | 3.850 | % | 20,000 | 19,163 | |||||||||||
| Cisco Systems, Inc. 09/20/19 | 1.400 | % | 80,000 | 79,128 | |||||||||||
| International Business Machine Corp. 11/19/19 | 1.375 | % | EUR | 112,000 | 122,854 | ||||||||||
| Microsoft Corp. 11/03/18 | 1.300 | % | 30,000 | 29,976 | |||||||||||
08/08/46 | 3.700 | % | 5,000 | 4,707 | |||||||||||
| Oracle Corp. 01/10/21 | 2.250 | % | EUR | 100,000 | 114,214 | ||||||||||
09/15/21 | 1.900 | % | 50,000 | 48,860 | |||||||||||
07/15/46 | 4.000 | % | 25,000 | 23,912 | |||||||||||
Total | 570,890 | ||||||||||||||
Corporate Bonds & Notes(c) (continued)
Issuer | Coupon Rate | Principal Amount ($) | Value ($) | ||||||||||||
TRANSPORTATION SERVICES —% | |||||||||||||||
| ERAC U.S.A. Finance LLC(d) 11/01/23 | 2.700 | % | 85,000 | 81,657 | |||||||||||
12/01/26 | 3.300 | % | 130,000 | 124,737 | |||||||||||
11/01/46 | 4.200 | % | 10,000 | 9,138 | |||||||||||
| FedEx Corp. 04/01/46 | 4.550 | % | 35,000 | 35,270 | |||||||||||
| Heathrow Funding Ltd.(d) 02/15/23 | 5.225 | % | GBP | 56,000 | 81,901 | ||||||||||
Total | 332,703 | ||||||||||||||
WIRELESS —% | |||||||||||||||
| Rogers Communications, Inc. 03/15/23 | 3.000 | % | 91,000 | 90,409 | |||||||||||
WIRELINES —% | |||||||||||||||
| AT&T, Inc. 06/15/45 | 4.350 | % | 95,000 | 84,648 | |||||||||||
| Orange SA 02/21/17 | 4.750 | % | EUR | 50,000 | 52,977 | ||||||||||
| Verizon Communications, Inc. 11/01/42 | 3.850 | % | 89,000 | 76,815 | |||||||||||
03/15/55 | 4.672 | % | 20,000 | 18,782 | |||||||||||
Total | 233,222 | ||||||||||||||
| Total Corporate Bonds & Notes (Cost: $11,669,515) | 11,497,796 | ||||||||||||||
Residential Mortgage-Backed Securities —
Agency 5.7%
| Federal National Mortgage Association(e) 01/23/32 | 2.500 | % | 12,750,000 | 12,770,170 | |||||||||||
01/23/32 | 3.000 | % | 1,750,000 | 1,795,801 | |||||||||||
01/23/32 - 01/18/47 | 3.500 | % | 54,675,000 | 56,341,706 | |||||||||||
01/18/47 | 4.000 | % | 6,750,000 | 7,096,333 | |||||||||||
| Total Residential Mortgage-Backed Securities — Agency (Cost: $77,917,892) | 78,004,010 | ||||||||||||||
U.S. Treasury Obligations —%
| U.S. Treasury 05/15/45 | 3.000 | % | 25,000 | 24,662 | |||||||||||
| Total U.S. Treasury Obligations (Cost: $24,483) | 24,662 | ||||||||||||||
The accompanying Notes to Financial Statements are an integral part of this statement.
Annual Report 2016
11
COLUMBIA VARIABLE PORTFOLIO — MANAGED VOLATILITY CONSERVATIVE GROWTH FUND
PORTFOLIO OF INVESTMENTS (continued)
December 31, 2016
Options Purchased Puts 0.8%
Issuer | Notional ($)/ Contracts | Exercise Price ($) | Expiration Date | Value ($) | |||||||||||||||
S&P 500 Index | 125 | 1,700.00 | 06/15/18 | 693,750 | |||||||||||||||
S&P 500 Index | 300 | 1,800.00 | 06/15/18 | 2,140,500 | |||||||||||||||
S&P 500 Index | 335 | 1,850.00 | 06/15/18 | 2,701,775 | |||||||||||||||
S&P 500 Index | 240 | 1,800.00 | 12/21/18 | 2,341,200 | |||||||||||||||
S&P 500 Index | 265 | 1,850.00 | 12/21/18 | 2,889,825 | |||||||||||||||
| Total Options Purchased Puts (Cost: $12,474,516) | 10,767,050 | ||||||||||||||||||
Money Market Funds 21.2%
Shares | Value ($) | ||||||||||
| Columbia Short-Term Cash Fund, 0.594%(a)(f) | 287,582,585 | 287,582,585 | |||||||||
| Total Money Market Funds (Cost: $287,582,585) | 287,582,585 | ||||||||||
| Total Investments (Cost: $1,398,360,067) | 1,429,007,685 | ||||||||||
Other Assets & Liabilities, Net | (70,043,368 | ) | |||||||||
Net Assets | 1,358,964,317 | ||||||||||
At December 31, 2016, cash totaling $7,402,591 was pledged as collateral.
Investments in Derivatives
Forward Foreign Currency Exchange Contracts Open at December 31, 2016
Counterparty | Exchange Date | Currency to be Delivered | Currency to be Received | Unrealized Appreciation ($) | Unrealized Depreciation ($) | ||||||||||||||||||||||||||
Standard Chartered | 01/13/2017 | 238,000 | GBP | 297,867 | USD | 4,478 | — | ||||||||||||||||||||||||
State Street | 01/13/2017 | 105,000 | CAD | 78,459 | USD | 246 | — | ||||||||||||||||||||||||
UBS | 01/13/2017 | 793,000 | EUR | 844,791 | USD | 9,625 | — | ||||||||||||||||||||||||
Total | 14,349 | — | |||||||||||||||||||||||||||||
Futures Contracts Outstanding at December 31, 2016
Long Futures Contracts Outstanding
Contract Description | Number of Contracts | Trading Currency | Notional Market Value ($) | Expiration Date | Unrealized Appreciation ($) | Unrealized (Depreciation) ($) | |||||||||||||||||||||
| 10-Year Mini JGB | 1 | JPY | 128,582 | 03/2017 | 55 | — | |||||||||||||||||||||
| BP Currency | 67 | USD | 5,174,913 | 03/2017 | — | (143,460 | ) | ||||||||||||||||||||
Canadian Government 10-Year Bond | 2 | CAD | 204,864 | 03/2017 | — | (2,067 | ) | ||||||||||||||||||||
Euro FX | 35 | USD | 4,626,125 | 03/2017 | — | (46,942 | ) | ||||||||||||||||||||
Euro-Bobl | 3 | EUR | 421,997 | 03/2017 | 3,324 | — | |||||||||||||||||||||
Euro-Bund | 4 | EUR | 691,170 | 03/2017 | 9,635 | — | |||||||||||||||||||||
Euro-Schatz | 1 | EUR | 118,202 | 03/2017 | 198 | — | |||||||||||||||||||||
| JPY Currency | 100 | USD | 10,746,250 | 03/2017 | — | (152,983 | ) | ||||||||||||||||||||
Long Gilt | 3 | GBP | 465,219 | 03/2017 | 8,298 | — | |||||||||||||||||||||
S&P 500 E-mini | 770 | USD | 86,093,700 | 03/2017 | 1,195,482 | — | |||||||||||||||||||||
S&P 500 Index | 8 | USD | 4,472,400 | 03/2017 | 62,872 | — | |||||||||||||||||||||
SPI 200 Index | 30 | AUD | 3,047,709 | 03/2017 | 69,292 | — | |||||||||||||||||||||
TOPIX Index | 82 | JPY | 10,650,353 | 03/2017 | 240,889 | — | |||||||||||||||||||||
U.S. Long Bond | 90 | USD | 13,559,063 | 03/2017 | — | (106,221 | ) | ||||||||||||||||||||
U.S. Treasury 10-Year Note | 481 | USD | 59,779,281 | 03/2017 | — | (297,707 | ) | ||||||||||||||||||||
U.S. Treasury 2-Year Note | 367 | USD | 79,524,313 | 03/2017 | — | (96,467 | ) | ||||||||||||||||||||
The accompanying Notes to Financial Statements are an integral part of this statement.
Annual Report 2016
12
COLUMBIA VARIABLE PORTFOLIO — MANAGED VOLATILITY CONSERVATIVE GROWTH FUND
PORTFOLIO OF INVESTMENTS (continued)
December 31, 2016
Futures Contracts Outstanding at December 31, 2016 (continued)
Long Futures Contracts Outstanding (continued)
Contract Description | Number of Contracts | Trading Currency | Notional Market Value ($) | Expiration Date | Unrealized Appreciation ($) | Unrealized (Depreciation) ($) | |||||||||||||||||||||
U.S. Treasury 5-Year Note | 10 | USD | 1,176,641 | 03/2017 | — | (3,566 | ) | �� | |||||||||||||||||||
U.S. Treasury 5-Year Note | 313 | USD | 36,828,852 | 03/2017 | — | (176,626 | ) | ||||||||||||||||||||
U.S. Ultra Bond | 7 | USD | 1,121,750 | 03/2017 | — | (10,162 | ) | ||||||||||||||||||||
U.S. Ultra Bond | 10 | USD | 1,602,500 | 03/2017 | — | (17,520 | ) | ||||||||||||||||||||
Total | 320,433,884 | 1,590,045 | (1,053,721 | ) | |||||||||||||||||||||||
Short Futures Contracts Outstanding
Contract Description | Number of Contracts | Trading Currency | Notional Market Value ($) | Expiration Date | Unrealized Appreciation ($) | Unrealized (Depreciation) ($) | |||||||||||||||||||||
| EURO STOXX 50 | (71 | ) | EUR | (2,449,170 | ) | 03/2017 | — | (67,056 | ) | ||||||||||||||||||
FTSE 100 Index | (20 | ) | GBP | (1,737,684 | ) | 03/2017 | — | (57,393 | ) | ||||||||||||||||||
U.S. Long Bond | (17 | ) | USD | (2,561,156 | ) | 03/2017 | 19,893 | — | |||||||||||||||||||
U.S. Treasury 2-Year Note | (145 | ) | USD | (31,419,688 | ) | 03/2017 | 35,989 | — | |||||||||||||||||||
U.S. Treasury 2-Year Note | (3 | ) | USD | (650,063 | ) | 03/2017 | 605 | — | |||||||||||||||||||
U.S. Treasury Ultra 10-Year Note | (5 | ) | USD | (670,313 | ) | 03/2017 | 3,697 | — | |||||||||||||||||||
Total | (39,488,074 | ) | 60,184 | (124,449 | ) | ||||||||||||||||||||||
Notes to Portfolio of Investments
(a) As defined in the Investment Company Act of 1940, an affiliated company is one in which the Fund owns 5% or more of the company's outstanding voting securities, or a company which is under common ownership or control with the Fund. Holdings and transactions in these affiliated companies during the year ended December 31, 2016 are as follows:
Issuer | Beginning Cost ($) | Purchase Cost ($) | Proceeds From Sales ($) | Realized Gain (Loss) ($) | Ending Cost ($) | Capital Gain Distributions ($) | Dividends — Affiliated Issuers ($) | Value ($) | |||||||||||||||||||||||||||
| Columbia Short-Term Cash Fund, 0.594% | 226,336,987 | 257,990,464 | (196,744,921 | ) | 55 | 287,582,585 | — | 1,185,532 | 287,582,585 | ||||||||||||||||||||||||||
| Columbia Variable Portfolio — Contrarian Core Fund, Class 1 Shares | 13,335,766 | 5,540,797 | (522,402 | ) | 9,496 | 18,363,657 | — | — | 22,172,819 | ||||||||||||||||||||||||||
| Columbia Variable Portfolio — Disciplined Core Fund, Class 1 Shares | 42,190,320 | 23,781,159 | (3,102,692 | ) | 96,533 | 62,965,320 | — | — | 69,491,001 | ||||||||||||||||||||||||||
| Columbia Variable Portfolio — Dividend Opportunity Fund, Class 1 Shares | 15,615,283 | 5,167,843 | (565,860 | ) | 6,085 | 20,223,351 | — | — | 23,452,634 | ||||||||||||||||||||||||||
| Columbia Variable Portfolio — Income Opportunities Fund, Class 1 Shares | 22,191,704 | 484,999 | (22,435,687 | ) | (241,016 | ) | — | — | — | — | |||||||||||||||||||||||||
| Columbia Variable Portfolio — Intermediate Bond Fund, Class 1 Shares | 74,600,223 | 28,450,670 | (364 | ) | (27 | ) | 103,050,502 | 54,574 | 1,607,170 | 103,647,047 | |||||||||||||||||||||||||
| Columbia Variable Portfolio — Large Cap Growth Fund, Class 1 Shares | 5,721,074 | 13,167,430 | (276,606 | ) | (6 | ) | 18,611,892 | — | — | 20,376,049 | |||||||||||||||||||||||||
The accompanying Notes to Financial Statements are an integral part of this statement.
Annual Report 2016
13
COLUMBIA VARIABLE PORTFOLIO — MANAGED VOLATILITY CONSERVATIVE GROWTH FUND
PORTFOLIO OF INVESTMENTS (continued)
December 31, 2016
Notes to Portfolio of Investments (continued)
Issuer | Beginning Cost ($) | Purchase Cost ($) | Proceeds From Sales ($) | Realized Gain (Loss) ($) | Ending Cost ($) | Capital Gain Distributions ($) | Dividends — Affiliated Issuers ($) | Value ($) | |||||||||||||||||||||||||||
| Columbia Variable Portfolio — Limited Duration Credit Fund, Class 1 Shares | 23,876,045 | 9,291,806 | (178 | ) | (19 | ) | 33,167,654 | — | 1,069,163 | 31,538,008 | |||||||||||||||||||||||||
| Columbia Variable Portfolio — Long Government/Credit Bond Fund, Class 1 Shares | 18,630,225 | 37,603,573 | — | — | 56,233,798 | — | 913,559 | 54,362,955 | |||||||||||||||||||||||||||
| Columbia Variable Portfolio — Mid Cap Growth Fund, Class 1 Shares | — | 5,773,143 | (178,864 | ) | 1,607 | 5,595,886 | — | — | 5,834,216 | ||||||||||||||||||||||||||
| Columbia Variable Portfolio — Mid Cap Value Fund, Class 1 Shares | — | 5,626,710 | (370,870 | ) | 22,115 | 5,277,955 | — | — | 5,973,142 | ||||||||||||||||||||||||||
| Columbia Variable Portfolio — Select Large Cap Growth Fund, Class 1 Shares | 6,529,661 | 5,171,277 | (10,879,782 | ) | (821,156 | ) | — | 1,426,210 | — | — | |||||||||||||||||||||||||
| Columbia Variable Portfolio — Select Large-Cap Value Fund, Class 1 Shares | 7,757,048 | 2,289,425 | (815,879 | ) | 71,988 | 9,302,582 | — | — | 12,024,370 | ||||||||||||||||||||||||||
| Columbia Variable Portfolio — U.S. Equities Fund, Class 1 Shares | 24,648,534 | 4,325,860 | (16,624,996 | ) | (1,663,297 | ) | 10,686,101 | — | — | 13,187,893 | |||||||||||||||||||||||||
| Columbia Variable Portfolio — U.S. Government Mortgage Fund, Class 1 Shares | 21,871,400 | 9,516,396 | (196 | ) | (7 | ) | 31,387,593 | 199,597 | 768,001 | 31,084,764 | |||||||||||||||||||||||||
| Variable Portfolio — American Century Diversified Bond Fund, Class 1 Shares | 73,208,615 | 27,769,136 | (291 | ) | (3 | ) | 100,977,457 | 49,498 | 1,581,636 | 100,673,173 | |||||||||||||||||||||||||
| Variable Portfolio — Columbia Wanger International Equities Fund, Class 1 Shares | 2,168,170 | 12,682 | (1,904,993 | ) | (275,859 | ) | — | — | 12,683 | — | |||||||||||||||||||||||||
| Variable Portfolio — DFA International Value Fund, Class 1 Shares | 29,319,084 | 9,882,405 | (3,947,351 | ) | (873,824 | ) | 34,380,314 | 144,141 | 901,048 | 33,702,460 | |||||||||||||||||||||||||
| Variable Portfolio — J.P. Morgan Core Bond Fund, Class 1 Shares | 54,887,037 | 42,507,260 | (255 | ) | (5 | ) | 97,394,037 | 110,710 | 1,407,953 | 96,255,206 | |||||||||||||||||||||||||
| Variable Portfolio — Jennison Mid Cap Growth Fund, Class 1 Shares | 62,951 | 8,690,932 | (227,793 | ) | 2,267 | 8,528,357 | — | — | 8,908,916 | ||||||||||||||||||||||||||
| Variable Portfolio — Lazard International Equity Advantage Fund, Class 1 Shares | 7,470,080 | 6,240,985 | (82,639 | ) | (6,053 | ) | 13,622,373 | — | 227,940 | 13,506,960 | |||||||||||||||||||||||||
| Variable Portfolio — Loomis Sayles Growth Fund, Class 1 Shares | 6,030,048 | 22,860,282 | (26,759 | ) | (126 | ) | 28,863,445 | — | — | 31,508,577 | |||||||||||||||||||||||||
| Variable Portfolio — MFS Value Fund, Class 1 Shares | 7,314,080 | 2,979,833 | (487,022 | ) | 15,283 | 9,822,174 | — | — | 12,410,797 | ||||||||||||||||||||||||||
| Variable Portfolio — MFS® Blended Research® Core Equity Fund, Class 1 Shares | 16,479,000 | 5,666,338 | (650,980 | ) | 16,410 | 21,510,768 | — | — | 25,241,338 | ||||||||||||||||||||||||||
| Variable Portfolio — Morgan Stanley Advantage Fund, Class 1 Shares | 6,172,627 | 2,433,333 | (33,855 | ) | (185 | ) | 8,571,920 | — | — | 9,925,864 | |||||||||||||||||||||||||
| Variable Portfolio — Nuveen Winslow Large Cap Growth Fund, Class 1 Shares | 7,521,891 | 3,766,634 | (21,284 | ) | (581 | ) | 11,266,660 | — | — | 12,412,264 | |||||||||||||||||||||||||
The accompanying Notes to Financial Statements are an integral part of this statement.
Annual Report 2016
14
COLUMBIA VARIABLE PORTFOLIO — MANAGED VOLATILITY CONSERVATIVE GROWTH FUND
PORTFOLIO OF INVESTMENTS (continued)
December 31, 2016
Notes to Portfolio of Investments (continued)
Issuer | Beginning Cost ($) | Purchase Cost ($) | Proceeds From Sales ($) | Realized Gain (Loss) ($) | Ending Cost ($) | Capital Gain Distributions ($) | Dividends — Affiliated Issuers ($) | Value ($) | |||||||||||||||||||||||||||
| Variable Portfolio — Oppenheimer International Growth Fund, Class 1 Shares | 30,828,512 | 11,206,452 | (1,524,025 | ) | (408,679 | ) | 40,102,260 | 391,018 | 480,227 | 36,155,676 | |||||||||||||||||||||||||
| Variable Portfolio — Partners Small Cap Growth Fund, Class 1 Shares | 8,108,750 | 2,791,700 | (621,362 | ) | (37,437 | ) | 10,241,651 | — | — | 11,187,728 | |||||||||||||||||||||||||
| Variable Portfolio — Partners Small Cap Value Fund, Class 1 Shares | 18,620,890 | 3,775,964 | (13,088,301 | ) | (132,580 | ) | 9,175,973 | — | — | 11,983,513 | |||||||||||||||||||||||||
| Variable Portfolio — Pyramis® International Equity Fund, Class 1 Shares | 30,953,444 | 11,599,795 | (2,621,220 | ) | (753,743 | ) | 39,178,276 | — | 761,997 | 35,715,204 | |||||||||||||||||||||||||
| Variable Portfolio — T. Rowe Price Large Cap Value Fund, Class 1 Shares | 8,038,742 | 2,666,341 | (591,103 | ) | 32,423 | 10,146,403 | — | — | 11,971,602 | ||||||||||||||||||||||||||
| Variable Portfolio — TCW Core Plus Bond Fund, Class 1 Shares | 73,598,910 | 30,987,801 | (374 | ) | (2 | ) | 104,586,335 | 381,204 | 1,106,106 | 104,464,161 | |||||||||||||||||||||||||
| Variable Portfolio — Victory Sycamore Established Value Fund, Class 1 Shares | 26,920 | 7,801,764 | (500,016 | ) | 35,081 | 7,363,749 | — | — | 8,526,643 | ||||||||||||||||||||||||||
| Variable Portfolio — Wells Fargo Short Duration Government Fund, Class 1 Shares | 7,295,108 | 2,964,357 | (54 | ) | (1 | ) | 10,259,410 | 34,405 | 81,253 | 10,139,096 | |||||||||||||||||||||||||
Total | 891,409,129 | 620,785,546 | (278,848,974 | ) | (4,905,263 | ) | 1,228,440,438 | 2,791,357 | 12,104,268 | 1,255,416,661 | |||||||||||||||||||||||||
(b) Non-income producing investment.
(c) Principal amounts are denominated in United States Dollars unless otherwise noted.
(d) Represents privately placed and other securities and instruments exempt from SEC registration (collectively, private placements), such as Section 4(a)(2) and Rule 144A eligible securities, which are often sold only to qualified institutional buyers. The Fund may invest in private placements determined to be liquid as well as those determined to be illiquid. Private placements may be determined to be liquid under guidelines established by the Fund's Board of Trustees. At December 31, 2016, the value of these securities amounted to $2,212,622 or 0.16% of net assets.
(e) Security, or a portion thereof, has been purchased on a when-issued or delayed delivery basis.
(f) The rate shown is the seven-day current annualized yield at December 31, 2016.
Currency Legend
AUD Australian Dollar
CAD Canadian Dollar
EUR Euro
GBP British Pound
JPY Japanese Yen
USD US Dollar
The accompanying Notes to Financial Statements are an integral part of this statement.
Annual Report 2016
15
COLUMBIA VARIABLE PORTFOLIO — MANAGED VOLATILITY CONSERVATIVE GROWTH FUND
PORTFOLIO OF INVESTMENTS (continued)
December 31, 2016
Fair Value Measurements
The Fund categorizes its fair value measurements according to a three-level hierarchy that maximizes the use of observable inputs and minimizes the use of unobservable inputs by prioritizing that the most observable input be used when available. Observable inputs are those that market participants would use in pricing an investment based on market data obtained from sources independent of the reporting entity. Unobservable inputs are those that reflect the Fund's assumptions about the information market participants would use in pricing an investment. An investment's level within the fair value hierarchy is based on the lowest level of any input that is deemed significant to the asset's or liability's fair value measurement. The input levels are not necessarily an indication of the risk or liquidity associated with investments at that level. For example, certain U.S. government securities are generally high quality and liquid, however, they are reflected as Level 2 because the inputs used to determine fair value may not always be quoted prices in an active market.
Fair value inputs are summarized in the three broad levels listed below:
> Level 1 — Valuations based on quoted prices for investments in active markets that the Fund has the ability to access at the measurement date (including NAV for open-end mutual funds). Valuation adjustments are not applied to Level 1 investments.
> Level 2 — Valuations based on other significant observable inputs (including quoted prices for similar securities, interest rates, prepayment speeds, credit risks, etc.).
> Level 3 — Valuations based on significant unobservable inputs (including the Fund's own assumptions and judgment in determining the fair value of investments).
Inputs that are used in determining fair value of an investment may include price information, credit data, volatility statistics, and other factors. These inputs can be either observable or unobservable. The availability of observable inputs can vary between investments, and is affected by various factors such as the type of investment, and the volume and level of activity for that investment or similar investments in the marketplace. The inputs will be considered by the Investment Manager, along with any other relevant factors in the calculation of an investment's fair value. The Fund uses prices and inputs that are current as of the measurement date, which may include periods of market dislocations. During these periods, the availability of prices and inputs may be reduced for many investments. This condition could cause an investment to be reclassified between the various levels within the hierarchy.
Certain investments that have been measured at fair value using the net asset value (NAV) per share (or its equivalent) are not categorized in the fair value hierarchy. The fair value amounts presented in the table are intended to reconcile the fair value hierarchy to the amounts presented in the Portfolio of Investments. The Variable Portfolios serve as investment vehicles for variable annuity contracts and variable life insurance policies. Principle investment strategies within these Variable Portfolios vary based on the Portfolios investment objective. Investments in the Variable Portfolios may be redeemed on a daily basis without restriction. The Columbia Short-Term Cash Fund seeks to provide shareholders with maximum current income consistent with liquidity and stability of principal. Columbia Short-Term Cash Fund prices its shares with a floating NAV and no longer seeks to maintain a stable NAV.
Investments falling into the Level 3 category are primarily supported by quoted prices from brokers and dealers participating in the market for those investments. However, these may be classified as Level 3 investments due to lack of market transparency and corroboration to support these quoted prices. Additionally, valuation models may be used as the pricing source for any remaining investments classified as Level 3. These models may rely on one or more significant unobservable inputs and/or significant assumptions by the Investment Manager. Inputs used in valuations may include, but are not limited to, financial statement analysis, capital account balances, discount rates and estimated cash flows, and comparable company data.
Under the direction of the Fund's Board of Trustees (the Board), the Investment Manager's Valuation Committee (the Committee) is responsible for overseeing the valuation procedures approved by the Board. The Committee consists of voting and non-voting members from various groups within the Investment Manager's organization, including operations and accounting, trading and investments, compliance, risk management and legal.
The Committee meets at least monthly to review and approve valuation matters, which may include a description of specific valuation determinations, data regarding pricing information received from approved pricing vendors and brokers and the results of Board-approved valuation control policies and procedures (the Policies). The Policies address, among other things, instances when market quotations are or are not readily available, including recommendations of third party pricing vendors and a determination of appropriate pricing methodologies; events that require specific valuation determinations and assessment of fair value techniques; securities with a potential for stale pricing, including those that are illiquid, restricted, or in default; and the effectiveness of third party pricing vendors, including periodic reviews of vendors. The Committee meets more frequently, as needed, to discuss additional valuation matters, which may include the need to review back-testing results, review time-sensitive information or approve related valuation actions. The Committee reports to the Board, with members of the Committee meeting with the Board at each of its regularly scheduled meetings to discuss valuation matters and actions during the period, similar to those described earlier.
For investments categorized as Level 3, the Committee monitors information similar to that described above, which may include: (i) data specific to the issuer or comparable issuers, (ii) general market or specific sector news and (iii) quoted prices and specific or similar security transactions. The Committee considers this data and any changes from prior periods in order to assess the reasonableness of observable and unobservable inputs, any assumptions or internal models used to value those securities and changes in fair value. This data is also used to corroborate, when available, information received from approved pricing vendors and brokers. Various factors impact the frequency of monitoring this information (which may occur as often as daily). However, the Committee may determine that changes to inputs, assumptions and models are not required as a result of the monitoring procedures performed.
The accompanying Notes to Financial Statements are an integral part of this statement.
Annual Report 2016
16
COLUMBIA VARIABLE PORTFOLIO — MANAGED VOLATILITY CONSERVATIVE GROWTH FUND
PORTFOLIO OF INVESTMENTS (continued)
December 31, 2016
Fair Value Measurements (continued)
The following table is a summary of the inputs used to value the Fund's investments at December 31, 2016:
| Level 1 Quoted Prices in Active Markets for Identical Assets ($) | Level 2 Other Significant Observable Inputs ($) | Level 3 Significant Unobservable Inputs ($) | Total ($) | ||||||||||||||||
Investments | |||||||||||||||||||
Exchange-Traded Funds | 73,297,506 | — | — | 73,297,506 | |||||||||||||||
Corporate Bonds & Notes | — | 11,497,796 | — | 11,497,796 | |||||||||||||||
| Residential Mortgage-Backed Securities — Agency | — | 78,004,010 | — | 78,004,010 | |||||||||||||||
U.S. Treasury Obligations | 24,662 | — | — | 24,662 | |||||||||||||||
Options Purchased Puts | 10,767,050 | — | — | 10,767,050 | |||||||||||||||
Investments measured at net asset value | |||||||||||||||||||
Equity Funds | — | — | — | 435,669,666 | |||||||||||||||
Fixed-Income Funds | — | — | — | 532,164,410 | |||||||||||||||
Money Market Funds | — | — | — | 287,582,585 | |||||||||||||||
Total Investments | 84,089,218 | 89,501,806 | — | 1,429,007,685 | |||||||||||||||
Derivatives | |||||||||||||||||||
Assets | |||||||||||||||||||
| Forward Foreign Currency Exchange Contracts | — | 14,349 | — | 14,349 | |||||||||||||||
Futures Contracts | 1,650,229 | — | — | 1,650,229 | |||||||||||||||
Liabilities | |||||||||||||||||||
Futures Contracts | (1,178,170 | ) | — | — | (1,178,170 | ) | |||||||||||||
Total | 84,561,277 | 89,516,155 | — | 1,429,494,093 | |||||||||||||||
See the Portfolio of Investments for all investment classifications not indicated in the table.
The Fund's assets assigned to the Level 2 input category are generally valued using the market approach, in which a security's value is determined through reference to prices and information from market transactions for similar or identical assets.
Forward foreign currency exchange contracts and futures contracts are valued at unrealized appreciation (depreciation).
There were no transfers of financial assets between levels during the period.
The accompanying Notes to Financial Statements are an integral part of this statement.
Annual Report 2016
17
COLUMBIA VARIABLE PORTFOLIO — MANAGED VOLATILITY CONSERVATIVE GROWTH FUND
STATEMENT OF ASSETS AND LIABILITIES
December 31, 2016
Assets | |||||||
Investments, at value | |||||||
Unaffiliated issuers (identified cost $157,445,113) | $ | 162,823,974 | |||||
Affiliated issuers (identified cost $1,228,440,438) | 1,255,416,661 | ||||||
Options purchased (identified cost $12,474,516) | 10,767,050 | ||||||
Total investments (identified cost $1,398,360,067) | 1,429,007,685 | ||||||
Cash | 350,000 | ||||||
Foreign currency (identified cost $15,668) | 15,706 | ||||||
Cash collateral held at broker | 80,000 | ||||||
Margin deposits | 7,322,591 | ||||||
Unrealized appreciation on forward foreign currency exchange contracts | 14,349 | ||||||
Receivable for: | |||||||
Investments sold | 887,830 | ||||||
Dividends | 459,197 | ||||||
Interest | 228,429 | ||||||
Foreign tax reclaims | 93 | ||||||
Variation margin | 405,354 | ||||||
Prepaid expenses | 6,430 | ||||||
Trustees' deferred compensation plan | 20,708 | ||||||
Total assets | 1,438,798,372 | ||||||
Liabilities | |||||||
Payable for: | |||||||
Investments purchased on a delayed delivery basis | 78,052,445 | ||||||
Capital shares purchased | 1,268,329 | ||||||
Variation margin | 425,148 | ||||||
Management services fees | 8,219 | ||||||
Distribution and/or service fees | 9,289 | ||||||
Transfer agent fees | 641 | ||||||
Compensation of board members | 2,169 | ||||||
Chief compliance officer expenses | 143 | ||||||
Other expenses | 46,964 | ||||||
Trustees' deferred compensation plan | 20,708 | ||||||
Total liabilities | 79,834,055 | ||||||
Net assets applicable to outstanding capital stock | $ | 1,358,964,317 | |||||
Represented by | |||||||
Trust capital | $ | 1,358,964,317 | |||||
Total — representing net assets applicable to outstanding capital stock | $ | 1,358,964,317 | |||||
Class 2 | |||||||
Net assets | $ | 1,358,964,317 | |||||
Shares outstanding | 122,601,577 | ||||||
Net asset value per share | $ | 11.08 | |||||
The accompanying Notes to Financial Statements are an integral part of this statement.
Annual Report 2016
18
COLUMBIA VARIABLE PORTFOLIO — MANAGED VOLATILITY CONSERVATIVE GROWTH FUND
STATEMENT OF OPERATIONS
Year Ended December 31, 2016
Net investment income | |||||||
Income: | |||||||
Dividends — unaffiliated issuers | $ | 1,098,332 | |||||
Dividends — affiliated issuers | 12,104,268 | ||||||
Interest | 373,804 | ||||||
Total income | 13,576,404 | ||||||
Expenses: | |||||||
Management services fees | 2,652,764 | ||||||
Distribution and/or service fees | |||||||
Class 2 | 2,944,778 | ||||||
Transfer agent fees | |||||||
Class 2 | 207,187 | ||||||
Compensation of board members | 37,613 | ||||||
Custodian fees | 34,488 | ||||||
Printing and postage fees | 63,990 | ||||||
Audit fees | 22,542 | ||||||
Legal fees | 29,729 | ||||||
Chief compliance officer expenses | 545 | ||||||
Other | 28,290 | ||||||
Total expenses | 6,021,926 | ||||||
Net investment income | 7,554,478 | ||||||
Realized and unrealized gain (loss) — net | |||||||
Net realized gain (loss) on: | |||||||
Investments — unaffiliated issuers | 607,838 | ||||||
Investments — affiliated issuers | (4,905,263 | ) | |||||
Capital gain distributions from underlying affiliated funds | 2,791,357 | ||||||
Foreign currency translations | 60,607 | ||||||
Forward foreign currency exchange contracts | 91,037 | ||||||
Futures contracts | 1,042,251 | ||||||
Options purchased | (10,209,983 | ) | |||||
Net realized loss | (10,522,156 | ) | |||||
Net change in unrealized appreciation (depreciation) on: | |||||||
Investments — unaffiliated issuers | 3,990,620 | ||||||
Investments — affiliated issuers | 32,368,379 | ||||||
Foreign currency translations | (58,027 | ) | |||||
Forward foreign currency exchange contracts | 8,387 | ||||||
Futures contracts | (438,485 | ) | |||||
Options purchased | 2,112,163 | ||||||
Net change in unrealized appreciation | 37,983,037 | ||||||
Net realized and unrealized gain | 27,460,881 | ||||||
Net increase in net assets resulting from operations | $ | 35,015,359 | |||||
The accompanying Notes to Financial Statements are an integral part of this statement.
Annual Report 2016
19
COLUMBIA VARIABLE PORTFOLIO — MANAGED VOLATILITY CONSERVATIVE GROWTH FUND
STATEMENT OF CHANGES IN NET ASSETS
| Year Ended December 31, 2016 | Year Ended December 31, 2015 | ||||||||||
Operations | |||||||||||
Net investment income | $ | 7,554,478 | $ | 6,831,951 | |||||||
Net realized loss | (10,522,156 | ) | (330,384 | ) | |||||||
Net change in unrealized appreciation (depreciation) | 37,983,037 | (24,304,200 | ) | ||||||||
Net increase (decrease) in net assets resulting from operations | 35,015,359 | (17,802,633 | ) | ||||||||
Increase in net assets from capital stock activity | 387,407,865 | 250,501,749 | |||||||||
Total increase in net assets | 422,423,224 | 232,699,116 | |||||||||
Net assets at beginning of year | 936,541,093 | 703,841,977 | |||||||||
Net assets at end of year | $ | 1,358,964,317 | $ | 936,541,093 | |||||||
The accompanying Notes to Financial Statements are an integral part of this statement.
Annual Report 2016
20
COLUMBIA VARIABLE PORTFOLIO — MANAGED VOLATILITY CONSERVATIVE GROWTH FUND
STATEMENT OF CHANGES IN NET ASSETS (continued)
Year Ended December 31, 2016 | Year Ended December 31, 2015 | ||||||||||||||||||
Shares | Dollars ($) | Shares | Dollars ($) | ||||||||||||||||
Capital stock activity | |||||||||||||||||||
Class 2 shares | |||||||||||||||||||
Subscriptions | 39,216,296 | 429,179,666 | 24,351,464 | 267,161,723 | |||||||||||||||
Redemptions | (3,795,946 | ) | (41,771,801 | ) | (1,525,915 | ) | (16,659,974 | ) | |||||||||||
Net increase | 35,420,350 | 387,407,865 | 22,825,549 | 250,501,749 | |||||||||||||||
Total net increase | 35,420,350 | 387,407,865 | 22,825,549 | 250,501,749 | |||||||||||||||
The accompanying Notes to Financial Statements are an integral part of this statement.
Annual Report 2016
21
COLUMBIA VARIABLE PORTFOLIO — MANAGED VOLATILITY CONSERVATIVE GROWTH FUND
FINANCIAL HIGHLIGHTS
The following table is intended to help you understand the Fund's financial performance. Certain information reflects financial results for a single share of a class held for the periods shown. Per share net investment income (loss) amounts are calculated based on average shares outstanding during the period. Total return assumes reinvestment of all dividends and distributions, if any. Total return does not reflect any fees and expenses imposed under your Contract and/or Qualified Plan, as applicable; such fees and expenses would reduce the total returns for all periods shown. Total return and portfolio turnover are not annualized for periods of less than one year. The portfolio turnover rate is calculated without regard to purchase and sales transactions of short-term instruments and certain derivatives, if any. If such transactions were included, the Fund's portfolio turnover rate may be higher.
Year Ended December 31, | |||||||||||||||||||
Class 2 | 2016 | 2015 | 2014 | 2013(a) | |||||||||||||||
Per share data | |||||||||||||||||||
Net asset value, beginning of period | $ | 10.74 | $ | 10.94 | $ | 10.45 | $ | 10.00 | |||||||||||
Income from investment operations: | |||||||||||||||||||
Net investment income | 0.07 | 0.09 | 0.05 | 0.05 | |||||||||||||||
Net realized and unrealized gain (loss) | 0.27 | (0.29 | ) | 0.44 | 0.40 | ||||||||||||||
Total from investment operations | 0.34 | (0.20 | ) | 0.49 | 0.45 | ||||||||||||||
Net asset value, end of period | $ | 11.08 | $ | 10.74 | $ | 10.94 | $ | 10.45 | |||||||||||
Total return | 3.17 | % | (1.83 | %) | 4.69 | % | 4.50 | % | |||||||||||
Ratios to average net assets(b) | |||||||||||||||||||
Total gross expenses | 0.51 | % | 0.52 | % | 0.52 | % | 0.65 | %(c) | |||||||||||
Total net expenses(d) | 0.51 | % | 0.52 | % | 0.52 | % | 0.61 | %(c) | |||||||||||
Net investment income | 0.64 | % | 0.83 | % | 0.51 | % | 0.71 | %(c) | |||||||||||
Supplemental data | |||||||||||||||||||
Net assets, end of period (in thousands) | $ | 1,358,964 | $ | 936,541 | $ | 703,842 | $ | 257,285 | |||||||||||
Portfolio turnover | 108 | % | 118 | % | 122 | % | 60 | % | |||||||||||
Notes to Financial Highlights
(a) Based on operations from April 12, 2013 (commencement of operations) through the stated period end.
(b) In addition to the fees and expenses that the Fund bears directly, the Fund indirectly bears a pro rata share of the fees and expenses of any other funds in which it invests. Such indirect expenses are not included in the Fund's reported expense ratios.
(c) Annualized.
(d) Total net expenses include the impact of certain fee waivers/expense reimbursements made by the Investment Manager and certain of its affiliates, if applicable.
The accompanying Notes to Financial Statements are an integral part of this statement.
Annual Report 2016
22
COLUMBIA VARIABLE PORTFOLIO — MANAGED VOLATILITY CONSERVATIVE GROWTH FUND
NOTES TO FINANCIAL STATEMENTS
December 31, 2016
Note 1. Organization
Columbia Variable Portfolio — Managed Volatility Conservative Growth Fund (the Fund), a series of Columbia Funds Variable Insurance Trust (the Trust), is a diversified fund. The Trust is registered under the Investment Company Act of 1940, as amended (the 1940 Act), as an open-end management investment company organized as a Massachusetts business trust.
The Fund is a "fund-of-funds", investing significantly in affiliated funds managed by Columbia Management Investment Advisers, LLC (the Investment Manager), a wholly-owned subsidiary of Ameriprise Financial, Inc. (Ameriprise Financial), its affiliates, or third-party advised (unaffiliated) funds, including exchange-traded funds (collectively, Underlying Funds).
For information on the Underlying Funds, please refer to the Fund's current prospectus and the prospectuses of the Underlying Funds, which are available, free of charge, from the Securities and Exchange Commission website, www.sec.gov.
Fund Shares
The Trust may issue an unlimited number of shares (without par value). The Fund offers Class 2 shares to separate accounts funding variable annuity contracts and variable life insurance policies (collectively, Contracts) issued by affiliated and unaffiliated life insurance companies as well as other qualified institutional investors (Qualified Investors) authorized by Columbia Management Investment Distributors, Inc. (the Distributor). You may not buy (nor will you own) shares of the Fund directly. You may invest by buying a Contract.
Note 2. Summary of Significant Accounting Policies
Basis of Preparation
The Fund is an investment company that applies the accounting and reporting guidance in the Financial Accounting Standards Board (FASB) Accounting Standards Codification Topic 946, Financial Services — Investment Companies (ASC 946). The financial statements are prepared in accordance with U.S. generally accepted accounting principles (GAAP), which requires management to make certain estimates and assumptions that affect the reported amounts of assets and liabilities, the disclosure of contingent assets and liabilities at the date of the financial statements and the reported amounts of income and expenses during the reporting period. Actual results could differ from those estimates.
The following is a summary of significant accounting policies followed by the Fund in the preparation of its financial statements.
Security Valuation
All equity securities and exchange-traded funds are valued at the close of business of the New York Stock Exchange. Equity securities and exchange-traded funds are valued at the last quoted sales price on the principal exchange or market on which they trade, except for securities traded on the NASDAQ Stock Market, which are valued at the NASDAQ official close price. Unlisted securities or listed securities for which there were no sales during the day are valued at the mean of the latest quoted bid and ask prices on such exchanges or markets.
Debt securities generally are valued by pricing services approved by the Board of Trustees based upon market transactions for normal, institutional-size trading units of similar securities. The services may use various pricing techniques that take into account, as applicable, factors such as yield, quality, coupon rate, maturity, type of issue, trading characteristics and other data, as well as approved independent broker-dealer quotes. Debt securities for which quotations are not readily available or not believed to be reflective of market value may also be valued based upon a bid quote from an approved independent broker-dealer. Debt securities maturing in 60 days or less are valued primarily at amortized cost value, unless this method results in a valuation that management believes does not approximate market value.
Asset- and mortgage-backed securities are generally valued by pricing services, which utilize pricing models that incorporate the securities' cash flow and loan performance data. These models also take into account available market data, including trades, market quotations, and benchmark yield curves for identical or similar securities. Factors used to identify similar securities may include, but are not limited to, issuer, collateral type, vintage, prepayment speeds, collateral performance, credit ratings, credit enhancement and expected life. Asset-backed securities for which quotations are readily available may also be valued based upon an over-the-counter or exchange bid quote from an approved independent broker-dealer.
Investments in the Underlying Funds are valued at the net asset value of the applicable class of the Underlying Fund determined as of the close of the New York Stock Exchange on the valuation date.
Annual Report 2016
23
COLUMBIA VARIABLE PORTFOLIO — MANAGED VOLATILITY CONSERVATIVE GROWTH FUND
NOTES TO FINANCIAL STATEMENTS (continued)
December 31, 2016
Forward foreign currency exchange contracts are marked-to-market based upon foreign currency exchange rates provided by a pricing service.
Futures and options on futures contracts are valued based upon the settlement price at the close of regular trading on their principal exchanges or, in the absence of transactions, at the mean of the latest quoted bid and ask prices.
Option contracts are valued at the mean of the latest quoted bid and ask prices on their primary exchanges. Option contracts, including over-the-counter option contracts, with no readily available market quotations are valued using quotes obtained from independent brokers as of the close of the New York Stock Exchange.
Investments for which market quotations are not readily available, or that have quotations which management believes are not reflective of market value or reliable, are valued at fair value as determined in good faith under procedures approved by and under the general supervision of the Board of Trustees. If a security or class of securities (such as foreign securities) is valued at fair value, such value is likely to be different from the quoted or published price for the security.
The determination of fair value often requires significant judgment. To determine fair value, management may use assumptions including but not limited to future cash flows and estimated risk premiums. Multiple inputs from various sources may be used to determine fair value.
GAAP requires disclosure regarding the inputs and valuation techniques used to measure fair value and any changes in valuation inputs or techniques. In addition, investments shall be disclosed by major category. This information is disclosed following the Fund's Portfolio of Investments.
Foreign Currency Transactions and Translations
The values of all assets and liabilities denominated in foreign currencies are generally translated into U.S. dollars at exchange rates determined at the close of regular trading on the New York Stock Exchange. Net realized and unrealized gains (losses) on foreign currency transactions and translations include gains (losses) arising from the fluctuation in exchange rates between trade and settlement dates on securities transactions, gains (losses) arising from the disposition of foreign currency and currency gains (losses) between the accrual and payment dates on dividends, interest income and foreign withholding taxes.
For financial statement purposes, the Fund does not distinguish that portion of gains (losses) on investments which is due to changes in foreign exchange rates from that which is due to changes in market prices of the investments. Such fluctuations are included with the net realized and unrealized gains (losses) on investments in the Statement of Operations.
Derivative Instruments
The Fund invests in certain derivative instruments, as detailed below, to meet its investment objectives. Derivatives are instruments whose values depend on, or are derived from, in whole or in part, the value of one or more securities, currencies, commodities, indices, or other assets or instruments. Derivatives may be used to increase investment flexibility (including to maintain cash reserves while maintaining desired exposure to certain assets), for risk management (hedging) purposes, to facilitate trading, to reduce transaction costs and to pursue higher investment returns. The Fund may also use derivative instruments to mitigate certain investment risks, such as foreign currency exchange rate risk, interest rate risk and credit risk. Derivatives may involve various risks, including the potential inability of the counterparty to fulfill its obligations under the terms of the contract, the potential for an illiquid secondary market (making it difficult for the Fund to sell or terminate, including at favorable prices) and the potential for market movements which may expose the Fund to gains or losses in excess of the amount shown in the Statement of Assets and Liabilities. The notional amounts of derivative instruments, if applicable, are not recorded in the financial statements.
A derivative instrument may suffer a marked-to-market loss if the value of the contract decreases due to an unfavorable change in the market rates or values of the underlying instrument. Losses can also occur if the counterparty does not perform its obligations under the contract. The Fund's risk of loss from counterparty credit risk on over-the-counter derivatives is generally limited to the aggregate unrealized gain netted against any collateral held by the Fund and the amount of any variation margin held by the counterparty, plus any replacement costs or related amounts. With exchange-traded or centrally cleared derivatives, there is reduced counterparty credit risk to the Fund since the clearinghouse or central counterparty (CCP) provides some protection in the case of clearing member default. The clearinghouse or CCP stands between the buyer and the seller of the contract; therefore, additional
Annual Report 2016
24
COLUMBIA VARIABLE PORTFOLIO — MANAGED VOLATILITY CONSERVATIVE GROWTH FUND
NOTES TO FINANCIAL STATEMENTS (continued)
December 31, 2016
counterparty credit risk is failure of the clearinghouse or CCP. However, credit risk still exists in exchange-traded or centrally cleared derivatives with respect to initial and variation margin that is held in a broker's customer account. While brokers are required to segregate customer margin from their own assets, in the event that a broker becomes insolvent or goes into bankruptcy and at that time there is a shortfall in the aggregate amount of margin held by the broker for all its clients, U.S. bankruptcy laws will typically allocate that shortfall on a pro-rata basis across all the broker's customers (including the Fund), potentially resulting in losses to the Fund.
In order to better define its contractual rights and to secure rights that will help the Fund mitigate its counterparty risk, the Fund may enter into an International Swaps and Derivatives Association, Inc. Master Agreement (ISDA Master Agreement) or similar agreement with its derivatives contract counterparties. An ISDA Master Agreement is an agreement between the Fund and a counterparty that governs over-the-counter derivatives and typically contains, among other things, collateral posting terms and netting provisions in the event of a default and/or termination event. Under an ISDA Master Agreement, the Fund may, under certain circumstances, offset with the counterparty certain derivative instrument's payables and/or receivables with collateral held and/or posted and create one single net payment. The provisions of the ISDA Master Agreement typically permit a single net payment in the event of default (close-out netting), including the bankruptcy or insolvency of the counterparty. Note, however, that bankruptcy or insolvency laws of a particular jurisdiction may impose restrictions on or prohibitions against the right of offset or netting in bankruptcy, insolvency or other events.
Collateral (margin) requirements differ by type of derivative. Margin requirements are established by the clearinghouse or CCP for exchange-traded and centrally cleared derivatives. Brokers can ask for margin in excess of the minimum in certain circumstances. Collateral terms are contract specific for over-the-counter derivatives. For over-the-counter derivatives traded under an ISDA Master Agreement, the collateral requirements are typically calculated by netting the marked-to-market amount for each transaction under such agreement and comparing that amount to the value of any variation margin currently pledged by the Fund and/or the counterparty. Generally, the amount of collateral due from or to a party has to exceed a minimum transfer amount
threshold (e.g., $250,000) before a transfer has to be made. To the extent amounts due to the Fund from its counterparties are not fully collateralized, contractually or otherwise, the Fund bears the risk of loss from counterparty nonperformance. The Fund attempts to mitigate counterparty risk by only entering into agreements with counterparties that it believes have the financial resources to honor their obligations and by monitoring the financial stability of those counterparties.
Certain ISDA Master Agreements allow counterparties of over-the-counter derivatives transactions to terminate derivatives contracts prior to maturity in the event the Fund's net asset value declines by a stated percentage over a specified time period or if the Fund fails to meet certain terms of the ISDA Master Agreement, which would cause the Fund to accelerate payment of any net liability owed to the counterparty. The Fund also has termination rights if the counterparty fails to meet certain terms of the ISDA Master Agreement. In addition to considering counterparty credit risk, the Fund would consider terminating the derivatives contracts based on whether termination would result in a net liability owed from the counterparty.
For financial reporting purposes, the Fund does not offset derivative assets and derivative liabilities that are subject to netting arrangements in the Statement of Assets and Liabilities.
Forward Foreign Currency Exchange Contracts
Forward foreign currency exchange contracts are over-the-counter agreements between two parties to buy and sell a currency at a set price on a future date. The Fund utilized forward foreign currency exchange contracts to hedge the currency exposure associated with some or all of the Fund's securities, to shift foreign currency exposure back to U.S. dollars, to shift investment exposure from one currency to another, to shift U.S. dollar exposure to achieve a representative weighted mix of major currencies in its benchmark, and/or to recover an underweight country exposure in its portfolio. These instruments may be used for other purposes in future periods.
The values of forward foreign currency exchange contracts fluctuate daily with changes in foreign currency exchange rates. Changes in the value of these contracts are recorded as unrealized appreciation or depreciation until the contract is exercised or has expired. The Fund will realize a gain or loss when the forward foreign currency exchange contract is closed or expires.
Annual Report 2016
25
COLUMBIA VARIABLE PORTFOLIO — MANAGED VOLATILITY CONSERVATIVE GROWTH FUND
NOTES TO FINANCIAL STATEMENTS (continued)
December 31, 2016
The use of forward foreign currency exchange contracts does not eliminate fluctuations in the prices of the Fund's portfolio securities. The risks of forward foreign currency exchange contracts include movement in the values of the foreign currencies relative to the U.S. dollar (or other foreign currencies) and the possibility that counterparties will not complete their contractual obligations, which may be in excess of the amount reflected, if any, in the Statement of Assets and Liabilities.
Futures Contracts
Futures contracts are exchange-traded and represent commitments for the future purchase or sale of an asset at a specified price on a specified date. The Fund bought and sold futures contracts to produce incremental earnings, to manage the duration and yield curve exposure of the Fund versus the benchmark, to manage exposure to movements in interest rates, to manage exposure to the securities market and to maintain appropriate equity market exposure while keeping sufficient cash to accommodate daily redemptions. These instruments may be used for other purposes in future periods. Upon entering into futures contracts, the Fund bears risks that it may not achieve the anticipated benefits of the futures contracts and may realize a loss. Additional risks include counterparty credit risk, the possibility of an illiquid market, and that a change in the value of the contract or option may not correlate with changes in the value of the underlying asset.
Upon entering into a futures contract, the Fund deposits cash or securities with the broker, known as a futures commission merchant (FCM), in an amount sufficient to meet the initial margin requirement. The initial margin deposit must be maintained at an established level over the life of the contract. Cash deposited as initial margin is recorded in the Statement of Assets and Liabilities as margin deposits. Securities deposited as initial margin are designated in the Portfolio of Investments. Subsequent payments (variation margin) are made or received by the Fund each day. The variation margin payments are equal to the daily change in the contract value and are recorded as variation margin receivable or payable and are offset in unrealized gains or losses. The Fund recognizes a realized gain or loss when the contract is closed or expires. Futures contracts involve, to varying degrees, risk of loss in excess of the variation margin disclosed in the Statement of Assets and Liabilities.
Options Contracts
Options are contracts which entitle the holder to purchase or sell securities or other identified assets at a specified price, or in the case of index option contracts, to receive or pay the difference between the index value and the strike price of the index option contract. Option contracts can be either exchange-traded or over-the-counter. The Fund purchased and wrote option contracts to produce incremental earnings, to decrease the Fund's exposure to equity market risk and to increase return on investments and to facilitate buying and selling of securities for investments. These instruments may be used for other purposes in future periods. Completion of transactions for option contracts traded in the over-the-counter market depends upon the performance of the other party. Cash collateral may be collected or posted by the Fund to secure certain over-the-counter option contract trades. Cash collateral held or posted by the Fund for such option contract trades must be returned to the broker or the Fund upon closure, exercise or expiration of the contract.
Options contracts purchased are recorded as investments. When the Fund writes an options contract, the premium received is recorded as an asset and an amount equivalent to the premium is recorded as a liability in the Statement of Assets and Liabilities and is subsequently adjusted to reflect the current fair value of the option written. Changes in the fair value of the written option are recorded as unrealized appreciation or depreciation until the contract is exercised or has expired. The Fund will realize a gain or loss when the option contract is closed or expires. When option contracts are exercised, the proceeds on sales for a written call or purchased put option contract, or the purchase cost for a written put or purchased call option contract, is adjusted by the amount of premium received or paid.
For over-the-counter options purchased, the Fund bears the risk of loss of the amount of the premiums paid plus the positive change in market values net of any collateral held by the Fund should the counterparty fail to perform under the contracts. Option contracts written by the Fund do not typically give rise to significant counterparty credit risk, as options written generally obligate the Fund and not the counterparty to perform. The risk in writing a call option contract is that the Fund gives up the opportunity for profit if the market price of the security increases
Annual Report 2016
26
COLUMBIA VARIABLE PORTFOLIO — MANAGED VOLATILITY CONSERVATIVE GROWTH FUND
NOTES TO FINANCIAL STATEMENTS (continued)
December 31, 2016
above the strike price and the option contract is exercised. The risk in writing a put option contract is that the Fund may incur a loss if the market price of the security decreases below the strike price and the option contract is exercised. Exercise of a written option could result in the Fund purchasing or selling a security or foreign currency when it otherwise would not, or at a price different from the current market value. In purchasing and writing options, the Fund bears the risk of an unfavorable change in the value of the underlying instrument or the risk that the Fund may not be able to enter into a closing transaction due to an illiquid market.
Effects of Derivative Transactions in the Financial Statements
The following tables are intended to provide additional information about the effect of derivatives on the financial statements of the Fund, including: the fair value of derivatives by risk category and the location of those fair values in the Statement of Assets and Liabilities; and the impact of derivative transactions over the period in the Statement of Operations, including realized and unrealized gains (losses). The derivative instrument schedules following the Portfolio of Investments present additional information regarding derivative instruments outstanding at the end of the period, if any.
The following table is a summary of the fair value of derivative instruments (not considered to be hedging instruments for accounting disclosure purposes) at December 31, 2016:
Asset Derivatives | |||||||||||
| Risk Exposure Category | Statement of Assets and Liabilities Location | Fair Value ($) | |||||||||
| Equity risk | Component of trust capital — unrealized appreciation on futures contracts | 1,568,535 | * | ||||||||
| Equity risk | Investments, at value — Options purchased | 10,767,050 | |||||||||
| Foreign exchange risk | Unrealized appreciation on forward foreign currency exchange contracts | 14,349 | |||||||||
| Interest rate risk | Component of trust capital — unrealized appreciation on futures contracts | 81,694 | * | ||||||||
Total | 12,431,628 | ||||||||||
Liability Derivatives | |||||||||||
| Risk Exposure Category | Statement of Assets and Liabilities Location | Fair Value ($) | |||||||||
| Equity risk | Component of trust capital — unrealized depreciation on futures contracts | 124,449 | * | ||||||||
| Foreign exchange risk | Component of trust capital — unrealized depreciation on futures contracts | 343,385 | * | ||||||||
| Interest rate risk | Component of trust capital — unrealized depreciation on futures contracts | 710,336 | * | ||||||||
Total | 1,178,170 | ||||||||||
*Includes cumulative appreciation (depreciation) as reported in the tables following the Portfolio of Investments. Only the current day's variation margin is reported in receivables or payables in the Statement of Assets and Liabilities.
The following table indicates the effect of derivative instruments (not considered to be hedging instruments for accounting disclosure purposes) in the Statement of Operations for the year ended December 31, 2016:
Amount of Realized Gain (Loss) on Derivatives Recognized in Income | |||||||||||||||||||
Risk Exposure Category | Forward Foreign Currency Exchange Contracts ($) | Futures Contracts ($) | Options Contracts Purchased ($) | Total ($) | |||||||||||||||
Equity risk | — | 1,597,905 | (10,209,983 | ) | (8,612,078 | ) | |||||||||||||
Foreign exchange risk | 91,037 | (446,727 | ) | — | (355,690 | ) | |||||||||||||
Interest rate risk | — | (108,927 | ) | — | (108,927 | ) | |||||||||||||
Total | 91,037 | 1,042,251 | (10,209,983 | ) | (9,076,695 | ) | |||||||||||||
Annual Report 2016
27
COLUMBIA VARIABLE PORTFOLIO — MANAGED VOLATILITY CONSERVATIVE GROWTH FUND
NOTES TO FINANCIAL STATEMENTS (continued)
December 31, 2016
Change in Unrealized Appreciation (Depreciation) on Derivatives Recognized in Income | |||||||||||||||||||
Risk Exposure Category | Forward Foreign Currency Exchange Contracts ($) | Futures Contracts ($) | Options Contracts Purchased ($) | Total ($) | |||||||||||||||
Equity risk | — | 861,246 | 2,112,163 | 2,973,409 | |||||||||||||||
Foreign exchange risk | 8,387 | (517,897 | ) | — | (509,510 | ) | |||||||||||||
Interest rate risk | — | (781,834 | ) | — | (781,834 | ) | |||||||||||||
Total | 8,387 | (438,485 | ) | 2,112,163 | 1,682,065 | ||||||||||||||
The following table provides a summary of the average outstanding volume by derivative instrument for the year ended December 31, 2016:
Derivative Instrument | Average notional amounts ($)* | ||||||
Futures contracts — Long | 321,352,697 | ||||||
Futures contracts — Short | 47,802,534 | ||||||
Derivative Instrument | Average market value ($)* | ||||||
Options contracts — Purchased | 9,034,566 | ||||||
Derivative Instrument | Average unrealized appreciation ($)* | Average unrealized depreciation ($)* | |||||||||
| Forward foreign currency exchange contracts | 15,462 | (1,536 | ) | ||||||||
*Based on the ending quarterly outstanding amounts for the year ended December 31, 2016.
Asset- and Mortgage-Backed Securities
The Fund may invest in asset-backed and mortgage-backed securities. The maturity dates shown represent the original maturity of the underlying obligation. Actual maturity may vary based upon prepayment activity on these obligations. All, or a portion, of the obligation may be prepaid at any time because the underlying asset may be prepaid. As a result, decreasing market interest rates could result in an increased level of prepayment. An increased prepayment rate will have the effect of shortening the maturity of the security. Unless otherwise noted, the coupon rates presented are fixed rates.
Delayed Delivery Securities
The Fund may trade securities on other than normal settlement terms, including securities purchased or sold on a "when-issued" basis. This may increase risk to the Fund since the other party to the transaction may fail to deliver, which could cause the Fund to subsequently invest at less advantageous prices. The Fund designates cash or liquid securities in an amount equal to the delayed delivery commitment.
To Be Announced Securities
The Fund may trade securities on a To Be Announced (TBA) basis. As with other delayed-delivery transactions,
a seller agrees to issue a TBA security at a future date. However, the seller does not specify the particular securities to be delivered. Instead, the Fund agrees to accept any security that meets specified terms.
In some cases, Master Securities Forward Transaction Agreements (MSFTAs) may be used to govern transactions of certain forward-settling agency mortgage-backed securities, such as delayed-delivery and TBAs, between the Fund and counterparty. The MSFTA maintains provisions for, among other things, initiation and confirmation, payment and transfer, events of default, termination, and maintenance of collateral relating to such transactions.
Mortgage Dollar Roll Transactions
The Fund may enter into mortgage "dollar rolls" in which the Fund sells securities for delivery in the current month and simultaneously contracts with the same counterparty to repurchase similar but not identical securities (same type, coupon and maturity) on a specified future date. During the roll period, the Fund loses the right to receive principal and interest paid on the securities sold. However, the Fund will benefit because it receives negotiated amounts in the form of reductions of the purchase price for the future purchase plus the interest earned on the cash proceeds of the securities sold until the settlement date of the forward purchase. The Fund records the incremental difference between the forward purchase and sale of each forward roll as a realized gain or loss. Unless any realized gains exceed the income, capital appreciation, and gain or loss due to mortgage prepayments that would have been realized on the securities sold as part of the mortgage dollar roll, the use of this technique will diminish the investment performance of the Fund compared to what the performance would have been without the use of mortgage dollar rolls. All cash proceeds will be invested in instruments that are permissible investments for the Fund. The Fund identifies cash or liquid securities in an amount equal to the forward purchase price.
For financial reporting and tax purposes, the Fund treats "to be announced" mortgage dollar rolls as two separate
Annual Report 2016
28
COLUMBIA VARIABLE PORTFOLIO — MANAGED VOLATILITY CONSERVATIVE GROWTH FUND
NOTES TO FINANCIAL STATEMENTS (continued)
December 31, 2016
transactions, one involving the purchase of a security and a separate transaction involving a sale. These transactions may increase the Fund's portfolio turnover rate. The Fund does not currently enter into mortgage dollar rolls that are accounted for as financing transactions.
Mortgage dollar rolls involve the risk that the market value of the securities the Fund is obligated to repurchase may decline below the repurchase price, or that the counterparty may default on its obligations.
Offsetting of Assets and Liabilities
The following table presents the Fund's gross and net amount of assets and liabilities available for offset under netting arrangements as well as any related collateral received or pledged by the Fund as of December 31, 2016:
| Deutsche Bank ($) | Standard Chartered ($) | State Street ($) | UBS ($) | Total ($) | |||||||||||||||||||
Assets | |||||||||||||||||||||||
Forward foreign currency exchange contracts | — | 4,478 | 246 | 9,625 | 14,349 | ||||||||||||||||||
Options purchased puts | 10,767,050 | — | — | — | 10,767,050 | ||||||||||||||||||
Total Assets | 10,767,050 | 4,478 | 246 | 9,625 | 10,781,399 | ||||||||||||||||||
Total Financial and Derivative Net Assets | 10,767,050 | 4,478 | 246 | 9,625 | 10,781,399 | ||||||||||||||||||
Total collateral received (pledged)(a) | — | — | — | — | — | ||||||||||||||||||
Net Amount(b) | 10,767,050 | 4,478 | 246 | 9,625 | 10,781,399 | ||||||||||||||||||
(a) In some instances, the actual collateral received and/or pledged may be more than the amount shown due to overcollateralization.
(b) Represents the net amount due from/(to) counterparties in the event of default.
Security Transactions
Security transactions are accounted for on the trade date. Cost is determined and gains (losses) are based upon the specific identification method for both financial statement and federal income tax purposes.
Income Recognition
Interest income is recorded on an accrual basis. Market premiums and discounts, including original issue discounts, are amortized and accreted, respectively, over the expected life of the security on all debt securities, unless otherwise noted. The Fund classifies gains and losses realized on prepayments received on mortgage-backed securities as adjustments to interest income.
The Fund may place a debt security on non-accrual status and reduce related interest income when it becomes probable that the interest will not be collected and the amount of uncollectible interest can be reasonably estimated. A defaulted debt security is removed from non-accrual status when the issuer resumes interest payments or when collectibility of interest is reasonably assured.
Corporate actions and dividend income are recorded on the ex-dividend date.
The Fund may receive distributions from holdings in equity securities, business development companies (BDCs), exchange-traded funds, other regulated
investment companies (RICs), and real estate investment trusts (REITs), which report information on the tax character of their distributions annually. These distributions are allocated to dividend income, capital gain and return of capital based on actual information reported. Return of capital is recorded as a reduction of the cost basis of securities held. If the Fund no longer owns the applicable securities, return of capital is recorded as a realized gain. With respect to REITs, to the extent actual information has not yet been reported, estimates for return of capital are made by the Fund's management. Management's estimates are subsequently adjusted when the actual character of the distributions is disclosed by the REITs, which could result in a proportionate change in return of capital to shareholders.
Awards from class action litigation are recorded as a reduction of cost basis if the Fund still owns the applicable securities on the payment date. If the Fund no longer owns the applicable securities, the proceeds are recorded as realized gains.
Income and capital gain distributions from the Underlying Funds, if any, are recorded on the ex-dividend date.
Expenses
General expenses of the Trust are allocated to the Fund and other funds of the Trust based upon relative net assets or other expense allocation methodologies
Annual Report 2016
29
COLUMBIA VARIABLE PORTFOLIO — MANAGED VOLATILITY CONSERVATIVE GROWTH FUND
NOTES TO FINANCIAL STATEMENTS (continued)
December 31, 2016
determined by the nature of the expense. Expenses directly attributable to the Fund are charged to the Fund.
Federal Income Tax Status
The Fund is treated as a partnership for federal income tax purposes, and the Fund does not expect to make regular distributions. The Fund will not be subject to federal income tax, and therefore, there is no provision for federal income taxes. The partners of the Fund are subject to tax on their distributive share of the Fund's income and loss. The components of the Fund's net assets are reported at the partner-level for federal income tax purposes, and therefore, are not presented in the Statement of Assets and Liabilities.
Management of the Fund has concluded that there are no significant uncertain tax positions in the Fund that would require recognition in the financial statements. However, management's conclusion may be subject to review and adjustment at a later date based on factors including, but not limited to, new tax laws, regulations, and administrative interpretations (including relevant court decisions). Generally, the Fund's federal tax returns for the prior three fiscal years remain subject to examination by the Internal Revenue Service.
Guarantees and Indemnifications
Under the Trust's organizational documents and, in some cases by contract, its officers and trustees are indemnified against certain liabilities arising out of the performance of their duties to the Trust or its funds. In addition, certain of the Funds' contracts with their service providers contain general indemnification clauses. The Funds' maximum exposure under these arrangements is unknown since the amount of any future claims that may be made against the Funds cannot be determined, and the Funds have no historical basis for predicting the likelihood of any such claims.
Investment Company Reporting Modernization
In October 2016, the U.S. Securities and Exchange Commission adopted new rules and forms, and amendments to certain current rules and forms, to modernize reporting and disclosure of information by registered investment companies. The amendments to Regulation S-X will require standardized, enhanced disclosure about derivatives in investment company financial statements, and will also change the rules governing the form and content of such financial statements. The amendments to Regulation S-X take effect on August 1, 2017. At this time, management is
assessing the anticipated impact of these regulatory developments.
Note 3. Fees and Other Transactions with Affiliates
Management Services Fees and Underlying Fund Fees
Effective May 1, 2016, the Fund entered into a Management Agreement with the Investment Manager. Under the Management Agreement, the Investment Manager provides the Fund with investment research and advice, as well as administrative and accounting services. The management services fee is an annual fee that is a blend of (i) 0.02% on assets invested in affiliated underlying funds (including exchange-traded funds and closed-end funds) that pay a management services fee (or investment advisory services fee, as applicable) to the Investment Manager and (ii) a fee that declines from 0.72% to 0.52%, depending on asset levels, on assets invested in securities, (other than affiliated underlying funds (including exchange-traded funds and closed-end funds) that pay a management services fee (or investment advisory services fee, as applicable) to the Investment Manager), including other funds advised by the Investment Manager that do not pay a management services fee to the Investment Manager, third party funds, derivatives and individual securities. Prior to May 1, 2016, the Fund paid the Investment Manager an annual fee for advisory services under an Investment Management Services Agreement and a separate annual fee for administrative and accounting services under an Administrative Services Agreement. The effective management services fee rate for the year ended December 31, 2016 (reflecting all advisory and administrative services fees paid to the Investment Manager) was 0.23% of the Fund's average daily net assets. For the period from January 1, 2016 through April 30, 2016, the investment advisory services fee paid to the Investment Manager was $638,571, and the administrative services fee paid to the Investment Manager was $103,661.
In addition to the fees and expenses which the Funds bear directly, the Funds indirectly bear a pro rata share of the fees and expenses of the Underlying Funds in which the Funds invest. Because the Underlying Funds have varied expense and fee levels and the Funds may own different proportions of Underlying Funds at different times, the amount of fees and expenses incurred indirectly by the Funds will vary. These expenses are not reflected in the expenses shown in Statement of
Annual Report 2016
30
COLUMBIA VARIABLE PORTFOLIO — MANAGED VOLATILITY CONSERVATIVE GROWTH FUND
NOTES TO FINANCIAL STATEMENTS (continued)
December 31, 2016
Operations and are not included in the ratios to average net assets shown in the Financial Highlights.
Compensation of Board Members
Board of Trustee members, who are not officers or employees of the Investment Manager or Ameriprise Financial, are compensated for their services to the Fund as disclosed in the Statement of Operations. These Board of Trustee members may participate in a Deferred Compensation Plan (the Plan) which may be terminated at any time. Obligations of the Plan will be paid solely out of the Fund's assets, and all amounts payable under the Plan constitute a general unsecured obligation of the Fund.
Compensation of Chief Compliance Officer
The Board of Trustees has appointed a Chief Compliance Officer to the Fund in accordance with federal securities regulations. The Fund is allocated a portion of the expenses associated with the Chief Compliance Officer based on relative net assets of the Trust.
Transfer Agency Fees
The Fund has a Transfer and Dividend Disbursing Agent Agreement with Columbia Management Investment Services Corp. (the Transfer Agent), an affiliate of the Investment Manager and a wholly-owned subsidiary of Ameriprise Financial. The annual fee rate under this agreement is 0.00% on assets invested in Underlying Funds that pay a transfer agency fee to the Transfer Agent and 0.06% of the Fund's average daily net assets on assets invested in securities (other than Underlying Funds that pay a transfer agency fee to the Transfer Agent), including other funds that do not pay a transfer agency fee to the Transfer Agent, exchange-traded funds, derivatives and individual securities.
For the year ended December 31, 2016, the Fund's effective transfer agency fee rate as a percentage of average daily net assets of Class 2 shares was 0.02%.
Distribution Fees
The Fund has an agreement with the Distributor, an affiliate of the Investment Manager and a wholly-owned subsidiary of Ameriprise Financial, for distribution services. The Board of Trustees has approved, and the Fund has adopted, a distribution plan (the Plan) which sets the distribution fees for the Fund. These fees are calculated daily and are intended to compensate the Distributor for selling shares of the Fund. The Fund pays a monthly distribution fee to the Distributor at the
maximum annual rate of 0.25% of the average daily net assets attributable to Class 2 shares of the Fund.
Expenses Waived/Reimbursed by the Investment Manager and its Affiliates
The Investment Manager and certain of its affiliates have contractually agreed to waive fees and/or reimburse expenses (excluding certain fees and expenses described below) for the period disclosed below, so that the Fund's net operating expenses, including indirect expenses of the Underlying Funds and after giving effect to fees waived/expenses reimbursed and any balance credits and/or overdraft charges from the Fund's custodian, do not exceed the following annual rate as a percentage of the class' average daily net assets:
| Fee Rate Contractual through April 30, 2017 | |||||||
Class 2 | 1.10 | % | |||||
Under the agreement governing these fee waivers and/or expense reimbursement arrangements, the following fees and expenses are excluded from the waiver/reimbursement commitment, and therefore will be paid by the Fund, if applicable: taxes (including foreign transaction taxes), transaction costs and brokerage commissions, costs related to any securities lending program, dividend and interest expenses associated with securities sold short, inverse floater program fees and expenses, transaction charges and interest on borrowed money, interest, infrequent and/or unusual expenses and any other expenses the exclusion of which is specifically approved by the Board of Trustees. This agreement may be modified or amended only with approval from the Investment Manager, certain of its affiliates and the Fund. Any fees waived and/or expenses reimbursed under the expense reimbursement arrangements described above are not recoverable by the Investment Manager or its affiliates in future periods.
Note 4. Portfolio Information
The cost of purchases and proceeds from sales of securities, excluding short-term investments and derivatives, if any, aggregated to $1,395,782,496 and $1,044,424,583, respectively, for the year ended December 31, 2016, of which $919,576,599 and 889,659,748, respectively, were U.S. government securities. The amount of purchase and sale activity impacts the portfolio turnover rate reported in the Financial Highlights.
Annual Report 2016
31
COLUMBIA VARIABLE PORTFOLIO — MANAGED VOLATILITY CONSERVATIVE GROWTH FUND
NOTES TO FINANCIAL STATEMENTS (continued)
December 31, 2016
Note 5. Affiliated Money Market Fund
The Fund invests in Columbia Short-Term Cash Fund, an affiliated money market fund established for the exclusive use by the Fund and other affiliated funds (the Affiliated MMF). The income earned by the Fund from such investments is included as Dividends — affiliated issuers in the Statement of Operations. As an investing fund, the Fund indirectly bears its proportionate share of the expenses of the Affiliated MMF. Effective October 1, 2016, the Affiliated MMF prices its shares with a floating net asset value (NAV) and no longer seeks to maintain a stable NAV. In addition, the Board of Trustees of the Affiliated MMF may impose a fee on redemptions (sometimes referred to as a liquidity fee) or temporarily suspend redemptions (sometimes referred to as imposing a redemption gate) in the event its liquidity falls below regulatory limits.
Note 6. Line of Credit
The Fund has access to a revolving credit facility with a syndicate of banks led by Citibank, N.A., HSBC Bank USA, N.A. and JPMorgan Chase Bank, N.A. whereby the Fund may borrow for the temporary funding of shareholder redemptions or for other temporary or emergency purposes. The credit facility agreement, which is a collective agreement between the Fund and certain other funds managed by the Investment Manager, severally and not jointly, that permits collective borrowings up to $1 billion. Interest is charged to each participating fund based on its borrowings at a rate equal to the higher of (i) the overnight federal funds rate plus 1.00% or (ii) the one-month LIBOR rate plus 1.00%. Each borrowing under the credit facility matures no later than 60 days after the date of borrowing. The Fund also pays a commitment fee equal to its pro rata share of the amount of the credit facility at a rate of 0.15% per annum. The commitment fee is included in other expenses in the Statement of Operations.
The Fund had no borrowings during the year ended December 31, 2016.
Note 7. Significant Risks
Shareholder Concentration Risk
At December 31, 2016, affiliated shareholders of record owned 100.0% of the outstanding shares of the Fund in one or more accounts. Subscription and redemption activity by concentrated accounts may have a significant effect on the operations of the Fund. In the case of a large redemption, the Fund may be forced to sell
investments at inopportune times, including its liquid or more liquid positions, resulting in Fund losses and the Fund holding a higher percentage of less liquid or illiquid securities. Large redemptions could result in decreased economies of scale and increased operating expenses for non-redeeming Fund shareholders.
Note 8. Subsequent Events
Management has evaluated the events and transactions that have occurred through the date the financial statements were issued and noted no items requiring adjustment of the financial statements or additional disclosure.
Note 9. Information Regarding Pending and Settled Legal Proceedings
Ameriprise Financial and certain of its affiliates have historically been involved in a number of legal, arbitration and regulatory proceedings, including routine litigation, class actions, and governmental actions, concerning matters arising in connection with the conduct of their business activities. Ameriprise Financial believes that the Funds are not currently the subject of, and that neither Ameriprise Financial nor any of its affiliates are the subject of, any pending legal, arbitration or regulatory proceedings that are likely to have a material adverse effect on the Funds or the ability of Ameriprise Financial or its affiliates to perform under their contracts with the Funds. Ameriprise Financial is required to make quarterly (10-Q), annual (10-K) and, as necessary, 8-K filings with the Securities and Exchange Commission (SEC) on legal and regulatory matters that relate to Ameriprise Financial and its affiliates. Copies of these filings may be obtained by accessing the SEC website at www.sec.gov.
There can be no assurance that these matters, or the adverse publicity associated with them, will not result in increased fund redemptions, reduced sale of fund shares or other adverse consequences to the Funds. Further, although we believe proceedings are not likely to have a material adverse effect on the Funds or the ability of Ameriprise Financial or its affiliates to perform under their contracts with the Funds, these proceedings are subject to uncertainties and, as such, we are unable to estimate the possible loss or range of loss that may result. An adverse outcome in one or more of these proceedings could result in adverse judgments, settlements, fines, penalties or other relief that could have a material adverse effect on the consolidated financial condition or results of operations of Ameriprise Financial.
Annual Report 2016
32
COLUMBIA VARIABLE PORTFOLIO — MANAGED VOLATILITY CONSERVATIVE GROWTH FUND
REPORT OF INDEPENDENT REGISTERED PUBLIC ACCOUNTING FIRM
To the Trustees of Columbia Funds Variable Insurance Trust and the Shareholders of
Columbia Variable Portfolio — Managed Volatility Conservative Growth Fund
In our opinion, the accompanying statement of assets and liabilities, including the portfolio of investments, and the related statements of operations and of changes in net assets and the financial highlights present fairly, in all material respects, the financial position of Columbia Variable Portfolio — Managed Volatility Conservative Growth Fund (the "Fund," a series of Columbia Funds Variable Insurance Trust) as of December 31, 2016, the results of its operations for the year then ended, the changes in its net assets for each of the two years in the period then ended and the financial highlights for each of the three years in the period then ended and for the period April 12, 2013 (commencement of operations) through December 31, 2013, in conformity with accounting principles generally accepted in the United States of America. These financial statements and financial highlights (hereafter referred to as "financial statements") are the responsibility of the Fund's management. Our responsibility is to express an opinion on these financial statements based on our audits. We conducted our audits of these financial statements in accordance with the standards of the Public Company Accounting Oversight Board (United States). Those standards require that we plan and perform the audit to obtain reasonable assurance about whether the financial statements are free of material misstatement. An audit includes examining, on a test basis, evidence supporting the amounts and disclosures in the financial statements, assessing the accounting principles used and significant estimates made by management, and evaluating the overall financial statement presentation. We believe that our audits, which included confirmation of securities as of December 31, 2016 by correspondence with the custodian, brokers and transfer agent, and the application of alternative auditing procedures where such confirmations had not been received, provide a reasonable basis for our opinion.
PricewaterhouseCoopers LLP
Minneapolis, MN
February 17, 2017
Annual Report 2016
33
COLUMBIA VARIABLE PORTFOLIO — MANAGED VOLATILITY CONSERVATIVE GROWTH FUND
TRUSTEES AND OFFICERS
Shareholders elect the Board that oversees the Fund's operations. The Board appoints officers who are responsible for day-to-day business decisions based on policies set by the Board. The following table provides basic biographical information about the Fund's Trustees, including their principal occupations during the past five years, although specific titles for individuals may have varied over the period. The year set forth beneath Length of Service in the table below is the year in which the Trustee was first appointed or elected as Trustee to any Fund currently in the Columbia Funds Complex or a predecessor thereof. Under current Board policy, members serve terms of indefinite duration.
Independent Trustees
| Name, Address, Year of Birth | Position Held With the Trust and Length of Service | Principal Occupation(s) During the Past Five Years and Other Relevant Professional Experience | Number of Funds in the Columbia Funds Complex Overseen | Other Directorships Held by Trustee During the Past Five Years | |||||||||||||||
| Janet Langford Carrig c/o Columbia Management Investment Advisers, LLC, 225 Franklin Street Mail Drop BX32 05228, Boston, MA 02110 1957 | Trustee 1996 | Senior Vice President, General Counsel and Corporate Secretary, ConocoPhillips (independent energy company) since September 2007 | 59 | None | |||||||||||||||
| Douglas A. Hacker c/o Columbia Management Investment Advisers, LLC, 225 Franklin Street Mail Drop BX32 05228, Boston, MA 02110 1955 | Trustee and Chairman of the Board 1996 | Independent business executive since May 2006; Executive Vice President — Strategy of United Airlines from December 2002 to May 2006; President of UAL Loyalty Services (airline marketing company) from September 2001 to December 2002; Executive Vice President and Chief Financial Officer of United Airlines from July 1999 to September 2001 | 59 | Spartan Nash Company (food distributor); Nash Finch Company (food distributor) from 2005 to 2013; Aircastle Limited (aircraft leasing); SeaCube Container Leasing Ltd. (container leasing) from 2010 to 2013; and Travelport Worldwide Limited (travel information technology) | |||||||||||||||
| Nancy T. Lukitsh c/o Columbia Management Investment Advisers, LLC, 225 Franklin Street Mail Drop BX32 05228, Boston, MA 02110 1956 | Trustee 2011 | Senior Vice President, Partner and Director of Marketing, Wellington Management Company, LLP (investment adviser) from 1997 to 2010; Chair, Wellington Management Portfolios (commingled non-U.S. investment pools) from 2007 to 2010; Director, Wellington Trust Company, NA and other Wellington affiliates from 1997 to 2010 | 59 | None | |||||||||||||||
Annual Report 2016
34
COLUMBIA VARIABLE PORTFOLIO — MANAGED VOLATILITY CONSERVATIVE GROWTH FUND
TRUSTEES AND OFFICERS (continued)
Independent Trustees (continued)
| Name, Address, Year of Birth | Position Held With the Trust and Length of Service | Principal Occupation(s) During the Past Five Years and Other Relevant Professional Experience | Number of Funds in the Columbia Funds Complex Overseen | Other Directorships Held by Trustee During the Past Five Years | |||||||||||||||
| David M. Moffett c/o Columbia Management Investment Advisers, LLC, 225 Franklin Street Mail Drop BX32 05228, Boston, MA 02110 1952 | Trustee 2011 | Retired. Consultant to Bridgewater and Associates | 59 | Director, CSX Corporation; Genworth Financial, Inc. (financial and insurance products and services); Paypal Holdings Inc. (payment and data processing services); Trustee University of Oklahoma Foundation; former Director eBay Inc. (online trading community), 2007-2015; and former Director, CIT Bank, CIT Group Inc. (commercial and consumer finance), 2010-2016 | |||||||||||||||
| Charles R. Nelson c/o Columbia Management Investment Advisers, LLC, 225 Franklin Street Mail Drop BX32 05228, Boston, MA 02110 1942 | Trustee 1981 | Retired. Professor Emeritus, University of Washington since 2011; Professor of Economics, University of Washington from 1976 to 2011; Ford and Louisa Van Voorhis Professor of Political Economy, University of Washington from 1993 to 2011; Adjunct Professor of Statistics, University of Washington from 1980 to 2011; Associate Editor, Journal of Money, Credit and Banking from September 1993 to 2008; consultant on econometric and statistical matters | 59 | None | |||||||||||||||
| John J. Neuhauser c/o Columbia Management Investment Advisers, LLC, 225 Franklin Street Mail Drop BX32 05228, Boston, MA 02110 1943 | Trustee 1984 | President, Saint Michael's College since August 2007; Director or Trustee of several non-profit organizations, including University of Vermont Medical Center; Academic Vice President and Dean of Faculties, Boston College from August 1999 to October 2005; University Professor, Boston College from November 2005 to August 2007 | 59 | Liberty All-Star Equity Fund and Liberty All-Star Growth Fund (closed-end funds) | |||||||||||||||
| Patrick J. Simpson c/o Columbia Management Investment Advisers, LLC, 225 Franklin Street Mail Drop BX32 05228, Boston, MA 02110 1944 | Trustee 2000 | Of Counsel, Perkins Coie LLP (law firm) since 2015; Partner, Perkins Coie LLP from 1988 to 2014 | 59 | None | |||||||||||||||
Annual Report 2016
35
COLUMBIA VARIABLE PORTFOLIO — MANAGED VOLATILITY CONSERVATIVE GROWTH FUND
TRUSTEES AND OFFICERS (continued)
Independent Trustees (continued)
| Name, Address, Year of Birth | Position Held With the Trust and Length of Service | Principal Occupation(s) During the Past Five Years and Other Relevant Professional Experience | Number of Funds in the Columbia Funds Complex Overseen | Other Directorships Held by Trustee During the Past Five Years | |||||||||||||||
| Anne-Lee Verville c/o Columbia Management Investment Advisers, LLC, 225 Franklin Street Mail Drop BX32 05228, Boston, MA 02110 1945 | Trustee 1998 | Retired. General Manager, Global Education Industry from 1994 to 1997, President — Application Systems Division from 1991 to 1994, Chief Financial Officer — US Marketing & Services from 1988 to 1991, and Chief Information Officer from 1987 to 1988, IBM Corporation (computer and technology) | 59 | Enesco Group, Inc. (producer of giftware and home and garden decor products) from 2001 to 2006 | |||||||||||||||
Consultants to the Independent Trustees*
| Name, Address, Year of Birth | Position Held With the Trust and Length of Service | Principal Occupation(s) During the Past Five Years and Other Relevant Professional Experience | Number of Funds in the Columbia Funds Complex Overseen | Other Directorships Held by Trustee During the Past Five Years | |||||||||||||||
| J. Kevin Connaughton c/o Columbia Management Investment Advisers, LLC, 225 Franklin Street Mail Drop BX32 05228, Boston, MA 02110 1964 | Independent Trustee Consultant 2016 | Independent Trustee Consultant, Columbia Funds since March 2016; Managing Director and General Manager of Mutual Fund Products, Columbia Management Investment Advisers, LLC from May 2010 to February 2015; President, Columbia Funds from 2009 to 2015; and senior officer of Columbia Funds and affiliated funds from 2003 to 2015 | 59 | Board of Governors, Gateway Healthcare since January 2016; Trustee, New Century Portfolios since March 2015; and Director, The Autism Project since March 2015 | |||||||||||||||
| Natalie A. Trunow c/o Columbia Management Investment Advisers, LLC, 225 Franklin Street Mail Drop BX32 05228, Boston, MA 02110 1967 | Independent Trustee Consultant 2016 | Independent Trustee Consultant, Columbia Funds since September 2016; Senior Vice President and Chief Executive Officer, Millennial Partners (investment consulting services to institutions) since January 2016; Director of Investments, Casey Family Programs from April 2016 to September 2016; Chief Investment Officer, Calvert Investments from August 2008 to January 2016; Section Head and Portfolio Manager, General Motors Asset Management from June 1997 to August 2008 | 59 | Healthcare Services for Children with Special Needs | |||||||||||||||
* J. Kevin Connaughton was appointed consultant to the Independent Trustees effective March 1, 2016. Natalie A. Trunow was appointed consultant to the Independent Trustees effective September 1, 2016. Shareholders of the Funds are expected to be asked to elect each of Mr. Connaughton and Ms. Trunow as a Trustee at a future shareholder meeting.
Annual Report 2016
36
COLUMBIA VARIABLE PORTFOLIO — MANAGED VOLATILITY CONSERVATIVE GROWTH FUND
TRUSTEES AND OFFICERS (continued)
Interested Trustee Affiliated with Investment Manager*
| Name, Address, Year of Birth | Position Held With the Trust and Length of Service | Principal Occupation(s) During the Past Five Years and Other Relevant Professional Experience | Number of Funds in the Columbia Funds Complex Overseen | Other Directorships Held by Trustee During the Past Five Years | |||||||||||||||
| William F. Truscott c/o Columbia Management Investment Advisers, LLC, 225 Franklin Street Boston, MA 02110 1960 | Trustee 2012 | Chairman of the Board and President, Columbia Management Investment Advisers, LLC since May 2010 and February 2012, respectively; Chief Executive Officer, Global Asset Management, Ameriprise Financial, Inc. since September 2012 (previously Chief Executive Officer, U.S. Asset Management & President, Annuities, May 2010- September 2012); Director and Chief Executive Officer, Columbia Management Investment Distributors, Inc. since May 2010 and February 2012, respectively; Chairman of the Board and Chief Executive Officer, RiverSource Distributors, Inc. since 2006; Director, Threadneedle Asset Management Holdings, SARL since 2014; President and Chief Executive Officer, Ameriprise Certificate Company, 2006-August 2012. | 185 | Trustee to other Columbia Funds since 2001; Chairman of the Board, Columbia Management Investment Advisers, LLC since May 2010; Director, Columbia Management Investment Distributors, Inc. since May 2010; Former Director, Ameriprise Certificate Company, 2006-January 2013 | |||||||||||||||
* Interested person (as defined under the 1940 Act) by reason of being an officer, director, security holder and/or employee of the Investment Manager or Ameriprise Financial.
The Statement of Additional Information has additional information about the Fund's Board members and is available, without charge, upon request by calling 800.345.6611 or contacting your financial intermediary.
Annual Report 2016
37
COLUMBIA VARIABLE PORTFOLIO — MANAGED VOLATILITY CONSERVATIVE GROWTH FUND
TRUSTEES AND OFFICERS (continued)
The Board has appointed officers who are responsible for day-to-day business decisions based on policies it has established. The officers serve at the pleasure of the Board. The following table provides basic information about the Officers of the Fund, including principal occupations during the past five years, although their specific titles may have varied over the period. In addition to Mr. Truscott, who is Senior Vice President, the Fund's other officers are:
Fund Officers
| Name, Address and Year of Birth | Position and Year First Appointed to Position for any Fund in the Columbia Funds Complex or a Predecessor Thereof | Principal Occupation(s) During Past Five Years | |||||||||
| Christopher O. Petersen 5228 Ameriprise Financial Center Minneapolis, MN 55474 Born 1970 | President and Principal Executive Officer (2015) | Vice President and Lead Chief Counsel, Ameriprise Financial, Inc. since January 2015 (previously, Vice President and Chief Counsel January 2010-December 2014); officer of Columbia Funds and affiliated funds since 2007. | |||||||||
| Michael G. Clarke 225 Franklin Street Boston, MA 02110 Born 1969 | Treasurer (2011), Chief Financial Officer (2009) and Chief Accounting Officer (2015) | Vice President — Mutual Fund Administration, Columbia Management Investment Advisers, LLC, since May 2010; senior officer of Columbia Funds and affiliated funds since 2002. | |||||||||
| Paul B. Goucher 100 Park Avenue New York, NY 10017 Born 1968 | Senior Vice President (2011), Chief Legal Officer (2015) and Assistant Secretary (2008) | Senior Vice President and Assistant General Counsel, Ameriprise Financial, Inc. since January 2017 (previously Vice President and Lead Chief Counsel, November 2008-January 2017 and January 2013-2017, respectively, and Chief Counsel, January 2010-January 2013); Vice President, Chief Legal Officer and Assistant Secretary, Columbia Management Investment Advisers, LLC since May 2010. | |||||||||
| Thomas P. McGuire 225 Franklin Street Boston, MA 02110 Born 1972 | Senior Vice President and Chief Compliance Officer (2012) | Vice President — Asset Management Compliance, Ameriprise Financial, Inc., since May 2010; Chief Compliance Officer, Ameriprise Certificate Company since September 2010. | |||||||||
| Colin Moore 225 Franklin Street Boston, MA 02110 Born 1958 | Senior Vice President (2010) | Executive Vice President and Global Chief Investment Officer, Ameriprise Financial, Inc., since July 2013; Executive Vice President and Global Chief Investment Officer, Columbia Management Investment Advisers, LLC since July 2013 (previously Director and Global Chief Investment Officer, 2010-2013). | |||||||||
| Michael E. DeFao 225 Franklin Street Boston, MA 02110 Born 1968 | Vice President (2011) and Assistant Secretary (2010) | Vice President and Chief Counsel, Ameriprise Financial, Inc. since May 2010. | |||||||||
| Amy Johnson 5228 Ameriprise Financial Center Minneapolis, MN 55474 Born 1965 | Vice President (2006) | Managing Director and Global Head of Operations, Columbia Management Investment Advisers, LLC since April 2016 (previously Managing Director and Chief Operating Officer, 2010-2016). | |||||||||
| Lyn Kephart-Strong 5228 Ameriprise Financial Center Minneapolis, MN 55474 Born 1960 | Vice President (2015) | President, Columbia Management Investment Services Corp. since October 2014; Vice President & Resolution Officer, Ameriprise Trust Company since August 2009. | |||||||||
| Ryan C. Larrenaga 225 Franklin Street Boston, MA 02110 Born 1970 | Vice President and Secretary (2015) | Vice President and Group Counsel, Ameriprise Financial, Inc. since August 2011; officer of Columbia Funds and affiliated funds since 2005. | |||||||||
Annual Report 2016
38
This page intentionally left blank.
Annual Report 2016
39
This page intentionally left blank.
Annual Report 2016
40
COLUMBIA VARIABLE PORTFOLIO — MANAGED VOLATILITY CONSERVATIVE GROWTH FUND
IMPORTANT INFORMATION ABOUT THIS REPORT
The policy of the Board is to vote the proxies of the companies in which each fund holds investments consistent with the procedures as stated in the Statement of Additional Information (SAI). You may obtain a copy of the SAI without charge by calling 800.345.6611; contacting your financial intermediary or searching the website of the Securities and Exchange Commission (SEC) at sec.gov. Information regarding how each fund voted proxies relating to portfolio securities is filed with the SEC by August 31st for the most recent 12-month period ending June 30th of that year, and is available without charge by visiting investor.columbiathreadneedleus.com, or searching the website of the SEC at sec.gov.
Each fund files a complete schedule of portfolio holdings with the SEC for the first and third quarters of each fiscal year on Form N-Q. Each fund's Form N-Q is available on the SEC's website at sec.gov and may be reviewed and copied at the SEC's Public Reference Room in Washington, D.C. Information on the operation of the Public Reference Room may be obtained by calling 800.SEC.0330. Each fund's complete schedule of portfolio holdings, as filed on Form N-Q, can also be obtained without charge, upon request, by calling 800.345.6611.
Annual Report 2016
41
Columbia Variable Portfolio — Managed Volatility Conservative Growth Fund
P.O. Box 8081
Boston, MA 02266-8081

Please read and consider the investment objectives, risks, charges and expenses for any fund carefully before investing. For fund and other investment product prospectuses, which contain this and other important information, contact your financial advisor or insurance representative. Please read the prospectus carefully before you invest. The Fund is distributed by Columbia Management Investment Distributors, Inc., member FINRA, and managed by Columbia Management Investment Advisers, LLC.
Columbia Threadneedle Investments (Columbia Threadneedle) is the global brand name of the Columbia and Threadneedle group of companies.
All rights reserved. Columbia Management Investment Distributors, Inc., 225 Franklin Street, Boston, MA 02110-2804
© 2017 Columbia Management Investment Advisers, LLC.
S-6613 AN (2/17)

ANNUAL REPORT
December 31, 2016

COLUMBIA VARIABLE PORTFOLIO — MANAGED VOLATILITY GROWTH FUND
Please remember that you may not buy (nor will you own) shares of the Fund directly. The Fund is available through variable annuity contracts or life insurance policies offered by the separate accounts of affiliated insurance companies and other qualified institutional investors authorized by Columbia Management Investment Distributors, Inc. Please contact your financial advisor or insurance representative for more information.

COLUMBIA VARIABLE PORTFOLIO — MANAGED VOLATILITY GROWTH FUND
TABLE OF CONTENTS
Performance Overview | 2 | ||||||
Manager Discussion of Fund Performance | 4 | ||||||
Understanding Your Fund's Expenses | 6 | ||||||
Portfolio of Investments | 7 | ||||||
Statement of Assets and Liabilities | 19 | ||||||
Statement of Operations | 20 | ||||||
Statement of Changes in Net Assets | 21 | ||||||
Financial Highlights | 23 | ||||||
Notes to Financial Statements | 24 | ||||||
Report of Independent Registered Public Accounting Firm | 36 | ||||||
Trustees and Officers | 37 | ||||||
Important Information About This Report | 45 | ||||||
The views expressed in this report reflect the current views of the respective parties. These views are not guarantees of future performance and involve certain risks, uncertainties and assumptions that are difficult to predict, so actual outcomes and results may differ significantly from the views expressed. These views are subject to change at any time based upon economic, market or other conditions and the respective parties disclaim any responsibility to update such views. These views may not be relied on as investment advice and, because investment decisions for a Columbia fund are based on numerous factors, may not be relied on as an indication of trading intent on behalf of any particular Columbia fund. References to specific securities should not be construed as a recommendation or investment advice.
Annual Report 2016
COLUMBIA VARIABLE PORTFOLIO — MANAGED VOLATILITY GROWTH FUND
PERFORMANCE OVERVIEW
Performance Summary
n Columbia Variable Portfolio — Managed Volatility Growth Fund (the Fund) Class 2 shares returned 3.37% for the 12-month period ended December 31, 2016.
n The Fund underperformed its Blended Benchmark, which gained 7.07% for the same time period.
n The broad U.S. equity market, as measured by the Russell 3000 Index, returned 12.74% over the same 12 months.
n Disappointing results from underlying funds, especially U.S. large-cap equity funds, and an underweight in equities accounted for a significant portion of the Fund's shortfall relative to its Blended Benchmark. The Fund's dynamic algorithm-based allocation and event protection strategies also detracted modestly from relative results.
Average Annual Total Returns (%) (for period ended December 31, 2016)
Inception | 1 Year | Life | |||||||||||||
Class 2 | 04/12/13 | 3.37 | 4.24 | ||||||||||||
Blended Benchmark | 7.07 | 6.55 | |||||||||||||
Russell 3000 Index | 12.74 | 11.86 | |||||||||||||
Performance data quoted represents past performance and current performance may be lower or higher. Past performance is no guarantee of future results. The investment return and principal value will fluctuate so that shares, when redeemed, may be worth more or less than the original cost. For current month-end performance information, please contact your financial advisor or insurance representative.
Performance results reflect the effect of any fee waivers or reimbursements of fund expenses by Columbia Management Investment Advisers, LLC and/or any of its affiliates. Absent these fee waivers or expense reimbursement arrangements, performance results would have been lower.
Investment earnings, if any, are tax-deferred until distributed to shareholders, at which time taxes may become due. Total return performance includes changes in share price and assumes reinvestment of dividends and capital gains, if any. Performance results reflect the effect of all fund expenses, but do not include any fees and expenses imposed under your variable annuity contract and/or variable life insurance policy or qualified pension or retirement plan. If performance results included the effect of these additional charges, they would be lower.
Effective March 10, 2016, the Fund compares its performance to that of a New Blended Index consisting of 46% Russell 3000 Index, 35% Bloomberg Barclays U.S. Aggregate Bond Index and 19% MSCI EAFE Index (Net) and the Russell 3000 Index. Prior to this date, the Fund compared its performance to that of an index consisting of 35% Bloomberg Barclays U.S. Aggregate Bond Index, 34% S&P 500 Index, 19% MSCI EAFE Index (Net) and 12% Russell 2000 Index (the Former Blended Index) and the S&P 500 Index. The Fund's investment manager believes that the New Blended Index and the Russell 3000 Index provide a more appropriate basis for comparing the Fund's performance.
The Russell 3000 Index, an unmanaged index, measures the performance of the 3,000 largest U.S. companies based on total market capitalization, which represents approximately 98% of the investable U.S. equity market. The Bloomberg Barclays U.S. Aggregate Bond Index is a broad-based benchmark that measures the investment-grade, U.S. dollar-denominated, fixed-rate taxable bond market, including Treasuries, government-related and corporate securities, mortgage-backed securities (agency fixed-rate and hybrid adjustable-rate mortgage passthroughs), asset-backed securities, and commercial mortgage-backed securities. The MSCI EAFE (Europe, Australasia, Far East) Index (Net) is a free float-adjusted market capitalization index that is designed to measure the equity market performance of developed markets, excluding the U.S. and Canada. The index is compiled from a composite of securities markets of Europe, Australasia and the Far East and is widely recognized by investors in foreign markets as the measurement index for portfolios of non-North American securities.
The S&P 500 Index, an unmanaged index, measures the performance of 500 widely held, large-capitalization U.S. stocks and is frequently used as a general measure of market performance. The Russell 2000 Index measures the performance of the small-cap segment of the U.S. equity universe. It is a subset of the Russell 3000 Index representing approximately 10% of the total market capitalization of that index. It includes approximately 2000 of the smallest securities based on a combination of their market cap and current index membership.
Indices are not available for investment, are not professionally managed and do not reflect sales charges, fees, brokerage commissions, taxes (except the MSCI EAFE Index (Net), which reflects reinvested dividends net of withholding taxes) or other expenses of investing. Securities in the Fund may not match those in an index.
Annual Report 2016
2
COLUMBIA VARIABLE PORTFOLIO — MANAGED VOLATILITY GROWTH FUND
PERFORMANCE OVERVIEW (continued)
Performance of a Hypothetical $10,000 Investment (April 12, 2013 – December 31, 2016)

The chart above shows the change in value of a hypothetical $10,000 investment in Class 2 shares of Columbia Variable Portfolio — Managed Volatility Growth Fund during the stated time period, and does not reflect the deduction of taxes, if any, that a shareholder may pay on Fund distributions or on the redemption of Fund shares. The returns also do not reflect fees and expenses imposed under your variable annuity contract and/or variable life insurance policy or qualified pension or retirement plan, if any.
Annual Report 2016
3
COLUMBIA VARIABLE PORTFOLIO — MANAGED VOLATILITY GROWTH FUND
MANAGER DISCUSSION OF FUND PERFORMANCE
Portfolio Management
Jeffrey Knight, CFA
Anwiti Bahuguna, Ph.D.
David Weiss
Brian Virginia
Effective January 27, 2017, Kent Peterson no longer serves as a portfolio manager of the Fund.
| Portfolio Allocation (%) (at December 31, 2016) | |||||||
Allocations to Underlying Funds | |||||||
Underlying Funds: Equity | 59.6 | ||||||
International | 15.7 | ||||||
U.S. Large Cap | 35.0 | ||||||
U.S. Mid Cap | 3.4 | ||||||
U.S. Small Cap | 5.5 | ||||||
Underlying Funds: Fixed Income | 10.2 | ||||||
Investment Grade | 10.2 | ||||||
Corporate Bonds & Notes | 0.6 | ||||||
Exchange-Traded Funds | 7.5 | ||||||
| Money Market Fund Shares Held to Cover Open Derivatives Instruments(a) | 15.5 | ||||||
Options Purchased Puts | 1.4 | ||||||
Foreign Government Obligations | 0.0 | (b) | |||||
Residential Mortgage-Backed Securities — Agency | 5.2 | ||||||
U.S. Treasury Obligations | 0.0 | (b) | |||||
Total | 100.0 | ||||||
Percentages indicated are based upon total investments. The Fund's portfolio composition is subject to change.
(a) Includes investments in an affiliated money market fund (amounting to $1,335.3 million) which have been segregated to cover obligations relating to the Fund's investment in derivatives as part of its tactical allocation strategy. For a description of the Fund's investments in derivatives, see Investments in Derivatives following the Portfolio of Investments, and Note 2 to the financial statements.
(b) Rounds to zero.
For the 12-month period that ended December 31, 2016, the Fund's Class 2 shares returned 3.37%. The Fund underperformed its Blended Benchmark, which gained 7.07% for the same time period. The broad U.S. equity market, as measured by the Russell 3000 Index, returned 12.74% over the same 12 months. Disappointing results from underlying U.S. large-cap equity funds, as well as an underweight in equities, accounted for much of the Fund's shortfall relative to its Blended Benchmark. The Fund's dynamic algorithm-based allocation methodology, which helps guide the Fund's asset allocation strategy, also detracted from relative results, as did event protection strategies designed to minimize losses in the event of steep market declines. Performance from underlying fixed-income funds and a modest overweight in U.S. small caps, one of the year's best equity sectors, aided relative returns.
Global Markets Posted Mixed Results
Global events, political uncertainty and mixed economic data were enough to keep investors off balance in 2016, as financial markets moved sharply in reaction to each significant change on the world stage. Early in the year, concerns about U.S. monetary policy, China and oil rattled the equity markets and drove stock prices downward. After a swift March rebound, the U.S. stock market fell again in the early summer in reaction to the U.K. vote to exit the European Union, and U.S. Treasury yields also plummeted. Once again, the markets rebounded but investors retreated in the third quarter in reaction to mixed economic data and uncertainty surrounding the U.S. Presidential race. Following the November election and with mostly positive economic data, stocks moved higher in the fourth quarter to keep the eight-year bull market alive. In the United States, steady job growth drove unemployment down, corporate earnings growth picked up, manufacturing activity accelerated, and the price of oil stabilized. Growth was lackluster in developed foreign market countries. In Europe and Japan, GDP advanced less than 1% for the year. China expanded at an estimated pace of 7.5%, in line with expectations, while most emerging markets struggled with volatile international capital flows and currency fluctuations. South American economies contracted.
In December 2016, the Federal Reserve (the Fed) raised the target range of its benchmark interest rate by a quarter of a point to between 0.50% and 0.75%, its first such move in a year. The Fed's action had been widely anticipated and had little or no impact on the financial markets when it occurred. The Fed indicated that it would continue to monitor inflation and the job market in considering future rate hikes.
Against this backdrop, the S&P 500 Index, a broad measure of U.S. stock market performance, rose 11.96%. Foreign stock markets lagged the U.S. markets. The MSCI EAFE Index (Net), a broad measure of performance in developed markets outside the United States, rose just 1.00% for the year. Rising interest rates kept a lid on price in most sectors of the bond market. As noted above, the Bloomberg Barclays U.S. Aggregate Bond Index, a broad measure of the performance of investment-grade bonds, returned 2.65% for the year. High-yield bonds outperformed both stocks and investment-grade bonds, returning 17.49%, as measured by the Bank of America Merrill Lynch U.S. High Yield Constrained Index.
Annual Report 2016
4
COLUMBIA VARIABLE PORTFOLIO — MANAGED VOLATILITY GROWTH FUND
MANAGER DISCUSSION OF FUND PERFORMANCE (continued)
Significant Performance Factors
Underlying fund performance had a significant impact on relative returns in 2016. Tactical asset allocation decisions also affected Fund performance.
Underlying fund performance detracted from relative performance, although results were mixed. U.S. fixed-income funds made a strong showing, which aided results relative to the Blended Benchmark. Multi-sector bond strategies with exposure to the strong-performing corporate credit markets were particularly beneficial to results. Equity funds detracted from relative returns, especially those centered on large-cap equities. Value funds generally outperformed growth- and blend-oriented funds.
The market's back-and-forth volatility undermined the effectiveness of the dynamic algorithm as it was executed during the year. We widened the range within which we could vary from the targets indicated by the dynamic algorithm. This additional degree of tactical discretion aided performance when we lowered equity exposure more than the methodology indicated in late June, just ahead of the U.K. referendum on leaving the European Union — and we felt it was prudently cautious to keep equity exposure lower than the target suggested by the algorithm. However, the equity markets snapped back quickly and exercising this added flexibility detracted from overall relative performance because it resulted in lower equity exposure during the sharp market rebounds of the second half of the year. It should be noted that safe haven assets, such as U.S. Treasury-related synthetic bond positions, currency hedging instruments and other tactical positioning within the funds also detracted from relative results.
Derivative securities such as forward foreign currency exchange contracts, futures and options were used to execute the Fund's dynamic algorithm and event protection strategies, which account for approximately 30% of the portfolio. As noted above, these strategies detracted from relative performance for the year.
Subadvisor Changes
As part of an ongoing effort to monitor the individual teams that manage underlying funds, subadvisor changes were implemented for certain underlying funds during the second quarter of 2016 and again late in the period in an effort to improve results in the underlying funds. The Fund seeks to deliver a strong risk-adjusted return over time with broad diversification across asset classes. Tactical decisions and positioning changes are generally small in scope and magnitude.
Annual Report 2016
5
COLUMBIA VARIABLE PORTFOLIO — MANAGED VOLATILITY GROWTH FUND
UNDERSTANDING YOUR FUND'S EXPENSES
(Unaudited)
As an investor, you incur ongoing costs, which generally include management fees, distribution and/or service fees, and other fund expenses. The following information is intended to help you understand your ongoing costs (in dollars) of investing in the Fund and to help you compare these costs with the ongoing costs of investing in other mutual funds.
The information below does not reflect fees and expenses imposed under your variable annuity contract and/or variable life insurance policy (collectively, Contracts) or qualified pension and retirement plan (Qualified Plan), if any. The total fees and expenses you bear may therefore be higher than those shown below.
Analyzing Your Fund's Expenses
To illustrate these ongoing costs, we have provided examples and calculated the expenses paid by investors in Class 2 shares of the Fund during the period. The actual and hypothetical information in the table is based on an initial investment of $1,000 at the beginning of the period indicated and held for the entire period. Expense information is calculated two ways and each method provides you with different information. The amount listed in the "Actual" column is calculated using the Fund's actual operating expenses and total return for the period. You may use the Actual information, together with the amount invested, to estimate the expenses that you paid over the period. Simply divide your account value by $1,000 (for example, an $8,600 account value divided by $1,000 = 8.6), then multiply the results by the expenses paid during the period under the "Actual" column. The amount listed in the "Hypothetical" column assumes a 5% annual rate of return before expenses (which is not the Fund's actual return) and then applies the Fund's actual expense ratio for the period to the hypothetical return. You should not use the hypothetical account values and expenses to estimate either your actual account balance at the end of the period or the expenses you paid during the period. See "Compare With Other Funds" below for details on how to use the hypothetical data.
In addition to the ongoing expenses which the Fund bears directly, the Fund's shareholders indirectly bear the Fund's allocable share of the costs and expenses of each underlying fund in which the Fund invests. You can estimate the effective expenses paid during the period, which includes the indirect fees associated with investing in the underlying funds, by using the amounts listed in the "Effective Expenses Paid During the Period" column.
Compare With Other Funds
Since all mutual funds are required to include the same hypothetical calculations about expenses in shareholder reports, you can use this information to compare the ongoing cost of investing in the Fund with other funds. To do so, compare the hypothetical example with the 5% hypothetical examples that appear in the shareholder reports of other funds. As you compare hypothetical examples of other funds, it is important to note that hypothetical examples are meant to highlight the ongoing costs of investing in a fund only and do not reflect any transaction costs, such as redemption or exchange fees, or expenses that apply to the subaccount or the Contract. Therefore, the hypothetical calculations are useful in comparing ongoing costs only, and will not help you determine the relative total costs of owning different funds. If the fees and expenses imposed under your Contract or Qualified Plan, if any, were included, your costs would be higher.
July 1, 2016 – December 31, 2016
| Account Value at the Beginning of the Period ($) | Account Value at the End of the Period ($) | Expenses Paid During the Period ($) | Fund's Annualized Expense Ratio (%) | Effective Expenses Paid During the Period ($) | Fund's Effective Annualized Expense Ratio (%) | ||||||||||||||||||||||||||||||||||||||
Actual | Hypothetical | Actual | Hypothetical | Actual | Hypothetical | Actual | Actual | Hypothetical | Actual | ||||||||||||||||||||||||||||||||||
Class 2 | 1,000.00 | 1,000.00 | 1,027.30 | 1,022.65 | 2.38 | 2.38 | 0.47 | 5.32 | 5.31 | 1.05 | |||||||||||||||||||||||||||||||||
Expenses paid during the period are equal to the annualized expense ratio for each class as indicated above, multiplied by the average account value over the period and then multiplied by the number of days in the Fund's most recent fiscal half year and divided by 366.
Effective expenses paid during the period and the Fund's effective annualized expense ratio include expenses borne directly to the class plus the Fund's indirect pro rata portion of the ongoing expenses charged by the underlying funds using the expense ratio of each class of the underlying funds as of the underlying fund's most recent shareholder report.
Annual Report 2016
6
COLUMBIA VARIABLE PORTFOLIO — MANAGED VOLATILITY GROWTH FUND
PORTFOLIO OF INVESTMENTS
December 31, 2016
(Percentages represent value of investments compared to net assets)
Equity Funds 62.2%
Shares | Value ($) | ||||||||||
INTERNATIONAL 16.4% | |||||||||||
| Variable Portfolio — DFA International Value Fund, Class 1 Shares(a) | 43,017,670 | 401,785,034 | |||||||||
| Variable Portfolio — Lazard International Equity Advantage Fund, Class 1 Shares(a) | 14,149,927 | 138,386,284 | |||||||||
| Variable Portfolio — Oppenheimer International Growth Fund, Class 1 Shares(a) | 37,969,141 | 406,269,810 | |||||||||
| Variable Portfolio — Pyramis® International Equity Fund, Class 1 Shares(a) | 40,495,247 | 401,307,902 | |||||||||
Total | 1,347,749,030 | ||||||||||
U.S. LARGE CAP 36.5% | |||||||||||
| Columbia Variable Portfolio — Contrarian Core Fund, Class 1 Shares(a)(b) | 15,117,568 | 273,930,327 | |||||||||
| Columbia Variable Portfolio — Disciplined Core Fund, Class 1 Shares(a)(b) | 20,379,407 | 797,038,606 | |||||||||
| Columbia Variable Portfolio — Dividend Opportunity Fund, Class 1 Shares(a)(b) | 13,211,095 | 292,229,426 | |||||||||
| Columbia Variable Portfolio — Large Cap Growth Fund, Class 1 Shares(a)(b) | 18,300,452 | 239,369,913 | |||||||||
| Columbia Variable Portfolio — Select Large-Cap Value Fund, Class 1 Shares(a)(b) | 8,061,819 | 165,751,008 | |||||||||
| Variable Portfolio — Loomis Sayles Growth Fund, Class 1 Shares(a)(b) | 16,404,263 | 360,073,572 | |||||||||
| Variable Portfolio — MFS Value Fund, Class 1 Shares(a)(b) | 7,199,592 | 152,775,331 | |||||||||
| Variable Portfolio — MFS® Blended Research® Core Equity Fund, Class 1 Shares(a)(b) | 18,409,232 | 312,956,943 | |||||||||
| Variable Portfolio — Morgan Stanley Advantage Fund, Class 1 Shares(a)(b) | 5,862,199 | 120,175,071 | |||||||||
| Variable Portfolio — Nuveen Winslow Large Cap Growth Fund, Class 1 Shares(a)(b) | 7,125,983 | 144,301,158 | |||||||||
| Variable Portfolio — T. Rowe Price Large Cap Value Fund, Class 1 Shares(a)(b) | 7,691,441 | 150,906,076 | |||||||||
Total | 3,009,507,431 | ||||||||||
Equity Funds (continued)
Shares | Value ($) | ||||||||||
U.S. MID CAP 3.5% | |||||||||||
| Columbia Variable Portfolio — Mid Cap Growth Fund, Class 1 Shares(a)(b) | 2,735,949 | 57,372,849 | |||||||||
| Columbia Variable Portfolio — Mid Cap Value Fund, Class 1 Shares(a)(b) | 3,038,380 | 60,797,979 | |||||||||
| Variable Portfolio — Jennison Mid Cap Growth Fund, Class 1 Shares(a)(b) | 4,446,796 | 84,755,942 | |||||||||
| Variable Portfolio — Victory Sycamore Established Value Fund, Class 1 Shares(a)(b) | 3,849,949 | 87,316,836 | |||||||||
Total | 290,243,606 | ||||||||||
U.S. SMALL CAP 5.8% | |||||||||||
| Columbia Variable Portfolio — U.S. Equities Fund, Class 1 Shares(a)(b) | 8,226,251 | 171,188,277 | |||||||||
| Variable Portfolio — Partners Small Cap Growth Fund, Class 1 Shares(a)(b) | 7,918,728 | 146,338,102 | |||||||||
| Variable Portfolio — Partners Small Cap Value Fund, Class 1 Shares(a)(b) | 6,020,276 | 157,370,020 | |||||||||
Total | 474,896,399 | ||||||||||
| Total Equity Funds (Cost: $4,799,782,751) | 5,122,396,466 | ||||||||||
Fixed-Income Funds 10.7%
INVESTMENT GRADE 10.7% | |||||||||||
| Columbia Variable Portfolio — Intermediate Bond Fund, Class 1 Shares(a) | 14,942,020 | 154,649,909 | |||||||||
| Columbia Variable Portfolio — Limited Duration Credit Fund, Class 1 Shares(a) | 4,919,529 | 46,587,944 | |||||||||
| Columbia Variable Portfolio — Long Government/Credit Bond Fund, Class 1 Shares(a) | 8,200,534 | 81,349,301 | |||||||||
| Columbia Variable Portfolio — U.S. Government Mortgage Fund, Class 1 Shares(a) | 4,396,993 | 45,376,972 | |||||||||
| Variable Portfolio — American Century Diversified Bond Fund, Class 1 Shares(a) | 14,031,057 | 153,640,071 | |||||||||
| Variable Portfolio — J.P. Morgan Core Bond Fund, Class 1 Shares(a) | 20,327,506 | 219,943,616 | |||||||||
| Variable Portfolio — TCW Core Plus Bond Fund, Class 1 Shares(a) | 15,494,165 | 162,378,844 | |||||||||
The accompanying Notes to Financial Statements are an integral part of this statement.
Annual Report 2016
7
COLUMBIA VARIABLE PORTFOLIO — MANAGED VOLATILITY GROWTH FUND
PORTFOLIO OF INVESTMENTS (continued)
December 31, 2016
Fixed-Income Funds (continued)
Shares | Value ($) | ||||||||||
| Variable Portfolio — Wells Fargo Short Duration Government Fund, Class 1 Shares(a) | 1,484,177 | 14,960,502 | |||||||||
Total | 878,887,159 | ||||||||||
| Total Fixed-Income Funds (Cost: $883,682,851) | 878,887,159 | ||||||||||
Exchange-Traded Funds 7.8%
SPDR S&P 500 ETF Trust | 1,738,300 | 388,562,199 | |||||||||
iShares MSCI EAFE ETF | 4,435,000 | 256,032,550 | |||||||||
| Total Exchange-Traded Funds (Cost: $597,423,107) | 644,594,749 | ||||||||||
Corporate Bonds & Notes(c) 0.6%
Issuer | Coupon Rate | Principal Amount ($) | Value ($) | ||||||||||||||||
AEROSPACE & DEFENSE —% | |||||||||||||||||||
| BAE Systems Holdings, Inc.(d) 10/07/24 | 3.800 | % | 400,000 | 409,884 | |||||||||||||||
| L-3 Communications Corp. 02/15/21 | 4.950 | % | 71,000 | 75,853 | |||||||||||||||
05/28/24 | 3.950 | % | 366,000 | 372,242 | |||||||||||||||
| Lockheed Martin Corp. 11/23/18 | 1.850 | % | 154,000 | 154,613 | |||||||||||||||
01/15/23 | 3.100 | % | 15,000 | 15,164 | |||||||||||||||
| Northrop Grumman Corp. 06/01/18 | 1.750 | % | 600,000 | 601,649 | |||||||||||||||
08/01/23 | 3.250 | % | 60,000 | 61,167 | |||||||||||||||
Total | 1,690,572 | ||||||||||||||||||
APARTMENT REIT —% | |||||||||||||||||||
| Grand City Properties SA(d) 04/17/25 | 1.500 | % | EUR | 200,000 | 205,422 | ||||||||||||||
BANKING 0.1% | |||||||||||||||||||
| Bank of America Corp. 04/19/26 | 3.500 | % | 460,000 | 453,869 | |||||||||||||||
| Bank of Nova Scotia (The) 06/11/18 | 1.700 | % | 330,000 | 330,118 | |||||||||||||||
| Citigroup, Inc. 05/01/26 | 3.400 | % | 295,000 | 286,640 | |||||||||||||||
10/21/26 | 3.200 | % | 315,000 | 301,210 | |||||||||||||||
| Goldman Sachs Group, Inc. (The) 01/23/25 | 3.500 | % | 259,000 | 255,569 | |||||||||||||||
02/25/26 | 3.750 | % | 158,000 | 158,341 | |||||||||||||||
Corporate Bonds & Notes(c) (continued)
Issuer | Coupon Rate | Principal Amount ($) | Value ($) | ||||||||||||||||
| JPMorgan Chase & Co. 03/01/18 | 1.700 | % | 215,000 | 214,963 | |||||||||||||||
03/22/19 | 1.850 | % | 200,000 | 199,369 | |||||||||||||||
10/01/26 | 2.950 | % | 295,000 | 281,574 | |||||||||||||||
| Morgan Stanley 04/21/21 | 2.500 | % | 160,000 | 158,261 | |||||||||||||||
07/27/26 | 3.125 | % | 155,000 | 148,083 | |||||||||||||||
| Wells Fargo & Co. 10/23/26 | 3.000 | % | 570,000 | 542,866 | |||||||||||||||
Total | 3,330,863 | ||||||||||||||||||
CABLE AND SATELLITE —% | |||||||||||||||||||
| Comcast Corp. 02/15/18 | 5.875 | % | 270,000 | 283,096 | |||||||||||||||
| Sky PLC(d) 11/26/22 | 3.125 | % | 135,000 | 133,903 | |||||||||||||||
11/24/23 | 1.875 | % | EUR | 640,000 | 706,904 | ||||||||||||||
09/16/24 | 3.750 | % | 215,000 | 215,683 | |||||||||||||||
Total | 1,339,586 | ||||||||||||||||||
CHEMICALS —% | |||||||||||||||||||
| LYB International Finance BV 03/15/44 | 4.875 | % | 75,000 | 77,669 | |||||||||||||||
| LyondellBasell Industries NV 04/15/19 | 5.000 | % | 290,000 | 306,429 | |||||||||||||||
Total | 384,098 | ||||||||||||||||||
CONSUMER CYCLICAL SERVICES —% | |||||||||||||||||||
| Motability Operations Group PLC(d) 07/16/26 | 3.750 | % | GBP | 225,000 | 318,498 | ||||||||||||||
DIVERSIFIED MANUFACTURING —% | |||||||||||||||||||
| General Electric Co. 05/26/23 | 1.250 | % | EUR | 585,000 | 644,838 | ||||||||||||||
| Honeywell International, Inc. 10/30/19 | 1.400 | % | 375,000 | 371,532 | |||||||||||||||
02/22/23 | 1.300 | % | EUR | 440,000 | 481,315 | ||||||||||||||
| United Technologies Corp. 05/22/23 | 1.250 | % | EUR | 270,000 | 294,602 | ||||||||||||||
11/01/46 | 3.750 | % | 75,000 | 71,377 | |||||||||||||||
Total | 1,863,664 | ||||||||||||||||||
ELECTRIC 0.2% | |||||||||||||||||||
| Appalachian Power Co. 05/15/44 | 4.400 | % | 170,000 | 172,501 | |||||||||||||||
06/01/45 | 4.450 | % | 195,000 | 199,243 | |||||||||||||||
| Arizona Public Service Co. 05/15/46 | 3.750 | % | 140,000 | 131,303 | |||||||||||||||
The accompanying Notes to Financial Statements are an integral part of this statement.
Annual Report 2016
8
COLUMBIA VARIABLE PORTFOLIO — MANAGED VOLATILITY GROWTH FUND
PORTFOLIO OF INVESTMENTS (continued)
December 31, 2016
Corporate Bonds & Notes(c) (continued)
Issuer | Coupon Rate | Principal Amount ($) | Value ($) | ||||||||||||||||
| Berkshire Hathaway Energy Co. 11/15/23 | 3.750 | % | 220,000 | 230,055 | |||||||||||||||
11/15/43 | 5.150 | % | 12,000 | 13,473 | |||||||||||||||
02/01/45 | 4.500 | % | 291,000 | 301,889 | |||||||||||||||
| CMS Energy Corp. 03/15/22 | 5.050 | % | 100,000 | 109,548 | |||||||||||||||
03/01/24 | 3.875 | % | 165,000 | 171,604 | |||||||||||||||
11/15/25 | 3.600 | % | 710,000 | 718,732 | |||||||||||||||
02/15/27 | 2.950 | % | 140,000 | 132,873 | |||||||||||||||
03/01/44 | 4.875 | % | 3,000 | 3,216 | |||||||||||||||
| Consolidated Edison Co. of New York, Inc. 06/15/46 | 3.850 | % | 100,000 | 95,413 | |||||||||||||||
| DTE Energy Co. 06/01/24 | 3.500 | % | 345,000 | 347,696 | |||||||||||||||
10/01/26 | 2.850 | % | 1,110,000 | 1,031,543 | |||||||||||||||
| Dominion Resources, Inc. 06/15/18 | 1.900 | % | 435,000 | 435,227 | |||||||||||||||
| Duke Energy Corp. 10/15/23 | 3.950 | % | 1,433,000 | 1,503,041 | |||||||||||||||
09/01/46 | 3.750 | % | 80,000 | 72,016 | |||||||||||||||
| Duke Energy Progress LLC 10/15/46 | 3.700 | % | 120,000 | 113,630 | |||||||||||||||
| Emera US Finance LP(d) 06/15/46 | 4.750 | % | 370,000 | 373,125 | |||||||||||||||
| Eversource Energy 01/15/18 | 1.600 | % | 108,000 | 107,755 | |||||||||||||||
05/01/18 | 1.450 | % | 754,000 | 751,520 | |||||||||||||||
| Indiana Michigan Power Co. 03/15/23 | 3.200 | % | 245,000 | 247,352 | |||||||||||||||
| NextEra Energy Capital Holdings, Inc. 04/01/19 | 2.300 | % | 65,000 | 65,495 | |||||||||||||||
| Oncor Electric Delivery Co. LLC 09/30/17 | 5.000 | % | 766,000 | 786,202 | |||||||||||||||
| Pacific Gas & Electric Co. 02/15/24 | 3.750 | % | 155,000 | 161,769 | |||||||||||||||
02/15/44 | 4.750 | % | 280,000 | 307,140 | |||||||||||||||
| Public Service Enterprise Group, Inc. 11/15/19 | 1.600 | % | 145,000 | 142,916 | |||||||||||||||
| Sierra Pacific Power Co. 05/01/26 | 2.600 | % | 35,000 | 33,487 | |||||||||||||||
| Southern California Edison Co. 02/01/45 | 3.600 | % | 35,000 | 33,106 | |||||||||||||||
| Southern Co. (The) 07/01/46 | 4.400 | % | 440,000 | 435,211 | |||||||||||||||
| TransAlta Corp. 06/03/17 | 1.900 | % | 430,000 | 427,850 | |||||||||||||||
11/25/20 | 5.000 | % | CAD | 430,000 | 328,826 | ||||||||||||||
| Virginia Electric & Power Co. 11/15/46 | 4.000 | % | 30,000 | 29,909 | |||||||||||||||
Corporate Bonds & Notes(c) (continued)
Issuer | Coupon Rate | Principal Amount ($) | Value ($) | ||||||||||||||||
| WEC Energy Group, Inc. 06/15/18 | 1.650 | % | 180,000 | 179,835 | |||||||||||||||
06/15/25 | 3.550 | % | 158,000 | 161,023 | |||||||||||||||
| Western Power Distribution PLC(d) 11/06/23 | 3.625 | % | GBP | 630,000 | 838,648 | ||||||||||||||
| Xcel Energy, Inc. 05/15/20 | 4.700 | % | 379,000 | 403,066 | |||||||||||||||
12/01/26 | 3.350 | % | 445,000 | 445,369 | |||||||||||||||
Total | 12,042,607 | ||||||||||||||||||
FOOD AND BEVERAGE 0.1% | |||||||||||||||||||
Anheuser-Busch InBev Finance, Inc. | |||||||||||||||||||
01/17/23 | 2.625 | % | 17,000 | 16,664 | |||||||||||||||
02/01/23 | 3.300 | % | 125,000 | 127,217 | |||||||||||||||
02/01/26 | 3.650 | % | 830,000 | 842,608 | |||||||||||||||
| Anheuser-Busch InBev Worldwide, Inc. 07/15/17 | 1.375 | % | 595,000 | 595,519 | |||||||||||||||
01/15/22 | 3.750 | % | 280,000 | 292,257 | |||||||||||||||
| Bacardi Ltd.(d) 07/15/26 | 2.750 | % | 415,000 | 387,276 | |||||||||||||||
| ConAgra Foods, Inc. 01/25/23 | 3.200 | % | 711,000 | 710,341 | |||||||||||||||
| General Mills, Inc. 10/20/17 | 1.400 | % | 207,000 | 207,240 | |||||||||||||||
11/16/20 | 2.100 | % | EUR | 440,000 | 495,769 | ||||||||||||||
| Grupo Bimbo SAB de CV(d) 06/27/44 | 4.875 | % | 400,000 | 360,527 | |||||||||||||||
| Kellogg Co. 12/01/23 | 2.650 | % | 515,000 | 498,207 | |||||||||||||||
| Kraft Heinz Co. (The)(d) 07/01/27 | 4.125 | % | GBP | 260,000 | 358,221 | ||||||||||||||
| Kraft Heinz Foods Co. 06/01/26 | 3.000 | % | 45,000 | 42,248 | |||||||||||||||
06/01/46 | 4.375 | % | 75,000 | 70,573 | |||||||||||||||
| Kraft Heinz Foods Co 06/05/17 | 2.250 | % | 147,000 | 147,469 | |||||||||||||||
| Molson Coors Brewing Co. 07/15/26 | 3.000 | % | 325,000 | 307,226 | |||||||||||||||
05/01/42 | 5.000 | % | 56,000 | 58,540 | |||||||||||||||
07/15/46 | 4.200 | % | 106,000 | 98,826 | |||||||||||||||
| Mondelez International Holdings Netherlands BV(d) 10/28/19 | 1.625 | % | 340,000 | 333,396 | |||||||||||||||
| PepsiCo, Inc. 02/22/19 | 1.500 | % | 445,000 | 443,444 | |||||||||||||||
| Sysco Corp. 07/15/21 | 2.500 | % | 80,000 | 79,146 | |||||||||||||||
| Tyson Foods, Inc. 08/15/19 | 2.650 | % | 265,000 | 267,526 | |||||||||||||||
The accompanying Notes to Financial Statements are an integral part of this statement.
Annual Report 2016
9
COLUMBIA VARIABLE PORTFOLIO — MANAGED VOLATILITY GROWTH FUND
PORTFOLIO OF INVESTMENTS (continued)
December 31, 2016
Corporate Bonds & Notes(c) (continued)
Issuer | Coupon Rate | Principal Amount ($) | Value ($) | ||||||||||||||||
| Wm. Wrigley Jr., Co.(d) 10/21/18 | 2.400 | % | 68,000 | 68,608 | |||||||||||||||
10/21/19 | 2.900 | % | 605,000 | 615,565 | |||||||||||||||
Total | 7,424,413 | ||||||||||||||||||
HEALTH CARE —% | |||||||||||||||||||
| Becton Dickinson and Co. 12/15/44 | 4.685 | % | 105,000 | 108,774 | |||||||||||||||
| Express Scripts Holding Co. 07/15/46 | 4.800 | % | 40,000 | 38,297 | |||||||||||||||
Total | 147,071 | ||||||||||||||||||
HEALTHCARE INSURANCE —% | |||||||||||||||||||
| Aetna, Inc. 06/07/19 | 1.900 | % | 205,000 | 204,530 | |||||||||||||||
06/15/46 | 4.375 | % | 100,000 | 100,415 | |||||||||||||||
| UnitedHealth Group, Inc. 12/15/17 | 1.400 | % | 352,000 | 352,065 | |||||||||||||||
Total | 657,010 | ||||||||||||||||||
INDEPENDENT ENERGY —% | |||||||||||||||||||
| Anadarko Petroleum Corp. 07/15/44 | 4.500 | % | 145,000 | 136,235 | |||||||||||||||
| Canadian Natural Resources Ltd. 05/15/17 | 5.700 | % | 56,000 | 56,834 | |||||||||||||||
02/01/35 | 5.850 | % | 185,000 | 196,901 | |||||||||||||||
03/15/38 | 6.250 | % | 64,000 | 72,810 | |||||||||||||||
| Noble Energy, Inc. 11/15/43 | 5.250 | % | 119,000 | 121,215 | |||||||||||||||
| Woodside Finance Ltd.(d) 03/05/25 | 3.650 | % | 523,000 | 510,910 | |||||||||||||||
Total | 1,094,905 | ||||||||||||||||||
INTEGRATED ENERGY —% | |||||||||||||||||||
| Cenovus Energy, Inc. 09/15/42 | 4.450 | % | 372,000 | 322,138 | |||||||||||||||
09/15/43 | 5.200 | % | 260,000 | 247,650 | |||||||||||||||
Total | 569,788 | ||||||||||||||||||
LIFE INSURANCE 0.1% | |||||||||||||||||||
| Five Corners Funding Trust(d) 11/15/23 | 4.419 | % | 1,035,000 | 1,091,788 | |||||||||||||||
| Guardian Life Insurance Co. of America (The) Subordinated(d) 06/19/64 | 4.875 | % | 400,000 | 392,921 | |||||||||||||||
| MetLife, Inc. 12/15/17 | 1.756 | % | 55,000 | 55,092 | |||||||||||||||
09/15/23 | 4.368 | % | 227,000 | 244,275 | |||||||||||||||
03/01/45 | 4.050 | % | 85,000 | 81,511 | |||||||||||||||
Corporate Bonds & Notes(c) (continued)
Issuer | Coupon Rate | Principal Amount ($) | Value ($) | ||||||||||||||||
| Northwestern Mutual Life Insurance Co. (The) Subordinated(d) 03/30/40 | 6.063 | % | 205,000 | 252,434 | |||||||||||||||
| Peachtree Corners Funding Trust(d) 02/15/25 | 3.976 | % | 536,000 | 522,982 | |||||||||||||||
| TIAA Asset Management Finance Co. LLC(d) 11/01/19 | 2.950 | % | 180,000 | 183,107 | |||||||||||||||
| Teachers Insurance & Annuity Association of America Subordinated(d) 09/15/44 | 4.900 | % | 555,000 | 597,206 | |||||||||||||||
| Voya Financial, Inc. 06/15/46 | 4.800 | % | 130,000 | 126,386 | |||||||||||||||
Total | 3,547,702 | ||||||||||||||||||
MEDIA AND ENTERTAINMENT —% | |||||||||||||||||||
| 21st Century Fox America, Inc. 09/15/44 | 4.750 | % | 365,000 | 364,845 | |||||||||||||||
| 21st Century Fox America, Inc.(d) 11/15/46 | 4.750 | % | 55,000 | 55,164 | |||||||||||||||
| Scripps Networks Interactive, Inc. 11/15/24 | 3.900 | % | 513,000 | 521,328 | |||||||||||||||
| Thomson Reuters Corp. 10/15/19 | 4.700 | % | 140,000 | 148,645 | |||||||||||||||
05/23/43 | 4.500 | % | 248,000 | 232,608 | |||||||||||||||
| Time Warner, Inc. 09/15/23 | 1.950 | % | EUR | 120,000 | 134,373 | ||||||||||||||
Total | 1,456,963 | ||||||||||||||||||
MIDSTREAM 0.1% | |||||||||||||||||||
| Columbia Pipeline Group, Inc. 06/01/45 | 5.800 | % | 31,000 | 35,649 | |||||||||||||||
| Enterprise Products Operating LLC 05/07/18 | 1.650 | % | 170,000 | 169,523 | |||||||||||||||
02/15/45 | 5.100 | % | 164,000 | 172,962 | |||||||||||||||
05/15/46 | 4.900 | % | 260,000 | 266,890 | |||||||||||||||
| Kinder Morgan Energy Partners LP 03/01/43 | 5.000 | % | 464,000 | 447,420 | |||||||||||||||
| Kinder Morgan, Inc. 02/15/46 | 5.050 | % | 115,000 | 113,839 | |||||||||||||||
| Plains All American Pipeline LP/Finance Corp. 01/31/23 | 2.850 | % | 311,000 | 294,001 | |||||||||||||||
10/15/23 | 3.850 | % | 460,000 | 454,788 | |||||||||||||||
11/01/24 | 3.600 | % | 35,000 | 33,513 | |||||||||||||||
06/15/44 | 4.700 | % | 63,000 | 56,135 | |||||||||||||||
| Southern Natural Gas Co. LLC(d) 04/01/17 | 5.900 | % | 101,000 | 102,052 | |||||||||||||||
| Williams Partners LP 09/15/45 | 5.100 | % | 321,000 | 305,094 | |||||||||||||||
Total | 2,451,866 | ||||||||||||||||||
The accompanying Notes to Financial Statements are an integral part of this statement.
Annual Report 2016
10
COLUMBIA VARIABLE PORTFOLIO — MANAGED VOLATILITY GROWTH FUND
PORTFOLIO OF INVESTMENTS (continued)
December 31, 2016
Corporate Bonds & Notes(c) (continued)
Issuer | Coupon Rate | Principal Amount ($) | Value ($) | ||||||||||||||||
NATURAL GAS —% | |||||||||||||||||||
| NiSource Finance Corp. 02/15/43 | 5.250 | % | 195,000 | 215,754 | |||||||||||||||
| Sempra Energy 04/01/17 | 2.300 | % | 245,000 | 245,480 | |||||||||||||||
12/01/23 | 4.050 | % | 15,000 | 15,666 | |||||||||||||||
06/15/24 | 3.550 | % | 940,000 | 951,293 | |||||||||||||||
Total | 1,428,193 | ||||||||||||||||||
OIL FIELD SERVICES —% | |||||||||||||||||||
| Noble Holding International Ltd. 03/15/42 | 5.250 | % | 227,000 | 149,820 | |||||||||||||||
PHARMACEUTICALS —% | |||||||||||||||||||
| Actavis Funding 03/15/45 | 4.750 | % | 174,000 | 170,822 | |||||||||||||||
| Amgen, Inc.(d) 06/15/51 | 4.663 | % | 299,000 | 288,312 | |||||||||||||||
| Pfizer, Inc. 06/01/18 | 1.200 | % | 630,000 | 628,349 | |||||||||||||||
12/15/46 | 4.125 | % | 110,000 | 111,899 | |||||||||||||||
| Shire Acquisitions Investments Ireland DAC 09/23/19 | 1.900 | % | 375,000 | 370,246 | |||||||||||||||
| Teva Pharmaceutical Finance Netherlands III BV 10/01/46 | 4.100 | % | 85,000 | 72,833 | |||||||||||||||
Total | 1,642,461 | ||||||||||||||||||
PROPERTY & CASUALTY —% | |||||||||||||||||||
| Berkshire Hathaway Finance Corp. 05/15/42 | 4.400 | % | 15,000 | 15,791 | |||||||||||||||
| Berkshire Hathaway, Inc. 03/16/35 | 1.625 | % | EUR | 140,000 | 137,394 | ||||||||||||||
| CNA Financial Corp. 05/15/24 | 3.950 | % | 122,000 | 123,746 | |||||||||||||||
03/01/26 | 4.500 | % | 105,000 | 109,803 | |||||||||||||||
| Liberty Mutual Group, Inc.(d) 06/15/23 | 4.250 | % | 585,000 | 612,481 | |||||||||||||||
Total | 999,215 | ||||||||||||||||||
RAILROADS —% | |||||||||||||||||||
| CSX Corp. 11/01/46 | 3.800 | % | 270,000 | 250,312 | |||||||||||||||
REFINING —% | |||||||||||||||||||
| Phillips 66 05/01/17 | 2.950 | % | 305,000 | 306,701 | |||||||||||||||
Corporate Bonds & Notes(c) (continued)
Issuer | Coupon Rate | Principal Amount ($) | Value ($) | ||||||||||||||||
RESTAURANTS —% | |||||||||||||||||||
| McDonald's Corp. 03/01/18 | 5.350 | % | 505,000 | 526,275 | |||||||||||||||
12/09/45 | 4.875 | % | 60,000 | 64,265 | |||||||||||||||
Total | 590,540 | ||||||||||||||||||
RETAILERS —% | |||||||||||||||||||
| CVS Health Corp. 06/01/21 | 2.125 | % | 305,000 | 299,066 | |||||||||||||||
06/01/26 | 2.875 | % | 270,000 | 257,355 | |||||||||||||||
| Wal-Mart Stores, Inc. 04/11/18 | 1.125 | % | 150,000 | 149,651 | |||||||||||||||
Total | 706,072 | ||||||||||||||||||
TECHNOLOGY —% | |||||||||||||||||||
| Apple, Inc. 02/23/18 | 1.300 | % | 342,000 | 342,252 | |||||||||||||||
01/17/24 | 1.375 | % | EUR | 140,000 | 155,570 | ||||||||||||||
02/09/45 | 3.450 | % | 154,000 | 135,928 | |||||||||||||||
08/04/46 | 3.850 | % | 70,000 | 67,070 | |||||||||||||||
| Cisco Systems, Inc. 09/20/19 | 1.400 | % | 330,000 | 326,401 | |||||||||||||||
| International Business Machine Corp. 11/19/19 | 1.375 | % | EUR | 466,000 | 511,161 | ||||||||||||||
| Microsoft Corp. 11/03/18 | 1.300 | % | 115,000 | 114,908 | |||||||||||||||
08/08/46 | 3.700 | % | 35,000 | 32,951 | |||||||||||||||
| Oracle Corp. 01/10/21 | 2.250 | % | EUR | 349,000 | 398,605 | ||||||||||||||
09/15/21 | 1.900 | % | 205,000 | 200,325 | |||||||||||||||
07/15/46 | 4.000 | % | 125,000 | 119,562 | |||||||||||||||
Total | 2,404,733 | ||||||||||||||||||
TRANSPORTATION SERVICES —% | |||||||||||||||||||
| ERAC U.S.A. Finance LLC(d) 11/01/23 | 2.700 | % | 360,000 | 345,840 | |||||||||||||||
12/01/26 | 3.300 | % | 545,000 | 522,937 | |||||||||||||||
11/01/46 | 4.200 | % | 25,000 | 22,845 | |||||||||||||||
| FedEx Corp. 04/01/46 | 4.550 | % | 125,000 | 125,964 | |||||||||||||||
| Heathrow Funding Ltd.(d) 02/15/23 | 5.225 | % | GBP | 233,000 | 340,768 | ||||||||||||||
Total | 1,358,354 | ||||||||||||||||||
WIRELESS— % | |||||||||||||||||||
| Rogers Communications, Inc. 08/15/18 | 6.800 | % | 65,000 | 70,024 | |||||||||||||||
03/15/23 | 3.000 | % | 360,000 | 357,662 | |||||||||||||||
Total | 427,686 | ||||||||||||||||||
The accompanying Notes to Financial Statements are an integral part of this statement.
Annual Report 2016
11
COLUMBIA VARIABLE PORTFOLIO — MANAGED VOLATILITY GROWTH FUND
PORTFOLIO OF INVESTMENTS (continued)
December 31, 2016
Corporate Bonds & Notes(c) (continued)
Issuer | Coupon Rate | Principal Amount ($) | Value ($) | ||||||||||||||||
WIRELINES —% | |||||||||||||||||||
| AT&T, Inc. 06/15/45 | 4.350 | % | 410,000 | 365,323 | |||||||||||||||
| Orange SA 02/21/17 | 4.750 | % | EUR | 163,000 | 172,707 | ||||||||||||||
| Verizon Communications, Inc. 11/01/42 | 3.850 | % | 385,000 | 332,288 | |||||||||||||||
03/15/55 | 4.672 | % | 66,000 | 61,981 | |||||||||||||||
Total | 932,299 | ||||||||||||||||||
| Total Corporate Bonds & Notes (Cost: $50,579,385) | 49,721,414 | ||||||||||||||||||
Residential Mortgage-Backed Securities — Agency 5.4%
| Federal National Mortgage Association(e) 01/23/32 | 2.500 | % | 55,000,000 | 55,087,010 | |||||||||||
01/23/32 | 3.000 | % | 25,000,000 | 25,654,297 | |||||||||||
01/23/32-01/18/47 | 3.500 | % | 311,275,000 | 320,806,487 | |||||||||||
01/18/47 | 4.000 | % | 43,000,000 | 45,206,270 | |||||||||||
| Total Residential Mortgage-Backed Securities — Agency (Cost: $446,278,333) | 446,754,064 | ||||||||||||||
U.S. Treasury Obligations —%
| U.S. Treasury 05/15/45 | 3.000 | % | 100,000 | 98,648 | |||||||||||
| Total U.S. Treasury Obligations (Cost: $97,933) | 98,648 | ||||||||||||||
Foreign Government Obligations(c)(f) —%
Issuer | Coupon Rate | Principal Amount ($) | Value ($) | ||||||||||||||||
NETHERLANDS —% | |||||||||||||||||||
| Enexis Holding NV(d) 04/28/26 | 0.875 | % | 300,000 | 313,303 | |||||||||||||||
NORWAY —% | |||||||||||||||||||
| Avinor AS(d) 04/29/25 | 1.000 | % | EUR | 200,000 | 211,498 | ||||||||||||||
| Total Foreign Government Obligations (Cost: $523,023) | 524,801 | ||||||||||||||||||
Options Purchased Puts 1.5%
Issuer | Notional ($)/ Contracts | Exercise Price ($) | Expiration Date | Value ($) | |||||||||||||||
S&P 500 Index | 4,050 | 1,850.00 | 06/15/18 | 32,663,250 | |||||||||||||||
S&P 500 Index | 3,000 | 1,800.00 | 06/15/18 | 21,405,000 | |||||||||||||||
S&P 500 Index | 1,000 | 1,700.00 | 06/15/18 | 5,550,000 | |||||||||||||||
S&P 500 Index | 3,100 | 1,850.00 | 12/21/18 | 33,805,500 | |||||||||||||||
S&P 500 Index | 2,812 | 1,800.00 | 12/21/18 | 27,431,060 | |||||||||||||||
| Total Options Purchased Puts (Cost: $139,357,352) | 120,854,810 | ||||||||||||||||||
Money Market Funds 16.2%
Shares | Value ($) | ||||||||||||||||||
| Columbia Short-Term Cash Fund, 0.594%(a)(g) | 1,335,260,139 | 1,335,260,139 | |||||||||||||||||
| Total Money Market Funds (Cost: $1,335,260,139) | 1,335,260,139 | ||||||||||||||||||
| Total Investments (Cost: $8,252,984,874) | 8,599,092,250 | ||||||||||||||||||
Other Assets & Liabilities, Net | (366,245,872 | ) | |||||||||||||||||
Net Assets | 8,232,846,378 | ||||||||||||||||||
At December 31, 2016, cash totaling $80,069,131 was pledged as collateral.
Investments in Derivatives
Forward Foreign Currency Exchange Contracts Open at December 31, 2016
Counterparty | Exchange Date | Currency to be Delivered | Currency to be Received | Unrealized Appreciation ($) | Unrealized Depreciation ($) | ||||||||||||||||||||||||||
Standard Chartered | 01/13/2017 | 1,511,000 | GBP | 1,891,077 | USD | 28,431 | — | ||||||||||||||||||||||||
State Street | 01/13/2017 | 425,000 | CAD | 317,571 | USD | 996 | — | ||||||||||||||||||||||||
UBS | 01/13/2017 | 4,358,000 | EUR | 4,642,621 | USD | 52,896 | — | ||||||||||||||||||||||||
Total | 82,323 | — | |||||||||||||||||||||||||||||
The accompanying Notes to Financial Statements are an integral part of this statement.
Annual Report 2016
12
COLUMBIA VARIABLE PORTFOLIO — MANAGED VOLATILITY GROWTH FUND
PORTFOLIO OF INVESTMENTS (continued)
December 31, 2016
Futures Contracts Outstanding at December 31, 2016
Long Futures Contracts Outstanding
Contract Description | Number of Contracts | Trading Currency | Notional Market Value ($) | Expiration Date | Unrealized Appreciation ($) | Unrealized (Depreciation) ($) | |||||||||||||||||||||
| 10-Year Mini JGB | 3 | JPY | 385,745 | 03/2017 | 165 | — | |||||||||||||||||||||
| BP Currency | 930 | USD | 71,830,875 | 03/2017 | — | (1,991,316 | ) | ||||||||||||||||||||
Canadian Government 10-Year Bond | 6 | CAD | 614,591 | 03/2017 | — | (6,201 | ) | ||||||||||||||||||||
DAX Index | 10 | EUR | 3,017,159 | 03/2017 | 80,255 | — | |||||||||||||||||||||
Euro FX | 550 | USD | 72,696,250 | 03/2017 | — | (737,660 | ) | ||||||||||||||||||||
Euro-Bobl | 8 | EUR | 1,125,325 | 03/2017 | 8,864 | — | |||||||||||||||||||||
Euro-Bund | 12 | EUR | 2,073,511 | 03/2017 | 33,990 | — | |||||||||||||||||||||
Euro-Buxl 30-Year | 1 | EUR | 182,656 | 03/2017 | 1,976 | — | |||||||||||||||||||||
Euro-Schatz | 6 | EUR | 709,213 | 03/2017 | 1,190 | — | |||||||||||||||||||||
FTSE/MIB Index | 28 | EUR | 2,830,261 | 03/2017 | 139,049 | — | |||||||||||||||||||||
| JPY Currency | 1,300 | USD | 139,701,250 | 03/2017 | — | (1,988,774 | ) | ||||||||||||||||||||
Long Gilt | 8 | GBP | 1,240,583 | 03/2017 | 22,129 | — | |||||||||||||||||||||
S&P 500 E-mini | 8,400 | USD | 939,204,000 | 03/2017 | 13,127,155 | — | |||||||||||||||||||||
S&P 500 Index | 190 | USD | 106,219,500 | 03/2017 | 1,493,210 | — | |||||||||||||||||||||
SPI 200 Index | 328 | AUD | 33,321,619 | 03/2017 | 757,589 | — | |||||||||||||||||||||
TOPIX Index | 884 | JPY | 114,816,000 | 03/2017 | 2,596,897 | — | |||||||||||||||||||||
U.S. Long Bond | 70 | USD | 10,545,938 | 03/2017 | — | (82,617 | ) | ||||||||||||||||||||
U.S. Treasury 10-Year Note | 2,269 | USD | 281,994,156 | 03/2017 | — | (1,404,361 | ) | ||||||||||||||||||||
U.S. Treasury 2-Year Note | 1,362 | USD | 295,128,375 | 03/2017 | — | (358,004 | ) | ||||||||||||||||||||
U.S. Treasury 5-Year Note | 62 | USD | 7,295,172 | 03/2017 | — | (2,540 | ) | ||||||||||||||||||||
U.S. Treasury 5-Year Note | 37 | USD | 4,353,570 | 03/2017 | — | (15,071 | ) | ||||||||||||||||||||
U.S. Ultra Bond | 27 | USD | 4,326,750 | 03/2017 | — | (39,195 | ) | ||||||||||||||||||||
U.S. Ultra Bond | 413 | USD | 66,183,250 | 03/2017 | — | (723,576 | ) | ||||||||||||||||||||
Total | 2,159,795,749 | 18,262,469 | (7,349,315 | ) | |||||||||||||||||||||||
Short Futures Contracts Outstanding
Contract Description | Number of Contracts | Trading Currency | Notional Market Value ($) | Expiration Date | Unrealized Appreciation ($) | Unrealized (Depreciation) ($) | |||||||||||||||||||||
| EURO STOXX 50 | (1,061 | ) | EUR | (36,599,571 | ) | 03/2017 | — | (1,002,059 | ) | ||||||||||||||||||
FTSE 100 Index | (300 | ) | GBP | (26,065,256 | ) | 03/2017 | — | (860,888 | ) | ||||||||||||||||||
U.S. Long Bond | (60 | ) | USD | (9,039,375 | ) | 03/2017 | 70,210 | — | |||||||||||||||||||
U.S. Treasury 2-Year Note | (2,460 | ) | USD | (533,051,250 | ) | 03/2017 | 610,572 | — | |||||||||||||||||||
U.S. Treasury 2-Year Note | (6 | ) | USD | (1,300,125 | ) | 03/2017 | 1,209 | — | |||||||||||||||||||
U.S. Treasury Ultra 10-Year Note | (33 | ) | USD | (4,424,063 | ) | 03/2017 | 19,681 | — | |||||||||||||||||||
Total | (610,479,640 | ) | 701,672 | (1,862,947 | ) | ||||||||||||||||||||||
The accompanying Notes to Financial Statements are an integral part of this statement.
Annual Report 2016
13
COLUMBIA VARIABLE PORTFOLIO — MANAGED VOLATILITY GROWTH FUND
PORTFOLIO OF INVESTMENTS (continued)
December 31, 2016
Cleared Credit Default Swap Contracts Outstanding at December 31, 2016
Sell Protection
Counterparty | Reference Entity | Expiration Date | Receive Fixed Rate (%) | Implied Credit Spread (%)* | Notional Currency | Notional Amount ($) | Unrealized Appreciation ($) | Unrealized Depreciation ($) | |||||||||||||||||||||||||||
| Morgan Stanley | Markit CDX North America Investment Grade Index, Series 27 | 12/20/2021 | 1.000 | 0.686 | USD | (300,000,000) | 872,101 | — | |||||||||||||||||||||||||||
*Implied credit spreads, represented in absolute terms, utilized in determining the market value of credit default swap agreements on corporate or sovereign issues as of period end serve as an indicator of the current status of the payment/performance risk and represent the likelihood or risk of default for the credit derivative. The implied credit spread of a particular referenced entity reflects the cost of buying/selling protection and may include upfront payments required to be made to enter into the agreement. Wider credit spreads represent a deterioration of the referenced entity's credit soundness and a greater likelihood or risk of default or other credit event occurring as defined under the terms of the agreement.
Notes to Portfolio of Investments
(a) As defined in the Investment Company Act of 1940, an affiliated company is one in which the Fund owns 5% or more of the company's outstanding voting securities, or a company which is under common ownership or control with the Fund. Holdings and transactions in these affiliated companies during the year ended December 31, 2016 are as follows:
Issuer | Beginning Cost ($) | Purchase Cost ($) | Proceeds From Sales ($) | Realized Gain (Loss) ($) | Ending Cost ($) | Capital Gain Distributions ($) | Dividends — Affiliated Issuers ($) | Value ($) | |||||||||||||||||||||||||||
| Columbia Short-Term Cash Fund, 0.594% | 1,628,390,047 | 1,893,299,668 | (2,186,429,502 | ) | (74 | ) | 1,335,260,139 | — | 6,453,571 | 1,335,260,139 | |||||||||||||||||||||||||
| Columbia Variable Portfolio — Contrarian Core Fund, Class 1 Shares | 210,315,812 | 12,682,702 | (3,692,871 | ) | 131,945 | 219,437,588 | — | — | 273,930,327 | ||||||||||||||||||||||||||
| Columbia Variable Portfolio — Disciplined Core Fund, Class 1 Shares | 491,777,409 | 237,489,580 | (7,084,833 | ) | (9,673 | ) | 722,172,483 | — | — | 797,038,606 | |||||||||||||||||||||||||
| Columbia Variable Portfolio — Dividend Opportunity Fund, Class 1 Shares | 247,709,836 | 2,808,521 | (3,954,015 | ) | 192,661 | 246,757,003 | — | — | 292,229,426 | ||||||||||||||||||||||||||
| Columbia Variable Portfolio — Income Opportunities Fund, Class 1 Shares | 45,043,969 | — | (43,937,095 | ) | (1,106,874 | ) | — | — | — | — | |||||||||||||||||||||||||
| Columbia Variable Portfolio — Intermediate Bond Fund, Class 1 Shares | 150,430,388 | 4,263,719 | (1,852,951 | ) | (119,189 | ) | 152,721,967 | 93,664 | 2,758,343 | 154,649,909 | |||||||||||||||||||||||||
| Columbia Variable Portfolio — Large Cap Growth Fund, Class 1 Shares | 89,689,865 | 126,078,736 | (1,661,312 | ) | (12,403 | ) | 214,094,886 | — | — | 239,369,913 | |||||||||||||||||||||||||
| Columbia Variable Portfolio — Limited Duration Credit Fund, Class 1 Shares | 47,955,680 | 2,616,835 | (541,226 | ) | (54,463 | ) | 49,976,826 | — | 1,817,730 | 46,587,944 | |||||||||||||||||||||||||
The accompanying Notes to Financial Statements are an integral part of this statement.
Annual Report 2016
14
COLUMBIA VARIABLE PORTFOLIO — MANAGED VOLATILITY GROWTH FUND
PORTFOLIO OF INVESTMENTS (continued)
December 31, 2016
Notes to Portfolio of Investments (continued)
Issuer | Beginning Cost ($) | Purchase Cost ($) | Proceeds From Sales ($) | Realized Gain (Loss) ($) | Ending Cost ($) | Capital Gain Distributions ($) | Dividends — Affiliated Issuers ($) | Value ($) | |||||||||||||||||||||||||||
| Columbia Variable Portfolio — Long Government/Credit Bond Fund, Class 1 Shares | 38,717,689 | 45,776,768 | (907,389 | ) | 4,516 | 83,591,584 | — | 1,611,300 | 81,349,301 | ||||||||||||||||||||||||||
| Columbia Variable Portfolio — Mid Cap Growth Fund, Class 1 Shares | — | 55,832,851 | (127,055 | ) | (2,502 | ) | 55,703,294 | — | — | 57,372,849 | |||||||||||||||||||||||||
| Columbia Variable Portfolio — Mid Cap Value Fund, Class 1 Shares | — | 55,714,650 | (130,117 | ) | (82 | ) | 55,584,451 | — | — | 60,797,979 | |||||||||||||||||||||||||
| Columbia Variable Portfolio — Select Large Cap Growth Fund, Class 1 Shares | 99,996,607 | 41,243,464 | (130,723,242 | ) | (10,516,829 | ) | — | 18,041,556 | — | — | |||||||||||||||||||||||||
| Columbia Variable Portfolio — Select Large-Cap Value Fund, Class 1 Shares | 121,718,446 | 9,547,970 | (2,669,267 | ) | 197,346 | 128,794,495 | — | — | 165,751,008 | ||||||||||||||||||||||||||
| Columbia Variable Portfolio — U.S. Equities Fund, Class 1 Shares | 348,631,518 | 24,900,392 | (199,043,319 | ) | (28,988,530 | ) | 145,500,061 | — | — | 171,188,277 | |||||||||||||||||||||||||
| Columbia Variable Portfolio — U.S. Government Mortgage Fund, Class 1 Shares | 43,952,775 | 2,220,767 | (538,255 | ) | (18,609 | ) | 45,616,678 | 337,467 | 1,298,487 | 45,376,972 | |||||||||||||||||||||||||
| Variable Portfolio — American Century Diversified Bond Fund, Class 1 Shares | 151,243,941 | 4,034,191 | (1,851,835 | ) | (21,164 | ) | 153,405,133 | 87,057 | 2,781,796 | 153,640,071 | |||||||||||||||||||||||||
| Variable Portfolio — Columbia Wanger International Equities Fund, Class 1 Shares | 39,218,573 | 225,468 | (33,881,730 | ) | (5,562,311 | ) | — | — | 225,468 | — | |||||||||||||||||||||||||
| Variable Portfolio — DFA International Value Fund, Class 1 Shares | 428,897,269 | 23,789,101 | (4,723,771 | ) | (1,755,218 | ) | 446,207,381 | 1,587,469 | 10,408,706 | 401,785,034 | |||||||||||||||||||||||||
| Variable Portfolio — J.P. Morgan Core Bond Fund, Class 1 Shares | 217,464,533 | 6,827,224 | (2,663,403 | ) | (16,346 | ) | 221,612,008 | 369,427 | 4,698,203 | 219,943,616 | |||||||||||||||||||||||||
| Variable Portfolio — Jennison Mid Cap Growth Fund, Class 1 Shares | 1,159,445 | 81,081,845 | (7,519 | ) | 1,075 | 82,234,846 | — | — | 84,755,942 | ||||||||||||||||||||||||||
| Variable Portfolio — Lazard International Equity Advantage Fund, Class 1 Shares | 118,984,033 | 25,204,406 | (1,179,648 | ) | (122,478 | ) | 142,886,313 | — | 2,584,025 | 138,386,284 | |||||||||||||||||||||||||
| Variable Portfolio — Loomis Sayles Growth Fund, Class 1 Shares | 195,740,246 | 125,522,576 | (4,187,264 | ) | 200,025 | 317,275,583 | — | — | 360,073,572 | ||||||||||||||||||||||||||
| Variable Portfolio — MFS Value Fund, Class 1 Shares | 116,173,139 | 3,403,891 | (2,102,244 | ) | 128,871 | 117,603,657 | — | — | 152,775,331 | ||||||||||||||||||||||||||
The accompanying Notes to Financial Statements are an integral part of this statement.
Annual Report 2016
15
COLUMBIA VARIABLE PORTFOLIO — MANAGED VOLATILITY GROWTH FUND
PORTFOLIO OF INVESTMENTS (continued)
December 31, 2016
Notes to Portfolio of Investments (continued)
Issuer | Beginning Cost ($) | Purchase Cost ($) | Proceeds From Sales ($) | Realized Gain (Loss) ($) | Ending Cost ($) | Capital Gain Distributions ($) | Dividends — Affiliated Issuers ($) | Value ($) | |||||||||||||||||||||||||||
| Variable Portfolio — MFS® Blended Research® Core Equity Fund, Class 1 Shares | 258,969,498 | 5,534,314 | (3,979,495 | ) | 137,010 | 260,661,327 | — | — | 312,956,943 | ||||||||||||||||||||||||||
| Variable Portfolio — Morgan Stanley Advantage Fund, Class 1 Shares | 97,310,732 | 4,888,658 | (1,421,868 | ) | 25,009 | 100,802,531 | — | — | 120,175,071 | ||||||||||||||||||||||||||
| Variable Portfolio — Nuveen Winslow Large Cap Growth Fund, Class 1 Shares | 121,167,297 | 8,238,808 | (1,709,886 | ) | (36,382 | ) | 127,659,837 | — | — | 144,301,158 | |||||||||||||||||||||||||
| Variable Portfolio — Oppenheimer International Growth Fund, Class 1 Shares | 462,262,218 | 18,922,109 | (4,251,599 | ) | (1,173,398 | ) | 475,759,330 | 4,285,751 | 5,464,641 | 406,269,810 | |||||||||||||||||||||||||
| Variable Portfolio — Partners Small Cap Growth Fund, Class 1 Shares | 126,421,589 | 13,215,827 | (2,181,927 | ) | (230,846 | ) | 137,224,643 | — | — | 146,338,102 | |||||||||||||||||||||||||
| Variable Portfolio — Partners Small Cap Value Fund, Class 1 Shares | 306,822,871 | 11,675,588 | (185,299,808 | ) | (6,770,715 | ) | 126,427,936 | — | — | 157,370,020 | |||||||||||||||||||||||||
| Variable Portfolio — Pyramis® International Equity Fund, Class 1 Shares | 453,118,958 | 21,903,464 | (3,972,651 | ) | (1,256,182 | ) | 469,793,589 | — | 8,810,080 | 401,307,902 | |||||||||||||||||||||||||
| Variable Portfolio — T. Rowe Price Large Cap Value Fund, Class 1 Shares | 125,491,240 | 4,193,192 | (2,179,279 | ) | 102,663 | 127,607,816 | — | — | 150,906,076 | ||||||||||||||||||||||||||
| Variable Portfolio — TCW Core Plus Bond Fund, Class 1 Shares | 160,342,723 | 3,258,807 | (2,018,927 | ) | 3,790 | 161,586,393 | 683,987 | 1,984,666 | 162,378,844 | ||||||||||||||||||||||||||
| Variable Portfolio — Victory Sycamore Established Value Fund, Class 1 Shares | 551,779 | 79,044,987 | (3,981 | ) | 916 | 79,593,701 | — | — | 87,316,836 | ||||||||||||||||||||||||||
| Variable Portfolio — Wells Fargo Short Duration Government Fund, Class 1 Shares | 14,858,788 | 491,573 | (176,279 | ) | (1,820 | ) | 15,172,262 | 59,234 | 139,889 | 14,960,502 | |||||||||||||||||||||||||
Total | 6,960,528,913 | 2,955,932,652 | (2,841,085,563 | ) | (56,650,261 | ) | 7,018,725,741 | 25,545,612 | 51,036,905 | 7,336,543,764 | |||||||||||||||||||||||||
(b) Non-income producing investment.
(c) Principal amounts are denominated in United States Dollars unless otherwise noted.
(d) Represents privately placed and other securities and instruments exempt from SEC registration (collectively, private placements), such as Section 4(a)(2) and Rule 144A eligible securities, which are often sold only to qualified institutional buyers. The Fund may invest in private placements determined to be liquid as well as those determined to be illiquid. Private placements may be determined to be liquid under guidelines established by the Fund's Board of Trustees. At December 31, 2016, the value of these securities amounted to $11,692,208 or 0.14% of net assets.
(e) Security, or a portion thereof, has been purchased on a when-issued or delayed delivery basis.
(f) Principal and interest may not be guaranteed by the government.
(g) The rate shown is the seven-day current annualized yield at December 31, 2016.
The accompanying Notes to Financial Statements are an integral part of this statement.
Annual Report 2016
16
COLUMBIA VARIABLE PORTFOLIO — MANAGED VOLATILITY GROWTH FUND
PORTFOLIO OF INVESTMENTS (continued)
December 31, 2016
Currency Legend
AUD Australian Dollar
CAD Canadian Dollar
EUR Euro
GBP British Pound
JPY Japanese Yen
USD US Dollar
Fair Value Measurements
The Fund categorizes its fair value measurements according to a three-level hierarchy that maximizes the use of observable inputs and minimizes the use of unobservable inputs by prioritizing that the most observable input be used when available. Observable inputs are those that market participants would use in pricing an investment based on market data obtained from sources independent of the reporting entity. Unobservable inputs are those that reflect the Fund's assumptions about the information market participants would use in pricing an investment. An investment's level within the fair value hierarchy is based on the lowest level of any input that is deemed significant to the asset's or liability's fair value measurement. The input levels are not necessarily an indication of the risk or liquidity associated with investments at that level. For example, certain U.S. government securities are generally high quality and liquid, however, they are reflected as Level 2 because the inputs used to determine fair value may not always be quoted prices in an active market.
Fair value inputs are summarized in the three broad levels listed below:
> Level 1 — Valuations based on quoted prices for investments in active markets that the Fund has the ability to access at the measurement date (including NAV for open-end mutual funds). Valuation adjustments are not applied to Level 1 investments.
> Level 2 — Valuations based on other significant observable inputs (including quoted prices for similar securities, interest rates, prepayment speeds, credit risks, etc.).
> Level 3 — Valuations based on significant unobservable inputs (including the Fund's own assumptions and judgment in determining the fair value of investments).
Inputs that are used in determining fair value of an investment may include price information, credit data, volatility statistics, and other factors. These inputs can be either observable or unobservable. The availability of observable inputs can vary between investments, and is affected by various factors such as the type of investment, and the volume and level of activity for that investment or similar investments in the marketplace. The inputs will be considered by the Investment Manager, along with any other relevant factors in the calculation of an investment's fair value. The Fund uses prices and inputs that are current as of the measurement date, which may include periods of market dislocations. During these periods, the availability of prices and inputs may be reduced for many investments. This condition could cause an investment to be reclassified between the various levels within the hierarchy.
Certain investments that have been measured at fair value using the net asset value (NAV) per share (or its equivalent) are not categorized in the fair value hierarchy. The fair value amounts presented in the table are intended to reconcile the fair value hierarchy to the amounts presented in the Portfolio of Investments. The Variable Portfolios serve as investment vehicles for variable annuity contracts and variable life insurance policies. Principle investment strategies within these Variable Portfolios vary based on the Portfolios investment objective. Investments in the Variable Portfolios may be redeemed on a daily basis without restriction. The Columbia Short-Term Cash Fund seeks to provide shareholders with maximum current income consistent with liquidity and stability of principal. Columbia Short-Term Cash Fund prices its shares with a floating NAV and no longer seeks to maintain a stable NAV.
Investments falling into the Level 3 category are primarily supported by quoted prices from brokers and dealers participating in the market for those investments. However, these may be classified as Level 3 investments due to lack of market transparency and corroboration to support these quoted prices. Additionally, valuation models may be used as the pricing source for any remaining investments classified as Level 3. These models may rely on one or more significant unobservable inputs and/or significant assumptions by the Investment Manager. Inputs used in valuations may include, but are not limited to, financial statement analysis, capital account balances, discount rates and estimated cash flows, and comparable company data.
Under the direction of the Fund's Board of Trustees (the Board), the Investment Manager's Valuation Committee (the Committee) is responsible for overseeing the valuation procedures approved by the Board. The Committee consists of voting and non-voting members from various groups within the Investment Manager's organization, including operations and accounting, trading and investments, compliance, risk management and legal.
The accompanying Notes to Financial Statements are an integral part of this statement.
Annual Report 2016
17
COLUMBIA VARIABLE PORTFOLIO — MANAGED VOLATILITY GROWTH FUND
PORTFOLIO OF INVESTMENTS (continued)
December 31, 2016
Fair Value Measurements (continued)
The Committee meets at least monthly to review and approve valuation matters, which may include a description of specific valuation determinations, data regarding pricing information received from approved pricing vendors and brokers and the results of Board-approved valuation control policies and procedures (the Policies). The Policies address, among other things, instances when market quotations are or are not readily available, including recommendations of third party pricing vendors and a determination of appropriate pricing methodologies; events that require specific valuation determinations and assessment of fair value techniques; securities with a potential for stale pricing, including those that are illiquid, restricted, or in default; and the effectiveness of third party pricing vendors, including periodic reviews of vendors. The Committee meets more frequently, as needed, to discuss additional valuation matters, which may include the need to review back-testing results, review time-sensitive information or approve related valuation actions. The Committee reports to the Board, with members of the Committee meeting with the Board at each of its regularly scheduled meetings to discuss valuation matters and actions during the period, similar to those described earlier.
For investments categorized as Level 3, the Committee monitors information similar to that described above, which may include: (i) data specific to the issuer or comparable issuers, (ii) general market or specific sector news and (iii) quoted prices and specific or similar security transactions. The Committee considers this data and any changes from prior periods in order to assess the reasonableness of observable and unobservable inputs, any assumptions or internal models used to value those securities and changes in fair value. This data is also used to corroborate, when available, information received from approved pricing vendors and brokers. Various factors impact the frequency of monitoring this information (which may occur as often as daily). However, the Committee may determine that changes to inputs, assumptions and models are not required as a result of the monitoring procedures performed.
The following table is a summary of the inputs used to value the Fund's investments at December 31, 2016:
| Level 1 Quoted Prices in Active Markets for Identical Assets ($) | Level 2 Other Significant Observable Inputs ($) | Level 3 Significant Unobservable Inputs ($) | Total ($) | ||||||||||||||||
Investments | |||||||||||||||||||
Exchange-Traded Funds | 644,594,749 | — | — | 644,594,749 | |||||||||||||||
Corporate Bonds & Notes | — | 49,721,414 | — | 49,721,414 | |||||||||||||||
| Residential Mortgage-Backed Securities — Agency | — | 446,754,064 | — | 446,754,064 | |||||||||||||||
U.S. Treasury Obligations | 98,648 | — | — | 98,648 | |||||||||||||||
Foreign Government Obligations | — | 524,801 | — | 524,801 | |||||||||||||||
Options Purchased Puts | 120,854,810 | — | — | 120,854,810 | |||||||||||||||
Investments measured at net asset value | |||||||||||||||||||
Equity Funds | — | — | — | 5,122,396,466 | |||||||||||||||
Fixed-Income Funds | — | — | — | 878,887,159 | |||||||||||||||
Money Market Funds | — | — | — | 1,335,260,139 | |||||||||||||||
Total Investments | 765,548,207 | 497,000,279 | — | 8,599,092,250 | |||||||||||||||
Derivatives | |||||||||||||||||||
Assets | |||||||||||||||||||
| Forward Foreign Currency Exchange Contracts | — | 82,323 | — | 82,323 | |||||||||||||||
Futures Contracts | 18,964,141 | — | — | 18,964,141 | |||||||||||||||
Swap Contracts | — | 872,101 | — | 872,101 | |||||||||||||||
Liabilities | |||||||||||||||||||
Futures Contracts | (9,212,262 | ) | — | — | (9,212,262 | ) | |||||||||||||
Total | 775,300,086 | 497,954,703 | — | 8,609,798,553 | |||||||||||||||
See the Portfolio of Investments for all investment classifications not indicated in the table.
The Fund's assets assigned to the Level 2 input category are generally valued using the market approach, in which a security's value is determined through reference to prices and information from market transactions for similar or identical assets.
Forward foreign currency exchange contracts, futures contracts and swap contracts are valued at unrealized appreciation (depreciation).
There were no transfers of financial assets between levels during the period.
The accompanying Notes to Financial Statements are an integral part of this statement.
Annual Report 2016
18
COLUMBIA VARIABLE PORTFOLIO — MANAGED VOLATILITY GROWTH FUND
STATEMENT OF ASSETS AND LIABILITIES
December 31, 2016
Assets | |||||||
Investments, at value | |||||||
Unaffiliated issuers (identified cost $1,094,901,781) | $ | 1,141,693,676 | |||||
Affiliated issuers (identified cost $7,018,725,741) | 7,336,543,764 | ||||||
Options purchased (identified cost $139,357,352) | 120,854,810 | ||||||
Total investments (identified cost $8,252,984,874) | 8,599,092,250 | ||||||
Cash | 823,000 | ||||||
Foreign currency (identified cost $36,679) | 36,536 | ||||||
Cash collateral held at broker | 442,000 | ||||||
Margin deposits | 79,627,131 | ||||||
Unrealized appreciation on forward foreign currency exchange contracts | 82,323 | ||||||
Receivable for: | |||||||
Investments sold | 4,036,471 | ||||||
Dividends | 2,908,028 | ||||||
Interest | 1,187,919 | ||||||
Foreign tax reclaims | 388 | ||||||
Variation margin | 2,460,536 | ||||||
Prepaid expenses | 42,669 | ||||||
Trustees' deferred compensation plan | 89,298 | ||||||
Total assets | 8,690,828,549 | ||||||
Liabilities | |||||||
Payable for: | |||||||
Investments purchased on a delayed delivery basis | 447,054,926 | ||||||
Capital shares purchased | 5,766,388 | ||||||
Variation margin | 4,871,582 | ||||||
Management services fees | 42,132 | ||||||
Distribution and/or service fees | 56,355 | ||||||
Transfer agent fees | 3,657 | ||||||
Compensation of board members | 8,577 | ||||||
Chief compliance officer expenses | 907 | ||||||
Other expenses | 88,349 | ||||||
Trustees' deferred compensation plan | 89,298 | ||||||
Total liabilities | 457,982,171 | ||||||
Net assets applicable to outstanding capital stock | $ | 8,232,846,378 | |||||
Represented by | |||||||
Trust capital | $ | 8,232,846,378 | |||||
Total — representing net assets applicable to outstanding capital stock | $ | 8,232,846,378 | |||||
Class 2 | |||||||
Net assets | $ | 8,232,846,378 | |||||
Shares outstanding | 705,735,953 | ||||||
Net asset value per share | $ | 11.67 | |||||
The accompanying Notes to Financial Statements are an integral part of this statement.
Annual Report 2016
19
COLUMBIA VARIABLE PORTFOLIO — MANAGED VOLATILITY GROWTH FUND
STATEMENT OF OPERATIONS
Year Ended December 31, 2016
Net investment income | |||||||
Income: | |||||||
Dividends — unaffiliated issuers | $ | 12,874,230 | |||||
Dividends — affiliated issuers | 51,036,905 | ||||||
Interest | 1,639,225 | ||||||
Total income | 65,550,360 | ||||||
Expenses: | |||||||
Management services fees | 15,209,448 | ||||||
Distribution and/or service fees | |||||||
Class 2 | 19,480,708 | ||||||
Transfer agent fees | |||||||
Class 2 | 1,326,010 | ||||||
Compensation of board members | 158,834 | ||||||
Custodian fees | 46,294 | ||||||
Printing and postage fees | 109,473 | ||||||
Audit fees | 24,280 | ||||||
Legal fees | 192,877 | ||||||
Chief compliance officer expenses | 3,669 | ||||||
Other | 186,198 | ||||||
Total expenses | 36,737,791 | ||||||
Net investment income | 28,812,569 | ||||||
Realized and unrealized gain (loss) — net | |||||||
Net realized gain (loss) on: | |||||||
Investments — unaffiliated issuers | (6,875,121 | ) | |||||
Investments — affiliated issuers | (56,650,261 | ) | |||||
Capital gain distributions from underlying affiliated funds | 25,545,612 | ||||||
Foreign currency translations | 154,873 | ||||||
Forward foreign currency exchange contracts | 539,268 | ||||||
Futures contracts | (20,122,647 | ) | |||||
Options purchased | (128,740,891 | ) | |||||
Swap contracts | 343,056 | ||||||
Net realized loss | (185,806,111 | ) | |||||
Net change in unrealized appreciation (depreciation) on: | |||||||
Investments — unaffiliated issuers | 38,568,937 | ||||||
Investments — affiliated issuers | 351,914,298 | ||||||
Foreign currency translations | (84,495 | ) | |||||
Forward foreign currency exchange contracts | 49,806 | ||||||
Futures contracts | (1,446,321 | ) | |||||
Options purchased | 39,068,760 | ||||||
Swap contracts | 872,101 | ||||||
Net change in unrealized appreciation | 428,943,086 | ||||||
Net realized and unrealized gain | 243,136,975 | ||||||
Net increase in net assets resulting from operations | $ | 271,949,544 | |||||
The accompanying Notes to Financial Statements are an integral part of this statement.
Annual Report 2016
20
COLUMBIA VARIABLE PORTFOLIO — MANAGED VOLATILITY GROWTH FUND
STATEMENT OF CHANGES IN NET ASSETS
| Year Ended December 31, 2016 | Year Ended December 31, 2015 | ||||||||||
Operations | |||||||||||
Net investment income | $ | 28,812,569 | $ | 19,867,611 | |||||||
Net realized loss | (185,806,111 | ) | (16,000,541 | ) | |||||||
Net change in unrealized appreciation (depreciation) | 428,943,086 | (265,488,821 | ) | ||||||||
Net increase (decrease) in net assets resulting from operations | 271,949,544 | (261,621,751 | ) | ||||||||
Increase in net assets from capital stock activity | 519,362,729 | 1,697,673,651 | |||||||||
Total increase in net assets | 791,312,273 | 1,436,051,900 | |||||||||
Net assets at beginning of year | 7,441,534,105 | 6,005,482,205 | |||||||||
Net assets at end of year | $ | 8,232,846,378 | $ | 7,441,534,105 | |||||||
The accompanying Notes to Financial Statements are an integral part of this statement.
Annual Report 2016
21
COLUMBIA VARIABLE PORTFOLIO — MANAGED VOLATILITY GROWTH FUND
STATEMENT OF CHANGES IN NET ASSETS (continued)
Year Ended December 31, 2016 | Year Ended December 31, 2015 | ||||||||||||||||||
Shares | Dollars ($) | Shares | Dollars ($) | ||||||||||||||||
Capital stock activity | |||||||||||||||||||
Class 2 shares | |||||||||||||||||||
Subscriptions | 55,380,621 | 621,499,142 | 147,549,141 | 1,727,373,535 | |||||||||||||||
Redemptions | (8,865,923 | ) | (102,136,413 | ) | (2,552,566 | ) | (29,699,884 | ) | |||||||||||
Net increase | 46,514,698 | 519,362,729 | 144,996,575 | 1,697,673,651 | |||||||||||||||
Total net increase | 46,514,698 | 519,362,729 | 144,996,575 | 1,697,673,651 | |||||||||||||||
The accompanying Notes to Financial Statements are an integral part of this statement.
Annual Report 2016
22
COLUMBIA VARIABLE PORTFOLIO — MANAGED VOLATILITY GROWTH FUND
FINANCIAL HIGHLIGHTS
The following table is intended to help you understand the Fund's financial performance. Certain information reflects financial results for a single share of a class held for the periods shown. Per share net investment income (loss) amounts are calculated based on average shares outstanding during the period. Total return assumes reinvestment of all dividends and distributions, if any. Total return does not reflect any fees and expenses imposed under your Contract and/or Qualified Plan, as applicable; such fees and expenses would reduce the total returns for all periods shown. Total return and portfolio turnover are not annualized for periods of less than one year. The portfolio turnover rate is calculated without regard to purchase and sales transactions of short-term instruments and certain derivatives, if any. If such transactions were included, the Fund's portfolio turnover rate may be higher.
Year Ended December 31, | |||||||||||||||||||
Class 2 | 2016 | 2015 | 2014 | 2013(a) | |||||||||||||||
Per share data | |||||||||||||||||||
Net asset value, beginning of period | $ | 11.29 | $ | 11.68 | $ | 11.14 | $ | 10.00 | |||||||||||
Income from investment operations: | |||||||||||||||||||
Net investment income | 0.04 | 0.03 | 0.03 | 0.02 | |||||||||||||||
Net realized and unrealized gain (loss) | 0.34 | (0.42 | ) | 0.51 | 1.12 | ||||||||||||||
Total from investment operations | 0.38 | (0.39 | ) | 0.54 | 1.14 | ||||||||||||||
Net asset value, end of period | $ | 11.67 | $ | 11.29 | $ | 11.68 | $ | 11.14 | |||||||||||
Total return | 3.37 | % | (3.34 | %) | 4.85 | % | 11.40 | % | |||||||||||
Ratios to average net assets(b) | |||||||||||||||||||
Total gross expenses | 0.47 | % | 0.48 | % | 0.49 | % | 0.53 | %(c) | |||||||||||
Total net expenses(d) | 0.47 | % | 0.48 | % | 0.49 | % | 0.51 | %(c) | |||||||||||
Net investment income | 0.37 | % | 0.29 | % | 0.26 | % | 0.27 | %(c) | |||||||||||
Supplemental data | |||||||||||||||||||
Net assets, end of period (in thousands) | $ | 8,232,846 | $ | 7,441,534 | $ | 6,005,482 | $ | 1,992,053 | |||||||||||
Portfolio turnover | 91 | % | 74 | % | 47 | % | 36 | % | |||||||||||
Notes to Financial Highlights
(a) Based on operations from April 12, 2013 (commencement of operations) through the stated period end.
(b) In addition to the fees and expenses that the Fund bears directly, the Fund indirectly bears a pro rata share of the fees and expenses of any other funds in which it invests. Such indirect expenses are not included in the Fund's reported expense ratios.
(c) Annualized.
(d) Total net expenses include the impact of certain fee waivers/expense reimbursements made by the Investment Manager and certain of its affiliates, if applicable.
The accompanying Notes to Financial Statements are an integral part of this statement.
Annual Report 2016
23
COLUMBIA VARIABLE PORTFOLIO — MANAGED VOLATILITY GROWTH FUND
NOTES TO FINANCIAL STATEMENTS
December 31, 2016
Note 1. Organization
Columbia Variable Portfolio — Managed Volatility Growth Fund (the Fund), a series of Columbia Funds Variable Insurance Trust (the Trust), is a diversified fund. The Trust is registered under the Investment Company Act of 1940, as amended (the 1940 Act), as an open-end management investment company organized as a Massachusetts business trust.
The Fund is a "fund-of-funds", investing significantly in affiliated funds managed by Columbia Management Investment Advisers, LLC (the Investment Manager), a wholly-owned subsidiary of Ameriprise Financial, Inc. (Ameriprise Financial), its affiliates, or third-party advised (unaffiliated) funds, including exchange-traded funds (collectively, Underlying Funds).
For information on the Underlying Funds, please refer to the Fund's current prospectus and the prospectuses of the Underlying Funds, which are available, free of charge, from the Securities and Exchange Commission website, www.sec.gov.
Fund Shares
The Trust may issue an unlimited number of shares (without par value). The Fund offers Class 2 shares to separate accounts funding variable annuity contracts and variable life insurance policies (collectively, Contracts) issued by affiliated and unaffiliated life insurance companies as well as other qualified institutional investors (Qualified Investors) authorized by Columbia Management Investment Distributors, Inc. (the Distributor). You may not buy (nor will you own) shares of the Fund directly. You may invest by buying a Contract.
Note 2. Summary of Significant Accounting Policies
Basis of Preparation
The Fund is an investment company that applies the accounting and reporting guidance in the Financial Accounting Standards Board (FASB) Accounting Standards Codification Topic 946, Financial Services — Investment Companies (ASC 946). The financial statements are prepared in accordance with U.S. generally accepted accounting principles (GAAP), which requires management to make certain estimates and assumptions that affect the reported amounts of assets and liabilities, the disclosure of contingent assets and liabilities at the date of the financial statements and the reported amounts of income and expenses during the
reporting period. Actual results could differ from those estimates.
The following is a summary of significant accounting policies followed by the Fund in the preparation of its financial statements.
Security Valuation
All equity securities and exchange-traded funds are valued at the close of business of the New York Stock Exchange. Equity securities and exchange-traded funds are valued at the last quoted sales price on the principal exchange or market on which they trade, except for securities traded on the NASDAQ Stock Market, which are valued at the NASDAQ official close price. Unlisted securities or listed securities for which there were no sales during the day are valued at the mean of the latest quoted bid and ask prices on such exchanges or markets.
Debt securities generally are valued by pricing services approved by the Board of Trustees based upon market transactions for normal, institutional-size trading units of similar securities. The services may use various pricing techniques that take into account, as applicable, factors such as yield, quality, coupon rate, maturity, type of issue, trading characteristics and other data, as well as approved independent broker-dealer quotes. Debt securities for which quotations are not readily available or not believed to be reflective of market value may also be valued based upon a bid quote from an approved independent broker-dealer. Debt securities maturing in 60 days or less are valued primarily at amortized cost value, unless this method results in a valuation that management believes does not approximate market value.
Asset- and mortgage-backed securities are generally valued by pricing services, which utilize pricing models that incorporate the securities' cash flow and loan performance data. These models also take into account available market data, including trades, market quotations, and benchmark yield curves for identical or similar securities. Factors used to identify similar securities may include, but are not limited to, issuer, collateral type, vintage, prepayment speeds, collateral performance, credit ratings, credit enhancement and expected life. Asset-backed securities for which quotations are readily available may also be valued based upon an over-the-counter or exchange bid quote from an approved independent broker-dealer.
Annual Report 2016
24
COLUMBIA VARIABLE PORTFOLIO — MANAGED VOLATILITY GROWTH FUND
NOTES TO FINANCIAL STATEMENTS (continued)
December 31, 2016
Investments in the Underlying Funds are valued at the net asset value of the applicable class of the Underlying Fund determined as of the close of the New York Stock Exchange on the valuation date.
Forward foreign currency exchange contracts are marked-to-market based upon foreign currency exchange rates provided by a pricing service.
Futures and options on futures contracts are valued based upon the settlement price at the close of regular trading on their principal exchanges or, in the absence of transactions, at the mean of the latest quoted bid and ask prices.
Option contracts are valued at the mean of the latest quoted bid and ask prices on their primary exchanges. Option contracts, including over-the-counter option contracts, with no readily available market quotations are valued using quotes obtained from independent brokers as of the close of the New York Stock Exchange.
Swap transactions are valued through an independent pricing service or broker, or if neither is available, through an internal model based upon observable inputs.
Investments for which market quotations are not readily available, or that have quotations which management believes are not reflective of market value or reliable, are valued at fair value as determined in good faith under procedures approved by and under the general supervision of the Board of Trustees. If a security or class of securities (such as foreign securities) is valued at fair value, such value is likely to be different from the quoted or published price for the security.
The determination of fair value often requires significant judgment. To determine fair value, management may use assumptions including but not limited to future cash flows and estimated risk premiums. Multiple inputs from various sources may be used to determine fair value.
GAAP requires disclosure regarding the inputs and valuation techniques used to measure fair value and any changes in valuation inputs or techniques. In addition, investments shall be disclosed by major category. This information is disclosed following the Fund's Portfolio of Investments.
Foreign Currency Transactions and Translations
The values of all assets and liabilities denominated in foreign currencies are generally translated into U.S. dollars at exchange rates determined at the close of regular trading on the New York Stock Exchange. Net realized and unrealized gains (losses) on foreign currency transactions and translations include gains (losses)
arising from the fluctuation in exchange rates between trade and settlement dates on securities transactions, gains (losses) arising from the disposition of foreign currency and currency gains (losses) between the accrual and payment dates on dividends, interest income and foreign withholding taxes.
For financial statement purposes, the Fund does not distinguish that portion of gains (losses) on investments which is due to changes in foreign exchange rates from that which is due to changes in market prices of the investments. Such fluctuations are included with the net realized and unrealized gains (losses) on investments in the Statement of Operations.
Derivative Instruments
The Fund invests in certain derivative instruments, as detailed below, to meet its investment objectives. Derivatives are instruments whose values depend on, or are derived from, in whole or in part, the value of one or more securities, currencies, commodities, indices, or other assets or instruments. Derivatives may be used to increase investment flexibility (including to maintain cash reserves while maintaining desired exposure to certain assets), for risk management (hedging) purposes, to facilitate trading, to reduce transaction costs and to pursue higher investment returns. The Fund may also use derivative instruments to mitigate certain investment risks, such as foreign currency exchange rate risk, interest rate risk and credit risk. Derivatives may involve various risks, including the potential inability of the counterparty to fulfill its obligations under the terms of the contract, the potential for an illiquid secondary market (making it difficult for the Fund to sell or terminate, including at favorable prices) and the potential for market movements which may expose the Fund to gains or losses in excess of the amount shown in the Statement of Assets and Liabilities. The notional amounts of derivative instruments, if applicable, are not recorded in the financial statements.
A derivative instrument may suffer a marked-to-market loss if the value of the contract decreases due to an unfavorable change in the market rates or values of the underlying instrument. Losses can also occur if the counterparty does not perform its obligations under the contract. The Fund's risk of loss from counterparty credit risk on over-the-counter derivatives is generally limited to the aggregate unrealized gain netted against any collateral held by the Fund and the amount of any variation margin held by the counterparty, plus any replacement costs or related amounts. With exchange-traded or centrally cleared derivatives, there is reduced
Annual Report 2016
25
COLUMBIA VARIABLE PORTFOLIO — MANAGED VOLATILITY GROWTH FUND
NOTES TO FINANCIAL STATEMENTS (continued)
December 31, 2016
counterparty credit risk to the Fund since the clearinghouse or central counterparty (CCP) provides some protection in the case of clearing member default. The clearinghouse or CCP stands between the buyer and the seller of the contract; therefore, additional counterparty credit risk is failure of the clearinghouse or CCP. However, credit risk still exists in exchange-traded or centrally cleared derivatives with respect to initial and variation margin that is held in a broker's customer account. While brokers are required to segregate customer margin from their own assets, in the event that a broker becomes insolvent or goes into bankruptcy and at that time there is a shortfall in the aggregate amount of margin held by the broker for all its clients, U.S. bankruptcy laws will typically allocate that shortfall on a pro-rata basis across all the broker's customers (including the Fund), potentially resulting in losses to the Fund.
In order to better define its contractual rights and to secure rights that will help the Fund mitigate its counterparty risk, the Fund may enter into an International Swaps and Derivatives Association, Inc. Master Agreement (ISDA Master Agreement) or similar agreement with its derivatives contract counterparties. An ISDA Master Agreement is an agreement between the Fund and a counterparty that governs over-the-counter derivatives and typically contains, among other things, collateral posting terms and netting provisions in the event of a default and/or termination event. Under an ISDA Master Agreement, the Fund may, under certain circumstances, offset with the counterparty certain derivative instrument's payables and/or receivables with collateral held and/or posted and create one single net payment. The provisions of the ISDA Master Agreement typically permit a single net payment in the event of default (close-out netting), including the bankruptcy or insolvency of the counterparty. Note, however, that bankruptcy or insolvency laws of a particular jurisdiction may impose restrictions on or prohibitions against the right of offset or netting in bankruptcy, insolvency or other events.
Collateral (margin) requirements differ by type of derivative. Margin requirements are established by the clearinghouse or CCP for exchange-traded and centrally cleared derivatives. Brokers can ask for margin in excess of the minimum in certain circumstances. Collateral terms are contract specific for over-the-counter derivatives. For over-the-counter derivatives traded under an ISDA Master Agreement, the collateral requirements are typically calculated by netting the marked-to-market amount for each transaction under such agreement and
comparing that amount to the value of any variation margin currently pledged by the Fund and/or the counterparty. Generally, the amount of collateral due from or to a party has to exceed a minimum transfer amount threshold (e.g., $250,000) before a transfer has to be made. To the extent amounts due to the Fund from its counterparties are not fully collateralized, contractually or otherwise, the Fund bears the risk of loss from counterparty nonperformance. The Fund attempts to mitigate counterparty risk by only entering into agreements with counterparties that it believes have the financial resources to honor their obligations and by monitoring the financial stability of those counterparties.
Certain ISDA Master Agreements allow counterparties of over-the-counter derivatives transactions to terminate derivatives contracts prior to maturity in the event the Fund's net asset value declines by a stated percentage over a specified time period or if the Fund fails to meet certain terms of the ISDA Master Agreement, which would cause the Fund to accelerate payment of any net liability owed to the counterparty. The Fund also has termination rights if the counterparty fails to meet certain terms of the ISDA Master Agreement. In addition to considering counterparty credit risk, the Fund would consider terminating the derivatives contracts based on whether termination would result in a net liability owed from the counterparty.
For financial reporting purposes, the Fund does not offset derivative assets and derivative liabilities that are subject to netting arrangements in the Statement of Assets and Liabilities.
Forward Foreign Currency Exchange Contracts
Forward foreign currency exchange contracts are over-the-counter agreements between two parties to buy and sell a currency at a set price on a future date. The Fund utilized forward foreign currency exchange contracts to hedge the currency exposure associated with some or all of the Fund's securities, to shift foreign currency exposure back to U.S. dollars, to shift investment exposure from one currency to another, to shift U.S. dollar exposure to achieve a representative weighted mix of major currencies in its benchmark, and/or to recover an underweight country exposure in its portfolio. These instruments may be used for other purposes in future periods.
The values of forward foreign currency exchange contracts fluctuate daily with changes in foreign currency exchange rates. Changes in the value of these contracts are recorded as unrealized appreciation or depreciation
Annual Report 2016
26
COLUMBIA VARIABLE PORTFOLIO — MANAGED VOLATILITY GROWTH FUND
NOTES TO FINANCIAL STATEMENTS (continued)
December 31, 2016
until the contract is exercised or has expired. The Fund will realize a gain or loss when the forward foreign currency exchange contract is closed or expires.
The use of forward foreign currency exchange contracts does not eliminate fluctuations in the prices of the Fund's portfolio securities. The risks of forward foreign currency exchange contracts include movement in the values of the foreign currencies relative to the U.S. dollar (or other foreign currencies) and the possibility that counterparties will not complete their contractual obligations, which may be in excess of the amount reflected, if any, in the Statement of Assets and Liabilities.
Futures Contracts
Futures contracts are exchange-traded and represent commitments for the future purchase or sale of an asset at a specified price on a specified date. The Fund bought and sold futures contracts to produce incremental earnings, to manage the duration and yield curve exposure of the Fund versus the benchmark, to manage exposure to movements in interest rates, to manage exposure to the securities market and to maintain appropriate equity market exposure while keeping sufficient cash to accommodate daily redemptions. These instruments may be used for other purposes in future periods. Upon entering into futures contracts, the Fund bears risks that it may not achieve the anticipated benefits of the futures contracts and may realize a loss. Additional risks include counterparty credit risk, the possibility of an illiquid market, and that a change in the value of the contract or option may not correlate with changes in the value of the underlying asset.
Upon entering into a futures contract, the Fund deposits cash or securities with the broker, known as a futures commission merchant (FCM), in an amount sufficient to meet the initial margin requirement. The initial margin deposit must be maintained at an established level over the life of the contract. Cash deposited as initial margin is recorded in the Statement of Assets and Liabilities as margin deposits. Securities deposited as initial margin are designated in the Portfolio of Investments. Subsequent payments (variation margin) are made or received by the Fund each day. The variation margin payments are equal to the daily change in the contract value and are recorded as variation margin receivable or payable and are offset in unrealized gains or losses. The Fund recognizes a realized gain or loss when the contract is closed or expires. Futures contracts involve, to varying degrees, risk of loss in excess of the variation margin disclosed in the Statement of Assets and Liabilities.
Options Contracts
Options are contracts which entitle the holder to purchase or sell securities or other identified assets at a specified price, or in the case of index option contracts, to receive or pay the difference between the index value and the strike price of the index option contract. Option contracts can be either exchange-traded or over-the-counter. The Fund purchased and wrote option contracts to produce incremental earnings, to decrease the Fund's exposure to equity market risk and to increase return on investments and to facilitate buying and selling of securities for investments. These instruments may be used for other purposes in future periods. Completion of transactions for option contracts traded in the over-the-counter market depends upon the performance of the other party. Cash collateral may be collected or posted by the Fund to secure certain over-the-counter option contract trades. Cash collateral held or posted by the Fund for such option contract trades must be returned to the broker or the Fund upon closure, exercise or expiration of the contract.
Options contracts purchased are recorded as investments. When the Fund writes an options contract, the premium received is recorded as an asset and an amount equivalent to the premium is recorded as a liability in the Statement of Assets and Liabilities and is subsequently adjusted to reflect the current fair value of the option written. Changes in the fair value of the written option are recorded as unrealized appreciation or depreciation until the contract is exercised or has expired. The Fund will realize a gain or loss when the option contract is closed or expires. When option contracts are exercised, the proceeds on sales for a written call or purchased put option contract, or the purchase cost for a written put or purchased call option contract, is adjusted by the amount of premium received or paid.
For over-the-counter options purchased, the Fund bears the risk of loss of the amount of the premiums paid plus the positive change in market values net of any collateral held by the Fund should the counterparty fail to perform under the contracts. Option contracts written by the Fund do not typically give rise to significant counterparty credit risk, as options written generally obligate the Fund and not the counterparty to perform. The risk in writing a call option contract is that the Fund gives up the opportunity for profit if the market price of the security increases above the strike price and the option contract is exercised. The risk in writing a put option contract is that
Annual Report 2016
27
COLUMBIA VARIABLE PORTFOLIO — MANAGED VOLATILITY GROWTH FUND
NOTES TO FINANCIAL STATEMENTS (continued)
December 31, 2016
the Fund may incur a loss if the market price of the security decreases below the strike price and the option contract is exercised. Exercise of a written option could result in the Fund purchasing or selling a security or foreign currency when it otherwise would not, or at a price different from the current market value. In purchasing and writing options, the Fund bears the risk of an unfavorable change in the value of the underlying instrument or the risk that the Fund may not be able to enter into a closing transaction due to an illiquid market.
Swap Contracts
Swap contracts are negotiated in the over-the-counter market and may be entered into as a bilateral contract or centrally cleared (centrally cleared swap contract). In a centrally cleared swap contract, immediately following execution of the swap contract with a broker, the swap contract is novated to a central counterparty (the CCP) and the CCP becomes the Fund's counterparty to the centrally cleared swap contract. The Fund is required to deposit initial margin with the futures commission merchant (FCM), which pledges it through to the CCP in the form of cash or securities in an amount that varies depending on the size and risk profile of the particular swap contract. Securities deposited as initial margin are designated in the Portfolio of Investments and cash deposited is recorded in the Statement of Assets and Liabilities as margin deposits. Unlike a bilateral swap contract, for centrally cleared swap contracts, the Fund has minimal credit exposure to the FCM because the CCP stands between the Fund and the relevant buyer/seller on the other side of the contract. Swap contracts are marked-to-market daily and changes in value are recorded as unrealized appreciation (depreciation). The daily change in valuation of centrally cleared swap contracts, if any, is recorded as a receivable or payable for variation margin in the Statement of Assets and Liabilities.
Entering into these contracts involves, to varying degrees, elements of interest, liquidity and counterparty credit risk in excess of the amounts recognized in the Statement of Assets and Liabilities. Such risks involve the possibility that there may be unfavorable changes in interest rates, market conditions or other conditions, it may be difficult to initiate a swap transaction or liquidate a position at an advantageous time or price which may result in significant losses, and that the FCM or CCP may not fulfill its obligation under the contract.
Credit Default Swap Contracts
The Fund entered into credit default swap contracts to increase or decrease its credit exposure to an index, increase or decrease its credit exposure to a specific debt security or a basket of debt securities, as a protection buyer to reduce overall credit exposure and to manage credit risk exposure. These instruments may be used for other purposes in future periods. Credit default swap contracts are agreements in which one party pays fixed periodic payments to a counterparty in consideration for an agreement from the counterparty to make a specific payment should a specified credit event(s) take place. Although specified credit events are contract specific, credit events are generally defined as bankruptcy, failure to pay, restructuring, obligation acceleration, obligation default, or repudiation/moratorium.
As the purchaser of a credit default swap contract, the Fund purchases protection by paying a periodic interest rate on the notional amount to the counterparty. The interest amount is accrued daily as a component of unrealized appreciation (depreciation) and is recorded as a realized loss upon payment. If a credit event as specified in the contract occurs, the Fund may have the option either to deliver the reference obligation to the seller in exchange for a cash payment of its par amount, or to receive a net cash settlement equal to the par amount less an agreed-upon value of the reference obligation as of the date of the credit event. The difference between the value of the obligation or cash delivered and the notional amount received will be recorded as a realized gain (loss).
As the seller of a credit default swap contract, the Fund sells protection to a buyer and will generally receive a periodic interest rate on a notional amount. The interest amount is accrued daily as a component of unrealized appreciation (depreciation) and is recorded as a realized gain upon receipt of the payment. If a credit event as specified in the contract with the counterparty occurs, the Fund may either be required to accept the reference obligation from the buyer in exchange for a cash payment of its notional amount, or to pay the buyer a net cash settlement equal to the notional amount less an agreed-upon value of the reference obligation (recovery value) as of the date of the credit event. The difference between the value of the obligation or cash received and the notional amount paid will be recorded as a realized gain (loss). The maximum potential amount of undiscounted future payments the Fund could be required to make as
Annual Report 2016
28
COLUMBIA VARIABLE PORTFOLIO — MANAGED VOLATILITY GROWTH FUND
NOTES TO FINANCIAL STATEMENTS (continued)
December 31, 2016
the seller of protection under a credit default swap contract is equal to the notional amount of the reference obligation. These potential amounts may be partially offset by any recovery values of the respective reference obligations or premiums received upon entering into the agreement. The notional amounts and market values of all credit default swap contracts in which the Fund is the seller of protection, if any, are disclosed in the Credit Default Swap Contracts Outstanding schedule following the Portfolio of Investments. These potential amounts may be partially offset by any recovery values of the respective reference obligations or premiums received upon entering into the agreement.
As a protection seller, the Fund bears the risk of loss from the credit events specified in the contract with the counterparty. For credit default swap contracts on credit indices, quoted market prices and resulting market values serve as an indicator of the current status of the payment/performance risk. Increasing market values, in absolute terms when compared to the notional amount of the swap, represent a deterioration of the reference entity's credit soundness and a greater likelihood or risk of default or other credit event occurring as defined under the terms of the contract.
Any premium paid or received by the Fund upon entering into a credit default swap contract is recorded as an asset or liability, respectively, and amortized daily as a component of realized gain (loss) in the Statement of Operations. Credit default swap contracts are valued daily, and the change in value is recorded as unrealized appreciation (depreciation) until the termination of the swap, at which time a realized gain (loss) is recorded.
Credit default swap contracts can involve greater risks than if a fund had invested in the reference obligation directly since, in addition to general market risks, credit default swaps are subject to counterparty credit risk, leverage risk, hedging risk, correlation risk and liquidity risk.
Effects of Derivative Transactions in the Financial Statements
The following tables are intended to provide additional information about the effect of derivatives on the financial statements of the Fund, including: the fair value of derivatives by risk category and the location of those fair values in the Statement of Assets and Liabilities; and the impact of derivative transactions over the period in the Statement of Operations, including realized and unrealized gains (losses). The derivative instrument schedules following the Portfolio of Investments present
additional information regarding derivative instruments outstanding at the end of the period, if any.
The following table is a summary of the fair value of derivative instruments (not considered to be hedging instruments for accounting disclosure purposes) at December 31, 2016:
Asset Derivatives | |||||||||||
| Risk Exposure Category | Statement of Assets and Liabilities Location | Fair Value ($) | |||||||||
| Credit risk | Component of trust capital — unrealized appreciation on swap contracts | 872,101 | * | ||||||||
| Equity risk | Component of trust capital — unrealized appreciation on futures contracts | 18,194,155 | * | ||||||||
| Equity risk | Investments, at value — Options purchased | 120,854,810 | |||||||||
| Foreign exchange risk | Unrealized appreciation on forward foreign currency exchange contracts | 82,323 | |||||||||
| Interest rate risk | Component of trust capital — unrealized appreciation on futures contracts | 769,986 | * | ||||||||
Total | 140,773,375 | ||||||||||
Liability Derivatives | |||||||||||
| Risk Exposure Category | Statement of Assets and Liabilities Location | Fair Value ($) | |||||||||
| Equity risk | Component of trust capital — unrealized depreciation on futures contracts | 1,862,948 | * | ||||||||
| Foreign exchange risk | Component of trust capital — unrealized depreciation on futures contracts | 4,717,749 | * | ||||||||
| Interest rate risk | Component of trust capital — unrealized depreciation on futures contracts | 2,631,565 | * | ||||||||
Total | 9,212,262 | ||||||||||
*Includes cumulative appreciation (depreciation) as reported in the tables following the Portfolio of Investments. Only the current day's variation margin is reported in receivables or payables in the Statement of Assets and Liabilities.
Annual Report 2016
29
COLUMBIA VARIABLE PORTFOLIO — MANAGED VOLATILITY GROWTH FUND
NOTES TO FINANCIAL STATEMENTS (continued)
December 31, 2016
The following table indicates the effect of derivative instruments (not considered to be hedging instruments for accounting disclosure purposes) in the Statement of Operations for the year ended December 31, 2016:
Amount of Realized Gain (Loss) on Derivatives Recognized in Income | |||||||||||||||||||||||
Risk Exposure Category | Forward Foreign Currency Exchange Contracts ($) | Futures Contracts ($) | Options Contracts Purchased ($) | Swap Contracts ($) | Total ($) | ||||||||||||||||||
Credit risk | — | — | — | 343,056 | 343,056 | ||||||||||||||||||
Equity risk | — | (15,600,714 | ) | (128,740,891 | ) | — | (144,341,605 | ) | |||||||||||||||
Foreign exchange risk | 539,268 | 529,265 | — | — | 1,068,533 | ||||||||||||||||||
Interest rate risk | — | (5,051,198 | ) | — | — | (5,051,198 | ) | ||||||||||||||||
Total | 539,268 | (20,122,647 | ) | (128,740,891 | ) | 343,056 | (147,981,214 | ) | |||||||||||||||
Change in Unrealized Appreciation (Depreciation) on Derivatives Recognized in Income | |||||||||||||||||||||||
Risk Exposure Category | Forward Foreign Currency Exchange Contracts ($) | Futures Contracts ($) | Options Contracts Purchased ($) | Swap Contracts ($) | Total ($) | ||||||||||||||||||
Credit risk | — | — | — | 872,101 | 872,101 | ||||||||||||||||||
Equity risk | — | 9,450,537 | 39,068,760 | — | 48,519,297 | ||||||||||||||||||
Foreign exchange risk | 49,806 | (7,581,302 | ) | — | — | (7,531,496 | ) | ||||||||||||||||
Interest rate risk | — | (3,315,556 | ) | — | — | (3,315,556 | ) | ||||||||||||||||
Total | 49,806 | (1,446,321 | ) | 39,068,760 | 872,101 | 38,544,346 | |||||||||||||||||
The following table provides a summary of the average outstanding volume by derivative instrument for the year ended December 31, 2016:
Derivative Instrument | Average Notional Amounts ($)* | ||||||
Futures contracts — Long | 2,418,657,692 | ||||||
Futures contracts — Short | 752,334,619 | ||||||
Credit default swap contracts — sell protection | 75,000,000 | ||||||
Derivative Instrument | Average Market Value ($)* | ||||||
Options contracts — Purchased | 110,264,203 | ||||||
Derivative Instrument | Average Unrealized Appreciation ($)* | Average Unrealized Depreciation ($)* | |||||||||
| Forward foreign currency exchange contracts | 91,085 | (8,239 | ) | ||||||||
*Based on the ending quarterly outstanding amounts for the year ended December 31, 2016.
Asset- and Mortgage-Backed Securities
The Fund may invest in asset-backed and mortgage-backed securities. The maturity dates shown represent the original maturity of the underlying obligation. Actual maturity may vary based upon prepayment activity on these obligations. All, or a portion, of the obligation may be prepaid at any time because the underlying asset may be prepaid. As a result, decreasing market interest rates could result in an increased level of prepayment. An increased prepayment rate will have the effect of
shortening the maturity of the security. Unless otherwise noted, the coupon rates presented are fixed rates.
Delayed Delivery Securities
The Fund may trade securities on other than normal settlement terms, including securities purchased or sold on a "when-issued" basis. This may increase risk to the Fund since the other party to the transaction may fail to deliver, which could cause the Fund to subsequently invest at less advantageous prices. The Fund designates cash or liquid securities in an amount equal to the delayed delivery commitment.
To Be Announced Securities
The Fund may trade securities on a To Be Announced (TBA) basis. As with other delayed-delivery transactions, a seller agrees to issue a TBA security at a future date. However, the seller does not specify the particular securities to be delivered. Instead, the Fund agrees to accept any security that meets specified terms.
In some cases, Master Securities Forward Transaction Agreements (MSFTAs) may be used to govern transactions of certain forward-settling agency mortgage-backed securities, such as delayed-delivery and TBAs, between the Fund and counterparty. The MSFTA maintains provisions for, among other things, initiation and confirmation, payment and transfer, events of default, termination, and maintenance of collateral relating to such transactions.
Annual Report 2016
30
COLUMBIA VARIABLE PORTFOLIO — MANAGED VOLATILITY GROWTH FUND
NOTES TO FINANCIAL STATEMENTS (continued)
December 31, 2016
Mortgage Dollar Roll Transactions
The Fund may enter into mortgage "dollar rolls" in which the Fund sells securities for delivery in the current month and simultaneously contracts with the same counterparty to repurchase similar but not identical securities (same type, coupon and maturity) on a specified future date. During the roll period, the Fund loses the right to receive principal and interest paid on the securities sold. However, the Fund will benefit because it receives negotiated amounts in the form of reductions of the purchase price for the future purchase plus the interest earned on the cash proceeds of the securities sold until the settlement date of the forward purchase. The Fund records the incremental difference between the forward purchase and sale of each forward roll as a realized gain or loss. Unless any realized gains exceed the income, capital appreciation, and gain or loss due to mortgage prepayments that would have been realized on the securities sold as part of the mortgage dollar roll, the
use of this technique will diminish the investment performance of the Fund compared to what the performance would have been without the use of mortgage dollar rolls. All cash proceeds will be invested in instruments that are permissible investments for the Fund. The Fund identifies cash or liquid securities in an amount equal to the forward purchase price.
For financial reporting and tax purposes, the Fund treats "to be announced" mortgage dollar rolls as two separate transactions, one involving the purchase of a security and a separate transaction involving a sale. These transactions may increase the Fund's portfolio turnover rate. The Fund does not currently enter into mortgage dollar rolls that are accounted for as financing transactions.
Mortgage dollar rolls involve the risk that the market value of the securities the Fund is obligated to repurchase may decline below the repurchase price, or that the counterparty may default on its obligations.
Offsetting of Assets and Liabilities
The following table presents the Fund's gross and net amount of assets and liabilities available for offset under netting arrangements as well as any related collateral received or pledged by the Fund as of December 31, 2016:
| Deutsche Bank ($) | Morgan Stanley ($) | Standard Chartered ($) | State Street ($) | UBS ($) | Total ($) | ||||||||||||||||||||||
Assets | |||||||||||||||||||||||||||
Forward foreign currency exchange contracts | — | — | 28,431 | 996 | 52,896 | 82,323 | |||||||||||||||||||||
Options purchased puts | 120,854,810 | — | — | — | — | 120,854,810 | |||||||||||||||||||||
Total Assets | 120,854,810 | — | 28,431 | 996 | 52,896 | 120,937,133 | |||||||||||||||||||||
Liabilities | |||||||||||||||||||||||||||
Centrally cleared credit default swap contracts(a) | — | 16,645 | — | — | — | 16,645 | |||||||||||||||||||||
Total Liabilities | — | 16,645 | — | — | — | 16,645 | |||||||||||||||||||||
Total Financial and Derivative Net Assets | 120,854,810 | (16,645 | ) | 28,431 | 996 | 52,896 | 120,920,488 | ||||||||||||||||||||
Total collateral received (pledged)(b) | — | (16,645 | ) | — | — | — | (16,645 | ) | |||||||||||||||||||
Net Amount(c) | 120,854,810 | — | 28,431 | 996 | 52,896 | 120,937,133 | |||||||||||||||||||||
(a) Centrally cleared swaps are included within payable/receivable for variation margin on the Statement of Assets and Liabilities.
(b) In some instances, the actual collateral received and/or pledged may be more than the amount shown due to overcollateralization.
(c) Represents the net amount due from/(to) counterparties in the event of default.
Security Transactions
Security transactions are accounted for on the trade date. Cost is determined and gains (losses) are based upon the specific identification method for both financial statement and federal income tax purposes.
Income Recognition
Interest income is recorded on an accrual basis. Market premiums and discounts, including original issue discounts, are amortized and accreted, respectively, over the expected life of the security on all debt securities, unless otherwise noted. The Fund classifies gains and
Annual Report 2016
31
COLUMBIA VARIABLE PORTFOLIO — MANAGED VOLATILITY GROWTH FUND
NOTES TO FINANCIAL STATEMENTS (continued)
December 31, 2016
losses realized on prepayments received on mortgage-backed securities as adjustments to interest income.
The Fund may place a debt security on non-accrual status and reduce related interest income when it becomes probable that the interest will not be collected and the amount of uncollectible interest can be reasonably estimated. A defaulted debt security is removed from non-accrual status when the issuer resumes interest payments or when collectibility of interest is reasonably assured.
Corporate actions and dividend income are recorded on the ex-dividend date.
The Fund may receive distributions from holdings in equity securities, business development companies (BDCs), exchange-traded funds, other regulated investment companies (RICs), and real estate investment trusts (REITs), which report information on the tax character of their distributions annually. These distributions are allocated to dividend income, capital gain and return of capital based on actual information reported. Return of capital is recorded as a reduction of the cost basis of securities held. If the Fund no longer owns the applicable securities, return of capital is recorded as a realized gain. With respect to REITs, to the extent actual information has not yet been reported, estimates for return of capital are made by the Fund's management. Management's estimates are subsequently adjusted when the actual character of the distributions is disclosed by the REITs, which could result in a proportionate change in return of capital to shareholders.
Awards from class action litigation are recorded as a reduction of cost basis if the Fund still owns the applicable securities on the payment date. If the Fund no longer owns the applicable securities, the proceeds are recorded as realized gains.
Income and capital gain distributions from the Underlying Funds, if any, are recorded on the ex-dividend date.
Expenses
General expenses of the Trust are allocated to the Fund and the other series of the Trust based upon relative net assets or other expense allocation methodologies determined by the nature of the expense. Expenses directly attributable to the Fund are charged to the Fund.
Federal Income Tax Status
The Fund is treated as a partnership for federal income tax purposes. The Fund will not be subject to federal
income tax, and therefore, there is no provision for federal income taxes. The partners of the Fund are subject to tax on their distributive share of the Fund's income and loss. The components of the Fund's net assets are reported at the partner-level for federal income tax purposes, and therefore, are not presented in the Statement of Assets and Liabilities.
Management of the Fund has concluded that there are no significant uncertain tax positions in the Fund that would require recognition in the financial statements. However, management's conclusion may be subject to review and adjustment at a later date based on factors including, but not limited to, new tax laws, regulations, and administrative interpretations (including relevant court decisions). Generally, the Fund's federal tax returns for the prior three fiscal years remain subject to examination by the Internal Revenue Service.
Guarantees and Indemnifications
Under the Trust's organizational documents and, in some cases by contract, its officers and trustees are indemnified against certain liabilities arising out of the performance of their duties to the Trust or its funds. In addition, certain of the Funds' contracts with their service providers contain general indemnification clauses. The Funds' maximum exposure under these arrangements is unknown since the amount of any future claims that may be made against the Funds cannot be determined, and the Funds have no historical basis for predicting the likelihood of any such claims.
Investment Company Reporting Modernization
In October 2016, the U.S. Securities and Exchange Commission adopted new rules and forms, and amendments to certain current rules and forms, to modernize reporting and disclosure of information by registered investment companies. The amendments to Regulation S-X will require standardized, enhanced disclosure about derivatives in investment company financial statements, and will also change the rules governing the form and content of such financial statements. The amendments to Regulation S-X take effect on August 1, 2017. At this time, management is assessing the anticipated impact of these regulatory developments.
Annual Report 2016
32
COLUMBIA VARIABLE PORTFOLIO — MANAGED VOLATILITY GROWTH FUND
NOTES TO FINANCIAL STATEMENTS (continued)
December 31, 2016
Note 3. Fees and Other Transactions with Affiliates
Management Services Fees and Underlying Fund Fees
Effective May 1, 2016, the Fund entered into a Management Agreement with the Investment Manager. Under the Management Agreement, the Investment Manager provides the Fund with investment research and advice, as well as administrative and accounting services. The management services fee is an annual fee that is a blend of (i) 0.02% on assets invested in affiliated underlying funds (including exchange-traded funds and closed-end funds) that pay a management services fee (or investment advisory services fee, as applicable) to the Investment Manager and (ii) a fee that declines from 0.72% to 0.52%, depending on asset levels, on assets invested in securities, (other than affiliated underlying funds (including exchange-traded funds and closed-end funds) that pay a management services fee (or investment advisory services fee, as applicable) to the Investment Manager), including other funds advised by the Investment Manager that do not pay a management services fee to the Investment Manager, third party funds, derivatives and individual securities. Prior to May 1, 2016, the Fund paid the Investment Manager an annual fee for advisory services under an Investment Management Services Agreement and a separate annual fee for administrative and accounting services under an Administrative Services Agreement. The effective management services fee rate for the year ended December 31, 2016 (reflecting all advisory and administrative services fees paid to the Investment Manager) was 0.20% of the Fund's average daily net assets. For the period from January 1, 2016 through April 30, 2016, the investment advisory services fee paid to the Investment Manager was $4,147,191, and the administrative services fee paid to the Investment Manager was $720,999.
In addition to the fees and expenses which the Fund bears directly, the Fund indirectly bears a pro rata share of the fees and expenses of the Underlying Funds in which the Fund invests. Because the Underlying Funds have varied expense and fee levels and the Fund may own different proportions of Underlying Funds at different times, the amount of fees and expenses incurred indirectly by the Fund will vary. These expenses are not reflected in the expenses shown in Statement of Operations and are not included in the ratios to average net assets shown in the Financial Highlights.
Compensation of Board Members
Board of Trustee members, who are not officers or employees of the Investment Manager or Ameriprise Financial, are compensated for their services to the Fund as disclosed in the Statement of Operations. These Board of Trustee members may participate in a Deferred Compensation Plan (the Plan) which may be terminated at any time. Obligations of the Plan will be paid solely out of the Fund's assets, and all amounts payable under the Plan constitute a general unsecured obligation of the Fund.
Compensation of Chief Compliance Officer
The Board of Trustees has appointed a Chief Compliance Officer to the Fund in accordance with federal securities regulations. The Fund is allocated a portion of the expenses associated with the Chief Compliance Officer based on relative net assets of the Trust.
Transfer Agency Fees
The Fund has a Transfer and Dividend Disbursing Agent Agreement with Columbia Management Investment Services Corp. (the Transfer Agent), an affiliate of the Investment Manager and a wholly-owned subsidiary of Ameriprise Financial. The annual fee rate under this agreement is 0.00% on assets invested in Underlying Funds that pay a transfer agency fee to the Transfer Agent and 0.06% of the Fund's average daily net assets on assets invested in securities (other than Underlying Funds that pay a transfer agency fee to the Transfer Agent), including other funds that do not pay a transfer agency fee to the Transfer Agent, exchange-traded funds, derivatives and individual securities.
For the year ended December 31, 2016, the Fund's effective transfer agency fee rate as a percentage of average daily net assets of Class 2 shares was 0.02%.
Distribution Fees
The Fund has an agreement with the Distributor, an affiliate of the Investment Manager and a wholly-owned subsidiary of Ameriprise Financial, for distribution services. The Board of Trustees has approved, and the Fund has adopted, a distribution plan (the Plan) which sets the distribution fees for the Fund. These fees are calculated daily and are intended to compensate the Distributor for selling shares of the Fund. The Fund pays a monthly distribution fee to the Distributor at the maximum annual rate of 0.25% of the average daily net assets attributable to Class 2 shares of the Fund.
Annual Report 2016
33
COLUMBIA VARIABLE PORTFOLIO — MANAGED VOLATILITY GROWTH FUND
NOTES TO FINANCIAL STATEMENTS (continued)
December 31, 2016
Expenses Waived/Reimbursed by the Investment Manager and its Affiliates
The Investment Manager and certain of its affiliates have contractually agreed to waive fees and/or reimburse expenses (excluding certain fees and expenses described below) for the period disclosed below, so that the Fund's net operating expenses, including indirect expenses of the Underlying Funds and after giving effect to fees waived/expenses reimbursed and any balance credits and/or overdraft charges from the Fund's custodian, do not exceed the following annual rate as a percentage of the class' average daily net assets:
| Fee Rate Contractual Through April 30, 2017 | |||||||
Class 2 | 1.10 | % | |||||
Under the agreement governing these fee waivers and/or expense reimbursement arrangements, the following fees and expenses are excluded from the waiver/reimbursement commitment, and therefore will be paid by the Fund, if applicable: taxes (including foreign transaction taxes), transaction costs and brokerage commissions, costs related to any securities lending program, dividend and interest expenses associated with securities sold short, inverse floater program fees and expenses, transaction charges and interest on borrowed money, interest, infrequent and/or unusual expenses and any other expenses the exclusion of which is specifically approved by the Board of Trustees. This agreement may be modified or amended only with approval from the Investment Manager, certain of its affiliates and the Fund. Any fees waived and/or expenses reimbursed under the expense reimbursement arrangements described above are not recoverable by the Investment Manager or its affiliates in future periods.
Note 4. Portfolio Information
The cost of purchases and proceeds from sales of securities, excluding short-term investments and derivatives, if any, aggregated to $6,910,270,536 and $5,950,664,135, respectively, for the year ended December 31, 2016, of which $4,873,872,883 and $4,618,975,368, respectively, were U.S. government securities. The amount of purchase and sale activity impacts the portfolio turnover rate reported in the Financial Highlights.
Note 5. Affiliated Money Market Fund
The Fund invests in Columbia Short-Term Cash Fund, an affiliated money market fund established for the exclusive use by the Fund and other affiliated funds (the Affiliated MMF). The income earned by the Fund from such investments is included as Dividends — affiliated issuers in the Statement of Operations. As an investing fund, the Fund indirectly bears its proportionate share of the expenses of the Affiliated MMF. Effective October 1, 2016, the Affiliated MMF prices its shares with a floating net asset value (NAV) and no longer seeks to maintain a stable NAV. In addition, the Board of Trustees of the Affiliated MMF may impose a fee on redemptions (sometimes referred to as a liquidity fee) or temporarily suspend redemptions (sometimes referred to as imposing a redemption gate) in the event its liquidity falls below regulatory limits.
Note 6. Line of Credit
The Fund has access to a revolving credit facility with a syndicate of banks led by Citibank, N.A., HSBC Bank USA, N.A. and JPMorgan Chase Bank, N.A. whereby the Fund may borrow for the temporary funding of shareholder redemptions or for other temporary or emergency purposes. The credit facility agreement, which is a collective agreement between the Fund and certain other funds managed by the Investment Manager, severally and not jointly, that permits collective borrowings up to $1 billion. Interest is charged to each participating fund based on its borrowings at a rate equal to the higher of (i) the overnight federal funds rate plus 1.00% or (ii) the one-month LIBOR rate plus 1.00%. Each borrowing under the credit facility matures no later than 60 days after the date of borrowing. The Fund also pays a commitment fee equal to its pro rata share of the amount of the credit facility at a rate of 0.15% per annum. The commitment fee is included in other expenses in the Statement of Operations.
The Fund had no borrowings during the year ended December 31, 2016.
Note 7. Significant Risks
Shareholder Concentration Risk
At December 31, 2016, affiliated shareholders of record owned 100.0% of the outstanding shares of the Fund in one or more accounts. Subscription and redemption activity by concentrated accounts may have a significant effect on the operations of the Fund. In the case of a large redemption, the Fund may be forced to sell
Annual Report 2016
34
COLUMBIA VARIABLE PORTFOLIO — MANAGED VOLATILITY GROWTH FUND
NOTES TO FINANCIAL STATEMENTS (continued)
December 31, 2016
investments at inopportune times, including its liquid or more liquid positions, resulting in Fund losses and the Fund holding a higher percentage of less liquid or illiquid securities. Large redemptions could result in decreased economies of scale and increased operating expenses for non-redeeming Fund shareholders.
Note 8. Subsequent Events
Management has evaluated the events and transactions that have occurred through the date the financial statements were issued and noted no items requiring adjustment of the financial statements or additional disclosure.
Note 9. Information Regarding Pending and Settled Legal Proceedings
Ameriprise Financial and certain of its affiliates have historically been involved in a number of legal, arbitration and regulatory proceedings, including routine litigation, class actions, and governmental actions, concerning matters arising in connection with the conduct of their business activities. Ameriprise Financial believes that the Funds are not currently the subject of, and that neither Ameriprise Financial nor any of its affiliates are the subject of, any pending legal, arbitration or regulatory proceedings that are likely to have a material adverse effect on the Funds or the ability of Ameriprise Financial or its affiliates to perform under their contracts with the Funds. Ameriprise Financial is required to make quarterly (10-Q), annual (10-K) and, as necessary, 8-K filings with the Securities and Exchange Commission (SEC) on legal and regulatory matters that relate to Ameriprise Financial and its affiliates. Copies of these filings may be obtained by accessing the SEC website at www.sec.gov.
There can be no assurance that these matters, or the adverse publicity associated with them, will not result in increased fund redemptions, reduced sale of fund shares or other adverse consequences to the Funds. Further, although we believe proceedings are not likely to have a material adverse effect on the Funds or the ability of Ameriprise Financial or its affiliates to perform under their contracts with the Funds, these proceedings are subject to uncertainties and, as such, we are unable to estimate the possible loss or range of loss that may result. An adverse outcome in one or more of these proceedings could result in adverse judgments, settlements, fines, penalties or other relief that could have a material adverse effect on the consolidated financial condition or results of operations of Ameriprise Financial.
Annual Report 2016
35
COLUMBIA VARIABLE PORTFOLIO — MANAGED VOLATILITY GROWTH FUND
REPORT OF INDEPENDENT REGISTERED PUBLIC ACCOUNTING FIRM
To the Trustees of Columbia Funds Variable Insurance Trust and the Shareholders of
Columbia Variable Portfolio — Managed Volatility Growth Fund
In our opinion, the accompanying statement of assets and liabilities, including the portfolio of investments, and the related statements of operations and of changes in net assets and the financial highlights present fairly, in all material respects, the financial position of Columbia Variable Portfolio — Managed Volatility Growth Fund (the "Fund," a series of Columbia Funds Variable Insurance Trust) as of December 31, 2016, the results of its operations for the year then ended, the changes in its net assets for each of the two years in the period then ended and the financial highlights for each of the three years in the period then ended and for the period April 12, 2013 (commencement of operations) through December 31, 2013, in conformity with accounting principles generally accepted in the United States of America. These financial statements and financial highlights (hereafter referred to as "financial statements") are the responsibility of the Fund's management. Our responsibility is to express an opinion on these financial statements based on our audits. We conducted our audits of these financial statements in accordance with the standards of the Public Company Accounting Oversight Board (United States). Those standards require that we plan and perform the audit to obtain reasonable assurance about whether the financial statements are free of material misstatement. An audit includes examining, on a test basis, evidence supporting the amounts and disclosures in the financial statements, assessing the accounting principles used and significant estimates made by management, and evaluating the overall financial statement presentation. We believe that our audits, which included confirmation of securities as of December 31, 2016 by correspondence with the custodian, brokers and transfer agent, and the application of alternative auditing procedures where such confirmations had not been received, provide a reasonable basis for our opinion.
PricewaterhouseCoopers LLP
Minneapolis, MN
February 17, 2017
Annual Report 2016
36
COLUMBIA VARIABLE PORTFOLIO — MANAGED VOLATILITY GROWTH FUND
TRUSTEES AND OFFICERS
Shareholders elect the Board that oversees the Fund's operations. The Board appoints officers who are responsible for day-to-day business decisions based on policies set by the Board. The following table provides basic biographical information about the Fund's Trustees, including their principal occupations during the past five years, although specific titles for individuals may have varied over the period. The year set forth beneath Length of Service in the table below is the year in which the Trustee was first appointed or elected as Trustee to any Fund currently in the Columbia Funds Complex or a predecessor thereof. Under current Board policy, members serve terms of indefinite duration.
Independent Trustees
| Name, Address, Year of Birth | Position Held With the Trust and Length of Service | Principal Occupation(s) During the Past Five Years and Other Relevant Professional Experience | Number of Funds in the Columbia Funds Complex Overseen | Other Directorships Held by Trustee During the Past Five Years | |||||||||||||||
| Janet Langford Carrig c/o Columbia Management Investment Advisers, LLC, 225 Franklin Street Mail Drop BX32 05228, Boston, MA 02110 1957 | Trustee 1996 | Senior Vice President, General Counsel and Corporate Secretary, ConocoPhillips (independent energy company) since September 2007 | 59 | None | |||||||||||||||
| Douglas A. Hacker c/o Columbia Management Investment Advisers, LLC, 225 Franklin Street Mail Drop BX32 05228, Boston, MA 02110 1955 | Trustee and Chairman of the Board 1996 | Independent business executive since May 2006; Executive Vice President — Strategy of United Airlines from December 2002 to May 2006; President of UAL Loyalty Services (airline marketing company) from September 2001 to December 2002; Executive Vice President and Chief Financial Officer of United Airlines from July 1999 to September 2001 | 59 | Spartan Nash Company (food distributor); Nash Finch Company (food distributor) from 2005 to 2013; Aircastle Limited (aircraft leasing); SeaCube Container Leasing Ltd. (container leasing) from 2010 to 2013; and Travelport Worldwide Limited (travel information technology) | |||||||||||||||
| Nancy T. Lukitsh c/o Columbia Management Investment Advisers, LLC, 225 Franklin Street Mail Drop BX32 05228, Boston, MA 02110 1956 | Trustee 2011 | Senior Vice President, Partner and Director of Marketing, Wellington Management Company, LLP (investment adviser) from 1997 to 2010; Chair, Wellington Management Portfolios (commingled non-U.S. investment pools) from 2007 to 2010; Director, Wellington Trust Company, NA and other Wellington affiliates from 1997 to 2010 | 59 | None | |||||||||||||||
Annual Report 2016
37
COLUMBIA VARIABLE PORTFOLIO — MANAGED VOLATILITY GROWTH FUND
TRUSTEES AND OFFICERS (continued)
Independent Trustees (continued)
| Name, Address, Year of Birth | Position Held With the Trust and Length of Service | Principal Occupation(s) During the Past Five Years and Other Relevant Professional Experience | Number of Funds in the Columbia Funds Complex Overseen | Other Directorships Held by Trustee During the Past Five Years | |||||||||||||||
| David M. Moffett c/o Columbia Management Investment Advisers, LLC, 225 Franklin Street Mail Drop BX32 05228, Boston, MA 02110 1952 | Trustee 2011 | Retired. Consultant to Bridgewater and Associates | 59 | Director, CSX Corporation; Genworth Financial, Inc. (financial and insurance products and services); Paypal Holdings Inc. (payment and data processing services); Trustee University of Oklahoma Foundation; former Director eBay Inc. (online trading community), 2007-2015; and former Director, CIT Bank, CIT Group Inc. (commercial and consumer finance), 2010-2016 | |||||||||||||||
| Charles R. Nelson c/o Columbia Management Investment Advisers, LLC, 225 Franklin Street Mail Drop BX32 05228, Boston, MA 02110 1942 | Trustee 1981 | Retired. Professor Emeritus, University of Washington since 2011; Professor of Economics, University of Washington from 1976 to 2011; Ford and Louisa Van Voorhis Professor of Political Economy, University of Washington from 1993 to 2011; Adjunct Professor of Statistics, University of Washington from 1980 to 2011; Associate Editor, Journal of Money, Credit and Banking from September 1993 to 2008; consultant on econometric and statistical matters | 59 | None | |||||||||||||||
| John J. Neuhauser c/o Columbia Management Investment Advisers, LLC, 225 Franklin Street Mail Drop BX32 05228, Boston, MA 02110 1943 | Trustee 1984 | President, Saint Michael's College since August 2007; Director or Trustee of several non-profit organizations, including University of Vermont Medical Center; Academic Vice President and Dean of Faculties, Boston College from August 1999 to October 2005; University Professor, Boston College from November 2005 to August 2007 | 59 | Liberty All-Star Equity Fund and Liberty All-Star Growth Fund (closed-end funds) | |||||||||||||||
| Patrick J. Simpson c/o Columbia Management Investment Advisers, LLC, 225 Franklin Street Mail Drop BX32 05228, Boston, MA 02110 1944 | Trustee 2000 | Of Counsel, Perkins Coie LLP (law firm) since 2015; Partner, Perkins Coie LLP from 1988 to 2014 | 59 | None | |||||||||||||||
Annual Report 2016
38
COLUMBIA VARIABLE PORTFOLIO — MANAGED VOLATILITY GROWTH FUND
TRUSTEES AND OFFICERS (continued)
Independent Trustees (continued)
| Name, Address, Year of Birth | Position Held With the Trust and Length of Service | Principal Occupation(s) During the Past Five Years and Other Relevant Professional Experience | Number of Funds in the Columbia Funds Complex Overseen | Other Directorships Held by Trustee During the Past Five Years | |||||||||||||||
| Anne-Lee Verville c/o Columbia Management Investment Advisers, LLC, 225 Franklin Street Mail Drop BX32 05228, Boston, MA 02110 1945 | Trustee 1998 | Retired. General Manager, Global Education Industry from 1994 to 1997, President — Application Systems Division from 1991 to 1994, Chief Financial Officer — US Marketing & Services from 1988 to 1991, and Chief Information Officer from 1987 to 1988, IBM Corporation (computer and technology) | 59 | Enesco Group, Inc. (producer of giftware and home and garden decor products) from 2001 to 2006 | |||||||||||||||
Consultants to the Independent Trustees*
| Name, Address, Year of Birth | Position Held With the Trust and Length of Service | Principal Occupation(s) During the Past Five Years and Other Relevant Professional Experience | Number of Funds in the Columbia Funds Complex Overseen | Other Directorships Held by Trustee During the Past Five Years | |||||||||||||||
| J. Kevin Connaughton c/o Columbia Management Investment Advisers, LLC, 225 Franklin Street Mail Drop BX32 05228, Boston, MA 02110 1964 | Independent Trustee Consultant 2016 | Independent Trustee Consultant, Columbia Funds since March 2016; Managing Director and General Manager of Mutual Fund Products, Columbia Management Investment Advisers, LLC from May 2010 to February 2015; President, Columbia Funds from 2009 to 2015; and senior officer of Columbia Funds and affiliated funds from 2003 to 2015 | 59 | Board of Governors, Gateway Healthcare since January 2016; Trustee, New Century Portfolios since March 2015; and Director, The Autism Project since March 2015 | |||||||||||||||
| Natalie A. Trunow c/o Columbia Management Investment Advisers, LLC, 225 Franklin Street Mail Drop BX32 05228, Boston, MA 02110 1967 | Independent Trustee Consultant 2016 | Independent Trustee Consultant, Columbia Funds since September 2016; Senior Vice President and Chief Executive Officer, Millennial Partners (investment consulting services to institutions) since January 2016; Director of Investments, Casey Family Programs from April 2016 to September 2016; Chief Investment Officer, Calvert Investments from August 2008 to January 2016; Section Head and Portfolio Manager, General Motors Asset Management from June 1997 to August 2008 | 59 | Healthcare Services for Children with Special Needs | |||||||||||||||
* J. Kevin Connaughton was appointed consultant to the Independent Trustees effective March 1, 2016. Natalie A. Trunow was appointed consultant to the Independent Trustees effective September 1, 2016. Shareholders of the Funds are expected to be asked to elect each of Mr. Connaughton and Ms. Trunow as a Trustee at a future shareholder meeting.
Annual Report 2016
39
COLUMBIA VARIABLE PORTFOLIO — MANAGED VOLATILITY GROWTH FUND
TRUSTEES AND OFFICERS (continued)
Interested Trustee Affiliated with Investment Manager*
| Name, Address, Year of Birth | Position Held With the Trust and Length of Service | Principal Occupation(s) During the Past Five Years and Other Relevant Professional Experience | Number of Funds in the Columbia Funds Complex Overseen | Other Directorships Held by Trustee During the Past Five Years | |||||||||||||||
| William F. Truscott c/o Columbia Management Investment Advisers, LLC, 225 Franklin Street Boston, MA 02110 1960 | Trustee 2012 | Chairman of the Board and President, Columbia Management Investment Advisers, LLC since May 2010 and February 2012, respectively; Chief Executive Officer, Global Asset Management, Ameriprise Financial, Inc. since September 2012 (previously Chief Executive Officer, U.S. Asset Management & President, Annuities, May 2010- September 2012); Director and Chief Executive Officer, Columbia Management Investment Distributors, Inc. since May 2010 and February 2012, respectively; Chairman of the Board and Chief Executive Officer, RiverSource Distributors, Inc. since 2006; Director, Threadneedle Asset Management Holdings, SARL since 2014; President and Chief Executive Officer, Ameriprise Certificate Company, 2006-August 2012. | 185 | Trustee to other Columbia Funds since 2001; Chairman of the Board, Columbia Management Investment Advisers, LLC since May 2010; Director, Columbia Management Investment Distributors, Inc. since May 2010; Former Director, Ameriprise Certificate Company, 2006-January 2013 | |||||||||||||||
* Interested person (as defined under the 1940 Act) by reason of being an officer, director, security holder and/or employee of the Investment Manager or Ameriprise Financial.
The Statement of Additional Information has additional information about the Fund's Board members and is available, without charge, upon request by calling 800.345.6611 or contacting your financial intermediary.
Annual Report 2016
40
COLUMBIA VARIABLE PORTFOLIO — MANAGED VOLATILITY GROWTH FUND
TRUSTEES AND OFFICERS (continued)
The Board has appointed officers who are responsible for day-to-day business decisions based on policies it has established. The officers serve at the pleasure of the Board. The following table provides basic information about the Officers of the Fund, including principal occupations during the past five years, although their specific titles may have varied over the period. In addition to Mr. Truscott, who is Senior Vice President, the Fund's other officers are:
Fund Officers
| Name, Address and Year of Birth | Position and Year First Appointed to Position for any Fund in the Columbia Funds Complex or a Predecessor Thereof | Principal Occupation(s) During Past Five Years | |||||||||
| Christopher O. Petersen 5228 Ameriprise Financial Center Minneapolis, MN 55474 Born 1970 | President and Principal Executive Officer (2015) | Vice President and Lead Chief Counsel, Ameriprise Financial, Inc. since January 2015 (previously, Vice President and Chief Counsel January 2010-December 2014); officer of Columbia Funds and affiliated funds since 2007. | |||||||||
| Michael G. Clarke 225 Franklin Street Boston, MA 02110 Born 1969 | Treasurer (2011), Chief Financial Officer (2009) and Chief Accounting Officer (2015) | Vice President — Mutual Fund Administration, Columbia Management Investment Advisers, LLC, since May 2010; senior officer of Columbia Funds and affiliated funds since 2002. | |||||||||
| Paul B. Goucher 100 Park Avenue New York, NY 10017 Born 1968 | Senior Vice President (2011), Chief Legal Officer (2015) and Assistant Secretary (2008) | Senior Vice President and Assistant General Counsel, Ameriprise Financial, Inc. since January 2017 (previously Vice President and Lead Chief Counsel, November 2008-January 2017 and January 2013-2017, respectively, and Chief Counsel, January 2010-January 2013); Vice President, Chief Legal Officer and Assistant Secretary, Columbia Management Investment Advisers, LLC since May 2010. | |||||||||
| Thomas P. McGuire 225 Franklin Street Boston, MA 02110 Born 1972 | Senior Vice President and Chief Compliance Officer (2012) | Vice President — Asset Management Compliance, Ameriprise Financial, Inc., since May 2010; Chief Compliance Officer, Ameriprise Certificate Company since September 2010. | |||||||||
| Colin Moore 225 Franklin Street Boston, MA 02110 Born 1958 | Senior Vice President (2010) | Executive Vice President and Global Chief Investment Officer, Ameriprise Financial, Inc., since July 2013; Executive Vice President and Global Chief Investment Officer, Columbia Management Investment Advisers, LLC since July 2013 (previously Director and Global Chief Investment Officer, 2010-2013). | |||||||||
| Michael E. DeFao 225 Franklin Street Boston, MA 02110 Born 1968 | Vice President (2011) and Assistant Secretary (2010) | Vice President and Chief Counsel, Ameriprise Financial, Inc. since May 2010. | |||||||||
| Amy Johnson 5228 Ameriprise Financial Center Minneapolis, MN 55474 Born 1965 | Vice President (2006) | Managing Director and Global Head of Operations, Columbia Management Investment Advisers, LLC since April 2016 (previously Managing Director and Chief Operating Officer, 2010-2016). | |||||||||
| Lyn Kephart-Strong 5228 Ameriprise Financial Center Minneapolis, MN 55474 Born 1960 | Vice President (2015) | President, Columbia Management Investment Services Corp. since October 2014; Vice President & Resolution Officer, Ameriprise Trust Company since August 2009. | |||||||||
| Ryan C. Larrenaga 225 Franklin Street Boston, MA 02110 Born 1970 | Vice President and Secretary (2015) | Vice President and Group Counsel, Ameriprise Financial, Inc. since August 2011; officer of Columbia Funds and affiliated funds since 2005. | |||||||||
Annual Report 2016
41
This page intentionally left blank.
Annual Report 2016
42
This page intentionally left blank.
Annual Report 2016
43
This page intentionally left blank.
Annual Report 2016
44
COLUMBIA VARIABLE PORTFOLIO — MANAGED VOLATILITY GROWTH FUND
IMPORTANT INFORMATION ABOUT THIS REPORT
The policy of the Board is to vote the proxies of the companies in which each fund holds investments consistent with the procedures as stated in the Statement of Additional Information (SAI). You may obtain a copy of the SAI without charge by calling 800.345.6611; contacting your financial intermediary or searching the website of the Securities and Exchange Commission (SEC) at sec.gov. Information regarding how each fund voted proxies relating to portfolio securities is filed with the SEC by August 31st for the most recent 12-month period ending June 30th of that year, and is available without charge by visiting investor.columbiathreadneedleus.com, or searching the website of the SEC at sec.gov.
Each fund files a complete schedule of portfolio holdings with the SEC for the first and third quarters of each fiscal year on Form N-Q. Each fund's Form N-Q is available on the SEC's website at sec.gov and may be reviewed and copied at the SEC's Public Reference Room in Washington, D.C. Information on the operation of the Public Reference Room may be obtained by calling 800.SEC.0330. Each fund's complete schedule of portfolio holdings, as filed on Form N-Q, can also be obtained without charge, upon request, by calling 800.345.6611.
Annual Report 2016
45
Columbia Variable Portfolio — Managed Volatility Growth Fund
P.O. Box 8081
Boston, MA 02266-8081

Please read and consider the investment objectives, risks, charges and expenses for any fund carefully before investing. For fund and other investment product prospectuses, which contain this and other important information, contact your financial advisor or insurance representative. Please read the prospectus carefully before you invest. The Fund is distributed by Columbia Management Investment Distributors, Inc., member FINRA, and managed by Columbia Management Investment Advisers, LLC.
Columbia Threadneedle Investments (Columbia Threadneedle) is the global brand name of the Columbia and Threadneedle group of companies.
All rights reserved. Columbia Management Investment Distributors, Inc., 225 Franklin Street, Boston, MA 02110-2804
© 2017 Columbia Management Investment Advisers, LLC.
S-6598 AN (2/17)

ANNUAL REPORT
December 31, 2016

COLUMBIA VARIABLE PORTFOLIO — U.S. FLEXIBLE GROWTH FUND
Please remember that you may not buy (nor will you own) shares of the Fund directly. The Fund is available through variable annuity contracts or life insurance policies offered by the separate accounts of affiliated insurance companies and other qualified institutional investors authorized by Columbia Management Investment Distributors, Inc. Please contact your financial advisor or insurance representative for more information.

COLUMBIA VARIABLE PORTFOLIO — U.S. FLEXIBLE GROWTH FUND
TABLE OF CONTENTS
Portfolio Overview | 2 | ||||||
Understanding Your Fund's Expenses | 3 | ||||||
Portfolio of Investments | 4 | ||||||
Statement of Assets and Liabilities | 9 | ||||||
Statement of Operations | 10 | ||||||
Statement of Changes in Net Assets | 11 | ||||||
Financial Highlights | 13 | ||||||
Notes to Financial Statements | 14 | ||||||
Report of Independent Registered Public Accounting Firm | 21 | ||||||
Trustees and Officers | 22 | ||||||
| Board Consideration and Approval of Management Agreement | 27 | ||||||
Important Information About This Report | 33 | ||||||
The views expressed in this report reflect the current views of the respective parties. These views are not guarantees of future performance and involve certain risks, uncertainties and assumptions that are difficult to predict, so actual outcomes and results may differ significantly from the views expressed. These views are subject to change at any time based upon economic, market or other conditions and the respective parties disclaim any responsibility to update such views. These views may not be relied on as investment advice and, because investment decisions for a Columbia fund are based on numerous factors, may not be relied on as an indication of trading intent on behalf of any particular Columbia fund. References to specific securities should not be construed as a recommendation or investment advice.
Annual Report 2016
COLUMBIA VARIABLE PORTFOLIO — U.S. FLEXIBLE GROWTH FUND
PORTFOLIO OVERVIEW
(Unaudited)
Portfolio Management
Jeffrey Knight, CFA
Anwiti Bahuguna, Ph.D.
David Weiss, CFA
Brian Virginia
Effective January 27, 2017, Kent Peterson no longer serves as a portfolio manager of the Fund.
| Portfolio Allocation (%) (at December 31, 2016) | |||||||
Allocations to Underlying Funds | |||||||
Underlying Funds: Equity | 58.7 | ||||||
U.S. Large Cap | 58.7 | ||||||
Underlying Funds: Fixed Income | 12.7 | ||||||
High Yield | 0.7 | ||||||
Investment Grade | 12.0 | ||||||
Allocations to Tactical Assets | |||||||
Exchange-Traded Funds | 2.0 | ||||||
Money Market Fund Shares Held to Cover Open Derivatives Instruments(a) | 26.6 | ||||||
Total | 100.0 | ||||||
Percentages indicated are based upon total investments. The Fund's portfolio composition is subject to change.
(a) Includes investments in an affiliated money market fund (amounting to $43.4 million) which have been segregated to cover obligations relating to the Fund's investment in derivatives as part of its tactical allocation strategy. For a description of the Fund's investments in derivatives, see Investments in Derivatives following the Portfolio of Investments, and Note 2 to the financial statements.
Annual Report 2016
2
COLUMBIA VARIABLE PORTFOLIO — U.S. FLEXIBLE GROWTH FUND
UNDERSTANDING YOUR FUND'S EXPENSES
(Unaudited)
As an investor, you incur ongoing costs, which generally include management fees, distribution and/or service fees, and other fund expenses. The following information is intended to help you understand your ongoing costs (in dollars) of investing in the Fund and to help you compare these costs with the ongoing costs of investing in other mutual funds.
The information below does not reflect fees and expenses imposed under your variable annuity contract and/or variable life insurance policy (collectively, Contracts) or qualified pension and retirement plan (Qualified Plan), if any. The total fees and expenses you bear may therefore be higher than those shown below.
Analyzing Your Fund's Expenses
To illustrate these ongoing costs, we have provided examples and calculated the expenses paid by investors in Class 2 shares of the Fund during the period. The actual and hypothetical information in the table is based on an initial investment of $1,000 at the beginning of the period indicated and held for the entire period. Expense information is calculated two ways and each method provides you with different information. The amount listed in the "Actual" column is calculated using the Fund's actual operating expenses and total return for the period. You may use the Actual information, together with the amount invested, to estimate the expenses that you paid over the period. Simply divide your account value by $1,000 (for example, an $8,600 account value divided by $1,000 = 8.6), then multiply the results by the expenses paid during the period under the "Actual" column. The amount listed in the "Hypothetical" column assumes a 5% annual rate of return before expenses (which is not the Fund's actual return) and then applies the Fund's actual expense ratio for the period to the hypothetical return. You should not use the hypothetical account values and expenses to estimate either your actual account balance at the end of the period or the expenses you paid during the period. See "Compare With Other Funds" below for details on how to use the hypothetical data.
In addition to the ongoing expenses which the Fund bears directly, the Fund's shareholders indirectly bear the Fund's allocable share of the costs and expenses of each underlying fund in which the Fund invests. You can estimate the effective expenses paid during the period, which includes the indirect fees associated with investing in the underlying funds, by using the amounts listed in the "Effective Expenses Paid During the Period" column.
Compare With Other Funds
Since all mutual funds are required to include the same hypothetical calculations about expenses in shareholder reports, you can use this information to compare the ongoing cost of investing in the Fund with other funds. To do so, compare the hypothetical example with the 5% hypothetical examples that appear in the shareholder reports of other funds. As you compare hypothetical examples of other funds, it is important to note that hypothetical examples are meant to highlight the ongoing costs of investing in a fund only and do not reflect any transaction costs, such as redemption or exchange fees, or expenses that apply to the subaccount or the Contract. Therefore, the hypothetical calculations are useful in comparing ongoing costs only, and will not help you determine the relative total costs of owning different funds. If the fees and expenses imposed under your Contract or Qualified Plan, if any, were included, your costs would be higher.
July 1, 2016 – December 31, 2016
| Account Value at the Beginning of the Period ($) | Account Value at the End of the Period ($) | Expenses Paid During the Period ($) | Fund's Annualized Expense Ratio (%) | Effective Expenses Paid During the Period ($) | Fund's Effective Annualized Expense Ratio (%) | ||||||||||||||||||||||||||||||||||||||
Actual | Hypothetical | Actual | Hypothetical | Actual | Hypothetical | Actual | Actual | Hypothetical | Actual | ||||||||||||||||||||||||||||||||||
Class 2 | 1,000.00 | 1,000.00 | 1035.00 | (a) | 1,021.85 | 1.02 | (a) | 3.18 | 0.63 | (a) | 1.77 | (a) | 5.56 | 1.10 | (a) | ||||||||||||||||||||||||||||
(a) Based on operations from November 2, 2016 (commencement of operations) through the stated period end.
Expenses paid during the period are equal to the annualized expense ratio for each class as indicated above, multiplied by the average account value over the period and then multiplied by the number of days in the Fund's most recent fiscal half year and divided by 366.
Effective expenses paid during the period and the Fund's effective annualized expense ratio include expenses borne directly to the class plus the Fund's indirect pro rata portion of the ongoing expenses charged by the underlying funds using the expense ratio of each class of the underlying funds as of the underlying fund's most recent shareholder report.
Annual Report 2016
3
COLUMBIA VARIABLE PORTFOLIO — U.S. FLEXIBLE GROWTH FUND
PORTFOLIO OF INVESTMENTS
December 31, 2016
(Percentages represent value of investments compared to net assets)
Equity Funds 57.6%
Shares | Value ($) | ||||||||||
U.S. LARGE CAP 57.6% | |||||||||||
| Columbia Variable Portfolio — Large Cap Index Fund, Class 1 Shares(a)(b) | 1,249,982 | 21,324,691 | |||||||||
| Columbia Variable Portfolio — Disciplined Core Fund, Class 1 Shares(a)(b) | 272,624 | 10,662,346 | |||||||||
| Columbia Variable Portfolio — Select Large-Cap Value Fund, Class 1 Shares(a)(b) | 518,597 | 10,662,347 | |||||||||
| Variable Portfolio — Loomis Sayles Growth Fund, Class 1 Shares(a)(b) | 485,756 | 10,662,345 | |||||||||
| Variable Portfolio — MFS® Blended Research® Core Equity Fund, Class 1 Shares(a)(b) | 1,253,707 | 21,313,012 | |||||||||
| Variable Portfolio — Morgan Stanley Advantage Fund, Class 1 Shares(a)(b) | 520,114 | 10,662,344 | |||||||||
| Variable Portfolio — T. Rowe Price Large Cap Value Fund, Class 1 Shares(a)(b) | 543,443 | 10,662,347 | |||||||||
Total | 95,949,432 | ||||||||||
| Total Equity Funds (Cost: $95,691,759) | 95,949,432 | ||||||||||
Fixed-Income Funds 12.5%
HIGH YIELD 0.7% | |||||||||||
| Columbia Variable Portfolio — Income Opportunities Fund, Class 1 Shares(a) | 160,655 | 1,214,550 | |||||||||
INVESTMENT GRADE 11.8% | |||||||||||
| Columbia Variable Portfolio — Intermediate Bond Fund, Class 1 Shares(a) | 400,562 | 4,145,820 | |||||||||
| Columbia Variable Portfolio — Limited Duration Credit Fund, Class 1 Shares(a) | 128,252 | 1,214,550 | |||||||||
Fixed-Income Funds (continued)
Shares | Value ($) | ||||||||||
| Columbia Variable Portfolio — Long Government/Credit Bond Fund, Class 1 Shares(a) | 100,067 | 992,661 | |||||||||
| Columbia Variable Portfolio — U.S. Government Mortgage Fund, Class 1 Shares(a) | 117,689 | 1,214,550 | |||||||||
| Variable Portfolio — American Century Diversified Bond Fund, Class 1 Shares(a) | 366,882 | 4,017,358 | |||||||||
| Variable Portfolio — J.P. Morgan Core Bond Fund, Class 1 Shares(a) | 332,434 | 3,596,937 | |||||||||
| Variable Portfolio — TCW Core Plus Bond Fund, Class 1 Shares(a) | 369,964 | 3,877,218 | |||||||||
| Variable Portfolio — Wells Fargo Short Duration Government Fund, Class 1 Shares(a) | 55,611 | 560,561 | |||||||||
Total | 19,619,655 | ||||||||||
| Total Fixed-Income Funds (Cost: $20,763,647) | 20,834,205 | ||||||||||
Exchange-Traded Funds 1.9%
SPDR S&P 500 ETF Trust | 14,500 | 3,241,185 | |||||||||
| Total Exchange-Traded Funds (Cost: $3,256,961) | 3,241,185 | ||||||||||
Money Market Funds 26.1%
| Columbia Short-Term Cash Fund, 0.594%(a)(c) | 43,436,635 | 43,436,635 | |||||||||
| Total Money Market Funds (Cost: $43,436,778) | 43,436,635 | ||||||||||
| Total Investments (Cost: $163,149,145) | 163,461,457 | ||||||||||
Other Assets & Liabilities, Net | 3,170,178 | ||||||||||
Net Assets | 166,631,635 | ||||||||||
At December 31, 2016, cash totaling $1,876,250 was pledged as collateral.
Investments in Derivatives
Futures Contracts Outstanding at December 31, 2016
Long Futures Contracts Outstanding
Contract Description | Number of Contracts | Trading Currency | Notional Market Value ($) | Expiration Date | Unrealized Appreciation ($) | Unrealized (Depreciation) ($) | |||||||||||||||||||||
S&P 500 E-mini | 405 | USD | 45,283,050 | 03/2017 | 43,537 | — | |||||||||||||||||||||
The accompanying Notes to Financial Statements are an integral part of this statement.
Annual Report 2016
4
COLUMBIA VARIABLE PORTFOLIO — U.S. FLEXIBLE GROWTH FUND
PORTFOLIO OF INVESTMENTS (continued)
December 31, 2016
Notes to Portfolio of Investments
(a) As defined in the Investment Company Act of 1940, an affiliated company is one in which the Fund owns 5% or more of the company's outstanding voting securities, or a company which is under common ownership or control with the Fund. Holdings and transactions in these affiliated companies during the year ended December 31, 2016 are as follows:
Issuer | Beginning Cost ($) | Purchase Cost ($) | Proceeds From Sales ($) | Realized Gain (Loss) ($) | Ending Cost ($) | Dividends — Affiliated Issuers ($) | Value ($) | ||||||||||||||||||||||||
| Columbia Short-Term Cash Fund | 10,000,000 | 45,554,156 | (12,117,161 | ) | (217 | ) | 43,436,778 | 14,881 | 43,436,635 | ||||||||||||||||||||||
| Columbia Variable Portfolio — Disciplined Core Fund, Class 1 Shares | — | 10,955,990 | (313,242 | ) | (2,375 | ) | 10,640,373 | — | 10,662,346 | ||||||||||||||||||||||
| Columbia Variable Portfolio — Income Opportunities Fund, Class 1 Shares | — | 1,245,637 | (41,858 | ) | — | 1,203,779 | — | 1,214,550 | |||||||||||||||||||||||
| Columbia Variable Portfolio — Intermediate Bond Fund, Class 1 Shares | — | 4,272,389 | (137,447 | ) | (3,606 | ) | 4,131,336 | — | 4,145,820 | ||||||||||||||||||||||
| Columbia Variable Portfolio — Large Cap Index Fund, Class 1 Shares | — | 21,771,396 | (618,325 | ) | (5,045 | ) | 21,148,026 | — | 21,324,691 | ||||||||||||||||||||||
| Columbia Variable Portfolio — Limited Duration Credit Fund, Class 1 Shares | — | 1,252,853 | (40,991 | ) | (216 | ) | 1,211,646 | — | 1,214,550 | ||||||||||||||||||||||
| Columbia Variable Portfolio — Long Government/ Credit Bond Fund, Class 1 Shares | — | 1,019,956 | (34,211 | ) | (2,524 | ) | 983,221 | — | 992,661 | ||||||||||||||||||||||
| Columbia Variable Portfolio — Select Large-Cap Value Fund, Class 1 Shares | — | 10,790,792 | (298,157 | ) | (2,896 | ) | 10,489,739 | — | 10,662,347 | ||||||||||||||||||||||
| Columbia Variable Portfolio — U.S. Government Mortgage Fund, Class 1 Shares | — | 1,253,027 | (39,470 | ) | (845 | ) | 1,212,712 | — | 1,214,550 | ||||||||||||||||||||||
| Variable Portfolio — American Century Diversified Bond Fund, Class 1 Shares | — | 4,137,890 | (130,989 | ) | (3,491 | ) | 4,003,410 | — | 4,017,358 | ||||||||||||||||||||||
The accompanying Notes to Financial Statements are an integral part of this statement.
Annual Report 2016
5
COLUMBIA VARIABLE PORTFOLIO — U.S. FLEXIBLE GROWTH FUND
PORTFOLIO OF INVESTMENTS (continued)
December 31, 2016
Notes to Portfolio of Investments (continued)
Issuer | Beginning Cost ($) | Purchase Cost ($) | Proceeds From Sales ($) | Realized Gain (Loss) ($) | Ending Cost ($) | Dividends — Affiliated Issuers ($) | Value ($) | ||||||||||||||||||||||||
| Variable Portfolio — J.P. Morgan Core Bond Fund, Class 1 Shares | — | 3,709,530 | (117,200 | ) | (3,380 | ) | 3,588,950 | — | 3,596,937 | ||||||||||||||||||||||
| Variable Portfolio — Loomis Sayles Growth Fund, Class 1 Shares | — | 11,039,192 | (300,402 | ) | (2,823 | ) | 10,735,967 | — | 10,662,345 | ||||||||||||||||||||||
| Variable Portfolio — MFS® Blended Research® Core Equity Fund, Class 1 Shares | — | 21,875,084 | (617,987 | ) | (5,041 | ) | 21,252,056 | — | 21,313,012 | ||||||||||||||||||||||
| Variable Portfolio — Morgan Stanley Advantage Fund, Class 1 Shares | — | 11,153,782 | (313,066 | ) | (2,382 | ) | 10,838,334 | — | 10,662,344 | ||||||||||||||||||||||
| Variable Portfolio — T. Rowe Price Large Cap Value Fund, Class 1 Shares | — | 10,895,908 | (306,011 | ) | (2,633 | ) | 10,587,264 | — | 10,662,347 | ||||||||||||||||||||||
| Variable Portfolio — TCW Core Plus Bond Fund, Class 1 Shares | — | 3,997,573 | (126,095 | ) | (3,513 | ) | 3,867,965 | — | 3,877,218 | ||||||||||||||||||||||
| Variable Portfolio — Wells Fargo Short Duration Government Fund, Class 1 Shares | — | 579,722 | (18,943 | ) | (151 | ) | 560,628 | — | 560,561 | ||||||||||||||||||||||
Total | 10,000,000 | 165,504,877 | (15,571,555 | ) | (41,138 | ) | 159,892,184 | 14,881 | 160,220,272 | ||||||||||||||||||||||
(b) Non-income producing investment.
(c) The rate shown is the seven-day current annualized yield at December 31, 2016.
Currency Legend
USD US Dollar
The accompanying Notes to Financial Statements are an integral part of this statement.
Annual Report 2016
6
COLUMBIA VARIABLE PORTFOLIO — U.S. FLEXIBLE GROWTH FUND
PORTFOLIO OF INVESTMENTS (continued)
December 31, 2016
Fair Value Measurements
The Fund categorizes its fair value measurements according to a three-level hierarchy that maximizes the use of observable inputs and minimizes the use of unobservable inputs by prioritizing that the most observable input be used when available. Observable inputs are those that market participants would use in pricing an investment based on market data obtained from sources independent of the reporting entity. Unobservable inputs are those that reflect the Fund's assumptions about the information market participants would use in pricing an investment. An investment's level within the fair value hierarchy is based on the lowest level of any input that is deemed significant to the asset's or liability's fair value measurement. The input levels are not necessarily an indication of the risk or liquidity associated with investments at that level. For example, certain U.S. government securities are generally high quality and liquid, however, they are reflected as Level 2 because the inputs used to determine fair value may not always be quoted prices in an active market.
Fair value inputs are summarized in the three broad levels listed below:
> Level 1 — Valuations based on quoted prices for investments in active markets that the Fund has the ability to access at the measurement date (including NAV for open-end mutual funds). Valuation adjustments are not applied to Level 1 investments.
> Level 2 — Valuations based on other significant observable inputs (including quoted prices for similar securities, interest rates, prepayment speeds, credit risks, etc.).
> Level 3 — Valuations based on significant unobservable inputs (including the Fund's own assumptions and judgment in determining the fair value of investments).
Inputs that are used in determining fair value of an investment may include price information, credit data, volatility statistics, and other factors. These inputs can be either observable or unobservable. The availability of observable inputs can vary between investments, and is affected by various factors such as the type of investment, and the volume and level of activity for that investment or similar investments in the marketplace. The inputs will be considered by the Investment Manager, along with any other relevant factors in the calculation of an investment's fair value. The Fund uses prices and inputs that are current as of the measurement date, which may include periods of market dislocations. During these periods, the availability of prices and inputs may be reduced for many investments. This condition could cause an investment to be reclassified between the various levels within the hierarchy.
Certain investments that have been measured at fair value using the net asset value (NAV) per share (or its equivalent) are not categorized in the fair value hierarchy. The fair value amounts presented in the table are intended to reconcile the fair value hierarchy to the amounts presented in the Portfolio of Investments. The Variable Portfolios serve as investment vehicles for variable annuity contracts and variable life insurance policies. Principle investment strategies within these Variable Portfolios vary based on the Portfolios investment objective. Investments in the Variable Portfolios may be redeemed on a daily basis without restriction. The Columbia Short-Term Cash Fund seeks to provide shareholders with maximum current income consistent with liquidity and stability of principal. Columbia Short-Term Cash Fund prices its shares with a floating NAV and no longer seeks to maintain a stable NAV.
Investments falling into the Level 3 category are primarily supported by quoted prices from brokers and dealers participating in the market for those investments. However, these may be classified as Level 3 investments due to lack of market transparency and corroboration to support these quoted prices. Additionally, valuation models may be used as the pricing source for any remaining investments classified as Level 3. These models may rely on one or more significant unobservable inputs and/or significant assumptions by the Investment Manager. Inputs used in valuations may include, but are not limited to, financial statement analysis, capital account balances, discount rates and estimated cash flows, and comparable company data.
Under the direction of the Fund's Board of Trustees (the Board), the Investment Manager's Valuation Committee (the Committee) is responsible for overseeing the valuation procedures approved by the Board. The Committee consists of voting and non-voting members from various groups within the Investment Manager's organization, including operations and accounting, trading and investments, compliance, risk management and legal.
The Committee meets at least monthly to review and approve valuation matters, which may include a description of specific valuation determinations, data regarding pricing information received from approved pricing vendors and brokers and the results of Board-approved valuation control policies and procedures (the Policies). The Policies address, among other things, instances when market quotations are or are not readily available, including recommendations of third party pricing vendors and a determination of appropriate pricing methodologies; events that require specific valuation determinations and assessment of fair value techniques; securities with a potential for stale pricing, including those that are illiquid, restricted, or in default; and the effectiveness of third party pricing vendors, including periodic reviews of vendors. The Committee meets more frequently, as needed, to discuss additional valuation matters, which may include the need to review back-testing results, review time-sensitive information or approve related valuation actions. The Committee reports to the Board, with members of the Committee meeting with the Board at each of its regularly scheduled meetings to discuss valuation matters and actions during the period, similar to those described earlier.
For investments categorized as Level 3, the Committee monitors information similar to that described above, which may include: (i) data specific to the issuer or comparable issuers, (ii) general market or specific sector news and (iii) quoted prices and specific or similar security transactions. The Committee considers this data and any changes from prior periods in order to assess the reasonableness of observable and unobservable inputs, any assumptions or internal models used to value those securities and changes in fair value. This data is also used to corroborate, when available, information received from approved pricing vendors and brokers. Various factors impact the frequency of monitoring this information (which may occur as often as daily). However, the Committee may determine that changes to inputs, assumptions and models are not required as a result of the monitoring procedures performed.
The accompanying Notes to Financial Statements are an integral part of this statement.
Annual Report 2016
7
COLUMBIA VARIABLE PORTFOLIO — U.S. FLEXIBLE GROWTH FUND
PORTFOLIO OF INVESTMENTS (continued)
December 31, 2016
Fair Value Measurements (continued)
The following table is a summary of the inputs used to value the Fund's investments at December 31, 2016:
| Level 1 Quoted Prices in Active Markets for Identical Assets ($) | Level 2 Other Significant Observable Inputs ($) | Level 3 Significant Unobservable Inputs ($) | Total ($) | ||||||||||||||||
Investments | |||||||||||||||||||
Exchange-Traded Funds | 3,241,185 | — | — | 3,241,185 | |||||||||||||||
Investments measured at net asset value | |||||||||||||||||||
Equity Funds | — | — | — | 95,949,432 | |||||||||||||||
Fixed-Income Funds | — | — | — | 20,834,205 | |||||||||||||||
Money Market Funds | — | — | — | 43,436,635 | |||||||||||||||
Total Investments | 3,241,185 | — | — | 163,461,457 | |||||||||||||||
Derivatives | |||||||||||||||||||
Assets | |||||||||||||||||||
Futures Contracts | 43,537 | — | — | 43,537 | |||||||||||||||
Total | 3,284,722 | — | — | 163,504,994 | |||||||||||||||
See the Portfolio of Investments for all investment classifications not indicated in the table.
Derivative instruments are valued at unrealized appreciation (depreciation).
There were no transfers of financial assets between levels during the period.
The accompanying Notes to Financial Statements are an integral part of this statement.
Annual Report 2016
8
COLUMBIA VARIABLE PORTFOLIO — U.S. FLEXIBLE GROWTH FUND
STATEMENT OF ASSETS AND LIABILITIES
December 31, 2016
Assets | |||||||
Investments, at value | |||||||
Unaffiliated issuers (identified cost $3,256,961) | $ | 3,241,185 | |||||
Affiliated issuers (identified cost $159,892,184) | 160,220,272 | ||||||
Total investments (identified cost $163,149,145) | 163,461,457 | ||||||
Margin deposits | 1,876,250 | ||||||
Receivable for: | |||||||
Investments sold on a delayed delivery basis | 261,253 | ||||||
Capital shares sold | 4,935,665 | ||||||
Dividends | 32,059 | ||||||
Variation margin | 1,075 | ||||||
Trustees' deferred compensation plan | 75 | ||||||
Total assets | 170,567,834 | ||||||
Liabilities | |||||||
Payable for: | |||||||
Investments purchased | 3,454,264 | ||||||
Investments purchased on a delayed delivery basis | 263,236 | ||||||
Capital shares purchased | 1,001 | ||||||
Variation margin | 175,775 | ||||||
Management services fees | 998 | ||||||
Distribution and/or service fees | 1,088 | ||||||
Transfer agent fees | 78 | ||||||
Compensation of board members | 750 | ||||||
Chief compliance officer expenses | 12 | ||||||
Other expenses | 38,922 | ||||||
Trustees' deferred compensation plan | 75 | ||||||
Total liabilities | 3,936,199 | ||||||
Net assets applicable to outstanding capital stock | $ | 166,631,635 | |||||
Represented by | |||||||
Trust capital | $ | 166,631,635 | |||||
Total — representing net assets applicable to outstanding capital stock | $ | 166,631,635 | |||||
Class 2 | |||||||
Net assets | $ | 166,631,635 | |||||
Shares outstanding | 16,105,944 | ||||||
Net asset value per share | $ | 10.35 | |||||
The accompanying Notes to Financial Statements are an integral part of this statement.
Annual Report 2016
9
COLUMBIA VARIABLE PORTFOLIO — U.S. FLEXIBLE GROWTH FUND
STATEMENT OF OPERATIONS
Year Ended December 31, 2016(a)
Net investment income | |||||||
Income: | |||||||
Dividends — unaffiliated issuers | $ | 23,246 | |||||
Dividends — affiliated issuers | 14,881 | ||||||
Total income | 38,127 | ||||||
Expenses: | |||||||
Management services fees | 23,689 | ||||||
Distribution and/or service fees | |||||||
Class 2 | 25,809 | ||||||
Transfer agent fees | |||||||
Class 2 | 1,854 | ||||||
Compensation of board members | 750 | ||||||
Custodian fees | 5,171 | ||||||
Printing and postage fees | 12,497 | ||||||
Audit fees | 18,924 | ||||||
Legal fees | 404 | ||||||
Chief compliance officer expenses | 12 | ||||||
Other | 1,386 | ||||||
Total expenses | 90,496 | ||||||
Net investment loss | (52,369 | ) | |||||
Realized and unrealized gain (loss) — net | |||||||
Net realized gain (loss) on: | |||||||
Investments — unaffiliated issuers | (57,930 | ) | |||||
Investments — affiliated issuers | (41,138 | ) | |||||
Futures contracts | 126,611 | ||||||
Net realized gain | 27,543 | ||||||
Net change in unrealized appreciation (depreciation) on: | |||||||
Investments — unaffiliated issuers | (15,776 | ) | |||||
Investments — affiliated issuers | 328,088 | ||||||
Futures contracts | 43,537 | ||||||
Net change in unrealized appreciation | 355,849 | ||||||
Net realized and unrealized gain | 383,392 | ||||||
Net increase in net assets resulting from operations | $ | 331,023 | |||||
(a) Based on operations from November 2, 2016 (commencement of operations) through the stated period end.
The accompanying Notes to Financial Statements are an integral part of this statement.
Annual Report 2016
10
COLUMBIA VARIABLE PORTFOLIO — U.S. FLEXIBLE GROWTH FUND
STATEMENT OF CHANGES IN NET ASSETS
| Year Ended December 31, 2016(a) | |||||||
Operations | |||||||
Net investment loss | $ | (52,369 | ) | ||||
Net realized gain | 27,543 | ||||||
Net change in unrealized appreciation | 355,849 | ||||||
Net increase in net assets resulting from operations | 331,023 | ||||||
Increase in net assets from capital stock activity | 156,300,612 | ||||||
Total increase in net assets | 156,631,635 | ||||||
Net assets at beginning of year | 10,000,000 | ||||||
Net assets at end of year | $ | 166,631,635 | |||||
(a) Based on operations from November 2, 2016 (commencement of operations) through the stated period end.
The accompanying Notes to Financial Statements are an integral part of this statement.
Annual Report 2016
11
COLUMBIA VARIABLE PORTFOLIO — U.S. FLEXIBLE GROWTH FUND
STATEMENT OF CHANGES IN NET ASSETS (continued)
Year Ended December 31, 2016(a) | |||||||||||
Shares | Dollars ($) | ||||||||||
Capital stock activity | |||||||||||
Class 2 shares | |||||||||||
Subscriptions | 16,106,336 | 166,734,675 | |||||||||
Redemptions | (1,000,392 | ) | (10,434,063 | ) | |||||||
Net increase | 15,105,944 | 156,300,612 | |||||||||
Total net increase | 15,105,944 | 156,300,612 | |||||||||
(a) Based on operations from November 2, 2016 (commencement of operations) through the stated period end.
The accompanying Notes to Financial Statements are an integral part of this statement.
Annual Report 2016
12
COLUMBIA VARIABLE PORTFOLIO — U.S. FLEXIBLE GROWTH FUND
FINANCIAL HIGHLIGHTS
The following table is intended to help you understand the Fund's financial performance. Certain information reflects financial results for a single share of a class held for the periods shown. Per share net investment income (loss) amounts are calculated based on average shares outstanding during the period. Total return assumes reinvestment of all dividends and distributions, if any. Total return does not reflect any fees and expenses imposed under your Contract and/or Qualified Plan, as applicable; such fees and expenses would reduce the total returns for all periods shown. Total return and portfolio turnover are not annualized for periods of less than one year. The portfolio turnover rate is calculated without regard to purchase and sales transactions of short-term instruments and certain derivatives, if any. If such transactions were included, the Fund's portfolio turnover rate may be higher.
Class 2 | Year Ended December 31, 2016(a) | ||||||
Per share data | |||||||
Net asset value, beginning of period | $ | 10.00 | |||||
Income from investment operations: | |||||||
Net investment loss | (0.01 | ) | |||||
Net realized and unrealized gain | 0.36 | ||||||
Total from investment operations | 0.35 | ||||||
Net asset value, end of period | $ | 10.35 | |||||
Total return | 3.50 | % | |||||
Ratios to average net assets(b) | |||||||
Total gross expenses | 0.63 | %(c) | |||||
Total net expenses(d) | 0.63 | %(c) | |||||
Net investment loss | (0.26 | %)(c) | |||||
Supplemental data | |||||||
Net assets, end of period (in thousands) | $ | 166,632 | |||||
Portfolio turnover | 12 | % | |||||
Notes to Financial Highlights
(a) Based on operations from November 2, 2016 (commencement of operations) through the stated period end.
(b) In addition to the fees and expenses that the Fund bears directly, the Fund indirectly bears a pro rata share of the fees and expenses of the underlying funds in which the Fund invests. Such indirect expenses are not included in the Fund's reported expense ratios.
(c) Annualized.
(d) Total net expenses include the impact of certain fee waivers/expense reimbursements made by the Investment Manager and certain of its affiliates, if applicable.
The accompanying Notes to Financial Statements are an integral part of this statement.
Annual Report 2016
13
COLUMBIA VARIABLE PORTFOLIO — U.S. FLEXIBLE GROWTH FUND
NOTES TO FINANCIAL STATEMENTS
December 31, 2016
Note 1. Organization
Columbia Variable Portfolio — U.S. Flexible Growth Fund (the Fund), a series of Columbia Funds Variable Insurance Trust (the Trust), is a diversified fund. The Trust is registered under the Investment Company Act of 1940, as amended (the 1940 Act), as an open-end management investment company organized as a Massachusetts business trust.
On November 1, 2016, Columbia Management Investment Advisers, LLC (the Investment Manager), a wholly-owned subsidiary of Ameriprise Financial, Inc. (Ameriprise Financial), invested $10,000,000 in the Fund (1,000,000 shares for Class 2), which represented the initial capital at $10 per share. Shares of the Fund were first offered to the public on November 14, 2016.
These financial statements cover the period from November 2, 2016 (commencement of operations) through December 31, 2016.
The Fund is a "fund-of-funds", investing significantly in affiliated funds managed by the Investment Manager, its affiliates, or third-party advised (unaffiliated) funds, including exchange-traded funds (collectively, Underlying Funds).
For information on the Underlying Funds, please refer to the Fund's current prospectus and the prospectuses of the Underlying Funds, which are available, free of charge, from the Securities and Exchange Commission website, www.sec.gov.
Fund Shares
The Trust may issue an unlimited number of shares (without par value). The Fund offers Class 2 shares to separate accounts funding variable annuity contracts and variable life insurance policies (collectively, Contracts) issued by affiliated and unaffiliated life insurance companies as well as other qualified institutional investors (Qualified Investors) authorized by Columbia Management Investment Distributors, Inc. (the Distributor). You may not buy (nor will you own) shares of the Fund directly. You may invest by buying a Contract.
Note 2. Summary of Significant Accounting Policies
Basis of Preparation
The Fund is an investment company that applies the accounting and reporting guidance in the Financial Accounting Standards Board (FASB) Accounting Standards Codification Topic 946, Financial Services — Investment Companies (ASC 946). The financial
statements are prepared in accordance with U.S. generally accepted accounting principles (GAAP), which requires management to make certain estimates and assumptions that affect the reported amounts of assets and liabilities, the disclosure of contingent assets and liabilities at the date of the financial statements and the reported amounts of income and expenses during the reporting period. Actual results could differ from those estimates.
The following is a summary of significant accounting policies followed by the Fund in the preparation of its financial statements.
Security Valuation
All equity securities and exchange-traded funds are valued at the close of business of the New York Stock Exchange. Equity securities and exchange-traded funds are valued at the last quoted sales price on the principal exchange or market on which they trade, except for securities traded on the NASDAQ Stock Market, which are valued at the NASDAQ official close price. Unlisted securities or listed securities for which there were no sales during the day are valued at the mean of the latest quoted bid and ask prices on such exchanges or markets.
Investments in the Underlying Funds are valued at the net asset value of the applicable class of the Underlying Fund determined as of the close of the New York Stock Exchange on the valuation date.
Futures and options on futures contracts are valued based upon the settlement price at the close of regular trading on their principal exchanges or, in the absence of transactions, at the mean of the latest quoted bid and ask prices.
Investments for which market quotations are not readily available, or that have quotations which management believes are not reflective of market value or reliable, are valued at fair value as determined in good faith under procedures approved by and under the general supervision of the Board of Trustees. If a security or class of securities (such as foreign securities) is valued at fair value, such value is likely to be different from the quoted or published price for the security.
The determination of fair value often requires significant judgment. To determine fair value, management may use assumptions including but not limited to future cash flows and estimated risk premiums. Multiple inputs from various sources may be used to determine fair value.
GAAP requires disclosure regarding the inputs and valuation techniques used to measure fair value and any
Annual Report 2016
14
COLUMBIA VARIABLE PORTFOLIO — U.S. FLEXIBLE GROWTH FUND
NOTES TO FINANCIAL STATEMENTS
December 31, 2016 (continued)
changes in valuation inputs or techniques. In addition, investments shall be disclosed by major category. This information is disclosed following the Fund's Portfolio of Investments.
Derivative Instruments
The Fund invests in certain derivative instruments, as detailed below, to meet its investment objectives. Derivatives are instruments whose values depend on, or are derived from, in whole or in part, the value of one or more securities, currencies, commodities, indices, or other assets or instruments. Derivatives may be used to increase investment flexibility (including to maintain cash reserves while maintaining desired exposure to certain assets), for risk management (hedging) purposes, to facilitate trading, to reduce transaction costs and to pursue higher investment returns. The Fund may also use derivative instruments to mitigate certain investment risks, such as foreign currency exchange rate risk, interest rate risk and credit risk. Derivatives may involve various risks, including the potential inability of the counterparty to fulfill its obligations under the terms of the contract, the potential for an illiquid secondary market (making it difficult for the Fund to sell or terminate, including at favorable prices) and the potential for market movements which may expose the Fund to gains or losses in excess of the amount shown in the Statement of Assets and Liabilities. The notional amounts of derivative instruments, if applicable, are not recorded in the financial statements.
A derivative instrument may suffer a marked-to-market loss if the value of the contract decreases due to an unfavorable change in the market rates or values of the underlying instrument. Losses can also occur if the counterparty does not perform its obligations under the contract. The Fund's risk of loss from counterparty credit risk on over-the-counter derivatives is generally limited to the aggregate unrealized gain netted against any collateral held by the Fund and the amount of any variation margin held by the counterparty, plus any replacement costs or related amounts. With exchange-traded or centrally cleared derivatives, there is reduced counterparty credit risk to the Fund since the clearinghouse or central counterparty (CCP) provides some protection in the case of clearing member default. The clearinghouse or CCP stands between the buyer and the seller of the contract; therefore, additional counterparty credit risk is failure of the clearinghouse or CCP. However, credit risk still exists in exchange-traded or centrally cleared derivatives with respect to initial and
variation margin that is held in a broker's customer account. While brokers are required to segregate customer margin from their own assets, in the event that a broker becomes insolvent or goes into bankruptcy and at that time there is a shortfall in the aggregate amount of margin held by the broker for all its clients, U.S. bankruptcy laws will typically allocate that shortfall on a pro-rata basis across all the broker's customers (including the Fund), potentially resulting in losses to the Fund.
In order to better define its contractual rights and to secure rights that will help the Fund mitigate its counterparty risk, the Fund may enter into an International Swaps and Derivatives Association, Inc. Master Agreement (ISDA Master Agreement) or similar agreement with its derivatives contract counterparties. An ISDA Master Agreement is an agreement between the Fund and a counterparty that governs over-the-counter derivatives and typically contains, among other things, collateral posting terms and netting provisions in the event of a default and/or termination event. Under an ISDA Master Agreement, the Fund may, under certain circumstances, offset with the counterparty certain derivative instrument's payables and/or receivables with collateral held and/or posted and create one single net payment. The provisions of the ISDA Master Agreement typically permit a single net payment in the event of default (close-out netting), including the bankruptcy or insolvency of the counterparty. Note, however, that bankruptcy or insolvency laws of a particular jurisdiction may impose restrictions on or prohibitions against the right of offset or netting in bankruptcy, insolvency or other events.
Collateral (margin) requirements differ by type of derivative. Margin requirements are established by the clearinghouse or CCP for exchange-traded and centrally cleared derivatives. Brokers can ask for margin in excess of the minimum in certain circumstances. Collateral terms are contract specific for over-the-counter derivatives. For over-the-counter derivatives traded under an ISDA Master Agreement, the collateral requirements are typically calculated by netting the marked-to-market amount for each transaction under such agreement and comparing that amount to the value of any variation margin currently pledged by the Fund and/or the counterparty. Generally, the amount of collateral due from or to a party has to exceed a minimum transfer amount threshold (e.g., $250,000) before a transfer has to be made. To the extent amounts due to the Fund from its counterparties are not fully collateralized, contractually or
Annual Report 2016
15
COLUMBIA VARIABLE PORTFOLIO — U.S. FLEXIBLE GROWTH FUND
NOTES TO FINANCIAL STATEMENTS
December 31, 2016 (continued)
otherwise, the Fund bears the risk of loss from counterparty nonperformance. The Fund attempts to mitigate counterparty risk by only entering into agreements with counterparties that it believes have the financial resources to honor their obligations and by monitoring the financial stability of those counterparties.
Certain ISDA Master Agreements allow counterparties of over-the-counter derivatives transactions to terminate derivatives contracts prior to maturity in the event the Fund's net asset value declines by a stated percentage over a specified time period or if the Fund fails to meet certain terms of the ISDA Master Agreement, which would cause the Fund to accelerate payment of any net liability owed to the counterparty. The Fund also has termination rights if the counterparty fails to meet certain terms of the ISDA Master Agreement. In addition to considering counterparty credit risk, the Fund would consider terminating the derivatives contracts based on whether termination would result in a net liability owed from the counterparty.
For financial reporting purposes, the Fund does not offset derivative assets and derivative liabilities that are subject to netting arrangements in the Statement of Assets and Liabilities.
Futures Contracts
Futures contracts are exchange-traded and represent commitments for the future purchase or sale of an asset at a specified price on a specified date. The Fund bought and sold futures contracts to produce incremental earnings, to manage the duration and yield curve exposure of the Fund versus the benchmark, to manage exposure to movements in interest rates, to manage exposure to the securities market and to maintain appropriate equity market exposure while keeping sufficient cash to accommodate daily redemptions. These instruments may be used for other purposes in future periods. Upon entering into futures contracts, the Fund bears risks that it may not achieve the anticipated benefits of the futures contracts and may realize a loss. Additional risks include counterparty credit risk, the possibility of an illiquid market, and that a change in the value of the contract or option may not correlate with changes in the value of the underlying asset.
Upon entering into a futures contract, the Fund deposits cash or securities with the broker, known as a futures commission merchant (FCM), in an amount sufficient to meet the initial margin requirement. The initial margin deposit must be maintained at an established level over the life of the contract. Cash deposited as initial margin
is recorded in the Statement of Assets and Liabilities as margin deposits. Securities deposited as initial margin are designated in the Portfolio of Investments. Subsequent payments (variation margin) are made or received by the Fund each day. The variation margin payments are equal to the daily change in the contract value and are recorded as variation margin receivable or payable and are offset in unrealized gains or losses. The Fund recognizes a realized gain or loss when the contract is closed or expires. Futures contracts involve, to varying degrees, risk of loss in excess of the variation margin disclosed in the Statement of Assets and Liabilities.
Effects of Derivative Transactions in the Financial Statements
The following tables are intended to provide additional information about the effect of derivatives on the financial statements of the Fund, including: the fair value of derivatives by risk category and the location of those fair values in the Statement of Assets and Liabilities; and the impact of derivative transactions over the period in the Statement of Operations, including realized and unrealized gains (losses). The derivative instrument schedules following the Portfolio of Investments present additional information regarding derivative instruments outstanding at the end of the period, if any.
The following table is a summary of the fair value of derivative instruments (not considered to be hedging instruments for accounting disclosure purposes) at December 31, 2016:
Asset Derivatives | |||||||||||
| Risk Exposure Category | Statement of Assets and Liabilities Location | Fair Value ($) | |||||||||
| Equity risk | Component of trust capital — unrealized appreciation on futures contracts | 43,537* | |||||||||
*Includes cumulative appreciation (depreciation) as reported in the tables following the Portfolio of Investments. Only the current day's variation margin is reported in receivables or payables in the Statement of Assets and Liabilities.
The following table indicates the effect of derivative instruments (not considered to be hedging instruments for accounting disclosure purposes) in the Statement of Operations for the period ended December 31, 2016:
Amount of Realized Gain (Loss) on Derivatives Recognized in Income | |||||||
Risk Exposure Category | Futures Contracts ($) | ||||||
Equity risk | 163,669 | ||||||
Interest rate risk | (37,058 | ) | |||||
Total | 126,611 | ||||||
Annual Report 2016
16
COLUMBIA VARIABLE PORTFOLIO — U.S. FLEXIBLE GROWTH FUND
NOTES TO FINANCIAL STATEMENTS
December 31, 2016 (continued)
| Change in Unrealized Appreciation (Depreciation) on Derivatives Recognized in Income | |||||||
Risk Exposure Category | Futures Contracts ($) | ||||||
Equity risk | 43,537 | ||||||
The following table provides a summary of the average outstanding volume by derivative instrument for the period ended December 31, 2016:
Derivative Instrument | Average Notional Amounts ($)* | ||||||
Futures contracts — Long | 16,970,127 | ||||||
*Based on the daily outstanding amounts for the period ended December 31, 2016.
Delayed Delivery Securities
The Fund may trade securities on other than normal settlement terms, including securities purchased or sold on a "when-issued" basis. This may increase risk to the Fund since the other party to the transaction may fail to deliver, which could cause the Fund to subsequently invest at less advantageous prices. The Fund designates cash or liquid securities in an amount equal to the delayed delivery commitment.
Mortgage Dollar Roll Transactions
The Fund may enter into mortgage "dollar rolls" in which the Fund sells securities for delivery in the current month and simultaneously contracts with the same counterparty to repurchase similar but not identical securities (same type, coupon and maturity) on a specified future date. During the roll period, the Fund loses the right to receive principal and interest paid on the securities sold. However, the Fund will benefit because it receives negotiated amounts in the form of reductions of the purchase price for the future purchase plus the interest earned on the cash proceeds of the securities sold until the settlement date of the forward purchase. The Fund records the incremental difference between the forward purchase and sale of each forward roll as a realized gain or loss. Unless any realized gains exceed the income, capital appreciation, and gain or loss due to mortgage prepayments that would have been realized on the securities sold as part of the mortgage dollar roll, the use of this technique will diminish the investment performance of the Fund compared to what the performance would have been without the use of mortgage dollar rolls. All cash proceeds will be invested in instruments that are permissible investments for the Fund. The Fund identifies cash or liquid securities in an amount equal to the forward purchase price.
For financial reporting and tax purposes, the Fund treats "to be announced" mortgage dollar rolls as two separate transactions, one involving the purchase of a security and a separate transaction involving a sale. These transactions may increase the Fund's portfolio turnover rate. The Fund does not currently enter into mortgage dollar rolls that are accounted for as financing transactions.
Mortgage dollar rolls involve the risk that the market value of the securities the Fund is obligated to repurchase may decline below the repurchase price, or that the counterparty may default on its obligations.
Security Transactions
Security transactions are accounted for on the trade date. Cost is determined and gains (losses) are based upon the specific identification method for both financial statement and federal income tax purposes.
Income Recognition
Corporate actions and dividend income are recorded on the ex-dividend date.
The Fund may receive distributions from holdings in equity securities, business development companies (BDCs), exchange-traded funds, other regulated investment companies (RICs), and real estate investment trusts (REITs), which report information on the tax character of their distributions annually. These distributions are allocated to dividend income, capital gain and return of capital based on actual information reported. Return of capital is recorded as a reduction of the cost basis of securities held. If the Fund no longer owns the applicable securities, return of capital is recorded as a realized gain. With respect to REITs, to the extent actual information has not yet been reported, estimates for return of capital are made by the Fund's management. Management's estimates are subsequently adjusted when the actual character of the distributions is disclosed by the REITs, which could result in a proportionate change in return of capital to shareholders.
Awards from class action litigation are recorded as a reduction of cost basis if the Fund still owns the applicable securities on the payment date. If the Fund no longer owns the applicable securities, the proceeds are recorded as realized gains.
Income and capital gain distributions from the Underlying Funds, if any, are recorded on the ex-dividend date.
Annual Report 2016
17
COLUMBIA VARIABLE PORTFOLIO — U.S. FLEXIBLE GROWTH FUND
NOTES TO FINANCIAL STATEMENTS
December 31, 2016 (continued)
Expenses
General expenses of the Trust are allocated to the Fund and other funds of the Trust based upon relative net assets or other expense allocation methodologies determined by the nature of the expense. Expenses directly attributable to the Fund are charged to the Fund. Expenses directly attributable to a specific class of shares are charged to that share class.
Federal Income Tax Status
The Fund is treated as a partnership for federal income tax purposes, and the Fund does not expect to make regular distributions. The Fund will not be subject to federal income tax, and therefore, there is no provision for federal income taxes. The partners of the Fund are subject to tax on their distributive share of the Fund's income and loss. The components of the Fund's net assets are reported at the partner-level for federal income tax purposes, and therefore, are not presented in the Statement of Assets and Liabilities.
Management of the Fund has concluded that there are no significant uncertain tax positions in the Fund that would require recognition in the financial statements. However, management's conclusion may be subject to review and adjustment at a later date based on factors including, but not limited to, new tax laws, regulations, and administrative interpretations (including relevant court decisions). Generally, the Fund's federal tax returns for the prior three fiscal years remain subject to examination by the Internal Revenue Service.
Guarantees and Indemnifications
Under the Trust's organizational documents and, in some cases, by contract, its officers and trustees are indemnified against certain liabilities arising out of the performance of their duties to the Trust or its funds. In addition, certain of the Fund's contracts with its service providers contain general indemnification clauses. The Fund's maximum exposure under these arrangements is unknown since the amount of any future claims that may be made against the Fund cannot be determined, and the Fund has no historical basis for predicting the likelihood of any such claims.
Investment Company Reporting Modernization
In October 2016, the U.S. Securities and Exchange Commission adopted new rules and forms, and amendments to certain current rules and forms, to modernize reporting and disclosure of information by registered investment companies. The amendments to Regulation S-X will require standardized, enhanced
disclosure about derivatives in investment company financial statements, and will also change the rules governing the form and content of such financial statements. The amendments to Regulation S-X take effect on August 1, 2017. At this time, management is assessing the anticipated impact of these regulatory developments.
Note 3. Fees and Other Transactions with Affiliates
Management Services Fees and Underlying Fund Fees
The Fund entered into a Management Agreement with the Investment Manager. Under the Management Agreement, the Investment Manager provides the Fund with investment research and advice, as well as administrative and accounting services. The management services fee is an annual fee that is a blend of (i) 0.020% on assets invested in affiliated underlying funds (including exchange-traded funds and closed-end funds) that pay a management services fee (or investment advisory services fee, as applicable) to the Investment Manager and (ii) a fee that declines from 0.720% to 0.520%, depending on asset levels, on assets invested in securities (other than affiliated underlying funds (including exchange-traded funds and closed-end funds) that pay a management services fee (or investment advisory services fee, as applicable) to the Investment Manager), including other funds advised by the Investment Manager that do not pay a management services fee to the Investment Manager, third party funds, derivatives and individual securities. The annualized effective management services fee rate for the period ended December 31, 2016 was 0.229% of the Fund's average daily net assets.
In addition to the fees and expenses which the Fund bears directly, the Fund indirectly bears a pro rata share of the fees and expenses of the Underlying Funds in which the Fund invests. Because the Underlying Funds have varied expense and fee levels and the Fund may own different proportions of Underlying Funds at different times, the amount of fees and expenses incurred indirectly by the Fund will vary. These expenses are not reflected in the expenses shown in Statement of Operations and are not included in the ratios to average net assets shown in the Financial Highlights.
Other Expenses
Other expenses include offering costs which were incurred prior to the shares of the Fund being offered.
Annual Report 2016
18
COLUMBIA VARIABLE PORTFOLIO — U.S. FLEXIBLE GROWTH FUND
NOTES TO FINANCIAL STATEMENTS
December 31, 2016 (continued)
Offering costs include printing costs and as applicable, miscellaneous and legal fees. The Fund amortizes offering costs over a period of 12 months from the commencement of operations.
Compensation of Board Members
Board of Trustee members, who are not officers or employees of the Investment Manager or Ameriprise Financial, are compensated for their services to the Fund as disclosed in the Statement of Operations. These Board of Trustee members may participate in a Deferred Compensation Plan (the Plan) which may be terminated at any time. Obligations of the Plan will be paid solely out of the Fund's assets, and all amounts payable under the Plan constitute a general unsecured obligation of the Fund.
Compensation of Chief Compliance Officer
The Board of Trustees has appointed a Chief Compliance Officer to the Fund in accordance with federal securities regulations. The Fund is allocated a portion of the expenses associated with the Chief Compliance Officer based on relative net assets of the Trust.
Transfer Agency Fees
The Fund has a Transfer and Dividend Disbursing Agent Agreement with Columbia Management Investment Services Corp. (the Transfer Agent), an affiliate of the Investment Manager and a wholly-owned subsidiary of Ameriprise Financial. The annual fee rate under this agreement is 0.00% on assets invested in Underlying Funds that pay a transfer agency fee to the Transfer Agent and 0.06% of the Fund's average daily net assets on assets invested in securities (other than Underlying Funds that pay a transfer agency fee to the Transfer Agent), including other funds that do not pay a transfer agency fee to the Transfer Agent, exchange-traded funds, derivatives and individual securities.
For the period ended December 31, 2016, the Fund's annualized effective transfer agency fee rate as a percentage of average daily net assets of Class 2 shares was 0.02%.
Distribution Fees
The Fund has an agreement with the Distributor, an affiliate of the Investment Manager and a wholly-owned subsidiary of Ameriprise Financial, for distribution services. The Board of Trustees has approved, and the Fund has adopted, a distribution plan (the Plan) which sets the distribution fees for the Fund. These fees are calculated daily and are intended to compensate the Distributor for selling shares of the Fund. The Fund pays
a monthly distribution fee to the Distributor at the maximum annual rate of 0.25% of the average daily net assets attributable to Class 2 shares of the Fund.
Expenses Waived/Reimbursed by the Investment Manager and its Affiliates
The Investment Manager and certain of its affiliates have contractually agreed to waive fees and/or reimburse expenses (excluding certain fees and expenses described below) for the period(s) disclosed below, so that the Fund's net operating expenses, including indirect expenses of the Underlying Funds, after giving effect to fees waived/expenses reimbursed and any balance credits and/or overdraft charges from the Fund's custodian, do not exceed the following annual rate(s) as a percentage of the class' average daily net assets:
| Fee Rate(s) Contractual through April 30, 2017 | |||||||
Class 2 | 1.10 | % | |||||
Under the agreement, the following fees and expenses are excluded from the waiver/reimbursement commitment, and therefore will be paid by the Fund, if applicable: taxes (including foreign transaction taxes), transaction costs and brokerage commissions, costs related to any securities lending program, dividend and interest expenses associated with securities sold short, inverse floater program fees and expenses, transaction charges and interest on borrowed money, interest, infrequent and/or unusual expenses and any other expenses the exclusion of which is specifically approved by the Board of Trustees. This agreement may be modified or amended only with approval from the Investment Manager, certain of its affiliates and the Fund. Any fees waived and/or expenses reimbursed under the expense reimbursement arrangements described above are not recoverable by the Investment Manager or its affiliates in future periods.
Note 4. Portfolio Information
The cost of purchases and proceeds from sales of securities, excluding short-term investments and derivatives, if any, aggregated to $128,661,232 and $8,850,014, respectively, for the period ended December 31, 2016, of which $1,332,839 and $1,323,191, respectively, were U.S. government securities. The amount of purchase and sale activity impacts the portfolio turnover rate reported in the Financial Highlights.
Annual Report 2016
19
COLUMBIA VARIABLE PORTFOLIO — U.S. FLEXIBLE GROWTH FUND
NOTES TO FINANCIAL STATEMENTS
December 31, 2016 (continued)
Note 5. Affiliated Money Market Fund
The Fund invests significantly in Columbia Short-Term Cash Fund, an affiliated money market fund established for the exclusive use by the Fund and other affiliated funds (the Affiliated MMF). The income earned by the Fund from such investments is included as Dividends — affiliated issuers in the Statement of Operations. As an investing fund, the Fund indirectly bears its proportionate share of the expenses of the Affiliated MMF. Effective October 1, 2016, the Affiliated MMF prices its shares with a floating net asset value (NAV) and no longer seeks to maintain a stable NAV. In addition, the Board of Trustees of the Affiliated MMF may impose a fee on redemptions (sometimes referred to as a liquidity fee) or temporarily suspend redemptions (sometimes referred to as imposing a redemption gate) in the event its liquidity falls below regulatory limits.
Note 6. Line of Credit
The Fund has access to a revolving credit facility with a syndicate of banks led by Citibank, N.A., HSBC Bank USA, N.A. and JPMorgan Chase Bank, N.A. whereby the Fund may borrow for the temporary funding of shareholder redemptions or for other temporary or emergency purposes. The credit facility agreement, which is a collective agreement between the Fund and certain other funds managed by the Investment Manager, severally and not jointly, that permits collective borrowings up to $1 billion. Interest is charged to each participating fund based on its borrowings at a rate equal to the higher of (i) the overnight federal funds rate plus 1.00% or (ii) the one-month LIBOR rate plus 1.00%. Each borrowing under the credit facility matures no later than 60 days after the date of borrowing. The Fund also pays a commitment fee equal to its pro rata share of the amount of the credit facility at a rate of 0.15% per annum. The commitment fee is included in other expenses in the Statement of Operations.
The Fund had no borrowings during the period ended December 31, 2016.
Note 7. Significant Risks
Shareholder Concentration Risk
At December 31, 2016, affiliated shareholders of record owned 100.0% of the outstanding shares of the Fund in one or more accounts. Subscription and redemption activity by concentrated accounts may have a significant effect on the operations of the Fund. In the case of a large redemption, the Fund may be forced to sell
investments at inopportune times, including its liquid or more liquid positions, resulting in Fund losses and the Fund holding a higher percentage of less liquid or illiquid securities. Large redemptions could result in decreased economies of scale and increased operating expenses for non-redeeming Fund shareholders.
Note 8. Subsequent Events
Management has evaluated the events and transactions that have occurred through the date the financial statements were issued and noted no items requiring adjustment of the financial statements or additional disclosure.
Note 9. Information Regarding Pending and settled Legal Proceedings
Ameriprise Financial and certain of its affiliates have historically been involved in a number of legal, arbitration and regulatory proceedings, including routine litigation, class actions, and governmental actions, concerning matters arising in connection with the conduct of their business activities. Ameriprise Financial believes that the Funds are not currently the subject of, and that neither Ameriprise Financial nor any of its affiliates are the subject of, any pending legal, arbitration or regulatory proceedings that are likely to have a material adverse effect on the Funds or the ability of Ameriprise Financial or its affiliates to perform under their contracts with the Funds. Ameriprise Financial is required to make quarterly (10-Q), annual (10-K) and, as necessary, 8-K filings with the Securities and Exchange Commission (SEC) on legal and regulatory matters that relate to Ameriprise Financial and its affiliates. Copies of these filings may be obtained by accessing the SEC website at www.sec.gov.
There can be no assurance that these matters, or the adverse publicity associated with them, will not result in increased fund redemptions, reduced sale of fund shares or other adverse consequences to the Funds. Further, although we believe proceedings are not likely to have a material adverse effect on the Funds or the ability of Ameriprise Financial or its affiliates to perform under their contracts with the Funds, these proceedings are subject to uncertainties and, as such, we are unable to estimate the possible loss or range of loss that may result. An adverse outcome in one or more of these proceedings could result in adverse judgments, settlements, fines, penalties or other relief that could have a material adverse effect on the consolidated financial condition or results of operations of Ameriprise Financial.
Annual Report 2016
20
COLUMBIA VARIABLE PORTFOLIO — U.S. FLEXIBLE GROWTH FUND
REPORT OF INDEPENDENT REGISTERED PUBLIC ACCOUNTING FIRM
To the Trustees of Columbia Funds Variable Insurance Trust and the Shareholders of
Columbia Variable Portfolio — U.S. Flexible Growth Fund
In our opinion, the accompanying statement of assets and liabilities, including the portfolio of investments, and the related statements of operations and of changes in net assets and the financial highlights present fairly, in all material respects, the financial position of Columbia Variable Portfolio — U.S. Flexible Growth Fund (the "Fund," a series of Columbia Funds Variable Insurance Trust) at December 31, 2016 and the results of its operations, the changes in its net assets and the financial highlights for the period November 2, 2016 (commencement of operations) through December 31, 2016, in conformity with accounting principles generally accepted in the United States of America. These financial statements and financial highlights (hereafter referred to as "financial statements") are the responsibility of the Fund's management. Our responsibility is to express an opinion on these financial statements based on our audit. We conducted our audit of these financial statements in accordance with the standards of the Public Company Accounting Oversight Board (United States). Those standards require that we plan and perform the audit to obtain reasonable assurance about whether the financial statements are free of material misstatement. An audit includes examining, on a test basis, evidence supporting the amounts and disclosures in the financial statements, assessing the accounting principles used and significant estimates made by management, and evaluating the overall financial statement presentation. We believe that our audit, which included confirmation of securities as of December 31, 2016 by correspondence with the custodian, brokers and transfer agent, and the application of alternative auditing procedures where such confirmations had not been received, provide a reasonable basis for our opinion.
PricewaterhouseCoopers LLP
Minneapolis, MN
February 17, 2017
Annual Report 2016
21
COLUMBIA VARIABLE PORTFOLIO — U.S. FLEXIBLE GROWTH FUND
TRUSTEES AND OFFICERS
Shareholders elect the Board that oversees the Fund's operations. The Board appoints officers who are responsible for day-to-day business decisions based on policies set by the Board. The following table provides basic biographical information about the Fund's Trustees, including their principal occupations during the past five years, although specific titles for individuals may have varied over the period. The year set forth beneath Length of Service in the table below is the year in which the Trustee was first appointed or elected as Trustee to any Fund currently in the Columbia Funds Complex or a predecessor thereof. Under current Board policy, members serve terms of indefinite duration.
Independent Trustees
| Name, Address, Year of Birth | Position Held With the Trust and Length of Service | Principal Occupation(s) During the Past Five Years and Other Relevant Professional Experience | Number of Funds in the Columbia Funds Complex Overseen | Other Directorships Held by Trustee During the Past Five Years | |||||||||||||||
| Janet Langford Carrig c/o Columbia Management Investment Advisers, LLC, 225 Franklin Street Mail Drop BX32 05228, Boston, MA 02110 1957 | Trustee 1996 | Senior Vice President, General Counsel and Corporate Secretary, ConocoPhillips (independent energy company) since September 2007 | 59 | None | |||||||||||||||
| Douglas A. Hacker c/o Columbia Management Investment Advisers, LLC, 225 Franklin Street Mail Drop BX32 05228, Boston, MA 02110 1955 | Trustee and Chairman of the Board 1996 | Independent business executive since May 2006; Executive Vice President — Strategy of United Airlines from December 2002 to May 2006; President of UAL Loyalty Services (airline marketing company) from September 2001 to December 2002; Executive Vice President and Chief Financial Officer of United Airlines from July 1999 to September 2001 | 59 | Spartan Nash Company (food distributor); Nash Finch Company (food distributor) from 2005 to 2013; Aircastle Limited (aircraft leasing); SeaCube Container Leasing Ltd. (container leasing) from 2010 to 2013; and Travelport Worldwide Limited (travel information technology) | |||||||||||||||
| Nancy T. Lukitsh c/o Columbia Management Investment Advisers, LLC, 225 Franklin Street Mail Drop BX32 05228, Boston, MA 02110 1956 | Trustee 2011 | Senior Vice President, Partner and Director of Marketing, Wellington Management Company, LLP (investment adviser) from 1997 to 2010; Chair, Wellington Management Portfolios (commingled non-U.S. investment pools) from 2007 to 2010; Director, Wellington Trust Company, NA and other Wellington affiliates from 1997 to 2010 | 59 | None | |||||||||||||||
Annual Report 2016
22
COLUMBIA VARIABLE PORTFOLIO — U.S. FLEXIBLE GROWTH FUND
TRUSTEES AND OFFICERS (continued)
Independent Trustees (continued)
| Name, Address, Year of Birth | Position Held With the Trust and Length of Service | Principal Occupation(s) During the Past Five Years and Other Relevant Professional Experience | Number of Funds in the Columbia Funds Complex Overseen | Other Directorships Held by Trustee During the Past Five Years | |||||||||||||||
| David M. Moffett c/o Columbia Management Investment Advisers, LLC, 225 Franklin Street Mail Drop BX32 05228, Boston, MA 02110 1952 | Trustee 2011 | Retired. Consultant to Bridgewater and Associates | 59 | Director, CSX Corporation; Genworth Financial, Inc. (financial and insurance products and services); Paypal Holdings Inc. (payment and data processing services); Trustee University of Oklahoma Foundation; former Director eBay Inc. (online trading community), 2007-2015; and former Director, CIT Bank, CIT Group Inc. (commercial and consumer finance), 2010-2016 | |||||||||||||||
| Charles R. Nelson c/o Columbia Management Investment Advisers, LLC, 225 Franklin Street Mail Drop BX32 05228, Boston, MA 02110 1942 | Trustee 1981 | Retired. Professor Emeritus, University of Washington since 2011; Professor of Economics, University of Washington from 1976 to 2011; Ford and Louisa Van Voorhis Professor of Political Economy, University of Washington from 1993 to 2011; Adjunct Professor of Statistics, University of Washington from 1980 to 2011; Associate Editor, Journal of Money, Credit and Banking from September 1993 to 2008; consultant on econometric and statistical matters | 59 | None | |||||||||||||||
| John J. Neuhauser c/o Columbia Management Investment Advisers, LLC, 225 Franklin Street Mail Drop BX32 05228, Boston, MA 02110 1943 | Trustee 1984 | President, Saint Michael's College since August 2007; Director or Trustee of several non-profit organizations, including University of Vermont Medical Center; Academic Vice President and Dean of Faculties, Boston College from August 1999 to October 2005; University Professor, Boston College from November 2005 to August 2007 | 59 | Liberty All-Star Equity Fund and Liberty All-Star Growth Fund (closed-end funds) | |||||||||||||||
| Patrick J. Simpson c/o Columbia Management Investment Advisers, LLC, 225 Franklin Street Mail Drop BX32 05228, Boston, MA 02110 1944 | Trustee 2000 | Of Counsel, Perkins Coie LLP (law firm) since 2015; Partner, Perkins Coie LLP from 1988 to 2014 | 59 | None | |||||||||||||||
Annual Report 2016
23
COLUMBIA VARIABLE PORTFOLIO — U.S. FLEXIBLE GROWTH FUND
TRUSTEES AND OFFICERS (continued)
Independent Trustees (continued)
| Name, Address, Year of Birth | Position Held With the Trust and Length of Service | Principal Occupation(s) During the Past Five Years and Other Relevant Professional Experience | Number of Funds in the Columbia Funds Complex Overseen | Other Directorships Held by Trustee During the Past Five Years | |||||||||||||||
| Anne-Lee Verville c/o Columbia Management Investment Advisers, LLC, 225 Franklin Street Mail Drop BX32 05228, Boston, MA 02110 1945 | Trustee 1998 | Retired. General Manager, Global Education Industry from 1994 to 1997, President — Application Systems Division from 1991 to 1994, Chief Financial Officer — US Marketing & Services from 1988 to 1991, and Chief Information Officer from 1987 to 1988, IBM Corporation (computer and technology) | 59 | Enesco Group, Inc. (producer of giftware and home and garden decor products) from 2001 to 2006 | |||||||||||||||
Consultants to the Independent Trustees*
| Name, Address, Year of Birth | Position Held With the Trust and Length of Service | Principal Occupation(s) During the Past Five Years and Other Relevant Professional Experience | Number of Funds in the Columbia Funds Complex Overseen | Other Directorships Held by Trustee During the Past Five Years | |||||||||||||||
| J. Kevin Connaughton c/o Columbia Management Investment Advisers, LLC, 225 Franklin Street Mail Drop BX32 05228, Boston, MA 02110 1964 | Independent Trustee Consultant 2016 | Independent Trustee Consultant, Columbia Funds since March 2016; Managing Director and General Manager of Mutual Fund Products, Columbia Management Investment Advisers, LLC from May 2010 to February 2015; President, Columbia Funds from 2009 to 2015; and senior officer of Columbia Funds and affiliated funds from 2003 to 2015 | 59 | Board of Governors, Gateway Healthcare since January 2016; Trustee, New Century Portfolios since March 2015; and Director, The Autism Project since March 2015 | |||||||||||||||
| Natalie A. Trunow c/o Columbia Management Investment Advisers, LLC, 225 Franklin Street Mail Drop BX32 05228, Boston, MA 02110 1967 | Independent Trustee Consultant 2016 | Independent Trustee Consultant, Columbia Funds since September 2016; Senior Vice President and Chief Executive Officer, Millennial Partners (investment consulting services to institutions) since January 2016; Director of Investments, Casey Family Programs from April 2016 to September 2016; Chief Investment Officer, Calvert Investments from August 2008 to January 2016; Section Head and Portfolio Manager, General Motors Asset Management from June 1997 to August 2008 | 59 | Healthcare Services for Children with Special Needs | |||||||||||||||
* J. Kevin Connaughton was appointed consultant to the Independent Trustees effective March 1, 2016. Natalie A. Trunow was appointed consultant to the Independent Trustees effective September 1, 2016. Shareholders of the Funds are expected to be asked to elect each of Mr. Connaughton and Ms. Trunow as a Trustee at a future shareholder meeting.
Annual Report 2016
24
COLUMBIA VARIABLE PORTFOLIO — U.S. FLEXIBLE GROWTH FUND
TRUSTEES AND OFFICERS (continued)
Interested Trustee Affiliated with Investment Manager*
| Name, Address, Year of Birth | Position Held With the Trust and Length of Service | Principal Occupation(s) During the Past Five Years and Other Relevant Professional Experience | Number of Funds in the Columbia Funds Complex Overseen | Other Directorships Held by Trustee During the Past Five Years | |||||||||||||||
| William F. Truscott c/o Columbia Management Investment Advisers, LLC, 225 Franklin Street Boston, MA 02110 1960 | Trustee 2012 | Chairman of the Board and President, Columbia Management Investment Advisers, LLC since May 2010 and February 2012, respectively; Chief Executive Officer, Global Asset Management, Ameriprise Financial, Inc. since September 2012 (previously Chief Executive Officer, U.S. Asset Management & President, Annuities, May 2010- September 2012); Director and Chief Executive Officer, Columbia Management Investment Distributors, Inc. since May 2010 and February 2012, respectively; Chairman of the Board and Chief Executive Officer, RiverSource Distributors, Inc. since 2006; Director, Threadneedle Asset Management Holdings, SARL since 2014; President and Chief Executive Officer, Ameriprise Certificate Company, 2006-August 2012. | 185 | Trustee to other Columbia Funds since 2001; Chairman of the Board, Columbia Management Investment Advisers, LLC since May 2010; Director, Columbia Management Investment Distributors, Inc. since May 2010; Former Director, Ameriprise Certificate Company, 2006-January 2013 | |||||||||||||||
* Interested person (as defined under the 1940 Act) by reason of being an officer, director, security holder and/or employee of the Investment Manager or Ameriprise Financial.
The Statement of Additional Information has additional information about the Fund's Board members and is available, without charge, upon request by calling 800.345.6611 or contacting your financial intermediary.
Annual Report 2016
25
COLUMBIA VARIABLE PORTFOLIO — U.S. FLEXIBLE GROWTH FUND
TRUSTEES AND OFFICERS (continued)
The Board has appointed officers who are responsible for day-to-day business decisions based on policies it has established. The officers serve at the pleasure of the Board. The following table provides basic information about the Officers of the Fund, including principal occupations during the past five years, although their specific titles may have varied over the period. In addition to Mr. Truscott, who is Senior Vice President, the Fund's other officers are:
Fund Officers
| Name, Address and Year of Birth | Position and Year First Appointed to Position for any Fund in the Columbia Funds Complex or a Predecessor Thereof | Principal Occupation(s) During Past Five Years | |||||||||
| Christopher O. Petersen 5228 Ameriprise Financial Center Minneapolis, MN 55474 Born 1970 | President and Principal Executive Officer (2015) | Vice President and Lead Chief Counsel, Ameriprise Financial, Inc. since January 2015 (previously, Vice President and Chief Counsel January 2010-December 2014); officer of Columbia Funds and affiliated funds since 2007. | |||||||||
| Michael G. Clarke 225 Franklin Street Boston, MA 02110 Born 1969 | Treasurer (2011), Chief Financial Officer (2009) and Chief Accounting Officer (2015) | Vice President — Mutual Fund Administration, Columbia Management Investment Advisers, LLC, since May 2010; senior officer of Columbia Funds and affiliated funds since 2002. | |||||||||
| Paul B. Goucher 100 Park Avenue New York, NY 10017 Born 1968 | Senior Vice President (2011), Chief Legal Officer (2015) and Assistant Secretary (2008) | Senior Vice President and Assistant General Counsel, Ameriprise Financial, Inc. since January 2017 (previously Vice President and Lead Chief Counsel, November 2008-January 2017 and January 2013-2017, respectively, and Chief Counsel, January 2010-January 2013); Vice President, Chief Legal Officer and Assistant Secretary, Columbia Management Investment Advisers, LLC since May 2010. | |||||||||
| Thomas P. McGuire 225 Franklin Street Boston, MA 02110 Born 1972 | Senior Vice President and Chief Compliance Officer (2012) | Vice President — Asset Management Compliance, Ameriprise Financial, Inc., since May 2010; Chief Compliance Officer, Ameriprise Certificate Company since September 2010. | |||||||||
| Colin Moore 225 Franklin Street Boston, MA 02110 Born 1958 | Senior Vice President (2010) | Executive Vice President and Global Chief Investment Officer, Ameriprise Financial, Inc., since July 2013; Executive Vice President and Global Chief Investment Officer, Columbia Management Investment Advisers, LLC since July 2013 (previously Director and Global Chief Investment Officer, 2010-2013). | |||||||||
| Michael E. DeFao 225 Franklin Street Boston, MA 02110 Born 1968 | Vice President (2011) and Assistant Secretary (2010) | Vice President and Chief Counsel, Ameriprise Financial, Inc. since May 2010. | |||||||||
| Amy Johnson 5228 Ameriprise Financial Center Minneapolis, MN 55474 Born 1965 | Vice President (2006) | Managing Director and Global Head of Operations, Columbia Management Investment Advisers, LLC since April 2016 (previously Managing Director and Chief Operating Officer, 2010-2016). | |||||||||
| Lyn Kephart-Strong 5228 Ameriprise Financial Center Minneapolis, MN 55474 Born 1960 | Vice President (2015) | President, Columbia Management Investment Services Corp. since October 2014; Vice President & Resolution Officer, Ameriprise Trust Company since August 2009. | |||||||||
| Ryan C. Larrenaga 225 Franklin Street Boston, MA 02110 Born 1970 | Vice President and Secretary (2015) | Vice President and Group Counsel, Ameriprise Financial, Inc. since August 2011; officer of Columbia Funds and affiliated funds since 2005. | |||||||||
Annual Report 2016
26
COLUMBIA VARIABLE PORTFOLIO — U.S. FLEXIBLE GROWTH FUND
BOARD CONSIDERATION AND APPROVAL OF MANAGEMENT AGREEMENT
On October 25, 2016, the Board of Trustees (the Board) and the Trustees who are not interested persons (as defined in the Investment Company Act of 1940) (the Independent Trustees) of Columbia Funds Variable Insurance Trust (the Trust) unanimously approved, for an initial two-year term, the Management Agreement (the Management Agreement) with Columbia Management Investment Advisers, LLC (the Investment Manager) with respect to Columbia Variable Portfolio — U.S. Flexible Growth Fund (the Fund), a series of the Trust. As detailed below, the Board met on multiple occasions to review and discuss, both among themselves and with the management team of the Investment Manager, materials provided by the Investment Manager and others before determining to approve the Management Agreement.
In connection with their deliberations regarding the proposed Management Agreement, the Board evaluated materials requested from the Investment Manager regarding the Fund and the Management Agreement, and discussed these materials, as well as other materials provided by the Investment Manager in connection with the Board's most recent annual approval of the continuation of the management agreements with respect to other series of the Trust, with representatives of the Investment Manager at the Product and Distribution Committee meeting held on June 9, 2016 and at Board meetings held on June 10, 2016 and October 24, 2016. The Board also consulted with Fund counsel and with the Independent Trustees' independent legal counsel, who advised on various matters with respect to the Board's considerations and otherwise assisted the Board in their deliberations.
The Board considered all information that they, their legal counsel or the Investment Manager believed reasonably necessary to evaluate and to determine whether to approve the Management Agreement. The information and factors considered by the Board in approving the Management Agreement for the Fund included the following:
• Information regarding the reputation, regulatory history and resources of the Investment Manager, including information regarding senior management, portfolio managers and other personnel;
• Information regarding the capabilities of the Investment Manager with respect to compliance monitoring services, including an assessment of the Investment Manager's compliance system by the Fund's Chief Compliance Officer;
• The terms and conditions of the Management Agreement;
• The current and proposed terms and conditions of other agreements and arrangements with affiliates of the Investment Manager relating to the operations of the Fund, including agreements with respect to the provision of distribution and transfer agency services to the Fund;
• The Investment Manager's agreement to contractually limit or cap total operating expenses for the Fund through April 30, 2017 so that total operating expenses (excluding certain fees and expenses, such as transaction costs and certain other investment related expenses, interest, taxes, and infrequent and/or unusual expenses) would not exceed a specified annual rate, as a percentage of the Fund's net assets;
• Descriptions of various functions performed by the Investment Manager under the Management Agreement, including portfolio management and portfolio trading practices; and
• Information regarding the investment management fees and other expenses of the Fund relative to those of comparable funds determined by the independent third-party data provider to be in the same peer group or universe of funds.
Nature, Extent and Quality of Services to be Provided under the Management Agreement
The Board considered the nature, extent and quality of services to be provided to the Fund by the Investment Manager and its affiliates under the Management Agreement and under separate agreements for the provision of transfer agency services, the similar type of services currently provided by the Investment Manager to other funds in the fund complex, and the resources to be dedicated to the Fund and the other Columbia Funds by the Investment Manager and its affiliates. The Board considered, among other things, the Investment Manager's ability to attract, motivate and retain highly qualified research, advisory and supervisory investment professionals (including personnel and other resources, compensation programs for personnel involved in fund management, reputation and other attributes), the portfolio management services provided by those investment professionals,
Annual Report 2016
27
COLUMBIA VARIABLE PORTFOLIO — U.S. FLEXIBLE GROWTH FUND
BOARD CONSIDERATION AND APPROVAL OF MANAGEMENT AGREEMENT (continued)
and the quality of the Investment Manager's investment research capabilities and trade execution services. The Board also considered the potential benefits to shareholders of investing in a mutual fund that is part of a fund complex offering exposure to a variety of asset classes and investment disciplines and providing a variety of fund and shareholder services.
The Board also considered the professional experience and qualifications of the senior personnel of the Investment Manager, which included consideration of the Investment Manager's experience with similarly-structured funds. The Board noted the compliance programs of and the compliance-related resources provided to the Fund by the Investment Manager and its affiliates, and considered the Investment Manager's ability to provide administrative services to the Fund and coordinate the activities of the Fund's other service providers.
After reviewing these and related factors, the Board concluded, within the context of their overall conclusions, that the expected nature, extent and quality of the services to be provided to the Fund under the Management Agreement supported the approval of the Management Agreement.
Investment Performance
Because the Fund had not yet commenced operations, the Board did not have investment performance to compare to the returns of a group of comparable mutual funds. However, the Board expected to consider, in connection with their next review and consideration of the continuation of the Management Agreement, the investment performance of the Fund in relation to the annualized return for various time periods of both a group of comparable funds, as determined by the independent third-party data provider, and a benchmark.
The Board also considered the Investment Manager's performance and reputation generally, the Investment Manager's historical responsiveness to Board concerns about performance, and the Investment Manager's willingness to take steps intended to improve performance. After reviewing these and related factors, the Board concluded, within the context of their overall conclusions, that the performance of the Investment Manager was sufficient, in light of other considerations, to warrant the approval of the Management Agreement.
Investment Management Fee Rates and Other Expenses
The Board considered the fees to be charged to the Fund under the Management Agreement, as well as the total expenses expected to be incurred by the Fund. In assessing the reasonableness of the proposed fees under the Management Agreement, the Board considered, among other information, the Fund's proposed management fee and its expected total expense ratio as a percentage of average daily net assets. The Board also took into account the proposed fee waiver and expense limitation arrangements that the Investment Manager would observe during the Fund's first year, and the management fees and total expense ratios of comparable funds identified by the independent third-party data provider for purposes of expense comparison.
After reviewing these and related factors, the Board concluded, within the context of their overall conclusions, that the management fee rates and expenses of the Fund supported the approval of the Management Agreement.
Costs of Services to be Provided and Profitability
The Board considered information provided by the Investment Manager with respect to estimated costs of services and profitability, and expected to consider the costs of services and the profitability of the Investment Manager and its affiliates in connection with the Board's next review and consideration of the continuation of the Management Agreement. The Board also considered court cases in which adviser profitability was an issue in whole or in part, the expected expense ratio of the Fund, and the implementation of expense limitations with respect to the Fund. In addition, the Board considered information provided by the Investment Manager regarding its financial condition.
After reviewing these and related factors, the Board concluded, within the context of their overall conclusions, that the anticipated costs of services to be provided and the expected profitability to the Investment Manager and its affiliates from their relationships with the Fund supported the approval of the Management Agreement.
Annual Report 2016
28
COLUMBIA VARIABLE PORTFOLIO — U.S. FLEXIBLE GROWTH FUND
BOARD CONSIDERATION AND APPROVAL OF MANAGEMENT AGREEMENT (continued)
Economies of Scale
The Board considered the potential existence of economies of scale in the provision by the Investment Manager of services to the Fund, to groups of related funds, and to the Investment Manager's investment advisory clients as a whole, and whether those economies of scale were expected to be shared with the Fund through breakpoints in the proposed investment management fees or other means, such as expense limitation arrangements and additional investments by the Investment Manager in investment, trading and compliance resources. The Board noted that the management fee schedules for the Fund contained breakpoints that would reduce the fee rate on assets above specified threshold levels.
After reviewing these and related factors, the Board concluded, within the context of their overall conclusions, that the extent to which any economies of scale were expected to be shared with the Fund supported the approval of the Management Agreement.
Other Benefits to the Investment Manager
The Board received and considered information regarding "fall-out" or ancillary benefits to be received by the Investment Manager and its affiliates as a result of their relationships with the Fund, such as the engagement of the Investment Manager's affiliates to provide distribution and transfer agency services to the Fund. The Board considered that the Fund's distributor retains a portion of the distribution fees from the Fund. The Board also considered the benefits of research made available to the Investment Manager by reason of brokerage commissions to be generated by the Fund's securities transactions, and reviewed information about the Investment Manager's practices with respect to allocating portfolio transactions for brokerage and research services. The Board considered the possible conflicts of interest associated with certain fall-out or other ancillary benefits and the reporting, disclosure and other processes that are in place to address such possible conflicts of interest. The Board recognized that the Investment Manager's profitability would be somewhat lower without these benefits.
Conclusion
The Board reviewed all of the above considerations in reaching their decisions to approve the proposed Management Agreement. In their deliberations, the Trustees did not identify any particular information that was all-important or controlling, and individual Trustees may have attributed different weights to the various factors. Based on their evaluation of all factors that they deemed to be material, including those factors described above, and assisted by the advice of independent legal counsel, the Board, including the Independent Trustees, voting separately, approved the Management Agreement.
Annual Report 2016
29
This page intentionally left blank.
Annual Report 2016
30
This page intentionally left blank.
Annual Report 2016
31
This page intentionally left blank.
Annual Report 2016
32
COLUMBIA VARIABLE PORTFOLIO — U.S. FLEXIBLE GROWTH FUND
IMPORTANT INFORMATION ABOUT THIS REPORT
The policy of the Board is to vote the proxies of the companies in which each fund holds investments consistent with the procedures as stated in the Statement of Additional Information (SAI). You may obtain a copy of the SAI without charge by calling 800.345.6611; contacting your financial intermediary or searching the website of the Securities and Exchange Commission (SEC) at sec.gov. Information regarding how each fund voted proxies relating to portfolio securities is filed with the SEC by August 31st for the most recent 12-month period ending June 30th of that year, and is available without charge by visiting investor.columbiathreadneedleus.com, or searching the website of the SEC at sec.gov.
Each fund files a complete schedule of portfolio holdings with the SEC for the first and third quarters of each fiscal year on Form N-Q. Each fund's Form N-Q is available on the SEC's website at sec.gov and may be reviewed and copied at the SEC's Public Reference Room in Washington, D.C. Information on the operation of the Public Reference Room may be obtained by calling 800.SEC.0330. Each fund's complete schedule of portfolio holdings, as filed on Form N-Q, can also be obtained without charge, upon request, by calling 800.345.6611.
Annual Report 2016
33
Columbia Variable Portfolio — U.S. Flexible Growth Fund
P.O. Box 8081
Boston, MA 02266-8081

Please read and consider the investment objectives, risks, charges and expenses for any fund carefully before investing. For fund and other investment product prospectuses, which contain this and other important information, contact your financial advisor or insurance representative. Please read the prospectus carefully before you invest. The Fund is distributed by Columbia Management Investment Distributors, Inc., member FINRA, and managed by Columbia Management Investment Advisers, LLC.
Columbia Threadneedle Investments (Columbia Threadneedle) is the global brand name of the Columbia and Threadneedle group of companies.
All rights reserved. Columbia Management Investment Distributors, Inc., 225 Franklin Street, Boston, MA 02110-2804
© 2017 Columbia Management Investment Advisers, LLC.
S-2015 AN (2/17)

ANNUAL REPORT
December 31, 2016

COLUMBIA VARIABLE PORTFOLIO — U.S. FLEXIBLE MODERATE GROWTH FUND
Please remember that you may not buy (nor will you own) shares of the Fund directly. The Fund is available through variable annuity contracts or life insurance policies offered by the separate accounts of affiliated insurance companies and other qualified institutional investors authorized by Columbia Management Investment Distributors, Inc. Please contact your financial advisor or insurance representative for more information.

COLUMBIA VARIABLE PORTFOLIO — U.S. FLEXIBLE MODERATE GROWTH FUND
TABLE OF CONTENTS
Portfolio Overview | 2 | ||||||
Understanding Your Fund's Expenses | 3 | ||||||
Portfolio of Investments | 4 | ||||||
Statement of Assets and Liabilities | 9 | ||||||
Statement of Operations | 10 | ||||||
Statement of Changes in Net Assets | 11 | ||||||
Financial Highlights | 13 | ||||||
Notes to Financial Statements | 14 | ||||||
Report of Independent Registered Public Accounting Firm | 22 | ||||||
Trustees and Officers | 23 | ||||||
| Board Consideration and Approval of Management Agreement | 28 | ||||||
Important Information About This Report | 33 | ||||||
| |||
| |||
| |||
| |||
| |||
| |||
| |||
| |||
| |||
| |||
| |||
| |||
| |||
| |||
| |||
| |||
| |||
| |||
| |||
The views expressed in this report reflect the current views of the respective parties. These views are not guarantees of future performance and involve certain risks, uncertainties and assumptions that are difficult to predict, so actual outcomes and results may differ significantly from the views expressed. These views are subject to change at any time based upon economic, market or other conditions and the respective parties disclaim any responsibility to update such views. These views may not be relied on as investment advice and, because investment decisions for a Columbia fund are based on numerous factors, may not be relied on as an indication of trading intent on behalf of any particular Columbia fund. References to specific securities should not be construed as a recommendation or investment advice.
Annual Report 2016
COLUMBIA VARIABLE PORTFOLIO — U.S. FLEXIBLE MODERATE GROWTH FUND
PORTFOLIO OVERVIEW
(Unaudited)
Portfolio Management
Jeffrey Knight, CFA
Anwiti Bahuguna, Ph.D.
David Weiss, CFA
Brian Virginia
Effective January 27, 2017, Kent Peterson no longer serves as a portfolio manager of the Fund.
| Portfolio Allocation (%) (at December 31, 2016) | |||||||
Allocations to Underlying Funds | |||||||
Underlying Funds: Equity | 44.7 | ||||||
U.S. Large Cap | 44.7 | ||||||
Underlying Funds: Fixed Income | 26.0 | ||||||
High Yield | 1.5 | ||||||
Investment Grade | 24.5 | ||||||
Allocations to Tactical Assets | |||||||
Exchange-Traded Funds | 5.0 | ||||||
Money Market Fund Shares Held to Cover Open Derivatives Instruments(a) | 23.8 | ||||||
Residential Mortgage-Backed Securities — Agency | 0.5 | ||||||
Total | 100.0 | ||||||
Percentages indicated are based upon total investments. The Fund's portfolio composition is subject to change.
(a) Includes investments in an affiliated money market fund (amounting to $21.2 million) which have been segregated to cover obligations relating to the Fund's investment in derivatives as part of its tactical allocation strategy. For a description of the Fund's investments in derivatives, see Investments in Derivatives following the Portfolio of Investments, and Note 2 to the financial statements.
Annual Report 2016
2
COLUMBIA VARIABLE PORTFOLIO — U.S. FLEXIBLE MODERATE GROWTH FUND
UNDERSTANDING YOUR FUND'S EXPENSES
(Unaudited)
As an investor, you incur ongoing costs, which generally include management fees, distribution and/or service fees, and other fund expenses. The following information is intended to help you understand your ongoing costs (in dollars) of investing in the Fund and to help you compare these costs with the ongoing costs of investing in other mutual funds.
The information below does not reflect fees and expenses imposed under your variable annuity contract and/or variable life insurance policy (collectively, Contracts) or qualified pension and retirement plan (Qualified Plan), if any. The total fees and expenses you bear may therefore be higher than those shown below.
Analyzing Your Fund's Expenses
To illustrate these ongoing costs, we have provided examples and calculated the expenses paid by investors in Class 2 shares of the Fund during the period. The actual and hypothetical information in the table is based on an initial investment of $1,000 at the beginning of the period indicated and held for the entire period. Expense information is calculated two ways and each method provides you with different information. The amount listed in the "Actual" column is calculated using the Fund's actual operating expenses and total return for the period. You may use the Actual information, together with the amount invested, to estimate the expenses that you paid over the period. Simply divide your account value by $1,000 (for example, an $8,600 account value divided by $1,000 = 8.6), then multiply the results by the expenses paid during the period under the "Actual" column. The amount listed in the "Hypothetical" column assumes a 5% annual rate of return before expenses (which is not the Fund's actual return) and then applies the Fund's actual expense ratio for the period to the hypothetical return. You should not use the hypothetical account values and expenses to estimate either your actual account balance at the end of the period or the expenses you paid during the period. See "Compare With Other Funds" below for details on how to use the hypothetical data.
In addition to the ongoing expenses which the Fund bears directly, the Fund's shareholders indirectly bear the Fund's allocable share of the costs and expenses of each underlying fund in which the Fund invests. You can estimate the effective expenses paid during the period, which includes the indirect fees associated with investing in the underlying funds, by using the amounts listed in the "Effective Expenses Paid During the Period" column.
Compare With Other Funds
Since all mutual funds are required to include the same hypothetical calculations about expenses in shareholder reports, you can use this information to compare the ongoing cost of investing in the Fund with other funds. To do so, compare the hypothetical example with the 5% hypothetical examples that appear in the shareholder reports of other funds. As you compare hypothetical examples of other funds, it is important to note that hypothetical examples are meant to highlight the ongoing costs of investing in a fund only and do not reflect any transaction costs, such as redemption or exchange fees, or expenses that apply to the subaccount or the Contract. Therefore, the hypothetical calculations are useful in comparing ongoing costs only, and will not help you determine the relative total costs of owning different funds. If the fees and expenses imposed under your Contract or Qualified Plan, if any, were included, your costs would be higher.
July 1, 2016 – December 31, 2016
| Account Value at the Beginning of the Period ($) | Account Value at the End of the Period ($) | Expenses Paid During the Period ($) | Fund's Annualized Expense Ratio (%) | Effective Expenses Paid During the Period ($) | Fund's Effective Annualized Expense Ratio (%) | ||||||||||||||||||||||||||||||||||||||
Actual | Hypothetical | Actual | Hypothetical | Actual | Hypothetical | Actual | Actual | Hypothetical | Actual | ||||||||||||||||||||||||||||||||||
Class 2 | 1,000.00 | 1,000.00 | 1,021.00 | (a) | 1,021.80 | 1.02 | (a) | 3.23 | 0.64 | (a) | 1.76 | (a) | 5.56 | 1.10 | (a) | ||||||||||||||||||||||||||||
(a) Based on operations from November 2, 2016 (commencement of operations) through the stated period end.
Expenses paid during the period are equal to the annualized expense ratio for each class as indicated above, multiplied by the average account value over the period and then multiplied by the number of days in the Fund's most recent fiscal half year and divided by 366.
Effective expenses paid during the period and the Fund's effective annualized expense ratio include expenses borne directly to the class plus the Fund's indirect pro rata portion of the ongoing expenses charged by the underlying funds using the expense ratio of each class of the underlying funds as of the underlying fund's most recent shareholder report.
Had Columbia Management Investment Advisers, LLC and/or certain of its affiliates not waived/reimbursed certain fees and expenses, account value at the end of the period would have been reduced.
Annual Report 2016
3
COLUMBIA VARIABLE PORTFOLIO — U.S. FLEXIBLE MODERATE GROWTH FUND
PORTFOLIO OF INVESTMENTS
December 31, 2016
(Percentages represent value of investments compared to net assets)
Equity Funds 44.4%
Shares | Value ($) | ||||||||||
U.S. LARGE CAP 44.4% | |||||||||||
| Columbia Variable Portfolio — Large Cap Index Fund, Class 1 Shares(a)(b) | 519,100 | 8,855,855 | |||||||||
| Columbia Variable Portfolio — Disciplined Core Fund, Class 1 Shares(a)(b) | 113,137 | 4,424,776 | |||||||||
| Columbia Variable Portfolio — Select Large-Cap Value Fund, Class 1 Shares(a)(b) | 215,213 | 4,424,777 | |||||||||
| Variable Portfolio — Loomis Sayles Growth Fund, Class 1 Shares(a)(b) | 201,584 | 4,424,775 | |||||||||
| Variable Portfolio — MFS® Blended Research® Core Equity Fund, Class 1 Shares(a)(b) | 521,303 | 8,862,158 | |||||||||
| Variable Portfolio — Morgan Stanley Advantage Fund, Class 1 Shares(a)(b) | 215,843 | 4,424,774 | |||||||||
| Variable Portfolio — T. Rowe Price Large Cap Value Fund, Class 1 Shares(a)(b) | 225,524 | 4,424,777 | |||||||||
Total | 39,841,892 | ||||||||||
| Total Equity Funds (Cost: $39,624,071) | 39,841,892 | ||||||||||
Fixed-Income Funds 25.9%
HIGH YIELD 1.5% | |||||||||||
| Columbia Variable Portfolio — Income Opportunities Fund, Class 1 Shares(b) | 178,421 | 1,348,864 | |||||||||
INVESTMENT GRADE 24.4% | |||||||||||
| Columbia Variable Portfolio — Intermediate Bond Fund, Class 1 Shares(b) | 445,785 | 4,613,873 | |||||||||
| Columbia Variable Portfolio — Limited Duration Credit Fund, Class 1 Shares(b) | 143,101 | 1,355,167 | |||||||||
| Columbia Variable Portfolio — Long Government/Credit Bond Fund, Class 1 Shares(b) | 111,830 | 1,109,347 | |||||||||
| Columbia Variable Portfolio — U.S. Government Mortgage Fund, Class 1 Shares(b) | 131,315 | 1,355,168 | |||||||||
| Variable Portfolio — American Century Diversified Bond Fund, Class 1 Shares(b) | 408,119 | 4,468,901 | |||||||||
| Variable Portfolio — J.P. Morgan Core Bond Fund, Class 1 Shares(b) | 369,914 | 4,002,471 | |||||||||
Fixed-Income Funds (continued)
Shares | Value ($) | ||||||||||
| Variable Portfolio — TCW Core Plus Bond Fund, Class 1 Shares(b) | 411,987 | 4,317,627 | |||||||||
| Variable Portfolio — Wells Fargo Short Duration Government Fund, Class 1 Shares(b) | 61,280 | 617,704 | |||||||||
Total | 21,840,258 | ||||||||||
| Total Fixed-Income Funds (Cost: $23,110,310) | 23,189,122 | ||||||||||
Exchange-Traded Funds 4.9%
SPDR S&P 500 ETF Trust | 7,600 | 1,698,828 | |||||||||
Vanguard Total Bond Market ETF | 14,010 | 1,131,868 | |||||||||
iShares Core U.S. Aggregate Bond ETF | 12,200 | 1,318,332 | |||||||||
| iShares iBoxx $ Investment Grade Corporate Bond ETF | 2,313 | 271,037 | |||||||||
| Total Exchange-Traded Funds (Cost: $4,438,833) | 4,420,065 | ||||||||||
Residential Mortgage-Backed
Securities — Agency 0.5%
Issuer | Coupon Rate | Principal Amount ($) | Value ($) | ||||||||||||
| Federal National Mortgage Association(c) 01/18/47 | 4.000 | % | 450,000 | 473,089 | |||||||||||
| Total Residential Mortgage-Backed Securities — Agency (Cost: $472,974) | 473,089 | ||||||||||||||
Money Market Funds 23.6%
Shares | Value ($) | ||||||||||
| Columbia Short-Term Cash Fund, 0.594%(b)(d) | 21,195,848 | 21,195,848 | |||||||||
| Total Money Market Funds (Cost: $21,195,881) | 21,195,848 | ||||||||||
| Total Investments (Cost: $88,842,069) | 89,120,016 | ||||||||||
Other Assets & Liabilities, Net | 663,794 | ||||||||||
Net Assets | 89,783,810 | ||||||||||
The accompanying Notes to Financial Statements are an integral part of this statement.
Annual Report 2016
4
COLUMBIA VARIABLE PORTFOLIO — U.S. FLEXIBLE MODERATE GROWTH FUND
PORTFOLIO OF INVESTMENTS (continued)
December 31, 2016
At December 31, 2016, cash totaling $781,550 was pledged as collateral.
Investments in Derivatives
Futures Contracts Outstanding at December 31, 2016
Long Futures Contracts Outstanding
Contract Description | Number of Contracts | Trading Currency | Notional Market Value ($) | Expiration Date | Unrealized Appreciation ($) | Unrealized (Depreciation) ($) | |||||||||||||||||||||
S&P 500 E-mini | 167 | USD | 18,672,270 | 03/2017 | 22,895 | — | |||||||||||||||||||||
U.S. Long Bond | 2 | USD | 301,313 | 03/2017 | 4,121 | — | |||||||||||||||||||||
U.S. Treasury 10-Year Note | 2 | USD | 248,563 | 03/2017 | — | (1,238 | ) | ||||||||||||||||||||
U.S. Treasury 2-Year Note | 2 | USD | 433,375 | 03/2017 | — | (441 | ) | ||||||||||||||||||||
U.S. Treasury 2-Year Note | 4 | USD | 866,750 | 03/2017 | — | (831 | ) | ||||||||||||||||||||
U.S. Treasury 5-Year Note | 5 | USD | 588,320 | 03/2017 | 4,405 | — | |||||||||||||||||||||
U.S. Treasury 5-Year Note | 1 | USD | 117,664 | 03/2017 | — | (510 | ) | ||||||||||||||||||||
U.S. Ultra Bond | 1 | USD | 160,250 | 03/2017 | — | (3,096 | ) | ||||||||||||||||||||
Total | 21,388,505 | 31,421 | (6,116 | ) | |||||||||||||||||||||||
Notes to Portfolio of Investments
(a) Non-income producing investment.
(b) As defined in the Investment Company Act of 1940, an affiliated company is one in which the Fund owns 5% or more of the company's outstanding voting securities, or a company which is under common ownership or control with the Fund. Holdings and transactions in these affiliated companies during the period ended December 31, 2016 are as follows:
Issuer | Beginning Cost ($) | Purchase Cost ($) | Proceeds From Sales ($) | Realized Gain (Loss) ($) | Ending Cost ($) | Dividends — Affiliated Issuers ($) | Value ($) | ||||||||||||||||||||||||
| Columbia Short-Term Cash Fund | 10,000,000 | 23,043,011 | (11,846,954 | ) | (176 | ) | 21,195,881 | 7,691 | 21,195,848 | ||||||||||||||||||||||
| Columbia Variable Portfolio — Disciplined Core Fund, Class 1 Shares | — | 4,705,327 | (301,749 | ) | (1,849 | ) | 4,401,729 | — | 4,424,776 | ||||||||||||||||||||||
| Columbia Variable Portfolio — Income Opportunities Fund, Class 1 Shares | — | 1,435,608 | (99,048 | ) | 41 | 1,336,601 | — | 1,348,864 | |||||||||||||||||||||||
| Columbia Variable Portfolio — Intermediate Bond Fund, Class 1 Shares | — | 4,939,203 | (332,572 | ) | (8,726 | ) | 4,597,905 | — | 4,613,873 | ||||||||||||||||||||||
| Columbia Variable Portfolio — Large Cap Index Fund, Class 1 Shares | — | 9,360,438 | (600,440 | ) | (3,930 | ) | 8,756,068 | — | 8,855,855 | ||||||||||||||||||||||
The accompanying Notes to Financial Statements are an integral part of this statement.
Annual Report 2016
5
COLUMBIA VARIABLE PORTFOLIO — U.S. FLEXIBLE MODERATE GROWTH FUND
PORTFOLIO OF INVESTMENTS (continued)
December 31, 2016
Notes to Portfolio of Investments (continued)
Issuer | Beginning Cost ($) | Purchase Cost ($) | Proceeds From Sales ($) | Realized Gain (Loss) ($) | Ending Cost ($) | Dividends — Affiliated Issuers ($) | Value ($) | ||||||||||||||||||||||||
| Columbia Variable Portfolio — Limited Duration Credit Fund, Class 1 Shares | — | 1,450,975 | (98,514 | ) | (521 | ) | 1,351,940 | — | 1,355,167 | ||||||||||||||||||||||
| Columbia Variable Portfolio — Long Government/ Credit Bond Fund, Class 1 Shares | — | 1,186,491 | (81,460 | ) | (6,009 | ) | 1,099,022 | — | 1,109,347 | ||||||||||||||||||||||
| Columbia Variable Portfolio — Select Large-Cap Value Fund, Class 1 Shares | — | 4,627,761 | (295,305 | ) | (2,745 | ) | 4,329,711 | — | 4,424,777 | ||||||||||||||||||||||
| Columbia Variable Portfolio — U.S. Government Mortgage Fund, Class 1 Shares | — | 1,451,715 | (96,767 | ) | (2,071 | ) | 1,352,877 | — | 1,355,168 | ||||||||||||||||||||||
| Variable Portfolio — American Century Diversified Bond Fund, Class 1 Shares | — | 4,781,577 | (319,605 | ) | (8,519 | ) | 4,453,453 | — | 4,468,901 | ||||||||||||||||||||||
| Variable Portfolio — J.P. Morgan Core Bond Fund, Class 1 Shares | — | 4,288,058 | (286,155 | ) | (8,252 | ) | 3,993,651 | — | 4,002,471 | ||||||||||||||||||||||
| Variable Portfolio — Loomis Sayles Growth Fund, Class 1 Shares | — | 4,751,910 | (296,264 | ) | (2,324 | ) | 4,453,322 | — | 4,424,775 | ||||||||||||||||||||||
| Variable Portfolio — MFS® Blended Research® Core Equity Fund, Class 1 Shares | — | 9,419,872 | (600,868 | ) | (4,471 | ) | 8,814,533 | — | 8,862,158 | ||||||||||||||||||||||
| Variable Portfolio — Morgan Stanley Advantage Fund, Class 1 Shares | — | 4,796,446 | (301,674 | ) | (2,248 | ) | 4,492,524 | — | 4,424,774 | ||||||||||||||||||||||
| Variable Portfolio — T. Rowe Price Large Cap Value Fund, Class 1 Shares | — | 4,677,049 | (298,660 | ) | (2,205 | ) | 4,376,184 | — | 4,424,777 | ||||||||||||||||||||||
The accompanying Notes to Financial Statements are an integral part of this statement.
Annual Report 2016
6
COLUMBIA VARIABLE PORTFOLIO — U.S. FLEXIBLE MODERATE GROWTH FUND
PORTFOLIO OF INVESTMENTS (continued)
December 31, 2016
Notes to Portfolio of Investments (continued)
Issuer | Beginning Cost ($) | Purchase Cost ($) | Proceeds From Sales ($) | Realized Gain (Loss) ($) | Ending Cost ($) | Dividends — Affiliated Issuers ($) | Value ($) | ||||||||||||||||||||||||
| Variable Portfolio — TCW Core Plus Bond Fund, Class 1 Shares | — | 4,624,107 | (308,415 | ) | (8,592 | ) | 4,307,100 | — | 4,317,627 | ||||||||||||||||||||||
| Variable Portfolio — Wells Fargo Short Duration Government Fund, Class 1 Shares | — | 663,050 | (44,932 | ) | (357 | ) | 617,761 | — | 617,704 | ||||||||||||||||||||||
Total | 10,000,000 | 90,202,598 | (16,209,382 | ) | (62,954 | ) | 83,930,262 | 7,691 | 84,226,862 | ||||||||||||||||||||||
(c) Security, or a portion thereof, has been purchased on a when-issued or delayed delivery basis.
(d) The rate shown is the seven-day current annualized yield at December 31, 2016.
Currency Legend
USD US Dollar
Fair Value Measurements
The Fund categorizes its fair value measurements according to a three-level hierarchy that maximizes the use of observable inputs and minimizes the use of unobservable inputs by prioritizing that the most observable input be used when available. Observable inputs are those that market participants would use in pricing an investment based on market data obtained from sources independent of the reporting entity. Unobservable inputs are those that reflect the Fund's assumptions about the information market participants would use in pricing an investment. An investment's level within the fair value hierarchy is based on the lowest level of any input that is deemed significant to the asset's or liability's fair value measurement. The input levels are not necessarily an indication of the risk or liquidity associated with investments at that level. For example, certain U.S. government securities are generally high quality and liquid, however, they are reflected as Level 2 because the inputs used to determine fair value may not always be quoted prices in an active market.
Fair value inputs are summarized in the three broad levels listed below:
> Level 1 — Valuations based on quoted prices for investments in active markets that the Fund has the ability to access at the measurement date (including NAV for open-end mutual funds). Valuation adjustments are not applied to Level 1 investments.
> Level 2 — Valuations based on other significant observable inputs (including quoted prices for similar securities, interest rates, prepayment speeds, credit risks, etc.).
> Level 3 — Valuations based on significant unobservable inputs (including the Fund's own assumptions and judgment in determining the fair value of investments).
Inputs that are used in determining fair value of an investment may include price information, credit data, volatility statistics, and other factors. These inputs can be either observable or unobservable. The availability of observable inputs can vary between investments, and is affected by various factors such as the type of investment, and the volume and level of activity for that investment or similar investments in the marketplace. The inputs will be considered by the Investment Manager, along with any other relevant factors in the calculation of an investment's fair value. The Fund uses prices and inputs that are current as of the measurement date, which may include periods of market dislocations. During these periods, the availability of prices and inputs may be reduced for many investments. This condition could cause an investment to be reclassified between the various levels within the hierarchy.
Certain investments that have been measured at fair value using the net asset value (NAV) per share (or its equivalent) are not categorized in the fair value hierarchy. The fair value amounts presented in the table are intended to reconcile the fair value hierarchy to the amounts presented in the Portfolio of Investments. The Variable Portfolios serve as investment vehicles for variable annuity contracts and variable life insurance policies. Principle investment strategies within these Variable Portfolios vary based on the Portfolios investment objective. Investments in the Variable Portfolios may be redeemed on a daily basis without restriction. The Columbia Short-Term Cash Fund seeks to provide shareholders with maximum current income consistent with liquidity and stability of principal. Columbia Short-Term Cash Fund prices its shares with a floating NAV and no longer seeks to maintain a stable NAV.
Investments falling into the Level 3 category are primarily supported by quoted prices from brokers and dealers participating in the market for those investments. However, these may be classified as Level 3 investments due to lack of market transparency and corroboration to support
The accompanying Notes to Financial Statements are an integral part of this statement.
Annual Report 2016
7
COLUMBIA VARIABLE PORTFOLIO — U.S. FLEXIBLE MODERATE GROWTH FUND
PORTFOLIO OF INVESTMENTS (continued)
December 31, 2016
Fair Value Measurements (continued)
these quoted prices. Additionally, valuation models may be used as the pricing source for any remaining investments classified as Level 3. These models may rely on one or more significant unobservable inputs and/or significant assumptions by the Investment Manager. Inputs used in valuations may include, but are not limited to, financial statement analysis, capital account balances, discount rates and estimated cash flows, and comparable company data.
Under the direction of the Fund's Board of Trustees (the Board), the Investment Manager's Valuation Committee (the Committee) is responsible for overseeing the valuation procedures approved by the Board. The Committee consists of voting and non-voting members from various groups within the Investment Manager's organization, including operations and accounting, trading and investments, compliance, risk management and legal.
The Committee meets at least monthly to review and approve valuation matters, which may include a description of specific valuation determinations, data regarding pricing information received from approved pricing vendors and brokers and the results of Board-approved valuation control policies and procedures (the Policies). The Policies address, among other things, instances when market quotations are or are not readily available, including recommendations of third party pricing vendors and a determination of appropriate pricing methodologies; events that require specific valuation determinations and assessment of fair value techniques; securities with a potential for stale pricing, including those that are illiquid, restricted, or in default; and the effectiveness of third party pricing vendors, including periodic reviews of vendors. The Committee meets more frequently, as needed, to discuss additional valuation matters, which may include the need to review back-testing results, review time-sensitive information or approve related valuation actions. The Committee reports to the Board, with members of the Committee meeting with the Board at each of its regularly scheduled meetings to discuss valuation matters and actions during the period, similar to those described earlier.
For investments categorized as Level 3, the Committee monitors information similar to that described above, which may include: (i) data specific to the issuer or comparable issuers, (ii) general market or specific sector news and (iii) quoted prices and specific or similar security transactions. The Committee considers this data and any changes from prior periods in order to assess the reasonableness of observable and unobservable inputs, any assumptions or internal models used to value those securities and changes in fair value. This data is also used to corroborate, when available, information received from approved pricing vendors and brokers. Various factors impact the frequency of monitoring this information (which may occur as often as daily). However, the Committee may determine that changes to inputs, assumptions and models are not required as a result of the monitoring procedures performed.
The following table is a summary of the inputs used to value the Fund's investments at December 31, 2016:
| Level 1 Quoted Prices in Active Markets for Identical Assets ($) | Level 2 Other Significant Observable Inputs ($) | Level 3 Significant Unobservable Inputs ($) | Total ($) | ||||||||||||||||
Investments | |||||||||||||||||||
Exchange-Traded Funds | 4,420,065 | — | — | 4,420,065 | |||||||||||||||
| Residential Mortgage-Backed Securities — Agency | — | 473,089 | — | 473,089 | |||||||||||||||
Investments measured at net asset value | |||||||||||||||||||
Equity Funds | — | — | — | 39,841,892 | |||||||||||||||
Fixed-Income Funds | — | — | — | 23,189,122 | |||||||||||||||
Money Market Funds | — | — | — | 21,195,848 | |||||||||||||||
Total Investments | 4,420,065 | 473,089 | — | 89,120,016 | |||||||||||||||
Derivatives | |||||||||||||||||||
Assets | |||||||||||||||||||
Futures Contracts | 31,421 | — | — | 31,421 | |||||||||||||||
Liabilities | |||||||||||||||||||
Futures Contracts | (6,116 | ) | — | — | (6,116 | ) | |||||||||||||
Total | 4,445,370 | 473,089 | — | 89,145,321 | |||||||||||||||
See the Portfolio of Investments for all investment classifications not indicated in the table.
The Fund's assets assigned to the Level 2 input category are generally valued using the market approach, in which a security's value is determined through reference to prices and information from market transactions for similar or identical assets.
Derivative instruments are valued at unrealized appreciation (depreciation).
There were no transfers of financial assets between levels during the period.
The accompanying Notes to Financial Statements are an integral part of this statement.
Annual Report 2016
8
COLUMBIA VARIABLE PORTFOLIO — U.S. FLEXIBLE MODERATE GROWTH FUND
STATEMENT OF ASSETS AND LIABILITIES
December 31, 2016
Assets | |||||||
Investments, at value | |||||||
Unaffiliated issuers (identified cost $4,911,807) | $ | 4,893,154 | |||||
Affiliated issuers (identified cost $83,930,262) | 84,226,862 | ||||||
Total investments (identified cost $88,842,069) | 89,120,016 | ||||||
Margin deposits | 781,550 | ||||||
Receivable for: | |||||||
Capital shares sold | 1,507,307 | ||||||
Dividends | 16,380 | ||||||
Interest | 850 | ||||||
Variation margin | 5,053 | ||||||
Trustees' deferred compensation plan | 74 | ||||||
Total assets | 91,431,230 | ||||||
Liabilities | |||||||
Payable for: | |||||||
Investments purchased | 1,052,502 | ||||||
Investments purchased on a delayed delivery basis | 473,825 | ||||||
Capital shares purchased | 3,732 | ||||||
Variation margin | 72,832 | ||||||
Management services fees | 536 | ||||||
Distribution and/or service fees | 587 | ||||||
Transfer agent fees | 42 | ||||||
Compensation of board members | 750 | ||||||
Chief compliance officer expenses | 6 | ||||||
Other expenses | 42,534 | ||||||
Trustees' deferred compensation plan | 74 | ||||||
Total liabilities | 1,647,420 | ||||||
Net assets applicable to outstanding capital stock | $ | 89,783,810 | |||||
Represented by | |||||||
Trust capital | $ | 89,783,810 | |||||
Total — representing net assets applicable to outstanding capital stock | $ | 89,783,810 | |||||
Class 2 | |||||||
Net assets | $ | 89,783,810 | |||||
Shares outstanding | 8,793,085 | ||||||
Net asset value per share | $ | 10.21 | |||||
The accompanying Notes to Financial Statements are an integral part of this statement.
Annual Report 2016
9
COLUMBIA VARIABLE PORTFOLIO — U.S. FLEXIBLE MODERATE GROWTH FUND
STATEMENT OF OPERATIONS
Year Ended December 31, 2016(a)
Net investment income | |||||||
Income: | |||||||
Dividends — unaffiliated issuers | $ | 19,966 | |||||
Dividends — affiliated issuers | 7,691 | ||||||
Total income | 27,657 | ||||||
Expenses: | |||||||
Management services fees | 13,410 | ||||||
Distribution and/or service fees | |||||||
Class 2 | 14,643 | ||||||
Transfer agent fees | |||||||
Class 2 | 1,049 | ||||||
Compensation of board members | 750 | ||||||
Custodian fees | 6,447 | ||||||
Printing and postage fees | 11,907 | ||||||
Audit fees | 22,505 | ||||||
Legal fees | 245 | ||||||
Chief compliance officer expenses | 6 | ||||||
Other | 2,207 | ||||||
Total expenses | 73,169 | ||||||
Fees waived or expenses reimbursed by Investment Manager and its affiliates | (7,000 | ) | |||||
Total net expenses | 66,169 | ||||||
Net investment loss | (38,512 | ) | |||||
Realized and unrealized gain (loss) — net | |||||||
Net realized gain (loss) on: | |||||||
Investments — unaffiliated issuers | (35,256 | ) | |||||
Investments — affiliated issuers | (62,954 | ) | |||||
Futures contracts | 55,272 | ||||||
Net realized loss | (42,938 | ) | |||||
Net change in unrealized appreciation (depreciation) on: | |||||||
Investments — unaffiliated issuers | (18,653 | ) | |||||
Investments — affiliated issuers | 296,600 | ||||||
Futures contracts | 25,305 | ||||||
Net change in unrealized appreciation | 303,252 | ||||||
Net realized and unrealized gain | 260,314 | ||||||
Net increase in net assets resulting from operations | $ | 221,802 | |||||
(a) Based on operations from November 2, 2016 (commencement of operations) through the stated period end.
The accompanying Notes to Financial Statements are an integral part of this statement.
Annual Report 2016
10
COLUMBIA VARIABLE PORTFOLIO — U.S. FLEXIBLE MODERATE GROWTH FUND
STATEMENT OF CHANGES IN NET ASSETS
| Year Ended December 31, 2016(a) | |||||||
Operations | |||||||
Net investment loss | $ | (38,512 | ) | ||||
Net realized loss | (42,938 | ) | |||||
Net change in unrealized appreciation | 303,252 | ||||||
Net increase in net assets resulting from operations | 221,802 | ||||||
Increase in net assets from capital stock activity | 79,562,008 | ||||||
Total increase in net assets | 79,783,810 | ||||||
Net assets at beginning of year | 10,000,000 | ||||||
Net assets at end of year | $ | 89,783,810 | |||||
(a) Based on operations from November 2, 2016 (commencement of operations) through the stated period end.
The accompanying Notes to Financial Statements are an integral part of this statement.
Annual Report 2016
11
COLUMBIA VARIABLE PORTFOLIO — U.S. FLEXIBLE MODERATE GROWTH FUND
STATEMENT OF CHANGES IN NET ASSETS (continued)
Year Ended December 31, 2016(a) | |||||||||||
Shares | Dollars ($) | ||||||||||
Capital stock activity | |||||||||||
Class 2 shares | |||||||||||
Subscriptions | 8,793,452 | 89,825,752 | |||||||||
Redemptions | (1,000,367 | ) | (10,263,744 | ) | |||||||
Net increase | 7,793,085 | 79,562,008 | |||||||||
Total net increase | 7,793,085 | 79,562,008 | |||||||||
(a) Based on operations from November 2, 2016 (commencement of operations) through the stated period end.
The accompanying Notes to Financial Statements are an integral part of this statement.
Annual Report 2016
12
COLUMBIA VARIABLE PORTFOLIO — U.S. FLEXIBLE MODERATE GROWTH FUND
FINANCIAL HIGHLIGHTS
The following table is intended to help you understand the Fund's financial performance. Certain information reflects financial results for a single share of a class held for the periods shown. Per share net investment income (loss) amounts are calculated based on average shares outstanding during the period. Total return assumes reinvestment of all dividends and distributions, if any. Total return does not reflect any fees and expenses imposed under your Contract and/or Qualified Plan, as applicable; such fees and expenses would reduce the total returns for all periods shown. Total return and portfolio turnover are not annualized for periods of less than one year. The portfolio turnover rate is calculated without regard to purchase and sales transactions of short-term instruments and certain derivatives, if any. If such transactions were included, the Fund's portfolio turnover rate may be higher.
Class 2 | Year Ended December 31, 2016(a) | ||||||
Per share data | |||||||
Net asset value, beginning of period | $ | 10.00 | |||||
Income from investment operations: | |||||||
Net investment loss | (0.01 | ) | |||||
Net realized and unrealized gain | 0.22 | ||||||
Total from investment operations | 0.21 | ||||||
Net asset value, end of period | $ | 10.21 | |||||
Total return | 2.10 | % | |||||
Ratios to average net assets(b) | |||||||
Total gross expenses | 0.75 | %(c) | |||||
Total net expenses(d) | 0.64 | %(c) | |||||
Net investment loss | (0.16 | %)(c) | |||||
Supplemental data | |||||||
Net assets, end of period (in thousands) | $ | 89,784 | |||||
Portfolio turnover | 16 | % | |||||
Notes to Financial Highlights
(a) Based on operations from November 2, 2016 (commencement of operations) through the stated period end.
(b) In addition to the fees and expenses that the Fund bears directly, the Fund indirectly bears a pro rata share of the fees and expenses of the underlying funds in which the Fund invests. Such indirect expenses are not included in the Fund's reported expense ratios.
(c) Annualized.
(d) Total net expenses include the impact of certain fee waivers/expense reimbursements made by the Investment Manager and certain of its affiliates, if applicable.
The accompanying Notes to Financial Statements are an integral part of this statement.
Annual Report 2016
13
COLUMBIA VARIABLE PORTFOLIO — U.S. FLEXIBLE MODERATE GROWTH FUND
NOTES TO FINANCIAL STATEMENTS
December 31, 2016
Note 1. Organization
Columbia Variable Portfolio — U.S. Flexible Moderate Growth Fund (the Fund), a series of Columbia Funds Variable Insurance Trust (the Trust), is a diversified fund. The Trust is registered under the Investment Company Act of 1940, as amended (the 1940 Act), as an open-end management investment company organized as a Massachusetts business trust.
On November 1, 2016, Columbia Management Investment Advisers, LLC (the Investment Manager), a wholly-owned subsidiary of Ameriprise Financial, Inc. (Ameriprise Financial), invested $10,000,000 in the Fund (1,000,000 shares for Class 2), which represented the initial capital at $10 per share. Shares of the Fund were first offered to the public on November 14, 2016.
These financial statements cover the period from November 2, 2016 (commencement of operations) through December 31, 2016.
The Fund is a "fund-of-funds", investing significantly in affiliated funds managed by the Investment Manager, its affiliates, or third-party advised (unaffiliated) funds, including exchange-traded funds (collectively, Underlying Funds).
For information on the Underlying Funds, please refer to the Fund's current prospectus and the prospectuses of the Underlying Funds, which are available, free of charge, from the Securities and Exchange Commission website, www.sec.gov.
Fund Shares
The Trust may issue an unlimited number of shares (without par value). The Fund offers Class 2 shares to separate accounts funding variable annuity contracts and variable life insurance policies (collectively, Contracts) issued by affiliated and unaffiliated life insurance companies as well as other qualified institutional investors (Qualified Investors) authorized by Columbia Management Investment Distributors, Inc. (the Distributor). You may not buy (nor will you own) shares of the Fund directly. You may invest by buying a Contract.
Note 2. Summary of Significant Accounting Policies
Basis of Preparation
The Fund is an investment company that applies the accounting and reporting guidance in the Financial Accounting Standards Board (FASB) Accounting Standards Codification Topic 946, Financial Services — Investment
Companies (ASC 946). The financial statements are prepared in accordance with U.S. generally accepted accounting principles (GAAP), which requires management to make certain estimates and assumptions that affect the reported amounts of assets and liabilities, the disclosure of contingent assets and liabilities at the date of the financial statements and the reported amounts of income and expenses during the reporting period. Actual results could differ from those estimates.
The following is a summary of significant accounting policies followed by the Fund in the preparation of its financial statements.
Security Valuation
All equity securities and exchange-traded funds are valued at the close of business of the New York Stock Exchange. Equity securities and exchange-traded funds are valued at the last quoted sales price on the principal exchange or market on which they trade, except for securities traded on the NASDAQ Stock Market, which are valued at the NASDAQ official close price. Unlisted securities or listed securities for which there were no sales during the day are valued at the mean of the latest quoted bid and ask prices on such exchanges or markets.
Asset- and mortgage-backed securities are generally valued by pricing services, which utilize pricing models that incorporate the securities' cash flow and loan performance data. These models also take into account available market data, including trades, market quotations, and benchmark yield curves for identical or similar securities. Factors used to identify similar securities may include, but are not limited to, issuer, collateral type, vintage, prepayment speeds, collateral performance, credit ratings, credit enhancement and expected life. Asset-backed securities for which quotations are readily available may also be valued based upon an over-the-counter or exchange bid quote from an approved independent broker-dealer.
Investments in the Underlying Funds are valued at the net asset value of the applicable class of the Underlying Fund determined as of the close of the New York Stock Exchange on the valuation date.
Futures and options on futures contracts are valued based upon the settlement price at the close of regular trading on their principal exchanges or, in the absence of transactions, at the mean of the latest quoted bid and ask prices.
Annual Report 2016
14
COLUMBIA VARIABLE PORTFOLIO — U.S. FLEXIBLE MODERATE GROWTH FUND
NOTES TO FINANCIAL STATEMENTS (continued)
December 31, 2016
Investments for which market quotations are not readily available, or that have quotations which management believes are not reflective of market value or reliable, are valued at fair value as determined in good faith under procedures approved by and under the general supervision of the Board of Trustees. If a security or class of securities (such as foreign securities) is valued at fair value, such value is likely to be different from the quoted or published price for the security.
The determination of fair value often requires significant judgment. To determine fair value, management may use assumptions including but not limited to future cash flows and estimated risk premiums. Multiple inputs from various sources may be used to determine fair value.
GAAP requires disclosure regarding the inputs and valuation techniques used to measure fair value and any changes in valuation inputs or techniques. In addition, investments shall be disclosed by major category. This information is disclosed following the Fund's Portfolio of Investments.
Derivative Instruments
The Fund invests in certain derivative instruments, as detailed below, to meet its investment objectives. Derivatives are instruments whose values depend on, or are derived from, in whole or in part, the value of one or more securities, currencies, commodities, indices, or other assets or instruments. Derivatives may be used to increase investment flexibility (including to maintain cash reserves while maintaining desired exposure to certain assets), for risk management (hedging) purposes, to facilitate trading, to reduce transaction costs and to pursue higher investment returns. The Fund may also use derivative instruments to mitigate certain investment risks, such as foreign currency exchange rate risk, interest rate risk and credit risk. Derivatives may involve various risks, including the potential inability of the counterparty to fulfill its obligations under the terms of the contract, the potential for an illiquid secondary market (making it difficult for the Fund to sell or terminate, including at favorable prices) and the potential for market movements which may expose the Fund to gains or losses in excess of the amount shown in the Statement of Assets and Liabilities. The notional amounts of derivative instruments, if applicable, are not recorded in the financial statements.
A derivative instrument may suffer a marked-to-market loss if the value of the contract decreases due to an unfavorable change in the market rates or values of the underlying instrument. Losses can also occur if the
counterparty does not perform its obligations under the contract. The Fund's risk of loss from counterparty credit risk on over-the-counter derivatives is generally limited to the aggregate unrealized gain netted against any collateral held by the Fund and the amount of any variation margin held by the counterparty, plus any replacement costs or related amounts. With exchange-traded or centrally cleared derivatives, there is reduced counterparty credit risk to the Fund since the clearinghouse or central counterparty (CCP) provides some protection in the case of clearing member default. The clearinghouse or CCP stands between the buyer and the seller of the contract; therefore, additional counterparty credit risk is failure of the clearinghouse or CCP. However, credit risk still exists in exchange-traded or centrally cleared derivatives with respect to initial and variation margin that is held in a broker's customer account. While brokers are required to segregate customer margin from their own assets, in the event that a broker becomes insolvent or goes into bankruptcy and at that time there is a shortfall in the aggregate amount of margin held by the broker for all its clients, U.S. bankruptcy laws will typically allocate that shortfall on a pro-rata basis across all the broker's customers (including the Fund), potentially resulting in losses to the Fund.
In order to better define its contractual rights and to secure rights that will help the Fund mitigate its counterparty risk, the Fund may enter into an International Swaps and Derivatives Association, Inc. Master Agreement (ISDA Master Agreement) or similar agreement with its derivatives contract counterparties. An ISDA Master Agreement is an agreement between the Fund and a counterparty that governs over-the-counter derivatives and typically contains, among other things, collateral posting terms and netting provisions in the event of a default and/or termination event. Under an ISDA Master Agreement, the Fund may, under certain circumstances, offset with the counterparty certain derivative instrument's payables and/or receivables with collateral held and/or posted and create one single net payment. The provisions of the ISDA Master Agreement typically permit a single net payment in the event of default (close-out netting), including the bankruptcy or insolvency of the counterparty. Note, however, that bankruptcy or insolvency laws of a particular jurisdiction may impose restrictions on or prohibitions against the right of offset or netting in bankruptcy, insolvency or other events.
Annual Report 2016
15
COLUMBIA VARIABLE PORTFOLIO — U.S. FLEXIBLE MODERATE GROWTH FUND
NOTES TO FINANCIAL STATEMENTS (continued)
December 31, 2016
Collateral (margin) requirements differ by type of derivative. Margin requirements are established by the clearinghouse or CCP for exchange-traded and centrally cleared derivatives. Brokers can ask for margin in excess of the minimum in certain circumstances. Collateral terms are contract specific for over-the-counter derivatives. For over-the-counter derivatives traded under an ISDA Master Agreement, the collateral requirements are typically calculated by netting the marked-to-market amount for each transaction under such agreement and comparing that amount to the value of any variation margin currently pledged by the Fund and/or the counterparty. Generally, the amount of collateral due from or to a party has to exceed a minimum transfer amount threshold (e.g., $250,000) before a transfer has to be made. To the extent amounts due to the Fund from its counterparties are not fully collateralized, contractually or otherwise, the Fund bears the risk of loss from counterparty nonperformance. The Fund attempts to mitigate counterparty risk by only entering into agreements with counterparties that it believes have the financial resources to honor their obligations and by monitoring the financial stability of those counterparties.
Certain ISDA Master Agreements allow counterparties of over-the-counter derivatives transactions to terminate derivatives contracts prior to maturity in the event the Fund's net asset value declines by a stated percentage over a specified time period or if the Fund fails to meet certain terms of the ISDA Master Agreement, which would cause the Fund to accelerate payment of any net liability owed to the counterparty. The Fund also has termination rights if the counterparty fails to meet certain terms of the ISDA Master Agreement. In addition to considering counterparty credit risk, the Fund would consider terminating the derivatives contracts based on whether termination would result in a net liability owed from the counterparty.
For financial reporting purposes, the Fund does not offset derivative assets and derivative liabilities that are subject to netting arrangements in the Statement of Assets and Liabilities.
Futures Contracts
Futures contracts are exchange-traded and represent commitments for the future purchase or sale of an asset at a specified price on a specified date. The Fund bought and sold futures contracts to produce incremental earnings, to manage the duration and yield curve
exposure of the Fund versus the benchmark, to manage exposure to movements in interest rates, to manage exposure to the securities market and to maintain appropriate equity market exposure while keeping sufficient cash to accommodate daily redemptions. These instruments may be used for other purposes in future periods. Upon entering into futures contracts, the Fund bears risks that it may not achieve the anticipated benefits of the futures contracts and may realize a loss. Additional risks include counterparty credit risk, the possibility of an illiquid market, and that a change in the value of the contract or option may not correlate with changes in the value of the underlying asset.
Upon entering into a futures contract, the Fund deposits cash or securities with the broker, known as a futures commission merchant (FCM), in an amount sufficient to meet the initial margin requirement. The initial margin deposit must be maintained at an established level over the life of the contract. Cash deposited as initial margin is recorded in the Statement of Assets and Liabilities as margin deposits. Securities deposited as initial margin are designated in the Portfolio of Investments. Subsequent payments (variation margin) are made or received by the Fund each day. The variation margin payments are equal to the daily change in the contract value and are recorded as variation margin receivable or payable and are offset in unrealized gains or losses. The Fund recognizes a realized gain or loss when the contract is closed or expires. Futures contracts involve, to varying degrees, risk of loss in excess of the variation margin disclosed in the Statement of Assets and Liabilities.
Effects of Derivative Transactions in the Financial Statements
The following tables are intended to provide additional information about the effect of derivatives on the financial statements of the Fund, including: the fair value of derivatives by risk category and the location of those fair values in the Statement of Assets and Liabilities; and the impact of derivative transactions over the period in the Statement of Operations, including realized and unrealized gains (losses). The derivative instrument schedules following the Portfolio of Investments present additional information regarding derivative instruments outstanding at the end of the period, if any.
The following table is a summary of the fair value of derivative instruments (not considered to be hedging
Annual Report 2016
16
COLUMBIA VARIABLE PORTFOLIO — U.S. FLEXIBLE MODERATE GROWTH FUND
NOTES TO FINANCIAL STATEMENTS (continued)
December 31, 2016
instruments for accounting disclosure purposes) at December 31, 2016:
Asset Derivatives | |||||||||||
| Risk Exposure Category | Statement of Assets and Liabilities Location | Fair Value ($) | |||||||||
| Equity risk | Component of trust capital — unrealized appreciation on futures contracts | 22,895 | * | ||||||||
| Interest rate risk | Component of trust capital — unrealized appreciation on futures contracts | 8,526 | * | ||||||||
Total | 31,421 | ||||||||||
Liability Derivatives | |||||||||||
| Risk Exposure Category | Statement of Assets and Liabilities Location | Fair Value ($) | |||||||||
| Interest rate risk | Component of trust capital — unrealized appreciation on futures contracts | 6,116 | * | ||||||||
*Includes cumulative appreciation (depreciation) as reported in the tables following the Portfolio of Investments. Only the current day's variation margin is reported in receivables or payables in the Statement of Assets and Liabilities.
The following table indicates the effect of derivative instruments (not considered to be hedging instruments for accounting disclosure purposes) in the Statement of Operations for the period ended December 31, 2016:
Amount of Realized Gain (Loss) on Derivatives Recognized in Income | |||||||
Risk Exposure Category | Futures Contracts ($) | ||||||
Equity risk | 86,002 | ||||||
Interest rate risk | (30,730 | ) | |||||
Total | 55,272 | ||||||
| Change in Unrealized Appreciation (Depreciation) on Derivatives Recognized in Income | |||||||
Risk Exposure Category | Futures Contracts ($) | ||||||
Equity risk | 22,895 | ||||||
Interest rate risk | 2,410 | ||||||
Total | 25,305 | ||||||
The following table provides a summary of the average outstanding volume by derivative instrument for the period ended December 31, 2016:
Derivative Instrument | Average Notional Amounts ($)* | ||||||
Futures contracts — Long | 8,789,265 | ||||||
*Based on the daily outstanding amounts for the period ended December 31, 2016.
Asset- and Mortgage-Backed Securities
The Fund may invest in asset-backed and mortgage-backed securities. The maturity dates shown represent
the original maturity of the underlying obligation. Actual maturity may vary based upon prepayment activity on these obligations. All, or a portion, of the obligation may be prepaid at any time because the underlying asset may be prepaid. As a result, decreasing market interest rates could result in an increased level of prepayment. An increased prepayment rate will have the effect of shortening the maturity of the security. Unless otherwise noted, the coupon rates presented are fixed rates.
Delayed Delivery Securities
The Fund may trade securities on other than normal settlement terms, including securities purchased or sold on a "when-issued" basis. This may increase risk to the Fund since the other party to the transaction may fail to deliver, which could cause the Fund to subsequently invest at less advantageous prices. The Fund designates cash or liquid securities in an amount equal to the delayed delivery commitment.
To Be Announced Securities
The Fund may trade securities on a To Be Announced (TBA) basis. As with other delayed-delivery transactions, a seller agrees to issue a TBA security at a future date. However, the seller does not specify the particular securities to be delivered. Instead, the Fund agrees to accept any security that meets specified terms.
In some cases, Master Securities Forward Transaction Agreements (MSFTAs) may be used to govern transactions of certain forward-settling agency mortgage-backed securities, such as delayed-delivery and TBAs, between the Fund and counterparty. The MSFTA maintains provisions for, among other things, initiation and confirmation, payment and transfer, events of default, termination, and maintenance of collateral relating to such transactions.
Mortgage Dollar Roll Transactions
The Fund may enter into mortgage "dollar rolls" in which the Fund sells securities for delivery in the current month and simultaneously contracts with the same counterparty to repurchase similar but not identical securities (same type, coupon and maturity) on a specified future date. During the roll period, the Fund loses the right to receive principal and interest paid on the securities sold. However, the Fund will benefit because it receives negotiated amounts in the form of reductions of the purchase price for the future purchase plus the interest earned on the cash proceeds of the securities sold until the settlement date of the forward purchase. The Fund records the incremental difference between the forward
Annual Report 2016
17
COLUMBIA VARIABLE PORTFOLIO — U.S. FLEXIBLE MODERATE GROWTH FUND
NOTES TO FINANCIAL STATEMENTS (continued)
December 31, 2016
purchase and sale of each forward roll as a realized gain or loss. Unless any realized gains exceed the income, capital appreciation, and gain or loss due to mortgage prepayments that would have been realized on the securities sold as part of the mortgage dollar roll, the use of this technique will diminish the investment performance of the Fund compared to what the performance would have been without the use of mortgage dollar rolls. All cash proceeds will be invested in instruments that are permissible investments for the Fund. The Fund identifies cash or liquid securities in an amount equal to the forward purchase price.
For financial reporting and tax purposes, the Fund treats "to be announced" mortgage dollar rolls as two separate transactions, one involving the purchase of a security and a separate transaction involving a sale. These transactions may increase the Fund's portfolio turnover rate. The Fund does not currently enter into mortgage dollar rolls that are accounted for as financing transactions.
Mortgage dollar rolls involve the risk that the market value of the securities the Fund is obligated to repurchase may decline below the repurchase price, or that the counterparty may default on its obligations.
Security Transactions
Security transactions are accounted for on the trade date. Cost is determined and gains (losses) are based upon the specific identification method for both financial statement and federal income tax purposes.
Income Recognition
Interest income is recorded on an accrual basis. Market premiums and discounts, including original issue discounts, are amortized and accreted, respectively, over the expected life of the security on all debt securities, unless otherwise noted. The Fund classifies gains and losses realized on prepayments received on mortgage-backed securities as adjustments to interest income.
The Fund may place a debt security on non-accrual status and reduce related interest income when it becomes probable that the interest will not be collected and the amount of uncollectible interest can be reasonably estimated. A defaulted debt security is removed from non-accrual status when the issuer resumes interest payments or when collectibility of interest is reasonably assured.
Corporate actions and dividend income is recorded on the ex-dividend date.
The Fund may receive distributions from holdings in equity securities, business development companies (BDCs), exchange-traded funds, other regulated investment companies (RICs), and real estate investment trusts (REITs), which report information on the tax character of their distributions annually. These distributions are allocated to dividend income, capital gain and return of capital based on actual information reported. Return of capital is recorded as a reduction of the cost basis of securities held. If the Fund no longer owns the applicable securities, return of capital is recorded as a realized gain. With respect to REITs, to the extent actual information has not yet been reported, estimates for return of capital are made by the Fund's management. Management's estimates are subsequently adjusted when the actual character of the distributions is disclosed by the REITs, which could result in a proportionate change in return of capital to shareholders.
Awards from class action litigation are recorded as a reduction of cost basis if the Fund still owns the applicable securities on the payment date. If the Fund no longer owns the applicable securities, the proceeds are recorded as realized gains.
Income and capital gain distributions from the Underlying Funds, if any, are recorded on the ex-dividend date.
Expenses
General expenses of the Trust are allocated to the Fund and other funds of the Trust based upon relative net assets or other expense allocation methodologies determined by the nature of the expense. Expenses directly attributable to the Fund are charged to the Fund. Expenses directly attributable to a specific class of shares are charged to that share class.
Federal Income Tax Status
The Fund is treated as a partnership for federal income tax purposes, and the Fund does not expect to make regular distributions. The Fund will not be subject to federal income tax, and therefore, there is no provision for federal income taxes. The partners of the Fund are subject to tax on their distributive share of the Fund's income and loss. The components of the Fund's net assets are reported at the partner-level for federal income tax purposes, and therefore, are not presented in the Statement of Assets and Liabilities.
Management of the Fund has concluded that there are no significant uncertain tax positions in the Fund that would require recognition in the financial statements.
Annual Report 2016
18
COLUMBIA VARIABLE PORTFOLIO — U.S. FLEXIBLE MODERATE GROWTH FUND
NOTES TO FINANCIAL STATEMENTS (continued)
December 31, 2016
However, management's conclusion may be subject to review and adjustment at a later date based on factors including, but not limited to, new tax laws, regulations, and administrative interpretations (including relevant court decisions). Generally, the Fund's federal tax returns for the prior three fiscal years remain subject to examination by the Internal Revenue Service.
Guarantees and Indemnifications
Under the Trust's organizational documents and, in some cases, by contract, its officers and trustees are indemnified against certain liabilities arising out of the performance of their duties to the Trust or its funds. In addition, certain of the Fund's contracts with its service providers contain general indemnification clauses. The Fund's maximum exposure under these arrangements is unknown since the amount of any future claims that may be made against the Fund cannot be determined, and the Fund has no historical basis for predicting the likelihood of any such claims.
Investment Company Reporting Modernization
In October 2016, the U.S. Securities and Exchange Commission adopted new rules and forms, and amendments to certain current rules and forms, to modernize reporting and disclosure of information by registered investment companies. The amendments to Regulation S-X will require standardized, enhanced disclosure about derivatives in investment company financial statements, and will also change the rules governing the form and content of such financial statements. The amendments to Regulation S-X take effect on August 1, 2017. At this time, management is assessing the anticipated impact of these regulatory developments.
Note 3. Fees and Other Transactions with Affiliates
Management Services Fees and Underlying Fund Fees
The Fund entered into a Management Agreement with the Investment Manager. Under the Management Agreement, the Investment Manager provides the Fund with investment research and advice, as well as administrative and accounting services. The management services fee is an annual fee that is a blend of (i) 0.020% on assets invested in affiliated underlying funds (including exchange-traded funds and closed-end funds) that pay a management services fee (or investment advisory services fee, as applicable) to
the Investment Manager and (ii) a fee that declines from 0.720% to 0.520%, depending on asset levels, on assets invested in securities (other than affiliated underlying funds (including exchange-traded funds and closed-end funds) that pay a management services fee (or investment advisory services fee, as applicable) to the Investment Manager), including other funds advised by the Investment Manager that do not pay a management services fee to the Investment Manager, third party funds, derivatives and individual securities. The annualized effective management services fee rate for the period ended December 31, 2016 was 0.229% of the Fund's average daily net assets.
In addition to the fees and expenses which the Fund bears directly, the Fund indirectly bears a pro rata share of the fees and expenses of the Underlying Funds in which the Fund invests. Because the Underlying Funds have varied expense and fee levels and the Fund may own different proportions of Underlying Funds at different times, the amount of fees and expenses incurred indirectly by the Fund will vary. These expenses are not reflected in the expenses shown in Statement of Operations and are not included in the ratios to average net assets shown in the Financial Highlights.
Other Expenses
Other expenses include offering costs which were incurred prior to the shares of the Fund being offered. Offering costs include printing costs and as applicable, miscellaneous and legal fees. The Fund amortizes offering costs over a period of 12 months from the commencement of operations.
Compensation of Board Members
Board of Trustee members, who are not officers or employees of the Investment Manager or Ameriprise Financial, are compensated for their services to the Fund as disclosed in the Statement of Operations. These Board of Trustee members may participate in a Deferred Compensation Plan (the Plan) which may be terminated at any time. Obligations of the Plan will be paid solely out of the Fund's assets, and all amounts payable under the Plan constitute a general unsecured obligation of the Fund.
Compensation of Chief Compliance Officer
The Board of Trustees has appointed a Chief Compliance Officer to the Fund in accordance with federal securities regulations. The Fund is allocated a portion of the expenses associated with the Chief Compliance Officer based on relative net assets of the Trust.
Annual Report 2016
19
COLUMBIA VARIABLE PORTFOLIO — U.S. FLEXIBLE MODERATE GROWTH FUND
NOTES TO FINANCIAL STATEMENTS (continued)
December 31, 2016
Transfer Agency Fees
The Fund has a Transfer and Dividend Disbursing Agent Agreement with Columbia Management Investment Services Corp. (the Transfer Agent), an affiliate of the Investment Manager and a wholly-owned subsidiary of Ameriprise Financial. The annual fee rate under this agreement is 0.00% on assets invested in Underlying Funds that pay a transfer agency fee to the Transfer Agent and 0.06% of the Fund's average daily net assets on assets invested in securities (other than Underlying Funds that pay a transfer agency fee to the Transfer Agent), including other funds that do not pay a transfer agency fee to the Transfer Agent, exchange-traded funds, derivatives and individual securities.
For the period ended December 31, 2016, the Fund's annualized effective transfer agency fee rate as a percentage of average daily net assets of Class 2 shares was 0.02%.
Distribution Fees
The Fund has an agreement with the Distributor, an affiliate of the Investment Manager and a wholly-owned subsidiary of Ameriprise Financial, for distribution services. The Board of Trustees has approved, and the Fund has adopted, a distribution plan (the Plan) which sets the distribution fees for the Fund. These fees are calculated daily and are intended to compensate the Distributor for selling shares of the Fund. The Fund pays a monthly distribution fee to the Distributor at the maximum annual rate of 0.25% of the average daily net assets attributable to Class 2 shares of the Fund.
Expenses Waived/Reimbursed by the Investment Manager and its Affiliates
The Investment Manager and certain of its affiliates have contractually agreed to waive fees and/or reimburse expenses (excluding certain fees and expenses described below) for the period(s) disclosed below, so that the Fund's net operating expenses, including indirect expenses of the Underlying Funds, after giving effect to fees waived/expenses reimbursed and any balance credits and/or overdraft charges from the Fund's custodian, do not exceed the following annual rate(s) as a percentage of the class' average daily net assets:
| Fee Rate(s) Contractual through April 30, 2017 | |||||||
Class 2 | 1.10 | % | |||||
Under the agreement, the following fees and expenses are excluded from the waiver/reimbursement
commitment, and therefore will be paid by the Fund, if applicable: taxes (including foreign transaction taxes), transaction costs and brokerage commissions, costs related to any securities lending program, dividend and interest expenses associated with securities sold short, inverse floater program fees and expenses, transaction charges and interest on borrowed money, interest, infrequent and/or unusual expenses and any other expenses the exclusion of which is specifically approved by the Board of Trustees. This agreement may be modified or amended only with approval from the Investment Manager, certain of its affiliates and the Fund. Any fees waived and/or expenses reimbursed under the expense reimbursement arrangements described above are not recoverable by the Investment Manager or its affiliates in future periods.
Note 4. Portfolio Information
The cost of purchases and proceeds from sales of securities, excluding short-term investments and derivatives, if any, aggregated to $74,753,834 and $7,009,612, respectively, for the period ended December 31, 2016, of which $1,543,050 and $1,061,354, respectively, were U.S. government securities. The amount of purchase and sale activity impacts the portfolio turnover rate reported in the Financial Highlights.
Note 5. Affiliated Money Market Fund
The Fund invests in Columbia Short-Term Cash Fund, an affiliated money market fund established for the exclusive use by the Fund and other affiliated funds (the Affiliated MMF). The income earned by the Fund from such investments is included as Dividends — affiliated issuers in the Statement of Operations. As an investing fund, the Fund indirectly bears its proportionate share of the expenses of the Affiliated MMF. Effective October 1, 2016, the Affiliated MMF prices its shares with a floating net asset value (NAV) and no longer seeks to maintain a stable NAV. In addition, the Board of Trustees of the Affiliated MMF may impose a fee on redemptions (sometimes referred to as a liquidity fee) or temporarily suspend redemptions (sometimes referred to as imposing a redemption gate) in the event its liquidity falls below regulatory limits.
Note 6. Line of Credit
The Fund has access to a revolving credit facility with a syndicate of banks led by Citibank, N.A., HSBC Bank USA, N.A. and JPMorgan Chase Bank, N.A. whereby the Fund may borrow for the temporary funding of
Annual Report 2016
20
COLUMBIA VARIABLE PORTFOLIO — U.S. FLEXIBLE MODERATE GROWTH FUND
NOTES TO FINANCIAL STATEMENTS (continued)
December 31, 2016
shareholder redemptions or for other temporary or emergency purposes. The credit facility agreement, which is a collective agreement between the Fund and certain other funds managed by the Investment Manager, severally and not jointly, that permits collective borrowings up to $1 billion. Interest is charged to each participating fund based on its borrowings at a rate equal to the higher of (i) the overnight federal funds rate plus 1.00% or (ii) the one-month LIBOR rate plus 1.00%. Each borrowing under the credit facility matures no later than 60 days after the date of borrowing. The Fund also pays a commitment fee equal to its pro rata share of the amount of the credit facility at a rate of 0.15% per annum. The commitment fee is included in other expenses in the Statement of Operations.
The Fund had no borrowings during the period ended December 31, 2016.
Note 7. Significant Risks
Shareholder Concentration Risk
At December 31, 2016, affiliated shareholders of record owned 100.0% of the outstanding shares of the Fund in one or more accounts. Subscription and redemption activity by concentrated accounts may have a significant effect on the operations of the Fund. In the case of a large redemption, the Fund may be forced to sell investments at inopportune times, including its liquid or more liquid positions, resulting in Fund losses and the Fund holding a higher percentage of less liquid or illiquid securities. Large redemptions could result in decreased economies of scale and increased operating expenses for non-redeeming Fund shareholders.
Note 8. Subsequent Events
Management has evaluated the events and transactions that have occurred through the date the financial statements were issued and noted no items requiring adjustment of the financial statements or additional disclosure.
Note 9. Information Regarding Pending and Settled Legal Proceedings
Ameriprise Financial and certain of its affiliates have historically been involved in a number of legal, arbitration and regulatory proceedings, including routine litigation, class actions, and governmental actions, concerning matters arising in connection with the conduct of their business activities. Ameriprise Financial believes that the Funds are not currently the subject of, and that neither Ameriprise Financial nor any of its
affiliates are the subject of, any pending legal, arbitration or regulatory proceedings that are likely to have a material adverse effect on the Funds or the ability of Ameriprise Financial or its affiliates to perform under their contracts with the Funds. Ameriprise Financial is required to make quarterly (10-Q), annual (10-K) and, as necessary, 8-K filings with the Securities and Exchange Commission (SEC) on legal and regulatory matters that relate to Ameriprise Financial and its affiliates. Copies of these filings may be obtained by accessing the SEC website at www.sec.gov.
There can be no assurance that these matters, or the adverse publicity associated with them, will not result in increased fund redemptions, reduced sale of fund shares or other adverse consequences to the Funds. Further, although we believe proceedings are not likely to have a material adverse effect on the Funds or the ability of Ameriprise Financial or its affiliates to perform under their contracts with the Funds, these proceedings are subject to uncertainties and, as such, we are unable to estimate the possible loss or range of loss that may result. An adverse outcome in one or more of these proceedings could result in adverse judgments, settlements, fines, penalties or other relief that could have a material adverse effect on the consolidated financial condition or results of operations of Ameriprise Financial.
Annual Report 2016
21
COLUMBIA VARIABLE PORTFOLIO — U.S. FLEXIBLE MODERATE GROWTH FUND
REPORT OF INDEPENDENT REGISTERED PUBLIC ACCOUNTING FIRM
To the Trustees of Columbia Funds Variable Insurance Trust and the Shareholders of
Columbia Variable Portfolio — U.S. Flexible Moderate Growth Fund
In our opinion, the accompanying statement of assets and liabilities, including the portfolio of investments, and the related statements of operations and of changes in net assets and the financial highlights present fairly, in all material respects, the financial position of Columbia Variable Portfolio — U.S. Flexible Moderate Growth Fund (the "Fund," a series of Columbia Funds Variable Insurance Trust) at December 31, 2016 and the results of its operations, the changes in its net assets and the financial highlights for the period November 2, 2016 (commencement of operations) through December 31, 2016, in conformity with accounting principles generally accepted in the United States of America. These financial statements and financial highlights (hereafter referred to as "financial statements") are the responsibility of the Fund's management. Our responsibility is to express an opinion on these financial statements based on our audit. We conducted our audit of these financial statements in accordance with the standards of the Public Company Accounting Oversight Board (United States). Those standards require that we plan and perform the audit to obtain reasonable assurance about whether the financial statements are free of material misstatement. An audit includes examining, on a test basis, evidence supporting the amounts and disclosures in the financial statements, assessing the accounting principles used and significant estimates made by management, and evaluating the overall financial statement presentation. We believe that our audit, which included confirmation of securities as of December 31, 2016 by correspondence with the custodian, brokers and transfer agent, and the application of alternative auditing procedures where such confirmations had not been received, provide a reasonable basis for our opinion.
PricewaterhouseCoopers LLP
Minneapolis, MN
February 17, 2017
Annual Report 2016
22
COLUMBIA VARIABLE PORTFOLIO — U.S. FLEXIBLE MODERATE GROWTH FUND
TRUSTEES AND OFFICERS
Shareholders elect the Board that oversees the Fund's operations. The Board appoints officers who are responsible for day-to-day business decisions based on policies set by the Board. The following table provides basic biographical information about the Fund's Trustees, including their principal occupations during the past five years, although specific titles for individuals may have varied over the period. The year set forth beneath Length of Service in the table below is the year in which the Trustee was first appointed or elected as Trustee to any Fund currently in the Columbia Funds Complex or a predecessor thereof. Under current Board policy, members serve terms of indefinite duration.
Independent Trustees
| Name, Address, Year of Birth | Position Held With the Trust and Length of Service | Principal Occupation(s) During the Past Five Years and Other Relevant Professional Experience | Number of Funds in the Columbia Funds Complex Overseen | Other Directorships Held by Trustee During the Past Five Years | |||||||||||||||
| Janet Langford Carrig c/o Columbia Management Investment Advisers, LLC, 225 Franklin Street Mail Drop BX32 05228, Boston, MA 02110 1957 | Trustee 1996 | Senior Vice President, General Counsel and Corporate Secretary, ConocoPhillips (independent energy company) since September 2007 | 59 | None | |||||||||||||||
| Douglas A. Hacker c/o Columbia Management Investment Advisers, LLC, 225 Franklin Street Mail Drop BX32 05228, Boston, MA 02110 1955 | Trustee and Chairman of the Board 1996 | Independent business executive since May 2006; Executive Vice President — Strategy of United Airlines from December 2002 to May 2006; President of UAL Loyalty Services (airline marketing company) from September 2001 to December 2002; Executive Vice President and Chief Financial Officer of United Airlines from July 1999 to September 2001 | 59 | Spartan Nash Company (food distributor); Nash Finch Company (food distributor) from 2005 to 2013; Aircastle Limited (aircraft leasing); SeaCube Container Leasing Ltd. (container leasing) from 2010 to 2013; and Travelport Worldwide Limited (travel information technology) | |||||||||||||||
| Nancy T. Lukitsh c/o Columbia Management Investment Advisers, LLC, 225 Franklin Street Mail Drop BX32 05228, Boston, MA 02110 1956 | Trustee 2011 | Senior Vice President, Partner and Director of Marketing, Wellington Management Company, LLP (investment adviser) from 1997 to 2010; Chair, Wellington Management Portfolios (commingled non-U.S. investment pools) from 2007 to 2010; Director, Wellington Trust Company, NA and other Wellington affiliates from 1997 to 2010 | 59 | None | |||||||||||||||
Annual Report 2016
23
COLUMBIA VARIABLE PORTFOLIO — U.S. FLEXIBLE MODERATE GROWTH FUND
TRUSTEES AND OFFICERS (continued)
Independent Trustees (continued)
| Name, Address, Year of Birth | Position Held With the Trust and Length of Service | Principal Occupation(s) During the Past Five Years and Other Relevant Professional Experience | Number of Funds in the Columbia Funds Complex Overseen | Other Directorships Held by Trustee During the Past Five Years | |||||||||||||||
| David M. Moffett c/o Columbia Management Investment Advisers, LLC, 225 Franklin Street Mail Drop BX32 05228, Boston, MA 02110 1952 | Trustee 2011 | Retired. Consultant to Bridgewater and Associates | 59 | Director, CSX Corporation; Genworth Financial, Inc. (financial and insurance products and services); Paypal Holdings Inc. (payment and data processing services); Trustee University of Oklahoma Foundation; former Director eBay Inc. (online trading community), 2007-2015; and former Director, CIT Bank, CIT Group Inc. (commercial and consumer finance), 2010-2016 | |||||||||||||||
| Charles R. Nelson c/o Columbia Management Investment Advisers, LLC, 225 Franklin Street Mail Drop BX32 05228, Boston, MA 02110 1942 | Trustee 1981 | Retired. Professor Emeritus, University of Washington since 2011; Professor of Economics, University of Washington from 1976 to 2011; Ford and Louisa Van Voorhis Professor of Political Economy, University of Washington from 1993 to 2011; Adjunct Professor of Statistics, University of Washington from 1980 to 2011; Associate Editor, Journal of Money, Credit and Banking from September 1993 to 2008; consultant on econometric and statistical matters | 59 | None | |||||||||||||||
| John J. Neuhauser c/o Columbia Management Investment Advisers, LLC, 225 Franklin Street Mail Drop BX32 05228, Boston, MA 02110 1943 | Trustee 1984 | President, Saint Michael's College since August 2007; Director or Trustee of several non-profit organizations, including University of Vermont Medical Center; Academic Vice President and Dean of Faculties, Boston College from August 1999 to October 2005; University Professor, Boston College from November 2005 to August 2007 | 59 | Liberty All-Star Equity Fund and Liberty All-Star Growth Fund (closed-end funds) | |||||||||||||||
| Patrick J. Simpson c/o Columbia Management Investment Advisers, LLC, 225 Franklin Street Mail Drop BX32 05228, Boston, MA 02110 1944 | Trustee 2000 | Of Counsel, Perkins Coie LLP (law firm) since 2015; Partner, Perkins Coie LLP from 1988 to 2014 | 59 | None | |||||||||||||||
Annual Report 2016
24
COLUMBIA VARIABLE PORTFOLIO — U.S. FLEXIBLE MODERATE GROWTH FUND
TRUSTEES AND OFFICERS (continued)
Independent Trustees (continued)
| Name, Address, Year of Birth | Position Held With the Trust and Length of Service | Principal Occupation(s) During the Past Five Years and Other Relevant Professional Experience | Number of Funds in the Columbia Funds Complex Overseen | Other Directorships Held by Trustee During the Past Five Years | |||||||||||||||
| Anne-Lee Verville c/o Columbia Management Investment Advisers, LLC, 225 Franklin Street Mail Drop BX32 05228, Boston, MA 02110 1945 | Trustee 1998 | Retired. General Manager, Global Education Industry from 1994 to 1997, President — Application Systems Division from 1991 to 1994, Chief Financial Officer — US Marketing & Services from 1988 to 1991, and Chief Information Officer from 1987 to 1988, IBM Corporation (computer and technology) | 59 | Enesco Group, Inc. (producer of giftware and home and garden decor products) from 2001 to 2006 | |||||||||||||||
Consultants to the Independent Trustees*
| Name, Address, Year of Birth | Position Held With the Trust and Length of Service | Principal Occupation(s) During the Past Five Years and Other Relevant Professional Experience | Number of Funds in the Columbia Funds Complex Overseen | Other Directorships Held by Trustee During the Past Five Years | |||||||||||||||
| J. Kevin Connaughton c/o Columbia Management Investment Advisers, LLC, 225 Franklin Street Mail Drop BX32 05228, Boston, MA 02110 1964 | Independent Trustee Consultant 2016 | Independent Trustee Consultant, Columbia Funds since March 2016; Managing Director and General Manager of Mutual Fund Products, Columbia Management Investment Advisers, LLC from May 2010 to February 2015; President, Columbia Funds from 2009 to 2015; and senior officer of Columbia Funds and affiliated funds from 2003 to 2015 | 59 | Board of Governors, Gateway Healthcare since January 2016; Trustee, New Century Portfolios since March 2015; and Director, The Autism Project since March 2015 | |||||||||||||||
| Natalie A. Trunow c/o Columbia Management Investment Advisers, LLC, 225 Franklin Street Mail Drop BX32 05228, Boston, MA 02110 1967 | Independent Trustee Consultant 2016 | Independent Trustee Consultant, Columbia Funds since September 2016; Senior Vice President and Chief Executive Officer, Millennial Partners (investment consulting services to institutions) since January 2016; Director of Investments, Casey Family Programs from April 2016 to September 2016; Chief Investment Officer, Calvert Investments from August 2008 to January 2016; Section Head and Portfolio Manager, General Motors Asset Management from June 1997 to August 2008 | 59 | Healthcare Services for Children with Special Needs | |||||||||||||||
* J. Kevin Connaughton was appointed consultant to the Independent Trustees effective March 1, 2016. Natalie A. Trunow was appointed consultant to the Independent Trustees effective September 1, 2016. Shareholders of the Funds are expected to be asked to elect each of Mr. Connaughton and Ms. Trunow as a Trustee at a future shareholder meeting.
Annual Report 2016
25
COLUMBIA VARIABLE PORTFOLIO — U.S. FLEXIBLE MODERATE GROWTH FUND
TRUSTEES AND OFFICERS (continued)
Interested Trustee Affiliated with Investment Manager*
| Name, Address, Year of Birth | Position Held With the Trust and Length of Service | Principal Occupation(s) During the Past Five Years and Other Relevant Professional Experience | Number of Funds in the Columbia Funds Complex Overseen | Other Directorships Held by Trustee During the Past Five Years | |||||||||||||||
| William F. Truscott c/o Columbia Management Investment Advisers, LLC, 225 Franklin Street Boston, MA 02110 1960 | Trustee 2012 | Chairman of the Board and President, Columbia Management Investment Advisers, LLC since May 2010 and February 2012, respectively; Chief Executive Officer, Global Asset Management, Ameriprise Financial, Inc. since September 2012 (previously Chief Executive Officer, U.S. Asset Management & President, Annuities, May 2010- September 2012); Director and Chief Executive Officer, Columbia Management Investment Distributors, Inc. since May 2010 and February 2012, respectively; Chairman of the Board and Chief Executive Officer, RiverSource Distributors, Inc. since 2006; Director, Threadneedle Asset Management Holdings, SARL since 2014; President and Chief Executive Officer, Ameriprise Certificate Company, 2006-August 2012. | 185 | Trustee to other Columbia Funds since 2001; Chairman of the Board, Columbia Management Investment Advisers, LLC since May 2010; Director, Columbia Management Investment Distributors, Inc. since May 2010; Former Director, Ameriprise Certificate Company, 2006-January 2013 | |||||||||||||||
* Interested person (as defined under the 1940 Act) by reason of being an officer, director, security holder and/or employee of the Investment Manager or Ameriprise Financial.
The Statement of Additional Information has additional information about the Fund's Board members and is available, without charge, upon request by calling 800.345.6611 or contacting your financial intermediary.
Annual Report 2016
26
COLUMBIA VARIABLE PORTFOLIO — U.S. FLEXIBLE MODERATE GROWTH FUND
TRUSTEES AND OFFICERS (continued)
The Board has appointed officers who are responsible for day-to-day business decisions based on policies it has established. The officers serve at the pleasure of the Board. The following table provides basic information about the Officers of the Fund, including principal occupations during the past five years, although their specific titles may have varied over the period. In addition to Mr. Truscott, who is Senior Vice President, the Fund's other officers are:
Fund Officers
| Name, Address and Year of Birth | Position and Year First Appointed to Position for any Fund in the Columbia Funds Complex or a Predecessor Thereof | Principal Occupation(s) During Past Five Years | |||||||||
| Christopher O. Petersen 5228 Ameriprise Financial Center Minneapolis, MN 55474 Born 1970 | President and Principal Executive Officer (2015) | Vice President and Lead Chief Counsel, Ameriprise Financial, Inc. since January 2015 (previously, Vice President and Chief Counsel January 2010-December 2014); officer of Columbia Funds and affiliated funds since 2007. | |||||||||
| Michael G. Clarke 225 Franklin Street Boston, MA 02110 Born 1969 | Treasurer (2011), Chief Financial Officer (2009) and Chief Accounting Officer (2015) | Vice President — Mutual Fund Administration, Columbia Management Investment Advisers, LLC, since May 2010; senior officer of Columbia Funds and affiliated funds since 2002. | |||||||||
| Paul B. Goucher 100 Park Avenue New York, NY 10017 Born 1968 | Senior Vice President (2011), Chief Legal Officer (2015) and Assistant Secretary (2008) | Senior Vice President and Assistant General Counsel, Ameriprise Financial, Inc. since January 2017 (previously Vice President and Lead Chief Counsel, November 2008-January 2017 and January 2013-2017, respectively, and Chief Counsel, January 2010-January 2013); Vice President, Chief Legal Officer and Assistant Secretary, Columbia Management Investment Advisers, LLC since May 2010. | |||||||||
| Thomas P. McGuire 225 Franklin Street Boston, MA 02110 Born 1972 | Senior Vice President and Chief Compliance Officer (2012) | Vice President — Asset Management Compliance, Ameriprise Financial, Inc., since May 2010; Chief Compliance Officer, Ameriprise Certificate Company since September 2010. | |||||||||
| Colin Moore 225 Franklin Street Boston, MA 02110 Born 1958 | Senior Vice President (2010) | Executive Vice President and Global Chief Investment Officer, Ameriprise Financial, Inc., since July 2013; Executive Vice President and Global Chief Investment Officer, Columbia Management Investment Advisers, LLC since July 2013 (previously Director and Global Chief Investment Officer, 2010-2013). | |||||||||
| Michael E. DeFao 225 Franklin Street Boston, MA 02110 Born 1968 | Vice President (2011) and Assistant Secretary (2010) | Vice President and Chief Counsel, Ameriprise Financial, Inc. since May 2010. | |||||||||
| Amy Johnson 5228 Ameriprise Financial Center Minneapolis, MN 55474 Born 1965 | Vice President (2006) | Managing Director and Global Head of Operations, Columbia Management Investment Advisers, LLC since April 2016 (previously Managing Director and Chief Operating Officer, 2010-2016). | |||||||||
| Lyn Kephart-Strong 5228 Ameriprise Financial Center Minneapolis, MN 55474 Born 1960 | Vice President (2015) | President, Columbia Management Investment Services Corp. since October 2014; Vice President & Resolution Officer, Ameriprise Trust Company since August 2009. | |||||||||
| Ryan C. Larrenaga 225 Franklin Street Boston, MA 02110 Born 1970 | Vice President and Secretary (2015) | Vice President and Group Counsel, Ameriprise Financial, Inc. since August 2011; officer of Columbia Funds and affiliated funds since 2005. | |||||||||
Annual Report 2016
27
COLUMBIA VARIABLE PORTFOLIO — U.S. FLEXIBLE MODERATE GROWTH FUND
BOARD CONSIDERATION AND APPROVAL OF MANAGEMENT AGREEMENT
On October 25, 2016, the Board of Trustees (the Board) and the Trustees who are not interested persons (as defined in the Investment Company Act of 1940) (the Independent Trustees) of Columbia Funds Variable Insurance Trust (the Trust) unanimously approved, for an initial two-year term, the Management Agreement (the Management Agreement) with Columbia Management Investment Advisers, LLC (the Investment Manager) with respect to Columbia Variable Portfolio — U.S. Flexible Moderate Growth Fund (the Fund), a series of the Trust. As detailed below, the Board met on multiple occasions to review and discuss, both among themselves and with the management team of the Investment Manager, materials provided by the Investment Manager and others before determining to approve the Management Agreement.
In connection with their deliberations regarding the proposed Management Agreement, the Board evaluated materials requested from the Investment Manager regarding the Fund and the Management Agreement, and discussed these materials, as well as other materials provided by the Investment Manager in connection with the Board's most recent annual approval of the continuation of the management agreements with respect to other series of the Trust, with representatives of the Investment Manager at the Product and Distribution Committee meeting held on June 9, 2016 and at Board meetings held on June 10, 2016 and October 24, 2016. The Board also consulted with Fund counsel and with the Independent Trustees' independent legal counsel, who advised on various matters with respect to the Board's considerations and otherwise assisted the Board in their deliberations.
The Board considered all information that they, their legal counsel or the Investment Manager believed reasonably necessary to evaluate and to determine whether to approve the Management Agreement. The information and factors considered by the Board in approving the Management Agreement for the Fund included the following:
• Information regarding the reputation, regulatory history and resources of the Investment Manager, including information regarding senior management, portfolio managers and other personnel;
• Information regarding the capabilities of the Investment Manager with respect to compliance monitoring services, including an assessment of the Investment Manager's compliance system by the Fund's Chief Compliance Officer;
• The terms and conditions of the Management Agreement;
• The current and proposed terms and conditions of other agreements and arrangements with affiliates of the Investment Manager relating to the operations of the Fund, including agreements with respect to the provision of distribution and transfer agency services to the Fund;
• The Investment Manager's agreement to contractually limit or cap total operating expenses for the Fund through April 30, 2017 so that total operating expenses (excluding certain fees and expenses, such as transaction costs and certain other investment related expenses, interest, taxes, and infrequent and/or unusual expenses) would not exceed a specified annual rate, as a percentage of the Fund's net assets;
• Descriptions of various functions performed by the Investment Manager under the Management Agreement, including portfolio management and portfolio trading practices; and
• Information regarding the investment management fees and other expenses of the Fund relative to those of comparable funds determined by the independent third-party data provider to be in the same peer group or universe of funds.
Nature, Extent and Quality of Services to be Provided under the Management Agreement
The Board considered the nature, extent and quality of services to be provided to the Fund by the Investment Manager and its affiliates under the Management Agreement and under separate agreements for the provision of transfer agency services, the similar type of services currently provided by the Investment Manager to other funds in the fund complex, and the resources to be dedicated to the Fund and the other Columbia Funds by the Investment Manager and its affiliates. The Board considered, among other things, the Investment Manager's ability to attract, motivate and retain highly qualified research, advisory and supervisory investment professionals (including personnel and other resources, compensation programs for personnel involved in fund management, reputation and other attributes), the portfolio management services provided by those investment professionals,
Annual Report 2016
28
COLUMBIA VARIABLE PORTFOLIO — U.S. FLEXIBLE MODERATE GROWTH FUND
BOARD CONSIDERATION AND APPROVAL OF MANAGEMENT AGREEMENT (continued)
and the quality of the Investment Manager's investment research capabilities and trade execution services. The Board also considered the potential benefits to shareholders of investing in a mutual fund that is part of a fund complex offering exposure to a variety of asset classes and investment disciplines and providing a variety of fund and shareholder services.
The Board also considered the professional experience and qualifications of the senior personnel of the Investment Manager, which included consideration of the Investment Manager's experience with similarly-structured funds. The Board noted the compliance programs of and the compliance-related resources provided to the Fund by the Investment Manager and its affiliates, and considered the Investment Manager's ability to provide administrative services to the Fund and coordinate the activities of the Fund's other service providers.
After reviewing these and related factors, the Board concluded, within the context of their overall conclusions, that the expected nature, extent and quality of the services to be provided to the Fund under the Management Agreement supported the approval of the Management Agreement.
Investment Performance
Because the Fund had not yet commenced operations, the Board did not have investment performance to compare to the returns of a group of comparable mutual funds. However, the Board expected to consider, in connection with their next review and consideration of the continuation of the Management Agreement, the investment performance of the Fund in relation to the annualized return for various time periods of both a group of comparable funds, as determined by the independent third-party data provider, and a benchmark.
The Board also considered the Investment Manager's performance and reputation generally, the Investment Manager's historical responsiveness to Board concerns about performance, and the Investment Manager's willingness to take steps intended to improve performance. After reviewing these and related factors, the Board concluded, within the context of their overall conclusions, that the performance of the Investment Manager was sufficient, in light of other considerations, to warrant the approval of the Management Agreement.
Investment Management Fee Rates and Other Expenses
The Board considered the fees to be charged to the Fund under the Management Agreement, as well as the total expenses expected to be incurred by the Fund. In assessing the reasonableness of the proposed fees under the Management Agreement, the Board considered, among other information, the Fund's proposed management fee and its expected total expense ratio as a percentage of average daily net assets. The Board also took into account the proposed fee waiver and expense limitation arrangements that the Investment Manager would observe during the Fund's first year, and the management fees and total expense ratios of comparable funds identified by the independent third-party data provider for purposes of expense comparison.
After reviewing these and related factors, the Board concluded, within the context of their overall conclusions, that the management fee rates and expenses of the Fund supported the approval of the Management Agreement.
Costs of Services to be Provided and Profitability
The Board considered information provided by the Investment Manager with respect to estimated costs of services and profitability, and expected to consider the costs of services and the profitability of the Investment Manager and its affiliates in connection with the Board's next review and consideration of the continuation of the Management Agreement. The Board also considered court cases in which adviser profitability was an issue in whole or in part, the expected expense ratio of the Fund, and the implementation of expense limitations with respect to the Fund. In addition, the Board considered information provided by the Investment Manager regarding its financial condition.
After reviewing these and related factors, the Board concluded, within the context of their overall conclusions, that the anticipated costs of services to be provided and the expected profitability to the Investment Manager and its affiliates from their relationships with the Fund supported the approval of the Management Agreement.
Annual Report 2016
29
COLUMBIA VARIABLE PORTFOLIO — U.S. FLEXIBLE MODERATE GROWTH FUND
BOARD CONSIDERATION AND APPROVAL OF MANAGEMENT AGREEMENT (continued)
Economies of Scale
The Board considered the potential existence of economies of scale in the provision by the Investment Manager of services to the Fund, to groups of related funds, and to the Investment Manager's investment advisory clients as a whole, and whether those economies of scale were expected to be shared with the Fund through breakpoints in the proposed investment management fees or other means, such as expense limitation arrangements and additional investments by the Investment Manager in investment, trading and compliance resources. The Board noted that the management fee schedules for the Fund contained breakpoints that would reduce the fee rate on assets above specified threshold levels.
After reviewing these and related factors, the Board concluded, within the context of their overall conclusions, that the extent to which any economies of scale were expected to be shared with the Fund supported the approval of the Management Agreement.
Other Benefits to the Investment Manager
The Board received and considered information regarding "fall-out" or ancillary benefits to be received by the Investment Manager and its affiliates as a result of their relationships with the Fund, such as the engagement of the Investment Manager's affiliates to provide distribution and transfer agency services to the Fund. The Board considered that the Fund's distributor retains a portion of the distribution fees from the Fund. The Board also considered the benefits of research made available to the Investment Manager by reason of brokerage commissions to be generated by the Fund's securities transactions, and reviewed information about the Investment Manager's practices with respect to allocating portfolio transactions for brokerage and research services. The Board considered the possible conflicts of interest associated with certain fall-out or other ancillary benefits and the reporting, disclosure and other processes that are in place to address such possible conflicts of interest. The Board recognized that the Investment Manager's profitability would be somewhat lower without these benefits.
Conclusion
The Board reviewed all of the above considerations in reaching their decisions to approve the proposed Management Agreement. In their deliberations, the Trustees did not identify any particular information that was all-important or controlling, and individual Trustees may have attributed different weights to the various factors. Based on their evaluation of all factors that they deemed to be material, including those factors described above, and assisted by the advice of independent legal counsel, the Board, including the Independent Trustees, voting separately, approved the Management Agreement.
Annual Report 2016
30
This page intentionally left blank.
Annual Report 2016
31
This page intentionally left blank.
Annual Report 2016
32
COLUMBIA VARIABLE PORTFOLIO — U.S. FLEXIBLE MODERATE GROWTH FUND
IMPORTANT INFORMATION ABOUT THIS REPORT
The policy of the Board is to vote the proxies of the companies in which each fund holds investments consistent with the procedures as stated in the Statement of Additional Information (SAI). You may obtain a copy of the SAI without charge by calling 800.345.6611; contacting your financial intermediary or searching the website of the Securities and Exchange Commission (SEC) at sec.gov. Information regarding how each fund voted proxies relating to portfolio securities is filed with the SEC by August 31st for the most recent 12-month period ending June 30th of that year, and is available without charge by visiting investor.columbiathreadneedleus.com, or searching the website of the SEC at sec.gov.
Each fund files a complete schedule of portfolio holdings with the SEC for the first and third quarters of each fiscal year on Form N-Q. Each fund's Form N-Q is available on the SEC's website at sec.gov and may be reviewed and copied at the SEC's Public Reference Room in Washington, D.C. Information on the operation of the Public Reference Room may be obtained by calling 800.SEC.0330. Each fund's complete schedule of portfolio holdings, as filed on Form N-Q, can also be obtained without charge, upon request, by calling 800.345.6611.
Annual Report 2016
33
Columbia Variable Portfolio — U.S. Flexible Moderate Growth Fund
P.O. Box 8081
Boston, MA 02266-8081

Please read and consider the investment objectives, risks, charges and expenses for any fund carefully before investing. For fund and other investment product prospectuses, which contain this and other important information, contact your financial advisor or insurance representative. Please read the prospectus carefully before you invest. The Fund is distributed by Columbia Management Investment Distributors, Inc., member FINRA, and managed by Columbia Management Investment Advisers, LLC.
Columbia Threadneedle Investments (Columbia Threadneedle) is the global brand name of the Columbia and Threadneedle group of companies.
All rights reserved. Columbia Management Investment Distributors, Inc., 225 Franklin Street, Boston, MA 02110-2804
© 2017 Columbia Management Investment Advisers, LLC.
S-2020 AN (2/17)
Item 2. Code of Ethics.
(a) The registrant has adopted a code of ethics that applies to the registrant’s principal executive officer, principal financial officer, principal accounting officer or controller, or persons performing similar functions, regardless of whether these individuals are employed by the registrant or a third party.
(b) During the period covered by this report, there were not any amendments to a provision of the code of ethics adopted in 2(a) above.
(c) During the period covered by this report, there were no waivers, including any implicit waivers, from a provision of the code of ethics described in 2(a) above that relates to one or more of the items set forth in paragraph (b) of this item’s instructions.
Item 3. Audit Committee Financial Expert.
The registrant’s Board of Trustees has determined that Douglas A. Hacker, David M. Moffett and Anne-Lee Verville, each of whom are members of the registrant’s Board of Trustees and Audit Committee, each qualify as an audit committee financial expert. Mr. Hacker, Mr. Moffett and Ms. Verville are each independent trustees, as defined in paragraph (a)(2) of this item’s instructions.
Item 4. Principal Accountant Fees and Services.
Fee information below is disclosed for the seventeen series of the registrant whose report to stockholders are included in this annual filing. Fee information for fiscal year end 2016 includes fees for one fund that liquidated during the period and three funds that commenced operations during the period. Fee information for fiscal year end 2015 includes fees for one fund that liquidated during the period.
(a) Audit Fees. Aggregate Audit Fees billed by the principal accountant for professional services rendered during the fiscal years ended December 31, 2016 and December 31, 2015 are approximately as follows:
2016 |
| 2015 |
| ||
$ | 365,400 |
| $ | 305,400 |
|
Audit Fees include amounts related to the audit of the registrant’s annual financial statements or services that are normally provided by the accountant in connection with statutory and regulatory filings or engagements for those fiscal years.
(b) Audit-Related Fees. Aggregate Audit-Related Fees billed to the registrant by the principal accountant for professional services rendered during the fiscal years ended December 31, 2016 and December 31, 2015 are approximately as follows:
2016 |
| 2015 |
| ||
$ | 6,000 |
| $ | 6,000 |
|
Audit-Related Fees include amounts for assurance and related services by the principal accountant that are reasonably related to the performance of the audit of the registrant’s financial statements and are not reported in Audit Fees above. In fiscal years 2016 and 2015, Audit-Related Fees consist of agreed-upon procedures performed for semi-annual shareholder reports.
During the fiscal years ended December 31, 2016 and December 31, 2015, there were no Audit-Related Fees billed by the registrant’s principal accountant to the registrant’s investment adviser (not including any sub-adviser whose role is primarily portfolio management and is subcontracted with or overseen by another investment adviser) and any entity controlling, controlled by, or under common control with the adviser that provides ongoing services to the registrant for an engagement that related directly to the operations and financial reporting of the registrant.
(c) Tax Fees. Aggregate Tax Fees billed by the principal accountant to the registrant for professional services rendered during the fiscal years ended December 31, 2016 and December 31, 2015 are approximately as follows:
2016 |
| 2015 |
| ||
$ | 52,400 |
| $ | 74,700 |
|
Tax Fees include amounts for the review of annual tax returns, the review of required shareholder distribution calculations and typically include amounts for professional services by the principal accountant for tax compliance, tax advice and tax planning. Fiscal years 2016 and 2015, also include Tax Fees for agreed-upon procedures related to foreign tax filings. Fiscal year 2015 also includes Tax Fees for agreed-upon procedures for a fund merger and the review of a final tax return.
During the fiscal years ended December 31, 2016 and December 31, 2015, there were no Tax Fees billed by the registrant’s principal accountant to the registrant’s investment adviser (not including any sub-adviser whose role is primarily portfolio management and is subcontracted with or overseen by another investment adviser) and any entity controlling, controlled by, or under common control with the adviser that provides ongoing services to the registrant for an engagement that related directly to the operations and financial reporting of the registrant.
(d) All Other Fees. Aggregate All Other Fees billed by the principal accountant to the registrant for professional services rendered during the fiscal years ended December 31, 2016 and December 31, 2015 are approximately as follows:
2016 |
| 2015 |
| ||
$ | 0 |
| $ | 0 |
|
All Other Fees include amounts for products and services provided by the principal accountant, other than the services reported in paragraphs (a) through (c) above.
Aggregate All Other Fees billed by the registrant’s principal accountant to the registrant’s investment adviser (not including any sub-adviser whose role is primarily portfolio management and is subcontracted with or overseen by another investment adviser) and any entity controlling, controlled by, or under common control with the adviser that provides ongoing services to the registrant for an engagement that related directly to the operations and financial reporting of the registrant during the fiscal years ended December 31, 2016 and December 31, 2015 are approximately as follows:
2016 |
| 2015 |
| ||
$ | 235,000 |
| $ | 225,000 |
|
In fiscal years 2016 and 2015, All Other Fees primarily consists of fees billed for internal control examinations of the registrant’s transfer agent and investment adviser.
(e)(1) Audit Committee Pre-Approval Policies and Procedures
The registrant’s Audit Committee is required to pre-approve the engagement of the registrant’s independent auditors to provide audit and non-audit services to the registrant and non-audit services to its investment adviser (excluding any sub-adviser whose role is primarily portfolio management and is sub-contracted or overseen by another investment adviser (the “Adviser”) or any entity controlling, controlled by or under common control with the Adviser that provides ongoing services to the Fund (a “Control Affiliate”) if the engagement relates directly to the operations and financial reporting of the registrant.
The Audit Committee has adopted a Policy for Engagement of Independent Auditors for Audit and Non-Audit Services (the “Policy”). The Policy sets forth the understanding of the Audit Committee regarding the engagement of the registrant’s independent accountants to provide (i) audit and permissible audit-related, tax and other services to the registrant (“Fund Services”); (ii) non-audit services to the registrant’s Adviser and any Control Affiliates, that relates directly to the operations and financial reporting of a Fund (“Fund-related Adviser Services”); and (iii) certain other audit and non-audit services to the registrant’s Adviser and its Control Affiliates. A service will require specific pre-approval by the Audit Committee if it is to be provided by the Fund’s independent auditor; provided, however, that pre-approval of non-audit services to the Fund, the Adviser or Control Affiliates may be waived if certain de minimis requirements set forth in the SEC’s rules are met.
Under the Policy, the Audit Committee may delegate pre-approval authority to any pre-designated member or members who are independent board members. The member(s) to whom such authority is delegated must report, for informational purposes only, any pre-approval decisions to the Audit Committee at its next regular meeting. The Audit Committee’s responsibilities with respect to the pre-approval of services performed by the independent auditor may not be delegated to management.
On an annual basis, at a regularly scheduled Audit Committee meeting, the Fund’s Treasurer or other Fund officer shall submit to the Audit Committee a schedule of the types of Fund Services and Fund-related Adviser Services that are subject to specific pre-approval. This schedule will provide a description of each type of service that is subject to specific pre-approval, along with total projected fees for each service. The pre-approval will generally cover a one-year period. The Audit Committee will review and approve the types of services and the projected fees for the next one-year period and may add to, or subtract from, the list of pre-approved services from time to time, based on subsequent determinations. This specific approval acknowledges that the Audit Committee is in agreement with the specific types of services that the independent auditor will be permitted to perform and the projected fees for each service.
The Fund’s Treasurer or other Fund officer shall report to the Audit Committee at each of its regular meetings regarding all Fund Services or Fund-related Adviser Services provided since the last such report was rendered, including a description of the services, by category, with forecasted fees for the annual reporting period, proposed changes requiring specific pre-approval and a description of services provided by the independent auditor, by category, with actual fees during the current reporting period.
*****
(e)(2) 100% of the services performed for items (b) through (d) above during 2016 and 2015 were pre-approved by the registrant’s Audit Committee.
(f) Not applicable.
(g) The aggregate non-audit fees billed by the registrant’s accountant for services rendered to the registrant, and rendered to the registrant’s investment adviser (not including any sub-adviser whose role is primarily portfolio management and is subcontracted with or overseen by another investment adviser), and any entity controlling, controlled by, or under common control with the adviser that provides ongoing services to the registrant during the fiscal years ended December 31, 2016 and December 31, 2015 are approximately as follows:
2016 |
| 2015 |
| ||
$ | 293,400 |
| $ | 305,700 |
|
(h) The registrant’s Audit Committee of the Board of Directors has considered whether the provision of non-audit services that were rendered to the registrant’s adviser (not including any sub-adviser whose role is primarily portfolio management and is
subcontracted with or overseen by another investment adviser), and any entity controlling, controlled by, or under common control with the investment adviser that provides ongoing services to the registrant that were not pre-approved pursuant to paragraph (c)(7)(ii) of Rule 2-01 of Regulation S-X, is compatible with maintaining the principal accountant’s independence.
Item 5. Audit Committee of Listed Registrants.
Not applicable.
Item 6. Investments
(a) The registrant’s “Schedule I — Investments in securities of unaffiliated issuers” (as set forth in 17 CFR 210.12-12) is included in Item 1 of this Form N-CSR.
(b) Not applicable.
Item 7. Disclosure of Proxy Voting Policies and Procedures for Closed-End Management Investment Companies.
Not applicable.
Item 8. Portfolio Managers of Closed-End Management Investment Companies.
Not applicable.
Item 9. Purchases of Equity Securities by Closed-End Management Investment Company and Affiliated Purchasers.
Not applicable.
Item 10. Submission of Matters to a Vote of Security Holders.
There were no material changes to the procedures by which shareholders may recommend nominees to the registrant’s board of directors.
Item 11. Controls and Procedures.
(a) The registrant’s principal executive officer and principal financial officer, based on their evaluation of the registrant’s disclosure controls and procedures as of a date within 90 days of the filing of this report, have concluded that such controls and procedures are adequately designed to ensure that material information required to be disclosed by the registrant in Form N-CSR is accumulated and communicated to the registrant’s management, including the principal executive officer and principal financial officer, or persons performing similar functions, as appropriate to allow timely decisions regarding required disclosure.
(b) There was no change in the registrant’s internal control over financial reporting that occurred during the registrant’s second fiscal quarter of the period covered by this report that has materially affected, or is reasonably likely to materially affect, the registrant’s internal control over financial reporting.
Item 12. Exhibits.
(a)(1) Code of ethics required to be disclosed under Item 2 of Form N-CSR attached hereto as Exhibit 99.CODE ETH.
(a)(2) Certifications pursuant to Rule 30a-2(a) under the Investment Company Act of 1940 (17 CFR 270.30a-2(a)) attached hereto as Exhibit 99.CERT.
(a)(3) Not applicable.
(b) Certification pursuant to Rule 30a-2(b) under the Investment Company Act of 1940 (17 CFR 270.30a-2(b)) attached hereto as Exhibit 99.906CERT.
SIGNATURES
Pursuant to the requirements of the Securities Exchange Act of 1934 and the Investment Company Act of 1940, the registrant has duly caused this report to be signed on its behalf by the undersigned, thereunto duly authorized.
(registrant) | Columbia Funds Variable Insurance Trust |
|
By (Signature and Title) | /s/ Christopher O. Petersen |
| |
|
| Christopher O. Petersen, President and Principal Executive Officer |
|
Date | February 21, 2017 |
|
Pursuant to the requirements of the Securities Exchange Act of 1934 and the Investment Company Act of 1940, this report has been signed below by the following persons on behalf of the registrant and in the capacities and on the dates indicated.
By (Signature and Title) | /s/ Christopher O. Petersen |
|
| Christopher O. Petersen, President and Principal Executive Officer |
|
Date | February 21, 2017 |
|
By (Signature and Title) | /s/ Michael G. Clarke |
|
| Michael G. Clarke, Treasurer and Chief Financial Officer |
|
Date | February 21, 2017 |
|