UNITED STATES
SECURITIES AND EXCHANGE COMMISSION
Washington, D.C. 20549
FORM N-CSR
CERTIFIED SHAREHOLDER REPORT OF REGISTERED MANAGEMENT INVESTMENT COMPANIES
Investment Company Act file number 811-05199
Columbia Funds Variable Insurance Trust
(Exact name of registrant as specified in charter)
290 Congress Street, Boston, MA 02210
(Address of principal executive offices) (Zip code)
Daniel J. Beckman
c/o Columbia Management Investment Advisers, LLC
290 Congress Street
Boston, MA 02210
Ryan C. Larrenaga, Esq.
c/o Columbia Management Investment Advisers, LLC
Boston, MA 02210
(Name and address of agent for service)
Registrant's telephone number, including area code: (800) 345-6611
Date of fiscal year end: December 31
Date of reporting period: December 31, 2023
Form N-CSR is to be used by management investment companies to file reports with the Commission not later than 10 days after the transmission to stockholders of any report that is required to be transmitted to stockholders under Rule 30e-1 under the Investment Company Act of 1940 (17 CFR 270.30e-1). The Commission may use the information provided on Form N-CSR in its regulatory, disclosure review, inspection, and policymaking roles.
A registrant is required to disclose the information specified by Form N-CSR, and the Commission will make this information public. A registrant is not required to respond to the collection of information contained in Form N-CSR unless the Form displays a currently valid Office of Management and Budget ("OMB") control number. Please direct comments concerning the accuracy of the information collection burden estimate and any suggestions for reducing the burden to Secretary, Securities and Exchange Commission, 100 F Street, NE, Washington, DC 20549. The OMB has reviewed this collection of information under the clearance requirements of 44 U.S.C. § 3507.
Item 1. Reports to Stockholders.


3 | |
5 | |
7 | |
8 | |
15 | |
16 | |
17 | |
18 | |
20 | |
31 | |
32 |
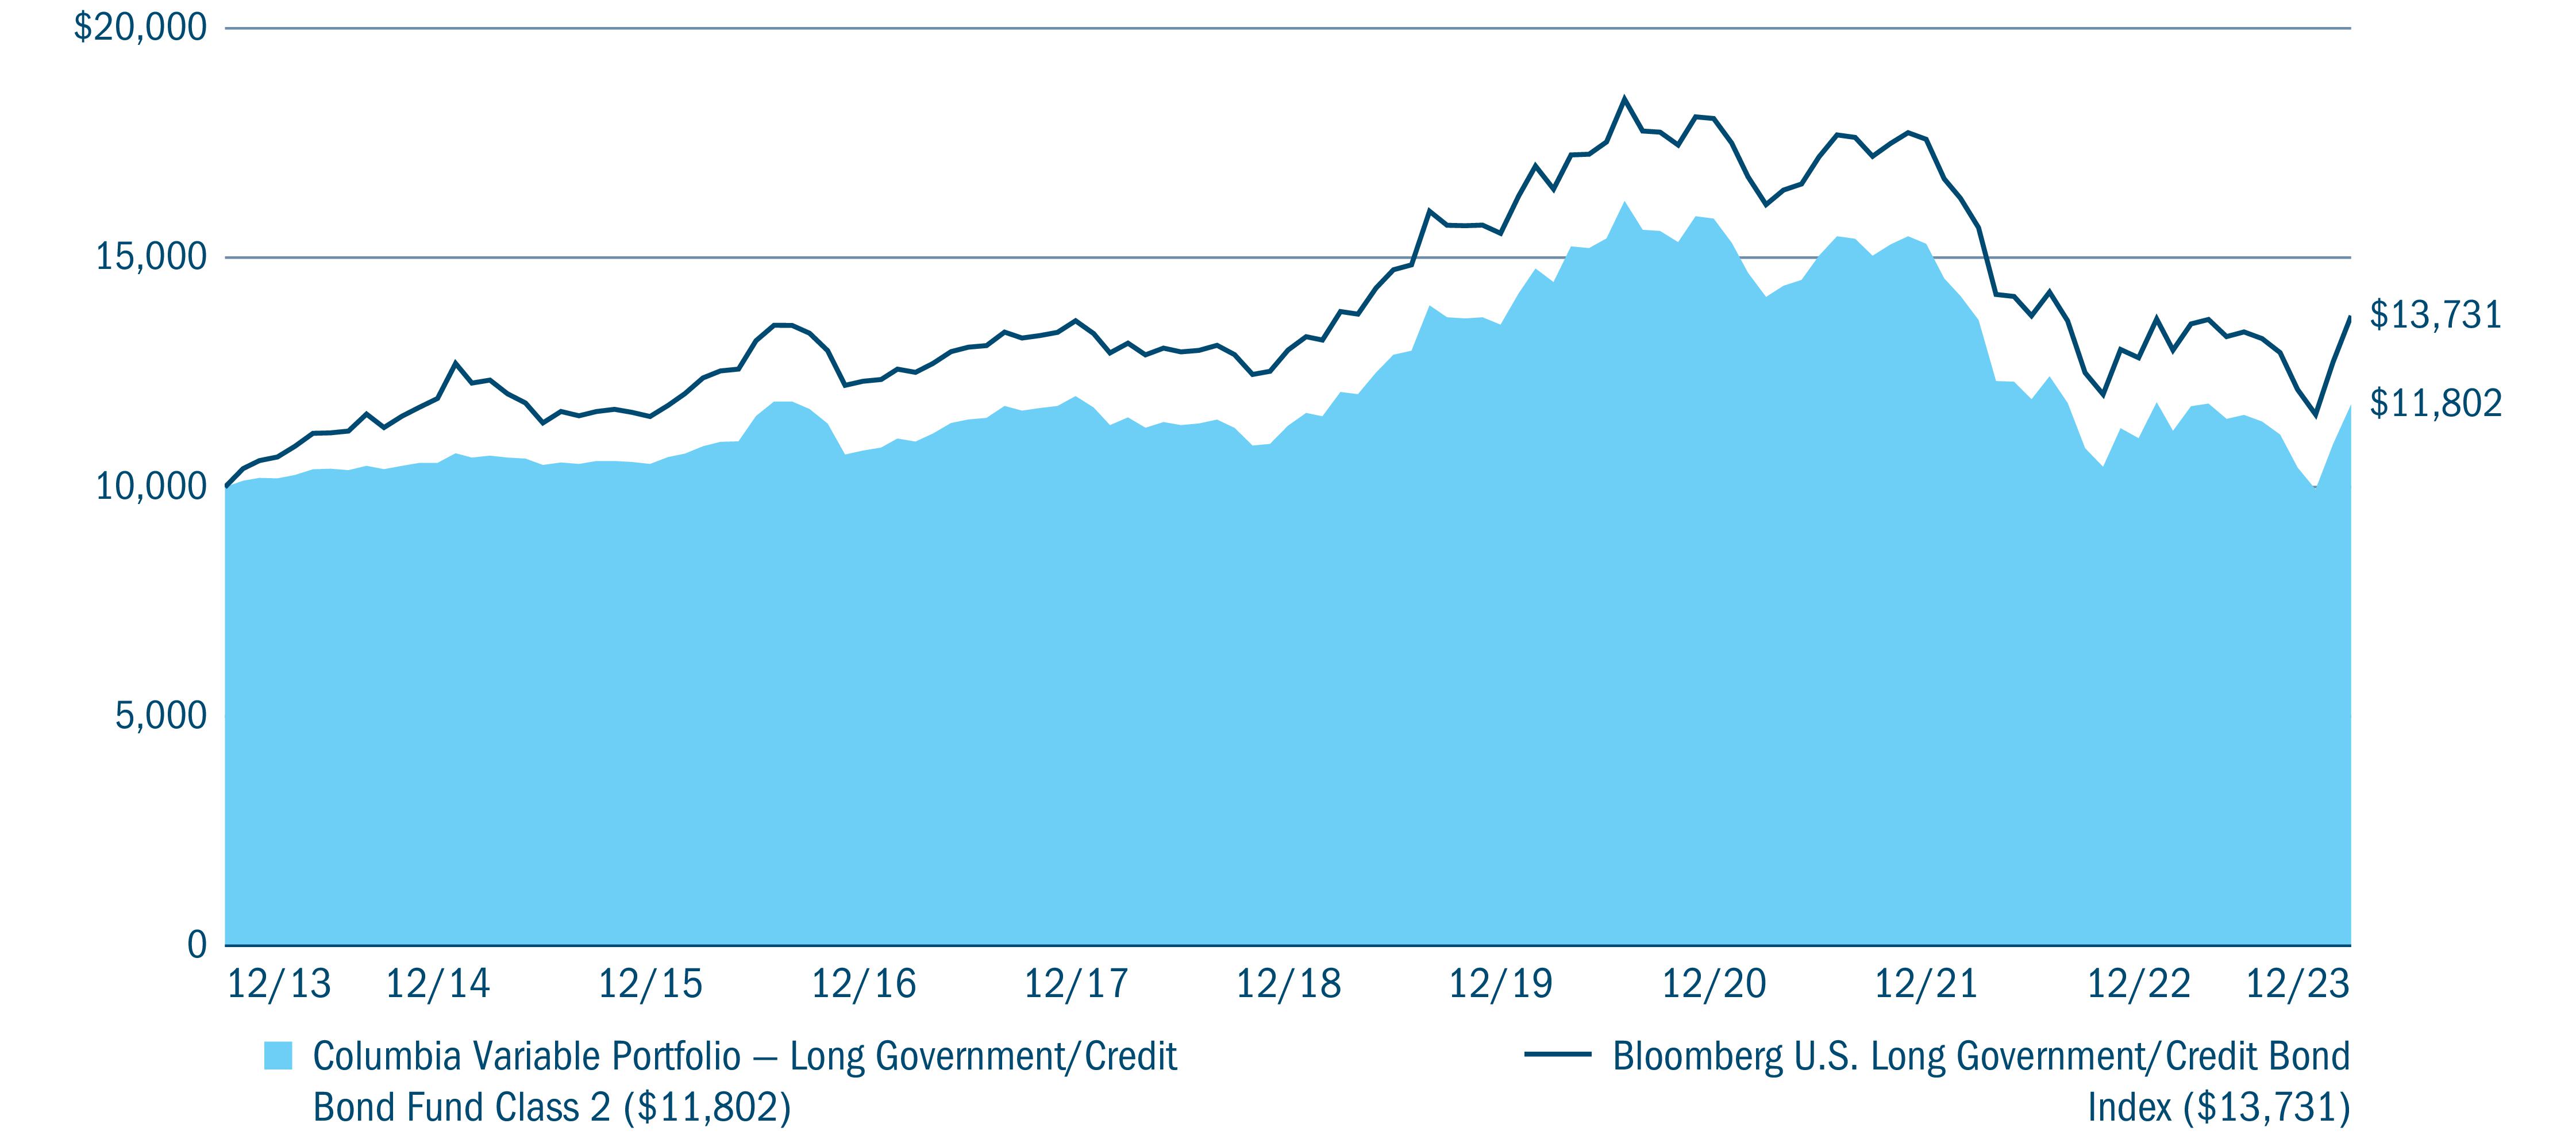
Average annual total returns (%) (for the period ended December 31, 2023) | |||||
Inception | 1 Year | 5 Years | 10 Years | ||
Class 1 | 04/30/13 | 6.97 | 1.04 | 1.93 | |
Class 2 | 04/30/13 | 6.68 | 0.81 | 1.67 | |
Bloomberg U.S. Long Government/Credit Bond Index | 7.13 | 1.12 | 3.22 | ||
Portfolio breakdown (%) (at December 31, 2023) | |
Asset-Backed Securities — Agency | 0.6 |
Corporate Bonds & Notes | 49.7 |
Foreign Government Obligations | 0.7 |
Money Market Funds | 2.2 |
U.S. Treasury Obligations | 46.8 |
Total | 100.0 |
Quality breakdown (%) (at December 31, 2023) | |
AA rating | 50.9 |
A rating | 15.7 |
BBB rating | 32.1 |
BB rating | 0.8 |
Not rated | 0.5 |
Total | 100.0 |
July 1, 2023 — December 31, 2023 | |||||||
Account value at the beginning of the period ($) | Account value at the end of the period ($) | Expenses paid during the period ($) | Fund’s annualized expense ratio (%) | ||||
Actual | Hypothetical | Actual | Hypothetical | Actual | Hypothetical | Actual | |
Class 1 | 1,000.00 | 1,000.00 | 1,020.20 | 1,022.49 | 2.47 | 2.47 | 0.49 |
Class 2 | 1,000.00 | 1,000.00 | 1,019.90 | 1,021.24 | 3.73 | 3.73 | 0.74 |
Asset-Backed Securities — Agency 0.6% | ||||
Issuer | Coupon Rate | Principal Amount ($) | Value ($) | |
United States Small Business Administration | ||||
Series 2016-20L Class 1 | ||||
12/01/2036 | 2.810% | 2,552,688 | 2,345,022 | |
Series 2017-20E Class 1 | ||||
05/01/2037 | 2.880% | 229,753 | 211,442 | |
Series 2017-20F Class 1 | ||||
06/01/2037 | 2.810% | 1,926,665 | 1,765,084 | |
Series 2017-20G Class 1 | ||||
07/01/2037 | 2.980% | 1,724,596 | 1,598,164 | |
Series 2017-20H Class 1 | ||||
08/01/2037 | 2.750% | 1,661,524 | 1,529,515 | |
Series 2017-20I Class 1 | ||||
09/01/2037 | 2.590% | 2,496,415 | 2,287,534 | |
Total Asset-Backed Securities — Agency (Cost $10,591,641) | 9,736,761 | |||
Corporate Bonds & Notes 49.2% | ||||
Aerospace & Defense 3.3% | ||||
BAE Systems PLC(a) | ||||
02/15/2031 | 1.900% | 14,330,000 | 11,785,072 | |
Boeing Co. (The) | ||||
08/01/2059 | 3.950% | 11,129,000 | 8,545,030 | |
05/01/2060 | 5.930% | 5,635,000 | 5,850,120 | |
L3Harris Technologies, Inc. | ||||
07/31/2033 | 5.400% | 2,910,000 | 3,027,583 | |
Lockheed Martin Corp. | ||||
02/15/2055 | 5.200% | 3,290,000 | 3,462,687 | |
Northrop Grumman Corp. | ||||
06/01/2043 | 4.750% | 735,000 | 703,735 | |
10/15/2047 | 4.030% | 6,765,000 | 5,812,833 | |
03/15/2053 | 4.950% | 3,876,000 | 3,845,298 | |
United Technologies Corp. | ||||
06/01/2036 | 6.050% | 256,000 | 277,655 | |
07/15/2038 | 6.125% | 7,375,000 | 8,038,047 | |
11/01/2046 | 3.750% | 3,000 | 2,386 | |
Total | 51,350,446 | |||
Automotive 0.2% | ||||
General Motors Co. | ||||
04/01/2048 | 5.400% | 2,835,000 | 2,598,745 | |
Banking 7.6% | ||||
Bank of America Corp.(b) | ||||
10/24/2031 | 1.922% | 8,270,000 | 6,716,674 | |
10/20/2032 | 2.572% | 811,000 | 672,788 | |
02/04/2033 | 2.972% | 14,212,000 | 12,076,835 | |
Corporate Bonds & Notes (continued) | ||||
Issuer | Coupon Rate | Principal Amount ($) | Value ($) | |
Subordinated | ||||
09/21/2036 | 2.482% | 5,337,000 | 4,234,555 | |
Citigroup, Inc.(b) | ||||
06/03/2031 | 2.572% | 8,233,000 | 7,033,118 | |
01/25/2033 | 3.057% | 6,748,000 | 5,759,003 | |
Goldman Sachs Group, Inc. (The)(b) | ||||
07/21/2032 | 2.383% | 21,945,000 | 18,043,817 | |
HSBC Holdings PLC(b) | ||||
05/24/2032 | 2.804% | 9,819,000 | 8,194,883 | |
11/22/2032 | 2.871% | 7,818,000 | 6,506,295 | |
Subordinated | ||||
11/13/2034 | 7.399% | 750,000 | 823,423 | |
JPMorgan Chase & Co.(b) | ||||
11/15/2048 | 3.964% | 10,023,000 | 8,430,286 | |
Morgan Stanley(b) | ||||
07/21/2032 | 2.239% | 5,084,000 | 4,154,249 | |
10/20/2032 | 2.511% | 557,000 | 461,963 | |
07/21/2034 | 5.424% | 1,055,000 | 1,069,755 | |
Subordinated | ||||
09/16/2036 | 2.484% | 9,260,000 | 7,350,322 | |
PNC Financial Services Group, Inc. (The)(b) | ||||
10/20/2034 | 6.875% | 5,115,000 | 5,680,297 | |
US Bancorp(b) | ||||
06/12/2034 | 5.836% | 3,488,000 | 3,600,022 | |
Wells Fargo & Co.(b) | ||||
07/25/2034 | 5.557% | 16,440,000 | 16,753,273 | |
Total | 117,561,558 | |||
Cable and Satellite 2.1% | ||||
Charter Communications Operating LLC/Capital | ||||
05/01/2047 | 5.375% | 17,780,000 | 15,166,736 | |
06/30/2062 | 3.950% | 4,652,000 | 2,956,666 | |
Comcast Corp. | ||||
11/01/2056 | 2.937% | 9,750,000 | 6,426,896 | |
05/15/2064 | 5.500% | 1,760,000 | 1,855,213 | |
NBCUniversal Media LLC | ||||
01/15/2043 | 4.450% | 7,282,000 | 6,666,672 | |
Total | 33,072,183 | |||
Chemicals 0.1% | ||||
LYB International Finance III LLC | ||||
04/01/2051 | 3.625% | 2,550,000 | 1,861,673 | |
Construction Machinery 0.4% | ||||
Caterpillar, Inc. | ||||
09/19/2049 | 3.250% | 2,755,000 | 2,181,720 | |
Corporate Bonds & Notes (continued) | ||||
Issuer | Coupon Rate | Principal Amount ($) | Value ($) | |
United Rentals North America, Inc. | ||||
02/15/2031 | 3.875% | 4,075,000 | 3,703,569 | |
Total | 5,885,289 | |||
Diversified Manufacturing 0.4% | ||||
Carrier Global Corp. | ||||
04/05/2040 | 3.377% | 4,325,000 | 3,484,012 | |
Carrier Global Corp.(a) | ||||
03/15/2054 | 6.200% | 2,754,000 | 3,193,133 | |
Total | 6,677,145 | |||
Electric 6.0% | ||||
AEP Texas, Inc. | ||||
01/15/2050 | 3.450% | 13,470,000 | 9,759,870 | |
05/15/2052 | 5.250% | 1,840,000 | 1,782,356 | |
AES Corp. (The) | ||||
01/15/2031 | 2.450% | 1,790,000 | 1,504,408 | |
Berkshire Hathaway Energy Co. | ||||
05/01/2053 | 4.600% | 2,606,000 | 2,325,805 | |
CenterPoint Energy, Inc. | ||||
09/01/2049 | 3.700% | 4,290,000 | 3,236,371 | |
Consolidated Edison Co. of New York, Inc. | ||||
11/15/2053 | 5.900% | 2,885,000 | 3,183,441 | |
Dominion Resources, Inc. | ||||
12/01/2044 | 4.700% | 5,510,000 | 4,886,330 | |
Duke Energy Corp. | ||||
08/15/2052 | 5.000% | 18,745,000 | 17,528,692 | |
Duke Energy Florida LLC | ||||
11/15/2053 | 6.200% | 1,592,000 | 1,821,823 | |
Duke Energy Indiana LLC | ||||
04/01/2050 | 2.750% | 955,000 | 618,975 | |
Emera US Finance LP | ||||
06/15/2046 | 4.750% | 6,725,000 | 5,541,152 | |
Eversource Energy | ||||
08/15/2030 | 1.650% | 6,053,000 | 4,927,969 | |
Exelon Corp. | ||||
03/15/2052 | 4.100% | 8,365,000 | 6,796,828 | |
03/15/2053 | 5.600% | 4,950,000 | 5,036,585 | |
FirstEnergy Corp. | ||||
03/01/2050 | 3.400% | 3,370,000 | 2,390,343 | |
Jersey Central Power & Light Co.(a) | ||||
03/01/2032 | 2.750% | 2,179,000 | 1,847,969 | |
Pacific Gas and Electric Co. | ||||
07/01/2050 | 4.950% | 9,395,000 | 8,056,852 | |
PacifiCorp | ||||
05/15/2054 | 5.500% | 3,555,000 | 3,492,280 | |
Corporate Bonds & Notes (continued) | ||||
Issuer | Coupon Rate | Principal Amount ($) | Value ($) | |
Virginia Electric and Power Co. | ||||
08/15/2053 | 5.700% | 2,737,000 | 2,906,780 | |
Xcel Energy, Inc. | ||||
06/01/2032 | 4.600% | 3,345,000 | 3,265,894 | |
12/01/2049 | 3.500% | 2,902,000 | 2,146,124 | |
Total | 93,056,847 | |||
Environmental 0.4% | ||||
GFL Environmental, Inc.(a) | ||||
09/01/2028 | 3.500% | 6,450,000 | 5,933,858 | |
Food and Beverage 3.8% | ||||
Bacardi Ltd.(a) | ||||
05/15/2038 | 5.150% | 9,541,000 | 9,065,037 | |
05/15/2048 | 5.300% | 2,402,000 | 2,298,074 | |
Constellation Brands, Inc. | ||||
05/01/2033 | 4.900% | 18,208,000 | 18,321,725 | |
Diageo Capital PLC | ||||
10/05/2033 | 5.625% | 10,790,000 | 11,646,348 | |
J M Smucker Co. (The) | ||||
11/15/2053 | 6.500% | 1,661,000 | 1,918,562 | |
Mars, Inc.(a) | ||||
04/20/2033 | 4.750% | 12,505,000 | 12,605,370 | |
04/01/2054 | 4.125% | 480,000 | 410,439 | |
04/01/2059 | 4.200% | 4,053,000 | 3,482,065 | |
Total | 59,747,620 | |||
Health Care 1.7% | ||||
Cigna Corp. | ||||
03/15/2050 | 3.400% | 7,765,000 | 5,741,816 | |
CVS Health Corp. | ||||
07/20/2045 | 5.125% | 12,440,000 | 11,789,955 | |
03/25/2048 | 5.050% | 1,335,000 | 1,252,687 | |
HCA, Inc. | ||||
03/15/2052 | 4.625% | 5,789,000 | 4,940,541 | |
New York and Presbyterian Hospital (The) | ||||
08/01/2036 | 3.563% | 3,425,000 | 2,913,005 | |
Total | 26,638,004 | |||
Healthcare Insurance 2.3% | ||||
Aetna, Inc. | ||||
11/15/2042 | 4.125% | 4,360,000 | 3,625,964 | |
08/15/2047 | 3.875% | 1,927,000 | 1,509,597 | |
Anthem, Inc. | ||||
08/15/2044 | 4.650% | 3,500,000 | 3,247,892 | |
Centene Corp. | ||||
02/15/2030 | 3.375% | 5,874,000 | 5,270,887 | |
10/15/2030 | 3.000% | 4,918,000 | 4,280,920 | |
03/01/2031 | 2.500% | 4,508,000 | 3,756,173 | |
Corporate Bonds & Notes (continued) | ||||
Issuer | Coupon Rate | Principal Amount ($) | Value ($) | |
UnitedHealth Group, Inc. | ||||
02/15/2053 | 5.875% | 7,930,000 | 8,980,235 | |
04/15/2053 | 5.050% | 2,510,000 | 2,539,009 | |
04/15/2063 | 5.200% | 2,232,000 | 2,281,287 | |
Total | 35,491,964 | |||
Independent Energy 0.2% | ||||
Canadian Natural Resources Ltd. | ||||
02/15/2037 | 6.500% | 2,580,000 | 2,738,924 | |
Integrated Energy 0.4% | ||||
BP Capital Markets America, Inc. | ||||
03/17/2052 | 3.001% | 1,780,000 | 1,251,373 | |
Cenovus Energy, Inc. | ||||
02/15/2052 | 3.750% | 6,384,000 | 4,706,735 | |
Total Capital International SA | ||||
06/29/2060 | 3.386% | 1,315,000 | 979,186 | |
Total | 6,937,294 | |||
Life Insurance 1.4% | ||||
MetLife, Inc. | ||||
07/15/2052 | 5.000% | 4,428,000 | 4,401,908 | |
New York Life Insurance Co.(a) | ||||
Subordinated | ||||
05/15/2050 | 3.750% | 5,359,000 | 4,315,650 | |
Northwestern Mutual Life Insurance Co. (The)(a) | ||||
Subordinated | ||||
09/30/2059 | 3.625% | 7,768,000 | 5,805,635 | |
Teachers Insurance & Annuity Association of America(a) | ||||
Subordinated | ||||
05/15/2050 | 3.300% | 9,275,000 | 6,837,065 | |
Total | 21,360,258 | |||
Media and Entertainment 1.5% | ||||
CBS Corp. | ||||
07/01/2042 | 4.850% | 1,118,000 | 895,943 | |
Fox Corp. | ||||
01/25/2049 | 5.576% | 1,950,000 | 1,874,369 | |
Meta Platforms, Inc. | ||||
05/15/2063 | 5.750% | 5,455,000 | 5,979,773 | |
Viacom, Inc. | ||||
03/15/2043 | 4.375% | 3,203,000 | 2,378,574 | |
Warnermedia Holdings, Inc. | ||||
03/15/2062 | 5.391% | 13,421,000 | 11,542,061 | |
Total | 22,670,720 | |||
Corporate Bonds & Notes (continued) | ||||
Issuer | Coupon Rate | Principal Amount ($) | Value ($) | |
Midstream 2.2% | ||||
Kinder Morgan Energy Partners LP | ||||
03/01/2043 | 5.000% | 1,345,000 | 1,204,244 | |
09/01/2044 | 5.400% | 3,058,000 | 2,869,217 | |
Kinder Morgan, Inc. | ||||
02/15/2046 | 5.050% | 4,996,000 | 4,471,309 | |
08/01/2052 | 5.450% | 1,952,000 | 1,874,813 | |
MPLX LP | ||||
04/15/2048 | 4.700% | 1,427,000 | 1,232,838 | |
03/14/2052 | 4.950% | 5,551,000 | 4,956,675 | |
Plains All American Pipeline LP/Finance Corp. | ||||
06/15/2044 | 4.700% | 6,020,000 | 5,041,028 | |
Western Gas Partners LP | ||||
08/15/2048 | 5.500% | 2,400,000 | 2,134,936 | |
Western Midstream Operating LP(b) | ||||
02/01/2050 | 5.250% | 3,885,000 | 3,470,128 | |
Williams Companies, Inc. (The) | ||||
06/24/2044 | 5.750% | 7,165,000 | 7,233,253 | |
Total | 34,488,441 | |||
Natural Gas 0.8% | ||||
NiSource, Inc. | ||||
02/15/2043 | 5.250% | 1,575,000 | 1,531,395 | |
02/15/2044 | 4.800% | 7,017,000 | 6,451,477 | |
05/15/2047 | 4.375% | 1,794,000 | 1,548,574 | |
Sempra Energy | ||||
02/01/2048 | 4.000% | 3,650,000 | 3,005,299 | |
Total | 12,536,745 | |||
Pharmaceuticals 4.3% | ||||
Amgen, Inc. | ||||
02/22/2062 | 4.400% | 4,107,000 | 3,472,642 | |
03/02/2063 | 5.750% | 14,807,000 | 15,573,836 | |
Bayer US Finance LLC(a) | ||||
11/21/2033 | 6.500% | 4,760,000 | 4,899,903 | |
Merck & Co., Inc. | ||||
05/17/2053 | 5.000% | 4,275,000 | 4,401,492 | |
Pfizer Investment Enterprises Pte., Ltd. | ||||
05/19/2043 | 5.110% | 20,385,000 | 20,339,242 | |
05/19/2063 | 5.340% | 3,825,000 | 3,867,651 | |
Roche Holdings, Inc.(a) | ||||
11/13/2030 | 5.489% | 5,415,000 | 5,714,076 | |
11/13/2033 | 5.593% | 7,735,000 | 8,332,343 | |
Total | 66,601,185 | |||
Property & Casualty 0.6% | ||||
Berkshire Hathaway Finance Corp. | ||||
03/15/2052 | 3.850% | 7,240,000 | 6,074,258 | |
Corporate Bonds & Notes (continued) | ||||
Issuer | Coupon Rate | Principal Amount ($) | Value ($) | |
Liberty Mutual Group, Inc.(a) | ||||
10/15/2050 | 3.951% | 4,435,000 | 3,367,262 | |
Total | 9,441,520 | |||
Railroads 0.9% | ||||
CSX Corp. | ||||
11/15/2033 | 5.200% | 5,655,000 | 5,900,571 | |
Norfolk Southern Corp. | ||||
08/01/2054 | 5.350% | 5,665,000 | 5,896,568 | |
03/15/2064 | 5.950% | 2,520,000 | 2,808,237 | |
Total | 14,605,376 | |||
Restaurants 0.4% | ||||
McDonald’s Corp. | ||||
08/14/2053 | 5.450% | 6,331,000 | 6,743,751 | |
Retailers 1.4% | ||||
Amazon.com, Inc. | ||||
05/12/2051 | 3.100% | 5,095,000 | 3,808,127 | |
04/13/2062 | 4.100% | 790,000 | 698,536 | |
Lowe’s Companies, Inc. | ||||
04/01/2062 | 4.450% | 10,319,000 | 8,745,531 | |
09/15/2062 | 5.800% | 6,574,000 | 6,947,837 | |
04/01/2063 | 5.850% | 1,811,000 | 1,904,342 | |
Total | 22,104,373 | |||
Technology 3.0% | ||||
Broadcom, Inc.(a) | ||||
11/15/2036 | 3.187% | 15,867,000 | 12,876,825 | |
Intel Corp. | ||||
08/12/2051 | 3.050% | 7,075,000 | 5,004,882 | |
International Business Machines Corp. | ||||
02/06/2053 | 5.100% | 3,420,000 | 3,439,484 | |
MSCI, Inc.(a) | ||||
11/01/2031 | 3.625% | 5,850,000 | 5,157,660 | |
NXP BV/Funding LLC/USA, Inc. | ||||
05/01/2030 | 3.400% | 1,255,000 | 1,153,118 | |
01/15/2033 | 5.000% | 3,516,000 | 3,510,048 | |
02/15/2042 | 3.125% | 3,530,000 | 2,638,172 | |
Oracle Corp. | ||||
07/08/2034 | 4.300% | 8,105,000 | 7,568,294 | |
07/15/2046 | 4.000% | 2,500,000 | 2,005,238 | |
04/01/2050 | 3.600% | 2,661,000 | 1,970,783 | |
03/25/2061 | 4.100% | 1,518,000 | 1,159,948 | |
Total | 46,484,452 | |||
Tobacco 0.4% | ||||
BAT Capital Corp. | ||||
08/02/2043 | 7.079% | 2,275,000 | 2,419,018 | |
Corporate Bonds & Notes (continued) | ||||
Issuer | Coupon Rate | Principal Amount ($) | Value ($) | |
Reynolds American, Inc. | ||||
08/15/2035 | 5.700% | 3,027,000 | 2,987,044 | |
Total | 5,406,062 | |||
Wireless 0.4% | ||||
T-Mobile US, Inc. | ||||
04/15/2050 | 4.500% | 1,670,000 | 1,478,489 | |
11/15/2060 | 3.600% | 6,515,000 | 4,763,862 | |
Total | 6,242,351 | |||
Wirelines 3.0% | ||||
AT&T, Inc. | ||||
12/01/2057 | 3.800% | 26,408,000 | 19,656,699 | |
Telefonica Emisiones SAU | ||||
03/06/2048 | 4.895% | 6,755,000 | 5,972,311 | |
Verizon Communications, Inc. | ||||
03/15/2032 | 2.355% | 10,860,000 | 9,040,784 | |
03/22/2041 | 3.400% | 14,500,000 | 11,575,309 | |
Total | 46,245,103 | |||
Total Corporate Bonds & Notes (Cost $816,022,111) | 764,481,887 | |||
Foreign Government Obligations(c) 0.7% | ||||
Mexico 0.7% | ||||
Mexico Government International Bond | ||||
05/04/2053 | 6.338% | 10,495,000 | 10,703,792 | |
Total Foreign Government Obligations (Cost $10,494,790) | 10,703,792 | |||
U.S. Treasury Obligations 46.4% | ||||
U.S. Treasury | ||||
07/31/2024 | 3.000% | 8,113,800 | 8,016,498 | |
05/15/2033 | 3.375% | 4,909,800 | 4,714,942 | |
02/15/2036 | 4.500% | 37,500,000 | 39,996,094 | |
05/15/2038 | 4.500% | 30,000,000 | 31,884,375 | |
02/15/2039 | 3.500% | 49,000,000 | 46,404,531 | |
08/15/2040 | 3.875% | 10,000,000 | 9,756,250 | |
02/15/2041 | 4.750% | 8,000,000 | 8,656,250 | |
05/15/2041 | 4.375% | 25,383,000 | 26,196,049 | |
05/15/2043 | 2.875% | 17,600,000 | 14,470,500 | |
05/15/2043 | 3.875% | 19,723,500 | 18,842,106 | |
08/15/2043 | 4.375% | 104,581,000 | 106,950,413 | |
08/15/2044 | 3.125% | 16,500,000 | 13,986,328 | |
11/15/2044 | 3.000% | 10,000,000 | 8,287,500 | |
11/15/2045 | 3.000% | 12,000,000 | 9,886,875 | |
11/15/2047 | 2.750% | 20,750,000 | 16,188,242 | |
02/15/2048 | 3.000% | 101,200,000 | 82,636,125 | |
08/15/2049 | 2.250% | 495,000 | 346,500 | |
02/15/2050 | 2.000% | 2,900,000 | 1,912,641 | |
05/15/2050 | 1.250% | 22,250,000 | 12,025,430 | |
11/15/2050 | 1.625% | 24,800,000 | 14,814,125 | |
U.S. Treasury Obligations (continued) | ||||
Issuer | Coupon Rate | Principal Amount ($) | Value ($) | |
02/15/2051 | 1.875% | 22,000,000 | 13,994,063 | |
05/15/2051 | 2.375% | 2,600,000 | 1,860,625 | |
05/15/2052 | 2.875% | 102,497,900 | 81,806,136 | |
02/15/2053 | 3.625% | 12,877,300 | 11,921,563 | |
U.S. Treasury(d) | ||||
05/15/2047 | 3.000% | 122,157,900 | 99,978,606 | |
U.S. Treasury(e) | ||||
STRIPS | ||||
02/15/2040 | 0.000% | 38,410,800 | 20,356,224 | |
11/15/2041 | 0.000% | 13,661,000 | 6,537,002 | |
05/15/2043 | 0.000% | 19,069,000 | 8,443,247 | |
Total U.S. Treasury Obligations (Cost $829,611,009) | 720,869,240 | |||
Money Market Funds 2.2% | ||
Shares | Value ($) | |
Columbia Short-Term Cash Fund, 5.569%(f),(g) | 33,615,444 | 33,608,721 |
Total Money Market Funds (Cost $33,596,042) | 33,608,721 | |
Total Investments in Securities (Cost: $1,700,315,593) | 1,539,400,401 | |
Other Assets & Liabilities, Net | 14,472,939 | |
Net Assets | 1,553,873,340 | |
Long futures contracts | ||||||
Description | Number of contracts | Expiration date | Trading currency | Notional amount | Value/Unrealized appreciation ($) | Value/Unrealized depreciation ($) |
U.S. Long Bond | 1,227 | 03/2024 | USD | 153,298,313 | 11,363,671 | — |
U.S. Treasury 5-Year Note | 21 | 03/2024 | USD | 2,284,242 | 1,608 | — |
U.S. Treasury Ultra Bond | 925 | 03/2024 | USD | 123,574,219 | 10,707,577 | — |
Total | 22,072,856 | — | ||||
Short futures contracts | ||||||
Description | Number of contracts | Expiration date | Trading currency | Notional amount | Value/Unrealized appreciation ($) | Value/Unrealized depreciation ($) |
U.S. Treasury 10-Year Note | (1,233) | 03/2024 | USD | (139,194,141 ) | — | (4,766,837 ) |
U.S. Treasury 2-Year Note | (34) | 03/2024 | USD | (7,001,078 ) | — | (71,472 ) |
U.S. Treasury Ultra 10-Year Note | (733) | 03/2024 | USD | (86,505,453 ) | — | (3,463,201 ) |
Total | — | (8,301,510 ) | ||||
(a) | Represents privately placed and other securities and instruments exempt from Securities and Exchange Commission registration (collectively, private placements), such as Section 4(a)(2) and Rule 144A eligible securities, which are often sold only to qualified institutional buyers. At December 31, 2023, the total value of these securities amounted to $107,927,436, which represents 6.95% of total net assets. |
(b) | Represents a variable rate security with a step coupon where the rate adjusts according to a schedule for a series of periods, typically lower for an initial period and then increasing to a higher coupon rate thereafter. The interest rate shown was the current rate as of December 31, 2023. |
(c) | Principal and interest may not be guaranteed by a governmental entity. |
(d) | This security or a portion of this security has been pledged as collateral in connection with derivative contracts. |
(e) | Zero coupon bond. |
(f) | The rate shown is the seven-day current annualized yield at December 31, 2023. |
(g) | As defined in the Investment Company Act of 1940, as amended, an affiliated company is one in which the Fund owns 5% or more of the company’s outstanding voting securities, or a company which is under common ownership or control with the Fund. The value of the holdings and transactions in these affiliated companies during the year ended December 31, 2023 are as follows: |
Affiliated issuers | Beginning of period($) | Purchases($) | Sales($) | Net change in unrealized appreciation (depreciation)($) | End of period($) | Realized gain (loss)($) | Dividends($) | End of period shares |
Columbia Short-Term Cash Fund, 5.569% | ||||||||
70,178,871 | 420,520,379 | (457,090,228 ) | (301 ) | 33,608,721 | (1,202 ) | 4,642,187 | 33,615,444 | |
STRIPS | Separate Trading of Registered Interest and Principal Securities |
USD | US Dollar |
Level 1 ($) | Level 2 ($) | Level 3 ($) | Total ($) | |
Investments in Securities | ||||
Asset-Backed Securities — Agency | — | 9,736,761 | — | 9,736,761 |
Corporate Bonds & Notes | — | 764,481,887 | — | 764,481,887 |
Foreign Government Obligations | — | 10,703,792 | — | 10,703,792 |
U.S. Treasury Obligations | — | 720,869,240 | — | 720,869,240 |
Money Market Funds | 33,608,721 | — | — | 33,608,721 |
Total Investments in Securities | 33,608,721 | 1,505,791,680 | — | 1,539,400,401 |
Investments in Derivatives | ||||
Asset | ||||
Futures Contracts | 22,072,856 | — | — | 22,072,856 |
Liability | ||||
Futures Contracts | (8,301,510 ) | — | — | (8,301,510 ) |
Total | 47,380,067 | 1,505,791,680 | — | 1,553,171,747 |
Assets | |
Investments in securities, at value | |
Unaffiliated issuers (cost $1,666,719,551) | $1,505,791,680 |
Affiliated issuers (cost $33,596,042) | 33,608,721 |
Cash | 7 |
Receivable for: | |
Investments sold | 221,553 |
Capital shares sold | 400 |
Dividends | 156,026 |
Interest | 16,501,314 |
Foreign tax reclaims | 19,894 |
Variation margin for futures contracts | 75,263 |
Expense reimbursement due from Investment Manager | 480 |
Prepaid expenses | 12,708 |
Deferred compensation of board members | 155,884 |
Total assets | 1,556,543,930 |
Liabilities | |
Payable for: | |
Capital shares redeemed | 1,675,672 |
Variation margin for futures contracts | 749,990 |
Management services fees | 21,066 |
Distribution and/or service fees | 121 |
Service fees | 809 |
Compensation of chief compliance officer | 268 |
Compensation of board members | 1,912 |
Other expenses | 27,617 |
Deferred compensation of board members | 193,135 |
Total liabilities | 2,670,590 |
Net assets applicable to outstanding capital stock | $1,553,873,340 |
Represented by | |
Paid in capital | 1,927,237,476 |
Total distributable earnings (loss) | (373,364,136 ) |
Total - representing net assets applicable to outstanding capital stock | $1,553,873,340 |
Class 1 | |
Net assets | $1,536,406,283 |
Shares outstanding | 194,407,429 |
Net asset value per share | $7.90 |
Class 2 | |
Net assets | $17,467,057 |
Shares outstanding | 2,216,366 |
Net asset value per share | $7.88 |
Net investment income | |
Income: | |
Dividends — affiliated issuers | $4,642,187 |
Interest | 61,018,038 |
Interfund lending | 1,721 |
Foreign taxes withheld | (5,070 ) |
Total income | 65,656,876 |
Expenses: | |
Management services fees | 7,324,106 |
Distribution and/or service fees | |
Class 2 | 37,034 |
Service fees | 9,306 |
Custodian fees | 11,566 |
Printing and postage fees | 9,537 |
Accounting services fees | 40,290 |
Legal fees | 30,969 |
Interest on collateral | 5,054 |
Compensation of chief compliance officer | 283 |
Compensation of board members | 29,773 |
Deferred compensation of board members | 11,066 |
Other | 29,622 |
Total expenses | 7,538,606 |
Fees waived or expenses reimbursed by Investment Manager and its affiliates | (138,508 ) |
Total net expenses | 7,400,098 |
Net investment income | 58,256,778 |
Realized and unrealized gain (loss) — net | |
Net realized gain (loss) on: | |
Investments — unaffiliated issuers | (71,424,173 ) |
Investments — affiliated issuers | (1,202 ) |
Futures contracts | (30,075,373 ) |
Net realized loss | (101,500,748 ) |
Net change in unrealized appreciation (depreciation) on: | |
Investments — unaffiliated issuers | 131,846,383 |
Investments — affiliated issuers | (301 ) |
Futures contracts | 14,483,376 |
Net change in unrealized appreciation (depreciation) | 146,329,458 |
Net realized and unrealized gain | 44,828,710 |
Net increase in net assets resulting from operations | $103,085,488 |
Year Ended December 31, 2023 | Year Ended December 31, 2022 | |
Operations | ||
Net investment income | $58,256,778 | $50,351,569 |
Net realized loss | (101,500,748 ) | (155,586,846 ) |
Net change in unrealized appreciation (depreciation) | 146,329,458 | (441,045,910 ) |
Net increase (decrease) in net assets resulting from operations | 103,085,488 | (546,281,187 ) |
Distributions to shareholders | ||
Net investment income and net realized gains | ||
Class 1 | (49,849,960 ) | (93,715,132 ) |
Class 2 | (486,344 ) | (721,980 ) |
Total distributions to shareholders | (50,336,304 ) | (94,437,112 ) |
Increase in net assets from capital stock activity | 30,938,931 | 131,127,680 |
Total increase (decrease) in net assets | 83,688,115 | (509,590,619 ) |
Net assets at beginning of year | 1,470,185,225 | 1,979,775,844 |
Net assets at end of year | $1,553,873,340 | $1,470,185,225 |
Year Ended | Year Ended | |||
December 31, 2023 | December 31, 2022 | |||
Shares | Dollars ($) | Shares | Dollars ($) | |
Capital stock activity | ||||
Class 1 | ||||
Shares sold | 1,594,824 | 11,886,605 | 5,886,038 | 49,880,640 |
Distributions reinvested | 6,541,990 | 49,849,960 | 10,948,029 | 93,715,132 |
Shares redeemed | (4,544,138 ) | (35,632,922 ) | (1,214,162 ) | (11,077,426 ) |
Net increase | 3,592,676 | 26,103,643 | 15,619,905 | 132,518,346 |
Class 2 | ||||
Shares sold | 718,506 | 5,597,904 | 257,108 | 2,160,410 |
Distributions reinvested | 63,908 | 486,344 | 84,541 | 721,980 |
Shares redeemed | (164,255 ) | (1,248,960 ) | (463,734 ) | (4,273,056 ) |
Net increase (decrease) | 618,159 | 4,835,288 | (122,085 ) | (1,390,666 ) |
Total net increase | 4,210,835 | 30,938,931 | 15,497,820 | 131,127,680 |
Net asset value, beginning of period | Net investment income | Net realized and unrealized gain (loss) | Total from investment operations | Distributions from net investment income | Distributions from net realized gains | Total distributions to shareholders | |
Class 1 | |||||||
Year Ended 12/31/2023 | $7.64 | 0.30 | 0.22 | 0.52 | (0.26 ) | — | (0.26 ) |
Year Ended 12/31/2022 | $11.19 | 0.27 | (3.30 ) | (3.03 ) | (0.25 ) | (0.27 ) | (0.52 ) |
Year Ended 12/31/2021 | $12.38 | 0.26 | (0.65 ) | (0.39 ) | (0.24 ) | (0.56 ) | (0.80 ) |
Year Ended 12/31/2020 | $10.99 | 0.29 | 1.62 | 1.91 | (0.33 ) | (0.19 ) | (0.52 ) |
Year Ended 12/31/2019 | $9.44 | 0.31 | 1.54 | 1.85 | (0.30 ) | — | (0.30 ) |
Class 2 | |||||||
Year Ended 12/31/2023 | $7.62 | 0.28 | 0.22 | 0.50 | (0.24 ) | — | (0.24 ) |
Year Ended 12/31/2022 | $11.15 | 0.25 | (3.28 ) | (3.03 ) | (0.23 ) | (0.27 ) | (0.50 ) |
Year Ended 12/31/2021 | $12.34 | 0.24 | (0.66 ) | (0.42 ) | (0.21 ) | (0.56 ) | (0.77 ) |
Year Ended 12/31/2020 | $10.95 | 0.26 | 1.62 | 1.88 | (0.30 ) | (0.19 ) | (0.49 ) |
Year Ended 12/31/2019 | $9.41 | 0.28 | 1.53 | 1.81 | (0.27 ) | — | (0.27 ) |
Notes to Financial Highlights | |
(a) | In addition to the fees and expenses that the Fund bears directly, the Fund indirectly bears a pro rata share of the fees and expenses of any other funds in which it invests. Such indirect expenses are not included in the Fund’s reported expense ratios. |
(b) | Total net expenses include the impact of certain fee waivers/expense reimbursements made by the Investment Manager and certain of its affiliates, if applicable. |
(c) | Ratios include interest on collateral expense which is less than 0.01%. |
Net asset value, end of period | Total return | Total gross expense ratio to average net assets(a) | Total net expense ratio to average net assets(a),(b) | Net investment income ratio to average net assets | Portfolio turnover | Net assets, end of period (000’s) | |
Class 1 | |||||||
Year Ended 12/31/2023 | $7.90 | 6.97% | 0.50% (c) | 0.49% (c) | 3.91% | 50% | $1,536,406 |
Year Ended 12/31/2022 | $7.64 | (27.55% ) | 0.50% (c) | 0.50% (c) | 3.13% | 53% | $1,458,011 |
Year Ended 12/31/2021 | $11.19 | (3.21% ) | 0.50% (c) | 0.50% (c) | 2.32% | 48% | $1,960,592 |
Year Ended 12/31/2020 | $12.38 | 17.25% | 0.50% | 0.50% | 2.38% | 46% | $1,747,792 |
Year Ended 12/31/2019 | $10.99 | 19.74% | 0.50% | 0.50% | 2.94% | 49% | $1,607,152 |
Class 2 | |||||||
Year Ended 12/31/2023 | $7.88 | 6.68% | 0.75% (c) | 0.74% (c) | 3.69% | 50% | $17,467 |
Year Ended 12/31/2022 | $7.62 | (27.70% ) | 0.75% (c) | 0.75% (c) | 2.85% | 53% | $12,175 |
Year Ended 12/31/2021 | $11.15 | (3.47% ) | 0.75% (c) | 0.75% (c) | 2.07% | 48% | $19,183 |
Year Ended 12/31/2020 | $12.34 | 17.07% | 0.75% | 0.75% | 2.11% | 46% | $28,746 |
Year Ended 12/31/2019 | $10.95 | 19.42% | 0.75% | 0.75% | 2.68% | 49% | $16,192 |
Asset derivatives | ||
Risk exposure category | Statement of assets and liabilities location | Fair value ($) |
Interest rate risk | Component of total distributable earnings (loss) — unrealized appreciation on futures contracts | 22,072,856 * |
Liability derivatives | ||
Risk exposure category | Statement of assets and liabilities location | Fair value ($) |
Interest rate risk | Component of total distributable earnings (loss) — unrealized depreciation on futures contracts | 8,301,510 * |
* | Includes cumulative appreciation (depreciation) as reported in the tables following the Portfolio of Investments. Only the current day’s variation margin for futures and centrally cleared swaps, if any, is reported in receivables or payables in the Statement of Assets and Liabilities. |
Amount of realized gain (loss) on derivatives recognized in income | |
Risk exposure category | Futures contracts ($) |
Interest rate risk | (30,075,373 ) |
Change in unrealized appreciation (depreciation) on derivatives recognized in income | |
Risk exposure category | Futures contracts ($) |
Interest rate risk | 14,483,376 |
Derivative instrument | Average notional amounts ($) |
Futures contracts — long | 296,032,457 |
Futures contracts — short | 196,107,516 |
May 1, 2023 through April 30, 2024 | Prior to May 1, 2023 | |
Class 1 | 0.49 % | 0.54 % |
Class 2 | 0.74 | 0.79 |
Undistributed net investment income ($) | Accumulated net realized (loss) ($) | Paid in capital ($) |
25,392 | (25,393 ) | 1 |
Year Ended December 31, 2023 | Year Ended December 31, 2022 | ||||
Ordinary income ($) | Long-term capital gains ($) | Total ($) | Ordinary income ($) | Long-term capital gains ($) | Total ($) |
50,336,304 | — | 50,336,304 | 54,924,506 | 39,512,606 | 94,437,112 |
Undistributed ordinary income ($) | Undistributed long-term capital gains ($) | Capital loss carryforwards ($) | Net unrealized (depreciation) ($) |
57,893,945 | — | (259,730,963 ) | (171,351,479 ) |
Federal tax cost ($) | Gross unrealized appreciation ($) | Gross unrealized (depreciation) ($) | Net unrealized (depreciation) ($) |
1,724,523,226 | 20,358,361 | (191,709,840 ) | (171,351,479 ) |
No expiration short-term ($) | No expiration long-term ($) | Total ($) | Utilized ($) |
(75,024,925 ) | (184,706,038 ) | (259,730,963 ) | — |
Borrower or lender | Average loan balance ($) | Weighted average interest rate (%) | Number of days with outstanding loans |
Lender | 1,000,000 | 5.63 | 11 |
Name, address, year of birth | Position held with the Columbia Funds and length of service | Principal occupation(s) during past five years and other relevant professional experience | Number of Funds in the Columbia Funds Complex* overseen | Other directorships held by Trustee during the past five years and other relevant Board experience |
George S. Batejan c/o Columbia Management Investment Advisers, LLC 290 Congress Street Boston, MA 02210 1954 | Trustee since 2017 | Executive Vice President, Global Head of Technology and Operations, Janus Capital Group, Inc., 2010-2016 | 161 | Former Chairman of the Board, NICSA (National Investment Company Services Association) (Executive Committee, Nominating Committee and Governance Committee), 2014-2016; former Director, Intech Investment Management, 2011-2016; former Board Member, Metro Denver Chamber of Commerce, 2015-2016; former Advisory Board Member, University of Colorado Business School, 2015-2018; former Board Member, Chase Bank International, 1993-1994 |
Kathleen Blatz c/o Columbia Management Investment Advisers, LLC 290 Congress Street Boston, MA 02210 1954 | Trustee since 2006 | Attorney, specializing in arbitration and mediation; Trustee of Gerald Rauenhorst 1982 Trusts, since 2020; Chief Justice, Minnesota Supreme Court, 1998-2006; Associate Justice, Minnesota Supreme Court, 1996-1998; Fourth Judicial District Court Judge, Hennepin County, 1994-1996; Attorney in private practice and public service, 1984-1993; State Representative, Minnesota House of Representatives, 1979-1993, which included service on the Tax and Financial Institutions and Insurance Committees; Member and Interim Chair, Minnesota Sports Facilities Authority, January-July 2017; Interim President and Chief Executive Officer, Blue Cross and Blue Shield of Minnesota (health care insurance), February-July 2018, April-October 2021 | 161 | Former Trustee, Blue Cross and Blue Shield of Minnesota, 2009-2021 (Chair of the Business Development Committee, 2014-2017; Chair of the Governance Committee, 2017-2019); former Member and Chair of the Board, Minnesota Sports Facilities Authority, January 2017-July 2017; former Director, Robina Foundation, 2009-2020 (Chair, 2014-2020); Director, Richard M. Schulze Family Foundation, since 2021 |
Name, address, year of birth | Position held with the Columbia Funds and length of service | Principal occupation(s) during past five years and other relevant professional experience | Number of Funds in the Columbia Funds Complex* overseen | Other directorships held by Trustee during the past five years and other relevant Board experience |
Pamela G. Carlton c/o Columbia Management Investment Advisers, LLC 290 Congress Street Boston, MA 02210 1954 | Chair since 2023; Trustee since 2007 | President, Springboard – Partners in Cross Cultural Leadership (consulting company), since 2003; Managing Director of US Equity Research, JP Morgan Chase, 1999-2003; Director of US Equity Research, Chase Asset Management, 1996-1999; Co-Director Latin America Research, 1993-1996, COO Global Research, 1992-1996, Co-Director of US Research, 1991-1992, Investment Banker, 1982-1991, Morgan Stanley; Attorney, Cleary Gottlieb Steen & Hamilton LLP, 1980-1982 | 161 | Trustee, New York Presbyterian Hospital Board, since 1996; Director, DR Bank (Audit Committee, since 2017 and Audit Committee Chair, since November 2023); Director, Evercore Inc. (Audit Committee, Nominating and Governance Committee) (financial services company), since 2019; Director, Apollo Commercial Real Estate Finance, Inc. (Chair, Nominating and Governance Committee), since 2021; the Governing Council of the Independent Directors Council (IDC), since 2021 |
Janet Langford Carrig c/o Columbia Management Investment Advisers, LLC 290 Congress Street Boston, MA 02210 1957 | Trustee since 1996 | Senior Vice President, General Counsel and Corporate Secretary, ConocoPhillips (independent energy company), September 2007-October 2018 | 161 | Director, EQT Corporation (natural gas producer), since 2019; former Director, Whiting Petroleum Corporation (independent oil and gas company), 2020-2022 |
J. Kevin Connaughton c/o Columbia Management Investment Advisers, LLC 290 Congress Street Boston, MA 02210 1964 | Trustee since 2020 | CEO and President, RhodeWay Financial (non-profit financial planning firm), since December 2022; Member, FINRA National Adjudicatory Council, January 2020-December 31, 2023; Adjunct Professor of Finance, Bentley University January 2018-April 2023; Consultant to Independent Trustees of CFVIT and CFST I from March 2016 to June 2020 with respect to CFVIT and to December 2020 with respect to CFST I; Managing Director and General Manager of Mutual Fund Products, Columbia Management Investment Advisers, LLC, May 2010-February 2015; President, Columbia Funds, 2008-2015; and senior officer of Columbia Funds and affiliated funds, 2003-2015 | 159 | Former Director, The Autism Project, March 2015-December 2021; former Member of the Investment Committee, St. Michael’s College, November 2015-February 2020; former Trustee, St. Michael’s College, June 2017-September 2019; former Trustee, New Century Portfolios (former mutual fund complex), January 2015-December 2017 |
Olive M. Darragh c/o Columbia Management Investment Advisers, LLC 290 Congress Street Boston, MA 02210 1962 | Trustee since 2020 | Managing Director of Darragh Inc. (strategy and talent management consulting firm), since 2010; Founder and CEO, Zolio, Inc. (investment management talent identification platform), since 2004; Consultant to Independent Trustees of CFVIT and CFST I from June 2019 to June 2020 with respect to CFVIT and to December 2020 with respect to CFST I; Partner, Tudor Investments, 2004-2010; Senior Partner, McKinsey & Company (consulting), 1990-2004; Touche Ross CPA, 1985-1988 | 159 | Treasurer, Edinburgh University US Trust Board, since January 2023; Member, HBS Community Action Partners Board, since September 2022; former Director, University of Edinburgh Business School (Member of US Board), 2004-2019; former Director, Boston Public Library Foundation, 2008-2017 |
Name, address, year of birth | Position held with the Columbia Funds and length of service | Principal occupation(s) during past five years and other relevant professional experience | Number of Funds in the Columbia Funds Complex* overseen | Other directorships held by Trustee during the past five years and other relevant Board experience |
Patricia M. Flynn c/o Columbia Management Investment Advisers, LLC 290 Congress Street Boston, MA 02210 1950 | Trustee since 2004 | Professor Emeritus of Economics and Management, Bentley University, since 2023; Professor of Economics and Management, Bentley University, 1976-2023; Dean, McCallum Graduate School of Business, Bentley University, 1992-2002 | 161 | Former Trustee, MA Taxpayers Foundation, 1997-2022; former Director, The MA Business Roundtable, 2003-2019; former Chairperson, Innovation Index Advisory Committee, MA Technology Collaborative, 1997-2020 |
Brian J. Gallagher c/o Columbia Management Investment Advisers, LLC 290 Congress Street Boston, MA 02210 1954 | Trustee since 2017 | Retired; Partner with Deloitte & Touche LLP and its predecessors, 1977-2016 | 161 | Trustee, Catholic Schools Foundation, since 2004 |
Douglas A. Hacker c/o Columbia Management Investment Advisers, LLC 290 Congress Street Boston, MA 02210 1955 | Trustee since 1996 | Independent business executive, since May 2006; Executive Vice President – Strategy of United Airlines, December 2002 - May 2006; President of UAL Loyalty Services (airline marketing company), September 2001-December 2002; Executive Vice President and Chief Financial Officer of United Airlines, July 1999-September 2001 | 161 | Director, SpartanNash Company since November 2013 (Chair of the Board, since May 2021) (food distributor); Director, Aircastle Limited (Chair of Audit Committee) (aircraft leasing), since August 2006; former Director, Nash Finch Company (food distributor), 2005-2013; former Director, SeaCube Container Leasing Ltd. (container leasing), 2010-2013; and former Director, Travelport Worldwide Limited (travel information technology), 2014-2019 |
Nancy T. Lukitsh c/o Columbia Management Investment Advisers, LLC 290 Congress Street Boston, MA 02210 1956 | Trustee since 2011 | Senior Vice President, Partner and Director of Marketing, Wellington Management Company, LLP (investment adviser), 1997-2010; Chair, Wellington Management Portfolios (commingled non-U.S. investment pools), 2007-2010; Director, Wellington Trust Company, NA and other Wellington affiliates, 1997-2010 | 159 | None |
Name, address, year of birth | Position held with the Columbia Funds and length of service | Principal occupation(s) during past five years and other relevant professional experience | Number of Funds in the Columbia Funds Complex* overseen | Other directorships held by Trustee during the past five years and other relevant Board experience |
David M. Moffett c/o Columbia Management Investment Advisers, LLC 290 Congress Street Boston, MA 02210 1952 | Trustee since 2011 | Retired; former Chief Executive Officer of Freddie Mac and Chief Financial Officer of U.S. Bank | 161 | Director, CSX Corporation (transportation suppliers); Director, PayPal Holdings Inc. (payment and data processing services); former Director, eBay Inc. (online trading community), 2007-2015; and former Director, CIT Bank, CIT Group Inc. (commercial and consumer finance), 2010-2016; former Senior Adviser to The Carlyle Group (financial services), March 2008-September 2008; former Governance Consultant to Bridgewater Associates, January 2013-December 2015 |
Catherine James Paglia c/o Columbia Management Investment Advisers, LLC 290 Congress Street Boston, MA 02210 1952 | Trustee since 2004 | Director, Enterprise Asset Management, Inc. (private real estate and asset management company), since September 1998; Managing Director and Partner, Interlaken Capital, Inc., 1989-1997; Vice President, 1982-1985, Principal, 1985-1987, Managing Director, 1987-1989, Morgan Stanley; Vice President, Investment Banking, 1980-1982, Associate, Investment Banking, 1976-1980, Dean Witter Reynolds, Inc. | 161 | Director, Valmont Industries, Inc. (irrigation systems manufacturer), since 2012; Trustee, Carleton College (on the Investment Committee), since 1987; Trustee, Carnegie Endowment for International Peace (on the Investment Committee), since 2009 |
Natalie A. Trunow c/o Columbia Management Investment Advisers, LLC 290 Congress Street Boston, MA 02210 1967 | Trustee since 2020 | Chief Executive Officer, Millennial Portfolio Solutions LLC (asset management and consulting services), January 2016-January 2021; Non-executive Member of the Investment Committee and Valuation Committee, Sarona Asset Management Inc. (private equity firm) since September 2019; Advisor, Horizon Investments (asset management and consulting services), August 2018-January 2022; Advisor, Paradigm Asset Management, November 2016-January 2022; Consultant to Independent Trustees of CFVIT and CFST I from September 2016 to June 2020 with respect to CFVIT and to December 2020 with respect to CFST I; Director of Investments/Consultant, Casey Family Programs, April 2016-November 2016; Senior Vice President and Chief Investment Officer, Calvert Investments, August 2008-January 2016; Section Head and Portfolio Manager, General Motors Asset Management, June 1997-August 2008 | 159 | Independent Director, Investment Committee, Health Services for Children with Special Needs, Inc., 2010-2021; Independent Director, (Executive Committee and Chair, Audit Committee), Consumer Credit Counseling Services (formerly Guidewell Financial Solutions), since 2016; Independent Director, (Investment Committee), Sarona Asset Management, since 2019 |
Sandra L. Yeager c/o Columbia Management Investment Advisers, LLC 290 Congress Street Boston, MA 02210 1964 | Trustee since 2017 | Retired; President and founder, Hanoverian Capital, LLC (SEC registered investment advisor firm), 2008-2016; Managing Director, DuPont Capital, 2006-2008; Managing Director, Morgan Stanley Investment Management, 2004-2006; Senior Vice President, Alliance Bernstein, 1990-2004 | 161 | Former Director, NAPE (National Alliance for Partnerships in Equity) Education Foundation, October 2016-October 2020; Advisory Board, Jennersville YMCA, June 2022-June 2023 |
Name, address, year of birth | Position held with the Columbia Funds and length of service | Principal occupation(s) during the past five years and other relevant professional experience | Number of Funds in the Columbia Funds Complex* overseen | Other directorships held by Trustee during the past five years and other relevant Board experience |
Daniel J. Beckman c/o Columbia Management Investment Advisers, LLC 290 Congress Street Boston, MA 02210 1962 | Trustee since November 2021 and President since June 2021 | President and Principal Executive Officer of the Columbia Funds, since June 2021; Vice President, Columbia Management Investment Advisers, LLC, since April 2015; formerly, Vice President – Head of North America Product, Columbia Management Investment Advisers, LLC, April 2015 – December 2023; President and Principal Executive Officer, Columbia Acorn/Wanger Funds, since July 2021 | 161 | Director, Ameriprise Trust Company, since October 2016; Director, Columbia Management Investment Distributors, Inc., since November 2018; Board of Governors, Columbia Wanger Asset Management, LLC, since January 2022 |
* | The term “Columbia Funds Complex” as used herein includes Columbia Seligman Premium Technology Growth Fund, Tri-Continental Corporation and each series of Columbia Funds Series Trust (CFST), Columbia Funds Series Trust I (CFST I), Columbia Funds Series Trust II (CFST II), Columbia ETF Trust I (CET I), Columbia ETF Trust II (CET II), Columbia Funds Variable Insurance Trust (CFVIT) and Columbia Funds Variable Series Trust II (CFVST II). Messrs. Batejan, Beckman, Gallagher, Hacker and Moffett and Mses. Blatz, Carlton, Carrig, Flynn, Paglia, and Yeager serve as directors of Columbia Seligman Premium Technology Growth Fund and Tri-Continental Corporation. |
** | Interested person (as defined under the 1940 Act) by reason of being an officer, director, security holder and/or employee of the Investment Manager or Ameriprise Financial. |
Name, address and year of birth | Position and year first appointed to position for any Fund in the Columbia Funds Complex or a predecessor thereof | Principal occupation(s) during past five years |
Michael G. Clarke 290 Congress Street Boston, MA 02210 1969 | Chief Financial Officer and Principal Financial Officer (2009); Senior Vice President (2019); Treasurer and Chief Accounting Officer (Principal Accounting Officer) (2024) for CFST, CFST I, CFST II, CFVIT and CFVST II | Senior Vice President and North America Head of Operations & Investor Services, Columbia Management Investment Advisers, LLC, since June 2023 (previously Senior Vice President and Head of Global Operations, March 2022 – June 2023, Vice President, Head of North America Operations, and Co-Head of Global Operations, June 2019 - February 2022 and Vice President – Accounting and Tax, May 2010 - May 2019); senior officer of Columbia Funds and affiliated funds, since 2002. Director, Ameriprise Trust Company, since June 2023. |
Name, address and year of birth | Position and year first appointed to position for any Fund in the Columbia Funds Complex or a predecessor thereof | Principal occupation(s) during past five years |
Marybeth Pilat 290 Congress Street Boston, MA 02210 1968 | Treasurer and Chief Accounting Officer (Principal Accounting Officer) and Principal Financial Officer (2020) for CET I and CET II; Assistant Treasurer, CFST, CFST I, CFST II, CFVIT and CFVST II | Vice President – Product Pricing and Administration, Columbia Management Investment Advisers, LLC, since May 2017. |
William F. Truscott 290 Congress Street Boston, MA 02210 1960 | Senior Vice President (2001) | Formerly, Trustee/Director of Columbia Funds Complex or legacy funds, November 2001 - January 1, 2021; Chief Executive Officer, Global Asset Management, Ameriprise Financial, Inc., since September 2012; Chairman of the Board and President, Columbia Management Investment Advisers, LLC, since July 2004 and February 2012, respectively; Chairman of the Board and Chief Executive Officer, Columbia Management Investment Distributors, Inc., since November 2008 and February 2012, respectively; Chairman of the Board and Director, TAM UK International Holdings Limited, since July 2021; formerly Chairman of the Board and Director, Threadneedle Asset Management Holdings, Sàrl, March 2013 – December 2022 and December 2008 – December 2022, respectively; senior executive of various entities affiliated with Columbia Threadneedle Investments. |
Christopher O. Petersen 5228 Ameriprise Financial Center Minneapolis, MN 55474 1970 | Senior Vice President and Assistant Secretary (2021) | Formerly, Trustee/Director of funds within the Columbia Funds Complex, July 1, 2020 - November 22, 2021; Senior Vice President and Assistant General Counsel, Ameriprise Financial, Inc., since September 2021 (previously Vice President and Lead Chief Counsel, January 2015 - September 2021); formerly, President and Principal Executive Officer of the Columbia Funds, 2015 - 2021; officer of Columbia Funds and affiliated funds, since 2007. |
Thomas P. McGuire 290 Congress Street Boston, MA 02210 1972 | Senior Vice President and Chief Compliance Officer (2012) | Vice President – Asset Management Compliance, Ameriprise Financial, Inc., since May 2010; Chief Compliance Officer, Columbia Acorn/Wanger Funds, since December 2015; formerly, Chief Compliance Officer, Ameriprise Certificate Company, September 2010 – September 2020. |
Ryan C. Larrenaga 290 Congress Street Boston, MA 02210 1970 | Senior Vice President (2017), Chief Legal Officer (2017), and Secretary (2015) | Vice President and Chief Counsel, Ameriprise Financial, Inc., since August 2018 (previously Vice President and Group Counsel, August 2011 - August 2018); Chief Legal Officer, Columbia Acorn/Wanger Funds, since September 2020; officer of Columbia Funds and affiliated funds, since 2005. |
Michael E. DeFao 290 Congress Street Boston, MA 02210 1968 | Vice President (2011) and Assistant Secretary (2010) | Vice President and Chief Counsel, Ameriprise Financial, Inc., since May 2010; Vice President, Chief Legal Officer and Assistant Secretary, Columbia Management Investment Advisers, LLC, since October 2021 (previously Vice President and Assistant Secretary, May 2010 – September 2021). |
Lyn Kephart-Strong 5903 Ameriprise Financial Center Minneapolis, MN 55474 1960 | Vice President (2015) | Vice President, Global Investment Operations Services, Columbia Management Investment Advisers, LLC, since 2010; President, Columbia Management Investment Services Corp., since October 2014; President, Ameriprise Trust Company, since January 2017. |


3 | |
5 | |
7 | |
8 | |
13 | |
14 | |
15 | |
16 | |
18 | |
26 | |
27 |
Average annual total returns (%) (for the period ended December 31, 2023) | |||||
Inception | 1 Year | 5 Years | 10 Years | ||
Class 1 | 01/01/89 | 26.63 | 13.72 | 10.42 | |
Class 2 | 06/01/00 | 26.32 | 13.43 | 10.15 | |
Russell 2000 Growth Index | 18.66 | 9.22 | 7.16 | ||

Portfolio breakdown (%) (at December 31, 2023) | |
Common Stocks | 99.2 |
Money Market Funds | 0.8 |
Total | 100.0 |
Equity sector breakdown (%) (at December 31, 2023) | |
Communication Services | 2.4 |
Consumer Discretionary | 13.2 |
Consumer Staples | 1.8 |
Energy | 4.4 |
Financials | 3.6 |
Health Care | 22.1 |
Industrials | 26.7 |
Information Technology | 20.7 |
Materials | 5.1 |
Total | 100.0 |
July 1, 2023 — December 31, 2023 | |||||||
Account value at the beginning of the period ($) | Account value at the end of the period ($) | Expenses paid during the period ($) | Fund’s annualized expense ratio (%) | ||||
Actual | Hypothetical | Actual | Hypothetical | Actual | Hypothetical | Actual | |
Class 1 | 1,000.00 | 1,000.00 | 1,044.80 | 1,020.69 | 4.33 | 4.28 | 0.85 |
Class 2 | 1,000.00 | 1,000.00 | 1,043.70 | 1,019.45 | 5.60 | 5.54 | 1.10 |
Common Stocks 99.1% | ||
Issuer | Shares | Value ($) |
Communication Services 2.4% | ||
Entertainment 1.2% | ||
Atlanta Braves Holdings, Inc., Class C(a) | 96,174 | 3,806,567 |
Interactive Media & Services 1.2% | ||
ZoomInfo Technologies, Inc.(a) | 192,600 | 3,561,174 |
Total Communication Services | 7,367,741 | |
Consumer Discretionary 13.1% | ||
Broadline Retail 1.2% | ||
Global-e Online Ltd.(a) | 20,333 | 805,797 |
Ollie’s Bargain Outlet Holdings, Inc.(a) | 39,736 | 3,015,565 |
Total | 3,821,362 | |
Diversified Consumer Services 0.6% | ||
WW International, Inc.(a) | 203,024 | 1,776,460 |
Hotels, Restaurants & Leisure 6.5% | ||
Cava Group, Inc.(a) | 122,470 | 5,263,761 |
Churchill Downs, Inc. | 43,608 | 5,884,027 |
Kura Sushi USA, Inc., Class A(a) | 61,596 | 4,681,296 |
Texas Roadhouse, Inc. | 37,959 | 4,639,729 |
Total | 20,468,813 | |
Household Durables 1.2% | ||
Installed Building Products, Inc. | 20,997 | 3,838,671 |
Specialty Retail 3.6% | ||
Floor & Decor Holdings, Inc., Class A(a) | 57,893 | 6,458,543 |
Valvoline, Inc.(a) | 124,082 | 4,663,002 |
Total | 11,121,545 | |
Total Consumer Discretionary | 41,026,851 | |
Consumer Staples 1.8% | ||
Beverages 1.8% | ||
Celsius Holdings, Inc.(a) | 105,001 | 5,724,654 |
Total Consumer Staples | 5,724,654 | |
Energy 4.3% | ||
Energy Equipment & Services 1.5% | ||
ChampionX Corp. | 106,951 | 3,124,039 |
Tidewater, Inc.(a) | 21,810 | 1,572,719 |
Total | 4,696,758 | |
Common Stocks (continued) | ||
Issuer | Shares | Value ($) |
Oil, Gas & Consumable Fuels 2.8% | ||
Antero Resources Corp.(a) | 106,776 | 2,421,680 |
Northern Oil and Gas, Inc. | 80,004 | 2,965,748 |
Permian Resources Corp. | 171,972 | 2,338,819 |
Uranium Energy Corp.(a) | 174,894 | 1,119,321 |
Total | 8,845,568 | |
Total Energy | 13,542,326 | |
Financials 3.6% | ||
Banks 1.0% | ||
Western Alliance Bancorp | 47,311 | 3,112,591 |
Financial Services 1.1% | ||
Flywire Corp.(a) | 140,330 | 3,248,639 |
Insurance 1.5% | ||
RLI Corp. | 16,850 | 2,243,072 |
Skyward Specialty Insurance Group, Inc.(a) | 75,222 | 2,548,521 |
Total | 4,791,593 | |
Total Financials | 11,152,823 | |
Health Care 21.9% | ||
Biotechnology 5.3% | ||
Akero Therapeutics, Inc.(a) | 34,382 | 802,820 |
Arcus Biosciences, Inc.(a) | 87,143 | 1,664,431 |
Beam Therapeutics, Inc.(a) | 37,090 | 1,009,590 |
Intellia Therapeutics, Inc.(a) | 39,445 | 1,202,678 |
Natera, Inc.(a) | 137,646 | 8,622,146 |
Revolution Medicines, Inc.(a) | 39,312 | 1,127,468 |
Scholar Rock Holding Corp.(a) | 38,475 | 723,330 |
Syndax Pharmaceuticals, Inc.(a) | 70,469 | 1,522,835 |
Total | 16,675,298 | |
Health Care Equipment & Supplies 4.7% | ||
Glaukos Corp.(a) | 46,703 | 3,712,421 |
ICU Medical, Inc.(a) | 32,346 | 3,226,190 |
Inspire Medical Systems, Inc.(a) | 24,048 | 4,892,085 |
LivaNova PLC(a) | 58,858 | 3,045,313 |
Total | 14,876,009 | |
Common Stocks (continued) | ||
Issuer | Shares | Value ($) |
Health Care Providers & Services 3.6% | ||
Addus HomeCare Corp.(a) | 26,906 | 2,498,222 |
Chemed Corp. | 10,649 | 6,227,003 |
Universal Health Services, Inc., Class B | 15,715 | 2,395,594 |
Total | 11,120,819 | |
Health Care Technology 0.7% | ||
GoodRx Holdings, Inc., Class A(a) | 327,696 | 2,195,563 |
Life Sciences Tools & Services 6.9% | ||
10X Genomics, Inc., Class A(a) | 69,658 | 3,898,062 |
BioLife Solutions, Inc.(a) | 58,777 | 955,126 |
Bio-Techne Corp. | 86,087 | 6,642,473 |
Caris Life Sciences, Inc.(a),(b),(c),(d) | 308,642 | 836,420 |
DNA Script(a),(b),(c),(d) | 1,585 | 329,725 |
MaxCyte, Inc.(a) | 158,885 | 746,760 |
Pacific Biosciences of California, Inc.(a) | 142,540 | 1,398,317 |
Repligen Corp.(a) | 36,975 | 6,648,105 |
Total | 21,454,988 | |
Pharmaceuticals 0.7% | ||
EyePoint Pharmaceuticals, Inc.(a) | 92,091 | 2,128,223 |
Total Health Care | 68,450,900 | |
Industrials 26.4% | ||
Aerospace & Defense 4.1% | ||
BWX Technologies, Inc. | 64,379 | 4,939,801 |
Curtiss-Wright Corp. | 20,666 | 4,604,178 |
Kratos Defense & Security Solutions, Inc.(a) | 158,659 | 3,219,191 |
Total | 12,763,170 | |
Building Products 2.2% | ||
AAON, Inc. | 67,418 | 4,980,168 |
Trex Company, Inc.(a) | 21,843 | 1,808,382 |
Total | 6,788,550 | |
Commercial Services & Supplies 1.7% | ||
Casella Waste Systems, Inc., Class A(a) | 63,779 | 5,450,553 |
Electrical Equipment 2.2% | ||
Atkore, Inc.(a) | 19,944 | 3,191,040 |
Enovix Corp.(a) | 118,897 | 1,488,590 |
nVent Electric PLC | 37,885 | 2,238,625 |
Total | 6,918,255 | |
Common Stocks (continued) | ||
Issuer | Shares | Value ($) |
Ground Transportation 5.8% | ||
RXO, Inc.(a) | 169,112 | 3,933,545 |
Saia, Inc.(a) | 14,908 | 6,532,984 |
XPO, Inc.(a) | 88,119 | 7,718,343 |
Total | 18,184,872 | |
Professional Services 2.9% | ||
Exponent, Inc. | 52,103 | 4,587,148 |
MAXIMUS, Inc. | 53,041 | 4,448,019 |
Total | 9,035,167 | |
Trading Companies & Distributors 7.5% | ||
Core & Main, Inc., Class A(a) | 211,786 | 8,558,272 |
FTAI Aviation Ltd. | 137,793 | 6,393,595 |
SiteOne Landscape Supply, Inc.(a) | 47,032 | 7,642,700 |
Xometry, Inc., Class A(a) | 29,958 | 1,075,792 |
Total | 23,670,359 | |
Total Industrials | 82,810,926 | |
Information Technology 20.5% | ||
Communications Equipment 1.2% | ||
Harmonic, Inc.(a) | 288,684 | 3,764,439 |
Electronic Equipment, Instruments & Components 1.2% | ||
908 Devices, Inc.(a) | 269,150 | 3,019,863 |
Cognex Corp. | 18,065 | 754,033 |
Total | 3,773,896 | |
IT Services 0.6% | ||
Couchbase, Inc.(a) | 88,093 | 1,983,854 |
Semiconductors & Semiconductor Equipment 6.2% | ||
Aehr Test Systems(a) | 88,180 | 2,339,415 |
Axcelis Technologies, Inc.(a) | 18,749 | 2,431,558 |
Lattice Semiconductor Corp.(a) | 21,738 | 1,499,705 |
Onto Innovation, Inc.(a) | 37,665 | 5,758,979 |
Rambus, Inc.(a) | 89,012 | 6,075,069 |
SiTime Corp.(a) | 10,227 | 1,248,512 |
Total | 19,353,238 | |
Common Stocks (continued) | ||
Issuer | Shares | Value ($) |
Software 10.1% | ||
BILL Holdings, Inc.(a) | 50,968 | 4,158,479 |
Freshworks, Inc., Class A(a) | 81,032 | 1,903,442 |
Procore Technologies, Inc.(a) | 108,063 | 7,480,121 |
Sprout Social, Inc., Class A(a) | 26,205 | 1,610,035 |
SPS Commerce, Inc.(a) | 12,989 | 2,517,788 |
Tenable Holdings, Inc.(a) | 110,708 | 5,099,211 |
Varonis Systems, Inc.(a) | 79,569 | 3,602,884 |
Workiva, Inc., Class A(a) | 52,187 | 5,298,546 |
Total | 31,670,506 | |
Technology Hardware, Storage & Peripherals 1.2% | ||
Super Micro Computer, Inc.(a) | 12,542 | 3,565,189 |
Total Information Technology | 64,111,122 | |
Materials 5.1% | ||
Chemicals 2.9% | ||
Aspen Aerogels, Inc.(a) | 151,725 | 2,394,220 |
Balchem Corp. | 34,957 | 5,199,854 |
Livent Corp.(a) | 76,653 | 1,378,221 |
Total | 8,972,295 | |
Common Stocks (continued) | ||
Issuer | Shares | Value ($) |
Construction Materials 0.9% | ||
Knife River Corp.(a) | 42,100 | 2,786,178 |
Metals & Mining 1.3% | ||
Osisko Gold Royalties Ltd. | 180,377 | 2,575,784 |
Triple Flag Precious Metals Corp. | 120,308 | 1,601,299 |
Total | 4,177,083 | |
Total Materials | 15,935,556 | |
Total Common Stocks (Cost $280,484,578) | 310,122,899 | |
Money Market Funds 0.8% | ||
Shares | Value ($) | |
Columbia Short-Term Cash Fund, 5.569%(e),(f) | 2,568,752 | 2,568,239 |
Total Money Market Funds (Cost $2,568,004) | 2,568,239 | |
Total Investments in Securities (Cost: $283,052,582) | 312,691,138 | |
Other Assets & Liabilities, Net | 387,106 | |
Net Assets | 313,078,244 | |
(a) | Non-income producing investment. |
(b) | Represents fair value as determined in good faith under procedures approved by the Board of Trustees. At December 31, 2023, the total value of these securities amounted to $1,166,145, which represents 0.37% of total net assets. |
(c) | Denotes a restricted security, which is subject to legal or contractual restrictions on resale under federal securities laws. Disposal of a restricted investment may involve time-consuming negotiations and expenses, and prompt sale at an acceptable price may be difficult to achieve. Private placement securities are generally considered to be restricted, although certain of those securities may be traded between qualified institutional investors under the provisions of Section 4(a)(2) and Rule 144A. The Fund will not incur any registration costs upon such a trade. These securities are valued at fair value determined in good faith under consistently applied procedures approved by the Fund’s Board of Trustees. At December 31, 2023, the total market value of these securities amounted to $1,166,145, which represents 0.37% of total net assets. Additional information on these securities is as follows: |
Security | Acquisition Dates | Shares | Cost ($) | Value ($) |
Caris Life Sciences, Inc. | 05/11/2021 | 308,642 | 2,502,312 | 836,420 |
DNA Script | 10/01/2021 | 1,585 | 1,382,080 | 329,725 |
3,884,392 | 1,166,145 |
(d) | Valuation based on significant unobservable inputs. |
(e) | The rate shown is the seven-day current annualized yield at December 31, 2023. |
(f) | As defined in the Investment Company Act of 1940, as amended, an affiliated company is one in which the Fund owns 5% or more of the company’s outstanding voting securities, or a company which is under common ownership or control with the Fund. The value of the holdings and transactions in these affiliated companies during the year ended December 31, 2023 are as follows: |
Affiliated issuers | Beginning of period($) | Purchases($) | Sales($) | Net change in unrealized appreciation (depreciation)($) | End of period($) | Realized gain (loss)($) | Dividends($) | End of period shares |
Columbia Short-Term Cash Fund, 5.569% | ||||||||
10,573,791 | 218,305,001 | (226,310,788 ) | 235 | 2,568,239 | 1,083 | 561,278 | 2,568,752 | |
Level 1 ($) | Level 2 ($) | Level 3 ($) | Total ($) | |
Investments in Securities | ||||
Common Stocks | ||||
Communication Services | 7,367,741 | — | — | 7,367,741 |
Consumer Discretionary | 41,026,851 | — | — | 41,026,851 |
Consumer Staples | 5,724,654 | — | — | 5,724,654 |
Energy | 13,542,326 | — | — | 13,542,326 |
Financials | 11,152,823 | — | — | 11,152,823 |
Health Care | 67,284,755 | — | 1,166,145 | 68,450,900 |
Level 1 ($) | Level 2 ($) | Level 3 ($) | Total ($) | |
Industrials | 82,810,926 | — | — | 82,810,926 |
Information Technology | 64,111,122 | — | — | 64,111,122 |
Materials | 15,935,556 | — | — | 15,935,556 |
Total Common Stocks | 308,956,754 | — | 1,166,145 | 310,122,899 |
Money Market Funds | 2,568,239 | — | — | 2,568,239 |
Total Investments in Securities | 311,524,993 | — | 1,166,145 | 312,691,138 |
Assets | |
Investments in securities, at value | |
Unaffiliated issuers (cost $280,484,578) | $310,122,899 |
Affiliated issuers (cost $2,568,004) | 2,568,239 |
Receivable for: | |
Investments sold | 2,175,724 |
Capital shares sold | 753 |
Dividends | 117,556 |
Foreign tax reclaims | 784 |
Expense reimbursement due from Investment Manager | 584 |
Prepaid expenses | 5,288 |
Deferred compensation of board members | 76,739 |
Total assets | 315,068,566 |
Liabilities | |
Payable for: | |
Investments purchased | 1,763,331 |
Capital shares redeemed | 82,720 |
Management services fees | 7,574 |
Distribution and/or service fees | 1 |
Service fees | 3,385 |
Compensation of chief compliance officer | 55 |
Compensation of board members | 991 |
Other expenses | 19,041 |
Deferred compensation of board members | 113,224 |
Total liabilities | 1,990,322 |
Net assets applicable to outstanding capital stock | $313,078,244 |
Represented by | |
Paid in capital | 318,136,178 |
Total distributable earnings (loss) | (5,057,934 ) |
Total - representing net assets applicable to outstanding capital stock | $313,078,244 |
Class 1 | |
Net assets | $312,918,531 |
Shares outstanding | 26,868,824 |
Net asset value per share | $11.65 |
Class 2 | |
Net assets | $159,713 |
Shares outstanding | 15,554 |
Net asset value per share | $10.27 |
Net investment income | |
Income: | |
Dividends — unaffiliated issuers | $1,494,941 |
Dividends — affiliated issuers | 561,278 |
Interfund lending | 3,593 |
Foreign taxes withheld | (7,051 ) |
Total income | 2,052,761 |
Expenses: | |
Management services fees | 2,493,922 |
Distribution and/or service fees | |
Class 2 | 364 |
Service fees | 31,380 |
Custodian fees | 13,144 |
Printing and postage fees | 12,118 |
Accounting services fees | 30,090 |
Legal fees | 15,639 |
Compensation of chief compliance officer | 56 |
Compensation of board members | 14,212 |
Deferred compensation of board members | 5,933 |
Other | 12,169 |
Total expenses | 2,629,027 |
Fees waived or expenses reimbursed by Investment Manager and its affiliates | (174,026 ) |
Total net expenses | 2,455,001 |
Net investment loss | (402,240 ) |
Realized and unrealized gain (loss) — net | |
Net realized gain (loss) on: | |
Investments — unaffiliated issuers | 11,273,259 |
Investments — affiliated issuers | 1,083 |
Net realized gain | 11,274,342 |
Net change in unrealized appreciation (depreciation) on: | |
Investments — unaffiliated issuers | 56,430,950 |
Investments — affiliated issuers | 235 |
Net change in unrealized appreciation (depreciation) | 56,431,185 |
Net realized and unrealized gain | 67,705,527 |
Net increase in net assets resulting from operations | $67,303,287 |
Year Ended December 31, 2023 | Year Ended December 31, 2022 | |
Operations | ||
Net investment loss | $(402,240 ) | $(1,746,639 ) |
Net realized gain (loss) | 11,274,342 | (44,658,962 ) |
Net change in unrealized appreciation (depreciation) | 56,431,185 | (97,472,455 ) |
Net increase (decrease) in net assets resulting from operations | 67,303,287 | (143,878,056 ) |
Distributions to shareholders | ||
Net investment income and net realized gains | ||
Class 1 | — | (112,900,711 ) |
Class 2 | — | (65,674 ) |
Total distributions to shareholders | — | (112,966,385 ) |
Increase (decrease) in net assets from capital stock activity | (8,739,418 ) | 107,492,039 |
Total increase (decrease) in net assets | 58,563,869 | (149,352,402 ) |
Net assets at beginning of year | 254,514,375 | 403,866,777 |
Net assets at end of year | $313,078,244 | $254,514,375 |
Year Ended | Year Ended | |||
December 31, 2023 | December 31, 2022 | |||
Shares | Dollars ($) | Shares | Dollars ($) | |
Capital stock activity | ||||
Class 1 | ||||
Shares sold | 106,733 | 1,160,397 | 25 | 356 |
Distributions reinvested | — | — | 11,485,321 | 112,900,711 |
Shares redeemed | (893,325 ) | (9,896,668 ) | (356,728 ) | (5,050,130 ) |
Net increase (decrease) | (786,592 ) | (8,736,271 ) | 11,128,618 | 107,850,937 |
Class 2 | ||||
Distributions reinvested | — | — | 7,549 | 65,674 |
Shares redeemed | (339 ) | (3,147 ) | (26,973 ) | (424,572 ) |
Net decrease | (339 ) | (3,147 ) | (19,424 ) | (358,898 ) |
Total net increase (decrease) | (786,931 ) | (8,739,418 ) | 11,109,194 | 107,492,039 |
Net asset value, beginning of period | Net investment income (loss) | Net realized and unrealized gain (loss) | Total from investment operations | Distributions from net realized gains | Total distributions to shareholders | |
Class 1 | ||||||
Year Ended 12/31/2023 | $9.20 | (0.01 ) | 2.46 | 2.45 | — | — |
Year Ended 12/31/2022 | $24.39 | (0.08 ) | (8.20 ) | (8.28 ) | (6.91 ) | (6.91 ) |
Year Ended 12/31/2021 | $29.97 | (0.22 ) | (0.18 )(c) | (0.40 ) | (5.18 ) | (5.18 ) |
Year Ended 12/31/2020 | $17.82 | (0.12 ) | 12.66 | 12.54 | (0.39 ) | (0.39 ) |
Year Ended 12/31/2019 | $15.64 | (0.06 ) | 6.33 | 6.27 | (4.09 ) | (4.09 ) |
Class 2 | ||||||
Year Ended 12/31/2023 | $8.13 | (0.04 ) | 2.18 | 2.14 | — | — |
Year Ended 12/31/2022 | $22.67 | (0.14 ) | (7.56 ) | (7.70 ) | (6.84 ) | (6.84 ) |
Year Ended 12/31/2021 | $28.21 | (0.29 ) | (0.13 )(c) | (0.42 ) | (5.12 ) | (5.12 ) |
Year Ended 12/31/2020 | $16.80 | (0.17 ) | 11.92 | 11.75 | (0.34 ) | (0.34 ) |
Year Ended 12/31/2019 | $14.91 | (0.11 ) | 6.04 | 5.93 | (4.04 ) | (4.04 ) |
Notes to Financial Highlights | |
(a) | In addition to the fees and expenses that the Fund bears directly, the Fund indirectly bears a pro rata share of the fees and expenses of any other funds in which it invests. Such indirect expenses are not included in the Fund’s reported expense ratios. |
(b) | Total net expenses include the impact of certain fee waivers/expense reimbursements made by the Investment Manager and certain of its affiliates, if applicable. |
(c) | Calculation of the net gain (loss) per share (both realized and unrealized) does not correlate to the aggregate realized and unrealized gain (loss) presented in the Statement of Operations due to timing of Fund shares sold and redeemed in relation to fluctuations in the market value of the portfolio. |
Net asset value, end of period | Total return | Total gross expense ratio to average net assets(a) | Total net expense ratio to average net assets(a),(b) | Net investment income (loss) ratio to average net assets | Portfolio turnover | Net assets, end of period (000’s) | |
Class 1 | |||||||
Year Ended 12/31/2023 | $11.65 | 26.63% | 0.92% | 0.86% | (0.14% ) | 152% | $312,919 |
Year Ended 12/31/2022 | $9.20 | (35.77% ) | 0.92% | 0.88% | (0.61% ) | 76% | $254,385 |
Year Ended 12/31/2021 | $24.39 | (2.90% ) | 0.91% | 0.90% | (0.76% ) | 61% | $403,066 |
Year Ended 12/31/2020 | $29.97 | 71.12% | 0.91% | 0.90% | (0.57% ) | 80% | $568,792 |
Year Ended 12/31/2019 | $17.82 | 40.70% | 0.97% | 0.89% | (0.36% ) | 100% | $337,568 |
Class 2 | |||||||
Year Ended 12/31/2023 | $10.27 | 26.32% | 1.17% | 1.11% | (0.39% ) | 152% | $160 |
Year Ended 12/31/2022 | $8.13 | (35.96% ) | 1.15% | 1.13% | (0.93% ) | 76% | $129 |
Year Ended 12/31/2021 | $22.67 | (3.13% ) | 1.15% | 1.15% | (1.01% ) | 61% | $801 |
Year Ended 12/31/2020 | $28.21 | 70.67% | 1.17% | 1.15% | (0.81% ) | 80% | $1,840 |
Year Ended 12/31/2019 | $16.80 | 40.39% | 1.22% | 1.14% | (0.62% ) | 100% | $572 |
May 1, 2023 through April 30, 2024 | Prior to May 1, 2023 | |
Class 1 | 0.85 % | 0.87 % |
Class 2 | 1.10 | 1.12 |
Undistributed net investment income ($) | Accumulated net realized (loss) ($) | Paid in capital ($) |
3,907,017 | (3,903,020 ) | (3,997 ) |
Year Ended December 31, 2023 | Year Ended December 31, 2022 | ||||
Ordinary income ($) | Long-term capital gains ($) | Total ($) | Ordinary income ($) | Long-term capital gains ($) | Total ($) |
— | — | — | 36,518,384 | 76,448,001 | 112,966,385 |
Undistributed ordinary income ($) | Undistributed long-term capital gains ($) | Capital loss carryforwards ($) | Net unrealized appreciation ($) |
6,581,134 | — | (37,492,415 ) | 25,959,804 |
Federal tax cost ($) | Gross unrealized appreciation ($) | Gross unrealized (depreciation) ($) | Net unrealized appreciation ($) |
286,731,334 | 38,380,197 | (12,420,393 ) | 25,959,804 |
No expiration short-term ($) | No expiration long-term ($) | Total ($) | Utilized ($) |
(16,654,310 ) | (20,838,105 ) | (37,492,415 ) | 7,691,941 |
Borrower or lender | Average loan balance ($) | Weighted average interest rate (%) | Number of days with outstanding loans |
Lender | 7,700,000 | 5.60 | 3 |
Name, address, year of birth | Position held with the Columbia Funds and length of service | Principal occupation(s) during past five years and other relevant professional experience | Number of Funds in the Columbia Funds Complex* overseen | Other directorships held by Trustee during the past five years and other relevant Board experience |
George S. Batejan c/o Columbia Management Investment Advisers, LLC 290 Congress Street Boston, MA 02210 1954 | Trustee since 2017 | Executive Vice President, Global Head of Technology and Operations, Janus Capital Group, Inc., 2010-2016 | 161 | Former Chairman of the Board, NICSA (National Investment Company Services Association) (Executive Committee, Nominating Committee and Governance Committee), 2014-2016; former Director, Intech Investment Management, 2011-2016; former Board Member, Metro Denver Chamber of Commerce, 2015-2016; former Advisory Board Member, University of Colorado Business School, 2015-2018; former Board Member, Chase Bank International, 1993-1994 |
Kathleen Blatz c/o Columbia Management Investment Advisers, LLC 290 Congress Street Boston, MA 02210 1954 | Trustee since 2006 | Attorney, specializing in arbitration and mediation; Trustee of Gerald Rauenhorst 1982 Trusts, since 2020; Chief Justice, Minnesota Supreme Court, 1998-2006; Associate Justice, Minnesota Supreme Court, 1996-1998; Fourth Judicial District Court Judge, Hennepin County, 1994-1996; Attorney in private practice and public service, 1984-1993; State Representative, Minnesota House of Representatives, 1979-1993, which included service on the Tax and Financial Institutions and Insurance Committees; Member and Interim Chair, Minnesota Sports Facilities Authority, January-July 2017; Interim President and Chief Executive Officer, Blue Cross and Blue Shield of Minnesota (health care insurance), February-July 2018, April-October 2021 | 161 | Former Trustee, Blue Cross and Blue Shield of Minnesota, 2009-2021 (Chair of the Business Development Committee, 2014-2017; Chair of the Governance Committee, 2017-2019); former Member and Chair of the Board, Minnesota Sports Facilities Authority, January 2017-July 2017; former Director, Robina Foundation, 2009-2020 (Chair, 2014-2020); Director, Richard M. Schulze Family Foundation, since 2021 |
Name, address, year of birth | Position held with the Columbia Funds and length of service | Principal occupation(s) during past five years and other relevant professional experience | Number of Funds in the Columbia Funds Complex* overseen | Other directorships held by Trustee during the past five years and other relevant Board experience |
Pamela G. Carlton c/o Columbia Management Investment Advisers, LLC 290 Congress Street Boston, MA 02210 1954 | Chair since 2023; Trustee since 2007 | President, Springboard – Partners in Cross Cultural Leadership (consulting company), since 2003; Managing Director of US Equity Research, JP Morgan Chase, 1999-2003; Director of US Equity Research, Chase Asset Management, 1996-1999; Co-Director Latin America Research, 1993-1996, COO Global Research, 1992-1996, Co-Director of US Research, 1991-1992, Investment Banker, 1982-1991, Morgan Stanley; Attorney, Cleary Gottlieb Steen & Hamilton LLP, 1980-1982 | 161 | Trustee, New York Presbyterian Hospital Board, since 1996; Director, DR Bank (Audit Committee, since 2017 and Audit Committee Chair, since November 2023); Director, Evercore Inc. (Audit Committee, Nominating and Governance Committee) (financial services company), since 2019; Director, Apollo Commercial Real Estate Finance, Inc. (Chair, Nominating and Governance Committee), since 2021; the Governing Council of the Independent Directors Council (IDC), since 2021 |
Janet Langford Carrig c/o Columbia Management Investment Advisers, LLC 290 Congress Street Boston, MA 02210 1957 | Trustee since 1996 | Senior Vice President, General Counsel and Corporate Secretary, ConocoPhillips (independent energy company), September 2007-October 2018 | 161 | Director, EQT Corporation (natural gas producer), since 2019; former Director, Whiting Petroleum Corporation (independent oil and gas company), 2020-2022 |
J. Kevin Connaughton c/o Columbia Management Investment Advisers, LLC 290 Congress Street Boston, MA 02210 1964 | Trustee since 2020 | CEO and President, RhodeWay Financial (non-profit financial planning firm), since December 2022; Member, FINRA National Adjudicatory Council, January 2020-December 31, 2023; Adjunct Professor of Finance, Bentley University January 2018-April 2023; Consultant to Independent Trustees of CFVIT and CFST I from March 2016 to June 2020 with respect to CFVIT and to December 2020 with respect to CFST I; Managing Director and General Manager of Mutual Fund Products, Columbia Management Investment Advisers, LLC, May 2010-February 2015; President, Columbia Funds, 2008-2015; and senior officer of Columbia Funds and affiliated funds, 2003-2015 | 159 | Former Director, The Autism Project, March 2015-December 2021; former Member of the Investment Committee, St. Michael’s College, November 2015-February 2020; former Trustee, St. Michael’s College, June 2017-September 2019; former Trustee, New Century Portfolios (former mutual fund complex), January 2015-December 2017 |
Olive M. Darragh c/o Columbia Management Investment Advisers, LLC 290 Congress Street Boston, MA 02210 1962 | Trustee since 2020 | Managing Director of Darragh Inc. (strategy and talent management consulting firm), since 2010; Founder and CEO, Zolio, Inc. (investment management talent identification platform), since 2004; Consultant to Independent Trustees of CFVIT and CFST I from June 2019 to June 2020 with respect to CFVIT and to December 2020 with respect to CFST I; Partner, Tudor Investments, 2004-2010; Senior Partner, McKinsey & Company (consulting), 1990-2004; Touche Ross CPA, 1985-1988 | 159 | Treasurer, Edinburgh University US Trust Board, since January 2023; Member, HBS Community Action Partners Board, since September 2022; former Director, University of Edinburgh Business School (Member of US Board), 2004-2019; former Director, Boston Public Library Foundation, 2008-2017 |
Name, address, year of birth | Position held with the Columbia Funds and length of service | Principal occupation(s) during past five years and other relevant professional experience | Number of Funds in the Columbia Funds Complex* overseen | Other directorships held by Trustee during the past five years and other relevant Board experience |
Patricia M. Flynn c/o Columbia Management Investment Advisers, LLC 290 Congress Street Boston, MA 02210 1950 | Trustee since 2004 | Professor Emeritus of Economics and Management, Bentley University, since 2023; Professor of Economics and Management, Bentley University, 1976-2023; Dean, McCallum Graduate School of Business, Bentley University, 1992-2002 | 161 | Former Trustee, MA Taxpayers Foundation, 1997-2022; former Director, The MA Business Roundtable, 2003-2019; former Chairperson, Innovation Index Advisory Committee, MA Technology Collaborative, 1997-2020 |
Brian J. Gallagher c/o Columbia Management Investment Advisers, LLC 290 Congress Street Boston, MA 02210 1954 | Trustee since 2017 | Retired; Partner with Deloitte & Touche LLP and its predecessors, 1977-2016 | 161 | Trustee, Catholic Schools Foundation, since 2004 |
Douglas A. Hacker c/o Columbia Management Investment Advisers, LLC 290 Congress Street Boston, MA 02210 1955 | Trustee since 1996 | Independent business executive, since May 2006; Executive Vice President – Strategy of United Airlines, December 2002 - May 2006; President of UAL Loyalty Services (airline marketing company), September 2001-December 2002; Executive Vice President and Chief Financial Officer of United Airlines, July 1999-September 2001 | 161 | Director, SpartanNash Company since November 2013 (Chair of the Board, since May 2021) (food distributor); Director, Aircastle Limited (Chair of Audit Committee) (aircraft leasing), since August 2006; former Director, Nash Finch Company (food distributor), 2005-2013; former Director, SeaCube Container Leasing Ltd. (container leasing), 2010-2013; and former Director, Travelport Worldwide Limited (travel information technology), 2014-2019 |
Nancy T. Lukitsh c/o Columbia Management Investment Advisers, LLC 290 Congress Street Boston, MA 02210 1956 | Trustee since 2011 | Senior Vice President, Partner and Director of Marketing, Wellington Management Company, LLP (investment adviser), 1997-2010; Chair, Wellington Management Portfolios (commingled non-U.S. investment pools), 2007-2010; Director, Wellington Trust Company, NA and other Wellington affiliates, 1997-2010 | 159 | None |
Name, address, year of birth | Position held with the Columbia Funds and length of service | Principal occupation(s) during past five years and other relevant professional experience | Number of Funds in the Columbia Funds Complex* overseen | Other directorships held by Trustee during the past five years and other relevant Board experience |
David M. Moffett c/o Columbia Management Investment Advisers, LLC 290 Congress Street Boston, MA 02210 1952 | Trustee since 2011 | Retired; former Chief Executive Officer of Freddie Mac and Chief Financial Officer of U.S. Bank | 161 | Director, CSX Corporation (transportation suppliers); Director, PayPal Holdings Inc. (payment and data processing services); former Director, eBay Inc. (online trading community), 2007-2015; and former Director, CIT Bank, CIT Group Inc. (commercial and consumer finance), 2010-2016; former Senior Adviser to The Carlyle Group (financial services), March 2008-September 2008; former Governance Consultant to Bridgewater Associates, January 2013-December 2015 |
Catherine James Paglia c/o Columbia Management Investment Advisers, LLC 290 Congress Street Boston, MA 02210 1952 | Trustee since 2004 | Director, Enterprise Asset Management, Inc. (private real estate and asset management company), since September 1998; Managing Director and Partner, Interlaken Capital, Inc., 1989-1997; Vice President, 1982-1985, Principal, 1985-1987, Managing Director, 1987-1989, Morgan Stanley; Vice President, Investment Banking, 1980-1982, Associate, Investment Banking, 1976-1980, Dean Witter Reynolds, Inc. | 161 | Director, Valmont Industries, Inc. (irrigation systems manufacturer), since 2012; Trustee, Carleton College (on the Investment Committee), since 1987; Trustee, Carnegie Endowment for International Peace (on the Investment Committee), since 2009 |
Natalie A. Trunow c/o Columbia Management Investment Advisers, LLC 290 Congress Street Boston, MA 02210 1967 | Trustee since 2020 | Chief Executive Officer, Millennial Portfolio Solutions LLC (asset management and consulting services), January 2016-January 2021; Non-executive Member of the Investment Committee and Valuation Committee, Sarona Asset Management Inc. (private equity firm) since September 2019; Advisor, Horizon Investments (asset management and consulting services), August 2018-January 2022; Advisor, Paradigm Asset Management, November 2016-January 2022; Consultant to Independent Trustees of CFVIT and CFST I from September 2016 to June 2020 with respect to CFVIT and to December 2020 with respect to CFST I; Director of Investments/Consultant, Casey Family Programs, April 2016-November 2016; Senior Vice President and Chief Investment Officer, Calvert Investments, August 2008-January 2016; Section Head and Portfolio Manager, General Motors Asset Management, June 1997-August 2008 | 159 | Independent Director, Investment Committee, Health Services for Children with Special Needs, Inc., 2010-2021; Independent Director, (Executive Committee and Chair, Audit Committee), Consumer Credit Counseling Services (formerly Guidewell Financial Solutions), since 2016; Independent Director, (Investment Committee), Sarona Asset Management, since 2019 |
Sandra L. Yeager c/o Columbia Management Investment Advisers, LLC 290 Congress Street Boston, MA 02210 1964 | Trustee since 2017 | Retired; President and founder, Hanoverian Capital, LLC (SEC registered investment advisor firm), 2008-2016; Managing Director, DuPont Capital, 2006-2008; Managing Director, Morgan Stanley Investment Management, 2004-2006; Senior Vice President, Alliance Bernstein, 1990-2004 | 161 | Former Director, NAPE (National Alliance for Partnerships in Equity) Education Foundation, October 2016-October 2020; Advisory Board, Jennersville YMCA, June 2022-June 2023 |
Name, address, year of birth | Position held with the Columbia Funds and length of service | Principal occupation(s) during the past five years and other relevant professional experience | Number of Funds in the Columbia Funds Complex* overseen | Other directorships held by Trustee during the past five years and other relevant Board experience |
Daniel J. Beckman c/o Columbia Management Investment Advisers, LLC 290 Congress Street Boston, MA 02210 1962 | Trustee since November 2021 and President since June 2021 | President and Principal Executive Officer of the Columbia Funds, since June 2021; Vice President, Columbia Management Investment Advisers, LLC, since April 2015; formerly, Vice President – Head of North America Product, Columbia Management Investment Advisers, LLC, April 2015 – December 2023; President and Principal Executive Officer, Columbia Acorn/Wanger Funds, since July 2021 | 161 | Director, Ameriprise Trust Company, since October 2016; Director, Columbia Management Investment Distributors, Inc., since November 2018; Board of Governors, Columbia Wanger Asset Management, LLC, since January 2022 |
* | The term “Columbia Funds Complex” as used herein includes Columbia Seligman Premium Technology Growth Fund, Tri-Continental Corporation and each series of Columbia Funds Series Trust (CFST), Columbia Funds Series Trust I (CFST I), Columbia Funds Series Trust II (CFST II), Columbia ETF Trust I (CET I), Columbia ETF Trust II (CET II), Columbia Funds Variable Insurance Trust (CFVIT) and Columbia Funds Variable Series Trust II (CFVST II). Messrs. Batejan, Beckman, Gallagher, Hacker and Moffett and Mses. Blatz, Carlton, Carrig, Flynn, Paglia, and Yeager serve as directors of Columbia Seligman Premium Technology Growth Fund and Tri-Continental Corporation. |
** | Interested person (as defined under the 1940 Act) by reason of being an officer, director, security holder and/or employee of the Investment Manager or Ameriprise Financial. |
Name, address and year of birth | Position and year first appointed to position for any Fund in the Columbia Funds Complex or a predecessor thereof | Principal occupation(s) during past five years |
Michael G. Clarke 290 Congress Street Boston, MA 02210 1969 | Chief Financial Officer and Principal Financial Officer (2009); Senior Vice President (2019); Treasurer and Chief Accounting Officer (Principal Accounting Officer) (2024) for CFST, CFST I, CFST II, CFVIT and CFVST II | Senior Vice President and North America Head of Operations & Investor Services, Columbia Management Investment Advisers, LLC, since June 2023 (previously Senior Vice President and Head of Global Operations, March 2022 – June 2023, Vice President, Head of North America Operations, and Co-Head of Global Operations, June 2019 - February 2022 and Vice President – Accounting and Tax, May 2010 - May 2019); senior officer of Columbia Funds and affiliated funds, since 2002. Director, Ameriprise Trust Company, since June 2023. |
Name, address and year of birth | Position and year first appointed to position for any Fund in the Columbia Funds Complex or a predecessor thereof | Principal occupation(s) during past five years |
Marybeth Pilat 290 Congress Street Boston, MA 02210 1968 | Treasurer and Chief Accounting Officer (Principal Accounting Officer) and Principal Financial Officer (2020) for CET I and CET II; Assistant Treasurer, CFST, CFST I, CFST II, CFVIT and CFVST II | Vice President – Product Pricing and Administration, Columbia Management Investment Advisers, LLC, since May 2017. |
William F. Truscott 290 Congress Street Boston, MA 02210 1960 | Senior Vice President (2001) | Formerly, Trustee/Director of Columbia Funds Complex or legacy funds, November 2001 - January 1, 2021; Chief Executive Officer, Global Asset Management, Ameriprise Financial, Inc., since September 2012; Chairman of the Board and President, Columbia Management Investment Advisers, LLC, since July 2004 and February 2012, respectively; Chairman of the Board and Chief Executive Officer, Columbia Management Investment Distributors, Inc., since November 2008 and February 2012, respectively; Chairman of the Board and Director, TAM UK International Holdings Limited, since July 2021; formerly Chairman of the Board and Director, Threadneedle Asset Management Holdings, Sàrl, March 2013 – December 2022 and December 2008 – December 2022, respectively; senior executive of various entities affiliated with Columbia Threadneedle Investments. |
Christopher O. Petersen 5228 Ameriprise Financial Center Minneapolis, MN 55474 1970 | Senior Vice President and Assistant Secretary (2021) | Formerly, Trustee/Director of funds within the Columbia Funds Complex, July 1, 2020 - November 22, 2021; Senior Vice President and Assistant General Counsel, Ameriprise Financial, Inc., since September 2021 (previously Vice President and Lead Chief Counsel, January 2015 - September 2021); formerly, President and Principal Executive Officer of the Columbia Funds, 2015 - 2021; officer of Columbia Funds and affiliated funds, since 2007. |
Thomas P. McGuire 290 Congress Street Boston, MA 02210 1972 | Senior Vice President and Chief Compliance Officer (2012) | Vice President – Asset Management Compliance, Ameriprise Financial, Inc., since May 2010; Chief Compliance Officer, Columbia Acorn/Wanger Funds, since December 2015; formerly, Chief Compliance Officer, Ameriprise Certificate Company, September 2010 – September 2020. |
Ryan C. Larrenaga 290 Congress Street Boston, MA 02210 1970 | Senior Vice President (2017), Chief Legal Officer (2017), and Secretary (2015) | Vice President and Chief Counsel, Ameriprise Financial, Inc., since August 2018 (previously Vice President and Group Counsel, August 2011 - August 2018); Chief Legal Officer, Columbia Acorn/Wanger Funds, since September 2020; officer of Columbia Funds and affiliated funds, since 2005. |
Michael E. DeFao 290 Congress Street Boston, MA 02210 1968 | Vice President (2011) and Assistant Secretary (2010) | Vice President and Chief Counsel, Ameriprise Financial, Inc., since May 2010; Vice President, Chief Legal Officer and Assistant Secretary, Columbia Management Investment Advisers, LLC, since October 2021 (previously Vice President and Assistant Secretary, May 2010 – September 2021). |
Lyn Kephart-Strong 5903 Ameriprise Financial Center Minneapolis, MN 55474 1960 | Vice President (2015) | Vice President, Global Investment Operations Services, Columbia Management Investment Advisers, LLC, since 2010; President, Columbia Management Investment Services Corp., since October 2014; President, Ameriprise Trust Company, since January 2017. |


3 | |
6 | |
8 | |
9 | |
34 | |
35 | |
36 | |
38 | |
40 | |
58 | |
59 |
Average annual total returns (%) (for the period ended December 31, 2023) | |||||
Inception | 1 Year | 5 Years | 10 Years | ||
Class 1 | 07/05/94 | 9.67 | 3.19 | 3.27 | |
Class 2 | 06/01/00 | 9.20 | 2.91 | 2.99 | |
Bloomberg U.S. Aggregate Bond Index | 5.53 | 1.10 | 1.81 | ||
ICE BofA US Cash Pay High Yield Constrained Index | 13.41 | 5.20 | 4.50 | ||
FTSE Non-U.S. World Government Bond (All Maturities) Index - Unhedged | 5.83 | -2.77 | -1.26 | ||
JPMorgan Emerging Markets Bond Index - Global | 10.45 | 1.94 | 3.06 | ||

Portfolio breakdown (%) (at December 31, 2023) | |
Asset-Backed Securities — Non-Agency | 5.1 |
Call Option Contracts Purchased | 0.1 |
Commercial Mortgage-Backed Securities - Non-Agency | 1.5 |
Common Stocks | 0.0 (a) |
Convertible Bonds | 0.1 |
Corporate Bonds & Notes | 34.3 |
Foreign Government Obligations | 6.1 |
Inflation-Indexed Bonds | 0.2 |
Money Market Funds | 6.0 |
Residential Mortgage-Backed Securities - Agency | 27.9 |
Residential Mortgage-Backed Securities - Non-Agency | 9.7 |
Senior Loans | 6.6 |
U.S. Treasury Obligations | 2.4 |
Total | 100.0 |
(a) | Rounds to zero. |
Quality breakdown (%) (at December 31, 2023) | |
AA rating | 35.3 |
A rating | 9.6 |
BBB rating | 17.4 |
BB rating | 15.2 |
B rating | 15.6 |
CCC rating | 2.6 |
Not rated | 4.3 |
Total | 100.0 |
Derivative breakdown (%) (at December 31, 2023)(a) | |||
Asset | Liability | Net | |
Forward foreign currency exchange contracts | — | (0.02 ) | (0.02 ) |
Long futures contracts | 0.76 | — | 0.76 |
Short futures contracts | — | (0.91 ) | (0.91 ) |
Swap contracts | 0.47 | (0.18 ) | 0.29 |
Call option contracts written | — | (0.06 ) | (0.06 ) |
July 1, 2023 — December 31, 2023 | |||||||
Account value at the beginning of the period ($) | Account value at the end of the period ($) | Expenses paid during the period ($) | Fund’s annualized expense ratio (%) | ||||
Actual | Hypothetical | Actual | Hypothetical | Actual | Hypothetical | Actual | |
Class 1 | 1,000.00 | 1,000.00 | 1,057.50 | 1,021.49 | 3.54 | 3.48 | 0.69 |
Class 2 | 1,000.00 | 1,000.00 | 1,055.40 | 1,020.29 | 4.77 | 4.68 | 0.93 |
Asset-Backed Securities — Non-Agency 5.8% | ||||
Issuer | Coupon Rate | Principal Amount ($) | Value ($) | |
Affirm Asset Securitization Trust(a) | ||||
Series 2023-B Class A | ||||
09/15/2028 | 6.820% | 750,000 | 762,404 | |
ARES XLIV CLO Ltd.(a),(b) | ||||
Series 2017-44A Class DR | ||||
3-month Term SOFR + 7.132% Floor 6.870% 04/15/2034 | 12.526% | 500,000 | 468,912 | |
Bain Capital Credit CLO Ltd.(a),(b) | ||||
Series 2021-6A Class E | ||||
3-month Term SOFR + 6.762% Floor 6.500% 10/21/2034 | 12.174% | 250,000 | 242,928 | |
Series 2021-7A Class E | ||||
3-month Term SOFR + 7.012% Floor 6.750% 01/22/2035 | 12.424% | 250,000 | 244,266 | |
Ballyrock CLO Ltd.(a),(b) | ||||
Series 2021-18A Class D | ||||
3-month Term SOFR + 6.762% Floor 6.500% 01/15/2035 | 12.156% | 250,000 | 234,322 | |
Barings CLO Ltd.(a),(b) | ||||
Series 2021-2A Class E | ||||
3-month Term SOFR + 6.512% Floor 6.250% 07/15/2034 | 11.906% | 250,000 | 240,346 | |
Exeter Automobile Receivables Trust | ||||
Subordinated Series 2023-3A Class B | ||||
09/15/2027 | 6.110% | 500,000 | 501,149 | |
LendingPoint Asset Securitization Trust(a) | ||||
Subordinated Series 2022-A Class C | ||||
06/15/2029 | 2.820% | 211,125 | 208,365 | |
Madison Park Funding LXII Ltd.(a),(b) | ||||
Series 2022-62A Class AR | ||||
3-month Term SOFR + 1.850% Floor 1.850% 07/17/2036 | 7.253% | 750,000 | 750,961 | |
Madison Park Funding XXII Ltd.(a),(b) | ||||
Series 2016-22A Class DR | ||||
3-month Term SOFR + 3.762% Floor 3.500% 01/15/2033 | 9.156% | 400,000 | 399,968 | |
Netcredit Combined Receivables LLC(a),(c) | ||||
Series 2023-A Class A | ||||
12/20/2027 | 7.780% | 278,323 | 277,627 | |
Asset-Backed Securities — Non-Agency (continued) | ||||
Issuer | Coupon Rate | Principal Amount ($) | Value ($) | |
Octagon 55 Ltd.(a),(b) | ||||
Series 2021-1A Class E | ||||
3-month Term SOFR + 6.762% Floor 6.500% 07/20/2034 | 12.177% | 300,000 | 286,625 | |
Octagon Investment Partners 48 Ltd.(a),(b) | ||||
Series 2020-3A Class ER | ||||
3-month Term SOFR + 6.962% Floor 6.700% 10/20/2034 | 12.377% | 250,000 | 232,540 | |
Pagaya AI Debt Selection Trust(a) | ||||
Subordinated Series 2021-3 Class B | ||||
05/15/2029 | 1.740% | 362,625 | 358,861 | |
Pagaya AI Debt Trust(a) | ||||
Series 2022-2 Class A | ||||
01/15/2030 | 4.970% | 75,982 | 75,486 | |
Series 2023-6 Class A | ||||
06/16/2031 | 7.128% | 808,443 | 810,157 | |
Subordinated Series 2022-1 Class B | ||||
10/15/2029 | 3.344% | 399,947 | 384,230 | |
Subordinated Series 2022-3 Class B | ||||
03/15/2030 | 8.050% | 349,966 | 352,545 | |
Subordinated Series 2023-6 Class B | ||||
06/16/2031 | 7.464% | 300,000 | 302,127 | |
Subordinated Series 2023-6 Class C | ||||
06/16/2031 | 8.491% | 400,000 | 403,728 | |
Pagaya AI Debt Trust(a),(d) | ||||
Subordinated Series 2023-5 Class AB | ||||
04/15/2031 | 7.277% | 513,967 | 515,701 | |
Research-Driven Pagaya Motor Asset Trust(a) | ||||
Series 2023-4A Class A | ||||
03/25/2032 | 7.540% | 600,000 | 602,127 | |
Theorem Funding Trust(a) | ||||
Series 2022-3A Class A | ||||
04/15/2029 | 7.600% | 236,484 | 238,134 | |
Upstart Structured Pass-Through Trust(a) | ||||
Series 2022-1A Class A | ||||
04/15/2030 | 3.400% | 374,043 | 367,488 | |
Total Asset-Backed Securities — Non-Agency (Cost $9,297,569) | 9,260,997 | |||
Commercial Mortgage-Backed Securities - Non-Agency 1.8% | ||||
Braemar Hotels & Resorts Trust(a),(b) | ||||
Series 2018-PRME Class E | ||||
1-month Term SOFR + 2.447% Floor 2.400% 06/15/2035 | 7.877% | 300,000 | 286,693 | |
Commercial Mortgage-Backed Securities - Non-Agency (continued) | ||||
Issuer | Coupon Rate | Principal Amount ($) | Value ($) | |
Subordinated Series 2018-PRME Class D | ||||
1-month Term SOFR + 1.847% Floor 1.925% 06/15/2035 | 7.277% | 300,000 | 292,848 | |
CLNY Trust(a),(b) | ||||
Subordinated Series 2019-IKPR Class E | ||||
1-month Term SOFR + 2.835% Floor 2.721% 11/15/2038 | 8.195% | 300,000 | 267,537 | |
Subordinated Series 2019-IKPR Class F | ||||
1-month Term SOFR + 3.531% Floor 3.417% 11/15/2038 | 8.891% | 150,000 | 132,746 | |
COMM Mortgage Trust(a),(d) | ||||
Subordinated Series 2020-CBM Class F | ||||
02/10/2037 | 3.633% | 150,000 | 137,402 | |
Credit Suisse Mortgage Capital Certificates OA LLC(a) | ||||
Subordinated Series 2014-USA Class E | ||||
09/15/2037 | 4.373% | 500,000 | 234,971 | |
Subordinated Series 2014-USA Class F | ||||
09/15/2037 | 4.373% | 400,000 | 155,135 | |
Extended Stay America Trust(a),(b) | ||||
Series 2021-ESH Class D | ||||
1-month Term SOFR + 2.364% Floor 2.250% 07/15/2038 | 7.726% | 186,688 | 183,420 | |
Morgan Stanley Capital I Trust(a),(d) | ||||
Series 2019-MEAD Class E | ||||
11/10/2036 | 3.177% | 600,000 | 481,856 | |
Progress Residential Trust(a) | ||||
Subordinated Series 2020-SFR2 Class F | ||||
06/17/2037 | 6.152% | 500,000 | 493,073 | |
SFO Commercial Mortgage Trust(a),(b) | ||||
Series 2021-555 Class A | ||||
1-month Term SOFR + 1.264% Floor 1.150% 05/15/2038 | 6.626% | 150,000 | 140,341 | |
Total Commercial Mortgage-Backed Securities - Non-Agency (Cost $3,328,526) | 2,806,022 | |||
Common Stocks 0.0% | ||
Issuer | Shares | Value ($) |
Financials —% | ||
Financial Services —% | ||
Fairlane Management Corp.(c),(e),(f) | 2,000 | — |
Total Financials | — | |
Common Stocks (continued) | ||
Issuer | Shares | Value ($) |
Information Technology 0.0% | ||
Software 0.0% | ||
Avaya Holdings Corp.(c),(f) | 702 | 4,914 |
Avaya Holdings Corp.(c),(f) | 3,344 | 23,408 |
Total | 28,322 | |
Total Information Technology | 28,322 | |
Materials —% | ||
Containers & Packaging —% | ||
Flint Group Packaging(c),(e),(f) | 95,393 | 0 |
Total Materials | 0 | |
Total Common Stocks (Cost $63,213) | 28,322 | |
Convertible Bonds 0.1% | ||||
Issuer | Coupon Rate | Principal Amount ($) | Value ($) | |
Cable and Satellite 0.1% | ||||
DISH Network Corp. | ||||
Subordinated | ||||
08/15/2026 | 3.375% | 303,000 | 160,590 | |
Total Convertible Bonds (Cost $242,972) | 160,590 | |||
Corporate Bonds & Notes(g) 39.4% | ||||
Aerospace & Defense 1.2% | ||||
BAE Systems PLC(a) | ||||
02/15/2031 | 1.900% | 460,000 | 378,307 | |
Boeing Co. (The) | ||||
08/01/2059 | 3.950% | 427,000 | 327,858 | |
Bombardier, Inc.(a) | ||||
04/15/2027 | 7.875% | 37,000 | 37,013 | |
Howmet Aerospace, Inc. | ||||
01/15/2029 | 3.000% | 107,000 | 97,748 | |
L3Harris Technologies, Inc. | ||||
07/31/2033 | 5.400% | 106,000 | 110,283 | |
Raytheon Technologies Corp. | ||||
03/15/2032 | 2.375% | 515,000 | 428,811 | |
Spirit AeroSystems, Inc.(a) | ||||
11/30/2029 | 9.375% | 36,000 | 39,417 | |
11/15/2030 | 9.750% | 59,000 | 63,441 | |
TransDigm, Inc.(a) | ||||
03/15/2026 | 6.250% | 332,000 | 331,606 | |
08/15/2028 | 6.750% | 103,000 | 105,701 | |
Total | 1,920,185 | |||
Corporate Bonds & Notes(g) (continued) | ||||
Issuer | Coupon Rate | Principal Amount ($) | Value ($) | |
Airlines 0.5% | ||||
Air Canada(a) | ||||
08/15/2026 | 3.875% | 90,000 | 86,136 | |
American Airlines, Inc.(a) | ||||
05/15/2029 | 8.500% | 30,000 | 31,733 | |
American Airlines, Inc./AAdvantage Loyalty IP Ltd.(a) | ||||
04/20/2026 | 5.500% | 135,010 | 133,917 | |
04/20/2029 | 5.750% | 196,729 | 191,893 | |
Hawaiian Brand Intellectual Property Ltd./Miles Loyalty Ltd.(a) | ||||
01/20/2026 | 5.750% | 136,696 | 129,056 | |
United Airlines, Inc.(a) | ||||
04/15/2026 | 4.375% | 124,000 | 120,940 | |
04/15/2029 | 4.625% | 89,000 | 82,940 | |
Total | 776,615 | |||
Automotive 0.5% | ||||
American Axle & Manufacturing, Inc. | ||||
04/01/2027 | 6.500% | 34,000 | 34,122 | |
Clarios Global LP/US Finance Co.(a) | ||||
05/15/2028 | 6.750% | 94,000 | 96,777 | |
Ford Motor Credit Co. LLC | ||||
09/08/2024 | 3.664% | 47,000 | 46,195 | |
06/16/2025 | 5.125% | 112,000 | 110,651 | |
11/13/2025 | 3.375% | 40,000 | 38,264 | |
05/28/2027 | 4.950% | 235,000 | 229,436 | |
08/17/2027 | 4.125% | 74,000 | 70,152 | |
Goodyear Tire & Rubber Co. (The) | ||||
07/15/2029 | 5.000% | 49,000 | 46,250 | |
IHO Verwaltungs GmbH(a),(h) | ||||
09/15/2026 | 4.750% | 15,000 | 14,361 | |
KAR Auction Services, Inc.(a) | ||||
06/01/2025 | 5.125% | 21,000 | 20,618 | |
Panther BF Aggregator 2 LP/Finance Co., Inc.(a) | ||||
05/15/2026 | 6.250% | 17,000 | 17,008 | |
05/15/2027 | 8.500% | 88,000 | 88,615 | |
ZF North America Capital, Inc.(a) | ||||
04/14/2030 | 7.125% | 51,000 | 54,179 | |
Total | 866,628 | |||
Banking 7.6% | ||||
Ally Financial, Inc. | ||||
05/21/2024 | 3.875% | 22,000 | 21,791 | |
Subordinated | ||||
11/20/2025 | 5.750% | 108,000 | 107,742 | |
Corporate Bonds & Notes(g) (continued) | ||||
Issuer | Coupon Rate | Principal Amount ($) | Value ($) | |
Bank of America Corp.(i) | ||||
10/22/2030 | 2.884% | 1,010,000 | 896,876 | |
07/23/2031 | 1.898% | 1,000,000 | 816,790 | |
10/20/2032 | 2.572% | 791,000 | 656,196 | |
02/04/2033 | 2.972% | 440,000 | 373,896 | |
Subordinated | ||||
09/21/2036 | 2.482% | 57,000 | 45,226 | |
Citigroup, Inc.(i) | ||||
01/25/2033 | 3.057% | 521,000 | 444,642 | |
Goldman Sachs Group, Inc. (The)(i) | ||||
07/21/2032 | 2.383% | 1,183,000 | 972,697 | |
10/21/2032 | 2.650% | 3,000 | 2,500 | |
HSBC Holdings PLC(i) | ||||
05/24/2032 | 2.804% | 540,000 | 450,681 | |
11/22/2032 | 2.871% | 754,000 | 627,494 | |
JPMorgan Chase & Co.(i) | ||||
04/22/2032 | 2.580% | 902,000 | 763,390 | |
11/08/2032 | 2.545% | 1,226,000 | 1,024,160 | |
Morgan Stanley(i) | ||||
07/21/2032 | 2.239% | 392,000 | 320,312 | |
10/20/2032 | 2.511% | 1,073,000 | 889,922 | |
07/21/2034 | 5.424% | 121,000 | 122,692 | |
Subordinated | ||||
09/16/2036 | 2.484% | 70,000 | 55,564 | |
PNC Financial Services Group, Inc. (The)(i) | ||||
06/12/2029 | 5.582% | 371,000 | 378,433 | |
10/20/2034 | 6.875% | 495,000 | 549,706 | |
US Bancorp(i) | ||||
06/12/2034 | 5.836% | 123,000 | 126,950 | |
Wells Fargo & Co.(i) | ||||
07/25/2029 | 5.574% | 36,000 | 36,753 | |
10/23/2029 | 6.303% | 176,000 | 185,663 | |
10/30/2030 | 2.879% | 485,000 | 430,954 | |
07/25/2034 | 5.557% | 1,549,000 | 1,578,517 | |
10/23/2034 | 6.491% | 183,000 | 199,303 | |
Total | 12,078,850 | |||
Brokerage/Asset Managers/Exchanges 0.4% | ||||
AG Issuer LLC(a) | ||||
03/01/2028 | 6.250% | 2,000 | 1,988 | |
AG TTMT Escrow Issuer LLC(a) | ||||
09/30/2027 | 8.625% | 80,000 | 84,198 | |
Aretec Escrow Issuer 2, Inc.(a) | ||||
08/15/2030 | 10.000% | 85,000 | 90,335 | |
Aretec Escrow Issuer, Inc.(a) | ||||
04/01/2029 | 7.500% | 38,000 | 34,200 | |
Hightower Holding LLC(a) | ||||
04/15/2029 | 6.750% | 96,000 | 87,131 | |
Corporate Bonds & Notes(g) (continued) | ||||
Issuer | Coupon Rate | Principal Amount ($) | Value ($) | |
NFP Corp.(a) | ||||
08/15/2028 | 4.875% | 131,000 | 130,214 | |
08/15/2028 | 6.875% | 171,000 | 173,936 | |
10/01/2030 | 7.500% | 6,000 | 6,407 | |
10/01/2031 | 8.500% | 47,000 | 50,807 | |
Total | 659,216 | |||
Building Materials 0.6% | ||||
American Builders & Contractors Supply Co., Inc.(a) | ||||
01/15/2028 | 4.000% | 182,000 | 172,686 | |
Beacon Roofing Supply, Inc.(a) | ||||
11/15/2026 | 4.500% | 45,000 | 43,682 | |
05/15/2029 | 4.125% | 26,000 | 23,694 | |
08/01/2030 | 6.500% | 51,000 | 52,294 | |
James Hardie International Finance DAC(a) | ||||
01/15/2028 | 5.000% | 87,000 | 84,558 | |
SRS Distribution, Inc.(a) | ||||
07/01/2028 | 4.625% | 75,000 | 71,437 | |
07/01/2029 | 6.125% | 85,000 | 80,637 | |
12/01/2029 | 6.000% | 77,000 | 72,495 | |
Standard Industries, Inc.(a) | ||||
01/15/2028 | 4.750% | 145,000 | 139,643 | |
Summit Materials LLC /Finance Corp.(a) | ||||
01/15/2031 | 7.250% | 70,000 | 73,811 | |
Summit Materials LLC/Finance Corp.(a) | ||||
01/15/2029 | 5.250% | 12,000 | 11,639 | |
White Cap Buyer LLC(a) | ||||
10/15/2028 | 6.875% | 97,000 | 94,105 | |
Total | 920,681 | |||
Cable and Satellite 1.7% | ||||
CCO Holdings LLC/Capital Corp.(a) | ||||
05/01/2027 | 5.125% | 158,000 | 152,877 | |
02/01/2028 | 5.000% | 48,000 | 45,949 | |
06/01/2029 | 5.375% | 60,000 | 56,775 | |
03/01/2030 | 4.750% | 58,000 | 53,055 | |
08/15/2030 | 4.500% | 181,000 | 163,472 | |
02/01/2031 | 4.250% | 131,000 | 114,448 | |
02/01/2032 | 4.750% | 55,000 | 48,496 | |
CCO Holdings LLC/Capital Corp. | ||||
05/01/2032 | 4.500% | 206,000 | 176,612 | |
Charter Communications Operating LLC/Capital | ||||
05/01/2047 | 5.375% | 140,000 | 119,423 | |
06/30/2062 | 3.950% | 248,000 | 157,621 | |
CSC Holdings LLC(a) | ||||
12/01/2030 | 4.125% | 146,000 | 110,986 | |
12/01/2030 | 4.625% | 122,000 | 73,156 | |
02/15/2031 | 3.375% | 197,000 | 144,777 | |
11/15/2031 | 5.000% | 64,000 | 38,466 | |
Corporate Bonds & Notes(g) (continued) | ||||
Issuer | Coupon Rate | Principal Amount ($) | Value ($) | |
DISH DBS Corp. | ||||
11/15/2024 | 5.875% | 79,000 | 74,431 | |
06/01/2029 | 5.125% | 145,000 | 74,745 | |
DISH Network Corp.(a) | ||||
11/15/2027 | 11.750% | 109,000 | 113,705 | |
Sirius XM Radio, Inc.(a) | ||||
09/01/2026 | 3.125% | 84,000 | 79,400 | |
07/15/2028 | 4.000% | 110,000 | 101,979 | |
07/01/2030 | 4.125% | 78,000 | 69,831 | |
Videotron Ltd.(a) | ||||
06/15/2029 | 3.625% | 388,000 | 354,600 | |
Virgin Media Finance PLC(a) | ||||
07/15/2030 | 5.000% | 81,000 | 71,479 | |
Virgin Media Secured Finance PLC(a) | ||||
05/15/2029 | 5.500% | 36,000 | 34,717 | |
VZ Secured Financing BV(a) | ||||
01/15/2032 | 5.000% | 101,000 | 86,552 | |
Ziggo Bond Co. BV(a) | ||||
02/28/2030 | 5.125% | 118,000 | 98,709 | |
Ziggo BV(a) | ||||
01/15/2030 | 4.875% | 102,000 | 90,765 | |
Total | 2,707,026 | |||
Chemicals 1.2% | ||||
Avient Corp.(a) | ||||
08/01/2030 | 7.125% | 47,000 | 48,738 | |
Axalta Coating Systems LLC(a) | ||||
02/15/2029 | 3.375% | 110,000 | 98,933 | |
Axalta Coating Systems LLC/Dutch Holding B BV(a) | ||||
06/15/2027 | 4.750% | 53,000 | 51,460 | |
Braskem Netherlands Finance BV(a) | ||||
01/31/2030 | 4.500% | 324,000 | 248,501 | |
Cheever Escrow Issuer LLC(a) | ||||
10/01/2027 | 7.125% | 42,000 | 41,978 | |
Element Solutions, Inc.(a) | ||||
09/01/2028 | 3.875% | 116,000 | 106,992 | |
HB Fuller Co. | ||||
10/15/2028 | 4.250% | 86,000 | 80,841 | |
Herens Holdco Sarl(a) | ||||
05/15/2028 | 4.750% | 103,000 | 84,215 | |
Illuminate Buyer LLC/Holdings IV, Inc.(a) | ||||
07/01/2028 | 9.000% | 65,000 | 62,685 | |
INEOS Quattro Finance 2 Plc(a) | ||||
01/15/2026 | 3.375% | 55,000 | 52,119 | |
INEOS Quattro Finance 2 PLC(a) | ||||
03/15/2029 | 9.625% | 84,000 | 89,436 | |
Corporate Bonds & Notes(g) (continued) | ||||
Issuer | Coupon Rate | Principal Amount ($) | Value ($) | |
Ingevity Corp.(a) | ||||
11/01/2028 | 3.875% | 76,000 | 68,290 | |
Innophos Holdings, Inc.(a) | ||||
02/15/2028 | 9.375% | 63,000 | 57,298 | |
Iris Holdings, Inc.(a),(h) | ||||
02/15/2026 | 8.750% | 54,000 | 45,924 | |
Olympus Water US Holding Corp.(a) | ||||
10/01/2028 | 4.250% | 125,000 | 113,012 | |
11/15/2028 | 9.750% | 147,000 | 156,722 | |
10/01/2029 | 6.250% | 66,000 | 58,895 | |
SPCM SA(a) | ||||
03/15/2027 | 3.125% | 4,000 | 3,643 | |
Tronox, Inc.(a) | ||||
03/15/2029 | 4.625% | 42,000 | 37,182 | |
WR Grace Holdings LLC(a) | ||||
06/15/2027 | 4.875% | 178,000 | 171,491 | |
08/15/2029 | 5.625% | 144,000 | 127,184 | |
03/01/2031 | 7.375% | 46,000 | 46,027 | |
Total | 1,851,566 | |||
Construction Machinery 0.3% | ||||
H&E Equipment Services, Inc.(a) | ||||
12/15/2028 | 3.875% | 192,000 | 174,372 | |
Herc Holdings, Inc.(a) | ||||
07/15/2027 | 5.500% | 50,000 | 49,414 | |
Ritchie Bros Holdings, Inc.(a) | ||||
03/15/2028 | 6.750% | 149,000 | 153,624 | |
03/15/2031 | 7.750% | 18,000 | 19,197 | |
United Rentals North America, Inc. | ||||
01/15/2032 | 3.750% | 19,000 | 16,875 | |
Total | 413,482 | |||
Consumer Cyclical Services 0.4% | ||||
APX Group, Inc.(a) | ||||
07/15/2029 | 5.750% | 14,000 | 13,070 | |
Arches Buyer, Inc.(a) | ||||
06/01/2028 | 4.250% | 116,000 | 105,077 | |
12/01/2028 | 6.125% | 100,000 | 87,179 | |
ASGN, Inc.(a) | ||||
05/15/2028 | 4.625% | 77,000 | 73,214 | |
Match Group, Inc.(a) | ||||
12/15/2027 | 5.000% | 18,000 | 17,573 | |
06/01/2028 | 4.625% | 180,000 | 172,614 | |
Uber Technologies, Inc.(a) | ||||
09/15/2027 | 7.500% | 17,000 | 17,601 | |
01/15/2028 | 6.250% | 97,000 | 97,604 | |
08/15/2029 | 4.500% | 109,000 | 103,972 | |
Total | 687,904 | |||
Corporate Bonds & Notes(g) (continued) | ||||
Issuer | Coupon Rate | Principal Amount ($) | Value ($) | |
Consumer Products 0.3% | ||||
Acushnet Co.(a) | ||||
10/15/2028 | 7.375% | 47,000 | 49,094 | |
CD&R Smokey Buyer, Inc.(a) | ||||
07/15/2025 | 6.750% | 154,000 | 152,766 | |
Newell Brands, Inc. | ||||
09/15/2027 | 6.375% | 23,000 | 22,946 | |
Newell, Inc. | ||||
04/01/2026 | 5.200% | 26,000 | 25,601 | |
Scotts Miracle-Gro Co. (The) | ||||
04/01/2031 | 4.000% | 55,000 | 47,341 | |
02/01/2032 | 4.375% | 37,000 | 31,618 | |
Spectrum Brands, Inc.(a) | ||||
10/01/2029 | 5.000% | 48,000 | 45,942 | |
07/15/2030 | 5.500% | 21,000 | 20,465 | |
03/15/2031 | 3.875% | 37,000 | 33,601 | |
Total | 429,374 | |||
Diversified Manufacturing 1.3% | ||||
Carrier Global Corp. | ||||
02/15/2030 | 2.722% | 1,330,000 | 1,190,745 | |
Chart Industries, Inc.(a) | ||||
01/01/2030 | 7.500% | 37,000 | 38,727 | |
Emerald Debt Merger Sub LLC(a) | ||||
12/15/2030 | 6.625% | 106,000 | 108,866 | |
Gates Global LLC/Co.(a) | ||||
01/15/2026 | 6.250% | 81,000 | 81,104 | |
Madison IAQ LLC(a) | ||||
06/30/2028 | 4.125% | 73,000 | 66,586 | |
06/30/2029 | 5.875% | 83,000 | 73,222 | |
Resideo Funding, Inc.(a) | ||||
09/01/2029 | 4.000% | 101,000 | 88,396 | |
Vertical Holdco GmbH(a) | ||||
07/15/2028 | 7.625% | 64,000 | 63,199 | |
Vertical US Newco, Inc.(a) | ||||
07/15/2027 | 5.250% | 88,000 | 86,315 | |
WESCO Distribution, Inc.(a) | ||||
06/15/2025 | 7.125% | 96,000 | 96,692 | |
06/15/2028 | 7.250% | 97,000 | 99,677 | |
Total | 1,993,529 | |||
Electric 2.2% | ||||
AEP Texas, Inc. | ||||
01/15/2050 | 3.450% | 435,000 | 315,185 | |
Calpine Corp.(a) | ||||
02/15/2028 | 4.500% | 44,000 | 41,863 | |
Corporate Bonds & Notes(g) (continued) | ||||
Issuer | Coupon Rate | Principal Amount ($) | Value ($) | |
Clearway Energy Operating LLC(a) | ||||
03/15/2028 | 4.750% | 83,000 | 79,929 | |
02/15/2031 | 3.750% | 261,000 | 230,107 | |
01/15/2032 | 3.750% | 96,000 | 83,403 | |
Duke Energy Corp. | ||||
06/15/2031 | 2.550% | 510,000 | 435,220 | |
08/15/2052 | 5.000% | 144,000 | 134,656 | |
Edison International | ||||
11/15/2028 | 5.250% | 244,000 | 245,666 | |
Emera US Finance LP | ||||
06/15/2046 | 4.750% | 365,000 | 300,747 | |
Exelon Corp. | ||||
03/15/2053 | 5.600% | 110,000 | 111,924 | |
FirstEnergy Corp. | ||||
03/01/2050 | 3.400% | 80,000 | 56,744 | |
Leeward Renewable Energy Operations LLC(a) | ||||
07/01/2029 | 4.250% | 41,000 | 35,642 | |
NextEra Energy Operating Partners LP(a) | ||||
07/15/2024 | 4.250% | 24,000 | 23,779 | |
09/15/2027 | 4.500% | 246,000 | 236,838 | |
01/15/2029 | 7.250% | 64,000 | 67,055 | |
NRG Energy, Inc. | ||||
01/15/2028 | 5.750% | 28,000 | 27,895 | |
NRG Energy, Inc.(a) | ||||
06/15/2029 | 5.250% | 64,000 | 62,202 | |
02/15/2032 | 3.875% | 16,000 | 13,701 | |
Pacific Gas and Electric Co. | ||||
07/01/2050 | 4.950% | 550,000 | 471,662 | |
Pattern Energy Operations LP/Inc.(a) | ||||
08/15/2028 | 4.500% | 28,000 | 26,438 | |
PG&E Corp. | ||||
07/01/2028 | 5.000% | 31,000 | 30,149 | |
TerraForm Power Operating LLC(a) | ||||
01/31/2028 | 5.000% | 69,000 | 67,447 | |
01/15/2030 | 4.750% | 107,000 | 100,122 | |
Vistra Operations Co. LLC(a) | ||||
09/01/2026 | 5.500% | 88,000 | 87,427 | |
02/15/2027 | 5.625% | 75,000 | 74,159 | |
07/31/2027 | 5.000% | 24,000 | 23,370 | |
10/15/2031 | 7.750% | 116,000 | 120,504 | |
Total | 3,503,834 | |||
Environmental 0.2% | ||||
Clean Harbors, Inc.(a) | ||||
02/01/2031 | 6.375% | 9,000 | 9,149 | |
Corporate Bonds & Notes(g) (continued) | ||||
Issuer | Coupon Rate | Principal Amount ($) | Value ($) | |
GFL Environmental, Inc.(a) | ||||
06/01/2025 | 4.250% | 68,000 | 66,970 | |
08/01/2025 | 3.750% | 19,000 | 18,543 | |
08/01/2028 | 4.000% | 56,000 | 51,674 | |
01/15/2031 | 6.750% | 96,000 | 98,908 | |
Waste Pro USA, Inc.(a) | ||||
02/15/2026 | 5.500% | 107,000 | 103,171 | |
Total | 348,415 | |||
Finance Companies 0.8% | ||||
GGAM Finance Ltd.(a) | ||||
02/15/2027 | 8.000% | 84,000 | 86,208 | |
Navient Corp. | ||||
06/25/2025 | 6.750% | 58,000 | 58,726 | |
03/15/2027 | 5.000% | 41,000 | 39,594 | |
03/15/2031 | 11.500% | 64,000 | 70,484 | |
OneMain Finance Corp. | ||||
01/15/2029 | 9.000% | 85,000 | 89,898 | |
03/15/2030 | 7.875% | 76,000 | 78,374 | |
09/15/2030 | 4.000% | 50,000 | 42,784 | |
Provident Funding Associates LP/Finance Corp.(a) | ||||
06/15/2025 | 6.375% | 57,000 | 52,095 | |
Quicken Loans LLC/Co-Issuer, Inc.(a) | ||||
03/01/2029 | 3.625% | 111,000 | 100,745 | |
03/01/2031 | 3.875% | 82,000 | 72,323 | |
Rocket Mortgage LLC/Co-Issuer, Inc.(a) | ||||
10/15/2033 | 4.000% | 486,000 | 415,303 | |
Springleaf Finance Corp. | ||||
03/15/2026 | 7.125% | 92,000 | 93,751 | |
11/15/2029 | 5.375% | 6,000 | 5,618 | |
United Wholesale Mortgage LLC(a) | ||||
04/15/2029 | 5.500% | 5,000 | 4,732 | |
Total | 1,210,635 | |||
Food and Beverage 1.4% | ||||
Bacardi Ltd.(a) | ||||
05/15/2048 | 5.300% | 520,000 | 497,501 | |
Constellation Brands, Inc. | ||||
05/01/2033 | 4.900% | 801,000 | 806,003 | |
Darling Ingredients, Inc.(a) | ||||
04/15/2027 | 5.250% | 70,000 | 68,934 | |
Lamb Weston Holdings, Inc.(a) | ||||
05/15/2028 | 4.875% | 36,000 | 35,204 | |
01/31/2030 | 4.125% | 45,000 | 41,514 | |
Post Holdings, Inc.(a) | ||||
03/01/2027 | 5.750% | 62,000 | 61,840 | |
01/15/2028 | 5.625% | 96,000 | 95,016 | |
04/15/2030 | 4.625% | 28,000 | 25,859 | |
09/15/2031 | 4.500% | 53,000 | 47,635 | |
Corporate Bonds & Notes(g) (continued) | ||||
Issuer | Coupon Rate | Principal Amount ($) | Value ($) | |
Primo Water Holdings, Inc.(a) | ||||
04/30/2029 | 4.375% | 114,000 | 105,239 | |
Simmons Foods, Inc./Prepared Foods, Inc./Pet Food, Inc./Feed(a) | ||||
03/01/2029 | 4.625% | 141,000 | 122,261 | |
Triton Water Holdings, Inc.(a) | ||||
04/01/2029 | 6.250% | 99,000 | 86,871 | |
US Foods, Inc.(a) | ||||
09/15/2028 | 6.875% | 47,000 | 48,476 | |
02/15/2029 | 4.750% | 83,000 | 78,956 | |
06/01/2030 | 4.625% | 94,000 | 87,611 | |
01/15/2032 | 7.250% | 44,000 | 45,967 | |
Total | 2,254,887 | |||
Gaming 0.9% | ||||
Boyd Gaming Corp.(a) | ||||
06/15/2031 | 4.750% | 123,000 | 112,891 | |
Caesars Entertainment, Inc.(a) | ||||
10/15/2029 | 4.625% | 147,000 | 132,893 | |
02/15/2030 | 7.000% | 109,000 | 112,061 | |
Churchill Downs, Inc.(a) | ||||
01/15/2028 | 4.750% | 92,000 | 87,429 | |
05/01/2031 | 6.750% | 33,000 | 33,522 | |
Colt Merger Sub, Inc.(a) | ||||
07/01/2025 | 5.750% | 109,000 | 108,920 | |
07/01/2025 | 6.250% | 60,000 | 59,976 | |
07/01/2027 | 8.125% | 89,000 | 91,215 | |
Light & Wonder International, Inc.(a) | ||||
09/01/2031 | 7.500% | 19,000 | 19,847 | |
MGM Resorts International | ||||
09/01/2026 | 4.625% | 66,000 | 64,381 | |
Midwest Gaming Borrower LLC(a) | ||||
05/01/2029 | 4.875% | 133,000 | 123,825 | |
Penn National Gaming, Inc.(a) | ||||
01/15/2027 | 5.625% | 18,000 | 17,492 | |
07/01/2029 | 4.125% | 111,000 | 95,230 | |
Scientific Games Holdings LP/US FinCo, Inc.(a) | ||||
03/01/2030 | 6.625% | 121,000 | 113,091 | |
Scientific Games International, Inc.(a) | ||||
05/15/2028 | 7.000% | 45,000 | 45,476 | |
11/15/2029 | 7.250% | 61,000 | 62,547 | |
Studio City Finance Ltd.(a) | ||||
01/15/2029 | 5.000% | 200,000 | 167,718 | |
Wynn Las Vegas LLC/Capital Corp.(a) | ||||
03/01/2025 | 5.500% | 20,000 | 19,898 | |
Total | 1,468,412 | |||
Corporate Bonds & Notes(g) (continued) | ||||
Issuer | Coupon Rate | Principal Amount ($) | Value ($) | |
Health Care 1.9% | ||||
Acadia Healthcare Co., Inc.(a) | ||||
07/01/2028 | 5.500% | 38,000 | 37,468 | |
04/15/2029 | 5.000% | 74,000 | 71,320 | |
AdaptHealth LLC(a) | ||||
03/01/2030 | 5.125% | 66,000 | 51,982 | |
Avantor Funding, Inc.(a) | ||||
07/15/2028 | 4.625% | 29,000 | 27,914 | |
11/01/2029 | 3.875% | 113,000 | 102,812 | |
Bausch & Lomb Escrow Corp.(a) | ||||
10/01/2028 | 8.375% | 74,000 | 78,106 | |
Becton Dickinson Euro Finance SARL | ||||
08/13/2041 | 1.336% | EUR | 227,000 | 172,425 |
Catalent Pharma Solutions, Inc.(a) | ||||
02/15/2029 | 3.125% | 10,000 | 8,754 | |
04/01/2030 | 3.500% | 67,000 | 58,521 | |
Charles River Laboratories International, Inc.(a) | ||||
05/01/2028 | 4.250% | 17,000 | 16,229 | |
03/15/2029 | 3.750% | 21,000 | 19,336 | |
03/15/2031 | 4.000% | 19,000 | 17,236 | |
CHS/Community Health Systems, Inc.(a) | ||||
04/15/2029 | 6.875% | 44,000 | 28,721 | |
05/15/2030 | 5.250% | 155,000 | 129,522 | |
02/15/2031 | 4.750% | 39,000 | 30,722 | |
01/15/2032 | 10.875% | 43,000 | 45,155 | |
HCA, Inc. | ||||
09/01/2030 | 3.500% | 951,000 | 862,610 | |
IQVIA, Inc.(a) | ||||
10/15/2026 | 5.000% | 16,000 | 15,853 | |
05/15/2027 | 5.000% | 61,000 | 60,038 | |
05/15/2030 | 6.500% | 60,000 | 61,741 | |
Mozart Debt Merger Sub, Inc.(a) | ||||
04/01/2029 | 3.875% | 90,000 | 81,405 | |
10/01/2029 | 5.250% | 252,000 | 237,982 | |
Select Medical Corp.(a) | ||||
08/15/2026 | 6.250% | 168,000 | 169,003 | |
Star Parent, Inc.(a) | ||||
10/01/2030 | 9.000% | 132,000 | 139,294 | |
Surgery Center Holdings, Inc.(a) | ||||
04/15/2027 | 10.000% | 38,000 | 38,579 | |
Tenet Healthcare Corp. | ||||
02/01/2027 | 6.250% | 110,000 | 110,335 | |
11/01/2027 | 5.125% | 98,000 | 95,870 | |
06/15/2028 | 4.625% | 75,000 | 71,484 | |
10/01/2028 | 6.125% | 74,000 | 73,658 | |
01/15/2030 | 4.375% | 174,000 | 161,521 | |
Total | 3,075,596 | |||
Corporate Bonds & Notes(g) (continued) | ||||
Issuer | Coupon Rate | Principal Amount ($) | Value ($) | |
Healthcare Insurance 0.6% | ||||
Aetna, Inc. | ||||
11/15/2042 | 4.125% | 54,000 | 44,909 | |
08/15/2047 | 3.875% | 51,000 | 39,953 | |
Centene Corp. | ||||
10/15/2030 | 3.000% | 842,000 | 732,927 | |
08/01/2031 | 2.625% | 217,000 | 180,951 | |
Total | 998,740 | |||
Home Construction 0.1% | ||||
Shea Homes LP/Funding Corp. | ||||
02/15/2028 | 4.750% | 110,000 | 104,247 | |
Taylor Morrison Communities, Inc.(a) | ||||
01/15/2028 | 5.750% | 52,000 | 52,468 | |
Total | 156,715 | |||
Independent Energy 0.8% | ||||
Baytex Energy Corp.(a) | ||||
04/30/2030 | 8.500% | 101,000 | 104,491 | |
Callon Petroleum Co.(a) | ||||
08/01/2028 | 8.000% | 42,000 | 42,980 | |
06/15/2030 | 7.500% | 15,000 | 15,160 | |
Civitas Resources, Inc.(a) | ||||
07/01/2028 | 8.375% | 28,000 | 29,284 | |
11/01/2030 | 8.625% | 24,000 | 25,531 | |
07/01/2031 | 8.750% | 30,000 | 31,873 | |
CNX Resources Corp.(a) | ||||
03/14/2027 | 7.250% | 3,000 | 3,022 | |
01/15/2029 | 6.000% | 88,000 | 84,572 | |
Colgate Energy Partners III LLC(a) | ||||
07/01/2029 | 5.875% | 257,000 | 250,053 | |
CrownRock LP/Finance, Inc.(a) | ||||
10/15/2025 | 5.625% | 67,000 | 66,863 | |
05/01/2029 | 5.000% | 63,000 | 61,571 | |
Hilcorp Energy I LP/Finance Co.(a) | ||||
11/01/2028 | 6.250% | 39,000 | 38,925 | |
02/01/2029 | 5.750% | 75,000 | 72,856 | |
02/01/2031 | 6.000% | 83,000 | 79,917 | |
11/01/2033 | 8.375% | 52,000 | 55,305 | |
Matador Resources Co. | ||||
09/15/2026 | 5.875% | 81,000 | 80,352 | |
Matador Resources Co.(a) | ||||
04/15/2028 | 6.875% | 35,000 | 35,639 | |
Permian Resources Operating LLC(a) | ||||
01/15/2032 | 7.000% | 115,000 | 118,608 | |
Corporate Bonds & Notes(g) (continued) | ||||
Issuer | Coupon Rate | Principal Amount ($) | Value ($) | |
Southwestern Energy Co. | ||||
02/01/2029 | 5.375% | 17,000 | 16,553 | |
02/01/2032 | 4.750% | 132,000 | 122,487 | |
Total | 1,336,042 | |||
Leisure 0.7% | ||||
Carnival Corp.(a) | ||||
03/01/2026 | 7.625% | 64,000 | 65,097 | |
03/01/2027 | 5.750% | 16,000 | 15,592 | |
05/01/2029 | 6.000% | 96,000 | 92,249 | |
08/15/2029 | 7.000% | 58,000 | 60,493 | |
Carnival Holdings Bermuda Ltd.(a) | ||||
05/01/2028 | 10.375% | 74,000 | 80,845 | |
Cedar Fair LP | ||||
07/15/2029 | 5.250% | 84,000 | 79,147 | |
Cedar Fair LP/Canada’s Wonderland Co./Magnum Management Corp./Millennium Op(a) | ||||
05/01/2025 | 5.500% | 15,000 | 14,923 | |
Cedar Fair LP/Canada’s Wonderland Co./Magnum Management Corp./Millennium Op | ||||
04/15/2027 | 5.375% | 18,000 | 17,651 | |
10/01/2028 | 6.500% | 29,000 | 28,972 | |
Cinemark USA, Inc.(a) | ||||
03/15/2026 | 5.875% | 90,000 | 88,421 | |
Live Nation Entertainment, Inc.(a) | ||||
03/15/2026 | 5.625% | 109,000 | 108,017 | |
NCL Corp., Ltd.(a) | ||||
03/15/2026 | 5.875% | 55,000 | 53,748 | |
02/15/2027 | 5.875% | 23,000 | 22,725 | |
Royal Caribbean Cruises Ltd.(a) | ||||
08/31/2026 | 5.500% | 63,000 | 62,462 | |
07/15/2027 | 5.375% | 8,000 | 7,878 | |
01/15/2029 | 9.250% | 15,000 | 16,142 | |
01/15/2030 | 7.250% | 181,000 | 188,997 | |
Six Flags Entertainment Corp.(a) | ||||
05/15/2031 | 7.250% | 47,000 | 47,116 | |
Viking Cruises Ltd.(a) | ||||
09/15/2027 | 5.875% | 55,000 | 53,600 | |
07/15/2031 | 9.125% | 59,000 | 63,177 | |
Total | 1,167,252 | |||
Life Insurance 0.3% | ||||
Northwestern Mutual Life Insurance Co. (The)(a) | ||||
Subordinated | ||||
09/30/2059 | 3.625% | 230,000 | 171,897 | |
Peachtree Corners Funding Trust(a) | ||||
02/15/2025 | 3.976% | 300,000 | 293,932 | |
Total | 465,829 | |||
Corporate Bonds & Notes(g) (continued) | ||||
Issuer | Coupon Rate | Principal Amount ($) | Value ($) | |
Media and Entertainment 1.4% | ||||
Clear Channel International BV(a) | ||||
08/01/2025 | 6.625% | 60,000 | 60,318 | |
Clear Channel Outdoor Holdings, Inc.(a) | ||||
04/15/2028 | 7.750% | 19,000 | 16,386 | |
09/15/2028 | 9.000% | 66,000 | 68,877 | |
06/01/2029 | 7.500% | 157,000 | 130,336 | |
Clear Channel Worldwide Holdings, Inc.(a) | ||||
08/15/2027 | 5.125% | 165,000 | 157,387 | |
iHeartCommunications, Inc. | ||||
05/01/2026 | 6.375% | 70,159 | 59,723 | |
05/01/2027 | 8.375% | 94,000 | 60,998 | |
iHeartCommunications, Inc.(a) | ||||
08/15/2027 | 5.250% | 209,000 | 165,985 | |
Netflix, Inc. | ||||
05/15/2029 | 4.625% | EUR | 110,000 | 129,831 |
Outfront Media Capital LLC/Corp.(a) | ||||
08/15/2027 | 5.000% | 79,000 | 76,983 | |
01/15/2029 | 4.250% | 15,000 | 13,524 | |
03/15/2030 | 4.625% | 78,000 | 69,936 | |
02/15/2031 | 7.375% | 21,000 | 22,179 | |
Playtika Holding Corp.(a) | ||||
03/15/2029 | 4.250% | 134,000 | 117,453 | |
Roblox Corp.(a) | ||||
05/01/2030 | 3.875% | 122,000 | 108,785 | |
Univision Communications, Inc.(a) | ||||
08/15/2028 | 8.000% | 49,000 | 50,649 | |
05/01/2029 | 4.500% | 90,000 | 80,257 | |
06/30/2030 | 7.375% | 35,000 | 34,991 | |
Warnermedia Holdings, Inc. | ||||
03/15/2062 | 5.391% | 843,000 | 724,980 | |
Total | 2,149,578 | |||
Metals and Mining 0.5% | ||||
Allegheny Technologies, Inc. | ||||
12/01/2027 | 5.875% | 31,000 | 30,623 | |
10/01/2029 | 4.875% | 16,000 | 15,006 | |
10/01/2031 | 5.125% | 63,000 | 58,664 | |
Constellium SE(a) | ||||
06/15/2028 | 5.625% | 88,000 | 86,340 | |
04/15/2029 | 3.750% | 291,000 | 264,811 | |
Hudbay Minerals, Inc.(a) | ||||
04/01/2026 | 4.500% | 36,000 | 35,022 | |
04/01/2029 | 6.125% | 143,000 | 140,601 | |
Kaiser Aluminum Corp.(a) | ||||
06/01/2031 | 4.500% | 33,000 | 28,453 | |
Corporate Bonds & Notes(g) (continued) | ||||
Issuer | Coupon Rate | Principal Amount ($) | Value ($) | |
Novelis Corp.(a) | ||||
11/15/2026 | 3.250% | 28,000 | 26,350 | |
01/30/2030 | 4.750% | 120,000 | 113,059 | |
08/15/2031 | 3.875% | 33,000 | 29,104 | |
Total | 828,033 | |||
Midstream 2.5% | ||||
CNX Midstream Partners LP(a) | ||||
04/15/2030 | 4.750% | 92,000 | 81,514 | |
DCP Midstream Operating LP | ||||
04/01/2044 | 5.600% | 32,000 | 31,255 | |
Delek Logistics Partners LP/Finance Corp. | ||||
05/15/2025 | 6.750% | 32,000 | 31,671 | |
DT Midstream, Inc.(a) | ||||
06/15/2029 | 4.125% | 72,000 | 66,390 | |
06/15/2031 | 4.375% | 82,000 | 74,051 | |
EQM Midstream Partners LP(a) | ||||
07/01/2027 | 6.500% | 22,000 | 22,455 | |
01/15/2029 | 4.500% | 45,000 | 42,576 | |
01/15/2031 | 4.750% | 119,000 | 111,119 | |
EQM Midstream Partners LP | ||||
07/15/2048 | 6.500% | 104,000 | 107,336 | |
Galaxy Pipeline Assets Bidco Ltd.(a) | ||||
03/31/2036 | 2.625% | 400,000 | 330,441 | |
09/30/2040 | 3.250% | 200,000 | 156,909 | |
Greensaif Pipelines Bidco Sarl(a) | ||||
02/23/2038 | 6.129% | 200,000 | 209,009 | |
Hess Midstream Operations LP(a) | ||||
02/15/2026 | 5.625% | 77,000 | 76,462 | |
Kinder Morgan Energy Partners LP | ||||
09/01/2044 | 5.400% | 225,000 | 211,110 | |
Kinder Morgan, Inc. | ||||
02/15/2046 | 5.050% | 83,000 | 74,283 | |
NuStar Logistics LP | ||||
10/01/2025 | 5.750% | 150,000 | 149,649 | |
06/01/2026 | 6.000% | 109,000 | 108,694 | |
Plains All American Pipeline LP/Finance Corp. | ||||
06/15/2044 | 4.700% | 702,000 | 587,841 | |
Sunoco LP/Finance Corp.(a) | ||||
09/15/2028 | 7.000% | 45,000 | 46,454 | |
TransMontaigne Partners LP/TLP Finance Corp. | ||||
02/15/2026 | 6.125% | 98,000 | 89,878 | |
Venture Global Calcasieu Pass LLC(a) | ||||
08/15/2029 | 3.875% | 81,000 | 72,945 | |
08/15/2031 | 4.125% | 170,000 | 150,204 | |
11/01/2033 | 3.875% | 341,000 | 289,333 | |
Corporate Bonds & Notes(g) (continued) | ||||
Issuer | Coupon Rate | Principal Amount ($) | Value ($) | |
Venture Global LNG, Inc.(a) | ||||
02/01/2029 | 9.500% | 75,000 | 79,294 | |
06/01/2031 | 8.375% | 44,000 | 44,010 | |
02/01/2032 | 9.875% | 75,000 | 78,103 | |
Western Midstream Operating LP | ||||
01/15/2029 | 6.350% | 117,000 | 122,231 | |
Williams Companies, Inc. (The) | ||||
08/15/2028 | 5.300% | 460,000 | 470,961 | |
Total | 3,916,178 | |||
Natural Gas 0.2% | ||||
NiSource, Inc. | ||||
05/01/2030 | 3.600% | 196,000 | 182,866 | |
05/15/2047 | 4.375% | 132,000 | 113,942 | |
Total | 296,808 | |||
Oil Field Services 0.3% | ||||
Archrock Partners LP/Finance Corp.(a) | ||||
04/01/2028 | 6.250% | 78,000 | 76,921 | |
Nabors Industries Ltd.(a) | ||||
01/15/2026 | 7.250% | 136,000 | 130,288 | |
Nabors Industries, Inc.(a) | ||||
05/15/2027 | 7.375% | 29,000 | 28,446 | |
01/31/2030 | 9.125% | 35,000 | 35,288 | |
Transocean Aquila Ltd.(a) | ||||
09/30/2028 | 8.000% | 87,000 | 88,786 | |
Transocean Titan Financing Ltd.(a) | ||||
02/01/2028 | 8.375% | 91,000 | 94,171 | |
USA Compression Partners LP/Finance Corp. | ||||
04/01/2026 | 6.875% | 44,000 | 43,902 | |
Total | 497,802 | |||
Other REIT 0.3% | ||||
Blackstone Mortgage Trust, Inc.(a) | ||||
01/15/2027 | 3.750% | 60,000 | 53,639 | |
Ladder Capital Finance Holdings LLLP/Corp.(a) | ||||
10/01/2025 | 5.250% | 42,000 | 41,487 | |
02/01/2027 | 4.250% | 105,000 | 98,941 | |
06/15/2029 | 4.750% | 115,000 | 103,701 | |
Park Intermediate Holdings LLC/PK Domestic Property LLC/Finance Co-Issuer(a) | ||||
05/15/2029 | 4.875% | 97,000 | 90,499 | |
RHP Hotel Properties LP/Finance Corp.(a) | ||||
07/15/2028 | 7.250% | 18,000 | 18,732 | |
02/15/2029 | 4.500% | 15,000 | 13,994 | |
RLJ Lodging Trust LP(a) | ||||
07/01/2026 | 3.750% | 20,000 | 19,051 | |
Corporate Bonds & Notes(g) (continued) | ||||
Issuer | Coupon Rate | Principal Amount ($) | Value ($) | |
Service Properties Trust(a) | ||||
11/15/2031 | 8.625% | 45,000 | 47,170 | |
Total | 487,214 | |||
Packaging 0.3% | ||||
Ardagh Metal Packaging Finance USA LLC/PLC(a) | ||||
06/15/2027 | 6.000% | 61,000 | 60,728 | |
09/01/2029 | 4.000% | 191,000 | 161,873 | |
Ardagh Packaging Finance PLC/Holdings USA, Inc.(a) | ||||
08/15/2026 | 4.125% | 49,000 | 44,808 | |
Ball Corp. | ||||
06/15/2029 | 6.000% | 43,000 | 43,887 | |
Canpack SA/Eastern PA Land Investment Holding LLC(a) | ||||
11/01/2025 | 3.125% | 38,000 | 36,143 | |
Canpack SA/US LLC(a) | ||||
11/15/2029 | 3.875% | 84,000 | 72,044 | |
Trivium Packaging Finance BV(a) | ||||
08/15/2026 | 5.500% | 96,000 | 94,461 | |
08/15/2027 | 8.500% | 39,000 | 38,292 | |
Total | 552,236 | |||
Pharmaceuticals 0.9% | ||||
1375209 BC Ltd.(a) | ||||
01/30/2028 | 9.000% | 11,000 | 10,704 | |
Amgen, Inc. | ||||
03/02/2063 | 5.750% | 291,000 | 306,071 | |
Bausch Health Companies, Inc.(a) | ||||
02/01/2027 | 6.125% | 41,000 | 27,668 | |
06/01/2028 | 4.875% | 73,000 | 44,028 | |
09/30/2028 | 11.000% | 19,000 | 13,841 | |
10/15/2030 | 14.000% | 3,000 | 1,674 | |
Grifols Escrow Issuer SA(a) | ||||
10/15/2028 | 4.750% | 68,000 | 61,828 | |
Jazz Securities DAC(a) | ||||
01/15/2029 | 4.375% | 73,000 | 67,994 | |
Organon Finance 1 LLC(a) | ||||
04/30/2028 | 4.125% | 37,000 | 34,055 | |
04/30/2031 | 5.125% | 166,000 | 141,505 | |
Pfizer Investment Enterprises Pte., Ltd. | ||||
05/19/2033 | 4.750% | 723,000 | 724,308 | |
Total | 1,433,676 | |||
Property & Casualty 0.7% | ||||
Alliant Holdings Intermediate LLC/Co-Issuer(a) | ||||
10/15/2027 | 4.250% | 129,000 | 123,874 | |
10/15/2027 | 6.750% | 79,000 | 78,730 | |
04/15/2028 | 6.750% | 124,000 | 126,953 | |
11/01/2029 | 5.875% | 17,000 | 16,140 | |
01/15/2031 | 7.000% | 29,000 | 30,584 | |
Corporate Bonds & Notes(g) (continued) | ||||
Issuer | Coupon Rate | Principal Amount ($) | Value ($) | |
AssuredPartners, Inc.(a) | ||||
08/15/2025 | 7.000% | 105,000 | 105,269 | |
01/15/2029 | 5.625% | 49,000 | 45,697 | |
BroadStreet Partners, Inc.(a) | ||||
04/15/2029 | 5.875% | 114,000 | 106,870 | |
GTCR AP Finance, Inc.(a) | ||||
05/15/2027 | 8.000% | 16,000 | 16,176 | |
HUB International Ltd.(a) | ||||
05/01/2026 | 7.000% | 193,000 | 193,281 | |
HUB International, Ltd.(a) | ||||
06/15/2030 | 7.250% | 230,000 | 242,819 | |
USI, Inc.(a) | ||||
01/15/2032 | 7.500% | 44,000 | 45,044 | |
Total | 1,131,437 | |||
Railroads 0.3% | ||||
Norfolk Southern Corp. | ||||
08/01/2030 | 5.050% | 390,000 | 399,997 | |
Refining 0.1% | ||||
HF Sinclair Corp.(a) | ||||
04/15/2027 | 6.375% | 55,000 | 55,462 | |
02/01/2028 | 5.000% | 38,000 | 36,793 | |
Total | 92,255 | |||
Restaurants 0.3% | ||||
1011778 BC ULC/New Red Finance, Inc.(a) | ||||
04/15/2025 | 5.750% | 18,000 | 17,963 | |
01/15/2028 | 3.875% | 66,000 | 62,387 | |
01/15/2028 | 4.375% | 163,000 | 155,714 | |
Fertitta Entertainment LLC/Finance Co., Inc.(a) | ||||
01/15/2029 | 4.625% | 20,000 | 18,178 | |
01/15/2030 | 6.750% | 79,000 | 69,350 | |
IRB Holding Corp.(a) | ||||
06/15/2025 | 7.000% | 124,000 | 124,127 | |
Yum! Brands, Inc. | ||||
04/01/2032 | 5.375% | 53,000 | 52,231 | |
Total | 499,950 | |||
Retailers 1.1% | ||||
Asbury Automotive Group, Inc.(a) | ||||
11/15/2029 | 4.625% | 14,000 | 12,976 | |
02/15/2032 | 5.000% | 44,000 | 40,087 | |
Group 1 Automotive, Inc.(a) | ||||
08/15/2028 | 4.000% | 21,000 | 19,481 | |
Hanesbrands, Inc.(a) | ||||
05/15/2026 | 4.875% | 48,000 | 46,199 | |
02/15/2031 | 9.000% | 85,000 | 83,268 | |
Corporate Bonds & Notes(g) (continued) | ||||
Issuer | Coupon Rate | Principal Amount ($) | Value ($) | |
L Brands, Inc.(a) | ||||
07/01/2025 | 9.375% | 180,000 | 189,776 | |
10/01/2030 | 6.625% | 38,000 | 38,877 | |
L Brands, Inc. | ||||
11/01/2035 | 6.875% | 60,000 | 60,708 | |
LCM Investments Holdings II LLC(a) | ||||
05/01/2029 | 4.875% | 67,000 | 62,379 | |
08/01/2031 | 8.250% | 28,000 | 29,287 | |
Lithia Motors, Inc.(a) | ||||
01/15/2031 | 4.375% | 30,000 | 27,310 | |
Lowe’s Companies, Inc. | ||||
04/01/2062 | 4.450% | 125,000 | 105,940 | |
09/15/2062 | 5.800% | 726,000 | 767,285 | |
PetSmart, Inc./Finance Corp.(a) | ||||
02/15/2028 | 4.750% | 92,000 | 86,503 | |
02/15/2029 | 7.750% | 47,000 | 45,808 | |
Wolverine World Wide, Inc.(a) | ||||
08/15/2029 | 4.000% | 92,000 | 72,622 | |
Total | 1,688,506 | |||
Supermarkets 0.1% | ||||
Albertsons Companies LLC/Safeway, Inc./New Albertsons LP/Albertsons LLC(a) | ||||
02/15/2028 | 6.500% | 140,000 | 142,203 | |
Albertsons Companies, Inc./Safeway, Inc./New Albertsons LP/Albertsons LLC(a) | ||||
03/15/2026 | 3.250% | 68,000 | 64,318 | |
Total | 206,521 | |||
Technology 2.3% | ||||
Black Knight InfoServ LLC(a) | ||||
09/01/2028 | 3.625% | 16,000 | 15,238 | |
Block, Inc. | ||||
06/01/2026 | 2.750% | 166,000 | 156,319 | |
06/01/2031 | 3.500% | 31,000 | 27,529 | |
Boxer Parent Co., Inc.(a) | ||||
10/02/2025 | 7.125% | 17,000 | 17,077 | |
Broadcom, Inc.(a) | ||||
11/15/2036 | 3.187% | 529,000 | 429,309 | |
Camelot Finance SA(a) | ||||
11/01/2026 | 4.500% | 35,000 | 34,177 | |
Central Parent LLC/CDK Global II LLC/Financing, Co., Inc.(a) | ||||
06/15/2029 | 8.000% | 16,000 | 16,691 | |
Central Parent, Inc./CDK Global, Inc.(a) | ||||
06/15/2029 | 7.250% | 40,000 | 40,771 | |
Clarivate Science Holdings Corp.(a) | ||||
07/01/2028 | 3.875% | 26,000 | 24,481 | |
07/01/2029 | 4.875% | 173,000 | 162,358 | |
Cloud Software Group, Inc.(a) | ||||
09/30/2029 | 9.000% | 148,000 | 140,612 | |
Corporate Bonds & Notes(g) (continued) | ||||
Issuer | Coupon Rate | Principal Amount ($) | Value ($) | |
CommScope Technologies LLC(a) | ||||
06/15/2025 | 6.000% | 40,000 | 32,614 | |
Condor Merger Sub, Inc.(a) | ||||
02/15/2030 | 7.375% | 121,000 | 110,784 | |
Entegris Escrow Corp.(a) | ||||
04/15/2029 | 4.750% | 136,000 | 130,988 | |
06/15/2030 | 5.950% | 81,000 | 80,484 | |
GTCR W-2 Merger Sub LLC(a) | ||||
01/15/2031 | 7.500% | 170,000 | 180,360 | |
HealthEquity, Inc.(a) | ||||
10/01/2029 | 4.500% | 96,000 | 88,795 | |
Helios Software Holdings, Inc.(a) | ||||
05/01/2028 | 4.625% | 44,000 | 40,193 | |
ION Trading Technologies Sarl(a) | ||||
05/15/2028 | 5.750% | 76,000 | 67,288 | |
Iron Mountain, Inc.(a) | ||||
09/15/2027 | 4.875% | 215,000 | 209,497 | |
Logan Merger Sub, Inc.(a) | ||||
09/01/2027 | 5.500% | 179,000 | 86,169 | |
Minerva Merger Sub, Inc.(a) | ||||
02/15/2030 | 6.500% | 141,000 | 127,945 | |
NCR Atleos Escrow Corp.(a) | ||||
04/01/2029 | 9.500% | 141,000 | 150,245 | |
NCR Corp.(a) | ||||
10/01/2028 | 5.000% | 94,000 | 88,905 | |
04/15/2029 | 5.125% | 91,000 | 86,660 | |
10/01/2030 | 5.250% | 74,000 | 68,056 | |
Neptune Bidco US, Inc.(a) | ||||
04/15/2029 | 9.290% | 112,000 | 104,683 | |
NXP BV/Funding LLC/USA, Inc. | ||||
01/15/2033 | 5.000% | 194,000 | 193,672 | |
Picard Midco, Inc.(a) | ||||
03/31/2029 | 6.500% | 179,000 | 170,672 | |
Seagate HDD Cayman(a) | ||||
12/15/2029 | 8.250% | 63,000 | 67,924 | |
07/15/2031 | 8.500% | 36,000 | 39,136 | |
Sensata Technologies BV(a) | ||||
09/01/2030 | 5.875% | 50,000 | 49,758 | |
Shift4 Payments LLC/Finance Sub, Inc.(a) | ||||
11/01/2026 | 4.625% | 116,000 | 112,446 | |
Synaptics, Inc.(a) | ||||
06/15/2029 | 4.000% | 80,000 | 72,120 | |
Tempo Acquisition LLC/Finance Corp.(a) | ||||
06/01/2025 | 5.750% | 28,000 | 28,047 | |
Verscend Escrow Corp.(a) | ||||
08/15/2026 | 9.750% | 120,000 | 120,682 | |
Corporate Bonds & Notes(g) (continued) | ||||
Issuer | Coupon Rate | Principal Amount ($) | Value ($) | |
ZoomInfo Technologies LLC/Finance Corp.(a) | ||||
02/01/2029 | 3.875% | 176,000 | 159,509 | |
Total | 3,732,194 | |||
Transportation Services 0.2% | ||||
ERAC USA Finance LLC(a) | ||||
05/01/2028 | 4.600% | 393,000 | 391,165 | |
Wireless 1.2% | ||||
Altice France Holding SA(a) | ||||
02/15/2028 | 6.000% | 75,000 | 35,640 | |
Altice France SA(a) | ||||
07/15/2029 | 5.125% | 190,000 | 147,900 | |
10/15/2029 | 5.500% | 35,000 | 27,426 | |
American Tower Corp. | ||||
08/15/2029 | 3.800% | 87,000 | 82,584 | |
SBA Communications Corp. | ||||
02/15/2027 | 3.875% | 44,000 | 42,235 | |
02/01/2029 | 3.125% | 112,000 | 100,812 | |
Sprint Capital Corp. | ||||
11/15/2028 | 6.875% | 88,000 | 95,397 | |
Sprint Corp. | ||||
06/15/2024 | 7.125% | 17,000 | 17,087 | |
T-Mobile US, Inc. | ||||
02/15/2031 | 2.875% | 1,024,000 | 901,786 | |
04/15/2031 | 3.500% | 217,000 | 198,491 | |
Vmed O2 UK Financing I PLC(a) | ||||
01/31/2031 | 4.250% | 51,000 | 44,696 | |
07/15/2031 | 4.750% | 247,000 | 220,598 | |
Total | 1,914,652 | |||
Wirelines 0.8% | ||||
Frontier Communications Holdings LLC(a) | ||||
05/15/2030 | 8.750% | 76,000 | 78,231 | |
03/15/2031 | 8.625% | 64,000 | 65,264 | |
Iliad Holding SAS(a) | ||||
10/15/2026 | 6.500% | 178,000 | 177,601 | |
10/15/2028 | 7.000% | 103,000 | 102,511 | |
Verizon Communications, Inc. | ||||
03/21/2031 | 2.550% | 1,039,000 | 896,051 | |
Total | 1,319,658 | |||
Total Corporate Bonds & Notes (Cost $63,435,187) | 62,829,273 | |||
Foreign Government Obligations(g),(j) 7.0% | ||||
Angola 0.1% | ||||
Angolan Government International Bond(a) | ||||
11/26/2029 | 8.000% | 200,000 | 177,577 | |
Foreign Government Obligations(g),(j) (continued) | ||||
Issuer | Coupon Rate | Principal Amount ($) | Value ($) | |
Brazil 0.1% | ||||
Brazilian Government International Bond | ||||
06/12/2030 | 3.875% | 202,000 | 184,787 | |
Canada 0.3% | ||||
MEGlobal Canada ULC(a) | ||||
05/18/2025 | 5.000% | 200,000 | 197,753 | |
NOVA Chemicals Corp.(a) | ||||
05/01/2025 | 5.000% | 61,000 | 59,832 | |
06/01/2027 | 5.250% | 70,000 | 65,701 | |
11/15/2028 | 8.500% | 27,000 | 28,338 | |
05/15/2029 | 4.250% | 45,000 | 38,009 | |
Total | 389,633 | |||
Colombia 0.1% | ||||
Colombia Government International Bond | ||||
05/15/2049 | 5.200% | 273,000 | 213,567 | |
Dominican Republic 0.4% | ||||
Dominican Republic International Bond(a) | ||||
01/25/2027 | 5.950% | 218,000 | 219,060 | |
04/30/2044 | 7.450% | 200,000 | 211,929 | |
01/27/2045 | 6.850% | 200,000 | 198,956 | |
Total | 629,945 | |||
Egypt 0.4% | ||||
Egypt Government International Bond(a) | ||||
04/11/2031 | 6.375% | EUR | 100,000 | 70,715 |
05/29/2032 | 7.625% | 474,000 | 328,786 | |
01/31/2047 | 8.500% | 250,000 | 155,245 | |
Total | 554,746 | |||
Hungary 0.4% | ||||
Hungary Government International Bond(a) | ||||
09/22/2031 | 2.125% | 730,000 | 587,965 | |
India 0.7% | ||||
Export-Import Bank of India(a) | ||||
01/15/2030 | 3.250% | 239,000 | 217,645 | |
India Government Bond | ||||
02/06/2033 | 7.260% | INR | 58,090,000 | 699,842 |
Indian Railway Finance Corp., Ltd.(a) | ||||
02/10/2031 | 2.800% | 200,000 | 172,269 | |
Total | 1,089,756 | |||
Indonesia 0.7% | ||||
Indonesia Government International Bond | ||||
10/30/2049 | 3.700% | 200,000 | 167,475 | |
Foreign Government Obligations(g),(j) (continued) | ||||
Issuer | Coupon Rate | Principal Amount ($) | Value ($) | |
Indonesia Treasury Bond | ||||
04/15/2027 | 5.125% | IDR | 6,685,000,000 | 418,563 |
04/15/2039 | 8.375% | IDR | 2,025,000,000 | 151,285 |
PT Pertamina Persero(a) | ||||
05/30/2044 | 6.450% | 400,000 | 436,903 | |
Total | 1,174,226 | |||
Ivory Coast 0.2% | ||||
Ivory Coast Government International Bond(a) | ||||
10/17/2031 | 5.875% | EUR | 353,000 | 348,893 |
Kazakhstan 0.1% | ||||
KazMunayGas National Co., JSC(a) | ||||
10/24/2048 | 6.375% | 200,000 | 188,130 | |
Malaysia 0.1% | ||||
Petronas Capital Ltd.(a) | ||||
04/21/2030 | 3.500% | 225,000 | 210,977 | |
Mexico 1.1% | ||||
Mexico Government International Bond | ||||
04/16/2030 | 3.250% | 200,000 | 181,122 | |
05/29/2031 | 7.750% | MXN | 12,190,000 | 671,682 |
Petroleos Mexicanos | ||||
03/13/2027 | 6.500% | 279,000 | 259,920 | |
01/28/2031 | 5.950% | 22,000 | 17,562 | |
02/16/2032 | 6.700% | 672,000 | 557,314 | |
01/23/2050 | 7.690% | 90,000 | 64,112 | |
Total | 1,751,712 | |||
Oman 0.1% | ||||
Oman Government International Bond(a) | ||||
01/17/2048 | 6.750% | 200,000 | 208,917 | |
Panama 0.1% | ||||
Panama Government International Bond | ||||
01/19/2033 | 3.298% | 200,000 | 158,300 | |
Paraguay 0.1% | ||||
Paraguay Government International Bond(a) | ||||
08/11/2044 | 6.100% | 200,000 | 196,137 | |
Qatar 0.2% | ||||
Qatar Government International Bond(a) | ||||
03/14/2049 | 4.817% | 200,000 | 194,840 | |
Qatar Petroleum(a) | ||||
07/12/2031 | 2.250% | 200,000 | 170,169 | |
Total | 365,009 | |||
Romania 0.1% | ||||
Romanian Government International Bond(a) | ||||
04/03/2049 | 4.625% | EUR | 150,000 | 139,458 |
Foreign Government Obligations(g),(j) (continued) | ||||
Issuer | Coupon Rate | Principal Amount ($) | Value ($) | |
Saudi Arabia 0.7% | ||||
Saudi Arabian Oil Co.(a) | ||||
11/24/2030 | 2.250% | 453,000 | 389,209 | |
Saudi Government International Bond(a) | ||||
10/22/2030 | 3.250% | 800,000 | 742,204 | |
Total | 1,131,413 | |||
South Africa 0.2% | ||||
Republic of South Africa Government Bond | ||||
01/31/2030 | 8.000% | ZAR | 6,288,891 | 316,403 |
South Korea 0.5% | ||||
Korea Treasury Bond | ||||
03/10/2028 | 3.250% | KRW | 939,380,000 | 738,214 |
United Arab Emirates 0.3% | ||||
DP World Crescent Ltd.(a) | ||||
07/18/2029 | 3.875% | 200,000 | 189,660 | |
DP World Ltd.(a) | ||||
09/25/2048 | 5.625% | 200,000 | 191,498 | |
Total | 381,158 | |||
Total Foreign Government Obligations (Cost $11,666,091) | 11,136,923 | |||
Inflation-Indexed Bonds 0.2% | ||||
United States 0.2% | ||||
U.S. Treasury Inflation-Indexed Bond | ||||
10/15/2028 | 2.375% | 381,717 | 393,237 | |
Total Inflation-Indexed Bonds (Cost $392,366) | 393,237 | |||
Residential Mortgage-Backed Securities - Agency 32.0% | ||||
Federal Home Loan Mortgage Corp. | ||||
05/01/2052 | 3.000% | 1,371,491 | 1,222,880 | |
08/01/2052 | 4.000% | 905,097 | 865,271 | |
10/01/2053 | 5.000% | 987,220 | 989,544 | |
12/01/2053 | 5.500% | 1,000,000 | 1,014,546 | |
12/01/2053 | 6.000% | 1,000,000 | 1,029,400 | |
Federal Home Loan Mortgage Corp.(b),(k) | ||||
CMO Series 4620 Class AS | ||||
-1.0 x 30-day Average SOFR + 0.554% 11/15/2042 | 0.000% | 448,986 | 28,545 | |
Federal Home Loan Mortgage Corp. REMICS(k) | ||||
CMO Series 5051 Class KI | ||||
12/25/2050 | 2.500% | 1,627,203 | 252,783 | |
CMO Series 5192 Class PI | ||||
10/25/2051 | 2.500% | 1,696,253 | 185,724 | |
Residential Mortgage-Backed Securities - Agency (continued) | ||||
Issuer | Coupon Rate | Principal Amount ($) | Value ($) | |
CMO Series 5198 Class KI | ||||
02/25/2052 | 3.000% | 1,166,878 | 221,142 | |
Federal National Mortgage Association | ||||
11/01/2051- 05/01/2052 | 3.000% | 9,830,108 | 8,760,102 | |
05/01/2052- 06/01/2052 | 3.500% | 5,416,387 | 5,029,406 | |
10/01/2053 | 5.500% | 991,004 | 1,005,419 | |
Federal National Mortgage Association(d),(k) | ||||
CMO Series 2006-5 Class N1 | ||||
08/25/2034 | 0.000% | 989,840 | 10 | |
Federal National Mortgage Association(k) | ||||
CMO Series 2012-133 Class EI | ||||
07/25/2031 | 3.500% | 39,550 | 222 | |
CMO Series 2013-1 Class AI | ||||
02/25/2043 | 3.500% | 603,521 | 81,402 | |
CMO Series 2021-3 Class TI | ||||
02/25/2051 | 2.500% | 2,141,183 | 357,069 | |
Federal National Mortgage Association(b),(k) | ||||
CMO Series 2014-93 Class ES | ||||
-1.0 x 30-day Average SOFR + 6.036% Cap 6.150% 01/25/2045 | 0.698% | 218,319 | 28,651 | |
CMO Series 2016-31 Class VS | ||||
-1.0 x 30-day Average SOFR + 5.886% Cap 6.000% 06/25/2046 | 0.548% | 407,426 | 49,314 | |
CMO Series 2017-47 Class SE | ||||
-1.0 x 30-day Average SOFR + 5.986% Cap 6.100% 06/25/2047 | 0.648% | 315,105 | 53,972 | |
CMO Series 2017-56 Class SB | ||||
-1.0 x 30-day Average SOFR + 6.036% Cap 6.150% 07/25/2047 | 0.698% | 651,484 | 98,657 | |
CMO Series 2018-76 Class SN | ||||
-1.0 x 30-day Average SOFR + 6.036% Cap 6.150% 10/25/2048 | 0.698% | 291,591 | 36,726 | |
Federal National Mortgage Association REMICS(b),(k) | ||||
CMO Series 2023-61 Class GS | ||||
-1.0 x 30-day Average SOFR + 5.700% Cap 5.700% 12/25/2053 | 0.363% | 4,958,879 | 252,379 | |
Residential Mortgage-Backed Securities - Agency (continued) | ||||
Issuer | Coupon Rate | Principal Amount ($) | Value ($) | |
Freddie Mac REMICS(k) | ||||
CMO Series 5287 Class NI | ||||
05/25/2051 | 3.500% | 1,119,622 | 210,460 | |
Government National Mortgage Association(k) | ||||
CMO Series 2014-190 Class AI | ||||
12/20/2038 | 3.500% | 665,172 | 48,837 | |
CMO Series 2020-138 Class GI | ||||
09/20/2050 | 3.000% | 714,942 | 112,950 | |
CMO Series 2021-140 Class IW | ||||
08/20/2051 | 3.500% | 976,704 | 172,931 | |
CMO Series 2021-16 Class KI | ||||
01/20/2051 | 2.500% | 1,197,428 | 163,138 | |
CMO Series 2021-57 Class KI | ||||
03/20/2051 | 3.500% | 1,409,364 | 227,675 | |
CMO Series 2021-89 Class IO | ||||
05/20/2051 | 3.000% | 1,034,904 | 165,135 | |
Government National Mortgage Association(b),(k) | ||||
CMO Series 2016-20 Class SQ | ||||
-1.0 x 1-month Term SOFR + 5.986% Cap 6.100% 02/20/2046 | 0.628% | 358,222 | 38,765 | |
CMO Series 2017-129 Class SA | ||||
-1.0 x 1-month Term SOFR + 6.086% Cap 6.200% 08/20/2047 | 0.728% | 300,003 | 33,491 | |
CMO Series 2017-133 Class SM | ||||
-1.0 x 1-month Term SOFR + 6.136% Cap 6.250% 09/20/2047 | 0.778% | 323,780 | 33,903 | |
CMO Series 2018-124 Class SA | ||||
-1.0 x 1-month Term SOFR + 6.086% Cap 6.200% 09/20/2048 | 0.728% | 542,168 | 56,118 | |
CMO Series 2018-155 Class ES | ||||
-1.0 x 1-month Term SOFR + 5.986% Cap 6.100% 11/20/2048 | 0.628% | 427,041 | 42,320 | |
CMO Series 2018-168 Class SA | ||||
-1.0 x 1-month Term SOFR + 5.986% Cap 6.100% 12/20/2048 | 0.628% | 377,235 | 45,674 | |
Residential Mortgage-Backed Securities - Agency (continued) | ||||
Issuer | Coupon Rate | Principal Amount ($) | Value ($) | |
CMO Series 2018-67 Class SP | ||||
-1.0 x 1-month Term SOFR + 6.086% Cap 6.200% 05/20/2048 | 0.728% | 692,055 | 72,446 | |
CMO Series 2019-152 Class BS | ||||
-1.0 x 1-month Term SOFR + 5.936% Cap 6.050% 12/20/2049 | 0.578% | 772,119 | 80,281 | |
CMO Series 2019-23 Class LS | ||||
-1.0 x 1-month Term SOFR + 5.936% Cap 6.050% 02/20/2049 | 0.578% | 254,682 | 26,627 | |
CMO Series 2019-29 Class DS | ||||
-1.0 x 1-month Term SOFR + 5.936% Cap 6.050% 03/20/2049 | 0.578% | 608,844 | 52,552 | |
CMO Series 2019-41 Class AS | ||||
-1.0 x 1-month Term SOFR + 5.936% Cap 6.050% 03/20/2049 | 0.578% | 504,160 | 51,827 | |
CMO Series 2019-5 Class SH | ||||
-1.0 x 1-month Term SOFR + 6.036% Cap 6.150% 01/20/2049 | 0.678% | 402,497 | 43,124 | |
CMO Series 2019-59 Class JS | ||||
-1.0 x 1-month Term SOFR + 6.036% Cap 6.150% 05/20/2049 | 0.678% | 384,204 | 40,953 | |
CMO Series 2020-101 Class SA | ||||
-1.0 x 1-month Term SOFR + 6.086% Cap 6.200% 07/20/2050 | 0.728% | 1,648,676 | 207,550 | |
CMO Series 2020-61 Class SM | ||||
-1.0 x 1-month Term SOFR + 6.486% Cap 6.600% 07/20/2043 | 1.128% | 1,106,910 | 159,378 | |
CMO Series 2021-155 Class SG | ||||
-1.0 x 1-month Term SOFR + 6.186% Cap 6.300% 09/20/2051 | 0.828% | 1,102,598 | 145,144 | |
Residential Mortgage-Backed Securities - Agency (continued) | ||||
Issuer | Coupon Rate | Principal Amount ($) | Value ($) | |
CMO Series 2022-90 Class SD | ||||
-1.0 x 1-month Term SOFR + 5.936% Cap 6.050% 05/20/2050 | 0.578% | 1,232,399 | 159,554 | |
CMO Series 2022-90 Class SM | ||||
-1.0 x 1-month Term SOFR + 6.036% Cap 6.150% 07/20/2050 | 0.678% | 2,027,585 | 245,625 | |
CMO Series 2023-66 Class SK | ||||
-1.0 x 1-month Term SOFR + 6.086% Cap 6.200% 07/20/2050 | 0.728% | 2,170,301 | 247,776 | |
CMO Series 2023-75 Class SB | ||||
-1.0 x 1-month Term SOFR + 5.936% Cap 6.050% 06/20/2050 | 0.578% | 2,350,994 | 274,870 | |
Government National Mortgage Association TBA(l) | ||||
01/22/2054 | 3.000% | 2,000,000 | 1,810,620 | |
Uniform Mortgage-Backed Security TBA(l) | ||||
01/18/2039 | 3.000% | 1,000,000 | 942,773 | |
01/16/2054 | 4.000% | 6,000,000 | 5,674,453 | |
01/16/2054 | 4.500% | 5,000,000 | 4,846,484 | |
01/16/2054 | 5.000% | 1,000,000 | 989,297 | |
01/16/2054 | 5.500% | 5,000,000 | 5,021,094 | |
01/16/2054 | 6.000% | 7,000,000 | 7,107,187 | |
Total Residential Mortgage-Backed Securities - Agency (Cost $52,346,900) | 51,114,176 | |||
Residential Mortgage-Backed Securities - Non-Agency 11.1% | ||||
510 Asset Backed Trust(a),(d) | ||||
CMO Series 2021-NPL2 Class A1 | ||||
06/25/2061 | 2.116% | 255,107 | 242,264 | |
BRAVO Residential Funding Trust(a),(d) | ||||
CMO Series 2021-A Class A1 | ||||
10/25/2059 | 1.991% | 944,464 | 925,687 | |
CMO Series 2021-B Class A1 | ||||
04/01/2069 | 2.115% | 261,973 | 254,282 | |
BVRT Financing Trust(a),(b),(c) | ||||
CMO Series 2021-3F Class M2 | ||||
30-day Average SOFR + 2.900% Floor 2.900% 07/12/2033 | 4.187% | 438,036 | 438,036 | |
CMO Series 2021-CRT1 Class M4 | ||||
30-day Average SOFR + 3.614% Floor 3.500% 07/10/2032 | 8.927% | 679,087 | 653,397 | |
Residential Mortgage-Backed Securities - Non-Agency (continued) | ||||
Issuer | Coupon Rate | Principal Amount ($) | Value ($) | |
CAFL Issuer LLC(a),(d) | ||||
CMO Series 2021-RTL1 Class A1 | ||||
03/28/2029 | 2.239% | 300,000 | 282,300 | |
CIM Trust(a),(d) | ||||
CMO Series 2021-NR4 Class A1 | ||||
10/25/2061 | 2.816% | 186,870 | 179,565 | |
Connecticut Avenue Securities Trust(a),(b) | ||||
Subordinated CMO Series 2022-R01 Class 1B2 | ||||
30-day Average SOFR + 6.000% 12/25/2041 | 11.337% | 600,000 | 613,013 | |
Subordinated CMO Series 2022-R07 Class 1B2 | ||||
30-day Average SOFR + 12.000% 06/25/2042 | 17.337% | 300,000 | 358,368 | |
CTS Corp.(a) | ||||
CMO Series 2015-6R Class 3A2 | ||||
02/27/2036 | 3.750% | 161,885 | 156,526 | |
Eagle Re Ltd.(a),(b) | ||||
CMO Series 2021-1 Class M1C | ||||
30-day Average SOFR + 2.700% Floor 2.700% 10/25/2033 | 8.028% | 152,898 | 153,389 | |
Fannie Mae Connecticut Avenue Securities(a),(b) | ||||
Subordinated CMO Series 2021-R02 Class 2B1 | ||||
30-day Average SOFR + 3.300% 11/25/2041 | 8.637% | 200,000 | 201,836 | |
Freddie Mac STACR(b) | ||||
CMO Series 2020-CS02 Class M4 | ||||
30-day Average SOFR + 0.000% 06/25/2033 | 4.617% | 692,929 | 659,843 | |
Freddie Mac STACR REMIC Trust(a),(b) | ||||
CMO Series 2021-HQA1 Class M2 | ||||
30-day Average SOFR + 2.250% 08/25/2033 | 7.587% | 177,135 | 176,615 | |
CMO Series 2022-HQA1 Class M2 | ||||
30-day Average SOFR + 5.250% 03/25/2042 | 10.587% | 400,000 | 426,618 | |
Subordinated CMO Series 2020-DNA4 Class B1 | ||||
30-day Average SOFR + 6.114% 08/25/2050 | 11.452% | 584,226 | 656,947 | |
Subordinated CMO Series 2020-DNA6 Class B1 | ||||
30-day Average SOFR + 3.000% 12/25/2050 | 8.337% | 600,000 | 620,898 | |
Subordinated CMO Series 2021-DNA5 Class B1 | ||||
30-day Average SOFR + 3.050% 01/25/2034 | 8.387% | 300,000 | 304,052 | |
Subordinated CMO Series 2021-HQA1 Class B2 | ||||
30-day Average SOFR + 5.000% 08/25/2033 | 10.337% | 550,000 | 556,726 | |
Residential Mortgage-Backed Securities - Non-Agency (continued) | ||||
Issuer | Coupon Rate | Principal Amount ($) | Value ($) | |
Freddie Mac Structured Agency Credit Risk Debt Notes(a),(b) | ||||
CMO Series 2019-CS03 Class M2 | ||||
30-day Average SOFR + 0.114% 10/25/2032 | 5.452% | 161,689 | 160,652 | |
Subordinated CMO Series 2020-HQA5 Class B1 | ||||
30-day Average SOFR + 4.000% 11/25/2050 | 9.337% | 550,000 | 596,405 | |
Subordinated CMO Series 2022-DNA2 Class B1 | ||||
30-day Average SOFR + 4.750% 02/25/2042 | 10.087% | 450,000 | 464,952 | |
Subordinated CMO Series 2022-DNA2 Class B2 | ||||
30-day Average SOFR + 8.500% 02/25/2042 | 13.837% | 290,000 | 310,862 | |
New York Mortgage Trust(a),(d) | ||||
CMO Series 2021-BPL1 Class A1 | ||||
05/25/2026 | 2.239% | 226,344 | 222,863 | |
NRZ Excess Spread-Collateralized Notes(a) | ||||
Series 2020-PLS1 Class A | ||||
12/25/2025 | 3.844% | 183,358 | 174,764 | |
Oaktown Re VI Ltd.(a),(b) | ||||
CMO Series 2021-1A Class M1C | ||||
30-day Average SOFR + 3.000% Floor 3.000% 10/25/2033 | 8.337% | 200,000 | 202,164 | |
PMT Credit Risk Transfer Trust(a),(b) | ||||
Series 2019-2R Class A | ||||
1-month Term SOFR + 3.864% Floor 3.750% 05/30/2025 | 9.221% | 252,813 | 254,243 | |
PNMAC GMSR Issuer Trust(a),(b) | ||||
CMO Series 2018-GT2 Class A | ||||
1-month Term SOFR + 2.764% 08/25/2025 | 8.120% | 1,078,846 | 1,079,162 | |
Point Securitization Trust(a),(d) | ||||
CMO Series 2021-1 Class A1 | ||||
02/25/2052 | 3.228% | 351,113 | 327,347 | |
Preston Ridge Partners Mortgage(a),(d) | ||||
CMO Series 2021-4 Class A1 | ||||
04/25/2026 | 1.867% | 251,260 | 245,414 | |
Preston Ridge Partners Mortgage Trust(a),(d) | ||||
CMO Series 2021-1 Class A1 | ||||
01/25/2026 | 2.115% | 230,708 | 224,405 | |
CMO Series 2021-2 Class A1 | ||||
03/25/2026 | 2.115% | 193,224 | 187,257 | |
CMO Series 2021-3 Class A1 | ||||
04/25/2026 | 1.867% | 199,594 | 190,935 | |
CMO Series 2023-RCF1 Class M1 | ||||
06/25/2053 | 4.000% | 350,000 | 295,010 | |
Residential Mortgage-Backed Securities - Non-Agency (continued) | ||||
Issuer | Coupon Rate | Principal Amount ($) | Value ($) | |
Pretium Mortgage Credit Partners(a),(d) | ||||
CMO Series 2022-NPL1 Class A1 | ||||
01/25/2052 | 2.981% | 299,127 | 296,376 | |
Pretium Mortgage Credit Partners I LLC(a),(d) | ||||
CMO Series 2021-NPL1 Class A1 | ||||
09/27/2060 | 2.240% | 137,510 | 138,065 | |
Pretium Mortgage Credit Partners LLC(a),(d) | ||||
CMO Series 2021-RN2 Class A1 | ||||
07/25/2051 | 1.744% | 155,249 | 146,289 | |
Radnor Re Ltd.(a),(b) | ||||
CMO Series 2021-1 Class M2 | ||||
30-day Average SOFR + 3.150% 12/27/2033 | 8.837% | 400,000 | 396,963 | |
Stonnington Mortgage Trust(a),(c),(d) | ||||
CMO Series 2020-1 Class A | ||||
07/28/2024 | 5.500% | 17,576 | 17,312 | |
Toorak Mortgage Corp., Ltd.(a),(d) | ||||
CMO Series 2021-1 Class A1 | ||||
06/25/2024 | 2.240% | 220,817 | 217,612 | |
Triangle Re Ltd.(a),(b) | ||||
CMO Series 2021-2 Class M2 | ||||
1-month Term SOFR + 5.614% Floor 5.500% 10/25/2033 | 10.970% | 250,000 | 259,445 | |
Unlock HEA Trust(a) | ||||
CMO Series 2023-1 Class A | ||||
10/25/2038 | 7.000% | 392,259 | 365,469 | |
VCAT Asset Securitization LLC(a),(d) | ||||
CMO Series 2021-NPL6 Class A1 | ||||
09/25/2051 | 1.917% | 325,666 | 318,324 | |
VCAT LLC(a),(d) | ||||
CMO Series 2021-NPL5 Class A1 | ||||
08/25/2051 | 1.868% | 395,338 | 387,962 | |
Vericrest Opportunity Loan Transferee(a),(d) | ||||
CMO Series 2021-NPL4 Class A1 | ||||
03/27/2051 | 2.240% | 328,169 | 316,223 | |
Vericrest Opportunity Loan Transferee XCIII LLC(a),(d) | ||||
CMO Series 2021-NPL2 Class A1 | ||||
02/27/2051 | 1.893% | 241,731 | 230,506 | |
Verus Securitization Trust(a),(d) | ||||
CMO Series 2020-1 Class M1 | ||||
01/25/2060 | 3.021% | 400,000 | 336,458 | |
CMO Series 2023-1 Class M1 | ||||
12/25/2067 | 6.972% | 1,000,000 | 990,494 | |
Subordinated CMO Series 2019-INV3 Class B1 | ||||
11/25/2059 | 3.731% | 300,000 | 252,353 | |
Visio Trust(a),(d) | ||||
CMO Series 2019-2 Class M1 | ||||
11/25/2054 | 3.260% | 200,000 | 173,445 | |
Residential Mortgage-Backed Securities - Non-Agency (continued) | ||||
Issuer | Coupon Rate | Principal Amount ($) | Value ($) | |
Subordinated CMO Series 2019-2 Class B1 | ||||
11/25/2054 | 3.910% | 100,000 | 87,739 | |
Total Residential Mortgage-Backed Securities - Non-Agency (Cost $17,469,136) | 17,727,832 | |||
Senior Loans 7.6% | ||||
Borrower | Coupon Rate | Principal Amount ($) | Value ($) | |
Cable and Satellite 0.4% | ||||
Virgin Media Bristol LLC(b),(m) | ||||
Tranche Q Term Loan | ||||
1-month Term SOFR + 3.250% 01/31/2029 | 8.726% | 600,000 | 598,020 | |
Chemicals 0.3% | ||||
Ineos US Finance LLC(b),(m) | ||||
Term Loan | ||||
1-month Term SOFR + 3.750% 11/08/2027 | 9.206% | 481,097 | 482,151 | |
Consumer Cyclical Services 0.3% | ||||
8th Avenue Food & Provisions, Inc.(b),(m) | ||||
1st Lien Term Loan | ||||
1-month Term SOFR + 3.750% 10/01/2025 | 9.220% | 32,876 | 31,451 | |
2nd Lien Term Loan | ||||
1-month Term SOFR + 7.750% 10/01/2026 | 13.220% | 63,566 | 50,178 | |
Arches Buyer, Inc.(b),(m) | ||||
Term Loan | ||||
1-month Term SOFR + 3.250% Floor 0.500% 12/06/2027 | 8.706% | 485,000 | 473,549 | |
Total | 555,178 | |||
Diversified Manufacturing 0.3% | ||||
TK Elevator Midco GmbH(b),(m) | ||||
Tranche B1 Term Loan | ||||
6-month Term SOFR + 3.500% Floor 0.500% 07/30/2027 | 9.381% | 483,992 | 484,597 | |
Electric 0.5% | ||||
Calpine Corp.(b),(m) | ||||
Term Loan | ||||
1-month Term SOFR + 2.500% 12/16/2027 | 7.970% | 358,975 | 359,452 | |
Senior Loans (continued) | ||||
Borrower | Coupon Rate | Principal Amount ($) | Value ($) | |
Constellation Renewables LLC(b),(m) | ||||
Term Loan | ||||
3-month Term SOFR + 2.500% Floor 1.000% 12/15/2027 | 8.150% | 434,973 | 434,360 | |
Total | 793,812 | |||
Food and Beverage 0.3% | ||||
Aramark Intermediate HoldCo Corp.(b),(m) | ||||
Tranche B6 Term Loan | ||||
1-month Term SOFR + 2.500% 06/22/2030 | 7.970% | 497,500 | 498,042 | |
Gaming 0.3% | ||||
Caesars Entertainment, Inc.(b),(m) | ||||
Tranche B Term Loan | ||||
1-month Term SOFR + 3.250% Floor 0.500% 02/06/2030 | 8.706% | 498,744 | 499,447 | |
Health Care 0.6% | ||||
ICON PLC(b),(m) | ||||
Term Loan | ||||
3-month Term SOFR + 2.250% Floor 0.500% 07/03/2028 | 7.860% | 342,357 | 343,318 | |
3-month Term SOFR + 2.250% Cap 0.500% 07/03/2028 | 7.860% | 85,298 | 85,538 | |
Medline Borrower LP(b),(m) | ||||
Term Loan | ||||
1-month Term SOFR + 3.000% Floor 0.500% 10/23/2028 | 8.470% | 458,500 | 460,362 | |
Total | 889,218 | |||
Leisure 0.7% | ||||
Carnival Corp.(b),(m) | ||||
Tranche B Term Loan | ||||
1-month Term SOFR + 3.250% Floor 0.750% 10/18/2028 | 8.720% | 497,462 | 497,671 | |
NAI Entertainment Holdings LLC(b),(m) | ||||
Tranche B Term Loan | ||||
1-month Term SOFR + 3.000% Floor 1.000% 05/08/2025 | 8.473% | 667,471 | 661,631 | |
Total | 1,159,302 | |||
Senior Loans (continued) | ||||
Borrower | Coupon Rate | Principal Amount ($) | Value ($) | |
Media and Entertainment 0.3% | ||||
Gray Television, Inc.(b),(m) | ||||
Tranche E Term Loan | ||||
1-month Term SOFR + 2.500% 01/02/2026 | 7.957% | 425,886 | 424,821 | |
Packaging 0.1% | ||||
Flint Group Packaging Inks North America Holdings LLC(b),(m) | ||||
Tranche B 1st Lien Term Loan | ||||
3-month Term SOFR + 0.100% 12/30/2027 | 5.774% | 81,649 | 59,196 | |
Tranche B 2nd Lien Term Loan | ||||
3-month Term SOFR + 0.100% 12/30/2027 | 5.774% | 108,884 | 10,888 | |
Tranche B Term Loan | ||||
3-month Term SOFR + 4.512% 12/31/2026 | 9.924% | 167,446 | 151,957 | |
Total | 222,041 | |||
Pharmaceuticals 0.3% | ||||
Organon & Co.(b),(m) | ||||
Term Loan | ||||
1-month Term SOFR + 3.000% Floor 0.500% 06/02/2028 | 8.472% | 400,000 | 400,252 | |
Property & Casualty 0.9% | ||||
Asurion LLC(b),(m) | ||||
Tranche B8 Term Loan | ||||
1-month Term SOFR + 3.250% 12/23/2026 | 8.720% | 433,830 | 432,385 | |
Broadstreet Partners, Inc.(b),(m),(n) | ||||
Tranche B Term Loan | ||||
3-month Term SOFR + 3.750% 01/27/2029 | 1,000,000 | 998,120 | ||
Total | 1,430,505 | |||
Retailers 0.3% | ||||
Great Outdoors Group LLC(b),(m) | ||||
Tranche B2 Term Loan | ||||
1-month Term SOFR + 3.750% Floor 0.750% 03/06/2028 | 9.220% | 497,455 | 496,958 | |
Technology 1.7% | ||||
athenahealth Group, Inc.(b),(m) | ||||
Term Loan | ||||
1-month Term SOFR + 3.250% Floor 0.500% 02/15/2029 | 8.606% | 442,925 | 440,489 | |
Senior Loans (continued) | ||||
Borrower | Coupon Rate | Principal Amount ($) | Value ($) | |
Avaya, Inc.(b),(m) | ||||
Term Loan | ||||
1-month Term SOFR + 8.500% Floor 1.000% 08/01/2028 | 13.856% | 106,528 | 93,699 | |
Endurance International Group Holdings, Inc.(b),(m) | ||||
Term Loan | ||||
3-month Term SOFR + 3.500% Floor 0.750% 02/10/2028 | 9.422% | 865,382 | 844,561 | |
GoTo Group, Inc.(b),(m) | ||||
1st Lien Term Loan | ||||
3-month Term SOFR + 4.750% 08/31/2027 | 10.283% | 487,437 | 320,144 | |
Peraton Corp.(b),(m) | ||||
Tranche B 1st Lien Term Loan | ||||
1-month Term SOFR + 3.750% Floor 0.750% 02/01/2028 | 9.206% | 555,243 | 555,937 | |
Verscend Holdings Corp.(b),(m) | ||||
Tranche B1 Term Loan | ||||
1-month Term SOFR + 4.000% 08/27/2025 | 9.470% | 397,959 | 398,290 | |
Total | 2,653,120 | |||
Wireless 0.3% | ||||
SBA Senior Finance II LLC(b),(m) | ||||
Term Loan | ||||
1-month Term SOFR + 1.750% 04/11/2025 | 7.210% | 480,916 | 481,301 | |
Total Senior Loans (Cost $12,246,281) | 12,068,765 | |||
U.S. Treasury Obligations 2.7% | ||||
Issuer | Coupon Rate | Principal Amount ($) | Value ($) | |
U.S. Treasury | ||||
04/30/2024 | 2.500% | 1,635,000 | 1,619,608 | |
05/15/2032 | 2.875% | 2,905,000 | 2,693,480 | |
Total U.S. Treasury Obligations (Cost $4,553,814) | 4,313,088 | |||
Call Option Contracts Purchased 0.1% | ||||
Value ($) | ||||
(Cost $126,800) | 213,212 | |||
Money Market Funds 6.9% | ||
Shares | Value ($) | |
Columbia Short-Term Cash Fund, 5.569%(o),(p) | 10,967,236 | 10,965,043 |
Total Money Market Funds (Cost $10,963,519) | 10,965,043 | |
Total Investments in Securities (Cost: $186,132,374) | 183,017,480 | |
Other Assets & Liabilities, Net | (23,501,206 ) | |
Net Assets | 159,516,274 | |
Forward foreign currency exchange contracts | |||||
Currency to be sold | Currency to be purchased | Counterparty | Settlement date | Unrealized appreciation ($) | Unrealized depreciation ($) |
948,000 EUR | 1,028,841 USD | Citi | 01/16/2024 | — | (18,291 ) |
5,700,000 ZAR | 302,837 USD | HSBC | 01/16/2024 | — | (8,394 ) |
Total | — | (26,685 ) | |||
Long futures contracts | ||||||
Description | Number of contracts | Expiration date | Trading currency | Notional amount | Value/Unrealized appreciation ($) | Value/Unrealized depreciation ($) |
Long Gilt | 12 | 03/2024 | GBP | 1,231,800 | 77,479 | — |
U.S. Treasury 5-Year Note | 456 | 03/2024 | USD | 49,600,688 | 1,136,367 | — |
Total | 1,213,846 | — | ||||
Short futures contracts | ||||||
Description | Number of contracts | Expiration date | Trading currency | Notional amount | Value/Unrealized appreciation ($) | Value/Unrealized depreciation ($) |
U.S. Long Bond | (67) | 03/2024 | USD | (8,370,813 ) | — | (623,318 ) |
U.S. Treasury 10-Year Note | (136) | 03/2024 | USD | (15,353,125 ) | — | (560,864 ) |
U.S. Treasury 2-Year Note | (48) | 03/2024 | USD | (9,883,875 ) | — | (100,927 ) |
U.S. Treasury Ultra Bond | (14) | 03/2024 | USD | (1,870,313 ) | — | (167,637 ) |
Total | — | (1,452,746 ) | ||||
Call option contracts purchased | ||||||||
Description | Counterparty | Trading currency | Notional amount | Number of contracts | Exercise price/Rate | Expiration date | Cost ($) | Value ($) |
10-Year OTC interest rate swap with Morgan Stanley to receive exercise rate and pay SOFR | Morgan Stanley | USD | 4,000,000 | 4,000,000 | 3.75 | 11/29/2024 | 126,800 | 213,212 |
Call option contracts written | ||||||||
Description | Counterparty | Trading currency | Notional amount | Number of contracts | Exercise price/Rate | Expiration date | Premium received ($) | Value ($) |
10-Year OTC interest rate swap with Citi to receive SOFR and pay exercise rate | Citi | USD | (4,490,000 ) | (4,490,000 ) | 3.65 | 1/05/2024 | (29,185 ) | (68,754 ) |
10-Year OTC interest rate swap with Citi to receive SOFR and pay exercise rate | Citi | USD | (4,000,000 ) | (4,000,000 ) | 3.35 | 1/22/2024 | (26,000 ) | (20,893 ) |
Total | (55,185 ) | (89,647 ) | ||||||
Cleared interest rate swap contracts | |||||||||||
Fund receives | Fund pays | Payment frequency | Counterparty | Maturity date | Notional currency | Notional amount | Value ($) | Upfront payments ($) | Upfront receipts ($) | Unrealized appreciation ($) | Unrealized depreciation ($) |
Fixed rate of 6.361% | 28-Day MXN TIIE-Banxico | Receives Monthly, Pays Monthly | Morgan Stanley | 10/24/2025 | MXN | 17,000,000 | (59,513 ) | — | — | — | (59,513 ) |
Fixed rate of 5.985% | 28-Day MXN TIIE-Banxico | Receives Monthly, Pays Monthly | Morgan Stanley | 01/21/2026 | MXN | 8,000,000 | (32,609 ) | — | — | — | (32,609 ) |
Fixed rate of 5.960% | 28-Day MXN TIIE-Banxico | Receives Monthly, Pays Monthly | Morgan Stanley | 02/02/2026 | MXN | 20,000,000 | (85,652 ) | — | — | — | (85,652 ) |
SOFR plus 0.262% | Fixed rate of 1.781% | Receives Quarterly, Pays SemiAnnually | Morgan Stanley | 08/09/2049 | USD | 2,100,000 | 666,669 | — | — | 666,669 | — |
Total | 488,895 | — | — | 666,669 | (177,774 ) | ||||||
Credit default swap contracts - buy protection | ||||||||||||
Reference entity | Counterparty | Maturity date | Pay fixed rate (%) | Payment frequency | Notional currency | Notional amount | Value ($) | Periodic payments receivable (payable) ($) | Upfront payments ($) | Upfront receipts ($) | Unrealized appreciation ($) | Unrealized depreciation ($) |
Markit CMBX North America Index, Series 11 BBB- | Citi | 11/18/2054 | 3.000 | Monthly | USD | 500,000 | 82,528 | (208 ) | 124,135 | — | — | (41,815 ) |
Markit CMBX North America Index, Series 12 BBB- | Citi | 08/17/2061 | 3.000 | Monthly | USD | 300,000 | 70,907 | (125 ) | 80,757 | — | — | (9,975 ) |
Markit CMBX North America Index, Series 11 BBB- | Goldman Sachs International | 11/18/2054 | 3.000 | Monthly | USD | 200,000 | 33,011 | (83 ) | 29,780 | — | 3,148 | — |
Markit CMBX North America Index, Series 11 BBB- | JPMorgan | 11/18/2054 | 3.000 | Monthly | USD | 200,000 | 33,011 | (83 ) | 6,584 | — | 26,344 | — |
Markit CMBX North America Index, Series 16 BBB- | Morgan Stanley | 04/17/2065 | 3.000 | Monthly | USD | 320,000 | 58,656 | (133 ) | 73,710 | — | — | (15,187 ) |
Total | 278,113 | (632 ) | 314,966 | — | 29,492 | (66,977 ) | ||||||
Credit default swap contracts - sell protection | |||||||||||||
Reference entity | Counterparty | Maturity date | Receive fixed rate (%) | Payment frequency | Implied credit spread (%)* | Notional currency | Notional amount | Value ($) | Periodic payments receivable (payable) ($) | Upfront payments ($) | Upfront receipts ($) | Unrealized appreciation ($) | Unrealized depreciation ($) |
Markit CMBX North America Index, Series 10 BBB- | JPMorgan | 11/17/2059 | 3.000 | Monthly | 13.887 | USD | 500,000 | (118,498 ) | 208 | — | (105,114 ) | — | (13,176 ) |
Markit CMBX North America Index, Series 10 BBB- | JPMorgan | 11/17/2059 | 3.000 | Monthly | 13.887 | USD | 500,000 | (118,498 ) | 208 | — | (81,425 ) | — | (36,865 ) |
Markit CMBX North America Index, Series 8 BBB- | Morgan Stanley | 10/17/2057 | 3.000 | Monthly | 26.623 | USD | 250,000 | (38,126 ) | 104 | — | (49,959 ) | 11,937 | — |
Total | (275,122 ) | 520 | — | (236,498 ) | 11,937 | (50,041 ) | |||||||
Cleared credit default swap contracts - sell protection | ||||||||||||
Reference entity | Counterparty | Maturity date | Receive fixed rate (%) | Payment frequency | Implied credit spread (%)* | Notional currency | Notional amount | Value ($) | Upfront payments ($) | Upfront receipts ($) | Unrealized appreciation ($) | Unrealized depreciation ($) |
Markit CDX North America Investment Grade Index, Series 41 | Morgan Stanley | 12/20/2028 | 5.000 | Quarterly | 3.532 | USD | 664,290 | 43,679 | — | — | 43,679 | — |
Reference index and values for swap contracts as of period end | ||
Reference index | Reference rate | |
28-Day MXN TIIE-Banxico | Interbank Equilibrium Interest Rate | 11.503% |
SOFR | Secured Overnight Financing Rate | 5.380% |
(a) | Represents privately placed and other securities and instruments exempt from Securities and Exchange Commission registration (collectively, private placements), such as Section 4(a)(2) and Rule 144A eligible securities, which are often sold only to qualified institutional buyers. At December 31, 2023, the total value of these securities amounted to $67,109,141, which represents 42.07% of total net assets. |
(b) | Variable rate security. The interest rate shown was the current rate as of December 31, 2023. |
(c) | Valuation based on significant unobservable inputs. |
(d) | Variable or floating rate security, the interest rate of which adjusts periodically based on changes in current interest rates and prepayments on the underlying pool of assets. The interest rate shown was the current rate as of December 31, 2023. |
(e) | Represents fair value as determined in good faith under procedures approved by the Board of Trustees. At December 31, 2023, the total value of these securities amounted to $0, which represents less than 0.01% of total net assets. |
(f) | Non-income producing investment. |
(g) | Principal amounts are denominated in United States Dollars unless otherwise noted. |
(h) | Payment-in-kind security. Interest can be paid by issuing additional par of the security or in cash. |
(i) | Represents a variable rate security with a step coupon where the rate adjusts according to a schedule for a series of periods, typically lower for an initial period and then increasing to a higher coupon rate thereafter. The interest rate shown was the current rate as of December 31, 2023. |
(j) | Principal and interest may not be guaranteed by a governmental entity. |
(k) | Represents interest only securities which have the right to receive the monthly interest payments on an underlying pool of mortgage loans. |
(l) | Represents a security purchased on a when-issued basis. |
(m) | The stated interest rate represents the weighted average interest rate at December 31, 2023 of contracts within the senior loan facility. Interest rates on contracts are primarily determined either weekly, monthly or quarterly by reference to the indicated base lending rate and spread and the reset period. Base lending rates may be subject to a floor or minimum rate. The interest rate for senior loans purchased on a when-issued or delayed delivery basis will be determined upon settlement, therefore no interest rate is disclosed. Senior loans often require prepayments from excess cash flows or permit the borrowers to repay at their election. The degree to which borrowers repay cannot be predicted with accuracy. As a result, remaining maturities of senior loans may be less than the stated maturities. Generally, the Fund is contractually obligated to receive approval from the agent bank and/or borrower prior to the disposition of a senior loan. |
(n) | Represents a security purchased on a forward commitment basis. |
(o) | The rate shown is the seven-day current annualized yield at December 31, 2023. |
(p) | As defined in the Investment Company Act of 1940, as amended, an affiliated company is one in which the Fund owns 5% or more of the company’s outstanding voting securities, or a company which is under common ownership or control with the Fund. The value of the holdings and transactions in these affiliated companies during the year ended December 31, 2023 are as follows: |
Affiliated issuers | Beginning of period($) | Purchases($) | Sales($) | Net change in unrealized appreciation (depreciation)($) | End of period($) | Realized gain (loss)($) | Dividends($) | End of period shares |
Columbia Short-Term Cash Fund, 5.569% | ||||||||
13,811,358 | 60,790,048 | (63,636,001 ) | (362 ) | 10,965,043 | 878 | 432,245 | 10,967,236 | |
CMO | Collateralized Mortgage Obligation |
SOFR | Secured Overnight Financing Rate |
TBA | To Be Announced |
EUR | Euro |
GBP | British Pound |
IDR | Indonesian Rupiah |
INR | Indian Rupee |
KRW | South Korean Won |
MXN | Mexican Peso |
USD | US Dollar |
ZAR | South African Rand |
Level 1 ($) | Level 2 ($) | Level 3 ($) | Total ($) | |
Investments in Securities | ||||
Asset-Backed Securities — Non-Agency | — | 8,983,370 | 277,627 | 9,260,997 |
Commercial Mortgage-Backed Securities - Non-Agency | — | 2,806,022 | — | 2,806,022 |
Common Stocks | ||||
Financials | — | — | 0 * | 0 * |
Information Technology | — | — | 28,322 | 28,322 |
Materials | — | — | 0 * | 0 * |
Total Common Stocks | — | — | 28,322 | 28,322 |
Convertible Bonds | — | 160,590 | — | 160,590 |
Corporate Bonds & Notes | — | 62,829,273 | — | 62,829,273 |
Foreign Government Obligations | — | 11,136,923 | — | 11,136,923 |
Inflation-Indexed Bonds | — | 393,237 | — | 393,237 |
Residential Mortgage-Backed Securities - Agency | — | 51,114,176 | — | 51,114,176 |
Residential Mortgage-Backed Securities - Non-Agency | — | 16,619,087 | 1,108,745 | 17,727,832 |
Senior Loans | — | 12,068,765 | — | 12,068,765 |
U.S. Treasury Obligations | — | 4,313,088 | — | 4,313,088 |
Call Option Contracts Purchased | — | 213,212 | — | 213,212 |
Money Market Funds | 10,965,043 | — | — | 10,965,043 |
Total Investments in Securities | 10,965,043 | 170,637,743 | 1,414,694 | 183,017,480 |
Investments in Derivatives | ||||
Asset | ||||
Futures Contracts | 1,213,846 | — | — | 1,213,846 |
Swap Contracts | — | 751,777 | — | 751,777 |
Liability | ||||
Forward Foreign Currency Exchange Contracts | — | (26,685 ) | — | (26,685 ) |
Futures Contracts | (1,452,746 ) | — | — | (1,452,746 ) |
Call Option Contracts Written | — | (89,647 ) | — | (89,647 ) |
Swap Contracts | — | (294,792 ) | — | (294,792 ) |
Total | 10,726,143 | 170,978,396 | 1,414,694 | 183,119,233 |
* | Rounds to zero. |
Balance as of 12/31/2022 ($) | Increase (decrease) in accrued discounts/ premiums ($) | Realized gain (loss) ($) | Change in unrealized appreciation (depreciation)(a) ($) | Purchases ($) | Sales ($) | Transfers into Level 3 ($) | Transfers out of Level 3 ($) | Balance as of 12/31/2023 ($) | |
Asset-Backed Securities — Non-Agency | 25,751 | 3,655 | — | 1,810 | 593,952 | (347,541 ) | — | — | 277,627 |
Common Stocks | — | — | — | (34,890 ) | 63,212 | — | — | — | 28,322 |
Residential Mortgage-Backed Securities — Non-Agency | 1,578,158 | — | 1,451 | 9,883 | — | (480,747 ) | — | — | 1,108,745 |
Total | 1,603,909 | 3,655 | 1,451 | (23,197 ) | 657,164 | (828,288 ) | — | — | 1,414,694 |
Assets | |
Investments in securities, at value | |
Unaffiliated issuers (cost $175,042,055) | $171,839,225 |
Affiliated issuers (cost $10,963,519) | 10,965,043 |
Option contracts purchased (cost $126,800) | 213,212 |
Cash | 67,508 |
Foreign currency (cost $52,811) | 53,848 |
Cash collateral held at broker for: | |
Swap contracts | 450,000 |
Margin deposits on: | |
Futures contracts | 298,064 |
Swap contracts | 275,710 |
Unrealized appreciation on swap contracts | 41,429 |
Upfront payments on swap contracts | 314,966 |
Receivable for: | |
Investments sold | 1,162,615 |
Investments sold on a delayed delivery basis | 8,330,741 |
Capital shares sold | 96,330 |
Dividends | 37,852 |
Interest | 1,425,005 |
Foreign tax reclaims | 2,794 |
Variation margin for futures contracts | 59,188 |
Variation margin for swap contracts | 9,566 |
Expense reimbursement due from Investment Manager | 513 |
Prepaid expenses | 2,605 |
Deferred compensation of board members | 109,630 |
Total assets | 195,755,844 |
Liabilities | |
Option contracts written, at value (premiums received $55,185) | 89,647 |
Unrealized depreciation on forward foreign currency exchange contracts | 26,685 |
Unrealized depreciation on swap contracts | 117,018 |
Upfront receipts on swap contracts | 236,498 |
Payable for: | |
Investments purchased on a delayed delivery basis | 34,882,430 |
Capital shares redeemed | 681,252 |
Variation margin for futures contracts | 17,166 |
Variation margin for swap contracts | 498 |
Management services fees | 2,631 |
Distribution and/or service fees | 953 |
Service fees | 24,558 |
Compensation of chief compliance officer | 29 |
Compensation of board members | 878 |
Other expenses | 33,966 |
Deferred compensation of board members | 125,361 |
Total liabilities | 36,239,570 |
Net assets applicable to outstanding capital stock | $159,516,274 |
Represented by | |
Paid in capital | 167,258,407 |
Total distributable earnings (loss) | (7,742,133 ) |
Total - representing net assets applicable to outstanding capital stock | $159,516,274 |
Class 1 | |
Net assets | $21,021,827 |
Shares outstanding | 5,682,283 |
Net asset value per share | $3.70 |
Class 2 | |
Net assets | $138,494,447 |
Shares outstanding | 37,903,543 |
Net asset value per share | $3.65 |
Net investment income | |
Income: | |
Dividends — affiliated issuers | $432,245 |
Interest | 8,623,689 |
Interfund lending | 3,240 |
Foreign taxes withheld | (11,512 ) |
Total income | 9,047,662 |
Expenses: | |
Management services fees | 872,971 |
Distribution and/or service fees | |
Class 2 | 314,533 |
Service fees | 166,717 |
Custodian fees | 38,710 |
Printing and postage fees | 13,107 |
Accounting services fees | 54,857 |
Legal fees | 13,833 |
Interest on collateral | 23,534 |
Compensation of chief compliance officer | 31 |
Compensation of board members | 12,401 |
Deferred compensation of board members | 4,784 |
Other | 7,341 |
Total expenses | 1,522,819 |
Fees waived or expenses reimbursed by Investment Manager and its affiliates | (210,171 ) |
Total net expenses | 1,312,648 |
Net investment income | 7,735,014 |
Realized and unrealized gain (loss) — net | |
Net realized gain (loss) on: | |
Investments — unaffiliated issuers | (4,660,321 ) |
Investments — affiliated issuers | 878 |
Foreign currency translations | (52,165 ) |
Forward foreign currency exchange contracts | (38,658 ) |
Futures contracts | 449,279 |
Option contracts purchased | (1,176,001 ) |
Option contracts written | 9,883 |
Swap contracts | (926,571 ) |
Net realized loss | (6,393,676 ) |
Net change in unrealized appreciation (depreciation) on: | |
Investments — unaffiliated issuers | 11,326,807 |
Investments — affiliated issuers | (362 ) |
Foreign currency translations | 818 |
Forward foreign currency exchange contracts | (13,050 ) |
Futures contracts | (460,509 ) |
Option contracts purchased | 843,662 |
Option contracts written | (122,048 ) |
Swap contracts | 562,871 |
Net change in unrealized appreciation (depreciation) | 12,138,189 |
Net realized and unrealized gain | 5,744,513 |
Net increase in net assets resulting from operations | $13,479,527 |
Year Ended December 31, 2023 | Year Ended December 31, 2022 | |
Operations | ||
Net investment income | $7,735,014 | $5,369,318 |
Net realized loss | (6,393,676 ) | (5,836,327 ) |
Net change in unrealized appreciation (depreciation) | 12,138,189 | (17,296,147 ) |
Net increase (decrease) in net assets resulting from operations | 13,479,527 | (17,763,156 ) |
Distributions to shareholders | ||
Net investment income and net realized gains | ||
Class 1 | (735,148 ) | (1,229,058 ) |
Class 2 | (4,343,022 ) | (8,819,259 ) |
Total distributions to shareholders | (5,078,170 ) | (10,048,317 ) |
Increase in net assets from capital stock activity | 13,827,394 | 18,332,155 |
Total increase (decrease) in net assets | 22,228,751 | (9,479,318 ) |
Net assets at beginning of year | 137,287,523 | 146,766,841 |
Net assets at end of year | $159,516,274 | $137,287,523 |
Year Ended | Year Ended | |||
December 31, 2023 | December 31, 2022 | |||
Shares | Dollars ($) | Shares | Dollars ($) | |
Capital stock activity | ||||
Class 1 | ||||
Shares sold | 979,645 | 3,510,648 | 1,348,582 | 4,852,596 |
Distributions reinvested | 208,849 | 735,148 | 337,653 | 1,229,058 |
Shares redeemed | (941,107 ) | (3,349,031 ) | (731,953 ) | (2,812,156 ) |
Net increase | 247,387 | 896,765 | 954,282 | 3,269,498 |
Class 2 | ||||
Shares sold | 7,688,525 | 27,040,891 | 12,016,613 | 44,656,341 |
Distributions reinvested | 1,247,994 | 4,343,022 | 2,449,794 | 8,819,259 |
Shares redeemed | (5,241,750 ) | (18,453,284 ) | (10,652,434 ) | (38,412,943 ) |
Net increase | 3,694,769 | 12,930,629 | 3,813,973 | 15,062,657 |
Total net increase | 3,942,156 | 13,827,394 | 4,768,255 | 18,332,155 |
Net asset value, beginning of period | Net investment income | Net realized and unrealized gain (loss) | Total from investment operations | Distributions from net investment income | Distributions from net realized gains | Total distributions to shareholders | |
Class 1 | |||||||
Year Ended 12/31/2023 | $3.50 | 0.20 | 0.13 | 0.33 | (0.13 ) | — | (0.13 ) |
Year Ended 12/31/2022 | $4.25 | 0.15 | (0.62 ) | (0.47 ) | (0.12 ) | (0.16 ) | (0.28 ) |
Year Ended 12/31/2021 | $4.40 | 0.14 | (0.05 ) | 0.09 | (0.24 ) | — | (0.24 ) |
Year Ended 12/31/2020 | $4.27 | 0.15 | 0.13 | 0.28 | (0.15 ) | — | (0.15 ) |
Year Ended 12/31/2019 | $4.02 | 0.18 | 0.23 | 0.41 | (0.16 ) | — | (0.16 ) |
Class 2 | |||||||
Year Ended 12/31/2023 | $3.46 | 0.19 | 0.12 | 0.31 | (0.12 ) | — | (0.12 ) |
Year Ended 12/31/2022 | $4.20 | 0.14 | (0.61 ) | (0.47 ) | (0.11 ) | (0.16 ) | (0.27 ) |
Year Ended 12/31/2021 | $4.36 | 0.13 | (0.06 ) | 0.07 | (0.23 ) | — | (0.23 ) |
Year Ended 12/31/2020 | $4.23 | 0.14 | 0.13 | 0.27 | (0.14 ) | — | (0.14 ) |
Year Ended 12/31/2019 | $3.98 | 0.16 | 0.24 | 0.40 | (0.15 ) | — | (0.15 ) |
Notes to Financial Highlights | |
(a) | In addition to the fees and expenses that the Fund bears directly, the Fund indirectly bears a pro rata share of the fees and expenses of any other funds in which it invests. Such indirect expenses are not included in the Fund’s reported expense ratios. |
(b) | Total net expenses include the impact of certain fee waivers/expense reimbursements made by the Investment Manager and certain of its affiliates, if applicable. |
(c) | Ratios include interest on collateral expense. For the periods indicated below, if interest on collateral expense had been excluded, expenses would have been lower by: |
Class | 12/31/2023 | 12/31/2022 | 12/31/2021 | 12/31/2020 | 12/31/2019 |
Class 1 | 0.02% | 0.01% | 0.01% | less than 0.01% | less than 0.01% |
Class 2 | 0.02% | 0.01% | 0.01% | less than 0.01% | less than 0.01% |
Net asset value, end of period | Total return | Total gross expense ratio to average net assets(a) | Total net expense ratio to average net assets(a),(b) | Net investment income ratio to average net assets | Portfolio turnover | Net assets, end of period (000’s) | |
Class 1 | |||||||
Year Ended 12/31/2023 | $3.70 | 9.67% | 0.83% (c) | 0.69% (c) | 5.53% | 276% | $21,022 |
Year Ended 12/31/2022 | $3.50 | (11.37% ) | 0.83% (c) | 0.69% (c) | 4.03% | 182% | $19,019 |
Year Ended 12/31/2021 | $4.25 | 2.09% | 0.80% (c) | 0.69% (c) | 3.21% | 136% | $19,045 |
Year Ended 12/31/2020 | $4.40 | 6.82% | 0.74% (c) | 0.69% (c) | 3.58% | 166% | $118,832 |
Year Ended 12/31/2019 | $4.27 | 10.38% | 0.74% (c) | 0.69% (c) | 4.19% | 193% | $109,698 |
Class 2 | |||||||
Year Ended 12/31/2023 | $3.65 | 9.20% | 1.08% (c) | 0.94% (c) | 5.28% | 276% | $138,494 |
Year Ended 12/31/2022 | $3.46 | (11.52% ) | 1.08% (c) | 0.94% (c) | 3.76% | 182% | $118,268 |
Year Ended 12/31/2021 | $4.20 | 1.63% | 1.08% (c) | 0.94% (c) | 3.04% | 136% | $127,722 |
Year Ended 12/31/2020 | $4.36 | 6.62% | 0.99% (c) | 0.94% (c) | 3.33% | 166% | $105,403 |
Year Ended 12/31/2019 | $4.23 | 10.22% | 0.99% (c) | 0.94% (c) | 3.92% | 193% | $102,773 |
Asset derivatives | ||
Risk exposure category | Statement of assets and liabilities location | Fair value ($) |
Credit risk | Component of total distributable earnings (loss) — unrealized appreciation on swap contracts | 85,108 * |
Credit risk | Upfront payments on swap contracts | 314,966 |
Interest rate risk | Component of total distributable earnings (loss) — unrealized appreciation on futures contracts | 1,213,846 * |
Interest rate risk | Investments, at value — Option contracts purchased | 213,212 |
Interest rate risk | Component of total distributable earnings (loss) — unrealized appreciation on swap contracts | 666,669 * |
Total | 2,493,801 |
Liability derivatives | ||
Risk exposure category | Statement of assets and liabilities location | Fair value ($) |
Credit risk | Component of total distributable earnings (loss) — unrealized depreciation on swap contracts | 117,018 * |
Credit risk | Upfront receipts on swap contracts | 236,498 |
Foreign exchange risk | Unrealized depreciation on forward foreign currency exchange contracts | 26,685 |
Interest rate risk | Component of total distributable earnings (loss) — unrealized depreciation on futures contracts | 1,452,746 * |
Interest rate risk | Option contracts written, at value | 89,647 |
Interest rate risk | Component of total distributable earnings (loss) — unrealized depreciation on swap contracts | 177,774 * |
Total | 2,100,368 |
* | Includes cumulative appreciation (depreciation) as reported in the tables following the Portfolio of Investments. Only the current day’s variation margin for futures and centrally cleared swaps, if any, is reported in receivables or payables in the Statement of Assets and Liabilities. |
Amount of realized gain (loss) on derivatives recognized in income | ||||||
Risk exposure category | Forward foreign currency exchange contracts ($) | Futures contracts ($) | Option contracts purchased ($) | Option contracts written ($) | Swap contracts ($) | Total ($) |
Credit risk | — | — | — | — | (863,769 ) | (863,769 ) |
Foreign exchange risk | (38,658 ) | — | — | — | — | (38,658 ) |
Interest rate risk | — | 449,279 | (1,176,001 ) | 9,883 | (62,802 ) | (779,641 ) |
Total | (38,658 ) | 449,279 | (1,176,001 ) | 9,883 | (926,571 ) | (1,682,068 ) |
Change in unrealized appreciation (depreciation) on derivatives recognized in income | ||||||
Risk exposure category | Forward foreign currency exchange contracts ($) | Futures contracts ($) | Option contracts purchased ($) | Option contracts written ($) | Swap contracts ($) | Total ($) |
Credit risk | — | — | — | — | 523,936 | 523,936 |
Foreign exchange risk | (13,050 ) | — | — | — | — | (13,050 ) |
Interest rate risk | — | (460,509 ) | 843,662 | (122,048 ) | 38,935 | 300,040 |
Total | (13,050 ) | (460,509 ) | 843,662 | (122,048 ) | 562,871 | 810,926 |
Derivative instrument | Average notional amounts ($) |
Futures contracts — long | 42,845,016 |
Futures contracts — short | 68,802,286 |
Credit default swap contracts — buy protection | 4,049,027 |
Credit default swap contracts — sell protection | 3,159,392 |
Derivative instrument | Average value ($) |
Option contracts purchased | 171,466 |
Option contracts written | (57,574 ) |
Derivative instrument | Average unrealized appreciation ($) | Average unrealized depreciation ($) |
Forward foreign currency exchange contracts | 12,726 | (16,227 ) |
Interest rate swap contracts | 698,424 | (202,075 ) |
Citi ($)(a) | Citi ($)(a) | Goldman Sachs International ($) | HSBC ($) | JPMorgan ($) | Morgan Stanley ($)(a) | Morgan Stanley ($)(a) | Total ($) | |
Assets | ||||||||
Centrally cleared interest rate swap contracts (b) | - | - | - | - | - | - | 9,566 | 9,566 |
Call option contracts purchased | - | - | - | - | - | 213,212 | - | 213,212 |
OTC credit default swap contracts (c) | - | 204,892 | 32,928 | - | 32,928 | 85,647 | - | 356,395 |
Total assets | - | 204,892 | 32,928 | - | 32,928 | 298,859 | 9,566 | 579,173 |
Liabilities | ||||||||
Centrally cleared credit default swap contracts (b) | - | - | - | - | - | - | 498 | 498 |
Forward foreign currency exchange contracts | 18,291 | - | - | 8,394 | - | - | - | 26,685 |
Call option contracts written | 89,647 | - | - | - | - | - | - | 89,647 |
OTC credit default swap contracts (c) | - | 51,790 | - | - | 236,580 | 65,146 | - | 353,516 |
Total liabilities | 107,938 | 51,790 | - | 8,394 | 236,580 | 65,146 | 498 | 470,346 |
Total financial and derivative net assets | (107,938 ) | 153,102 | 32,928 | (8,394 ) | (203,652 ) | 233,713 | 9,068 | 108,827 |
Total collateral received (pledged) (d) | - | - | - | - | (203,652 ) | 233,713 | - | 30,061 |
Net amount (e) | (107,938 ) | 153,102 | 32,928 | (8,394 ) | - | - | 9,068 | 78,766 |
(a) | Exposure can only be netted across transactions governed under the same master agreement with the same legal entity. |
(b) | Centrally cleared swaps are included within payable/receivable for variation margin in the Statement of Assets and Liabilities. |
(c) | Over-the-Counter (OTC) swap contracts are presented at market value plus periodic payments receivable (payable), which is comprised of unrealized appreciation, unrealized depreciation, upfront payments and upfront receipts. |
(d) | In some instances, the actual collateral received and/or pledged may be more than the amount shown due to overcollateralization. |
(e) | Represents the net amount due from/(to) counterparties in the event of default. |
Contractual expense cap July 1, 2023 through April 30, 2024 | Voluntary expense cap May 1, 2023 through June 30, 2023 | Contractual expense cap prior to May 1, 2023 | |
Class 1 | 0.67 % | 0.67 % | 0.67 % |
Class 2 | 0.92 | 0.92 | 0.92 |
Undistributed net investment income ($) | Accumulated net realized (loss) ($) | Paid in capital ($) |
(161,009 ) | 161,010 | (1 ) |
Year Ended December 31, 2023 | Year Ended December 31, 2022 | ||||
Ordinary income ($) | Long-term capital gains ($) | Total ($) | Ordinary income ($) | Long-term capital gains ($) | Total ($) |
5,078,170 | — | 5,078,170 | 6,412,812 | 3,635,505 | 10,048,317 |
Undistributed ordinary income ($) | Undistributed long-term capital gains ($) | Capital loss carryforwards ($) | Net unrealized (depreciation) ($) |
7,373,211 | — | (10,219,969 ) | (4,779,681 ) |
Federal tax cost ($) | Gross unrealized appreciation ($) | Gross unrealized (depreciation) ($) | Net unrealized (depreciation) ($) |
187,977,382 | 2,049,870 | (6,829,551 ) | (4,779,681 ) |
No expiration short-term ($) | No expiration long-term ($) | Total ($) | Utilized ($) |
(2,491,906 ) | (7,728,063 ) | (10,219,969 ) | — |
Borrower or lender | Average loan balance ($) | Weighted average interest rate (%) | Number of days with outstanding loans |
Lender | 1,890,909 | 5.51 | 11 |
Name, address, year of birth | Position held with the Columbia Funds and length of service | Principal occupation(s) during past five years and other relevant professional experience | Number of Funds in the Columbia Funds Complex* overseen | Other directorships held by Trustee during the past five years and other relevant Board experience |
George S. Batejan c/o Columbia Management Investment Advisers, LLC 290 Congress Street Boston, MA 02210 1954 | Trustee since 2017 | Executive Vice President, Global Head of Technology and Operations, Janus Capital Group, Inc., 2010-2016 | 161 | Former Chairman of the Board, NICSA (National Investment Company Services Association) (Executive Committee, Nominating Committee and Governance Committee), 2014-2016; former Director, Intech Investment Management, 2011-2016; former Board Member, Metro Denver Chamber of Commerce, 2015-2016; former Advisory Board Member, University of Colorado Business School, 2015-2018; former Board Member, Chase Bank International, 1993-1994 |
Kathleen Blatz c/o Columbia Management Investment Advisers, LLC 290 Congress Street Boston, MA 02210 1954 | Trustee since 2006 | Attorney, specializing in arbitration and mediation; Trustee of Gerald Rauenhorst 1982 Trusts, since 2020; Chief Justice, Minnesota Supreme Court, 1998-2006; Associate Justice, Minnesota Supreme Court, 1996-1998; Fourth Judicial District Court Judge, Hennepin County, 1994-1996; Attorney in private practice and public service, 1984-1993; State Representative, Minnesota House of Representatives, 1979-1993, which included service on the Tax and Financial Institutions and Insurance Committees; Member and Interim Chair, Minnesota Sports Facilities Authority, January-July 2017; Interim President and Chief Executive Officer, Blue Cross and Blue Shield of Minnesota (health care insurance), February-July 2018, April-October 2021 | 161 | Former Trustee, Blue Cross and Blue Shield of Minnesota, 2009-2021 (Chair of the Business Development Committee, 2014-2017; Chair of the Governance Committee, 2017-2019); former Member and Chair of the Board, Minnesota Sports Facilities Authority, January 2017-July 2017; former Director, Robina Foundation, 2009-2020 (Chair, 2014-2020); Director, Richard M. Schulze Family Foundation, since 2021 |
Name, address, year of birth | Position held with the Columbia Funds and length of service | Principal occupation(s) during past five years and other relevant professional experience | Number of Funds in the Columbia Funds Complex* overseen | Other directorships held by Trustee during the past five years and other relevant Board experience |
Pamela G. Carlton c/o Columbia Management Investment Advisers, LLC 290 Congress Street Boston, MA 02210 1954 | Chair since 2023; Trustee since 2007 | President, Springboard – Partners in Cross Cultural Leadership (consulting company), since 2003; Managing Director of US Equity Research, JP Morgan Chase, 1999-2003; Director of US Equity Research, Chase Asset Management, 1996-1999; Co-Director Latin America Research, 1993-1996, COO Global Research, 1992-1996, Co-Director of US Research, 1991-1992, Investment Banker, 1982-1991, Morgan Stanley; Attorney, Cleary Gottlieb Steen & Hamilton LLP, 1980-1982 | 161 | Trustee, New York Presbyterian Hospital Board, since 1996; Director, DR Bank (Audit Committee, since 2017 and Audit Committee Chair, since November 2023); Director, Evercore Inc. (Audit Committee, Nominating and Governance Committee) (financial services company), since 2019; Director, Apollo Commercial Real Estate Finance, Inc. (Chair, Nominating and Governance Committee), since 2021; the Governing Council of the Independent Directors Council (IDC), since 2021 |
Janet Langford Carrig c/o Columbia Management Investment Advisers, LLC 290 Congress Street Boston, MA 02210 1957 | Trustee since 1996 | Senior Vice President, General Counsel and Corporate Secretary, ConocoPhillips (independent energy company), September 2007-October 2018 | 161 | Director, EQT Corporation (natural gas producer), since 2019; former Director, Whiting Petroleum Corporation (independent oil and gas company), 2020-2022 |
J. Kevin Connaughton c/o Columbia Management Investment Advisers, LLC 290 Congress Street Boston, MA 02210 1964 | Trustee since 2020 | CEO and President, RhodeWay Financial (non-profit financial planning firm), since December 2022; Member, FINRA National Adjudicatory Council, January 2020-December 31, 2023; Adjunct Professor of Finance, Bentley University January 2018-April 2023; Consultant to Independent Trustees of CFVIT and CFST I from March 2016 to June 2020 with respect to CFVIT and to December 2020 with respect to CFST I; Managing Director and General Manager of Mutual Fund Products, Columbia Management Investment Advisers, LLC, May 2010-February 2015; President, Columbia Funds, 2008-2015; and senior officer of Columbia Funds and affiliated funds, 2003-2015 | 159 | Former Director, The Autism Project, March 2015-December 2021; former Member of the Investment Committee, St. Michael’s College, November 2015-February 2020; former Trustee, St. Michael’s College, June 2017-September 2019; former Trustee, New Century Portfolios (former mutual fund complex), January 2015-December 2017 |
Olive M. Darragh c/o Columbia Management Investment Advisers, LLC 290 Congress Street Boston, MA 02210 1962 | Trustee since 2020 | Managing Director of Darragh Inc. (strategy and talent management consulting firm), since 2010; Founder and CEO, Zolio, Inc. (investment management talent identification platform), since 2004; Consultant to Independent Trustees of CFVIT and CFST I from June 2019 to June 2020 with respect to CFVIT and to December 2020 with respect to CFST I; Partner, Tudor Investments, 2004-2010; Senior Partner, McKinsey & Company (consulting), 1990-2004; Touche Ross CPA, 1985-1988 | 159 | Treasurer, Edinburgh University US Trust Board, since January 2023; Member, HBS Community Action Partners Board, since September 2022; former Director, University of Edinburgh Business School (Member of US Board), 2004-2019; former Director, Boston Public Library Foundation, 2008-2017 |
Name, address, year of birth | Position held with the Columbia Funds and length of service | Principal occupation(s) during past five years and other relevant professional experience | Number of Funds in the Columbia Funds Complex* overseen | Other directorships held by Trustee during the past five years and other relevant Board experience |
Patricia M. Flynn c/o Columbia Management Investment Advisers, LLC 290 Congress Street Boston, MA 02210 1950 | Trustee since 2004 | Professor Emeritus of Economics and Management, Bentley University, since 2023; Professor of Economics and Management, Bentley University, 1976-2023; Dean, McCallum Graduate School of Business, Bentley University, 1992-2002 | 161 | Former Trustee, MA Taxpayers Foundation, 1997-2022; former Director, The MA Business Roundtable, 2003-2019; former Chairperson, Innovation Index Advisory Committee, MA Technology Collaborative, 1997-2020 |
Brian J. Gallagher c/o Columbia Management Investment Advisers, LLC 290 Congress Street Boston, MA 02210 1954 | Trustee since 2017 | Retired; Partner with Deloitte & Touche LLP and its predecessors, 1977-2016 | 161 | Trustee, Catholic Schools Foundation, since 2004 |
Douglas A. Hacker c/o Columbia Management Investment Advisers, LLC 290 Congress Street Boston, MA 02210 1955 | Trustee since 1996 | Independent business executive, since May 2006; Executive Vice President – Strategy of United Airlines, December 2002 - May 2006; President of UAL Loyalty Services (airline marketing company), September 2001-December 2002; Executive Vice President and Chief Financial Officer of United Airlines, July 1999-September 2001 | 161 | Director, SpartanNash Company since November 2013 (Chair of the Board, since May 2021) (food distributor); Director, Aircastle Limited (Chair of Audit Committee) (aircraft leasing), since August 2006; former Director, Nash Finch Company (food distributor), 2005-2013; former Director, SeaCube Container Leasing Ltd. (container leasing), 2010-2013; and former Director, Travelport Worldwide Limited (travel information technology), 2014-2019 |
Nancy T. Lukitsh c/o Columbia Management Investment Advisers, LLC 290 Congress Street Boston, MA 02210 1956 | Trustee since 2011 | Senior Vice President, Partner and Director of Marketing, Wellington Management Company, LLP (investment adviser), 1997-2010; Chair, Wellington Management Portfolios (commingled non-U.S. investment pools), 2007-2010; Director, Wellington Trust Company, NA and other Wellington affiliates, 1997-2010 | 159 | None |
Name, address, year of birth | Position held with the Columbia Funds and length of service | Principal occupation(s) during past five years and other relevant professional experience | Number of Funds in the Columbia Funds Complex* overseen | Other directorships held by Trustee during the past five years and other relevant Board experience |
David M. Moffett c/o Columbia Management Investment Advisers, LLC 290 Congress Street Boston, MA 02210 1952 | Trustee since 2011 | Retired; former Chief Executive Officer of Freddie Mac and Chief Financial Officer of U.S. Bank | 161 | Director, CSX Corporation (transportation suppliers); Director, PayPal Holdings Inc. (payment and data processing services); former Director, eBay Inc. (online trading community), 2007-2015; and former Director, CIT Bank, CIT Group Inc. (commercial and consumer finance), 2010-2016; former Senior Adviser to The Carlyle Group (financial services), March 2008-September 2008; former Governance Consultant to Bridgewater Associates, January 2013-December 2015 |
Catherine James Paglia c/o Columbia Management Investment Advisers, LLC 290 Congress Street Boston, MA 02210 1952 | Trustee since 2004 | Director, Enterprise Asset Management, Inc. (private real estate and asset management company), since September 1998; Managing Director and Partner, Interlaken Capital, Inc., 1989-1997; Vice President, 1982-1985, Principal, 1985-1987, Managing Director, 1987-1989, Morgan Stanley; Vice President, Investment Banking, 1980-1982, Associate, Investment Banking, 1976-1980, Dean Witter Reynolds, Inc. | 161 | Director, Valmont Industries, Inc. (irrigation systems manufacturer), since 2012; Trustee, Carleton College (on the Investment Committee), since 1987; Trustee, Carnegie Endowment for International Peace (on the Investment Committee), since 2009 |
Natalie A. Trunow c/o Columbia Management Investment Advisers, LLC 290 Congress Street Boston, MA 02210 1967 | Trustee since 2020 | Chief Executive Officer, Millennial Portfolio Solutions LLC (asset management and consulting services), January 2016-January 2021; Non-executive Member of the Investment Committee and Valuation Committee, Sarona Asset Management Inc. (private equity firm) since September 2019; Advisor, Horizon Investments (asset management and consulting services), August 2018-January 2022; Advisor, Paradigm Asset Management, November 2016-January 2022; Consultant to Independent Trustees of CFVIT and CFST I from September 2016 to June 2020 with respect to CFVIT and to December 2020 with respect to CFST I; Director of Investments/Consultant, Casey Family Programs, April 2016-November 2016; Senior Vice President and Chief Investment Officer, Calvert Investments, August 2008-January 2016; Section Head and Portfolio Manager, General Motors Asset Management, June 1997-August 2008 | 159 | Independent Director, Investment Committee, Health Services for Children with Special Needs, Inc., 2010-2021; Independent Director, (Executive Committee and Chair, Audit Committee), Consumer Credit Counseling Services (formerly Guidewell Financial Solutions), since 2016; Independent Director, (Investment Committee), Sarona Asset Management, since 2019 |
Sandra L. Yeager c/o Columbia Management Investment Advisers, LLC 290 Congress Street Boston, MA 02210 1964 | Trustee since 2017 | Retired; President and founder, Hanoverian Capital, LLC (SEC registered investment advisor firm), 2008-2016; Managing Director, DuPont Capital, 2006-2008; Managing Director, Morgan Stanley Investment Management, 2004-2006; Senior Vice President, Alliance Bernstein, 1990-2004 | 161 | Former Director, NAPE (National Alliance for Partnerships in Equity) Education Foundation, October 2016-October 2020; Advisory Board, Jennersville YMCA, June 2022-June 2023 |
Name, address, year of birth | Position held with the Columbia Funds and length of service | Principal occupation(s) during the past five years and other relevant professional experience | Number of Funds in the Columbia Funds Complex* overseen | Other directorships held by Trustee during the past five years and other relevant Board experience |
Daniel J. Beckman c/o Columbia Management Investment Advisers, LLC 290 Congress Street Boston, MA 02210 1962 | Trustee since November 2021 and President since June 2021 | President and Principal Executive Officer of the Columbia Funds, since June 2021; Vice President, Columbia Management Investment Advisers, LLC, since April 2015; formerly, Vice President – Head of North America Product, Columbia Management Investment Advisers, LLC, April 2015 – December 2023; President and Principal Executive Officer, Columbia Acorn/Wanger Funds, since July 2021 | 161 | Director, Ameriprise Trust Company, since October 2016; Director, Columbia Management Investment Distributors, Inc., since November 2018; Board of Governors, Columbia Wanger Asset Management, LLC, since January 2022 |
* | The term “Columbia Funds Complex” as used herein includes Columbia Seligman Premium Technology Growth Fund, Tri-Continental Corporation and each series of Columbia Funds Series Trust (CFST), Columbia Funds Series Trust I (CFST I), Columbia Funds Series Trust II (CFST II), Columbia ETF Trust I (CET I), Columbia ETF Trust II (CET II), Columbia Funds Variable Insurance Trust (CFVIT) and Columbia Funds Variable Series Trust II (CFVST II). Messrs. Batejan, Beckman, Gallagher, Hacker and Moffett and Mses. Blatz, Carlton, Carrig, Flynn, Paglia, and Yeager serve as directors of Columbia Seligman Premium Technology Growth Fund and Tri-Continental Corporation. |
** | Interested person (as defined under the 1940 Act) by reason of being an officer, director, security holder and/or employee of the Investment Manager or Ameriprise Financial. |
Name, address and year of birth | Position and year first appointed to position for any Fund in the Columbia Funds Complex or a predecessor thereof | Principal occupation(s) during past five years |
Michael G. Clarke 290 Congress Street Boston, MA 02210 1969 | Chief Financial Officer and Principal Financial Officer (2009); Senior Vice President (2019); Treasurer and Chief Accounting Officer (Principal Accounting Officer) (2024) for CFST, CFST I, CFST II, CFVIT and CFVST II | Senior Vice President and North America Head of Operations & Investor Services, Columbia Management Investment Advisers, LLC, since June 2023 (previously Senior Vice President and Head of Global Operations, March 2022 – June 2023, Vice President, Head of North America Operations, and Co-Head of Global Operations, June 2019 - February 2022 and Vice President – Accounting and Tax, May 2010 - May 2019); senior officer of Columbia Funds and affiliated funds, since 2002. Director, Ameriprise Trust Company, since June 2023. |
Name, address and year of birth | Position and year first appointed to position for any Fund in the Columbia Funds Complex or a predecessor thereof | Principal occupation(s) during past five years |
Marybeth Pilat 290 Congress Street Boston, MA 02210 1968 | Treasurer and Chief Accounting Officer (Principal Accounting Officer) and Principal Financial Officer (2020) for CET I and CET II; Assistant Treasurer, CFST, CFST I, CFST II, CFVIT and CFVST II | Vice President – Product Pricing and Administration, Columbia Management Investment Advisers, LLC, since May 2017. |
William F. Truscott 290 Congress Street Boston, MA 02210 1960 | Senior Vice President (2001) | Formerly, Trustee/Director of Columbia Funds Complex or legacy funds, November 2001 - January 1, 2021; Chief Executive Officer, Global Asset Management, Ameriprise Financial, Inc., since September 2012; Chairman of the Board and President, Columbia Management Investment Advisers, LLC, since July 2004 and February 2012, respectively; Chairman of the Board and Chief Executive Officer, Columbia Management Investment Distributors, Inc., since November 2008 and February 2012, respectively; Chairman of the Board and Director, TAM UK International Holdings Limited, since July 2021; formerly Chairman of the Board and Director, Threadneedle Asset Management Holdings, Sàrl, March 2013 – December 2022 and December 2008 – December 2022, respectively; senior executive of various entities affiliated with Columbia Threadneedle Investments. |
Christopher O. Petersen 5228 Ameriprise Financial Center Minneapolis, MN 55474 1970 | Senior Vice President and Assistant Secretary (2021) | Formerly, Trustee/Director of funds within the Columbia Funds Complex, July 1, 2020 - November 22, 2021; Senior Vice President and Assistant General Counsel, Ameriprise Financial, Inc., since September 2021 (previously Vice President and Lead Chief Counsel, January 2015 - September 2021); formerly, President and Principal Executive Officer of the Columbia Funds, 2015 - 2021; officer of Columbia Funds and affiliated funds, since 2007. |
Thomas P. McGuire 290 Congress Street Boston, MA 02210 1972 | Senior Vice President and Chief Compliance Officer (2012) | Vice President – Asset Management Compliance, Ameriprise Financial, Inc., since May 2010; Chief Compliance Officer, Columbia Acorn/Wanger Funds, since December 2015; formerly, Chief Compliance Officer, Ameriprise Certificate Company, September 2010 – September 2020. |
Ryan C. Larrenaga 290 Congress Street Boston, MA 02210 1970 | Senior Vice President (2017), Chief Legal Officer (2017), and Secretary (2015) | Vice President and Chief Counsel, Ameriprise Financial, Inc., since August 2018 (previously Vice President and Group Counsel, August 2011 - August 2018); Chief Legal Officer, Columbia Acorn/Wanger Funds, since September 2020; officer of Columbia Funds and affiliated funds, since 2005. |
Michael E. DeFao 290 Congress Street Boston, MA 02210 1968 | Vice President (2011) and Assistant Secretary (2010) | Vice President and Chief Counsel, Ameriprise Financial, Inc., since May 2010; Vice President, Chief Legal Officer and Assistant Secretary, Columbia Management Investment Advisers, LLC, since October 2021 (previously Vice President and Assistant Secretary, May 2010 – September 2021). |
Lyn Kephart-Strong 5903 Ameriprise Financial Center Minneapolis, MN 55474 1960 | Vice President (2015) | Vice President, Global Investment Operations Services, Columbia Management Investment Advisers, LLC, since 2010; President, Columbia Management Investment Services Corp., since October 2014; President, Ameriprise Trust Company, since January 2017. |


3 | |
5 | |
7 | |
8 | |
15 | |
16 | |
17 | |
18 | |
20 | |
29 | |
30 | |
30 |
Average annual total returns (%) (for the period ended December 31, 2023) | |||||
Inception | 1 Year | 5 Years | 10 Years | ||
Class 1 | 05/19/98 | 21.94 | 13.68 | 8.67 | |
Class 2 | 06/01/00 | 21.67 | 13.39 | 8.40 | |
Russell 2000 Value Index | 14.65 | 10.00 | 6.76 | ||

Portfolio breakdown (%) (at December 31, 2023) | |
Common Stocks | 99.9 |
Money Market Funds | 0.1 |
Total | 100.0 |
Equity sector breakdown (%) (at December 31, 2023) | |
Communication Services | 2.6 |
Consumer Discretionary | 14.4 |
Consumer Staples | 1.6 |
Energy | 6.8 |
Financials | 22.6 |
Health Care | 8.5 |
Industrials | 16.2 |
Information Technology | 9.0 |
Materials | 9.4 |
Real Estate | 5.5 |
Utilities | 3.4 |
Total | 100.0 |
July 1, 2023 — December 31, 2023 | |||||||
Account value at the beginning of the period ($) | Account value at the end of the period ($) | Expenses paid during the period ($) | Fund’s annualized expense ratio (%) | ||||
Actual | Hypothetical | Actual | Hypothetical | Actual | Hypothetical | Actual | |
Class 1 | 1,000.00 | 1,000.00 | 1,130.00 | 1,020.54 | 4.67 | 4.43 | 0.88 |
Class 2 | 1,000.00 | 1,000.00 | 1,128.20 | 1,019.30 | 6.00 | 5.69 | 1.13 |
Common Stocks 100.2% | ||
Issuer | Shares | Value ($) |
Communication Services 2.7% | ||
Diversified Telecommunication Services 0.2% | ||
Bandwidth, Inc., Class A(a) | 97,100 | 1,405,037 |
Entertainment 0.6% | ||
Gaia, Inc.(a) | 306,036 | 826,297 |
IMAX Corp.(a) | 104,460 | 1,568,990 |
Playstudios, Inc.(a) | 253,886 | 688,031 |
Total | 3,083,318 | |
Interactive Media & Services 0.4% | ||
Shutterstock, Inc. | 43,630 | 2,106,456 |
Media 0.5% | ||
AdTheorent Holding Co., Inc.(a) | 715,811 | 1,037,926 |
Innovid Corp.(a) | 1,063,146 | 1,594,719 |
Total | 2,632,645 | |
Wireless Telecommunication Services 1.0% | ||
Telephone and Data Systems, Inc. | 162,685 | 2,985,270 |
United States Cellular Corp.(a) | 54,138 | 2,248,892 |
Total | 5,234,162 | |
Total Communication Services | 14,461,618 | |
Consumer Discretionary 14.4% | ||
Automobile Components 1.5% | ||
Gentherm, Inc.(a) | 40,990 | 2,146,237 |
Modine Manufacturing Co.(a) | 65,069 | 3,884,619 |
Visteon Corp.(a) | 18,880 | 2,358,112 |
Total | 8,388,968 | |
Broadline Retail 1.1% | ||
Articore Group Ltd.(a) | 2,158,982 | 1,018,135 |
Savers Value Village, Inc.(a) | 275,084 | 4,780,960 |
Total | 5,799,095 | |
Distributors 0.0% | ||
Educational Development Corp.(a) | 144,855 | 168,032 |
Diversified Consumer Services 1.0% | ||
American Public Education, Inc.(a) | 232,146 | 2,240,209 |
Stride, Inc.(a) | 49,823 | 2,957,991 |
Total | 5,198,200 | |
Common Stocks (continued) | ||
Issuer | Shares | Value ($) |
Hotels, Restaurants & Leisure 0.9% | ||
Everi Holdings, Inc.(a) | 185,200 | 2,087,204 |
PlayAGS, Inc.(a) | 346,657 | 2,922,319 |
Total | 5,009,523 | |
Household Durables 3.5% | ||
Cavco Industries, Inc.(a) | 9,577 | 3,319,580 |
Century Communities, Inc. | 34,860 | 3,177,140 |
Hamilton Beach Brands Holding Co. | 185,308 | 3,241,037 |
iRobot Corp.(a) | 44,020 | 1,703,574 |
Landsea Homes Corp.(a) | 108,646 | 1,427,608 |
Legacy Housing Corp.(a) | 95,516 | 2,408,914 |
Lifetime Brands, Inc. | 176,561 | 1,184,724 |
Lovesac Co. (The)(a) | 40,394 | 1,032,067 |
Universal Electronics, Inc.(a) | 133,574 | 1,254,260 |
Total | 18,748,904 | |
Leisure Products 1.3% | ||
Latham Group, Inc.(a) | 368,920 | 970,260 |
Malibu Boats, Inc., Class A(a) | 34,865 | 1,911,299 |
Topgolf Callaway Brands Corp.(a) | 295,907 | 4,243,306 |
Total | 7,124,865 | |
Specialty Retail 3.4% | ||
1-800-Flowers.com, Inc., Class A(a) | 112,039 | 1,207,781 |
Advance Auto Parts, Inc. | 42,230 | 2,577,297 |
Beyond, Inc.(a) | 64,400 | 1,783,236 |
Brilliant Earth Group, Inc., Class A(a) | 181,081 | 673,621 |
Citi Trends, Inc.(a) | 54,220 | 1,533,342 |
Leslie’s, Inc.(a) | 325,740 | 2,250,863 |
Lulu’s Fashion Lounge Holdings, Inc.(a) | 342,390 | 636,845 |
National Vision Holdings, Inc.(a) | 135,331 | 2,832,478 |
ThredUp, Inc., Class A(a) | 639,227 | 1,438,261 |
Victoria’s Secret & Co.(a) | 74,039 | 1,964,995 |
Zumiez, Inc.(a) | 70,910 | 1,442,309 |
Total | 18,341,028 | |
Common Stocks (continued) | ||
Issuer | Shares | Value ($) |
Textiles, Apparel & Luxury Goods 1.7% | ||
Canada Goose Holdings, Inc.(a) | 228,820 | 2,711,517 |
Culp, Inc.(a) | 117,040 | 677,661 |
Fossil Group, Inc.(a) | 403,758 | 589,487 |
Movado Group, Inc. | 61,185 | 1,844,728 |
Steven Madden Ltd. | 86,754 | 3,643,668 |
Total | 9,467,061 | |
Total Consumer Discretionary | 78,245,676 | |
Consumer Staples 1.6% | ||
Consumer Staples Distribution & Retail 0.6% | ||
Andersons, Inc. (The) | 54,062 | 3,110,728 |
Food Products 0.7% | ||
Fresh Del Monte Produce, Inc. | 86,943 | 2,282,254 |
Mission Produce, Inc.(a) | 166,873 | 1,683,748 |
Total | 3,966,002 | |
Personal Care Products 0.3% | ||
Honest Co., Inc. (The)(a) | 532,721 | 1,757,979 |
Total Consumer Staples | 8,834,709 | |
Energy 6.8% | ||
Energy Equipment & Services 2.1% | ||
Natural Gas Services Group, Inc.(a) | 139,024 | 2,235,506 |
Newpark Resources, Inc.(a) | 226,838 | 1,506,204 |
Pason Systems, Inc. | 272,949 | 3,330,882 |
Patterson-UTI Energy, Inc. | 322,110 | 3,478,788 |
Profire Energy, Inc.(a) | 440,433 | 797,184 |
Total | 11,348,564 | |
Oil, Gas & Consumable Fuels 4.7% | ||
Callon Petroleum Co.(a) | 71,610 | 2,320,164 |
CVR Energy, Inc. | 98,560 | 2,986,368 |
Delek U.S. Holdings, Inc. | 110,170 | 2,842,386 |
Kinetik Holdings, Inc. | 74,123 | 2,475,708 |
Magnolia Oil & Gas Corp., Class A | 98,910 | 2,105,794 |
Murphy Oil Corp. | 165,138 | 7,044,787 |
Ring Energy, Inc.(a) | 962,224 | 1,404,847 |
Talos Energy, Inc.(a) | 202,191 | 2,877,178 |
W&T Offshore, Inc. | 446,372 | 1,455,173 |
Total | 25,512,405 | |
Total Energy | 36,860,969 | |
Common Stocks (continued) | ||
Issuer | Shares | Value ($) |
Financials 22.7% | ||
Banks 14.4% | ||
Ameris Bancorp | 92,178 | 4,890,043 |
Bank of Marin Bancorp | 61,099 | 1,345,400 |
BankUnited, Inc. | 121,082 | 3,926,689 |
Banner Corp. | 65,654 | 3,516,428 |
Capital Bancorp, Inc. | 77,627 | 1,878,573 |
Central Pacific Financial Corp. | 90,423 | 1,779,525 |
Central Valley Community Bancorp | 82,808 | 1,850,759 |
Columbia Banking System, Inc. | 184,492 | 4,922,246 |
Community Trust Bancorp, Inc. | 35,644 | 1,563,346 |
Eastern Bankshares, Inc. | 203,700 | 2,892,540 |
First Community Corp. | 82,087 | 1,767,333 |
First Financial Corp. | 38,134 | 1,640,906 |
Heritage Financial Corp. | 98,880 | 2,115,043 |
HomeStreet, Inc. | 95,007 | 978,572 |
Northrim BanCorp, Inc. | 56,720 | 3,244,951 |
OFG Bancorp | 88,878 | 3,331,147 |
Popular, Inc. | 66,298 | 5,441,077 |
Provident Financial Holdings, Inc. | 77,436 | 976,468 |
Riverview Bancorp, Inc. | 196,669 | 1,258,682 |
Sierra Bancorp | 78,698 | 1,774,640 |
Southern First Bancshares, Inc.(a) | 62,982 | 2,336,632 |
Synovus Financial Corp. | 112,910 | 4,251,061 |
Territorial Bancorp, Inc. | 100,233 | 1,117,598 |
Towne Bank | 106,156 | 3,159,203 |
UMB Financial Corp. | 69,213 | 5,782,746 |
WaFd, Inc. | 121,736 | 4,012,419 |
Western New England Bancorp, Inc. | 232,672 | 2,094,048 |
Zions Bancorp | 104,680 | 4,592,312 |
Total | 78,440,387 | |
Capital Markets 0.7% | ||
StoneX Group, Inc.(a) | 52,014 | 3,840,194 |
Consumer Finance 0.4% | ||
PROG Holdings, Inc.(a) | 67,408 | 2,083,581 |
Financial Services 4.9% | ||
Alerus Financial Corp. | 85,952 | 1,924,465 |
Cass Information Systems, Inc. | 35,391 | 1,594,365 |
Common Stocks (continued) | ||
Issuer | Shares | Value ($) |
Essent Group Ltd. | 130,523 | 6,883,783 |
EVERTEC, Inc. | 58,940 | 2,413,004 |
International Money Express, Inc.(a) | 73,810 | 1,630,463 |
MGIC Investment Corp. | 263,126 | 5,075,700 |
NMI Holdings, Inc., Class A(a) | 139,475 | 4,139,618 |
Payoneer Global, Inc.(a) | 576,367 | 3,002,872 |
Total | 26,664,270 | |
Insurance 2.3% | ||
Global Indemnity Group LLC | 82,753 | 2,667,957 |
Greenlight Capital Re Ltd., Class A(a) | 129,793 | 1,482,236 |
Horace Mann Educators Corp. | 89,025 | 2,911,117 |
Mercury General Corp. | 90,970 | 3,394,091 |
ProAssurance Corp. | 137,024 | 1,889,561 |
Total | 12,344,962 | |
Total Financials | 123,373,394 | |
Health Care 8.5% | ||
Biotechnology 3.8% | ||
Apellis Pharmaceuticals, Inc.(a) | 61,346 | 3,672,172 |
Arcutis Biotherapeutics, Inc.(a) | 280,730 | 906,758 |
Arrowhead Pharmaceuticals, Inc.(a) | 64,269 | 1,966,631 |
BioCryst Pharmaceuticals, Inc.(a) | 249,398 | 1,493,894 |
Bioxcel Therapeutics, Inc.(a) | 140,364 | 414,074 |
Celcuity, Inc.(a) | 73,729 | 1,074,232 |
Insmed, Inc.(a) | 88,640 | 2,746,954 |
Lexicon Pharmaceuticals, Inc.(a) | 491,608 | 752,160 |
Natera, Inc.(a) | 22,210 | 1,391,234 |
Olema Pharmaceuticals, Inc.(a) | 67,108 | 941,525 |
SpringWorks Therapeutics, Inc.(a) | 73,666 | 2,688,809 |
Travere Therapeutics, Inc.(a) | 120,782 | 1,085,830 |
uniQure NV(a) | 211,430 | 1,431,381 |
Total | 20,565,654 | |
Health Care Equipment & Supplies 1.0% | ||
Inogen, Inc.(a) | 229,118 | 1,257,858 |
LivaNova PLC(a) | 46,366 | 2,398,977 |
Zimvie, Inc.(a) | 104,260 | 1,850,615 |
Total | 5,507,450 | |
Common Stocks (continued) | ||
Issuer | Shares | Value ($) |
Health Care Providers & Services 1.0% | ||
Castle Biosciences, Inc.(a) | 57,695 | 1,245,058 |
Enhabit, Inc.(a) | 107,080 | 1,108,278 |
Fulgent Genetics, Inc.(a) | 49,480 | 1,430,467 |
Guardant Health, Inc.(a) | 60,834 | 1,645,560 |
Total | 5,429,363 | |
Health Care Technology 0.6% | ||
Computer Programs & Systems, Inc.(a) | 97,926 | 1,096,771 |
GoodRx Holdings, Inc., Class A(a) | 350,813 | 2,350,447 |
Total | 3,447,218 | |
Life Sciences Tools & Services 0.2% | ||
Codexis, Inc.(a) | 296,911 | 905,578 |
Pharmaceuticals 1.9% | ||
ANI Pharmaceuticals, Inc.(a) | 36,779 | 2,027,994 |
Perrigo Co. PLC | 99,110 | 3,189,360 |
Supernus Pharmaceuticals, Inc.(a) | 64,117 | 1,855,546 |
Taro Pharmaceutical Industries Ltd.(a) | 79,926 | 3,339,308 |
Total | 10,412,208 | |
Total Health Care | 46,267,471 | |
Industrials 16.2% | ||
Aerospace & Defense 0.9% | ||
Moog, Inc., Class A | 33,214 | 4,808,723 |
Air Freight & Logistics 0.3% | ||
Radiant Logistics, Inc.(a) | 266,294 | 1,768,192 |
Building Products 2.1% | ||
AZEK Co., Inc. (The)(a) | 64,277 | 2,458,595 |
AZZ, Inc. | 60,252 | 3,500,039 |
UFP Industries, Inc. | 41,206 | 5,173,413 |
Total | 11,132,047 | |
Commercial Services & Supplies 1.3% | ||
ACCO Brands Corp. | 221,930 | 1,349,335 |
Healthcare Services Group, Inc.(a) | 129,400 | 1,341,878 |
HNI Corp. | 68,495 | 2,865,146 |
VSE Corp. | 26,548 | 1,715,266 |
Total | 7,271,625 | |
Common Stocks (continued) | ||
Issuer | Shares | Value ($) |
Electrical Equipment 1.4% | ||
Encore Wire Corp. | 24,239 | 5,177,451 |
Thermon(a) | 66,202 | 2,156,199 |
Total | 7,333,650 | |
Ground Transportation 2.1% | ||
Hertz Global Holdings, Inc.(a) | 314,030 | 3,262,772 |
Marten Transport Ltd. | 142,966 | 2,999,427 |
Schneider National, Inc., Class B | 138,790 | 3,532,205 |
Werner Enterprises, Inc. | 43,660 | 1,849,874 |
Total | 11,644,278 | |
Machinery 3.2% | ||
Energy Recovery, Inc.(a) | 59,717 | 1,125,068 |
Gorman-Rupp Co. | 50,175 | 1,782,718 |
Greenbrier Companies, Inc. (The) | 61,128 | 2,700,635 |
Hurco Companies, Inc. | 72,970 | 1,571,044 |
John Bean Technologies Corp. | 36,920 | 3,671,694 |
Manitex International, Inc.(a) | 154,980 | 1,354,525 |
Markforged Holding Corp.(a) | 822,767 | 674,669 |
Miller Industries, Inc. | 29,974 | 1,267,600 |
Mueller Industries, Inc. | 71,024 | 3,348,782 |
Total | 17,496,735 | |
Marine Transportation 1.0% | ||
Costamare, Inc. | 239,885 | 2,497,203 |
Kirby Corp.(a) | 36,407 | 2,857,221 |
Total | 5,354,424 | |
Passenger Airlines 0.6% | ||
Spirit Airlines, Inc. | 126,516 | 2,073,597 |
Sun Country Airlines Holdings, Inc.(a) | 89,199 | 1,403,101 |
Total | 3,476,698 | |
Professional Services 2.1% | ||
IBEX Holdings Ltd.(a) | 91,180 | 1,733,332 |
Korn/Ferry International | 78,010 | 4,629,893 |
MAXIMUS, Inc. | 29,700 | 2,490,642 |
TaskUS, Inc., Class A(a) | 194,400 | 2,540,808 |
Total | 11,394,675 | |
Common Stocks (continued) | ||
Issuer | Shares | Value ($) |
Trading Companies & Distributors 1.2% | ||
BlueLinx Holdings, Inc.(a) | 15,807 | 1,791,091 |
H&E Equipment Services, Inc. | 48,580 | 2,541,706 |
Karat Packaging, Inc. | 89,374 | 2,220,944 |
Total | 6,553,741 | |
Total Industrials | 88,234,788 | |
Information Technology 9.0% | ||
Communications Equipment 1.8% | ||
Applied Optoelectronics, Inc.(a) | 117,732 | 2,274,582 |
Casa Systems, Inc.(a) | 613,913 | 325,374 |
Infinera Corp.(a) | 301,270 | 1,431,033 |
Lumentum Holdings, Inc.(a) | 75,068 | 3,935,065 |
Netscout Systems, Inc.(a) | 83,512 | 1,833,088 |
Total | 9,799,142 | |
Electronic Equipment, Instruments & Components 3.1% | ||
Airgain, Inc.(a) | 161,649 | 575,470 |
FARO Technologies, Inc.(a) | 90,822 | 2,046,220 |
IPG Photonics Corp.(a) | 26,430 | 2,868,712 |
OSI Systems, Inc.(a) | 21,007 | 2,710,953 |
Powerfleet, Inc.(a) | 622,238 | 2,128,054 |
TTM Technologies, Inc.(a) | 184,400 | 2,915,364 |
Vishay Precision Group, Inc.(a) | 33,096 | 1,127,581 |
Vontier Corp. | 81,490 | 2,815,480 |
Total | 17,187,834 | |
IT Services 0.8% | ||
Kyndryl Holdings, Inc.(a) | 205,857 | 4,277,708 |
Semiconductors & Semiconductor Equipment 1.8% | ||
Cohu, Inc.(a) | 83,391 | 2,951,208 |
MagnaChip Semiconductor Corp.(a) | 156,110 | 1,170,825 |
Synaptics, Inc.(a) | 43,340 | 4,944,227 |
Valens Semiconductor Ltd.(a) | 339,149 | 830,915 |
Total | 9,897,175 | |
Software 1.3% | ||
Cerence, Inc.(a) | 64,755 | 1,273,083 |
Cognyte Software Ltd.(a) | 173,473 | 1,115,431 |
Expensify, Inc., Class A(a) | 179,525 | 443,427 |
Mitek Systems, Inc.(a) | 106,628 | 1,390,429 |
Common Stocks (continued) | ||
Issuer | Shares | Value ($) |
Red Violet, Inc.(a) | 75,825 | 1,514,225 |
Upland Software, Inc.(a) | 298,490 | 1,262,613 |
Total | 6,999,208 | |
Technology Hardware, Storage & Peripherals 0.2% | ||
Nano Dimension Ltd., ADR(a) | 403,930 | 969,432 |
Total Information Technology | 49,130,499 | |
Materials 9.4% | ||
Chemicals 2.6% | ||
Aspen Aerogels, Inc.(a) | 195,577 | 3,086,205 |
Chemours Co. LLC (The) | 137,031 | 4,321,958 |
Livent Corp.(a) | 199,398 | 3,585,176 |
Tronox Holdings PLC, Class A | 228,043 | 3,229,089 |
Total | 14,222,428 | |
Construction Materials 1.2% | ||
Summit Materials, Inc., Class A(a) | 168,838 | 6,493,509 |
Containers & Packaging 0.5% | ||
Greif, Inc., Class A | 41,579 | 2,727,167 |
Metals & Mining 4.7% | ||
Ampco-Pittsburgh Corp.(a) | 255,423 | 697,305 |
Capstone Copper Corp.(a) | 561,175 | 2,731,654 |
Centerra Gold, Inc. | 370,070 | 2,209,165 |
ERO Copper Corp.(a) | 148,451 | 2,347,118 |
Ferroglobe PLC(a) | 371,196 | 2,416,486 |
Hudbay Minerals, Inc. | 450,667 | 2,479,425 |
MP Materials Corp.(a) | 202,055 | 4,010,792 |
Olympic Steel, Inc. | 24,547 | 1,637,285 |
Pan American Silver Corp. | 217,813 | 3,556,886 |
Torex Gold Resources, Inc.(a) | 144,684 | 1,596,378 |
Universal Stainless & Alloy Products, Inc.(a) | 97,194 | 1,951,655 |
Total | 25,634,149 | |
Paper & Forest Products 0.4% | ||
Clearwater Paper Corp.(a) | 35,194 | 1,271,207 |
Glatfelter Corp.(a) | 423,163 | 820,936 |
Total | 2,092,143 | |
Total Materials | 51,169,396 | |
Real Estate 5.5% | ||
Diversified REITs 0.6% | ||
American Assets Trust, Inc. | 140,530 | 3,163,331 |
Common Stocks (continued) | ||
Issuer | Shares | Value ($) |
Health Care REITs 0.2% | ||
Universal Health Realty Income Trust | 25,500 | 1,102,875 |
Hotel & Resort REITs 1.3% | ||
Park Hotels & Resorts, Inc. | 235,600 | 3,604,680 |
RLJ Lodging Trust | 305,975 | 3,586,027 |
Total | 7,190,707 | |
Office REITs 1.0% | ||
Brandywine Realty Trust | 377,650 | 2,039,310 |
Highwoods Properties, Inc. | 139,270 | 3,197,639 |
Total | 5,236,949 | |
Retail REITs 0.9% | ||
Macerich Co. (The) | 305,440 | 4,712,939 |
Specialized REITs 1.5% | ||
Outfront Media, Inc. | 283,800 | 3,961,848 |
PotlatchDeltic Corp. | 88,702 | 4,355,268 |
Total | 8,317,116 | |
Total Real Estate | 29,723,917 | |
Utilities 3.4% | ||
Gas Utilities 2.0% | ||
National Fuel Gas Co. | 84,985 | 4,263,698 |
RGC Resources, Inc. | 91,957 | 1,870,405 |
UGI Corp. | 198,460 | 4,882,116 |
Total | 11,016,219 | |
Multi-Utilities 1.4% | ||
Black Hills Corp. | 73,085 | 3,942,936 |
Northwestern Energy Group, Inc. | 66,834 | 3,401,182 |
Total | 7,344,118 | |
Total Utilities | 18,360,337 | |
Total Common Stocks (Cost $500,807,352) | 544,662,774 | |
Money Market Funds 0.1% | ||
Shares | Value ($) | |
Columbia Short-Term Cash Fund, 5.569%(b),(c) | 435,202 | 435,115 |
Total Money Market Funds (Cost $435,074) | 435,115 | |
Total Investments in Securities (Cost: $501,242,426) | 545,097,889 | |
Other Assets & Liabilities, Net | (1,814,274 ) | |
Net Assets | 543,283,615 | |
(a) | Non-income producing investment. |
(b) | The rate shown is the seven-day current annualized yield at December 31, 2023. |
(c) | As defined in the Investment Company Act of 1940, as amended, an affiliated company is one in which the Fund owns 5% or more of the company’s outstanding voting securities, or a company which is under common ownership or control with the Fund. The value of the holdings and transactions in these affiliated companies during the year ended December 31, 2023 are as follows: |
Affiliated issuers | Beginning of period($) | Purchases($) | Sales($) | Net change in unrealized appreciation (depreciation)($) | End of period($) | Realized gain (loss)($) | Dividends($) | End of period shares |
Columbia Short-Term Cash Fund, 5.569% | ||||||||
17,351 | 103,093,798 | (102,676,075 ) | 41 | 435,115 | (1,211 ) | 106,176 | 435,202 | |
ADR | American Depositary Receipt |
Level 1 ($) | Level 2 ($) | Level 3 ($) | Total ($) | |
Investments in Securities | ||||
Common Stocks | ||||
Communication Services | 14,461,618 | — | — | 14,461,618 |
Consumer Discretionary | 77,227,541 | 1,018,135 | — | 78,245,676 |
Consumer Staples | 8,834,709 | — | — | 8,834,709 |
Energy | 36,860,969 | — | — | 36,860,969 |
Financials | 123,373,394 | — | — | 123,373,394 |
Health Care | 46,267,471 | — | — | 46,267,471 |
Industrials | 88,234,788 | — | — | 88,234,788 |
Information Technology | 49,130,499 | — | — | 49,130,499 |
Materials | 51,169,396 | — | — | 51,169,396 |
Real Estate | 29,723,917 | — | — | 29,723,917 |
Utilities | 18,360,337 | — | — | 18,360,337 |
Total Common Stocks | 543,644,639 | 1,018,135 | — | 544,662,774 |
Money Market Funds | 435,115 | — | — | 435,115 |
Total Investments in Securities | 544,079,754 | 1,018,135 | — | 545,097,889 |
Assets | |
Investments in securities, at value | |
Unaffiliated issuers (cost $500,807,352) | $544,662,774 |
Affiliated issuers (cost $435,074) | 435,115 |
Receivable for: | |
Investments sold | 1,211,505 |
Capital shares sold | 141,203 |
Dividends | 851,814 |
Foreign tax reclaims | 2,472 |
Expense reimbursement due from Investment Manager | 1,496 |
Prepaid expenses | 6,265 |
Deferred compensation of board members | 113,708 |
Total assets | 547,426,352 |
Liabilities | |
Foreign currency (cost $2,473) | 2,472 |
Payable for: | |
Investments purchased | 1,450,426 |
Capital shares redeemed | 1,254,822 |
Management services fees | 13,084 |
Distribution and/or service fees | 1,518 |
Service fees | 52,131 |
Compensation of chief compliance officer | 93 |
Interfund lending | 1,200,000 |
Compensation of board members | 1,151 |
Other expenses | 30,935 |
Deferred compensation of board members | 136,105 |
Total liabilities | 4,142,737 |
Net assets applicable to outstanding capital stock | $543,283,615 |
Represented by | |
Paid in capital | 474,952,619 |
Total distributable earnings (loss) | 68,330,996 |
Total - representing net assets applicable to outstanding capital stock | $543,283,615 |
Class 1 | |
Net assets | $323,831,515 |
Shares outstanding | 24,956,517 |
Net asset value per share | $12.98 |
Class 2 | |
Net assets | $219,452,100 |
Shares outstanding | 17,131,325 |
Net asset value per share | $12.81 |
Net investment income | |
Income: | |
Dividends — unaffiliated issuers | $8,174,244 |
Dividends — affiliated issuers | 106,176 |
Foreign taxes withheld | (66,540 ) |
Total income | 8,213,880 |
Expenses: | |
Management services fees | 4,402,734 |
Distribution and/or service fees | |
Class 2 | 489,405 |
Service fees | 417,933 |
Custodian fees | 25,582 |
Printing and postage fees | 31,415 |
Accounting services fees | 30,090 |
Legal fees | 18,414 |
Interest on interfund lending | 4,005 |
Compensation of chief compliance officer | 93 |
Compensation of board members | 17,126 |
Deferred compensation of board members | 6,598 |
Other | 18,514 |
Total expenses | 5,461,909 |
Fees waived or expenses reimbursed by Investment Manager and its affiliates | (508,195 ) |
Total net expenses | 4,953,714 |
Net investment income | 3,260,166 |
Realized and unrealized gain (loss) — net | |
Net realized gain (loss) on: | |
Investments — unaffiliated issuers | 22,260,088 |
Investments — affiliated issuers | (1,211 ) |
Foreign currency translations | 224 |
Net realized gain | 22,259,101 |
Net change in unrealized appreciation (depreciation) on: | |
Investments — unaffiliated issuers | 79,127,151 |
Investments — affiliated issuers | 41 |
Foreign currency translations | 1 |
Net change in unrealized appreciation (depreciation) | 79,127,193 |
Net realized and unrealized gain | 101,386,294 |
Net increase in net assets resulting from operations | $104,646,460 |
Year Ended December 31, 2023 | Year Ended December 31, 2022 | |
Operations | ||
Net investment income | $3,260,166 | $3,223,931 |
Net realized gain | 22,259,101 | 37,000,599 |
Net change in unrealized appreciation (depreciation) | 79,127,193 | (95,438,319 ) |
Net increase (decrease) in net assets resulting from operations | 104,646,460 | (55,213,789 ) |
Distributions to shareholders | ||
Net investment income and net realized gains | ||
Class 1 | (25,154,005 ) | (134,518,457 ) |
Class 2 | (15,116,508 ) | (79,388,766 ) |
Total distributions to shareholders | (40,270,513 ) | (213,907,223 ) |
Increase (decrease) in net assets from capital stock activity | (33,372,469 ) | 139,563,102 |
Total increase (decrease) in net assets | 31,003,478 | (129,557,910 ) |
Net assets at beginning of year | 512,280,137 | 641,838,047 |
Net assets at end of year | $543,283,615 | $512,280,137 |
Year Ended | Year Ended | |||
December 31, 2023 | December 31, 2022 | |||
Shares | Dollars ($) | Shares | Dollars ($) | |
Capital stock activity | ||||
Class 1 | ||||
Shares sold | 293,748 | 3,436,519 | 223,773 | 3,532,153 |
Distributions reinvested | 2,070,289 | 25,154,005 | 11,738,085 | 134,518,457 |
Shares redeemed | (5,153,857 ) | (63,532,349 ) | (3,664,462 ) | (54,106,164 ) |
Net increase (decrease) | (2,789,820 ) | (34,941,825 ) | 8,297,396 | 83,944,446 |
Class 2 | ||||
Shares sold | 1,269,224 | 14,950,934 | 807,729 | 13,543,027 |
Distributions reinvested | 1,258,660 | 15,116,508 | 7,006,952 | 79,388,766 |
Shares redeemed | (2,416,891 ) | (28,498,086 ) | (2,371,837 ) | (37,313,137 ) |
Net increase | 110,993 | 1,569,356 | 5,442,844 | 55,618,656 |
Total net increase (decrease) | (2,678,827 ) | (33,372,469 ) | 13,740,240 | 139,563,102 |
Net asset value, beginning of period | Net investment income | Net realized and unrealized gain (loss) | Total from investment operations | Distributions from net investment income | Distributions from net realized gains | Total distributions to shareholders | |
Class 1 | |||||||
Year Ended 12/31/2023 | $11.50 | 0.09 | 2.37 | 2.46 | (0.10 ) | (0.88 ) | (0.98 ) |
Year Ended 12/31/2022 | $20.75 | 0.10 | (1.93 ) | (1.83 ) | (0.14 ) | (7.28 ) | (7.42 ) |
Year Ended 12/31/2021 | $16.17 | 0.12 | 4.59 | 4.71 | (0.13 ) | — | (0.13 ) |
Year Ended 12/31/2020 | $15.67 | 0.14 | 1.01 | 1.15 | (0.08 ) | (0.57 ) | (0.65 ) |
Year Ended 12/31/2019 | $14.22 | 0.15 | 2.79 | 2.94 | (0.09 ) | (1.40 ) | (1.49 ) |
Class 2 | |||||||
Year Ended 12/31/2023 | $11.35 | 0.06 | 2.34 | 2.40 | (0.06 ) | (0.88 ) | (0.94 ) |
Year Ended 12/31/2022 | $20.58 | 0.06 | (1.92 ) | (1.86 ) | (0.09 ) | (7.28 ) | (7.37 ) |
Year Ended 12/31/2021 | $16.06 | 0.06 | 4.56 | 4.62 | (0.10 ) | — | (0.10 ) |
Year Ended 12/31/2020 | $15.55 | 0.10 | 1.02 | 1.12 | (0.04 ) | (0.57 ) | (0.61 ) |
Year Ended 12/31/2019 | $14.12 | 0.08 | 2.79 | 2.87 | (0.04 ) | (1.40 ) | (1.44 ) |
Notes to Financial Highlights | |
(a) | In addition to the fees and expenses that the Fund bears directly, the Fund indirectly bears a pro rata share of the fees and expenses of any other funds in which it invests. Such indirect expenses are not included in the Fund’s reported expense ratios. |
(b) | Total net expenses include the impact of certain fee waivers/expense reimbursements made by the Investment Manager and certain of its affiliates, if applicable. |
(c) | Ratios include interfund lending expense which is less than 0.01%. |
Net asset value, end of period | Total return | Total gross expense ratio to average net assets(a) | Total net expense ratio to average net assets(a),(b) | Net investment income ratio to average net assets | Portfolio turnover | Net assets, end of period (000’s) | |
Class 1 | |||||||
Year Ended 12/31/2023 | $12.98 | 21.94% | 0.98% (c) | 0.88% (c) | 0.73% | 59% | $323,832 |
Year Ended 12/31/2022 | $11.50 | (8.69% ) | 0.95% (c) | 0.88% (c) | 0.67% | 52% | $319,024 |
Year Ended 12/31/2021 | $20.75 | 29.19% | 0.97% (c) | 0.88% (c) | 0.58% | 69% | $403,571 |
Year Ended 12/31/2020 | $16.17 | 8.80% | 1.02% (c) | 0.90% (c) | 1.05% | 57% | $373,200 |
Year Ended 12/31/2019 | $15.67 | 21.34% | 1.04% (c) | 0.92% (c) | 1.00% | 60% | $316,513 |
Class 2 | |||||||
Year Ended 12/31/2023 | $12.81 | 21.67% | 1.23% (c) | 1.13% (c) | 0.50% | 59% | $219,452 |
Year Ended 12/31/2022 | $11.35 | (8.97% ) | 1.20% (c) | 1.13% (c) | 0.43% | 52% | $193,256 |
Year Ended 12/31/2021 | $20.58 | 28.80% | 1.21% (c) | 1.13% (c) | 0.31% | 69% | $238,267 |
Year Ended 12/31/2020 | $16.06 | 8.59% | 1.27% (c) | 1.15% (c) | 0.80% | 57% | $322,390 |
Year Ended 12/31/2019 | $15.55 | 20.98% | 1.31% (c) | 1.17% (c) | 0.52% | 60% | $315,238 |
Purchases ($) | Sales ($) | Net realized gain (loss) ($) |
185,476 | — | — |
Fee rate(s) contractual through April 30, 2024 | |
Class 1 | 0.88 % |
Class 2 | 1.13 |
Undistributed net investment income ($) | Accumulated net realized gain ($) | Paid in capital ($) |
(53,972 ) | 53,972 | — |
Year Ended December 31, 2023 | Year Ended December 31, 2022 | ||||
Ordinary income ($) | Long-term capital gains ($) | Total ($) | Ordinary income ($) | Long-term capital gains ($) | Total ($) |
7,917,695 | 32,352,818 | 40,270,513 | 64,453,867 | 149,453,356 | 213,907,223 |
Undistributed ordinary income ($) | Undistributed long-term capital gains ($) | Capital loss carryforwards ($) | Net unrealized appreciation ($) |
16,737,898 | 8,071,056 | — | 43,648,164 |
Federal tax cost ($) | Gross unrealized appreciation ($) | Gross unrealized (depreciation) ($) | Net unrealized appreciation ($) |
501,449,725 | 96,763,834 | (53,115,670 ) | 43,648,164 |
Borrower or lender | Average loan balance ($) | Weighted average interest rate (%) | Number of days with outstanding loans |
Borrower | 881,250 | 5.54 | 32 |
Dividends received deduction | Capital gain dividend |
81.48% | $8,576,598 |
Name, address, year of birth | Position held with the Columbia Funds and length of service | Principal occupation(s) during past five years and other relevant professional experience | Number of Funds in the Columbia Funds Complex* overseen | Other directorships held by Trustee during the past five years and other relevant Board experience |
George S. Batejan c/o Columbia Management Investment Advisers, LLC 290 Congress Street Boston, MA 02210 1954 | Trustee since 2017 | Executive Vice President, Global Head of Technology and Operations, Janus Capital Group, Inc., 2010-2016 | 161 | Former Chairman of the Board, NICSA (National Investment Company Services Association) (Executive Committee, Nominating Committee and Governance Committee), 2014-2016; former Director, Intech Investment Management, 2011-2016; former Board Member, Metro Denver Chamber of Commerce, 2015-2016; former Advisory Board Member, University of Colorado Business School, 2015-2018; former Board Member, Chase Bank International, 1993-1994 |
Name, address, year of birth | Position held with the Columbia Funds and length of service | Principal occupation(s) during past five years and other relevant professional experience | Number of Funds in the Columbia Funds Complex* overseen | Other directorships held by Trustee during the past five years and other relevant Board experience |
Kathleen Blatz c/o Columbia Management Investment Advisers, LLC 290 Congress Street Boston, MA 02210 1954 | Trustee since 2006 | Attorney, specializing in arbitration and mediation; Trustee of Gerald Rauenhorst 1982 Trusts, since 2020; Chief Justice, Minnesota Supreme Court, 1998-2006; Associate Justice, Minnesota Supreme Court, 1996-1998; Fourth Judicial District Court Judge, Hennepin County, 1994-1996; Attorney in private practice and public service, 1984-1993; State Representative, Minnesota House of Representatives, 1979-1993, which included service on the Tax and Financial Institutions and Insurance Committees; Member and Interim Chair, Minnesota Sports Facilities Authority, January-July 2017; Interim President and Chief Executive Officer, Blue Cross and Blue Shield of Minnesota (health care insurance), February-July 2018, April-October 2021 | 161 | Former Trustee, Blue Cross and Blue Shield of Minnesota, 2009-2021 (Chair of the Business Development Committee, 2014-2017; Chair of the Governance Committee, 2017-2019); former Member and Chair of the Board, Minnesota Sports Facilities Authority, January 2017-July 2017; former Director, Robina Foundation, 2009-2020 (Chair, 2014-2020); Director, Richard M. Schulze Family Foundation, since 2021 |
Pamela G. Carlton c/o Columbia Management Investment Advisers, LLC 290 Congress Street Boston, MA 02210 1954 | Chair since 2023; Trustee since 2007 | President, Springboard – Partners in Cross Cultural Leadership (consulting company), since 2003; Managing Director of US Equity Research, JP Morgan Chase, 1999-2003; Director of US Equity Research, Chase Asset Management, 1996-1999; Co-Director Latin America Research, 1993-1996, COO Global Research, 1992-1996, Co-Director of US Research, 1991-1992, Investment Banker, 1982-1991, Morgan Stanley; Attorney, Cleary Gottlieb Steen & Hamilton LLP, 1980-1982 | 161 | Trustee, New York Presbyterian Hospital Board, since 1996; Director, DR Bank (Audit Committee, since 2017 and Audit Committee Chair, since November 2023); Director, Evercore Inc. (Audit Committee, Nominating and Governance Committee) (financial services company), since 2019; Director, Apollo Commercial Real Estate Finance, Inc. (Chair, Nominating and Governance Committee), since 2021; the Governing Council of the Independent Directors Council (IDC), since 2021 |
Janet Langford Carrig c/o Columbia Management Investment Advisers, LLC 290 Congress Street Boston, MA 02210 1957 | Trustee since 1996 | Senior Vice President, General Counsel and Corporate Secretary, ConocoPhillips (independent energy company), September 2007-October 2018 | 161 | Director, EQT Corporation (natural gas producer), since 2019; former Director, Whiting Petroleum Corporation (independent oil and gas company), 2020-2022 |
J. Kevin Connaughton c/o Columbia Management Investment Advisers, LLC 290 Congress Street Boston, MA 02210 1964 | Trustee since 2020 | CEO and President, RhodeWay Financial (non-profit financial planning firm), since December 2022; Member, FINRA National Adjudicatory Council, January 2020-December 31, 2023; Adjunct Professor of Finance, Bentley University January 2018-April 2023; Consultant to Independent Trustees of CFVIT and CFST I from March 2016 to June 2020 with respect to CFVIT and to December 2020 with respect to CFST I; Managing Director and General Manager of Mutual Fund Products, Columbia Management Investment Advisers, LLC, May 2010-February 2015; President, Columbia Funds, 2008-2015; and senior officer of Columbia Funds and affiliated funds, 2003-2015 | 159 | Former Director, The Autism Project, March 2015-December 2021; former Member of the Investment Committee, St. Michael’s College, November 2015-February 2020; former Trustee, St. Michael’s College, June 2017-September 2019; former Trustee, New Century Portfolios (former mutual fund complex), January 2015-December 2017 |
Name, address, year of birth | Position held with the Columbia Funds and length of service | Principal occupation(s) during past five years and other relevant professional experience | Number of Funds in the Columbia Funds Complex* overseen | Other directorships held by Trustee during the past five years and other relevant Board experience |
Olive M. Darragh c/o Columbia Management Investment Advisers, LLC 290 Congress Street Boston, MA 02210 1962 | Trustee since 2020 | Managing Director of Darragh Inc. (strategy and talent management consulting firm), since 2010; Founder and CEO, Zolio, Inc. (investment management talent identification platform), since 2004; Consultant to Independent Trustees of CFVIT and CFST I from June 2019 to June 2020 with respect to CFVIT and to December 2020 with respect to CFST I; Partner, Tudor Investments, 2004-2010; Senior Partner, McKinsey & Company (consulting), 1990-2004; Touche Ross CPA, 1985-1988 | 159 | Treasurer, Edinburgh University US Trust Board, since January 2023; Member, HBS Community Action Partners Board, since September 2022; former Director, University of Edinburgh Business School (Member of US Board), 2004-2019; former Director, Boston Public Library Foundation, 2008-2017 |
Patricia M. Flynn c/o Columbia Management Investment Advisers, LLC 290 Congress Street Boston, MA 02210 1950 | Trustee since 2004 | Professor Emeritus of Economics and Management, Bentley University, since 2023; Professor of Economics and Management, Bentley University, 1976-2023; Dean, McCallum Graduate School of Business, Bentley University, 1992-2002 | 161 | Former Trustee, MA Taxpayers Foundation, 1997-2022; former Director, The MA Business Roundtable, 2003-2019; former Chairperson, Innovation Index Advisory Committee, MA Technology Collaborative, 1997-2020 |
Brian J. Gallagher c/o Columbia Management Investment Advisers, LLC 290 Congress Street Boston, MA 02210 1954 | Trustee since 2017 | Retired; Partner with Deloitte & Touche LLP and its predecessors, 1977-2016 | 161 | Trustee, Catholic Schools Foundation, since 2004 |
Douglas A. Hacker c/o Columbia Management Investment Advisers, LLC 290 Congress Street Boston, MA 02210 1955 | Trustee since 1996 | Independent business executive, since May 2006; Executive Vice President – Strategy of United Airlines, December 2002 - May 2006; President of UAL Loyalty Services (airline marketing company), September 2001-December 2002; Executive Vice President and Chief Financial Officer of United Airlines, July 1999-September 2001 | 161 | Director, SpartanNash Company since November 2013 (Chair of the Board, since May 2021) (food distributor); Director, Aircastle Limited (Chair of Audit Committee) (aircraft leasing), since August 2006; former Director, Nash Finch Company (food distributor), 2005-2013; former Director, SeaCube Container Leasing Ltd. (container leasing), 2010-2013; and former Director, Travelport Worldwide Limited (travel information technology), 2014-2019 |
Nancy T. Lukitsh c/o Columbia Management Investment Advisers, LLC 290 Congress Street Boston, MA 02210 1956 | Trustee since 2011 | Senior Vice President, Partner and Director of Marketing, Wellington Management Company, LLP (investment adviser), 1997-2010; Chair, Wellington Management Portfolios (commingled non-U.S. investment pools), 2007-2010; Director, Wellington Trust Company, NA and other Wellington affiliates, 1997-2010 | 159 | None |
Name, address, year of birth | Position held with the Columbia Funds and length of service | Principal occupation(s) during past five years and other relevant professional experience | Number of Funds in the Columbia Funds Complex* overseen | Other directorships held by Trustee during the past five years and other relevant Board experience |
David M. Moffett c/o Columbia Management Investment Advisers, LLC 290 Congress Street Boston, MA 02210 1952 | Trustee since 2011 | Retired; former Chief Executive Officer of Freddie Mac and Chief Financial Officer of U.S. Bank | 161 | Director, CSX Corporation (transportation suppliers); Director, PayPal Holdings Inc. (payment and data processing services); former Director, eBay Inc. (online trading community), 2007-2015; and former Director, CIT Bank, CIT Group Inc. (commercial and consumer finance), 2010-2016; former Senior Adviser to The Carlyle Group (financial services), March 2008-September 2008; former Governance Consultant to Bridgewater Associates, January 2013-December 2015 |
Catherine James Paglia c/o Columbia Management Investment Advisers, LLC 290 Congress Street Boston, MA 02210 1952 | Trustee since 2004 | Director, Enterprise Asset Management, Inc. (private real estate and asset management company), since September 1998; Managing Director and Partner, Interlaken Capital, Inc., 1989-1997; Vice President, 1982-1985, Principal, 1985-1987, Managing Director, 1987-1989, Morgan Stanley; Vice President, Investment Banking, 1980-1982, Associate, Investment Banking, 1976-1980, Dean Witter Reynolds, Inc. | 161 | Director, Valmont Industries, Inc. (irrigation systems manufacturer), since 2012; Trustee, Carleton College (on the Investment Committee), since 1987; Trustee, Carnegie Endowment for International Peace (on the Investment Committee), since 2009 |
Natalie A. Trunow c/o Columbia Management Investment Advisers, LLC 290 Congress Street Boston, MA 02210 1967 | Trustee since 2020 | Chief Executive Officer, Millennial Portfolio Solutions LLC (asset management and consulting services), January 2016-January 2021; Non-executive Member of the Investment Committee and Valuation Committee, Sarona Asset Management Inc. (private equity firm) since September 2019; Advisor, Horizon Investments (asset management and consulting services), August 2018-January 2022; Advisor, Paradigm Asset Management, November 2016-January 2022; Consultant to Independent Trustees of CFVIT and CFST I from September 2016 to June 2020 with respect to CFVIT and to December 2020 with respect to CFST I; Director of Investments/Consultant, Casey Family Programs, April 2016-November 2016; Senior Vice President and Chief Investment Officer, Calvert Investments, August 2008-January 2016; Section Head and Portfolio Manager, General Motors Asset Management, June 1997-August 2008 | 159 | Independent Director, Investment Committee, Health Services for Children with Special Needs, Inc., 2010-2021; Independent Director, (Executive Committee and Chair, Audit Committee), Consumer Credit Counseling Services (formerly Guidewell Financial Solutions), since 2016; Independent Director, (Investment Committee), Sarona Asset Management, since 2019 |
Sandra L. Yeager c/o Columbia Management Investment Advisers, LLC 290 Congress Street Boston, MA 02210 1964 | Trustee since 2017 | Retired; President and founder, Hanoverian Capital, LLC (SEC registered investment advisor firm), 2008-2016; Managing Director, DuPont Capital, 2006-2008; Managing Director, Morgan Stanley Investment Management, 2004-2006; Senior Vice President, Alliance Bernstein, 1990-2004 | 161 | Former Director, NAPE (National Alliance for Partnerships in Equity) Education Foundation, October 2016-October 2020; Advisory Board, Jennersville YMCA, June 2022-June 2023 |
Name, address, year of birth | Position held with the Columbia Funds and length of service | Principal occupation(s) during the past five years and other relevant professional experience | Number of Funds in the Columbia Funds Complex* overseen | Other directorships held by Trustee during the past five years and other relevant Board experience |
Daniel J. Beckman c/o Columbia Management Investment Advisers, LLC 290 Congress Street Boston, MA 02210 1962 | Trustee since November 2021 and President since June 2021 | President and Principal Executive Officer of the Columbia Funds, since June 2021; Vice President, Columbia Management Investment Advisers, LLC, since April 2015; formerly, Vice President – Head of North America Product, Columbia Management Investment Advisers, LLC, April 2015 – December 2023; President and Principal Executive Officer, Columbia Acorn/Wanger Funds, since July 2021 | 161 | Director, Ameriprise Trust Company, since October 2016; Director, Columbia Management Investment Distributors, Inc., since November 2018; Board of Governors, Columbia Wanger Asset Management, LLC, since January 2022 |
* | The term “Columbia Funds Complex” as used herein includes Columbia Seligman Premium Technology Growth Fund, Tri-Continental Corporation and each series of Columbia Funds Series Trust (CFST), Columbia Funds Series Trust I (CFST I), Columbia Funds Series Trust II (CFST II), Columbia ETF Trust I (CET I), Columbia ETF Trust II (CET II), Columbia Funds Variable Insurance Trust (CFVIT) and Columbia Funds Variable Series Trust II (CFVST II). Messrs. Batejan, Beckman, Gallagher, Hacker and Moffett and Mses. Blatz, Carlton, Carrig, Flynn, Paglia, and Yeager serve as directors of Columbia Seligman Premium Technology Growth Fund and Tri-Continental Corporation. |
** | Interested person (as defined under the 1940 Act) by reason of being an officer, director, security holder and/or employee of the Investment Manager or Ameriprise Financial. |
Name, address and year of birth | Position and year first appointed to position for any Fund in the Columbia Funds Complex or a predecessor thereof | Principal occupation(s) during past five years |
Michael G. Clarke 290 Congress Street Boston, MA 02210 1969 | Chief Financial Officer and Principal Financial Officer (2009); Senior Vice President (2019); Treasurer and Chief Accounting Officer (Principal Accounting Officer) (2024) for CFST, CFST I, CFST II, CFVIT and CFVST II | Senior Vice President and North America Head of Operations & Investor Services, Columbia Management Investment Advisers, LLC, since June 2023 (previously Senior Vice President and Head of Global Operations, March 2022 – June 2023, Vice President, Head of North America Operations, and Co-Head of Global Operations, June 2019 - February 2022 and Vice President – Accounting and Tax, May 2010 - May 2019); senior officer of Columbia Funds and affiliated funds, since 2002. Director, Ameriprise Trust Company, since June 2023. |
Name, address and year of birth | Position and year first appointed to position for any Fund in the Columbia Funds Complex or a predecessor thereof | Principal occupation(s) during past five years |
Marybeth Pilat 290 Congress Street Boston, MA 02210 1968 | Treasurer and Chief Accounting Officer (Principal Accounting Officer) and Principal Financial Officer (2020) for CET I and CET II; Assistant Treasurer, CFST, CFST I, CFST II, CFVIT and CFVST II | Vice President – Product Pricing and Administration, Columbia Management Investment Advisers, LLC, since May 2017. |
William F. Truscott 290 Congress Street Boston, MA 02210 1960 | Senior Vice President (2001) | Formerly, Trustee/Director of Columbia Funds Complex or legacy funds, November 2001 - January 1, 2021; Chief Executive Officer, Global Asset Management, Ameriprise Financial, Inc., since September 2012; Chairman of the Board and President, Columbia Management Investment Advisers, LLC, since July 2004 and February 2012, respectively; Chairman of the Board and Chief Executive Officer, Columbia Management Investment Distributors, Inc., since November 2008 and February 2012, respectively; Chairman of the Board and Director, TAM UK International Holdings Limited, since July 2021; formerly Chairman of the Board and Director, Threadneedle Asset Management Holdings, Sàrl, March 2013 – December 2022 and December 2008 – December 2022, respectively; senior executive of various entities affiliated with Columbia Threadneedle Investments. |
Christopher O. Petersen 5228 Ameriprise Financial Center Minneapolis, MN 55474 1970 | Senior Vice President and Assistant Secretary (2021) | Formerly, Trustee/Director of funds within the Columbia Funds Complex, July 1, 2020 - November 22, 2021; Senior Vice President and Assistant General Counsel, Ameriprise Financial, Inc., since September 2021 (previously Vice President and Lead Chief Counsel, January 2015 - September 2021); formerly, President and Principal Executive Officer of the Columbia Funds, 2015 - 2021; officer of Columbia Funds and affiliated funds, since 2007. |
Thomas P. McGuire 290 Congress Street Boston, MA 02210 1972 | Senior Vice President and Chief Compliance Officer (2012) | Vice President – Asset Management Compliance, Ameriprise Financial, Inc., since May 2010; Chief Compliance Officer, Columbia Acorn/Wanger Funds, since December 2015; formerly, Chief Compliance Officer, Ameriprise Certificate Company, September 2010 – September 2020. |
Ryan C. Larrenaga 290 Congress Street Boston, MA 02210 1970 | Senior Vice President (2017), Chief Legal Officer (2017), and Secretary (2015) | Vice President and Chief Counsel, Ameriprise Financial, Inc., since August 2018 (previously Vice President and Group Counsel, August 2011 - August 2018); Chief Legal Officer, Columbia Acorn/Wanger Funds, since September 2020; officer of Columbia Funds and affiliated funds, since 2005. |
Michael E. DeFao 290 Congress Street Boston, MA 02210 1968 | Vice President (2011) and Assistant Secretary (2010) | Vice President and Chief Counsel, Ameriprise Financial, Inc., since May 2010; Vice President, Chief Legal Officer and Assistant Secretary, Columbia Management Investment Advisers, LLC, since October 2021 (previously Vice President and Assistant Secretary, May 2010 – September 2021). |
Lyn Kephart-Strong 5903 Ameriprise Financial Center Minneapolis, MN 55474 1960 | Vice President (2015) | Vice President, Global Investment Operations Services, Columbia Management Investment Advisers, LLC, since 2010; President, Columbia Management Investment Services Corp., since October 2014; President, Ameriprise Trust Company, since January 2017. |


3 | |
5 | |
7 | |
8 | |
12 | |
13 | |
14 | |
16 | |
18 | |
25 | |
26 |
Average annual total returns (%) (for the period ended December 31, 2023) | |||||
Inception | 1 Year | 5 Years | 10 Years | ||
Class 1 | 04/30/12 | 32.17 | 16.83 | 11.82 | |
Class 2 | 04/30/12 | 31.88 | 16.54 | 11.54 | |
Russell 1000 Index | 26.53 | 15.52 | 11.80 | ||

Portfolio breakdown (%) (at December 31, 2023) | |
Common Stocks | 98.4 |
Money Market Funds | 1.6 |
Total | 100.0 |
Equity sector breakdown (%) (at December 31, 2023) | |
Communication Services | 12.8 |
Consumer Discretionary | 7.7 |
Consumer Staples | 5.2 |
Energy | 4.0 |
Financials | 12.4 |
Health Care | 13.2 |
Industrials | 10.1 |
Information Technology | 28.3 |
Materials | 2.8 |
Real Estate | 1.3 |
Utilities | 2.2 |
Total | 100.0 |
July 1, 2023 — December 31, 2023 | |||||||
Account value at the beginning of the period ($) | Account value at the end of the period ($) | Expenses paid during the period ($) | Fund’s annualized expense ratio (%) | ||||
Actual | Hypothetical | Actual | Hypothetical | Actual | Hypothetical | Actual | |
Class 1 | 1,000.00 | 1,000.00 | 1,094.80 | 1,021.54 | 3.55 | 3.43 | 0.68 |
Class 2 | 1,000.00 | 1,000.00 | 1,093.90 | 1,020.29 | 4.85 | 4.68 | 0.93 |
Common Stocks 98.1% | ||
Issuer | Shares | Value ($) |
Communication Services 12.6% | ||
Entertainment 1.6% | ||
Endeavor Group Holdings, Inc., Class A | 422,116 | 10,016,813 |
Take-Two Interactive Software, Inc.(a) | 74,777 | 12,035,358 |
Total | 22,052,171 | |
Interactive Media & Services 8.9% | ||
Alphabet, Inc., Class A(a) | 206,020 | 28,778,934 |
Alphabet, Inc., Class C(a) | 176,798 | 24,916,142 |
Match Group, Inc.(a) | 290,175 | 10,591,388 |
Meta Platforms, Inc., Class A(a) | 109,149 | 38,634,380 |
Pinterest, Inc., Class A(a) | 333,728 | 12,361,285 |
ZoomInfo Technologies, Inc.(a) | 508,388 | 9,400,094 |
Total | 124,682,223 | |
Media 1.0% | ||
Comcast Corp., Class A | 311,752 | 13,670,325 |
Wireless Telecommunication Services 1.1% | ||
T-Mobile US, Inc. | 96,103 | 15,408,194 |
Total Communication Services | 175,812,913 | |
Consumer Discretionary 7.5% | ||
Automobiles 0.6% | ||
Tesla, Inc.(a) | 35,662 | 8,861,294 |
Broadline Retail 4.3% | ||
Amazon.com, Inc.(a) | 390,540 | 59,338,648 |
Hotels, Restaurants & Leisure 0.8% | ||
Las Vegas Sands Corp. | 212,570 | 10,460,569 |
McDonald’s Corp. | 4,633 | 1,373,731 |
Total | 11,834,300 | |
Textiles, Apparel & Luxury Goods 1.8% | ||
NIKE, Inc., Class B | 128,819 | 13,985,879 |
Tapestry, Inc. | 302,123 | 11,121,147 |
Total | 25,107,026 | |
Total Consumer Discretionary | 105,141,268 | |
Common Stocks (continued) | ||
Issuer | Shares | Value ($) |
Consumer Staples 5.1% | ||
Consumer Staples Distribution & Retail 2.6% | ||
Dollar Tree, Inc.(a) | 56,426 | 8,015,313 |
Sysco Corp. | 153,303 | 11,211,049 |
Walmart, Inc. | 110,882 | 17,480,547 |
Total | 36,706,909 | |
Food Products 0.8% | ||
Mondelez International, Inc., Class A | 159,378 | 11,543,748 |
Household Products 1.0% | ||
Procter & Gamble Co. (The) | 96,815 | 14,187,270 |
Personal Care Products 0.7% | ||
Coty, Inc., Class A(a) | 708,802 | 8,803,321 |
Total Consumer Staples | 71,241,248 | |
Energy 4.0% | ||
Oil, Gas & Consumable Fuels 4.0% | ||
Canadian Natural Resources Ltd. | 240,598 | 15,763,981 |
Chevron Corp. | 172,830 | 25,779,323 |
EOG Resources, Inc. | 114,630 | 13,864,498 |
Total | 55,407,802 | |
Total Energy | 55,407,802 | |
Financials 12.2% | ||
Banks 4.0% | ||
Bank of America Corp. | 560,815 | 18,882,641 |
JPMorgan Chase & Co. | 136,741 | 23,259,644 |
Wells Fargo & Co. | 285,313 | 14,043,106 |
Total | 56,185,391 | |
Capital Markets 2.9% | ||
BlackRock, Inc. | 28,676 | 23,279,177 |
Charles Schwab Corp. (The) | 85,973 | 5,914,942 |
S&P Global, Inc. | 24,205 | 10,662,787 |
Total | 39,856,906 | |
Consumer Finance 0.7% | ||
American Express Co. | 55,198 | 10,340,794 |
Common Stocks (continued) | ||
Issuer | Shares | Value ($) |
Financial Services 4.5% | ||
Berkshire Hathaway, Inc., Class B(a) | 25,491 | 9,091,620 |
Block, Inc., Class A(a) | 126,477 | 9,782,996 |
MasterCard, Inc., Class A | 47,735 | 20,359,455 |
Visa, Inc., Class A | 89,952 | 23,419,003 |
Total | 62,653,074 | |
Insurance 0.1% | ||
Aon PLC, Class A | 4,864 | 1,415,521 |
Total Financials | 170,451,686 | |
Health Care 13.0% | ||
Biotechnology 3.3% | ||
AbbVie, Inc. | 141,858 | 21,983,734 |
BioMarin Pharmaceutical, Inc.(a) | 108,930 | 10,503,031 |
Vertex Pharmaceuticals, Inc.(a) | 34,266 | 13,942,493 |
Total | 46,429,258 | |
Health Care Equipment & Supplies 1.9% | ||
Abbott Laboratories | 61,599 | 6,780,202 |
Becton Dickinson & Co. | 37,589 | 9,165,326 |
Boston Scientific Corp.(a) | 176,652 | 10,212,252 |
Total | 26,157,780 | |
Health Care Providers & Services 3.1% | ||
Elevance Health, Inc. | 52,232 | 24,630,522 |
UnitedHealth Group, Inc. | 35,281 | 18,574,388 |
Total | 43,204,910 | |
Life Sciences Tools & Services 2.0% | ||
Danaher Corp. | 32,076 | 7,420,462 |
IQVIA Holdings, Inc.(a) | 31,668 | 7,327,342 |
Thermo Fisher Scientific, Inc. | 25,611 | 13,594,062 |
Total | 28,341,866 | |
Pharmaceuticals 2.7% | ||
Eli Lilly & Co. | 34,019 | 19,830,356 |
Pfizer, Inc. | 588,075 | 16,930,679 |
Total | 36,761,035 | |
Total Health Care | 180,894,849 | |
Common Stocks (continued) | ||
Issuer | Shares | Value ($) |
Industrials 9.9% | ||
Aerospace & Defense 1.5% | ||
L3Harris Technologies, Inc. | 53,666 | 11,303,133 |
RTX Corp. | 121,196 | 10,197,431 |
Total | 21,500,564 | |
Air Freight & Logistics 1.3% | ||
United Parcel Service, Inc., Class B | 114,944 | 18,072,645 |
Electrical Equipment 1.2% | ||
Emerson Electric Co. | 173,873 | 16,923,059 |
Ground Transportation 2.4% | ||
Uber Technologies, Inc.(a) | 176,472 | 10,865,381 |
Union Pacific Corp. | 90,129 | 22,137,485 |
Total | 33,002,866 | |
Industrial Conglomerates 2.3% | ||
General Electric Co. | 113,237 | 14,452,439 |
Honeywell International, Inc. | 82,072 | 17,211,319 |
Total | 31,663,758 | |
Machinery 1.2% | ||
Parker-Hannifin Corp. | 38,060 | 17,534,242 |
Total Industrials | 138,697,134 | |
Information Technology 27.7% | ||
Electronic Equipment, Instruments & Components 1.3% | ||
TE Connectivity Ltd. | 129,219 | 18,155,270 |
IT Services 2.3% | ||
Accenture PLC, Class A | 41,474 | 14,553,641 |
International Business Machines Corp. | 104,940 | 17,162,937 |
Total | 31,716,578 | |
Semiconductors & Semiconductor Equipment 7.7% | ||
Advanced Micro Devices, Inc.(a) | 63,154 | 9,309,531 |
Entegris, Inc. | 70,543 | 8,452,462 |
Lam Research Corp. | 21,660 | 16,965,412 |
Marvell Technology, Inc. | 94,114 | 5,676,015 |
NVIDIA Corp. | 101,667 | 50,347,532 |
QUALCOMM, Inc. | 123,095 | 17,803,230 |
Total | 108,554,182 | |
Common Stocks (continued) | ||
Issuer | Shares | Value ($) |
Software 10.4% | ||
Adobe, Inc.(a) | 23,615 | 14,088,709 |
Intuit, Inc. | 35,888 | 22,431,077 |
Microsoft Corp. | 269,560 | 101,365,342 |
Palo Alto Networks, Inc.(a) | 23,836 | 7,028,760 |
Total | 144,913,888 | |
Technology Hardware, Storage & Peripherals 6.0% | ||
Apple, Inc. | 435,738 | 83,892,637 |
Total Information Technology | 387,232,555 | |
Materials 2.7% | ||
Chemicals 1.1% | ||
Sherwin-Williams Co. (The) | 48,157 | 15,020,168 |
Containers & Packaging 0.8% | ||
Avery Dennison Corp. | 57,212 | 11,565,978 |
Metals & Mining 0.8% | ||
Newmont Corp. | 280,682 | 11,617,428 |
Total Materials | 38,203,574 | |
Real Estate 1.3% | ||
Specialized REITs 1.3% | ||
American Tower Corp. | 82,631 | 17,838,380 |
Total Real Estate | 17,838,380 | |
Common Stocks (continued) | ||
Issuer | Shares | Value ($) |
Utilities 2.1% | ||
Multi-Utilities 2.1% | ||
Ameren Corp. | 154,132 | 11,149,909 |
DTE Energy Co. | 90,603 | 9,989,887 |
Public Service Enterprise Group, Inc. | 138,210 | 8,451,541 |
Total | 29,591,337 | |
Total Utilities | 29,591,337 | |
Total Common Stocks (Cost $987,426,655) | 1,370,512,746 | |
Money Market Funds 1.6% | ||
Shares | Value ($) | |
Columbia Short-Term Cash Fund, 5.569%(b),(c) | 22,897,052 | 22,892,473 |
Total Money Market Funds (Cost $22,892,473) | 22,892,473 | |
Total Investments in Securities (Cost: $1,010,319,128) | 1,393,405,219 | |
Other Assets & Liabilities, Net | 3,680,338 | |
Net Assets | 1,397,085,557 | |
(a) | Non-income producing investment. |
(b) | The rate shown is the seven-day current annualized yield at December 31, 2023. |
(c) | As defined in the Investment Company Act of 1940, as amended, an affiliated company is one in which the Fund owns 5% or more of the company’s outstanding voting securities, or a company which is under common ownership or control with the Fund. The value of the holdings and transactions in these affiliated companies during the year ended December 31, 2023 are as follows: |
Affiliated issuers | Beginning of period($) | Purchases($) | Sales($) | Net change in unrealized appreciation (depreciation)($) | End of period($) | Realized gain (loss)($) | Dividends($) | End of period shares |
Columbia Short-Term Cash Fund, 5.569% | ||||||||
37,684,790 | 302,564,085 | (317,353,481 ) | (2,921 ) | 22,892,473 | (1,444 ) | 1,123,288 | 22,897,052 | |
Level 1 ($) | Level 2 ($) | Level 3 ($) | Total ($) | |
Investments in Securities | ||||
Common Stocks | ||||
Communication Services | 175,812,913 | — | — | 175,812,913 |
Consumer Discretionary | 105,141,268 | — | — | 105,141,268 |
Consumer Staples | 71,241,248 | — | — | 71,241,248 |
Energy | 55,407,802 | — | — | 55,407,802 |
Financials | 170,451,686 | — | — | 170,451,686 |
Health Care | 180,894,849 | — | — | 180,894,849 |
Industrials | 138,697,134 | — | — | 138,697,134 |
Information Technology | 387,232,555 | — | — | 387,232,555 |
Materials | 38,203,574 | — | — | 38,203,574 |
Real Estate | 17,838,380 | — | — | 17,838,380 |
Utilities | 29,591,337 | — | — | 29,591,337 |
Total Common Stocks | 1,370,512,746 | — | — | 1,370,512,746 |
Money Market Funds | 22,892,473 | — | — | 22,892,473 |
Total Investments in Securities | 1,393,405,219 | — | — | 1,393,405,219 |
Assets | |
Investments in securities, at value | |
Unaffiliated issuers (cost $987,426,655) | $1,370,512,746 |
Affiliated issuers (cost $22,892,473) | 22,892,473 |
Receivable for: | |
Investments sold | 12,838,045 |
Capital shares sold | 23,247 |
Dividends | 714,383 |
Foreign tax reclaims | 18,158 |
Expense reimbursement due from Investment Manager | 2,472 |
Prepaid expenses | 12,005 |
Deferred compensation of board members | 196,083 |
Total assets | 1,407,209,612 |
Liabilities | |
Payable for: | |
Investments purchased | 8,105,064 |
Capital shares redeemed | 1,721,996 |
Management services fees | 27,826 |
Distribution and/or service fees | 1,191 |
Service fees | 12,521 |
Compensation of chief compliance officer | 256 |
Compensation of board members | 1,860 |
Other expenses | 22,977 |
Deferred compensation of board members | 230,364 |
Total liabilities | 10,124,055 |
Net assets applicable to outstanding capital stock | $1,397,085,557 |
Represented by | |
Trust capital | $1,397,085,557 |
Total - representing net assets applicable to outstanding capital stock | $1,397,085,557 |
Class 1 | |
Net assets | $1,223,796,528 |
Shares outstanding | 27,969,334 |
Net asset value per share | $43.75 |
Class 2 | |
Net assets | $173,289,029 |
Shares outstanding | 4,075,689 |
Net asset value per share | $42.52 |
Net investment income | |
Income: | |
Dividends — unaffiliated issuers | $17,160,582 |
Dividends — affiliated issuers | 1,123,288 |
Interfund lending | 114 |
Foreign taxes withheld | (103,145 ) |
Total income | 18,180,839 |
Expenses: | |
Management services fees | 9,760,107 |
Distribution and/or service fees | |
Class 2 | 372,615 |
Service fees | 105,977 |
Custodian fees | 17,180 |
Printing and postage fees | 13,904 |
Accounting services fees | 30,090 |
Legal fees | 29,119 |
Compensation of chief compliance officer | 257 |
Compensation of board members | 27,871 |
Deferred compensation of board members | 10,306 |
Other | 27,056 |
Total expenses | 10,394,482 |
Fees waived or expenses reimbursed by Investment Manager and its affiliates | (873,397 ) |
Total net expenses | 9,521,085 |
Net investment income | 8,659,754 |
Realized and unrealized gain (loss) — net | |
Net realized gain (loss) on: | |
Investments — unaffiliated issuers | 117,213,864 |
Investments — affiliated issuers | (1,444 ) |
Foreign currency translations | 444 |
Net realized gain | 117,212,864 |
Net change in unrealized appreciation (depreciation) on: | |
Investments — unaffiliated issuers | 252,857,436 |
Investments — affiliated issuers | (2,921 ) |
Foreign currency translations | 2,693 |
Net change in unrealized appreciation (depreciation) | 252,857,208 |
Net realized and unrealized gain | 370,070,072 |
Net increase in net assets resulting from operations | $378,729,826 |
Year Ended December 31, 2023 | Year Ended December 31, 2022 | |
Operations | ||
Net investment income | $8,659,754 | $9,384,893 |
Net realized gain | 117,212,864 | 83,119,653 |
Net change in unrealized appreciation (depreciation) | 252,857,208 | (394,766,107 ) |
Net increase (decrease) in net assets resulting from operations | 378,729,826 | (302,261,561 ) |
Decrease in net assets from capital stock activity | (265,606,743 ) | (89,032,389 ) |
Total increase (decrease) in net assets | 113,123,083 | (391,293,950 ) |
Net assets at beginning of year | 1,283,962,474 | 1,675,256,424 |
Net assets at end of year | $1,397,085,557 | $1,283,962,474 |
Year Ended | Year Ended | |||
December 31, 2023 | December 31, 2022 | |||
Shares | Dollars ($) | Shares | Dollars ($) | |
Capital stock activity | ||||
Class 1 | ||||
Shares sold | 111,810 | 4,292,255 | 146,080 | 5,048,992 |
Shares redeemed | (7,001,895 ) | (271,742,749 ) | (2,457,534 ) | (91,794,593 ) |
Net decrease | (6,890,085 ) | (267,450,494 ) | (2,311,454 ) | (86,745,601 ) |
Class 2 | ||||
Shares sold | 400,990 | 15,216,965 | 293,304 | 10,284,646 |
Shares redeemed | (361,383 ) | (13,373,214 ) | (358,478 ) | (12,571,434 ) |
Net increase (decrease) | 39,607 | 1,843,751 | (65,174 ) | (2,286,788 ) |
Total net decrease | (6,850,478 ) | (265,606,743 ) | (2,376,628 ) | (89,032,389 ) |
Net asset value, beginning of period | Net investment income | Net realized and unrealized gain (loss) | Total from investment operations | |
Class 1 | ||||
Year Ended 12/31/2023 | $33.10 | 0.25 | 10.40 | 10.65 |
Year Ended 12/31/2022 | $40.69 | 0.25 | (7.84 ) | (7.59 ) |
Year Ended 12/31/2021 | $32.74 | 0.20 | 7.75 | 7.95 |
Year Ended 12/31/2020 | $26.76 | 0.25 | 5.73 | 5.98 |
Year Ended 12/31/2019 | $20.10 | 0.27 | 6.39 | 6.66 |
Class 2 | ||||
Year Ended 12/31/2023 | $32.24 | 0.16 | 10.12 | 10.28 |
Year Ended 12/31/2022 | $39.73 | 0.15 | (7.64 ) | (7.49 ) |
Year Ended 12/31/2021 | $32.05 | 0.11 | 7.57 | 7.68 |
Year Ended 12/31/2020 | $26.27 | 0.17 | 5.61 | 5.78 |
Year Ended 12/31/2019 | $19.78 | 0.21 | 6.28 | 6.49 |
Notes to Financial Highlights | |
(a) | In addition to the fees and expenses that the Fund bears directly, the Fund indirectly bears a pro rata share of the fees and expenses of any other funds in which it invests. Such indirect expenses are not included in the Fund’s reported expense ratios. |
(b) | Total net expenses include the impact of certain fee waivers/expense reimbursements made by the Investment Manager and certain of its affiliates, if applicable. |
(c) | Ratios include interfund lending expense which is less than 0.01%. |
Net asset value, end of period | Total return | Total gross expense ratio to average net assets(a) | Total net expense ratio to average net assets(a),(b) | Net investment income ratio to average net assets | Portfolio turnover | Net assets, end of period (000’s) | |
Class 1 | |||||||
Year Ended 12/31/2023 | $43.75 | 32.17% | 0.74% | 0.68% | 0.67% | 42% | $1,223,797 |
Year Ended 12/31/2022 | $33.10 | (18.65% ) | 0.74% | 0.69% | 0.69% | 48% | $1,153,825 |
Year Ended 12/31/2021 | $40.69 | 24.28% | 0.73% | 0.70% | 0.54% | 45% | $1,512,305 |
Year Ended 12/31/2020 | $32.74 | 22.35% | 0.74% (c) | 0.69% (c) | 0.91% | 58% | $1,449,079 |
Year Ended 12/31/2019 | $26.76 | 33.13% | 0.74% (c) | 0.70% (c) | 1.16% | 43% | $1,433,380 |
Class 2 | |||||||
Year Ended 12/31/2023 | $42.52 | 31.88% | 1.00% | 0.93% | 0.42% | 42% | $173,289 |
Year Ended 12/31/2022 | $32.24 | (18.85% ) | 0.99% | 0.94% | 0.44% | 48% | $130,137 |
Year Ended 12/31/2021 | $39.73 | 23.96% | 0.98% | 0.95% | 0.29% | 45% | $162,952 |
Year Ended 12/31/2020 | $32.05 | 22.00% | 0.99% (c) | 0.94% (c) | 0.65% | 58% | $132,736 |
Year Ended 12/31/2019 | $26.27 | 32.81% | 0.99% (c) | 0.95% (c) | 0.90% | 43% | $112,800 |
Contractual expense cap July 1, 2023 through April 30, 2024 | Voluntary expense cap May 1, 2023 through June 30, 2023 | Contractual expense cap prior to May 1, 2023 | |
Class 1 | 0.68 % | 0.68 % | 0.68 % |
Class 2 | 0.93 | 0.93 | 0.93 |
Borrower or lender | Average loan balance ($) | Weighted average interest rate (%) | Number of days with outstanding loans |
Lender | 700,000 | 5.85 | 1 |
Name, address, year of birth | Position held with the Columbia Funds and length of service | Principal occupation(s) during past five years and other relevant professional experience | Number of Funds in the Columbia Funds Complex* overseen | Other directorships held by Trustee during the past five years and other relevant Board experience |
George S. Batejan c/o Columbia Management Investment Advisers, LLC 290 Congress Street Boston, MA 02210 1954 | Trustee since 2017 | Executive Vice President, Global Head of Technology and Operations, Janus Capital Group, Inc., 2010-2016 | 161 | Former Chairman of the Board, NICSA (National Investment Company Services Association) (Executive Committee, Nominating Committee and Governance Committee), 2014-2016; former Director, Intech Investment Management, 2011-2016; former Board Member, Metro Denver Chamber of Commerce, 2015-2016; former Advisory Board Member, University of Colorado Business School, 2015-2018; former Board Member, Chase Bank International, 1993-1994 |
Kathleen Blatz c/o Columbia Management Investment Advisers, LLC 290 Congress Street Boston, MA 02210 1954 | Trustee since 2006 | Attorney, specializing in arbitration and mediation; Trustee of Gerald Rauenhorst 1982 Trusts, since 2020; Chief Justice, Minnesota Supreme Court, 1998-2006; Associate Justice, Minnesota Supreme Court, 1996-1998; Fourth Judicial District Court Judge, Hennepin County, 1994-1996; Attorney in private practice and public service, 1984-1993; State Representative, Minnesota House of Representatives, 1979-1993, which included service on the Tax and Financial Institutions and Insurance Committees; Member and Interim Chair, Minnesota Sports Facilities Authority, January-July 2017; Interim President and Chief Executive Officer, Blue Cross and Blue Shield of Minnesota (health care insurance), February-July 2018, April-October 2021 | 161 | Former Trustee, Blue Cross and Blue Shield of Minnesota, 2009-2021 (Chair of the Business Development Committee, 2014-2017; Chair of the Governance Committee, 2017-2019); former Member and Chair of the Board, Minnesota Sports Facilities Authority, January 2017-July 2017; former Director, Robina Foundation, 2009-2020 (Chair, 2014-2020); Director, Richard M. Schulze Family Foundation, since 2021 |
Name, address, year of birth | Position held with the Columbia Funds and length of service | Principal occupation(s) during past five years and other relevant professional experience | Number of Funds in the Columbia Funds Complex* overseen | Other directorships held by Trustee during the past five years and other relevant Board experience |
Pamela G. Carlton c/o Columbia Management Investment Advisers, LLC 290 Congress Street Boston, MA 02210 1954 | Chair since 2023; Trustee since 2007 | President, Springboard – Partners in Cross Cultural Leadership (consulting company), since 2003; Managing Director of US Equity Research, JP Morgan Chase, 1999-2003; Director of US Equity Research, Chase Asset Management, 1996-1999; Co-Director Latin America Research, 1993-1996, COO Global Research, 1992-1996, Co-Director of US Research, 1991-1992, Investment Banker, 1982-1991, Morgan Stanley; Attorney, Cleary Gottlieb Steen & Hamilton LLP, 1980-1982 | 161 | Trustee, New York Presbyterian Hospital Board, since 1996; Director, DR Bank (Audit Committee, since 2017 and Audit Committee Chair, since November 2023); Director, Evercore Inc. (Audit Committee, Nominating and Governance Committee) (financial services company), since 2019; Director, Apollo Commercial Real Estate Finance, Inc. (Chair, Nominating and Governance Committee), since 2021; the Governing Council of the Independent Directors Council (IDC), since 2021 |
Janet Langford Carrig c/o Columbia Management Investment Advisers, LLC 290 Congress Street Boston, MA 02210 1957 | Trustee since 1996 | Senior Vice President, General Counsel and Corporate Secretary, ConocoPhillips (independent energy company), September 2007-October 2018 | 161 | Director, EQT Corporation (natural gas producer), since 2019; former Director, Whiting Petroleum Corporation (independent oil and gas company), 2020-2022 |
J. Kevin Connaughton c/o Columbia Management Investment Advisers, LLC 290 Congress Street Boston, MA 02210 1964 | Trustee since 2020 | CEO and President, RhodeWay Financial (non-profit financial planning firm), since December 2022; Member, FINRA National Adjudicatory Council, January 2020-December 31, 2023; Adjunct Professor of Finance, Bentley University January 2018-April 2023; Consultant to Independent Trustees of CFVIT and CFST I from March 2016 to June 2020 with respect to CFVIT and to December 2020 with respect to CFST I; Managing Director and General Manager of Mutual Fund Products, Columbia Management Investment Advisers, LLC, May 2010-February 2015; President, Columbia Funds, 2008-2015; and senior officer of Columbia Funds and affiliated funds, 2003-2015 | 159 | Former Director, The Autism Project, March 2015-December 2021; former Member of the Investment Committee, St. Michael’s College, November 2015-February 2020; former Trustee, St. Michael’s College, June 2017-September 2019; former Trustee, New Century Portfolios (former mutual fund complex), January 2015-December 2017 |
Olive M. Darragh c/o Columbia Management Investment Advisers, LLC 290 Congress Street Boston, MA 02210 1962 | Trustee since 2020 | Managing Director of Darragh Inc. (strategy and talent management consulting firm), since 2010; Founder and CEO, Zolio, Inc. (investment management talent identification platform), since 2004; Consultant to Independent Trustees of CFVIT and CFST I from June 2019 to June 2020 with respect to CFVIT and to December 2020 with respect to CFST I; Partner, Tudor Investments, 2004-2010; Senior Partner, McKinsey & Company (consulting), 1990-2004; Touche Ross CPA, 1985-1988 | 159 | Treasurer, Edinburgh University US Trust Board, since January 2023; Member, HBS Community Action Partners Board, since September 2022; former Director, University of Edinburgh Business School (Member of US Board), 2004-2019; former Director, Boston Public Library Foundation, 2008-2017 |
Name, address, year of birth | Position held with the Columbia Funds and length of service | Principal occupation(s) during past five years and other relevant professional experience | Number of Funds in the Columbia Funds Complex* overseen | Other directorships held by Trustee during the past five years and other relevant Board experience |
Patricia M. Flynn c/o Columbia Management Investment Advisers, LLC 290 Congress Street Boston, MA 02210 1950 | Trustee since 2004 | Professor Emeritus of Economics and Management, Bentley University, since 2023; Professor of Economics and Management, Bentley University, 1976-2023; Dean, McCallum Graduate School of Business, Bentley University, 1992-2002 | 161 | Former Trustee, MA Taxpayers Foundation, 1997-2022; former Director, The MA Business Roundtable, 2003-2019; former Chairperson, Innovation Index Advisory Committee, MA Technology Collaborative, 1997-2020 |
Brian J. Gallagher c/o Columbia Management Investment Advisers, LLC 290 Congress Street Boston, MA 02210 1954 | Trustee since 2017 | Retired; Partner with Deloitte & Touche LLP and its predecessors, 1977-2016 | 161 | Trustee, Catholic Schools Foundation, since 2004 |
Douglas A. Hacker c/o Columbia Management Investment Advisers, LLC 290 Congress Street Boston, MA 02210 1955 | Trustee since 1996 | Independent business executive, since May 2006; Executive Vice President – Strategy of United Airlines, December 2002 - May 2006; President of UAL Loyalty Services (airline marketing company), September 2001-December 2002; Executive Vice President and Chief Financial Officer of United Airlines, July 1999-September 2001 | 161 | Director, SpartanNash Company since November 2013 (Chair of the Board, since May 2021) (food distributor); Director, Aircastle Limited (Chair of Audit Committee) (aircraft leasing), since August 2006; former Director, Nash Finch Company (food distributor), 2005-2013; former Director, SeaCube Container Leasing Ltd. (container leasing), 2010-2013; and former Director, Travelport Worldwide Limited (travel information technology), 2014-2019 |
Nancy T. Lukitsh c/o Columbia Management Investment Advisers, LLC 290 Congress Street Boston, MA 02210 1956 | Trustee since 2011 | Senior Vice President, Partner and Director of Marketing, Wellington Management Company, LLP (investment adviser), 1997-2010; Chair, Wellington Management Portfolios (commingled non-U.S. investment pools), 2007-2010; Director, Wellington Trust Company, NA and other Wellington affiliates, 1997-2010 | 159 | None |
Name, address, year of birth | Position held with the Columbia Funds and length of service | Principal occupation(s) during past five years and other relevant professional experience | Number of Funds in the Columbia Funds Complex* overseen | Other directorships held by Trustee during the past five years and other relevant Board experience |
David M. Moffett c/o Columbia Management Investment Advisers, LLC 290 Congress Street Boston, MA 02210 1952 | Trustee since 2011 | Retired; former Chief Executive Officer of Freddie Mac and Chief Financial Officer of U.S. Bank | 161 | Director, CSX Corporation (transportation suppliers); Director, PayPal Holdings Inc. (payment and data processing services); former Director, eBay Inc. (online trading community), 2007-2015; and former Director, CIT Bank, CIT Group Inc. (commercial and consumer finance), 2010-2016; former Senior Adviser to The Carlyle Group (financial services), March 2008-September 2008; former Governance Consultant to Bridgewater Associates, January 2013-December 2015 |
Catherine James Paglia c/o Columbia Management Investment Advisers, LLC 290 Congress Street Boston, MA 02210 1952 | Trustee since 2004 | Director, Enterprise Asset Management, Inc. (private real estate and asset management company), since September 1998; Managing Director and Partner, Interlaken Capital, Inc., 1989-1997; Vice President, 1982-1985, Principal, 1985-1987, Managing Director, 1987-1989, Morgan Stanley; Vice President, Investment Banking, 1980-1982, Associate, Investment Banking, 1976-1980, Dean Witter Reynolds, Inc. | 161 | Director, Valmont Industries, Inc. (irrigation systems manufacturer), since 2012; Trustee, Carleton College (on the Investment Committee), since 1987; Trustee, Carnegie Endowment for International Peace (on the Investment Committee), since 2009 |
Natalie A. Trunow c/o Columbia Management Investment Advisers, LLC 290 Congress Street Boston, MA 02210 1967 | Trustee since 2020 | Chief Executive Officer, Millennial Portfolio Solutions LLC (asset management and consulting services), January 2016-January 2021; Non-executive Member of the Investment Committee and Valuation Committee, Sarona Asset Management Inc. (private equity firm) since September 2019; Advisor, Horizon Investments (asset management and consulting services), August 2018-January 2022; Advisor, Paradigm Asset Management, November 2016-January 2022; Consultant to Independent Trustees of CFVIT and CFST I from September 2016 to June 2020 with respect to CFVIT and to December 2020 with respect to CFST I; Director of Investments/Consultant, Casey Family Programs, April 2016-November 2016; Senior Vice President and Chief Investment Officer, Calvert Investments, August 2008-January 2016; Section Head and Portfolio Manager, General Motors Asset Management, June 1997-August 2008 | 159 | Independent Director, Investment Committee, Health Services for Children with Special Needs, Inc., 2010-2021; Independent Director, (Executive Committee and Chair, Audit Committee), Consumer Credit Counseling Services (formerly Guidewell Financial Solutions), since 2016; Independent Director, (Investment Committee), Sarona Asset Management, since 2019 |
Sandra L. Yeager c/o Columbia Management Investment Advisers, LLC 290 Congress Street Boston, MA 02210 1964 | Trustee since 2017 | Retired; President and founder, Hanoverian Capital, LLC (SEC registered investment advisor firm), 2008-2016; Managing Director, DuPont Capital, 2006-2008; Managing Director, Morgan Stanley Investment Management, 2004-2006; Senior Vice President, Alliance Bernstein, 1990-2004 | 161 | Former Director, NAPE (National Alliance for Partnerships in Equity) Education Foundation, October 2016-October 2020; Advisory Board, Jennersville YMCA, June 2022-June 2023 |
Name, address, year of birth | Position held with the Columbia Funds and length of service | Principal occupation(s) during the past five years and other relevant professional experience | Number of Funds in the Columbia Funds Complex* overseen | Other directorships held by Trustee during the past five years and other relevant Board experience |
Daniel J. Beckman c/o Columbia Management Investment Advisers, LLC 290 Congress Street Boston, MA 02210 1962 | Trustee since November 2021 and President since June 2021 | President and Principal Executive Officer of the Columbia Funds, since June 2021; Vice President, Columbia Management Investment Advisers, LLC, since April 2015; formerly, Vice President – Head of North America Product, Columbia Management Investment Advisers, LLC, April 2015 – December 2023; President and Principal Executive Officer, Columbia Acorn/Wanger Funds, since July 2021 | 161 | Director, Ameriprise Trust Company, since October 2016; Director, Columbia Management Investment Distributors, Inc., since November 2018; Board of Governors, Columbia Wanger Asset Management, LLC, since January 2022 |
* | The term “Columbia Funds Complex” as used herein includes Columbia Seligman Premium Technology Growth Fund, Tri-Continental Corporation and each series of Columbia Funds Series Trust (CFST), Columbia Funds Series Trust I (CFST I), Columbia Funds Series Trust II (CFST II), Columbia ETF Trust I (CET I), Columbia ETF Trust II (CET II), Columbia Funds Variable Insurance Trust (CFVIT) and Columbia Funds Variable Series Trust II (CFVST II). Messrs. Batejan, Beckman, Gallagher, Hacker and Moffett and Mses. Blatz, Carlton, Carrig, Flynn, Paglia, and Yeager serve as directors of Columbia Seligman Premium Technology Growth Fund and Tri-Continental Corporation. |
** | Interested person (as defined under the 1940 Act) by reason of being an officer, director, security holder and/or employee of the Investment Manager or Ameriprise Financial. |
Name, address and year of birth | Position and year first appointed to position for any Fund in the Columbia Funds Complex or a predecessor thereof | Principal occupation(s) during past five years |
Michael G. Clarke 290 Congress Street Boston, MA 02210 1969 | Chief Financial Officer and Principal Financial Officer (2009); Senior Vice President (2019); Treasurer and Chief Accounting Officer (Principal Accounting Officer) (2024) for CFST, CFST I, CFST II, CFVIT and CFVST II | Senior Vice President and North America Head of Operations & Investor Services, Columbia Management Investment Advisers, LLC, since June 2023 (previously Senior Vice President and Head of Global Operations, March 2022 – June 2023, Vice President, Head of North America Operations, and Co-Head of Global Operations, June 2019 - February 2022 and Vice President – Accounting and Tax, May 2010 - May 2019); senior officer of Columbia Funds and affiliated funds, since 2002. Director, Ameriprise Trust Company, since June 2023. |
Name, address and year of birth | Position and year first appointed to position for any Fund in the Columbia Funds Complex or a predecessor thereof | Principal occupation(s) during past five years |
Marybeth Pilat 290 Congress Street Boston, MA 02210 1968 | Treasurer and Chief Accounting Officer (Principal Accounting Officer) and Principal Financial Officer (2020) for CET I and CET II; Assistant Treasurer, CFST, CFST I, CFST II, CFVIT and CFVST II | Vice President – Product Pricing and Administration, Columbia Management Investment Advisers, LLC, since May 2017. |
William F. Truscott 290 Congress Street Boston, MA 02210 1960 | Senior Vice President (2001) | Formerly, Trustee/Director of Columbia Funds Complex or legacy funds, November 2001 - January 1, 2021; Chief Executive Officer, Global Asset Management, Ameriprise Financial, Inc., since September 2012; Chairman of the Board and President, Columbia Management Investment Advisers, LLC, since July 2004 and February 2012, respectively; Chairman of the Board and Chief Executive Officer, Columbia Management Investment Distributors, Inc., since November 2008 and February 2012, respectively; Chairman of the Board and Director, TAM UK International Holdings Limited, since July 2021; formerly Chairman of the Board and Director, Threadneedle Asset Management Holdings, Sàrl, March 2013 – December 2022 and December 2008 – December 2022, respectively; senior executive of various entities affiliated with Columbia Threadneedle Investments. |
Christopher O. Petersen 5228 Ameriprise Financial Center Minneapolis, MN 55474 1970 | Senior Vice President and Assistant Secretary (2021) | Formerly, Trustee/Director of funds within the Columbia Funds Complex, July 1, 2020 - November 22, 2021; Senior Vice President and Assistant General Counsel, Ameriprise Financial, Inc., since September 2021 (previously Vice President and Lead Chief Counsel, January 2015 - September 2021); formerly, President and Principal Executive Officer of the Columbia Funds, 2015 - 2021; officer of Columbia Funds and affiliated funds, since 2007. |
Thomas P. McGuire 290 Congress Street Boston, MA 02210 1972 | Senior Vice President and Chief Compliance Officer (2012) | Vice President – Asset Management Compliance, Ameriprise Financial, Inc., since May 2010; Chief Compliance Officer, Columbia Acorn/Wanger Funds, since December 2015; formerly, Chief Compliance Officer, Ameriprise Certificate Company, September 2010 – September 2020. |
Ryan C. Larrenaga 290 Congress Street Boston, MA 02210 1970 | Senior Vice President (2017), Chief Legal Officer (2017), and Secretary (2015) | Vice President and Chief Counsel, Ameriprise Financial, Inc., since August 2018 (previously Vice President and Group Counsel, August 2011 - August 2018); Chief Legal Officer, Columbia Acorn/Wanger Funds, since September 2020; officer of Columbia Funds and affiliated funds, since 2005. |
Michael E. DeFao 290 Congress Street Boston, MA 02210 1968 | Vice President (2011) and Assistant Secretary (2010) | Vice President and Chief Counsel, Ameriprise Financial, Inc., since May 2010; Vice President, Chief Legal Officer and Assistant Secretary, Columbia Management Investment Advisers, LLC, since October 2021 (previously Vice President and Assistant Secretary, May 2010 – September 2021). |
Lyn Kephart-Strong 5903 Ameriprise Financial Center Minneapolis, MN 55474 1960 | Vice President (2015) | Vice President, Global Investment Operations Services, Columbia Management Investment Advisers, LLC, since 2010; President, Columbia Management Investment Services Corp., since October 2014; President, Ameriprise Trust Company, since January 2017. |


3 | |
6 | |
8 | |
9 | |
15 | |
16 | |
17 | |
18 | |
20 | |
33 | |
34 |
Average annual total returns (%) (for the period ended December 31, 2023) | |||||
Inception | 1 Year | 5 Years | 10 Years | ||
Class 1* | 02/20/19 | 10.19 | 3.91 | 3.17 | |
Class 2 | 04/12/13 | 9.98 | 3.66 | 3.05 | |
Blended Benchmark | 11.64 | 5.44 | 4.59 | ||
Bloomberg U.S. Aggregate Bond Index | 5.53 | 1.10 | 1.81 | ||

Portfolio Allocation (%) (at December 31, 2023) | |
Allocations to Underlying Funds | |
Equity Funds | 29.3 |
International | 8.9 |
U.S. Large Cap | 16.5 |
U.S. Mid Cap | 1.0 |
U.S. Small Cap | 2.9 |
Exchange-Traded Equity Funds | 1.7 |
U.S. Large Cap | 0.7 |
U.S. Mid Cap | 0.3 |
U.S. Mid Large Cap | 0.7 |
Exchange-Traded Fixed Income Funds | 2.0 |
Investment Grade | 2.0 |
Fixed Income Funds | 37.5 |
Investment Grade | 37.5 |
Allocations to Tactical Assets | |
Money Market Funds(a) | 21.2 |
Call Option Contracts Purchased | 0.0 (b) |
Put Option Contracts Purchased | 0.4 |
Residential Mortgage-Backed Securities - Agency | 7.9 |
Total | 100.0 |
(a) | Includes investments in Money Market Funds, including investing for the purpose of covering obligations relating to the Fund’s investment in derivatives. For a description of the Fund’s investments in derivatives, see Investments in derivatives following the Portfolio of Investments and the derivative instruments discussion in Note 2 to the Notes to Financial Statements. |
(b) | Rounds to zero. |
July 1, 2023 — December 31, 2023 | ||||||||||
Account value at the beginning of the period ($) | Account value at the end of the period ($) | Expenses paid during the period ($) | Fund’s annualized expense ratio (%) | Effective expenses paid during the period ($) | Fund’s effective annualized expense ratio (%) | |||||
Actual | Hypothetical | Actual | Hypothetical | Actual | Hypothetical | Actual | Actual | Hypothetical | Actual | |
Class 1 | 1,000.00 | 1,000.00 | 1,045.40 | 1,023.49 | 1.48 | 1.46 | 0.29 | 3.72 | 3.68 | 0.73 |
Class 2 | 1,000.00 | 1,000.00 | 1,044.40 | 1,022.24 | 2.75 | 2.72 | 0.54 | 5.00 | 4.94 | 0.98 |
Equity Funds 31.5% | ||
Shares | Value ($) | |
International 9.6% | ||
Columbia Variable Portfolio – Overseas Core Fund, Class 1 Shares(a) | 4,581,402 | 61,161,721 |
Variable Portfolio – Partners International Core Equity Fund, Class 1 Shares(a) | 2,377,872 | 24,278,073 |
Variable Portfolio – Partners International Growth Fund, Class 1 Shares(a) | 1,248,669 | 14,347,202 |
Variable Portfolio – Partners International Value Fund, Class 1 Shares(a) | 1,424,755 | 14,304,545 |
Total | 114,091,541 | |
U.S. Large Cap 17.7% | ||
Columbia Variable Portfolio – Contrarian Core Fund, Class 1 Shares(a),(b) | 328,908 | 14,393,021 |
Columbia Variable Portfolio – Disciplined Core Fund, Class 1 Shares(a),(b) | 505,168 | 45,258,000 |
Columbia Variable Portfolio – Large Cap Growth Fund, Class 1 Shares(a),(b) | 551,828 | 20,572,161 |
Columbia Variable Portfolio – Select Large Cap Equity Fund, Class 1 Shares(a),(b) | 2,387,037 | 45,258,222 |
Columbia Variable Portfolio – Select Large Cap Value Fund, Class 1 Shares(a),(b) | 533,188 | 20,639,684 |
CTIVP® – MFS® Value Fund, Class 1 Shares(a),(b) | 473,513 | 18,197,111 |
CTIVP® – Principal Blue Chip Growth Fund, Class 1 Shares(a),(b) | 300,364 | 17,724,476 |
CTIVP® – T. Rowe Price Large Cap Value Fund, Class 1 Shares(a),(b) | 506,294 | 17,765,857 |
Variable Portfolio – Partners Core Equity Fund, Class 1 Shares(a),(b) | 308,734 | 11,500,334 |
Total | 211,308,866 | |
U.S. Mid Cap 1.1% | ||
Columbia Variable Portfolio – Select Mid Cap Growth Fund, Class 1 Shares(a),(b) | 75,466 | 3,426,167 |
Columbia Variable Portfolio – Select Mid Cap Value Fund, Class 1 Shares(a),(b) | 93,094 | 3,429,568 |
CTIVP® – Victory Sycamore Established Value Fund, Class 1 Shares(a),(b) | 74,114 | 3,423,353 |
CTIVP® – Westfield Mid Cap Growth Fund, Class 1 Shares(a),(b) | 76,877 | 3,437,165 |
Total | 13,716,253 | |
Equity Funds (continued) | ||
Shares | Value ($) | |
U.S. Small Cap 3.1% | ||
Columbia Variable Portfolio – Small Cap Value Fund, Class 1 Shares(a) | 319,961 | 4,153,088 |
Columbia Variable Portfolio – Small Company Growth Fund, Class 1 Shares(a),(b) | 353,688 | 4,120,459 |
Variable Portfolio – Partners Small Cap Growth Fund, Class 1 Shares(a),(b) | 492,118 | 14,291,117 |
Variable Portfolio – Partners Small Cap Value Fund, Class 1 Shares(a),(b) | 392,951 | 14,307,357 |
Total | 36,872,021 | |
Total Equity Funds (Cost $223,273,254) | 375,988,681 | |
Exchange-Traded Equity Funds 1.8% | ||
U.S. Large Cap 0.8% | ||
Vanguard Russell 1000 Growth ETF | 119,189 | 9,299,125 |
U.S. Mid Cap 0.2% | ||
iShares Core S&P Mid-Cap ETF | 11,000 | 3,048,650 |
U.S. Mid Large Cap 0.8% | ||
iShares Russell 1000 Growth Index Fund | 30,699 | 9,307,016 |
Total Exchange-Traded Equity Funds (Cost $19,725,639) | 21,654,791 | |
Exchange-Traded Fixed Income Funds 2.2% | ||
Investment Grade 2.2% | ||
iShares iBoxx $ Investment Grade Corporate Bond ETF | 125,650 | 13,904,429 |
Vanguard Intermediate-Term Corporate Bond ETF | 150,500 | 12,232,640 |
Total | 26,137,069 | |
Total Exchange-Traded Fixed Income Funds (Cost $24,116,629) | 26,137,069 | |
Fixed Income Funds 40.2% | ||
Investment Grade 40.2% | ||
Columbia Variable Portfolio – Intermediate Bond Fund, Class 1 Shares(a) | 11,031,544 | 94,760,963 |
Columbia Variable Portfolio – Limited Duration Credit Fund, Class 1 Shares(a) | 2,693,951 | 25,538,652 |
Columbia Variable Portfolio – Long Government/Credit Bond Fund, Class 1 Shares(a) | 6,895,494 | 54,474,403 |
Columbia Variable Portfolio – U.S. Government Mortgage Fund, Class 1 Shares(a) | 2,946,883 | 26,315,665 |
Fixed Income Funds (continued) | ||
Shares | Value ($) | |
CTIVP® – American Century Diversified Bond Fund, Class 1 Shares(a) | 8,306,602 | 76,254,602 |
CTIVP® – TCW Core Plus Bond Fund, Class 1 Shares(a) | 9,593,741 | 90,277,107 |
Variable Portfolio – Partners Core Bond Fund, Class 1 Shares(a) | 11,605,468 | 112,921,204 |
Total | 480,542,596 | |
Total Fixed Income Funds (Cost $549,259,766) | 480,542,596 | |
Residential Mortgage-Backed Securities - Agency 8.5% | ||||
Issuer | Coupon Rate | Principal Amount ($) | Value ($) | |
Uniform Mortgage-Backed Security TBA(c) | ||||
01/18/2039- 01/16/2054 | 3.000% | 36,693,000 | 32,629,515 | |
01/18/2039- 01/16/2054 | 3.500% | 12,300,000 | 11,419,149 | |
01/18/2039- 01/16/2054 | 4.000% | 27,346,000 | 26,003,672 | |
01/16/2054 | 4.500% | 11,000,000 | 10,662,266 | |
01/16/2054 | 5.000% | 20,500,000 | 20,280,586 | |
Total Residential Mortgage-Backed Securities - Agency (Cost $98,591,434) | 100,995,188 | |||
Call Option Contracts Purchased 0.0% | ||||
Value ($) | ||||
(Cost $119,356) | 132,660 | |||
Put Option Contracts Purchased 0.4% | ||||
(Cost $5,830,959) | 5,244,250 | |||
Money Market Funds 22.8% | ||
Shares | Value ($) | |
Columbia Short-Term Cash Fund, 5.569%(a),(d) | 271,948,113 | 271,893,724 |
Total Money Market Funds (Cost $271,828,482) | 271,893,724 | |
Total Investments in Securities (Cost: $1,192,745,519) | 1,282,588,959 | |
Other Assets & Liabilities, Net | (87,963,577 ) | |
Net Assets | 1,194,625,382 | |
Forward foreign currency exchange contracts | |||||
Currency to be sold | Currency to be purchased | Counterparty | Settlement date | Unrealized appreciation ($) | Unrealized depreciation ($) |
2,946,636 USD | 4,000,000 CAD | Barclays | 02/09/2024 | 73,722 | — |
9,390,675 USD | 7,500,000 GBP | Citi | 02/09/2024 | 171,240 | — |
3,018,247 USD | 33,000,000 NOK | Citi | 02/09/2024 | 232,881 | — |
15,410,805 USD | 14,250,000 EUR | Morgan Stanley | 02/09/2024 | 344,950 | — |
6,254,097 USD | 9,500,000 AUD | UBS | 02/09/2024 | 227,759 | — |
26,000,000 SEK | 2,494,531 USD | Wells Fargo | 02/09/2024 | — | (87,321 ) |
7,529,285 USD | 1,085,000,000 JPY | Wells Fargo | 02/09/2024 | 211,427 | — |
592,856 USD | 6,000,000 SEK | Wells Fargo | 02/09/2024 | 2,956 | — |
Total | 1,264,935 | (87,321 ) | |||
Long futures contracts | ||||||
Description | Number of contracts | Expiration date | Trading currency | Notional amount | Value/Unrealized appreciation ($) | Value/Unrealized depreciation ($) |
Euro STOXX 50 Index | 256 | 03/2024 | EUR | 11,630,080 | — | (59,400 ) |
FTSE 100 Index | 51 | 03/2024 | GBP | 3,955,815 | 109,632 | — |
MSCI Singapore Index | 36 | 01/2024 | SGD | 1,035,720 | 25,407 | — |
OMXS30 Index | 259 | 01/2024 | SEK | 62,192,375 | 151,349 | — |
S&P 500 Index E-mini | 425 | 03/2024 | USD | 102,425,000 | 3,464,027 | — |
SPI 200 Index | 12 | 03/2024 | AUD | 2,275,500 | 31,302 | — |
Long futures contracts (continued) | ||||||
Description | Number of contracts | Expiration date | Trading currency | Notional amount | Value/Unrealized appreciation ($) | Value/Unrealized depreciation ($) |
TOPIX Index | 70 | 03/2024 | JPY | 1,656,200,000 | 64,541 | — |
U.S. Treasury 10-Year Note | 154 | 03/2024 | USD | 17,385,156 | 548,832 | — |
U.S. Treasury 2-Year Note | 95 | 03/2024 | USD | 19,561,836 | 215,079 | — |
U.S. Treasury 5-Year Note | 247 | 03/2024 | USD | 26,867,039 | 609,744 | — |
Total | 5,219,913 | (59,400 ) | ||||
Short futures contracts | ||||||
Description | Number of contracts | Expiration date | Trading currency | Notional amount | Value/Unrealized appreciation ($) | Value/Unrealized depreciation ($) |
Russell 2000 Index E-mini | (165) | 03/2024 | USD | (16,893,525 ) | — | (1,238,787 ) |
U.S. Long Bond | (66) | 03/2024 | USD | (8,245,875 ) | — | (599,015 ) |
U.S. Treasury Ultra Bond | (66) | 03/2024 | USD | (8,817,188 ) | — | (761,766 ) |
Total | — | (2,599,568 ) | ||||
Call option contracts purchased | ||||||||
Description | Counterparty | Trading currency | Notional amount | Number of contracts | Exercise price/Rate | Expiration date | Cost ($) | Value ($) |
S&P 500 Index | Morgan Stanley | USD | 5,246,813 | 11 | 4,785.00 | 03/15/2024 | 119,356 | 132,660 |
Put option contracts purchased | ||||||||
Description | Counterparty | Trading currency | Notional amount | Number of contracts | Exercise price/Rate | Expiration date | Cost ($) | Value ($) |
S&P 500 Index | Morgan Stanley | USD | 72,501,416 | 152 | 3,550.00 | 06/20/2025 | 1,373,121 | 1,081,480 |
S&P 500 Index | Morgan Stanley | USD | 35,296,742 | 74 | 3,800.00 | 06/20/2025 | 699,930 | 707,440 |
S&P 500 Index | Morgan Stanley | USD | 38,635,623 | 81 | 3,650.00 | 06/20/2025 | 780,882 | 649,620 |
S&P 500 Index | Morgan Stanley | USD | 35,296,742 | 74 | 3,900.00 | 12/19/2025 | 1,056,981 | 1,065,600 |
S&P 500 Index | Morgan Stanley | USD | 35,296,742 | 74 | 3,800.00 | 12/19/2025 | 951,530 | 961,260 |
S&P 500 Index | Morgan Stanley | USD | 35,296,742 | 74 | 3,600.00 | 12/19/2025 | 968,515 | 778,850 |
Total | 5,830,959 | 5,244,250 | ||||||
Put option contracts written | ||||||||
Description | Counterparty | Trading currency | Notional amount | Number of contracts | Exercise price/Rate | Expiration date | Premium received ($) | Value ($) |
S&P 500 Index | Morgan Stanley | USD | (5,246,813 ) | (11 ) | 4,785.00 | 03/15/2024 | (118,244 ) | (99,330 ) |
(a) | As defined in the Investment Company Act of 1940, as amended, an affiliated company is one in which the Fund owns 5% or more of the company’s outstanding voting securities, or a company which is under common ownership or control with the Fund. The value of the holdings and transactions in these affiliated companies during the year ended December 31, 2023 are as follows: |
Affiliated issuers | Beginning of period($) | Purchases($) | Sales($) | Net change in unrealized appreciation (depreciation)($) | End of period($) | Capital gain distributions($) | Realized gain (loss)($) | Dividends — affiliated issuers ($) | End of period shares |
Columbia Short-Term Cash Fund, 5.569% | |||||||||
213,788,464 | 254,467,648 | (196,398,420 ) | 36,032 | 271,893,724 | — | (7,597 ) | 13,576,718 | 271,948,113 | |
Columbia Variable Portfolio – Contrarian Core Fund, Class 1 Shares | |||||||||
19,051,676 | 11,192 | (3,558,765 ) | (1,111,082 ) | 14,393,021 | — | 5,678,830 | — | 328,908 | |
Columbia Variable Portfolio – Disciplined Core Fund, Class 1 Shares | |||||||||
47,899,780 | 55,725 | (5,804,687 ) | 3,107,182 | 45,258,000 | — | 7,258,028 | — | 505,168 | |
Columbia Variable Portfolio – Intermediate Bond Fund, Class 1 Shares | |||||||||
95,747,596 | 2,317,929 | (8,642,835 ) | 5,338,273 | 94,760,963 | — | (1,841,710 ) | 2,214,443 | 11,031,544 | |
Affiliated issuers | Beginning of period($) | Purchases($) | Sales($) | Net change in unrealized appreciation (depreciation)($) | End of period($) | Capital gain distributions($) | Realized gain (loss)($) | Dividends — affiliated issuers ($) | End of period shares |
Columbia Variable Portfolio – Large Cap Growth Fund, Class 1 Shares | |||||||||
21,222,410 | 72,632 | (3,513,897 ) | 2,791,016 | 20,572,161 | — | 4,930,320 | — | 551,828 | |
Columbia Variable Portfolio – Limited Duration Credit Fund, Class 1 Shares | |||||||||
26,816,211 | 929,491 | (3,394,105 ) | 1,187,055 | 25,538,652 | — | (350,561 ) | 879,247 | 2,693,951 | |
Columbia Variable Portfolio – Long Government/Credit Bond Fund, Class 1 Shares | |||||||||
53,118,597 | 2,496,858 | (4,594,097 ) | 3,453,045 | 54,474,403 | — | (1,546,745 ) | 1,803,308 | 6,895,494 | |
Columbia Variable Portfolio – Overseas Core Fund, Class 1 Shares | |||||||||
52,558,558 | 8,275,758 | (8,061,222 ) | 8,388,627 | 61,161,721 | — | (1,238,525 ) | 1,148,303 | 4,581,402 | |
Columbia Variable Portfolio – Select Large Cap Equity Fund, Class 1 Shares | |||||||||
48,113,883 | 72,709 | (12,676,841 ) | 9,748,471 | 45,258,222 | — | 1,900,783 | — | 2,387,037 | |
Columbia Variable Portfolio – Select Large Cap Value Fund, Class 1 Shares | |||||||||
22,396,696 | 470,561 | (2,689,032 ) | 461,459 | 20,639,684 | — | 735,421 | — | 533,188 | |
Columbia Variable Portfolio – Select Mid Cap Growth Fund, Class 1 Shares | |||||||||
4,306,450 | 28,592 | (986,872 ) | 77,997 | 3,426,167 | — | 914,621 | — | 75,466 | |
Columbia Variable Portfolio – Select Mid Cap Value Fund, Class 1 Shares | |||||||||
4,451,436 | 138,708 | (847,949 ) | (312,627 ) | 3,429,568 | — | 740,460 | — | 93,094 | |
Columbia Variable Portfolio – Small Cap Value Fund, Class 1 Shares | |||||||||
4,460,089 | 503,303 | (1,442,618 ) | 632,314 | 4,153,088 | 310,968 | (67,415 ) | 32,223 | 319,961 | |
Columbia Variable Portfolio – Small Company Growth Fund, Class 1 Shares | |||||||||
3,843,889 | 116,944 | (1,906,164 ) | 2,065,790 | 4,120,459 | — | (1,050,043 ) | — | 353,688 | |
Columbia Variable Portfolio – U.S. Government Mortgage Fund, Class 1 Shares | |||||||||
26,613,565 | 777,018 | (2,169,752 ) | 1,094,834 | 26,315,665 | — | (400,965 ) | 733,978 | 2,946,883 | |
CTIVP® – American Century Diversified Bond Fund, Class 1 Shares | |||||||||
77,088,441 | 2,620,837 | (6,378,407 ) | 2,923,731 | 76,254,602 | — | (1,375,195 ) | 2,517,759 | 8,306,602 | |
CTIVP® – MFS® Value Fund, Class 1 Shares | |||||||||
19,709,907 | 121,003 | (2,143,884 ) | 510,085 | 18,197,111 | — | 930,775 | — | 473,513 | |
CTIVP® – Morgan Stanley Advantage Fund, Class 1 Shares | |||||||||
14,947,792 | — | (8,505,139 ) | (6,442,653 ) | — | — | 8,930,172 | — | — | |
CTIVP® – Principal Blue Chip Growth Fund, Class 1 Shares | |||||||||
18,499,920 | 44,883 | (2,797,308 ) | 1,976,981 | 17,724,476 | — | 4,160,710 | — | 300,364 | |
CTIVP® – T. Rowe Price Large Cap Value Fund, Class 1 Shares | |||||||||
19,207,880 | 270,895 | (2,248,949 ) | 536,031 | 17,765,857 | — | 1,174,160 | — | 506,294 | |
CTIVP® – TCW Core Plus Bond Fund, Class 1 Shares | |||||||||
91,547,737 | 2,332,609 | (7,618,769 ) | 4,015,530 | 90,277,107 | — | (1,151,244 ) | 2,250,806 | 9,593,741 | |
CTIVP® – Victory Sycamore Established Value Fund, Class 1 Shares | |||||||||
4,471,600 | 99,592 | (728,823 ) | (419,016 ) | 3,423,353 | — | 827,207 | — | 74,114 | |
CTIVP® – Westfield Mid Cap Growth Fund, Class 1 Shares | |||||||||
4,367,122 | 33,500 | (859,737 ) | (103,720 ) | 3,437,165 | — | 1,097,034 | — | 76,877 | |
Variable Portfolio – Partners Core Bond Fund, Class 1 Shares | |||||||||
114,736,163 | 3,238,018 | (10,349,023 ) | 5,296,046 | 112,921,204 | — | (1,626,777 ) | 3,115,409 | 11,605,468 | |
Variable Portfolio – Partners Core Equity Fund, Class 1 Shares | |||||||||
12,309,096 | 13,176 | (1,413,081 ) | 591,143 | 11,500,334 | — | 2,039,393 | — | 308,734 | |
Variable Portfolio – Partners International Core Equity Fund, Class 1 Shares | |||||||||
20,589,405 | 2,709,345 | (2,757,744 ) | 3,737,067 | 24,278,073 | — | (435,658 ) | 342,688 | 2,377,872 | |
Affiliated issuers | Beginning of period($) | Purchases($) | Sales($) | Net change in unrealized appreciation (depreciation)($) | End of period($) | Capital gain distributions($) | Realized gain (loss)($) | Dividends — affiliated issuers ($) | End of period shares |
Variable Portfolio – Partners International Growth Fund, Class 1 Shares | |||||||||
11,965,295 | 1,424,809 | (783,516 ) | 1,740,614 | 14,347,202 | — | (15,306 ) | 65,970 | 1,248,669 | |
Variable Portfolio – Partners International Value Fund, Class 1 Shares | |||||||||
12,227,016 | 1,372,221 | (1,045,245 ) | 1,750,553 | 14,304,545 | — | 65,618 | 283,840 | 1,424,755 | |
Variable Portfolio – Partners Small Cap Growth Fund, Class 1 Shares | |||||||||
15,166,728 | 431,002 | (2,792,749 ) | 1,486,136 | 14,291,117 | — | (356,386 ) | — | 492,118 | |
Variable Portfolio – Partners Small Cap Value Fund, Class 1 Shares | |||||||||
15,354,062 | 515,120 | (2,191,638 ) | 629,813 | 14,307,357 | — | 1,090,529 | — | 392,951 | |
Total | 1,096,577,464 | 55,186,727 | 1,128,425,001 | 310,968 | 31,009,934 | 28,964,692 | |||
(b) | Non-income producing investment. |
(c) | Represents a security purchased on a when-issued basis. |
(d) | The rate shown is the seven-day current annualized yield at December 31, 2023. |
TBA | To Be Announced |
AUD | Australian Dollar |
CAD | Canada Dollar |
EUR | Euro |
GBP | British Pound |
JPY | Japanese Yen |
NOK | Norwegian Krone |
SEK | Swedish Krona |
SGD | Singapore Dollar |
USD | US Dollar |
Level 1 ($) | Level 2 ($) | Level 3 ($) | Assets at NAV ($) | Total ($) | |
Investments in Securities | |||||
Equity Funds | — | — | — | 375,988,681 | 375,988,681 |
Exchange-Traded Equity Funds | 21,654,791 | — | — | — | 21,654,791 |
Exchange-Traded Fixed Income Funds | 26,137,069 | — | — | — | 26,137,069 |
Fixed Income Funds | — | — | — | 480,542,596 | 480,542,596 |
Residential Mortgage-Backed Securities - Agency | — | 100,995,188 | — | — | 100,995,188 |
Call Option Contracts Purchased | 132,660 | — | — | — | 132,660 |
Put Option Contracts Purchased | 5,244,250 | — | — | — | 5,244,250 |
Money Market Funds | 271,893,724 | — | — | — | 271,893,724 |
Total Investments in Securities | 325,062,494 | 100,995,188 | — | 856,531,277 | 1,282,588,959 |
Investments in Derivatives | |||||
Asset | |||||
Forward Foreign Currency Exchange Contracts | — | 1,264,935 | — | — | 1,264,935 |
Futures Contracts | 5,219,913 | — | — | — | 5,219,913 |
Liability | |||||
Forward Foreign Currency Exchange Contracts | — | (87,321 ) | — | — | (87,321 ) |
Futures Contracts | (2,658,968 ) | — | — | — | (2,658,968 ) |
Put Option Contracts Written | (99,330 ) | — | — | — | (99,330 ) |
Total | 327,524,109 | 102,172,802 | — | 856,531,277 | 1,286,228,188 |
Assets | |
Investments in securities, at value | |
Unaffiliated issuers (cost $142,433,702) | $148,787,048 |
Affiliated issuers (cost $1,044,361,502) | 1,128,425,001 |
Option contracts purchased (cost $5,950,315) | 5,376,910 |
Cash | 1,210 |
Cash collateral held at broker for: | |
Option contracts written | 1,187,922 |
Margin deposits on: | |
Futures contracts | 7,396,197 |
Unrealized appreciation on forward foreign currency exchange contracts | 1,264,935 |
Receivable for: | |
Investments sold | 837,823 |
Investments sold on a delayed delivery basis | 6,566,328 |
Capital shares sold | 413 |
Dividends | 1,181,090 |
Interest | 174,686 |
Variation margin for futures contracts | 411,446 |
Prepaid expenses | 12,017 |
Deferred compensation of board members | 124,639 |
Total assets | 1,301,747,665 |
Liabilities | |
Option contracts written, at value (premiums received $118,244) | 99,330 |
Unrealized depreciation on forward foreign currency exchange contracts | 87,321 |
Payable for: | |
Investments purchased on a delayed delivery basis | 105,208,190 |
Capital shares redeemed | 1,197,303 |
Variation margin for futures contracts | 270,462 |
Management services fees | 7,144 |
Distribution and/or service fees | 8,192 |
Service fees | 55,736 |
Compensation of chief compliance officer | 224 |
Compensation of board members | 1,721 |
Other expenses | 28,293 |
Deferred compensation of board members | 158,367 |
Total liabilities | 107,122,283 |
Net assets applicable to outstanding capital stock | $1,194,625,382 |
Represented by | |
Trust capital | $1,194,625,382 |
Total - representing net assets applicable to outstanding capital stock | $1,194,625,382 |
Class 1 | |
Net assets | $1,721,023 |
Shares outstanding | 120,564 |
Net asset value per share | $14.27 |
Class 2 | |
Net assets | $1,192,904,359 |
Shares outstanding | 84,563,282 |
Net asset value per share | $14.11 |
Net investment income | |
Income: | |
Dividends — unaffiliated issuers | $1,668,495 |
Dividends — affiliated issuers | 28,964,692 |
Interest | 269,707 |
Total income | 30,902,894 |
Expenses: | |
Management services fees | 2,532,621 |
Distribution and/or service fees | |
Class 2 | 2,991,271 |
Service fees | 718,133 |
Custodian fees | 34,035 |
Printing and postage fees | 17,838 |
Accounting services fees | 30,090 |
Legal fees | 27,261 |
Interest on collateral | 103 |
Compensation of chief compliance officer | 223 |
Compensation of board members | 26,137 |
Deferred compensation of board members | 9,872 |
Other | 23,073 |
Total expenses | 6,410,657 |
Net investment income | 24,492,237 |
Realized and unrealized gain (loss) — net | |
Net realized gain (loss) on: | |
Investments — unaffiliated issuers | (2,223,104 ) |
Investments — affiliated issuers | 31,009,934 |
Capital gain distributions from underlying affiliated funds | 310,968 |
Foreign currency translations | (124,948 ) |
Forward foreign currency exchange contracts | (1,713,755 ) |
Futures contracts | 6,334,425 |
Option contracts purchased | (8,270,972 ) |
Option contracts written | (295,780 ) |
Net realized gain | 25,026,768 |
Net change in unrealized appreciation (depreciation) on: | |
Investments — unaffiliated issuers | 7,487,662 |
Investments — affiliated issuers | 55,186,727 |
Forward foreign currency exchange contracts | 1,601,254 |
Futures contracts | 207,790 |
Option contracts purchased | (289,169 ) |
Option contracts written | 18,914 |
Net change in unrealized appreciation (depreciation) | 64,213,178 |
Net realized and unrealized gain | 89,239,946 |
Net increase in net assets resulting from operations | $113,732,183 |
Year Ended December 31, 2023 | Year Ended December 31, 2022 | |
Operations | ||
Net investment income | $24,492,237 | $12,638,536 |
Net realized gain (loss) | 25,026,768 | (35,077,677 ) |
Net change in unrealized appreciation (depreciation) | 64,213,178 | (248,797,127 ) |
Net increase (decrease) in net assets resulting from operations | 113,732,183 | (271,236,268 ) |
Decrease in net assets from capital stock activity | (131,443,576 ) | (152,156,246 ) |
Total decrease in net assets | (17,711,393 ) | (423,392,514 ) |
Net assets at beginning of year | 1,212,336,775 | 1,635,729,289 |
Net assets at end of year | $1,194,625,382 | $1,212,336,775 |
Year Ended | Year Ended | |||
December 31, 2023 | December 31, 2022 | |||
Shares | Dollars ($) | Shares | Dollars ($) | |
Capital stock activity | ||||
Class 1 | ||||
Shares sold | 53,861 | 720,492 | 22,089 | 300,328 |
Shares redeemed | (11,808 ) | (158,741 ) | (8,865 ) | (127,334 ) |
Net increase | 42,053 | 561,751 | 13,224 | 172,994 |
Class 2 | ||||
Shares sold | 1,016,340 | 13,439,219 | 1,076,283 | 14,934,932 |
Shares redeemed | (10,895,105 ) | (145,444,546 ) | (12,283,693 ) | (167,264,172 ) |
Net decrease | (9,878,765 ) | (132,005,327 ) | (11,207,410 ) | (152,329,240 ) |
Total net decrease | (9,836,712 ) | (131,443,576 ) | (11,194,186 ) | (152,156,246 ) |
Net asset value, beginning of period | Net investment income | Net realized and unrealized gain (loss) | Total from investment operations | |
Class 1 | ||||
Year Ended 12/31/2023 | $12.95 | 0.31 | 1.01 | 1.32 |
Year Ended 12/31/2022 | $15.58 | 0.17 | (2.80 ) | (2.63 ) |
Year Ended 12/31/2021 | $14.73 | 0.13 | 0.72 | 0.85 |
Year Ended 12/31/2020 | $13.47 | 0.14 | 1.12 | 1.26 |
Year Ended 12/31/2019(d) | $12.36 | 0.16 | 0.95 | 1.11 |
Class 2 | ||||
Year Ended 12/31/2023 | $12.83 | 0.27 | 1.01 | 1.28 |
Year Ended 12/31/2022 | $15.47 | 0.13 | (2.77 ) | (2.64 ) |
Year Ended 12/31/2021 | $14.67 | 0.09 | 0.71 | 0.80 |
Year Ended 12/31/2020 | $13.44 | 0.11 | 1.12 | 1.23 |
Year Ended 12/31/2019 | $11.79 | 0.20 | 1.45 | 1.65 |
Notes to Financial Highlights | |
(a) | In addition to the fees and expenses that the Fund bears directly, the Fund indirectly bears a pro rata share of the fees and expenses of any other funds in which it invests. Such indirect expenses are not included in the Fund’s reported expense ratios. |
(b) | Total net expenses include the impact of certain fee waivers/expense reimbursements made by the Investment Manager and certain of its affiliates, if applicable. |
(c) | Ratios include interest on collateral expense which is less than 0.01%. |
(d) | Class 1 shares commenced operations on February 20, 2019. Per share data and total return reflect activity from that date. |
Net asset value, end of period | Total return | Total gross expense ratio to average net assets(a) | Total net expense ratio to average net assets(a),(b) | Net investment income ratio to average net assets | Portfolio turnover | Net assets, end of period (000’s) | |
Class 1 | |||||||
Year Ended 12/31/2023 | $14.27 | 10.19% | 0.29% (c) | 0.29% (c) | 2.29% | 167% | $1,721 |
Year Ended 12/31/2022 | $12.95 | (16.88% ) | 0.28% (c) | 0.28% (c) | 1.23% | 138% | $1,016 |
Year Ended 12/31/2021 | $15.58 | 5.77% | 0.28% (c) | 0.28% (c) | 0.85% | 180% | $1,017 |
Year Ended 12/31/2020 | $14.73 | 9.35% | 0.29% | 0.29% | 1.06% | 152% | $544 |
Year Ended 12/31/2019(d) | $13.47 | 8.98% | 0.29% | 0.29% | 1.46% | 137% | $207 |
Class 2 | |||||||
Year Ended 12/31/2023 | $14.11 | 9.98% | 0.54% (c) | 0.54% (c) | 2.04% | 167% | $1,192,904 |
Year Ended 12/31/2022 | $12.83 | (17.07% ) | 0.53% (c) | 0.53% (c) | 0.93% | 138% | $1,211,320 |
Year Ended 12/31/2021 | $15.47 | 5.45% | 0.53% (c) | 0.53% (c) | 0.62% | 180% | $1,634,712 |
Year Ended 12/31/2020 | $14.67 | 9.15% | 0.54% | 0.54% | 0.78% | 152% | $1,694,592 |
Year Ended 12/31/2019 | $13.44 | 14.00% | 0.54% | 0.54% | 1.58% | 137% | $1,520,725 |
Asset derivatives | ||
Risk exposure category | Statement of assets and liabilities location | Fair value ($) |
Equity risk | Component of trust capital — unrealized appreciation on futures contracts | 3,846,258 * |
Equity risk | Investments, at value — Option contracts purchased | 5,376,910 |
Foreign exchange risk | Unrealized appreciation on forward foreign currency exchange contracts | 1,264,935 |
Interest rate risk | Component of trust capital — unrealized appreciation on futures contracts | 1,373,655 * |
Total | 11,861,758 |
Liability derivatives | ||
Risk exposure category | Statement of assets and liabilities location | Fair value ($) |
Equity risk | Component of trust capital - unrealized depreciation on futures contracts | 1,298,187 * |
Equity risk | Option contracts written, at value | 99,330 |
Foreign exchange risk | Unrealized depreciation on forward foreign currency exchange contracts | 87,321 |
Interest rate risk | Component of trust capital - unrealized depreciation on futures contracts | 1,360,781 * |
Total | 2,845,619 |
* | Includes cumulative appreciation (depreciation) as reported in the tables following the Portfolio of Investments. Only the current day’s variation margin for futures and centrally cleared swaps, if any, is reported in receivables or payables in the Statement of Assets and Liabilities. |
Amount of realized gain (loss) on derivatives recognized in income | |||||
Risk exposure category | Forward foreign currency exchange contracts ($) | Futures contracts ($) | Option contracts purchased ($) | Option contracts written ($) | Total ($) |
Equity risk | — | 8,407,348 | (8,270,972 ) | (295,780 ) | (159,404 ) |
Foreign exchange risk | (1,713,755 ) | — | — | — | (1,713,755 ) |
Interest rate risk | — | (2,072,923 ) | — | — | (2,072,923 ) |
Total | (1,713,755 ) | 6,334,425 | (8,270,972 ) | (295,780 ) | (3,946,082 ) |
Change in unrealized appreciation (depreciation) on derivatives recognized in income | |||||
Risk exposure category | Forward foreign currency exchange contracts ($) | Futures contracts ($) | Option contracts purchased ($) | Option contracts written ($) | Total ($) |
Equity risk | — | 47,586 | (289,169 ) | 18,914 | (222,669 ) |
Foreign exchange risk | 1,601,254 | — | — | — | 1,601,254 |
Interest rate risk | — | 160,204 | — | — | 160,204 |
Total | 1,601,254 | 207,790 | (289,169 ) | 18,914 | 1,538,789 |
Derivative instrument | Average notional amounts ($) |
Futures contracts — long | 179,086,535 |
Futures contracts — short | 25,626,875 |
Derivative instrument | Average value ($) |
Option contracts purchased | 5,274,443 |
Option contracts written | (37,517 ) |
Derivative instrument | Average unrealized appreciation ($) | Average unrealized depreciation ($) |
Forward foreign currency exchange contracts | 407,351 | (612,836 ) |
Barclays ($) | Citi ($) | Morgan Stanley ($) | UBS ($) | Wells Fargo ($) | Total ($) | |
Assets | ||||||
Forward foreign currency exchange contracts | 73,722 | 404,121 | 344,950 | 227,759 | 214,383 | 1,264,935 |
Call option contracts purchased | — | — | 132,660 | — | — | 132,660 |
Put option contracts purchased | — | — | 5,244,250 | — | — | 5,244,250 |
Total assets | 73,722 | 404,121 | 5,721,860 | 227,759 | 214,383 | 6,641,845 |
Liabilities | ||||||
Forward foreign currency exchange contracts | — | — | — | — | 87,321 | 87,321 |
Put option contracts written | — | — | 99,330 | — | — | 99,330 |
Total liabilities | — | — | 99,330 | — | 87,321 | 186,651 |
Total financial and derivative net assets | 73,722 | 404,121 | 5,622,530 | 227,759 | 127,062 | 6,455,194 |
Total collateral received (pledged) (a) | — | — | — | — | — | — |
Net amount (b) | 73,722 | 404,121 | 5,622,530 | 227,759 | 127,062 | 6,455,194 |
(a) | In some instances, the actual collateral received and/or pledged may be more than the amount shown due to overcollateralization. |
(b) | Represents the net amount due from/(to) counterparties in the event of default. |
May 1, 2023 through April 30, 2024 | Prior to May 1, 2023 | |
Class 1 | 0.78 % | 0.79 % |
Class 2 | 1.03 | 1.04 |
Name, address, year of birth | Position held with the Columbia Funds and length of service | Principal occupation(s) during past five years and other relevant professional experience | Number of Funds in the Columbia Funds Complex* overseen | Other directorships held by Trustee during the past five years and other relevant Board experience |
George S. Batejan c/o Columbia Management Investment Advisers, LLC 290 Congress Street Boston, MA 02210 1954 | Trustee since 2017 | Executive Vice President, Global Head of Technology and Operations, Janus Capital Group, Inc., 2010-2016 | 161 | Former Chairman of the Board, NICSA (National Investment Company Services Association) (Executive Committee, Nominating Committee and Governance Committee), 2014-2016; former Director, Intech Investment Management, 2011-2016; former Board Member, Metro Denver Chamber of Commerce, 2015-2016; former Advisory Board Member, University of Colorado Business School, 2015-2018; former Board Member, Chase Bank International, 1993-1994 |
Kathleen Blatz c/o Columbia Management Investment Advisers, LLC 290 Congress Street Boston, MA 02210 1954 | Trustee since 2006 | Attorney, specializing in arbitration and mediation; Trustee of Gerald Rauenhorst 1982 Trusts, since 2020; Chief Justice, Minnesota Supreme Court, 1998-2006; Associate Justice, Minnesota Supreme Court, 1996-1998; Fourth Judicial District Court Judge, Hennepin County, 1994-1996; Attorney in private practice and public service, 1984-1993; State Representative, Minnesota House of Representatives, 1979-1993, which included service on the Tax and Financial Institutions and Insurance Committees; Member and Interim Chair, Minnesota Sports Facilities Authority, January-July 2017; Interim President and Chief Executive Officer, Blue Cross and Blue Shield of Minnesota (health care insurance), February-July 2018, April-October 2021 | 161 | Former Trustee, Blue Cross and Blue Shield of Minnesota, 2009-2021 (Chair of the Business Development Committee, 2014-2017; Chair of the Governance Committee, 2017-2019); former Member and Chair of the Board, Minnesota Sports Facilities Authority, January 2017-July 2017; former Director, Robina Foundation, 2009-2020 (Chair, 2014-2020); Director, Richard M. Schulze Family Foundation, since 2021 |
Name, address, year of birth | Position held with the Columbia Funds and length of service | Principal occupation(s) during past five years and other relevant professional experience | Number of Funds in the Columbia Funds Complex* overseen | Other directorships held by Trustee during the past five years and other relevant Board experience |
Pamela G. Carlton c/o Columbia Management Investment Advisers, LLC 290 Congress Street Boston, MA 02210 1954 | Chair since 2023; Trustee since 2007 | President, Springboard – Partners in Cross Cultural Leadership (consulting company), since 2003; Managing Director of US Equity Research, JP Morgan Chase, 1999-2003; Director of US Equity Research, Chase Asset Management, 1996-1999; Co-Director Latin America Research, 1993-1996, COO Global Research, 1992-1996, Co-Director of US Research, 1991-1992, Investment Banker, 1982-1991, Morgan Stanley; Attorney, Cleary Gottlieb Steen & Hamilton LLP, 1980-1982 | 161 | Trustee, New York Presbyterian Hospital Board, since 1996; Director, DR Bank (Audit Committee, since 2017 and Audit Committee Chair, since November 2023); Director, Evercore Inc. (Audit Committee, Nominating and Governance Committee) (financial services company), since 2019; Director, Apollo Commercial Real Estate Finance, Inc. (Chair, Nominating and Governance Committee), since 2021; the Governing Council of the Independent Directors Council (IDC), since 2021 |
Janet Langford Carrig c/o Columbia Management Investment Advisers, LLC 290 Congress Street Boston, MA 02210 1957 | Trustee since 1996 | Senior Vice President, General Counsel and Corporate Secretary, ConocoPhillips (independent energy company), September 2007-October 2018 | 161 | Director, EQT Corporation (natural gas producer), since 2019; former Director, Whiting Petroleum Corporation (independent oil and gas company), 2020-2022 |
J. Kevin Connaughton c/o Columbia Management Investment Advisers, LLC 290 Congress Street Boston, MA 02210 1964 | Trustee since 2020 | CEO and President, RhodeWay Financial (non-profit financial planning firm), since December 2022; Member, FINRA National Adjudicatory Council, January 2020-December 31, 2023; Adjunct Professor of Finance, Bentley University January 2018-April 2023; Consultant to Independent Trustees of CFVIT and CFST I from March 2016 to June 2020 with respect to CFVIT and to December 2020 with respect to CFST I; Managing Director and General Manager of Mutual Fund Products, Columbia Management Investment Advisers, LLC, May 2010-February 2015; President, Columbia Funds, 2008-2015; and senior officer of Columbia Funds and affiliated funds, 2003-2015 | 159 | Former Director, The Autism Project, March 2015-December 2021; former Member of the Investment Committee, St. Michael’s College, November 2015-February 2020; former Trustee, St. Michael’s College, June 2017-September 2019; former Trustee, New Century Portfolios (former mutual fund complex), January 2015-December 2017 |
Olive M. Darragh c/o Columbia Management Investment Advisers, LLC 290 Congress Street Boston, MA 02210 1962 | Trustee since 2020 | Managing Director of Darragh Inc. (strategy and talent management consulting firm), since 2010; Founder and CEO, Zolio, Inc. (investment management talent identification platform), since 2004; Consultant to Independent Trustees of CFVIT and CFST I from June 2019 to June 2020 with respect to CFVIT and to December 2020 with respect to CFST I; Partner, Tudor Investments, 2004-2010; Senior Partner, McKinsey & Company (consulting), 1990-2004; Touche Ross CPA, 1985-1988 | 159 | Treasurer, Edinburgh University US Trust Board, since January 2023; Member, HBS Community Action Partners Board, since September 2022; former Director, University of Edinburgh Business School (Member of US Board), 2004-2019; former Director, Boston Public Library Foundation, 2008-2017 |
Name, address, year of birth | Position held with the Columbia Funds and length of service | Principal occupation(s) during past five years and other relevant professional experience | Number of Funds in the Columbia Funds Complex* overseen | Other directorships held by Trustee during the past five years and other relevant Board experience |
Patricia M. Flynn c/o Columbia Management Investment Advisers, LLC 290 Congress Street Boston, MA 02210 1950 | Trustee since 2004 | Professor Emeritus of Economics and Management, Bentley University, since 2023; Professor of Economics and Management, Bentley University, 1976-2023; Dean, McCallum Graduate School of Business, Bentley University, 1992-2002 | 161 | Former Trustee, MA Taxpayers Foundation, 1997-2022; former Director, The MA Business Roundtable, 2003-2019; former Chairperson, Innovation Index Advisory Committee, MA Technology Collaborative, 1997-2020 |
Brian J. Gallagher c/o Columbia Management Investment Advisers, LLC 290 Congress Street Boston, MA 02210 1954 | Trustee since 2017 | Retired; Partner with Deloitte & Touche LLP and its predecessors, 1977-2016 | 161 | Trustee, Catholic Schools Foundation, since 2004 |
Douglas A. Hacker c/o Columbia Management Investment Advisers, LLC 290 Congress Street Boston, MA 02210 1955 | Trustee since 1996 | Independent business executive, since May 2006; Executive Vice President – Strategy of United Airlines, December 2002 - May 2006; President of UAL Loyalty Services (airline marketing company), September 2001-December 2002; Executive Vice President and Chief Financial Officer of United Airlines, July 1999-September 2001 | 161 | Director, SpartanNash Company since November 2013 (Chair of the Board, since May 2021) (food distributor); Director, Aircastle Limited (Chair of Audit Committee) (aircraft leasing), since August 2006; former Director, Nash Finch Company (food distributor), 2005-2013; former Director, SeaCube Container Leasing Ltd. (container leasing), 2010-2013; and former Director, Travelport Worldwide Limited (travel information technology), 2014-2019 |
Nancy T. Lukitsh c/o Columbia Management Investment Advisers, LLC 290 Congress Street Boston, MA 02210 1956 | Trustee since 2011 | Senior Vice President, Partner and Director of Marketing, Wellington Management Company, LLP (investment adviser), 1997-2010; Chair, Wellington Management Portfolios (commingled non-U.S. investment pools), 2007-2010; Director, Wellington Trust Company, NA and other Wellington affiliates, 1997-2010 | 159 | None |
Name, address, year of birth | Position held with the Columbia Funds and length of service | Principal occupation(s) during past five years and other relevant professional experience | Number of Funds in the Columbia Funds Complex* overseen | Other directorships held by Trustee during the past five years and other relevant Board experience |
David M. Moffett c/o Columbia Management Investment Advisers, LLC 290 Congress Street Boston, MA 02210 1952 | Trustee since 2011 | Retired; former Chief Executive Officer of Freddie Mac and Chief Financial Officer of U.S. Bank | 161 | Director, CSX Corporation (transportation suppliers); Director, PayPal Holdings Inc. (payment and data processing services); former Director, eBay Inc. (online trading community), 2007-2015; and former Director, CIT Bank, CIT Group Inc. (commercial and consumer finance), 2010-2016; former Senior Adviser to The Carlyle Group (financial services), March 2008-September 2008; former Governance Consultant to Bridgewater Associates, January 2013-December 2015 |
Catherine James Paglia c/o Columbia Management Investment Advisers, LLC 290 Congress Street Boston, MA 02210 1952 | Trustee since 2004 | Director, Enterprise Asset Management, Inc. (private real estate and asset management company), since September 1998; Managing Director and Partner, Interlaken Capital, Inc., 1989-1997; Vice President, 1982-1985, Principal, 1985-1987, Managing Director, 1987-1989, Morgan Stanley; Vice President, Investment Banking, 1980-1982, Associate, Investment Banking, 1976-1980, Dean Witter Reynolds, Inc. | 161 | Director, Valmont Industries, Inc. (irrigation systems manufacturer), since 2012; Trustee, Carleton College (on the Investment Committee), since 1987; Trustee, Carnegie Endowment for International Peace (on the Investment Committee), since 2009 |
Natalie A. Trunow c/o Columbia Management Investment Advisers, LLC 290 Congress Street Boston, MA 02210 1967 | Trustee since 2020 | Chief Executive Officer, Millennial Portfolio Solutions LLC (asset management and consulting services), January 2016-January 2021; Non-executive Member of the Investment Committee and Valuation Committee, Sarona Asset Management Inc. (private equity firm) since September 2019; Advisor, Horizon Investments (asset management and consulting services), August 2018-January 2022; Advisor, Paradigm Asset Management, November 2016-January 2022; Consultant to Independent Trustees of CFVIT and CFST I from September 2016 to June 2020 with respect to CFVIT and to December 2020 with respect to CFST I; Director of Investments/Consultant, Casey Family Programs, April 2016-November 2016; Senior Vice President and Chief Investment Officer, Calvert Investments, August 2008-January 2016; Section Head and Portfolio Manager, General Motors Asset Management, June 1997-August 2008 | 159 | Independent Director, Investment Committee, Health Services for Children with Special Needs, Inc., 2010-2021; Independent Director, (Executive Committee and Chair, Audit Committee), Consumer Credit Counseling Services (formerly Guidewell Financial Solutions), since 2016; Independent Director, (Investment Committee), Sarona Asset Management, since 2019 |
Sandra L. Yeager c/o Columbia Management Investment Advisers, LLC 290 Congress Street Boston, MA 02210 1964 | Trustee since 2017 | Retired; President and founder, Hanoverian Capital, LLC (SEC registered investment advisor firm), 2008-2016; Managing Director, DuPont Capital, 2006-2008; Managing Director, Morgan Stanley Investment Management, 2004-2006; Senior Vice President, Alliance Bernstein, 1990-2004 | 161 | Former Director, NAPE (National Alliance for Partnerships in Equity) Education Foundation, October 2016-October 2020; Advisory Board, Jennersville YMCA, June 2022-June 2023 |
Name, address, year of birth | Position held with the Columbia Funds and length of service | Principal occupation(s) during the past five years and other relevant professional experience | Number of Funds in the Columbia Funds Complex* overseen | Other directorships held by Trustee during the past five years and other relevant Board experience |
Daniel J. Beckman c/o Columbia Management Investment Advisers, LLC 290 Congress Street Boston, MA 02210 1962 | Trustee since November 2021 and President since June 2021 | President and Principal Executive Officer of the Columbia Funds, since June 2021; Vice President, Columbia Management Investment Advisers, LLC, since April 2015; formerly, Vice President – Head of North America Product, Columbia Management Investment Advisers, LLC, April 2015 – December 2023; President and Principal Executive Officer, Columbia Acorn/Wanger Funds, since July 2021 | 161 | Director, Ameriprise Trust Company, since October 2016; Director, Columbia Management Investment Distributors, Inc., since November 2018; Board of Governors, Columbia Wanger Asset Management, LLC, since January 2022 |
* | The term “Columbia Funds Complex” as used herein includes Columbia Seligman Premium Technology Growth Fund, Tri-Continental Corporation and each series of Columbia Funds Series Trust (CFST), Columbia Funds Series Trust I (CFST I), Columbia Funds Series Trust II (CFST II), Columbia ETF Trust I (CET I), Columbia ETF Trust II (CET II), Columbia Funds Variable Insurance Trust (CFVIT) and Columbia Funds Variable Series Trust II (CFVST II). Messrs. Batejan, Beckman, Gallagher, Hacker and Moffett and Mses. Blatz, Carlton, Carrig, Flynn, Paglia, and Yeager serve as directors of Columbia Seligman Premium Technology Growth Fund and Tri-Continental Corporation. |
** | Interested person (as defined under the 1940 Act) by reason of being an officer, director, security holder and/or employee of the Investment Manager or Ameriprise Financial. |
Name, address and year of birth | Position and year first appointed to position for any Fund in the Columbia Funds Complex or a predecessor thereof | Principal occupation(s) during past five years |
Michael G. Clarke 290 Congress Street Boston, MA 02210 1969 | Chief Financial Officer and Principal Financial Officer (2009); Senior Vice President (2019); Treasurer and Chief Accounting Officer (Principal Accounting Officer) (2024) for CFST, CFST I, CFST II, CFVIT and CFVST II | Senior Vice President and North America Head of Operations & Investor Services, Columbia Management Investment Advisers, LLC, since June 2023 (previously Senior Vice President and Head of Global Operations, March 2022 – June 2023, Vice President, Head of North America Operations, and Co-Head of Global Operations, June 2019 - February 2022 and Vice President – Accounting and Tax, May 2010 - May 2019); senior officer of Columbia Funds and affiliated funds, since 2002. Director, Ameriprise Trust Company, since June 2023. |
Name, address and year of birth | Position and year first appointed to position for any Fund in the Columbia Funds Complex or a predecessor thereof | Principal occupation(s) during past five years |
Marybeth Pilat 290 Congress Street Boston, MA 02210 1968 | Treasurer and Chief Accounting Officer (Principal Accounting Officer) and Principal Financial Officer (2020) for CET I and CET II; Assistant Treasurer, CFST, CFST I, CFST II, CFVIT and CFVST II | Vice President – Product Pricing and Administration, Columbia Management Investment Advisers, LLC, since May 2017. |
William F. Truscott 290 Congress Street Boston, MA 02210 1960 | Senior Vice President (2001) | Formerly, Trustee/Director of Columbia Funds Complex or legacy funds, November 2001 - January 1, 2021; Chief Executive Officer, Global Asset Management, Ameriprise Financial, Inc., since September 2012; Chairman of the Board and President, Columbia Management Investment Advisers, LLC, since July 2004 and February 2012, respectively; Chairman of the Board and Chief Executive Officer, Columbia Management Investment Distributors, Inc., since November 2008 and February 2012, respectively; Chairman of the Board and Director, TAM UK International Holdings Limited, since July 2021; formerly Chairman of the Board and Director, Threadneedle Asset Management Holdings, Sàrl, March 2013 – December 2022 and December 2008 – December 2022, respectively; senior executive of various entities affiliated with Columbia Threadneedle Investments. |
Christopher O. Petersen 5228 Ameriprise Financial Center Minneapolis, MN 55474 1970 | Senior Vice President and Assistant Secretary (2021) | Formerly, Trustee/Director of funds within the Columbia Funds Complex, July 1, 2020 - November 22, 2021; Senior Vice President and Assistant General Counsel, Ameriprise Financial, Inc., since September 2021 (previously Vice President and Lead Chief Counsel, January 2015 - September 2021); formerly, President and Principal Executive Officer of the Columbia Funds, 2015 - 2021; officer of Columbia Funds and affiliated funds, since 2007. |
Thomas P. McGuire 290 Congress Street Boston, MA 02210 1972 | Senior Vice President and Chief Compliance Officer (2012) | Vice President – Asset Management Compliance, Ameriprise Financial, Inc., since May 2010; Chief Compliance Officer, Columbia Acorn/Wanger Funds, since December 2015; formerly, Chief Compliance Officer, Ameriprise Certificate Company, September 2010 – September 2020. |
Ryan C. Larrenaga 290 Congress Street Boston, MA 02210 1970 | Senior Vice President (2017), Chief Legal Officer (2017), and Secretary (2015) | Vice President and Chief Counsel, Ameriprise Financial, Inc., since August 2018 (previously Vice President and Group Counsel, August 2011 - August 2018); Chief Legal Officer, Columbia Acorn/Wanger Funds, since September 2020; officer of Columbia Funds and affiliated funds, since 2005. |
Michael E. DeFao 290 Congress Street Boston, MA 02210 1968 | Vice President (2011) and Assistant Secretary (2010) | Vice President and Chief Counsel, Ameriprise Financial, Inc., since May 2010; Vice President, Chief Legal Officer and Assistant Secretary, Columbia Management Investment Advisers, LLC, since October 2021 (previously Vice President and Assistant Secretary, May 2010 – September 2021). |
Lyn Kephart-Strong 5903 Ameriprise Financial Center Minneapolis, MN 55474 1960 | Vice President (2015) | Vice President, Global Investment Operations Services, Columbia Management Investment Advisers, LLC, since 2010; President, Columbia Management Investment Services Corp., since October 2014; President, Ameriprise Trust Company, since January 2017. |


3 | |
5 | |
7 | |
8 | |
14 | |
15 | |
16 | |
18 | |
20 | |
34 | |
35 |
Average annual total returns (%) (for the period ended December 31, 2023) | |||||
Inception | 1 Year | 5 Years | 10 Years | ||
Class 1* | 02/20/19 | 14.87 | 6.61 | 4.57 | |
Class 2 | 04/12/13 | 14.59 | 6.34 | 4.44 | |
Blended Benchmark | 17.14 | 9.11 | 6.92 | ||
Russell 3000 Index | 25.96 | 15.16 | 11.48 | ||

Portfolio Allocation (%) (at December 31, 2023) | |
Allocations to Underlying Funds | |
Equity Funds | 58.3 |
International | 17.2 |
U.S. Large Cap | 33.5 |
U.S. Mid Cap | 2.7 |
U.S. Small Cap | 4.9 |
Exchange-Traded Equity Funds | 2.7 |
U.S. Large Cap | 1.3 |
U.S. Mid Large Cap | 1.4 |
Exchange-Traded Fixed Income Funds | 2.1 |
Investment Grade | 2.1 |
Fixed Income Funds | 10.5 |
Investment Grade | 10.5 |
Allocations to Tactical Assets | |
Money Market Funds(a) | 21.6 |
Call Option Contracts Purchased | 0.0 (b) |
Put Option Contracts Purchased | 0.8 |
Residential Mortgage-Backed Securities - Agency | 4.0 |
Total | 100.0 |
(a) | Includes investments in Money Market Funds, including investing for the purpose of covering obligations relating to the Fund’s investment in derivatives. For a description of the Fund’s investments in derivatives, see Investments in derivatives following the Portfolio of Investments and the derivative instruments discussion in Note 2 to the Notes to Financial Statements. |
(b) | Rounds to zero. |
July 1, 2023 — December 31, 2023 | ||||||||||
Account value at the beginning of the period ($) | Account value at the end of the period ($) | Expenses paid during the period ($) | Fund’s annualized expense ratio (%) | Effective expenses paid during the period ($) | Fund’s effective annualized expense ratio (%) | |||||
Actual | Hypothetical | Actual | Hypothetical | Actual | Hypothetical | Actual | Actual | Hypothetical | Actual | |
Class 1 | 1,000.00 | 1,000.00 | 1,057.20 | 1,023.68 | 1.28 | 1.26 | 0.25 | 3.95 | 3.88 | 0.77 |
Class 2 | 1,000.00 | 1,000.00 | 1,055.20 | 1,022.44 | 2.56 | 2.52 | 0.50 | 5.23 | 5.14 | 1.02 |
Equity Funds 59.7% | ||
Shares | Value ($) | |
International 17.6% | ||
Columbia Variable Portfolio – Overseas Core Fund, Class 1 Shares(a) | 59,573,142 | 795,301,439 |
Variable Portfolio – Partners International Core Equity Fund, Class 1 Shares(a) | 55,939,694 | 571,144,273 |
Variable Portfolio – Partners International Growth Fund, Class 1 Shares(a) | 25,638,878 | 294,590,714 |
Variable Portfolio – Partners International Value Fund, Class 1 Shares(a) | 30,101,345 | 302,217,507 |
Total | 1,963,253,933 | |
U.S. Large Cap 34.3% | ||
Columbia Variable Portfolio – Contrarian Core Fund, Class 1 Shares(a),(b) | 6,259,610 | 273,920,541 |
Columbia Variable Portfolio – Disciplined Core Fund, Class 1 Shares(a),(b) | 7,125,260 | 638,351,999 |
Columbia Variable Portfolio – Large Cap Growth Fund, Class 1 Shares(a),(b) | 10,809,585 | 402,981,313 |
Columbia Variable Portfolio – Select Large Cap Equity Fund, Class 1 Shares(a),(b) | 33,735,827 | 639,631,275 |
Columbia Variable Portfolio – Select Large Cap Value Fund, Class 1 Shares(a),(b) | 10,152,328 | 392,996,627 |
CTIVP® – MFS® Value Fund, Class 1 Shares(a),(b) | 9,529,049 | 366,201,348 |
CTIVP® – Morgan Stanley Advantage Fund, Class 1 Shares(a),(b) | 326,358 | 15,116,916 |
CTIVP® – Principal Blue Chip Growth Fund, Class 1 Shares(a),(b) | 6,361,496 | 375,391,895 |
CTIVP® – T. Rowe Price Large Cap Value Fund, Class 1 Shares(a),(b) | 10,535,195 | 369,679,993 |
Variable Portfolio – Partners Core Equity Fund, Class 1 Shares(a),(b) | 9,470,503 | 352,776,238 |
Total | 3,827,048,145 | |
U.S. Mid Cap 2.8% | ||
Columbia Variable Portfolio – Select Mid Cap Growth Fund, Class 1 Shares(a),(b) | 1,713,688 | 77,801,417 |
Columbia Variable Portfolio – Select Mid Cap Value Fund, Class 1 Shares(a),(b) | 2,098,846 | 77,321,497 |
CTIVP® – Victory Sycamore Established Value Fund, Class 1 Shares(a),(b) | 1,667,495 | 77,021,593 |
CTIVP® – Westfield Mid Cap Growth Fund, Class 1 Shares(a),(b) | 1,765,010 | 78,913,596 |
Total | 311,058,103 | |
Equity Funds (continued) | ||
Shares | Value ($) | |
U.S. Small Cap 5.0% | ||
Columbia Variable Portfolio – Small Cap Value Fund, Class 1 Shares(a) | 6,389,738 | 82,938,801 |
Columbia Variable Portfolio – Small Company Growth Fund, Class 1 Shares(a),(b) | 6,617,891 | 77,098,425 |
Variable Portfolio – Partners Small Cap Growth Fund, Class 1 Shares(a),(b) | 6,659,509 | 193,392,148 |
Variable Portfolio – Partners Small Cap Value Fund, Class 1 Shares(a),(b) | 5,500,900 | 200,287,773 |
Total | 553,717,147 | |
Total Equity Funds (Cost $4,135,870,746) | 6,655,077,328 | |
Exchange-Traded Equity Funds 2.7% | ||
U.S. Large Cap 1.3% | ||
Vanguard Russell 1000 Growth ETF | 1,952,510 | 152,334,830 |
U.S. Mid Large Cap 1.4% | ||
iShares Russell 1000 Growth Index Fund | 502,894 | 152,462,374 |
Total Exchange-Traded Equity Funds (Cost $273,571,668) | 304,797,204 | |
Exchange-Traded Fixed Income Funds 2.1% | ||
Investment Grade 2.1% | ||
iShares iBoxx $ Investment Grade Corporate Bond ETF | 1,129,500 | 124,990,470 |
Vanguard Intermediate-Term Corporate Bond ETF | 1,374,000 | 111,678,720 |
Total | 236,669,190 | |
Total Exchange-Traded Fixed Income Funds (Cost $223,803,406) | 236,669,190 | |
Fixed Income Funds 10.8% | ||
Investment Grade 10.8% | ||
Columbia Variable Portfolio – Intermediate Bond Fund, Class 1 Shares(a) | 18,909,039 | 162,428,652 |
Columbia Variable Portfolio – Limited Duration Credit Fund, Class 1 Shares(a) | 8,362,705 | 79,278,443 |
Columbia Variable Portfolio – Long Government/Credit Bond Fund, Class 1 Shares(a) | 19,725,346 | 155,830,234 |
Columbia Variable Portfolio – U.S. Government Mortgage Fund, Class 1 Shares(a) | 9,042,368 | 80,748,344 |
CTIVP® – American Century Diversified Bond Fund, Class 1 Shares(a) | 17,550,316 | 161,111,901 |
Fixed Income Funds (continued) | ||
Shares | Value ($) | |
CTIVP® – TCW Core Plus Bond Fund, Class 1 Shares(a) | 21,443,577 | 201,784,058 |
Variable Portfolio – Partners Core Bond Fund, Class 1 Shares(a) | 37,257,762 | 362,518,025 |
Total | 1,203,699,657 | |
Total Fixed Income Funds (Cost $1,385,585,090) | 1,203,699,657 | |
Residential Mortgage-Backed Securities - Agency 4.1% | ||||
Issuer | Coupon Rate | Principal Amount ($) | Value ($) | |
Uniform Mortgage-Backed Security TBA(c) | ||||
01/18/2039- 01/16/2054 | 3.000% | 162,100,000 | 143,819,121 | |
01/18/2039- 01/16/2054 | 3.500% | 73,600,000 | 68,086,946 | |
01/18/2039- 01/16/2054 | 4.000% | 131,850,000 | 125,360,717 | |
01/16/2054 | 4.500% | 56,000,000 | 54,280,625 | |
01/16/2054 | 5.000% | 70,300,000 | 69,547,571 | |
Total Residential Mortgage-Backed Securities - Agency (Cost $452,213,600) | 461,094,980 | |||
Call Option Contracts Purchased 0.0% | ||||
Value ($) | ||||
(Cost $2,072,449) | 2,303,460 | |||
Put Option Contracts Purchased 0.8% | ||||
(Cost $100,768,397) | 90,605,575 | |||
Money Market Funds 22.2% | ||
Shares | Value ($) | |
Columbia Short-Term Cash Fund, 5.569%(a),(d) | 2,468,951,462 | 2,468,457,671 |
Total Money Market Funds (Cost $2,467,844,093) | 2,468,457,671 | |
Total Investments in Securities (Cost: $9,041,729,449) | 11,422,705,065 | |
Other Assets & Liabilities, Net | (271,845,653 ) | |
Net Assets | 11,150,859,412 | |
Forward foreign currency exchange contracts | |||||
Currency to be sold | Currency to be purchased | Counterparty | Settlement date | Unrealized appreciation ($) | Unrealized depreciation ($) |
25,783,068 USD | 35,000,000 CAD | Barclays | 02/09/2024 | 645,064 | — |
143,990,350 USD | 115,000,000 GBP | Citi | 02/09/2024 | 2,625,680 | — |
31,097,087 USD | 340,000,000 NOK | Citi | 02/09/2024 | 2,399,385 | — |
22,943,542 USD | 20,000,000 CHF | HSBC | 02/09/2024 | 931,389 | — |
11,660,962 USD | 10,000,000 CHF | Morgan Stanley | 02/09/2024 | 276,504 | — |
272,527,920 USD | 252,000,000 EUR | Morgan Stanley | 02/09/2024 | 6,100,164 | — |
87,228,195 USD | 132,500,000 AUD | UBS | 02/09/2024 | 3,176,643 | — |
120,000,000 SEK | 11,513,221 USD | Wells Fargo | 02/09/2024 | — | (403,019 ) |
154,402,376 USD | 22,250,000,000 JPY | Wells Fargo | 02/09/2024 | 4,335,710 | — |
6,916,654 USD | 70,000,000 SEK | Wells Fargo | 02/09/2024 | 34,486 | — |
Total | 20,525,025 | (403,019 ) | |||
Long futures contracts | ||||||
Description | Number of contracts | Expiration date | Trading currency | Notional amount | Value/Unrealized appreciation ($) | Value/Unrealized depreciation ($) |
Euro STOXX 50 Index | 4,989 | 03/2024 | EUR | 226,650,270 | — | (1,147,119 ) |
FTSE 100 Index | 1,075 | 03/2024 | GBP | 83,382,375 | 2,310,207 | — |
MSCI Singapore Index | 660 | 01/2024 | SGD | 18,988,200 | 465,790 | — |
OMXS30 Index | 5,126 | 01/2024 | SEK | 1,230,880,750 | 2,975,595 | — |
S&P 500 Index E-mini | 7,579 | 03/2024 | USD | 1,826,539,000 | 61,739,848 | — |
SPI 200 Index | 267 | 03/2024 | AUD | 50,629,875 | 696,472 | — |
TOPIX Index | 1,343 | 03/2024 | JPY | 31,775,380,000 | 1,238,265 | — |
Long futures contracts (continued) | ||||||
Description | Number of contracts | Expiration date | Trading currency | Notional amount | Value/Unrealized appreciation ($) | Value/Unrealized depreciation ($) |
U.S. Long Bond | 75 | 03/2024 | USD | 9,370,313 | 34,501 | — |
U.S. Treasury 10-Year Note | 541 | 03/2024 | USD | 61,073,828 | 2,007,139 | — |
U.S. Treasury 2-Year Note | 641 | 03/2024 | USD | 131,990,914 | 1,119,690 | — |
U.S. Treasury 5-Year Note | 1,366 | 03/2024 | USD | 148,584,516 | 2,769,848 | — |
U.S. Treasury Ultra Bond | 20 | 03/2024 | USD | 2,671,875 | 8,337 | — |
U.S. Treasury Ultra Bond | 55 | 03/2024 | USD | 7,347,656 | — | (25,891 ) |
Total | 75,365,692 | (1,173,010 ) | ||||
Short futures contracts | ||||||
Description | Number of contracts | Expiration date | Trading currency | Notional amount | Value/Unrealized appreciation ($) | Value/Unrealized depreciation ($) |
Russell 2000 Index E-mini | (1,680) | 03/2024 | USD | (172,006,800 ) | — | (12,980,653 ) |
Call option contracts purchased | ||||||||
Description | Counterparty | Trading currency | Notional amount | Number of contracts | Exercise price/Rate | Expiration date | Cost ($) | Value ($) |
S&P 500 Index | Morgan Stanley | USD | 91,103,753 | 191 | 4,785.00 | 03/15/2024 | 2,072,449 | 2,303,460 |
Put option contracts purchased | ||||||||
Description | Counterparty | Trading currency | Notional amount | Number of contracts | Exercise price/Rate | Expiration date | Cost ($) | Value ($) |
S&P 500 Index | Morgan Stanley | USD | 1,225,846,310 | 2,570 | 3,550.00 | 06/20/2025 | 23,243,872 | 18,285,550 |
S&P 500 Index | Morgan Stanley | USD | 608,153,325 | 1,275 | 3,800.00 | 06/20/2025 | 12,059,612 | 12,189,000 |
S&P 500 Index | Morgan Stanley | USD | 701,165,010 | 1,470 | 3,650.00 | 06/20/2025 | 14,171,564 | 11,789,400 |
S&P 500 Index | Morgan Stanley | USD | 608,153,325 | 1,275 | 3,900.00 | 12/19/2025 | 18,211,487 | 18,360,000 |
S&P 500 Index | Morgan Stanley | USD | 608,153,325 | 1,275 | 3,800.00 | 12/19/2025 | 16,394,612 | 16,562,250 |
S&P 500 Index | Morgan Stanley | USD | 608,153,325 | 1,275 | 3,600.00 | 12/19/2025 | 16,687,250 | 13,419,375 |
Total | 100,768,397 | 90,605,575 | ||||||
Put option contracts written | ||||||||
Description | Counterparty | Trading currency | Notional amount | Number of contracts | Exercise price/Rate | Expiration date | Premium received ($) | Value ($) |
S&P 500 Index | Morgan Stanley | USD | (91,103,753 ) | (191 ) | 4,785.00 | 03/15/2024 | (2,053,151 ) | (1,724,730 ) |
(a) | As defined in the Investment Company Act of 1940, as amended, an affiliated company is one in which the Fund owns 5% or more of the company’s outstanding voting securities, or a company which is under common ownership or control with the Fund. The value of the holdings and transactions in these affiliated companies during the year ended December 31, 2023 are as follows: |
Affiliated issuers | Beginning of period($) | Purchases($) | Sales($) | Net change in unrealized appreciation (depreciation)($) | End of period($) | Capital gain distributions($) | Realized gain (loss)($) | Dividends — affiliated issuers ($) | End of period shares |
Columbia Short-Term Cash Fund, 5.569% | |||||||||
1,531,523,227 | 4,051,348,892 | (3,114,732,366 ) | 317,918 | 2,468,457,671 | — | (42,084 ) | 113,251,106 | 2,468,951,462 | |
Columbia Variable Portfolio – Contrarian Core Fund, Class 1 Shares | |||||||||
279,558,542 | — | (31,321,328 ) | 25,683,327 | 273,920,541 | — | 52,007,039 | — | 6,259,610 | |
Columbia Variable Portfolio – Disciplined Core Fund, Class 1 Shares | |||||||||
688,410,889 | — | (88,787,708 ) | 38,728,818 | 638,351,999 | — | 106,808,077 | — | 7,125,260 | |
Columbia Variable Portfolio – Intermediate Bond Fund, Class 1 Shares | |||||||||
160,911,341 | 3,652,494 | (11,398,582 ) | 9,263,399 | 162,428,652 | — | (3,005,857 ) | 3,652,474 | 18,909,039 | |
Affiliated issuers | Beginning of period($) | Purchases($) | Sales($) | Net change in unrealized appreciation (depreciation)($) | End of period($) | Capital gain distributions($) | Realized gain (loss)($) | Dividends — affiliated issuers ($) | End of period shares |
Columbia Variable Portfolio – Large Cap Growth Fund, Class 1 Shares | |||||||||
365,480,375 | — | (69,542,611 ) | 107,043,549 | 402,981,313 | — | 36,313,082 | — | 10,809,585 | |
Columbia Variable Portfolio – Limited Duration Credit Fund, Class 1 Shares | |||||||||
79,345,806 | 2,614,200 | (5,910,559 ) | 3,228,996 | 79,278,443 | — | (613,026 ) | 2,614,200 | 8,362,705 | |
Columbia Variable Portfolio – Long Government/Credit Bond Fund, Class 1 Shares | |||||||||
145,795,471 | 5,005,602 | (174,631 ) | 5,203,792 | 155,830,234 | — | (55,652 ) | 5,005,275 | 19,725,346 | |
Columbia Variable Portfolio – Overseas Core Fund, Class 1 Shares | |||||||||
712,946,095 | 14,165,517 | (33,995,481 ) | 102,185,308 | 795,301,439 | — | (7,253,228 ) | 14,165,325 | 59,573,142 | |
Columbia Variable Portfolio – Select Large Cap Equity Fund, Class 1 Shares | |||||||||
620,404,929 | — | (129,277,229 ) | 148,503,575 | 639,631,275 | — | 8,880,140 | — | 33,735,827 | |
Columbia Variable Portfolio – Select Large Cap Value Fund, Class 1 Shares | |||||||||
404,475,800 | 146 | (27,531,212 ) | 16,051,893 | 392,996,627 | — | 5,322,407 | — | 10,152,328 | |
Columbia Variable Portfolio – Select Mid Cap Growth Fund, Class 1 Shares | |||||||||
75,240,537 | — | (10,067,550 ) | 12,628,430 | 77,801,417 | — | 5,508,541 | — | 1,713,688 | |
Columbia Variable Portfolio – Select Mid Cap Value Fund, Class 1 Shares | |||||||||
79,700,465 | 26 | (5,335,423 ) | 2,956,429 | 77,321,497 | — | 5,032,444 | — | 2,098,846 | |
Columbia Variable Portfolio – Small Cap Value Fund, Class 1 Shares | |||||||||
79,772,875 | 6,324,401 | (15,767,869 ) | 12,609,394 | 82,938,801 | 5,730,568 | (2,463,358 ) | 593,818 | 6,389,738 | |
Columbia Variable Portfolio – Small Company Growth Fund, Class 1 Shares | |||||||||
60,896,008 | 139 | (39,523 ) | 16,241,801 | 77,098,425 | — | (24,963 ) | — | 6,617,891 | |
Columbia Variable Portfolio – U.S. Government Mortgage Fund, Class 1 Shares | |||||||||
77,187,720 | 2,158,496 | (1,001,276 ) | 2,403,404 | 80,748,344 | — | (193,925 ) | 2,158,472 | 9,042,368 | |
CTIVP® – American Century Diversified Bond Fund, Class 1 Shares | |||||||||
154,828,244 | 5,120,433 | (2,866,037 ) | 4,029,261 | 161,111,901 | — | (584,086 ) | 5,120,386 | 17,550,316 | |
CTIVP® – MFS® Value Fund, Class 1 Shares | |||||||||
370,881,091 | — | (27,892,967 ) | 23,213,224 | 366,201,348 | — | 4,772,419 | — | 9,529,049 | |
CTIVP® – Morgan Stanley Advantage Fund, Class 1 Shares | |||||||||
246,445,238 | — | (182,122,145 ) | (49,206,177 ) | 15,116,916 | — | 91,079,957 | — | 326,358 | |
CTIVP® – Principal Blue Chip Growth Fund, Class 1 Shares | |||||||||
343,539,561 | — | (76,838,487 ) | 108,690,821 | 375,391,895 | — | 13,394,150 | — | 6,361,496 | |
CTIVP® – T. Rowe Price Large Cap Value Fund, Class 1 Shares | |||||||||
367,913,102 | — | (25,715,675 ) | 27,482,566 | 369,679,993 | — | 6,276,048 | — | 10,535,195 | |
CTIVP® – TCW Core Plus Bond Fund, Class 1 Shares | |||||||||
194,519,340 | 4,846,561 | (4,791,984 ) | 7,210,141 | 201,784,058 | — | (718,515 ) | 4,846,518 | 21,443,577 | |
CTIVP® – Victory Sycamore Established Value Fund, Class 1 Shares | |||||||||
80,433,712 | — | (5,084,115 ) | 1,671,996 | 77,021,593 | — | 6,015,496 | — | 1,667,495 | |
CTIVP® – Westfield Mid Cap Growth Fund, Class 1 Shares | |||||||||
77,178,263 | — | (8,166,435 ) | 9,901,768 | 78,913,596 | — | 8,538,266 | — | 1,765,010 | |
Variable Portfolio – Partners Core Bond Fund, Class 1 Shares | |||||||||
351,475,038 | 9,651,280 | (12,661,657 ) | 14,053,364 | 362,518,025 | — | (2,104,132 ) | 9,651,230 | 37,257,762 | |
Variable Portfolio – Partners Core Equity Fund, Class 1 Shares | |||||||||
343,663,784 | — | (29,139,194 ) | 38,251,648 | 352,776,238 | — | 38,739,696 | — | 9,470,503 | |
Variable Portfolio – Partners International Core Equity Fund, Class 1 Shares | |||||||||
501,896,065 | 7,774,598 | (22,231,214 ) | 83,704,824 | 571,144,273 | — | (4,015,966 ) | 7,774,598 | 55,939,694 | |
Affiliated issuers | Beginning of period($) | Purchases($) | Sales($) | Net change in unrealized appreciation (depreciation)($) | End of period($) | Capital gain distributions($) | Realized gain (loss)($) | Dividends — affiliated issuers ($) | End of period shares |
Variable Portfolio – Partners International Growth Fund, Class 1 Shares | |||||||||
257,842,160 | 1,344,924 | (1,673,987 ) | 37,077,617 | 294,590,714 | — | (427,902 ) | 1,344,672 | 25,638,878 | |
Variable Portfolio – Partners International Value Fund, Class 1 Shares | |||||||||
273,642,375 | 6,200,203 | (18,676,513 ) | 41,051,442 | 302,217,507 | — | (1,535,052 ) | 6,200,175 | 30,101,345 | |
Variable Portfolio – Partners Small Cap Growth Fund, Class 1 Shares | |||||||||
185,770,658 | 258 | (6,343,976 ) | 13,965,208 | 193,392,148 | — | (680,484 ) | — | 6,659,509 | |
Variable Portfolio – Partners Small Cap Value Fund, Class 1 Shares | |||||||||
196,658,758 | 60 | (13,310,352 ) | 16,939,307 | 200,287,773 | — | 4,859,729 | — | 5,500,900 | |
Total | 9,308,337,469 | 881,087,043 | 10,327,234,656 | 5,730,568 | 369,829,261 | 176,378,249 | |||
(b) | Non-income producing investment. |
(c) | Represents a security purchased on a when-issued basis. |
(d) | The rate shown is the seven-day current annualized yield at December 31, 2023. |
TBA | To Be Announced |
AUD | Australian Dollar |
CAD | Canada Dollar |
CHF | Swiss Franc |
EUR | Euro |
GBP | British Pound |
JPY | Japanese Yen |
NOK | Norwegian Krone |
SEK | Swedish Krona |
SGD | Singapore Dollar |
USD | US Dollar |
Level 1 ($) | Level 2 ($) | Level 3 ($) | Assets at NAV ($) | Total ($) | |
Investments in Securities | |||||
Equity Funds | — | — | — | 6,655,077,328 | 6,655,077,328 |
Exchange-Traded Equity Funds | 304,797,204 | — | — | — | 304,797,204 |
Exchange-Traded Fixed Income Funds | 236,669,190 | — | — | — | 236,669,190 |
Fixed Income Funds | — | — | — | 1,203,699,657 | 1,203,699,657 |
Residential Mortgage-Backed Securities - Agency | — | 461,094,980 | — | — | 461,094,980 |
Call Option Contracts Purchased | 2,303,460 | — | — | — | 2,303,460 |
Put Option Contracts Purchased | 90,605,575 | — | — | — | 90,605,575 |
Money Market Funds | 2,468,457,671 | — | — | — | 2,468,457,671 |
Total Investments in Securities | 3,102,833,100 | 461,094,980 | — | 7,858,776,985 | 11,422,705,065 |
Investments in Derivatives | |||||
Asset | |||||
Forward Foreign Currency Exchange Contracts | — | 20,525,025 | — | — | 20,525,025 |
Futures Contracts | 75,365,692 | — | — | — | 75,365,692 |
Liability | |||||
Forward Foreign Currency Exchange Contracts | — | (403,019 ) | — | — | (403,019 ) |
Futures Contracts | (14,153,663 ) | — | — | — | (14,153,663 ) |
Put Option Contracts Written | (1,724,730 ) | — | — | — | (1,724,730 ) |
Total | 3,162,320,399 | 481,216,986 | — | 7,858,776,985 | 11,502,314,370 |
Assets | |
Investments in securities, at value | |
Unaffiliated issuers (cost $949,588,674) | $1,002,561,374 |
Affiliated issuers (cost $7,989,299,929) | 10,327,234,656 |
Option contracts purchased (cost $102,840,846) | 92,909,035 |
Cash | 1,206 |
Cash collateral held at broker for: | |
Option contracts written | 17,150,627 |
Margin deposits on: | |
Futures contracts | 137,759,944 |
Unrealized appreciation on forward foreign currency exchange contracts | 20,525,025 |
Receivable for: | |
Investments sold | 7,826,035 |
Investments sold on a delayed delivery basis | 117,704,665 |
Capital shares sold | 8,963 |
Dividends | 10,721,519 |
Interest | 789,061 |
Variation margin for futures contracts | 4,213,603 |
Prepaid expenses | 82,089 |
Deferred compensation of board members | 596,281 |
Total assets | 11,740,084,083 |
Liabilities | |
Option contracts written, at value (premiums received $2,053,151) | 1,724,730 |
Unrealized depreciation on forward foreign currency exchange contracts | 403,019 |
Payable for: | |
Investments purchased on a delayed delivery basis | 569,504,474 |
Capital shares redeemed | 11,189,013 |
Variation margin for futures contracts | 4,906,267 |
Management services fees | 59,720 |
Distribution and/or service fees | 76,402 |
Service fees | 514,634 |
Compensation of chief compliance officer | 2,033 |
Compensation of board members | 9,554 |
Other expenses | 58,017 |
Deferred compensation of board members | 776,808 |
Total liabilities | 589,224,671 |
Net assets applicable to outstanding capital stock | $11,150,859,412 |
Represented by | |
Trust capital | $11,150,859,412 |
Total - representing net assets applicable to outstanding capital stock | $11,150,859,412 |
Class 1 | |
Net assets | $28,645,541 |
Shares outstanding | 1,648,535 |
Net asset value per share | $17.38 |
Class 2 | |
Net assets | $11,122,213,871 |
Shares outstanding | 646,550,944 |
Net asset value per share | $17.20 |
Net investment income | |
Income: | |
Dividends — unaffiliated issuers | $17,065,254 |
Dividends — affiliated issuers | 176,378,249 |
Interest | 4,104,580 |
Total income | 197,548,083 |
Expenses: | |
Management services fees | 19,691,527 |
Distribution and/or service fees | |
Class 2 | 26,783,659 |
Service fees | 6,436,980 |
Custodian fees | 49,192 |
Printing and postage fees | 54,881 |
Accounting services fees | 30,090 |
Legal fees | 148,982 |
Interest on collateral | 8,648 |
Compensation of chief compliance officer | 2,058 |
Compensation of board members | 149,417 |
Deferred compensation of board members | 53,757 |
Other | 160,396 |
Total expenses | 53,569,587 |
Net investment income | 143,978,496 |
Realized and unrealized gain (loss) — net | |
Net realized gain (loss) on: | |
Investments — unaffiliated issuers | (135,813,763 ) |
Investments — affiliated issuers | 369,829,261 |
Capital gain distributions from underlying affiliated funds | 5,730,568 |
Foreign currency translations | (824,942 ) |
Forward foreign currency exchange contracts | (31,200,806 ) |
Futures contracts | 118,782,672 |
Option contracts purchased | (135,731,810 ) |
Option contracts written | (4,077,838 ) |
Swap contracts | 1,919,319 |
Net realized gain | 188,612,661 |
Net change in unrealized appreciation (depreciation) on: | |
Investments — unaffiliated issuers | 204,108,429 |
Investments — affiliated issuers | 881,087,043 |
Forward foreign currency exchange contracts | 24,853,477 |
Futures contracts | 32,981,037 |
Option contracts purchased | (5,361,409 ) |
Option contracts written | 328,421 |
Swap contracts | (1,074,338 ) |
Net change in unrealized appreciation (depreciation) | 1,136,922,660 |
Net realized and unrealized gain | 1,325,535,321 |
Net increase in net assets resulting from operations | $1,469,513,817 |
Year Ended December 31, 2023 | Year Ended December 31, 2022 | |
Operations | ||
Net investment income | $143,978,496 | $52,281,268 |
Net realized gain (loss) | 188,612,661 | (388,740,469 ) |
Net change in unrealized appreciation (depreciation) | 1,136,922,660 | (2,352,151,659 ) |
Net increase (decrease) in net assets resulting from operations | 1,469,513,817 | (2,688,610,860 ) |
Decrease in net assets from capital stock activity | (863,420,824 ) | (788,930,941 ) |
Total increase (decrease) in net assets | 606,092,993 | (3,477,541,801 ) |
Net assets at beginning of year | 10,544,766,419 | 14,022,308,220 |
Net assets at end of year | $11,150,859,412 | $10,544,766,419 |
Year Ended | Year Ended | |||
December 31, 2023 | December 31, 2022 | |||
Shares | Dollars ($) | Shares | Dollars ($) | |
Capital stock activity | ||||
Class 1 | ||||
Shares sold | 588,271 | 9,460,924 | 489,034 | 7,781,582 |
Shares redeemed | (112,385 ) | (1,775,016 ) | (119,217 ) | (1,808,536 ) |
Net increase | 475,886 | 7,685,908 | 369,817 | 5,973,046 |
Class 2 | ||||
Shares sold | 144,423 | 2,284,313 | 428,250 | 6,701,801 |
Shares redeemed | (54,843,071 ) | (873,391,045 ) | (50,861,787 ) | (801,605,788 ) |
Net decrease | (54,698,648 ) | (871,106,732 ) | (50,433,537 ) | (794,903,987 ) |
Total net decrease | (54,222,762 ) | (863,420,824 ) | (50,063,720 ) | (788,930,941 ) |
Net asset value, beginning of period | Net investment income | Net realized and unrealized gain (loss) | Total from investment operations | |
Class 1 | ||||
Year Ended 12/31/2023 | $15.13 | 0.25 | 2.00 | 2.25 |
Year Ended 12/31/2022 | $18.73 | 0.12 | (3.72 ) | (3.60 ) |
Year Ended 12/31/2021 | $16.69 | 0.08 | 1.96 | 2.04 |
Year Ended 12/31/2020 | $14.96 | 0.06 | 1.67 | 1.73 |
Year Ended 12/31/2019(d) | $13.62 | 0.11 | 1.23 | 1.34 |
Class 2 | ||||
Year Ended 12/31/2023 | $15.01 | 0.21 | 1.98 | 2.19 |
Year Ended 12/31/2022 | $18.63 | 0.07 | (3.69 ) | (3.62 ) |
Year Ended 12/31/2021 | $16.65 | 0.04 | 1.94 | 1.98 |
Year Ended 12/31/2020 | $14.96 | 0.02 | 1.67 | 1.69 |
Year Ended 12/31/2019 | $12.65 | 0.13 | 2.18 | 2.31 |
Notes to Financial Highlights | |
(a) | In addition to the fees and expenses that the Fund bears directly, the Fund indirectly bears a pro rata share of the fees and expenses of any other funds in which it invests. Such indirect expenses are not included in the Fund’s reported expense ratios. |
(b) | Total net expenses include the impact of certain fee waivers/expense reimbursements made by the Investment Manager and certain of its affiliates, if applicable. |
(c) | Ratios include interest on collateral expense which is less than 0.01%. |
(d) | Class 1 shares commenced operations on February 20, 2019. Per share data and total return reflect activity from that date. |
Net asset value, end of period | Total return | Total gross expense ratio to average net assets(a) | Total net expense ratio to average net assets(a),(b) | Net investment income ratio to average net assets | Portfolio turnover | Net assets, end of period (000’s) | |
Class 1 | |||||||
Year Ended 12/31/2023 | $17.38 | 14.87% | 0.25% (c) | 0.25% (c) | 1.58% | 163% | $28,646 |
Year Ended 12/31/2022 | $15.13 | (19.22% ) | 0.25% (c) | 0.25% (c) | 0.73% | 151% | $17,737 |
Year Ended 12/31/2021 | $18.73 | 12.22% | 0.25% (c) | 0.25% (c) | 0.46% | 196% | $15,036 |
Year Ended 12/31/2020 | $16.69 | 11.56% | 0.25% | 0.25% | 0.42% | 184% | $6,085 |
Year Ended 12/31/2019(d) | $14.96 | 9.84% | 0.25% | 0.25% | 0.88% | 128% | $1,985 |
Class 2 | |||||||
Year Ended 12/31/2023 | $17.20 | 14.59% | 0.50% (c) | 0.50% (c) | 1.34% | 163% | $11,122,214 |
Year Ended 12/31/2022 | $15.01 | (19.43% ) | 0.50% (c) | 0.50% (c) | 0.45% | 151% | $10,527,029 |
Year Ended 12/31/2021 | $18.63 | 11.89% | 0.50% (c) | 0.50% (c) | 0.22% | 196% | $14,007,272 |
Year Ended 12/31/2020 | $16.65 | 11.30% | 0.50% | 0.50% | 0.16% | 184% | $12,503,225 |
Year Ended 12/31/2019 | $14.96 | 18.26% | 0.49% | 0.49% | 0.91% | 128% | $11,450,160 |
Asset derivatives | ||
Risk exposure category | Statement of assets and liabilities location | Fair value ($) |
Equity risk | Component of trust capital — unrealized appreciation on futures contracts | 69,426,177 * |
Equity risk | Investments, at value — Option contracts purchased | 92,909,035 |
Foreign exchange risk | Unrealized appreciation on forward foreign currency exchange contracts | 20,525,025 |
Interest rate risk | Component of trust capital — unrealized appreciation on futures contracts | 5,939,515 * |
Total | 188,799,752 |
Liability derivatives | ||
Risk exposure category | Statement of assets and liabilities location | Fair value ($) |
Equity risk | Component of trust capital - unrealized depreciation on futures contracts | 14,127,772 * |
Equity risk | Option contracts written, at value | 1,724,730 |
Foreign exchange risk | Unrealized depreciation on forward foreign currency exchange contracts | 403,019 |
Interest rate risk | Component of trust capital - unrealized depreciation on futures contracts | 25,891 * |
Total | 16,281,412 |
* | Includes cumulative appreciation (depreciation) as reported in the tables following the Portfolio of Investments. Only the current day’s variation margin for futures and centrally cleared swaps, if any, is reported in receivables or payables in the Statement of Assets and Liabilities. |
Amount of realized gain (loss) on derivatives recognized in income | ||||||
Risk exposure category | Forward foreign currency exchange contracts ($) | Futures contracts ($) | Option contracts purchased ($) | Option contracts written ($) | Swap contracts ($) | Total ($) |
Credit risk | — | — | — | — | 1,919,319 | 1,919,319 |
Equity risk | — | 134,489,075 | (135,731,810 ) | (4,077,838 ) | — | (5,320,573 ) |
Foreign exchange risk | (31,200,806 ) | — | — | — | — | (31,200,806 ) |
Interest rate risk | — | (15,706,403 ) | — | — | — | (15,706,403 ) |
Total | (31,200,806 ) | 118,782,672 | (135,731,810 ) | (4,077,838 ) | 1,919,319 | (50,308,463 ) |
Change in unrealized appreciation (depreciation) on derivatives recognized in income | ||||||
Risk exposure category | Forward foreign currency exchange contracts ($) | Futures contracts ($) | Option contracts purchased ($) | Option contracts written ($) | Swap contracts ($) | Total ($) |
Credit risk | — | — | — | — | (1,074,338 ) | (1,074,338 ) |
Equity risk | — | 23,866,868 | (5,361,409 ) | 328,421 | — | 18,833,880 |
Foreign exchange risk | 24,853,477 | — | — | — | — | 24,853,477 |
Interest rate risk | — | 9,114,169 | — | — | — | 9,114,169 |
Total | 24,853,477 | 32,981,037 | (5,361,409 ) | 328,421 | (1,074,338 ) | 51,727,188 |
Derivative instrument | Average notional amounts ($) |
Futures contracts — long | 2,197,046,896 |
Futures contracts — short | 172,800,232 |
Credit default swap contracts — sell protection | 11,744,505 |
Derivative instrument | Average value ($) |
Option contracts purchased | 87,675,798 |
Option contracts written | (560,343 ) |
Derivative instrument | Average unrealized appreciation ($) | Average unrealized depreciation ($) |
Forward foreign currency exchange contracts | 4,539,945 | (8,746,127 ) |
Barclays ($) | Citi ($) | HSBC ($) | Morgan Stanley ($) | UBS ($) | Wells Fargo ($) | Total ($) | |
Assets | |||||||
Forward foreign currency exchange contracts | 645,064 | 5,025,065 | 931,389 | 6,376,668 | 3,176,643 | 4,370,196 | 20,525,025 |
Call option contracts purchased | - | - | - | 2,303,460 | - | - | 2,303,460 |
Put option contracts purchased | - | - | - | 90,605,575 | - | - | 90,605,575 |
Total assets | 645,064 | 5,025,065 | 931,389 | 99,285,703 | 3,176,643 | 4,370,196 | 113,434,060 |
Liabilities | |||||||
Forward foreign currency exchange contracts | - | - | - | - | - | 403,019 | 403,019 |
Put option contracts written | - | - | - | 1,724,730 | - | - | 1,724,730 |
Total liabilities | - | - | - | 1,724,730 | - | 403,019 | 2,127,749 |
Total financial and derivative net assets | 645,064 | 5,025,065 | 931,389 | 97,560,973 | 3,176,643 | 3,967,177 | 111,306,311 |
Total collateral received (pledged) (a) | - | - | - | - | - | - | - |
Net amount (b) | 645,064 | 5,025,065 | 931,389 | 97,560,973 | 3,176,643 | 3,967,177 | 111,306,311 |
(a) | In some instances, the actual collateral received and/or pledged may be more than the amount shown due to overcollateralization. |
(b) | Represents the net amount due from/(to) counterparties in the event of default. |
May 1, 2023 through April 30, 2024 | Prior to May 1, 2023 | |
Class 1 | 0.78 % | 0.79 % |
Class 2 | 1.03 | 1.04 |
Name, address, year of birth | Position held with the Columbia Funds and length of service | Principal occupation(s) during past five years and other relevant professional experience | Number of Funds in the Columbia Funds Complex* overseen | Other directorships held by Trustee during the past five years and other relevant Board experience |
George S. Batejan c/o Columbia Management Investment Advisers, LLC 290 Congress Street Boston, MA 02210 1954 | Trustee since 2017 | Executive Vice President, Global Head of Technology and Operations, Janus Capital Group, Inc., 2010-2016 | 161 | Former Chairman of the Board, NICSA (National Investment Company Services Association) (Executive Committee, Nominating Committee and Governance Committee), 2014-2016; former Director, Intech Investment Management, 2011-2016; former Board Member, Metro Denver Chamber of Commerce, 2015-2016; former Advisory Board Member, University of Colorado Business School, 2015-2018; former Board Member, Chase Bank International, 1993-1994 |
Kathleen Blatz c/o Columbia Management Investment Advisers, LLC 290 Congress Street Boston, MA 02210 1954 | Trustee since 2006 | Attorney, specializing in arbitration and mediation; Trustee of Gerald Rauenhorst 1982 Trusts, since 2020; Chief Justice, Minnesota Supreme Court, 1998-2006; Associate Justice, Minnesota Supreme Court, 1996-1998; Fourth Judicial District Court Judge, Hennepin County, 1994-1996; Attorney in private practice and public service, 1984-1993; State Representative, Minnesota House of Representatives, 1979-1993, which included service on the Tax and Financial Institutions and Insurance Committees; Member and Interim Chair, Minnesota Sports Facilities Authority, January-July 2017; Interim President and Chief Executive Officer, Blue Cross and Blue Shield of Minnesota (health care insurance), February-July 2018, April-October 2021 | 161 | Former Trustee, Blue Cross and Blue Shield of Minnesota, 2009-2021 (Chair of the Business Development Committee, 2014-2017; Chair of the Governance Committee, 2017-2019); former Member and Chair of the Board, Minnesota Sports Facilities Authority, January 2017-July 2017; former Director, Robina Foundation, 2009-2020 (Chair, 2014-2020); Director, Richard M. Schulze Family Foundation, since 2021 |
Name, address, year of birth | Position held with the Columbia Funds and length of service | Principal occupation(s) during past five years and other relevant professional experience | Number of Funds in the Columbia Funds Complex* overseen | Other directorships held by Trustee during the past five years and other relevant Board experience |
Pamela G. Carlton c/o Columbia Management Investment Advisers, LLC 290 Congress Street Boston, MA 02210 1954 | Chair since 2023; Trustee since 2007 | President, Springboard – Partners in Cross Cultural Leadership (consulting company), since 2003; Managing Director of US Equity Research, JP Morgan Chase, 1999-2003; Director of US Equity Research, Chase Asset Management, 1996-1999; Co-Director Latin America Research, 1993-1996, COO Global Research, 1992-1996, Co-Director of US Research, 1991-1992, Investment Banker, 1982-1991, Morgan Stanley; Attorney, Cleary Gottlieb Steen & Hamilton LLP, 1980-1982 | 161 | Trustee, New York Presbyterian Hospital Board, since 1996; Director, DR Bank (Audit Committee, since 2017 and Audit Committee Chair, since November 2023); Director, Evercore Inc. (Audit Committee, Nominating and Governance Committee) (financial services company), since 2019; Director, Apollo Commercial Real Estate Finance, Inc. (Chair, Nominating and Governance Committee), since 2021; the Governing Council of the Independent Directors Council (IDC), since 2021 |
Janet Langford Carrig c/o Columbia Management Investment Advisers, LLC 290 Congress Street Boston, MA 02210 1957 | Trustee since 1996 | Senior Vice President, General Counsel and Corporate Secretary, ConocoPhillips (independent energy company), September 2007-October 2018 | 161 | Director, EQT Corporation (natural gas producer), since 2019; former Director, Whiting Petroleum Corporation (independent oil and gas company), 2020-2022 |
J. Kevin Connaughton c/o Columbia Management Investment Advisers, LLC 290 Congress Street Boston, MA 02210 1964 | Trustee since 2020 | CEO and President, RhodeWay Financial (non-profit financial planning firm), since December 2022; Member, FINRA National Adjudicatory Council, January 2020-December 31, 2023; Adjunct Professor of Finance, Bentley University January 2018-April 2023; Consultant to Independent Trustees of CFVIT and CFST I from March 2016 to June 2020 with respect to CFVIT and to December 2020 with respect to CFST I; Managing Director and General Manager of Mutual Fund Products, Columbia Management Investment Advisers, LLC, May 2010-February 2015; President, Columbia Funds, 2008-2015; and senior officer of Columbia Funds and affiliated funds, 2003-2015 | 159 | Former Director, The Autism Project, March 2015-December 2021; former Member of the Investment Committee, St. Michael’s College, November 2015-February 2020; former Trustee, St. Michael’s College, June 2017-September 2019; former Trustee, New Century Portfolios (former mutual fund complex), January 2015-December 2017 |
Olive M. Darragh c/o Columbia Management Investment Advisers, LLC 290 Congress Street Boston, MA 02210 1962 | Trustee since 2020 | Managing Director of Darragh Inc. (strategy and talent management consulting firm), since 2010; Founder and CEO, Zolio, Inc. (investment management talent identification platform), since 2004; Consultant to Independent Trustees of CFVIT and CFST I from June 2019 to June 2020 with respect to CFVIT and to December 2020 with respect to CFST I; Partner, Tudor Investments, 2004-2010; Senior Partner, McKinsey & Company (consulting), 1990-2004; Touche Ross CPA, 1985-1988 | 159 | Treasurer, Edinburgh University US Trust Board, since January 2023; Member, HBS Community Action Partners Board, since September 2022; former Director, University of Edinburgh Business School (Member of US Board), 2004-2019; former Director, Boston Public Library Foundation, 2008-2017 |
Name, address, year of birth | Position held with the Columbia Funds and length of service | Principal occupation(s) during past five years and other relevant professional experience | Number of Funds in the Columbia Funds Complex* overseen | Other directorships held by Trustee during the past five years and other relevant Board experience |
Patricia M. Flynn c/o Columbia Management Investment Advisers, LLC 290 Congress Street Boston, MA 02210 1950 | Trustee since 2004 | Professor Emeritus of Economics and Management, Bentley University, since 2023; Professor of Economics and Management, Bentley University, 1976-2023; Dean, McCallum Graduate School of Business, Bentley University, 1992-2002 | 161 | Former Trustee, MA Taxpayers Foundation, 1997-2022; former Director, The MA Business Roundtable, 2003-2019; former Chairperson, Innovation Index Advisory Committee, MA Technology Collaborative, 1997-2020 |
Brian J. Gallagher c/o Columbia Management Investment Advisers, LLC 290 Congress Street Boston, MA 02210 1954 | Trustee since 2017 | Retired; Partner with Deloitte & Touche LLP and its predecessors, 1977-2016 | 161 | Trustee, Catholic Schools Foundation, since 2004 |
Douglas A. Hacker c/o Columbia Management Investment Advisers, LLC 290 Congress Street Boston, MA 02210 1955 | Trustee since 1996 | Independent business executive, since May 2006; Executive Vice President – Strategy of United Airlines, December 2002 - May 2006; President of UAL Loyalty Services (airline marketing company), September 2001-December 2002; Executive Vice President and Chief Financial Officer of United Airlines, July 1999-September 2001 | 161 | Director, SpartanNash Company since November 2013 (Chair of the Board, since May 2021) (food distributor); Director, Aircastle Limited (Chair of Audit Committee) (aircraft leasing), since August 2006; former Director, Nash Finch Company (food distributor), 2005-2013; former Director, SeaCube Container Leasing Ltd. (container leasing), 2010-2013; and former Director, Travelport Worldwide Limited (travel information technology), 2014-2019 |
Nancy T. Lukitsh c/o Columbia Management Investment Advisers, LLC 290 Congress Street Boston, MA 02210 1956 | Trustee since 2011 | Senior Vice President, Partner and Director of Marketing, Wellington Management Company, LLP (investment adviser), 1997-2010; Chair, Wellington Management Portfolios (commingled non-U.S. investment pools), 2007-2010; Director, Wellington Trust Company, NA and other Wellington affiliates, 1997-2010 | 159 | None |
Name, address, year of birth | Position held with the Columbia Funds and length of service | Principal occupation(s) during past five years and other relevant professional experience | Number of Funds in the Columbia Funds Complex* overseen | Other directorships held by Trustee during the past five years and other relevant Board experience |
David M. Moffett c/o Columbia Management Investment Advisers, LLC 290 Congress Street Boston, MA 02210 1952 | Trustee since 2011 | Retired; former Chief Executive Officer of Freddie Mac and Chief Financial Officer of U.S. Bank | 161 | Director, CSX Corporation (transportation suppliers); Director, PayPal Holdings Inc. (payment and data processing services); former Director, eBay Inc. (online trading community), 2007-2015; and former Director, CIT Bank, CIT Group Inc. (commercial and consumer finance), 2010-2016; former Senior Adviser to The Carlyle Group (financial services), March 2008-September 2008; former Governance Consultant to Bridgewater Associates, January 2013-December 2015 |
Catherine James Paglia c/o Columbia Management Investment Advisers, LLC 290 Congress Street Boston, MA 02210 1952 | Trustee since 2004 | Director, Enterprise Asset Management, Inc. (private real estate and asset management company), since September 1998; Managing Director and Partner, Interlaken Capital, Inc., 1989-1997; Vice President, 1982-1985, Principal, 1985-1987, Managing Director, 1987-1989, Morgan Stanley; Vice President, Investment Banking, 1980-1982, Associate, Investment Banking, 1976-1980, Dean Witter Reynolds, Inc. | 161 | Director, Valmont Industries, Inc. (irrigation systems manufacturer), since 2012; Trustee, Carleton College (on the Investment Committee), since 1987; Trustee, Carnegie Endowment for International Peace (on the Investment Committee), since 2009 |
Natalie A. Trunow c/o Columbia Management Investment Advisers, LLC 290 Congress Street Boston, MA 02210 1967 | Trustee since 2020 | Chief Executive Officer, Millennial Portfolio Solutions LLC (asset management and consulting services), January 2016-January 2021; Non-executive Member of the Investment Committee and Valuation Committee, Sarona Asset Management Inc. (private equity firm) since September 2019; Advisor, Horizon Investments (asset management and consulting services), August 2018-January 2022; Advisor, Paradigm Asset Management, November 2016-January 2022; Consultant to Independent Trustees of CFVIT and CFST I from September 2016 to June 2020 with respect to CFVIT and to December 2020 with respect to CFST I; Director of Investments/Consultant, Casey Family Programs, April 2016-November 2016; Senior Vice President and Chief Investment Officer, Calvert Investments, August 2008-January 2016; Section Head and Portfolio Manager, General Motors Asset Management, June 1997-August 2008 | 159 | Independent Director, Investment Committee, Health Services for Children with Special Needs, Inc., 2010-2021; Independent Director, (Executive Committee and Chair, Audit Committee), Consumer Credit Counseling Services (formerly Guidewell Financial Solutions), since 2016; Independent Director, (Investment Committee), Sarona Asset Management, since 2019 |
Sandra L. Yeager c/o Columbia Management Investment Advisers, LLC 290 Congress Street Boston, MA 02210 1964 | Trustee since 2017 | Retired; President and founder, Hanoverian Capital, LLC (SEC registered investment advisor firm), 2008-2016; Managing Director, DuPont Capital, 2006-2008; Managing Director, Morgan Stanley Investment Management, 2004-2006; Senior Vice President, Alliance Bernstein, 1990-2004 | 161 | Former Director, NAPE (National Alliance for Partnerships in Equity) Education Foundation, October 2016-October 2020; Advisory Board, Jennersville YMCA, June 2022-June 2023 |
Name, address, year of birth | Position held with the Columbia Funds and length of service | Principal occupation(s) during the past five years and other relevant professional experience | Number of Funds in the Columbia Funds Complex* overseen | Other directorships held by Trustee during the past five years and other relevant Board experience |
Daniel J. Beckman c/o Columbia Management Investment Advisers, LLC 290 Congress Street Boston, MA 02210 1962 | Trustee since November 2021 and President since June 2021 | President and Principal Executive Officer of the Columbia Funds, since June 2021; Vice President, Columbia Management Investment Advisers, LLC, since April 2015; formerly, Vice President – Head of North America Product, Columbia Management Investment Advisers, LLC, April 2015 – December 2023; President and Principal Executive Officer, Columbia Acorn/Wanger Funds, since July 2021 | 161 | Director, Ameriprise Trust Company, since October 2016; Director, Columbia Management Investment Distributors, Inc., since November 2018; Board of Governors, Columbia Wanger Asset Management, LLC, since January 2022 |
* | The term “Columbia Funds Complex” as used herein includes Columbia Seligman Premium Technology Growth Fund, Tri-Continental Corporation and each series of Columbia Funds Series Trust (CFST), Columbia Funds Series Trust I (CFST I), Columbia Funds Series Trust II (CFST II), Columbia ETF Trust I (CET I), Columbia ETF Trust II (CET II), Columbia Funds Variable Insurance Trust (CFVIT) and Columbia Funds Variable Series Trust II (CFVST II). Messrs. Batejan, Beckman, Gallagher, Hacker and Moffett and Mses. Blatz, Carlton, Carrig, Flynn, Paglia, and Yeager serve as directors of Columbia Seligman Premium Technology Growth Fund and Tri-Continental Corporation. |
** | Interested person (as defined under the 1940 Act) by reason of being an officer, director, security holder and/or employee of the Investment Manager or Ameriprise Financial. |
Name, address and year of birth | Position and year first appointed to position for any Fund in the Columbia Funds Complex or a predecessor thereof | Principal occupation(s) during past five years |
Michael G. Clarke 290 Congress Street Boston, MA 02210 1969 | Chief Financial Officer and Principal Financial Officer (2009); Senior Vice President (2019); Treasurer and Chief Accounting Officer (Principal Accounting Officer) (2024) for CFST, CFST I, CFST II, CFVIT and CFVST II | Senior Vice President and North America Head of Operations & Investor Services, Columbia Management Investment Advisers, LLC, since June 2023 (previously Senior Vice President and Head of Global Operations, March 2022 – June 2023, Vice President, Head of North America Operations, and Co-Head of Global Operations, June 2019 - February 2022 and Vice President – Accounting and Tax, May 2010 - May 2019); senior officer of Columbia Funds and affiliated funds, since 2002. Director, Ameriprise Trust Company, since June 2023. |
Name, address and year of birth | Position and year first appointed to position for any Fund in the Columbia Funds Complex or a predecessor thereof | Principal occupation(s) during past five years |
Marybeth Pilat 290 Congress Street Boston, MA 02210 1968 | Treasurer and Chief Accounting Officer (Principal Accounting Officer) and Principal Financial Officer (2020) for CET I and CET II; Assistant Treasurer, CFST, CFST I, CFST II, CFVIT and CFVST II | Vice President – Product Pricing and Administration, Columbia Management Investment Advisers, LLC, since May 2017. |
William F. Truscott 290 Congress Street Boston, MA 02210 1960 | Senior Vice President (2001) | Formerly, Trustee/Director of Columbia Funds Complex or legacy funds, November 2001 - January 1, 2021; Chief Executive Officer, Global Asset Management, Ameriprise Financial, Inc., since September 2012; Chairman of the Board and President, Columbia Management Investment Advisers, LLC, since July 2004 and February 2012, respectively; Chairman of the Board and Chief Executive Officer, Columbia Management Investment Distributors, Inc., since November 2008 and February 2012, respectively; Chairman of the Board and Director, TAM UK International Holdings Limited, since July 2021; formerly Chairman of the Board and Director, Threadneedle Asset Management Holdings, Sàrl, March 2013 – December 2022 and December 2008 – December 2022, respectively; senior executive of various entities affiliated with Columbia Threadneedle Investments. |
Christopher O. Petersen 5228 Ameriprise Financial Center Minneapolis, MN 55474 1970 | Senior Vice President and Assistant Secretary (2021) | Formerly, Trustee/Director of funds within the Columbia Funds Complex, July 1, 2020 - November 22, 2021; Senior Vice President and Assistant General Counsel, Ameriprise Financial, Inc., since September 2021 (previously Vice President and Lead Chief Counsel, January 2015 - September 2021); formerly, President and Principal Executive Officer of the Columbia Funds, 2015 - 2021; officer of Columbia Funds and affiliated funds, since 2007. |
Thomas P. McGuire 290 Congress Street Boston, MA 02210 1972 | Senior Vice President and Chief Compliance Officer (2012) | Vice President – Asset Management Compliance, Ameriprise Financial, Inc., since May 2010; Chief Compliance Officer, Columbia Acorn/Wanger Funds, since December 2015; formerly, Chief Compliance Officer, Ameriprise Certificate Company, September 2010 – September 2020. |
Ryan C. Larrenaga 290 Congress Street Boston, MA 02210 1970 | Senior Vice President (2017), Chief Legal Officer (2017), and Secretary (2015) | Vice President and Chief Counsel, Ameriprise Financial, Inc., since August 2018 (previously Vice President and Group Counsel, August 2011 - August 2018); Chief Legal Officer, Columbia Acorn/Wanger Funds, since September 2020; officer of Columbia Funds and affiliated funds, since 2005. |
Michael E. DeFao 290 Congress Street Boston, MA 02210 1968 | Vice President (2011) and Assistant Secretary (2010) | Vice President and Chief Counsel, Ameriprise Financial, Inc., since May 2010; Vice President, Chief Legal Officer and Assistant Secretary, Columbia Management Investment Advisers, LLC, since October 2021 (previously Vice President and Assistant Secretary, May 2010 – September 2021). |
Lyn Kephart-Strong 5903 Ameriprise Financial Center Minneapolis, MN 55474 1960 | Vice President (2015) | Vice President, Global Investment Operations Services, Columbia Management Investment Advisers, LLC, since 2010; President, Columbia Management Investment Services Corp., since October 2014; President, Ameriprise Trust Company, since January 2017. |


3 | |
6 | |
8 | |
9 | |
15 | |
16 | |
17 | |
18 | |
20 | |
34 | |
35 |
Average annual total returns (%) (for the period ended December 31, 2023) | |||||
Inception | 1 Year | 5 Years | 10 Years | ||
Class 1* | 02/20/19 | 8.05 | 2.63 | 2.45 | |
Class 2 | 04/12/13 | 7.87 | 2.39 | 2.33 | |
Blended Benchmark | 9.01 | 3.62 | 3.44 | ||
Bloomberg U.S. Aggregate Bond Index | 5.53 | 1.10 | 1.81 | ||

Portfolio Allocation (%) (at December 31, 2023) | |
Allocations to Underlying Funds | |
Equity Funds | 16.3 |
International | 4.8 |
U.S. Large Cap | 9.2 |
U.S. Mid Cap | 0.6 |
U.S. Small Cap | 1.7 |
Exchange-Traded Equity Funds | 0.7 |
U.S. Large Cap | 0.2 |
U.S. Mid Cap | 0.3 |
U.S. Mid Large Cap | 0.2 |
Exchange-Traded Fixed Income Funds | 2.2 |
Investment Grade | 2.2 |
Fixed Income Funds | 50.2 |
Investment Grade | 50.2 |
Allocations to Tactical Assets | |
Money Market Funds(a) | 20.9 |
Call Option Contracts Purchased | 0.0 (b) |
Put Option Contracts Purchased | 0.2 |
Residential Mortgage-Backed Securities - Agency | 9.5 |
Total | 100.0 |
(a) | Includes investments in Money Market Funds, including investing for the purpose of covering obligations relating to the Fund’s investment in derivatives. For a description of the Fund’s investments in derivatives, see Investments in derivatives following the Portfolio of Investments and the derivative instruments discussion in Note 2 to the Notes to Financial Statements. |
(b) | Rounds to zero. |
July 1, 2023 — December 31, 2023 | ||||||||||
Account value at the beginning of the period ($) | Account value at the end of the period ($) | Expenses paid during the period ($) | Fund’s annualized expense ratio (%) | Effective expenses paid during the period ($) | Fund’s effective annualized expense ratio (%) | |||||
Actual | Hypothetical | Actual | Hypothetical | Actual | Hypothetical | Actual | Actual | Hypothetical | Actual | |
Class 1 | 1,000.00 | 1,000.00 | 1,039.50 | 1,023.44 | 1.53 | 1.51 | 0.30 | 3.61 | 3.58 | 0.71 |
Class 2 | 1,000.00 | 1,000.00 | 1,039.10 | 1,022.24 | 2.75 | 2.72 | 0.54 | 4.83 | 4.79 | 0.95 |
Equity Funds 17.9% | ||
Shares | Value ($) | |
International 5.3% | ||
Columbia Variable Portfolio – Overseas Core Fund, Class 1 Shares(a) | 1,502,802 | 20,062,403 |
Variable Portfolio – Partners International Core Equity Fund, Class 1 Shares(a) | 341,543 | 3,487,150 |
Variable Portfolio – Partners International Growth Fund, Class 1 Shares(a) | 305,410 | 3,509,167 |
Variable Portfolio – Partners International Value Fund, Class 1 Shares(a) | 348,519 | 3,499,134 |
Total | 30,557,854 | |
U.S. Large Cap 10.1% | ||
Columbia Variable Portfolio – Contrarian Core Fund, Class 1 Shares(a),(b) | 135,185 | 5,915,683 |
Columbia Variable Portfolio – Disciplined Core Fund, Class 1 Shares(a),(b) | 161,016 | 14,425,389 |
Columbia Variable Portfolio – Large Cap Growth Fund, Class 1 Shares(a),(b) | 147,082 | 5,483,207 |
Columbia Variable Portfolio – Select Large Cap Equity Fund, Class 1 Shares(a),(b) | 830,396 | 15,744,315 |
Columbia Variable Portfolio – Select Large Cap Value Fund, Class 1 Shares(a),(b) | 141,889 | 5,492,513 |
CTIVP® – MFS® Value Fund, Class 1 Shares(a),(b) | 68,743 | 2,641,813 |
CTIVP® – Principal Blue Chip Growth Fund, Class 1 Shares(a),(b) | 44,723 | 2,639,133 |
CTIVP® – T. Rowe Price Large Cap Value Fund, Class 1 Shares(a),(b) | 75,263 | 2,640,993 |
Variable Portfolio – Partners Core Equity Fund, Class 1 Shares(a),(b) | 99,419 | 3,703,351 |
Total | 58,686,397 | |
U.S. Mid Cap 0.7% | ||
Columbia Variable Portfolio – Select Mid Cap Growth Fund, Class 1 Shares(a),(b) | 40,375 | 1,833,029 |
Columbia Variable Portfolio – Select Mid Cap Value Fund, Class 1 Shares(a),(b) | 49,801 | 1,834,660 |
Total | 3,667,689 | |
Equity Funds (continued) | ||
Shares | Value ($) | |
U.S. Small Cap 1.8% | ||
Columbia Variable Portfolio – Small Cap Value Fund, Class 1 Shares(a) | 59,036 | 766,283 |
Columbia Variable Portfolio – Small Company Growth Fund, Class 1 Shares(a),(b) | 65,707 | 765,484 |
Variable Portfolio – Partners Small Cap Growth Fund, Class 1 Shares(a),(b) | 156,311 | 4,539,282 |
Variable Portfolio – Partners Small Cap Value Fund, Class 1 Shares(a),(b) | 124,762 | 4,542,573 |
Total | 10,613,622 | |
Total Equity Funds (Cost $61,292,396) | 103,525,562 | |
Exchange-Traded Equity Funds 0.8% | ||
U.S. Large Cap 0.2% | ||
Vanguard Russell 1000 Growth ETF | 19,142 | 1,493,459 |
U.S. Mid Cap 0.3% | ||
iShares Core S&P Mid-Cap ETF | 5,500 | 1,524,325 |
U.S. Mid Large Cap 0.3% | ||
iShares Russell 1000 Growth Index Fund | 4,929 | 1,494,325 |
Total Exchange-Traded Equity Funds (Cost $4,153,390) | 4,512,109 | |
Exchange-Traded Fixed Income Funds 2.4% | ||
Investment Grade 2.4% | ||
iShares iBoxx $ Investment Grade Corporate Bond ETF | 70,850 | 7,840,261 |
Vanguard Intermediate-Term Corporate Bond ETF | 77,000 | 6,258,560 |
Total | 14,098,821 | |
Total Exchange-Traded Fixed Income Funds (Cost $13,567,476) | 14,098,821 | |
Fixed Income Funds 55.0% | ||
Investment Grade 55.0% | ||
Columbia Variable Portfolio – Intermediate Bond Fund, Class 1 Shares(a) | 6,641,500 | 57,050,490 |
Columbia Variable Portfolio – Limited Duration Credit Fund, Class 1 Shares(a) | 2,244,951 | 21,282,133 |
Columbia Variable Portfolio – Long Government/Credit Bond Fund, Class 1 Shares(a) | 4,412,672 | 34,860,108 |
Columbia Variable Portfolio – U.S. Government Mortgage Fund, Class 1 Shares(a) | 2,431,490 | 21,713,205 |
Fixed Income Funds (continued) | ||
Shares | Value ($) | |
CTIVP® – American Century Diversified Bond Fund, Class 1 Shares(a) | 6,438,426 | 59,104,752 |
CTIVP® – TCW Core Plus Bond Fund, Class 1 Shares(a) | 6,058,928 | 57,014,515 |
Variable Portfolio – Partners Core Bond Fund, Class 1 Shares(a) | 6,947,708 | 67,601,195 |
Total | 318,626,398 | |
Total Fixed Income Funds (Cost $359,634,230) | 318,626,398 | |
Residential Mortgage-Backed Securities - Agency 10.3% | ||||
Issuer | Coupon Rate | Principal Amount ($) | Value ($) | |
Uniform Mortgage-Backed Security TBA(c) | ||||
01/18/2039- 01/16/2054 | 3.000% | 22,900,000 | 20,313,153 | |
01/18/2039- 01/16/2054 | 3.500% | 8,000,000 | 7,406,660 | |
01/18/2039- 01/16/2054 | 4.000% | 12,397,000 | 11,790,473 | |
01/16/2054 | 4.500% | 8,250,000 | 7,996,699 | |
01/16/2054 | 5.000% | 12,500,000 | 12,366,211 | |
Total Residential Mortgage-Backed Securities - Agency (Cost $58,382,725) | 59,873,196 | |||
Call Option Contracts Purchased 0.0% | ||||
Value ($) | ||||
(Cost $32,551) | 36,180 | |||
Put Option Contracts Purchased 0.2% | ||||
(Cost $1,610,192) | 1,446,115 | |||
Money Market Funds 22.9% | ||
Shares | Value ($) | |
Columbia Short-Term Cash Fund, 5.569%(a),(d) | 132,528,935 | 132,502,429 |
Total Money Market Funds (Cost $132,472,876) | 132,502,429 | |
Total Investments in Securities (Cost: $631,145,836) | 634,620,810 | |
Other Assets & Liabilities, Net | (55,135,924 ) | |
Net Assets | 579,484,886 | |
Forward foreign currency exchange contracts | |||||
Currency to be sold | Currency to be purchased | Counterparty | Settlement date | Unrealized appreciation ($) | Unrealized depreciation ($) |
1,289,153 USD | 1,750,000 CAD | Barclays | 02/09/2024 | 32,253 | — |
3,443,248 USD | 2,750,000 GBP | Citi | 02/09/2024 | 62,788 | — |
1,371,930 USD | 15,000,000 NOK | Citi | 02/09/2024 | 105,855 | — |
550,000 CHF | 630,947 USD | HSBC | 02/09/2024 | — | (25,613 ) |
4,596,205 USD | 4,250,000 EUR | Morgan Stanley | 02/09/2024 | 102,880 | — |
2,468,723 USD | 3,750,000 AUD | UBS | 02/09/2024 | 89,905 | — |
15,000,000 SEK | 1,439,153 USD | Wells Fargo | 02/09/2024 | — | (50,377 ) |
1,734,858 USD | 250,000,000 JPY | Wells Fargo | 02/09/2024 | 48,716 | — |
296,428 USD | 3,000,000 SEK | Wells Fargo | 02/09/2024 | 1,478 | — |
Total | 443,875 | (75,990 ) | |||
Long futures contracts | ||||||
Description | Number of contracts | Expiration date | Trading currency | Notional amount | Value/Unrealized appreciation ($) | Value/Unrealized depreciation ($) |
Euro STOXX 50 Index | 64 | 03/2024 | EUR | 2,907,520 | — | (15,901 ) |
FTSE 100 Index | 13 | 03/2024 | GBP | 1,008,345 | 27,980 | — |
MSCI Singapore Index | 9 | 01/2024 | SGD | 258,930 | 6,352 | — |
OMXS30 Index | 69 | 01/2024 | SEK | 16,568,625 | 39,618 | — |
S&P 500 Index E-mini | 110 | 03/2024 | USD | 26,510,000 | 863,182 | — |
SPI 200 Index | 3 | 03/2024 | AUD | 568,875 | 7,825 | — |
Long futures contracts (continued) | ||||||
Description | Number of contracts | Expiration date | Trading currency | Notional amount | Value/Unrealized appreciation ($) | Value/Unrealized depreciation ($) |
TOPIX Index | 18 | 03/2024 | JPY | 425,880,000 | 16,596 | — |
U.S. Treasury 10-Year Note | 105 | 03/2024 | USD | 11,853,516 | 388,535 | — |
U.S. Treasury 2-Year Note | 50 | 03/2024 | USD | 10,295,703 | 113,199 | — |
U.S. Treasury 5-Year Note | 140 | 03/2024 | USD | 15,228,281 | 351,045 | — |
Total | 1,814,332 | (15,901 ) | ||||
Short futures contracts | ||||||
Description | Number of contracts | Expiration date | Trading currency | Notional amount | Value/Unrealized appreciation ($) | Value/Unrealized depreciation ($) |
Russell 2000 Index E-mini | (54) | 03/2024 | USD | (5,528,790 ) | — | (419,454 ) |
U.S. Long Bond | (43) | 03/2024 | USD | (5,372,313 ) | — | (413,753 ) |
U.S. Treasury Ultra Bond | (43) | 03/2024 | USD | (5,744,531 ) | — | (529,536 ) |
Total | — | (1,362,743 ) | ||||
Call option contracts purchased | ||||||||
Description | Counterparty | Trading currency | Notional amount | Number of contracts | Exercise price/Rate | Expiration date | Cost ($) | Value ($) |
S&P 500 Index | Morgan Stanley | USD | 1,430,949 | 3 | 4,785.00 | 03/15/2024 | 32,551 | 36,180 |
Put option contracts purchased | ||||||||
Description | Counterparty | Trading currency | Notional amount | Number of contracts | Exercise price/Rate | Expiration date | Cost ($) | Value ($) |
S&P 500 Index | Morgan Stanley | USD | 21,464,235 | 45 | 3,550.00 | 06/20/2025 | 404,329 | 320,175 |
S&P 500 Index | Morgan Stanley | USD | 9,539,660 | 20 | 3,800.00 | 06/20/2025 | 189,170 | 191,200 |
S&P 500 Index | Morgan Stanley | USD | 10,493,626 | 22 | 3,650.00 | 06/20/2025 | 212,092 | 176,440 |
S&P 500 Index | Morgan Stanley | USD | 9,539,660 | 20 | 3,900.00 | 12/19/2025 | 285,670 | 288,000 |
S&P 500 Index | Morgan Stanley | USD | 9,539,660 | 20 | 3,800.00 | 12/19/2025 | 257,170 | 259,800 |
S&P 500 Index | Morgan Stanley | USD | 9,539,660 | 20 | 3,600.00 | 12/19/2025 | 261,761 | 210,500 |
Total | 1,610,192 | 1,446,115 | ||||||
Put option contracts written | ||||||||
Description | Counterparty | Trading currency | Notional amount | Number of contracts | Exercise price/Rate | Expiration date | Premium received ($) | Value ($) |
S&P 500 Index | Morgan Stanley | USD | (1,430,949 ) | (3 ) | 4,785.00 | 03/15/2024 | (32,248 ) | (27,090 ) |
(a) | As defined in the Investment Company Act of 1940, as amended, an affiliated company is one in which the Fund owns 5% or more of the company’s outstanding voting securities, or a company which is under common ownership or control with the Fund. The value of the holdings and transactions in these affiliated companies during the year ended December 31, 2023 are as follows: |
Affiliated issuers | Beginning of period($) | Purchases($) | Sales($) | Net change in unrealized appreciation (depreciation)($) | End of period($) | Capital gain distributions($) | Realized gain (loss)($) | Dividends — affiliated issuers ($) | End of period shares |
Columbia Short-Term Cash Fund, 5.569% | |||||||||
113,478,981 | 100,933,504 | (81,928,816 ) | 18,760 | 132,502,429 | — | (5,865 ) | 6,861,941 | 132,528,935 | |
Columbia Variable Portfolio – Contrarian Core Fund, Class 1 Shares | |||||||||
5,915,448 | 187,611 | (1,105,030 ) | 917,654 | 5,915,683 | — | 776,225 | — | 135,185 | |
Columbia Variable Portfolio – Disciplined Core Fund, Class 1 Shares | |||||||||
14,446,491 | 608,736 | (2,356,708 ) | 1,726,870 | 14,425,389 | — | 1,520,025 | — | 161,016 | |
Columbia Variable Portfolio – Intermediate Bond Fund, Class 1 Shares | |||||||||
58,751,972 | 2,325,096 | (7,746,651 ) | 3,720,073 | 57,050,490 | — | (1,691,299 ) | 1,382,400 | 6,641,500 | |
Affiliated issuers | Beginning of period($) | Purchases($) | Sales($) | Net change in unrealized appreciation (depreciation)($) | End of period($) | Capital gain distributions($) | Realized gain (loss)($) | Dividends — affiliated issuers ($) | End of period shares |
Columbia Variable Portfolio – Large Cap Growth Fund, Class 1 Shares | |||||||||
5,446,525 | 177,137 | (1,431,865 ) | 1,291,410 | 5,483,207 | — | 733,422 | — | 147,082 | |
Columbia Variable Portfolio – Limited Duration Credit Fund, Class 1 Shares | |||||||||
22,436,050 | 1,665,385 | (3,708,173 ) | 888,871 | 21,282,133 | — | (207,359 ) | 744,187 | 2,244,951 | |
Columbia Variable Portfolio – Long Government/Credit Bond Fund, Class 1 Shares | |||||||||
35,519,784 | 3,067,900 | (7,202,381 ) | 3,474,805 | 34,860,108 | — | (2,264,469 ) | 1,200,450 | 4,412,672 | |
Columbia Variable Portfolio – Overseas Core Fund, Class 1 Shares | |||||||||
20,358,331 | 1,481,268 | (4,925,638 ) | 3,148,442 | 20,062,403 | — | (561,848 ) | 406,754 | 1,502,802 | |
Columbia Variable Portfolio – Select Large Cap Equity Fund, Class 1 Shares | |||||||||
15,752,251 | 585,162 | (3,969,064 ) | 3,375,966 | 15,744,315 | — | 618,409 | — | 830,396 | |
Columbia Variable Portfolio – Select Large Cap Value Fund, Class 1 Shares | |||||||||
5,499,908 | 592,778 | (832,487 ) | 232,314 | 5,492,513 | — | 81,458 | — | 141,889 | |
Columbia Variable Portfolio – Select Mid Cap Growth Fund, Class 1 Shares | |||||||||
1,093,571 | 970,314 | (531,345 ) | 300,489 | 1,833,029 | — | 50,627 | — | 40,375 | |
Columbia Variable Portfolio – Select Mid Cap Value Fund, Class 1 Shares | |||||||||
1,100,151 | 1,045,232 | (478,744 ) | 168,021 | 1,834,660 | — | 53,106 | — | 49,801 | |
Columbia Variable Portfolio – Small Cap Value Fund, Class 1 Shares | |||||||||
1,101,266 | 225,546 | (642,190 ) | 81,661 | 766,283 | 75,373 | 41,580 | 7,810 | 59,036 | |
Columbia Variable Portfolio – Small Company Growth Fund, Class 1 Shares | |||||||||
930,475 | 148,217 | (995,727 ) | 682,519 | 765,484 | — | (436,517 ) | — | 65,707 | |
Columbia Variable Portfolio – U.S. Government Mortgage Fund, Class 1 Shares | |||||||||
22,371,948 | 1,136,240 | (2,933,739 ) | 1,138,756 | 21,713,205 | — | (599,272 ) | 628,686 | 2,431,490 | |
CTIVP® – American Century Diversified Bond Fund, Class 1 Shares | |||||||||
60,851,444 | 3,086,534 | (7,725,397 ) | 2,892,171 | 59,104,752 | — | (1,814,146 ) | 2,029,308 | 6,438,426 | |
CTIVP® – MFS® Value Fund, Class 1 Shares | |||||||||
2,640,698 | 208,917 | (316,874 ) | 109,072 | 2,641,813 | — | 100,275 | — | 68,743 | |
CTIVP® – Morgan Stanley Advantage Fund, Class 1 Shares | |||||||||
2,358,978 | — | (1,633,963 ) | (725,015 ) | — | — | 1,114,088 | — | — | |
CTIVP® – Principal Blue Chip Growth Fund, Class 1 Shares | |||||||||
2,630,456 | 115,943 | (618,416 ) | 511,150 | 2,639,133 | — | 387,716 | — | 44,723 | |
CTIVP® – T. Rowe Price Large Cap Value Fund, Class 1 Shares | |||||||||
2,640,241 | 272,274 | (406,512 ) | 134,990 | 2,640,993 | — | 118,044 | — | 75,263 | |
CTIVP® – TCW Core Plus Bond Fund, Class 1 Shares | |||||||||
58,781,109 | 2,277,953 | (7,017,780 ) | 2,973,233 | 57,014,515 | — | (1,239,938 ) | 1,472,307 | 6,058,928 | |
Variable Portfolio – Partners Core Bond Fund, Class 1 Shares | |||||||||
69,723,227 | 3,016,645 | (8,839,632 ) | 3,700,955 | 67,601,195 | — | (1,592,053 ) | 1,925,929 | 6,947,708 | |
Variable Portfolio – Partners Core Equity Fund, Class 1 Shares | |||||||||
3,722,826 | 154,012 | (563,597 ) | 390,110 | 3,703,351 | — | 447,550 | — | 99,419 | |
Variable Portfolio – Partners International Core Equity Fund, Class 1 Shares | |||||||||
3,512,756 | 196,578 | (682,274 ) | 460,090 | 3,487,150 | — | 70,962 | 53,203 | 341,543 | |
Variable Portfolio – Partners International Growth Fund, Class 1 Shares | |||||||||
3,505,079 | 194,373 | (640,823 ) | 450,538 | 3,509,167 | — | 32,884 | 17,909 | 305,410 | |
Variable Portfolio – Partners International Value Fund, Class 1 Shares | |||||||||
3,539,253 | 302,198 | (738,715 ) | 396,398 | 3,499,134 | — | 101,561 | 80,099 | 348,519 | |
Affiliated issuers | Beginning of period($) | Purchases($) | Sales($) | Net change in unrealized appreciation (depreciation)($) | End of period($) | Capital gain distributions($) | Realized gain (loss)($) | Dividends — affiliated issuers ($) | End of period shares |
Variable Portfolio – Partners Small Cap Growth Fund, Class 1 Shares | |||||||||
6,567,972 | 707,020 | (3,322,911 ) | 587,201 | 4,539,282 | — | (131,966 ) | — | 156,311 | |
Variable Portfolio – Partners Small Cap Value Fund, Class 1 Shares | |||||||||
6,583,967 | 834,252 | (2,839,179 ) | (36,467 ) | 4,542,573 | — | 713,269 | — | 124,762 | |
Total | 551,261,158 | 33,011,037 | 554,654,389 | 75,373 | (3,583,531 ) | 16,810,983 | |||
(b) | Non-income producing investment. |
(c) | Represents a security purchased on a when-issued basis. |
(d) | The rate shown is the seven-day current annualized yield at December 31, 2023. |
TBA | To Be Announced |
AUD | Australian Dollar |
CAD | Canada Dollar |
CHF | Swiss Franc |
EUR | Euro |
GBP | British Pound |
JPY | Japanese Yen |
NOK | Norwegian Krone |
SEK | Swedish Krona |
SGD | Singapore Dollar |
USD | US Dollar |
Level 1 ($) | Level 2 ($) | Level 3 ($) | Assets at NAV ($) | Total ($) | |
Investments in Securities | |||||
Equity Funds | — | — | — | 103,525,562 | 103,525,562 |
Exchange-Traded Equity Funds | 4,512,109 | — | — | — | 4,512,109 |
Exchange-Traded Fixed Income Funds | 14,098,821 | — | — | — | 14,098,821 |
Fixed Income Funds | — | — | — | 318,626,398 | 318,626,398 |
Residential Mortgage-Backed Securities - Agency | — | 59,873,196 | — | — | 59,873,196 |
Call Option Contracts Purchased | 36,180 | — | — | — | 36,180 |
Put Option Contracts Purchased | 1,446,115 | — | — | — | 1,446,115 |
Money Market Funds | 132,502,429 | — | — | — | 132,502,429 |
Total Investments in Securities | 152,595,654 | 59,873,196 | — | 422,151,960 | 634,620,810 |
Investments in Derivatives | |||||
Asset | |||||
Forward Foreign Currency Exchange Contracts | — | 443,875 | — | — | 443,875 |
Futures Contracts | 1,814,332 | — | — | — | 1,814,332 |
Liability | |||||
Forward Foreign Currency Exchange Contracts | — | (75,990 ) | — | — | (75,990 ) |
Futures Contracts | (1,378,644 ) | — | — | — | (1,378,644 ) |
Put Option Contracts Written | (27,090 ) | — | — | — | (27,090 ) |
Total | 153,004,252 | 60,241,081 | — | 422,151,960 | 635,397,293 |
Assets | |
Investments in securities, at value | |
Unaffiliated issuers (cost $76,103,591) | $78,484,126 |
Affiliated issuers (cost $553,399,502) | 554,654,389 |
Option contracts purchased (cost $1,642,743) | 1,482,295 |
Cash | 1,217 |
Cash collateral held at broker for: | |
Option contracts written | 495,708 |
Margin deposits on: | |
Futures contracts | 1,997,930 |
Unrealized appreciation on forward foreign currency exchange contracts | 443,875 |
Receivable for: | |
Investments sold | 435,379 |
Investments sold on a delayed delivery basis | 1,471,849 |
Dividends | 569,050 |
Interest | 103,338 |
Variation margin for futures contracts | 152,603 |
Prepaid expenses | 7,170 |
Deferred compensation of board members | 74,925 |
Total assets | 640,373,854 |
Liabilities | |
Option contracts written, at value (premiums received $32,248) | 27,090 |
Unrealized depreciation on forward foreign currency exchange contracts | 75,990 |
Payable for: | |
Investments purchased on a delayed delivery basis | 59,934,025 |
Capital shares redeemed | 621,971 |
Variation margin for futures contracts | 69,912 |
Management services fees | 3,339 |
Distribution and/or service fees | 3,977 |
Service fees | 27,067 |
Compensation of chief compliance officer | 109 |
Compensation of board members | 1,224 |
Other expenses | 25,828 |
Deferred compensation of board members | 98,436 |
Total liabilities | 60,888,968 |
Net assets applicable to outstanding capital stock | $579,484,886 |
Represented by | |
Trust capital | $579,484,886 |
Total - representing net assets applicable to outstanding capital stock | $579,484,886 |
Class 1 | |
Net assets | $615,603 |
Shares outstanding | 47,742 |
Net asset value per share | $12.89 |
Class 2 | |
Net assets | $578,869,283 |
Shares outstanding | 45,413,884 |
Net asset value per share | $12.75 |
Net investment income | |
Income: | |
Dividends — unaffiliated issuers | $772,632 |
Dividends — affiliated issuers | 16,810,983 |
Interest | 89,591 |
Total income | 17,673,206 |
Expenses: | |
Management services fees | 1,253,939 |
Distribution and/or service fees | |
Class 2 | 1,487,036 |
Service fees | 356,898 |
Custodian fees | 32,564 |
Printing and postage fees | 13,325 |
Accounting services fees | 30,090 |
Legal fees | 19,563 |
Interest on collateral | 34 |
Compensation of chief compliance officer | 109 |
Compensation of board members | 18,307 |
Deferred compensation of board members | 6,981 |
Other | 14,189 |
Total expenses | 3,233,035 |
Net investment income | 14,440,171 |
Realized and unrealized gain (loss) — net | |
Net realized gain (loss) on: | |
Investments — unaffiliated issuers | 1,119,144 |
Investments — affiliated issuers | (3,583,531 ) |
Capital gain distributions from underlying affiliated funds | 75,373 |
Foreign currency translations | (75,776 ) |
Forward foreign currency exchange contracts | (753,067 ) |
Futures contracts | 1,577,423 |
Option contracts purchased | (2,367,944 ) |
Option contracts written | (91,116 ) |
Swap contracts | 1,356 |
Net realized loss | (4,098,138 ) |
Net change in unrealized appreciation (depreciation) on: | |
Investments — unaffiliated issuers | 602,329 |
Investments — affiliated issuers | 33,011,037 |
Forward foreign currency exchange contracts | 651,538 |
Futures contracts | (666,961 ) |
Option contracts purchased | (105,012 ) |
Option contracts written | 5,158 |
Net change in unrealized appreciation (depreciation) | 33,498,089 |
Net realized and unrealized gain | 29,399,951 |
Net increase in net assets resulting from operations | $43,840,122 |
Year Ended December 31, 2023 | Year Ended December 31, 2022 | |
Operations | ||
Net investment income | $14,440,171 | $7,850,999 |
Net realized loss | (4,098,138 ) | (17,425,562 ) |
Net change in unrealized appreciation (depreciation) | 33,498,089 | (106,181,533 ) |
Net increase (decrease) in net assets resulting from operations | 43,840,122 | (115,756,096 ) |
Decrease in net assets from capital stock activity | (69,890,944 ) | (23,485,279 ) |
Total decrease in net assets | (26,050,822 ) | (139,241,375 ) |
Net assets at beginning of year | 605,535,708 | 744,777,083 |
Net assets at end of year | $579,484,886 | $605,535,708 |
Year Ended | Year Ended | |||
December 31, 2023 | December 31, 2022 | |||
Shares | Dollars ($) | Shares | Dollars ($) | |
Capital stock activity | ||||
Class 1 | ||||
Shares sold | 17,901 | 220,889 | 10,507 | 133,359 |
Shares redeemed | (5,531 ) | (67,537 ) | (4,883 ) | (64,059 ) |
Net increase | 12,370 | 153,352 | 5,624 | 69,300 |
Class 2 | ||||
Shares sold | 2,130,562 | 25,752,752 | 5,599,945 | 69,257,663 |
Shares redeemed | (7,899,764 ) | (95,797,048 ) | (7,336,956 ) | (92,812,242 ) |
Net decrease | (5,769,202 ) | (70,044,296 ) | (1,737,011 ) | (23,554,579 ) |
Total net decrease | (5,756,832 ) | (69,890,944 ) | (1,731,387 ) | (23,485,279 ) |
Net asset value, beginning of period | Net investment income | Net realized and unrealized gain (loss) | Total from investment operations | |
Class 1 | ||||
Year Ended 12/31/2023 | $11.93 | 0.33 | 0.63 | 0.96 |
Year Ended 12/31/2022 | $14.16 | 0.20 | (2.43 ) | (2.23 ) |
Year Ended 12/31/2021 | $13.76 | 0.16 | 0.24 | 0.40 |
Year Ended 12/31/2020 | $12.70 | 0.15 | 0.91 | 1.06 |
Year Ended 12/31/2019(d) | $11.70 | 0.17 | 0.83 | 1.00 |
Class 2 | ||||
Year Ended 12/31/2023 | $11.82 | 0.29 | 0.64 | 0.93 |
Year Ended 12/31/2022 | $14.07 | 0.15 | (2.40 ) | (2.25 ) |
Year Ended 12/31/2021 | $13.71 | 0.11 | 0.25 | 0.36 |
Year Ended 12/31/2020 | $12.68 | 0.15 | 0.88 | 1.03 |
Year Ended 12/31/2019 | $11.33 | 0.23 | 1.12 | 1.35 |
Notes to Financial Highlights | |
(a) | In addition to the fees and expenses that the Fund bears directly, the Fund indirectly bears a pro rata share of the fees and expenses of any other funds in which it invests. Such indirect expenses are not included in the Fund’s reported expense ratios. |
(b) | Total net expenses include the impact of certain fee waivers/expense reimbursements made by the Investment Manager and certain of its affiliates, if applicable. |
(c) | Ratios include interest on collateral expense which is less than 0.01%. |
(d) | Class 1 shares commenced operations on February 20, 2019. Per share data and total return reflect activity from that date. |
Net asset value, end of period | Total return | Total gross expense ratio to average net assets(a) | Total net expense ratio to average net assets(a),(b) | Net investment income ratio to average net assets | Portfolio turnover | Net assets, end of period (000’s) | |
Class 1 | |||||||
Year Ended 12/31/2023 | $12.89 | 8.05% | 0.29% (c) | 0.29% (c) | 2.73% | 178% | $616 |
Year Ended 12/31/2022 | $11.93 | (15.75% ) | 0.29% (c) | 0.29% (c) | 1.56% | 147% | $422 |
Year Ended 12/31/2021 | $14.16 | 2.91% | 0.29% (c) | 0.29% (c) | 1.18% | 195% | $421 |
Year Ended 12/31/2020 | $13.76 | 8.35% | 0.30% | 0.30% | 1.16% | 132% | $363 |
Year Ended 12/31/2019(d) | $12.70 | 8.55% | 0.31% | 0.31% | 1.57% | 139% | $53 |
Class 2 | |||||||
Year Ended 12/31/2023 | $12.75 | 7.87% | 0.54% (c) | 0.54% (c) | 2.43% | 178% | $578,869 |
Year Ended 12/31/2022 | $11.82 | (15.99% ) | 0.54% (c) | 0.54% (c) | 1.22% | 147% | $605,114 |
Year Ended 12/31/2021 | $14.07 | 2.63% | 0.54% (c) | 0.54% (c) | 0.81% | 195% | $744,356 |
Year Ended 12/31/2020 | $13.71 | 8.12% | 0.55% | 0.55% | 1.15% | 132% | $901,838 |
Year Ended 12/31/2019 | $12.68 | 11.91% | 0.57% | 0.57% | 1.90% | 139% | $572,701 |
Asset derivatives | ||
Risk exposure category | Statement of assets and liabilities location | Fair value ($) |
Equity risk | Component of trust capital — unrealized appreciation on futures contracts | 961,553 * |
Equity risk | Investments, at value — Option contracts purchased | 1,482,295 |
Foreign exchange risk | Unrealized appreciation on forward foreign currency exchange contracts | 443,875 |
Interest rate risk | Component of trust capital — unrealized appreciation on futures contracts | 852,779 * |
Total | 3,740,502 |
Liability derivatives | ||
Risk exposure category | Statement of assets and liabilities location | Fair value ($) |
Equity risk | Component of trust capital - unrealized depreciation on futures contracts | 435,355 * |
Equity risk | Option contracts written, at value | 27,090 |
Foreign exchange risk | Unrealized depreciation on forward foreign currency exchange contracts | 75,990 |
Interest rate risk | Component of trust capital - unrealized depreciation on futures contracts | 943,289 * |
Total | 1,481,724 |
* | Includes cumulative appreciation (depreciation) as reported in the tables following the Portfolio of Investments. Only the current day’s variation margin for futures and centrally cleared swaps, if any, is reported in receivables or payables in the Statement of Assets and Liabilities. |
Amount of realized gain (loss) on derivatives recognized in income | ||||||
Risk exposure category | Forward foreign currency exchange contracts ($) | Futures contracts ($) | Option contracts purchased ($) | Option contracts written ($) | Swap contracts ($) | Total ($) |
Credit risk | — | — | — | — | 1,356 | 1,356 |
Equity risk | — | 2,558,111 | (2,367,944 ) | (91,116 ) | — | 99,051 |
Foreign exchange risk | (753,067 ) | — | — | — | — | (753,067 ) |
Interest rate risk | — | (980,688 ) | — | — | — | (980,688 ) |
Total | (753,067 ) | 1,577,423 | (2,367,944 ) | (91,116 ) | 1,356 | (1,633,348 ) |
Change in unrealized appreciation (depreciation) on derivatives recognized in income | |||||
Risk exposure category | Forward foreign currency exchange contracts ($) | Futures contracts ($) | Option contracts purchased ($) | Option contracts written ($) | Total ($) |
Equity risk | — | (655,156 ) | (105,012 ) | 5,158 | (755,010 ) |
Foreign exchange risk | 651,538 | — | — | — | 651,538 |
Interest rate risk | — | (11,805 ) | — | — | (11,805 ) |
Total | 651,538 | (666,961 ) | (105,012 ) | 5,158 | (115,277 ) |
Derivative instrument | Average notional amounts ($) |
Futures contracts — long | 75,375,516 |
Futures contracts — short | 15,775,691 |
Credit default swap contracts — sell protection | 142,857 |
Derivative instrument | Average value ($) |
Option contracts purchased | 1,521,718 |
Option contracts written | (11,577 ) |
Derivative instrument | Average unrealized appreciation ($) | Average unrealized depreciation ($) |
Forward foreign currency exchange contracts | 176,799 | (245,207 ) |
Barclays ($) | Citi ($) | HSBC ($) | Morgan Stanley ($) | UBS ($) | Wells Fargo Securities LLC ($) | Total ($) | |
Assets | |||||||
Forward foreign currency exchange contracts | 32,253 | 168,643 | - | 102,880 | 89,905 | 50,194 | 443,875 |
Call option contracts purchased | - | - | - | 36,180 | - | - | 36,180 |
Put option contracts purchased | - | - | - | 1,446,115 | - | - | 1,446,115 |
Total assets | 32,253 | 168,643 | - | 1,585,175 | 89,905 | 50,194 | 1,926,170 |
Liabilities | |||||||
Forward foreign currency exchange contracts | - | - | 25,613 | - | - | 50,377 | 75,990 |
Put option contracts written | - | - | - | 27,090 | - | - | 27,090 |
Total liabilities | - | - | 25,613 | 27,090 | - | 50,377 | 103,080 |
Total financial and derivative net assets | 32,253 | 168,643 | (25,613 ) | 1,558,085 | 89,905 | (183 ) | 1,823,090 |
Total collateral received (pledged) (a) | - | - | - | - | - | - | - |
Net amount (b) | 32,253 | 168,643 | (25,613 ) | 1,558,085 | 89,905 | (183 ) | 1,823,090 |
(a) | In some instances, the actual collateral received and/or pledged may be more than the amount shown due to overcollateralization. |
(b) | Represents the net amount due from/(to) counterparties in the event of default. |
May 1, 2023 through April 30, 2024 | Prior to May 1, 2023 | |
Class 1 | 0.78 % | 0.79 % |
Class 2 | 1.03 | 1.04 |
Name, address, year of birth | Position held with the Columbia Funds and length of service | Principal occupation(s) during past five years and other relevant professional experience | Number of Funds in the Columbia Funds Complex* overseen | Other directorships held by Trustee during the past five years and other relevant Board experience |
George S. Batejan c/o Columbia Management Investment Advisers, LLC 290 Congress Street Boston, MA 02210 1954 | Trustee since 2017 | Executive Vice President, Global Head of Technology and Operations, Janus Capital Group, Inc., 2010-2016 | 161 | Former Chairman of the Board, NICSA (National Investment Company Services Association) (Executive Committee, Nominating Committee and Governance Committee), 2014-2016; former Director, Intech Investment Management, 2011-2016; former Board Member, Metro Denver Chamber of Commerce, 2015-2016; former Advisory Board Member, University of Colorado Business School, 2015-2018; former Board Member, Chase Bank International, 1993-1994 |
Kathleen Blatz c/o Columbia Management Investment Advisers, LLC 290 Congress Street Boston, MA 02210 1954 | Trustee since 2006 | Attorney, specializing in arbitration and mediation; Trustee of Gerald Rauenhorst 1982 Trusts, since 2020; Chief Justice, Minnesota Supreme Court, 1998-2006; Associate Justice, Minnesota Supreme Court, 1996-1998; Fourth Judicial District Court Judge, Hennepin County, 1994-1996; Attorney in private practice and public service, 1984-1993; State Representative, Minnesota House of Representatives, 1979-1993, which included service on the Tax and Financial Institutions and Insurance Committees; Member and Interim Chair, Minnesota Sports Facilities Authority, January-July 2017; Interim President and Chief Executive Officer, Blue Cross and Blue Shield of Minnesota (health care insurance), February-July 2018, April-October 2021 | 161 | Former Trustee, Blue Cross and Blue Shield of Minnesota, 2009-2021 (Chair of the Business Development Committee, 2014-2017; Chair of the Governance Committee, 2017-2019); former Member and Chair of the Board, Minnesota Sports Facilities Authority, January 2017-July 2017; former Director, Robina Foundation, 2009-2020 (Chair, 2014-2020); Director, Richard M. Schulze Family Foundation, since 2021 |
Name, address, year of birth | Position held with the Columbia Funds and length of service | Principal occupation(s) during past five years and other relevant professional experience | Number of Funds in the Columbia Funds Complex* overseen | Other directorships held by Trustee during the past five years and other relevant Board experience |
Pamela G. Carlton c/o Columbia Management Investment Advisers, LLC 290 Congress Street Boston, MA 02210 1954 | Chair since 2023; Trustee since 2007 | President, Springboard – Partners in Cross Cultural Leadership (consulting company), since 2003; Managing Director of US Equity Research, JP Morgan Chase, 1999-2003; Director of US Equity Research, Chase Asset Management, 1996-1999; Co-Director Latin America Research, 1993-1996, COO Global Research, 1992-1996, Co-Director of US Research, 1991-1992, Investment Banker, 1982-1991, Morgan Stanley; Attorney, Cleary Gottlieb Steen & Hamilton LLP, 1980-1982 | 161 | Trustee, New York Presbyterian Hospital Board, since 1996; Director, DR Bank (Audit Committee, since 2017 and Audit Committee Chair, since November 2023); Director, Evercore Inc. (Audit Committee, Nominating and Governance Committee) (financial services company), since 2019; Director, Apollo Commercial Real Estate Finance, Inc. (Chair, Nominating and Governance Committee), since 2021; the Governing Council of the Independent Directors Council (IDC), since 2021 |
Janet Langford Carrig c/o Columbia Management Investment Advisers, LLC 290 Congress Street Boston, MA 02210 1957 | Trustee since 1996 | Senior Vice President, General Counsel and Corporate Secretary, ConocoPhillips (independent energy company), September 2007-October 2018 | 161 | Director, EQT Corporation (natural gas producer), since 2019; former Director, Whiting Petroleum Corporation (independent oil and gas company), 2020-2022 |
J. Kevin Connaughton c/o Columbia Management Investment Advisers, LLC 290 Congress Street Boston, MA 02210 1964 | Trustee since 2020 | CEO and President, RhodeWay Financial (non-profit financial planning firm), since December 2022; Member, FINRA National Adjudicatory Council, January 2020-December 31, 2023; Adjunct Professor of Finance, Bentley University January 2018-April 2023; Consultant to Independent Trustees of CFVIT and CFST I from March 2016 to June 2020 with respect to CFVIT and to December 2020 with respect to CFST I; Managing Director and General Manager of Mutual Fund Products, Columbia Management Investment Advisers, LLC, May 2010-February 2015; President, Columbia Funds, 2008-2015; and senior officer of Columbia Funds and affiliated funds, 2003-2015 | 159 | Former Director, The Autism Project, March 2015-December 2021; former Member of the Investment Committee, St. Michael’s College, November 2015-February 2020; former Trustee, St. Michael’s College, June 2017-September 2019; former Trustee, New Century Portfolios (former mutual fund complex), January 2015-December 2017 |
Olive M. Darragh c/o Columbia Management Investment Advisers, LLC 290 Congress Street Boston, MA 02210 1962 | Trustee since 2020 | Managing Director of Darragh Inc. (strategy and talent management consulting firm), since 2010; Founder and CEO, Zolio, Inc. (investment management talent identification platform), since 2004; Consultant to Independent Trustees of CFVIT and CFST I from June 2019 to June 2020 with respect to CFVIT and to December 2020 with respect to CFST I; Partner, Tudor Investments, 2004-2010; Senior Partner, McKinsey & Company (consulting), 1990-2004; Touche Ross CPA, 1985-1988 | 159 | Treasurer, Edinburgh University US Trust Board, since January 2023; Member, HBS Community Action Partners Board, since September 2022; former Director, University of Edinburgh Business School (Member of US Board), 2004-2019; former Director, Boston Public Library Foundation, 2008-2017 |
Name, address, year of birth | Position held with the Columbia Funds and length of service | Principal occupation(s) during past five years and other relevant professional experience | Number of Funds in the Columbia Funds Complex* overseen | Other directorships held by Trustee during the past five years and other relevant Board experience |
Patricia M. Flynn c/o Columbia Management Investment Advisers, LLC 290 Congress Street Boston, MA 02210 1950 | Trustee since 2004 | Professor Emeritus of Economics and Management, Bentley University, since 2023; Professor of Economics and Management, Bentley University, 1976-2023; Dean, McCallum Graduate School of Business, Bentley University, 1992-2002 | 161 | Former Trustee, MA Taxpayers Foundation, 1997-2022; former Director, The MA Business Roundtable, 2003-2019; former Chairperson, Innovation Index Advisory Committee, MA Technology Collaborative, 1997-2020 |
Brian J. Gallagher c/o Columbia Management Investment Advisers, LLC 290 Congress Street Boston, MA 02210 1954 | Trustee since 2017 | Retired; Partner with Deloitte & Touche LLP and its predecessors, 1977-2016 | 161 | Trustee, Catholic Schools Foundation, since 2004 |
Douglas A. Hacker c/o Columbia Management Investment Advisers, LLC 290 Congress Street Boston, MA 02210 1955 | Trustee since 1996 | Independent business executive, since May 2006; Executive Vice President – Strategy of United Airlines, December 2002 - May 2006; President of UAL Loyalty Services (airline marketing company), September 2001-December 2002; Executive Vice President and Chief Financial Officer of United Airlines, July 1999-September 2001 | 161 | Director, SpartanNash Company since November 2013 (Chair of the Board, since May 2021) (food distributor); Director, Aircastle Limited (Chair of Audit Committee) (aircraft leasing), since August 2006; former Director, Nash Finch Company (food distributor), 2005-2013; former Director, SeaCube Container Leasing Ltd. (container leasing), 2010-2013; and former Director, Travelport Worldwide Limited (travel information technology), 2014-2019 |
Nancy T. Lukitsh c/o Columbia Management Investment Advisers, LLC 290 Congress Street Boston, MA 02210 1956 | Trustee since 2011 | Senior Vice President, Partner and Director of Marketing, Wellington Management Company, LLP (investment adviser), 1997-2010; Chair, Wellington Management Portfolios (commingled non-U.S. investment pools), 2007-2010; Director, Wellington Trust Company, NA and other Wellington affiliates, 1997-2010 | 159 | None |
Name, address, year of birth | Position held with the Columbia Funds and length of service | Principal occupation(s) during past five years and other relevant professional experience | Number of Funds in the Columbia Funds Complex* overseen | Other directorships held by Trustee during the past five years and other relevant Board experience |
David M. Moffett c/o Columbia Management Investment Advisers, LLC 290 Congress Street Boston, MA 02210 1952 | Trustee since 2011 | Retired; former Chief Executive Officer of Freddie Mac and Chief Financial Officer of U.S. Bank | 161 | Director, CSX Corporation (transportation suppliers); Director, PayPal Holdings Inc. (payment and data processing services); former Director, eBay Inc. (online trading community), 2007-2015; and former Director, CIT Bank, CIT Group Inc. (commercial and consumer finance), 2010-2016; former Senior Adviser to The Carlyle Group (financial services), March 2008-September 2008; former Governance Consultant to Bridgewater Associates, January 2013-December 2015 |
Catherine James Paglia c/o Columbia Management Investment Advisers, LLC 290 Congress Street Boston, MA 02210 1952 | Trustee since 2004 | Director, Enterprise Asset Management, Inc. (private real estate and asset management company), since September 1998; Managing Director and Partner, Interlaken Capital, Inc., 1989-1997; Vice President, 1982-1985, Principal, 1985-1987, Managing Director, 1987-1989, Morgan Stanley; Vice President, Investment Banking, 1980-1982, Associate, Investment Banking, 1976-1980, Dean Witter Reynolds, Inc. | 161 | Director, Valmont Industries, Inc. (irrigation systems manufacturer), since 2012; Trustee, Carleton College (on the Investment Committee), since 1987; Trustee, Carnegie Endowment for International Peace (on the Investment Committee), since 2009 |
Natalie A. Trunow c/o Columbia Management Investment Advisers, LLC 290 Congress Street Boston, MA 02210 1967 | Trustee since 2020 | Chief Executive Officer, Millennial Portfolio Solutions LLC (asset management and consulting services), January 2016-January 2021; Non-executive Member of the Investment Committee and Valuation Committee, Sarona Asset Management Inc. (private equity firm) since September 2019; Advisor, Horizon Investments (asset management and consulting services), August 2018-January 2022; Advisor, Paradigm Asset Management, November 2016-January 2022; Consultant to Independent Trustees of CFVIT and CFST I from September 2016 to June 2020 with respect to CFVIT and to December 2020 with respect to CFST I; Director of Investments/Consultant, Casey Family Programs, April 2016-November 2016; Senior Vice President and Chief Investment Officer, Calvert Investments, August 2008-January 2016; Section Head and Portfolio Manager, General Motors Asset Management, June 1997-August 2008 | 159 | Independent Director, Investment Committee, Health Services for Children with Special Needs, Inc., 2010-2021; Independent Director, (Executive Committee and Chair, Audit Committee), Consumer Credit Counseling Services (formerly Guidewell Financial Solutions), since 2016; Independent Director, (Investment Committee), Sarona Asset Management, since 2019 |
Sandra L. Yeager c/o Columbia Management Investment Advisers, LLC 290 Congress Street Boston, MA 02210 1964 | Trustee since 2017 | Retired; President and founder, Hanoverian Capital, LLC (SEC registered investment advisor firm), 2008-2016; Managing Director, DuPont Capital, 2006-2008; Managing Director, Morgan Stanley Investment Management, 2004-2006; Senior Vice President, Alliance Bernstein, 1990-2004 | 161 | Former Director, NAPE (National Alliance for Partnerships in Equity) Education Foundation, October 2016-October 2020; Advisory Board, Jennersville YMCA, June 2022-June 2023 |
Name, address, year of birth | Position held with the Columbia Funds and length of service | Principal occupation(s) during the past five years and other relevant professional experience | Number of Funds in the Columbia Funds Complex* overseen | Other directorships held by Trustee during the past five years and other relevant Board experience |
Daniel J. Beckman c/o Columbia Management Investment Advisers, LLC 290 Congress Street Boston, MA 02210 1962 | Trustee since November 2021 and President since June 2021 | President and Principal Executive Officer of the Columbia Funds, since June 2021; Vice President, Columbia Management Investment Advisers, LLC, since April 2015; formerly, Vice President – Head of North America Product, Columbia Management Investment Advisers, LLC, April 2015 – December 2023; President and Principal Executive Officer, Columbia Acorn/Wanger Funds, since July 2021 | 161 | Director, Ameriprise Trust Company, since October 2016; Director, Columbia Management Investment Distributors, Inc., since November 2018; Board of Governors, Columbia Wanger Asset Management, LLC, since January 2022 |
* | The term “Columbia Funds Complex” as used herein includes Columbia Seligman Premium Technology Growth Fund, Tri-Continental Corporation and each series of Columbia Funds Series Trust (CFST), Columbia Funds Series Trust I (CFST I), Columbia Funds Series Trust II (CFST II), Columbia ETF Trust I (CET I), Columbia ETF Trust II (CET II), Columbia Funds Variable Insurance Trust (CFVIT) and Columbia Funds Variable Series Trust II (CFVST II). Messrs. Batejan, Beckman, Gallagher, Hacker and Moffett and Mses. Blatz, Carlton, Carrig, Flynn, Paglia, and Yeager serve as directors of Columbia Seligman Premium Technology Growth Fund and Tri-Continental Corporation. |
** | Interested person (as defined under the 1940 Act) by reason of being an officer, director, security holder and/or employee of the Investment Manager or Ameriprise Financial. |
Name, address and year of birth | Position and year first appointed to position for any Fund in the Columbia Funds Complex or a predecessor thereof | Principal occupation(s) during past five years |
Michael G. Clarke 290 Congress Street Boston, MA 02210 1969 | Chief Financial Officer and Principal Financial Officer (2009); Senior Vice President (2019); Treasurer and Chief Accounting Officer (Principal Accounting Officer) (2024) for CFST, CFST I, CFST II, CFVIT and CFVST II | Senior Vice President and North America Head of Operations & Investor Services, Columbia Management Investment Advisers, LLC, since June 2023 (previously Senior Vice President and Head of Global Operations, March 2022 – June 2023, Vice President, Head of North America Operations, and Co-Head of Global Operations, June 2019 - February 2022 and Vice President – Accounting and Tax, May 2010 - May 2019); senior officer of Columbia Funds and affiliated funds, since 2002. Director, Ameriprise Trust Company, since June 2023. |
Name, address and year of birth | Position and year first appointed to position for any Fund in the Columbia Funds Complex or a predecessor thereof | Principal occupation(s) during past five years |
Marybeth Pilat 290 Congress Street Boston, MA 02210 1968 | Treasurer and Chief Accounting Officer (Principal Accounting Officer) and Principal Financial Officer (2020) for CET I and CET II; Assistant Treasurer, CFST, CFST I, CFST II, CFVIT and CFVST II | Vice President – Product Pricing and Administration, Columbia Management Investment Advisers, LLC, since May 2017. |
William F. Truscott 290 Congress Street Boston, MA 02210 1960 | Senior Vice President (2001) | Formerly, Trustee/Director of Columbia Funds Complex or legacy funds, November 2001 - January 1, 2021; Chief Executive Officer, Global Asset Management, Ameriprise Financial, Inc., since September 2012; Chairman of the Board and President, Columbia Management Investment Advisers, LLC, since July 2004 and February 2012, respectively; Chairman of the Board and Chief Executive Officer, Columbia Management Investment Distributors, Inc., since November 2008 and February 2012, respectively; Chairman of the Board and Director, TAM UK International Holdings Limited, since July 2021; formerly Chairman of the Board and Director, Threadneedle Asset Management Holdings, Sàrl, March 2013 – December 2022 and December 2008 – December 2022, respectively; senior executive of various entities affiliated with Columbia Threadneedle Investments. |
Christopher O. Petersen 5228 Ameriprise Financial Center Minneapolis, MN 55474 1970 | Senior Vice President and Assistant Secretary (2021) | Formerly, Trustee/Director of funds within the Columbia Funds Complex, July 1, 2020 - November 22, 2021; Senior Vice President and Assistant General Counsel, Ameriprise Financial, Inc., since September 2021 (previously Vice President and Lead Chief Counsel, January 2015 - September 2021); formerly, President and Principal Executive Officer of the Columbia Funds, 2015 - 2021; officer of Columbia Funds and affiliated funds, since 2007. |
Thomas P. McGuire 290 Congress Street Boston, MA 02210 1972 | Senior Vice President and Chief Compliance Officer (2012) | Vice President – Asset Management Compliance, Ameriprise Financial, Inc., since May 2010; Chief Compliance Officer, Columbia Acorn/Wanger Funds, since December 2015; formerly, Chief Compliance Officer, Ameriprise Certificate Company, September 2010 – September 2020. |
Ryan C. Larrenaga 290 Congress Street Boston, MA 02210 1970 | Senior Vice President (2017), Chief Legal Officer (2017), and Secretary (2015) | Vice President and Chief Counsel, Ameriprise Financial, Inc., since August 2018 (previously Vice President and Group Counsel, August 2011 - August 2018); Chief Legal Officer, Columbia Acorn/Wanger Funds, since September 2020; officer of Columbia Funds and affiliated funds, since 2005. |
Michael E. DeFao 290 Congress Street Boston, MA 02210 1968 | Vice President (2011) and Assistant Secretary (2010) | Vice President and Chief Counsel, Ameriprise Financial, Inc., since May 2010; Vice President, Chief Legal Officer and Assistant Secretary, Columbia Management Investment Advisers, LLC, since October 2021 (previously Vice President and Assistant Secretary, May 2010 – September 2021). |
Lyn Kephart-Strong 5903 Ameriprise Financial Center Minneapolis, MN 55474 1960 | Vice President (2015) | Vice President, Global Investment Operations Services, Columbia Management Investment Advisers, LLC, since 2010; President, Columbia Management Investment Services Corp., since October 2014; President, Ameriprise Trust Company, since January 2017. |


3 | |
5 | |
7 | |
8 | |
13 | |
14 | |
15 | |
16 | |
18 | |
30 | |
31 |
Average annual total returns (%) (for the period ended December 31, 2023) | |||||
Inception | 1 Year | 5 Years | Life | ||
Class 1* | 02/20/19 | 11.53 | 4.16 | 4.23 | |
Class 2 | 11/02/16 | 11.22 | 3.90 | 4.04 | |
Blended Benchmark | 12.50 | 6.32 | 5.68 | ||
Bloomberg U.S. Aggregate Bond Index | 5.53 | 1.10 | 0.93 | ||
S&P 500 Index | 26.29 | 15.69 | 14.19 | ||

Portfolio Allocation (%) (at December 31, 2023) | |
Allocations to Underlying Funds | |
Equity Funds | 28.2 |
U.S. Large Cap | 28.2 |
Exchange-Traded Equity Funds | 3.2 |
U.S. Large Cap | 1.6 |
U.S. Mid Large Cap | 1.6 |
Exchange-Traded Fixed Income Funds | 3.0 |
Investment Grade | 3.0 |
Fixed Income Funds | 37.8 |
Investment Grade | 37.8 |
Allocations to Tactical Assets | |
Money Market Funds(a) | 20.8 |
Call Option Contracts Purchased | 0.0 (b) |
Put Option Contracts Purchased | 0.4 |
Residential Mortgage-Backed Securities - Agency | 6.6 |
Total | 100.0 |
(a) | Includes investments in Money Market Funds, including investing for the purpose of covering obligations relating to the Fund’s investment in derivatives. For a description of the Fund’s investments in derivatives, see Investments in derivatives following the Portfolio of Investments and the derivative instruments discussion in Note 2 to the Notes to Financial Statements. |
(b) | Rounds to zero. |
July 1, 2023 — December 31, 2023 | ||||||||||
Account value at the beginning of the period ($) | Account value at the end of the period ($) | Expenses paid during the period ($) | Fund’s annualized expense ratio (%) | Effective expenses paid during the period ($) | Fund’s effective annualized expense ratio (%) | |||||
Actual | Hypothetical | Actual | Hypothetical | Actual | Hypothetical | Actual | Actual | Hypothetical | Actual | |
Class 1 | 1,000.00 | 1,000.00 | 1,050.80 | 1,023.39 | 1.59 | 1.56 | 0.31 | 3.63 | 3.58 | 0.71 |
Class 2 | 1,000.00 | 1,000.00 | 1,049.00 | 1,022.14 | 2.86 | 2.82 | 0.56 | 4.90 | 4.84 | 0.96 |
Equity Funds 29.9% | ||
Shares | Value ($) | |
U.S. Large Cap 29.9% | ||
Columbia Variable Portfolio – Disciplined Core Fund, Class 1 Shares(a),(b) | 141,541 | 12,680,690 |
Columbia Variable Portfolio – Large Cap Index Fund, Class 1 Shares(a),(b) | 592,346 | 23,912,994 |
Columbia Variable Portfolio – Select Large Cap Equity Fund, Class 1 Shares(a),(b) | 660,444 | 12,522,011 |
Columbia Variable Portfolio – Select Large Cap Value Fund, Class 1 Shares(a),(b) | 249,367 | 9,653,003 |
CTIVP® – Principal Blue Chip Growth Fund, Class 1 Shares(a),(b) | 165,612 | 9,772,784 |
CTIVP® – T. Rowe Price Large Cap Value Fund, Class 1 Shares(a),(b) | 279,234 | 9,798,322 |
Variable Portfolio – Partners Core Equity Fund, Class 1 Shares(a),(b) | 513,248 | 19,118,472 |
Total | 97,458,276 | |
Total Equity Funds (Cost $50,435,561) | 97,458,276 | |
Exchange-Traded Equity Funds 3.4% | ||
U.S. Large Cap 1.7% | ||
Vanguard Russell 1000 Growth ETF | 71,887 | 5,608,624 |
U.S. Mid Large Cap 1.7% | ||
iShares Russell 1000 Growth Index Fund | 18,515 | 5,613,192 |
Total Exchange-Traded Equity Funds (Cost $10,070,570) | 11,221,816 | |
Exchange-Traded Fixed Income Funds 3.2% | ||
Investment Grade 3.2% | ||
iShares Core U.S. Aggregate Bond ETF | 22,610 | 2,244,043 |
iShares iBoxx $ Investment Grade Corporate Bond ETF | 34,877 | 3,859,489 |
Vanguard Intermediate-Term Corporate Bond ETF | 52,930 | 4,302,150 |
Total | 10,405,682 | |
Total Exchange-Traded Fixed Income Funds (Cost $9,944,585) | 10,405,682 | |
Fixed Income Funds 40.1% | ||
Shares | Value ($) | |
Investment Grade 40.1% | ||
Columbia Variable Portfolio – Intermediate Bond Fund, Class 1 Shares(a) | 3,614,355 | 31,047,309 |
Columbia Variable Portfolio – Limited Duration Credit Fund, Class 1 Shares(a) | 753,961 | 7,147,554 |
Columbia Variable Portfolio – Long Government/Credit Bond Fund, Class 1 Shares(a) | 1,264,910 | 9,992,786 |
Columbia Variable Portfolio – U.S. Government Mortgage Fund, Class 1 Shares(a) | 829,287 | 7,405,531 |
CTIVP® – American Century Diversified Bond Fund, Class 1 Shares(a) | 2,959,750 | 27,170,505 |
CTIVP® – TCW Core Plus Bond Fund, Class 1 Shares(a) | 2,608,724 | 24,548,093 |
Variable Portfolio – Partners Core Bond Fund, Class 1 Shares(a) | 2,422,627 | 23,572,161 |
Total | 130,883,939 | |
Total Fixed Income Funds (Cost $148,081,441) | 130,883,939 | |
Residential Mortgage-Backed Securities - Agency 6.9% | ||||
Issuer | Coupon Rate | Principal Amount ($) | Value ($) | |
Uniform Mortgage-Backed Security TBA(c) | ||||
01/18/2039- 01/16/2054 | 3.000% | 8,427,500 | 7,483,198 | |
01/18/2039- 01/16/2054 | 3.500% | 2,850,000 | 2,648,385 | |
01/18/2039- 01/16/2054 | 4.000% | 6,442,500 | 6,128,296 | |
01/16/2054 | 4.500% | 2,250,000 | 2,180,918 | |
01/16/2054 | 5.000% | 4,250,000 | 4,204,511 | |
Total Residential Mortgage-Backed Securities - Agency (Cost $22,049,613) | 22,645,308 | |||
Call Option Contracts Purchased 0.0% | ||||
Value ($) | ||||
(Cost $32,551) | 36,180 | |||
Put Option Contracts Purchased 0.5% | ||||
(Cost $1,611,019) | 1,451,025 | |||
Money Market Funds 22.0% | ||
Shares | Value ($) | |
Columbia Short-Term Cash Fund, 5.569%(a),(d) | 71,984,784 | 71,970,388 |
Total Money Market Funds (Cost $71,952,397) | 71,970,388 | |
Total Investments in Securities (Cost: $314,177,737) | 346,072,614 | |
Other Assets & Liabilities, Net | (19,587,358 ) | |
Net Assets | 326,485,256 | |
Long futures contracts | ||||||
Description | Number of contracts | Expiration date | Trading currency | Notional amount | Value/Unrealized appreciation ($) | Value/Unrealized depreciation ($) |
S&P 500 Index E-mini | 163 | 03/2024 | USD | 39,283,000 | 1,180,072 | — |
U.S. Treasury 10-Year Note | 16 | 03/2024 | USD | 1,806,250 | 9,984 | — |
U.S. Treasury 2-Year Note | 19 | 03/2024 | USD | 3,912,367 | 43,016 | — |
U.S. Treasury 5-Year Note | 46 | 03/2024 | USD | 5,003,578 | 106,431 | — |
Total | 1,339,503 | — | ||||
Short futures contracts | ||||||
Description | Number of contracts | Expiration date | Trading currency | Notional amount | Value/Unrealized appreciation ($) | Value/Unrealized depreciation ($) |
U.S. Long Bond | (8) | 03/2024 | USD | (999,500 ) | — | (47,891 ) |
U.S. Treasury Ultra Bond | (8) | 03/2024 | USD | (1,068,750 ) | — | (59,370 ) |
Total | — | (107,261 ) | ||||
Call option contracts purchased | ||||||||
Description | Counterparty | Trading currency | Notional amount | Number of contracts | Exercise price/Rate | Expiration date | Cost ($) | Value ($) |
S&P 500 Index | Morgan Stanley | USD | 1,430,949 | 3 | 4,785.00 | 03/15/2024 | 32,551 | 36,180 |
Put option contracts purchased | ||||||||
Description | Counterparty | Trading currency | Notional amount | Number of contracts | Exercise price/Rate | Expiration date | Cost ($) | Value ($) |
S&P 500 Index | Morgan Stanley | USD | 14,309,490 | 30 | 3,650.00 | 06/20/2025 | 289,216 | 240,600 |
S&P 500 Index | Morgan Stanley | USD | 14,309,490 | 30 | 3,550.00 | 06/20/2025 | 278,342 | 213,450 |
S&P 500 Index | Morgan Stanley | USD | 10,016,643 | 21 | 3,800.00 | 06/20/2025 | 198,629 | 200,760 |
S&P 500 Index | Morgan Stanley | USD | 10,016,643 | 21 | 3,900.00 | 12/19/2025 | 299,954 | 302,400 |
S&P 500 Index | Morgan Stanley | USD | 10,016,643 | 21 | 3,800.00 | 12/19/2025 | 270,029 | 272,790 |
S&P 500 Index | Morgan Stanley | USD | 10,016,643 | 21 | 3,600.00 | 12/19/2025 | 274,849 | 221,025 |
Total | 1,611,019 | 1,451,025 | ||||||
Put option contracts written | ||||||||
Description | Counterparty | Trading currency | Notional amount | Number of contracts | Exercise price/Rate | Expiration date | Premium received ($) | Value ($) |
S&P 500 Index | Morgan Stanley | USD | (1,430,949 ) | (3 ) | 4,785.00 | 03/15/2024 | (32,248 ) | (27,090 ) |
(a) | As defined in the Investment Company Act of 1940, as amended, an affiliated company is one in which the Fund owns 5% or more of the company’s outstanding voting securities, or a company which is under common ownership or control with the Fund. The value of the holdings and transactions in these affiliated companies during the year ended December 31, 2023 are as follows: |
Affiliated issuers | Beginning of period($) | Purchases($) | Sales($) | Net change in unrealized appreciation (depreciation)($) | End of period($) | Capital gain distributions($) | Realized gain (loss)($) | Dividends — affiliated issuers ($) | End of period shares |
Columbia Short-Term Cash Fund, 5.569% | |||||||||
54,051,707 | 71,957,357 | (54,047,790 ) | 9,114 | 71,970,388 | — | (1,900 ) | 3,367,505 | 71,984,784 | |
Columbia Variable Portfolio – Disciplined Core Fund, Class 1 Shares | |||||||||
11,741,069 | 582,927 | (1,737,913 ) | 2,094,607 | 12,680,690 | — | 664,751 | — | 141,541 | |
Columbia Variable Portfolio – Intermediate Bond Fund, Class 1 Shares | |||||||||
29,013,810 | 2,380,228 | (1,932,796 ) | 1,586,067 | 31,047,309 | — | (455,599 ) | 707,738 | 3,614,355 | |
Columbia Variable Portfolio – Large Cap Index Fund, Class 1 Shares | |||||||||
22,204,402 | 1,162,786 | (3,402,033 ) | 3,947,839 | 23,912,994 | — | 1,564,844 | — | 592,346 | |
Columbia Variable Portfolio – Limited Duration Credit Fund, Class 1 Shares | |||||||||
6,993,105 | 700,004 | (814,963 ) | 269,408 | 7,147,554 | — | (43,294 ) | 240,765 | 753,961 | |
Columbia Variable Portfolio – Long Government/Credit Bond Fund, Class 1 Shares | |||||||||
9,322,310 | 1,370,340 | (1,664,766 ) | 964,902 | 9,992,786 | — | (591,889 ) | 326,880 | 1,264,910 | |
Columbia Variable Portfolio – Select Large Cap Equity Fund, Class 1 Shares | |||||||||
11,731,441 | 532,607 | (2,438,537 ) | 2,696,500 | 12,522,011 | — | 417,779 | — | 660,444 | |
Columbia Variable Portfolio – Select Large Cap Value Fund, Class 1 Shares | |||||||||
9,201,605 | 1,107,309 | (1,120,831 ) | 464,920 | 9,653,003 | — | 86,074 | — | 249,367 | |
Columbia Variable Portfolio – U.S. Government Mortgage Fund, Class 1 Shares | |||||||||
6,912,700 | 678,814 | (474,240 ) | 288,257 | 7,405,531 | — | (91,159 ) | 201,216 | 829,287 | |
CTIVP® – American Century Diversified Bond Fund, Class 1 Shares | |||||||||
25,425,414 | 2,360,988 | (1,475,965 ) | 860,068 | 27,170,505 | — | (313,253 ) | 876,276 | 2,959,750 | |
CTIVP® – Morgan Stanley Advantage Fund, Class 1 Shares | |||||||||
8,648,770 | — | (7,807,022 ) | (841,748 ) | — | — | 2,250,476 | — | — | |
CTIVP® – Principal Blue Chip Growth Fund, Class 1 Shares | |||||||||
9,102,264 | 632,135 | (2,412,158 ) | 2,450,543 | 9,772,784 | — | 805,867 | — | 165,612 | |
CTIVP® – T. Rowe Price Large Cap Value Fund, Class 1 Shares | |||||||||
9,195,248 | 1,059,632 | (1,225,534 ) | 768,976 | 9,798,322 | — | 164,703 | — | 279,234 | |
CTIVP® – TCW Core Plus Bond Fund, Class 1 Shares | |||||||||
22,980,149 | 1,966,952 | (1,435,356 ) | 1,036,348 | 24,548,093 | — | (268,569 ) | 597,104 | 2,608,724 | |
Variable Portfolio – Partners Core Bond Fund, Class 1 Shares | |||||||||
22,119,629 | 1,875,937 | (1,430,238 ) | 1,006,833 | 23,572,161 | — | (258,401 ) | 634,310 | 2,422,627 | |
Variable Portfolio – Partners Core Equity Fund, Class 1 Shares | |||||||||
17,749,506 | 913,057 | (2,556,371 ) | 3,012,280 | 19,118,472 | — | 1,190,398 | — | 513,248 | |
Total | 276,393,129 | 20,614,914 | 300,312,603 | — | 5,120,828 | 6,951,794 | |||
(b) | Non-income producing investment. |
(c) | Represents a security purchased on a when-issued basis. |
(d) | The rate shown is the seven-day current annualized yield at December 31, 2023. |
TBA | To Be Announced |
USD | US Dollar |
Level 1 ($) | Level 2 ($) | Level 3 ($) | Assets at NAV ($) | Total ($) | |
Investments in Securities | |||||
Equity Funds | — | — | — | 97,458,276 | 97,458,276 |
Exchange-Traded Equity Funds | 11,221,816 | — | — | — | 11,221,816 |
Exchange-Traded Fixed Income Funds | 10,405,682 | — | — | — | 10,405,682 |
Fixed Income Funds | — | — | — | 130,883,939 | 130,883,939 |
Residential Mortgage-Backed Securities - Agency | — | 22,645,308 | — | — | 22,645,308 |
Call Option Contracts Purchased | 36,180 | — | — | — | 36,180 |
Put Option Contracts Purchased | 1,451,025 | — | — | — | 1,451,025 |
Money Market Funds | 71,970,388 | — | — | — | 71,970,388 |
Total Investments in Securities | 95,085,091 | 22,645,308 | — | 228,342,215 | 346,072,614 |
Investments in Derivatives | |||||
Asset | |||||
Futures Contracts | 1,339,503 | — | — | — | 1,339,503 |
Level 1 ($) | Level 2 ($) | Level 3 ($) | Assets at NAV ($) | Total ($) | |
Liability | |||||
Futures Contracts | (107,261 ) | — | — | — | (107,261 ) |
Put Option Contracts Written | (27,090 ) | — | — | — | (27,090 ) |
Total | 96,290,243 | 22,645,308 | — | 228,342,215 | 347,277,766 |
Assets | |
Investments in securities, at value | |
Unaffiliated issuers (cost $42,064,768) | $44,272,806 |
Affiliated issuers (cost $270,469,399) | 300,312,603 |
Option contracts purchased (cost $1,643,570) | 1,487,205 |
Cash | 1,216 |
Cash collateral held at broker for: | |
Option contracts written | 371,226 |
Margin deposits on: | |
Futures contracts | 1,989,480 |
Receivable for: | |
Investments sold | 182,096 |
Investments sold on a delayed delivery basis | 4,447,774 |
Dividends | 302,435 |
Interest | 38,952 |
Variation margin for futures contracts | 12,078 |
Prepaid expenses | 4,322 |
Deferred compensation of board members | 32,092 |
Total assets | 353,454,285 |
Liabilities | |
Option contracts written, at value (premiums received $32,248) | 27,090 |
Payable for: | |
Investments purchased on a delayed delivery basis | 26,487,955 |
Capital shares redeemed | 260,136 |
Variation margin for futures contracts | 99,838 |
Management services fees | 2,065 |
Distribution and/or service fees | 2,239 |
Service fees | 15,218 |
Compensation of chief compliance officer | 60 |
Compensation of board members | 1,012 |
Other expenses | 22,808 |
Deferred compensation of board members | 50,608 |
Total liabilities | 26,969,029 |
Net assets applicable to outstanding capital stock | $326,485,256 |
Represented by | |
Trust capital | $326,485,256 |
Total - representing net assets applicable to outstanding capital stock | $326,485,256 |
Class 1 | |
Net assets | $422,886 |
Shares outstanding | 31,447 |
Net asset value per share | $13.45 |
Class 2 | |
Net assets | $326,062,370 |
Shares outstanding | 24,548,394 |
Net asset value per share | $13.28 |
Net investment income | |
Income: | |
Dividends — unaffiliated issuers | $608,105 |
Dividends — affiliated issuers | 6,951,794 |
Interest | 80,171 |
Total income | 7,640,070 |
Expenses: | |
Management services fees | 669,536 |
Distribution and/or service fees | |
Class 2 | 791,148 |
Service fees | 190,086 |
Custodian fees | 23,452 |
Printing and postage fees | 11,382 |
Accounting services fees | 30,090 |
Legal fees | 16,013 |
Compensation of chief compliance officer | 61 |
Compensation of board members | 14,626 |
Deferred compensation of board members | 5,593 |
Other | 9,592 |
Total expenses | 1,761,579 |
Net investment income | 5,878,491 |
Realized and unrealized gain (loss) — net | |
Net realized gain (loss) on: | |
Investments — unaffiliated issuers | (2,797,124 ) |
Investments — affiliated issuers | 5,120,828 |
Futures contracts | 2,020,003 |
Option contracts purchased | (2,108,937 ) |
Option contracts written | (99,066 ) |
Net realized gain | 2,135,704 |
Net change in unrealized appreciation (depreciation) on: | |
Investments — unaffiliated issuers | 5,040,101 |
Investments — affiliated issuers | 20,614,914 |
Futures contracts | 445,904 |
Option contracts purchased | (112,394 ) |
Option contracts written | 5,158 |
Net change in unrealized appreciation (depreciation) | 25,993,683 |
Net realized and unrealized gain | 28,129,387 |
Net increase in net assets resulting from operations | $34,007,878 |
Year Ended December 31, 2023 | Year Ended December 31, 2022 | |
Operations | ||
Net investment income | $5,878,491 | $2,867,098 |
Net realized gain (loss) | 2,135,704 | (12,296,175 ) |
Net change in unrealized appreciation (depreciation) | 25,993,683 | (52,535,882 ) |
Net increase (decrease) in net assets resulting from operations | 34,007,878 | (61,964,959 ) |
Decrease in net assets from capital stock activity | (13,636,353 ) | (6,592,349 ) |
Total increase (decrease) in net assets | 20,371,525 | (68,557,308 ) |
Net assets at beginning of year | 306,113,731 | 374,671,039 |
Net assets at end of year | $326,485,256 | $306,113,731 |
Year Ended | Year Ended | |||
December 31, 2023 | December 31, 2022 | |||
Shares | Dollars ($) | Shares | Dollars ($) | |
Capital stock activity | ||||
Class 1 | ||||
Shares sold | 7,594 | 94,337 | 15,736 | 208,051 |
Shares redeemed | (1,508 ) | (19,010 ) | (374 ) | (4,650 ) |
Net increase | 6,086 | 75,327 | 15,362 | 203,401 |
Class 2 | ||||
Shares sold | 1,699,570 | 20,884,282 | 2,667,069 | 33,325,540 |
Shares redeemed | (2,757,247 ) | (34,595,962 ) | (3,172,580 ) | (40,121,290 ) |
Net decrease | (1,057,677 ) | (13,711,680 ) | (505,511 ) | (6,795,750 ) |
Total net decrease | (1,051,591 ) | (13,636,353 ) | (490,149 ) | (6,592,349 ) |
Net asset value, beginning of period | Net investment income | Net realized and unrealized gain (loss) | Total from investment operations | |
Class 1 | ||||
Year Ended 12/31/2023 | $12.06 | 0.27 | 1.12 | 1.39 |
Year Ended 12/31/2022 | $14.45 | 0.16 | (2.55 ) | (2.39 ) |
Year Ended 12/31/2021 | $13.41 | 0.10 | 0.94 | 1.04 |
Year Ended 12/31/2020 | $12.63 | 0.09 | 0.69 | 0.78 |
Year Ended 12/31/2019(c) | $11.47 | 0.20 | 0.96 | 1.16 |
Class 2 | ||||
Year Ended 12/31/2023 | $11.94 | 0.23 | 1.11 | 1.34 |
Year Ended 12/31/2022 | $14.34 | 0.11 | (2.51 ) | (2.40 ) |
Year Ended 12/31/2021 | $13.34 | 0.06 | 0.94 | 1.00 |
Year Ended 12/31/2020 | $12.60 | 0.11 | 0.63 | 0.74 |
Year Ended 12/31/2019 | $10.97 | 0.17 | 1.46 | 1.63 |
Notes to Financial Highlights | |
(a) | In addition to the fees and expenses that the Fund bears directly, the Fund indirectly bears a pro rata share of the fees and expenses of any other funds in which it invests. Such indirect expenses are not included in the Fund’s reported expense ratios. |
(b) | Total net expenses include the impact of certain fee waivers/expense reimbursements made by the Investment Manager and certain of its affiliates, if applicable. |
(c) | Class 1 shares commenced operations on February 20, 2019. Per share data and total return reflect activity from that date. |
Net asset value, end of period | Total return | Total gross expense ratio to average net assets(a) | Total net expense ratio to average net assets(a),(b) | Net investment income ratio to average net assets | Portfolio turnover | Net assets, end of period (000’s) | |
Class 1 | |||||||
Year Ended 12/31/2023 | $13.45 | 11.53% | 0.31% | 0.31% | 2.17% | 169% | $423 |
Year Ended 12/31/2022 | $12.06 | (16.54% ) | 0.30% | 0.30% | 1.29% | 149% | $306 |
Year Ended 12/31/2021 | $14.45 | 7.76% | 0.30% | 0.30% | 0.70% | 179% | $144 |
Year Ended 12/31/2020 | $13.41 | 6.18% | 0.32% | 0.32% | 0.74% | 243% | $97 |
Year Ended 12/31/2019(c) | $12.63 | 10.11% | 0.32% | 0.32% | 1.98% | 156% | $3 |
Class 2 | |||||||
Year Ended 12/31/2023 | $13.28 | 11.22% | 0.56% | 0.56% | 1.86% | 169% | $326,062 |
Year Ended 12/31/2022 | $11.94 | (16.74% ) | 0.55% | 0.55% | 0.88% | 149% | $305,808 |
Year Ended 12/31/2021 | $14.34 | 7.50% | 0.55% | 0.55% | 0.45% | 179% | $374,527 |
Year Ended 12/31/2020 | $13.34 | 5.87% | 0.56% | 0.56% | 0.84% | 243% | $417,276 |
Year Ended 12/31/2019 | $12.60 | 14.86% | 0.59% | 0.59% | 1.42% | 156% | $288,927 |
Asset derivatives | ||
Risk exposure category | Statement of assets and liabilities location | Fair value ($) |
Equity risk | Component of trust capital — unrealized appreciation on futures contracts | 1,180,072 * |
Equity risk | Investments, at value — Option contracts purchased | 1,487,205 |
Interest rate risk | Component of trust capital — unrealized appreciation on futures contracts | 159,431 * |
Total | 2,826,708 |
Liability derivatives | ||
Risk exposure category | Statement of assets and liabilities location | Fair value ($) |
Equity risk | Option contracts written, at value | 27,090 |
Interest rate risk | Component of trust capital - unrealized depreciation on futures contracts | 107,261 * |
Total | 134,351 |
* | Includes cumulative appreciation (depreciation) as reported in the tables following the Portfolio of Investments. Only the current day’s variation margin for futures and centrally cleared swaps, if any, is reported in receivables or payables in the Statement of Assets and Liabilities. |
Amount of realized gain (loss) on derivatives recognized in income | ||||
Risk exposure category | Futures contracts ($) | Option contracts purchased ($) | Option contracts written ($) | Total ($) |
Equity risk | 2,258,505 | (2,108,937 ) | (99,066 ) | 50,502 |
Interest rate risk | (238,502 ) | — | — | (238,502 ) |
Total | 2,020,003 | (2,108,937 ) | (99,066 ) | (188,000 ) |
Change in unrealized appreciation (depreciation) on derivatives recognized in income | ||||
Risk exposure category | Futures contracts ($) | Option contracts purchased ($) | Option contracts written ($) | Total ($) |
Equity risk | 325,147 | (112,394 ) | 5,158 | 217,911 |
Interest rate risk | 120,757 | — | — | 120,757 |
Total | 445,904 | (112,394 ) | 5,158 | 338,668 |
Derivative instrument | Average notional amounts ($) |
Futures contracts — long | 41,501,145 |
Futures contracts — short | 3,599,201 |
Derivative instrument | Average value ($) |
Option contracts purchased | 1,413,995 |
Option contracts written | (11,213 ) |
Morgan Stanley ($) | |
Assets | |
Call option contracts purchased | 36,180 |
Put option contracts purchased | 1,451,025 |
Total assets | 1,487,205 |
Liabilities | |
Put option contracts written | 27,090 |
Total liabilities | 27,090 |
Total financial and derivative net assets | 1,460,115 |
Total collateral received (pledged) (a) | - |
Net amount (b) | 1,460,115 |
(a) | In some instances, the actual collateral received and/or pledged may be more than the amount shown due to overcollateralization. |
(b) | Represents the net amount due from/(to) counterparties in the event of default. |
May 1, 2023 through April 30, 2024 | Prior to May 1, 2023 | |
Class 1 | 0.78 % | 0.79 % |
Class 2 | 1.03 | 1.04 |
Name, address, year of birth | Position held with the Columbia Funds and length of service | Principal occupation(s) during past five years and other relevant professional experience | Number of Funds in the Columbia Funds Complex* overseen | Other directorships held by Trustee during the past five years and other relevant Board experience |
George S. Batejan c/o Columbia Management Investment Advisers, LLC 290 Congress Street Boston, MA 02210 1954 | Trustee since 2017 | Executive Vice President, Global Head of Technology and Operations, Janus Capital Group, Inc., 2010-2016 | 161 | Former Chairman of the Board, NICSA (National Investment Company Services Association) (Executive Committee, Nominating Committee and Governance Committee), 2014-2016; former Director, Intech Investment Management, 2011-2016; former Board Member, Metro Denver Chamber of Commerce, 2015-2016; former Advisory Board Member, University of Colorado Business School, 2015-2018; former Board Member, Chase Bank International, 1993-1994 |
Kathleen Blatz c/o Columbia Management Investment Advisers, LLC 290 Congress Street Boston, MA 02210 1954 | Trustee since 2006 | Attorney, specializing in arbitration and mediation; Trustee of Gerald Rauenhorst 1982 Trusts, since 2020; Chief Justice, Minnesota Supreme Court, 1998-2006; Associate Justice, Minnesota Supreme Court, 1996-1998; Fourth Judicial District Court Judge, Hennepin County, 1994-1996; Attorney in private practice and public service, 1984-1993; State Representative, Minnesota House of Representatives, 1979-1993, which included service on the Tax and Financial Institutions and Insurance Committees; Member and Interim Chair, Minnesota Sports Facilities Authority, January-July 2017; Interim President and Chief Executive Officer, Blue Cross and Blue Shield of Minnesota (health care insurance), February-July 2018, April-October 2021 | 161 | Former Trustee, Blue Cross and Blue Shield of Minnesota, 2009-2021 (Chair of the Business Development Committee, 2014-2017; Chair of the Governance Committee, 2017-2019); former Member and Chair of the Board, Minnesota Sports Facilities Authority, January 2017-July 2017; former Director, Robina Foundation, 2009-2020 (Chair, 2014-2020); Director, Richard M. Schulze Family Foundation, since 2021 |
Name, address, year of birth | Position held with the Columbia Funds and length of service | Principal occupation(s) during past five years and other relevant professional experience | Number of Funds in the Columbia Funds Complex* overseen | Other directorships held by Trustee during the past five years and other relevant Board experience |
Pamela G. Carlton c/o Columbia Management Investment Advisers, LLC 290 Congress Street Boston, MA 02210 1954 | Chair since 2023; Trustee since 2007 | President, Springboard – Partners in Cross Cultural Leadership (consulting company), since 2003; Managing Director of US Equity Research, JP Morgan Chase, 1999-2003; Director of US Equity Research, Chase Asset Management, 1996-1999; Co-Director Latin America Research, 1993-1996, COO Global Research, 1992-1996, Co-Director of US Research, 1991-1992, Investment Banker, 1982-1991, Morgan Stanley; Attorney, Cleary Gottlieb Steen & Hamilton LLP, 1980-1982 | 161 | Trustee, New York Presbyterian Hospital Board, since 1996; Director, DR Bank (Audit Committee, since 2017 and Audit Committee Chair, since November 2023); Director, Evercore Inc. (Audit Committee, Nominating and Governance Committee) (financial services company), since 2019; Director, Apollo Commercial Real Estate Finance, Inc. (Chair, Nominating and Governance Committee), since 2021; the Governing Council of the Independent Directors Council (IDC), since 2021 |
Janet Langford Carrig c/o Columbia Management Investment Advisers, LLC 290 Congress Street Boston, MA 02210 1957 | Trustee since 1996 | Senior Vice President, General Counsel and Corporate Secretary, ConocoPhillips (independent energy company), September 2007-October 2018 | 161 | Director, EQT Corporation (natural gas producer), since 2019; former Director, Whiting Petroleum Corporation (independent oil and gas company), 2020-2022 |
J. Kevin Connaughton c/o Columbia Management Investment Advisers, LLC 290 Congress Street Boston, MA 02210 1964 | Trustee since 2020 | CEO and President, RhodeWay Financial (non-profit financial planning firm), since December 2022; Member, FINRA National Adjudicatory Council, January 2020-December 31, 2023; Adjunct Professor of Finance, Bentley University January 2018-April 2023; Consultant to Independent Trustees of CFVIT and CFST I from March 2016 to June 2020 with respect to CFVIT and to December 2020 with respect to CFST I; Managing Director and General Manager of Mutual Fund Products, Columbia Management Investment Advisers, LLC, May 2010-February 2015; President, Columbia Funds, 2008-2015; and senior officer of Columbia Funds and affiliated funds, 2003-2015 | 159 | Former Director, The Autism Project, March 2015-December 2021; former Member of the Investment Committee, St. Michael’s College, November 2015-February 2020; former Trustee, St. Michael’s College, June 2017-September 2019; former Trustee, New Century Portfolios (former mutual fund complex), January 2015-December 2017 |
Olive M. Darragh c/o Columbia Management Investment Advisers, LLC 290 Congress Street Boston, MA 02210 1962 | Trustee since 2020 | Managing Director of Darragh Inc. (strategy and talent management consulting firm), since 2010; Founder and CEO, Zolio, Inc. (investment management talent identification platform), since 2004; Consultant to Independent Trustees of CFVIT and CFST I from June 2019 to June 2020 with respect to CFVIT and to December 2020 with respect to CFST I; Partner, Tudor Investments, 2004-2010; Senior Partner, McKinsey & Company (consulting), 1990-2004; Touche Ross CPA, 1985-1988 | 159 | Treasurer, Edinburgh University US Trust Board, since January 2023; Member, HBS Community Action Partners Board, since September 2022; former Director, University of Edinburgh Business School (Member of US Board), 2004-2019; former Director, Boston Public Library Foundation, 2008-2017 |
Name, address, year of birth | Position held with the Columbia Funds and length of service | Principal occupation(s) during past five years and other relevant professional experience | Number of Funds in the Columbia Funds Complex* overseen | Other directorships held by Trustee during the past five years and other relevant Board experience |
Patricia M. Flynn c/o Columbia Management Investment Advisers, LLC 290 Congress Street Boston, MA 02210 1950 | Trustee since 2004 | Professor Emeritus of Economics and Management, Bentley University, since 2023; Professor of Economics and Management, Bentley University, 1976-2023; Dean, McCallum Graduate School of Business, Bentley University, 1992-2002 | 161 | Former Trustee, MA Taxpayers Foundation, 1997-2022; former Director, The MA Business Roundtable, 2003-2019; former Chairperson, Innovation Index Advisory Committee, MA Technology Collaborative, 1997-2020 |
Brian J. Gallagher c/o Columbia Management Investment Advisers, LLC 290 Congress Street Boston, MA 02210 1954 | Trustee since 2017 | Retired; Partner with Deloitte & Touche LLP and its predecessors, 1977-2016 | 161 | Trustee, Catholic Schools Foundation, since 2004 |
Douglas A. Hacker c/o Columbia Management Investment Advisers, LLC 290 Congress Street Boston, MA 02210 1955 | Trustee since 1996 | Independent business executive, since May 2006; Executive Vice President – Strategy of United Airlines, December 2002 - May 2006; President of UAL Loyalty Services (airline marketing company), September 2001-December 2002; Executive Vice President and Chief Financial Officer of United Airlines, July 1999-September 2001 | 161 | Director, SpartanNash Company since November 2013 (Chair of the Board, since May 2021) (food distributor); Director, Aircastle Limited (Chair of Audit Committee) (aircraft leasing), since August 2006; former Director, Nash Finch Company (food distributor), 2005-2013; former Director, SeaCube Container Leasing Ltd. (container leasing), 2010-2013; and former Director, Travelport Worldwide Limited (travel information technology), 2014-2019 |
Nancy T. Lukitsh c/o Columbia Management Investment Advisers, LLC 290 Congress Street Boston, MA 02210 1956 | Trustee since 2011 | Senior Vice President, Partner and Director of Marketing, Wellington Management Company, LLP (investment adviser), 1997-2010; Chair, Wellington Management Portfolios (commingled non-U.S. investment pools), 2007-2010; Director, Wellington Trust Company, NA and other Wellington affiliates, 1997-2010 | 159 | None |
Name, address, year of birth | Position held with the Columbia Funds and length of service | Principal occupation(s) during past five years and other relevant professional experience | Number of Funds in the Columbia Funds Complex* overseen | Other directorships held by Trustee during the past five years and other relevant Board experience |
David M. Moffett c/o Columbia Management Investment Advisers, LLC 290 Congress Street Boston, MA 02210 1952 | Trustee since 2011 | Retired; former Chief Executive Officer of Freddie Mac and Chief Financial Officer of U.S. Bank | 161 | Director, CSX Corporation (transportation suppliers); Director, PayPal Holdings Inc. (payment and data processing services); former Director, eBay Inc. (online trading community), 2007-2015; and former Director, CIT Bank, CIT Group Inc. (commercial and consumer finance), 2010-2016; former Senior Adviser to The Carlyle Group (financial services), March 2008-September 2008; former Governance Consultant to Bridgewater Associates, January 2013-December 2015 |
Catherine James Paglia c/o Columbia Management Investment Advisers, LLC 290 Congress Street Boston, MA 02210 1952 | Trustee since 2004 | Director, Enterprise Asset Management, Inc. (private real estate and asset management company), since September 1998; Managing Director and Partner, Interlaken Capital, Inc., 1989-1997; Vice President, 1982-1985, Principal, 1985-1987, Managing Director, 1987-1989, Morgan Stanley; Vice President, Investment Banking, 1980-1982, Associate, Investment Banking, 1976-1980, Dean Witter Reynolds, Inc. | 161 | Director, Valmont Industries, Inc. (irrigation systems manufacturer), since 2012; Trustee, Carleton College (on the Investment Committee), since 1987; Trustee, Carnegie Endowment for International Peace (on the Investment Committee), since 2009 |
Natalie A. Trunow c/o Columbia Management Investment Advisers, LLC 290 Congress Street Boston, MA 02210 1967 | Trustee since 2020 | Chief Executive Officer, Millennial Portfolio Solutions LLC (asset management and consulting services), January 2016-January 2021; Non-executive Member of the Investment Committee and Valuation Committee, Sarona Asset Management Inc. (private equity firm) since September 2019; Advisor, Horizon Investments (asset management and consulting services), August 2018-January 2022; Advisor, Paradigm Asset Management, November 2016-January 2022; Consultant to Independent Trustees of CFVIT and CFST I from September 2016 to June 2020 with respect to CFVIT and to December 2020 with respect to CFST I; Director of Investments/Consultant, Casey Family Programs, April 2016-November 2016; Senior Vice President and Chief Investment Officer, Calvert Investments, August 2008-January 2016; Section Head and Portfolio Manager, General Motors Asset Management, June 1997-August 2008 | 159 | Independent Director, Investment Committee, Health Services for Children with Special Needs, Inc., 2010-2021; Independent Director, (Executive Committee and Chair, Audit Committee), Consumer Credit Counseling Services (formerly Guidewell Financial Solutions), since 2016; Independent Director, (Investment Committee), Sarona Asset Management, since 2019 |
Sandra L. Yeager c/o Columbia Management Investment Advisers, LLC 290 Congress Street Boston, MA 02210 1964 | Trustee since 2017 | Retired; President and founder, Hanoverian Capital, LLC (SEC registered investment advisor firm), 2008-2016; Managing Director, DuPont Capital, 2006-2008; Managing Director, Morgan Stanley Investment Management, 2004-2006; Senior Vice President, Alliance Bernstein, 1990-2004 | 161 | Former Director, NAPE (National Alliance for Partnerships in Equity) Education Foundation, October 2016-October 2020; Advisory Board, Jennersville YMCA, June 2022-June 2023 |
Name, address, year of birth | Position held with the Columbia Funds and length of service | Principal occupation(s) during the past five years and other relevant professional experience | Number of Funds in the Columbia Funds Complex* overseen | Other directorships held by Trustee during the past five years and other relevant Board experience |
Daniel J. Beckman c/o Columbia Management Investment Advisers, LLC 290 Congress Street Boston, MA 02210 1962 | Trustee since November 2021 and President since June 2021 | President and Principal Executive Officer of the Columbia Funds, since June 2021; Vice President, Columbia Management Investment Advisers, LLC, since April 2015; formerly, Vice President – Head of North America Product, Columbia Management Investment Advisers, LLC, April 2015 – December 2023; President and Principal Executive Officer, Columbia Acorn/Wanger Funds, since July 2021 | 161 | Director, Ameriprise Trust Company, since October 2016; Director, Columbia Management Investment Distributors, Inc., since November 2018; Board of Governors, Columbia Wanger Asset Management, LLC, since January 2022 |
* | The term “Columbia Funds Complex” as used herein includes Columbia Seligman Premium Technology Growth Fund, Tri-Continental Corporation and each series of Columbia Funds Series Trust (CFST), Columbia Funds Series Trust I (CFST I), Columbia Funds Series Trust II (CFST II), Columbia ETF Trust I (CET I), Columbia ETF Trust II (CET II), Columbia Funds Variable Insurance Trust (CFVIT) and Columbia Funds Variable Series Trust II (CFVST II). Messrs. Batejan, Beckman, Gallagher, Hacker and Moffett and Mses. Blatz, Carlton, Carrig, Flynn, Paglia, and Yeager serve as directors of Columbia Seligman Premium Technology Growth Fund and Tri-Continental Corporation. |
** | Interested person (as defined under the 1940 Act) by reason of being an officer, director, security holder and/or employee of the Investment Manager or Ameriprise Financial. |
Name, address and year of birth | Position and year first appointed to position for any Fund in the Columbia Funds Complex or a predecessor thereof | Principal occupation(s) during past five years |
Michael G. Clarke 290 Congress Street Boston, MA 02210 1969 | Chief Financial Officer and Principal Financial Officer (2009); Senior Vice President (2019); Treasurer and Chief Accounting Officer (Principal Accounting Officer) (2024) for CFST, CFST I, CFST II, CFVIT and CFVST II | Senior Vice President and North America Head of Operations & Investor Services, Columbia Management Investment Advisers, LLC, since June 2023 (previously Senior Vice President and Head of Global Operations, March 2022 – June 2023, Vice President, Head of North America Operations, and Co-Head of Global Operations, June 2019 - February 2022 and Vice President – Accounting and Tax, May 2010 - May 2019); senior officer of Columbia Funds and affiliated funds, since 2002. Director, Ameriprise Trust Company, since June 2023. |
Name, address and year of birth | Position and year first appointed to position for any Fund in the Columbia Funds Complex or a predecessor thereof | Principal occupation(s) during past five years |
Marybeth Pilat 290 Congress Street Boston, MA 02210 1968 | Treasurer and Chief Accounting Officer (Principal Accounting Officer) and Principal Financial Officer (2020) for CET I and CET II; Assistant Treasurer, CFST, CFST I, CFST II, CFVIT and CFVST II | Vice President – Product Pricing and Administration, Columbia Management Investment Advisers, LLC, since May 2017. |
William F. Truscott 290 Congress Street Boston, MA 02210 1960 | Senior Vice President (2001) | Formerly, Trustee/Director of Columbia Funds Complex or legacy funds, November 2001 - January 1, 2021; Chief Executive Officer, Global Asset Management, Ameriprise Financial, Inc., since September 2012; Chairman of the Board and President, Columbia Management Investment Advisers, LLC, since July 2004 and February 2012, respectively; Chairman of the Board and Chief Executive Officer, Columbia Management Investment Distributors, Inc., since November 2008 and February 2012, respectively; Chairman of the Board and Director, TAM UK International Holdings Limited, since July 2021; formerly Chairman of the Board and Director, Threadneedle Asset Management Holdings, Sàrl, March 2013 – December 2022 and December 2008 – December 2022, respectively; senior executive of various entities affiliated with Columbia Threadneedle Investments. |
Christopher O. Petersen 5228 Ameriprise Financial Center Minneapolis, MN 55474 1970 | Senior Vice President and Assistant Secretary (2021) | Formerly, Trustee/Director of funds within the Columbia Funds Complex, July 1, 2020 - November 22, 2021; Senior Vice President and Assistant General Counsel, Ameriprise Financial, Inc., since September 2021 (previously Vice President and Lead Chief Counsel, January 2015 - September 2021); formerly, President and Principal Executive Officer of the Columbia Funds, 2015 - 2021; officer of Columbia Funds and affiliated funds, since 2007. |
Thomas P. McGuire 290 Congress Street Boston, MA 02210 1972 | Senior Vice President and Chief Compliance Officer (2012) | Vice President – Asset Management Compliance, Ameriprise Financial, Inc., since May 2010; Chief Compliance Officer, Columbia Acorn/Wanger Funds, since December 2015; formerly, Chief Compliance Officer, Ameriprise Certificate Company, September 2010 – September 2020. |
Ryan C. Larrenaga 290 Congress Street Boston, MA 02210 1970 | Senior Vice President (2017), Chief Legal Officer (2017), and Secretary (2015) | Vice President and Chief Counsel, Ameriprise Financial, Inc., since August 2018 (previously Vice President and Group Counsel, August 2011 - August 2018); Chief Legal Officer, Columbia Acorn/Wanger Funds, since September 2020; officer of Columbia Funds and affiliated funds, since 2005. |
Michael E. DeFao 290 Congress Street Boston, MA 02210 1968 | Vice President (2011) and Assistant Secretary (2010) | Vice President and Chief Counsel, Ameriprise Financial, Inc., since May 2010; Vice President, Chief Legal Officer and Assistant Secretary, Columbia Management Investment Advisers, LLC, since October 2021 (previously Vice President and Assistant Secretary, May 2010 – September 2021). |
Lyn Kephart-Strong 5903 Ameriprise Financial Center Minneapolis, MN 55474 1960 | Vice President (2015) | Vice President, Global Investment Operations Services, Columbia Management Investment Advisers, LLC, since 2010; President, Columbia Management Investment Services Corp., since October 2014; President, Ameriprise Trust Company, since January 2017. |


3 | |
5 | |
7 | |
8 | |
13 | |
14 | |
15 | |
16 | |
18 | |
31 | |
32 |
Average annual total returns (%) (for the period ended December 31, 2023) | |||||
Inception | 1 Year | 5 Years | Life | ||
Class 1* | 02/20/19 | 17.14 | 6.95 | 7.23 | |
Class 2 | 11/02/16 | 16.80 | 6.67 | 7.03 | |
Blended Benchmark | 18.72 | 10.71 | 9.67 | ||
S&P 500 Index | 26.29 | 15.69 | 14.19 | ||
Bloomberg U.S. Aggregate Bond Index | 5.53 | 1.10 | 0.93 | ||

Portfolio Allocation (%) (at December 31, 2023) | |
Allocations to Underlying Funds | |
Equity Funds | 56.8 |
U.S. Large Cap | 56.8 |
Exchange-Traded Equity Funds | 5.3 |
U.S. Large Cap | 2.6 |
U.S. Mid Large Cap | 2.7 |
Exchange-Traded Fixed Income Funds | 0.9 |
Investment Grade | 0.9 |
Fixed Income Funds | 10.5 |
Investment Grade | 10.5 |
Allocations to Tactical Assets | |
Money Market Funds(a) | 23.2 |
Call Option Contracts Purchased | 0.0 (b) |
Put Option Contracts Purchased | 0.8 |
Residential Mortgage-Backed Securities - Agency | 2.5 |
Total | 100.0 |
(a) | Includes investments in Money Market Funds, including investing for the purpose of covering obligations relating to the Fund’s investment in derivatives. For a description of the Fund’s investments in derivatives, see Investments in derivatives following the Portfolio of Investments and the derivative instruments discussion in Note 2 to the Notes to Financial Statements. |
(b) | Rounds to zero. |
July 1, 2023 — December 31, 2023 | ||||||||||
Account value at the beginning of the period ($) | Account value at the end of the period ($) | Expenses paid during the period ($) | Fund’s annualized expense ratio (%) | Effective expenses paid during the period ($) | Fund’s effective annualized expense ratio (%) | |||||
Actual | Hypothetical | Actual | Hypothetical | Actual | Hypothetical | Actual | Actual | Hypothetical | Actual | |
Class 1 | 1,000.00 | 1,000.00 | 1,066.00 | 1,023.54 | 1.44 | 1.41 | 0.28 | 3.61 | 3.53 | 0.70 |
Class 2 | 1,000.00 | 1,000.00 | 1,064.80 | 1,022.29 | 2.73 | 2.67 | 0.53 | 4.89 | 4.79 | 0.95 |
Equity Funds 57.4% | ||
Shares | Value ($) | |
U.S. Large Cap 57.4% | ||
Columbia Variable Portfolio – Disciplined Core Fund, Class 1 Shares(a),(b) | 2,591,564 | 232,178,208 |
Columbia Variable Portfolio – Large Cap Index Fund, Class 1 Shares(a),(b) | 14,582,738 | 588,705,120 |
Columbia Variable Portfolio – Select Large Cap Equity Fund, Class 1 Shares(a),(b) | 12,332,507 | 233,824,330 |
Columbia Variable Portfolio – Select Large Cap Value Fund, Class 1 Shares(a),(b) | 5,997,728 | 232,172,039 |
CTIVP® – Principal Blue Chip Growth Fund, Class 1 Shares(a),(b) | 4,212,546 | 248,582,364 |
CTIVP® – T. Rowe Price Large Cap Value Fund, Class 1 Shares(a),(b) | 6,760,913 | 237,240,448 |
Variable Portfolio – Partners Core Equity Fund, Class 1 Shares(a),(b) | 13,063,983 | 486,633,358 |
Total | 2,259,335,867 | |
Total Equity Funds (Cost $1,220,541,229) | 2,259,335,867 | |
Exchange-Traded Equity Funds 5.4% | ||
U.S. Large Cap 2.7% | ||
Vanguard Russell 1000 Growth ETF | 1,351,182 | 105,419,219 |
U.S. Mid Large Cap 2.7% | ||
iShares Russell 1000 Growth Index Fund | 348,017 | 105,508,314 |
Total Exchange-Traded Equity Funds (Cost $189,284,453) | 210,927,533 | |
Exchange-Traded Fixed Income Funds 0.9% | ||
Investment Grade 0.9% | ||
iShares iBoxx $ Investment Grade Corporate Bond ETF | 172,850 | 19,127,581 |
Vanguard Intermediate-Term Corporate Bond ETF | 205,150 | 16,674,592 |
Total | 35,802,173 | |
Total Exchange-Traded Fixed Income Funds (Cost $32,303,571) | 35,802,173 | |
Fixed Income Funds 10.6% | ||
Shares | Value ($) | |
Investment Grade 10.6% | ||
Columbia Variable Portfolio – Limited Duration Credit Fund, Class 1 Shares(a) | 4,390,890 | 41,625,640 |
Columbia Variable Portfolio – Long Government/Credit Bond Fund, Class 1 Shares(a) | 5,711,336 | 45,119,557 |
Columbia Variable Portfolio – U.S. Government Mortgage Fund, Class 1 Shares(a) | 3,116,091 | 27,826,694 |
CTIVP® – American Century Diversified Bond Fund, Class 1 Shares(a) | 7,860,457 | 72,158,993 |
CTIVP® – TCW Core Plus Bond Fund, Class 1 Shares(a) | 9,143,217 | 86,037,673 |
Variable Portfolio – Partners Core Bond Fund, Class 1 Shares(a) | 14,874,242 | 144,726,372 |
Total | 417,494,929 | |
Total Fixed Income Funds (Cost $473,708,177) | 417,494,929 | |
Residential Mortgage-Backed Securities - Agency 2.5% | ||||
Issuer | Coupon Rate | Principal Amount ($) | Value ($) | |
Uniform Mortgage-Backed Security TBA(c) | ||||
01/18/2039- 01/16/2054 | 3.500% | 9,500,000 | 8,839,267 | |
01/18/2039- 01/16/2054 | 4.000% | 32,700,000 | 31,137,880 | |
01/16/2054 | 3.000% | 39,500,000 | 34,937,441 | |
01/16/2054 | 4.500% | 8,125,000 | 7,875,537 | |
01/16/2054 | 5.000% | 15,750,000 | 15,581,426 | |
Total Residential Mortgage-Backed Securities - Agency (Cost $95,744,839) | 98,371,551 | |||
Call Option Contracts Purchased 0.0% | ||||
Value ($) | ||||
(Cost $770,387) | 856,260 | |||
Put Option Contracts Purchased 0.8% | ||||
(Cost $35,866,565) | 32,315,925 | |||
Money Market Funds 23.4% | ||
Shares | Value ($) | |
Columbia Short-Term Cash Fund, 5.569%(a),(d) | 921,095,446 | 920,911,227 |
Total Money Market Funds (Cost $920,687,901) | 920,911,227 | |
Total Investments in Securities (Cost: $2,968,907,122) | 3,976,015,465 | |
Other Assets & Liabilities, Net | (41,175,148 ) | |
Net Assets | 3,934,840,317 | |
Long futures contracts | ||||||
Description | Number of contracts | Expiration date | Trading currency | Notional amount | Value/Unrealized appreciation ($) | Value/Unrealized depreciation ($) |
S&P 500 Index E-mini | 3,934 | 03/2024 | USD | 948,094,000 | 29,623,031 | — |
U.S. Treasury 10-Year Note | 195 | 03/2024 | USD | 22,013,672 | 608,924 | — |
U.S. Treasury 2-Year Note | 108 | 03/2024 | USD | 22,238,719 | 244,511 | — |
U.S. Treasury 5-Year Note | 246 | 03/2024 | USD | 26,758,266 | 616,836 | — |
Total | 31,093,302 | — | ||||
Short futures contracts | ||||||
Description | Number of contracts | Expiration date | Trading currency | Notional amount | Value/Unrealized appreciation ($) | Value/Unrealized depreciation ($) |
U.S. Long Bond | (11) | 03/2024 | USD | (1,374,313 ) | — | (11,021 ) |
U.S. Treasury Ultra Bond | (11) | 03/2024 | USD | (1,469,531 ) | — | (10,700 ) |
Total | — | (21,721 ) | ||||
Call option contracts purchased | ||||||||
Description | Counterparty | Trading currency | Notional amount | Number of contracts | Exercise price/Rate | Expiration date | Cost ($) | Value ($) |
S&P 500 Index | Morgan Stanley | USD | 33,865,793 | 71 | 4,785.00 | 03/15/2024 | 770,387 | 856,260 |
Put option contracts purchased | ||||||||
Description | Counterparty | Trading currency | Notional amount | Number of contracts | Exercise price/Rate | Expiration date | Cost ($) | Value ($) |
S&P 500 Index | Morgan Stanley | USD | 321,963,525 | 675 | 3,650.00 | 06/20/2025 | 6,507,351 | 5,413,500 |
S&P 500 Index | Morgan Stanley | USD | 307,654,035 | 645 | 3,550.00 | 06/20/2025 | 6,005,574 | 4,589,175 |
S&P 500 Index | Morgan Stanley | USD | 224,182,010 | 470 | 3,800.00 | 06/20/2025 | 4,445,504 | 4,493,200 |
S&P 500 Index | Morgan Stanley | USD | 224,182,010 | 470 | 3,900.00 | 12/19/2025 | 6,713,254 | 6,768,000 |
S&P 500 Index | Morgan Stanley | USD | 224,182,010 | 470 | 3,800.00 | 12/19/2025 | 6,043,504 | 6,105,300 |
S&P 500 Index | Morgan Stanley | USD | 224,182,010 | 470 | 3,600.00 | 12/19/2025 | 6,151,378 | 4,946,750 |
Total | 35,866,565 | 32,315,925 | ||||||
Put option contracts written | ||||||||
Description | Counterparty | Trading currency | Notional amount | Number of contracts | Exercise price/Rate | Expiration date | Premium received ($) | Value ($) |
S&P 500 Index | Morgan Stanley | USD | (33,865,793 ) | (71 ) | 4,785.00 | 03/15/2024 | (763,213 ) | (641,130 ) |
(a) | As defined in the Investment Company Act of 1940, as amended, an affiliated company is one in which the Fund owns 5% or more of the company’s outstanding voting securities, or a company which is under common ownership or control with the Fund. The value of the holdings and transactions in these affiliated companies during the year ended December 31, 2023 are as follows: |
Affiliated issuers | Beginning of period($) | Purchases($) | Sales($) | Net change in unrealized appreciation (depreciation)($) | End of period($) | Capital gain distributions($) | Realized gain (loss)($) | Dividends — affiliated issuers ($) | End of period shares |
Columbia Short-Term Cash Fund, 5.569% | |||||||||
546,764,868 | 1,562,630,470 | (1,188,607,878 ) | 123,767 | 920,911,227 | — | (21,309 ) | 39,102,013 | 921,095,446 | |
Columbia Variable Portfolio – Disciplined Core Fund, Class 1 Shares | |||||||||
204,363,567 | 447 | (12,884,348 ) | 40,698,542 | 232,178,208 | — | 7,174,456 | — | 2,591,564 | |
Columbia Variable Portfolio – Large Cap Index Fund, Class 1 Shares | |||||||||
516,432,302 | — | (36,736,431 ) | 109,009,249 | 588,705,120 | — | 19,095,030 | — | 14,582,738 | |
Columbia Variable Portfolio – Limited Duration Credit Fund, Class 1 Shares | |||||||||
40,098,999 | 1,692,380 | (1,675,734 ) | 1,509,995 | 41,625,640 | — | (131,118 ) | 1,321,528 | 4,390,890 | |
Columbia Variable Portfolio – Long Government/Credit Bond Fund, Class 1 Shares | |||||||||
42,224,564 | 2,926,106 | (2,559,606 ) | 2,528,493 | 45,119,557 | — | (845,494 ) | 1,400,590 | 5,711,336 | |
Columbia Variable Portfolio – Select Large Cap Equity Fund, Class 1 Shares | |||||||||
204,244,742 | 11,718 | (21,968,226 ) | 51,536,096 | 233,824,330 | — | 3,011,428 | — | 12,332,507 | |
Columbia Variable Portfolio – Select Large Cap Value Fund, Class 1 Shares | |||||||||
226,349,031 | 2,051,567 | (5,453,541 ) | 9,224,982 | 232,172,039 | — | 2,874,118 | — | 5,997,728 | |
Columbia Variable Portfolio – U.S. Government Mortgage Fund, Class 1 Shares | |||||||||
26,092,953 | 1,362,733 | (502,619 ) | 873,627 | 27,826,694 | — | (92,418 ) | 729,018 | 3,116,091 | |
CTIVP® – American Century Diversified Bond Fund, Class 1 Shares | |||||||||
68,080,721 | 3,790,820 | (1,605,652 ) | 1,893,104 | 72,158,993 | — | (291,832 ) | 2,246,478 | 7,860,457 | |
CTIVP® – Morgan Stanley Advantage Fund, Class 1 Shares | |||||||||
162,563,022 | — | (140,758,179 ) | (21,804,843 ) | — | — | 48,280,032 | — | — | |
CTIVP® – Principal Blue Chip Growth Fund, Class 1 Shares | |||||||||
210,584,710 | — | (32,551,143 ) | 70,548,797 | 248,582,364 | — | 6,499,017 | — | 4,212,546 | |
CTIVP® – T. Rowe Price Large Cap Value Fund, Class 1 Shares | |||||||||
219,934,402 | 1,854,363 | (3,884,271 ) | 19,335,954 | 237,240,448 | — | 1,606,258 | — | 6,760,913 | |
CTIVP® – TCW Core Plus Bond Fund, Class 1 Shares | |||||||||
80,912,841 | 3,791,923 | (1,785,155 ) | 3,118,064 | 86,037,673 | — | (311,127 ) | 2,022,376 | 9,143,217 | |
Variable Portfolio – Partners Core Bond Fund, Class 1 Shares | |||||||||
135,983,224 | 6,421,759 | (3,049,212 ) | 5,370,601 | 144,726,372 | — | (518,760 ) | 3,751,781 | 14,874,242 | |
Variable Portfolio – Partners Core Equity Fund, Class 1 Shares | |||||||||
427,770,847 | — | (38,520,464 ) | 97,382,975 | 486,633,358 | — | 3,819,817 | — | 13,063,983 | |
Total | 3,112,400,793 | 391,349,403 | 3,597,742,023 | — | 90,148,098 | 50,573,784 | |||
(b) | Non-income producing investment. |
(c) | Represents a security purchased on a when-issued basis. |
(d) | The rate shown is the seven-day current annualized yield at December 31, 2023. |
TBA | To Be Announced |
USD | US Dollar |
Level 1 ($) | Level 2 ($) | Level 3 ($) | Assets at NAV ($) | Total ($) | |
Investments in Securities | |||||
Equity Funds | — | — | — | 2,259,335,867 | 2,259,335,867 |
Exchange-Traded Equity Funds | 210,927,533 | — | — | — | 210,927,533 |
Exchange-Traded Fixed Income Funds | 35,802,173 | — | — | — | 35,802,173 |
Fixed Income Funds | — | — | — | 417,494,929 | 417,494,929 |
Residential Mortgage-Backed Securities - Agency | — | 98,371,551 | — | — | 98,371,551 |
Call Option Contracts Purchased | 856,260 | — | — | — | 856,260 |
Put Option Contracts Purchased | 32,315,925 | — | — | — | 32,315,925 |
Money Market Funds | 920,911,227 | — | — | — | 920,911,227 |
Total Investments in Securities | 1,200,813,118 | 98,371,551 | — | 2,676,830,796 | 3,976,015,465 |
Investments in Derivatives | |||||
Asset | |||||
Futures Contracts | 31,093,302 | — | — | — | 31,093,302 |
Liability | |||||
Futures Contracts | (21,721 ) | — | — | — | (21,721 ) |
Put Option Contracts Written | (641,130 ) | — | — | — | (641,130 ) |
Total | 1,231,243,569 | 98,371,551 | — | 2,676,830,796 | 4,006,445,916 |
Assets | |
Investments in securities, at value | |
Unaffiliated issuers (cost $317,332,863) | $345,101,257 |
Affiliated issuers (cost $2,614,937,307) | 3,597,742,023 |
Option contracts purchased (cost $36,636,952) | 33,172,185 |
Cash collateral held at broker for: | |
Option contracts written | 7,201,779 |
Margin deposits on: | |
Futures contracts | 47,233,785 |
Receivable for: | |
Investments sold | 2,913,860 |
Investments sold on a delayed delivery basis | 91,181,224 |
Capital shares sold | 2,458 |
Dividends | 3,778,367 |
Interest | 167,644 |
Variation margin for futures contracts | 42,547 |
Prepaid expenses | 26,022 |
Deferred compensation of board members | 86,765 |
Total assets | 4,128,649,916 |
Liabilities | |
Option contracts written, at value (premiums received $763,213) | 641,130 |
Due to custodian | 349,786 |
Payable for: | |
Investments purchased on a delayed delivery basis | 185,818,785 |
Capital shares redeemed | 4,165,116 |
Variation margin for futures contracts | 2,409,575 |
Management services fees | 24,950 |
Distribution and/or service fees | 26,977 |
Service fees | 181,620 |
Compensation of chief compliance officer | 710 |
Compensation of board members | 3,823 |
Other expenses | 34,355 |
Deferred compensation of board members | 152,772 |
Total liabilities | 193,809,599 |
Net assets applicable to outstanding capital stock | $3,934,840,317 |
Represented by | |
Trust capital | $3,934,840,317 |
Total - representing net assets applicable to outstanding capital stock | $3,934,840,317 |
Class 1 | |
Net assets | $9,690,458 |
Shares outstanding | 588,369 |
Net asset value per share | $16.47 |
Class 2 | |
Net assets | $3,925,149,859 |
Shares outstanding | 241,228,824 |
Net asset value per share | $16.27 |
Net investment income | |
Income: | |
Dividends — unaffiliated issuers | $5,756,585 |
Dividends — affiliated issuers | 50,573,784 |
Interest | 1,766,057 |
Total income | 58,096,426 |
Expenses: | |
Management services fees | 7,538,928 |
Distribution and/or service fees | |
Class 2 | 9,164,195 |
Service fees | 2,202,770 |
Custodian fees | 29,192 |
Printing and postage fees | 27,307 |
Accounting services fees | 30,090 |
Legal fees | 58,730 |
Compensation of chief compliance officer | 721 |
Compensation of board members | 57,794 |
Deferred compensation of board members | 20,509 |
Other | 57,053 |
Total expenses | 19,187,289 |
Net investment income | 38,909,137 |
Realized and unrealized gain (loss) — net | |
Net realized gain (loss) on: | |
Investments — unaffiliated issuers | (56,290,588 ) |
Investments — affiliated issuers | 90,148,098 |
Foreign currency translations | (3,969 ) |
Futures contracts | 50,180,248 |
Option contracts purchased | (44,641,724 ) |
Option contracts written | (1,917,676 ) |
Swap contracts | 310,573 |
Net realized gain | 37,784,962 |
Net change in unrealized appreciation (depreciation) on: | |
Investments — unaffiliated issuers | 95,526,048 |
Investments — affiliated issuers | 391,349,403 |
Futures contracts | 17,213,379 |
Option contracts purchased | (2,673,708 ) |
Option contracts written | 122,083 |
Swap contracts | 159,271 |
Net change in unrealized appreciation (depreciation) | 501,696,476 |
Net realized and unrealized gain | 539,481,438 |
Net increase in net assets resulting from operations | $578,390,575 |
Year Ended December 31, 2023 | Year Ended December 31, 2022 | |
Operations | ||
Net investment income | $38,909,137 | $8,116,751 |
Net realized gain (loss) | 37,784,962 | (208,890,668 ) |
Net change in unrealized appreciation (depreciation) | 501,696,476 | (618,452,650 ) |
Net increase (decrease) in net assets resulting from operations | 578,390,575 | (819,226,567 ) |
Increase (decrease) in net assets from capital stock activity | (191,994,787 ) | 8,722,844 |
Total increase (decrease) in net assets | 386,395,788 | (810,503,723 ) |
Net assets at beginning of year | 3,548,444,529 | 4,358,948,252 |
Net assets at end of year | $3,934,840,317 | $3,548,444,529 |
Year Ended | Year Ended | |||
December 31, 2023 | December 31, 2022 | |||
Shares | Dollars ($) | Shares | Dollars ($) | |
Capital stock activity | ||||
Class 1 | ||||
Shares sold | 225,063 | 3,327,862 | 175,555 | 2,638,081 |
Shares redeemed | (88,942 ) | (1,302,992 ) | (6,226 ) | (88,448 ) |
Net increase | 136,121 | 2,024,870 | 169,329 | 2,549,633 |
Class 2 | ||||
Shares sold | 1,623,367 | 24,481,439 | 7,223,908 | 107,961,086 |
Shares redeemed | (14,710,559 ) | (218,501,096 ) | (6,933,243 ) | (101,787,875 ) |
Net increase (decrease) | (13,087,192 ) | (194,019,657 ) | 290,665 | 6,173,211 |
Total net increase (decrease) | (12,951,071 ) | (191,994,787 ) | 459,994 | 8,722,844 |
Net asset value, beginning of period | Net investment income (loss) | Net realized and unrealized gain (loss) | Total from investment operations | |
Class 1 | ||||
Year Ended 12/31/2023 | $14.06 | 0.20 | 2.21 | 2.41 |
Year Ended 12/31/2022 | $17.26 | 0.08 | (3.28 ) | (3.20 ) |
Year Ended 12/31/2021 | $14.91 | 0.01 | 2.34 | 2.35 |
Year Ended 12/31/2020 | $14.19 | 0.05 | 0.67 | 0.72 |
Year Ended 12/31/2019(d) | $12.62 | 0.06 | 1.51 | 1.57 |
Class 2 | ||||
Year Ended 12/31/2023 | $13.93 | 0.16 | 2.18 | 2.34 |
Year Ended 12/31/2022 | $17.14 | 0.03 | (3.24 ) | (3.21 ) |
Year Ended 12/31/2021 | $14.84 | (0.03 ) | 2.33 | 2.30 |
Year Ended 12/31/2020 | $14.16 | 0.02 | 0.66 | 0.68 |
Year Ended 12/31/2019 | $11.78 | 0.08 | 2.30 | 2.38 |
Notes to Financial Highlights | |
(a) | In addition to the fees and expenses that the Fund bears directly, the Fund indirectly bears a pro rata share of the fees and expenses of any other funds in which it invests. Such indirect expenses are not included in the Fund’s reported expense ratios. |
(b) | Total net expenses include the impact of certain fee waivers/expense reimbursements made by the Investment Manager and certain of its affiliates, if applicable. |
(c) | Ratios include interest on collateral expense which is less than 0.01%. |
(d) | Class 1 shares commenced operations on February 20, 2019. Per share data and total return reflect activity from that date. |
Net asset value, end of period | Total return | Total gross expense ratio to average net assets(a) | Total net expense ratio to average net assets(a),(b) | Net investment income (loss) ratio to average net assets | Portfolio turnover | Net assets, end of period (000’s) | |
Class 1 | |||||||
Year Ended 12/31/2023 | $16.47 | 17.14% | 0.27% | 0.27% | 1.33% | 177% | $9,690 |
Year Ended 12/31/2022 | $14.06 | (18.54% ) | 0.27% | 0.27% | 0.51% | 173% | $6,360 |
Year Ended 12/31/2021 | $17.26 | 15.76% | 0.27% (c) | 0.27% (c) | 0.06% | 189% | $4,884 |
Year Ended 12/31/2020 | $14.91 | 5.07% | 0.28% | 0.28% | 0.34% | 279% | $936 |
Year Ended 12/31/2019(d) | $14.19 | 12.44% | 0.30% | 0.30% | 0.52% | 132% | $132 |
Class 2 | |||||||
Year Ended 12/31/2023 | $16.27 | 16.80% | 0.52% | 0.52% | 1.06% | 177% | $3,925,150 |
Year Ended 12/31/2022 | $13.93 | (18.73% ) | 0.52% | 0.52% | 0.22% | 173% | $3,542,085 |
Year Ended 12/31/2021 | $17.14 | 15.50% | 0.52% (c) | 0.52% (c) | (0.20% ) | 189% | $4,354,064 |
Year Ended 12/31/2020 | $14.84 | 4.80% | 0.53% | 0.53% | 0.14% | 279% | $3,611,822 |
Year Ended 12/31/2019 | $14.16 | 20.20% | 0.54% | 0.54% | 0.57% | 132% | $3,032,993 |
Asset derivatives | ||
Risk exposure category | Statement of assets and liabilities location | Fair value ($) |
Equity risk | Component of trust capital — unrealized appreciation on futures contracts | 29,623,031 * |
Equity risk | Investments, at value — Option contracts purchased | 33,172,185 |
Interest rate risk | Component of trust capital — unrealized appreciation on futures contracts | 1,470,271 * |
Total | 64,265,487 |
Liability derivatives | ||
Risk exposure category | Statement of assets and liabilities location | Fair value ($) |
Equity risk | Option contracts written, at value | 641,130 |
Interest rate risk | Component of trust capital - unrealized depreciation on futures contracts | 21,721 * |
Total | 662,851 |
* | Includes cumulative appreciation (depreciation) as reported in the tables following the Portfolio of Investments. Only the current day’s variation margin for futures and centrally cleared swaps, if any, is reported in receivables or payables in the Statement of Assets and Liabilities. |
Amount of realized gain (loss) on derivatives recognized in income | |||||
Risk exposure category | Futures contracts ($) | Option contracts purchased ($) | Option contracts written ($) | Swap contracts ($) | Total ($) |
Credit risk | — | — | — | 310,573 | 310,573 |
Equity risk | 48,487,409 | (44,641,724 ) | (1,917,676 ) | — | 1,928,009 |
Interest rate risk | 1,692,839 | — | — | — | 1,692,839 |
Total | 50,180,248 | (44,641,724 ) | (1,917,676 ) | 310,573 | 3,931,421 |
Change in unrealized appreciation (depreciation) on derivatives recognized in income | |||||
Risk exposure category | Futures contracts ($) | Option contracts purchased ($) | Option contracts written ($) | Swap contracts ($) | Total ($) |
Credit risk | — | — | — | 159,271 | 159,271 |
Equity risk | 13,603,450 | (2,673,708 ) | 122,083 | — | 11,051,825 |
Interest rate risk | 3,609,929 | — | — | — | 3,609,929 |
Total | 17,213,379 | (2,673,708 ) | 122,083 | 159,271 | 14,821,025 |
Derivative instrument | Average notional amounts ($) |
Futures contracts — long | 787,422,801 |
Futures contracts — short | 48,791,028 |
Credit default swap contracts — sell protection | 7,252,747 |
Derivative instrument | Average value ($) |
Option contracts purchased | 30,229,502 |
Option contracts written | (223,106 ) |
Morgan Stanley ($) | |
Assets | |
Call option contracts purchased | 856,260 |
Put option contracts purchased | 32,315,925 |
Total assets | 33,172,185 |
Liabilities | |
Put option contracts written | 641,130 |
Total financial and derivative net assets | 32,531,055 |
Total collateral received (pledged) (a) | - |
Net amount (b) | 32,531,055 |
(a) | In some instances, the actual collateral received and/or pledged may be more than the amount shown due to overcollateralization. |
(b) | Represents the net amount due from/(to) counterparties in the event of default. |
May 1, 2023 through April 30, 2024 | Prior to May 1, 2023 | |
Class 1 | 0.78 % | 0.79 % |
Class 2 | 1.03 | 1.04 |
Name, address, year of birth | Position held with the Columbia Funds and length of service | Principal occupation(s) during past five years and other relevant professional experience | Number of Funds in the Columbia Funds Complex* overseen | Other directorships held by Trustee during the past five years and other relevant Board experience |
George S. Batejan c/o Columbia Management Investment Advisers, LLC 290 Congress Street Boston, MA 02210 1954 | Trustee since 2017 | Executive Vice President, Global Head of Technology and Operations, Janus Capital Group, Inc., 2010-2016 | 161 | Former Chairman of the Board, NICSA (National Investment Company Services Association) (Executive Committee, Nominating Committee and Governance Committee), 2014-2016; former Director, Intech Investment Management, 2011-2016; former Board Member, Metro Denver Chamber of Commerce, 2015-2016; former Advisory Board Member, University of Colorado Business School, 2015-2018; former Board Member, Chase Bank International, 1993-1994 |
Kathleen Blatz c/o Columbia Management Investment Advisers, LLC 290 Congress Street Boston, MA 02210 1954 | Trustee since 2006 | Attorney, specializing in arbitration and mediation; Trustee of Gerald Rauenhorst 1982 Trusts, since 2020; Chief Justice, Minnesota Supreme Court, 1998-2006; Associate Justice, Minnesota Supreme Court, 1996-1998; Fourth Judicial District Court Judge, Hennepin County, 1994-1996; Attorney in private practice and public service, 1984-1993; State Representative, Minnesota House of Representatives, 1979-1993, which included service on the Tax and Financial Institutions and Insurance Committees; Member and Interim Chair, Minnesota Sports Facilities Authority, January-July 2017; Interim President and Chief Executive Officer, Blue Cross and Blue Shield of Minnesota (health care insurance), February-July 2018, April-October 2021 | 161 | Former Trustee, Blue Cross and Blue Shield of Minnesota, 2009-2021 (Chair of the Business Development Committee, 2014-2017; Chair of the Governance Committee, 2017-2019); former Member and Chair of the Board, Minnesota Sports Facilities Authority, January 2017-July 2017; former Director, Robina Foundation, 2009-2020 (Chair, 2014-2020); Director, Richard M. Schulze Family Foundation, since 2021 |
Name, address, year of birth | Position held with the Columbia Funds and length of service | Principal occupation(s) during past five years and other relevant professional experience | Number of Funds in the Columbia Funds Complex* overseen | Other directorships held by Trustee during the past five years and other relevant Board experience |
Pamela G. Carlton c/o Columbia Management Investment Advisers, LLC 290 Congress Street Boston, MA 02210 1954 | Chair since 2023; Trustee since 2007 | President, Springboard – Partners in Cross Cultural Leadership (consulting company), since 2003; Managing Director of US Equity Research, JP Morgan Chase, 1999-2003; Director of US Equity Research, Chase Asset Management, 1996-1999; Co-Director Latin America Research, 1993-1996, COO Global Research, 1992-1996, Co-Director of US Research, 1991-1992, Investment Banker, 1982-1991, Morgan Stanley; Attorney, Cleary Gottlieb Steen & Hamilton LLP, 1980-1982 | 161 | Trustee, New York Presbyterian Hospital Board, since 1996; Director, DR Bank (Audit Committee, since 2017 and Audit Committee Chair, since November 2023); Director, Evercore Inc. (Audit Committee, Nominating and Governance Committee) (financial services company), since 2019; Director, Apollo Commercial Real Estate Finance, Inc. (Chair, Nominating and Governance Committee), since 2021; the Governing Council of the Independent Directors Council (IDC), since 2021 |
Janet Langford Carrig c/o Columbia Management Investment Advisers, LLC 290 Congress Street Boston, MA 02210 1957 | Trustee since 1996 | Senior Vice President, General Counsel and Corporate Secretary, ConocoPhillips (independent energy company), September 2007-October 2018 | 161 | Director, EQT Corporation (natural gas producer), since 2019; former Director, Whiting Petroleum Corporation (independent oil and gas company), 2020-2022 |
J. Kevin Connaughton c/o Columbia Management Investment Advisers, LLC 290 Congress Street Boston, MA 02210 1964 | Trustee since 2020 | CEO and President, RhodeWay Financial (non-profit financial planning firm), since December 2022; Member, FINRA National Adjudicatory Council, January 2020-December 31, 2023; Adjunct Professor of Finance, Bentley University January 2018-April 2023; Consultant to Independent Trustees of CFVIT and CFST I from March 2016 to June 2020 with respect to CFVIT and to December 2020 with respect to CFST I; Managing Director and General Manager of Mutual Fund Products, Columbia Management Investment Advisers, LLC, May 2010-February 2015; President, Columbia Funds, 2008-2015; and senior officer of Columbia Funds and affiliated funds, 2003-2015 | 159 | Former Director, The Autism Project, March 2015-December 2021; former Member of the Investment Committee, St. Michael’s College, November 2015-February 2020; former Trustee, St. Michael’s College, June 2017-September 2019; former Trustee, New Century Portfolios (former mutual fund complex), January 2015-December 2017 |
Olive M. Darragh c/o Columbia Management Investment Advisers, LLC 290 Congress Street Boston, MA 02210 1962 | Trustee since 2020 | Managing Director of Darragh Inc. (strategy and talent management consulting firm), since 2010; Founder and CEO, Zolio, Inc. (investment management talent identification platform), since 2004; Consultant to Independent Trustees of CFVIT and CFST I from June 2019 to June 2020 with respect to CFVIT and to December 2020 with respect to CFST I; Partner, Tudor Investments, 2004-2010; Senior Partner, McKinsey & Company (consulting), 1990-2004; Touche Ross CPA, 1985-1988 | 159 | Treasurer, Edinburgh University US Trust Board, since January 2023; Member, HBS Community Action Partners Board, since September 2022; former Director, University of Edinburgh Business School (Member of US Board), 2004-2019; former Director, Boston Public Library Foundation, 2008-2017 |
Name, address, year of birth | Position held with the Columbia Funds and length of service | Principal occupation(s) during past five years and other relevant professional experience | Number of Funds in the Columbia Funds Complex* overseen | Other directorships held by Trustee during the past five years and other relevant Board experience |
Patricia M. Flynn c/o Columbia Management Investment Advisers, LLC 290 Congress Street Boston, MA 02210 1950 | Trustee since 2004 | Professor Emeritus of Economics and Management, Bentley University, since 2023; Professor of Economics and Management, Bentley University, 1976-2023; Dean, McCallum Graduate School of Business, Bentley University, 1992-2002 | 161 | Former Trustee, MA Taxpayers Foundation, 1997-2022; former Director, The MA Business Roundtable, 2003-2019; former Chairperson, Innovation Index Advisory Committee, MA Technology Collaborative, 1997-2020 |
Brian J. Gallagher c/o Columbia Management Investment Advisers, LLC 290 Congress Street Boston, MA 02210 1954 | Trustee since 2017 | Retired; Partner with Deloitte & Touche LLP and its predecessors, 1977-2016 | 161 | Trustee, Catholic Schools Foundation, since 2004 |
Douglas A. Hacker c/o Columbia Management Investment Advisers, LLC 290 Congress Street Boston, MA 02210 1955 | Trustee since 1996 | Independent business executive, since May 2006; Executive Vice President – Strategy of United Airlines, December 2002 - May 2006; President of UAL Loyalty Services (airline marketing company), September 2001-December 2002; Executive Vice President and Chief Financial Officer of United Airlines, July 1999-September 2001 | 161 | Director, SpartanNash Company since November 2013 (Chair of the Board, since May 2021) (food distributor); Director, Aircastle Limited (Chair of Audit Committee) (aircraft leasing), since August 2006; former Director, Nash Finch Company (food distributor), 2005-2013; former Director, SeaCube Container Leasing Ltd. (container leasing), 2010-2013; and former Director, Travelport Worldwide Limited (travel information technology), 2014-2019 |
Nancy T. Lukitsh c/o Columbia Management Investment Advisers, LLC 290 Congress Street Boston, MA 02210 1956 | Trustee since 2011 | Senior Vice President, Partner and Director of Marketing, Wellington Management Company, LLP (investment adviser), 1997-2010; Chair, Wellington Management Portfolios (commingled non-U.S. investment pools), 2007-2010; Director, Wellington Trust Company, NA and other Wellington affiliates, 1997-2010 | 159 | None |
Name, address, year of birth | Position held with the Columbia Funds and length of service | Principal occupation(s) during past five years and other relevant professional experience | Number of Funds in the Columbia Funds Complex* overseen | Other directorships held by Trustee during the past five years and other relevant Board experience |
David M. Moffett c/o Columbia Management Investment Advisers, LLC 290 Congress Street Boston, MA 02210 1952 | Trustee since 2011 | Retired; former Chief Executive Officer of Freddie Mac and Chief Financial Officer of U.S. Bank | 161 | Director, CSX Corporation (transportation suppliers); Director, PayPal Holdings Inc. (payment and data processing services); former Director, eBay Inc. (online trading community), 2007-2015; and former Director, CIT Bank, CIT Group Inc. (commercial and consumer finance), 2010-2016; former Senior Adviser to The Carlyle Group (financial services), March 2008-September 2008; former Governance Consultant to Bridgewater Associates, January 2013-December 2015 |
Catherine James Paglia c/o Columbia Management Investment Advisers, LLC 290 Congress Street Boston, MA 02210 1952 | Trustee since 2004 | Director, Enterprise Asset Management, Inc. (private real estate and asset management company), since September 1998; Managing Director and Partner, Interlaken Capital, Inc., 1989-1997; Vice President, 1982-1985, Principal, 1985-1987, Managing Director, 1987-1989, Morgan Stanley; Vice President, Investment Banking, 1980-1982, Associate, Investment Banking, 1976-1980, Dean Witter Reynolds, Inc. | 161 | Director, Valmont Industries, Inc. (irrigation systems manufacturer), since 2012; Trustee, Carleton College (on the Investment Committee), since 1987; Trustee, Carnegie Endowment for International Peace (on the Investment Committee), since 2009 |
Natalie A. Trunow c/o Columbia Management Investment Advisers, LLC 290 Congress Street Boston, MA 02210 1967 | Trustee since 2020 | Chief Executive Officer, Millennial Portfolio Solutions LLC (asset management and consulting services), January 2016-January 2021; Non-executive Member of the Investment Committee and Valuation Committee, Sarona Asset Management Inc. (private equity firm) since September 2019; Advisor, Horizon Investments (asset management and consulting services), August 2018-January 2022; Advisor, Paradigm Asset Management, November 2016-January 2022; Consultant to Independent Trustees of CFVIT and CFST I from September 2016 to June 2020 with respect to CFVIT and to December 2020 with respect to CFST I; Director of Investments/Consultant, Casey Family Programs, April 2016-November 2016; Senior Vice President and Chief Investment Officer, Calvert Investments, August 2008-January 2016; Section Head and Portfolio Manager, General Motors Asset Management, June 1997-August 2008 | 159 | Independent Director, Investment Committee, Health Services for Children with Special Needs, Inc., 2010-2021; Independent Director, (Executive Committee and Chair, Audit Committee), Consumer Credit Counseling Services (formerly Guidewell Financial Solutions), since 2016; Independent Director, (Investment Committee), Sarona Asset Management, since 2019 |
Sandra L. Yeager c/o Columbia Management Investment Advisers, LLC 290 Congress Street Boston, MA 02210 1964 | Trustee since 2017 | Retired; President and founder, Hanoverian Capital, LLC (SEC registered investment advisor firm), 2008-2016; Managing Director, DuPont Capital, 2006-2008; Managing Director, Morgan Stanley Investment Management, 2004-2006; Senior Vice President, Alliance Bernstein, 1990-2004 | 161 | Former Director, NAPE (National Alliance for Partnerships in Equity) Education Foundation, October 2016-October 2020; Advisory Board, Jennersville YMCA, June 2022-June 2023 |
Name, address, year of birth | Position held with the Columbia Funds and length of service | Principal occupation(s) during the past five years and other relevant professional experience | Number of Funds in the Columbia Funds Complex* overseen | Other directorships held by Trustee during the past five years and other relevant Board experience |
Daniel J. Beckman c/o Columbia Management Investment Advisers, LLC 290 Congress Street Boston, MA 02210 1962 | Trustee since November 2021 and President since June 2021 | President and Principal Executive Officer of the Columbia Funds, since June 2021; Vice President, Columbia Management Investment Advisers, LLC, since April 2015; formerly, Vice President – Head of North America Product, Columbia Management Investment Advisers, LLC, April 2015 – December 2023; President and Principal Executive Officer, Columbia Acorn/Wanger Funds, since July 2021 | 161 | Director, Ameriprise Trust Company, since October 2016; Director, Columbia Management Investment Distributors, Inc., since November 2018; Board of Governors, Columbia Wanger Asset Management, LLC, since January 2022 |
* | The term “Columbia Funds Complex” as used herein includes Columbia Seligman Premium Technology Growth Fund, Tri-Continental Corporation and each series of Columbia Funds Series Trust (CFST), Columbia Funds Series Trust I (CFST I), Columbia Funds Series Trust II (CFST II), Columbia ETF Trust I (CET I), Columbia ETF Trust II (CET II), Columbia Funds Variable Insurance Trust (CFVIT) and Columbia Funds Variable Series Trust II (CFVST II). Messrs. Batejan, Beckman, Gallagher, Hacker and Moffett and Mses. Blatz, Carlton, Carrig, Flynn, Paglia, and Yeager serve as directors of Columbia Seligman Premium Technology Growth Fund and Tri-Continental Corporation. |
** | Interested person (as defined under the 1940 Act) by reason of being an officer, director, security holder and/or employee of the Investment Manager or Ameriprise Financial. |
Name, address and year of birth | Position and year first appointed to position for any Fund in the Columbia Funds Complex or a predecessor thereof | Principal occupation(s) during past five years |
Michael G. Clarke 290 Congress Street Boston, MA 02210 1969 | Chief Financial Officer and Principal Financial Officer (2009); Senior Vice President (2019); Treasurer and Chief Accounting Officer (Principal Accounting Officer) (2024) for CFST, CFST I, CFST II, CFVIT and CFVST II | Senior Vice President and North America Head of Operations & Investor Services, Columbia Management Investment Advisers, LLC, since June 2023 (previously Senior Vice President and Head of Global Operations, March 2022 – June 2023, Vice President, Head of North America Operations, and Co-Head of Global Operations, June 2019 - February 2022 and Vice President – Accounting and Tax, May 2010 - May 2019); senior officer of Columbia Funds and affiliated funds, since 2002. Director, Ameriprise Trust Company, since June 2023. |
Name, address and year of birth | Position and year first appointed to position for any Fund in the Columbia Funds Complex or a predecessor thereof | Principal occupation(s) during past five years |
Marybeth Pilat 290 Congress Street Boston, MA 02210 1968 | Treasurer and Chief Accounting Officer (Principal Accounting Officer) and Principal Financial Officer (2020) for CET I and CET II; Assistant Treasurer, CFST, CFST I, CFST II, CFVIT and CFVST II | Vice President – Product Pricing and Administration, Columbia Management Investment Advisers, LLC, since May 2017. |
William F. Truscott 290 Congress Street Boston, MA 02210 1960 | Senior Vice President (2001) | Formerly, Trustee/Director of Columbia Funds Complex or legacy funds, November 2001 - January 1, 2021; Chief Executive Officer, Global Asset Management, Ameriprise Financial, Inc., since September 2012; Chairman of the Board and President, Columbia Management Investment Advisers, LLC, since July 2004 and February 2012, respectively; Chairman of the Board and Chief Executive Officer, Columbia Management Investment Distributors, Inc., since November 2008 and February 2012, respectively; Chairman of the Board and Director, TAM UK International Holdings Limited, since July 2021; formerly Chairman of the Board and Director, Threadneedle Asset Management Holdings, Sàrl, March 2013 – December 2022 and December 2008 – December 2022, respectively; senior executive of various entities affiliated with Columbia Threadneedle Investments. |
Christopher O. Petersen 5228 Ameriprise Financial Center Minneapolis, MN 55474 1970 | Senior Vice President and Assistant Secretary (2021) | Formerly, Trustee/Director of funds within the Columbia Funds Complex, July 1, 2020 - November 22, 2021; Senior Vice President and Assistant General Counsel, Ameriprise Financial, Inc., since September 2021 (previously Vice President and Lead Chief Counsel, January 2015 - September 2021); formerly, President and Principal Executive Officer of the Columbia Funds, 2015 - 2021; officer of Columbia Funds and affiliated funds, since 2007. |
Thomas P. McGuire 290 Congress Street Boston, MA 02210 1972 | Senior Vice President and Chief Compliance Officer (2012) | Vice President – Asset Management Compliance, Ameriprise Financial, Inc., since May 2010; Chief Compliance Officer, Columbia Acorn/Wanger Funds, since December 2015; formerly, Chief Compliance Officer, Ameriprise Certificate Company, September 2010 – September 2020. |
Ryan C. Larrenaga 290 Congress Street Boston, MA 02210 1970 | Senior Vice President (2017), Chief Legal Officer (2017), and Secretary (2015) | Vice President and Chief Counsel, Ameriprise Financial, Inc., since August 2018 (previously Vice President and Group Counsel, August 2011 - August 2018); Chief Legal Officer, Columbia Acorn/Wanger Funds, since September 2020; officer of Columbia Funds and affiliated funds, since 2005. |
Michael E. DeFao 290 Congress Street Boston, MA 02210 1968 | Vice President (2011) and Assistant Secretary (2010) | Vice President and Chief Counsel, Ameriprise Financial, Inc., since May 2010; Vice President, Chief Legal Officer and Assistant Secretary, Columbia Management Investment Advisers, LLC, since October 2021 (previously Vice President and Assistant Secretary, May 2010 – September 2021). |
Lyn Kephart-Strong 5903 Ameriprise Financial Center Minneapolis, MN 55474 1960 | Vice President (2015) | Vice President, Global Investment Operations Services, Columbia Management Investment Advisers, LLC, since 2010; President, Columbia Management Investment Services Corp., since October 2014; President, Ameriprise Trust Company, since January 2017. |


3 | |
5 | |
7 | |
8 | |
13 | |
14 | |
15 | |
16 | |
18 | |
30 | |
31 |
Average annual total returns (%) (for the period ended December 31, 2023) | |||||
Inception | 1 Year | 5 Years | Life | ||
Class 1* | 02/20/19 | 14.29 | 5.62 | 5.79 | |
Class 2 | 11/02/16 | 13.87 | 5.37 | 5.61 | |
Blended Benchmark | 15.58 | 8.53 | 7.68 | ||
S&P 500 Index | 26.29 | 15.69 | 14.19 | ||
Bloomberg U.S. Aggregate Bond Index | 5.53 | 1.10 | 0.93 | ||

Portfolio Allocation (%) (at December 31, 2023) | |
Allocations to Underlying Funds | |
Equity Funds | 42.4 |
U.S. Large Cap | 42.4 |
Exchange-Traded Equity Funds | 3.8 |
U.S. Large Cap | 1.9 |
U.S. Mid Large Cap | 1.9 |
Exchange-Traded Fixed Income Funds | 1.6 |
Investment Grade | 1.6 |
Fixed Income Funds | 24.7 |
Investment Grade | 24.7 |
Allocations to Tactical Assets | |
Money Market Funds(a) | 22.3 |
Call Option Contracts Purchased | 0.0 (b) |
Put Option Contracts Purchased | 0.6 |
Residential Mortgage-Backed Securities - Agency | 4.6 |
Total | 100.0 |
(a) | Includes investments in Money Market Funds, including investing for the purpose of covering obligations relating to the Fund’s investment in derivatives. For a description of the Fund’s investments in derivatives, see Investments in derivatives following the Portfolio of Investments and the derivative instruments discussion in Note 2 to the Notes to Financial Statements. |
(b) | Rounds to zero. |
July 1, 2023 — December 31, 2023 | ||||||||||
Account value at the beginning of the period ($) | Account value at the end of the period ($) | Expenses paid during the period ($) | Fund’s annualized expense ratio (%) | Effective expenses paid during the period ($) | Fund’s effective annualized expense ratio (%) | |||||
Actual | Hypothetical | Actual | Hypothetical | Actual | Hypothetical | Actual | Actual | Hypothetical | Actual | |
Class 1 | 1,000.00 | 1,000.00 | 1,058.70 | 1,023.54 | 1.44 | 1.41 | 0.28 | 3.54 | 3.48 | 0.69 |
Class 2 | 1,000.00 | 1,000.00 | 1,056.50 | 1,022.29 | 2.72 | 2.67 | 0.53 | 4.82 | 4.74 | 0.94 |
Equity Funds 43.9% | ||
Shares | Value ($) | |
U.S. Large Cap 43.9% | ||
Columbia Variable Portfolio – Disciplined Core Fund, Class 1 Shares(a),(b) | 1,126,775 | 100,947,738 |
Columbia Variable Portfolio – Large Cap Index Fund, Class 1 Shares(a),(b) | 5,545,884 | 223,887,348 |
Columbia Variable Portfolio – Select Large Cap Equity Fund, Class 1 Shares(a),(b) | 5,343,542 | 101,313,557 |
Columbia Variable Portfolio – Select Large Cap Value Fund, Class 1 Shares(a),(b) | 2,337,888 | 90,499,631 |
CTIVP® – Principal Blue Chip Growth Fund, Class 1 Shares(a),(b) | 1,575,439 | 92,966,639 |
CTIVP® – T. Rowe Price Large Cap Value Fund, Class 1 Shares(a),(b) | 2,601,907 | 91,300,924 |
Variable Portfolio – Partners Core Equity Fund, Class 1 Shares(a),(b) | 4,807,763 | 179,089,176 |
Total | 880,005,013 | |
Total Equity Funds (Cost $464,250,612) | 880,005,013 | |
Exchange-Traded Equity Funds 3.9% | ||
U.S. Large Cap 1.9% | ||
Vanguard Russell 1000 Growth ETF | 503,724 | 39,300,546 |
U.S. Mid Large Cap 2.0% | ||
iShares Russell 1000 Growth Index Fund | 129,741 | 39,333,579 |
Total Exchange-Traded Equity Funds (Cost $70,565,689) | 78,634,125 | |
Exchange-Traded Fixed Income Funds 1.7% | ||
Investment Grade 1.7% | ||
iShares iBoxx $ Investment Grade Corporate Bond ETF | 146,463 | 16,207,596 |
Vanguard Intermediate-Term Corporate Bond ETF | 203,850 | 16,568,928 |
Total | 32,776,524 | |
Total Exchange-Traded Fixed Income Funds (Cost $29,611,984) | 32,776,524 | |
Fixed Income Funds 25.5% | ||
Shares | Value ($) | |
Investment Grade 25.5% | ||
Columbia Variable Portfolio – Intermediate Bond Fund, Class 1 Shares(a) | 10,566,182 | 90,763,505 |
Columbia Variable Portfolio – Limited Duration Credit Fund, Class 1 Shares(a) | 3,020,642 | 28,635,688 |
Columbia Variable Portfolio – Long Government/Credit Bond Fund, Class 1 Shares(a) | 5,835,055 | 46,096,933 |
Columbia Variable Portfolio – U.S. Government Mortgage Fund, Class 1 Shares(a) | 3,282,405 | 29,311,873 |
CTIVP® – American Century Diversified Bond Fund, Class 1 Shares(a) | 13,988,087 | 128,410,637 |
CTIVP® – TCW Core Plus Bond Fund, Class 1 Shares(a) | 11,162,913 | 105,043,015 |
Variable Portfolio – Partners Core Bond Fund, Class 1 Shares(a) | 8,528,693 | 82,984,186 |
Total | 511,245,837 | |
Total Fixed Income Funds (Cost $588,926,383) | 511,245,837 | |
Residential Mortgage-Backed Securities - Agency 4.8% | ||||
Issuer | Coupon Rate | Principal Amount ($) | Value ($) | |
Uniform Mortgage-Backed Security TBA(c) | ||||
01/18/2039- 01/16/2054 | 3.000% | 36,350,000 | 32,253,283 | |
01/18/2039- 01/16/2054 | 3.500% | 11,500,000 | 10,651,319 | |
01/18/2039- 01/16/2054 | 4.000% | 27,300,000 | 25,924,816 | |
01/16/2054 | 4.500% | 11,550,000 | 11,195,379 | |
01/16/2054 | 5.000% | 15,500,000 | 15,334,102 | |
Total Residential Mortgage-Backed Securities - Agency (Cost $92,796,237) | 95,358,899 | |||
Call Option Contracts Purchased 0.0% | ||||
Value ($) | ||||
(Cost $303,815) | 337,680 | |||
Put Option Contracts Purchased 0.6% | ||||
(Cost $14,001,852) | 12,618,105 | |||
Money Market Funds 23.1% | ||
Shares | Value ($) | |
Columbia Short-Term Cash Fund, 5.569%(a),(d) | 463,423,799 | 463,331,114 |
Total Money Market Funds (Cost $463,218,645) | 463,331,114 | |
Total Investments in Securities (Cost: $1,723,675,217) | 2,074,307,297 | |
Other Assets & Liabilities, Net | (69,809,509 ) | |
Net Assets | 2,004,497,788 | |
Long futures contracts | ||||||
Description | Number of contracts | Expiration date | Trading currency | Notional amount | Value/Unrealized appreciation ($) | Value/Unrealized depreciation ($) |
S&P 500 Index E-mini | 1,481 | 03/2024 | USD | 356,921,000 | 11,152,790 | — |
U.S. Treasury 10-Year Note | 104 | 03/2024 | USD | 11,740,625 | 116,773 | — |
U.S. Treasury 2-Year Note | 98 | 03/2024 | USD | 20,179,578 | 221,871 | — |
U.S. Treasury 5-Year Note | 221 | 03/2024 | USD | 24,038,930 | 554,149 | — |
Total | 12,045,583 | — | ||||
Short futures contracts | ||||||
Description | Number of contracts | Expiration date | Trading currency | Notional amount | Value/Unrealized appreciation ($) | Value/Unrealized depreciation ($) |
U.S. Long Bond | (42) | 03/2024 | USD | (5,247,375 ) | — | (152,926 ) |
U.S. Treasury Ultra Bond | (42) | 03/2024 | USD | (5,610,938 ) | — | (169,443 ) |
Total | — | (322,369 ) | ||||
Call option contracts purchased | ||||||||
Description | Counterparty | Trading currency | Notional amount | Number of contracts | Exercise price/Rate | Expiration date | Cost ($) | Value ($) |
S&P 500 Index | Morgan Stanley | USD | 13,355,524 | 28 | 4,785.00 | 03/15/2024 | 303,815 | 337,680 |
Put option contracts purchased | ||||||||
Description | Counterparty | Trading currency | Notional amount | Number of contracts | Exercise price/Rate | Expiration date | Cost ($) | Value ($) |
S&P 500 Index | Morgan Stanley | USD | 126,400,495 | 265 | 3,650.00 | 06/20/2025 | 2,554,738 | 2,125,300 |
S&P 500 Index | Morgan Stanley | USD | 87,764,872 | 184 | 3,800.00 | 06/20/2025 | 1,740,368 | 1,759,040 |
S&P 500 Index | Morgan Stanley | USD | 117,814,801 | 247 | 3,550.00 | 06/20/2025 | 2,304,412 | 1,757,405 |
S&P 500 Index | Morgan Stanley | USD | 87,764,872 | 184 | 3,900.00 | 12/19/2025 | 2,628,167 | 2,649,600 |
S&P 500 Index | Morgan Stanley | USD | 87,764,872 | 184 | 3,800.00 | 12/19/2025 | 2,365,968 | 2,390,160 |
S&P 500 Index | Morgan Stanley | USD | 87,764,872 | 184 | 3,600.00 | 12/19/2025 | 2,408,199 | 1,936,600 |
Total | 14,001,852 | 12,618,105 | ||||||
Put option contracts written | ||||||||
Description | Counterparty | Trading currency | Notional amount | Number of contracts | Exercise price/Rate | Expiration date | Premium received ($) | Value ($) |
S&P 500 Index | Morgan Stanley | USD | (13,355,524 ) | (28 ) | 4,785.00 | 03/15/2024 | (300,985 ) | (252,840 ) |
(a) | As defined in the Investment Company Act of 1940, as amended, an affiliated company is one in which the Fund owns 5% or more of the company’s outstanding voting securities, or a company which is under common ownership or control with the Fund. The value of the holdings and transactions in these affiliated companies during the year ended December 31, 2023 are as follows: |
Affiliated issuers | Beginning of period($) | Purchases($) | Sales($) | Net change in unrealized appreciation (depreciation)($) | End of period($) | Capital gain distributions($) | Realized gain (loss)($) | Dividends — affiliated issuers ($) | End of period shares |
Columbia Short-Term Cash Fund, 5.569% | |||||||||
296,140,598 | 620,385,669 | (453,253,934 ) | 58,781 | 463,331,114 | — | (7,437 ) | 20,253,014 | 463,423,799 | |
Columbia Variable Portfolio – Disciplined Core Fund, Class 1 Shares | |||||||||
93,766,141 | 7,165 | (8,927,431 ) | 16,101,863 | 100,947,738 | — | 5,436,068 | — | 1,126,775 | |
Columbia Variable Portfolio – Intermediate Bond Fund, Class 1 Shares | |||||||||
85,031,624 | 3,747,001 | (1,924,515 ) | 3,909,395 | 90,763,505 | — | (542,858 ) | 2,024,468 | 10,566,182 | |
Columbia Variable Portfolio – Large Cap Index Fund, Class 1 Shares | |||||||||
207,948,461 | 15,805 | (20,817,608 ) | 36,740,690 | 223,887,348 | — | 13,678,498 | — | 5,545,884 | |
Columbia Variable Portfolio – Limited Duration Credit Fund, Class 1 Shares | |||||||||
28,367,683 | 1,325,130 | (2,140,517 ) | 1,083,392 | 28,635,688 | — | (146,299 ) | 938,966 | 3,020,642 | |
Columbia Variable Portfolio – Long Government/Credit Bond Fund, Class 1 Shares | |||||||||
42,693,642 | 3,219,021 | (2,211,003 ) | 2,395,273 | 46,096,933 | — | (717,804 ) | 1,446,824 | 5,835,055 | |
Columbia Variable Portfolio – Select Large Cap Equity Fund, Class 1 Shares | |||||||||
93,676,075 | 7,165 | (14,957,139 ) | 22,587,456 | 101,313,557 | — | 1,883,786 | — | 5,343,542 | |
Columbia Variable Portfolio – Select Large Cap Value Fund, Class 1 Shares | |||||||||
89,922,855 | 1,279,934 | (3,675,225 ) | 2,972,067 | 90,499,631 | — | 1,812,290 | — | 2,337,888 | |
Columbia Variable Portfolio – U.S. Government Mortgage Fund, Class 1 Shares | |||||||||
27,538,896 | 1,375,216 | (494,679 ) | 892,440 | 29,311,873 | — | (92,771 ) | 779,930 | 3,282,405 | |
CTIVP® – American Century Diversified Bond Fund, Class 1 Shares | |||||||||
120,414,202 | 6,896,734 | (2,077,531 ) | 3,177,232 | 128,410,637 | — | (467,009 ) | 4,058,953 | 13,988,087 | |
CTIVP® – Morgan Stanley Advantage Fund, Class 1 Shares | |||||||||
60,603,908 | — | (47,606,174 ) | (12,997,734 ) | — | — | 22,867,870 | — | — | |
CTIVP® – Principal Blue Chip Growth Fund, Class 1 Shares | |||||||||
84,235,324 | 6,427 | (15,700,081 ) | 24,424,969 | 92,966,639 | — | 5,575,719 | — | 1,575,439 | |
CTIVP® – T. Rowe Price Large Cap Value Fund, Class 1 Shares | |||||||||
87,774,625 | 422,005 | (3,513,132 ) | 6,617,426 | 91,300,924 | — | 1,541,742 | — | 2,601,907 | |
CTIVP® – TCW Core Plus Bond Fund, Class 1 Shares | |||||||||
99,046,020 | 4,443,906 | (2,230,900 ) | 3,783,989 | 105,043,015 | — | (442,119 ) | 2,510,246 | 11,162,913 | |
Variable Portfolio – Partners Core Bond Fund, Class 1 Shares | |||||||||
78,431,206 | 3,626,223 | (2,156,071 ) | 3,082,828 | 82,984,186 | — | (379,052 ) | 2,195,919 | 8,528,693 | |
Variable Portfolio – Partners Core Equity Fund, Class 1 Shares | |||||||||
166,770,972 | 12,644 | (15,914,971 ) | 28,220,531 | 179,089,176 | — | 10,254,334 | — | 4,807,763 | |
Total | 1,662,362,232 | 143,050,598 | 1,854,581,964 | — | 60,254,958 | 34,208,320 | |||
(b) | Non-income producing investment. |
(c) | Represents a security purchased on a when-issued basis. |
(d) | The rate shown is the seven-day current annualized yield at December 31, 2023. |
TBA | To Be Announced |
USD | US Dollar |
Level 1 ($) | Level 2 ($) | Level 3 ($) | Assets at NAV ($) | Total ($) | |
Investments in Securities | |||||
Equity Funds | — | — | — | 880,005,013 | 880,005,013 |
Exchange-Traded Equity Funds | 78,634,125 | — | — | — | 78,634,125 |
Exchange-Traded Fixed Income Funds | 32,776,524 | — | — | — | 32,776,524 |
Fixed Income Funds | — | — | — | 511,245,837 | 511,245,837 |
Residential Mortgage-Backed Securities - Agency | — | 95,358,899 | — | — | 95,358,899 |
Call Option Contracts Purchased | 337,680 | — | — | — | 337,680 |
Put Option Contracts Purchased | 12,618,105 | — | — | — | 12,618,105 |
Money Market Funds | 463,331,114 | — | — | — | 463,331,114 |
Total Investments in Securities | 587,697,548 | 95,358,899 | — | 1,391,250,850 | 2,074,307,297 |
Investments in Derivatives | |||||
Asset | |||||
Futures Contracts | 12,045,583 | — | — | — | 12,045,583 |
Level 1 ($) | Level 2 ($) | Level 3 ($) | Assets at NAV ($) | Total ($) | |
Liability | |||||
Futures Contracts | (322,369 ) | — | — | — | (322,369 ) |
Put Option Contracts Written | (252,840 ) | — | — | — | (252,840 ) |
Total | 599,167,922 | 95,358,899 | — | 1,391,250,850 | 2,085,777,671 |
Assets | |
Investments in securities, at value | |
Unaffiliated issuers (cost $192,973,910) | $206,769,548 |
Affiliated issuers (cost $1,516,395,640) | 1,854,581,964 |
Option contracts purchased (cost $14,305,667) | 12,955,785 |
Cash | 1,221 |
Cash collateral held at broker for: | |
Option contracts written | 4,593,322 |
Margin deposits on: | |
Futures contracts | 17,834,420 |
Receivable for: | |
Investments sold | 1,228,477 |
Investments sold on a delayed delivery basis | 33,042,631 |
Capital shares sold | 13,529 |
Dividends | 1,928,530 |
Interest | 163,052 |
Variation margin for futures contracts | 61,430 |
Prepaid expenses | 15,188 |
Deferred compensation of board members | 64,637 |
Total assets | 2,133,253,734 |
Liabilities | |
Option contracts written, at value (premiums received $300,985) | 252,840 |
Payable for: | |
Investments purchased on a delayed delivery basis | 125,570,259 |
Capital shares redeemed | 1,768,496 |
Variation margin for futures contracts | 907,113 |
Management services fees | 12,729 |
Distribution and/or service fees | 13,737 |
Service fees | 92,855 |
Compensation of chief compliance officer | 366 |
Compensation of board members | 2,334 |
Other expenses | 28,557 |
Deferred compensation of board members | 106,660 |
Total liabilities | 128,755,946 |
Net assets applicable to outstanding capital stock | $2,004,497,788 |
Represented by | |
Trust capital | $2,004,497,788 |
Total - representing net assets applicable to outstanding capital stock | $2,004,497,788 |
Class 1 | |
Net assets | $4,838,499 |
Shares outstanding | 323,521 |
Net asset value per share | $14.96 |
Class 2 | |
Net assets | $1,999,659,289 |
Shares outstanding | 135,267,783 |
Net asset value per share | $14.78 |
Net investment income | |
Income: | |
Dividends — unaffiliated issuers | $3,101,743 |
Dividends — affiliated issuers | 34,208,320 |
Interest | 689,898 |
Total income | 37,999,961 |
Expenses: | |
Management services fees | 3,974,480 |
Distribution and/or service fees | |
Class 2 | 4,761,165 |
Service fees | 1,144,372 |
Custodian fees | 26,187 |
Printing and postage fees | 20,881 |
Accounting services fees | 30,090 |
Legal fees | 36,281 |
Compensation of chief compliance officer | 369 |
Compensation of board members | 35,180 |
Deferred compensation of board members | 12,803 |
Other | 32,563 |
Total expenses | 10,074,371 |
Net investment income | 27,925,590 |
Realized and unrealized gain (loss) — net | |
Net realized gain (loss) on: | |
Investments — unaffiliated issuers | (18,978,857 ) |
Investments — affiliated issuers | 60,254,958 |
Futures contracts | 17,660,174 |
Option contracts purchased | (17,766,440 ) |
Option contracts written | (798,330 ) |
Net realized gain | 40,371,505 |
Net change in unrealized appreciation (depreciation) on: | |
Investments — unaffiliated issuers | 35,138,991 |
Investments — affiliated issuers | 143,050,598 |
Futures contracts | 5,372,631 |
Option contracts purchased | (1,089,034 ) |
Option contracts written | 48,145 |
Net change in unrealized appreciation (depreciation) | 182,521,331 |
Net realized and unrealized gain | 222,892,836 |
Net increase in net assets resulting from operations | $250,818,426 |
Year Ended December 31, 2023 | Year Ended December 31, 2022 | |
Operations | ||
Net investment income | $27,925,590 | $11,356,453 |
Net realized gain (loss) | 40,371,505 | (90,886,717 ) |
Net change in unrealized appreciation (depreciation) | 182,521,331 | (327,631,215 ) |
Net increase (decrease) in net assets resulting from operations | 250,818,426 | (407,161,479 ) |
Decrease in net assets from capital stock activity | (115,351,364 ) | (57,597,370 ) |
Total increase (decrease) in net assets | 135,467,062 | (464,758,849 ) |
Net assets at beginning of year | 1,869,030,726 | 2,333,789,575 |
Net assets at end of year | $2,004,497,788 | $1,869,030,726 |
Year Ended | Year Ended | |||
December 31, 2023 | December 31, 2022 | |||
Shares | Dollars ($) | Shares | Dollars ($) | |
Capital stock activity | ||||
Class 1 | ||||
Shares sold | 69,956 | 973,927 | 87,876 | 1,216,328 |
Shares redeemed | (7,811 ) | (108,172 ) | (13,254 ) | (187,764 ) |
Net increase | 62,145 | 865,755 | 74,622 | 1,028,564 |
Class 2 | ||||
Shares sold | 1,524,523 | 21,220,528 | 3,179,908 | 43,866,401 |
Shares redeemed | (10,037,622 ) | (137,437,647 ) | (7,492,766 ) | (102,492,335 ) |
Net decrease | (8,513,099 ) | (116,217,119 ) | (4,312,858 ) | (58,625,934 ) |
Total net decrease | (8,450,954 ) | (115,351,364 ) | (4,238,236 ) | (57,597,370 ) |
Net asset value, beginning of period | Net investment income | Net realized and unrealized gain (loss) | Total from investment operations | |
Class 1 | ||||
Year Ended 12/31/2023 | $13.09 | 0.24 | 1.63 | 1.87 |
Year Ended 12/31/2022 | $15.84 | 0.12 | (2.87 ) | (2.75 ) |
Year Ended 12/31/2021 | $14.18 | 0.07 | 1.59 | 1.66 |
Year Ended 12/31/2020 | $13.41 | 0.08 | 0.69 | 0.77 |
Year Ended 12/31/2019(d) | $12.05 | 0.20 | 1.16 | 1.36 |
Class 2 | ||||
Year Ended 12/31/2023 | $12.98 | 0.20 | 1.60 | 1.80 |
Year Ended 12/31/2022 | $15.74 | 0.08 | (2.84 ) | (2.76 ) |
Year Ended 12/31/2021 | $14.12 | 0.02 | 1.60 | 1.62 |
Year Ended 12/31/2020 | $13.38 | 0.06 | 0.68 | 0.74 |
Year Ended 12/31/2019 | $11.38 | 0.13 | 1.87 | 2.00 |
Notes to Financial Highlights | |
(a) | In addition to the fees and expenses that the Fund bears directly, the Fund indirectly bears a pro rata share of the fees and expenses of any other funds in which it invests. Such indirect expenses are not included in the Fund’s reported expense ratios. |
(b) | Total net expenses include the impact of certain fee waivers/expense reimbursements made by the Investment Manager and certain of its affiliates, if applicable. |
(c) | Ratios include interest on collateral expense which is less than 0.01%. |
(d) | Class 1 shares commenced operations on February 20, 2019. Per share data and total return reflect activity from that date. |
Net asset value, end of period | Total return | Total gross expense ratio to average net assets(a) | Total net expense ratio to average net assets(a),(b) | Net investment income ratio to average net assets | Portfolio turnover | Net assets, end of period (000’s) | |
Class 1 | |||||||
Year Ended 12/31/2023 | $14.96 | 14.29% | 0.28% | 0.28% | 1.75% | 165% | $4,838 |
Year Ended 12/31/2022 | $13.09 | (17.36% ) | 0.28% | 0.28% | 0.87% | 151% | $3,423 |
Year Ended 12/31/2021 | $15.84 | 11.71% | 0.28% (c) | 0.28% (c) | 0.44% | 175% | $2,959 |
Year Ended 12/31/2020 | $14.18 | 5.74% | 0.29% | 0.29% | 0.63% | 232% | $1,583 |
Year Ended 12/31/2019(d) | $13.41 | 11.29% | 0.30% | 0.30% | 1.84% | 125% | $299 |
Class 2 | |||||||
Year Ended 12/31/2023 | $14.78 | 13.87% | 0.53% | 0.53% | 1.46% | 165% | $1,999,659 |
Year Ended 12/31/2022 | $12.98 | (17.54% ) | 0.53% | 0.53% | 0.57% | 151% | $1,865,608 |
Year Ended 12/31/2021 | $15.74 | 11.47% | 0.53% (c) | 0.53% (c) | 0.16% | 175% | $2,330,831 |
Year Ended 12/31/2020 | $14.12 | 5.53% | 0.54% | 0.54% | 0.48% | 232% | $2,066,289 |
Year Ended 12/31/2019 | $13.38 | 17.57% | 0.55% | 0.55% | 1.05% | 125% | $1,832,787 |
Asset derivatives | ||
Risk exposure category | Statement of assets and liabilities location | Fair value ($) |
Equity risk | Component of trust capital — unrealized appreciation on futures contracts | 11,152,790 * |
Equity risk | Investments, at value — Option contracts purchased | 12,955,785 |
Interest rate risk | Component of trust capital — unrealized appreciation on futures contracts | 892,793 * |
Total | 25,001,368 |
Liability derivatives | ||
Risk exposure category | Statement of assets and liabilities location | Fair value ($) |
Equity risk | Option contracts written, at value | 252,840 |
Interest rate risk | Component of trust capital - unrealized depreciation on futures contracts | 322,369 * |
Total | 575,209 |
* | Includes cumulative appreciation (depreciation) as reported in the tables following the Portfolio of Investments. Only the current day’s variation margin for futures and centrally cleared swaps, if any, is reported in receivables or payables in the Statement of Assets and Liabilities. |
Amount of realized gain (loss) on derivatives recognized in income | ||||
Risk exposure category | Futures contracts ($) | Option contracts purchased ($) | Option contracts written ($) | Total ($) |
Equity risk | 18,059,619 | (17,766,440 ) | (798,330 ) | (505,151 ) |
Interest rate risk | (399,445 ) | — | — | (399,445 ) |
Total | 17,660,174 | (17,766,440 ) | (798,330 ) | (904,596 ) |
Change in unrealized appreciation (depreciation) on derivatives recognized in income | ||||
Risk exposure category | Futures contracts ($) | Option contracts purchased ($) | Option contracts written ($) | Total ($) |
Equity risk | 4,320,690 | (1,089,034 ) | 48,145 | 3,279,801 |
Interest rate risk | 1,051,941 | — | — | 1,051,941 |
Total | 5,372,631 | (1,089,034 ) | 48,145 | 4,331,742 |
Derivative instrument | Average notional amounts ($) |
Futures contracts — long | 322,362,973 |
Futures contracts — short | 27,848,100 |
Derivative instrument | Average value ($) |
Option contracts purchased | 12,033,107 |
Option contracts written | (91,207 ) |
Morgan Stanley ($) | |
Assets | |
Call option contracts purchased | 337,680 |
Put option contracts purchased | 12,618,105 |
Total assets | 12,955,785 |
Liabilities | |
Put option contracts written | 252,840 |
Total financial and derivative net assets | 12,702,945 |
Total collateral received (pledged) (a) | - |
Net amount (b) | 12,702,945 |
(a) | In some instances, the actual collateral received and/or pledged may be more than the amount shown due to overcollateralization. |
(b) | Represents the net amount due from/(to) counterparties in the event of default. |
May 1, 2023 through April 30, 2024 | Prior to May 1, 2023 | |
Class 1 | 0.78 % | 0.79 % |
Class 2 | 1.03 | 1.04 |
Name, address, year of birth | Position held with the Columbia Funds and length of service | Principal occupation(s) during past five years and other relevant professional experience | Number of Funds in the Columbia Funds Complex* overseen | Other directorships held by Trustee during the past five years and other relevant Board experience |
George S. Batejan c/o Columbia Management Investment Advisers, LLC 290 Congress Street Boston, MA 02210 1954 | Trustee since 2017 | Executive Vice President, Global Head of Technology and Operations, Janus Capital Group, Inc., 2010-2016 | 161 | Former Chairman of the Board, NICSA (National Investment Company Services Association) (Executive Committee, Nominating Committee and Governance Committee), 2014-2016; former Director, Intech Investment Management, 2011-2016; former Board Member, Metro Denver Chamber of Commerce, 2015-2016; former Advisory Board Member, University of Colorado Business School, 2015-2018; former Board Member, Chase Bank International, 1993-1994 |
Kathleen Blatz c/o Columbia Management Investment Advisers, LLC 290 Congress Street Boston, MA 02210 1954 | Trustee since 2006 | Attorney, specializing in arbitration and mediation; Trustee of Gerald Rauenhorst 1982 Trusts, since 2020; Chief Justice, Minnesota Supreme Court, 1998-2006; Associate Justice, Minnesota Supreme Court, 1996-1998; Fourth Judicial District Court Judge, Hennepin County, 1994-1996; Attorney in private practice and public service, 1984-1993; State Representative, Minnesota House of Representatives, 1979-1993, which included service on the Tax and Financial Institutions and Insurance Committees; Member and Interim Chair, Minnesota Sports Facilities Authority, January-July 2017; Interim President and Chief Executive Officer, Blue Cross and Blue Shield of Minnesota (health care insurance), February-July 2018, April-October 2021 | 161 | Former Trustee, Blue Cross and Blue Shield of Minnesota, 2009-2021 (Chair of the Business Development Committee, 2014-2017; Chair of the Governance Committee, 2017-2019); former Member and Chair of the Board, Minnesota Sports Facilities Authority, January 2017-July 2017; former Director, Robina Foundation, 2009-2020 (Chair, 2014-2020); Director, Richard M. Schulze Family Foundation, since 2021 |
Name, address, year of birth | Position held with the Columbia Funds and length of service | Principal occupation(s) during past five years and other relevant professional experience | Number of Funds in the Columbia Funds Complex* overseen | Other directorships held by Trustee during the past five years and other relevant Board experience |
Pamela G. Carlton c/o Columbia Management Investment Advisers, LLC 290 Congress Street Boston, MA 02210 1954 | Chair since 2023; Trustee since 2007 | President, Springboard – Partners in Cross Cultural Leadership (consulting company), since 2003; Managing Director of US Equity Research, JP Morgan Chase, 1999-2003; Director of US Equity Research, Chase Asset Management, 1996-1999; Co-Director Latin America Research, 1993-1996, COO Global Research, 1992-1996, Co-Director of US Research, 1991-1992, Investment Banker, 1982-1991, Morgan Stanley; Attorney, Cleary Gottlieb Steen & Hamilton LLP, 1980-1982 | 161 | Trustee, New York Presbyterian Hospital Board, since 1996; Director, DR Bank (Audit Committee, since 2017 and Audit Committee Chair, since November 2023); Director, Evercore Inc. (Audit Committee, Nominating and Governance Committee) (financial services company), since 2019; Director, Apollo Commercial Real Estate Finance, Inc. (Chair, Nominating and Governance Committee), since 2021; the Governing Council of the Independent Directors Council (IDC), since 2021 |
Janet Langford Carrig c/o Columbia Management Investment Advisers, LLC 290 Congress Street Boston, MA 02210 1957 | Trustee since 1996 | Senior Vice President, General Counsel and Corporate Secretary, ConocoPhillips (independent energy company), September 2007-October 2018 | 161 | Director, EQT Corporation (natural gas producer), since 2019; former Director, Whiting Petroleum Corporation (independent oil and gas company), 2020-2022 |
J. Kevin Connaughton c/o Columbia Management Investment Advisers, LLC 290 Congress Street Boston, MA 02210 1964 | Trustee since 2020 | CEO and President, RhodeWay Financial (non-profit financial planning firm), since December 2022; Member, FINRA National Adjudicatory Council, January 2020-December 31, 2023; Adjunct Professor of Finance, Bentley University January 2018-April 2023; Consultant to Independent Trustees of CFVIT and CFST I from March 2016 to June 2020 with respect to CFVIT and to December 2020 with respect to CFST I; Managing Director and General Manager of Mutual Fund Products, Columbia Management Investment Advisers, LLC, May 2010-February 2015; President, Columbia Funds, 2008-2015; and senior officer of Columbia Funds and affiliated funds, 2003-2015 | 159 | Former Director, The Autism Project, March 2015-December 2021; former Member of the Investment Committee, St. Michael’s College, November 2015-February 2020; former Trustee, St. Michael’s College, June 2017-September 2019; former Trustee, New Century Portfolios (former mutual fund complex), January 2015-December 2017 |
Olive M. Darragh c/o Columbia Management Investment Advisers, LLC 290 Congress Street Boston, MA 02210 1962 | Trustee since 2020 | Managing Director of Darragh Inc. (strategy and talent management consulting firm), since 2010; Founder and CEO, Zolio, Inc. (investment management talent identification platform), since 2004; Consultant to Independent Trustees of CFVIT and CFST I from June 2019 to June 2020 with respect to CFVIT and to December 2020 with respect to CFST I; Partner, Tudor Investments, 2004-2010; Senior Partner, McKinsey & Company (consulting), 1990-2004; Touche Ross CPA, 1985-1988 | 159 | Treasurer, Edinburgh University US Trust Board, since January 2023; Member, HBS Community Action Partners Board, since September 2022; former Director, University of Edinburgh Business School (Member of US Board), 2004-2019; former Director, Boston Public Library Foundation, 2008-2017 |
Name, address, year of birth | Position held with the Columbia Funds and length of service | Principal occupation(s) during past five years and other relevant professional experience | Number of Funds in the Columbia Funds Complex* overseen | Other directorships held by Trustee during the past five years and other relevant Board experience |
Patricia M. Flynn c/o Columbia Management Investment Advisers, LLC 290 Congress Street Boston, MA 02210 1950 | Trustee since 2004 | Professor Emeritus of Economics and Management, Bentley University, since 2023; Professor of Economics and Management, Bentley University, 1976-2023; Dean, McCallum Graduate School of Business, Bentley University, 1992-2002 | 161 | Former Trustee, MA Taxpayers Foundation, 1997-2022; former Director, The MA Business Roundtable, 2003-2019; former Chairperson, Innovation Index Advisory Committee, MA Technology Collaborative, 1997-2020 |
Brian J. Gallagher c/o Columbia Management Investment Advisers, LLC 290 Congress Street Boston, MA 02210 1954 | Trustee since 2017 | Retired; Partner with Deloitte & Touche LLP and its predecessors, 1977-2016 | 161 | Trustee, Catholic Schools Foundation, since 2004 |
Douglas A. Hacker c/o Columbia Management Investment Advisers, LLC 290 Congress Street Boston, MA 02210 1955 | Trustee since 1996 | Independent business executive, since May 2006; Executive Vice President – Strategy of United Airlines, December 2002 - May 2006; President of UAL Loyalty Services (airline marketing company), September 2001-December 2002; Executive Vice President and Chief Financial Officer of United Airlines, July 1999-September 2001 | 161 | Director, SpartanNash Company since November 2013 (Chair of the Board, since May 2021) (food distributor); Director, Aircastle Limited (Chair of Audit Committee) (aircraft leasing), since August 2006; former Director, Nash Finch Company (food distributor), 2005-2013; former Director, SeaCube Container Leasing Ltd. (container leasing), 2010-2013; and former Director, Travelport Worldwide Limited (travel information technology), 2014-2019 |
Nancy T. Lukitsh c/o Columbia Management Investment Advisers, LLC 290 Congress Street Boston, MA 02210 1956 | Trustee since 2011 | Senior Vice President, Partner and Director of Marketing, Wellington Management Company, LLP (investment adviser), 1997-2010; Chair, Wellington Management Portfolios (commingled non-U.S. investment pools), 2007-2010; Director, Wellington Trust Company, NA and other Wellington affiliates, 1997-2010 | 159 | None |
Name, address, year of birth | Position held with the Columbia Funds and length of service | Principal occupation(s) during past five years and other relevant professional experience | Number of Funds in the Columbia Funds Complex* overseen | Other directorships held by Trustee during the past five years and other relevant Board experience |
David M. Moffett c/o Columbia Management Investment Advisers, LLC 290 Congress Street Boston, MA 02210 1952 | Trustee since 2011 | Retired; former Chief Executive Officer of Freddie Mac and Chief Financial Officer of U.S. Bank | 161 | Director, CSX Corporation (transportation suppliers); Director, PayPal Holdings Inc. (payment and data processing services); former Director, eBay Inc. (online trading community), 2007-2015; and former Director, CIT Bank, CIT Group Inc. (commercial and consumer finance), 2010-2016; former Senior Adviser to The Carlyle Group (financial services), March 2008-September 2008; former Governance Consultant to Bridgewater Associates, January 2013-December 2015 |
Catherine James Paglia c/o Columbia Management Investment Advisers, LLC 290 Congress Street Boston, MA 02210 1952 | Trustee since 2004 | Director, Enterprise Asset Management, Inc. (private real estate and asset management company), since September 1998; Managing Director and Partner, Interlaken Capital, Inc., 1989-1997; Vice President, 1982-1985, Principal, 1985-1987, Managing Director, 1987-1989, Morgan Stanley; Vice President, Investment Banking, 1980-1982, Associate, Investment Banking, 1976-1980, Dean Witter Reynolds, Inc. | 161 | Director, Valmont Industries, Inc. (irrigation systems manufacturer), since 2012; Trustee, Carleton College (on the Investment Committee), since 1987; Trustee, Carnegie Endowment for International Peace (on the Investment Committee), since 2009 |
Natalie A. Trunow c/o Columbia Management Investment Advisers, LLC 290 Congress Street Boston, MA 02210 1967 | Trustee since 2020 | Chief Executive Officer, Millennial Portfolio Solutions LLC (asset management and consulting services), January 2016-January 2021; Non-executive Member of the Investment Committee and Valuation Committee, Sarona Asset Management Inc. (private equity firm) since September 2019; Advisor, Horizon Investments (asset management and consulting services), August 2018-January 2022; Advisor, Paradigm Asset Management, November 2016-January 2022; Consultant to Independent Trustees of CFVIT and CFST I from September 2016 to June 2020 with respect to CFVIT and to December 2020 with respect to CFST I; Director of Investments/Consultant, Casey Family Programs, April 2016-November 2016; Senior Vice President and Chief Investment Officer, Calvert Investments, August 2008-January 2016; Section Head and Portfolio Manager, General Motors Asset Management, June 1997-August 2008 | 159 | Independent Director, Investment Committee, Health Services for Children with Special Needs, Inc., 2010-2021; Independent Director, (Executive Committee and Chair, Audit Committee), Consumer Credit Counseling Services (formerly Guidewell Financial Solutions), since 2016; Independent Director, (Investment Committee), Sarona Asset Management, since 2019 |
Sandra L. Yeager c/o Columbia Management Investment Advisers, LLC 290 Congress Street Boston, MA 02210 1964 | Trustee since 2017 | Retired; President and founder, Hanoverian Capital, LLC (SEC registered investment advisor firm), 2008-2016; Managing Director, DuPont Capital, 2006-2008; Managing Director, Morgan Stanley Investment Management, 2004-2006; Senior Vice President, Alliance Bernstein, 1990-2004 | 161 | Former Director, NAPE (National Alliance for Partnerships in Equity) Education Foundation, October 2016-October 2020; Advisory Board, Jennersville YMCA, June 2022-June 2023 |
Name, address, year of birth | Position held with the Columbia Funds and length of service | Principal occupation(s) during the past five years and other relevant professional experience | Number of Funds in the Columbia Funds Complex* overseen | Other directorships held by Trustee during the past five years and other relevant Board experience |
Daniel J. Beckman c/o Columbia Management Investment Advisers, LLC 290 Congress Street Boston, MA 02210 1962 | Trustee since November 2021 and President since June 2021 | President and Principal Executive Officer of the Columbia Funds, since June 2021; Vice President, Columbia Management Investment Advisers, LLC, since April 2015; formerly, Vice President – Head of North America Product, Columbia Management Investment Advisers, LLC, April 2015 – December 2023; President and Principal Executive Officer, Columbia Acorn/Wanger Funds, since July 2021 | 161 | Director, Ameriprise Trust Company, since October 2016; Director, Columbia Management Investment Distributors, Inc., since November 2018; Board of Governors, Columbia Wanger Asset Management, LLC, since January 2022 |
* | The term “Columbia Funds Complex” as used herein includes Columbia Seligman Premium Technology Growth Fund, Tri-Continental Corporation and each series of Columbia Funds Series Trust (CFST), Columbia Funds Series Trust I (CFST I), Columbia Funds Series Trust II (CFST II), Columbia ETF Trust I (CET I), Columbia ETF Trust II (CET II), Columbia Funds Variable Insurance Trust (CFVIT) and Columbia Funds Variable Series Trust II (CFVST II). Messrs. Batejan, Beckman, Gallagher, Hacker and Moffett and Mses. Blatz, Carlton, Carrig, Flynn, Paglia, and Yeager serve as directors of Columbia Seligman Premium Technology Growth Fund and Tri-Continental Corporation. |
** | Interested person (as defined under the 1940 Act) by reason of being an officer, director, security holder and/or employee of the Investment Manager or Ameriprise Financial. |
Name, address and year of birth | Position and year first appointed to position for any Fund in the Columbia Funds Complex or a predecessor thereof | Principal occupation(s) during past five years |
Michael G. Clarke 290 Congress Street Boston, MA 02210 1969 | Chief Financial Officer and Principal Financial Officer (2009); Senior Vice President (2019); Treasurer and Chief Accounting Officer (Principal Accounting Officer) (2024) for CFST, CFST I, CFST II, CFVIT and CFVST II | Senior Vice President and North America Head of Operations & Investor Services, Columbia Management Investment Advisers, LLC, since June 2023 (previously Senior Vice President and Head of Global Operations, March 2022 – June 2023, Vice President, Head of North America Operations, and Co-Head of Global Operations, June 2019 - February 2022 and Vice President – Accounting and Tax, May 2010 - May 2019); senior officer of Columbia Funds and affiliated funds, since 2002. Director, Ameriprise Trust Company, since June 2023. |
Name, address and year of birth | Position and year first appointed to position for any Fund in the Columbia Funds Complex or a predecessor thereof | Principal occupation(s) during past five years |
Marybeth Pilat 290 Congress Street Boston, MA 02210 1968 | Treasurer and Chief Accounting Officer (Principal Accounting Officer) and Principal Financial Officer (2020) for CET I and CET II; Assistant Treasurer, CFST, CFST I, CFST II, CFVIT and CFVST II | Vice President – Product Pricing and Administration, Columbia Management Investment Advisers, LLC, since May 2017. |
William F. Truscott 290 Congress Street Boston, MA 02210 1960 | Senior Vice President (2001) | Formerly, Trustee/Director of Columbia Funds Complex or legacy funds, November 2001 - January 1, 2021; Chief Executive Officer, Global Asset Management, Ameriprise Financial, Inc., since September 2012; Chairman of the Board and President, Columbia Management Investment Advisers, LLC, since July 2004 and February 2012, respectively; Chairman of the Board and Chief Executive Officer, Columbia Management Investment Distributors, Inc., since November 2008 and February 2012, respectively; Chairman of the Board and Director, TAM UK International Holdings Limited, since July 2021; formerly Chairman of the Board and Director, Threadneedle Asset Management Holdings, Sàrl, March 2013 – December 2022 and December 2008 – December 2022, respectively; senior executive of various entities affiliated with Columbia Threadneedle Investments. |
Christopher O. Petersen 5228 Ameriprise Financial Center Minneapolis, MN 55474 1970 | Senior Vice President and Assistant Secretary (2021) | Formerly, Trustee/Director of funds within the Columbia Funds Complex, July 1, 2020 - November 22, 2021; Senior Vice President and Assistant General Counsel, Ameriprise Financial, Inc., since September 2021 (previously Vice President and Lead Chief Counsel, January 2015 - September 2021); formerly, President and Principal Executive Officer of the Columbia Funds, 2015 - 2021; officer of Columbia Funds and affiliated funds, since 2007. |
Thomas P. McGuire 290 Congress Street Boston, MA 02210 1972 | Senior Vice President and Chief Compliance Officer (2012) | Vice President – Asset Management Compliance, Ameriprise Financial, Inc., since May 2010; Chief Compliance Officer, Columbia Acorn/Wanger Funds, since December 2015; formerly, Chief Compliance Officer, Ameriprise Certificate Company, September 2010 – September 2020. |
Ryan C. Larrenaga 290 Congress Street Boston, MA 02210 1970 | Senior Vice President (2017), Chief Legal Officer (2017), and Secretary (2015) | Vice President and Chief Counsel, Ameriprise Financial, Inc., since August 2018 (previously Vice President and Group Counsel, August 2011 - August 2018); Chief Legal Officer, Columbia Acorn/Wanger Funds, since September 2020; officer of Columbia Funds and affiliated funds, since 2005. |
Michael E. DeFao 290 Congress Street Boston, MA 02210 1968 | Vice President (2011) and Assistant Secretary (2010) | Vice President and Chief Counsel, Ameriprise Financial, Inc., since May 2010; Vice President, Chief Legal Officer and Assistant Secretary, Columbia Management Investment Advisers, LLC, since October 2021 (previously Vice President and Assistant Secretary, May 2010 – September 2021). |
Lyn Kephart-Strong 5903 Ameriprise Financial Center Minneapolis, MN 55474 1960 | Vice President (2015) | Vice President, Global Investment Operations Services, Columbia Management Investment Advisers, LLC, since 2010; President, Columbia Management Investment Services Corp., since October 2014; President, Ameriprise Trust Company, since January 2017. |


3 | |
5 | |
7 | |
8 | |
13 | |
14 | |
15 | |
16 | |
18 | |
32 | |
33 |
Average annual total returns (%) (for the period ended December 31, 2023) | |||||
Inception | 1 Year | 5 Years | Life | ||
Class 1* | 02/20/19 | 12.59 | 5.40 | 4.00 | |
Class 2 | 09/12/17 | 12.26 | 5.14 | 3.79 | |
Blended Benchmark | 14.37 | 7.29 | 5.67 | ||
Bloomberg U.S. Aggregate Bond Index | 5.53 | 1.10 | 0.89 | ||
Russell 3000 Index | 25.96 | 15.16 | 12.23 | ||
MSCI EAFE Index (Net) | 18.24 | 8.16 | 4.70 | ||

Portfolio Allocation (%) (at December 31, 2023) | |
Allocations to Underlying Funds | |
Equity Funds | 51.2 |
International | 15.1 |
U.S. Large Cap | 30.2 |
U.S. Small Cap | 5.9 |
Exchange-Traded Equity Funds | 3.0 |
U.S. Mid Cap | 3.0 |
Exchange-Traded Fixed Income Funds | 3.2 |
Investment Grade | 3.2 |
Fixed Income Funds | 27.3 |
Investment Grade | 27.3 |
Allocations to Tactical Assets | |
Money Market Funds | 8.2 |
Call Option Contracts Purchased | 0.0 (a) |
Put Option Contracts Purchased | 0.5 |
Residential Mortgage-Backed Securities - Agency | 6.6 |
Total | 100.0 |
(a) | Rounds to zero. |
July 1, 2023 — December 31, 2023 | ||||||||||
Account value at the beginning of the period ($) | Account value at the end of the period ($) | Expenses paid during the period ($) | Fund’s annualized expense ratio (%) | Effective expenses paid during the period ($) | Fund’s effective annualized expense ratio (%) | |||||
Actual | Hypothetical | Actual | Hypothetical | Actual | Hypothetical | Actual | Actual | Hypothetical | Actual | |
Class 1 | 1,000.00 | 1,000.00 | 1,049.20 | 1,023.78 | 1.18 | 1.16 | 0.23 | 3.98 | 3.94 | 0.78 |
Class 2 | 1,000.00 | 1,000.00 | 1,048.10 | 1,022.54 | 2.45 | 2.42 | 0.48 | 5.26 | 5.19 | 1.03 |
Equity Funds 54.2% | ||
Shares | Value ($) | |
International 16.0% | ||
Columbia Variable Portfolio – Overseas Core Fund, Class 1 Shares(a) | 1,384,395 | 18,481,681 |
Variable Portfolio – Partners International Core Equity Fund, Class 1 Shares(a) | 1,988,626 | 20,303,869 |
Total | 38,785,550 | |
U.S. Large Cap 31.9% | ||
Columbia Variable Portfolio – Disciplined Core Fund, Class 1 Shares(a),(b) | 162,418 | 14,551,036 |
Columbia Variable Portfolio – Select Large Cap Equity Fund, Class 1 Shares(a),(b) | 760,586 | 14,420,722 |
Variable Portfolio – Partners Core Equity Fund, Class 1 Shares(a),(b) | 1,296,902 | 48,309,589 |
Total | 77,281,347 | |
U.S. Small Cap 6.3% | ||
Variable Portfolio – Partners Small Cap Growth Fund, Class 1 Shares(a),(b) | 261,296 | 7,588,032 |
Variable Portfolio – Partners Small Cap Value Fund, Class 1 Shares(a),(b) | 208,565 | 7,593,844 |
Total | 15,181,876 | |
Total Equity Funds (Cost $101,002,886) | 131,248,773 | |
Exchange-Traded Equity Funds 3.2% | ||
U.S. Mid Cap 3.2% | ||
iShares Core S&P Mid-Cap ETF | 27,500 | 7,621,625 |
Total Exchange-Traded Equity Funds (Cost $7,284,184) | 7,621,625 | |
Exchange-Traded Fixed Income Funds 3.4% | ||
Investment Grade 3.4% | ||
iShares Core U.S. Aggregate Bond ETF | 5,750 | 570,688 |
iShares iBoxx $ Investment Grade Corporate Bond ETF | 29,270 | 3,239,018 |
Vanguard Intermediate-Term Corporate Bond ETF | 49,950 | 4,059,936 |
Vanguard Total Bond Market ETF | 5,000 | 367,750 |
Total | 8,237,392 | |
Total Exchange-Traded Fixed Income Funds (Cost $7,916,053) | 8,237,392 | |
Fixed Income Funds 28.9% | ||
Shares | Value ($) | |
Investment Grade 28.9% | ||
Columbia Variable Portfolio – Intermediate Bond Fund, Class 1 Shares(a) | 3,947,547 | 33,909,426 |
Variable Portfolio – Partners Core Bond Fund, Class 1 Shares(a) | 3,718,735 | 36,183,291 |
Total | 70,092,717 | |
Total Fixed Income Funds (Cost $78,578,909) | 70,092,717 | |
Residential Mortgage-Backed Securities - Agency 7.0% | ||||
Issuer | Coupon Rate | Principal Amount ($) | Value ($) | |
Uniform Mortgage-Backed Security TBA(c) | ||||
01/18/2039- 01/16/2054 | 3.000% | 4,351,000 | 3,860,082 | |
01/18/2039- 01/16/2054 | 3.500% | 3,550,000 | 3,279,206 | |
01/18/2039- 01/16/2054 | 4.000% | 3,658,000 | 3,480,736 | |
01/16/2054 | 4.500% | 3,550,000 | 3,441,004 | |
01/16/2054 | 5.000% | 3,000,000 | 2,967,891 | |
Total Residential Mortgage-Backed Securities - Agency (Cost $16,592,263) | 17,028,919 | |||
Call Option Contracts Purchased 0.0% | ||||
Value ($) | ||||
(Cost $32,552) | 36,180 | |||
Put Option Contracts Purchased 0.6% | ||||
(Cost $1,500,010) | 1,353,620 | |||
Money Market Funds 8.6% | ||
Shares | Value ($) | |
Columbia Short-Term Cash Fund, 5.569%(a),(d) | 20,941,162 | 20,936,974 |
Total Money Market Funds (Cost $20,930,739) | 20,936,974 | |
Total Investments in Securities (Cost: $233,837,596) | 256,556,200 | |
Other Assets & Liabilities, Net | (14,406,984 ) | |
Net Assets | 242,149,216 | |
Forward foreign currency exchange contracts | |||||
Currency to be sold | Currency to be purchased | Counterparty | Settlement date | Unrealized appreciation ($) | Unrealized depreciation ($) |
552,494 USD | 750,000 CAD | Barclays | 02/09/2024 | 13,824 | — |
751,254 USD | 600,000 GBP | Citi | 02/09/2024 | 13,699 | — |
548,772 USD | 6,000,000 NOK | Citi | 02/09/2024 | 42,342 | — |
950,000 CHF | 1,089,818 USD | HSBC | 02/09/2024 | — | (44,241 ) |
324,438 USD | 300,000 EUR | Morgan Stanley | 02/09/2024 | 7,262 | — |
625,410 USD | 950,000 AUD | UBS | 02/09/2024 | 22,776 | — |
60,000,000 JPY | 416,366 USD | Wells Fargo | 02/09/2024 | — | (11,692 ) |
8,000,000 SEK | 767,548 USD | Wells Fargo | 02/09/2024 | — | (26,868 ) |
197,619 USD | 2,000,000 SEK | Wells Fargo | 02/09/2024 | 985 | — |
Total | 100,888 | (82,801 ) | |||
Long futures contracts | ||||||
Description | Number of contracts | Expiration date | Trading currency | Notional amount | Value/Unrealized appreciation ($) | Value/Unrealized depreciation ($) |
S&P 500 Index E-mini | 25 | 03/2024 | USD | 6,025,000 | 166,425 | — |
TOPIX Index | 4 | 03/2024 | JPY | 94,640,000 | 1,099 | — |
U.S. Long Bond | 15 | 03/2024 | USD | 1,874,063 | 116,424 | — |
U.S. Treasury 2-Year Note | 15 | 03/2024 | USD | 3,088,711 | 33,960 | — |
U.S. Treasury 5-Year Note | 32 | 03/2024 | USD | 3,480,750 | 80,239 | — |
U.S. Treasury Ultra Bond | 14 | 03/2024 | USD | 1,870,313 | 146,269 | — |
Total | 544,416 | — | ||||
Short futures contracts | ||||||
Description | Number of contracts | Expiration date | Trading currency | Notional amount | Value/Unrealized appreciation ($) | Value/Unrealized depreciation ($) |
Euro STOXX 50 Index | (6) | 03/2024 | EUR | (272,580 ) | 1,945 | — |
FTSE 100 Index | (2) | 03/2024 | GBP | (155,130 ) | — | (3,160 ) |
OMXS30 Index | (16) | 01/2024 | SEK | (3,842,000 ) | — | (7,093 ) |
Russell 2000 Index E-mini | (112) | 03/2024 | USD | (11,467,120 ) | — | (886,080 ) |
SPI 200 Index | (4) | 03/2024 | AUD | (758,500 ) | — | (10,719 ) |
U.S. Treasury 10-Year Note | (4) | 03/2024 | USD | (451,563 ) | — | (8,179 ) |
Total | 1,945 | (915,231 ) | ||||
Call option contracts purchased | ||||||||
Description | Counterparty | Trading currency | Notional amount | Number of contracts | Exercise price/Rate | Expiration date | Cost ($) | Value ($) |
S&P 500 Index | Morgan Stanley | USD | 1,430,949 | 3 | 4,785.00 | 03/15/2024 | 32,552 | 36,180 |
Put option contracts purchased | ||||||||
Description | Counterparty | Trading currency | Notional amount | Number of contracts | Exercise price/Rate | Expiration date | Cost ($) | Value ($) |
S&P 500 Index | Morgan Stanley | USD | 15,263,456 | 32 | 3,550.00 | 06/20/2025 | 294,147 | 227,680 |
S&P 500 Index | Morgan Stanley | USD | 9,539,660 | 20 | 3,800.00 | 06/20/2025 | 189,170 | 191,200 |
S&P 500 Index | Morgan Stanley | USD | 10,493,626 | 22 | 3,650.00 | 06/20/2025 | 212,092 | 176,440 |
S&P 500 Index | Morgan Stanley | USD | 9,539,660 | 20 | 3,900.00 | 12/19/2025 | 285,670 | 288,000 |
S&P 500 Index | Morgan Stanley | USD | 9,539,660 | 20 | 3,800.00 | 12/19/2025 | 257,170 | 259,800 |
S&P 500 Index | Morgan Stanley | USD | 9,539,660 | 20 | 3,600.00 | 12/19/2025 | 261,761 | 210,500 |
Total | 1,500,010 | 1,353,620 | ||||||
Put option contracts written | ||||||||
Description | Counterparty | Trading currency | Notional amount | Number of contracts | Exercise price/Rate | Expiration date | Premium received ($) | Value ($) |
S&P 500 Index | Morgan Stanley | USD | (1,430,949 ) | (3 ) | 4,785.00 | 03/15/2024 | (32,248 ) | (27,090 ) |
Cleared credit default swap contracts - sell protection | ||||||||||||
Reference entity | Counterparty | Maturity date | Receive fixed rate (%) | Payment frequency | Implied credit spread (%)* | Notional currency | Notional amount | Value ($) | Upfront payments ($) | Upfront receipts ($) | Unrealized appreciation ($) | Unrealized depreciation ($) |
Markit CDX North America Investment Grade Index, Series 41 | Morgan Stanley | 12/20/2028 | 1.000 | Quarterly | 0.567 | USD | 6,000,000 | 32,446 | — | — | 32,446 | — |
(a) | As defined in the Investment Company Act of 1940, as amended, an affiliated company is one in which the Fund owns 5% or more of the company’s outstanding voting securities, or a company which is under common ownership or control with the Fund. The value of the holdings and transactions in these affiliated companies during the year ended December 31, 2023 are as follows: |
Affiliated issuers | Beginning of period($) | Purchases($) | Sales($) | Net change in unrealized appreciation (depreciation)($) | End of period($) | Capital gain distributions($) | Realized gain (loss)($) | Dividends — affiliated issuers ($) | End of period shares |
Columbia Short-Term Cash Fund, 5.569% | |||||||||
13,357,020 | 46,282,983 | (38,706,063 ) | 3,034 | 20,936,974 | — | (679 ) | 1,088,017 | 20,941,162 | |
Columbia Variable Portfolio – Disciplined Core Fund, Class 1 Shares | |||||||||
12,982,782 | 249,989 | (1,127,609 ) | 2,445,874 | 14,551,036 | — | 626,888 | — | 162,418 | |
Columbia Variable Portfolio – Intermediate Bond Fund, Class 1 Shares | |||||||||
29,714,142 | 3,798,349 | (1,132,735 ) | 1,529,670 | 33,909,426 | — | (342,697 ) | 761,845 | 3,947,547 | |
Columbia Variable Portfolio – Overseas Core Fund, Class 1 Shares | |||||||||
17,495,143 | 699,089 | (2,420,419 ) | 2,707,868 | 18,481,681 | — | (438,655 ) | 339,106 | 1,384,395 | |
Columbia Variable Portfolio – Select Large Cap Equity Fund, Class 1 Shares | |||||||||
12,903,391 | 92,261 | (1,749,887 ) | 3,174,957 | 14,420,722 | — | 272,315 | — | 760,586 | |
Variable Portfolio – Partners Core Bond Fund, Class 1 Shares | |||||||||
33,433,974 | 2,733,108 | (1,407,029 ) | 1,423,238 | 36,183,291 | — | (279,864 ) | 960,787 | 3,718,735 | |
Variable Portfolio – Partners Core Equity Fund, Class 1 Shares | |||||||||
43,420,738 | 594,229 | (5,232,621 ) | 9,527,243 | 48,309,589 | — | 775,777 | — | 1,296,902 | |
Variable Portfolio – Partners International Core Equity Fund, Class 1 Shares | |||||||||
19,021,326 | 718,396 | (3,161,584 ) | 3,725,731 | 20,303,869 | — | (785,569 ) | 285,174 | 1,988,626 | |
Variable Portfolio – Partners Small Cap Growth Fund, Class 1 Shares | |||||||||
6,001,350 | 2,239,500 | (1,460,194 ) | 807,376 | 7,588,032 | — | (263,331 ) | — | 261,296 | |
Variable Portfolio – Partners Small Cap Value Fund, Class 1 Shares | |||||||||
6,236,945 | 1,899,137 | (1,408,142 ) | 865,904 | 7,593,844 | — | 9,946 | — | 208,565 | |
Total | 194,566,811 | 26,210,895 | 222,278,464 | — | (425,869 ) | 3,434,929 | |||
(b) | Non-income producing investment. |
(c) | Represents a security purchased on a when-issued basis. |
(d) | The rate shown is the seven-day current annualized yield at December 31, 2023. |
TBA | To Be Announced |
AUD | Australian Dollar |
CAD | Canada Dollar |
CHF | Swiss Franc |
EUR | Euro |
GBP | British Pound |
JPY | Japanese Yen |
NOK | Norwegian Krone |
SEK | Swedish Krona |
USD | US Dollar |
Level 1 ($) | Level 2 ($) | Level 3 ($) | Assets at NAV ($) | Total ($) | |
Investments in Securities | |||||
Equity Funds | — | — | — | 131,248,773 | 131,248,773 |
Exchange-Traded Equity Funds | 7,621,625 | — | — | — | 7,621,625 |
Exchange-Traded Fixed Income Funds | 8,237,392 | — | — | — | 8,237,392 |
Fixed Income Funds | — | — | — | 70,092,717 | 70,092,717 |
Residential Mortgage-Backed Securities - Agency | — | 17,028,919 | — | — | 17,028,919 |
Call Option Contracts Purchased | 36,180 | — | — | — | 36,180 |
Put Option Contracts Purchased | 1,353,620 | — | — | — | 1,353,620 |
Money Market Funds | 20,936,974 | — | — | — | 20,936,974 |
Total Investments in Securities | 38,185,791 | 17,028,919 | — | 201,341,490 | 256,556,200 |
Investments in Derivatives | |||||
Asset | |||||
Forward Foreign Currency Exchange Contracts | — | 100,888 | — | — | 100,888 |
Futures Contracts | 546,361 | — | — | — | 546,361 |
Swap Contracts | — | 32,446 | — | — | 32,446 |
Liability | |||||
Forward Foreign Currency Exchange Contracts | — | (82,801 ) | — | — | (82,801 ) |
Futures Contracts | (915,231 ) | — | — | — | (915,231 ) |
Put Option Contracts Written | (27,090 ) | — | — | — | (27,090 ) |
Total | 37,789,831 | 17,079,452 | — | 201,341,490 | 256,210,773 |
Assets | |
Investments in securities, at value | |
Unaffiliated issuers (cost $31,792,500) | $32,887,936 |
Affiliated issuers (cost $200,512,534) | 222,278,464 |
Option contracts purchased (cost $1,532,562) | 1,389,800 |
Cash | 5,131 |
Cash collateral held at broker for: | |
Option contracts written | 489,845 |
Margin deposits on: | |
Futures contracts | 1,380,168 |
Swap contracts | 151,251 |
Unrealized appreciation on forward foreign currency exchange contracts | 100,888 |
Receivable for: | |
Investments sold | 158,004 |
Dividends | 92,860 |
Interest | 29,883 |
Variation margin for futures contracts | 185,770 |
Expense reimbursement due from Investment Manager | 74 |
Prepaid expenses | 3,314 |
Deferred compensation of board members | 25,756 |
Total assets | 259,179,144 |
Liabilities | |
Option contracts written, at value (premiums received $32,248) | 27,090 |
Unrealized depreciation on forward foreign currency exchange contracts | 82,801 |
Payable for: | |
Investments purchased on a delayed delivery basis | 16,622,145 |
Capital shares redeemed | 185,888 |
Variation margin for futures contracts | 26,557 |
Variation margin for swap contracts | 4,763 |
Management services fees | 914 |
Distribution and/or service fees | 1,662 |
Service fees | 11,227 |
Compensation of chief compliance officer | 45 |
Compensation of board members | 943 |
Other expenses | 23,034 |
Deferred compensation of board members | 42,859 |
Total liabilities | 17,029,928 |
Net assets applicable to outstanding capital stock | $242,149,216 |
Represented by | |
Trust capital | $242,149,216 |
Total - representing net assets applicable to outstanding capital stock | $242,149,216 |
Class 1 | |
Net assets | $3,052 |
Shares outstanding | 239 |
Net asset value per share(a) | $12.79 |
Class 2 | |
Net assets | $242,146,164 |
Shares outstanding | 19,152,724 |
Net asset value per share | $12.64 |
(a) | Net asset value per share rounds to this amount due to fractional shares outstanding. |
Net investment income | |
Income: | |
Dividends — unaffiliated issuers | $405,162 |
Dividends — affiliated issuers | 3,434,929 |
Interest | 71,102 |
Total income | 3,911,193 |
Expenses: | |
Management services fees | 314,276 |
Distribution and/or service fees | |
Class 2 | 575,825 |
Service fees | 138,151 |
Custodian fees | 26,450 |
Printing and postage fees | 17,116 |
Accounting services fees | 30,090 |
Legal fees | 14,911 |
Compensation of chief compliance officer | 45 |
Compensation of board members | 13,506 |
Deferred compensation of board members | 5,186 |
Other | 8,291 |
Total expenses | 1,143,847 |
Fees waived or expenses reimbursed by Investment Manager and its affiliates | (26,773 ) |
Total net expenses | 1,117,074 |
Net investment income | 2,794,119 |
Realized and unrealized gain (loss) — net | |
Net realized gain (loss) on: | |
Investments — unaffiliated issuers | (1,162,617 ) |
Investments — affiliated issuers | (425,869 ) |
Foreign currency translations | (19,566 ) |
Forward foreign currency exchange contracts | (269,259 ) |
Futures contracts | 580,490 |
Option contracts purchased | (2,149,785 ) |
Option contracts written | (13,501 ) |
Swap contracts | 150,854 |
Net realized loss | (3,309,253 ) |
Net change in unrealized appreciation (depreciation) on: | |
Investments — unaffiliated issuers | 2,467,452 |
Investments — affiliated issuers | 26,210,895 |
Forward foreign currency exchange contracts | 216,579 |
Futures contracts | (1,389,487 ) |
Option contracts purchased | (177,834 ) |
Option contracts written | 5,158 |
Swap contracts | (10,528 ) |
Net change in unrealized appreciation (depreciation) | 27,322,235 |
Net realized and unrealized gain | 24,012,982 |
Net increase in net assets resulting from operations | $26,807,101 |
Year Ended December 31, 2023 | Year Ended December 31, 2022 | |
Operations | ||
Net investment income | $2,794,119 | $1,877,106 |
Net realized loss | (3,309,253 ) | (7,160,901 ) |
Net change in unrealized appreciation (depreciation) | 27,322,235 | (43,229,771 ) |
Net increase (decrease) in net assets resulting from operations | 26,807,101 | (48,513,566 ) |
Decrease in net assets from capital stock activity | (3,237,795 ) | (10,618,003 ) |
Total increase (decrease) in net assets | 23,569,306 | (59,131,569 ) |
Net assets at beginning of year | 218,579,910 | 277,711,479 |
Net assets at end of year | $242,149,216 | $218,579,910 |
Year Ended | Year Ended | |||
December 31, 2023 | December 31, 2022 | |||
Shares | Dollars ($) | Shares | Dollars ($) | |
Capital stock activity | ||||
Class 2 | ||||
Shares sold | 1,133,007 | 13,355,538 | 665,562 | 8,267,656 |
Shares redeemed | (1,398,035 ) | (16,593,333 ) | (1,615,433 ) | (18,885,659 ) |
Net decrease | (265,028 ) | (3,237,795 ) | (949,871 ) | (10,618,003 ) |
Total net decrease | (265,028 ) | (3,237,795 ) | (949,871 ) | (10,618,003 ) |
Net asset value, beginning of period | Net investment income | Net realized and unrealized gain (loss) | Total from investment operations | |
Class 1 | ||||
Year Ended 12/31/2023 | $11.36 | 0.18 | 1.25 | 1.43 |
Year Ended 12/31/2022 | $13.73 | 0.13 | (2.50 ) | (2.37 ) |
Year Ended 12/31/2021 | $12.37 | 0.12 | 1.24 | 1.36 |
Year Ended 12/31/2020 | $11.44 | 0.09 | 0.84 | 0.93 |
Year Ended 12/31/2019(d) | $10.48 | 0.15 | 0.81 | 0.96 |
Class 2 | ||||
Year Ended 12/31/2023 | $11.26 | 0.14 | 1.24 | 1.38 |
Year Ended 12/31/2022 | $13.63 | 0.09 | (2.46 ) | (2.37 ) |
Year Ended 12/31/2021 | $12.31 | 0.08 | 1.24 | 1.32 |
Year Ended 12/31/2020 | $11.42 | 0.06 | 0.83 | 0.89 |
Year Ended 12/31/2019 | $9.84 | 0.12 | 1.46 | 1.58 |
Notes to Financial Highlights | |
(a) | In addition to the fees and expenses that the Fund bears directly, the Fund indirectly bears a pro rata share of the fees and expenses of any other funds in which it invests. Such indirect expenses are not included in the Fund’s reported expense ratios. |
(b) | Total net expenses include the impact of certain fee waivers/expense reimbursements made by the Investment Manager and certain of its affiliates, if applicable. |
(c) | Ratios include interest on collateral expense. For the periods indicated below, if interest on collateral expense had been excluded, expenses would have been lower by: |
Class | 12/31/2022 | 12/31/2021 | 12/31/2020 |
Class 1 | less than 0.01% | 0.01% | 0.01% |
Class 2 | less than 0.01% | 0.01% | 0.01% |
(d) | Class 1 shares commenced operations on February 20, 2019. Per share data and total return reflect activity from that date. |
Net asset value, end of period | Total return | Total gross expense ratio to average net assets(a) | Total net expense ratio to average net assets(a),(b) | Net investment income ratio to average net assets | Portfolio turnover | Net assets, end of period (000’s) | |
Class 1 | |||||||
Year Ended 12/31/2023 | $12.79 | 12.59% | 0.24% | 0.23% | 1.48% | 110% | $3 |
Year Ended 12/31/2022 | $11.36 | (17.26% ) | 0.27% (c) | 0.25% (c) | 1.06% | 113% | $3 |
Year Ended 12/31/2021 | $13.73 | 10.99% | 0.25% (c) | 0.25% (c) | 0.88% | 116% | $3 |
Year Ended 12/31/2020 | $12.37 | 8.13% | 0.25% (c) | 0.25% (c) | 0.75% | 89% | $3 |
Year Ended 12/31/2019(d) | $11.44 | 9.16% | 0.25% | 0.25% | 1.57% | 37% | $3 |
Class 2 | |||||||
Year Ended 12/31/2023 | $12.64 | 12.26% | 0.50% | 0.48% | 1.21% | 110% | $242,146 |
Year Ended 12/31/2022 | $11.26 | (17.39% ) | 0.52% (c) | 0.50% (c) | 0.78% | 113% | $218,577 |
Year Ended 12/31/2021 | $13.63 | 10.72% | 0.50% (c) | 0.50% (c) | 0.63% | 116% | $277,708 |
Year Ended 12/31/2020 | $12.31 | 7.79% | 0.50% (c) | 0.50% (c) | 0.49% | 89% | $230,561 |
Year Ended 12/31/2019 | $11.42 | 16.06% | 0.51% | 0.51% | 1.12% | 37% | $186,750 |
Asset derivatives | ||
Risk exposure category | Statement of assets and liabilities location | Fair value ($) |
Credit risk | Component of trust capital — unrealized appreciation on swap contracts | 32,446 * |
Equity risk | Component of trust capital — unrealized appreciation on futures contracts | 169,469 * |
Equity risk | Investments, at value — Option contracts purchased | 1,389,800 |
Foreign exchange risk | Unrealized appreciation on forward foreign currency exchange contracts | 100,888 |
Interest rate risk | Component of trust capital — unrealized appreciation on futures contracts | 376,892 * |
Total | 2,069,495 |
Liability derivatives | ||
Risk exposure category | Statement of assets and liabilities location | Fair value ($) |
Equity risk | Component of trust capital - unrealized depreciation on futures contracts | 907,052 * |
Equity risk | Option contracts written, at value | 27,090 |
Foreign exchange risk | Unrealized depreciation on forward foreign currency exchange contracts | 82,801 |
Interest rate risk | Component of trust capital - unrealized depreciation on futures contracts | 8,179 * |
Total | 1,025,122 |
* | Includes cumulative appreciation (depreciation) as reported in the tables following the Portfolio of Investments. Only the current day’s variation margin for futures and centrally cleared swaps, if any, is reported in receivables or payables in the Statement of Assets and Liabilities. |
Amount of realized gain (loss) on derivatives recognized in income | ||||||
Risk exposure category | Forward foreign currency exchange contracts ($) | Futures contracts ($) | Option contracts purchased ($) | Option contracts written ($) | Swap contracts ($) | Total ($) |
Credit risk | — | — | — | — | 150,854 | 150,854 |
Equity risk | — | 1,300,560 | (2,149,785 ) | (13,501 ) | — | (862,726 ) |
Foreign exchange risk | (269,259 ) | — | — | — | — | (269,259 ) |
Interest rate risk | — | (720,070 ) | — | — | — | (720,070 ) |
Total | (269,259 ) | 580,490 | (2,149,785 ) | (13,501 ) | 150,854 | (1,701,201 ) |
Change in unrealized appreciation (depreciation) on derivatives recognized in income | ||||||
Risk exposure category | Forward foreign currency exchange contracts ($) | Futures contracts ($) | Option contracts purchased ($) | Option contracts written ($) | Swap contracts ($) | Total ($) |
Credit risk | — | — | — | — | (10,528 ) | (10,528 ) |
Equity risk | — | (1,807,114 ) | (177,834 ) | 5,158 | — | (1,979,790 ) |
Foreign exchange risk | 216,579 | — | — | — | — | 216,579 |
Interest rate risk | — | 417,627 | — | — | — | 417,627 |
Total | 216,579 | (1,389,487 ) | (177,834 ) | 5,158 | (10,528 ) | (1,356,112 ) |
Derivative instrument | Average notional amounts ($) |
Futures contracts — long | 20,262,924 |
Futures contracts — short | 12,427,661 |
Credit default swap contracts — sell protection | 6,000,000 |
Derivative instrument | Average value ($) |
Option contracts purchased | 1,390,733 |
Option contracts written | (5,274 ) |
Derivative instrument | Average unrealized appreciation ($) | Average unrealized depreciation ($) |
Forward foreign currency exchange contracts | 88,899 | (103,947 ) |
Barclays ($) | Citi ($) | HSBC ($) | Morgan Stanley ($)(a) | Morgan Stanley ($)(a) | UBS ($) | Wells Fargo ($) | Total ($) | |
Assets | ||||||||
Forward foreign currency exchange contracts | 13,824 | 56,041 | - | 7,262 | - | 22,776 | 985 | 100,888 |
Call option contracts purchased | - | - | - | 36,180 | - | - | - | 36,180 |
Put option contracts purchased | - | - | - | 1,353,620 | - | - | - | 1,353,620 |
Total assets | 13,824 | 56,041 | - | 1,397,062 | - | 22,776 | 985 | 1,490,688 |
Liabilities | ||||||||
Centrally cleared credit default swap contracts (b) | - | - | - | - | 4,763 | - | - | 4,763 |
Forward foreign currency exchange contracts | - | - | 44,241 | - | - | - | 38,560 | 82,801 |
Put option contracts written | - | - | - | 27,090 | - | - | - | 27,090 |
Total liabilities | - | - | 44,241 | 27,090 | 4,763 | - | 38,560 | 114,654 |
Total financial and derivative net assets | 13,824 | 56,041 | (44,241 ) | 1,369,972 | (4,763 ) | 22,776 | (37,575 ) | 1,376,034 |
Total collateral received (pledged) (c) | - | - | - | - | (4,763 ) | - | - | (4,763 ) |
Net amount (d) | 13,824 | 56,041 | (44,241 ) | 1,369,972 | - | 22,776 | (37,575 ) | 1,380,797 |
(a) | Exposure can only be netted across transactions governed under the same master agreement with the same legal entity. |
(b) | Centrally cleared swaps are included within payable/receivable for variation margin in the Statement of Assets and Liabilities. |
(c) | In some instances, the actual collateral received and/or pledged may be more than the amount shown due to overcollateralization. |
(d) | Represents the net amount due from/(to) counterparties in the event of default. |
May 1, 2023 through April 30, 2024 | Prior to May 1, 2023 | |
Class 1 | 0.78 % | 0.79 % |
Class 2 | 1.03 | 1.04 |
Name, address, year of birth | Position held with the Columbia Funds and length of service | Principal occupation(s) during past five years and other relevant professional experience | Number of Funds in the Columbia Funds Complex* overseen | Other directorships held by Trustee during the past five years and other relevant Board experience |
George S. Batejan c/o Columbia Management Investment Advisers, LLC 290 Congress Street Boston, MA 02210 1954 | Trustee since 2017 | Executive Vice President, Global Head of Technology and Operations, Janus Capital Group, Inc., 2010-2016 | 161 | Former Chairman of the Board, NICSA (National Investment Company Services Association) (Executive Committee, Nominating Committee and Governance Committee), 2014-2016; former Director, Intech Investment Management, 2011-2016; former Board Member, Metro Denver Chamber of Commerce, 2015-2016; former Advisory Board Member, University of Colorado Business School, 2015-2018; former Board Member, Chase Bank International, 1993-1994 |
Kathleen Blatz c/o Columbia Management Investment Advisers, LLC 290 Congress Street Boston, MA 02210 1954 | Trustee since 2006 | Attorney, specializing in arbitration and mediation; Trustee of Gerald Rauenhorst 1982 Trusts, since 2020; Chief Justice, Minnesota Supreme Court, 1998-2006; Associate Justice, Minnesota Supreme Court, 1996-1998; Fourth Judicial District Court Judge, Hennepin County, 1994-1996; Attorney in private practice and public service, 1984-1993; State Representative, Minnesota House of Representatives, 1979-1993, which included service on the Tax and Financial Institutions and Insurance Committees; Member and Interim Chair, Minnesota Sports Facilities Authority, January-July 2017; Interim President and Chief Executive Officer, Blue Cross and Blue Shield of Minnesota (health care insurance), February-July 2018, April-October 2021 | 161 | Former Trustee, Blue Cross and Blue Shield of Minnesota, 2009-2021 (Chair of the Business Development Committee, 2014-2017; Chair of the Governance Committee, 2017-2019); former Member and Chair of the Board, Minnesota Sports Facilities Authority, January 2017-July 2017; former Director, Robina Foundation, 2009-2020 (Chair, 2014-2020); Director, Richard M. Schulze Family Foundation, since 2021 |
Name, address, year of birth | Position held with the Columbia Funds and length of service | Principal occupation(s) during past five years and other relevant professional experience | Number of Funds in the Columbia Funds Complex* overseen | Other directorships held by Trustee during the past five years and other relevant Board experience |
Pamela G. Carlton c/o Columbia Management Investment Advisers, LLC 290 Congress Street Boston, MA 02210 1954 | Chair since 2023; Trustee since 2007 | President, Springboard – Partners in Cross Cultural Leadership (consulting company), since 2003; Managing Director of US Equity Research, JP Morgan Chase, 1999-2003; Director of US Equity Research, Chase Asset Management, 1996-1999; Co-Director Latin America Research, 1993-1996, COO Global Research, 1992-1996, Co-Director of US Research, 1991-1992, Investment Banker, 1982-1991, Morgan Stanley; Attorney, Cleary Gottlieb Steen & Hamilton LLP, 1980-1982 | 161 | Trustee, New York Presbyterian Hospital Board, since 1996; Director, DR Bank (Audit Committee, since 2017 and Audit Committee Chair, since November 2023); Director, Evercore Inc. (Audit Committee, Nominating and Governance Committee) (financial services company), since 2019; Director, Apollo Commercial Real Estate Finance, Inc. (Chair, Nominating and Governance Committee), since 2021; the Governing Council of the Independent Directors Council (IDC), since 2021 |
Janet Langford Carrig c/o Columbia Management Investment Advisers, LLC 290 Congress Street Boston, MA 02210 1957 | Trustee since 1996 | Senior Vice President, General Counsel and Corporate Secretary, ConocoPhillips (independent energy company), September 2007-October 2018 | 161 | Director, EQT Corporation (natural gas producer), since 2019; former Director, Whiting Petroleum Corporation (independent oil and gas company), 2020-2022 |
J. Kevin Connaughton c/o Columbia Management Investment Advisers, LLC 290 Congress Street Boston, MA 02210 1964 | Trustee since 2020 | CEO and President, RhodeWay Financial (non-profit financial planning firm), since December 2022; Member, FINRA National Adjudicatory Council, January 2020-December 31, 2023; Adjunct Professor of Finance, Bentley University January 2018-April 2023; Consultant to Independent Trustees of CFVIT and CFST I from March 2016 to June 2020 with respect to CFVIT and to December 2020 with respect to CFST I; Managing Director and General Manager of Mutual Fund Products, Columbia Management Investment Advisers, LLC, May 2010-February 2015; President, Columbia Funds, 2008-2015; and senior officer of Columbia Funds and affiliated funds, 2003-2015 | 159 | Former Director, The Autism Project, March 2015-December 2021; former Member of the Investment Committee, St. Michael’s College, November 2015-February 2020; former Trustee, St. Michael’s College, June 2017-September 2019; former Trustee, New Century Portfolios (former mutual fund complex), January 2015-December 2017 |
Olive M. Darragh c/o Columbia Management Investment Advisers, LLC 290 Congress Street Boston, MA 02210 1962 | Trustee since 2020 | Managing Director of Darragh Inc. (strategy and talent management consulting firm), since 2010; Founder and CEO, Zolio, Inc. (investment management talent identification platform), since 2004; Consultant to Independent Trustees of CFVIT and CFST I from June 2019 to June 2020 with respect to CFVIT and to December 2020 with respect to CFST I; Partner, Tudor Investments, 2004-2010; Senior Partner, McKinsey & Company (consulting), 1990-2004; Touche Ross CPA, 1985-1988 | 159 | Treasurer, Edinburgh University US Trust Board, since January 2023; Member, HBS Community Action Partners Board, since September 2022; former Director, University of Edinburgh Business School (Member of US Board), 2004-2019; former Director, Boston Public Library Foundation, 2008-2017 |
Name, address, year of birth | Position held with the Columbia Funds and length of service | Principal occupation(s) during past five years and other relevant professional experience | Number of Funds in the Columbia Funds Complex* overseen | Other directorships held by Trustee during the past five years and other relevant Board experience |
Patricia M. Flynn c/o Columbia Management Investment Advisers, LLC 290 Congress Street Boston, MA 02210 1950 | Trustee since 2004 | Professor Emeritus of Economics and Management, Bentley University, since 2023; Professor of Economics and Management, Bentley University, 1976-2023; Dean, McCallum Graduate School of Business, Bentley University, 1992-2002 | 161 | Former Trustee, MA Taxpayers Foundation, 1997-2022; former Director, The MA Business Roundtable, 2003-2019; former Chairperson, Innovation Index Advisory Committee, MA Technology Collaborative, 1997-2020 |
Brian J. Gallagher c/o Columbia Management Investment Advisers, LLC 290 Congress Street Boston, MA 02210 1954 | Trustee since 2017 | Retired; Partner with Deloitte & Touche LLP and its predecessors, 1977-2016 | 161 | Trustee, Catholic Schools Foundation, since 2004 |
Douglas A. Hacker c/o Columbia Management Investment Advisers, LLC 290 Congress Street Boston, MA 02210 1955 | Trustee since 1996 | Independent business executive, since May 2006; Executive Vice President – Strategy of United Airlines, December 2002 - May 2006; President of UAL Loyalty Services (airline marketing company), September 2001-December 2002; Executive Vice President and Chief Financial Officer of United Airlines, July 1999-September 2001 | 161 | Director, SpartanNash Company since November 2013 (Chair of the Board, since May 2021) (food distributor); Director, Aircastle Limited (Chair of Audit Committee) (aircraft leasing), since August 2006; former Director, Nash Finch Company (food distributor), 2005-2013; former Director, SeaCube Container Leasing Ltd. (container leasing), 2010-2013; and former Director, Travelport Worldwide Limited (travel information technology), 2014-2019 |
Nancy T. Lukitsh c/o Columbia Management Investment Advisers, LLC 290 Congress Street Boston, MA 02210 1956 | Trustee since 2011 | Senior Vice President, Partner and Director of Marketing, Wellington Management Company, LLP (investment adviser), 1997-2010; Chair, Wellington Management Portfolios (commingled non-U.S. investment pools), 2007-2010; Director, Wellington Trust Company, NA and other Wellington affiliates, 1997-2010 | 159 | None |
Name, address, year of birth | Position held with the Columbia Funds and length of service | Principal occupation(s) during past five years and other relevant professional experience | Number of Funds in the Columbia Funds Complex* overseen | Other directorships held by Trustee during the past five years and other relevant Board experience |
David M. Moffett c/o Columbia Management Investment Advisers, LLC 290 Congress Street Boston, MA 02210 1952 | Trustee since 2011 | Retired; former Chief Executive Officer of Freddie Mac and Chief Financial Officer of U.S. Bank | 161 | Director, CSX Corporation (transportation suppliers); Director, PayPal Holdings Inc. (payment and data processing services); former Director, eBay Inc. (online trading community), 2007-2015; and former Director, CIT Bank, CIT Group Inc. (commercial and consumer finance), 2010-2016; former Senior Adviser to The Carlyle Group (financial services), March 2008-September 2008; former Governance Consultant to Bridgewater Associates, January 2013-December 2015 |
Catherine James Paglia c/o Columbia Management Investment Advisers, LLC 290 Congress Street Boston, MA 02210 1952 | Trustee since 2004 | Director, Enterprise Asset Management, Inc. (private real estate and asset management company), since September 1998; Managing Director and Partner, Interlaken Capital, Inc., 1989-1997; Vice President, 1982-1985, Principal, 1985-1987, Managing Director, 1987-1989, Morgan Stanley; Vice President, Investment Banking, 1980-1982, Associate, Investment Banking, 1976-1980, Dean Witter Reynolds, Inc. | 161 | Director, Valmont Industries, Inc. (irrigation systems manufacturer), since 2012; Trustee, Carleton College (on the Investment Committee), since 1987; Trustee, Carnegie Endowment for International Peace (on the Investment Committee), since 2009 |
Natalie A. Trunow c/o Columbia Management Investment Advisers, LLC 290 Congress Street Boston, MA 02210 1967 | Trustee since 2020 | Chief Executive Officer, Millennial Portfolio Solutions LLC (asset management and consulting services), January 2016-January 2021; Non-executive Member of the Investment Committee and Valuation Committee, Sarona Asset Management Inc. (private equity firm) since September 2019; Advisor, Horizon Investments (asset management and consulting services), August 2018-January 2022; Advisor, Paradigm Asset Management, November 2016-January 2022; Consultant to Independent Trustees of CFVIT and CFST I from September 2016 to June 2020 with respect to CFVIT and to December 2020 with respect to CFST I; Director of Investments/Consultant, Casey Family Programs, April 2016-November 2016; Senior Vice President and Chief Investment Officer, Calvert Investments, August 2008-January 2016; Section Head and Portfolio Manager, General Motors Asset Management, June 1997-August 2008 | 159 | Independent Director, Investment Committee, Health Services for Children with Special Needs, Inc., 2010-2021; Independent Director, (Executive Committee and Chair, Audit Committee), Consumer Credit Counseling Services (formerly Guidewell Financial Solutions), since 2016; Independent Director, (Investment Committee), Sarona Asset Management, since 2019 |
Sandra L. Yeager c/o Columbia Management Investment Advisers, LLC 290 Congress Street Boston, MA 02210 1964 | Trustee since 2017 | Retired; President and founder, Hanoverian Capital, LLC (SEC registered investment advisor firm), 2008-2016; Managing Director, DuPont Capital, 2006-2008; Managing Director, Morgan Stanley Investment Management, 2004-2006; Senior Vice President, Alliance Bernstein, 1990-2004 | 161 | Former Director, NAPE (National Alliance for Partnerships in Equity) Education Foundation, October 2016-October 2020; Advisory Board, Jennersville YMCA, June 2022-June 2023 |
Name, address, year of birth | Position held with the Columbia Funds and length of service | Principal occupation(s) during the past five years and other relevant professional experience | Number of Funds in the Columbia Funds Complex* overseen | Other directorships held by Trustee during the past five years and other relevant Board experience |
Daniel J. Beckman c/o Columbia Management Investment Advisers, LLC 290 Congress Street Boston, MA 02210 1962 | Trustee since November 2021 and President since June 2021 | President and Principal Executive Officer of the Columbia Funds, since June 2021; Vice President, Columbia Management Investment Advisers, LLC, since April 2015; formerly, Vice President – Head of North America Product, Columbia Management Investment Advisers, LLC, April 2015 – December 2023; President and Principal Executive Officer, Columbia Acorn/Wanger Funds, since July 2021 | 161 | Director, Ameriprise Trust Company, since October 2016; Director, Columbia Management Investment Distributors, Inc., since November 2018; Board of Governors, Columbia Wanger Asset Management, LLC, since January 2022 |
* | The term “Columbia Funds Complex” as used herein includes Columbia Seligman Premium Technology Growth Fund, Tri-Continental Corporation and each series of Columbia Funds Series Trust (CFST), Columbia Funds Series Trust I (CFST I), Columbia Funds Series Trust II (CFST II), Columbia ETF Trust I (CET I), Columbia ETF Trust II (CET II), Columbia Funds Variable Insurance Trust (CFVIT) and Columbia Funds Variable Series Trust II (CFVST II). Messrs. Batejan, Beckman, Gallagher, Hacker and Moffett and Mses. Blatz, Carlton, Carrig, Flynn, Paglia, and Yeager serve as directors of Columbia Seligman Premium Technology Growth Fund and Tri-Continental Corporation. |
** | Interested person (as defined under the 1940 Act) by reason of being an officer, director, security holder and/or employee of the Investment Manager or Ameriprise Financial. |
Name, address and year of birth | Position and year first appointed to position for any Fund in the Columbia Funds Complex or a predecessor thereof | Principal occupation(s) during past five years |
Michael G. Clarke 290 Congress Street Boston, MA 02210 1969 | Chief Financial Officer and Principal Financial Officer (2009); Senior Vice President (2019); Treasurer and Chief Accounting Officer (Principal Accounting Officer) (2024) for CFST, CFST I, CFST II, CFVIT and CFVST II | Senior Vice President and North America Head of Operations & Investor Services, Columbia Management Investment Advisers, LLC, since June 2023 (previously Senior Vice President and Head of Global Operations, March 2022 – June 2023, Vice President, Head of North America Operations, and Co-Head of Global Operations, June 2019 - February 2022 and Vice President – Accounting and Tax, May 2010 - May 2019); senior officer of Columbia Funds and affiliated funds, since 2002. Director, Ameriprise Trust Company, since June 2023. |
Name, address and year of birth | Position and year first appointed to position for any Fund in the Columbia Funds Complex or a predecessor thereof | Principal occupation(s) during past five years |
Marybeth Pilat 290 Congress Street Boston, MA 02210 1968 | Treasurer and Chief Accounting Officer (Principal Accounting Officer) and Principal Financial Officer (2020) for CET I and CET II; Assistant Treasurer, CFST, CFST I, CFST II, CFVIT and CFVST II | Vice President – Product Pricing and Administration, Columbia Management Investment Advisers, LLC, since May 2017. |
William F. Truscott 290 Congress Street Boston, MA 02210 1960 | Senior Vice President (2001) | Formerly, Trustee/Director of Columbia Funds Complex or legacy funds, November 2001 - January 1, 2021; Chief Executive Officer, Global Asset Management, Ameriprise Financial, Inc., since September 2012; Chairman of the Board and President, Columbia Management Investment Advisers, LLC, since July 2004 and February 2012, respectively; Chairman of the Board and Chief Executive Officer, Columbia Management Investment Distributors, Inc., since November 2008 and February 2012, respectively; Chairman of the Board and Director, TAM UK International Holdings Limited, since July 2021; formerly Chairman of the Board and Director, Threadneedle Asset Management Holdings, Sàrl, March 2013 – December 2022 and December 2008 – December 2022, respectively; senior executive of various entities affiliated with Columbia Threadneedle Investments. |
Christopher O. Petersen 5228 Ameriprise Financial Center Minneapolis, MN 55474 1970 | Senior Vice President and Assistant Secretary (2021) | Formerly, Trustee/Director of funds within the Columbia Funds Complex, July 1, 2020 - November 22, 2021; Senior Vice President and Assistant General Counsel, Ameriprise Financial, Inc., since September 2021 (previously Vice President and Lead Chief Counsel, January 2015 - September 2021); formerly, President and Principal Executive Officer of the Columbia Funds, 2015 - 2021; officer of Columbia Funds and affiliated funds, since 2007. |
Thomas P. McGuire 290 Congress Street Boston, MA 02210 1972 | Senior Vice President and Chief Compliance Officer (2012) | Vice President – Asset Management Compliance, Ameriprise Financial, Inc., since May 2010; Chief Compliance Officer, Columbia Acorn/Wanger Funds, since December 2015; formerly, Chief Compliance Officer, Ameriprise Certificate Company, September 2010 – September 2020. |
Ryan C. Larrenaga 290 Congress Street Boston, MA 02210 1970 | Senior Vice President (2017), Chief Legal Officer (2017), and Secretary (2015) | Vice President and Chief Counsel, Ameriprise Financial, Inc., since August 2018 (previously Vice President and Group Counsel, August 2011 - August 2018); Chief Legal Officer, Columbia Acorn/Wanger Funds, since September 2020; officer of Columbia Funds and affiliated funds, since 2005. |
Michael E. DeFao 290 Congress Street Boston, MA 02210 1968 | Vice President (2011) and Assistant Secretary (2010) | Vice President and Chief Counsel, Ameriprise Financial, Inc., since May 2010; Vice President, Chief Legal Officer and Assistant Secretary, Columbia Management Investment Advisers, LLC, since October 2021 (previously Vice President and Assistant Secretary, May 2010 – September 2021). |
Lyn Kephart-Strong 5903 Ameriprise Financial Center Minneapolis, MN 55474 1960 | Vice President (2015) | Vice President, Global Investment Operations Services, Columbia Management Investment Advisers, LLC, since 2010; President, Columbia Management Investment Services Corp., since October 2014; President, Ameriprise Trust Company, since January 2017. |


3 | |
5 | |
7 | |
8 | |
12 | |
13 | |
14 | |
16 | |
18 | |
31 | |
32 |
Average annual total returns (%) (for the period ended December 31, 2023) | |||||
Inception | 1 Year | 5 Years | Life | ||
Class 1* | 02/20/19 | 14.81 | 7.16 | 5.81 | |
Class 2 | 09/12/17 | 14.54 | 6.90 | 5.60 | |
Blended Benchmark | 15.58 | 8.53 | 7.03 | ||
Bloomberg U.S. Aggregate Bond Index | 5.53 | 1.10 | 0.89 | ||
S&P 500 Index | 26.29 | 15.69 | 12.78 | ||
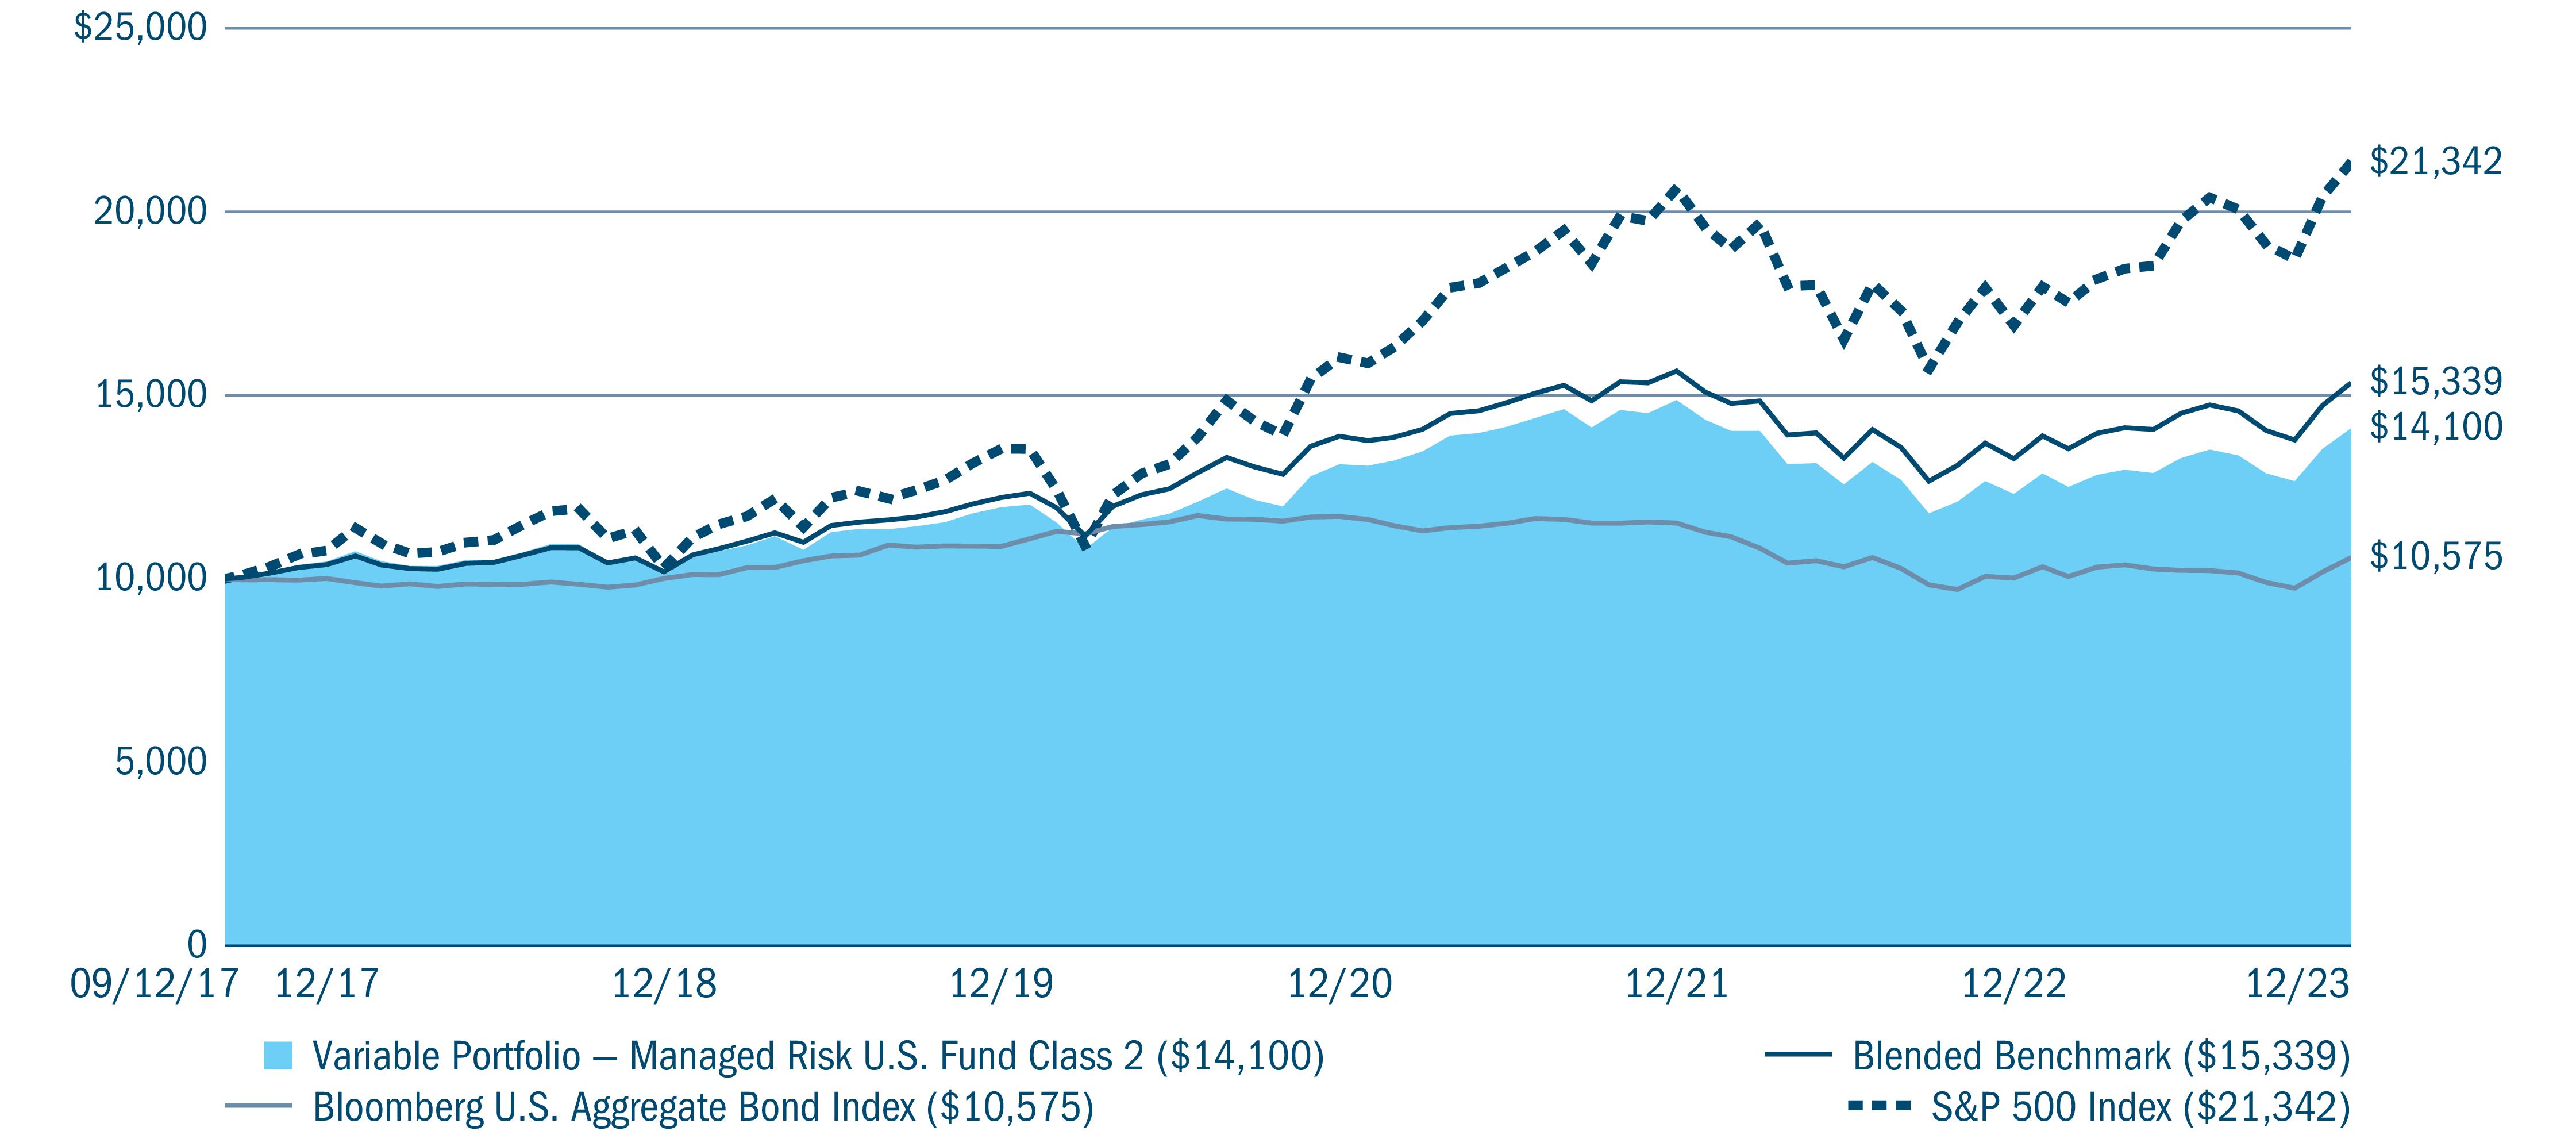
Portfolio Allocation (%) (at December 31, 2023) | |
Allocations to Underlying Funds | |
Equity Funds | 51.0 |
U.S. Large Cap | 51.0 |
Exchange-Traded Fixed Income Funds | 2.7 |
Investment Grade | 2.7 |
Fixed Income Funds | 27.2 |
Investment Grade | 27.2 |
Allocations to Tactical Assets | |
Money Market Funds(a) | 11.7 |
Call Option Contracts Purchased | 0.0 (b) |
Put Option Contracts Purchased | 0.5 |
Residential Mortgage-Backed Securities - Agency | 6.9 |
Total | 100.0 |
(a) | Includes investments in Money Market Funds, including investing for the purpose of covering obligations relating to the Fund’s investment in derivatives. For a description of the Fund’s investments in derivatives, see Investments in derivatives following the Portfolio of Investments and the derivative instruments discussion in Note 2 to the Notes to Financial Statements. |
(b) | Rounds to zero. |
July 1, 2023 — December 31, 2023 | ||||||||||
Account value at the beginning of the period ($) | Account value at the end of the period ($) | Expenses paid during the period ($) | Fund’s annualized expense ratio (%) | Effective expenses paid during the period ($) | Fund’s effective annualized expense ratio (%) | |||||
Actual | Hypothetical | Actual | Hypothetical | Actual | Hypothetical | Actual | Actual | Hypothetical | Actual | |
Class 1 | 1,000.00 | 1,000.00 | 1,062.60 | 1,023.73 | 1.23 | 1.21 | 0.24 | 3.91 | 3.83 | 0.76 |
Class 2 | 1,000.00 | 1,000.00 | 1,061.00 | 1,022.54 | 2.47 | 2.42 | 0.48 | 5.14 | 5.04 | 1.00 |
Equity Funds 54.4% | ||
Shares | Value ($) | |
U.S. Large Cap 54.4% | ||
Columbia Variable Portfolio – Disciplined Core Fund, Class 1 Shares(a),(b) | 444,516 | 39,824,232 |
Columbia Variable Portfolio – Select Large Cap Equity Fund, Class 1 Shares(a),(b) | 2,103,325 | 39,879,039 |
CTIVP® – Principal Blue Chip Growth Fund, Class 1 Shares(a),(b) | 564,864 | 33,332,616 |
CTIVP® – T. Rowe Price Large Cap Value Fund, Class 1 Shares(a),(b) | 950,129 | 33,340,012 |
Variable Portfolio – Partners Core Equity Fund, Class 1 Shares(a),(b) | 1,875,109 | 69,847,826 |
Total | 216,223,725 | |
Total Equity Funds (Cost $143,471,888) | 216,223,725 | |
Exchange-Traded Fixed Income Funds 2.9% | ||
Investment Grade 2.9% | ||
iShares iBoxx $ Investment Grade Corporate Bond ETF | 48,685 | 5,387,482 |
Vanguard Intermediate-Term Corporate Bond ETF | 76,150 | 6,189,472 |
Total | 11,576,954 | |
Total Exchange-Traded Fixed Income Funds (Cost $10,974,376) | 11,576,954 | |
Fixed Income Funds 29.0% | ||
Investment Grade 29.0% | ||
Columbia Variable Portfolio – Intermediate Bond Fund, Class 1 Shares(a) | 6,488,397 | 55,735,335 |
Variable Portfolio – Partners Core Bond Fund, Class 1 Shares(a) | 6,119,433 | 59,542,081 |
Total | 115,277,416 | |
Total Fixed Income Funds (Cost $129,250,371) | 115,277,416 | |
Residential Mortgage-Backed Securities - Agency 7.3% | ||||
Issuer | Coupon Rate | Principal Amount ($) | Value ($) | |
Uniform Mortgage-Backed Security TBA(c) | ||||
01/18/2039- 01/16/2054 | 3.000% | 5,970,000 | 5,325,295 | |
01/18/2039- 01/16/2054 | 3.500% | 7,150,000 | 6,615,599 | |
01/18/2039- 01/16/2054 | 4.000% | 6,150,000 | 5,862,272 | |
01/16/2054 | 4.500% | 7,650,000 | 7,415,121 | |
01/16/2054 | 5.000% | 4,000,000 | 3,957,188 | |
Total Residential Mortgage-Backed Securities - Agency (Cost $28,444,489) | 29,175,475 | |||
Call Option Contracts Purchased 0.0% | ||||
Value ($) | ||||
(Cost $54,253) | 60,300 | |||
Put Option Contracts Purchased 0.6% | ||||
(Cost $2,437,605) | 2,197,435 | |||
Money Market Funds 12.5% | ||
Shares | Value ($) | |
Columbia Short-Term Cash Fund, 5.569%(a),(d) | 49,725,663 | 49,715,718 |
Total Money Market Funds (Cost $49,702,113) | 49,715,718 | |
Total Investments in Securities (Cost: $364,335,095) | 424,227,023 | |
Other Assets & Liabilities, Net | (26,490,087 ) | |
Net Assets | 397,736,936 | |
Long futures contracts | ||||||
Description | Number of contracts | Expiration date | Trading currency | Notional amount | Value/Unrealized appreciation ($) | Value/Unrealized depreciation ($) |
S&P 500 Index E-mini | 46 | 03/2024 | USD | 11,086,000 | 340,335 | — |
U.S. Long Bond | 25 | 03/2024 | USD | 3,123,438 | 211,264 | — |
U.S. Treasury 2-Year Note | 26 | 03/2024 | USD | 5,353,766 | 58,864 | — |
Long futures contracts (continued) | ||||||
Description | Number of contracts | Expiration date | Trading currency | Notional amount | Value/Unrealized appreciation ($) | Value/Unrealized depreciation ($) |
U.S. Treasury 5-Year Note | 55 | 03/2024 | USD | 5,982,539 | 137,910 | — |
U.S. Treasury Ultra Bond | 25 | 03/2024 | USD | 3,339,844 | 266,762 | — |
Total | 1,015,135 | — | ||||
Short futures contracts | ||||||
Description | Number of contracts | Expiration date | Trading currency | Notional amount | Value/Unrealized appreciation ($) | Value/Unrealized depreciation ($) |
S&P 500 Index E-mini | (28) | 03/2024 | USD | (6,748,000 ) | — | (108,260 ) |
Call option contracts purchased | ||||||||
Description | Counterparty | Trading currency | Notional amount | Number of contracts | Exercise price/Rate | Expiration date | Cost ($) | Value ($) |
S&P 500 Index | Morgan Stanley | USD | 2,384,915 | 5 | 4,785.00 | 03/15/2024 | 54,253 | 60,300 |
Put option contracts purchased | ||||||||
Description | Counterparty | Trading currency | Notional amount | Number of contracts | Exercise price/Rate | Expiration date | Cost ($) | Value ($) |
S&P 500 Index | Morgan Stanley | USD | 27,188,031 | 57 | 3,550.00 | 06/20/2025 | 519,792 | 405,555 |
S&P 500 Index | Morgan Stanley | USD | 15,263,456 | 32 | 3,800.00 | 06/20/2025 | 302,673 | 305,920 |
S&P 500 Index | Morgan Stanley | USD | 16,217,422 | 34 | 3,650.00 | 06/20/2025 | 327,778 | 272,680 |
S&P 500 Index | Morgan Stanley | USD | 15,263,456 | 32 | 3,900.00 | 12/19/2025 | 457,072 | 460,800 |
S&P 500 Index | Morgan Stanley | USD | 15,263,456 | 32 | 3,800.00 | 12/19/2025 | 411,473 | 415,680 |
S&P 500 Index | Morgan Stanley | USD | 15,263,456 | 32 | 3,600.00 | 12/19/2025 | 418,817 | 336,800 |
Total | 2,437,605 | 2,197,435 | ||||||
Put option contracts written | ||||||||
Description | Counterparty | Trading currency | Notional amount | Number of contracts | Exercise price/Rate | Expiration date | Premium received ($) | Value ($) |
S&P 500 Index | Morgan Stanley | USD | (2,384,915 ) | (5 ) | 4,785.00 | 03/15/2024 | (53,747 ) | (45,150 ) |
Cleared credit default swap contracts - sell protection | ||||||||||||
Reference entity | Counterparty | Maturity date | Receive fixed rate (%) | Payment frequency | Implied credit spread (%)* | Notional currency | Notional amount | Value ($) | Upfront payments ($) | Upfront receipts ($) | Unrealized appreciation ($) | Unrealized depreciation ($) |
Markit CDX North America Investment Grade Index, Series 41 | Morgan Stanley | 12/20/2028 | 1.000 | Quarterly | 0.567 | USD | 11,000,000 | 59,484 | — | — | 59,484 | — |
(a) | As defined in the Investment Company Act of 1940, as amended, an affiliated company is one in which the Fund owns 5% or more of the company’s outstanding voting securities, or a company which is under common ownership or control with the Fund. The value of the holdings and transactions in these affiliated companies during the year ended December 31, 2023 are as follows: |
Affiliated issuers | Beginning of period($) | Purchases($) | Sales($) | Net change in unrealized appreciation (depreciation)($) | End of period($) | Capital gain distributions($) | Realized gain (loss)($) | Dividends — affiliated issuers ($) | End of period shares |
Columbia Short-Term Cash Fund, 5.569% | |||||||||
31,415,032 | 66,810,259 | (48,516,104 ) | 6,531 | 49,715,718 | — | 32 | 2,392,400 | 49,725,663 | |
Columbia Variable Portfolio – Disciplined Core Fund, Class 1 Shares | |||||||||
36,164,245 | 418,066 | (4,577,333 ) | 7,819,254 | 39,824,232 | — | 554,956 | — | 444,516 | |
Columbia Variable Portfolio – Intermediate Bond Fund, Class 1 Shares | |||||||||
51,602,314 | 4,085,854 | (2,814,691 ) | 2,861,858 | 55,735,335 | — | (767,862 ) | 1,215,970 | 6,488,397 | |
Columbia Variable Portfolio – Select Large Cap Equity Fund, Class 1 Shares | |||||||||
36,134,958 | 438,890 | (5,509,864 ) | 8,815,055 | 39,879,039 | — | 648,947 | — | 2,103,325 | |
CTIVP® – Principal Blue Chip Growth Fund, Class 1 Shares | |||||||||
30,190,056 | 190,644 | (7,790,696 ) | 10,742,612 | 33,332,616 | — | (19,691 ) | — | 564,864 | |
CTIVP® – T. Rowe Price Large Cap Value Fund, Class 1 Shares | |||||||||
30,532,920 | 1,583,065 | (1,697,589 ) | 2,921,616 | 33,340,012 | — | 74,206 | — | 950,129 | |
Variable Portfolio – Partners Core Bond Fund, Class 1 Shares | |||||||||
55,325,569 | 4,763,093 | (3,067,305 ) | 2,520,724 | 59,542,081 | — | (570,234 ) | 1,534,868 | 6,119,433 | |
Variable Portfolio – Partners Core Equity Fund, Class 1 Shares | |||||||||
63,362,654 | 886,254 | (8,278,497 ) | 13,877,415 | 69,847,826 | — | 914,885 | — | 1,875,109 | |
Total | 334,727,748 | 49,565,065 | 381,216,859 | — | 835,239 | 5,143,238 | |||
(b) | Non-income producing investment. |
(c) | Represents a security purchased on a when-issued basis. |
(d) | The rate shown is the seven-day current annualized yield at December 31, 2023. |
TBA | To Be Announced |
USD | US Dollar |
Level 1 ($) | Level 2 ($) | Level 3 ($) | Assets at NAV ($) | Total ($) | |
Investments in Securities | |||||
Equity Funds | — | — | — | 216,223,725 | 216,223,725 |
Exchange-Traded Fixed Income Funds | 11,576,954 | — | — | — | 11,576,954 |
Fixed Income Funds | — | — | — | 115,277,416 | 115,277,416 |
Residential Mortgage-Backed Securities - Agency | — | 29,175,475 | — | — | 29,175,475 |
Call Option Contracts Purchased | 60,300 | — | — | — | 60,300 |
Put Option Contracts Purchased | 2,197,435 | — | — | — | 2,197,435 |
Money Market Funds | 49,715,718 | — | — | — | 49,715,718 |
Total Investments in Securities | 63,550,407 | 29,175,475 | — | 331,501,141 | 424,227,023 |
Investments in Derivatives | |||||
Asset | |||||
Futures Contracts | 1,015,135 | — | — | — | 1,015,135 |
Swap Contracts | — | 59,484 | — | — | 59,484 |
Liability | |||||
Futures Contracts | (108,260 ) | — | — | — | (108,260 ) |
Put Option Contracts Written | (45,150 ) | — | — | — | (45,150 ) |
Total | 64,412,132 | 29,234,959 | — | 331,501,141 | 425,148,232 |
Assets | |
Investments in securities, at value | |
Unaffiliated issuers (cost $39,418,865) | $40,752,429 |
Affiliated issuers (cost $322,424,372) | 381,216,859 |
Option contracts purchased (cost $2,491,858) | 2,257,735 |
Cash | 1,473 |
Cash collateral held at broker for: | |
Option contracts written | 400,667 |
Margin deposits on: | |
Futures contracts | 1,246,400 |
Swap contracts | 277,293 |
Receivable for: | |
Investments sold | 300,425 |
Dividends | 217,830 |
Interest | 51,477 |
Variation margin for futures contracts | 25,126 |
Prepaid expenses | 3,857 |
Deferred compensation of board members | 25,549 |
Total assets | 426,777,120 |
Liabilities | |
Option contracts written, at value (premiums received $53,747) | 45,150 |
Payable for: | |
Investments purchased on a delayed delivery basis | 28,495,966 |
Capital shares redeemed | 353,441 |
Variation margin for futures contracts | 46,144 |
Variation margin for swap contracts | 8,733 |
Management services fees | 1,489 |
Distribution and/or service fees | 2,731 |
Service fees | 18,332 |
Compensation of chief compliance officer | 72 |
Compensation of board members | 1,064 |
Other expenses | 22,877 |
Deferred compensation of board members | 44,185 |
Total liabilities | 29,040,184 |
Net assets applicable to outstanding capital stock | $397,736,936 |
Represented by | |
Trust capital | $397,736,936 |
Total - representing net assets applicable to outstanding capital stock | $397,736,936 |
Class 1 | |
Net assets | $3,316 |
Shares outstanding | 233 |
Net asset value per share(a) | $14.26 |
Class 2 | |
Net assets | $397,733,620 |
Shares outstanding | 28,206,352 |
Net asset value per share | $14.10 |
(a) | Net asset value per share rounds to this amount due to fractional shares outstanding. |
Net investment income | |
Income: | |
Dividends — unaffiliated issuers | $464,296 |
Dividends — affiliated issuers | 5,143,238 |
Interest | 89,379 |
Total income | 5,696,913 |
Expenses: | |
Management services fees | 518,371 |
Distribution and/or service fees | |
Class 2 | 943,201 |
Service fees | 226,255 |
Custodian fees | 23,563 |
Printing and postage fees | 12,120 |
Accounting services fees | 30,090 |
Legal fees | 16,786 |
Interest on collateral | 160 |
Compensation of chief compliance officer | 75 |
Compensation of board members | 15,406 |
Deferred compensation of board members | 5,783 |
Other | 10,109 |
Total expenses | 1,801,919 |
Net investment income | 3,894,994 |
Realized and unrealized gain (loss) — net | |
Net realized gain (loss) on: | |
Investments — unaffiliated issuers | (2,083,168 ) |
Investments — affiliated issuers | 835,239 |
Futures contracts | 481,821 |
Option contracts purchased | (3,405,571 ) |
Option contracts written | (23,818 ) |
Swap contracts | 276,565 |
Net realized loss | (3,918,932 ) |
Net change in unrealized appreciation (depreciation) on: | |
Investments — unaffiliated issuers | 3,022,933 |
Investments — affiliated issuers | 49,565,065 |
Futures contracts | (565,605 ) |
Option contracts purchased | (326,177 ) |
Option contracts written | 8,597 |
Swap contracts | (19,301 ) |
Net change in unrealized appreciation (depreciation) | 51,685,512 |
Net realized and unrealized gain | 47,766,580 |
Net increase in net assets resulting from operations | $51,661,574 |
Year Ended December 31, 2023 | Year Ended December 31, 2022 | |
Operations | ||
Net investment income | $3,894,994 | $2,150,362 |
Net realized loss | (3,918,932 ) | (17,016,542 ) |
Net change in unrealized appreciation (depreciation) | 51,685,512 | (53,719,591 ) |
Net increase (decrease) in net assets resulting from operations | 51,661,574 | (68,585,771 ) |
Increase (decrease) in net assets from capital stock activity | (20,972,548 ) | 47,809,432 |
Total increase (decrease) in net assets | 30,689,026 | (20,776,339 ) |
Net assets at beginning of year | 367,047,910 | 387,824,249 |
Net assets at end of year | $397,736,936 | $367,047,910 |
Year Ended | Year Ended | |||
December 31, 2023 | December 31, 2022 | |||
Shares | Dollars ($) | Shares | Dollars ($) | |
Capital stock activity | ||||
Class 2 | ||||
Shares sold | 957,472 | 12,489,745 | 4,809,296 | 61,661,766 |
Shares redeemed | (2,575,649 ) | (33,462,293 ) | (1,070,788 ) | (13,852,334 ) |
Net increase (decrease) | (1,618,177 ) | (20,972,548 ) | 3,738,508 | 47,809,432 |
Total net increase (decrease) | (1,618,177 ) | (20,972,548 ) | 3,738,508 | 47,809,432 |
Net asset value, beginning of period | Net investment income | Net realized and unrealized gain (loss) | Total from investment operations | |
Class 1 | ||||
Year Ended 12/31/2023 | $12.42 | 0.17 | 1.67 | 1.84 |
Year Ended 12/31/2022 | $14.96 | 0.11 | (2.65 ) | (2.54 ) |
Year Ended 12/31/2021 | $13.18 | 0.08 | 1.70 | 1.78 |
Year Ended 12/31/2020 | $11.97 | 0.09 | 1.12 | 1.21 |
Year Ended 12/31/2019(d) | $10.75 | 0.10 | 1.12 | 1.22 |
Class 2 | ||||
Year Ended 12/31/2023 | $12.31 | 0.13 | 1.66 | 1.79 |
Year Ended 12/31/2022 | $14.87 | 0.08 | (2.64 ) | (2.56 ) |
Year Ended 12/31/2021 | $13.12 | 0.05 | 1.70 | 1.75 |
Year Ended 12/31/2020 | $11.95 | 0.06 | 1.11 | 1.17 |
Year Ended 12/31/2019 | $10.10 | 0.07 | 1.78 | 1.85 |
Notes to Financial Highlights | |
(a) | In addition to the fees and expenses that the Fund bears directly, the Fund indirectly bears a pro rata share of the fees and expenses of any other funds in which it invests. Such indirect expenses are not included in the Fund’s reported expense ratios. |
(b) | Total net expenses include the impact of certain fee waivers/expense reimbursements made by the Investment Manager and certain of its affiliates, if applicable. |
(c) | Ratios include interest on collateral expense which is less than 0.01%. |
(d) | Class 1 shares commenced operations on February 20, 2019. Per share data and total return reflect activity from that date. |
Net asset value, end of period | Total return | Total gross expense ratio to average net assets(a) | Total net expense ratio to average net assets(a),(b) | Net investment income ratio to average net assets | Portfolio turnover | Net assets, end of period (000’s) | |
Class 1 | |||||||
Year Ended 12/31/2023 | $14.26 | 14.81% | 0.24% (c) | 0.24% (c) | 1.30% | 115% | $3 |
Year Ended 12/31/2022 | $12.42 | (16.98% ) | 0.24% (c) | 0.24% (c) | 0.84% | 114% | $3 |
Year Ended 12/31/2021 | $14.96 | 13.51% | 0.23% (c) | 0.23% (c) | 0.57% | 113% | $3 |
Year Ended 12/31/2020 | $13.18 | 10.11% | 0.24% | 0.24% | 0.75% | 94% | $3 |
Year Ended 12/31/2019(d) | $11.97 | 11.35% | 0.25% | 0.25% | 1.02% | 24% | $3 |
Class 2 | |||||||
Year Ended 12/31/2023 | $14.10 | 14.54% | 0.48% (c) | 0.48% (c) | 1.03% | 115% | $397,734 |
Year Ended 12/31/2022 | $12.31 | (17.22% ) | 0.48% (c) | 0.48% (c) | 0.59% | 114% | $367,045 |
Year Ended 12/31/2021 | $14.87 | 13.34% | 0.48% (c) | 0.48% (c) | 0.32% | 113% | $387,821 |
Year Ended 12/31/2020 | $13.12 | 9.79% | 0.49% | 0.49% | 0.46% | 94% | $284,037 |
Year Ended 12/31/2019 | $11.95 | 18.32% | 0.52% | 0.52% | 0.61% | 24% | $186,201 |
Asset derivatives | ||
Risk exposure category | Statement of assets and liabilities location | Fair value ($) |
Credit risk | Component of trust capital — unrealized appreciation on swap contracts | 59,484 * |
Equity risk | Component of trust capital — unrealized appreciation on futures contracts | 340,335 * |
Equity risk | Investments, at value — Option contracts purchased | 2,257,735 |
Interest rate risk | Component of trust capital — unrealized appreciation on futures contracts | 674,800 * |
Total | 3,332,354 |
Liability derivatives | ||
Risk exposure category | Statement of assets and liabilities location | Fair value ($) |
Equity risk | Component of trust capital - unrealized depreciation on futures contracts | 108,260 * |
Equity risk | Option contracts written, at value | 45,150 |
Total | 153,410 |
* | Includes cumulative appreciation (depreciation) as reported in the tables following the Portfolio of Investments. Only the current day’s variation margin for futures and centrally cleared swaps, if any, is reported in receivables or payables in the Statement of Assets and Liabilities. |
Amount of realized gain (loss) on derivatives recognized in income | |||||
Risk exposure category | Futures contracts ($) | Option contracts purchased ($) | Option contracts written ($) | Swap contracts ($) | Total ($) |
Credit risk | — | — | — | 276,565 | 276,565 |
Equity risk | 1,718,297 | (3,405,571 ) | (23,818 ) | — | (1,711,092 ) |
Interest rate risk | (1,236,476 ) | — | — | — | (1,236,476 ) |
Total | 481,821 | (3,405,571 ) | (23,818 ) | 276,565 | (2,671,003 ) |
Change in unrealized appreciation (depreciation) on derivatives recognized in income | |||||
Risk exposure category | Futures contracts ($) | Option contracts purchased ($) | Option contracts written ($) | Swap contracts ($) | Total ($) |
Credit risk | — | — | — | (19,301 ) | (19,301 ) |
Equity risk | (1,325,490 ) | (326,177 ) | 8,597 | — | (1,643,070 ) |
Interest rate risk | 759,885 | — | — | — | 759,885 |
Total | (565,605 ) | (326,177 ) | 8,597 | (19,301 ) | (902,486 ) |
Derivative instrument | Average notional amounts ($) |
Futures contracts — long | 33,193,259 |
Futures contracts — short | 8,447,716 |
Credit default swap contracts — sell protection | 11,000,000 |
Derivative instrument | Average value ($) |
Option contracts purchased | 2,270,550 |
Option contracts written | (6,627 ) |
Morgan Stanley ($)(a) | Morgan Stanley ($)(a) | Total ($) | |
Assets | |||
Call option contracts purchased | 60,300 | - | 60,300 |
Put option contracts purchased | 2,197,435 | - | 2,197,435 |
Total assets | 2,257,735 | - | 2,257,735 |
Liabilities | |||
Centrally cleared credit default swap contracts (b) | - | 8,733 | 8,733 |
Put option contracts written | 45,150 | - | 45,150 |
Total liabilities | 45,150 | 8,733 | 53,883 |
Total financial and derivative net assets | 2,212,585 | (8,733 ) | 2,203,852 |
Total collateral received (pledged) (c) | - | (8,733 ) | (8,733 ) |
Net amount (d) | 2,212,585 | - | 2,212,585 |
(a) | Exposure can only be netted across transactions governed under the same master agreement with the same legal entity. |
(b) | Centrally cleared swaps are included within payable/receivable for variation margin in the Statement of Assets and Liabilities. |
(c) | In some instances, the actual collateral received and/or pledged may be more than the amount shown due to overcollateralization. |
(d) | Represents the net amount due from/(to) counterparties in the event of default. |
May 1, 2023 through April 30, 2024 | Prior to May 1, 2023 | |
Class 1 | 0.78 % | 0.79 % |
Class 2 | 1.03 | 1.04 |
Name, address, year of birth | Position held with the Columbia Funds and length of service | Principal occupation(s) during past five years and other relevant professional experience | Number of Funds in the Columbia Funds Complex* overseen | Other directorships held by Trustee during the past five years and other relevant Board experience |
George S. Batejan c/o Columbia Management Investment Advisers, LLC 290 Congress Street Boston, MA 02210 1954 | Trustee since 2017 | Executive Vice President, Global Head of Technology and Operations, Janus Capital Group, Inc., 2010-2016 | 161 | Former Chairman of the Board, NICSA (National Investment Company Services Association) (Executive Committee, Nominating Committee and Governance Committee), 2014-2016; former Director, Intech Investment Management, 2011-2016; former Board Member, Metro Denver Chamber of Commerce, 2015-2016; former Advisory Board Member, University of Colorado Business School, 2015-2018; former Board Member, Chase Bank International, 1993-1994 |
Kathleen Blatz c/o Columbia Management Investment Advisers, LLC 290 Congress Street Boston, MA 02210 1954 | Trustee since 2006 | Attorney, specializing in arbitration and mediation; Trustee of Gerald Rauenhorst 1982 Trusts, since 2020; Chief Justice, Minnesota Supreme Court, 1998-2006; Associate Justice, Minnesota Supreme Court, 1996-1998; Fourth Judicial District Court Judge, Hennepin County, 1994-1996; Attorney in private practice and public service, 1984-1993; State Representative, Minnesota House of Representatives, 1979-1993, which included service on the Tax and Financial Institutions and Insurance Committees; Member and Interim Chair, Minnesota Sports Facilities Authority, January-July 2017; Interim President and Chief Executive Officer, Blue Cross and Blue Shield of Minnesota (health care insurance), February-July 2018, April-October 2021 | 161 | Former Trustee, Blue Cross and Blue Shield of Minnesota, 2009-2021 (Chair of the Business Development Committee, 2014-2017; Chair of the Governance Committee, 2017-2019); former Member and Chair of the Board, Minnesota Sports Facilities Authority, January 2017-July 2017; former Director, Robina Foundation, 2009-2020 (Chair, 2014-2020); Director, Richard M. Schulze Family Foundation, since 2021 |
Name, address, year of birth | Position held with the Columbia Funds and length of service | Principal occupation(s) during past five years and other relevant professional experience | Number of Funds in the Columbia Funds Complex* overseen | Other directorships held by Trustee during the past five years and other relevant Board experience |
Pamela G. Carlton c/o Columbia Management Investment Advisers, LLC 290 Congress Street Boston, MA 02210 1954 | Chair since 2023; Trustee since 2007 | President, Springboard – Partners in Cross Cultural Leadership (consulting company), since 2003; Managing Director of US Equity Research, JP Morgan Chase, 1999-2003; Director of US Equity Research, Chase Asset Management, 1996-1999; Co-Director Latin America Research, 1993-1996, COO Global Research, 1992-1996, Co-Director of US Research, 1991-1992, Investment Banker, 1982-1991, Morgan Stanley; Attorney, Cleary Gottlieb Steen & Hamilton LLP, 1980-1982 | 161 | Trustee, New York Presbyterian Hospital Board, since 1996; Director, DR Bank (Audit Committee, since 2017 and Audit Committee Chair, since November 2023); Director, Evercore Inc. (Audit Committee, Nominating and Governance Committee) (financial services company), since 2019; Director, Apollo Commercial Real Estate Finance, Inc. (Chair, Nominating and Governance Committee), since 2021; the Governing Council of the Independent Directors Council (IDC), since 2021 |
Janet Langford Carrig c/o Columbia Management Investment Advisers, LLC 290 Congress Street Boston, MA 02210 1957 | Trustee since 1996 | Senior Vice President, General Counsel and Corporate Secretary, ConocoPhillips (independent energy company), September 2007-October 2018 | 161 | Director, EQT Corporation (natural gas producer), since 2019; former Director, Whiting Petroleum Corporation (independent oil and gas company), 2020-2022 |
J. Kevin Connaughton c/o Columbia Management Investment Advisers, LLC 290 Congress Street Boston, MA 02210 1964 | Trustee since 2020 | CEO and President, RhodeWay Financial (non-profit financial planning firm), since December 2022; Member, FINRA National Adjudicatory Council, January 2020-December 31, 2023; Adjunct Professor of Finance, Bentley University January 2018-April 2023; Consultant to Independent Trustees of CFVIT and CFST I from March 2016 to June 2020 with respect to CFVIT and to December 2020 with respect to CFST I; Managing Director and General Manager of Mutual Fund Products, Columbia Management Investment Advisers, LLC, May 2010-February 2015; President, Columbia Funds, 2008-2015; and senior officer of Columbia Funds and affiliated funds, 2003-2015 | 159 | Former Director, The Autism Project, March 2015-December 2021; former Member of the Investment Committee, St. Michael’s College, November 2015-February 2020; former Trustee, St. Michael’s College, June 2017-September 2019; former Trustee, New Century Portfolios (former mutual fund complex), January 2015-December 2017 |
Olive M. Darragh c/o Columbia Management Investment Advisers, LLC 290 Congress Street Boston, MA 02210 1962 | Trustee since 2020 | Managing Director of Darragh Inc. (strategy and talent management consulting firm), since 2010; Founder and CEO, Zolio, Inc. (investment management talent identification platform), since 2004; Consultant to Independent Trustees of CFVIT and CFST I from June 2019 to June 2020 with respect to CFVIT and to December 2020 with respect to CFST I; Partner, Tudor Investments, 2004-2010; Senior Partner, McKinsey & Company (consulting), 1990-2004; Touche Ross CPA, 1985-1988 | 159 | Treasurer, Edinburgh University US Trust Board, since January 2023; Member, HBS Community Action Partners Board, since September 2022; former Director, University of Edinburgh Business School (Member of US Board), 2004-2019; former Director, Boston Public Library Foundation, 2008-2017 |
Name, address, year of birth | Position held with the Columbia Funds and length of service | Principal occupation(s) during past five years and other relevant professional experience | Number of Funds in the Columbia Funds Complex* overseen | Other directorships held by Trustee during the past five years and other relevant Board experience |
Patricia M. Flynn c/o Columbia Management Investment Advisers, LLC 290 Congress Street Boston, MA 02210 1950 | Trustee since 2004 | Professor Emeritus of Economics and Management, Bentley University, since 2023; Professor of Economics and Management, Bentley University, 1976-2023; Dean, McCallum Graduate School of Business, Bentley University, 1992-2002 | 161 | Former Trustee, MA Taxpayers Foundation, 1997-2022; former Director, The MA Business Roundtable, 2003-2019; former Chairperson, Innovation Index Advisory Committee, MA Technology Collaborative, 1997-2020 |
Brian J. Gallagher c/o Columbia Management Investment Advisers, LLC 290 Congress Street Boston, MA 02210 1954 | Trustee since 2017 | Retired; Partner with Deloitte & Touche LLP and its predecessors, 1977-2016 | 161 | Trustee, Catholic Schools Foundation, since 2004 |
Douglas A. Hacker c/o Columbia Management Investment Advisers, LLC 290 Congress Street Boston, MA 02210 1955 | Trustee since 1996 | Independent business executive, since May 2006; Executive Vice President – Strategy of United Airlines, December 2002 - May 2006; President of UAL Loyalty Services (airline marketing company), September 2001-December 2002; Executive Vice President and Chief Financial Officer of United Airlines, July 1999-September 2001 | 161 | Director, SpartanNash Company since November 2013 (Chair of the Board, since May 2021) (food distributor); Director, Aircastle Limited (Chair of Audit Committee) (aircraft leasing), since August 2006; former Director, Nash Finch Company (food distributor), 2005-2013; former Director, SeaCube Container Leasing Ltd. (container leasing), 2010-2013; and former Director, Travelport Worldwide Limited (travel information technology), 2014-2019 |
Nancy T. Lukitsh c/o Columbia Management Investment Advisers, LLC 290 Congress Street Boston, MA 02210 1956 | Trustee since 2011 | Senior Vice President, Partner and Director of Marketing, Wellington Management Company, LLP (investment adviser), 1997-2010; Chair, Wellington Management Portfolios (commingled non-U.S. investment pools), 2007-2010; Director, Wellington Trust Company, NA and other Wellington affiliates, 1997-2010 | 159 | None |
Name, address, year of birth | Position held with the Columbia Funds and length of service | Principal occupation(s) during past five years and other relevant professional experience | Number of Funds in the Columbia Funds Complex* overseen | Other directorships held by Trustee during the past five years and other relevant Board experience |
David M. Moffett c/o Columbia Management Investment Advisers, LLC 290 Congress Street Boston, MA 02210 1952 | Trustee since 2011 | Retired; former Chief Executive Officer of Freddie Mac and Chief Financial Officer of U.S. Bank | 161 | Director, CSX Corporation (transportation suppliers); Director, PayPal Holdings Inc. (payment and data processing services); former Director, eBay Inc. (online trading community), 2007-2015; and former Director, CIT Bank, CIT Group Inc. (commercial and consumer finance), 2010-2016; former Senior Adviser to The Carlyle Group (financial services), March 2008-September 2008; former Governance Consultant to Bridgewater Associates, January 2013-December 2015 |
Catherine James Paglia c/o Columbia Management Investment Advisers, LLC 290 Congress Street Boston, MA 02210 1952 | Trustee since 2004 | Director, Enterprise Asset Management, Inc. (private real estate and asset management company), since September 1998; Managing Director and Partner, Interlaken Capital, Inc., 1989-1997; Vice President, 1982-1985, Principal, 1985-1987, Managing Director, 1987-1989, Morgan Stanley; Vice President, Investment Banking, 1980-1982, Associate, Investment Banking, 1976-1980, Dean Witter Reynolds, Inc. | 161 | Director, Valmont Industries, Inc. (irrigation systems manufacturer), since 2012; Trustee, Carleton College (on the Investment Committee), since 1987; Trustee, Carnegie Endowment for International Peace (on the Investment Committee), since 2009 |
Natalie A. Trunow c/o Columbia Management Investment Advisers, LLC 290 Congress Street Boston, MA 02210 1967 | Trustee since 2020 | Chief Executive Officer, Millennial Portfolio Solutions LLC (asset management and consulting services), January 2016-January 2021; Non-executive Member of the Investment Committee and Valuation Committee, Sarona Asset Management Inc. (private equity firm) since September 2019; Advisor, Horizon Investments (asset management and consulting services), August 2018-January 2022; Advisor, Paradigm Asset Management, November 2016-January 2022; Consultant to Independent Trustees of CFVIT and CFST I from September 2016 to June 2020 with respect to CFVIT and to December 2020 with respect to CFST I; Director of Investments/Consultant, Casey Family Programs, April 2016-November 2016; Senior Vice President and Chief Investment Officer, Calvert Investments, August 2008-January 2016; Section Head and Portfolio Manager, General Motors Asset Management, June 1997-August 2008 | 159 | Independent Director, Investment Committee, Health Services for Children with Special Needs, Inc., 2010-2021; Independent Director, (Executive Committee and Chair, Audit Committee), Consumer Credit Counseling Services (formerly Guidewell Financial Solutions), since 2016; Independent Director, (Investment Committee), Sarona Asset Management, since 2019 |
Sandra L. Yeager c/o Columbia Management Investment Advisers, LLC 290 Congress Street Boston, MA 02210 1964 | Trustee since 2017 | Retired; President and founder, Hanoverian Capital, LLC (SEC registered investment advisor firm), 2008-2016; Managing Director, DuPont Capital, 2006-2008; Managing Director, Morgan Stanley Investment Management, 2004-2006; Senior Vice President, Alliance Bernstein, 1990-2004 | 161 | Former Director, NAPE (National Alliance for Partnerships in Equity) Education Foundation, October 2016-October 2020; Advisory Board, Jennersville YMCA, June 2022-June 2023 |
Name, address, year of birth | Position held with the Columbia Funds and length of service | Principal occupation(s) during the past five years and other relevant professional experience | Number of Funds in the Columbia Funds Complex* overseen | Other directorships held by Trustee during the past five years and other relevant Board experience |
Daniel J. Beckman c/o Columbia Management Investment Advisers, LLC 290 Congress Street Boston, MA 02210 1962 | Trustee since November 2021 and President since June 2021 | President and Principal Executive Officer of the Columbia Funds, since June 2021; Vice President, Columbia Management Investment Advisers, LLC, since April 2015; formerly, Vice President – Head of North America Product, Columbia Management Investment Advisers, LLC, April 2015 – December 2023; President and Principal Executive Officer, Columbia Acorn/Wanger Funds, since July 2021 | 161 | Director, Ameriprise Trust Company, since October 2016; Director, Columbia Management Investment Distributors, Inc., since November 2018; Board of Governors, Columbia Wanger Asset Management, LLC, since January 2022 |
* | The term “Columbia Funds Complex” as used herein includes Columbia Seligman Premium Technology Growth Fund, Tri-Continental Corporation and each series of Columbia Funds Series Trust (CFST), Columbia Funds Series Trust I (CFST I), Columbia Funds Series Trust II (CFST II), Columbia ETF Trust I (CET I), Columbia ETF Trust II (CET II), Columbia Funds Variable Insurance Trust (CFVIT) and Columbia Funds Variable Series Trust II (CFVST II). Messrs. Batejan, Beckman, Gallagher, Hacker and Moffett and Mses. Blatz, Carlton, Carrig, Flynn, Paglia, and Yeager serve as directors of Columbia Seligman Premium Technology Growth Fund and Tri-Continental Corporation. |
** | Interested person (as defined under the 1940 Act) by reason of being an officer, director, security holder and/or employee of the Investment Manager or Ameriprise Financial. |
Name, address and year of birth | Position and year first appointed to position for any Fund in the Columbia Funds Complex or a predecessor thereof | Principal occupation(s) during past five years |
Michael G. Clarke 290 Congress Street Boston, MA 02210 1969 | Chief Financial Officer and Principal Financial Officer (2009); Senior Vice President (2019); Treasurer and Chief Accounting Officer (Principal Accounting Officer) (2024) for CFST, CFST I, CFST II, CFVIT and CFVST II | Senior Vice President and North America Head of Operations & Investor Services, Columbia Management Investment Advisers, LLC, since June 2023 (previously Senior Vice President and Head of Global Operations, March 2022 – June 2023, Vice President, Head of North America Operations, and Co-Head of Global Operations, June 2019 - February 2022 and Vice President – Accounting and Tax, May 2010 - May 2019); senior officer of Columbia Funds and affiliated funds, since 2002. Director, Ameriprise Trust Company, since June 2023. |
Name, address and year of birth | Position and year first appointed to position for any Fund in the Columbia Funds Complex or a predecessor thereof | Principal occupation(s) during past five years |
Marybeth Pilat 290 Congress Street Boston, MA 02210 1968 | Treasurer and Chief Accounting Officer (Principal Accounting Officer) and Principal Financial Officer (2020) for CET I and CET II; Assistant Treasurer, CFST, CFST I, CFST II, CFVIT and CFVST II | Vice President – Product Pricing and Administration, Columbia Management Investment Advisers, LLC, since May 2017. |
William F. Truscott 290 Congress Street Boston, MA 02210 1960 | Senior Vice President (2001) | Formerly, Trustee/Director of Columbia Funds Complex or legacy funds, November 2001 - January 1, 2021; Chief Executive Officer, Global Asset Management, Ameriprise Financial, Inc., since September 2012; Chairman of the Board and President, Columbia Management Investment Advisers, LLC, since July 2004 and February 2012, respectively; Chairman of the Board and Chief Executive Officer, Columbia Management Investment Distributors, Inc., since November 2008 and February 2012, respectively; Chairman of the Board and Director, TAM UK International Holdings Limited, since July 2021; formerly Chairman of the Board and Director, Threadneedle Asset Management Holdings, Sàrl, March 2013 – December 2022 and December 2008 – December 2022, respectively; senior executive of various entities affiliated with Columbia Threadneedle Investments. |
Christopher O. Petersen 5228 Ameriprise Financial Center Minneapolis, MN 55474 1970 | Senior Vice President and Assistant Secretary (2021) | Formerly, Trustee/Director of funds within the Columbia Funds Complex, July 1, 2020 - November 22, 2021; Senior Vice President and Assistant General Counsel, Ameriprise Financial, Inc., since September 2021 (previously Vice President and Lead Chief Counsel, January 2015 - September 2021); formerly, President and Principal Executive Officer of the Columbia Funds, 2015 - 2021; officer of Columbia Funds and affiliated funds, since 2007. |
Thomas P. McGuire 290 Congress Street Boston, MA 02210 1972 | Senior Vice President and Chief Compliance Officer (2012) | Vice President – Asset Management Compliance, Ameriprise Financial, Inc., since May 2010; Chief Compliance Officer, Columbia Acorn/Wanger Funds, since December 2015; formerly, Chief Compliance Officer, Ameriprise Certificate Company, September 2010 – September 2020. |
Ryan C. Larrenaga 290 Congress Street Boston, MA 02210 1970 | Senior Vice President (2017), Chief Legal Officer (2017), and Secretary (2015) | Vice President and Chief Counsel, Ameriprise Financial, Inc., since August 2018 (previously Vice President and Group Counsel, August 2011 - August 2018); Chief Legal Officer, Columbia Acorn/Wanger Funds, since September 2020; officer of Columbia Funds and affiliated funds, since 2005. |
Michael E. DeFao 290 Congress Street Boston, MA 02210 1968 | Vice President (2011) and Assistant Secretary (2010) | Vice President and Chief Counsel, Ameriprise Financial, Inc., since May 2010; Vice President, Chief Legal Officer and Assistant Secretary, Columbia Management Investment Advisers, LLC, since October 2021 (previously Vice President and Assistant Secretary, May 2010 – September 2021). |
Lyn Kephart-Strong 5903 Ameriprise Financial Center Minneapolis, MN 55474 1960 | Vice President (2015) | Vice President, Global Investment Operations Services, Columbia Management Investment Advisers, LLC, since 2010; President, Columbia Management Investment Services Corp., since October 2014; President, Ameriprise Trust Company, since January 2017. |
Item 2. Code of Ethics.
The registrant has adopted a code of ethics (the “Code”) that applies to the registrant’s principal executive officer, principal financial officer, principal accounting officer or controller, or persons performing similar functions, regardless of whether these individuals are employed by the registrant or a third party. During the period covered by this report, there were not any amendments to a provision of the Code that relates to any element of the code of ethics definition enumerated in paragraph (b) of Item 2 of Form N-CSR. During the period covered by this report, there were no waivers, including any implicit waivers, from a provision of the Code that relates to one or more of the items set forth in paragraph (b) of Item 2 of Form N-CSR. A copy of the Code is attached hereto.
Item 3. Audit Committee Financial Expert.
The registrant’s Board of Trustees has determined that David M. Moffett, Brian J. Gallagher, J. Kevin Connaughton, Sandra L. Yeager, and Douglas A. Hacker, each of whom are members of the registrant’s Board of Trustees and Audit Committee, each qualify as an audit committee financial expert. Mr. Moffett, Mr. Gallagher, Mr. Connaughton, Ms. Yeager, and Mr. Hacker are each independent trustees, as defined in paragraph (a)(2) of this item’s instructions.
Item 4. Principal Accountant Fees and Services.
Fee information below is disclosed for the series of the relevant registrant whose reports to shareholders are included in this annual filing.
(a) Audit Fees. Aggregate Audit Fees billed by the principal accountant for professional services rendered during the fiscal years ended December 31, 2023 and December 31, 2022 are approximately as follows:
2023 | 2022 |
$421,800 | $413,500 |
Audit Fees include amounts related to the audit of the registrant’s annual financial statements or services that are normally provided by the accountant in connection with statutory and regulatory filings or engagements for those fiscal years.
(b) Audit-Related Fees. Aggregate Audit-Related Fees billed to the registrant by the principal accountant for professional services rendered during the fiscal years ended December 31, 2023 and December 31, 2022 are approximately as follows:
2023 | 2022 |
$0 | $0 |
Audit-Related Fees, if any, include amounts for assurance and related services by the principal accountant that are reasonably related to the performance of the audit of the registrant’s financial statements and are not reported in Audit Fees above.
During the fiscal years ended December 31, 2023 and December 31, 2022, there were no Audit-Related Fees billed by the registrant’s principal accountant to the registrant’s investment adviser (not including any sub-adviser whose role is primarily portfolio management and is subcontracted with or overseen by another investment adviser) and any entity controlling, controlled by, or under common control with the adviser that provides ongoing services to the registrant for an engagement that related directly to the operations and financial reporting of the registrant.
(c) Tax Fees. Aggregate Tax Fees billed by the principal accountant to the registrant for professional services rendered during the fiscal years ended December 31, 2023 and December 31, 2022 are approximately as follows:
2023 | 2022 |
$177,800 | $193,700 |
Tax Fees include amounts for the review of annual tax returns, the review of required shareholder distribution calculations and typically include amounts for professional services by the principal accountant for tax compliance, tax advice and tax planning. Fiscal years 2022 and 2023 also include tax fees for foreign tax filings.
During the fiscal years ended December 31, 2023 and December 31, 2022, there were no Tax Fees billed by the registrant’s principal accountant to the registrant’s investment adviser (not including any sub-adviser whose role is primarily portfolio management and is subcontracted with or overseen by another investment adviser) and any entity controlling, controlled by, or under common control with the adviser that provides ongoing services to the registrant for an engagement that related directly to the operations and financial reporting of the registrant.
(d) All Other Fees. Aggregate All Other Fees billed by the principal accountant to the registrant for professional services rendered during the fiscal years ended December 31, 2023 and December 31, 2022 are approximately as follows:
2023 | 2022 |
$0 | $0 |
All Other Fees, if any, include amounts for products and services provided by the principal accountant, other than the services reported in paragraphs (a) through (c) above.
Aggregate All Other Fees billed by the registrant’s principal accountant to the registrant’s investment adviser (not including any sub-adviser whose role is primarily portfolio management and is subcontracted with or overseen by another investment adviser) and any entity controlling, controlled by, or under common control with the adviser that provides ongoing services to the registrant for an engagement that related directly to the operations and financial reporting of the registrant during the fiscal years ended December 31, 2023 and December 31, 2022 are approximately as follows:
2023 | 2022 |
$557,000 | $535,000 |
In fiscal years 2023 and 2022, All Other Fees primarily consists of fees billed for internal control examinations of the registrant’s transfer agent and investment adviser.
(e)(1) Audit Committee Pre-Approval Policies and Procedures
The registrant’s Audit Committee is required to pre-approve the engagement of the registrant’s independent auditors to provide audit and non-audit services to the registrant and non-audit services to its investment adviser (excluding any sub-adviser whose role is primarily portfolio management and is sub-contracted or overseen by another investment adviser (the “Adviser”) or any entity controlling, controlled by or under common control with the Adviser that provides ongoing services to the Fund (a “Control Affiliate”) if the engagement relates directly to the operations and financial reporting of the registrant.
The Audit Committee has adopted a Policy for Engagement of Independent Auditors for Audit and Non-Audit Services (the “Policy”). The Policy sets forth the understanding of the Audit Committee regarding the engagement of the registrant’s independent accountants to provide (i) audit and permissible audit-related, tax and other services to the registrant (“Fund Services”); (ii) non-audit services to the registrant’s Adviser and any Control Affiliates, that relates directly to the operations and financial reporting of a Fund (“Fund-related Adviser Services”); and (iii) certain other audit and non-audit services to the registrant’s Adviser and its Control Affiliates. A service will require specific pre-approval by the Audit Committee if it is to be provided by the Fund’s independent auditor; provided, however, that pre-approval of non-audit services to the Fund, the Adviser or Control Affiliates may be waived if certain de minimis requirements set forth in the SEC’s rules are met.
Under the Policy, the Audit Committee may delegate pre-approval authority to any pre-designated member or members who are independent board members. The member(s) to whom such authority is delegated must report, for informational purposes only, any pre-approval decisions to the Audit Committee at its next regular meeting. The Audit Committee's responsibilities with respect to the pre-approval of services performed by the independent auditor may not be delegated to management.
On an annual basis, at a regularly scheduled Audit Committee meeting, the Fund’s Treasurer or other Fund officer shall submit to the Audit Committee a schedule of the types of Fund Services and Fund-related Adviser Services that are subject to specific pre-approval. This schedule will provide a description of each type of service that is subject to specific pre-approval, along with total projected fees for each service. The pre-approval will generally cover a one-year period. The Audit Committee will review and approve the types of services and the projected fees for the next one-year period and may add to, or subtract from, the list of pre-approved services from time to time, based on subsequent determinations. This specific approval acknowledges that the Audit Committee is in agreement with the specific types of services that the independent auditor will be permitted to perform and the projected fees for each service.
The Fund’s Treasurer or other Fund officer shall report to the Audit Committee at each of its regular meetings regarding all Fund Services or Fund-related Adviser Services provided since the last such report was rendered, including a description of the services, by category, with forecasted fees for the annual reporting period, proposed changes requiring specific pre-approval and a description of services provided by the independent auditor, by category, with actual fees during the current reporting period.
*****
(e)(2) None, or 0%, of the Audit-Related Fees, Tax Fees and All Other Fees paid by the Fund or affiliated entities relating directly to the operations and financial reporting of the Registrant disclosed above were approved by the audit committee pursuant to paragraphs (c)(7)(i)(C) of Rule 2-01 of Regulation S-X (which permits audit committee approval after the start of the engagement with respect to services other than audit, review or attest services, if certain conditions are satisfied).
(f) Not applicable.
(g) The aggregate non-audit fees billed by the registrant’s accountant for services rendered to the registrant, and rendered to the registrant’s investment adviser (not including any sub-adviser whose role is primarily portfolio management and is subcontracted with or overseen by another investment adviser), and any entity controlling, controlled by, or under common control with the adviser that provides ongoing services to the registrant for the fiscal years ended December 31, 2023 and December 31, 2022 are approximately as follows:
2023 | 2022 |
$734,800 | $728,700 |
(h) The registrant’s Audit Committee of the Board of Directors has considered whether the provision of non-audit services that were rendered to the registrant’s adviser (not including any sub-adviser whose role is primarily portfolio management and is subcontracted with or overseen by another investment adviser), and any entity controlling, controlled by, or under common control with the investment adviser that provides ongoing services to the registrant that were not pre-approved pursuant to paragraph (c)(7)(ii) of Rule 2-01 of Regulation S-X, is compatible with maintaining the principal accountant’s independence.
(i) Not applicable.
(j) Not applicable.
Item 5. Audit Committee of Listed Registrants.
Not applicable.
Item 6. Investments
(a) | The registrant’s “Schedule I – Investments in securities of unaffiliated issuers” (as set forth in 17 CFR 210.12-12) is included in Item 1 of this Form N-CSR. |
(b) | Not applicable. |
Item 7. Disclosure of Proxy Voting Policies and Procedures for Closed-End Management Investment Companies.
Not applicable.
Item 8. Portfolio Managers of Closed-End Management Investment Companies.
Not applicable.
Item 9. Purchases of Equity Securities by Closed-End Management Investment Company and Affiliated Purchasers.
Not applicable.
Item 10. Submission of Matters to a Vote of Security Holders.
There were no material changes to the procedures by which shareholders may recommend nominees to the registrant's board of directors.
Item 11. Controls and Procedures.
(a) | The registrant’s principal executive officer and principal financial officer, based on their evaluation of the registrant’s disclosure controls and procedures as of a date within 90 days of the filing of this report, have concluded that such controls and procedures are adequately designed to ensure that information required to be disclosed by the registrant in Form N-CSR is accumulated and communicated to the registrant’s management, including the principal executive officer and principal financial officer, or persons performing similar functions, as appropriate to allow timely decisions regarding required disclosure. |
(b) | There was no change in the registrant's internal control over financial reporting that occurred during the period covered by this report that has materially affected, or is reasonably likely to materially affect, the registrant's internal control over financial reporting. |
Item 12. Disclosure of Securities Lending Activities for Closed-End Management Investment Companies
Not applicable.
Item 13. Exhibits.
SIGNATURES
Pursuant to the requirements of the Securities Exchange Act of 1934 and the Investment Company Act of 1940, the registrant has duly caused this report to be signed on its behalf by the undersigned, thereunto duly authorized.
(registrant) | Columbia Funds Variable Insurance Trust |
|
|
By (Signature and Title) | /s/ Daniel J. Beckman |
| Daniel J. Beckman, President and Principal Executive Officer |
|
|
Date | February 22, 2024 |
|
|
|
|
Pursuant to the requirements of the Securities Exchange Act of 1934 and the Investment Company Act of 1940, this report has been signed below by the following persons on behalf of the registrant and in the capacities and on the dates indicated.
By (Signature and Title) | /s/ Daniel J. Beckman |
| Daniel J. Beckman, President and Principal Executive Officer |
|
|
Date | February 22, 2024 |
By (Signature and Title) | /s/ Michael G. Clarke |
| Michael G. Clarke, Chief Financial Officer, |
| Principal Financial Officer and Senior Vice President |
|
|
Date | February 22, 2024 |
By (Signature and Title) | /s/ Joseph Beranek |
| Joseph Beranek, Treasurer, Chief Accounting |
| Officer and Principal Financial Officer |
|
|
Date | February 22, 2024 |